Impact of severe forest dieback caused by Phytophthora cinnamomi on macrofungal diversity in the...
8
Impact of severe forest dieback caused by Phytophthora cinnamomi on macrofungal diversity in the northern jarrah forest of Western Australia Prue Anderson a , Mark Brundrett a, *, Pauline Grierson a , Richard Robinson b a School of Plant Biology, University of Western Australia, 35 Stirling Highway, Crawley 6009, Western Australia, Australia b Science Division, Department of Environment and Conservation, Manjimup 6258, Western Australia, Australia 1. Introduction Jarrah forest is dominated by jarrah (Eucalyptus marginata Donn ex Sm.) and mari (Corymbia calophylla Lindl.), which are eucalypt trees. This ecosystem covers about 4.5 million ha in southwestern Australia (Environmental Protection Authority, 2007). A type of severe forest decline (dieback), caused by Phytophthora cinnamomi Rands, is a major environmental problem that has severe impacts on the health of jarrah forest, woodlands and coastal heath in this region. P. cinnamomi is an exotic soil borne pathogen that kills plants by rotting the root system and lower stem tissues which restricts the plant’s ability to uptake water and nutrients (Shearer et al., 2004; D’Souza et al., 2005). Plants native to southwest Western Australia (WA) did not evolve with P. cinnamomi and many are highly susceptible to infection. Dieback of vegetation linked to Phytophthora is considered to be one of the major threats to biodiversity in this region (McDougall et al., 2002; D’Souza et al., 2005; Hardham, 2005). It is estimated that 15–20% of the jarrah forest is infested with P. cinnamomi, with the most severe impacts occurring in highest rainfall areas (Department of Environment and Conservation, 2006). Substantial knowledge has been obtained by research on the effect of dieback on vegetation structure and species composition in the jarrah forest (Shearer and Dillon, 1996; McDougall et al., 2002; Hardham, 2005; Department of Environment and Conservation, 2007) and there is some data on indirect impacts on animals (Garkaklis et al., 2004). In the northern jarrah forest, 33% of the flora is susceptible to P. cinnamomi and dieback causes major changes in floral community structure and composition due to loss of prevalent species such as jarrah and Banksia grandis Willd. (McDougall et al., 2005; Department of Environment and Conservation, 2006). McDougall et al. (2005) observed that the dominant overstorey species are killed by dieback leaving scattered marri (C. calophylla) with a sparse herbaceous understorey, resulting in a massive reduction in primary productivity. McDougall et al. (2002) suggest that death of susceptible canopy species may affect understorey plants that are not susceptible to P. cinnamomi infection but are reliant on canopy cover of the dominants. It is estimated that over 12,000 species of larger fungi (macrofungi) occur in Australia, but only about 25% of these have Forest Ecology and Management 259 (2010) 1033–1040 ARTICLE INFO Article history: Received 21 October 2009 Received in revised form 15 December 2009 Accepted 15 December 2009 Keywords: Phytophthora cinnamomi dieback Forest decline Ectomycorrhizal fungi Saprophytic fungi Jarrah forest Litter Mediterranean ecosystem ABSTRACT The relative diversity and abundance of different functional groups of macrofungi were investigated in the northern jarrah forest, a mediterranean climate sclerophyllous forest dominated by eucalyptus trees in Western Australia. We sampled paired sites that were either severely affected by dieback, a disease caused by Phytophthora cinnamomi which causes selective plant mortality, or unaffected by this type of forest decline. Macrofungi were sampled 3 times during the growing season along six 100 m 2m transects in these sites. Dieback-unaffected sites were found to have significantly different macrofungal floras than unaffected sites. Macrofungal abundance and diversity were approximately 1.5 times and 1.8 times greater respectively in dieback-unaffected sites than in severely affected sites. Dieback-affected sites had a similar diversity of saprotrophic and ectomycorrhizal fungi, whereas more fungal taxa on dieback-unaffected sites were mycorrhizal (>60%). Dung fungi were the most common saprophytes, especially in dieback-affected sites, but abundance data greatly overestimated the importance of these relatively small fungi. We concluded that vegetation changes linked to dieback had a negative effect on fungal community structure and biodiversity in the northern jarrah forest, in a similar manner to other forms of severe disturbance. Conversely, high tree mortality increased the abundance of wood decay fungi, at least in the short term. We expect that reductions in macrofungal species richness were indirectly linked to impacts on mycorrhizal host plants and saprotrophic substrates. Our data show that changes in vegetation composition had the greatest effect on ectomycorrhizal fungi, presumably due to their obligate symbiotic associations. ß 2010 Elsevier B.V. All rights reserved. * Corresponding author. E-mail address: [email protected] (M. Brundrett). Contents lists available at ScienceDirect Forest Ecology and Management journal homepage: www.elsevier.com/locate/foreco 0378-1127/$ – see front matter ß 2010 Elsevier B.V. All rights reserved. doi:10.1016/j.foreco.2009.12.015
Transcript of Impact of severe forest dieback caused by Phytophthora cinnamomi on macrofungal diversity in the...

Impact of severe forest dieback caused by Phytophthora cinnamomi onmacrofungal diversity in the northern jarrah forest of Western Australia
Prue Anderson a, Mark Brundrett a,*, Pauline Grierson a, Richard Robinson b
a School of Plant Biology, University of Western Australia, 35 Stirling Highway, Crawley 6009, Western Australia, Australiab Science Division, Department of Environment and Conservation, Manjimup 6258, Western Australia, Australia
Forest Ecology and Management 259 (2010) 1033–1040
A R T I C L E I N F O
Article history:
Received 21 October 2009
Received in revised form 15 December 2009
Accepted 15 December 2009
Keywords:
Phytophthora cinnamomi dieback
Forest decline
Ectomycorrhizal fungi
Saprophytic fungi
Jarrah forest
Litter
Mediterranean ecosystem
A B S T R A C T
The relative diversity and abundance of different functional groups of macrofungi were investigated in
the northern jarrah forest, a mediterranean climate sclerophyllous forest dominated by eucalyptus trees
in Western Australia. We sampled paired sites that were either severely affected by dieback, a disease
caused by Phytophthora cinnamomi which causes selective plant mortality, or unaffected by this type of
forest decline. Macrofungi were sampled 3 times during the growing season along six 100 m � 2 m
transects in these sites. Dieback-unaffected sites were found to have significantly different macrofungal
floras than unaffected sites. Macrofungal abundance and diversity were approximately 1.5 times and 1.8
times greater respectively in dieback-unaffected sites than in severely affected sites. Dieback-affected
sites had a similar diversity of saprotrophic and ectomycorrhizal fungi, whereas more fungal taxa on
dieback-unaffected sites were mycorrhizal (>60%). Dung fungi were the most common saprophytes,
especially in dieback-affected sites, but abundance data greatly overestimated the importance of these
relatively small fungi. We concluded that vegetation changes linked to dieback had a negative effect on
fungal community structure and biodiversity in the northern jarrah forest, in a similar manner to other
forms of severe disturbance. Conversely, high tree mortality increased the abundance of wood decay
fungi, at least in the short term. We expect that reductions in macrofungal species richness were
indirectly linked to impacts on mycorrhizal host plants and saprotrophic substrates. Our data show that
changes in vegetation composition had the greatest effect on ectomycorrhizal fungi, presumably due to
their obligate symbiotic associations.
� 2010 Elsevier B.V. All rights reserved.
Contents lists available at ScienceDirect
Forest Ecology and Management
journa l homepage: www.e lsevier .com/ locate / foreco
1. Introduction
Jarrah forest is dominated by jarrah (Eucalyptus marginata Donnex Sm.) and mari (Corymbia calophylla Lindl.), which are eucalypttrees. This ecosystem covers about 4.5 million ha in southwesternAustralia (Environmental Protection Authority, 2007). A type ofsevere forest decline (dieback), caused by Phytophthora cinnamomi
Rands, is a major environmental problem that has severe impactson the health of jarrah forest, woodlands and coastal heath in thisregion. P. cinnamomi is an exotic soil borne pathogen that killsplants by rotting the root system and lower stem tissues whichrestricts the plant’s ability to uptake water and nutrients (Sheareret al., 2004; D’Souza et al., 2005). Plants native to southwestWestern Australia (WA) did not evolve with P. cinnamomi andmany are highly susceptible to infection. Dieback of vegetationlinked to Phytophthora is considered to be one of the major threatsto biodiversity in this region (McDougall et al., 2002; D’Souza et al.,2005; Hardham, 2005). It is estimated that 15–20% of the jarrah
* Corresponding author.
E-mail address: [email protected] (M. Brundrett).
0378-1127/$ – see front matter � 2010 Elsevier B.V. All rights reserved.
doi:10.1016/j.foreco.2009.12.015
forest is infested with P. cinnamomi, with the most severe impactsoccurring in highest rainfall areas (Department of Environmentand Conservation, 2006).
Substantial knowledge has been obtained by research on theeffect of dieback on vegetation structure and species composition inthe jarrah forest (Shearer and Dillon, 1996; McDougall et al., 2002;Hardham, 2005; Department of Environment and Conservation,2007) and there is some data on indirect impacts on animals(Garkaklis et al., 2004). In the northern jarrah forest, 33% of the florais susceptible to P. cinnamomi and dieback causes major changes infloral community structure and composition due to loss of prevalentspecies such as jarrah and Banksia grandis Willd. (McDougall et al.,2005; Department of Environment and Conservation, 2006).McDougall et al. (2005) observed that the dominant overstoreyspecies are killed by dieback leaving scattered marri (C. calophylla)with a sparse herbaceous understorey, resulting in a massivereduction in primary productivity. McDougall et al. (2002) suggestthat death of susceptible canopy species may affect understoreyplants that are not susceptible to P. cinnamomi infection but arereliant on canopy cover of the dominants.
It is estimated that over 12,000 species of larger fungi(macrofungi) occur in Australia, but only about 25% of these have

Fig. 1. Contrasting appearance of dieback-unaffected (A) and -affected (B) transects
at the Myara Rd site.
Fig. 2. Temperature and rainfall data for the year when sampling occurred (2007)
and the 44-year average rainfall at the Myara Forest Block. Observations from
Karnet Rehabilitation Center, approximately 4 km north of the study site
(www.bom.gov.au).
P. Anderson et al. / Forest Ecology and Management 259 (2010) 1033–10401034
been named (Chapman, 2005). Macrofungi play major roles indecomposition and nutrient cycling, contribute to soil structureand health and fruit bodies provide a food resource for nativefauna, such as potoroos and woylies (Fitter and Garbaye, 1993;Claridge and May, 1994; Maser et al., 2008). Mycorrhizas enhancewater and nutrient uptake (especially phosphorus, zinc andcopper) for the majority of plants and in return fungi gain energyfrom the plants, but can also protect roots in adverse soilconditions such as low pH and high soil temperature (Smith andRead, 1997; Brundrett, 2004). The majority of jarrah forest plantsrely on mycorrhizal associations with fungi for survival, butcarnivorous plants, parasitic plants and those with non-mycor-rhizal cluster roots are also very important in the nutrient poorsoils of Western Australia (Lamont, 1982; Brundrett and Abbott,1991; Lambers et al., 2006; Brundrett, 2009). The diversity of fungiin jarrah forest sites has been investigated in rehabilitated areasfollowing bauxite mining (Gardner and Malajczuk, 1988; Glenet al., 2008) and in a broader context by the Forestcheckmonitoring program (Department of Environment and Conserva-tion, 2003–2007). Despite their high ecological significance injarrah forest ecosystems, there have been no prior studies on theimpacts that forest decline caused by dieback disease may have onfungal communities.
We postulate that there are likely to be substantial indirectimpacts of dieback disease on the diversity and abundance ofjarrah forest macrofungi, particularly on those species that formmycorrhizal associations with susceptible plant species. Converse-ly, fungi that decompose the remains of dead plants may benefitfrom dieback, at least in the short term. The aim of this project wasto compare the diversity and composition of macrofungi onseverely dieback affected and adjacent unaffected sites in order toinvestigate the impact that jarrah forest dieback caused by P.
cinnamomi may have on macrofungal communities in the northernjarrah forest. Paired dieback-affected and -unaffected areas werestudied by measuring: (i) macrofungal abundance and biodiversityon transects, (ii) relative dominance of mycorrhizal and sapro-trophic fungi fruiting on different substrates, (iii) changes tovegetation structure and composition and the relative dominanceof plants with mycorrhizal associations and those without, (iv)interrelationships between fungal and plant diversity and (v) littercover and soil chemistry.
2. Materials and methods
2.1. Study sites
Three sites located in similar vegetation within 5 km of eachother were established in Myara forest block which is approxi-mately 60 km southeast of Perth (Fig. 1). These locations wereidentified in previous studies of the impacts of P. cinnamomi onvegetation in the jarrah forest by McDougall et al. (2002, 2005)who confirmed the presence of dieback disease using baitingtechniques. Myara Rd, Berkeley Rd and North Rd sites were chosenfor wet season accessibility to adjacent dieback-affected and -unaffected jarrah forest (referred to as paired sites here). Dieback-unaffected forest was defined as areas without visible impacts onvegetation structure or composition (i.e. totally symptom free)(Fig. 1). GPS coordinates for each site were as follows: North Rd3282901300S and 1168502300E, Berkeley Rd 3282802300S and11682802300S, Myara Rd 3282705800S and 116830100E.
The study sites have a mediterranean climate, characterized bycool, wet winters and hot, dry summers (Fig. 2). The mean annualrainfall for this area is 1170 mm, with the majority of rainfalloccurring from April to October (Fig. 2), but during this study thestudy sites received below average rainfall (Bureau of Meteorology,2007). The maximum rainfall during the study period occurred
from June to July, when the majority of macrofungi fruit in WA(Fig. 2).
All three sites were on gravelly sandy loam over lateriticduricrust and were level or had gentle slopes (<108). The dieback-unaffected transect at the Berkeley Rd site had a dominant jarrahoverstorey with a dense understorey including Macrozamia riedei
Gaudich., Xanthorrhoea preissii Endl., Bossiaea aquifolium Benth.,Thomasia triphylla Labill. and Clematis pubescens Endl. The adjacentdieback-affected transect was lower in the landscape, and parallelwith a seasonal creek line. A sparse overstorey was dominated bymarri with an open herbaceous understorey including B. aquifo-
lium, Phyllanthus calycinus Labill., Hypocalymma angustifolium Endl.and Trymalium ledifolium Fenzl.
The dieback-unaffected transect at the North Rd site wasdominated by jarrah and B. grandis with a dense understorey of B.
aquifolium and other shrubs and herbs. The adjacent dieback-affected transect was on a gravelly slope and had a sparse

P. Anderson et al. / Forest Ecology and Management 259 (2010) 1033–1040 1035
overstorey of marri and an open herbaceous understorey includingConostylis sp., B. aquifolium, Banksia dallanneyi (formerly Dryandra
lindleyana) and H. angustifolium.The dieback-unaffected transect at the Myara Rd site had a
mixed dominant overstorey of jarrah, Xylomelum occidentale R. Br.and B. grandis Willd. and an open understorey (Fig. 1) includingConostylis sp., Adenanthos barbiger Lindl., Lomandra sp., Hibbertia
diamesogenos Steud., Gompholobium sp. and X. preissii. The adjacentdieback-affected transect was on an exposed gravelly hillside witha sparse overstorey of marri and an open understorey dominatedby B. dallanneyi, Conostylis sp., H. diamesogenos and Lepidosperma
sp. (Fig. 1). All plant names are consistent with Florabase(florabase.calm.wa.gov.au, accessed February 2009).
2.2. Sampling design
At Myara Rd, North Rd and Berkeley Rd sites paired100 m � 2 m transects were established in areas with severeforest decline symptoms and adjacent symptomless areas. Thesepaired transects are referred to as dieback-affected and unaffectedhere. Dieback-affected transects were located near the centre ofpatches where dieback has been slowly spreading for many yearsand which displayed prominent tree and understorey death, asestablished by the detailed studies of McDougall et al. (2005).Unaffected transects were positioned well in advance of thedisease front, which was visible due to recent jarrah and Banksia
deaths and other susceptible plants showing symptoms of diseaseadjacent to healthy vegetation. All of the sites were sampled 3times, approximately every fortnight for two months in the earlywinter (22/6/07, 10/7/07 and 25/7/07). On each of the six transects,all visible fresh fungal fruit bodies were counted and photographedin situ. The transect positions and abundance of each macrofunguscategory was recorded. Where possible taxa were identified in thefield, but some fungal categories could not be identifiedimmediately, so were sampled for examination in the laboratoryto determine their identity (see below).
2.3. Vegetation surveys
For each transect, 1 m2 quadrats at 10 m intervals were used toestimate overstorey cover, understorey cover, coarse woodydebris, litter depth and litter cover. Overstorey cover was alsoestimated to the nearest 10% for every 10 m � 1 m block thenaveraged for each transect. Percentage cover of individual specieswere identified and recorded for each transect and furthercategorized into mycorrhizal and non-mycorrhizal plants byreferring to Brundrett and Abbott (1991) and the lists of Australianhost plants at mycorrhizas.info (Brundrett, 2008). Root sampleswere also collected to assess the mycorrhizal status of someadditional plants and confirmed using a standard clearing andstaining protocol with 10% KOH and Trypan blue in lacto-glycerolfollowed by microscopic assessment (Brundrett et al., 1996).
2.4. Identification of macrofungi
Macrofungi were selected as the focus for this study as theyproduce readily visible fruit bodies (mushrooms, puffballs, coral,bracket fungi, etc.) that can be relatively easily counted andcollected. Hypogeal macrofungi were only opportunisticallysampled to avoid major disturbance to transects. Macrofungiwere assigned to species where possible, and otherwise assigned tomorphotypes within genera. Morphotypes were defined by a shortdescription (e.g. Cortinarius sp. ‘chestnut’) and species groups (e.g.Cortinarius spp. 7 – ‘small brown’). Many of the taxa encounteredwere unnamed but familiar from other studies on jarrah forestfungi (R. Robinson, pers. comm.). A list of fungal names and
corresponding herbarium voucher specimen numbers for many ofthese fungi are provided by Robinson and Tunsell (2007) andreports from other monitoring within jarrah forest (Department ofEnvironment and Conservation, 2003–2007). Voucher collectionsfor some of the less-common species encountered during thissurvey were also lodged at the Perth Herbarium. Saprophytic fungiwere assigned to ecological categories based on their substrate andectomycorrhizal fungi were assigned based on the list of familiesand genera of these fungi at mycorrhizas.info (Brundrett, 2008).
The average diameter of fruit bodies was measured for eachspecies to compensate for the relative size of fungi, since somefungi had numerous small fruit bodies while others produced a fewlarger fruit bodies. This ‘‘fruiting effort’’ data was used as a scalingfactor for abundance data to provide more representative values.
2.5. Soil analysis
Soil samples were taken at the beginning and then every 20 malong each transect. Percent moisture (wet soil weight–dryweight) was determined. Labile inorganic nitrogen was extractedusing the method of Rayment and Higginson (1992). Nitrate(NO3
�) and ammonium (NH4+) were analysed using auto analyzer
techniques (Technicon, 1977) after extraction in 1 M KCl. Inorganicphosphorus was extracted by adding a dilute acid-fluoride solutionto approximately 2.85 g of air dry soil, shaking by hand for 45 s andthen filtering immediately (Bray and Kurtz, 1945). The filtrate wasthen analysed for inorganic P using the Murphy and Riley methodby measuring absorbance of the extractant and added reagents(Kuo, 1996). For total percentage of soil C and N, air dried sampleswere ground to a fine powder in a ball mill and 19–21 mg used todetermine total nitrogen and carbon using mass spectrometrytechniques (Roboprep-Tracermass Spectrometer, Europa, UK) atthe Western Australia Biochemistry Centre (WABC), University ofWestern Australia.
2.6. Data analysis
Differences in fungal community composition and abundance,vegetation structure and environmental data between sites wereanalysed using multivariate statistics in Primer 6 with Permanovausing Multidimensional Scaling (MDS) and Principal CoordinateAnalysis (PCO) using square root transformed data (Clarke andGorley, 2006). Canonical Discrimination Analysis (CAP) in Primerwith was also used to test hypotheses about macrofungal diversity(Ratkowsky, 2007). The StatView 5 statistical package was used foranalysis of variance (www.sas.com).
3. Results
3.1. Vegetation, litter and soil properties
There were substantial differences in the understorey andoverstorey structure and litter cover between dieback-affected and-unaffected sites (Fig. 3 and Table 1). Overstorey and litter coverwere significantly different among the three locations (Table 1).Litter and coarse woody debris differed significantly between sites,but only the former was correlated with dieback (Table 1). Soilchemical data are not presented here as the measured parameterswere variable across sites within treatments and only nitrate wassignificantly different between the dieback-affected and -unaf-fected sites (Table 1).
As shown in Fig. 3, plants with ectomycorrhizal (EM) and non-mycorrhizal (NM) roots are co-dominant in the overstorey of theunaffected sites. In affected sites, there is an almost total loss of NMtrees (B. grandis), as well as major reductions in EM canopy trees(eucalypts) and some reduction in NM and EM understorey plants.

Fig. 3. Understorey, overstorey and litter cover in dieback-affected and dieback-
unaffected sites, averaged across sampling times. NM = non-mycorrhizal,
EM = ectomycorrhizal, ERC = ericoid mycorrhiza, AM = arbuscular mycorrhiza,
B = Berkeley Rd, M = Myara Rd, N = North Rd.
Table 1Two-way ANOVAs contrasting the effects of dieback, site and their interactions on
(A) vegetation and litter, (B) soils and (C) fungi.
Factor P-value
Dieback Site Dieback
� site
(A) Vegetation and litter
Total understorey cover (%) <0.0001* 0.8694 0.0122*
Total overstorey cover (%) <0.0001* 0.0245* 0.5605
Total litter cover (%) <0.0001* <0.0001* 0.6559
Non-mycorrhizal plant cover (%) 0.0418* 0.0137* 0.0019*
Mycorrhizal plant cover (%) 0.0004* 0.0175* 0.3924
Cover of coarse woody debris (%) 0.7405 0.0124* 0.2567
(B) Soils
NO3� (ppm) <0.0001* <0.0001* <0.0001*
NH4+ (ppm) 0.5455 <0.0001* 0.2604
Soil moisture (%) 0.8443 <0.0001* 0.0802*
Pi (mg/g dry weight soil) 0.8029 <0.0001* 0.4030
Total C (%) 0.4399 0.0075* 0.1261
Total N (%) 0.7714 0.1077 0.1172
(C) Fungi
Total fungal species diversity <0.0001* 0.0415* 0.1253
Species diversity of mycorrhizal fungi <0.0001* 0.0002* 0.0127*
Species diversity of saprotrophic fungi 0.0148* 0.4421 0.5715
Average fungal abundance 0.0490* 0.0952 0.5164
Abundance of saprotrophic fungi (%) 0.1103 0.0179* 0.0528
Abundance of mycorrhizal fungi (%) 0.0072* 0.0025* 0.0051*
* indicates a significant difference, P<0.05.
Fig. 4. Principal Coordinate Analysis plot showing the relative dissimilarity in
vegetation cover between sites. Vectors of the relative cover of common plant
species are overlain on the plot (longer vectors have represent higher correlation
and the circle represents 100% correlation, trees and saplings are separated).
B = Berkeley Rd, M = Myara Rd, and N = North Rd.
P. Anderson et al. / Forest Ecology and Management 259 (2010) 1033–10401036
The PCO plot in Fig. 4 illustrates strong trends in vegetationstructure attributed to dieback in addition to a high degree innatural heterogeneity in vegetation. These data suggest thegreatest impacts of dieback were on the trees E. marginata, C.
calophylla and B. grandis. Fig. 4 also shows that vegetation at theNorth Rd site is less severely affected that the other two sites.
3.2. Macrofungal diversity and abundance
Overall, 149 putative species of macrofungi were recorded, ofwhich 64 could be identified to species. The most dominant generawere Cortinarius (32 spp.), Galerina (9), Collybia (8), Russula (6) andBoletus (6). Many species were only encountered once and only 30species (20% of total) were recorded in both dieback-affected and -unaffected transects. Overall, unaffected transects had almosttwice the macrofungal diversity of dieback-affected transects and84 species (57% of total) were exclusive to unaffected transects, butonly 34 (23% of total) were exclusive to dieback-affected transects(Fig. 5). Mycorrhizal fungi were significantly more diverse inunaffected transects, but there was no significant difference in thediversity of saprotrophic fungi across sites (Figs. 5 and 6, Table 1).
When comparing sampling sites, the Berkeley Rd site had thehighest total macrofungal diversity (120 spp.) and abundance
(869) and North Rd had the lowest diversity (112 spp.) andabundance (426). The average diversity was significantly higher inall the unaffected transects than the dieback-affected transects,with Berkeley Rd and North Rd having the highest average
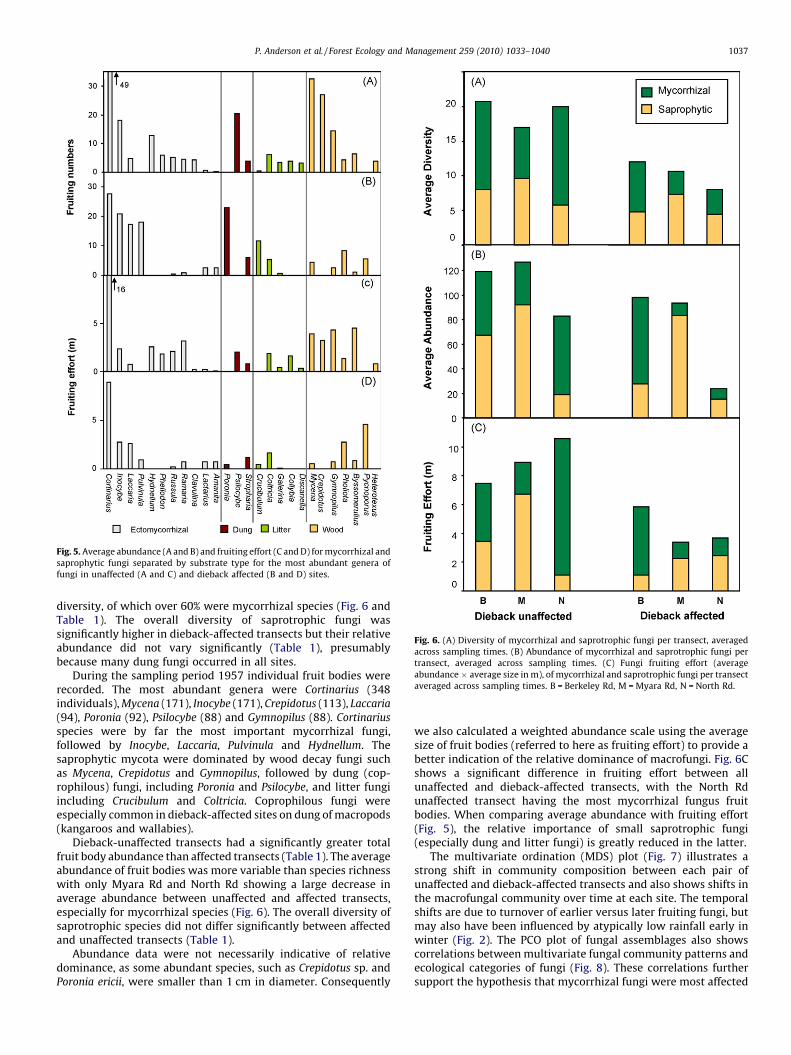
Fig. 5. Average abundance (A and B) and fruiting effort (C and D) for mycorrhizal and
saprophytic fungi separated by substrate type for the most abundant genera of
fungi in unaffected (A and C) and dieback affected (B and D) sites.
Fig. 6. (A) Diversity of mycorrhizal and saprotrophic fungi per transect, averaged
across sampling times. (B) Abundance of mycorrhizal and saprotrophic fungi per
transect, averaged across sampling times. (C) Fungi fruiting effort (average
abundance � average size in m), of mycorrhizal and saprotrophic fungi per transect
averaged across sampling times. B = Berkeley Rd, M = Myara Rd, N = North Rd.
P. Anderson et al. / Forest Ecology and Management 259 (2010) 1033–1040 1037
diversity, of which over 60% were mycorrhizal species (Fig. 6 andTable 1). The overall diversity of saprotrophic fungi wassignificantly higher in dieback-affected transects but their relativeabundance did not vary significantly (Table 1), presumablybecause many dung fungi occurred in all sites.
During the sampling period 1957 individual fruit bodies wererecorded. The most abundant genera were Cortinarius (348individuals), Mycena (171), Inocybe (171), Crepidotus (113), Laccaria
(94), Poronia (92), Psilocybe (88) and Gymnopilus (88). Cortinarius
species were by far the most important mycorrhizal fungi,followed by Inocybe, Laccaria, Pulvinula and Hydnellum. Thesaprophytic mycota were dominated by wood decay fungi suchas Mycena, Crepidotus and Gymnopilus, followed by dung (cop-rophilous) fungi, including Poronia and Psilocybe, and litter fungiincluding Crucibulum and Coltricia. Coprophilous fungi wereespecially common in dieback-affected sites on dung of macropods(kangaroos and wallabies).
Dieback-unaffected transects had a significantly greater totalfruit body abundance than affected transects (Table 1). The averageabundance of fruit bodies was more variable than species richnesswith only Myara Rd and North Rd showing a large decrease inaverage abundance between unaffected and affected transects,especially for mycorrhizal species (Fig. 6). The overall diversity ofsaprotrophic species did not differ significantly between affectedand unaffected transects (Table 1).
Abundance data were not necessarily indicative of relativedominance, as some abundant species, such as Crepidotus sp. andPoronia ericii, were smaller than 1 cm in diameter. Consequently
we also calculated a weighted abundance scale using the averagesize of fruit bodies (referred to here as fruiting effort) to provide abetter indication of the relative dominance of macrofungi. Fig. 6Cshows a significant difference in fruiting effort between allunaffected and dieback-affected transects, with the North Rdunaffected transect having the most mycorrhizal fungus fruitbodies. When comparing average abundance with fruiting effort(Fig. 5), the relative importance of small saprotrophic fungi(especially dung and litter fungi) is greatly reduced in the latter.
The multivariate ordination (MDS) plot (Fig. 7) illustrates astrong shift in community composition between each pair ofunaffected and dieback-affected transects and also shows shifts inthe macrofungal community over time at each site. The temporalshifts are due to turnover of earlier versus later fruiting fungi, butmay also have been influenced by atypically low rainfall early inwinter (Fig. 2). The PCO plot of fungal assemblages also showscorrelations between multivariate fungal community patterns andecological categories of fungi (Fig. 8). These correlations furthersupport the hypothesis that mycorrhizal fungi were most affected

Fig. 7. Multidimensional Scaling plot summarising variations in fungal diversity
between jarrah forest dieback-affected and -unaffected sites at different sampling
times. B = Berkeley Rd, M = Myara Rd, and N = North Rd.
Fig. 9. The first two axes of a Canonical Correlation analysis showing the
relationship between macrofungal assemblages and vegetation structure for
transects in dieback-affected and -unaffected jarrah forest. Multiple letters with
the same treatment denote different sampling times. Correlation vectors show
the relative abundance of fungal genera. B = Berkeley Rd, M = Myara Rd, and
N = North Rd.
P. Anderson et al. / Forest Ecology and Management 259 (2010) 1033–10401038
by dieback associated vegetation changes at these sites. Fungiparasitic on other fungi were also observed most often in dieback-affected sites, but were relatively uncommon (Fig. 8).
3.3. Comparison of fungal communities to plant communities
A Canonical Correlation Analysis (CAP) contrasting fungalcommunity composition and vegetation structure is presented inFig. 9. This analysis illustrates both the gradient betweenunaffected transects (positive scores on Axis 2) and thedieback-affected transects (negative scores on Axis 2), but alsostrongly demonstrates the uniqueness of the North Rd site(separated by Axis 1). The North Rd site had the lowest fungalspecies diversity and abundance, but had a higher tree cover thanthe other dieback-affected sites (Figs. 3 and 6). Cross validationand permutation tests from the CAP analysis confirmed there wasa significant relationship between vegetation and macrofungalassemblages (cross validation test: 15/18 (83.333%), permutationtest: P = 0.0001).
Fig. 8. Principal Coordinate Analysis plot of macrofungal species abundance data
between sites averaged over sampling times. Correlation vectors show the relative
abundance of different functional groups of fungi. B = Berkeley Rd, M = Myara Rd,
and N = North Rd.
4. Discussion
Our findings were consistent with previous observations of themajor impacts of dieback on the jarrah forest (Podger, 1972;Shearer and Dillon, 1996; McDougall et al., 2002, 2005). Inparticular, overstorey cover, understorey cover and litter were allsignificantly lower in dieback-affected sites, which were relativelyopen and exposed. This study is one of relatively few that includedata on the relative dominance of mycorrhizal and non-mycor-rhizal plants. Results for the jarrah forest presented here aresimilar to those from the study of a site 20 km further northeast byBrundrett and Abbott (1994), except that NM plants were lessdominant, even in the absence of dieback impacts. Indeed therelative dominance of AM, EM and NM plants varied considerablybetween sites due to natural variations in relative plant dominancein the jarrah forest, even before major impacts of dieback, whichare patchy due to localized disease fronts, as well as the impacts ofpast logging practices and fires.
Many of the fungi observed in this study were identified usingdesignated field names, which are consistent with broader jarrahforest area surveys (Department of Environment and Conservation,2003–2007). Improved taxonomic knowledge of fungi in the jarrahforest and the use of molecular techniques to identify fungi in theplant roots in the absence of their fruiting bodies will allow for amore comprehensive dataset of fungal diversity. However, issueswith the detection and identification of fungi were less importantto this study which compared paired sample sites with similarvegetation composition, over the same sampling period.
Our results suggest that dramatic changes to vegetationstructure and composition resulting from Phytophthora diebackhave a major impact on the diversity and abundance of macrofungi,

P. Anderson et al. / Forest Ecology and Management 259 (2010) 1033–1040 1039
especially ectomycorrhizal fungi. This is not surprising since EMfungi are considered to be highly dependent on host plants forenergy (Smith and Read, 1997; Brundrett, 2004). At each site, theoverstorey and litter cover appeared to be closely related to themacrofungal diversity and abundance, especially for mycorrhizalfungi, presumably because both are linked to tree cover. Otherdisturbances which have substantially altered vegetation cover inforests, such as fire and logging, can also reduce the diversity andabundance of some macrofungi in the short term (Byrd et al., 2000;Dahlberg et al., 2001; Robinson and Bougher, 2003; Robinson et al.,2008).
This study provides fungal fruiting abundance and fruitingeffort data (corrected for size differences in fungi) that indicatesthe productivity of fungi in this ecosystem. However, speciesdiversity and abundance measures from each site may beunderestimated, as hypogeal and microfungi were excluded fromsampling, and some taxa not yet formally named but referred to byfield names may include multiple species. Additionally, macro-fungi which fruited between sampling times or outside theduration of the study have also been missed. Other studies haveshown that above-ground fruiting bodies do not fully reflect thebelow-ground diversity, especially in regard to ectomycorrhizalfungi (Dahlberg and Stenlid, 1995; Gardes and Bruns, 1996; Peteret al., 2001; Yamada and Katsuya, 2001; Glen et al., 2008). Becauseall fungi do not fruit every year (Tyler, 1992), an extended studycovering several years and a variety of sampling methods isrequired to gain better estimates of species diversity andabundance.
Difference in fruit body abundance between affected andunaffected transects was less dramatic than differences in speciesdiversity but were still significant and were consistent with trendsin both litter cover and overstorey cover. The relative size of themost abundant fruit bodies in the dieback-affected areas wasconsiderably smaller than that of the unaffected areas, e.g. fruitbodies of P. ericii, Pulvinula tetraspora, Laccaria fraterna andCrucibulum laeve are an order of magnitude smaller than mostother species observed in this study. Consequently, the relativeimportance of these species was better represented by fruitingeffort data. This index provides a correction for major differences infungal size, but would be less accurate than biomass data.However, biomass sampling requires destructive harvesting whichis not always appropriate or feasible.
Our results suggest mycorrhizal fungi are generally moredominant in the jarrah forest than saprotrophic fungi, especiallyunder relatively healthy trees. These results are consistent withthe findings of Brundrett and Abbott (1991), Gardner andMalajczuk (1988), Hilton et al. (1989) and Glen et al. (2008) thatshow that the two most dominant forest trees E. marginata andC. calophylla, have mycorrhizal associations. In contrast, theabundance of saprotrophic fungi did not decrease substantiallyin dieback-affected transects. This is not surprising sincesaprotrophic fungi will feed on dead or dying vegetationremains and some litter would blow in from adjacent healthyforest. Also, saprotrophic fungi may tend to fruit moreabundantly when their substrates become depleted. The amountof organic materials available to support the formation ofsporocarps would vary across sites because of varying timessince P. cinnamomi infection and the impact of fire on fallenwood. In the long term, the quantity of infected dead trees andwood debris can be expected to decline as woody debris isdecayed by saprotrophic fungi or burnt by fire. Therefore, forestdieback should also eventually have a negative impact onsaprotrophic fungi.
Multidimensional Scaling, Principal Component Analysis andCanonical Correlation were found to be valuable tools forvisualising differences in plant and fungal diversity across sites
(see Ratkowsky, 2007). The latter also allowed correlation vectorsto be overlain that show dominant trends in fungal and plantdistribution across sites. These ordination methods showed thatthe variation in fungal communities between the differentdieback-affected sites was a lot greater than variation betweendifferent unaffected sites, which may be attributed to variations inthe impacts if dieback on tree cover, perhaps due to the time sinceP. cinnamomi infection, as well as difference in original vegetationcomposition.
Fungal communities can respond to changes in soil nutrientstatus (Grierson and Adams, 2000; Packham et al., 2002; Robinsonand Bougher, 2003; Kranabetter et al., 2009). In our study, nitrate,ammonium, soil moisture and total soil carbon all variedsignificantly between sites, possibly helping to explain theobserved differences in macrofungal communities between sites.However, only nitrate showed a significant difference betweenaffected and unaffected transects, with proportions higher indieback-affected transects. Mycorrhizal fungi influence theacquisition of nitrogen and phosphorus for plants (Hobbieet al., 1998; Smith and Read, 1997), therefore, the greater plantavailable nitrate in affected transects may be due to lesscompetition from plants and mycorrhizal fungi for availablenutrients.
This study provided valuable new insight into the impacts ofjarrah forest dieback on fungal communities, especially concerningthe relative abundance of saprophytic and mycorrhizal fungi.Future studies would benefit from the investigation of host andsubstrate specificity to better understand successional dynamics offungi as plant communities change due to major disturbances suchas dieback. Fire and logging also have impacts on the relativedominance and abundance of trees and understorey vegetation,and potential interactions of these with dieback are worthy offurther investigations.
In addition to the impacts of dieback on plant communitieswe observed substantial changes in the relative dominance ofmany genera and functional groups of fungi. Our data show thatsevere dieback on the jarrah forest plants is linked to majorimpact on fungal diversity, as is the case with other types ofdisturbance to ectomycorrhizal tree dominated ecosystems. Inthis study, particular mycorrhizal genera including Lactarius,Amanita and Entoloma were observed to be more common indieback-affected areas than unaffected areas, in contrast to othergenera including Russula, Ramaria and Cortinarius that werelargely absent from affected areas. Fungi such as Laccaria are wellknown as early colonists of jarrah forest following bauxitemining (Gardner and Malajczuk, 1988; Glen et al., 2008) as wellas young eucalypt plantations in Western Australia (Lu et al.,1999). The reverse is true of Russula and Cortinarius which aretypically absent from disturbed habitats. Thus, despite greatlyreduced tree cover, dieback-affected forest stands still containmycorrhizal fungi, but these tend to be relatively disturbancetolerant species. Our results suggest that dieback is impactingfungal communities in a similar way to other forms of severedisturbance, perhaps because trees affected by dieback are lessable to support the most specialised mycorrhizal fungi. However,reduced soil quality and litter cover are also likely to contributeto these trends.
Acknowledgements
Doug Ford and Kate Bowler are gratefully acknowledged forproviding assistance with laboratory procedures and we areespecially grateful to Chloe Flaherty for her help and company inthe field as well as laboratory assistance. We thank to Giles Hardyfor providing advice about field sites. Mark Brundrett is supportedby a Lotterywest grant to conserve threatened species.
P. Anderson et al. / Forest Ecology and Management 259 (2010) 1033–10401040
References
Bray, R., Kurtz, L., 1945. Determination of total, organic and available forms ofphosphorus in soils. Soil Sci. 59, 39–45.
Brundrett, M.C., 2004. Diversity and classification of mycorrhizal associations. Biol.Rev. 79, 473–495.
Brundrett, M.C., 2008. Mycorrhizal Associations: The Web Resource. www.mycorrhizas.info.
Brundrett, M.C., 2009. Mycorrhizal associations and other means of nutrition ofvascular plants: understanding the global diversity of host plants by resolvingconflict information and developing reliable means of diagnosis. Plant Soil 320,37–77.
Brundrett, M.C., Abbott, L.K., 1991. Roots of jarrah forest plants. I. Mycorrhizalassociations of shrubs and herbaceous plants. Aust. J. Bot. 39, 445–457.
Brundrett, M.C., Abbott, L.K., 1994. Mycorrhizal fungus propagules in the jarrahforest. I. Seasonal study of inoculum levels. New Phytol. 127, 539–546.
Brundrett, M.C., Bougher, N., Dell, B., Grove, T., Malajczuk, N., 1996. Working withMycorrhizas in Forestry and Agriculture. ACIAR Monograph 32. AustralianCentre for International Agricultural Research, Canberra.
Bureau of Meteorology, 2007. Climate Statistics for Western Australia. www.bom.gov.au.
Byrd, K., Parker, T., Vogler, D., Cullings, K., 2000. The influence of clear-cutting onectomycorrhizal fungus diversity in a lodgepole pine (Pinus contorta) stand,Yellowstone National Park, Wyoming, and Gallatin National Forest, Montana.Can. J. Bot. 78, 149–156.
Chapman, A.D., 2005. Numbers of living species in Australia and the world.Australian Biodiversity Information Services, Toowoomba, Australia. A reportfor the Department of the Environment and Heritage, September 2005.
Claridge, A.W., May, T.W., 1994. Mycophagy among Australian mammals. Aust. J.Ecol. 19, 251–257.
Clarke, K., Gorley, R., 2006. PRIMER v6. User Manual/Tutorial. PRIMER-E Ltd.,Plymouth.
D’Souza, N.K., Colquhoun, I.J., Shearer, B.L., Hardey, G.E.S.J., 2005. Assessing thepotential for biological control of Phytophthora cinnamomi by fifteen nativeWestern Australian jarrah-forest legume species. Australasian Plant Pathol. 34,533–540.
Dahlberg, A., Schimmel, J., Taylor, A., Johannesson, H., 2001. Post-fire legacy ofectomycorrhizal fungal communities in the Swedish boreal forest in relation tofire severity and logging intensity. Biol. Conserv. 100, 151–161.
Dahlberg, A., Stenlid, J., 1995. Spatiotemporal patterns in ectomycorrhizal popula-tions. Can. J. Bot. 73, 1222–1230.
Department of Environment and Conservation, 2006. Phytophthora Dieback Atlasfrom the Bush to Your Back Fence: What You Need to Know. Kensington, WA.
Department of Environment and Conservation, 2003–2007. Forestcheck: Reports ofProgress. http://www.naturebase.net/content/view/2388/482.
Department of Environment and Conservation, 2007. Managing Dieback – Impactsin WA. http://www.dec.wa.gov.au/diebackatlas/impacts-in-wa.html.
Environmental Protection Authority, 2007. State of the Environment Report: West-ern Australia 2007. http://www.dec.wa.gov.au/content/view/5605/2290/.
Fitter, A.H., Garbaye, J., 1993. Interactions between mycorrhizal fungi and other soilorganisms. Plant Soil 159, 123–132.
Gardes, M., Bruns, T., 1996. Community structure of ectomycorrhizal fungi in a Pinusmuricata forest: above- and below-ground views. Can. J. Bot. 74, 1572–1583.
Gardner, J.H., Malajczuk, N., 1988. Recolonisation of rehabilitated bauxite mine sitesin Western Australia by mycorrhizal fungi. For. Ecol. Manage. 24, 27–42.
Garkaklis, M.J., Calver, M.C., Wilson, B.A., Hardy, G.E.St.J., 2004. Habitat alterationcaused by an introduced plant disease – Phytophthora cinnamomi: a potentialthreat to the conservation of Australian forest fauna. In: Lunney, D. (Ed.),Conservation of Australia’s Forest Fauna. 2nd ed. Royal Zoological Societyof New South Wales, Sydney, pp. 899–913.
Glen, M., Bougher, N.L., Colquhoun, I.J., Vlahos, S., Loneragan, W.A., O’Brien, P.A.,Hardy, G.E.St.J., 2008. Ectomycorrhizal fungal communities of rehabilitatedbauxite mines and adjacent, natural jarrah forest in Western Australia. For.Ecol Manage. 255, 214–225.
Grierson, P.F., Adams, M.A., 2000. Plant species affect acid phosphatase, ergosteroland microbial P in a Jarrah (Eucalyptus marginata Donn ex Sm.) forest in south-western Australia. Soil Biol. Biochem. 32, 1817–1827.
Hardham, A.R., 2005. Pathogen profile: Phytophthora cinnamomi. Mol. Plant Pathol.6, 589–604.
Hilton, R., Malajczuk, N., Pearce, M., 1989. Larger fungi of the jarrah forest: anecological and taxonomic survey. In: Dell, B. (Ed.), The Jarrah Forest. KluwerAcademic Publishers, Dordrecht, pp. 89–109.
Hobbie, E., Macko, S., Shugart, H., 1998. Insights into nitrogen and carbon dynamicsof ectomycorrhizal and saprotrophic fungi from isotopic evidence. Oecologia118, 353–360.
Kranabetter, J.M., Friesen, J., Gamiet, S., Kroeger, P., 2009. Epigeous fruiting bodies ofectomycorrhizal fungi as indicators of soil fertility and associated nitrogenstatus of boreal forests. Mycorrhiza 19, 535–548.
Kuo, S., 1996. Phosphorus. In: Sparks, D.L. (Ed.), Methods of Soil Analysis. Part 3.Chemical Methods. 3rd ed. Soil Science Society of America, Madison, Wisconsin,pp. 869–920.
Lambers, H., Shane, M.W., Cramer, M.D., Pearse, S.J., Veneklaas, J., 2006. Rootstructure and functioning for efficient acquisition of phosphorus: matchingmorphological and physiological traits. Ann. Bot. 98, 693–713.
Lamont, B., 1982. Mechanisms for enhancing nutrient uptake in plants, withparticular reference to mediterranean South Africa and Western Australia.Bot. Rev. 48, 597–689.
Lu, X.H., Malajczuk, N., Brundrett, M., Dell, B., 1999. Fruiting of putative ectomycor-rhizal fungi under blue gum (Eucalyptus globulus) plantations of different ages inWestern Australia. Mycorrhiza 8, 255–261.
Maser, C., Claridge, A.W., Trappe, J.M., 2008. Trees, Truffles, and Beasts. RutgersUniversity Press, New Brunswick.
McDougall, K.L., Hobbs, R.J., Hardy, G.E.S.J., 2002. Vegetation of Phytophthoracinnamomi-infested and adjoining uninfested sites in the northern jarrah(Eucalyptus marginata) forest of Western Australia. Aust. J. Bot. 50, 277–288.
McDougall, K.L., Hobbs, R.J., Hardy, G.E.S.J., 2005. Distribution of understoreyspecies in forest affected by Phytophthora cinnamomi in south-western WesternAustralia. Aust. J. Bot. 53, 819–831.
Packham, J.M., May, T.W., Brown, M.J., Wardlaw, T.J., Mills, A.K., 2002. Macrofungaldiversity and community ecology in mature and regrowth wet eucalypt forestin Tasmania: a multivariate study. Austral. Ecol. 27, 149–161.
Peter, M., Ayer, F., Egli, S., Honegger, R., 2001. Above- and below-ground communitystructure of ectomycorrhizal fungi in three Norway spruce (Picea abies) standsin Switzerland. Can. J. Bot. 79, 1134–1151.
Podger, F.D., 1972. Phytophthora cinnamomi, a cause of lethal disease in indigenousplant communities in Western Australia. Phytopathology 62, 972–981.
Ratkowsky, D.A., 2007. Visualising macrofungal species assemblage compositionsusing canonical discrimination analysis. Australasian Mycol. 26, 75–85.
Rayment, G.E., Higginson, F.R., 1992. Australian Laboratory Handbook of Soil andWater Chemical Analysis Methods. Inkata Press, Sydney.
Robinson, R., Bougher, N., 2003. The response of fungi to fire in Jarrah (Eucalyptusmarginata) and Karri (Eucalyptus diversicolour) forests of south-west WesternAustralia. In: Abbott, I., Burrows, N. (Eds.), Fire in Ecosystems of South-WestWestern Australia: Impacts and Management. Backhuys Publishers, Leiden,Netherlands, pp. 269–289.
Robinson, R.M., Tunsell, V.L., 2007. A list of macrofungi recorded in burnt andunburnt Eucalyptus diversicolor regrowth forest in the southwest of WesternAustralia: 1998–2002. Conserv. Sci. West. Aust. 6, 75–96.
Robinson, R.M., Mellican, A.E., Smith, R.H., 2008. Epigeous macrofungal successionin the first five years following a wildfire in karri (Eucalyptus diversicolor)regrowth forest in Western Australia. Austral. Ecol. 33, 807–820.
Shearer, B.L., Dillon, M., 1996. Susceptibility of plant species in banksia woodlandson the swan coastal plain, Western Australia, to infection by Phytophthoracinnamomi. Aust. J. Bot. 44, 433–445.
Shearer, B.L., Crane, C.E., Cochrane, A., 2004. Quantification of the susceptibility ofthe native flora of the South West Botanical Province, Western Australia, toPhytophthora cinnamomi. Aust. J. Bot. 52, 435–443.
Smith, S.E., Read, D.J., 1997. Mycorrhizal Symbiosis, 2nd ed. Academic Press,London.
Technicon, 1977. Individual/Simultaneous Determination of Nitrogen and/or Phos-phorus in BD Acid Digests. Industrial Method No. 329–374 W/B. TechniconIndustrial Systems, New York.
Tyler, G., 1992. Tree species affinity of decomposer and ectomycorrhizal macrofungiin beech (Fagus sylvatica L.), oak (Quercus robur L.) and hornbeam (Carpinusbetulus L.) forests. For. Ecol. Manage. 47, 269–284.
Yamada, A., Katsuya, K., 2001. The disparity between the number of ectomycor-rhizal fungi and those producing fruit bodies in a Pinus densiflora stand. Mycol.Res. 105, 957–965.