Impact of Secondary Salinisation on Freshwater Ecosystems: Effects of Contrasting, Experimental,...
15
CSIRO PUBLISHING www.publish.csiro.au/journals/mfr Marine and Freshwater Research, 2004, 55, 509–523 Impact of secondary salinisation on freshwater ecosystems: effects of contrasting, experimental, short-term releases of saline wastewater on macroinvertebrates in a lowland stream Nadine A. Marshall A,B and Paul C. E. Bailey A,C A School of Biological Sciences and CRC Freshwater Ecology, Monash University, Clayton, Victoria 3800, Australia. B Present address: Department of Marine Science, James Cook University, Townsville, Qld 4810,Australia. C Corresponding author. Email: [email protected] Abstract. In Australia, secondary salinisation of land and water resources is a serious environmental problem. We conducted two field experiments to examine the effects on macroinvertebrates of increased salt concentration (approximately 1000 and 2000 mg L −1 total dissolved solids (TDS)) and mode of salt water release (continuous press release approximately 1500 mg L −1 and four, separate pulses of approximately 3400 mg L −1 TDS). The abun- dance of the gastropod Ferrissia tasmanica, the mayfly Baetis sp. 5 and scraper and predator functional feeding groups were significantly reduced at 1500 mg L −1 , with the effect exacerbated in pulse release channels. Moreover, the pooled abundance of Oligochaeta, Copepoda and Acarina was significantly reduced at 2000 mg L −1 and the number of drifting animals in the pulse treatment channels significantly increased following commencement of salt water release during daylight hours. In contrast, the abundance of 49 other macroinvertebrate taxa, collector– gatherer functional group and species diversity were unaffected by salinity or release schedule. We conclude that much of the existing macroinvertebrate fauna appears to be halotolerant. However, the abundance of halosensitive species will be reduced at 1500 mg L −1 . Delivering short pulses of high salt concentration is more detrimental than delivering the same salt load at a low concentration over a longer period of time. Extra keywords: Baetis, benthic macroinvertebrates, Ferrissia tasmanica, lowland rivers, salt pollution. Introduction Secondary salinisation is the result of the mobilisation of salt stored in the soil profile and/or groundwater, brought about by human activities, particularly land-use disturbance, such as inappropriate land clearing and irrigation. These activities cause changes in the natural hydrology, including increases in the pressure of confined aquifers and raising of the water table. Water evaporates when the water table approaches the soil surface, leaving salts behind and caus- ing land salinisation. The mobilised salt or salty groundwater can also move laterally or vertically towards watercourses, increasing the salinity of rivers and wetlands (Williams 1987; Bailey et al. 2004). Globally, secondary salinisation is a major ecological perturbation (Ghessemi et al. 1995; Bailey et al. 2004), with an estimated 80–110 million ha of irrigated land (i.e. 34%– 47% of all irrigated land) and 61–77 million ha of arid land affected (Ghessemi et al. 1995; Williams 1999). However, the extent to which water resources are impacted is not known, although it is likely to be increasingly extensive, as discussed by Ghessemi et al. (1995) and Williams (1999). In Australia, secondary salinisation is arguably the most serious land and water resources problem. Approximately 5.7 million ha of land is currently affected or designated within regions ‘at risk’, but this will increase to approximately 17 million ha by 2050 (National Land and Water Resources Audit 2001). Secondary salinisation is now found in all states and terri- tories of Australia, with large areas of south-west Western Australia, South Australia, and eastern Australia, includ- ing the Murray–Darling Basin (MDB), significantly affected (National Land and Water ResourcesAudit 2001; Bailey et al. 2004). Recent projections have estimated that up to 20 000 km of streams could be significantly salt-affected by dryland salinity over the next 20 years (National Land and Water Resources Audit 2001) and average water salinities in large parts of the MDB will rise significantly, exceeding critical thresholds for domestic and irrigation water supplies and riverine environments (MDBC 1999). Currently, a common engineering practice to lower the water table involves groundwater pumping. Pumped saline groundwater is either temporally stored in ponds or wet- lands for later release or discharged directly into irrigation drains, creeks, or rivers. In many situations, aquatic resource managers have some degree of control over the timing and © CSIRO 2004 10.1071/MF03018 1323-1650/04/050509
-
Upload
independent -
Category
Documents
-
view
2 -
download
0
Transcript of Impact of Secondary Salinisation on Freshwater Ecosystems: Effects of Contrasting, Experimental,...
CSIRO PUBLISHING
www.publish.csiro.au/journals/mfr Marine and Freshwater Research, 2004, 55, 509–523
Impact of secondary salinisation on freshwater ecosystems: effectsof contrasting, experimental, short-term releases of saline
wastewater on macroinvertebrates in a lowland stream
Nadine A. MarshallA,B and Paul C. E. BaileyA,C
ASchool of Biological Sciences and CRC Freshwater Ecology, Monash University,Clayton, Victoria 3800, Australia.
BPresent address: Department of Marine Science, James Cook University, Townsville, Qld 4810, Australia.CCorresponding author. Email: [email protected]
Abstract. In Australia, secondary salinisation of land and water resources is a serious environmental problem.We conducted two field experiments to examine the effects on macroinvertebrates of increased salt concentration(approximately 1000 and 2000 mg L−1 total dissolved solids (TDS)) and mode of salt water release (continuouspress release approximately 1500 mg L−1 and four, separate pulses of approximately 3400 mg L−1 TDS). The abun-dance of the gastropod Ferrissia tasmanica, the mayfly Baetis sp. 5 and scraper and predator functional feedinggroups were significantly reduced at 1500 mg L−1, with the effect exacerbated in pulse release channels. Moreover,the pooled abundance of Oligochaeta, Copepoda and Acarina was significantly reduced at 2000 mg L−1 and thenumber of drifting animals in the pulse treatment channels significantly increased following commencement ofsalt water release during daylight hours. In contrast, the abundance of 49 other macroinvertebrate taxa, collector–gatherer functional group and species diversity were unaffected by salinity or release schedule. We conclude thatmuch of the existing macroinvertebrate fauna appears to be halotolerant. However, the abundance of halosensitivespecies will be reduced at 1500 mg L−1. Delivering short pulses of high salt concentration is more detrimental thandelivering the same salt load at a low concentration over a longer period of time.
Extra keywords: Baetis, benthic macroinvertebrates, Ferrissia tasmanica, lowland rivers, salt pollution.
Introduction
Secondary salinisation is the result of the mobilisation ofsalt stored in the soil profile and/or groundwater, broughtabout by human activities, particularly land-use disturbance,such as inappropriate land clearing and irrigation. Theseactivities cause changes in the natural hydrology, includingincreases in the pressure of confined aquifers and raisingof the water table. Water evaporates when the water tableapproaches the soil surface, leaving salts behind and caus-ing land salinisation. The mobilised salt or salty groundwatercan also move laterally or vertically towards watercourses,increasing the salinity of rivers and wetlands (Williams 1987;Bailey et al. 2004).
Globally, secondary salinisation is a major ecologicalperturbation (Ghessemi et al. 1995; Bailey et al. 2004), withan estimated 80–110 million ha of irrigated land (i.e. 34%–47% of all irrigated land) and 61–77 million ha of arid landaffected (Ghessemi et al. 1995; Williams 1999). However, theextent to which water resources are impacted is not known,although it is likely to be increasingly extensive, as discussedby Ghessemi et al. (1995) and Williams (1999). In Australia,secondary salinisation is arguably the most serious land and
water resources problem. Approximately 5.7 million ha ofland is currently affected or designated within regions ‘atrisk’, but this will increase to approximately 17 million haby 2050 (National Land and Water Resources Audit 2001).Secondary salinisation is now found in all states and terri-tories of Australia, with large areas of south-west WesternAustralia, South Australia, and eastern Australia, includ-ing the Murray–Darling Basin (MDB), significantly affected(National Land and Water ResourcesAudit 2001; Bailey et al.2004). Recent projections have estimated that up to 20 000 kmof streams could be significantly salt-affected by drylandsalinity over the next 20 years (National Land and WaterResources Audit 2001) and average water salinities in largeparts of the MDB will rise significantly, exceeding criticalthresholds for domestic and irrigation water supplies andriverine environments (MDBC 1999).
Currently, a common engineering practice to lower thewater table involves groundwater pumping. Pumped salinegroundwater is either temporally stored in ponds or wet-lands for later release or discharged directly into irrigationdrains, creeks, or rivers. In many situations, aquatic resourcemanagers have some degree of control over the timing and
© CSIRO 2004 10.1071/MF03018 1323-1650/04/050509
510 Marine and Freshwater Research N. A. Marshall and P. C. E. Bailey
duration of saline wastewater release and, as a conse-quence, in-stream concentration. However, the environmentalimpacts of different salt concentrations and release scheduleson receiving aquatic ecosystems are poorly understood and, asa consequence, appropriate information enabling concentra-tions, timing, and flow duration for released saline wastewateris largely lacking (Hart et al. 1991; Bailey and James 1999;Bailey et al. 2002). Of particular importance are the rela-tive environmental impacts between continuous discharge ofsaline wastewater (‘press’ release) and those of releases ofshort duration but higher concentration (‘pulse’ release; Hartet al. 1989, 1991; Bailey et al. 2004).
Available data on environmental effects on freshwaterbiota are minimal and equivocal. The reviews of Hart et al.(1989, 1991), Bailey and James (1999) and Bailey et al.(2002) suggest that, for many non-halophytic biota, lethaland sublethal effects would be manifest at concentrationsin excess of 1000 mg L−1 total dissolved solids (TDS).Williams et al. (1991) surveyed macroinvertebrates fromthe Blackwood River (Western Australia) and the GlenelgRiver (Victoria), Australia, which experience salinitiesranging from 2600 to 51 700 mg L−1 and from 700 to13 800 mg L−1 TDS, respectively. Williams et al. (1991)found no relationship between macroinvertebrate commu-nity composition and salinity, and suggested that either thepresent macroinvertebrate fauna was more tolerant to salin-ity than had been assumed or that it now represents onlyhalotolerant forms of a once more-diverse fauna. Similarly,Metzeling (1993) found no correlation between either thenumber of invertebrate taxa or faunal abundance with salin-ity at nine sites in six lowland, perennially flowing streamsin central Victoria, Australia. The salinity of these streamsranged from 51 to 1100 mg L−1 TDS but, historically, hasbeen higher, up to approximately 2000 mg L−1 TDS. How-ever, rare taxa most clearly distinguished between sites ofdifferent salinities and Metzeling (1993) concluded that theyare possibly more sensitive to changes in salinity than morecommon taxa.
In contrast with the above studies, Bunn and Davies(1992) concluded that the low diversity of macroinverte-brates found at two sites on the Hotham River and foursites on Thirty-four Mile Brook (south-western WesternAustralia) was caused directly by poor water quality asso-ciated with salinity (i.e. >5000 mg L−1 TDS). Moreover, theinvertebrate fauna was atypical of that generally encoun-tered in stream systems. Insects made up only a minorpercentage (14.5%) of total invertebrates collected, the com-munity being dominated by Crustacea, several common tosalt lakes. Furthermore, Mitchell and Richard (1992) foundspecies richness was reduced at salinities between 4000 and26 000 mg L−1 TDS compared with unaffected sections alongtwo tributaries of the Hopkins River (Victoria), although thisrelationship was more difficult to identify at salinities lessthan 12 000 mg L−1 TDS.
The experiments reported in the present paper set out totest the predictions of Hart et al. (1991) by examining theeffects of a short-term (i.e. 5–6 days) increase in salt con-centration on the abundance of macroinvertebrates foundin a lowland stream in south-eastern Australia. The short-term nature of the increase in concentration was designedto mimic conditions when pumped salty groundwater ofdifferent concentrations was released into a stream.
We predicted for Experiment 1 that the abundance ofmacroinvertebrates would not decrease when exposed tosalinities of 1000 mg L−1 but would decrease when exposedto 2000 mg L−1. In the second experiment, we compared theeffect of two different saline wastewater release schedules,continuous or pulsed. We predicted that macroinvertebrateabundance would decrease when exposed continuously toa concentration of approximately 1500 mg L−1 and period-ically exposed to a pulse concentration of 3500 mg L−1, butthe magnitude of the effect would be greater for the higherconcentration. Both release schedules were calculated todeliver the same salt load (approximately 7200 kg) over a5-day release period: a chronic press release of saline waste-water of nominally 1500 mg L−1 discharged continuously(press treatment) and four separate acute pulse releases ofnominally 3500 mg L−1, each of approximately 12 h dura-tion, discharged at intervals during the same 5 days (pulsetreatment).
We tested these hypotheses by performing field experi-ments during April and May 1993 (Experiment 1) and Marchand April 1994 (Experiment 2), using replicated channelslocated in a lowland stream that is currently unaffected butthreatened with future secondary salinisation. Salt concen-trations were selected based on groundwater measurementsfrom the Shepparton Irrigation System, 45 km to the northof the field site, and current management practice. Shouldan impact occur, we also wanted to examine the potentialrecovery of the biota in the short term and, consequently, wealso quantified changes in abundance of macroinvertebratesfor 5 days after termination of saline water release in bothexperiments.
Methods
Study site
The study site was located on Hughes Creek (36◦54′S, 145◦14′E), athird-order, lowland, permanent and unregulated creek in an agriculturalregion of central Victoria, Australia. This stream is currently unaffectedby secondary salinisation, but has been affected by surrounding landuse and agricultural practices and is classified as being in environmen-tally poor condition (Mitchell 1990). Hughes Creek is a tributary of theGoulburn River and runs approximately 160 km north of Melbourne ina north-westerly direction from headwaters in the Strathbogie Ranges.The catchment is estimated to cover 383 km2, with small-scale cat-tle and sheep grazing comprising the main agricultural activities. Theheadwaters of Hughes Creek are densely forested, with some areas pro-tected in reserves. In contrast, riparian vegetation further downstream,including the study site, is patchy, with significant areas having been

Impact of salinisation on stream invertebrates Marine and Freshwater Research 511
cleared. The vegetation is composed of indigenous species, such as theRiver Red Gum, Eucalyptus camaldulensis, Acacia spp., and exotics,predominantly willow, Salix spp. In many cleared areas, introducedgrasses extend to the stream bank and invade sand bars in the channel,many areas of which exhibit excessive sedimentation.
Water quality characteristics of Hughes Creek are typical of lowlandstreams in central Victoria that are unaffected by increasing salinity:mean conductivity of 310 µS cm−1 (range 158–490 µS cm−1), pH 7.6(range 6.2–8.6), turbidity 9 NTU (nephelometric turbidity units; range5–18 NTU), and temperature 16◦C (range 7–29.5◦C). The mean dis-charge is 152 ML day−1, with a minimum in summer of 14 ML day−1
and a maximum in winter of 1810 ML day−1 (data collected 1976–1981;fromVertessy 1995).The local climate is temperate; mean monthly rain-fall ranges from between 32 and 44 mm in late spring to early summer(November–December) to 57–65 mm in winter and early spring (July–September; Bureau of Meteorology 1900–1988, http://www.bom.gov.au/climate/averages/tables/supply.shtml).
A 50 m reach of Hughes Creek, 17 km from the confluence withthe Goulburn River, was selected as the study site. Stream width wasapproximately 8 m, with depth ranging from 20 to 40 cm, and a substrateconsisting of stones, pebbles, gravel, and sand. Flow at the site variedfrom 15 to 32 cm s−1.
Experimental design and mesocosm construction
The effects of increasing stream salinity on the macroinvertebrate com-munity were examined using replicated mesocosms, consisting of anest of nine open-ended channels. Each open-ended channel was con-structed of industrial strength polyvinyl chloride (PVC; 3 mm thick),6 m in length × 30 cm wide and 40 cm high. The open-ended channelswere placed on the stream bed parallel to stream flow and secured toiron stakes anchored into the sediment. In Experiment 1, the effectsof high salt addition (2000 mg L−1; high-salt treatment) and low saltaddition (1000 mg L−1; low-salt treatment) were compared with non-manipulated channels (Control). In Experiment 2, three treatmentswere used to test the effect of different salt release regimens on themacroinvertebrate community. These were: (1) no added salt (controls);(2) continuous press release over 5 days of nominally 1500 mg L−1
(press treatment); and (3) four pulsed releases of nominally 3500 mg L−1
concentration during the 5 days (pulse treatment). The first pulsecommenced at 1800 hours on Day 1 and terminated at 2200 hours (4 hduration); the second pulse commenced 1400 hours on Day 2 and termi-nated at 0300 hours on Day 3 (13 h duration); the third pulse commencedat 2000 hours on Day 3 and terminated at 0800 hours on Day 4 (12 h dura-tion); the final pulse commenced at 1200 hours on Day 4 and terminatedat 2300 hours on Day 4 (11 h duration).
In both experiments, each channel was assigned to one of thesetreatments (three replicate channels per treatment) according to a ran-domised block design (Sokal and Rohlf 1981). Channels were installedand trialed 2 months before the commencement of experiments.
Sampling units were polyethylene trays (13 × 20 × 5 cm deep).Trayswere filled with river substrate of various particle sizes and left in thestream for a minimum of 30 days before transferring 40 trays to eachchannel. During this time, each tray naturally accumulated organic andinorganic debris and a representative invertebrate community was estab-lished. Previous colonisation experiments in the same stream had shownthat this colonisation period provided the maximum number of taxawith minimal between-tray variability (Vertessy 1995).Trays were trans-ferred carefully to channels 10 days before commencing the release ofsaline wastewater.
Saline wastewater release
Different salinity concentrations were maintained among the six salttreatment channels through the controlled addition of a near-saturated
saline solution. Salt was purchased as ‘table-salt’grade, sea salt (PacificSalt, Adelaide, SA, Australia), which was then dissolved in four above-ground swimming pools (1.5 m depth, 5 m diameter) built on the streambank to serve as reservoirs. The concentration in the reservoirs wascalculated to be approximately 300 g L−1. Chemical analysis of saltreflected results obtained typically for sea salt and indicated that thesalt was of the same ionic composition as the groundwater in the region.
Two large PVC header tanks (2 × 1 × 1 m deep) with tapped out-lets were placed at the upstream entrance of the channels and weresupported on a constructed platform that straddled the entire nestof channels, ensuring channels were unobstructed. The header tankscontained the salt-saturated solution, which was gravity fed from thereservoirs approximately 50 m away. Float valves maintained a constanthead pressure. Each header tank fed three channels and each channelconcentration could be regulated through tap control. Tap settings hadbeen calibrated previously against stream flow so that an appropriatesetting could be used. The initial rate of flow of salt solution required toproduce the desired salt concentration in the channels was determinedby measuring the average velocity and volume of water in the channel.Channel salinity (measured as conductivity) was logged continuouslyby in situ conductivity probes located at 2-m intervals along the lengthof each channel and displayed on a laptop personal computer. Tap flowcould be adjusted as necessary to vary salinity as required. Stream waterflowing into the channel diluted the concentrated salt water and the firstmeter of the channel was designated as a mixing compartment and nosubstrate-filled trays were placed there. Previous test runs had indi-cated that salt was evenly distributed throughout the water column inthe channel following mixing within this compartment.
Sampling and processing macroinvertebrates
Five trays were selected randomly for collection from each channel oneach retrieval date (see below). Water depth and flow above each traywere measured before removing and placing individual trays into labeledplastic bags and drenching with 100 mL of 100% ethanol. Similar traysfilled with substrate, but excluding invertebrates, were used to fill thegaps created by removing the trays.This ensured that flow characteristicsalong the channel due to the presence of trays remained similar through-out the experiment. In the laboratory, samples were rinsed through anest of sieves and separated into the following mesh size fractions:2 mm, 1 mm, 500 µm, 250 µm, 125 µm, and 63 µm. The 2-mm frac-tion was further divided into stones, leaf material and twigs. Onlythe 2-mm, 1-mm, and 500-µm size classes were examined for inver-tebrates. Individuals were removed, identified to lowest possible taxa(normally genus or species) using voucher collections identified previ-ously from Hughes Creek (Vertessy 1995), and counted. Chironomidswere identified to sub-family level only. Once identified, invertebrateswere assigned to functional feeding groups based on data available inthe literature (McCafferty 1983; Chessman 1986; O’Keefe and Lake1987; Downes et al. 1993; Vertessy 1995). Where uncertainty existed(e.g. Ecnomus cygnitus), the taxon most closely resembling the specieswas chosen to be representative.
To estimate within-tray substrate variation as a confounding factorin determining invertebrate abundance or diversity, the substrate in eachtray was examined for organic and inorganic content, number and sizeof stones, and amount of leaf and wood. The remaining material fromthe processed trays was oven-dried to constant weight (approximately3–4 days at 60◦C) and organic content estimated by weight loss onignition (500◦C for 12 h, Lindberg 828 muffle furnace; Lindberg Co.,Watertown, WI, USA). Homogeneity of stones across trays was tested bychoosing, at random, 50 trays from the entire experiment. The numberof stones (>5 mm) per tray was recorded and the physical dimensions(mass, greatest length, shortest width, and volume, calculated by volumeof water displaced) of each were measured. Leaf and wood materialremoved from the 2-mm fraction was dried to constant weight.
512 Marine and Freshwater Research N. A. Marshall and P. C. E. Bailey
Quantification of drift
To quantify the proportion of invertebrates that entered the drift inresponse to increasing salinity, drift rates were calculated from the num-ber of animals caught in drift nets. Nets (20 cm × 30 cm × 1.8 m long;500-µm mesh) were slotted into grooved metal runners located on theinside walls at the rear of each channel, which facilitated both removaland repositioning during sampling. Current velocity was measured atthe mouth of each net with a flow meter. Once removed, contents weremixed with 70% v/v ethanol and stored in snap-lock plastic bags. In thelaboratory, samples were examined and invertebrates removed, identi-fied, and enumerated as above. Drift data were converted to numberof individuals m−3 of water filtered (Allan and Russek 1985). Driftsamples were collected each day. Nets were slotted into the channels1 h before sunset and emptied 1 h after sunset in order to correspondwith the common peak period of drifting activity (Waters 1962; Bailey1981a, 1981b). Owing to the amount of organic material in transportin the water column, it was not feasible to sample over an entire 24-hperiod or logistically possible to empty nets each hour.
In Experiment 2, in order to examine the effect of the commence-ment of each pulse release on the magnitude of drift, additional driftsamples were collected for 2 h after each saline pulse had commenced,irrespective of the time of day.
Retrieval of sampling trays
In Experiment 1, the two salt treatments were imposed continuously for6 days. This was followed by a 6-day recovery period. Tray samples(n = 5) were taken on six occasions: one taken 24 h before commence-ment of release (prerelease), three samples taken during release (24 h,4 days and 6 days from commencement), and two samples after the saltrelease had been terminated (24 h and 6 days recovery). For Experiment2, the two release schedules were imposed over 5 days, followed by a5-day recovery period. Trays (n = 5) were removed from each channelon four occasions over the entire experimental period: one 24 h prere-lease, one after 5 days saline release, at the termination of saline releaseperiod, one 24 h after release was terminated and one 4 days later (i.e.after 5 days recovery).
Statistical analysis
The experimental design comprised three treatments, each replicated inthree channels. To test for a treatment effect, a split-plot nested ANOVAwas used with channels (plots) randomly distributed. The model testedeach effect by constructing different error terms after Green (1993).If treatment had a significant interaction with channel or time, it wasinterpreted as being dependent on these factors. A Student–Newman–Keuls’ (SNK) test was used to compare invertebrate means in eachchannel. If the results of the SNK test indicated that means within controlchannels were too variable, then interaction terms were interpreted assalinity effects not being as important as channel effects in determininginvertebrate distribution.
Pearson correlation coefficients were calculated between physicalfactors (potentially confounding factors) and the invertebrate dependentvariables. Covariates were considered to be depth (cm), flow (m s−1),the amount of leaf litter, wood, and inorganic and organic matter pertray (g dry weight), and number and physical characteristics of stones(>5 mm) per tray. Where significant correlations were found, the factorwas used as a covarying factor and a mixed-model split-plot nestedANOVA was used. Analysis of covariance requires that the coefficientof the covariate (slope of the regression) is the same for each treatmentgroup (Wildt and Ahtola 1978). This assumption was tested by usingthe covariable as an independent factor and testing whether a significanttreatment–slope interaction existed. Any such heterogeneity suggestedthat the relationship between treatment and the covariables is complexand no further analyses were attempted. However, if the relationship washomogeneous, then the analysis of covariance was used.
Statistical analyses were conducted on the total number of individualinvertebrates, the number of individuals of each common species (i.e.those species that made up at least 0.5% of the total number of individ-uals collected), the number of individuals in each order and functionalfeeding group, and species diversity indices. Several species diversityindices were used: no. of taxa, Margalef, Menhinick, Simpson, Shannon,Brillouin and Heip (Magurran 1988).
Drift samples collected from each channel over the duration ofthe experiment during the 2-h ‘dusk’ period, were corrected for flow,summed together, used as a replicate, and tested using ANOVA to testthe effect of treatment. To examine the effect of commencement of apulse release on drift rates at different times of the day (Experiment 2),drift samples (corrected for flow) collected for pulse 1 (commenced1800 hours), pulse 2 (commenced 1400 hours), pulse 3 (commenced2000 hours) and pulse 4 (commenced 1200 hours) were analysed witha repeated-measures two-way ANOVA. A Tukey–Kramer test was usedto identify differences between treatment means. These data were notincluded in overall drift analysis.
Assumptions of normal distribution and homogeneity of varianceswere tested using boxplots and by plotting the spread of residualsagainst estimates of the means (Sokal and Rohlf 1981). When necessary,data were transformed, log10(x + 1). All statistical analyses were con-ducted using SYSTAT Version 5.2.1 (for Macintosh; SYSTAT Products,Chicago, IL, USA).
Results
Physicochemical environment of channels
Salinity in Hughes Creek and control channels was similarduring both experiments, with a mean (±s.d.) value of 139 ±1.5 and 142 ± 2.7 mg L−1, for Experiments 1 and 2, respec-tively. During both experiments, the target salt concentrationswere achieved. During Experiment 1, conductivity in low-salt treatment channels was maintained at 1013 ± 36 mg L−1,whereas that of high-salt treatment channels averaged 2111 ±78 mg L−1. Similarly, in Experiment 2, conductivity in presstreatment channels averaged 1486 ± 46 mg L−1, whereas thatin the pulse treatment channels during the pulse releasesaveraged 3400 ± 112 mg L−1. Mean conductivity in the pulsetreatment channels over the entire 5-day release period was1378 ± 182 mg L−1.
Flow and water depth between channels were similarduring both experiments, with flow ranging 12–38 and 15–48 cm s−1 for Experiments 1 and 2, respectively. Water depthranged from 15.9 ± 0.7 to 34.5 ± 1.8 cm during Experiment1, and from 12.8 ± 1.2 cm to 26.2 ± 2.5 cm during Experi-ment 2. (The shallow depths observed in the channels duringExperiment 2 reflected the lower water depth in HughesCreek at that time of year.) However, during both experiments,mean depths for each treatment were similar at 23.8 ± 0.8 cmand 16.8 ± 2.8 cm for Experiments 1 and 2, respectively.
The composition of substrate in the trays was similarin both experiments. There were no significant differences(P > 0.05, ANOVA) between channels in either the numberof stones (>5 mm), the average mass of stones, the size classcomposition of stones, or average length or width of eachstone. Furthermore, the frequency distributions of stones ofdifferent sizes from each tray were not significantly different

Impact of salinisation on stream invertebrates Marine and Freshwater Research 513
Table 1. Macroinvertebrates present in trays or the drift community at Hughes Creek, Victoria, during Experiment 1 (30 April–13May 1993) and Experiment 2 (26 March–5 April 1994)
Taxa collected, with allocated functional feeding group shown in parenthesis, percentage abundance of each taxon, and whether species wereclassified as common* (i.e. represents at least 0.5% of total abundance)
Taxa Percentage abundance Taxa Percentage abundance
Trays Drift Trays Drift
Expt 1 Expt 2 Expt 1 Expt 2 Expt 1 Expt 2 Expt 1 Expt 2
Trichoptera Coloburiscoides sp. (GA) 0 0 0.25 0
Cheumatopsyche sp. 4 (FF) 3.5* 27.3* 3.4* 3.2* Atalophlebia sp. (GA) 0.3 0.2 0.6* 0.48*
Cheumatopsyche sp. 1 (FF) 0.76* 2.8* 0.48* 0.41 ColeopteraCheumatopsyche sp. 2 (FF) 0.1 0.08 0 0 Austrolimnius waterhousei (SC) 2.4* 17.4* 0.36 1.87*Ecnomus continentalis (PR) 41.0* 5.1* 4.9* 0.6* Austrolimnius sp. L36E (SC) 0 0.1 0 0Ecnomus pansus (PR) 1.0* 0.4 0 0.14 Austrolimnius spp. (SC) 0 0.01 0 0.1Ecnomus cygnitus (PR) 0.8* 0.13 0 0.12 Berosus spp. (PR) 0.4 6.6* 0.24 0.24Ecnomus sp. (PR) 0 1.02* 0 0.48* Kingolus spp. (SH) 0 0.3 0 0.1Triplectides spp. (SH) 0.1 0.22 14.8* 9.92* Gyrinidae sp. (PR) 0 0.06 0 3.36*Leptoceridae spp. (SH) 0 0 1.38* 0 Simsonia wilsoni (SC) 0 0.02 0 1.87*Hydroptila scamandra (SC) 0.3 0.03 1.4* 0.52* Simsonia spp. (SC) 0.1 0.1 0.24 0.24Hydroptila sp. (SC) 0 0.05 0 0.03 Psephenidae (SC) 0 0.6* 0 0.1Hellyethira simplex (SC) 0.1 0.04 0.18 2.28* Adult Hydrophilidae sp. 1 (GA) 0.04 2.0* 0.18 0.18Ulmerochorema sp. (PR) 0 0.05 0 0.2 Adult Hydrophilidae sp. 2 (GA) 0 0.02 0 0.7Apsilochorema sp. (PR) 0 0.02 0 0.04 Adult Sternopriscus (PR) 0 0 2.0* 2.0*Smicrophylax sp. (PR) 0 0.1 0 0 Adult Dytiscidae (PR) 0 0 0 0.1Glossosomatidae (SC) 0 0.06 0 0.28 Adult Necterosoma sp. (PR) 0 0 0 0.3
Plecoptera Other insectaGripopterygidae spp. (SC) 0 0.2 0 0.48* Hemigomphus gouldii (PR) 0.1 0.1 0.12 0.12Riekoperla tuberculata (SC) 0 0.01 0 0 Archicauliodes sp. (PR) 0.03 0.1 0.03 0Leptoperla neboisii (SC) 0.01 0.01 0 0.1 Micronecta spp. (GA) 0.05 0.01 14.1* 0.1
Diptera Naucoridae (PR) 0 0 0 0.1
Orthocladiinae spp. (GA) 11.4* 3.13* 11* 14.1* Veliidae (PR) 0 0 0 2.1*
Chironominae spp. (GA) 22.9* 12.4* 9.7* 5.6* Anisops sp. (PR) 0 0 0 0.12
Tanypodinae spp. (PR) 2.1* 1.6* 0.6* 1.6* Pleidae (PR) 0 0 0 0.1
Chironomidae spp. pupae (NA) 1.5* 1.1* 6.1* 6.9* Non-insectaSimuliidae spp. (FF) 0 0.5* 4.4* 4.8* Ferrissia tasmanica (SC) 0.9* 10.2* 0.42 3.3*Ceratopogonidae spp. ( GA) 0 0.1 0 0.03 Gastropoda spp. (SC) 0 0.1 0 0.9*Tipulidae spp. (GA) 0 0.3 0 0 Atyidae (GA) 0 0.01 0 0.1Dolichopodidae (PR) 0 0.1 0 0 Oligochaeta (GA) 0.2 0.03 2.0* 0.01Tabanidae (PR) 0 0 0 0.02 Copepoda (GA) 0.3 0.02 2.88* 0.23Stratiomyidae (GA) 0 0 0 0.01 Araneae (PR) 0.01 0.01 1.08* 0.39
Ephemeroptera Functional feeding groupsTasmanocoenis tillyardi (GA) 9.0* 0.04 12.9* 2.28* Filter feeders (FF) 4.4 30.7 8.3 8.4Tasmanocoenis sp. 2 (GA) 0 0.05 0 0.2 Gatherers (GA) 44.0 21.0 51.0 36.6Baetis sp. 5. (SC) 0 0.02 0 0.04 Predators (PR) 45.5 15.4 12.0 5.0Baetis sp. 2. (SC) 0 0.1 0 0 Scrapers (SC) 3.8 31.0 5.0 25.1Baetis spp. (SC) 0 0.06 2.4* 0.28 Shredders (SH) 0.4 0.5 16.8 10.0
FF, filter feeder; SH, shredder; SC, scraper; PR, predator; GA, gatherer–collector; NA, not applicable.Total no. individuals collected: Experiment 1, 71 280 (trays), 1662 (drift); Experiment 2, 56 897 (trays), 17 770 (drift).
between channels. The total amount of organic and inorganicmaterial collected in the trays did not differ between channels;however, in Experiment 1, significantly less organic mate-rial of the 250-µm size fraction was found in trays collectedfrom the deeper/faster channels, whereas in both experi-ments significantly more leaf/twig material and the 125-µmorganic fraction were found in trays collected from channelswith slower flow. Water temperature averaged 18.4◦C andranged from 16.4◦C (0700 hours) to a maximum of 21.4◦C(1900 hours).
Invertebrate community found in trays
Thirty-three invertebrate taxa were identified to the low-est taxonomic level possible during Experiment 1; of these,12 were classified as common (i.e. each taxa comprisedmore than 0.5% of the total number of individuals collected;n = 71 280). In contrast, 55 taxa were identified, 16 common(n = 56 897), during Experiment 2 (Table 1). In both Experi-ment 1 and Experiment 2, insects dominated the invertebratecommunity found in tray samples (approximately 98% and
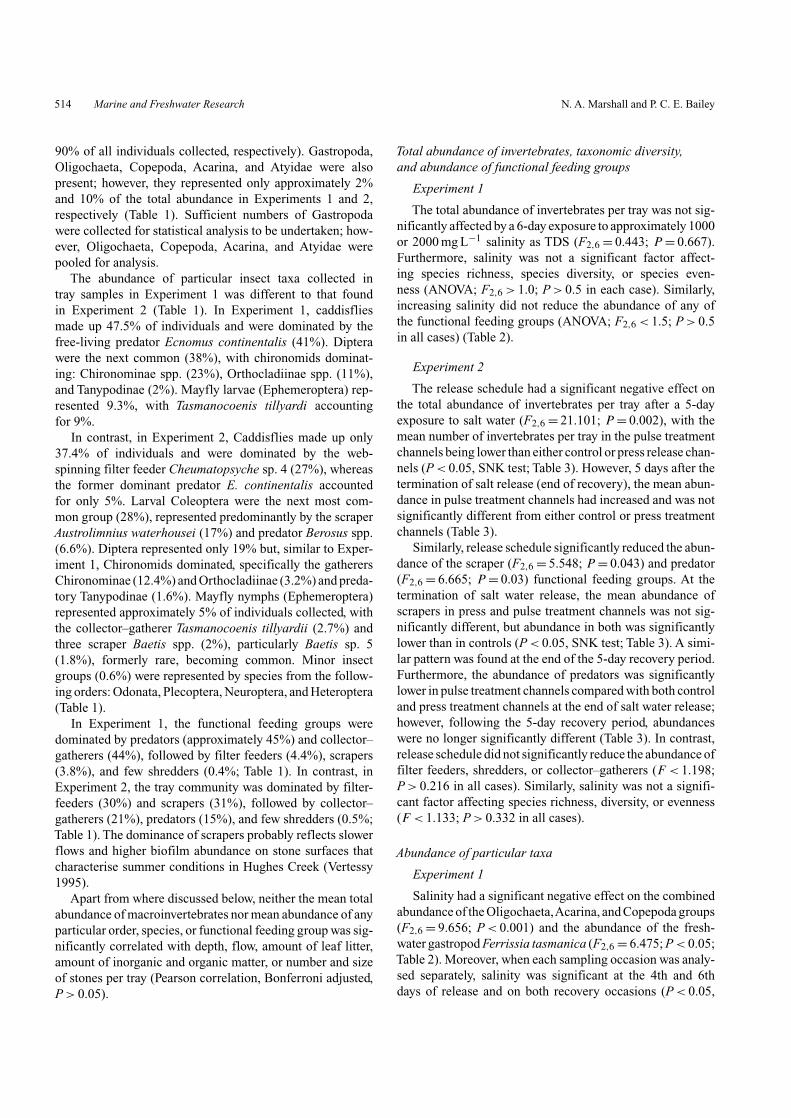
514 Marine and Freshwater Research N. A. Marshall and P. C. E. Bailey
90% of all individuals collected, respectively). Gastropoda,Oligochaeta, Copepoda, Acarina, and Atyidae were alsopresent; however, they represented only approximately 2%and 10% of the total abundance in Experiments 1 and 2,respectively (Table 1). Sufficient numbers of Gastropodawere collected for statistical analysis to be undertaken; how-ever, Oligochaeta, Copepoda, Acarina, and Atyidae werepooled for analysis.
The abundance of particular insect taxa collected intray samples in Experiment 1 was different to that foundin Experiment 2 (Table 1). In Experiment 1, caddisfliesmade up 47.5% of individuals and were dominated by thefree-living predator Ecnomus continentalis (41%). Dipterawere the next common (38%), with chironomids dominat-ing: Chironominae spp. (23%), Orthocladiinae spp. (11%),and Tanypodinae (2%). Mayfly larvae (Ephemeroptera) rep-resented 9.3%, with Tasmanocoenis tillyardi accountingfor 9%.
In contrast, in Experiment 2, Caddisflies made up only37.4% of individuals and were dominated by the web-spinning filter feeder Cheumatopsyche sp. 4 (27%), whereasthe former dominant predator E. continentalis accountedfor only 5%. Larval Coleoptera were the next most com-mon group (28%), represented predominantly by the scraperAustrolimnius waterhousei (17%) and predator Berosus spp.(6.6%). Diptera represented only 19% but, similar to Exper-iment 1, Chironomids dominated, specifically the gatherersChironominae (12.4%) and Orthocladiinae (3.2%) and preda-tory Tanypodinae (1.6%). Mayfly nymphs (Ephemeroptera)represented approximately 5% of individuals collected, withthe collector–gatherer Tasmanocoenis tillyardii (2.7%) andthree scraper Baetis spp. (2%), particularly Baetis sp. 5(1.8%), formerly rare, becoming common. Minor insectgroups (0.6%) were represented by species from the follow-ing orders: Odonata, Plecoptera, Neuroptera, and Heteroptera(Table 1).
In Experiment 1, the functional feeding groups weredominated by predators (approximately 45%) and collector–gatherers (44%), followed by filter feeders (4.4%), scrapers(3.8%), and few shredders (0.4%; Table 1). In contrast, inExperiment 2, the tray community was dominated by filter-feeders (30%) and scrapers (31%), followed by collector–gatherers (21%), predators (15%), and few shredders (0.5%;Table 1). The dominance of scrapers probably reflects slowerflows and higher biofilm abundance on stone surfaces thatcharacterise summer conditions in Hughes Creek (Vertessy1995).
Apart from where discussed below, neither the mean totalabundance of macroinvertebrates nor mean abundance of anyparticular order, species, or functional feeding group was sig-nificantly correlated with depth, flow, amount of leaf litter,amount of inorganic and organic matter, or number and sizeof stones per tray (Pearson correlation, Bonferroni adjusted,P > 0.05).
Total abundance of invertebrates, taxonomic diversity,and abundance of functional feeding groups
Experiment 1
The total abundance of invertebrates per tray was not sig-nificantly affected by a 6-day exposure to approximately 1000or 2000 mg L−1 salinity as TDS (F2,6 = 0.443; P = 0.667).Furthermore, salinity was not a significant factor affect-ing species richness, species diversity, or species even-ness (ANOVA; F2,6 > 1.0; P > 0.5 in each case). Similarly,increasing salinity did not reduce the abundance of any ofthe functional feeding groups (ANOVA; F2,6 < 1.5; P > 0.5in all cases) (Table 2).
Experiment 2
The release schedule had a significant negative effect onthe total abundance of invertebrates per tray after a 5-dayexposure to salt water (F2,6 = 21.101; P = 0.002), with themean number of invertebrates per tray in the pulse treatmentchannels being lower than either control or press release chan-nels (P < 0.05, SNK test; Table 3). However, 5 days after thetermination of salt release (end of recovery), the mean abun-dance in pulse treatment channels had increased and was notsignificantly different from either control or press treatmentchannels (Table 3).
Similarly, release schedule significantly reduced the abun-dance of the scraper (F2,6 = 5.548; P = 0.043) and predator(F2,6 = 6.665; P = 0.03) functional feeding groups. At thetermination of salt water release, the mean abundance ofscrapers in press and pulse treatment channels was not sig-nificantly different, but abundance in both was significantlylower than in controls (P < 0.05, SNK test; Table 3). A simi-lar pattern was found at the end of the 5-day recovery period.Furthermore, the abundance of predators was significantlylower in pulse treatment channels compared with both controland press treatment channels at the end of salt water release;however, following the 5-day recovery period, abundanceswere no longer significantly different (Table 3). In contrast,release schedule did not significantly reduce the abundance offilter feeders, shredders, or collector–gatherers (F < 1.198;P > 0.216 in all cases). Similarly, salinity was not a signifi-cant factor affecting species richness, diversity, or evenness(F < 1.133; P > 0.332 in all cases).
Abundance of particular taxa
Experiment 1
Salinity had a significant negative effect on the combinedabundance of the Oligochaeta,Acarina, and Copepoda groups(F2,6 = 9.656; P < 0.001) and the abundance of the fresh-water gastropod Ferrissia tasmanica (F2,6 = 6.475; P < 0.05;Table 2). Moreover, when each sampling occasion was analy-sed separately, salinity was significant at the 4th and 6thdays of release and on both recovery occasions (P < 0.05,
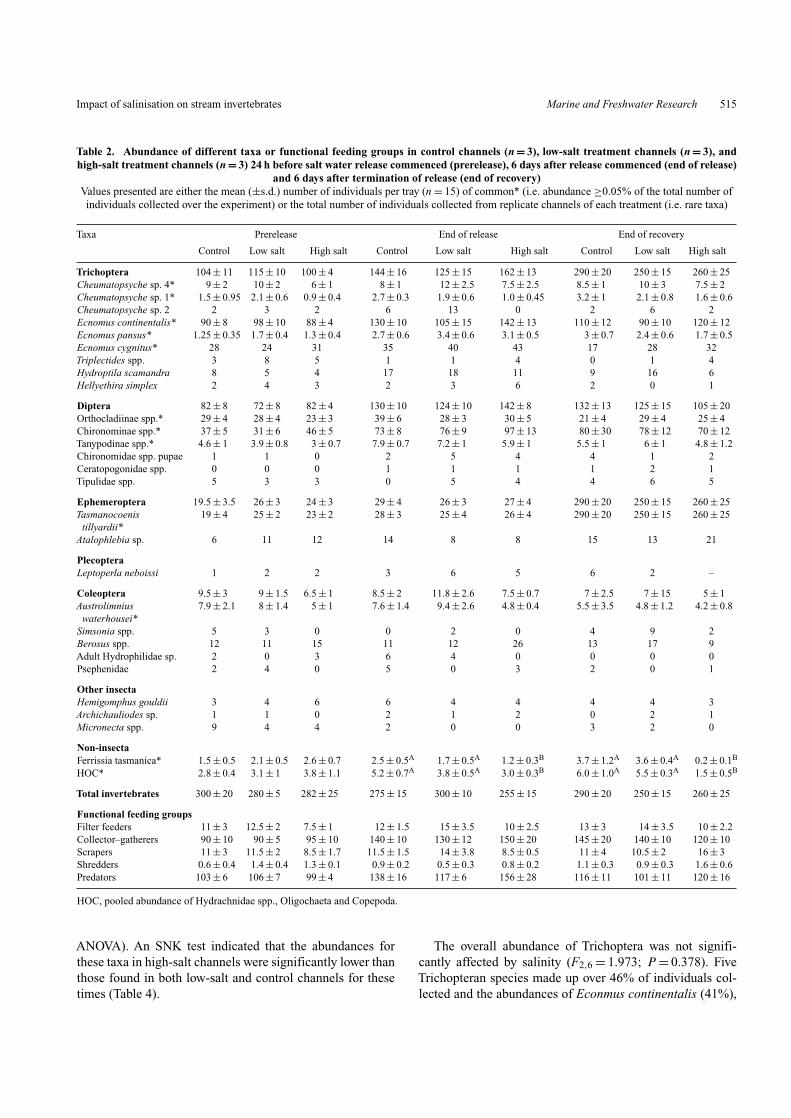
Impact of salinisation on stream invertebrates Marine and Freshwater Research 515
Table 2. Abundance of different taxa or functional feeding groups in control channels (n = 3), low-salt treatment channels (n = 3), andhigh-salt treatment channels (n = 3) 24 h before salt water release commenced (prerelease), 6 days after release commenced (end of release)
and 6 days after termination of release (end of recovery)Values presented are either the mean (±s.d.) number of individuals per tray (n = 15) of common* (i.e. abundance ≥0.05% of the total number ofindividuals collected over the experiment) or the total number of individuals collected from replicate channels of each treatment (i.e. rare taxa)
Taxa Prerelease End of release End of recovery
Control Low salt High salt Control Low salt High salt Control Low salt High salt
Trichoptera 104 ± 11 115 ± 10 100 ± 4 144 ± 16 125 ± 15 162 ± 13 290 ± 20 250 ± 15 260 ± 25Cheumatopsyche sp. 4* 9 ± 2 10 ± 2 6 ± 1 8 ± 1 12 ± 2.5 7.5 ± 2.5 8.5 ± 1 10 ± 3 7.5 ± 2Cheumatopsyche sp. 1* 1.5 ± 0.95 2.1 ± 0.6 0.9 ± 0.4 2.7 ± 0.3 1.9 ± 0.6 1.0 ± 0.45 3.2 ± 1 2.1 ± 0.8 1.6 ± 0.6Cheumatopsyche sp. 2 2 3 2 6 13 0 2 6 2Ecnomus continentalis* 90 ± 8 98 ± 10 88 ± 4 130 ± 10 105 ± 15 142 ± 13 110 ± 12 90 ± 10 120 ± 12Ecnomus pansus* 1.25 ± 0.35 1.7 ± 0.4 1.3 ± 0.4 2.7 ± 0.6 3.4 ± 0.6 3.1 ± 0.5 3 ± 0.7 2.4 ± 0.6 1.7 ± 0.5Ecnomus cygnitus* 28 24 31 35 40 43 17 28 32Triplectides spp. 3 8 5 1 1 4 0 1 4Hydroptila scamandra 8 5 4 17 18 11 9 16 6Hellyethira simplex 2 4 3 2 3 6 2 0 1
Diptera 82 ± 8 72 ± 8 82 ± 4 130 ± 10 124 ± 10 142 ± 8 132 ± 13 125 ± 15 105 ± 20Orthocladiinae spp.* 29 ± 4 28 ± 4 23 ± 3 39 ± 6 28 ± 3 30 ± 5 21 ± 4 29 ± 4 25 ± 4Chironominae spp.* 37 ± 5 31 ± 6 46 ± 5 73 ± 8 76 ± 9 97 ± 13 80 ± 30 78 ± 12 70 ± 12Tanypodinae spp.* 4.6 ± 1 3.9 ± 0.8 3 ± 0.7 7.9 ± 0.7 7.2 ± 1 5.9 ± 1 5.5 ± 1 6 ± 1 4.8 ± 1.2Chironomidae spp. pupae 1 1 0 2 5 4 4 1 2Ceratopogonidae spp. 0 0 0 1 1 1 1 2 1Tipulidae spp. 5 3 3 0 5 4 4 6 5
Ephemeroptera 19.5 ± 3.5 26 ± 3 24 ± 3 29 ± 4 26 ± 3 27 ± 4 290 ± 20 250 ± 15 260 ± 25Tasmanocoenis 19 ± 4 25 ± 2 23 ± 2 28 ± 3 25 ± 4 26 ± 4 290 ± 20 250 ± 15 260 ± 25
tillyardii*Atalophlebia sp. 6 11 12 14 8 8 15 13 21
PlecopteraLeptoperla neboissi 1 2 2 3 6 5 6 2 –
Coleoptera 9.5 ± 3 9 ± 1.5 6.5 ± 1 8.5 ± 2 11.8 ± 2.6 7.5 ± 0.7 7 ± 2.5 7 ± 15 5 ± 1Austrolimnius 7.9 ± 2.1 8 ± 1.4 5 ± 1 7.6 ± 1.4 9.4 ± 2.6 4.8 ± 0.4 5.5 ± 3.5 4.8 ± 1.2 4.2 ± 0.8
waterhousei*Simsonia spp. 5 3 0 0 2 0 4 9 2Berosus spp. 12 11 15 11 12 26 13 17 9Adult Hydrophilidae sp. 2 0 3 6 4 0 0 0 0Psephenidae 2 4 0 5 0 3 2 0 1
Other insectaHemigomphus gouldii 3 4 6 6 4 4 4 4 3Archichauliodes sp. 1 1 0 2 1 2 0 2 1Micronecta spp. 9 4 4 2 0 0 3 2 0
Non-insectaFerrissia tasmanica* 1.5 ± 0.5 2.1 ± 0.5 2.6 ± 0.7 2.5 ± 0.5A 1.7 ± 0.5A 1.2 ± 0.3B 3.7 ± 1.2A 3.6 ± 0.4A 0.2 ± 0.1B
HOC* 2.8 ± 0.4 3.1 ± 1 3.8 ± 1.1 5.2 ± 0.7A 3.8 ± 0.5A 3.0 ± 0.3B 6.0 ± 1.0A 5.5 ± 0.3A 1.5 ± 0.5B
Total invertebrates 300 ± 20 280 ± 5 282 ± 25 275 ± 15 300 ± 10 255 ± 15 290 ± 20 250 ± 15 260 ± 25
Functional feeding groupsFilter feeders 11 ± 3 12.5 ± 2 7.5 ± 1 12 ± 1.5 15 ± 3.5 10 ± 2.5 13 ± 3 14 ± 3.5 10 ± 2.2Collector–gatherers 90 ± 10 90 ± 5 95 ± 10 140 ± 10 130 ± 12 150 ± 20 145 ± 20 140 ± 10 120 ± 10Scrapers 11 ± 3 11.5 ± 2 8.5 ± 1.7 11.5 ± 1.5 14 ± 3.8 8.5 ± 0.5 11 ± 4 10.5 ± 2 16 ± 3Shredders 0.6 ± 0.4 1.4 ± 0.4 1.3 ± 0.1 0.9 ± 0.2 0.5 ± 0.3 0.8 ± 0.2 1.1 ± 0.3 0.9 ± 0.3 1.6 ± 0.6Predators 103 ± 6 106 ± 7 99 ± 4 138 ± 16 117 ± 6 156 ± 28 116 ± 11 101 ± 11 120 ± 16
HOC, pooled abundance of Hydrachnidae spp., Oligochaeta and Copepoda.
ANOVA). An SNK test indicated that the abundances forthese taxa in high-salt channels were significantly lower thanthose found in both low-salt and control channels for thesetimes (Table 4).
The overall abundance of Trichoptera was not signifi-cantly affected by salinity (F2,6 = 1.973; P = 0.378). FiveTrichopteran species made up over 46% of individuals col-lected and the abundances of Econmus continentalis (41%),

516 Marine and Freshwater Research N. A. Marshall and P. C. E. Bailey
Table 3. Abundance of different taxa or functional feeding groups in control treatment channels (n = 3), press treatment channels (n = 3),and pulse treatment channels (n = 3) 24 h before salt water release commenced (prerelease), 5 days after release commenced (end of release)
and 5 days after termination of release (end of recovery)Values presented are either the mean (± s.d.) number of individuals per tray (n = 15) of common* (i.e. abundance ≥0.05% of the total number ofindividuals collected over the experiment) or the total number of individuals collected from replicate channels of each treatment (i.e. rare taxa).
Treatment means for species for each sampling time not sharing same superscript letter are significantly different (P < 0.05, SNK test)
Taxa Prerelease End of release End of recovery
Control Press Pulse Control Press Pulse Control Press Pulse
Trichoptera 110 ± 15 115 ± 15 95 ± 10 108 ± 17 115 ± 10 125 ± 10 130 ± 20 128 ± 8 150 ± 10Cheumatopsyche sp. 4* 80 ± 15 85 ± 12 78 ± 7 78 ± 12 82 ± 13 95 ± 15 92 ± 13 88 ± 7 110 ± 10Cheumatopsyche sp. 1* 6 ± 1.0 5.8 ± 1.0 7.5 ± 1.0 7.0 ± 1.3 8.0 ± 1.5 8.0 ± 2.4 11.0 ± 2.0 15 ± 3.0 14.5 ± 1.6Ecnomus continentalis* 17 ± 5 11.5 ± 2 13.5 ± 3.0 10 ± 3 7 ± 1.5 5.5 ± 15 9.5 ± 2 17 ± 5 5 ± 0.5Ecnomus spp.* 0.8 ± 0.4 0.2 ± 0.05 0.3 ± 0.1 2 ± 0.5 1.8 ± 1.0 4.1 ± 1.0 4 ± 1.0 4.4 ± 0.6 10 ± 3
Diptera 88 ± 17 75 ± 6 74 ± 6 65 ± 15 60 ± 10 40 ± 8 64 ± 6 70 ± 10 45 ± 4Orthocladiinae spp.* 17 ± 5.5 11 ± 2.4 13.5 ± 2.5 10 ± 3 7 ± 2.5 6 ± 1 9.5 ± 1.5 17.5 ± 5.5 5 ± 1Chironominae spp.* 55 ± 7 43 ± 8 42 ± 5 46 ± 14 45 ± 11 23 ± 8 39 ± 7 40 ± 6 28 ± 4Tanypodinae spp.* 12.6 ± 3.4 10.2 ± 1.3 11.5 ± 2 1.5 ± 0.7 2.8 ± 0.4 1.0 ± 0.2 3.0 ± 0.4 5.8 ± 1.2 4.0 ± 1.0Chironomidae spp. pupae 4.5 ± 0.5 6.8 ± 1.0 4.2 ± 0.6 3.6 ± 2.7 2.5 ± 0.5 4.4 ± 0.6 1.5 ± 0.3 2.5 ± 0.5 2.0 ± 0.5Simuliidae 0.2 ± 0.1 0.15 ± 0.1 0 0.5 ± 0.3 0.3 ± 0.2 0.8 ± 0.2 4.0 ± 1.4 3.8 ± 1.5 4.4 ± 1.4
Ephemeroptera 13.0 ± 1.5 17 ± 2 14.5 ± 1.5 19 ± 2 12 ± 0.3 9 ± 1 23 ± 3 19 ± 3 13 ± 2Tasmanocoenis tillyardii* 9.2 ± 1.3 8.8 ± 1.2 7.8 ± 1.4 12 ± 2 10.2 ± 1.3 7.2 ± 1.6 10 ± 2 8 ± 2 3.5 ± 0.5Baetis sp. 5 2.6 ± 0.4 7 ± 1 5.5 ± 0.4 6.2 ± 0.8A 1.2 ± 0.2B 1.0 ± 0.1B 10.5 ± 2A 9.5 ± 1.1A 6.5 ± 2.0A
ColeopteraAustrolimnius waterhousei* 7.9 ± 2.1 8 ± 1.4 5 ± 1 7.6 ± 1.4 9.4 ± 2.6 4.8 ± 0.4 5.5 ± 3.5 4.8 ± 1.2 4.2 ± 0.8Berosus spp. 12 11 15 11 12 26 13 17 9Adult Hydrophilidae sp. 1 2 0 3 6 4 0 0 0 0Psephenidae 2 4 0 5 0 3 2 0 1
Non-insectaFerrissia tasmanica* 55 ± 9 40 ± 11 48 ± 13 52 ± 10A 8 ± 2B 2 ± 1C 65 ± 10A 15 ± 3B 2 ± 1C
Total invertebrates 370 ± 100 350 ± 60 355 ± 85 320 ± 25A 290 ± 40A 230 ± 30B 380 ± 70A 315 ± 70A 280 ± 40A
Functional feeding groupsFilter feeders 88 ± 17 99 ± 18 80 ± 10 80 ± 18 90 ± 15 105 ± 10 115 ± 15 108 ± 10 132 ± 13Gatherers 82 ± 13 65 ± 7 64 ± 7 70 ± 15 65 ± 10 42 ± 8 60 ± 10 68 ± 11 38 ± 2Scrapers 122 ± 18 100 ± 12 135 ± 17 102 ± 10A 65 ± 5B 70 ± 10B 118 ± 10A 60 ± 10B 62 ± 8B
Shredders 1.2 ± 0.4 1.3 ± 0.3 1.0 ± 0.4 1.3 ± 0.2 1.4 ± 0.3 1.0 ± 0.2 1.4 ± 0.5 1.9 ± 0.6 1.9 ± 0.7Predators 36 ± 6 33.5 ± 4.5 25 ± 3.5 26 ± 4.5A 29 ± 4.5A 16 ± 3B 27 ± 4.5 32 ± 5 27 ± 3.9
Table 4. Mean (±s.d.) number of individuals per tray of Ferrissia tasmanica and pooled adundance of Oligochaeta, Acarina,and Copepoda (OAC) in control and low- and high-salt treatment channels before salt release (0 day), 1, 4, and 6 days after
commencement of salt release, and 1 and 6 days after termination of salt release (recovery)
Taxa Treatment Sampling time
0 day 1 day 4 daysA 6 daysA 1 day recoveryA 6 days recoveryA
Ferrissia tasmanica Control 1.5 ± 0.5 2.0 ± 0.4 3.2 ± 1.0 2.5 ± 0.5 4.8 ± 2.0 3.7 ± 1.2Low salt 2.1 ± 0.5 2.8 ± 0.5 4.0 ± 0.7 1.7 ± 0.2 2.0 ± 0.4 3.6 ± 0.4High salt 2.6 ± 0.7 2.1 ± 0.6 1.0 ± 0.3B 1.2 ± 0.3B 1.0 ± 0.2B 0.2 ± 0.08B
OAC combined Control 2.8 ± 0.4 3.2 ± 0.2 5.0 ± 1.0 5.2 ± 0.7 6.5 ± 1.2 6.0 ± 1.0Low salt 3.1 ± 1.0 3.5 ± 0.6 6.0 ± 1.0 3.8 ± 0.5 5.1 ± 0.2 5.5 ± 0.3High salt 3.8 ± 1.2 3.4 ± 0.7 3.2 ± 0.3B 3.0 ± 0.3B 2.1 ± 0.4B 1.5 ± 0.5B
ATreatment effect on sampling occasion (P < 0.05, ANOVA).BMeans from high-salt treatment channels differ significantly from controls or low-salt treatment (P < 0.05, SNK test).
E. pansus (1%), E. cygnitus (0.8%), Cheumatopsyche sp. 4(3.5%), and Cheumatopsyche sp. 1 (0.8%) did not respondsignificantly to elevated salinity (ANOVA; F2,6 < 1.3;P > 0.24; Table 2).
A similar pattern was found for Diptera, which madeup 38% of the tray community (F2,6 = 1.025; P = 0.414).There was no significant salinity effect on abundance ofthe Dipteran total or three common subfamilies, namely
Impact of salinisation on stream invertebrates Marine and Freshwater Research 517
Chironominae spp., Orthocladiinae spp., and Tanypodinaespp. (ANOVA; F2,6 < 0.8; P > 0.5 in all cases) and theSNK test again showed significant variation among controlchannels for these three taxa (Table 2).
Tasmanocoenis tillyardi was the dominant Ephemeropteraspecies in the tray community, making up 9% of total, whereasAtalophlebia sp. made up 0.3%. The 6-day exposure toincreased salinity did not affect the abundance of T. tillyardiin trays (ANOVA; F2,6 = 1.137; P = 0.323), which was dif-ferent across control channels. Similarly, the abundance of thedominant Coleopteran, Austrolimnius waterhousei (2.4%),was not reduced by increased salinity (ANOVA; F2,6 = 0.481;P = 0.69; Table 2).
Experiment 2
Release schedule had a significant negative effect onthe abundance of the freshwater gastropod F. tasmanica(F2,6 = 106.1; P < 0.001; Table 3). Moreover, when eachsampling occasion was analysed separately, this treatmenteffect was significant at the end of the release and after1 and 5 days following termination of release (P < 0.05,ANOVA; Table 3). An SNK test indicated that abundancein pulse treatment channels was lower (P < 0.05) than that inpress treatment channels and abundance in both channels wassignificantly lower than that in control channels (P < 0.05).Similarly, the abundance of the mayfly Baetis sp. 5 was sig-nificantly reduced in press and pulse treatment channels after5 days exposure (F2,6 = 7.453; P < 0.05; Table 3); howeverthis treatment effect was not evident after the 5-day recoveryperiod (SNK test) and abundances were not different fromthose in control channels (Table 3).
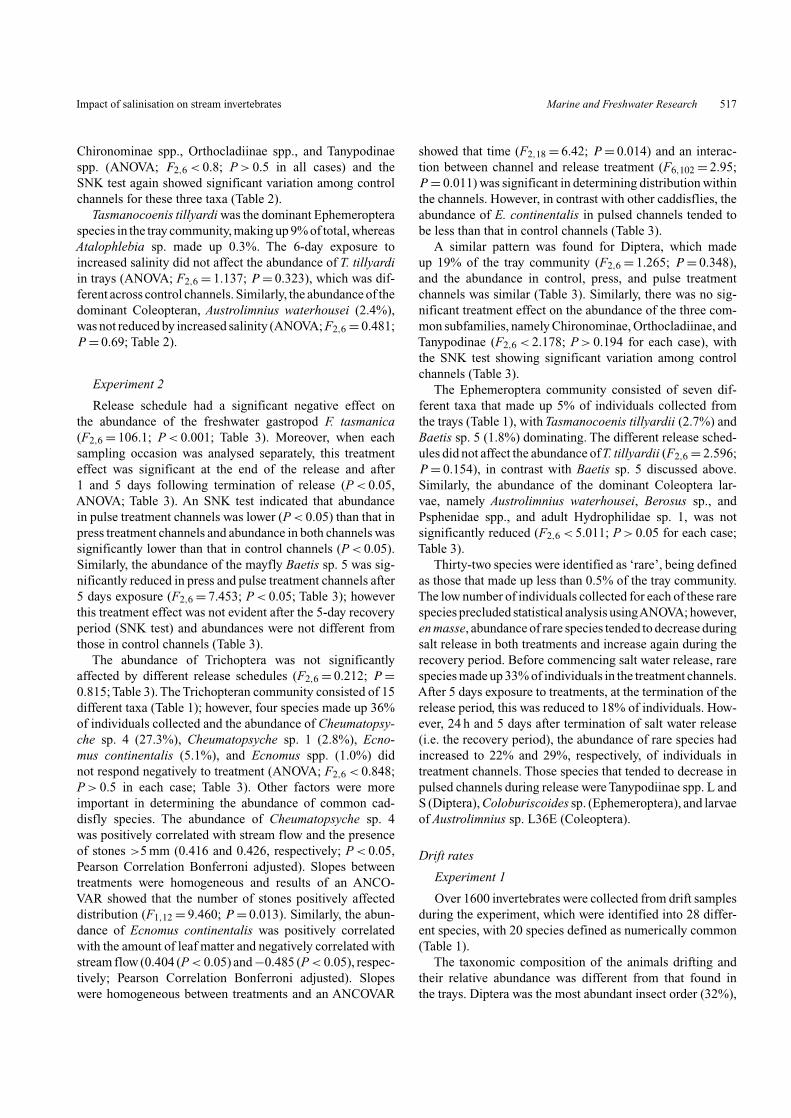
The abundance of Trichoptera was not significantlyaffected by different release schedules (F2,6 = 0.212; P =0.815; Table 3). The Trichopteran community consisted of 15different taxa (Table 1); however, four species made up 36%of individuals collected and the abundance of Cheumatopsy-che sp. 4 (27.3%), Cheumatopsyche sp. 1 (2.8%), Ecno-mus continentalis (5.1%), and Ecnomus spp. (1.0%) didnot respond negatively to treatment (ANOVA; F2,6 < 0.848;P > 0.5 in each case; Table 3). Other factors were moreimportant in determining the abundance of common cad-disfly species. The abundance of Cheumatopsyche sp. 4was positively correlated with stream flow and the presenceof stones >5 mm (0.416 and 0.426, respectively; P < 0.05,Pearson Correlation Bonferroni adjusted). Slopes betweentreatments were homogeneous and results of an ANCO-VAR showed that the number of stones positively affecteddistribution (F1,12 = 9.460; P = 0.013). Similarly, the abun-dance of Ecnomus continentalis was positively correlatedwith the amount of leaf matter and negatively correlated withstream flow (0.404 (P < 0.05) and −0.485 (P < 0.05), respec-tively; Pearson Correlation Bonferroni adjusted). Slopeswere homogeneous between treatments and an ANCOVAR
showed that time (F2,18 = 6.42; P = 0.014) and an interac-tion between channel and release treatment (F6,102 = 2.95;P = 0.011) was significant in determining distribution withinthe channels. However, in contrast with other caddisflies, theabundance of E. continentalis in pulsed channels tended tobe less than that in control channels (Table 3).
A similar pattern was found for Diptera, which madeup 19% of the tray community (F2,6 = 1.265; P = 0.348),and the abundance in control, press, and pulse treatmentchannels was similar (Table 3). Similarly, there was no sig-nificant treatment effect on the abundance of the three com-mon subfamilies, namely Chironominae, Orthocladiinae, andTanypodinae (F2,6 < 2.178; P > 0.194 for each case), withthe SNK test showing significant variation among controlchannels (Table 3).
The Ephemeroptera community consisted of seven dif-ferent taxa that made up 5% of individuals collected fromthe trays (Table 1), with Tasmanocoenis tillyardii (2.7%) andBaetis sp. 5 (1.8%) dominating. The different release sched-ules did not affect the abundance ofT. tillyardii (F2,6 = 2.596;P = 0.154), in contrast with Baetis sp. 5 discussed above.Similarly, the abundance of the dominant Coleoptera lar-vae, namely Austrolimnius waterhousei, Berosus sp., andPsphenidae spp., and adult Hydrophilidae sp. 1, was notsignificantly reduced (F2,6 < 5.011; P > 0.05 for each case;Table 3).
Thirty-two species were identified as ‘rare’, being definedas those that made up less than 0.5% of the tray community.The low number of individuals collected for each of these rarespecies precluded statistical analysis usingANOVA; however,en masse, abundance of rare species tended to decrease duringsalt release in both treatments and increase again during therecovery period. Before commencing salt water release, rarespecies made up 33% of individuals in the treatment channels.After 5 days exposure to treatments, at the termination of therelease period, this was reduced to 18% of individuals. How-ever, 24 h and 5 days after termination of salt water release(i.e. the recovery period), the abundance of rare species hadincreased to 22% and 29%, respectively, of individuals intreatment channels. Those species that tended to decrease inpulsed channels during release were Tanypodiinae spp. L andS (Diptera), Coloburiscoides sp. (Ephemeroptera), and larvaeof Austrolimnius sp. L36E (Coleoptera).
Drift rates
Experiment 1
Over 1600 invertebrates were collected from drift samplesduring the experiment, which were identified into 28 differ-ent species, with 20 species defined as numerically common(Table 1).
The taxonomic composition of the animals drifting andtheir relative abundance was different from that found inthe trays. Diptera was the most abundant insect order (32%),

518 Marine and Freshwater Research N. A. Marshall and P. C. E. Bailey
consisting predominantly of Orthocladiinae spp. (11%) andChironominae spp. (9.7%). Many chironomid pupae werealso collected (6%) and Simulidae larvae, not found intrays, made up 4% of drifting individuals. The Trichoptera(27%) was dominated by Triplectides spp., which was, infact, the most common species of the drift community(14.8%), although it was a rare (0.1%) species within thetrays (Table 1).
There was no significant effect of salinity on the totalnumber of individuals drifting (ANOVA; F2,62 = 0.700; P =0.721) or on the drift abundance of any of the 12 commontray species (ANOVA; F2,62 < 1.788; P > 0.20). Qualita-tively, data suggested that the abundance of F. tasmanicaincreased in the drift in association with high salt treatment;however, low numbers (0.4% of total) precluded statisticalanalysis.
Experiment 2
Over 17 770 invertebrates were collected from drift netsduring the experiment, which were identified into 54 differ-ent species with 25 defined as numerically common (Table 1).The taxonomic composition of the animals drifting and theirrelative abundance was different from that found in the traysand, to a large extent, reflected drift data collected dur-ing Experiment 1. Diptera was the most abundant insectorder (33% of individuals drifting), consisting predomi-nantly of Orthocladiinae (14%) and Chironominae (approx-imately 6%). Many chironomid pupae were also collected(7%) and Simulidae larvae made up almost 5% of drifting
Table 5. Mean number (±s.d.) of drifting Ferrissia tasmanica andBaetis sp. 5, corrected for flow, collected from control channels(n = 3), press channels (n = 3), and pulse treatment channels (n = 3)
in Hughes Creek, Victoria, March 1994Drifting animals were collected from each channel for 1 h beforesunset and 1 h after sunset for 5 days during salt water release.
Treatment means for each species not sharing the same superscriptletter are significantly different (P < 0.05, Tukey–Kramer test)
Taxa Control Press Pulse
Ferrisia tasmanica 2.6 ± 1.8A 28.8 ± 9.6B 32.5 ± 12.3B
Baetis sp. 5 2.1 ± 2.2A 8.6 ± 4.8B 12.3 ± 6.8B
Table 6. Mean number (±s.d.) of drifting invertebrates, corrected for flow, collected from control (n = 3), press (n = 3) and pulsetreatment channels (n = 3) at different times during saltwater release in Hughes Creek, Victoria, March 1994
Drifting animals were collected for 2 h after salt water released commenced in the pulse treatment channels at time shown. Treatment meansfor each sampling time not sharing same letter significantly different (Tukey-Kramer test, P < 0.05)
Sampling time Control Press Pulse
1800–2000 h (commencement of pulse 1, 1800 h, day 1) 481 ± 71A 396 ± 95A 411 ± 157A
1400–1600 h (commencement of Pulse 2, 1400 h, day 2) 166 ± 42A 153 ± 13A 341 ± 39B
2000–2200 h (commencement of pulse 3, 2000 h, day 3) 340 ± 150A 280 ± 72A 346 ± 133A
1200–1400 h (commencement of pulse 4, 1200 h, day 4) 100 ± 55A 161 ± 78A 313 ± 58B
individuals. The drifting Trichoptera (19%) were dominatedby Triplectides spp. (approximately 10%), although Triplec-tides spp. were rare in trays (0.2%). Only those speciesthat were common to both tray and drift communities wereincluded in further analysis (Table 1).
Results of theANCOVAR showed that the release schedulewas a significant independent factor in determining the num-ber of F. tasmanica (F2,75 = 5.272; P = 0.007) and Baetissp. 5, (F2,75 = 12.018; P = 0.001) drifting. Significantlymore individuals were collected from press and pulse treat-ment channels compared with control channels (P < 0.05,Tukey–Kramer test; Table 5). Moreover, there was a signifi-cant time (F = 9.8371; P = 0.01) and treatment (F = 3.2774;P = 0.04) effect on the number of individuals drifting duringthe first 2 h after the commencement of each pulse release.Given no significant interaction, pair-wise comparisons oftreatment means for each pulse showed that the numberof drifting individuals was significantly higher (P < 0.05,Tukey–Kramer test) in the pulse treatment channels 2 h afterthe salt water pulse commenced during the daylight at 1400hours (pulse 2) and 1200 hours (pulse 4; Table 6). In contrast,no difference was observed between treatment means whenthe salt water pulse commenced at either 1800 hours (pulse 1)or 2000 hours (pulse 3; i.e. during dusk or night-time;Table 6).
Discussion
Our experiments had two overall objectives. First, we exam-ined the general predictions of Hart et al. (1991) thatthe abundance of macroinvertebrates would be negativelyaffected when exposed to salt concentrations greater than1000 mg L−1. Second, we examined the effect of releasing thesame salt load (7200 kg) by two different release schedules ofsaline wastewater, a continuous press release over 5 days andfour separate pulses of higher concentration, released at inter-vals over the same 5 days. Based on results from Experiment1, we hypothesised that both release schedules would nega-tively affect the abundance of invertebrates, but the pulsedtreatment would impact more severely.
The invertebrates that colonised our sampling trays didnot reflect the entire community found in Hughes Creek,
Impact of salinisation on stream invertebrates Marine and Freshwater Research 519
probably because of the lack of larger rocks and debris damsin the trays. Nevertheless, tray communities did contain themost common taxa present in Hughes Creek (Vertessy 1995).Given the widespread distribution of these species through-out Victoria and other localities in south-eastern Australia,and the nature of Hughes Creek, which typifies many of thelowland stream systems of the region, we consider our find-ings transferable across similar aquatic habitats in this region.The absence of some taxa in our trays requires cautionaryextrapolation of salinity effects to all lowland invertebrates.
Effect of increased salt concentration
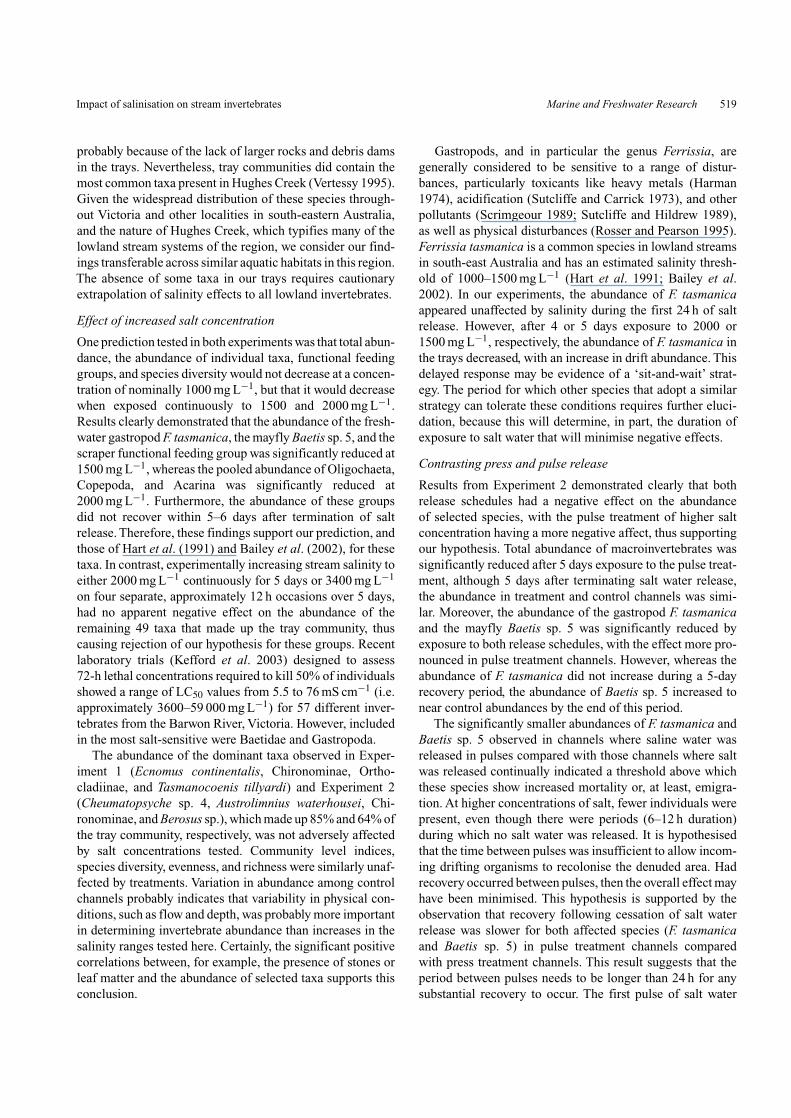
One prediction tested in both experiments was that total abun-dance, the abundance of individual taxa, functional feedinggroups, and species diversity would not decrease at a concen-tration of nominally 1000 mg L−1, but that it would decreasewhen exposed continuously to 1500 and 2000 mg L−1.Results clearly demonstrated that the abundance of the fresh-water gastropod F. tasmanica, the mayfly Baetis sp. 5, and thescraper functional feeding group was significantly reduced at1500 mg L−1, whereas the pooled abundance of Oligochaeta,Copepoda, and Acarina was significantly reduced at2000 mg L−1. Furthermore, the abundance of these groupsdid not recover within 5–6 days after termination of saltrelease. Therefore, these findings support our prediction, andthose of Hart et al. (1991) and Bailey et al. (2002), for thesetaxa. In contrast, experimentally increasing stream salinity toeither 2000 mg L−1 continuously for 5 days or 3400 mg L−1
on four separate, approximately 12 h occasions over 5 days,had no apparent negative effect on the abundance of theremaining 49 taxa that made up the tray community, thuscausing rejection of our hypothesis for these groups. Recentlaboratory trials (Kefford et al. 2003) designed to assess72-h lethal concentrations required to kill 50% of individualsshowed a range of LC50 values from 5.5 to 76 mS cm−1 (i.e.approximately 3600–59 000 mg L−1) for 57 different inver-tebrates from the Barwon River, Victoria. However, includedin the most salt-sensitive were Baetidae and Gastropoda.
The abundance of the dominant taxa observed in Exper-iment 1 (Ecnomus continentalis, Chironominae, Ortho-cladiinae, and Tasmanocoenis tillyardi) and Experiment 2(Cheumatopsyche sp. 4, Austrolimnius waterhousei, Chi-ronominae, and Berosus sp.), which made up 85% and 64% ofthe tray community, respectively, was not adversely affectedby salt concentrations tested. Community level indices,species diversity, evenness, and richness were similarly unaf-fected by treatments. Variation in abundance among controlchannels probably indicates that variability in physical con-ditions, such as flow and depth, was probably more importantin determining invertebrate abundance than increases in thesalinity ranges tested here. Certainly, the significant positivecorrelations between, for example, the presence of stones orleaf matter and the abundance of selected taxa supports thisconclusion.
Gastropods, and in particular the genus Ferrissia, aregenerally considered to be sensitive to a range of distur-bances, particularly toxicants like heavy metals (Harman1974), acidification (Sutcliffe and Carrick 1973), and otherpollutants (Scrimgeour 1989; Sutcliffe and Hildrew 1989),as well as physical disturbances (Rosser and Pearson 1995).Ferrissia tasmanica is a common species in lowland streamsin south-east Australia and has an estimated salinity thresh-old of 1000–1500 mg L−1 (Hart et al. 1991; Bailey et al.2002). In our experiments, the abundance of F. tasmanicaappeared unaffected by salinity during the first 24 h of saltrelease. However, after 4 or 5 days exposure to 2000 or1500 mg L−1, respectively, the abundance of F. tasmanica inthe trays decreased, with an increase in drift abundance. Thisdelayed response may be evidence of a ‘sit-and-wait’ strat-egy. The period for which other species that adopt a similarstrategy can tolerate these conditions requires further eluci-dation, because this will determine, in part, the duration ofexposure to salt water that will minimise negative effects.
Contrasting press and pulse release
Results from Experiment 2 demonstrated clearly that bothrelease schedules had a negative effect on the abundanceof selected species, with the pulse treatment of higher saltconcentration having a more negative affect, thus supportingour hypothesis. Total abundance of macroinvertebrates wassignificantly reduced after 5 days exposure to the pulse treat-ment, although 5 days after terminating salt water release,the abundance in treatment and control channels was simi-lar. Moreover, the abundance of the gastropod F. tasmanicaand the mayfly Baetis sp. 5 was significantly reduced byexposure to both release schedules, with the effect more pro-nounced in pulse treatment channels. However, whereas theabundance of F. tasmanica did not increase during a 5-dayrecovery period, the abundance of Baetis sp. 5 increased tonear control abundances by the end of this period.
The significantly smaller abundances of F. tasmanica andBaetis sp. 5 observed in channels where saline water wasreleased in pulses compared with those channels where saltwas released continually indicated a threshold above whichthese species show increased mortality or, at least, emigra-tion. At higher concentrations of salt, fewer individuals werepresent, even though there were periods (6–12 h duration)during which no salt water was released. It is hypothesisedthat the time between pulses was insufficient to allow incom-ing drifting organisms to recolonise the denuded area. Hadrecovery occurred between pulses, then the overall effect mayhave been minimised. This hypothesis is supported by theobservation that recovery following cessation of salt waterrelease was slower for both affected species (F. tasmanicaand Baetis sp. 5) in pulse treatment channels comparedwith press treatment channels. This result suggests that theperiod between pulses needs to be longer than 24 h for anysubstantial recovery to occur. The first pulse of salt water
520 Marine and Freshwater Research N. A. Marshall and P. C. E. Bailey
was probably sufficient to reduce the abundance of the salt-sensitive species, whereas the second and following pulsesintensified the effect by removing more individuals (Hartet al. 1991; Kratz et al. 1994). Therefore, the frequency ofrepeated pulsing is an important factor influencing the effectof high concentrations of salt on invertebrate abundance(Loucks 1970; Dimbleby 1978; Underwood 1989).
The abundance of the scraper functional group was alsosignificantly reduced by both release treatments, with pulsedreleases having a more profound affect. The pulse treatmentalso reduced the number of predators. However, whereas thenumber of predators increased during the recovery period,the abundance of scrapers remained either low or absent inpress and pulse treatment channels, respectively. The impli-cation of the observed reduction in the abundance of thescraper functional group is more than one of lost of bio-diversity. The abundance of this feeding group was likelyto have been significant in Hughes Creek before catchmentdisturbance and increased sedimentation (Vertessy 1995).Moreover, the present abundance of scrapers in Hughes Creekis both spatially and temporally highly variable and can repre-sent over 15% of all macroinvertebrates present in this stream(Vertessy 1995). Thus, biofilm consumption and associatedstream productivity is likely to be affected directly by a reduc-tion in scraper abundance. Further research that quantifies theextent and magnitude of salinity effects on community inter-actions and ecosystem processes (e.g. primary productivityand decomposition) is required.
Comparison with other ecosystem studies
We are unaware of any studies in Australia that have testedthe effect of increasing salinity in streams experimentally.Furthermore, there have been few studies worldwide exam-ining the effects of secondary salinisation on non-halophyticstream invertebrates. Williams et al. (1991), Bunn and Davies(1992), Mitchell and Richard (1992), and Metzeling (1993)have investigated the community structure of macroinver-tebrates in rivers subjected to salinisation in south-westernWestern Australia and Victoria. Their results are largelyequivocal because, in most cases, the streams and rivers cur-rently affected by salinisation have been exposed previouslyto significant landscape and catchment disturbance, largelydue to agriculture and other land use practices. As a conse-quence, the diversity of macroinvertebrates has been reducedand tends towards taxa that are resilient and halotolerant (seealso Williams et al. 1991). One earlier study by Crowtherand Hynes (1977) is, however, of note. In that study theauthors examined the effect of pulses of road de-icing saltthat ran off into streams in Ontario, Canada, over five 24-hperiods and concluded that pulses of up to 800 mg L−1 had noeffect on invertebrate drift, whereas pulses of 2000 mg L−1
did. Crowther and Hynes (1977) suggested that a thresh-old level of 1000 mg L−1 would produce a significant driftresponse. The present study demonstrated that exposure to
a salt concentration as low as 1500 mg L−1 increased driftrates for some species and that this effect was exacerbatedat higher concentrations. Moreover, the study by Crowtherand Hynes (1977) is relevant because of the temporal simi-larity with the present study. It could be argued that the 5- or6-day release periods used in our experiments are too shortto observe effects. We would contend, however, that the sig-nificant negative effects observed occurred despite the shortrelease period and are likely to be more severe the longerthe release. Clearly, studies of longer duration are required toelucidate such effects.
Other studies have indicated that some invertebrate assem-blages are apparently well adapted to marginal increases insalinity associated with drought. Chessman and Robinson(1987), for example, observed that invertebrate species wereequally common in the lower La Trobe River, south-easternAustralia, before and after a drought; salinities reached800 mg L−1 during the drought, double those recorded overthe previous 3 years. Furthermore, Forbes and Allanson(1970b) found that the distribution of euryhaline baetidmayflies in the Sundays River system in South Africa, a sys-tem exposed to saline groundwater seepage as well as aridityin the upper reaches, was correlated with the salinity profileof the river system. Supplementary laboratory studies foundthat these mayflies were able to tolerate up to 10 500 mg L−1
(Forbes and Allanson 1970a).
Invertebrate recovery following increased salinity
The magnitude and speed of recovery of a species affectedby disturbance are potentially as important in evaluating thestability of a community as are the resistance (at a physio-logical level) of the species and the magnitude of structuralchanges within the community (Karlson and Hurd 1993).Consequently, one of the additional objectives of the presentstudy was to examine the potential for recovery of the dis-turbed community following a short-term disturbance fromsalt increase.
The results showed that the extent and rate of recoveryvaried with the magnitude of the disturbance. Recovery wasslower in the high-salt treatment channels of Experiment 1for the pooled abundance of Oligochaeta, Copepoda,Acarina,F. tasmanica, and Baetis sp. 5 and in pulse treatment channelsin Experiment 2 for F. tasmanica and Baetis sp. 5.
Stream invertebrate communities are characteristicallyresilient in that they are able to recover quickly if abundancesare reduced suddenly (Lake and Doeg 1985; Reice 1985;Lake et al. 1989; Dole-Oliver and Marmonier 1992). Oth-ers of the same species commonly replace individuals lostfrom the community relatively quickly (Reice 1984, 1985;Muirhead-Thompson 1987). For example, after physicallydisturbing the substrate of a creek, Reice (1985) found thatrecolonisation occurred within 4 weeks. He concluded thatinvertebrates were living temporarily in suboptimal habitatsand recolonised from these after the disturbance had passed.
Impact of salinisation on stream invertebrates Marine and Freshwater Research 521
In the present study, the abundance of Baetis sp. 5 waslow after pulsed and continual saline release; however, recov-ery to predisturbance levels was evident after only 5 days.Other field studies have also shown mayflies to be highlyresilient (e.g. Chessman and Robinson 1987). Thus, althoughBaetis sp. 5 was detrimentally affected by increased salin-ity, it showed a high resilience through rapid recolonisation.Consequently, this species is susceptible to population fluc-tuations in response to short-term saline disturbance, but it isunlikely to show long-term effects at the spatial scale studied.In contrast, F. tasmanica is especially sensitive to increasesin salinity. After the experimental addition of salt had ceased,only minor increases in abundance occurred in the press treat-ment channels, whereas the pulse treatment channels showedno sign of recovery. Thus, a short salt release of large mag-nitude can severely reduce populations of F. tasmanica withminimal prospect of recovery in the short term. The inabilityof gastropods to recover rapidly after a disturbance has beenobserved elsewhere. For example, a slurry of calcium hydrox-ide eliminated the gastropod population in an unnamed riverin Virginia, USA, and there was no evidence of recovery 2years later (Harman 1974). Similarly, 6 months passed beforeFerrissia sp. began to be collected, albeit in very small num-bers, after a petroleum spill in theYellow River, Dakota, USA(Harman 1974).
Our results demonstrate how variable the magnitude ofeffect is following a salt disturbance on the invertebratebenthic community. As illustrated by Baetis sp. 5, the effectof disturbance can be major, yet transitory (Reice 1984; Lakeet al. 1989). Observations made during the present study indi-cate that such a transitory effect occurred for Baetis sp. 5, arapid coloniser. However, the effect of saline disturbance onthe tray community at Hughes Creek was not transitory inthese experiments for the poor coloniser F. tasmanica. Assuch, the response of the stream community to a salt distur-bance is highly variable and species dependent. Species thatnormally enter the drift have a higher probability of beingable to recover from a disturbance, such as increased salin-ity, much more quickly than species that tend not to enterthe drift. However, from a catchment scale perspective, theeffects of the impact would not be transitory if the pool ofpotential recolonisers was also affected, such as would occurwhen saline waters were present throughout the catchment.In most cases, salinity effects occur over a landscape scale.Depending on the severity of the impact, available reser-voirs of colonisers (both immature and adults) may be rare.Thus, the geographical extent and magnitude of salinisation,both within and between neighboring catchments, will clearlyaffect the potential for communities to recover.
Implications for salinity effects on streammacroinvertebrates
Our results show that some invertebrates found in HughesCreek are adversely affected by as low an increase in stream
salinity as approximately 1500 mg L−1, significantly moreso at approximately 2000 mg L−1, and even short expo-sures (<12 h) to 3500 mg L−1. Furthermore, the results fromExperiment 2 demonstrate that delivering several short pulsesof a high salt concentration is more detrimental to the abun-dance of invertebrates than delivering the same total salt loadover a longer duration at a lower concentration. It is postu-lated that the frequency of pulses, the duration of each pulse,and the time between pulses are significant factors deter-mining the magnitude of the effect of salinity. The effectof repeated pulsing may be minimised if sufficient time isallowed between pulses to allow invertebrate recolonisationto occur. In this way, the effect of subsequent pulses willnot be compounded. However, for species that are slow torecover after a saline disturbance (e.g. F. tasmanica in thepresent study), substantial periods of time would be requiredto minimise the effects of repeated pulsing. These recoveryperiods are likely to vary for different taxa. Moreover, thelocation of potential recolonisers is important. In catchmentswhere salinity is widespread, viable populations are likely tobe rare. Currently, appropriate data to predict likely recovery,for even common and geographically widespread species, arelargely lacking.
Although not examined in the present study, organismscan be affected sublethally when exposed to deleteriousinsults over time.The extent and magnitude of these sublethaleffects result in intergenerational effects that, in contrastwith the intragenerational effects of the present study, arepoorly understood but almost certainly will have significantfitness implications. For this reason, Hart et al. (1989) recom-mended a concentration of 1000 mg L−1, which should not beexceeded, in order to minimise sublethal effects to freshwa-ter biota. We have observed significant reductions in growth,feeding behavior, fecundity, and age-dependent mortality intwo other gastropods, namely Isidorella newcombi (Planor-bidae) and Lymnaea sp. (Lymnaeidae), when exposed to1250–6000 mg L−1 (Forshaw 1994; P. C. E. Bailey, unpub-lished data). Quantification of the extent and magnitude ofthe sublethal effects of increased salinity will permit a morerealistic estimate of population viability and persistence insalt-impacted landscapes.
Secondary salinisation rarely occurs in isolation fromother landscape changes caused by human activity. Withregard to freshwater ecosystems, additional impacts are asso-ciated with altered water regimens, increased sedimentation,eutrophication, and altered riparian or floodplain vegetation.We concur with Williams et al. (1991) that, largely as a resultof such disturbance, in all likelihood much of the existingmacroinvertebrate fauna found in disturbed lowland rivers insouth-east Australia probably consists of halotolerant forms,sensitive species having been lost or replaced over the past150 years of human impact. However, some halosensitiveforms do remain and are likely to be negatively affected bysalt concentrations as low as 1500 mg L−1 and relatively short
522 Marine and Freshwater Research N. A. Marshall and P. C. E. Bailey
exposure to higher concentrations. Moreover, the extent towhich apparently halotolerant forms can survive and repro-duce over longer time frames in river systems that are subjectto either increasing concentration of salt or rapid changes inconcentration associated with saline discharge or rainfall iscurrently unknown.
Acknowledgments
Funding for this project and a postgraduate scholarship toN. A. M. was provided by grant UMO18, from the Land andWater Resources Research and Development Corporation toP. C. E. B. Their support is gratefully acknowledged. Permis-sion to conduct this work was granted by the EnvironmentProtection Agency, Victoria. We sincerely thank the follow-ing colleagues for untiring help in the field: Paul Marshall,Jim Radford, Deb Nias, Annaleise Sampey, Mich Cubberley,Judy Dundas, and Bryce Stewart. Danny Vertessy and JohnHawking provided taxonomic help. Gerry Quinn and GraemeInglis provided statistical advice. Michael Barry, Kay Morris,Paul Boon, Elisa Raulings, and an anonymous referee arethanked for their constructive critical comments on earlierdrafts.
References
Allan, J. D., and Russek, E. (1985). The quantification of stream drift.Canadian Journal of Fisheries and Aquatic Sciences 428, 210–215.
Bailey, P. C. E. (1981a). Insect drift in Condor Creek, Australian CapitalTerritory.Australian Journal of Marine and Freshwater Research 32,111–120.
Bailey, P. C. E. (1981b). Diel activity patterns in nymphs of anAustralian mayfly, Atalophlebioides sp. (Ephemeroptera: Leptophe-liidae). Australian Journal of Marine and Freshwater Research 32,121–131.
Bailey, P. C. E., and James, K. (1999). ‘Riverine and Wetland SalinityImpacts: Assessment of R&D Needs.’ Occasional Paper No. 25/99.(Land and Water Resources Research & Development Corporation:Canberra.)
Bailey, P. C. E., Boon, P. I., and Morris, K. (2002). ‘Australian Biodiver-sity: Salt Sensitivity Database.’ http://www.rivers.gov.au/research/contaminants/saltsen.htm
Bailey, P. C. E., Boon, P. I., Blinn, D. W., and Williams, W. D. (2004).Salinisation as an ecological perturbation to rivers, streams andwetlands of arid and semi-arid zones. In ‘Changeable Changed,Changing: The Ecology of Rivers from the World’s Dry Regions’.(Ed. R. T. Kingsford.) (Cambridge University Press: Cambridge,UK.)
Bunn, S. E., and Davies, P. M. (1992). Community structure of themacroinvertebrate fauna and water quality of a saline river systemin south Western Australia. Hydrobiologia 248, 143–160.
Chessman, B. C. (1986). Dietary studies of aquatic insects from twoVictorian rivers. Australian Journal of Marine and FreshwaterResearch 37, 129–146.
Chessman, B. C., and Robinson, D. P. (1987). Some effects of the1982 drought on water quality. Australian Journal of Marine andFreshwater Research 38, 289–299.
Crowther, R. A., and Hynes, H. B. N. (1977). The effect of roadde-icing salt on the drift of stream benthos. Environmental Pollution14, 113–126. doi:10.1016/0013-9327(77)90103-3
Dimbleby, G. W. (1978). ‘Ecology and Archaeology.’ (Arnold: London.)Dole-Oliver, M., and Marmonier, P. (1992). Effects of spates in the ver-
tical distribution of the interstitial community. Hydrobiologia 230,49–61.
Downes, B. J., Lake, P. S., and Schreiber, E. S. G. (1993). Spatialvariation in the distribution of stream invertebrates: implicationsof patchiness for models of community organisation. FreshwaterBiology 30, 119–132.
Forbes, A. T., and Allanson, B. R. (1970a). Ecology of the SundaysRiver. Part I. Water chemistry. Hydrobiologia 36, 479–488.
Forbes, A. T., and Allanson, B. R. (1970b). Ecology of the SundaysRiver. Part II. Osmoregulation in some mayfly nymphs Ephe-meroptera: Baetidae. Hydrobiologia 36, 489–503.
Forshaw, J. (1994). ‘The Effects of Salinity and Live Macrophytes onthe Survival of Two Species of Freshwater Gastropods.’ BSc(Hons)Thesis. (Monash University: Melbourne, Australia.)
Ghessemi, F., Jakeman, A. J., and Dix, H. A. (1995). ‘Salinisation ofLand and Water Resources: Human Causes, Extent, Managementand Case Studies.’ (University of New South Wales Press: Sydney.)
Green, R. H. (1993). Application of repeated measures design in envi-ronmental impact and monitoring studies. Australian Journal ofEcology 18, 81–98.
Harman, W. N. (1974). Snails Mollusca: Gastropoda. In ‘PollutionEcology of Freshwater Macroinvertebrates’. (Eds C. W. Hart andS. L. H. Fuller.) pp. 275–302. (Academic Press: New York.)
Hart, B. T., Bailey, P. C. E., Edwards, R., Hortle, K., James, K.,McMahon, A., Meredith, C., and Swadling, K. (1989). ‘BiologicalEffects of Saline Discharges to Streams and Wetlands.’ (Centre forStream Ecology, Chisholm Institute of Technology: Melbourne.)
Hart, B. T., Bailey, P. C. E., Edwards, R., Hortle, K., James, K.,McMahon, A., Meredith, C., and Swadling, K. (1991). A review ofsalt sensitivity of Australian freshwater biota. Hydrobiologia 210,105–144.
Karlson, R. H., and Hurd, L. E. (1993). Disturbance, coral reef com-munities, and changing ecological paradigms. Coral Reefs 12,117–125.
Kefford, B. J., Papas, P. J., and Nugegoda, D. (2003). Relativesalinity tolerance of macroinvertebrates from the Barwon River,Victoria, Australia. Marine and Freshwater Research 54, 755–765.doi:10.1071/MF02081
Kratz, K. W., Cooper, S. D., and Melak, J. M. (1994). Effects ofa single and repeated experimental acid pulses on invertebratesin a high altitude Sierra Nevada stream. Freshwater Biology 32,161–183.
Lake, P. S., and Doeg, T. G. (1985). Macroinvertebrate colonisation ofstones in two upland southern Australian streams. Hydrobiologia126, 199–211.
Lake, P. S., Doeg, T. G., and Marchant, R. (1989). Effects of multipledisturbance on macroinvertebrate communities in theAcheron River,Victoria. Australian Journal of Ecology 14, 507–514.
Loucks, O. L. (1970). Evolution of diversity, efficiency, and communitystability. American Zoologist 10, 17–25.
Magurran, A. E. (1988). ‘Ecological Diversity and its Measurement.’(Princeton University Press: New Jersey, USA.)
McCafferty, W. P. (1983). ‘Aquatic Entomology.’ (Jones and Bartlett:Boston.)
MDBC (1999). ‘The Salinity Audit.’ (Murray-Darling Basin Commis-sion: Canberra.)
Metzeling, L. (1993). Benthic macroinvertebrate community structurein streams of different salinity. Australian Journal of Marine andFreshwater Research 44, 335–351.
Mitchell, P. (1990). ‘The Environmental Condition of VictorianStreams.’ (Department of Water Resources Victoria: Melbourne,Australia.)

Impact of salinisation on stream invertebrates Marine and Freshwater Research 523
Mitchell, B. D., and Richard, K. (1992). Macroinvertebrate communi-ties in two salt affected tributaries of the Hopkins River, Victoria.International Journal of Salt Lake Research 1, 81–102.
Muirhead-Thompson, R. C. (1987). ‘Pesticide Impact on Stream Fauna,with Special Reference to Macroinvertebrates.’ (Cambridge Univer-sity Press: Cambridge.)
National Land and Water Resources Audit (2001). ‘Australian DrylandSalinity Assessment 2000. Extent, Impacts, Processes, Monitoringand Management Options.’ (Land and Water Australia: Canberra.)
O’Keefe, M. A., and Lake, P. S. (1987). The decomposition of fineeucalypt andAcacia litter in a small uplandVictorian stream. Bulletinof the Australian Society for Limnology 11, 15–32.
Reice, S. R. (1984). The impact of disturbance frequency on the struc-ture of a lotic riffle community. Proceedings of the InternationalAssociation of Theoretical and Applied Limnology 22, 1906–1910.
Reice, S. R. (1985). Experimental disturbance and the maintenance ofspecies diversity in a stream community. Oecologia 67, 90–97.
Rosser, Z. C., and Pearson, R. G. (1995). Responses of rock poolfauna to physical disturbances in two Australian tropical rainforeststreams. Journal of the North American Benthological Society 14,183–196.
Scrimgeour, G. J. (1989). Effects of bleached kraft mill effluent onmacroinvertebrates and fish populations in weedbeds in a NewZealand hydro-electric lake. New Zealand Journal of Marine andFreshwater Research 23, 373–379.
Sokal, R. R., and Rohlf, F. J. (1981). ‘Biometry. The Principles and Prac-tices of Statistics in Biological Research’, 2nd edn. (W. H. Freemanand Co.: New York.)
http://www.publish.csiro.au/journals/mfr
Sutcliffe, D. W., and Carrick, T. R. (1973). Studies on mountain streamsin the English Lake District, 1. pH, calcium and the distribution ofinvertebrates in the River Duddon. Freshwater Biology 3, 437–462.
Sutcliffe, D. W., and Hildrew, A. G. (1989). Invertebrate communitiesin acid streams. In ‘Acid Toxicity and Aquatic Animals’. (Eds R.Morris, E. W. Taylor, D. J. E. Brown and J. A. Brown.) pp. 13–29.(Cambridge University Press: Cambridge.)
Underwood, A. J. (1989). The analysis of stress in natural populations.Biological Journal of the Linnean Society 37, 51–78.
Vertessy, D. R. (1995). ‘Effects of Increasing Stream Salinity on aTypicalLowland Macroinvertebrate Community, Hughes Creek, Victoria.’MSc Thesis. (Monash University: Melbourne, Australia.)
Waters, T. F. (1962). Diurnal periodicity in the drift of stream inverte-brates. Ecology 43, 316–320.
Wildt, A. R., and Ahtola, O. (1978). ‘Analysis of Covariance.’ (SagePublications: Beverly Hills.)
Williams, W. D. (1987). Salinisation of rivers and streams: an importantenvironmental hazard. Ambio 16, 180–185.
Williams, W. D. (1999). Salinisation: a major threat to water resourcesin the arid and semi-arid regions of the world. Lakes andReservoirs Research Management 4, 85–91. doi:10.1046/J.1440-1770.1999.00089.X
Williams, W. D., Taaffe, R. G., and Boulton, A. J. (1991). Longitu-dinal distribution of macroinvertebrates in two rivers subject tosalinisation. Hydrobiologia 210, 151–160.
Manuscript received 11 February 2003; revised 28 November 2003; andaccepted 22 April 2004.