Promotion of BAT / BEP to reduce releases of uPOPs from ...
62
Promot reduce from ope NATIONAL PRA December 2017 tion of BAT / BEP e releases of uPO en burning of was Madagascar INVENTORIES OF WASTE OPEN BURN ACTICES SITES AND uPOPS RELEASE P to OPs ste in NING
-
Upload
khangminh22 -
Category
Documents
-
view
2 -
download
0
Transcript of Promotion of BAT / BEP to reduce releases of uPOPs from ...

December 2017
Promotion of BAT / BEP toreduce releases of uPOPs
from open burning of waste inMadagascar
NATIONAL INVENTORIES OF WASTE OPEN BURNING
PRACTICES SITES AND uPOPS RELEASE
December 2017
Promotion of BAT / BEP toreduce releases of uPOPs
from open burning of waste inMadagascar
NATIONAL INVENTORIES OF WASTE OPEN BURNING
PRACTICES SITES AND uPOPS RELEASE
December 2017
Promotion of BAT / BEP toreduce releases of uPOPs
from open burning of waste inMadagascar
NATIONAL INVENTORIES OF WASTE OPEN BURNING
PRACTICES SITES AND uPOPS RELEASE

2

3
ABREVIATIONS
AFD : Agence Française de Développement
COI : Commission de l’Océan Indien
DASRI : Déchets d’Activités de Soins à Risques Infectieux
DGF/SRRLF : Direction Générale des Forêts/Service Reboisement Reforestation et Lutte contreles feux
FIVMPAMA : Fivondronan’ny Mpandraharaha Malagasy
GEM : Groupement des Entreprises à Madagascar
HDPE : High Density Polyethylen ( Polyéthylène Haute Densité)
INSTAT : Institut National de la Statistique de Madagascar
LDPE : Low Density Polyethylen (Polyéthylène Basse Densité)
OMS : Organisation Mondiale de la Santé
PET : Polyéthylène Terephtalate
PNUD : Programme des Nations Unies pour le Développement
POP : Polluants Organiques Persistants
PP : Polypropylène
SIM : Syndicats des Industries de Madagascar
SMTP : Société Malgache de Transformation des Plastiques
SPAH : Société Malgaches de production d’Articles Hygiéniques

4
TABLE OF CONTENTS1 Context andjustification ....................................................................................... 7
2 Methodological approach .....................................................................................9
3 Inventory of landfills and other relevant hot spots .............................................11
3.1 Situation of waste management in Madagascar ...........................................11
3.1.1 Texts regulating waste management .....................................................11
3.1.2 Management Infrastructures: .............................................................. 12
3.1.3 Waste production ................................................................................. 12
3.2 Landfills and mode of management ............................................................ 16
3.3 Landfill mapping..........................................................................................24
3.4 Inventory of other hot spots ........................................................................29
3.4.1 Forest fires............................................................................................29
3.4.2 The treatment of sugar cane................................................................. 31
4 Situationof the recycling industry and market at national level ........................34
4.1 Valorization of sector in Madagascar ..........................................................34
4.1.1 Recycling activities by industrial units................................................. 37
4.1.2 Some initiatives by some associations / projects: ................................39
4.2 Current market estimation for some sectors ...............................................43
5 Update of the inventory of Dioxins and Furans .................................................44
5.1 Estimation des émissions de dioxines et furannes par le brûlage de
biomasse (6.a) pour l’année 2015...........................................................................44
5.1.1 Forest fires............................................................................................44
5.1.2 Grassland and savannah fires...............................................................46
5.1.3 Sugarcane burning ...............................................................................46
5.2 Estimation of PCDD/PCDF emissions by open burning of waste (6.b) for
2015 47
5.2.1 Open burning of domestic waste.......................................................... 47
5.3 Summary of emissions for Open burning....................................................48
6 Conclusion ..........................................................................................................49
5
LIST OF FIGURES
FIGURE 3-1HOUSEHOLD SURVEY OF 2010-2012.............................................................................13
FIGURE 3-2MAP AT NATIONAL-LEVEL SITES REPRESENTING AREAS OCCUPIED BY LANDFILLS.......... 25
FIGURE 3-3MAP OF SITES AT THE NATIONAL LEVEL REPRESENTING SURFACE BURN RATES IN
LANDFILLS ............................................................................................................................ 26
FIGURE 3-4MAP SHOWING LANDFILLS IN ANTANANARIVO AND SURROUNDINGS ............................ 27
FIGURE 3-5MAPS SHOWING THE BURNING OF WASTE IN LANDFILLS IN AND AROUND ANTANANARIVO
.............................................................................................................................................28
FIGURE 3-6 EVOLUTION OF FIRE POINTS ........................................................................................30
FIGURE 4-1INFORMAL WORKERS IN THE RECUPERATION OF RECOVERABLE WASTE .......................... 35
FIGURE 4-2SUMMARY OF VALUE CHAINS ............................................................................................ 42

6
LIST OF TABLES
TABLE3-1ESTIMATION OF THE PRODUCTION OF HOUSEHOLD WASTE BY CHEF LIEU DE RÉGION ...... 13
TABLE3-2ESTIMATED ANNUAL PRODUCTION OF RECOVERABLE WASTE IN MADAGASCAR................. 15
TABLE3-3RATIO OF RECOVERABLE MATERIALS IN HOUSEHOLD WASTE ............................................. 15
TABLE3-4ESTIMATION OF THE MAIN TYPES OF HAZARDOUS WASTE IN MADAGASCAR ...................... 16
TABLE3-5SITUATION OF DUMPSITES AT ANTANANARIVO AND ITS SURROUNDINGS ..................... 17
TABLE3-6SITUATION OF DUMPSITE AT ANTSIRANANA .................................................................. 19
TABLE3-7LANDFILL SITUATION IN THE VAKINANKARATRA REGION................................................... 19
TABLE3-8SITUATION OF DUMPSITES IN FIANARANTSOA AND AMBOSITRA ........................................ 20
TABLEAU 3-9STATUS OF DUMPSITE IN TOLIARA .............................................................................. 22
TABLE3-10LOCATION OF THE LANDFILL AT TAOLAGNARO ............................................................ 23
TABLE3-11SITUATIONS OF FIRE POINTS AND AREA BURNED FROM 2006 TO 2016 ............................ 29
TABLEAU 3-12 TOTAL AREA OF LAND AND FOREST BURNED FROM 2003 – 2012 IN MADAGASCAR . 30
TABLE3-13SURFACE PLANTED WITH SUGAR CANE AT AMBILOBE AND NAMAKIA ............................... 31
TABLE3-14CANE PRODUCTION IN AMBILOBE AND NAMAKIA ............................................................. 32
TABLE4-1- VALORISATION OF WASTE AT ANDRALANITRA................................................................... 36
TABLE4-2- CURRENT MARKET ESTIMATION FOR SOME SECTORS........................................................ 43
TABLE5-1ESTIMATED EMISSIONS OF DIOXINS AND FURANS IN 2010.................................................. 44
TABLE 5-2- ESTIMATION OF EMISSIONS FOR FOREST FIRES ................................................................ 45
TABLE 5-3 ESTIMATION OF EMISSIONS FOR GRASSLAND AND SAVANNAH FIRES ................................ 46
TABLE 5-4 – SUMMARY OF EMISSION FOR SUGARCAN BURNING ........................................................ 47
TABLE 5-5 EMISSIONS FOR OPEN BURNING OF DOMESTIC WASTE....................................................... 48
TABLE 5-6 SUMMARY OF EMISSIONS OF DIOXIN AND FURAN FOR 2015 ............................................ 48

7
1 Context andjustificationAs part of the Stockholm Convention on Persistent Organic Pollutants ratified by
Madagascar in August 2005, Parties are required to take the necessary measures to
reduce or eliminate releases of POPs covered by the Convention, namely, inter alia:
• measures to reduce or eliminate releases from intentional
production and use;
• measures to reduce or eliminate releases from unintentional
production;
• measures to reduce or eliminate releases from stockage and
wastes.
In Madagascar, the implementation of integrated waste management practices
including: reduction and separation (sorting) at source, reuse, treatments such as
recycling, recovery, composting before landfilling of waste ultimate, is still only in its
phase of experimentation at the country level. There are very few waste treatment
facilities, such as incinerators that meet standards or sanitary landfills, and recycling
activities are only at beginning stage.
As a result, municipal waste and other types of waste are typically dumped in open
dumps and eliminate by open burning. In urban areas, waste is mainly composed of
food waste, packaging (bottles, plastic bags, etc.) and hazardous waste (such as
batteries and electronic devices), whereas in rural areas, agricultural waste
predominates. In addition, hazardous waste is often diverted for purposes other
than final disposal and discarded with other wastes
With regard to health care waste, their management from collection to disposal is
generally correct in large hospitals with the necessary structures and infrastructure.
On the other hand, in small health facilities (CSB, private clinics), especially in rural
areas, waste is often not properly collected for disposal in appropriate
infrastructure and is instead found in municipal waste

8
In addition, new types of waste appear like electrical and electronic waste. It is
recognized that poorly managed mixed materials in the presence of chlorinated
precursors and catalytic metals (copper, iron) are the main factors in the formation
and release of uPOPs in open burning processes.
Therefore, as long as the open burning of mixed waste and agricultural residues is
not properly addressed, the releases of unintentionally produced POPs would
increase significantly in the future if adequate measures are not taken.
The regional project "Promoting BAT / BEP to reduce uPOPs releases from open
burning of waste in participating SADC African countries" has its overall objective to
significantly and sustainably reduce the releases of uPOPs in the combustion sector
open waste by improving guidelines on Best Available Techniques and Best
Environmental Practices (BAT / BEP) for open burning processes of waste and
biomass.
The specific objective of the project is to achieve a continuous reduction of uPOP
releases in the open burning waste sector in participating African countries in the
SADC region by introducing best available techniques and best environmental
practices (BAT / BEP) on certain priority demonstration sites.
In accordance with Article 5 of the Stockholm Convention on Persistent Organic
Pollutants, the "Party" Countries must take measures to reduce the total volume of
anthropogenic releases of unintentionally produced POPs, which is reflected in the
implementation of a national or regional action plan to characterize and manage
the uPOPs' releases.
The expected results of component 1 of the project are the updating of regional
information on open burning practices and inventory of uPOPs in this sector.
For Madagascar to have this information, the identification of dumping sites and
their management as well as the quantification of dioxin and furan releases must be
made.

9
The objective of the inventory is to have all the information on municipal waste
disposal sites, how they are managed, and the quantification of dioxin and furan
emissions in this sector using the new UNEP Toolkit.
To do this, the consultant is asked to:
- Conduct national inventories of landfill sites and other relevant hot spots. :
map, GPS coordinates;
- Provide information on the quantities of daily or monthly waste
- Identify the methods of waste management;
- Collect existing data on waste recycling into biomass and disposal and waste
recycling companies;
- Update the results of dioxins and furans;
- Compile the information obtained in a report;
- Present the results of the study at the validation workshop;
2 Methodological approachTo carry out the various activities entrusted to the mandatary, the following
procedure is adopted:
o Field visit to collect information relating to landfills: GPS coordinates of the
landfill site, estimation of the area occupied, mode of waste management,
particularly burning. In addition, those responsible for waste management at
the local level (Urban District or Rural District) are contacted to have the
quantity of waste produced and collected;
o Synthesis of the information collected in an excel file and processing in a
cartographic database using a Geographical Information System taking into
account the location, the surface of the landfill, the quantity of waste and
the management mode in order to generate the maps landfills;
o Database consultation:

10
On the one hand, that of INSTAT, the official body responsible for registering
companies at the time of their creation in order to identify companies whose
activities are recycling and secondly, the other databases (Table Environmental
Board, National Profile of Chemicals Management, National POPs Profile, ...) to
provide information on waste management; other open burning activities
(forest fires, ...)
o Contact and interview with the people in charge of the recycling process at
the company level to determine the situation of the recycling industry and
the related market. In the same way as for companies, people with
information relating to other open burning activities are met: ministerial
departments, municipalities, associations, etc.
o Compilation and synthesis of all information collected;
o Updating of the dioxins and furans inventory through the exploitation of
collected data and using the latest version of the UNEP Toolkit to calculate
the emissions of the different subcategories: biomass combustion and waste
burning.

11
3 Inventory of landfills and other relevant hot spots
3.1 Situation of waste management in Madagascar
3.1.1 Texts regulating waste management
Apart from the various conventions that are ratified by Madagascar, such as the
Basel Convention on the Transboundary Movement of Hazardous Wastes, the texts
regulating waste management are presented in the table below:
Table 3-1 Summary of texts regulating waste management
Types Contents
DECREE N ° 2012-753 of
07/08/12
Ban on waste under the Basel Convention in
Madagascar until the installation of a suitable
treatment center
DECREE N°2012-754 of
07/08/12
End-of-Life Products, Waste Sources and Hazardous
Waste Management Procedures for the
Implementation of the Basel Convention
DECREE N°2012-900 of 23
/01/13
Prohibiting the importation, distribution, sale, use
and production of pesticides active ingredients of
pesticides in agriculture and of chemicals for
industries in the framework of the application of the
Rotterdam Convention and the Convention of
Stockholm in Madagascar
DECREE N°2014 – 1587 of
07/10/2014,
Prohibiting the production, importation, marketing
and use of plastic bags on the Malagasy national
territory
DECREE N° 2015- 930
Classification and environmentally sound
management of waste electrical and electronic
equipment in Madagascar

12
Types Contents
DECREE N° 2017-010
Prohibiting the production, importation, marketing,
stockpiling and use of plastic bags and bags made
with plastics on the national territory
3.1.2 Management Infrastructures:
With the exception of a few sites (Taolagnaro, Fianarantsoa, Mahajanga, Nosy Be)
with sanitary or controlled landfills, these waste management infrastructures are
lacking in the other localities. The waste is deposited in wild dumps, which are for
the most part "official dumps" for the districts.
However, some waste recovery and site development initiatives exist at the level of
the projects of some NGOs and Associations (Fakofia, Madacompost ...) intervening
in some cities (Mahajanga, Fianarantsoa, Toliara ...)
3.1.3 Waste production
As mentioned in the context, the integrated waste management system including:
reduction and separation (sorting) at source, reuse, treatments such as recycling,
recovery, composting before landfilling waste ultimate, is still only in its phase of
experimentation at the country level. Only a few projects or associations working in
waste management are developing this type of initiative. In addition, the structures
and infrastructures necessary for the implementation of a selective sorting system,
which is the basis of any recycling and recovery process, are poor.
A survey conducted by INSTAT on household behavior shows that sorting is not yet
part of their habits because a large part is thrown away without any form of
selection / separation (see figure 3.1).
In addition, Hery Rajaomanana's estimate of the amount of household waste
produced by the main town in his thesis has shown that around 7840 tonnes of
waste per day will be produced in the major cities of Madagascar in 2018 (see Table
3.2).

13
Figure 3-1Household Survey of 2010-2012
Source: INSTAT /DMS/EMP 2010 ET INSTAT /ENSOMD 2012-2013
Table3-1Estimation of the production of household waste by Chef lieu deRégion
Estimation of the production of household waste by Chef lieu de Région
(Kg/city/day)
1993 2000 2003 2008 2013 2018 2023
Antananarivo-
Renivohitra
426 142 526 601 575 357 661 851 756 562 860 713 973 192
ANTSIRABE I 75637 93468 102122 117474 134285 152771 172735
TSIROANOMAN
DIDY
102 186 126 276 137 967 158 708 181 419 206 394 233 365
MIARINARIVO 85 477 105 628 115 408 132 757 151 754 172 645 195 207
Fianarantsoa I 65 556 1 952 925 2 163
782
2 553
600
2 999
458
3 508
525
4 076 400
AMBOSITRA 104 146 132 924 147 276 173 808 204 155 238 804 277 456
TOAMASINA I 82 669 104 055 114 625 133 980 156 071 181 004 208 427

14
Estimation of the production of household waste by Chef lieu de Région
(Kg/city/day)
1993 2000 2003 2008 2013 2018 2023
FENOARIVO-
ATSINANANA
111 088 139 826 154 029 180 038 209 724 243 227 280 078
AMBATONDRAZ
AKA
110 870 139 552 153 727 179 685 209 313 242 750 279 529
Mahajanga I 64 068 79 011 86 414 100 177 115 918 133 391 152 237
Maevatanana 50 355 62 100 67 918 78 735 91 107 104 840 119 653
Maintirano 24 889 30 694 33 569 38 916 45 031 51 819 59 140
TOLIARY I 48 496 59 276 64 620 74 442 85 498 97 657 110 746
MORONDAVA 38 442 46 988 51 224 59 009 67 773 77 412 87 788
TAOLANARO 101 737 124 353 135 563 156 168 179 361 204 869 232 330
ANTSIRANANA 572 839 693 880 753 772 864 000 986 727 1 119
585
1 260 600
ANTALAHA 89 810 108 787 118 177 135 459 154 700 175 530 197 638
ANTSIRANANA I 35 424 42 909 46 613 53 429 61 019 69 234 77 955
TOTAL 2 189 831 4 569 253 5 022 163 5 852 236 6 789 875 7 841 170 8 994 476
Source :INSTAT, RAJAOMANANA H – Gestion et traitement des déchets ménagersdans les pays en voie de développement. Thèse : Sciences et techniques (pollution)-Traitement : ONE
The IOC and AFD diagnostic study for optimized waste management in the Indian
Ocean conducted in 2013 and 2014 presents in its session 1 the state of waste
production and management in the member countries. (Comoros,Reunion,
Madagascar, Mauritius and Seychelles).
For Madagascar, the production of hazardous waste and that of recoverable waste
are presented in the tables below:

15
Table3-2Estimated annual production of recoverable waste in Madagascar
TYPES QUANTITY (Tons)
Paper - Carton 89 681
Metals 13 797
Plastics 68 985
Tires 666
Source : Étude de diagnostic pour une gestion optimisée des déchets dans l’Océan
Indien (COI/AFD-Décembre 2014)
The parts of recoverable waste are presented in the table below:
Table3-3Ratio of recoverable materials in household waste
Organic Matter 60%
Plastics 10%
Papers /Cartons 13%
Metals 2%
Glasses 4%
Others 11%
Source : Étude de diagnostic pour une gestion optimisée des déchets dans l’Océan
Indien (COI/AFD-Décembre 2014

16
Table3-4Estimation of the main types of hazardous waste in Madagascar
TYPES QUANTITY (Tonnes)
Batteries and accumulators 4 940
Lamp, neon 1 000
Used mineral oils 6 906
Car batteries 3 039
Refrigerants 524
DASRI 1 594
Source : Étude de diagnostic pour une gestion optimisée des déchets dans l’Océan
Indien (COI/AFD-Décembre 2014)
Note that the capacity of collection and treatment of this waste is rather weak for
the country. For example, for used oils, approximately 19% of the quantity
produced is collected and processed, that is 1,322 T per year.
3.2 Landfills and mode of management
The field investigation provided information on the sites visited: location, GPS
points, area, quantity of waste sent to landfill, the percentage of waste burned, the
existence of development and the activities that are carried out (see Annex 2 -
Summary of the results of the field trips).
The tables below summarize the different situations of landfills:

17
Table3-5Situation of dumpsites at ANTANANARIVO and its surroundings
ANTANANARIVO and ITS SURROUNDINGS
Localisation Surface(estimation)
Quantity(estimation) % burned Laying out Activities
TONGARIVO 486 16 T/day 6% None Sorting by thescavengers
ALASORA 13 200 5 T/day 25% None Sorting by thescavengers
ANDRALANITRA 180 000 1500 - 2000m3/day 10%
FencedLeachatedrainage
Sorting by thescavengers
Composting
ANTEHIROKA :Andramiarana 2 400 23
m3/day 20% None Sorting by thescavengers
TALATAMATY :Andramiarana 2 400 18 T/day 20% None Sorting by the
scavengers
IVATO
800 m2 (site 1)
10 T/day 15% None
2637 m2 (site 2)

18
ANDRAMIARANA : TALATAMATY and AMBOHIBAO ANTEHIROKA
TONGARIVO TANJOMBATO ALASORA
ANDRALANITRA
IVATO

19
Table3-6Situation of dumpsite at ANTSIRANANA
ANTSIRANANA
Localisation Surface(estimation)
Quantity(estimation) % burned Laying out Activités
Routed'Anamakia 8 370 70 T/day 100% None
Table3-7Landfill situation in the Vakinankaratra region
VAKINANKARATRA
Localisation Surface(estimation)
Quantity(estimation) % burned Laying out Activités
AMBATOLAMPY :Marché 12
0,5 T/day 10%
None
AMBATOLAMPY:Malamamaina 16 None
Antsirabe :Ivohitra 1 377 60 T/day 80% None
Sorting by thescavengers
Composting
DUMPSITE ALONG THE ANAMAKIA ROAD

20
Table3-8Situation of dumpsites in Fianarantsoa and Ambositra
FIANARANTSOA
Localisation Surface(estimation)
Quantity(estimation) % burned Laying out Activities
Maromby (NearSœurs) 16 786 50 T/day 70% None
Maromby PK6 1 932 18,5 T/day 0,50% Landfill cellComposting area
Sortingcomposting
burying
AMBOSITRA
Antsenan'omby -Ambohipierenana 652
18m3/day 100%
DUMPSITE OF THE CITY OF ANTSIRABE AT IVOHITRA

21
Sorting
Composting
Composting
Burying
BrûlageEnfouissement
FIRST DUMPSITE AT MAROMBY (Near les Soeurs)
SECOND LANDFILL AT MAROMBY MANAGED BY FAKOFIA
22
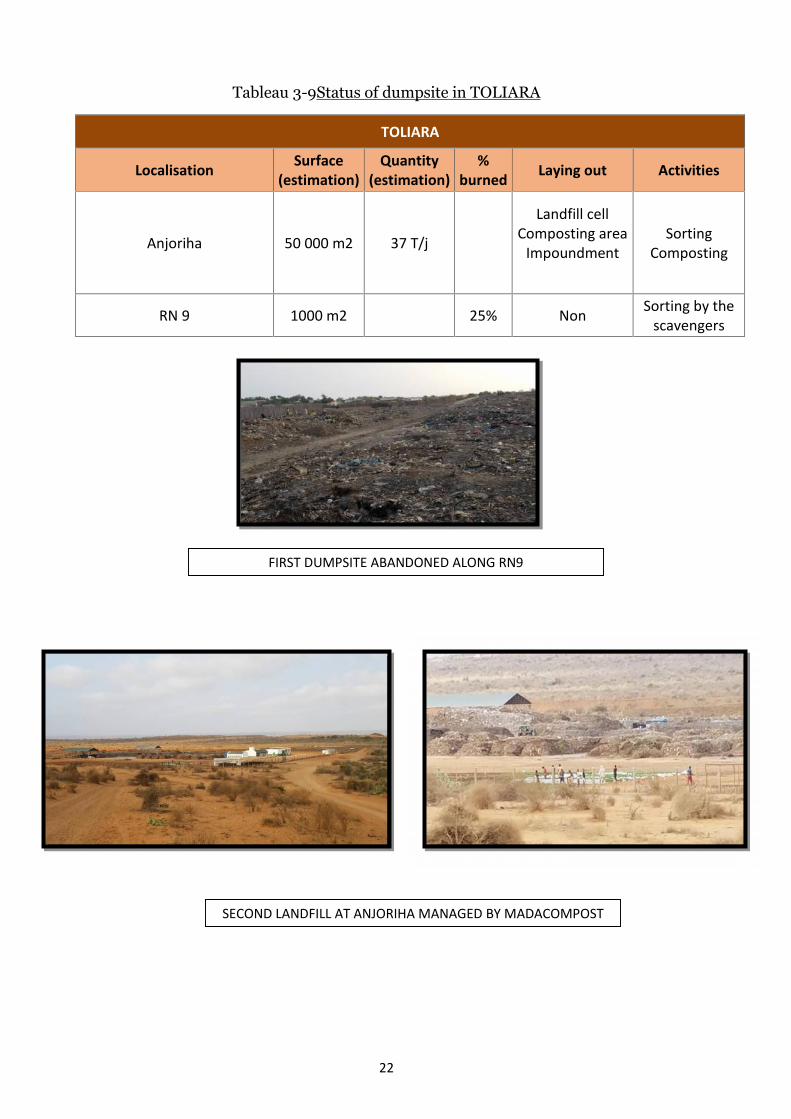
Tableau 3-9Status of dumpsite in TOLIARA
TOLIARA
Localisation Surface(estimation)
Quantity(estimation)
%burned Laying out Activities
Anjoriha 50 000 m2 37 T/j
Landfill cellComposting area
ImpoundmentSorting
Composting
RN 9 1000 m2 25% Non Sorting by thescavengers
SECOND LANDFILL AT ANJORIHA MANAGED BY MADACOMPOST
FIRST DUMPSITE ABANDONED ALONG RN9
23
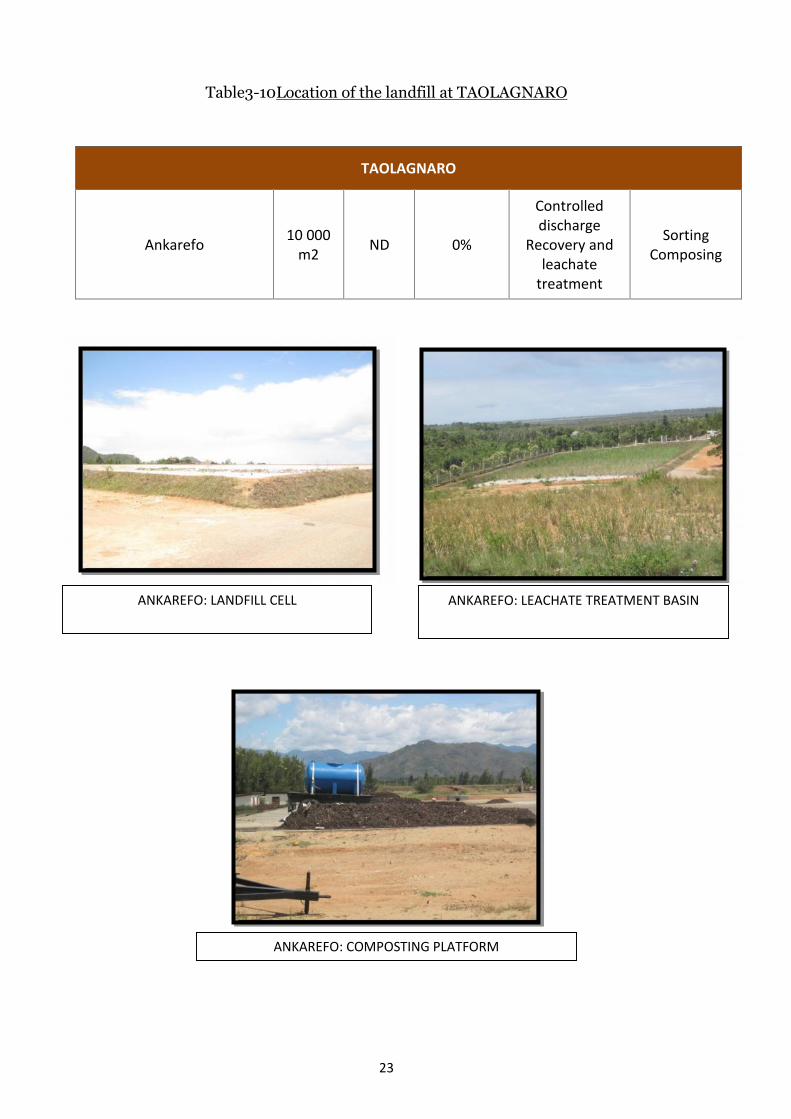
Table3-10Location of the landfill at TAOLAGNARO
TAOLAGNARO
Ankarefo 10 000m2 ND 0%
Controlleddischarge
Recovery andleachate
treatment
SortingComposing
ANKAREFO: COMPOSTING PLATFORM
ANKAREFO: LANDFILL CELL ANKAREFO: LEACHATE TREATMENT BASIN

24
The visits to the various landfill sites revealed the following main points:
o The vast majority of landfills have not been developed. The waste is
deposited on the ground;
o Only a few sites (Fianarantsoa, Toliara, Taolagnaro) have been developed to
meet the technical standards of sanitary landfills: geotextile / geo-
membrane layer cell, leachate recovery system, leachate treatment,
evacuation of gases, control the quality of groundwater...
o The mode of treatment including burning varies from one site to another.
Burning decreases when the site has a sorting system for composting: the
case of Fianarantsoa, Toliara, Taolagnaro. It is between 0 and 100% and the
average of the different rates is about 32%;
o The BAT / BEP used at the site level is composting.
3.3 Landfill mapping
The information collected during field study is processed in a map database and is
presented as a form of:
- Maps of landfill sites at the national level showing occupied areas and burn
rate (see Figures 3.2 to 3.5);
- site maps at the regional level;

25
Figure 3-2Map at national-level sites representing areas occupied by landfills

26
Figure 3-3Map of sites at the national level representing surface burn rates inlandfills

27
Figure 3-4Map showing landfills in Antananarivo and surroundings

28
Figure 3-5Maps showing the burning of waste in landfills in and aroundAntananarivo

29
3.4 Inventory of other hot spots
Other hot spots that have been inventoried include bush fires that are divided into
"Forest fires" and "non-forest", the burning of sugarcane during its production
process including during the cutting.
3.4.1 Forest fires
Table 3.12 shows the situations of fire points and areas burned while Figure 3.5
shows the evolution of fire points from 2006 to 2016.
Table3-11Situations of fire points and area burned from 2006 to 2016
Source : DGF/DVRF/SRRLF

30
Figure 3-6 Evolution of fire points
ONE's National Environmental Scorecard states that areas burned at the national
level include tanety, natural forests, reforestation forests and unauthorized
clearings.
FAO in its Report "Global Forest Resources Assessment 2015" mentions the
following points regarding forest fires:
o For the year 2012, the area burned is 124 000 ha and the forest area
is 8 600 ha (see Table 3.12)
Tableau 3-12 Total area of land and forest burned from 2003 – 2012 inMadagascar
Années 2003 2004 2005 2006 2007 2008 2009 2010 2011 2012
Terrains brûlés(x 1000 ha)
546 42 356 456 320 169 424 496 188 124
Forêts brûlées(x1000 ha)
24.0 7.0 38.7 9.8 10.0 4.0 52.8 10.5 0.8 8.6
(Source: Global Forest Resources Assessment 2015 – FAO)

31
For bushfires, note the following:
o Significant increase in fire points during the years 2015 and 2016. It could
be related to several factors: climate (drought in some regions), political
(manifestation of dissatisfaction), security (increased theft of cattle and
creation of fire to eliminate traces);
o the fire points located in the forests tripled in 2015 compared to 2012;
o Tendency to increase the area burned since 2013;
o In 2015, the Global Forest Resources Asssessment mentions that the forest
occupied 21.4% of the land
3.4.2 The treatment of sugar cane
In the process of treating sugar cane, two methods are used for cutting: a
mechanized cut and a manual cut that requires burning of the cane stems. In
Madagascar, only two sites (Ambilobe and Namakia) still apply this method. In order
to be able to estimate the quantities burned, the tables below give the areas
planted as well as cane production in tones at these two sites. Note that the burned
parts represent about 10% of the cane.
Table3-13Surface planted with sugar cane at Ambilobe and Namakia
Source : Centre Malgache de la Canne et du Sucre

32
Table3-14Cane production in Ambilobe and Namakia
Source : Centre Malgache de la Canne et du Sucre

33
Photos showing the burnt parts of the cane before cutting
Photo showing the cane after burning

34
4 Situationof the recycling industry and market at
national levelIn Madagascar, the recycling industry is in its beginning. Very little formal value
chain exists in Madagascar. In fact, apart from a few large industrial units located in
the Analamanga region, small businesses or associations carry out recycling
activities, which, for the most part, are not yet registered in the formal system.
4.1 Valorization of sector in Madagascar
As previously mentioned, there are few formal channels for upgrading and
processing capacity. Much of the valuable waste is recovered by the informal
sector. Informal workers are one of the main actors in the waste cycle in
Madagascar. Figure 3.2 shows their place in the sorting recovery circuit and
valorization.

35
Figure 4-1Informal workers in the recuperation of recoverable waste
Discharge / Landfill
LORRIES
Scavengers
Intermediate collectors
Export ProcessingIndustry Artisan recyclers Reuse
Dump collectors orstreet collectors
Large intermediates

36
To illustrate this description of the informal sector, two cases are presented below:
Waste recovery case at the Andralanitra landfill
A survey carried out by Gevalor in 2012 at the Andralanitra landfill site, the main
landfill site of the Urban Community of Antananarivo, the capital of Madagascar,
gave the results presented in Table 4-1 for recycling and valorisation of waste:
Table4-1- Valorisation of waste at Andralanitra
Source : Tableau de Bord Environnemental – Enquête Gevalor 2012
Note that this recycled / valuable waste represents only a small part of the
approximately 800 tons of waste collected per day in the city of Antananarivo,
which themselves constitute for only about 37% of the waste generated by the
population.
Case of recycling circuit of aluminum cans
The cans are recovered either at the level of the Lorries or at the level of the
dumpsites by the scavengers and the ambulant pickers. They are then brought back

37
to the intermediaries who deliver them to the recyclers’ artisans for the
manufacture of kitchenware (cooking pots ...) or works of art.
In addition to this informal sector of valorization of waste, one of the alternatives of
some companies is the search for units outside the country to treat their waste, ie
the export of recovered materials.
Regarding hazardous waste, apart from ADONIS Environnement, which recovers
waste such as used oil, batteries, hospital waste, very few companies are involved in
collecting this type of waste.
4.1.1 Recycling activities by industrial units
There are some industrial units whose main activity or part of their activities is
recycling recyclable materials. Among those located in Antananarivo and its
surroundings are:
The SMTP(SociétéMalgache de Transformation des Plastiques)
A forerunner in sustainable development, it has started recycling used plastics,
especially low-density polyethylene (LDPE) purchased directly from local customers.
This in a constant effort to fight against global warming. It produces, among other
things, pits, tanks, food trays and pipes (HDPE, PPR).
TheSPAH (Société malgache de Production d’Articles Hygiéniques)
Kitchen articles and works of art made from aluminum
recycling

38
SPAH collects and recycles paper waste into "toilet paper". It works with the
Ministry of the Environment, Ecology and Forests for the collection and
recycling of office waste. SPAH has been producing ecological products for five
years.
Recyclage des déchets de papiers en tissus de papiers

39
ADONIS ENVIRONNEMENT
ADONIS ENVIRONNEMENT deals with the treatment and recovery of hazardous
waste such as hydrocarbons, filters, batteries and valuable materials such as
plastics.
SACOPLAST
Industrial unit whose main activity is the production and sale of plastic packaging
can recycle LDPE, HDPE and PP.
VITAPLAST
Company that manufactures plastic household items (buckets, cuvettes ...) has
devoted part of its production process to the recycling of LDPE, HDPE, and PP.
In addition, some large companies have in their waste management system a
recycling process of those they generate. Let us mention the case of NEWPACK, a
company that manufactures cardboard packaging that recovers the drops of
cardboard from their production and those of its customers to export them for
recycling. The STAR, manufacturer of drinks, for its part, subcontracts with a cement
plant for the recycling of glasses.
4.1.2 Some initiatives by some associations / projects:
o FAKOFIA
Company with Socioeconomic Goal (EBS) acting at the level of the city of
Fianarantsoa, FAKOFIA takes care of the collection, sorting of organic waste,
recoverable and ultimate. Organic waste will be composted while reusable waste
(channels) made of plastics, metals, glass, rubber,.... are stored at the Sorting and
Valorization Center in anticipation of a valuation process depending on the case
(resale for the needs of local crafts: pots, watering cans, shoes or treatment at the
national level). The ultimate waste will be landfilled on site.

40
o MADACOMPOST
In the city of Mahajanga, Madacompost, a local Malagasy company that has entered
into a partnership with Gevalor, a French association specializing in the recovery of
urban waste in the South, is composting the organic part of household waste that
constitutes more than 70% of the total. Farmers use this compost as a natural
fertilizer. In addition to compost production, other types of waste are also valued:

41
- Manufacture of interlocking tiles and bricks from plastic bags. As an
indication, in 2014, 11 million of plastics bags were recycled (Source
Madacompost),
- Use as a biological fertilizer the crushed zebus horns,
- Conversion of green and woody waste into fuel briquettes,
o M’IHARISOA
The M'Ihari-Soa association in Ambohidratrimo transforms PET bottles into
interlocking tiles by mixing them with sand after melting them in an oven.
Transformation of PET bottles into interlocking tiles
42
o Association TAFITA
As an association working in the collection and processing of organic waste in the
community of Ambohimanambola, TAFITA deals with the sorting of waste and the
composting of organic waste. Street pickers take up other types of waste such as
plastics, cans, cartons.
Note also the existence of some initiatives that are still at the research or project
stage. Among these, let us mention the transformation of this plastic waste in bricks
as well as building tiles that do not deteriorate, carried out by two (2) researchers at
the University of Diego.
The plastic waste collected is initially melted without emanating toxic smoke and
mixed with sand, earth, rice bran and wooden sawdust among others to obtain a
kind of tar that will be poured into specific molds, then cooled.
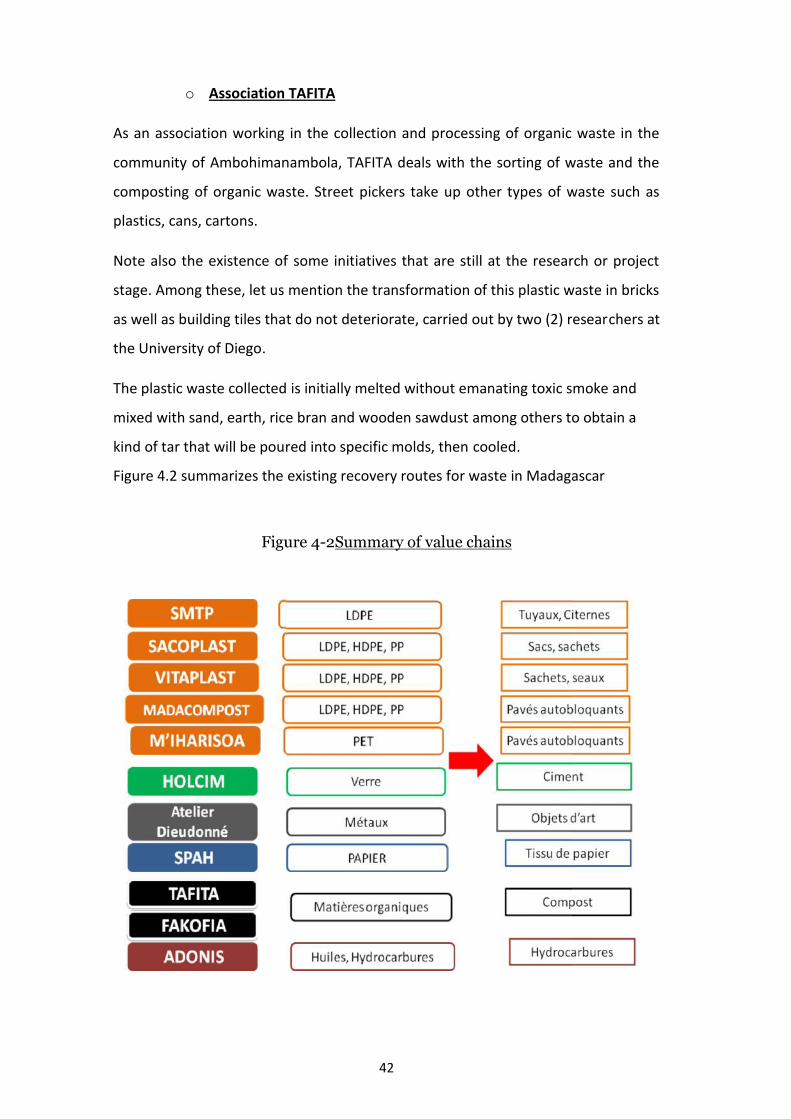
Figure 4.2 summarizes the existing recovery routes for waste in Madagascar
Figure 4-2Summary of value chains
42
o Association TAFITA
As an association working in the collection and processing of organic waste in the
community of Ambohimanambola, TAFITA deals with the sorting of waste and the
composting of organic waste. Street pickers take up other types of waste such as
plastics, cans, cartons.
Note also the existence of some initiatives that are still at the research or project
stage. Among these, let us mention the transformation of this plastic waste in bricks
as well as building tiles that do not deteriorate, carried out by two (2) researchers at
the University of Diego.
The plastic waste collected is initially melted without emanating toxic smoke and
mixed with sand, earth, rice bran and wooden sawdust among others to obtain a
kind of tar that will be poured into specific molds, then cooled.
Figure 4.2 summarizes the existing recovery routes for waste in Madagascar
Figure 4-2Summary of value chains

43
4.2 Current market estimation for some sectors
An estimation of the current market for some sectors is made taking into account the data
mentioned above. Table 3.4 summarizes this information and the evolution of this market:
Table4-2- Current market estimation for some sectors
SECTORS TYPES ESTIMATION QUANTITY ESTIMATED(T/Yr)
2014 (a) 2018 (b)
PLASTICS
LDPE, HDPE 29% 20 000 82 940
PP 18% 12 417 51 480
PVC 12% 8 278 34 320
PS 8% 5 518 22 880
PET 7% 4 828 20 020
PAPER- CARTON - 100% 89 000 371 800
METALS Ferrous andnon-ferrous
2% householdwaste
13 797 57 200
GLASS ND ND ND
MINERAL OILS - 20% collected 1 400 ND
ORGANICMATERIALS
COMPOSTING 60% householdwaste
413 910 1 716 000
(a) Production de déchets estimée à 689 850 T(b) Production de déchets estimée à 2 860 000 T

44
5 Update of the inventory of Dioxins and Furans
Recall that for emission sources in category 6 (Open Burning), the latest emissions estimate
(2010) calculated with the new version of the Toolkit is shown in the table below:
Table5-1Estimated emissions of dioxins and furans in 2010
Emission FactorCalculated by New version of Toolkit
(g TEQ/ year)
2010
Air 16.437
Water ND
Land 2,868
Product NA
Residue NA
Total 19.305
(Source : Rapport d’inventaire des dix nouveaux POPs- Rapport de mise à jour des inventaires –MINENVF)
5.1 Estimation des émissions de dioxines et furannes par le brûlage de biomasse
(6.a) pour l’année 2015
5.1.1 Forest fires
5.1.1.1 Activity rates
The data used to estimate activity rates are those presented in section 3.4.1. Given that until
now the satellite monitoring system of fires does not allow to have directly burned surfaces but
points of fire, an estimation of these surfaces is necessary by using the available data.
Remind the following points:
o The available data for forest fire in the FAO's Global Forest Resources Assessment
2015 concern 2012 : 124,000 ha burned and 8,600 ha burned forest;

45
o localized fire points in forest tripled in 2015 (19331) compared to 2012 (6366) (DGF /
SRRLR)
o In 2015, the total area burned is 189,327 ha (DGF/SRRLR)
o In 2015, the forest occupied 21.4% of the land (Global Forest Resources Assessment)
In order to estimate the area of forest burned in 2015, the 2012 data could be taken as a
reference.
The following hypotheses could be advanced in estimating the area burned in 2015:
o The 8600 ha of forest burned in 2012 are maintained in 2015,
o Considering that the fire points tripled in 2015, there is 65,327 ha increase between 2012
and 2015 (189,327 ha Vs 124,000 ha)
o Of these 65,327 ha, 21.4% could be occupied by forest which corresponds to 13,900 ha;
o The total area of burned forest could be estimated at around 22,500 ha
In order to calculate the tdm / ha, these 22,500 ha of forests are mostly classified in "tertiary
tropical forests" as mentioned in the last inventory. If we refer to the latest version of the
Toolkit, the value is 32 tdm / ha. The 22 500 ha correspond to 720 000 T of dry matter.
5.1.1.2 Estimation of emissions
If these values are reported in the Toolkit, forest fire emissions are presented in the table below:
Table 5-2- Estimation of emissions for forest fires
Biomass burningEmission Factors
(gTEQ/an)
Air Water Land Product Résidue
Forest fires 0.72 ND 0.108 NA ND
46
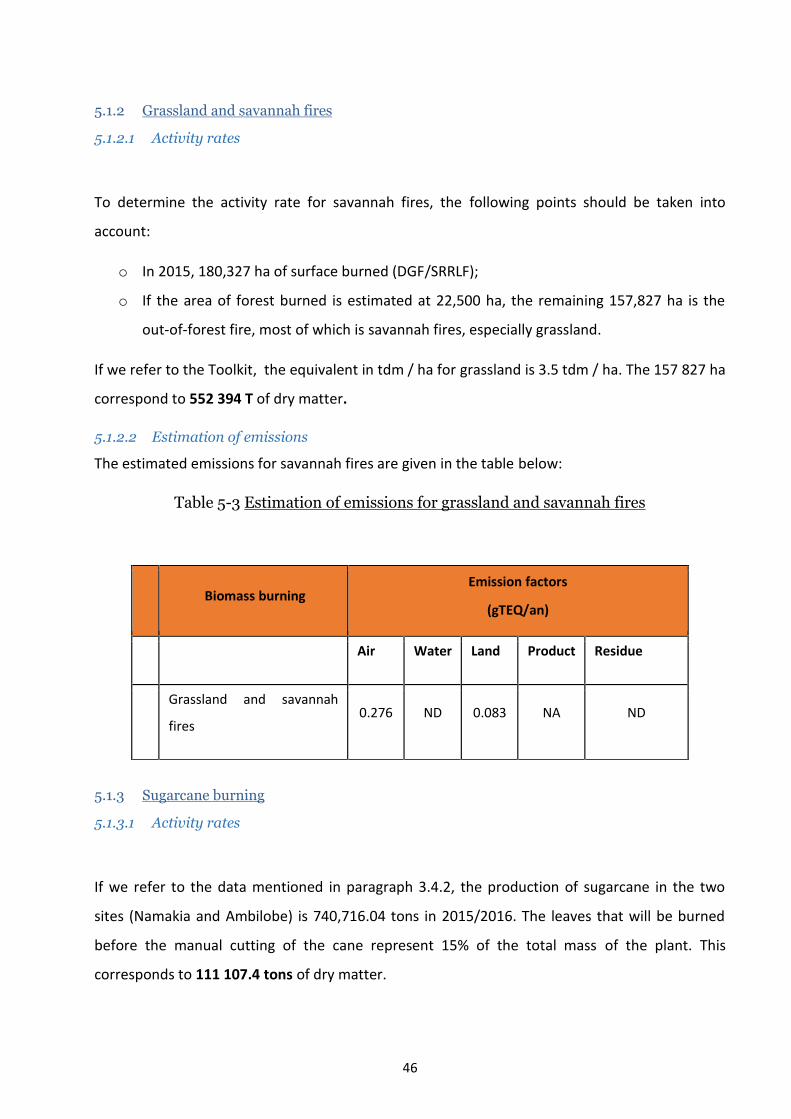
5.1.2 Grassland and savannah fires
5.1.2.1 Activity rates
To determine the activity rate for savannah fires, the following points should be taken into
account:
o In 2015, 180,327 ha of surface burned (DGF/SRRLF);
o If the area of forest burned is estimated at 22,500 ha, the remaining 157,827 ha is the
out-of-forest fire, most of which is savannah fires, especially grassland.
If we refer to the Toolkit, the equivalent in tdm / ha for grassland is 3.5 tdm / ha. The 157 827 ha
correspond to 552 394 T of dry matter.
5.1.2.2 Estimation of emissions
The estimated emissions for savannah fires are given in the table below:
Table 5-3 Estimation of emissions for grassland and savannah fires
5.1.3 Sugarcane burning
5.1.3.1 Activity rates
If we refer to the data mentioned in paragraph 3.4.2, the production of sugarcane in the two
sites (Namakia and Ambilobe) is 740,716.04 tons in 2015/2016. The leaves that will be burned
before the manual cutting of the cane represent 15% of the total mass of the plant. This
corresponds to 111 107.4 tons of dry matter.
Biomass burningEmission factors
(gTEQ/an)
Air Water Land Product Residue
Grassland and savannah
fires0.276 ND 0.083 NA ND
47
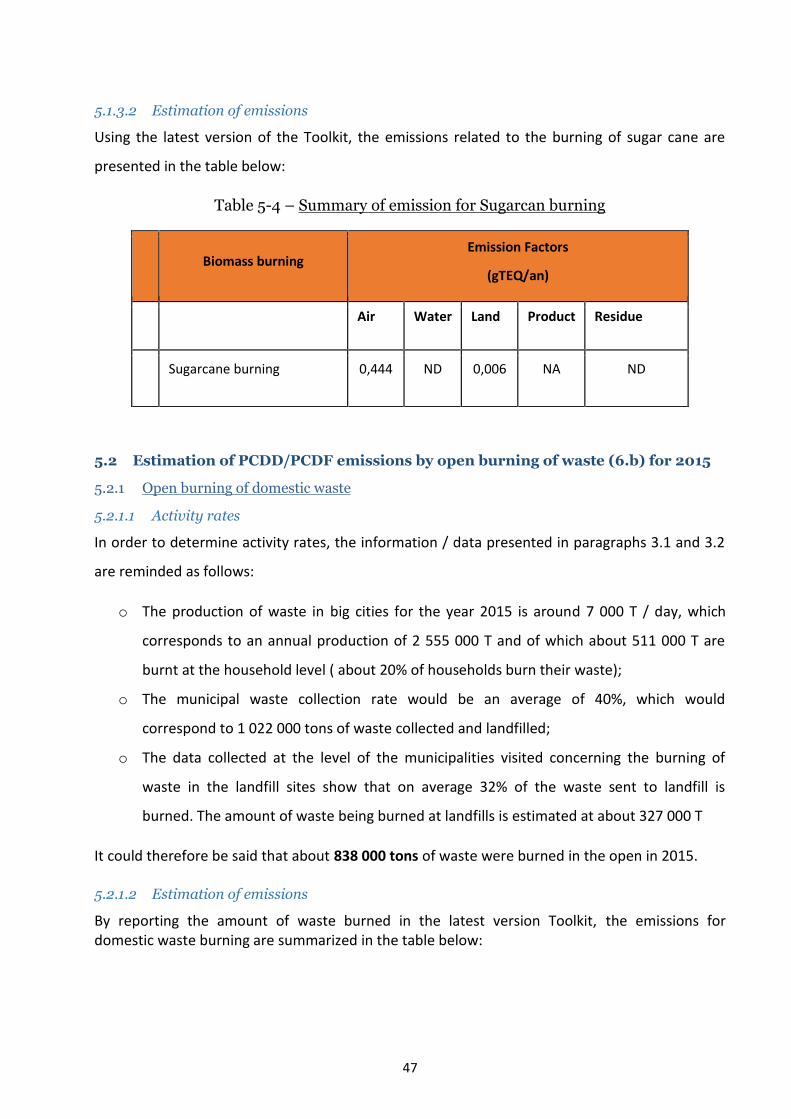
5.1.3.2 Estimation of emissions
Using the latest version of the Toolkit, the emissions related to the burning of sugar cane are
presented in the table below:
Table 5-4 – Summary of emission for Sugarcan burning
5.2 Estimation of PCDD/PCDF emissions by open burning of waste (6.b) for 2015
5.2.1 Open burning of domestic waste
5.2.1.1 Activity rates
In order to determine activity rates, the information / data presented in paragraphs 3.1 and 3.2
are reminded as follows:
o The production of waste in big cities for the year 2015 is around 7 000 T / day, which
corresponds to an annual production of 2 555 000 T and of which about 511 000 T are
burnt at the household level ( about 20% of households burn their waste);
o The municipal waste collection rate would be an average of 40%, which would
correspond to 1 022 000 tons of waste collected and landfilled;
o The data collected at the level of the municipalities visited concerning the burning of
waste in the landfill sites show that on average 32% of the waste sent to landfill is
burned. The amount of waste being burned at landfills is estimated at about 327 000 T
It could therefore be said that about 838 000 tons of waste were burned in the open in 2015.
5.2.1.2 Estimation of emissions
By reporting the amount of waste burned in the latest version Toolkit, the emissions fordomestic waste burning are summarized in the table below:
Biomass burningEmission Factors
(gTEQ/an)
Air Water Land Product Residue
Sugarcane burning 0,444 ND 0,006 NA ND

48
Table 5-5 Emissions for open burning of domestic waste
5.3 Summary of emissions for Open burning
The estimates of dioxin and furan emissions for 2015 concerning different subcategories are
summarized in Table 5.5:
Table 5-6 Summary of emissions of Dioxin and Furan for 2015
Open burning of waste andaccidental fires
Emission Factors
(gTEQ/an)
Air Water Land Product Residue
Open burning of domestic waste 33.52 ND 0.838 NA NA
Open burning Emission Factors(gTEQ/an)
Air Water Land Product Residue
6.1 Biomass burning
1 Forest fires 0.72 ND 0.108 NA NA
2 Grassland and savannah fires 0.276 ND 0.083 NA NA
5 Sugarcane burning 0.444 ND 0.006 NA NA
6.2Open burning of waste and
accidental fires
3 Open burning of domestic waste 33.52 ND 0.838 NA NA
TOTAL 34.961 1.034

49
TOTAL OF EMISSIONS IN 2015 : 35,995 gTEQ/an
Notons que les estimations dépendent des informations disponibles.
Note that a survey conducted with the Ministry in charge of Agriculture and Agricultural Statistics
found that, apart from the rice bran used as fuel in bricks production in the highlands,
agricultural residues from major crops ( Maize , Rice, Cassava) are for the most part used by
farmers as fodder.
From 2010 to 2015, an increase in emissions of 16.69 gTEQ / year is observed. This increase
mainly concerns the burning of waste. In fact, the estimated amount of waste burned has
increased significantly. 174 000 T of waste were estimated in 2010 while they are estimated at
838 000 T for 2015. The following explanations could be put forward:
o Increase in waste production linked of the population growth,
o Availability of data relating to waste management: inventory made in the different sites
to know the practices, study carried out and projection compared to the production
The estimates depend on the availability of information.
6 ConclusionThe inventory of landfill sites and other fire points at the national level has made it possible to:
- identify the various practices including open burning in these different sites and to
estimate their magnitude;
- know the situation of landfills (location, surface, quantity of stored waste, etc.) and the
existing treatment methods;
The updating of the emissions inventory has, on the one hand, made it possible to see the
important place of open burning of domestic waste and, on the other hand, to have a reflect on
the choice of Best Available Technologies (BAT) and Best Environmental Practices (BEP) to be
implemented at these sites as well as actions that should be taken to reduce dioxin and furan
emissions.

50

51
BIBLIOGRAPHY- COI/AFD (2014) – Etude de diagnostic pour une gestion optimisée des déchets dans l’Océan
Indien
- Christian A. Kull (2002) – Madagascar aflame : landscape burning as peasant protest, resistance,
or a resource management tool ?
- FAO (2015) – Global Forest Resources Assessment
- Kellie Koenig/NASA/CI ( 2017) – Firecast : a fire prevention and forest monitoring system
- MEEF (2015), Rapport d’inventaire des dix nouveaux POPs- Rapport de mise à jour des
inventaires des Dioxines, Furannes et Polycholorobiphényles
- PNUE, STOCKHOLM CONVENTION (2013) – Toolkit for identification and quantification of
releases of Dioxins, Furans and other unintentional POPs
- RAJAOMANANA Hery/ONE – Gestion et traitement des déchets ménagers dans les pays en voie
de développement
- RALAIMIHOATRA Solofoniaina Nandrianina- CI – Le système de suivi satellitaire des feux, un outil
de gestion des ressources naturelles à Madagascar
- http:/www. Etcterra.org/fr/energie-déchets/africompost
- http:/mg.one.un.org/content/unct/madagascar
- https:/www.pnae.mg/tbe/national
- https:/logiprod.conservation.org/FirecastWebAnalytics
52
APPENDICES

53
Appendix 1: List of people contacted

54
REGION Nom et prénoms Entité Titre/Responsabilité Coordonnées
DIANA
DJAONARANA Jean Francis Commune UrbaineDiego-Suarez Directeur Technique 00 261 32 04 826 35
MAHATONDRA Elisée R. Protection civileDirecteur des Affaires
Juridiques et protectioncivile
032 02 542 79
Elvire VONIARISOA Min AGRICULTURE Responsable suivi-évaluation 034 05 652 30
Michel MinENV-DREFFT 032 50 592 88
Sana MAROSON Min ENV-DREFFT Chef de Service Régionaldes Forêts
032 04 250 06034 05 250 06
AMBOSITRARABEMAHAFALY Jean Rock Albert CU Ambositra Adjoint Chef de Service
Technique 034 38 916 99
RAZAKANDRAINY Felix CU Ambositra Chef de Service Technique 034 31 624 19
FIANARANTSOA
ANDRIAMAMPIONONA Dida CU Fianarantsoa Chef de Service Technique 034 16 878 85
Mr HERY Le Relais 034 75 510 63
KOTOVELO Roland Le Relais Animateur PôleValorisation des déchets
034 75 510 [email protected]
Mr ANDO DREFF HauteMatsiatra
Chef de ServiceEnvironnement 034 60 505 71
RAKOTOSON Sitraka DREFF HauteMatsiatra Directeur Régional

55
REGION Nom et prénoms Entité Titre/Responsabilité Coordonnées
RAHERINIAINA Elmy Elien FAKOFIA Responsable activitéFAKOFIA/Agro-écologie
034 75 510 [email protected]
ANTSIRABE
FALIARISON Lalaina CU Ambatolampy Contrôleur de Marché
RAMANOELINA Jodia CU Ambatolampy Responsable du marché
RANDRIANARISOA Ferdinand CU Ambatolampy Agent Voyer 033 16 119 78
RATSIMBAZAFY Vonjy Harivelo DRAE Vakinankaratra
ResponsablePhytopharmacie- Contrôle
des semences et despesticides
034 27 803 83
RAMANANJATOVO Tahiana DREEFVakinankaratra
Service ForêtVakinankaratra 034 05 621 39
RAZAFIMANDIMBY Pierre EugèneFidèle CU Antsirabe Directeur Technique 032 74 877 75 - 034 01 984 12
ANTANANARIVO
SAHOLIARISOA Marie Jeannie CR Tanjombato Service Technique 033 14 026 37
Jean Samuel RANDRIANARISOA CR Tanjombato 1er Adjoint au Maire 034 05 772 [email protected]
RAHERINDRAIBE Prosper CR Alasora Service Technique 034 08 318 14
Jimmy CR Alasora 1er Adjoint au Maire 033 11 848 [email protected]

56
REGION Nom et prénoms Entité Titre/Responsabilité Coordonnées
RALALARISOA Tantely CRAmbohimangakely Secrétariat
RAFALY Harrison Hery L CUA Antananarivo Service Technique 033 33 214 30
RAJAOHARIVELO Fenitra CRAmbohitrimanjaka Service Technique 033 04 045 70
RAKOTOMAMONJY ZakariasFerdinand CR Antehiroka Service Technique 034 29 212 35 / 034 70 074 98
RAZAFIMAHERY Niaina CR IVATO Voirie 034 45 359 33
RAKOTOSOLO Albert Clément CR IVATO 2ème Adjoint au Maire 033 04 129 97
Mr NICO CR Talatamaty Voirie 034 69 365 19
RATOVONDRAINY Sitraka CR SabotsyNamehana Voirie 034 48 633 63
Bodoarilala RASOLOMANANA MINENVChef de service
Reboisement, reforestationet lutte contre les feux
034 18 649 51

57
REGION Nom et prénoms Entité Titre/Responsabilité Coordonnées
RAKOTONOELY HermannCMCS (Centre
Malgache de laCanne et du Sucre)
Agent 033 03 361 51/ 034 44 361 51
RAKOTOARIJAONA Mamy Madagascar NationalPark Directeur des Opérations 032 09 400 03
ANDRIAMARO Luciano ConservationInternationale
Director Science andKnowledge Departement 033 14 070 51/ 034 02 438 23
RANDRIANARIVELO Lucien Ministère Chargé del’Agriculture
Directeur Général del’Agriculture

58
Appendix 2: Summary table of the results of the on-site
visit

59

60
CATEGORY 6 : OPEN BURNINGSub-category Location GPS Estimated
surface Unit Estimatedquantity Unit Année Comments
3- Open burning ofdomestic waste
ANTANANARIVO
TONGARIVO S 18° 57' 58.0"E 047° 31' 21.8" 486 m2 16 To/day 2017
Burned : 1 To/day(ririnina)
0,1 To/day (Fahavaratra)
ALASORA S 18° 57' 59.7"E 047° 34' 42.3" 13 200 m2 5 To/day 2017 Burned : 1,25 To/day
ANDRALANITRA S 18° 54' 36.9"E 047° 34' 35.1" 180 000 m2 1500 - 2000 m3/day 2017 Pas de brûlage
AMBOHITRIMANJAKA
Pas de déchargecommunautaire
Décharge par ménage /Population : 40 000
80% Brûlés
ANTEHIROKA :Andramiarana
S 18° 51' 45.2"E 047° 27' 53.6" 2 400 m2 23 m3/day 2017 20% burned - Projet de
site à Antsilolika
TALATAMATY :Andramiarana
S 18° 51' 45.2"E 047° 27' 53.6" 2 400 m2 18 To/day 2017 20%
IVATO S 18° 45' 50.9"E 045° 28' 12.8" 800 m2 10 To/day 15% burned

61
CATEGORY 6 : OPEN BURNINGSub-category Location GPS Estimated
surface Unit Estimatedquantity Unit Année Comments
S 18° 46' 28.9"E 047° 28' 12.2 " 2 637 m2
SABOTSY NAMEHANA 500 m2
ANTSIRANANARoute d'Anamakia S 12°19'00.7"
E 049°16'51.1" 8 370 m2 26 000Tonnes
Totallyburned
Route RAMENA S 12°17'58.7"E 049°17'55.3"
VAKINANKARATRA
AMBATOLAMPY :Marché
S 18° 46' 28.9 "E 047° 28' 12.3" 12 m2
0,5 To/Day 201790% récupérés par les
paysans10% brûlésAMBATOLAMPY:
MalamamainaS 19° 24' 20.6"
E 047° 25' 26.0" 16 m2
ANTSIRABE : Ivohitra S 19° 52' 29.8"E 047° 00' 22.2" 1 377 m2 60 To/Day 2017 80% burned
HAUTE MATSIATRAMaromby (Près Sœurs) S 21° 24' 59.5"
E 047° 06' 30.8" 16 786 m2 50 To/day 2016 -2017 70% Burned
Maromby PK6 S 21° 24' 34.9"E 047° 05' 05.5" 1 932 m2 550 To/month 0,5% burned
AMORON'I MANIA Antsenan'omby -Ambohipierenana
S 20° 33' 23.1"E 047° 13' 57.3" 652 m2 18 m3/day 2017 100% burned

62