Framework for estimating toxic releases from the application of ...
30
General rights Copyright and moral rights for the publications made accessible in the public portal are retained by the authors and/or other copyright owners and it is a condition of accessing publications that users recognise and abide by the legal requirements associated with these rights. Users may download and print one copy of any publication from the public portal for the purpose of private study or research. You may not further distribute the material or use it for any profit-making activity or commercial gain You may freely distribute the URL identifying the publication in the public portal If you believe that this document breaches copyright please contact us providing details, and we will remove access to the work immediately and investigate your claim. Framework for estimating toxic releases from the application of manure on agricultural soil: National release inventories for heavy metals in 2000-2014 Leclerc, Alexandra Segolene Corinne; Laurent, Alexis Published in: Science of the Total Environment Link to article, DOI: 10.1016/j.scitotenv.2017.01.117 Publication date: 2017 Document Version Peer reviewed version Link back to DTU Orbit Citation (APA): Leclerc, A. S. C., & Laurent, A. (2017). Framework for estimating toxic releases from the application of manure on agricultural soil: National release inventories for heavy metals in 2000-2014. Science of the Total Environment, 590-591, 452-460. DOI: 10.1016/j.scitotenv.2017.01.117 brought to you by CORE View metadata, citation and similar papers at core.ac.uk provided by Online Research Database In Technology
-
Upload
khangminh22 -
Category
Documents
-
view
6 -
download
0
Transcript of Framework for estimating toxic releases from the application of ...

General rights Copyright and moral rights for the publications made accessible in the public portal are retained by the authors and/or other copyright owners and it is a condition of accessing publications that users recognise and abide by the legal requirements associated with these rights.
Users may download and print one copy of any publication from the public portal for the purpose of private study or research.
You may not further distribute the material or use it for any profit-making activity or commercial gain
You may freely distribute the URL identifying the publication in the public portal If you believe that this document breaches copyright please contact us providing details, and we will remove access to the work immediately and investigate your claim.
Downloaded from orbit.dtu.dk on: Mar 30, 2019
Framework for estimating toxic releases from the application of manure on agriculturalsoil: National release inventories for heavy metals in 2000-2014
Leclerc, Alexandra Segolene Corinne; Laurent, Alexis
Published in:Science of the Total Environment
Link to article, DOI:10.1016/j.scitotenv.2017.01.117
Publication date:2017
Document VersionPeer reviewed version
Link back to DTU Orbit
Citation (APA):Leclerc, A. S. C., & Laurent, A. (2017). Framework for estimating toxic releases from the application of manureon agricultural soil: National release inventories for heavy metals in 2000-2014. Science of the TotalEnvironment, 590-591, 452-460. DOI: 10.1016/j.scitotenv.2017.01.117
brought to you by COREView metadata, citation and similar papers at core.ac.uk
provided by Online Research Database In Technology
Framework for estimating toxic releases from the 1
application of manure on agricultural soil: National release 2
inventories for heavy metals in 2000-2014 3
4
Alexandra Leclerc1*, Alexis Laurent1 5
1Division for Quantitative Sustainability Assessment, Department of Management Engineering, 6
Technical University of Denmark 7
*Corresponding author: [email protected], tel: (+45) 45 25 47 29 8
9
0
Abstract 10 Livestock manure is commonly applied on agricultural land for its fertilising properties. However, 11
the presence of toxic substances in animal manure such as pathogens, antibiotics and heavy metals, 12
can result in damages to ecosystems and human health. To date, although relevant for policy-13
making, e.g. regulation framing, their releases to agricultural land have been incompletely and 14
inconsistently quantified at global and national scales. Here, we thus developed a generic 15
framework for estimating such releases based on the quantities of manure applied and 16
concentrations of toxic substances. Applying this framework, we built a global release inventory for 17
arsenic, cadmium, chromium, copper, mercury, nickel, lead and zinc differentiated into 215 18
countries and 15 years (period 2000-2014). Comparisons with more narrowly-focused inventories 19
showed overall consistency in our inventory results, although a number of uncertainties and 20
limitations were identified. In particular, the need for harmonising sampling and analytical methods 21
for estimating heavy metal contents in manure and generating more country-differentiated data, 22
especially for developing countries, should be prioritised by future research studies. Using life cycle 23
impact assessment methods, it was additionally found that mercury, zinc and copper are the 24
substances contributing the most to the toxic impacts on human health and freshwater ecosystems 25
resulting from manure application to land. While countries such as China, India, Russia, Brazil and 26
the United States of America contributed to half the heavy metal releases from manure application 27
worldwide, the impact intensity per area of agricultural land was observed to be highest for island 28
countries, the European Union and South-East Asia because of higher per-area applications of 29
manure. These findings demonstrate the need to perform country-specific impact assessment to 30
support policy-making regulating the concentrations of toxic substances such as heavy metals in 31
utilised manure. 32
Keywords 33 Manure management, heavy metal concentration, inventory, toxicity, impact assessment, life cycle 34 assessment 35
1

1. Introduction 36 Reusing animal manure as an organic crop fertiliser has been shown to enable a better use of 37
nutrient sources and to help reduce pollution due to nitrogen leaching compared to utilisation of 38
conventional mineral fertilisers (e.g. EC, 2012; Kramer et al., 2006). In addition, the application of 39
animal manure on agricultural land has been reported to result in high crop productivity and soil 40
fertility over longer time periods than synthetic fertilisers, thus making it a relevant alternative 41
(Hepperly et al., 2009; Jensen, 2013; Redding et al., 2016; Russo and Taylor, 2010). However, 42
animal manure contains traces of antibiotics, heavy metals and pathogens, which may damage 43
ecosystems and human health (Eneji et al., 2003; Kumar et al., 2005, 2013; Millner, 2009; 44
Nicholson et al., 2003). These potentially toxic substances may affect not only the plants through 45
direct uptake (Kornegay et al., 1976; Tien et al., 2016; Zhou et al., 2005), but also the grazing cattle 46
and humans by ingestion of contaminated food and water (Kumar et al., 2013). Manure treatment 47
(e.g. anaerobic digester, chemical addition, thermal treatment) may help reduce the concentrations 48
of antibiotics and pathogens to reach limits defined by authorities, e.g. the European Union (Bicudo 49
and Goyal, 2003; Dolliver et al., 2008; EC, 2011). For many other pollutants (including heavy 50
metals), some countries have implemented national regulations setting concentrations thresholds for 51
composted waste (Cai et al., 2007; DüMV, 2012; MoE, 2006) 52
Estimating the current inputs of toxic substances to soil and their potential damage on the 53
environment can aid define proper concentration thresholds and prioritise pollutants to address in 54
policy-making. To date, the total releases of harmful substances resulting from the application of 55
manure in a given country have only been quantified in few studies and for specific cases. 56
Inventories of heavy metal releases have been built for the world as a whole in 1988 (Nriagu and 57
Pacyna, 1988), for England and Wales in 2000 (Nicholson et al., 2003), for France in 2012 (Belon 58
et al., 2012) and for China in 2005 (Luo et al., 2009). As an intermediate step to derive a global 59
toxic release inventory (hence not disclosed), Cucurachi et al. (2014) quantified total heavy metal 60
releases from manure application in Europe in 2010, using country-specific manure production 61
2
statistics combined with average heavy metal contents for Europe. The European inventory was 62
thus used as a basis to extrapolate to the global scale using different proxies, i.e. gross domestic 63
product, carbon dioxide emissions or mercury emissions. Likewise, Sleeswijk et al. (2008) 64
estimated heavy metal releases from manure application in the world in 2000 based on total 65
livestock statistics, excretion rates and heavy metal concentrations reported for the Netherlands 66
(detailed results not available either). Although highly relevant in environmental policy-making 67
context, e.g. to aid frame existing or new regulations, none of these studies address a consistent 68
national and temporal differentiation in their estimates of chemical releases from manure 69
application in a global perspective. 70
In this study, we therefore aim to (i) develop a harmonised framework for estimating the total 71
releases of toxic substances to agricultural soil resulting from the application of manure in a given 72
country; (ii) apply this framework to derive national inventories of heavy metal releases in the 73
world in the period 2000-2014 ; and (iii) quantify the impact of these releases on ecosystems and 74
human health. The focus on heavy metals was motivated by their data availability and their 75
environmental relevance as they range among the top contributors to damages on human health and 76
freshwater ecosystems (Laurent et al., 2011). 77
2. Materials and methods 78
2.1. Release inventory framework 79 The release of a substance to agricultural soil is directly related to the quantity of applied manure 80
and to the concentration of the substance in the manure. The latter mainly depends on the amount of 81
substance present in the feed ingested by the animals, which is regulated for each livestock (EC, 82
2003, 2002). Furthermore, the form of the manure, either as a liquid or a solid waste, influences its 83
composition and thus its content in toxic substances (Amlinger et al., 2004). 84
3

Following the method used by Cucurachi et al. (2014), we propose a general framework to estimate 85
the input quantity Q(S)l,t,c,y of a substance S to the agricultural soil resulting from the application of 86
manure of type t (solid or liquid) from the livestock l in the country c in year y – see Equation 1: 87
yctlyctlyclyctl SCPMSQ ,,,,,,,,,,, )(××=)( (Equation 1) 88
Where Ml,c,y is the quantity of manure from the livestock l applied in the country c in year y (in kg 89
N-content); Pl,t,c,y is the proportion of manure managed through a solid or liquid system (type t) for 90
the livestock l in the country c in year y (in %); C(S)l,t,c,y is the concentration of substance S in 91
manure of type t from the livestock l in the country c in year y (in g/kg N-content). 92
2.2. Data collection 93
2.2.1. Manure applied to soil Mc,y,l 94 Quantities of manure applied to soil, expressed as kg of nitrogen content (kg N-content), can be 95
retrieved from the statistic division of the Food and Agriculture Organization of the United Nations 96
(FAOSTAT) for 215 countries across the world from 2000 to 2014 (FAOSTAT, 2015a). The 97
quantity of nitrogen in manure applied to soil is calculated by FAOSTAT following the 2006 98
Intergovernmental Panel on Climate Change guidelines for estimating nitrous oxide emissions from 99
nitrogen present in the manure added to agricultural soils by farmers (FAOSTAT, 2015a; IPCC, 100
2006). It is expressed as the amount of nitrogen excreted by livestock, net of the nitrogen losses due 101
to manure management systems, plus the nitrogen contribution from bedding materials when 102
present. The amount of nitrogen excreted is obtained by multiplying the number of livestock heads 103
in a country by typical animal masses and by nitrogen excretion coefficients specific to each 104
livestock. Thus, FAOSTAT (2015a) assumes that the totality of livestock manure is used for crop 105
fertilisation. 106
The applied manure data set is differentiated into 16 livestock species: buffaloes, cattle (dairy, non-107
dairy), sheep, goats, swine (market, breeding), chickens (layers, broilers), turkeys, horses, donkeys, 108
mules, camels, ducks, and llamas (FAOSTAT, 2015a). Manure from horses, camels, lamas, mules, 109
4
donkeys and buffaloes represented only 0.4% of the total manure applied in Europe, and 7.2% in 110
the world (FAOSTAT, 2015a). Because their manure is poorly used and seldom analysed (see 111
Section 3.1), these livestock were considered as cattle (non-dairy) when building the inventory of 112
heavy metal releases. For the same reason, turkey was treated as broiler poultry. 113
2.2.2. Manure management system Pl,t,c,y 114 Livestock excreta can be collected as solid manure (i.e. scraped from the floor with beddings) or 115
liquid slurry (i.e. flushed out of enclosed areas). The choice of the manure management system 116
depends on many factors, including the type of livestock, the size of the farm, the management 117
costs and the environmental and regulatory policies (BIOFerm, 2009; Westerman and Bicudo, 118
2005). The proportion of cattle (dairy and non-dairy), swine and poultry kept on either solid or 119
liquid manure management systems was compiled for 17 European countries from a questionnaire 120
addressed to experts across the United Nations Economic Commission for Europe (UNECE) in 121
2003 – see Table B1 (Kuczyński et al., 2005). For a specific livestock, the proportion of animals 122
kept on a liquid manure management system is considered equivalent to the proportion of excreta 123
collected as liquid slurry, and likewise for solid manure management systems and solid manure. 124
The analysis of the proportion of animals kept on a liquid manure management system (Table B1) 125
shows clear differences between the types of livestock. While most of the swine are kept on liquid 126
manure management system, nearly all layer chickens are kept on solid manure management 127
systems. These proportions also vary considerably between EU countries, for example ranging for 128
non-dairy and dairy cattle from 0-3% in Hungary to 100-100% in the Netherlands (Table B1). For 129
poultry, slurry was assumed to have the same heavy metal content as solid manure as very little data 130
exist on heavy metal concentrations in poultry slurry. This assumption should be acceptable because 131
liquid manure management system is rarely used for poultry (see Table B1). For countries for which 132
no information exist about the type of manure management systems, the geometric means of the 133
available data were used as approximations. This assumption is deemed of little influence on the 134
total releases as the metal concentrations show little variations across solid and liquid manure for a 135
5
given livestock (see Section 3.1). Further work is required to refine this assumption and extend data 136
of manure management systems to all countries in the world. 137
2.2.3. Heavy metal content in manure C(HM)l,t,c,y 138 Heavy metals are commonly added to animal feeds for health and welfare reasons, and a large part 139
of the consumed heavy metals may then be excreted and end up in manure (Faridullah et al., 2014; 140
Nicholson et al., 2003). In intense pig farming, the amounts of copper and zinc eliminated through 141
the animal manure can thus correspond to 72-80% and 92-96% of the amount ingested, respectively 142
(Mantovi et al., 2003). Most studies investigating heavy metal contents in manure report 143
concentrations in milligram of heavy metal per kilogram of dry matter (mg/kg.dm) (Amlinger et al., 144
2004; Møller et al., 2007). To obtain the heavy metal content C(HM)l,t,c,y in g/kg N-content, 145
information about the dry matter content and the nitrogen content in manure are necessary, as 146
shown in Equation 2. 147
[ ] [ ] yctlyctlyctlyctl N
DMHMHMC,,,
,,,,,,,,,1%)( ××= (Equation 2) 148
Where [HM]l,t,c,y is the concentration of heavy metal HM in manure of type t from the livestock l in 149
the country c in year y (in g/t.dm); %DMl,t,c,y is the dry matter content in manure of type t from the 150
livestock l in the country c in year y (in %); and [N]l,t,c,y is the nitrogen content in manure of type t 151
from the livestock l in the country c in year y (in kg-N/tonne fresh matter). 152
The organic matter and nitrogen contents in manure strongly depend on its treatment, making 153
difficult any time or country differentiation (Amlinger et al., 2004; Faridullah et al., 2014; 154
Westerman and Bicudo, 2005). Typical dry matter content and nitrogen content on a fresh weight 155
basis in solid manures and slurries from cattle, pig, sheep, duck, layer, broiler and turkey have been 156
retrieved from Chambers et al. (2001). Albeit old, these data are assumed to be valid for the purpose 157
of the current study. Further studies to determine dry matter contents and nitrogen contents in 158
manure are recommended to improve the accuracy of these estimates. 159
6
With respect to heavy metal concentrations, the Assessment and Reduction of Heavy Metal Input 160
into Agro-ecosystems (AROMIS) database contains information about the concentrations of 161
cadmium, chromium, copper, nickel, lead and zinc in animal manure. These data were compiled 162
from 32 reports and scientific articles published prior to 2003 for 10 European countries – see Table 163
B2 (KTBL, 2005). In spite of its relative comprehensiveness, the AROMIS database does not 164
document arsenic and mercury concentrations, does not provide any data related to non-European 165
countries and does not include data more recent than 2003. New European regulations concerning 166
heavy metal contents in animal feeding stuffs were implemented in 2002 and 2003 (EC, 2003, 167
2002), and may have resulted in changes in heavy metal concentrations in manure. The AROMIS 168
database includes only 1 study carried out after these regulations from 2002 – 2003, and could 169
therefore be assumed outdated. To address these gaps, an additional literature review was 170
conducted, using Web of Science database (Thomson Reuters, 2017) and Google Scholar 171
(https://scholar.google.com), with the keywords ‘heavy metal’, ‘content’, ‘concentration’, ‘manure’. 172
2.3. Impact assessment 173 To evaluate the toxicity-related environmental impacts caused by the releases of heavy metals to 174
agricultural soil, the USEtox 2.02 model was used (Hauschild et al., 2008; Rosenbaum et al., 2008). 175
It is a scientific consensus-based model for characterising impacts of chemicals on human health 176
(termed ‘human toxicity’, differentiated between cancer and non-cancer effects) and freshwater 177
ecosystems (termed ‘freshwater ecotoxicity’), and it is typically used in life cycle impact 178
assessment (Hauschild et al., 2013, 2008; Rosenbaum et al., 2008). 179
The model enables the calculation of substance-specific characterisation factors (CF), which are 180
used to assess their potential environmental impacts. These CF are the product of three factors, 181
which describe the transport and distribution of the substance in the different environmental 182
compartments (i.e. fate factor), the increase in the amount of substance transferred to living 183
organisms (i.e. exposure factor), and the resulting probability of adverse effects in the organisms 184
(i.e. effect factor) (Rosenbaum et al., 2008). In USEtox 2.02, CF are available for the ionic forms of 185
7
the eight heavy metals considered in this study, with arsenic being differentiated between arsenic III 186
and V, and chromium being differentiated between chromium III and VI. Chromium is primarily 187
emitted as chromium III and, while chromium VI is highly toxic, it is likely reduced to chromium 188
III in soil (EFSA, 2009). The CF for chromium III was therefore selected for the purpose of this 189
study. As emission distribution of arsenic species remain unclear, the average of the CF for arsenic 190
III and arsenic V was used to characterise arsenic releases (Fantke, 2016). 191
Characterised impact scores were calculated by combining release data with CF for each heavy 192
metal, thus leading to impact results for human toxicity (cancer and non-cancer), expressed in 193
number of disease cases, and freshwater ecotoxicity, expressed as potentially affected fraction of 194
species integrated over time and volume (PAF.m3.day). Within an impact category (i.e. human 195
toxicity or freshwater ecotoxicity), the impact scores of all metals can be compared against each 196
other to identify the highest contributor, and they can be aggregated to obtain a total impact score 197
from the application of manure to agricultural soil (only covering impacts from heavy metals). 198
Assuming an equal weighting factor of 1, cancer and non-cancer effects can be aggregated together, 199
thus yielding a single impact indicator result for human toxicity (Rosenbaum et al., 2008). 200
To facilitate the interpretation of the results across countries, “impact intensities” can be calculated. 201
These are defined as the toxicity impact scores divided by the area of cultivated agricultural land, 202
thus reflecting the magnitude of the toxic impacts stemming from a unit of agricultural land on 203
which manure is assumed to be applied. Cultivated agricultural land was defined as the sum of 204
arable land, permanent crops, and permanent cultivated meadows and pastures (data retrieved from 205
FAOSTAT (2015b)). 206
3. Results and discussion 207 The results of the study and their analyses are presented in Sections 3.1-3.4, each addressing a key 208
aspect. The literature review of heavy metal concentrations in manure is addressed in Section 3.1 as 209
it reports an up-to-date attempt at consolidating different data sources to obtain consistent 210
8
concentration estimates. The resulting inventory of heavy metal releases is documented in Section 211
3.2 and it is later compared with alternative literature sources for validation purposes in Section 3.3. 212
Finally, Section 3.4 describes the use of the inventory for toxicity impact assessment of manure 213
application (focus on heavy metals). 214
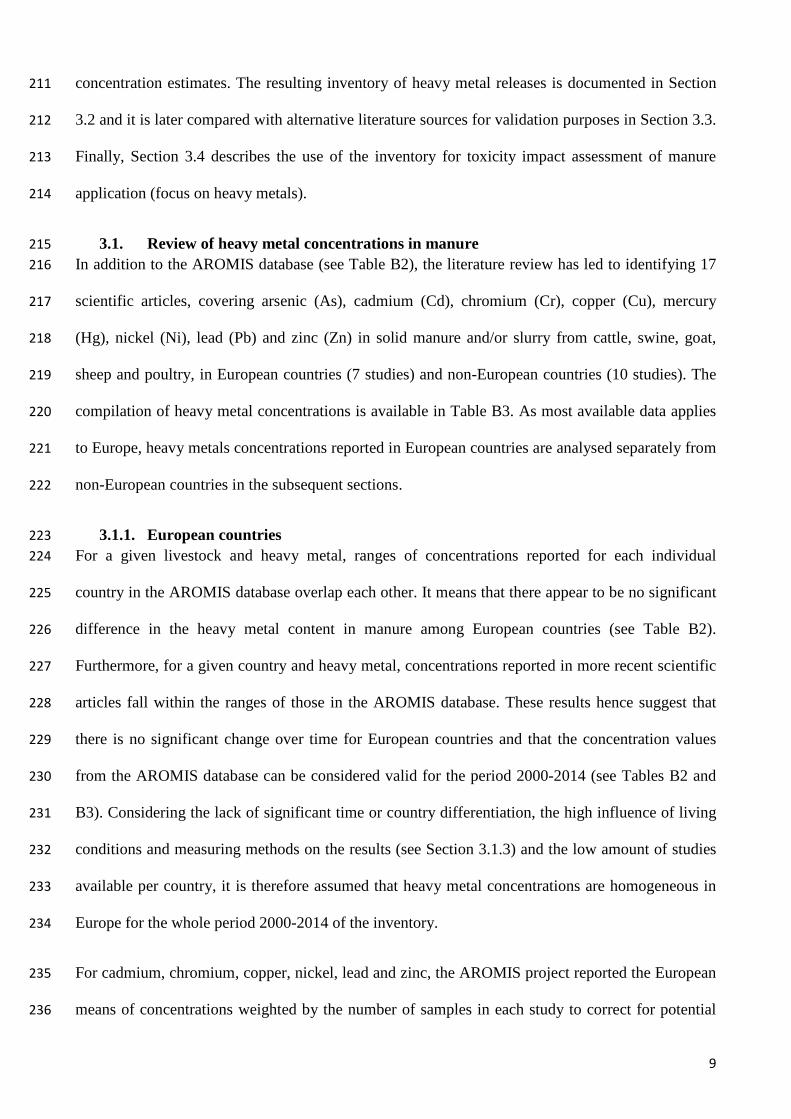
3.1. Review of heavy metal concentrations in manure 215 In addition to the AROMIS database (see Table B2), the literature review has led to identifying 17 216
scientific articles, covering arsenic (As), cadmium (Cd), chromium (Cr), copper (Cu), mercury 217
(Hg), nickel (Ni), lead (Pb) and zinc (Zn) in solid manure and/or slurry from cattle, swine, goat, 218
sheep and poultry, in European countries (7 studies) and non-European countries (10 studies). The 219
compilation of heavy metal concentrations is available in Table B3. As most available data applies 220
to Europe, heavy metals concentrations reported in European countries are analysed separately from 221
non-European countries in the subsequent sections. 222
3.1.1. European countries 223 For a given livestock and heavy metal, ranges of concentrations reported for each individual 224
country in the AROMIS database overlap each other. It means that there appear to be no significant 225
difference in the heavy metal content in manure among European countries (see Table B2). 226
Furthermore, for a given country and heavy metal, concentrations reported in more recent scientific 227
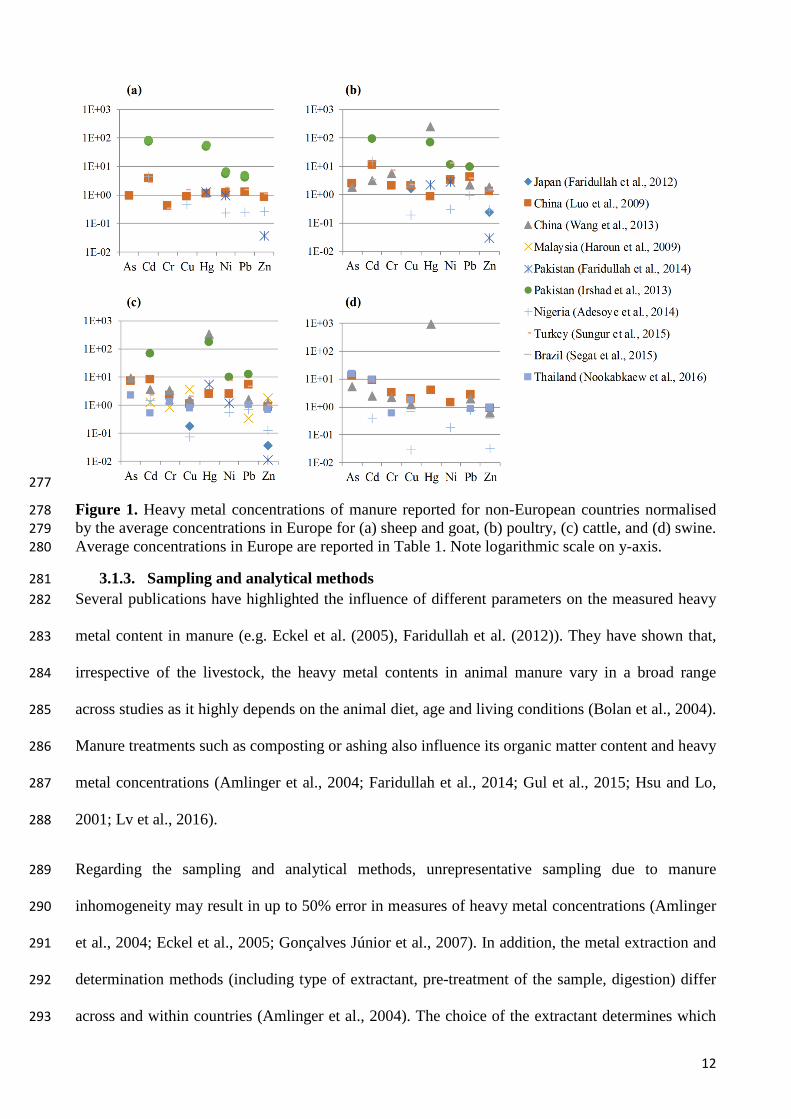
articles fall within the ranges of those in the AROMIS database. These results hence suggest that 228
there is no significant change over time for European countries and that the concentration values 229
from the AROMIS database can be considered valid for the period 2000-2014 (see Tables B2 and 230
B3). Considering the lack of significant time or country differentiation, the high influence of living 231
conditions and measuring methods on the results (see Section 3.1.3) and the low amount of studies 232
available per country, it is therefore assumed that heavy metal concentrations are homogeneous in 233
Europe for the whole period 2000-2014 of the inventory. 234
For cadmium, chromium, copper, nickel, lead and zinc, the AROMIS project reported the European 235
means of concentrations weighted by the number of samples in each study to correct for potential 236
9
biases due to individual sampling and analytical errors (KTBL, 2005). Because the articles from the 237
literature review rarely document the number of analysed samples and have concentrations similar 238
to the ones reported in the AROMIS database (see Table B2 and B3), the weighted means were 239
directly used in the inventory. For heavy metals and livestock not included in the AROMIS project 240
(i.e. arsenic and mercury; duck, sheep and goat), geometric means were calculated from the data 241
retrieved for Europe from the literature review (see data in Table B3). The resulting heavy metal 242
concentrations representative for Europe are reported in Table 1. 243
As illustrated in Table 1, which highlights in bold the highest metal concentrations for each heavy 244
metal, copper and zinc show the highest concentrations in swine manure. Manure from sheep and 245
goat present the highest concentrations of arsenic, chromium, mercury, nickel and lead due to 246
maximal values reported by Amlinger et al. (2004). Heavy metal contents in manure from such 247
livestock have rarely been quantified and additional analytical studies should be conducted to 248
reduce the uncertainty associated with these values. It was noted that for most livestock, heavy 249
metal concentrations in manure do not necessarily respect the thresholds defined by national 250
legislations, e.g. in Denmark (MoE, 2006) and Germany (DüMV, 2012) (data not shown here). 251
252
Table 1. Heavy metal contents in manure C(HM)l,t by livestock and manure type retained for 253 European countries 254
Livestock Manure type
As Cd Cr Cu Hg Ni Pb Zn (in g/kg N-content)
Dairy cattle Solid 3.46E-2 1.25E-2 3.13E-1 9.58E-1 5.00E-3 1.83E-1 1.58E-1 4.96E+0 Liquid 1.44E-2 8.00E-3 1.38E-1 8.40E-1 1.80E-3 1.24E-1 1.12E-1 4.14E+0
Non-dairy cattle
Solid 3.46E-2 1.25E-2 3.13E-1 9.58E-1 5.00E-3 1.83E-1 1.58E-1 4.96E+0 Liquid 1.88E-2 1.04E-2 1.80E-1 1.10E+0 2.35E-3 1.62E-1 1.46E-1 5.40E+0
Swine Solid 3.46E-2 1.79E-2 5.00E-1 8.46E+0 1.07E-3 2.96E-1 1.29E-1 3.31E+1 Liquid 9.60E-3 3.00E-3 9.40E-2 1.93E+0 6.00E-4 1.20E-1 3.00E-2 9.34E+0
Sheep & goat 6.75E-2 1.41E-2 8.10E-1 1.36E+0 7.08E-3 4.35E-1 4.07E-1 6.16E+0 Layer chicken 9.56E-3 7.50E-3 1.22E-1 1.16E+0 9.38E-4 1.31E-1 6.00E-2 8.83E+0 Broiler chicken 1.02E-2 8.00E-3 4.00E-1 1.78E+0 1.00E-3 1.24E-1 7.40E-2 7.06E+0 Duck 1.95E-2 2.25E-2 2.78E-1 2.84E+0 2.11E-3 3.39E-1 1.97E-1 1.54E+1 Standard deviation 1.70E-2 5.19E-3 1.98E-1 2.09E+0 2.06E-3 1.02E-1 9.68E-2 7.98E+0
10
3.1.2. Non-European countries 255 As shown in Table B3, heavy metal contents in manure could be retrieved from 10 publications 256
covering 8 non-European countries (i.e. China, Pakistan, Turkey, Nigeria, Japan, Malaysia, 257
Thailand and Brazil). This underlines the lack of data and the need for further research in this area. 258
To build interim inventories at national and global scales, extrapolations and assumptions are 259
therefore necessary. Concentrations in non-European countries were compared to the average 260
values retrieved for Europe as part of the literature review, and the heavy metal contents were 261
observed to be generally higher for non-European countries than for European countries (values 262
higher than 1 in Figure 1). For copper and zinc, concentrations however remain in the same ranges 263
as in Europe or end up lower than the means calculated in Table 1 (e.g. Adesoye et al. (2014), 264
Faridullah et al. (2014)). Higher heavy metal contents in manure in non-European countries may be 265
due to less restrictive regulations concerning animal feed, or to higher background concentrations in 266
the environment caused by other sources of pollution, e.g. intense traffic and industrial activities 267
(Wang et al., 2013). 268
Large data gaps exist with respect to non-European country coverage (only 8 represented countries) 269
and large discrepancies are observed in the estimation of the heavy metal contents in manure, with 270
differences of more than one order of magnitude for some metals within a same country, e.g. 271
Pakistan and China for mercury (see Figure 1). These shortcomings, along with the lack of 272
harmonised heavy metal extraction methods (see Section 3.1.3), led to privilege the use of the 273
means established for Europe, as reported in Table 1. These are recommended for use until more 274
consistent sets of data become available, although studies specifically addressing developing 275
countries should carefully check for possible underestimations when using these proxies. 276
11
277
Figure 1. Heavy metal concentrations of manure reported for non-European countries normalised 278 by the average concentrations in Europe for (a) sheep and goat, (b) poultry, (c) cattle, and (d) swine. 279 Average concentrations in Europe are reported in Table 1. Note logarithmic scale on y-axis. 280
3.1.3. Sampling and analytical methods 281 Several publications have highlighted the influence of different parameters on the measured heavy 282
metal content in manure (e.g. Eckel et al. (2005), Faridullah et al. (2012)). They have shown that, 283
irrespective of the livestock, the heavy metal contents in animal manure vary in a broad range 284
across studies as it highly depends on the animal diet, age and living conditions (Bolan et al., 2004). 285
Manure treatments such as composting or ashing also influence its organic matter content and heavy 286
metal concentrations (Amlinger et al., 2004; Faridullah et al., 2014; Gul et al., 2015; Hsu and Lo, 287
2001; Lv et al., 2016). 288
Regarding the sampling and analytical methods, unrepresentative sampling due to manure 289
inhomogeneity may result in up to 50% error in measures of heavy metal concentrations (Amlinger 290
et al., 2004; Eckel et al., 2005; Gonçalves Júnior et al., 2007). In addition, the metal extraction and 291
determination methods (including type of extractant, pre-treatment of the sample, digestion) differ 292
across and within countries (Amlinger et al., 2004). The choice of the extractant determines which 293
12
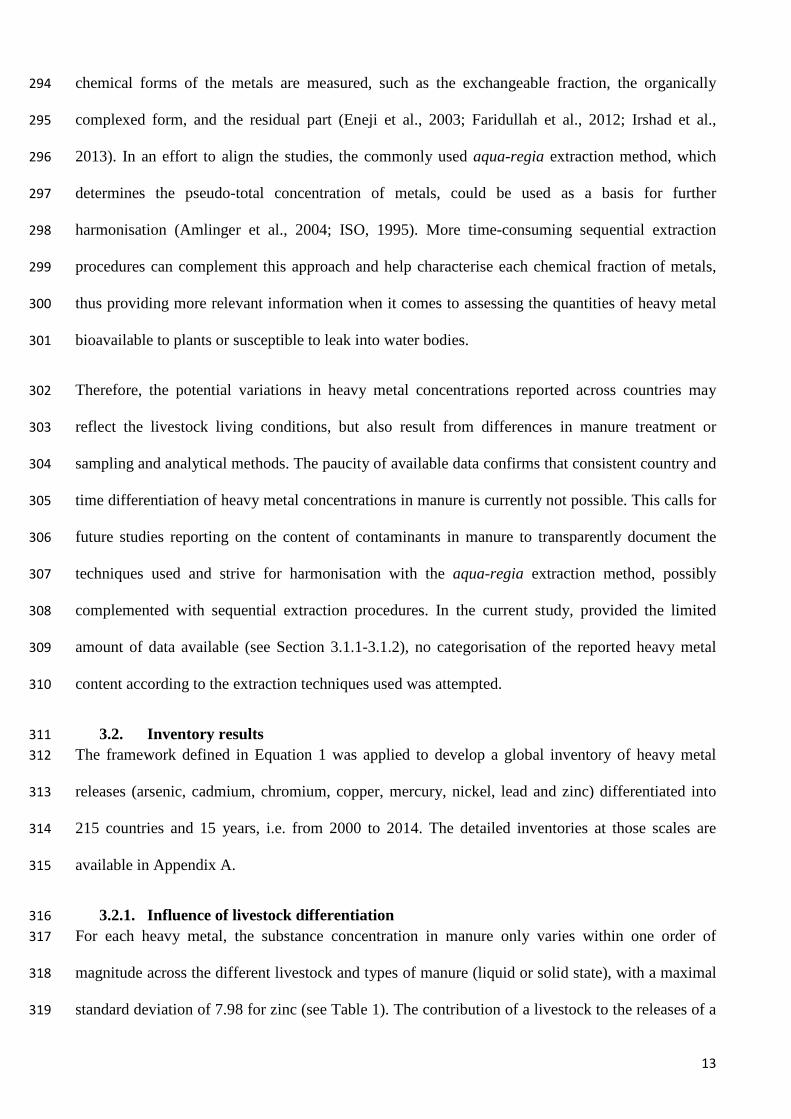
chemical forms of the metals are measured, such as the exchangeable fraction, the organically 294
complexed form, and the residual part (Eneji et al., 2003; Faridullah et al., 2012; Irshad et al., 295
2013). In an effort to align the studies, the commonly used aqua-regia extraction method, which 296
determines the pseudo-total concentration of metals, could be used as a basis for further 297
harmonisation (Amlinger et al., 2004; ISO, 1995). More time-consuming sequential extraction 298
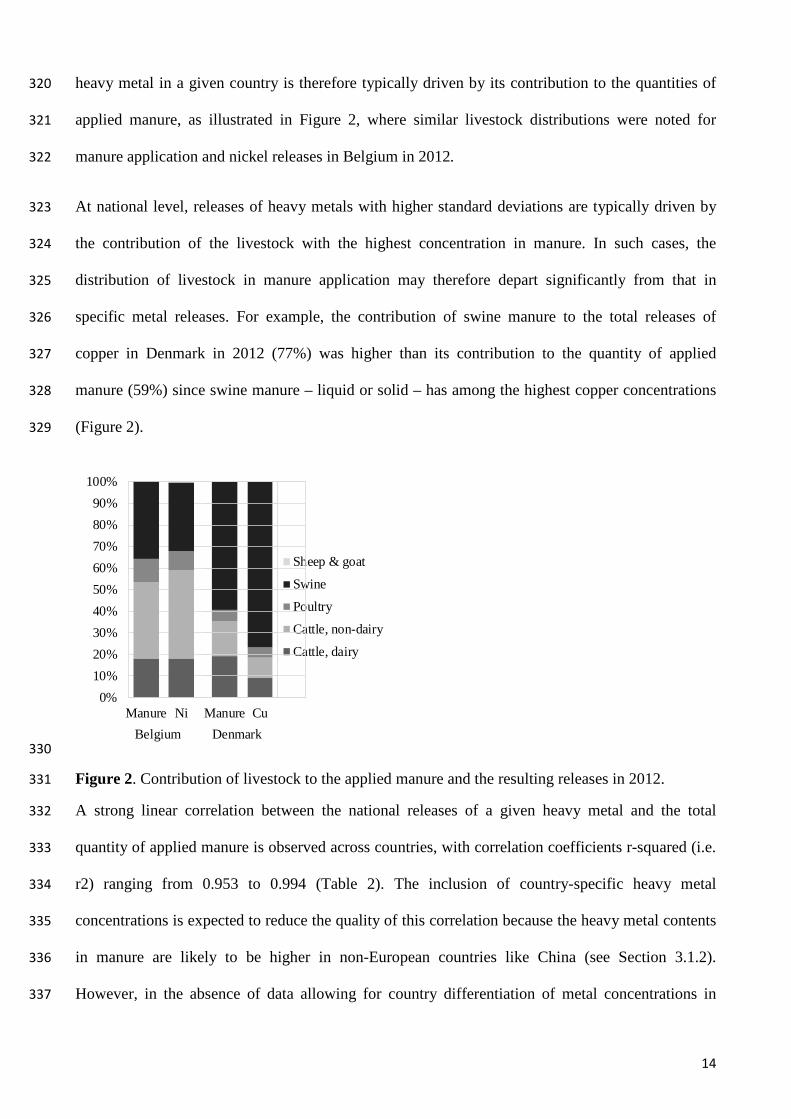
procedures can complement this approach and help characterise each chemical fraction of metals, 299
thus providing more relevant information when it comes to assessing the quantities of heavy metal 300
bioavailable to plants or susceptible to leak into water bodies. 301
Therefore, the potential variations in heavy metal concentrations reported across countries may 302
reflect the livestock living conditions, but also result from differences in manure treatment or 303
sampling and analytical methods. The paucity of available data confirms that consistent country and 304
time differentiation of heavy metal concentrations in manure is currently not possible. This calls for 305
future studies reporting on the content of contaminants in manure to transparently document the 306
techniques used and strive for harmonisation with the aqua-regia extraction method, possibly 307
complemented with sequential extraction procedures. In the current study, provided the limited 308
amount of data available (see Section 3.1.1-3.1.2), no categorisation of the reported heavy metal 309
content according to the extraction techniques used was attempted. 310
3.2. Inventory results 311 The framework defined in Equation 1 was applied to develop a global inventory of heavy metal 312
releases (arsenic, cadmium, chromium, copper, mercury, nickel, lead and zinc) differentiated into 313
215 countries and 15 years, i.e. from 2000 to 2014. The detailed inventories at those scales are 314
available in Appendix A. 315
3.2.1. Influence of livestock differentiation 316 For each heavy metal, the substance concentration in manure only varies within one order of 317
magnitude across the different livestock and types of manure (liquid or solid state), with a maximal 318
standard deviation of 7.98 for zinc (see Table 1). The contribution of a livestock to the releases of a 319
13
heavy metal in a given country is therefore typically driven by its contribution to the quantities of 320
applied manure, as illustrated in Figure 2, where similar livestock distributions were noted for 321
manure application and nickel releases in Belgium in 2012. 322
At national level, releases of heavy metals with higher standard deviations are typically driven by 323
the contribution of the livestock with the highest concentration in manure. In such cases, the 324
distribution of livestock in manure application may therefore depart significantly from that in 325
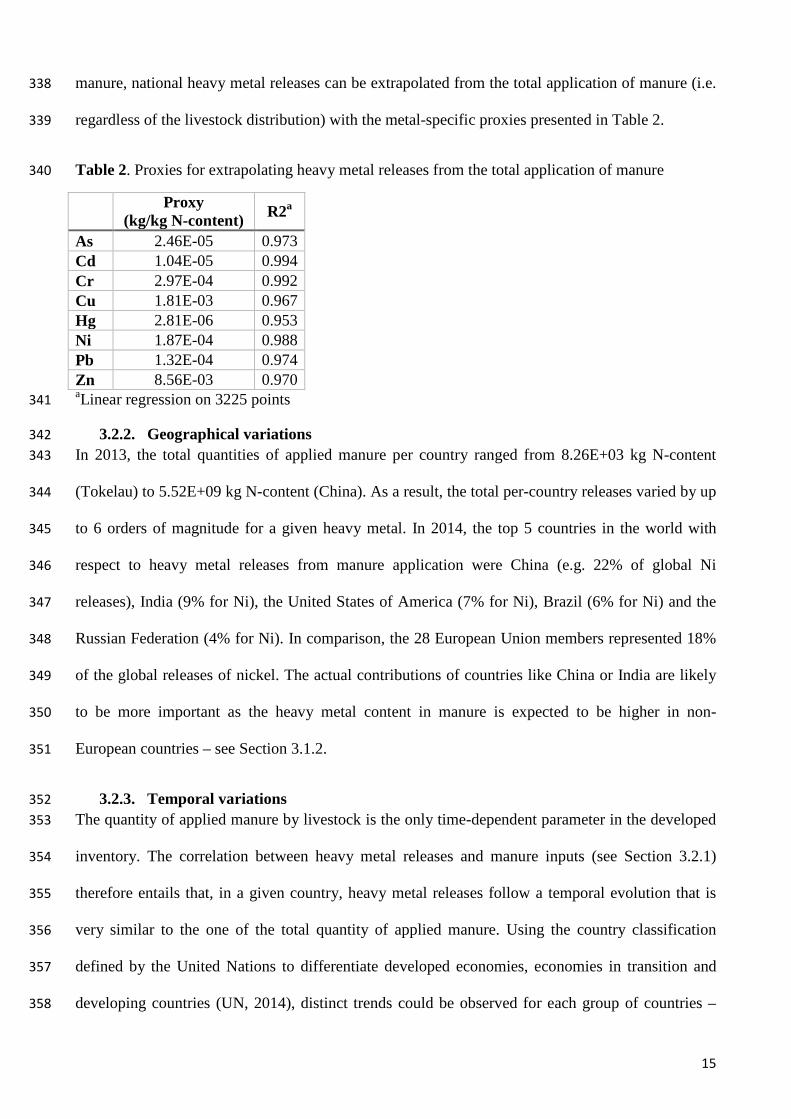
specific metal releases. For example, the contribution of swine manure to the total releases of 326
copper in Denmark in 2012 (77%) was higher than its contribution to the quantity of applied 327
manure (59%) since swine manure – liquid or solid – has among the highest copper concentrations 328
(Figure 2). 329
330
Figure 2. Contribution of livestock to the applied manure and the resulting releases in 2012. 331
A strong linear correlation between the national releases of a given heavy metal and the total 332
quantity of applied manure is observed across countries, with correlation coefficients r-squared (i.e. 333
r2) ranging from 0.953 to 0.994 (Table 2). The inclusion of country-specific heavy metal 334
concentrations is expected to reduce the quality of this correlation because the heavy metal contents 335
in manure are likely to be higher in non-European countries like China (see Section 3.1.2). 336
However, in the absence of data allowing for country differentiation of metal concentrations in 337
Manure Cu
Sheep & goat
Swine
Poultry
Cattle, non-dairy
Cattle, dairy
Denmark
0%10%20%30%40%50%60%70%80%90%
100%
Manure Ni
Belgium
14
manure, national heavy metal releases can be extrapolated from the total application of manure (i.e. 338
regardless of the livestock distribution) with the metal-specific proxies presented in Table 2. 339
Table 2. Proxies for extrapolating heavy metal releases from the total application of manure 340
Proxy
(kg/kg N-content) R2a
As 2.46E-05 0.973 Cd 1.04E-05 0.994 Cr 2.97E-04 0.992 Cu 1.81E-03 0.967 Hg 2.81E-06 0.953 Ni 1.87E-04 0.988 Pb 1.32E-04 0.974 Zn 8.56E-03 0.970 aLinear regression on 3225 points 341
3.2.2. Geographical variations 342 In 2013, the total quantities of applied manure per country ranged from 8.26E+03 kg N-content 343
(Tokelau) to 5.52E+09 kg N-content (China). As a result, the total per-country releases varied by up 344
to 6 orders of magnitude for a given heavy metal. In 2014, the top 5 countries in the world with 345
respect to heavy metal releases from manure application were China (e.g. 22% of global Ni 346
releases), India (9% for Ni), the United States of America (7% for Ni), Brazil (6% for Ni) and the 347
Russian Federation (4% for Ni). In comparison, the 28 European Union members represented 18% 348
of the global releases of nickel. The actual contributions of countries like China or India are likely 349
to be more important as the heavy metal content in manure is expected to be higher in non-350
European countries – see Section 3.1.2. 351
3.2.3. Temporal variations 352 The quantity of applied manure by livestock is the only time-dependent parameter in the developed 353
inventory. The correlation between heavy metal releases and manure inputs (see Section 3.2.1) 354
therefore entails that, in a given country, heavy metal releases follow a temporal evolution that is 355
very similar to the one of the total quantity of applied manure. Using the country classification 356
defined by the United Nations to differentiate developed economies, economies in transition and 357
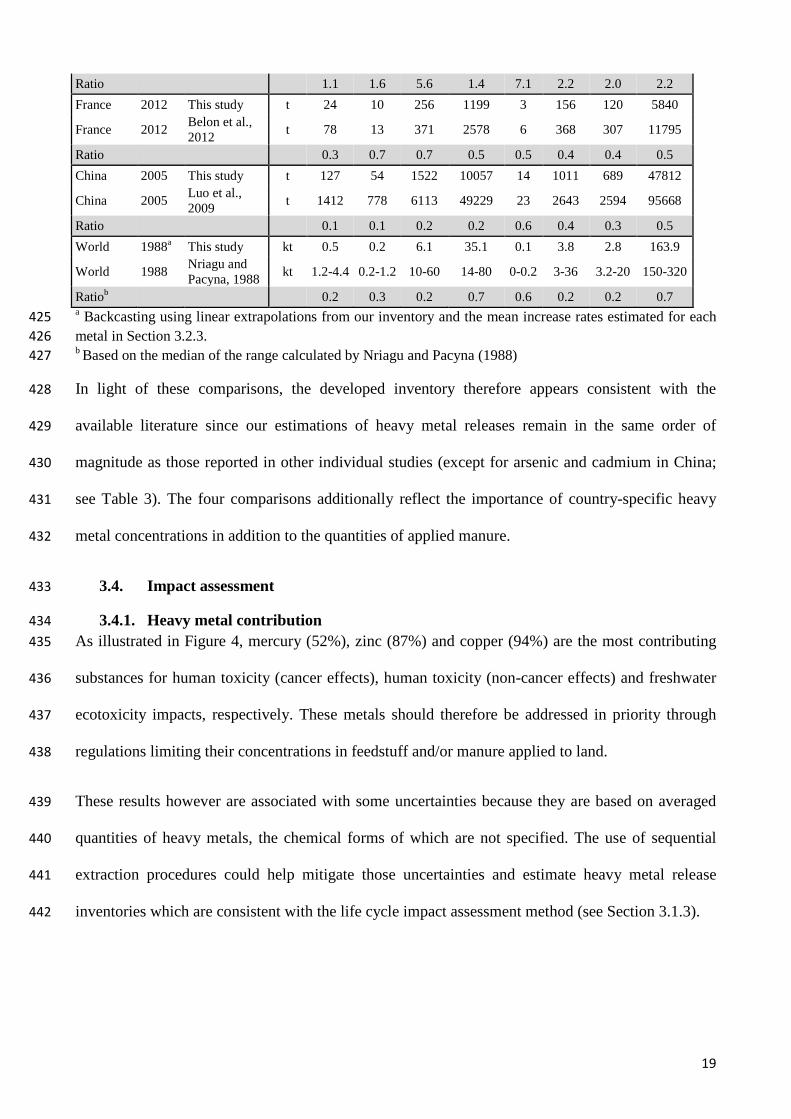
developing countries (UN, 2014), distinct trends could be observed for each group of countries – 358
15
see the example of zinc in Figure 3. In developing economies (red lines), total releases have 359
generally increased by a factor of 1-2.5 between 2000 and 2014 (exception of Sao Tome and 360
Principe and Rwanda). In contrast, heavy metal releases have generally decreased by a factor 361
ranging from 1 to 2 in developed countries (blue lines). No general trend could be observed for 362
economies in transition (in yellow). 363
At the global scale, there has been a linear increase of soil-borne releases for all heavy metals 364
between 2000 and 2014, with R-squared values higher than 0.959 (thick black curve in Figure 3). 365
Each year, the releases of heavy metals were thus calculated to increase by 5.57 t/yr (As), 23.9 t/yr 366
(Cd), 80.8 t/yr (Cr), 479 t/yr (Cu), 0.58 t/yr (Hg), 46.6 t/yr (Ni), 31.0 t/yr (Pb) and 2.27 kt/yr (Ni). 367
These values are believed to be sufficiently representative at global scale to be used as basis to 368
develop forecast heavy metal release inventories. 369
370
Figure 3. Temporal evolution of zinc releases by country indexed on values in 2000. STP: Sao 371 Tome and Principe, RWA: Rwanda 372
3.3. Validation of the framework 373 The globally-differentiated inventory described in Section 3.2 demonstrates the operationalisation 374
of the proposed framework although several uncertainties and limitations can be noted given the 375
current level of data availability. Taking the different terms of Equation 2, the quantity of applied 376
0.0
0.5
1.0
1.5
2.0
2.5
3.0
3.5
4.0
2000 2005 2010
STP:10 in 2014
RWA:5 in 2014
Economy in transition
Developed economy Developing economy
World
16

manure was found to be the most influential parameter to the determination of heavy metal releases 377
(see Section 3.2.1) and may be overestimated since it does not consider other utilisations of manure 378
than for fertilising purposes (FAOSTAT, 2015a). Although it was evaluated to be less influential, 379
the proportion of animals kept on liquid or solid manure management system was averaged for all 380
non-European countries based on European data, which may not be representative. Finally, the 381
discrepancies observed in the measuring and analytical methods used to determine heavy metal 382
concentrations and the lack of sufficient number of country-specific data on the heavy metal, 383
organic matter and nitrogen contents in manure led to calculating concentration means 384
representative for all years and countries. As indicated in Section 3.1.2, these can be questioned as 385
concentrations are very likely underestimated for developing countries due to lower regulations. 386
Further studies addressing these shortcomings and providing harmonised and country-specific data 387
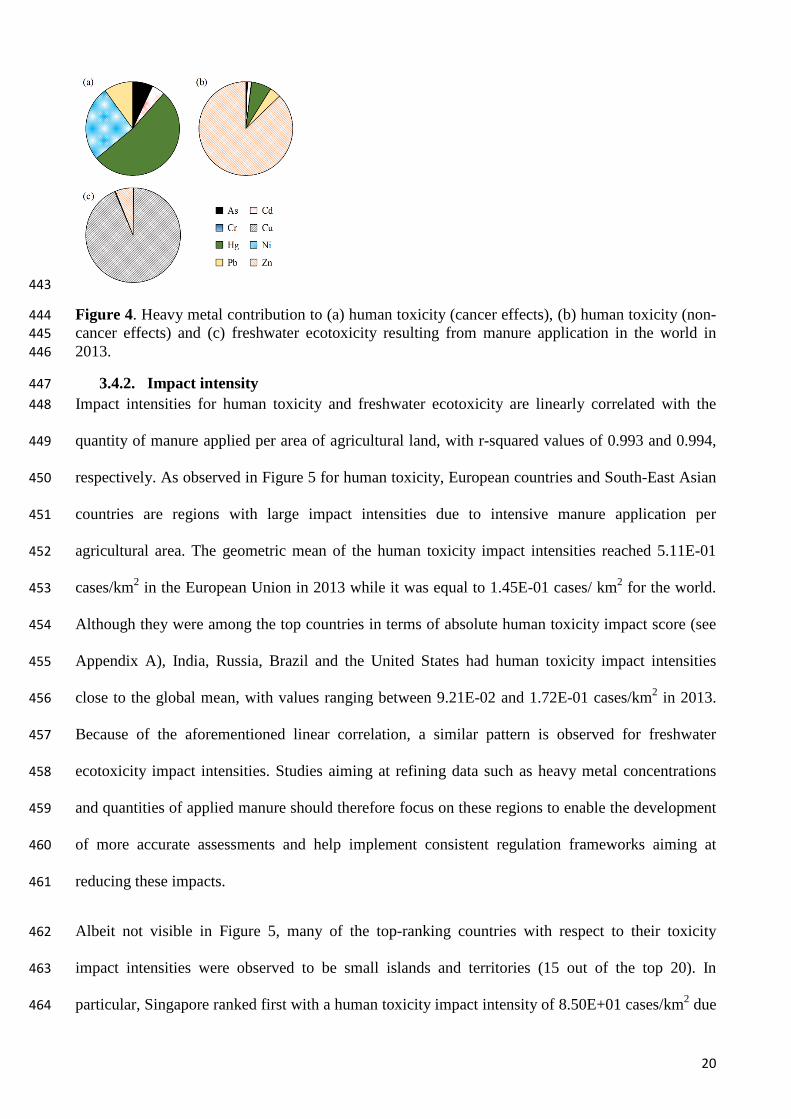
are therefore recommended to improve the overall quality of the inventory. 388
To test the precision of the inventory results, comparisons were performed with previous studies 389
having disclosed national or regional inventories of heavy metals, viz. releases resulting from 390
manure application in England and Wales, in France, in China and in the whole world – see Table 391
3. 392
Nicholson et al. (2003) estimated the heavy metal releases in England and Wales resulting from 393
manure application based on livestock numbers, excreta production quantities, and average heavy 394
metal concentrations in manure. Heavy metal releases calculated in our study for the United 395
Kingdom are found to be 1.1 to 7.1 times higher than in Nicholson et al. (2003) – see Table 3. The 396
discrepancies may be explained by the different geographical scope, i.e. Scotland and Northern 397
Ireland being included in our study and not in Nicholson et al. (2003), and by the generally lower 398
manure concentrations in Nicholson et al. (2003). For example, the chromium concentrations used 399
by Nicholson et al. (2003) are ca. 50% smaller than the European geometric means calculated in the 400
AROMIS project (Table B2). 401
17
While Belon et al. (2012) generally used the same methodology as Nicholson et al. (2003), the 402
study also accounted for the type of effluents and the time spent by animals inside and outside the 403
farm buildings. The authors estimated heavy metal releases, which are 1.4 to 3.2 times higher than 404
the values from our inventory (see Table 3). The concentration data used by Belon et al. (2012) 405
could only be retrieved for swine, and are 1.1 to 1.9 times higher than those used in our inventory 406
for this livestock. The absence of further documentation precluded any further analysis of the 407
discrepancies, including the possible influence of the time spent inside and outside the farm on the 408
heavy metal concentration of manure. 409
When calculating the heavy metal inputs to agricultural soil due to the application of manure in 410
China, Luo et al. (2009) applied the same method than Nicholson et al. (2003). However, Luo et al. 411
(2009) used concentrations higher than those applied in our inventory (see Figure 1), thus resulting 412
in systematically higher release estimates. As discussed in Section 3.1.2, there is a likelihood that 413
estimates for non-European countries are underestimated in our study, thus calling for developing 414
approaches to derive more consistent release inventories for these countries. 415
At global scale, Nriagu and Pacyna (1988) built an inventory based on the combination of annual 416
global discharge to soil of animal waste and manure with ranges of heavy metal concentrations. 417
They disregarded any differentiation of livestock. Heavy metal releases calculated in our inventory 418
are observed to fall within the ranges found by Nriagu and Pacyna (1988) for cadmium, copper, 419
mercury and zinc, while they are up to two times lower than the minimum of the ranges for arsenic, 420
nickel and chromium (Table 3). The higher releases obtained by Nriagu and Pacyna (1988) are 421
likely explained by the use of concentrations ranges higher than those in our study and the lack of 422
livestock differentiation. 423
Table 3. Comparison of heavy metal inventory results with retrieved literature sources. 424
Region Year Reference Unit As Cd Cr Cu Hg Ni Pb Zn United Kingdom 2000 This study t 18 6.5 203 909 2.1 119 97 4200
England & Wales 2000 Nicholson et
al., 2003 t 16 4.2 36 643 0.3 53 48 1858
18
Ratio 1.1 1.6 5.6 1.4 7.1 2.2 2.0 2.2 France 2012 This study t 24 10 256 1199 3 156 120 5840
France 2012 Belon et al., 2012 t 78 13 371 2578 6 368 307 11795
Ratio 0.3 0.7 0.7 0.5 0.5 0.4 0.4 0.5 China 2005 This study t 127 54 1522 10057 14 1011 689 47812
China 2005 Luo et al., 2009 t 1412 778 6113 49229 23 2643 2594 95668
Ratio 0.1 0.1 0.2 0.2 0.6 0.4 0.3 0.5 World 1988a This study kt 0.5 0.2 6.1 35.1 0.1 3.8 2.8 163.9
World 1988 Nriagu and Pacyna, 1988 kt 1.2-4.4 0.2-1.2 10-60 14-80 0-0.2 3-36 3.2-20 150-320
Ratiob 0.2 0.3 0.2 0.7 0.6 0.2 0.2 0.7 a Backcasting using linear extrapolations from our inventory and the mean increase rates estimated for each 425 metal in Section 3.2.3. 426 b Based on the median of the range calculated by Nriagu and Pacyna (1988) 427
In light of these comparisons, the developed inventory therefore appears consistent with the 428
available literature since our estimations of heavy metal releases remain in the same order of 429
magnitude as those reported in other individual studies (except for arsenic and cadmium in China; 430
see Table 3). The four comparisons additionally reflect the importance of country-specific heavy 431
metal concentrations in addition to the quantities of applied manure. 432
3.4. Impact assessment 433
3.4.1. Heavy metal contribution 434 As illustrated in Figure 4, mercury (52%), zinc (87%) and copper (94%) are the most contributing 435
substances for human toxicity (cancer effects), human toxicity (non-cancer effects) and freshwater 436
ecotoxicity impacts, respectively. These metals should therefore be addressed in priority through 437
regulations limiting their concentrations in feedstuff and/or manure applied to land. 438
These results however are associated with some uncertainties because they are based on averaged 439
quantities of heavy metals, the chemical forms of which are not specified. The use of sequential 440
extraction procedures could help mitigate those uncertainties and estimate heavy metal release 441
inventories which are consistent with the life cycle impact assessment method (see Section 3.1.3). 442
19
443
Figure 4. Heavy metal contribution to (a) human toxicity (cancer effects), (b) human toxicity (non-444 cancer effects) and (c) freshwater ecotoxicity resulting from manure application in the world in 445 2013. 446
3.4.2. Impact intensity 447 Impact intensities for human toxicity and freshwater ecotoxicity are linearly correlated with the 448
quantity of manure applied per area of agricultural land, with r-squared values of 0.993 and 0.994, 449
respectively. As observed in Figure 5 for human toxicity, European countries and South-East Asian 450
countries are regions with large impact intensities due to intensive manure application per 451
agricultural area. The geometric mean of the human toxicity impact intensities reached 5.11E-01 452
cases/km2 in the European Union in 2013 while it was equal to 1.45E-01 cases/ km2 for the world. 453
Although they were among the top countries in terms of absolute human toxicity impact score (see 454
Appendix A), India, Russia, Brazil and the United States had human toxicity impact intensities 455
close to the global mean, with values ranging between 9.21E-02 and 1.72E-01 cases/km2 in 2013. 456
Because of the aforementioned linear correlation, a similar pattern is observed for freshwater 457
ecotoxicity impact intensities. Studies aiming at refining data such as heavy metal concentrations 458
and quantities of applied manure should therefore focus on these regions to enable the development 459
of more accurate assessments and help implement consistent regulation frameworks aiming at 460
reducing these impacts. 461
Albeit not visible in Figure 5, many of the top-ranking countries with respect to their toxicity 462
impact intensities were observed to be small islands and territories (15 out of the top 20). In 463
particular, Singapore ranked first with a human toxicity impact intensity of 8.50E+01 cases/km2 due 464
20

to large inputs of manure in comparison to the available area of agricultural land. The second 465
country (Saint Kitts and Nevis) obtained an impact intensity 10 times lower, i.e. 8.27E+01 466
cases/km2, which still was 57 times higher than the global mean. Such outlying results are 467
interpreted as misreporting of manure application data. FAOSTAT indeed reports that 43% of the 468
total manure applied in Singapore in 2013 originated from swine (FAOSTAT, 2015a) while pig-469
farming was phased out by the government in the mid-80s (Chien-Fang and Savage, 2015). In 470
addition, the potential imports of manure and the usage of manure for other purposes than crop 471
fertilisation (e.g. heating) are not included in the data reported by FAOSTAT (2015a). Results 472
should therefore be used with caution in countries where applying manure to agricultural soil is not 473
the main practice (see also Section 3.3). 474
475 Figure 5. Map of human toxicity impact intensities (aggregated cancer and non-cancer effects) in 476 2013, created with QGIS 2.18.0 (QGIS Development Team, 2016). 477
4. Conclusions and recommendations 478 A framework was developed for estimating soil-borne releases of potentially toxic substances from 479
the application of manure on agricultural land. When applied to eight heavy metals typically present 480
in manure, it allowed calculations of national inventories for 215 countries over 2000-2014. 481
Although the results showed good consistency with previous inventories performed for single 482
21

countries or the entire world, several points were identified as requiring further research. In 483
particular, additional studies are required to get country-specific and harmonised data on heavy 484
metal contents in manure. 485
The characterisation of impacts on human health and freshwater ecosystems resulting from manure 486
application evidenced the contribution of mercury, copper and zinc, as well as important impact 487
intensities in Europe and South-East Asia. Policy-making addressing manure management should 488
therefore target these specific metals and regions for framing regulations on heavy metal contents in 489
feedstuff and manure. In a broader perspective, these findings and recommendations also 490
demonstrate the need and relevance of such country- and time-differentiated global inventory of 491
toxic releases that can be used for example with life cycle impact assessment to support effective 492
policy-making. 493
Acknowledgements 494 The authors would like to thank Maria Farago for her guidance to the QGIS software. 495
22

Appendix A. Supplementary Results (electronic file) 496 Contains inventories of the releases of arsenic, cadmium, chromium, copper, mercury, nickel, lead 497
and zinc to agricultural soil resulting from the application of manure for 215 countries between 498
2000 and 2014. Inventory results by country, year and livestock, and aggregated totals by country 499
and year are both available. Impact scores for human toxicity (aggregated cancer and non-cancer 500
effects) and freshwater ecotoxicity by country in 2013 are also presented. 501
Appendix B. Supplementary Materials (electronic file) 502 Table B1 displays the proportion of cattle (dairy and non-dairy), swine and layer chicken kept on a 503
liquid manure management system in 17 European countries. 504
Table B2 is a compilation of heavy metal concentrations extracted from the AROMIS project, 505
indicating calculated ranges and geometric means of data for each metal, country and livestock. 506
Table B3 presents the heavy metal concentrations retrieved from the literature review.507
23
References Adesoye, A.M., Adekola, F.A., Olukomaiya, K.O., Olukomaiya, O.O., Iwuchukwu, P.O.,
2014. Evaluation of physical properties and heavy metal composition of manure of some domestic animals. Int. J. Innov. Sci. Res. 9, 293–296.
Amlinger, F., Pollak, M., Favoino, E., 2004. Heavy metals and organic compounds from wastes used as organic fertilisers.
Belon, E., Boisson, M., Deportes, I.Z., Eglin, T.K., Feix, I., Bispo, A.O., Galsomies, L., Leblond, S., Guellier, C.R., 2012. An inventory of trace elements inputs to French agricultural soils. Sci. Total Environ. 439:87–95. http://dx.doi.org/10.1016/j.scitotenv.2012.09.011
Bicudo, J.R., Goyal, S.M., 2003. Pathogens and manure management systems: A review. Environ. Technol. 24:115–130. http://dx.doi.org/10.1080/09593330309385542
BIOFerm, 2009. Benefits of solid manure management. http://www.biofermenergy.com/benefits-of-solid-manure-management/ (accessed 2016 Apr 23).
Bolan, N.S., Adriano, D.C., Mahimairaja, S., 2004. Distribution and Bioavailability of Trace Elements in Livestock and Poultry Manure By-Products Distribution and Bioavailability of Trace Elements in Livestock and Poultry Manure By-Products. Crit. Rev. Environ. Sci. Technol. 34:291–338. http://dx.doi.org/10.1080/10643380490434128
Cai, Q.-Y., Mo, C.-H., Wu, Q.-T., Zeng, Q.-Y., Katsoyiannis, A., 2007. Concentration and speciation of heavy metals in six different sewage sludge-composts. J. Hazard. Mater. 147:1063–1072. http:/dx.doi.org/10.1016/j.jhazmat.2007.01.142
Chambers, B., Nicholson, N., Smith, K., Pain, B., Cumby, T., Scotford, I., 2001. Making better use of livestock manures on arable land.
Chien-Fang, L., Savage, V.R., 2015. Singapore’s fresh pork supply: food security and environmental impacts, in: Sustainability Matters: Environmental and Climate Changes in the Asia-Pacific. pp. 205–235.
Cucurachi, S., Sala, S., Laurent, A., Heijungs, R., 2014. Building and Characterizing Regional and Global Emission Inventories of Toxic Pollutants. Environ. Sci. Technol. 48:5674–5682. http://dx.doi.org/10.1021/es405798x
Dolliver, H., Gupta, S., Noll, S., 2008. Antibiotic degradation during manure composting. J. Environ. Qual. 37:1245–1253. http://dx.doi.org/10.2134/jeq2007.0399
DüMV, 2012. Verordnung über das Inverkehrbringen von Düngemitteln, Bodenhilfsstoffen, Kultursubstraten und Pflanzenhilfsmitteln (Düngemittelverordnung - DüMV). https://www.gesetze-im-internet.de/bundesrecht/d_mv_2012/gesamt.pdf (accessed 2016 Oct 31).
EC, 2012. The implementation of the Soil Thematic Strategy and ongoing activities. European Commission, Brussels.
24
EC, 2011. Commission Regulation (EU) No 142/2011 implementing Regulations (EC) No 1069/2009 of the European Parliament and of the Council laying down health rules as regards animal by-products a derived products not intended for human consumption and implementing C. Off. J. Eur. Union.
EC, 2003. Commission regulation (EC) No 1334/2003 amending the conditions for authorisation of a number of additives in feedingstuffs belonging to the group of trace elements. Off. J. Eur. Union.
EC, 2002. Directive 2002/32/EC on undesirable substances in animal feed. Off. J. Eur. Communities.
Eckel, H., Döhler, H., Roth, U., Unwin, R., Golik, B., Magyar, M., Menzi, H., Gil-Sotres, F., Nicholson, F., Boghal, A., Schultheiss, U., Römkens, P., Mantovi, P., 2005. Assessment and reduction of heavy metal input into agro-ecosystems. Darmstadt.
EFSA, 2009. Safety and efficacy of chromium methionine (Availa® Cr) as feed additive for all species. EFSA J. 7.
Eneji, A.E., Honna, T., Yamamoto, S., Masuda, T., Endo, T., Irshad, M., 2003. The Relationship Between Total and Available Heavy Metals in Composted Manure. J. Sustain. Agric. 23:125–134. http://dx.doi.org/10.1300/J064v23n01_09
[dataset] FAOSTAT, 2015a. Manure applied to soil. http://faostat3.fao.org/download/G1/GU/E (accessed 2016 Jun 19).
[dataset] FAOSTAT, 2015b. Land. http://faostat3.fao.org/download/R/RL/E (accessed 2016 Nov 2).
Faridullah, A.P., Hafeez, S., Alam, A., Ma, J., Shah, S.H., Waseem, A., 2014. Evaluating nutrient elements and heavy metals in fresh and composted manure of different livestock. Fresenius Environ. Bull. 23, 1773–1778.
Faridullah, A.P., Irshad, M., Sabir, M.A., 2012. Investigation of Heavy Metals using Various Extraction Methods in Livestock Manures. Commun. Soil Sci. Plant Anal. 43:2801–2808. http://dx.doi.org/10.1080/00103624.2012.719977
Fantke, P., 2016. Personal communication.
Gonçalves Júnior, A.C., Pozza, P.C., Nacke, H., Lazzeri, D.B., Selzlein, C., Castilha, D.L., 2007. Homogeneização e níveis de metais em dejetos provenientes da bovinocultura de leite. Acta Sci. Technol. 29:213–217. http://dx.doi.org/10.4025/actascitechnol.v29i2.712
Gul, S., Naz, A., Fareed, I., Khan, A., Irshad, M., 2015. Speciation of heavy metals during co-composting of livestock manure. Polish J. Chem. Technol. 17:19–23. http://dx.doi.org/10.1515/pjct-2015-0044
Hauschild, M.Z., Goedkoop, M., Guinée, J., Heijungs, R., Huijbregts, M., Jolliet, O., Margni, M., De Schryver, A., Humbert, S., Laurent, A., Sala, S., Pant, R., 2013. Identifying best existing practice for characterization modeling in life cycle impact assessment. Int. J. Life Cycle Assess. 19:683–697. http://dx.doi.org/10.1007/s11367-012-0489-5
25
Hauschild, M.Z., Huijbregts, M., Jolliet, O., Macleod, M., Margni, M., Ven de Meent, D., Rosenbaum, R.K., McKone, T.E., 2008. Building a Model Based on Scientific Consensus for Life Cycle Impact Assessment of Chemicals: The Search for Harmony and Parsimony. Environ. Sci. Technol. 42:7032–7037. http://dx.doi.org/10.1021/es703145t
Hepperly, P., Lotter, D., Ziegler Ulsh, C., Seidel, R., Reider, C., 2009. Compost, manure and synthetic fertilizer influences crop yields, soil properties, nitrate leaching and crop nutrient content. Compost Sci. Util. 17:117–126. http://dx.doi.org/10.1080/1065657X.2009.10702410
Hsu, J.-H., Lo, S.-L., 2001. Effect of composting on characterization and leaching of copper, manganese, and zinc from swine manure. Environ. Pollut. 114:119–127. http://dx.doi.org/10.1016/S0269-7491(00)00198-6
IPCC, 2006. Emissions from Livestock and Emissions from Livestock and Manure Management, in: 2006 IPCC Guidelines for National Greenhouse Gas Inventories - Volume 4: Agriculture, Forestry and Other Land Use.
Irshad, M., Malik, A.H., Shaukat, S., Mushtaq, S., Ashraf, M., 2013. Characterization of heavy metals in livestock manures. Polish J. Environ. Stud. 22:1257–1262.
ISO, 1995. ISO 11466:1995: Soil Quality – Extraction of Trace Elements Soluble in Aqua Regia.
Jensen, L.S., 2013. Animal Manure Fertiliser Value, Crop Utilisation and Soil Quality Impacts, in: Animal Manure Recycling: Treatment and Management. John Wiley & Sons, Ltd, Chichester, UK, pp. 295–328. http://dx.doi.org/10.1002/9781118676677.ch15
Kornegay, E.T., Hedges, J.D., Martens, D.C., Kramer, C.Y., 1976. Effect on soil and plant mineral levels following application of manures of different copper contents. Plant Soil 45:151–162. http://dx.doi.org/10.1007/BF00011137
Kramer, S.B., Reganold, J.P., Glover, J.D., Bohannan, B.J.M., Mooney, H.A., 2006. Reduced nitrate leaching and enhanced denitrifier activity and efficiency in organically fertilized soils. Proc. Natl. Acad. Sci. U. S. A. 1034522–4527. http://dx.doi.org/10.1073/pnas.0600359103
KTBL, 2005. Welcome to AROMIS. http://daten.ktbl.de/ aromis/welcome.do (accessed 2016 May 13).
Kuczyński, T., Dämmgen, U., Webb, J., Myczko, A., 2005. Emissions from European Agriculture. Wageningen Universiteit (Wageningen University).
Kumar, K., Gupta, S.C., Baidoo, S.K., Chander, Y., Rosen, C.J., 2005. Antibiotic uptake by plants from soil fertilized with animal manure. J. Environ. Qual. 34:2082–2085. http://dx.doi.org/10.2134/jeq2005.0026
Kumar, R.R., Park, B.J., Cho, J.Y., 2013. Application and Environmental Risks of Livestock Manure. J. Korean Soc. Appl. Biol. Chem. 56:497–503. http://dx.doi.org/10.1007/s13765-013-3184-8
26
Laurent, A., Lautier, A., Rosenbaum, R.K., Olsen, S.I., Hauschild, M.Z., 2011. Normalization references for Europe and North America for application with USEtoxTM characterization factors. Int. J. Life Cycle Assess. 16:728–738. http://dx.doi.org/10.1007/s11367-011-0285-7 LCIA
Luo, L., Ma, Y., Zhang, S., Wei, D., Zhu, Y.-G., 2009. An inventory of trace element inputs to agricultural soils in China. J. Environ. Manage. 90:2524–2530. http://dx.doi.org/10.1016/j.jenvman.2009.01.011
Lv, B., Xing, M., Yang, J., 2016. Speciation and transformation of heavy metals during vermicomposting of animal manure. Bioresour. Technol. 209:397–401. http://dx.doi.org/10.1016/j.biortech.2016.03.015
Mantovi, P., Bonazzi, G., Maestri, E., Marmiroli, N., 2003. Accumulation of copper and zinc from liquid manure in agricultural soils and crop plants. Plant Soil 250:249–257. http://dx.doi.org/10.1023/A:1022848131043
Millner, P.D., 2009. Manure Management, in: Matthews, K.R., Sapers, G.M., Gerba, C.P. (Eds.), The Produce Contamination Problem: Causes and Solutions. Elsevier Inc., pp. 85–106. http://dx.doi.org/10.1016/B978-0-12-404611-5.00004-X
MoE, 2006. Bekendtgørelse om anvendelse af affald til jordbrugsformål. BEK nr 1650 af 13/12/2006. https://www.retsinformation.dk/forms/R0710.aspx?id=13056 (accessed 2016 Oct 31).
Møller, H.B., Jensen, H.S., Tobiasen, L., Hansen, M.N., 2007. Heavy Metal and Phosphorus Content of Fractions from Manure Treatment and Incineration. Environ. Technol. 28:1403–1418. http://dx.doi.org/10.1080/09593332808618900
Nicholson, F.A., Smith, S.R., Alloway, B.J., Carlton-Smith, C., Chambers, B.J., 2003. An inventory of heavy metals inputs to agricultural soils in England and Wales. Sci. Total Environ. 311:205–219. http://dx.doi.org/10.1016/S0048-9697(03)00139-6
Nriagu, J.O., Pacyna, J.M., 1988. Quantitative assessment of worldwide contamination of air, water and soils by trace elements. Nature 333:134–139. http://dx.doi.org/10.1038/333134a0
QGIS Development Team, 2016. QGIS 2.18.0 Geographic Information System.
Redding, M.R., Lewis, R., Kearton, T., Smith, O., 2016. Manure and sorbent fertilisers increase on-going nutrient availability relative to conventional fertilisers. Sci. Total Environ. 569–570:927–936. http://dx.doi.org/10.1016/j.scitotenv.2016.05.068
Reuters, T., 2017. Web of Science. www.webofknowledge.com (accessed 2017 Jan 4).
Rosenbaum, R.K., Bachmann, T.M., Hauschild, M.Z., Huijbregts, M.A.J., Jolliet, O., Juraske, R., Koehler, A., Larsen, H.F., Macleod, M., Margni, M., Mckone, T.E., Payet, J., Schuhmacher, M., Van De Meent, D., Hauschild, M.Z., 2008. USEtox : UNEP-SETAC recommended characterisation model and factors for human toxicity and freshwater ecotoxicity in LCIA. Int. J. Life Cycle Assess. 13:532–546. http://dx.doi.org/10.1007/s11367-008-0038-4
27
Russo, V.M., Taylor, M., 2010. Frequency of Manure Application in Organic versus Annual Application of Synthetic Fertilizer in Conventional Vegetable Production. HortScience 45, 1673–1680.
Sleeswijk, A.W., van Oers, L., Guinée, J., Struijs, J., Huijbregts, M., 2008. Normalisation in product life cycle assessment: An LCA of the global and European economic systems in the year 2000. Sci. Total Environ. 390:227–240. http://dx.doi.org/10.1016/j.scitotenv.2007.09.040
Tien, Y.-C., Li, B., Zhang, T., Scott, A., Murray, R., Sabourin, L., Marti, R., Topp, E., 2016. Impact of dairy manure pre-application treatment on manure composition, soil dynamics of antibiotic resistance genes, and abundance of antibiotic-resistance genes on vegetables at harvest. Sci. Total Environ. 581–582:32–39. http://dx.doi.org/10.1016/j.scitotenv.2016.12.138
UN, 2014. World Economic Situation and Prospects 2014. New York.
Wang, H., Dong, Y., Yang, Y., Toor, G.S., Zhang, X., 2013. Changes in heavy metal contents in animal feeds and manures in an intensive animal production region of China. J. Environ. Sci. 25:2435–2442. http://dx.doi.org/10.1016/S1001-0742(13)60473-8
Westerman, P.W., Bicudo, J.R., 2005. Management considerations for organic waste use in agriculture. Bioresour. Technol. 96:215–221. http://dx.doi.org/10.1016/j.biortech.2004.05.011
Zhou, D.-M., Hao, X.-Z., Wang, Y.-J., Dong, Y.-H., Cang, L., 2005. Copper and Zn uptake by radish and pakchoi as affected by application of livestock and poultry manures. Chemosphere 59:167–175. http://dx.doi.org/10.1016/j.chemosphere.2004.11.008
28