
FADA Releases March'22 and FY'22 Vehicle Retail Data
18
Media Contact| Saharsh Damani | CEO | [email protected] | +91 99107 22552 1 FEDERATION OF AUTOMOBILE DEALERS ASSOCIATIONS 804-805-806, Surya Kiran, 19, K G Marg New Delhi - 110 001 (INDIA) T +91 11 6630 4852, 2332 0095, 4153 1495 E [email protected] CIN U74140DL2004PNL130324 www.fada.in FOR IMMEDIATE RELEASE FADA Releases March’22 and FY’22 Vehicle Retail Data Brief Analysis for March’22 • On YoY basis, total vehicle retail for the month of March’22 decreases by -3% and -30% when compared to March’20 (the month when all India lockdown was announced). • On YoY basis, 3W and CV were up by 27% and 15%. 2W, PV and Tractors fell by -4%, -5% and -8% respectively. • Bharat is clearly not showing any sign of recovery as both 2W and Tractors continue to sell less. • Despite demand from PV remaining strong, supply crunch due to various global phenomenon (Russia – Ukraine war and China lockdown) restricts customers from purchasing their favourite vehicle. • CVs continue to record double digit growth when compared to last year even though the ride to pre-covid levels is still an uphill task. Brief Analysis for FY’22 • For full FY’22, total vehicle retail increased by 7% YoY but fell by -25% when compared to FY’20 which was largely a pre-covid year. • Except Tractors, which fell by -1%, all other categories like 2W, 3W, PV and CV grew by 4%, 50%, 14% and 45% YoY respectively. • The year was no different when compared to the month of March as Tractors and 2W (with low single digit growth) which largely represent Bharat underperformed thus giving signals of stress which continues to prevail in that specific market. • Already snarled by supply bottlenecks, persistent high inflation and tightening financial conditions, the global economy is being dragged to the edge of a cliff. • The recent challenges in the rural economy, however, are due to the devastation caused by the second wave in April-June. Workers who returned to their villages from urban areas are yet to go back to their jobs. • PV segment for the entire year saw high demand with low supplies due to the semi- conductor shortage. • 3W segment is witnessing a shrinking market. A tactical shift from ICE to EV is also visible as 45% 3W market is now driven by EVs. • International crude prices crossed US$ 100 mark for the first time since 2014. This resulted in petrol / diesel prices skyrocket thus negatively impacting consumer confidence.
-
Upload
khangminh22 -
Category
Documents
-
view
4 -
download
0
Transcript of FADA Releases March'22 and FY'22 Vehicle Retail Data

Media Contact| Saharsh Damani | CEO | [email protected] | +91 99107 22552 1
FEDERATION OF AUTOMOBILE DEALERS ASSOCIATIONS 804-805-806, Surya Kiran, 19, K G Marg
New Delhi - 110 001 (INDIA) T +91 11 6630 4852, 2332 0095, 4153 1495
E [email protected] CIN U74140DL2004PNL130324
www.fada.in
FORIMMEDIATERELEASE
FADA Releases March’22 and FY’22 Vehicle Retail Data
Brief Analysis for March’22 • On YoY basis, total vehicle retail for the month of March’22 decreases by -3% and
-30% when compared to March’20 (the month when all India lockdown was announced).
• On YoY basis, 3W and CV were up by 27% and 15%. 2W, PV and Tractors fell by -4%, -5% and -8% respectively.
• Bharat is clearly not showing any sign of recovery as both 2W and Tractors continue to sell less.
• Despite demand from PV remaining strong, supply crunch due to various global phenomenon (Russia – Ukraine war and China lockdown) restricts customers from purchasing their favourite vehicle.
• CVs continue to record double digit growth when compared to last year even though the ride to pre-covid levels is still an uphill task.
Brief Analysis for FY’22
• For full FY’22, total vehicle retail increased by 7% YoY but fell by -25% when compared to FY’20 which was largely a pre-covid year.
• Except Tractors, which fell by -1%, all other categories like 2W, 3W, PV and CV grew by 4%, 50%, 14% and 45% YoY respectively.
• The year was no different when compared to the month of March as Tractors and 2W (with low single digit growth) which largely represent Bharat underperformed thus giving signals of stress which continues to prevail in that specific market.
• Already snarled by supply bottlenecks, persistent high inflation and tightening financial conditions, the global economy is being dragged to the edge of a cliff.
• The recent challenges in the rural economy, however, are due to the devastation caused by the second wave in April-June. Workers who returned to their villages from urban areas are yet to go back to their jobs.
• PV segment for the entire year saw high demand with low supplies due to the semi-conductor shortage.
• 3W segment is witnessing a shrinking market. A tactical shift from ICE to EV is also visible as 45% 3W market is now driven by EVs.
• International crude prices crossed US$ 100 mark for the first time since 2014. This resulted in petrol / diesel prices skyrocket thus negatively impacting consumer confidence.

Media Contact| Saharsh Damani | CEO | [email protected] | +91 99107 22552 2
FEDERATION OF AUTOMOBILE DEALERS ASSOCIATIONS 804-805-806, Surya Kiran, 19, K G Marg
New Delhi - 110 001 (INDIA) T +91 11 6630 4852, 2332 0095, 4153 1495
E [email protected] CIN U74140DL2004PNL130324
www.fada.in
5th April’22, New Delhi: The Federation of Automobile Dealers Associations (FADA) today released Vehicle Retail Data for March’22 and Financial Year 21-22. March’22 Retails Commenting on how March’22 performed, FADA President, Mr. Vinkesh Gulati said, “Indian Auto Industry during March tried its best to be at par YoY but fell short by - 3% and -30% when compared to March’20 (a month which saw BS4 to BS6 transition). The 2W segment which was already a non-performer due to rural distress, saw further dampening due to rise in vehicle ownership cost coupled with rising fuel cost. I once again urge all 2W OEMs to introduce special schemes to uplift the morale of this segment to boost sales. The 3W segment was witnessing a shrinkage in market size due to permit issues, educational institutions being closed and work from home phenomenon. With India now completely opening up, the segment is seeing strong double digit growth when compared to YoY. EVs are now contributing 45% + market share in this segment. There is also good demand for load vehicles from captive customers. PV’s continues to see high demand and long waiting period as semi-conductor availability still remains a challenge even though supplies slightly improved from previous month. The Russia-Ukraine war and China lockdown will further dent supplies and hence press brakes on vehicle availability thus making waiting period more frustrating for customers. CV’s continues to inch forward even though full recovery from FY’20 perspective is still away. Sentiment for the segment remain positive as Government’s infra push coupled with replacement demand is driving sales.” Financial Year 21-22 Retails Commenting on how FY’22 performed, FADA President, Mr. Vinkesh Gulati said, “FY 2022 was the first year of recovery after Covid hit us in 2020-21. The FY didn’t begin on a good note as with the beginning of April, , 2nd wave of Covid hit us hard. This time, the spread was not only limited to urban markets but had also taken rural India in its grasp. Unlike last year, the lockdown this time around had been imposed by State Governments and not the Central. Many states continued to remain under lockdown even in May and for over 60 days thus impacting lives, economy and auto sales. Despite total chaos especially in Bharat, India Auto Retails saw a 7% rise YoY. All segments except Tractors closed in positive. While 2W saw the lowest growth (due to rural phenomenon), 3W, PV and CV all saw double digit growths. The Government’s vaccination drive saved India from the 3rd wave which saw negligible impact in terms of either lives or auto retails on an overall basis. Overall full recovery is yet to be seen as Auto Retails are down by -25% when compared to FY20 which was largely a pre-covid year and a year of BS-4 to BS-6 transition.” Near Term Outlook With impact of covid lockdown during last two April’s (FY20 and FY21), April’22 will see growth, though on low base. This however when compared to a pre-covid year will still be in deep red.

Media Contact| Saharsh Damani | CEO | [email protected] | +91 99107 22552 3
FEDERATION OF AUTOMOBILE DEALERS ASSOCIATIONS 804-805-806, Surya Kiran, 19, K G Marg
New Delhi - 110 001 (INDIA) T +91 11 6630 4852, 2332 0095, 4153 1495
E [email protected] CIN U74140DL2004PNL130324
www.fada.in
The near term outlook for Indian Auto Industry continues to remain a challenge as the on-going Russia Ukraine war and China lockdown does not hint towards a smooth path. Crude is on a boil and hence fuel prices have been raised by around Rs 10. This will continue to rise and further hit sentiments on lowering the spending. Along with this, increase in raw material costs have made OEMs increase the prices of their vehicles. While no dent in terms of demand has been seen in PV segment, it will definitely have its impact on 2W segment which is an extremely price sensitive market. On the other hand, with Gudi Padwa, marriage season and re-opening of educational institutions & offices, we will see some pent up demand coming in especially in the 2W segment. Precious metals and neon gas which comes from the war hit zone will further slow the supply of semi-conductors thus making waiting periods longer for PVs. Overall, FADA remains extremely cautious in terms of any recovery in sight until Russia Ukraine war and China lockdown comes to an end. Long Term Outlook RBI in its recent note has said that the age of abundant liquidity is drawing to a close. Already snarled by supply bottlenecks, persistent high inflation and tightening financial conditions, the global economy is being dragged to the edge of the wall. The longer- term implications are disruptions to global supply chains if physical infrastructure such as pipelines and ports are destroyed. For India, the recent reverberations of war have, in fact, tilted the balance of risks downwards. The Government’s thrust on capital expenditure in 2022-23 can, however, be the gamechanger this time around by enhancing productive capacity, crowding in private investment and strengthening aggregate demand amidst the conducive financial conditions engendered by the RBI, and improving business and consumer confidence. Overall, a lot depends on how the Russia Ukraine war unfolds. Also, for India to come out of the woods faster than other economics, we anticipate that there will be no further impact of covid with vaccination being the shield. Overall, we anticipate that Auto Industry may come out of the woods and reach pre-pandemic highs by FY2024. Key Findings from our Online Members Survey
• Inventory at the end of March’22 o Average inventory for Passenger Vehicles ranges from 15 – 20 days o Average inventory for Two – Wheelers ranges from 25 – 27 days
• Liquidity
o Good 50.3% o Neutral 33.7% o Bad 16.1%
• Sentiment
o Good 52.3% o Neutral 27.6% o Bad 20.1%

Media Contact| Saharsh Damani | CEO | [email protected] | +91 99107 22552 4
FEDERATION OF AUTOMOBILE DEALERS ASSOCIATIONS 804-805-806, Surya Kiran, 19, K G Marg
New Delhi - 110 001 (INDIA) T +91 11 6630 4852, 2332 0095, 4153 1495
E [email protected] CIN U74140DL2004PNL130324
www.fada.in
Chart showing Vehicle Retail Data All India Vehicle Retail Data for March’22
CATEGORY MAR'22 MAR'21 YoY % MAR'20 % Chg, MAR'20 2W 11,57,681 12,06,191 -4.02% 18,47,314 -37.33% 3W 48,284 38,135 26.61% 77,184 -37.44% PV 2,71,358 2,85,240 -4.87% 2,18,076 24.43% TRAC 63,920 69,602 -8.16% 53,477 19.53% CV 77,938 67,828 14.91% 1,16,817 -33.28%
LCV 45,945 38,740 18.60% 70,653 -34.97%
MCV 4,188 4,682 -10.55% 8,352 -49.86% HCV 24,169 18,699 29.25% 33,563 -27.99% Others 3,636 5,707 -36.29% 4,249 -14.43%
Total 16,19,181 16,66,996 -2.87% 23,12,868 -29.99% Source: FADA Research Disclaimer:
1- The above numbers do not have figures from AP, MP, LD & TS as they are not yet on Vahan 4. 2- Vehicle Retail Data has been collated as on 03.04.22 in collaboration with Ministry of Road Transport & Highways,
Government of India and has been gathered from 1,397 out of 1,605 RTOs. 3- CV is subdivided in the following manner
a. LCV – Light Commercial Vehicle (incl. Passenger & Goods Vehicle) b. MCV – Medium Commercial Vehicle (incl. Passenger & Goods Vehicle) c. HCV – Heavy Commercial Vehicle (incl. Passenger & Goods Vehicle) d. Others – Construction Equipment Vehicles and others
All India Vehicle Retail Data for FY’22
CATEGORY FY'22 FY'21 YoY % (FY'21) FY'20 % Chg, FY'20 2W 1,19,73,415 1,15,33,928 3.81% 1,68,46,527 -28.93% 3W 3,88,093 2,58,172 50.32% 7,19,643 -46.07% PV 27,26,047 23,87,925 14.16% 27,74,340 -1.74% TRAC 6,36,119 6,44,965 -1.37% 5,55,540 14.50% CV 6,52,125 4,49,324 45.13% 8,82,524 -26.11%
LCV 3,96,007 3,01,776 31.23% 5,41,038 -26.81%
MCV 39,430 23,345 68.90% 53,633 -26.48% HCV 1,81,541 90,562 100.46% 2,53,072 -28.27% Others 35,147 33,641 4.48% 34,781 1.05%
Total 1,63,75,799 1,52,74,314 7.21% 2,17,78,574 -24.81% Source: FADA Research Disclaimer:
4- The above numbers do not have figures from AP, MP, LD & TS as they are not yet on Vahan 4. 5- Vehicle Retail Data has been collated as on 03.04.22 in collaboration with Ministry of Road Transport & Highways,
Government of India and has been gathered from 1,397 out of 1,605 RTOs. 6- CV is subdivided in the following manner
a. LCV – Light Commercial Vehicle (incl. Passenger & Goods Vehicle) b. MCV – Medium Commercial Vehicle (incl. Passenger & Goods Vehicle)

Media Contact| Saharsh Damani | CEO | [email protected] | +91 99107 22552 5
FEDERATION OF AUTOMOBILE DEALERS ASSOCIATIONS 804-805-806, Surya Kiran, 19, K G Marg
New Delhi - 110 001 (INDIA) T +91 11 6630 4852, 2332 0095, 4153 1495
E [email protected] CIN U74140DL2004PNL130324
www.fada.in
c. HCV – Heavy Commercial Vehicle (incl. Passenger & Goods Vehicle) d. Others – Construction Equipment Vehicles and others
All India Electric Vehicle Retail Data for FY’22
CATEGORY FY'22 FY'21 FY'20 YoY % (2021) YoY % (2020) E - 2W 2,31,338 41,046 24,843 463.61% 831.20% E - 3W 1,77,874 88,391 1,40,684 101.24% 26.44% E - CV 2,203 400 493 450.75% 346.86% E - PV 17,802 4,984 2,280 257.18% 680.79% Total 4,29,217 1,34,821 1,68,300 218.36% 155.03%
Source: FADA Research Disclaimer:
1- The above numbers do not have figures from AP, MP, LD & TS as they are not yet on Vahan 4. 2- Vehicle Retail Data has been collated as on 03.04.22 in collaboration with Ministry of Road Transport & Highways,
Government of India and has been gathered from 1,397 out of 1,605 RTOs. March’22 and FY’22 Category-wise and EV market share can be found in Annexure 1, Page No. 06
----- End of Press Release ----
About FADA India Founded in 1964, Federation of Automobile Dealers Associations (FADA), is the apex national body of Automobile Retail Industry in India engaged in the sale, service and spares of 2/3 Wheelers, Passenger Cars, UVs, Commercial Vehicles (including buses and trucks) and Tractors. FADA India represents over 15,000 automobile dealers having 26,500 dealerships including multiple Associations of Automobile Dealers at the Regional, State and City levels representing the entire Auto Retail Industry. Together we employ ~4 million people at dealerships and service centres. FADA India, at the same time also actively networks with the Industries and the authorities, both at the Central & State levels to provide its inputs and suggestions on the Auto Policy, Taxation, Vehicle Registration Procedure, Road Safety and Clean Environment, etc. to sustain the growth of the Automobile Retail Trade in India.

Media Contact| Saharsh Damani | CEO | [email protected] | +91 99107 22552 6
FEDERATION OF AUTOMOBILE DEALERS ASSOCIATIONS 804-805-806, Surya Kiran, 19, K G Marg
New Delhi - 110 001 (INDIA) T +91 11 6630 4852, 2332 0095, 4153 1495
E [email protected] CIN U74140DL2004PNL130324
www.fada.in
Annexure 1 OEM wise Market Share Data for the Month of March’22 & FY’22 with YoY comparison
Two – Wheeler (2W) – March Data
Two-Wheeler OEM MAR'22 Market Share (%), MAR'22 MAR'21 Market Share
(%), MAR'21 HERO MOTOCORP LTD 3,73,528 32.27% 3,99,206 33.10% HONDA MOTORCYCLE AND SCOOTER INDIA (P) LTD 2,81,725 24.34% 3,16,936 26.28%
TVS MOTOR COMPANY LTD 1,81,328 15.66% 1,79,521 14.88% BAJAJ AUTO LTD 1,23,413 10.66% 1,38,290 11.47% ROYAL-ENFIELD (UNIT OF EICHER LTD) 50,762 4.38% 60,847 5.04% SUZUKI MOTORCYCLE INDIA PVT LTD 49,371 4.26% 48,741 4.04% INDIA YAMAHA MOTOR PVT LTD 41,812 3.61% 44,311 3.67% HERO ELECTRIC VEHICLES PVT. LTD 13,023 1.12% 5,235 0.43% OLA ELECTRIC TECHNOLOGIES PVT LTD 9,121 0.79% - 0.00% OKINAWA AUTOTECH PVT LTD 8,284 0.72% 1,530 0.13% AMPERE VEHICLES PRIVATE LIMITED 6,338 0.55% 941 0.08% CLASSIC LEGENDS PVT LTD 4,234 0.37% 2,561 0.21% PIAGGIO VEHICLES PVT LTD 3,870 0.33% 4,826 0.40% ATHER ENERGY PVT LTD 2,222 0.19% 1,064 0.09% PUR ENERGY PVT LTD 2,066 0.18% 679 0.06% REVOLT INTELLICORP PVT LTD 1,409 0.12% 53 0.00% Others including EV 5,175 0.45% 1,450 0.12% Total 11,57,681 100.00% 12,06,191 100.0%
Source: FADA Research Disclaimer:
1- The above numbers do not have figures from AP, MP, LD & TS as they are not yet on Vahan 4. 2- Vehicle Retail Data has been collated as on 03.04.22 in collaboration with Ministry of Road Transport & Highways,
Government of India and has been gathered from 1,397 out of 1,605 RTOs. 3- Others include OEMs accounting less than 0.1% Market Share.
Media Contact| Saharsh Damani | CEO | [email protected] | +91 99107 22552 7
FEDERATION OF AUTOMOBILE DEALERS ASSOCIATIONS 804-805-806, Surya Kiran, 19, K G Marg
New Delhi - 110 001 (INDIA) T +91 11 6630 4852, 2332 0095, 4153 1495
E [email protected] CIN U74140DL2004PNL130324
www.fada.in
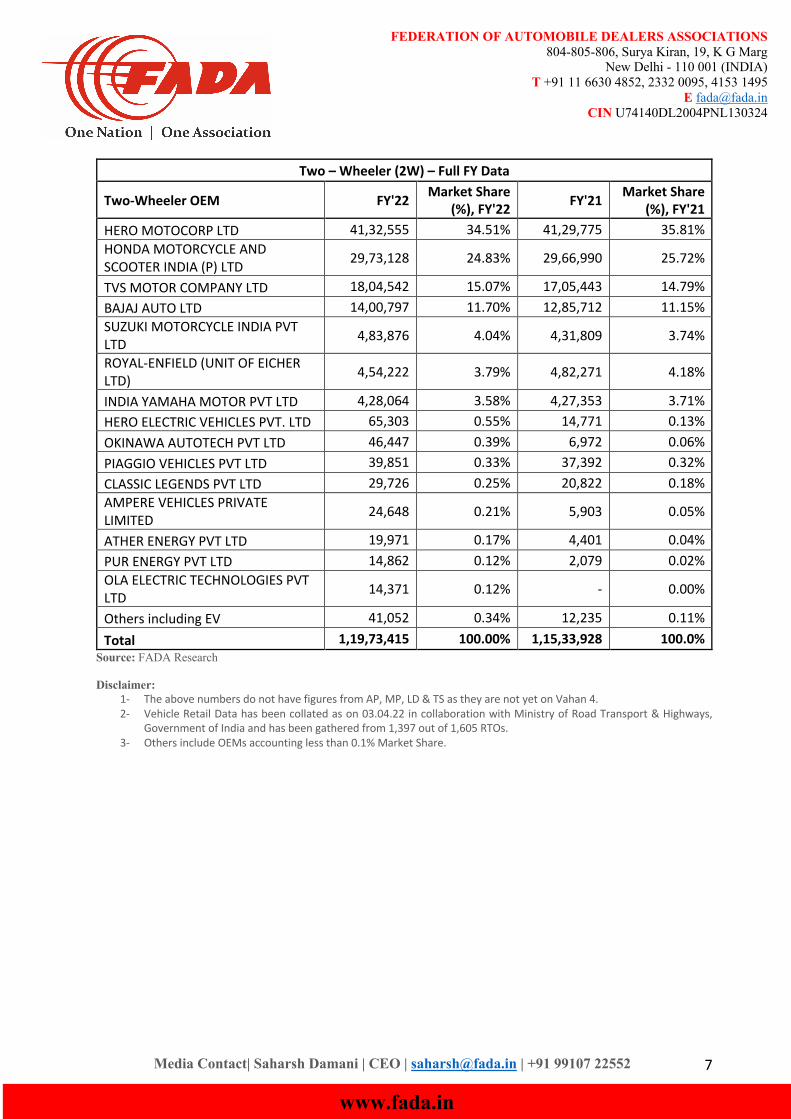
Two – Wheeler (2W) – Full FY Data
Two-Wheeler OEM FY'22 Market Share (%), FY'22 FY'21 Market Share
(%), FY'21 HERO MOTOCORP LTD 41,32,555 34.51% 41,29,775 35.81% HONDA MOTORCYCLE AND SCOOTER INDIA (P) LTD 29,73,128 24.83% 29,66,990 25.72%
TVS MOTOR COMPANY LTD 18,04,542 15.07% 17,05,443 14.79% BAJAJ AUTO LTD 14,00,797 11.70% 12,85,712 11.15% SUZUKI MOTORCYCLE INDIA PVT LTD 4,83,876 4.04% 4,31,809 3.74%
ROYAL-ENFIELD (UNIT OF EICHER LTD) 4,54,222 3.79% 4,82,271 4.18%
INDIA YAMAHA MOTOR PVT LTD 4,28,064 3.58% 4,27,353 3.71% HERO ELECTRIC VEHICLES PVT. LTD 65,303 0.55% 14,771 0.13% OKINAWA AUTOTECH PVT LTD 46,447 0.39% 6,972 0.06% PIAGGIO VEHICLES PVT LTD 39,851 0.33% 37,392 0.32% CLASSIC LEGENDS PVT LTD 29,726 0.25% 20,822 0.18% AMPERE VEHICLES PRIVATE LIMITED 24,648 0.21% 5,903 0.05%
ATHER ENERGY PVT LTD 19,971 0.17% 4,401 0.04% PUR ENERGY PVT LTD 14,862 0.12% 2,079 0.02% OLA ELECTRIC TECHNOLOGIES PVT LTD 14,371 0.12% - 0.00%
Others including EV 41,052 0.34% 12,235 0.11% Total 1,19,73,415 100.00% 1,15,33,928 100.0%
Source: FADA Research Disclaimer:
1- The above numbers do not have figures from AP, MP, LD & TS as they are not yet on Vahan 4. 2- Vehicle Retail Data has been collated as on 03.04.22 in collaboration with Ministry of Road Transport & Highways,
Government of India and has been gathered from 1,397 out of 1,605 RTOs. 3- Others include OEMs accounting less than 0.1% Market Share.

Media Contact| Saharsh Damani | CEO | [email protected] | +91 99107 22552 8
FEDERATION OF AUTOMOBILE DEALERS ASSOCIATIONS 804-805-806, Surya Kiran, 19, K G Marg
New Delhi - 110 001 (INDIA) T +91 11 6630 4852, 2332 0095, 4153 1495
E [email protected] CIN U74140DL2004PNL130324
www.fada.in
Electric Two – Wheeler (2W) – Full FY Data
Electric Two-Wheeler OEM FY'22 Market
Share (%), FY'22
FY'21 Market Share (%), FY'21
HERO ELECTRIC VEHICLES PVT. LTD 65,303 28.23% 14,771 35.99% OKINAWA AUTOTECH PVT LTD 46,447 20.08% 6,972 16.99% AMPERE VEHICLES PRIVATE LIMITED 24,648 10.65% 5,903 14.38% ATHER ENERGY PVT LTD 19,971 8.63% 4,401 10.72% PUR ENERGY PVT LTD 14,862 6.42% 2,079 5.07% OLA ELECTRIC TECHNOLOGIES PVT LTD 14,371 6.21% - 0.00% TVS MOTOR COMPANY LTD 9,458 4.09% 837 2.04% REVOLT INTELLICORP PVT LTD 7,623 3.30% 1,793 4.37% BENLING INDIA ENERGY AND TECHNOLOGY PVT LTD 7,084 3.06% 1,108 2.70%
BAJAJ AUTO LTD 7,012 3.03% 1,470 3.58% JITENDRA NEW EV-TECH PVT. LTD 3,788 1.64% 619 1.51% MEW ELECTRICALS LIMITED 2,760 1.19% 327 0.80% GOREEN E-MOBILITY PVT LTD 2,741 1.18% 227 0.55% KLB KOMAKI PVT LTD 1,882 0.81% 38 0.09% RGM BUSINESS PLUS PVT LTD 791 0.34% - 0.00% ELTHOR ENERGY PRIVATE LIMITED 525 0.23% 57 0.14% ECO FUEL SYSTEMS (I) PVT LTD 439 0.19% 48 0.12% BOOMA INNOVATIVE TRANSPORT SULUTIONS PVT LTD 241 0.10% - 0.00%
CHANDANA CORPORATION 233 0.10% - 0.00% Others 1,159 0.50% 396 0.96% Total 2,31,338 100.00% 41,046 100.00%
Source: FADA Research Disclaimer:
1- The above numbers do not have figures from AP, MP, LD & TS as they are not yet on Vahan 4. 2- Vehicle Retail Data has been collated as on 03.04.22 in collaboration with Ministry of Road Transport & Highways,
Government of India and has been gathered from 1,397 out of 1,605 RTOs. 3- Others include OEMs accounting less than 0.1% Market Share.

Media Contact| Saharsh Damani | CEO | [email protected] | +91 99107 22552 9
FEDERATION OF AUTOMOBILE DEALERS ASSOCIATIONS 804-805-806, Surya Kiran, 19, K G Marg
New Delhi - 110 001 (INDIA) T +91 11 6630 4852, 2332 0095, 4153 1495
E [email protected] CIN U74140DL2004PNL130324
www.fada.in
Three-Wheeler (3W) – March Data
Three-Wheeler OEM MAR'22 Market Share (%), MAR'22 MAR'21 Market Share
(%), MAR'21 BAJAJ AUTO LTD 15,997 33.13% 13,449 35.27% PIAGGIO VEHICLES PVT LTD 4,646 9.62% 5,647 14.81% YC ELECTRIC VEHICLE 2,421 5.01% 1,456 3.82% MAHINDRA & MAHINDRA LIMITED 1,816 3.76% 1,859 4.87% ATUL AUTO LTD 1,367 2.83% 1,351 3.54% SAERA ELECTRIC AUTO PVT LTD 1,238 2.56% 532 1.40% TVS MOTOR COMPANY LTD 1,215 2.52% 1,029 2.70% MAHINDRA REVA ELECTRIC VEHICLES PVT LTD 1,208 2.50% 605 1.59%
DILLI ELECTRIC AUTO PVT LTD 908 1.88% 389 1.02% CHAMPION POLY PLAST 897 1.86% 557 1.46% UNIQUE INTERNATIONAL 747 1.55% 266 0.70% BEST WAY AGENCIES PVT LTD 746 1.55% 351 0.92% MINI METRO EV L.L.P 643 1.33% 306 0.80% TERRA MOTORS INDIA PVT LTD 543 1.12% 323 0.85% THUKRAL ELECTRIC BIKES PVT LTD 537 1.11% 315 0.83% VANI ELECTRIC VEHICLES PVT LTD 535 1.11% 328 0.86% J. S. AUTO (P) LTD 533 1.10% 414 1.09% Others including EV 12,287 25.45% 8,958 23.49% Total 48,284 100.00% 38,135 100.00%
Source: FADA Research Disclaimer:
1- The above numbers do not have figures from AP, MP, LD & TS as they are not yet on Vahan 4. 2- Vehicle Retail Data has been collated as on 03.04.22 in collaboration with Ministry of Road Transport & Highways,
Government of India and has been gathered from 1,397 out of 1,605 RTOs. 3- Others include OEMs accounting less than 1% Market Share.

Media Contact| Saharsh Damani | CEO | [email protected] | +91 99107 22552 10
FEDERATION OF AUTOMOBILE DEALERS ASSOCIATIONS 804-805-806, Surya Kiran, 19, K G Marg
New Delhi - 110 001 (INDIA) T +91 11 6630 4852, 2332 0095, 4153 1495
E [email protected] CIN U74140DL2004PNL130324
www.fada.in
Three-Wheeler (3W) – Full FY Data
Three-Wheeler OEM FY'22 Market Share (%), FY'22 FY'21 Market Share
(%), FY'21 BAJAJ AUTO LTD 1,35,699 34.97% 94,634 36.66% PIAGGIO VEHICLES PVT LTD 43,591 11.23% 47,323 18.33%
YC ELECTRIC VEHICLE 17,049 4.39%
8,936 3.46% MAHINDRA & MAHINDRA LIMITED 14,713 3.79% 9,917 3.84% ATUL AUTO LTD 13,256 3.42% 10,678 4.14% SAERA ELECTRIC AUTO PVT LTD 8,475 2.18% 3,937 1.52% MAHINDRA REVA ELECTRIC VEHICLES PVT LTD 8,037 2.07% 3,218 1.25% TVS MOTOR COMPANY LTD 7,817 2.01% 6,819 2.64% CHAMPION POLY PLAST 7,528 1.94% 3,071 1.19% DILLI ELECTRIC AUTO PVT LTD 6,456 1.66% 2,429 0.94% BEST WAY AGENCIES PVT LTD 6,254 1.61% 2,171 0.84% UNIQUE INTERNATIONAL 5,022 1.29% 1,667 0.65% J. S. AUTO (P) LTD 4,733 1.22% 2,883 1.12% THUKRAL ELECTRIC BIKES PVT LTD 4,334 1.12% 2,004 0.78% MINI METRO EV L.L.P 4,311 1.11% 1,726 0.67% VANI ELECTRIC VEHICLES PVT LTD 4,105 1.06% 2,960 1.15% Others including EV 96,713 24.92% 53,799 20.84% Total 3,88,093 100.00% 2,58,172 100.00%
Source: FADA Research Disclaimer:
1- The above numbers do not have figures from AP, MP, LD & TS as they are not yet on Vahan 4. 2- Vehicle Retail Data has been collated as on 03.04.22 in collaboration with Ministry of Road Transport & Highways,
Government of India and has been gathered from 1,397 out of 1,605 RTOs. 3- Others include OEMs accounting less than 1% Market Share.

Media Contact| Saharsh Damani | CEO | [email protected] | +91 99107 22552 11
FEDERATION OF AUTOMOBILE DEALERS ASSOCIATIONS 804-805-806, Surya Kiran, 19, K G Marg
New Delhi - 110 001 (INDIA) T +91 11 6630 4852, 2332 0095, 4153 1495
E [email protected] CIN U74140DL2004PNL130324
www.fada.in
Electric Three-Wheeler (3W) – Full FY Data
Electric Three-Wheeler OEM FY'22 Market Share (%), FY'22 FY'21 Market Share
(%), FY'21 YC ELECTRIC VEHICLE 17,049 9.58% 8,936 10.11% SAERA ELECTRIC AUTO PVT LTD 8,475 4.76% 3,937 4.45% MAHINDRA REVA ELECTRIC VEHICLES PVT LTD 8,037 4.52% 3,218 3.64%
CHAMPION POLY PLAST 7,528 4.23% 3,071 3.47% DILLI ELECTRIC AUTO PVT LTD 6,456 3.63% 2,429 2.75% BEST WAY AGENCIES PVT LTD 6,254 3.52% 2,171 2.46% UNIQUE INTERNATIONAL 5,022 2.82% 1,667 1.89% MAHINDRA & MAHINDRA LIMITED 4,809 2.70% 3,358 3.80% THUKRAL ELECTRIC BIKES PVT LTD 4,334 2.44% 2,004 2.27% MINI METRO EV L.L.P 4,311 2.42% 1,726 1.95% VANI ELECTRIC VEHICLES PVT LTD 4,105 2.31% 2,960 3.35% TERRA MOTORS INDIA PVT LTD 3,792 2.13% 2,275 2.57% J. S. AUTO (P) LTD 3,622 2.04% 1,416 1.60% ENERGY ELECTRIC VEHICLES 3,464 1.95% 1,300 1.47% PIAGGIO VEHICLES PVT LTD 3,426 1.93% 106 0.12% G.K. RICKSHAW 2,728 1.53% 2,226 2.52% ALLFINE INDUSTRIES PVT LTD 2,689 1.51% 1,179 1.33% SKS TRADE INDIA PVT LTD 2,617 1.47% 948 1.07% SPEEGO VEHICLES CO PVT LTD 2,317 1.30% 929 1.05% BRIGHT AUTOZONE PVT LTD 2,262 1.27% 489 0.55% MAA SHAKTI EXIM PVT LTD 2,070 1.16% 840 0.95% Others 72,507 40.76% 41,206 46.62% Total 1,77,874 100.00% 88,391 100.00%
Source: FADA Research Disclaimer:
1- The above numbers do not have figures from AP, MP, LD & TS as they are not yet on Vahan 4. 2- Vehicle Retail Data has been collated as on 03.04.22 in collaboration with Ministry of Road Transport & Highways,
Government of India and has been gathered from 1,397 out of 1,605 RTOs. 3- Others include OEMs accounting less than 1% Market Share.

Media Contact| Saharsh Damani | CEO | [email protected] | +91 99107 22552 12
FEDERATION OF AUTOMOBILE DEALERS ASSOCIATIONS 804-805-806, Surya Kiran, 19, K G Marg
New Delhi - 110 001 (INDIA) T +91 11 6630 4852, 2332 0095, 4153 1495
E [email protected] CIN U74140DL2004PNL130324
www.fada.in
Commercial Vehicle (CV) – March Data
Commercial Vehicle OEM MAR'22 Market Share (%), MAR'22 MAR'21 Market Share
(%), MAR'21 TATA MOTORS LTD 33,900 43.50% 28,942 42.67% MAHINDRA & MAHINDRA LIMITED 17,349 22.26% 11,901 17.55% ASHOK LEYLAND LTD 11,676 14.98% 10,563 15.57% VE COMMERCIAL VEHICLES LTD 4,566 5.86% 4,224 6.23% MARUTI SUZUKI INDIA LTD 3,803 4.88% 3,828 5.64% DAIMLER INDIA COMMERCIAL VEHICLES PVT. LTD 1,548 1.99% 1,442 2.13%
SML ISUZU LTD 662 0.85% 589 0.87% FORCE MOTORS LIMITED, A FIRODIA ENTERPRISE 631 0.81% 405 0.60%
Others 3,803 4.88% 5,934 8.75% Total 77,938 100.00% 67,828 100.00%
Source: FADA Research Disclaimer:
1- The above numbers do not have figures from AP, MP, LD & TS as they are not yet on Vahan 4. 2- Vehicle Retail Data has been collated as on 03.04.22 in collaboration with Ministry of Road Transport & Highways,
Government of India and has been gathered from 1,397 out of 1,605 RTOs.
Commercial Vehicle (CV) – Full FY Data
Commercial Vehicle OEM FY'22 Market Share (%), FY'22 FY'21 Market Share
(%), FY'21 TATA MOTORS LTD 2,75,380 42.23% 1,63,171 36.31% MAHINDRA & MAHINDRA LIMITED 1,41,950 21.77% 1,29,011 28.71% ASHOK LEYLAND LTD 92,585 14.20% 58,130 12.94% VE COMMERCIAL VEHICLES LTD 40,214 6.17% 23,372 5.20% MARUTI SUZUKI INDIA LTD 38,486 5.90% 24,447 5.44% DAIMLER INDIA COMMERCIAL VEHICLES PVT. LTD 12,929 1.98% 7,865 1.75%
FORCE MOTORS LIMITED, A FIRODIA ENTERPRISE 8,019 1.23% 4,154 0.92%
SML ISUZU LTD 5,837 0.90% 3,533 0.79% Others 36,725 5.63% 35,641 7.93% Total 6,52,125 100.00% 4,49,324 100.00%
Source: FADA Research Disclaimer:
1- The above numbers do not have figures from AP, MP, LD & TS as they are not yet on Vahan 4. 2- Vehicle Retail Data has been collated as on 03.04.22 in collaboration with Ministry of Road Transport & Highways,
Government of India and has been gathered from 1,397 out of 1,605 RTOs.

Media Contact| Saharsh Damani | CEO | [email protected] | +91 99107 22552 13
FEDERATION OF AUTOMOBILE DEALERS ASSOCIATIONS 804-805-806, Surya Kiran, 19, K G Marg
New Delhi - 110 001 (INDIA) T +91 11 6630 4852, 2332 0095, 4153 1495
E [email protected] CIN U74140DL2004PNL130324
www.fada.in
Electric Commercial Vehicle (CV) – Full FY Data
Electric Commercial Vehicle OEM FY'22 Market Share (%), FY'22 FY'21 Market Share
(%), FY'21 KINETIC GREEN ENERGY & POWER SOLUTIONS LTD 833 37.81% 10 2.50%
PMI ELECTRO MOBILITY SOLUTIONS PRIVATE LIMITED 397 18.02% 1 0.25%
TATA MOTORS LTD 280 12.71% 156 39.00% JBM AUTO LIMITED 247 11.21% 125 31.25% OLECTRA GREENTECH LTD 222 10.08% 58 14.50% MAHINDRA & MAHINDRA LIMITED 91 4.13% 14 3.50% OMEGA SEIKI PVT LTD 56 2.54% 0 0.00% ASHOK LEYLAND LTD 40 1.82% 28 7.00%
Others 37 1.68%
8 2.00%
Total 2,203 100.00% 400 100.00%
Source: FADA Research Disclaimer:
1- The above numbers do not have figures from AP, MP, LD & TS as they are not yet on Vahan 4. 2- Vehicle Retail Data has been collated as on 03.04.22 in collaboration with Ministry of Road Transport & Highways,
Government of India and has been gathered from 1,397 out of 1,605 RTOs. 3- Others include OEMs accounting less than 1% Market Share.

Media Contact| Saharsh Damani | CEO | [email protected] | +91 99107 22552 14
FEDERATION OF AUTOMOBILE DEALERS ASSOCIATIONS 804-805-806, Surya Kiran, 19, K G Marg
New Delhi - 110 001 (INDIA) T +91 11 6630 4852, 2332 0095, 4153 1495
E [email protected] CIN U74140DL2004PNL130324
www.fada.in
Passenger Vehicle (PV) – March Data
Passenger Vehicle OEM MAR'22 Market
Share (%), MAR'22
MAR'21 Market Share (%), MAR'21
MARUTI SUZUKI INDIA LTD 1,11,466 41.08% 1,31,233 46.01% HYUNDAI MOTOR INDIA LTD 40,567 14.95% 46,466 16.29% TATA MOTORS LTD 36,419 13.42% 25,120 8.81% MAHINDRA & MAHINDRA LIMITED 22,384 8.25% 15,632 5.48% KIA MOTORS INDIA PVT LTD 17,144 6.32% 15,767 5.53% TOYOTA KIRLOSKAR MOTOR PVT LTD 10,471 3.86% 13,043 4.57% HONDA CARS INDIA LTD 7,101 2.62% 8,478 2.97% SKODA AUTO VOLKSWAGEN GROUP 7,114 2.62% 3,384 1.19%
SKODA AUTO VOLKSWAGEN INDIA PVT LTD 7,047 2.60% 3,164 1.11%
VOLKSWAGEN AG/INDIA PVT. LTD. 11 0.00% 109 0.04%
AUDI AG 55 0.02% 99 0.03%
SKODA AUTO INDIA/AS PVT LTD 1 0.00% 12 0.00%
RENAULT INDIA PVT LTD 6,509 2.40% 9,136 3.20% MG MOTOR INDIA PVT LTD 3,530 1.30% 4,411 1.55% NISSAN MOTOR INDIA PVT LTD 2,835 1.04% 3,202 1.12% MERCEDES -BENZ GROUP 1,253 0.46% 888 0.31%
MERCEDES-BENZ INDIA PVT LTD 1,232 0.45% 831 0.29%
MERCEDES -BENZ AG 18 0.01% 34 0.01%
DAIMLER AG 3 0.00% 23 0.01%
BMW INDIA PVT LTD 969 0.36% 884 0.31% FIAT INDIA AUTOMOBILES PVT LTD 897 0.33% 1,052 0.37% FORCE MOTORS LIMITED, A FIRODIA ENTERPRISE 179 0.07% 268 0.09%
VOLVO AUTO INDIA PVT LTD 136 0.05% 104 0.04% JAGUAR LAND ROVER INDIA LIMITED 102 0.04% 219 0.08% PORSCHE AG GERMANY 62 0.02% 37 0.01% FORD INDIA PVT LTD 49 0.02% 4,817 1.69% PCA AUTOMOBILES INDIA PVT LTD 33 0.01% 0 0.00% AUTOMOBILI LAMBORGHINI S.P.A 14 0.01% 5 0.00% BENTLEY MOTORS LTD 2 0.00% 1 0.00% ROLLS ROYCE 0 0.00% 1 0.00% Others 2,122 0.78% 1,092 0.38% Total 2,71,358 100.00% 2,85,240 100.00%
Source: FADA Research Disclaimer:
1- The above numbers do not have figures from AP, MP, LD & TS as they are not yet on Vahan 4. 2- Vehicle Retail Data has been collated as on 03.04.22 in collaboration with Ministry of Road Transport & Highways,
Government of India and has been gathered from 1,397 out of 1,605 RTOs.

Media Contact| Saharsh Damani | CEO | [email protected] | +91 99107 22552 15
FEDERATION OF AUTOMOBILE DEALERS ASSOCIATIONS 804-805-806, Surya Kiran, 19, K G Marg
New Delhi - 110 001 (INDIA) T +91 11 6630 4852, 2332 0095, 4153 1495
E [email protected] CIN U74140DL2004PNL130324
www.fada.in
Passenger Vehicle (PV) – Full FY Data
Passenger Vehicle OEM FY'22 Market Share (%), FY'22 FY'21 Market Share
(%), FY'21 MARUTI SUZUKI INDIA LTD 11,65,483 42.75% 11,63,042 48.71% HYUNDAI MOTOR INDIA LTD 4,42,677 16.24% 4,14,552 17.36% TATA MOTORS LTD 3,12,088 11.45% 1,87,974 7.87% MAHINDRA & MAHINDRA LIMITED 1,87,043 6.86% 1,27,737 5.35% KIA MOTORS INDIA PVT LTD 1,55,699 5.71% 1,31,429 5.50% TOYOTA KIRLOSKAR MOTOR PVT LTD 1,10,485 4.05% 77,408 3.24% RENAULT INDIA PVT LTD 84,012 3.08% 75,333 3.15% HONDA CARS INDIA LTD 78,011 2.86% 71,486 2.99% SKODA AUTO VOLKSWAGEN GROUP 50,895 1.87% 26,066 1.09%
SKODA AUTO VOLKSWAGEN INDIA PVT LTD 48,773 1.79% 22,422 0.94%
VOLKSWAGEN AG/INDIA PVT. LTD. 980 0.04% 1,818 0.08%
AUDI AG 1,088 0.04% 409 0.02%
SKODA AUTO INDIA/AS PVT LTD 54 0.00% 1,417 0.06%
MG MOTOR INDIA PVT LTD 35,378 1.30% 26,831 1.12% NISSAN MOTOR INDIA PVT LTD 33,684 1.24% 12,297 0.51% FORD INDIA PVT LTD 21,239 0.78% 41,917 1.76% MERCEDES -BENZ GROUP 10,874 0.40% 7,260 0.30%
MERCEDES-BENZ INDIA PVT LTD 10,354 0.38% 6,858 0.29%
MERCEDES -BENZ AG 429 0.02% 262 0.01%
DAIMLER AG 91 0.00% 140 0.01%
FIAT INDIA AUTOMOBILES PVT LTD 10,708 0.39% 5,171 0.22% BMW INDIA PVT LTD 8,320 0.31% 5,856 0.25% JAGUAR LAND ROVER INDIA LIMITED 1,923 0.07% 1,706 0.07% FORCE MOTORS LIMITED, A FIRODIA ENTERPRISE 1,821 0.07% 1,377 0.06%
VOLVO AUTO INDIA PVT LTD 1,376 0.05% 1,206 0.05% PCA AUTOMOBILES INDIA PVT LTD 542 0.02% 2 0.00% PORSCHE AG GERMANY 413 0.02% 251 0.01% AUTOMOBILI LAMBORGHINI S.P.A 63 0.00% 28 0.00% BENTLEY MOTORS LTD 26 0.00% 13 0.00% ROLLS ROYCE 17 0.00% 21 0.00% Others 13,270 0.49% 8,962 0.38% Total 27,26,047 100.00% 23,87,925 100.00%
Source: FADA Research Disclaimer:
1- The above numbers do not have figures from AP, MP, LD & TS as they are not yet on Vahan 4. 2- Vehicle Retail Data has been collated as on 03.04.22 in collaboration with Ministry of Road Transport & Highways,
Government of India and has been gathered from 1,397 out of 1,605 RTOs.
Media Contact| Saharsh Damani | CEO | [email protected] | +91 99107 22552 16
FEDERATION OF AUTOMOBILE DEALERS ASSOCIATIONS 804-805-806, Surya Kiran, 19, K G Marg
New Delhi - 110 001 (INDIA) T +91 11 6630 4852, 2332 0095, 4153 1495
E [email protected] CIN U74140DL2004PNL130324
www.fada.in
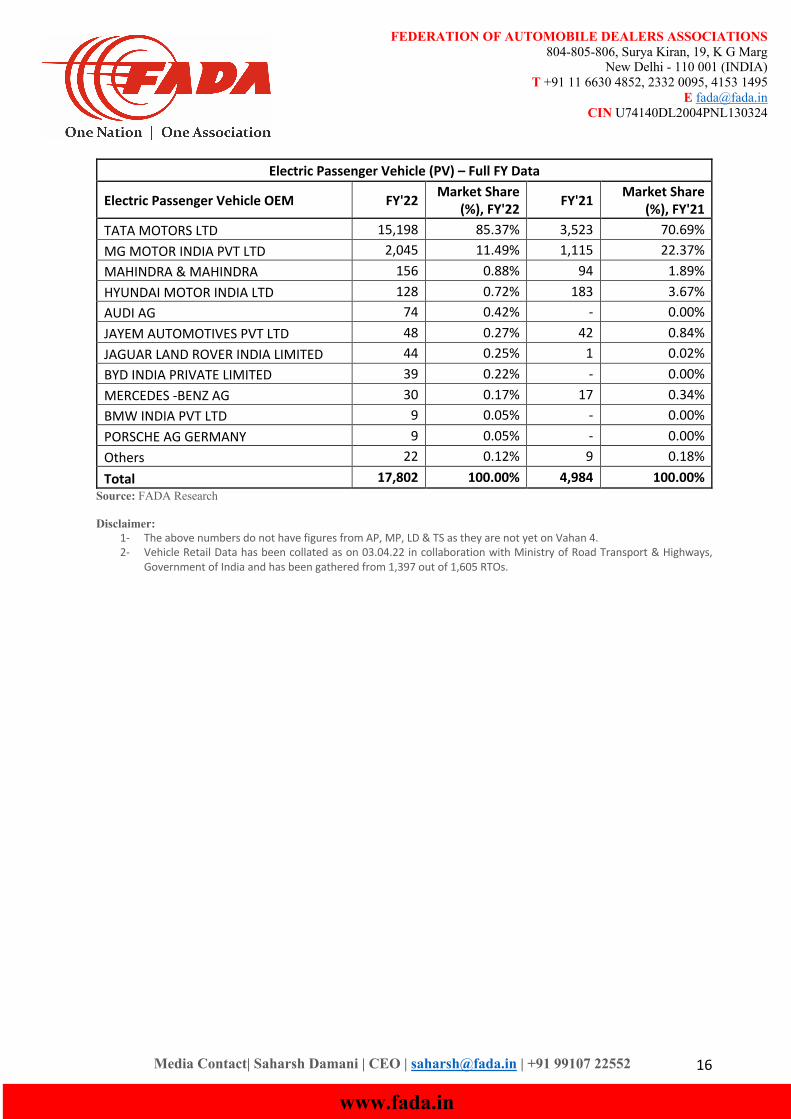
Electric Passenger Vehicle (PV) – Full FY Data
Electric Passenger Vehicle OEM FY'22 Market Share (%), FY'22 FY'21 Market Share
(%), FY'21 TATA MOTORS LTD 15,198 85.37% 3,523 70.69% MG MOTOR INDIA PVT LTD 2,045 11.49% 1,115 22.37% MAHINDRA & MAHINDRA 156 0.88% 94 1.89% HYUNDAI MOTOR INDIA LTD 128 0.72% 183 3.67% AUDI AG 74 0.42% - 0.00% JAYEM AUTOMOTIVES PVT LTD 48 0.27% 42 0.84% JAGUAR LAND ROVER INDIA LIMITED 44 0.25% 1 0.02% BYD INDIA PRIVATE LIMITED 39 0.22% - 0.00% MERCEDES -BENZ AG 30 0.17% 17 0.34% BMW INDIA PVT LTD 9 0.05% - 0.00% PORSCHE AG GERMANY 9 0.05% - 0.00% Others 22 0.12% 9 0.18% Total 17,802 100.00% 4,984 100.00%
Source: FADA Research Disclaimer:
1- The above numbers do not have figures from AP, MP, LD & TS as they are not yet on Vahan 4. 2- Vehicle Retail Data has been collated as on 03.04.22 in collaboration with Ministry of Road Transport & Highways,
Government of India and has been gathered from 1,397 out of 1,605 RTOs.

Media Contact| Saharsh Damani | CEO | [email protected] | +91 99107 22552 17
FEDERATION OF AUTOMOBILE DEALERS ASSOCIATIONS 804-805-806, Surya Kiran, 19, K G Marg
New Delhi - 110 001 (INDIA) T +91 11 6630 4852, 2332 0095, 4153 1495
E [email protected] CIN U74140DL2004PNL130324
www.fada.in
Tractor (TRAC) – March Data
Tractor OEM MAR'22 Market Share (%), MAR'22 MAR'21 Market Share
(%), MAR'21 MAHINDRA & MAHINDRA LIMITED (TRACTOR) 14,085 22.04% 15,106 21.70%
MAHINDRA & MAHINDRA LIMITED (SWARAJ DIVISION) 10,784 16.87% 11,670 16.77%
INTERNATIONAL TRACTORS LIMITED 7,514 11.76% 8,717 12.52% TAFE LIMITED 7,022 10.99% 7,143 10.26% ESCORTS LIMITED (AGRI MACHINERY GROUP) 6,568 10.28% 8,435 12.12%
JOHN DEERE INDIA PVT LTD(TRACTOR DEVISION) 5,560 8.70% 6,176 8.87%
EICHER TRACTORS 4,026 6.30% 4,412 6.34% CNH INDUSTRIAL (INDIA) PVT LTD 2,443 3.82% 2,678 3.85% KUBOTA AGRICULTURAL MACHINERY INDIA PVT.LTD. 1,626 2.54% 1,283 1.84%
V.S.T. TILLERS TRACTORS LIMITED 557 0.87% 495 0.71% FORCE MOTORS LIMITED, A FIRODIA ENTERPRISE 483 0.76% 390 0.56%
INDO FARM EQUIPMENT LIMITED 423 0.66% 310 0.45% CAPTAIN TRACTORS PVT. LTD. 160 0.25% 96 0.14% Others 2,669 4.18% 2,691 3.87% Total 63,920 100.00% 69,602 100.00%
Source: FADA Research Disclaimer:
1- The above numbers do not have figures from AP, MP, LD & TS as they are not yet on Vahan 4. 2- Vehicle Retail Data has been collated as on 03.04.22 in collaboration with Ministry of Road Transport & Highways,
Government of India and has been gathered from 1,397 out of 1,605 RTOs.

Media Contact| Saharsh Damani | CEO | [email protected] | +91 99107 22552 18
FEDERATION OF AUTOMOBILE DEALERS ASSOCIATIONS 804-805-806, Surya Kiran, 19, K G Marg
New Delhi - 110 001 (INDIA) T +91 11 6630 4852, 2332 0095, 4153 1495
E [email protected] CIN U74140DL2004PNL130324
www.fada.in
Tractor (TRAC) – Full FY Data
Tractor OEM FY'22 Market Share (%), FY'22 FY'21 Market Share
(%), FY'21 MAHINDRA & MAHINDRA LIMITED (TRACTOR) 1,45,855 22.93% 1,49,718 23.21%
MAHINDRA & MAHINDRA LIMITED (SWARAJ DIVISION) 1,04,625 16.45% 1,06,455 16.51%
INTERNATIONAL TRACTORS LIMITED 77,334 12.16% 81,022 12.56% TAFE LIMITED 73,628 11.57% 75,640 11.73% ESCORTS LIMITED (AGRI MACHINERY GROUP) 66,518 10.46% 70,695 10.96%
JOHN DEERE INDIA PVT LTD(TRACTOR DEVISION) 52,426 8.24% 50,072 7.76%
EICHER TRACTORS 38,345 6.03% 40,821 6.33% CNH INDUSTRIAL (INDIA) PVT LTD 25,044 3.94% 24,507 3.80% KUBOTA AGRICULTURAL MACHINERY INDIA PVT.LTD. 14,402 2.26% 11,376 1.76%
V.S.T. TILLERS TRACTORS LIMITED 5,906 0.93% 5,991 0.93% FORCE MOTORS LIMITED, A FIRODIA ENTERPRISE 4,067 0.64% 3,611 0.56%
CAPTAIN TRACTORS PVT. LTD. 3,847 0.60% 2,893 0.45% INDO FARM EQUIPMENT LIMITED 3,296 0.52% 1,766 0.27% Others 20,826 3.27% 20,398 3.16% Total 6,36,119 100.00% 6,44,965 100.00%
Source: FADA Research Disclaimer:
1- The above numbers do not have figures from AP, MP, LD & TS as they are not yet on Vahan 4. 2- Vehicle Retail Data has been collated as on 03.04.22 in collaboration with Ministry of Road Transport & Highways,
Government of India and has been gathered from 1,397 out of 1,605 RTOs.