Macroinvertebrates as ecological indicators of the wellbeing of ...
88
i Macroinvertebrates as ecological indicators of the wellbeing of the lower uMvoti and Thukela Rivers, KwaZulu-Natal, South Africa. Ntombiphumile Perceverence Tenza Submitted in fulfilment of the academic requirements for the degree of Master of Science in the Discipline of Ecological Sciences School of Life Sciences College of Agriculture, Science and Engineering University of KwaZulu-Natal Pietermaritzburg Campus 2018
-
Upload
khangminh22 -
Category
Documents
-
view
2 -
download
0
Transcript of Macroinvertebrates as ecological indicators of the wellbeing of ...

i
Macroinvertebrates as ecological indicators of the
wellbeing of the lower uMvoti and Thukela Rivers,
KwaZulu-Natal, South Africa.
Ntombiphumile Perceverence Tenza
Submitted in fulfilment of the academic requirements for the degree of
Master of Science
in the Discipline of Ecological Sciences
School of Life Sciences
College of Agriculture, Science and Engineering
University of KwaZulu-Natal
Pietermaritzburg Campus
2018
ii
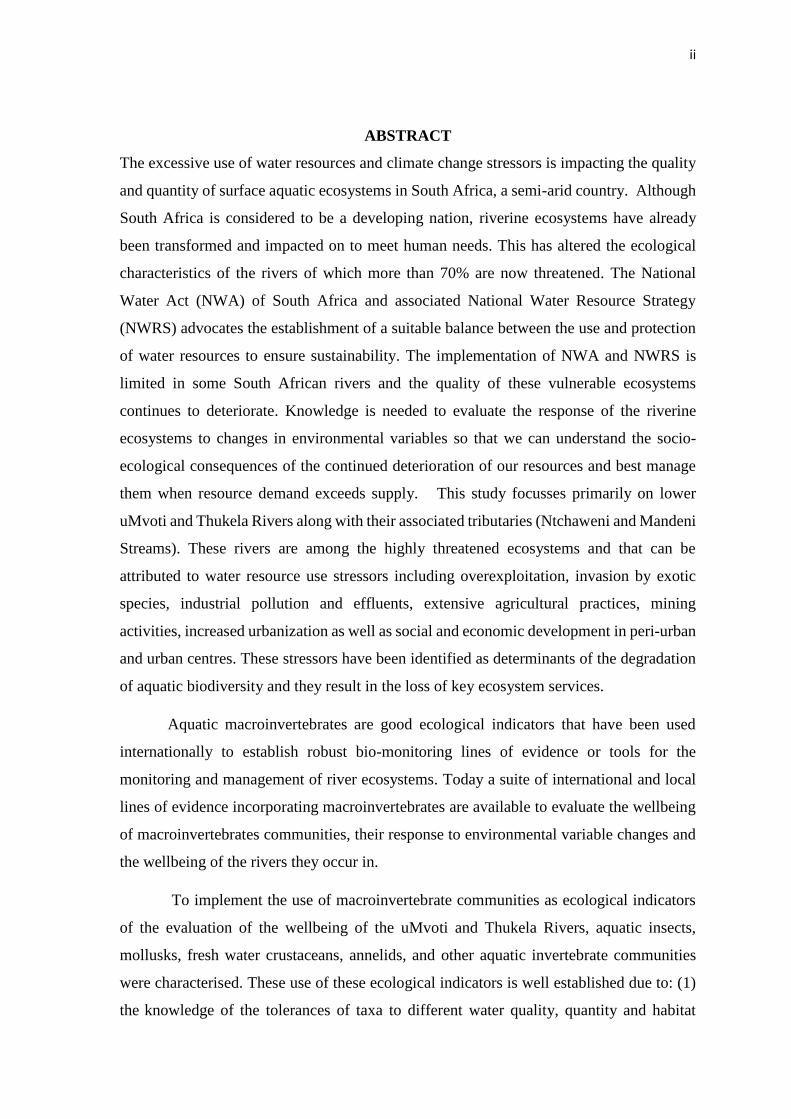
ABSTRACT
The excessive use of water resources and climate change stressors is impacting the quality
and quantity of surface aquatic ecosystems in South Africa, a semi-arid country. Although
South Africa is considered to be a developing nation, riverine ecosystems have already
been transformed and impacted on to meet human needs. This has altered the ecological
characteristics of the rivers of which more than 70% are now threatened. The National
Water Act (NWA) of South Africa and associated National Water Resource Strategy
(NWRS) advocates the establishment of a suitable balance between the use and protection
of water resources to ensure sustainability. The implementation of NWA and NWRS is
limited in some South African rivers and the quality of these vulnerable ecosystems
continues to deteriorate. Knowledge is needed to evaluate the response of the riverine
ecosystems to changes in environmental variables so that we can understand the socio-
ecological consequences of the continued deterioration of our resources and best manage
them when resource demand exceeds supply. This study focusses primarily on lower
uMvoti and Thukela Rivers along with their associated tributaries (Ntchaweni and Mandeni
Streams). These rivers are among the highly threatened ecosystems and that can be
attributed to water resource use stressors including overexploitation, invasion by exotic
species, industrial pollution and effluents, extensive agricultural practices, mining
activities, increased urbanization as well as social and economic development in peri-urban
and urban centres. These stressors have been identified as determinants of the degradation
of aquatic biodiversity and they result in the loss of key ecosystem services.
Aquatic macroinvertebrates are good ecological indicators that have been used
internationally to establish robust bio-monitoring lines of evidence or tools for the
monitoring and management of river ecosystems. Today a suite of international and local
lines of evidence incorporating macroinvertebrates are available to evaluate the wellbeing
of macroinvertebrates communities, their response to environmental variable changes and
the wellbeing of the rivers they occur in.
To implement the use of macroinvertebrate communities as ecological indicators
of the evaluation of the wellbeing of the uMvoti and Thukela Rivers, aquatic insects,
mollusks, fresh water crustaceans, annelids, and other aquatic invertebrate communities
were characterised. These use of these ecological indicators is well established due to: (1)
the knowledge of the tolerances of taxa to different water quality, quantity and habitat

iii
stresses, (2) the high diversity of taxa that are representative of a wide range of river
ecosystem types and (3) they are abundant, easy to collect (visible to the naked eye) and
easy to identify. Two community metric measure tools namely the South African Scoring
System (SASS, version 5) and the Macroinvertebrate Response Assessment Index (MIRAI)
were used to evaluate the wellbeing of macroinvertebrate communities of the lowland
uMvoti and Thukela Rivers in this study. The ecological integrity of both rivers were found
to be adversely impacted and their integrity state ranged mostly from class C (moderately
modified) to class E/F (seriously or extremely modified). Reduced habitat heterogeneity
and altered water quality were found to be driving factors that cause the degradation in
macroinvertebrate communities.
Multivariate statistical analyses were used to evaluate the responses of
macroinvertebrate communities to water resource use activities associated with the uMvoti
and Thukela Rivers. In the early part of the study period many intolerant macroinvertebrate
taxa contributed to the structure of communities. However, towards the latter part of the
study, pollution tolerant taxa dominated communities. Both rivers also showed a decreasing
trend in estimated macroinvertebrates estimated abundance and number of taxa. In the
uMvoti River this can be attributed to the combined effect of the urban runoff, effluence
discharge from the Gledhow sugar mill and Sappi Stanger Mill, informal settlements and
agricultural activities. Results reported from the Thukela River can be ascribed to the
synergistic effects of water quality stressors associated with the Isithebe Industrial
complex, wastewater treatment works, effluent from the Sappi mill, sugarcane plantations
as well as domestic use by local communities.
The outcomes of this study showed that there is not sufficient protection and
management measures afforded to the systems. The requirements of the National Water
Act to establish a sustainable balance between the use and protection of the water resources
in the system is not being achieved. No action is being taken to mitigate pollution from
major sources in the study area. Thus, an appropriate management plan and its
implementation is urgently needed, with monitoring activities, to mitigate these stressors
and attain a balance between use and protection of these socio-ecologically important
ecosystems. Failure to implement effective management plans may result in continued
deterioration of the wellbeing of the ecosystem and potential loss of biodiversity, ecosystem
services and functions that these rivers provide.

iv
PREFACE
The data described in this dissertation were collected in KwaZulu-Natal, Republic of South
Africa. This study is part of a long-term river monitoring program which included both
historical and present datasets. The historical data was collected from 1999 – 2015. The
present data was collected in 2016 while registered at the School of Life Sciences,
University of KwaZulu-Natal, Pietermaritzburg, under the supervision of Prof Colleen T.
Downs and Dr. Gordon O’Brien.
This dissertation, submitted for the degree of Master of Science in the College of
Agriculture, Engineering and Science, University of KwaZulu-Natal, School of Life
Sciences, Pietermaritzburg campus, represents original work by the author and has not
otherwise been submitted in any form for any degree or diploma to any University. Where
use has been made of the work of others, it is duly acknowledged in the text.
………………………….
Ntombiphumile Perceverence Tenza
February 2018
I certify that the above statement is correct and as the candidate’s supervisor I have
approved this dissertation for submission.
…………………………..
Professor Colleen T. Downs
Supervisor
February 2018
…………………………..
Dr. Gordon O’Brien
Supervisor
February 2018
v
COLLEGE OF AGRICULTURE, SCIENCE AND ENGINEERING
DECLARATION 1 - PLAGIARISM
I, Ntombiphumile Perceverence Tenza, declare that
1. The research reported in this dissertation, except where otherwise indicated, is
my original research.
2. This dissertation has not been submitted for any degree or examination at any
other university.
3. This dissertation does not contain other persons’ data, pictures, graphs or other
information, unless specifically acknowledged as being sourced from other
persons.
4. This dissertation does not contain other persons' writing, unless specifically
acknowledged as being sourced from other researchers. Where other written
sources have been quoted, then:
a. Their words have been re-written but the general information attributed to
them has been referenced
b. Where their exact words have been used, then their writing has been placed
in italics and inside quotation marks, and referenced.
5. This dissertation does not contain text, graphics or tables copied and pasted from
the Internet, unless specifically acknowledged, and the source being detailed in
the dissertation and in the References sections.
Signed: ………………………………………
Ntombiphumile Perceverence Tenza
February 2018

vi
COLLEGE OF AGRICULTURE, SCIENCE AND ENGINEERING
DECLARATION 2 - PUBLICATIONS
Details of contribution to publications that form part and/or include research presented in
this dissertation:
Publication 1 (Formatted for African Journal of Aquatic Science)
NP Tenza, CT Downs & G O’Brien
Application of community metric measures to evaluate the wellbeing of
macroinvertebrate communities in lowland rivers of KwaZulu-Natal
Author contributions:
NPT conceived paper with CTD and GO. NPT collected and analyzed data and wrote the
paper. CTD and GO contributed valuable comments to the manuscript.
Publication 2 (Formatted for African Journal of Aquatic Science)
NP Tenza, CT Downs & G O’Brien
Macroinvertebrate communities of lowland rivers in KwaZulu-Natal and their
response to water quality, quantity and habitat changes
Author contributions:
NPT conceived paper with CTD and GO. NPT collected and analyzed data and wrote the
paper. CTD and GO contributed valuable comments to the manuscript.
Signed: …………………………………………………
Ntombiphumile Perceverence Tenza
February 2018
vii
ACKNOWLEDGEMENTS
First and foremost, I would like to thank Almighty God who have given me the power to
believe in myself and follow my dreams. He gave me faith, hope, perseverance, strength,
knowledge and the opportunity to do this research. I take pride in acknowledging the
insightful guidance of my supervisors Professor CT Downs and Dr GC O’Brien, for sparing
their valuable time whenever I approached them, creative suggestions and for showing me
the way ahead. My sincere appreciation to the National Research Foundation (ZA), Aquatic
Ecosystem Research Programme and South African Pulp and Paper Industries Limited
(Sappi) for financial support.
I sincerely thank my mother TB Cele and step father TD Mthenbu whose wisdom,
love and guidance are with me in everything I pursue. I will also like to thank them and my
little sister SA Mthembu for taking care of my son while I was always away studying. Most
importantly, I would like to express my gratitude to my wonderful son, LS Hlengwa who
provide unending inspiration in everything I do. I have great pleasure in thanking PS
Hlengwa for endless support and the encouragement for pursuing this research
successfully. I sincerely thank N Senoge and O Agboola in ensuring that I pass my SASS5
accreditation and for assisting me in data collection. I would also like to thank my friends
for being my support structure and keeping me motivated always.
viii
TABLE OF CONTENTS
ABSTRACT ........................................................................................................................ ii
PREFACE .......................................................................................................................... iv
DECLARATION 1 - PLAGIARISM ............................................................................... v
DECLARATION 2 - PUBLICATIONS .......................................................................... vi
ACKNOWLEDGEMENTS ............................................................................................ vii
TABLE OF CONTENTS .............................................................................................. viii
LIST OF FIGURES .......................................................................................................... xi
LIST OF TABLES ......................................................................................................... xiii
CHAPTER 1 ....................................................................................................................... 1
Introduction ........................................................................................................................ 1
1.1 Riverine ecosystem drivers ........................................................................................ 2
1.1.1 Water quality ....................................................................................................... 3
1.1.2 Habitat ................................................................................................................. 4
1.1.3 Sediment/ substrate ............................................ Error! Bookmark not defined.
1.2 Freshwater macroinvertebrates .................................................................................. 4
1.3 Description of study areas .......................................................................................... 5
1.3.1 Thukela River ...................................................................................................... 5
1.3.2 uMvoti River........................................................................................................ 6
1.4 Problem statement ...................................................................................................... 7
1.5 Hypotheses and predictions ........................................................................................ 8
1.6 Aim and objectives ..................................................................................................... 8
1.7 Dissertation structure.................................................................................................. 8
1.8 References .................................................................................................................. 9
CHAPTER 2 ..................................................................................................................... 14
ix
Application of community metric measures to evaluate the wellbeing of
macroinvertebrate communities in lowland rivers of KwaZulu-Natal ........... 14
Abstract .......................................................................................................................... 14
2.1 Introduction .............................................................................................................. 15
2.2 Methods .................................................................................................................... 18
2.2.1 Study area .............................................................................................................. 18
2.2.2 Site selection ...................................................................................................... 19
2.2.3 Field data collection ........................................................................................... 21
2.2.4 Habitat integrity ................................................................................................. 22
2.2.5 Data analysis ...................................................................................................... 23
2.3 Results ...................................................................................................................... 24
2.3.1 uMvoti River and its associated tributary (Ntchaweni) ..................................... 24
2.3.2 Thukela River and its associated tributary (Mandeni) ....................................... 28
2.4. Discussion ............................................................................................................... 32
2.4.1 uMvoti River and its associated tributary (Ntchaweni) ..................................... 32
2.4.2 Thukela River and its associated tributary (Mandeni) ....................................... 34
2.4.3 uMvoti and Thukela Rivers (along with their associated tributaries) ............... 35
2.4.5 Conclusions ....................................................................................................... 36
2.5 Acknowledgements .................................................................................................. 37
2.6 References ................................................................................................................ 37
2.7 Appendices ............................................................................................................... 42
CHAPTER 3 ..................................................................................................................... 45
Macroinvertebrate communities of lowland rivers in KwaZulu-Natal and their
response to water quality, quantity and habitat changes ................................. 45
Abstract .......................................................................................................................... 45
3.1 Introduction .............................................................................................................. 46
3.2 Methods .................................................................................................................... 47
3.2.1 Study sites .......................................................................................................... 47
x
3.2.2 Field data collection ........................................................................................... 49
3.2.3 Physico-chemical variables ............................................................................... 50
3.2.4 Data analysis ...................................................................................................... 50
3.3 Results ...................................................................................................................... 51
3.3.1. Multivariate Statistical Analysis ....................................................................... 52
3.3.2 Physico-chemical parameters ............................................................................ 59
3.4. Discussion ............................................................................................................... 60
3.4.1 uMvoti River and its associated tributary .......................................................... 61
3.4.2 Thukela River and its associated tributary ........................................................ 62
3.4.3 Conclusions ....................................................................................................... 64
3.5 Acknowledgements .................................................................................................. 65
3.6 References ................................................................................................................ 65
3.7 Appendices ............................................................................................................... 70
CHAPTER 4 ..................................................................................................................... 72
Conclusions ....................................................................................................................... 72
4.1 Conclusions .............................................................................................................. 72
4.2 Recommendations .................................................................................................... 74
4.3 References ................................................................................................................ 75
xi
LIST OF FIGURES
Figure 2. 1: Map of the study area showing all 9 study sites from uMvoti and Thukela
Rivers as well as associated tributaries (Ntchaweni and Mandeni Rivers). ............... 18
Figure 2. 2: Trends regarding the macroinvertebrate community wellbeing determined by
a) SASS5 and b) MIRAI analysis during the study period (1999 – 2016) for the high
(H) and low (L) flow surveys in the four study sites of the uMvoti River. ................ 25
Figure 2. 3: Average score per taxa (ASPT) (y-axis) and South African Scoring System
(SASS) score (x-axis) plotted for the lower uMvoti river. This plot is primarily based
on the integrity category bands from North Eastern Coastal Belt developed by Dallas
(2007).......................................................................................................................... 26
Figure 2. 4: Number of taxa recorded during the study period (1999 – 2016) for the high
(H) and low (L) flow surveys in the four study sites of the uMvoti River. ................ 27
Figure 2. 5: Trends regarding the macroinvertebrate community wellbeing determined by
a) SASS5 and b) MIRAI analysis during the study period (2005 – 2016) for the high
(H) and low (L) flow surveys in the four study sites of the Thukela River. ............... 30
Figure 2. 6: Average score per taxa (ASPT) (x axis) and South African Scoring System
(SASS) score (x-axis) plotted for the lower Thukela river. This plot is primarily
based on the integrity category bands from North Eastern Coastal Belt developed by
Dallas (2007). ............................................................................................................. 30
Figure 2. 7: Number of taxa recorded during the study period (2005– 2016) for the high
(H) and low (L) flow surveys in the four study sites for Thukela River .................... 31
Figure 3. 1: Map of the study area showing all 9 sites from uMvoti and Thukela Rivers as
well as associated tributaries (Ntchaweni and Mandeni Rivers). ............................... 49
Figure 3. 2: Redundancy analysis bi-plots of the macroinvertebrate community
structures, displaying dissimilarity among sites evaluated in this study. The points on
the RDA ordination diagram represented the variation in macroinvertebrate
communities whereas the arrows represented sites. The first two axes of the RDA
accounted for 70.3% of the total variation explained by the different sites, 50% on
the first axis and an additional 19.5% on the second axis. ......................................... 52
Figure 3. 3: Redundancy analysis bi-plots of the macroinvertebrate communities and
temporal changes (historical and present). The points on the RDA ordination diagram
represented the variation in macroinvertebrate communities whereas the arrows
represented and temporal changes. In the ordination bi-plot, 100% of the variation

xii
within the data is represented, 71.3% on the first axis and an additional 28.7% on the
second axis. ................................................................................................................. 53
Figure 3. 4: Redundancy analysis bi-plots of the uMvoti and Thukela Rivers
macroinvertebrate communities and SASS5 variables. The points on the RDA
ordination diagram represented the variation in macroinvertebrate communities
whereas the arrows represented SASS5 variables. In total, the RDA summarized
84.2% of the total variation in the first two axes, with axis one explaining 63.1% and
an additional 48.1% on the second axis ...................................................................... 54
Figure 3. 5: a) Redundancy analysis bi-plots of the macroinvertebrate communities,
MIRAI scores and SASS5 outcomes. In the ordination bi-plot, 75.8% of the variation
within the data is represented, 52% on the first axis and an additional 23.8% on the
second axis. b) Redundancy analysis bi-plots of the macroinvertebrate communities,
MIRAI and SASS5 ecological classes. The first two axes of the RDA account for
76.6% of the total variation explained by the different sites, 55.6% on the first axis
and an additional 22% on the second axis. On both ordination bi-plots, the points
represented the variation in macroinvertebrate communities whereas the arrows
represented SASS5 and MIRAI variables. ................................................................. 57
Figure 3. 6: Redundancy analysis bi-plot of macroinvertebrate communities and water
quality variables. The points on the RDA ordination diagram represented the
variation in macroinvertebrate communities whereas the arrows represented water
quality variables. In the ordination plot 69.7% of the variation within the data was
presented, 51.3% on the first axis and an additional 18.4% on the second axis. ....... 58
Figure 3. 7: Redundancy analysis bi-plot of macroinvertebrates and sediment grain-size
variables. The points on the RDA ordination diagram represented the variation in
macroinvertebrate communities whereas the arrows represented sediment grain-size. The
first two axes of the RDA accounted for 93.6% of the total variation explained by the
different sites, 85.7% on the first axis and an additional 7.9% on the second axis...59

xiii
LIST OF TABLES
Table 2. 1: Habitat integrity assessment categories for the IHAS and IHI habitat quality
indices (following Kleynhans 1999; Dallas 2005). .................................................... 23
Table 2. 2: The Index of Habitat Integrity (IHI) and Integrated Habitat Assessment
System (IHAS) of the lower uMvoti River during the study period (1999 – 2016)... 28
Table 2. 3: The Index of Habitat Integrity (IHI) and Integrated Habitat Assessment
System (IHAS) of the lower Thukela River during the study period (2005 – 2016). 32
1
CHAPTER 1
Introduction
Seventy one percent (%) of earth is covered in water, 97 % of which contains salt, leaving
only 3 % as freshwater (William 2014). Very little amount (1%) support total life (readily
available surface freshwater). Of that 1%, approximately 68.7% is frozen in icecaps and
glaciers while another 30% or so is locked up in the ground (Mishra and Dubey, 2015).
Climate change has been gradually causing major concerns about the limited accessible
surface freshwater and the impact has been that many countries are water scarce. In addition
to being hit by this phenomenon, South Africa is currently classified as a semi-arid and
water scarce country that receives an average precipitation of approximately 450 mm per
year, less than the world average (approximately 860 mm p.a.) (DWAF 2004; Hill 2007;
Otieno and Ochieng 2007; Kohler 2016). Freshwater resources are regarded as the most
degraded ecosystems in South Africa and that due to anthropogenic stressors like
overexploitation, invasion by exotic species, industrial pollution and effluents, extensive
agricultural practices, mining activities, increased urbanisation as well as social and
economic development in peri-urban and urban centers (Farrel 2014). Such stressors
exacerbate the degradation of aquatic biodiversity and they also result in the loss of key
ecosystem services (Deborde et al. 2016). Hence, it is of great importance to protect,
manage and conserve freshwater ecosystems.
In 1998, the South African National Water Act (NWA), Act 36 of 1998 (NWA
1998) was formed to protect, manage and conserve South Africa’s water resources in a way
that considers human basic needs of the present and the future. The NWA was also aimed
at promoting equality to access, efficient use and the beneficial use of water in the public
interest (NWA 1998). Additionally, the NWA was developed for ensuring that the current
and future ecological integrity of aquatic ecosystems are developed and sustained (NWA
1998). For this to happen, factors that drive the ecological integrity of aquatic ecosystems
need to be determined and controlled if possible (Malherbe 2006). Over the years, water
quality (physico-chemical parameters) has been the most widely used method for assessing
the ecological integrity of aquatic ecosystems. However, the use of this method alone was
found to be insufficient, meaning that it cannot provide a precise explanation of the overall
condition of an ecosystem, instead it reflects snapshots of the condition (Kenney et al.
2009). Many factors other than water quality have a significant impact on the overall
2
condition of aquatic ecosystems. Such factors include habitat modifications, altered flows
as well as invasion by exotic species (Roux 1999). Therefore, the effective method for a
comprehensive assessment of aquatic ecosystem must consider the cumulative effect of all
these factors (Roux 1999).
Biomonitoring has increasingly been recognised as a crucial method for assessing
and monitoring aquatic ecosystems. This assessment method uses biological responses of
aquatic communities such as algae, fish and macroinvertebrates to evaluate changes in the
aquatic environment (Li et al. 2010). The use of biomonitoring programmes has been
adopted in many parts of the world and the most famous existing programs include the
British River Invertebrate Prediction and Classification (RIVACS) methodology, the
Australian National River Health Programme and the Rapid Bioassessment Protocol for
Use in Stream and Rivers of the United States (Roux 1999). Appropriate concepts from
these programmes were used in the development of the South African River Health
Programme (RHP) in 1994 by the Department of Water Affairs and Forestry (Roux 1999).
The RHP development was based on the idea that combined aquatic communities (such as
fish, macroinvertebrate and riparian vegetation) reveal the effects of anthropogenic
disturbances that occur in rivers over a long period of time (DWAF 2008). Information
obtained through the RHP gives an overall condition of the riverine ecosystems (Boulton
1999). It is also used in the development of effective strategies for river protection,
conservation and management (Boulton 1999). To further support the management and
protection of riverine ecosystems, ecological classification (Eco Classification) was
developed. The purpose of Eco classification was to determine and categorise the current
ecological integrity of rivers compared to their pristine state (Kleynhans and Louw 2007).
This allowed researchers to gain insights and understanding about the causes and sources
of the deviation of the current ecological state from the reference/pristine condition
(Kleynhans and Louw 2007). The Eco Classification permits the collection of information
that is desirable and attainable for developing future ecological objectives for the riverine
ecosystems (Kleynhans and Louw 2007).
1.1 Riverine ecosystem drivers
Riverine ecosystems are very important as they provide valuable ecosystem services. They
are documented to have rich fauna that have communities with a complex structure and
3
high biological value (Benetti 2012). Riverine ecosystems have special topology which
makes them fragile and vulnerable to direct and indirect anthropogenic stressors (Benetti
2012; Maddock 1999). To satisfy human needs, rivers systems have been manipulated over
the past years by constructing dams, weirs and reservoirs. This alters the ecological
characteristics of the rivers and it has adverse impact on habitat quality and availability.
The degradation of habitat itself pose the greatest threat to the biodiversity of aquatic
communities (Ferrel 2014). Other important pressures that affects riverine ecosystems
include change in land-use, altered flow regimes, loss of river connectivity due to river
regulation, excessive nutrient loads inputs, sedimentation through erosion, invasion by
exotic species and climate change (Gosselin et al. 2016). All these pressures have been
recognised to act simultaneously and somehow, they partially intensify or cancel each
other’s effect (Gosselin et al. 2016). Rivers are identified as significant and sensitive
ecosystems, however, the mitigation opportunities for them are inadequate because the way
in which they respond to the water resource use stressors is poorly understood. Thus, it is
very importance to do more research that assess the response of the riverine ecosystems to
changes in environmental variables.
1.1.1 Water quality
Water quality is fundamental for healthy ecosystems and it is defined by it physical,
chemical and aesthetic (appearance and smell) characteristics (Venter 2013). Different
land-use can significantly alter both chemical and physical water conditions which can
subsequently reduce the biological integrity within riverine ecosystems (Farrel 2014). The
physical, chemical and aesthetic characteristics are primarily influenced by the substances
that are either suspended or dissolved in water column. Impacts of agriculture and
urbanisation particularly in lowland areas are most predominant, placing a significant strain
on water quality and quantity. Pesticides and fertilisers containing phosphate and nitrate
from cultivated areas cause nutrient enrichment which accelerates the growth of
phytoplankton (Johnston and Dawson 2005). Increased growth rates of such species (and
bacteria) lead to an increase in water turbidity, macrophyte growth and algal blooms
(Chapman 1996). The presence of excessive algae in water results in the reduction of
dissolved oxygen which is a vital feature for riverine ecosystems. Low oxygen content in
water impacts many aquatic organisms which require high levels of dissolved oxygen to
survive (McCartney 2010). For example, stoneflies (Plecoptera) and caddisfly larvae
4
(Trichoptera) are always abundant in well oxygenated and running waters, suggesting that
they are intolerant to pollution and oxygen depletion (Olomukoro and Dirisu 2014).
Water temperature is another important feature which affects water quality
(Chapman 1996). An increase in water temperature is correlated with an increase in water
chemical reactions, this lead to high evaporation and volatilisation (Chapman 1996).
Moreover, solubility of gases like oxygen, carbon dioxide and nitrogen tend to decrease if
the water temperature increases (Chapman 1996). As a result, the respiration rate of
organisms intensifies causing an increase in oxygen consumption and decomposition of
matter (McCartney 2010). Changes in pH also have a significant impact on water quality
because higher pH can convert ammonium (NH4) to a more toxic form, ammonia (NH3)
(McCartney 2010). Low pH also has a negative effect to some aquatic macroinvertebrates,
for example, Mayflies and Stoneflies faces an increased loss of sodium in their blood when
exposed to low pH (Sutcliffe and Hildrew 1989). Thus, alterations in pH in a system has
an adverse impact on the biodiversity of aquatic organisms.
1.1.2 Habitat
Habitat quality and availability are the most considered aspects when assessing habitat
integrity of many systems because they determine the survival of different organisms
within an ecosystem (Malherbe 2006; Carminati 2008). Habitat types of rivers include
pools, rapids, sandbanks, bedrock, boulders, cobbles, gravel, sand, mud, runs and riffles
(Malherbe, 2006). Riparian zones and vegetation are known to be extremely important
because they promote heathy aquatic ecosystems (Malherbe 2006). For example, shrub and
tree roots hold streambanks in place, preventing erosion (Venter 2013). Riparian vegetation
filters light and nutrients, provides multiple habitats for aquatic organisms and they are
responsible for flood attenuation (Malherbe 2006).
1.2 Freshwater macroinvertebrates
For this study, changes in habitat and water quality are the main aspects that are evaluated
using freshwater macroinvertebrates as bioindicators. Freshwater macroinvertebrates are
regarded as a fundamental part of aquatic ecosystems. They include aquatic insects (such
as stoneflies, mayflies, dragonflies, and rat-tailed maggots), mollusks (snails), fresh water
crustaceans (crayfish and scuds), annelids (worms and leeches), and all other organisms
that live permanently or during certain periods of their life cycle linked to the aquatic

5
ecosystems (O’Keeffe and Dickens 2000). Freshwater macroinvertebrates have individuals
with macroscopic size of normally above 1 mm (Benetti 2012). They are regarded as
excellent indicators of anthropogenic impacts and because of that they are highly
recommended and frequently used when evaluating the biological integrity of riverine
ecosystems. The reliability of using such organisms is based on the idea that there is a vast
knowledge of their sensitivity to different stresses, they are abundant, easy to collect
(visible to the naked eye) and easy to identify in the laboratory (Bredenhand 2005; Leunda
et al. 2009). Other benefits of using freshwater macroinvertebrates as biological indicators
include their limited mobility and relatively long-life histories (often live for more than a
year) which enables them to integrate the effects of the stressors to which they are exposed
to over time (Ferrel 2014).
In the mid-1990s macroinvertebrate community structures were commonly used to
assess the ecological integrity of lotic and riverine ecosystems (O’Brien 2011). By the late
1990s many South African researchers had already adopted the frequent use of such
communities as biological indicators of ecosystem health (O’Brien 2011, O’Keeffe and
Dickens 2000). Reece and Richardson (1999) stated that macroinvertebrate community
structures change both temporally and spatially. This is due to alterations that usually occur
in the environment within which they inhabit. Such environmental changes are caused by
a mixture of geographic factors, water chemistry, habitat stability, and/or land use (Reece
and Richardson 1999). Seasonal change was also documented to be one of the major aspects
that drive environmental factors (like water temperature and resource availability) which
play an important role on the persistence of macroinvertebrate communities. Hence, the
present research considered both low flow and high flow seasons when sampling.
1.3 Description of study areas
1.3.1 Thukela River
The Thukela River is the largest river system in KwaZulu-Natal (KZN) Province, South
Africa (Stryftombolars 2008). This catchment originates from the Drakensburg escarpment
and it meanders 520 km through the central KZN until it reaches the Indian Ocean at
approximately 85 km north of Durban (Stryftombolars 2008, Venter 2013). Tributaries of
this catchment include the Klip River, Mooi River, Mzinyathi “Buffalo” River, Sundays
River, Ingangani River, Blood River and Bushmans River (DWAF 2001a; Stryftombolars

6
2008; Venter 2013). The catchment area of this river is estimated to be approximately 29
000 km2 with the MAR (mean annual runoff) of 3 865x106 m3 (Whitfield and Harrison
2003; Stryftombolars 2008). When looking at the MAR alone, Thukela catchment is the
second largest river in South Africa, following the Orange River which is in first position
(Stryftombolars 2008). Thukela catchment water is transferred to other systems, for
example, the Tugela-Vaal Transfer Scheme which was commissioned in November 1974
(Davies 1982). A certain amount of the water from the Tugela River is transferred via
canals, pipelines and dams into the Vaal River system (DWS 2014) to provide for
increasing water demand due to urbanisation and industrialisation in the Gauteng area.
Water from the Thukela catchment is also used by people that reside within the
Thukela basin. The areas that this study focused primarily on included the Sundumbili
community, eMandini community and industrial complexes (Stryftombolars 2008, Venter
2013). The hazards generated by these areas (especially industries) include several water
quality related impacts and habitat disturbance (Stryftombolas 2008; O’Brien et al. 2009;
O’Brien 2010). The Sappi Tugela Pulp and Paper Mill is one of the industries which largely
impacts the lower Thukela River as it has the extraction and discharge point for effluents
which gives high solid waste (Stryftombolars 2008). The influence of this industry is
intensified by the presence of waste water treatment works as well as the prevalent sugar
plantations (Stryftombolars 2008) which is responsible for nutrient enrichment and
increased siltation.
1.3.2 uMvoti River
The uMvoti River originates from the Natal Midlands, KZN Province, South Africa; it
meanders through a south easterly direction past Greytown and Stanger until pours into the
Indian Ocean at a point that is close to Blythedale Beach (Malherbe 2006; Venter 2013).
The length of this river is approximately 197 km (Shaddock and Wepener 2015). The
Hlimbitwa River is regarded as one of the main tributaries of the UMvoti River and they
both join near Dhlakati (Malherbe 2006; Venter 2013). In 2004 the Department of Water
Affairs and Forestry characterised the uMvoti River as a medium sized river with a total
MAR of approximately 595 million m3/a (DWAF 2004a; Malherbe 2006; Venter 2013).
Stanger and Greytown communities depend largely on the uMvoti River and it is regarded
as having a high socio-economic value (Carminati, 2008, Swemmer, 2011). This catchment
7
is highly impacted by town and village development, sugarcane plantations as well as heavy
industries like Ushukela Sugar Mill, Glendale Distillery and the Sappi Stanger Mill
(Carminati 2008). O'Brien (2010) documented that the habitat integrity of the lower uMvoti
River had decreased to the lowest rating available, suggesting that this system was highly
stressed. As a result, the biodiversity and numerous basic ecosystem functions had been
altered negatively. The pulp and paper mill that is found near the lower uMvoti catchment
produces large amounts of solid waste which have become deposited into the catchment
(Swemmer 2010). Furthermore, informal settlements and intensive poor irrigation and
cultivation practices remove riparian vegetation on the uMvoti River banks which promote
erosion (Swemmer 2010). Sand mining is another factor that has impacted this catchment
by producing lose soils that become eroded to the river channel (Swemmer 2010). This
process turns the river into a winding narrow and braided stream with unnatural flow
(Carminati 2008; Swemmer 2010).
1.4 Problem statement
The Thukela and uMvoti Rivers (along with their associated tributaries) are among the
major rivers in KZN Province. They suffer heavily from anthropogenic disturbances which
require the direct or indirect water uptake from the Thukela and uMvoti Rivers. Some of
the disturbances discharge partially treated effluence on the streams, which in turn results in the
degradation of the ecological integrity. Drought has exacerbated the impact of anthropogenic
disturbances; hence, it is of great important to evaluate the potential impacts such
disturbances have on the overall ecological integrity of the lowland Thukela and uMvoti
Rivers. The present study examined the freshwater macroinvertebrate communities as
ecological indicators of historical and current ecological integrity of these study rivers. The
outcomes will contribute to the implementation of effective strategies for sustaining these
rivers before they reach a point of irreversible changes. The outcomes will also help in
developing suitable strategies for maintaining a desirable balance between the water
resource use and the protection at the lowland sections of both the Thukela and uMvoti
Rivers.
8
1.5 Hypotheses and predictions
It was hypothesised that macroinvertebrates are suitable ecological indicators of the
ecological integrity of the lower uMvoti and Thukela Rivers, KwaZulu-Natal, South Africa.
It was predicted that (1) natural and anthropogenic disturbances have an adverse effect on
stream ecological integrity, and (2) macroinvertebrate communities decrease due to habitat
heterogeneity, changes in water quality parameters and anthropogenic activities on both
rivers. It was also predicted that there is significant change in the ecological integrity of the
lower Thukela and uMvoti Rivers when comparing current and historical data.
1.6 Aim and objectives
The aim of this study was to use macroinvertebrates as ecological indicators of the
wellbeing of lower Thukela and uMvoti Rivers, KZN. The objectives were to:
(1) Assess the freshwater macroinvertebrate communities at the study sites on a spatial
and temporal scale.
(2) Identify environmental driver parameters that were strongly associated with the
persistence of macroinvertebrates communities.
(3) Evaluate the response of freshwater macroinvertebrate communities to changes in
environmental driver parameters.
(4) Determine the link between the macroinvertebrate community changes to the
surrounding anthropogenic land-uses in the study area (agriculture and industrial
activities)
(5) Evaluate the historical and current ecological integrity of the lowland Thukela and
uMvoti Rivers.
(6) Provide river management recommendations.
1.7 Dissertation structure
The dissertation is structured with each data chapter written in a manuscript format for
submission to an international peer review journal. Any repetition was unavoidable. The
chapters are as follows:
Chapter 1: Literature review
9
Chapter 2: Application of community metric measures to evaluate the wellbeing of
macroinvertebrate communities in lowland rivers of KwaZulu-Natal
Chapter 3: Macroinvertebrate communities of lowland rivers in KwaZulu-Natal and their
response to water quality, quantity and habitat changes
Chapter 4: Concluding chapter - Macroinvertebrates as ecological indicators of the
wellbeing of lowland rivers of KwaZulu-Natal.
1.8 References
Benetti CJ, Pérez-Bilbao A, Garrido J. 2012. Macroinvertebrates as indicators of water
quality in running waters: 10 years of research in rivers with different degrees of
anthropogenic impacts. In Ecological Water Quality-Water Treatment and Reuse.
InTech.
Boulton AJ. 1999. An overview of river health assessment: philosophies, practices,
problems and prognosis. Freshwater Biology 41: 469–479.
Bredenhand E. 2005. Evaluation of macroinvertebrates as bio-indicators of water quality
and the assessment of the impact of the Klein Plaas dam on the Eerste River. MSc
Dissertation, University of Stellenbosch, Stellenbosch.
Carminati AV. 2008. An Assessment of the Effects of Sugar Mill Activities on the
Ecological Integrity of the UMvoti and Amatikulu Rivers, KwaZulu Natal. MSc
dissertation, University of Johannesburg, Johannesburg.
Chapman DV. (Ed.). 1996. Water quality assessments: a guide to the use of biota,
sediments, and water in environmental monitoring. 2nd Ed. F & FN Spon. London
de Castro-Català, N, Kuzmanovic M, Roig N, Sierra J, Ginebreda A, Barceló D, ... Muñoz
I. 2016. Ecotoxicity of sediments in rivers: Invertebrate community, toxicity
bioassays and the toxic unit approach as complementary assessment tools.
Science of the Total Environment 540: 297–306.
Deborde DDD, Hernandez MBM, Magbanua FS. 2016. Benthic macroinvertebrate
community as an indicator of stream health: the effects of land use on stream
benthic macroinvertebrates. Science Diliman, 28: 5–26
Department of Water Affairs and Forestry (DWAF). 2008. National Aquatic Ecosystem
Health Monitoring Programme (NAEHMP): River Health Programme (RHP)
10
Implementation Manual. Version 2. ISBN No. 978-0-621-383343-0,
Department of Water Affairs and Forestry, Pretoria.
Department of Water Affairs and Forestry (DWAF). 2004. Draft background information:
South African Forestry, Pulp and Paper industries: Draft version 1. DWAF,
Pretoria.
Department of Water Affairs and Forestry (DWAF). 2004a. National Water Resource
Strategy. DWAF, Pretoria, South Africa.
Farrell KT. 2014. Aquatic Macroinvertebrate Community in the Wilge River. PhD
dissertation, University of Johannesburg, Johannesburg.
Ferreira M, 2005. A study into the anthropogenic impacts affecting the Elands River,
Mpumalanga. PhD dissertation, University of Johannesburg, Johannesburg.
Gosselin MP, Kiesel J, Fohrer N, Langhans S, Jähnig S, Venohr M., Push M. 2016.
Analysing the effects of pressures on riverine ecosystems using models in the
context of ecosystem-based management. 11th ISE, Melbourne, Australia
Hill L 2007. Focus on CSIR research in pollution waste: The South African river health
programme. CSIR, Pretoria.
International Atomic Energy Agency (IAEA). 2003. Collection and Preparation of Bottom
Sediment Samples for Analysis of Radionuclides and Trace Elements. Report No.
IAEA-TECDOC-1360. IAEA, Vienna.
Johnston AE, Dawson CJ. 2005. Phosphorus in agriculture and in relation to water quality.
Peterborough: Agricultural Industries Confederation.
Kenney MA, Sutton-Grier AE, Smith RF, Gresens SE. 2009. Benthic macroinvertebrates
as indicators of water quality: The intersection of science and policy. Terrestrial
Arthropod Reviews 2: 99.
Kleynhans CJ, Louw MD. 2007. Module A: EcoClassification and EcoStatus
determination in River EcoClassification: Manual for EcoStatus
Determination (version 2). Joint Water Research Commission and Department of
Water Affairs and Forestry report. WRC Report, Pretoria.
Kleynhans CJ. 1996. A qualitative procedure for the assessment of the habitat integrity
status of the Luvuvhu River (Limpopo system, South Africa). Journal of Aquatic
Ecosystem Health 5: 41–54.
Kohler M. 2016. Confronting South Africa’s Water Challenge: A Decomposition Analysis
of Water Intensity. South African Journal of Economic and Management Sciences
19: a1590.

11
Leunda PM, Oscoz J, Miranda R, Ariño AH. 2009. Longitudinal and seasonal variation of
the benthic macroinvertebrate community and biotic indices in an undisturbed
Pyrenean river. Ecological Indicators 9: 52–63.
Li L, Zheng B, Liu L. 2010. Biomonitoring and bioindicators used for river ecosystems:
definitions, approaches and trends. Procedia Environmental Sciences 2: 1510–
1524.
Malherbe CW. 2006. The current ecological state of the lower UMvoti River, KwaZulu-
Natal. MSc dissertation, University of Johannesburg, Johannesburg.
McCartney BA. 2010. Evaluation of Water Quality and Aquatic Ecosystem Health in the
Mara River Basin East Africa. PhD dissertation, Florida International University,
Miami.
McMillan PH. 1998. An Integrated Habitat Assessment System (IHAS v2) for Rapid
Biological Assessments of Rivers and Systems. Division of the Environment and
Forestry Technology. Report No. Env-P-I 98132. CSIR, Pretoria.
Mishra RK, Dubey, SC. 2015. Fresh Water Availability and its Global
Challenge. International Journal of Engineering Science Invention Research and
Development 2: 351–407.
National Water Act (Act No. 36 of 1998). Republic of South Africa 1998. Government
Gazette, (19182).
Niemirycz E, Gozdek J, Koszka-Maron D. 2006. Variability of organic Carbon in water
and sediments of the Odra River and its tributaries. Polish Journal of
Environmental Studies 15: 557–563.
O’Brien GC, Swemmer R, Wepener V. 2009. Ecological integrity assessment of fish
assemblages of the Matigulu/Nyoni and UMvoti estuaries, KwaZulu-Natal, South
Africa. African Journal of Aquatic Science 34: 293–302.
O'Brien GC. 2010. Ecological State Assessment of the Lower Thukela River/Estuary,
KwaZulu-Natal. Investigational Report. Rivers of Life: Aquatic Health Services,
Potchefstroom.
O'Brien GC. 2011. Regional Scale Risk Assessment Methodology using the Relative Risk
Model as a Management Tool for Aquatic Ecosystems in South Africa.
Unpublished PhD dissertation. University of Johannesburg, Johannesburg, South
Africa.
O'Keeffe J. Dickens C. 2000. Aquatic invertebrates. In: King J.M., Tharme R.E. and De
Villiers M.S. (eds.) Environmental Flow Assessments for Rivers: Manual for the

12
Building Block Methodology. WRC Report No. 576/1/98. Water Research
Commission, Pretoria. pp. 231–244.
Olomukoro JO, Dirisu A. 2014. Macroinvertebrate community and pollution tolerance
index in Edion and Omodo Rivers in derived savannah wetlands in Southern
Nigeria. Jordan Journal of Biological Sciences 7: 19–24.
Otieno FAO, Ochieng GMM. 2007. Water management tools as a means of averting a
possible water scarcity in South Africa by the year 2025. Water South Africa 30:
120–124.
Page DW. 2002. Characterisation of organic matter in sediment from Corin Reservoir,
Australia. Journal for Analytical and Applied Pyrolysis 70: 69–183.
Reece PF, Richardson JS. 1999. Biomonitoring with the reference condition approach for
the detection of aquatic ecosystems at risk. In: L.M. Darling (ed.) Proceedings of
a Conference on the Biology and Management of Species and Habitats at Risk.
15–19 February 1999, Kamloops, B.C. pp. 549–552.
Roux DJ. 1999. Incorporating Technologies for the Monitoring and Assessment of
Biological Indicators into a Holistic Resource-Based Water Quality Management
Approach-Conceptual Models and Some Case Studies. PhD dissertation, Rand
Afrikaans University, Johannesburg.
Shaddock BF, Wepener V. 2015. An evaluation of the weight of evidence approach to
assess sediment quality in the UMvoti Estuary, KwaZulu-Natal, South Africa,
African Journal of Aquatic Science 40: 235–246
Stryftombolas IC. 2008. Ecotoxicological Assessment of the Impact of Paper and Pulp
Effluent on the Lower Thukela River Catchment, KwaZulu-Natal, South Africa,
and the Toxicological Assessment of Similar Effluent from Two Other Mills.
MSc Dissertation, University of Johannesburg, Johannesburg.
Sutcliffe DW, Hildrew A.G. 1989. Invertebrate communities in acid streams. Acid toxicity
and aquatic animals 34: 13–28.
Swemmer R. 2010. Ecological integrity assessment of the UMvoti Estuary, KwaZulu-
Natal, South Africa. MSc dissertation, University of Johannesburg,
Johannesburg.
Venter AJ, van Vuuren JHJ. 1997. The effects of gold mine related operations on the
physical and chemical characteristics of sediment texture. Water SA 23: 249–256.

13
Venter JJ. 2013. An ecological integrity assessment of the lower Amatikulu, Thukela and
UMvoti Rivers, KwaZulu-Natal, South Africa. PhD dissertation, North-West
University, Potchefstroom.
Whitfield AK, Harrison TD. 2003. River flow and fish estimated abundance in a South
African estuary. Journal of Fish Biology 62: 1467–1472.
Williams M, 2014. What Percent of Earth is Water. Universe Today. Available at
http://www. Universe today. com/65588/what-percent-of-earth-is.
14
CHAPTER 2
Application of macroinvertebrates bioassessment metrics to evaluate the ecological
integrity of lowland Thukela and uMvoti rivers of KwaZulu-Natal
NP Tenza, CT Downs and GC O’Brien
School of Life Sciences, University of KwaZulu-Natal, Private Bag X01,
Pietermaritzburg 3209, South Africa
Formatted for African Journal of Aquatic Science
Abstract
Aquatic macroinvertebrates are a fundamental part of aquatic ecosystems and they are
frequently used and highly recommended as biological indicators of stream health. This
study incorporated the use of macroinvertebrate community structures to evaluate the
ecological integrity of the lower uMvoti and Thukela Rivers along with their associated
tributaries (Ntchaweni and Mandeni). Two community metric measure approaches namely
the South African Scoring System (SASS, version 5) and the Macroinvertebrate Response
Assessment Index (MIRAI) were used in this study. The outcomes revealed better
ecological integrity state within the two sites situated in the upper reaches of the study area
due to minimal human disturbances and adequate habitat heterogeneity which allowed
more families to thrive successfully. Results also demonstrated that the ecological integrity
of the uMvoti and Ntchaweni Rivers were being degraded and they were dominated by
pollution tolerant families. The Thukela and Mandeni Rivers also demonstrated relatively
poor ecological integrity throughout the study periods. The SASS5 and MIRAI tools were
implemented successfully as they generated suitable trends which indicated the response
of macroinvertebrate community to changes in environmental variable conditions due to
water resource use. However, the SASS5 tool was to some extent less suitable for the
overall assessment of the integrity states as it considered water quality at the primary driver
of change. On the other side, the MIRAI tool was found to be more responsive, robust and
more informative about the drivers of change. This can be attributed to the fact that it
considers multi-metric approach when generating the macroinvertebrates integrity states.
15
The outcomes of the study further illustrated that macroinvertebrate integrity trends
generated by SASS5 tool had high variability whereas the MIRAI trends had less
variability. Again, this can be associated with the use of multiple metrics as probably driver
of changes in macroinvertebrates communities.
Keywords Macroinvertebrate communities · SASS5 · MIRAI · Anthropogenic activities ·
Ecological integrity state
2.1 Introduction
Aquatic macroinvertebrate communities are frequently used and highly recommended as
biological indicators of the wellbeing of aquatic ecosystems (Oertel and Salánki 2003). The
long history of using macroinvertebrates as bioindicators is ascribed to representative taxa
preferring sedentary habits, rapid life cycles, taxa occupying varied trophic levels and
variable pollution tolerances. This information in turn provides strong evidence for
interpreting cumulative effects of natural and anthropogenic disturbances on riverine
ecosystems (Li et al. 2010). Macroinvertebrate biological indices have been used as early
as 1970’s. The implementation of the Clean Water Act in 1972 in the United States paved
the way for the development of bioassement methods for assessing conditions of water
resources (Fourie et al. 2014). Such bioassement methods were developed based on
biological communities including fish, periphyton, benthic macroinvertebrates, plants,
birds and amphibians (Jun et al. 2012). From then, benthic macroinvertebrate communities
were the commonly used set organisms for assessing the effect of disturbances on riverine
ecosystems worldwide (Jun et al. 2012). New biological indices based on
macroinvertebrate communities have been developed after the implementation of Water
Framework Directive (WFD) in Europe in 2003 (Poikane et al. 2014). These biological
indices focus primarily on a multimeric approach. Even before this, community metric
measures have been advocated by many aquatic biologists as an efficient tool for
biomonitoring (Poquet et al. 2009). These approaches use measures or metrics that
represent different characters of biological communities in order assess the effect of natural
and anthropogenic disturbances on streams (Yuan and Norton 2003). They also summarize
the overall ecological integrity of a system into single index value or score (Poquet et al.
2009). The success of using such an approach has increased over the past years, and that is
due to diverse measures it uses which includes taxonomic diversity, compositional

16
estimated abundance, and autecological characteristics (e.g., feeding types, habits, and
stressor tolerance values) (Poquet et al. 2009). Each of these measures reveal information
that is potentially useful in distinguishing and understanding biological responses of
macroinvertebrate communities to disturbances (Poquet et al. 2009).
Although many community metrics have been developed thus far, only few have
proven to be robust and have been extensively implemented for assessing effect of
disturbances on streams (Chambers and Messinger 2001). They include the RIVPACS
implement in Europe (Clarke et al. 2003), AusRivas in Australia (Wright 1995), BEAST in
Canada (Reynoldson et al. 1995), Multimetric Macroinvertebrate Index Flanders in
Belgium (Flanders) (Gabriels et al. 2010), the I2M2 in France (Mondy et al. 2012), the
STARICMi in Italy (Buffagni et al. 2006), the multimetric index (METI) in NW Spain
(Pardo et al. 2009) and the South African Scoring System (SASS) version 5 (Dickens and
Graham 2002). In 1994, Chutter developed the simple, quick and cost-effective method for
sampling macroinvertebrate communities in river systems of South Africa. This SASS
method was developed based on the British Biological Monitoring Working Party (BMWP)
method as a foundation (Dickens and Graham 2002). The SASS method is similar to rapid
bioassessment methods such as RIVPACS (Wright et al. 1984), IBMWP (Alba-Tercedor
et al. 2002) and SIGNAL (Chessman 1995) because it also evaluates macroinvertebrate
diversity at a family level (Bellingan et al. 2015). This assessment also allocates sensitivity
scores to each macroinvertebrate family based on how the organisms within that family are
intolerant to water quality alteration or habitat modifications (Bellingan et al. 2015). For
example, Oligoneuridae, Blephariceridae and Ephemeridae are given a sensitivity score of
15 suggesting that they are highly intolerant families that require good water quality to
survive. The Oligochaeta, Coelenterata and Culicidae possesses a sensitivity score of 1,
suggesting that they are highly tolerant families that can survive in poor water quality. Such
families have adaptations that enables them to thrive successfully in water with low
dissolved oxygen, turbid waters or nutrient-enriched waters. Historically, the SASS method
been refined/upgraded (SASS 1 – SASS5), with each upgrade improving robustness
(Dickens and Graham 2002). The current method, SASS version 5 (SASS5), has become
the backbone of the South African River Health Programme (RHP), River Eco-Status
Monitoring Programme (REMP) and other organisations e.g. Umgeni Water and other
environmental consultancies. The SASS method relies primarily on water quality and this
limit the success of using this method because water quality alone does not identify specific

17
drivers of macroinvertebrate community structure changes and it is insufficient for
providing a precise explanation of the overall condition of an ecosystem (Kenney et al.
2009).
In 2007, the macroinvertebrate Response Assessment Index (MIRAI) was
developed in South Africa for evaluating riverine ecosystems wellbeing using
macroinvertebrates (Thirion, 2007). The MIRAI primarily depends on the SASS5 method
as it uses information collected using the standard SASS5 method (Dickens and Graham
2002). The MIRAI offers a habitat-based cause-and-effect foundation of community
responses to water quality, flow and habitat variability, to deduce the deviation of the
macroinvertebrate communities from the reference or baseline conditions (Venter 2013).
The MIRAI tool was built on the notion that macroinvertebrate communities incorporate
the effects of the alterations in hydrology, geomorphology and physico-chemical
conditions of riverine ecosystems (Thirion 2016). A draft spreadsheet that includes a semi-
quantitative rating of the intolerances (based on SASS weights), habitat and velocity
preferences is used for MIRAI analysis (Thirion 2007).
The SASS5 and MIRAI tools provide qualitative and quantitative information about
the ecological integrity state of riverine ecosystems (Thirion 2007). Such information is
necessary for steady management of water resource as continuous satisfaction of human
needs pose the greatest threat to the sustainable use of water resources. Creditable data
obtained though monitoring using the SASS5 and MIRAI tools will provide better
understanding of the riverine ecosystems and that will allow for the implementation of
effective strategies for promoting a balance between use and protection rights of South
Africa’s water resources.
The aim of this study was to apply the SASS5 and MIRAI tools to evaluate the
wellbeing of macroinvertebrate communities of the lower uMvoti and Thukela Rivers of
KwaZulu-Natal, South Africa. It was predicted that both indices will exhibit poor
macroinvertebrate community states on both rivers demonstrating the synergistic effect of
excessive water resource use that has altered water quality, flows and habitat. Results from
this study will make an important contribution to understanding the lowland river
ecosystems in KwaZulu-Natal. The information gained in this study will also help uMvoti
and Thukela Rivers stakeholders to better understand the nature of their water resource, as
a means of developing appropriate strategies and/or policies for conserving and managing
such rivers and their associated tributaries.

18
2.2 Methods
2.2.1 Study area
The study area included the lower reaches of the uMvoti and Thukela Rivers in KwaZulu-
Natal, South Africa (Fig. 2.1). The forever increasing demand for water resources in the
Thukela River pose the greatest threat to the structure and functioning of the river
(Whitfield and Harrison 2003). This river is heavily impacted by ecosystem service use that
includes water abstraction for domestic use, industries, agricultural activities, mining,
recreation, wastewater treatments works and roads and rail networks (Malherbe 2006;
Venter 2013; Jacobs 2017). Such ecosystem service negatively impacts natural flow
regimes, water quality and quantity as well as habitat quality (Lamberth et al. 2009). The
uMvoti River is the second river that this study will focus on and it is also heavily impacted
by excessive use of ecosystem services. Activities at the lower uMvoti River include
sugarcane plantations, heavy industries, informal settlements, rural areas, and sewage
treatment works (Malherbe 2006; Venter 2013).
Figure 2. 1: Map of the study area showing all 9 study sites from uMvoti and Thukela
Rivers as well as associated tributaries (Ntchaweni and Mandeni Rivers).
19
2.2.2 Site selection
The study sites selection was based primarily on the aim and objectives of this study as
well as the availability of historical data sampled (O’Brien et al. 2005; Malherbe 2006;
O’Brien et al. 2009; O’Brien 2010; O’Brien 2012; Venter 2013). This study is part of a
long-term river monitoring program which included both historical and present datasets.
The historical data was collected almost every year and during both high and low flows
periods between 1999 – 2015. The present data was collected in 2016. For the latter dataset
two surveys were carried out, the first survey was conducted in April 2016 (high flow
period). This period occurs during the wet season and it is associated with increased water
flow. The second survey was conducted between September and October 2016 (low flow
period). This is regarded as a seasonal phenomenon which is vital for river flow regime and
is defined as reduced flow of water in rivers during lengthy dry weather periods (Deksissa
et al. 2003).
uMvoti River sites and its associated tributary (Ntchaweni)
U4NTCHA-GLEDH: This site was in the Ntchaweni River and it was positioned upstream
of the confluence between Ntchaweni and uMvoti Rivers. This site was heavily impacted
by the Gledhow Sugar Mill nearby. The U4NTCHA-SAPPI site was the second site within
the Ntchaweni River, it was further downstream, and it was highly impacted by the combine
effect of Gledhow Sugar Mill and Sappi Pulp and Paper making activities. The selection of
these sites were based on the notion that they will show the effects caused by industrial
activities of the Ntchaweni stream wellbeing. The marginal vegetation of both sites was
dominated by reeds and grasses. The U4NTCHA-SAPPI was also dominated tress. The
substrate of the U4NTCHA-GLEDH site was dominated by sand and remote gravel while
the U4NTCHA-SAPPI site consists of sand and mud.
U4MVOT-GLEDH: This site was located upstream of the confluence between
Ntchaweni-uMvoti Rivers. This site has minimal human disturbances that may deteriorate
the ecological integrity of the uMvoti River. Sugarcane plantations which occurs upstream
of this site might pose a threat to the river wellbeing. The sand substrate was dominating,
and marginal vegetation was mainly composed of reeds.
U4MVOT-N2BRG: This site was located below the confluence point between
Ntchaweni, Mbozano and uMvoti Rivers. The selection of this site was based on the idea
that this site can reveal the changes in ecological state of uMvoti River after it has mixed
20
with the Ntchaweni stream. It can also be used to evaluate the effect of pollution originating
from the Ntchaweni Stream on the uMvoti River wellbeing. Marginal vegetation was
dominated by reeds and the substrate of this site consists mostly of sand and a bit of gravel.
Thukela River sites and its associated tributary (Mandeni)
V1MAND-WASTE: This site is located in Mandeni tributary and it was situated
downstream of both Isithebe rural area and Isithebe industrial complex as well as iLembe
wastewater treatment works. Furthermore, this site had a lot of solid waste coming from
the dumping site nearby. The selection of this site was based on the idea that it will show
the effects caused by water resource use activities associated with the Mandeni Stream. The
substrate of this site comprised a mixture of bedrock, boulders, and cobbles as well patches
of gravel and sand. The marginal vegetation consists of overhanging vegetation that
includes trees, shrubs, sedges, grasses and reeds.
V1MAND-WEIR: This site was located downstream of the V1MAND-WASTE
and information obtained by monitoring this site will be of great use for revealing the
cumulative impacts caused by industrial activities of Isithebe and Mandeni, wastewater
treatment works, agricultural activities and domestic use of the local communities on the
Mandeni stream. The substrate was dominated by boulders, however, there are isolated
areas of cobbles and mud. The marginal vegetation that consists of large trees, reeds,
sedges, shrubs and grasses
V1THUK-RAILB: This was located upstream of the confluence between Mandeni
and Thukela Rivers. Effluent discharges that originate from the Mandeni Stream does not
affect this site. However, sugarcane plantations, urbanised Sundumbili and the local
communities may pose a threat to the ecological integrity of this site. This site was
dominated by bedrock substrate with few boulders, cobles and sand. Marginal vegetation
of this site was comprised of reeds, shrubs, sedges, grasses and large trees. There was poor
representation of sand biotope.
V1THUK-JOHNR: This site was located downstream of the SAPPI effluent
discharge point and it was also below the confluence between Mandeni and Thukela Rivers.
The selection of this site was based primarily on the notion that it will reveal the impacts
caused by pollution originating from the Mandeni stream as well as the Sappi Tugela Mill
effluent discharges. This site was dominated by sandy substrate and its marginal vegetation
consists of reeds, grasses, shrubs, grasses and trees.
21
V1THUK-ULTIM: This site was in the lower reaches of the Thukela River and it
was found further below VITHUK-JOHNR. The selection of this site was based on the idea
that it will provide reveal the synergistic effects of local communities, pollution originating
from the Mandeni stream, sugarcane plantation and sewage treatment works on the
ecological integrity of the lowland Thukela River. This site was dominated by sandy
substrate and sparse marginal vegetation that consists of large trees, reeds, sedges and
grasses.
2.2.3 Field data collection
The assessment of freshwater macroinvertebrate biota was conducted using the South
African Scoring System (SASS) (version 5), the bioassessment protocol designed for the
rapid water quality assessments (Dickens and Graham 2002). Different macroinvertebrate
families exhibit varied response to pollution and such responses range from highly tolerant
families such as Muscidae, Culicidae and Oligochaeta to highly sensitive families like
Oligoneuridae and Ephemeridae (Mahlangu 2014). Thus, this method enables aquatic
macroinvertebrate communities to indicate the impact of perturbation and habitat
modifications. Samples were collected in the following biotopes:
Stones biotopes
(1) Stones in current (SIC): These included movable stones in current (pebbles and cobbles
of 2–25 cm average size) and/or bedrock (which includes boulders of >25 cm) which were
sampled for approximately 2 minutes (min.). If the bedrock or rocks were highly embedded
the maximum sample time was extended up to 5 min. The SASS net (1 mm mesh on a 30
cm square frame) was placed in a position where the water current will transport the
dislodged organisms into the net.
(2) Stones out of current: The sampling of stones out of current (SOOC) followed
immediately after the SIC were sampled. These were stones out of any noticeable flow and
included bedrock or any solid objects out of current such as movable pebbles and cobbles
of 2–25 cm average size. This was sampled by 1 min. of kicking, turning or scraping of
stones whilst continuously sweeping the net through the disturbed area to collect biota. The
dislodged biota was collected into a net and placed inside a SASS tray (30 cm × 45 cm and
10 cm deep) for identification.
22
Vegetation biotopes
(1) Marginal vegetation (in and out of river current): Any emergent and overhanging
vegetation growing at the edge of the stream both in and out of current were marginal
vegetation and was sampled for an approximate of 2 m in total length. Macroinvertebrates
were sampled by pushing and pulling the net vigorously on the vegetation. (2) Aquatic
vegetation: This comprised mainly of submerged vegetation, which included roots, stems
and floating aquatics and it was sampled for about 1 m2. Even here, macroinvertebrates
were sampled by pushing and pulling the net vigorously on the vegetation.
Gravel, sand and mud biotopes
Gravel, sand and mud (GSM) biotopes were sampled for approximately 1 min. combined.
(1) Gravel: This was mainly small stones of <2 cm in size and these were sampled by
continuous shuffling of feet whilst sweeping the net over the disturbed area to catch
dislodged biota. (2) Sand: This comprised of particles that were <2 mm diameter in size.
Sampling was done by stirring and shuffling the feet in sand whilst continuously sweeping
the net over the disturbed area, mostly in slow moving or still water to catch dislodged
biota. Shuffling of feet should be about 10 – 20 cm deep. (3) Mud, silt and clay particles:
(<0.06 mm diameter) were sampled in the same way as gravel and sand.
Hand picking and visual observation
While sampling different biotopes, approximately 1 min. of “hand picking and visual
observation” was carried out to identify specimens that may have been missed by the
sampling procedure. Thus, extra taxa were recorded on the SASS sheet. Samples were
identified using a macroinvertebrate guide (Dickens and Graham 2002) and total SASS5
score, total number of taxa and ASPT were calculated for each sample. The abundance was
also estimated as per SASS5 method,1 = 1, A = 10, B = 100, C = 1000, D = >1000
After sample identification, the voucher specimens were preserved in polyethylene honey
jars (350 g) with 70% ethanol and were stained with phloxine.
2.2.4 Habitat integrity
The habitat integrity was determined by means of Invertebrate Habitat Assessment Systems
(IHAS) which was developed by McMillan, (1998) and Index of Habitat Integrity (IHI)
developed by Kleynhans, (1996). These two indices are very good at assessing habitat
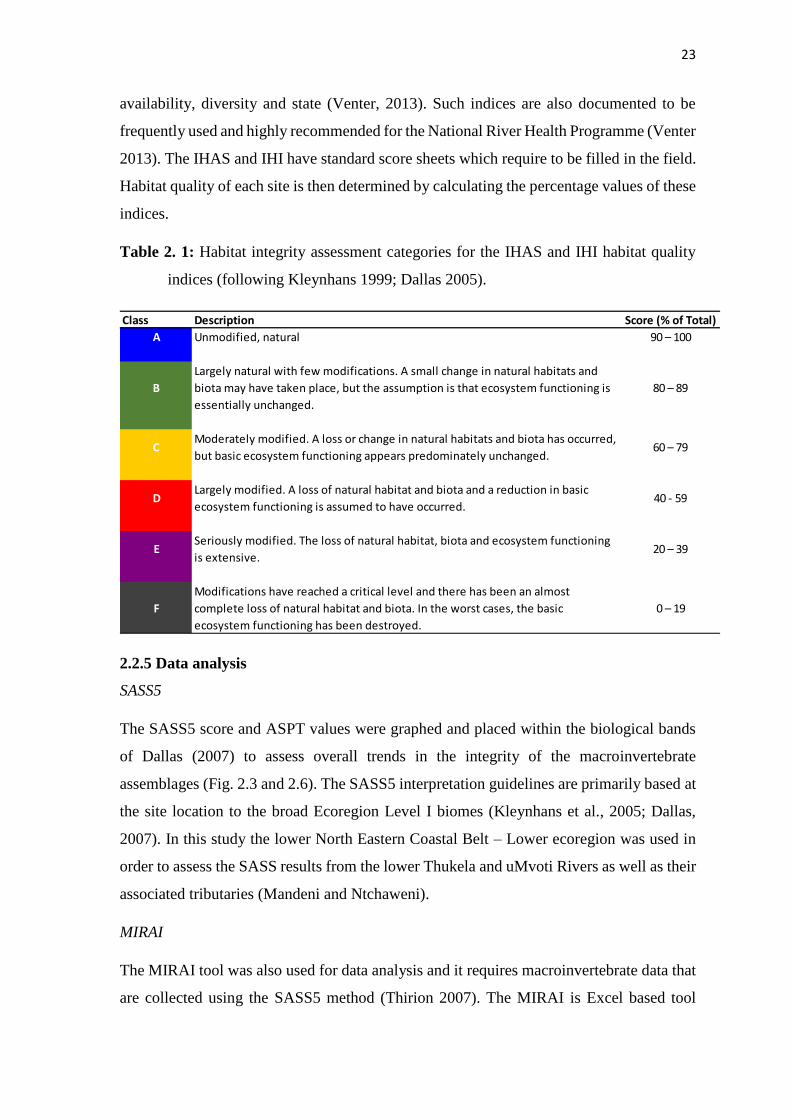
23
availability, diversity and state (Venter, 2013). Such indices are also documented to be
frequently used and highly recommended for the National River Health Programme (Venter
2013). The IHAS and IHI have standard score sheets which require to be filled in the field.
Habitat quality of each site is then determined by calculating the percentage values of these
indices.
Table 2. 1: Habitat integrity assessment categories for the IHAS and IHI habitat quality
indices (following Kleynhans 1999; Dallas 2005).
2.2.5 Data analysis
SASS5
The SASS5 score and ASPT values were graphed and placed within the biological bands
of Dallas (2007) to assess overall trends in the integrity of the macroinvertebrate
assemblages (Fig. 2.3 and 2.6). The SASS5 interpretation guidelines are primarily based at
the site location to the broad Ecoregion Level I biomes (Kleynhans et al., 2005; Dallas,
2007). In this study the lower North Eastern Coastal Belt – Lower ecoregion was used in
order to assess the SASS results from the lower Thukela and uMvoti Rivers as well as their
associated tributaries (Mandeni and Ntchaweni).
MIRAI
The MIRAI tool was also used for data analysis and it requires macroinvertebrate data that
are collected using the SASS5 method (Thirion 2007). The MIRAI is Excel based tool
Class Description Score (% of Total)
A 90 – 100
B
Largely natural with few modifications. A small change in natural habitats and
biota may have taken place, but the assumption is that ecosystem functioning is
essentially unchanged.
80 – 89
CModerately modified. A loss or change in natural habitats and biota has occurred,
but basic ecosystem functioning appears predominately unchanged.60 – 79
DLargely modified. A loss of natural habitat and biota and a reduction in basic
ecosystem functioning is assumed to have occurred.40 - 59
ESeriously modified. The loss of natural habitat, biota and ecosystem functioning
is extensive.20 – 39
F
Modifications have reached a critical level and there has been an almost
complete loss of natural habitat and biota. In the worst cases, the basic
ecosystem functioning has been destroyed.
0 – 19
Unmodified, natural
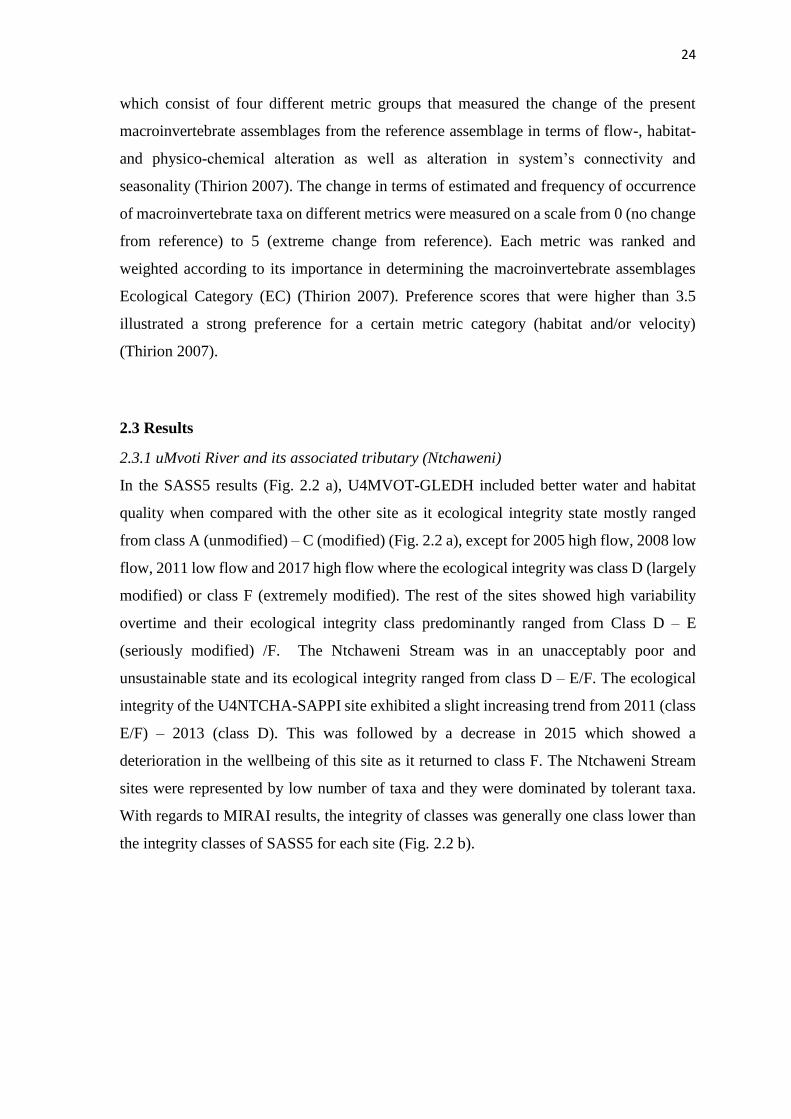
24
which consist of four different metric groups that measured the change of the present
macroinvertebrate assemblages from the reference assemblage in terms of flow-, habitat-
and physico-chemical alteration as well as alteration in system’s connectivity and
seasonality (Thirion 2007). The change in terms of estimated and frequency of occurrence
of macroinvertebrate taxa on different metrics were measured on a scale from 0 (no change
from reference) to 5 (extreme change from reference). Each metric was ranked and
weighted according to its importance in determining the macroinvertebrate assemblages
Ecological Category (EC) (Thirion 2007). Preference scores that were higher than 3.5
illustrated a strong preference for a certain metric category (habitat and/or velocity)
(Thirion 2007).
2.3 Results
2.3.1 uMvoti River and its associated tributary (Ntchaweni)
In the SASS5 results (Fig. 2.2 a), U4MVOT-GLEDH included better water and habitat
quality when compared with the other site as it ecological integrity state mostly ranged
from class A (unmodified) – C (modified) (Fig. 2.2 a), except for 2005 high flow, 2008 low
flow, 2011 low flow and 2017 high flow where the ecological integrity was class D (largely
modified) or class F (extremely modified). The rest of the sites showed high variability
overtime and their ecological integrity class predominantly ranged from Class D – E
(seriously modified) /F. The Ntchaweni Stream was in an unacceptably poor and
unsustainable state and its ecological integrity ranged from class D – E/F. The ecological
integrity of the U4NTCHA-SAPPI site exhibited a slight increasing trend from 2011 (class
E/F) – 2013 (class D). This was followed by a decrease in 2015 which showed a
deterioration in the wellbeing of this site as it returned to class F. The Ntchaweni Stream
sites were represented by low number of taxa and they were dominated by tolerant taxa.
With regards to MIRAI results, the integrity of classes was generally one class lower than
the integrity classes of SASS5 for each site (Fig. 2.2 b).
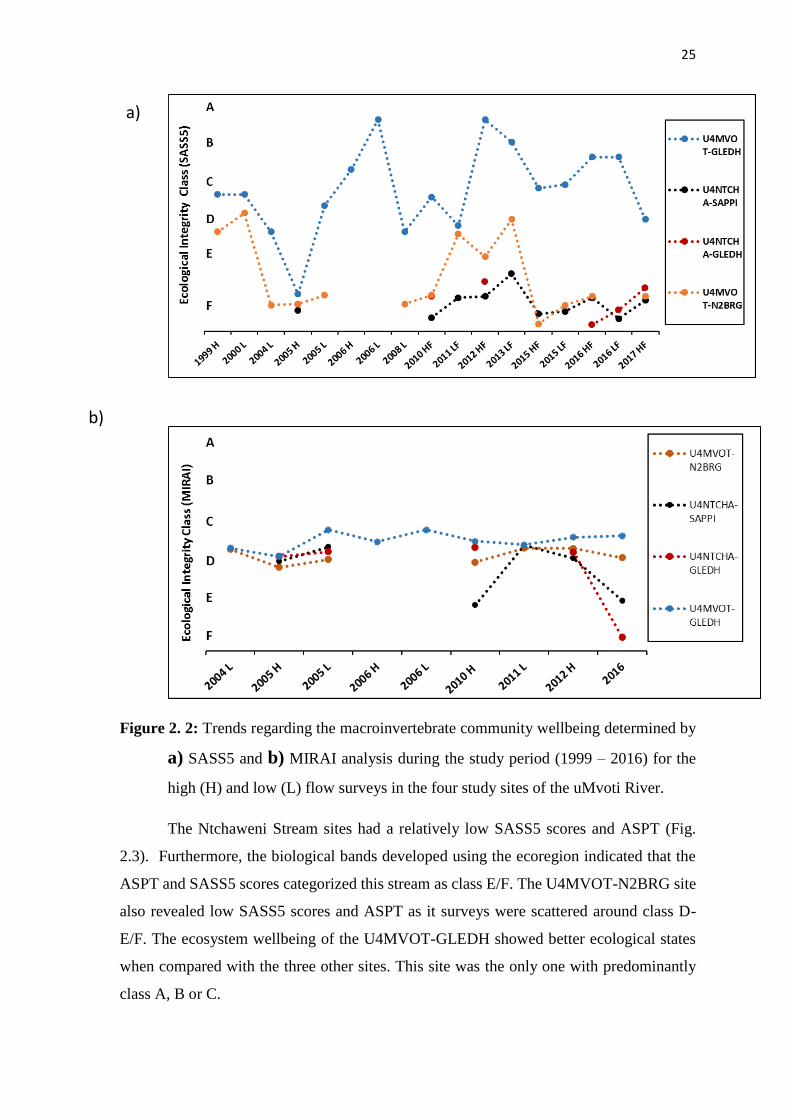
25
Figure 2. 2: Trends regarding the macroinvertebrate community wellbeing determined by
a) SASS5 and b) MIRAI analysis during the study period (1999 – 2016) for the
high (H) and low (L) flow surveys in the four study sites of the uMvoti River.
The Ntchaweni Stream sites had a relatively low SASS5 scores and ASPT (Fig.
2.3). Furthermore, the biological bands developed using the ecoregion indicated that the
ASPT and SASS5 scores categorized this stream as class E/F. The U4MVOT-N2BRG site
also revealed low SASS5 scores and ASPT as it surveys were scattered around class D-
E/F. The ecosystem wellbeing of the U4MVOT-GLEDH showed better ecological states
when compared with the three other sites. This site was the only one with predominantly
class A, B or C.
a)
b)

26
Figure 2. 3: Average score per taxa (ASPT) (y-axis) and South African Scoring System
(SASS) score (x-axis) plotted for the lower uMvoti river. This plot is primarily
based on the integrity category bands from North Eastern Coastal Belt developed
by Dallas (2007). U4MVOT-GLEDH = M-GH, U4MVOT-N2BRG = M-N2,
U4NTCHA-SAPPI = N-SP and U4NTCHA-GLEDH = N-GH.
The number of taxa found within each year in all sites varied extensively depending
on how favourable conditions were during the surveys. Noticeable fluctuations in number
of taxa were observed over the study period (Fig. 2.4). U4MVOT-GLEDH had the highest
number of different taxa, followed by U4MVOT-N2BRG, U4NTCHA-SAPPI and
U4NTCHA-GLEDH. The highest number of taxa was recorded during the 2013 low flow
survey in U4MVOT-GLEDH (23 taxa) whereas the lowest number of taxa was recorded
during the 2016 high flow survey in U4NTCH-GLEDH (2 taxa).
SASS5 Score
ASP
T
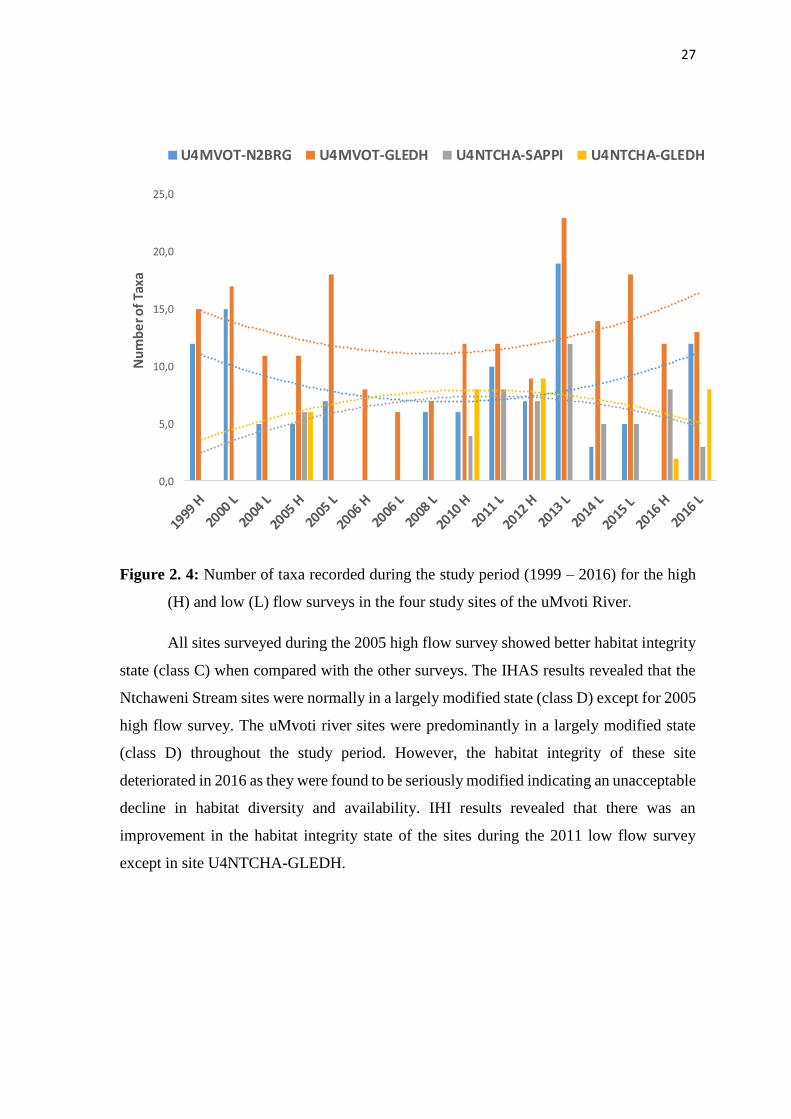
27
Figure 2. 4: Number of taxa recorded during the study period (1999 – 2016) for the high
(H) and low (L) flow surveys in the four study sites of the uMvoti River.
All sites surveyed during the 2005 high flow survey showed better habitat integrity
state (class C) when compared with the other surveys. The IHAS results revealed that the
Ntchaweni Stream sites were normally in a largely modified state (class D) except for 2005
high flow survey. The uMvoti river sites were predominantly in a largely modified state
(class D) throughout the study period. However, the habitat integrity of these site
deteriorated in 2016 as they were found to be seriously modified indicating an unacceptable
decline in habitat diversity and availability. IHI results revealed that there was an
improvement in the habitat integrity state of the sites during the 2011 low flow survey
except in site U4NTCHA-GLEDH.
0,0
5,0
10,0
15,0
20,0
25,0
Nu
mb
er o
f Ta
xa
U4MVOT-N2BRG U4MVOT-GLEDH U4NTCHA-SAPPI U4NTCHA-GLEDH
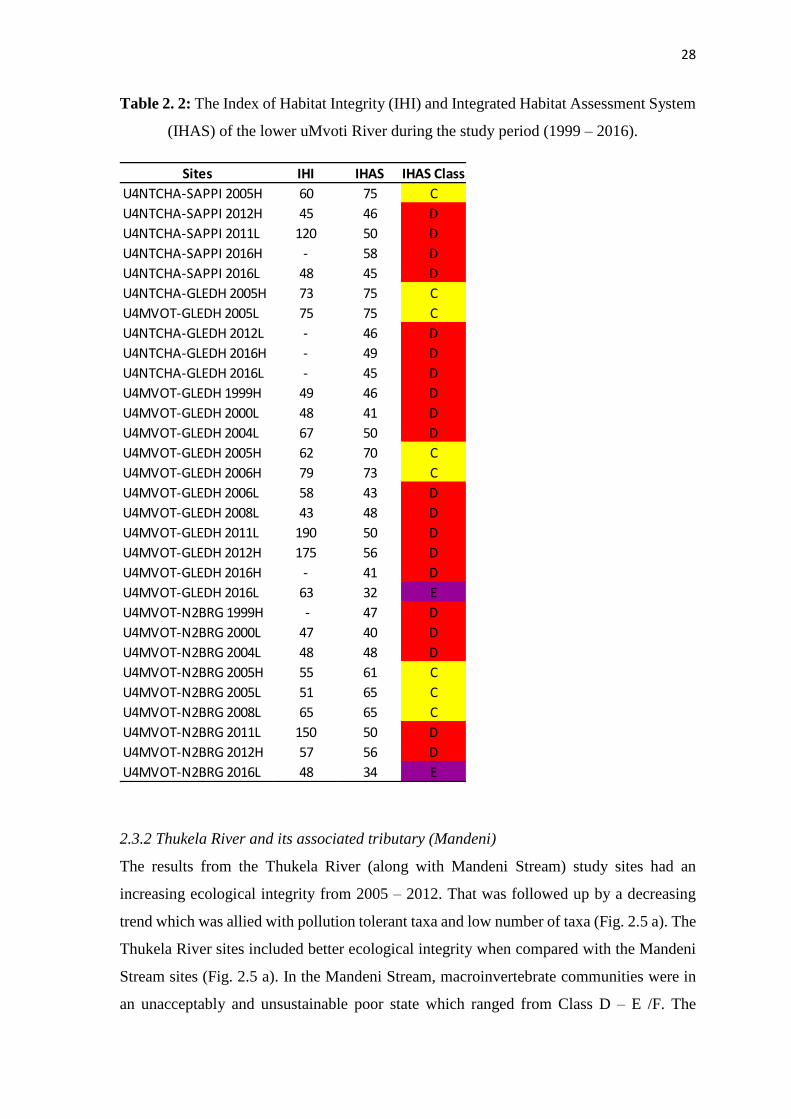
28
Table 2. 2: The Index of Habitat Integrity (IHI) and Integrated Habitat Assessment System
(IHAS) of the lower uMvoti River during the study period (1999 – 2016).
2.3.2 Thukela River and its associated tributary (Mandeni)
The results from the Thukela River (along with Mandeni Stream) study sites had an
increasing ecological integrity from 2005 – 2012. That was followed up by a decreasing
trend which was allied with pollution tolerant taxa and low number of taxa (Fig. 2.5 a). The
Thukela River sites included better ecological integrity when compared with the Mandeni
Stream sites (Fig. 2.5 a). In the Mandeni Stream, macroinvertebrate communities were in
an unacceptably and unsustainable poor state which ranged from Class D – E /F. The
Sites IHI IHAS IHAS Class
U4NTCHA-SAPPI 2005H 60 75 C
U4NTCHA-SAPPI 2012H 45 46 D
U4NTCHA-SAPPI 2011L 120 50 D
U4NTCHA-SAPPI 2016H - 58 D
U4NTCHA-SAPPI 2016L 48 45 D
U4NTCHA-GLEDH 2005H 73 75 C
U4MVOT-GLEDH 2005L 75 75 C
U4NTCHA-GLEDH 2012L - 46 D
U4NTCHA-GLEDH 2016H - 49 D
U4NTCHA-GLEDH 2016L - 45 D
U4MVOT-GLEDH 1999H 49 46 D
U4MVOT-GLEDH 2000L 48 41 D
U4MVOT-GLEDH 2004L 67 50 D
U4MVOT-GLEDH 2005H 62 70 C
U4MVOT-GLEDH 2006H 79 73 C
U4MVOT-GLEDH 2006L 58 43 D
U4MVOT-GLEDH 2008L 43 48 D
U4MVOT-GLEDH 2011L 190 50 D
U4MVOT-GLEDH 2012H 175 56 D
U4MVOT-GLEDH 2016H - 41 D
U4MVOT-GLEDH 2016L 63 32 E
U4MVOT-N2BRG 1999H - 47 D
U4MVOT-N2BRG 2000L 47 40 D
U4MVOT-N2BRG 2004L 48 48 D
U4MVOT-N2BRG 2005H 55 61 C
U4MVOT-N2BRG 2005L 51 65 C
U4MVOT-N2BRG 2008L 65 65 C
U4MVOT-N2BRG 2011L 150 50 D
U4MVOT-N2BRG 2012H 57 56 D
U4MVOT-N2BRG 2016L 48 34 E
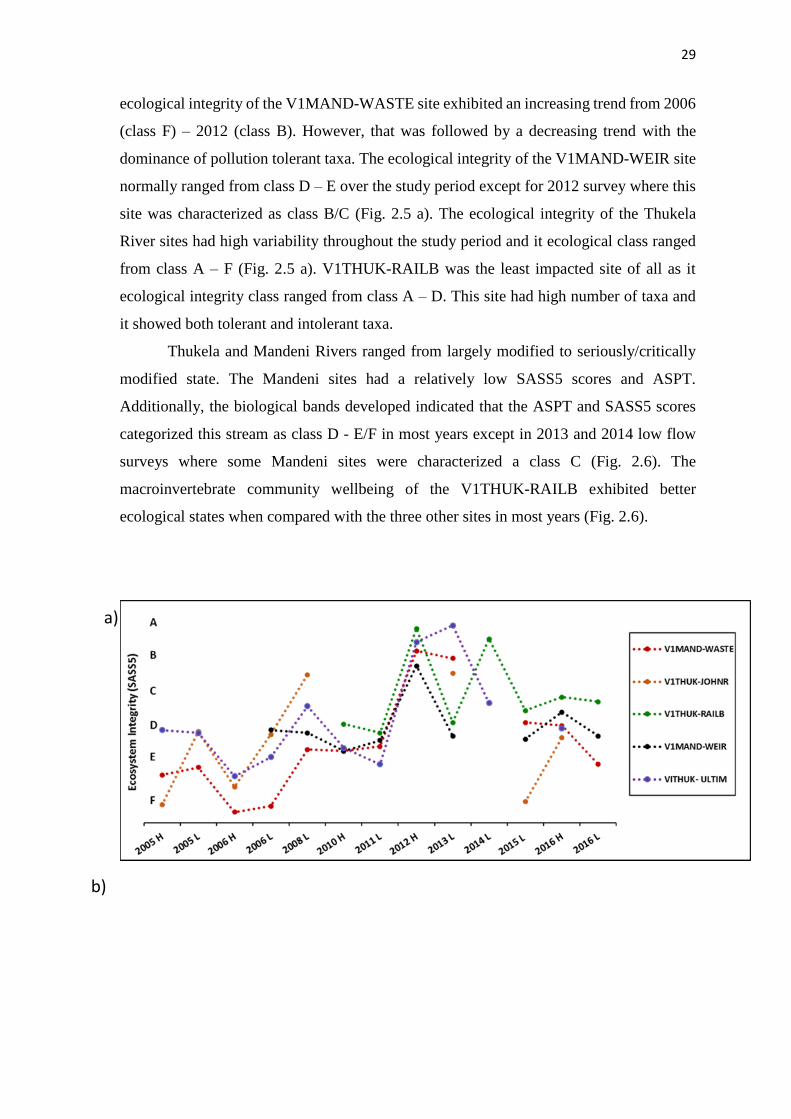
29
ecological integrity of the V1MAND-WASTE site exhibited an increasing trend from 2006
(class F) – 2012 (class B). However, that was followed by a decreasing trend with the
dominance of pollution tolerant taxa. The ecological integrity of the V1MAND-WEIR site
normally ranged from class D – E over the study period except for 2012 survey where this
site was characterized as class B/C (Fig. 2.5 a). The ecological integrity of the Thukela
River sites had high variability throughout the study period and it ecological class ranged
from class A – F (Fig. 2.5 a). V1THUK-RAILB was the least impacted site of all as it
ecological integrity class ranged from class A – D. This site had high number of taxa and
it showed both tolerant and intolerant taxa.
Thukela and Mandeni Rivers ranged from largely modified to seriously/critically
modified state. The Mandeni sites had a relatively low SASS5 scores and ASPT.
Additionally, the biological bands developed indicated that the ASPT and SASS5 scores
categorized this stream as class D - E/F in most years except in 2013 and 2014 low flow
surveys where some Mandeni sites were characterized a class C (Fig. 2.6). The
macroinvertebrate community wellbeing of the V1THUK-RAILB exhibited better
ecological states when compared with the three other sites in most years (Fig. 2.6).
a)
b)

30
Figure 2. 5: Trends regarding the macroinvertebrate community wellbeing determined by
a) SASS5 and b) MIRAI analysis during the study period (2005 – 2016) for the
high (H) and low (L) flow surveys in the four study sites of the Thukela River.
Based on the SASS5 scores and the ASPT, the macroinvertebrate wellbeing of the
Figure 2. 6: Average score per taxa (ASPT) (x axis) and South African Scoring System
(SASS) score (x-axis) plotted for the lower Thukela river. This plot is primarily
SASS5 Score
ASP
T

31
based on the integrity category bands from North Eastern Coastal Belt developed
by Dallas (2007).
The number of taxa found within each year in all sites varied extensively depending
on how favourable the conditions were during the surveys. From 2006 up to 2012, the
highest number of different taxa was recorded in the Mandeni stream sites. However, in
2013 – 2016 the highest number of different taxa was observed in the Thukela River sites.
Figure 2. 7: Number of taxa recorded during the study period (2005– 2016) for the high
(H) and low (L) flow surveys in the four study sites for Thukela River
The IHAS results revealed that the Thukela and Mandeni rivers sites ranged from modified
state (class C) to largely modified state (class D). The Thukela river sites were
predominantly in a largely modified (class D) state throughout the study period except for
VITHUK-RAILB and V1THUK-JOHNR which was classified as class C in 2005 and 2016
high flow surveys (Table 2.3).
Nu
mb
er o
f Ta
xa
V1MAND-WASTE V1MAND-WEIR V1THUK-JOHNR V1THUK-RAILB VITHUK- ULTIM
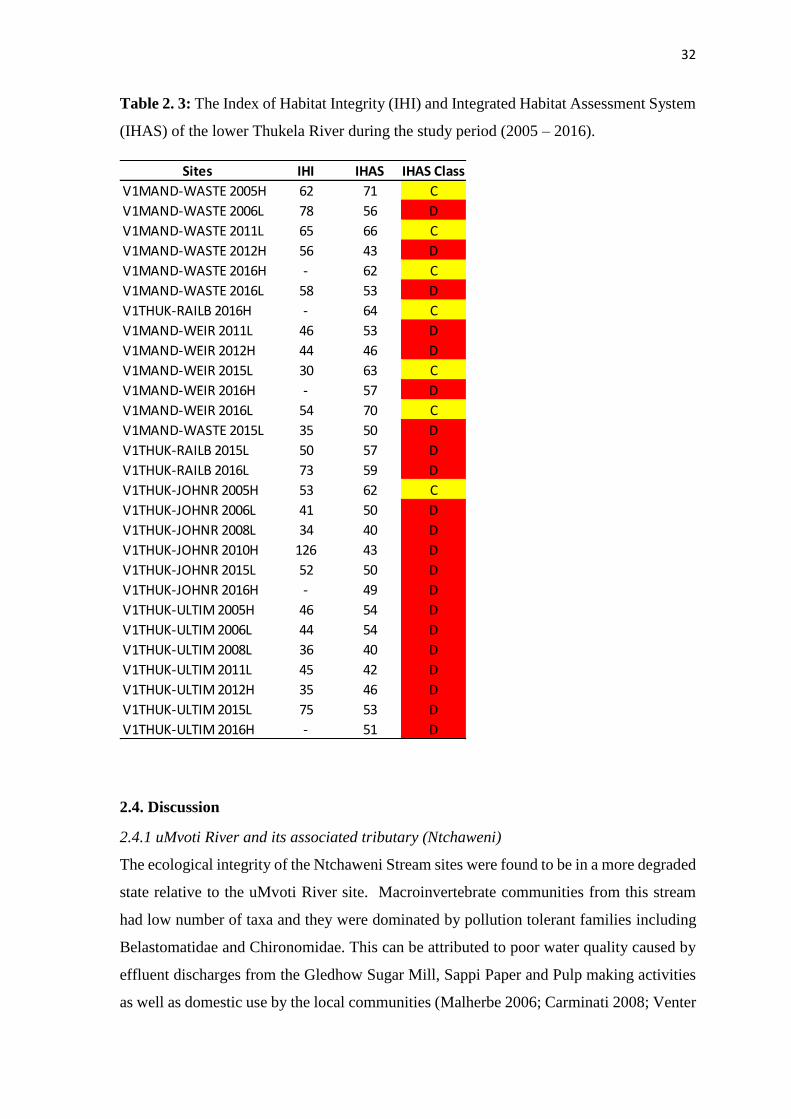
32
Table 2. 3: The Index of Habitat Integrity (IHI) and Integrated Habitat Assessment System
(IHAS) of the lower Thukela River during the study period (2005 – 2016).
2.4. Discussion
2.4.1 uMvoti River and its associated tributary (Ntchaweni)
The ecological integrity of the Ntchaweni Stream sites were found to be in a more degraded
state relative to the uMvoti River site. Macroinvertebrate communities from this stream
had low number of taxa and they were dominated by pollution tolerant families including
Belastomatidae and Chironomidae. This can be attributed to poor water quality caused by
effluent discharges from the Gledhow Sugar Mill, Sappi Paper and Pulp making activities
as well as domestic use by the local communities (Malherbe 2006; Carminati 2008; Venter
Sites IHI IHAS IHAS Class
V1MAND-WASTE 2005H 62 71 C
V1MAND-WASTE 2006L 78 56 D
V1MAND-WASTE 2011L 65 66 C
V1MAND-WASTE 2012H 56 43 D
V1MAND-WASTE 2016H - 62 C
V1MAND-WASTE 2016L 58 53 D
V1THUK-RAILB 2016H - 64 C
V1MAND-WEIR 2011L 46 53 D
V1MAND-WEIR 2012H 44 46 D
V1MAND-WEIR 2015L 30 63 C
V1MAND-WEIR 2016H - 57 D
V1MAND-WEIR 2016L 54 70 C
V1MAND-WASTE 2015L 35 50 D
V1THUK-RAILB 2015L 50 57 D
V1THUK-RAILB 2016L 73 59 D
V1THUK-JOHNR 2005H 53 62 C
V1THUK-JOHNR 2006L 41 50 D
V1THUK-JOHNR 2008L 34 40 D
V1THUK-JOHNR 2010H 126 43 D
V1THUK-JOHNR 2015L 52 50 D
V1THUK-JOHNR 2016H - 49 D
V1THUK-ULTIM 2005H 46 54 D
V1THUK-ULTIM 2006L 44 54 D
V1THUK-ULTIM 2008L 36 40 D
V1THUK-ULTIM 2011L 45 42 D
V1THUK-ULTIM 2012H 35 46 D
V1THUK-ULTIM 2015L 75 53 D
V1THUK-ULTIM 2016H - 51 D
33
2013). The SASS5 results exhibited high variability of the ecological integrity state of the
Ntchaweni River sites whereas the MIRAI results had less variability. This can be attributed
to the SASS5 tool considering water quality as the main driver of change in the structure
of macroinvertebrate communities (Dickens and Graham 2002) whereas the MIRAI tool
considers a combination of different metrics as probable drivers of change (Thirion 2007).
The MIRAI tool include habitat availability and heterogeneity, flow regimes, season
variations as well as water quality (Thirion 2007). Thus, effective monitoring of the
ecological integrity state of macroinvertebrate communities in river ecosystems must
consider the cumulative effect of all the metrics included in MIRAI tool. Farrell (2014)
documented that the macroinvertebrate communities in the Wilge River normally exhibit
low number taxa due to poor availability of habitat. Similar results were obtained in this
study and the MIRAI tool revealed that the lack of stone biotopes had an adverse impact
on macroinvertebrate communities since habitat heterogeneity and complexity was
reduced. As a result, families which were strongly allied with the stone biotopes like
Polymitarcyiae, Tricoptera and Plecoptera (Farrell 2014) were not recorded, contributing
to lower ASPT scores in Ntchaweni stream sites. The uMvoti and Thukela River sites were
mostly dominated by sandy substrate and that had a negative effect on macroinvertebrate
communities which exhibited by estimated and low number of different taxa. Low number
of macroinvertebrate communities due to sandy substrates has also been documented by
several researchers (Quinn and Hickey1990; Brewin et al. 1995; Dallas 2007). The SASS5
and MIRAI results included a decreasing overall trend of the macroinvertebrate community
integrity state at the Ntchaweni Stream sites. That suggested that poor habitat heterogeneity
as well as anthropogenic activities associated with the Ntchaweni stream negatively impact
the overall wellbeing, which in turn will result in the loss of key ecosystem services the
stream provides (Deborde et al. 2016).
The severe impact of degraded ecological integrity state at the Ntchaweni Stream
sites were further evident at the uMvoti River site (U4MVOT-N2BRG) situated below the
Ntchaweni – uMvoti confluence. This site had a low number of taxa and relatively poor
ecological integrity state which ranged from class D – E/F when using SASS5 and MIRAI
tools. This can be attributed to dominant sandy substrate which reduces the habitat
heterogeneity of the stream (Anthony 2001). Other stressors that may be attributed to the
degradation of macroinvertebrates integrity state of the U4MVOT-N2BRG site includes
excessive water abstraction, sand mining and sugarcane plantations located upstream of
this site (Malherbe 2006; Venter 2013). Macroinvertebrate communities in the U4MVOT-

34
N2BRG site were dominated by pollution tolerant taxa and that may be attributed to Stanger
sewage treatment works that originates from the Mbozano River which converge with the
uMvoti River upstream of the U4MVOT-N2BRG site (Venter 2013). Sewage treatment
works have been documented to have a direct detrimental effect on aquatic organisms by
impairing water quality, which in turn alters the biological community structure and
ecosystem functioning of many rivers (Aristi et al. 2015). This suggests that changes in
water quality plays a major role in macroinvertebrate community structures and that the
SASS5 tool was successfully implemented in this study.
The U4MVOT-GLEDH site had minimal human disturbances, good habitat quality
and consistently better macroinvertebrates integrity state when compared with the other
sites. The pollution intolerant families were prevalent in most years within this site and they
included Atydae, Baetidae, Heptageniidae Naucoridae, Oligoneuridae, and many others. It
also had high number of taxa which can be associated with adequate habitat availability,
heterogeneity and complexity. Baptista et al. (2001) observed a similar association in their
study as they observed high habitat heterogeneity and complexity which was allied with
high aquatic insect’s diversity. This becomes an issue when monitoring rivers using the
SASS5 tool alone because it does not include habitat quality and availability as it metric,
meaning that this tool accuses water quality as the sole driver of change in
macroinvertebrates diversity. However, the biological bands tried to overcome this issue
by creating interpretation guidelines for SASS data which considers spatial variation
(Dallas 2007). The development of the guidelines was based on the positive correlation that
SASS5 score and number of taxa have with the number of biotopes sampled as well as the
negative correlation ASPT had with number of biotopes sampled (Dallas 2007). This
biological bands interpretation guidelines allows natural variation in the SASS5 biotopes
sampled (gravel/sand/mud, vegetation and stone) to be considered (Dallas 2007).
2.4.2 Thukela River and its associated tributary (Mandeni)
The ecological integrity of the Mandeni Stream sites were predominantly found to be in a
poor ecological state (class D – E) and they were dominated by pollution tolerant species
which included Culicidae, Chironomidae, Sphaeridae, Belastomatidae and a couple of
other families with the SASS5 QV scores between 1 – 5. This can be attributed to impaired
water quality due to Isithebe industrial complex and iLembe wastewater treatment works
35
(Venter (2013). The macroinvertebrate community integrity states at the Mandeni Stream
sites were probably impacted by cattle grazing and trampling which was excessive. Bracia
and Voshel (2006) documented that trampled stream banks faces increased erosion and
sedimentation which is not ideal for many aquatic organisms.
The severe impact of anthropogenic stressors associated with the Mandeni Stream
was further evident in Thukela River sites (V1THUK-JOHNR and V1THUK-ULTIM)
below the Mandeni – Thukela confluence. The ecological integrity of these sites fluctuated
markedly (class B – F) when using the SASS5 tool. The degradation of the integrity state
observed in the V1THUK-JOHNR and V1THUK-ULTIM sites can be associated with
pollution originating from the Mandeni stream sites, exotic vegetation, shallow water
column as well as sedimentation caused by intensive sand mining (Venter 2013). These
activities affected vulnerable macroinvertebrates. For example, number of Tricoptera,
Hydropyschidae, Oligonuerida exhibited a decreasing trend from 1999 – 2016, whereas
Chironomidae, Belastomatidae, Simuliidae were found to be predominant in the late study
period.
V1THUK-RAILB was situated upstream of the confluence between the Mandeni
and Thukela Rivers and it revealed consistently better macroinvertebrates integrity state
trend when compared with the other sites. Results also revealed a relatively good species
diversity within this site due to adequate habitat heterogeneity which allowed more families
to thrive successfully. Several pollution intolerant taxa were recorded in this sites in most
years, indicating minimal impact by the anthropogenic stressors. The pollution intolerant
families included Atydae, Baetidae, Heptageniidae, Naucoridae, Oligoneuridae,
Notonemouridae and Limnichidae
2.4.3 uMvoti and Thukela Rivers (along with their associated tributaries)
The MIRAI and SASS5 tools indicated that the macroinvertebrate communities in this
study rivers have suffered a general loss in integrity. The SASS5 tool attributed the possible
driver of such trend to water quality states whereas the MIRAI tool attributed such change
to a combined effect of habitat quality and availability, river flow regimes, seasonal
variations and alterations in water quality. The reduced macroinvertebrate communities in
the study rivers indicates that the overall ecological integrity of most lower uMvoti and
Thukela Rivers are in a poor state and that can have adverse effect on sustainable use of
ecological services associated with these rivers. Hence, protection measures are required in
order attain sustainable use of such ecosystem services. Both indices (SASS5 and MIRAI)
36
played a role in generating suitable trends for the uMvoti and Thukela Rivers, as well as
their associated tributaries. The SASS5 tool was able to integrate the effects of multiple
pollutants or types of impacts on the macroinvertebrate community structures. However, it
overall assessment was primarily based on water quality and that resulted in high variability
of macroinvertebrates integrity states of both rivers.
The MIRAI classification indicated lower class from what was observed from the
SASS5 results. With regards to MIRAI results for uMvoti and Thukela Rivers, there was a
steady ecological integrity in most years and this may be due to added metrics which
assisted in identifying specific drivers of change and they also gave a more refined
ecological integrity.
2.4.5 Conclusions
The use of freshwater macroinvertebrate community metrics revealed a more robust
framework for evaluating both the short-term and long-term effects of anthropogenic
activities in riverine ecosystems. The tools were implemented successfully as they
generated suitable trends which indicated the ecological integrity state of the study rivers.
The SASS5 tool was observed to be less effective when monitoring the overall ecological
integrity because it depends primarily on water quality as the main driver of change. Many
factors other than water quality impact the ecological integrity of river systems. The MIRAI
tool on the other side was found to be the better, more responsive, robust and more
informative tool.
The outcomes of this study illustrated that the uMvoti River ecological integrity
was decreasing. This can be attributed to both poor habitat quality and excessive
anthropogenic stressors which results in the uMvoti River being in a seriously modified
state. The SASS5 and MIRAI results indicated that ecological integrity of the Ntchaweni
Stream sites were largely modified. This could probably be due to water resource use
stressors like Gledhow Sugar Mill, Sappi Pulp and Paper making activities and agricultural
practices. The Thukela and Mandeni Rivers also exhibited poor ecological integrity. This
can be attributed to major industrial activities, wastewater treatment works, and excessive
water abstraction and sugarcane plantations. Also low habitat heterogeneity at the uMvoti
and Thukela study sites had an adverse effect on the streams ecological integrity. Because
of this, it is very important to monitor these rivers in order to get information that is will be
of great use in the development of effective strategies for management, protection and

37
conservation. This will help in reaching the sustainable use of water resources and it will
promote the balance between the water resource use and protection.
2.5 Acknowledgements
We thank the Aquatic Ecosystem Research Program (AER) and South African Pulp and
Paper Industries Limited (Sappi) for the opportunity to do this research and for providing
running costs. Our sincere gratitude to the National Research Fund (ZA) for funding as well
the Ezemvelo KZN Wildlife for permits. We are grateful to N Senoge and O Agboola for
assisting in data collection. We thank Christine for helping with laboratory work.
2.6 References
Alba-Tercedor J, Jáimez-Cuéllar P, Álvarez M, Avilés J, Bonada N, Casas J, Mellado A,
Ortega M, Pardo I, Prat N, Rieradevall M, Robles S, Sáinz-Cantero CE, Sánchez-
Ortega A, Suárez ML, Toro M, Vidal-Abarca MR, Vivas S, Zamora-Munoz C.
2002. Caracterización del estado ecológico de ríos mediterráneos ibéricos mediante
el índice IBMWP (antes BMWP’). Limnetica 21: 175–185.
Anthony DJ. (Ed.). 2001. Applying geomorphology to environmental management. Water
Resources Publication.
Arimoro FO, Ikomi RB, Erebe E. 2007. Macroinvertebrate community diversity in relation
to water quality status of River Ase, Niger Delta, Nigeria. Journal of Fisheries and
Aquatic Science 2: 337–344.
Aristi I, Schiller D, Arroita M, Barceló D, Ponsatí L, García‐Galán, M. J., ... Acuña V. 2015. Mixed
effects of effluents from a wastewater treatment plant on river ecosystem metabolism:
subsidy or stress? Freshwater biology 60: 1398–1410.
Aura CM, Raburu PO, Herrmann J. 2010. A preliminary macroinvertebrate Index of Biotic
Integrity for bioassessment of the Kipkaren and Sosiani Rivers, Nzoia River basin,
Kenya. Lakes & Reservoirs: Research & Management, 15: 119–128.
Baptista DF, Buss DF, Dorvillé LFM, Nessimian JL. 2001. Diversity and habitat preference
of aquatic insects along the longitudinal gradient of the Macaé river basin, Rio de
Janeiro, Brazil. Revista Brasileira de Biologia 61: 249–258.
Bellingan TA, Woodford DJ, Gouws J, Villet MH, Weyl OLF. 2015. Rapid bioassessment
of the effects of repeated rotenone treatments on invertebrate assemblages in the
Rondegat River, South Africa. African Journal of Aquatic Science 40: 89–94.

38
Braccia A, Voshell Jr JR. 2006. Benthic macroinvertebrate fauna in small streams used by
cattle in the Blue Ridge Mountains, Virginia. Northeastern Naturalist 13: 269–286.
Buffagni A, Erba S, Cazzola M, Murray-Bligh J, Soszka H, Genoni P. 2006. The STAR
common metrics approach to the WFD intercalibration process: Full application for
small, lowland rivers in three European countries. In The Ecological Status of
European Rivers: Evaluation and Intercalibration of Assessment Methods (pp. 379–
399). Springer Netherlands.
Brewin PA, Newman TML, Ormerod SJ. 1995. Patterns of macroinvertebrate distribution
in relation to altitude, habitat structure and land use in streams of the Nepalese
Himalaya. Archiv für Hydrobiologie 135: 79–100.
Carminati AV. 2008. An Assessment of the effects of sugar mill cctivities on the ecological
integrity of the UMvoti and Amatikulu Rivers, KwaZulu Natal. MSc Dissertation,
University of Johannesburg, Johannesburg.
Chambers DB, Messinger T. 2001. Benthic invertebrate communities and their responses
to selected environmental factors in the Kanawha River Basin, West Virginia,
Virginia, and North Carolina. US Department of the Interior, US Geological
Survey.
Chessman BC. 1995. Rapid assessment of rivers using macroinvertebrates: a procedure
based on habitat-specific sampling, family-level identification and a biotic index.
Australian Journal of Ecology 20: 122–129.
Chutter FM. 1994. The rapid biological assessment of streams and river water quality by
means of macroinvertebrate communities in South Africa. In: Uys, M.C. (ed.)
Classification of Rivers and Environmental Health Indicators. WRC Report No. TT
63/94. Water Research Commission, South Africa. pp 217–234.
Clark DL. 2015. Effects of livestock grazing on aquatic macroinvertebrates in
southerninterior wetlands of British Columbia, Canada. PhD Dissertation,
Thompson Rivers University.
Clarke RT, Furse MT, Wright JF, Moss D. 2003. Derivation of a biological quality index
for river sites: comparison of the observed with the expected fauna. Journal of
Applied Statistics 1996: 311–332.
Dallas H.F. 2007. The effect of biotope-specific sampling for aquatic macroinvertebrates
on reference site classification and the identification of environmental predictors in
Mpumalanga, South Africa. African Journal of Aquatic Science, 32:165–173.
39
Dallas HF. 2007. River health programme: South African scoring system (SASS) data
interpretation guidelines. Report produced for the Department of Water Affairs and
Forestry (Resource Quality Services) and the Institute of Natural Resources.
Dallas HF. 2007. The influence of biotope availability on macroinvertebrate assemblages
in South African rivers: implications for aquatic bioassessment. Freshwater biology
52: 370–380.
Davies AG. 1982. The construction of the Tugela-Vaal Project dams. Civil Engineer in
South Africa, 24(8), 385-388.
Deborde DDD, Hernandez MBM, Magbanua FS. 2016. Benthic macroinvertebrate
community as an indicator of stream health: the effects of land use on stream
benthic macroinvertebrates. Science Diliman 28.
Deksissa T, Ashton PJ, Vanrolleghem PA. 2003. Control options for river water quality
improvement: A case study of TDS and inorganic nitrogen in the Crocodile River
(South Africa). Water SA 29: 209–218.
Dickens CW, Graham PM. 2002. The South African Scoring System (SASS) Version 5
Rapid Bioassessment Method for Rivers. African Journal of Aquatic Science 27: 1–
10.
Farrell KT. 2014. Aquatic Macroinvertebrate Community in the Wilge River. PhD
Dissertation, University of Johannesburg, Johannesburg.
Fourie HE, Thirion C, Weldon CW. 2014. Do SASS5 scores vary with season in the South
African Highveld? A case study on the Skeerpoort River, North West province,
South Africa. African journal of aquatic science 39: 369–376.
Gabriels W, Lock K, De Pauw N, Goethals PL. 2010. Multimetric Macroinvertebrate Index
Flanders (MMIF) for biological assessment of rivers and lakes in Flanders
(Belgium). Limnologica-Ecology and Management of Inland Waters 40: 199–207.
Hammer DA. 1996. Creating freshwater wetlands. CRC Press.
Jacobs PG. 2017. Hydrological assessment to predict velocity-flow classes in the lower
Thukela River. PhD Dissertation, North-West University, Potchefstroom.
Jun YC, Won DH, Lee SH, Kong DS, Hwang SJ. 2012. A multimetric benthic
macroinvertebrate index for the assessment of stream biotic integrity in Korea.
International Journal of Environmental Research and Public Health 9: 3599–3628.
Kenney MA, Sutton-Grier AE, Smith RF, Gresens SE. 2009. Benthic macroinvertebrates
as indicators of water quality: The intersection of science and policy. Terrestrial
Arthropod Reviews 2: 99.
40
Kleynhans CJ, Louw MD, Thirion C, Rossouw N, Rowntree K. 2005. River
Ecoclassification: Manual for EcoStatus determination (Version 1). Joint Water
Research Commission (WRC) and Department of Water Affairs and Forestry
(DWAF) report. WRC Report No. KV 168/05. Water Research Commission,
Pretoria, South Africa
Lamberth SJ, Drapeau L, Branch GM. 2009. The effects of altered freshwater inflows on
catch rates of non-estuarine-dependent fish in a multispecies nearshore line fishery.
Estuarine, Coastal and Shelf Science 84:527–538.
Li L, Zheng B, Liu L. 2010. Biomonitoring and bioindicators used for river ecosystems:
definitions, approaches and trends. Procedia environmental sciences 2: 1510–1524.
Mahlangu SE. 2014. Aquatic health assessment of the Klip River System, Gauteng, South
Africa (Doctoral dissertation, University of Johannesburg).
Malherbe CW. 2006. The current ecological state of the lower UMvoti River, KwaZulu-
Natal. MSc Dissertation, University of Johannesburg.
Mondy CP, Villeneuve B, Archaimbault V, Usseglio-Polatera P. 2012. A new
macroinvertebrate-based multimetric index (I 2 M 2) to evaluate ecological quality
of French wadeable streams fulfilling the WFD demands: A taxonomical and trait
approach. Ecological Indicators 18: 452–467.
Nakano D, Nagayama S, Kawaguchi Y, Nakamura F. 2008. River restoration for
macroinvertebrate communities in lowland rivers: insights from restorations of the
Shibetsu River, north Japan. Landscape and Ecological Engineering 4: 63–68.
O’Brien GC, Swemmer R, Wepener V. 2009. Ecological integrity assessment of fish
assemblages of the Matigulu/Nyoni and UUMvoti estuaries, KwaZulu-Natal, South
Africa. African Journal of Aquatic Science 34: 293–302.
O’Brien GC, Wepener V, Malherbe W, Swemmer R, Von Bratt C. 2005. Ecological
Integrity Assessment of the Lower Mvoti River/Estuary, KwaZulu-Natal: Update
of the 2000 Ecological Evaluation of the Lower Mvoti River and Estuary. Report
prepared for the Sappi Stanger Environmental Liaison Committee (SSELC). Report
No. 2005/06/001. Stanger, South Africa.
O'Brien GC, Venter H. 2012. Evaluation of eight years (2005 to 2012) of ecological
integrity data from the lower Thukela River/Estuary and associated systems with
management considerations based on the risk of hazards affecting ecosystem
structure and function, KwaZulu-Natal., Water Research Group, North West
University, Potchefstroom.
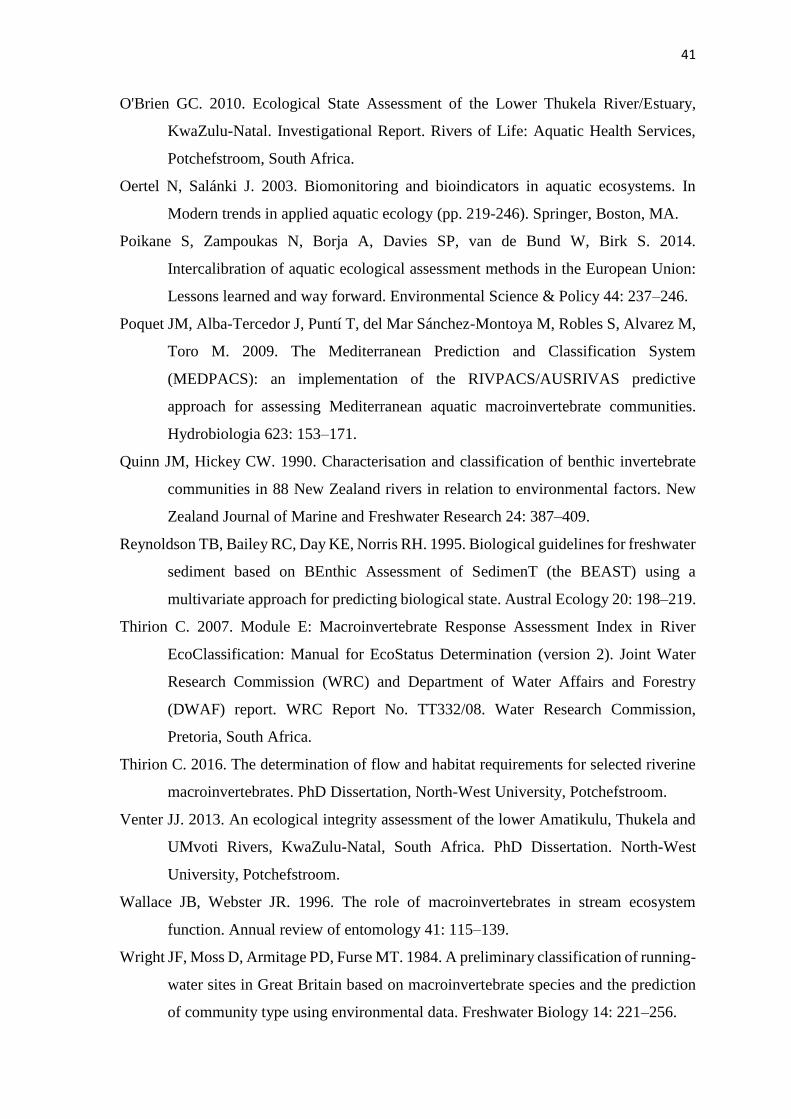
41
O'Brien GC. 2010. Ecological State Assessment of the Lower Thukela River/Estuary,
KwaZulu-Natal. Investigational Report. Rivers of Life: Aquatic Health Services,
Potchefstroom, South Africa.
Oertel N, Salánki J. 2003. Biomonitoring and bioindicators in aquatic ecosystems. In
Modern trends in applied aquatic ecology (pp. 219-246). Springer, Boston, MA.
Poikane S, Zampoukas N, Borja A, Davies SP, van de Bund W, Birk S. 2014.
Intercalibration of aquatic ecological assessment methods in the European Union:
Lessons learned and way forward. Environmental Science & Policy 44: 237–246.
Poquet JM, Alba-Tercedor J, Puntí T, del Mar Sánchez-Montoya M, Robles S, Alvarez M,
Toro M. 2009. The Mediterranean Prediction and Classification System
(MEDPACS): an implementation of the RIVPACS/AUSRIVAS predictive
approach for assessing Mediterranean aquatic macroinvertebrate communities.
Hydrobiologia 623: 153–171.
Quinn JM, Hickey CW. 1990. Characterisation and classification of benthic invertebrate
communities in 88 New Zealand rivers in relation to environmental factors. New
Zealand Journal of Marine and Freshwater Research 24: 387–409.
Reynoldson TB, Bailey RC, Day KE, Norris RH. 1995. Biological guidelines for freshwater
sediment based on BEnthic Assessment of SedimenT (the BEAST) using a
multivariate approach for predicting biological state. Austral Ecology 20: 198–219.
Thirion C. 2007. Module E: Macroinvertebrate Response Assessment Index in River
EcoClassification: Manual for EcoStatus Determination (version 2). Joint Water
Research Commission (WRC) and Department of Water Affairs and Forestry
(DWAF) report. WRC Report No. TT332/08. Water Research Commission,
Pretoria, South Africa.
Thirion C. 2016. The determination of flow and habitat requirements for selected riverine
macroinvertebrates. PhD Dissertation, North-West University, Potchefstroom.
Venter JJ. 2013. An ecological integrity assessment of the lower Amatikulu, Thukela and
UMvoti Rivers, KwaZulu-Natal, South Africa. PhD Dissertation. North-West
University, Potchefstroom.
Wallace JB, Webster JR. 1996. The role of macroinvertebrates in stream ecosystem
function. Annual review of entomology 41: 115–139.
Wright JF, Moss D, Armitage PD, Furse MT. 1984. A preliminary classification of running-
water sites in Great Britain based on macroinvertebrate species and the prediction
of community type using environmental data. Freshwater Biology 14: 221–256.
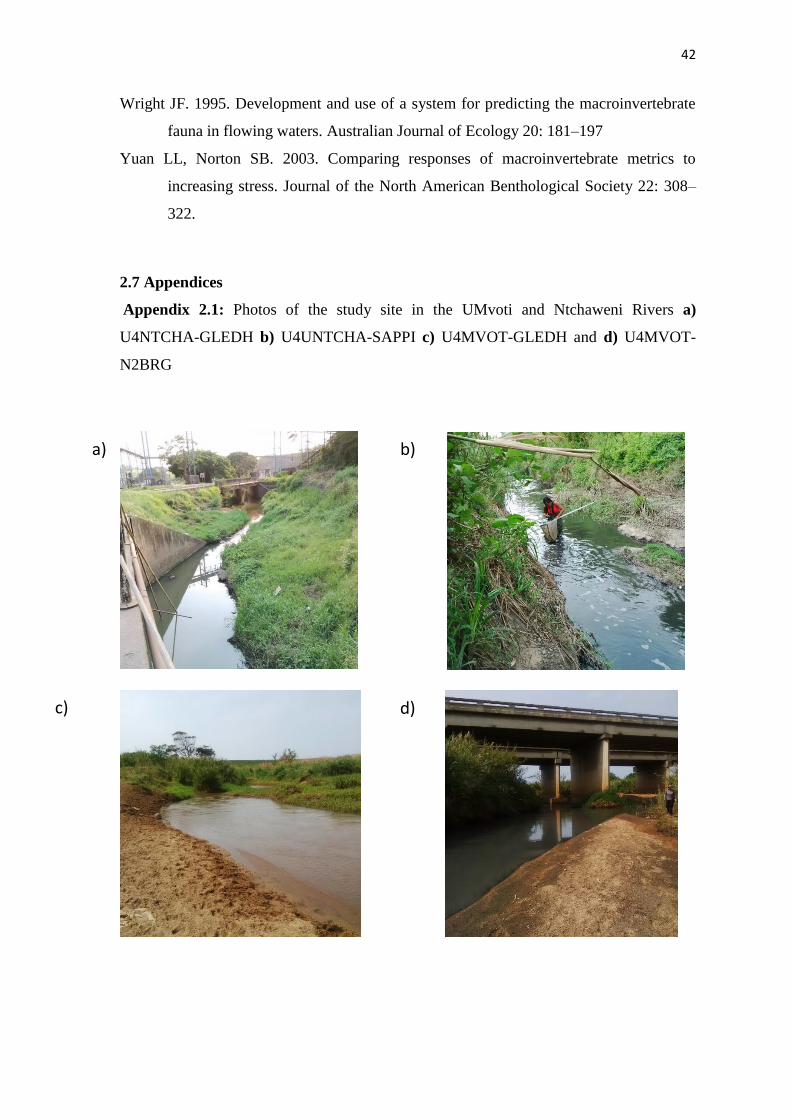
42
Wright JF. 1995. Development and use of a system for predicting the macroinvertebrate
fauna in flowing waters. Australian Journal of Ecology 20: 181–197
Yuan LL, Norton SB. 2003. Comparing responses of macroinvertebrate metrics to
increasing stress. Journal of the North American Benthological Society 22: 308–
322.
2.7 Appendices
Appendix 2.1: Photos of the study site in the UMvoti and Ntchaweni Rivers a)
U4NTCHA-GLEDH b) U4UNTCHA-SAPPI c) U4MVOT-GLEDH and d) U4MVOT-
N2BRG
a) b)
c) d)
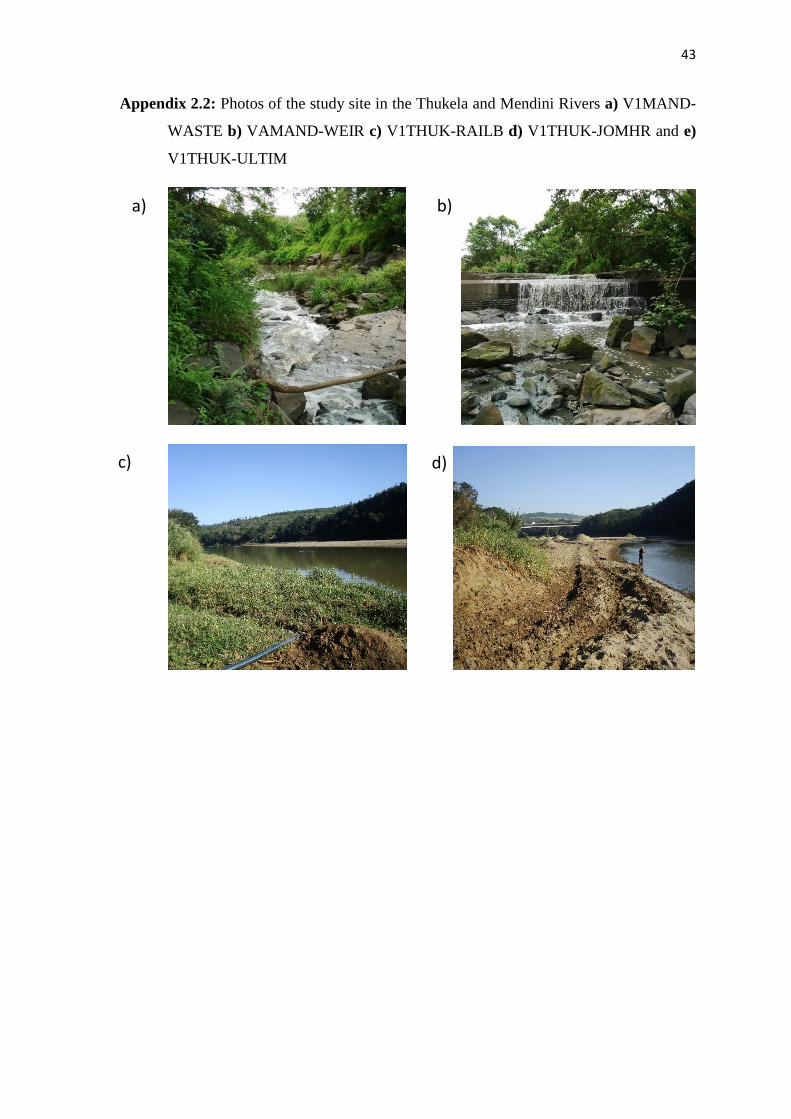
43
Appendix 2.2: Photos of the study site in the Thukela and Mendini Rivers a) V1MAND-
WASTE b) VAMAND-WEIR c) V1THUK-RAILB d) V1THUK-JOMHR and e)
V1THUK-ULTIM
a) b)
c) d)
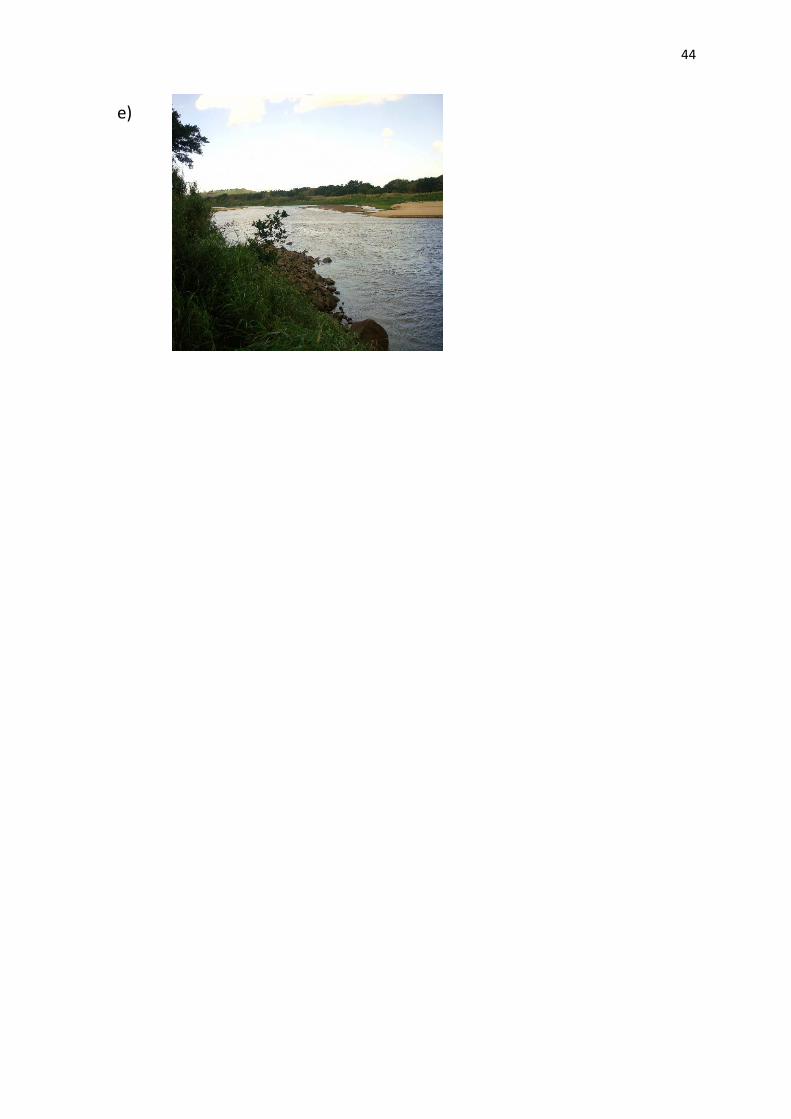
44
e)

45
CHAPTER 3
Macroinvertebrate communities of lowland rivers in KwaZulu-Natal and their
response to water quality, quantity and habitat changes
NP Tenza, CT Downs and GC O’Brien
School of Life Sciences, University of KwaZulu-Natal, Private Bag X01, Pietermaritzburg
3209, South Africa
Formatted for African Journal of Aquatic Science
Abstract
Water serves as a natural resource that is crucial to humankind and all the other life forms
on earth. Anthropogenic natural stressors including climate change threatens limited
freshwater resources, especially in water scares areas. South Africa is currently classified
as a water scarce and semi-arid country that receives an average precipitation of
approximately 450 mm per year, less that the world’s average. Hence, it is of great
importance to assess, monitor and understand the environmental changes that affect South
Africa's aquatic ecosystems. The aim of this study was to evaluate the responses of
macroinvertebrate communities to water resource use stressors at the lowland uMvoti and
Thukela Rivers, South Africa. A redundancy analysis (RDA) approach using Canoco for
Windows version 4.5 was used to statistically analyze all data. Results demonstrated that
the prevalence of pollution tolerant families and less diverse macroinvertebrate
communities at the uMvoti and Ntchaweni Rivers was ascribed to effluent discharges from
the industries, Stanger sewage treatment works as well as domestic use by the local
communities. The Thukela and Mandeni Rivers also exhibited pollution tolerant families
and relatively poor macroinvertebrate communities. This can be attributed synergistic
effect of effluent discharges from industries, wastewater treatment works, solid waste,
water abstraction and sedimentation. Both uMvoti and Thukela Rivers are highly impacted
by water resource use stressors and they require urgent management and protection
interventions.
46
3.1 Introduction
Water resources are currently facing unprecedented threats from multiple stressors arising
from both anthropogenic activities and natural events (Wheater and Gober 2015). Such
stressors include a decrease in river flows, loss of habitat, reduction in groundwater levels
as well as a rapid increase pollution (King and Pienaar 2011). The Food and Agriculture
Organization (FAO) has predicted that in 2050, the world will be required to feed 9 billion
people and that will demand a 60 percent (%) increase in the agricultural production (Wise
2013). That alone will cause serious concerns to the limited amount of freshwater available
as the agricultural sector accounts for the total of 70% of freshwater withdrawal (UN-Water
2014). Countries like South Africa will be impacted heavily by these developments since
it is currently classified as a semi-arid and water scarce country that receives an average
precipitation of approximately 450mm per year (Hill 2007; Otieno and Ochieng 2007),
making it the 30th driest country on the world (Kohler 2016).
The earth’s temperature continues to increase and that promote greater evaporation
rate which cause devastating effects of frequent and severe drought as well as flooding on
different regions of the world (Cassardo 2014). The combination of anthropogenic stressors
results in the loss of many significant ecosystem services (Venter 2013). Globally, it has
been predicted that if high water utility rates continue, water demand will exceed supply
(Kohler 2016). Therefore, it is of great importance to protect water as a natural resource
that sustains all life on earth (Malherbe 2006; Venter 2013; Vörösmarty et al. 2010). The
recognition of the vital role played by water in South Africa resulted in the formation of
National Water Act (NWA), Act 36 of 1998 (NWA, 1998). This act was aimed at ensuring
that South African water is used, protected, conserved, managed and controlled in a way
that considers human basic needs of the present and the future (NWA, 1998). The NWA
was also aimed at promoting equality to access, efficient use and the beneficial use of water
in the public interest (NWA, 1998). Additionally, the NWA was developed for ensuring
that the current and future ecological integrity of aquatic ecosystems are developed and
sustained (NWA, 1998). For this to happen, factors that drive the ecological integrity of
aquatic ecosystems need to be determined through biomonitoring, and controlled if possible
(Malherbe, 2006). Biomonitoring is a valuable assessment tool that is frequently applied
when evaluating the ecological status of aquatic ecosystems (Li et al. 2010). This
assessment tool uses biological responses of aquatic plants and animals to evaluate changes
in the environment (Li et al. 2010).
47
This study focused primarily on freshwater macroinvertebrate communities. Such
communities have been established as ecological indicators of the wellbeing of aquatic
ecosystems and they are frequently used when assessing the ecological health of many
systems because they reveal the impact of perturbation and habitat modifications (Arimoro
et al. 2007). Aquatic macroinvertebrates are regarded as fundamental part of aquatic
ecosystems and they include aquatic insects (such as stoneflies, mayflies, dragonflies, and
rat-tailed maggots), mollusks (snails), fresh water crustaceans (crayfish and scuds),
annelids (worms and leeches), and all other macroinvertebrates that reside in water for all
or part of their life (O’Keeffe and Dickens 2000). Worldwide, macroinvertebrates are
highly recommended and frequently used (Oertel and Salánki 2003) when assessing the
biological integrity of riverine ecosystems, mainly because there is vast knowledge of their
intolerant to different stresses. In addition, they are abundant, easy to collect (visible to the
naked eye), easy to identify, have rapid life cycles and they have large sedentary habits
(Bredenhand 2005; Leunda et al. 2009).
In this study the spatial and temporal composition of freshwater macroinvertebrate
communities were quantified and compared in the lower uMvoti and Thukela Rivers in
KwaZulu-Natal (KZN) Province, South Africa. The overall aim was to evaluate the
responses of macroinvertebrate communities to water quality, quantity and habitat changes.
It was predicted that macroinvertebrates estimated abundance and diversity will change due
to both natural and anthropogenic stressors altering their aquatic environment. Results from
this study will make an important contribution to the development of macroinvertebrates
protection plans, which in turn will result in the protection, management and conservation
of the uMvoti and Thukela Rivers water resources during this ongoing drought period.
3.2 Methods
3.2.1 Study sites
The study area included the lower reaches of the uMvoti and Thukela Rivers in KwaZulu-
Natal, South Africa (Fig. 3.1). The uMvoti and Thukela Rivers are heavily impacted by
water resource use activities. The uMvoti River originates from the Natal Midlands, KZN
Province, South Africa; it meanders through a south easterly direction past Greytown and
Stanger until pours into the Indian Ocean at a point that is close to Blythedale Beach. The
lower uMvoti River catchment is characterised by commercial dry land agriculture and
subsistence farming that includes excessive sugarcane plantations, industrial activities,
48
sewage treatment works, excessive water abstraction and domestic use by surrounding
households (Venter 2013). The synergistic effect these anthropogenic stressors
progressively worsen the ecological integrity of the uMvoti River, resulting the dominance
of tolerant families such Chironomidae, Belastomatidae and Simuliidae in this stream. The
Thukela River is the second largest river in South Africa (DWAF, 2004). This catchment
originates from the Drakensburg escarpment and it meanders 520 km through the central
KZN until it reaches the Indian Ocean at approximately 85 km north of Durban
(Stryftombolars 2008, Venter 2013). The lower reaches of the Thukela River are
characterised by excessive sugarcane plantations and highly industrialised areas which pose
the greatest threat to the persistence of intolerant taxa as they normally exhibit estimated
and diversity in this stream.
This study is part of a long-term river monitoring program which included both
historical and present datasets. The historical data was collected almost every year and
during both high and low flows periods between 1999 – 2015 (O’Brien et al. 2005;
Malherbe 2006; O’Brien et al. 2009; O’Brien 2010; O’Brien 2012; Venter 2013). The
present data was collected in 2016. For the latter dataset two surveys were carried out, the
first survey was conducted in April 2016 (high flow period). This period occurs during the
wet season and it is associated with increased water flow. The second survey was
conducted between September and October 2016 (low flow period). This is regarded as a
seasonal phenomenon which is vital for river flow regime and is defined as reduced flow
of water in rivers during lengthy dry weather periods (Deksissa et al. 2003).

49
Figure 3.1: Map of the study area showing all 9 sites from uMvoti and Thukela Rivers as
well as associated tributaries (Ntchaweni and Mandeni Rivers).
3.2.2 Field data collection
The data collection was undertaken according to the method defined by Dickens and
Graham (2002). Data collection was done by accredited SASS5 practitioners. The SASS
net (1 mm mesh on a 30 cm square frame) was used to collect macroinvertebrates. For each
site, three biotopes were selected and they included stones, vegetation as well as gravel,
sand and mud. 1) Stones included movable pebbles, cobbles (970 of 2–25 cm average size)
as well as bedrock which includes boulders of >25 cm. Stones were sampled according to
the SASS5 method which stipulates that they should be sampled for approximately 3
minutes (min.). The maximum sample time was extended up to 5 min in sites with highly
embedded bedrock or rocks. 2) Vegetation biotope was divided into two (marginal and
aquatic). Marginal vegetation includes emergent and overhanging vegetation growing at
the edge of the stream. Marginal vegetation was sampled for an approximate of 2 m in total
length. Aquatic vegetation comprised mainly of submerged vegetation, which included
roots, stems and floating aquatics and it was sampled for about 1 m2. 3) Gravel, sand and

50
mud included small stones (<0.06 mm - 2 cm in size). This biotope was sampled for
approximately 1 min on each site.
Samples were identified using a macroinvertebrate guide (Dickens and Graham 2002) and
total SASS5 Score, total number of taxa and ASPT were calculated for each sample. The
abundance was also estimated as per SASS5 method,1 = 1, A = 10, B = 100, C = 1000,
D = >1000
3.2.3 Physico-chemical variables
A range of physico-chemical parameters were assessed following the proposed ecological
reserve determination methodology that was developed by the South African Department
of Water Affairs and Forestry in 1999 (DWAF 1999). Water quality was assessed for all
site and the sampling procedure was undertaken during the high/low flow surveys. The
collection of in situ physico-chemical variables measured in this study was primarily based
on the variables selected in the historical assessments which were conducted by CRUZ
2000; O’Brien et al. 2005; Malherbe 2006; O’Brien et al. 2009; O’Brien 2010; O’Brien
2012 and Venter 2013. A calibrated portable meter (Eutech instruments CyberScan series
600, Thermo Fisher, USA) was used to measure physical in situ data which include
temperature, pH, conductivity, total dissolved solids (TDS) and dissolved oxygen
concentration and saturation. In addition, sub-surface water samples were collected using
polyethylene bottles for laboratory analysis. The water samples collected were kept frozen
until the analysis was done. Samples were further analysed at the Umgeni Water Laboratory
(an accredited laboratory with the South African National Accreditation System and the
International Standard ISO/IEC 17025:2005). Variables analyses included nutrients
(ammonium, nitrites, nitrates, phosphate and sulphates), salts (chloride, sodium, calcium
and total alkalinity), Chemical Oxygen Demand (COD), chlorophyll a and microbiological
assessments of faecal coliforms, total coliforms and heterotrophic plate count.
3.2.4 Data analysis
The multivariate statistical analysis approaches have been frequently used to evaluate the
structure and patterns of biological communities in diverse ecosystems (Van den Brink et
al 2003; Malherbe 2006; O’Brien et al. 2009). In this study, a redundancy analysis (RDA)
approach using Canoco for Windows version 4.5 was utilised to statistically analyse all
data obtained throughout the study period (1999 – 2016). The RDA approach is regarded
51
as a linear response model (Van den Brink et al 2003, Chahourki 2011). Two datasets were
required to run RDA, the first dataset include response variables (macroinvertebrate
communities) whereas the second dataset consists of explanatory variable (environmental
data) (Paliy and Shankar 2016). The RDA approach linked macroinvertebrate communities
with explanatory environmental data. The sites, seasons, systems, water quality parameters,
sediment and habitat were environmental data. In this study the RDA evaluated changes in
macroinvertebrate community structures and then tested the statistical significance of
differences in communities after incorporated with Monte Carlo permutation testing (Van
den Brink et al., 2003; Ter Braak and Smillauer, 2004). The output of the RDA ordination
was a map of samples analysed on a two-dimensional (2D) bases, showing both
macroinvertebrate communities and environmental data overlain (biplot) (Farrel 2014).
The environmental variables were symbolised by arrows whereas the macroinvertebrate
communities were represented by points (Chahourki 2011). The RDA ordination plots
summarised the patterns of alterations in the macroinvertebrate communities which can be
explained by selected environmental variables in this study (Chahourki 2011). Since SASS5
only provides a relative indication of the estimated abundance, the macroinvertebrates
community estimated abundance was estimated as follows: 1 = 1, A = 10, B = 100, C =
1000, D = >1000. All the estimated macroinvertebrate community data were transformed
using Log transformation (Van den Brink et al., 2003). Additionally, site codes were
modified in order to avoid too much wording on the RDA biplots, thus, U4NTCH-SAPPI
= NS-P, U4NTCH-GLEEDH = N-GH, U4MVOT-N2BRG = M-N2, U4MVOT-GLEDH =
M-GH, V1MAND-WASTE = M-WA, V1MAND-WEIR = M-WR, V1THUK-RAILB =
T-RBG, V1THUK-JOHNR = T-JNR and V1THUK-ULTIM = T-ULT.
3.3 Results
Macroinvertebrate community structures were evaluated to determine whether
anthropogenic and/or natural stressors drive their changes. The number of taxa and
estimated were compared within sites, between sampling periods as well as between rives.
The water quality parameters were also considered as drivers of macroinvertebrate changes
at the lower uMvoti and Thukela Rivers (appendix 3.1 and 3.2).
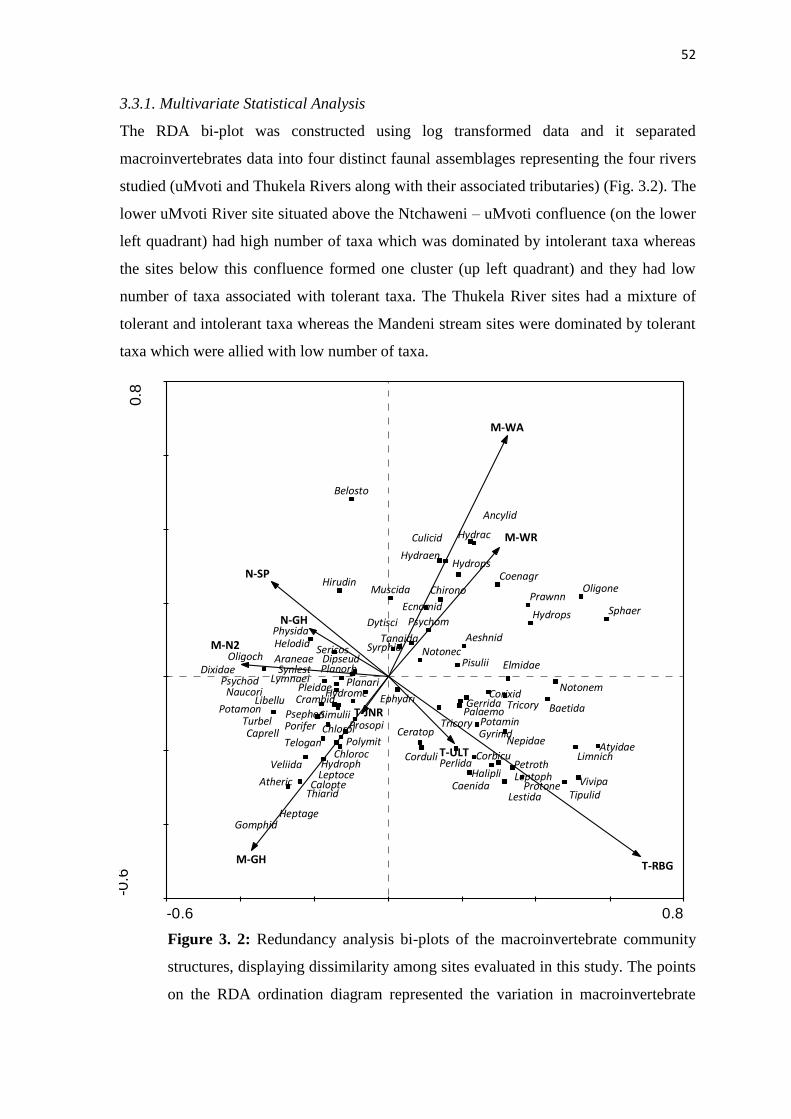
52
3.3.1. Multivariate Statistical Analysis
The RDA bi-plot was constructed using log transformed data and it separated
macroinvertebrates data into four distinct faunal assemblages representing the four rivers
studied (uMvoti and Thukela Rivers along with their associated tributaries) (Fig. 3.2). The
lower uMvoti River site situated above the Ntchaweni – uMvoti confluence (on the lower
left quadrant) had high number of taxa which was dominated by intolerant taxa whereas
the sites below this confluence formed one cluster (up left quadrant) and they had low
number of taxa associated with tolerant taxa. The Thukela River sites had a mixture of
tolerant and intolerant taxa whereas the Mandeni stream sites were dominated by tolerant
taxa which were allied with low number of taxa.
Figure 3. 2: Redundancy analysis bi-plots of the macroinvertebrate community
structures, displaying dissimilarity among sites evaluated in this study. The points
on the RDA ordination diagram represented the variation in macroinvertebrate
-0.6 0.8
-0.6
0.8
Aeshnid
Ancylid
Araneae
Atheric
Atyidae
Baetida
Belosto
CaenidaCalopte
Caprell Ceratop
Chirono
Chloroc
Chlorol
Coenagr
CorbicuCorduli
CorixidCrambid
Culicid
DipseudDixidae
Dytisci
Ecnomid
Elmidae
Ephydri Gerrida
Gomphid
Gyrinid
Halipli
Helodid
Heptage
Hirudin
Hydrac
Hydraen
Hydroph
Hydrome
Hydrops
Hydrops
Leptoce Leptoph
Lestida
Libellu
Limnich
Lymnaei
Muscida
Naucori
Nepidae
Notonec
Notonem
Oligoch
Oligone
Palaemo
Perlida Petroth
Physida
Pisulii
PlanariPlanorb
Pleidae
Polymit
Porifer PotaminPotamon
Prawnn
Prosopi
Protone
Psephen
Psychod
Psychom
Sericos
Simulii
Sphaer
Synlest
SyrphidTanaida
Telogan
Thiarid Tipulid
TricoryTurbel
Tricory
Veliida
Vivipa
M-N2
M-GH
N-SP
N-GH
M-WA
M-WR
T-JNR
T-ULT
T-RBG
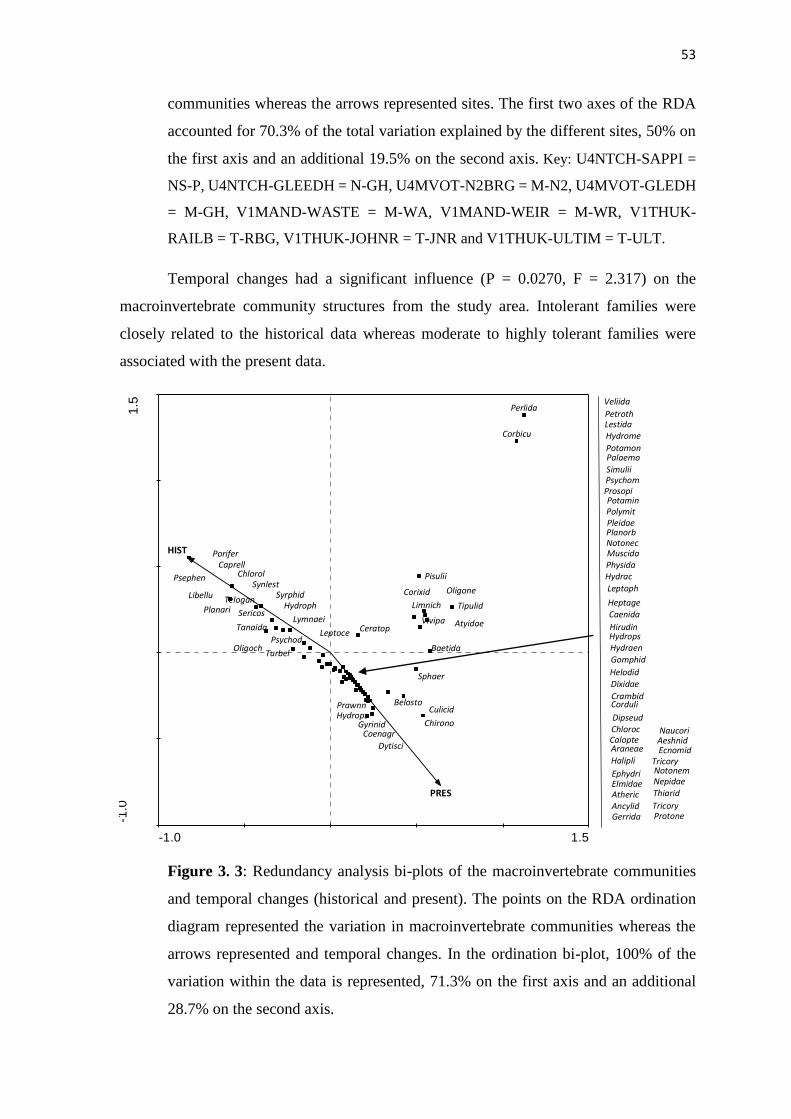
53
communities whereas the arrows represented sites. The first two axes of the RDA
accounted for 70.3% of the total variation explained by the different sites, 50% on
the first axis and an additional 19.5% on the second axis. Key: U4NTCH-SAPPI =
NS-P, U4NTCH-GLEEDH = N-GH, U4MVOT-N2BRG = M-N2, U4MVOT-GLEDH
= M-GH, V1MAND-WASTE = M-WA, V1MAND-WEIR = M-WR, V1THUK-
RAILB = T-RBG, V1THUK-JOHNR = T-JNR and V1THUK-ULTIM = T-ULT.
Temporal changes had a significant influence (P = 0.0270, F = 2.317) on the
macroinvertebrate community structures from the study area. Intolerant families were
closely related to the historical data whereas moderate to highly tolerant families were
associated with the present data.
Figure 3. 3: Redundancy analysis bi-plots of the macroinvertebrate communities
and temporal changes (historical and present). The points on the RDA ordination
diagram represented the variation in macroinvertebrate communities whereas the
arrows represented and temporal changes. In the ordination bi-plot, 100% of the
variation within the data is represented, 71.3% on the first axis and an additional
28.7% on the second axis.
-1.0 1.5
-1.0
1.5
Aeshnid
Ancylid
Araneae
Atheric
Atyidae
Baetida
Belosto
Caenida
Calopte
Caprell
Ceratop
ChironoChloroc
Chlorol
Coenagr
Corbicu
Corduli
Corixid
Crambid
CulicidDipseud
Dixidae
Dytisci Ecnomid
ElmidaeEphydri
Gerrida
Gomphid
Gyrinid
Halipli
Helodid
Heptage
Hirudin
Hydrac
Hydraen
Hydroph
Hydrome
Hydrops
Hydrops
Leptoce
Leptoph
Lestida
LibelluLimnich
Lymnaei
Muscida
Naucori
Nepidae
Notonec
Notonem
Oligoch
Oligone
Palaemo
PerlidaPetroth
PhysidaPisulii
Planari
PlanorbPleidaePolymit
Porifer
Potamin
Potamon
Prawnn
Prosopi
Protone
Psephen
Psychod
Psychom
Sericos
Simulii
Sphaer
SynlestSyrphid
Tanaida
Telogan
Thiarid
Tipulid
Tricory
Turbel
Tricory
Veliida
Vivipa
HIST
PRES

54
The Monte Carlo permutation test revealed significant different (P-value of 0.0010,
F-ratio of 4.827) (Fig. 3.4). The three SASS5 variables that were hypothesised to represent
significant changes in macroinvertebrate communities were the number of taxa (P = 0.001,
F= 10.90), estimated (P = 0.001, F = 6.67) and SASS5 scores (P = 0.002, F = 3.53). There
was no statistical significance between the macroinvertebrate communities and the ASPT
(P = 0.535, F = 0.9).The results further revealed that the SASS5 scores had a correlation
with number of taxa and ASPT.
Figure 3. 4: Redundancy analysis bi-plots of the uMvoti and Thukela Rivers
macroinvertebrate communities and SASS5 variables. The points on the RDA
ordination diagram represented the variation in macroinvertebrate communities
whereas the arrows represented SASS5 variables. In total, the RDA summarized
84.2% of the total variation in the first two axes, with axis one explaining 63.1%
-0.5 1.5
-1.0
1.5
Aeshnid
AncylidAraneae
Atheric
Atyidae
Baetida
Belosto
Caenida
CalopteCaprell
Ceratop
Chirono
ChlorocChlorol Coenagr
Corbicu
CorduliCorixid
Crambid
Culicid
DipseudDixidae
Dytisci
Ecnomid
Elmidae
Ephydri
Gerrida
Gomphid
Gyrinid
Halipli
Helodid
Heptage
Hirudin
Hydrac
Hydraen
Hydroph
HydromeHydrops
Hydrops
Leptoce
Leptoph
Lestida
LibelluLimnich
Lymnaei
Muscida
NaucoriNepidaeNotonec
Notonem
Oligoch
Oligone
Palaemo
Perlida
Petroth
Physida
Pisulii
Planari
Planorb
Pleidae
Polymit Porifer
PotaminPotamon
Prawnn
ProsopiProtone
Psephen
Psychod
Psychom
Sericos
Simulii
Sphaer
Synlest
Syrphid
Tanaida
TeloganThiarid
Tipulid
TricoryTurbel
Tricory
Veliida
Vivipa
ABN
.Taxa
ASPTSASS Sco
.Biotope

55
and an additional 48.1% on the second axis. Key: ABN = estimated estimated
abundance, Tax = number of taxa, SASS Sco = SASS5 Scores and Biotope =
number of biotopes.
The South African Scoring System (SASS) and Macroinvertebrate Response
Assessment Index (MIRAI) scores (Fig. 3.5 a) were significant different (P = 0.001 and F
= 2.717). Another analysis was done to further assess the relationship between
macroinvertebrate communities, SASS5 and MIRAI ecological classes (Fig. 3.5 b). The
RDA bi-plot, separated macroinvertebrates data into three distinct faunal assemblages (Fig.
3.5). The SASS5 class B and MIRAI class C formed one group that had low number of
taxa and it was dominated by tolerant macroinvertebrate families including Heptageniidae,
Athericidae, Calopterygidae. The second faunal assemblage was formed by the SASS5
class E/F and MIRAI class D and they were associated with many tolerant families
including Oligochaeta, Belastomatidae, Hirudinea and Ephydridae. The last grouped was
represented by the SASS5 class C – D and MIRAI class CD – EF. This faunal assemblage
was allied by a mixture of tolerant and intolerant families with low number of taxa.
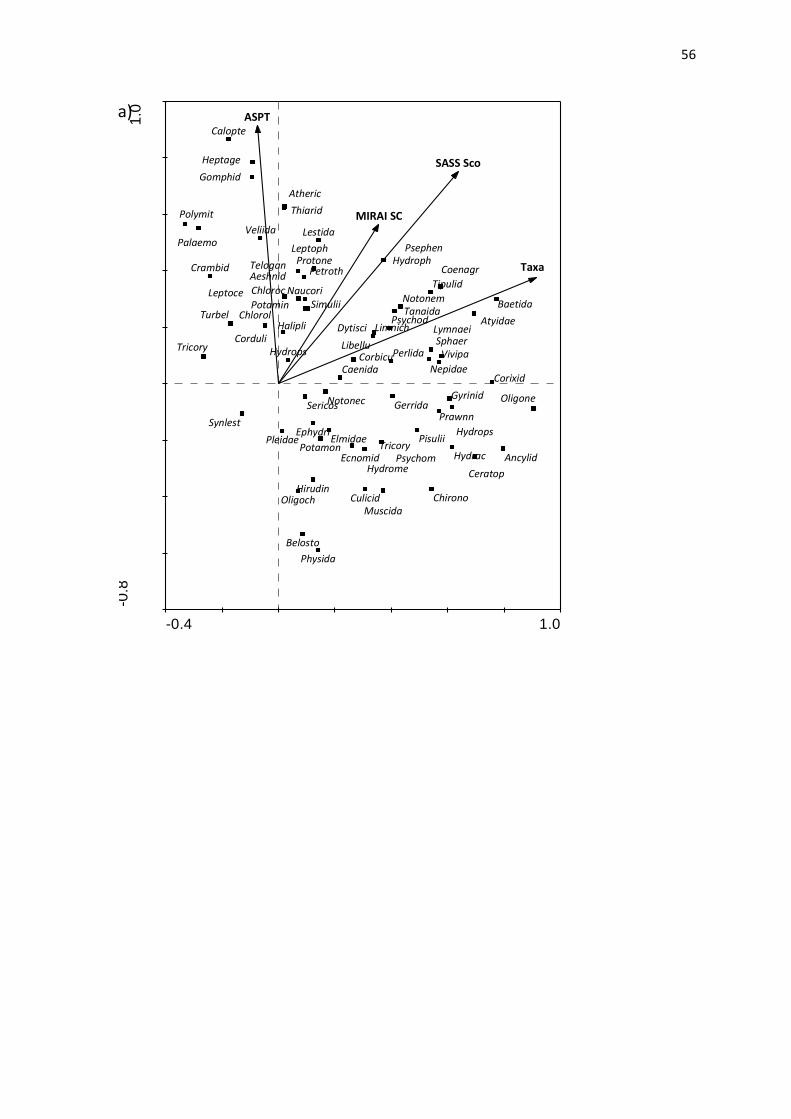
56
-0.4 1.0
-0.8
1.0
Aeshnid
Ancylid
Atheric
Atyidae
Baetida
Belosto
Caenida
Calopte
Ceratop
Chirono
Chloroc
Chlorol
Coenagr
Corbicu
Corduli
Corixid
Crambid
Culicid
Dytisci
Ecnomid
ElmidaeEphydri
Gerrida
Gomphid
Gyrinid
Halipli
Heptage
Hirudin
Hydrac
Hydroph
Hydrome
Hydrops
Hydrops
Leptoce
Leptoph
Lestida
Libellu
Limnich Lymnaei
Muscida
Naucori
Nepidae
Notonec
Notonem
Oligoch
Oligone
Palaemo
Perlida
Petroth
Physida
PisuliiPleidae
Polymit
Potamin
Potamon
Prawnn
ProtonePsephen
Psychod
Psychom
Sericos
Simulii
Sphaer
Synlest
Tanaida
Telogan
Thiarid
Tipulid
Tricory
Turbel
Tricory
Veliida
Vivipa
Taxa
ASPT
SASS Sco
MIRAI SC
a)

57
Figure 3. 5: a) Redundancy analysis bi-plots of the macroinvertebrate
communities, MIRAI scores and SASS5 outcomes. In the ordination bi-plot, 75.8%
of the variation within the data is represented, 52% on the first axis and an additional
23.8% on the second axis. b) Redundancy analysis bi-plots of the macroinvertebrate
communities, MIRAI and SASS5 ecological classes. The first two axes of the RDA
account for 76.6% of the total variation explained by the different sites, 55.6% on
the first axis and an additional 22% on the second axis. On both ordination bi-plots,
the points represented the variation in macroinvertebrate communities whereas the
arrows represented SASS5 and MIRAI variables.
Water quality parameters accountable for structuring the macroinvertebrate
community assemblages in the uMvoti and Thukela Rivers are shown in Fig. 3.5. Results
showed a significant difference (P = 0.0010, F = 1.890) between macroinvertebrate
communities when looking at the different preferences to water quality. The oxygen levels
(both percentages and mg/l) were not significance. An increase in pH exhibited a
correlation with an increase in COD and such parameters were associated with tolerant
families. The pH exhibited similar correlation with the electricity conductivity (EC).
Chloride and alkalinity demonstrated a correlation and they were allied with families that
require good water quality to persist successfully.
-1.0 1.0
-0.4
1.0
Aeshnid
Ancylid
Atheric
Atyidae
Baetida
Belosto
Caenida
Calopte
Ceratop Chirono
Chloroc
Chlorol
Coenagr
Corbicu
Corduli
Corixid
Crambid Culicid
Dytisci
EcnomidElmidae
Ephydri
Gerrida
Gomphid
Gyrinid
Halipli
Heptage
Hirudin
Hydrac
Hydroph
Hydrome
Hydrops
Hydrops
Leptoce
Leptoph
LestidaLibellu
Limnich
Lymnaei
Muscida
Naucori
Nepidae
Notonec
Notonem
Oligoch
OligonePalaemo
Perlida
Petroth
Physida
PisuliiPleidae
PolymitPotamin
Potamon Prawnn
Protone
PsephenPsychod
Psychom
Sericos
Simulii
Sphaer
Synlest
Tanaida
Telogan
Thiarid
Tipulid
TricoryTurbel
Tricory
Veliida
Vivipa
S-B
S-C
S-D
S-EF
M-C
M-CDM-D
M-EF
S-A
b)
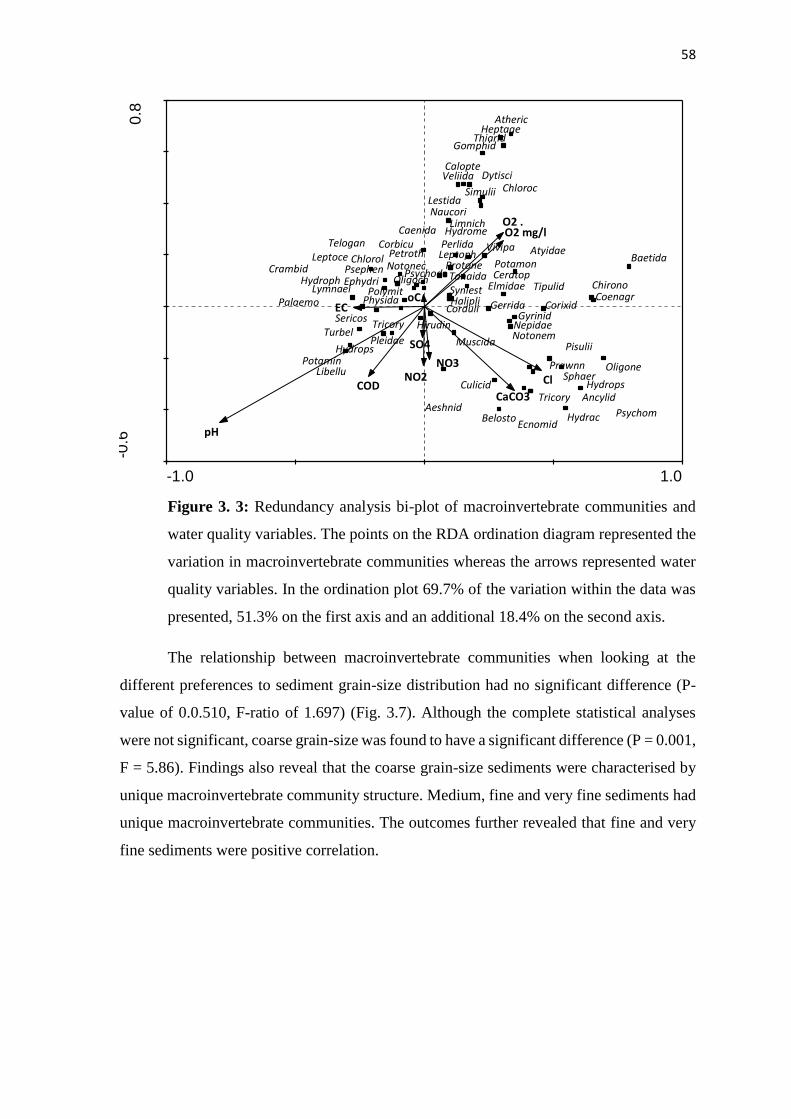
58
Figure 3. 3: Redundancy analysis bi-plot of macroinvertebrate communities and
water quality variables. The points on the RDA ordination diagram represented the
variation in macroinvertebrate communities whereas the arrows represented water
quality variables. In the ordination plot 69.7% of the variation within the data was
presented, 51.3% on the first axis and an additional 18.4% on the second axis.
The relationship between macroinvertebrate communities when looking at the
different preferences to sediment grain-size distribution had no significant difference (P-
value of 0.0.510, F-ratio of 1.697) (Fig. 3.7). Although the complete statistical analyses
were not significant, coarse grain-size was found to have a significant difference (P = 0.001,
F = 5.86). Findings also reveal that the coarse grain-size sediments were characterised by
unique macroinvertebrate community structure. Medium, fine and very fine sediments had
unique macroinvertebrate communities. The outcomes further revealed that fine and very
fine sediments were positive correlation.
-1.0 1.0
-0.6
0.8
AeshnidAncylid
Atheric
AtyidaeBaetida
Belosto
Caenida
Calopte
CeratopChirono
Chloroc
Chlorol
Coenagr
Corbicu
Corduli Corixid
Crambid
Culicid
Dytisci
Ecnomid
ElmidaeEphydri
Gerrida
Gomphid
Gyrinid
Halipli
Heptage
Hirudin
Hydrac
Hydroph
Hydrome
Hydrops
Hydrops
Leptoce Leptoph
Lestida
Libellu
Limnich
Lymnaei
Muscida
Naucori
Nepidae
Notonec
Notonem
Oligoch
Oligone
Palaemo
PerlidaPetroth
Physida
PisuliiPleidae
Polymit
Potamin
Potamon
Prawnn
ProtonePsephen Psychod
Psychom
Sericos
Simulii
Sphaer
SynlestTanaida
Telogan
Thiarid
Tipulid
Tricory
TurbelTricory
Veliida
Vivipa
oC
O2 mg/lO2 .
EC
pH
NO3NO2 Cl
CaCO3COD
SO4

59
Figure 3. 4: Redundancy analysis bi-plot of macroinvertebrates and sediment
grain-size variables. The points on the RDA ordination diagram represented the
variation in macroinvertebrate communities whereas the arrows represented
sediment grain-size. The first two axes of the RDA accounted for 93.6% of the total
variation explained by the different sites, 85.7% on the first axis and an additional
7.9% on the second axis.
3.3.2 Physico-chemical parameters
High water temperatures (31 and 30 oC) were recorded in the uMvoti River sites during the
2005 high flow survey (Appendix 3.1) whereas the minimum temperature of 14.3 oC was
recorded during the 2006 low flow survey. In the Thukela River, minimum water
temperature of 13.7 oC was recorded during the 2006 low flow survey whereas the
maximum water temperature of 32.97 oC was recorded during the 2012 high flow survey
(Appendix 3.2).
The DO levels of the showed a generally decreasing trend from upper to lower
reaches of the study area. In the uMvoti River, high DO levels O (9.0 and 11.3 mg/l) were
recorded during the 2005 and 2008 low flow surveys. Such values were allied with reduced
water temperatures shown on Appendix 3.1. In the Thukela River, the minimum DO level
of 0.6 mg/l was recorded during the 2008 low flow whereas the maximum of 10.1 mg/l was
recorded during the 2006 low flow survey (Appendix 3.2).
-1.0 1.5
-0.8
0.6
AeshnidAncylid
Atheric
Atyidae
Baetida
Belosto
Caenida
Calopte
Ceratop
Chirono
Chloroc
Chlorol
Coenagr
Corbicu
CorduliCorixid
Crambid
Culicid
Dytisci
EcnomidElmidae
EphydriGerrida
Gomphid
Gyrinid
Heptage
Hirudin
HydracHydroph
Hydrome
Hydrops
Hydrops
Leptoce
Leptoph
Lestida
Libellu
Limnich
Lymnaei
Muscida
Naucori
Nepidae
Notonec
Notonem
Oligoch
Oligone
Palaemo
PerlidaPetroth
PhysidaPisulii
Pleidae
Polymit
Potamin
Potamon
Prawnn
Protone
PsephenPsychod
Psychom
Sericos
Simulii
Sphaer
Synlest
Tanaida
Telogan
Thiarid
Tipulid
TricoryTurbel
Tricory
Veliida
Vivipa
Coarse
Medium
Fine
Very fine
60
The uMvoti River had low nitrate loads and ammonium between 1999 – 2005.
Afterwards, nitrate loads fluctuated noticeably (Appendix 3.1). High nitrate (6.7 mg/l) was
recorded during the 2012 low flow survey whereas high ammonium level of 10.9 mg/l was
recorded during the 2010 high flow survey. In the Thukela River, the minimum nitrate load
of 0.01 mg/l was recorded during the 2005 high flow survey and 2006 low flow survey
whereas the maximum level of 4.69 mg/l was recorded during the 2012 high flow survey
(Appendix 3.2).
In the uMvoti River, the highest chloride level of 269 mg/l was measured during
the 2004 low flow survey whereas the lowest chloride level (0.4 mg/l) was measured during
the 2008 low flow survey. Sodium was another salt parameter that influenced the ecological
integrity of the study sites. Highest sodium value of 270 mg/l was recorded during the 2016
high flow survey whereas the lowest value of 0.1 mg/l was recorded during the 2008 low
flow survey. In the Thukela River, the minimum chloride level of 0.1 mg/l was recorded
during the 2010 high flow survey whereas maximum of 373 mg/l was obtained during the
high 2016 flow survey.
3.4. Discussion
Temporal changes on both lowland rivers had a significant influence (P = 0.0270) on
macroinvertebrate community structures of the study area. Low number of
macroinvertebrate taxa were associated with the present dataset whereas high diversity was
allied with historical dataset. This suggests that the trend is getting worse with time. In most
sites, this can be ascribed to poor water quality, reduced habitat heterogeneity and
complexity as well as anthropogenic influences. The uMvoti and Thukela Rivers had the
prevalence of pollution tolerant families like Chironomidae and Oligochaeta, that was
indicative of how polluted these systems are (Rae 1989). The uMvoti River water quality
condition has been reported to be highly impacted by anthropogenic stressors associated
with this stream (Malherbe 2006; Venter 2013). The severe impact of these activities was
reflected in the water quality, which in turn was reflected in the macroinvertebrate
communities by containing low number of taxa and estimated abundance s. The uMvoti
River has been documented to be seriously modified, with nearly total loss of its ecosystem
services (Tharme 1996). Even the Department of Water Affairs and Forestry referred this
river as a ‘working river’ (DWAF, 2004).

61
The lower Thukela River has been characterised as an ecologically important
section of the Thukela catchment with numerous ecosystem services (DWAF 2004).
Increasing demand for such ecosystem services has resulted in the degradation of the
integrity of this river. The Thukela River has been categorised as the moderately modified
(Class C) river (IWR 2004), suggesting that some structure and function aspects of this
catchment are negatively impacted by water resource use stressors associated with this river
(DWAF 2004).
3.4.1 uMvoti River and its associated tributary
The macroinvertebrate communities at the Ntchaweni Stream sites were relatively in a poor
integrity state (class D – F) throughout the study period. This site was dominated by tolerant
families like Physidae, Planorbinae, Chironomidae and Belastomatidae (per.obs.) and it had
a decreasing trend for macroinvertebrates estimated estimated abundance and number of
taxa. This can be attributed to low dissolved oxygen concentrations which were mostly
found to be below the TWQG required for aquatic ecosystems (DWAF, 1996b). Relatively
high-water temperatures were also recorded in the Ntchaweni Stream sites and that had an
adverse effect on macroinvertebrate communities as high-water temperatures are reported
to lower the organism’s resistance to pollution, diseases and parasites (Kale 2016). The
decrease in macroinvertebrates estimated abundance at the Ntchaweni Stream sites were
also driven by the combined effect of the urban runoff as well as effluence discharge from
the Gledhow sugar mill and Sappi Stanger Mill (Malherbe 2006; Venter 2013). The nitrate
and ammonium concentrations of this stream exhibited an increasing trend throughout the
study period and they were normally above the recommended aquatic ecosystem guidelines
(DWAF 1996 e). Such increase can be attributed to fertilisers used for intensive sugarcane
plantations as in other studies (Pawar and Shaikh 1995). Sanseveriono (2016) reported that
high nitrate levels promote algal blooms as well as the release of toxic substances that can
cause death of many aquatic species.
The severe impact of water resource use activities at the Ntchaweni Stream sites
were further evident at the lower reach site (U4MVOT-N2BRG) of the uMvoti River
(below the Ntchaweni – uMvoti confluence). In most surveys, this site consistently had
low macroinvertebrates estimated abundance and diversity which was dominated by
pollution tolerant families including Oligochaeta, Psychodidae, and Chironomiade (per.
62
obs.). This can be ascribed to the increased organic and inorganic pollution originating from
the Ntchaweni River sites (Venter 2013). The informal settlements and agricultural
activities situated upstream of this site worsened water quality condition (Malherbe 2006),
which in turn created unfavourable conditions for many tolerance families. Chloride was
found to be an important parameter for explaining the biological variation observed in
macroinvertebrate community structures (P = 0.046) and in the lower reach site of the
uMvoti River, high levels such parameter of were recorded and they were attributed to the
combined effect of industrial effluence as well as Stanger sewage treatment works
originating from the Mbozano stream which meets the uMvoti River upstream of this site.
The chloride levels are reported to enhance excess ions on water column, causing major
concerns to the river wellbeing (Gillis 2011) as well as the persistence of tolerant
macroinvertebrates.
The upper reach study site (M-GH) at the uMvoti River had more diverse
macroinvertebrate communities and they were dominated by intolerant families including
Atydae, Baetidae, Heptageniidae, Naucoridae, Oligoneuridae, Heptageniidae
Chlorocyphidae, Calopterygidae, Athericidae and others. These families were prevalent in
most years and that can be attributed to relatively good dissolved oxygen levels which were
normally within the target water quality guidelines (TWQG) of 6 – 9 mg/l (DWAF 1996b).
This site was also characterised by low sodium, calcium and chloride levels which
promoted the persistence of intolerant families obtained. Some number of pollution tolerant
families like Chironomidae, Oligochaeta, Thiaridae and Corixidae were also recorded in
this study site and that may be attributed to water quality related stressors that occurs
upstream of this site and they include sugarcane plantations, water abstraction for industrial
use as well as domestic use by local communities. Despite the occurrence such families,
macroinvertebrate communities revealed a relatively better condition throughout the study
period in this site.
3.4.2 Thukela River and its associated tributary
Throughout the study period, the Mandeni stream sites were dominated by of pollution
tolerant taxa which included Culicidae, Chironomidae, Ancylidae, Coenagrionidae,
Sphaeridae, Belastomatidae and a couple of other families. This may be due to the synergistic
effects of water quality stressors associated with the Isithebe Industrial complex and
wastewater treatment works and the Sappi Mill (Malherbe 2006; Venter 2013). The
dissolved oxygen concentrations at the Mandeni Stream sites were normally found to be
63
below the acceptable TWQR requirement of > 6 mg/l (DWAF 1996b) and this contributed
to the poor macroinvertebrate communities observed. The Mandeni Stream sites also had
high electrical conductivity and Chemical Oxygen Demand levels which have been found
to cause the biological variation in macroinvertebrate communities (DWAF, 2003). Other
important environmental variables driving macroinvertebrate communities in this stream
includes high nitrate, chloride and sulphate levels.
The impact of anthropogenic stressors associated with the Mandeni Stream was
further evident at the sites (T-JNR and T-ULT) situated downstream of the Thukela –
Mendini confluence ((Stryftombolas 2008).). These sites had relatively high electrical
conductivity and that may be attributed to the Mandeni Stream and the Sappi Pulp and
Paper Mill and this affect the availability of oxygen in the system. The most important
variables driving macroinvertebrate communities in these sites include domestic use,
industries, agriculture, mining, recreation, wastewater treatment and road and rail networks
(Malherbe 2006; Stryftombolas 2008; O'Brien 2010; Venter 2013). The dissolved oxygen
concentration trends in these sites showed a considerable decreasing trend which was
associated with increased temperature levels. This resulted in the prevalence of pollution
tolerant families which were allied with low number of taxa. The T-JNR is situated at
proximity to the Thukela – Mandeni confluence and its macroinvertebrate communities
included highly tolerant families like Planaria, Ephydridae and Simulidae. On the other
hand, the T-ULT (further down the confluence) had a mixture of pollution tolerant and
intolerant families. The tolerant families were attributed to pollution originating from the
Mandeni River as well as the land-use activities associated with the upper Thukela River
reaches. Despite this, tolerant families like Oligoneuridae, Limnichidae and Baetidae were
prevalent in this site and it can be ascribed to the assimilation capacity of the Thukela River
which decreased the effect of such stressors as you move down stream of the study area.
Water temperature levels recorded in the upper reach study site (T-RBG) of the
Thukela River were mostly within the acceptable range of the TWQG requirements
(DWAF 1996b) except for the 2012 high flow survey where relatively high temperature
level of 32.97 oC were recorded. This high temperature tied with low dissolved oxygen
content which had an adverse effect on macroinvertebrate communities as a low number of
taxa were obtained during this survey (pers. obs.) Normally this site exhibit high levels of
dissolved oxygen when compared with the other sites and that can be attributed to this site
being located upstream of the Mandeni – Thukela confluence (Ferreira et al. 2008;
64
Stryftombolas 2008). This may also be ascribed to minimal human pressure and that
promoted the persistence of tolerant families like Protoneuridae, Lestidae, Leptophlebiidae,
Petrothrincidae, Atydae, Baetidae, Heptaganidae, Naucoridae, Oligoneuridae,
Notonemouridae and Limnichidae in this site.
3.4.3 Conclusions
The macroinvertebrate community structures of the Ntchaweni Stream sites were largely
modified due to water resource use stressors like the Gledhow Sugar Mill, Sappi Pulp and
Paper making activities, agricultural activities and domestic uses by local communities. In
most surveys this stream was dominated by tolerant families (like Chironomidae,
Oligochaeta, Planaria, Simuliidae and many others) which were associated with a low
estimated abundance and number of taxa. The severe impact of the water resource use
stressors in the Ntchaweni River was further evident at the site below uMvoti – Ntchaweni
confluence as this site also exhibited low macroinvertebrate estimated abundance
throughout the study period. With regards to the Thukela River, poor macroinvertebrates
diversity and low estimated abundance was observed in most surveys and that can be
ascribed to major industrial activities associated with Isithebe industrial complex, the
wastewater treatment works of Sundumbili, excessive water abstraction and sugarcane
plantations. Again, the impacts of Mandeni Steam associated stressors were observed in
the Thukela River sites situated below the Thukela – Mandeni confluence. The spatial and
temporal variation in the physico-chemical parameters of the studied rivers had significant
effect on the diversity and estimated abundance of macroinvertebrate community
structures. The water quality state of the uMvoti river was in a seriously modified state
which is why the Department of Water Affairs and Forestry referred this river as a ‘working
river’ (DWAF 2004). Water resource stressors associated with the Ntchaweni streams
worsens the ecosystem wellbeing of uMvoti River. Hence, appropriate management plans
are urgently needed for this river to minimise these stressors and for attaining a balance
between use and protection rights. The Thukela River is categorised as the moderately
modified (Class C) river (IWR 2004). Stressors associated with the Mandeni stream
worsens the Thukela River, so, urgent management and protection interventions are
required.
Both uMvoti and Thukela Rivers along with their associated tributaries need to be
monitored and properly managed to reduce stressors that negatively impacts
65
macroinvertebrate communities. This will promote the protection of river ecosystems
themselves. Failure to implement effective plans for these river ecosystems may results in
a complete loss of ecosystem services and functions that these rivers provide, and rivers
might reach a point of irreversible changes.
3.5 Acknowledgements
We thank the Aquatic Ecosystem Research Program (AER) and South African Pulp and
Paper Industries Limited (Sappi) for the opportunity to do this research and for providing
running costs. We thank the National Research Fund (ZA) for funding. Thanks are also
extended to Ezemvelo KZN Wildlife for permits. Also, we are grateful to the Umgeni
Water for the use of their facilities to perform water quality analyses.
3.6 References
Arimoro FO, Ikomi RB, Erebe E. 2007. Macroinvertebrate community diversity in
relation to water quality status of River Ase, Niger Delta, Nigeria. Journal of
fisheries and Aquatic Science 2: 337–344.
Biswas AK. 2008. Integrated Water Resources Management: Is It Working? International
Journal of Water Resources Development 24: 5–22
Bouwer H. 2000. Integrated water management: emerging issues and challenges.
Agricultural water management 45: 217–228.
Bredenhand E. 2005. Evaluation of macroinvertebrates as bio-indicators of water quality
and the assessment of the impact of the Klein Plaas dam on the Eerste River. MSc
Dissertation, University of Stellenbosch, Stellenbosch.
Carminati AV. 2008. An Assessment of the Effects of Sugar Mill Activities on the
Ecological Integrity of the UMvoti and Amatikulu Rivers, KwaZulu Natal. MSc
dissertation, University of Johannesburg, Johannesburg.
Cassardo C. 2014. Global warming and water sustainability. In E3S Web of Conferences
(Vol. 2). EDP Sciences.
Chahouki MAZ. 2011. Multivariate analysis techniques in environmental science. In
Earth and Environmental Sciences. InTech.
Chutter FM. 1998. Research on the rapid Biological Assessment of Water Quality
Impacts in Streams and Rivers. Water Research Commission (WRC) Report No
422/1/98. Water Research Commission, Pretoria.

66
Coastal Research Unit of Zululand (CRUZ). 2000. Ecological evaluation of the lower
Mvoti River and Estuary. CRUZ Environmental Report No. 4, CRUZ, University
of Zululand, Empangeni, South Africa.
Daniels SM, Evans MG, Agnew CT, Allott THE. 2012. Ammonium release from a
blanket peatland into headwater stream systems. Environmental pollution 163:
261–272.
Deksissa T, Ashton PJ, Vanrolleghem PA. 2003. Control options for river water quality
improvement: A case study of TDS and inorganic nitrogen in the Crocodile River
(South Africa). Water SA 29: 209–218.
Department of Water Affairs and Forestry (DWAF). 1996b. South African Water Quality
Guidelines. 2nd edn. Volume 7: Aquatic Ecosystems. DWAF, Pretoria, South
Africa.
Department of Water Affairs and Forestry (DWAF). 2004. Draft background
information: South African Forestry, Pulp and Paper industries: Draft version 1.
DWAF, Pretoria.
Department of Water Affairs and Forestry, 1996e. South African water quality guidelines,
Volume 5, Agricultural Water Use: Livestock Watering. 2nd Edition. Pretoria,
South Africa.
Dickens CW, Graham PM. 2002. The South African Scoring System (SASS) Version 5
Rapid Bioassessment Method for Rivers. African Journal of Aquatic Science 27:
1–10.
Farrell KT. 2014. Aquatic Macroinvertebrate Community in the Wilge River (Doctoral
dissertation, University of Johannesburg).
Ferreira M, Malherbe W, Cloete Y, Wepener V, O’Brien G. 2008. Ecological integrity
assessment of the lower UMvoti River/Estuary, KwaZulu-Natal: 2008 update of
the 2005 ecological integrity assessment of the lower Thukela River/Estuary,
KwaZulu-Natal. University of Johannesburg, Auckland Park, Johannesburg, South
Africa.
Ferreira M. 2005. A study into the anthropogenic impacts affecting the Elands River,
Mpumalanga.
Gillis PL. 2011. Assessing the toxicity of sodium chloride to the glochidia of freshwater
mussels: Implications for salinization of surface waters. Environmental Pollution
159: 1702–1708.

67
Harvey R, Lye L, Khan A, Paterson R. 2011. The Influence of air temperature on water
temperature and the concentration of dissolved oxygen in Newfoundland Rivers.
Canadian Water Resources Journal 36: 171–192.
Hill L. 2007. Focus on CSIR research in pollution waste: The South African river health
programme.
Kale VS. 2016. Consequence of Temperature, pH, Turbidity and Dissolved Oxygen
Water Quality Parameters. Organization (WHO), 3(8).
King J Pienaar H. 2011. Sustainable use of South Africa’s inland waters: a situation
assessment of resource directed measures 12 years after the 1998 National Water
Act. Water Research Commission Report No. TT, 491: 1–245.
Kleynhans CJ. 1996. A qualitative procedure for the assessment of the habitat integrity
status of the Luvuvhu River (Limpopo system, South Africa). Journal of Aquatic
Ecosystem Health 5: 41–54.
Kleynhans CJ. 1999. The development of a fish index to assess the biological integrity of
South African Rivers. Water SA 25: 265–278.
Kohler M. 2016. Confronting South Africa’s Water Challenge: A Decomposition
Analysis of Water Intensity. ERSA (Economic Research Southern Africa) working
paper 605.
Leunda PM, Oscoz J, Miranda R, Ariño AH. 2009. Longitudinal and seasonal variation
of the benthic macroinvertebrate community and biotic indices in an undisturbed
Pyrenean river. Ecological Indicators 9: 52-63.
Li L, Zheng B, Liu L. 2010. Biomonitoring and bioindicators used for river ecosystems:
definitions, approaches and trends. Procedia environmental sciences 2: 1510–
1524.
Malherbe CW. 2006. The current ecological state of the lower UMvoti River, KwaZulu-
Natal. MSc Dissertation, University of Johannesburg, Johannesburg.
Mathebula B. 2016. Assessment of the surface water quality of the main rivers feeding at
Katse Dam Lesotho. PhD Dissertation, University of Pretoria, Pretoria
McMillan PH. 1998. An Integrated Habitat Assessment System (IHAS v2) for Rapid
Biological Assessments of Rivers and Systems. Division of the Environment and
Forestry Technology. Report No. Env-P-I 98132. CSIR, Pretoria, South Africa.
National Water Act (Act No. 36 of 1998). Republic of South Africa 1998. Government
Gazette, (19182).
68
O’Brien GC, Swemmer R, Wepener V. 2009. Ecological integrity assessment of fish
assemblages of the Matigulu/Nyoni and UMvoti estuaries, KwaZulu-Natal, South
Africa. African Journal of Aquatic Science 34: 293–302.
O’Brien GC, Wepener V, Malherbe W, Swemmer R, Von Bratt C. 2005. Ecological
Integrity Assessment of the Lower Mvoti River/Estuary, KwaZulu-Natal: Update
of the 2000 Ecological Evaluation of the Lower Mvoti River and Estuary. Report
prepared for the Sappi Stanger Environmental Liaison Committee (SSELC).
Report No. 2005/06/001. Stanger, South Africa.
O'Brien GC, Venter H. 2012. Evaluation of eight years (2005 to 2012) of ecological
integrity data from the lower Thukela River/Estuary and associated systems with
management considerations based on the risk of hazards affecting ecosystem
structure and function, KwaZulu-Natal., Water Research Group, North West
University, Potchefstroom.
O'Brien GC. 2010. Ecological State Assessment of the Lower Thukela River/Estuary,
KwaZulu-Natal. Investigational Report. Rivers of Life: Aquatic Health Services,
Potchefstroom, South Africa.
Oertel N, Salánki J. 2003. Biomonitoring and bioindicators in aquatic ecosystems. In
Modern trends in applied aquatic ecology (pp. 219-246). Springer, Boston, MA.
O'Keeffe J, Dickens C. 2000. Aquatic invertebrates. In: King J.M., Tharme R.E. and De
Villiers M.S. (eds.) Environmental Flow Assessments for Rivers: Manual for the
Building Block Methodology. WRC Report No. 576/1/98. Water Research
Commission, Pretoria, South Africa. pp. 231–244.
Otieno FAO, Ochieng GMM. 2007. Water management tools as a means of averting a
possible water scarcity in South Africa by the year 2025. Water South Africa 30:
120–124.
Paliy O, Shankar V. 2016. Application of multivariate statistical techniques in microbial
ecology. Molecular Ecology 25: 1032–1057.
Pawar NJ, Shaikh IJ. 1995. Nitrate pollution of ground waters from shallow basaltic
aquifers, Deccan Trap Hydrologic Province, India. Environmental Geology 25(3):
197–204.
Rae JG. 1989. Chironomid Midges as indicators of organic pollution in Scioto River
Basin, Ohio. Ohio Journal of Science 89: 5–9.
Sanseverino I, Conduto D, Pozzoli L, Dobricic S, Lettieri T. 2016. Algal bloom and its
economic impact. EUR 27905 EN; doi: 10.2788, 660478.
69
Shaw PJA. 2003. Multivariate Statistics for the Environmental Sciences. London, UK:
Arnold Publishers.
Stryftombolas IC. 2008. Ecotoxicological Assessment of the Impact of Paper and Pulp
Effluent on the Lower Thukela River Catchment, KwaZulu-Natal, South Africa,
and the Toxicological Assessment of Similar Effluent from Two Other Mills.
Unpublished M.Sc. Dissertation, University of Johannesburg, Johannesburg.
Swemmer, R., 2011. Ecological integrity assessment of the UMvoti Estuary, KwaZulu-
Natal, South Africa. PhD Dissertation, University of Johannesburg, Johannesburg.
Ter Braak CJF, Smilauer F. 2004. Canoco for Windows Version 4.53. © 1997-2004
Biometrics – Plant Research International, Wageningen, The Netherlands
Tharme R. 1996. Rivers of southern Africa: UMvoti River. African Wildlife 50: 31.
UN Water, 2014. http://www.unwater.org/statistics/statistics-detail/ar/c/246663/
United Nations, 2017. https://www.un.org/development/desa/publications/world-
population-prospects-the-2017-revision.html
Van den Brink PJ, Van den Brink NW, Ter Braak, CJF. 2003. Multivariate analysis of
ecotoxicological data using ordination: Demonstrations of utility on the basis of
various examples. Australasian Journal of Ecotoxicology 9: 141–156.
Venter JJ. 2013. An ecological integrity assessment of the lower Amatikulu, Thukela and
UMvoti Rivers, KwaZulu-Natal, South Africa. North-West University, Doctoral
dissertation, Potchefstroom.
Vörösmarty CJ, McIntyre PB, Gessner MO, Dudgeon D, Prusevich A, Green P, Glidden
S, Bunn SE, Sullivan CA, Liermann CR, Davies PM. 2010. Global threats to
human water security and river biodiversity. Nature 467: 555–561.
Wheater HS. Gober P. 2015. Water security and the science agenda. Water Resources
Research 51: 5406–5424.
Wise TA. 2013. Can we feed the world in 2050? A scoping paper to assess the evidence.
Global Development and Environment Institute Working Paper: 13–04.
WR (Institute for Water Research), 2003. Thukela water project decision support phase.
Reserve determination Thukela system water quality report, Department of Water
Affairs and Forestry, Pretoria.
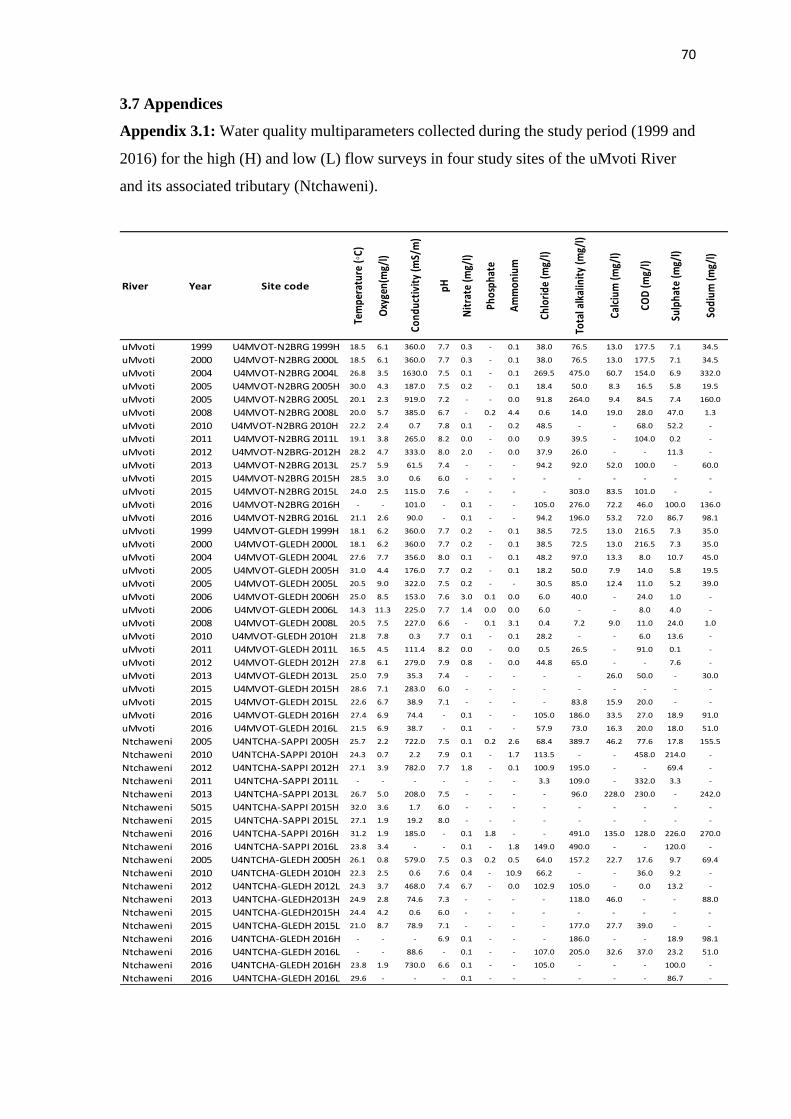
70
3.7 Appendices
Appendix 3.1: Water quality multiparameters collected during the study period (1999 and
2016) for the high (H) and low (L) flow surveys in four study sites of the uMvoti River
and its associated tributary (Ntchaweni).
River Year Site code
Tem
pera
ture
(◦C)
Oxy
gen(
mg/
l)
Cond
ucti
vity
(mS/
m)
pH
Nit
rate
(mg/
l)
Phos
phat
e
Am
mon
ium
Chlo
ride
(mg/
l)
Tota
l alk
alin
ity
(mg/
l)
Calc
ium
(mg/
l)
COD
(mg/
l)
Sulp
hate
(mg/
l)
Sodi
um (m
g/l)
uMvoti 1999 U4MVOT-N2BRG 1999H 18.5 6.1 360.0 7.7 0.3 - 0.1 38.0 76.5 13.0 177.5 7.1 34.5
uMvoti 2000 U4MVOT-N2BRG 2000L 18.5 6.1 360.0 7.7 0.3 - 0.1 38.0 76.5 13.0 177.5 7.1 34.5
uMvoti 2004 U4MVOT-N2BRG 2004L 26.8 3.5 1630.0 7.5 0.1 - 0.1 269.5 475.0 60.7 154.0 6.9 332.0
uMvoti 2005 U4MVOT-N2BRG 2005H 30.0 4.3 187.0 7.5 0.2 - 0.1 18.4 50.0 8.3 16.5 5.8 19.5
uMvoti 2005 U4MVOT-N2BRG 2005L 20.1 2.3 919.0 7.2 - - 0.0 91.8 264.0 9.4 84.5 7.4 160.0
uMvoti 2008 U4MVOT-N2BRG 2008L 20.0 5.7 385.0 6.7 - 0.2 4.4 0.6 14.0 19.0 28.0 47.0 1.3
uMvoti 2010 U4MVOT-N2BRG 2010H 22.2 2.4 0.7 7.8 0.1 - 0.2 48.5 - - 68.0 52.2 -
uMvoti 2011 U4MVOT-N2BRG 2011L 19.1 3.8 265.0 8.2 0.0 - 0.0 0.9 39.5 - 104.0 0.2 -
uMvoti 2012 U4MVOT-N2BRG-2012H 28.2 4.7 333.0 8.0 2.0 - 0.0 37.9 26.0 - - 11.3 -
uMvoti 2013 U4MVOT-N2BRG 2013L 25.7 5.9 61.5 7.4 - - - 94.2 92.0 52.0 100.0 - 60.0
uMvoti 2015 U4MVOT-N2BRG 2015H 28.5 3.0 0.6 6.0 - - - - - - - - -
uMvoti 2015 U4MVOT-N2BRG 2015L 24.0 2.5 115.0 7.6 - - - - 303.0 83.5 101.0 - -
uMvoti 2016 U4MVOT-N2BRG 2016H - - 101.0 - 0.1 - - 105.0 276.0 72.2 46.0 100.0 136.0
uMvoti 2016 U4MVOT-N2BRG 2016L 21.1 2.6 90.0 - 0.1 - - 94.2 196.0 53.2 72.0 86.7 98.1
uMvoti 1999 U4MVOT-GLEDH 1999H 18.1 6.2 360.0 7.7 0.2 - 0.1 38.5 72.5 13.0 216.5 7.3 35.0
uMvoti 2000 U4MVOT-GLEDH 2000L 18.1 6.2 360.0 7.7 0.2 - 0.1 38.5 72.5 13.0 216.5 7.3 35.0
uMvoti 2004 U4MVOT-GLEDH 2004L 27.6 7.7 356.0 8.0 0.1 - 0.1 48.2 97.0 13.3 8.0 10.7 45.0
uMvoti 2005 U4MVOT-GLEDH 2005H 31.0 4.4 176.0 7.7 0.2 - 0.1 18.2 50.0 7.9 14.0 5.8 19.5
uMvoti 2005 U4MVOT-GLEDH 2005L 20.5 9.0 322.0 7.5 0.2 - - 30.5 85.0 12.4 11.0 5.2 39.0
uMvoti 2006 U4MVOT-GLEDH 2006H 25.0 8.5 153.0 7.6 3.0 0.1 0.0 6.0 40.0 - 24.0 1.0 -
uMvoti 2006 U4MVOT-GLEDH 2006L 14.3 11.3 225.0 7.7 1.4 0.0 0.0 6.0 - - 8.0 4.0 -
uMvoti 2008 U4MVOT-GLEDH 2008L 20.5 7.5 227.0 6.6 - 0.1 3.1 0.4 7.2 9.0 11.0 24.0 1.0
uMvoti 2010 U4MVOT-GLEDH 2010H 21.8 7.8 0.3 7.7 0.1 - 0.1 28.2 - - 6.0 13.6 -
uMvoti 2011 U4MVOT-GLEDH 2011L 16.5 4.5 111.4 8.2 0.0 - 0.0 0.5 26.5 - 91.0 0.1 -
uMvoti 2012 U4MVOT-GLEDH 2012H 27.8 6.1 279.0 7.9 0.8 - 0.0 44.8 65.0 - - 7.6 -
uMvoti 2013 U4MVOT-GLEDH 2013L 25.0 7.9 35.3 7.4 - - - - - 26.0 50.0 - 30.0
uMvoti 2015 U4MVOT-GLEDH 2015H 28.6 7.1 283.0 6.0 - - - - - - - - -
uMvoti 2015 U4MVOT-GLEDH 2015L 22.6 6.7 38.9 7.1 - - - - 83.8 15.9 20.0 - -
uMvoti 2016 U4MVOT-GLEDH 2016H 27.4 6.9 74.4 - 0.1 - - 105.0 186.0 33.5 27.0 18.9 91.0
uMvoti 2016 U4MVOT-GLEDH 2016L 21.5 6.9 38.7 - 0.1 - - 57.9 73.0 16.3 20.0 18.0 51.0
Ntchaweni 2005 U4NTCHA-SAPPI 2005H 25.7 2.2 722.0 7.5 0.1 0.2 2.6 68.4 389.7 46.2 77.6 17.8 155.5
Ntchaweni 2010 U4NTCHA-SAPPI 2010H 24.3 0.7 2.2 7.9 0.1 - 1.7 113.5 - - 458.0 214.0 -
Ntchaweni 2012 U4NTCHA-SAPPI 2012H 27.1 3.9 782.0 7.7 1.8 - 0.1 100.9 195.0 - - 69.4 -
Ntchaweni 2011 U4NTCHA-SAPPI 2011L - - - - - - - 3.3 109.0 - 332.0 3.3 -
Ntchaweni 2013 U4NTCHA-SAPPI 2013L 26.7 5.0 208.0 7.5 - - - - 96.0 228.0 230.0 - 242.0
Ntchaweni 5015 U4NTCHA-SAPPI 2015H 32.0 3.6 1.7 6.0 - - - - - - - - -
Ntchaweni 2015 U4NTCHA-SAPPI 2015L 27.1 1.9 19.2 8.0 - - - - - - - - -
Ntchaweni 2016 U4NTCHA-SAPPI 2016H 31.2 1.9 185.0 - 0.1 1.8 - - 491.0 135.0 128.0 226.0 270.0
Ntchaweni 2016 U4NTCHA-SAPPI 2016L 23.8 3.4 - - 0.1 - 1.8 149.0 490.0 - - 120.0 -
Ntchaweni 2005 U4NTCHA-GLEDH 2005H 26.1 0.8 579.0 7.5 0.3 0.2 0.5 64.0 157.2 22.7 17.6 9.7 69.4
Ntchaweni 2010 U4NTCHA-GLEDH 2010H 22.3 2.5 0.6 7.6 0.4 - 10.9 66.2 - - 36.0 9.2 -
Ntchaweni 2012 U4NTCHA-GLEDH 2012L 24.3 3.7 468.0 7.4 6.7 - 0.0 102.9 105.0 - 0.0 13.2 -
Ntchaweni 2013 U4NTCHA-GLEDH2013H 24.9 2.8 74.6 7.3 - - - - 118.0 46.0 - - 88.0
Ntchaweni 2015 U4NTCHA-GLEDH2015H 24.4 4.2 0.6 6.0 - - - - - - - - -
Ntchaweni 2015 U4NTCHA-GLEDH 2015L 21.0 8.7 78.9 7.1 - - - - 177.0 27.7 39.0 - -
Ntchaweni 2016 U4NTCHA-GLEDH 2016H - - - 6.9 0.1 - - - 186.0 - - 18.9 98.1
Ntchaweni 2016 U4NTCHA-GLEDH 2016L - - 88.6 - 0.1 - - 107.0 205.0 32.6 37.0 23.2 51.0
Ntchaweni 2016 U4NTCHA-GLEDH 2016H 23.8 1.9 730.0 6.6 0.1 - - 105.0 - - - 100.0 -
Ntchaweni 2016 U4NTCHA-GLEDH 2016L 29.6 - - - 0.1 - - - - - - 86.7 -

71
Appendix 3.2: Summary of water quality multiparameters recorded at the lower uThukela
River and associated tributary (Mandeni River) during low (L) and high (H) river flow
periods from 2005 – 2016
River Year Site code
Tem
pe
ratu
re (
◦C)
Oxy
gen
(mg/
l)
Co
nd
uct
ivit
y (m
S/m
)
pH
Nit
rate
(m
g/l)
Ph
osp
hat
e (
mg/
l)
Am
mo
niu
um
(m
g/l)
Ch
lori
de
(m
g/l)
Cal
ciu
m (
mg/
l)
CO
D (
mg/
l)
Sulp
hat
e (
mg/
l)
Sod
ium
(m
g /l
)
Mandeni 2005 V1MAND-WASTE 2005H 18.8 5.6 2310.0 7.8 0.0 - 0.5 43.0 - 10.0 300.0 -
Mandeni 2006 V1MAND-WASTE 2006L 13.7 6.0 2010.0 8.0 - - - - - - - -
Mandeni 2008 V1MAND-WASTE 2008L 20.1 0.6 853.0 8.7 0.1 - 3.2 76.0 25.0 54.0 212.0 218.0
Mandeni 2010 V1MAND-WASTE 2010H 27.5 3.2 146.7 8.5 0.1 - 0.3 200.1 19.6 83.0 63.5 375.0
Mandeni 2011 V1MAND-WASTE 2011L 20.1 3.1 1025.0 8.8 0.0 - 0.1 6.1 - 155.0 0.4 -
Mandeni 2012 V1MAND-WASTE 2012H 24.6 5.1 1050.0 8.2 3.8 - 0.0 182.8 - - 48.6 -
Mandeni 2013 V1MAND-WASTE 2013L 21.7 4.1 256.0 7.7 - - - - 50.0 170.0 - 364.0
Mandeni 2015 V1MAND-WASTE 2015L 22.1 4.6 226.3 7.5 - - - - 21.5 72.0 - -
Mandeni 2016 V1MAND-WASTE 2016H 24.7 3.9 2.3 7.4 - - - - - - - -
Mandeni 2016 V1MAND-WASTE 2016L 22.6 3.6 1.7 6.9 - - - - - - - -
Mandeni 2010 V1MAND-WEIR 2010H 26.3 5.9 121.5 9.0 0.5 - 0.2 235.1 23.3 87.0 56.7 289.0
Mandeni 2011 V1MAND-WEIR 2011L 17.1 3.6 1143.0 8.5 0.2 - 0.0 5.1 - 144.0 0.8 -
Mandeni 2012 V1MAND-WEIR 2012H 25.8 5.0 1018.0 8.4 4.7 - 0.0 156.3 - - 110.2 -
Mandeni 2013 V1MAND-WEIR 2013L 23.7 7.6 221.0 8.3 - - - - 48.0 180.0 - 292.0
Mandeni 2015 V1MAND-WEIR 2015L 21.7 7.9 190.1 7.3 - - - - 21.6 51.0 - -
Mandeni 2016 V1MAND-WEIR 2016H 25.6 8.3 215.0 - 3.3 - - 373.0 38.8 51.0 49.6 668.0
Mandeni 2016 V1MAND-WEIR 2016L 21.9 7.8 1.3 6.9 - - - - - - - -
Thukela 2005 V1THUK-JOHNR 2005H 21.5 7.3 482.0 7.4 1.5 - - 4.0 - 36.0 164.0 -
Thukela 2006 V1THUK-JOHNR 2006L 27.5 4.6 900.0 7.0 - 0.0 - - - 26.0 86.0 -
Thukela 2008 V1THUK-JOHNR 2008L 21.8 8.3 343.0 7.7 - 98.7 0.6 31.0 15.0 26.0 44.0 3.9
Thukela 2010 V1THUK-JOHNR 2010H 27.1 6.8 33.4 9.0 0.2 0.2 - 0.1 14.8 17.0 31.9 47.0
Thukela 2013 V1THUK-JOHNR 2013L 24.2 8.3 49.9 8.2 - - - - 48.0 20.0 - 24.0
Thukela 2015 V1THUK-JOHNR 2015L 27.0 7.6 24.0 7.3 - - - - 15.8 38.0 - -
Thukela 2016 V1THUK-JOHNR 2016H 24.8 7.2 34.5 - 0.1 0.1 - - 25.3 27.0 35.7 76.7
Thukela 2016 V1THUK-JOHNR 2016L 29.0 7.2 239.4 7.0 - - - - - - - -
Thukela 2005 V1THUK-ULTIM 2005H 22.9 4.6 388.0 7.6 0.3 0.3 - - - 1.0 6.0 -
Thukela 2006 V1THUK-ULTIM 2006L 18.6 10.1 316.0 7.9 0.0 0.0 - - - 10.0 13.0 -
Thukela 2008 V1THUK-ULTIM 2008L 23.5 6.0 249.0 7.0 - 76.3 0.1 15.0 6.0 20.0 23.0 8.1
Thukela 2010 V1THUK-ULTIM 2010H 27.6 3.6 35.8 8.8 0.1 0.1 - 0.1 17.8 15.0 32.2 34.0
Thukela 2011 V1THUK-ULTIM 2011L 19.4 7.9 223.0 8.2 0.0 0.0 - - - 115.0 0.2 -
Thukela 2012 V1THUK-ULTIM 2012H 33.0 3.6 370.0 8.2 0.2 0.2 - 0.0 - - 36.7 -
Thukela 2014 V1THUK-ULTIM 2014H 26.5 4.1 38.8 7.7 - - - - - - - -
Thukela 2015 V1THUK-ULTIM 2015L 23.1 5.4 29.7 7.0 - - - - 18.7 20.0 - -
Thukela 2016 V1THUK-ULTIM 2016H - 2.4 65.4 - 0.1 0.1 - 109.0 24.3 20.0 43.6 62.9
Thukela 2016 V1THUK-ULTIM 2016L 27.2 2.4 672.4 7.0 - - - - - - - -
Thukela 2011 V1THUK-RAILB 2011L 14.5 9.2 190.0 7.1 0.0 0.0 - - - 119.0 0.2 -
Thukela 2012 V1THUK-RAILB 2012H 27.3 5.6 198.0 7.9 1.7 1.7 - - - - 11.1 -
Thukela 2013 V1THUK-RAILB 2013L 23.3 8.6 40.1 8.1 - - - - 50.0 110.0 - 22.0
Thukela 2014 V1THUK-RAILB 2014H 25.8 6.2 39.5 7.8 - - - - - - - -
Thukela 2015 V1THUK-RAILB 2015L 24.8 9.5 19.8 8.0 - - - - 14.3 20.0 - -
Thukela 2016 V1THUK-RAILB 2016H 24.5 6.7 30.0 - 0.1 0.1 - - 22.8 20.0 25.6 23.9
Thukela 2016 V1THUK-RAILB 2016L 21.4 8.4 29.6 7.0 - - - - - - - -
72
CHAPTER 4
Conclusions
4.1 Conclusions
The outcomes of this dissertation contribute to the monitoring and management of water
resource in the lower uMvoti and Thukela Rivers. The macroinvertebrate communities were
successfully used as ecological indicators representing the response of the ecosystem to
changes in environmental variable conditions. The uMvoti and Thukela Rivers along with their
associated tributaries (Ntchaweni and Mandeni) were rivers of interest. Both rivers are faced
with increased water resource use and that greatly impact their ecosystem wellbeing.
Two community metric measure tools namely the South African Scoring System
(SASS, version 5) and the Macroinvertebrate Response Assessment Index (MIRAI) were used
to evaluate the ecological integrity of the lowland uMvoti and Thukela Rivers (Chapter 3). The
use of these tools was a success as they were able come up with appropriate trends indicating
the response of macroinvertebrate communities to environmental changes. The SASS5 tool
was observed to be a good tool for monitoring. However, it had some limitations due to
primarily focusing on water quality as the driver of change. The MIRAI tool was found to be
the best at monitoring because it considered the cumulative impact of different metrices that
are important drivers of macroinvertebrate communities (Thirion 2007). The Ntchaweni River
had a poorer ecological state than the uMvoti River. This can be attributed to water resource
use stressors which include effluent discharges from the Gledhow Sugar Mill, Sappi Paper and
Pulp making activities as well as domestic use (Malherbe 2006). Impacts of such stressors were
observed in the uMvoti River below the confluence point. The Thukela and Mandeni Rivers
also had poor ecological integrity state due to major industrial activities, wastewater treatment
works, excessive water abstraction and sugarcane plantations (Venter 2013). The lack of stone
biotopes in the lower uMvoti and Thukela Rivers reduced heterogeneity and complexity, and
this had a huge impact on macroinvertebrate communities observed. Poor macroinvertebrate
communities observed indicated that the ecological wellbeing of these river systems has
deteriorated over the year and that have a huge impact on the availability of freshwater
resources. Therefore, the water resources of the uMvoti and Thukela River need to be properly
administered in a suitable manner.

73
Multivariate statistical analysis was used to evaluate the responses of
macroinvertebrate communities to water resource use activities associated with the uMvoti and
Thukela Rivers (Chapter 3). This multimeric analysis has been widely used and highly
recommended for evaluating the structure and patterns of biological communities in diverse
ecosystems (Van den Brink et al 2003; Malherbe 2006; O’Brien et al. 2009). The RDA bi-plot
exhibited temporal changes of macroinvertebrate community structures throughout the study
period. High number of taxa and estimated abundance was associated with historical dataset
whereas the current dataset was allied with low number of taxa and estimated abundance. Also,
historical data had an association with intolerant families including Psephenidae,
Chlorocyphidae, Teloganodidae and others. However, such families have been replaced by
intolerant families which dominated in the current dataset. This indicated that
macroinvertebrate community trend is getting worse with time. The uMvoti River showed a
decreasing trend of macroinvertebrate communities. That was not surprising because studies
have already reported this river to be seriously modified, with nearly total loss of its ecosystem
services (Tharme 1996; DWAF, 2004). With regards to the Thukela River, poor
macroinvertebrates communities and estimated was observed in most surveys and that can be
ascribed to water resource use stressors. The impact of such stressors was not only evident in
macroinvertebrate communities, however, the overall ecological integrity of this river has been
categorized as moderately modified (Class C) (IWR 2004). This threatens biodiversity and key
ecosystem processes. Thus, proper management strategies need to be implemented on this river
system.
4.2 Degree to which the hypothesis and objectives were met
The hypothesis that macroinvertebrates are suitable ecological indicators of the
ecological integrity of the lower uMvoti and Thukela Rivers, KwaZulu-Natal, South Africa
was accepted. Three predictions were established for this study and they were all achieved. 1)
Natural and anthropogenic disturbances exhibited adverse effect on stream ecological integrity,
and (2) Macroinvertebrate communities varied through time due to habitat heterogeneity,
changes in water quality parameters and anthropogenic activities on both rivers. 3) There was
also a significant change in the ecological integrity of the lower Thukela and uMvoti Rivers
when comparing current and historical data.
74
4.3 Recommendations
From the outcomes of the study we make the following recommendations:
More studies that assess impacts of water resource use on these systems should be
implemented in the study area. Such studies should consider the use of ecological
indicators including macroinvertebrates and other useful indicators including; fish,
diatoms and riparian vegetation. This will provide a better holistic view on how the
ecosystem is being affected by multiple-stressors.
Water resource management policies and principles that are currently exist such as the
National Water Resource Strategy (Version 2) should be implemented for each of the
rivers in the study. This will ensure that the management and protection plans consider
the land-use activity scenarios on each river.
Industries that use water resources from uMvoti and Thukela Rivers must obtain water
use licenses. Industries without licenses should face legal action. The polluter pays
principle of the National Water Act should be implemented so that these polluters pay
for the mitigation of the wellbeing of the river ecosystems Environmental performance
of all activities should be monitored. The results should be integrated by regional
regulators.
Monthly water quality monitoring should be undertaken at the effluent discharge points
to ensure that industries comply with their licences. Industries that fail to do so should
face legal action. The polluter pays principle of the National Water Act should be
implemented so that these polluters pay for the mitigation of the wellbeing of the river
ecosystems.
The dumping of physical waste should be managed by local municipalities who should
make polluters accountable.
Management plans should include the development of riparian buffers which will
decrease the rate of sedimentation and erosion. This will also encourage natural
filtration (assimilation) of runoff from sugarcane plantations and improve the status and
function of the ecosystem
Also, political support is required to enhance information collection that can be used
for better decision making about the management and use of water.

75
4.4 References
Department of Water Affairs and Forestry (DWAF). 2004. Draft background information:
South African Forestry, Pulp and Paper industries: Draft version 1. DWAF, Pretoria.
IWR (Institute for Water Research), 2004. Thukela water project decision support phase.
Reserve determination study. Thukela estuarine flow requirements, Department of Water
Affairs and Forestry, Pretoria
Malherbe CW. 2006. The current ecological state of the lower UMvoti River, KwaZulu-Natal.
MSc Dissertation, University of Johannesburg, Johanesburg.
O’Brien GC, Swemmer R, Wepener V. 2009. Ecological integrity assessment of fish
assemblages of the Matigulu/Nyoni and UMvoti estuaries, KwaZulu-Natal, South Africa.
African Journal of Aquatic Science 34: 293–302.
Tharme R. 1996. Rivers of southern Africa: UMvoti River. African Wildlife 50: 31.
Thirion C. 2007. Module E: Macroinvertebrate Response Assessment Index in River
EcoClassification: Manual for EcoStatus Determination (version 2). Joint Water
Research Commission (WRC) and Department of Water Affairs and Forestry (DWAF)
report. WRC Report No. TT332/08. Water Research Commission, Pretoria, South Africa.
Van den Brink PJ, Van den Brink NW, Ter Braak, CJF. 2003. Multivariate analysis of
ecotoxicological data using ordination: Demonstrations of utility on the basis of various
examples. Australasian Journal of Ecotoxicology 9: 141–156.
Venter JJ. 2013. An ecological integrity assessment of the lower Amatikulu, Thukela and
UMvoti Rivers, KwaZulu-Natal, South Africa. PhD Dissertation, North-West
University, Potchefstroom