transformational infrastructure for development of a wellbeing ...
Upload
khangminh22Category
view
0download
0
REFERENCE:
HWB/09/19
NOTICE OF MEETING Date : THURSDAY, 19 SEPTEMBER 2019
Time : 18:00
Place : COMMITTEE ROOM 3 TOWN HALL, LUTON, LU1 2BQ
MEMBERS:
Councillor Simmons Leader (Chair)
Councillor Campbell Minority Group Representative, Luton Council
Councillor J. Hussain Portfolio Holder, People (Adults)
Councillor M. Hussain Portfolio Holder, People (Children)
Councillor Hopkins Portfolio Holder, Commissioning and Public Health
Dr Chirag Bakhai (Clinical Director for Planned Care, Luton CCG)
Michelle Bradley (Director of Beds and Luton Mental Health and Wellbeing Services, ELFT)
Georgie Brown (NHS England)
David Carter (CEO, L&D Hospital)
Laura Church (Chair, Community Safety Executive)
Supt. Greg Horsford (Beds Police)
Amanda Lewis (Director of People, Luton Council)
Lucy Nicholson (CEO Healthwatch Luton)
Maud O,Leary (Service Director, Adult Social Care)
Dr Nina Pearson (Chair - Luton CCG)
Anita Pisani (Deputy CEO, CCS)
Nicky Poulain (Chief Operating Officer, Luton CCG)
Robin Porter (Chief Executive, Luton Council)
Gerry Taylor (Director of Public Health, Commissioning and Procurement, Luton Council)
Philip Turner (Chair Healthwatch Luton)
Quorum: 7 of the members listed above, in person.
Contact Officer: Bert Siong (01582 546781)
Purpose: This Board provides the leadership for and oversight of the development of wider health and social care partnership arrangements, operating within the statutory framework established under the Health and Social Care Act 2012. It is locally accountable for improving the health and wellbeing of the population of Luton, through integration and joint working/ commissioning of services across the NHS, Social Care and Public Health.
Public Information: This meeting is open to the public, who are welcome to attend. Members of the public are entitled to take photographs, film, audio-record and report on all public meetings in accordance with the Openness of Local Government Bodies Regulations 2014. People may not however act in any way considered to be disruptive and may be asked to leave. Notice will be given verbally at the meeting.
HEALTH AND WELLBEING BOARD
Page 1 of 252
EMERGENCY EVACUATION PROCEDURE Committee Rooms 1, 2, 4 & Council Chamber:
Turn left, follow the green emergency exit signs to the main town hall entrance and proceed to the assembly point at St George's Square.
Committee Room 3:
Proceed straight ahead through the double doors, follow the green emergency exit signs to the main Town Hall entrance and proceed to the assembly point at St George's Square.
Page 2 of 252
AGENDA Agenda Subject Page Item No.
INTRODUCTIONS
1 APOLOGIES FOR ABSENCE
2 MINUTES
1. Minutes 16th July 2019
5 - 15
3 DISCLOSURES OF INTEREST
Members are reminded that they must disclose both the existence and nature of any disclosable pecuniary interest and any personal interest that they have in any matter to be considered at the meeting unless the interest is a sensitive interest in which event they need not disclose the nature of the interest.
A member with a disclosable pecuniary interest must not further participate in any discussion of, vote on, or take any executive steps in relation to the item of business.
A member with a personal interest, which a member of the public with knowledge of the relevant facts would reasonably regard as so significant that it is likely to prejudice the member’s judgment of the public interest, must similarly not participate in any discussion of, vote on, or take any executive steps in relation to the item of business.
Disclosable pecuniary interests and Personal Interests are defined in the Council’s Code of Conduct for Members and Co-opted members.
4 URGENT BUSINESS The Chair to report on any business which is considered to be urgent and which should be discussed at the meeting in accordance with Section 100B(4)(b) of the Local Government Act 1972 and to determine when, during the meeting, any such business should be discussed.
5 REFERENCES FROM COMMITTEES AND OTHER BODIES
REPORTS
6 Luton’s Health And Wellbeing Strategy (Report of the Corporate Director, Public Health and Wellbeing)
16 - 26
7 Luton Better Care Fund Template 2019-2020 (Report of the Corporate Director, Public Health and Wellbeing)
27 - 122
Page 3 of 252
8 Luton’s Response to Advancing Our Health - Prevention in the 2020s (Report of the Corporate Director, Public Health and Wellbeing)
123 - 206
9 Update Report from Luton Transformation Board (Report of the Chief Operating Officer, Luton CCG)
207 - 225
10 Integrated Strategy for People with Learning Disabilities in Luton (Report of the Chief Operating Officer, Luton CCG)
226 - 234
11 Health Inequalities Delivery Board (Report of the Corporate Director, Public Health and Wellbeing)
235 - 237
INFORMATION ITEMS
12 Healthwatch Luton Quarterly Update – Reference Only (Report of the Chief Executive, Healthwatch Luton)
238 - 244
13 HEALTH AND WELLBEING BOARD WORK PROGRAMME REPORT 2019 (Report of the Senior Public Health Manager)
245 - 252
14 LOCAL GOVERNMENT ACT 1972, PART VA To consider whether to pass a resolution under Section 100A(4) of the Local Government Act 1972 to exclude the public from the meeting during consideration of any item listed above if it is likely that if members of the public were present during those items there would be disclosure to them of exempt information falling within the Paragraphs of Part 1 of Schedule 12A to the Local Government Act 1972.
Page 4 of 252
MINUTES OF THE HEALTH AND WELLBEING BOARD
16TH JULY 2019 AT 6.00 PM
MEMBERS PRESENT:
Councillor Simmons Leader (Chair) Councillor Campbell Minority Group Representative, Luton Council Councillor J. Hussain Portfolio Holder, People (Adults) Councillor Hopkins Portfolio Holder, Commissioning and Public Health Dr Chirag Bakhai (Clinical Director for Planned Care, Luton CCG)
Michelle Bradley (Director of Beds and Luton Mental Health and Wellbeing Services, ELFT)
Amanda Lewis (Director of People, Luton Council) Lucy Nicholson (CEO Healthwatch Luton) Dr Nina Pearson (Chair - Luton CCG) Anita Pisani (Deputy CEO, CCS) Nicky Poulain (Chief Operating Officer, Luton CCG) Robin Porter (Chief Executive, Luton Council)
Gerry Taylor (Director of Public Health, Commissioning and Procurement, Luton Council)
Philip Turner (Chair Healthwatch Luton)
NAMED SUBSTITUTES MEMBERS: OBSERVERS:
Councillor Agbley Chair-Scrutiny Health and Social Care Review Group IN ATTENDANCE/ ADVISORS:
Stephen Gunther Service Director, Healthcare and Adults Commissioning, Luton Council
INTRODUCTIONS
Councillor Simmons led the introductions and welcomed all Members, Partners and Officers present.
AGENDA ITEM
2.1
Page 5 of 252
16 APPOINTMENT OF VICE CHAIR – LUTON CCG (REF: 1)
Resolved: That the Dr. Nina Pearson, Chair of the Luton Clinical Commissioning Group be appointed Vice Chair of Health and Wellbeing Board for the ensuing municipal year 2019/20.
17 APOLOGIES FOR ABSENCE (REF: 2)
Resolved: Apologies for absence from the meeting were received from Councillor M. Hussain and Maud O’Leary Service Director Adult Social Services.
18 MINUTES (REF: 3)
Resolved: That the minutes of the meeting held on 13th March 2019 be taken as read, approved as a correct record and the Chair be authorised to sign them.
19 LUTON’S HEALTH AND WELLBEING STRATEGY DEVELOPMENT ACTION PLAN (REF: 7)
The Service Director Healthcare and Adults Commissioning delivered a Power
Point presentation entitled Health and Wellbeing Strategy Development. He explained the context of the presentation and stated that this was a reflection of progress of work since 2012, and an understanding of the current health and wellbeing challenges. He said it was time to shape and develop the board’s approach and set priorities and determine how success could be measured.
The Service Director explained that the Health and Wellbeing Boards were
established to create and improve the key health and wellbeing issues in specific areas and particularly look at issues which could be resolved by partners working together for a common purpose.
He said that the 2012 strategy had three main priorities, namely:
1. Every child and young person had a healthy start in life 2. Reduce health inequalities in Luton 3. Healthier and more independent adults and older people
He explained that one of the key drivers of infant mortality was poverty but a slight
improvement had been recorded over the past few years and a lot remained still to be done. He highlighted the key outcomes namely:
• Reduced the infant mortality rate • Increased life expectancy and narrowed the inequality gap compared with
the rest of England • Narrowed gap in life expectancy between the most and least deprived areas
in Luton • Increased disability free life expectancy at age 65.
Page 6 of 252
In terms of the refresh health and wellbeing board strategy for 2016/19, the main focus was on homelessness and housing with progress measured through 11 outcomes including family homelessness rate per 1,000 households, excess winter deaths index, proportion of older people over 65s and emergency hospital admissions due to falls in this age group. Some progress had been recorded in terms of winter access and learning disabilities in settled accommodations.
Members were further informed of recent changes including Public Health (PH)
Peer review, NHS Long-term plan with wider NHS changes and place based prioritisation response, refreshed Joint Strategic Needs Assessment (JSNA) prioritisation process and new Luton council focus on eradicating poverty planned delivery through Luton 2040.
One of the key recommendations of the PH Peer review was for Luton to become a
public health town. Other recommendations include: • Use of refresh of the Luton investment Framework (LiF) to have one vision and
ambition for Luton developed and over by partners, stakeholders, and the community.
• Outcome based, clear delivery, refreshed governance and ongoing evaluation. • Need for the HWB to decide how it could become more inclusive of
neighbourhood, place and system level. • Need for the HWB to consider how it could improve current population health
management capability that would enable data driven planning, and insight and analysis.
• Need for the HWB to consider how it could achieve its ambition for the residents and to address health inequalities to increase pace, particularly given the fast moving transient nature of Luton’s population.
Gaps exist between the NHS Long-Term Plan aspiration and current services such
as; • Cancer, especially early identification and prevention, • Children and young people, especially Learning Disability (LD), and autism and
mental health, adult mental health • Adult Mental Health – early support and 24/7 crises care In relation to core key areas, members of the HWB should consider the level of
engagement it wishes to partake in, bearing in mind that there could be a further Government regeneration plans, etc. There were other key areas coming out of adults such as social isolation and physical health of adults, etc.
The Director of Public Commissioning and Procurement Luton Council explained
that this was more of a summary of proposed actions to identify the board’s priorities. She stated that some of these issues had been discussed and agreed at several partnership and council meetings and invited members to make comments to inform the proposals.
The Chair of the Luton CCG commented on the demographics and mobility of the
population and asked if new residents have an impact on the board’s priorities and how it would provide support to the new arrivals in Luton. How would the HWB factor in the mobility aspect into its priorities?
Page 7 of 252

In response, the Director of Public Commissioning and Procurement stated that issues which have impact on the priorities of the HWB would be factored into the proposals. She stated that there was need to think about how the Board would deliver its cross cutting priorities. One of the outcomes of the Peer review was that Luton was fairly unique and the task for the HWB would include mobilising inclusive growth and to encourage people to stay in the town, it’s about encouraging place based.
Members of the Board agreed the approach and the priority areas of focus with
some amendments. The Luton 2019 Draft Strategic Priorities Summary for Consultation were presented
for comments from members of the Board. The strategic priorities for consultation where highlighted in sub headings;
Place • Focus on family prosperity • Meeting Housing Need and ensuring that people of Luton lived in safe and
suitable homes • Inclusive Growth • Creating Healthy environment People and Best Start • Improve mental health and wellbeing of children • Needs of children with special needs • Increase in employment, education and training opportunities for children and
young people • Increase in school attendance • Increase in the number of children that were of healthy weight • Ensuring healthy start to life for children and young people Adult Wellbeing • Increase the number of adults with healthy weight, nutrition and physical activity • Improve mental health and wellbeing for adults • Decrease drug and alcohol related hard in adults Ageing Well • Increase in social connections • Improving Physical Health in Older People The Chair of the HWB commented about the challenges around dental matters in
Luton and stated that it be included in the priorities to link in with the Joint Strategic Needs Assessment (JSNA).
The Director of People stated that the approach for the strategic priorities should
include 19-25 years young people who were considered to be at risk of serious youth violence. She said this area was less explicit in the report and should be seen as a priority to ensure safeguarding for children and young people. She asked what the Board’s level of ambition would be around school attainment and whether there was need to word it slightly different.
The Clinical Director for Planned Care Luton CCG commended that there was need
to support people in terms of engagement and inclusiveness and to encourage them to take actions themselves to improve their own health.
Page 8 of 252

The approach for the Luton 2019 draft strategic priorities summary areas was supported by the HWB subject to inclusion of areas in relation to self-help health, serious youth violence and school attendance.
Recent Evidence Review This required a common and clear purpose including clarity around governance
arrangements to manage decisions, risk and failure and the need to continue to review and refine place based outcomes and performance framework. There was also the need to develop longer finance and a broader ambition for plan by 2040 to shift resources from acute provision to community social and primary care as a proportion of total funding monitored through the place based outcomes and performance framework. In terms of delivering this, four pillar approach had been proposed namely:
• The wider determinants of health • An integrated health and care system • Our health behaviour and lifestyles • The places and communities we live in and with. In terms of approach for the proposed priorities, members were asked to consider
and comment on the caption “enabling the people of Luton to thrive where everyone in Luton will have the opportunity to live a life in which they are mentally and physically healthy, their potential is maximised and inequalities are reduced”. This was an attempt to capture key elements in terms of the approach. Members were asked if they agreed with the approach.
The Director of People suggested that in terms of enabling, the HWB should move
from the enabling to keep the essence of what was been articulated. She also suggested that the later part of the phrase should be more inclusive.
There was also suggestion about the need to capture plans to eradicate poverty. Another member stated that the key work in the phrase was “thrive”. The Director of Public Health, Commissioning and Procurement welcomed the
comments and stated that officers would work with the comments received and progress would be reported at a future meeting of the HWB.
The approach for the Board to take This was about changing the narratives and engaging more robustly to ensure that
everyone was involved in matters that concerns them. The Service Director Healthcare and Adult Commissioning asked members of the Board to comment on the direction of travel in terms of the approach and delivery where there was need to strike a deal with the citizens to ensure that both the Board and the citizens have a role to play.
Page 9 of 252
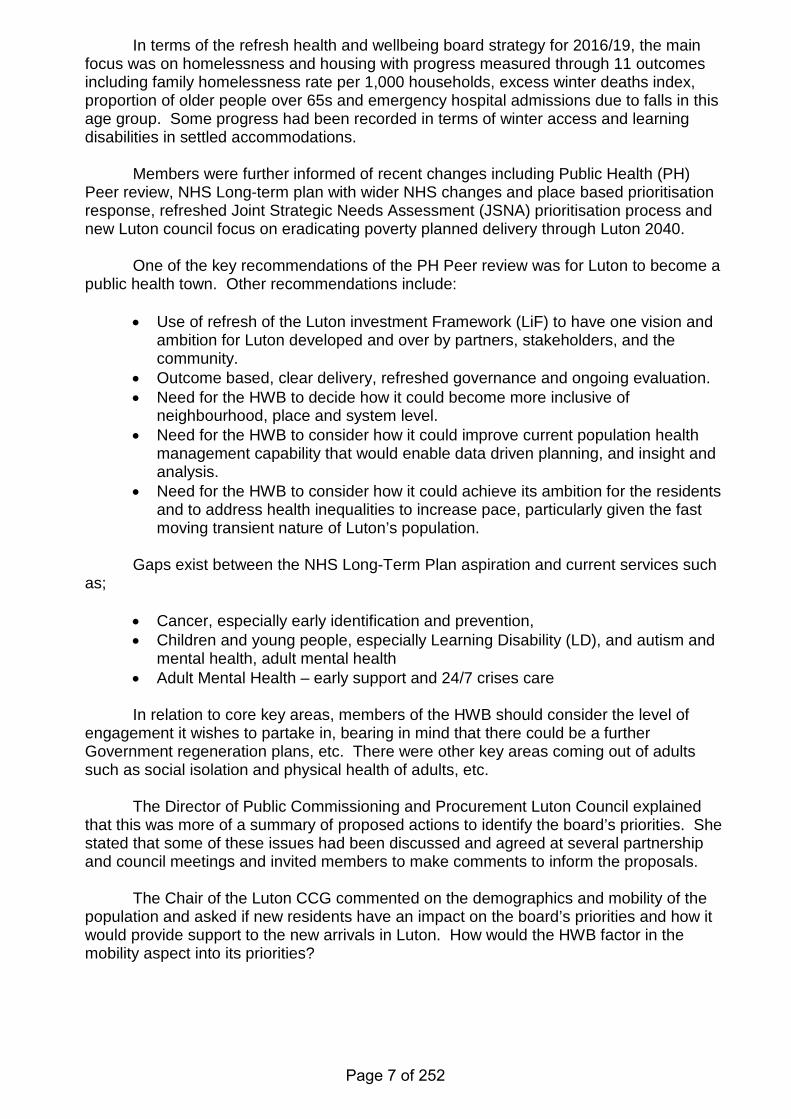
He explained Wigan’s example of the changing governance model which focuses on areas D-E. Members commented that unless a whole town approach was adopted no impact would be made, however, there was need to identify how the conversation would be enabled. The general steer of the Board was to move towards D and E so as to have a plan that would become everybody’s business and should be done in a consistent manner.
Proposed Life –course approach There was need to have the commitment as an employer to go the extra mile and
ensure that a good foundation for a healthy life was well developed to ensure that people develop the opportunity to live a health life and age well.
In terms of skills and learning, there was need to have sufficient focus on primary
age and there might be need to strengthen the gap between children and young people. It might be necessary also to increase the Board’s aspiration to ensure that the proposals work well. There should also be focus on messaging the ambition around supporting children and young people.
In terms of starting and developing well, this was an ambition, how much should be
included and should the Board focus on ageing in the HWB priority. The Health and Wellbeing Strategy was part of the delivery of key strategic priorities.
Members agreed the general concept and approach that everyone in Luton should
have the level of meaningful social contact and lives the end of their life with dignity in the place of their choice.
In terms of the main outcome measures, the key areas should focus on mortality
rate and preventable hospitalisations, mental health services and preventative health and social care. There was need for improvement and for continuous review to be iterated.
In relation to the proposed approach the focus should include, use of data and intelligence, quantify the burden at pollution level and identifies inequalities and risks, seek evidence of effectiveness to improve the problem, work with communities, etc.
Page 10 of 252

Regarding implementation this was the time to progress the plans and proposals.
The support and development requirements needed to enable effective implementations and what sort of direction was required from the Board, steer and or immediate suggestions.
The next steps were highlighted: • Collate feedback and draft the HWBS • Engage with wider interest parties – review and refine where appropriate • Develop support programme for implementation and • Draft for sign off at next HWBB.
Members agreed that clear communication plan was essential to the strategy and
therefore would like to see clear actions in terms of how communication could be improved to reach out to citizens.
The Chief Executive stated that the strategy was currently in draft form and that it
was important to have a clear and accurate process. The process would include substantial exercise of reaching out to the public, including public and private sectors.
The issue of how to inform people without raising expectation was raised. The Chair of Luton CCG commented about the need to engage and to celebrate
success in the process. She said the still birth rate in Luton had dropped considerably when compared to national target and therefor Luton’s achievement should be celebrated whilst ensuring an effective HWB strategy.
The Director of Public Health, Commissioning and Procurement explained that in
relation to the proposed approach, we can take a more asset based approach to build on success. Matters relating to communication and consultation with partners, the draft strategy would be presented to the Scrutiny Health and Social Care Review Group as part of the consultation and engagement of the proposals. There would be need to develop the plans and to describe the Board’s approach to work with people and to also identify the next steps in terms of delivery.
Another member stated that the strategy could be shaped in terms expectation and
actions to ensure that everyone could thrive. There should be a snappy message in the way members plan to engage to understand the priorities.
It was also suggested that the strategy should also be submitted to the next Health
and Social Care Engagement Group meeting. The Service Director Healthcare and Adults Commissioning commented that the
engagement and communication plans had improved in terms of development of the JSNA and wider community stake holders. It had shifted positively in the last couple of years.
Resolved: (i) That the contents of the presentation and emerging priorities from the
Joint Strategic Needs Assessment (JSNA), NHS Long-term plan place based response and recommendations from the Public Health (PH) Peer review in respect of the priorities for a new Health and Wellbeing Strategy be noted.
(ii) That the approach and proposals of the Luton’s Health and Wellbeing Strategy
Development and Action Plan be supported subject to comments and suggestions from the HWB.
Page 11 of 252
HEALTHWATCH LUTON ANNUAL REPORT 2018 – UPDATE AND OVERVIEW (REF: 8)
The Chief Executive Luton Healthwatch presented the quarterly activities of the
organisation. She stated that the Healthwatch network had been funded by NHS England to carry out engagement with communities across the country to establish how the Long Term Plan (LTP) should be implemented at a local level.
It was intended that the views gathered would feed into the development of the
NHS’ local plans. Prior to the start of this project, local HW met with ICS colleagues to outline the
engagement programme and to determine their priorities. Following discussions, it was agreed that in addition to seeking public views on general health and care services, local HW would also conduct focused engagement on cancer and mental health services as these had been identified as priority areas for BLMK ICS.
She advised that the full report had been submitted to BLMK ICS and had been split
into two reports; one at scale and one at local level. The full report would be published on 17th July 2019.
She highlighted the keys points of the engagement as follows; • Access and Jointed up approach and improved communication • In Luton, most people were generally happy with the care received but had
issues with access to service. • Communication awareness It was expected that the key points would feed into the Luton Plan to try and engage
more in communications and GP access. A member of the Board commented that there had always been an issue in regards
to GP access and what was sufficient for local people. There were pressures to meet the needs of people in a timely manner.
There were other options available to service users who require urgent GP access,
the111 service. HW commented that this was one of the well-known but highlighted issues from the report, that people in Luton were struggling to access GP’s – resulting in more people using A&E.
A Member of the Board from rom Luton CCG commented that it was important to
ensure that GP practices should not be operating closed GP list. The Vice Chair of the Board stated that the CCG should be informed of GPs practices in Luton who were operating closed list.
The Chief Executive, Luton Healthwatch stated that where people were unable to
get urgent appointment with their GPs first thing in the morning they turn up at the hospital and just compounds the waiting list and urgent care provided at hospital.
Resolved: That the Healthwatch Luton Annual Report (Ref: 8) progress update, overview of its activities be noted.
Page 12 of 252

12 PROSPERITY THROUGH PROCUREMENT A FIVE YEAR STRATEGY (REF: 9) Members of the Board received the report (Ref: 12) on the “Prosperity Through
Procurement”. The report informed the Board about the draft procurement strategy and its links and proposed contributions towards addressing health inequalities and the need to explore various opportunities for increased collaboration to achieve its identified outcomes.
The Council’s current procurement strategy was due for review in June 2019 and
the ‘Prosperity Through Procurement’ was under consultation as the new procurement strategy for the Council. Child poverty had increased with an estimated 28,400 children (46%) living in poverty and projections showed that child poverty would increase highly within the next five years. The strategy could be a significant challenge for Luton therefore, it should be focussed on local issues in terms of addressing and tackling poverty as a priority which would link unemployment and local economy.
Members of the Board welcomed the proposals. A member asked what would be the marker that the strategy was effective and
whether the timeframe was realistic. In response, members were advised that very earlier on, on the journey it was identified that the 1st year would be spent to pull data together and to identify concreate ways of measuring social outcomes and systematic way of measuring values.
Commenting on the report and its proposals, the Chief Executive of Luton Council
explained that this was a process that would effectively tackle policy and absolutely hit a number Luton’s agenda in terms of town centre, community cohesion, etc. It would be one of the starting points to address poverty in the town and would then be presented to the Executive with a desire to adopt the strategy.
A member of the Board stated that there was need to encourage Suppliers to pay
the living wage and asked what the longer term strategy was. Officers advised that the ‘Prosperity Through Procurement’ strategy would focus on two key areas namely:
• Harnessing the collective power of the local public sector ‘anchor institutions’ to
work together to maximise wider economic benefits to the local community; and • Making a range of internal changes to the way the Council procures good and
services It was stated that the Luton Inclusive Growth Commission, established in 2018, had
the key aims of improving skills and productivity, raising aspirations, attracting more quality jobs, supporting communities to be healthier, ensuring equality as well as encouraging people to remain and spend their money in the town. The way in which the Council uses its spending leverage through procurement could significantly help deliver these aims and aspirations and act as a foundation for building local wealth. The estimate of the overall public sector spend in Luton was said to be around £800m; increasing the proportion of this expenditure locally, supporting local people in employment, would have a significant impact on local economy and the quality of life of local residents.
The November 2019 deadline, was expected to trigger dialogue and there was
need to be mindful of the financial challenge over the next four years. In terms of consultation, dialogue was currently taken place within the Council,
including Departmental Management Teams and the Corporate Leadership Management Team. In addition the Bedfordshire Chamber of Commerce and Federation of Small Businesses were also being consulted.
Page 13 of 252
The Director of People welcomed the proposals and stated that it was an added
value to the Council and the community in general, she stated however, that the Service should endeavour to be more inclusive and to extend the ambition to highlight the interest of young people. She said that giving the value of the proposals, it would be interesting to see what approach would be taken by the Council’s partners in terms of adopting and implementing the strategy including sign up and commitment.
In terms of general practice and consumables, partners would require time to
establish themselves and to have good understanding of the strategy likewise in terms of recruitment there was need to think about the way forward and how this could be adopted within.
In terms of direction of travel, the Service would work with partners and the
Council’s Suppliers across the town. This was the right time to think about the involvement of the Health and Wellbeing Board and what it could contribute to the proposals and implementation of the strategy.
Members were informed that a range of actions arising from the strategy were set
out within the report and including a range of changes and improvements to internal procurement processes, proposals for greater collaboration with the public and the development of a new social value framework.
The Joint Strategic Needs Assessment 2012/19 sets out strategic
recommendations in four areas listed below which link in with the draft strategy.
• Healthy Place • Healthy Start • Adult Wellbeing • Ageing well
Resolved: (i) That the draft procurement strategy ‘Prosperity Through
Procurement’ be received, noted and supported by the Health and Wellbeing Board. (ii) That the Service Director, Quality and Corporate Procurement Public Health,
Commissioning and Procurement be requested to consider the inclusion of “Children in Care or Looked After Children” (LAC) as part of the final Strategy.
INFORMATION ITEMS ONLY
13 UPDATE ON THE IMPACT OF UNIVERSAL CREDIT (REF: 10) Resolved: Noted.
14 MINUTES OF HEALTH AND SOCIAL CARE ENGAGEMENT GROUP MEETING – 26TH MARCH 2019 (REF: 11)
Resolved: Noted.
15 LUTON SAFE GUARDING CHILDREN BOARD ANNUAL REPORT (REF: 12) Resolved: Noted.
Page 14 of 252
16 DRAFT WORK PROGRAMME REPORT 2019-20 (REF: 13)
The Board received the work programme and resolved as set out below. Resolved: That the Democracy and Scrutiny Officer be delegated the responsibility
to update the work programme, following consultation with the Chair, and Public Health in line with the addition of items agreed by the Board, as follows:
• Progress on Proposed Development – September meeting • Procurement Standards – September meeting • Luton’s Health and Wellbeing Strategy Development and Action Plan.
(Note: The meeting ended at 19.50)
Page 15 of 252
HEALTH AND WELLBEING BOARD
AGENDA ITEM 6
DATE OF MEETING: 19TH SEPTEMBER 2019 REPORT OF: THE CORPORATE DIRECTOR, PUBLIC HEALTH AND WELLBEING REPORT AUTHOR: YACCUB ENUM, SENIOR PUBLIC HEALTH MANAGER SUBJECT: LUTON’S HEALTH AND WELLBEING STRATEGY
WARD(S) AFFECTED: ALL PURPOSE
1. For the Board to comment on the first draft of the joint Health and Wellbeing Strategy following initial discussions at the July Board.
RECOMMENDATION(S)
2. To note the contents and comment on the first draft joint Health and Wellbeing Strategy and proposed governance arrangements.
3. To agree to have the final version at the next meeting for sign off.
4. To agree to have a Board development session at a future Board meeting.
BACKGROUND
5. At the meeting in July 2019, the Board discussed the prioritisation of action and outcomes for the Health and Wellbeing Strategy and requested a draft report for discussion at the next meeting (September 2019).
6. The draft report is attached as appendix 1
REPORT
7. The report sets out our ambition - Luton is a more equitable place where we enable people to thrive, to have the opportunity to live a healthy life mentally, socially and physically; and maximize their potential.
8. It then outlines out our broad approach, which is to take action on the wide range of factors that affect people’s health in three stages:
a. Starting & Developing Well – where we lay the foundations for a healthy life,
Page 16 of 252
b. Living & Working Well – where we ensure people have the opportunity to
live a healthy life in a healthy environment and have access to good employment
c. Ageing & Dying Well – where we capitalise on the work done above to live a healthy old age.
9. Our goals, action and outcomes are underpinned by these themes
IMPLICATIONS
10. The strategy will drive our work to improve the health and wellbeing of Lutonians. CONSULTATIONS
11. In addition to the consultation carried out as part of identifying the priorities, the draft strategy was presented to the following groups for comment; and feedback incorporated
a. 30th July Luton and Health and Social Reference Group b. 2nd September – Public Health & Wellbeing DMT c. 9th September - Place Based Management Team
APPENDICES
12. Appendix 1 – Luton’s joint Population wellbeing Strategy 2019-2024
LIST OF BACKGROUND PAPERS LOCAL GOVERNMENT ACT 1972, SECTION 100D None
Page 17 of 252
APPENDIX 1
Luton’s joint Population wellbeing Strategy 2019-2024
Our ambition: Luton is a more equitable place where people thrive, have the opportunity to live a
healthy life mentally, socially and physically; and maximize their potential.
Foreword Health and Wellbeing Boards were created to improve the key health and wellbeing issues in an area: those issues that can only be resolved by partners working together to a common goal. This strategy is part of a wider programme of action we are taking to eradicate poverty, Luton 2040 (A growing town built on fairness: A town of hope and aspiration, where everyone can share in its success). By working together to build trust and gain a common purpose to deliver our first strategy published in 2012, the partners on Luton’s Health and Wellbeing Board have made a real impact on the lives of some of our more vulnerable citizens in our town. We will continue to strive to improve the health and wellbeing of Lutonians. Over the next five years we can make some real changes that will enable people to reach their full potential. Real success will come from us working with Luton’s community, building on all our strengths to maximise the solid foundations we have already built to enable the people of Luton to thrive. Hazel Simmons Chair of the Health and Wellbeing Board, Leader of Luton Borough Council Nina Pearson Vice Chair of the Health and Wellbeing Board Chair Luton Clinical Commissioning Group
Page 18 of 252
Background Much has changed since the Health and Wellbeing Board set out its initial strategy in 2012 and refreshed it in 2016. We have seen reductions in infant deaths, improvements in life expectancy and a reduction in the gap between the richest and poorest communities within the borough as well as reductions in homelessness. However, this progress in life expectancy has stalled in the last couple of years, as nationally and therefore there is still more we wish to do together. This strategy is our on-going commitment to come together to agree and work for the future we want for Luton and a starting point from which we will develop ever-stronger future versions. We will look to refresh our ambitions periodically with the aim of Eradicating poverty in Luton by 2040. Throughout 2019 we have been discussing and agreeing where the areas of focus should be to achieve this aim. We have updated our membership to ensure we have the right voices around the table and agreed on where we should put our collective energies so that everyone in Luton will have the opportunity to live a life where they are mentally, socially and physically healthy; where there is equity and everyone can maximise their potential. This is in the context of the Council setting out its long-term plan for the town (Luton 2040 – to eradicate poverty by 2040). This strategy’s parallel strategy, Inclusive Economy, sets out local priorities for us to deliver on. Delivery strategies will include Luton’s response to the NHS Long-term plan, as part of a wider partnership across Beds, Luton and Milton Keynes. These actions collectively will enable us to continue to drive improvements in health and wellbeing for the people of Luton. Our Ambition
Luton is a more equitable place where people thrive, have the opportunity to live a healthy life mentally, socially and physically; and maximize their potential.
What approach will we take? We know poor health can be experienced throughout life and the circumstances in which people are born, grow, live, work and age will have an impact on people’s wellbeing. If we do not try to positively promote wellbeing from birth (if not pre-birth), we will always be managing or seeking to ameliorate poor health. From this point of view, a preventative approach from the beginning of life to death, considering the wide range of factors that influence health, is our keystone. We will do this by approaching a healthy life in three stages, taking action on the wider factors that affect people’s health.
1) Starting & Developing Well – where we lay the foundations for a healthy life, 2) Living & Working Well – where we ensure people have the opportunity to live a healthy life in a
healthy environment and have access to good employment 3) Ageing & Dying Well – where we capitalise on the work done above to live a healthy old age.
Therefore, our action and outcomes will be under these three main themes. This Strategy sets out the Board’s view of the critical foundations on which a healthier population, living longer lives in healthy environments, free from health inequalities will be based. Our goals are that;
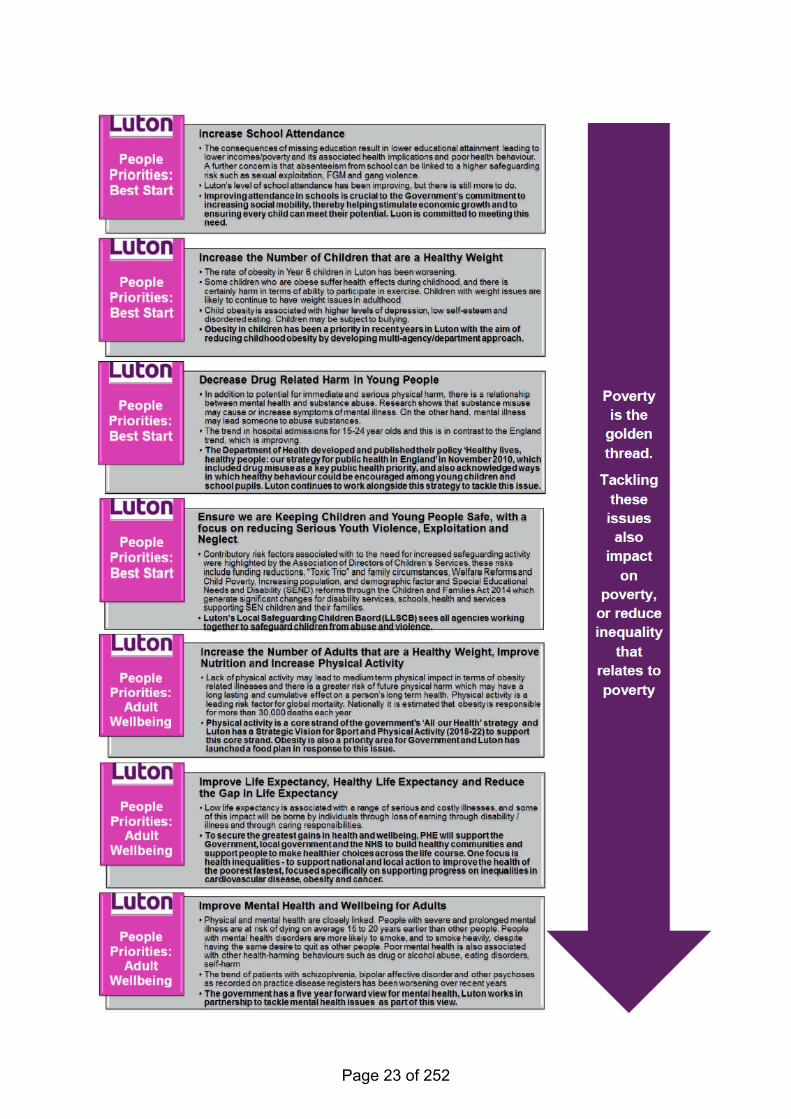
1. Every child in Luton achieves the level of development needed in their early years to provide the foundation for a healthy life
2. Every child is healthy, including having a healthy weight and good oral health 3. Every child and young person has access to a good education support when needed 4. Every young person in Luton is safe, skilled and equipped to be successful throughout
their life 5. Every adult in Luton is physically and mentally healthy and able to thrive 6. Every adult in Luton has access to training to develop skills and access to good
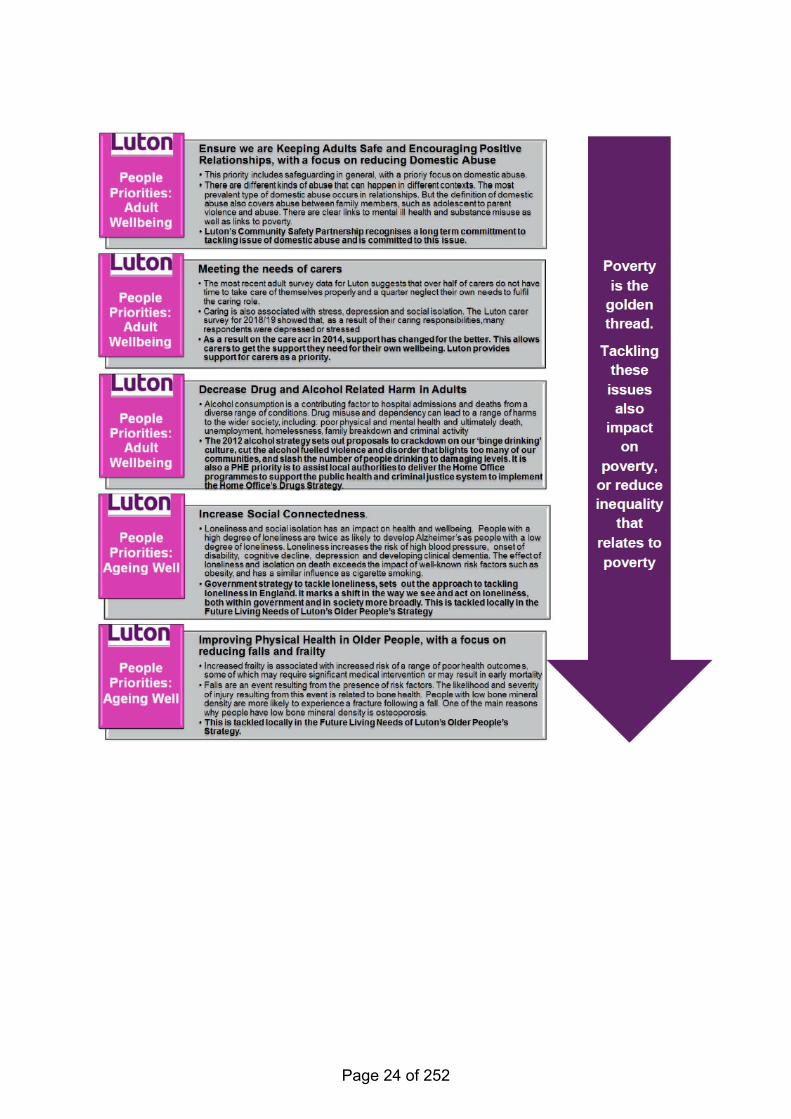
employment required to drive our commitment to eradicate poverty 7. Everyone in Luton lives in good quality housing, has access to green space and good air
quality 8. Everyone in Luton has the level of meaningful social contact that they want
Page 19 of 252
9. Everyone in Luton lives the end of their life with dignity in the place of their choice
Our Inclusive Economy work aims to make improvements to the social and economic factors that impact on people’s wellbeing (i.e. better incomes, improved skills, regenerated town and neighbourhood areas, opportunities for participation in culture) and acts in conjunction with the Health and Wellbeing Board to achieve our Luton 2040 ambition. How will we know we are successful? The overall success of the strategy will be measured through improvements in a number of overarching outcomes as set out below from a baseline of 2019 to 2024 (APPENDIX C). These outcome measures, which have been developed as part of our population health indicators, will be reviewed and updated as required. Specific improvements in these indicators will be developed by the Delivery Boards and agreed with the Health and Wellbeing Board. Delivery Boards will give bi-annual updates on progress. Healthy life expectancy is the best overall measure of both health and health inequalities, representing the number of years someone can expect to live in good health. In Luton, the gap between the best and worst off is 13 years for males and 15 years for females. This is similar to our statistical neighbours. Our goal therefore is primarily to close the gap in healthy life expectancy in Luton by improving the health and wellbeing of the poorest and most vulnerable the fastest. Implementation The Board will continue to provide direction and vision, acting as a guiding partnership, offering partners the opportunity for shared decision-making to deliver shared outcomes. The general principles in which the Board will work are;
• This is a collective effort and we will not be constrained by professional or organisational boundaries
• We will set our ambitions with stakeholders and residents, working with and for communities • We will learn from the best and adapt to local circumstances • Our work will be led by data, evidence and local intelligence taking in the whole picture • Our efforts will focus on what is effective to solve problems and deliver outcomes • We will generate both long-term and short-term solutions and be honest about what happens
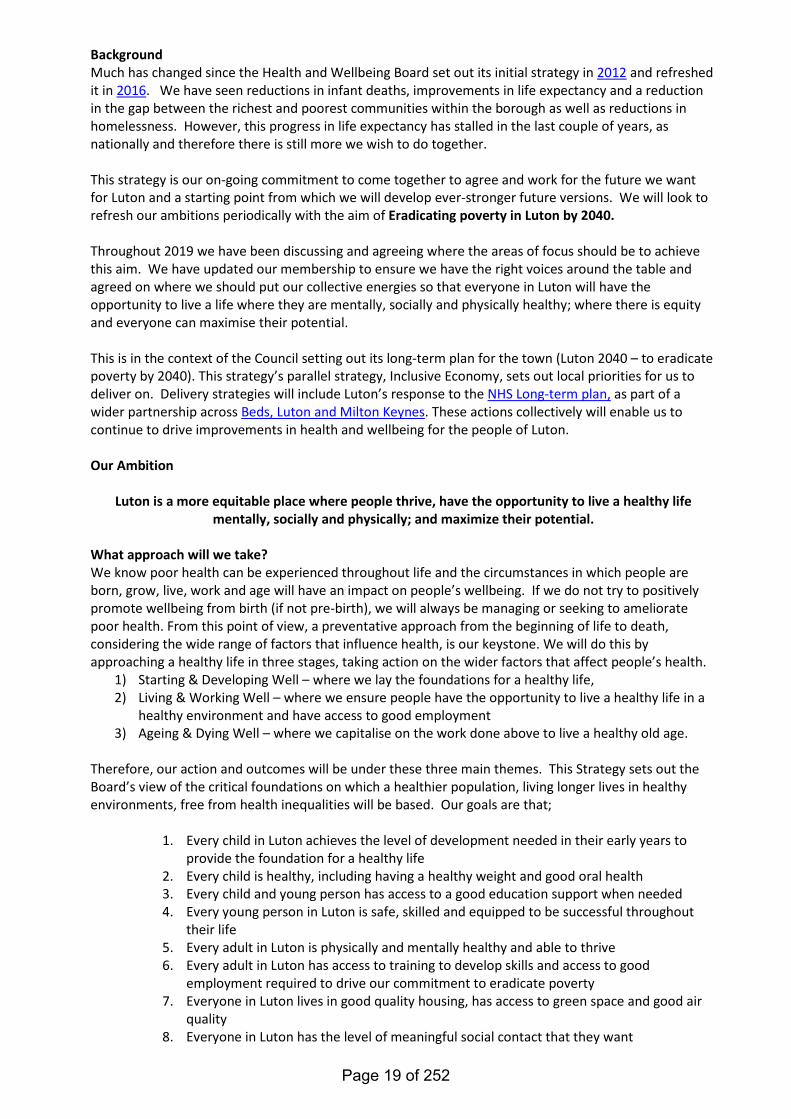
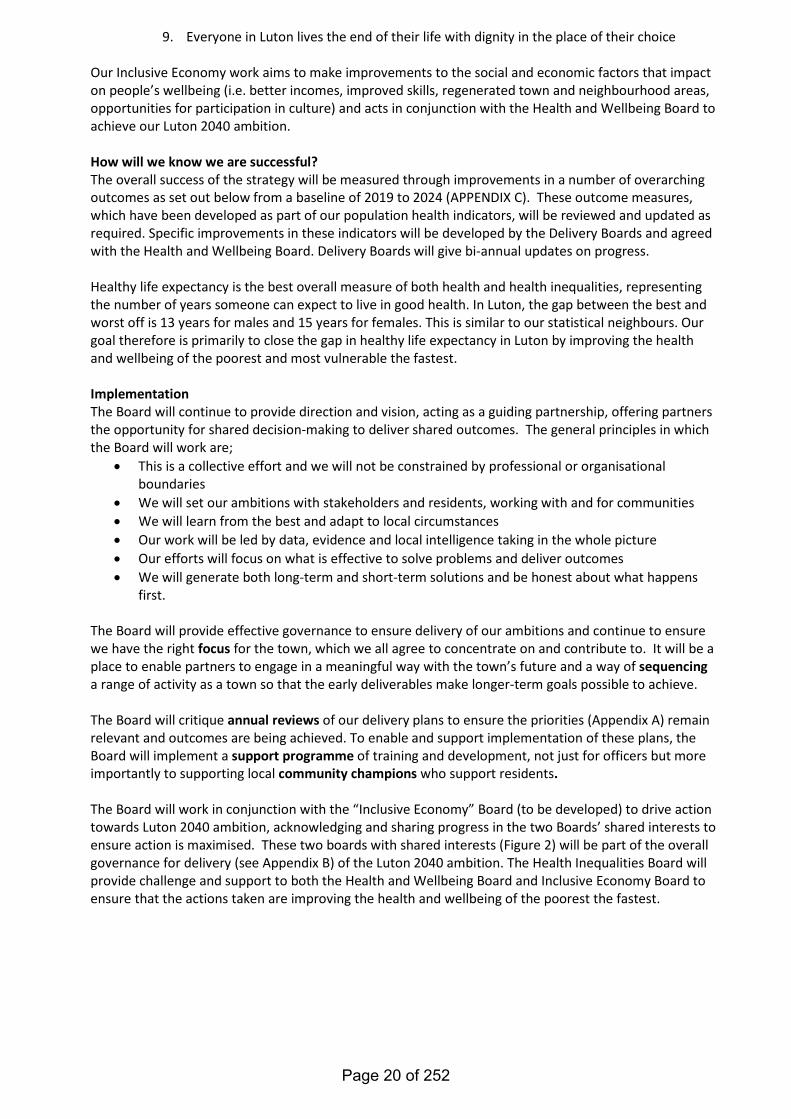
first. The Board will provide effective governance to ensure delivery of our ambitions and continue to ensure we have the right focus for the town, which we all agree to concentrate on and contribute to. It will be a place to enable partners to engage in a meaningful way with the town’s future and a way of sequencing a range of activity as a town so that the early deliverables make longer-term goals possible to achieve. The Board will critique annual reviews of our delivery plans to ensure the priorities (Appendix A) remain relevant and outcomes are being achieved. To enable and support implementation of these plans, the Board will implement a support programme of training and development, not just for officers but more importantly to supporting local community champions who support residents. The Board will work in conjunction with the “Inclusive Economy” Board (to be developed) to drive action towards Luton 2040 ambition, acknowledging and sharing progress in the two Boards’ shared interests to ensure action is maximised. These two boards with shared interests (Figure 2) will be part of the overall governance for delivery (see Appendix B) of the Luton 2040 ambition. The Health Inequalities Board will provide challenge and support to both the Health and Wellbeing Board and Inclusive Economy Board to ensure that the actions taken are improving the health and wellbeing of the poorest the fastest.
Page 20 of 252
Figure 1. DRAFT Delivery model
Figure 2: DRAFT parallel work streams outlining shared interests
Shared leadership
Effective goverance
Evidence led preventative
action
Co-produced action with
our community
Evaluated outcomes
People & Place strategies
Eradicating poverty by 2040
Ambition
A growing town built on fairness: A town of hope and aspiration, where everyone can share in its
success
Outcome
Page 21 of 252
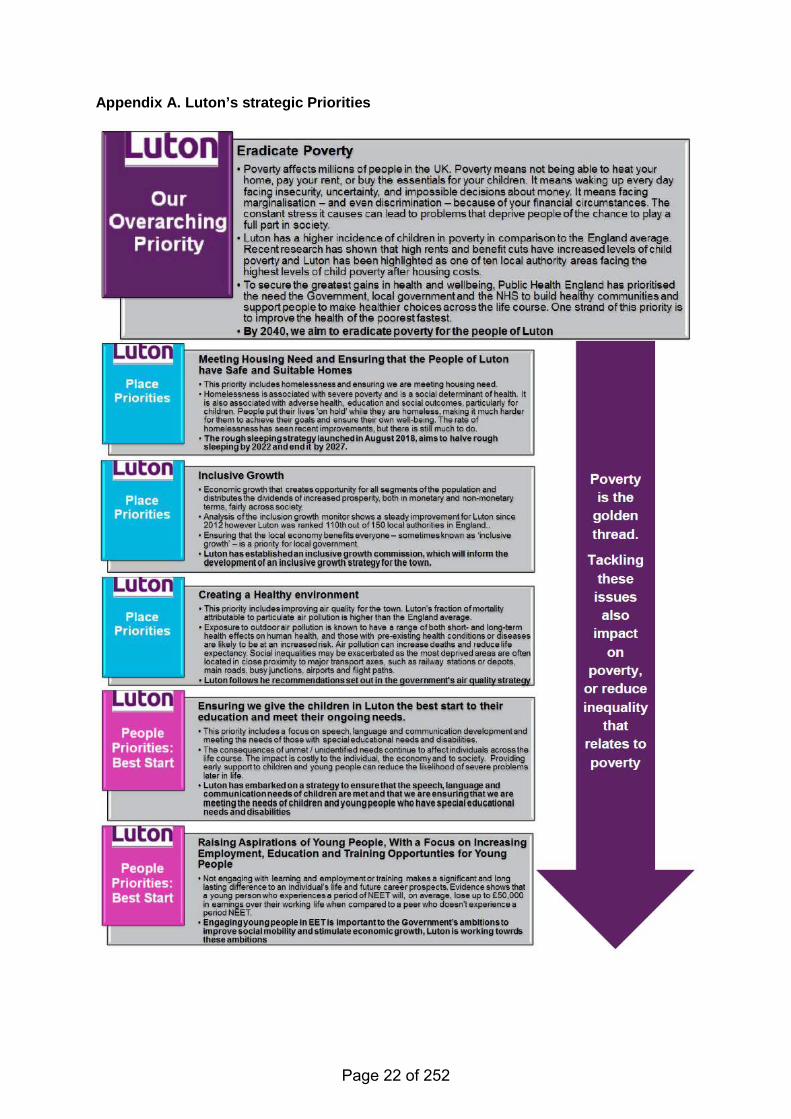
Appendix A. Luton’s strategic Priorities
Page 22 of 252
Page 23 of 252
Page 24 of 252
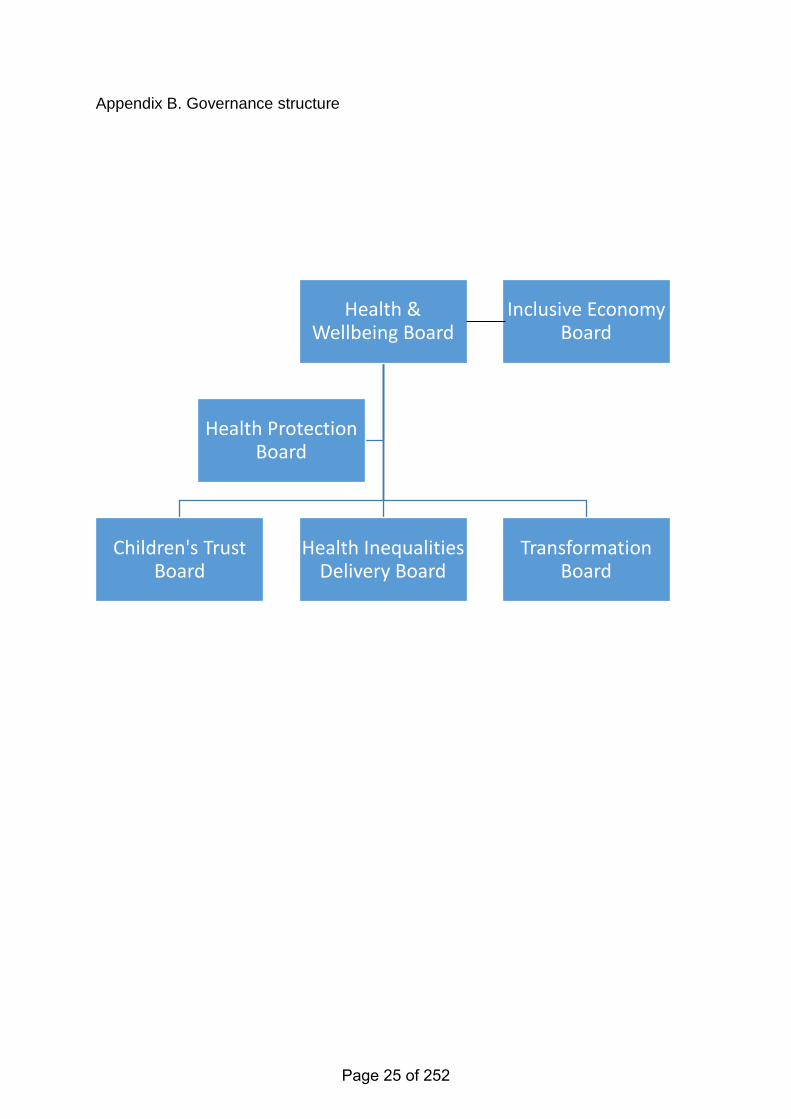
Appendix B. Governance structure
Health & Wellbeing Board
Children's Trust Board
Health Inequalities Delivery Board
Transformation Board
Health Protection Board
Inclusive Economy Board
Page 25 of 252
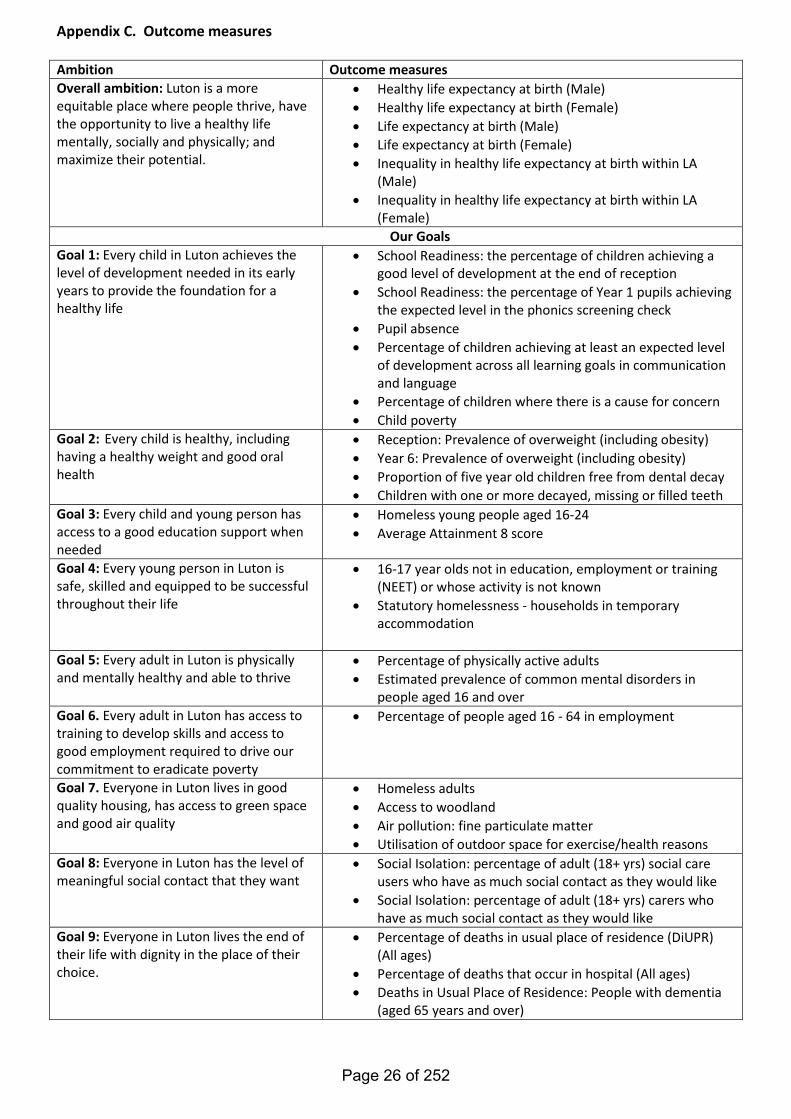
Appendix C. Outcome measures Ambition Outcome measures Overall ambition: Luton is a more equitable place where people thrive, have the opportunity to live a healthy life mentally, socially and physically; and maximize their potential.
• Healthy life expectancy at birth (Male) • Healthy life expectancy at birth (Female) • Life expectancy at birth (Male) • Life expectancy at birth (Female) • Inequality in healthy life expectancy at birth within LA
(Male) • Inequality in healthy life expectancy at birth within LA
(Female) Our Goals
Goal 1: Every child in Luton achieves the level of development needed in its early years to provide the foundation for a healthy life
• School Readiness: the percentage of children achieving a good level of development at the end of reception
• School Readiness: the percentage of Year 1 pupils achieving the expected level in the phonics screening check
• Pupil absence • Percentage of children achieving at least an expected level
of development across all learning goals in communication and language
• Percentage of children where there is a cause for concern • Child poverty
Goal 2: Every child is healthy, including having a healthy weight and good oral health
• Reception: Prevalence of overweight (including obesity) • Year 6: Prevalence of overweight (including obesity) • Proportion of five year old children free from dental decay • Children with one or more decayed, missing or filled teeth
Goal 3: Every child and young person has access to a good education support when needed
• Homeless young people aged 16-24 • Average Attainment 8 score
Goal 4: Every young person in Luton is safe, skilled and equipped to be successful throughout their life
• 16-17 year olds not in education, employment or training (NEET) or whose activity is not known
• Statutory homelessness - households in temporary accommodation
Goal 5: Every adult in Luton is physically and mentally healthy and able to thrive
• Percentage of physically active adults • Estimated prevalence of common mental disorders in
people aged 16 and over Goal 6. Every adult in Luton has access to training to develop skills and access to good employment required to drive our commitment to eradicate poverty
• Percentage of people aged 16 - 64 in employment
Goal 7. Everyone in Luton lives in good quality housing, has access to green space and good air quality
• Homeless adults • Access to woodland • Air pollution: fine particulate matter • Utilisation of outdoor space for exercise/health reasons
Goal 8: Everyone in Luton has the level of meaningful social contact that they want
• Social Isolation: percentage of adult (18+ yrs) social care users who have as much social contact as they would like
• Social Isolation: percentage of adult (18+ yrs) carers who have as much social contact as they would like
Goal 9: Everyone in Luton lives the end of their life with dignity in the place of their choice.
• Percentage of deaths in usual place of residence (DiUPR) (All ages)
• Percentage of deaths that occur in hospital (All ages) • Deaths in Usual Place of Residence: People with dementia
(aged 65 years and over)
Page 26 of 252
HEALTH AND WELLBEING BOARD
AGENDA ITEM
7
DATE OF MEETING: 19 September 2019 REPORT OF: The Corporate Director Public Health and Wellbeing REPORT AUTHOR: Kate Sutherland SUBJECT: Luton Better Care Fund Template 2019-2020
WARD(S) AFFECTED: All PURPOSE 1. The purpose of the Better Care Fund submission to the Health and Wellbeing
Board is to obtain approval on the 2019-2020 Better Care Fund templates. The NHS England national templates replace the narrative local Better Care Fund Plan required in previous years.
2. The documents represent two parts of the whole; a main template and a
financial template, which will be merged in the next few days. The templates, jointly set out the Luton Better Care Fund investment position against national expectations and criteria, income and expenditure, High Impact Change Model status, Better Care Fund designated metrics, planning requirement compliance and a strategic narrative based on the key lines of enquiry outlined in the Better Care Fund Planning Requirements.
RECOMMENDATION(S) 3. It is recommended that the Board:
• Review the templates individually, starting with the main template and following on with the financial template
• Recognise that the content of the report represents the 2019-2020 business as usual service allocations, the CCG adult social care minimum spend, the Disability Fund Grant, winter pressure funding, change schemes and projects agreed at Joint Strategy Commissioning Group, October 2018
• Consider and comment on the narrative within the template, as outlined in section 3.2
• Final sign off from Chair required before submission to NHS England on the 23rd September.
Page 27 of 252
Please note; due to pressure against the submission timetable and aligned governance schedule, the templates will require minor additions, after the date circulated. Assurance is given to the Board that only two items are outstanding: 1. Main template and Finance template to be merged 2. A short paragraph is required, detailing the actions needed to
take the maturity level of the High Impact Change Model Home First/Discharge to Assess from mature to exemplary.
REPORTING 4. The NHS England Better Care Fund Plan Template provides an overview of
how the allocations support person centred care, Luton’s approach to integrated care, wider system level alignment, for example to the NHS Long Term Plan, the Health and Wellbeing Strategy and the Luton ‘At Place’ Single System Operating Plan.
5. Due to the tight timeframe and the scheduling for submission of documents to the Health and Wellbeing Board the BCF Template has been submitted in two parts:
1. Main document (Sheets 4,7,8 and 9) 2. Finance document (Sheets 3,5 and 6)
6. The following key points are highlighted:
Template one (1) sheet 4 provides a narrative view of Luton Better Care Fund Strategy associated with the key lines of enquiry detailed in the questions below:
1. Person centred, Luton’s approach to prevention, self-care,
choice and independence, including key schemes and projects. 2. Integrated services at health and wellbeing level and where
relevant neighbourhood level; joint commissioning arrangements, alignment to Primary Care Networks and the voluntary and community services.
3. Alignment with wider services e.g. Housing; Luton’s approach to the Disabilities Fund Grant, and strategic planning for adaptations and technology.
4. System level alignment; BCF’s alignment to the wider integration landscape e.g. the STP/ICS, include joint governance arrangements for BCF.
Template one (1) sheet 7, details the level of maturity against the High Impact Change Model. Luton is classified as a high performer against the High Impact Change Model objectives, five out of eight models are exemplary, a further two will attain exemplary in 2019-2020.
Template one (1) sheet 8, details the metrics set by the Better Care Fund Board for 2018-2019. The metrics will remain the same for 2019-2020. The sheet contains a narrative briefly outlining the plan for achieving the BCF metrics (A-D) in 2019-2020:
Page 28 of 252
1. Total number of acute non-elective spells per 100,000 of the
population – on track 2. Delayed transfers of care per day (daily delays) from hospital
(18+) – exemplary on track 3. Long term support needs of older people (65+) met by
admission to residential and nursing care homes (per 100,000 population) – sustainable – on track
4. The proportion of older people (65+) who were still at home 91 days after discharge from hospital into reablement or rehabilitation – on track
Template one (1) sheet 9, provides confirmation that Luton has met the key lines of enquiry as detailed in the Better Care Fund Planning Requirements. Template two (2) sheet 5, details the income received for 2019-2020. Please note that he winter pressure funding 2019-2020 now sits under the umbrella of BCF. Template two (2) sheet 6, details expenditure against the business as usual strategies, schemes and projects. BCF and iBCF 2019-2020 business as usual strategies, schemes and individual projects are a continuation from 2018-2019. In each case, a further year funding was deemed essential for the realisation of the benefits outlined in the business cases. The refreshed Business Cases for 2019-2020 were reviewed and approved by the Joint Strategic Commissioning Board, in October 2018. Early approval ensured BCF and iBCF allocations were finalised prior to the ratification of 2019 -2020 Luton Borough Council budget.
BACKGROUND 7. The Better Care Fund Plan Template publication was originally due for
release in February 2019. Delays at NHS England and Better Care Fund Board level continued, until the publication in August 2019. The submission date for the Luton Template is the 23rd September. Approval is sought from the Luton Health and Wellbeing Board prior to submission to NHS England on the 23rd September 2019.
8. Please note that the NHS England template is not an easy format to read. It
has been designed to provide a formulated platform for an equitably assessment of each Health and Wellbeing area, against the national conditions and criteria assigned to the fund. In order to prevent variation between each area’s spreadsheet the Better Care Fund administrators have locked the document cells. Unfortunately, this means, if printed, the narrative cannot be seen in full.
9. Guidance for reading the templates:
• The document must be read as an electronic document • Right click on each yellow box within the document, highlight the
narrative and scroll down to bring up the full narrative assigned to each box
Page 29 of 252
• Main Template – Sheets 2, 3,4,7,8 and 9. (Please ignore income and expenditure sheets 5 and 6)
• Finance Template – Sheets 5 and 6
OPPORTUNITIES 10. The initial goal is to understand the impact and opportunities the Long Term
Plan presents for Luton. In particular integration and co-production opportunities, including Primary Care Networks. The publication of the Green Papers, the Spending Review and the Workforce Plan will add significant depth to the process.
FINANCIAL IMPLICATIONS
11. There are no financial implications to this report since the funding has been
received and allocated in accordance with the conditions and criteria against the fund.
KEY RISKS 12. None noted
CONSULTATION ARRANGMENTS
13. Stakeholder engagement and partnership collaboration form part of the
project, schemes or fund managers responsibility. Issues or risks related to engagement or partnership arrangements are reported via the monthly highlight reports submitted by the project and scheme managers, ensuring robust arrangements and ongoing communication forms the backbone of each project and scheme.
APPENDICES Appendix A - Main Better Care Fund 2019-20 Template v5.0 Appendix B - Better Care Fund 2019-20 Finance Template v1.1 LIST OF BACKGROUND PAPERS LOCAL GOVERNMENT ACT 1972, SECTION 100D Papers in relation to drafting of the Better Care Fund Plan Template BCF Business Cases submitted to JSCG October 2019 prior to allocation BCF Project/Scheme Monthly Highlight Reports BCF Luton Programme Tracker BCF Policy Framework (Link) BCF Planning Requirements Guidance – (Link)
Page 30 of 252
Better Care Fund 2019/20 Template1. Guidance
Overview
Note on entering information into this template
Throughout the template, cells which are open for input have a yellow background and those that are pre-populated have a grey background, as below:Data needs inputting in the cellPre-populated cellsNote on viewing the sheets optimallyFor a more optimal view each of the sheets and in particular the drop down lists clearly on screen, please change the zoom level between 90% - 100%. Most drop downs are also available to view as lists within the relevant sheet or in the guidance sheet for readability if required.
The details of each sheet within the template are outlined below.Checklist (click to go to Checklist, included in the Cover sheet)1. This section helps identify the data fields that have not been completed. All fields that appear as incomplete should be complete before sending to the Better Care Support Team.2. It is sectioned out by sheet name and contains the description of the information required, cell reference for the question and the 'checker' column which updates automatically as questions within each sheet are completed.3. The checker column will appear 'Red' and contain the word 'No' if the information has not been completed. Clicking on the corresponding 'Cell Reference' column will link to the incomplete cell for completion. Once completed the checker column will change to 'Green' and contain the word 'Yes'
4. The 'sheet completed' cell will update when all 'checker' values for the sheet are green containing the word 'Yes'.5. Once the checker column contains all cells marked 'Yes' the 'Incomplete Template' cell (below the title) will change to 'Complete Template'.6. Please ensure that all boxes on the checklist are green before submission.2. Cover (click to go to sheet)1. The cover sheet provides essential information on the area for which the template is being completed, contacts and sign off.
2. Question completion tracks the number of questions that have been completed; when all the questions in each section of the template have been completed the cell will turn green. Only when all cells are green should the template be sent to [email protected]. Please note that in line with fair processing of personal data we collect email addresses to communicate with key individuals from the local areas for various purposes relating to the delivery of the BCF plans including plan development, assurance, approval and provision of support. We remove these addresses from the supplied templates when they are collated and delete them when they are no longer needed. Please let us know if any of the submitted contact information changes during the BCF planning cycle so we are able to communicate with the right people in a timely manner.
4. Strategic Narrative (click to go to sheet)This section of the template should set out the agreed approach locally to integration of health & social care. The narratives should focus on updating existing plans, and changes since integration plans were set out until 2020 rather than reiterating them and can be short. Word limits have been applied to each section and these are indicated on the worksheet.
1. Approach to integrating care around the person. This should set out your approach to integrating health and social care around the people, particularly those with long term health and care needs. This should highlight developments since 2017 and cover areas such as prevention.
2 i. Approach to integrating services at HWB level (including any arrangements at neighbourhood level where relevant). This should set out the agreed approach and services that will be commissioned through the BCF. Where schemes are new or approaches locally have changed, you should set out a short rationale.2 ii. DFG and wider services. This should describe your approach to integration and joint commissioning/delivery with wider services. In all cases this should include housing, and a short narrative on use of the DFG to support people with care needs to remain independent through adaptations or other capital expenditure on their homes. This should include any discretionary use of the DFG.3. How your BCF plan and other local plans align with the wider system and support integrated approaches. Examples may include the read across to the STP (Sustainability Transformation Partnerships) or ICS (Integrated Care Systems) plan(s) for your area and any other relevant strategies.
You can attach (in the e-mail) visuals and illustrations to aid understanding if this will assist assurers in understanding your local approach.5. Income (click to go to sheet)
1. This sheet should be used to specify all funding contributions to the Health and Wellbeing Board's Better Care Fund (BCF) plan and pooled budget for 2019/20. On selected the HWB from the Cover page, this sheet will be pre-populated with the minimum CCG contributions to the BCF, DFG (Disabled Facilities Grant), iBCF (improved Better Care Fund) and Winter Pressures allocations to be pooled within the BCF. These cannot be edited.2. Please select whether any additional contributions to the BCF pool are being made from Local Authorities or the CCGs and as applicable enter the amounts in the fields highlighted in ‘yellow’. These will appear as funding sources when planning expenditure. The fields for Additional contributions can be utilised to include any relevant carry-overs from the previous year.3. Please use the comment boxes alongside to add any specific detail around this additional contribution including any relevant carry-overs assigned from previous years. All allocations are rounded to the nearest pound.4. For any questions regarding the BCF funding allocations, please contact [email protected]
Page 31 of 252
6. Expenditure (click to go to sheet)This sheet should be used to set out the schemes that constitute the BCF plan for the HWB including the planned expenditure and the attributes to describe the scheme. This information is then aggregated and utilised to analyse the BCF plans nationally and sets the basis for future reporting and to particularly demonstrate that National Condition 2 and 3 are met.
The table is set out to capture a range of information about how schemes are being funded and the types of services they are providing. There may be scenarios when several lines need to be completed in order to fully describe a single scheme or where a scheme is funded by multiple funding streams (eg: iBCF and CCG minimum). In this case please use a consistent scheme ID for each line to ensure integrity of aggregating and analysing schemes.On this sheet please enter the following information:1. Scheme ID:- This field only permits numbers. Please enter a number to represent the Scheme ID for the scheme being entered. Please enter the same Scheme ID in this column for any schemes that are described across multiple rows.2. Scheme Name: - This is a free field to aid identification during the planning process. Please use the scheme name consistently if the scheme is described across multiple lines in line with the scheme ID described above.3. Brief Description of Scheme- This is free text field to include a brief headline description of the scheme being planned.4. Scheme Type and Sub Type: - Please select the Scheme Type from the drop-down list that best represents the type of scheme being planned. A description of each scheme is available at the end of the table (follow the link to the description section at the top of the main expenditure table). - Where the Scheme Types has further options to choose from, the Sub Type column alongside will be editable and turn "yellow". Please select the Sub Type from the drop down list that best describes the scheme being planned.- Please note that the drop down list has a scroll bar to scroll through the list and all the options may not appear in one view.- If the scheme is not adequately described by the available options, please choose ‘Other’ and add a free field description for the scheme type in the column alongside.- While selecting schemes and sub-types, the sub-type field will be flagged in ‘red’ font if it is from a previously selected scheme type. In this case please clear the sub-type field and reselect from the dropdown if the subtype field is editable.
5. Planned Outputs- The BCF Planning requirements document requires areas to set out planned outputs for certain scheme types (those which lend themselves to delivery of discrete units of delivery) to help to better understand and account for the activity funded through the BCF. - The Planned Outputs fields will only be editable if one of the relevant scheme types is selected. Please select a relevant unit from the drop down and an estimate of the outputs expected over the year. This is a numerical field.6. Metric Impact- This field is collecting information on the metrics that a chem will impact on (rather than the actual planned impact on the metric)- For the schemes being planned please select from the drop-down options of ‘High-Medium-Low-n/a’ to provide an indicative level of impact on the four BCF metrics. Where the scheme impacts multiple metrics, this can be expressed by selecting the appropriate level from the drop down for each of the metrics. For example, a discharge to assess scheme might have a medium impact on Delayed Transfers of Care and permanent admissions to residential care. Where the scheme is not expected to impact a metric, the ‘n/a’ option could be selected from the drop-down menu.7. Area of Spend:- Please select the area of spend from the drop-down list by considering the area of the health and social system which is most supported by investing in the scheme. - Please note that where ‘Social Care’ is selected and the source of funding is “CCG minimum” then the planned spend would count towards National Condition 2.- If the scheme is not adequately described by the available options, please choose ‘Other’ and add a free field description for the scheme type in the column alongside. - We encourage areas to try to use the standard scheme types where possible.8. Commissioner:- Identify the commissioning entity for the scheme based on who commissions the scheme from the provider. If there is a single commissioner, please select the option from the drop-down list. - Please note this field is utilised in the calculations for meeting National Condition 3.- If the scheme is commissioned jointly, please select ‘Joint’. Please estimate the proportion of the scheme being commissioned by the local authority and CCG/NHS and enter the respective percentages on the two columns alongside.9. Provider:- Please select the ‘Provider’ commissioned to provide the scheme from the drop-down list.- If the scheme is being provided by multiple providers, please split the scheme across multiple lines.
10. Source of Funding:- Based on the funding sources for the BCF pool for the HWB, please select the source of funding for the scheme from the drop-down list- If the scheme is funding across multiple sources of funding, please split the scheme across multiple lines, reflecting the financial contribution from each.11. Expenditure (£) 2019/20:- Please enter the planned spend for the scheme (or the scheme line, if the scheme is expressed across multiple lines)12. New/Existing Scheme- Please indicate whether the planned scheme is a new scheme for this year or an existing scheme being carried forward.
This is the only detailed information on BCF schemes being collected centrally for 2019/20 and will inform the understanding of planned spend for the iBCF and Winter Funding grants.
Page 32 of 252
7. HICM (click to go to sheet)
National condition four of the BCF requires that areas continue to make progress in implementing the High Impact Change model for managing transfers of care and continue to work towards the centrally set expectations for reducing DToC. In the planning template, you should provide:- An assessment of your current level of implementation against each of the 8 elements of the model – from a drop-down list- Your planned level of implementation by the end March 2020 – again from a drop-down listA narrative that sets out the approach to implementing the model further. The Narrative section in the HICM tab sets out further details.8. Metrics (click to go to sheet)This sheet should be used to set out the Health and Wellbeing Board's performance plans for each of the Better Care Fund metrics in 2019/20. The BCF requires plans to be agreed for the four metrics. This should build on planned and actual performance on these metrics in 2018/19.
1. Non-Elective Admissions (NEA) metric planning:- BCF plans as in previous years mirror the latest CCG Operating Plans for the NEA metric. Therefore, this metric is not collected via this template.
2. Residential Admissions (RES) planning: - This section requires inputting the information for the numerator of the measure.- Please enter the planned number of council-supported older people (aged 65 and over) whose long-term support needs will be met by a change of setting to residential and nursing care during the year (excluding transfers between residential and nursing care) for the Residential Admissions numerator measure.- The prepopulated denominator of the measure is the size of the older people population in the area (aged 65 and over) taken from ONS subnational population projections.- The annual rate is then calculated and populated based on the entered information.- Please include a brief narrative associated with this metric plan
3. Reablement (REA) planning: - This section requires inputting the information for the numerator and denominator of the measure.- Please enter the planned denominator figure, which is the planned number of older people discharged from hospital to their own home for rehabilitation (or from hospital to a residential or nursing care home or extra care housing for rehabilitation, with a clear intention that they will move on/back to their own home).- Please then enter the planned numerator figure, which is the planned number of older people discharged from hospital to their own home for rehabilitation (from within the denominator) that will still be at home 91 days after discharge.- The annual proportion (%) Reablement measure will then be calculated and populated based on this information.- Please include a brief narrative associated with this metric plan
4. Delayed Transfers of Care (DToC) planning: - The expectations for this metric from 2018/19 are retained for 2019/20 and these are prepopulated. - Please include a brief narrative associated with this metric plan. - This narrative should include details of the plan, agreed between the local authority and the CCG for using the Winter Pressures grant to manage pressures on the system over Winter.9. Planning Requirements (click to go to sheet)This sheet requires the Health & Wellbeing Board to confirm whether the National Conditions and other Planning Requirements detailed in the BCF Policy Framework and the BCF Requirements document are met. Please refer to the BCF Policy Framework and BCF Planning Requirements documents for 2019/20 for further details.The Key Lines of Enquiry (KLOE) underpinning the Planning Requirements are also provided for reference as they will be utilised to assure plans by the regional assurance panel.1. For each Planning Requirement please select ‘Yes’ or ‘No’ to confirm whether the requirement is met for the BCF Plan.2. Where the confirmation selected is ‘No’, please use the comments boxes to include the actions in place towards meeting the requirement and the target timeframes.10. CCG-HWB Mapping (click to go to sheet)
The final sheet provides details of the CCG - HWB mapping used to calculate contributions to Health and Wellbeing Board level non-elective activity figures.
Page 33 of 252
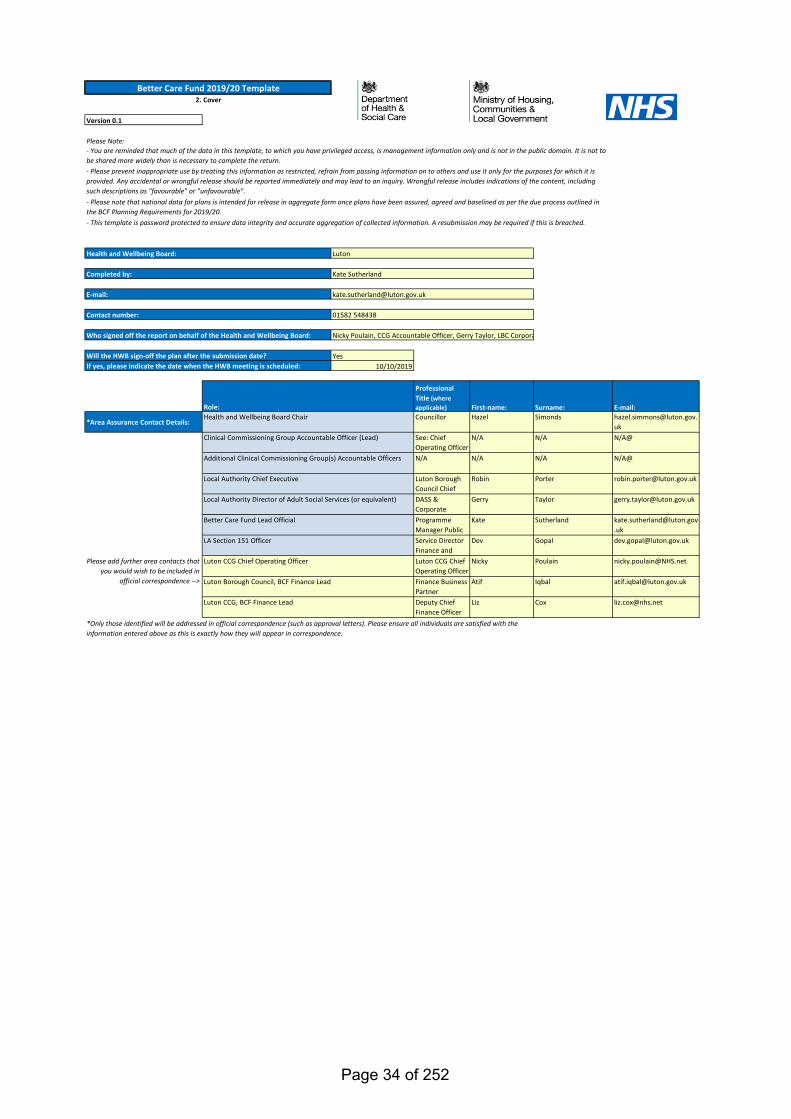
Version 0.1
Please Note:
Yes10/10/2019
Professional Title (where applicable) First-name: Surname: E-mail:
*Area Assurance Contact Details:Councillor Hazel Simonds [email protected].
ukSee: Chief Operating Officer
N/A N/A N/A@
N/A N/A N/A N/A@
Luton Borough Council Chief
Robin Porter [email protected]
DASS & Corporate
Gerry Taylor [email protected]
Programme Manager Public
Kate Sutherland [email protected]
Service Director Finance and
Dev Gopal [email protected]
Luton CCG Chief Operating Officer
Nicky Poulain [email protected]
Finance Business Partner
Atif Iqbal [email protected]
Deputy Chief Finance Officer
Liz Cox [email protected]
Please add further area contacts that you would wish to be included in
official correspondence --> Luton Borough Council, BCF Finance Lead
Luton CCG, BCF Finance Lead
Role:Health and Wellbeing Board Chair
Clinical Commissioning Group Accountable Officer (Lead)
Additional Clinical Commissioning Group(s) Accountable Officers
Local Authority Chief Executive
Local Authority Director of Adult Social Services (or equivalent)
Better Care Fund Lead Official
LA Section 151 Officer
Luton CCG Chief Operating Officer
Who signed off the report on behalf of the Health and Wellbeing Board:
Better Care Fund 2019/20 Template2. Cover
Kate Sutherland
Luton
01582 548438
Health and Wellbeing Board:
Completed by:
E-mail:
Contact number:
- You are reminded that much of the data in this template, to which you have privileged access, is management information only and is not in the public domain. It is not to be shared more widely than is necessary to complete the return.- Please prevent inappropriate use by treating this information as restricted, refrain from passing information on to others and use it only for the purposes for which it is provided. Any accidental or wrongful release should be reported immediately and may lead to an inquiry. Wrongful release includes indications of the content, including such descriptions as "favourable" or "unfavourable".- Please note that national data for plans is intended for release in aggregate form once plans have been assured, agreed and baselined as per the due process outlined in the BCF Planning Requirements for 2019/20.- This template is password protected to ensure data integrity and accurate aggregation of collected information. A resubmission may be required if this is breached.
Nicky Poulain, CCG Accountable Officer, Gerry Taylor, LBC Corpora
Will the HWB sign-off the plan after the submission date?If yes, please indicate the date when the HWB meeting is scheduled:
*Only those identified will be addressed in official correspondence (such as approval letters). Please ensure all individuals are satisfied with the information entered above as this is exactly how they will appear in correspondence.
Page 34 of 252
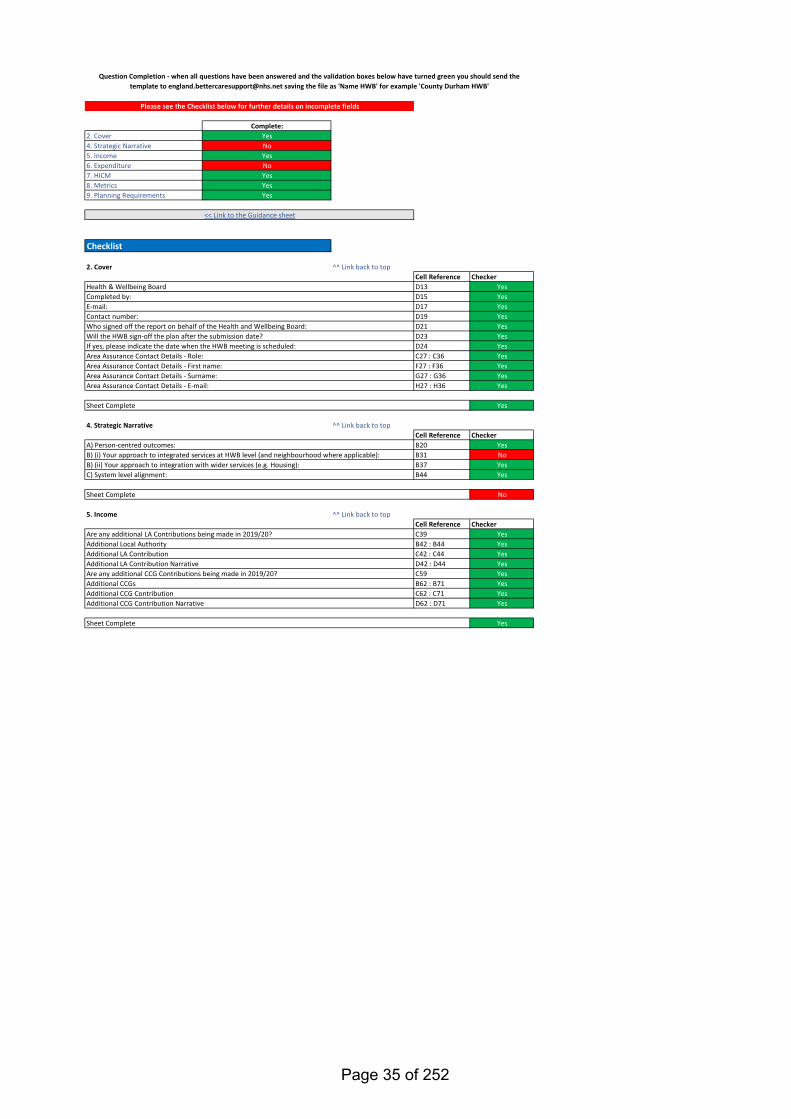
Complete:2. Cover Yes4. Strategic Narrative No5. Income Yes6. Expenditure No7. HICM Yes8. Metrics Yes9. Planning Requirements Yes
2. Cover ^^ Link back to topCell Reference CheckerD13 YesD15 YesD17 YesD19 YesD21 YesD23 YesD24 YesC27 : C36 YesF27 : F36 YesG27 : G36 YesH27 : H36 Yes
Yes
4. Strategic Narrative ^^ Link back to topCell Reference CheckerB20 YesB31 NoB37 YesB44 Yes
No
5. Income ^^ Link back to topCell Reference CheckerC39 YesB42 : B44 YesC42 : C44 YesD42 : D44 YesC59 YesB62 : B71 YesC62 : C71 YesD62 : D71 Yes
Yes
Area Assurance Contact Details - First name:Area Assurance Contact Details - Surname:
Sheet Complete
Are any additional CCG Contributions being made in 2019/20?Additional CCGsAdditional CCG Contribution
Area Assurance Contact Details - E-mail:
Are any additional LA Contributions being made in 2019/20?
C) System level alignment:
<< Link to the Guidance sheet
Checklist
A) Person-centred outcomes:B) (i) Your approach to integrated services at HWB level (and neighbourhood where applicable):B) (ii) Your approach to integration with wider services (e.g. Housing):
Question Completion - when all questions have been answered and the validation boxes below have turned green you should send the template to [email protected] saving the file as 'Name HWB' for example 'County Durham HWB'
Contact number:Who signed off the report on behalf of the Health and Wellbeing Board:
Sheet Complete
Please see the Checklist below for further details on incomplete fields
Health & Wellbeing BoardCompleted by:E-mail:
Area Assurance Contact Details - Role:
Additional CCG Contribution Narrative
Sheet Complete
Additional Local AuthorityAdditional LA ContributionAdditional LA Contribution Narrative
Will the HWB sign-off the plan after the submission date?If yes, please indicate the date when the HWB meeting is scheduled:
Page 35 of 252
6. Expenditure ^^ Link back to topCell Reference CheckerB22 : B271 YesC22 : C271 YesD22 : D271 NoE22 : E271 NoF22 : F271 YesG22 : G271 YesH22 : H271 YesI22 : I271 YesJ22 : J271 NoK22 : K271 NoL22 : L271 NoM22 : M271 NoN22 : N271 NoO22 : O271 YesP22 : P271 NoQ22 : Q271 YesS22 : S271 NoT22 : T271 NoU22 : U271 NoV22 : V271 No
No
7. HICM ^^ Link back to topCell Reference CheckerB11 YesD15 YesD16 YesD17 YesD18 YesD19 YesD20 YesD21 YesD22 YesE15 YesE16 YesE17 YesE18 YesE19 YesE20 YesE21 YesE22 YesF15 YesF16 YesF17 YesF18 YesF19 YesF20 YesF21 YesF22 Yes
Yes
Chg 7) Focus on choice - Current Level:Chg 8) Enhancing health in care homes - Current Level:
Provider:Source of Funding:Expenditure:New/Existing Scheme:
Sheet Complete
Impact: Reablement:Area of Spend:Specify if area of spend is Other:Commissioner:Joint Commissioner %:
Planned Output:Planned Output Unit Estimate:
Scheme ID:
Chg 1) Early discharge planning - Current Level:Chg 2) Systems to monitor patient flow - Current Level:Chg 3) Multi-disciplinary/Multi-agency discharge teams - Current Level:Chg 4) Home first / discharge to assess - Current Level:Chg 5) Seven-day service - Current Level:Chg 6) Trusted assessors - Current Level:
Impact: Delayed Transfers of Care:Impact: Residential Admissions:
Sub Types:
Scheme Name:Brief Description of Scheme:Scheme Type:
Specify if scheme type is Other:
Impact: Non-Elective Admissions:
Priorities for embedding elements of the HCIM for Managing Transfers of Care locally:
Chg 1) Early discharge planning - Planned Level:Chg 2) Systems to monitor patient flow - Planned Level:Chg 3) Multi-disciplinary/Multi-agency discharge teams - Planned Level:Chg 4) Home first / discharge to assess - Planned Level:Chg 5) Seven-day service - Planned Level:Chg 6) Trusted assessors - Planned Level:Chg 7) Focus on choice - Planned Level:Chg 8) Enhancing health in care homes - Planned Level:
Sheet Complete
Chg 1) Early discharge planning - Reasons:Chg 2) Systems to monitor patient flow - Reasons:Chg 3) Multi-disciplinary/Multi-agency discharge teams - Reasons:Chg 4) Home first / discharge to assess - Reasons:Chg 5) Seven-day service - Reasons:Chg 6) Trusted assessors - Reasons:Chg 7) Focus on choice - Reasons:Chg 8) Enhancing health in care homes - Reasons:
Page 36 of 252
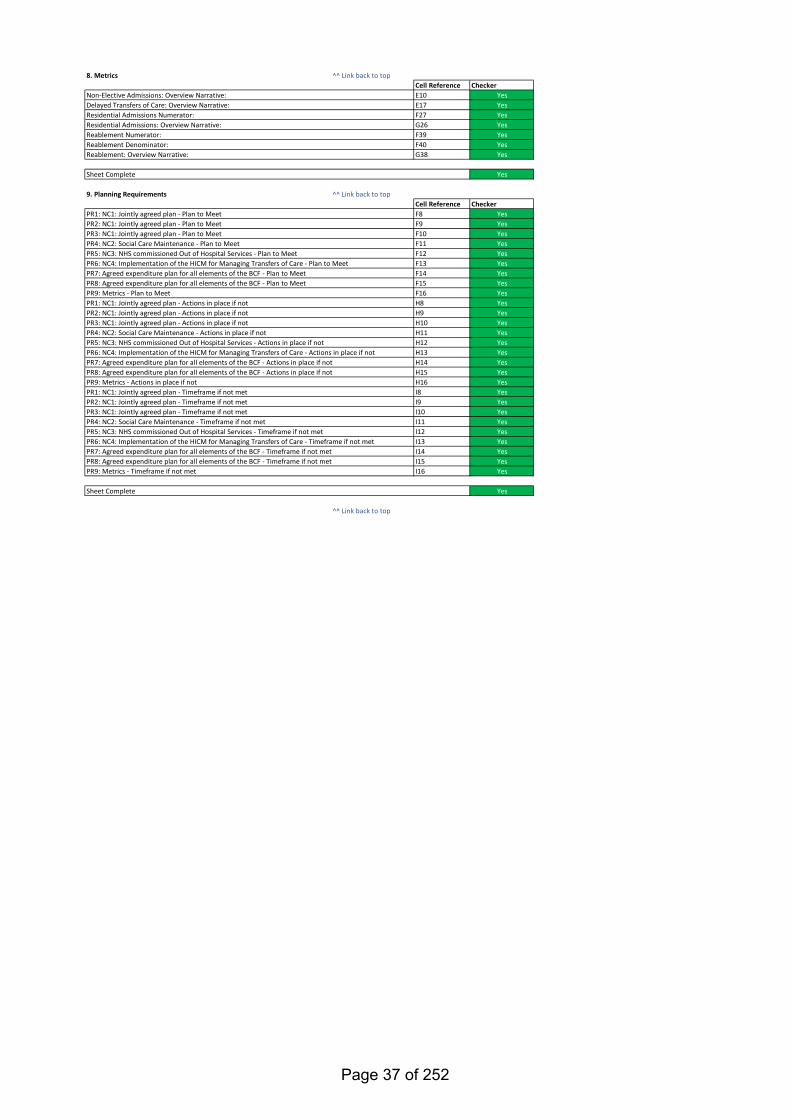
8. Metrics ^^ Link back to topCell Reference CheckerE10 YesE17 YesF27 YesG26 YesF39 YesF40 YesG38 Yes
Yes
9. Planning Requirements ^^ Link back to topCell Reference CheckerF8 YesF9 YesF10 YesF11 YesF12 YesF13 YesF14 YesF15 YesF16 YesH8 YesH9 YesH10 YesH11 YesH12 YesH13 YesH14 YesH15 YesH16 YesI8 YesI9 YesI10 YesI11 YesI12 YesI13 YesI14 YesI15 YesI16 Yes
Yes
^^ Link back to top
Non-Elective Admissions: Overview Narrative:Delayed Transfers of Care: Overview Narrative:Residential Admissions Numerator:Residential Admissions: Overview Narrative:Reablement Numerator:
Sheet Complete
PR5: NC3: NHS commissioned Out of Hospital Services - Actions in place if not
PR2: NC1: Jointly agreed plan - Timeframe if not metPR3: NC1: Jointly agreed plan - Timeframe if not metPR4: NC2: Social Care Maintenance - Timeframe if not metPR5: NC3: NHS commissioned Out of Hospital Services - Timeframe if not metPR6: NC4: Implementation of the HICM for Managing Transfers of Care - Timeframe if not metPR7: Agreed expenditure plan for all elements of the BCF - Timeframe if not metPR8: Agreed expenditure plan for all elements of the BCF - Timeframe if not metPR9: Metrics - Timeframe if not met
PR1: NC1: Jointly agreed plan - Actions in place if notPR2: NC1: Jointly agreed plan - Actions in place if not
PR1: NC1: Jointly agreed plan - Plan to Meet
PR6: NC4: Implementation of the HICM for Managing Transfers of Care - Actions in place if notPR7: Agreed expenditure plan for all elements of the BCF - Actions in place if notPR8: Agreed expenditure plan for all elements of the BCF - Actions in place if notPR9: Metrics - Actions in place if notPR1: NC1: Jointly agreed plan - Timeframe if not met
PR3: NC1: Jointly agreed plan - Actions in place if notPR4: NC2: Social Care Maintenance - Actions in place if not
PR2: NC1: Jointly agreed plan - Plan to MeetPR3: NC1: Jointly agreed plan - Plan to MeetPR4: NC2: Social Care Maintenance - Plan to MeetPR5: NC3: NHS commissioned Out of Hospital Services - Plan to MeetPR6: NC4: Implementation of the HICM for Managing Transfers of Care - Plan to MeetPR7: Agreed expenditure plan for all elements of the BCF - Plan to MeetPR8: Agreed expenditure plan for all elements of the BCF - Plan to MeetPR9: Metrics - Plan to Meet
Reablement Denominator:Reablement: Overview Narrative:
Sheet Complete
Page 37 of 252
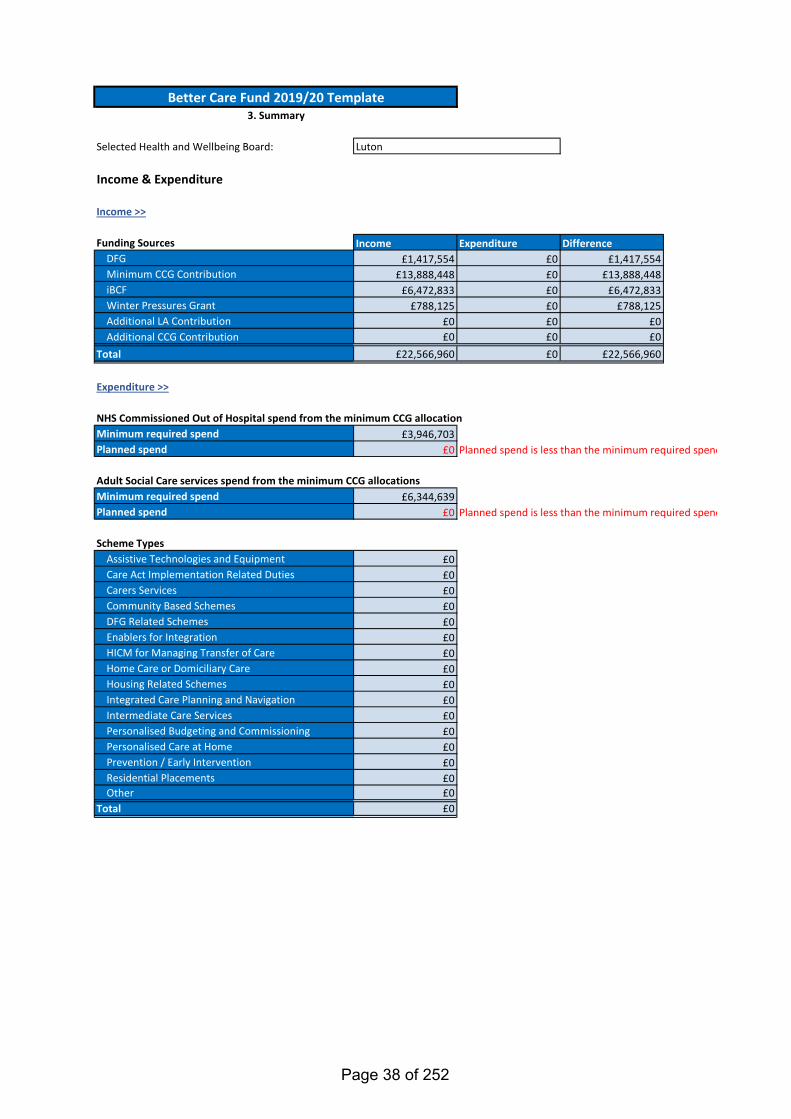
Income Expenditure Difference£1,417,554 £0 £1,417,554
£13,888,448 £0 £13,888,448£6,472,833 £0 £6,472,833
£788,125 £0 £788,125£0 £0 £0£0 £0 £0
£22,566,960 £0 £22,566,960
£3,946,703£0 Planned spend is less than the minimum required spend
£6,344,639£0 Planned spend is less than the minimum required spend
£0£0£0£0£0£0£0£0£0£0£0£0£0£0£0£0£0
Income & Expenditure
Selected Health and Wellbeing Board: Luton
NHS Commissioned Out of Hospital spend from the minimum CCG allocation
Funding Sources
Income >>
Total
Planned spend
Minimum required spendPlanned spend
Assistive Technologies and EquipmentCare Act Implementation Related Duties
Scheme Types
Other
Personalised Care at Home
Adult Social Care services spend from the minimum CCG allocations
Carers ServicesCommunity Based SchemesDFG Related SchemesEnablers for IntegrationHICM for Managing Transfer of CareHome Care or Domiciliary CareHousing Related Schemes
Expenditure >>
Integrated Care Planning and NavigationIntermediate Care ServicesPersonalised Budgeting and Commissioning
Better Care Fund 2019/20 Template3. Summary
DFGMinimum CCG ContributioniBCFWinter Pressures GrantAdditional LA ContributionAdditional CCG Contribution
Total
Minimum required spend
Prevention / Early InterventionResidential Placements
Page 38 of 252
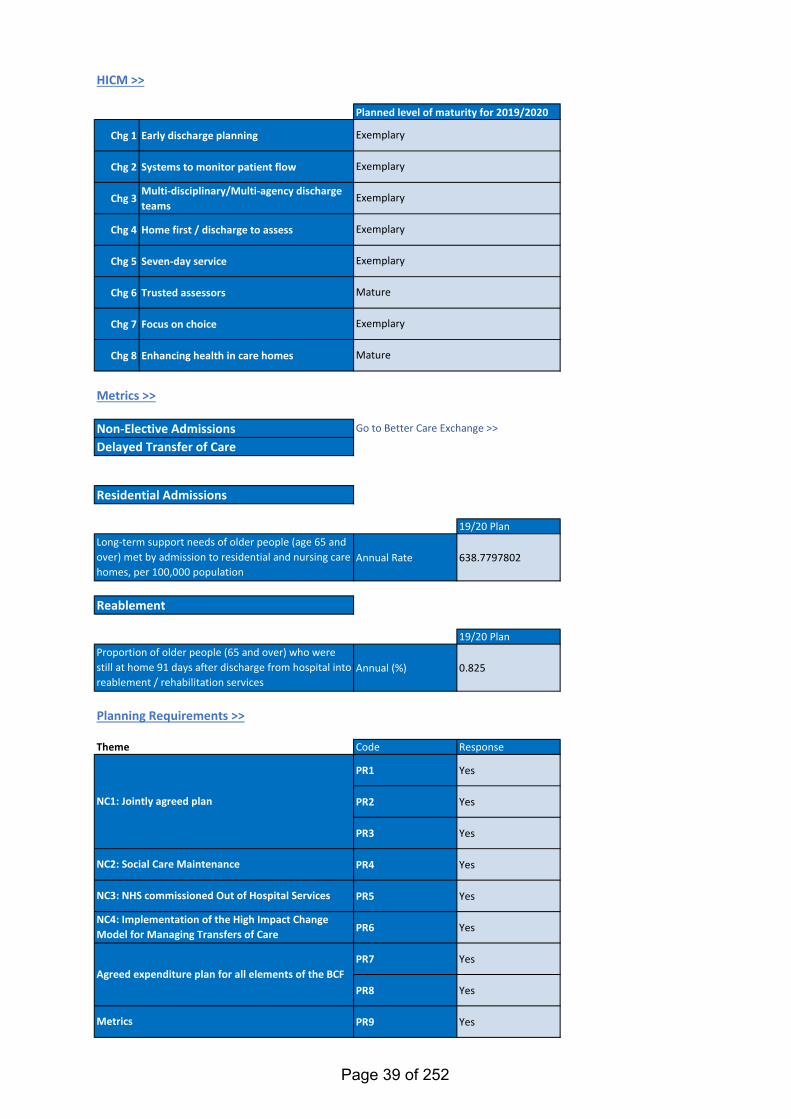
Chg 1 Early discharge planning
Chg 2 Systems to monitor patient flow
Chg 3Multi-disciplinary/Multi-agency discharge teams
Chg 4 Home first / discharge to assess
Chg 5 Seven-day service
Chg 6 Trusted assessors
Chg 7 Focus on choice
Chg 8 Enhancing health in care homes
19/20 Plan
Annual Rate 638.7797802
19/20 Plan
Annual (%) 0.825
Theme Code Response
PR1 Yes
PR2 Yes
PR3 Yes
PR4 Yes
PR5 Yes
PR6 Yes
PR7 Yes
PR8 Yes
PR9 Yes
Exemplary
Mature
Exemplary
Exemplary
Exemplary
Exemplary
Mature
Planned level of maturity for 2019/2020
Exemplary
Go to Better Care Exchange >>
Metrics
HICM >>
Planning Requirements >>
Reablement
Residential Admissions
Non-Elective AdmissionsDelayed Transfer of Care
NC2: Social Care Maintenance
NC3: NHS commissioned Out of Hospital Services
NC4: Implementation of the High Impact Change Model for Managing Transfers of Care
Metrics >>
NC1: Jointly agreed plan
Agreed expenditure plan for all elements of the BCF
Proportion of older people (65 and over) who were still at home 91 days after discharge from hospital into reablement / rehabilitation services
Long-term support needs of older people (age 65 and over) met by admission to residential and nursing care homes, per 100,000 population
Page 39 of 252
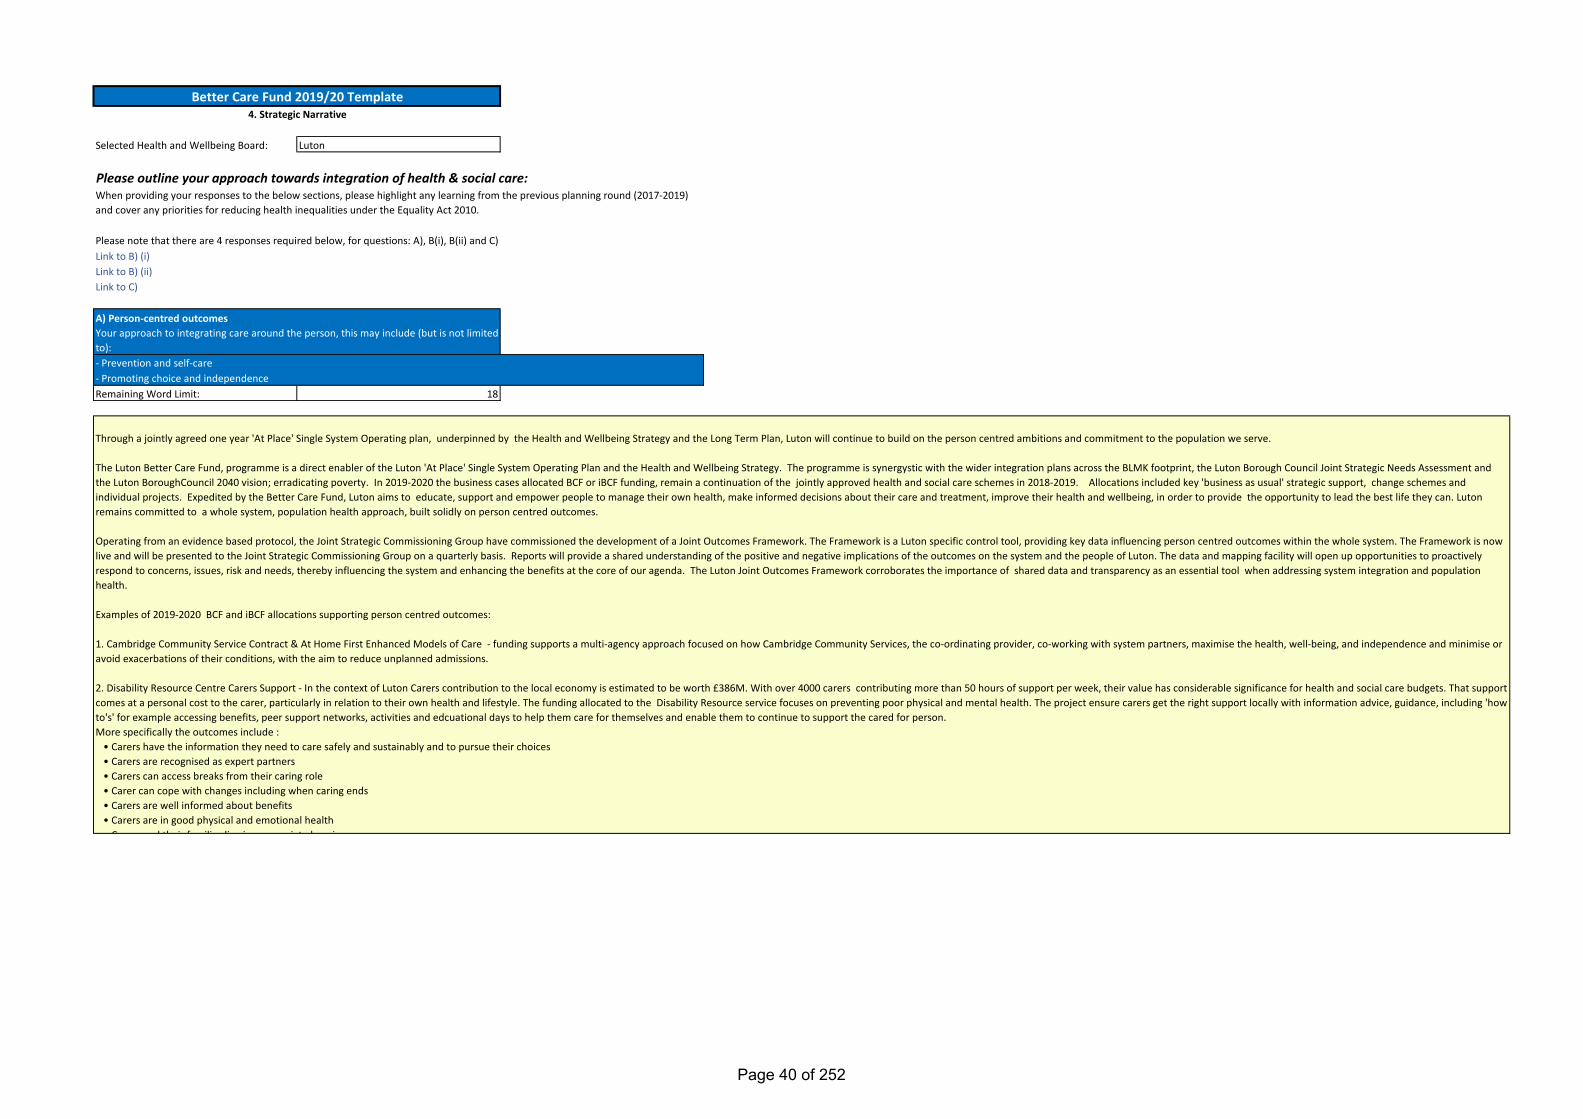
Selected Health and Wellbeing Board: Luton
Please outline your approach towards integration of health & social care:
Link to B) (i)Link to B) (ii)Link to C)
Remaining Word Limit: 18
Better Care Fund 2019/20 Template4. Strategic Narrative
- Prevention and self-care- Promoting choice and independence
When providing your responses to the below sections, please highlight any learning from the previous planning round (2017-2019) and cover any priorities for reducing health inequalities under the Equality Act 2010.
A) Person-centred outcomesYour approach to integrating care around the person, this may include (but is not limited to):
Through a jointly agreed one year 'At Place' Single System Operating plan, underpinned by the Health and Wellbeing Strategy and the Long Term Plan, Luton will continue to build on the person centred ambitions and commitment to the population we serve.
The Luton Better Care Fund, programme is a direct enabler of the Luton 'At Place' Single System Operating Plan and the Health and Wellbeing Strategy. The programme is synergystic with the wider integration plans across the BLMK footprint, the Luton Borough Council Joint Strategic Needs Assessment and the Luton BoroughCouncil 2040 vision; erradicating poverty. In 2019-2020 the business cases allocated BCF or iBCF funding, remain a continuation of the jointly approved health and social care schemes in 2018-2019. Allocations included key 'business as usual' strategic support, change schemes and individual projects. Expedited by the Better Care Fund, Luton aims to educate, support and empower people to manage their own health, make informed decisions about their care and treatment, improve their health and wellbeing, in order to provide the opportunity to lead the best life they can. Luton remains committed to a whole system, population health approach, built solidly on person centred outcomes.
Operating from an evidence based protocol, the Joint Strategic Commissioning Group have commissioned the development of a Joint Outcomes Framework. The Framework is a Luton specific control tool, providing key data influencing person centred outcomes within the whole system. The Framework is now live and will be presented to the Joint Strategic Commissioning Group on a quarterly basis. Reports will provide a shared understanding of the positive and negative implications of the outcomes on the system and the people of Luton. The data and mapping facility will open up opportunities to proactively respond to concerns, issues, risk and needs, thereby influencing the system and enhancing the benefits at the core of our agenda. The Luton Joint Outcomes Framework corroborates the importance of shared data and transparency as an essential tool when addressing system integration and population health.
Examples of 2019-2020 BCF and iBCF allocations supporting person centred outcomes:
1. Cambridge Community Service Contract & At Home First Enhanced Models of Care - funding supports a multi-agency approach focused on how Cambridge Community Services, the co-ordinating provider, co-working with system partners, maximise the health, well-being, and independence and minimise or avoid exacerbations of their conditions, with the aim to reduce unplanned admissions.
2. Disability Resource Centre Carers Support - In the context of Luton Carers contribution to the local economy is estimated to be worth £386M. With over 4000 carers contributing more than 50 hours of support per week, their value has considerable significance for health and social care budgets. That support comes at a personal cost to the carer, particularly in relation to their own health and lifestyle. The funding allocated to the Disability Resource service focuses on preventing poor physical and mental health. The project ensure carers get the right support locally with information advice, guidance, including 'how to's' for example accessing benefits, peer support networks, activities and edcuational days to help them care for themselves and enable them to continue to support the cared for person. More specifically the outcomes include : • Carers have the information they need to care safely and sustainably and to pursue their choices • Carers are recognised as expert partners • Carers can access breaks from their caring role • Carer can cope with changes including when caring ends • Carers are well informed about benefits • Carers are in good physical and emotional health • Carers and their families live in appropriate housing
Please note that there are 4 responses required below, for questions: A), B(i), B(ii) and C)
Page 40 of 252
^^ Link back to topRemaining Word Limit: 0 Please do not exceed the word limit
- Joint commissioning arrangements
B) HWB level
- Alignment with primary care services (including PCNs (Primary Care Networks))- Alignment of services and the approach to partnership with the VCS (Voluntary and Community Sector)
Primary Care Networks (PCNs) - context for delivery in Luton
Responsive, proactive and accessible primary care needs to be led by general practice. It must be delivered in partnership with a wide range of professionals who are supported to better understand the health and wellbeing needs of the local communities they serve. 'At Place' in Luton and in close partnership with BLMK ICS, we see this being achieved through an enhanced delivery model, which in design and as an operating model, draws inspiration from the Primary Care Home (PCH) model. The integration of community health, mental health and social care services with primary care clinicians is crucial. However, this integration will be only be effective and sustainable if services are co-designed with GPs and communities, as a wrapped around, strengthened and scaled primary care delivery model.Luton is currently co-designing a resilient, multi-disciplinary and high quality primary care system in the heart of our local community. GPs will be at the centre of patient care, supporting and directing the provision and co-ordination of high quality medical care and treatment for those that are ill, but also in bringing about improved health and well-being for our population as a whole. The new model of care ‘a complete care community’ is built around patients and for patients, ensuring they receive the Right Care in the Right Place at the Right Time. How the BCF plan supports the development of PCNs:All PCNs are encouraged to consistently evaluate their progress as they develop their emerging ‘new care models’. This includes:• Identifying and agreeing system and PCN population health priorities• Having a clear definition of the change that is required as a result of the population health intervention• A balance of measures are agreed and in place to inform PCH decisions• The PCN routinely reviews its chosen metrics• Evaluation data is used to facilitate a collective approach to local resource management
The following BCF/iBCF initiatives will enable the development of PCNs and support development of their emerging care models:
• Systems integration supported by technology• Population Management and Self Care Project• Enhanced care in care homes• Social prescription• All initiatives related to the development of integrated teams
Working to the principles of the Luton Health & Wellbeing Strategy (“A Healthier Future – Improving Health and Wellbeing in Luton 2012 to 2019”), the BCF Plan 2019-20 commitment continues towards the increasing development of integrated community services, built solidly around a proactive and effective primary care system. Having achieved significant success around Delayed Transfers of Care, Luton is focusing on the reduction of non-elective admissions and providing effective, quality care within the community. An Out of Hospital strategy and associated model has been developed, further enabling health and care professionals to provide improved and integrated pathways for the people of Luton. The Out of Hospital model will form the foundation stone for improved community care. This is aligned to the Better Care Funding allocated to existing service contracts, supporting increased capacity and subsequent innovative changes within the system Schemes such as Community Based Prevention the Integrated Rapid Response & the Reablement are key to enabling preventative care closer to home
(i) Your approach to integrated services at HWB level (and neighbourhood where applicable), this may include (but is not limited to):
Page 41 of 252
^^ Link back to topRemaining Word Limit: 156
- Your approach to using the DFG to support the housing needs of people with disabilities or care needs. This should include any arrangements for strategic planning for the use of adaptations and technologies to support independent living in line with the
BCF plan for 2019-20 is aligned with The Luton Borough Council and the Luton Clinical Commissioning Group Section 75 Partnership Agreement 2018-21. The S75 provides structure and agreement for new ways of working, staffing arrangements, pooled, non-pooled, aligned budgets and risk share arrangements. A refresh for 2019-2020 is underway and schedules have been drafted pending agreement of the BCF Pln 2019-2020.
S75 2019-2020 Schedules:1. Integrated Children & Young Peoples Commissioning2. Commissioning Integrated Mental Health & Wellbeing3. Learning Disabilities and Autism4. Better Care Fund and the Improved Better Care Fund 5. Joint Commissioning Arrangements and Joint Posts6.The Joint Strategic Commissioning Group7.Financial Arrangements8. GDPR9. Equality & Diversity Service10. Integrated Translation & Interpretation Service
Joint working arrangements between specific services have been outlined in the S75 Schedule 5, Joint Commissioning Arrangements and Joint Posts. The schedule outlines the interdependency between commissioning local comprehensive maternity services and heath visiting services. It is imperative the CCG and LA work in partnership to ensure best outcomes to women and neonates. Luton Council commission health visitor services to in-reach within the antenatal care period for pregnant women to ensure early identification of risk or additional need and to provide a smooth transition post-delivery. Additionally, the Luton Council Public Health Team commission a public health midwife to develop and ensure delivery of pathways to improve the health of this population, including vaccinations, weight management and smoking.
Luton continues to work collaboratively on ways to commission differently, placing patient experience and outcomes at the centre of the commissioning strategy . In 2019 the Luton Total Wellbeing Service became the first jointly commissioned service. Total Wellbeing is an integrated provision, offering healthy lifestyle support, social prescription and Improving Access to Psychological Therapies (IAPT) services. The holistic and collaborative approach exemplifies the whole person approach to wellbeing. Luton commissioning intentions are to develop further opportunities to jointly commission services, building on the whole system approach to commissioning
Co-location of Luton Borough Council, Public Health and Wellbeing Directorate, which includes adults and childrens commissioning and Luton Clinical Commissioning Group is helping to drive forward a whole system population approach; strengthening relationships and providing a platform for closer collaboration and further integration opportunities. The benefits of day to day informal conversations, impromptu meetings, shared environment and cultural merging are strengthening relationships, common values and objectives, whilst engendering the ethos of a one system team.
As per DFG grant determination 2019-20, DFG allocation for Luton is £1,417,554. The strategy for 2019-2020 is to continue to build on the good work carried out in 2018-2019. For council properties the council has a programme of extensions that are used to enable disabled people to access suitable h i Th i i f ll i t t d i t th ti l th i f b th hild d d lt Th i d t b ild l d t d h i th i bli l f ili ith b h i di bl d t li i d d tl Th il’ it l f th t
(ii) Your approach to integration with wider services (e.g. Housing), this should include:
Page 42 of 252
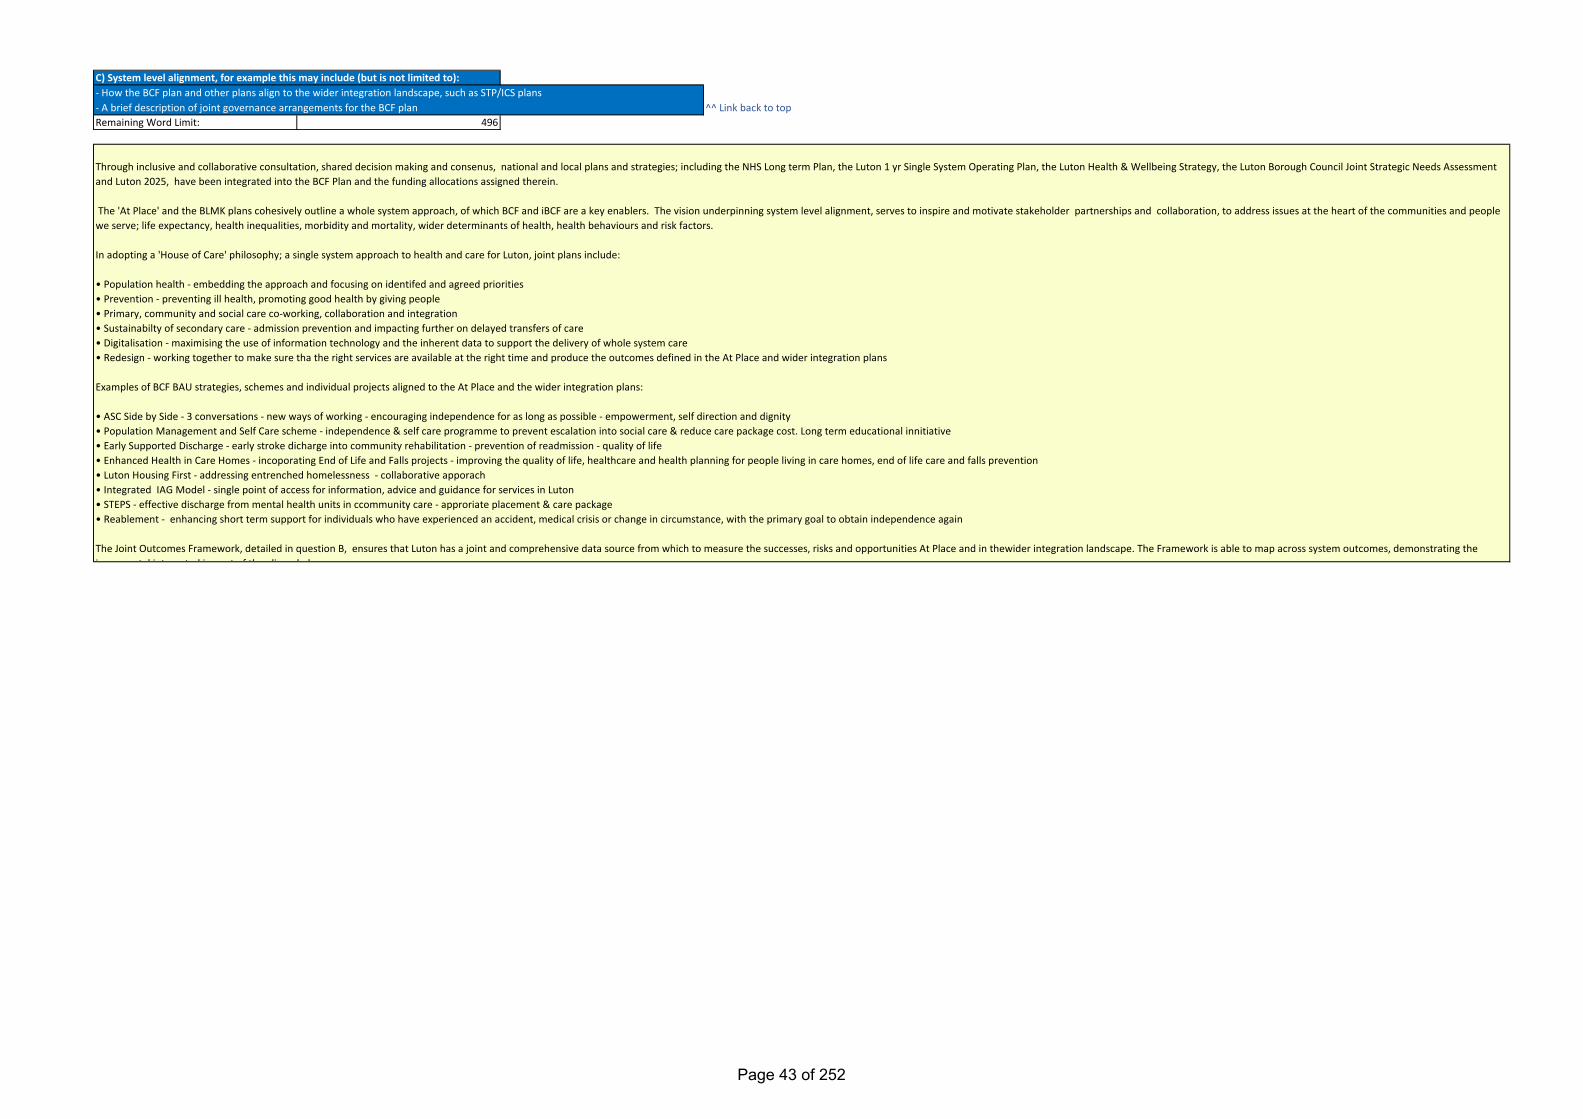
^^ Link back to topRemaining Word Limit: 496
C) System level alignment, for example this may include (but is not limited to):- How the BCF plan and other plans align to the wider integration landscape, such as STP/ICS plans- A brief description of joint governance arrangements for the BCF plan
Through inclusive and collaborative consultation, shared decision making and consenus, national and local plans and strategies; including the NHS Long term Plan, the Luton 1 yr Single System Operating Plan, the Luton Health & Wellbeing Strategy, the Luton Borough Council Joint Strategic Needs Assessment and Luton 2025, have been integrated into the BCF Plan and the funding allocations assigned therein.
The 'At Place' and the BLMK plans cohesively outline a whole system approach, of which BCF and iBCF are a key enablers. The vision underpinning system level alignment, serves to inspire and motivate stakeholder partnerships and collaboration, to address issues at the heart of the communities and people we serve; life expectancy, health inequalities, morbidity and mortality, wider determinants of health, health behaviours and risk factors.
In adopting a 'House of Care' philosophy; a single system approach to health and care for Luton, joint plans include:
• Population health - embedding the approach and focusing on identifed and agreed priorities• Prevention - preventing ill health, promoting good health by giving people • Primary, community and social care co-working, collaboration and integration• Sustainabilty of secondary care - admission prevention and impacting further on delayed transfers of care• Digitalisation - maximising the use of information technology and the inherent data to support the delivery of whole system care• Redesign - working together to make sure tha the right services are available at the right time and produce the outcomes defined in the At Place and wider integration plans
Examples of BCF BAU strategies, schemes and individual projects aligned to the At Place and the wider integration plans:
• ASC Side by Side - 3 conversations - new ways of working - encouraging independence for as long as possible - empowerment, self direction and dignity• Population Management and Self Care scheme - independence & self care programme to prevent escalation into social care & reduce care package cost. Long term educational innitiative• Early Supported Discharge - early stroke dicharge into community rehabilitation - prevention of readmission - quality of life• Enhanced Health in Care Homes - incoporating End of Life and Falls projects - improving the quality of life, healthcare and health planning for people living in care homes, end of life care and falls prevention• Luton Housing First - addressing entrenched homelessness - collaborative apporach• Integrated IAG Model - single point of access for information, advice and guidance for services in Luton• STEPS - effective discharge from mental health units in ccommunity care - approriate placement & care package• Reablement - enhancing short term support for individuals who have experienced an accident, medical crisis or change in circumstance, with the primary goal to obtain independence again
The Joint Outcomes Framework, detailed in question B, ensures that Luton has a joint and comprehensive data source from which to measure the successes, risks and opportunities At Place and in thewider integration landscape. The Framework is able to map across system outcomes, demonstrating the incremental integrated impact of the aligned plans
Page 43 of 252
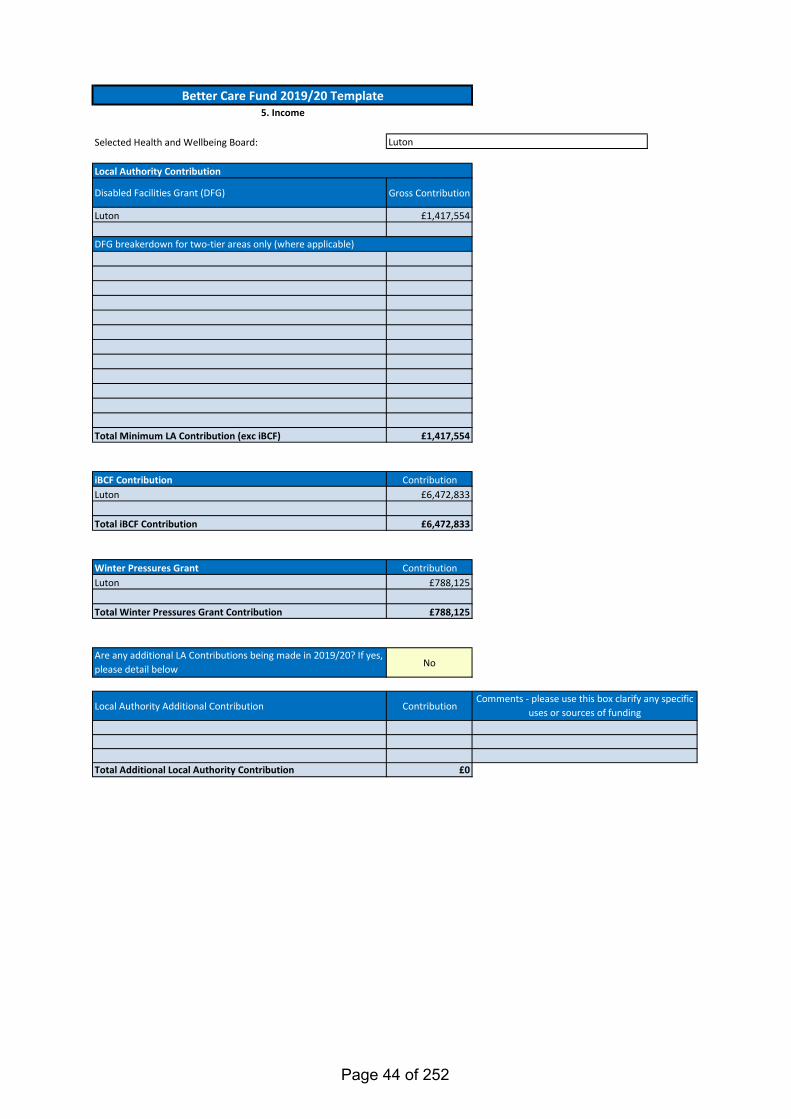
Selected Health and Wellbeing Board:
Disabled Facilities Grant (DFG) Gross Contribution
Luton £1,417,554
123456789
101112
Total Minimum LA Contribution (exc iBCF) £1,417,554
iBCF Contribution ContributionLuton £6,472,833
Total iBCF Contribution £6,472,833
Winter Pressures Grant ContributionLuton £788,125
Total Winter Pressures Grant Contribution £788,125
Are any additional LA Contributions being made in 2019/20? If yes, please detail below No
Local Authority Additional Contribution Contribution
Total Additional Local Authority Contribution £0
Better Care Fund 2019/20 Template5. Income
DFG breakerdown for two-tier areas only (where applicable)
Local Authority Contribution
Comments - please use this box clarify any specific uses or sources of funding
Luton
Page 44 of 252
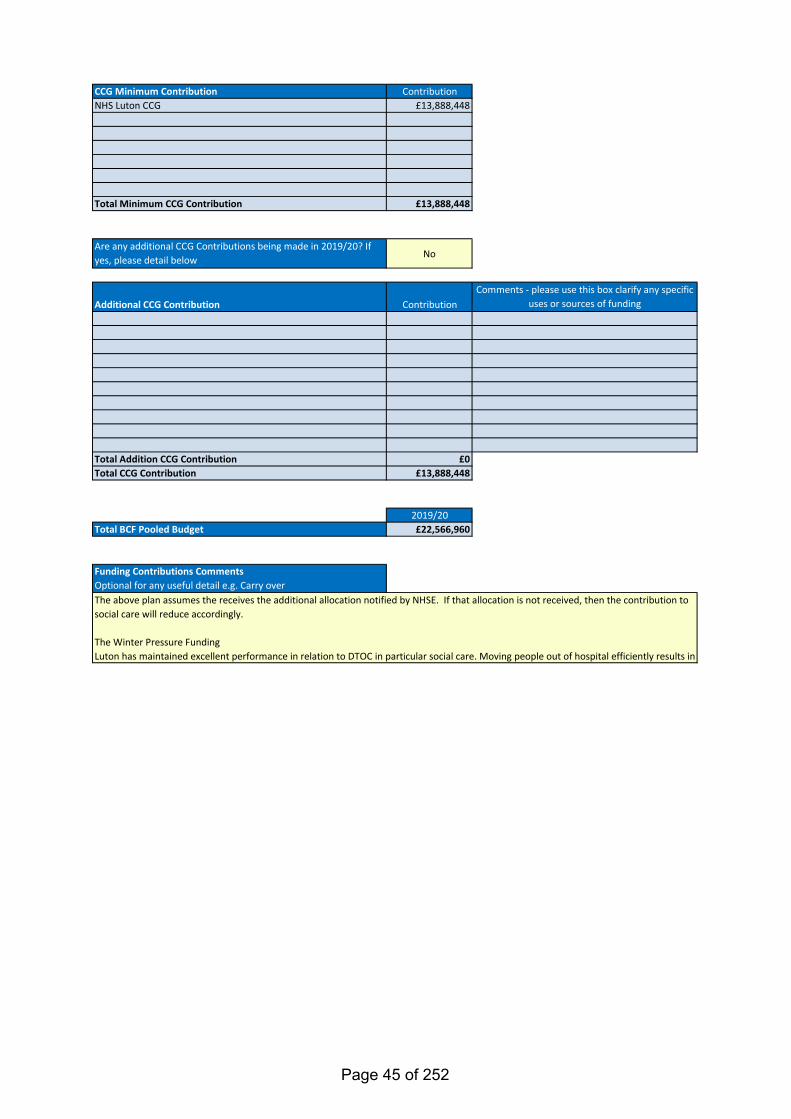
CCG Minimum Contribution Contribution1 NHS Luton CCG £13,888,448234567
Total Minimum CCG Contribution £13,888,448
Are any additional CCG Contributions being made in 2019/20? If yes, please detail below No
Additional CCG Contribution Contribution
Total Addition CCG Contribution £0Total CCG Contribution £13,888,448
2019/20Total BCF Pooled Budget £22,566,960
Funding Contributions CommentsOptional for any useful detail e.g. Carry overThe above plan assumes the receives the additional allocation notified by NHSE. If that allocation is not received, then the contribution to social care will reduce accordingly.
The Winter Pressure FundingLuton has maintained excellent performance in relation to DTOC in particular social care. Moving people out of hospital efficiently results in
Comments - please use this box clarify any specific uses or sources of funding
Page 45 of 252
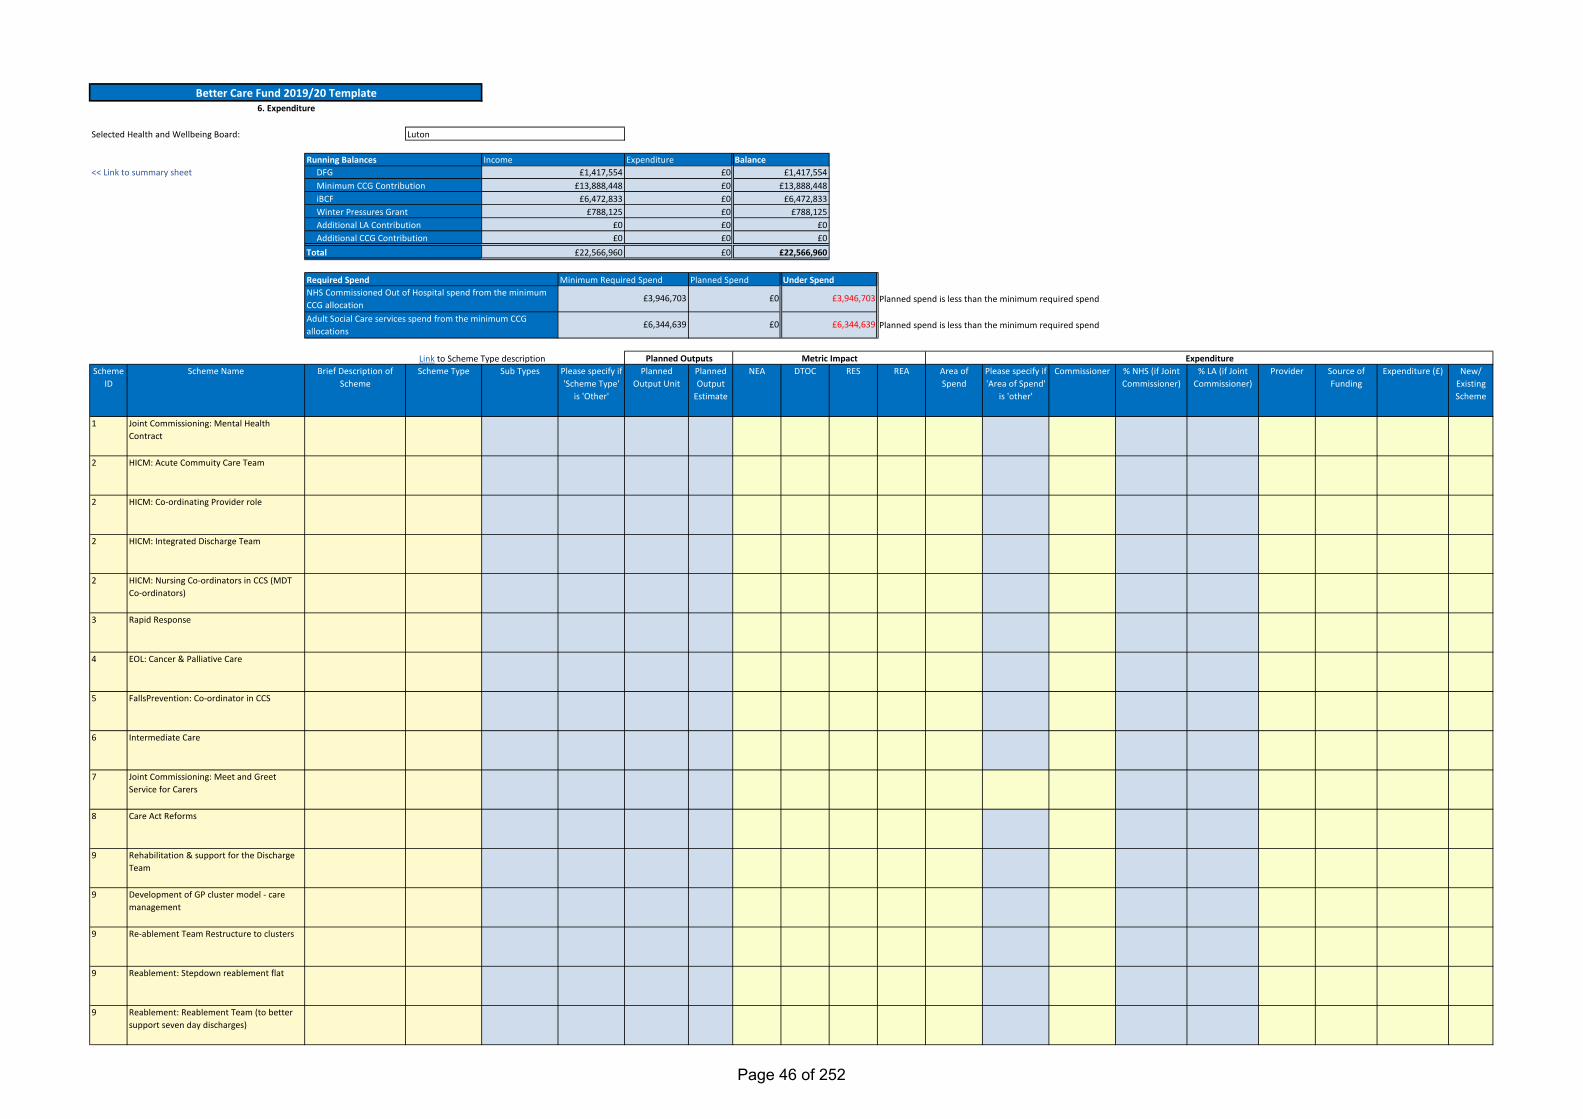
Planned spend is less than the minimum required spend
Planned spend is less than the minimum required spend
Link to Scheme Type descriptionScheme
IDScheme Name Brief Description of
SchemeScheme Type Sub Types Please specify if
'Scheme Type' is 'Other'
Planned Output Unit
Planned Output
Estimate
NEA DTOC RES REA Area of Spend
Please specify if 'Area of Spend'
is 'other'
Commissioner % NHS (if Joint Commissioner)
% LA (if Joint Commissioner)
Provider Source of Funding
Expenditure (£) New/ Existing Scheme
1 Joint Commissioning: Mental Health Contract
2 HICM: Acute Commuity Care Team
2 HICM: Co-ordinating Provider role
2 HICM: Integrated Discharge Team
2 HICM: Nursing Co-ordinators in CCS (MDT Co-ordinators)
3 Rapid Response
4 EOL: Cancer & Palliative Care
5 FallsPrevention: Co-ordinator in CCS
6 Intermediate Care
7 Joint Commissioning: Meet and Greet Service for Carers
8 Care Act Reforms
9 Rehabilitation & support for the Discharge Team
9 Development of GP cluster model - care management
9 Re-ablement Team Restructure to clusters
9 Reablement: Stepdown reablement flat
9 Reablement: Reablement Team (to better support seven day discharges)
BalanceIncome Expenditure£0£0£0
<< Link to summary sheetRunning Balances
DFGMinimum CCG ContributioniBCF
£1,417,554£13,888,448
£6,472,833
£1,417,554£13,888,448
£6,472,833
£0£0Winter Pressures Grant £788,125£788,125
£0£22,566,960
£6,344,639
£0
£0
£3,946,703
£6,344,639
Required SpendNHS Commissioned Out of Hospital spend from the minimum CCG allocationAdult Social Care services spend from the minimum CCG allocations
Minimum Required Spend Planned Spend Under Spend
Better Care Fund 2019/20 Template6. Expenditure
ExpenditurePlanned Outputs Metric Impact
£0£0£0
£0
Luton
Additional LA ContributionAdditional CCG Contribution
Total
Selected Health and Wellbeing Board:
£3,946,703
£0£22,566,960
Page 46 of 252
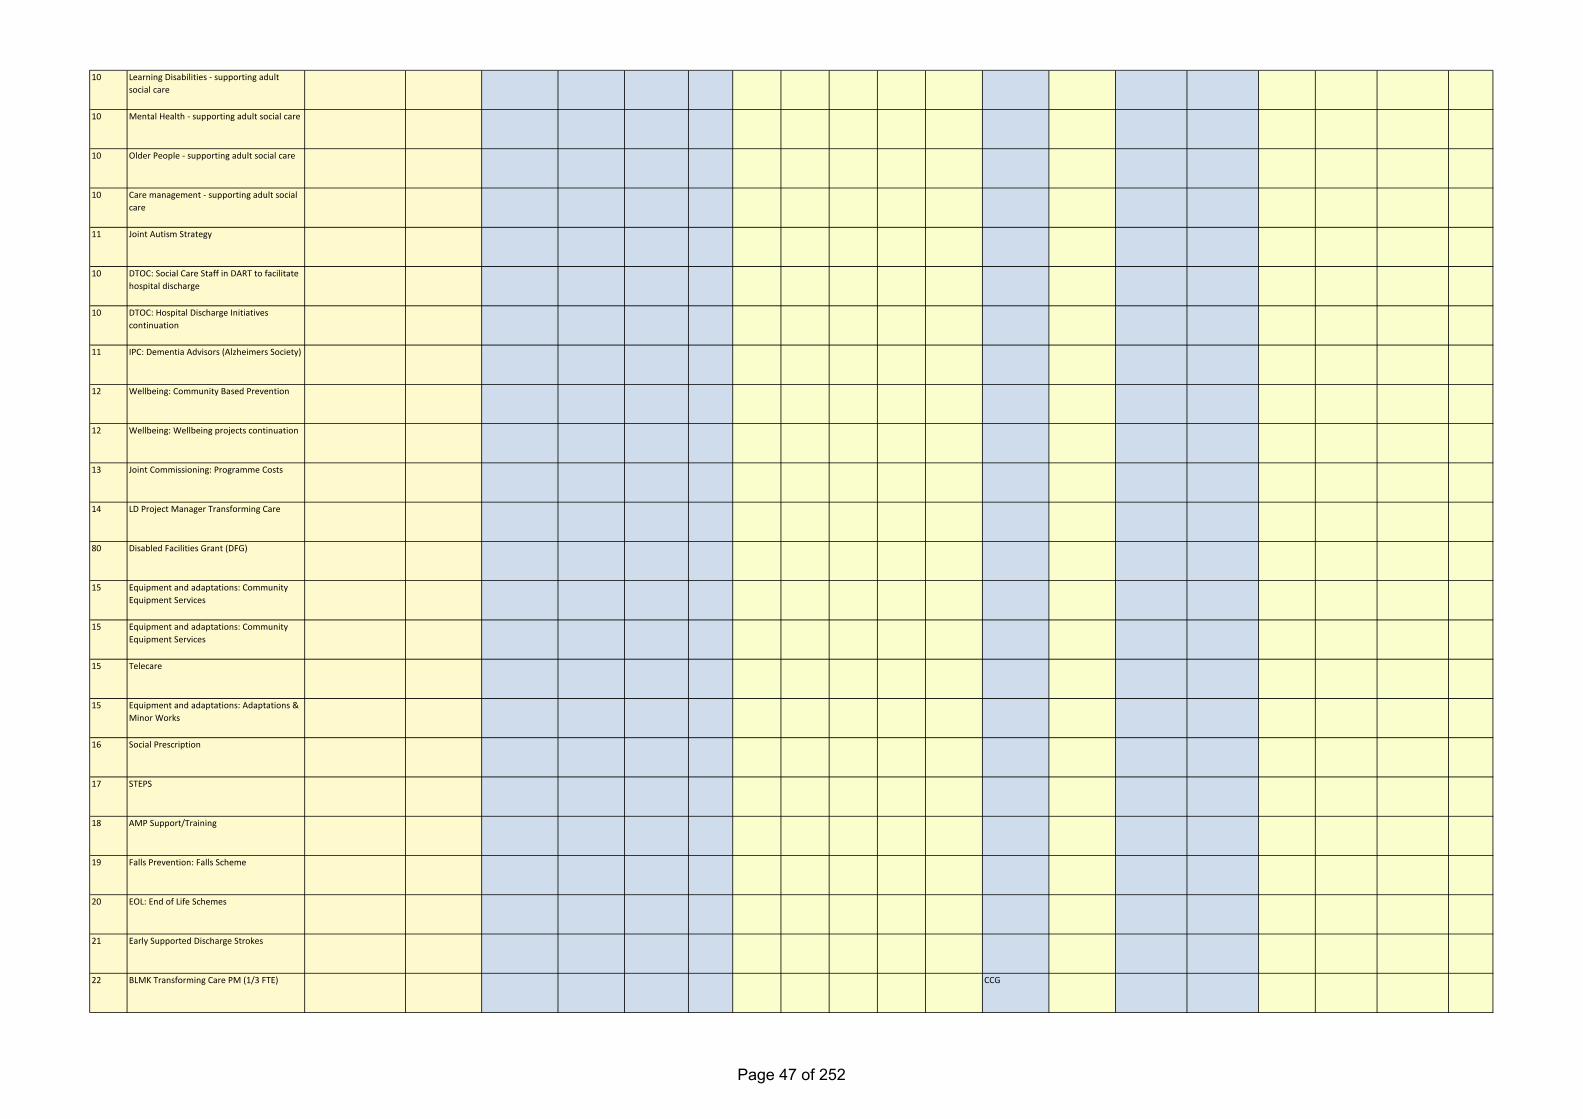
10 Learning Disabilities - supporting adult social care
10 Mental Health - supporting adult social care
10 Older People - supporting adult social care
10 Care management - supporting adult social care
11 Joint Autism Strategy
10 DTOC: Social Care Staff in DART to facilitate hospital discharge
10 DTOC: Hospital Discharge Initiatives continuation
11 IPC: Dementia Advisors (Alzheimers Society)
12 Wellbeing: Community Based Prevention
12 Wellbeing: Wellbeing projects continuation
13 Joint Commissioning: Programme Costs
14 LD Project Manager Transforming Care
80 Disabled Facilities Grant (DFG)
15 Equipment and adaptations: Community Equipment Services
15 Equipment and adaptations: Community Equipment Services
15 Telecare
15 Equipment and adaptations: Adaptations & Minor Works
16 Social Prescription
17 STEPS
18 AMP Support/Training
19 Falls Prevention: Falls Scheme
20 EOL: End of Life Schemes
21 Early Supported Discharge Strokes
22 BLMK Transforming Care PM (1/3 FTE) CCG
Page 47 of 252
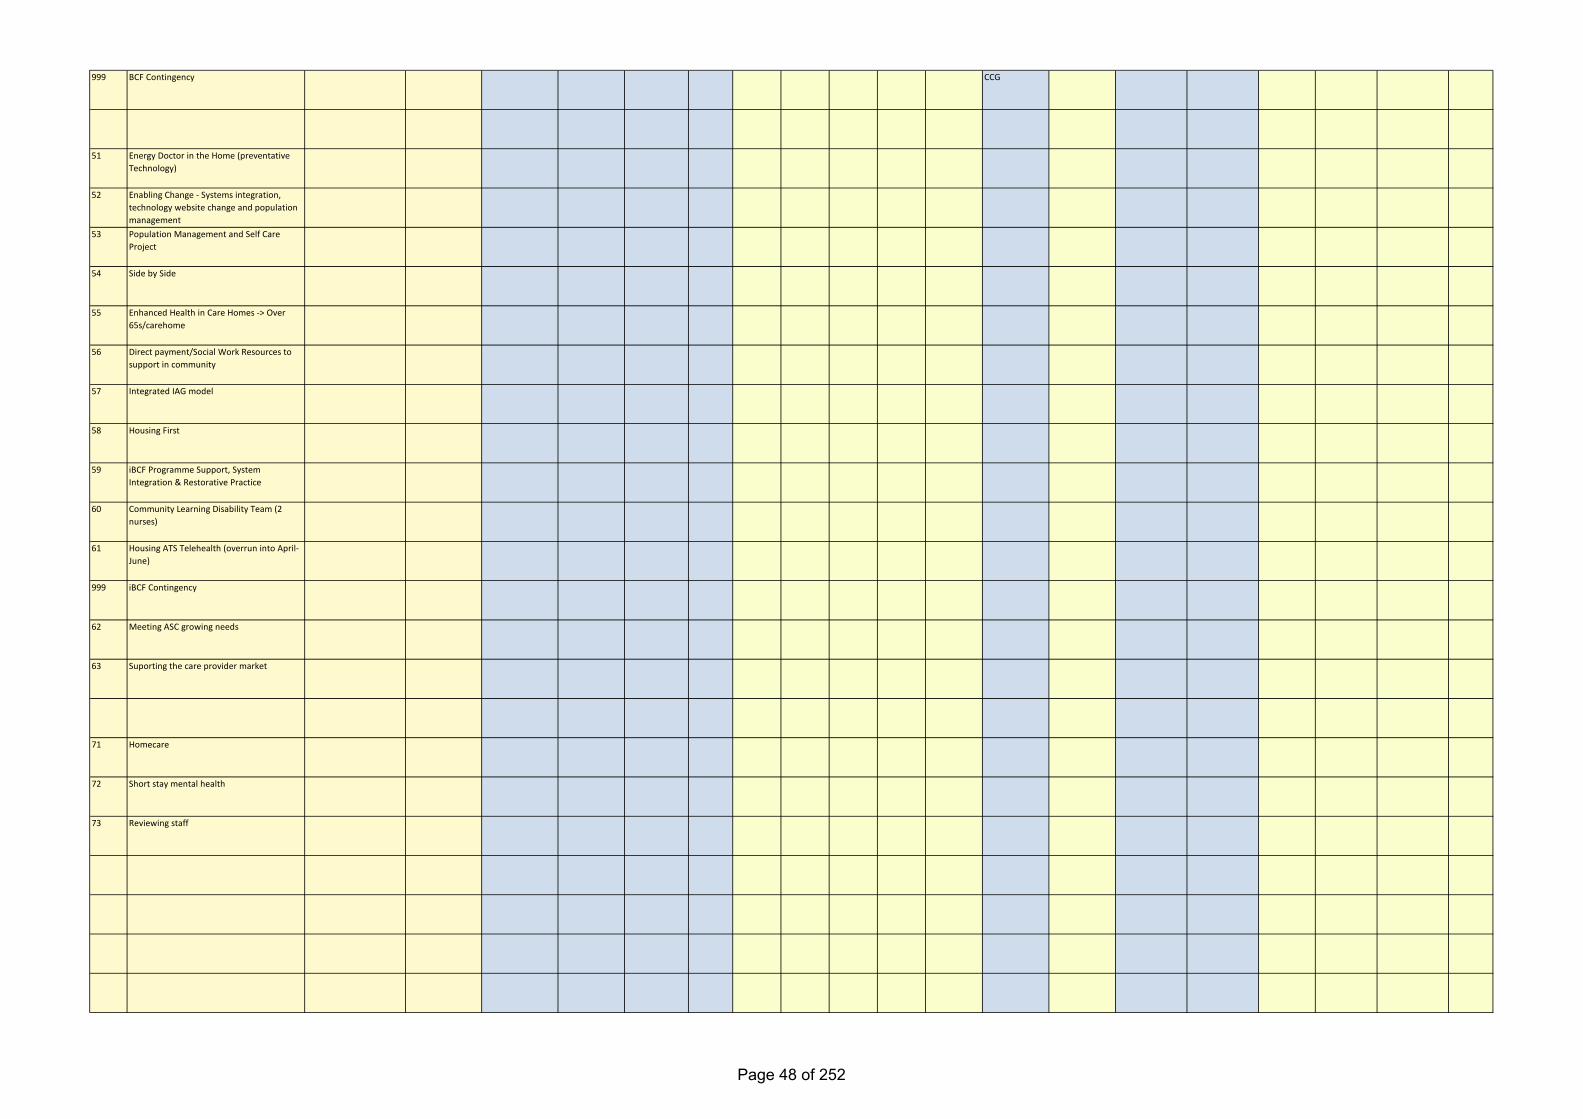
999 BCF Contingency CCG
51 Energy Doctor in the Home (preventative Technology)
52 Enabling Change - Systems integration, technology website change and population management
53 Population Management and Self Care Project
54 Side by Side
55 Enhanced Health in Care Homes -> Over 65s/carehome
56 Direct payment/Social Work Resources to support in community
57 Integrated IAG model
58 Housing First
59 iBCF Programme Support, System Integration & Restorative Practice
60 Community Learning Disability Team (2 nurses)
61 Housing ATS Telehealth (overrun into April-June)
999 iBCF Contingency
62 Meeting ASC growing needs
63 Suporting the care provider market
71 Homecare
72 Short stay mental health
73 Reviewing staff
Page 48 of 252

Page 49 of 252

Page 50 of 252

Page 51 of 252

Page 52 of 252
Page 53 of 252

Page 54 of 252

Page 55 of 252
Page 56 of 252

^^ Link back up
Funding planned towards the implementation of Care Act related duties.Supporting people to sustain their role as carers and reduce the likelihood of crisis. Advice, advocacy, information, assessment, emotional and physical support, training, access to services to support wellbeing and improve independence. This also includes the implementation of the Care Act as a sub-type.Schemes that are based in the community and constitute a range of cross sector practitioners delivering collaborative services in the community typically at a neighbourhood level (eg: Integrated Neighbourhood Teams)The DFG is a means-tested capital grant to help meet the costs of adapting a property; supporting people to stay independent in their own homes.
Using technology in care processes to supportive self-management, maintenance of independence and more efficient and effective delivery of care. (eg. Telecare, Wellness services, Digital participation services).
DescriptionScheme TypeAssistive Technologies and Equipment
Care Act Implementation Related Duties
Carers Services
Community Based Schemes
DFG Related Schemes
Sub TypeTelecareWellness ServicesDigital Participation ServicesCommunity Based EquipmentOthDeprivation of Liberty Safeguards (DoLS)OtherCarer Advice and SupportRespite ServicesOther
AdaptationsOther
Page 57 of 252
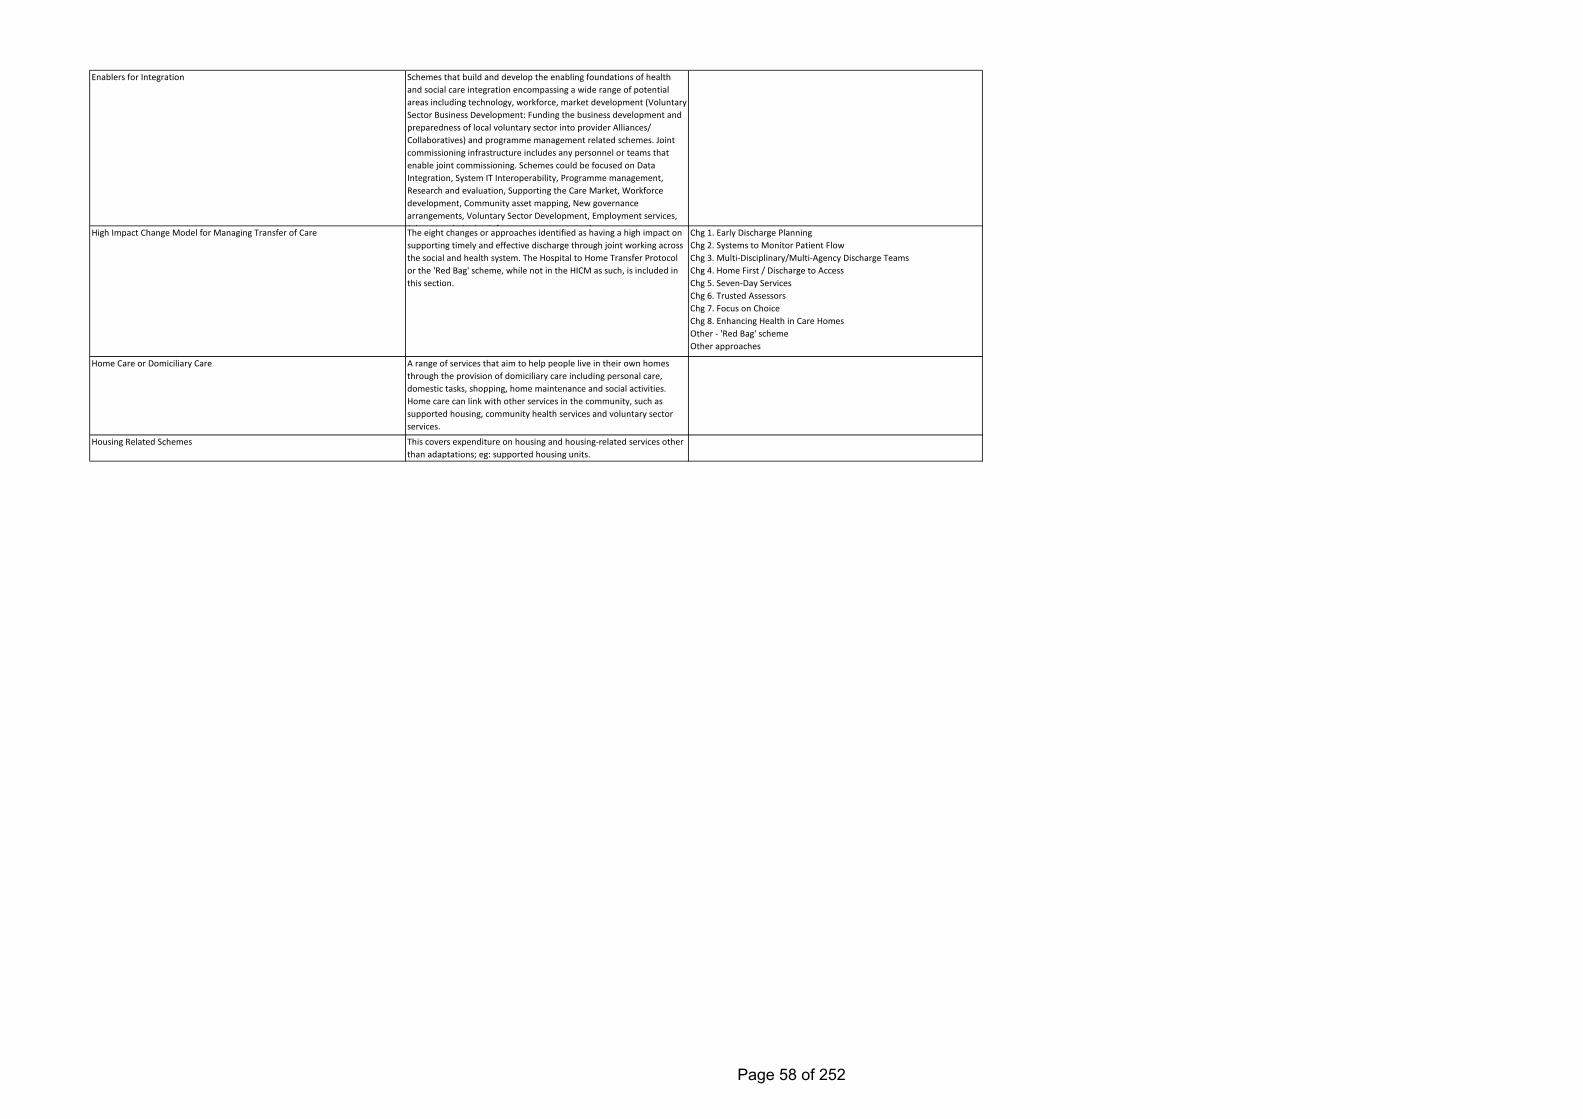
Enablers for Integration
High Impact Change Model for Managing Transfer of Care
Home Care or Domiciliary Care
Housing Related Schemes
Schemes that build and develop the enabling foundations of health and social care integration encompassing a wide range of potential areas including technology, workforce, market development (Voluntary Sector Business Development: Funding the business development and preparedness of local voluntary sector into provider Alliances/ Collaboratives) and programme management related schemes. Joint commissioning infrastructure includes any personnel or teams that enable joint commissioning. Schemes could be focused on Data Integration, System IT Interoperability, Programme management, Research and evaluation, Supporting the Care Market, Workforce development, Community asset mapping, New governance arrangements, Voluntary Sector Development, Employment services, J i t i i i i f t t t thThe eight changes or approaches identified as having a high impact on supporting timely and effective discharge through joint working across the social and health system. The Hospital to Home Transfer Protocol or the 'Red Bag' scheme, while not in the HICM as such, is included in this section.
A range of services that aim to help people live in their own homes through the provision of domiciliary care including personal care, domestic tasks, shopping, home maintenance and social activities. Home care can link with other services in the community, such as supported housing, community health services and voluntary sector services.
This covers expenditure on housing and housing-related services other than adaptations; eg: supported housing units.
Chg 1. Early Discharge PlanningChg 2. Systems to Monitor Patient FlowChg 3. Multi-Disciplinary/Multi-Agency Discharge TeamsChg 4. Home First / Discharge to AccessChg 5. Seven-Day ServicesChg 6. Trusted AssessorsChg 7. Focus on ChoiceChg 8. Enhancing Health in Care HomesOther - 'Red Bag' schemeOther approaches
Page 58 of 252
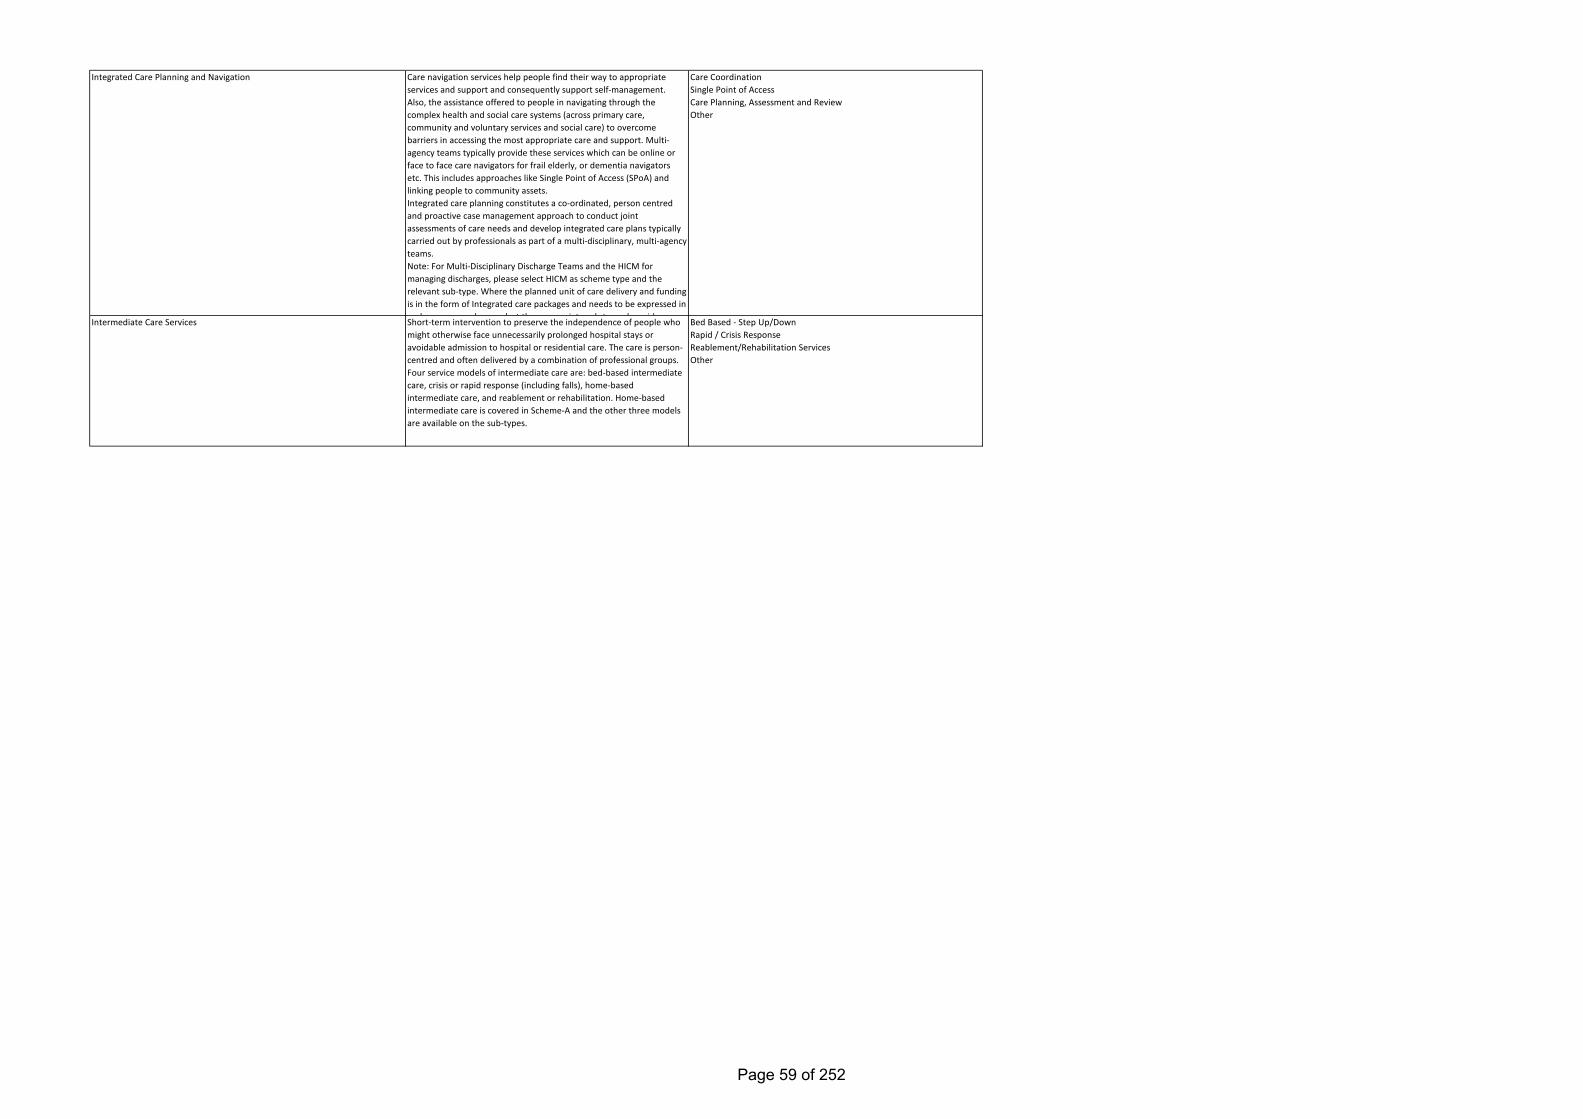
Short-term intervention to preserve the independence of people who might otherwise face unnecessarily prolonged hospital stays or avoidable admission to hospital or residential care. The care is person-centred and often delivered by a combination of professional groups. Four service models of intermediate care are: bed-based intermediate care, crisis or rapid response (including falls), home-based intermediate care, and reablement or rehabilitation. Home-based intermediate care is covered in Scheme-A and the other three models are available on the sub-types.
Intermediate Care Services
Care navigation services help people find their way to appropriate services and support and consequently support self-management. Also, the assistance offered to people in navigating through the complex health and social care systems (across primary care, community and voluntary services and social care) to overcome barriers in accessing the most appropriate care and support. Multi-agency teams typically provide these services which can be online or face to face care navigators for frail elderly, or dementia navigators etc. This includes approaches like Single Point of Access (SPoA) and linking people to community assets.Integrated care planning constitutes a co-ordinated, person centred and proactive case management approach to conduct joint assessments of care needs and develop integrated care plans typically carried out by professionals as part of a multi-disciplinary, multi-agency teams. Note: For Multi-Disciplinary Discharge Teams and the HICM for managing discharges, please select HICM as scheme type and the relevant sub-type. Where the planned unit of care delivery and funding is in the form of Integrated care packages and needs to be expressed in such a manner please select the appropriate sub type alongside
Integrated Care Planning and Navigation Care CoordinationSingle Point of AccessCare Planning, Assessment and ReviewOther
Bed Based - Step Up/DownRapid / Crisis ResponseReablement/Rehabilitation ServicesOther
Page 59 of 252
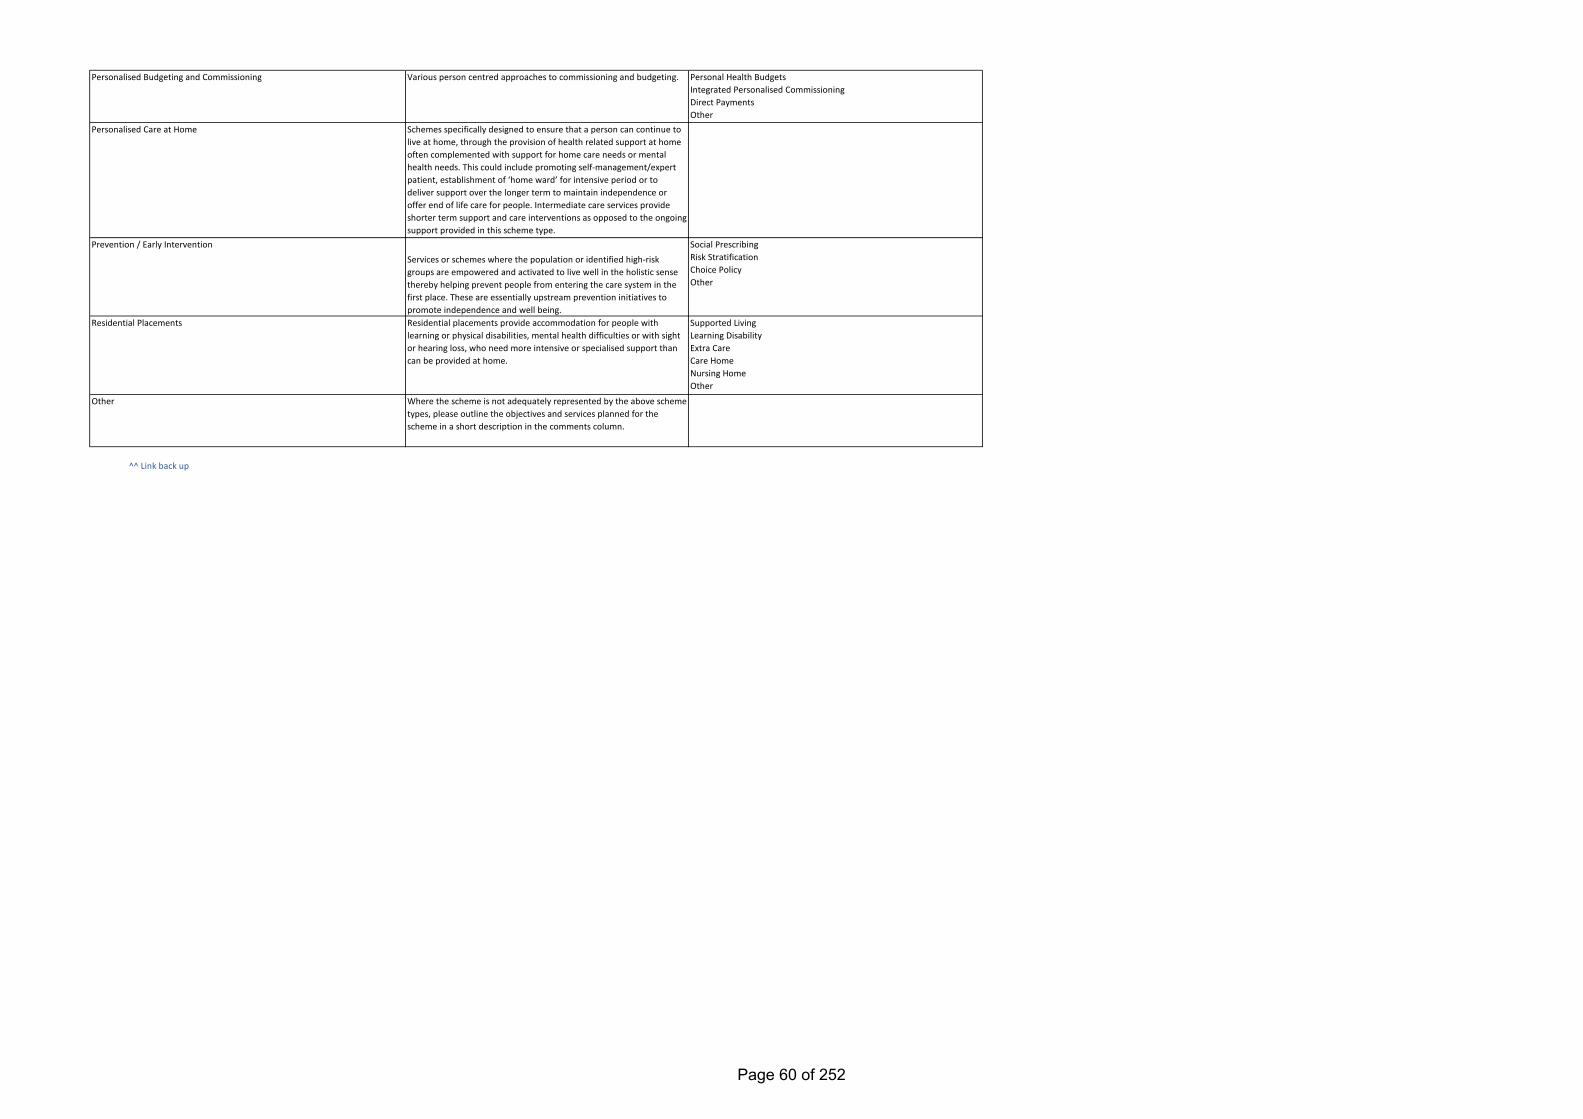
^^ Link back up
Residential Placements
Personalised Budgeting and Commissioning
Personalised Care at Home
Various person centred approaches to commissioning and budgeting.
Schemes specifically designed to ensure that a person can continue to live at home, through the provision of health related support at home often complemented with support for home care needs or mental health needs. This could include promoting self-management/expert patient, establishment of ‘home ward’ for intensive period or to deliver support over the longer term to maintain independence or offer end of life care for people. Intermediate care services provide shorter term support and care interventions as opposed to the ongoing support provided in this scheme type.
Services or schemes where the population or identified high-risk groups are empowered and activated to live well in the holistic sense thereby helping prevent people from entering the care system in the first place. These are essentially upstream prevention initiatives to promote independence and well being.Residential placements provide accommodation for people with learning or physical disabilities, mental health difficulties or with sight or hearing loss, who need more intensive or specialised support than can be provided at home.
Prevention / Early Intervention
Where the scheme is not adequately represented by the above scheme types, please outline the objectives and services planned for the scheme in a short description in the comments column.
Other
Personal Health BudgetsIntegrated Personalised CommissioningDirect PaymentsOther
Social PrescribingRisk StratificationChoice PolicyOther
Supported LivingLearning DisabilityExtra CareCare HomeNursing HomeOther
Page 60 of 252
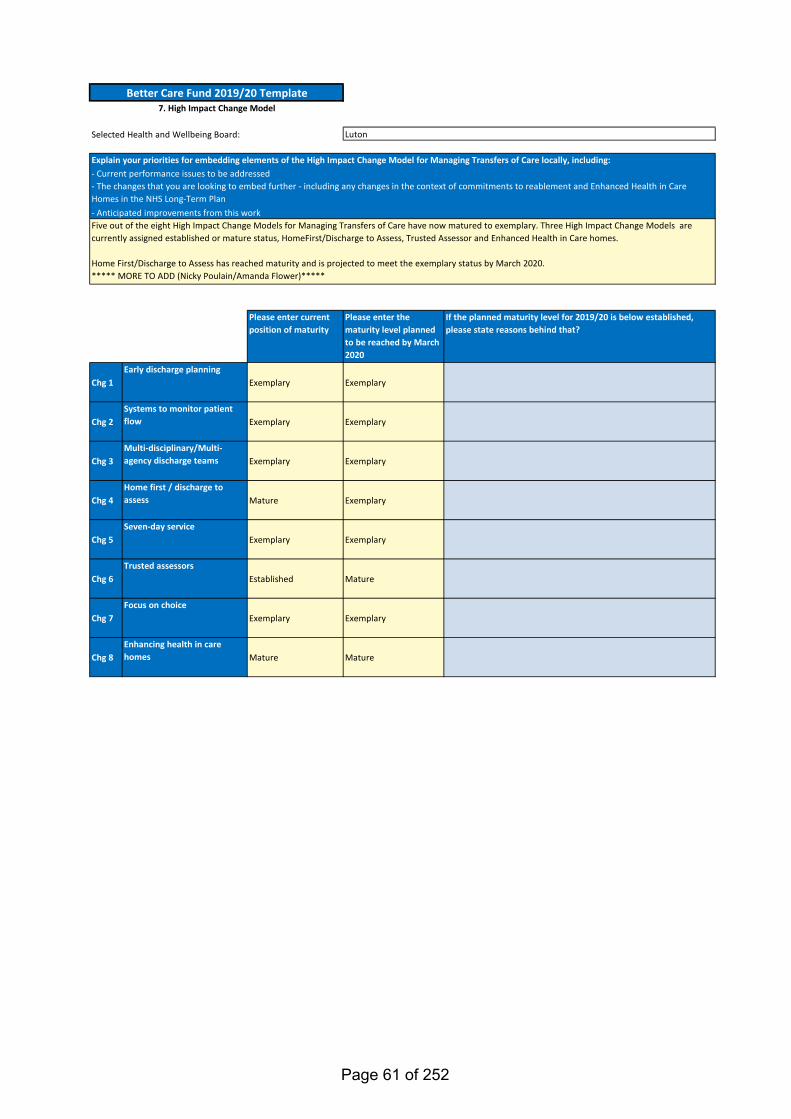
Selected Health and Wellbeing Board:
Please enter current position of maturity
Please enter the maturity level planned to be reached by March 2020
If the planned maturity level for 2019/20 is below established, please state reasons behind that?
Chg 1Early discharge planning
Exemplary Exemplary
Chg 2Systems to monitor patient flow Exemplary Exemplary
Chg 3Multi-disciplinary/Multi-agency discharge teams Exemplary Exemplary
Chg 4Home first / discharge to assess Mature Exemplary
Chg 5Seven-day service
Exemplary Exemplary
Chg 6Trusted assessors
Established Mature
Chg 7Focus on choice
Exemplary Exemplary
Chg 8Enhancing health in care homes Mature Mature
Better Care Fund 2019/20 Template7. High Impact Change Model
Five out of the eight High Impact Change Models for Managing Transfers of Care have now matured to exemplary. Three High Impact Change Models are currently assigned established or mature status, HomeFirst/Discharge to Assess, Trusted Assessor and Enhanced Health in Care homes.
Home First/Discharge to Assess has reached maturity and is projected to meet the exemplary status by March 2020. ***** MORE TO ADD (Nicky Poulain/Amanda Flower)*****
Luton
- The changes that you are looking to embed further - including any changes in the context of commitments to reablement and Enhanced Health in Care Homes in the NHS Long-Term Plan
Explain your priorities for embedding elements of the High Impact Change Model for Managing Transfers of Care locally, including:- Current performance issues to be addressed
- Anticipated improvements from this work
Page 61 of 252
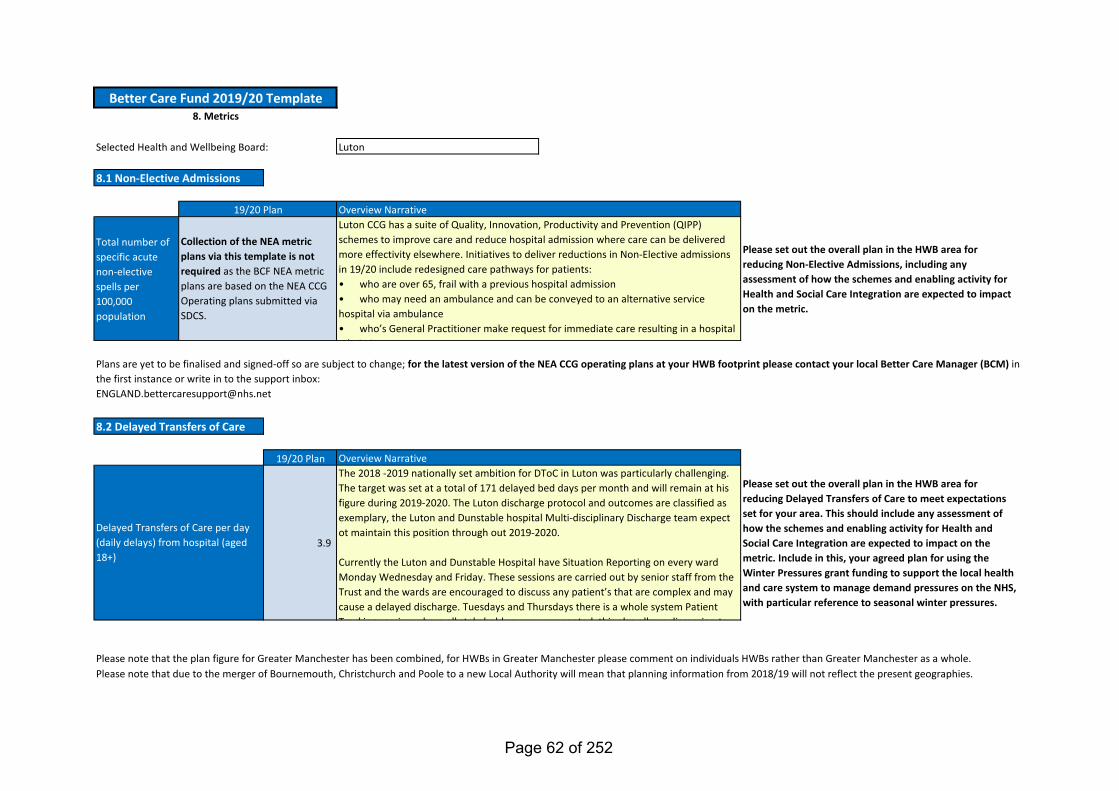
Total number of specific acute non-elective spells per 100,000 population
Please set out the overall plan in the HWB area for reducing Non-Elective Admissions, including any assessment of how the schemes and enabling activity for Health and Social Care Integration are expected to impact on the metric.
19/20 Plan
3.9
Please set out the overall plan in the HWB area for reducing Delayed Transfers of Care to meet expectations set for your area. This should include any assessment of how the schemes and enabling activity for Health and Social Care Integration are expected to impact on the metric. Include in this, your agreed plan for using the Winter Pressures grant funding to support the local health and care system to manage demand pressures on the NHS, with particular reference to seasonal winter pressures.
Selected Health and Wellbeing Board: Luton
Delayed Transfers of Care per day (daily delays) from hospital (aged 18+)
Luton CCG has a suite of Quality, Innovation, Productivity and Prevention (QIPP) schemes to improve care and reduce hospital admission where care can be delivered more effectivity elsewhere. Initiatives to deliver reductions in Non-Elective admissions in 19/20 include redesigned care pathways for patients:• who are over 65, frail with a previous hospital admission• who may need an ambulance and can be conveyed to an alternative service hospital via ambulance • who’s General Practitioner make request for immediate care resulting in a hospital
d i i
Overview NarrativeThe 2018 -2019 nationally set ambition for DToC in Luton was particularly challenging. The target was set at a total of 171 delayed bed days per month and will remain at his figure during 2019-2020. The Luton discharge protocol and outcomes are classified as exemplary, the Luton and Dunstable hospital Multi-disciplinary Discharge team expect ot maintain this position through out 2019-2020.
Currently the Luton and Dunstable Hospital have Situation Reporting on every ward Monday Wednesday and Friday. These sessions are carried out by senior staff from the Trust and the wards are encouraged to discuss any patient’s that are complex and may cause a delayed discharge. Tuesdays and Thursdays there is a whole system Patient Tracking session where all stakeholders are represented this also allows discussion to
8.1 Non-Elective Admissions
Please note that the plan figure for Greater Manchester has been combined, for HWBs in Greater Manchester please comment on individuals HWBs rather than Greater Manchester as a whole.
Better Care Fund 2019/20 Template8. Metrics
8.2 Delayed Transfers of Care
Please note that due to the merger of Bournemouth, Christchurch and Poole to a new Local Authority will mean that planning information from 2018/19 will not reflect the present geographies.
Overview Narrative19/20 Plan
Collection of the NEA metric plans via this template is not required as the BCF NEA metric plans are based on the NEA CCG Operating plans submitted via SDCS.
Plans are yet to be finalised and signed-off so are subject to change; for the latest version of the NEA CCG operating plans at your HWB footprint please contact your local Better Care Manager (BCM) in the first instance or write in to the support inbox:[email protected]
Page 62 of 252
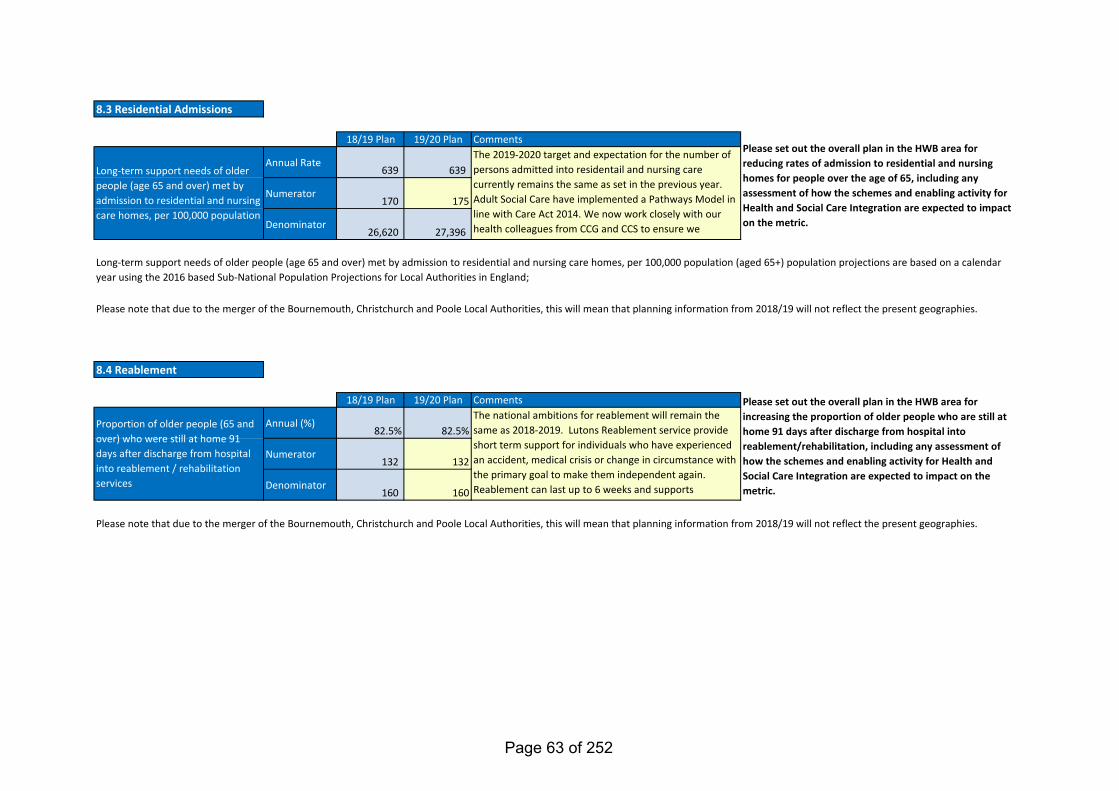
18/19 Plan 19/20 Plan
Annual Rate639 639
Numerator170 175
Denominator26,620 27,396
18/19 Plan 19/20 Plan
Annual (%)82.5% 82.5%
Numerator132 132
Denominator160 160
Please note that due to the merger of the Bournemouth, Christchurch and Poole Local Authorities, this will mean that planning information from 2018/19 will not reflect the present geographies.
Please set out the overall plan in the HWB area for reducing rates of admission to residential and nursing homes for people over the age of 65, including any assessment of how the schemes and enabling activity for Health and Social Care Integration are expected to impact on the metric.
Please set out the overall plan in the HWB area for increasing the proportion of older people who are still at home 91 days after discharge from hospital into reablement/rehabilitation, including any assessment of how the schemes and enabling activity for Health and Social Care Integration are expected to impact on the metric.
The national ambitions for reablement will remain the same as 2018-2019. Lutons Reablement service provide short term support for individuals who have experienced an accident, medical crisis or change in circumstance with the primary goal to make them independent again. Reablement can last up to 6 weeks and supports
d d l f h l
Comments
8.4 Reablement
Proportion of older people (65 and over) who were still at home 91 days after discharge from hospital into reablement / rehabilitation services
Please note that due to the merger of the Bournemouth, Christchurch and Poole Local Authorities, this will mean that planning information from 2018/19 will not reflect the present geographies.
Long-term support needs of older people (age 65 and over) met by admission to residential and nursing care homes, per 100,000 population (aged 65+) population projections are based on a calendar year using the 2016 based Sub-National Population Projections for Local Authorities in England;
CommentsThe 2019-2020 target and expectation for the number of persons admitted into residentail and nursing care currently remains the same as set in the previous year. Adult Social Care have implemented a Pathways Model in line with Care Act 2014. We now work closely with our health colleagues from CCG and CCS to ensure we
d d h d f ld l d f l ld l
Long-term support needs of older people (age 65 and over) met by admission to residential and nursing care homes, per 100,000 population
8.3 Residential Admissions
Page 63 of 252
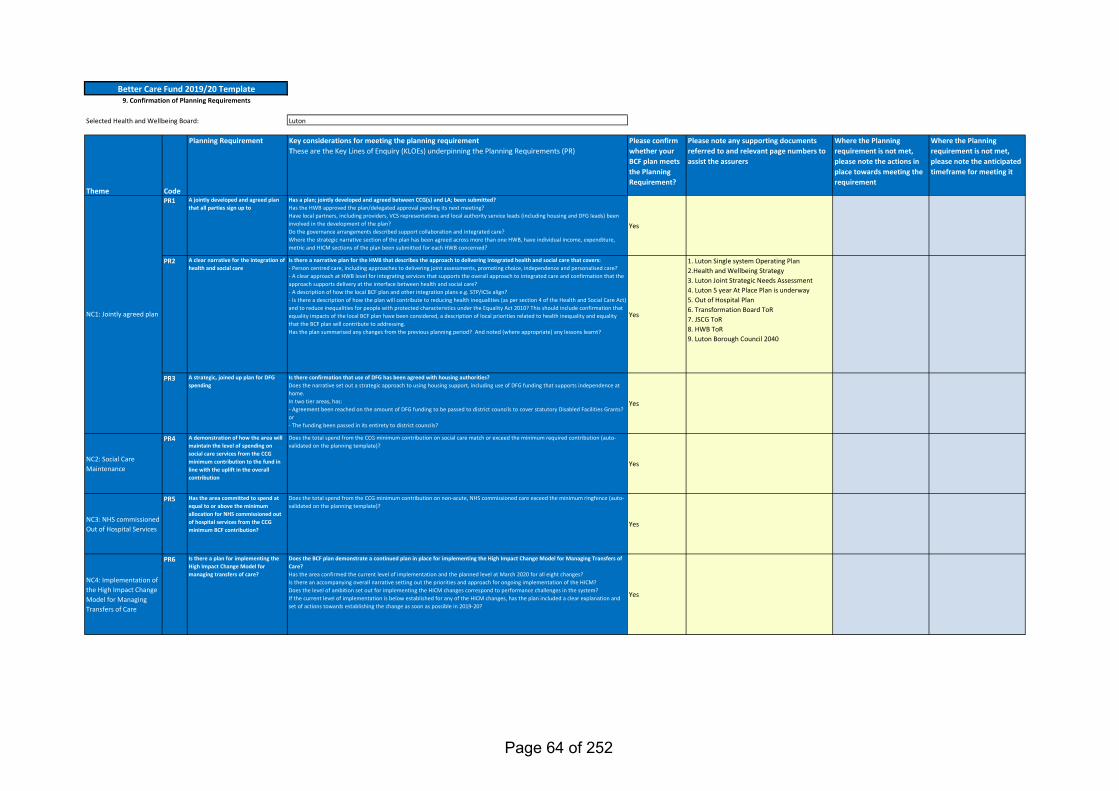
Selected Health and Wellbeing Board: Luton
Theme Code
Planning Requirement Key considerations for meeting the planning requirementThese are the Key Lines of Enquiry (KLOEs) underpinning the Planning Requirements (PR)
Please confirm whether your BCF plan meets the Planning Requirement?
Please note any supporting documents referred to and relevant page numbers to assist the assurers
Where the Planning requirement is not met, please note the actions in place towards meeting the requirement
Where the Planning requirement is not met, please note the anticipated timeframe for meeting it
PR1 A jointly developed and agreed plan that all parties sign up to
Has a plan; jointly developed and agreed between CCG(s) and LA; been submitted?Has the HWB approved the plan/delegated approval pending its next meeting?Have local partners, including providers, VCS representatives and local authority service leads (including housing and DFG leads) been involved in the development of the plan?Do the governance arrangements described support collaboration and integrated care?Where the strategic narrative section of the plan has been agreed across more than one HWB, have individual income, expenditure, metric and HICM sections of the plan been submitted for each HWB concerned?
Yes
PR2 A clear narrative for the integration of health and social care
Is there a narrative plan for the HWB that describes the approach to delivering integrated health and social care that covers:- Person centred care, including approaches to delivering joint assessments, promoting choice, independence and personalised care?- A clear approach at HWB level for integrating services that supports the overall approach to integrated care and confirmation that the approach supports delivery at the interface between health and social care?- A description of how the local BCF plan and other integration plans e.g. STP/ICSs align?- Is there a description of how the plan will contribute to reducing health inequalities (as per section 4 of the Health and Social Care Act) and to reduce inequalities for people with protected characteristics under the Equality Act 2010? This should include confirmation that equality impacts of the local BCF plan have been considered, a description of local priorities related to health inequality and equality that the BCF plan will contribute to addressing.Has the plan summarised any changes from the previous planning period? And noted (where appropriate) any lessons learnt?
Yes
1. Luton Single system Operating Plan2.Health and Wellbeing Strategy3. Luton Joint Strategic Needs Assessment 4. Luton 5 year At Place Plan is underway5. Out of Hospital Plan6. Transformation Board ToR7. JSCG ToR8. HWB ToR9. Luton Borough Council 2040
PR3 A strategic, joined up plan for DFG spending
Is there confirmation that use of DFG has been agreed with housing authorities?Does the narrative set out a strategic approach to using housing support, including use of DFG funding that supports independence at home.In two tier areas, has: - Agreement been reached on the amount of DFG funding to be passed to district councils to cover statutory Disabled Facilities Grants? or - The funding been passed in its entirety to district councils?
Yes
NC2: Social Care Maintenance
PR4 A demonstration of how the area will maintain the level of spending on social care services from the CCG minimum contribution to the fund in line with the uplift in the overall contribution
Does the total spend from the CCG minimum contribution on social care match or exceed the minimum required contribution (auto-validated on the planning template)?
Yes
NC3: NHS commissioned Out of Hospital Services
PR5 Has the area committed to spend at equal to or above the minimum allocation for NHS commissioned out of hospital services from the CCG minimum BCF contribution?
Does the total spend from the CCG minimum contribution on non-acute, NHS commissioned care exceed the minimum ringfence (auto-validated on the planning template)?
Yes
NC4: Implementation of the High Impact Change Model for Managing Transfers of Care
PR6 Is there a plan for implementing the High Impact Change Model for managing transfers of care?
Does the BCF plan demonstrate a continued plan in place for implementing the High Impact Change Model for Managing Transfers of Care?Has the area confirmed the current level of implementation and the planned level at March 2020 for all eight changes?Is there an accompanying overall narrative setting out the priorities and approach for ongoing implementation of the HICM?Does the level of ambition set out for implementing the HICM changes correspond to performance challenges in the system?If the current level of implementation is below established for any of the HICM changes, has the plan included a clear explanation and set of actions towards establishing the change as soon as possible in 2019-20?
Yes
NC1: Jointly agreed plan
Better Care Fund 2019/20 Template9. Confirmation of Planning Requirements
Page 64 of 252
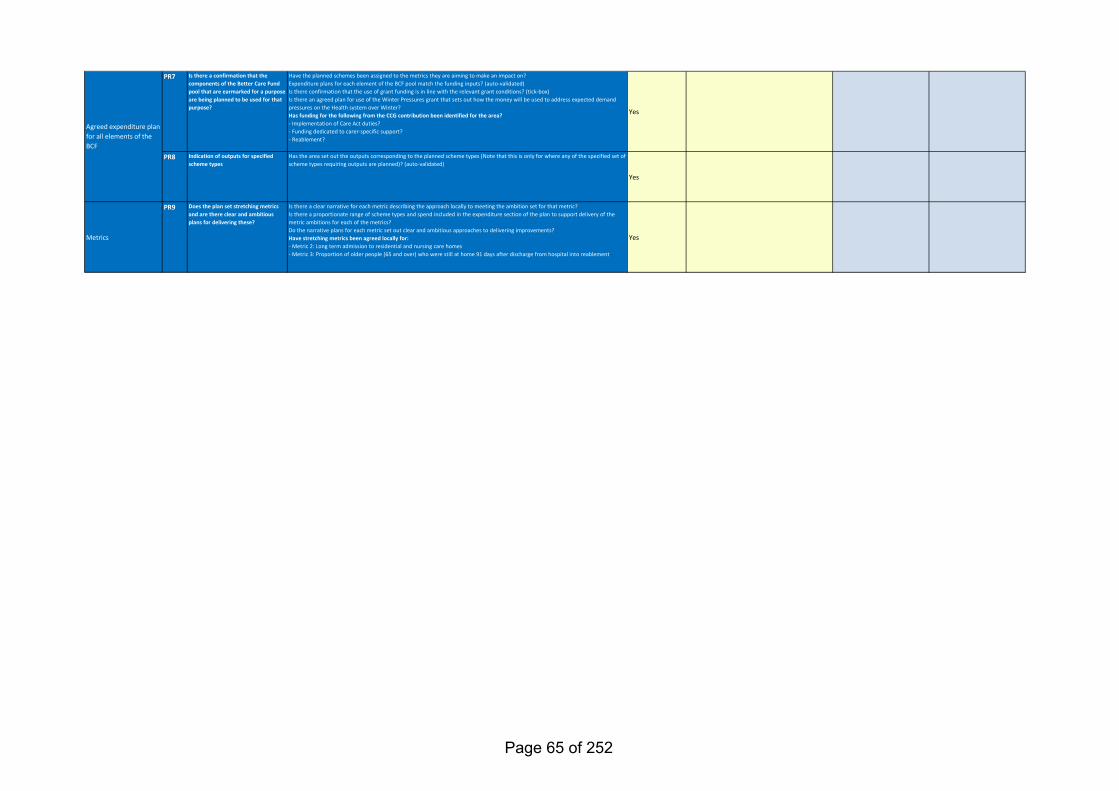
PR7 Is there a confirmation that the components of the Better Care Fund pool that are earmarked for a purpose are being planned to be used for that purpose?
Have the planned schemes been assigned to the metrics they are aiming to make an impact on?Expenditure plans for each element of the BCF pool match the funding inputs? (auto-validated)Is there confirmation that the use of grant funding is in line with the relevant grant conditions? (tick-box)Is there an agreed plan for use of the Winter Pressures grant that sets out how the money will be used to address expected demand pressures on the Health system over Winter?Has funding for the following from the CCG contribution been identified for the area?- Implementation of Care Act duties?- Funding dedicated to carer-specific support?- Reablement?
Yes
PR8 Indication of outputs for specified scheme types
Has the area set out the outputs corresponding to the planned scheme types (Note that this is only for where any of the specified set of scheme types requiring outputs are planned)? (auto-validated)
Yes
Metrics
PR9 Does the plan set stretching metrics and are there clear and ambitious plans for delivering these?
Is there a clear narrative for each metric describing the approach locally to meeting the ambition set for that metric?Is there a proportionate range of scheme types and spend included in the expenditure section of the plan to support delivery of the metric ambitions for each of the metrics?Do the narrative plans for each metric set out clear and ambitious approaches to delivering improvements?Have stretching metrics been agreed locally for:- Metric 2: Long term admission to residential and nursing care homes- Metric 3: Proportion of older people (65 and over) who were still at home 91 days after discharge from hospital into reablement
Yes
Agreed expenditure plan for all elements of the BCF
Page 65 of 252
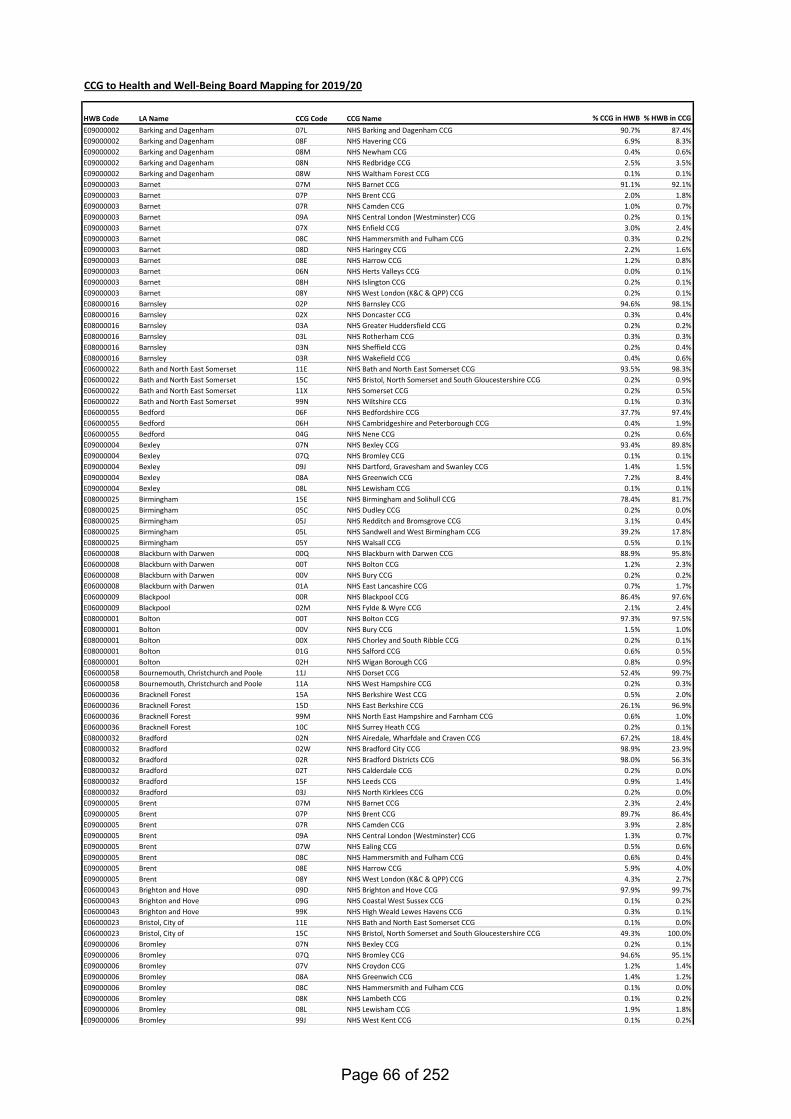
CCG to Health and Well-Being Board Mapping for 2019/20
HWB Code LA Name CCG Code CCG Name % CCG in HWB % HWB in CCGE09000002 Barking and Dagenham 07L NHS Barking and Dagenham CCG 90.7% 87.4%E09000002 Barking and Dagenham 08F NHS Havering CCG 6.9% 8.3%E09000002 Barking and Dagenham 08M NHS Newham CCG 0.4% 0.6%E09000002 Barking and Dagenham 08N NHS Redbridge CCG 2.5% 3.5%E09000002 Barking and Dagenham 08W NHS Waltham Forest CCG 0.1% 0.1%E09000003 Barnet 07M NHS Barnet CCG 91.1% 92.1%E09000003 Barnet 07P NHS Brent CCG 2.0% 1.8%E09000003 Barnet 07R NHS Camden CCG 1.0% 0.7%E09000003 Barnet 09A NHS Central London (Westminster) CCG 0.2% 0.1%E09000003 Barnet 07X NHS Enfield CCG 3.0% 2.4%E09000003 Barnet 08C NHS Hammersmith and Fulham CCG 0.3% 0.2%E09000003 Barnet 08D NHS Haringey CCG 2.2% 1.6%E09000003 Barnet 08E NHS Harrow CCG 1.2% 0.8%E09000003 Barnet 06N NHS Herts Valleys CCG 0.0% 0.1%E09000003 Barnet 08H NHS Islington CCG 0.2% 0.1%E09000003 Barnet 08Y NHS West London (K&C & QPP) CCG 0.2% 0.1%E08000016 Barnsley 02P NHS Barnsley CCG 94.6% 98.1%E08000016 Barnsley 02X NHS Doncaster CCG 0.3% 0.4%E08000016 Barnsley 03A NHS Greater Huddersfield CCG 0.2% 0.2%E08000016 Barnsley 03L NHS Rotherham CCG 0.3% 0.3%E08000016 Barnsley 03N NHS Sheffield CCG 0.2% 0.4%E08000016 Barnsley 03R NHS Wakefield CCG 0.4% 0.6%E06000022 Bath and North East Somerset 11E NHS Bath and North East Somerset CCG 93.5% 98.3%E06000022 Bath and North East Somerset 15C NHS Bristol, North Somerset and South Gloucestershire CCG 0.2% 0.9%E06000022 Bath and North East Somerset 11X NHS Somerset CCG 0.2% 0.5%E06000022 Bath and North East Somerset 99N NHS Wiltshire CCG 0.1% 0.3%E06000055 Bedford 06F NHS Bedfordshire CCG 37.7% 97.4%E06000055 Bedford 06H NHS Cambridgeshire and Peterborough CCG 0.4% 1.9%E06000055 Bedford 04G NHS Nene CCG 0.2% 0.6%E09000004 Bexley 07N NHS Bexley CCG 93.4% 89.8%E09000004 Bexley 07Q NHS Bromley CCG 0.1% 0.1%E09000004 Bexley 09J NHS Dartford, Gravesham and Swanley CCG 1.4% 1.5%E09000004 Bexley 08A NHS Greenwich CCG 7.2% 8.4%E09000004 Bexley 08L NHS Lewisham CCG 0.1% 0.1%E08000025 Birmingham 15E NHS Birmingham and Solihull CCG 78.4% 81.7%E08000025 Birmingham 05C NHS Dudley CCG 0.2% 0.0%E08000025 Birmingham 05J NHS Redditch and Bromsgrove CCG 3.1% 0.4%E08000025 Birmingham 05L NHS Sandwell and West Birmingham CCG 39.2% 17.8%E08000025 Birmingham 05Y NHS Walsall CCG 0.5% 0.1%E06000008 Blackburn with Darwen 00Q NHS Blackburn with Darwen CCG 88.9% 95.8%E06000008 Blackburn with Darwen 00T NHS Bolton CCG 1.2% 2.3%E06000008 Blackburn with Darwen 00V NHS Bury CCG 0.2% 0.2%E06000008 Blackburn with Darwen 01A NHS East Lancashire CCG 0.7% 1.7%E06000009 Blackpool 00R NHS Blackpool CCG 86.4% 97.6%E06000009 Blackpool 02M NHS Fylde & Wyre CCG 2.1% 2.4%E08000001 Bolton 00T NHS Bolton CCG 97.3% 97.5%E08000001 Bolton 00V NHS Bury CCG 1.5% 1.0%E08000001 Bolton 00X NHS Chorley and South Ribble CCG 0.2% 0.1%E08000001 Bolton 01G NHS Salford CCG 0.6% 0.5%E08000001 Bolton 02H NHS Wigan Borough CCG 0.8% 0.9%E06000058 Bournemouth, Christchurch and Poole 11J NHS Dorset CCG 52.4% 99.7%E06000058 Bournemouth, Christchurch and Poole 11A NHS West Hampshire CCG 0.2% 0.3%E06000036 Bracknell Forest 15A NHS Berkshire West CCG 0.5% 2.0%E06000036 Bracknell Forest 15D NHS East Berkshire CCG 26.1% 96.9%E06000036 Bracknell Forest 99M NHS North East Hampshire and Farnham CCG 0.6% 1.0%E06000036 Bracknell Forest 10C NHS Surrey Heath CCG 0.2% 0.1%E08000032 Bradford 02N NHS Airedale, Wharfdale and Craven CCG 67.2% 18.4%E08000032 Bradford 02W NHS Bradford City CCG 98.9% 23.9%E08000032 Bradford 02R NHS Bradford Districts CCG 98.0% 56.3%E08000032 Bradford 02T NHS Calderdale CCG 0.2% 0.0%E08000032 Bradford 15F NHS Leeds CCG 0.9% 1.4%E08000032 Bradford 03J NHS North Kirklees CCG 0.2% 0.0%E09000005 Brent 07M NHS Barnet CCG 2.3% 2.4%E09000005 Brent 07P NHS Brent CCG 89.7% 86.4%E09000005 Brent 07R NHS Camden CCG 3.9% 2.8%E09000005 Brent 09A NHS Central London (Westminster) CCG 1.3% 0.7%E09000005 Brent 07W NHS Ealing CCG 0.5% 0.6%E09000005 Brent 08C NHS Hammersmith and Fulham CCG 0.6% 0.4%E09000005 Brent 08E NHS Harrow CCG 5.9% 4.0%E09000005 Brent 08Y NHS West London (K&C & QPP) CCG 4.3% 2.7%E06000043 Brighton and Hove 09D NHS Brighton and Hove CCG 97.9% 99.7%E06000043 Brighton and Hove 09G NHS Coastal West Sussex CCG 0.1% 0.2%E06000043 Brighton and Hove 99K NHS High Weald Lewes Havens CCG 0.3% 0.1%E06000023 Bristol, City of 11E NHS Bath and North East Somerset CCG 0.1% 0.0%E06000023 Bristol, City of 15C NHS Bristol, North Somerset and South Gloucestershire CCG 49.3% 100.0%E09000006 Bromley 07N NHS Bexley CCG 0.2% 0.1%E09000006 Bromley 07Q NHS Bromley CCG 94.6% 95.1%E09000006 Bromley 07V NHS Croydon CCG 1.2% 1.4%E09000006 Bromley 08A NHS Greenwich CCG 1.4% 1.2%E09000006 Bromley 08C NHS Hammersmith and Fulham CCG 0.1% 0.0%E09000006 Bromley 08K NHS Lambeth CCG 0.1% 0.2%E09000006 Bromley 08L NHS Lewisham CCG 1.9% 1.8%E09000006 Bromley 99J NHS West Kent CCG 0.1% 0.2%
Page 66 of 252
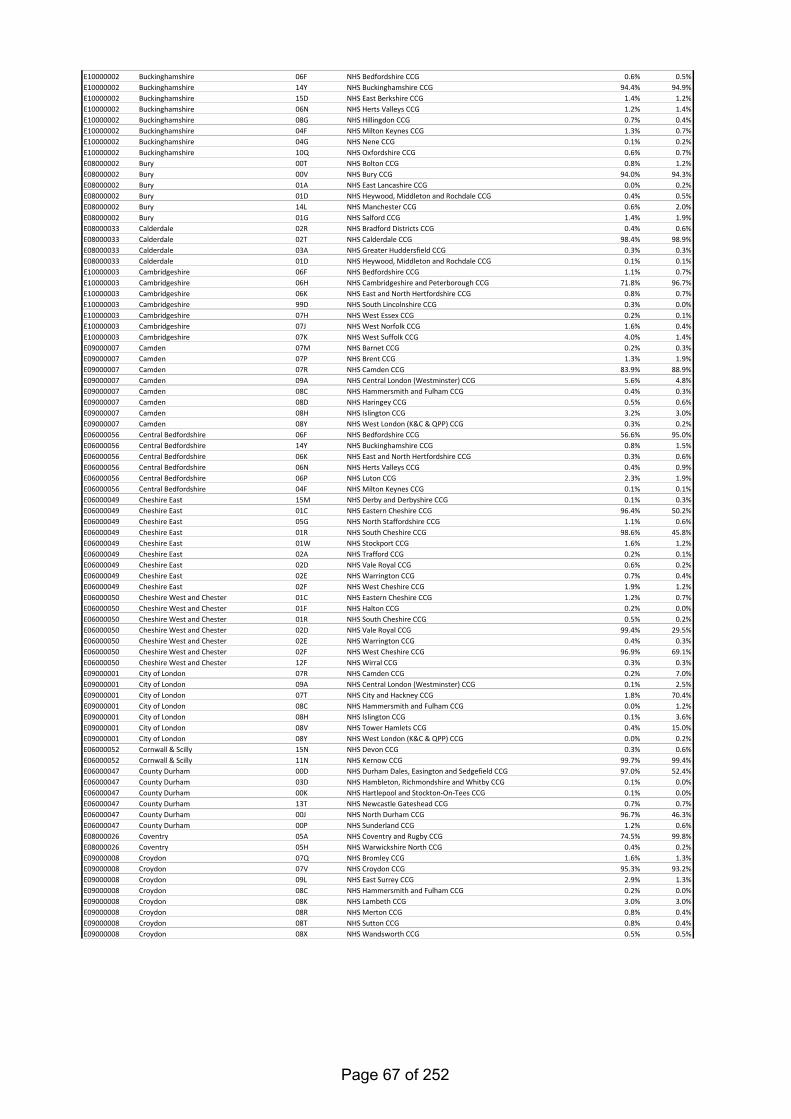
E10000002 Buckinghamshire 06F NHS Bedfordshire CCG 0.6% 0.5%E10000002 Buckinghamshire 14Y NHS Buckinghamshire CCG 94.4% 94.9%E10000002 Buckinghamshire 15D NHS East Berkshire CCG 1.4% 1.2%E10000002 Buckinghamshire 06N NHS Herts Valleys CCG 1.2% 1.4%E10000002 Buckinghamshire 08G NHS Hillingdon CCG 0.7% 0.4%E10000002 Buckinghamshire 04F NHS Milton Keynes CCG 1.3% 0.7%E10000002 Buckinghamshire 04G NHS Nene CCG 0.1% 0.2%E10000002 Buckinghamshire 10Q NHS Oxfordshire CCG 0.6% 0.7%E08000002 Bury 00T NHS Bolton CCG 0.8% 1.2%E08000002 Bury 00V NHS Bury CCG 94.0% 94.3%E08000002 Bury 01A NHS East Lancashire CCG 0.0% 0.2%E08000002 Bury 01D NHS Heywood, Middleton and Rochdale CCG 0.4% 0.5%E08000002 Bury 14L NHS Manchester CCG 0.6% 2.0%E08000002 Bury 01G NHS Salford CCG 1.4% 1.9%E08000033 Calderdale 02R NHS Bradford Districts CCG 0.4% 0.6%E08000033 Calderdale 02T NHS Calderdale CCG 98.4% 98.9%E08000033 Calderdale 03A NHS Greater Huddersfield CCG 0.3% 0.3%E08000033 Calderdale 01D NHS Heywood, Middleton and Rochdale CCG 0.1% 0.1%E10000003 Cambridgeshire 06F NHS Bedfordshire CCG 1.1% 0.7%E10000003 Cambridgeshire 06H NHS Cambridgeshire and Peterborough CCG 71.8% 96.7%E10000003 Cambridgeshire 06K NHS East and North Hertfordshire CCG 0.8% 0.7%E10000003 Cambridgeshire 99D NHS South Lincolnshire CCG 0.3% 0.0%E10000003 Cambridgeshire 07H NHS West Essex CCG 0.2% 0.1%E10000003 Cambridgeshire 07J NHS West Norfolk CCG 1.6% 0.4%E10000003 Cambridgeshire 07K NHS West Suffolk CCG 4.0% 1.4%E09000007 Camden 07M NHS Barnet CCG 0.2% 0.3%E09000007 Camden 07P NHS Brent CCG 1.3% 1.9%E09000007 Camden 07R NHS Camden CCG 83.9% 88.9%E09000007 Camden 09A NHS Central London (Westminster) CCG 5.6% 4.8%E09000007 Camden 08C NHS Hammersmith and Fulham CCG 0.4% 0.3%E09000007 Camden 08D NHS Haringey CCG 0.5% 0.6%E09000007 Camden 08H NHS Islington CCG 3.2% 3.0%E09000007 Camden 08Y NHS West London (K&C & QPP) CCG 0.3% 0.2%E06000056 Central Bedfordshire 06F NHS Bedfordshire CCG 56.6% 95.0%E06000056 Central Bedfordshire 14Y NHS Buckinghamshire CCG 0.8% 1.5%E06000056 Central Bedfordshire 06K NHS East and North Hertfordshire CCG 0.3% 0.6%E06000056 Central Bedfordshire 06N NHS Herts Valleys CCG 0.4% 0.9%E06000056 Central Bedfordshire 06P NHS Luton CCG 2.3% 1.9%E06000056 Central Bedfordshire 04F NHS Milton Keynes CCG 0.1% 0.1%E06000049 Cheshire East 15M NHS Derby and Derbyshire CCG 0.1% 0.3%E06000049 Cheshire East 01C NHS Eastern Cheshire CCG 96.4% 50.2%E06000049 Cheshire East 05G NHS North Staffordshire CCG 1.1% 0.6%E06000049 Cheshire East 01R NHS South Cheshire CCG 98.6% 45.8%E06000049 Cheshire East 01W NHS Stockport CCG 1.6% 1.2%E06000049 Cheshire East 02A NHS Trafford CCG 0.2% 0.1%E06000049 Cheshire East 02D NHS Vale Royal CCG 0.6% 0.2%E06000049 Cheshire East 02E NHS Warrington CCG 0.7% 0.4%E06000049 Cheshire East 02F NHS West Cheshire CCG 1.9% 1.2%E06000050 Cheshire West and Chester 01C NHS Eastern Cheshire CCG 1.2% 0.7%E06000050 Cheshire West and Chester 01F NHS Halton CCG 0.2% 0.0%E06000050 Cheshire West and Chester 01R NHS South Cheshire CCG 0.5% 0.2%E06000050 Cheshire West and Chester 02D NHS Vale Royal CCG 99.4% 29.5%E06000050 Cheshire West and Chester 02E NHS Warrington CCG 0.4% 0.3%E06000050 Cheshire West and Chester 02F NHS West Cheshire CCG 96.9% 69.1%E06000050 Cheshire West and Chester 12F NHS Wirral CCG 0.3% 0.3%E09000001 City of London 07R NHS Camden CCG 0.2% 7.0%E09000001 City of London 09A NHS Central London (Westminster) CCG 0.1% 2.5%E09000001 City of London 07T NHS City and Hackney CCG 1.8% 70.4%E09000001 City of London 08C NHS Hammersmith and Fulham CCG 0.0% 1.2%E09000001 City of London 08H NHS Islington CCG 0.1% 3.6%E09000001 City of London 08V NHS Tower Hamlets CCG 0.4% 15.0%E09000001 City of London 08Y NHS West London (K&C & QPP) CCG 0.0% 0.2%E06000052 Cornwall & Scilly 15N NHS Devon CCG 0.3% 0.6%E06000052 Cornwall & Scilly 11N NHS Kernow CCG 99.7% 99.4%E06000047 County Durham 00D NHS Durham Dales, Easington and Sedgefield CCG 97.0% 52.4%E06000047 County Durham 03D NHS Hambleton, Richmondshire and Whitby CCG 0.1% 0.0%E06000047 County Durham 00K NHS Hartlepool and Stockton-On-Tees CCG 0.1% 0.0%E06000047 County Durham 13T NHS Newcastle Gateshead CCG 0.7% 0.7%E06000047 County Durham 00J NHS North Durham CCG 96.7% 46.3%E06000047 County Durham 00P NHS Sunderland CCG 1.2% 0.6%E08000026 Coventry 05A NHS Coventry and Rugby CCG 74.5% 99.8%E08000026 Coventry 05H NHS Warwickshire North CCG 0.4% 0.2%E09000008 Croydon 07Q NHS Bromley CCG 1.6% 1.3%E09000008 Croydon 07V NHS Croydon CCG 95.3% 93.2%E09000008 Croydon 09L NHS East Surrey CCG 2.9% 1.3%E09000008 Croydon 08C NHS Hammersmith and Fulham CCG 0.2% 0.0%E09000008 Croydon 08K NHS Lambeth CCG 3.0% 3.0%E09000008 Croydon 08R NHS Merton CCG 0.8% 0.4%E09000008 Croydon 08T NHS Sutton CCG 0.8% 0.4%E09000008 Croydon 08X NHS Wandsworth CCG 0.5% 0.5%
Page 67 of 252
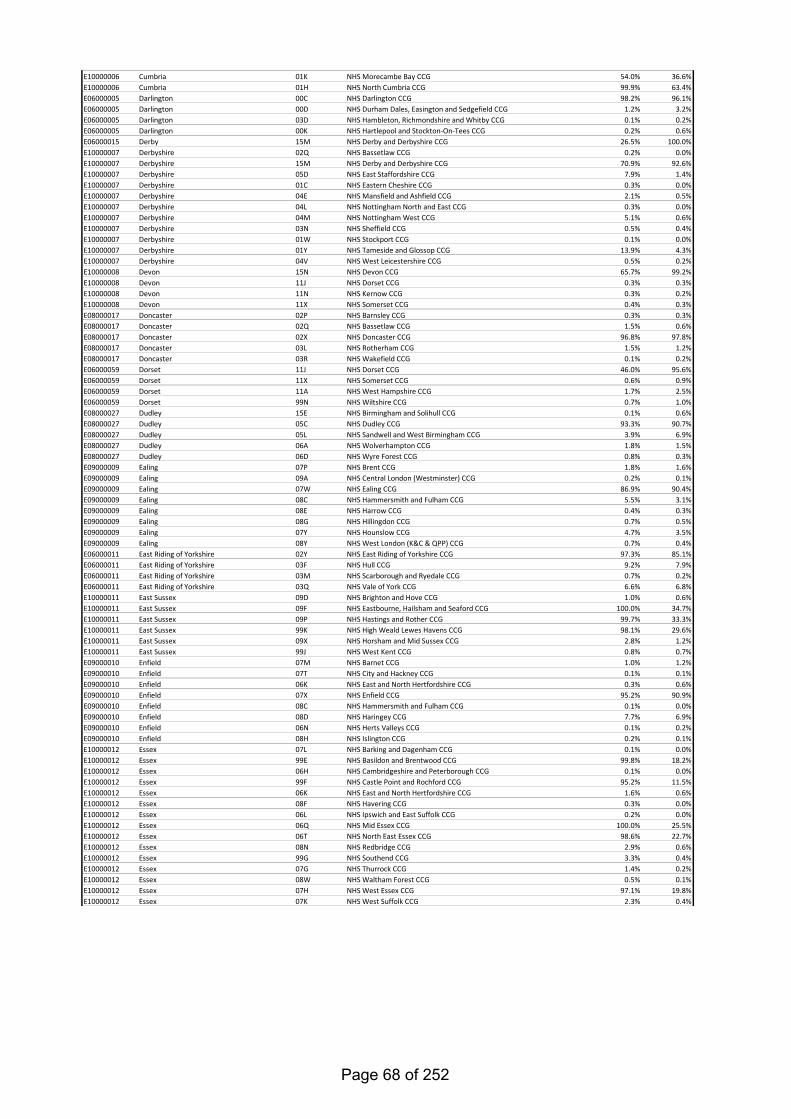
E10000006 Cumbria 01K NHS Morecambe Bay CCG 54.0% 36.6%E10000006 Cumbria 01H NHS North Cumbria CCG 99.9% 63.4%E06000005 Darlington 00C NHS Darlington CCG 98.2% 96.1%E06000005 Darlington 00D NHS Durham Dales, Easington and Sedgefield CCG 1.2% 3.2%E06000005 Darlington 03D NHS Hambleton, Richmondshire and Whitby CCG 0.1% 0.2%E06000005 Darlington 00K NHS Hartlepool and Stockton-On-Tees CCG 0.2% 0.6%E06000015 Derby 15M NHS Derby and Derbyshire CCG 26.5% 100.0%E10000007 Derbyshire 02Q NHS Bassetlaw CCG 0.2% 0.0%E10000007 Derbyshire 15M NHS Derby and Derbyshire CCG 70.9% 92.6%E10000007 Derbyshire 05D NHS East Staffordshire CCG 7.9% 1.4%E10000007 Derbyshire 01C NHS Eastern Cheshire CCG 0.3% 0.0%E10000007 Derbyshire 04E NHS Mansfield and Ashfield CCG 2.1% 0.5%E10000007 Derbyshire 04L NHS Nottingham North and East CCG 0.3% 0.0%E10000007 Derbyshire 04M NHS Nottingham West CCG 5.1% 0.6%E10000007 Derbyshire 03N NHS Sheffield CCG 0.5% 0.4%E10000007 Derbyshire 01W NHS Stockport CCG 0.1% 0.0%E10000007 Derbyshire 01Y NHS Tameside and Glossop CCG 13.9% 4.3%E10000007 Derbyshire 04V NHS West Leicestershire CCG 0.5% 0.2%E10000008 Devon 15N NHS Devon CCG 65.7% 99.2%E10000008 Devon 11J NHS Dorset CCG 0.3% 0.3%E10000008 Devon 11N NHS Kernow CCG 0.3% 0.2%E10000008 Devon 11X NHS Somerset CCG 0.4% 0.3%E08000017 Doncaster 02P NHS Barnsley CCG 0.3% 0.3%E08000017 Doncaster 02Q NHS Bassetlaw CCG 1.5% 0.6%E08000017 Doncaster 02X NHS Doncaster CCG 96.8% 97.8%E08000017 Doncaster 03L NHS Rotherham CCG 1.5% 1.2%E08000017 Doncaster 03R NHS Wakefield CCG 0.1% 0.2%E06000059 Dorset 11J NHS Dorset CCG 46.0% 95.6%E06000059 Dorset 11X NHS Somerset CCG 0.6% 0.9%E06000059 Dorset 11A NHS West Hampshire CCG 1.7% 2.5%E06000059 Dorset 99N NHS Wiltshire CCG 0.7% 1.0%E08000027 Dudley 15E NHS Birmingham and Solihull CCG 0.1% 0.6%E08000027 Dudley 05C NHS Dudley CCG 93.3% 90.7%E08000027 Dudley 05L NHS Sandwell and West Birmingham CCG 3.9% 6.9%E08000027 Dudley 06A NHS Wolverhampton CCG 1.8% 1.5%E08000027 Dudley 06D NHS Wyre Forest CCG 0.8% 0.3%E09000009 Ealing 07P NHS Brent CCG 1.8% 1.6%E09000009 Ealing 09A NHS Central London (Westminster) CCG 0.2% 0.1%E09000009 Ealing 07W NHS Ealing CCG 86.9% 90.4%E09000009 Ealing 08C NHS Hammersmith and Fulham CCG 5.5% 3.1%E09000009 Ealing 08E NHS Harrow CCG 0.4% 0.3%E09000009 Ealing 08G NHS Hillingdon CCG 0.7% 0.5%E09000009 Ealing 07Y NHS Hounslow CCG 4.7% 3.5%E09000009 Ealing 08Y NHS West London (K&C & QPP) CCG 0.7% 0.4%E06000011 East Riding of Yorkshire 02Y NHS East Riding of Yorkshire CCG 97.3% 85.1%E06000011 East Riding of Yorkshire 03F NHS Hull CCG 9.2% 7.9%E06000011 East Riding of Yorkshire 03M NHS Scarborough and Ryedale CCG 0.7% 0.2%E06000011 East Riding of Yorkshire 03Q NHS Vale of York CCG 6.6% 6.8%E10000011 East Sussex 09D NHS Brighton and Hove CCG 1.0% 0.6%E10000011 East Sussex 09F NHS Eastbourne, Hailsham and Seaford CCG 100.0% 34.7%E10000011 East Sussex 09P NHS Hastings and Rother CCG 99.7% 33.3%E10000011 East Sussex 99K NHS High Weald Lewes Havens CCG 98.1% 29.6%E10000011 East Sussex 09X NHS Horsham and Mid Sussex CCG 2.8% 1.2%E10000011 East Sussex 99J NHS West Kent CCG 0.8% 0.7%E09000010 Enfield 07M NHS Barnet CCG 1.0% 1.2%E09000010 Enfield 07T NHS City and Hackney CCG 0.1% 0.1%E09000010 Enfield 06K NHS East and North Hertfordshire CCG 0.3% 0.6%E09000010 Enfield 07X NHS Enfield CCG 95.2% 90.9%E09000010 Enfield 08C NHS Hammersmith and Fulham CCG 0.1% 0.0%E09000010 Enfield 08D NHS Haringey CCG 7.7% 6.9%E09000010 Enfield 06N NHS Herts Valleys CCG 0.1% 0.2%E09000010 Enfield 08H NHS Islington CCG 0.2% 0.1%E10000012 Essex 07L NHS Barking and Dagenham CCG 0.1% 0.0%E10000012 Essex 99E NHS Basildon and Brentwood CCG 99.8% 18.2%E10000012 Essex 06H NHS Cambridgeshire and Peterborough CCG 0.1% 0.0%E10000012 Essex 99F NHS Castle Point and Rochford CCG 95.2% 11.5%E10000012 Essex 06K NHS East and North Hertfordshire CCG 1.6% 0.6%E10000012 Essex 08F NHS Havering CCG 0.3% 0.0%E10000012 Essex 06L NHS Ipswich and East Suffolk CCG 0.2% 0.0%E10000012 Essex 06Q NHS Mid Essex CCG 100.0% 25.5%E10000012 Essex 06T NHS North East Essex CCG 98.6% 22.7%E10000012 Essex 08N NHS Redbridge CCG 2.9% 0.6%E10000012 Essex 99G NHS Southend CCG 3.3% 0.4%E10000012 Essex 07G NHS Thurrock CCG 1.4% 0.2%E10000012 Essex 08W NHS Waltham Forest CCG 0.5% 0.1%E10000012 Essex 07H NHS West Essex CCG 97.1% 19.8%E10000012 Essex 07K NHS West Suffolk CCG 2.3% 0.4%
Page 68 of 252
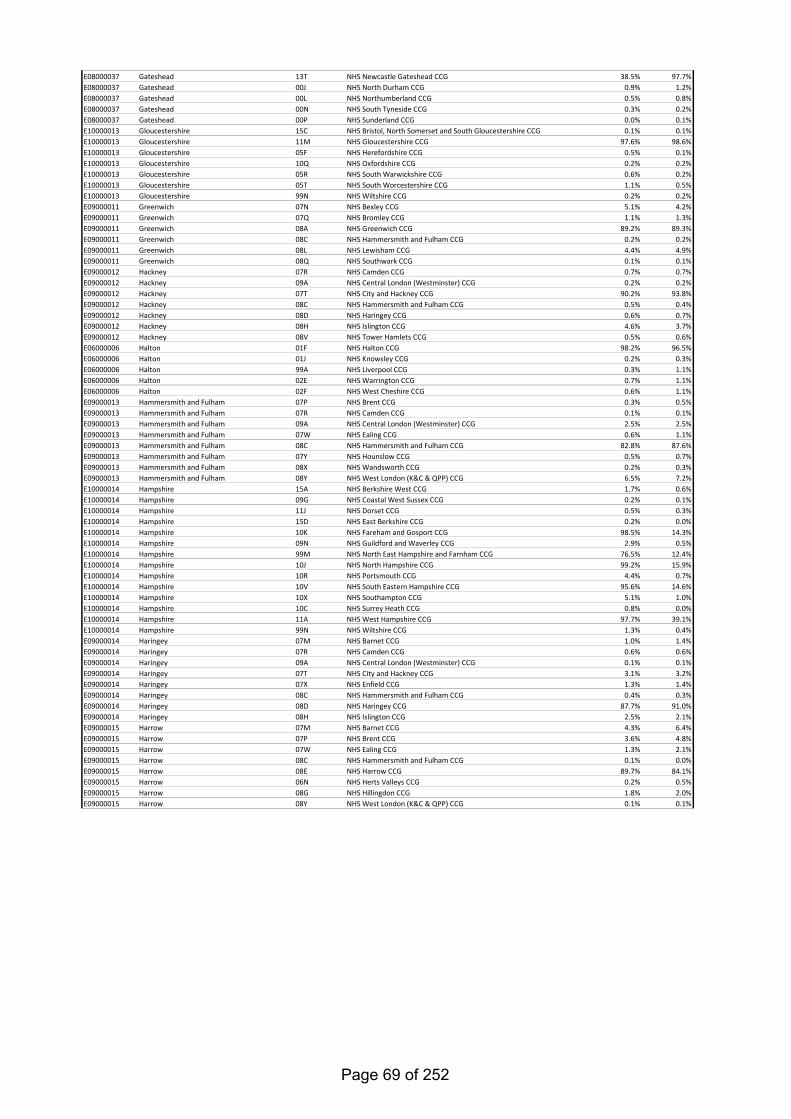
E08000037 Gateshead 13T NHS Newcastle Gateshead CCG 38.5% 97.7%E08000037 Gateshead 00J NHS North Durham CCG 0.9% 1.2%E08000037 Gateshead 00L NHS Northumberland CCG 0.5% 0.8%E08000037 Gateshead 00N NHS South Tyneside CCG 0.3% 0.2%E08000037 Gateshead 00P NHS Sunderland CCG 0.0% 0.1%E10000013 Gloucestershire 15C NHS Bristol, North Somerset and South Gloucestershire CCG 0.1% 0.1%E10000013 Gloucestershire 11M NHS Gloucestershire CCG 97.6% 98.6%E10000013 Gloucestershire 05F NHS Herefordshire CCG 0.5% 0.1%E10000013 Gloucestershire 10Q NHS Oxfordshire CCG 0.2% 0.2%E10000013 Gloucestershire 05R NHS South Warwickshire CCG 0.6% 0.2%E10000013 Gloucestershire 05T NHS South Worcestershire CCG 1.1% 0.5%E10000013 Gloucestershire 99N NHS Wiltshire CCG 0.2% 0.2%E09000011 Greenwich 07N NHS Bexley CCG 5.1% 4.2%E09000011 Greenwich 07Q NHS Bromley CCG 1.1% 1.3%E09000011 Greenwich 08A NHS Greenwich CCG 89.2% 89.3%E09000011 Greenwich 08C NHS Hammersmith and Fulham CCG 0.2% 0.2%E09000011 Greenwich 08L NHS Lewisham CCG 4.4% 4.9%E09000011 Greenwich 08Q NHS Southwark CCG 0.1% 0.1%E09000012 Hackney 07R NHS Camden CCG 0.7% 0.7%E09000012 Hackney 09A NHS Central London (Westminster) CCG 0.2% 0.2%E09000012 Hackney 07T NHS City and Hackney CCG 90.2% 93.8%E09000012 Hackney 08C NHS Hammersmith and Fulham CCG 0.5% 0.4%E09000012 Hackney 08D NHS Haringey CCG 0.6% 0.7%E09000012 Hackney 08H NHS Islington CCG 4.6% 3.7%E09000012 Hackney 08V NHS Tower Hamlets CCG 0.5% 0.6%E06000006 Halton 01F NHS Halton CCG 98.2% 96.5%E06000006 Halton 01J NHS Knowsley CCG 0.2% 0.3%E06000006 Halton 99A NHS Liverpool CCG 0.3% 1.1%E06000006 Halton 02E NHS Warrington CCG 0.7% 1.1%E06000006 Halton 02F NHS West Cheshire CCG 0.6% 1.1%E09000013 Hammersmith and Fulham 07P NHS Brent CCG 0.3% 0.5%E09000013 Hammersmith and Fulham 07R NHS Camden CCG 0.1% 0.1%E09000013 Hammersmith and Fulham 09A NHS Central London (Westminster) CCG 2.5% 2.5%E09000013 Hammersmith and Fulham 07W NHS Ealing CCG 0.6% 1.1%E09000013 Hammersmith and Fulham 08C NHS Hammersmith and Fulham CCG 82.8% 87.6%E09000013 Hammersmith and Fulham 07Y NHS Hounslow CCG 0.5% 0.7%E09000013 Hammersmith and Fulham 08X NHS Wandsworth CCG 0.2% 0.3%E09000013 Hammersmith and Fulham 08Y NHS West London (K&C & QPP) CCG 6.5% 7.2%E10000014 Hampshire 15A NHS Berkshire West CCG 1.7% 0.6%E10000014 Hampshire 09G NHS Coastal West Sussex CCG 0.2% 0.1%E10000014 Hampshire 11J NHS Dorset CCG 0.5% 0.3%E10000014 Hampshire 15D NHS East Berkshire CCG 0.2% 0.0%E10000014 Hampshire 10K NHS Fareham and Gosport CCG 98.5% 14.3%E10000014 Hampshire 09N NHS Guildford and Waverley CCG 2.9% 0.5%E10000014 Hampshire 99M NHS North East Hampshire and Farnham CCG 76.5% 12.4%E10000014 Hampshire 10J NHS North Hampshire CCG 99.2% 15.9%E10000014 Hampshire 10R NHS Portsmouth CCG 4.4% 0.7%E10000014 Hampshire 10V NHS South Eastern Hampshire CCG 95.6% 14.6%E10000014 Hampshire 10X NHS Southampton CCG 5.1% 1.0%E10000014 Hampshire 10C NHS Surrey Heath CCG 0.8% 0.0%E10000014 Hampshire 11A NHS West Hampshire CCG 97.7% 39.1%E10000014 Hampshire 99N NHS Wiltshire CCG 1.3% 0.4%E09000014 Haringey 07M NHS Barnet CCG 1.0% 1.4%E09000014 Haringey 07R NHS Camden CCG 0.6% 0.6%E09000014 Haringey 09A NHS Central London (Westminster) CCG 0.1% 0.1%E09000014 Haringey 07T NHS City and Hackney CCG 3.1% 3.2%E09000014 Haringey 07X NHS Enfield CCG 1.3% 1.4%E09000014 Haringey 08C NHS Hammersmith and Fulham CCG 0.4% 0.3%E09000014 Haringey 08D NHS Haringey CCG 87.7% 91.0%E09000014 Haringey 08H NHS Islington CCG 2.5% 2.1%E09000015 Harrow 07M NHS Barnet CCG 4.3% 6.4%E09000015 Harrow 07P NHS Brent CCG 3.6% 4.8%E09000015 Harrow 07W NHS Ealing CCG 1.3% 2.1%E09000015 Harrow 08C NHS Hammersmith and Fulham CCG 0.1% 0.0%E09000015 Harrow 08E NHS Harrow CCG 89.7% 84.1%E09000015 Harrow 06N NHS Herts Valleys CCG 0.2% 0.5%E09000015 Harrow 08G NHS Hillingdon CCG 1.8% 2.0%E09000015 Harrow 08Y NHS West London (K&C & QPP) CCG 0.1% 0.1%
Page 69 of 252
E06000001 Hartlepool 00D NHS Durham Dales, Easington and Sedgefield CCG 0.2% 0.6%E06000001 Hartlepool 00K NHS Hartlepool and Stockton-On-Tees CCG 32.4% 99.4%E09000016 Havering 07L NHS Barking and Dagenham CCG 3.5% 2.9%E09000016 Havering 08F NHS Havering CCG 91.7% 96.2%E09000016 Havering 08M NHS Newham CCG 0.1% 0.2%E09000016 Havering 08N NHS Redbridge CCG 0.6% 0.7%E09000016 Havering 07G NHS Thurrock CCG 0.1% 0.0%E06000019 Herefordshire, County of 11M NHS Gloucestershire CCG 0.3% 0.9%E06000019 Herefordshire, County of 05F NHS Herefordshire CCG 98.2% 97.3%E06000019 Herefordshire, County of 05N NHS Shropshire CCG 0.3% 0.5%E06000019 Herefordshire, County of 05T NHS South Worcestershire CCG 0.8% 1.3%E10000015 Hertfordshire 07M NHS Barnet CCG 0.2% 0.0%E10000015 Hertfordshire 06F NHS Bedfordshire CCG 0.1% 0.0%E10000015 Hertfordshire 14Y NHS Buckinghamshire CCG 0.2% 0.1%E10000015 Hertfordshire 06H NHS Cambridgeshire and Peterborough CCG 2.1% 1.6%E10000015 Hertfordshire 06K NHS East and North Hertfordshire CCG 97.0% 46.5%E10000015 Hertfordshire 07X NHS Enfield CCG 0.5% 0.1%E10000015 Hertfordshire 08E NHS Harrow CCG 0.6% 0.1%E10000015 Hertfordshire 06N NHS Herts Valleys CCG 98.0% 50.7%E10000015 Hertfordshire 08G NHS Hillingdon CCG 2.2% 0.6%E10000015 Hertfordshire 06P NHS Luton CCG 0.4% 0.0%E10000015 Hertfordshire 07H NHS West Essex CCG 0.8% 0.2%E09000017 Hillingdon 14Y NHS Buckinghamshire CCG 0.0% 0.1%E09000017 Hillingdon 07W NHS Ealing CCG 5.2% 6.9%E09000017 Hillingdon 08C NHS Hammersmith and Fulham CCG 0.5% 0.3%E09000017 Hillingdon 08E NHS Harrow CCG 2.2% 1.8%E09000017 Hillingdon 08G NHS Hillingdon CCG 94.3% 89.8%E09000017 Hillingdon 07Y NHS Hounslow CCG 1.1% 1.0%E09000018 Hounslow 07W NHS Ealing CCG 5.4% 7.4%E09000018 Hounslow 08C NHS Hammersmith and Fulham CCG 1.2% 0.9%E09000018 Hounslow 08G NHS Hillingdon CCG 0.2% 0.2%E09000018 Hounslow 07Y NHS Hounslow CCG 88.2% 87.1%E09000018 Hounslow 09Y NHS North West Surrey CCG 0.3% 0.4%E09000018 Hounslow 08P NHS Richmond CCG 5.7% 3.8%E09000018 Hounslow 08Y NHS West London (K&C & QPP) CCG 0.2% 0.1%E06000046 Isle of Wight 10L NHS Isle of Wight CCG 100.0% 100.0%E09000019 Islington 07R NHS Camden CCG 4.9% 5.4%E09000019 Islington 09A NHS Central London (Westminster) CCG 0.5% 0.5%E09000019 Islington 07T NHS City and Hackney CCG 3.4% 4.2%E09000019 Islington 08C NHS Hammersmith and Fulham CCG 0.5% 0.5%E09000019 Islington 08D NHS Haringey CCG 1.2% 1.5%E09000019 Islington 08H NHS Islington CCG 89.1% 87.9%E09000020 Kensington and Chelsea 07P NHS Brent CCG 0.0% 0.1%E09000020 Kensington and Chelsea 07R NHS Camden CCG 0.2% 0.3%E09000020 Kensington and Chelsea 09A NHS Central London (Westminster) CCG 4.0% 5.4%E09000020 Kensington and Chelsea 08C NHS Hammersmith and Fulham CCG 1.2% 1.7%E09000020 Kensington and Chelsea 08Y NHS West London (K&C & QPP) CCG 63.9% 92.5%E10000016 Kent 09C NHS Ashford CCG 100.0% 8.3%E10000016 Kent 07N NHS Bexley CCG 1.3% 0.2%E10000016 Kent 07Q NHS Bromley CCG 0.9% 0.2%E10000016 Kent 09E NHS Canterbury and Coastal CCG 100.0% 14.1%E10000016 Kent 09J NHS Dartford, Gravesham and Swanley CCG 98.3% 16.5%E10000016 Kent 09L NHS East Surrey CCG 0.1% 0.0%E10000016 Kent 08A NHS Greenwich CCG 0.2% 0.0%E10000016 Kent 09P NHS Hastings and Rother CCG 0.3% 0.0%E10000016 Kent 99K NHS High Weald Lewes Havens CCG 0.6% 0.0%E10000016 Kent 09W NHS Medway CCG 6.1% 1.1%E10000016 Kent 10A NHS South Kent Coast CCG 100.0% 12.9%E10000016 Kent 10D NHS Swale CCG 99.8% 7.1%E10000016 Kent 10E NHS Thanet CCG 100.0% 9.1%E10000016 Kent 99J NHS West Kent CCG 98.7% 30.4%E06000010 Kingston upon Hull, City of 02Y NHS East Riding of Yorkshire CCG 1.3% 1.4%E06000010 Kingston upon Hull, City of 03F NHS Hull CCG 90.8% 98.6%E09000021 Kingston upon Thames 08J NHS Kingston CCG 86.9% 95.9%E09000021 Kingston upon Thames 08R NHS Merton CCG 1.1% 1.3%E09000021 Kingston upon Thames 08P NHS Richmond CCG 0.7% 0.8%E09000021 Kingston upon Thames 99H NHS Surrey Downs CCG 0.7% 1.2%E09000021 Kingston upon Thames 08T NHS Sutton CCG 0.1% 0.1%E09000021 Kingston upon Thames 08X NHS Wandsworth CCG 0.3% 0.7%E08000034 Kirklees 02P NHS Barnsley CCG 0.1% 0.0%E08000034 Kirklees 02R NHS Bradford Districts CCG 1.0% 0.7%E08000034 Kirklees 02T NHS Calderdale CCG 1.4% 0.7%E08000034 Kirklees 03A NHS Greater Huddersfield CCG 99.6% 54.7%E08000034 Kirklees 15F NHS Leeds CCG 0.1% 0.3%E08000034 Kirklees 03J NHS North Kirklees CCG 98.9% 42.4%E08000034 Kirklees 03R NHS Wakefield CCG 1.5% 1.3%
Page 70 of 252
E08000011 Knowsley 01F NHS Halton CCG 1.0% 0.8%E08000011 Knowsley 01J NHS Knowsley CCG 86.8% 88.2%E08000011 Knowsley 99A NHS Liverpool CCG 2.4% 8.0%E08000011 Knowsley 01T NHS South Sefton CCG 0.1% 0.1%E08000011 Knowsley 01X NHS St Helens CCG 2.3% 2.8%E09000022 Lambeth 07R NHS Camden CCG 0.2% 0.1%E09000022 Lambeth 09A NHS Central London (Westminster) CCG 0.9% 0.6%E09000022 Lambeth 07V NHS Croydon CCG 0.7% 0.8%E09000022 Lambeth 08C NHS Hammersmith and Fulham CCG 0.6% 0.4%E09000022 Lambeth 08K NHS Lambeth CCG 85.5% 92.2%E09000022 Lambeth 08R NHS Merton CCG 1.0% 0.6%E09000022 Lambeth 08Q NHS Southwark CCG 1.9% 1.6%E09000022 Lambeth 08X NHS Wandsworth CCG 3.5% 3.7%E09000022 Lambeth 08Y NHS West London (K&C & QPP) CCG 0.1% 0.0%E10000017 Lancashire 02N NHS Airedale, Wharfdale and Craven CCG 0.2% 0.0%E10000017 Lancashire 00Q NHS Blackburn with Darwen CCG 11.1% 1.5%E10000017 Lancashire 00R NHS Blackpool CCG 13.6% 1.9%E10000017 Lancashire 00T NHS Bolton CCG 0.3% 0.0%E10000017 Lancashire 00V NHS Bury CCG 1.4% 0.2%E10000017 Lancashire 00X NHS Chorley and South Ribble CCG 99.8% 14.5%E10000017 Lancashire 01A NHS East Lancashire CCG 99.0% 30.0%E10000017 Lancashire 02M NHS Fylde & Wyre CCG 97.9% 13.8%E10000017 Lancashire 01E NHS Greater Preston CCG 100.0% 16.6%E10000017 Lancashire 01D NHS Heywood, Middleton and Rochdale CCG 0.9% 0.2%E10000017 Lancashire 01J NHS Knowsley CCG 0.1% 0.0%E10000017 Lancashire 01K NHS Morecambe Bay CCG 44.1% 12.1%E10000017 Lancashire 01T NHS South Sefton CCG 0.5% 0.0%E10000017 Lancashire 01V NHS Southport and Formby CCG 3.2% 0.3%E10000017 Lancashire 01X NHS St Helens CCG 0.5% 0.0%E10000017 Lancashire 02G NHS West Lancashire CCG 96.9% 8.7%E10000017 Lancashire 02H NHS Wigan Borough CCG 0.7% 0.2%E08000035 Leeds 02N NHS Airedale, Wharfdale and Craven CCG 0.1% 0.0%E08000035 Leeds 02W NHS Bradford City CCG 1.1% 0.2%E08000035 Leeds 02R NHS Bradford Districts CCG 0.5% 0.2%E08000035 Leeds 15F NHS Leeds CCG 97.7% 98.8%E08000035 Leeds 03J NHS North Kirklees CCG 0.3% 0.0%E08000035 Leeds 03Q NHS Vale of York CCG 0.6% 0.2%E08000035 Leeds 03R NHS Wakefield CCG 1.4% 0.6%E06000016 Leicester 03W NHS East Leicestershire and Rutland CCG 2.1% 1.8%E06000016 Leicester 04C NHS Leicester City CCG 92.8% 95.5%E06000016 Leicester 04V NHS West Leicestershire CCG 2.8% 2.7%E10000018 Leicestershire 03V NHS Corby CCG 0.5% 0.0%E10000018 Leicestershire 15M NHS Derby and Derbyshire CCG 0.4% 0.6%E10000018 Leicestershire 03W NHS East Leicestershire and Rutland CCG 85.5% 39.8%E10000018 Leicestershire 04C NHS Leicester City CCG 7.2% 4.1%E10000018 Leicestershire 04N NHS Rushcliffe CCG 5.4% 1.0%E10000018 Leicestershire 04Q NHS South West Lincolnshire CCG 5.6% 1.1%E10000018 Leicestershire 05H NHS Warwickshire North CCG 1.6% 0.4%E10000018 Leicestershire 04V NHS West Leicestershire CCG 96.2% 53.1%E09000023 Lewisham 07Q NHS Bromley CCG 1.4% 1.5%E09000023 Lewisham 09A NHS Central London (Westminster) CCG 0.2% 0.2%E09000023 Lewisham 08A NHS Greenwich CCG 2.1% 1.9%E09000023 Lewisham 08C NHS Hammersmith and Fulham CCG 0.3% 0.2%E09000023 Lewisham 08K NHS Lambeth CCG 0.3% 0.4%E09000023 Lewisham 08L NHS Lewisham CCG 91.5% 92.0%E09000023 Lewisham 08Q NHS Southwark CCG 3.9% 3.9%E10000019 Lincolnshire 06H NHS Cambridgeshire and Peterborough CCG 0.2% 0.3%E10000019 Lincolnshire 03W NHS East Leicestershire and Rutland CCG 0.2% 0.1%E10000019 Lincolnshire 03T NHS Lincolnshire East CCG 99.2% 32.0%E10000019 Lincolnshire 04D NHS Lincolnshire West CCG 98.6% 29.9%E10000019 Lincolnshire 04H NHS Newark & Sherwood CCG 2.4% 0.4%E10000019 Lincolnshire 03H NHS North East Lincolnshire CCG 2.7% 0.6%E10000019 Lincolnshire 03K NHS North Lincolnshire CCG 4.9% 1.1%E10000019 Lincolnshire 99D NHS South Lincolnshire CCG 90.8% 19.6%E10000019 Lincolnshire 04Q NHS South West Lincolnshire CCG 93.3% 16.1%E08000012 Liverpool 01J NHS Knowsley CCG 8.5% 2.7%E08000012 Liverpool 99A NHS Liverpool CCG 94.4% 96.3%E08000012 Liverpool 01T NHS South Sefton CCG 3.3% 1.0%E06000032 Luton 06F NHS Bedfordshire CCG 2.3% 4.5%E06000032 Luton 06P NHS Luton CCG 97.3% 95.5%E08000003 Manchester 00V NHS Bury CCG 0.4% 0.1%E08000003 Manchester 01D NHS Heywood, Middleton and Rochdale CCG 0.5% 0.2%E08000003 Manchester 14L NHS Manchester CCG 90.9% 95.6%E08000003 Manchester 00Y NHS Oldham CCG 0.9% 0.4%E08000003 Manchester 01G NHS Salford CCG 2.5% 1.1%E08000003 Manchester 01W NHS Stockport CCG 1.7% 0.8%E08000003 Manchester 01Y NHS Tameside and Glossop CCG 0.4% 0.2%E08000003 Manchester 02A NHS Trafford CCG 4.0% 1.6%
Page 71 of 252
E06000035 Medway 09J NHS Dartford, Gravesham and Swanley CCG 0.2% 0.2%E06000035 Medway 09W NHS Medway CCG 93.9% 99.5%E06000035 Medway 10D NHS Swale CCG 0.2% 0.0%E06000035 Medway 99J NHS West Kent CCG 0.2% 0.3%E09000024 Merton 07V NHS Croydon CCG 0.5% 0.9%E09000024 Merton 08C NHS Hammersmith and Fulham CCG 0.2% 0.2%E09000024 Merton 08J NHS Kingston CCG 3.4% 2.9%E09000024 Merton 08K NHS Lambeth CCG 1.0% 1.7%E09000024 Merton 08R NHS Merton CCG 87.7% 80.9%E09000024 Merton 08T NHS Sutton CCG 3.3% 2.6%E09000024 Merton 08X NHS Wandsworth CCG 6.6% 10.8%E06000002 Middlesbrough 03D NHS Hambleton, Richmondshire and Whitby CCG 0.2% 0.2%E06000002 Middlesbrough 00K NHS Hartlepool and Stockton-On-Tees CCG 0.2% 0.3%E06000002 Middlesbrough 00M NHS South Tees CCG 52.3% 99.5%E06000042 Milton Keynes 06F NHS Bedfordshire CCG 1.5% 2.5%E06000042 Milton Keynes 04F NHS Milton Keynes CCG 95.5% 96.2%E06000042 Milton Keynes 04G NHS Nene CCG 0.6% 1.3%E08000021 Newcastle upon Tyne 13T NHS Newcastle Gateshead CCG 58.9% 95.2%E08000021 Newcastle upon Tyne 99C NHS North Tyneside CCG 5.9% 4.0%E08000021 Newcastle upon Tyne 00L NHS Northumberland CCG 0.8% 0.8%E09000025 Newham 07L NHS Barking and Dagenham CCG 0.5% 0.3%E09000025 Newham 09A NHS Central London (Westminster) CCG 0.7% 0.4%E09000025 Newham 07T NHS City and Hackney CCG 0.1% 0.0%E09000025 Newham 08C NHS Hammersmith and Fulham CCG 0.5% 0.3%E09000025 Newham 08M NHS Newham CCG 96.6% 97.3%E09000025 Newham 08N NHS Redbridge CCG 0.3% 0.2%E09000025 Newham 08V NHS Tower Hamlets CCG 0.2% 0.2%E09000025 Newham 08W NHS Waltham Forest CCG 1.7% 1.4%E10000020 Norfolk 06H NHS Cambridgeshire and Peterborough CCG 0.7% 0.7%E10000020 Norfolk 06M NHS Great Yarmouth and Waveney CCG 47.7% 12.2%E10000020 Norfolk 06L NHS Ipswich and East Suffolk CCG 0.2% 0.0%E10000020 Norfolk 06V NHS North Norfolk CCG 100.0% 18.6%E10000020 Norfolk 06W NHS Norwich CCG 100.0% 25.2%E10000020 Norfolk 99D NHS South Lincolnshire CCG 0.2% 0.0%E10000020 Norfolk 06Y NHS South Norfolk CCG 98.9% 24.1%E10000020 Norfolk 07J NHS West Norfolk CCG 98.4% 18.5%E10000020 Norfolk 07K NHS West Suffolk CCG 2.6% 0.7%E06000012 North East Lincolnshire 03T NHS Lincolnshire East CCG 0.8% 1.2%E06000012 North East Lincolnshire 03H NHS North East Lincolnshire CCG 95.9% 98.6%E06000012 North East Lincolnshire 03K NHS North Lincolnshire CCG 0.2% 0.2%E06000013 North Lincolnshire 02Q NHS Bassetlaw CCG 0.2% 0.2%E06000013 North Lincolnshire 02X NHS Doncaster CCG 0.0% 0.1%E06000013 North Lincolnshire 02Y NHS East Riding of Yorkshire CCG 0.0% 0.1%E06000013 North Lincolnshire 04D NHS Lincolnshire West CCG 1.0% 1.3%E06000013 North Lincolnshire 03H NHS North East Lincolnshire CCG 1.4% 1.4%E06000013 North Lincolnshire 03K NHS North Lincolnshire CCG 94.9% 96.9%E06000024 North Somerset 11E NHS Bath and North East Somerset CCG 1.6% 1.5%E06000024 North Somerset 15C NHS Bristol, North Somerset and South Gloucestershire CCG 21.8% 98.3%E06000024 North Somerset 11X NHS Somerset CCG 0.0% 0.2%E08000022 North Tyneside 13T NHS Newcastle Gateshead CCG 1.0% 2.6%E08000022 North Tyneside 99C NHS North Tyneside CCG 93.2% 96.3%E08000022 North Tyneside 00L NHS Northumberland CCG 0.7% 1.1%E10000023 North Yorkshire 02N NHS Airedale, Wharfdale and Craven CCG 32.5% 8.3%E10000023 North Yorkshire 00C NHS Darlington CCG 1.3% 0.2%E10000023 North Yorkshire 02X NHS Doncaster CCG 0.2% 0.1%E10000023 North Yorkshire 00D NHS Durham Dales, Easington and Sedgefield CCG 0.2% 0.1%E10000023 North Yorkshire 01A NHS East Lancashire CCG 0.1% 0.0%E10000023 North Yorkshire 02Y NHS East Riding of Yorkshire CCG 1.4% 0.7%E10000023 North Yorkshire 03D NHS Hambleton, Richmondshire and Whitby CCG 98.3% 22.8%E10000023 North Yorkshire 03E NHS Harrogate and Rural District CCG 99.8% 26.2%E10000023 North Yorkshire 00K NHS Hartlepool and Stockton-On-Tees CCG 0.2% 0.1%E10000023 North Yorkshire 15F NHS Leeds CCG 0.9% 1.3%E10000023 North Yorkshire 01K NHS Morecambe Bay CCG 1.9% 1.0%E10000023 North Yorkshire 03M NHS Scarborough and Ryedale CCG 99.3% 19.2%E10000023 North Yorkshire 03Q NHS Vale of York CCG 32.6% 18.8%E10000023 North Yorkshire 03R NHS Wakefield CCG 2.0% 1.2%E10000021 Northamptonshire 06F NHS Bedfordshire CCG 0.1% 0.0%E10000021 Northamptonshire 06H NHS Cambridgeshire and Peterborough CCG 1.6% 1.9%E10000021 Northamptonshire 03V NHS Corby CCG 99.2% 9.8%E10000021 Northamptonshire 05A NHS Coventry and Rugby CCG 0.3% 0.2%E10000021 Northamptonshire 03W NHS East Leicestershire and Rutland CCG 2.0% 0.8%E10000021 Northamptonshire 04F NHS Milton Keynes CCG 3.1% 1.2%E10000021 Northamptonshire 04G NHS Nene CCG 98.8% 84.9%E10000021 Northamptonshire 10Q NHS Oxfordshire CCG 1.1% 1.0%E10000021 Northamptonshire 99D NHS South Lincolnshire CCG 0.9% 0.2%E06000057 Northumberland 13T NHS Newcastle Gateshead CCG 0.3% 0.5%E06000057 Northumberland 01H NHS North Cumbria CCG 0.1% 0.1%E06000057 Northumberland 00J NHS North Durham CCG 0.2% 0.2%E06000057 Northumberland 99C NHS North Tyneside CCG 0.9% 0.6%E06000057 Northumberland 00L NHS Northumberland CCG 97.9% 98.7%
Page 72 of 252

E06000018 Nottingham 04K NHS Nottingham City CCG 89.9% 95.4%E06000018 Nottingham 04L NHS Nottingham North and East CCG 4.6% 2.0%E06000018 Nottingham 04M NHS Nottingham West CCG 4.1% 1.1%E06000018 Nottingham 04N NHS Rushcliffe CCG 4.3% 1.5%E10000024 Nottinghamshire 02Q NHS Bassetlaw CCG 97.1% 13.5%E10000024 Nottinghamshire 15M NHS Derby and Derbyshire CCG 1.5% 1.8%E10000024 Nottinghamshire 02X NHS Doncaster CCG 1.6% 0.6%E10000024 Nottinghamshire 03W NHS East Leicestershire and Rutland CCG 0.3% 0.1%E10000024 Nottinghamshire 04D NHS Lincolnshire West CCG 0.4% 0.1%E10000024 Nottinghamshire 04E NHS Mansfield and Ashfield CCG 97.9% 22.5%E10000024 Nottinghamshire 04H NHS Newark & Sherwood CCG 97.6% 15.6%E10000024 Nottinghamshire 04K NHS Nottingham City CCG 10.1% 4.6%E10000024 Nottinghamshire 04L NHS Nottingham North and East CCG 95.1% 17.2%E10000024 Nottinghamshire 04M NHS Nottingham West CCG 90.8% 10.2%E10000024 Nottinghamshire 04N NHS Rushcliffe CCG 90.3% 13.6%E10000024 Nottinghamshire 04Q NHS South West Lincolnshire CCG 0.7% 0.1%E10000024 Nottinghamshire 04V NHS West Leicestershire CCG 0.1% 0.0%E08000004 Oldham 01D NHS Heywood, Middleton and Rochdale CCG 1.5% 1.4%E08000004 Oldham 14L NHS Manchester CCG 0.8% 2.1%E08000004 Oldham 00Y NHS Oldham CCG 94.5% 96.3%E08000004 Oldham 01Y NHS Tameside and Glossop CCG 0.2% 0.2%E10000025 Oxfordshire 15A NHS Berkshire West CCG 0.5% 0.3%E10000025 Oxfordshire 14Y NHS Buckinghamshire CCG 2.4% 1.8%E10000025 Oxfordshire 11M NHS Gloucestershire CCG 0.2% 0.2%E10000025 Oxfordshire 04G NHS Nene CCG 0.1% 0.1%E10000025 Oxfordshire 10Q NHS Oxfordshire CCG 97.4% 96.5%E10000025 Oxfordshire 05R NHS South Warwickshire CCG 0.6% 0.2%E10000025 Oxfordshire 12D NHS Swindon CCG 2.7% 0.9%E06000031 Peterborough 06H NHS Cambridgeshire and Peterborough CCG 23.0% 96.3%E06000031 Peterborough 99D NHS South Lincolnshire CCG 5.1% 3.7%E06000026 Plymouth 15N NHS Devon CCG 22.1% 100.0%E06000044 Portsmouth 10K NHS Fareham and Gosport CCG 1.5% 1.4%E06000044 Portsmouth 10R NHS Portsmouth CCG 95.6% 98.4%E06000044 Portsmouth 10V NHS South Eastern Hampshire CCG 0.2% 0.2%E06000038 Reading 15A NHS Berkshire West CCG 35.3% 99.4%E06000038 Reading 10Q NHS Oxfordshire CCG 0.2% 0.6%E09000026 Redbridge 07L NHS Barking and Dagenham CCG 4.9% 3.3%E09000026 Redbridge 08C NHS Hammersmith and Fulham CCG 0.1% 0.1%E09000026 Redbridge 08F NHS Havering CCG 0.8% 0.7%E09000026 Redbridge 08M NHS Newham CCG 1.4% 1.7%E09000026 Redbridge 08N NHS Redbridge CCG 92.3% 89.4%E09000026 Redbridge 08W NHS Waltham Forest CCG 3.3% 3.1%E09000026 Redbridge 07H NHS West Essex CCG 1.8% 1.7%E06000003 Redcar and Cleveland 03D NHS Hambleton, Richmondshire and Whitby CCG 1.1% 1.1%E06000003 Redcar and Cleveland 00M NHS South Tees CCG 47.3% 98.9%E09000027 Richmond upon Thames 08C NHS Hammersmith and Fulham CCG 0.5% 0.5%E09000027 Richmond upon Thames 07Y NHS Hounslow CCG 4.9% 7.0%E09000027 Richmond upon Thames 08J NHS Kingston CCG 1.6% 1.5%E09000027 Richmond upon Thames 08P NHS Richmond CCG 91.7% 90.3%E09000027 Richmond upon Thames 99H NHS Surrey Downs CCG 0.0% 0.1%E09000027 Richmond upon Thames 08X NHS Wandsworth CCG 0.4% 0.7%E08000005 Rochdale 00V NHS Bury CCG 0.7% 0.6%E08000005 Rochdale 01A NHS East Lancashire CCG 0.2% 0.3%E08000005 Rochdale 01D NHS Heywood, Middleton and Rochdale CCG 96.5% 96.6%E08000005 Rochdale 14L NHS Manchester CCG 0.6% 1.6%E08000005 Rochdale 00Y NHS Oldham CCG 0.9% 1.0%E08000018 Rotherham 02P NHS Barnsley CCG 3.3% 3.1%E08000018 Rotherham 02Q NHS Bassetlaw CCG 1.0% 0.4%E08000018 Rotherham 02X NHS Doncaster CCG 1.1% 1.2%E08000018 Rotherham 03L NHS Rotherham CCG 97.9% 93.5%E08000018 Rotherham 03N NHS Sheffield CCG 0.8% 1.7%E06000017 Rutland 06H NHS Cambridgeshire and Peterborough CCG 0.0% 0.3%E06000017 Rutland 03V NHS Corby CCG 0.2% 0.5%E06000017 Rutland 03W NHS East Leicestershire and Rutland CCG 9.9% 86.3%E06000017 Rutland 99D NHS South Lincolnshire CCG 2.6% 11.5%E06000017 Rutland 04Q NHS South West Lincolnshire CCG 0.4% 1.4%E08000006 Salford 00T NHS Bolton CCG 0.2% 0.3%E08000006 Salford 00V NHS Bury CCG 1.8% 1.4%E08000006 Salford 14L NHS Manchester CCG 1.1% 2.5%E08000006 Salford 01G NHS Salford CCG 94.1% 94.6%E08000006 Salford 02A NHS Trafford CCG 0.2% 0.2%E08000006 Salford 02H NHS Wigan Borough CCG 0.9% 1.1%E08000028 Sandwell 15E NHS Birmingham and Solihull CCG 1.9% 7.0%E08000028 Sandwell 05C NHS Dudley CCG 3.0% 2.7%E08000028 Sandwell 05L NHS Sandwell and West Birmingham CCG 55.1% 88.6%E08000028 Sandwell 05Y NHS Walsall CCG 1.7% 1.3%E08000028 Sandwell 06A NHS Wolverhampton CCG 0.3% 0.3%E08000014 Sefton 01J NHS Knowsley CCG 1.8% 1.0%E08000014 Sefton 99A NHS Liverpool CCG 2.9% 5.3%E08000014 Sefton 01T NHS South Sefton CCG 96.0% 51.6%E08000014 Sefton 01V NHS Southport and Formby CCG 96.8% 41.9%E08000014 Sefton 02G NHS West Lancashire CCG 0.3% 0.1%
Page 73 of 252

E08000019 Sheffield 02P NHS Barnsley CCG 0.8% 0.4%E08000019 Sheffield 15M NHS Derby and Derbyshire CCG 0.2% 0.4%E08000019 Sheffield 03L NHS Rotherham CCG 0.4% 0.2%E08000019 Sheffield 03N NHS Sheffield CCG 98.5% 99.1%E06000051 Shropshire 05F NHS Herefordshire CCG 0.4% 0.3%E06000051 Shropshire 05G NHS North Staffordshire CCG 0.5% 0.3%E06000051 Shropshire 05N NHS Shropshire CCG 96.7% 95.4%E06000051 Shropshire 01R NHS South Cheshire CCG 0.4% 0.3%E06000051 Shropshire 05Q NHS South East Staffs and Seisdon Peninsular CCG 1.2% 0.9%E06000051 Shropshire 05T NHS South Worcestershire CCG 1.0% 1.0%E06000051 Shropshire 05X NHS Telford and Wrekin CCG 2.3% 1.4%E06000051 Shropshire 02F NHS West Cheshire CCG 0.1% 0.1%E06000051 Shropshire 06D NHS Wyre Forest CCG 0.8% 0.3%E06000039 Slough 14Y NHS Buckinghamshire CCG 1.8% 6.2%E06000039 Slough 07W NHS Ealing CCG 0.0% 0.1%E06000039 Slough 15D NHS East Berkshire CCG 33.8% 93.4%E06000039 Slough 08G NHS Hillingdon CCG 0.0% 0.1%E06000039 Slough 07Y NHS Hounslow CCG 0.0% 0.1%E06000039 Slough 09Y NHS North West Surrey CCG 0.0% 0.1%E08000029 Solihull 15E NHS Birmingham and Solihull CCG 17.0% 98.9%E08000029 Solihull 05A NHS Coventry and Rugby CCG 0.0% 0.1%E08000029 Solihull 05J NHS Redditch and Bromsgrove CCG 0.4% 0.3%E08000029 Solihull 05L NHS Sandwell and West Birmingham CCG 0.0% 0.1%E08000029 Solihull 05R NHS South Warwickshire CCG 0.4% 0.4%E08000029 Solihull 05H NHS Warwickshire North CCG 0.2% 0.2%E10000027 Somerset 11E NHS Bath and North East Somerset CCG 3.1% 1.1%E10000027 Somerset 15C NHS Bristol, North Somerset and South Gloucestershire CCG 0.2% 0.3%E10000027 Somerset 15N NHS Devon CCG 0.2% 0.5%E10000027 Somerset 11J NHS Dorset CCG 0.5% 0.7%E10000027 Somerset 11X NHS Somerset CCG 98.5% 97.3%E10000027 Somerset 99N NHS Wiltshire CCG 0.1% 0.1%E06000025 South Gloucestershire 11E NHS Bath and North East Somerset CCG 0.8% 0.6%E06000025 South Gloucestershire 15C NHS Bristol, North Somerset and South Gloucestershire CCG 28.2% 97.5%E06000025 South Gloucestershire 11M NHS Gloucestershire CCG 0.8% 1.8%E06000025 South Gloucestershire 99N NHS Wiltshire CCG 0.0% 0.1%E08000023 South Tyneside 13T NHS Newcastle Gateshead CCG 0.0% 0.2%E08000023 South Tyneside 00N NHS South Tyneside CCG 99.2% 99.2%E08000023 South Tyneside 00P NHS Sunderland CCG 0.3% 0.6%E06000045 Southampton 10X NHS Southampton CCG 94.9% 99.5%E06000045 Southampton 11A NHS West Hampshire CCG 0.2% 0.5%E06000033 Southend-on-Sea 99F NHS Castle Point and Rochford CCG 4.8% 4.7%E06000033 Southend-on-Sea 99G NHS Southend CCG 96.7% 95.3%E09000028 Southwark 07R NHS Camden CCG 0.3% 0.3%E09000028 Southwark 09A NHS Central London (Westminster) CCG 2.5% 1.6%E09000028 Southwark 08C NHS Hammersmith and Fulham CCG 0.7% 0.5%E09000028 Southwark 08K NHS Lambeth CCG 6.6% 7.7%E09000028 Southwark 08L NHS Lewisham CCG 2.1% 2.0%E09000028 Southwark 08Q NHS Southwark CCG 94.1% 87.9%E09000028 Southwark 08X NHS Wandsworth CCG 0.1% 0.1%E08000013 St. Helens 01F NHS Halton CCG 0.2% 0.1%E08000013 St. Helens 01J NHS Knowsley CCG 2.6% 2.3%E08000013 St. Helens 01X NHS St Helens CCG 91.2% 96.3%E08000013 St. Helens 02E NHS Warrington CCG 0.1% 0.1%E08000013 St. Helens 02H NHS Wigan Borough CCG 0.7% 1.2%E10000028 Staffordshire 15E NHS Birmingham and Solihull CCG 0.3% 0.4%E10000028 Staffordshire 04Y NHS Cannock Chase CCG 99.3% 14.9%E10000028 Staffordshire 15M NHS Derby and Derbyshire CCG 0.5% 0.5%E10000028 Staffordshire 05C NHS Dudley CCG 1.4% 0.5%E10000028 Staffordshire 05D NHS East Staffordshire CCG 92.1% 14.7%E10000028 Staffordshire 01C NHS Eastern Cheshire CCG 0.6% 0.1%E10000028 Staffordshire 05G NHS North Staffordshire CCG 95.1% 23.4%E10000028 Staffordshire 05N NHS Shropshire CCG 1.0% 0.3%E10000028 Staffordshire 01R NHS South Cheshire CCG 0.5% 0.1%E10000028 Staffordshire 05Q NHS South East Staffs and Seisdon Peninsular CCG 96.2% 23.6%E10000028 Staffordshire 05V NHS Stafford and Surrounds CCG 99.5% 16.7%E10000028 Staffordshire 05W NHS Stoke on Trent CCG 8.8% 2.9%E10000028 Staffordshire 05X NHS Telford and Wrekin CCG 1.0% 0.2%E10000028 Staffordshire 05Y NHS Walsall CCG 1.6% 0.5%E10000028 Staffordshire 05H NHS Warwickshire North CCG 1.1% 0.2%E10000028 Staffordshire 06A NHS Wolverhampton CCG 2.6% 0.8%E10000028 Staffordshire 06D NHS Wyre Forest CCG 0.2% 0.0%E08000007 Stockport 01C NHS Eastern Cheshire CCG 1.6% 1.1%E08000007 Stockport 14L NHS Manchester CCG 1.1% 2.2%E08000007 Stockport 01W NHS Stockport CCG 94.9% 96.5%E08000007 Stockport 01Y NHS Tameside and Glossop CCG 0.2% 0.2%E06000004 Stockton-on-Tees 00C NHS Darlington CCG 0.4% 0.2%E06000004 Stockton-on-Tees 00D NHS Durham Dales, Easington and Sedgefield CCG 0.4% 0.6%E06000004 Stockton-on-Tees 03D NHS Hambleton, Richmondshire and Whitby CCG 0.1% 0.1%E06000004 Stockton-on-Tees 00K NHS Hartlepool and Stockton-On-Tees CCG 66.9% 98.4%E06000004 Stockton-on-Tees 00M NHS South Tees CCG 0.4% 0.7%
Page 74 of 252

E06000021 Stoke-on-Trent 05G NHS North Staffordshire CCG 3.3% 2.7%E06000021 Stoke-on-Trent 05V NHS Stafford and Surrounds CCG 0.5% 0.3%E06000021 Stoke-on-Trent 05W NHS Stoke on Trent CCG 91.2% 97.1%E10000029 Suffolk 06H NHS Cambridgeshire and Peterborough CCG 0.2% 0.2%E10000029 Suffolk 06M NHS Great Yarmouth and Waveney CCG 52.3% 16.3%E10000029 Suffolk 06L NHS Ipswich and East Suffolk CCG 99.6% 52.9%E10000029 Suffolk 06T NHS North East Essex CCG 1.4% 0.6%E10000029 Suffolk 06Y NHS South Norfolk CCG 1.1% 0.3%E10000029 Suffolk 07H NHS West Essex CCG 0.1% 0.0%E10000029 Suffolk 07K NHS West Suffolk CCG 91.1% 29.7%E08000024 Sunderland 00D NHS Durham Dales, Easington and Sedgefield CCG 0.9% 0.9%E08000024 Sunderland 13T NHS Newcastle Gateshead CCG 0.5% 0.9%E08000024 Sunderland 00J NHS North Durham CCG 2.2% 1.9%E08000024 Sunderland 00N NHS South Tyneside CCG 0.5% 0.3%E08000024 Sunderland 00P NHS Sunderland CCG 98.5% 96.0%E10000030 Surrey 07Q NHS Bromley CCG 0.4% 0.1%E10000030 Surrey 09G NHS Coastal West Sussex CCG 0.2% 0.0%E10000030 Surrey 09H NHS Crawley CCG 6.6% 0.7%E10000030 Surrey 07V NHS Croydon CCG 1.3% 0.4%E10000030 Surrey 15D NHS East Berkshire CCG 3.4% 1.2%E10000030 Surrey 09L NHS East Surrey CCG 96.6% 14.1%E10000030 Surrey 09N NHS Guildford and Waverley CCG 94.0% 16.9%E10000030 Surrey 09X NHS Horsham and Mid Sussex CCG 1.5% 0.3%E10000030 Surrey 07Y NHS Hounslow CCG 0.7% 0.2%E10000030 Surrey 08J NHS Kingston CCG 4.5% 0.7%E10000030 Surrey 08R NHS Merton CCG 0.3% 0.0%E10000030 Surrey 99M NHS North East Hampshire and Farnham CCG 23.0% 4.2%E10000030 Surrey 10J NHS North Hampshire CCG 0.1% 0.0%E10000030 Surrey 09Y NHS North West Surrey CCG 99.4% 29.5%E10000030 Surrey 08P NHS Richmond CCG 0.7% 0.1%E10000030 Surrey 10V NHS South Eastern Hampshire CCG 0.1% 0.0%E10000030 Surrey 99H NHS Surrey Downs CCG 97.4% 23.8%E10000030 Surrey 10C NHS Surrey Heath CCG 98.9% 7.6%E10000030 Surrey 08T NHS Sutton CCG 1.2% 0.2%E10000030 Surrey 99J NHS West Kent CCG 0.2% 0.0%E09000029 Sutton 07V NHS Croydon CCG 1.0% 1.9%E09000029 Sutton 08J NHS Kingston CCG 3.5% 3.4%E09000029 Sutton 08K NHS Lambeth CCG 0.1% 0.2%E09000029 Sutton 08R NHS Merton CCG 6.3% 6.7%E09000029 Sutton 99H NHS Surrey Downs CCG 1.3% 1.9%E09000029 Sutton 08T NHS Sutton CCG 94.7% 85.6%E09000029 Sutton 08X NHS Wandsworth CCG 0.2% 0.3%E06000030 Swindon 11M NHS Gloucestershire CCG 0.0% 0.2%E06000030 Swindon 12D NHS Swindon CCG 96.0% 98.2%E06000030 Swindon 99N NHS Wiltshire CCG 0.7% 1.5%E08000008 Tameside 14L NHS Manchester CCG 2.2% 5.8%E08000008 Tameside 00Y NHS Oldham CCG 3.6% 3.9%E08000008 Tameside 01W NHS Stockport CCG 1.8% 2.3%E08000008 Tameside 01Y NHS Tameside and Glossop CCG 85.2% 88.0%E06000020 Telford and Wrekin 05N NHS Shropshire CCG 1.8% 2.9%E06000020 Telford and Wrekin 05X NHS Telford and Wrekin CCG 96.7% 97.1%E06000034 Thurrock 07L NHS Barking and Dagenham CCG 0.3% 0.3%E06000034 Thurrock 99E NHS Basildon and Brentwood CCG 0.2% 0.3%E06000034 Thurrock 08F NHS Havering CCG 0.2% 0.4%E06000034 Thurrock 07G NHS Thurrock CCG 98.5% 99.0%E06000027 Torbay 15N NHS Devon CCG 11.7% 100.0%E09000030 Tower Hamlets 07R NHS Camden CCG 1.1% 0.9%E09000030 Tower Hamlets 09A NHS Central London (Westminster) CCG 0.5% 0.3%E09000030 Tower Hamlets 07T NHS City and Hackney CCG 0.9% 0.9%E09000030 Tower Hamlets 08C NHS Hammersmith and Fulham CCG 0.8% 0.5%E09000030 Tower Hamlets 08H NHS Islington CCG 0.2% 0.1%E09000030 Tower Hamlets 08M NHS Newham CCG 0.2% 0.2%E09000030 Tower Hamlets 08V NHS Tower Hamlets CCG 98.9% 96.9%E08000009 Trafford 14L NHS Manchester CCG 2.7% 7.0%E08000009 Trafford 01G NHS Salford CCG 0.1% 0.1%E08000009 Trafford 02A NHS Trafford CCG 95.7% 92.7%E08000009 Trafford 02E NHS Warrington CCG 0.1% 0.1%E08000036 Wakefield 02P NHS Barnsley CCG 0.9% 0.6%E08000036 Wakefield 15F NHS Leeds CCG 0.4% 1.0%E08000036 Wakefield 03J NHS North Kirklees CCG 0.6% 0.3%E08000036 Wakefield 03R NHS Wakefield CCG 94.5% 98.0%E08000030 Walsall 15E NHS Birmingham and Solihull CCG 1.1% 4.8%E08000030 Walsall 04Y NHS Cannock Chase CCG 0.7% 0.3%E08000030 Walsall 05L NHS Sandwell and West Birmingham CCG 1.6% 3.1%E08000030 Walsall 05Y NHS Walsall CCG 92.8% 90.4%E08000030 Walsall 06A NHS Wolverhampton CCG 1.4% 1.4%E09000031 Waltham Forest 07T NHS City and Hackney CCG 0.4% 0.4%E09000031 Waltham Forest 08C NHS Hammersmith and Fulham CCG 0.3% 0.2%E09000031 Waltham Forest 08D NHS Haringey CCG 0.1% 0.1%E09000031 Waltham Forest 08M NHS Newham CCG 1.3% 1.7%E09000031 Waltham Forest 08N NHS Redbridge CCG 1.4% 1.4%E09000031 Waltham Forest 08W NHS Waltham Forest CCG 94.3% 96.1%
Page 75 of 252
E09000032 Wandsworth 09A NHS Central London (Westminster) CCG 0.9% 0.6%E09000032 Wandsworth 08C NHS Hammersmith and Fulham CCG 1.0% 0.6%E09000032 Wandsworth 08J NHS Kingston CCG 0.1% 0.0%E09000032 Wandsworth 08K NHS Lambeth CCG 3.2% 3.5%E09000032 Wandsworth 08R NHS Merton CCG 2.8% 1.6%E09000032 Wandsworth 08P NHS Richmond CCG 1.3% 0.7%E09000032 Wandsworth 08X NHS Wandsworth CCG 88.3% 92.6%E09000032 Wandsworth 08Y NHS West London (K&C & QPP) CCG 0.7% 0.4%E06000007 Warrington 01F NHS Halton CCG 0.3% 0.2%E06000007 Warrington 01G NHS Salford CCG 0.5% 0.6%E06000007 Warrington 01X NHS St Helens CCG 2.2% 2.0%E06000007 Warrington 02E NHS Warrington CCG 97.6% 97.0%E06000007 Warrington 02H NHS Wigan Borough CCG 0.2% 0.2%E10000031 Warwickshire 15E NHS Birmingham and Solihull CCG 0.2% 0.5%E10000031 Warwickshire 05A NHS Coventry and Rugby CCG 25.2% 21.5%E10000031 Warwickshire 11M NHS Gloucestershire CCG 0.2% 0.2%E10000031 Warwickshire 04G NHS Nene CCG 0.2% 0.2%E10000031 Warwickshire 10Q NHS Oxfordshire CCG 0.3% 0.3%E10000031 Warwickshire 05J NHS Redditch and Bromsgrove CCG 0.7% 0.2%E10000031 Warwickshire 05Q NHS South East Staffs and Seisdon Peninsular CCG 0.8% 0.3%E10000031 Warwickshire 05R NHS South Warwickshire CCG 96.1% 45.8%E10000031 Warwickshire 05H NHS Warwickshire North CCG 96.7% 30.7%E10000031 Warwickshire 04V NHS West Leicestershire CCG 0.5% 0.3%E06000037 West Berkshire 15A NHS Berkshire West CCG 30.0% 97.6%E06000037 West Berkshire 10J NHS North Hampshire CCG 0.7% 0.9%E06000037 West Berkshire 10Q NHS Oxfordshire CCG 0.2% 1.1%E06000037 West Berkshire 99N NHS Wiltshire CCG 0.1% 0.4%E10000032 West Sussex 09D NHS Brighton and Hove CCG 1.1% 0.4%E10000032 West Sussex 09G NHS Coastal West Sussex CCG 99.5% 57.5%E10000032 West Sussex 09H NHS Crawley CCG 93.4% 14.0%E10000032 West Sussex 09L NHS East Surrey CCG 0.3% 0.0%E10000032 West Sussex 09N NHS Guildford and Waverley CCG 3.1% 0.8%E10000032 West Sussex 99K NHS High Weald Lewes Havens CCG 1.1% 0.2%E10000032 West Sussex 09X NHS Horsham and Mid Sussex CCG 95.7% 25.9%E10000032 West Sussex 10V NHS South Eastern Hampshire CCG 4.1% 1.0%E10000032 West Sussex 99H NHS Surrey Downs CCG 0.6% 0.2%E09000033 Westminster 07P NHS Brent CCG 1.3% 2.0%E09000033 Westminster 07R NHS Camden CCG 3.0% 3.4%E09000033 Westminster 09A NHS Central London (Westminster) CCG 79.3% 71.3%E09000033 Westminster 08C NHS Hammersmith and Fulham CCG 0.6% 0.6%E09000033 Westminster 08K NHS Lambeth CCG 0.1% 0.2%E09000033 Westminster 08Y NHS West London (K&C & QPP) CCG 23.1% 22.6%E08000010 Wigan 00T NHS Bolton CCG 0.2% 0.1%E08000010 Wigan 01G NHS Salford CCG 0.8% 0.6%E08000010 Wigan 01X NHS St Helens CCG 3.8% 2.2%E08000010 Wigan 02E NHS Warrington CCG 0.4% 0.2%E08000010 Wigan 02G NHS West Lancashire CCG 2.8% 1.0%E08000010 Wigan 02H NHS Wigan Borough CCG 96.7% 95.7%E06000054 Wiltshire 11E NHS Bath and North East Somerset CCG 0.9% 0.4%E06000054 Wiltshire 15A NHS Berkshire West CCG 0.2% 0.2%E06000054 Wiltshire 15C NHS Bristol, North Somerset and South Gloucestershire CCG 0.2% 0.5%E06000054 Wiltshire 11J NHS Dorset CCG 0.3% 0.4%E06000054 Wiltshire 11M NHS Gloucestershire CCG 0.4% 0.5%E06000054 Wiltshire 11X NHS Somerset CCG 0.3% 0.4%E06000054 Wiltshire 12D NHS Swindon CCG 1.3% 0.6%E06000054 Wiltshire 11A NHS West Hampshire CCG 0.1% 0.2%E06000054 Wiltshire 99N NHS Wiltshire CCG 96.7% 96.8%E06000040 Windsor and Maidenhead 15A NHS Berkshire West CCG 0.4% 1.3%E06000040 Windsor and Maidenhead 14Y NHS Buckinghamshire CCG 0.3% 1.1%E06000040 Windsor and Maidenhead 15D NHS East Berkshire CCG 34.1% 96.9%E06000040 Windsor and Maidenhead 09Y NHS North West Surrey CCG 0.2% 0.5%E06000040 Windsor and Maidenhead 10Q NHS Oxfordshire CCG 0.0% 0.2%E06000040 Windsor and Maidenhead 10C NHS Surrey Heath CCG 0.1% 0.0%E08000015 Wirral 02F NHS West Cheshire CCG 0.4% 0.3%E08000015 Wirral 12F NHS Wirral CCG 99.7% 99.7%E06000041 Wokingham 15A NHS Berkshire West CCG 31.5% 97.0%E06000041 Wokingham 15D NHS East Berkshire CCG 1.0% 2.6%E06000041 Wokingham 10Q NHS Oxfordshire CCG 0.1% 0.4%E08000031 Wolverhampton 05C NHS Dudley CCG 1.3% 1.5%E08000031 Wolverhampton 05L NHS Sandwell and West Birmingham CCG 0.1% 0.3%E08000031 Wolverhampton 05Q NHS South East Staffs and Seisdon Peninsular CCG 1.8% 1.4%E08000031 Wolverhampton 05Y NHS Walsall CCG 3.4% 3.5%E08000031 Wolverhampton 06A NHS Wolverhampton CCG 93.8% 93.4%E10000034 Worcestershire 15E NHS Birmingham and Solihull CCG 0.9% 2.0%E10000034 Worcestershire 05C NHS Dudley CCG 0.7% 0.4%E10000034 Worcestershire 11M NHS Gloucestershire CCG 0.5% 0.6%E10000034 Worcestershire 05F NHS Herefordshire CCG 0.9% 0.3%E10000034 Worcestershire 05J NHS Redditch and Bromsgrove CCG 95.8% 27.7%E10000034 Worcestershire 05N NHS Shropshire CCG 0.3% 0.1%E10000034 Worcestershire 05R NHS South Warwickshire CCG 2.3% 1.1%E10000034 Worcestershire 05T NHS South Worcestershire CCG 97.2% 49.3%E10000034 Worcestershire 06D NHS Wyre Forest CCG 98.3% 18.6%E06000014 York 03E NHS Harrogate and Rural District CCG 0.2% 0.1%E06000014 York 03Q NHS Vale of York CCG 60.2% 99.9%Produced by NHS England using data from National Health Applications and Infrastructure Services (NHAIS) as supplied by NHS Digital.
Page 76 of 252

Better Care Fund 2019/20 Template1. Guidance
Overview
Note on entering information into this template
Throughout the template, cells which are open for input have a yellow background and those that are pre-populated have a grey background, as below:Data needs inputting in the cellPre-populated cellsNote on viewing the sheets optimallyFor a more optimal view each of the sheets and in particular the drop down lists clearly on screen, please change the zoom level between 90% - 100%. Most drop downs are also available to view as lists within the relevant sheet or in the guidance sheet for readability if required.
The details of each sheet within the template are outlined below.Checklist (click to go to Checklist, included in the Cover sheet)1. This section helps identify the data fields that have not been completed. All fields that appear as incomplete should be complete before sending to the Better Care Support Team.2. It is sectioned out by sheet name and contains the description of the information required, cell reference for the question and the 'checker' column which updates automatically as questions within each sheet are completed.3. The checker column will appear 'Red' and contain the word 'No' if the information has not been completed. Clicking on the corresponding 'Cell Reference' column will link to the incomplete cell for completion. Once completed the checker column will change to 'Green' and contain the word 'Yes'
4. The 'sheet completed' cell will update when all 'checker' values for the sheet are green containing the word 'Yes'.5. Once the checker column contains all cells marked 'Yes' the 'Incomplete Template' cell (below the title) will change to 'Complete Template'.6. Please ensure that all boxes on the checklist are green before submission.2. Cover (click to go to sheet)1. The cover sheet provides essential information on the area for which the template is being completed, contacts and sign off.
2. Question completion tracks the number of questions that have been completed; when all the questions in each section of the template have been completed the cell will turn green. Only when all cells are green should the template be sent to [email protected]. Please note that in line with fair processing of personal data we collect email addresses to communicate with key individuals from the local areas for various purposes relating to the delivery of the BCF plans including plan development, assurance, approval and provision of support. We remove these addresses from the supplied templates when they are collated and delete them when they are no longer needed. Please let us know if any of the submitted contact information changes during the BCF planning cycle so we are able to communicate with the right people in a timely manner.
4. Strategic Narrative (click to go to sheet)This section of the template should set out the agreed approach locally to integration of health & social care. The narratives should focus on updating existing plans, and changes since integration plans were set out until 2020 rather than reiterating them and can be short. Word limits have been applied to each section and these are indicated on the worksheet.
1. Approach to integrating care around the person. This should set out your approach to integrating health and social care around the people, particularly those with long term health and care needs. This should highlight developments since 2017 and cover areas such as prevention.
2 i. Approach to integrating services at HWB level (including any arrangements at neighbourhood level where relevant). This should set out the agreed approach and services that will be commissioned through the BCF. Where schemes are new or approaches locally have changed, you should set out a short rationale.2 ii. DFG and wider services. This should describe your approach to integration and joint commissioning/delivery with wider services. In all cases this should include housing, and a short narrative on use of the DFG to support people with care needs to remain independent through adaptations or other capital expenditure on their homes. This should include any discretionary use of the DFG.3. How your BCF plan and other local plans align with the wider system and support integrated approaches. Examples may include the read across to the STP (Sustainability Transformation Partnerships) or ICS (Integrated Care Systems) plan(s) for your area and any other relevant strategies.
You can attach (in the e-mail) visuals and illustrations to aid understanding if this will assist assurers in understanding your local approach.5. Income (click to go to sheet)
1. This sheet should be used to specify all funding contributions to the Health and Wellbeing Board's Better Care Fund (BCF) plan and pooled budget for 2019/20. On selected the HWB from the Cover page, this sheet will be pre-populated with the minimum CCG contributions to the BCF, DFG (Disabled Facilities Grant), iBCF (improved Better Care Fund) and Winter Pressures allocations to be pooled within the BCF. These cannot be edited.2. Please select whether any additional contributions to the BCF pool are being made from Local Authorities or the CCGs and as applicable enter the amounts in the fields highlighted in ‘yellow’. These will appear as funding sources when planning expenditure. The fields for Additional contributions can be utilised to include any relevant carry-overs from the previous year.3. Please use the comment boxes alongside to add any specific detail around this additional contribution including any relevant carry-overs assigned from previous years. All allocations are rounded to the nearest pound.4. For any questions regarding the BCF funding allocations, please contact [email protected]
Page 77 of 252

6. Expenditure (click to go to sheet)This sheet should be used to set out the schemes that constitute the BCF plan for the HWB including the planned expenditure and the attributes to describe the scheme. This information is then aggregated and utilised to analyse the BCF plans nationally and sets the basis for future reporting and to particularly demonstrate that National Condition 2 and 3 are met.
The table is set out to capture a range of information about how schemes are being funded and the types of services they are providing. There may be scenarios when several lines need to be completed in order to fully describe a single scheme or where a scheme is funded by multiple funding streams (eg: iBCF and CCG minimum). In this case please use a consistent scheme ID for each line to ensure integrity of aggregating and analysing schemes.On this sheet please enter the following information:1. Scheme ID:- This field only permits numbers. Please enter a number to represent the Scheme ID for the scheme being entered. Please enter the same Scheme ID in this column for any schemes that are described across multiple rows.2. Scheme Name: - This is a free field to aid identification during the planning process. Please use the scheme name consistently if the scheme is described across multiple lines in line with the scheme ID described above.3. Brief Description of Scheme- This is free text field to include a brief headline description of the scheme being planned.4. Scheme Type and Sub Type: - Please select the Scheme Type from the drop-down list that best represents the type of scheme being planned. A description of each scheme is available at the end of the table (follow the link to the description section at the top of the main expenditure table). - Where the Scheme Types has further options to choose from, the Sub Type column alongside will be editable and turn "yellow". Please select the Sub Type from the drop down list that best describes the scheme being planned.- Please note that the drop down list has a scroll bar to scroll through the list and all the options may not appear in one view.- If the scheme is not adequately described by the available options, please choose ‘Other’ and add a free field description for the scheme type in the column alongside.- While selecting schemes and sub-types, the sub-type field will be flagged in ‘red’ font if it is from a previously selected scheme type. In this case please clear the sub-type field and reselect from the dropdown if the subtype field is editable.5. Planned Outputs- The BCF Planning requirements document requires areas to set out planned outputs for certain scheme types (those which lend themselves to delivery of discrete units of delivery) to help to better understand and account for the activity funded through the BCF. - The Planned Outputs fields will only be editable if one of the relevant scheme types is selected. Please select a relevant unit from the drop down and an estimate of the outputs expected over the year. This is a numerical field.6. Metric Impact- This field is collecting information on the metrics that a chem will impact on (rather than the actual planned impact on the metric)- For the schemes being planned please select from the drop-down options of ‘High-Medium-Low-n/a’ to provide an indicative level of impact on the four BCF metrics. Where the scheme impacts multiple metrics, this can be expressed by selecting the appropriate level from the drop down for each of the metrics. For example, a discharge to assess scheme might have a medium impact on Delayed Transfers of Care and permanent admissions to residential care. Where the scheme is not expected to impact a metric, the ‘n/a’ option could be selected from the drop-down menu.7. Area of Spend:- Please select the area of spend from the drop-down list by considering the area of the health and social system which is most supported by investing in the scheme. - Please note that where ‘Social Care’ is selected and the source of funding is “CCG minimum” then the planned spend would count towards National Condition 2.- If the scheme is not adequately described by the available options, please choose ‘Other’ and add a free field description for the scheme type in the column alongside. - We encourage areas to try to use the standard scheme types where possible.8. Commissioner:- Identify the commissioning entity for the scheme based on who commissions the scheme from the provider. If there is a single commissioner, please select the option from the drop-down list. - Please note this field is utilised in the calculations for meeting National Condition 3.- If the scheme is commissioned jointly, please select ‘Joint’. Please estimate the proportion of the scheme being commissioned by the local authority and CCG/NHS and enter the respective percentages on the two columns alongside.9. Provider:- Please select the ‘Provider’ commissioned to provide the scheme from the drop-down list.- If the scheme is being provided by multiple providers, please split the scheme across multiple lines.
10. Source of Funding:- Based on the funding sources for the BCF pool for the HWB, please select the source of funding for the scheme from the drop-down list- If the scheme is funding across multiple sources of funding, please split the scheme across multiple lines, reflecting the financial contribution from each.11. Expenditure (£) 2019/20:- Please enter the planned spend for the scheme (or the scheme line, if the scheme is expressed across multiple lines)12. New/Existing Scheme- Please indicate whether the planned scheme is a new scheme for this year or an existing scheme being carried forward.
This is the only detailed information on BCF schemes being collected centrally for 2019/20 and will inform the understanding of planned spend for the iBCF and Winter Funding grants.
Page 78 of 252
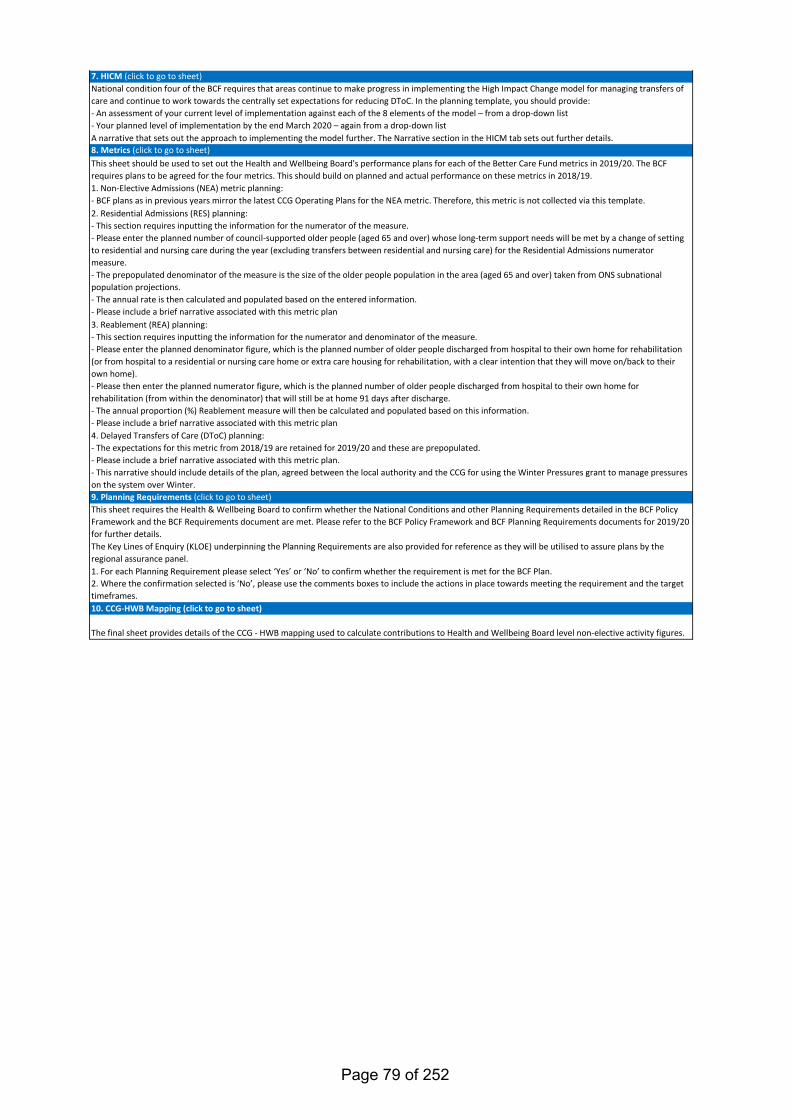
7. HICM (click to go to sheet)National condition four of the BCF requires that areas continue to make progress in implementing the High Impact Change model for managing transfers of care and continue to work towards the centrally set expectations for reducing DToC. In the planning template, you should provide:- An assessment of your current level of implementation against each of the 8 elements of the model – from a drop-down list- Your planned level of implementation by the end March 2020 – again from a drop-down listA narrative that sets out the approach to implementing the model further. The Narrative section in the HICM tab sets out further details.8. Metrics (click to go to sheet)This sheet should be used to set out the Health and Wellbeing Board's performance plans for each of the Better Care Fund metrics in 2019/20. The BCF requires plans to be agreed for the four metrics. This should build on planned and actual performance on these metrics in 2018/19.1. Non-Elective Admissions (NEA) metric planning:- BCF plans as in previous years mirror the latest CCG Operating Plans for the NEA metric. Therefore, this metric is not collected via this template.2. Residential Admissions (RES) planning: - This section requires inputting the information for the numerator of the measure.- Please enter the planned number of council-supported older people (aged 65 and over) whose long-term support needs will be met by a change of setting to residential and nursing care during the year (excluding transfers between residential and nursing care) for the Residential Admissions numerator measure.- The prepopulated denominator of the measure is the size of the older people population in the area (aged 65 and over) taken from ONS subnational population projections.- The annual rate is then calculated and populated based on the entered information.- Please include a brief narrative associated with this metric plan3. Reablement (REA) planning: - This section requires inputting the information for the numerator and denominator of the measure.- Please enter the planned denominator figure, which is the planned number of older people discharged from hospital to their own home for rehabilitation (or from hospital to a residential or nursing care home or extra care housing for rehabilitation, with a clear intention that they will move on/back to their own home).- Please then enter the planned numerator figure, which is the planned number of older people discharged from hospital to their own home for rehabilitation (from within the denominator) that will still be at home 91 days after discharge.- The annual proportion (%) Reablement measure will then be calculated and populated based on this information.- Please include a brief narrative associated with this metric plan4. Delayed Transfers of Care (DToC) planning: - The expectations for this metric from 2018/19 are retained for 2019/20 and these are prepopulated. - Please include a brief narrative associated with this metric plan. - This narrative should include details of the plan, agreed between the local authority and the CCG for using the Winter Pressures grant to manage pressures on the system over Winter.9. Planning Requirements (click to go to sheet)This sheet requires the Health & Wellbeing Board to confirm whether the National Conditions and other Planning Requirements detailed in the BCF Policy Framework and the BCF Requirements document are met. Please refer to the BCF Policy Framework and BCF Planning Requirements documents for 2019/20 for further details.The Key Lines of Enquiry (KLOE) underpinning the Planning Requirements are also provided for reference as they will be utilised to assure plans by the regional assurance panel.1. For each Planning Requirement please select ‘Yes’ or ‘No’ to confirm whether the requirement is met for the BCF Plan.2. Where the confirmation selected is ‘No’, please use the comments boxes to include the actions in place towards meeting the requirement and the target timeframes.10. CCG-HWB Mapping (click to go to sheet)
The final sheet provides details of the CCG - HWB mapping used to calculate contributions to Health and Wellbeing Board level non-elective activity figures.
Page 79 of 252
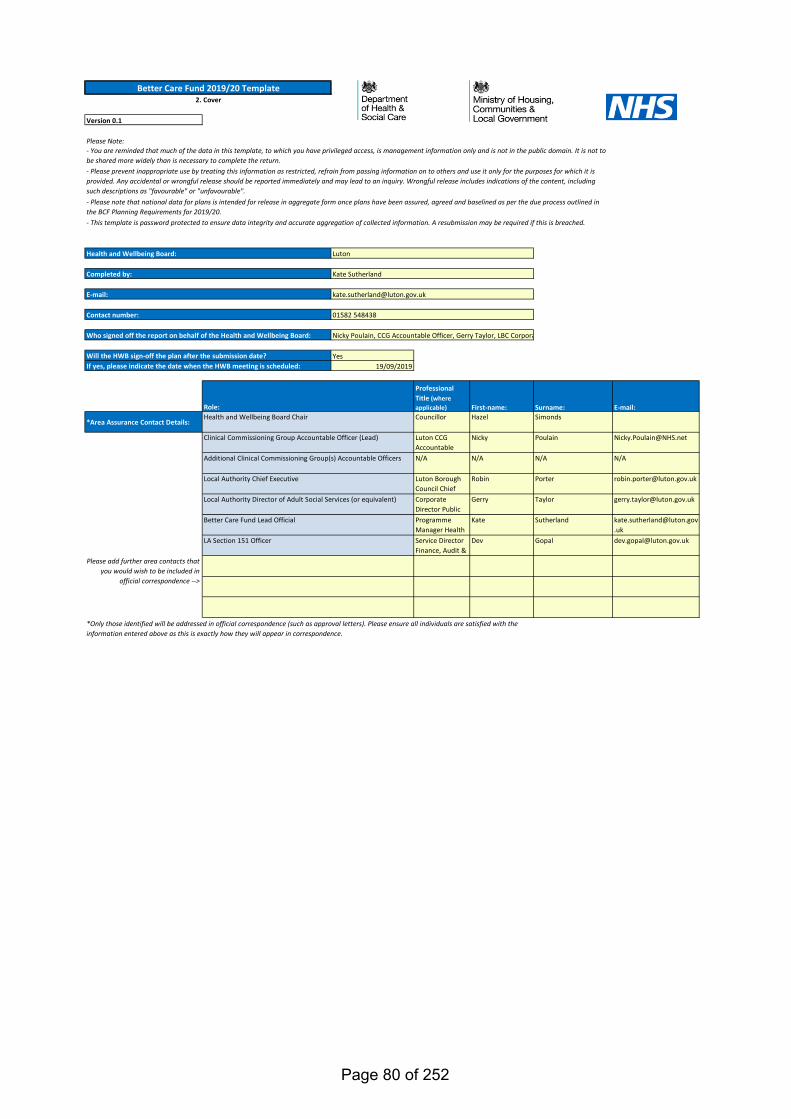
Version 0.1
Please Note:
Yes19/09/2019
Professional Title (where applicable) First-name: Surname: E-mail:
*Area Assurance Contact Details:Councillor Hazel Simonds
Luton CCG Accountable
Nicky Poulain [email protected]
N/A N/A N/A N/A
Luton Borough Council Chief
Robin Porter [email protected]
Corporate Director Public
Gerry Taylor [email protected]
Programme Manager Health
Kate Sutherland [email protected]
Service Director Finance, Audit &
Dev Gopal [email protected]
Please add further area contacts that you would wish to be included in
official correspondence -->
Role:Health and Wellbeing Board Chair
Clinical Commissioning Group Accountable Officer (Lead)
Additional Clinical Commissioning Group(s) Accountable Officers
Local Authority Chief Executive
Local Authority Director of Adult Social Services (or equivalent)
Better Care Fund Lead Official
LA Section 151 Officer
Who signed off the report on behalf of the Health and Wellbeing Board:
Better Care Fund 2019/20 Template2. Cover
Kate Sutherland
Luton
01582 548438
Health and Wellbeing Board:
Completed by:
E-mail:
Contact number:
- You are reminded that much of the data in this template, to which you have privileged access, is management information only and is not in the public domain. It is not to be shared more widely than is necessary to complete the return.- Please prevent inappropriate use by treating this information as restricted, refrain from passing information on to others and use it only for the purposes for which it is provided. Any accidental or wrongful release should be reported immediately and may lead to an inquiry. Wrongful release includes indications of the content, including such descriptions as "favourable" or "unfavourable".- Please note that national data for plans is intended for release in aggregate form once plans have been assured, agreed and baselined as per the due process outlined in the BCF Planning Requirements for 2019/20.- This template is password protected to ensure data integrity and accurate aggregation of collected information. A resubmission may be required if this is breached.
Nicky Poulain, CCG Accountable Officer, Gerry Taylor, LBC Corpora
Will the HWB sign-off the plan after the submission date?If yes, please indicate the date when the HWB meeting is scheduled:
*Only those identified will be addressed in official correspondence (such as approval letters). Please ensure all individuals are satisfied with the information entered above as this is exactly how they will appear in correspondence.
Page 80 of 252
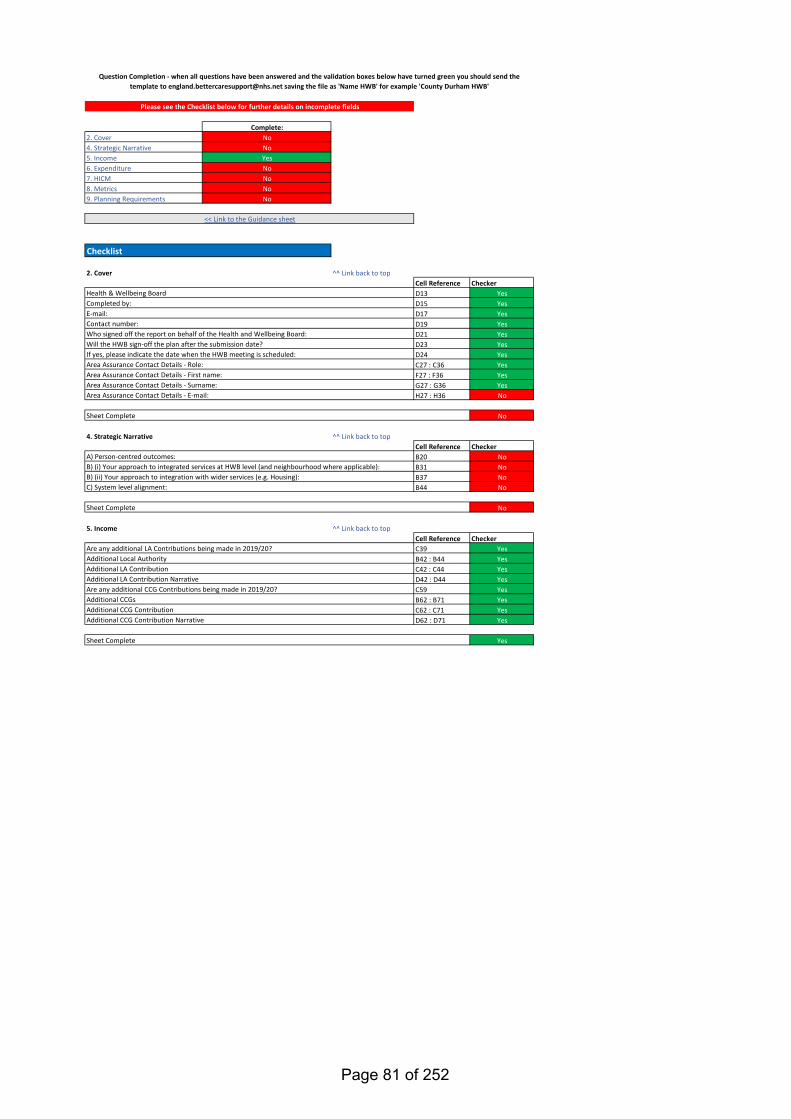
Complete:2. Cover No4. Strategic Narrative No5. Income Yes6. Expenditure No7. HICM No8. Metrics No9. Planning Requirements No
2. Cover ^^ Link back to topCell Reference CheckerD13 YesD15 YesD17 YesD19 YesD21 YesD23 YesD24 YesC27 : C36 YesF27 : F36 YesG27 : G36 YesH27 : H36 No
No
4. Strategic Narrative ^^ Link back to topCell Reference CheckerB20 NoB31 NoB37 NoB44 No
No
5. Income ^^ Link back to topCell Reference CheckerC39 YesB42 : B44 YesC42 : C44 YesD42 : D44 YesC59 YesB62 : B71 YesC62 : C71 YesD62 : D71 Yes
Yes
Area Assurance Contact Details - First name:Area Assurance Contact Details - Surname:
Sheet Complete
Are any additional CCG Contributions being made in 2019/20?Additional CCGsAdditional CCG Contribution
Area Assurance Contact Details - E-mail:
Are any additional LA Contributions being made in 2019/20?
C) System level alignment:
<< Link to the Guidance sheet
Checklist
A) Person-centred outcomes:B) (i) Your approach to integrated services at HWB level (and neighbourhood where applicable):B) (ii) Your approach to integration with wider services (e.g. Housing):
Question Completion - when all questions have been answered and the validation boxes below have turned green you should send the template to [email protected] saving the file as 'Name HWB' for example 'County Durham HWB'
Contact number:Who signed off the report on behalf of the Health and Wellbeing Board:
Sheet Complete
Please see the Checklist below for further details on incomplete fields
Health & Wellbeing BoardCompleted by:E-mail:
Area Assurance Contact Details - Role:
Additional CCG Contribution Narrative
Sheet Complete
Additional Local AuthorityAdditional LA ContributionAdditional LA Contribution Narrative
Will the HWB sign-off the plan after the submission date?If yes, please indicate the date when the HWB meeting is scheduled:
Page 81 of 252
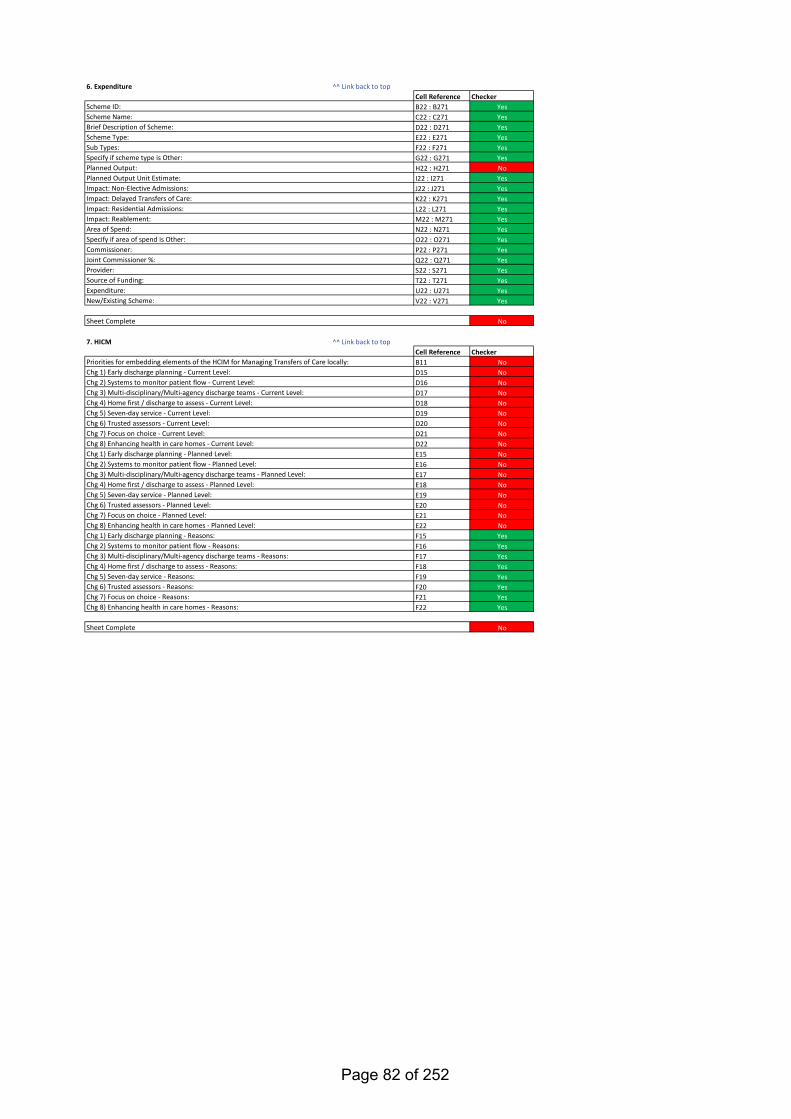
6. Expenditure ^^ Link back to topCell Reference CheckerB22 : B271 YesC22 : C271 YesD22 : D271 YesE22 : E271 YesF22 : F271 YesG22 : G271 YesH22 : H271 NoI22 : I271 YesJ22 : J271 YesK22 : K271 YesL22 : L271 YesM22 : M271 YesN22 : N271 YesO22 : O271 YesP22 : P271 YesQ22 : Q271 YesS22 : S271 YesT22 : T271 YesU22 : U271 YesV22 : V271 Yes
No
7. HICM ^^ Link back to topCell Reference CheckerB11 NoD15 NoD16 NoD17 NoD18 NoD19 NoD20 NoD21 NoD22 NoE15 NoE16 NoE17 NoE18 NoE19 NoE20 NoE21 NoE22 NoF15 YesF16 YesF17 YesF18 YesF19 YesF20 YesF21 YesF22 Yes
No
Chg 7) Focus on choice - Current Level:Chg 8) Enhancing health in care homes - Current Level:
Provider:Source of Funding:Expenditure:New/Existing Scheme:
Sheet Complete
Impact: Reablement:Area of Spend:Specify if area of spend is Other:Commissioner:Joint Commissioner %:
Planned Output:Planned Output Unit Estimate:
Scheme ID:
Chg 1) Early discharge planning - Current Level:Chg 2) Systems to monitor patient flow - Current Level:Chg 3) Multi-disciplinary/Multi-agency discharge teams - Current Level:Chg 4) Home first / discharge to assess - Current Level:Chg 5) Seven-day service - Current Level:Chg 6) Trusted assessors - Current Level:
Impact: Delayed Transfers of Care:Impact: Residential Admissions:
Sub Types:
Scheme Name:Brief Description of Scheme:Scheme Type:
Specify if scheme type is Other:
Impact: Non-Elective Admissions:
Priorities for embedding elements of the HCIM for Managing Transfers of Care locally:
Chg 1) Early discharge planning - Planned Level:Chg 2) Systems to monitor patient flow - Planned Level:Chg 3) Multi-disciplinary/Multi-agency discharge teams - Planned Level:Chg 4) Home first / discharge to assess - Planned Level:Chg 5) Seven-day service - Planned Level:Chg 6) Trusted assessors - Planned Level:Chg 7) Focus on choice - Planned Level:Chg 8) Enhancing health in care homes - Planned Level:
Sheet Complete
Chg 1) Early discharge planning - Reasons:Chg 2) Systems to monitor patient flow - Reasons:Chg 3) Multi-disciplinary/Multi-agency discharge teams - Reasons:Chg 4) Home first / discharge to assess - Reasons:Chg 5) Seven-day service - Reasons:Chg 6) Trusted assessors - Reasons:Chg 7) Focus on choice - Reasons:Chg 8) Enhancing health in care homes - Reasons:
Page 82 of 252
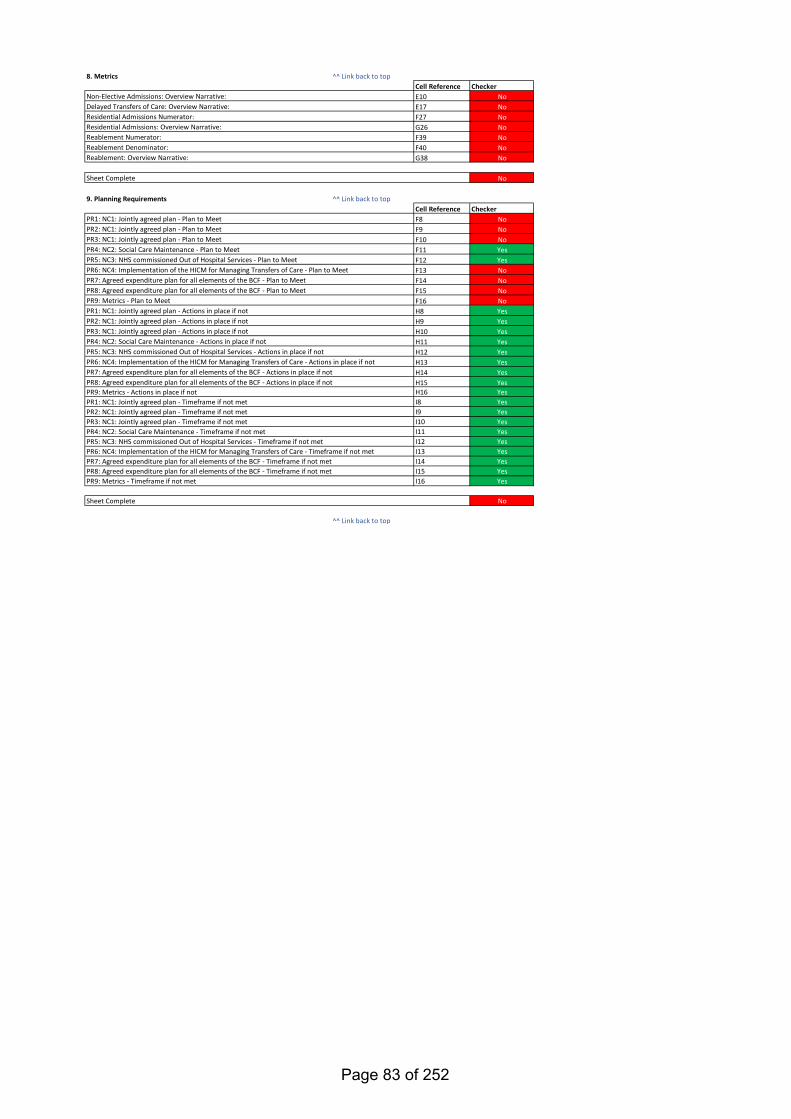
8. Metrics ^^ Link back to topCell Reference CheckerE10 NoE17 NoF27 NoG26 NoF39 NoF40 NoG38 No
No
9. Planning Requirements ^^ Link back to topCell Reference CheckerF8 NoF9 NoF10 NoF11 YesF12 YesF13 NoF14 NoF15 NoF16 NoH8 YesH9 YesH10 YesH11 YesH12 YesH13 YesH14 YesH15 YesH16 YesI8 YesI9 YesI10 YesI11 YesI12 YesI13 YesI14 YesI15 YesI16 Yes
No
^^ Link back to top
Non-Elective Admissions: Overview Narrative:Delayed Transfers of Care: Overview Narrative:Residential Admissions Numerator:Residential Admissions: Overview Narrative:Reablement Numerator:
Sheet Complete
PR5: NC3: NHS commissioned Out of Hospital Services - Actions in place if not
PR2: NC1: Jointly agreed plan - Timeframe if not metPR3: NC1: Jointly agreed plan - Timeframe if not metPR4: NC2: Social Care Maintenance - Timeframe if not metPR5: NC3: NHS commissioned Out of Hospital Services - Timeframe if not metPR6: NC4: Implementation of the HICM for Managing Transfers of Care - Timeframe if not metPR7: Agreed expenditure plan for all elements of the BCF - Timeframe if not metPR8: Agreed expenditure plan for all elements of the BCF - Timeframe if not metPR9: Metrics - Timeframe if not met
PR1: NC1: Jointly agreed plan - Actions in place if notPR2: NC1: Jointly agreed plan - Actions in place if not
PR1: NC1: Jointly agreed plan - Plan to Meet
PR6: NC4: Implementation of the HICM for Managing Transfers of Care - Actions in place if notPR7: Agreed expenditure plan for all elements of the BCF - Actions in place if notPR8: Agreed expenditure plan for all elements of the BCF - Actions in place if notPR9: Metrics - Actions in place if notPR1: NC1: Jointly agreed plan - Timeframe if not met
PR3: NC1: Jointly agreed plan - Actions in place if notPR4: NC2: Social Care Maintenance - Actions in place if not
PR2: NC1: Jointly agreed plan - Plan to MeetPR3: NC1: Jointly agreed plan - Plan to MeetPR4: NC2: Social Care Maintenance - Plan to MeetPR5: NC3: NHS commissioned Out of Hospital Services - Plan to MeetPR6: NC4: Implementation of the HICM for Managing Transfers of Care - Plan to MeetPR7: Agreed expenditure plan for all elements of the BCF - Plan to MeetPR8: Agreed expenditure plan for all elements of the BCF - Plan to MeetPR9: Metrics - Plan to Meet
Reablement Denominator:Reablement: Overview Narrative:
Sheet Complete
Page 83 of 252
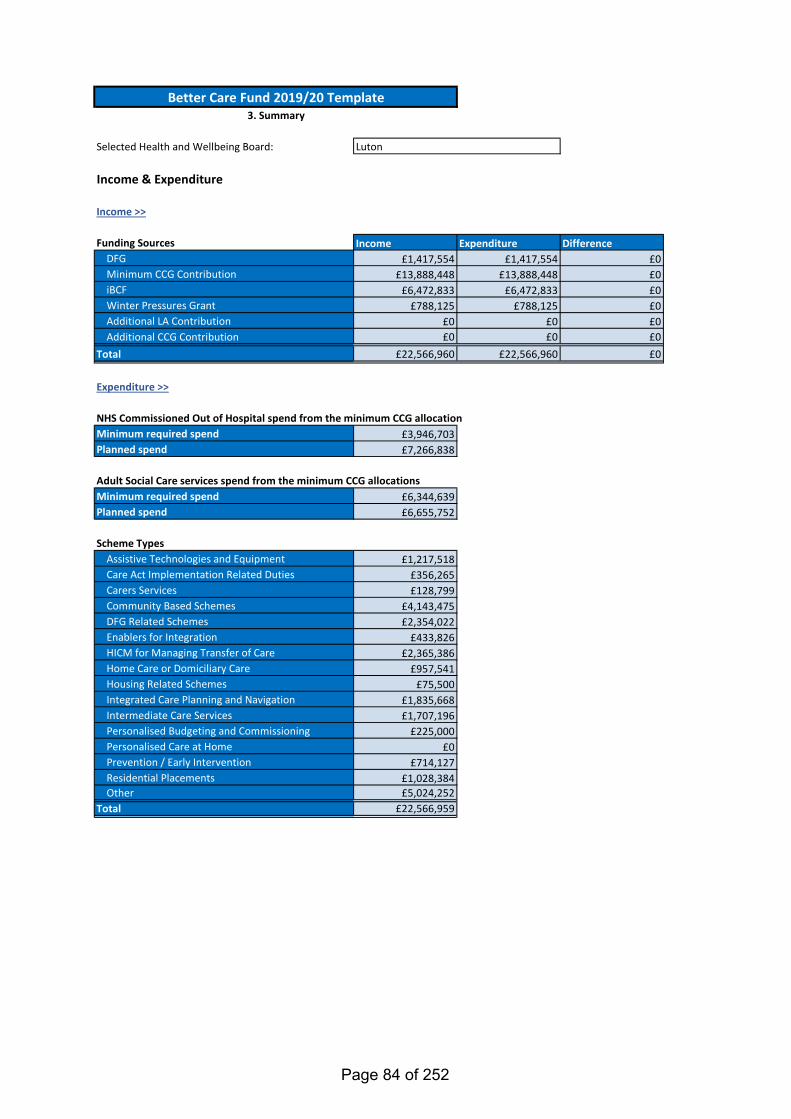
Income Expenditure Difference£1,417,554 £1,417,554 £0
£13,888,448 £13,888,448 £0£6,472,833 £6,472,833 £0
£788,125 £788,125 £0£0 £0 £0£0 £0 £0
£22,566,960 £22,566,960 £0
£3,946,703£7,266,838
£6,344,639£6,655,752
£1,217,518£356,265£128,799
£4,143,475£2,354,022
£433,826£2,365,386
£957,541£75,500
£1,835,668£1,707,196
£225,000£0
£714,127£1,028,384£5,024,252
£22,566,959
Income & Expenditure
Selected Health and Wellbeing Board: Luton
NHS Commissioned Out of Hospital spend from the minimum CCG allocation
Funding Sources
Income >>
Total
Planned spend
Minimum required spendPlanned spend
Assistive Technologies and EquipmentCare Act Implementation Related Duties
Scheme Types
Other
Personalised Care at Home
Adult Social Care services spend from the minimum CCG allocations
Carers ServicesCommunity Based SchemesDFG Related SchemesEnablers for IntegrationHICM for Managing Transfer of CareHome Care or Domiciliary CareHousing Related Schemes
Expenditure >>
Integrated Care Planning and NavigationIntermediate Care ServicesPersonalised Budgeting and Commissioning
Better Care Fund 2019/20 Template3. Summary
DFGMinimum CCG ContributioniBCFWinter Pressures GrantAdditional LA ContributionAdditional CCG Contribution
Total
Minimum required spend
Prevention / Early InterventionResidential Placements
Page 84 of 252

Chg 1 Early discharge planning
Chg 2 Systems to monitor patient flow
Chg 3Multi-disciplinary/Multi-agency discharge teams
Chg 4 Home first / discharge to assess
Chg 5 Seven-day service
Chg 6 Trusted assessors
Chg 7 Focus on choice
Chg 8 Enhancing health in care homes
19/20 Plan
Annual Rate 0
19/20 Plan
Annual (%)
Theme Code Response
PR1
PR2
PR3
PR4 Yes
PR5 Yes
PR6
PR7
PR8
PR9
Planned level of maturity for 2019/2020
Go to Better Care Exchange >>
Metrics
HICM >>
Planning Requirements >>
Reablement
Residential Admissions
Non-Elective AdmissionsDelayed Transfer of Care
NC2: Social Care Maintenance
NC3: NHS commissioned Out of Hospital Services
NC4: Implementation of the High Impact Change Model for Managing Transfers of Care
Metrics >>
NC1: Jointly agreed plan
Agreed expenditure plan for all elements of the BCF
Proportion of older people (65 and over) who were still at home 91 days after discharge from hospital into reablement / rehabilitation services
Long-term support needs of older people (age 65 and over) met by admission to residential and nursing care homes, per 100,000 population
Page 85 of 252
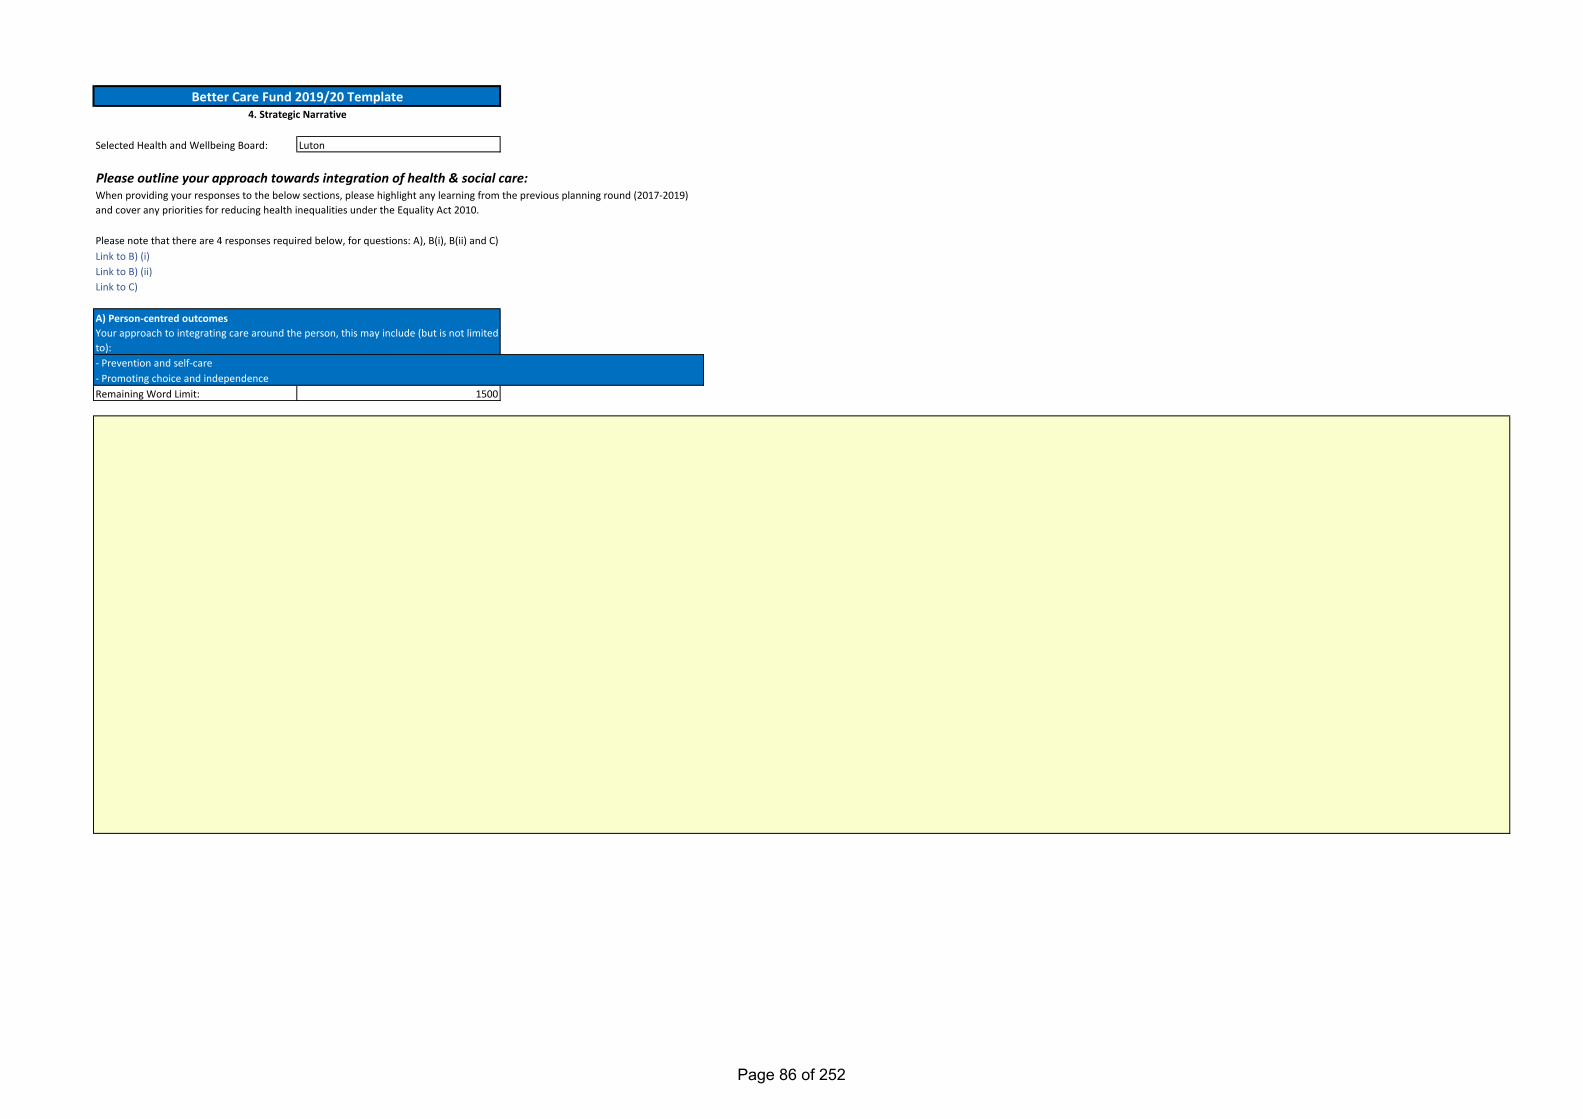
Selected Health and Wellbeing Board: Luton
Please outline your approach towards integration of health & social care:
Link to B) (i)Link to B) (ii)Link to C)
Remaining Word Limit: 1500
Better Care Fund 2019/20 Template4. Strategic Narrative
- Prevention and self-care- Promoting choice and independence
When providing your responses to the below sections, please highlight any learning from the previous planning round (2017-2019) and cover any priorities for reducing health inequalities under the Equality Act 2010.
A) Person-centred outcomesYour approach to integrating care around the person, this may include (but is not limited to):
Please note that there are 4 responses required below, for questions: A), B(i), B(ii) and C)
Page 86 of 252
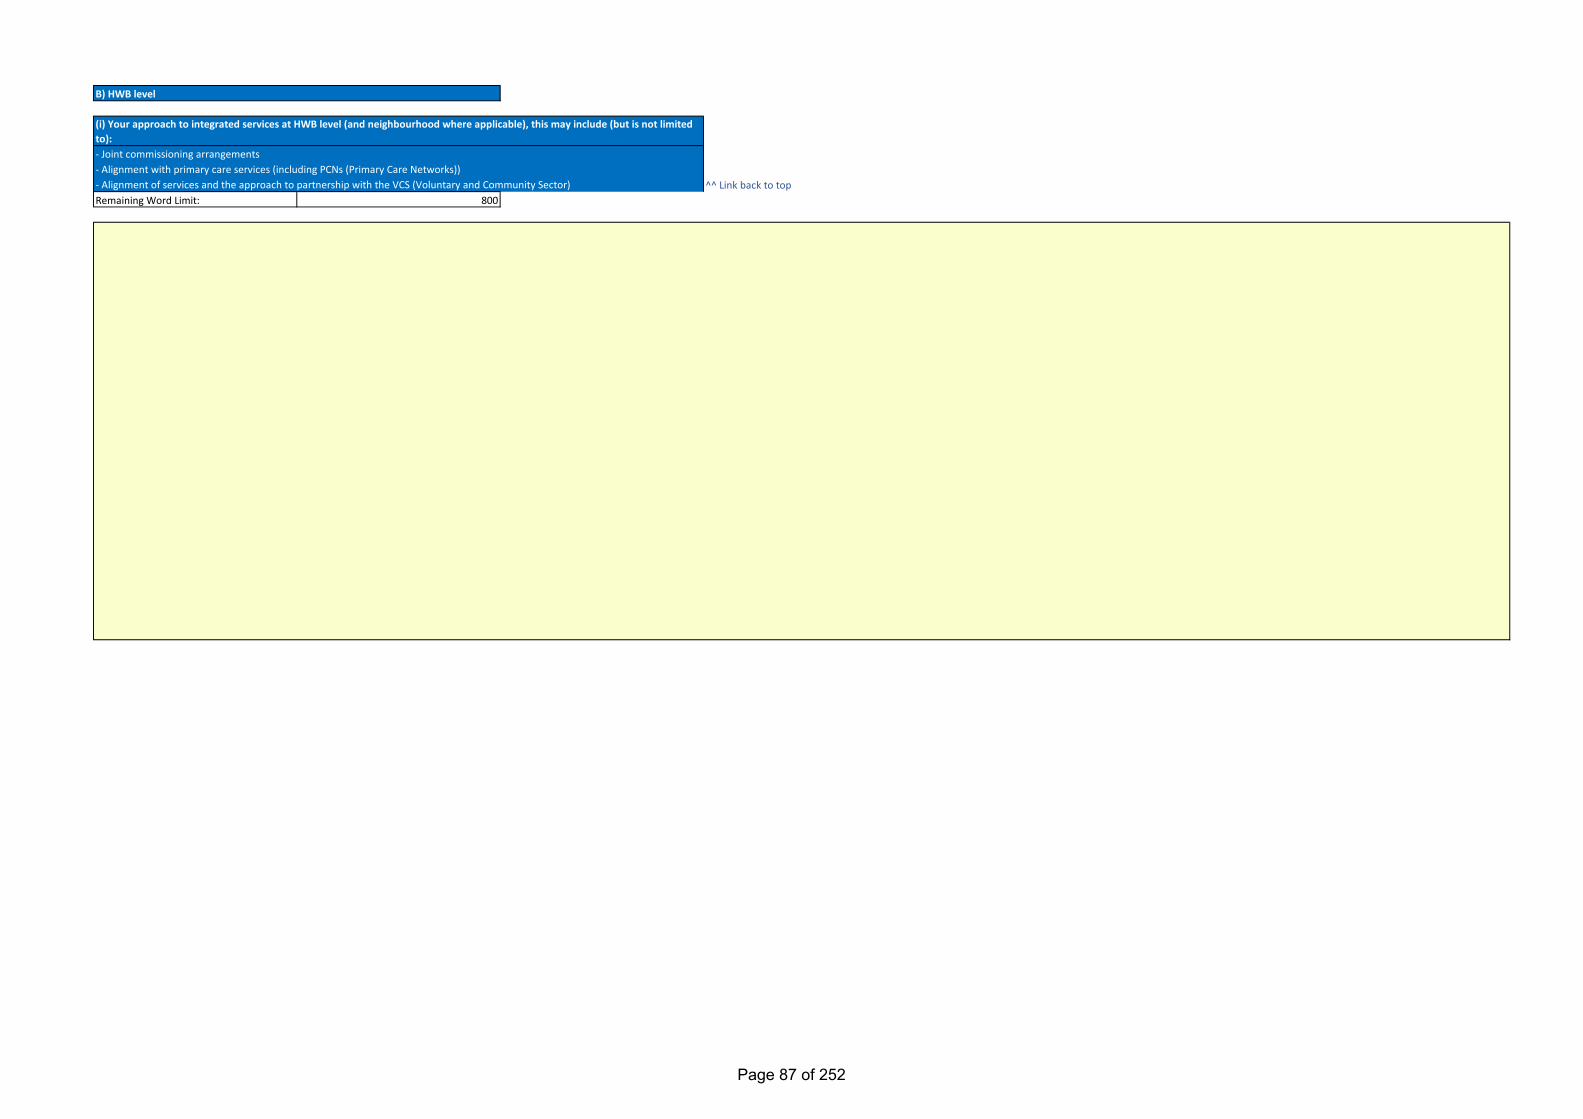
^^ Link back to topRemaining Word Limit: 800
- Joint commissioning arrangements
B) HWB level
- Alignment with primary care services (including PCNs (Primary Care Networks))- Alignment of services and the approach to partnership with the VCS (Voluntary and Community Sector)
(i) Your approach to integrated services at HWB level (and neighbourhood where applicable), this may include (but is not limited to):
Page 87 of 252
^^ Link back to topRemaining Word Limit: 800
- Your approach to using the DFG to support the housing needs of people with disabilities or care needs. This should include any arrangements for strategic planning for the use of adaptations and technologies to support independent living in line with the
(ii) Your approach to integration with wider services (e.g. Housing), this should include:
Page 88 of 252
^^ Link back to topRemaining Word Limit: 1500
C) System level alignment, for example this may include (but is not limited to):- How the BCF plan and other plans align to the wider integration landscape, such as STP/ICS plans- A brief description of joint governance arrangements for the BCF plan
Page 89 of 252
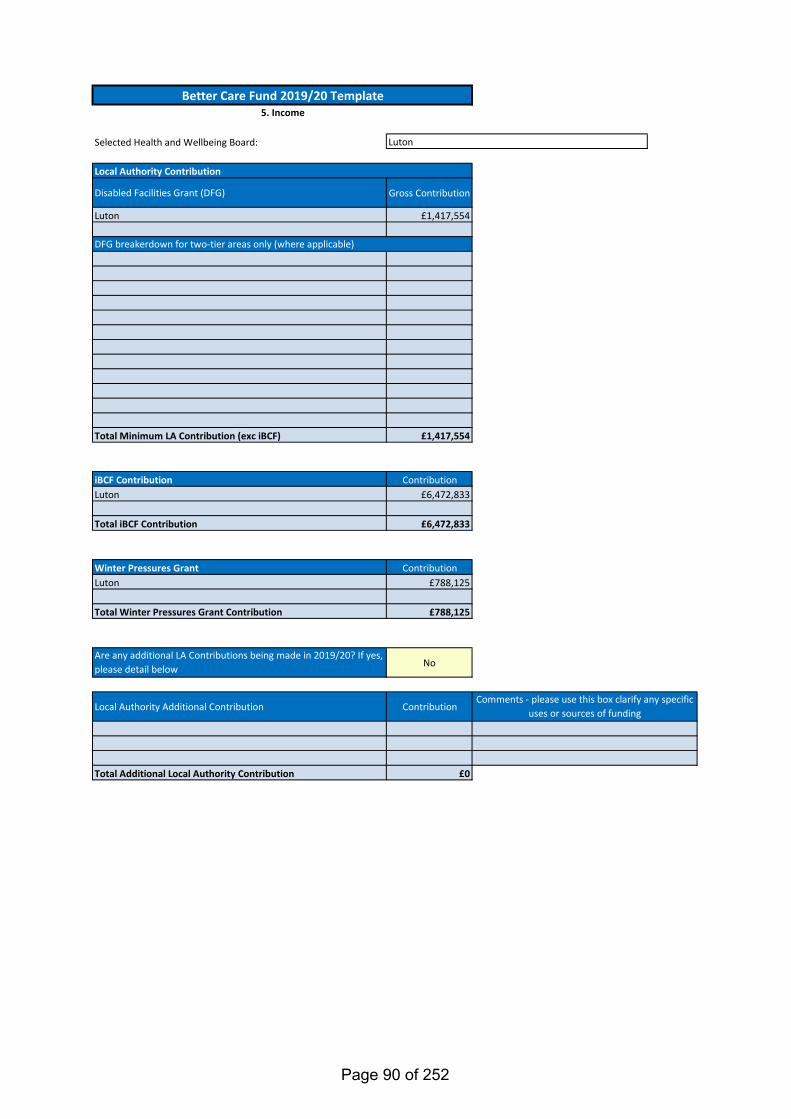
Selected Health and Wellbeing Board:
Disabled Facilities Grant (DFG) Gross Contribution
Luton £1,417,554
123456789
101112
Total Minimum LA Contribution (exc iBCF) £1,417,554
iBCF Contribution ContributionLuton £6,472,833
Total iBCF Contribution £6,472,833
Winter Pressures Grant ContributionLuton £788,125
Total Winter Pressures Grant Contribution £788,125
Are any additional LA Contributions being made in 2019/20? If yes, please detail below No
Local Authority Additional Contribution Contribution
Total Additional Local Authority Contribution £0
Better Care Fund 2019/20 Template5. Income
DFG breakerdown for two-tier areas only (where applicable)
Local Authority Contribution
Comments - please use this box clarify any specific uses or sources of funding
Luton
Page 90 of 252
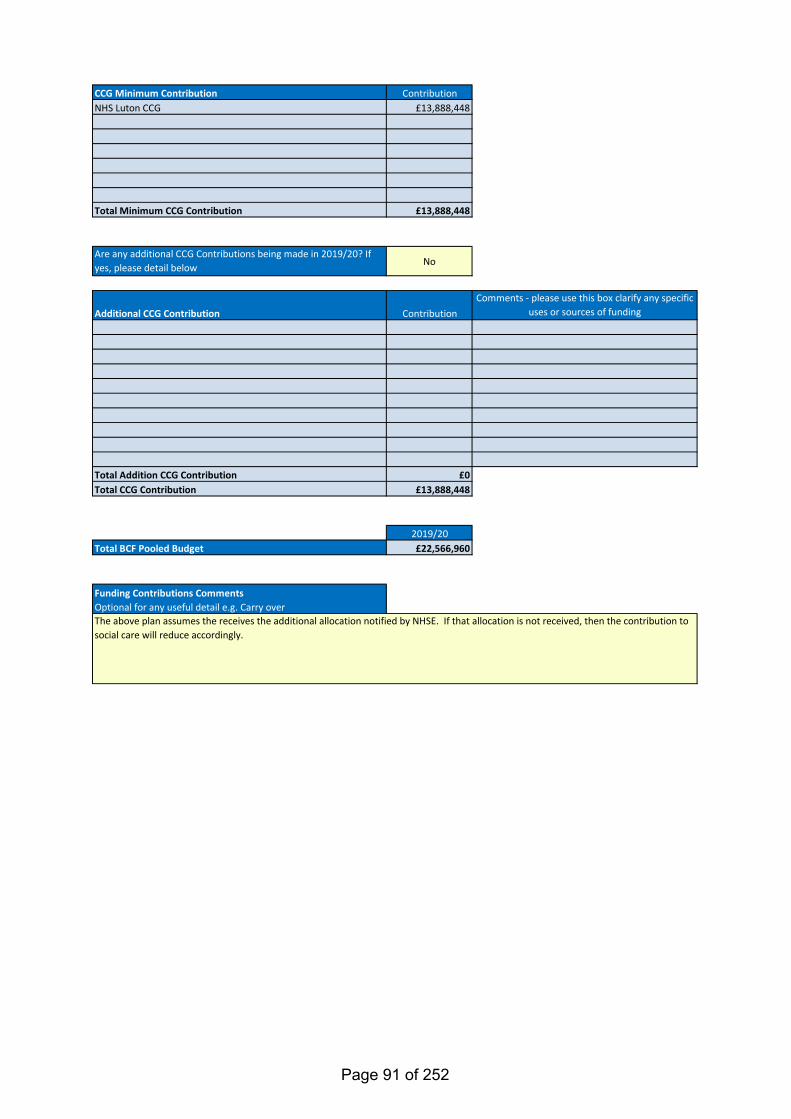
CCG Minimum Contribution Contribution1 NHS Luton CCG £13,888,448234567
Total Minimum CCG Contribution £13,888,448
Are any additional CCG Contributions being made in 2019/20? If yes, please detail below No
Additional CCG Contribution Contribution
Total Addition CCG Contribution £0Total CCG Contribution £13,888,448
2019/20Total BCF Pooled Budget £22,566,960
Funding Contributions CommentsOptional for any useful detail e.g. Carry overThe above plan assumes the receives the additional allocation notified by NHSE. If that allocation is not received, then the contribution to social care will reduce accordingly.
Comments - please use this box clarify any specific uses or sources of funding
Page 91 of 252
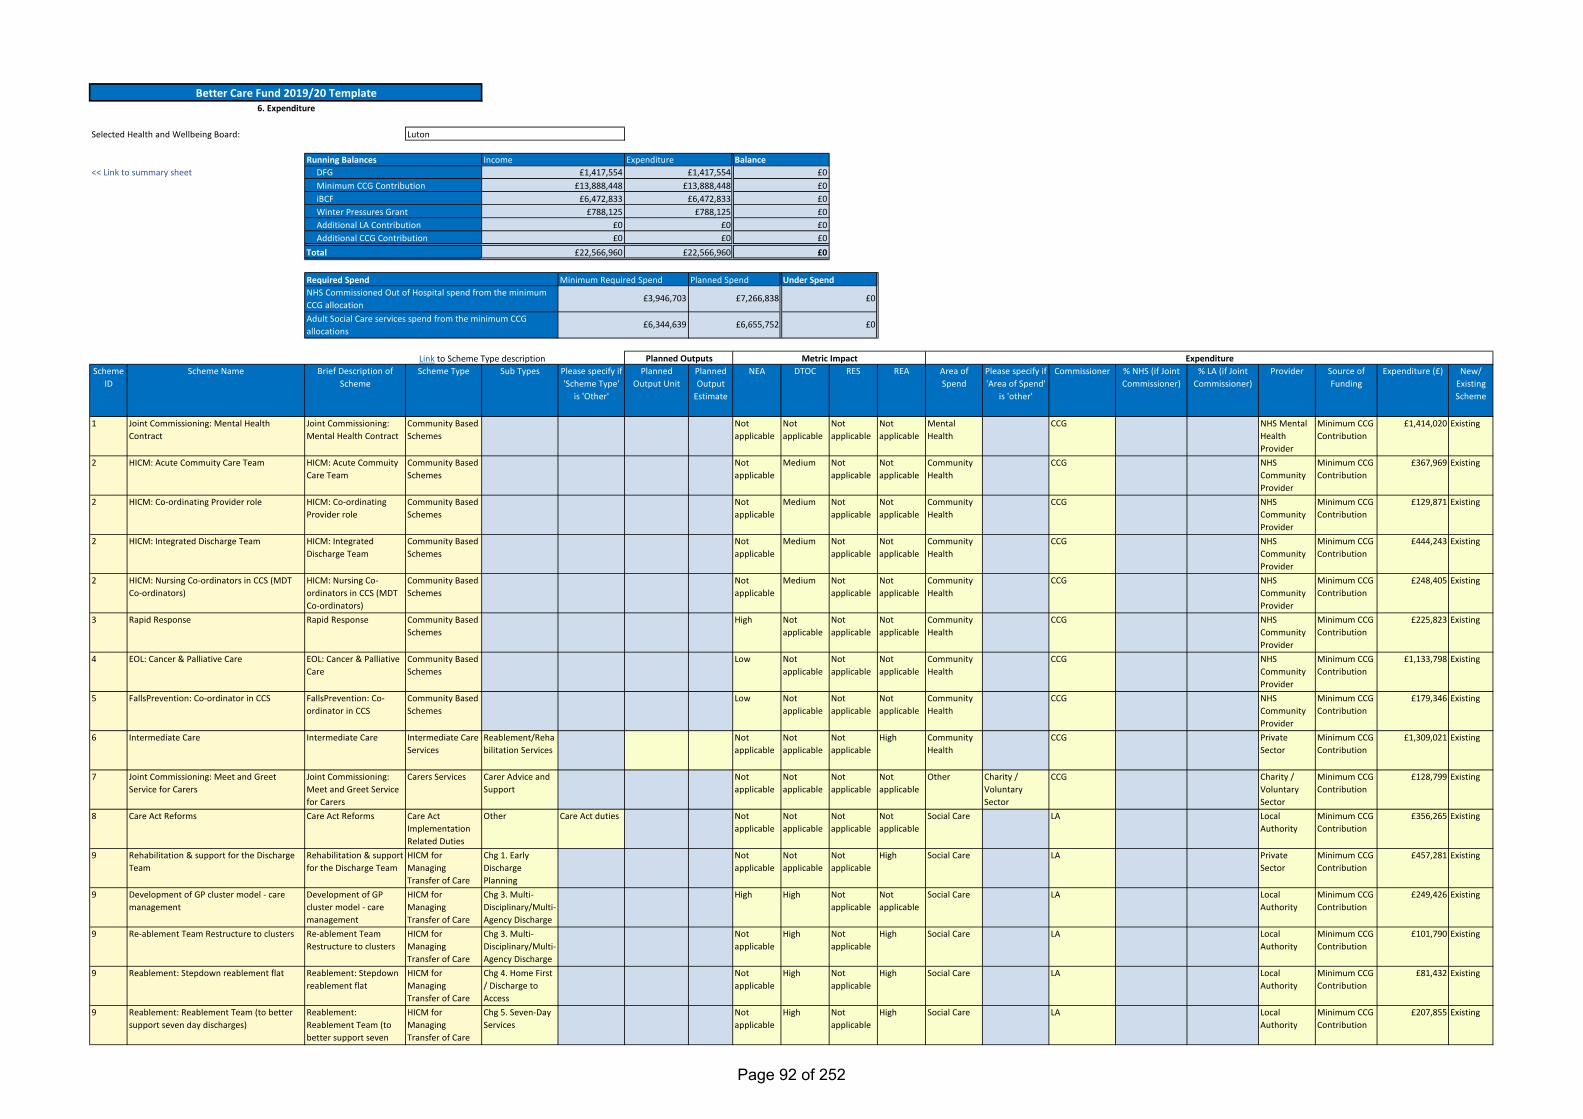
Link to Scheme Type descriptionScheme
IDScheme Name Brief Description of
SchemeScheme Type Sub Types Please specify if
'Scheme Type' is 'Other'
Planned Output Unit
Planned Output
Estimate
NEA DTOC RES REA Area of Spend
Please specify if 'Area of Spend'
is 'other'
Commissioner % NHS (if Joint Commissioner)
% LA (if Joint Commissioner)
Provider Source of Funding
Expenditure (£) New/ Existing Scheme
1 Joint Commissioning: Mental Health Contract
Joint Commissioning: Mental Health Contract
Community Based Schemes
Not applicable
Not applicable
Not applicable
Not applicable
Mental Health
CCG NHS Mental Health Provider
Minimum CCG Contribution
£1,414,020 Existing
2 HICM: Acute Commuity Care Team HICM: Acute Commuity Care Team
Community Based Schemes
Not applicable
Medium Not applicable
Not applicable
Community Health
CCG NHS Community Provider
Minimum CCG Contribution
£367,969 Existing
2 HICM: Co-ordinating Provider role HICM: Co-ordinating Provider role
Community Based Schemes
Not applicable
Medium Not applicable
Not applicable
Community Health
CCG NHS Community Provider
Minimum CCG Contribution
£129,871 Existing
2 HICM: Integrated Discharge Team HICM: Integrated Discharge Team
Community Based Schemes
Not applicable
Medium Not applicable
Not applicable
Community Health
CCG NHS Community Provider
Minimum CCG Contribution
£444,243 Existing
2 HICM: Nursing Co-ordinators in CCS (MDT Co-ordinators)
HICM: Nursing Co-ordinators in CCS (MDT Co-ordinators)
Community Based Schemes
Not applicable
Medium Not applicable
Not applicable
Community Health
CCG NHS Community Provider
Minimum CCG Contribution
£248,405 Existing
3 Rapid Response Rapid Response Community Based Schemes
High Not applicable
Not applicable
Not applicable
Community Health
CCG NHS Community Provider
Minimum CCG Contribution
£225,823 Existing
4 EOL: Cancer & Palliative Care EOL: Cancer & Palliative Care
Community Based Schemes
Low Not applicable
Not applicable
Not applicable
Community Health
CCG NHS Community Provider
Minimum CCG Contribution
£1,133,798 Existing
5 FallsPrevention: Co-ordinator in CCS FallsPrevention: Co-ordinator in CCS
Community Based Schemes
Low Not applicable
Not applicable
Not applicable
Community Health
CCG NHS Community Provider
Minimum CCG Contribution
£179,346 Existing
6 Intermediate Care Intermediate Care Intermediate Care Services
Reablement/Rehabilitation Services
Not applicable
Not applicable
Not applicable
High Community Health
CCG Private Sector
Minimum CCG Contribution
£1,309,021 Existing
7 Joint Commissioning: Meet and Greet Service for Carers
Joint Commissioning: Meet and Greet Service for Carers
Carers Services Carer Advice and Support
Not applicable
Not applicable
Not applicable
Not applicable
Other Charity / Voluntary Sector
CCG Charity / Voluntary Sector
Minimum CCG Contribution
£128,799 Existing
8 Care Act Reforms Care Act Reforms Care Act Implementation Related Duties
Other Care Act duties Not applicable
Not applicable
Not applicable
Not applicable
Social Care LA Local Authority
Minimum CCG Contribution
£356,265 Existing
9 Rehabilitation & support for the Discharge Team
Rehabilitation & support for the Discharge Team
HICM for Managing Transfer of Care
Chg 1. Early Discharge Planning
Not applicable
Not applicable
Not applicable
High Social Care LA Private Sector
Minimum CCG Contribution
£457,281 Existing
9 Development of GP cluster model - care management
Development of GP cluster model - care management
HICM for Managing Transfer of Care
Chg 3. Multi-Disciplinary/Multi-Agency Discharge
High High Not applicable
Not applicable
Social Care LA Local Authority
Minimum CCG Contribution
£249,426 Existing
9 Re-ablement Team Restructure to clusters Re-ablement Team Restructure to clusters
HICM for Managing Transfer of Care
Chg 3. Multi-Disciplinary/Multi-Agency Discharge
Not applicable
High Not applicable
High Social Care LA Local Authority
Minimum CCG Contribution
£101,790 Existing
9 Reablement: Stepdown reablement flat Reablement: Stepdown reablement flat
HICM for Managing Transfer of Care
Chg 4. Home First / Discharge to Access
Not applicable
High Not applicable
High Social Care LA Local Authority
Minimum CCG Contribution
£81,432 Existing
9 Reablement: Reablement Team (to better support seven day discharges)
Reablement: Reablement Team (to better support seven
HICM for Managing Transfer of Care
Chg 5. Seven-Day Services
Not applicable
High Not applicable
High Social Care LA Local Authority
Minimum CCG Contribution
£207,855 Existing
BalanceIncome Expenditure£1,417,554
£13,888,448£6,472,833
<< Link to summary sheetRunning Balances
DFGMinimum CCG ContributioniBCF
£0£0£0
£1,417,554£13,888,448
£6,472,833
£0£788,125Winter Pressures Grant £0£788,125
£0£0
£6,344,639
£7,266,838
£6,655,752
£0
£0
Required SpendNHS Commissioned Out of Hospital spend from the minimum CCG allocationAdult Social Care services spend from the minimum CCG allocations
Minimum Required Spend Planned Spend Under Spend
Better Care Fund 2019/20 Template6. Expenditure
ExpenditurePlanned Outputs Metric Impact
£0£0
£22,566,960
£0
Luton
Additional LA ContributionAdditional CCG Contribution
Total
Selected Health and Wellbeing Board:
£3,946,703
£0£22,566,960
Page 92 of 252
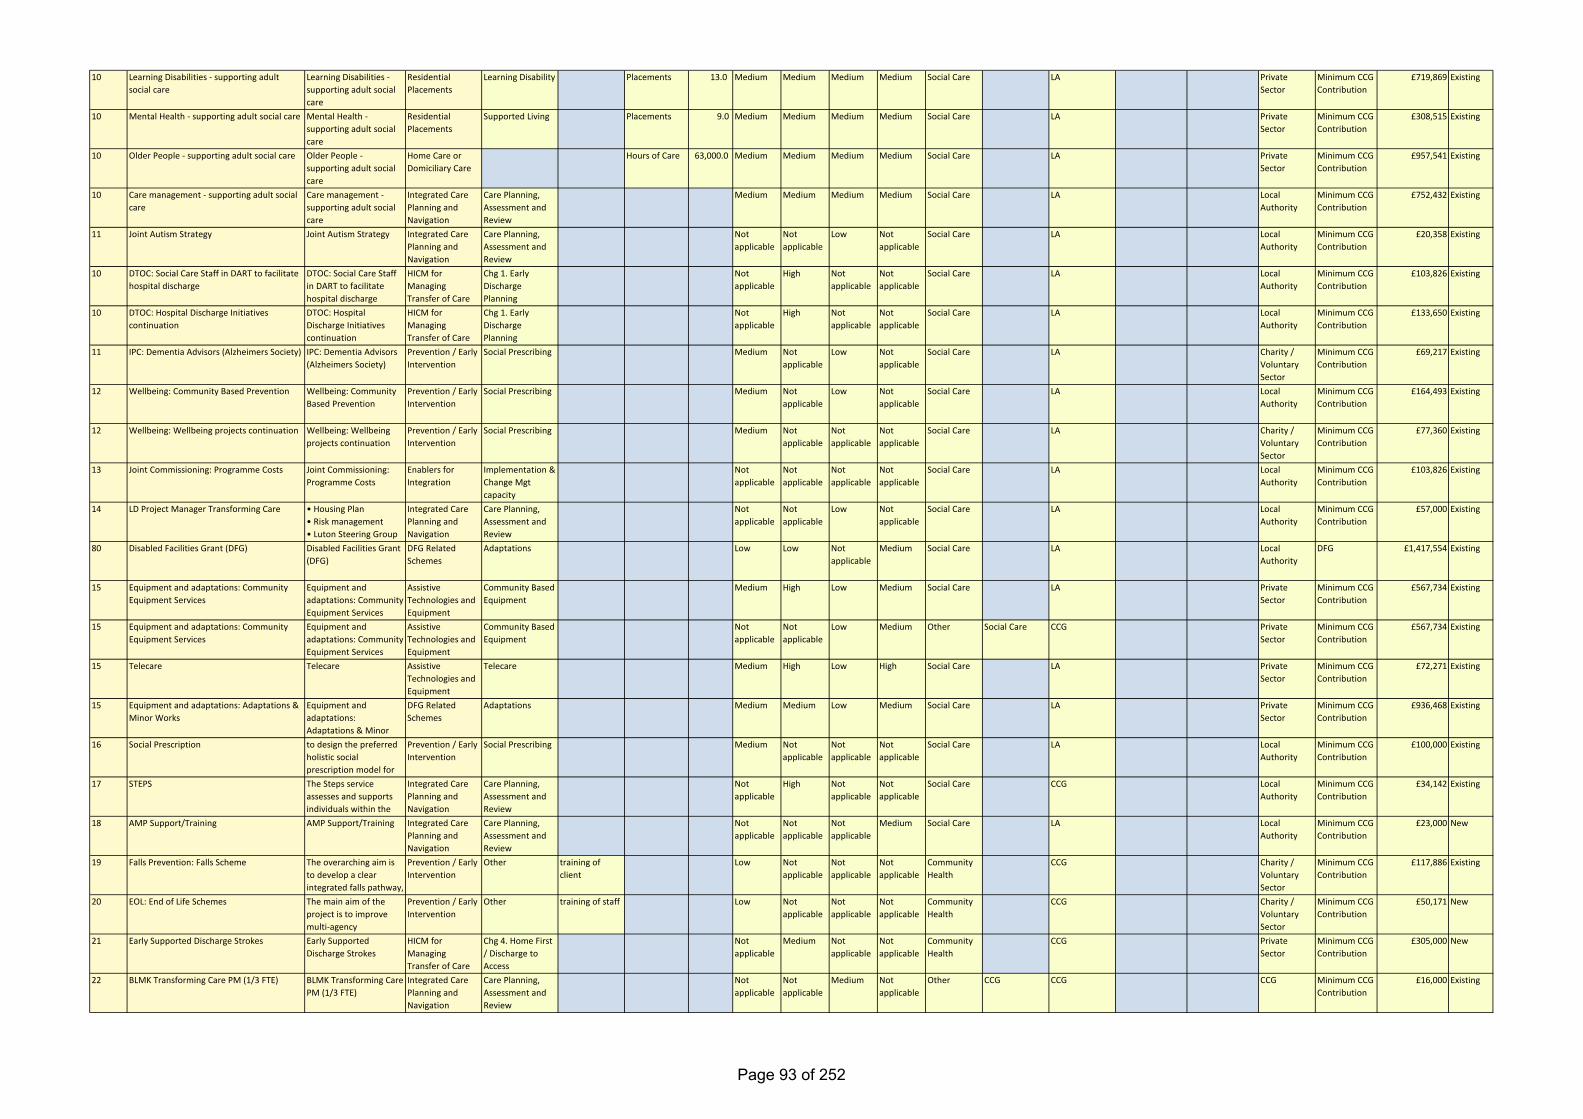
10 Learning Disabilities - supporting adult social care
Learning Disabilities - supporting adult social care
Residential Placements
Learning Disability Placements 13.0 Medium Medium Medium Medium Social Care LA Private Sector
Minimum CCG Contribution
£719,869 Existing
10 Mental Health - supporting adult social care Mental Health - supporting adult social care
Residential Placements
Supported Living Placements 9.0 Medium Medium Medium Medium Social Care LA Private Sector
Minimum CCG Contribution
£308,515 Existing
10 Older People - supporting adult social care Older People - supporting adult social care
Home Care or Domiciliary Care
Hours of Care 63,000.0 Medium Medium Medium Medium Social Care LA Private Sector
Minimum CCG Contribution
£957,541 Existing
10 Care management - supporting adult social care
Care management - supporting adult social care
Integrated Care Planning and Navigation
Care Planning, Assessment and Review
Medium Medium Medium Medium Social Care LA Local Authority
Minimum CCG Contribution
£752,432 Existing
11 Joint Autism Strategy Joint Autism Strategy Integrated Care Planning and Navigation
Care Planning, Assessment and Review
Not applicable
Not applicable
Low Not applicable
Social Care LA Local Authority
Minimum CCG Contribution
£20,358 Existing
10 DTOC: Social Care Staff in DART to facilitate hospital discharge
DTOC: Social Care Staff in DART to facilitate hospital discharge
HICM for Managing Transfer of Care
Chg 1. Early Discharge Planning
Not applicable
High Not applicable
Not applicable
Social Care LA Local Authority
Minimum CCG Contribution
£103,826 Existing
10 DTOC: Hospital Discharge Initiatives continuation
DTOC: Hospital Discharge Initiatives continuation
HICM for Managing Transfer of Care
Chg 1. Early Discharge Planning
Not applicable
High Not applicable
Not applicable
Social Care LA Local Authority
Minimum CCG Contribution
£133,650 Existing
11 IPC: Dementia Advisors (Alzheimers Society) IPC: Dementia Advisors (Alzheimers Society)
Prevention / Early Intervention
Social Prescribing Medium Not applicable
Low Not applicable
Social Care LA Charity / Voluntary Sector
Minimum CCG Contribution
£69,217 Existing
12 Wellbeing: Community Based Prevention Wellbeing: Community Based Prevention
Prevention / Early Intervention
Social Prescribing Medium Not applicable
Low Not applicable
Social Care LA Local Authority
Minimum CCG Contribution
£164,493 Existing
12 Wellbeing: Wellbeing projects continuation Wellbeing: Wellbeing projects continuation
Prevention / Early Intervention
Social Prescribing Medium Not applicable
Not applicable
Not applicable
Social Care LA Charity / Voluntary Sector
Minimum CCG Contribution
£77,360 Existing
13 Joint Commissioning: Programme Costs Joint Commissioning: Programme Costs
Enablers for Integration
Implementation & Change Mgt capacity
Not applicable
Not applicable
Not applicable
Not applicable
Social Care LA Local Authority
Minimum CCG Contribution
£103,826 Existing
14 LD Project Manager Transforming Care • Housing Plan• Risk management• Luton Steering Group
Integrated Care Planning and Navigation
Care Planning, Assessment and Review
Not applicable
Not applicable
Low Not applicable
Social Care LA Local Authority
Minimum CCG Contribution
£57,000 Existing
80 Disabled Facilities Grant (DFG) Disabled Facilities Grant (DFG)
DFG Related Schemes
Adaptations Low Low Not applicable
Medium Social Care LA Local Authority
DFG £1,417,554 Existing
15 Equipment and adaptations: Community Equipment Services
Equipment and adaptations: Community Equipment Services
Assistive Technologies and Equipment
Community Based Equipment
Medium High Low Medium Social Care LA Private Sector
Minimum CCG Contribution
£567,734 Existing
15 Equipment and adaptations: Community Equipment Services
Equipment and adaptations: Community Equipment Services
Assistive Technologies and Equipment
Community Based Equipment
Not applicable
Not applicable
Low Medium Other Social Care CCG Private Sector
Minimum CCG Contribution
£567,734 Existing
15 Telecare Telecare Assistive Technologies and Equipment
Telecare Medium High Low High Social Care LA Private Sector
Minimum CCG Contribution
£72,271 Existing
15 Equipment and adaptations: Adaptations & Minor Works
Equipment and adaptations: Adaptations & Minor
DFG Related Schemes
Adaptations Medium Medium Low Medium Social Care LA Private Sector
Minimum CCG Contribution
£936,468 Existing
16 Social Prescription to design the preferred holistic social prescription model for
Prevention / Early Intervention
Social Prescribing Medium Not applicable
Not applicable
Not applicable
Social Care LA Local Authority
Minimum CCG Contribution
£100,000 Existing
17 STEPS The Steps service assesses and supports individuals within the
Integrated Care Planning and Navigation
Care Planning, Assessment and Review
Not applicable
High Not applicable
Not applicable
Social Care CCG Local Authority
Minimum CCG Contribution
£34,142 Existing
18 AMP Support/Training AMP Support/Training Integrated Care Planning and Navigation
Care Planning, Assessment and Review
Not applicable
Not applicable
Not applicable
Medium Social Care LA Local Authority
Minimum CCG Contribution
£23,000 New
19 Falls Prevention: Falls Scheme The overarching aim is to develop a clear integrated falls pathway,
Prevention / Early Intervention
Other training of client
Low Not applicable
Not applicable
Not applicable
Community Health
CCG Charity / Voluntary Sector
Minimum CCG Contribution
£117,886 Existing
20 EOL: End of Life Schemes The main aim of the project is to improve multi-agency
Prevention / Early Intervention
Other training of staff Low Not applicable
Not applicable
Not applicable
Community Health
CCG Charity / Voluntary Sector
Minimum CCG Contribution
£50,171 New
21 Early Supported Discharge Strokes Early Supported Discharge Strokes
HICM for Managing Transfer of Care
Chg 4. Home First / Discharge to Access
Not applicable
Medium Not applicable
Not applicable
Community Health
CCG Private Sector
Minimum CCG Contribution
£305,000 New
22 BLMK Transforming Care PM (1/3 FTE) BLMK Transforming Care PM (1/3 FTE)
Integrated Care Planning and Navigation
Care Planning, Assessment and Review
Not applicable
Not applicable
Medium Not applicable
Other CCG CCG CCG Minimum CCG Contribution
£16,000 Existing
Page 93 of 252
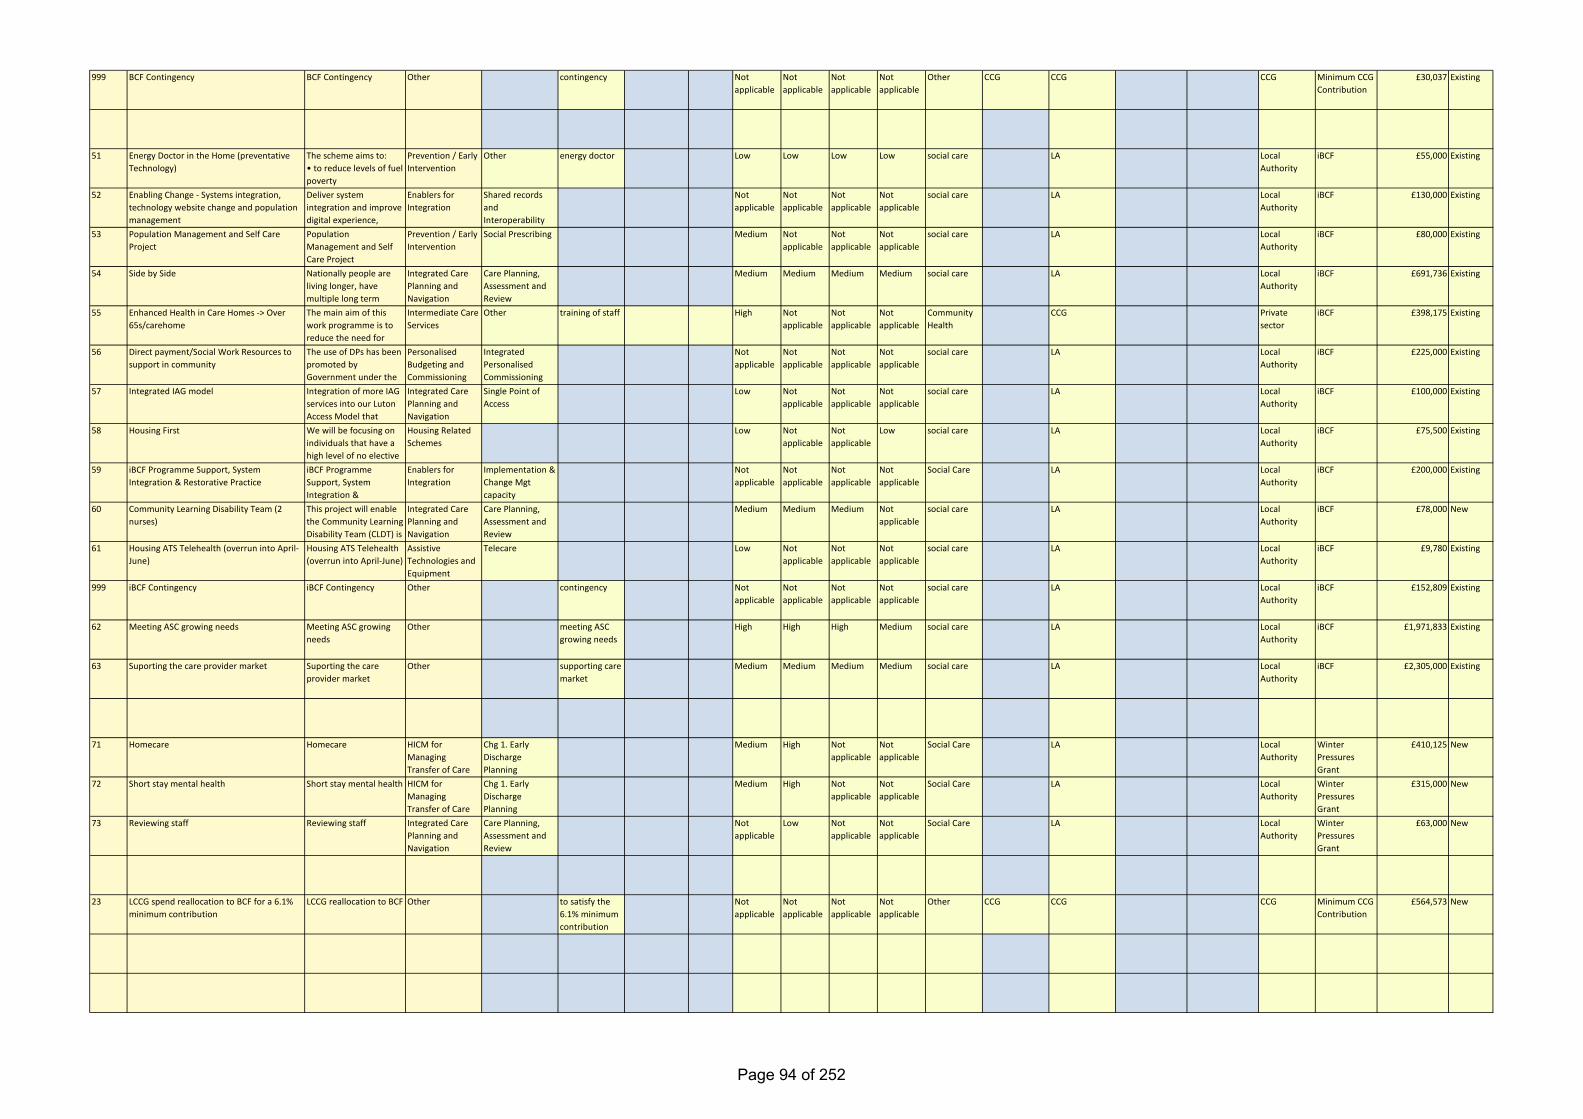
999 BCF Contingency BCF Contingency Other contingency Not applicable
Not applicable
Not applicable
Not applicable
Other CCG CCG CCG Minimum CCG Contribution
£30,037 Existing
51 Energy Doctor in the Home (preventative Technology)
The scheme aims to: • to reduce levels of fuel poverty
Prevention / Early Intervention
Other energy doctor Low Low Low Low social care LA Local Authority
iBCF £55,000 Existing
52 Enabling Change - Systems integration, technology website change and population management
Deliver system integration and improve digital experience,
Enablers for Integration
Shared records and Interoperability
Not applicable
Not applicable
Not applicable
Not applicable
social care LA Local Authority
iBCF £130,000 Existing
53 Population Management and Self Care Project
Population Management and Self Care Project
Prevention / Early Intervention
Social Prescribing Medium Not applicable
Not applicable
Not applicable
social care LA Local Authority
iBCF £80,000 Existing
54 Side by Side Nationally people are living longer, have multiple long term
Integrated Care Planning and Navigation
Care Planning, Assessment and Review
Medium Medium Medium Medium social care LA Local Authority
iBCF £691,736 Existing
55 Enhanced Health in Care Homes -> Over 65s/carehome
The main aim of this work programme is to reduce the need for
Intermediate Care Services
Other training of staff High Not applicable
Not applicable
Not applicable
Community Health
CCG Private sector
iBCF £398,175 Existing
56 Direct payment/Social Work Resources to support in community
The use of DPs has been promoted by Government under the
Personalised Budgeting and Commissioning
Integrated Personalised Commissioning
Not applicable
Not applicable
Not applicable
Not applicable
social care LA Local Authority
iBCF £225,000 Existing
57 Integrated IAG model Integration of more IAG services into our Luton Access Model that
Integrated Care Planning and Navigation
Single Point of Access
Low Not applicable
Not applicable
Not applicable
social care LA Local Authority
iBCF £100,000 Existing
58 Housing First We will be focusing on individuals that have a high level of no elective
Housing Related Schemes
Low Not applicable
Not applicable
Low social care LA Local Authority
iBCF £75,500 Existing
59 iBCF Programme Support, System Integration & Restorative Practice
iBCF Programme Support, System Integration &
Enablers for Integration
Implementation & Change Mgt capacity
Not applicable
Not applicable
Not applicable
Not applicable
Social Care LA Local Authority
iBCF £200,000 Existing
60 Community Learning Disability Team (2 nurses)
This project will enable the Community Learning Disability Team (CLDT) is
Integrated Care Planning and Navigation
Care Planning, Assessment and Review
Medium Medium Medium Not applicable
social care LA Local Authority
iBCF £78,000 New
61 Housing ATS Telehealth (overrun into April-June)
Housing ATS Telehealth (overrun into April-June)
Assistive Technologies and Equipment
Telecare Low Not applicable
Not applicable
Not applicable
social care LA Local Authority
iBCF £9,780 Existing
999 iBCF Contingency iBCF Contingency Other contingency Not applicable
Not applicable
Not applicable
Not applicable
social care LA Local Authority
iBCF £152,809 Existing
62 Meeting ASC growing needs Meeting ASC growing needs
Other meeting ASC growing needs
High High High Medium social care LA Local Authority
iBCF £1,971,833 Existing
63 Suporting the care provider market Suporting the care provider market
Other supporting care market
Medium Medium Medium Medium social care LA Local Authority
iBCF £2,305,000 Existing
71 Homecare Homecare HICM for Managing Transfer of Care
Chg 1. Early Discharge Planning
Medium High Not applicable
Not applicable
Social Care LA Local Authority
Winter Pressures Grant
£410,125 New
72 Short stay mental health Short stay mental health HICM for Managing Transfer of Care
Chg 1. Early Discharge Planning
Medium High Not applicable
Not applicable
Social Care LA Local Authority
Winter Pressures Grant
£315,000 New
73 Reviewing staff Reviewing staff Integrated Care Planning and Navigation
Care Planning, Assessment and Review
Not applicable
Low Not applicable
Not applicable
Social Care LA Local Authority
Winter Pressures Grant
£63,000 New
23 LCCG spend reallocation to BCF for a 6.1% minimum contribution
LCCG reallocation to BCF Other to satisfy the 6.1% minimum contribution
Not applicable
Not applicable
Not applicable
Not applicable
Other CCG CCG CCG Minimum CCG Contribution
£564,573 New
Page 94 of 252

Page 95 of 252

Page 96 of 252

Page 97 of 252

Page 98 of 252

Page 99 of 252

Page 100 of 252

Page 101 of 252
Page 102 of 252
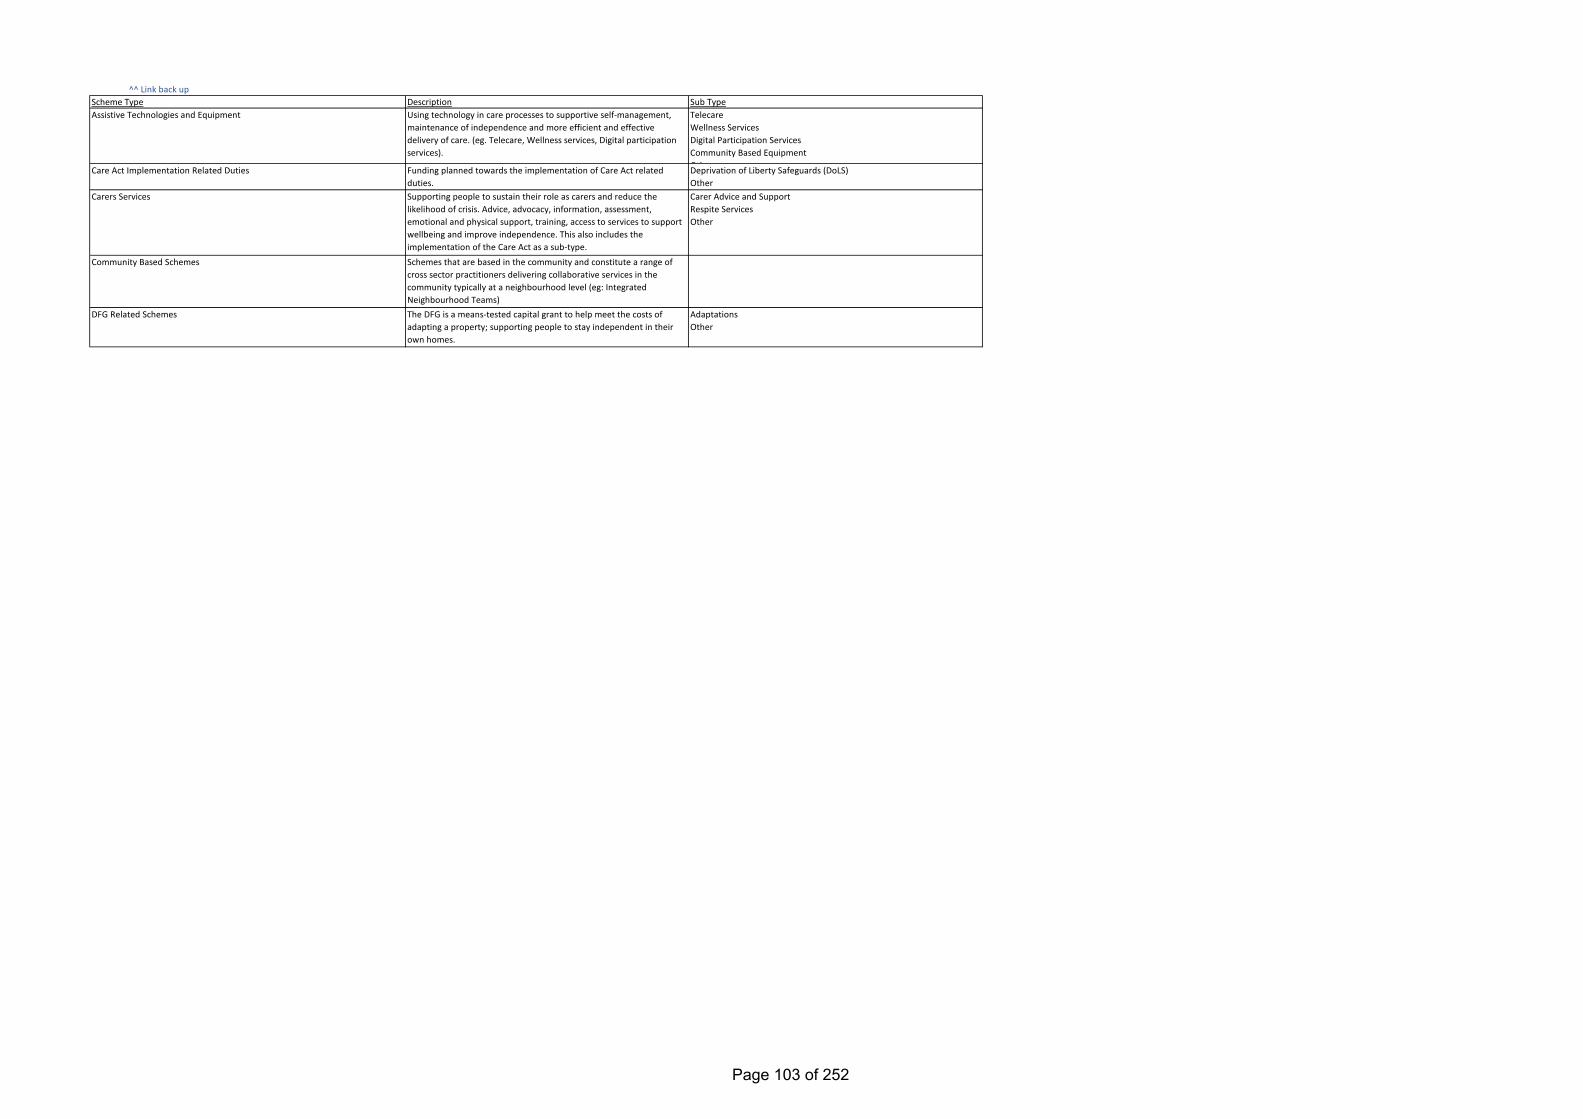
^^ Link back up
Funding planned towards the implementation of Care Act related duties.Supporting people to sustain their role as carers and reduce the likelihood of crisis. Advice, advocacy, information, assessment, emotional and physical support, training, access to services to support wellbeing and improve independence. This also includes the implementation of the Care Act as a sub-type.Schemes that are based in the community and constitute a range of cross sector practitioners delivering collaborative services in the community typically at a neighbourhood level (eg: Integrated Neighbourhood Teams)The DFG is a means-tested capital grant to help meet the costs of adapting a property; supporting people to stay independent in their own homes.
Using technology in care processes to supportive self-management, maintenance of independence and more efficient and effective delivery of care. (eg. Telecare, Wellness services, Digital participation services).
DescriptionScheme TypeAssistive Technologies and Equipment
Care Act Implementation Related Duties
Carers Services
Community Based Schemes
DFG Related Schemes
Sub TypeTelecareWellness ServicesDigital Participation ServicesCommunity Based EquipmentOthDeprivation of Liberty Safeguards (DoLS)OtherCarer Advice and SupportRespite ServicesOther
AdaptationsOther
Page 103 of 252

Enablers for Integration
High Impact Change Model for Managing Transfer of Care
Home Care or Domiciliary Care
Housing Related Schemes
Schemes that build and develop the enabling foundations of health and social care integration encompassing a wide range of potential areas including technology, workforce, market development (Voluntary Sector Business Development: Funding the business development and preparedness of local voluntary sector into provider Alliances/ Collaboratives) and programme management related schemes. Joint commissioning infrastructure includes any personnel or teams that enable joint commissioning. Schemes could be focused on Data Integration, System IT Interoperability, Programme management, Research and evaluation, Supporting the Care Market, Workforce development, Community asset mapping, New governance arrangements, Voluntary Sector Development, Employment services, J i t i i i i f t t t thThe eight changes or approaches identified as having a high impact on supporting timely and effective discharge through joint working across the social and health system. The Hospital to Home Transfer Protocol or the 'Red Bag' scheme, while not in the HICM as such, is included in this section.
A range of services that aim to help people live in their own homes through the provision of domiciliary care including personal care, domestic tasks, shopping, home maintenance and social activities. Home care can link with other services in the community, such as supported housing, community health services and voluntary sector services.
This covers expenditure on housing and housing-related services other than adaptations; eg: supported housing units.
Chg 1. Early Discharge PlanningChg 2. Systems to Monitor Patient FlowChg 3. Multi-Disciplinary/Multi-Agency Discharge TeamsChg 4. Home First / Discharge to AccessChg 5. Seven-Day ServicesChg 6. Trusted AssessorsChg 7. Focus on ChoiceChg 8. Enhancing Health in Care HomesOther - 'Red Bag' schemeOther approaches
Page 104 of 252

Short-term intervention to preserve the independence of people who might otherwise face unnecessarily prolonged hospital stays or avoidable admission to hospital or residential care. The care is person-centred and often delivered by a combination of professional groups. Four service models of intermediate care are: bed-based intermediate care, crisis or rapid response (including falls), home-based intermediate care, and reablement or rehabilitation. Home-based intermediate care is covered in Scheme-A and the other three models are available on the sub-types.
Intermediate Care Services
Care navigation services help people find their way to appropriate services and support and consequently support self-management. Also, the assistance offered to people in navigating through the complex health and social care systems (across primary care, community and voluntary services and social care) to overcome barriers in accessing the most appropriate care and support. Multi-agency teams typically provide these services which can be online or face to face care navigators for frail elderly, or dementia navigators etc. This includes approaches like Single Point of Access (SPoA) and linking people to community assets.Integrated care planning constitutes a co-ordinated, person centred and proactive case management approach to conduct joint assessments of care needs and develop integrated care plans typically carried out by professionals as part of a multi-disciplinary, multi-agency teams. Note: For Multi-Disciplinary Discharge Teams and the HICM for managing discharges, please select HICM as scheme type and the relevant sub-type. Where the planned unit of care delivery and funding is in the form of Integrated care packages and needs to be expressed in such a manner please select the appropriate sub type alongside
Integrated Care Planning and Navigation Care CoordinationSingle Point of AccessCare Planning, Assessment and ReviewOther
Bed Based - Step Up/DownRapid / Crisis ResponseReablement/Rehabilitation ServicesOther
Page 105 of 252

^^ Link back up
Residential Placements
Personalised Budgeting and Commissioning
Personalised Care at Home
Various person centred approaches to commissioning and budgeting.
Schemes specifically designed to ensure that a person can continue to live at home, through the provision of health related support at home often complemented with support for home care needs or mental health needs. This could include promoting self-management/expert patient, establishment of ‘home ward’ for intensive period or to deliver support over the longer term to maintain independence or offer end of life care for people. Intermediate care services provide shorter term support and care interventions as opposed to the ongoing support provided in this scheme type.
Services or schemes where the population or identified high-risk groups are empowered and activated to live well in the holistic sense thereby helping prevent people from entering the care system in the first place. These are essentially upstream prevention initiatives to promote independence and well being.Residential placements provide accommodation for people with learning or physical disabilities, mental health difficulties or with sight or hearing loss, who need more intensive or specialised support than can be provided at home.
Prevention / Early Intervention
Where the scheme is not adequately represented by the above scheme types, please outline the objectives and services planned for the scheme in a short description in the comments column.
Other
Personal Health BudgetsIntegrated Personalised CommissioningDirect PaymentsOther
Social PrescribingRisk StratificationChoice PolicyOther
Supported LivingLearning DisabilityExtra CareCare HomeNursing HomeOther
Page 106 of 252
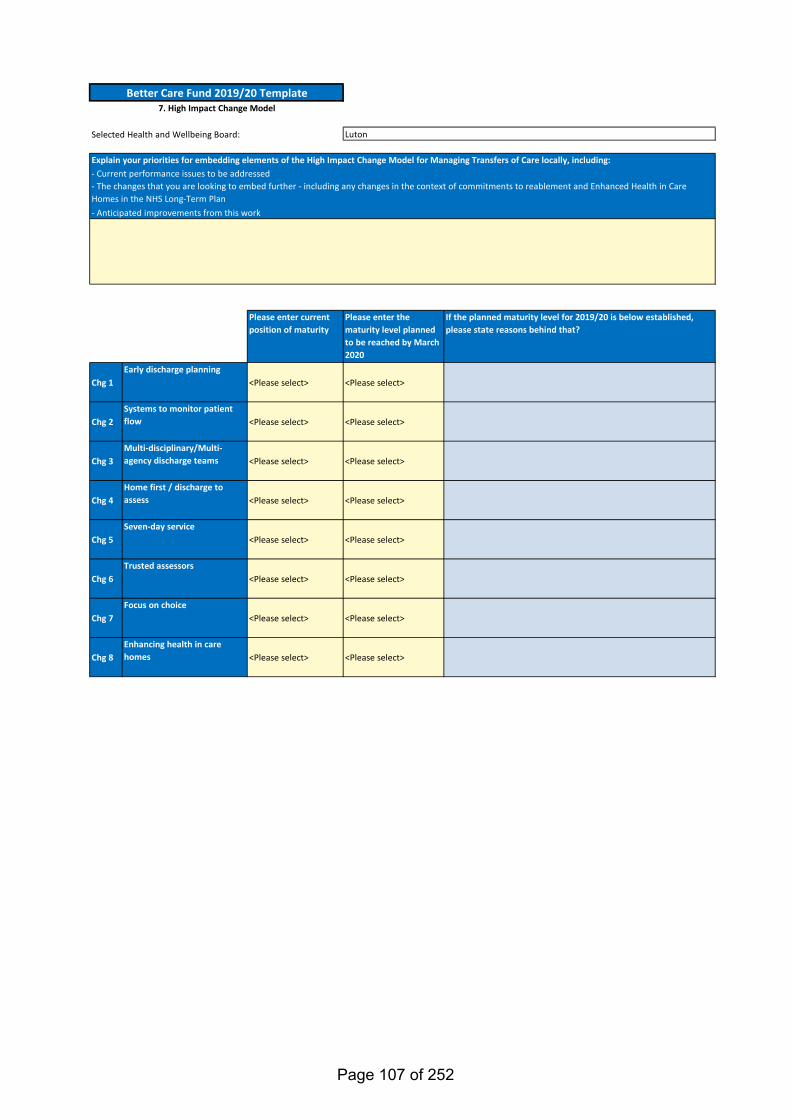
Selected Health and Wellbeing Board:
Please enter current position of maturity
Please enter the maturity level planned to be reached by March 2020
If the planned maturity level for 2019/20 is below established, please state reasons behind that?
Chg 1Early discharge planning
<Please select> <Please select>
Chg 2Systems to monitor patient flow <Please select> <Please select>
Chg 3Multi-disciplinary/Multi-agency discharge teams <Please select> <Please select>
Chg 4Home first / discharge to assess <Please select> <Please select>
Chg 5Seven-day service
<Please select> <Please select>
Chg 6Trusted assessors
<Please select> <Please select>
Chg 7Focus on choice
<Please select> <Please select>
Chg 8Enhancing health in care homes <Please select> <Please select>
Better Care Fund 2019/20 Template7. High Impact Change Model
Luton
- The changes that you are looking to embed further - including any changes in the context of commitments to reablement and Enhanced Health in Care Homes in the NHS Long-Term Plan
Explain your priorities for embedding elements of the High Impact Change Model for Managing Transfers of Care locally, including:- Current performance issues to be addressed
- Anticipated improvements from this work
Page 107 of 252
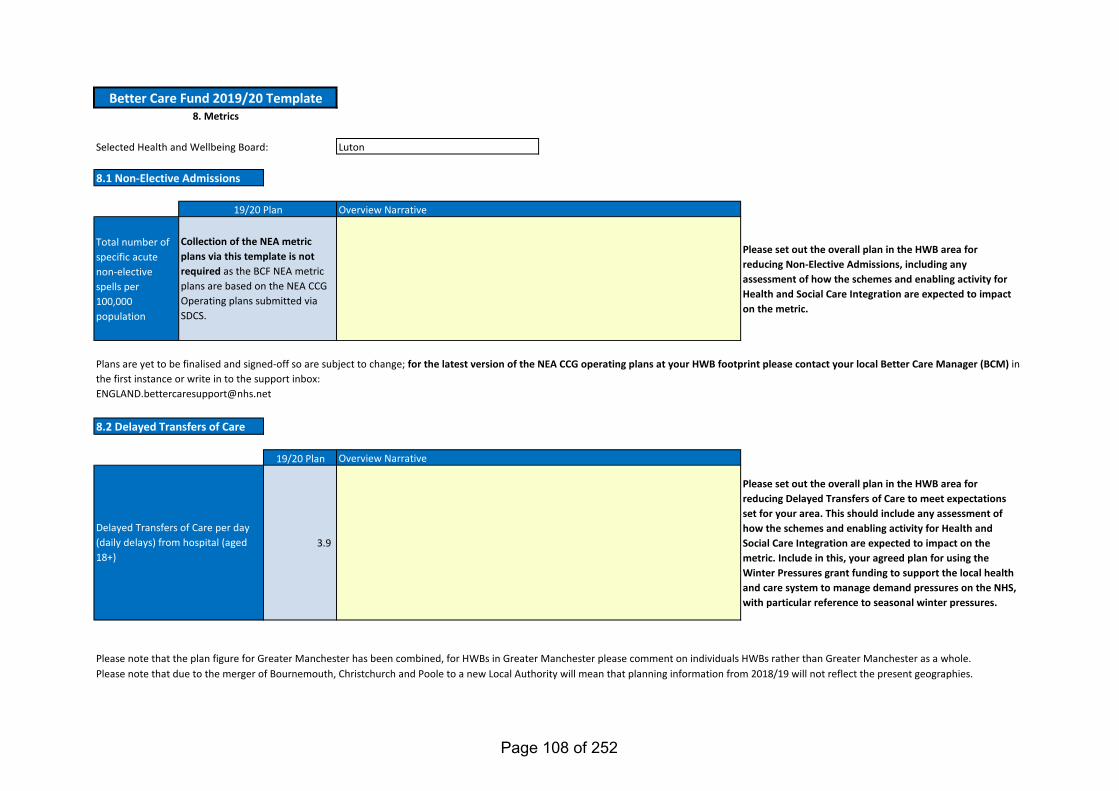
Total number of specific acute non-elective spells per 100,000 population
Please set out the overall plan in the HWB area for reducing Non-Elective Admissions, including any assessment of how the schemes and enabling activity for Health and Social Care Integration are expected to impact on the metric.
19/20 Plan
3.9
Please set out the overall plan in the HWB area for reducing Delayed Transfers of Care to meet expectations set for your area. This should include any assessment of how the schemes and enabling activity for Health and Social Care Integration are expected to impact on the metric. Include in this, your agreed plan for using the Winter Pressures grant funding to support the local health and care system to manage demand pressures on the NHS, with particular reference to seasonal winter pressures.
Selected Health and Wellbeing Board: Luton
Delayed Transfers of Care per day (daily delays) from hospital (aged 18+)
Overview Narrative
8.1 Non-Elective Admissions
Please note that the plan figure for Greater Manchester has been combined, for HWBs in Greater Manchester please comment on individuals HWBs rather than Greater Manchester as a whole.
Better Care Fund 2019/20 Template8. Metrics
8.2 Delayed Transfers of Care
Please note that due to the merger of Bournemouth, Christchurch and Poole to a new Local Authority will mean that planning information from 2018/19 will not reflect the present geographies.
Overview Narrative19/20 Plan
Collection of the NEA metric plans via this template is not required as the BCF NEA metric plans are based on the NEA CCG Operating plans submitted via SDCS.
Plans are yet to be finalised and signed-off so are subject to change; for the latest version of the NEA CCG operating plans at your HWB footprint please contact your local Better Care Manager (BCM) in the first instance or write in to the support inbox:[email protected]
Page 108 of 252
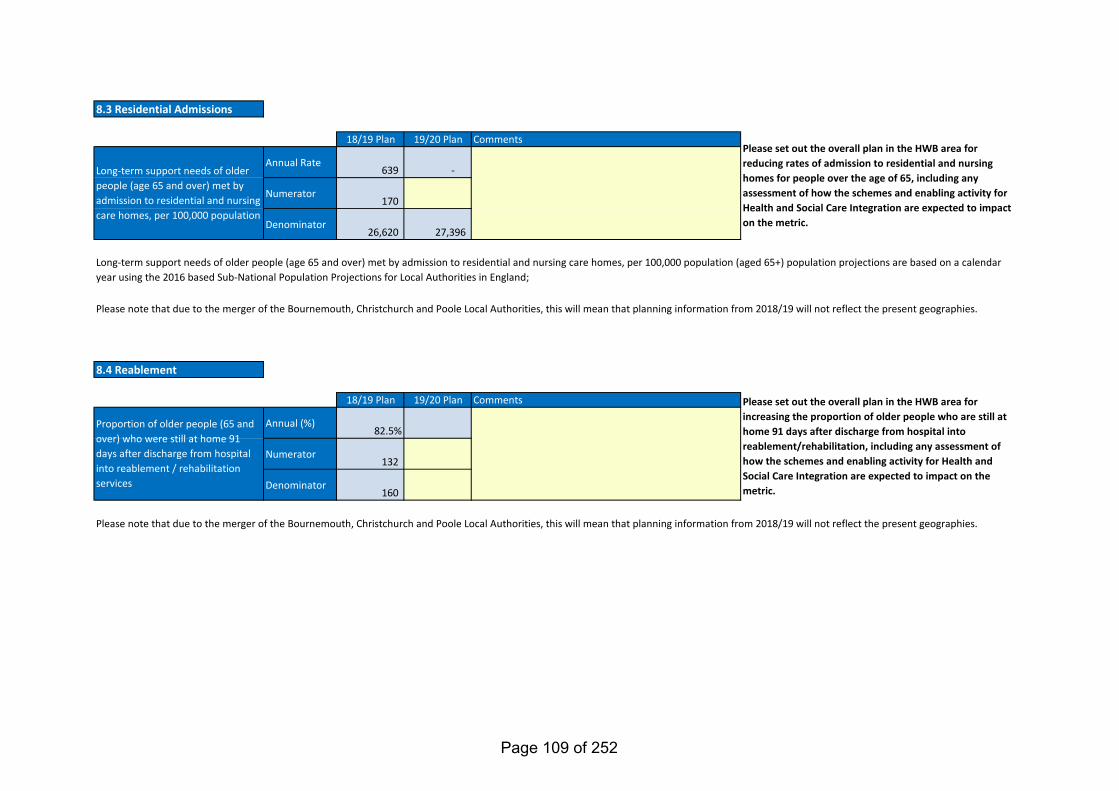
18/19 Plan 19/20 Plan
Annual Rate639 -
Numerator170
Denominator26,620 27,396
18/19 Plan 19/20 Plan
Annual (%)82.5%
Numerator132
Denominator160
Please note that due to the merger of the Bournemouth, Christchurch and Poole Local Authorities, this will mean that planning information from 2018/19 will not reflect the present geographies.
Please set out the overall plan in the HWB area for reducing rates of admission to residential and nursing homes for people over the age of 65, including any assessment of how the schemes and enabling activity for Health and Social Care Integration are expected to impact on the metric.
Please set out the overall plan in the HWB area for increasing the proportion of older people who are still at home 91 days after discharge from hospital into reablement/rehabilitation, including any assessment of how the schemes and enabling activity for Health and Social Care Integration are expected to impact on the metric.
Comments
8.4 Reablement
Proportion of older people (65 and over) who were still at home 91 days after discharge from hospital into reablement / rehabilitation services
Please note that due to the merger of the Bournemouth, Christchurch and Poole Local Authorities, this will mean that planning information from 2018/19 will not reflect the present geographies.
Long-term support needs of older people (age 65 and over) met by admission to residential and nursing care homes, per 100,000 population (aged 65+) population projections are based on a calendar year using the 2016 based Sub-National Population Projections for Local Authorities in England;
Comments
Long-term support needs of older people (age 65 and over) met by admission to residential and nursing care homes, per 100,000 population
8.3 Residential Admissions
Page 109 of 252
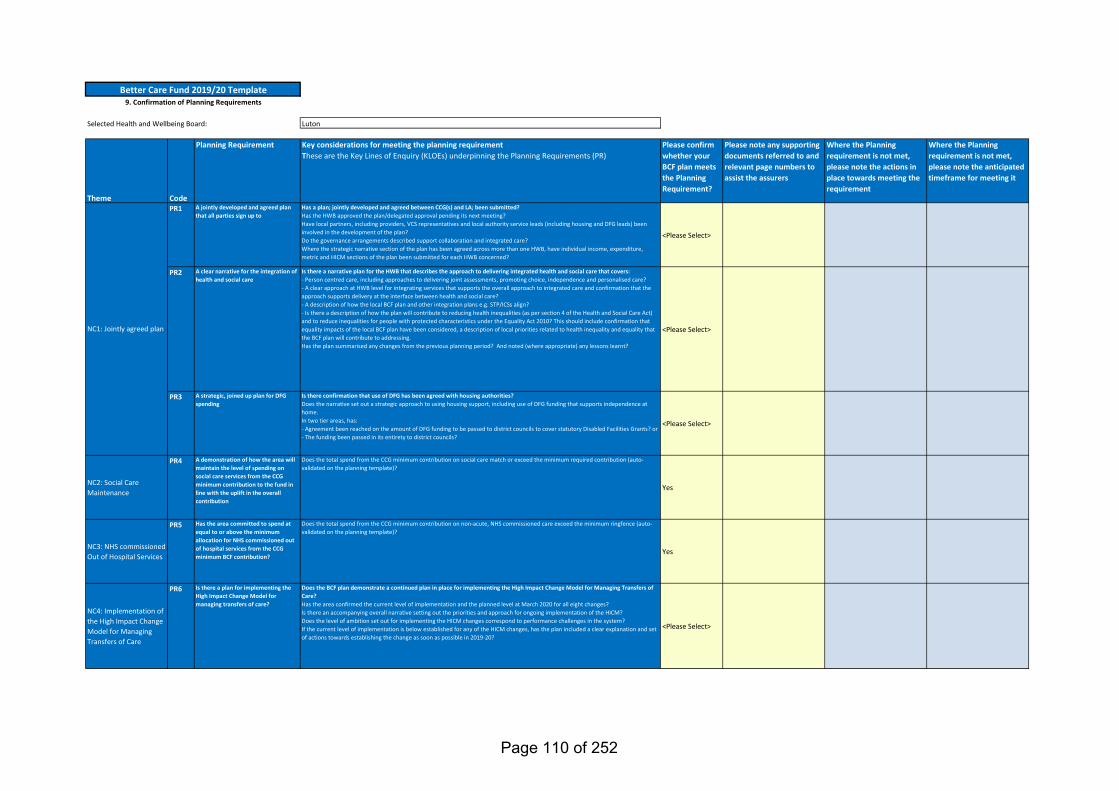
Selected Health and Wellbeing Board: Luton
Theme Code
Planning Requirement Key considerations for meeting the planning requirementThese are the Key Lines of Enquiry (KLOEs) underpinning the Planning Requirements (PR)
Please confirm whether your BCF plan meets the Planning Requirement?
Please note any supporting documents referred to and relevant page numbers to assist the assurers
Where the Planning requirement is not met, please note the actions in place towards meeting the requirement
Where the Planning requirement is not met, please note the anticipated timeframe for meeting it
PR1 A jointly developed and agreed plan that all parties sign up to
Has a plan; jointly developed and agreed between CCG(s) and LA; been submitted?Has the HWB approved the plan/delegated approval pending its next meeting?Have local partners, including providers, VCS representatives and local authority service leads (including housing and DFG leads) been involved in the development of the plan?Do the governance arrangements described support collaboration and integrated care?Where the strategic narrative section of the plan has been agreed across more than one HWB, have individual income, expenditure, metric and HICM sections of the plan been submitted for each HWB concerned?
<Please Select>
PR2 A clear narrative for the integration of health and social care
Is there a narrative plan for the HWB that describes the approach to delivering integrated health and social care that covers:- Person centred care, including approaches to delivering joint assessments, promoting choice, independence and personalised care?- A clear approach at HWB level for integrating services that supports the overall approach to integrated care and confirmation that the approach supports delivery at the interface between health and social care?- A description of how the local BCF plan and other integration plans e.g. STP/ICSs align?- Is there a description of how the plan will contribute to reducing health inequalities (as per section 4 of the Health and Social Care Act) and to reduce inequalities for people with protected characteristics under the Equality Act 2010? This should include confirmation that equality impacts of the local BCF plan have been considered, a description of local priorities related to health inequality and equality that the BCF plan will contribute to addressing.Has the plan summarised any changes from the previous planning period? And noted (where appropriate) any lessons learnt?
<Please Select>
PR3 A strategic, joined up plan for DFG spending
Is there confirmation that use of DFG has been agreed with housing authorities?Does the narrative set out a strategic approach to using housing support, including use of DFG funding that supports independence at home.In two tier areas, has: - Agreement been reached on the amount of DFG funding to be passed to district councils to cover statutory Disabled Facilities Grants? or - The funding been passed in its entirety to district councils?
<Please Select>
NC2: Social Care Maintenance
PR4 A demonstration of how the area will maintain the level of spending on social care services from the CCG minimum contribution to the fund in line with the uplift in the overall contribution
Does the total spend from the CCG minimum contribution on social care match or exceed the minimum required contribution (auto-validated on the planning template)?
Yes
NC3: NHS commissioned Out of Hospital Services
PR5 Has the area committed to spend at equal to or above the minimum allocation for NHS commissioned out of hospital services from the CCG minimum BCF contribution?
Does the total spend from the CCG minimum contribution on non-acute, NHS commissioned care exceed the minimum ringfence (auto-validated on the planning template)?
Yes
NC4: Implementation of the High Impact Change Model for Managing Transfers of Care
PR6 Is there a plan for implementing the High Impact Change Model for managing transfers of care?
Does the BCF plan demonstrate a continued plan in place for implementing the High Impact Change Model for Managing Transfers of Care?Has the area confirmed the current level of implementation and the planned level at March 2020 for all eight changes?Is there an accompanying overall narrative setting out the priorities and approach for ongoing implementation of the HICM?Does the level of ambition set out for implementing the HICM changes correspond to performance challenges in the system?If the current level of implementation is below established for any of the HICM changes, has the plan included a clear explanation and set of actions towards establishing the change as soon as possible in 2019-20?
<Please Select>
NC1: Jointly agreed plan
Better Care Fund 2019/20 Template9. Confirmation of Planning Requirements
Page 110 of 252
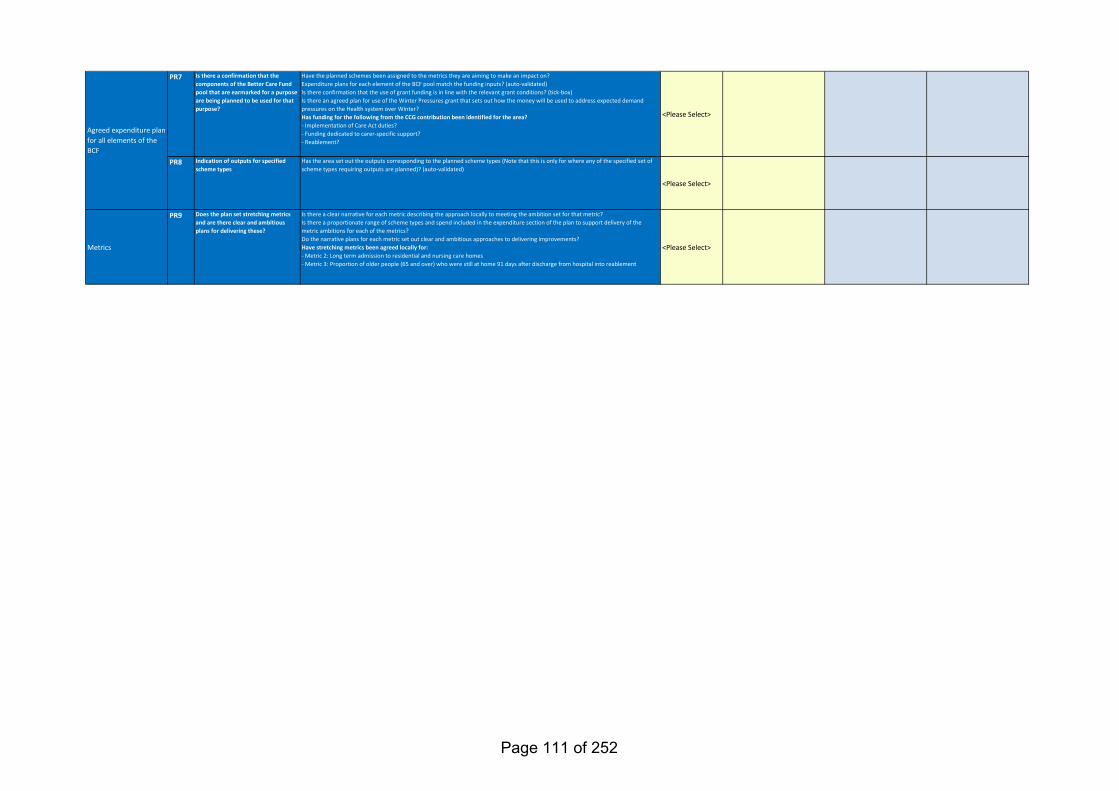
PR7 Is there a confirmation that the components of the Better Care Fund pool that are earmarked for a purpose are being planned to be used for that purpose?
Have the planned schemes been assigned to the metrics they are aiming to make an impact on?Expenditure plans for each element of the BCF pool match the funding inputs? (auto-validated)Is there confirmation that the use of grant funding is in line with the relevant grant conditions? (tick-box)Is there an agreed plan for use of the Winter Pressures grant that sets out how the money will be used to address expected demand pressures on the Health system over Winter?Has funding for the following from the CCG contribution been identified for the area?- Implementation of Care Act duties?- Funding dedicated to carer-specific support?- Reablement?
<Please Select>
PR8 Indication of outputs for specified scheme types
Has the area set out the outputs corresponding to the planned scheme types (Note that this is only for where any of the specified set of scheme types requiring outputs are planned)? (auto-validated)
<Please Select>
Metrics
PR9 Does the plan set stretching metrics and are there clear and ambitious plans for delivering these?
Is there a clear narrative for each metric describing the approach locally to meeting the ambition set for that metric?Is there a proportionate range of scheme types and spend included in the expenditure section of the plan to support delivery of the metric ambitions for each of the metrics?Do the narrative plans for each metric set out clear and ambitious approaches to delivering improvements?Have stretching metrics been agreed locally for:- Metric 2: Long term admission to residential and nursing care homes- Metric 3: Proportion of older people (65 and over) who were still at home 91 days after discharge from hospital into reablement
<Please Select>
Agreed expenditure plan for all elements of the BCF
Page 111 of 252
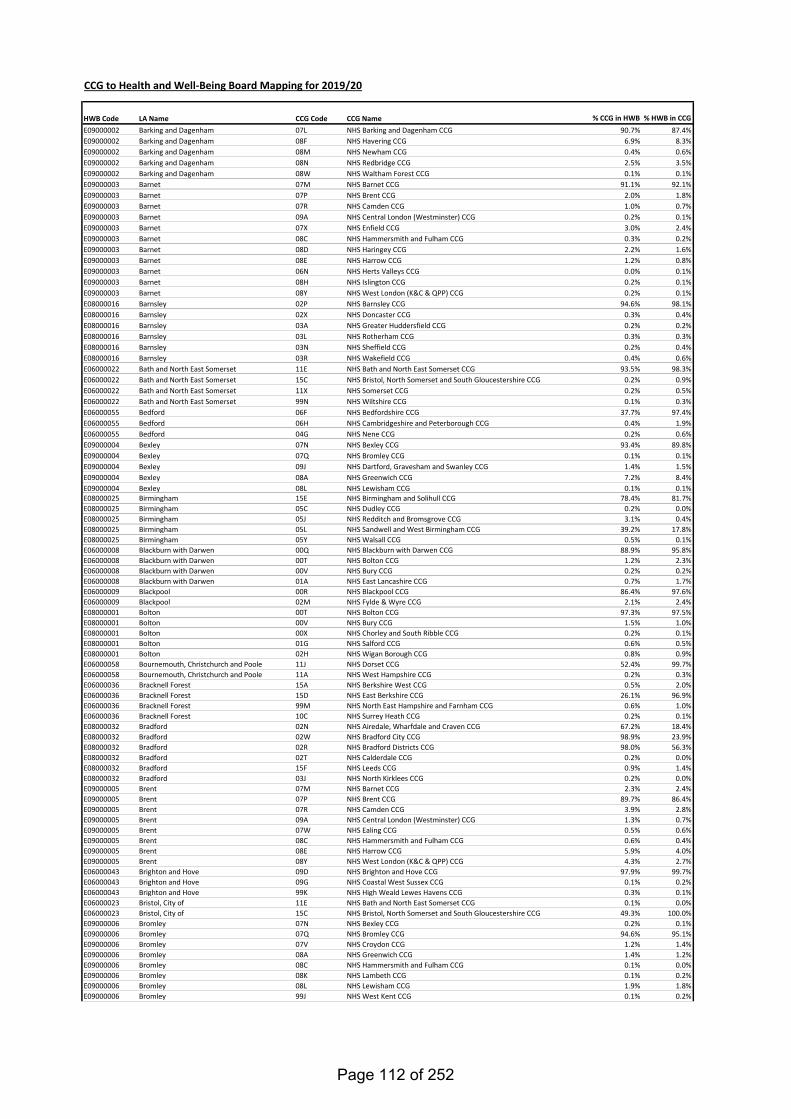
CCG to Health and Well-Being Board Mapping for 2019/20
HWB Code LA Name CCG Code CCG Name % CCG in HWB % HWB in CCGE09000002 Barking and Dagenham 07L NHS Barking and Dagenham CCG 90.7% 87.4%E09000002 Barking and Dagenham 08F NHS Havering CCG 6.9% 8.3%E09000002 Barking and Dagenham 08M NHS Newham CCG 0.4% 0.6%E09000002 Barking and Dagenham 08N NHS Redbridge CCG 2.5% 3.5%E09000002 Barking and Dagenham 08W NHS Waltham Forest CCG 0.1% 0.1%E09000003 Barnet 07M NHS Barnet CCG 91.1% 92.1%E09000003 Barnet 07P NHS Brent CCG 2.0% 1.8%E09000003 Barnet 07R NHS Camden CCG 1.0% 0.7%E09000003 Barnet 09A NHS Central London (Westminster) CCG 0.2% 0.1%E09000003 Barnet 07X NHS Enfield CCG 3.0% 2.4%E09000003 Barnet 08C NHS Hammersmith and Fulham CCG 0.3% 0.2%E09000003 Barnet 08D NHS Haringey CCG 2.2% 1.6%E09000003 Barnet 08E NHS Harrow CCG 1.2% 0.8%E09000003 Barnet 06N NHS Herts Valleys CCG 0.0% 0.1%E09000003 Barnet 08H NHS Islington CCG 0.2% 0.1%E09000003 Barnet 08Y NHS West London (K&C & QPP) CCG 0.2% 0.1%E08000016 Barnsley 02P NHS Barnsley CCG 94.6% 98.1%E08000016 Barnsley 02X NHS Doncaster CCG 0.3% 0.4%E08000016 Barnsley 03A NHS Greater Huddersfield CCG 0.2% 0.2%E08000016 Barnsley 03L NHS Rotherham CCG 0.3% 0.3%E08000016 Barnsley 03N NHS Sheffield CCG 0.2% 0.4%E08000016 Barnsley 03R NHS Wakefield CCG 0.4% 0.6%E06000022 Bath and North East Somerset 11E NHS Bath and North East Somerset CCG 93.5% 98.3%E06000022 Bath and North East Somerset 15C NHS Bristol, North Somerset and South Gloucestershire CCG 0.2% 0.9%E06000022 Bath and North East Somerset 11X NHS Somerset CCG 0.2% 0.5%E06000022 Bath and North East Somerset 99N NHS Wiltshire CCG 0.1% 0.3%E06000055 Bedford 06F NHS Bedfordshire CCG 37.7% 97.4%E06000055 Bedford 06H NHS Cambridgeshire and Peterborough CCG 0.4% 1.9%E06000055 Bedford 04G NHS Nene CCG 0.2% 0.6%E09000004 Bexley 07N NHS Bexley CCG 93.4% 89.8%E09000004 Bexley 07Q NHS Bromley CCG 0.1% 0.1%E09000004 Bexley 09J NHS Dartford, Gravesham and Swanley CCG 1.4% 1.5%E09000004 Bexley 08A NHS Greenwich CCG 7.2% 8.4%E09000004 Bexley 08L NHS Lewisham CCG 0.1% 0.1%E08000025 Birmingham 15E NHS Birmingham and Solihull CCG 78.4% 81.7%E08000025 Birmingham 05C NHS Dudley CCG 0.2% 0.0%E08000025 Birmingham 05J NHS Redditch and Bromsgrove CCG 3.1% 0.4%E08000025 Birmingham 05L NHS Sandwell and West Birmingham CCG 39.2% 17.8%E08000025 Birmingham 05Y NHS Walsall CCG 0.5% 0.1%E06000008 Blackburn with Darwen 00Q NHS Blackburn with Darwen CCG 88.9% 95.8%E06000008 Blackburn with Darwen 00T NHS Bolton CCG 1.2% 2.3%E06000008 Blackburn with Darwen 00V NHS Bury CCG 0.2% 0.2%E06000008 Blackburn with Darwen 01A NHS East Lancashire CCG 0.7% 1.7%E06000009 Blackpool 00R NHS Blackpool CCG 86.4% 97.6%E06000009 Blackpool 02M NHS Fylde & Wyre CCG 2.1% 2.4%E08000001 Bolton 00T NHS Bolton CCG 97.3% 97.5%E08000001 Bolton 00V NHS Bury CCG 1.5% 1.0%E08000001 Bolton 00X NHS Chorley and South Ribble CCG 0.2% 0.1%E08000001 Bolton 01G NHS Salford CCG 0.6% 0.5%E08000001 Bolton 02H NHS Wigan Borough CCG 0.8% 0.9%E06000058 Bournemouth, Christchurch and Poole 11J NHS Dorset CCG 52.4% 99.7%E06000058 Bournemouth, Christchurch and Poole 11A NHS West Hampshire CCG 0.2% 0.3%E06000036 Bracknell Forest 15A NHS Berkshire West CCG 0.5% 2.0%E06000036 Bracknell Forest 15D NHS East Berkshire CCG 26.1% 96.9%E06000036 Bracknell Forest 99M NHS North East Hampshire and Farnham CCG 0.6% 1.0%E06000036 Bracknell Forest 10C NHS Surrey Heath CCG 0.2% 0.1%E08000032 Bradford 02N NHS Airedale, Wharfdale and Craven CCG 67.2% 18.4%E08000032 Bradford 02W NHS Bradford City CCG 98.9% 23.9%E08000032 Bradford 02R NHS Bradford Districts CCG 98.0% 56.3%E08000032 Bradford 02T NHS Calderdale CCG 0.2% 0.0%E08000032 Bradford 15F NHS Leeds CCG 0.9% 1.4%E08000032 Bradford 03J NHS North Kirklees CCG 0.2% 0.0%E09000005 Brent 07M NHS Barnet CCG 2.3% 2.4%E09000005 Brent 07P NHS Brent CCG 89.7% 86.4%E09000005 Brent 07R NHS Camden CCG 3.9% 2.8%E09000005 Brent 09A NHS Central London (Westminster) CCG 1.3% 0.7%E09000005 Brent 07W NHS Ealing CCG 0.5% 0.6%E09000005 Brent 08C NHS Hammersmith and Fulham CCG 0.6% 0.4%E09000005 Brent 08E NHS Harrow CCG 5.9% 4.0%E09000005 Brent 08Y NHS West London (K&C & QPP) CCG 4.3% 2.7%E06000043 Brighton and Hove 09D NHS Brighton and Hove CCG 97.9% 99.7%E06000043 Brighton and Hove 09G NHS Coastal West Sussex CCG 0.1% 0.2%E06000043 Brighton and Hove 99K NHS High Weald Lewes Havens CCG 0.3% 0.1%E06000023 Bristol, City of 11E NHS Bath and North East Somerset CCG 0.1% 0.0%E06000023 Bristol, City of 15C NHS Bristol, North Somerset and South Gloucestershire CCG 49.3% 100.0%E09000006 Bromley 07N NHS Bexley CCG 0.2% 0.1%E09000006 Bromley 07Q NHS Bromley CCG 94.6% 95.1%E09000006 Bromley 07V NHS Croydon CCG 1.2% 1.4%E09000006 Bromley 08A NHS Greenwich CCG 1.4% 1.2%E09000006 Bromley 08C NHS Hammersmith and Fulham CCG 0.1% 0.0%E09000006 Bromley 08K NHS Lambeth CCG 0.1% 0.2%E09000006 Bromley 08L NHS Lewisham CCG 1.9% 1.8%E09000006 Bromley 99J NHS West Kent CCG 0.1% 0.2%
Page 112 of 252
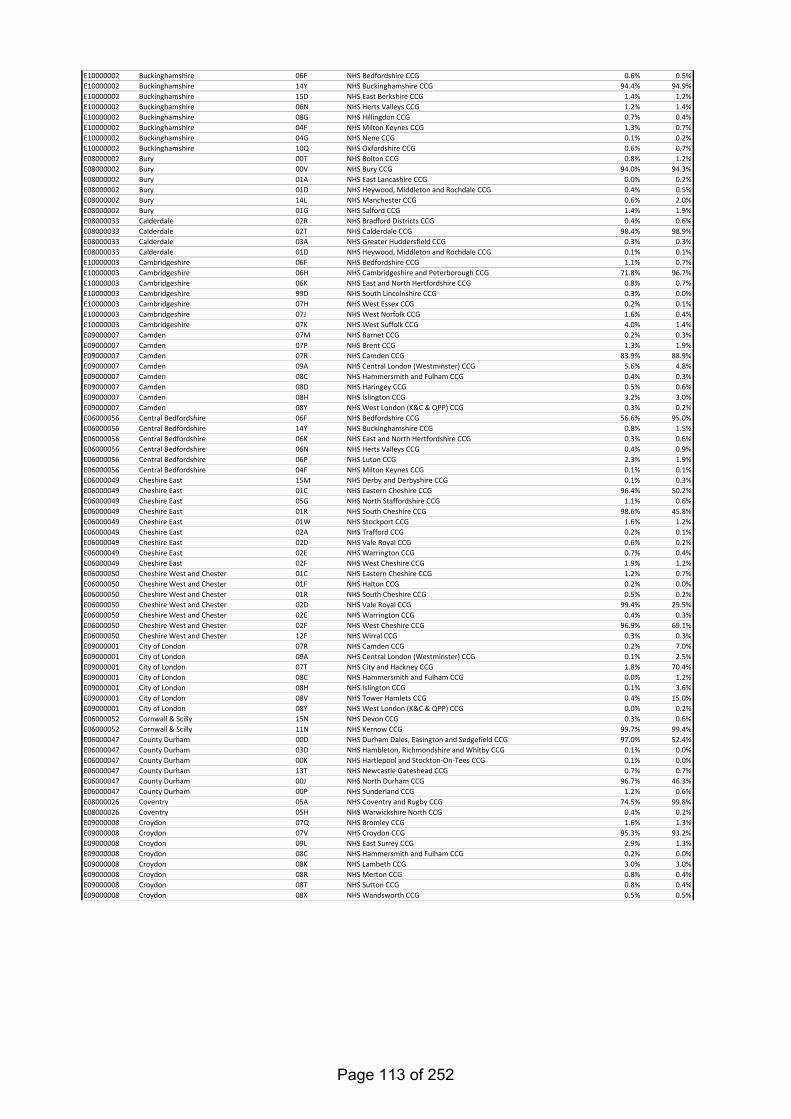
E10000002 Buckinghamshire 06F NHS Bedfordshire CCG 0.6% 0.5%E10000002 Buckinghamshire 14Y NHS Buckinghamshire CCG 94.4% 94.9%E10000002 Buckinghamshire 15D NHS East Berkshire CCG 1.4% 1.2%E10000002 Buckinghamshire 06N NHS Herts Valleys CCG 1.2% 1.4%E10000002 Buckinghamshire 08G NHS Hillingdon CCG 0.7% 0.4%E10000002 Buckinghamshire 04F NHS Milton Keynes CCG 1.3% 0.7%E10000002 Buckinghamshire 04G NHS Nene CCG 0.1% 0.2%E10000002 Buckinghamshire 10Q NHS Oxfordshire CCG 0.6% 0.7%E08000002 Bury 00T NHS Bolton CCG 0.8% 1.2%E08000002 Bury 00V NHS Bury CCG 94.0% 94.3%E08000002 Bury 01A NHS East Lancashire CCG 0.0% 0.2%E08000002 Bury 01D NHS Heywood, Middleton and Rochdale CCG 0.4% 0.5%E08000002 Bury 14L NHS Manchester CCG 0.6% 2.0%E08000002 Bury 01G NHS Salford CCG 1.4% 1.9%E08000033 Calderdale 02R NHS Bradford Districts CCG 0.4% 0.6%E08000033 Calderdale 02T NHS Calderdale CCG 98.4% 98.9%E08000033 Calderdale 03A NHS Greater Huddersfield CCG 0.3% 0.3%E08000033 Calderdale 01D NHS Heywood, Middleton and Rochdale CCG 0.1% 0.1%E10000003 Cambridgeshire 06F NHS Bedfordshire CCG 1.1% 0.7%E10000003 Cambridgeshire 06H NHS Cambridgeshire and Peterborough CCG 71.8% 96.7%E10000003 Cambridgeshire 06K NHS East and North Hertfordshire CCG 0.8% 0.7%E10000003 Cambridgeshire 99D NHS South Lincolnshire CCG 0.3% 0.0%E10000003 Cambridgeshire 07H NHS West Essex CCG 0.2% 0.1%E10000003 Cambridgeshire 07J NHS West Norfolk CCG 1.6% 0.4%E10000003 Cambridgeshire 07K NHS West Suffolk CCG 4.0% 1.4%E09000007 Camden 07M NHS Barnet CCG 0.2% 0.3%E09000007 Camden 07P NHS Brent CCG 1.3% 1.9%E09000007 Camden 07R NHS Camden CCG 83.9% 88.9%E09000007 Camden 09A NHS Central London (Westminster) CCG 5.6% 4.8%E09000007 Camden 08C NHS Hammersmith and Fulham CCG 0.4% 0.3%E09000007 Camden 08D NHS Haringey CCG 0.5% 0.6%E09000007 Camden 08H NHS Islington CCG 3.2% 3.0%E09000007 Camden 08Y NHS West London (K&C & QPP) CCG 0.3% 0.2%E06000056 Central Bedfordshire 06F NHS Bedfordshire CCG 56.6% 95.0%E06000056 Central Bedfordshire 14Y NHS Buckinghamshire CCG 0.8% 1.5%E06000056 Central Bedfordshire 06K NHS East and North Hertfordshire CCG 0.3% 0.6%E06000056 Central Bedfordshire 06N NHS Herts Valleys CCG 0.4% 0.9%E06000056 Central Bedfordshire 06P NHS Luton CCG 2.3% 1.9%E06000056 Central Bedfordshire 04F NHS Milton Keynes CCG 0.1% 0.1%E06000049 Cheshire East 15M NHS Derby and Derbyshire CCG 0.1% 0.3%E06000049 Cheshire East 01C NHS Eastern Cheshire CCG 96.4% 50.2%E06000049 Cheshire East 05G NHS North Staffordshire CCG 1.1% 0.6%E06000049 Cheshire East 01R NHS South Cheshire CCG 98.6% 45.8%E06000049 Cheshire East 01W NHS Stockport CCG 1.6% 1.2%E06000049 Cheshire East 02A NHS Trafford CCG 0.2% 0.1%E06000049 Cheshire East 02D NHS Vale Royal CCG 0.6% 0.2%E06000049 Cheshire East 02E NHS Warrington CCG 0.7% 0.4%E06000049 Cheshire East 02F NHS West Cheshire CCG 1.9% 1.2%E06000050 Cheshire West and Chester 01C NHS Eastern Cheshire CCG 1.2% 0.7%E06000050 Cheshire West and Chester 01F NHS Halton CCG 0.2% 0.0%E06000050 Cheshire West and Chester 01R NHS South Cheshire CCG 0.5% 0.2%E06000050 Cheshire West and Chester 02D NHS Vale Royal CCG 99.4% 29.5%E06000050 Cheshire West and Chester 02E NHS Warrington CCG 0.4% 0.3%E06000050 Cheshire West and Chester 02F NHS West Cheshire CCG 96.9% 69.1%E06000050 Cheshire West and Chester 12F NHS Wirral CCG 0.3% 0.3%E09000001 City of London 07R NHS Camden CCG 0.2% 7.0%E09000001 City of London 09A NHS Central London (Westminster) CCG 0.1% 2.5%E09000001 City of London 07T NHS City and Hackney CCG 1.8% 70.4%E09000001 City of London 08C NHS Hammersmith and Fulham CCG 0.0% 1.2%E09000001 City of London 08H NHS Islington CCG 0.1% 3.6%E09000001 City of London 08V NHS Tower Hamlets CCG 0.4% 15.0%E09000001 City of London 08Y NHS West London (K&C & QPP) CCG 0.0% 0.2%E06000052 Cornwall & Scilly 15N NHS Devon CCG 0.3% 0.6%E06000052 Cornwall & Scilly 11N NHS Kernow CCG 99.7% 99.4%E06000047 County Durham 00D NHS Durham Dales, Easington and Sedgefield CCG 97.0% 52.4%E06000047 County Durham 03D NHS Hambleton, Richmondshire and Whitby CCG 0.1% 0.0%E06000047 County Durham 00K NHS Hartlepool and Stockton-On-Tees CCG 0.1% 0.0%E06000047 County Durham 13T NHS Newcastle Gateshead CCG 0.7% 0.7%E06000047 County Durham 00J NHS North Durham CCG 96.7% 46.3%E06000047 County Durham 00P NHS Sunderland CCG 1.2% 0.6%E08000026 Coventry 05A NHS Coventry and Rugby CCG 74.5% 99.8%E08000026 Coventry 05H NHS Warwickshire North CCG 0.4% 0.2%E09000008 Croydon 07Q NHS Bromley CCG 1.6% 1.3%E09000008 Croydon 07V NHS Croydon CCG 95.3% 93.2%E09000008 Croydon 09L NHS East Surrey CCG 2.9% 1.3%E09000008 Croydon 08C NHS Hammersmith and Fulham CCG 0.2% 0.0%E09000008 Croydon 08K NHS Lambeth CCG 3.0% 3.0%E09000008 Croydon 08R NHS Merton CCG 0.8% 0.4%E09000008 Croydon 08T NHS Sutton CCG 0.8% 0.4%E09000008 Croydon 08X NHS Wandsworth CCG 0.5% 0.5%
Page 113 of 252
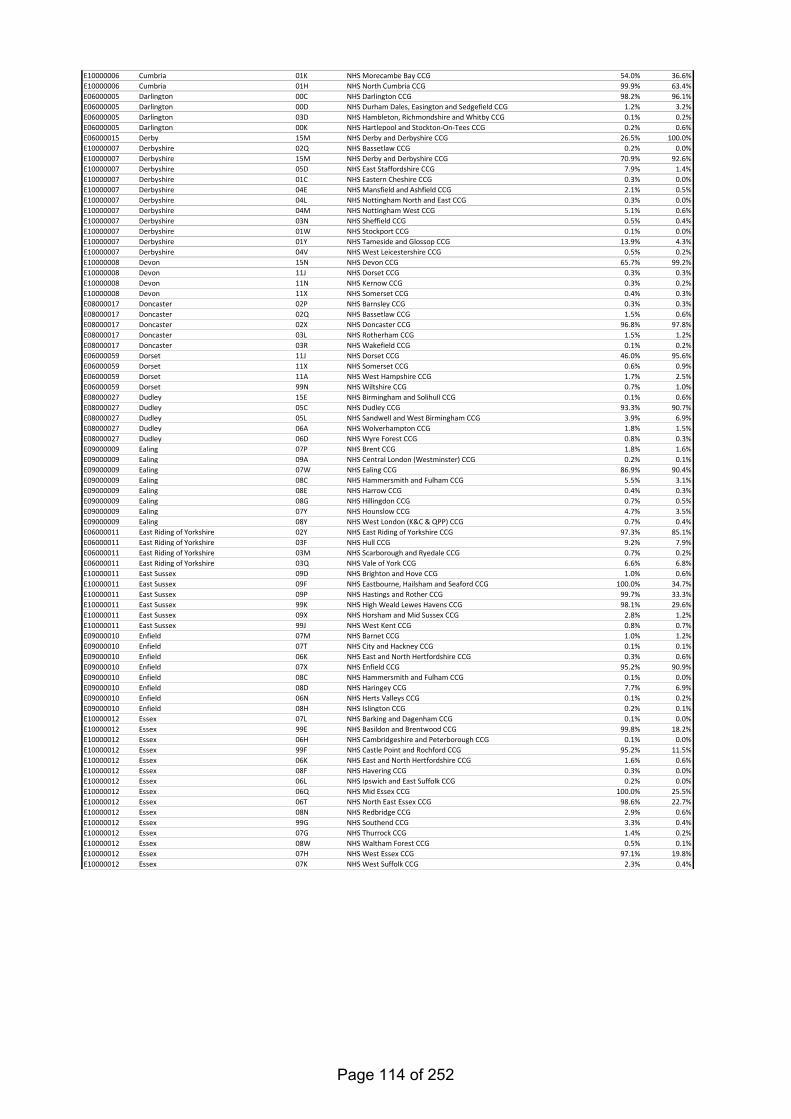
E10000006 Cumbria 01K NHS Morecambe Bay CCG 54.0% 36.6%E10000006 Cumbria 01H NHS North Cumbria CCG 99.9% 63.4%E06000005 Darlington 00C NHS Darlington CCG 98.2% 96.1%E06000005 Darlington 00D NHS Durham Dales, Easington and Sedgefield CCG 1.2% 3.2%E06000005 Darlington 03D NHS Hambleton, Richmondshire and Whitby CCG 0.1% 0.2%E06000005 Darlington 00K NHS Hartlepool and Stockton-On-Tees CCG 0.2% 0.6%E06000015 Derby 15M NHS Derby and Derbyshire CCG 26.5% 100.0%E10000007 Derbyshire 02Q NHS Bassetlaw CCG 0.2% 0.0%E10000007 Derbyshire 15M NHS Derby and Derbyshire CCG 70.9% 92.6%E10000007 Derbyshire 05D NHS East Staffordshire CCG 7.9% 1.4%E10000007 Derbyshire 01C NHS Eastern Cheshire CCG 0.3% 0.0%E10000007 Derbyshire 04E NHS Mansfield and Ashfield CCG 2.1% 0.5%E10000007 Derbyshire 04L NHS Nottingham North and East CCG 0.3% 0.0%E10000007 Derbyshire 04M NHS Nottingham West CCG 5.1% 0.6%E10000007 Derbyshire 03N NHS Sheffield CCG 0.5% 0.4%E10000007 Derbyshire 01W NHS Stockport CCG 0.1% 0.0%E10000007 Derbyshire 01Y NHS Tameside and Glossop CCG 13.9% 4.3%E10000007 Derbyshire 04V NHS West Leicestershire CCG 0.5% 0.2%E10000008 Devon 15N NHS Devon CCG 65.7% 99.2%E10000008 Devon 11J NHS Dorset CCG 0.3% 0.3%E10000008 Devon 11N NHS Kernow CCG 0.3% 0.2%E10000008 Devon 11X NHS Somerset CCG 0.4% 0.3%E08000017 Doncaster 02P NHS Barnsley CCG 0.3% 0.3%E08000017 Doncaster 02Q NHS Bassetlaw CCG 1.5% 0.6%E08000017 Doncaster 02X NHS Doncaster CCG 96.8% 97.8%E08000017 Doncaster 03L NHS Rotherham CCG 1.5% 1.2%E08000017 Doncaster 03R NHS Wakefield CCG 0.1% 0.2%E06000059 Dorset 11J NHS Dorset CCG 46.0% 95.6%E06000059 Dorset 11X NHS Somerset CCG 0.6% 0.9%E06000059 Dorset 11A NHS West Hampshire CCG 1.7% 2.5%E06000059 Dorset 99N NHS Wiltshire CCG 0.7% 1.0%E08000027 Dudley 15E NHS Birmingham and Solihull CCG 0.1% 0.6%E08000027 Dudley 05C NHS Dudley CCG 93.3% 90.7%E08000027 Dudley 05L NHS Sandwell and West Birmingham CCG 3.9% 6.9%E08000027 Dudley 06A NHS Wolverhampton CCG 1.8% 1.5%E08000027 Dudley 06D NHS Wyre Forest CCG 0.8% 0.3%E09000009 Ealing 07P NHS Brent CCG 1.8% 1.6%E09000009 Ealing 09A NHS Central London (Westminster) CCG 0.2% 0.1%E09000009 Ealing 07W NHS Ealing CCG 86.9% 90.4%E09000009 Ealing 08C NHS Hammersmith and Fulham CCG 5.5% 3.1%E09000009 Ealing 08E NHS Harrow CCG 0.4% 0.3%E09000009 Ealing 08G NHS Hillingdon CCG 0.7% 0.5%E09000009 Ealing 07Y NHS Hounslow CCG 4.7% 3.5%E09000009 Ealing 08Y NHS West London (K&C & QPP) CCG 0.7% 0.4%E06000011 East Riding of Yorkshire 02Y NHS East Riding of Yorkshire CCG 97.3% 85.1%E06000011 East Riding of Yorkshire 03F NHS Hull CCG 9.2% 7.9%E06000011 East Riding of Yorkshire 03M NHS Scarborough and Ryedale CCG 0.7% 0.2%E06000011 East Riding of Yorkshire 03Q NHS Vale of York CCG 6.6% 6.8%E10000011 East Sussex 09D NHS Brighton and Hove CCG 1.0% 0.6%E10000011 East Sussex 09F NHS Eastbourne, Hailsham and Seaford CCG 100.0% 34.7%E10000011 East Sussex 09P NHS Hastings and Rother CCG 99.7% 33.3%E10000011 East Sussex 99K NHS High Weald Lewes Havens CCG 98.1% 29.6%E10000011 East Sussex 09X NHS Horsham and Mid Sussex CCG 2.8% 1.2%E10000011 East Sussex 99J NHS West Kent CCG 0.8% 0.7%E09000010 Enfield 07M NHS Barnet CCG 1.0% 1.2%E09000010 Enfield 07T NHS City and Hackney CCG 0.1% 0.1%E09000010 Enfield 06K NHS East and North Hertfordshire CCG 0.3% 0.6%E09000010 Enfield 07X NHS Enfield CCG 95.2% 90.9%E09000010 Enfield 08C NHS Hammersmith and Fulham CCG 0.1% 0.0%E09000010 Enfield 08D NHS Haringey CCG 7.7% 6.9%E09000010 Enfield 06N NHS Herts Valleys CCG 0.1% 0.2%E09000010 Enfield 08H NHS Islington CCG 0.2% 0.1%E10000012 Essex 07L NHS Barking and Dagenham CCG 0.1% 0.0%E10000012 Essex 99E NHS Basildon and Brentwood CCG 99.8% 18.2%E10000012 Essex 06H NHS Cambridgeshire and Peterborough CCG 0.1% 0.0%E10000012 Essex 99F NHS Castle Point and Rochford CCG 95.2% 11.5%E10000012 Essex 06K NHS East and North Hertfordshire CCG 1.6% 0.6%E10000012 Essex 08F NHS Havering CCG 0.3% 0.0%E10000012 Essex 06L NHS Ipswich and East Suffolk CCG 0.2% 0.0%E10000012 Essex 06Q NHS Mid Essex CCG 100.0% 25.5%E10000012 Essex 06T NHS North East Essex CCG 98.6% 22.7%E10000012 Essex 08N NHS Redbridge CCG 2.9% 0.6%E10000012 Essex 99G NHS Southend CCG 3.3% 0.4%E10000012 Essex 07G NHS Thurrock CCG 1.4% 0.2%E10000012 Essex 08W NHS Waltham Forest CCG 0.5% 0.1%E10000012 Essex 07H NHS West Essex CCG 97.1% 19.8%E10000012 Essex 07K NHS West Suffolk CCG 2.3% 0.4%
Page 114 of 252
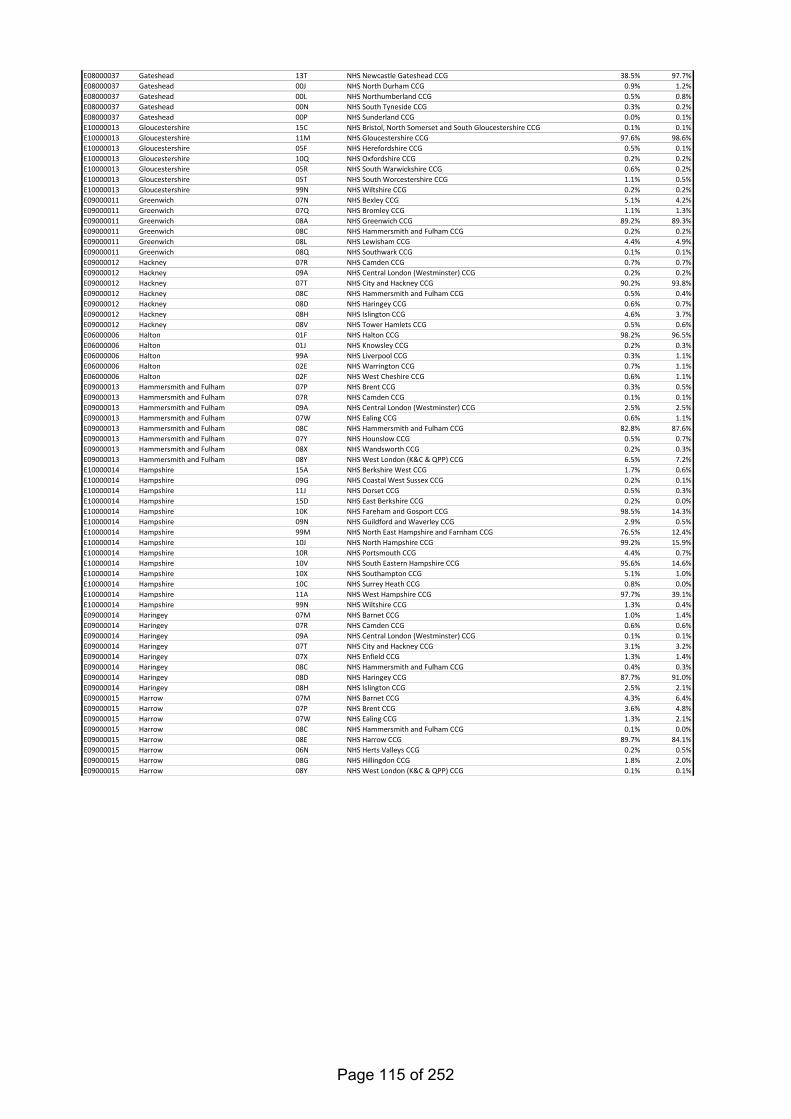
E08000037 Gateshead 13T NHS Newcastle Gateshead CCG 38.5% 97.7%E08000037 Gateshead 00J NHS North Durham CCG 0.9% 1.2%E08000037 Gateshead 00L NHS Northumberland CCG 0.5% 0.8%E08000037 Gateshead 00N NHS South Tyneside CCG 0.3% 0.2%E08000037 Gateshead 00P NHS Sunderland CCG 0.0% 0.1%E10000013 Gloucestershire 15C NHS Bristol, North Somerset and South Gloucestershire CCG 0.1% 0.1%E10000013 Gloucestershire 11M NHS Gloucestershire CCG 97.6% 98.6%E10000013 Gloucestershire 05F NHS Herefordshire CCG 0.5% 0.1%E10000013 Gloucestershire 10Q NHS Oxfordshire CCG 0.2% 0.2%E10000013 Gloucestershire 05R NHS South Warwickshire CCG 0.6% 0.2%E10000013 Gloucestershire 05T NHS South Worcestershire CCG 1.1% 0.5%E10000013 Gloucestershire 99N NHS Wiltshire CCG 0.2% 0.2%E09000011 Greenwich 07N NHS Bexley CCG 5.1% 4.2%E09000011 Greenwich 07Q NHS Bromley CCG 1.1% 1.3%E09000011 Greenwich 08A NHS Greenwich CCG 89.2% 89.3%E09000011 Greenwich 08C NHS Hammersmith and Fulham CCG 0.2% 0.2%E09000011 Greenwich 08L NHS Lewisham CCG 4.4% 4.9%E09000011 Greenwich 08Q NHS Southwark CCG 0.1% 0.1%E09000012 Hackney 07R NHS Camden CCG 0.7% 0.7%E09000012 Hackney 09A NHS Central London (Westminster) CCG 0.2% 0.2%E09000012 Hackney 07T NHS City and Hackney CCG 90.2% 93.8%E09000012 Hackney 08C NHS Hammersmith and Fulham CCG 0.5% 0.4%E09000012 Hackney 08D NHS Haringey CCG 0.6% 0.7%E09000012 Hackney 08H NHS Islington CCG 4.6% 3.7%E09000012 Hackney 08V NHS Tower Hamlets CCG 0.5% 0.6%E06000006 Halton 01F NHS Halton CCG 98.2% 96.5%E06000006 Halton 01J NHS Knowsley CCG 0.2% 0.3%E06000006 Halton 99A NHS Liverpool CCG 0.3% 1.1%E06000006 Halton 02E NHS Warrington CCG 0.7% 1.1%E06000006 Halton 02F NHS West Cheshire CCG 0.6% 1.1%E09000013 Hammersmith and Fulham 07P NHS Brent CCG 0.3% 0.5%E09000013 Hammersmith and Fulham 07R NHS Camden CCG 0.1% 0.1%E09000013 Hammersmith and Fulham 09A NHS Central London (Westminster) CCG 2.5% 2.5%E09000013 Hammersmith and Fulham 07W NHS Ealing CCG 0.6% 1.1%E09000013 Hammersmith and Fulham 08C NHS Hammersmith and Fulham CCG 82.8% 87.6%E09000013 Hammersmith and Fulham 07Y NHS Hounslow CCG 0.5% 0.7%E09000013 Hammersmith and Fulham 08X NHS Wandsworth CCG 0.2% 0.3%E09000013 Hammersmith and Fulham 08Y NHS West London (K&C & QPP) CCG 6.5% 7.2%E10000014 Hampshire 15A NHS Berkshire West CCG 1.7% 0.6%E10000014 Hampshire 09G NHS Coastal West Sussex CCG 0.2% 0.1%E10000014 Hampshire 11J NHS Dorset CCG 0.5% 0.3%E10000014 Hampshire 15D NHS East Berkshire CCG 0.2% 0.0%E10000014 Hampshire 10K NHS Fareham and Gosport CCG 98.5% 14.3%E10000014 Hampshire 09N NHS Guildford and Waverley CCG 2.9% 0.5%E10000014 Hampshire 99M NHS North East Hampshire and Farnham CCG 76.5% 12.4%E10000014 Hampshire 10J NHS North Hampshire CCG 99.2% 15.9%E10000014 Hampshire 10R NHS Portsmouth CCG 4.4% 0.7%E10000014 Hampshire 10V NHS South Eastern Hampshire CCG 95.6% 14.6%E10000014 Hampshire 10X NHS Southampton CCG 5.1% 1.0%E10000014 Hampshire 10C NHS Surrey Heath CCG 0.8% 0.0%E10000014 Hampshire 11A NHS West Hampshire CCG 97.7% 39.1%E10000014 Hampshire 99N NHS Wiltshire CCG 1.3% 0.4%E09000014 Haringey 07M NHS Barnet CCG 1.0% 1.4%E09000014 Haringey 07R NHS Camden CCG 0.6% 0.6%E09000014 Haringey 09A NHS Central London (Westminster) CCG 0.1% 0.1%E09000014 Haringey 07T NHS City and Hackney CCG 3.1% 3.2%E09000014 Haringey 07X NHS Enfield CCG 1.3% 1.4%E09000014 Haringey 08C NHS Hammersmith and Fulham CCG 0.4% 0.3%E09000014 Haringey 08D NHS Haringey CCG 87.7% 91.0%E09000014 Haringey 08H NHS Islington CCG 2.5% 2.1%E09000015 Harrow 07M NHS Barnet CCG 4.3% 6.4%E09000015 Harrow 07P NHS Brent CCG 3.6% 4.8%E09000015 Harrow 07W NHS Ealing CCG 1.3% 2.1%E09000015 Harrow 08C NHS Hammersmith and Fulham CCG 0.1% 0.0%E09000015 Harrow 08E NHS Harrow CCG 89.7% 84.1%E09000015 Harrow 06N NHS Herts Valleys CCG 0.2% 0.5%E09000015 Harrow 08G NHS Hillingdon CCG 1.8% 2.0%E09000015 Harrow 08Y NHS West London (K&C & QPP) CCG 0.1% 0.1%
Page 115 of 252
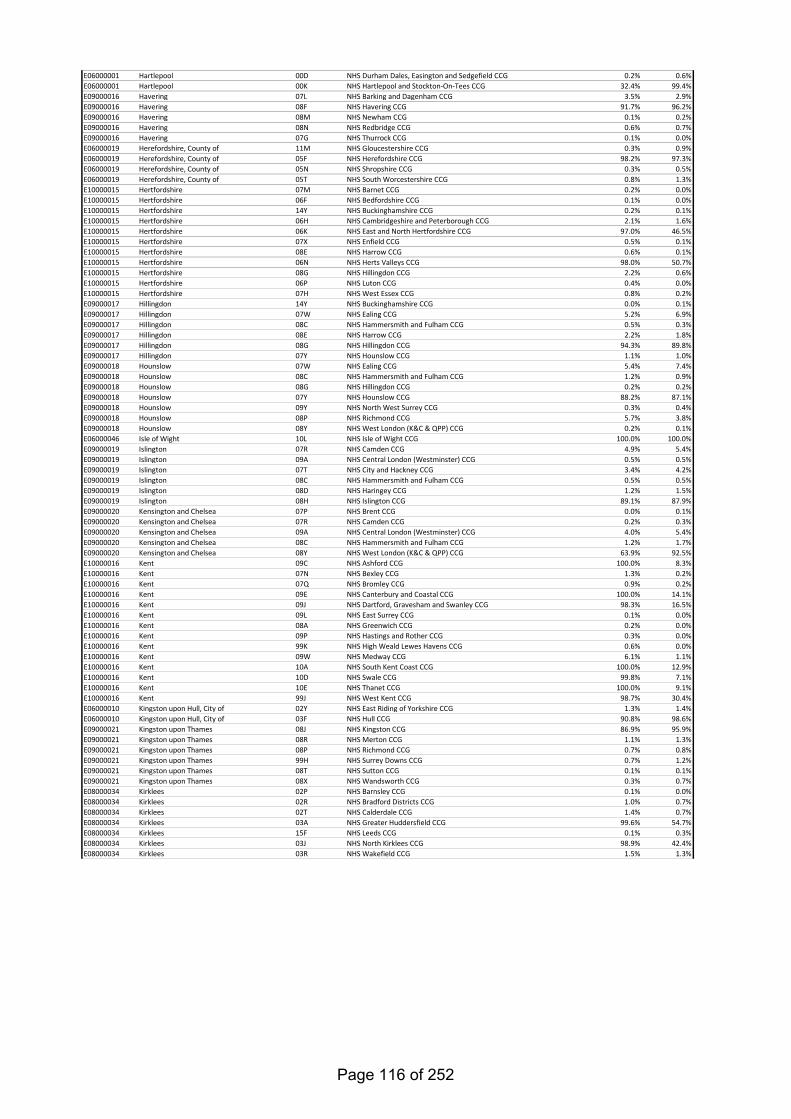
E06000001 Hartlepool 00D NHS Durham Dales, Easington and Sedgefield CCG 0.2% 0.6%E06000001 Hartlepool 00K NHS Hartlepool and Stockton-On-Tees CCG 32.4% 99.4%E09000016 Havering 07L NHS Barking and Dagenham CCG 3.5% 2.9%E09000016 Havering 08F NHS Havering CCG 91.7% 96.2%E09000016 Havering 08M NHS Newham CCG 0.1% 0.2%E09000016 Havering 08N NHS Redbridge CCG 0.6% 0.7%E09000016 Havering 07G NHS Thurrock CCG 0.1% 0.0%E06000019 Herefordshire, County of 11M NHS Gloucestershire CCG 0.3% 0.9%E06000019 Herefordshire, County of 05F NHS Herefordshire CCG 98.2% 97.3%E06000019 Herefordshire, County of 05N NHS Shropshire CCG 0.3% 0.5%E06000019 Herefordshire, County of 05T NHS South Worcestershire CCG 0.8% 1.3%E10000015 Hertfordshire 07M NHS Barnet CCG 0.2% 0.0%E10000015 Hertfordshire 06F NHS Bedfordshire CCG 0.1% 0.0%E10000015 Hertfordshire 14Y NHS Buckinghamshire CCG 0.2% 0.1%E10000015 Hertfordshire 06H NHS Cambridgeshire and Peterborough CCG 2.1% 1.6%E10000015 Hertfordshire 06K NHS East and North Hertfordshire CCG 97.0% 46.5%E10000015 Hertfordshire 07X NHS Enfield CCG 0.5% 0.1%E10000015 Hertfordshire 08E NHS Harrow CCG 0.6% 0.1%E10000015 Hertfordshire 06N NHS Herts Valleys CCG 98.0% 50.7%E10000015 Hertfordshire 08G NHS Hillingdon CCG 2.2% 0.6%E10000015 Hertfordshire 06P NHS Luton CCG 0.4% 0.0%E10000015 Hertfordshire 07H NHS West Essex CCG 0.8% 0.2%E09000017 Hillingdon 14Y NHS Buckinghamshire CCG 0.0% 0.1%E09000017 Hillingdon 07W NHS Ealing CCG 5.2% 6.9%E09000017 Hillingdon 08C NHS Hammersmith and Fulham CCG 0.5% 0.3%E09000017 Hillingdon 08E NHS Harrow CCG 2.2% 1.8%E09000017 Hillingdon 08G NHS Hillingdon CCG 94.3% 89.8%E09000017 Hillingdon 07Y NHS Hounslow CCG 1.1% 1.0%E09000018 Hounslow 07W NHS Ealing CCG 5.4% 7.4%E09000018 Hounslow 08C NHS Hammersmith and Fulham CCG 1.2% 0.9%E09000018 Hounslow 08G NHS Hillingdon CCG 0.2% 0.2%E09000018 Hounslow 07Y NHS Hounslow CCG 88.2% 87.1%E09000018 Hounslow 09Y NHS North West Surrey CCG 0.3% 0.4%E09000018 Hounslow 08P NHS Richmond CCG 5.7% 3.8%E09000018 Hounslow 08Y NHS West London (K&C & QPP) CCG 0.2% 0.1%E06000046 Isle of Wight 10L NHS Isle of Wight CCG 100.0% 100.0%E09000019 Islington 07R NHS Camden CCG 4.9% 5.4%E09000019 Islington 09A NHS Central London (Westminster) CCG 0.5% 0.5%E09000019 Islington 07T NHS City and Hackney CCG 3.4% 4.2%E09000019 Islington 08C NHS Hammersmith and Fulham CCG 0.5% 0.5%E09000019 Islington 08D NHS Haringey CCG 1.2% 1.5%E09000019 Islington 08H NHS Islington CCG 89.1% 87.9%E09000020 Kensington and Chelsea 07P NHS Brent CCG 0.0% 0.1%E09000020 Kensington and Chelsea 07R NHS Camden CCG 0.2% 0.3%E09000020 Kensington and Chelsea 09A NHS Central London (Westminster) CCG 4.0% 5.4%E09000020 Kensington and Chelsea 08C NHS Hammersmith and Fulham CCG 1.2% 1.7%E09000020 Kensington and Chelsea 08Y NHS West London (K&C & QPP) CCG 63.9% 92.5%E10000016 Kent 09C NHS Ashford CCG 100.0% 8.3%E10000016 Kent 07N NHS Bexley CCG 1.3% 0.2%E10000016 Kent 07Q NHS Bromley CCG 0.9% 0.2%E10000016 Kent 09E NHS Canterbury and Coastal CCG 100.0% 14.1%E10000016 Kent 09J NHS Dartford, Gravesham and Swanley CCG 98.3% 16.5%E10000016 Kent 09L NHS East Surrey CCG 0.1% 0.0%E10000016 Kent 08A NHS Greenwich CCG 0.2% 0.0%E10000016 Kent 09P NHS Hastings and Rother CCG 0.3% 0.0%E10000016 Kent 99K NHS High Weald Lewes Havens CCG 0.6% 0.0%E10000016 Kent 09W NHS Medway CCG 6.1% 1.1%E10000016 Kent 10A NHS South Kent Coast CCG 100.0% 12.9%E10000016 Kent 10D NHS Swale CCG 99.8% 7.1%E10000016 Kent 10E NHS Thanet CCG 100.0% 9.1%E10000016 Kent 99J NHS West Kent CCG 98.7% 30.4%E06000010 Kingston upon Hull, City of 02Y NHS East Riding of Yorkshire CCG 1.3% 1.4%E06000010 Kingston upon Hull, City of 03F NHS Hull CCG 90.8% 98.6%E09000021 Kingston upon Thames 08J NHS Kingston CCG 86.9% 95.9%E09000021 Kingston upon Thames 08R NHS Merton CCG 1.1% 1.3%E09000021 Kingston upon Thames 08P NHS Richmond CCG 0.7% 0.8%E09000021 Kingston upon Thames 99H NHS Surrey Downs CCG 0.7% 1.2%E09000021 Kingston upon Thames 08T NHS Sutton CCG 0.1% 0.1%E09000021 Kingston upon Thames 08X NHS Wandsworth CCG 0.3% 0.7%E08000034 Kirklees 02P NHS Barnsley CCG 0.1% 0.0%E08000034 Kirklees 02R NHS Bradford Districts CCG 1.0% 0.7%E08000034 Kirklees 02T NHS Calderdale CCG 1.4% 0.7%E08000034 Kirklees 03A NHS Greater Huddersfield CCG 99.6% 54.7%E08000034 Kirklees 15F NHS Leeds CCG 0.1% 0.3%E08000034 Kirklees 03J NHS North Kirklees CCG 98.9% 42.4%E08000034 Kirklees 03R NHS Wakefield CCG 1.5% 1.3%
Page 116 of 252
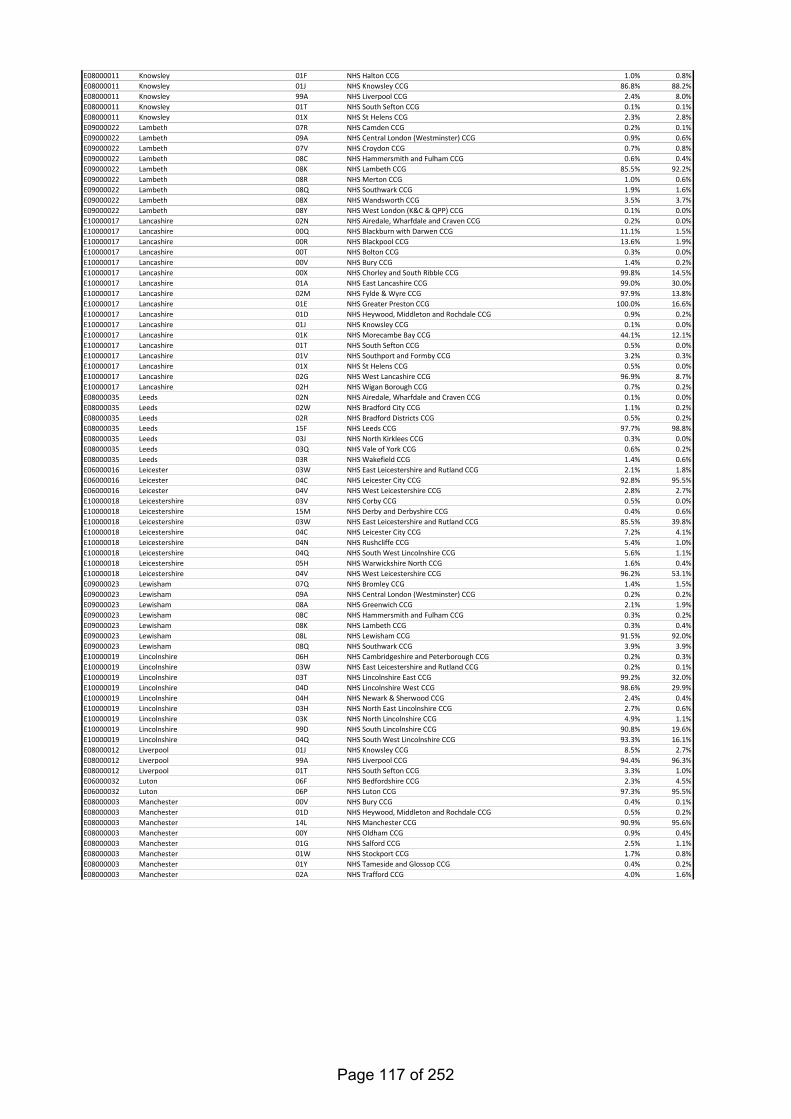
E08000011 Knowsley 01F NHS Halton CCG 1.0% 0.8%E08000011 Knowsley 01J NHS Knowsley CCG 86.8% 88.2%E08000011 Knowsley 99A NHS Liverpool CCG 2.4% 8.0%E08000011 Knowsley 01T NHS South Sefton CCG 0.1% 0.1%E08000011 Knowsley 01X NHS St Helens CCG 2.3% 2.8%E09000022 Lambeth 07R NHS Camden CCG 0.2% 0.1%E09000022 Lambeth 09A NHS Central London (Westminster) CCG 0.9% 0.6%E09000022 Lambeth 07V NHS Croydon CCG 0.7% 0.8%E09000022 Lambeth 08C NHS Hammersmith and Fulham CCG 0.6% 0.4%E09000022 Lambeth 08K NHS Lambeth CCG 85.5% 92.2%E09000022 Lambeth 08R NHS Merton CCG 1.0% 0.6%E09000022 Lambeth 08Q NHS Southwark CCG 1.9% 1.6%E09000022 Lambeth 08X NHS Wandsworth CCG 3.5% 3.7%E09000022 Lambeth 08Y NHS West London (K&C & QPP) CCG 0.1% 0.0%E10000017 Lancashire 02N NHS Airedale, Wharfdale and Craven CCG 0.2% 0.0%E10000017 Lancashire 00Q NHS Blackburn with Darwen CCG 11.1% 1.5%E10000017 Lancashire 00R NHS Blackpool CCG 13.6% 1.9%E10000017 Lancashire 00T NHS Bolton CCG 0.3% 0.0%E10000017 Lancashire 00V NHS Bury CCG 1.4% 0.2%E10000017 Lancashire 00X NHS Chorley and South Ribble CCG 99.8% 14.5%E10000017 Lancashire 01A NHS East Lancashire CCG 99.0% 30.0%E10000017 Lancashire 02M NHS Fylde & Wyre CCG 97.9% 13.8%E10000017 Lancashire 01E NHS Greater Preston CCG 100.0% 16.6%E10000017 Lancashire 01D NHS Heywood, Middleton and Rochdale CCG 0.9% 0.2%E10000017 Lancashire 01J NHS Knowsley CCG 0.1% 0.0%E10000017 Lancashire 01K NHS Morecambe Bay CCG 44.1% 12.1%E10000017 Lancashire 01T NHS South Sefton CCG 0.5% 0.0%E10000017 Lancashire 01V NHS Southport and Formby CCG 3.2% 0.3%E10000017 Lancashire 01X NHS St Helens CCG 0.5% 0.0%E10000017 Lancashire 02G NHS West Lancashire CCG 96.9% 8.7%E10000017 Lancashire 02H NHS Wigan Borough CCG 0.7% 0.2%E08000035 Leeds 02N NHS Airedale, Wharfdale and Craven CCG 0.1% 0.0%E08000035 Leeds 02W NHS Bradford City CCG 1.1% 0.2%E08000035 Leeds 02R NHS Bradford Districts CCG 0.5% 0.2%E08000035 Leeds 15F NHS Leeds CCG 97.7% 98.8%E08000035 Leeds 03J NHS North Kirklees CCG 0.3% 0.0%E08000035 Leeds 03Q NHS Vale of York CCG 0.6% 0.2%E08000035 Leeds 03R NHS Wakefield CCG 1.4% 0.6%E06000016 Leicester 03W NHS East Leicestershire and Rutland CCG 2.1% 1.8%E06000016 Leicester 04C NHS Leicester City CCG 92.8% 95.5%E06000016 Leicester 04V NHS West Leicestershire CCG 2.8% 2.7%E10000018 Leicestershire 03V NHS Corby CCG 0.5% 0.0%E10000018 Leicestershire 15M NHS Derby and Derbyshire CCG 0.4% 0.6%E10000018 Leicestershire 03W NHS East Leicestershire and Rutland CCG 85.5% 39.8%E10000018 Leicestershire 04C NHS Leicester City CCG 7.2% 4.1%E10000018 Leicestershire 04N NHS Rushcliffe CCG 5.4% 1.0%E10000018 Leicestershire 04Q NHS South West Lincolnshire CCG 5.6% 1.1%E10000018 Leicestershire 05H NHS Warwickshire North CCG 1.6% 0.4%E10000018 Leicestershire 04V NHS West Leicestershire CCG 96.2% 53.1%E09000023 Lewisham 07Q NHS Bromley CCG 1.4% 1.5%E09000023 Lewisham 09A NHS Central London (Westminster) CCG 0.2% 0.2%E09000023 Lewisham 08A NHS Greenwich CCG 2.1% 1.9%E09000023 Lewisham 08C NHS Hammersmith and Fulham CCG 0.3% 0.2%E09000023 Lewisham 08K NHS Lambeth CCG 0.3% 0.4%E09000023 Lewisham 08L NHS Lewisham CCG 91.5% 92.0%E09000023 Lewisham 08Q NHS Southwark CCG 3.9% 3.9%E10000019 Lincolnshire 06H NHS Cambridgeshire and Peterborough CCG 0.2% 0.3%E10000019 Lincolnshire 03W NHS East Leicestershire and Rutland CCG 0.2% 0.1%E10000019 Lincolnshire 03T NHS Lincolnshire East CCG 99.2% 32.0%E10000019 Lincolnshire 04D NHS Lincolnshire West CCG 98.6% 29.9%E10000019 Lincolnshire 04H NHS Newark & Sherwood CCG 2.4% 0.4%E10000019 Lincolnshire 03H NHS North East Lincolnshire CCG 2.7% 0.6%E10000019 Lincolnshire 03K NHS North Lincolnshire CCG 4.9% 1.1%E10000019 Lincolnshire 99D NHS South Lincolnshire CCG 90.8% 19.6%E10000019 Lincolnshire 04Q NHS South West Lincolnshire CCG 93.3% 16.1%E08000012 Liverpool 01J NHS Knowsley CCG 8.5% 2.7%E08000012 Liverpool 99A NHS Liverpool CCG 94.4% 96.3%E08000012 Liverpool 01T NHS South Sefton CCG 3.3% 1.0%E06000032 Luton 06F NHS Bedfordshire CCG 2.3% 4.5%E06000032 Luton 06P NHS Luton CCG 97.3% 95.5%E08000003 Manchester 00V NHS Bury CCG 0.4% 0.1%E08000003 Manchester 01D NHS Heywood, Middleton and Rochdale CCG 0.5% 0.2%E08000003 Manchester 14L NHS Manchester CCG 90.9% 95.6%E08000003 Manchester 00Y NHS Oldham CCG 0.9% 0.4%E08000003 Manchester 01G NHS Salford CCG 2.5% 1.1%E08000003 Manchester 01W NHS Stockport CCG 1.7% 0.8%E08000003 Manchester 01Y NHS Tameside and Glossop CCG 0.4% 0.2%E08000003 Manchester 02A NHS Trafford CCG 4.0% 1.6%
Page 117 of 252

E06000035 Medway 09J NHS Dartford, Gravesham and Swanley CCG 0.2% 0.2%E06000035 Medway 09W NHS Medway CCG 93.9% 99.5%E06000035 Medway 10D NHS Swale CCG 0.2% 0.0%E06000035 Medway 99J NHS West Kent CCG 0.2% 0.3%E09000024 Merton 07V NHS Croydon CCG 0.5% 0.9%E09000024 Merton 08C NHS Hammersmith and Fulham CCG 0.2% 0.2%E09000024 Merton 08J NHS Kingston CCG 3.4% 2.9%E09000024 Merton 08K NHS Lambeth CCG 1.0% 1.7%E09000024 Merton 08R NHS Merton CCG 87.7% 80.9%E09000024 Merton 08T NHS Sutton CCG 3.3% 2.6%E09000024 Merton 08X NHS Wandsworth CCG 6.6% 10.8%E06000002 Middlesbrough 03D NHS Hambleton, Richmondshire and Whitby CCG 0.2% 0.2%E06000002 Middlesbrough 00K NHS Hartlepool and Stockton-On-Tees CCG 0.2% 0.3%E06000002 Middlesbrough 00M NHS South Tees CCG 52.3% 99.5%E06000042 Milton Keynes 06F NHS Bedfordshire CCG 1.5% 2.5%E06000042 Milton Keynes 04F NHS Milton Keynes CCG 95.5% 96.2%E06000042 Milton Keynes 04G NHS Nene CCG 0.6% 1.3%E08000021 Newcastle upon Tyne 13T NHS Newcastle Gateshead CCG 58.9% 95.2%E08000021 Newcastle upon Tyne 99C NHS North Tyneside CCG 5.9% 4.0%E08000021 Newcastle upon Tyne 00L NHS Northumberland CCG 0.8% 0.8%E09000025 Newham 07L NHS Barking and Dagenham CCG 0.5% 0.3%E09000025 Newham 09A NHS Central London (Westminster) CCG 0.7% 0.4%E09000025 Newham 07T NHS City and Hackney CCG 0.1% 0.0%E09000025 Newham 08C NHS Hammersmith and Fulham CCG 0.5% 0.3%E09000025 Newham 08M NHS Newham CCG 96.6% 97.3%E09000025 Newham 08N NHS Redbridge CCG 0.3% 0.2%E09000025 Newham 08V NHS Tower Hamlets CCG 0.2% 0.2%E09000025 Newham 08W NHS Waltham Forest CCG 1.7% 1.4%E10000020 Norfolk 06H NHS Cambridgeshire and Peterborough CCG 0.7% 0.7%E10000020 Norfolk 06M NHS Great Yarmouth and Waveney CCG 47.7% 12.2%E10000020 Norfolk 06L NHS Ipswich and East Suffolk CCG 0.2% 0.0%E10000020 Norfolk 06V NHS North Norfolk CCG 100.0% 18.6%E10000020 Norfolk 06W NHS Norwich CCG 100.0% 25.2%E10000020 Norfolk 99D NHS South Lincolnshire CCG 0.2% 0.0%E10000020 Norfolk 06Y NHS South Norfolk CCG 98.9% 24.1%E10000020 Norfolk 07J NHS West Norfolk CCG 98.4% 18.5%E10000020 Norfolk 07K NHS West Suffolk CCG 2.6% 0.7%E06000012 North East Lincolnshire 03T NHS Lincolnshire East CCG 0.8% 1.2%E06000012 North East Lincolnshire 03H NHS North East Lincolnshire CCG 95.9% 98.6%E06000012 North East Lincolnshire 03K NHS North Lincolnshire CCG 0.2% 0.2%E06000013 North Lincolnshire 02Q NHS Bassetlaw CCG 0.2% 0.2%E06000013 North Lincolnshire 02X NHS Doncaster CCG 0.0% 0.1%E06000013 North Lincolnshire 02Y NHS East Riding of Yorkshire CCG 0.0% 0.1%E06000013 North Lincolnshire 04D NHS Lincolnshire West CCG 1.0% 1.3%E06000013 North Lincolnshire 03H NHS North East Lincolnshire CCG 1.4% 1.4%E06000013 North Lincolnshire 03K NHS North Lincolnshire CCG 94.9% 96.9%E06000024 North Somerset 11E NHS Bath and North East Somerset CCG 1.6% 1.5%E06000024 North Somerset 15C NHS Bristol, North Somerset and South Gloucestershire CCG 21.8% 98.3%E06000024 North Somerset 11X NHS Somerset CCG 0.0% 0.2%E08000022 North Tyneside 13T NHS Newcastle Gateshead CCG 1.0% 2.6%E08000022 North Tyneside 99C NHS North Tyneside CCG 93.2% 96.3%E08000022 North Tyneside 00L NHS Northumberland CCG 0.7% 1.1%E10000023 North Yorkshire 02N NHS Airedale, Wharfdale and Craven CCG 32.5% 8.3%E10000023 North Yorkshire 00C NHS Darlington CCG 1.3% 0.2%E10000023 North Yorkshire 02X NHS Doncaster CCG 0.2% 0.1%E10000023 North Yorkshire 00D NHS Durham Dales, Easington and Sedgefield CCG 0.2% 0.1%E10000023 North Yorkshire 01A NHS East Lancashire CCG 0.1% 0.0%E10000023 North Yorkshire 02Y NHS East Riding of Yorkshire CCG 1.4% 0.7%E10000023 North Yorkshire 03D NHS Hambleton, Richmondshire and Whitby CCG 98.3% 22.8%E10000023 North Yorkshire 03E NHS Harrogate and Rural District CCG 99.8% 26.2%E10000023 North Yorkshire 00K NHS Hartlepool and Stockton-On-Tees CCG 0.2% 0.1%E10000023 North Yorkshire 15F NHS Leeds CCG 0.9% 1.3%E10000023 North Yorkshire 01K NHS Morecambe Bay CCG 1.9% 1.0%E10000023 North Yorkshire 03M NHS Scarborough and Ryedale CCG 99.3% 19.2%E10000023 North Yorkshire 03Q NHS Vale of York CCG 32.6% 18.8%E10000023 North Yorkshire 03R NHS Wakefield CCG 2.0% 1.2%E10000021 Northamptonshire 06F NHS Bedfordshire CCG 0.1% 0.0%E10000021 Northamptonshire 06H NHS Cambridgeshire and Peterborough CCG 1.6% 1.9%E10000021 Northamptonshire 03V NHS Corby CCG 99.2% 9.8%E10000021 Northamptonshire 05A NHS Coventry and Rugby CCG 0.3% 0.2%E10000021 Northamptonshire 03W NHS East Leicestershire and Rutland CCG 2.0% 0.8%E10000021 Northamptonshire 04F NHS Milton Keynes CCG 3.1% 1.2%E10000021 Northamptonshire 04G NHS Nene CCG 98.8% 84.9%E10000021 Northamptonshire 10Q NHS Oxfordshire CCG 1.1% 1.0%E10000021 Northamptonshire 99D NHS South Lincolnshire CCG 0.9% 0.2%E06000057 Northumberland 13T NHS Newcastle Gateshead CCG 0.3% 0.5%E06000057 Northumberland 01H NHS North Cumbria CCG 0.1% 0.1%E06000057 Northumberland 00J NHS North Durham CCG 0.2% 0.2%E06000057 Northumberland 99C NHS North Tyneside CCG 0.9% 0.6%E06000057 Northumberland 00L NHS Northumberland CCG 97.9% 98.7%
Page 118 of 252

E06000018 Nottingham 04K NHS Nottingham City CCG 89.9% 95.4%E06000018 Nottingham 04L NHS Nottingham North and East CCG 4.6% 2.0%E06000018 Nottingham 04M NHS Nottingham West CCG 4.1% 1.1%E06000018 Nottingham 04N NHS Rushcliffe CCG 4.3% 1.5%E10000024 Nottinghamshire 02Q NHS Bassetlaw CCG 97.1% 13.5%E10000024 Nottinghamshire 15M NHS Derby and Derbyshire CCG 1.5% 1.8%E10000024 Nottinghamshire 02X NHS Doncaster CCG 1.6% 0.6%E10000024 Nottinghamshire 03W NHS East Leicestershire and Rutland CCG 0.3% 0.1%E10000024 Nottinghamshire 04D NHS Lincolnshire West CCG 0.4% 0.1%E10000024 Nottinghamshire 04E NHS Mansfield and Ashfield CCG 97.9% 22.5%E10000024 Nottinghamshire 04H NHS Newark & Sherwood CCG 97.6% 15.6%E10000024 Nottinghamshire 04K NHS Nottingham City CCG 10.1% 4.6%E10000024 Nottinghamshire 04L NHS Nottingham North and East CCG 95.1% 17.2%E10000024 Nottinghamshire 04M NHS Nottingham West CCG 90.8% 10.2%E10000024 Nottinghamshire 04N NHS Rushcliffe CCG 90.3% 13.6%E10000024 Nottinghamshire 04Q NHS South West Lincolnshire CCG 0.7% 0.1%E10000024 Nottinghamshire 04V NHS West Leicestershire CCG 0.1% 0.0%E08000004 Oldham 01D NHS Heywood, Middleton and Rochdale CCG 1.5% 1.4%E08000004 Oldham 14L NHS Manchester CCG 0.8% 2.1%E08000004 Oldham 00Y NHS Oldham CCG 94.5% 96.3%E08000004 Oldham 01Y NHS Tameside and Glossop CCG 0.2% 0.2%E10000025 Oxfordshire 15A NHS Berkshire West CCG 0.5% 0.3%E10000025 Oxfordshire 14Y NHS Buckinghamshire CCG 2.4% 1.8%E10000025 Oxfordshire 11M NHS Gloucestershire CCG 0.2% 0.2%E10000025 Oxfordshire 04G NHS Nene CCG 0.1% 0.1%E10000025 Oxfordshire 10Q NHS Oxfordshire CCG 97.4% 96.5%E10000025 Oxfordshire 05R NHS South Warwickshire CCG 0.6% 0.2%E10000025 Oxfordshire 12D NHS Swindon CCG 2.7% 0.9%E06000031 Peterborough 06H NHS Cambridgeshire and Peterborough CCG 23.0% 96.3%E06000031 Peterborough 99D NHS South Lincolnshire CCG 5.1% 3.7%E06000026 Plymouth 15N NHS Devon CCG 22.1% 100.0%E06000044 Portsmouth 10K NHS Fareham and Gosport CCG 1.5% 1.4%E06000044 Portsmouth 10R NHS Portsmouth CCG 95.6% 98.4%E06000044 Portsmouth 10V NHS South Eastern Hampshire CCG 0.2% 0.2%E06000038 Reading 15A NHS Berkshire West CCG 35.3% 99.4%E06000038 Reading 10Q NHS Oxfordshire CCG 0.2% 0.6%E09000026 Redbridge 07L NHS Barking and Dagenham CCG 4.9% 3.3%E09000026 Redbridge 08C NHS Hammersmith and Fulham CCG 0.1% 0.1%E09000026 Redbridge 08F NHS Havering CCG 0.8% 0.7%E09000026 Redbridge 08M NHS Newham CCG 1.4% 1.7%E09000026 Redbridge 08N NHS Redbridge CCG 92.3% 89.4%E09000026 Redbridge 08W NHS Waltham Forest CCG 3.3% 3.1%E09000026 Redbridge 07H NHS West Essex CCG 1.8% 1.7%E06000003 Redcar and Cleveland 03D NHS Hambleton, Richmondshire and Whitby CCG 1.1% 1.1%E06000003 Redcar and Cleveland 00M NHS South Tees CCG 47.3% 98.9%E09000027 Richmond upon Thames 08C NHS Hammersmith and Fulham CCG 0.5% 0.5%E09000027 Richmond upon Thames 07Y NHS Hounslow CCG 4.9% 7.0%E09000027 Richmond upon Thames 08J NHS Kingston CCG 1.6% 1.5%E09000027 Richmond upon Thames 08P NHS Richmond CCG 91.7% 90.3%E09000027 Richmond upon Thames 99H NHS Surrey Downs CCG 0.0% 0.1%E09000027 Richmond upon Thames 08X NHS Wandsworth CCG 0.4% 0.7%E08000005 Rochdale 00V NHS Bury CCG 0.7% 0.6%E08000005 Rochdale 01A NHS East Lancashire CCG 0.2% 0.3%E08000005 Rochdale 01D NHS Heywood, Middleton and Rochdale CCG 96.5% 96.6%E08000005 Rochdale 14L NHS Manchester CCG 0.6% 1.6%E08000005 Rochdale 00Y NHS Oldham CCG 0.9% 1.0%E08000018 Rotherham 02P NHS Barnsley CCG 3.3% 3.1%E08000018 Rotherham 02Q NHS Bassetlaw CCG 1.0% 0.4%E08000018 Rotherham 02X NHS Doncaster CCG 1.1% 1.2%E08000018 Rotherham 03L NHS Rotherham CCG 97.9% 93.5%E08000018 Rotherham 03N NHS Sheffield CCG 0.8% 1.7%E06000017 Rutland 06H NHS Cambridgeshire and Peterborough CCG 0.0% 0.3%E06000017 Rutland 03V NHS Corby CCG 0.2% 0.5%E06000017 Rutland 03W NHS East Leicestershire and Rutland CCG 9.9% 86.3%E06000017 Rutland 99D NHS South Lincolnshire CCG 2.6% 11.5%E06000017 Rutland 04Q NHS South West Lincolnshire CCG 0.4% 1.4%E08000006 Salford 00T NHS Bolton CCG 0.2% 0.3%E08000006 Salford 00V NHS Bury CCG 1.8% 1.4%E08000006 Salford 14L NHS Manchester CCG 1.1% 2.5%E08000006 Salford 01G NHS Salford CCG 94.1% 94.6%E08000006 Salford 02A NHS Trafford CCG 0.2% 0.2%E08000006 Salford 02H NHS Wigan Borough CCG 0.9% 1.1%E08000028 Sandwell 15E NHS Birmingham and Solihull CCG 1.9% 7.0%E08000028 Sandwell 05C NHS Dudley CCG 3.0% 2.7%E08000028 Sandwell 05L NHS Sandwell and West Birmingham CCG 55.1% 88.6%E08000028 Sandwell 05Y NHS Walsall CCG 1.7% 1.3%E08000028 Sandwell 06A NHS Wolverhampton CCG 0.3% 0.3%E08000014 Sefton 01J NHS Knowsley CCG 1.8% 1.0%E08000014 Sefton 99A NHS Liverpool CCG 2.9% 5.3%E08000014 Sefton 01T NHS South Sefton CCG 96.0% 51.6%E08000014 Sefton 01V NHS Southport and Formby CCG 96.8% 41.9%E08000014 Sefton 02G NHS West Lancashire CCG 0.3% 0.1%
Page 119 of 252
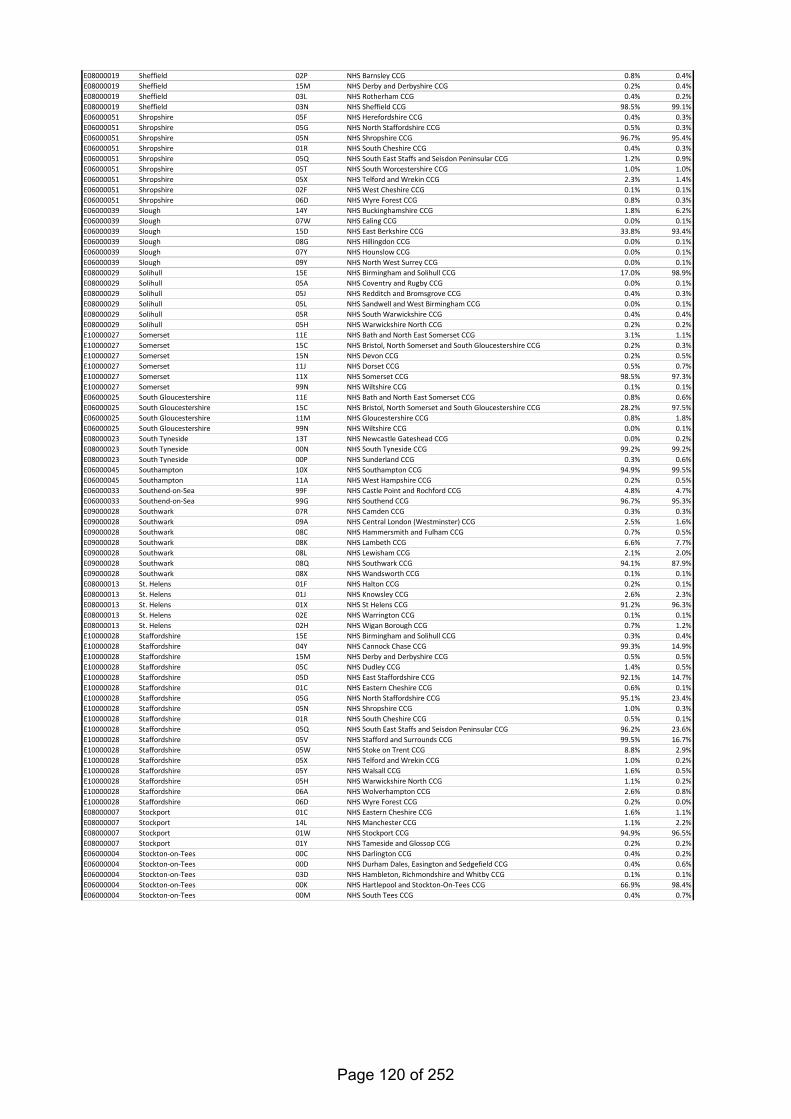
E08000019 Sheffield 02P NHS Barnsley CCG 0.8% 0.4%E08000019 Sheffield 15M NHS Derby and Derbyshire CCG 0.2% 0.4%E08000019 Sheffield 03L NHS Rotherham CCG 0.4% 0.2%E08000019 Sheffield 03N NHS Sheffield CCG 98.5% 99.1%E06000051 Shropshire 05F NHS Herefordshire CCG 0.4% 0.3%E06000051 Shropshire 05G NHS North Staffordshire CCG 0.5% 0.3%E06000051 Shropshire 05N NHS Shropshire CCG 96.7% 95.4%E06000051 Shropshire 01R NHS South Cheshire CCG 0.4% 0.3%E06000051 Shropshire 05Q NHS South East Staffs and Seisdon Peninsular CCG 1.2% 0.9%E06000051 Shropshire 05T NHS South Worcestershire CCG 1.0% 1.0%E06000051 Shropshire 05X NHS Telford and Wrekin CCG 2.3% 1.4%E06000051 Shropshire 02F NHS West Cheshire CCG 0.1% 0.1%E06000051 Shropshire 06D NHS Wyre Forest CCG 0.8% 0.3%E06000039 Slough 14Y NHS Buckinghamshire CCG 1.8% 6.2%E06000039 Slough 07W NHS Ealing CCG 0.0% 0.1%E06000039 Slough 15D NHS East Berkshire CCG 33.8% 93.4%E06000039 Slough 08G NHS Hillingdon CCG 0.0% 0.1%E06000039 Slough 07Y NHS Hounslow CCG 0.0% 0.1%E06000039 Slough 09Y NHS North West Surrey CCG 0.0% 0.1%E08000029 Solihull 15E NHS Birmingham and Solihull CCG 17.0% 98.9%E08000029 Solihull 05A NHS Coventry and Rugby CCG 0.0% 0.1%E08000029 Solihull 05J NHS Redditch and Bromsgrove CCG 0.4% 0.3%E08000029 Solihull 05L NHS Sandwell and West Birmingham CCG 0.0% 0.1%E08000029 Solihull 05R NHS South Warwickshire CCG 0.4% 0.4%E08000029 Solihull 05H NHS Warwickshire North CCG 0.2% 0.2%E10000027 Somerset 11E NHS Bath and North East Somerset CCG 3.1% 1.1%E10000027 Somerset 15C NHS Bristol, North Somerset and South Gloucestershire CCG 0.2% 0.3%E10000027 Somerset 15N NHS Devon CCG 0.2% 0.5%E10000027 Somerset 11J NHS Dorset CCG 0.5% 0.7%E10000027 Somerset 11X NHS Somerset CCG 98.5% 97.3%E10000027 Somerset 99N NHS Wiltshire CCG 0.1% 0.1%E06000025 South Gloucestershire 11E NHS Bath and North East Somerset CCG 0.8% 0.6%E06000025 South Gloucestershire 15C NHS Bristol, North Somerset and South Gloucestershire CCG 28.2% 97.5%E06000025 South Gloucestershire 11M NHS Gloucestershire CCG 0.8% 1.8%E06000025 South Gloucestershire 99N NHS Wiltshire CCG 0.0% 0.1%E08000023 South Tyneside 13T NHS Newcastle Gateshead CCG 0.0% 0.2%E08000023 South Tyneside 00N NHS South Tyneside CCG 99.2% 99.2%E08000023 South Tyneside 00P NHS Sunderland CCG 0.3% 0.6%E06000045 Southampton 10X NHS Southampton CCG 94.9% 99.5%E06000045 Southampton 11A NHS West Hampshire CCG 0.2% 0.5%E06000033 Southend-on-Sea 99F NHS Castle Point and Rochford CCG 4.8% 4.7%E06000033 Southend-on-Sea 99G NHS Southend CCG 96.7% 95.3%E09000028 Southwark 07R NHS Camden CCG 0.3% 0.3%E09000028 Southwark 09A NHS Central London (Westminster) CCG 2.5% 1.6%E09000028 Southwark 08C NHS Hammersmith and Fulham CCG 0.7% 0.5%E09000028 Southwark 08K NHS Lambeth CCG 6.6% 7.7%E09000028 Southwark 08L NHS Lewisham CCG 2.1% 2.0%E09000028 Southwark 08Q NHS Southwark CCG 94.1% 87.9%E09000028 Southwark 08X NHS Wandsworth CCG 0.1% 0.1%E08000013 St. Helens 01F NHS Halton CCG 0.2% 0.1%E08000013 St. Helens 01J NHS Knowsley CCG 2.6% 2.3%E08000013 St. Helens 01X NHS St Helens CCG 91.2% 96.3%E08000013 St. Helens 02E NHS Warrington CCG 0.1% 0.1%E08000013 St. Helens 02H NHS Wigan Borough CCG 0.7% 1.2%E10000028 Staffordshire 15E NHS Birmingham and Solihull CCG 0.3% 0.4%E10000028 Staffordshire 04Y NHS Cannock Chase CCG 99.3% 14.9%E10000028 Staffordshire 15M NHS Derby and Derbyshire CCG 0.5% 0.5%E10000028 Staffordshire 05C NHS Dudley CCG 1.4% 0.5%E10000028 Staffordshire 05D NHS East Staffordshire CCG 92.1% 14.7%E10000028 Staffordshire 01C NHS Eastern Cheshire CCG 0.6% 0.1%E10000028 Staffordshire 05G NHS North Staffordshire CCG 95.1% 23.4%E10000028 Staffordshire 05N NHS Shropshire CCG 1.0% 0.3%E10000028 Staffordshire 01R NHS South Cheshire CCG 0.5% 0.1%E10000028 Staffordshire 05Q NHS South East Staffs and Seisdon Peninsular CCG 96.2% 23.6%E10000028 Staffordshire 05V NHS Stafford and Surrounds CCG 99.5% 16.7%E10000028 Staffordshire 05W NHS Stoke on Trent CCG 8.8% 2.9%E10000028 Staffordshire 05X NHS Telford and Wrekin CCG 1.0% 0.2%E10000028 Staffordshire 05Y NHS Walsall CCG 1.6% 0.5%E10000028 Staffordshire 05H NHS Warwickshire North CCG 1.1% 0.2%E10000028 Staffordshire 06A NHS Wolverhampton CCG 2.6% 0.8%E10000028 Staffordshire 06D NHS Wyre Forest CCG 0.2% 0.0%E08000007 Stockport 01C NHS Eastern Cheshire CCG 1.6% 1.1%E08000007 Stockport 14L NHS Manchester CCG 1.1% 2.2%E08000007 Stockport 01W NHS Stockport CCG 94.9% 96.5%E08000007 Stockport 01Y NHS Tameside and Glossop CCG 0.2% 0.2%E06000004 Stockton-on-Tees 00C NHS Darlington CCG 0.4% 0.2%E06000004 Stockton-on-Tees 00D NHS Durham Dales, Easington and Sedgefield CCG 0.4% 0.6%E06000004 Stockton-on-Tees 03D NHS Hambleton, Richmondshire and Whitby CCG 0.1% 0.1%E06000004 Stockton-on-Tees 00K NHS Hartlepool and Stockton-On-Tees CCG 66.9% 98.4%E06000004 Stockton-on-Tees 00M NHS South Tees CCG 0.4% 0.7%
Page 120 of 252
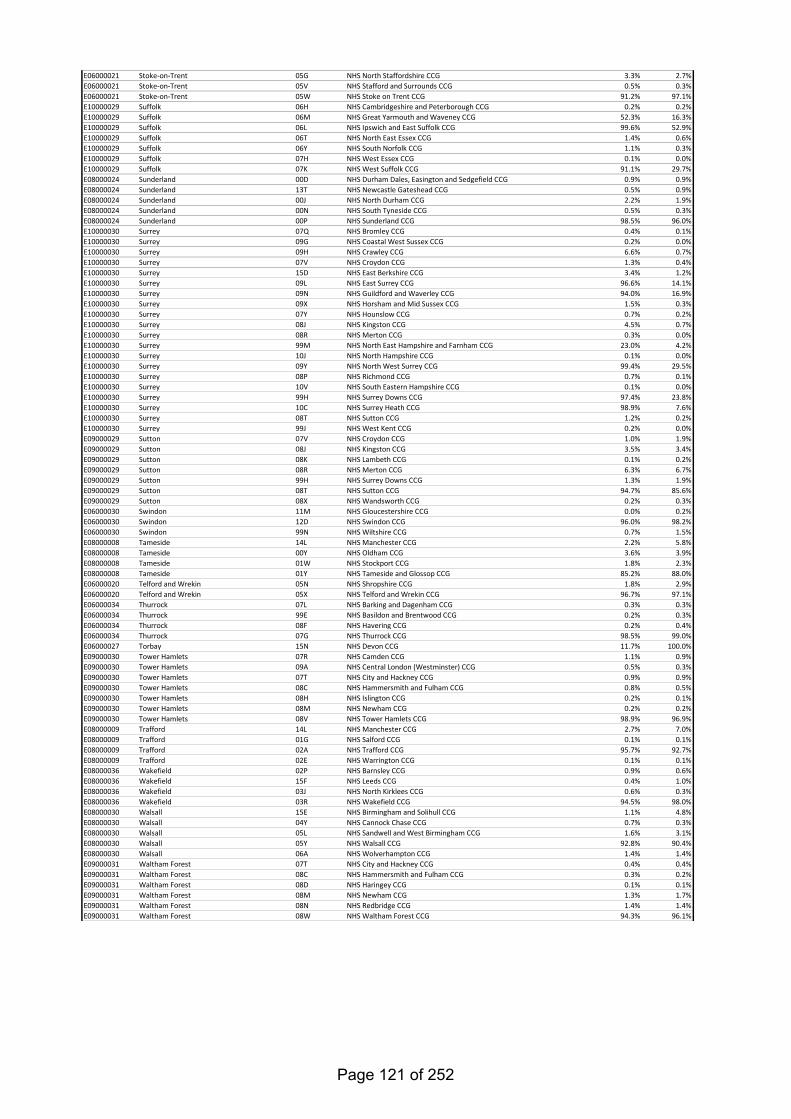
E06000021 Stoke-on-Trent 05G NHS North Staffordshire CCG 3.3% 2.7%E06000021 Stoke-on-Trent 05V NHS Stafford and Surrounds CCG 0.5% 0.3%E06000021 Stoke-on-Trent 05W NHS Stoke on Trent CCG 91.2% 97.1%E10000029 Suffolk 06H NHS Cambridgeshire and Peterborough CCG 0.2% 0.2%E10000029 Suffolk 06M NHS Great Yarmouth and Waveney CCG 52.3% 16.3%E10000029 Suffolk 06L NHS Ipswich and East Suffolk CCG 99.6% 52.9%E10000029 Suffolk 06T NHS North East Essex CCG 1.4% 0.6%E10000029 Suffolk 06Y NHS South Norfolk CCG 1.1% 0.3%E10000029 Suffolk 07H NHS West Essex CCG 0.1% 0.0%E10000029 Suffolk 07K NHS West Suffolk CCG 91.1% 29.7%E08000024 Sunderland 00D NHS Durham Dales, Easington and Sedgefield CCG 0.9% 0.9%E08000024 Sunderland 13T NHS Newcastle Gateshead CCG 0.5% 0.9%E08000024 Sunderland 00J NHS North Durham CCG 2.2% 1.9%E08000024 Sunderland 00N NHS South Tyneside CCG 0.5% 0.3%E08000024 Sunderland 00P NHS Sunderland CCG 98.5% 96.0%E10000030 Surrey 07Q NHS Bromley CCG 0.4% 0.1%E10000030 Surrey 09G NHS Coastal West Sussex CCG 0.2% 0.0%E10000030 Surrey 09H NHS Crawley CCG 6.6% 0.7%E10000030 Surrey 07V NHS Croydon CCG 1.3% 0.4%E10000030 Surrey 15D NHS East Berkshire CCG 3.4% 1.2%E10000030 Surrey 09L NHS East Surrey CCG 96.6% 14.1%E10000030 Surrey 09N NHS Guildford and Waverley CCG 94.0% 16.9%E10000030 Surrey 09X NHS Horsham and Mid Sussex CCG 1.5% 0.3%E10000030 Surrey 07Y NHS Hounslow CCG 0.7% 0.2%E10000030 Surrey 08J NHS Kingston CCG 4.5% 0.7%E10000030 Surrey 08R NHS Merton CCG 0.3% 0.0%E10000030 Surrey 99M NHS North East Hampshire and Farnham CCG 23.0% 4.2%E10000030 Surrey 10J NHS North Hampshire CCG 0.1% 0.0%E10000030 Surrey 09Y NHS North West Surrey CCG 99.4% 29.5%E10000030 Surrey 08P NHS Richmond CCG 0.7% 0.1%E10000030 Surrey 10V NHS South Eastern Hampshire CCG 0.1% 0.0%E10000030 Surrey 99H NHS Surrey Downs CCG 97.4% 23.8%E10000030 Surrey 10C NHS Surrey Heath CCG 98.9% 7.6%E10000030 Surrey 08T NHS Sutton CCG 1.2% 0.2%E10000030 Surrey 99J NHS West Kent CCG 0.2% 0.0%E09000029 Sutton 07V NHS Croydon CCG 1.0% 1.9%E09000029 Sutton 08J NHS Kingston CCG 3.5% 3.4%E09000029 Sutton 08K NHS Lambeth CCG 0.1% 0.2%E09000029 Sutton 08R NHS Merton CCG 6.3% 6.7%E09000029 Sutton 99H NHS Surrey Downs CCG 1.3% 1.9%E09000029 Sutton 08T NHS Sutton CCG 94.7% 85.6%E09000029 Sutton 08X NHS Wandsworth CCG 0.2% 0.3%E06000030 Swindon 11M NHS Gloucestershire CCG 0.0% 0.2%E06000030 Swindon 12D NHS Swindon CCG 96.0% 98.2%E06000030 Swindon 99N NHS Wiltshire CCG 0.7% 1.5%E08000008 Tameside 14L NHS Manchester CCG 2.2% 5.8%E08000008 Tameside 00Y NHS Oldham CCG 3.6% 3.9%E08000008 Tameside 01W NHS Stockport CCG 1.8% 2.3%E08000008 Tameside 01Y NHS Tameside and Glossop CCG 85.2% 88.0%E06000020 Telford and Wrekin 05N NHS Shropshire CCG 1.8% 2.9%E06000020 Telford and Wrekin 05X NHS Telford and Wrekin CCG 96.7% 97.1%E06000034 Thurrock 07L NHS Barking and Dagenham CCG 0.3% 0.3%E06000034 Thurrock 99E NHS Basildon and Brentwood CCG 0.2% 0.3%E06000034 Thurrock 08F NHS Havering CCG 0.2% 0.4%E06000034 Thurrock 07G NHS Thurrock CCG 98.5% 99.0%E06000027 Torbay 15N NHS Devon CCG 11.7% 100.0%E09000030 Tower Hamlets 07R NHS Camden CCG 1.1% 0.9%E09000030 Tower Hamlets 09A NHS Central London (Westminster) CCG 0.5% 0.3%E09000030 Tower Hamlets 07T NHS City and Hackney CCG 0.9% 0.9%E09000030 Tower Hamlets 08C NHS Hammersmith and Fulham CCG 0.8% 0.5%E09000030 Tower Hamlets 08H NHS Islington CCG 0.2% 0.1%E09000030 Tower Hamlets 08M NHS Newham CCG 0.2% 0.2%E09000030 Tower Hamlets 08V NHS Tower Hamlets CCG 98.9% 96.9%E08000009 Trafford 14L NHS Manchester CCG 2.7% 7.0%E08000009 Trafford 01G NHS Salford CCG 0.1% 0.1%E08000009 Trafford 02A NHS Trafford CCG 95.7% 92.7%E08000009 Trafford 02E NHS Warrington CCG 0.1% 0.1%E08000036 Wakefield 02P NHS Barnsley CCG 0.9% 0.6%E08000036 Wakefield 15F NHS Leeds CCG 0.4% 1.0%E08000036 Wakefield 03J NHS North Kirklees CCG 0.6% 0.3%E08000036 Wakefield 03R NHS Wakefield CCG 94.5% 98.0%E08000030 Walsall 15E NHS Birmingham and Solihull CCG 1.1% 4.8%E08000030 Walsall 04Y NHS Cannock Chase CCG 0.7% 0.3%E08000030 Walsall 05L NHS Sandwell and West Birmingham CCG 1.6% 3.1%E08000030 Walsall 05Y NHS Walsall CCG 92.8% 90.4%E08000030 Walsall 06A NHS Wolverhampton CCG 1.4% 1.4%E09000031 Waltham Forest 07T NHS City and Hackney CCG 0.4% 0.4%E09000031 Waltham Forest 08C NHS Hammersmith and Fulham CCG 0.3% 0.2%E09000031 Waltham Forest 08D NHS Haringey CCG 0.1% 0.1%E09000031 Waltham Forest 08M NHS Newham CCG 1.3% 1.7%E09000031 Waltham Forest 08N NHS Redbridge CCG 1.4% 1.4%E09000031 Waltham Forest 08W NHS Waltham Forest CCG 94.3% 96.1%
Page 121 of 252

E09000032 Wandsworth 09A NHS Central London (Westminster) CCG 0.9% 0.6%E09000032 Wandsworth 08C NHS Hammersmith and Fulham CCG 1.0% 0.6%E09000032 Wandsworth 08J NHS Kingston CCG 0.1% 0.0%E09000032 Wandsworth 08K NHS Lambeth CCG 3.2% 3.5%E09000032 Wandsworth 08R NHS Merton CCG 2.8% 1.6%E09000032 Wandsworth 08P NHS Richmond CCG 1.3% 0.7%E09000032 Wandsworth 08X NHS Wandsworth CCG 88.3% 92.6%E09000032 Wandsworth 08Y NHS West London (K&C & QPP) CCG 0.7% 0.4%E06000007 Warrington 01F NHS Halton CCG 0.3% 0.2%E06000007 Warrington 01G NHS Salford CCG 0.5% 0.6%E06000007 Warrington 01X NHS St Helens CCG 2.2% 2.0%E06000007 Warrington 02E NHS Warrington CCG 97.6% 97.0%E06000007 Warrington 02H NHS Wigan Borough CCG 0.2% 0.2%E10000031 Warwickshire 15E NHS Birmingham and Solihull CCG 0.2% 0.5%E10000031 Warwickshire 05A NHS Coventry and Rugby CCG 25.2% 21.5%E10000031 Warwickshire 11M NHS Gloucestershire CCG 0.2% 0.2%E10000031 Warwickshire 04G NHS Nene CCG 0.2% 0.2%E10000031 Warwickshire 10Q NHS Oxfordshire CCG 0.3% 0.3%E10000031 Warwickshire 05J NHS Redditch and Bromsgrove CCG 0.7% 0.2%E10000031 Warwickshire 05Q NHS South East Staffs and Seisdon Peninsular CCG 0.8% 0.3%E10000031 Warwickshire 05R NHS South Warwickshire CCG 96.1% 45.8%E10000031 Warwickshire 05H NHS Warwickshire North CCG 96.7% 30.7%E10000031 Warwickshire 04V NHS West Leicestershire CCG 0.5% 0.3%E06000037 West Berkshire 15A NHS Berkshire West CCG 30.0% 97.6%E06000037 West Berkshire 10J NHS North Hampshire CCG 0.7% 0.9%E06000037 West Berkshire 10Q NHS Oxfordshire CCG 0.2% 1.1%E06000037 West Berkshire 99N NHS Wiltshire CCG 0.1% 0.4%E10000032 West Sussex 09D NHS Brighton and Hove CCG 1.1% 0.4%E10000032 West Sussex 09G NHS Coastal West Sussex CCG 99.5% 57.5%E10000032 West Sussex 09H NHS Crawley CCG 93.4% 14.0%E10000032 West Sussex 09L NHS East Surrey CCG 0.3% 0.0%E10000032 West Sussex 09N NHS Guildford and Waverley CCG 3.1% 0.8%E10000032 West Sussex 99K NHS High Weald Lewes Havens CCG 1.1% 0.2%E10000032 West Sussex 09X NHS Horsham and Mid Sussex CCG 95.7% 25.9%E10000032 West Sussex 10V NHS South Eastern Hampshire CCG 4.1% 1.0%E10000032 West Sussex 99H NHS Surrey Downs CCG 0.6% 0.2%E09000033 Westminster 07P NHS Brent CCG 1.3% 2.0%E09000033 Westminster 07R NHS Camden CCG 3.0% 3.4%E09000033 Westminster 09A NHS Central London (Westminster) CCG 79.3% 71.3%E09000033 Westminster 08C NHS Hammersmith and Fulham CCG 0.6% 0.6%E09000033 Westminster 08K NHS Lambeth CCG 0.1% 0.2%E09000033 Westminster 08Y NHS West London (K&C & QPP) CCG 23.1% 22.6%E08000010 Wigan 00T NHS Bolton CCG 0.2% 0.1%E08000010 Wigan 01G NHS Salford CCG 0.8% 0.6%E08000010 Wigan 01X NHS St Helens CCG 3.8% 2.2%E08000010 Wigan 02E NHS Warrington CCG 0.4% 0.2%E08000010 Wigan 02G NHS West Lancashire CCG 2.8% 1.0%E08000010 Wigan 02H NHS Wigan Borough CCG 96.7% 95.7%E06000054 Wiltshire 11E NHS Bath and North East Somerset CCG 0.9% 0.4%E06000054 Wiltshire 15A NHS Berkshire West CCG 0.2% 0.2%E06000054 Wiltshire 15C NHS Bristol, North Somerset and South Gloucestershire CCG 0.2% 0.5%E06000054 Wiltshire 11J NHS Dorset CCG 0.3% 0.4%E06000054 Wiltshire 11M NHS Gloucestershire CCG 0.4% 0.5%E06000054 Wiltshire 11X NHS Somerset CCG 0.3% 0.4%E06000054 Wiltshire 12D NHS Swindon CCG 1.3% 0.6%E06000054 Wiltshire 11A NHS West Hampshire CCG 0.1% 0.2%E06000054 Wiltshire 99N NHS Wiltshire CCG 96.7% 96.8%E06000040 Windsor and Maidenhead 15A NHS Berkshire West CCG 0.4% 1.3%E06000040 Windsor and Maidenhead 14Y NHS Buckinghamshire CCG 0.3% 1.1%E06000040 Windsor and Maidenhead 15D NHS East Berkshire CCG 34.1% 96.9%E06000040 Windsor and Maidenhead 09Y NHS North West Surrey CCG 0.2% 0.5%E06000040 Windsor and Maidenhead 10Q NHS Oxfordshire CCG 0.0% 0.2%E06000040 Windsor and Maidenhead 10C NHS Surrey Heath CCG 0.1% 0.0%E08000015 Wirral 02F NHS West Cheshire CCG 0.4% 0.3%E08000015 Wirral 12F NHS Wirral CCG 99.7% 99.7%E06000041 Wokingham 15A NHS Berkshire West CCG 31.5% 97.0%E06000041 Wokingham 15D NHS East Berkshire CCG 1.0% 2.6%E06000041 Wokingham 10Q NHS Oxfordshire CCG 0.1% 0.4%E08000031 Wolverhampton 05C NHS Dudley CCG 1.3% 1.5%E08000031 Wolverhampton 05L NHS Sandwell and West Birmingham CCG 0.1% 0.3%E08000031 Wolverhampton 05Q NHS South East Staffs and Seisdon Peninsular CCG 1.8% 1.4%E08000031 Wolverhampton 05Y NHS Walsall CCG 3.4% 3.5%E08000031 Wolverhampton 06A NHS Wolverhampton CCG 93.8% 93.4%E10000034 Worcestershire 15E NHS Birmingham and Solihull CCG 0.9% 2.0%E10000034 Worcestershire 05C NHS Dudley CCG 0.7% 0.4%E10000034 Worcestershire 11M NHS Gloucestershire CCG 0.5% 0.6%E10000034 Worcestershire 05F NHS Herefordshire CCG 0.9% 0.3%E10000034 Worcestershire 05J NHS Redditch and Bromsgrove CCG 95.8% 27.7%E10000034 Worcestershire 05N NHS Shropshire CCG 0.3% 0.1%E10000034 Worcestershire 05R NHS South Warwickshire CCG 2.3% 1.1%E10000034 Worcestershire 05T NHS South Worcestershire CCG 97.2% 49.3%E10000034 Worcestershire 06D NHS Wyre Forest CCG 98.3% 18.6%E06000014 York 03E NHS Harrogate and Rural District CCG 0.2% 0.1%E06000014 York 03Q NHS Vale of York CCG 60.2% 99.9%Produced by NHS England using data from National Health Applications and Infrastructure Services (NHAIS) as supplied by NHS Digital.
Page 122 of 252
HEALTH AND WELLBEING BOARD
AGENDA ITEM
8 DATE OF MEETING: 19TH SEPTEMBER 2019 REPORT OF: THE CORPORATE DIRECTOR, PUBLIC HEALTH AND WELLBEING REPORT AUTHOR: YACCUB ENUM, SENIOR PUBLIC HEALTH MANAGER
SUBJECT: LUTON’S RESPONSE TO ADVANCING OUR HEALTH: PREVENTION IN THE 2020s
WARD(S) AFFECTED: ALL PURPOSE
1. For the Board to review the draft response to the Prevention Green Paper. RECOMMENDATION(S)
2. To comment on Luton’s response to the Prevention Green Paper with a view to a revised response being submitted in October 2019.
BACKGROUND
3. The government published, Advancing our health: prevention in the 2020s – consultation document, setting out its ambitions.
4. The consultation document set out a number of consultation questions, which our draft response attempts to cover, in addition to overall view of the document.
CONSULTATIONS
5. The draft response was presented to the Public Health & Wellbeing DMT for comment and feedback incorporated
APPENDICES Appendix 1 – Draft Luton’s response to Prevention Green Paper Appendix 2 - Advancing our health: prevention in the 2020s LIST OF BACKGROUND PAPERS LOCAL GOVERNMENT ACT 1972, SECTION 100D None
Page 123 of 252
APPENDIX 1 Luton’s response to Prevention Green Paper
General comments
We welcome the focus on prevention and the opportunities it offers. There is a brief mention of the contribution of other government departments towards the prevention agenda. There needs to be greater emphasis on wider opportunities and input from different government departments such as transport, education, treasury, DWP, etc.
The concept of prevention is largely framed around NHS/health. We would like to see:
• a broader context, taking into account health inequalities and their contributing factors e.g. education, unemployment, poverty, poor housing, homelessness running through the document
• clarity on the NHS’ role and contribution to prevention and reducing health inequalities.
In addition, the Green paper is very ‘service’ oriented – we need more of a population focus and place based approaches.
Finally, “making healthier choices easier” is welcome and we would like an approach that places individual and community resilience at the heart of policies and initiatives; and facilitates “taking more personal responsibility”.
Responses to consultation questions
Q1. Which health and social care policies should be reviewed to improve the health of people living in poorer communities or excluded groups?
The gap between rich and poor is growing, and so are health inequalities, yet the services that work to support those most in need are diminishing. We are therefore concerned that there is no mention of the necessary local government funding (e.g. reversal of public health funding cuts) to help address this. This will make our efforts to tackle poverty more difficult and worsen health inequalities.
The paper has a focus on personalised prevention but there is no commitment to the effective population-wide measures that are required in order to improve the public’s health.
Q2. Do you have any ideas for how the NHS Health Checks programme could be improved?
• Communicating risk and risk score (QRisk) needs to simplified as emerging evidence suggests that people attending the NHS Health Check are often confused by their cardiovascular risk score
• More focus on how lifestyle impacts on health following the NHS Health Check • More focus on tackling health inequalities through a targeted approach and funding
for outreach NHS Health Check in areas of high deprivation
Page 124 of 252
Q3. What ideas should the government consider to raise funds for helping people stop smoking?
Increase tax on tobacco products to generate funds
Q4. How can we do more to support mothers to breastfeed?
There are some great initiatives in the Green paper, for example on childhood obesity, mental health in schools, proposals to focus on infant feeding, and improve the nutritional content of foods aimed at babies and young children. However, it does not go far enough in other respects. For example, the absence of firm commitments in the early years, such as reducing alcohol exposure in the womb, and better support for the children of parents with mental health problems. Acknowledging adverse childhood experiences is a good step but there needs to be firm proposals for action. The following points will support mothers to breastfeed:
• Normalise breastfeeding through public awareness raising • Empower women to see breastfeeding as a normal part of raising a family • Creating breastfeeding-friendly environments in public places, work places, etc. • Include breastfeeding in pre conception literature • Allocate resources for sustainable breastfeeding champions in all communities
Q5. How can we better support families with children aged 0 to 5 years to eat well?
A wide-ranging approach should be adopted to create an environment which makes it easy for families to eat well including efforts to reduce child poverty. In addition specific actions would include:
• Make food labelling easier to understand • Make healthy food more accessible (price, quality, location in shop floors) • Working with manufacturers to improve healthier options in food • Continue the education of parents in adopting healthy food • Work with communities to explore healthier options of staple diets • Review the availability of Healthy start vitamins to increase uptake, especially among
vulnerable groups • Review planning laws to enable LAs to have better control on food environment.
Q6. How else can we help people reach and stay at a healthier weight?
Whilst we welcome the recognition of the role of a healthy diet in reducing the risk of illness, disease or disability and the intention to ban the sale of energy drinks to under-16s we would also like to see a focus on creating environments which support healthy weight. Other actions include:
• Helping people to incorporate active lifestyle into their daily routines • Education about the sugar contents of energy drinks • Introduce more NCMP-style child weight measurement opportunities (e.g. Year 3 and
Year 8/9), together with availability of information and services
Page 125 of 252
• Increase the reach of community food programmes which educate people about different types of healthy food and how to cook them
• Tackle wider issues about environment, planning laws on food premises and food poverty
• Enable and make active travel easier through transport policies • Sugar tax
Q7. Have you got examples or ideas that would help people to do more strength and balance exercises?
Use behavioural insights to identify the most acceptable way(s) of delivering exercises within available resources.
Train volunteers from communities as ‘exercise leaders’ so they can safely lead exercise sessions with their peers
Q8. Can you give any examples of any local schemes that help people to do more strength and balance exercises?
Q9. There are many factors affecting people’s mental health. How can we support the things that are good for mental health and prevent the things that are bad for mental health, in addition to the mental health actions in the green paper?
We welcome the mental health actions in the green paper. They are far reaching. Tackling wider issues such as inequality, homelessness, substance misuse, crime and fear of crime are vital.
Tackling stigma is also key. Isolation is a risk factor for poor mental health so develop initiatives that promote social networks and reduce isolation especially among older adults. Unfortunately many community centres that help older people socialise have been closed or at risk of closure.
Increasing social capital in neighbourhoods.
Physical activity is good for mental health. Increasing opportunities for physical activity e.g. green gyms, ‘cycle friendly’ towns and cities, tackling crime and antisocial behaviour so that people feel safe to walk or play outdoors.
Increase availability and utilisation of green spaces.
Ensuring mental health is always an integral part of health impact assessments of non-health policies and projects.
Q10. Have you got examples or ideas about using technology to prevent mental ill-health, and promote good mental health and wellbeing?
Q11. We recognise that sleep deprivation (not getting enough sleep) is bad for your health in several ways. What would help people get 7 to 9 hours of sleep a night?
Page 126 of 252
• Being physically and mentally active • Not eating late at night • Avoiding mobile phone, tablet etc. use at bed time • Build resilience so people can cope well with stress • Make debt counselling easily accessible • Promote mindfulness and other relaxation techniques
Q12. Have you got examples or ideas for services or advice that could be delivered by community pharmacies to promote health?
• NHS Health Checks • Blood pressure, blood glucose, cholesterol checks for those not eligible for NHS
Health Checks • Healthy eating advice, substance misuse advice, sexual health and contraception
advice and provision • Smoking cessation • Weight checks and healthy weight advice
Q13. What should the role of water companies be in water fluoridation schemes?
Government to make fluoridation mandatory so that water companies provide the required level of fluoride in water to help improve oral health at population level.
Q14. What would you like to see included in a call for evidence on musculoskeletal (MSK) health?
Q15. What could the government do to help people live more healthily: in homes and neighbourhoods, when going somewhere, in workplaces, in communities?
Creating healthy environments, learning from evidence and good practice, to include tackling poverty, regeneration and developing healthy town centres.
Increasing opportunities for physical activity e.g. green gyms, ‘cycle friendly’ towns and cities, tackling crime and antisocial behaviour so that people feel safe to walk or play outdoors.
Q16. What is your priority for making England the best country in the world to grow old in, alongside the work of PHE and national partner organisations?
Create healthy environments including improved neighbourhoods and housing options for people to grow older in.
Increase opportunities for older people to volunteer
Encourage and enable peer support
Expand community-based befrienders to reduce isolation and loneliness.
Page 127 of 252
Continue to develop dementia friendly environments.
Q17. What government policies (outside of health and social care) do you think have the biggest impact on people’s mental and physical health? Please describe a top 3.
Economic, Transport, Housing,
Q18. How can we make better use of existing assets – across both the public and private sectors – to promote the prevention agenda?
Partnership and collaborative working, focusing on asset based rather needs based support
Learn from international best practice.
Q19. What more can we do to help local authorities and NHS bodies work well together?
• Develop ongoing arrangements for funding and provision of adult social care • Parity of approach between NHS and LA funding • Review fragmentation of commissioning arrangements between NHS and LA • Accelerate the move towards integrated commissioning budgets and teams • More place based approach
Q20. What are the top 3 things you’d like to see covered in a future strategy on sexual and reproductive health?
• Clarity on commissioning Prep • End fragmentation of sexual health commissioning. Move to integrated
commissioning budgets and teams • Pre conception education • Sustained sexual health promotion (funded)
Q21. What other areas (in addition to those set out in this green paper) would you like future government policy on prevention to cover?
• More powers for HWBB to tackle prevention in local areas • Promotion of place-based initiatives
Page 128 of 252
Advancing our health: prevention in the 2020s
Published July 2019
CP 110
Page 129 of 252
Advancing our health: prevention in the 2020s Presented to Parliament by the Parliamentary Under Secretary of State for Public Health and Primary Care by Command of Her Majesty Published July 2019
CP 110
Page 130 of 252
© Crown copyright 2019
This publication is licensed under the terms of the Open Government Licence v3.0
except where otherwise stated. To view this licence,
visit nationalarchives.gov.uk/doc/open-government-licence/version/3.
Where we have identified any third party copyright information you will need to obtain
permission from the copyright holders concerned.
This publication is available at www.gov.uk/official-documents.
Any enquiries regarding this publication should be sent to us
ISBN 978-1-5286-1545-7 CCS CCS0619432956 07/19 Printed on paper containing 75% recycled fibre content minimum Printed in the UK by the APS Group on behalf of the Controller of Her Majesty’s Stationery Office
Page 131 of 252
Contents
Executive summary ............................................................................................................. 3
1. Opportunities ................................................................................................................ 3
2. Challenges.................................................................................................................... 4
3. Strong foundations ....................................................................................................... 5
Conclusion ........................................................................................................................ 5
Introduction .......................................................................................................................... 7
From life span to health span ........................................................................................... 7
The drivers of good health .............................................................................................. 10
Chapter 1: Opportunities .................................................................................................... 13
Intelligent public health ................................................................................................... 13
Predictive prevention ...................................................................................................... 13
Focused support and advice .......................................................................................... 15
Precision medicine ......................................................................................................... 18
Tackling current and future threats ................................................................................. 21
Chapter 2: Challenges ....................................................................................................... 24
Being smoke-free ........................................................................................................... 25
Maintaining a healthy weight .......................................................................................... 28
Staying active ................................................................................................................. 35
Taking care of our mental health .................................................................................... 38
Wider factors .................................................................................................................. 42
Prevention in the NHS .................................................................................................... 45
Chapter 3: Strong foundations ........................................................................................... 49
The early years ............................................................................................................... 49
Creating healthy places .................................................................................................. 52
Active ageing .................................................................................................................. 58
National action ................................................................................................................ 60
World-class research ...................................................................................................... 62
Local action .................................................................................................................... 62
Conclusion ......................................................................................................................... 67
References ........................................................................................................................ 68
Page 132 of 252

Page 133 of 252
3
Executive summary
1. Opportunities
The 2020s will be the decade of proactive, predictive, and personalised prevention. This
means:
• targeted support
• tailored lifestyle advice
• personalised care
• greater protection against future threats
New technologies such as genomics and artificial intelligence will help us create a new
prevention model that means the NHS will be there for people even before they are born.
For example, if a child had inherited a rare disease we might be able to diagnose and start
treatment while they are still in the womb, so they are born healthy.
Using data held by the NHS, and generated by smart devices worn by individuals, we will
be able to usher in a new wave of intelligent public health where everyone has access to
their health information and many more health interventions are personalised.
In the 2020s, people will not be passive recipients of care. They will be co-creators of their
own health. The challenge is to equip them with the skills, knowledge and confidence they
need to help themselves.
We are:
– Embedding genomics in routine healthcare and making the UK the home of the
genomic revolution
– Reviewing the NHS Health Check and setting out a bold future vision for NHS
screening
– Launching phase 1 of a Predictive Prevention work programme from Public Health
England
Page 134 of 252
4
2. Challenges
Over the decades, traditional public health interventions have led to significant
improvements in the nation's health.
Thanks to our concerted efforts on smoking, we now have one of the lowest smoking rates
in Europe with fewer than 1 in 6 adults smoking. Yet, for the 14% of adults who still smoke,
it's the main risk to health. Smokers are disproportionately located in areas of high
deprivation. In Blackpool, 1 in 4 pregnant women smoke. In Westminster, it's 1 in 50.
Obesity is a major health challenge that we've been less successful in tackling. And clean
air will continue to be challenging for the next decade. On mental health, we've improved
access to services. In the 2020s, we need to work towards 'parity of esteem' not just for
how conditions are treated, but also for how they are prevented. On dementia, we know
'what's good for your heart is also good for your head'. A timely diagnosis also enables
people with dementia to access the advice, information, care and support that can help
them to live well with the condition, and to remain independent for as long as possible.
The new personalised prevention model offers the opportunity to build on the success of
traditional public health interventions and rise to these new challenges.
The NHS is also doing more on prevention. The Long Term Plan contained a whole
chapter on prevention, and set out a package of new measures, including:
• all smokers who are admitted to hospital being offered support to stop smoking
• doubling the Diabetes Prevention Programme
• establishing alcohol care teams in more areas
• almost 1 million people benefiting from social prescribing by 2023 to 2024
These measures will help to shift the health system away from just treating illness, and
towards preventing problems in the first place.
We are:
– Announcing a smoke-free 2030 ambition, including options for revenue raising to
support action on smoking cessation.
– Publishing Chapter 3 of the Childhood Obesity Strategy, including bold action on:
infant feeding, clear labelling, food reformulation improving the nutritional content of foods,
and support for individuals to achieve and maintain a healthier weight. In addition, driving
forward policies in Chapter 2, including ending the sale of energy drinks to children.
Page 135 of 252
5
– Launching a mental health prevention package, including the national launch of
Every Mind Matters.
3. Strong foundations
When our health is good, we take it for granted. When it’s bad, we expect the NHS to do
their best to fix it. We need to view health as an asset to invest in throughout our lives, and
not just a problem to fix when it goes wrong. Everybody in this country should have a solid
foundation on which to build their health.
This is particularly important in the early years of life. Most children are born into safe and
loving homes that help them develop and thrive. But this is not always the case. We must
help all children get a good start in life.
This 'asset-based approach' should then follow through to other stages of life, including
adulthood and later life. It's difficult to live a fulfilling life if you're worried about money, live
in cold or damp conditions, or feel cut-off from those around you.
At national level, we will lay the foundations for good health by pushing for a stronger
focus on prevention across all areas of government policy. At local level, we expect
different organisations to be working together on prevention. This means moving from
dealing with the consequences of poor health to promoting the conditions for good health
and designing services around user need, not just the way we’ve done things in the past.
We will:
– Launch a new health index to help us track the health of the nation, alongside other
top-level indicators like GDP
– Modernise the Healthy Child Programme
– Consult on a new school toothbrushing scheme, and support water fluoridation
Conclusion
The commitments outlined in this green paper signal a new approach for the health and
care system. It will mean the government, both local and national, working with the health
and care system, to put prevention at the centre of all our decision-making. But for it to
succeed, and for us to transform the NHS and improve the nation's health over the next
decade, individuals and communities must play their part too. Health is a shared
Page 136 of 252
6
responsibility and only by working together can we achieve our vision of healthier and
happier lives for everyone.
To respond to this consultation, visit http://www.gov.uk. Alternatively, if you're reading the
HTML version, just click the questions themselves, which will take you through to the
consultation webpage.
Page 137 of 252
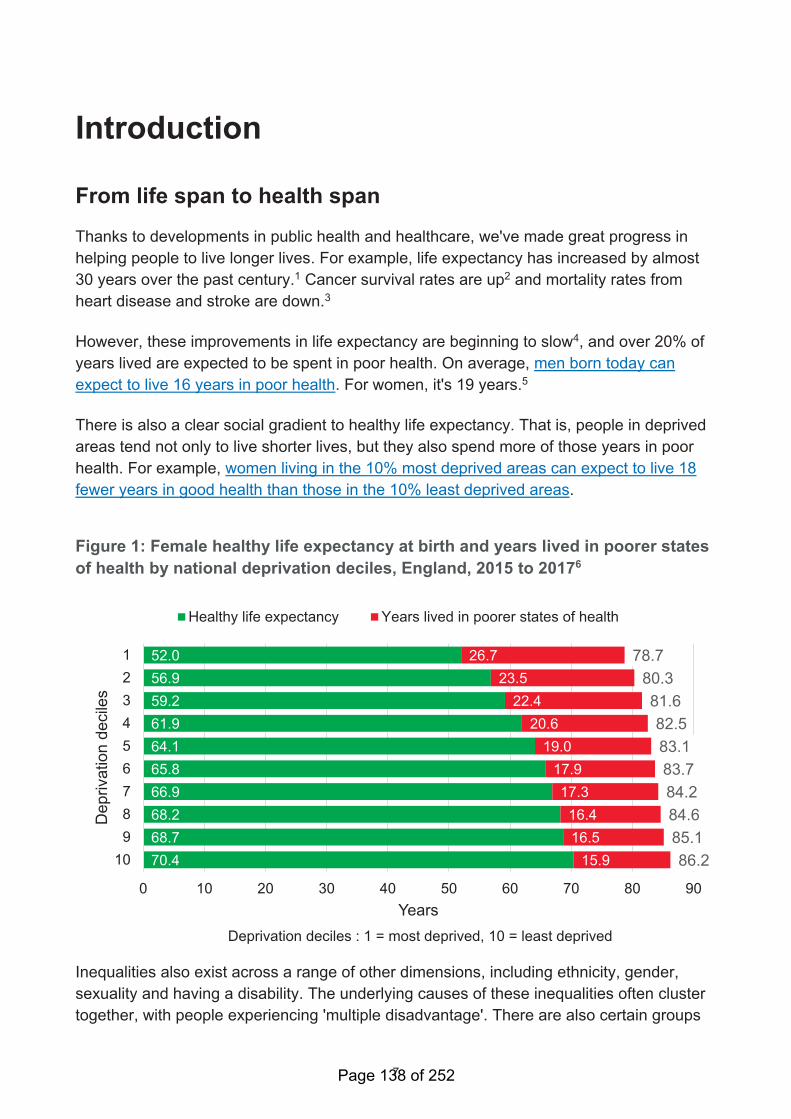
7
Introduction
From life span to health span
Thanks to developments in public health and healthcare, we've made great progress in
helping people to live longer lives. For example, life expectancy has increased by almost
30 years over the past century.1 Cancer survival rates are up2 and mortality rates from
heart disease and stroke are down.3
However, these improvements in life expectancy are beginning to slow4, and over 20% of
years lived are expected to be spent in poor health. On average, men born today can
expect to live 16 years in poor health. For women, it's 19 years.5
There is also a clear social gradient to healthy life expectancy. That is, people in deprived
areas tend not only to live shorter lives, but they also spend more of those years in poor
health. For example, women living in the 10% most deprived areas can expect to live 18
fewer years in good health than those in the 10% least deprived areas.
Figure 1: Female healthy life expectancy at birth and years lived in poorer states
of health by national deprivation deciles, England, 2015 to 20176
52.0
56.9
59.2
61.9
64.1
65.8
66.9
68.2
68.7
70.4
26.7
23.5
22.4
20.6
19.0
17.9
17.3
16.4
16.5
15.9
78.7
80.3
81.6
82.5
83.1
83.7
84.2
84.6
85.1
86.2
0 10 20 30 40 50 60 70 80 90
1
2
3
4
5
6
7
8
9
10
Years
Depriva
tion d
ecile
s
Healthy life expectancy Years lived in poorer states of health
Deprivation deciles : 1 = most deprived, 10 = least deprived
Inequalities also exist across a range of other dimensions, including ethnicity, gender,
sexuality and having a disability. The underlying causes of these inequalities often cluster
together, with people experiencing 'multiple disadvantage'. There are also certain groups
Page 138 of 252
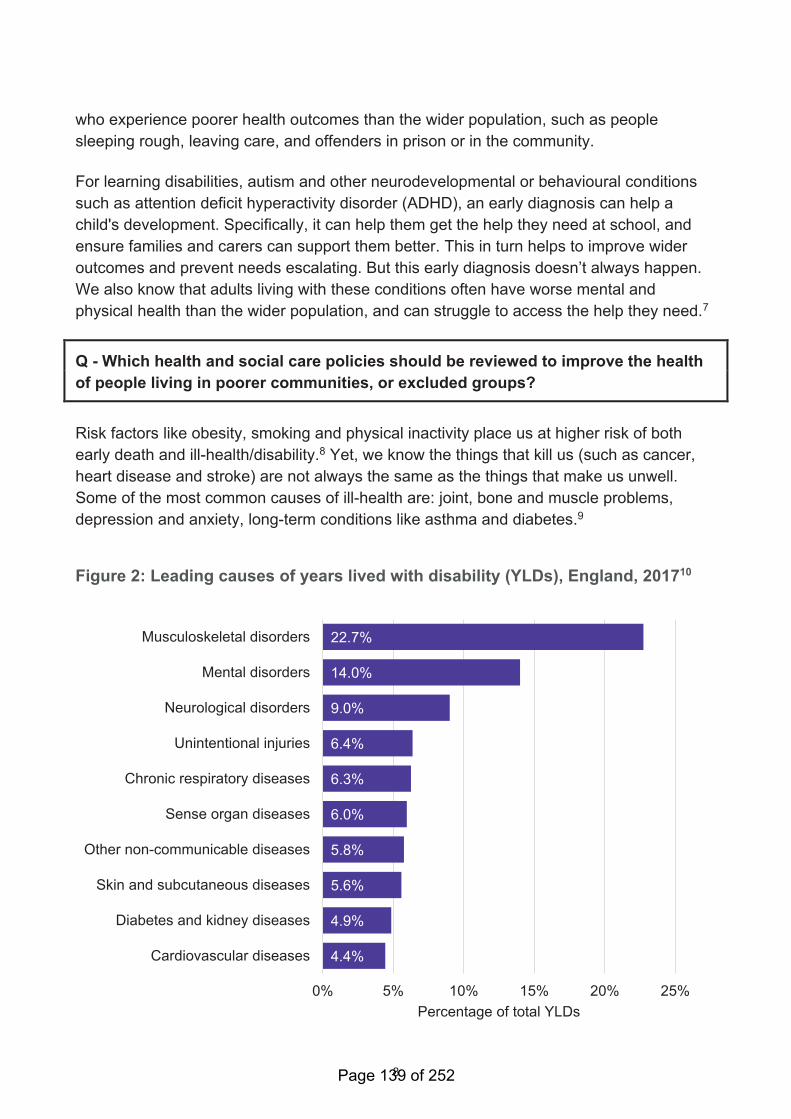
8
who experience poorer health outcomes than the wider population, such as people
sleeping rough, leaving care, and offenders in prison or in the community.
For learning disabilities, autism and other neurodevelopmental or behavioural conditions
such as attention deficit hyperactivity disorder (ADHD), an early diagnosis can help a
child's development. Specifically, it can help them get the help they need at school, and
ensure families and carers can support them better. This in turn helps to improve wider
outcomes and prevent needs escalating. But this early diagnosis doesn’t always happen.
We also know that adults living with these conditions often have worse mental and
physical health than the wider population, and can struggle to access the help they need.7
Q - Which health and social care policies should be reviewed to improve the health
of people living in poorer communities, or excluded groups?
Risk factors like obesity, smoking and physical inactivity place us at higher risk of both
early death and ill-health/disability.8 Yet, we know the things that kill us (such as cancer,
heart disease and stroke) are not always the same as the things that make us unwell.
Some of the most common causes of ill-health are: joint, bone and muscle problems,
depression and anxiety, long-term conditions like asthma and diabetes.9
Figure 2: Leading causes of years lived with disability (YLDs), England, 201710
22.7%
14.0%
9.0%
6.4%
6.3%
6.0%
5.8%
5.6%
4.9%
4.4%
0% 5% 10% 15% 20% 25%
Musculoskeletal disorders
Mental disorders
Neurological disorders
Unintentional injuries
Chronic respiratory diseases
Sense organ diseases
Other non-communicable diseases
Skin and subcutaneous diseases
Diabetes and kidney diseases
Cardiovascular diseases
Percentage of total YLDs
Page 139 of 252
9
Problems with joints, bones and muscles
For the last 30 years, problems with joints, bones and muscles have been the most
common cause of years lived with disability in England.11 They affect around 15 million
people (1 in 3 adults in England).12 They are sometimes called musculoskeletal (or 'MSK')
conditions. The most common are conditions of musculoskeletal pain, such as
osteoarthritis or back and neck pain. Women are more likely to be affected than men.13
The risk of having back pain also increases with rising body mass index.14 For this reason,
the policy priority is helping people to achieve a healthier weight, eat well and stay active.
Osteoarthritis: Nora’s story
Nora15 used to struggle to cope with the pain of osteoarthritis. Her muscles and joints had
become stiffer and more painful, making it harder to enjoy interests like jam-making,
gardening and art classes. Nora decided it was time to make some changes to push back
against the negative impact arthritis was having on her life.
After taking advice from healthcare professionals and doing online research, Nora started
an exercise routine that worked for her, incorporating Pilates, low-impact exercise on a
cross-trainer or a bike and swimming.
"My advice to anyone with arthritis is to keep moving. I know everyone says that but
take it from me I’ve seen such positive changes in my life since I’ve been exercising.
It’s the small things you notice that make the biggest difference to how you feel. For
the first time in years I’m able to make jam from the fruit I grow in my garden
without taking medication. That means the world to me."
Depression, anxiety and other mental health problems
Poor mental health is the second most common cause of years lived with disability in
England.16 The most common conditions are depression and anxiety, which make up the
majority of mental health cases.17 Approximately 1 in 4 people report living with a mental
health issue.18 Incidence is highest in the working-age population, and higher in women
than men.19 Other groups at greater risk include: those living on low incomes, people with
problem debt, and those identifying as lesbian, gay, bisexual, or transgender (LGBT).20
Anxiety and depression at work: Helen’s story
Helen21 was first diagnosed with a mental health condition 15 years ago. After speaking to
colleagues at work, Helen now receives the help and support she needs to continue in her
role.
Page 140 of 252
10
"It was around 3 years ago when I suffered panic attacks. I was feeling sick, not
wanting to go into work. I had depression as well; you don’t even want to get out of
bed, you just want to hide."
Other long-term health conditions
Together, musculoskeletal problems and mental health conditions account for almost 40%
of the total years lived with disability in England. The remaining 60% is split among a
number of mainly long-term conditions, such as diabetes, lung conditions like asthma and
chronic obstructive pulmonary disease (COPD), sight loss, hearing loss and dementia.22
In many cases, long-term conditions cluster together. This is sometimes called
multimorbidity. There are no official measures, but between 15 and 30% of the adult
population are thought to be living with multiple conditions.23 Problems are more common
in later life, in deprived communities, and among people who are overweight or who
smoke.24
Living with multiple conditions: Susan’s story
Susan25 used to work as a catering manager at a university. She had to stop work in 2008
when she got fibroids, and was bedridden for 2 weeks at a time. Since stopping work,
Susan has been diagnosed with osteoarthritis, COPD, hypothyroidism, angina, high blood
pressure and high cholesterol, depression and diabetes. She takes 14 different
medications every day and her illnesses can feel as though they consume her life.
"I just have to take each day as it comes. Planning doesn’t work."
The drivers of good health
The good news is that much premature ill-health and disability can be prevented, and
there are actions we can take to increase our chances of living longer, healthier lives.
Some health conditions we are born with and cannot avoid. Where this is the case, the
priority is supporting people to enjoy a good quality of life and to live well.
The mission
Last year, the government set a mission as part of the Ageing Society Grand Challenge26
to “ensure that people can enjoy at least 5 extra healthy, independent years of life by
2035, while narrowing the gap between the experience of the richest and poorest”.
Page 141 of 252
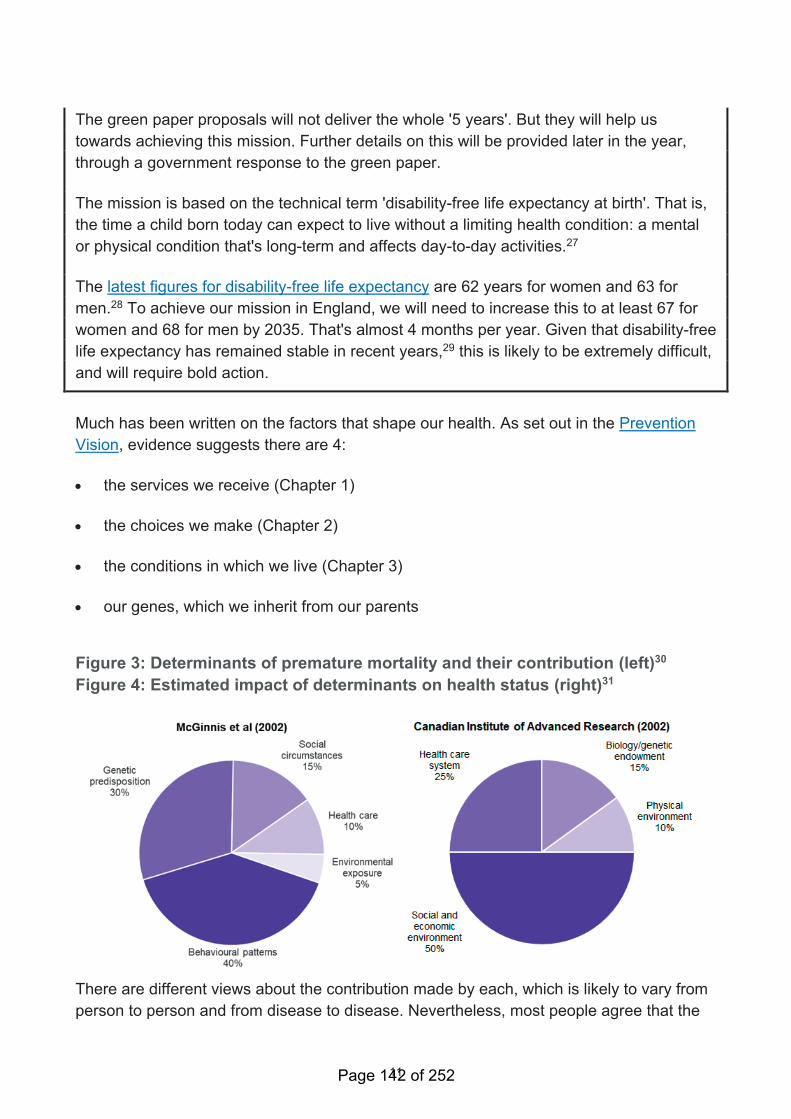
11
The green paper proposals will not deliver the whole '5 years'. But they will help us
towards achieving this mission. Further details on this will be provided later in the year,
through a government response to the green paper.
The mission is based on the technical term 'disability-free life expectancy at birth'. That is,
the time a child born today can expect to live without a limiting health condition: a mental
or physical condition that's long-term and affects day-to-day activities.27
The latest figures for disability-free life expectancy are 62 years for women and 63 for
men.28 To achieve our mission in England, we will need to increase this to at least 67 for
women and 68 for men by 2035. That's almost 4 months per year. Given that disability-free
life expectancy has remained stable in recent years,29 this is likely to be extremely difficult,
and will require bold action.
Much has been written on the factors that shape our health. As set out in the Prevention
Vision, evidence suggests there are 4:
• the services we receive (Chapter 1)
• the choices we make (Chapter 2)
• the conditions in which we live (Chapter 3)
• our genes, which we inherit from our parents
Figure 3: Determinants of premature mortality and their contribution (left)30
Figure 4: Estimated impact of determinants on health status (right)31
There are different views about the contribution made by each, which is likely to vary from
person to person and from disease to disease. Nevertheless, most people agree that the
Page 142 of 252
12
choices we make, shaped by the conditions in which we live, have the biggest impact. The
focus of this green paper is on services, choices and conditions.
If we are to achieve our mission, we need to take bold action in all areas - Making the most
of the opportunities in front of us and being open to innovations ahead. This includes:
• Bringing in a new wave of intelligent public health, which is more proactive,
predictive and personalised, while also taking tough action on our biggest challenges:
smoking, obesity and mental ill-health.32
• Taking a behavioural science approach to some of our biggest challenges on
prevention. This means making healthy choices as easy as possible for people, and,
in some cases, making all options healthier.
• Viewing health as our most precious asset, and not just a problem to fix when it
goes wrong. Good health is the foundation of happy families, thriving communities,
and a strong economy. When our health is good, we take it for granted. When our
health is bad, we expect the NHS to do their best to fix it. We need to lay the
foundations for good health so everyone has a chance to live a healthy and happy life.
Page 143 of 252
13
Chapter 1: Opportunities
Intelligent public health
In today’s increasingly digital world, technology and data have a clear role to play in
helping us to deliver more proactive, predictive and personalised services to people. We've
already taken the first steps in doing this.
Public Health England's (PHE) social marketing campaigns already personalise lifestyle
advice to different audiences, with 90% of their social media messaging on smoking being
seen by people who smoke. That’s modern, efficient and focused prevention in action.
The future is even greater personalisation and a closer fit with individual needs. There will
always be a place for interventions that improve everyone’s health. But it can be less
intrusive and better value for money to offer people more personalised and tailored
support. Many are already opting in to this kind of approach. In the next decade, intelligent
public health will mean:
• focused support and advice to those who need it and choose to participate
• precision medicine
• tackling current and future threats
Predictive prevention
Starting this year, PHE will work together with NHSX and other partners across the
public health system, academia, industry and the voluntary sector to build a
portfolio of new innovative projects that will help us evaluate and model Predictive
Prevention at scale. Phase one of the programme includes:
– getting the foundations right by building trust with the public about how data can be used
to improve their experience, and the benefits of participating
– refining our overall approach to analysis and insight generation to help us understand
and support the most at-risk and vulnerable groups
– developing exemplar projects to prove the concept of personalised prevention and
establish the evidence base
Page 144 of 252
14
- designing the future shape of the programme, with a view to increasing the scale and
ambition
Use of data: a citizen’s view
The data we generate about our health, our activities, our genomes and our environment
can empower us in unimaginable ways. We can tailor our diet to meet our metabolism, we
can account for air pollution in our exercise plans, and we can take action to prevent
painful diseases decades before they would begin. And we know this is only the beginning.
Finding insights in this data is an ongoing challenge, one that can be met on our phones
and tablets, in the GP surgery or nationally, at a population level. We are entering a new
era of evidence-based self-care, driven by us as patients in partnership with the NHS.
PHE and the NHS use data and insights to create these algorithms and models, and the
public can have a role in this if we choose to help by either allowing our phones and
devices to send data, or by allowing PHE and the NHS to access our anonymised clinical
data. There is some indication from PHE's targeted marketing campaigns that citizens are
willing to share their contact details to receive information, and to have an ongoing
dialogue around health issues relevant to them. To date, there have been over 7.1 million
responses to this type of offer from PHE. The UK Biobank has also been able to build a
record of the data of over half a million volunteers.
To make this work, PHE and NHS organisations will ensure that they respect and protect
our data. They will focus on the requirements of the General Data Protection Regulation
and Data Protection Act 2012, adhere to the Caldicott principles and implement
Department of Health and Social Care (DHSC) policy on patient preferences. At all stages,
they will work closely with the Information Commissioner’s Office, the National Data
Guardian, the new Centre for Data Ethics and Innovation, and academics and other
experts in information governance.
They will work closely with the public, privacy organisations and other relevant bodies
including the Information Commissioner’s Office and the Centre for Data Ethics and
Innovation, to understand what we consider to be acceptable use of our data. They will
also explore developing models of dynamic, informed consent, so we can choose how and
when we want to share our personal data for this purpose.
The impact achieved will be constantly evaluated in the open, with regular and transparent
engagement with the health sector and the public - ensuring that individual interventions
are having a positive impact overall, and that we are narrowing the gap between richest
and poorest.
Page 145 of 252
15
Some of the most exciting opportunities for intelligent prevention are those that can be
developed locally, including as part of devolution areas that have a broad focus on
economic development alongside a commitment to improve health. The learning from
these experiences can be shared more widely to enable other areas to benefit. In support
of this ambition, the government is exploring ways to support a West Midlands
Combined Authority Radical Prevention Fund. This will involve a programme of work to
explore, test and learn from new opportunities to prevent ill-health using the latest
technology – stimulating innovation in ways that can support both health and wealth.
Case study: Digital Diabetes Prevention programme
From August 2019, there will be a digital way to take part in the Healthier You: NHS
Diabetes Prevention Programme. The digital version gives the same advice on healthy
eating, exercise and weight management as the face-to-face programme, but through
wearable technologies, apps and websites. It is designed for those at risk of type 2
diabetes who find it difficult to attend sessions because of work or family commitments.
Early analysis from pilots involving over 4,000 people shows the digital programme is
reaching more people of working age.
Andrew, a 51 year old farmer from North Yorkshire, took part in the pilot. This helped him
lose weight and reduce his blood sugar levels out of the pre-diabetic range; he said:
“It’s given me a helping hand in the right direction. I get a video message from my
personal health coach a couple of times a week with diet recommendations and
fitness techniques personalised to me and my lifestyle plan. I send a text back and
we keep up the conversation digitally. I also like reading the comments and
conversations on the online community.”
The NHS is also working to give more people access to digital ways to manage their
diabetes, including through an online ‘healthy living for people with type 2 diabetes’
support tool, and by investing £2 million into a new NHS Test Bed programme. Last year
(2018), NHS England also launched a guide on NHS UK for managing type 1 diabetes.
Focused support and advice
In the future, the support and advice we provide to people will become much more focused
and tailored. We will start this transformation with 2 of our largest existing programmes –
screening and NHS Health Checks.
Page 146 of 252
16
Intelligent screening
Screening programmes have long been used to identify those at risk of or already living
with health problems. By preventing conditions – or detecting them at more treatable
stages – it's possible to save lives and improve outcomes.
Our vision for future screening in the NHS is for:
• Uptake to be maximised, including by making screening easier for people to access,
and tackling unjustified variations in take-up.
• Existing national screening programmes to become more personalised and
stratified by risk, so we focus interventions where they are most needed. For
example, reviewing the case for increasing cervical screening intervals for lower-risk
groups, such as women vaccinated against human papillomavirus. We also know that
the predictive power of a screening test is increased if you identify high-risk groups,
rather than screening everybody.
• Focused screening within high-risk populations to be offered for a greater range
of conditions. For example, considering introducing lung cancer screening to high-
risk individuals, such as smokers, together with more personalised ongoing support.
• Better use of technology, including an expansion of our offer on genomics,
better use of data and embedding the use of artificial intelligence. This includes
incorporating genetic testing into screening and diagnostics. For example, using next
generation sequencing to confirm cases of cystic fibrosis in children (currently being
tested in the newborn bloodspot programme), or screening for genes associated with
Lynch syndrome, which leads to an increased risk of bowel cancer.
• Recommendations to be developed in a co-ordinated way across different kinds
of screening opportunity, while continuing to be based on the best evidence and
advice. For example, by reviewing how the different sources of expert advice on
screening, in particular the National Institute for Health and Care Excellence (NICE)
and the UK National Screening Committee (UK NSC), relate to one another.
• Faster implementation of recommended interventions and programmes, with
clear accountability for delivery and investment in supporting IT.
Professor Sir Mike Richards is currently carrying out a review of cancer screening. The
report is due to be published in September 2019. This provides a good opportunity to
update and modernise our approach to screening.
We recognise that there are challenges in the existing screening arrangements, and that
reform is needed to achieve our vision for the future. Recommendations from the review
Page 147 of 252
17
will help shape our plans for change, supported by a strategic review of IT required
to enable our vision for future screening. NHSX will lead on this element of the
screening strategy.
We also recognise that there remains variation in screening outcomes across the country,
and by deprivation and ethnicity. As part of our response to Public Accounts
Committee (PAC) recommendations, we will set out our understanding of the
variation in performance and a plan for reducing these inequalities. We are due to
respond to these recommendations in July.
Intelligent health checks
NHS Health Checks is a national programme commissioned by councils. Health Checks
offer people aged 40 to 74 a free check-up of their overall health, every 5 years. The
results can tell people whether they are at higher risk of developing certain health
problems, such as heart disease, diabetes, stroke and dementia. They help underpin the
NHS Long Term Plan commitments to prevent 150,000 heart attacks, strokes and cases of
dementia, and to double the NHS Diabetes Prevention Programme.
Case study: Southwark Digital Health Check tool
Southwark Council developed an online digital health check tool to help more people
benefit from the NHS Health Check programme. People who had already been offered a
NHS Health Check, but had not responded, were sent a text message inviting them to
access the digital check.
A third of the people accessed the digital check. Half of these completed it to find out their
chance of having a heart attack or stroke in the next 10 years. More than 1 in 10 of those
using the digital check were found to be at high risk of having a heart attack or stroke and
so went on to complete a face-to-face NHS Health Check. These important checks focus
on the leading causes of premature death and ill health such as obesity, smoking, high
blood pressure and type 2 diabetes, therefore offering people the chance to lower or
manage their risk.
The NHS Health Check programme has achieved a lot. But uptake varies across the
country,33 the risks identified in a check could be followed up more consistently by the
NHS, and evidence is emerging that people could benefit from a more tailored service.34
There may also be a case for a particular focus on supporting people through key changes
in their life, in particular thinking about future care needs and how they can remain healthy
and active in older age.
Page 148 of 252
18
Building on the gains made over the last 10 years, we believe the time is right to take a
step back and consider whether changes to the programme could help it deliver even
greater benefits. The government will commission an evidence-based review of the
NHS Health Checks programme to maximise the benefits it delivers in the next
decade.
Details will be confirmed later this year, but the scope is likely to include:
• Ways of increasing uptake, particularly among high-risk groups.
• Options for making it more focused, for example identifying people on the basis of
information about their likely risks, rather than making the same offer to everyone. This
could mean more support to those who need it most.
• Considering how it's delivered, for example using developing digital service offers to
intervene in a more efficient and tailored way.
• Reviewing what's covered in a NHS Health Check, for example increasing the
range of health and care advice that checks can offer.
• Reviewing the evidence for a specific ‘MOT’ when approaching retirement age to
help prevent or delay future care and support needs.
Q - Do you have any ideas for how the NHS Health Checks programme could be
improved?
Precision medicine
Genomics is changing the future of health and medicine. From providing more tailored
cancer treatments to helping diagnose unknown conditions, it will underpin a new era of
precision medicine. Over the next decade, we want to build on our position as a world
leader in genomics and make the UK the number one destination to research and develop
the latest scientific advances in genomic healthcare.
How genomics works - The human genome is made of DNA and is the ‘instruction
manual’ for how our bodies come into existence, maintain our cells, and ultimately die. It is
the unique blueprint that makes every person different from every other, and tiny variations
in the genome can have significant impacts on our life and health. Sequencing these
variations can help doctors identify people at risk of developing treatable diseases, speed
Page 149 of 252
19
up diagnoses and find effective personalised treatments that deliver better results with
fewer side effects.
For the last 70 years, the UK has been at the forefront of the use of genetics to improve
healthcare. However, it's only in the last 10 years, with advances in science and
technology, that we have begun to unlock the wider potential. We have led the way
globally with initiatives like the 100,000 Genomes Project, which was led by Genomics
England and is the largest national sequencing project anywhere in the world. This project
is already making a real difference for patients. Early results show 1 in 4 rare disease
patients previously without a diagnosis now receive one, and up to half of cancer patients
could be provided with findings that put them and family members on a better care
pathway. Later this year, Genomics England and the NHS will start returning results of
additional findings related to preventable conditions to participants who have chosen to
receive them. These may be available based upon follow-up analysis of their samples.
The Genomic Medicine Service in the NHS is the first of its kind in the world to integrate
whole genome sequencing into the healthcare system. It aims to deliver equitable access
to genomic testing to help more accurately diagnose disease and personalise treatments
and interventions. Our partnerships with researchers, industry and governments,
domestically and internationally, all contribute to advancing this area.
Genomic approaches will be transformative for early detection of many of the common
diseases and cancers. Opportunities to understand how best to realise these benefits will
be explored as part of plans to sequence 5 million genomes by 2023 to 2024, through a
unique collaboration between the NHS, UK scientists and industry.
Genetic risk in healthy populations
We know genetic factors play a role in human health and disease, including most major
chronic diseases. For some diseases, many thousands of genetic variations across our
genomes each have a small impact on the chance that we will develop some common
diseases. It is now possible to combine this genetic information from many people into
polygenic risk scores (PRS) which identify those at highest risk of particular diseases. This
could allow individuals to make lifestyle changes that will help prevent disease or reduce
its impact, lead to more effective prescription medicines and improve other public health
interventions. PRS could also help to define new, currently invisible, patient populations.
This could, for example, include people at risk of heart disease who would benefit from
receiving statin therapy but who are currently not receiving preventative treatment because
their blood pressure and cholesterol levels are normal. As the evidence develops,
complementing existing risk scores (such as the QRisk Score for cardiovascular disease)
with this kind of genetic information will be a priority for the UK healthcare system.
Page 150 of 252
20
Building on recent advances realised through UK BioBank, the clinical implementation of
this approach will be pioneered at scale in the new Accelerating Detection of Disease
(ADD) challenge, which aims to recruit up to five million healthy participants into a world-
leading research cohort in order to shed new light on the detection and treatment of
common diseases. A key part of the ADD challenge will be to offer as many participants as
possible their PRS. Individuals will volunteer their genetic information, which will be used
in accordance with relevant legislation, regulation and good practice guidance on use of
data, in order to develop and improve the evidence base for the use of PRS.
The goal of the ADD challenge will be to support research, prevention and treatment
across major chronic diseases, including cancer, dementia, heart disease and mental
health conditions. The project will seek to enrol under-represented groups, such as ethnic
minorities, to enable a better understanding of disease and preventative measures for
every individual in society and reduce existing health inequalities. The project brings
together the NHS, industry and leading charities including Cancer Research UK, the
British Heart Foundation and Alzheimer’s Research UK. It will be the largest ever study of
its kind, collecting a broad range of data from healthy volunteers over many years.
We will be publishing a National Genomics Healthcare Strategy in autumn 2019. This
will set out how the genomics community can work together to make the UK the global
leader in genomic healthcare.
We have an ambition to embed genomics in routine healthcare and make the UK
home to the genomic revolution that's on the horizon: By 2023 to 2024, the UK will
aim to carry out 5 million genomic analyses, including sequencing at least 1 million whole
genomes from patients in the NHS and participants in the UK Biobank.
– Some of these genomic analyses will be provided by the Accelerating Detection of
Disease challenge, which will now incorporate the government’s commitment to develop a
genomic volunteer service and will be free to participants.
– This year, seriously ill children who are likely to have a rare genetic disorder, children
with cancer, and adults suffering from certain rare conditions or specific cancers will be
offered whole genome sequencing as part of their routine care. This will put the UK at the
cutting edge of genomic technologies to predict and diagnose inherited and acquired
disease, and to personalise treatments and interventions.
Case study: Whole Genome Sequencing
Genome sequencing has the potential to dramatically improve the speed of diagnosis and
influence the treatment plans for children with rare childhood conditions. The Next
Generation Children Project led by clinical researchers in Cambridge used whole genome
Page 151 of 252
21
sequencing to help doctors identify genetic diseases in 350 babies receiving intensive care
at Addenbrooke’s Hospital.
The study showed that the diagnosis and treatment of some of the most critically ill babies
can be improved by sequencing their whole genome. A diagnosis was provided in 2 to 3
weeks instead of around 3 to 6 months and identified a quarter of the babies as having an
underlying genetic condition. The diagnosis also changed the treatment plans for three
quarters of the babies which often saved the need for further tests.
Tackling current and future threats
Antimicrobial resistance
Antimicrobial resistance (AMR) is one of the most pressing global challenges we face this
century. If no action is taken, up to 10 million people per year could die worldwide. This
would make drug-resistant infections a bigger killer than cancer currently is.35 Over the
next 30 years, AMR is estimated to contribute on average to over 2,000 deaths annually
and cost the NHS approximately £95 million each year in the UK.36
In recognition that there are no 'quick fixes', the UK government set out its longer-term
vision of a world in which AMR is contained and controlled by 2040, supported by a 5-year
action plan. This covers actions across human and animal health, addressing infection
prevention, use of antimicrobials, increasing the availability of clean water, and minimising
spread through the environment and food.
Tackling sepsis
Our recent focus on sepsis has meant better awareness and improved recognition of
symptoms among clinicians, with more people being correctly diagnosed.37 At the same
time, as we face the possibility of a world without effective antibiotics, it's critical that we
conserve our antibiotics so that they remain effective when they are really needed.
The UK’s 5-year national action plan for AMR includes the commitment to develop a real-
time patient-level data source of patients' infection, treatment and resistance history that
will be used to inform their treatment and the development of interventions to tackle severe
infection, sepsis and AMR.
But the UK cannot tackle AMR alone. Global problems require global solutions. That's why
One-Health co-ordinates action in all sectors, across the world. In the UK, we continue to
play our part globally by modelling best practice, sharing this good practice with other
countries, and supporting international efforts.
Page 152 of 252
22
To maintain the UK’s position as world leaders on AMR and to deliver international
action, we have appointed Professor Dame Sally Davies as the UK Special Envoy on
AMR.
As an international expert, Dame Sally will support the UK government on the delivery of
their 5-year AMR action plan while working with the World Health Organization, World
Organisation for Animal Health, Food and Agriculture Organization and the United Nations
to maintain momentum on the global stage. Dame Sally will work across all sectors and
advise on the delivery of a 'One Health' response to AMR including health, agriculture and
the environment.
A new model for the evaluation and purchasing of antimicrobials in the UK
The national action plan includes a commitment to testing solutions that address the failure
of companies to develop new antimicrobials. We're the first country in the world to
announce that we'll test new, innovative models to pay companies for antibiotics based on
their value to the NHS, not volumes used. We hope this will send a strong signal to the
rest of the world that testing models to incentivise the development of new, vital medicines
is of great importance. The UK represents only a small part of the global market for these
drugs. For this to have the full effect, we need other countries to offer similar incentives in
their own domestic markets. We hope that by leading the way and promoting the project
internationally, they will do just that.
Immunisations
Vaccinations are one of the most cost-effective health interventions.38 Not only are there
substantial health gains – saving lives, protecting vulnerable groups and reducing disability
– but they also reduce pressure on the NHS and improve productivity.39 Despite this,
there's been a gradual decline in vaccine uptake in recent years, with too many people not
getting the vaccines they need for themselves or their children.40
By spring 2020, we will launch a Vaccination Strategy, to maintain and develop our
world-leading immunisation programme. The strategy will include action on:
– Operational work to increase uptake of all recommended vaccinations across all
communities and areas, to include the medium-term aim of reaching over 95% uptake for
childhood vaccinations and continuing to increase uptake of the seasonal influenza
vaccine. This includes implementing the UK measles and rubella elimination strategy to
increase uptake of the second dose of the MMR vaccine to at least 95%, to match the
aspiration for the first dose.
Page 153 of 252
23
– Enhanced use of local immunisation co-ordinators and primary care networks, ensuring
the right mechanisms are in place to increase uptake (through the GP Vaccines review)
including consistent application of call and recall, and improved data services.
– Continued evolution of our immunisation programme, incorporating new, more effective
and cost-effective vaccines and new uses for existing vaccines across the life course, as
advised by our expert group, the Joint Committee on Vaccination and Immunisation.
The government will also continue to emphasise the preventative value of vaccines at
every opportunity. This is to ensure that people have the facts they need, and that vaccine
misinformation is addressed as effectively as possible.
Page 154 of 252
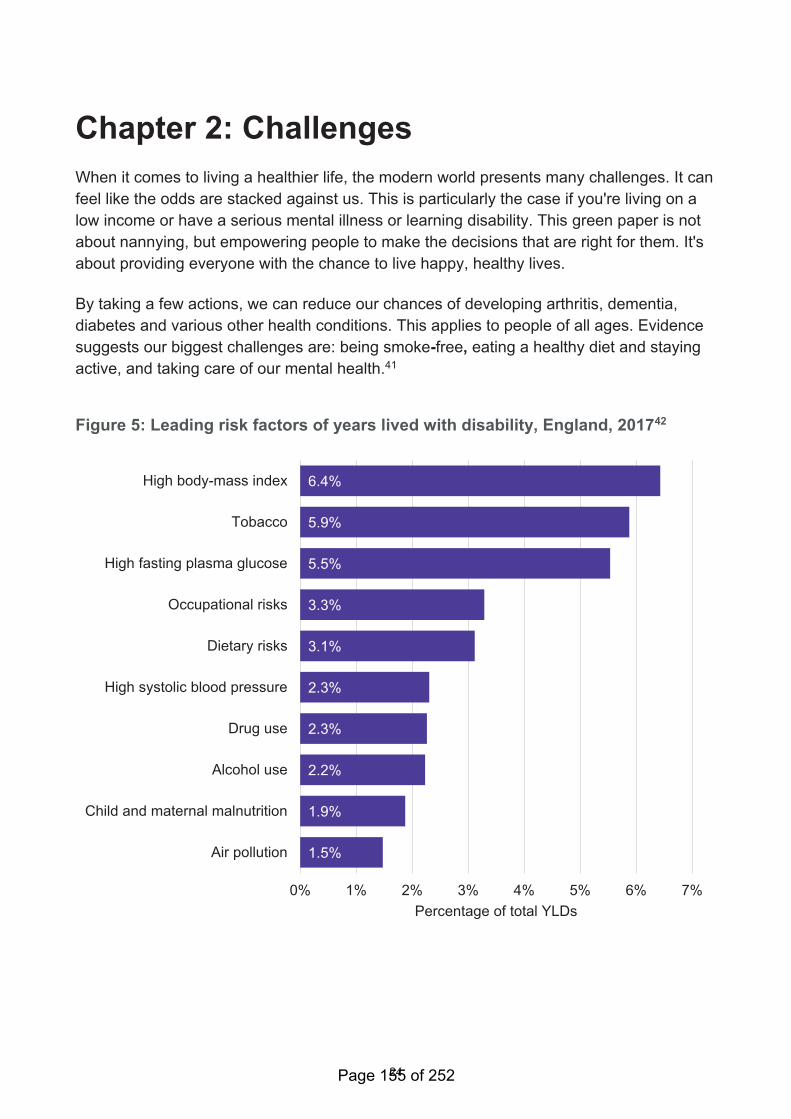
24
Chapter 2: Challenges
When it comes to living a healthier life, the modern world presents many challenges. It can
feel like the odds are stacked against us. This is particularly the case if you're living on a
low income or have a serious mental illness or learning disability. This green paper is not
about nannying, but empowering people to make the decisions that are right for them. It's
about providing everyone with the chance to live happy, healthy lives.
By taking a few actions, we can reduce our chances of developing arthritis, dementia,
diabetes and various other health conditions. This applies to people of all ages. Evidence
suggests our biggest challenges are: being smoke-free, eating a healthy diet and staying
active, and taking care of our mental health.41
Figure 5: Leading risk factors of years lived with disability, England, 201742
6.4%
5.9%
5.5%
3.3%
3.1%
2.3%
2.3%
2.2%
1.9%
1.5%
0% 1% 2% 3% 4% 5% 6% 7%
High body-mass index
Tobacco
High fasting plasma glucose
Occupational risks
Dietary risks
High systolic blood pressure
Drug use
Alcohol use
Child and maternal malnutrition
Air pollution
Percentage of total YLDs
Page 155 of 252
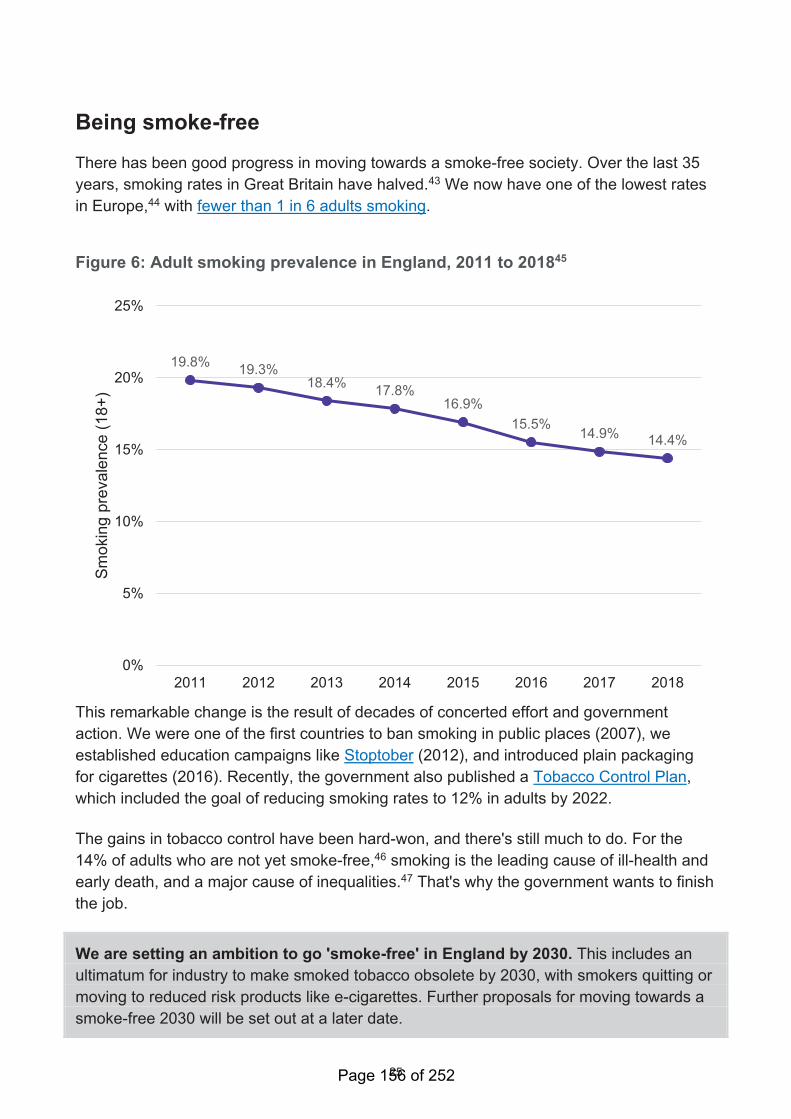
25
Being smoke-free
There has been good progress in moving towards a smoke-free society. Over the last 35
years, smoking rates in Great Britain have halved.43 We now have one of the lowest rates
in Europe,44 with fewer than 1 in 6 adults smoking.
Figure 6: Adult smoking prevalence in England, 2011 to 201845
19.8%19.3%
18.4%17.8%
16.9%
15.5%14.9%
14.4%
0%
5%
10%
15%
20%
25%
2011 2012 2013 2014 2015 2016 2017 2018
Sm
okin
g p
revale
nce (
18+
)
This remarkable change is the result of decades of concerted effort and government
action. We were one of the first countries to ban smoking in public places (2007), we
established education campaigns like Stoptober (2012), and introduced plain packaging
for cigarettes (2016). Recently, the government also published a Tobacco Control Plan,
which included the goal of reducing smoking rates to 12% in adults by 2022.
The gains in tobacco control have been hard-won, and there's still much to do. For the
14% of adults who are not yet smoke-free,46 smoking is the leading cause of ill-health and
early death, and a major cause of inequalities.47 That's why the government wants to finish
the job.
We are setting an ambition to go 'smoke-free' in England by 2030. This includes an
ultimatum for industry to make smoked tobacco obsolete by 2030, with smokers quitting or
moving to reduced risk products like e-cigarettes. Further proposals for moving towards a
smoke-free 2030 will be set out at a later date.
Page 156 of 252
26
This goal is extremely challenging. Although smoking rates are falling overall, they remain
stubbornly high in certain groups, including:
• in areas of deprivation. In Blackpool, 1 in 4 pregnant women smoke. In Westminster,
it's 1 in 50.48 Rates are also higher among manual workers and social renters49
• among people who identify as LGBT50
• among people living with mental health conditions. A joint report from the Royal
College of Physicians and the Royal College of Psychiatrists suggests that 1 in 3
cigarettes in England are smoked by somebody with poor mental health51
Tackling these inequalities is the core challenge in the years ahead. If we are to achieve
this vision of a smoke-free future, we need bold action to both discourage people from
starting in the first place, and to support smokers to quit.
Case study: Salford 'Swap to stop'
Social housing tenants are much more likely to smoke: 30% of adults in the social rented
sector are estimated to be smokers, double the national average.52
As part of comprehensive local action on smoking, Salford city council worked with a local
housing association, stop smoking service, pharmacies and a registered vape shop on the
Salford 'Swap to Stop' project, aimed at social housing and privately rented tenants in
some of the most deprived areas in the city. A free e-cigarette starter-pack was given as
well as behavioural support to quit smoking. Demand was high: over 1,000 smokers were
recruited in 10 weeks, of whom 20% quit smoking altogether.
Discouraging people from starting
Two in 3 people who experiment with smoking go on to become smokers. Discouraging
young people from trying cigarettes is an important priority.53 In 2007 the government
raised the age of sale for tobacco from 16 to 18. This helped contribute to lower teenage
smoking rates, and forms part of wider government action to deter people from starting in
the first place, including bans on:
• television advertising (1985)
• printed advertising (2003)
• sponsorship (2005)
Page 157 of 252
27
Supporting smokers to quit
Help to quit is mostly delivered by the NHS or local authorities, paid for through general
taxation. Given the pressure on local budgets, government is considering other ways of
ensuring people can get the help they need.
Other countries, such as France and the USA, have taken a 'polluter pays' approach
requiring tobacco companies to pay towards the cost of tobacco control. We're also
open to other ideas for funding, including proposals to raise funds under the Health
Act 2006.
We would aim to use any funds to focus stop smoking support on those groups
most in need, such as pregnant women, social renters, people living in mental
health institutions, and those in deprived communities; and to crack down on the
illicit tobacco market by improving trading standards enforcement.
We also believe that there could be a positive role for inserts in tobacco products
giving quitting advice and will consider this as part of our review of tobacco legislation
once we leave the European Union.
Q - What ideas should the government consider to raise funds for helping people
stop smoking?
The government is committed to monitoring the safety, uptake, impact and effectiveness of
e-cigarettes and to assess further innovative ways to deliver nicotine with less harm than
smoking tobacco. There is a large amount of research now available to support e-cigarette
use as a safer alternative to smoking and help people quit smoking, and we continue to
monitor the evidence. There are also claims that heated tobacco products could be less
harmful than smoking and help smokers quit. Heated tobacco products are relatively new
to the UK market in comparison with e-cigarettes, and research is in its infancy and mainly
led by the tobacco industry.
The latest evidence on heated tobacco (given by the independent Committee on Toxicity
in December 2017 and in the February 2018 PHE evidence review)54 stated that heated
tobacco products still pose harm to users, but may be less harmful than smoking
conventional cigarettes. Information on the impact on health is very limited and we
recommend that smokers quit completely rather than move to these products.
As part of our commitment to evaluate the evidence on new products, we will run a call
for independent evidence to assess further how effective heated tobacco products
Page 158 of 252
28
are, or are not, in helping people quit smoking and reducing health harms from
smoking. We'll keep the evidence on e-cigarettes under review.
Maintaining a healthy weight
For other areas, the trend is going in the wrong direction - with only a third of adults a
healthy weight. Since 1993, rates of adult obesity have almost doubled (to 29%), and
morbid obesity has quadrupled (to 4%).55 1 in 3 children aged 10 to 11 are now overweight
or obese, and we know that obese children are five times more likely to become obese
adults.56
Figure 7: Obesity - the scale of the problem57
This is storing up health problems for the future, and is a cause for serious concern. This is
because being overweight or obese is a major risk factor for a number of conditions,
including diabetes, heart disease and stroke, and some cancers.58 Improving our diet is
one of the biggest health-related actions we can take to improve the health of the nation.59
Eating a healthy diet
As a country, we need to eat more fruit, vegetables, fibre and oily fish. We consume too
many calories, as well as too much sugar, saturated fat and salt.60 We know it can be
difficult to eat healthily when unhealthy options are all around us. That’s why our focus
Page 159 of 252
29
must be on making healthier choices easier. This is not nannying, but reshaping the
environment to provide people with more choice, not less.
We have demonstrated through our childhood obesity plan our commitment to take bold
action. That’s why our plan for reducing childhood obesity by 50% by 2030 has focused on
making the food and drink available to families healthier.
Energy drinks are soft drinks that are typically distinguished by their significantly higher
caffeine content. Although diet versions are available, regular energy drinks on average
contain more calories and sugar than other regular soft drinks.
Research has suggested that excessive consumption of energy drinks by children may
affect some children adversely. In addition, energy drink consumption has also been
associated with unhealthy behaviours and deprivation.
Last year we consulted on ending the sale of energy drinks to children. The consultation
showed overwhelming public support, with 93% of consultation respondents agreeing that
businesses should be prohibited from selling these drinks to children. Teachers and health
professionals, in particular, were strong in their support for the government to take action.
Therefore, we can now announce that the government will end the sale of energy
drinks to children under the age of 16. We will be setting out the full policy in our
consultation response shortly.
We have also consulted on making calorie labelling mandatory in the out-of-home sector,
such as restaurants, takeaways and cafes. We will be setting out details of our policy in a
consultation response shortly. In addition, we set out our intention to, and consulted on,
banning promotions of foods and drinks high in fat, sugar and salt (HFSS) by price and by
location. We have also consulted on introducing a 9pm watershed on TV advertising of
HFSS products and similar protection for children viewing adverts online. We will be
setting out the government’s response and next steps on both policies as soon as
possible.
In Chapter 2 of our childhood obesity plan, we committed to deliver a Childhood Obesity
Trailblazer Programme in partnership with the Local Government Association and PHE,
working with local authorities to test the boundaries of their levers through innovative local
action to tackle childhood obesity. Where we live has a huge role to play in tackling
childhood obesity, whether it is the way our towns and cities are designed to ensure
greater active travel or safe physical activity, or how many hot food takeaways can operate
near schools. While local authorities have a range of powers to support local solutions to
address childhood obesity, many face challenges. We want to make sure that all local
authorities are empowered and confident in finding what works for them to tackle
childhood obesity.
Page 160 of 252
30
We have now selected 5 successful Childhood Obesity Trailblazer authorities, who
together will have access to £1.5 million of funding and support over the next 3 years.
They are: Blackburn with Darwen, Birmingham, Bradford, Lewisham and Nottinghamshire.
Across the 5 areas, Trailblazer activity will support and create opportunities for future
generations, from supporting families and children in the early years through to upskilling
adolescents and young adults. Between them, they will test the potential for existing local
levers to:
• restrict out-of-home HFSS advertising
• create healthier food environments through the planning system
• use community and faith assets
• incentivise businesses to improve their retail offer
• improve accessibility and affordability of healthier foods
• improve job opportunities and growth in health, food and physical activity sectors
This will help to inform further action the government can take in the future to enable
ambitious local action. We will also share the learning from the programme to encourage
and empower wider local action across the country.
While we know this represents a world-leading approach, we have always been clear that
we need to go further and faster in ensuring everyone has a chance to lead a healthier life.
That's why we're publishing Chapter 3 of the childhood obesity plan as part of this
green paper. This sets out our plans for: infant feeding, clear labelling, food reformulation
improving the nutritional content of foods, and support for individuals to achieve and
maintain a healthier weight.
Infant feeding
To support families, it's important to understand the choices they make when it comes to
infant feeding. In England, most mums start breastfeeding. However, after 6 to 8 weeks,
only 4 in 10 are still breastfeeding their babies.61 The UK has one of the lowest
breastfeeding rates in the world.62
Given the benefits of breastfeeding, we intend to commission an infant feeding
survey to provide information on breastfeeding and the use of foods and drinks
other than breastmilk in infancy. This will also provide the means to assess the impact
of the actions we are taking on infant feeding which are outlined below.
Page 161 of 252

31
Q - How can we do more to support mothers to breastfeed?
Currently 18% of boys and 21% of girls aged 2 to 4 years are overweight or obese.63
Therefore, we need to look at what we can do in the early years to help give children the
healthiest start in life.
We know that 3 in 4 children aged 4 to 18 months have energy intakes that exceed their
daily requirements.64 This figure increases with age following the introduction of solids.
Data shows that sugar levels in some commercial baby foods and drinks can be very
high.65 Around 9 in 10 children aged 1.5 to 3 years old exceed recommended daily sugar
intake levels.66 Consuming too much sugar, and too many foods and drinks high in sugar
can lead to weight gain, which in turn increases the risk of heart disease, type 2 diabetes,
stroke and some cancers in adulthood.67 Added sugar in foods can have a negative effect
on babies and young children’s health by putting them on this trajectory.68
High levels of sugar intake also increase the risk of tooth decay.69 Just under a quarter of 5
year olds in England have tooth decay70 and almost 9 out of 10 hospital tooth extractions
among children aged 0 to 5 could have been avoided.71
Because of this, we will challenge businesses to improve the nutritional content of
commercially available baby food and drinks. PHE will publish guidelines for
industry in early 2020. Industry’s progress will be monitored and reported to the
government. If insufficient progress is made, the government will consider other levers.
PHE will also explore including baby food within the popular Change4Life Food Scanner
app to help parents and carers make healthier choices for their infants.
Parents and carers want to know more about the nutritional value of the food and drink
they buy for their families. This is particularly important in the early years, when parents
and carers buying products marketed for infants and young children are making decisions
about when and what to feed their baby.
Too many commercially available foods and drinks marketed for infants and young
children have labels that do not align with the latest government scientific advice. They can
also make a product appear healthier than it really is, or do not contain enough information
about how they should be consumed.72 All of this can be confusing to parents and carers.
We will therefore explore how we can improve the marketing and labelling of infant
food. This is so that parents and carers have honest and accurate information on the
products they feed their babies at this critical stage of life. We will seek views on how we
do this.
Page 162 of 252
32
Q - How can we better support families with children aged 0 to 5 years to eat well?
Clear labelling
It's important that everyone, regardless of their age, has access to the information they
need to make informed decisions. But we know that identifying what food and drinks are
healthy is not always easy. To support consumers in making healthier food and drink
choices through labelling, we believe that people need 2 things:
• to know what's in the food they're buying
• for this information to be presented clearly and concisely, helping them to make
quick, informed decisions about what to buy
Since 2013, the UK has led the way in recommending a voluntary nutritional labelling
scheme, sometimes called ‘traffic light’ labelling. This uses colours, words and numbers to
help UK consumers understand the amount of fat, saturated fat, sugar, salt and calories in
a product. This scheme was the result of over 15 years of research to provide a label that
meets the needs of UK shoppers.
As a nation, we’re proud of the success of this scheme. Front-of-pack labels feature on a
significant proportion of pre-packaged food and drinks, and 9 in 10 shoppers agree it helps
them make informed decisions when shopping.73 We want to do more to ensure that our
label still meets the needs of UK shoppers and that wherever people shop and whatever
they buy they are presented with consistent front-of-pack nutritional labelling that they find
helpful and easy to understand.
Since we introduced the UK scheme, a number of other countries around the world have
introduced their own versions of front-of-pack nutrition labels. Some labels are similar to
the UK approach, but many differ. For example, some countries like Sweden, Denmark
and Norway choose to focus on signposting the healthier aspects of foods such as high
fibre, while Chile chooses to alert shoppers to products that are high in nutrients such as
fat, calories, salt and sugar that eaten in excess can be harmful to health.
We have previously committed in both Chapter 1 and Chapter 2 of the Childhood Obesity
Plan to explore what additional opportunities leaving the European Union presents for
front-of-pack food labelling in England.
As part of exploring this we will consult by the end of 2019 on how we can build on
the successes of our current front-of-pack nutritional labelling scheme once we
have left the European Union. Our consultation will consider the evidence underpinning
these many different forms of front-of-pack labelling. It will focus on ensuring that the UK
continues to be world-leading in providing UK shoppers with simple nutritional information
Page 163 of 252
33
that they need to make healthier decisions, while taking into account the UK’s ambitions
for trade once we have left the European Union.
Improving the nutritional content of food and drink
Central to our approach to improving diets is working with food and drink companies to
make their products healthier. We often call this reformulation. Over time, these small
changes can add up to big improvements in the nation's health.
The Soft Drinks Industry Levy (SDIL) has been hugely successful in removing the
equivalent of over 45,000 tonnes of sugar from our shelves. So far, we have not included
sugary milk drinks within this 'tax'. However, these drinks can also contribute to our sugar
and calorie intakes, particularly given some of the larger portion sizes available.
Therefore, if the evidence shows that industry has not made enough progress on
reducing sugar, we may extend the SDIL to sugary milk drinks.
We also need to do more to consume less salt. This is vital for reducing the risk of heart
disease and stroke.74 The government recommends that we should consume no more
than 6g per day, well below the current average in England (8g per day).75 This is mostly
through salt that is already in the food we buy, rather than the salt we might add ourselves.
Case study: Salt reduction
Voluntary salt reduction targets for particular types of food were set for industry in 2014,
building on 3 earlier sets of voluntary targets (in 2006, 2008 and 2011). These aimed to
gradually reduce the levels of salt in the foods that contribute most salt to our diet.
Public Health England’s 2018 report showed that 81% of products were meeting the
targets for 2017.76 Businesses achieving reductions include McCain Foods (GB) Ltd who
have reduced the amount of added salt in their products by 22% since 2001, while Mars
Food have reported an average reduction in salt of 30% since 2007 across their Dolmio
and Uncle Ben’s cooking sauces, as part of meeting the 2017 targets across their
products.
Our ambition is to reduce the population’s salt intakes to 7g per day. To achieve this,
we will publish revised salt reduction targets in 2020 for industry to achieve by mid-2023
and we will report on industry’s progress in 2024. Influencing consumer behaviour through
marketing and providing advice, including within the NHS, will also help. We will keep all
options open if a voluntary approach does not demonstrate enough progress by 2024. We
Page 164 of 252
34
will commission a urinary sodium survey in 2023 to measure progress towards the
ambition and understand how much salt individuals are consuming.
Developments in food technology also offer opportunities to improve the nutritional content
of food and drink in order to improve people’s health. For example, it is already possible to
enrich eggs or milk with omega 3. Government will continue to examine the growing
evidence in this area.
Support for individuals to achieve and maintain a healthier weight
We want to make it as easy as possible for people of all ages who want to lose weight to
access the support they need. Access to the right services can help people achieve a
healthier weight and reduce the cost to the NHS and public services further down the line.
Evidence shows that patients are receptive to brief interventions for obesity.77 On average,
they lose weight in the year following the intervention. Being able to deliver a brief
intervention and provide opportunistic advice in a primary care setting presents an
effective way for doctors to engage with obese patients about weight management and
lifestyle.
We will work with NHS England to develop approaches to improve the quality of
brief advice given on health issues, including weight management, in general
practice. We will also explore the use of quality improvement approaches, and test any
new, innovative proposals through the new NHS Primary Care Network Testbeds, as
appropriate.
As more services go online, we will drive the digital market for weight management apps;
helping health professionals to offer patients support in new, innovative ways that fit with
how they live their lives.
We will work with NHS England, PHE and NHSX to review the current digital weight
management offer on the NHS Apps Library, and promote the app marketplace to
encourage the availability of more products and services.
We will also continue to develop Our Family Health, a digital approach to support
families with children aged 4 to 7 years with lifestyle behaviour change. We will work
with local authorities to explore how Our Family Health can support families living in some
of our most deprived areas with high childhood obesity rates.
Every year, the National Child Measurement Programme (NCMP) measures the height
and weight of over 1 million children aged 4 to 5 and 10 to 11 in state schools across
England.78
Page 165 of 252
35
The programme provides key opportunities for parents to be informed of their child’s
weight status and to access support from health professionals and local services, where
appropriate. However, there is currently no standard route to share this vital information
with healthcare professionals; for example, through the health and care record. As such,
it's not done routinely.
Case study: Children's weight services in Essex
Livewell Child is a local initiative led by Braintree District Council that is all about
supporting children and families to eat well, keep active and feel good. Following the start
of the programme in 2016, there has been 1.2% decrease in the number of overweight
pupils in year 6 between 2016 to 2017 and 2017 to 2018 across the schools taking part in
the Livewell Child programme. This contrasts with an increase in the number of pupils who
were overweight in schools in Braintree that did not take part in the programme. Key to this
approach has been the development of a lasting and trusted relationship with the 10 pilot
schools, which has been built over the last 2 years.
To better enable families identified through the NCMP to access support, PHE will
work with NHS England and NHS Digital to explore how NCMP data can be shared
directly with digital child health records and presented appropriately so that it's
consistently accessible for both parents, carers and health professionals.
We will also explore how to embed Our Family Health within the NCMP, so that more
families are getting the help they need.
We will also look to the latest behavioural science to understand how we can best
communicate with parents and health professionals on obesity.
Q - How else can we help people reach and stay at a healthier weight?
Staying active
Becoming more active is good for our mental and physical health, and reduces our risk of
developing a number of health conditions. For example, regular activity can reduce our risk
of hip fractures by 68%, type 2 diabetes by 40%, heart disease by 35%, and depression by
30%.79
It can also help us keep the weight off after a (diet-led) weight-loss programme. It can also
help the third of people who are already a healthy weight to stay that way. 80 This has led
some experts to suggest:
Page 166 of 252
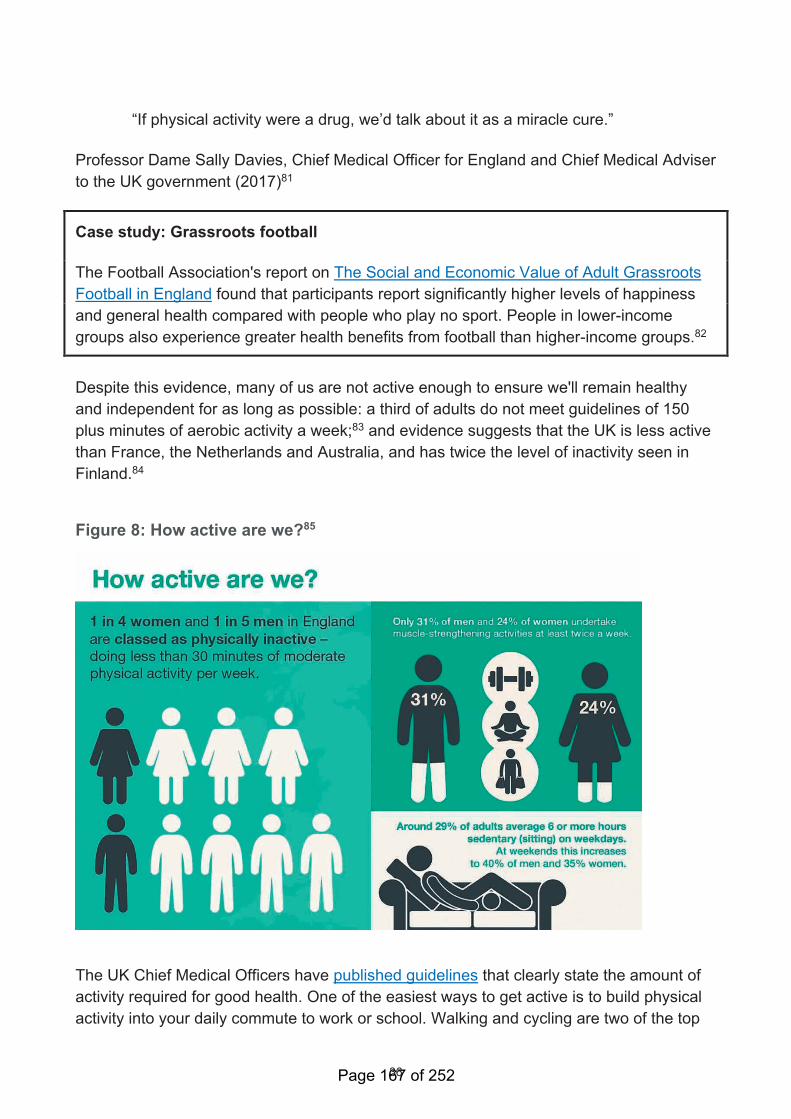
36
“If physical activity were a drug, we’d talk about it as a miracle cure.”
Professor Dame Sally Davies, Chief Medical Officer for England and Chief Medical Adviser
to the UK government (2017)81
Case study: Grassroots football
The Football Association's report on The Social and Economic Value of Adult Grassroots
Football in England found that participants report significantly higher levels of happiness
and general health compared with people who play no sport. People in lower-income
groups also experience greater health benefits from football than higher-income groups.82
Despite this evidence, many of us are not active enough to ensure we'll remain healthy
and independent for as long as possible: a third of adults do not meet guidelines of 150
plus minutes of aerobic activity a week;83 and evidence suggests that the UK is less active
than France, the Netherlands and Australia, and has twice the level of inactivity seen in
Finland.84
Figure 8: How active are we?85
The UK Chief Medical Officers have published guidelines that clearly state the amount of
activity required for good health. One of the easiest ways to get active is to build physical
activity into your daily commute to work or school. Walking and cycling are two of the top
Page 167 of 252
37
ways that people in England keep physically active86 and are the most accessible and
cheapest forms of transport.
Given the importance of physical activity we've asked the UK Chief Medical Officers
to review the current guidelines. New guidelines will be published in September 2019.
The guidance states that all adults should aim to be active every day. This should include
muscle-strengthening activity – such as exercising with weights, yoga or carrying heavy
shopping – on at least 2 days a week. These types of activity are particularly important for
people in or approaching later life. This is also the case for balance exercises, which are
recommended twice a week for older people at risk of falls. Yet rates of strength and
balance activity are particularly low, with just 1 in 4 women (and 1 in 3 men) meeting the
recommended guidelines.87
We will work with partners to launch a new 'digital design challenge' for strength
and balance exercises. This will ask 'how can we use digital to support the public to do
regular activities to increase their strength and balance?'. The challenge will be focused
on: (i) older people, (ii) those living with health conditions already, or (iii) people on low
income, in deprived areas. The final product or service should be free to use and available
across England. The design challenge will be launched in the autumn.
Physical activity can also help those living with a health condition to keep symptoms under
control, and to prevent additional conditions from developing.88 Yet we know that getting
more active can be daunting, especially if you haven’t done much exercise before or you're
managing a health condition. In the 2020s, we want to get everybody active, including
those of us who are already living with a health condition.
To support this, we are launching a second phase of the national Moving Healthcare
Professionals partnership programme led by PHE and Sport England, which supports
healthcare professionals to promote physical activity to their patients.
We will work with the UK’s leading health charities and Sport England to support
the launch of a new physical activity campaign, which seeks to empower and
inspire those living with health conditions to be more active. The campaign will be
launched later this year and is supported by Public Health England.
We will also be working across government to encourage: (i) local authority planning
decisions to promote active lifestyles, (ii) more people to switch from driving to public
transport, cycling and walking – especially on the school run, (iii) nurseries to build
opportunities into their daily routine for physical activity such as energetic play, walking
Page 168 of 252
38
and skipping89, and (iv) strengthening the evidence base about the social and economic
value of physical activity.
Q - Have you got examples or ideas that would help people to do more strength and
balance exercises?
Q - Can you give any examples of any local schemes that help people to do more
strength and balance exercises?
Taking care of our mental health
Good health is much more than the absence of illness. It's a state of wellbeing that
includes our mental as well as our physical health. Parity of esteem was enshrined in law
back in 2012. This requires the NHS and local authorities to consider the 'whole person',
and their mental and physical health needs as equally important.
This government has provided people with greater access to mental health services.90
And, in doing so, we began to close the 'treatment gap' between mental and physical
health:
• We are spending more on mental health services. The NHS Long Term Plan commits
at least a further £2.3 billion a year by 2023 to 2024.91
• One million people now have access to psychological therapies for common mental
health problems.92 The Long Term Plan promises to treat an extra 380,000 per year.
• An additional 24,000 women per year will benefit from increased access to perinatal
mental health care by 2023 to 2024, in addition to the extra 30,000 women getting
specialist help by 2020 to 2021.93
• At least 345,000 more children and young people will have access to mental health
support including via new mental health teams in schools.94
We now need to close the 'prevention gap' and achieve parity of esteem, not just for how
conditions are treated, but also for how they are prevented. When it comes to preventing
health problems, much of our focus is still on people's physical health. Less attention is
given to the steps we can take to improve our mental health and wider sense of wellbeing.
This is despite our physical and mental health being closely related – physical health
problems increase the risk of poor mental health, and vice versa.95
Page 169 of 252
39
Tackling risk factors and strengthening protective factors
We need to lay the foundations for good mental health across all parts of our society. This
is because the circumstances we're born into – and the conditions in which we live – all
have a major bearing on our mental health. We need to take urgent action to tackle the
risk factors that can lead to poor mental health, such as adverse childhood events,
violence, poverty, problem debt, housing insecurity, social isolation, bullying and
discrimination. We also need to invest in the protective factors that can act as a strong
foundation for good mental health throughout our lives, such as strong attachments in
childhood, living in a safe and secure home, access to good quality green spaces, security
of income, and a strong set of social connections.96 These will be considered in the next
chapter.
Mental health problems can have a broader impact on society. Poor mental health at work
costs the UK economy between £74 billion and £99 billion per year.97 Mental ill-health is
also associated with lower life expectancy, with some conditions associated with
reductions in life expectancy of 10 to 20 years.98
Case study: Prevention Concordat for Better Mental Health for All and Thrive Bristol
The Prevention Concordat for Better Mental Health for All brings together a wide range of
organisations that have committed to preventing mental health problems and promoting
good mental health. The organisations that join the Concordat agree to work together to
take local and national action to achieve the aim of better mental health for all.
‘Thrive Bristol’ is an example of the action taken by a signatory of the Prevention
Concordat, Bristol City Council. It is a 10 year programme to improve the mental health
and wellbeing of everyone in Bristol, with a focus on addressing inequality.
Thrive Bristol focuses on prevention of mental ill-health and early intervention. It aims to
work with public services, businesses, charities and others, taking advantage of everything
that is already available across the city to support mental health. Its ambitions include:
creating a city free from mental health stigma and discrimination, maximising people's
potential, building a healthy and happy workforce and becoming a suicide safe city.
25 employers in the city – from senior corporate lawyers to city farm managers – have
already committed to improve mental wellbeing in workplaces. In addition, some
employers have signed up to the Time to Change Employer Pledge and are developing
action plans for better mental health at work, including training on mental health and
suicide prevention.
Page 170 of 252
40
Taking action
There are actions we can take to improve our mental health. Many people know how to
improve their physical health but are less confident taking positive action for their mental
health and wellbeing. We want to create a society where people have high mental health
‘literacy’. Where everyone has the skills, knowledge and confidence to improve their
mental health and wellbeing throughout life. We also want to raise awareness of mental
health and wellbeing, so that everyone can recognise signs of distress in themselves and
others and know where to seek help if needed.
The government has already published the green paper, Transforming Children and
Young People's Mental Health Provision, and made mental health a mandatory part of the
school curriculum. Together, these amount to a transformation in how schools are
supported to promote good mental health in their pupils and refer them for support when
there are signs of illness.
DHSC will take additional actions, including:
Providing advice for children and young people on dealing with difficult emotions
and situations that can lead to problems such as stress, bullying and self-harm, through
the Rise Above programme in schools and online.
Encouraging all local authority areas to put in place mental health promotion plans
and to sign up to the Prevention Concordat for Better Mental Health for All, building on the
momentum of local authority suicide prevention plans.
Investing up to £600,000 in sector-led improvements to support local authorities to
strengthen their suicide prevention plans and implement the recommendations
identified by an independent evaluation of local plans.
Providing £1 million for the Office for Students to run a competition that will drive
innovation in the way university students are supported with their mental health,
including digital solutions.
Building on past work to address mental health stigma, we're now taking the next
step to support public action. We will launch the Every Mind Matters campaign
nationally in October 2019 with the goal of making 1 million adults better informed
and equipped to look after their mental health and support others. The campaign will
include a new tool that asks a series of questions and then recommends simple,
personalised actions to improve individuals’ mental health.
From 2020, the campaign will also include advice to parents on supporting their
children's mental health and wellbeing, which, for example, could include
information on subjects such as stress, screen time, online bullying, body image
Page 171 of 252

41
and self-harm. This advice will complement, and signpost parents to, existing sources of
support on self-harm.
These actions will be supported by wider efforts across other parts of government:
The government will establish a statutory Breathing Space scheme to provide
respite to those in problem debt while they seek support – with regulations laid before
the end of the year. This will include specific access arrangements for those receiving
mental health crisis treatment.
Every school has to protect its pupils from harm and provide support for pupils with mental
and physical health issues. The Department for Education will revise statutory
guidance to make sure that schools understand how mental health is embedded in
existing requirements so that they ensure staff can identify and support children
with mental health issues and how this can be delivered within whole school approaches
to mental wellbeing led by senior mental health leads.
The Department for Education will also be developing training for all new teachers
on how to spot the signs of mental health issues, backed up by updated statutory
guidance to make clear schools’ responsibilities to protect children’s mental
wellbeing. We will also be updating professional standards for social workers across
England to increase their knowledge and skills when helping those with mental health
issues.
The Department for Education is introducing a requirement for all schools to teach
about mental health and wellbeing, as part of compulsory Relationships Education for
all primary pupils, Relationships and Sex Education (RSE) for all secondary pupils and
Health Education for primary and secondary pupils in state-funded schools. Schools will be
encouraged to teach the new subjects from September 2019 and required to teach them
from September 2020.
As part of its support for high-quality teaching of the new subjects, the Department
for Education will put in place additional support to ensure schools have easy
access to world class interventions, training and materials on mental health.
We also know that in the most deprived areas of England, people tend to have the poorest
health and significantly less green space than wealthier areas.99 Evidence shows that
spending time in the natural environment can improve our mental health and wellbeing,100
so in the 25 Year Environment Plan, published in 2018, government sets out its aim to
connect people more systematically with green space to improve mental health, using the
natural environment as a resource for preventative and therapeutic purposes.
Page 172 of 252
42
We want to embed nature-based interventions as part of strategies for preventing
and treating mental ill health. Government is committed to helping more people connect
with nature to support their health and wellbeing, as set out in the 25 Year Environment
Plan. We will explore the potential to launch a programme in 2020 to protect and improve
people’s mental health and wellbeing by connecting them to nature-based activities
through social prescribing and the broader comprehensive model of personalised care.
The Department for Environment, Food and Rural Affairs is working with Public Health
England, NHS England and Natural England to understand current practice in nature-
based social prescribing and learn how the uptake of nature-based interventions can be
improved, working in 8 localities in England. We would like this work to underpin an
innovative follow-on programme that will help to enable the appropriate referral of people
with mild-moderate mental health needs, or at risk of poor mental health, to local nature-
based activities.
Q - There are many factors affecting people’s mental health. How can we support
the things that are good for mental health and prevent the things that are bad for
mental health, in addition to the mental health actions in the green paper?
Q - Have you got examples or ideas about using technology to prevent mental ill-
health, and promote good mental health and wellbeing?
Wider factors
Of course, factors other than weight, smoking and resilience matter. For example, we
know that problem gambling can have a major impact on health.101 The government has
an active agenda on this, which is set out elsewhere. Other factors include alcohol, drug
use and sleep.
Alcohol
Most people who drink, do so responsibly. Looking at the data, we also know that overall
consumption in England is falling, particularly among younger people.102 Despite this good
news, the harm caused by problem drinking is rising.103
Over 10 million people are drinking at levels above the official guidelines and putting
themselves at extra risk. The heaviest drinkers make up just 4% of the overall population,
yet account for 30% of all units of alcohol consumed.104 In England, drinking at increased
and higher risks of harm is twice as common among men (28%) than women (14%).105
The impact of harmful drinking and alcohol dependence for a given level of consumption is
also much greater for those in the lowest income bracket.106
Page 173 of 252
43
The government has been working to reduce the harm from problem drinking by:
• ensuring people are aware of the health risks through the One You campaign
• including an alcohol risk assessment in the NHS Health Check
• a £6 million investment to support children with alcohol dependent parents
Case study: Improving the lives of families affected by alcohol
PHE estimate that 200,000 children in England are growing up living with a parent who is
dependent on alcohol. These children are at greater risk of harm, including neglect and
maltreatment.
The government launched a £6m three-year programme to improve outcomes for these
very vulnerable children in April 2018. This includes PHE working with 9 areas to explore
how to reduce harm: testing innovative ways of finding and supporting children of parents
dependent on alcohol. Funding of £4.5 million – provided by DHSC and the Department for
Work and Pensions - is allowing these areas to test new ideas and improve services to
better meet the needs of children and parents where there is an alcohol problem in the
family. This includes:
- making sure schools and other services are aware of alcohol dependency and the
problems it can cause
- closer working between alcohol treatment and children's services
- working with families to reduce conflict between parents and help families deal with
challenges more easily, and providing support for children and young people
There will be an independent evaluation to identify what we can learn from the
programme. This will be published in 2021 to 2022.
Making alcohol-free and low-alcohol products more available would help to nudge the
general drinking population towards lower strength alternatives. This is already the
direction of travel, but we want to go further and faster:
– We will work with industry to deliver a significant increase in the availability of
alcohol-free and low-alcohol products by 2025.
– In order to support further innovation in the sector and encourage people to move
towards alcohol-free products we will review the evidence to consider increasing
Page 174 of 252
44
the alcohol-free descriptor threshold from 0.05% abv up to 0.5% abv in line with some
other countries in Europe.
Drug use
Drug misuse or dependency is associated with a range of harms including poor physical
and mental health, unemployment, homelessness, family breakdown and criminal activity.
The health of children, family members and carers can also be affected. Heroin and
cocaine are associated with the majority of social costs associated with drug misuse and
heroin dependence continues to be the common drug problem treated in England.107
The US and Canada are in the grip of an opioid epidemic, with the numbers of opioid-
related deaths having increased drastically in recent years.108 Although there are key
differences between the UK and the US, the risk of a similar epidemic happening here is a
real one and the experience of the US demonstrates the importance of being prepared.
Mitigation of the threat posed by illicit synthetic opioids includes work on early prevention
to build resilience among young people. Especially important is ensuring the continuation
of easy to access opioid substitution treatment with a reach into communities where there
is a higher risk of dependence forming, as well as increasing the availability of naloxone
(the opioid overdose antidote). Investing in drug treatment reduces mortality risk, improves
quality of life and saves money. Estimates suggest every £1 spent on drug treatment is
associated with a benefit to society of £4, increasing to £21 over 10 years.109
Once PHE’s review of Prescribed Medicines has been published, DHSC will work
with the Home Office, PHE and other partners to undertake further policy
development around issues related to prescribed and illicit opioid use, including
considering opportunities to overcome barriers within the current system and promote the
spread of good practice, as highlighted by a recent high-level roundtable on opioids
convened by the Chief Medical Officer for England and Deputy National Security Adviser.
DHSC, working with a range of partners including the recently appointed Recovery
Champion, will develop a shared understanding of the current challenges facing the
substance misuse treatment and recovery workforce.
DHSC will assess the adequacy of responses to cannabis and related mental health
problems and develop and implement an action plan, in relation to: treatment for heavy
cannabis users and people experiencing significant mental health problems; brief
interventions for other cannabis users; and initiatives aimed at raising awareness of
cannabis-related harms.
Page 175 of 252
45
Sleep
A topic that has received relatively little policy attention is sleep. There's growing evidence
on the health impacts of lack of sleep. Insufficient or poor quality sleep is associated with
physical and mental health problems, including: increased risk of obesity, strokes and
heart attacks, and depression and anxiety.110 Lack of sleep may also have a negative
impact on somebody's recovery from illness or surgery.111 Despite this, over one-third of
hospital patients report being bothered by noise created by other patients. One in 5 report
being bothered by noise created by staff. 112 However, it should be noted that the direction
of causality is likely to run in both directions – with poor sleep leading to health problems,
and health problems leading to poor sleep.113
Individuals, employers, schools, the NHS, local authorities and national government all
have a role to play in helping support healthy sleeping. There are many examples of good
practice. However, with some estimates suggesting up to three-quarters of adults in the
UK regularly sleeping less than 7 hours per night, there's much more left to achieve.114
As a first step, the government will review the evidence on sleep and health.
This is with a view to informing the case for clear national guidance on the daily
recommended hours of sleep for individuals in different age brackets, and to raise
awareness of the key ‘sleep hygiene’ factors that can support healthy sleeping.
The NHS will also determine what more can be done to ensure those in care settings
are getting the amount of rest that they need. This will include an assessment of
whether changes are needed to existing guidance (such as national roll-out of ‘protected
sleep time’ in hospitals, where staff leave patients sleeping unless clinically necessary).
Q - We recognise that sleep deprivation (not getting enough sleep) is bad for your
health in several ways. What would help people get 7 to 9 hours of sleep a night?
Prevention in the NHS
If we are to achieve our mission, we need everybody's help in preventing health problems
from arising - including from those who are normally used to treating them. In its Long
Term Plan, the NHS devoted a whole chapter to 'prevention'.115 Commitments include:
• Obesity – the NHS will fund a doubling of the NHS Diabetes Prevention Programme
over the next 5 years, and provide access to weight management services in primary
care for people with diabetes or hypertension with a BMI of 30 plus.
Page 176 of 252
46
• Smoking – by 2023 to 2024, all people admitted to hospital who smoke will be offered
NHS-funded tobacco treatment services, including a new smoke-free pregnancy
pathway for expectant mothers and their partners. A new smoking cessation offer will
also be available as part of specialist mental health and learning disability services for
long-term users.
• Alcohol – over the next 5 years, alcohol care teams will be fully established in those
hospitals with the highest rates of alcohol dependence-related admissions.
• Inequalities – the NHS will set out specific, measurable goals for narrowing
inequalities, including those relating to poverty, through the service improvements set
out in the plan.
Case study: Healthier You: The NHS Diabetes Prevention Programme
Five million people in England are at high risk of developing type 2 diabetes. If current
trends continue, 1 in 3 people will be obese by 2034 and 1 in 10 will develop type 2
diabetes.116 NHS England, Public Health England and Diabetes UK joined forces in 2016
to launch the Healthier You NHS Diabetes Prevention Programme which provides advice
on healthy eating, being more active and managing weight to those at high risk. In 2018 to
2019 the programme achieved full national coverage, becoming the first country-wide
prevention programme in the world.
To date over 400,000 people have been referred to the NHS Diabetes Prevention
Programme. The early findings show the programme has exceeded expectations with
patients losing an average of 3.4kg, 1 kilogram more than originally predicted. Just under
half of those signing up are men – a much higher proportion than typically attend weight
loss programmes. Roughly a quarter are from black, Asian and minority ethnic
communities - groups that are at significantly greater risk of developing type 2 diabetes.
Harry was diagnosed by his GP as being pre-diabetic and borderline obese when he was
56. Harry decided to take action, to review his sedentary and slow-paced lifestyle, and lost
over 3 stone after being referred to the NHS Diabetes Prevention Programme. Harry said:
“The prevention programme has changed my life. Since I started it, I’ve gone
through at least three different clothing sizes and from a waist 42 to a 28. Above and
beyond the weight loss – I’m healthier and I’m happier”.
The next step is to move from a national treatment service (focused on illness) to a
national 'wellness' service (focused on creating good health). This involves helping people
to help themselves. We will make this vision a reality by:
• allowing people to connect their own data into the whole record if they choose
Page 177 of 252
47
• giving people personalised advice based on aggregated data
• giving people the tools and motivation to make informed choices
The NHS is already working to give more people control of their care. For example, their
Comprehensive Model for Personalised Care will support up to 2.5 million to benefit from
personalised care by 2023 to 2024 (including 900,000 people receiving a social
prescription referral and 200,000 personal health budgets).117
Social prescribing is a way of GPs and other healthcare professionals referring people to
‘activities’ or services in their community instead of offering only medical solutions.
A new Social Prescribing Academy is being set up to help to champion social prescribing
and support national plans to make it available throughout England. By 2020 to 2021, over
1,000 trained link workers will be recruited, so that over 900,000 people can benefit from
social prescribing by 2023 to 2024.
The Social Prescribing Academy will help by brokering relationships across health, local
government, justice, arts and culture, sport and the outdoors, and other sectors, to
increase the range and availability of community-based activities and support that people
can be connected to, including people living with dementia.
This is a strong start and will contribute towards us making the 2020s a decade of
prevention. Further options to achieve scale and pace include:
• expanding the role of community pharmacists and other healthcare professionals to
support more people in the community to manage and improve their health and
wellbeing
• improving support options for people living with musculoskeletal conditions, and
increasing the join-up across mental and physical health services
• strengthening links with councils, charities and other local players. Otherwise, the NHS
will continue to be treating the symptoms of problems without influencing their causes.
We are committed to delivering an expanded role for community pharmacies and
want to see them become the first port of call for minor illness and health advice in
England.
Government has now set out a Community Pharmacy Contractual Framework that,
from October 2019, will redefine the integral role community pharmacies play in
delivering healthcare over the next 5 years. This will see pharmacy staff trained to
provide a wider range of health advice and support, including helping to identify and refer
Page 178 of 252
48
patients with unidentified health conditions, such as heart disease. Over the course of the
settlement period all pharmacies will become Healthy Living Pharmacies which will require
them to have trained health champions on site. These health champions will proactively
deliver a wide range of lifestyle and health interventions to help more people live happier,
healthier lives for longer.
We will commission more services from community pharmacies and support them
to become further integrated into local NHS provider networks.
Q - Have you got examples or ideas for services and or advice that could be
delivered by community pharmacies to promote health?
Page 179 of 252
49
Chapter 3: Strong foundations
Good health is one of the country's greatest assets. Just as we save for our retirement, we
should be investing in our health throughout life – from early years, through to older age.
But we know that some people find this easier than others. Not because of innate
differences in their decision-making, skills or values, but due to differences in the
circumstances they are born into and the conditions in which they live.
We believe that everybody has the right to a solid foundation on which to build their health.
Nowhere is this clearer than the early years.
The early years
We start building our health asset as a baby in the womb. The first 1,000 days of life are a
critical time for brain development,118 and parents and carers have a fundamental role to
play in supporting their child’s early development. Most babies are born healthy and enjoy
a safe and caring childhood that helps them develop. Some are born with a health
condition or are raised in challenging circumstances, which can adversely affect their
development. We know that a wide range of long-term outcomes are improved through the
positive relationships established between parents and carers and their baby from
pregnancy onwards.119
We are already working to make the NHS the safest place in the world to have a baby. In
the last 5 years we've also seen improvements in school readiness, and a fall in the
teenage smoking rate.120 However, this progress has not been felt equally.121 Children who
live in more deprived areas are more likely to be exposed to avoidable risks and have
poorer outcomes by the time they start school.122
Children are also affected by the wellbeing of their parent or primary carer. We need to
recognise the impact that parental mental ill-health, parental drug and alcohol addiction
and domestic abuse can have on a child's life chances.123 Providing timely and effective
support to help parents overcome these issues, and fostering healthy and collaborative
family relationships can have a positive impact on the health of both adult and child, and
can help to overcome a cycle where some children grow up to repeat the harmful
behaviours that they were exposed to in childhood. The £39m Reducing Parental Conflict
programme is working with councils across England to help them to integrate services and
approaches that address parental conflict into their local services for families. With the
right support and positive relationships, vulnerable children can thrive.
Because these challenges occur from birth onwards, it's vital that families and their
children who need extra support are identified early and receive tailored support. That
Page 180 of 252
50
way, we can prevent problems from arising in the first place, rather than dealing with the
consequences.
We're already working to provide families with the help they need through the Healthy
Child Programme, the public health approach at the centre of our universal service for
children and young people aged 0 to 19. This includes a set of health visits for 0 to 5 year
olds, and school nurse appointments for older children and some young people.
To support parents, we will modernise the Healthy Child Programme so it’s
universal in reach and personalised in response. This will enable effective, focused
services where additional needs are identified; use of the latest evidence on effective
practice; and help bring councils, the NHS and partners together to achieve priority
outcomes for children and families.
We will modernise the programme by: making better linkages to other health records,
including the digital red book; adding components including a digital support tool; and new
pathways for speech and language development and pre-conception and pregnancy
advice. We will also extend the upper age range of the programme (from 19 to 24 year
olds) for those young people needing extra support, and look to improve the way we
support perinatal mental health and the healthy social and emotional development of
babies and young children. We will seek views on this separately.
Speech, language and communication skills are an important indicator of children's
wellbeing. We know that a language-rich home learning environment is crucial to
improving children’s life chances.124 The government has launched a public-facing
campaign Hungry Little Minds to improve the quality and quantity of parent-child
interactions and make it easy for parents to adopt the positive behaviours we know will
help their children to develop their communication, language and literacy skills. Health
professionals have a key role to play in the success of the campaign and DHSC and PHE
will work with the Department for Education to support them to play a full part in the
campaign.
Government will continue to prioritise improving early speech and language outcomes as a
preventative measure with strategic leadership across education, health and social care to
narrow inequalities. If not addressed, we know that the long-term impact of language
difficulties is likely to be high for individuals and families.125 Government will also continue
to work with local areas to support them to put in place joined-up strategies and services at
local level that give children and families the support they need.
Page 181 of 252
51
Children's oral health
To give our children a good start in life, we need to do much better on oral health. Tooth
decay is the most common oral disease among children in England – affecting 1 in 4
children by the time they start school, and the most common reason for hospital admission
for children aged 5 to 9 years old – yet it is largely preventable.126 Improving the oral
health of children is a PHE priority, and a number of actions are already underway.
Case study: Leicester's Healthy Teeth, Happy Smiles
In 2012, Leicester City Council had the highest prevalence of tooth decay in 5 year olds
across local authorities in England: 53%.127 It responded by prioritising help for preschool
children as part of Leicester’s Healthy Teeth, Happy Smiles! programme. This evidence-
based programme ensures that good tooth brushing behaviour with a fluoride toothpaste is
established early in a child’s life and becomes part of their normal daily routine.
Almost 900 members of staff have been trained to deliver supervised tooth brushing with
almost 9,000 children benefiting from daily supervised brushing. By 2017, the prevalence
of tooth decay in Leicester had significantly reduced, to 39%.128
There are 2 areas where government is interested in going further and faster. Both are
aimed at addressing the unwarranted variation in children's oral health across the country.
In 2016 to 2017, 1 in 6 children aged 5 had tooth decay in south-east England, compared
with 1 in 3 in the North West. This variation is even greater between local authorities.129
We will consult on rolling out a school toothbrushing scheme in more pre-school
settings and primary schools in England.
Evidence suggests that these programmes have the ability to reduce tooth decay, mitigate
inequalities and establish lifelong behaviour to improve oral health. Half of all local
authorities already have a version of the scheme in place, but they are not always focused
on the children that would benefit the most.130 Next year, we'll consult on proposals that
will allow us to reach the most deprived 3 to 5 year olds in all areas of the country. The aim
would be to reach 30% by 2022.
We will explore ways of removing the funding barriers to fluoridating water to
encourage more local areas that are interested to come forward with proposals.
NHS England will actively seek partnerships between local authorities and the NHS,
with councils rewarded for their fluoridation efforts by receiving a share of the
savings from fewer child tooth fillings and extractions. This also includes examining
the role that water companies can play in supporting fluoridation efforts.
Page 182 of 252
52
Fluoride is a naturally occurring substance present in most water supplies, though typically
at levels too low to improve dental health. It has a protective effect on teeth that lessens
the impact of diets high in sugar and poor oral hygiene.
Six million people in England (1 in 10 of us) already drink fluoridated water because of
where they live. A further 400,000 live in areas where fluoride levels in water are already
naturally elevated due to the surrounding geology. There's evidence that these areas have
lower levels of dental disease than similar areas without fluoridation. For 5 year olds living
in the most deprived areas, the odds of tooth decay are reduced by a third.131
Water fluoridation schemes such as this have been used for over 70 years internationally,
and in England for over 55 years. In its 2018 report, PHE concluded, that "water
fluoridation is an effective and safe public health measure to reduce the frequency and
severity of dental decay, and narrow differences in dental health between more and less
deprived children and young people".
Q - What should the role of water companies be in water fluoridation schemes?
Creating healthy places
The transition into work is another important moment in our health journey. We know that
good work is good for health.132 A job can provide us with money in our pocket, social
connections, and a strong sense of purpose and identity. Yet, for some, health problems
can be a barrier to gaining and retaining employment. This is particularly the case for
those living with long-term health conditions like musculoskeletal problems, mental ill-
health, and other conditions.133
In the years ahead, we will continue to work towards the manifesto commitment to see a
million more disabled people in work by 2027, as set out in Improving Lives: the Future of
Work, Health and Disability. Employers have a critical role to play. In the 2020s, we
urgently need more employers to act like the best. The Thriving at Work review led by Lord
Stevenson and Paul Farmer set clear standards that all employers should follow to support
people's mental health at work. The government is committed to modelling these as an
employer and ensuring other parts of the public sector do the same. The government will
also create the right conditions for success.
The government recently published Health is Everyone’s Business: a consultation
on measures to reduce ill health-related job loss. This includes proposals for
improving access to occupational health. This activity will align with the government’s
plan for implementing the recommendations from the Matthew Taylor Review of Modern
Working Practices.
Page 183 of 252
53
Looking beyond the consultation, the government will also explore how to align
support for people with mental and physical health conditions across the NHS,
employers and occupational health – so that boundaries and responsibilities are clear
and good information about support is available.
Given the prevalence of musculoskeletal problems in the workforce, we want to
ensure all businesses are equipped with the knowledge and tools they need. The
government will assist by: (i) convening an MSK expert reference group to review
existing guidance about what has worked well and what could be improved, (ii) developing
a package of actionable MSK advice for employers, supported by free digital tools and
promoted through health and safety inspections, and (iii) launching and promoting these
employer resources through multiple, existing channels.
Given the scale and cost of MSK conditions – to individuals and the economy – we need to
take further action.134 Much is already being done at national and local level. Our
forthcoming consultation on reducing ill-health-related job losses will set out proposals for
strengthening action in the workplace. Some local areas are also already taking action, but
we need to do much better at translating this evidence into action, and at greater scale.
Key to this is understanding the evidence and what action to prioritise. There's already
robust evidence on various aspects of MSK health, including how conditions like back and
neck pain and arthritis can be prevented and managed. The government already has
research under way to explore this, but there is much further to go in terms of putting this
into practice.
To help support future action, the government will be launching a call for evidence
on MSK later in the year, building on the evidence we are already developing
through research and trials. This will be focused on priority areas for action, potentially
including: raising awareness of MSK conditions among the public, the role of physical
activity, population-level behaviour change programmes, action to support staff in the
workplace, and links between mental and MSK health. We're also interested in what data
should be routinely collected on MSK conditions.
Q – What would you like to see included in a call for evidence on musculoskeletal
(MSK) health?
Homes, neighbourhoods and communities
The homes and communities in which we live have a big impact on our health. They
influence our transport choices, how we spend our leisure time including keeping in touch
with friends and family, and whether we feel safe and secure at home and in public.
Page 184 of 252
54
Safer communities
Reducing knife crime and tackling serious violence is a government priority. In April 2018,
the government published its Serious Violence Strategy which set out a programme of
action including the Early Intervention Youth Fund, the media campaign #knifefree, and
the new National County Lines Co-ordination Centre. Since then, further measures have
been delivered including: £200 million investment in a Youth Endowment Fund to help
prevent and support those at risk of violent crime; an Independent Review of Drugs which
is now underway; a consultation on a proposed new statutory duty to underpin a public
health approach to tackling serious violence; and a £100 million investment to support
increased police activity and establish violence reduction units.
The Prime Minister chaired a cross-sector summit in April 2019 to bring over 140
stakeholders together to explore what can be done to reverse the rise in serious youth
violence. The government is driving forward a public health approach to tackle serious
violence with a focus on prevention and multi-agency working to tackle the issue. A wide
range of agencies and organisations came together locally to identify people and
communities at risk early and take action to reduce serious violence and protect people.
Government will support efforts to tackle this issue. Health organisations will need to play
their part in addressing the root causes of violence, including meeting the mental health
needs of young people and playing a full and active role in multi-agency partnerships to
tackle serious violence at a local level.
Case study: West Midlands Violence Prevention Alliance
West Midlands Police, the local Police and Crime Commissioner and Public Health
England have started a West Midlands Violence Prevention Alliance. This involves
bringing together organisations from local government, policing, health and education
along with charities and community groups to take a public health approach to preventing
violence. The alliance has used a range of existing information to understand where
violence is most likely to happen, what puts people more at risk of being victims and
perpetrators, and what the costs and consequences are. They have used this information
to promote, deliver and evaluate evidence-based approaches to reduce violence. These
include secondary school children teaching their peers to speak out against all forms of
violent and abusive behaviour; link workers in GPs to help those suffering domestic abuse
to access specialist support; as well as youth workers based in hospitals to help young
people break out of cycles of violence.
Connected communities
As set out in A Connected Society: a strategy for tackling loneliness in October 2018,
feeling lonely often is linked to early deaths - with the effect of loneliness on a par with
smoking or obesity. It's also linked to increased risk of coronary heart disease and stroke,
Page 185 of 252
55
depression, cognitive decline and Alzheimer's.135 Supporting people to avoid or move out
of loneliness before it becomes entrenched can help prevent the adverse health conditions
associated with frequent loneliness. The loneliness strategy is an important first step but
government is committed to long-lasting action to tackle the problem of loneliness. As set
out in the strategy, we will publish annual reports on the loneliness agenda, with the first
report planned for late 2019.
Government recently strengthened planning guidance to encourage more areas to
consider cycling and walking within local development plans, and other ways of getting
people more physically active. Work is also underway to make public transport more
inclusive - so disabled people, including those with less visible disabilities such as autism,
have the same opportunities to travel as everyone else.
Homes and neighbourhoods
For people living with a disability – or with some frailty, including those living with dementia
– having a suitable home is particularly important. We know that 8 in 10 of the homes we'll
occupy in 2050 have already been built.136 As such, it’s vital we look at existing homes, not
just new builds. That's why home repairs and adaptations are crucial. Whilst evidence
shows that only 7% of homes have all the access features required for people with limited
mobility, 72% have the potential to reach 'visitable standards', for example, so they could
be visited by somebody living with a physical disability.137
In the 2020s, home adaptations, assistive technology and supported housing will be more
important than ever; helping people to stay independent for longer and supporting those
with complex needs including serious mental illness, learning disabilities and autism to
lead good quality lives in communities. In the years ahead, the government has an
opportunity to shape this emerging market and test new ideas and innovations.
Case study: Middlesbrough Staying Put
The Middlesbrough Staying Put home improvement agency is an advice and repair service
that helps older people, people with disabilities, and those who are vulnerable, to live
independently and safely within their own homes.
Staying Put works closely with other organisations and services, including health and
social care. This means that people get co-ordinated support to help improve their health,
wellbeing and quality of life.
The agency offers a range of practical solutions to problems with housing, including:
- information & advice to help people live independently in their own homes
Page 186 of 252
56
- a handyperson service, which provides minor repairs and adaptations, and major
adaptations for people with a disability
- an assistive technology service, providing technology to help people to live independently
and safely (such as falls sensors, door alarms or GPS trackers)
- seasonal support, including a Winter Warmth programme that helps tackle fuel poverty
- staff based in hospitals providing support to help people live safely so that they can
return home more quickly and are less likely to need hospital treatment in future
There is a clear link between cold homes and ill-health, where existing conditions such as
respiratory illnesses or mental health conditions are exacerbated.138 Government wants all
fuel poor homes to be upgraded to Energy Performance Certificate (EPC) Band C by 2030
and our aspiration is for as many homes as possible to be EPC Band C by 2035 where
practical, cost-effective and affordable. To support these aims, existing policies are in
place to improve the energy performance of homes, such as the £3.6 billion of investment
provided by the Energy Company Obligation. Government is undertaking a review of the
Fuel Poverty Strategy and intends to ensure that work to improve the quality of homes is
aligned with preventative healthcare, with everyone living in a warm and safe home that
supports healthy and independent living.
Later this year, we'll launch the ‘Home of 2030’ design competition, bringing
together the Clean Growth and Ageing Society Grand Challenges. The competition will
explore how the combination of innovative design and construction with new technology
can create more energy efficient, accessible and adaptable homes designed to fit the
needs of all generations.
NHS England launched the Healthy New Towns programme in 2015 to explore how the
development of new places could provide an opportunity to create healthier and connected
communities with integrated and high quality services. Lessons from ten demonstrator
sites have been used to develop a set of principles for ‘Putting Health into Place’,
which will be published shortly. Local systems should use these principles as they
plan, design and manage new neighbourhoods, streets, parks and buildings so that
they prioritise health and wellbeing and incorporate new ways of providing health
and social care services relevant to current and future population needs.
Case study: Changing Places toilets
Changing Places toilets give people with severe disabilities and their families the
opportunity to visit public places which they otherwise would not be able to and can
therefore make a huge difference to their quality of life. It is estimated that at least 250,000
Page 187 of 252
57
people in the UK need Changing Places toilets in order to have their toileting needs met in
a safe, dignified and humane way.
There are only between 30 and 40 Changing Places facilities on the NHS Estate in
England which are registered with the Changing Places Consortium (although there may
be some facilities that aren’t registered). In December 2018, the Care Minister announced
£2 million funding for NHS Trusts in England to install Changing Places facilities in
hospitals and significantly increase the number available. From the 31 May 2019, NHS
Trusts have been able to bid for this funding, on a matched basis.
The government is also working to increase the number of other places with a Changing
Places toilet. The Department for Transport’s Inclusive Transport Strategy is providing £2
million funding for Changing Places toilets in motorway service areas. In May 2019, the
Ministry of Housing, Communities and Local Government launched a consultation on how
we can increase the number of Changing Places toilets in new, large buildings commonly
used by the public (such as cinemas, shopping centres, sports and music venues and
transport hubs), including a potential change to the Building Regulations.
Green spaces and clean air
The outdoors can also help us grow our health asset. For example, evidence shows that
spending time in the natural environment can improve our mental health and wellbeing. It
can reduce stress, anxiety and depression, and encourage physical activity which in itself
contributes to better mental health.139 Yet, air pollution is the top environmental risk to
human health in the UK and one of the greatest threats to our health after cancer, heart
disease and obesity. It affects people of all ages, but particularly at the beginning and later
stages of life.140 It is estimated that long-term exposure to man-made pollution in the UK
has an annual effect equivalent to between 28,000 to 36,000 deaths.141
The government published an ambitious Clean Air Strategy in January 2019, which builds
on the 25 Year Environment Plan commitments and complements the Industrial Strategy,
Clean Growth Strategy. Analysis of the Clean Air strategy suggests that delivering on
these commitments could cut the costs of air pollution to society by £1.7 billion every year
from 2020, rising to £5.3 billion every year from 2030. This is because air pollution is
associated with respiratory and heart diseases, and emerging evidence is increasingly
pointing to a possible contribution to other wider health risks such as stillbirth, low birth
weight and dementia.142
In the year ahead, we will be working with the Department for Environment, Food and
Rural Affairs on 2 priority areas:
– To improve public awareness about pollution sources, including campaigns about
wood and coal, to empower people to take action to reduce their own impact on and
Page 188 of 252
58
exposure to, local pollution. This will be achieved by conducting and publishing
independent research and national scale communication activities.
– To improve data on health impacts, using syndromic surveillance and other health
data routinely collected to support monitoring and evaluation of long-term trends in health
impacts associated with air quality. This will be achieved through internal research and
establishment of stronger links between health data sets and air quality monitoring
undertaken across the public sector. We will align the work plans of our independent group
(Committee on Medical Effects of Air Pollution - COMEAP) with Defra’s Independent
advisory group (Air Quality Expert Group – AQEG).
PHE is currently undertaking a five-year programme to ensure government has the
best possible advice on the health burden linked to indoor and outdoor air pollution,
and what might be done to reduce this. This includes research and interpretation of the
available scientific evidence around the effects on the length and quality of people's lives.
Q - What could the government do to help people live more healthily: in homes and
neighbourhoods; when going somewhere; in workplaces; in communities?
Active ageing
Active ageing is about creating opportunities for people to live well throughout their lives.
The decisions we take at midlife (around 45 years old) will have an important bearing on
our later lives. Hence, there are steps we can take – both as individuals and as a society –
to set ourselves up for longer, happier lives.
The menopause and women's health143
Women can lose up to 20% of their bone density in the 5 to 7 years after the menopause.
This risk of osteoporosis (weak bones) and fractures stays relatively low until women get
much older, however the menopause provides a useful time to take stock and adopt a
healthier, bone-friendly lifestyle.
The risk of osteoporosis and fractures can be reduced by staying active through moderate-
intensity activity (150 minutes is recommended per week), having a healthy diet, limiting
alcohol intake and not smoking. Effects of the menopause such as this - as well as the
benefits of Hormone Replacement Therapy (HRT) - reflect how it is a multifaceted health
issue, with longstanding consequences for women. This and other effects have been
highlighted during meetings of the Women’s Health Taskforce, established and co-chaired
by the Parliamentary Under Secretary of State for Mental Health, Inequalities and Suicide
Prevention.
Page 189 of 252
59
We also need to do more to educate both men and women on healthy periods. An
estimated 1 in 3 women are affected by fibroids, and 1 in 10 women of reproductive age
have endometriosis.144 Early intervention and education on these conditions can prevent
them becoming debilitating.
The population of England is becoming older.145 As older people make up a larger
proportion of the population, they will also make an increasing contribution to society. They
are our workers, volunteers, taxpayers and carers.
As a country, we're not always making the most of the opportunities afforded by an ageing
population. Too many people are forced out of work by poor health or unwelcoming
employers. Too few have access to the training they need to change careers. Too many
families face the hard choice between working or caring for a loved one. And too few
homes and neighbourhoods meet the needs of older people.146
If an older population means fewer workers and higher demands for public services, this
raises important questions about future sustainability. In the decades ahead, the challenge
will be to ensure the growing number of people in later life are healthy, empowered and
able to continue making a full contribution to society, and to enjoy their lives.
We know that people age differently and there is no typical experience of later life. Many
people age well and have a well-connected, purposeful older age with good health and a
strong sense of belonging. But there can be a negative discourse on ageing that's
unhelpful – one that describes older people as a burden, and later life as a time of ill-health
and loneliness. This negative narrative has an impact on attitudes towards ageing not only
among older people themselves, but also among some health and social care
professionals. We need to urgently reframe this narrative to an asset-based model.
Case study: Homeshare and Shared Lives Plus
Homeshare organisations bring people with spare rooms together with people who are
happy to chat and lend a hand around the house in return for affordable, sociable
accommodation. Together, Householders and Homesharers share home life, time, skills
and experience. Householders are often older people who need a bit of help around the
house or garden, a lift to the shops or just someone to have a meal with and chat to.
Homesharers might be new to a city, studying or in low-income employment.
Charlotte who is in her 90’s and has lived, worked and raised a family in Oxford says “Now
I have a Homesharer, my middle-aged children feel reassured because there is someone
else in the house with me. Esme is a great help with the telephone, as I am quite deaf.
She also helps with my computer and with online food shopping”.
Page 190 of 252
60
Where there is no local Homeshare service, councils can develop their own, commission a
new one, or develop a formal partnership with one or more existing programmes.
This government believes the 2020s needs to be a decade of active ageing.147 A decade
where ageist stereotypes are forgotten, and replaced with a more positive and nuanced
view of older age. A view that better reflects reality.
To support this shift, Public Health England with the Centre for Ageing Better and
national partner organisations is developing a Consensus Statement on Healthy
Ageing to set out key principles and ways of working together, as well as carrying
out a review of how we can focus more attention on older people's issues.
Q - What is your priority for making England the best country in the world to grow
old in, alongside the work of Public Health England and national partner
organisations?
- Support people with staying in work
- Support people with training to change careers in later life
- Support people with caring for a loved one
- Improve homes to meet the needs of older people
- Improve neighbourhoods to meet the needs of older people
- Other: __________
National action
Prevention in wider policies
Given the variety of factors that affect our health, many of the relevant policies sit outside
DHSC, in other departments like: HM Treasury, the Department for Education, the
Department for Work and Pensions, the Department for Transport, the Department for
Environment, Food and Rural Affairs, the Ministry of Housing, Communities and Local
Government, and the Department for Digital, Culture, Media & Sport.
Many wider government policies already contribute towards the prevention agenda. For
example, the Cycling and Walking Investment Strategy aims to get people more active in
their transport choices, for example by doubling the rates of cycling by 2025.
Page 191 of 252
61
In the 2020s, we believe that all of government should be 'pulling in the same direction' on
prevention. This requires sustained focus over the long-term, but there are a number of
actions we can take now to lay the foundations for good health in the years to come.
As recommended by the Chief Medical Officer for England in her 2018 Annual
Report, we will develop and launch a new Composite Health Index. The Index will
provide a visible, top-level indicator of health, and can be tracked alongside our nation's
GDP. It will measure changes in health over time and, along with other indicators, can be
used by the government to assess the health impacts of wider policies. This is part of a
broader shift towards viewing health as one of the primary assets of our nation,
contributing both to the economy and to the happiness of the population.
Alongside this we’ll be expanding PHE’s capacity to project and model the impact of
future trends in health, building on the foundation of its existing work to publish an
annual Health Profile for England.
We will also work across government to build on existing appraisal tools and
improve the quality and coverage of health impact assessments of non-health
policies.
Q - What government policies (outside of health and social care) do you think have
the biggest impact on people's mental and physical health? Please describe a top 3.
Value for money
Prevention is common sense. We also know it represents extremely good value for
money. A recent systematic review found that for every £1 spent on public health
interventions, there was an average £14 of benefit to wider society. This includes
healthcare savings, but also the longer-term gains in health and to wider society.148
Prevention forms around 5% of all public funding on health. This means in the UK we are
spending over £101 billion a year treating disease, and £8 billion preventing it.149
As a country, we need to ask ourselves some fundamental questions about how much we
value prevention, and what this means for our public services. Using obesity as an
example, each year we spend more on treating health problems than preventing them in
the first place.
Q - How can we make better use of existing assets - across both the public and
private sectors - to promote the prevention agenda?
Page 192 of 252
62
World-class research
Transformative change in prevention will only be achieved if it is underpinned by high-
quality research. We aim to build on existing strengths to make the UK the world leader in
public health and prevention research. This must deliver an evidence base that is much
more ambitious and draws on a whole new range of disciplines.
To achieve this, we will:
- Set clear ambitious goals and principles for the research community based on the
future needs of the nation – for example, understanding how to create and maintain built
and natural environments that support better health; focused national and local solutions to
meet the needs of excluded and vulnerable populations within their communities and
across different geographical locations.
– Spark a culture shift, increasing the input from disciplines such as engineering or
education, co-producing research with the public, policy makers and practitioners;
answering the most important questions facing local authorities and service providers.
– Focus research on the areas in the country where the public health challenges are
greatest, tackling some of the biggest and most entrenched issues in the populations
where the need for action is greatest.
– Inspire the next generation of researchers, attracting the best people into prevention
research; combining academic research with practice as a career pathway.
Local action
Prevention policies are not experienced in the abstract, but in the neighbourhoods and
communities in which people live. That's why the role of 'place' will be an integral part of
any prevention strategy. Local authorities will have a key role to play, given that they:
• have specific responsibilities around prevention, for example sexual health,
children's health, adult social care and support, and drug and alcohol services
• control many of the assets for good health, for example parks and green spaces,
leisure facilities, and cycling and walking infrastructure
• have decision-making power for areas like housing policy, planning and social care
and support, which have a big impact on people's health
Page 193 of 252
63
• shape other policies relevant to health, including economic development,
education, and growing the voluntary and community sector
Since they assumed their public health responsibilities in 2013, local authorities have
commissioned creatively and energetically. They have secured real improvements and
efficiencies by challenging historic service models and finding new ways of doing things,
including through 'digital first' service offers in areas such as sexual health.
In December 2017, the government announced its aim to increase business rates
retention to 75% by devolving grants of equivalent value, including the Public Health
Grant. The government is continuing to engage stakeholders on the implementation of this
aim. This includes consideration of what more needs to be done to build a full range of
assurance arrangements for delivering public health services and outcomes. The
government will take a final decision on these matters in due course.
Case study: The Wigan Deal
Wigan have worked to improve the health and wellbeing of local people through an ‘asset-
based approach’. This aims to understand the existing strengths that communities have
and make best use of them.
Wigan Council, the local NHS, charities and community groups have taken a new common
approach to working with people, families and communities. This has included prioritising
wellbeing, prevention and early intervention. Significant effort has been put into
communicating this to staff and local people, so that everyone has a common vision of
what to expect. This has led to ‘The Deal for Health and Wellbeing’ in which local services
and organisations make commitments to local people, including:
- ensuring there are a wide range of facilities within local communities, including timely
access to good quality GP services
- supporting families to give their children the best start in life
- helping those who are unemployed into work, and supporting older people to stay
independent for as long as possible
In return people are asked to contribute by:
- keeping active at whatever stage of life, quitting smoking, drinking and eating sensibly,
and registering with a GP and going for regular check-ups
- taking time to be supportive parents or guardians
Page 194 of 252
64
- taking advantage of training and job opportunities, and setting high aspirations, and
supporting older relatives, friends and neighbours to be independent for as long as
possible
Since 2012 to 2014, healthy life expectancy in Wigan has increased by approximately 17
months for women and 12 months for men – both around ten months more than the
average for the North West over that same time period.150
The role of local Health and Wellbeing Boards is to bring together the local partners in
local government, the NHS and more widely, to assess needs and to develop effective
strategies that meet them. The potential of local authorities to influence the wider
determinants of health and provide local leadership for health improvement action was one
of the key factors for returning a major health role to them in 2013. There are already
examples of integration working well across the country.
The shift towards Integrated Care Systems (ICSs) should help deliver more progress in
this area by bringing together commissioners, providers and local authorities, to make
decisions that are in the best interest of the entire health economy, not just individual
organisations. Health and Wellbeing Boards should form a key part of the local
infrastructure on prevention, working with ICSs. We believe that the key tools that are
needed – such as flexibility to pool budgets – already exist, and that Health and Wellbeing
Boards in particular should have an important role to play in the new structures.
Directors of public health provide expertise and leadership for improving and protecting the
health of their local populations. They have a key role to play in raising awareness and
knowledge of both core public health issues and the impact of the wider determinants of
health (such as housing, planning and transport). Since 2015, PHE has been running a
‘Future Directors’ leadership programme and providing support for newly appointed
directors of public health across the country.
Modern healthcare is complex, and there are some areas where concerns have been
raised about the effects of dividing responsibility between different NHS and local
government agencies. That's why the NHS Long Term Plan committed the government to
reviewing the commissioning arrangements for sexual and reproductive health, health
visiting and school nursing services, to ensure that they can deliver the best outcomes for
the people who need them.
We have now confirmed that local authorities will continue to be responsible for
commissioning these services, but that the NHS and local authorities must work much
more closely together on these services to deliver joined-up care for patients and to
embed prevention into the full range of health and other public services.
Page 195 of 252
65
Throughout the review people told us the importance of local authorities and the NHS
working together to plan and deliver these services. This is a complex task and while there
are some inspiring examples of success, this is too often dependent on the efforts of
particular individuals or favourable local circumstances. As a result, the extent and nature
of collaborative commissioning arrangements varies dramatically.
We want to see the NHS and local authorities working more closely with more
collaborative commissioning. In some areas – such as sexual and reproductive health –
we want collaborative commissioning to become the norm, building on best practice from
across the country. This will require local authorities and the NHS to work closely together
at both the national and local level.
Case study: ‘Our Dorset’: Prevention in an Integrated Care System
‘Our Dorset’ was one of the NHS’s first ICSs. Dorset’s NHS organisations came together,
in partnership with local councils and others, to take collective responsibility for improving
the health of local people and meeting NHS standards for healthcare.
Dorset put prevention at the heart of its plans for becoming an ICS. It recognised that staff
were key to making this work and so developed a culture of promoting and valuing
prevention. By challenging staff to work and think differently, great improvements have
been made in the number, size and results of actions to prevent ill-health. This includes:
- healthy living advice and coaching to help people get active, lose weight, stop smoking
and drink less, based on the evidence of what works.
- working with schools to improve health, particularly focusing on mental health and
wellbeing, and increasing physical activity.
- helping people stay warm through installing insulation for older people and those with
health conditions likely to deteriorate where their housing is cold and damp.
The move towards ICSs creates the opportunity to co-commission an integrated sexual
and reproductive health service. In fact, some areas like Hampshire are already doing this.
Throughout the review, we saw different ways of doing this, for example designating a lead
commissioner or pooling budgets via local arrangements. We recognise that local areas
need to be able to decide what suits them best. However, we want to encourage more
places to use the powers and levers they already have to develop joint approaches. This
might include more consistent co-commissioning arrangements, and making the best use
of Health and Wellbeing Boards.
Page 196 of 252
66
Q - What more can we do to help local authorities and NHS bodies work well
together?
Sexual and reproductive health
Sexual health services are core to prevention. Good progress has been made in a number
of areas. Most significantly, we have seen new diagnoses of HIV reduce by 28% since
2015151 and teenage pregnancy rates at an all-time low.152 The UK was one of the first
countries to meet the UN’s global goals on HIV153 and we are already committed to going
further and achieving zero infections by 2030 as announced by the Secretary of State in
January this year. We are considering how we move to mainstream commissioning of HIV
Pre-Exposure Prophylaxis.
More challenging are 2018 data published by Public Health England, which shows that
rates of some sexually transmitted infections, most notably gonorrhoea, are increasing.154
This underlines the need to continue to promote condom use and ensure that those at risk
can rapidly access services, including online testing.
We need to actively address how we maintain momentum in those areas where we are
doing well and to respond to the challenges where progress has stalled or been too slow.
We are therefore considering calls from the Health and Social Care Committee
(HSCC) and others to develop a new Sexual and Reproductive Health Strategy for
England. A full response to the select committee report will be published shortly. We want
your views on the development of a new strategy, and the areas that any new strategy
should prioritise.
Q - What are the top 3 things you’d like to see covered in a future strategy on sexual
and reproductive health?
Page 197 of 252
67
Conclusion
For the first 70 years of the NHS, we have concentrated on helping people live longer –
and we have been hugely successful. Now we must move from simply thinking about life
span to health span: the number of years we can keep people living healthy, independent
lives free from illness or disability.
The commitments outlined in this green paper signal a new approach to public health. One
that involves a new personalised, prevention model. It will mean the government, both
local and national, working with the NHS, to put prevention at the centre of our decision-
making.
These commitments will help us towards our mission of '5 more years of healthy,
independent life by 2035 while reducing the gap between richest and poorest'. However,
we've been clear that they won't deliver the whole 5 years, and that further action will be
needed. That's why we'll aim to publish a government response to the green paper
by spring 2020, setting out our proposals in more detail.
The government is committed to delivering the Ageing Society Grand Challenge - where
the '5 more years' ambition comes from - and ensuring the UK is at the cutting edge and
world-leading in our approach to demographic changes. We recognise that this requires
action across government and through the spending review process we will
establish how we best co-ordinate and drive delivery of this work, for example,
through the creation of an office to support healthy ageing.
Q - What other areas (in addition to those set out in this green paper) would you like
future government policy on prevention to cover?
For prevention to succeed, and to improve the nation's health over the next decade,
individuals and communities must play their part too. This involves making healthier
choices for ourselves and our families - eating well, staying active, being smoke-free, and
taking care of our mental health - and laying the foundations for good health throughout
our lives. Health is a shared responsibility. Only by working together can we achieve our
vision of healthier, happier lives for everyone.
Page 198 of 252
68
References
1 Office for National Statistics (2018) 'Past and projected data from the period and cohort life tables, 2016-based: England and Wales, 1841 to 2066' Office for National Statistics (2017) '2016 single year national life tables' Period life expectancy for England and Wales 1916 - 2016 2 Office for National Statistics (2019) 'Cancer survival in England: national estimates for patients followed up to 2017' 3 Public Health England (2018) 'Health Profile for England 2018: Chapter 2: trends in mortality' 4 Office for National Statistics (2018) 'Changing trends in mortality in England and Wales: 1990 to 2017 (Experimental Statistics)' 5 Office for National Statistics (2018) 'Health state life expectancies, UK: 2015 to 2017' "Poor health" relates to self-reported "fair", "bad" and "very bad" general health, whereas "good health" refers to self-reported "good" and "very good" general health. Estimates are for Healthy Life Expectancy at birth in England. 6 Office for National Statistics (2019) 'Health state life expectancies by national deprivation deciles, England and Wales: 2015 to 2017' Deprivation deciles are based on the Index of Multiple Deprivation 2015 which is the official measure of relative deprivation. Estimates shown for England. Please note figures will not sum due to rounding. 7 Heslop, P. et al (2013) 'Confidential Inquiry into premature deaths of people with learning disabilities (CIPOLD)' Public Health England (2016) 'People with learning disabilities in England 2015: Main report' NHS Digital (2019) 'Health and Care of People with Learning Disabilities, Experimental Statistics: 2017 to 2018' 8 "Institute for Health Metrics and Evaluation (IHME). GBD Compare. Seattle, WA: IHME, University of Washington, 2015. Available from http://vizhub.healthdata.org/gbd-compare (viewed 19/06/19) Bull, FC. and the Expert Working Groups (2010) 'Physical Activity Guidelines in the UK: Review and Recommendations' 9 Steel, N. et al (2018) 'Changes in health in the countries of the UK and 150 English Local Authority areas 1990–2016: a systematic analysis for the Global Burden of Disease Study 2016' 10 Institute for Health Metrics and Evaluation (IHME). GBD Compare. Seattle, WA: IHME, University of Washington, 2015. Available from http://vizhub.healthdata.org/gbd-compare (viewed 19/06/19) Percentage of total years lived with disability in England by level 2 cause (all ages, both sexes) - 2017 Years lived with disability (YLDs) is a measure of morbidity used in the Global Burden of Disease study (GBD) that combines the prevalence of each disease with a rating of the severity of its symptoms, to give an overall measure of the loss of quality of life. 11 Ibid 12 Versus Arthritis, formerly Arthritis Research UK (2018) 'State of Musculoskeletal Health 2018' 13 Ibid 14 Heuch, I. et al (2013) 'Body mass index as a risk factor for developing chronic low back pain: a follow-up in the Nord-Trøndelag Health Study' Spine, vol. 38, no. 2, pp.133-139, 2013 Smuck, M. et al (2014) 'Does physical activity influence the relationship between low back pain and obesity?' The Spine Journal, vol. 14, no. 2, pp. 209-216, 2014. 15 Versus Arthritis (2019) 'Nora's Story', versusarthritis.org (viewed: 01/07/2019) 16 Institute for Health Metrics and Evaluation (IHME). GBD Compare. Seattle, WA: IHME, University of Washington, 2015. Available from http://vizhub.healthdata.org/gbd-compare (viewed 19/06/19) Percentage of total years lived with disability in England by level 2 cause (all ages, both sexes) - 2017 17 NHS Digital (2015) 'Health Survey for England 2014' NHS Digital (2016) 'Adult Psychiatric Morbidity Survey: Survey of Mental Health and Wellbeing, England, 2014' This estimate reflects the balance of evidence across both the Health Survey for England and the Adult Psychiatric Morbidity Survey. 18 NHS Digital (2015) 'Health Survey for England 2014' Please note that these are self-reported diagnoses of mental health issues. The 2014 Adult Psychiatric Morbidity Survey further shows that 1 in 6 adults had a common mental disorder. This covers depression,
Page 199 of 252
69
generalised anxiety disorder (GAD), panic disorder, phobias, obsessive compulsive disorder (OCD), and common mental disorders not otherwise specified (CMD-NOS). 19 NHS Digital (2015) 'Health Survey for England 2014' NHS Digital (2016) 'Adult Psychiatric Morbidity Survey: Survey of Mental Health and Wellbeing, England, 2014' 20 NHS Digital (2015) 'Health Survey for England 2014' NHS Digital (2016) 'Adult Psychiatric Morbidity Survey: Survey of Mental Health and Wellbeing, England, 2014' Chakraborty, A. et al (2011) 'Mental health of the non-heterosexual population of England'. Journal of Psychiatry, 198, 143–148. 21 Mind (2015) 'My anxiety and depression at work', Mind.org.uk (viewed:10/06/2019) 22 Institute for Health Metrics and Evaluation (IHME). GBD Compare. Seattle, WA: IHME, University of Washington, 2015. Available from http://vizhub.healthdata.org/gbd-compare (viewed 19/06/19) Percentage of total years lived with disability in England by level 2 cause (all ages, both sexes) - 2017 23 The Richmond Group of Charities (2018) 'Multimorbidity - Understanding the Challenge' 24 The Richmond Group of Charities (2018) 'Multimorbidity - Understanding the Challenge' Fortin, M. et al (2014) ‘Lifestyle factors and multimorbidity: a cross sectional study’, BMC Public Health, 14, 686–694. Dhalwani, N. et al (2016) 'Association Between Lifestyle Factors and the Incidence of Multimorbidity in an Older English Population', The Journals of Gerontology: Series A, Volume 72, Issue 4, 528–534 25 The Richmond Group of Charities (2018) '"Just one thing after another": Living with multiple conditions' 26 Department for Business, Energy and Industrial Strategy (2019) 'The Grand Challenge missions: Ageing Society' 27 Office for National Statistics (2018) 'Health state life expectancies, UK: 2015 to 2017' Disability-free life expectancy is a measure of the average number of years a person would live without a long-lasting physical or mental health condition that limits daily activities. Please note that it is based on current age-specific mortality and disability rates and does not allow for future projected changes in mortality or disability. 28 Ibid; estimates are for Disability-Free Life Expectancy at birth in England. 29 Ibid 30 Adapted from McGinnis J., Williams-Russo P., Knickman J.R. (2002) 'The case for more active policy attention to health promotion' 31 Canadian Institute of Advanced Research (2002), quoted in Kuznetsova, D. (2012) 'Healthy places: Councils leading on public health' 32 Institute for Health Metrics and Evaluation (IHME). GBD Compare. Seattle, WA: IHME, University of Washington, 2015. Available from http://vizhub.healthdata.org/gbd-compare (viewed 19/06/19) Percentage of total years lived with disability in England by level 2 causes and risks (all ages, both sexes) - 2017 33 NHS Healthcheck (2019) 'Explore NHS Healthcheck data', healthcheck.nhs.uk (viewed 10/6/2019) 34 For example: Lindbohm, J.V. et al (2019) '5-year versus risk-category-specific screening intervals for cardiovascular disease prevention: a cohort study' 35 O'Neill, J (2016) 'The Review on Antimicrobial Resistance: Tackling drug-resistant infections globally: Final report and recommendations', Wellcome Trust & HM Government 36 OECD (2019) 'Health and economic burden of antimicrobial resistance', in Stemming the Superbug Tide: Just A Few Dollars More Average number of deaths due to AMR infections in the UK over 2015 - 2050 is estimated to be 2,126. Average annual health care expenditure associated with AMR in the UK over 2015-50 is estimated to be $179,183.10 per 100,000 persons (USD PPP). Scaling to the mid-2018 UK population of 66,435,550, and converting to GBP gives an annual cost of approximately £95m (to nearest £5m). This fluctuates depending on the exchange rate - for example looking at the range in rates over the last year, this could range between £89m to £95m. 37 NHS England (2019) 'Tackling Sepsis and saving lives', england.nhs.uk (viewed 24/06/19) Public Health England (2019) 'AMR local indicators': Sepsis CQUIN – Indicator 2a (inpatient, emergency) and 2b (inpatient, emergency) - England, fingertips.phe.org.uk (viewed 24/06/19)
Page 200 of 252
70
38 World Health Organization (2019) 'Immunization' (viewed 05/07/2019) Plotkin S.L., Plotkin S.A. (2004) 'A short history of vaccination', Vaccines; via WHO (2008) 'Vaccination greatly reduces disease, disability, death and inequity worldwide' 39 For example, the measles vaccination has prevented an estimated 20 million cases and 4,500 deaths in the UK since its introduction in 1968. Public Health England (2018) '50 years of measles vaccination in the UK' (viewed 10/6/2019) 40 NHS Digital (2018) 'Childhood Vaccination Coverage Statistics- England 2017-18' 41 Institute for Health Metrics and Evaluation (IHME). GBD Compare. Seattle, WA: IHME, University of Washington, 2015. Available from http://vizhub.healthdata.org/gbd-compare (viewed 19/06/19) Percentage of total years lived with disability in England by level 2 causes and risks (all ages, both sexes) - 2017 42 Institute for Health Metrics and Evaluation (IHME). GBD Compare. Seattle, WA: IHME, University of Washington, 2015. Available from http://vizhub.healthdata.org/gbd-compare (viewed 19/06/19) Percentage of total years lived with disability in England by level 2 risks (all ages, both sexes) - 2017 43 Office for National Statistics (2019) 'Adult smoking habits in the UK: 2018' Adult smoking habits in Great Britain 1974-2018' Estimates are for GB and based on the Opinions and Lifestyle Survey. Please note that estimates prior to 2000 are unweighted. 44 OECD (2018) 'Health at a Glance: Europe 2018': Smoking among adults Please note that this international comparison is for GB/UK (not England). Estimates are based on the Opinions and Lifestyle Survey for Great Britain. No data has been supplied by NISRA for NI for 2006 onwards, so current OECD figures for the UK relate to GB only Office for National Statistics (2019) 'Adult smoking habits in the UK: 2018' 14.4% of adults in England (14.7% in UK) smoked in 2018 (Annual Population Survey). The statement "fewer than 1 in 6" is also consistent with GB data from the Opinions and Lifestyle Survey (16.6% of adults). However, please note that headline prevalence figures for smoking are usually taken from the APS due to its greater precision. 45 Office for National Statistics (2019) 'Adult smoking habits in the UK: 2018' 14.4% of adults in England smoked in 2018 (Annual Population Survey) 46 Ibid 47 NHS Digital (2019) 'Statistics on Smoking, 2019' 48 NHS Digital (2019) 'Statistics on Women's Smoking Status at Time of Delivery, England - Quarter 4, 2018-19' 49 Office for National Statistics (2019) 'Adult smoking habits in the UK: 2018': Smoking habits in the UK and its constituent countries (Annual Population Survey) 50 Office for National Statistics (2019) 'Adult smoking habits in the UK: 2018' 15.6% of adults who identified as heterosexual in England smoked in 2017, compared to 22.4% of those identifying as gay or lesbian, and 24.0% of those identifying as bisexual (Annual Population Survey) 51 Royal College of Physicians and Royal College of Psychiatrists (2013) 'Smoking and mental health' 52 Office for National Statistics (2019) 'Adult smoking habits in the UK: 2018': Smoking habits in the UK and its constituent countries (Annual Population Survey) 53 Birge, M., Duffy, S., Astrid Miler, J. and Hajek, P. (2018) 'What Proportion of People Who Try One Cigarette Become Daily Smokers? A Meta-Analysis of Representative Surveys', Nicotine & Tobacco Research, 20(12), 1427–1433 54 Committee on Toxicity (2017) 'Statement on heat not burn tobacco products' Public Health England (2018) 'E-cigarettes and heated tobacco products: evidence review' 55 NHS Digital (2018) 'Health Survey for England 2017' 56 NHS Digital (2018) 'National Child Measurement Programme, England - 2017/18 School Year' Simmonds, M., Llewellyn, A., Owen, C.G. and Woolacott, N. (2016) 'Predicting adult obesity from childhood obesity: a systematic review and meta‐analysis' Obesity reviews, 17(2), 95-107. 57 NHS Digital (2018) 'National Child Measurement Programme, England - 2017/18 School Year' NHS Digital (2018) 'Health Survey for England 2017' 58 Public Health England (2017) 'Health matters: obesity and the food environment' Public Health England (2019) 'Adult obesity: applying All Our Health' 59 Public Health England (2018) 'Health Profile for England 2018: Chapter 3: trends in morbidity and risk factors'
Page 201 of 252
71
Institute for Health Metrics and Evaluation (IHME). GBD Compare. Seattle, WA: IHME, University of Washington, 2015. Available from http://vizhub.healthdata.org/gbd-compare (viewed 19/06/19) Percentage of total years lived with disability in England by level 2 risks (all ages, both sexes) - 2017 Diet and metabolic risk factors include obesity (high BMI), high blood glucose levels, high blood pressure and high cholesterol. 60 Food Standards Agency and Public Health England (2018) 'NDNS: results from years 7 and 8 (combined)' Public Health England (2018) 'Calorie reduction: The scope and ambition for action' Public Health England (2016) 'National Diet and Nutrition Survey: assessment of dietary sodium, adults in England 2014' 61 Public Health England (2019) 'Child Health Profiles': Indicator 2.02ii Breastfeeding prevalence at 6-8 weeks after birth, fingertips.phe.org.uk (viewed 19/06/19) 62 Victora, C.G. et al (2016) 'Breastfeeding in the 21st century: epidemiology, mechanisms, and lifelong effect' 63 NHS Digital (2018) 'Health Survey for England 2017' 64 Department of Health and Social Care (2013) 'Diet and nutrition survey of infants and young children, 2011' 65 Public Health England (2019) 'Foods and drinks aimed at infants and young children: evidence and opportunities for action' 66 Food Standards Agency and Public Health England (2018) 'NDNS: results from years 7 and 8 (combined)' 67 Public Health England (2017) 'Health matters: obesity and the food environment' Public Health England (2019) 'Adult obesity: applying All Our Health' 68 Public Health England (2019) 'Foods and drinks aimed at infants and young children: evidence and opportunities for action' 69 Moynihan, P.J. and Kelly, S.A.M. (2013) 'Effect on Caries of Restricting Sugars Intake: Systematic Review to Inform WHO Guidelines'. Journal of Dental Research,93(1):8–18 70 Public Health England (2018) 'Oral health survey of 5 year old children 2017' 71 Public Health England (2019) 'Hospital tooth extractions of 0 to 19 year olds' 72 Public Health England (2019) 'Foods and drinks aimed at infants and young children: evidence and opportunities for action' 73 Based on unpublished results of DHSC commissioned research by Kantar Worldpanel in 2014. 2,525 products were checked for front-of-pack labelling. Diabetes UK (2018) 'People with diabetes say all companies should use the same food labelling' , diabetes.org.uk (viewed: 10/06/2019) 74 Strazzullo, P., Kandala, N.B. and Cappuccio, P. (2009) 'Salt intake, stroke, and cardiovascular disease: meta-analysis of prospective studies' 75 Public Health England (2016) 'National Diet and Nutrition Survey: assessment of dietary sodium, adults in England 2014' 76 Public Health England (2018) 'Salt targets 2017: progress report' 77 Retat, L., Pimpin, L., Webber, L. et al (2019) 'Screening and brief intervention for obesity in primary care: cost-effectiveness analysis in the BWeL trial'. International Journal of Obesity 78 NHS Digital (2018) 'National Child Measurement Programme, England - 2017/18 School Year' 79 Public Health England (2016) 'Health matters: getting every adult active every day' 80 NHS Digital (2018) 'Health Survey for England 2017' 81 Davies, C. (2017) Twitter.com (viewed: 10/06/2019) 82 The FA (2019) 'The social and economic value of adult grassroots football in England' 83 NHS Digital (2019) 'Statistics on Obesity, Physical Activity and Diet, England, 2019: Part 5: Physical activity' 84 World Health Organization (2018) 'Global Health Observatory - Insufficient Physical Activity' Age-standardised estimates for 18+; both sexes 85 NHS Digital (2017) 'Health Survey for England 2016' 86 Sport England (2019) 'Active Lives Adult Survey November 2017/18' 87 NHS Digital (2017) 'Health Survey for England 2016' In 2016, 31% of men and 24% of women aged 19+ met the guidelines for muscle-strengthening exercises. This includes those who met both the guidelines for moderate/vigorous physical activity and muscle-strengthening activities, and those who met guidelines for the latter only. 88 Public Health England (2016) 'Health matters: getting every adult active every day'
Page 202 of 252
72
89 UK Chief Medical Officers (2011) ‘Physical activity guidelines for early years (under 5s) – for children who are capable of walking 90 Access to mental health services in primary care settings: NHS England (2019) 'Mental Health Five Year Forward View Dashboard Q3 2018/19' NHS Digital (2019) 'Psychological Therapies: Annual Report on the use of IAPT services - England, 2018-19' Time-series data on access to mental health services in secondary care settings is not currently available. The estimated number of contacts to secondary services has increased. NHS Digital (2018) 'Mental Health Bulletin 2017-18 Annual Report' 91 NHS England (2019) 'The NHS Long Term Plan' 92 NHS Digital (2019) 'Psychological Therapies: Annual Report on the use of IAPT services - England, 2018-19' 93 NHS England (2019) 'The NHS Long Term Plan' 94 Ibid 95 The King’s Fund and Centre for Mental Health (2012) 'Long-term conditions and mental health - the cost of co-morbidities' 96 Department of Health and Social Care (2014) 'Annual Report of the Chief Medical Officer 2013 - Public Mental Health Priorities: Investing in the Evidence' Royal College of Psychiatrists (2010) 'No health without public mental health' 97 Department for Work and Pensions and Department of Health and Social Care (2017) 'Thriving at work – The Stevenson / Farmer review of mental health and employers' 98 Chesney, E., Goodwin, G.M. and Fazel, S. (2014) 'Risks of all-cause and suicide mortality in mental disorders: a meta-review' World Psychiatry 13:2. 99 Public Health England (2018) 'Health profile for England: 2018: Chapter 5 (inequalities in health)' Public Health England (2014) 'Local action on health inequalities: Improving access to green spaces' 100 Public Health England (2014) 'Local action on health inequalities: Improving access to green spaces' Braubach, M. et al (2017) 'Effects of Urban Green Space on Environmental Health, Equity and Resilience'. In: Kabisch, N., Korn, H., Stadler, J. and Bonn, A. (eds) 'Nature-Based Solutions to Climate Change Adaptation in Urban Areas'. Theory and Practice of Urban Sustainability Transitions. Springer, Cham 101 Gambling Commission, Responsible Gambling Strategy Board and GambleAware (2018) 'Measuring Gambling-related Harms: a framework for action' Institute for Public Policy Research (2016) 'Cards on the table: The cost to government associated with people who are problem gamblers in Britain' 102 NHS Digital (2018) 'Health Survey for England 2017' 103 NHS Digital (2019) 'Statistics on Alcohol, England, 2019' 104 Public Health England (2016) 'The Public Health Burden of Alcohol and the Effectiveness and Cost-Effectiveness of Alcohol Control Policies: an evidence review' This relates to self-reported consumption of alcohol. 105 NHS Digital (2018) 'Health Survey for England 2017' 106 Katikireddi, S. et al (2017) 'Socioeconomic status as an effect modifier of alcohol consumption and harm: analysis of linked cohort data' Bellis, M. et al (2016) 'The alcohol harm paradox: using a national survey to explore how alcohol may disproportionately impact health in deprived individuals' 107 Public Health England (2017) 'An evidence review of the outcomes that can be expected of drug misuse treatment in England' 108 Centers for Disease Control and Prevention (2019) 'Drug Overdose Deaths', cdc.gov (viewed 24/06/19) Scholl, L. et al (2019) 'Drug and Opioid-Involved Overdose Deaths — United States, 2013–2017' Public Health Agency of Canada - Special Advisory Committee on the Epidemic of Opioid Overdoses (2019) 'National report: Apparent opioid-related deaths in Canada (January 2016 to December 2018)' 109 Public Health England (2018) 'Alcohol and drug prevention, treatment and recovery: why invest?' 110 NHS (2018) 'Why lack of sleep is bad for your health', nhs.uk (viewed 05/07/2019) Medic, G., Wille, M. and Hemels, M.E.H. (2017) 'Short- and long-term health consequences of sleep disruption' Nat Sci Sleep. 2017; 9:151–161 Royal Society for Public Health (2016) 'Waking up to the health benefits of sleep' 111 Kamdar, B.B, Needham, D.M and Collop, N.A (2012) 'Sleep Deprivation in Critical Illness: Its Role in Physical and Psychological Recovery', Journal of Intensive Care Med. 27(2), 97–111 112 Care Quality Commission (2018) 'Adult inpatient survey 2017'
Page 203 of 252
73
113 Medic, G., Wille, M. and Hemels, M.E.H. (2017) 'Short- and long-term health consequences of sleep disruption' Nat Sci Sleep. 2017; 9:151–161 Ibarra-Coronado, E.G. et al (2015) 'The Bidirectional Relationship between Sleep and Immunity against Infections', Journal of Immunology Research 114 The Sleep Council (2017) 'The Great British Bedtime Report, 2017' 115 NHS England (2019) 'The NHS Long Term Plan' 116 NHS (2019) 'NHS Diabetes Prevention Programme (NHS DPP)', nhs.uk (viewed 08/07/19) 117 NHS England (2019) 'Comprehensive model of personalised care', england.nhs.uk (viewed 24/06/19) NHS England (2019) 'The NHS Long Term Plan' 118 Center on the Developing Child (2007) 'The Science of Early Childhood Development (InBrief)' harvard.edu (viewed 13/06/2019) 119 Joseph Rowntree Foundation (2007) ‘Parenting and outcomes for children’ 120 Source data from Department for Education (2018) 'Early years foundation stage profile results: 2017 to 2018', but specific indicator accessible at Public Health England (2018) 'School Readiness: the percentage of children achieving a good level of development at the end of reception', fingertips.phe.org.uk (viewed 13/06/2019) NHS Digital (2017) 'Smoking, Drinking and Drug Use Among Young People in England - 2016' 121 Public Health England (2018) 'Health profile for England: 2018': Chapter 5 (inequalities in health) and 6 (wider determinants of health) 122 Department for Education (2018) 'Early years foundation stage profile results: 2017 to 2018' 123 Bellis, M.A. et al (2014) 'National household survey of adverse childhood experiences and their relationship with resilience to health-harming behaviors in England', BMC Medicine, 12,72 124 Early Intervention Foundation (2017) 'Language as a child wellbeing indicator' 125 Early Intervention Foundation (2017) 'Language as a child wellbeing indicator' Law, J. et al (2009) 'Modelling developmental language difficulties from school entry into adulthood: literacy, mental health, and employment outcomes' 126 Public Health England (2018) 'Oral health survey of 5 year old children 2017' Public Health England (2017) 'Health matters: child dental health' Estimates for hospital admissions are for 2015-16 127 Public Health England (2013) 'National Dental Epidemiology Programme for England; oral health survey of five year old children 2012. A report on the prevalence and severity of dental decay' 128 Public Health England (2018) 'Oral health survey of 5 year old children 2017' 129 Ibid 130 Public Health England (2016) 'Improving oral health: supervised tooth brushing programme toolkit' Public Health England (2018) 'Oral health improvement programmes commissioned by local authorities' 131 Public Health England (2018) 'Water fluoridation: health monitoring report for England 2018'. 132 Waddell, G., Burton, A.K. (2006) 'Is work good for your health and wellbeing?' 133 NHS Digital (2019) 'NHS Outcomes Framework Indicators - May 2019 Release: 2.2 Employment of people with long-term conditions' 134 Versus Arthritis, formerly Arthritis Research UK (2018) 'State of Musculoskeletal Health 2018' 135 HM Government (2018) 'A Connected Society: A Strategy for tackling loneliness – laying the foundations for change' Holt-Lunstad, J. et al. (2015) 'Loneliness and social isolation as risk factors for mortality: a meta-analytic review' Perspectives on Psychological Science, 10(2), 227–237 Valtorta, N.K. et al. (2016) 'Loneliness and social isolation as risk factors for coronary heart disease and stroke: systematic review and meta-analysis of longitudinal observational studies' Heart. 2016; 102(13): 1009–1016 Cacioppo, J.T, Hawkley, L.C and Thisted, R.A (2010) 'Perceived social isolation makes me sad: 5-year cross-lagged analyses of loneliness and depressive symptomatology in the Chicago Health, Aging, and Social Relations Study' Psychol Aging. 2010;25(2):453–463 136 Institution of Engineering and Technology & Nottingham Trent University (2018) 'Scaling Up Retrofit 2050' 137 Ministry of Housing, Communities and Local Government (2016) 'English Housing Survey 2014 to 2015: Adaptations and Accessibility of Homes Report' 138 Public Health England (2014) 'Local action on health inequalities: Fuel poverty and cold home-related health problems'
Page 204 of 252
74
139 Public Health England (2014) 'Local action on health inequalities: Improving access to green spaces' Braubach, M. et al (2017) 'Effects of Urban Green Space on Environmental Health, Equity and Resilience'. In: Kabisch, N., Korn, H., Stadler, J. and Bonn, A. (eds) 'Nature-Based Solutions to Climate Change Adaptation in Urban Areas'. Theory and Practice of Urban Sustainability Transitions. Springer, Cham 140 Department for Environment, Food and Rural Affairs (2019) 'Clean Air Strategy 2019' 141 Public Health England (2018) 'Associations of long-term average concentrations of nitrogen dioxide with mortality' 142 Department for Environment, Food and Rural Affairs (2019) 'Clean Air Strategy 2019' 143 NHS (2017) 'Menopause and your bone health', nhs.uk (viewed 24/06/19) 144 NHS (2018) 'Fibroids', nhs.uk (viewed 09/07/19) NICE (2014) 'Clinical Knowledge Summaries - Endometriosis', cks.nice.org.uk (viewed 09/07/19) The true prevalence of fibroids and endometriosis in the population is unknown, as fibroids may be asymptomatic and definitive diagnosis of endometriosis is only made after laparoscopic inspection and histological confirmation. 145 Office for National Statistics (2019) 'Population estimates for the UK, England and Wales, Scotland and Northern Ireland: mid-2018' 146 Ministry of Housing, Communities and Local Government (2016) 'English Housing Survey 2014 to 2015: Housing for Older People Report' Ministry of Housing, Communities and Local Government (2016) 'English Housing Survey 2014 to 2015: Adaptations and Accessibility of Homes Report' 147 World Health Organization (2002) 'Active Ageing: A Policy Framework' 148 Masters, R. et al (2017) 'Return on investment of public health interventions: a systematic review', Journal of Epidemiology and Community Health,71(8), 827–834 The return on investment estimate is a median of a review of published interventions worldwide (and not just limited to health interventions). It relates to the societal return, and not simply medical costs. 149 Office for National Statistics (2019) 'Healthcare expenditure, UK Health Accounts: 2017' Estimated government expenditure on healthcare is for the UK, not for England. Total government-financed healthcare expenditure in 2017 was £155.6 billion. 150 Office for National Statistics (2018) 'Health state life expectancies, UK: 2015 to 2017' Please note that subnational health state life expectancy estimates for local authority areas in England and Wales from 2012 to 2016 were revised, so comparisons should be made using estimates published here and not from the original 2012-14 release. 151 Public Health England (2018) 'Trends in new HIV diagnoses and people receiving HIV-related care in the United Kingdom: data to the end of December 2017' 152 Office for National Statistics (2019) 'Conceptions in England and Wales: 2017' 153 Public Health England (2018) 'Progress towards ending the HIV epidemic in the UK: 2018 report' 154 Public Health England (2019) 'Sexually transmitted infections and chlamydia screening in England: 2018'
Page 205 of 252

CCS0619432956
978-1-5286-1545-7
Page 206 of 252
HEALTH AND WELLBEING BOARD
AGENDA ITEM
9
DATE OF MEETING: Wednesday 19th September 2018 REPORT OF: The Chief Operating Officer, Luton CCG REPORT AUTHOR: Nicky Poulain, on behalf of the Luton Transformation Board SUBJECT: Update Report from Luton Transformation Board
WARD(S) AFFECTED: ALL PURPOSE 1. To Inform the Health and Well Being Board (HWBB) of key items being addressed
since April by the Luton Transformation Board and to report on their progress.
RECOMMENDATION(S) 2. The HWBB is asked to:
i. Note and comment on the report and supporting slides ii. Support the developing Luton Plan aligned to the NHS LTP.
BACKGROUND 3. The Luton Transformation Board has met monthly since April and directly reports to the
HWBB. 4. The Luton Transformation Board has met monthly since April and directly reports to the
HWBB 5. The Transformation Board is chaired by the LCCG Chair, and it is an active forum
where senior partners across the Luton health and social care system undertake collaborative planning, regular reviews and assessment of the impact of Primary, Community and Social Care Services.
6. The agenda has been influenced by the NHS Long Term Plan (LTP) and the need to
have an aligned Luton Place Based plan. The LTP encourages all organisations in each health and care system to join forces to offer well-coordinated efficient services to those who need them.
Page 207 of 252
7. The terms of reference has recently been updated and this included a shared ambition: Luton is a place where people are enabled to thrive, where everyone will have the opportunity to live a life in which we are mentally, socially and physically healthy, all potential is maximised and inequalities are reduced.
REPORT 8. The attached slides accompanying this summary demonstrate the key issues being
progressed via the Luton Transformation Board. 9. A Primary Care Strategy covering BLMK was developed in partnership with the
Transformation Board with the aim to develop a resilient, multi-disciplinary and high quality primary care platform to be front and centre in our local community. This strategy builds on the Luton ‘at Home First’ work where the GPs will remain at the centre of patient care, supporting and directing the provision and co-ordination of high quality medical care and treatment for those that are ill, but also in bringing about improved health and well-being for our population as a whole.
10. Five Primary Care Networks have been established in Luton. (Appendix A slide 2) 11. Population Health Management has been fully embedded into the Luton Work
Plan – this work was led by the Public Health Teams in partnership with colleagues in BLMK.
12. Right Care Programme: this national enabling program has been fully considered by
the Transformation Board and the opportunities realised with bespoke programmes of work for cardio vascular disease, (identification and better management of high blood pressure atrial fibrillation to reduce avoidable stroke), and chronic respiratory disease (to improve self-management and more timely management of exacerbations).
13. Luton will commence a targeted lung health programme to 55-74 year olds to
proactively target people who smoke or have a history of smoking. The programme will commence in the New Year. (Appendix A slide 3).
14. Joint Health and Social Care Score Card was developed via the Transformation Board
with Public Health leadership- latest copy Appendix B. 15. The Transformation Board supported a successful bid for developing Healthier
Neighbours which aims to improve working relationships with the local communities and the voluntarily sector.
16. Partnership working is being established between health and housing teams
recognising the impact housing issues have on health outcomes. The intial focus has been on supporting housing needs with the cohort of people with mental health needs. The ‘reimagining mental health’ programme is an integral part of this work.
17. The increased utilisation of acute emergency hospital care has been analysised and
reviewed by the Transformation Board and a focus on ‘access to same day’ urgent care was undertaken. Appendix A slides 4 & 5 show the latest development in supporting the Luton population to access timely primary care services.
Page 208 of 252
18. The Transformation Board received an independent review of its working as part of the ICS development from Deloitte. The summary findings were that the board had strong engagement and were good at building relationships and strategy development and plan building, however, delivery and execution needed more focus. (Appendix A, slide 7).
19. In view of learning from the independent review, developing the Luton Plan to support
the NHS LTP is an excellent opportunity for us to really make a difference to the population of Luton. Appendix A slides 10-15 provide an overview of progress to date and the draft plan will be forwarded by 26th September 2019.
IMPLICATIONS 20. To improve the outcomes for the population within the allocated national
resources.
CONSULTATIONS 21. Nil at present.
APPENDICES 22. The following appendices are attached to this report:
Appendix A – Report from Luton Transformation Board Appendix B – Joint Health & Social Care Outcomes Scorecard
LIST OF BACKGROUND PAPERS LOCAL GOVERNMENT ACT 1972, SECTION 100D 8. None.
Page 209 of 252
Luton Health and Wellbeing Board
Report from Luton Transformation Board
19 September 2019
We are Luton
Appendix A
Page 210 of 252
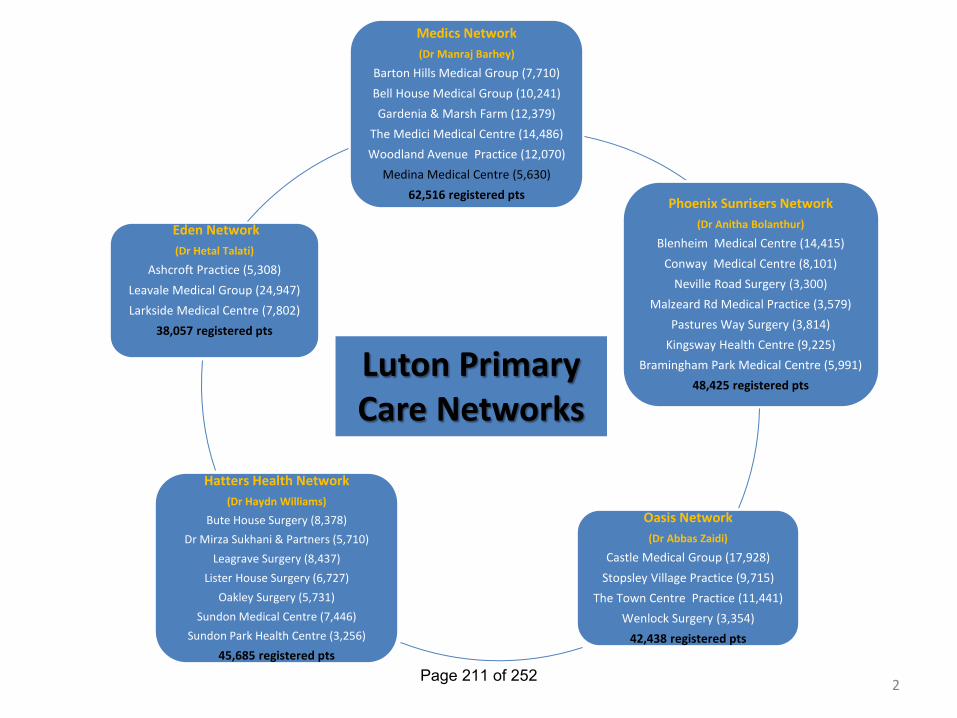
Medics Network (Dr Manraj Barhey)
Barton Hills Medical Group (7,710) Bell House Medical Group (10,241) Gardenia & Marsh Farm (12,379)
The Medici Medical Centre (14,486) Woodland Avenue Practice (12,070)
Medina Medical Centre (5,630) 62,516 registered pts Phoenix Sunrisers Network
(Dr Anitha Bolanthur)
Blenheim Medical Centre (14,415) Conway Medical Centre (8,101)
Neville Road Surgery (3,300) Malzeard Rd Medical Practice (3,579)
Pastures Way Surgery (3,814) Kingsway Health Centre (9,225)
Bramingham Park Medical Centre (5,991) 48,425 registered pts
Oasis Network (Dr Abbas Zaidi)
Castle Medical Group (17,928) Stopsley Village Practice (9,715)
The Town Centre Practice (11,441) Wenlock Surgery (3,354)
42,438 registered pts
Hatters Health Network (Dr Haydn Williams)
Bute House Surgery (8,378) Dr Mirza Sukhani & Partners (5,710)
Leagrave Surgery (8,437) Lister House Surgery (6,727)
Oakley Surgery (5,731) Sundon Medical Centre (7,446)
Sundon Park Health Centre (3,256)
45,685 registered pts
Eden Network (Dr Hetal Talati)
Ashcroft Practice (5,308) Leavale Medical Group (24,947) Larkside Medical Centre (7,802)
38,057 registered pts Luton Primary
Care Networks
2 Page 211 of 252
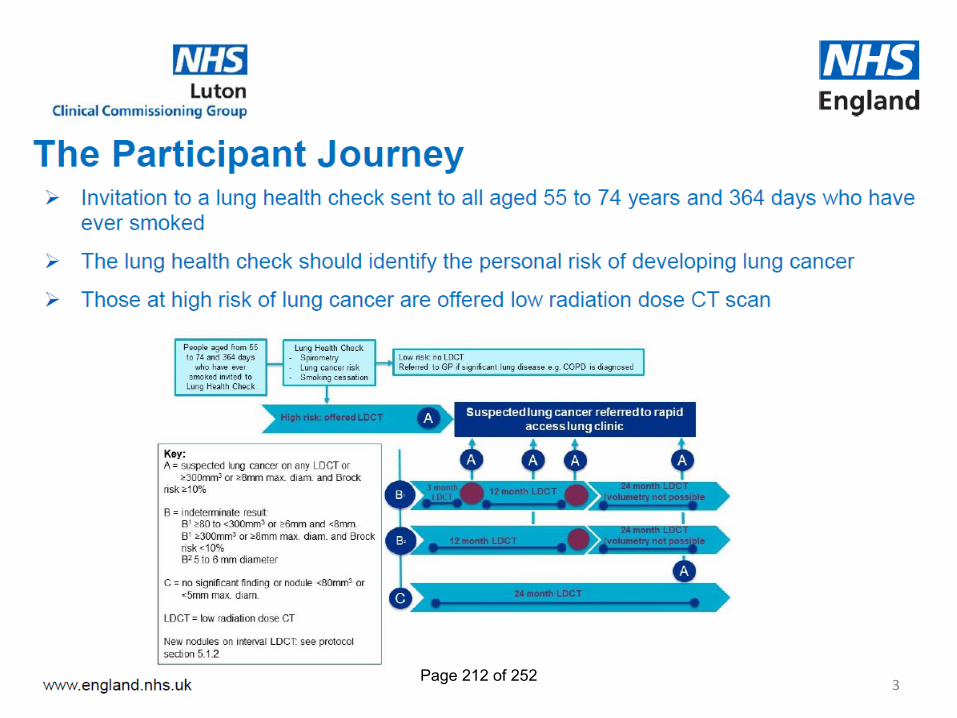
3 Page 212 of 252
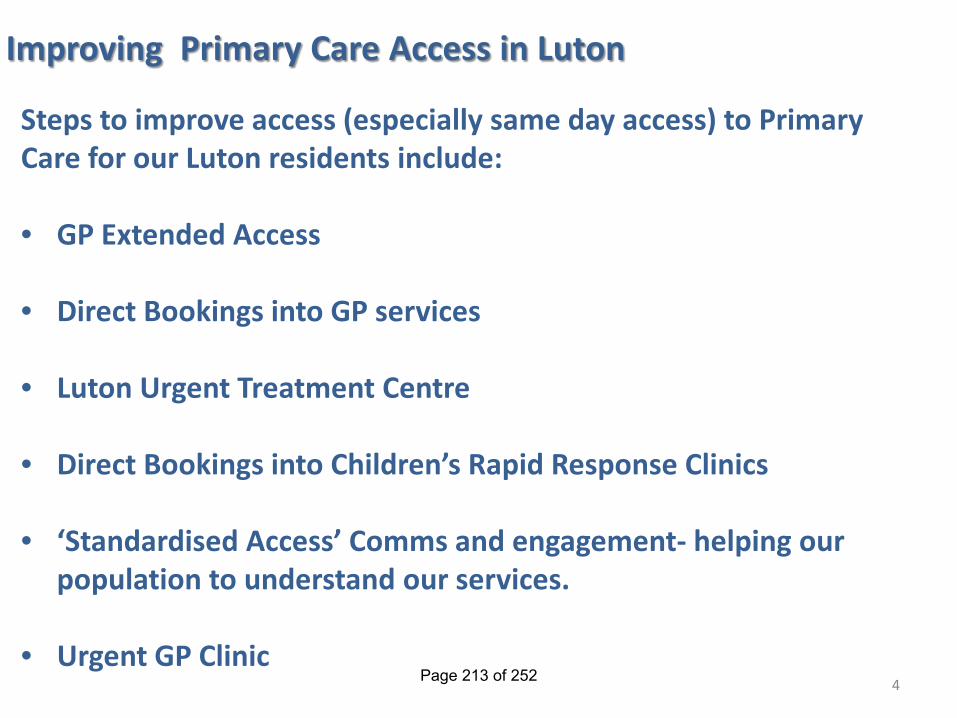
Improving Primary Care Access in Luton
Steps to improve access (especially same day access) to Primary Care for our Luton residents include:
• GP Extended Access
• Direct Bookings into GP services
• Luton Urgent Treatment Centre
• Direct Bookings into Children’s Rapid Response Clinics
• ‘Standardised Access’ Comms and engagement- helping our
population to understand our services.
• Urgent GP Clinic
4 Page 213 of 252
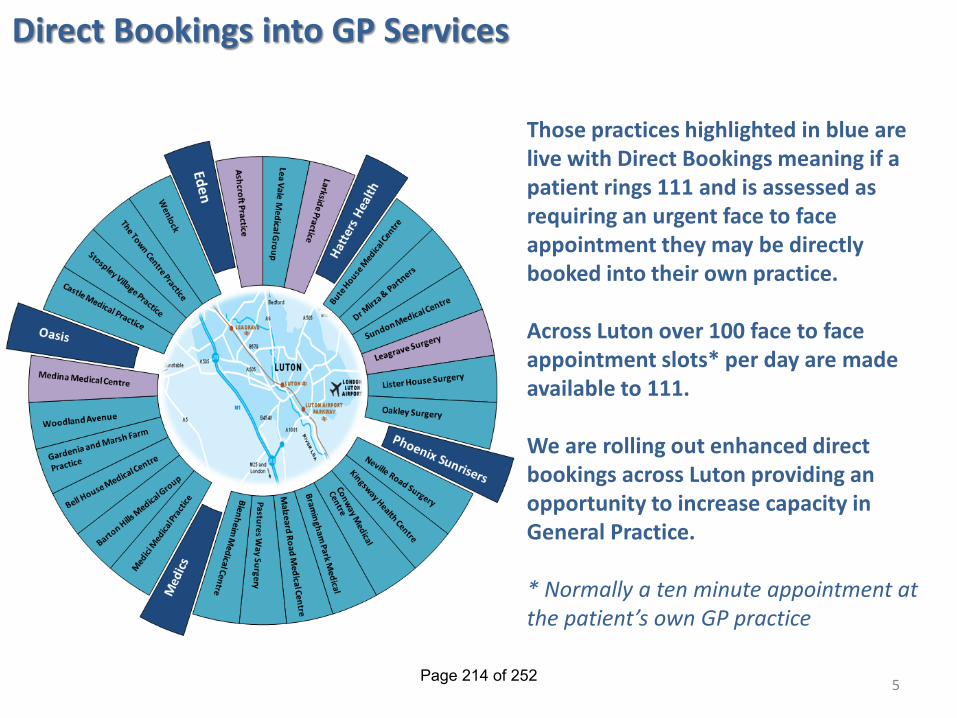
Direct Bookings into GP Services
Those practices highlighted in blue are live with Direct Bookings meaning if a patient rings 111 and is assessed as requiring an urgent face to face appointment they may be directly booked into their own practice. Across Luton over 100 face to face appointment slots* per day are made available to 111. We are rolling out enhanced direct bookings across Luton providing an opportunity to increase capacity in General Practice. * Normally a ten minute appointment at the patient’s own GP practice
5 Page 214 of 252
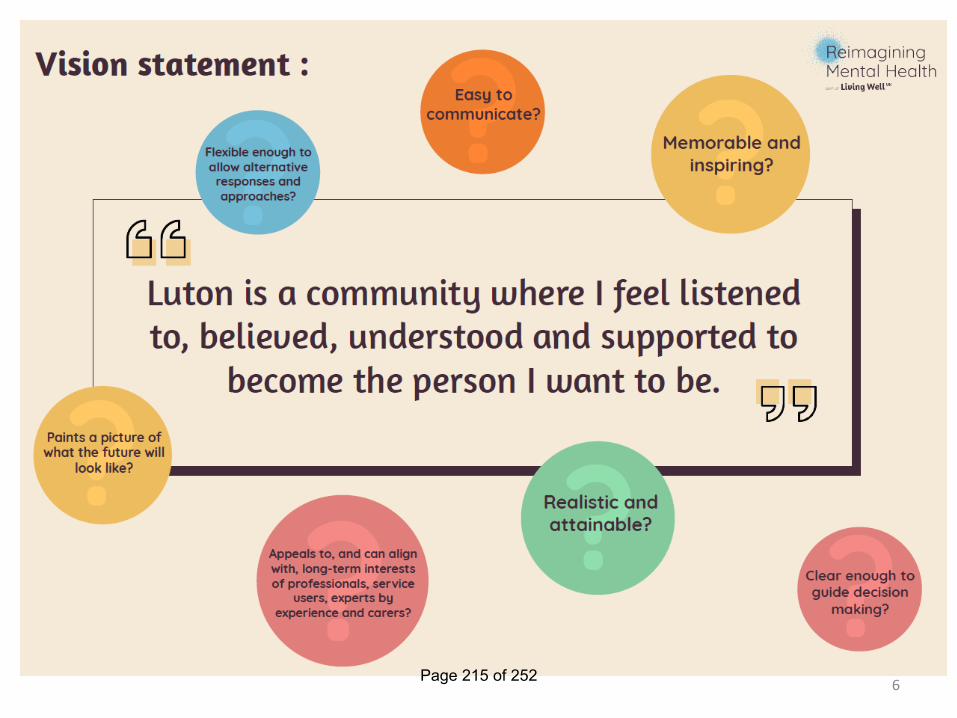
6 Page 215 of 252
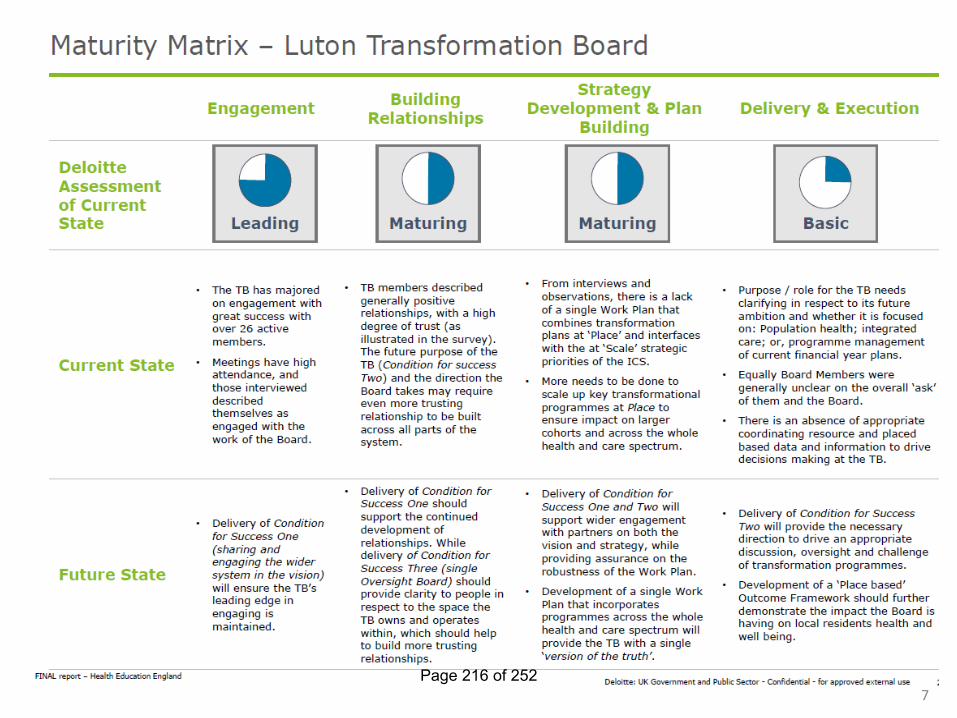
7 Page 216 of 252
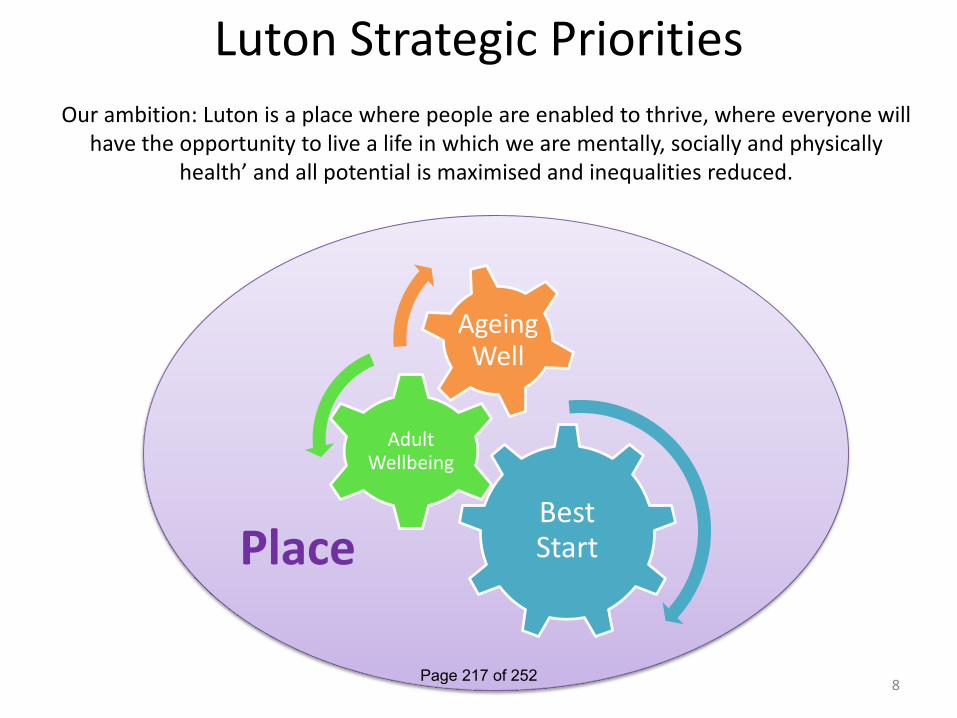
Luton Strategic Priorities
Best Start
Adult Wellbeing
Ageing Well
Place
Our ambition: Luton is a place where people are enabled to thrive, where everyone will have the opportunity to live a life in which we are mentally, socially and physically
health’ and all potential is maximised and inequalities reduced.
8 Page 217 of 252
Developing the Luton Plan
Alignment with the BLMK Long Term Plan (LTP)
We are Luton
9 Page 218 of 252
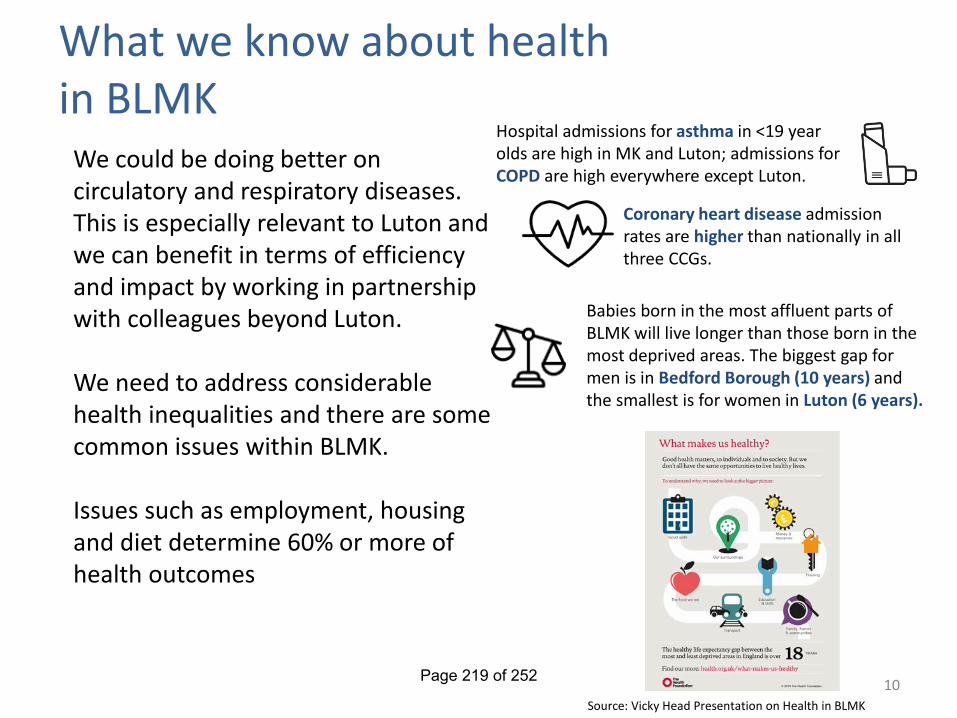
What we know about health in BLMK
10
We could be doing better on circulatory and respiratory diseases. This is especially relevant to Luton and we can benefit in terms of efficiency and impact by working in partnership with colleagues beyond Luton. We need to address considerable health inequalities and there are some common issues within BLMK. Issues such as employment, housing and diet determine 60% or more of health outcomes
Babies born in the most affluent parts of BLMK will live longer than those born in the most deprived areas. The biggest gap for men is in Bedford Borough (10 years) and the smallest is for women in Luton (6 years).
Hospital admissions for asthma in <19 year olds are high in MK and Luton; admissions for COPD are high everywhere except Luton.
Coronary heart disease admission rates are higher than nationally in all three CCGs.
Source: Vicky Head Presentation on Health in BLMK
Page 219 of 252
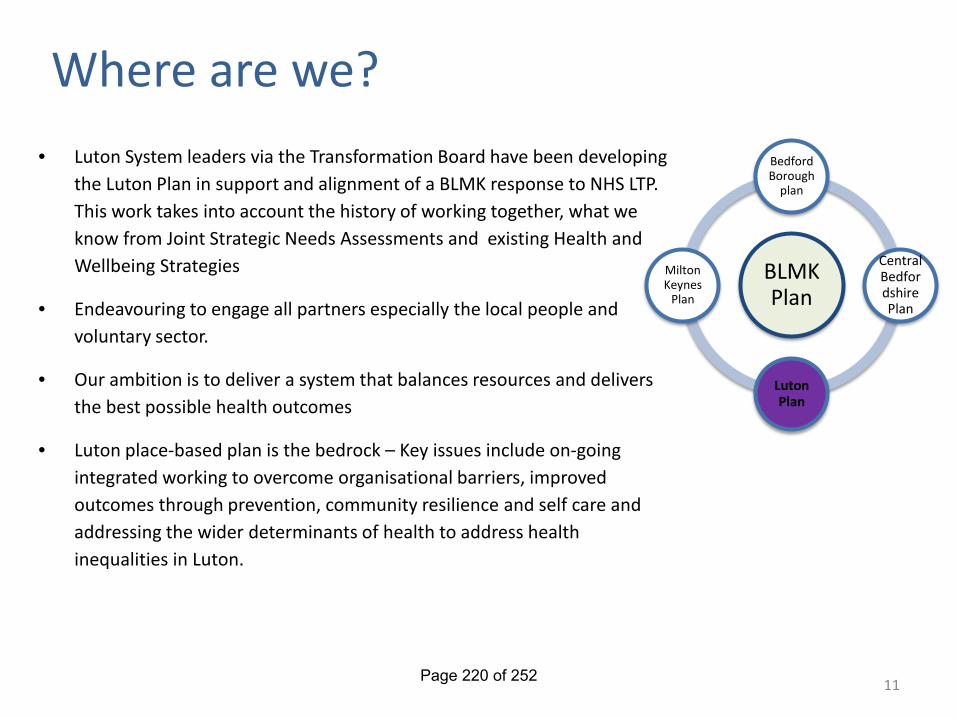
Where are we?
• Luton System leaders via the Transformation Board have been developing the Luton Plan in support and alignment of a BLMK response to NHS LTP. This work takes into account the history of working together, what we know from Joint Strategic Needs Assessments and existing Health and Wellbeing Strategies
• Endeavouring to engage all partners especially the local people and voluntary sector.
• Our ambition is to deliver a system that balances resources and delivers the best possible health outcomes
• Luton place-based plan is the bedrock – Key issues include on-going integrated working to overcome organisational barriers, improved outcomes through prevention, community resilience and self care and addressing the wider determinants of health to address health inequalities in Luton.
11
BLMK Plan
Bedford Borough
plan
Central Bedfordshire Plan
Luton Plan
Milton Keynes
Plan
Page 220 of 252
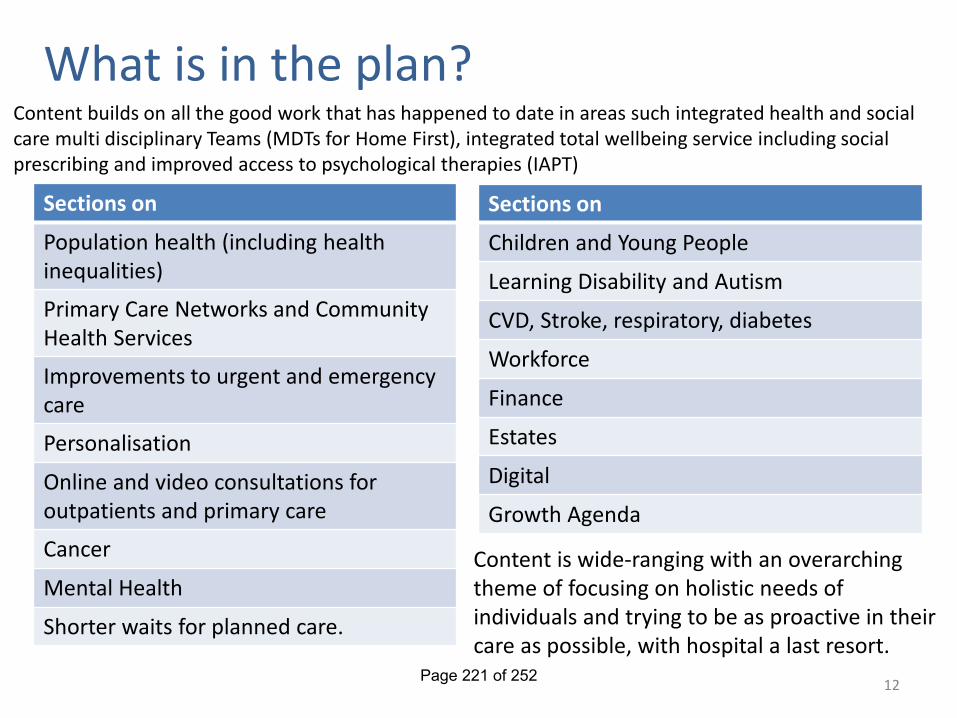
What is in the plan?
12
Sections on
Population health (including health inequalities)
Primary Care Networks and Community Health Services
Improvements to urgent and emergency care
Personalisation
Online and video consultations for outpatients and primary care
Cancer
Mental Health
Shorter waits for planned care.
Sections on
Children and Young People
Learning Disability and Autism
CVD, Stroke, respiratory, diabetes
Workforce
Finance
Estates
Digital
Growth Agenda
Content is wide-ranging with an overarching theme of focusing on holistic needs of individuals and trying to be as proactive in their care as possible, with hospital a last resort.
Content builds on all the good work that has happened to date in areas such integrated health and social care multi disciplinary Teams (MDTs for Home First), integrated total wellbeing service including social prescribing and improved access to psychological therapies (IAPT)
Page 221 of 252
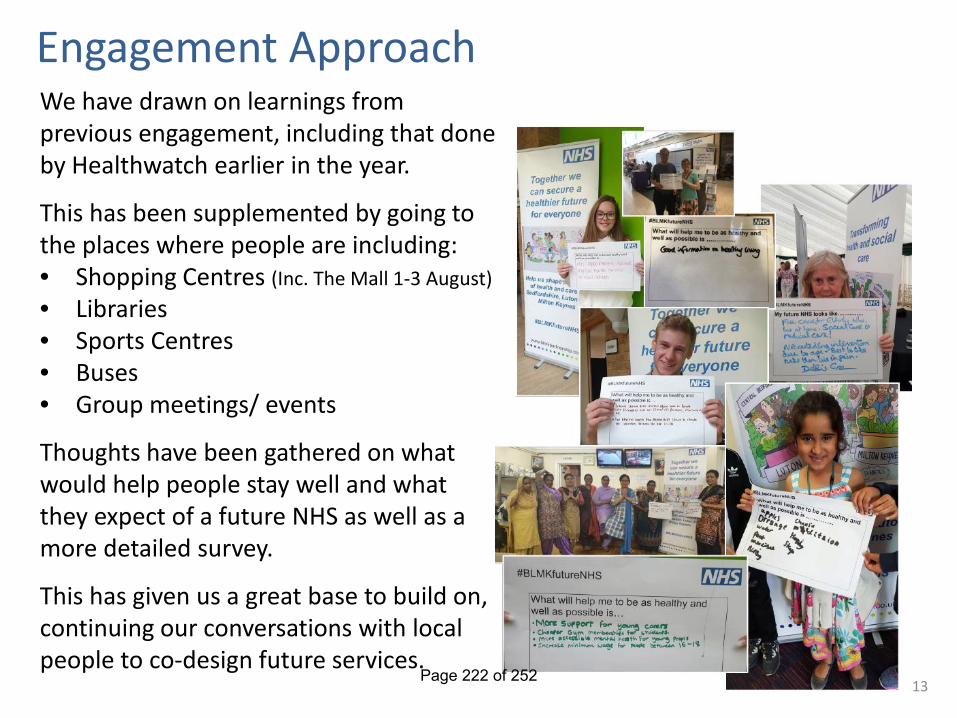
Engagement Approach
13
We have drawn on learnings from previous engagement, including that done by Healthwatch earlier in the year.
This has been supplemented by going to the places where people are including: • Shopping Centres (Inc. The Mall 1-3 August) • Libraries • Sports Centres • Buses • Group meetings/ events
Thoughts have been gathered on what would help people stay well and what they expect of a future NHS as well as a more detailed survey.
This has given us a great base to build on, continuing our conversations with local people to co-design future services.
13 Page 222 of 252
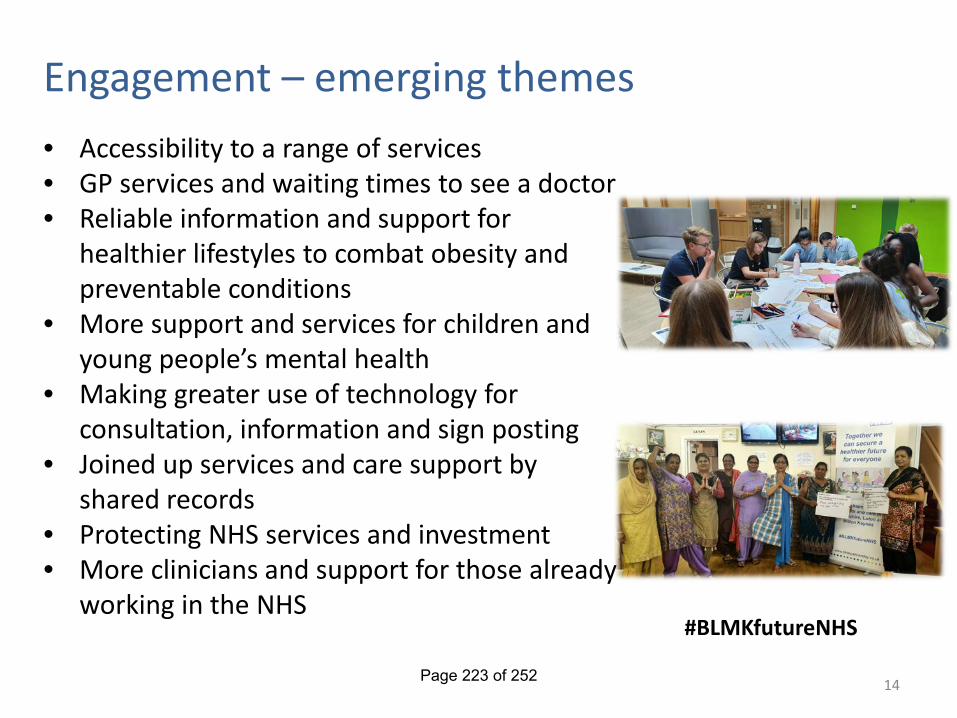
Engagement – emerging themes
14
• Accessibility to a range of services • GP services and waiting times to see a doctor • Reliable information and support for
healthier lifestyles to combat obesity and preventable conditions
• More support and services for children and young people’s mental health
• Making greater use of technology for consultation, information and sign posting
• Joined up services and care support by shared records
• Protecting NHS services and investment • More clinicians and support for those already
working in the NHS #BLMKfutureNHS
Page 223 of 252
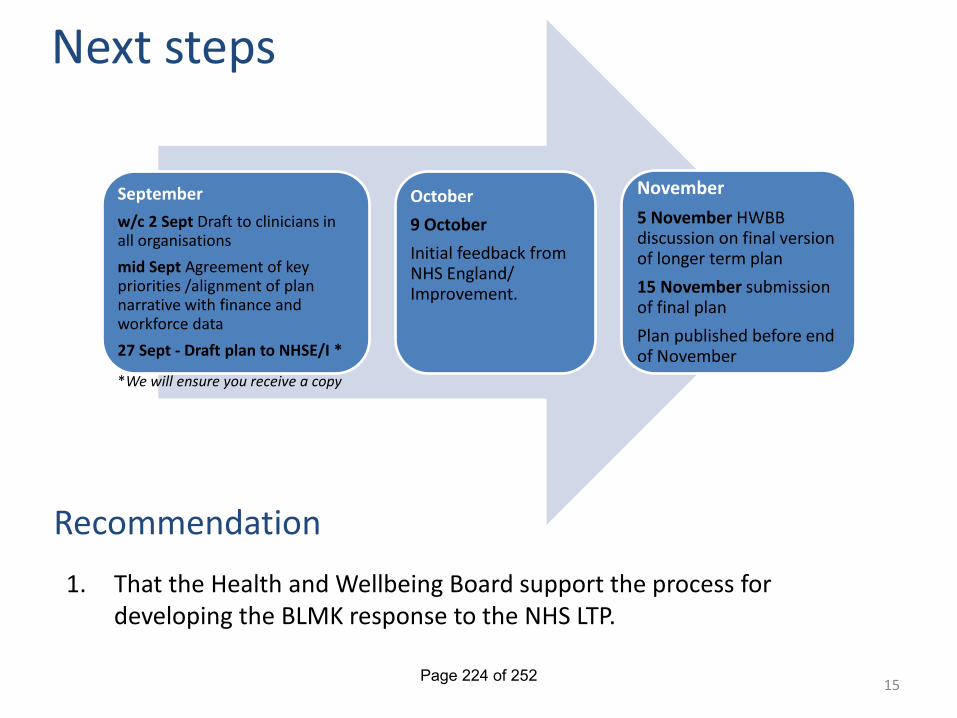
Next steps September
w/c 2 Sept Draft to clinicians in all organisations mid Sept Agreement of key priorities /alignment of plan narrative with finance and workforce data 27 Sept - Draft plan to NHSE/I *
October 9 October Initial feedback from NHS England/ Improvement.
November 5 November HWBB discussion on final version of longer term plan 15 November submission of final plan Plan published before end of November
1. That the Health and Wellbeing Board support the process for developing the BLMK response to the NHS LTP.
Recommendation
*We will ensure you receive a copy
15 Page 224 of 252
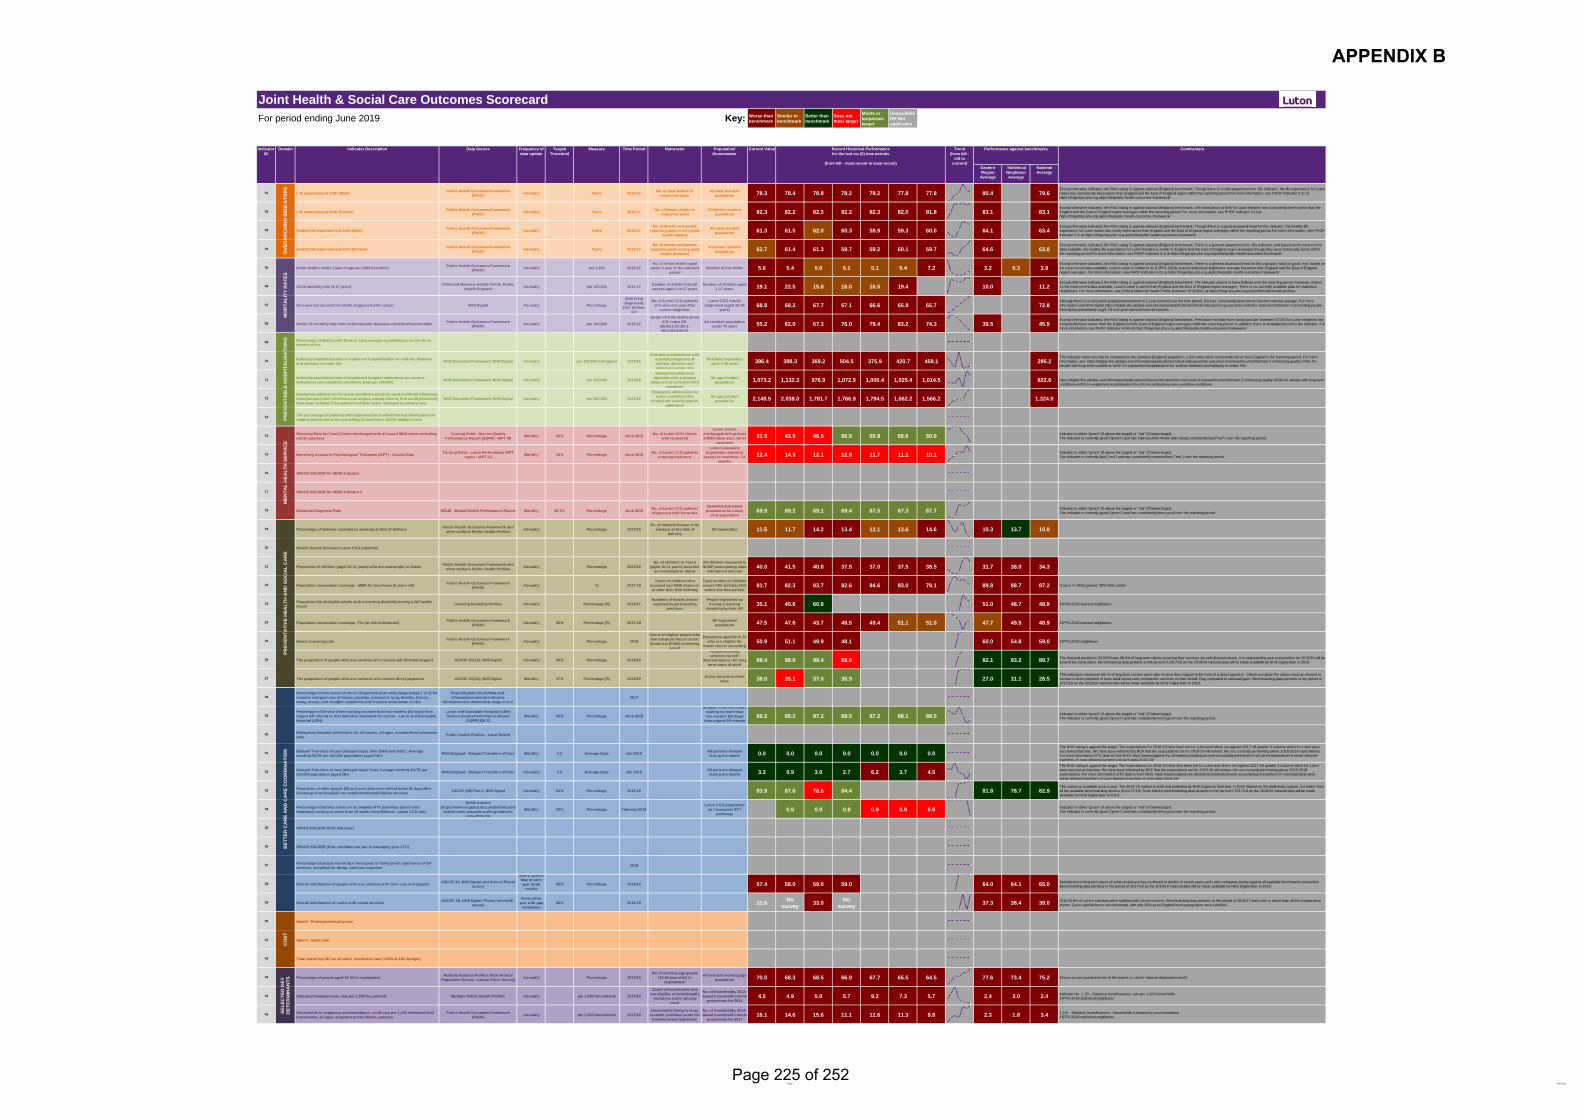
Page 1 June 2019
For period ending June 2019 Key: Worse than benchmark
Similar to benchmark
Better than benchmark
Does not meet target
Meets or surpasses target
Unavailable OR Not applicable
Eastern Region
Average
Statistical Neighbour Average
National Average
01 Life expectancy at birth (Male) Public Health Outcomes Framework (PHOF) Annually Years 2015-17 No. of male deaths in
respective yearsAll male resident
population 78.3 78.4 78.8 78.2 78.2 77.8 77.8 80.4 79.6Except otherwise indicated, the RAG rating is against national (England) benchmark. Though there is a mild upward trend for this indicator, the life expectancy for Luton males has consistently been worse than England and the East of England region within the reporting period.For more information, see PHOF Indicator 0.1ii at https://fingertips.phe.org.uk/profile/public-health-outcomes-framework/
02 Life expectancy at birth (Female) Public Health Outcomes Framework (PHOF) Annually Years 2015-17 No. of female deaths in
respective yearsAll female resident
population 82.3 82.2 82.3 82.2 82.3 82.0 81.8 83.1 83.1Except otherwise indicated, the RAG rating is against national (England) benchmark. Life expectancy at birth for Luton females has consistently been worse than the England and the East of England region averages within the reporting period. For more information, see PHOF Indicator 0.1ii at https://fingertips.phe.org.uk/profile/public-health-outcomes-framework/
03 Healthy life expectancy at birth (Male) Public Health Outcomes Framework (PHOF) Annually Years 2015-17
No. of deaths and people reporting good or very good
health (males)
All male resident population 61.3 61.5 62.0 60.3 58.9 59.3 60.0 64.1 63.4
Except otherwise indicated, the RAG rating is against national (England) benchmark. Though there is a general upward trend for this indicator, the healthy life expectancy for Luton males has mostly been worse than England and the East of England region averages within the reporting period.For more information, see PHOF Indicator 0.1i at https://fingertips.phe.org.uk/profile/public-health-outcomes-framework/
04 Healthy life expectancy at birth (Female) Public Health Outcomes Framework (PHOF) Annually Years 2015-17
No. of deaths and people reporting good or very good
health (females)
All female resident population 62.7 61.4 61.3 59.7 59.2 60.1 59.7 64.6 63.8
Except otherwise indicated, the RAG rating is against national (England) benchmark. There is a general upward trend for this indicator, and based on the most recent data available, the healthy life expectancy for Luton females is similar to England and the East of England region averages though they were historically worse within the reporting period.For more information, see PHOF Indicator 0.1i at https://fingertips.phe.org.uk/profile/public-health-outcomes-framework/
05 Infant deaths under 1 year of age per 1000 live births Public Health Outcomes Framework (PHOF) Annually per 1,000 2015-17
No. of infant deaths aged under 1 year in the relevant
periodNumber of live births 5.6 5.4 5.0 5.1 5.1 5.4 7.2 3.2 5.3 3.9
Except otherwise indicated, the RAG rating is against national (England) benchmark. There is a general downward trend for this indicator, which is good. And, based on the most recent data available, Luton's value is similar to its (CIPFA 2018) nearest statistical neighbours' average but worse than England and the East of England region averages. For more information, see PHOF Indicator 4.01 at https://fingertips.phe.org.uk/profile/public-health-outcomes-framework/
06 Child mortality rate (1-17 years) Child and Maternal Health Profile, Public Health England Annually per 100,000 2015-17 Number of deaths from all
causes aged 1 to 17 yearsNumber of children aged
1-17 years 19.1 22.5 15.8 16.0 16.5 19.4 10.0 11.2Except otherwise indicated, the RAG rating is against national (England) benchmark. The inidcator seems to have flatlined over the reporting period. However, based on the most recent data available, Luton's value is worse than England and the East of England region averages. There is no currently available data for statistical neighbours. For more information, see Child & Maternal Health Profile (Indicator ID 90801) at https://fingertips.phe.org.uk/profile/child-health-profiles.
07 One-year net survival for adults diagnosed with cancer NHS Digital Annually Percentage
2016 (Year diagnosed); 2017 (follow-
up)
No. of Luton CCG patients still alive one year after
cancer diagnosis
Luton CCG Adults diagnosed (aged 15-99
years)68.8 68.2 67.7 67.1 66.6 65.9 65.7 72.8
Although there is a consistent gradual improvement in 1-year survival over the time period, this has consistently been worse than the national average. For more information visit NHS digital: https://digital.nhs.uk/data-and-information/publications/clinical-indicators/ccg-outcomes-indicator-set/current/domain-1-preventing-people-from-dying-prematurely-ccg/1-10-one-year-survival-from-all-cancers.
08 Under 75 mortality rate from cardiovascular diseases considered preventable Public Health Outcomes Framework (PHOF) Annually per 100,000 2015-17
Under-75 CVD deaths (from ICD codes I20-
I26,I42.6,I71,I80.1-I80.3,I80.9,I82.9)
All resident population under 75 years 55.2 62.0 67.3 76.0 79.4 83.2 74.3 39.5 45.9
Except otherwise indicated, the RAG rating is against national (England) benchmark. Premature mortality from cardiovascular diseases (CVD) for Luton residents has consistently been worse than the England and the East of England region averages within the reporting period. In addition, there is downward trend for the indicator. For more information, see PHOF Indicator 4.04ii at https://fingertips.phe.org.uk/profile/public-health-outcomes-framework/
09 Percentage of deaths with three or more emergency admissions in last three months of life
10 Indirectly standarised rate of unplanned hospitalisation for asthma, diabetes and epilepsy in under 19s NHS Outcomes Framework, NHS Digital Annually per 100,000 in England 2017/18
Emergency admissions with a primary diagnosis of asthma, diabetes and epilepsy in under 19s
Resident population aged 0-18 years 386.4 388.3 369.2 504.5 375.9 420.7 458.1 286.2
The indicator rates can only be compared to the standard (England) population. Luton rates were consistently worse than England in the reporting period. For more information, see: https://digital.nhs.uk/data-and-information/publications/clinical-indicators/nhs-outcomes-framework/current/domain-2-enhancing-quality-of-life-for-people-with-long-term-conditions-nof/2-3-ii-unplanned-hospitalisation-for-asthma-diabetes-and-epilepsy-in-under-19s
11 Indirectly standarised rate of unplanned hospital admissions for chronic ambulatory care sensitive conditions (rate per 100,000) NHS Outcomes Framework, NHS Digital Annually per 100,000 2017/18
Emergency admission episodes with a primary
diagnosis of a chronic ACS condition
All-age resident population 1,073.2 1,132.3 976.9 1,072.9 1,006.4 1,025.4 1,014.5 822.6 https://digital.nhs.uk/data-and-information/publications/clinical-indicators/nhs-outcomes-framework/current/domain-2-enhancing-quality-of-life-for-people-with-long-term-
conditions-nof/2-3-i-unplanned-hospitalisation-for-chronic-ambulatory-care-sensitive-conditions
12Emergency admissions for acute conditions (such as ear/nose/throat infections, kidney/urinary tract infections and angina, among others), that could potentially have been avoided if the patient had been better managed in primary care.
NHS Outcomes Framework, NHS Digital Annually per 100,000 2017/18
Emergency admissions for acute conditions that
should not usually require admission
All-age resident population 2,148.5 2,038.0 1,781.7 1,766.9 1,794.5 1,662.2 1,566.2 1,324.0
13 The percentage of patients with hypertension in whom the last blood pressure reading (measured in the preceding 12 months) is 150/90 mmHg or less
14 Recovery Rate for Total Clients discharged with at least 2 MDS taken excluding not at caseness
Turning Point - Service Quality Performance Report (SQPR) - IAPT 08 Monthly 50% Percentage June 2019 No. of Luton CCG clients
who recovered
Luton clients discharged with at least 2 MDS taken excl. not at
caseness31.5 43.5 46.5 56.5 55.8 55.6 50.0 Indicator is either "green" (if above the target) or "red" (if below target).
The indicator is currently good ("green") and has improved this month after being consistently bad ("red") over the reporting period.
15 Improving Access to Psychological Therapies (IAPT) - Access Rate Turning Point - Luton Performance IAPT report - IAPT-13 Monthly 19% Percentage June 2019 No. of Luton CCG patients
entering treatment
Luton's prevalent population requiring
access to treatment / 12 months
12.4 14.3 12.1 12.9 11.7 11.1 10.1 Indicator is either "green" (if above the target) or "red" (if below target). The indicator is currently bad ("red") and has consistently remainedbad ("red") over the reporting period.
16 SPACE HOLDER for SEND Indicator
17 SPACE HOLDER for SEND Indicator 2
18 Dementia Diagnosis Rate NELIE - Mental Health Performance Report Monthly 66.7% Percentage June 2019 No. of Luton CCG patients diagnosed with Dementia
Dementia Estimated prevalence for Luton
CCG population69.9 69.2 69.1 69.4 67.5 67.3 67.7 Indicator is either "green" (if above the target) or "red" (if below target).
The indicator is currently good ("green") and has consistently been good over the reporting period.
19 Percentage of mothers recorded as smoking at time of delivery Public Health Outcomes Framework and other multiple Public Health Profiles Annually Percentage 2017/18
No. of mothers known to be smokers at the time of
deliveryAll maternities 11.5 11.7 14.2 13.4 12.1 13.6 14.6 10.3 13.7 10.8
20 Health checks Delivered Luton CCG (monthly)
21 Proportion of children (aged 10-11 years) who are overweight or obese Public Health Outcomes Framework and other multiple Public Health Profiles Annually Percentage 2017/18
No. of children in Year 6 (aged 10-11 years) classifed
as overweight or obese
All children measured in NCMP participating state
maintained schools40.0 41.5 40.8 37.5 37.0 37.5 38.5 31.7 38.0 34.3
22 Population vaccination coverage - MMR for two doses (5 years old) Public Health Outcomes Framework (PHOF) Annually % 2017-18
Count of children who received two MMR doses on or after their fifth birthday
Total number of children whose fifth birthday falls
within the time period.81.7 82.3 83.7 82.6 84.6 83.0 79.1 89.8 88.7 87.2 Goal is >= 95% (green). 90%-95% amber
23 Proportion (%) of eligible adults with a learning disability having a GP health check Learning Disability Profiles Annually Percentage (%) 2016/17
Numbers of health checks reported by participating
practices
People registered as having a learning
disability by their GP 35.1 40.6 60.8 51.0 48.7 48.9 CIPFA 2018 nearest neighbours
24 Population vaccination coverage - Flu (at risk individuals) Public Health Outcomes Framework (PHOF) Annually 55% Percentage (%) 2017-18 GP registered
population 47.5 47.6 43.7 48.5 49.4 51.1 51.0 47.7 49.5 48.9 CIPFA 2018 nearest neighbours
25 Bowel screening rate Public Health Outcomes Framework (PHOF) Annually Percentage 2018
Count of eligible people who had adequate faecal occult blood test (FOBt) screening
result
Population aged 60 to 74 who are eligible for
bowel cancer screening 50.9 51.1 49.9 48.1 60.0 54.8 59.0 CIPFA 2018 neighbours
26 The proportion of people who use services who receive self-directed support ASCOF 1C(1A), NHS Dgital Annually 90% Percentage 2018/19
People receiving services via self-
directed means / All long term users of adult i l h t t
98.4 98.6 98.4 68.6 82.1 93.2 89.7 The final end position in 2018/19 was 98.4% of long term clients receiving their services via self directed means. It is expected the year end position for 2019/20 will be around the same place. Benchmarking data pertains to the period of 2017/18 as the 2018/19 national data will be made available by NHS Digital later in 2019.
27 The proportion of people who use services who receive direct payments ASCOF 1C(2A), NHS Dgital Monthly 37% Percentage (%) 2018/19 Active long term client base 38.0 35.1 37.0 36.9 27.0 31.1 28.5
This indicators measures the % of long term service users who receive their support in the form of a direct payment. Clients are given the choice and can choose to receive a direct payment of have adult social care commission services on their behalf. Rag compared to national figure. Benchmarking data pertains to the period of 2017/18 as the 2018/19 national data will be made available by NHS Digital later in 2019.
28Percentage of new cases of cancer diagnosed at an early stage (stage 1 or 2) for invasive malignancies of breast, prostate, colorectal, lung, bladder, kidney, ovary, uterus, non-Hodgkin lymphoma and invasive melanomas of skin
https://digital.nhs.uk/data-and-information/national-indicator-
library/cancers-detected-at-stage-1-or-22017
29Percentage of Service Users waiting no more than two months (62 days) from urgent GP referral to first definitive treatment for cancer - Luton and Dunstable Hospital (LDH)
Luton and Dunstable Hospital (LDH) Service Quality Performance Report
(SQPR) EB 12Monthly 85% Percentage June 2019
Number of Service Users waiting no more than two months (62 days)
from urgent GP referral t fi t d fi iti
86.2 85.2 87.2 89.5 87.2 88.1 88.5 Indicator is either "green" (if above the target) or "red" (if below target). The indicator is currently good ("green") and has consistently been good over the reporting period.
30 Emergency hospital admissions for all causes, all ages, standardised admission ratio Public Health Profiles - Local Health
31 Delayed Transfers of care (delayed days) Joint (NHS and ASC) , Average monthly RATE per 100,000 population (aged 18+) NHS England - Delayed Transfers of Care Monthly 0.2 Average Days Jan 2019 All patients delayed
during the month 0.0 0.0 0.0 0.0 0.0 0.0 0.0The RAG rating is against the target. The expectations for 2018-19 have been set for Luton and where set against 2017-18 quarter 3 outturns which for Luton were very low at that time. We have been informed by BCF that the expectations set for 2018-19 will remain. We are currently performing above 2018-2019 expectations. For more information DTC data is from NHS; https://www.england.nhs.uk/statistics/statistical-work-areas/delayed-transfers-of-care/statistical-work-areas-delayed-transfers-of-care-delayed-transfers-of-care-data-2018-19/
32 Delayed Transfers of care (delayed days) Total, Average monthly RATE per 100,000 population (aged 18+) NHS England - Delayed Transfers of Care Annually 3.9 Average Days Jan 2019 All patients delayed
during the month 3.3 0.9 3.0 2.7 6.2 3.7 4.5The RAG rating is against the target. The expectations for 2018-19 have also been set for Luton and where set against 2017-18 quarter 3 outturns which for Luton were very low at that time. We have been informed by BCF that the expectations set for 2018-19 will remain. We are currently performing above 2018-2019 expectations. For more information DTC data is from NHS; https://www.england.nhs.uk/statistics/statistical-work-areas/delayed-transfers-of-care/statistical-work-areas-delayed-transfers-of-care-delayed-transfers-of-care-data-2018-19/
33 Proportion of older people (65 and over) who were still at home 91 days after discharge from hospital into reablement/rehabilitation services ASCOF (2B) Part 1, NHS Dgital Annually 81% Percentage 2018-19 93.9 87.6 78.6 84.4 81.8 78.7 82.9
This outturn is available once a year. The 2018-19 outturn is draft until published by NHS Digital as final later in 2019. Based on the preliminary outturn, it is better than all the available benchmarking metrics (from 17/18). Note that the benchmarking data pertains to the period of 2017/18 as the 2018/19 national data will be made available by NHS Digital later in 2019.
34 Percentage of Service Users on incomplete RTT pathways (yet to start treatment) waiting no more than 18 weeks from Referral - Luton CCG only
NHSE website (https://www.england.nhs.uk/statistics/sta
tistical-work-areas/rtt-waiting-times/rtt-data-2018-19)
Monthly 92% Percentage February 2019Luton CCG population
on incomplete RTT pathways
0.9 0.9 0.9 0.9 0.9 0.9 Indicator is either "green" (if above the target) or "red" (if below target). The indicator is currently good ("green") and has consistently been good over the reporting period.
35 SPACE HOLDER (CHC Indicator)
36 SPACE HOLDER (How confident are you in managing your LTC)
37 Percentage of people reporting a 'very good' or 'fairly good' experience of GP services, weighted for design and non-response 2018
38 Overall satisfaction of people who use services with their care and support ASCOF 3A, NHS Dgital and Annual Postal Survey
yearly, approx May of each year (draft
results il bl )
65% Percentage 2018/19 57.4 58.0 59.0 59.0 64.0 64.1 65.0 Satisfaction of long term users of adult social care has continued to decline in recent years and Luton compares poorly against all available benchmarks presented. Benchmarking data pertains to the period of 2017/18 as the 2018/19 national data will be made available by NHS Digital later in 2019.
39 Overall satisfaction of carers with social services ASCOF 3B, NHS Dgital / Postal Survey Bi-annual
Every other year with gap
inbetween40% 2018-19 33.6 No
survey 33.0 No survey 37.3 38.4 39.0 Only 33.6% of carers said they were satisfied with social services. Benchmarking data pertains to the period of 2016/17 and Luton is worse than all the comparators
shown. Carer satisfaction is low nationnally, with only 39% at an England level saying there were satisfied.
40 Spend - Primary/community care
41 Spend - acute care
42 Total spend by LBC on all adult residential care (<30% of ASC budget)
43 Percentage of people aged 16-64 in employment Multiple National Profiles (from Annual Population Survey - Labour Force Survey) Annually Percentage 2017/18
No. of working age people (16-64 year olds) in
employment
All resident working age population 70.0 68.3 68.5 66.9 67.7 65.5 64.5 77.6 73.4 75.2 Worse across board and one of the lowest in Luton's 'national deprivation decile'
44 Statutory homelessness, rate per 1,000 households Multiple Public Health Profiles Annually per 1,000 households 2017/18
Count of households who are eligible, unintentionally
homeless and in priority need
No. of households, 2012-based household interim
projections for 20144.5 4.9 5.0 5.7 9.2 7.3 5.7 2.4 3.0 2.4 Indicator No. 1.15i - Statutory homelessness: rate per 1,000 households
CIPFA 2018 statistical neighbours
45 Households in temporary accommodation, crude rate per 1,000 estimated total households, all ages, snapshot at 31st March, persons
Public Health Outcomes Framework (PHOF) Annually per 1,000 households 2017/18
Households living in temp. accomm. provided under the
homelessness legislation
No. of households, 2014-based household interim
projections for 201716.1 14.6 15.6 11.1 12.6 11.3 9.8 2.3 1.8 3.4 1.15ii - Statutory homelessness - households in temporary accommodation
CIPFA 2018 statistical neighbours
SELE
CTE
D K
EY
DET
ERM
INA
NTS
O
VER
AR
CH
ING
IND
ICA
TOR
S
Performance against benchmarks
MEN
TAL
HEA
LTH
SER
VIC
EC
OST
Trend (from left -
old to current)
Recent Historical Performancefor the last six (6) time periods
(from left - most recent to least recent)
Time Period Current Value
PREV
ENTA
TIVE
HEA
LTH
AN
D S
OC
IAL
CA
RE
BET
TER
CA
RE
AN
D C
AR
E C
OO
RD
INA
TIO
N
Numerator
Joint Health & Social Care Outcomes Scorecard
PREV
ENTA
BLE
HO
SPIT
ALI
SATI
ON
SM
OR
TALI
TY R
ATE
S
Indicator ID
Domain Indicator Description Data Source Frequency of data update
Target/Threshold
Measure CommentaryPopulation/ Denominator
APPENDIX B
Page 225 of 252
HEALTH AND WELLBEING BOARD
AGENDA ITEM
10
DATE OF MEETING: 19 September 2019 REPORT OF: The Chief Operating Officer, Luton CCG
REPORT AUTHOR: Angela Duce SUBJECT: Integrated Strategy for People with Learning Disabilities in
Luton WARD(S) AFFECTED: All PURPOSE 1. For approval.
RECOMMENDATION(S) 2. It is recommended that the strategy is supported and approved as the
direction of travel for the commissioning of learning disability services in Luton.
3. It is also recommended that a separate all-age neurodiversity strategy
is developed to address commissioning for people with autism spectrum disorders and other neuro-diverse conditions to enable active citizenship and healthy lives.
BACKGROUND 4. The draft strategy developed by the Integrated Commissioning Team for
Learning disabilities provides a focus for the commissioning of learning disabilities for people in Luton. It aims to provide a model to support people of all ages with a learning disability, including those with behaviour that challenges or with a mental health condition. Whilst it addresses support for people with autism who also have a learning disability, it is recommended that an additional neurodiversity strategy is developed.
5. The strategy is deliberately intended to be a short document, with the detail
of the underpinning schemes detailed in a key priorities document. This is a dynamic document which will inform delivery plans. The Learning Disability Partnership Forum has discussed the contents of the strategy and has provided further input to inform the delivery of priorities, with a particular focus on the reasonable adjustments needed to enable active citizenship.
Page 226 of 252
6. The strategy integrates with the Bedfordshire, Luton and Milton Keynes Transforming Care Programme, the priorities of which are attached in the Appendices. The strategy is also fully compliant with the NHS Long Term Plan priorities.
REPORT 7. The Strategy is attached.
IMPLICATIONS 8. Children, young people and adults with a learning disability including those who
display behaviour that challenges or with a mental health condition have the right to the same opportunities as anyone else to live satisfying and valued lives and to be treated with the same dignity and respect. They should have a home within their community, be able to develop and maintain relationships and get the support they need to live a healthy, safe and fulfilling life.
9. Working together as a single entity, Luton Borough Council and Luton Clinical
Commissioning Group (LBC/LCCG) will ensure the best outcomes for people by working in partnership with individuals and families/carers and through the adoption of person-centred approaches which are vital to delivering independence and control for people and ensuring that their wishes and aspirations for their own life are at the centre of their care and support arrangements.
CONSULTATIONS 10. The strategy was written following consultation with key stakeholders in Luton.
Three workshops were held in the summer of 2018 which focused on the areas of health and wellbeing, accommodation and support and work, learning and leisure. The Learning Disability Partnership Forum was also consulted.
11. The strategy has been agreed by the Joint Strategic Commissioning Group and
the Luton CCG Governing Body, it has also been shared with the Local Safeguarding Adults Board.
APPENDICES Appendix 1 - Learning Disability Strategy Appendix 2 - Transforming Care Partnership Priorities
LIST OF BACKGROUND PAPERS LOCAL GOVERNMENT ACT 1972, SECTION 100D Valuing People Now (2009); The Health and Social Care Act (2012); The Care Act (2014); ADASS/NHSE Service Model for Commissioners of Health and Social Care (October 2015); Building the Right Support (2015); The NHS Long Term Plan 2019.
Page 227 of 252
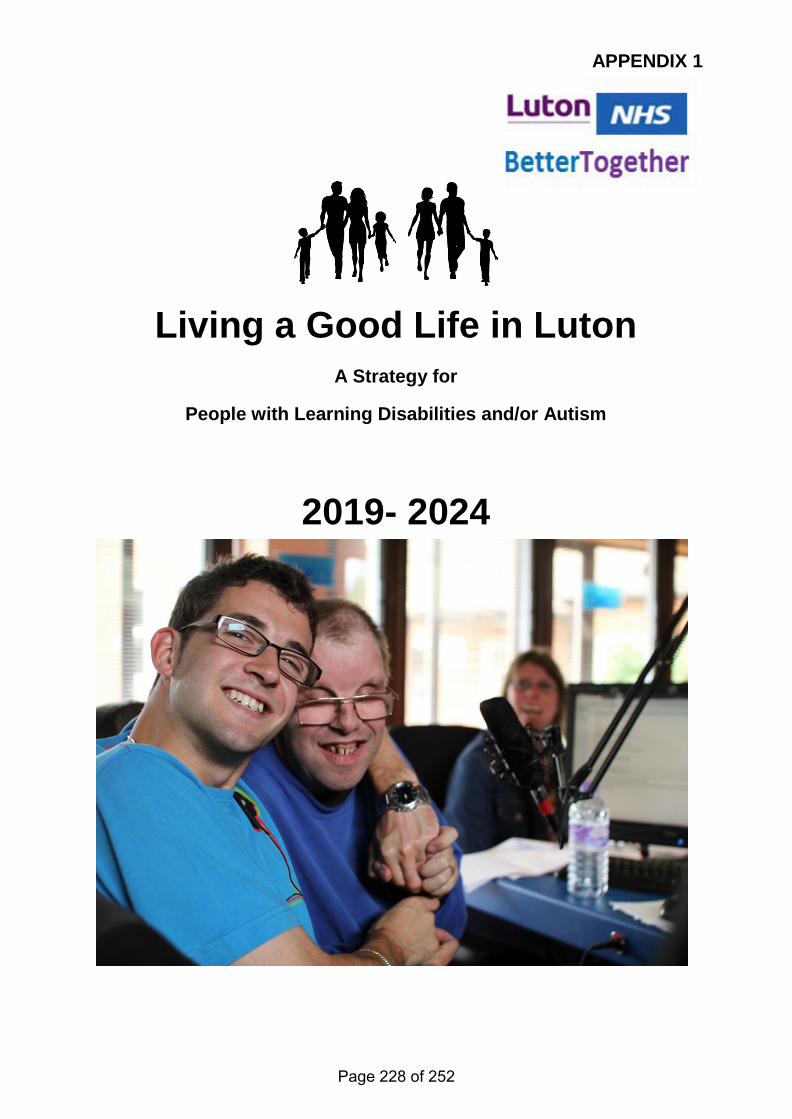
APPENDIX 1
Living a Good Life in Luton A Strategy for
People with Learning Disabilities and/or Autism
2019- 2024
Page 228 of 252
1 Systmone search March 2019
Who is the Strategy for? This strategy provides a model to support people of all ages with a learning disability, including those with behaviour that challenges or with a mental health condition, although the majority of interventions are aimed at people over the age of 14 years. It is also for people with autism who have a learning disability and anyone with a learning disability and/or autism whose behaviour can lead to contact with mental health services or the Criminal Justice System.
Support for this very diverse group of people needs to be highly individualised but there are some common needs that that services in Luton need to address to ensure that everyone is able to live a fulfilling, healthy life in their community. This strategy supports the priorities of the Bedfordshire, Luton and Milton Keynes Transforming Care Plan (Appendix A) and should also be read with the linked strategies:
• Strategy Children aged 0-25 years; • Bedfordshire, Luton and Milton Keynes Autism and other Neurodiversity Strategy (to be
written 2019); • Luton Carers’ Strategy; • Luton Housing Strategy.
The Vision We wish to enable people with learning disabilities and/or autism to maximise their opportunity to be part of their local community and to support them to live a fulfilling, meaningful life.
Working together, Luton Borough Council and Luton Clinical Commissioning Group will ensure best outcomes by working in partnership with the people we support, their families and carers to deliver high-quality local support that focuses on independence, promoting resilience and reducing the reliance on out-of-area placements.
We will adopt a strengths-based approach, starting with considering what people can do for themselves, what they could achieve with further support and what they will be able to do independently in the future.
Life in Luton for People with Learning Disabilities and/or Autism Nationally, it is know that only a proportion of people with learning disabilities are accessing statutory health and social care services. In Luton, there are 654 adults and children accessing social care (2018), however, we know that there are 2409 people (adults and children) with a learning disability registered with GP Practices1. This number increases to over 6000 when including people with an autistic spectrum condition.
We know that the population of Luton is relatively young, with most being under 40 years, but that there is an increase in the numbers of people growing older with a learning disability. There are more males in the younger age group accessing services and we need to understand why this is.
Page 229 of 252
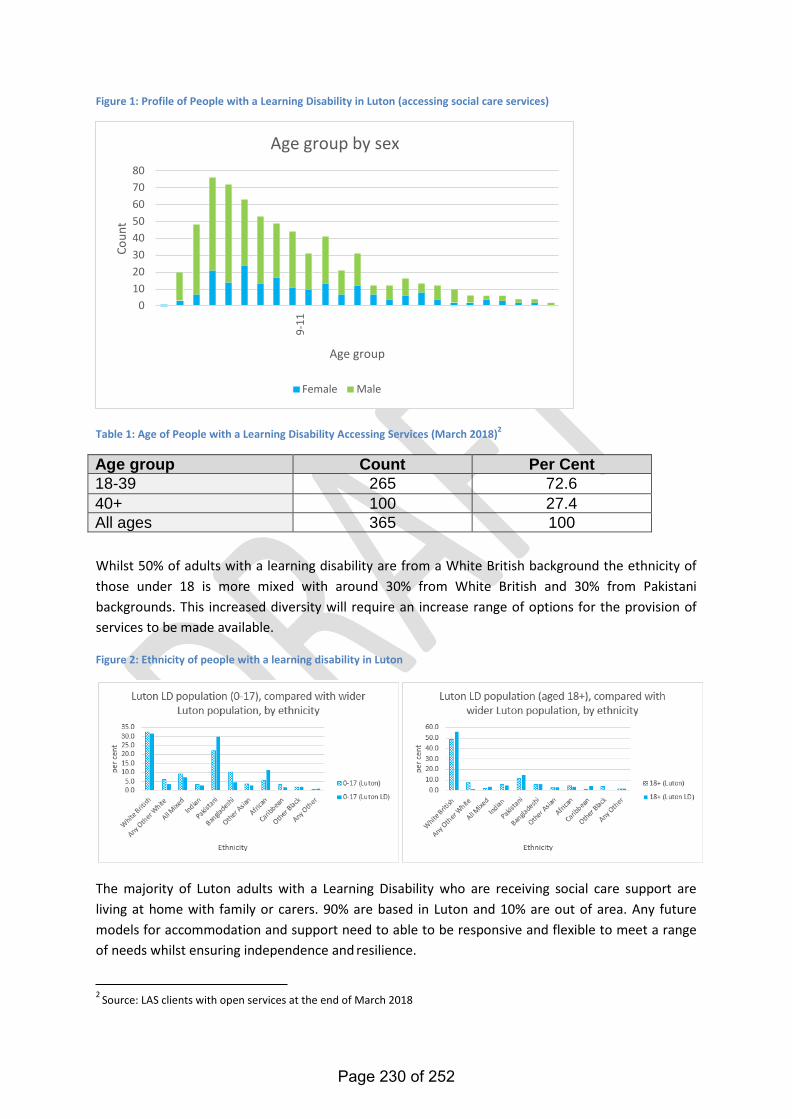
2 Source: LAS clients with open services at the end of March 2018
Figure 1: Profile of People with a Learning Disability in Luton (accessing social care services)
Age group by sex
80 70 60 50 40 30 20 10
0
Age group
Female Male
Table 1: Age of People with a Learning Disability Accessing Services (March 2018)2
Age group Count Per Cent 18-39 265 72.6 40+ 100 27.4 All ages 365 100
Whilst 50% of adults with a learning disability are from a White British background the ethnicity of those under 18 is more mixed with around 30% from White British and 30% from Pakistani backgrounds. This increased diversity will require an increase range of options for the provision of services to be made available.
Figure 2: Ethnicity of people with a learning disability in Luton
The majority of Luton adults with a Learning Disability who are receiving social care support are living at home with family or carers. 90% are based in Luton and 10% are out of area. Any future models for accommodation and support need to able to be responsive and flexible to meet a range of needs whilst ensuring independence and resilience.
Coun
t
9-
11
Page 230 of 252
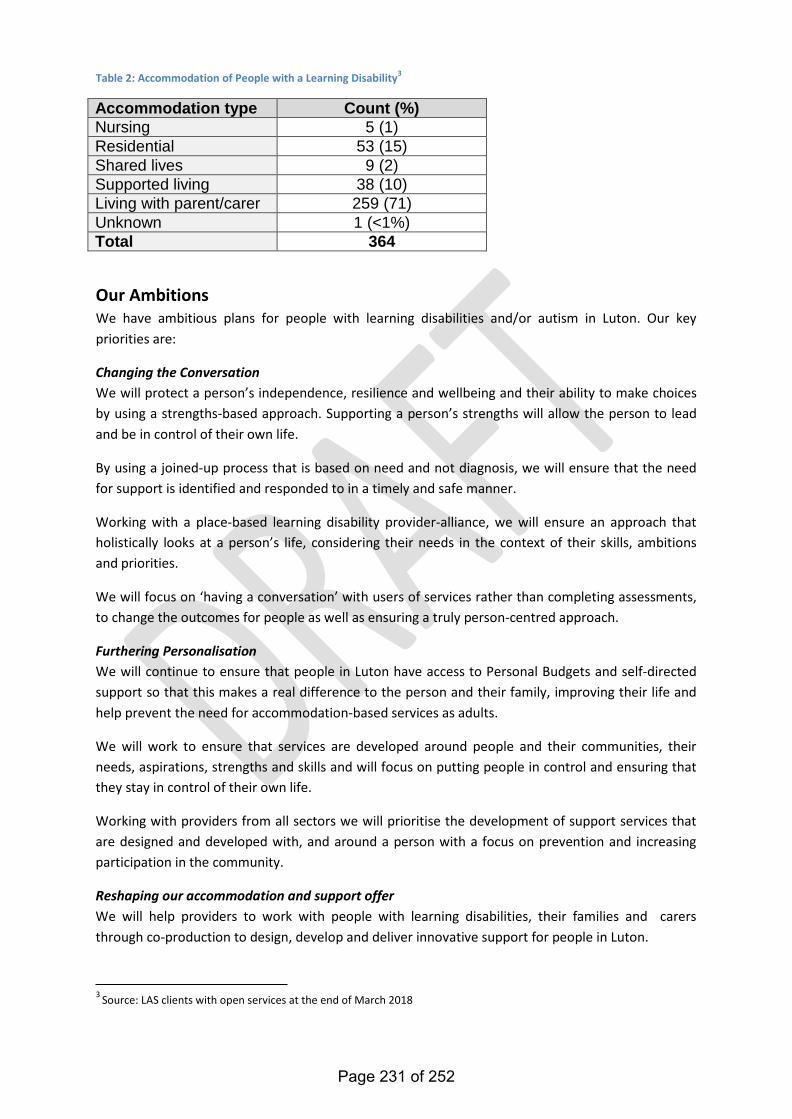
3 Source: LAS clients with open services at the end of March 2018
Table 2: Accommodation of People with a Learning Disability3
Accommodation type Count (%) Nursing 5 (1) Residential 53 (15) Shared lives 9 (2) Supported living 38 (10) Living with parent/carer 259 (71) Unknown 1 (<1%) Total 364
Our Ambitions We have ambitious plans for people with learning disabilities and/or autism in Luton. Our key priorities are:
Changing the Conversation We will protect a person’s independence, resilience and wellbeing and their ability to make choices by using a strengths-based approach. Supporting a person’s strengths will allow the person to lead and be in control of their own life.
By using a joined-up process that is based on need and not diagnosis, we will ensure that the need for support is identified and responded to in a timely and safe manner.
Working with a place-based learning disability provider-alliance, we will ensure an approach that holistically looks at a person’s life, considering their needs in the context of their skills, ambitions and priorities.
We will focus on ‘having a conversation’ with users of services rather than completing assessments, to change the outcomes for people as well as ensuring a truly person-centred approach.
Furthering Personalisation We will continue to ensure that people in Luton have access to Personal Budgets and self-directed support so that this makes a real difference to the person and their family, improving their life and help prevent the need for accommodation-based services as adults.
We will work to ensure that services are developed around people and their communities, their needs, aspirations, strengths and skills and will focus on putting people in control and ensuring that they stay in control of their own life.
Working with providers from all sectors we will prioritise the development of support services that are designed and developed with, and around a person with a focus on prevention and increasing participation in the community.
Reshaping our accommodation and support offer We will help providers to work with people with learning disabilities, their families and carers through co-production to design, develop and deliver innovative support for people in Luton.
Page 231 of 252
People will be able to choose where they live and who they live with. We will ensure that people will be helped to have their own home, in their own community and will reduce the reliance on residential care and out-of-area placements.
Building healthy, safe and fulfilling lives We will support people to be active in their community and to be able to do things for themselves with their own friends and family. We aspire to change Luton’s culture to ensure that employment, meaningful occupation and leisure activities are made available for everyone irrespective of ability.
To help people to have the best opportunities we will also focus on improving health and wellbeing and ensuring that reasonable adjustments are made to improve access to mainstream and universal health services.
Golden Threads The human rights of people with learning disabilities must be considered at all times; so there are a number of ‘golden threads’4 that run through the strategy:
• ‘A good Life’ – care and support will be centred on the person to help them to achieve their goals and aspirations. People will be treated with dignity and respect and be supported to live in their own homes within their community, supported by local services;
• Keeping people safe – people will be supported to take positive risks whilst ensuring that they are protected from harm. There should be a culture of transparent and open reporting ensuring that lessons are learned and acted upon;
• Choice – people will have choice and control over their own health and care services. There will be a shift away from ‘doing to’ to ‘working with people’ recognising that individuals, their families and carers are the experts in their own lives and are able to make informed decisions about the support that they receive. People should be supported to make their own decisions about care and support in line with the Mental Capacity Act (Year). For anyone that lacks capacity, decisions will be made in their best interests, involving them as much as possible;
• Freedom - people will always be supported in the least restrictive manner. Where a person needs extra support for their own protection or the protection of others, this will be for the shortest time possible;
• Healthy life – we want fair health for everyone. Universal services will be available to all people with reasonable adjustments made where necessary.
How will we do this? In line with the provisions of the Care Act 2014 and the Children and Families Act 2014 we are committed to a whole-scale transformation focusing on strengthening support in the community by building on prevention, avoiding crises and supporting active citizenship with all the benefits that this brings. We aim to:
4 Service Model for Commissioners of Health and Social Care (October 2015).
Page 232 of 252
• Commission preferred providers for supported living services including those who can specialise in supporting people with complex needs and behaviour that challenges;
• Ensure all providers adopt a model providing Positive Behaviour Support; • Provide community-based Intensive and Forensic support to those that need it, including the
provision of emergency accommodation; • Develop resilient and responsive third sector partners through a model of community-led
support; • Work with housing partners to increase housing options for people with learning disabilities
and/or autistic spectrum disorders including options for people who wish to live as a couple; • Support people to remain in, or move back to their community; • Ensure a range of life-long learning opportunities that support independence, active
citizenship and that can lead to employment; • Work to ensure that transport systems support access for people with learning and physical
disabilities; • Deliver positive health outcomes through Primary Care focused on prevention, self-care and
resilience; • Improve the uptake of annual health checks and the provision of health action plans for
people with learning disabilities; • Improve access to mainstream physical and health services by promoting the provision of
reasonable adjustments; • Supporting people to age well with a learning disability; • Progress the Confidential Inquiry into Premature Deaths of People with Learning Disabilities
through the Learning Disabilities Mortality Review (LeDeR). How we will know if we are successful? We will measure the outcomes of this strategy by using feedback from people with learning disabilities and/or autism, their families and their carers with support from the Luton Learning Disability Partnership Forum. We will measure success by an increase in the numbers of people with a learning disability from Luton who:
• Are living in their own home in their own community Luton; • Are having their support needs met close to home; • Say they feel safe and supported; • Have an increased number of community connections; • Have access to sports and leisure; • Are working or volunteering; • Are able to access transport and other services; • Manage their own health and wellbeing; • Have a Health Action Plan; • Have their health needs met in a timely manner.
Strong partnerships are essential if we are to meet the ambitions of this strategy. The Luton Learning Disability Partnership Forum is led and co-chaired by a person with a learning disability and the lead commissioner for learning disabilities. It involves people with a learning disability, families, carers, providers and commissioners. The Partnership will own the strategy whilst the Executive Board is responsible for ensuring that it is delivered. This will be monitored through the Joint Strategic Commissioning Group and ultimately by the Luton Health and Wellbeing Board.
Page 233 of 252
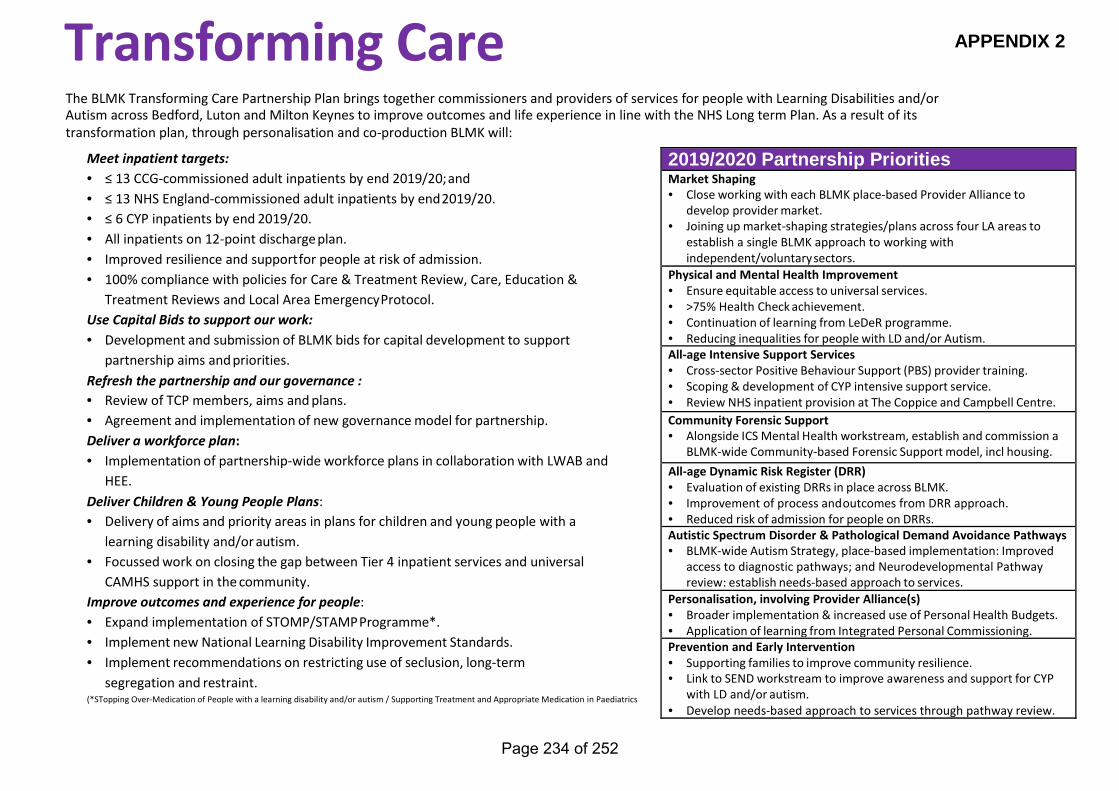
APPENDIX 2
Transforming Care
The BLMK Transforming Care Partnership Plan brings together commissioners and providers of services for people with Learning Disabilities and/or Autism across Bedford, Luton and Milton Keynes to improve outcomes and life experience in line with the NHS Long term Plan. As a result of its transformation plan, through personalisation and co-production BLMK will:
Meet inpatient targets: • ≤ 13 CCG-commissioned adult inpatients by end 2019/20; and • ≤ 13 NHS England-commissioned adult inpatients by end 2019/20. • ≤ 6 CYP inpatients by end 2019/20. • All inpatients on 12-point discharge plan. • Improved resilience and support for people at risk of admission. • 100% compliance with policies for Care & Treatment Review, Care, Education &
Treatment Reviews and Local Area Emergency Protocol. Use Capital Bids to support our work: • Development and submission of BLMK bids for capital development to support
partnership aims and priorities. Refresh the partnership and our governance : • Review of TCP members, aims and plans. • Agreement and implementation of new governance model for partnership. Deliver a workforce plan: • Implementation of partnership-wide workforce plans in collaboration with LWAB and
HEE. Deliver Children & Young People Plans: • Delivery of aims and priority areas in plans for children and young people with a
learning disability and/or autism. • Focussed work on closing the gap between Tier 4 inpatient services and universal
CAMHS support in the community. Improve outcomes and experience for people: • Expand implementation of STOMP/STAMP Programme*. • Implement new National Learning Disability Improvement Standards. • Implement recommendations on restricting use of seclusion, long-term
segregation and restraint. (*STopping Over-Medication of People with a learning disability and/or autism / Supporting Treatment and Appropriate Medication in Paediatrics
2019/2020 Partnership Priorities Market Shaping • Close working with each BLMK place-based Provider Alliance to
develop provider market. • Joining up market-shaping strategies/plans across four LA areas to
establish a single BLMK approach to working with independent/voluntary sectors.
Physical and Mental Health Improvement • Ensure equitable access to universal services. • >75% Health Check achievement. • Continuation of learning from LeDeR programme. • Reducing inequalities for people with LD and/or Autism. All-age Intensive Support Services • Cross-sector Positive Behaviour Support (PBS) provider training. • Scoping & development of CYP intensive support service. • Review NHS inpatient provision at The Coppice and Campbell Centre. Community Forensic Support • Alongside ICS Mental Health workstream, establish and commission a
BLMK-wide Community-based Forensic Support model, incl housing. All-age Dynamic Risk Register (DRR) • Evaluation of existing DRRs in place across BLMK. • Improvement of process and outcomes from DRR approach. • Reduced risk of admission for people on DRRs. Autistic Spectrum Disorder & Pathological Demand Avoidance Pathways • BLMK-wide Autism Strategy, place-based implementation: Improved
access to diagnostic pathways; and Neurodevelopmental Pathway review: establish needs-based approach to services.
Personalisation, involving Provider Alliance(s) • Broader implementation & increased use of Personal Health Budgets. • Application of learning from Integrated Personal Commissioning. Prevention and Early Intervention • Supporting families to improve community resilience. • Link to SEND workstream to improve awareness and support for CYP
with LD and/or autism. • Develop needs-based approach to services through pathway review.
Page 234 of 252
HEALTH AND WELLBEING BOARD
AGENDA ITEM
11 DATE OF MEETING: 19th September 2019 REPORT OF: The Chair of Health Inequalities Delivery Board REPORT AUTHOR: Gerry Taylor SUBJECT: Health Inequalities Delivery Board
WARD(S) AFFECTED: All PURPOSE
1. To inform the Board the on activity of the Health Inequalities Delivery Board (HIDB).
RECOMMENDATION(S) 2. To note the report BACKGROUND 3. he HIDB is one of the delivery boards of the Health and Wellbeing Board, the
remit covers issues around our aim to reduced health inequalities and incorporates oversight on actions around health risk, prevention and the wider determinants of health. The Board has developed a Health Inequalities Strategic Plan and monitors the delivery of this plan.
4. The Health Inequalities Strategic Plan which has a series of priorities
incorporating:
i. giving every child the best start in life ii. enabling all children, young people and adults to maximise their potential
and have control over their lives iii. creating fair employment and good work for all iv. ensuring a healthy standard of living for all v. creating and developing healthy and sustainable places and communities vi. strengthening the role and impact of ill health prevention.
5. The Board incorporates representatives of Luton Council members and officers,
Luton CCG, Bedfordshire Fire & Rescue, voluntary sector, Bedfordshire Police and Crime Commissioner, Healthwatch and Active Luton.
Page 235 of 252
REPORT 6. Recently the Board has worked on a number of programmes which have been
reported to the HWB such as the JSNA and the Health and Wellbeing Strategy and the development of the plan to support delivery of the NHS long term plan being considered by the HWB. The Board recently incorporated the Welfare Reform Board, expanded membership accordingly and reviewed the associated elements of the delivery plan. The housing elements of the delivery plan have also been considered and updated at a recent Board.
7. In addition to overseeing the delivery of the health inequalities plan, the Board
plays a key part in bringing together the leadership for addressing health inequalities and feeding that through to the HWB. It has also helped to broker and develop relationships between partners delivering for Luton and develop and build on actions and plans already in place.
8. The HIDB reviews a series of overarching indicators in relation to inequalities.
Table 1 below shows the latest position compared with the baseline position in 2006/08. It shows that in general, since the baseline period, there has been a narrowing of the gap between Luton and the England average, with the exception of infant mortality. Although the infant mortality rate has decreased since 2006/08, the national rate has decreased at a greater rate and recent figures have shown some deterioration. The life expectancy gap within Luton has fluctuated during this period, but overall has seen a decrease since 2006/08. Improvements in mortality rates have slowed or halted recently in line with the national picture.
Page 236 of 252
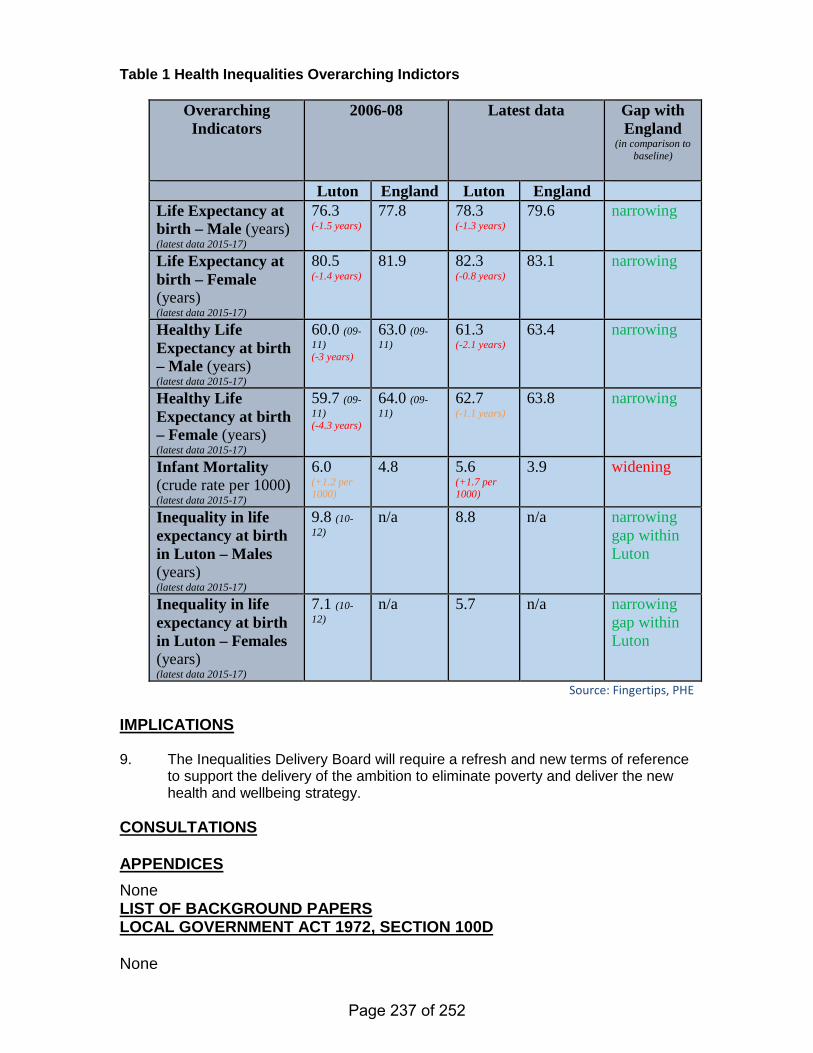
Table 1 Health Inequalities Overarching Indictors
Overarching Indicators
2006-08 Latest data Gap with England
(in comparison to baseline)
Luton England Luton England
Life Expectancy at birth – Male (years) (latest data 2015-17)
76.3 (-1.5 years)
77.8 78.3 (-1.3 years)
79.6 narrowing
Life Expectancy at birth – Female (years) (latest data 2015-17)
80.5 (-1.4 years)
81.9 82.3 (-0.8 years)
83.1 narrowing
Healthy Life Expectancy at birth – Male (years) (latest data 2015-17)
60.0 (09-11) (-3 years)
63.0 (09-11)
61.3 (-2.1 years)
63.4 narrowing
Healthy Life Expectancy at birth – Female (years) (latest data 2015-17)
59.7 (09-11) (-4.3 years)
64.0 (09-11)
62.7 (-1.1 years)
63.8 narrowing
Infant Mortality (crude rate per 1000) (latest data 2015-17)
6.0 (+1.2 per 1000)
4.8 5.6 (+1.7 per 1000)
3.9 widening
Inequality in life expectancy at birth in Luton – Males (years) (latest data 2015-17)
9.8 (10-12)
n/a 8.8 n/a narrowing gap within Luton
Inequality in life expectancy at birth in Luton – Females (years) (latest data 2015-17)
7.1 (10-12)
n/a 5.7 n/a narrowing gap within Luton
Source: Fingertips, PHE IMPLICATIONS 9. The Inequalities Delivery Board will require a refresh and new terms of reference
to support the delivery of the ambition to eliminate poverty and deliver the new health and wellbeing strategy.
CONSULTATIONS APPENDICES None LIST OF BACKGROUND PAPERS LOCAL GOVERNMENT ACT 1972, SECTION 100D None
Page 237 of 252
HEALTH AND WELLBEING BOARD
AGENDA ITEM
12 DATE OF MEETING: 19 September 2019 REPORT OF: The Chief Executive, Healthwatch Luton REPORT AUTHOR: Lucy Nicholson, CEO, HWL SUBJECT: Healthwatch Luton Quarterly Update – Reference Only
WARD(S) AFFECTED: ALL PURPOSE 1. Quarterly update to the Health and Wellbeing Board on Healthwatch Luton’s
independent feedback on health and care services in Luton. RECOMMENDATION(S) 2. For Board to note feedback and agree program of delivery 4. For Board to discuss ICS commitments within Luton for clarity 4. For the Board to discuss Healthwatch inductions within statutory services BACKGROUND 5. Overview of Q2 feedback for Healthwatch Luton to the Health and Wellbeing
Board – for information only. REPORT Quarterly Outcomes Narrative Healthwatch Luton Q2 (July-Sept)* No Title Page 1 Outcome Performance Monitoring 2 2 Current Feedback and Trends 3 3 Current Engagement 7 4 Next Quarter Focus: and 2019 8 *Feedback pulled on 5th Sept, incomplete month of data
Page 238 of 252
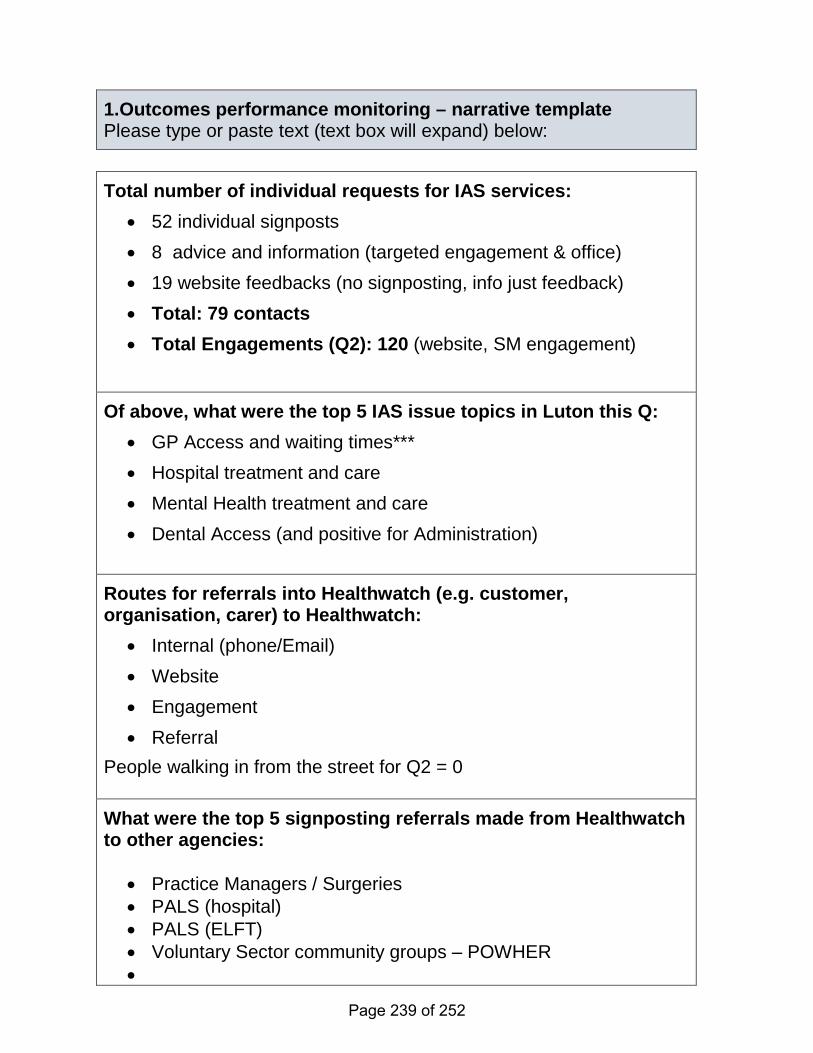
1.Outcomes performance monitoring – narrative template Please type or paste text (text box will expand) below: Total number of individual requests for IAS services:
• 52 individual signposts • 8 advice and information (targeted engagement & office) • 19 website feedbacks (no signposting, info just feedback) • Total: 79 contacts • Total Engagements (Q2): 120 (website, SM engagement)
Of above, what were the top 5 IAS issue topics in Luton this Q: • GP Access and waiting times*** • Hospital treatment and care • Mental Health treatment and care • Dental Access (and positive for Administration)
Routes for referrals into Healthwatch (e.g. customer, organisation, carer) to Healthwatch:
• Internal (phone/Email) • Website • Engagement • Referral
People walking in from the street for Q2 = 0 What were the top 5 signposting referrals made from Healthwatch to other agencies:
• Practice Managers / Surgeries • PALS (hospital) • PALS (ELFT) • Voluntary Sector community groups – POWHER •
Page 239 of 252
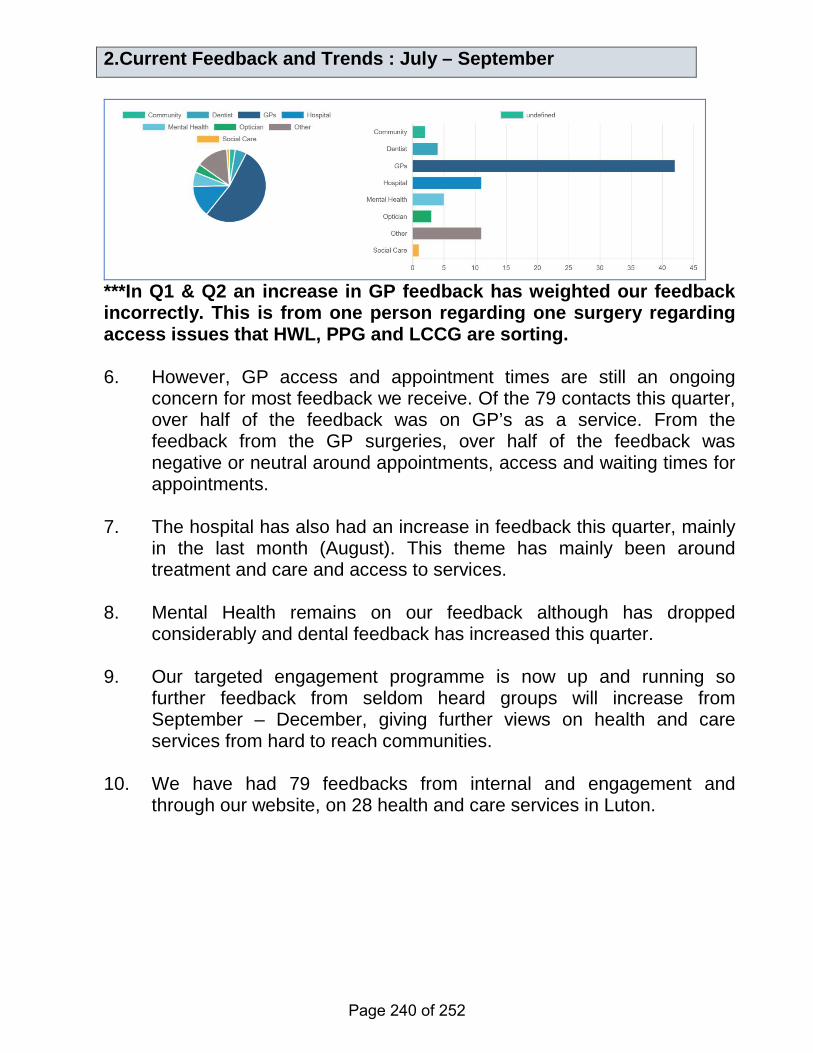
2.Current Feedback and Trends : July – September
***In Q1 & Q2 an increase in GP feedback has weighted our feedback incorrectly. This is from one person regarding one surgery regarding access issues that HWL, PPG and LCCG are sorting. 6. However, GP access and appointment times are still an ongoing
concern for most feedback we receive. Of the 79 contacts this quarter, over half of the feedback was on GP’s as a service. From the feedback from the GP surgeries, over half of the feedback was negative or neutral around appointments, access and waiting times for appointments.
7. The hospital has also had an increase in feedback this quarter, mainly
in the last month (August). This theme has mainly been around treatment and care and access to services.
8. Mental Health remains on our feedback although has dropped
considerably and dental feedback has increased this quarter. 9. Our targeted engagement programme is now up and running so
further feedback from seldom heard groups will increase from September – December, giving further views on health and care services from hard to reach communities.
10. We have had 79 feedbacks from internal and engagement and
through our website, on 28 health and care services in Luton.
Page 240 of 252
11. Healthwatch Luton are fully aware of the work that has been done around GP
access in Luton, however, we would like to direct further concentrated support in this area. This theme has been highlighted to Healthwatch for nearly 4 years and whilst improvements have been made, we feel we can support the LCCG going forward.
GP’s: Q2 shows a discrepancy in GP feedback due to before mentioned anomaly. Generally GP access is the largest feedback we receive constantly and our Chair sits on the Primary Care Commissioning group as well as many other Boards and groups supporting Primary care provision. Breakdown:
Administration and access to services is the largest feedback we have received this quarter. Sub themes of Administration feedback have been: Appointment availability / booking appointments / medical records. Sub themes of Access have been: Lack of access / convenience of appointments / patient choice. Healthwatch Luton sit on and support many of the primary developments in Luton, but have still concern on access for the general public. Whilst our numbers of feedback are low statistically speaking, for nearly 50 independent patients to inform us of issues with a service, Healthwatch Luton feel we need to focus priority into GP Access more this year, with the support of LCCG.
Page 241 of 252
What is Healthwatch Luton doing about GP feedback? 1. HWL have informed and are in discussions with LCCG
on supporting initiatives around GP access and communications
2. HW meet with and discuss instant primary care concerns and issues with Practices and LCCG ongoing.
3. HW work with PPG’s within Primary care and will be looking to support development under PCN’s and review of the PPG process in Luton.
4. We feed into the LCCG quarterly Quality meetings 5. We feedback to the providers (GP’s) as well as to the
Hospital: Q2 has shown an increase in feedback for HWL on the hospital, mainly around treatment and care and access to services. Individual concerns and issues means we have worked with PALS more frequently this quarter, not reflecting the overall feedback from the hospital. Breakdown:
Page 242 of 252
3. Current Engagement and Focus (July – Sept 2019) 12. This quarter we have focused on Learning Disability and Mental
Health feedback generally for our project work, but we are also setting up some targeted engagement out in the more culturally diverse areas of Luton for Q3.
Q2 1 Headway targeted engagement 2 Resolutions 3 FUN – LD 4 Switch Café 5 Penrose – targeted engagement 6 Freshers week: University engagement 7 ELFT carers 13. We will also be focusing on Q3 across Luton on community
engagement, using our growing volunteers to support our targeted engagement.
14. Our targeted engagement will continue in Q2. We will be continuing
our inpatient review for ELFT and look at Enter and Views for the next quarter.
What is Healthwatch Luton doing about Hospital feedback? 1. We inform the Hospital through quarterly meetings with
Chief Nurse and PALS department 2. We join the LCCG on their Quarterly Quality visits on wards 3. We will be joining the LCCG Quality Team visits and create
a programme with them for 2019 to have quarterly reviews of specific wards
4. We have completed our Enter and View reports and have published our recommendations
5. We are seeking CQC contact for Hospital care 6. We will be planning a further review of our Enter and View
recommendations 7. We are working across BLMK on hospital care
Page 243 of 252
15. Our current inpatient ward reviews have been interesting and provided mainly positive feedback from the wards. We are working with ELFT and inpatient mangers to support individual feedback and signposting.
4.Next Quarter Focus (Q3 Oct – Dec) 16. We will be running a Mental Health Professional Panel Forum, as well
as LD Professional Panel Forum this quarter allowing people to meet with and question professionals on these topic areas.
17. We will be running an Enter and View programme with ELFT’s
inpatient wards over the next few months, following on from our inpatient review (currently being completed).
18. We will also be looking at work with PPG’s, GP access cards,
Summary reports on all our feedback on services in Luton. 19. Healthwatch Luton have also been nominated by Healthwatch England for an
award for the Young Person’s event held in Luton in 2018 with the LCCG. We are also running a workshop with the Healthwatch England Managing Director, Imelda Redmond on the Long Term plan and local engagement.
20. Healthwatch Luton are also part of a King College review of the
Healthwatch network. IMPLICATIONS None – for information CONSULTATIONS APPENDICES None LIST OF BACKGROUND PAPERS LOCAL GOVERNMENT ACT 1972, SECTION 100D
Page 244 of 252
HEALTH AND WELLBEING BOARD
AGENDA ITEM
13
DATE OF MEETING: 19 SEPTEMBER 2019 REPORT OF: CORPORATE DIRECTOR - PUBLIC HEALTH, AND WELLBEING REPORT AUTHOR: YACCUB ENUM, SENIOR PUBLIC HEALTH MANAGER SUBJECT: HEALTH AND WELLBEING BOARD WORK PROGRAMME REPORT 2019
PURPOSE
1. To enable the Health and Wellbeing Board (HWB) to plan and determine its work programme for future meetings.
RECOMMENDATIONS
2. That HWB approves its work programme with or without any amendments, as appropriate;
3. That HWB notes forthcoming items in the Scrutiny, Health and
Social Care Review Group draft work programme for 2019; 4. That HWB delegates responsibility for making necessary changes
to its work programme between meetings, to Public Health in consultation with the Chair and Democratic Services.
REPORT
5. The HWB work programme with proposed items for future meetings is attached at Appendix A.
6. The Scrutiny, Health and Social Care Review Group’s draft work
programme 2019, showing proposed items for future meetings is attached as Appendix B for information and consideration.
7. Members are requested to review the documents and determine the
items they wish to include on the HWB work programme and suggest any other emerging matters not currently listed.
Page 245 of 252
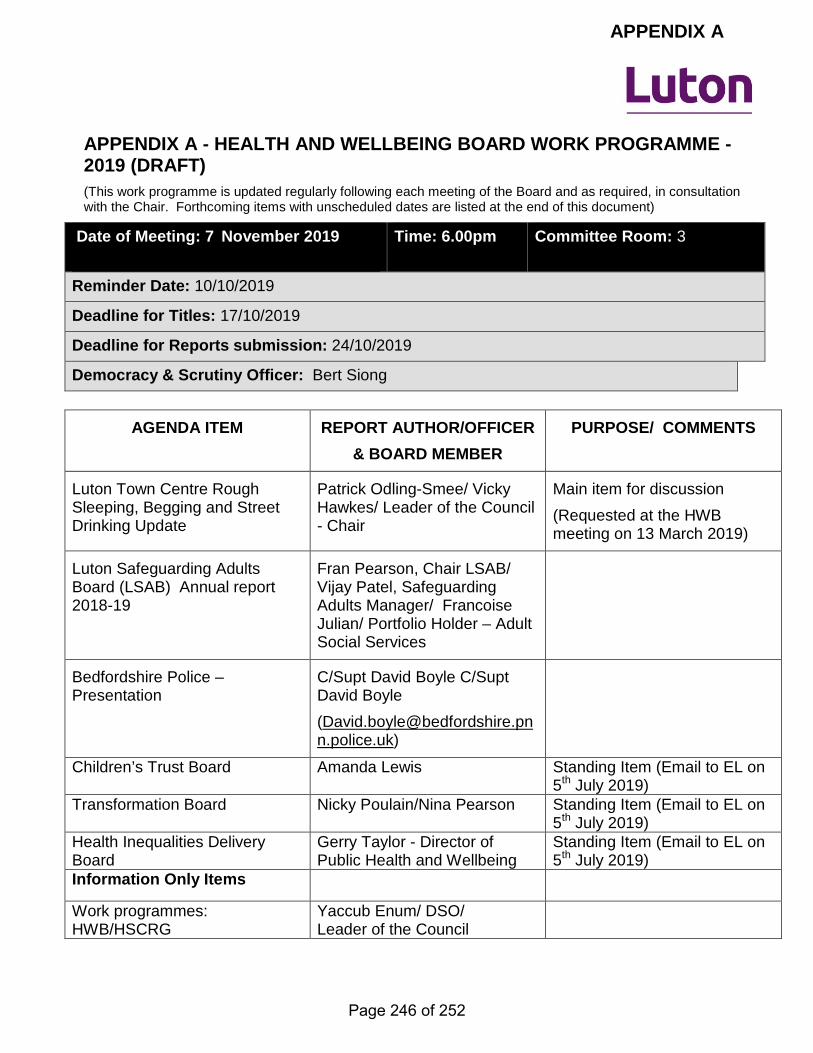
APPENDIX A - HEALTH AND WELLBEING BOARD WORK PROGRAMME - 2019 (DRAFT) (This work programme is updated regularly following each meeting of the Board and as required, in consultation with the Chair. Forthcoming items with unscheduled dates are listed at the end of this document)
Date of Meeting: 7 November 2019
Time: 6.00pm Committee Room: 3
Reminder Date: 10/10/2019
Deadline for Titles: 17/10/2019
Deadline for Reports submission: 24/10/2019
Democracy & Scrutiny Officer: Bert Siong
AGENDA ITEM REPORT AUTHOR/OFFICER & BOARD MEMBER
PURPOSE/ COMMENTS
Luton Town Centre Rough Sleeping, Begging and Street Drinking Update
Patrick Odling-Smee/ Vicky Hawkes/ Leader of the Council - Chair
Main item for discussion (Requested at the HWB meeting on 13 March 2019)
Luton Safeguarding Adults Board (LSAB) Annual report 2018-19
Fran Pearson, Chair LSAB/ Vijay Patel, Safeguarding Adults Manager/ Francoise Julian/ Portfolio Holder – Adult Social Services
Bedfordshire Police – Presentation
C/Supt David Boyle C/Supt David Boyle ([email protected])
Children’s Trust Board Amanda Lewis Standing Item (Email to EL on 5th July 2019)
Transformation Board Nicky Poulain/Nina Pearson Standing Item (Email to EL on 5th July 2019)
Health Inequalities Delivery Board
Gerry Taylor - Director of Public Health and Wellbeing
Standing Item (Email to EL on 5th July 2019)
Information Only Items
Work programmes: HWB/HSCRG
Yaccub Enum/ DSO/ Leader of the Council
APPENDIX A
Page 246 of 252
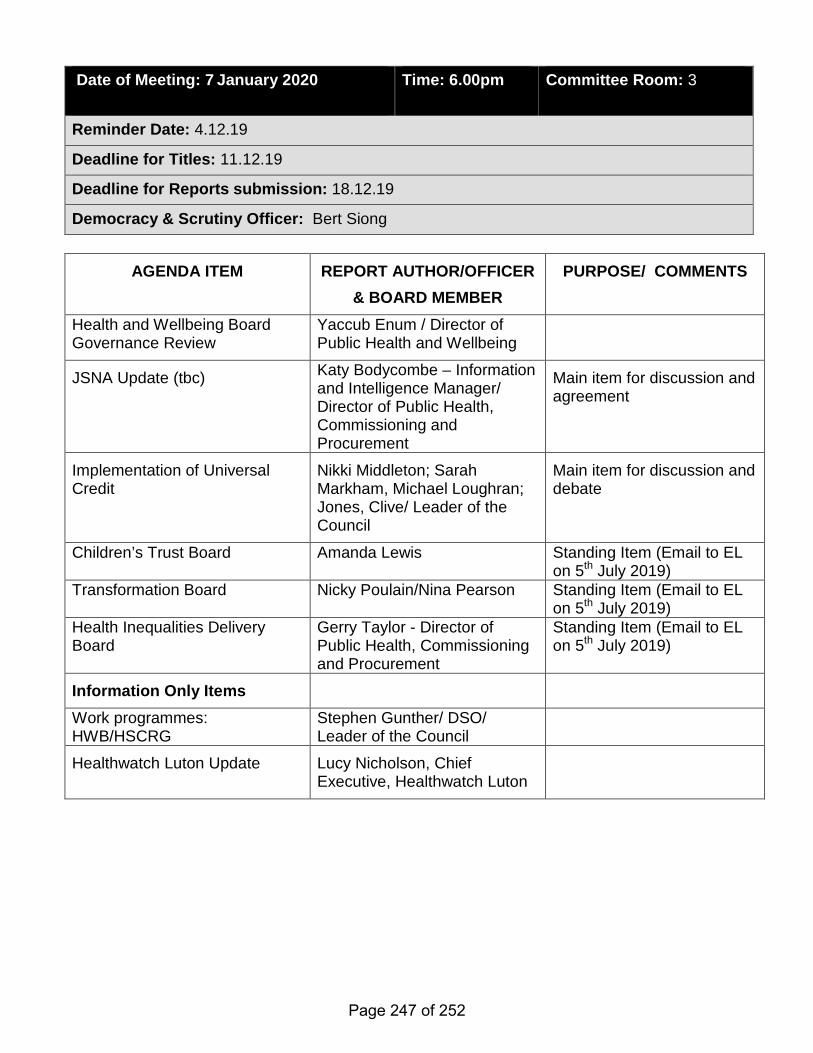
Date of Meeting: 7 January 2020
Time: 6.00pm Committee Room: 3
Reminder Date: 4.12.19
Deadline for Titles: 11.12.19
Deadline for Reports submission: 18.12.19
Democracy & Scrutiny Officer: Bert Siong
AGENDA ITEM REPORT AUTHOR/OFFICER & BOARD MEMBER
PURPOSE/ COMMENTS
Health and Wellbeing Board Governance Review
Yaccub Enum / Director of Public Health and Wellbeing
JSNA Update (tbc) Katy Bodycombe – Information and Intelligence Manager/ Director of Public Health, Commissioning and Procurement
Main item for discussion and agreement
Implementation of Universal Credit
Nikki Middleton; Sarah Markham, Michael Loughran; Jones, Clive/ Leader of the Council
Main item for discussion and debate
Children’s Trust Board Amanda Lewis Standing Item (Email to EL on 5th July 2019)
Transformation Board Nicky Poulain/Nina Pearson Standing Item (Email to EL on 5th July 2019)
Health Inequalities Delivery Board
Gerry Taylor - Director of Public Health, Commissioning and Procurement
Standing Item (Email to EL on 5th July 2019)
Information Only Items Work programmes: HWB/HSCRG
Stephen Gunther/ DSO/ Leader of the Council
Healthwatch Luton Update Lucy Nicholson, Chief Executive, Healthwatch Luton
Page 247 of 252
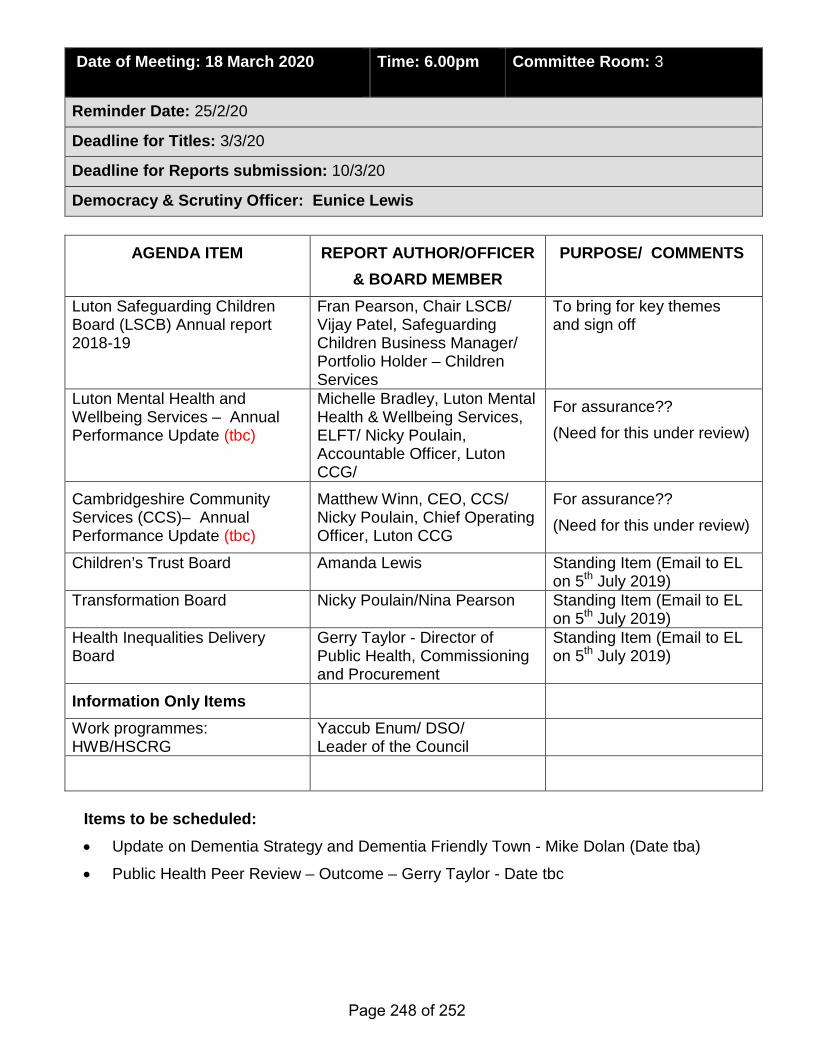
Date of Meeting: 18 March 2020
Time: 6.00pm Committee Room: 3
Reminder Date: 25/2/20
Deadline for Titles: 3/3/20
Deadline for Reports submission: 10/3/20
Democracy & Scrutiny Officer: Eunice Lewis
AGENDA ITEM REPORT AUTHOR/OFFICER & BOARD MEMBER
PURPOSE/ COMMENTS
Luton Safeguarding Children Board (LSCB) Annual report 2018-19
Fran Pearson, Chair LSCB/ Vijay Patel, Safeguarding Children Business Manager/ Portfolio Holder – Children Services
To bring for key themes and sign off
Luton Mental Health and Wellbeing Services – Annual Performance Update (tbc)
Michelle Bradley, Luton Mental Health & Wellbeing Services, ELFT/ Nicky Poulain, Accountable Officer, Luton CCG/
For assurance?? (Need for this under review)
Cambridgeshire Community Services (CCS)– Annual Performance Update (tbc)
Matthew Winn, CEO, CCS/ Nicky Poulain, Chief Operating Officer, Luton CCG
For assurance?? (Need for this under review)
Children’s Trust Board Amanda Lewis Standing Item (Email to EL on 5th July 2019)
Transformation Board Nicky Poulain/Nina Pearson Standing Item (Email to EL on 5th July 2019)
Health Inequalities Delivery Board
Gerry Taylor - Director of Public Health, Commissioning and Procurement
Standing Item (Email to EL on 5th July 2019)
Information Only Items Work programmes: HWB/HSCRG
Yaccub Enum/ DSO/ Leader of the Council
Items to be scheduled: • Update on Dementia Strategy and Dementia Friendly Town - Mike Dolan (Date tba)
• Public Health Peer Review – Outcome – Gerry Taylor - Date tbc
Page 248 of 252
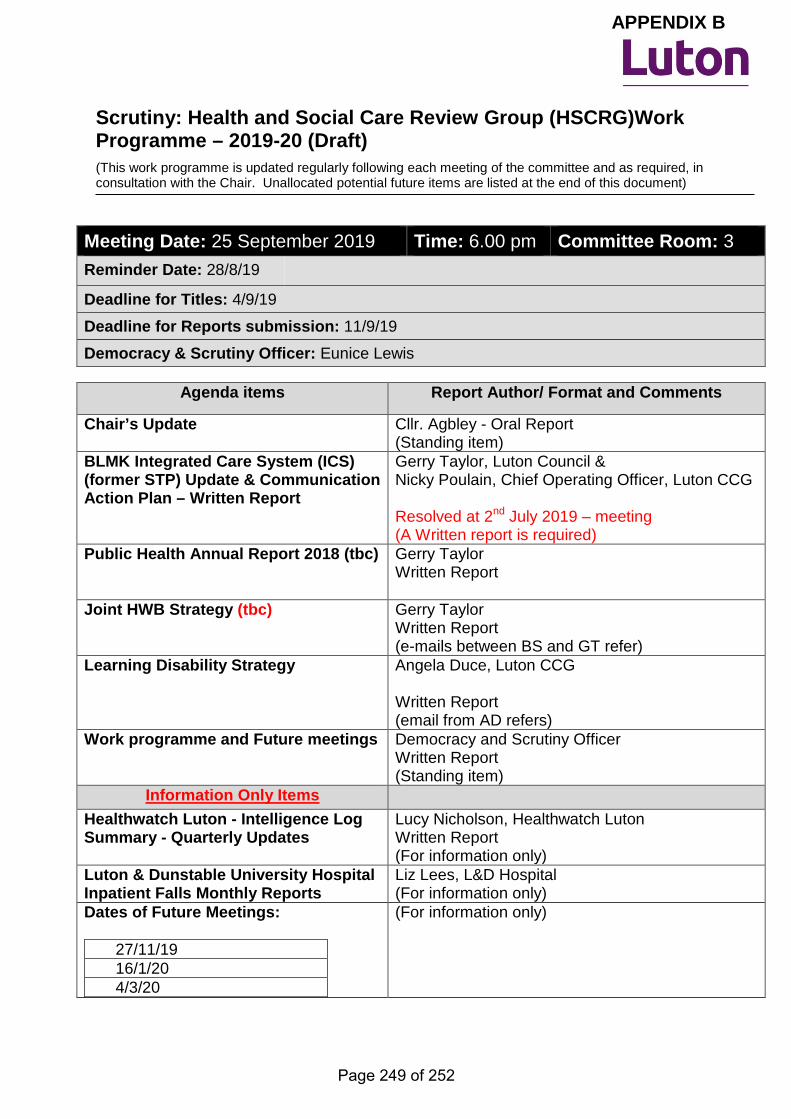
Scrutiny: Health and Social Care Review Group (HSCRG)Work Programme – 2019-20 (Draft) (This work programme is updated regularly following each meeting of the committee and as required, in consultation with the Chair. Unallocated potential future items are listed at the end of this document)
Meeting Date: 25 September 2019 Time: 6.00 pm Committee Room: 3 Reminder Date: 28/8/19
Deadline for Titles: 4/9/19
Deadline for Reports submission: 11/9/19
Democracy & Scrutiny Officer: Eunice Lewis
Agenda items Report Author/ Format and Comments
Chair’s Update
Cllr. Agbley - Oral Report (Standing item)
BLMK Integrated Care System (ICS) (former STP) Update & Communication Action Plan – Written Report
Gerry Taylor, Luton Council & Nicky Poulain, Chief Operating Officer, Luton CCG Resolved at 2nd July 2019 – meeting (A Written report is required)
Public Health Annual Report 2018 (tbc)
Gerry Taylor Written Report
Joint HWB Strategy (tbc)
Gerry Taylor Written Report (e-mails between BS and GT refer)
Learning Disability Strategy Angela Duce, Luton CCG Written Report (email from AD refers)
Work programme and Future meetings Democracy and Scrutiny Officer Written Report (Standing item)
Information Only Items Healthwatch Luton - Intelligence Log Summary - Quarterly Updates
Lucy Nicholson, Healthwatch Luton Written Report (For information only)
Luton & Dunstable University Hospital Inpatient Falls Monthly Reports
Liz Lees, L&D Hospital (For information only)
Dates of Future Meetings:
27/11/19 16/1/20 4/3/20
(For information only)
APPENDIX B
Page 249 of 252
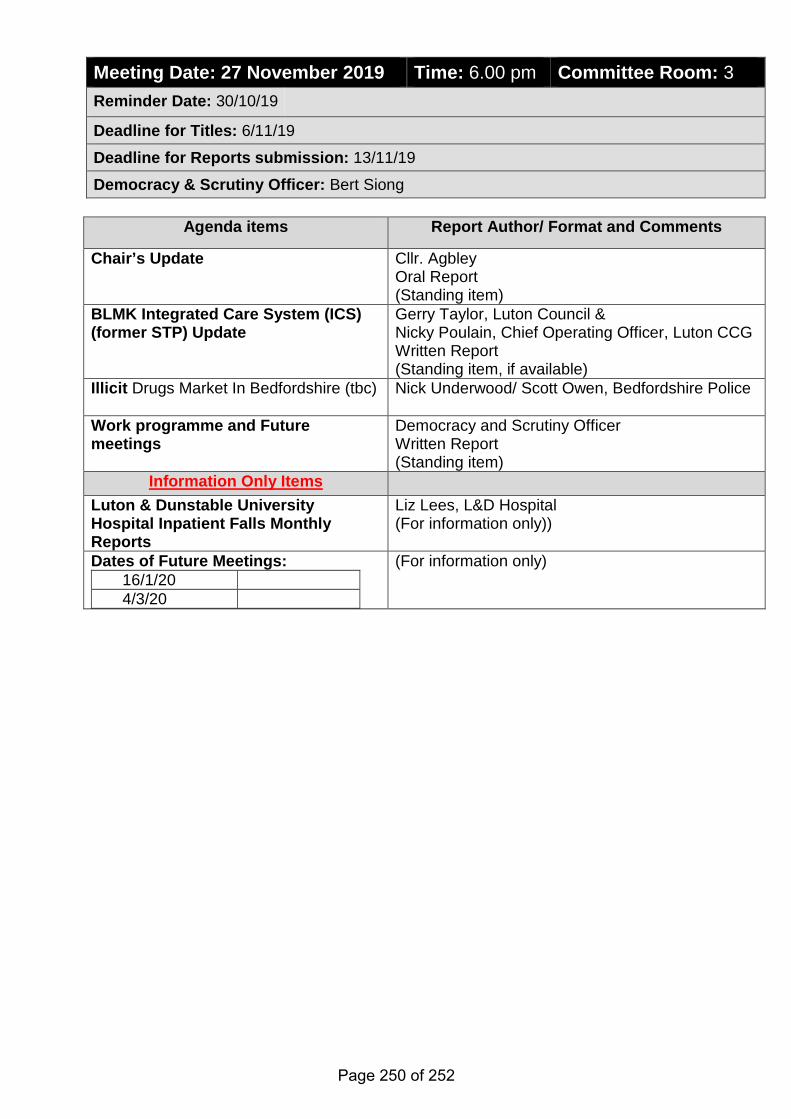
Meeting Date: 27 November 2019 Time: 6.00 pm Committee Room: 3 Reminder Date: 30/10/19
Deadline for Titles: 6/11/19
Deadline for Reports submission: 13/11/19
Democracy & Scrutiny Officer: Bert Siong
Agenda items Report Author/ Format and Comments
Chair’s Update Cllr. Agbley Oral Report (Standing item)
BLMK Integrated Care System (ICS) (former STP) Update
Gerry Taylor, Luton Council & Nicky Poulain, Chief Operating Officer, Luton CCG Written Report (Standing item, if available)
Illicit Drugs Market In Bedfordshire (tbc) Nick Underwood/ Scott Owen, Bedfordshire Police
Work programme and Future meetings
Democracy and Scrutiny Officer Written Report (Standing item)
Information Only Items Luton & Dunstable University Hospital Inpatient Falls Monthly Reports
Liz Lees, L&D Hospital (For information only))
Dates of Future Meetings: 16/1/20 4/3/20
(For information only)
Page 250 of 252
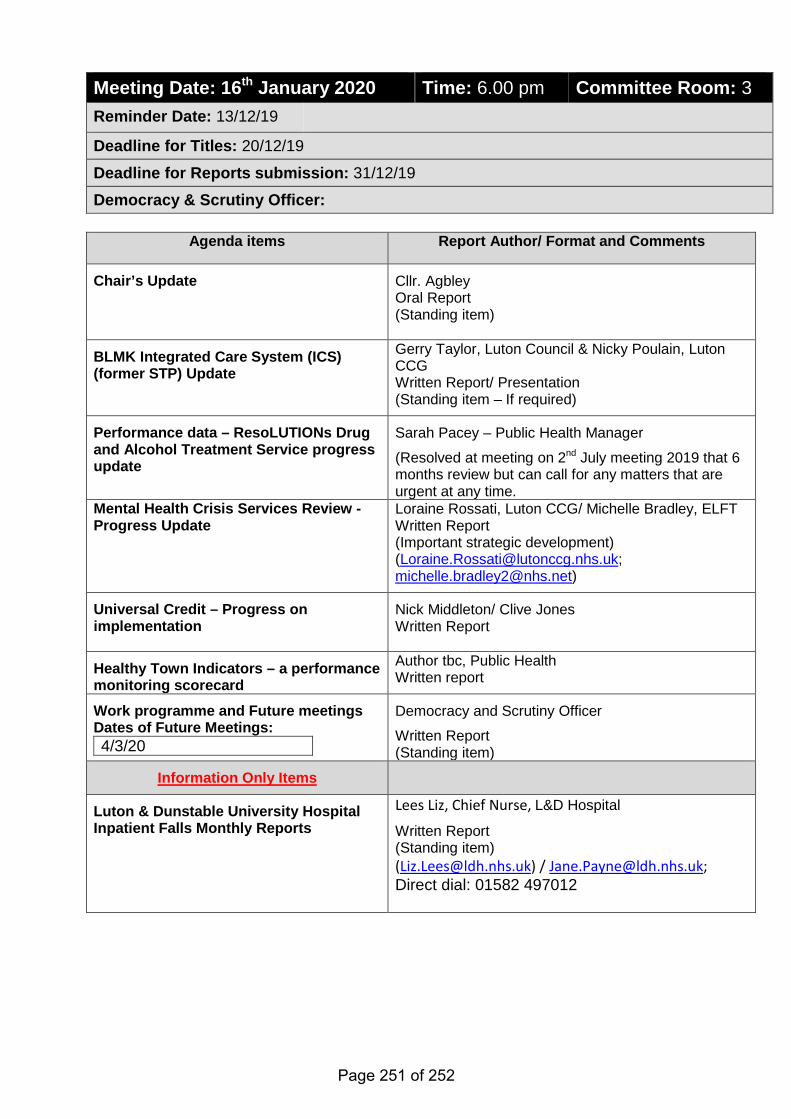
Meeting Date: 16th January 2020 Time: 6.00 pm Committee Room: 3 Reminder Date: 13/12/19
Deadline for Titles: 20/12/19
Deadline for Reports submission: 31/12/19
Democracy & Scrutiny Officer:
Agenda items Report Author/ Format and Comments
Chair’s Update Cllr. Agbley Oral Report (Standing item)
BLMK Integrated Care System (ICS) (former STP) Update
Gerry Taylor, Luton Council & Nicky Poulain, Luton CCG Written Report/ Presentation (Standing item – If required)
Performance data – ResoLUTIONs Drug and Alcohol Treatment Service progress update
Sarah Pacey – Public Health Manager
(Resolved at meeting on 2nd July meeting 2019 that 6 months review but can call for any matters that are urgent at any time.
Mental Health Crisis Services Review -Progress Update
Loraine Rossati, Luton CCG/ Michelle Bradley, ELFT Written Report (Important strategic development) ([email protected]; [email protected])
Universal Credit – Progress on implementation
Nick Middleton/ Clive Jones Written Report
Healthy Town Indicators – a performance monitoring scorecard
Author tbc, Public Health Written report
Work programme and Future meetings Dates of Future Meetings: 4/3/20
Democracy and Scrutiny Officer
Written Report (Standing item)
Information Only Items
Luton & Dunstable University Hospital Inpatient Falls Monthly Reports
Lees Liz, Chief Nurse, L&D Hospital
Written Report (Standing item) ([email protected]) / [email protected]; Direct dial: 01582 497012
Page 251 of 252
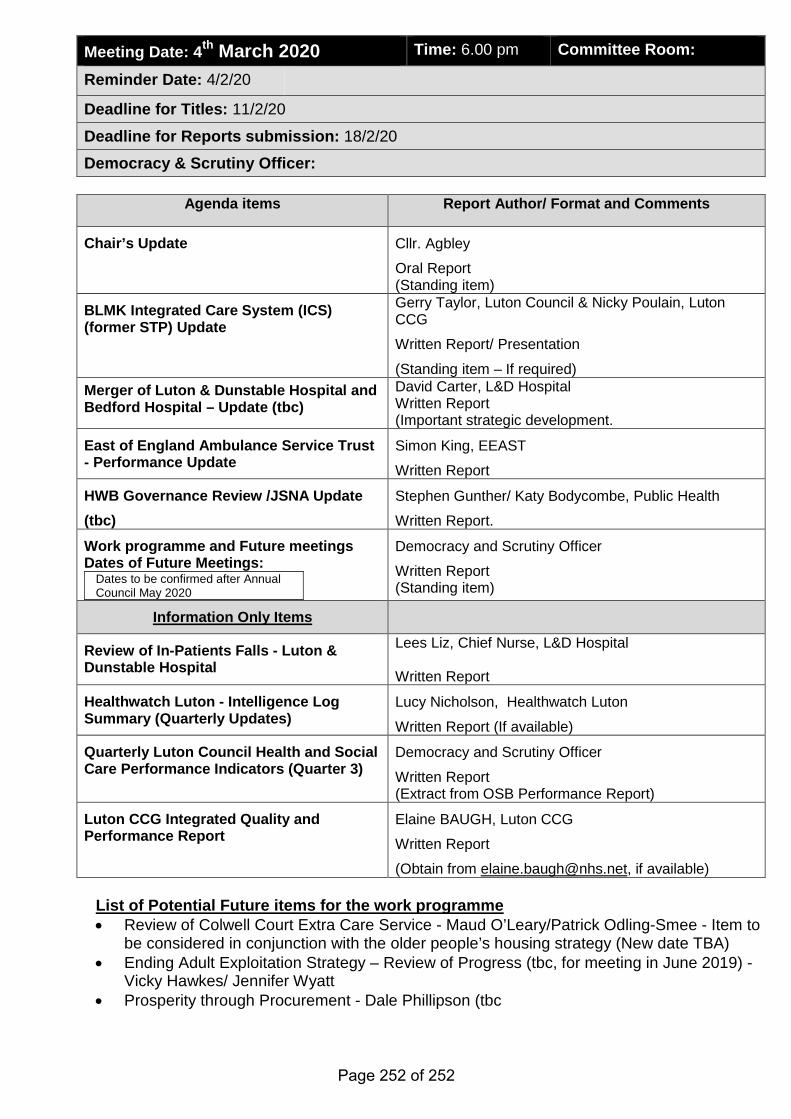
Meeting Date: 4th March 2020 Time: 6.00 pm Committee Room:
Reminder Date: 4/2/20
Deadline for Titles: 11/2/20
Deadline for Reports submission: 18/2/20
Democracy & Scrutiny Officer:
Agenda items Report Author/ Format and Comments
Chair’s Update
Cllr. Agbley
Oral Report (Standing item)
BLMK Integrated Care System (ICS) (former STP) Update
Gerry Taylor, Luton Council & Nicky Poulain, Luton CCG
Written Report/ Presentation
(Standing item – If required) Merger of Luton & Dunstable Hospital and Bedford Hospital – Update (tbc)
David Carter, L&D Hospital Written Report (Important strategic development.
East of England Ambulance Service Trust - Performance Update
Simon King, EEAST
Written Report
HWB Governance Review /JSNA Update (tbc)
Stephen Gunther/ Katy Bodycombe, Public Health
Written Report.
Work programme and Future meetings Dates of Future Meetings:
Dates to be confirmed after Annual Council May 2020
Democracy and Scrutiny Officer
Written Report (Standing item)
Information Only Items
Review of In-Patients Falls - Luton & Dunstable Hospital
Lees Liz, Chief Nurse, L&D Hospital Written Report
Healthwatch Luton - Intelligence Log Summary (Quarterly Updates)
Lucy Nicholson, Healthwatch Luton
Written Report (If available)
Quarterly Luton Council Health and Social Care Performance Indicators (Quarter 3)
Democracy and Scrutiny Officer
Written Report (Extract from OSB Performance Report)
Luton CCG Integrated Quality and Performance Report
Elaine BAUGH, Luton CCG
Written Report
(Obtain from [email protected], if available) List of Potential Future items for the work programme • Review of Colwell Court Extra Care Service - Maud O’Leary/Patrick Odling-Smee - Item to
be considered in conjunction with the older people’s housing strategy (New date TBA) • Ending Adult Exploitation Strategy – Review of Progress (tbc, for meeting in June 2019) -
Vicky Hawkes/ Jennifer Wyatt • Prosperity through Procurement - Dale Phillipson (tbc
Page 252 of 252
Copyright © 2022 FDOKUMEN