Impact of inherent variability and experimental parameters on the reliability of small animal PET...
10
ORIGINAL RESEARCH Open Access Impact of inherent variability and experimental parameters on the reliability of small animal PET data Marianne Isabelle Martic-Kehl 1,2* , Simon Mensah Ametamey 1 , Malte Frederick Alf 1 , Pius August Schubiger 1,2 and Michael Honer 1,3 Abstract Background: Noninvasive preclinical imaging methodologies such as small animal positron emission tomography (PET) allow the repeated measurement of the same subject which is generally assumed to reduce the variability of the experimental outcome parameter and to produce more robust results. In this study, the variability of tracer uptake in the rodent brain was assessed within and between subjects using the established radiopharmaceuticals 18 F-FDG and 18 F-fallypride. Moreover, experimental factors with potential impact on study outcome were elicited, and the effect of their strict homogenization was assessed. Methods: Brain standardized uptake values of rodents were compared between three PET scans of the same animal and scans of different individuals. 18 F-FDG ex vivo tissue sampling was performed under variation of the following experimental parameters: gender, age, cage occupancy, anesthetic protocol, environmental temperature during uptake phase, and tracer formulation. Results: No significant difference of variability in 18 F-FDG or 18 F-fallypride brain or striatal uptake was identified between scans of the same and scans of different animals (COV = 14 ± 7% vs. 21 ± 10% for 18 F-FDG). 18 F-FDG brain uptake was robust regarding a variety of experimental parameters; only anesthetic protocols showed a significant impact. In contrast to a heterogenization approach, homogenization of groups produced more false positive effects in 18 F-FDG organ distribution showing a false positive rate of 9% vs. 6%. Conclusions: Repeated measurements of the same animal may not reduce data variability compared with measurements on different animals. Controlled heterogenization of test groups with regard to experimental parameters is advisable as it decreases the generation of false positive results and thus increases external validity of study outcome. Keywords: Inter-animal variability, Intra-animal variability, Homogenization, Reproducibility, External validity Background Small animal positron emission tomography (PET) is a frequently used methodology to investigate rodent models of healthy and diseased states. Preclinical PET has been revolutionized with the development of dedicated small animal PET scanners [1-3]. Noninvasive imaging methods such as PET are considered to give more reliable results in longitudinal follow-up studies where animals can be used as their own control compared with studies where test and control animals are not identical [1,4]. Additionally, strict homogenization of experimental parameters reduces variability within test groups and is therefore believed to increase reliability of animal experiments [5,6]. Neverthe- less, recent investigations on mouse behavior revealed that the rate of false positive outcome was significantly higher under homogenized conditions compared with an ap- proach investigating pseudo-heterogenized groups [7]. Homogenization proved to decrease the reproducibility of results among test groups. It is therefore suggested to * Correspondence: [email protected] 1 Center for Radiopharmaceutical Sciences of ETH, Institute of Pharmaceutical Science of ETH Zürich, Wolfgang-Pauli-Str. 10, Zurich, 8093, Switzerland 2 Collegium Helveticum, ETH and USZ, Schmelzbergstr. 25, Zürich, 8092, Switzerland Full list of author information is available at the end of the article © 2012 Martic-Kehl et al.; licensee Springer. This is an Open Access article distributed under the terms of the Creative Commons Attribution License (http://creativecommons.org/licenses/by/2.0), which permits unrestricted use, distribution, and reproduction in any medium, provided the original work is properly cited. Martic-Kehl et al. EJNMMI Research 2012, 2:26 http://www.ejnmmires.com/content/2/1/26
-
Upload
independent -
Category
Documents
-
view
9 -
download
0
Transcript of Impact of inherent variability and experimental parameters on the reliability of small animal PET...

Martic-Kehl et al. EJNMMI Research 2012, 2:26http://www.ejnmmires.com/content/2/1/26
ORIGINAL RESEARCH Open Access
Impact of inherent variability and experimentalparameters on the reliability of small animalPET dataMarianne Isabelle Martic-Kehl1,2*, Simon Mensah Ametamey1, Malte Frederick Alf1, Pius August Schubiger1,2
and Michael Honer1,3
Abstract
Background: Noninvasive preclinical imaging methodologies such as small animal positron emission tomography(PET) allow the repeated measurement of the same subject which is generally assumed to reduce the variability ofthe experimental outcome parameter and to produce more robust results. In this study, the variability of traceruptake in the rodent brain was assessed within and between subjects using the established radiopharmaceuticals18F-FDG and 18F-fallypride. Moreover, experimental factors with potential impact on study outcome were elicited,and the effect of their strict homogenization was assessed.
Methods: Brain standardized uptake values of rodents were compared between three PET scans of the sameanimal and scans of different individuals. 18F-FDG ex vivo tissue sampling was performed under variation of thefollowing experimental parameters: gender, age, cage occupancy, anesthetic protocol, environmental temperatureduring uptake phase, and tracer formulation.
Results: No significant difference of variability in 18F-FDG or 18F-fallypride brain or striatal uptake was identifiedbetween scans of the same and scans of different animals (COV= 14 ± 7% vs. 21 ± 10% for 18F-FDG). 18F-FDG brainuptake was robust regarding a variety of experimental parameters; only anesthetic protocols showed a significantimpact. In contrast to a heterogenization approach, homogenization of groups produced more false positive effectsin 18F-FDG organ distribution showing a false positive rate of 9% vs. 6%.
Conclusions: Repeated measurements of the same animal may not reduce data variability compared withmeasurements on different animals. Controlled heterogenization of test groups with regard to experimentalparameters is advisable as it decreases the generation of false positive results and thus increases external validity ofstudy outcome.
Keywords: Inter-animal variability, Intra-animal variability, Homogenization, Reproducibility, External validity
BackgroundSmall animal positron emission tomography (PET) is afrequently used methodology to investigate rodent modelsof healthy and diseased states. Preclinical PET has beenrevolutionized with the development of dedicated smallanimal PET scanners [1-3]. Noninvasive imaging methodssuch as PET are considered to give more reliable results in
* Correspondence: [email protected] for Radiopharmaceutical Sciences of ETH, Institute of PharmaceuticalScience of ETH Zürich, Wolfgang-Pauli-Str. 10, Zurich, 8093, Switzerland2Collegium Helveticum, ETH and USZ, Schmelzbergstr. 25, Zürich, 8092,SwitzerlandFull list of author information is available at the end of the article
© 2012 Martic-Kehl et al.; licensee Springer. ThiCommons Attribution License (http://creativecoreproduction in any medium, provided the orig
longitudinal follow-up studies where animals can be usedas their own control compared with studies where testand control animals are not identical [1,4]. Additionally,strict homogenization of experimental parameters reducesvariability within test groups and is therefore believed toincrease reliability of animal experiments [5,6]. Neverthe-less, recent investigations on mouse behavior revealed thatthe rate of false positive outcome was significantly higherunder homogenized conditions compared with an ap-proach investigating pseudo-heterogenized groups [7].Homogenization proved to decrease the reproducibility ofresults among test groups. It is therefore suggested to
s is an Open Access article distributed under the terms of the Creativemmons.org/licenses/by/2.0), which permits unrestricted use, distribution, andinal work is properly cited.
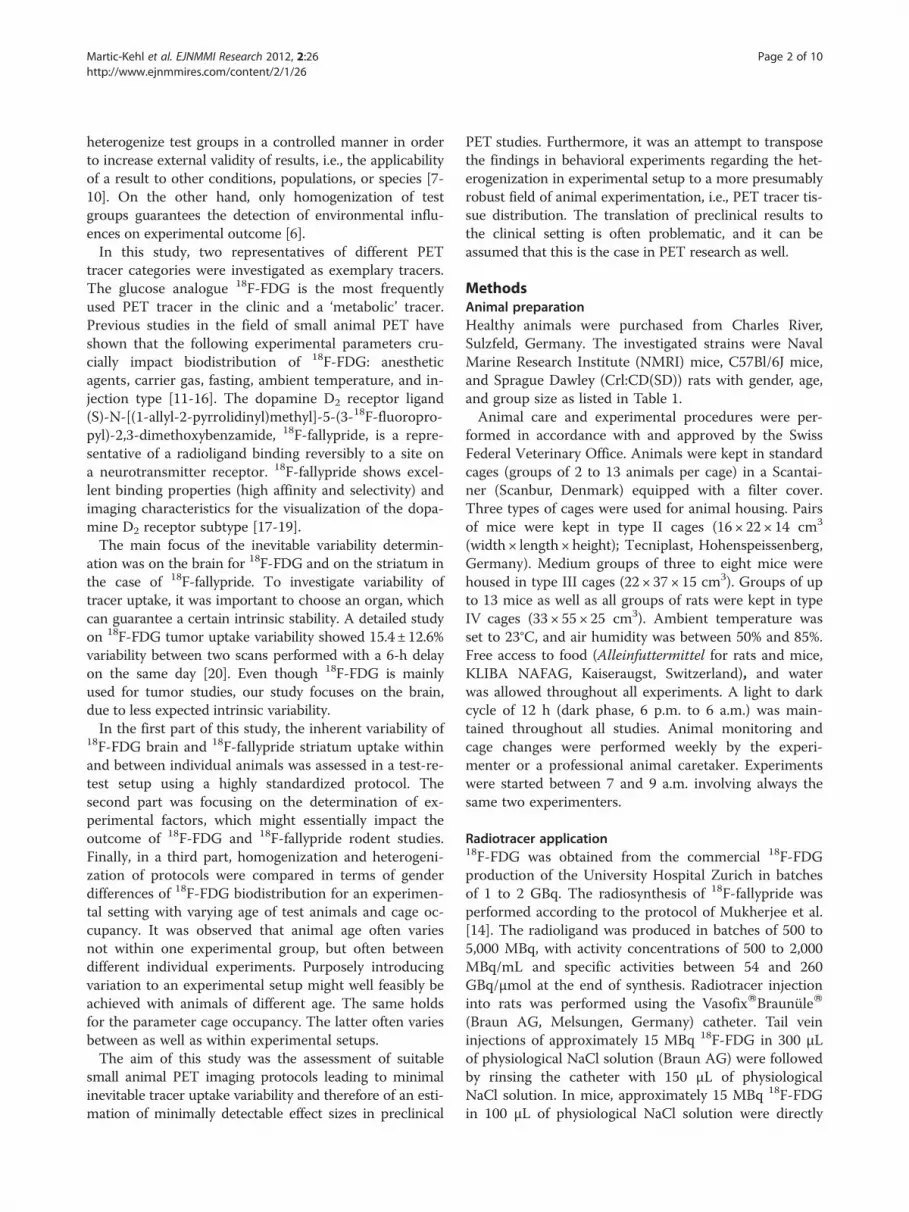
Martic-Kehl et al. EJNMMI Research 2012, 2:26 Page 2 of 10http://www.ejnmmires.com/content/2/1/26
heterogenize test groups in a controlled manner in orderto increase external validity of results, i.e., the applicabilityof a result to other conditions, populations, or species [7-10]. On the other hand, only homogenization of testgroups guarantees the detection of environmental influ-ences on experimental outcome [6].In this study, two representatives of different PET
tracer categories were investigated as exemplary tracers.The glucose analogue 18F-FDG is the most frequentlyused PET tracer in the clinic and a ‘metabolic’ tracer.Previous studies in the field of small animal PET haveshown that the following experimental parameters cru-cially impact biodistribution of 18F-FDG: anestheticagents, carrier gas, fasting, ambient temperature, and in-jection type [11-16]. The dopamine D2 receptor ligand(S)-N-[(1-allyl-2-pyrrolidinyl)methyl]-5-(3-18F-fluoropro-pyl)-2,3-dimethoxybenzamide, 18F-fallypride, is a repre-sentative of a radioligand binding reversibly to a site ona neurotransmitter receptor. 18F-fallypride shows excel-lent binding properties (high affinity and selectivity) andimaging characteristics for the visualization of the dopa-mine D2 receptor subtype [17-19].The main focus of the inevitable variability determin-
ation was on the brain for 18F-FDG and on the striatum inthe case of 18F-fallypride. To investigate variability oftracer uptake, it was important to choose an organ, whichcan guarantee a certain intrinsic stability. A detailed studyon 18F-FDG tumor uptake variability showed 15.4 ± 12.6%variability between two scans performed with a 6-h delayon the same day [20]. Even though 18F-FDG is mainlyused for tumor studies, our study focuses on the brain,due to less expected intrinsic variability.In the first part of this study, the inherent variability of
18F-FDG brain and 18F-fallypride striatum uptake withinand between individual animals was assessed in a test-re-test setup using a highly standardized protocol. Thesecond part was focusing on the determination of ex-perimental factors, which might essentially impact theoutcome of 18F-FDG and 18F-fallypride rodent studies.Finally, in a third part, homogenization and heterogeni-zation of protocols were compared in terms of genderdifferences of 18F-FDG biodistribution for an experimen-tal setting with varying age of test animals and cage oc-cupancy. It was observed that animal age often variesnot within one experimental group, but often betweendifferent individual experiments. Purposely introducingvariation to an experimental setup might well feasibly beachieved with animals of different age. The same holdsfor the parameter cage occupancy. The latter often variesbetween as well as within experimental setups.The aim of this study was the assessment of suitable
small animal PET imaging protocols leading to minimalinevitable tracer uptake variability and therefore of an esti-mation of minimally detectable effect sizes in preclinical
PET studies. Furthermore, it was an attempt to transposethe findings in behavioral experiments regarding the het-erogenization in experimental setup to a more presumablyrobust field of animal experimentation, i.e., PET tracer tis-sue distribution. The translation of preclinical results tothe clinical setting is often problematic, and it can beassumed that this is the case in PET research as well.
MethodsAnimal preparationHealthy animals were purchased from Charles River,Sulzfeld, Germany. The investigated strains were NavalMarine Research Institute (NMRI) mice, C57Bl/6J mice,and Sprague Dawley (Crl:CD(SD)) rats with gender, age,and group size as listed in Table 1.Animal care and experimental procedures were per-
formed in accordance with and approved by the SwissFederal Veterinary Office. Animals were kept in standardcages (groups of 2 to 13 animals per cage) in a Scantai-ner (Scanbur, Denmark) equipped with a filter cover.Three types of cages were used for animal housing. Pairsof mice were kept in type II cages (16 × 22 × 14 cm3
(width × length × height); Tecniplast, Hohenspeissenberg,Germany). Medium groups of three to eight mice werehoused in type III cages (22 × 37 × 15 cm3). Groups of upto 13 mice as well as all groups of rats were kept in typeIV cages (33 × 55 × 25 cm3). Ambient temperature wasset to 23°C, and air humidity was between 50% and 85%.Free access to food (Alleinfuttermittel for rats and mice,KLIBA NAFAG, Kaiseraugst, Switzerland), and waterwas allowed throughout all experiments. A light to darkcycle of 12 h (dark phase, 6 p.m. to 6 a.m.) was main-tained throughout all studies. Animal monitoring andcage changes were performed weekly by the experi-menter or a professional animal caretaker. Experimentswere started between 7 and 9 a.m. involving always thesame two experimenters.
Radiotracer application18F-FDG was obtained from the commercial 18F-FDGproduction of the University Hospital Zurich in batchesof 1 to 2 GBq. The radiosynthesis of 18F-fallypride wasperformed according to the protocol of Mukherjee et al.[14]. The radioligand was produced in batches of 500 to5,000 MBq, with activity concentrations of 500 to 2,000MBq/mL and specific activities between 54 and 260GBq/μmol at the end of synthesis. Radiotracer injectioninto rats was performed using the VasofixWBraunüleW
(Braun AG, Melsungen, Germany) catheter. Tail veininjections of approximately 15 MBq 18F-FDG in 300 μLof physiological NaCl solution (Braun AG) were followedby rinsing the catheter with 150 μL of physiologicalNaCl solution. In mice, approximately 15 MBq 18F-FDGin 100 μL of physiological NaCl solution were directly

Table 1 Test parameters of individual experiments18F tracer Anesthetic
protocol (min)Ambienttemperature (°C)
10%EtOH
Gender Age(weeks)
Cagedensity (n)
Experiment Strain n FDG fallypride Control (6) 40 60 RT 33 Yes No M F 5 7 to 10 14 2 3 to 8 13
Test-retest study 1 SD rat 6 x x x x x x x
Test-retest study 2 SD rat 6 x x x x x x x
Test-retest NMRI 6 x x x x x x x
C57BL/6 J 7 x x x x x x x
Anesthetic impact SD rat 6 x x x x x x
SD rat 7 x x x x x x
SD rat 7 x x x x x x
Temperature/EtOH impact
NMRI 8 x x x x x x x
NMRI 8 x x x x x x x
NMRI 8 x x x x x x x
NMRI 8 x x x x x x x
Homogenization/heterogenization
NMRI 10 x x x x x x x
NMRI 10 x x x x x x x
NMRI 11 x x x x x x x
NMRI 11 x x x x x x x
NMRI 9 x x x x x x x
NMRI 8 x x x x x x x
NMRI 11 x x x x x x x
NMRI 12 x x x x x x x
x, Experimental parameters applied for each individual animal group; EtOH, ethanol; C57Bl/6J mice; NMRI, Naval Marine Research Institute mice; SD rat, Sprague-Dawley rat.
Martic-Kehl et al. EJNMMI Research 2012, 2:26 Page 3 of 10http://www.ejnmmires.com/content/2/1/26
injected into the tail vein. Likewise, 18F-fallypride wasinjected into mice via direct tail vein injection of 100 μL.In order to keep the injected cold mass constantover each test day, decreasing radioactive doses of18F-fallypride were injected over each test day (between18 and 2 MBq). Over all test days, the injected cold massof 18F-fallypride was between 20 to 130 ng correspond-ing to 1.5 to 9.0 nmol/kg body weight.
Small animal PET imagingAll PET experiments were performed at the Animal Im-aging Center (Center for Radiopharmaceutical Sciences,ETH Zurich) using the dedicated 36-module eXploreVista-PET/CT tomograph (GE Healthcare, Waukesha,WI, USA) with a maximum resolution of higher than 2mm full width at half maximum and a field of view(FOV) with an axial length of 48 mm and a diameter of67 mm [21]. Animals underwent one bed position scanswith the brain in the center of the FOV.
PET protocol 1: anesthesia induction after tracer injectionAnimals were restrained and injected 30 min (18F-FDG)and 20 min (18F-fallypride) before scan start. The urinarybladder was emptied by pressing the lower abdomen be-fore induction of anesthesia 10 min before scan start,
and animals were then fixed on the bed of the scanner.Isoflurane was used as anesthetic agent of choice withoxygen/air (50%/50%) as carrier gas. Data were acquiredfrom 30 to 60 min post injection (p.i.) for 18F-FDG emis-sion scans and from 20 to 60 min p.i. for 18F-fallyprideemission scans (energy window 250 to 700 keV). Imageswere reconstructed using a two-dimensional-orderedsubset expectation maximization algorithm (2 iterations,16 subsets) with scatter and random correction; no at-tenuation correction was performed. Voxel size ofreconstructed images was 0.3875 × 0.3875 × 0.775 mm3.
PET protocol 2: anesthesia induction before tracer injectionAnimals were anesthetized, and an injection catheter(VasofixWBraunüleW (Braun AG), 22 G, 0.9 × 25 mm)was placed in a lateral tail vein and rinsed with 100 μLHeparin solution (Heparin-Na (Bichsel AG, Interlaken,Switzerland), 25,000 I.E./5 mL) before animals werepositioned on the scanner bed. Tracer injection and PETscan start were performed simultaneously. Data wasacquired from 0 to 60 min p.i. for 18F-FDG emissionscans in the list mode format (energy window 250 to700 keV). Data were split into two time frames of 30min each, and images were reconstructed as described
Martic-Kehl et al. EJNMMI Research 2012, 2:26 Page 4 of 10http://www.ejnmmires.com/content/2/1/26
above. For dynamic scanning protocol, only the second30 min frame was further investigated.Reconstructed images were inspected in coronal, sagit-
tal, and transverse planes throughout the reconstructedvolume. Region of interest (ROI) analysis was performedwith the biomedical image quantification software PMOD(Pmod Technologies Ltd, Adliswil, Switzerland) [22]. ROIswere drawn manually using the whole brain for 18F-FDGstudies and striatum for 18F-fallypride studies. Tracer up-take was quantified as standardized uptake value (SUV) bynormalizing the average activity concentration (counts persecond per milliliter) of each volume of interest (VOI) tothe injected dose per body weight (MBq/kg).
Measurement of physiological parametersBody temperature of all animals under isofluraneanesthesia was monitored using a rectal temperature sen-sor. A stream of warm air was blown through the scannertube to avoid hypothermia during anesthesia and to keepbody temperature constantly between 35°C and 37°C.Depth of anesthesia monitoring was achieved by sensingthe breath rate with an abdominal breathing belt (rats) orby visual breath rate counting (mice). The breath rate waskept constant at a rate of approximately 60 breaths/minby adjustment of anesthesia.
Assessment of test-retest variability of 18F-FDG wholebrain and 18F-fallypride striatum uptakeThree static PET scanning experiments were performedfor each individual animal of a group to assess the vari-ability between brain scans of the same animal (intra-ani-mal variability) and scans of different individuals (inter-animal variability). Between scans, animals underwent oneweek of recovery. 18F-FDG scans were performed with SDrats (male, 200 to 300 g, n= 6) and 18F-fallypride scanswith NMRI mice (male, 34 to 39 g, n=7) and C57Bl/6 Jmice (male, 18 to 26 g, n= 7). The 18F-FDG study was per-formed twice using two independent batches of animals,referred to as study 1 and study 2. Variability of tracer up-take to the brain (18F-FDG) or striatum (18F-fallypride)was calculated as coefficient of variation (COV), corre-sponding to the relative standard deviation of the mean.
Influence of experimental parameters on 18F-FDG and18F-fallypride biodistributionTo determine the impact of different experimental para-meters on 18F-FDG biodistribution, animals underwentPET scanning according to protocols 1 or 2. Subsequent toPET imaging, animals were euthanized by decapitation atapproximately 61 min p.i. Organs and tissues were col-lected; the wet weights were determined, and the sampleswere measured by classical gamma counting (Wallac 1480Wizard, PerkinElmer Instruments, Boston, MA, USA).Radiotracer uptake was expressed as percentage of injected
dose per gram tissue normalized to the body weight of theanimals (normalized percent injected dose per gram(norm. %ID/g)) and calculated as follows: sample activity(counts per minute)�100/[injected dose (counts per min-ute)�sample weight (grams)]/body weight (kilograms). Indi-vidual test parameters of experiments are listed in Table 1.
Anesthetic protocols (male SD rats, 220 to 280 g, n = 6)The impact of anesthetic protocols on 18F-FDG organand tissue uptake was investigated by applications of iso-flurane anesthesia of different durations (0 to 61 min p.i.for dynamic PET scanning (PET protocol 2), 20 to 61min p.i. for static PET scanning (PET protocol 2), and 55to 61 min p.i. as control conditions).
Temperature (male NMRI mice, 18 to 46 g, n = 8)Animals underwent a static PET scanning protocol (PETprotocol 2). Temperature control during 18F-FDG up-take phase (0 to 20 min p.i.) was achieved by placing theanimal under an infrared lamp subsequent to tracer in-jection. The temperature at the position of the animalwas 33°C. Control animals were kept in the same roomat 23°C.
EtOH in the administered tracer solution (18F-FDG: maleNMRI mice, 18 to 46 g, n = 8; 18F-fallypride: male C57Bl/6 Jmice, 20 to 25 g, n = 8)18F-FDG or 18F-fallypride were injected in physiologicalsaline solution containing 10% of EtOH (v/v). Thisamount corresponds to a blood concentration of ap-proximately 4% ethanol for a mouse of average size.Tracer solutions injected to control animals did not con-tain 10% EtOH. Experimental handling, data collection,and interpretation were performed in a blinded fashion.
Analysis of homogenization vs. pseudo-heterogenizationComparison of homogenization with heterogenization oftest groups was performed according to the study of Richterand co-workers (Figure 1) [7]. 18F-FDG scans according toPET protocol 1 were performed with eight groups of NMRImice under different homogenized conditions. Animalswere sacrificed subsequent to the PET scan (61 min p.i.); 19organs and tissue samples were collected and measured byclassical gamma counting. The data of all 4 × 8 animals ofeach gender were pooled, and the ‘true’ gender differencesin 18F-FDG uptake were determined. Gender differences in18F-FDG tissue distribution were then assessed by compar-ing four pairs of highly homogenized test groups (an ex-ample of one homogenized pair is indicated in dark grey,Figure 1). Each pair was statistically analyzed using a two-tailed Student's t test with subsequent Bonferroni correc-tion. The identified gender differences were compared withthe ones determined in the pooled setup, and the numberof false positive differences was assessed. This step was

Figure 2 Different variability types. (A) Different types ofvariability of 18F-FDG brain SUV in male Crl:CD(SD) rats (n= 6). Eachdata point corresponds to the 18F-FDG brain SUV of one individualanimal. Intra-animal variability is the variability between three brainscans of one individual (indicated in red). (B) Column barrepresentation of the data from (A). Inter-animal variability is thevariability between brain SUVs of different individuals acquired onthe same test day (represented by the SD, indicated in blue). Inter-study variability is the variability of 18F-FDG brain SUVs between twoindependent test groups acquired under exactly the sameexperimental conditions (indicated in green); *P< 0.05.
Figure 1 Experimental design of homogenization vs.heterogenization. The scheme of the experiment is in analogy tothe study of Richter et al. [7]; 8 × 8 animals underwent 18F-FDG scansaccording to PET protocol 1. Varying experimental parameters weregender, age, and cage occupancy of the animals (n= 2 or n= 13 percage). Animal groups were divided according to gender. This setupallowed for four strictly homogenized test group comparisons withthe only parameter varying being gender (one example of such acomparison pair is indicated in dark gray). On the other hand, byreordering the same data into 8 × 8 randomized groups, fourcomparisons of such pseudo-heterogenized groups were performed(indicated by the light grey squares).
Martic-Kehl et al. EJNMMI Research 2012, 2:26 Page 5 of 10http://www.ejnmmires.com/content/2/1/26
repeated for four pairs of ‘pseudo-heterogenized’ groups byrandomly distributing the same data to eight ‘new’ groups(indicated in light grey, Figure 1). The variability (COV) of18F-FDG tissue uptake between and within groups (2×4homogenized groups and 2×4 pseudo-heterogenizedgroups) was calculated and compared using a nonpara-metric Wilcoxon signed rank test. By adapting the signifi-cance level α for the heterogenized data, the false negativerate was brought to the same level as the one arising fromthe homogenized setup, thereby achieving direct compar-ability of false positive rates via a t test.
Statistical analysisFigures show mean±SD, unless stated otherwise. Differ-ences among experimental groups in SUVs and percentinjected dose per gram values of the various tissues inves-tigated were statistically evaluated by analysis of variance(ANOVA) and subsequent post hoc Tukey tests for com-parisons of three or more groups and by two-tailed Stu-dent's t tests of unpaired samples for comparisons of twogroups. Intraindividual variability COVs were statisticallycompared using a paired sample Student's t test. Statistical
significance was set at the 95% level, and Bonferroni cor-rection was applied where required. All statistical analyseswere performed using the computer software SPSS 15.0version for Windows (SPSS Inc. Chicago, Illinois).
Results and discussionResultsTest-retest variability of 18F-FDG brain uptake and striataluptake of 18F-fallyprideThe different variability types investigated are illustrated inFigure 2A. Inter- and intra-animal variability of 18F-FDGbrain uptake did not differ significantly: 8 ± 2% (inter-ani-mal COV) compared to 10±4% (intra-animal COV) forthe first study, and 14±7% (inter-animal COV) comparedto 21±10% (intra-animal COV) for the second study. Bytrend, intra-animal variability was greater than inter-animalvariability. Repetition of the test-retest setup resulted in aninter-study variability of 10±6% for 18F-FDG brain uptake.18F-FDG brain uptake of retest 1 compared to either testor retest 2 proved to be significantly different (16% and24%, P< 0.05; Figure 2B).

Figure 3 18F-fallypride SUV in striatum, retina, and cerebellum. Black, striatum; red, retina; blue, cerebellum. NMRI mice (light colors): n= 6,C57Bl/6 J mice (dark colors): n= 7; ***P< 0.001.
Martic-Kehl et al. EJNMMI Research 2012, 2:26 Page 6 of 10http://www.ejnmmires.com/content/2/1/26
Inter- and intra-animal variability of 18F-fallypride stri-atum uptake did not differ significantly: 16±4% (inter-ani-mal COV) compared to 23±8% (intra-animal COV) forC57Bl/6 J mice, and 11±4% (inter-animal COV) comparedto 9±8% (intra-animal COV) for NMRI mice. Likewise,18F-fallypride striatum uptake between individual test daysdid not differ significantly, whereas NMRI mice tendedto accumulate more 18F-fallypride in the striatum thanC57Bl/6 J mice; on the third test day, the difference was sig-nificant (Figure 3). Strain differences also occurred concern-ing accumulation of 18F-fallypride in the eye region. Thevery high 18F-fallypride accumulation in the eye regionobserved in C57Bl/6 J mice was mainly due to a non-block-able uptake or binding to the retina (autoradiographyexperiments, unpublished results). This phenomenon wasnot observed in NMRI mice; 18F-fallypride accumulation inthe eye region was in the background range, comparablewith cerebellum uptake (Figure 3).
Impact of experimental parameters on 18F-FDG and18F-fallypride ex vivo tissue distributionThe anesthetic protocol (PET protocol 1 vs. 2) had asignificant impact on 18F-FDG uptake in several tissues.18F-FDG brain uptake of animals anesthetized during thewhole tracer uptake phase (protocol 2) was reduced by 27%compared to animals investigated under protocol 1 condi-tions (P< 0.01). Protocol 1 resulted in a 17% reduction ofbrain uptake compared with the control group which wasnot scanned (short anesthesia of 6 min for humane decapi-tation; P< 0.01). 18F-FDG muscle uptake showed a similarpattern as brain uptake with highest uptake under controlconditions (P< 0.01). Contrary to these findings, 18F-FDGblood concentration was lowest in the control and high-est in the test group investigated according to protocol2 (P< 0.01), as shown in part A of Table 2. An ambient
temperature of 33°C during the first 20 min after 18F-FDGinjection resulted in 40% decreased 18F-FDG brown fat tis-sue uptake compared with control animals at roomtemperature (r.t.) or animals with 10% ethanol co-admin-istration at r.t. (not significant). Ethanol seemed to coun-teract the reduced 18F-FDG brown fat tissue uptakeobserved at 33°C ambient temperature alone. Further-more, animals receiving 10% ethanol showed a 34% de-crease in muscle uptake compared with the test groupkept at higher ambient temperature (P< 0.05, part B ofTable 2). Ex vivo biodistribution of 18F-fallypride was notsignificantly influenced by 10% ethanol in the adminis-tered tracer solution. Nevertheless, there was a trend to-wards increased 18F-fallypride accumulation in thestriatum under ethanol conditions (16%, not significant,part C of Table 2). Gender and age of test animals provedto significantly impact 18F-FDG uptake to certain periph-eral organs, but not to the brain. More than double theamount of 18F-FDG was accumulated in the fat offemales compared with males (P< 0.01), whereas18F-FDG blood concentration was 33% higher in males(P< 0.01, part D of Table 2). Older animals accumulated13% less 18F-FDG in their bone marrow (P< 0.05) and28% more 18F-FDG in their Harderian glands (P< 0.01)compared with the younger mice. The potential influenceof combined effects of two or three of the investigatedparameters was excluded by performance of a three-wayANOVA where no significant differences due to multipleparameters were confirmed.
Homogenization vs. pseudo-heterogenizationIn analogy to the study of Richter and co-workers [7], itwas investigated whether strict homogenization of experi-mental test groups in small animal 18F-FDG PET mightlead to reduced reproducibility of results compared with
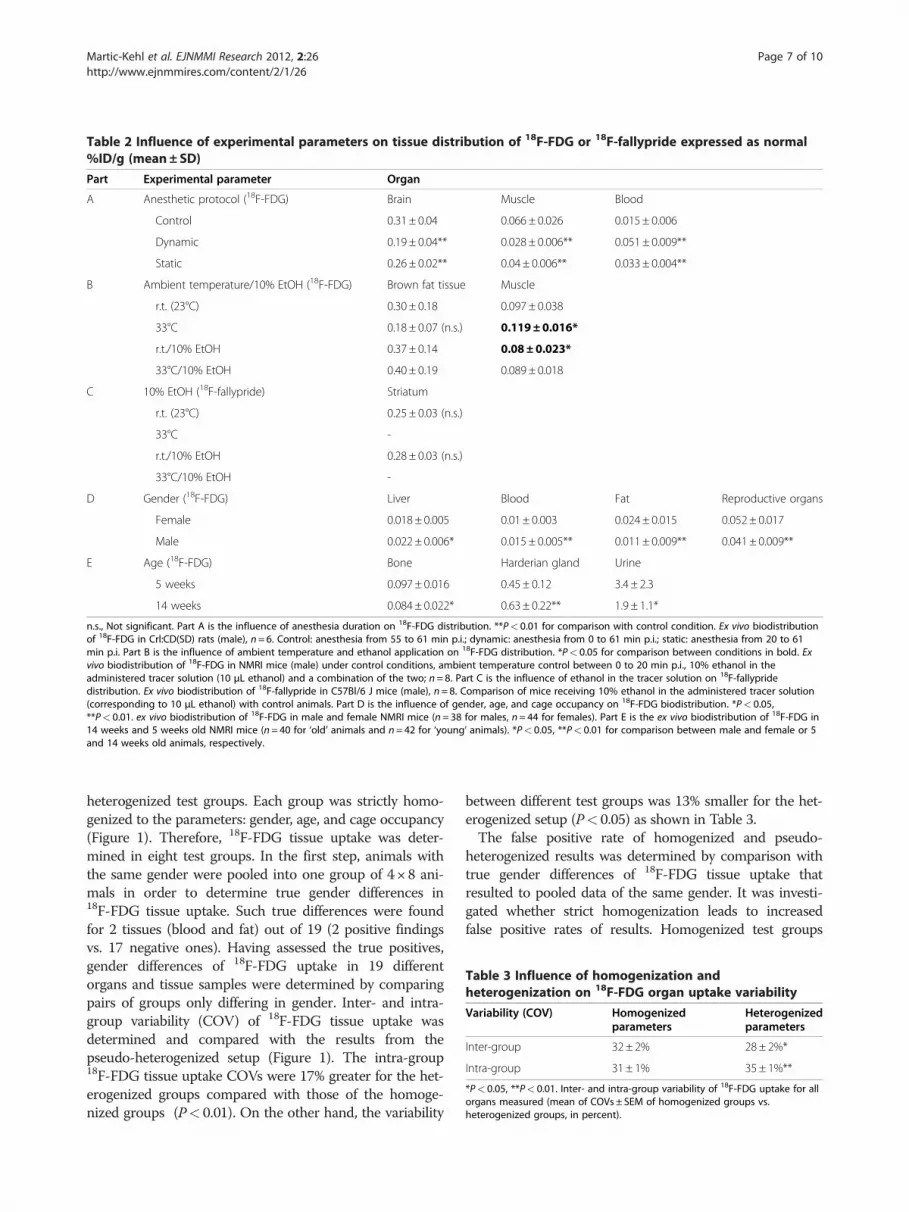
Table 2 Influence of experimental parameters on tissue distribution of 18F-FDG or 18F-fallypride expressed as normal%ID/g (mean± SD)
Part Experimental parameter Organ
A Anesthetic protocol (18F-FDG) Brain Muscle Blood
Control 0.31 ± 0.04 0.066 ± 0.026 0.015 ± 0.006
Dynamic 0.19 ± 0.04** 0.028 ± 0.006** 0.051 ± 0.009**
Static 0.26 ± 0.02** 0.04 ± 0.006** 0.033 ± 0.004**
B Ambient temperature/10% EtOH (18F-FDG) Brown fat tissue Muscle
r.t. (23°C) 0.30 ± 0.18 0.097 ± 0.038
33°C 0.18 ± 0.07 (n.s.) 0.119±0.016*
r.t./10% EtOH 0.37 ± 0.14 0.08±0.023*
33°C/10% EtOH 0.40 ± 0.19 0.089 ± 0.018
C 10% EtOH (18F-fallypride) Striatum
r.t. (23°C) 0.25 ± 0.03 (n.s.)
33°C -
r.t./10% EtOH 0.28 ± 0.03 (n.s.)
33°C/10% EtOH -
D Gender (18F-FDG) Liver Blood Fat Reproductive organs
Female 0.018 ± 0.005 0.01 ± 0.003 0.024 ± 0.015 0.052± 0.017
Male 0.022 ± 0.006* 0.015 ± 0.005** 0.011 ± 0.009** 0.041± 0.009**
E Age (18F-FDG) Bone Harderian gland Urine
5 weeks 0.097 ± 0.016 0.45 ± 0.12 3.4 ± 2.3
14 weeks 0.084 ± 0.022* 0.63 ± 0.22** 1.9 ± 1.1*
n.s., Not significant. Part A is the influence of anesthesia duration on 18F-FDG distribution. **P< 0.01 for comparison with control condition. Ex vivo biodistributionof 18F-FDG in Crl:CD(SD) rats (male), n= 6. Control: anesthesia from 55 to 61 min p.i.; dynamic: anesthesia from 0 to 61 min p.i.; static: anesthesia from 20 to 61min p.i. Part B is the influence of ambient temperature and ethanol application on 18F-FDG distribution. *P< 0.05 for comparison between conditions in bold. Exvivo biodistribution of 18F-FDG in NMRI mice (male) under control conditions, ambient temperature control between 0 to 20 min p.i., 10% ethanol in theadministered tracer solution (10 μL ethanol) and a combination of the two; n= 8. Part C is the influence of ethanol in the tracer solution on 18F-fallypridedistribution. Ex vivo biodistribution of 18F-fallypride in C57Bl/6 J mice (male), n= 8. Comparison of mice receiving 10% ethanol in the administered tracer solution(corresponding to 10 μL ethanol) with control animals. Part D is the influence of gender, age, and cage occupancy on 18F-FDG biodistribution. *P< 0.05,**P< 0.01. ex vivo biodistribution of 18F-FDG in male and female NMRI mice (n= 38 for males, n= 44 for females). Part E is the ex vivo biodistribution of 18F-FDG in14 weeks and 5 weeks old NMRI mice (n= 40 for ‘old’ animals and n= 42 for ‘young’ animals). *P< 0.05, **P< 0.01 for comparison between male and female or 5and 14 weeks old animals, respectively.
Table 3 Influence of homogenization andheterogenization on 18F-FDG organ uptake variability
Variability (COV) Homogenizedparameters
Heterogenizedparameters
Inter-group 32± 2% 28± 2%*
Intra-group 31± 1% 35± 1%**
*P< 0.05, **P< 0.01. Inter- and intra-group variability of 18F-FDG uptake for allorgans measured (mean of COVs ± SEM of homogenized groups vs.heterogenized groups, in percent).
Martic-Kehl et al. EJNMMI Research 2012, 2:26 Page 7 of 10http://www.ejnmmires.com/content/2/1/26
heterogenized test groups. Each group was strictly homo-genized to the parameters: gender, age, and cage occupancy(Figure 1). Therefore, 18F-FDG tissue uptake was deter-mined in eight test groups. In the first step, animals withthe same gender were pooled into one group of 4× 8 ani-mals in order to determine true gender differences in18F-FDG tissue uptake. Such true differences were foundfor 2 tissues (blood and fat) out of 19 (2 positive findingsvs. 17 negative ones). Having assessed the true positives,gender differences of 18F-FDG uptake in 19 differentorgans and tissue samples were determined by comparingpairs of groups only differing in gender. Inter- and intra-group variability (COV) of 18F-FDG tissue uptake wasdetermined and compared with the results from thepseudo-heterogenized setup (Figure 1). The intra-group18F-FDG tissue uptake COVs were 17% greater for the het-erogenized groups compared with those of the homoge-nized groups (P< 0.01). On the other hand, the variability
between different test groups was 13% smaller for the het-erogenized setup (P< 0.05) as shown in Table 3.The false positive rate of homogenized and pseudo-
heterogenized results was determined by comparison withtrue gender differences of 18F-FDG tissue uptake thatresulted to pooled data of the same gender. It was investi-gated whether strict homogenization leads to increasedfalse positive rates of results. Homogenized test groups
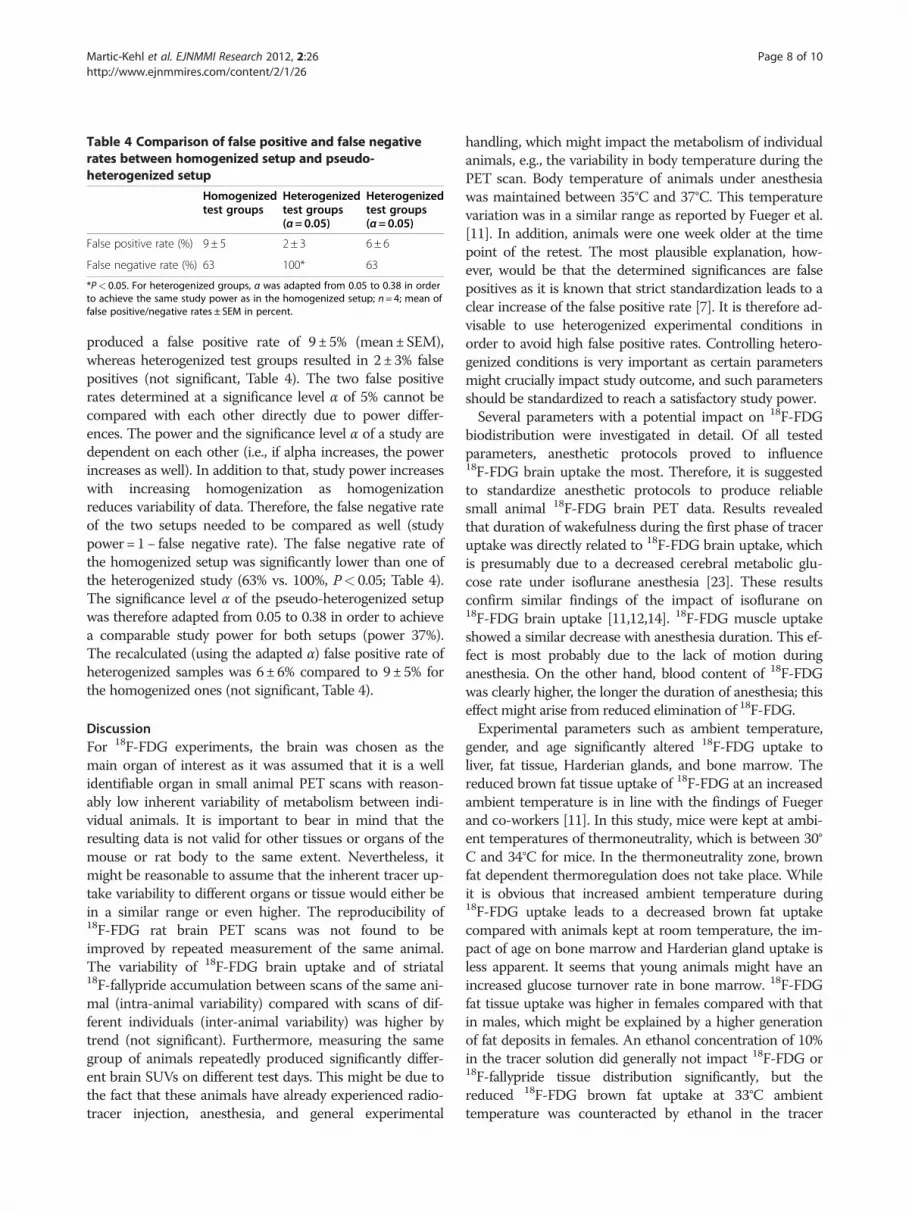
Table 4 Comparison of false positive and false negativerates between homogenized setup and pseudo-heterogenized setup
Homogenizedtest groups
Heterogenizedtest groups(α=0.05)
Heterogenizedtest groups(α=0.05)
False positive rate (%) 9 ± 5 2 ± 3 6 ± 6
False negative rate (%) 63 100* 63
*P< 0.05. For heterogenized groups, α was adapted from 0.05 to 0.38 in orderto achieve the same study power as in the homogenized setup; n= 4; mean offalse positive/negative rates ± SEM in percent.
Martic-Kehl et al. EJNMMI Research 2012, 2:26 Page 8 of 10http://www.ejnmmires.com/content/2/1/26
produced a false positive rate of 9± 5% (mean±SEM),whereas heterogenized test groups resulted in 2±3% falsepositives (not significant, Table 4). The two false positiverates determined at a significance level α of 5% cannot becompared with each other directly due to power differ-ences. The power and the significance level α of a study aredependent on each other (i.e., if alpha increases, the powerincreases as well). In addition to that, study power increaseswith increasing homogenization as homogenizationreduces variability of data. Therefore, the false negative rateof the two setups needed to be compared as well (studypower=1− false negative rate). The false negative rate ofthe homogenized setup was significantly lower than one ofthe heterogenized study (63% vs. 100%, P< 0.05; Table 4).The significance level α of the pseudo-heterogenized setupwas therefore adapted from 0.05 to 0.38 in order to achievea comparable study power for both setups (power 37%).The recalculated (using the adapted α) false positive rate ofheterogenized samples was 6±6% compared to 9±5% forthe homogenized ones (not significant, Table 4).
DiscussionFor 18F-FDG experiments, the brain was chosen as themain organ of interest as it was assumed that it is a wellidentifiable organ in small animal PET scans with reason-ably low inherent variability of metabolism between indi-vidual animals. It is important to bear in mind that theresulting data is not valid for other tissues or organs of themouse or rat body to the same extent. Nevertheless, itmight be reasonable to assume that the inherent tracer up-take variability to different organs or tissue would either bein a similar range or even higher. The reproducibility of18F-FDG rat brain PET scans was not found to beimproved by repeated measurement of the same animal.The variability of 18F-FDG brain uptake and of striatal18F-fallypride accumulation between scans of the same ani-mal (intra-animal variability) compared with scans of dif-ferent individuals (inter-animal variability) was higher bytrend (not significant). Furthermore, measuring the samegroup of animals repeatedly produced significantly differ-ent brain SUVs on different test days. This might be due tothe fact that these animals have already experienced radio-tracer injection, anesthesia, and general experimental
handling, which might impact the metabolism of individualanimals, e.g., the variability in body temperature during thePET scan. Body temperature of animals under anesthesiawas maintained between 35°C and 37°C. This temperaturevariation was in a similar range as reported by Fueger et al.[11]. In addition, animals were one week older at the timepoint of the retest. The most plausible explanation, how-ever, would be that the determined significances are falsepositives as it is known that strict standardization leads to aclear increase of the false positive rate [7]. It is therefore ad-visable to use heterogenized experimental conditions inorder to avoid high false positive rates. Controlling hetero-genized conditions is very important as certain parametersmight crucially impact study outcome, and such parametersshould be standardized to reach a satisfactory study power.Several parameters with a potential impact on 18F-FDG
biodistribution were investigated in detail. Of all testedparameters, anesthetic protocols proved to influence18F-FDG brain uptake the most. Therefore, it is suggestedto standardize anesthetic protocols to produce reliablesmall animal 18F-FDG brain PET data. Results revealedthat duration of wakefulness during the first phase of traceruptake was directly related to 18F-FDG brain uptake, whichis presumably due to a decreased cerebral metabolic glu-cose rate under isoflurane anesthesia [23]. These resultsconfirm similar findings of the impact of isoflurane on18F-FDG brain uptake [11,12,14]. 18F-FDG muscle uptakeshowed a similar decrease with anesthesia duration. This ef-fect is most probably due to the lack of motion duringanesthesia. On the other hand, blood content of 18F-FDGwas clearly higher, the longer the duration of anesthesia; thiseffect might arise from reduced elimination of 18F-FDG.Experimental parameters such as ambient temperature,
gender, and age significantly altered 18F-FDG uptake toliver, fat tissue, Harderian glands, and bone marrow. Thereduced brown fat tissue uptake of 18F-FDG at an increasedambient temperature is in line with the findings of Fuegerand co-workers [11]. In this study, mice were kept at ambi-ent temperatures of thermoneutrality, which is between 30°C and 34°C for mice. In the thermoneutrality zone, brownfat dependent thermoregulation does not take place. Whileit is obvious that increased ambient temperature during18F-FDG uptake leads to a decreased brown fat uptakecompared with animals kept at room temperature, the im-pact of age on bone marrow and Harderian gland uptake isless apparent. It seems that young animals might have anincreased glucose turnover rate in bone marrow. 18F-FDGfat tissue uptake was higher in females compared with thatin males, which might be explained by a higher generationof fat deposits in females. An ethanol concentration of 10%in the tracer solution did generally not impact 18F-FDG or18F-fallypride tissue distribution significantly, but thereduced 18F-FDG brown fat uptake at 33°C ambienttemperature was counteracted by ethanol in the tracer

Martic-Kehl et al. EJNMMI Research 2012, 2:26 Page 9 of 10http://www.ejnmmires.com/content/2/1/26
solution. Ethanol reduces the body temperature of mice[24], which might be compensated by glucose metabolismwithin the brown fat tissue. Additionally, 18F-fallypride stri-atum uptake was increased in animals receiving ethanolcompared with that in control animals (16%, not signifi-cant). This trend supports the hypothesis that the rate ofmetabolic transformation of 18F-fallypride might be sloweddown under acute ethanol conditions. It was assumed that18F-fallypride is metabolized via an oxidative process in theliver. Acute ethanol administration is known to induce hyp-oxia in the liver [25] and is therefore believed to impact theenzyme capacity of oxygenating enzymes. Ethanol wastherefore expected to slow down the degradation processof 18F-fallypride, a low extraction compound, resulting inaltered uptake characteristics in its target organs (mainlythe striatum). Varying contents of ethanol in the 18F-fally-pride solution might therefore lead to increased inter-ani-mal variability of striatum uptake, which may beconsidered for an optimal tracer formulation in futureexperiments.It was previously reported that overnight fasting was
beneficial for small animal 18F-FDG study outcome dueto reduced competition of glucose with 18F-FDG for cel-lular uptake [11,16,26,27]. For this study, it was assumedthat fasting of animals might conduce positively to theexperimental outcome in two ways. Besides increasingthe overall organ uptake of 18F-FDG, it was expectedthat the variability of blood glucose levels of individualanimals would be reduced crucially and a relatively uni-form low glucose concentration would be reached. Thiswas assumed to reduce the inter-animal variability of18F-FDG tissue uptake. However, a pilot experimentshowed that fasting did not lead to reduced blood glu-cose levels or reduced variability of blood glucose con-centration (data not shown). One reason for this mightbe the short fasting duration of only 4 h that was usedto fulfill the regulations of the local authorities. Thesefindings superseded a dedicated experiment to study theinfluence of blood glucose levels on 18F-FDG tissue up-take. Fasting of animals prior to 18F-FDG was thereforeomitted in this study.The homogenization study according to a protocol by
Richter and co-workers [7] suggests that a low intra-groupvariability does not necessarily correspond to low inter-group variability as generally assumed [5,6]. The signifi-cantly higher false positive rate under homogenizedconditions reported by Richter and colleagues were notconfirmed, most probably due to the smaller scale of thisstudy (4 group comparisons per homogenized and hetero-genized setup in this study vs. 18 group comparisons persetup in the study of Richter and co-workers). Nonetheless,the results revealed a clear trend towards affirmation of thefindings by Richter et al. [7]. Regarding the low power ofthis study as well as the fact that the setup mixed empirical
with data-mining data, it is important to interpret ourresults with care. Mainly, the results indicate thathomogenization of experimental setup might not only be aproblem in behavioral studies, but also in molecular im-aging. This prompts more research in this regard as well asunderlines the importance of careful interpretation and ex-trapolation of research results to the clinic. In the future,it might be worthwhile to investigate this topic by includ-ing different research centers to generate experimentalheterogenization.This study also shows that the variability of 18F-FDG
tissue uptake is strongly dependent on the tissue ofinterest. Brain uptake was rather stable with a variabilityranging from 6% to 16%, whereas the variability of 18F-FDG concentrations in blood and the Harderian glandwas in a range of 20% to 40%. Considering this highvariability for 18F-FDG organ uptake, it is advisable toperform sample size calculations prior to experiments toavoid exclusion of effects due to unsatisfactory studypower. Furthermore, it shows the range of effect sizethat can still be detected with small animal PET withoutbeing lost in evitable variability.
ConclusionsSmall animal PET studies should be designed with care,taking into account that using animals as their own con-trol does not necessarily increase reliability of results. Fur-thermore, experimental parameters which do not impairtracer distribution significantly (e.g., ambient temperature,housing conditions, gender, and age of animals) are sug-gested to be varied in a controlled manner to produceresults with maximal external validity. In the future, itwould be worthwhile to perform studies involving differ-ent PET centers pursuing small animal imaging to investi-gate closer the external validity of the results.
Competing interestThe authors declare that they have no competing interests.
Authors’ contributionsMIM-K participated in the study design, carried out all the experiments, didthe statistical analysis, and drafted the manuscript. SMA revised themanuscript critically for important intellectual content. MFA helped to adjustthe manuscript to fit the journal guidelines and revised the manuscriptcritically for important intellectual content. PAS revised the manuscriptcritically for important intellectual content. MH participated in the studydesign, biodistribution studies, as well as small animal PET scans and revisedthe manuscript critically for important intellectual content. All authors readand approved the final manuscript.
AcknowledgmentsThe authors thank Claudia Keller and Petra Wirth for their excellentexperimental support, Dr. Tobias Ross for his help with 18F-fallyprideproduction, and Dr. Stefanie Krämer for her fruitful discussions. Additionalthanks goes to the “Statistischer Beratungsdienst” at ETH Zürich.
Author details1Center for Radiopharmaceutical Sciences of ETH, Institute of PharmaceuticalScience of ETH Zürich, Wolfgang-Pauli-Str. 10, Zurich, 8093, Switzerland.2Collegium Helveticum, ETH and USZ, Schmelzbergstr. 25, Zürich, 8092,
Martic-Kehl et al. EJNMMI Research 2012, 2:26 Page 10 of 10http://www.ejnmmires.com/content/2/1/26
Switzerland. 3CNS Molecular Imaging, F. Hoffmann-La Roche Ltd.,Grenzacherstrasse 124, Basel, 4070, Switzerland.
Received: 16 February 2012 Accepted: 9 June 2012Published: 9 June 2012
References1. Nanni C, Rubello D, Fanti S (2007) Role of small animal PET for molecular
imaging in pre-clinical studies. Eur J Nucl Med Mol Imaging 34:1819–18222. Cherry SR (2006) Of mice and men (and positrons) – advances in PET
imaging technology. J Nucl Med 47:1735–17453. Ametamey SM, Honer M, Schubiger PA (2008) Molecular imaging with PET.
Chem Rev 108:1501–15164. Cherry SR, Gambhir SS (2001) Use of positron emission tomography in
animal research. ILAR J 42:219–2325. Van Zutphen LFM, Baumans V, Beynen AC (1995) Grundlagen der
Versuchstierkunde. Gustav Fischer Verlag, Stuttgart6. Van der Staay FJ, Steckler T (2002) The fallacy of behavioral phenotyping
without standardization. Genes Brain Behav 1:9–137. Richter SH, Garner JP, Würbel H (2009) Environmental standardization:
cure or cause of poor reproducibility in animal experiments? NatMethods 6:257–261
8. Crabbe JC, Wahlsten D, Dudek BC (1999) Genetics of mouse behavior:interactions with laboratory environment. Science 284:1670–1672
9. Würbel H (2002) Behavioural phenotyping enhanced – beyond(environmental) standardization. Genes Brain Behav 1:3–8
10. Paylor R (2009) Questioning standardization in science. Nat Methods 6:25311. Fueger BJ, Czernin J, Hildebranth I, Tran C, Halpern BS, Stout D, Phelps ME,
Weber WA (2006) Impact of animal handling on the results of 18F-FDGstudies in mice. J Nucl Med 47:999–1006
12. Toyama H, Ichise M, Liow J-S, Vines DC, Seneca NM, Modell KJ, Seidel J,Green MV, Innis RB (2004) Evaluation of anesthesia effects on 18F-FDGuptake in mouse brain and heart using small animal PET. Nucl Med Biol31:251–256
13. Flores JE, McFarland LM, Vanderbilt A, Ogasawara AK, Williams S-P (2008)The effects of anesthetic agent and carrier gas on blood glucose andtissue uptake in mice undergoing dynamic 18F-FDG-PET imaging:sevoflurane and isoflurane compared in air and in oxygen. Mol ImagingBiol 10:192–200
14. Woo S-K, Lee TS, Kim KM, Kim J-Y, Jung JH, Kang JH, Cheon GJ, Choi CW,Lim SM (2008) Anesthesia condition for 18F-FDG imaging of lungmetastasis tumors using small animal PET. Nucl Med Biol 35:143–150
15. Matsumura A, Mizokawa S, Tanaka M, Wada Y, Nozaki S, Nakamura F, ShiomiS, Ochi H, Watanabe Y (2003) Assessment of microPET performance inanalyzing the rat brain under different types of anesthesia: comparisonbetween quantitative data obtained with microPET and ex vivoautoradiography. Neuroimage 20:2040–2050
16. Wahl RL, Henry CA, Ethier SP (1992) Serum glucose: effects on tumor andnormal tissue accumulation of 2-18F-fluoro-2-deoxy-D-glucose in rodentswith mammary carcinoma. Radiology 183:643–647
17. Mukherjee J, Yang Z-Y, Das MK, Brown T (1995) Fluorinated benzamideneuroleptics—III. Development of (S)-N-[(1-allyl-2-pyrrolidinyl)methyl]-5-(3–18F-fluoropropyl)-2.3-di-methoxybenzamide as an improveddopamine D2 receptor tracer. Nucl Med Biol 22:283–296
18. Mukherjee J, Yang Z-Y, Brown T, Lew R, Wernick M, Ouyang X, Chen C-T, MintzerR, Cooper M (1999) Preliminary assessment of extrastriatal dopamine D-2receptor binding in the rodent and nonhuman primate brains using thehigh affinity radioligand, 18F-fallypride. Nucl Med Biol 26:519–527
19. Honer M, Brühlmeier M, Missimer J, Schubiger PA, Ametamey SM (2004)Dynamic imaging of striatal D2 receptors in mice using quad-HIDAC PET.J Nucl Med 45:464–470
20. Dandekar M, Tseng JR, Gambhir SS (2007) Reproducibility of 18F-FDGmicroPET studies in mouse tumor xenografts. J Nucl Med 48:602–607
21. Wang Y, Seidel J, Tsui BMW, Vaquero JJ, Pomper MG (2006) Performanceevaluation of the GE Healthcare eXplore VISTA dual-ring small-animalPET scanner. J Nucl Med 47:1891–1900
22. Mikolajczyk K, Szabatin M, Rudnicki P, Grodzki M, Burger C (1998) A JAVAenvironment for medical image data analysis: initial application for brainPET quantification. Med Inform 23:207–214
23. Cucchiara RF, Theye RA, Michenfelder JD (1974) The effects on caninecerebral metabolism and blood flow. Anesthesiology 40:571–574
24. Crabbe JC, Rigter H, Uijlen J, Strijbos C (1979) Rapid development oftolerance to the hypothermic effect of ethanol in mice. J Parmacol ExpTher 208:128–133
25. Arteel GE, Raleigh JA, Bradford BU, Thurman RG (1996) Acute alcoholproduces hypoxia directly in rat liver tissue in vivo: role of Kupffer cells.Am J Physiol 271:G494–G500
26. Ishizu K, Nishizawa S, Yonekura Y, Sadato N, Magata Y, Tamaki N, Tsuchida T,Okazawa H, Miyatake S-I, Ishikawa M, Kikuchi H, Konishi J (1994) Effects ofhyperglycemia on FDG uptake in human brain and glioma. J Nucl Med35:1104–1109
27. Lindholm P, Minn H, Leskinen-Kallio S, Bergmann J, Ruotsalainen U, JoensuuH (1993) Influence of the blood glucose concentration on FDG uptake incancer – a PET study. J Nucl Med 34:1–6
doi:10.1186/2191-219X-2-26Cite this article as: Martic-Kehl et al.: Impact of inherent variability andexperimental parameters on the reliability of small animal PET dataEJNMMI Research 2012 2:26.
Submit your manuscript to a journal and benefi t from:
7 Convenient online submission
7 Rigorous peer review
7 Immediate publication on acceptance
7 Open access: articles freely available online
7 High visibility within the fi eld
7 Retaining the copyright to your article
Submit your next manuscript at 7 springeropen.com