Susceptibility of northern British Columbia forests to spruce budworm defoliation
Upload
independentCategory
view
5download
0
Impact of clear and cloudy sky conditions on the vertical
distribution of photosynthetic CO2 uptake within a
spruce canopy
Otmar Urban1,*, Karel Klem1, Alexander Ac1, Katerina Havrankova1, Petra Holisova1,
Martin Navratil2, Martina Zitova1, Klara Kozlova1, Radek Pokorny1, Mirka Sprtova1,
Ivana Tomaskova1, Vladimır Spunda1,2 and John Grace3
1Global Change Research Centre, Academy of Sciences of the Czech Republic, Belidla 4a, CZ-60300 Brno, Czech
Republic; 2Department of Physics, Faculty of Science, University of Ostrava, 30. dubna 22, CZ-701 03 Ostrava 1, Czech
Republic; and 3Institute of Atmospheric and Environmental Science, School of GeoSciences, University of Edinburgh,
The Kings Buildings, Edinburgh EH9 3JN, UK
Summary
1. Cloud cover affects carbon exchange between biota and the atmosphere. Recent studies have
demonstrated that an increase in the diffuse radiation fraction enhances the photosynthetic
efficiency of canopies. Although the exact mechanism behind this effect is not clear, a more even
distribution of light among leaves across the vertical profile of the canopy is considered to be the
most important cause of this difference.
2. To test this hypothesis, the net ecosystem production (NEP) of a Norway spruce forest
(30-year-old) was measured under cloudy and sunny skies by the eddy covariance method. In
parallel, measurements of the diurnal courses of gas exchange and chlorophyll fluorescence
parameters were made in the upper sun (5th whorl; 1-year-old needles), middle (8th and 10th
whorl; 1- and 2-year-old needles) and lower shade (15th whorl; >2-year-old needles) shoots.
3. The higher diffuse radiation fraction during cloudy days resulted in significantly higher eco-
system carbon uptake than at corresponding incident photosynthetic photon flux density on
sunny days. Our shoot-level data show that shoots from deep within the canopy contribute sub-
stantially to the overall carbon balance during cloudy days. But, although shade-adapted shoots
had a markedly positive carbon balance over a 24-h period on cloudy days, their performance
was impaired on sunny days contributing only a marginal or even negative carbon balance from
the middle and shaded parts of the canopy. The uppermost sun shoots contributed 78% of the
total carbon assimilated during a sunny day, but only 43% during a cloudy day.
4. In addition, afternoon depression of canopy NEP and CO2 assimilation rates of the upper-
most shoots (5th and 8th whorl) occurred in response to irradiance on sunny days, characterized
by significant decreases in CO2 uptake and apparent quantum yield; however, this depression
did not occur under cloudy conditions. Stomatal and non-stomatal regulations of carbon
assimilation in the afternoon are discussed.
Key-words: afternoon depression of photosynthesis, daily course, diffuse ⁄direct radiation,
eddy covariance, light response curve, light use efficiency, net ecosystem production, photorespi-
ration, stomatal conductance
Introduction
The contribution of plants to the carbon cycle through pho-
tosynthetic assimilation relies on the absorption of radiant
energy. Solar energy reaches the Earth’s surface both as
direct beams from the sun and in diffuse form after scatter-
ing in the atmosphere. The ratio of these two components
has undergone substantial variation during recent decades
with trends described as global ‘dimming’ and ‘brightening’
effects (e.g. Wild 2009). In general, cloud cover and aerosol
loading in the atmosphere lead to (i) reduced incident pho-
tosynthetic photon flux density (I), (ii) an increased ratio*Correspondence author. E-mail: [email protected]
� 2011 The Authors. Functional Ecology � 2011 British Ecological Society
Functional Ecology 2012, 26, 46–55 doi: 10.1111/j.1365-2435.2011.01934.x

between the diffuse and direct solar radiation fractions, (iii)
altered spectral composition of incident radiation and (iv)
subsequent changes in microclimatic parameters (e.g.
decreases in temperature and vapour pressure deficit). These
effects were reviewed in Gu et al. (2002). Thus, the sky con-
ditions, not just the total incoming solar energy, may
influence photosynthesis of ecosystems.
Although cloud cover decreases primary productivity and
daily carbon sequestration, owing to the dramatic reduction
in total irradiance (Alton 2008), recent theoretical and obser-
vational studies have demonstrated that increases in the frac-
tion of diffuse radiation enhances photosynthetic efficiency
andmay, thus, intensify the net terrestrial carbon sink (Knohl
& Baldocchi 2008; Mercado et al. 2009). At canopy level, dif-
fuse radiation on cloudy days enhances photosynthesis and
results in a significantly lower compensation irradiance
(Hollinger et al. 1994; Law et al. 2002; Urban et al. 2007) and
a higher apparent quantum yield (AQY) (Gu et al. 2003;
Niyogi et al. 2004; Still et al. 2009; Dengel & Grace 2010).
The specific mechanisms whereby diffuse light stimulates
canopy-level photosynthesis are still not well understood. The
suggested reasons for these differences are (i) more favourable
microclimatic conditions during cloudy periods, i.e. lower
temperature and vapour pressure deficit (D), resulting in
lower ecosystem respiration and sufficient stomatal conduc-
tance (GS), (ii) stimulation of photochemical reactions and
stomatal opening via an increase in the blue ⁄ red light ratio
and (iii) increased penetration of light into the canopy, and
thus a more even distribution of light among leaves (reviewed
inGu et al. 2003; Urban et al. 2007; Knohl &Baldocchi 2008;
Still et al. 2009; Dengel &Grace 2010; Pingintha et al. 2010).
It is hypothesized that the nonlinear response between leaf-
level or shoot-level CO2 assimilation rate and I is responsible
for the photosynthetic advantages of diffuse radiation over
direct beam radiation at the canopy level (Gu et al. 2003; Still
et al. 2009), as whole-canopy photosynthesis includes the
contribution of photosynthesis from sunlit and shaded leaves.
Sunlit leaves are often brightly illuminated and photosynthe-
size at saturating rates, which leads to a less efficient use of
irradiance than those of shaded leaves, whereas the assimila-
tion rates of shaded leaves may be enhanced by additional
diffuse radiation reaching the lower parts of the canopy.
In addition, it is hypothesized that an excessive flux of
direct radiation and exposure to high tissue temperatures dur-
ing hot sunny daysmay lead to significant down-regulation of
photosynthesis, evident as stomatal closure, photo-inhibition
of photo-chemical reactions and ⁄or stimulation of photore-
spiratory CO2 efflux (Muraoka et al. 2000; Larcher 2003;
Franco, Matsubara & Orthen 2007; Stroch et al. 2010).
Within this hypothesis, down-regulation of carbon assimila-
tion is expected in the upper-sunlit leaves during hot sunny
days with a shift in the main assimilation activity to the lower
parts of the canopy. To the best of our knowledge, a compre-
hensive study on how individual levels of a canopy contribute
to the whole ecosystem exchange of CO2 under direct and dif-
fuse sky conditions is still lacking. Therefore, we investigated
this problem specifically within aNorway spruce (Picea abies)
canopy and compared the results during cloudy and sunny
days.
To test these hypotheses, net ecosystem production (NEP),
defined as the difference between ecosystem-level photosyn-
thetic gain of CO2 and ecosystem respiratory loss of CO2
(Chapin et al. 2006), over the spruce forest was measured
under conditions of cloudy and sunny days by the eddy
covariance method. In parallel, measurements of the diurnal
courses of related physiological processes were made on
shoots at different levels in the canopy.
Materials and methods
S I T E D ES C R I P T I O N
The forest stand selected for this study is located at the experimental
research site Bıly Krız (BeskydyMountains, 49�33¢N, 18�32¢E, NE of
the Czech Republic, 908 m a.s.l.) and it forms a part of the CarboEu-
rope-IP (http://www.carboeurope.org) and ICOS (http://www.icos-
infrastructure.eu) networks. This area has a cool (annual mean air
temperature 6Æ7 �C) and humid (annual mean relative air humidity
80%) climate with high annual precipitation (the average for
2000–2009 is 1374 mm).
The forest stand (6Æ2 ha) consists of P. abies (L.) Karst (99%) and
Abies albaMill. (1%) planted on the slope (11–16�) with SSWorienta-
tion (see details in Urban et al. 2007). At the time of the physiological
investigations, the stand density was 1428 trees ha)1 (hemi-surface
leaf area index c. 9Æ5 m2 m)2), tree height and stem diameter at
1Æ3 m were 13Æ4 ± 0Æ1 m and 15Æ8 ± 0Æ2 cm, respectively (means ±
standard deviation).
To analyse effects of diffuse and direct radiation on CO2 assimila-
tion processes, two successive periods during the growing season
(July) were used for the present analysis. The first period (16th–18th
July) – cloudy was characterized by a high diffuse index (DI > 0Æ7;DI is defined here as the ratio between the diffuse and total intensity
of photosynthetically active radiation), whereas the second period
(29th–31st July) – sunny was characterized by a DI < 0Æ3 (clear sky)atmaximum solar elevation angles.
M E A S U R E M E N T S O F M I C R O C L I M A T I C F A C T OR S
Interpretation of the carbon assimilation data was based on the inci-
dent photosynthetic photon flux density (I, waveband 400–700 nm).
Two quantum sensors (LI-190; Li-Cor, Lincoln, NE, USA) were
located above the stand canopy at the top of a 15-mhighmeteorologi-
cal mast. To measure daily courses of diffuse I, one quantum sensor
was shielded from direct light by shadow ring (CM 121B ⁄C; Kipp &
Zonen, Delft, the Netherlands). A laboratory-made optical device,
the canopy Fibre Optic System (CANFIB, Institute of Systems Biol-
ogy and Ecology, Czech Republic), was used for the measurement of
I within the tree canopy (see Urban et al. 2007 for detailed descrip-
tion). CANFIB sensors, calibrated according to LI-190 (Li-Cor),
were located at four levels (i.e. on 5th, 8th, 10th and 15th whorl)
within the vertical structure of the canopy (i.e. 2Æ9, 5Æ4, 6Æ9 and 9Æ1 m
from the apex of the tree). Each sensor was fixed perpendicular to the
main shoot axis. Instantaneous readings were taken every 30 s and
stored on a data logger (Delta-T, Burwell, Cambridgeshire, UK).
The spectral composition of incident (above canopy) and transmit-
ted (below canopy) solar radiation was obtained using a portable
spectroradiometer, LI-1800 (Li-Cor) equipped with a cosine
� 2011 The Authors. Functional Ecology � 2011 British Ecological Society, Functional Ecology, 26, 46–55
Vertical distribution of photosynthesis 47
corrector. Simultaneously, I was recorded using an LAI-2000
(Li-Cor) with a quantum sensor (LI-190) in the same place. Data were
collected at 8:30, 13:30 and 18:30 local solar time (i.e. at one-half,
maximum and one-quarter of expected maximum I, respectively),
during both clear and cloudy sky conditions. A single spectral scan
between 300 and 1100 nm with 1-nm spectral resolution took about
40 s and was measured only when irradiance fluctuated by <20%
during the scan. Spectral scans were normalized to actual irradiances.
Measurements of air temperature and humidity profiles (model
RHA1; Delta-T) were made during the eddy flux measuring cam-
paigns. Subsequently, the values of vapour pressure deficit (D) were
calculated according to formula published by Buck (1981). Soil tem-
perature (thermistor model Pt100) was measured at five depths of
0Æ05–0Æ50 m. The signals from all sensors were recorded as half-
hourly averages using a data logger (Delta-T). In addition, soil mois-
ture at a depth of 0Æ2 m was measured close to the trees investigated
at 2-h intervals during the measuring periods by time domain
reflectometry (TDR; TRIME-FN, IMKO, Ettingen, Germany).
E D D Y C O V A R I A N C E M E A S U R E M E N T S
An eddy covariance system was used to measure the CO2 and water
vapour fluxes between the forest and the atmosphere. The system
comprised: (i) a three-axis ultrasonic anemometer Solent 1012R2 (Gill
Instruments, Lymington, Hampshire, UK) mounted on the top of a
15-m tall triangular steel tower, (ii) an infrared gas analyser Li-6262
(Li-Cor) measuring the instantaneous concentration of CO2 and
water vapour in the air with a frequency of 10 Hz and (iii) the soft-
ware for real-time (Edisol) and post-processing analysis (EdiRe).
The half-hourly averagedH2O and CO2 flux values were evaluated
for data quality. The spike removal and quality check of the raw
signals were performed using the Quality Control (QC) Software
(Vickers&Mahrt 1997) and according to themost recentCarboEuro-
pe-IP recommendations (Gockede et al. 2008). Raw data were used
for the evaluated variables of vertical and the horizontal wind compo-
nents w and u, air temperature T, and H2O and CO2 concentrations
(see details in Urban et al. 2007).
C O M P L E M E N T A R Y PH Y S I O L OG I C A L M EA S U R E M E N T S
Shoot-level physiological measurements were carried out on three
representative trees situated within the flux footprint. Two shoots per
tree and whorl with SSW orientation were investigated in the upper
canopy (5th whorl; 1-year-old shoots), the middle canopy (8th and
10th whorl; 2-year-old shoots) and lower canopy (15th whorl; >2-
year-old shoots). Shoots for the estimation of water potential, nitro-
gen and chlorophyll content were cut from the same branches. The
same shoots ⁄ branches were measured on cloudy and sunny days.
Gas exchange measurements
Daily courses of CO2 assimilation rate (A) and stomatal conductance
(GS) were measured on intact shoots at their natural orientation using
two identical gas exchange systems Li-6400 (Li-Cor) under conditions
of ambient CO2 concentration (385 lmol CO2 mol)1), natural irradi-
ance, leaf temperature and D. Shoots at four levels were measured at
2 h intervals from 3:30 (pre-dawn) till 21:30 h (after sunset) and again
at 23:00 h (fully dark adapted). Night-time data were used for estima-
tion of the dark mitochondrial respiration rate (RD). The vertical dis-
tribution of mitochondrial respiration determined during the day
after 5 min of dark adaptation (Rd) was also determined.
Chlorophyll fluorescence measurements
Measurements of chlorophyll a fluorescence emission (PAM 2000
fluorometer; H. Walz, Effeltrich, Germany) were simultaneous with,
and used the same shoots within the canopy profile as, the gas
exchange measurements. Apparent photosynthetic electron transport
rate (J) was estimated as (Valentini et al. 1995):
J ¼ F0M � FS
F0M� I � 0:5 � a; ð1Þ
where FS is the fluorescence emission induced by the actual photo-
synthetic photon flux density (I), F¢M is the maximal fluorescence
emission observed during a 1-s saturating pulse, the factor 0Æ5
assumes that the incident quanta, used to excite both photosystems
(PSII and PSI), are equal, and a is the absorptance (0Æ82) estimated
for Norway spruce needles by spectroradiometric measurements.
See Spunda et al. (2005) for a detailed description.
Water potential and nitrogen analyses
The leaf water potential (W) was determined using a pressure chamber
(Model 610; PMS Instrument Co., Albany, Oregon USA). Shoots
from the same crown levels were sampled at 4:00 (pre-dawn), 8:00,
13:00, 18:00 and 20:00.
Subsequently, nitrogen concentration in the dry mass of needles
was measured by an automatic analyser (CNS-2000; LECOCorpora-
tion, St. Joseph,MI, USA) in 100 mg ofmixed samples. Before analy-
sis, each sample was dried to a constant mass in an oven (80 �C) over2 days. The specific leaf area of the needles (SLA) was defined as the
ratio between projected leaf area (one side of the needles) and leaf dry
mass.
M O D E L L I N G O F P H Y S I O L O G I C A L P R O C E S S E S
Instantaneous rates of CO2 assimilation at both canopy (NEP) and
shoot (A) levels were modelled as a general nonrectangular hyperbolic
function of incident I:
/A2 � aIþ Amaxð ÞAþ aIAmax ¼ 0 ð2Þ
where a is the AQY, / is a number between 0 and 1 determining
the shape of light response curve andAmax is the light-saturated value
ofA.
The rate of photorespiration (RL) during the day was calculated
from gas exchange measurements (A, Rd) and fluorescence measure-
ments (J), according toValentini et al. (1995):
RL ¼J� 4ðAþ RdÞ
12; ð3Þ
where Rd is the mitochondrial respiration determined during the
day after 5 min of dark adaptation. This equation assumes that
other electron-consuming processes are negligible.
S T A T I S T I C AL D AT A AN AL Y SI S
Two-way analysis of variance (ANOVA) was performed to evaluate the
physiological effects of different sky conditions and position of shoots
within canopy. To compare the differences between means, Tukey’s
post hoc test (P = 0Æ05) was used. All statistical tests were performed
using STATISTICA software (StatSoft, Tulsa, OK,USA).
� 2011 The Authors. Functional Ecology � 2011 British Ecological Society, Functional Ecology, 26, 46–55
48 O. Urban et al.

Results
M I C R O C L I M AT I C C O N D I T I ON S
The measuring campaigns included days that primarily dif-
fered in the proportion of diffuse radiation. There were tran-
sient changes in photosynthetic photon flux density (I;
Fig. 1a), but the diffuse index (DI) mostly remained <0Æ3and more than 0Æ7 during the sunny and cloudy days, respec-
tively (Fig. 1b). Diffuse radiation penetrated to lower depths
of the canopy more efficiently than direct radiation (Fig. 2b).
Extinction coefficients for the whole tree canopy were c. 0Æ33for cloudy days and 0Æ48 for sunny days. Microclimatic char-
acteristics, such as temperature and vapour pressure deficit,
measured above (Table 1) and within canopy (Fig. 2c,d), as
well as diurnal changes in leaf water potential (Table 2), fol-
lowed highly distinctive patterns for these selected days. The
average microclimatic conditions over the three preceding
days were similar to those during the measuring campaigns
(data not shown).
C A N O P Y N E P A N A L Y S E S A N D LE A F - LE V EL VE R T I C AL
D I S T R I BU T I O N OF P H O T O S YN T H E T I C AC T I V I T Y
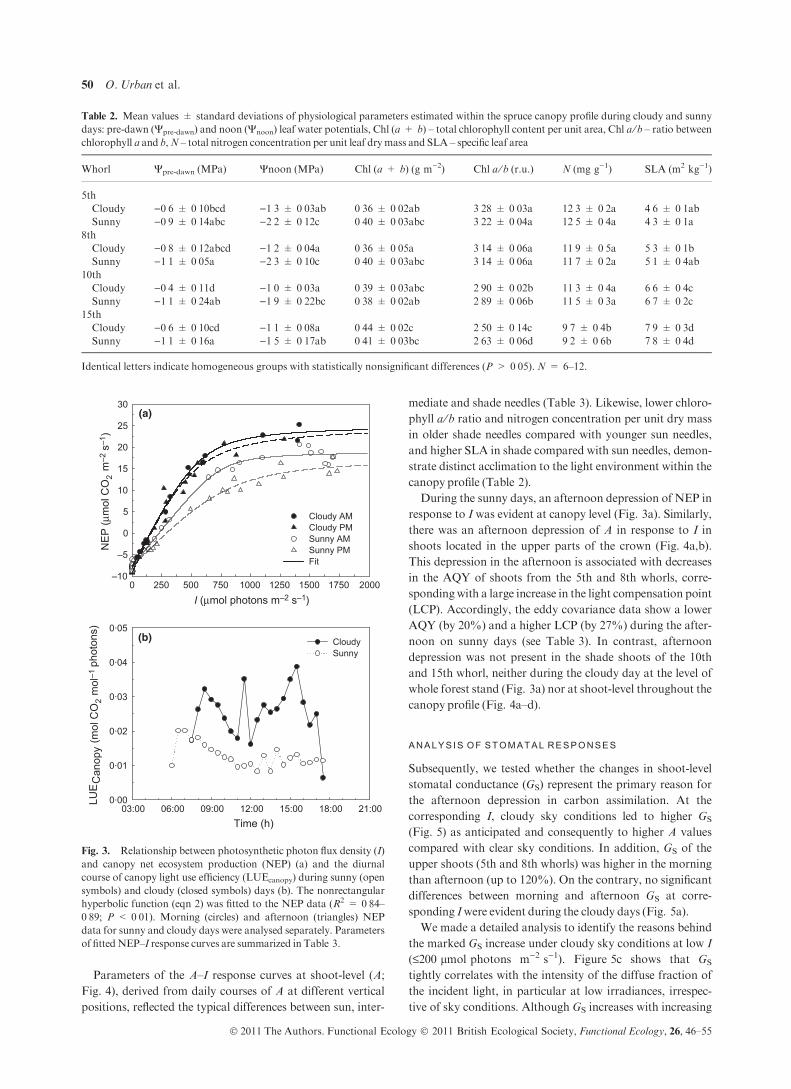
Based on the NEP light response curves (NEP–I; Fig. 3a), we
found significantly higher NEP during the cloudy day com-
pared with the sunny day at corresponding irradiances.
Cloudy sky conditions resulted in a lower compensation irra-
diance (by 38–51%), lower saturating irradiance (by 24–34%)
and higher AQY (by 77–121%), as compared with sunny
days, while night-time respiration remained almost
unchanged (Table 3). As the soil temperature of the dense
spruce stand was stable during the study period (9Æ5–10Æ5 �C),soil respiration amounted to 4Æ6 lmol m)2 s)1 irrespective of
sky conditions (data not shown). Canopy light use efficiency
(LUEcanopy), defined as the ratio between half-hourly aver-
aged NEP and incident I, was up to 3-fold higher during
cloudy days as compared with sunny days (Fig. 3b).
Time (h)03:00 06:00 09:00 12:00 15:00 18:00 21:00
DI (
dim
ensi
onle
ss)
0·0
0·2
0·4
0·6
0·8
1·0
I (µm
ol p
hoto
ns m
–2s–
1 )
0
250
500
750
1000
1250
1500
1750
2000
Sunny Cloudy
(a)
(b)
Fig. 1. Diurnal courses of incident photosynthetic photon flux den-
sity (I; a) and diffuse index (DI; b) during sunny (open circles and
dashed lines) and cloudy (closed circles and solid lines) days when
physiological measurements were carried out. The mean (points) and
standard deviations (error bars) of 30-min intervals are presented.
Projected leaf area (m2)
Who
rl
15
10
8
5
Transmitted I
SunnyCloudy
Air temperature (°C) D (kPa)0 5 10 15 20 0 20 40 60 80 100 12 14 16 18 20 22 24 26 28 0·0 0·5 1·0 1·5
(%)
(a) (b) (c) (d)
Fig. 2. Vertical distribution of projected leaf area (a), transmitted photosynthetic photon flux density (I; b), air temperature (c) and vapour pres-
sure deficit (D; d) at near-noon (11:00–13:00) during sunny (open circles) and cloudy days (black circles). Themean values (symbols) and standard
deviations (error bars) corresponding to the whorls investigated are presented.N = 18.
Table 1. Minimal (min) and maximal (max) values of air
temperature above the canopy (Tair), leaf temperature (Tleaf), vapour
pressure deficit (D) and soil moisture at a depth of 0Æ2 m. Mean
values (±standard deviations) of soil moisture are presented
(N = 20)
Tair (�C) Tleaf (�C) D (kPa)
Soil moisture (%)Min Max Min Max Min Max
Cloudy 11Æ7 18Æ7 13Æ4 22Æ7 0Æ3 1Æ0 30 (±5Æ2)Sunny 18Æ8 25Æ1 19Æ2 28Æ7 0Æ9 2Æ5 20 (±5Æ7)
� 2011 The Authors. Functional Ecology � 2011 British Ecological Society, Functional Ecology, 26, 46–55
Vertical distribution of photosynthesis 49
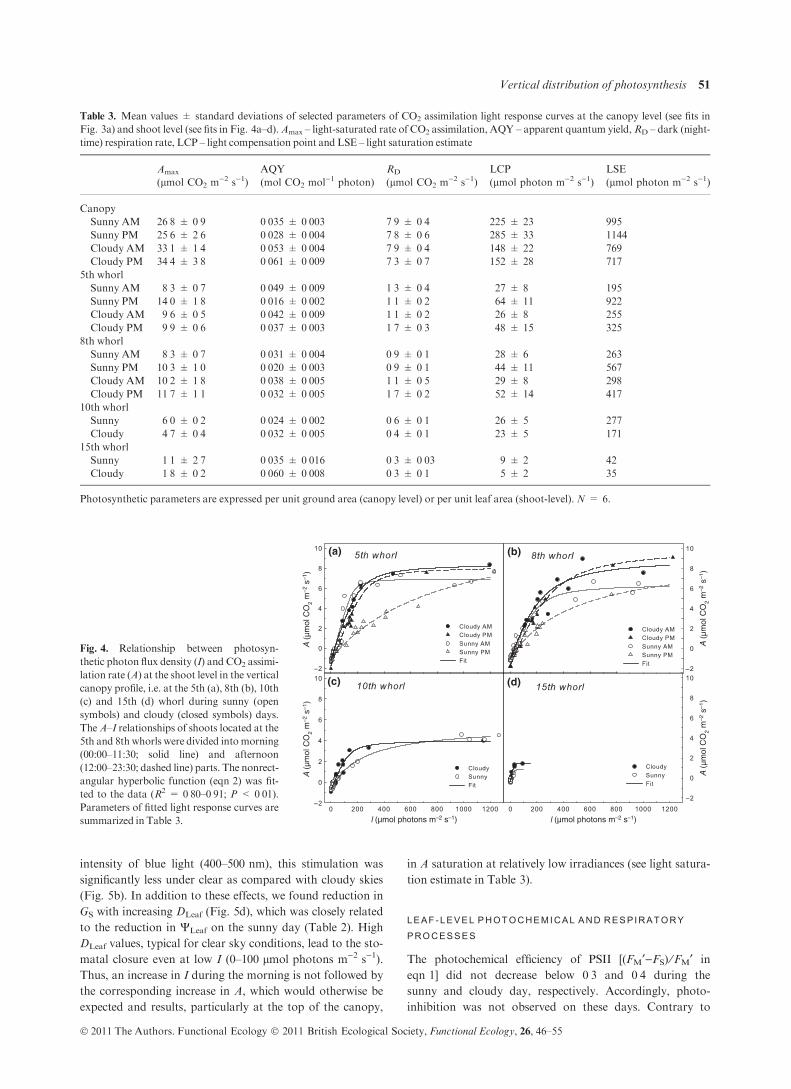
Parameters of the A–I response curves at shoot-level (A;
Fig. 4), derived from daily courses of A at different vertical
positions, reflected the typical differences between sun, inter-
mediate and shade needles (Table 3). Likewise, lower chloro-
phyll a ⁄ b ratio and nitrogen concentration per unit dry mass
in older shade needles compared with younger sun needles,
and higher SLA in shade compared with sun needles, demon-
strate distinct acclimation to the light environment within the
canopy profile (Table 2).
During the sunny days, an afternoon depression of NEP in
response to I was evident at canopy level (Fig. 3a). Similarly,
there was an afternoon depression of A in response to I in
shoots located in the upper parts of the crown (Fig. 4a,b).
This depression in the afternoon is associated with decreases
in the AQY of shoots from the 5th and 8th whorls, corre-
spondingwith a large increase in the light compensation point
(LCP). Accordingly, the eddy covariance data show a lower
AQY (by 20%) and a higher LCP (by 27%) during the after-
noon on sunny days (see Table 3). In contrast, afternoon
depression was not present in the shade shoots of the 10th
and 15th whorl, neither during the cloudy day at the level of
whole forest stand (Fig. 3a) nor at shoot-level throughout the
canopy profile (Fig. 4a–d).
A N A LY S I S O F ST OM AT AL R ES P O N SE S
Subsequently, we tested whether the changes in shoot-level
stomatal conductance (GS) represent the primary reason for
the afternoon depression in carbon assimilation. At the
corresponding I, cloudy sky conditions led to higher GS
(Fig. 5) as anticipated and consequently to higher A values
compared with clear sky conditions. In addition, GS of the
upper shoots (5th and 8th whorls) was higher in the morning
than afternoon (up to 120%). On the contrary, no significant
differences between morning and afternoon GS at corre-
sponding Iwere evident during the cloudy days (Fig. 5a).
We made a detailed analysis to identify the reasons behind
the marked GS increase under cloudy sky conditions at low I
(£200 lmol photons m)2 s)1). Figure 5c shows that GS
tightly correlates with the intensity of the diffuse fraction of
the incident light, in particular at low irradiances, irrespec-
tive of sky conditions. Although GS increases with increasing
Table 2. Mean values ± standard deviations of physiological parameters estimated within the spruce canopy profile during cloudy and sunny
days: pre-dawn (Wpre-dawn) and noon (Wnoon) leaf water potentials, Chl (a + b) – total chlorophyll content per unit area, Chl a ⁄ b – ratio between
chlorophyll a and b,N – total nitrogen concentration per unit leaf drymass and SLA – specific leaf area
Whorl Wpre-dawn (MPa) Wnoon (MPa) Chl (a + b) (g m)2) Chl a ⁄ b (r.u.) N (mg g)1) SLA (m2 kg)1)
5th
Cloudy )0Æ6 ± 0Æ10bcd )1Æ3 ± 0Æ03ab 0Æ36 ± 0Æ02ab 3Æ28 ± 0Æ03a 12Æ3 ± 0Æ2a 4Æ6 ± 0Æ1abSunny )0Æ9 ± 0Æ14abc )2Æ2 ± 0Æ12c 0Æ40 ± 0Æ03abc 3Æ22 ± 0Æ04a 12Æ5 ± 0Æ4a 4Æ3 ± 0Æ1a
8th
Cloudy )0Æ8 ± 0Æ12abcd )1Æ2 ± 0Æ04a 0Æ36 ± 0Æ05a 3Æ14 ± 0Æ06a 11Æ9 ± 0Æ5a 5Æ3 ± 0Æ1bSunny )1Æ1 ± 0Æ05a )2Æ3 ± 0Æ10c 0Æ40 ± 0Æ03abc 3Æ14 ± 0Æ06a 11Æ7 ± 0Æ2a 5Æ1 ± 0Æ4ab
10th
Cloudy )0Æ4 ± 0Æ11d )1Æ0 ± 0Æ03a 0Æ39 ± 0Æ03abc 2Æ90 ± 0Æ02b 11Æ3 ± 0Æ4a 6Æ6 ± 0Æ4cSunny )1Æ1 ± 0Æ24ab )1Æ9 ± 0Æ22bc 0Æ38 ± 0Æ02ab 2Æ89 ± 0Æ06b 11Æ5 ± 0Æ3a 6Æ7 ± 0Æ2c
15th
Cloudy )0Æ6 ± 0Æ10cd )1Æ1 ± 0Æ08a 0Æ44 ± 0Æ02c 2Æ50 ± 0Æ14c 9Æ7 ± 0Æ4b 7Æ9 ± 0Æ3dSunny )1Æ1 ± 0Æ16a )1Æ5 ± 0Æ17ab 0Æ41 ± 0Æ03bc 2Æ63 ± 0Æ06d 9Æ2 ± 0Æ6b 7Æ8 ± 0Æ4d
Identical letters indicate homogeneous groups with statistically nonsignificant differences (P > 0Æ05). N = 6–12.
I (µmol photons m–2 s–1)0 250 500 750 1000 1250 1500 1750 2000
NE
P (µ
mol
CO
2 m
–2s–
1 )
–10
–5
0
5
10
15
20
25
30
Cloudy AM Cloudy PM Sunny AM Sunny PMFit
Time (h)03:00 06:00 09:00 12:00 15:00 18:00 21:00
LUE
Can
opy
(mol
CO
2 m
ol–1
phot
ons)
0·00
0·01
0·02
0·03
0·04
0·05CloudySunny
(a)
(b)
Fig. 3. Relationship between photosynthetic photon flux density (I)
and canopy net ecosystem production (NEP) (a) and the diurnal
course of canopy light use efficiency (LUEcanopy) during sunny (open
symbols) and cloudy (closed symbols) days (b). The nonrectangular
hyperbolic function (eqn 2) was fitted to the NEP data (R2 = 0Æ84–0Æ89; P < 0Æ01). Morning (circles) and afternoon (triangles) NEP
data for sunny and cloudy days were analysed separately. Parameters
of fittedNEP–I response curves are summarized in Table 3.
� 2011 The Authors. Functional Ecology � 2011 British Ecological Society, Functional Ecology, 26, 46–55
50 O. Urban et al.
intensity of blue light (400–500 nm), this stimulation was
significantly less under clear as compared with cloudy skies
(Fig. 5b). In addition to these effects, we found reduction in
GS with increasing DLeaf (Fig. 5d), which was closely related
to the reduction in WLeaf on the sunny day (Table 2). High
DLeaf values, typical for clear sky conditions, lead to the sto-
matal closure even at low I (0–100 lmol photons m)2 s)1).
Thus, an increase in I during the morning is not followed by
the corresponding increase in A, which would otherwise be
expected and results, particularly at the top of the canopy,
in A saturation at relatively low irradiances (see light satura-
tion estimate in Table 3).
L E A F - L E V E L P H OT O C H E M I C A L A N D R ES P I R A T O R Y
P R O C ES S E S
The photochemical efficiency of PSII [(FM¢)FS) ⁄FM¢ in
eqn 1] did not decrease below 0Æ3 and 0Æ4 during the
sunny and cloudy day, respectively. Accordingly, photo-
inhibition was not observed on these days. Contrary to
Table 3. Mean values ± standard deviations of selected parameters of CO2 assimilation light response curves at the canopy level (see fits in
Fig. 3a) and shoot level (see fits in Fig. 4a–d).Amax – light-saturated rate of CO2 assimilation, AQY – apparent quantum yield,RD – dark (night-
time) respiration rate, LCP – light compensation point and LSE – light saturation estimate
Amax
(lmol CO2 m)2 s)1)
AQY
(mol CO2 mol)1 photon)
RD
(lmol CO2 m)2 s)1)
LCP
(lmol photon m)2 s)1)
LSE
(lmol photon m)2 s)1)
Canopy
Sunny AM 26Æ8 ± 0Æ9 0Æ035 ± 0Æ003 7Æ9 ± 0Æ4 225 ± 23 995
Sunny PM 25Æ6 ± 2Æ6 0Æ028 ± 0Æ004 7Æ8 ± 0Æ6 285 ± 33 1144
Cloudy AM 33Æ1 ± 1Æ4 0Æ053 ± 0Æ004 7Æ9 ± 0Æ4 148 ± 22 769
Cloudy PM 34Æ4 ± 3Æ8 0Æ061 ± 0Æ009 7Æ3 ± 0Æ7 152 ± 28 717
5th whorl
Sunny AM 8Æ3 ± 0Æ7 0Æ049 ± 0Æ009 1Æ3 ± 0Æ4 27 ± 8 195
Sunny PM 14Æ0 ± 1Æ8 0Æ016 ± 0Æ002 1Æ1 ± 0Æ2 64 ± 11 922
Cloudy AM 9Æ6 ± 0Æ5 0Æ042 ± 0Æ009 1Æ1 ± 0Æ2 26 ± 8 255
Cloudy PM 9Æ9 ± 0Æ6 0Æ037 ± 0Æ003 1Æ7 ± 0Æ3 48 ± 15 325
8th whorl
Sunny AM 8Æ3 ± 0Æ7 0Æ031 ± 0Æ004 0Æ9 ± 0Æ1 28 ± 6 263
Sunny PM 10Æ3 ± 1Æ0 0Æ020 ± 0Æ003 0Æ9 ± 0Æ1 44 ± 11 567
Cloudy AM 10Æ2 ± 1Æ8 0Æ038 ± 0Æ005 1Æ1 ± 0Æ5 29 ± 8 298
Cloudy PM 11Æ7 ± 1Æ1 0Æ032 ± 0Æ005 1Æ7 ± 0Æ2 52 ± 14 417
10th whorl
Sunny 6Æ0 ± 0Æ2 0Æ024 ± 0Æ002 0Æ6 ± 0Æ1 26 ± 5 277
Cloudy 4Æ7 ± 0Æ4 0Æ032 ± 0Æ005 0Æ4 ± 0Æ1 23 ± 5 171
15th whorl
Sunny 1Æ1 ± 2Æ7 0Æ035 ± 0Æ016 0Æ3 ± 0Æ03 9 ± 2 42
Cloudy 1Æ8 ± 0Æ2 0Æ060 ± 0Æ008 0Æ3 ± 0Æ1 5 ± 2 35
Photosynthetic parameters are expressed per unit ground area (canopy level) or per unit leaf area (shoot-level). N = 6.
A (
µmol
CO
2 m
–2 s
–1)
A (
µmol
CO
2 m
–2 s
–1)
l (µmol photons m–2 s–1) l (µmol photons m–2 s–1)
A (
µmol
CO
2 m
–2 s
–1)
A (
µmol
CO
2 m
–2 s
–1)
(a)
(d)(c)
(b)
Fig. 4. Relationship between photosyn-
thetic photon flux density (I) and CO2 assimi-
lation rate (A) at the shoot level in the vertical
canopy profile, i.e. at the 5th (a), 8th (b), 10th
(c) and 15th (d) whorl during sunny (open
symbols) and cloudy (closed symbols) days.
TheA–I relationships of shoots located at the
5th and 8th whorls were divided into morning
(00:00–11:30; solid line) and afternoon
(12:00–23:30; dashed line) parts. The nonrect-
angular hyperbolic function (eqn 2) was fit-
ted to the data (R2 = 0Æ80–0Æ91; P < 0Æ01).Parameters of fitted light response curves are
summarized in Table 3.
� 2011 The Authors. Functional Ecology � 2011 British Ecological Society, Functional Ecology, 26, 46–55
Vertical distribution of photosynthesis 51
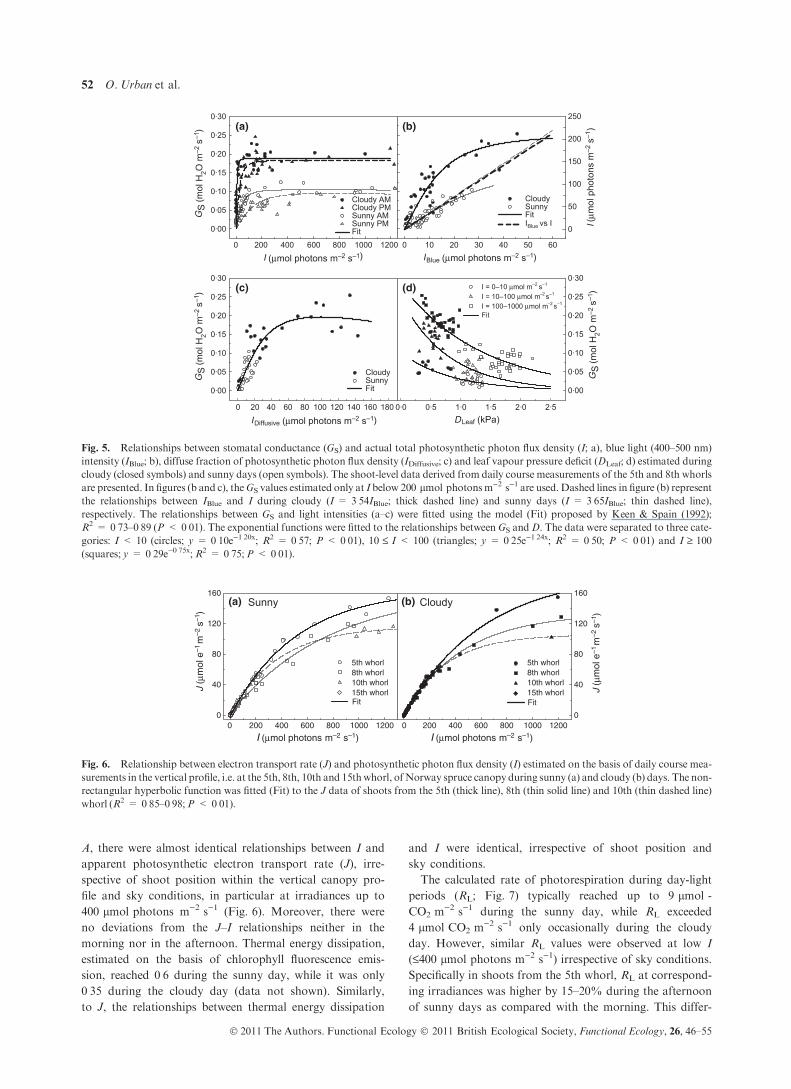
A, there were almost identical relationships between I and
apparent photosynthetic electron transport rate (J), irre-
spective of shoot position within the vertical canopy pro-
file and sky conditions, in particular at irradiances up to
400 lmol photons m)2 s)1 (Fig. 6). Moreover, there were
no deviations from the J–I relationships neither in the
morning nor in the afternoon. Thermal energy dissipation,
estimated on the basis of chlorophyll fluorescence emis-
sion, reached 0Æ6 during the sunny day, while it was only
0Æ35 during the cloudy day (data not shown). Similarly,
to J, the relationships between thermal energy dissipation
and I were identical, irrespective of shoot position and
sky conditions.
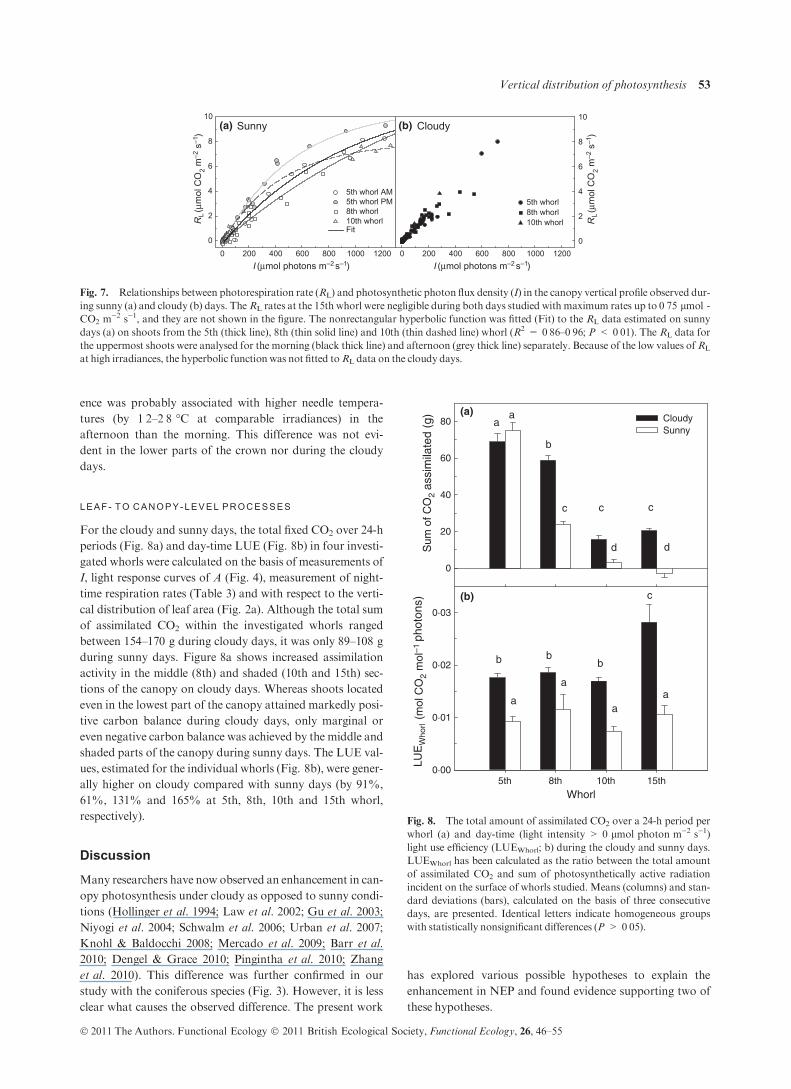
The calculated rate of photorespiration during day-light
periods (RL; Fig. 7) typically reached up to 9 lmol -
CO2 m)2 s)1 during the sunny day, while RL exceeded
4 lmol CO2 m)2 s)1 only occasionally during the cloudy
day. However, similar RL values were observed at low I
(£400 lmol photons m)2 s)1) irrespective of sky conditions.
Specifically in shoots from the 5th whorl, RL at correspond-
ing irradiances was higher by 15–20% during the afternoon
of sunny days as compared with the morning. This differ-
0·00
0·05
0·10
0·15
0·20
0·25
0·30
Cloudy AMCloudy PMSunny AMSunny PMFit
IDiffusive (µmol photons m–2 s–1)
IBlue (µmol photons m–2 s–1)I (µmol photons m–2 s–1)
0·00
0·05
0·10
0·15
0·20
0·25
0·30
CloudySunnyFit
I (µm
ol p
hoto
ns m
–2s–1
s–1)
0
50
100
150
200
250
CloudySunnyFitIBlue vs I
DLeaf (kPa)
0 200 400 600 800 1000 1200
0 20 40 60 80 100 120 140 160 180
0 10 20 30 40 50 60
0·0 0·5 1·0 1·5 2·0 2·5
GS
(mol
H2O
m–2
)
s–1G
S(m
ol H
2O m
–2)
s–1G
S(m
ol H
2O m
–2)
0·00
0·05
0·10
0·15
0·20
0·25
0·30I = 0–10 µmol m –2 s–1
I = 10–100 µmol m –2 s–1
I = 100–1000 µmol m –2 s–1
Fit
(a)
(d)(c)
(b)
Fig. 5. Relationships between stomatal conductance (GS) and actual total photosynthetic photon flux density (I; a), blue light (400–500 nm)
intensity (IBlue; b), diffuse fraction of photosynthetic photon flux density (IDiffusive; c) and leaf vapour pressure deficit (DLeaf; d) estimated during
cloudy (closed symbols) and sunny days (open symbols). The shoot-level data derived from daily course measurements of the 5th and 8th whorls
are presented. In figures (b and c), theGS values estimated only at I below 200 lmol photonsm)2 s)1 are used. Dashed lines in figure (b) represent
the relationships between IBlue and I during cloudy (I = 3Æ54IBlue; thick dashed line) and sunny days (I = 3Æ65IBlue; thin dashed line),
respectively. The relationships between GS and light intensities (a–c) were fitted using the model (Fit) proposed by Keen & Spain (1992);
R2 = 0Æ73–0Æ89 (P < 0Æ01). The exponential functions were fitted to the relationships between GS andD. The data were separated to three cate-
gories: I < 10 (circles; y = 0Æ10e)1Æ20x; R2 = 0Æ57; P < 0Æ01), 10 £ I < 100 (triangles; y = 0Æ25e)1Æ24x; R2 = 0Æ50; P < 0Æ01) and I ‡ 100
(squares; y = 0Æ29e)0Æ75x;R2 = 0Æ75;P < 0Æ01).
0
40
80
120
160
5th whorl8th whorl10th whorl15th whorlFit
I (µmol photons m–2 s–1)I (µmol photons m–2 s–1)0 200 400 600 800 1000 1200 0 200 400 600 800 1000 1200
J(µ
mol
e–1
m–2
s–1)
J(µ
mol
e–1
m–2
s–1)
0
40
80
120
160(a) (b)Sunny Cloudy
5th whorl8th whorl10th whorl15th whorlFit
Fig. 6. Relationship between electron transport rate (J) and photosynthetic photon flux density (I) estimated on the basis of daily course mea-
surements in the vertical profile, i.e. at the 5th, 8th, 10th and 15thwhorl, ofNorway spruce canopy during sunny (a) and cloudy (b) days. The non-
rectangular hyperbolic function was fitted (Fit) to the J data of shoots from the 5th (thick line), 8th (thin solid line) and 10th (thin dashed line)
whorl (R2 = 0Æ85–0Æ98;P < 0Æ01).
� 2011 The Authors. Functional Ecology � 2011 British Ecological Society, Functional Ecology, 26, 46–55
52 O. Urban et al.
ence was probably associated with higher needle tempera-
tures (by 1Æ2–2Æ8 �C at comparable irradiances) in the
afternoon than the morning. This difference was not evi-
dent in the lower parts of the crown nor during the cloudy
days.
L EA F - T O C A N O P Y- L EV E L PR OC ES S ES
For the cloudy and sunny days, the total fixed CO2 over 24-h
periods (Fig. 8a) and day-time LUE (Fig. 8b) in four investi-
gated whorls were calculated on the basis of measurements of
I, light response curves of A (Fig. 4), measurement of night-
time respiration rates (Table 3) and with respect to the verti-
cal distribution of leaf area (Fig. 2a). Although the total sum
of assimilated CO2 within the investigated whorls ranged
between 154–170 g during cloudy days, it was only 89–108 g
during sunny days. Figure 8a shows increased assimilation
activity in the middle (8th) and shaded (10th and 15th) sec-
tions of the canopy on cloudy days. Whereas shoots located
even in the lowest part of the canopy attained markedly posi-
tive carbon balance during cloudy days, only marginal or
even negative carbon balance was achieved by the middle and
shaded parts of the canopy during sunny days. The LUE val-
ues, estimated for the individual whorls (Fig. 8b), were gener-
ally higher on cloudy compared with sunny days (by 91%,
61%, 131% and 165% at 5th, 8th, 10th and 15th whorl,
respectively).
Discussion
Many researchers have now observed an enhancement in can-
opy photosynthesis under cloudy as opposed to sunny condi-
tions (Hollinger et al. 1994; Law et al. 2002; Gu et al. 2003;
Niyogi et al. 2004; Schwalm et al. 2006; Urban et al. 2007;
Knohl & Baldocchi 2008; Mercado et al. 2009; Barr et al.
2010; Dengel & Grace 2010; Pingintha et al. 2010; Zhang
et al. 2010). This difference was further confirmed in our
study with the coniferous species (Fig. 3). However, it is less
clear what causes the observed difference. The present work
has explored various possible hypotheses to explain the
enhancement in NEP and found evidence supporting two of
these hypotheses.
I (µmol photons m–2 s–1) I (µmol photons m–2 s–1)
0
2
4
6
8
10
5th whorl AM5th whorl PM8th whorl10th whorlFit
0 200 400 600 800 1000 1200 0 200 400 600 800 1000 1200
RL(µ
mol
CO
2 m
–2s–1
)
RL(µ
mol
CO
2 m
–2s–1
)
0
2
4
6
8
10
5th whorl8th whorl10th whorl
(a) (b)Sunny Cloudy
Fig. 7. Relationships between photorespiration rate (RL) and photosynthetic photon flux density (I) in the canopy vertical profile observed dur-
ing sunny (a) and cloudy (b) days. TheRL rates at the 15th whorl were negligible during both days studied with maximum rates up to 0Æ75 lmol -
CO2 m)2 s)1, and they are not shown in the figure. The nonrectangular hyperbolic function was fitted (Fit) to the RL data estimated on sunny
days (a) on shoots from the 5th (thick line), 8th (thin solid line) and 10th (thin dashed line) whorl (R2 = 0Æ86–0Æ96; P < 0Æ01). The RL data for
the uppermost shoots were analysed for the morning (black thick line) and afternoon (grey thick line) separately. Because of the low values ofRL
at high irradiances, the hyperbolic function was not fitted toRL data on the cloudy days.
Whorl5th 8th 10th 15th
LUE
Who
rl(m
ol C
O2
mol
–1ph
oton
s)
0·00
0·01
0·02
0·03
Sum
of C
O2
assi
mila
ted
(g)
0
20
40
60
80 Cloudy Sunny
(a)
(b)
aa
b
c c c
d d
aa
a
b b
a
c
b
Fig. 8. The total amount of assimilated CO2 over a 24-h period per
whorl (a) and day-time (light intensity > 0 lmol photon m)2 s)1)
light use efficiency (LUEWhorl; b) during the cloudy and sunny days.
LUEWhorl has been calculated as the ratio between the total amount
of assimilated CO2 and sum of photosynthetically active radiation
incident on the surface of whorls studied. Means (columns) and stan-
dard deviations (bars), calculated on the basis of three consecutive
days, are presented. Identical letters indicate homogeneous groups
with statistically nonsignificant differences (P > 0Æ05).
� 2011 The Authors. Functional Ecology � 2011 British Ecological Society, Functional Ecology, 26, 46–55
Vertical distribution of photosynthesis 53
1. Effective penetration of anisotropic diffuse radiation into
the canopy (Fig. 2b) causes lower whorls to receive more
radiation, and therefore become a major contributor to
canopy photosynthesis during cloudy days (Fig. 8). Mod-
elling the net CO2 exchange in a broad-leaved deciduous
forest stand, Still et al. (2009) found shade-leaf cumula-
tive photosynthetic fluxes to be less than half of sun-leaf
fluxes on sunny days, whereas they equalled or even
exceeded sun-leaf fluxes on partly cloudy and cloudy
days. However, directly measured leaf-level CO2 assimila-
tion rates corroborating these presumptions were miss-
ing, as well as the contributions of individual canopy
layers to the integrated net carbon exchange remained
unknown.
2. In days of predominantly direct radiation, the sunlit leaves
show an afternoon depression in photosynthetic rate
(Fig. 4), which is caused by substantial afternoon stomatal
closure (Fig. 5) associated and presumably caused by
higher vapour pressure deficits on those days and lower
leaf water potentials (Table 2). A similar afternoon
depression of photosynthesis was reported at the canopy
level of a peanut field (Pingintha et al. 2010). Recently, the
crucial contribution of GS to the midday depression of
photosynthesis under high D was confirmed in a study of
mist-spray effect in citrus (Hu et al. 2009). In addition,
sunlit leaves are often brightly illuminated during sunny
days, and they photosynthesize at saturating rates, lead-
ing, thus, to a dramatically lower LUE than that of shaded
leaves (Fig. 8b).
Based on our data, we rejected the following alternative
hypotheses.
1. Although there are reports of a stimulating effect of blue
light on the hydraulic conductance of leaf blades (Sellin
et al. 2011) and on the activation of photosynthetic pro-
cesses (Kosvancova-Zitova et al. 2009), blue light enrich-
ment in diffuse conditions did not cause a substantial
stimulation of photosynthesis through its effect on stoma-
tal conductance (Fig. 5b). On the contrary, GS tightly cor-
related with the flux of diffuse fraction of the incident light
irrespective of sky conditions (Fig. 5c). As the stomata are
usually located on the abaxial leaf side, anisotropic diffuse
light, thus, forms an important environmental driver ofGS
and A, particularly in spruce species (Leverenz & Jarvis
1979).
2. As revealed by fluorescence, there were no differences in
photo-inhibition and electron transport rates between
sunny and cloudy conditions (Fig. 6) nor in the afternoon
compared with the morning. Rapid degradation of D1
protein, decreased rate of plastoquinone reduction and
increased inactivation of PSII reaction centres have
already been identified as possible reasons for the decline
in electron transport on sunny days as the afternoon pro-
gresses (Guo et al. 2009). It is likely that efficient heat dis-
sipation of absorbed light energy was sufficient under the
given environmental conditions to protect spruce needles
against photo-inhibitory damage (Spunda et al. 2005;
Stroch et al. 2010).
3. Although a high rate of photorespiration was identified as
an important mechanism contributing to photosynthetic
depression with a potentially photoprotective role against
excessive light energy (Kitao et al. 2006; Zhang, Meng &
Cao 2009), photorespiration rates were similar functions
of incident radiation in sunny and cloudy conditions
(Fig. 7). Specifically, in shoots from the 5th whorl, RL was
up to 40% higher during the afternoon of sunny days as
compared with the morning at equivalent irradiances
(Fig. 7a). Increases in RL rates are usually associated with
low CO2 concentration in the chloroplasts and increased
leaf temperature leading to decreases in the ratios between
Michaelis–Menten constants for carboxylation and oxy-
genation and between CO2 and HCO3) concentrations
and the inhibition of Rubisco activase activity (Muraoka
et al. 2000; Xu et al. 2009).
In accordance with findings in broadleaf (Still et al. 2009)
as well as coniferous forest (Chasmer et al. 2008), we found
that LUE is inversely proportional to incident irradiance at
both canopy (Fig. 3b) and leaf ⁄whorl level (Fig. 8b) and that
it significantly increases as the diffuse radiation fraction
increases. It has been shown that increases in LUE with an
increasing fraction of diffuse radiation depend on canopy
structure and its openness (Alton et al. 2005), and on changes
in LUE in individual canopy layers. In our study, all canopy
layers displayed stimulation of LUE by diffuse light; how-
ever, the LUE stimulation in shade leaves seemed to be higher
compared with sun leaves (Fig. 8b).
Diffuse radiation, thus, has important direct effects on the
productivity and structure of vegetation (Roderick et al.
2001). On sunny days, most of the leaves in canopies with
high densities (LAI > 7 m2 m)2) are in deep shade, perform-
ing at marginal or negative carbon balances (Fig. 8).
Increased penetration and LUE under diffuse light conditions
may explain how forests with a high LAI canmaintain a posi-
tive carbon balance, despite having an apparently high degree
of self-shading by individual shoots (Roderick et al. 2001).
Forest canopies are, thus, probably adapted to the most com-
mon light conditions that they receive.We can expect that if a
forest is growing at a site where conditions are predominantly
cloudy, they will have a high LAI. This view is supported
by the results of measurements over dense forest canopies
(Hollinger et al. 1994; Law et al. 2002; Urban et al. 2007).
Acknowledgements
This work is part of the research supported by grants 2B06068
(INTERVIRON), SP ⁄ 2d1 ⁄ 93 ⁄ 07 (CzechTerra) and IAA600870701
(GA AV). This article is a product of the CzechGlobe Centre that is
being developed within the OP RDI and co-financed from EU funds
and the State Budget of the Czech Republic (CZ.1Æ05 ⁄ 1Æ1Æ00 ⁄02Æ0073). The experimental site Bıly Krız is within the National infra-
structure for carbon observations – CzeCOS ⁄ ICOS supported by
Ministry of Education CR (LM2010007).
� 2011 The Authors. Functional Ecology � 2011 British Ecological Society, Functional Ecology, 26, 46–55
54 O. Urban et al.
References
Alton, P.B. (2008) Reduced carbon sequestration in terrestrial ecosystems
under overcast skies compared to clear skies.Agricultural and Forest Meteo-
rology, 148, 1641–1653.
Alton, P.B., North, P., Kaduk, J. & Los, S. (2005) Radiative transfer modeling
of direct and diffuse sunlight in a Siberian pine forest. Journal of Geophysical
Research-Atmospheres, 110, D23209.
Barr, J.G., Engel, V., Fuentes, J.D., Zieman, J.C., O’Halloran, T.L., Smith,
T.J. & Anderson, G.H. (2010) Controls on mangrove forest-atmosphere
carbon dioxide exchanges in western Everglades National Park. Journal of
Geophysical Research-Biogeosciences, 115, G02020.
Buck, A.L. (1981) New equations for computing vapour pressure. Journal of
AppliedMeteorology, 20, 1527–1532.
Chapin III, F.S., Woodwell, G.M., Randerson, J.T., Rastetter, E.B., Lovett,
G.M., Baldocchi, D.D., Clark, D.A., Harmon, M.E., Schimel, D.S.,
Valentini, R., Wirth, C., Aber, J.D., Cole, J.J., Goulden, M.L., Harden,
J.W., Heimann, M., Howarth, R.W., Matson, P.A., McGuire, A.D.,
Melillo, J.M., Mooney, H.A., Neff, J.C., Houghton, R.A., Pace, M.L.,
Ryan,M.G., Running, S.W., Sala, O.E., Schlesinger,W.H. & Schulze, E.-D.
(2006) Reconciling carbon-cycle concepts, terminology, and methods.
Ecosystems, 9, 1041–1050.
Chasmer, L., McCaughey, H., Barr, A., Black, A., Shashkov, A., Treitz, P. &
Zha, T. (2008) Investigating light-use efficiency across a jack pine chronose-
quence during dry and wet years.Tree Physiology, 28, 1395–1406.
Dengel, S. & Grace, J. (2010) Carbon dioxide exchange and canopy conduc-
tance of two coniferous forests under various sky conditions.Oecologia, 164,
797–808.
Franco, A.C., Matsubara, S. & Orthen, B. (2007) Photoinhibition, carotenoid
composition and the co-regulation of photochemical and non-photochemi-
cal quenching in neotropical savanna trees.Tree Physiology, 27, 717–725.
Gockede, M., Foken, T., Aubinet, M., Aurela, M., Banza, J., Bernhofer, C.
et al. (2008) Quality control of CarboEurope flux data – Part 1: coupling
footprint analyses with flux data quality assessment to evaluate sites in forest
ecosystems.Biogeosciences, 5, 433–450.
Gu, L., Baldocchi, D., Verma, S.B., Black, T.A., Vesala, T., Falge, E.M. &
Dowty, P.R. (2002) Advantages of diffuse radiation for terrestrial ecosystem
productivity. Journal of Geophysical Research, 107, ACL2-1–ACL2-23.
Gu, L.H., Baldocchi, D.D., Wofsy, S.C., Munger, J.W., Michalsky, J.J.,
Urbanski, S.P. & Boden, T.A. (2003) Response of a deciduous forest to the
Mount Pinatubo eruption: enhanced photosynthesis. Science, 299, 2035–
2038.
Guo, W.-D., Guo, Y.-P., Liu, J.-R. & Mattson, N. (2009) Midday depression
of photosynthesis is related with carboxylation efficiency decrease and D1
degradation in bayberry (Myrica rubra) plants. Scientia Horticulturae, 123,
188–196.
Hollinger, D.Y., Kelliher, F.M., Byers, J.N., Hunt, J.E., McSeveny, T.M. &
Weir, P.L. (1994) Carbon-dioxide exchange between an undisturbed old-
growth temperate forest and the atmosphere.Ecology, 75, 134–150.
Hu,M.J., Guo, Y.P., Shen, Y.G., Guo, D.P. & Li, D.Y. (2009)Midday depres-
sion of photosynthesis and effects of mist spray in citrus. Annals of Applied
Biology, 154, 143–155.
Keen, R.E. & Spain, J.D. (1992) Computer Simulation in Biology. A BASIC
Introduction.Wiley-Liss,NewYork.
Kitao, M., Lei, T.T., Koike, T., Tobita, H. & Maruyama, Y. (2006) Tradeoff
between shade adaptation and mitigation of photoinhibition in leaves of
Quercus mongolica and Acer mono acclimated to deep shade. Tree Physiol-
ogy, 26, 441–448.
Knohl, A. & Baldocchi, D.D. (2008) Effects of diffuse radiation on canopy gas
exchange processes in a forest ecosystem. Journal of Geophysical Research-
Biogeosciences, 113, G02023.
Kosvancova-Zitova, M., Urban, O., Navratil, M., Spunda, V., Robson, T.M.
&Marek,M.V. (2009) Blue radiation stimulates photosynthetic induction in
Fagus sylvaticaL.Photosynthetica, 47, 388–398.
Larcher,W. (2003)Physiological Plant Ecology. Berlin, Springer.
Law, B.E., Falge, E., Gu, L., Baldocchi, D.D., Bakwin, P., Berbigier, P., Davis,
K., Dolman, A.J., Falk, M., Fuentes, J.D., Goldstein, A., Granier, A.,
Grelle, A., Hollinger, D., Janssens, I.A., Jarvis, P., Jensen, N.O., Katul, G.,
Mahli, Y.,Matteucci, G.,Meyers, T.,Monson, R.,Munger,W., Oechel,W.,
Olson, R., Pilegaard, K., Paw, K.T., Thorgeirsson, H., Valentini, R., Verma,
S., Vesala, T., Wilson, K. & Wofsy, S. (2002) Environmental controls over
carbon dioxide and water vapor exchange of terrestrial vegetation. Agricul-
tural and ForestMeteorology, 113, 97–120.
Leverenz, J.W. & Jarvis, P.G. (1979) Photosynthesis in Sitka spruce. 8. Effects
of light-flux density and direction on the rate of net photosynthesis and the
stomatal conductance of needles. Journal of Applied Ecology, 16, 919–932.
Mercado, L.M., Bellouin, N., Sitch, S., Boucher, O., Huntingford, C., Wild,M.
&Cox, P.M. (2009) Impact of changes in diffuse radiation on the global land
carbon sink.Nature, 458, 1014–1017.
Muraoka, H., Tang, Y.H., Terashima, I., Koizumi, H. & Washitani, I. (2000)
Contributions of diffusional limitation, photoinhibition and photorespira-
tion to midday depression of photosynthesis in Arisaema heterophyllum in
natural high light.Plant, Cell and Environment, 23, 235–250.
Niyogi,D., Chang,H.I., Saxena, V.K.,Holt, T., Alapaty,K., Booker, F., Chen,
F., Davis, K.J., Holben, B., Matsui, T., Meyers, T., Oechel, W.C., Pielke,
R.A., Wells, R., Wilson, K. & Xue, Y.K. (2004) Direct observations of the
effects of aerosol loading on net ecosystem CO2 exchanges over different
landscapes.Geophysical Research Letters, 31, L20506.
Pingintha, N., Leclerc, M.Y., Beasley, J.P., Durden, D., Zhang, G., Senthong,
C. & Rowland, D. (2010) Hysteresis response of daytime net ecosystem
exchange during drought.Biogeosciences, 7, 1159–1170.
Roderick, M.L., Farquhar, G.D., Berry, S.L. & Noble, I.R. (2001) On the
direct effect of clouds and atmospheric particles on the productivity and
structure of vegetation.Oecologia, 129, 21–30.
Schwalm, C.R., Black, T.A., Arniro, B.D., Arain, M.A., Barr, A.G., Bourque,
C.P.A., Dunn, A.L., Flanagan, L.B., Giasson, M.A., Lafleur, P.M.,
Margolis, H.A., McCaughey, J.H., Orchansky, A.L. & Wofsy, S.C. (2006)
Photosynthetic light use efficiency of three biomes across an east-west conti-
nental-scale transect in Canada. Agricultural and Forest Meteorology, 140,
269–286.
Sellin, A., Sack, L., Ounapuu, E. & Karusion, A. (2011) Impact of light quality
on leaf and shoot hydraulic properties: a case study in silver birch (Betula
pendula).Plant, Cell and Environment, 34, 1079–1087.
Spunda, V., Kalina, J., Urban, O., Luis, V.C., Sibisse, I., Puertolas, J., Sprtova,
M. & Marek, M.V. (2005) Diurnal dynamics of photosynthetic parameters
of Norway spruce trees cultivated under ambient and elevated CO2: the
reasons of midday depression in CO2 assimilation. Plant Science, 168, 1371–
1381.
Still, C.J., Riley,W.J., Biraud, S.C., Noone, D.C., Buenning, N.H., Randerson,
J.T., Torn, M.S., Welker, J., White, J.W.C., Vachon, R., Farquhar, G.D. &
Berry, J.A. (2009) Influence of clouds and diffuse radiation on ecosystem-
atmosphere CO2 and (COO)-O-18 exchanges. Journal of Geophysical
Research-Biogeosciences, 114, 17.
Stroch, M., Vrabl, D., Podolinska, J., Kalina, J., Urban, O. & Spunda, V.
(2010) Acclimation of Norway spruce photosynthetic apparatus to the com-
bined effect of high irradiance and temperature. Journal of Plant Physiology,
167, 597–605.
Urban, O., Janous, D., Acosta, M., Czerny, R., Markova, I., Navratil, M.,
Pavelka, M., Pokorny, R., Sprtova, M., Zhang, R., Spunda, V., Grace, J. &
Marek, M.V. (2007) Ecophysiological controls over the net ecosystem
exchange of mountain spruce stand. Comparison of the response in direct
vs. diffuse solar radiation.Global Change Biology, 13, 157–168.
Valentini, R., Epron, D., DeAngelis, P., Matteucci, G. & Dreyer, E. (1995) In
situ estimation of net CO2 assimilation, photosynthetic electron flow and
photorespiration in Turkey oak (Q. cerris L.) leaves: diurnal cycles under
different levels of water supply.Plant, Cell and Environment, 18, 631–640.
Vickers, D. &Mahrt, L. (1997) Quality control and flux sampling problems for
tower and aircraft data. Journal of Atmospheric and Oceanic Technology, 14,
512–526.
Wild,M. (2009)Global dimming and brightening: a review. Journal of Geophys-
ical Research-Atmospheres, 114, D00D16.
Xu, H.-L., Qin, F., Du, F., Xu, R., Xu, Q., Tian, C., Li, F. & Wang, F. (2009)
Photosynthesis in different parts of a wheat plant. Journal of Food, Agricul-
ture & Environment, 7, 399–404.
Zhang, J.-L., Meng, L.-Z. & Cao, K.-F. (2009) Sustained diurnal photosyn-
thetic depression in uppermost-canopy leaves of four dipterocarp species in
the rainy and dry seasons: does photorespiration play a role in photoprotec-
tion?Tree Physiology, 29, 217–228.
Zhang, M., Yu, G.-R., Zhang, L.-M., Sun, X.-M., Wen, X.-F., Han, S.-J. &
Yan, J.-H. (2010) Impact of cloudiness on net ecosystem exchange of carbon
dioxide in different types of forest ecosystems in China. Biogeosciences, 7,
711–722.
Received 6 June 2011; accepted 10October 2011
Handling Editor: DavidWhitehead
� 2011 The Authors. Functional Ecology � 2011 British Ecological Society, Functional Ecology, 26, 46–55
Vertical distribution of photosynthesis 55
Copyright © 2022 FDOKUMEN