Persistent effects of a severe drought on Amazonian forest canopy
6
Persistent effects of a severe drought on Amazonian forest canopy Sassan Saatchi a,b,1 , Salvi Asefi-Najafabady b , Yadvinder Malhi c , Luiz E. O. C. Aragão d , Liana O. Anderson c,e , Ranga B. Myneni f , and Ramakrishna Nemani g a Jet Propulsion Laboratory, California Institute of Technology, Pasadena, CA 91109; b Institute of Environment, University of California, Los Angeles, CA 90045; c Environmental Change Institute, School of Geography and the Environment, University of Oxford, Oxford OX1 3QY, United Kingdom; d College of Life and Environmental Sciences, University of Exeter, Devon EX4 4RJ, United Kingdom; e Remote Sensing Division, National Institute for Space Research (INPE), Sao Jose dos Campos, Sao Paulo 12227-010, Brazil; f Department of Geography and Environment, Boston University, Boston, MA 02215; and g Biospheric Sciences Branch, National Aeronautics and Space Administration/Ames Research Center, Moffett Field, CA 94035 Edited by Steven C. Wofsy, Harvard University, Cambridge, MA, and approved November 12, 2012 (received for review March 19, 2012) Recent Amazonian droughts have drawn attention to the vulner- ability of tropical forests to climate perturbations. Satellite and in situ observations have shown an increase in fire occurrence during drought years and tree mortality following severe droughts, but to date there has been no assessment of long-term impacts of these droughts across landscapes in Amazonia. Here, we use satellite microwave observations of rainfall and canopy backscatter to show that more than 70 million hectares of forest in western Amazonia experienced a strong water deficit during the dry season of 2005 and a closely corresponding decline in canopy structure and moisture. Remarkably, and despite the gradual recovery in total rainfall in subsequent years, the decrease in canopy backscatter persisted until the next major drought, in 2010. The decline in backscatter is attributed to changes in structure and water content associated with the forest upper canopy. The persistence of low backscatter supports the slow recovery (>4 y) of forest canopy structure after the severe drought in 2005. The result suggests that the occurrence of droughts in Amazonia at 5–10 y frequency may lead to persistent alteration of the forest canopy. radar | canopy water content | rainforest | QSCAT | canopy disturbance I n the past decade, Amazonia has experienced two major droughts, as highlighted by the water level of the Rio Negro recorded at Manaus in central Amazonia, the longest (109 y) available time series record. The first occurred in 2005 (1, 2), with the minimum river level at 14.75 m, the lowest in the past 40 y, and the second in 2010, with the river at 13.63 m, the lowest in the record (3). Severe droughts, often associated with the El Niño–Southern Oscillation (ENSO), cause a decline in soil moisture, pushing the plant-avail- able water below a critical threshold level for a prolonged period, resulting in higher rates of tree mortality and increased forest flammability (4–7). The drought of 2005 was unlike the ENSO-re- lated droughts because of its temporal and spatial extent: its peak of intensity during the dry season and its center of impact in south- western Amazonia, rather than the central and eastern regions, which are associated more with El Niño droughts (1). Warming of the tropical North Atlantic sea surface tempera- ture is considered a major contributing factor in the 2005 drought, which resulted in the lowest river levels recorded to that date in southern and western tributaries (1, 8, 9). Observations from ground stations show that precipitation over the southern region of Amazonia declined by almost 3.2% per year in the period before this decade (1970–1998) (10). The same region experi- enced several negative precipitation anomalies during the last decade, indicating an increase in dry conditions that culminated in severe 2005 drought (1–3, 11). Climate model predictions also suggest that the intensity of dry seasons and extreme dry events may increase with climate change, affecting the ecosystem func- tion and health of forests in Amazonia (11, 12). The short-term consequences of drought events are well estab- lished through ground and satellite observations (3–6, 13). How- ever, the extent and severity of longer-term impacts of droughts on the Amazonian rainforest and its functioning are not known. Measurements of forest structure and density from inventory plots over humid tropical forests have shown an increase in tree mor- tality and a decline in the aboveground biomass that may persist for several years (4, 14, 15). A relationship found between a simple measure of moisture stress and changes in forest biomass was used recently to predict the potential impacts of droughts on the Am- azon carbon dynamics (6). Direct evidence of long-term impacts of droughts on the Amazon vegetation has been demonstrated only in controlled small-scale (1-ha plot) field experiments (16). The study showed the most important forest response to severe droughts was the mortality of large trees with crowns in the upper canopy when plant-available soil water declined below a critical threshold (16, 17). Similar drought effects have been observed in Amazonia and other regions in research plots (4, 18). Sensitivity of satellite spectral observations to the forest’s upper- canopy characteristics (greenness, leaf area), particularly at optical wavelengths, potentially may provide the necessary information to assess the long-term impacts of droughts (18). However, recent results from optical satellites monitoring changes in vegetation greenness after the 2005 drought have been contradictory because of severe impacts of clouds and atmospheric aerosols on spectral observations (3, 19–22) over Amazonia. No study has examined the potential changes of vegetation detectable at microwave frequencies. Here, we analyze data from two microwave satellite sensors measuring precipitation and canopy water content to quantify the relative severity of recent droughts and potential impacts on Amazonian vegetation (Methods). First, we characterize the drought over Amazonia by calculating three indices derived from monthly precipitation measured by the Tropical Rainfall Measur- ing Mission (TRMM; 1998–2010): the dry-season precipitation anomaly (DPA), dry season water deficit anomaly (DWDA), and maximum climatological water deficit (MCWD) (SI Methods). These indices are complementary in their information content and provide spatially specific indicators about the extent and severity of moisture deficit in Amazonia. Second, we examine the impact of the water deficit on the Am- azon forest by using observations from the SeaWinds Scatterometer onboard QuickSCAT (QSCAT: 2000–2009). QSCAT operates in microwave frequency (13.4 GHz), providing backscatter measure- ments strongly affected by the temporal and spatial variations of water content and structure of the forest canopy (Fig. S1) (13, 22). Author contributions: S.S., L.E.O.C.A., R.B.M., and R.N. designed research; S.S., S.A.-N., and L.O.A. performed research; S.S., Y.M., L.E.O.C.A., R.B.M., and R.N. contributed new reagents/analytic tools; S.S. and S.A.-N. analyzed data; and S.S. and Y.M. wrote the paper. The authors declare no conflict of interest. This article is a PNAS Direct Submission. 1 To whom correspondence should be addressed. E-mail: [email protected]. This article contains supporting information online at www.pnas.org/lookup/suppl/doi:10. 1073/pnas.1204651110/-/DCSupplemental. www.pnas.org/cgi/doi/10.1073/pnas.1204651110 PNAS | January 8, 2013 | vol. 110 | no. 2 | 565–570 ENVIRONMENTAL SCIENCES
-
Upload
independent -
Category
Documents
-
view
1 -
download
0
Transcript of Persistent effects of a severe drought on Amazonian forest canopy

Persistent effects of a severe drought on Amazonianforest canopySassan Saatchia,b,1, Salvi Asefi-Najafabadyb, Yadvinder Malhic, Luiz E. O. C. Aragãod, Liana O. Andersonc,e,Ranga B. Mynenif, and Ramakrishna Nemanig
aJet Propulsion Laboratory, California Institute of Technology, Pasadena, CA 91109; bInstitute of Environment, University of California, Los Angeles, CA 90045;cEnvironmental Change Institute, School of Geography and the Environment, University of Oxford, Oxford OX1 3QY, United Kingdom; dCollege of Life andEnvironmental Sciences, University of Exeter, Devon EX4 4RJ, United Kingdom; eRemote Sensing Division, National Institute for Space Research (INPE), SaoJose dos Campos, Sao Paulo 12227-010, Brazil; fDepartment of Geography and Environment, Boston University, Boston, MA 02215; and gBiosphericSciences Branch, National Aeronautics and Space Administration/Ames Research Center, Moffett Field, CA 94035
Edited by Steven C. Wofsy, Harvard University, Cambridge, MA, and approved November 12, 2012 (received for review March 19, 2012)
Recent Amazonian droughts have drawn attention to the vulner-ability of tropical forests to climate perturbations. Satellite and insitu observations have shown an increase in fire occurrence duringdrought years and tree mortality following severe droughts, but todate there has been no assessment of long-term impacts of thesedroughts across landscapes in Amazonia. Here, we use satellitemicrowave observations of rainfall and canopy backscatter to showthat more than 70 million hectares of forest in western Amazoniaexperienced a strong water deficit during the dry season of 2005and a closely corresponding decline in canopy structure andmoisture. Remarkably, and despite the gradual recovery in totalrainfall in subsequent years, the decrease in canopy backscatterpersisted until the next major drought, in 2010. The decline inbackscatter is attributed to changes in structure and water contentassociated with the forest upper canopy. The persistence of lowbackscatter supports the slow recovery (>4 y) of forest canopystructure after the severe drought in 2005. The result suggests thatthe occurrence of droughts in Amazonia at 5–10 y frequency maylead to persistent alteration of the forest canopy.
radar | canopy water content | rainforest | QSCAT | canopy disturbance
In the past decade, Amazonia has experienced twomajor droughts,as highlighted by the water level of the Rio Negro recorded at
Manaus in central Amazonia, the longest (109 y) available timeseries record. The first occurred in 2005 (1, 2), with the minimumriver level at 14.75 m, the lowest in the past 40 y, and the second in2010, with the river at 13.63 m, the lowest in the record (3). Severedroughts, often associated with the El Niño–Southern Oscillation(ENSO), cause a decline in soil moisture, pushing the plant-avail-able water below a critical threshold level for a prolonged period,resulting in higher rates of tree mortality and increased forestflammability (4–7). The drought of 2005 was unlike the ENSO-re-lated droughts because of its temporal and spatial extent: its peak ofintensity during the dry season and its center of impact in south-western Amazonia, rather than the central and eastern regions,which are associated more with El Niño droughts (1).Warming of the tropical North Atlantic sea surface tempera-
ture is considered amajor contributing factor in the 2005 drought,which resulted in the lowest river levels recorded to that date insouthern and western tributaries (1, 8, 9). Observations fromground stations show that precipitation over the southern regionof Amazonia declined by almost 3.2% per year in the periodbefore this decade (1970–1998) (10). The same region experi-enced several negative precipitation anomalies during the lastdecade, indicating an increase in dry conditions that culminatedin severe 2005 drought (1–3, 11). Climate model predictions alsosuggest that the intensity of dry seasons and extreme dry eventsmay increase with climate change, affecting the ecosystem func-tion and health of forests in Amazonia (11, 12).The short-term consequences of drought events are well estab-
lished through ground and satellite observations (3–6, 13). How-ever, the extent and severity of longer-term impacts of droughts on
the Amazonian rainforest and its functioning are not known.Measurements of forest structure and density from inventory plotsover humid tropical forests have shown an increase in tree mor-tality and a decline in the aboveground biomass that may persistfor several years (4, 14, 15). A relationship found between a simplemeasure of moisture stress and changes in forest biomass was usedrecently to predict the potential impacts of droughts on the Am-azon carbon dynamics (6). Direct evidence of long-term impactsof droughts on the Amazon vegetation has been demonstratedonly in controlled small-scale (1-ha plot) field experiments (16).The study showed the most important forest response to severedroughts was the mortality of large trees with crowns in the uppercanopy when plant-available soil water declined below a criticalthreshold (16, 17). Similar drought effects have been observed inAmazonia and other regions in research plots (4, 18).Sensitivity of satellite spectral observations to the forest’s upper-
canopy characteristics (greenness, leaf area), particularly at opticalwavelengths, potentially may provide the necessary information toassess the long-term impacts of droughts (18). However, recentresults from optical satellites monitoring changes in vegetationgreenness after the 2005 drought have been contradictory becauseof severe impacts of clouds and atmospheric aerosols on spectralobservations (3, 19–22) over Amazonia. No study has examinedthe potential changes of vegetation detectable at microwavefrequencies.Here, we analyze data from two microwave satellite sensors
measuring precipitation and canopy water content to quantifythe relative severity of recent droughts and potential impacts onAmazonian vegetation (Methods). First, we characterize thedrought over Amazonia by calculating three indices derived frommonthly precipitation measured by the Tropical Rainfall Measur-ing Mission (TRMM; 1998–2010): the dry-season precipitationanomaly (DPA), dry season water deficit anomaly (DWDA), andmaximum climatological water deficit (MCWD) (SI Methods).These indices are complementary in their information content andprovide spatially specific indicators about the extent and severity ofmoisture deficit in Amazonia.Second, we examine the impact of the water deficit on the Am-
azon forest by using observations from the SeaWinds Scatterometeronboard QuickSCAT (QSCAT: 2000–2009). QSCAT operates inmicrowave frequency (13.4 GHz), providing backscatter measure-ments strongly affected by the temporal and spatial variations ofwater content and structure of the forest canopy (Fig. S1) (13, 22).
Author contributions: S.S., L.E.O.C.A., R.B.M., and R.N. designed research; S.S., S.A.-N., andL.O.A. performed research; S.S., Y.M., L.E.O.C.A., R.B.M., and R.N. contributed newreagents/analytic tools; S.S. and S.A.-N. analyzed data; and S.S. and Y.M. wrote the paper.
The authors declare no conflict of interest.
This article is a PNAS Direct Submission.1To whom correspondence should be addressed. E-mail: [email protected].
This article contains supporting information online at www.pnas.org/lookup/suppl/doi:10.1073/pnas.1204651110/-/DCSupplemental.
www.pnas.org/cgi/doi/10.1073/pnas.1204651110 PNAS | January 8, 2013 | vol. 110 | no. 2 | 565–570
ENVIRO
NMEN
TAL
SCIENCE
S

QSCAT signal propagating at 2.1-cm wavelength and incidenceangles of about 50° penetrates a few meters (1–5 m) into the forestcanopy, depending on forest gaps, and scatters from leaves andbranches of the upper canopy of trees. The backscatter measure-ments capture biophysical properties of forests, such as the watercontent in leaves and branches, and canopy structure (i.e., volumeor biomass) (SIMaterials and Methods). Temporal changes (diurnaland seasonal) of canopy water content (i.e., leaves and branches)and seasonal leaf phenology have the largest impact on the radarbackscatter (23). Structural changes such as large-scale forest deg-radation and deforestation that may change the canopy roughness(layering of tree crowns), create gaps, and affect the water contentor biomass of the upper canopy of forests can change the back-scatter signal significantly (Fig. S1). However, because of the in-cidence angle and large footprint of QSCAT radar, other factors,such as soil moisture and variations in leaf clumping or orientationof branches, have less impact on the QSCAT backscatter (23).In November 2009, QSCAT sensor scanning capability failed
and the sensor stopped collecting systematic data globally, lim-iting our analysis of the changes in canopy characteristics whenthe 2010 drought occurred. However, before its scanning failure,throughout its mission (1999–2009) QSCAT provided reliabledata over ocean and land surface without any bias or sensordegradation and continued providing limited data along its or-bital passes (SI Materials and Methods). To examine the impactof the 2010 drought, we analyzed TRMM precipitation radar(TRMM-PR) backscatter data operating at the same frequencyas QSCAT but with nadir-looking incidence angle and surfacebackscatter measurements for periods of no rain. TRMM-PRbackscatter responds to the surface moisture by penetratingdeeper into the canopy and scattering from soil and understoryvegetation through forest gaps (SI Materials and Methods).We used time series of QSCAT backscatter data from dawn
orbits to monitor vegetation in its least-stressed time of day bystudying its monthly and seasonal normalized anomaly and spatialvariations over Amazonia. Throughout the time-series analysis,the QSCAT backscatter measurement was used as a direct rep-resentation of the upper-canopy forest structure and water con-tent to avoid any indirect estimation and validation of watercontent or structure (13).
ResultsPatterns of Water Deficit. The three indices derived from TRMMdata show a strong negative anomaly over southwestern Amazoniain 2005 (Fig. S2). Of the total current forested area of the Amazonbasin (!5.5 M/km2), about 30% (1.7 M/km2) experienced stan-dardized DWDA less than "1.0 ! (!: SD) in 2005, and more than5% of total area (0.27 M/km2) was subject to severe anomalies(DWDA less than "2.0 !). Both the spatial extent and the severityof drought increased in 2010, resulting in more than 48% (2.6M/km2) of the forest area subject to DWDA less than "1.0 !, andabout 20% (1.1 M/km2) at DWDA less than "2.0 ! (Fig. S2). Insouth and southwestern regions of Amazonia, this anomaly wassuperimposed on a dry season that is fairly strong in normal years,resulting in the forests experiencing a very large water deficit(MCWD less than "300 mm) by the end of the dry season. Thegenerally wetter forests in central Amazonia with the largestnegative DPA and DWDA experienced low to moderate waterdeficit (MCWD less than "100 mm) in 2005 and 2010. Data showthat precipitation anomalies over these regions lasted only overa relatively short time span within the last decade. However, thespatial extent of precipitation anomaly (DPA) and MCWD insouthwestern Amazonia reached to the foothills of the Andes in2005 and extended to northern regions of Peru, Ecuador, andColombia, suggesting a pattern approximately consistent with thelow river stage measured in Rio Negro and other rivers in thesouthwestern Amazon basin (2, 9).
Patterns of Drought Impact on Forest Canopy. The impact of thisextensive water deficit on the Amazon forest was captured by theQSCAT (2000–2009) backscatter time series (SI Materials andMethods). The dry season standardized anomaly in 2005 showedwidespread (2.1 M/km2) decline in forest canopy backscatter(anomaly less than "1.0 !) in southwestern Amazonia (Fig. 1A).Nearly 40% of this area (0.77 M/km2) indicated a major declinein backscatter (anomaly less than "2.0 !). The backscatteranomaly on a monthly or seasonal basis calculated for 2000–2009shows a strong spatial correlation with the water deficit anomaly(WDA) observed by TRMM for the same period, indicating thatwater stress is the likely cause of the change in forest canopyproperties. The region affected by the QSCAT anomaly covereda variety of old-growth forests, from transitional semideciduousand bamboo forests in southwestern Brazil, northern Bolivia, andareas in southern Peru and along the Andean flank in westernAmazonia to a variety of inundated and terra firme forests in thenorth (24). All nonforested areas were excluded from the anal-ysis using a global land cover type (SI Materials and Methods).We performed cross-correlation between the QSCAT and
TRMM anomaly averaged over Amazonia and found correlationwas significant with 1–3 mo lag, but varied over the basin de-pending on the rainfall patterns (Fig. 1 B and C). In the south-western region, with a longer dry season, the correlation was laggedsignificantly by about 3 mo. However, in the northeastern region,where the dry season is moderate and short, the correlation wasstrong, with no time lag. Spatial variations of QSCAT and TRMManomaly in 2005 show that areas captured by highly negativeQSCAT anomaly (less than"3.0 !) are larger in extent than similarareas captured by WDA. The difference is explained by closelyexamining areas where maximum water deficit (MCWD) in 2005exceeded 300 mm and/or there was a strong water deficit duringthe entire driest quarter (DWDA less than "3.0 !). The reductionin QSCAT backscatter, causing the anomaly in the southwest re-gion, is closely associated with the WDA gradually developingthrough the dry season in 2005 (Fig. S3).
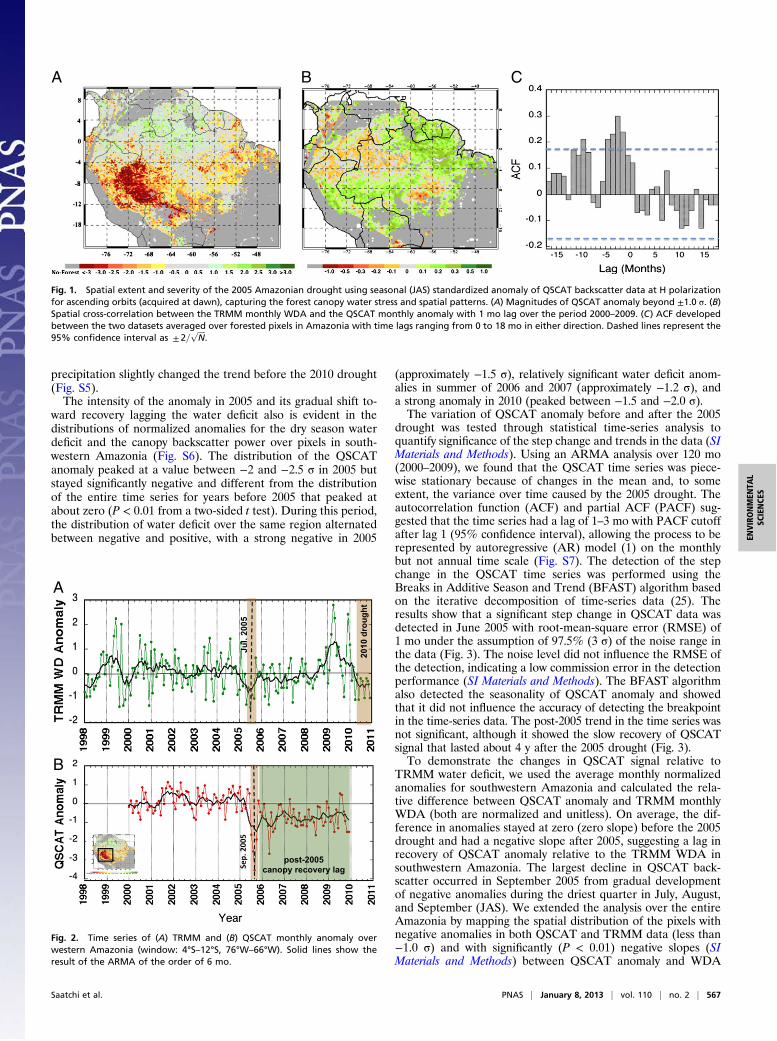
Slow Recovery of Forest Canopy. We used the time series ofTRMM and QSCAT anomaly averaged over the area affected bythe drought in southwestern Amazonia (4°S–12°S, 76°W–66°W)to examine the temporal patterns of the 2005 drought and itsimpacts. After 2005, the area affected by the drought had a re-covery of total rainfall, but WDA stayed negative on the averageduring the 2006 and 2007 dry seasons. Recovery of water deficitstarted in 2008 followed by an anomalously wet year in 2009 thatextended over all of Amazonia except the northeastern region(Fig. S4). From late 2009, the water deficit increased before itrapidly reached its highest value in the decade in southwesternregion (Fig. 2A). However, most remarkably, forest pixels af-fected by the water deficit over southwestern Amazonia contin-ued to show low values in the QSCAT backscatter (about 20%below previous mean) from 2005 through to the end of the re-cord in November 2009 (Fig. 2B). We used an autoregressivemoving-average (ARMA) model with an order of about 5% ofthe data points (>6 mo) to highlight the longer-term trends andcycles in the data. The time series of the QSCAT anomaly sug-gests that the 2005 drought caused a step change in the back-scatter properties of the canopy, with little recovery in thesubsequent years (SI Materials and Methods). The response isvery localized to regions in western Amazonia that experiencedthe strongest water deficit anomalies, hence cannot be attributedto hypothetical changes in sensor performance. We tested thesensor performance in other regions of Amazonia and the worldto ensure the stability of the backscatter signal and its calibration(Fig. S5). Spatial patterns of annual QSCAT anomaly for the dryseason support the long-term reduction in backscatter after the2005 drought until the end of 2009, when the positive anomaly of
566 | www.pnas.org/cgi/doi/10.1073/pnas.1204651110 Saatchi et al.
precipitation slightly changed the trend before the 2010 drought(Fig. S5).The intensity of the anomaly in 2005 and its gradual shift to-
ward recovery lagging the water deficit also is evident in thedistributions of normalized anomalies for the dry season waterdeficit and the canopy backscatter power over pixels in south-western Amazonia (Fig. S6). The distribution of the QSCATanomaly peaked at a value between "2 and "2.5 ! in 2005 butstayed significantly negative and different from the distributionof the entire time series for years before 2005 that peaked atabout zero (P < 0.01 from a two-sided t test). During this period,the distribution of water deficit over the same region alternatedbetween negative and positive, with a strong negative in 2005
(approximately "1.5 !), relatively significant water deficit anom-alies in summer of 2006 and 2007 (approximately "1.2 !), anda strong anomaly in 2010 (peaked between "1.5 and "2.0 !).The variation of QSCAT anomaly before and after the 2005
drought was tested through statistical time-series analysis toquantify significance of the step change and trends in the data (SIMaterials and Methods). Using an ARMA analysis over 120 mo(2000–2009), we found that the QSCAT time series was piece-wise stationary because of changes in the mean and, to someextent, the variance over time caused by the 2005 drought. Theautocorrelation function (ACF) and partial ACF (PACF) sug-gested that the time series had a lag of 1–3 mo with PACF cutoffafter lag 1 (95% confidence interval), allowing the process to berepresented by autoregressive (AR) model (1) on the monthlybut not annual time scale (Fig. S7). The detection of the stepchange in the QSCAT time series was performed using theBreaks in Additive Season and Trend (BFAST) algorithm basedon the iterative decomposition of time-series data (25). Theresults show that a significant step change in QSCAT data wasdetected in June 2005 with root-mean-square error (RMSE) of1 mo under the assumption of 97.5% (3 !) of the noise range inthe data (Fig. 3). The noise level did not influence the RMSE ofthe detection, indicating a low commission error in the detectionperformance (SI Materials and Methods). The BFAST algorithmalso detected the seasonality of QSCAT anomaly and showedthat it did not influence the accuracy of detecting the breakpointin the time-series data. The post-2005 trend in the time series wasnot significant, although it showed the slow recovery of QSCATsignal that lasted about 4 y after the 2005 drought (Fig. 3).To demonstrate the changes in QSCAT signal relative to
TRMM water deficit, we used the average monthly normalizedanomalies for southwestern Amazonia and calculated the rela-tive difference between QSCAT anomaly and TRMM monthlyWDA (both are normalized and unitless). On average, the dif-ference in anomalies stayed at zero (zero slope) before the 2005drought and had a negative slope after 2005, suggesting a lag inrecovery of QSCAT anomaly relative to the TRMM WDA insouthwestern Amazonia. The largest decline in QSCAT back-scatter occurred in September 2005 from gradual developmentof negative anomalies during the driest quarter in July, August,and September (JAS). We extended the analysis over the entireAmazonia by mapping the spatial distribution of the pixels withnegative anomalies in both QSCAT and TRMM data (less than"1.0 !) and with significantly (P < 0.01) negative slopes (SIMaterials and Methods) between QSCAT anomaly and WDA
A B C
Fig. 1. Spatial extent and severity of the 2005 Amazonian drought using seasonal (JAS) standardized anomaly of QSCAT backscatter data at H polarizationfor ascending orbits (acquired at dawn), capturing the forest canopy water stress and spatial patterns. (A) Magnitudes of QSCAT anomaly beyond ±1.0 !. (B)Spatial cross-correlation between the TRMM monthly WDA and the QSCAT monthly anomaly with 1 mo lag over the period 2000–2009. (C) ACF developedbetween the two datasets averaged over forested pixels in Amazonia with time lags ranging from 0 to 18 mo in either direction. Dashed lines represent the95% confidence interval as ± 2=
!!!!N
p.
Jul.
2005
2010
dro
ught
post-2005 canopy recovery lag
A
B
Fig. 2. Time series of (A) TRMM and (B) QSCAT monthly anomaly overwestern Amazonia (window: 4°S–12°S, 76°W–66°W). Solid lines show theresult of the ARMA of the order of 6 mo.
Saatchi et al. PNAS | January 8, 2013 | vol. 110 | no. 2 | 567
ENVIRO
NMEN
TAL
SCIENCE
S

after the 2005 drought (Fig. 4A). Pixels with larger negativeslopes represent areas with a longer lag in canopy recovery rel-ative to the recovery of the water deficit and showing persistentdrought impacts on canopy characteristics. Regions A and B,respectively, show the old-growth forests of southern Peru andthe states of Acre and Rondônia in the western Amazon ofBrazil. Region C covers a mosaic of undisturbed and disturbedforests in the state of Mato Grosso and southern Pará (both inBrazil). All three regions were reported to have an anomalouslyhigher number of fires in 2005 and subsequent years, suggestinga potential lower canopy water content and higher fuel loads(4, 22). The 2005–2009 forest loss and degradation from de-forestation and fire impacts did not change the persistentQSCAT negative anomaly (Fig. S8). However, a significantlylarge number of fires during 2005–2009 (>35%) occurred inQSCAT pixels with strong negative anomaly (less than "1.0 !) in2005, and more than 78% of fires in 2010 occurred in pixels withlarge negative slopes (less than "0.01). The occurrence of firesand the areas with slow recovery after the drought coincided withregions with large seasonality of backscatter in QSCAT data,pointing predominantly to transitional and seasonal forests ofAmazonia (Fig. 4B) (SI Materials and Methods).
DiscussionOverall, the results of QSCAT analysis indicate two importantconclusions. First, the QSCAT anomaly captures the extent andintensity of the 2005 drought impact on the Amazon forest andprovides patterns consistent with areas that experienced thelargest water deficit in the driest quarter. Changes in QSCATbackscatter are the result of changes in the properties of the top
layer of the canopy, consisting of emergent crowns that often areexposed to higher vapor-pressure deficits and consequently aremore sensitive to droughts (4, 16). Theoretically, the widespreaddecline in radar backscatter suggests changes in canopy watercontent and structure (e.g., fresh biomass), unlike what was ob-served in optical sensing (3, 20). The decline in backscattersuggests a reduction of upper-canopy biomass or canopy rough-ness attributed to potential drought-driven disturbance. Themagnitude of the decline in 2005 is significantly larger thanseasonal amplitude of the QSCAT backscatter caused by phe-nology and changes of canopy water content from natural cyclesof dry and wet seasons.Second, the QSCAT anomaly remained negative after the
2005 drought over a large area in western Amazonia, suggestingthe persistent effect of the drought on the forest canopy. Theseverity of the disturbance caused a slow recovery of the forestcanopy to its predrought condition in terms of biomass orroughness (canopy layering), lagging the precipitation recoveryof subsequent years until the 2010 drought. Notably, more than0.6 ! 106 km2 of areas affected by the 2005 drought (QSCATanomaly less than "2.0 !) coincided with the areas affected bythe 2010 water deficit (TRMM DWDA less than "2.0 !), sug-gesting a potentially widespread exacerbation of stress on forestsof south and western Amazonia.Without extensive surveys and perhaps airborne observations
and validations, the interpretation of the decline of backscatterand its direct relation to the forest disturbance remain chal-lenging. A simple wilting or shedding of leaves during the peakdrought, resulting in a temporary decline of net primary pro-duction, would be expected to be followed by recovery of canopyproperties within a year. Such recovery is apparent in centralAmazonia, where the backscatter anomaly recovered rapidly,despite experiencing a strong water deficit and QSCAT anomalyin 2005 (Figs. S2 and S3). The delayed recovery of QSCAT insouthwestern Amazonia suggests a decline in more long-livedaspects of canopy structure with recovery timescales greater than3–4 y, such as loss of leaves or dieback of branches, or potentialtree falls creating large gaps.We found no in situ observations over the region affected by
the 2005 drought that could be used to directly verify our results.However, in most tropical drought studies, there is strong evi-dence that large-diameter or emergent trees have significantlyhigher mortality than small trees (16–18, 26, 27). The effects ofextreme droughts on the understory light environment of tropicalforests may be compared with the effects of tree-fall gaps, al-though on much larger scales (27). With the recovery of rainfalland potential increase in light availability due to gaps fromcanopy disturbance, the understory vegetation and pioneer spe-cies may increase productivity a few months after severedroughts (22). These changes may affect nadir-looking opticalsatellite observations with sensitivity to vegetation greenness andphotosynthesis capacity (3, 21, 22). In situ measurements showthat the mortality of large trees remains elevated even a fewyears after the drought (4), suggesting a decline in canopystructure or biomass followed by gradual development of canopyemergent trees (4, 22). The recovery of canopy trees after thedrought event is a slower process and may take longer to reachthe predrought state (18, 22, 25, 26). Based on the results fromthis study and the evidence reported in the literature, we hy-pothesize that western Amazonia experienced a large-scalecanopy disturbance from the 2005 drought, resulting in the de-cline of emergent and canopy tree structure and biomass thatcontinued with a slow recovery for the next few years. We expectfuture field campaigns directed to examine the effect of severedroughts and analysis of existing in situ data from permanentresearch plots in western Amazonia (4) to test the hypothesis andpotentially verify the results of satellite observations.
Fig. 3. (A) BFAST seasonal trend decomposition of the QSCAT monthlynormalized anomaly time series of southwestern Amazonia (window: 4°S–12°S, 76°W–66°W) into seasonal, trend, and remainder components. (B) Theseasonal component is estimated by taking the mean of all seasonal sub-components starting from January 2000. The range of seasonal amplitude isless than 20% of the range of QSCAT anomaly. (C) One abrupt change in thetrend component of the time series is detected on June 2005. The shaded barindicates the 97.5% (3 !) confidence interval. (D) The remainder shows thevariation of the signal after the removal of the trend capturing the temporalvariations in the time series.
568 | www.pnas.org/cgi/doi/10.1073/pnas.1204651110 Saatchi et al.

A large-scale drought disturbance of forest structure frommortality of large trees and, to some extent, a drop in the leafarea of the forest (16, 28) may lead to a sustained efflux ofcarbon dioxide from the decay of wood, with the process sig-nificantly perturbing the net ecosystem exchange and carbonfluxes (11, 12, 14). Results from climate analysis for the period1995–2005 demonstrate a steady decline in plant water avail-ability over the same region, suggesting a decade of moderatewater stress before the 2005 drought (10, 22), helping to trigger alarge-scale canopy disturbance after the 2005 drought. A higherwater deficit in subsequent years, together with another stronglocal drought in 2007, suggests that soils from a large portion ofsouthwestern Amazonia may not have reached the field capacity,which would favor canopy recovery (29). Other factors, such asa decline in rainfall and larger variability in the dry season oversouthwestern Amazonia since the late 1980s and early 1990s(Fig. S9), may have contributed to an increasingly drier conditionin this region. We show that these recent negative anomalies andyear-to-year variations are strongly linked to both the warmingand variations in the sea surface temperature (1, 2). The mostrecent droughts are related to higher temperatures in the trop-ical Atlantic, showing a strong regional sensitivity of WDA to thetropical North Atlantic index (Fig. S10).Our analysis ends in 2009. It seems likely that the observed
canopy response was repeated in the more severe drought of2010 (Fig. S11), for which QSCAT data are not available; hence,a new wave of disturbance may have affected forest canopies notyet recovered from the previous droughts and water deficit. TheTRMM-PR backscatter anomaly suggests that the surfacemoisture in western and southern Amazonia dropped signifi-cantly in 2010 and lasted longer than the dry season (Fig. S11),potentially causing more stress on the forest canopy. If droughtscontinue to occur at 5–10-y frequency, or increase in frequency,large areas of Amazonian forest canopy likely will be exposed tothe persistent effect of droughts and the slow recovery of forestcanopy structure and function. In particular, areas of south andwestern Amazonia have been shown to be affected severely byincreasing rainfall variability in the past decade, suggesting that
this region may be witnessing the first signs of potential large-scale degradation of Amazonian rainforest from climate change(10, 11, 30).
Materials and MethodsThis study is based on the use of various microwave satellite observations ofAmazonia to detect the regional and potential severity of the impact of the2005 drought on the Amazon forests. Our approach includes five steps: (i)spatial analysis of monthly TRMM rainfall data to calculate the standardizedanomaly of rainfall during the dry season, maximum water deficit, andanomaly of monthly water deficit; (ii) spatial analysis of monthly QSCATbackscatter data to computer pixel-level standardized anomaly from thesatellite dawn orbits to monitor vegetation in its least-stressed time of dayand its spatial correlation with TRMM water deficit; (iii) time-series analysisof QSCAT monthly backscatter anomaly over western Amazonia using theARMA model, testing ACF and PACF with time lags, and iterative applicationof the additive decomposition algorithm BFAST to detect a significantbreakpoint and trend in the QSCAT data associated with the 2005 drought;(iv) quantifying the impact of deforestation and fire occurrence on theQSCAT anomaly and trend results and showing the independence of theresults from canopy disturbances that may have been caused by fire anddegradation during and after the 2005 drought; and (v) testing the regionalimpacts of variations in the historical climate data on the patterns of rainfallanomaly in Amazonia to explain the climatic cause of recent droughts inAmazonia. Our analysis of the QSCAT data was limited to the period 2000–2009 and could not provide information about the 2010 drought. We in-cluded the TRMM-PR backscatter anomaly to demonstrate the changes insurface moisture during the 2005 and 2010 droughts as evidence of thepotential impact of the 2010 drought on forests in southwestern Amazoniaalready affected.
We used the Moderate Resolution Imaging Spectroradiometer (MODIS)land cover map of 2005, GlobCover land cover map of 2009, and MODIS-derived pixel fire counts from 2001 to 2010 to exclude nonforest pixels fromour analysis and to quantify the percentage of pixels with a large QSCAT-negative anomaly affected by fires after the 2005 drought (2005–2009) andduring the 2010 drought. We had no independent ground measurements toverify our results because of the large pixel size of the satellite observationsand the recentness of the drought event. However, we provided biophysicalinterpretation of the satellite observations and evidence from in situmeasurements and ecological studies to corroborate our findings of thepersistent effect of droughts on forest canopy. We provide detailed in-formation about the data in SI Materials and Methods.
A B
Fig. 4. (A) Spatial representation of the rate of recovery of pixels affected by QSCAT-negative anomaly (less than "1.0 !) calculated by the slope of thedifference in QSCAT and TRMM monthly anomalies from September 2005 to November 2009 (SI Materials and Methods). Pixels with significantly largenegative slopes represent forests with slower recovery and cover an area of !4 ! 105 km2. Areas delineated in highlighted areas as A, B, and C representregions in southeastern Peru, the state of Acre in Brazil, and areas in the state of Mato Grosso, respectively, showing areas with potentially the largest impactsof the 2005 drought. (B) Spatial representation of areas with strongest seasonality in canopy properties detected by the QSCAT backscatter measurements(2000–2009).
Saatchi et al. PNAS | January 8, 2013 | vol. 110 | no. 2 | 569
ENVIRO
NMEN
TAL
SCIENCE
S

ACKNOWLEDGMENTS. We thank Ryan Harrington from the University ofCalifornia at Los Angeles (UCLA) Center for Tropical Research for his contribu-tion in time-series analysis. The enhanced-resolution QSCAT data were pro-duced by Prof. David Long at Brigham Young University as part of the NationalAeronautics and Space Administration (NASA)-sponsored Scatterometer Cli-mate Record Pathfinder. The precipitation data used in this study were acquired
as part of the TRMM project jointly sponsored by the Japan National SpaceDevelopment Agency (NASDA) and NASA Office of Earth Sciences. The researchwas partially supported by NASA grants at the Jet Propulsion Laboratory andthe UCLA Institute of Environment and by Natural Environment ResearchCouncil (London) Grants NE/F015356/2 and NE/l018123/1 at the University ofExeter and Grant NE/F005806/1 at the University of Oxford, United Kingdom.
1. Marengo JA, et al. (2008) The drought of Amazonia in 2005. J Clim 21:495–516.2. Marengo JA, et al. (2011) The drought of 2010 in the context of historical droughts in
the Amazon region. Geophys Res Lett 38:L12703 10.1029/2011GL047436.3. Xu L, et al. (2011) Widespread decline in greenness of Amazonian vegetation due to
the 2010 drought. Geophys Res Lett 38:L07402 10.1029/2011GL046824.4. Phillips OL, et al. (2009) Drought sensitivity of the Amazon rainforest. Science 323
(5919):1344–1347.5. Aragão LEOC, et al. (2008) Interactions between rainfall, deforestation and fires
during recent years in Brazilian Amazonia. Philos Trans R Soc Lond B Biol Sci 363(1498):1779–1785.
6. Lewis SL, Brando PM, Phillips OL, van der Heijden GM, Nepstad D (2011) The 2010Amazon drought. Science 331(6017):554.
7. Nepstad D, et al. (2004) Amazon drought and its implications for forest flammabilityand tree growth: A basin-wide analysis. Glob Change Biol 10:704–717.
8. Davidson EA, et al. (2012) The Amazon basin in transition. Nature 481(7381):321–328.9. Zeng N, et al. (2008) Causes and impacts of the 2005 Amazon drought. Environ Res
Lett 3(1), 10.1088/1748-9326/3/1/014002.10. Li W, Fu R, Juárez RI, Fernandes K (2008) Observed change of the standardized pre-
cipitation index, its potential cause and implications to future climate change in theAmazon region. Philos Trans R Soc Lond B Biol Sci 363(1498):1767–1772.
11. Malhi Y, et al. (2009) Exploring the likelihood and mechanism of a climate-change-induced dieback of the Amazon rainforest. Proc Natl Acad Sci USA 106(49):20610–20615.
12. Cox PM, et al. (2008) Increasing risk of Amazonian drought due to decreasing aerosolpollution. Nature 453(7192):212–215.
13. Frolking S, et al. (2010) Tropical forest backscatter anomaly evident in SeaWindsscatterometer morning overpass data during 2005 drought in Amazonia. RemoteSens Environ 115:897–907.
14. Phillips OL, et al. (2010) Drought-mortality relationships for tropical forests. NewPhytol 187(3):631–646.
15. Williamson GB, et al. (2000) Amazonian tree mortality during the 1997 El Niñodrought. Conserv Biol 14:1538–1542.
16. Nepstad DC, Tohver IM, Ray D, Moutinho P, Cardinot G (2007) Mortality of large treesand lianas following experimental drought in an Amazon forest. Ecology 88(9):2259–2269.
17. da Costa ACL, et al. (2010) Effect of 7 yr of experimental drought on vegetationdynamics and biomass storage of an eastern Amazonian rainforest. New Phytol 187(3):579–591.
18. Nakagawa M, et al. (2000) Impact of severe drought associated with the 1997-1998 ElNino in a tropical forest in Sarawak. J Trop Ecol 16:355–367.
19. Asner GP, Alencar A (2010) Drought impacts on the Amazon forest: The remotesensing perspective. New Phytol 187(3):569–578.
20. Saleska SR, Didan K, Huete AR, da Rocha HR (2007) Amazon forests green-up during2005 drought. Science 318(5850):612.
21. Samanta A, et al. (2010) Amazon forests did not green-up during the 2005 drought.Geophys Res Lett 37:L05401–L05406.
22. Anderson LO, et al. (2010) Remote sensing detection of droughts in Amazonian forestcanopies. New Phytol 187(3):733–750.
23. Frolking S, et al. (2006) Evaluation of the SeaWinds scatterometer for regionalmonitoring of vegetation phenology. J Geophys Res 111, 10.29/2005JD006588.
24. Pires JM, Prance GT (1985) The vegetation types of the Brazilian Amazon. KeyEnvironments: Amazonia, eds Prance GT, Lovejoy TE (Pergamon, New York), pp109–145.
25. Verbesselt J, Hyndman R, Zeileis A, Culvenor D (2010) Phenological change detectionwhile accounting for abrupt and gradual trends in satellite image time series. RemoteSens Environ 114:2970–2980.
26. Condit R, Hubble SP, Foster RB (1995) Mortality rates of 205 neotropical tree andshrub species and the impact of a severe drought. Ecol Monogr 65:419–439.
27. Slik JW (2004) El Niño droughts and their effects on tree species composition anddiversity in tropical rain forests. Oecologia 141(1):114–120.
28. Brando PM, et al. (2010) Seasonal and interannual variability of climate and vege-tation indices across the Amazon. Proc Natl Acad Sci USA 107(33):14685–14690,10.1073/pnas.0908741107.
29. Meir P, et al. (2009) The effects of drought on Amazonian rainforests. Amazonia andGlobal Change, Geophysical Monograph Series, ed Keller M, et al. (American Geo-physical Union, Washington, DC), Vol 186, pp 429–449.
30. Zelazowski P, Malhi Y, Huntingford C, Sitch S, Fisher JB (2011) Changes in the po-tential distribution of humid tropical forests on a warmer planet. Philos Transact AMath Phys Eng Sci 369(1934):137–160.
570 | www.pnas.org/cgi/doi/10.1073/pnas.1204651110 Saatchi et al.