HEALTH IMPACTS OF SOME PERSISTENT ORGANIC ...
211
HEALTH IMPACTS OF SOME PERSISTENT ORGANIC POLLUTANTS IN EXPECTING MOTHERS FROM PUNJAB By Anber Naqvi under the Supervision of Dr. Abdul Qadir M.Sc. (UAF), Ph.D. (QAU) Dr. Adeel Mahmood M.Sc. (QAU), Ph.D. (QAU) A thesis submitted to University of the Punjab in partial fulfillment of requirements for the degree of Ph.D in Environmental Sciences COLLEGE OF EARTH AND ENVIRONMENTAL SCIENCES UNIVERSITY OF THE PUNJAB, LAHORE, PAKISTAN SESSION: 2009-2014
-
Upload
khangminh22 -
Category
Documents
-
view
0 -
download
0
Transcript of HEALTH IMPACTS OF SOME PERSISTENT ORGANIC ...

HEALTH IMPACTS OF SOME PERSISTENT
ORGANIC POLLUTANTS IN EXPECTING
MOTHERS FROM PUNJAB
By
Anber Naqvi
under the Supervision of
Dr. Abdul Qadir
M.Sc. (UAF), Ph.D. (QAU)
Dr. Adeel Mahmood M.Sc. (QAU), Ph.D. (QAU)
A thesis submitted to University of the Punjab in partial fulfillment of
requirements for the degree of Ph.D in Environmental Sciences
COLLEGE OF EARTH AND ENVIRONMENTAL SCIENCES
UNIVERSITY OF THE PUNJAB, LAHORE, PAKISTAN
SESSION: 2009-2014

I dedicate this thesis to my late father, to my children and
husband
CERTIFICATE OF APPROVAL
We hereby certify that this research work is based on the results of experimental work
carried out by Ms. Anber Naqvi under my supervision. We have personally gone through
all data / results / materials reported in the manuscript and certify their correctness/
authenticity. We further certify that the materials included in this thesis have not been
used in part or full in the manuscript already submitted or in the process of submission in
partial / complete fulfillment for the award of any other degree from any other institution.
Ms. Anber Naqvi has fulfilled all conditions established by the University of the Punjab
for the submission of PhD thesis through the official procedure of the University.
(Dr. Abdul Qadir)
Assistant Professor / Supervisor
College of Earth and Environmental Sciences
University of the Punjab
Lahore-Pakistan
(Dr. Adeel Mahmood)
Assistant Professor
Department of Environmental Sciences
Govt. College Women University,
Sialkot-Pakistan
DECLARATION CERTIFICATE
The thesis being submitted for the degree of PhD in the University of the Punjab does not
contain any material which has been submitted for the award of PhD degree in any other
University and to the best of my knowledge and belief, neither does this thesis contain
any material published or written previously by another person, except when due
reference is made to the source in the text of the thesis.
Anber Naqvi
PhD Scholar
College of Earth and Environmental Sciences
University of the Punjab, Lahore
AUTHOR’S DECLARATION
I, Anber Naqvi hereby state that my PhD Thesis titled ―Health Impacts of some
persistent Organic Pollutants in Expecting Mothers from Punjab, Pakistan” is my own
work and has not been submitted previously by me for taking any degree from the
University of the Punjab, Lahore, Pakistan or anywhere else in the country / world. At
any time if my statement is found to be incorrect even after my graduation the University
has the right to withdraw my PhD degree.
Anber Naqvi
PhD Scholar
College of Earth and Environmental Sciences
University of the Punjab, Lahore
PLAGIARISM UNDERTAKING
I, solemnly declare that research work presented in the thesis titled ―Health Impacts of
some persistent Organic Pollutants in Expecting Mothers from Punjab, Pakistan” is
solely my research work with no significant contribution from any other person. Small
contribution / help wherever taken has been duly acknowledged and that complete thesis
has been written by me.
I understand the zero tolerance policy of the HEC and University of the Punjab, Lahore,
Pakistan towards plagiarism. Therefore I as an Author of the above titled thesis declare
that no portion of my thesis has been plagiarized and any material used as reference is
properly referred / cited.
I undertake that if I am found guilty of any formal plagiarism in the above titled thesis
even after award of PhD degree, the University reserves the rights to withdraw / revoke
my PhD degree and that HEC and the University has the right to publish my name on the
HEC / University Website on which names of students are placed who submitted
plagiarized thesis.
Anber Naqvi
PhD Scholar
College of Earth and Environmental Sciences
University of the Punjab, Lahore
i
ABSTRACT
Polychlorinated Biphenyls (PCBs) are persistent, toxic and bio-accumulative organic
pollutants present everywhere in the biosphere. PCBs enter the environment mainly as a
result of anthropogenic activities and accumulate in mothers through food and respiration.
These chemicals transfer from mother body to the fetus inside the womb. Keeping this in
view, the present study was conducted to monitor the PCBs and their impacts on
expecting mothers from the Punjab Province, Pakistan. In this regard, blood serum, milk
and placenta samples were collected from 45 women with the cesarean section from five
districts viz; Lahore, Sialkot, Khanewal, Okara and Chakwal. All samples were collected
and screened for the quantification of 34 PCB congeners including eight dioxin like PCBs
(dl-PCBs) viz: ∑PCB70, 126, 169, 105, 114, 118, 156 and 189) and six indicator PCBs
(∑PCB52, 101, 118, 138, 153 and 180 using Gas Chromatograph Mass Spectrometer
(GC/MS). The mean concentrations of ∑34 PCB in blood serum (232.33 ± 110.62 ng/g
lip), milk (44.07 ± 27.27 ng/g lip) and placenta (80.26 ± 19.87 ng/g lip) were recorded.
The mean concentration of indicator PCBs in blood serum, milk and the placentawas
49.55 ± 42.31 ng/g lip, 10.31 ± 11.70 ng/g lip and 17.69 ± 12.40 ng/g lip respectively.
Whereas, the mean concentration (ng/g lw) of dl-PCBs in blood serum, milk and placenta
of each study subject were 33.39 ± 40.18, 6.15 ± 8.72 and 9.48 ± 10.92, respectively. The
concentration of ∑34PCBs in blood serum on the basis of spatial distribution was recorded
highest in women belonging to Chakwal (310.59 ± 119.47 ng/g lip), whereas, the
minimum concentration at Okara (251.28 ± 152.61ng/g lip). A similar trend was observed
in the case of milk with the highest concentration of ∑34PCBs was recorded from
Chakwal (68.33 ± 20.11ng/g lip) and lowest from Okara (30.46 ± 31.07 ng/g lip). In the
case of the placenta, the highest concentration was recorded from Chakwal (93.47 ± 29.41
ng/g lip), and lowest from Khanewal (70.46 ± 31.20 ng/g lip). The spatial distribution
ii
pattern of PCBs homolog concentrations was represented in the maps developed using
Arc GIS.The mean Toxic Equivalent Concentration (TEQ) for ∑8dl-PCBs in blood serum
was calculated as 0.24 ng TEQ/g lipids. The mean TEQ concentration in human milk and
the placenta was calculated as 0.06 ng TEQ/g lipids and 0.08 ng TEQ/g lipids,
respectively. The potential risk of dl-PCBs to the health of subject mothers was calculated
by Estimated Daily Intake (EDI). The calculated EDI (pg WHO-Teq/ kg body weight) in
blood serum (1.94 x 10⁻³
), milk (5.10 x 10⁻⁴
) and placenta (6.56 x 10⁻⁴
) were found below
the WHO Tolerable Daily Intake (TDI). Among the socio-demographic parameters, dairy
products, maternal weight and height showed a positive significant relationship to
∑34PCBs in blood serum and placenta respectively. The concentrations of ∑34PCBs in
human milk showed a negative correlation with age of the mothers, parity and lactation.
The calculated EDI for dl-PCBs in nursing infants ranged from 400 to 26624.1 pg TEQ
kg-1
bw day-1
(mean: 8862.6 pg TEQ kg-1
bw day-1
) were found to be significantly higher
than the tolerable daily intake limits provided by WHO (1–4 pg TEQ kg-1
bw day-1
).A
negative association was observed in levels of PCBs in human milk and infant
anthropometric measures viz; birth weight, head circumference, mid arm circumference
and chest circumference and concentrations in human placenta showed a negative
relationship with infant‘s birth weight and crown to heel length. These results highlighted
that prenatal exposure to PCBs may affect fetal anthropometric development and impair
the health of infants. Similarly, the hazard quotient values for ∑8dl-PCBs (range: 40.42 to
2662.41) were far above the benchmark value of 1 at all the sampling sites, indicating the
high levels of adverse health risks to infants in the region through breast milk
consumption. These results highlighted the need for comprehensive monitoring of PCBs
in human and food products to assess and manage the continuous releases of PCB into the
environment to prevent future human exposure, particularly of fetuses and infants.
iii
ACKNOWLEDGMENTS
First and the foremost, all praise to Almighty ALLAH who granted me strength
for the completion of this research work. I express my sincere gratitude to Prof. Dr.
Sajid Rashid Ahmad, Procipal, College of Earth and Environmental Sciences,
University of the Punjab, Lahore for providing me the existing research facilities to
complete this research work. Special thanks are due to my supervisors, Dr. Abdul Qadir,
Assistant Professor, College of Earth and Environmental Sciences, University of the
Punjab, Lahoreand Dr. Adeel Mahmood, Assistant Professor, Department of
Environmental Sciences, Government College Women University, Sialkot for being
helpful and guiding me throughout this research work. It is due to their scientific spirit,
insightful and constructive criticism; I have been able to make this thesis in its present
form.
I am grateful to State Key Laboratory of Organic Geochemistry, Guangzhou
Institute of Geochemistry, Chinese Academy of Sciences, Guangzhou, China for
providing a platform to perform PCB analysis. A special thanks to Food and
Biotechnology Research Center (FBRC), Pakistan Council of Scientific and Industrial
Research (PCSIR) for facilitating the milk fat analysis. I express my utmost gratitude to
all those volunteers who donated their body matrices for this study. Many regard to the
paramedical staff for their assistance during sample collection.My heartiest gratitude is
due to Iqra Aslam for helping me in PCB analysis. I am extremely thankful to Hira
Iqbal, Mujtaba Baqir, Mehvish Mumtaz, Dr. Ammara Mumtaz, Dr. Rana Farhan
Sajid, Nomita Wajid, Abida Ayuband all the laboratory attendants for helping me at
various stages of this research work.
In the last, the morale support and sustained encouragement by my family,
parents, in-laws and husband cannot be overlooked. I am deeply indebted to all of them
for being my support during this research work.
ANBER NAQVI
iv
LIST OF TABLES
Sr. Number Title Page No
Chapter Four Results
Table 4.1 Descriptive Statistics of PCB Homolog in blood serum
collected from five districts of the Punjab, Pakistan
48
Table 4.2 Descriptive Statistics of PCB homolog in human milk
samples collected from five districts of the Punjab,
Pakistan
51
Table 4.3 Descriptive Statistics of PCB homolog in human placenta
samples collected from five districts of the Punjab,
Pakistan
54
Table 4.4 Toxic Equivalent (TEQs) calculated for blood serum
samples using WHO‘s 2005 Toxicity Equivalency Factors
(TEFs)
71
Table 4.5 Toxic Equivalent (TEQs) calculated for human milk
samples using WHO‘s 2005 Toxicity Equivalency Factors
(TEFs)
73
Table 4.6 Toxic Equivalent (TEQs) calculated for human placenta
samples using WHO‘s 2005 Toxicity Equivalency Factors
(TEFs)
75
Table 4.7 Socio-demographic characteristics and their relationship
with PCB concentration in blood serum
77
Table 4.8 Relationship of maternal characteristics and infant‘s
anthropometric measures with ∑34PCBs in human milk
80
Table 4.9 Relationship of maternal characteristics and infant‘s
anthropometric measures with ∑34PCBs in human
placenta
82
Table 4.10 Estimated Daily Intake EDI (ng kg-1
body weight day-1
)
and Hazard Quotient (HQ) in infants
92
v
Chapter Five Discussion
Table 5.1 Comparison of concentrations (ng/g lip) of PCB in blood
serum with other studies from developed and developing
countries
96
Table 5.2 Comparison of concentrations (ng/g lip) of PCB in human
milk with other studies
99
Table 5.3 Comparison of concentrations (ng/g lip) of PCB in
placenta with other studies
102
vi
LIST OF FIGURES
Sr. Number Title Page No.
Chapter One Introduction
Figure 1.1. Exposure pathways of PCBs in human and non-human
biota
6
Chapter
Three
Materials and Methods
Figure 3.1 Map of study area showing selected sampling districts of
the Punjab Pakistan
31
Figure 3.2 Agilent GC-MS used for PCB analysis during present
study
38
Chapter Four Results
Figure 4.1 Concentration of dioxin like and indicator PCB detected in
blood serum
47
Figure 4.2 Concentration of dioxin like and indicator PCBs detected
in human milk
50
Figure 4.3 Concentration of dioxin like and indicator PCBs detected
in human placenta
53
Figure 4.4 Distribution of PCB Homolog in human blood serum, milk
and placenta collected from five districts of Punjab
Pakistan
55
Figure 4.5 The comparison of dioxin like and indicator PCBs in blood
serum, milk and placenta
56
Figure 4.6 Spatial distribution patterns of PCB homolog in blood
serum from five districts of Punjab Pakistan
58
Figure 4.7 Spatial distribution patterns of PCB homolog in human
milk from five district of Punjab, Pakistan
59
Figure 4.8 Spatial Distribution patterns of PCB homolog in human
placenta from five district of Punjab, Pakistan
61
Figure 4.9 Spatial distribution patterns of blood, milk and placenta
collected from five districts of the Punjab, Pakistan
63
Figure 4.10 Spatial trends of PCB homolog in blood, milk and placenta 66

vii
samples collected from urban and rural areas of Lahore
Figure 4.11 Spatial trends of PCB homolog in blood, milk and placenta
samples collected from urban and rural areas of Khanewal
66
Figure 4.12 Spatial trends of PCB homolog in blood, milk and placenta
samples collected from urban and rural areas of Okara
67
Figure 4.13 Spatial trends of PCB homolog in blood, milk and placenta
samples collected from urban and rural areas of Sialkot
68
Figure 4.14 Spatial trends of PCB homolog in blood, milk and placenta
samples collected from urban and rural areas of Chakwal
69
Figure 4.15 Eating habits of mothers selected from five districts of
Punjab Pakistan
78
Figure 4.16 Relationship between ∑34PCBsin maternal serum and; a)
infant‘s height (cm); b) head circumference (cm) ; c) mid
arm circumference (cm) and d) chest circumference (cm)
e) Combined Anthropometric Measures (cm)
84
Figure 4.17 Relationship between ∑34PCBsin human milk and; a)
infant‘s body weight (kg) ; b) head circumference cm) ; c)
mid arm circumference (cm) and d) chest circumference
(cm) e) Combined Anthropometric Measures (cm)
86
Figure 4.18 Relationship between ∑34PCBsin human placenta and; a)
Maternal Height (meter) ; b) Maternal Body weight (kg) ;
c) Infant‘s Height (cm) and d) Infant‘s Body weight (kg)
e) Combined Anthropometric Measures (cm)
89

viii
LIST OF ABBREVIATIONS
Abbreviations Full Form
P Significance level
R2 Coefficient of determination
R Pearson‘s correlation Coefficient
SD Standard Deviation
Ah Aryl Hydrocarbon
APGAR Activity, Pulse, Grimace, Appearance, and Respiration
BMI Body Mass Index
CHOL Total Cholesterol
DCM Dichloromethane
DDE Dichlorodiphenyldichloroethylene
DDT Dichlorodiphenyltrichloroethane
ECNI Electron Capture Negative Ionization
EDI Estimated Daily Intake
EMV Electron Multiplier Voltage
EWRS E-Waste Dumps/Recycling Sites
EI Electron Ionization
GCMS Gas Chromatograph Mass Spectrometer
HCB Hexachlorobenzene
HCH Hexachlorocyclohexane
IUPAC International Union of Pure and Applied Chemistry
MEAs Multilateral Environmental Agreements
OCP Organochlorine Pesticide
OC Organochlorine
PAH Polyaromatic Hydrocarbon
PCB Polychlorinated Biphenyl
PBDE Polybrominated Diphenyl Ether
PBT Persistent, Bioaccumulative And Toxic
PCDD Polychlorinated Dibenzodioxins
PCDF Polychlorinated dibenzofurans
POPs Persistent Organic Pollutant
SPE Solid Phase Extraction
TDI Tolerable Daily Intake
TEF Toxicity Equivalent Factor
TEQ Toxic Equivalent
TG Triglycerides
UNEP United Nation‘s Environment Program
ix
LIST OF APPENDICES
Page No.
Appendix-1 Spatial details of women selected from five districts of
Punjab, Pakistan
154
Appendix-2 Consent Letter 156
Appendix-3 Socio-Demographic and Health Survey 157
Appendix-4 Descriptive Statistics of PCB Congeners in Blood Serum
collected from five districts of the Punjab, Pakistan
(Concentration in ng/g lip)
160
Appendix-5 Descriptive Statistics of PCB Congeners in human milk
collected from five districts of the Punjab, Pakistan
(Concentration in ng/g lip)
162
Appendix-6 Descriptive Statistics of PCB Congeners in human
placenta collected from five districts of the Punjab,
Pakistan (Concentration in ng/g lip)
164
Table of Contents Page No.
Abstract ............................................................................................................................ i
Acknowledgement ........................................................................................................ iii
List of Tables ................................................................................................................. iv
List of Figure.................................................................................................................. vi
List of Abbreviations .................................................................................................. viii
List of Appendices ......................................................................................................... ix
CHAPTER ONE: INTRODUCTION
1.1 Classes of POPs and their Implications ................................................................... 3
1.2 PCBs and their Legal Framework ............................................................................ 3
1.3 Global Distribution pattern of PCBs in the Environment ......................................... 5
1.4 Exposure Pathways of PCBs in Human ................................................................... 5
1.5 Problem Statement ................................................................................................... 8
1.6 Objectives .............................................................................................................. 10
CHAPTER TWO: LITERATURE REVIEW
2.1 Polychlorinated Biphenyls (PCBs) ........................................................................ 13
2.1.1 PCB congeners and homolog ....................................................................... 13
2.1.2 Dioxins like PCBs ........................................................................................ 14
2.2 Sources of PCBs .................................................................................................... 15
2.3 Global Production of PCBs .................................................................................... 17
2.4 Historical Events of PCBs Poisoning .................................................................... 17
2.5 Wildlife and PCBs ................................................................................................. 17
2.6 PCBs Exposure in Man .......................................................................................... 18
2.7 Metabolism of PCBs in Human ............................................................................. 19
2.8 Effects of PCBs on Human .................................................................................... 20
2.8.1 PCBs toxicity in women .............................................................................. 20
2.8.2 Women exposure to PCBs in Asia ............................................................... 22
2.8.3 Fetal exposure .............................................................................................. 23
2.8.4. Women exposure to PCBs in South Asia ................................................... 25
2.9 PCBs Scenario in Pakistan ..................................................................................... 26
CHAPTER THREE: MATERIALS AND METHODS
3.1 Study Area ............................................................................................................. 29
3.1.1 Lahore . ......................................................................................................... 30
3.1.2 Khanewal ..................................................................................................... 32
3.1.3 Okara ............................................................................................................ 33
3.1.4 Sialkot .......................................................................................................... 33
3.1.5 Chakwal ....................................................................................................... 33
3.2 Sampling Strategy .................................................................................................. 34
3.3 Sample Collection and Transportation ................................................................... 35
3.3.1. Blood Serum ............................................................................................... 35
3.3.2. Human Milk ................................................................................................ 35
3.3.3. Human Placenta .......................................................................................... 35
3.3.4 Transportation and storage .......................................................................... 35
3.4 Sample preparation ................................................................................................ 36
3.4.1 Extraction of PCBs ...................................................................................... 36
3.4.2 Sample cleanup ............................................................................................ 37
3.5 Instrumental Analysis ............................................................................................ 37
3.6 Chromatographical Analysis .................................................................................. 39
3.7. Lipid Determination .............................................................................................. 39
3.7.1 Determination of blood serum lipids ........................................................... 39
3.7.2 Determination of Milk Fat ........................................................................... 40
3.7.3 Determination of Placental Lipids ............................................................... 40
3.8 Quality Control and Assurance .............................................................................. 42
3.9 Socio-demographic Characteristics ....................................................................... 42
3.10 Risk Assessment .................................................................................................. 42
3.10.1 Toxicity Equivalent Factor (TEF) ............................................................. 42
3.10.2 Risk assessment of mothers and infants .................................................... 43
3.10.3. Estimated Daily Intake of dioxin like PCBs in women ............................ 43
3.10.4. Estimated Daily Intake of PCBs in Infants ............................................... 43
3.11 Statistical Analysis ............................................................................................... 44
CHAPTER FOUR: RESULTS
4.1 PCB profile and congener specific analysis in blood serum ................................... 46
4.2 PCB profile and congener specific analysis in human milk ................................... 49
4.3 PCB profile and congener specific analysis in human placenta ............................. 52
4.4 Comparison of PCBs homolog in human blood serum, milk and placenta ............ 55
4.5 Spatial Distribution Patterns of PCB Homolog ...................................................... 57
4.5.1 Spatial Distribution patterns of PCB Homolog in blood serum ................... 57
4.5.2 Spatial Distribution Patterns of PCB Homolog in human milk .................... 57
4.5.4 Comparison of spatial patterns of PCB hornolog in blood serum, milk and
placenta .................................................................................................................. 62
4.6 PCBs Trends in Urban and Rural areas ................................................................. 64
4.7 Toxicity Equivalent Fluxes of Dioxin like PCBs ................................................... 69
4.7.1 TEQ and estimated daily intake of dl-PCBs in blood serum ........................ 69
4.7.2 TEQ and estimated daily intake of dl-PCBs in human milk ........................ 72
4.7.3 T TEQ and estimated daily intake of dl-PCBs in human placenta ............... 74
4.7.4 Relative Comparison of TEQ ....................................................................... 76
4.8 Association of PCBs in blood, milk and placenta with maternal social and
demographic characteristics .......................................................................................... 76
4.9 Association of PCBs in blood, milk and placenta with infants anthropometric
characteristics ................................................................................................................ 83
4.10 Exposure and Risk assessment to nursing Infants (milk) ..................................... 92
CHAPTER FIVE: DISCUSSION
5.1 Comparative Analysis of PCBs profile ................................................................... 94
5.1.1 PCBs profile in blood serum ......................................................................... 94
5.1.2 PCB profile in human milk ........................................................................... 98
5.1.3 PCB profile in placenta ............................................................................... 101
5.1.4 Overall PCBs trend in multiple body matrices ........................................... 103
5.2 Spatial trends of PCB Homolog with potential sources ....................................... 104
5.3 PCB Trends in Urban and Rural areas .................................................................. 107
5.4 Risk Assessment of Maternal Health .................................................................... 109
5.4.1 Exposure to dl-PCBs and TEQ fluxes ........................................................ 109
5.4.2. Risk assessment of dioxin like PCBs......................................................... 109
5.4.3. Risk assessment of Physiological Characteristics ..................................... 110
5.5 Relationship of PCBs with neonatal anthropometric measures ............................ 113

CHAPTER SIX: CONCLUSION
Conclusion .................................................................................................................. 116
Recommendations and future perspectives ................................................................ 117
References ................................................................................................................... 119
Appendices .................................................................................................................. 154
Publications ................................................................................................................. 166

CHAPTER ONE
INTRODUCTION

Chapter One Introduction
2
Chapter One
INTRODUCTION
Industrial, urban and agricultural development has provided countless benefit to
mankind such as the provision of food, shelter, health, communication and transportation
facilities (McMichael, 2011). For the continuous supply of all these facilities, natural
resources are indiscriminately used and this process is going on (Nchuchuwe &
Adejuwon, 2012). In the course of modernization, thousands of new chemicals have been
introduced into the environment, which are putting the integrity of ecosystems at the risk
(Kodavanti et al., 2008). Organic compounds are one of the major groups of xenobiotic
chemicals. The synthesis of these organic chemicals is increasing tremendously which are
ultimately discharged into the environment. Even now these chemicals are found
everywhere on the planet from ocean sediments to the alpine glaciers. The chemicals
resulted as the product of anthropogenic activities have been reported from Arctic and
Antarctic Regions (AMAP, 1998; Wei et al., 2007). These are the Persistent Organic
Pollutants (POPs) stay in the environment for longer times, bio-accumulate and disrupt
the metabolic integrity within living organisms (Dórea, 2008). POPs exhibit properties
such as less soluble in water and are semi-volatile and bioaccumulative (Fiedler et al.,
2002; UNEP, 2011). POPs present in the environment as chemical mixtures; enter in the
body of organisms through multiple routes (Lohmann et al., 2007) viz; food, air and
working environment and due to lipophilic properties are capable to accumulate in lipid
rich tissues of living organisms (Lee et al., 2007). The origin of POPs is either
intentionally synthesized or accidentally formed as the by-product during different
chemical processes (Lignell, 2013).
Chapter One Introduction
3
1.1. Classes of POPs and their Implications
The most classical POPs are categorized as Organochlorine Pesticides (OCPs),
Industrial chemicals i.e. Polychlorinated Biphenyls (PCBs), Hexa Chlorobenzenes (HCB)
and their byproducts, which are unintentionally formed e.g. furans and dioxins (Zhang et
al., 2005). These cumulatively are called as the Dirty Dozen, whereas; example of
emerging POPs included polychlorinated dibenzo-p-dioxins (PCDD), dibenzofurans (Fs)
and Polycyclic Aromatic Hydrocarbons (PAHs; Lohmann et al., 2007). The Dirty Dozen
POPs have half-lives of 5 to 15 years (Ritter et al., 2011). Due to toxicological
implications of POPs in organisms,these have attained the attention of the global and
regional scientific community at the end of the 20th century (Breivik et al., 2004).
Eco-toxicological implications of POPs were recognized in the 1960s, starting
with the side effect of Dichlorodiphenyltrichloroethane (DDT) the first synthetic OCP on
the bird population. Among different POPs; PCBs are of growing concern as these are
endocrine disrupters and present in the environment, consumer goods and food, enter the
human body and interfere with reproduction (Schlumpf et al., 2011). Several authors have
been reported POPs to impart deleterious impacts on wildlife, human and environment
after the work of Rachel Carson in 1962 (Cui & Forssberg, 2003; Zhang et al., 2005).
1.2. PCBs and their Legal Framework
Polychlorinated Biphenyls (PCBs) are legacy POPs and ubiquitous in biological
and environmental media (Kodavanti et al., 2017). Generally, PCBs generated in one
place can be displaced to other countries through air circulations, water and sediment
movement, putting the wildlife and human health at risk (Jones & De Voogt, 1999). The
major reasons behind growing concerns about regulation of the PCBs are their hormone
disrupting capabilities in wildlife and human (Mehmood et al., 2017). According to the
Chapter One Introduction
4
concept of ―human-wildlife connection‖, detection of harmful effects in wildlife may act
as an early warning for mankind (Ross &Birnbaum, 2003). Birth defects and behavioral
abnormalities detected in birds, fish and mammals species around the Great Lake, Ontario
Canada (Gilbertson et al., 1991); reproductive disorders observed in Baltic Ringed Seals
(Helle et al., 1976) and thinning of egg shells of fish (contaminated by DDT) eating birds
(Jensen et al., 1969) instigated the scientist to investigate human population in relation to
PCBs exposure. The Great Lake was highly polluted due to discharges of heavy metals,
various POPs viz; PCBs and OCPs and other industrial and agricultural pollutants which
warranted the concerns about wildlife and human health.
The toxicological effects of PCBs attracted the attention of scientific community
all over the world. In connection to this, various measures had been taken by
governments, organizations and scientific communities around the globe to keep the
human and environment safe (Godduhn & Duffy, 2003). Several Multilateral
Environmental Agreements (MEAs) have been signed by nations all over the world to
overcome pollution caused by trans-boundary movement of these contaminants (Elabbas
et al., 2013). Thus nations across the world joined to sign the United Nation‘s
groundbreaking treaty named as the Stockholm Convention on POPs, adopted in 2001
(US EPA, 2002). The scope of PCBs under the Stockholm convention is to eliminate their
production, restricting their use or minimizing their unintentional production (Nost,
2014). The Stockholm Convention banned worldwide usage of twelve POPs and out of
these 12 POPs nine were ranked as highly hazardous pollutants (Gilden et al., 2010).
Other legal frameworks regulating the PCBs include; Rotterdam Convention, Basel
Convention, Aarhus Protocol and Helsinki Convention (Boalt et al., 2013).

Chapter One Introduction
5
1.3. Global Distribution Patterns of PCBs in the Environment
The distribution of PCBs is cosmopolitan ranging from the equator to poles and
from deep oceans to lofty mountains. Due to persistent nature, these chemicals could
reach to the longer distances governed by their physical and chemical properties (Wania
2003). PCBs enter into the food chain, accumulate in the organism and reach into those
areas, where they have not ever been produced (Aguilar et al., 2002). According to a
global fractionation theory proposed by Wania and Mackay (1993), atmospheric currents
circulate and condense the POPs (including PCBs) that are released at low latitude
towards the high latitudes e.g. Polar Regions. This dispersal mechanism of atmospheric
transport has been significant for legacy POPs such as PCBs whereas, emerging
pollutants tend to transport/disperse through oceanic currents (Lohmann et al., 2007).
Later on, several authors confirmed that least disturbed areas of the world like Antarctica
and the Arctic zone have been found contaminated with PCBs due to their wide range
atmospheric transport by different environmental matrices (Meijer et al., 2013). A study
on fish species from Elephant Island, Antarctica to monitor the levels of PCBs revealed
their detection in variable concentration in different fish species.
1.4. Exposure Pathways of PCBs in Human
Regardless their extraordinary roles in the development of modern society, PCBs
are recognized for many negative impacts on human and environmental health (Tan,
2009). Human exposure to PCBs include intake of food and water contaminated with
PCBs, inhalation of PCB contaminated air-borne particles and ambient air and dermal
absorption (Duarte & Jones, 1994). However, consumer products (Vestergren & Cousins
2009) and indoor environments such as building materials and air (Shoeib et al., 2011)
are additional exposure pathways of PCBs in human (Figure 1.1). PCBs may enter the
Chapter One Introduction
6
food chain from various industrial sources and once released into the environment, PCBs
persist for years, widely distribute in the environment by air, water and soil, enter the
food chain and bioaccumulate in living organisms (in their fatty tissues) up to seventy
thousand times higher than their initial levels (UNEP, 2009). Non-human biota is affected
through inhalation of PCBs contaminated air, water and eating plants and agricultural
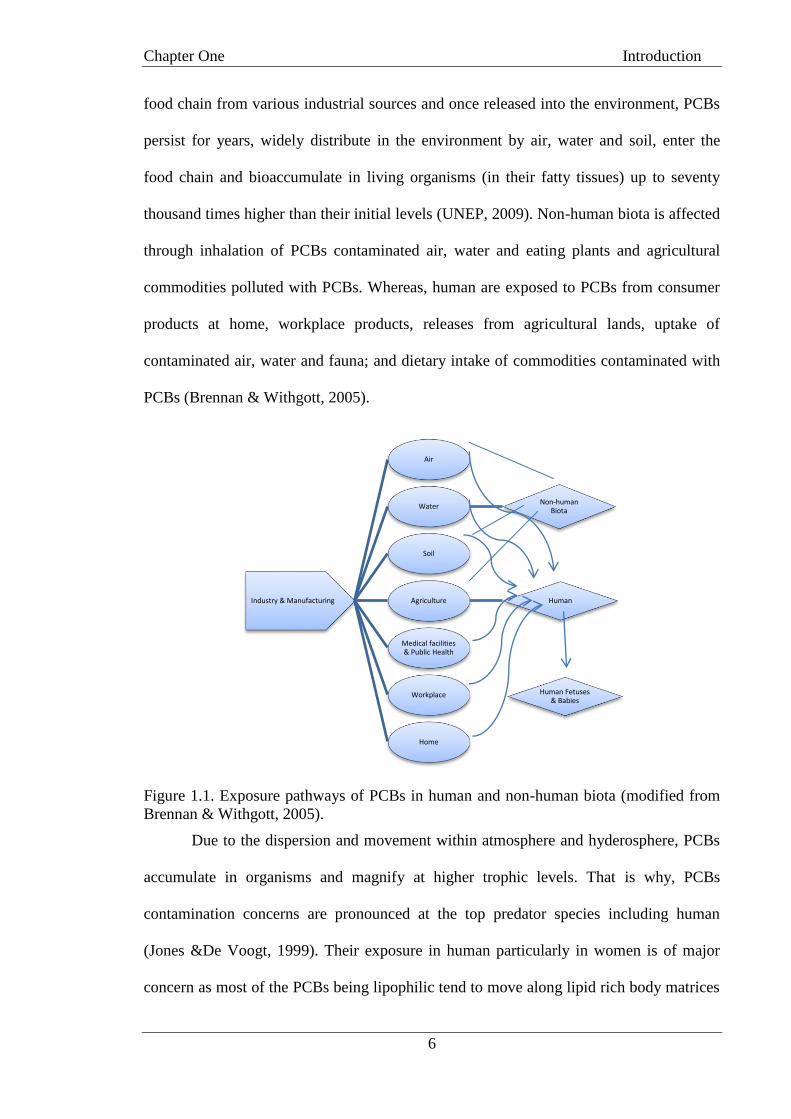
commodities polluted with PCBs. Whereas, human are exposed to PCBs from consumer
products at home, workplace products, releases from agricultural lands, uptake of
contaminated air, water and fauna; and dietary intake of commodities contaminated with
PCBs (Brennan & Withgott, 2005).
Figure 1.1. Exposure pathways of PCBs in human and non-human biota (modified from
Brennan & Withgott, 2005).
Due to the dispersion and movement within atmosphere and hyderosphere, PCBs
accumulate in organisms and magnify at higher trophic levels. That is why, PCBs
contamination concerns are pronounced at the top predator species including human
(Jones &De Voogt, 1999). Their exposure in human particularly in women is of major
concern as most of the PCBs being lipophilic tend to move along lipid rich body matrices
Industry & Manufacturing
Air
Water Non-human
Biota
Soil
Agriculture Human
Medical facilities & Public Health
Workplace
Home
Human Fetuses & Babies
Chapter One Introduction
7
of women into the fetuses and infants. Therefore, the toxicological implications of
perinatal exposure to PCBs have been extensively reviewed across the globe as they have
also been found to cause infertility in human (Spano et al., 2005). Due to their stability,
persistence in the environment and wide ranged toxic effects; PCBs are considered a
threat to the health of the environment and human which highlights a need for their
detailed monitoring in environmental and epidemiological studies (Porpora et al., 2013).
Studies have highlighted the transplacental transference of PCBs from mothers to
developing fetuses during pregnancy and transmammary into the infants during the
course of lactation (Hassine et al., 2012). In fetuses and infants, PCBs may induce
adverse health effects such as growth retardation reduced birth weight and behavioral
disorders.
Assessment of human exposure to PCBs has extensively relied upon blood serum
as a biomarker and most of the studies estimating the human body burden were focused
on PCBs in blood and serum (Song & Li, 2014). Govart et al., (2010) highlighted the
association between human PCB concentrations in blood serum and dietary intake.
Human milk has extensively been used to examine the amount and types of both desirable
and undesirable compounds in nursing mothers and their exposure to the breastfed
offspring. It is a primary food of developing infants and plays a pivotal role in their
development due to its high nutritional and lipids contents. Human milk; during first five
days is characterized as ‗colostrum‘ and is rich in protein and lower in lipids than mature
milk. Human milk provides all the nutrition requirement of nursing infants during the first
six months of their lives and protects infection (WHO, 2007). Researchers have reported
PCB levels in human milk, exposure to infants and their associated health risks to infants.
In the recent years, the human placenta has been identified as a biomarker for the
monitoring of PCBs (Leino et al., 2013). Several studies across the globe have reported

Chapter One Introduction
8
the PCB residues in the environmental media and human body matrices. But,
unfortunately, few studies are available in Pakistan regarding presence of PCBs in the
multiple human body matrices to make a cross comparison. With the rapid
industrialization, an ongoing and continuous use of PCBs has been reported in the
country. Hence, there is a dire need for monitoring the PCBs in human in order to assess
the risks to human and future generations.
1.5. Problem Statement
Pakistan is among those developing countries which are in the transitional phase
of their industrial and agricultural development. During the last three decades, rapid boost
in industrial development and urban sprawl has raised several environmental issues
pertaining to PCBs pollution and put the ecological integrities and human health at risk
(Ahmed, 2003). There are some reports that PCBs are also present in the glaciers in
Northern Areas of Pakistan, where industrial activities exist. A major share of PCBs
enters into the human body from food, whereas, the small share is contributed from direct
environmental exposure such as air, water and soil (Patandin, 1999). In Pakistan, PCBs
have been banned after Stockholm Convention, but these are still detected in various
matrices (Ullah et al., 2016). In this regard, several researchers put their efforts in tracing
PCBs in Pakistan, but most of the work was in the different environmental media such as
water, sediments and soil etc. But unfortunately, PCBs were not well characterized in
human studies in Punjab, Pakistan due to the paucity of data and lack of interest on
institutional level.
Chapter One Introduction
9
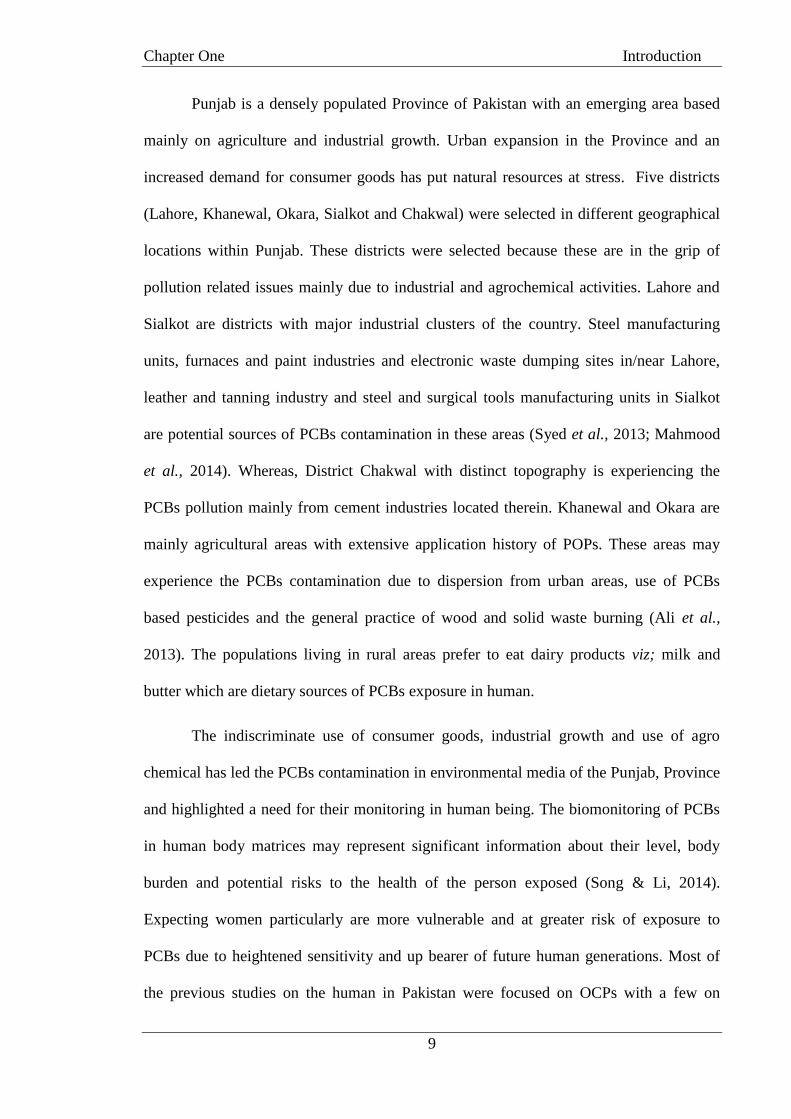
Punjab is a densely populated Province of Pakistan with an emerging area based
mainly on agriculture and industrial growth. Urban expansion in the Province and an
increased demand for consumer goods has put natural resources at stress. Five districts
(Lahore, Khanewal, Okara, Sialkot and Chakwal) were selected in different geographical
locations within Punjab. These districts were selected because these are in the grip of
pollution related issues mainly due to industrial and agrochemical activities. Lahore and
Sialkot are districts with major industrial clusters of the country. Steel manufacturing
units, furnaces and paint industries and electronic waste dumping sites in/near Lahore,
leather and tanning industry and steel and surgical tools manufacturing units in Sialkot
are potential sources of PCBs contamination in these areas (Syed et al., 2013; Mahmood
et al., 2014). Whereas, District Chakwal with distinct topography is experiencing the
PCBs pollution mainly from cement industries located therein. Khanewal and Okara are
mainly agricultural areas with extensive application history of POPs. These areas may
experience the PCBs contamination due to dispersion from urban areas, use of PCBs
based pesticides and the general practice of wood and solid waste burning (Ali et al.,
2013). The populations living in rural areas prefer to eat dairy products viz; milk and
butter which are dietary sources of PCBs exposure in human.
The indiscriminate use of consumer goods, industrial growth and use of agro
chemical has led the PCBs contamination in environmental media of the Punjab, Province
and highlighted a need for their monitoring in human being. The biomonitoring of PCBs
in human body matrices may represent significant information about their level, body
burden and potential risks to the health of the person exposed (Song & Li, 2014).
Expecting women particularly are more vulnerable and at greater risk of exposure to
PCBs due to heightened sensitivity and up bearer of future human generations. Most of
the previous studies on the human in Pakistan were focused on OCPs with a few on
Chapter One Introduction
10
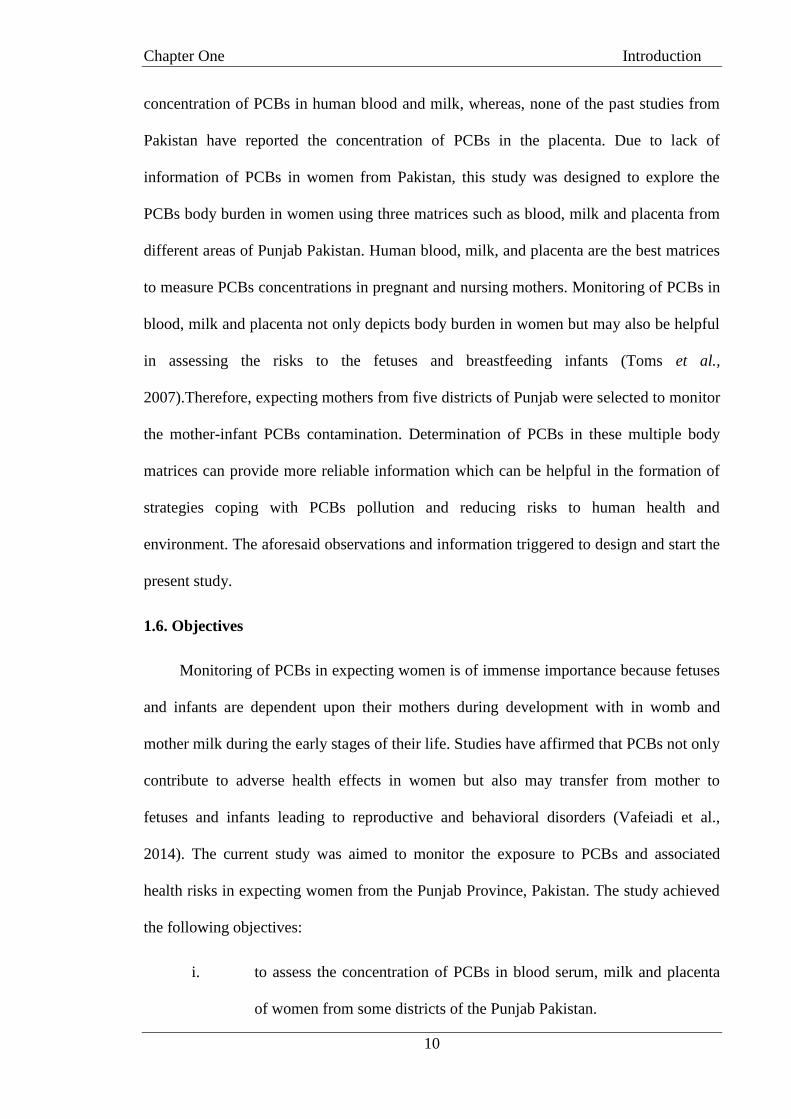
concentration of PCBs in human blood and milk, whereas, none of the past studies from
Pakistan have reported the concentration of PCBs in the placenta. Due to lack of
information of PCBs in women from Pakistan, this study was designed to explore the
PCBs body burden in women using three matrices such as blood, milk and placenta from
different areas of Punjab Pakistan. Human blood, milk, and placenta are the best matrices
to measure PCBs concentrations in pregnant and nursing mothers. Monitoring of PCBs in
blood, milk and placenta not only depicts body burden in women but may also be helpful
in assessing the risks to the fetuses and breastfeeding infants (Toms et al.,
2007).Therefore, expecting mothers from five districts of Punjab were selected to monitor
the mother-infant PCBs contamination. Determination of PCBs in these multiple body
matrices can provide more reliable information which can be helpful in the formation of
strategies coping with PCBs pollution and reducing risks to human health and
environment. The aforesaid observations and information triggered to design and start the
present study.
1.6. Objectives
Monitoring of PCBs in expecting women is of immense importance because fetuses
and infants are dependent upon their mothers during development with in womb and
mother milk during the early stages of their life. Studies have affirmed that PCBs not only
contribute to adverse health effects in women but also may transfer from mother to
fetuses and infants leading to reproductive and behavioral disorders (Vafeiadi et al.,
2014). The current study was aimed to monitor the exposure to PCBs and associated
health risks in expecting women from the Punjab Province, Pakistan. The study achieved
the following objectives:
i. to assess the concentration of PCBs in blood serum, milk and placenta
of women from some districts of the Punjab Pakistan.
Chapter One Introduction
11
ii. to monitor the spatial and urban rural distribution patterns of PCBs
among the women living in selected districts of the Punjab, Pakistan.
iii. To evaluate the association of PCBs with socio-demographic
characteristic to highlight the health impacts on mothers and infants

CHAPTER TWO
LITERATURE REVIEW
Chapter Two Literature Review
13
Chapter Two
LITERATURE REVIEW
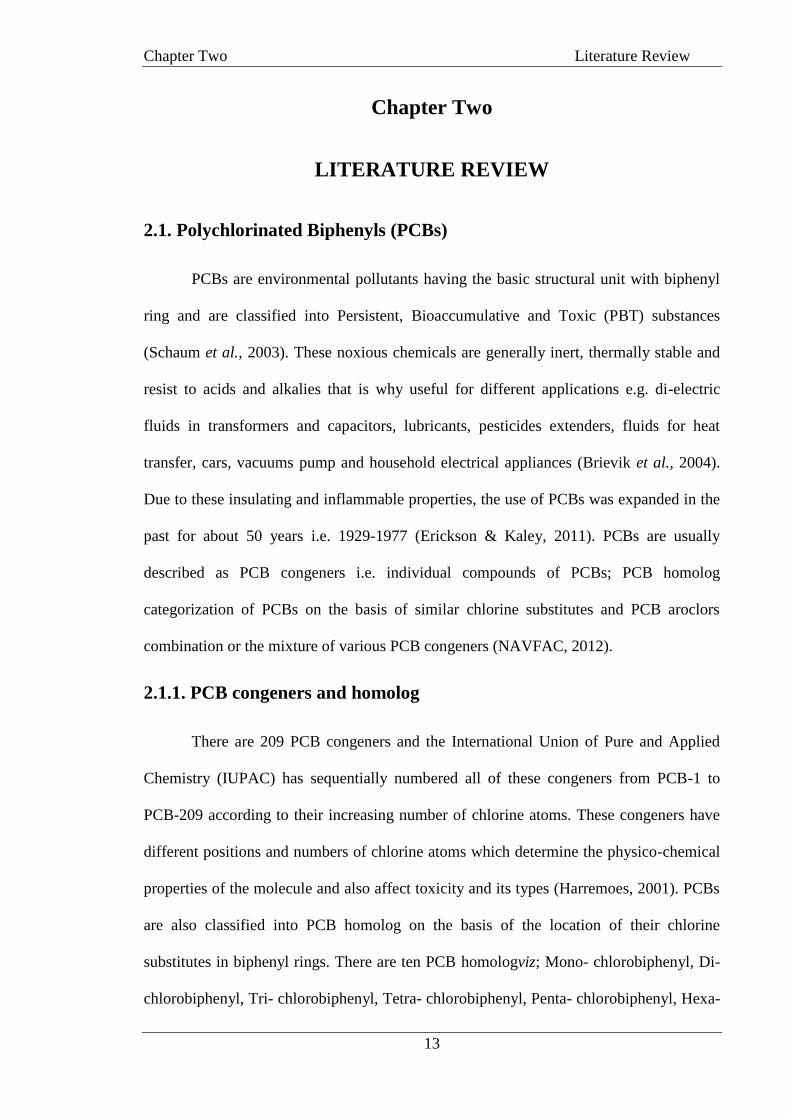
2.1. Polychlorinated Biphenyls (PCBs)
PCBs are environmental pollutants having the basic structural unit with biphenyl
ring and are classified into Persistent, Bioaccumulative and Toxic (PBT) substances
(Schaum et al., 2003). These noxious chemicals are generally inert, thermally stable and
resist to acids and alkalies that is why useful for different applications e.g. di-electric
fluids in transformers and capacitors, lubricants, pesticides extenders, fluids for heat
transfer, cars, vacuums pump and household electrical appliances (Brievik et al., 2004).
Due to these insulating and inflammable properties, the use of PCBs was expanded in the
past for about 50 years i.e. 1929-1977 (Erickson & Kaley, 2011). PCBs are usually
described as PCB congeners i.e. individual compounds of PCBs; PCB homolog
categorization of PCBs on the basis of similar chlorine substitutes and PCB aroclors
combination or the mixture of various PCB congeners (NAVFAC, 2012).
2.1.1. PCB congeners and homolog
There are 209 PCB congeners and the International Union of Pure and Applied
Chemistry (IUPAC) has sequentially numbered all of these congeners from PCB-1 to
PCB-209 according to their increasing number of chlorine atoms. These congeners have
different positions and numbers of chlorine atoms which determine the physico-chemical
properties of the molecule and also affect toxicity and its types (Harremoes, 2001). PCBs
are also classified into PCB homolog on the basis of the location of their chlorine
substitutes in biphenyl rings. There are ten PCB homologviz; Mono- chlorobiphenyl, Di-
chlorobiphenyl, Tri- chlorobiphenyl, Tetra- chlorobiphenyl, Penta- chlorobiphenyl, Hexa-
Chapter Two Literature Review
14
chlorobiphenyl, Hepta- chlorobiphenyl, Octa- chlorobiphenyl, Nona- chlorobiphenyl and
Deca-chlorobiphenyl. PCB congeners have been used in the past as mixture to obtain the
desired industrial materials under various trademarks and formulation namely i.e. Aroclor
by Monsanto (USA), Prodolec (France), Phenoclor (Japan) and Chlopen (Germany)
(Rushneck et al., 2004). Among these mixtures, aroclors were widely used in the USA
with distinctive congeners and homolog fingerprints.
2.1.2. Dioxins like PCBs
PCB congeners may be grouped as co-planar PCBs and other non-dioxin like
PCBs. The chemical subclasses of PCBs that exhibit similar toxic properties as of PCDDs
and Polychlorinated dibenzofurans (PCDFs) by exerting their effects through Aryl
Hydrocarbon (AhR) receptor are called dioxin-like PCBs and categorized as non-
orthosubstituded PCBs (PCB-77, 81, 126 and 169) and mono-orthosubstituded PCBs
(PCB-105, 114, 118, 123, 156, 157, 167 and 189; (Silverstone, 2009; Srogi, 2008).
The sources of dioxins in the environment include thermal processes, incomplete
combustion of municipal, medical and hazardous wastes and numerous chemical
formulation and industrial processes viz. copper smelting, paper and pulp chlorine
bleaching processes (Wittsiepe et al., 2015). US EPA has identified the sources of
exposure to dioxin like compound in an adult as under; food (96%), inhalation (2%), soil
(1%) and water (0.001%). Dioxin like PCBs are biologically persistent and ubiquitous in
the environment with diverse adverse effects viz. cancer, non-cancer effects such as
immunosuppression, changed hormonal and growth factors, diabetes, wasting syndrome,
chloracne and hyperplasia etc. (Ott et al., 2006).
Chapter Two Literature Review
15
2.2. Sources ofPCBs
Environmental releases of PCBs can be attributed to volatilization, accidental release
and leaks from facilities containing PCBs including disposal activities, open burning of
waste materials, incomplete burning of chlorine containing sewage sludge, landfills and
waste incinerations facilities (Kim & Yoon, 2014). Other sources of PCBs include
possible direct and indirect release into the environment during their applications. During
the recent years, substantial municipal waste open dumping in suburban areas around the
cities of developing countries in Asia has garnered ample attention as probable sources of
POPs (Someya et al., 2010). Low-cost repairing, auctions, and transportation of old
transformers to industries causing leakage of oil, burning of municipal and electronic
waste, rubber and plastic material release dioxin like PCBs which cumulatively leads to
PCBs contamination into the environment (Jain & Sareen, 2006). Atmospheric air
circulation plays a basic role in contaminating the environment with PCBs which can
dissipate from a specific point source towards distant areas. Apart from the air, urban
runoff, discharge of wastewaters and municipal sewage sludge into the rivers may also
lead to PCBs contamination in the marine environment. Once released into the
environment, PCBs bind firmly to sediments, soils and particulate matter (Eqani et al.,
2012). In soils, PCBs leach down slowly and translocate to plants insignificantly. Their
rate of breakdown may last for months to years; in soils and sediments, it decreases with
increasing degree of chlorination (ASTDR, 2000, 2014).
2.3. Global Production of PCBs
The use of PCBs was started on large scale since 1929 in the USA for commercial
purposes as lubricating oils, inks, a plastic, carbonless copy paper, impregnating, paints,
sealing liquids, adhesives and additives, waxes, immersion oils, fire retardants, plaster,
Chapter Two Literature Review
16
casting and dedusting agents in different industries (Wittsiepe et al., 2015). Several
decades of the 20th
century are recognized for wide use of PCBs (Nost, 2014) for
industrial applications and electrical companies as largest consumer worldwide (Erickson
& Kaley, 2011). Worldwide, about 1.5 million tons PCBs were manufactured and used in
industrial and agricultural sector (Iszatt, 2015) in the 1970s. Since their production in the
late 1920s, the amount of commercially produced PCBs is around 2×10⁹ kg out of which
2×10⁸ kg remains in environmental mobile reservoirs (WHO, 2003). Although their
detrimental effects became evident since 1937, the first warning of PCBs was reported by
Jensen et al., (1969) during their work, they found a remarkably high concentration of
PCBs in Baltic Sea Eagles. The major share of PCBs production is contributed by United
States of America(USA) i.e. the production of about 650,000 metric tons (half of the
world‘s) PCBs production and importer of 50% of the rest produced by other countries.
Therefore, manufacturing, distribution and use of PCBs got restricted by the United States
Environmental Protection Agency (US EPA) during 1979 (Schecter, 2013; UNEP, 1999).
In Japan, the historical origin of PCBs have been found in agricultural chemicals with
abrupt increase starting from late 1950s, peaked in 1967 to 1972 and declined
continuously from 1972-1981 till leveled off (Yao et al., 2002). An estimated ~80 metric
ton of PCBs have been utilized in oil of electric transformers as reported by the
Government of Bangladesh‘s Department of Environment (Mamun, 2007).
PCBs production on the industrial scale got banned in developed countries owing
to their toxicity, but till then about two million tons of PCBs were discharged in the
environment (Roszko et al., 2014). In Korea, PCBs were enormously used (about 4292
tons) until their ban in 1996. These were banned in China during 1974 but, some
electrical equipment with PCBs are still in use and a serious threat to the environment
(Shao, 2001). The International Agency for Research on Cancer (IARC) announced that
Chapter Two Literature Review
17
some PCBs have potential as carcinogens (Arrebola et al., 2012). Despiteworldwide ban
on PCBs commercial production, significant amounts of PCBs are purchased by industry
for commercial purposes in some countries (Ludewig, 2008). They still are detected in the
atmosphere, soil, sediments, rivers, lakes, fish, animals, wildlife and even in various
human tissues (Wu et al., 2011).
2.4. Historical Events of PCBs Poisoning
A number of events have been occurred in the past putting human individuals at
higher exposure levels of PCBs. The first historic and highly documented event of PCBs
poisoning of human was ―oil disease‖ in Japan in 1968. This mass exposure occurred
accidentally by ingestion of PCBs contaminated rice oil and dioxin like compound
causing poisoning to about 1800 persons and 300 of them were deceased (Yu, 2005). The
symptoms of this incident were characterized by imparting acne, skin manifestations and
eye discharge (Onozuka et al., 2009; Yoshimura, 2003). Another incident similar to oil
disease was also reported from central Taiwan between years 1978 to 1979, which was
later named as Yucheng (oil disease in Chinese). This human food poising was caused by
ingestion of contaminated rice-bran cooking oil with PCBs and 2060 human individuals
were reported as victims (Hsu et al., 2005). Later on, studies confirmed the presence of
PCBs in blood and adipose tissues of the Yusho / Yucheng victims which led to abnormal
pregnancy in women, reproductive and fetal developmental disorders and suggestive
carcinogenesis of lungs (Mitoma et al., 2015).
2.5. Wildlife and PCBs
Exposure to PCBs results in multiple adverse health outcomes in human as well as
in wildlife (Faroon & Ruiz, 2015). PCBs are endocrine disruptors and may be responsible
for various dysfunctions in the reproductive system of human and wildlife, change in
Chapter Two Literature Review
18
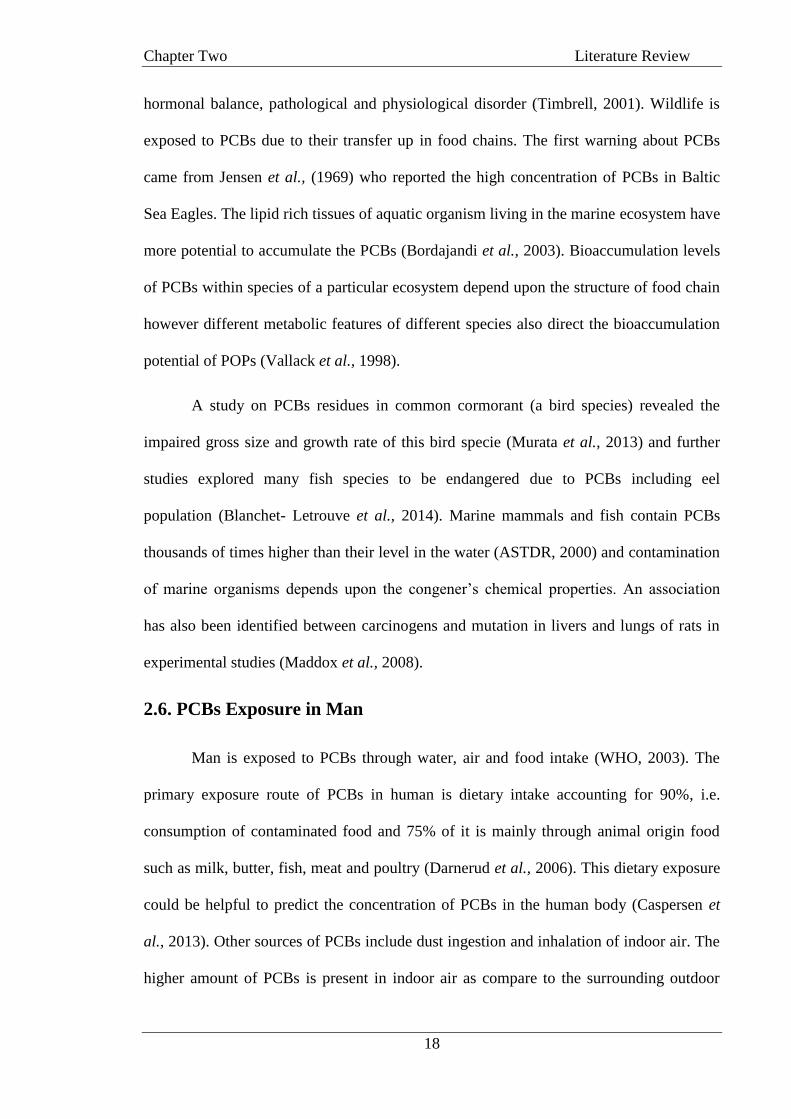
hormonal balance, pathological and physiological disorder (Timbrell, 2001). Wildlife is
exposed to PCBs due to their transfer up in food chains. The first warning about PCBs
came from Jensen et al., (1969) who reported the high concentration of PCBs in Baltic
Sea Eagles. The lipid rich tissues of aquatic organism living in the marine ecosystem have
more potential to accumulate the PCBs (Bordajandi et al., 2003). Bioaccumulation levels
of PCBs within species of a particular ecosystem depend upon the structure of food chain
however different metabolic features of different species also direct the bioaccumulation
potential of POPs (Vallack et al., 1998).
A study on PCBs residues in common cormorant (a bird species) revealed the
impaired gross size and growth rate of this bird specie (Murata et al., 2013) and further
studies explored many fish species to be endangered due to PCBs including eel
population (Blanchet- Letrouve et al., 2014). Marine mammals and fish contain PCBs
thousands of times higher than their level in the water (ASTDR, 2000) and contamination
of marine organisms depends upon the congener‘s chemical properties. An association
has also been identified between carcinogens and mutation in livers and lungs of rats in
experimental studies (Maddox et al., 2008).
2.6. PCBs Exposure in Man
Man is exposed to PCBs through water, air and food intake (WHO, 2003). The
primary exposure route of PCBs in human is dietary intake accounting for 90%, i.e.
consumption of contaminated food and 75% of it is mainly through animal origin food
such as milk, butter, fish, meat and poultry (Darnerud et al., 2006). This dietary exposure
could be helpful to predict the concentration of PCBs in the human body (Caspersen et
al., 2013). Other sources of PCBs include dust ingestion and inhalation of indoor air. The
higher amount of PCBs is present in indoor air as compare to the surrounding outdoor

Chapter Two Literature Review
19
ambient air (Macleod, 1981). Significant levels of PCBs have been detected in public
buildings having PCBs as a sealant (Kang et al., 2008). Man is the top of the food chain
with possible higher concentrations of PCBs in liver, brain, adipose tissue and skin,
blood, milk, placenta and cord blood (Esteban & Castano, 2009).
2.7. Metabolism of PCBs in Human
Once PCBs enter into the human body, these are partly metabolized and excreted
through urine and feces, whereas, most of the PCBs are resistant to metabolic
degradations, lipid soluble and sequester in fat/ lipid rich tissue (Hites, 2004). The half-
lives of PCBs depend upon the degree of chlorination and these may last from a few
months up to numerous decades (Lignell, 2013). The metabolism of PCBs in human takes
place through hepatic microsomal oxidases into hydroxylated metabolites (OH-PCBs)
that excretes through urine and excreta (Letcher et al., 2000). The metabolism rate and
excretion of PCBs and their metabolites from human body inversely depends upon the
degree and location of chlorine atom of biphenyl molecule, which also governs the rate of
elimination from body, vizmono and di-chlorinated biphenyls excrete via urinary tract
and high chlorinated biphenlys excrete via feces (Yu, 2005). Some of PCBs metabolites
bind to body matrices of human and wildlife and cause toxic effects. Hence, toxic effects
identified in an individual may be combined effects of concentration of PCBs and their
metabolites present in the body (Gomara et al., 2012).
Several techniques are being adapted to break down PCBs into less harmful
products in the environment, giving an insight to various fields of science. These include
physical process such as photolysis using ultraviolet radiations for dechlorination of
PCBs, use of magnetic nanoparticles and biological degradation in lakes, rivers, soils and
sediments e.g. microbial degradation, phytoremediation (Fang et al., 2013).
Chapter Two Literature Review
20
2.8. Effects of PCBs on Human
Nevertheless, PCBs withdrawals from use, these are still detected in soils,
sediments, water and living organisms due to their environmental persistence. Several
casting criticisms and environmental ills are endorsed to PCBs, which are also known as
immunosuppressive (Shaw & Chadwick, 1998). Monitoring of environmental
concentration is of major concern while assessing the potential harm that a particular
environmental pollutant may pose to the environment and organisms. Identification of
exposure to chemicals, responses to that specific chemical and its susceptible toxic effects
are fundamentals of toxicology. Biomarkers are tools that play pivotal role in this regard
and can be divided into three types, i.e. biomarkers of exposure, response and
susceptibility (Timbrell, 2001). Biomarkers of exposure have been used as a monitoring
tool for more than hundred years in occupational studies and have more recent
applications in environmental studies (Ott et al., 2006). Examples of human biomarker
are blood, milk, placenta and adipose tissues etc.
Recent epidemiological and experimental studies have highlighted that PCBs
exposure in humans may cause detrimental toxic effects viz; immunotoxicity,
developmental, physiological and structural disorders, endocrinal disruption, reproduction
abnormalities such as low birth weight, cancer, neurological effects, impairment of vision
and hearing disorder, depressive responsiveness and decreased Intelligence Quotient (IQ)
level (Kodavanti, 2014).
2.8.1. PCBs Toxicity in Women
Women are more vulnerable to PCBs exposure as compared to the men. They
have a relatively higher proportion of fatter than men and PCBs being lipophilic tend to
accumulate in fatty tissues. Consumption of these contaminants not only causes adverse
Chapter Two Literature Review
21
health effects to exposed women but pre and post natal exposure causes developmental,
reproductive, behavioral disorders and suboptimal neurological effects in the fetus
(Daglioglu et al., 2010). PCBs may enter in women through food, inhalation of
contaminated air, whereas, pregnancy and menstruation are major excretion routes for
PCBs in addition to urine and feces (Noren & Meironyte, 2000). Another important route
of their excretion from women is lactation/ breastfeeding the nursing infants (Rawn et al.,
2017). PCBs may also be released from the woman's body through the placenta, crossing
the placental barrier and may enter to the developing fetuses (Iyengar & Rapp, 2001).
Women blood serum, cord serum, placenta and milk have been used as indicators
of PCBs exposure in different studies. A research on Taiwanese mothers was conducted
on these four body matrices and showed highest concentration ratio of human milk
relative to blood serum levels as compared to the placenta and cord serum (Wang et al.,
2004). Maternal blood has been used as an important biomarker of exposure to PCBs in
Mexican women, participants, where significant PCB residues were detected than other
POPs in the study population (Orta-Garcia et al., 2014). Wittsiepe et al., (2015) provided
a detailed analysis of the impacts that PCBs have been causing on the individuals working
on the Electronic Waste Recycling Sites (EWRS) of Africa, located in Ghana and from
the suburb without direct exposure to electronic waste management activities. The study
established a direct as well as an indirect pathway of PCBs exposure among those
participating in the study.
PCBs presence in human milk is an alarming threat and it is in conjunction with
air and food has been selected by United Nation‘s Environment Program (UNEP) for the
POPs global monitoring (Sharma et al., 2014). Korrick & Altshul (1998) have identified a
correlation between PCB concentrations in human milk and occupational PCBs exposure.
According to Someya et al., (2010), the highest PCB levels in breast milk were consistent

Chapter Two Literature Review
22
with occupational PCBs exposure. They also focused on the feeding habits of the
community and established that the higher PCBs concentration in breast milk was due to
consumption of fish rather than occupational exposure. Postnatal exposure to PCBs was
also studied by Park et al., (2011). They evaluated PCB congeners and found their
concentrations in breastfeeding mothers in California, USA.
The placenta is one of the best biomarkers that could potentially establish a
relationship between POPs exposure and body burden is the placenta. The significance of
healthy placental life is crucial in determining the health of fetus in addition to different
pathways that may interfere with the normal placental functioning. The process of POPs
transference during pregnancy into the fetus is still not well recognized (Vizcaino et al.,
2014). In human, placenta performs dual transportation functions; at one end it facilitates
the bio-substances and nutrients passage from mother to the developing fetus and on the
other side for some materials, it acts as a barrier. Besides the passage of nutrients, some
harmful substances may also intrude and cross the placenta barrier and damage embryo
(Iyengar & Rapp, 2001). Myllynena et al., (2004) studied the toxicological impacts of
environmental exposures, including pesticides and dioxins in placenta samples. This
study provided a basis for further investigations, however, gave a set of historical data
highlighted the placental transfer of PCBs and emphasized on the further studies to
validate the role of PCBs in placental toxicology.
2.8.2. Women exposure to PCBs in Asia
Wang et al., (2004) studied the residues of PCBs and Dioxins in blood serum,
umbilical cord serum, milk and placenta in mothers of Central Taiwan. Dioxin like PCBs
was reported highest in human milk followed by venous serum, placenta and were least in
cord serum. Kang et al., (2008) highlight the OCPs and PCBs in human population,
Chapter Two Literature Review
23
including both male and female in urban areas of Korea. The results showed frequent
detection of HCB, HCH and trans-nonachlor and Dichlorodiphenyldichloroethylene
(DDE) as the most abundant OCP. Lipid adjusted serum levels of 23 PCB congeners were
also determined and showed PCB-153 as the dominant congener and concentrations of
PCB and OCP were positively correlated with each other. In Shanxi, China, Ma et al.,
(2012) detected PCBs and its metabolites in 130 placental tissues of women from rural
area (80 samples were from neonates with neural tube defects and the rest were from
healthy newborns). Level of PCBs was detected slightly higher in the samples from
defects neural tube than control samples, butit was concluded that no risk factor of neural
tube defects associated with the level of PCBs and PBDE.
2.8.3. Fetal exposure to PCBs
The chemicals which are present in food and environment of expecting mothers
could be traced in tissues and blood streams of their fetuses (Lopez-Espinosa et al.,
2007). In addition to pregnant women, fetuses, neonates, and children also are susceptible
to the harmful effects of these contaminants due to heightened sensitivity as their organs
are comparatively immature (Barr et al., 2007). There are several studies that highlighted
maternal levels of PCBs in relation to the developing fetuses and infants through the
placenta and breast milk (Doucet, 2009). The developmental processes in fetuses and
infants are more susceptible to PCBs exposure even at the low level (Mostafalou &
Abdollahi, 2013). This early development exposure may lead to health risks in fetuses
and infants, who are more susceptible to the impacts of these environmental toxins as
their immune system, organs, and detoxification mechanism, are partially developed than
adults (Wu et al., 2011). A common reason of exposure to these contaminants may
include maternal lifestyle habits, medication or environmental and occupational exposure.
Chapter Two Literature Review
24
Human placenta has been identified as a biomarker for the monitoring of particular
environmental contaminant transfers from mother to fetus (Myllynen et al., 2005).
Human milk plays a vital role in the growth and development of infants due to its
high contents of lipids and nutrients. Environmental exposure of PCBs to women results
in their accumulation in human milk which is carried over from mother to infants through
lactation (Dirtu et al., 2009). However, transmammary exposure has been reported to lead
to higher levels of POPs in neonates than in nursing mothers (Gascon et al., 2013; Verner
et al., 2013). Trans-placental exposure has been attributed to a similar or lesser level of
PCBs in infant‘s blood streams as compared to mothers (Mori et al., 2014).
The fetal organs in which these pollutants accumulate are blood, bone-marrow,
brain, spleen and liver (Leino et al., 2013). Preterm birth, reduced birth weight and
intrauterine growth retardation are resulted due to prenatal exposure to PCBs (Covaci et
al., 2002). Latent effects may include disturbed levels of thyroid hormone, reproductive
impairments, cognitive deficits, altered perceptual and motor development and adverse
neurobehavioral impacts (Kodavanti et al.,2017). Leino et al., (2013) reported the
association between pollutants fate in mothers and fetal exposure through the placenta.
The findings of the study reflected that fetal exposures to PCBs were dependent upon the
mother‘s demographic parameters such as age and parity. Lipophilicity and molecular
size are among the various PCBs and factors governing the exact dispersal of pollutants in
the body organs (Giaginis et al., 2009). Placental transfer of PCBs was also characterized
by Porpora et al., (2013) in maternal serum and cord blood collected from Rome and a
linear correlation was identified between concentrations in serum and cord blood.
However, maternal serum and maternal cord blood did not show association with infant‘s
birth weight and gestational age. The study also observed significant relationship between
Chapter Two Literature Review
25
increasing PCB concentrations in cord serum and decreasing Apgar score in infants was
also found in that study.
Similarly, a correlation of umbilical cord levels of PCBs in Chinese mothers with
premature birth, low birth weight, stillbirth and lowered Apgar score in infants was also
reported. A study on PCBs in seven birth cohorts from Europe was conducted by Iszatt
(2015) to report prenatal exposure in fetuses through cord serum and postnatal exposure
in infants through breastfeeding. The study findings revealed that maternal serum levels
of PCB-153 (a proxy biomarker for most of the PCB congeners) were not significantly
correlated with infant growth, but, postnatal exposure of PCB-153 in the infants (through
lactation) was associated with reduced infant growth.
2.8.4. Women exposure to PCBs in South Asia
PCB residues in human body tissues have also been reported in numerous studies
from India. High concentrations of PCBs in milk of women living in surroundings of e-
waste dumping site near Kolkata were detected and compared with a referenced site near
it. The findings of this study revealed that levels of dual- PCBs were significantly higher
in comparison to the referenced site. It was found that PCBs concentration is affected by
fish intake and the number of years of residence near the dumping site (Someya et
al.,2010). In contrast tothe above study, the PCBs level in human milk from Mumbai,
Delhi and Kolkata showed no significant relationship was studied among PCBs
concentrations and age and parity of mothers (Devanathan et al., 2009). Dewan et al.,
(2013) reported a detailed study on OCPs in blood, milk, and placenta of women from
New Delhi India had reported detectable levels. The results showed that trans-placental
transfer of all the OCPs was significant, whereas, insignificant results were observed for
trans-mammary transfer of most of the OCPs. Mamun (2007) highlighted the levels of
Chapter Two Literature Review
26
DDT, HCH, PCBs and HCB in human blood from Bangladesh and reported significant
levels of DDT with a low concentration of PCBs.
2.9. PCBs Scenario in Pakistan
Pakistan is a State Party and signatory of the Stockholm Convention, Basel
Convention, and Rotterdam Convention. Despite environmental legislations in the
country a gap exists in between the legislation and its implementation (Jaspal & Haider,
2014). Industry and agriculture are the major sectors of PCBs consumption in Pakistan;
their fresh inputs and continuous use have been reported in recent studies conducted
across the country (Ullah et al., 2016). A few studies were conducted in the country on
PCBs in relation to their occurrence and accumulation in freshwater resources, sediments
and freshwater fish of River Chenab, (Eqani et al.,2013; 2012), and Indus Basin soils
(Usman et al., 2015). Moreover, PCBs in the air, soil and indoor dust have also been
reported in the past (Ali et al., 2014; Syed et al., 2014). A detailed study on PCBs
exposure through contaminated food stuff (cereal crops) was reported in 2014 followed
by another study in 2016 (Mahmood et al., 2014; Mumtaz et al., 2016). Levels of
organochlorides (OC) have also been reported in the blood serum from different
Provinces of the country (Naqvi & Jahan, 1999; Parveen, 2001). In addition to the above
cited study, Yasmeen et al., (2016) and Khawaja et al., (2010) reported organochlorine
pesticides (OCPs) in the milk of breastfeeding mothers from Karachi and southern
Punjab, Pakistan. Several studies have been conducted to establish the transplacental
transfer of PCBs from mother to infants (Gascon et al., 2012; Porpara et al., 2013). But
data from Pakistan is scarce; so far no study on the placental transfer of PCBs in the
country has been conducted to trace the PCBs contamination according to the extent of
our knowledge.

Chapter Two Literature Review
27
The study was conducted to report the current status of PCBs in the blood, milk
and placenta of mothers from different districts of Punjab, Pakistan. According to our
known information, the present study is the pioneer in explaining and highlighting the
effects of PCBs on mothers and infants.
CHAPTER THREE
MATERIALS AND METHODS
Chapter Three Materials and Methods
29
Chapter Three
MATERIALS AND METHODS
3.1. Study Area
The Punjab province is a land of five rivers originating from Western Himalayas
and is one of the most fertile alluvial plains in South Asia. This province is historically
and culturally rich and experiences different regimes from the Indus valley civilization
the British Empire. With an area of 205,344 km2 and the population of 100 million
(population density = 353 persons per square kilometer), the Punjab is the most populous
province life-line of Pakistan. Most of the province population belongs to rural areas and
is dependent upon agriculture activities as it comprised of mostly intensified cultivated
areas of South Asia, where wheat, cotton, rice, maize and sugarcane is primarily grown
along with certain areas enriched with fruit and vegetable farming. Whereas, the
remaining population residing in cities is mainly engaged in urban and industrial
activities. Punjab experiences four distinct seasons viz; summer (including monsoon),
autumn, winter and short spring seasons, whereas, the temperature in the province ranges
between -2o to 40
oC. The rate of precipitation is higher in its north as compared to south
western parts.
The study area encompasses five districts of Province, Punjab, Pakistan viz;
Lahore, Khanewal, Okara, Sialkot and Chakwal (Figure 3.1). Rapid urbanization and
industrialization have caused an increase in environmental pollution in these major cities
of the province due to vehicular emission, chemical emissions and effluent discharge
from industries. The people purchase power in the area increases the demand of used or
end-of-life products that soon ends in the form of waste. The situation further worsens
due to the burning of tons of filth and solid waste by metropolitan corporations in most of
the parts of cities. There are electronic waste dumping sites near urban areas viz; Lahore,
Chapter Three Materials and Methods
30
which arepotential sources of PCBs contamination in these areas. The manufacturing and
distribution of PCBs and its use are not lawfully regulated in the country which is a major
reason of their ongoing detection in different environmental media and in the human.
3.1.1. Lahore
Lahore is an eminent city with a population around 10 million (increasing at a rate
of 4% per year) is considered as the second largest metropolitan of Pakistan and is located
in an arid region between 31°35′ North latitude and 74°21′ East longitude and 217m
above sea level (Jalees & Asim, 2016). Lahore is known as a business hub with most of
the population engaged in industry, trade and commerce and other services (Mirza, 2013).
The city is characterized as heavily industrialized and endured with 271 industrial units
mainly comprising of textile, chemical, paints and plastic, foundries and steel re-rolling
mills, dairy and food processing units, pulp and paper units, leather, tanneries, pesticides,
pharmaceuticals and poultry (Hamid et al., 2013). Rapid urbanization has resulted in an
increase of the municipal area of Lahore from 332 to 1000 km2 (Ali & Azhar, 2010). In
the race of massive industrialization and urbanization, Lahore is experiencing pollution
related issues due to industrial emissions, along with the lack of efficient pollution control
measures, solid waste management and mass transportation (Biswas et al., 2008).
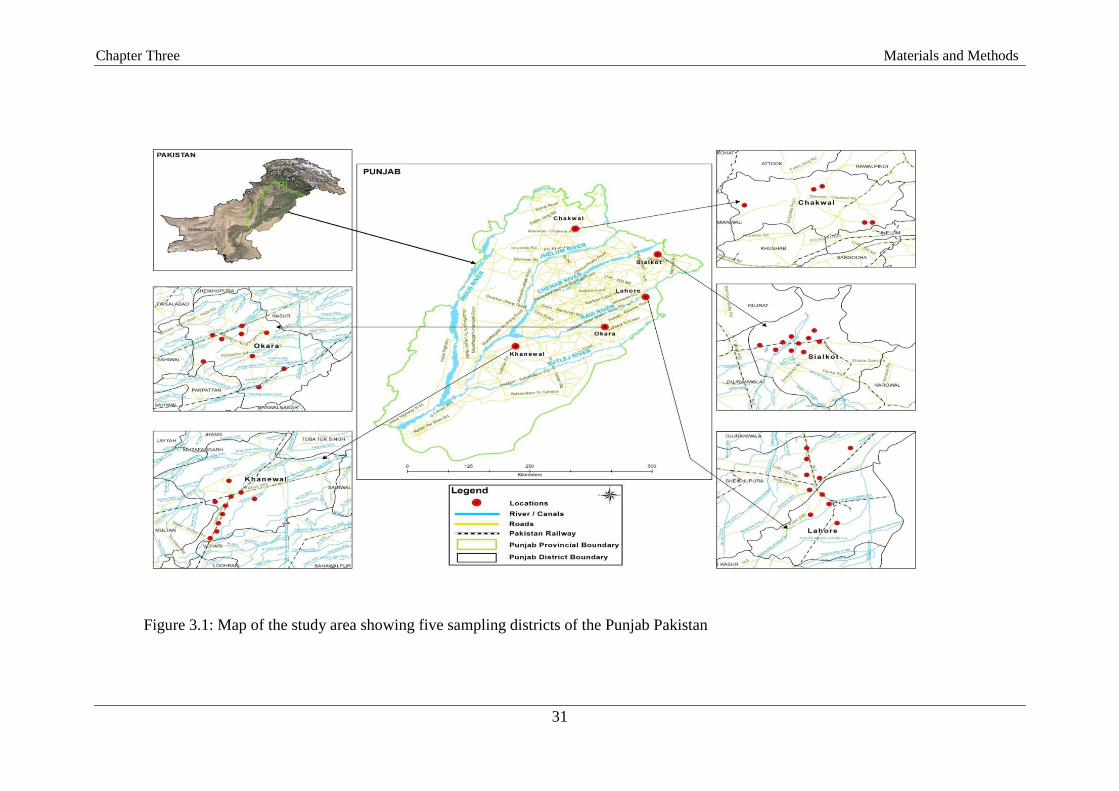
Chapter Three Materials and Methods
31
Figure 3.1: Map of the study area showing five sampling districts of the Punjab Pakistan
Chapter Three Materials and Methods
32
3.1.2. Khanewal
Khanewal is a district of Punjab, located between 30°18'0 N 71°56'0 E and 125 m
above sea level with an arid, subtropical continental climate (Tauseef et al., 2012). The
district has an area of about 1,059,630 acres. Khanewal is dominating with agriculture
land with major crops (wheat, sugarcane, and cotton), fruit orchards of mangoes, guava
and citrus, and a range of vegetable farmlands. The main industries of the district
Khanewal include textile spinning units, flour mills, weaving mills, vegetable ghee/oil
mills, sugar mill, a unit for solvent oil extraction, beverage unit, a number of oil expelling
and cotton ginning units and numerous engineering goods manufacturing industries
(GOP, 2016). There are uncontrolled discharges from industrial sources and the extensive
spraying of pesticides/ insecticides on the agricultural fields mainly on cotton crops
causing POPs pollution in the agricultural soils, contamination of water resources in the
area and ultimately affecting the human health (Azizullah et al., 2011).
3.1.3. Okara
Okara is a located between 30.801380°N and 73.448334°E with a total area of
4,377 km2. The district is comprised of three tehsils namely Okara, Depalpur and Renala
Khurd. The district Okara is renowned for its fertile agricultural lands supporting crop
and vegetable fields and fruit orchards. Major industries of the district Okara are dairy
products, poultry feed, cotton ginning and pressing, textile composite and textile weaving,
flour mills, deep freezers, food industry, oil mills, rice mills, sugar, seed processing, and
vegetable ghee/cooking oil (GoP, 2016). Application of agrochemicals in the agricultural
fields of the area to meet the food demand, improper disposal and burning of municipal
solid waste are causing the environmental contamination. In addition, there is a general
practice of burning of biomass as a household energy source in the rural areas of Pakistan.
Chapter Three Materials and Methods
33
This is a leading cause of indoor air pollution in most of the rural areas of the Pakistan
(Nasir et al., 2014).
3.1.4 Sialkot
Sialkot district is located between 32°29′33″N and 74°31′52″E about 244m above
the sea level in province Punjab Pakistan. It is considered as the 12th
most populous city
in the country with a population more than 3 million and population density 903 per km2
and annual growth rate of 1.99 % (GoP, 2016; Malik et al., 2010). It is an export oriented
and highly industrialized city with more than 300,000 population directly or indirectly
engaged in industry. The city is acknowledged for numerous medium and small sized
enterprises producing commodities, mainly leather products, sports goods (Qadir et al.,
2008). During the last two decades, this city has witnessed rapid urbanization,
industrialization along with agricultural development, making the city susceptible to
persistent effects of environmental pollution (Malik et al., 2010).
3.1.5. Chakwal
Chakwal is a district with a population of 0.10 million individuals and located
between 32°55′49″N and 72°51′20″E and 498m above sea level. It is a rain fed district
with hilly and plateau terrain that lies in the Potohar Plateau and the Salt Range. The
climatic conditions are sub-humid with scrubby vegetation and most of the population
living in rural areas (Ghazanfar et al., 2011). The district consists of four subdivisions i.e.
Chakwal, Talagang, Choasedan Shah and Kallar Kahar. Chakwal has some cement plants
and textile spinning units. Dust and gas emissions from these cement plants are
deteriorating the ambient air quality. Improper solid waste disposal is contaminating the
ground water in the area. Moreover, the city suffers from a load of thousands of
Chapter Three Materials and Methods
34
vehiclespassing through it every day. All these conditions are leading to environmental
pollution in the area.
3.2. Sampling Strategy
Five districts of the Province, Punjabwere selected as sampling sties viz; one
district of Potohar region (Chakwal), southern region (Khanewal), the central region
(Okara), eastern region (Lahore) and northeast (Sialkot). Site selection criterion was
based on the industrial and agricultural activities and spatial diversity and variation in
these districts. The areas within each selected five districts were further subdivided into
two zones viz; urban and rural to make the cross comparison between them. The rural
women were those who purely belonged from areas with agricultural activities. The urban
women were those who belong to areas with urban/ industrial localities and
anthropogenic activities leading to PCBs exposure in the study area (Appendix-1). A
group of gravid women (n=45) with cesarean sections at public sector hospitals located in
the study area was selected for the collection of blood, milk and placenta samples. Among
these women, 19 were from rural areas and 26 were from urban areas. The inclusion
criteria of the subject women included those who were born and currently residing in
Punjab province, age ranging between 18 years up to 45 years with no previous history of
cardiac disease (Thomas et al., 2006). Medical Officers were requested to help in the
collection of blood, milk and placenta from the women volunteers who have shown their
consent after they were briefed about the purpose of the research.
The placenta and blood serum samples were collected within a few hours of baby
birth, whereas, milk sample was taken within three days of the baby birth. Prior to the
sampling, the ethical and scientific approval of the present study was obtained from
Advanced Studies and Research Board (ASRB) at the University of the Punjab, Lahore,

Chapter Three Materials and Methods
35
Pakistan. All ethical responsibilities were strictly observed. A specimen of patient consent
used during this study is placed as Appendix-2.
3.3. Sample Collection and Transportation
3.3.1. Blood serum
About five to 8.0 mL of blood of each volunteer from five districts (Lahore,
Khanewal, Okara, Sialkot and Chakwal) was collected through venipuncture in red top
BD glass vacationers with the help of paramedical staff (Thomas et al.,2006). After
collection, the serum was separated by centrifugation 3000 revolutions per minutes (rpm)
to obtain approximately 3.0 mL of blood serum (Inoue et al., 2006).
3.3.2. Human milk
The volunteers were selected for collection of milk samples. About 20 ml of milk
sample was obtained from each volunteer through breast pumps with the help of
paramedical staff within three to four days after delivery. The collected milk samples
were transferred to designated glass bottles.
3.3.3. Human placenta
The women with caesarean sections in hospitals of the study area were selected as
subjects. Placental tissues (20g) were collected during the course of caesarean section in a
sterilized glass container. Placenta was cut in triangular portion, taken from fetal and
maternal disc side, including peripheral and central parts of the human placental disc.
3.3.4. Transportation and storage
After collection blood serum, milk and placenta samples were immediately kept
on dry ice in the ice box and transferred to the Ecotoxicological Laboratory at the College
of Earth and Environmental Sciences, University of the Punjab, Lahore, Pakistan,
Chapter Three Materials and Methods
36
whereall the collected samples were stored at -20oC in a freezer until further analysis
(Nanes et al., 2014).
3.4. Sample Preparation and Analysis
Assessment of PCBs residues needs their extraction from the sample using
organic solvents, clean up for lipid removal to avoid interference in analysis, gas
chromatography for PCBs separation from other compound present in the extract and its
confirmation by a mass spectrometer (MS). These are described below in detail.
3.4.1. Extraction of PCBs
The methods as described by Tyagi et al., (2015) and Covaci and Voorspoels
(2005) were used for sample extraction and cleanup with slight modifications i.e. using
ultrasonic treatment instead of mechanical shaker. The blood serum, placenta and milk
samples were thawed and homogenized at room temperature. Placenta samples were
weighed one gram (1g) in a weighing balance, shredded into small pieces and transferred
to glass vial. Maternal serum and milk (1 mL each) and 1g placenta tissue (finely
chopped) were taken and spiked with surrogate standards (5ppb) of PCB-209 and 2,4,5,6-
tetrachloro-m-xylene (TCmX), sonicated for 20 minutes and kept overnight at 40C. The
PCBs were extracted next day by adding n-hexane (6mL) and acetone (3mL) into the
spiked samples. The selection of these solvents was based on the fact that they facilitate
the PCBs transference from the sample into polar solvents, thus enhancing the extraction
efficiency of PCBs (Tan, 2009). All the samples were equilibrated by ultrasonic treatment
for one hour at 30C, followed by their centrifugation for ten minutes at 2000RPM (Dewan
et al., 2015). The clear upper layer of n-hexane, containing PCBs was then separated into
another glass vial and the remaining part was extracted twice by repeating the procedure
and addition of clear layers of n-hexane to the previous fractions.
Chapter Three Materials and Methods
37
3.4.2. Sample cleanup
The extracts were then cleaned up in an Agilent‘s solid phase extraction assembly
using Agilent Bond Elut polypropylene cartridges, prepared by filling the cartridges from
bottom to top, with acidic silica (2g), the 200mg silica (activated at 1200C for 2 hours)
and 500 mg anhydrous sodium sulphate, respectively. Acidified silica was prepared
according to the method described by Covaci and Schepens (2001). Briefly, it was
prepared by drop wise adding 27 mL of sulphuric acid into the 50 g silica gel. The
mixture was stirred for 30 minutes for good homogeneity. Prior to cartridges preparation,
the empty cartridges were cleaned with 5 mL DCM, activated through MeOH (5 mL) and
dionized-distilled water (5 mL). Moreover, the prepared clean-up cartridges were eluted
with DCM (5 mL) before sample loading. The cleanup process involved loading of PCBs
extract on the prepared column, elution of analytes with n-hexane (4 mL) and
dichloromethane (DCM 2 mL) (Jaraczewska et al., 2006). Each cleaned sample was then
concentrated through gentle nitrogen streaming by an injection volume viz. 0.5 mL and
equilibrated with 50µl of iso-octane (Vizcaino et al., 2014). About 10 µL of the internal
standard of 13
C-PCB-141 was added in the mixture followed by vortex and transferred to
the 1.5 mL septa vials. The prepared samples were then transferred to the State Key
Laboratory of Organic Geochemistry, Guangzhou Institute of Geochemistry, Chinese
Academy of Sciences, Guangzhou, China for further analysis on Gas Chromatography-
Mass Spectrometry (GC MS).
3.5. Instrumental Analysis
Gas Chromatograph (GC-7890A) connected to an Agilent 7000A Triple Quad
Mass Spectrometer (MS) and Autosampler (Agilent 7693) was used for the quantification
of PCBs (Figure 3.2). The operational mode of GCMS was electron-capture negative
ionization (ECNI). For PCBs analysis, a CP-8 capillary column (from Netherland) was
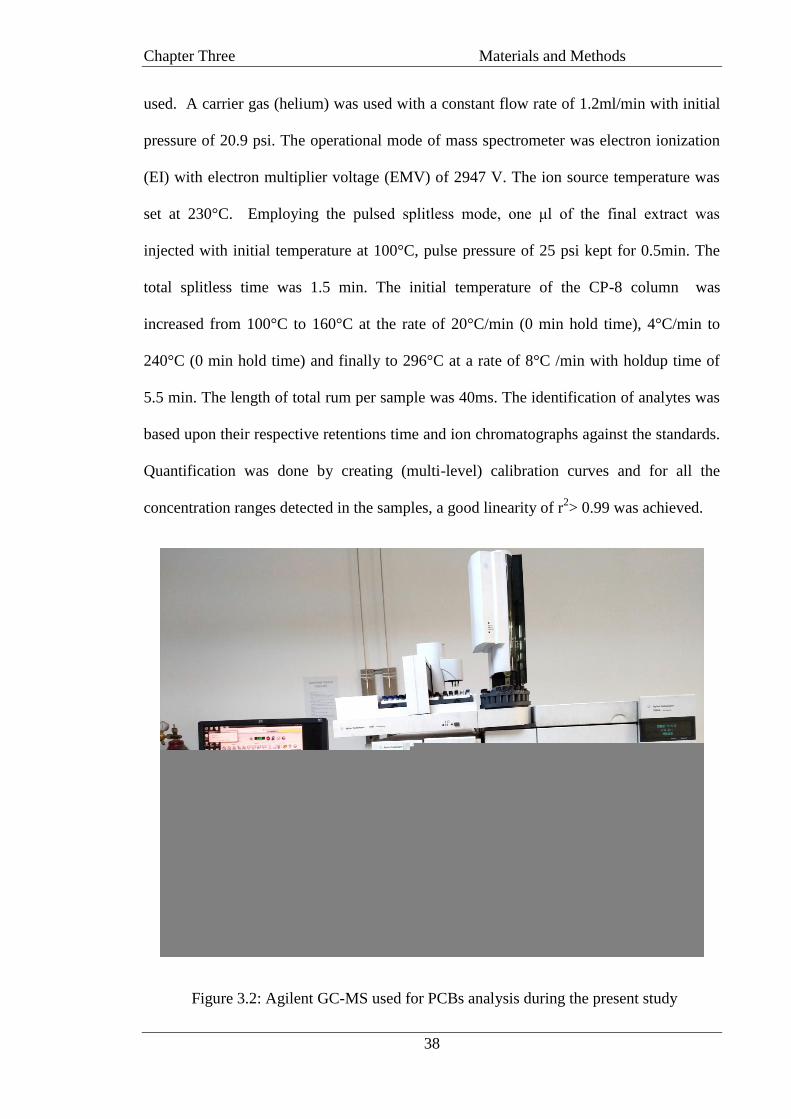
Chapter Three Materials and Methods
38
used. A carrier gas (helium) was used with a constant flow rate of 1.2ml/min with initial
pressure of 20.9 psi. The operational mode of mass spectrometer was electron ionization
(EI) with electron multiplier voltage (EMV) of 2947 V. The ion source temperature was
set at 230°C. Employing the pulsed splitless mode, one μl of the final extract was
injected with initial temperature at 100°C, pulse pressure of 25 psi kept for 0.5min. The
total splitless time was 1.5 min. The initial temperature of the CP-8 column was
increased from 100°C to 160°C at the rate of 20°C/min (0 min hold time), 4°C/min to
240°C (0 min hold time) and finally to 296°C at a rate of 8°C /min with holdup time of
5.5 min. The length of total rum per sample was 40ms. The identification of analytes was
based upon their respective retentions time and ion chromatographs against the standards.
Quantification was done by creating (multi-level) calibration curves and for all the
concentration ranges detected in the samples, a good linearity of r2> 0.99 was achieved.
Figure 3.2: Agilent GC-MS used for PCBs analysis during the present study

Chapter Three Materials and Methods
39
3.6. Chromatographical Analysis
The concentrations of 34 PCB congeners including eight dioxin like PCBs (PCB-
70, 126, 169, 105, 114, 118, 156 and 189) and six indicator PCBs (PCB-52, 101, 118,
138, 153 and 180) were determined. These 34 congener were grouped as follows: PCB
homolog: Tri-CBs (∑PCB-30 and37), Tetra-CBs (∑PCB-44,49,52,54,60,66,70,74 and
77),Penta-CBs (∑PCB-82,87,99,101,105,114,118 and 126), Hexa-CBs (∑PCB-128, 138,
153, 156, 158, 166 and 169) Hepta-CBs ∑PCB-170, 179, 180, 183, 187 and 189) Octa-
CB (PCB-198) and Deca-CB (PCB-209). The selection of these PCB congeners was
based upon the optimization of the instrumentation for these congeners, their relative
abundance, persistence and toxicity concerns in the environment (particularly of dioxin
like PCBs).
3.7. Lipid Determination
3.7.1. Determination of blood serum lipids
The total lipids in the serum samples were determined as demonstrated by Covaci
et al., (2005). Total Cholesterol (CHOL) and Triglycerides (TG) were analyzed using
enzymes in already separated aliquots/ subsets of the serum samples from a government
hospital‘s laboratory. The total lipids were determined by putting the CHOL and TG
values in the following formula i.e.
TL (g/l) = 1.12×CHOL+ 1.33×TG + 1.48 (Covaci & Voorspoels, 2005)
Final concentrations of PCBs in each sample were expressed as ng/g lipid weight
(ng/g lip).
Chapter Three Materials and Methods
40
3.7.2. Determination of milk fat
Fat content in human milk samples was determined in Food and Biotechnology
Research Center (FBRC), Pakistan Council of Scientific and Industrial Research
(PCSIR). Fat contents (%) of each milk sample were determined using separate aliquots
of samples by a method/ protocol of Association of Official Analytical Chemists (AOAC,
International) 2000.18. The method employs the use of sulfuric acid (10mL), taken in a
butyrometer along with milk sample (10.75 ml) pipetted out by the sides of butyrometer
and 1 ml of ISO- amyl alcohol was poured on it with tilt measure. The butyrometer was
stoppered and shaken well, kept in a hot water bath at 15-210C and then placed in a
Gerber centrifuge for four minutes at 1100 RPM. The butyrometer was then taken out and
tempered by placing again in water bath at 650C for five minutes. The fat content
appeared at the top was measured as percentage fat content, i.e. grams per 100 mL.
3.7.3. Determination of placental lipids
Placental lipids were measured gravimetrically through a method described earlier
by Vizcaino et al., (2014). The process involved taking placenta tissue (1g),
homogenizing it in a 5mL solution of chloroform: methanol: hydrochloric acid (20:10:0.1
i.e. v/v/v), repeating the previous process twice, followed by the addition of 0.1N HCl
(10mL) and centrifugation for ten minutes at 3000RPM. The organic phase containing
lipids was collected and the process was repeated to obtain maximum lipids. The extract
was then concentrated under a nitrogen stream and dry lipids were measured
gravimetrically.
3.8. Quality Control and Assurance
The surrogate standards of 2,4,5,6-tetrachloro-m-xylene (TCmX) and PCB-209
were purchased from CPA Chem Ltd. Stara Zagora, Bulgaria. Internal standard of 13
C
Chapter Three Materials and Methods
41
PCB-141 was purchased from Cambridge Isotope Laboratories, Inc. Highwood drive
Tewksbury, MS, USA. A blank of n-hexane was run prior to every batch of five samples.
All the solvent and procedural blanks were as run as the original samples to monitor the
influence of any possible contamination in the course of processing samples and the
instrumental analysis. Six calibration standards of PCBs (prepared in association) were
used to evaluate the method‘s and instrument‘s accuracy and precision. These were the
serial dilutions of standards ranging from 5 ppb to 200 ppb. These standards were
purchased from Aqua Standard Company, USA. The average surrogate standard
recovery in blood serum samples was 69 ± 6% for TCmX and 76 ±8 % for PCB-209 and
in human milk sample recovery rate was 72 ± 7 % for TCmX and 78 ± 9 % for PCB-209.
Whereas, the surrogate standard recovery in human placenta samples was 79 ± 8% for
TCmX and 82 ±9 % for PCB209.A follow up standard of 50 ppb was run daily to
calibrate the instrument. A deviation of the ion intensity ratios was considered as
acceptable when it was within 20% of the mean values of calibration standards. The
Calibration was made when the mean value exceeded 20%. Data processing was done
using Agilent Mass Hunter workstation software. Agilent Mass Hunter workstation
software was used for integrating peaks and data processing.
Organic solvents i.e. dichloromethane (DCM), n-hexane, methanol (MeOH),
acetone, and iso-octane were of HPLC grade purchased from Merck KGaA (Germany).
Concentrated sulphuric acid (H2SO4), anhydrous sodium sulphate (Na2SO4) and silica gel
were also purchased from Merck and Co., Inc. All the glassware used in the present study
were washed with DCM and later on with double-distilled water for 30 minutes, wrapped
in aluminum foil and oven dried at 115 oC for one day. These were baked next day at 450
oC in a muffle furnace for four hours.
Chapter Three Materials and Methods
42
3.9. Socio-demographic Characteristics
In order to depict the socio-demographic conditions of the sampling group, a
questionnaire was used that was filled by getting information from the each volunteer
woman during sampling. It included an array of question regarding the age, location,
marital status, parity, Body Mass Index (BMI), lifestyle and eating habits, fish and milk
intake, personal disease history (if any), number of children carried and breastfed and
child anthropometric measurements given below. Questions regarding demographic
characteristics and feeding habits were modified from US EPA studies on food and total
diet (USFDA, 2004). The concentrations of PCBs in these women were also evaluated on
the basis of their spatial distribution and for this purpose were categorized as rural and
urban.
3.10. Risk Assessment
3.10.1. Toxicity Equivalent Factor (TEQ)
There are some coplanar PCBs that exhibit similar properties and toxicity, as of
TCDD and are referred as dioxin like compounds (Chovancovaet al., 2012). In the
present study, eight dioxin like PCB congeners, i.e. three non-ortho and five mono-ortho
were studied. Individual congener‘s concentration was multiplied by its TEF to determine
TCDD equivalent, represented as WHO2005-TEQs (Van den Berg et al.,2006).
3.10.2. Risk assessment of mothers and infants
In order to assess the association between levels of PCBs in mothers and their
relationship with maternal health; their personal attributes viz; body weight, height, BMI,
age, parity, number of children carried and breast fed, location and eating habits were
compared with PCB residues in the body. Also the health risks to infants were assessed
using their anthropometric characteristics including head and chest circumference, mid
Chapter Three Materials and Methods
43
arm circumference, crown to heel length and birth weight was measured. The detailed
questionnaire used during sampling is attached as Appendix-3.
3.10.3. Estimated Daily Intake of dioxin like PCBs in women
Dioxin like PCBs are highly toxic, therefore, a small but long term
exposure to these chemical could be great public and scientific concern (Fromme et al.,
2009). Theses chemicals enterintothe human body through food.Dioxin like PCBs and
risks to the health of selected women in this study was evaluated by estimating their daily
intake of dl-PCBs using the following equation.
Where f is the absorption factor assumed to be 50% for absorption from food for
human, *ln2 = 0.693 and assumed half-life of 7.5 years. Moreover, a Tolerable Daily
Intake (TDI) of 1–4 pg TEQ/kg for human had also been recommended by a WHO
consultation. The risks to the health of the women using the aforesaid formula was
calculated and expressed as an Estimated Daily Intake (EDI).
3.10.4. Estimated daily intake of PCBs in infants
Several studies reported that PCBs could easily be transferred from mother to
infant through breast milk (Needham, 2011). The potential health risks of PCBs exposure
to infants through breast milk intake was assessed by determining hazard quotient (HQ)
for dl-PCBs using equation given bellow:
Hazard quotient is a ratio between exposure (i.e., the estimated daily intake (EDI)
and provisional tolerable daily intake (PTDI). The PTDI is the maximum daily amount of
Chapter Three Materials and Methods
44
a chemical that is considered safe during the entire human lifetime (FAO/WHO, 1995).
The calculated HQ value less than 1 indicates no adverse health effect is expected,
whereas an HQ greater than 1 indicates the possibility of adverse health effects.
Where EDI is the estimated daily intake (ng kg-1
body weight day-1
), CPCB is the
concentration of PCB. To calculate EDI, the concentration of PCBs analyzed in milk
samples of lactating mothers was multiplied with daily milk intake of infants, which was
700 ml and divided by individual infant weight (FAO/WHO,1 995; Klincic et al., 2016).
PTDI value used for PCBs was 10 pg kg-1
body weight day-1
(van Leeuwen et al., 2000).
Above this PTDI value, PCBs exposure is considered not safe for humans during their
entire life (FAO/WHO, 1995).
3.11. Statistical Analysis
The quantitative analysis of PCBs concentrations was carried out using statistical
software SPSS version 16.0 and Microsoft Excel, (2010) to represent basic descriptive
statistics. A Pearson‘s correlation analysis was performed to assess the relationship
between PCB concentrations in women body matrices and data on physiological
parameters of mothers and infants. Linear regression curves were plotted using Microsoft
Excel, 2010 for a graphical representation of the influence of prenatal exposure on the
mother and infant characteristics. The concentrations of PCBs (ng/g lipid weight) were
represented as descriptive data using mean, standard deviation and range. The Originpro,
2017 software, Arc GIS version 10.2.2 and soft stat. software 12.5 were employed to
exhibit spatial patterns of PCBs.

45
CHAPTER FOUR
RESULTS
Chapter Four Results
46
Chapter Four
RESULTS
4.1. PCBs Profile and Congener Specific Analysis in Blood Serum
The blood serum concentrations of PCBs were determined on the basis of lipid
concentration. The total lipids in blood serum samples were ranged between 4.34 to 5.97
g/L with the mean value of 4.98 ± 0.40 g/L. The concentrations of ∑34 PCBs in maternal
serum samples ranged between 47.49 to 522.06 ng/g lip (mean: 232.33 ± 110.62 ng/g lip).
Among the PCB congeners, the highest mean concentration was determined for PCB-70,
(18.72 ng/g lip) ranging between 0.56 to 44.25 ng/g lip, whereas, the lowest was observed
for PCB-166 (0.44 ng/g lip; range 0.00-2.38 ng/g lip). The other dominant congeners of
PCB were PCB-52 (17.46 ng/g lip, range: 3.67-51.98 ng/g lip), PCB-37 (17.20 ng/g lip,
range: 3.95-45.57 ng/g lip), PCB-60 (16.82 ng/g lip, range: 1.93-39.27 ng/g lip) and PCB-
66 (16.77 ng/g lip, range:0.00-37.31 ng/g lip). The descriptive statistics of each PCB
congener is presented in Appendix-4.
Six indicator PCBs were also determined in blood serum samples viz; PCB-52
(17.46 ng/g lip), PCB-101 (12.10 ng/g lip), PCB-118 (5.99 ng/g lip), PCB-138 (4.87 ng/g
lip), PCB-153 (6.64 ng/g lip) and PCB-180 (2.46 ng/g lip). The mean concentration of
indicator PCBs in blood serum was (49.55 ± 42.31 ng/g lip). These are the conveners
often found in human and in the environment. Among these congeners, PCB-153, PCB-
138 and PCB-180 are also known as the persistent congeners. Moreover, the mean
concentration of eight dioxins like PCBs (33.39 ± 40.18 ng/g lip) was recorded. The
concentrations of each PCBs congener are given in Figure 4.1. Based on the (mean)
concentrations, the PCBs homolog were in the descending order as; Tetra-CBs (mean:
128.05 ng/g lip) > Penta-CBs (54.38 ng/g lip) > Hexa-CBs (22.17 ng/g lip) > Tri-CBs
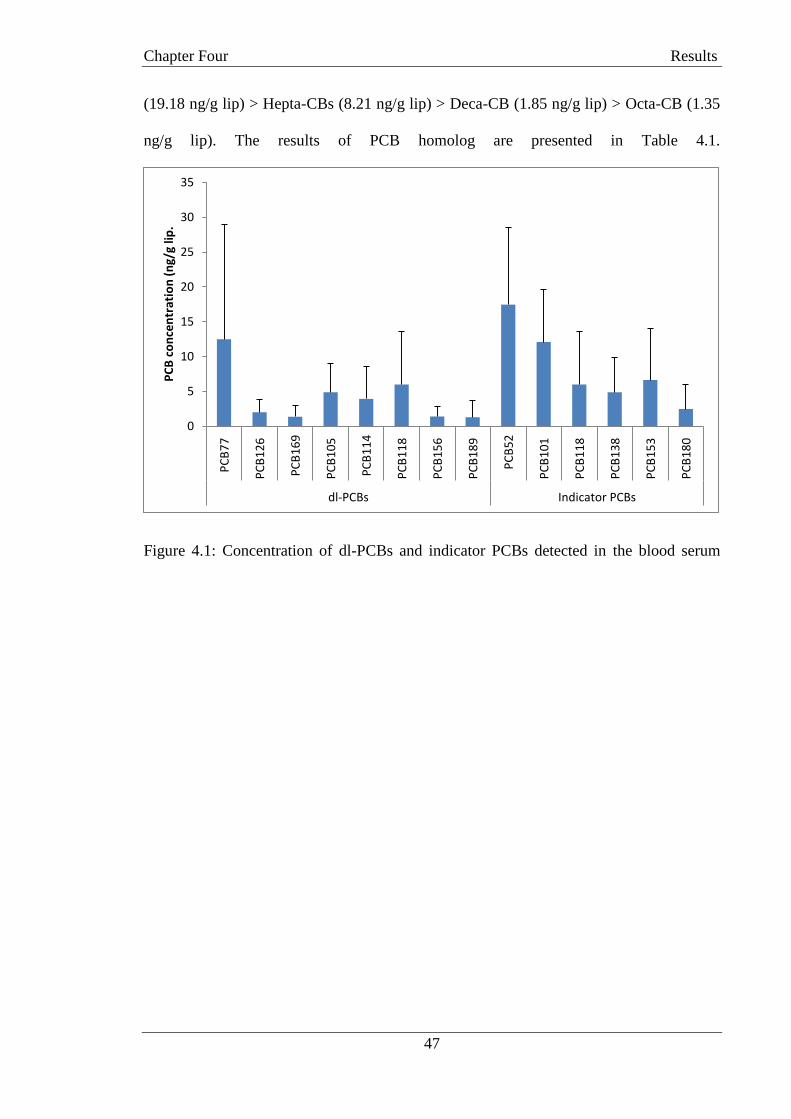
Chapter Four Results
47
(19.18 ng/g lip) > Hepta-CBs (8.21 ng/g lip) > Deca-CB (1.85 ng/g lip) > Octa-CB (1.35
ng/g lip). The results of PCB homolog are presented in Table 4.1.
Figure 4.1: Concentration of dl-PCBs and indicator PCBs detected in the blood serum
0
5
10
15
20
25
30
35
PC
B7
7
PC
B1
26
PC
B1
69
PC
B1
05
PC
B1
14
PC
B1
18
PC
B1
56
PC
B1
89
PC
B5
2
PC
B1
01
PC
B1
18
PC
B1
38
PC
B1
53
PC
B1
80
dl-PCBs Indicator PCBs
PC
B c
on
cen
trat
ion
(n
g/g
lip.
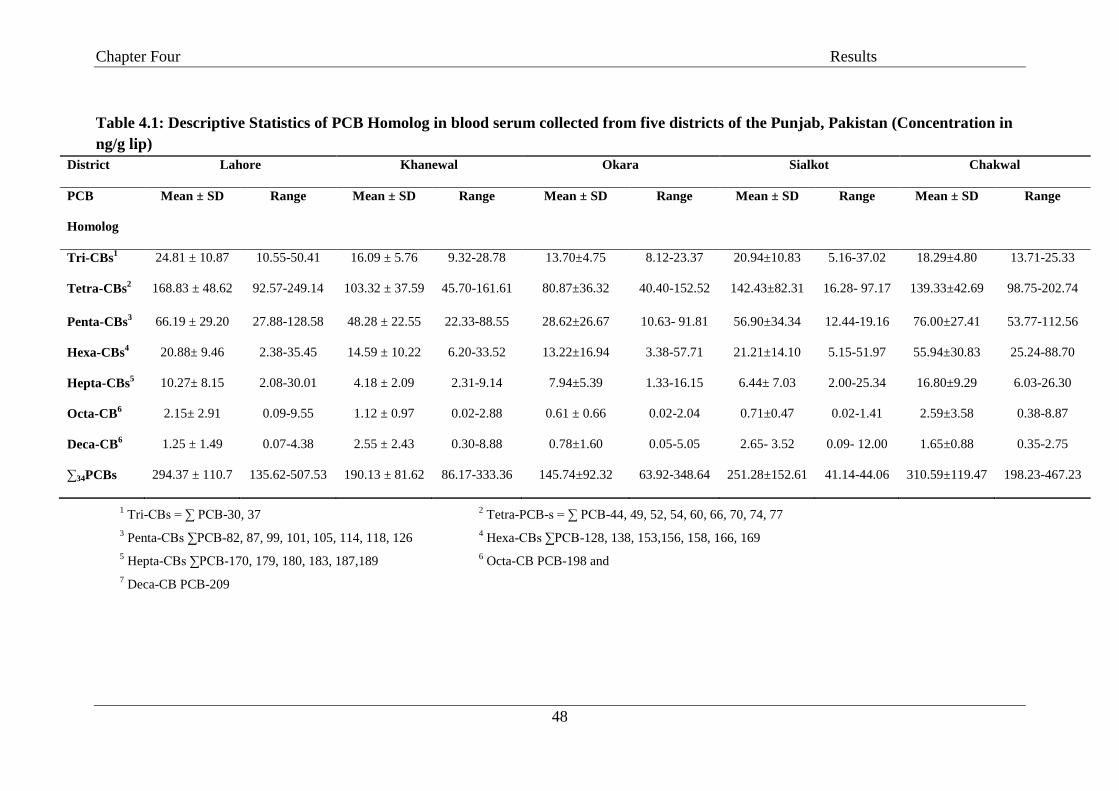
Chapter Four Results
48
Table 4.1: Descriptive Statistics of PCB Homolog in blood serum collected from five districts of the Punjab, Pakistan (Concentration in
ng/g lip)
District Lahore Khanewal Okara Sialkot Chakwal
PCB
Homolog
Mean ± SD Range Mean ± SD Range Mean ± SD Range Mean ± SD Range Mean ± SD Range
Tri-CBs1 24.81 ± 10.87 10.55-50.41 16.09 ± 5.76 9.32-28.78 13.70±4.75 8.12-23.37 20.94±10.83 5.16-37.02 18.29±4.80 13.71-25.33
Tetra-CBs2 168.83 ± 48.62 92.57-249.14 103.32 ± 37.59 45.70-161.61 80.87±36.32 40.40-152.52 142.43±82.31 16.28- 97.17 139.33±42.69 98.75-202.74
Penta-CBs3 66.19 ± 29.20 27.88-128.58 48.28 ± 22.55 22.33-88.55 28.62±26.67 10.63- 91.81 56.90±34.34 12.44-19.16 76.00±27.41 53.77-112.56
Hexa-CBs4 20.88± 9.46 2.38-35.45 14.59 ± 10.22 6.20-33.52 13.22±16.94 3.38-57.71 21.21±14.10 5.15-51.97 55.94±30.83 25.24-88.70
Hepta-CBs5 10.27± 8.15 2.08-30.01 4.18 ± 2.09 2.31-9.14 7.94±5.39 1.33-16.15 6.44± 7.03 2.00-25.34 16.80±9.29 6.03-26.30
Octa-CB6 2.15± 2.91 0.09-9.55 1.12 ± 0.97 0.02-2.88 0.61 ± 0.66 0.02-2.04 0.71±0.47 0.02-1.41 2.59±3.58 0.38-8.87
Deca-CB6 1.25 ± 1.49 0.07-4.38 2.55 ± 2.43 0.30-8.88 0.78±1.60 0.05-5.05 2.65- 3.52 0.09- 12.00 1.65±0.88 0.35-2.75
∑34PCBs 294.37 ± 110.7 135.62-507.53 190.13 ± 81.62 86.17-333.36 145.74±92.32 63.92-348.64 251.28±152.61 41.14-44.06 310.59±119.47 198.23-467.23
1 Tri-CBs = ∑ PCB-30, 37
2 Tetra-PCB-s = ∑ PCB-44, 49, 52, 54, 60, 66, 70, 74, 77
3 Penta-CBs ∑PCB-82, 87, 99, 101, 105, 114, 118, 126
4 Hexa-CBs ∑PCB-128, 138, 153,156, 158, 166, 169
5 Hepta-CBs ∑PCB-170, 179, 180, 183, 187,189
6 Octa-CB PCB-198 and
7 Deca-CB PCB-209
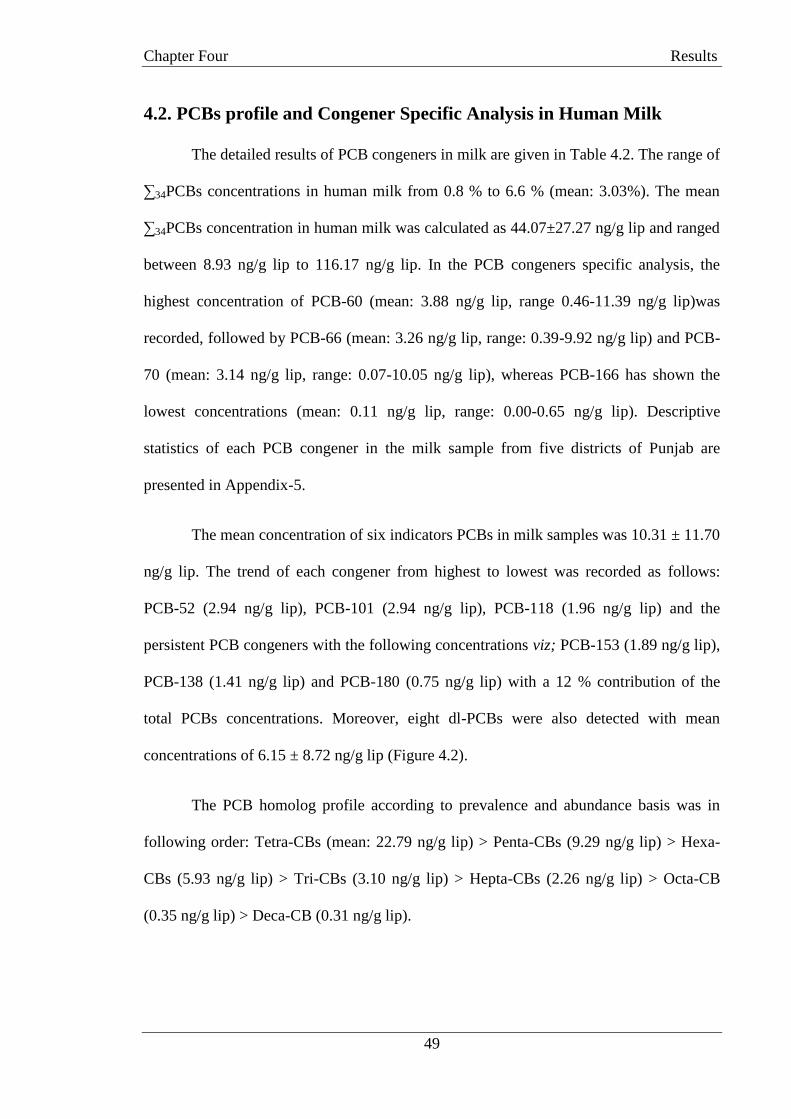
Chapter Four Results
49
4.2. PCBs profile and Congener Specific Analysis in Human Milk
The detailed results of PCB congeners in milk are given in Table 4.2. The range of
∑34PCBs concentrations in human milk from 0.8 % to 6.6 % (mean: 3.03%). The mean
∑34PCBs concentration in human milk was calculated as 44.07±27.27 ng/g lip and ranged
between 8.93 ng/g lip to 116.17 ng/g lip. In the PCB congeners specific analysis, the
highest concentration of PCB-60 (mean: 3.88 ng/g lip, range 0.46-11.39 ng/g lip)was
recorded, followed by PCB-66 (mean: 3.26 ng/g lip, range: 0.39-9.92 ng/g lip) and PCB-
70 (mean: 3.14 ng/g lip, range: 0.07-10.05 ng/g lip), whereas PCB-166 has shown the
lowest concentrations (mean: 0.11 ng/g lip, range: 0.00-0.65 ng/g lip). Descriptive
statistics of each PCB congener in the milk sample from five districts of Punjab are
presented in Appendix-5.
The mean concentration of six indicators PCBs in milk samples was 10.31 ± 11.70
ng/g lip. The trend of each congener from highest to lowest was recorded as follows:
PCB-52 (2.94 ng/g lip), PCB-101 (2.94 ng/g lip), PCB-118 (1.96 ng/g lip) and the
persistent PCB congeners with the following concentrations viz; PCB-153 (1.89 ng/g lip),
PCB-138 (1.41 ng/g lip) and PCB-180 (0.75 ng/g lip) with a 12 % contribution of the
total PCBs concentrations. Moreover, eight dl-PCBs were also detected with mean
concentrations of 6.15 ± 8.72 ng/g lip (Figure 4.2).
The PCB homolog profile according to prevalence and abundance basis was in
following order: Tetra-CBs (mean: 22.79 ng/g lip) > Penta-CBs (9.29 ng/g lip) > Hexa-
CBs (5.93 ng/g lip) > Tri-CBs (3.10 ng/g lip) > Hepta-CBs (2.26 ng/g lip) > Octa-CB
(0.35 ng/g lip) > Deca-CB (0.31 ng/g lip).
Chapter Four Results
50
Figure 4.2: Concentration of dl PCBs and indicator PCBs detected in human milk
0.00
1.00
2.00
3.00
4.00
5.00
6.00
7.00
PC
B7
7
PC
B1
26
PC
B1
69
PC
B1
05
PC
B1
14
PC
B1
18
PC
B1
56
PC
B1
89
PC
B5
2
PC
B1
01
PC
B1
18
PC
B1
38
PC
B1
53
PC
B1
80
dl-PCBs Indicator PCBs
PC
B c
on
cen
trat
ion
(n
g/g
lip)

Chapter Four Results
51
Table 4.2: Descriptive Statistics of PCB homolog in human milk samples collected from five districts of the Punjab, Pakistan
(Concentration in ng/g lip)
District Lahore Khanewal Okara Sialkot Chakwal
PCB
Homolog
Mean ± SD Range Mean ± SD Range Mean ± SD Range Mean ± SD Range Mean ± SD Range
Tri-CBs1 2.56± 2.29 0.96-8.81 2.92±1.43 0.96-5.56 2.99±1.81 0.93-7.29 3.52±1.50 1.73-5.64 4.21±1.53 2.66-6.37
Tetra-CBs2 18.37±15.73 7.67-61.80 23.16±15.37 10.97-58.28 16.27± 7.98 9.52-34.73 32.77±20.00 3.83-60.97 30.04±6.14 23.55-38.86
Penta-CBs3 6.48±5.27 2.19-20.29 10.92±8.76 2.07-24.12 5.07±2.80 1.64-11.33 12.18±7.25 1.60-24.80 16.42±2.87 12.88-19.05
Hexa-CBs4 5.80 ±4.42 2.25-17.68 4.37±3.33 0.75-10.80 3.85±2.64 1.16-9.41 6.24±5.55 0.43-5.48 12.75±6.51 4.90-1.24
Hepta-CBs5 2.15±2.20 0.31-7.46 1.72±1.55 0.72-5.69 1.86±1.25 0.23-4.54 2.52±2.27 0.96-7.42 3.94±2.00 1.17-6.62
Octa-CB6 0.43±0.44 0.02-1.25 0.17±0.18 0.03-0.50 0.44±0.57 0.03-1.86 0.14±0.14 0.01-0.42 0.65±0.90 0.09-2.23
Deca-CB6 0.23±0.24 0.00-0.70 0.40±0.44 0.00-1.10 0.38±0.54 0.00-1.80 0.24±0.30 0.00-0.80 0.32±0.15 0.10-0.50
∑34PCBs 36.03±30.60 13.4-118.0 43.67±31.07 15.49-106.05 30.86±17.60 13.50-70.96 57.62±37.03 8.57- 15.52 68.33±20.11 45.34-94.87
Chapter Four Results
52
4.3. PCBs Profile and Congener Specific Analysis in Human Placenta
The basic descriptive statistics of PCB homolog in human placenta are presented
in Table 4.3. The range of concentrations of PCBs was varied from 0.7 % to 3.0 % (mean:
1.8%). The descriptive statistics of PCB congeners in human placenta are presented in
provided as Appendix-6. The mean concentration of ∑34PCBs in placentas was recorded
as 80.26±19.87 ng/g lip with the range from 20.20 ng/g lip to 115.98 ng/g lip. In congener
specific analysis, PCB-70 (6.63 ng/g lip) was recorded as a dominant congener (range
2.21 ng/g lip -14.00 ng/g lip), whereas, PCB-166 (0.21 ng/g lip) exhibited the least
concentration ranging from 0.004 ng/g lip -1.308 ng/g lip.
The overall dominance profile of PCB congeners the placenta tissues was as
follow: PCB-70 (mean: 6.79 ng/g lip) > PCB-66 (6.41 ng/g lip) > PCB-52 (5.92 ng/g lip)
> PCB-49 (5.88 ng/g lip) > PCB-37 (5.58 ng/g lip) > PCB-60 (5.19 ng/g lip) > PCB-74
(4.67 ng/g lip). Alike blood serum and human milk samples, the presence of non-
persistent PCBs, including PCB-52 (mean: 6.001 ng/g lip), PCB-66 (6.553 ng/g lip),
PCB-74 (4.662 ng/g lip), PCB-101(4.179 ng/g lip), PCB-105(1.652 ng/g lip) and PCB-
128 (0.84 ng/g lip) was also detected in the placenta samples indicating the sampling
population‘s recent and continuous exposure to these congeners and thus ongoing usage
of PCBs in the study area.
In addition to this, six indicator PCBs and eight dl-PCBs were also measured in
placenta tissues with the mean concentration of 17.69 ± 12.40 ng/g lip and 9.48 ± 10.92
ng/g lip, respectively. The concentration of each congener from these two groups is
presented in Figure 4.3.

Chapter Four Results
53
Figure 4.3: Concentration of dl PCBs and indicator PCBs detected in human placenta
0.00
1.00
2.00
3.00
4.00
5.00
6.00
7.00
8.00
PC
B7
7
PC
B1
26
PC
B1
69
PC
B1
05
PC
B1
14
PC
B1
18
PC
B1
56
PC
B1
89
PC
B5
2
PC
B1
01
PC
B1
18
PC
B1
38
PC
B1
53
PC
B1
80
dl-PCBs Indicator PCBs
PC
B c
on
cen
trat
ion
(n
g/g
lip
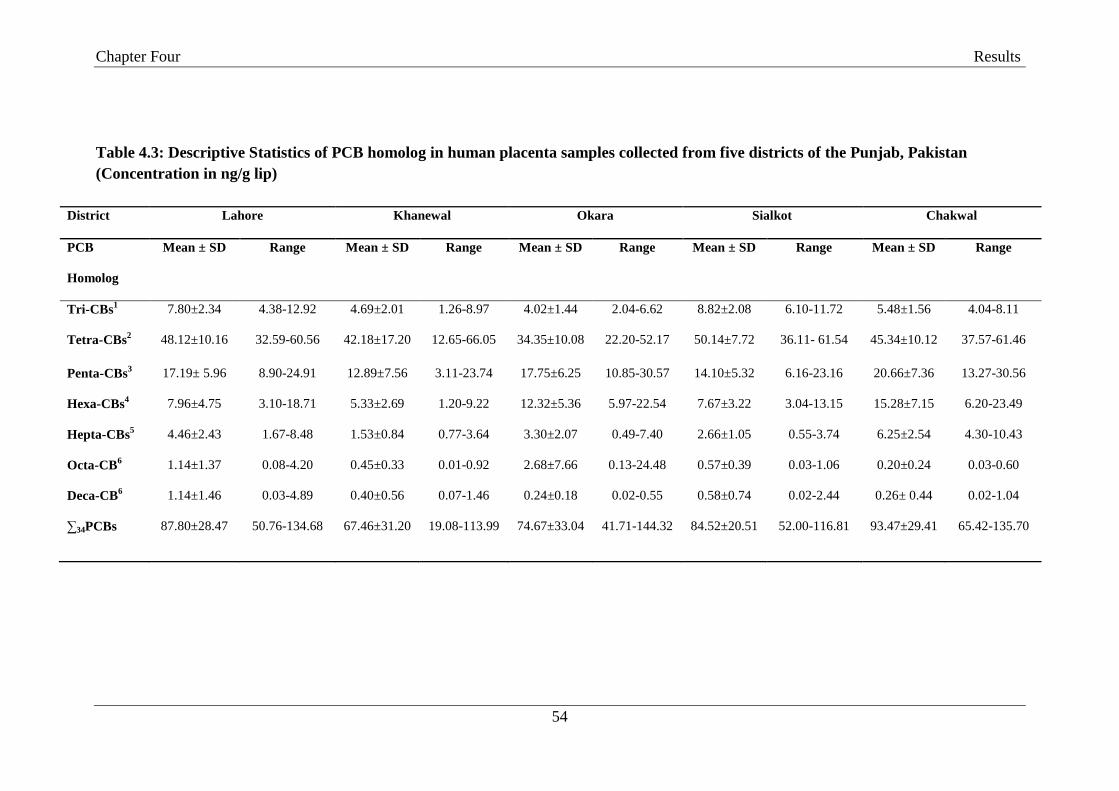
Chapter Four Results
54
Table 4.3: Descriptive Statistics of PCB homolog in human placenta samples collected from five districts of the Punjab, Pakistan
(Concentration in ng/g lip)
District Lahore Khanewal Okara Sialkot Chakwal
PCB
Homolog
Mean ± SD Range Mean ± SD Range Mean ± SD Range Mean ± SD Range Mean ± SD Range
Tri-CBs1 7.80±2.34 4.38-12.92 4.69±2.01 1.26-8.97 4.02±1.44 2.04-6.62 8.82±2.08 6.10-11.72 5.48±1.56 4.04-8.11
Tetra-CBs2 48.12±10.16 32.59-60.56 42.18±17.20 12.65-66.05 34.35±10.08 22.20-52.17 50.14±7.72 36.11- 61.54 45.34±10.12 37.57-61.46
Penta-CBs3 17.19± 5.96 8.90-24.91 12.89±7.56 3.11-23.74 17.75±6.25 10.85-30.57 14.10±5.32 6.16-23.16 20.66±7.36 13.27-30.56
Hexa-CBs4 7.96±4.75 3.10-18.71 5.33±2.69 1.20-9.22 12.32±5.36 5.97-22.54 7.67±3.22 3.04-13.15 15.28±7.15 6.20-23.49
Hepta-CBs5 4.46±2.43 1.67-8.48 1.53±0.84 0.77-3.64 3.30±2.07 0.49-7.40 2.66±1.05 0.55-3.74 6.25±2.54 4.30-10.43
Octa-CB6 1.14±1.37 0.08-4.20 0.45±0.33 0.01-0.92 2.68±7.66 0.13-24.48 0.57±0.39 0.03-1.06 0.20±0.24 0.03-0.60
Deca-CB6 1.14±1.46 0.03-4.89 0.40±0.56 0.07-1.46 0.24±0.18 0.02-0.55 0.58±0.74 0.02-2.44 0.26± 0.44 0.02-1.04
∑34PCBs 87.80±28.47 50.76-134.68 67.46±31.20 19.08-113.99 74.67±33.04 41.71-144.32 84.52±20.51 52.00-116.81 93.47±29.41 65.42-135.70
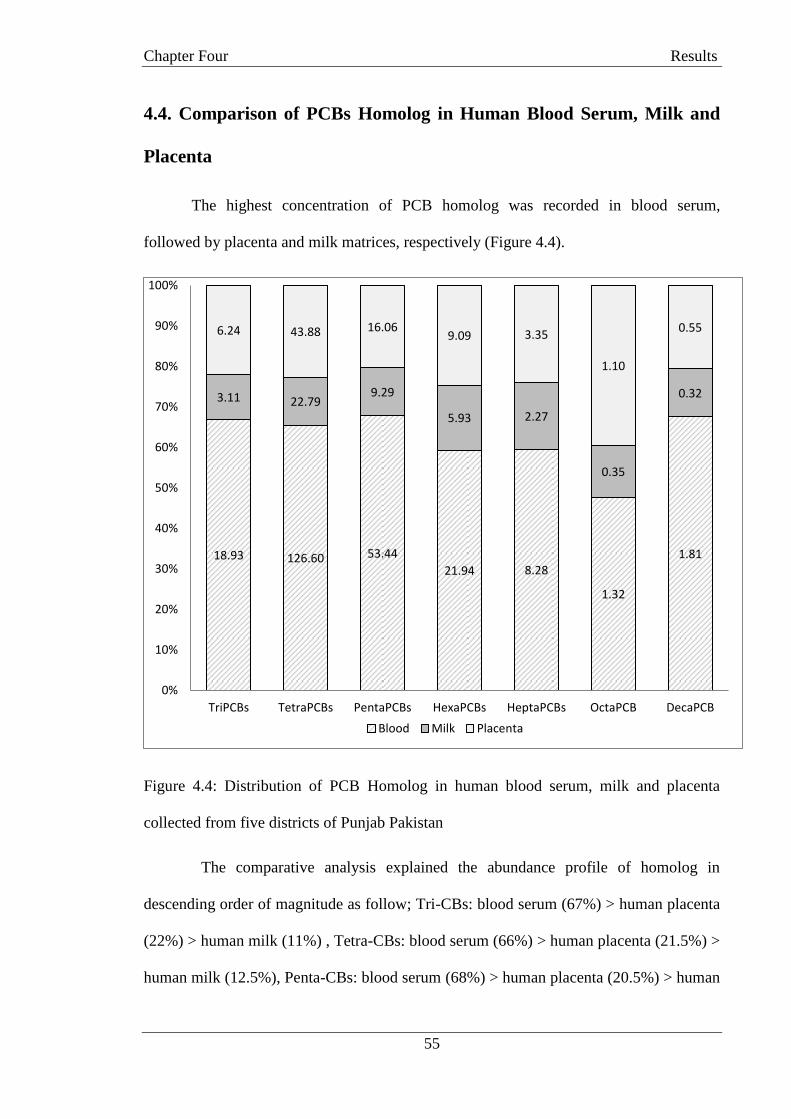
Chapter Four Results
55
4.4. Comparison of PCBs Homolog in Human Blood Serum, Milk and
Placenta
The highest concentration of PCB homolog was recorded in blood serum,
followed by placenta and milk matrices, respectively (Figure 4.4).
Figure 4.4: Distribution of PCB Homolog in human blood serum, milk and placenta
collected from five districts of Punjab Pakistan
The comparative analysis explained the abundance profile of homolog in
descending order of magnitude as follow; Tri-CBs: blood serum (67%) > human placenta
(22%) > human milk (11%) , Tetra-CBs: blood serum (66%) > human placenta (21.5%) >
human milk (12.5%), Penta-CBs: blood serum (68%) > human placenta (20.5%) > human
18.93 126.60 53.44
21.94 8.28
1.32
1.81
3.11 22.79 9.29
5.93 2.27
0.35
0.32
6.24 43.88 16.06 9.09 3.35
1.10
0.55
0%
10%
20%
30%
40%
50%
60%
70%
80%
90%
100%
TriPCBs TetraPCBs PentaPCBs HexaPCBs HeptaPCBs OctaPCB DecaPCB
Blood Milk Placenta
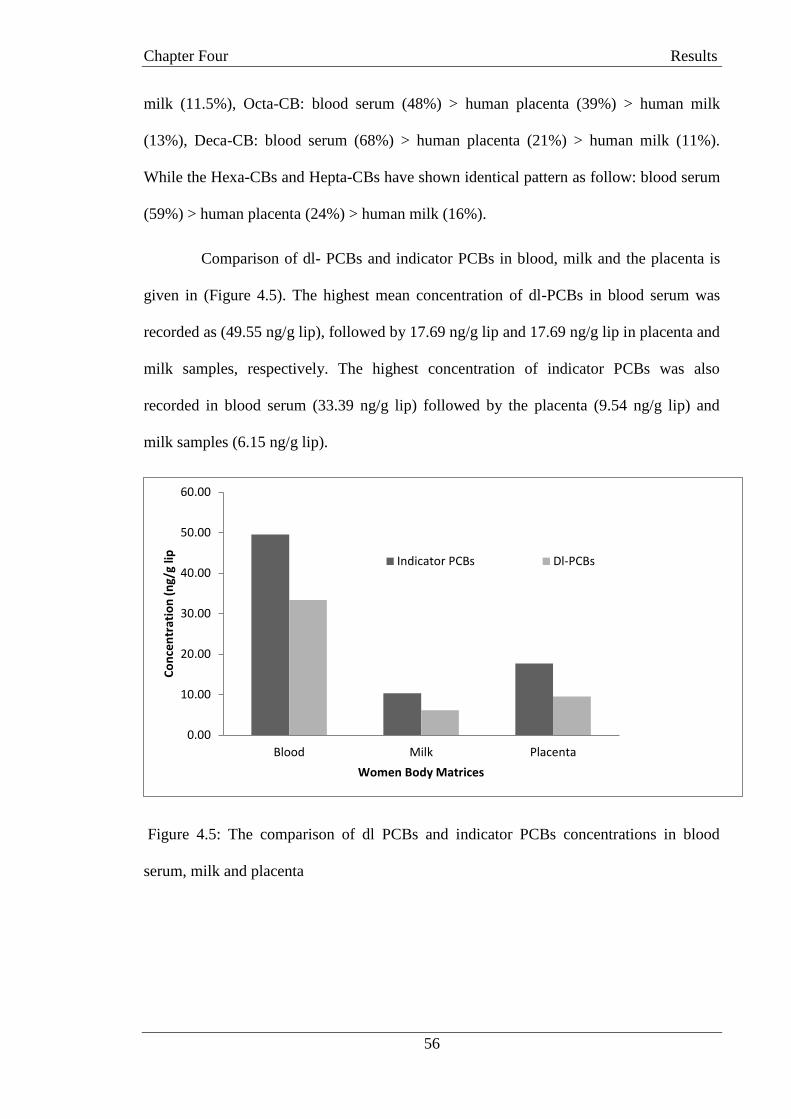
Chapter Four Results
56
milk (11.5%), Octa-CB: blood serum (48%) > human placenta (39%) > human milk
(13%), Deca-CB: blood serum (68%) > human placenta (21%) > human milk (11%).
While the Hexa-CBs and Hepta-CBs have shown identical pattern as follow: blood serum
(59%) > human placenta (24%) > human milk (16%).
Comparison of dl- PCBs and indicator PCBs in blood, milk and the placenta is
given in (Figure 4.5). The highest mean concentration of dl-PCBs in blood serum was
recorded as (49.55 ng/g lip), followed by 17.69 ng/g lip and 17.69 ng/g lip in placenta and
milk samples, respectively. The highest concentration of indicator PCBs was also
recorded in blood serum (33.39 ng/g lip) followed by the placenta (9.54 ng/g lip) and
milk samples (6.15 ng/g lip).
Figure 4.5: The comparison of dl PCBs and indicator PCBs concentrations in blood
serum, milk and placenta
0.00
10.00
20.00
30.00
40.00
50.00
60.00
Blood Milk Placenta
Co
nce
ntr
atio
n (
ng/
g lip
Women Body Matrices
Indicator PCBs Dl-PCBs

Chapter Four Results
57
4.5. Spatial Distribution Patterns of PCB Homolog
4.5.1 Spatial Distribution patterns of PCB homolog in blood serum
The spatial trend of PCB homolog in maternal serum from five sampling districts
is presented in Figure 4.6. The overall spatial distribution trend of PCB homolog in blood
serum on the basis of mean ∑34PCBs was followed as: Chakwal (310.59 ng/g lip) >
Lahore (294.37 ng/g lip) > Sialkot (251.28 ng/g lip) > Khanewal (190.13 ng/g lip) >
Okara (145.74 ng/g lip.). An overall prevalence of Tetra-CBs was observed highest in all
the sampling districts followed by Penta-CBs, and Hexa-CBs.
Level of lower chlorinated PCB homolog i.e. Tri-CBs and Tetra-CBs were highest
with the mean concentration of 24.81 ng/g lip and 168.83 ng/g lip in blood serum of
mothers from district Lahore in comparison to those from other districts. Whereas, higher
chlorinated PCB homolog in blood serum were prevalent in mothers from Chakwal with a
mean concentration of Penta-CBs (mean: 76.00 ng/g lip), Hexa-CBs (55.94 ng/g lip),
Hepta-CBs (16.80 ng/g lip), Octa-CB (2.59 ng/g lip) and Deca-CB (1.65 ng/g lip).
4.5.2. Spatial distribution patterns of PCB homolog in human milk
Spatial distribution of PCB homolog in human milk from five districts is
presented in Figure 4.7. The overall spatial distribution trend of PCB homolog in milk
samples from selected sampling districts was as follows: Chakwal (mean: 68.33 ng/g lip)
> Sialkot (57.61 ng/g lip) > Khanewal (43.67 ng/g lip) > Lahore (36.03 ng/g lip) > Okara
(30.86 ng/g lip). The concentration of PCB homolog on the basis of abundance was;
TetraCBs (22.79 ng/g lip) >PentaCBs (9.29 ng/g lip) > HexaCBs (5.93ng/g lip) > TriCBs
(3.11 ng/g lip) > HeptaCBs (2.27 ng/g lip) > OctaCB (0.35 ng/g lip) > DecaCB (0.32 ng/g
lip).
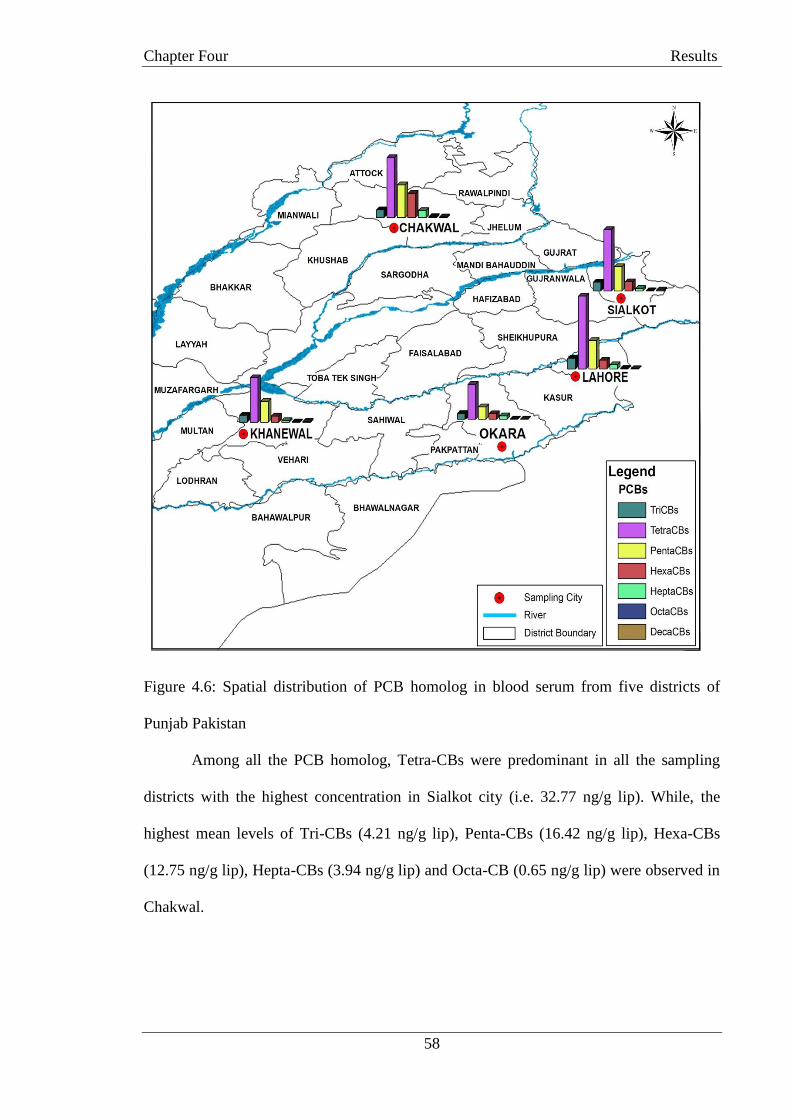
Chapter Four Results
58
Figure 4.6: Spatial distribution of PCB homolog in blood serum from five districts of
Punjab Pakistan
Among all the PCB homolog, Tetra-CBs were predominant in all the sampling
districts with the highest concentration in Sialkot city (i.e. 32.77 ng/g lip). While, the
highest mean levels of Tri-CBs (4.21 ng/g lip), Penta-CBs (16.42 ng/g lip), Hexa-CBs
(12.75 ng/g lip), Hepta-CBs (3.94 ng/g lip) and Octa-CB (0.65 ng/g lip) were observed in
Chakwal.

Chapter Four Results
59
Figure 4.7: Spatial distribution patterns of PCB homolog in human milk from five
district of Punjab, Pakistan
4.5.3. Spatial distribution pattern of PCB homolog in human placenta
The spatial distribution patterns of PCBs in placenta of sampling districts are
presented in Figure 4.8. The overall spatial distribution of PCB homolog in placental
samples on the basis of mean ∑34PCBs was followed the order as: Chakwal (93.45 ng/g
lip) > Lahore (87.80 ng/g lip) > Sialkot (84.52 ng/g lip) > Okara (74.66 ng/g lip) >
Khanewal (67.45 ng/g lip). The PCB homolog profile on abundance basis was in order
Chapter Four Results
60
follow: Tetra-CBs (43.87 ng/g lip) > Penta-CBs (16.05 ng/g lip) > Hexa-CBs (9.09 ng/g
lip) > Tri-CBs (6.23 ng/g lip) > Hepta-CBs (3.35 ng/g lip) > Octa-CB (1.09 ng/g lip) >
Deca-CB (0.55 ng/g lip).
The highest Tetra-CBs concentration was observed in Sialkot (50.14 ng/g lip)
followed by Lahore (48.12 ng/g lip) and Chakwal (45.34 ng/g lip). Similarly, the mean
concentration of Tri-CBs was highest in Sialkot (8.82 ng/g lip) and Lahore (7.80 ng/g
lip). Whereas, higher chlorinated PCBs i.e. Penta-CBs, Hexa-CBs and Hepta-CBs were
dominant in Chakwal with mean values 20.65 ng/g lip, 15.27 ng/g lip and 6.24 ng/g lip,
respectively.

Chapter Four Results
61
Figure 4.8: Spatial patterns of PCB homolog in human placenta from five district of
Punjab, Pakistan
Chapter Four Results
62
4.5.4. Comparison of spatial patterns of PCB homolog in blood serum, milk and
placenta
A comparison was made among concentrations of PCBs in blood serum, milk and
placentas collected from five districts of Punjab Pakistan and results are presented in
Figure 4.9. The concentrations of all the PCB homolog in blood serum were highest at all
the sampling districts followed by the placenta and milk. The spatial trend of Tri-CBs
showed the highest concentration in blood serum from district Lahore (24.81 ng/g lip) and
lower concentration in placentas (8.82 ng/g lip) of mothers from Sialkot and in human
milk (4.21 ng/g lip) from Chakwal. The concentration of Tetra-CBs (168.83 ng/g lip) was
also higher in blood serum from district Lahore in comparison to the placenta (50.14 ng/g
lip) and milk samples (32.77 ng/g lip) from district Sialkot. Moreover, the concentration
of Penta-CBs was highest in the blood (76.00 ng/g lip), placenta (20.66 ng/g lip) and milk
(16.46 ng/g lip) from district Chakwal.
Similarly, the concentration of higher chlorinated PCB homolog i.e. Hexa-CBs
and Hepta-CBs were also highest in the blood, placenta, and milk of mothers from district
Chakwal. The concentration trend of PCB homolog in District Chakwal was as follows:
Hexa-CBs in blood serum (55.94 ng/g lip)> human placenta (12.75ng/g lip) > human
milk (15.28 ng/g lip) and Hepta-CBs in blood serum (16.80 ng/g lip)> human placenta
(3.94 ng/g lip) > human milk (6.25 ng/g lip). The concentration of Octa-CB was also
highest in the blood serum (2.59 ng/g lip) and milk (0.65 ng/g lip) from Chakwal.
However, the placental concentration of Octa-CB was observed as highest in mothers
from Okara. The concentration of Deca-CB was highest in blood serum (2.65 ng/g lip) of
mothers from Sialkot and in placentas of mothers from Lahore (1.14 ng/g lip) and human
milk from Khanewal (0.40 ng/g lip).
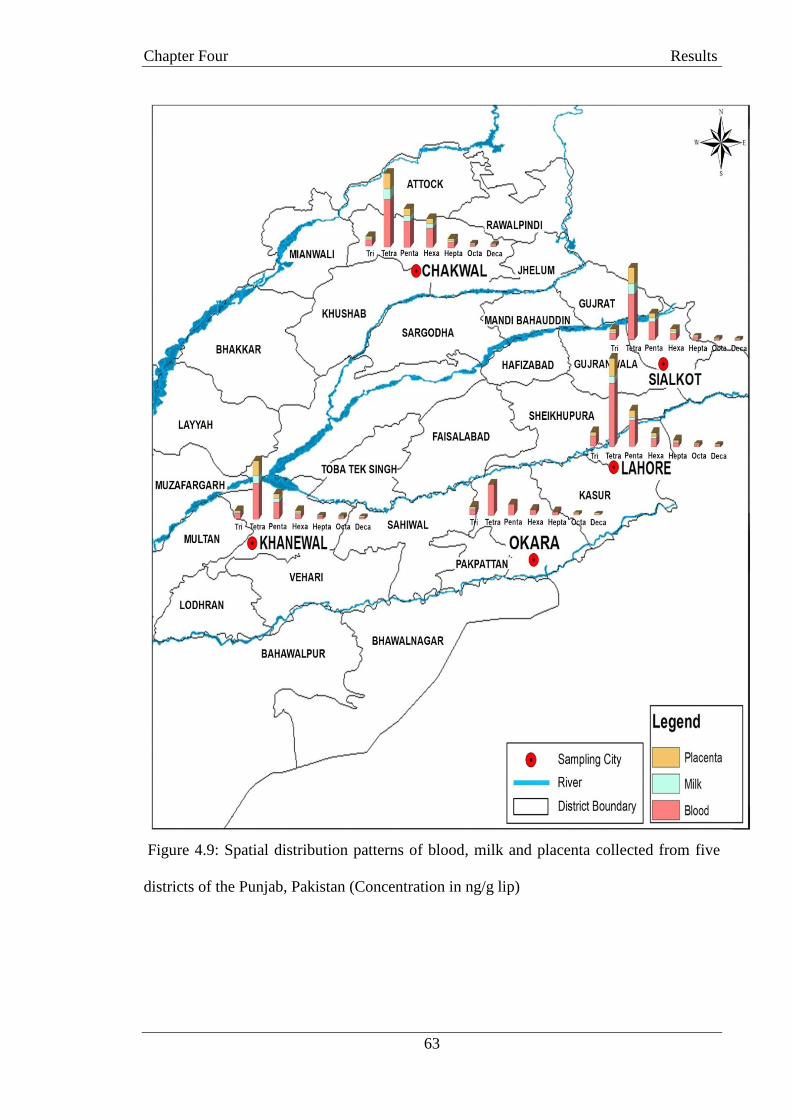
Chapter Four Results
63
Figure 4.9: Spatial distribution patterns of blood, milk and placenta collected from five
districts of the Punjab, Pakistan (Concentration in ng/g lip)
Chapter Four Results
64
4.6. PCBs Trends in Urban and Rural areas
The overall results of PCB homolog showed higher concentrations in blood, milk
and placenta of mothers from urban areas than those from rural areas. Spatial distribution
of PCB homolog in blood serum reflected their abundance in urban population
(235.66±118.93 ng/g lip) in comparison to rural population (231.09±98.93 ng/g lip). The
concentrations of ∑34PCBs in milk samples from urban areas (49.32±26.46 ng/g lip)
were higher than rural areas (36.66±27.44 ng/g lip). Levels of ∑34PCBs in human
placenta from urban mothers (84.62±16.58 ng/g lip) were higher than rural areas
(74.30±22.76 ng/g lip).
A district-wise comparison on concentration of PCB homolog in urban and rural
areas was performed and results depicted that the concentrations of Tri-CBs were
relatively higher in blood serum (24.82 ng/g lip), placenta (8.20 ng/g lip) and milk
samples (2.91 ng/g lip) of mothers from urban areas of Lahore than those found in blood
serum (24.74 ng/g lip), placenta (6.18 ng/g lip) and milk (1.14 ng/g lip) of mothers from
rural areas (Figure 4.10). Tetra-CBs were also prominent in blood serum 177.60 ng/g lip),
placenta (48.70 ng/g lip) and milk (20.59 ng/g lip) samples from urban areas of Lahore as
compared to rural areas. The profile of Penta-CBs was as followed: Blood (urban= 70.09
ng/g lip, rural = 50.58 ng/g lip) > Placenta (urban = 17.26 ng/g lip, rural = 16.91 ng/g lip)
> human milk (urban = 7.42 ng/g lip, rural = 2.71 ng/g lip). The concentration of Hepta-
CBs was higher in blood serum of rural mothers (12.80 ng/g lip) than urban mothers (9.64
ng/g lip).
The concentration of Tri-CBs was higher in the blood (17.10 ng/g lip) and milk
(3.30 ng/g lip) of urban mothers than those in the blood (15.07 ng/g lip) and milk (2.62
ng/g lip) of rural mothers. Whereas, Tri-CBs in the placenta of urban and rural mothers
showed less difference (urban = 4.45 ng/g lip, rural = 4.92 ng/g lip). Tetra-CBs, Penta-

Chapter Four Results
65
CBs and Hepta-CBs were prevalent in the body matrices of urban mothers than rural in
District Khanewal. These were in the following order: Penta-CBs in blood (urban = 51.31
ng/g lip, rural = 45.26 ng/g lip) > placenta (urban = 16.90 ng/g lip, rural = 8.87 ng/g lip) >
milk (urban = 15.21 ng/g lip, rural = 7.49 ng/g lip). Octa-CB was higher in the blood
(1.13 ng/g lip) and placenta (0.55 ng/g lip) samples of rural mothers than blood (0.93 ng/g
lip) and placenta (0.36 ng/g lip) of urban mothers (Figure 4.11).
In rural mothers from district Okara, Tri-CBs, Tetra-CBs and Hexa-CBs were
higher in blood and placenta and lower in milk samples as compared to urban mothers.
The concentrations of Tetra-CBs in blood serum of rural women were higher 89.75 ng/g
lip than urban women (69.77 ng/g lip) whereas; in placenta the concentration in urban and
rural mothers were 36.33 ng/g lip and 36.33 ng/g lip respectively. The overall trend
showed the concentration of most of the PCB homolog in blood and placenta was higher
in rural mothers than urban in district Okara. However, concentrations of all the PCB
homolog in milk samples of urban mothers were higher than rural mothers (Figure 4.12).
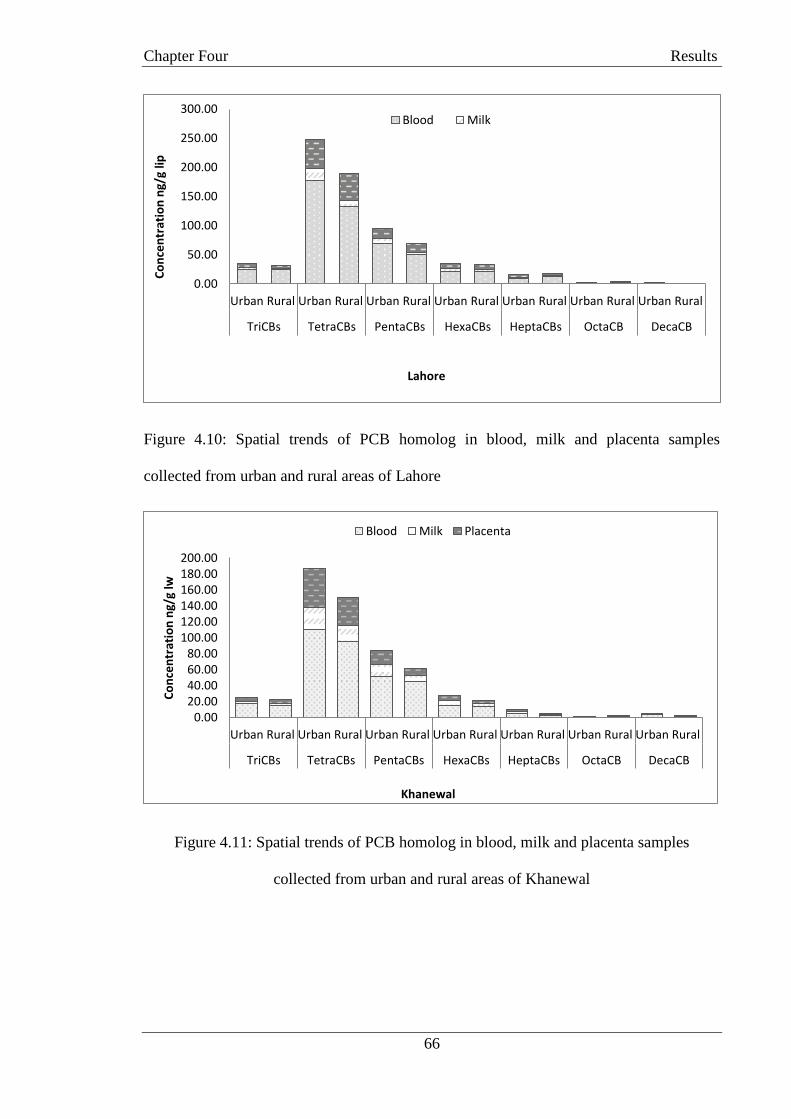
Chapter Four Results
66
Figure 4.10: Spatial trends of PCB homolog in blood, milk and placenta samples
collected from urban and rural areas of Lahore
Figure 4.11: Spatial trends of PCB homolog in blood, milk and placenta samples
collected from urban and rural areas of Khanewal
0.00
50.00
100.00
150.00
200.00
250.00
300.00
Urban Rural Urban Rural Urban Rural Urban Rural Urban Rural Urban Rural Urban Rural
TriCBs TetraCBs PentaCBs HexaCBs HeptaCBs OctaCB DecaCB
Co
nce
ntr
atio
n n
g/g
lip
Lahore
Blood Milk
0.0020.0040.0060.0080.00
100.00120.00140.00160.00180.00200.00
Urban Rural Urban Rural Urban Rural Urban Rural Urban Rural Urban Rural Urban Rural
TriCBs TetraCBs PentaCBs HexaCBs HeptaCBs OctaCB DecaCB
Co
nce
ntr
atio
n n
g/g
lw
Khanewal
Blood Milk Placenta

Chapter Four Results
67
Figure 4.12: Spatial trends of PCB homolog in blood, milk and placenta samples
collected from urban and rural areas of Okara
The concentration of all the PCB homolog in the milk of mothers from Sialkot
was higher in urban mothers except for Hepta-CBs which was higher in rural (4.26 ng/g
lip) mothers than urban ( 1.83 ng/g lip) Figure 4.13. Similarly, concentrations of all the
PCB homolog in the placenta were higher in urban mothers than rural except for Tetra-
CBs and Octa-CBs. The concentration in placenta samples was as follow: Tri-CBs (urban
= 9.01 ng/g lip, rural =8.53 ng/g lip), Penta-CBs (urban= 14.97 ng/g lip , rural = 12.79
ng/g lip), Hexa-CBs (urban = 8.27 ng/g lip, rural =6.76 ng/g lip), Hepta-CBs (urban =3.22
ng/g lip , rural = 1.82 ng/g lip) and Deca-CB (urban = 0.72 ng/g lip rural =0.38 ng/g lip).
The PCB homolog showed varying concentration in case of blood samples wherein, low
chlorinated PCBs were prevailing in rural mothers than urban.
0.00
20.00
40.00
60.00
80.00
100.00
120.00
140.00
160.00
Urban Rural Urban Rural Urban Rural Urban Rural Urban Rural Urban Rural Urban Rural
TriCBs TetraCBs PentaCBs HexaCBs HeptaCBs OctaCB DecaCB
Co
nce
ntr
atio
n n
g/g
lip
Okara
Blood Milk Placenta
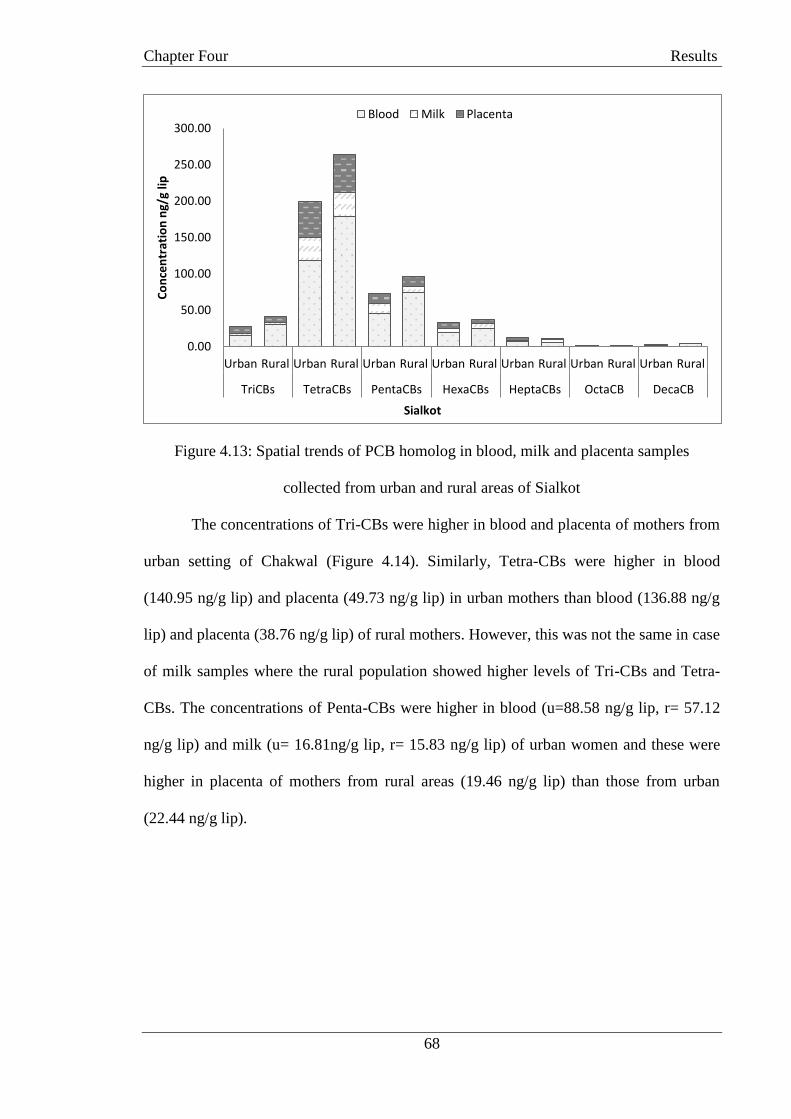
Chapter Four Results
68
Figure 4.13: Spatial trends of PCB homolog in blood, milk and placenta samples
collected from urban and rural areas of Sialkot
The concentrations of Tri-CBs were higher in blood and placenta of mothers from
urban setting of Chakwal (Figure 4.14). Similarly, Tetra-CBs were higher in blood
(140.95 ng/g lip) and placenta (49.73 ng/g lip) in urban mothers than blood (136.88 ng/g
lip) and placenta (38.76 ng/g lip) of rural mothers. However, this was not the same in case
of milk samples where the rural population showed higher levels of Tri-CBs and Tetra-
CBs. The concentrations of Penta-CBs were higher in blood (u=88.58 ng/g lip, r= 57.12
ng/g lip) and milk (u= 16.81ng/g lip, r= 15.83 ng/g lip) of urban women and these were
higher in placenta of mothers from rural areas (19.46 ng/g lip) than those from urban
(22.44 ng/g lip).
0.00
50.00
100.00
150.00
200.00
250.00
300.00
Urban Rural Urban Rural Urban Rural Urban Rural Urban Rural Urban Rural Urban Rural
TriCBs TetraCBs PentaCBs HexaCBs HeptaCBs OctaCB DecaCB
Co
nce
ntr
atio
n n
g/g
lip
Sialkot
Blood Milk Placenta

Chapter Four Results
69
Figure 4.14: Spatial trends of PCB homolog in blood, milk and placenta samples
collected from urban and rural areas of Chakwal
4.7. Toxicity Equivalent Fluxes of Dioxin like PCBs
4.7.1. TEQ and Estimated Daily Intake of dl-PCBs in blood serum
Dioxins like PCBs (dl-PCBs) including three non-ortho (PCB-77, PCB-126, PCB-
169), five mono-ortho (PCB-105, PCB-114, PCB-118, PCB-156, PCB-189) were
monitored in the present study. The concentration of these ∑8dl-PCBs were ranged
between 1.29 ng/g lip and 12.49 ng/g lip; with a mean value of 33.39±3.80 ng/g lip.
Whereas, mean levels of individual congeners was as: PCB-77 (12.495 ng/g lip), PCB-
126 (2.02 ng/g lip), PCB-169 (1.38 ng/g lip), PCB-105(4.87 ng/g lip), PCB-114 (3.93
ng/g lip), PCB-118 (5.99 ng/g lip), PCB-156 (1.40 ng/g lip), PCB-189 ( 1.29 ng/g lip).
Toxicity equivalents (TEQ) were calculated for dl-PCBs based on
WHO2005TEF(Van den Berg et al.,2006) and are presented in Table 4.4. The mean TEQ
of these dl-PCBs was recorded as 0.24 ng TEQ/g lipid and ranged between 3.8 x 10⁻⁵
ng
TEQ/g lipids - 0.20 ng TEQ/g lipids).
0.00
50.00
100.00
150.00
200.00
250.00
Urban Rural Urban Rural Urban Rural Urban Rural Urban Rural Urban Rural Urban Rural
TriCBs TetraCBs PentaCBs HexaCBs HeptaCBs OctaCB DecaCB
Co
nce
ntr
atio
n n
g/g
lip
Chakwal
Blood Milk Placenta
Chapter Four Results
70
Based upon the equation of WHO consultation in 1998 EDI of these dl-PCBs in
all the selected women were calculated and results are presented in Table 4.4. The EDI in
∑8dl-PCBs in blood serum was 1.94 x 10⁻³
with the lowest concentration in PCB-189
(3.07 x 10⁻⁷
) and the highest in PCB-126 (1.59 x 10⁻³
).
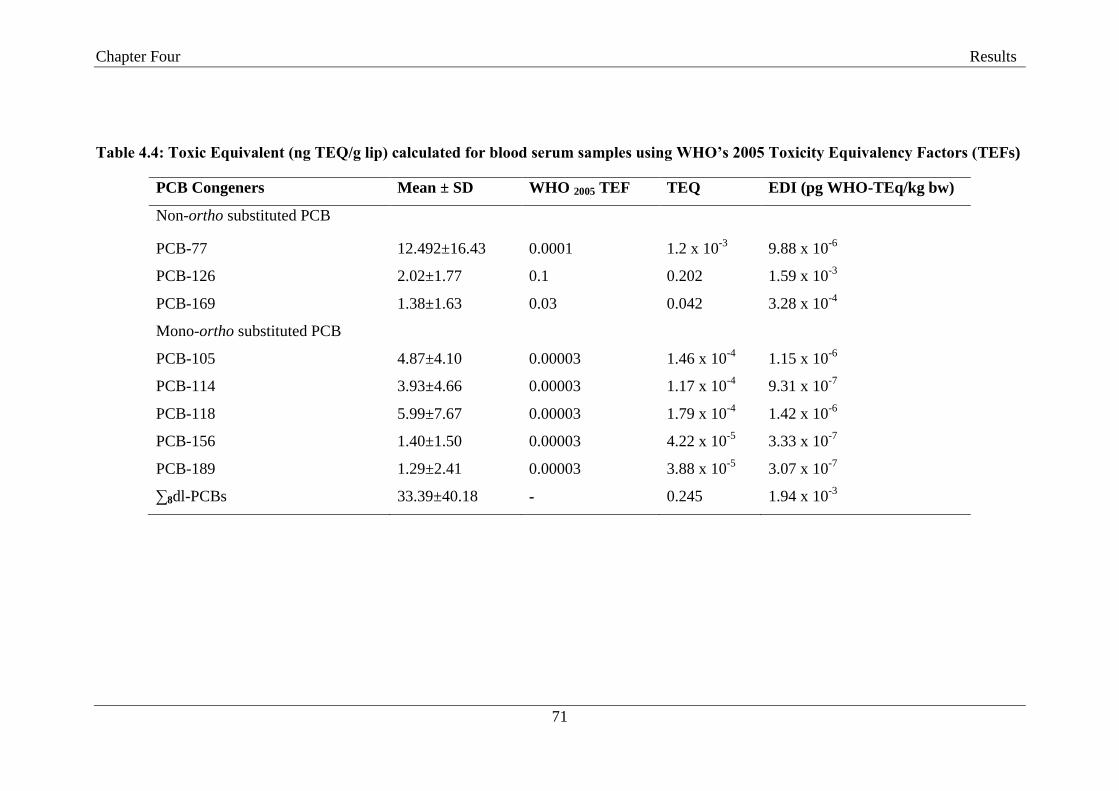
Chapter Four Results
71
Table 4.4: Toxic Equivalent (ng TEQ/g lip) calculated for blood serum samples using WHO’s 2005 Toxicity Equivalency Factors (TEFs)
PCB Congeners Mean ± SD WHO 2005 TEF TEQ EDI (pg WHO-TEq/kg bw)
Non-ortho substituted PCB
PCB-77 12.492±16.43 0.0001 1.2 x 10⁻³
9.88 x 10⁻⁶
PCB-126 2.02±1.77 0.1 0.202 1.59 x 10⁻³
PCB-169 1.38±1.63 0.03 0.042 3.28 x 10⁻⁴
Mono-ortho substituted PCB
PCB-105 4.87±4.10 0.00003 1.46 x 10⁻⁴
1.15 x 10⁻⁶
PCB-114 3.93±4.66 0.00003 1.17 x 10⁻⁴
9.31 x 10⁻⁷
PCB-118 5.99±7.67 0.00003 1.79 x 10⁻⁴
1.42 x 10⁻⁶
PCB-156 1.40±1.50 0.00003 4.22 x 10⁻⁵
3.33 x 10⁻⁷
PCB-189 1.29±2.41 0.00003 3.88 x 10⁻⁵
3.07 x 10⁻⁷
∑8dl-PCBs 33.39±40.18 - 0.245 1.94 x 10⁻³

Chapter Four Results
72
4.7.2. Toxicity Equivalent Fluxes of Dioxin like PCBs in human milk
The concentrations of dl-PCBs in human milk samples were also determined. The
∑8dl-PCBs concentrations were ranged from 0.29 ng/g lip to 1.35 ng/g lip, with mean
value of 6.15 ± 8.72 ng/g lip Whereas, mean levels of individual dl-PCB congeners were
in order as: PCB-77 (1.33 ng/g lip) , PCB-126 (0.54 ng/g lip) , PCB-169 (0.31 ng/g lip),
PCB-105 (1.02 ng/g lip), PCB-114 (0.89 ng/g lip), PCB-118 (1.35 ng/g lip), PCB-156
(0.44 ng/g lip), PCB-189 ( 0.29 ng/g lip). The toxicity equivalent fluxes of dioxin like
PCBs were also determined in human milk samples (Table 4.5). The TEQ values for dl-
PCBs were ranged from 8.5 x 10⁻⁶ ng TEQ/g lipid to 0.05 ng TEQ/g lipid with a mean
concentration calculated as 0.063 ng TEQ/g lipid.
The EDI of dl-PCBs in human milk were also calculated and results are presented
in Table 4.5. The EDI in ∑8dl-PCBs in human milk was 5.10 x 10⁻⁴
(pg WHO-TEq/kg
bw) and lowest in PCB-189 (6.96 x 10⁻⁸
pg WHO-TEq/kg bw) and highest in PCB-126
(4.35 x 10⁻⁴
pg WHO-TEq/kg bw).

Chapter Four Results
73
Table 4.5: Toxic Equivalent (ng TEQ/g lip) calculated for maternal human milk samples using WHO’s 2005 Toxicity Equivalency
Factors (TEFs)
PCB Congeners Mean ± SD WHO 2005 TEF TEQ EDI (pg WHO-TEq/kg bw)
Non-ortho substituted PCB
PCB-77 1.32±2.01 0.0001 1.32 x 10⁻⁴
1.11 x 10⁻⁶
PCB-126 0.54±0.41 0.1 0.05 4.35 x 10⁻⁴
PCB-169 0.31±0.34 0.03 0.01 7.34 x 10⁻⁵
Mono-ortho substituted PCB
PCB-105 1.02±0.87 0.00003 3.05 x 10⁻⁵
2.55 x 10⁻⁷
PCB-114 0.89±1.68 0.00003 2.68 x 10⁻⁵
2.00 x 10⁻⁷
PCB-118 1.35±2.22 0.00003 4.04 x 10⁻⁵
3.20 x 10⁻⁷
PCB-156 0.44±0.82 0.00003 1.31 x 10⁻⁵
1.07 x 10⁻⁷
PCB-189 0.29±0.38 0.00003 8.58 x 10⁻⁶
6.96 x 10⁻⁸
∑8dl-PCBs 6.15±8.72 - 0.063 5.10 x 10⁻⁴
Chapter Four Results
74
4.7.3. Toxicity Equivalent Fluxes of Dioxin like PCBs in human placenta
Similar to blood serum and human milk matrices, the dl-PCBs were also
determined in human placenta samples that contributed 14% of the total PCBs. The levels
of dl-PCBs in human placenta ranged from 0.39 ng/g lip to 3.42 ng/g lip; with mean
concentration of 9.48 ± 10.92 ng/g lip The mean levels of individual congeners was as:
PCB-77 (3.42 ng/g lip), PCB-126 (0.67 ng/g lip) , PCB-169 (0.54 ng/g lip), PCB-105
(1.65 ng/g lip), PCB-114 (0.88 ng/g lip), PCB-118 (1.49 ng/g lip), PCB-156 (0.39 ng/g
lip), PCB-189 ( 0.44 ng/g lip).
The TEQ values calculated using (WHO-TEF)2005for these dl-PCBs in human
placenta are presented in Table 4.6. The TEQ values in human placenta tissue were
ranged from 1.15 x 10⁻⁵
ng/g lip to 6.7 x 10⁻²
ng/g lip with ∑8 dl-PCBs calculated as 0.08
ng/g lip. These concentrations were higher than those reported in human placenta from
Taiwan (0.00291ng/g lip) and Japan (0.0012 ng/g lip) (Suzuki et al., 2005, Wang et al.,
2004).
The EDI of ∑8dl-PCBs in human placenta were calculated and presented in Table
4.6. The EDI of these dioxin like congeners was found to be 6.56 x 10⁻⁴
(pg WHO-TEq/kg
bw) and the lowest and the highest concentrations were observed in PCB-156 (9.27 x 10-
8)and PCB-126 (5.25 x 10
-4) respectively.
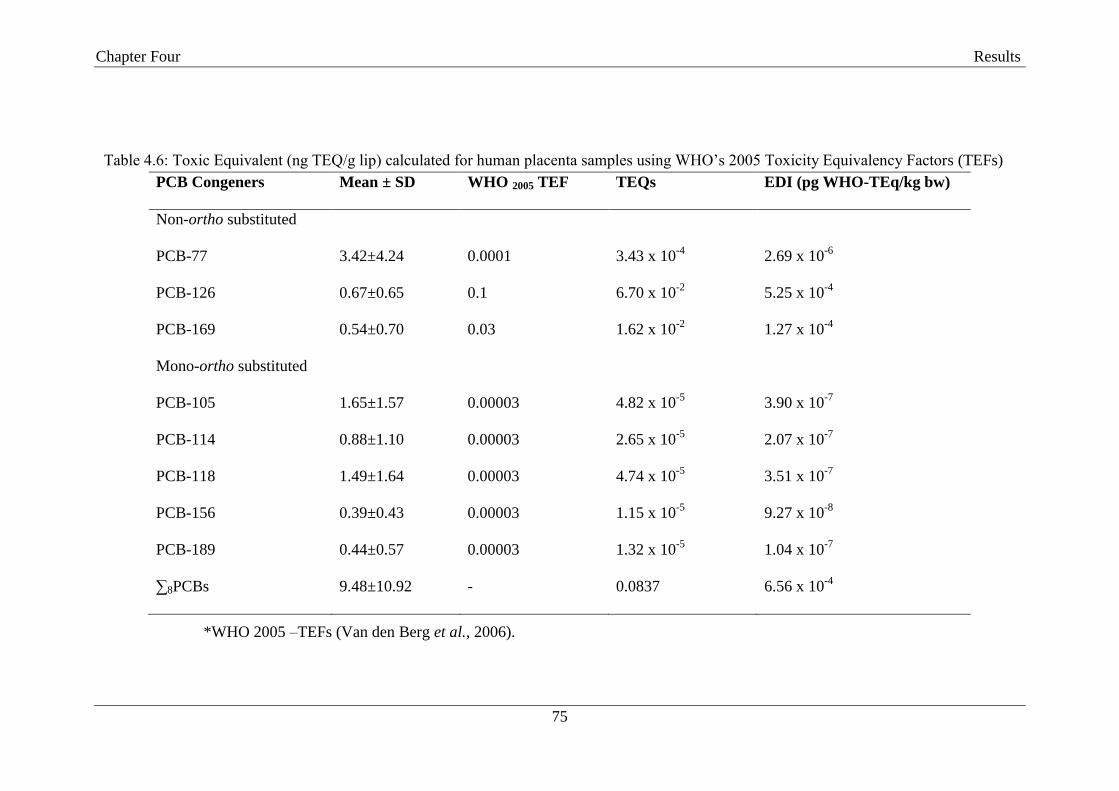
Chapter Four Results
75
Table 4.6: Toxic Equivalent (ng TEQ/g lip) calculated for human placenta samples using WHO‘s 2005 Toxicity Equivalency Factors (TEFs)
PCB Congeners Mean ± SD WHO 2005 TEF TEQs EDI (pg WHO-TEq/kg bw)
Non-ortho substituted
PCB-77 3.42±4.24 0.0001 3.43 x 10⁻⁴
2.69 x 10⁻⁶
PCB-126 0.67±0.65 0.1 6.70 x 10⁻²
5.25 x 10⁻⁴
PCB-169 0.54±0.70 0.03 1.62 x 10⁻²
1.27 x 10⁻⁴
Mono-ortho substituted
PCB-105 1.65±1.57 0.00003 4.82 x 10⁻⁵
3.90 x 10⁻⁷
PCB-114 0.88±1.10 0.00003 2.65 x 10⁻⁵
2.07 x 10⁻⁷
PCB-118 1.49±1.64 0.00003 4.74 x 10⁻⁵
3.51 x 10⁻⁷
PCB-156 0.39±0.43 0.00003 1.15 x 10⁻⁵
9.27 x 10⁻⁸
PCB-189 0.44±0.57 0.00003 1.32 x 10⁻⁵
1.04 x 10⁻⁷
∑8PCBs 9.48±10.92 - 0.0837 6.56 x 10⁻⁴
*WHO 2005 –TEFs (Van den Berg et al., 2006).
Chapter Four Results
76
4.7.4. Relative Comparison of TEQ
The TEQ concentrations of dl-PCBs in blood serum were higher in comparison to
the human milk and placenta tissues. The TEQ values for dl-PCBs was highest in blood
serum with value of 0.24 ng TEQ/g lip followed by placenta with 0.08 ng TEQ/g lip and
milk samples with 0.06 ng TEQ/g lip. In all the matrices PCB-126 was more predominant
with a highest TEQ value than other congeners, i.e. 0.20 ng TEQ/g lip in blood, 0.07 ng
TEQ/g lip in placenta and 0.05 ng TEQ/g lip in milk samples. Whereas the PCB-189 was
the congener with lowest TEQ values (ng TEQ/g lip) in the blood (3.88 x 10⁻⁵
) and milk
(8.58 x 10⁻⁶
) samples, while in placenta samples lowest TEQ was observed for PCB-156
(1.15 x 10⁻⁵
). Similarly the highest EDI of dl-PCBs were observed in blood serum (1.94 x
10-3
pg WHO-TEq/kg bw) followed by placenta (6.56 x 10⁻⁴
pg WHO-TEq/kg bw) and
milk samples (5.10 x 10⁻⁴
pg WHO-TEq/kg bw).
4.8. Association of PCBs in Blood, Milk and Placenta with Maternal
Social and Demographic Characteristics
The socio-demographic characteristics of mothers were evaluated in the present
study against the concentration of PCBs in body matrices to evaluate the association
between the two and to ascertain the potential impacts on the maternal health. The social
and demographic characteristics of mothers are presented in Table 4.7. The age of the
volunteersranged between 19 to 45 years and their average BMI was calculated as 25.77
kg/m2. Most of the women population was comprised of multiparae with the baby birth
weight of 2.21 kg, belonged to rural areas (61 %) and preferred to eat dairy products (34
%) and take milk daily (68 %) (Figure 4.15). The results of one way ANOVA for sum
PCBs, performed for the socio-demographic parameters viz; locality, age, BMI, the
number of children, eating habits and fish intake are given in Table 3.3. PCBs showed a
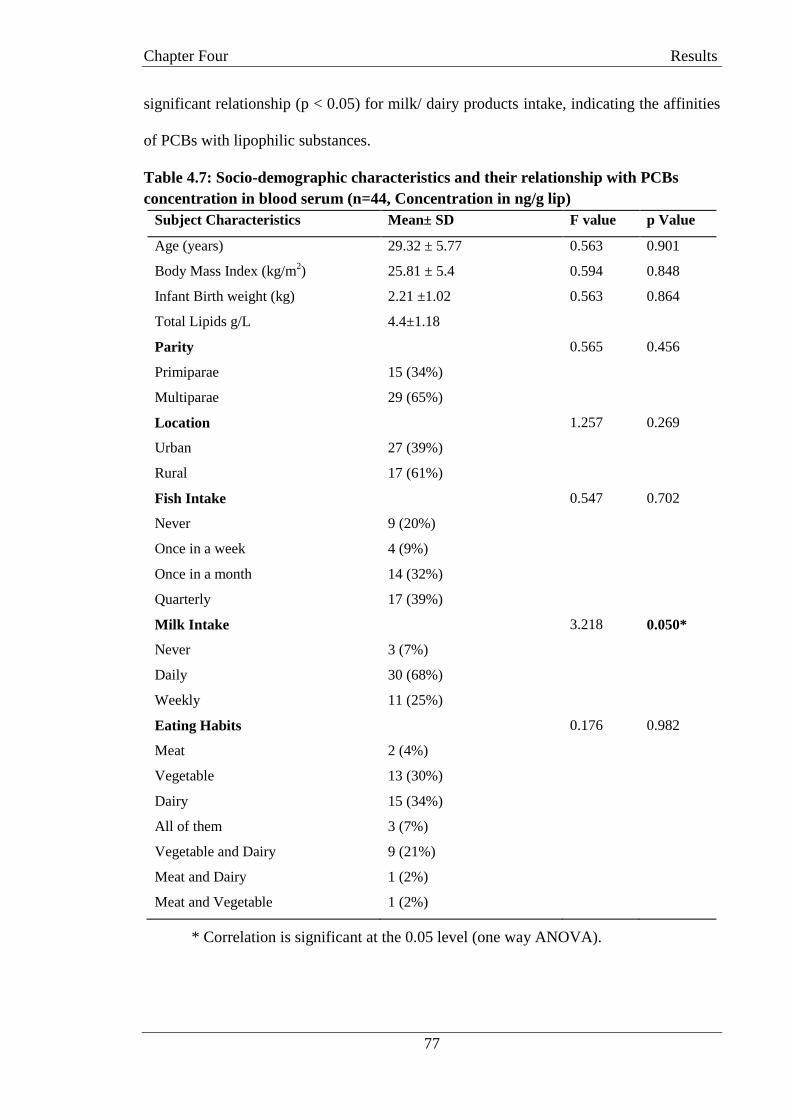
Chapter Four Results
77
significant relationship (p < 0.05) for milk/ dairy products intake, indicating the affinities
of PCBs with lipophilic substances.
Table 4.7: Socio-demographic characteristics and their relationship with PCBs
concentration in blood serum (n=44, Concentration in ng/g lip)
Subject Characteristics Mean± SD F value p Value
Age (years) 29.32 ± 5.77 0.563 0.901
Body Mass Index (kg/m2) 25.81 ± 5.4 0.594 0.848
Infant Birth weight (kg) 2.21 ±1.02 0.563 0.864
Total Lipids g/L 4.4±1.18
Parity 0.565 0.456
Primiparae 15 (34%)
Multiparae 29 (65%)
Location 1.257 0.269
Urban 27 (39%)
Rural 17 (61%)
Fish Intake 0.547 0.702
Never 9 (20%)
Once in a week 4 (9%)
Once in a month 14 (32%)
Quarterly 17 (39%)
Milk Intake 3.218 0.050*
Never 3 (7%)
Daily 30 (68%)
Weekly 11 (25%)
Eating Habits 0.176 0.982
Meat 2 (4%)
Vegetable 13 (30%)
Dairy 15 (34%)
All of them 3 (7%)
Vegetable and Dairy 9 (21%)
Meat and Dairy 1 (2%)
Meat and Vegetable 1 (2%)
* Correlation is significant at the 0.05 level (one way ANOVA).

Chapter Four Results
78
Figure 4.15: Eating habits of mothers selected from five districts of Punjab Pakistan
The detail of socio-demographic characteristics of sampling women and their
relationship with ∑34 PCBs concentration in human milk and the socio-demographic
characteristics was evaluated using Pearson‘s Correlation Coefficients and presented in
Table 4.8. The age of sampling mothers showed a negative relationship with the
concentration of PCBs (r = -0.310, p = 0.024). In the present study, for milk analysis,
primiparae and multiparae constituted 29% and 71% of the sampling population (n=41)
respectively. The ∑34 PCB levels were found higher in human milk of primiparae and
lower in multiparae and showed a significantly strong negative relationship between
parity and ∑34PCBs (r = -0.849, p =0.01).
Food is considered as a major source of PCBs in human. The sampling population
was evaluated on the basis eating habits such as meat, dairy, vegetable and a combination
of all of these. These eating habits were positively associated with ∑34 PCBs (r=0.353,
p=0.012).
Meat 5%
Vegetable 30%
Dairy 34%
All of them 7%
Vegetable and Dairy 20%
Meat and Dairy 2%
Meat and Vegetable
2%
Chapter Four Results
79
A moderate negative correlation was found between ∑34 PCBs in human milk and
lactation (r= -0.569, p=0.001) indicating that women who breastfed one child have a
higher level of PCBs than those who have breastfed more children. The fat content (%) in
human milk ranged between 0.8% and 6.6 % (mean 3.03 ± 1.20). A positive association
of lipids was observed with maternal age, parity and number of children carried (Table
4.8).
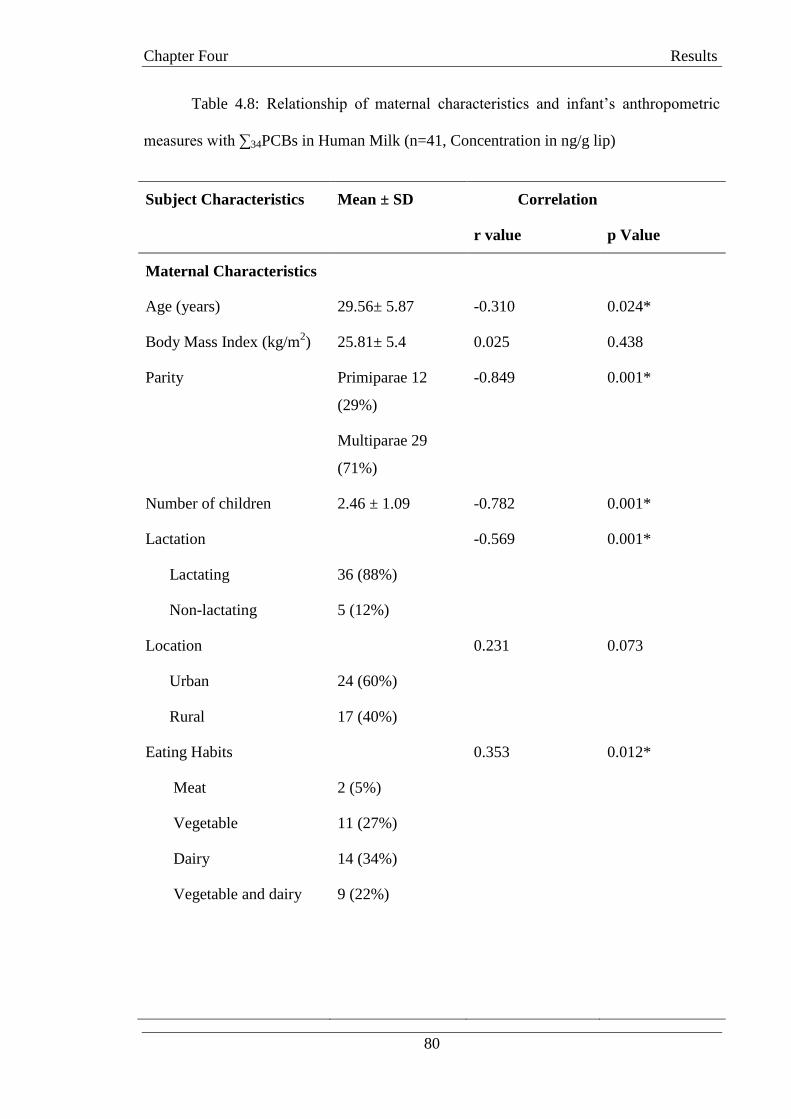
Chapter Four Results
80
Table 4.8: Relationship of maternal characteristics and infant‘s anthropometric
measures with ∑34PCBs in Human Milk (n=41, Concentration in ng/g lip)
Subject Characteristics Mean ± SD Correlation
r value p Value
Maternal Characteristics
Age (years) 29.56± 5.87 -0.310 0.024*
Body Mass Index (kg/m2) 25.81± 5.4 0.025 0.438
Parity
Primiparae 12
(29%)
Multiparae 29
(71%)
-0.849 0.001*
Number of children 2.46 ± 1.09 -0.782 0.001*
Lactation
36 (88%)
-0.569 0.001*
Lactating
Non-lactating 5 (12%)
Location
24 (60%)
0.231 0.073
Urban
Rural 17 (40%)
Eating Habits 0.353 0.012*
Meat 2 (5%)
Vegetable 11 (27%)
Dairy 14 (34%)
Vegetable and dairy 9 (22%)
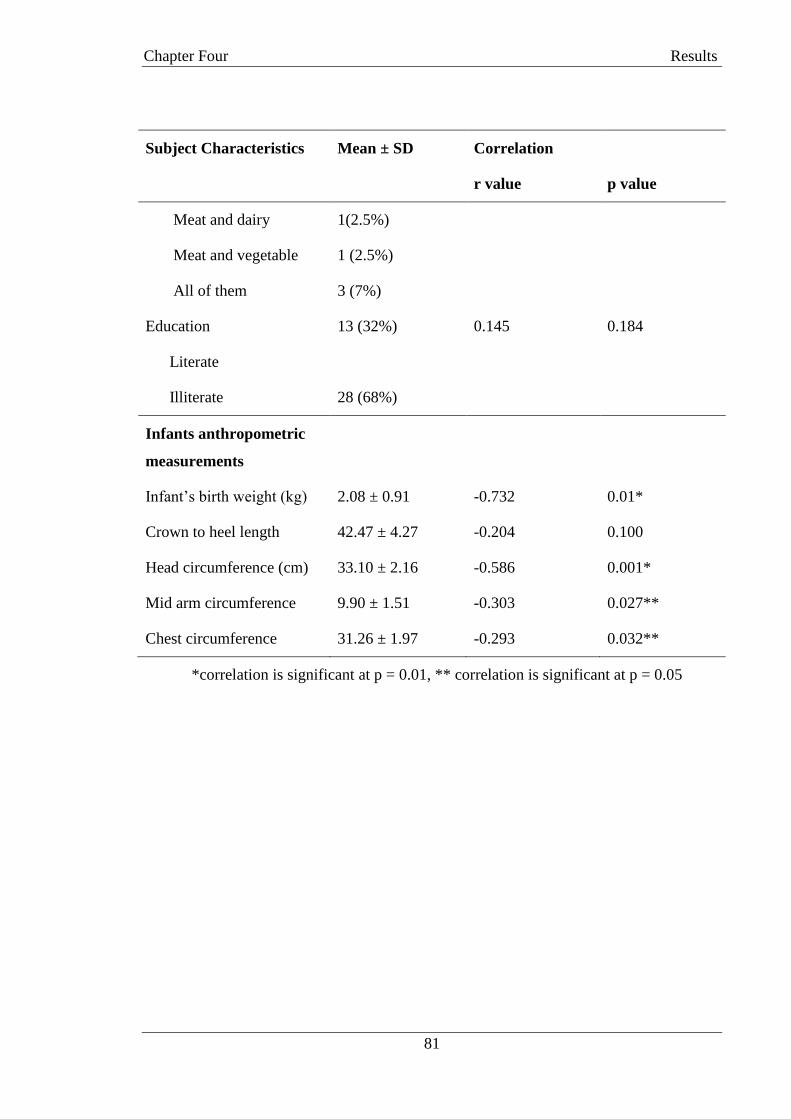
Chapter Four Results
81
Subject Characteristics Mean ± SD Correlation
r value p value
Meat and dairy 1(2.5%)
Meat and vegetable 1 (2.5%)
All of them 3 (7%)
Education 13 (32%) 0.145 0.184
Literate
Illiterate 28 (68%)
Infants anthropometric
measurements
Infant‘s birth weight (kg) 2.08 ± 0.91 -0.732 0.01*
Crown to heel length 42.47 ± 4.27 -0.204 0.100
Head circumference (cm) 33.10 ± 2.16 -0.586 0.001*
Mid arm circumference 9.90 ± 1.51 -0.303 0.027**
Chest circumference 31.26 ± 1.97 -0.293 0.032**
*correlation is significant at p = 0.01, ** correlation is significant at p = 0.05
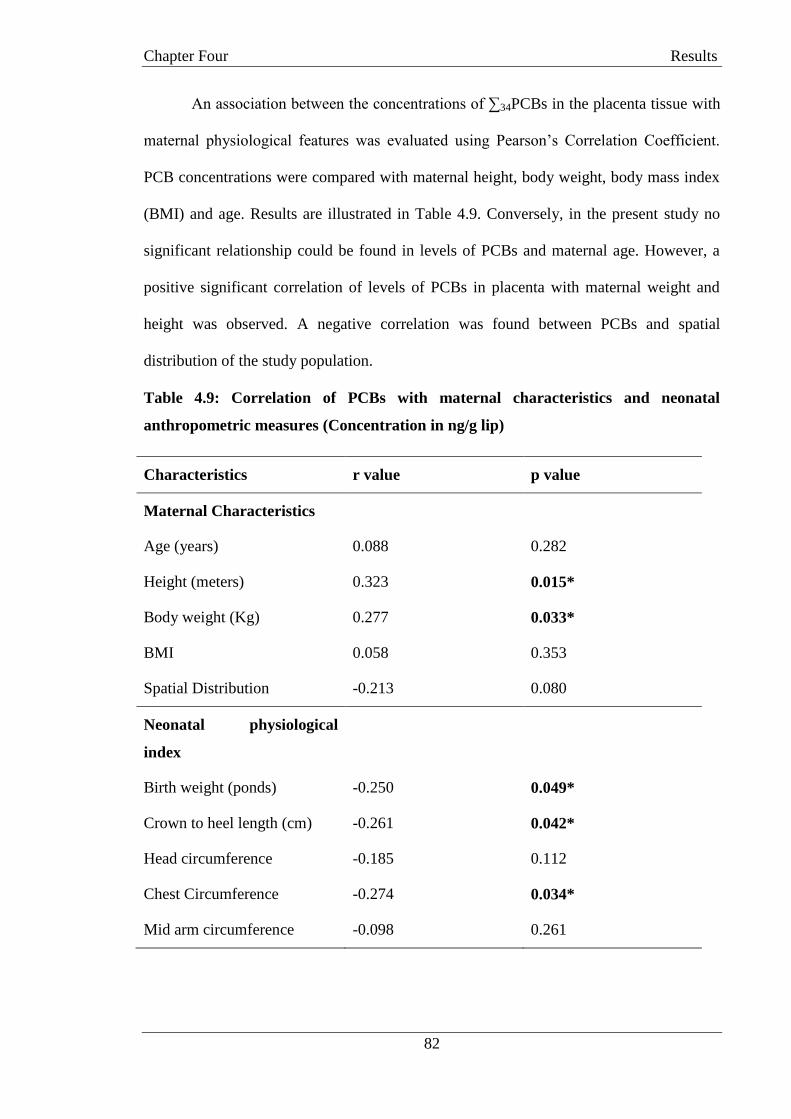
Chapter Four Results
82
An association between the concentrations of ∑34PCBs in the placenta tissue with
maternal physiological features was evaluated using Pearson‘s Correlation Coefficient.
PCB concentrations were compared with maternal height, body weight, body mass index
(BMI) and age. Results are illustrated in Table 4.9. Conversely, in the present study no
significant relationship could be found in levels of PCBs and maternal age. However, a
positive significant correlation of levels of PCBs in placenta with maternal weight and
height was observed. A negative correlation was found between PCBs and spatial
distribution of the study population.
Table 4.9: Correlation of PCBs with maternal characteristics and neonatal
anthropometric measures (Concentration in ng/g lip)
Characteristics r value p value
Maternal Characteristics
Age (years) 0.088 0.282
Height (meters) 0.323 0.015*
Body weight (Kg) 0.277 0.033*
BMI 0.058 0.353
Spatial Distribution -0.213 0.080
Neonatal physiological
index
Birth weight (ponds) -0.250 0.049*
Crown to heel length (cm) -0.261 0.042*
Head circumference -0.185 0.112
Chest Circumference -0.274 0.034*
Mid arm circumference -0.098 0.261
Chapter Four Results
83
4.9. Association of PCBs in Blood, Milk and Placenta with Infants
Anthropometric Characteristics
A Pearson‘s correlation was applied between the concentration of PCBs in blood
serum with infant‘s anthropometric parameters viz; height, head circumference, chest
circumference and mid arm circumference. The results showed a significant negative
correlation between PCB levels in blood and infant‘s head circumference (r= -0.446,
p=0.001) and a negative but non-significant relationship with infant‘s height (r= -0.081,
p=0.301) chest circumference (r= -0.059, p=0.352) and mid arm circumference (r= -
0.083, p=0.296). Regression plots were drawn to show the relationship between these
variable and blood serum levels (Figure 4.16).
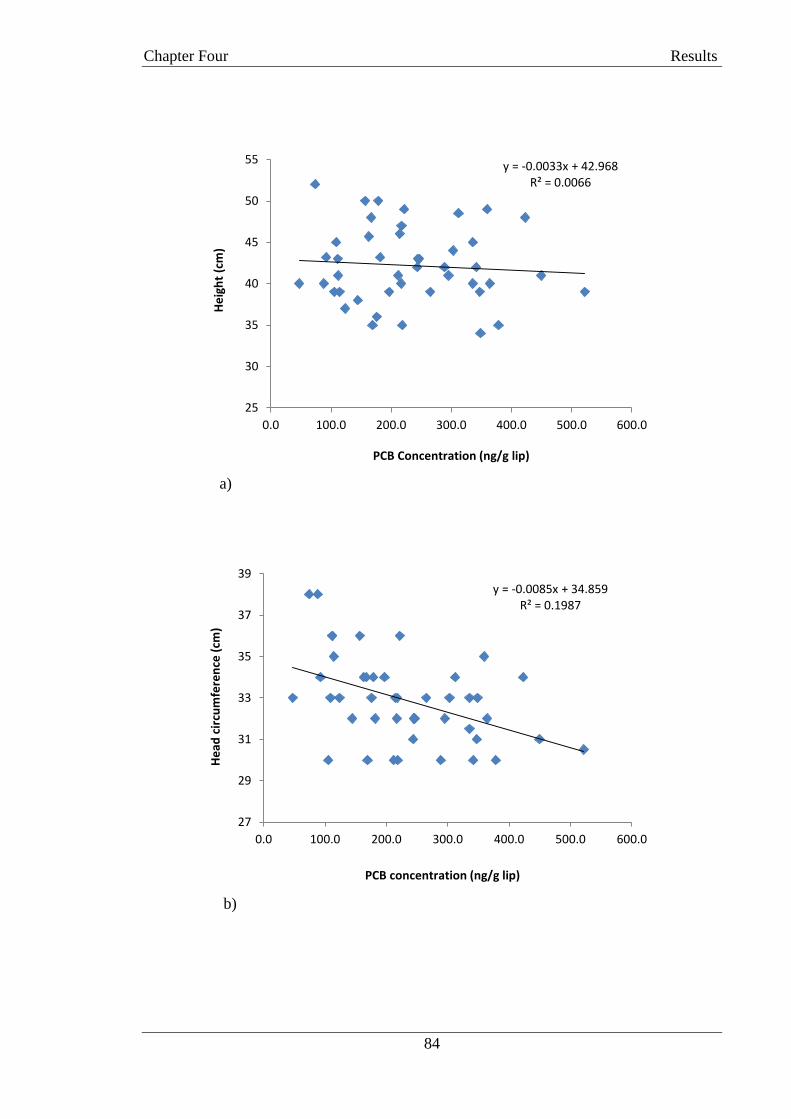
Chapter Four Results
84
a)
b)
y = -0.0033x + 42.968 R² = 0.0066
25
30
35
40
45
50
55
0.0 100.0 200.0 300.0 400.0 500.0 600.0
He
igh
t (c
m)
PCB Concentration (ng/g lip)
y = -0.0085x + 34.859 R² = 0.1987
27
29
31
33
35
37
39
0.0 100.0 200.0 300.0 400.0 500.0 600.0
He
ad c
ircu
mfe
ren
ce (
cm)
PCB concentration (ng/g lip)
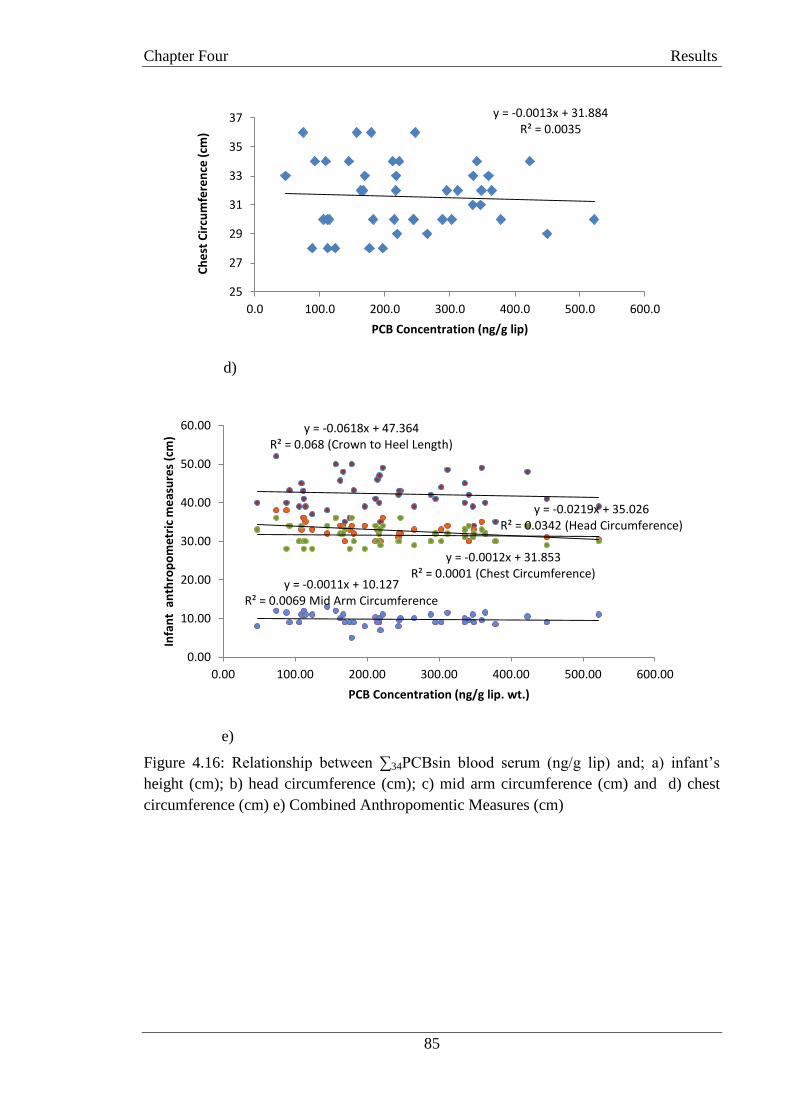
Chapter Four Results
85
d)
e)
Figure 4.16: Relationship between ∑34PCBsin blood serum (ng/g lip) and; a) infant‘s
height (cm); b) head circumference (cm); c) mid arm circumference (cm) and d) chest
circumference (cm) e) Combined Anthropomentic Measures (cm)
y = -0.0013x + 31.884 R² = 0.0035
25
27
29
31
33
35
37
0.0 100.0 200.0 300.0 400.0 500.0 600.0
Ch
est
Cir
cum
fere
nce
(cm
)
PCB Concentration (ng/g lip)
y = -0.0618x + 47.364 R² = 0.068 (Crown to Heel Length)
y = -0.0219x + 35.026 R² = 0.0342 (Head Circumference)
y = -0.0012x + 31.853 R² = 0.0001 (Chest Circumference)
y = -0.0011x + 10.127 R² = 0.0069 Mid Arm Circumference
0.00
10.00
20.00
30.00
40.00
50.00
60.00
0.00 100.00 200.00 300.00 400.00 500.00 600.00
Infa
nt
an
thro
po
me
tric
me
asu
res
(cm
)
PCB Concentration (ng/g lip. wt.)

Chapter Four Results
86
Different growth parameters of infants (birth weight, head circumference, chest
circumference and mid arm circumference) were correlated with the ∑34 PCBs in human
milk. A significant negative relationship was observed between the infant birth weight
and level of PCBs (r= -0.732, p=0.01) reflecting that with an increase in PCBs
concentration in human milk, the birth weight of the infants decreases. Similarly, a
significant negative correlation was found between ∑34 PCBs and other neonatal growth
parameters viz: head circumference (r= -0.586n p= 0.001), mid arm circumference (r= -
0.303, 0.027), chest circumference (r= -0.293, p=0.032). However, a negative but non-
significant relationship was also observed between the PCBs concentration and infant‘s
crown to heel length (r= -0.204, p=0.100). Linear regression plots were drawn to show the
relationship between these parameters and concentration of human milk samples (Figure
4.17).
a)
y = -0.0246x + 3.166 R² = 0.5357
0
0.5
1
1.5
2
2.5
3
3.5
4
4.5
0.00 20.00 40.00 60.00 80.00 100.00 120.00 140.00
Bo
dy
We
igh
t (k
g)
PCB Concentration (ng/g lip)
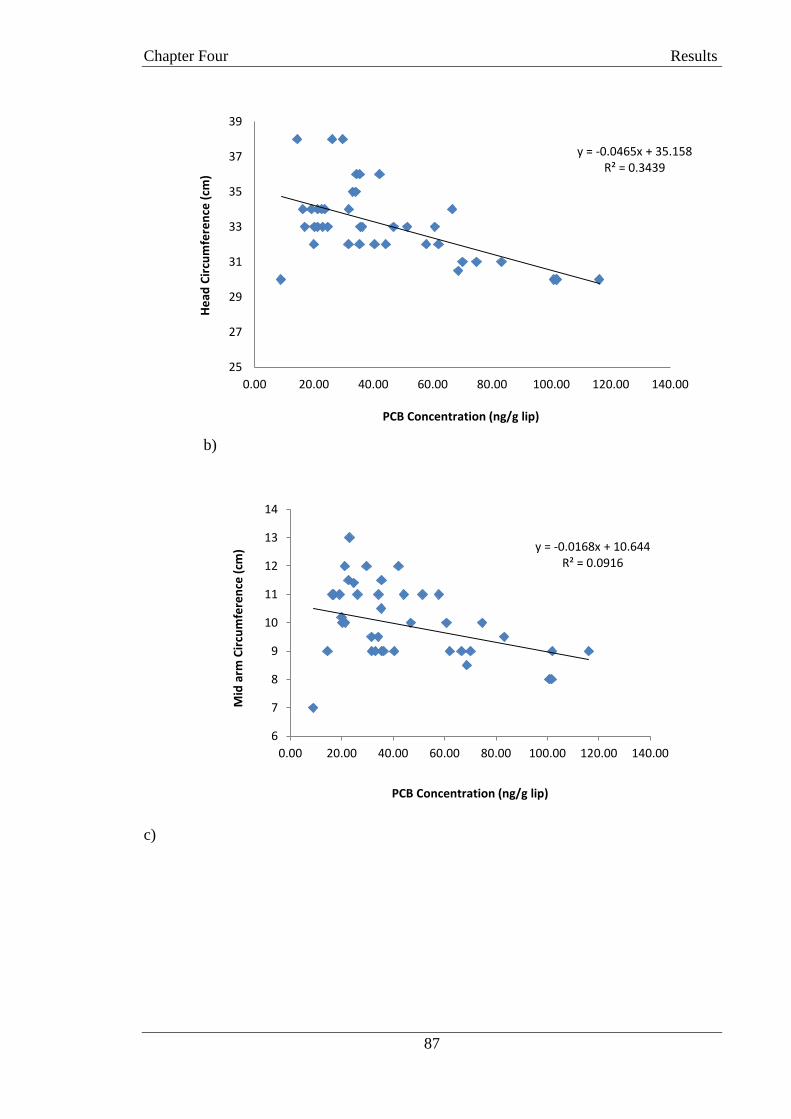
Chapter Four Results
87
b)
c)
y = -0.0465x + 35.158 R² = 0.3439
25
27
29
31
33
35
37
39
0.00 20.00 40.00 60.00 80.00 100.00 120.00 140.00
He
ad C
ircu
mfe
ren
ce (
cm)
PCB Concentration (ng/g lip)
y = -0.0168x + 10.644 R² = 0.0916
6
7
8
9
10
11
12
13
14
0.00 20.00 40.00 60.00 80.00 100.00 120.00 140.00
Mid
arm
Cir
cum
fere
nce
(cm
)
PCB Concentration (ng/g lip)

Chapter Four Results
88
d)
e)
Figure 4.17: Relationship between ∑34PCBsin human milk (ng/g lip) and; a) infant‘s
body weight (kg); b) head circumference cm); c) mid arm circumference (cm) and d)
chest circumference (cm); e) Combined Anthropometric Measures (cm)
y = -0.0212x + 32.203 R² = 0.0858
25
27
29
31
33
35
37
0.00 20.00 40.00 60.00 80.00 100.00 120.00 140.00
Ch
est
Cir
cum
fere
nce
(cm
)
PCB Concentration (ng/g lip)
y = -0.0618x + 47.364 R² = 0.068 (Crown to Heel Legth))
y = -0.0219x + 35.026 R² = 0.0342 (Head Circumference)
y = -0.0012x + 31.853 R² = 0.0001 (Chest Circumference)
y = -0.0011x + 10.127 R² = 0.0069 (Mid Arm Circumference
0.00
10.00
20.00
30.00
40.00
50.00
60.00
0.00 100.00 200.00 300.00 400.00 500.00 600.00
Infa
nt
an
thro
po
me
tric
me
asu
res
(cm
)
PCB Concentration Milk (ng/g lip. wt.)
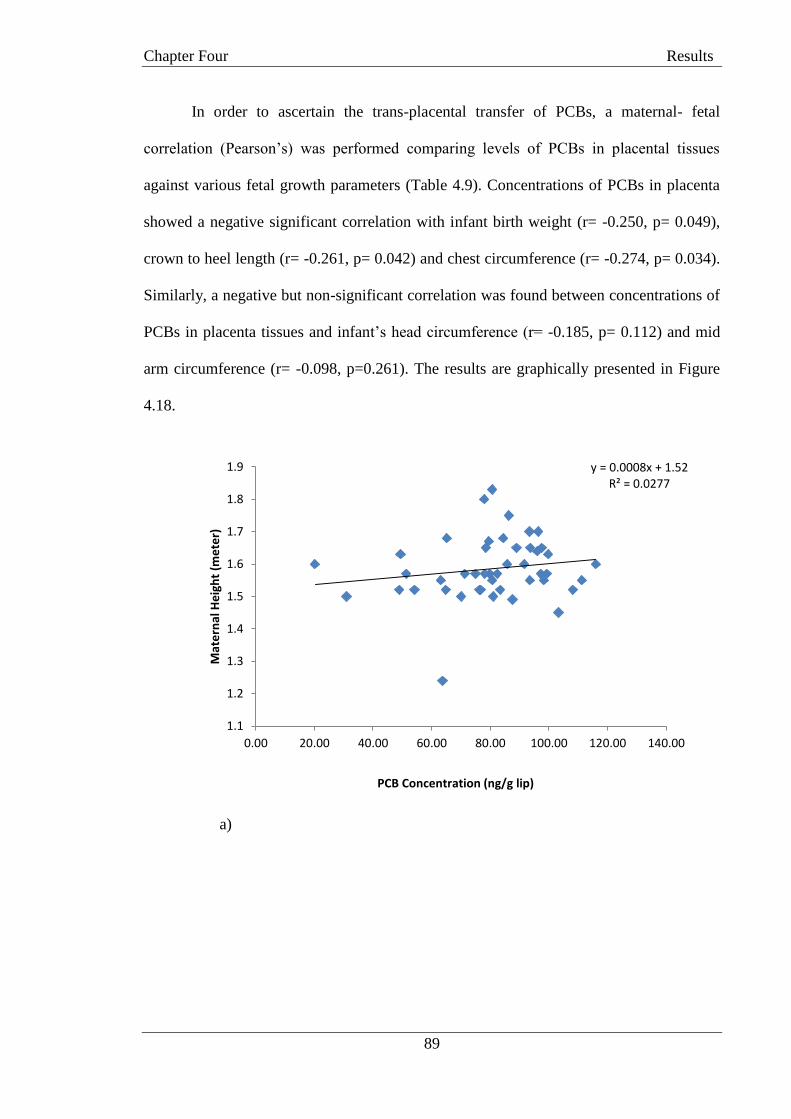
Chapter Four Results
89
In order to ascertain the trans-placental transfer of PCBs, a maternal- fetal
correlation (Pearson‘s) was performed comparing levels of PCBs in placental tissues
against various fetal growth parameters (Table 4.9). Concentrations of PCBs in placenta
showed a negative significant correlation with infant birth weight (r= -0.250, p= 0.049),
crown to heel length (r= -0.261, p= 0.042) and chest circumference (r= -0.274, p= 0.034).
Similarly, a negative but non-significant correlation was found between concentrations of
PCBs in placenta tissues and infant‘s head circumference (r= -0.185, p= 0.112) and mid
arm circumference (r= -0.098, p=0.261). The results are graphically presented in Figure
4.18.
a)
y = 0.0008x + 1.52 R² = 0.0277
1.1
1.2
1.3
1.4
1.5
1.6
1.7
1.8
1.9
0.00 20.00 40.00 60.00 80.00 100.00 120.00 140.00
Mat
ern
al H
eig
ht
(me
ter)
PCB Concentration (ng/g lip)
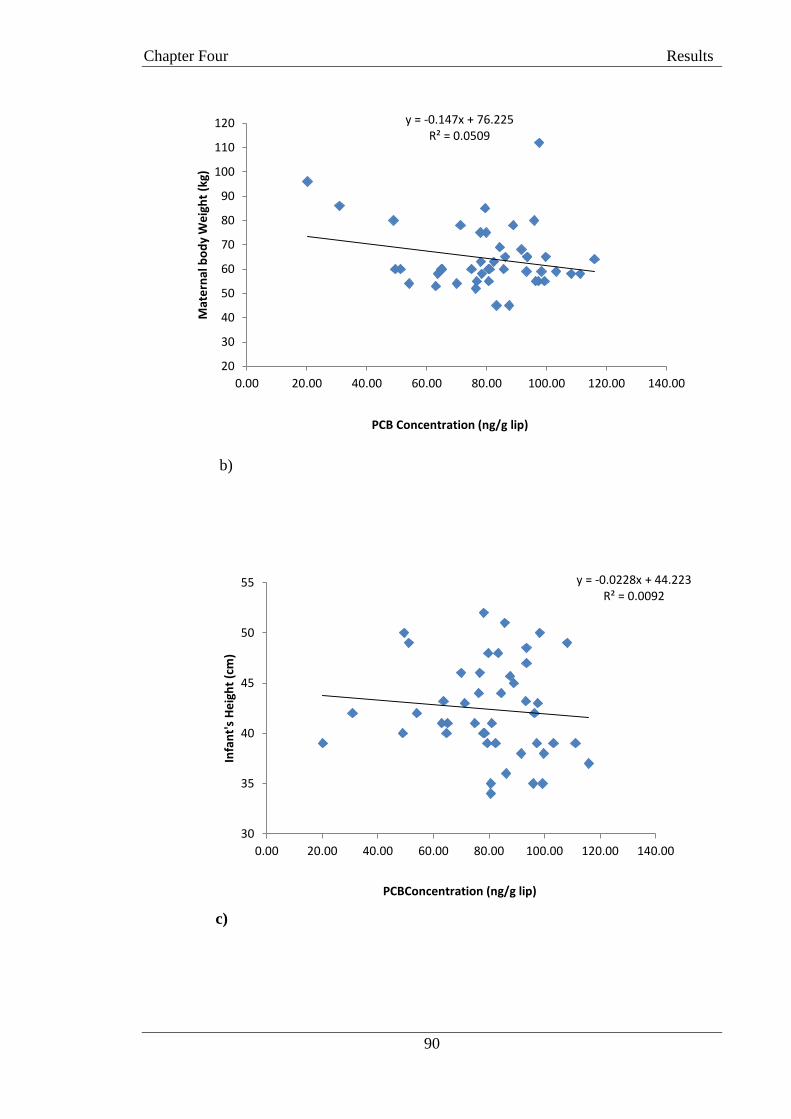
Chapter Four Results
90
b)
c)
y = -0.147x + 76.225 R² = 0.0509
20
30
40
50
60
70
80
90
100
110
120
0.00 20.00 40.00 60.00 80.00 100.00 120.00 140.00
Mat
ern
al b
od
y W
eig
ht
(kg)
PCB Concentration (ng/g lip)
y = -0.0228x + 44.223 R² = 0.0092
30
35
40
45
50
55
0.00 20.00 40.00 60.00 80.00 100.00 120.00 140.00
Infa
nt'
s H
eig
ht
(cm
)
PCBConcentration (ng/g lip)
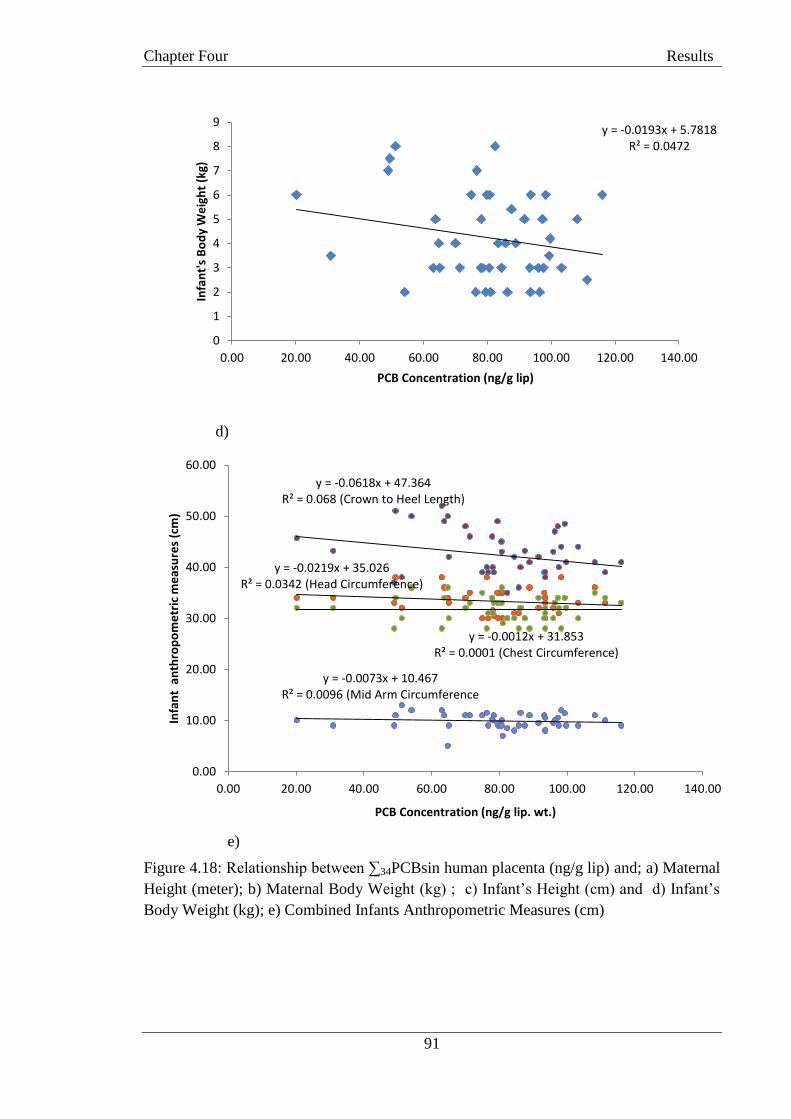
Chapter Four Results
91
d)
e)
Figure 4.18: Relationship between ∑34PCBsin human placenta (ng/g lip) and; a) Maternal
Height (meter); b) Maternal Body Weight (kg) ; c) Infant‘s Height (cm) and d) Infant‘s
Body Weight (kg); e) Combined Infants Anthropometric Measures (cm)
y = -0.0193x + 5.7818 R² = 0.0472
0
1
2
3
4
5
6
7
8
9
0.00 20.00 40.00 60.00 80.00 100.00 120.00 140.00
Infa
nt'
s B
od
y W
eig
ht
(kg)
PCB Concentration (ng/g lip)
y = -0.0618x + 47.364 R² = 0.068 (Crown to Heel Length)
y = -0.0219x + 35.026 R² = 0.0342 (Head Circumference)
y = -0.0012x + 31.853 R² = 0.0001 (Chest Circumference)
y = -0.0073x + 10.467 R² = 0.0096 (Mid Arm Circumference
0.00
10.00
20.00
30.00
40.00
50.00
60.00
0.00 20.00 40.00 60.00 80.00 100.00 120.00 140.00
Infa
nt
an
thro
po
me
tric
me
asu
res
(cm
)
PCB Concentration (ng/g lip. wt.)
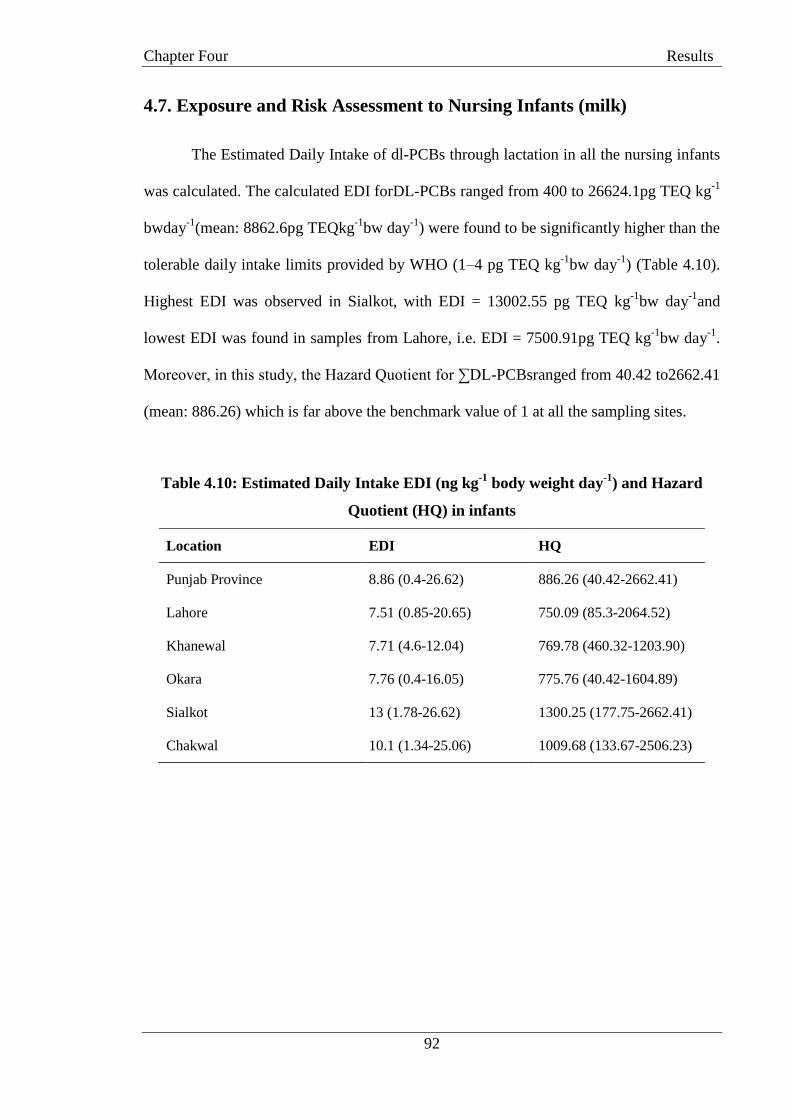
Chapter Four Results
92
4.7. Exposure and Risk Assessment to Nursing Infants (milk)
The Estimated Daily Intake of dl-PCBs through lactation in all the nursing infants
was calculated. The calculated EDI forDL-PCBs ranged from 400 to 26624.1pg TEQ kg-1
bwday-1
(mean: 8862.6pg TEQkg-1
bw day-1
) were found to be significantly higher than the
tolerable daily intake limits provided by WHO (1–4 pg TEQ kg-1
bw day-1
) (Table 4.10).
Highest EDI was observed in Sialkot, with EDI = 13002.55 pg TEQ kg-1
bw day-1
and
lowest EDI was found in samples from Lahore, i.e. EDI = 7500.91pg TEQ kg-1
bw day-1
.
Moreover, in this study, the Hazard Quotient for ∑DL-PCBsranged from 40.42 to2662.41
(mean: 886.26) which is far above the benchmark value of 1 at all the sampling sites.
Table 4.10: Estimated Daily Intake EDI (ng kg-1
body weight day-1
) and Hazard
Quotient (HQ) in infants
Location EDI HQ
Punjab Province 8.86 (0.4-26.62) 886.26 (40.42-2662.41)
Lahore 7.51 (0.85-20.65) 750.09 (85.3-2064.52)
Khanewal 7.71 (4.6-12.04) 769.78 (460.32-1203.90)
Okara 7.76 (0.4-16.05) 775.76 (40.42-1604.89)
Sialkot 13 (1.78-26.62) 1300.25 (177.75-2662.41)
Chakwal 10.1 (1.34-25.06) 1009.68 (133.67-2506.23)

93
CHAPTER FIVE
DISCUSSION
Chapter Five Discussion
94
Chapter Five
DISCUSSION
Monitoring of environmental pollutants in women, particularly; PCBs are of
immense importance because women play a crucial role in the survival of a society
through rearing and upbringing of future generations. Their exposure to environmental
pollutants ultimately lead to adverse health effects on their body as well as in fetuses and
infants. Thus, monitoring of PCBs in women is crucial as exposure to PCBs has been
considered to decrease their fecundity (Buck et al., 2000). In addition to pregnant women,
fetuses, neonates and children also are susceptible to the harmful effects of these
contaminants due to heightened sensitivity as their organs are comparatively immature
(Faroon and Ruiz 2015). Therefore, the present study was intended to monitor the levels
of PCBs in the multiple body matrices of women from different areas of Punjab, Pakistan
as a first step for assessing the risks to the health of women and their infants.
5.1. Comparative Analysis of PCBs Profile
5.1.1. PCBs profile in blood serum
Congener specific analysis of PCBs in blood serum reflected the occurrence of
some of the most persistent congeners with the mean values of PCB-153 (6.64 ng/g lip),
PCB-138 (4.9 ng/g lip) and PCB-180 (2.5 ng/g lip). The concentrations of these persistent
congeners were found higher than those reported in a previous study from Pakistan
highlighting the PCBs levels in blood serum of urban and rural mothers from Islamabad
and Gujrat, Pakistan respectively. The mean concentrations of PCBs were PCB-153 (2.63
ng/g lip), PCB-138 (2.04 ng/g lip) and PCB-180 (1.3 ng/g lip) (Ali et al., 2013). The
concentrations of these persistent PCB congeners were also higher than Mexican
population reporting mean values of 1.90 ng/g lip, 1.80 ng/g lip and 1.00 ng/g lip for
Chapter Five Discussion
95
PCB-153, PCB-138 and PCB-180, respectively (Garcia et al., 2014). Whereas, the
findings of persistent congeners from the current study were lower than those reported
from Bolivia, viz. PCB-153 (59 ng/g lip), PCB-138 (1.80 ng/g lip) and PCB-180 (1.00
ng/g lip) (Arrebola et al., 2012).
These persistent congeners belong to high Hexa-CBs and Hepta-CBs group and
their specific sources may include steel manufacturing units and coal burning in iron ore
sintering (Biterna & Voutsa, 2005). Moreover, non-persistent PCB congeners (PCB-52,
PCB-66, PCB-74, PCB-101, PCB-105, PCB-128 and PCB-149) have been detected in the
blood serum samples, which are indicating their continuous and recent exposure to the
sampling population from commercial use with multiple sources (Covaci et al., 2002). A
comparison of the present study with other studies from developed and developing
countries on PCBs residues in blood serum is given in Table 5.1. The mean concentration
of ∑34PCBs in the blood serum of the present study was 232.3 ng/g lip. The
concentration in the present study was comparable to the study reported from Japan (292
ng/g lip), Korea (127.0 ng/g lip) and Chinese electronic dismantling workers. In
comparison to other developing countries, the mean serum concentrations of PCBs in the
current study were lower than those reported in Belgium (595ng/g lip) and Romania (680
ng/g lip) (Table 5.1). This might be due to the industrialized and developed countries
have an extensive application history of PCBs used in the past than developing countries.
The aforesaid study had also mentioned the indiscriminate use of PCBs by these two
European countries in the past and the possibility of an ongoing use as a reason for their
higher levels of detection in general population.
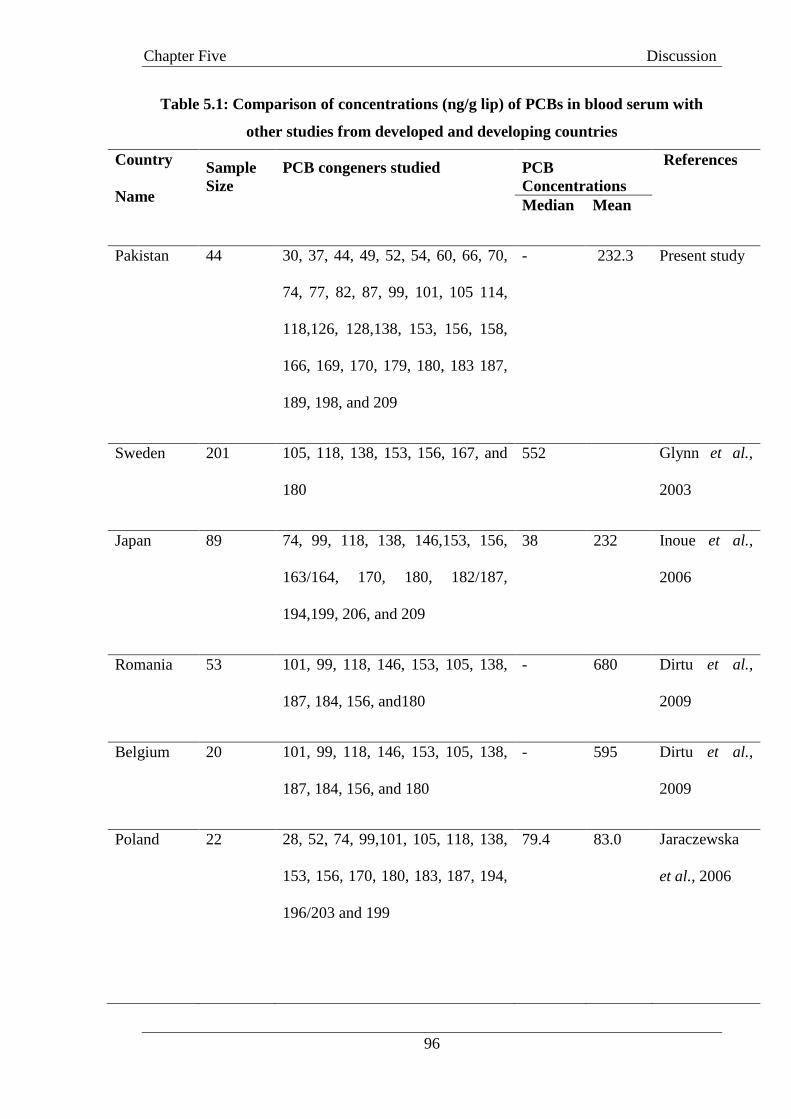
Chapter Five Discussion
96
Table 5.1: Comparison of concentrations (ng/g lip) of PCBs in blood serum with
other studies from developed and developing countries
Country
Name
Sample
Size
PCB congeners studied PCB
Concentrations
References
Median Mean
Pakistan 44 30, 37, 44, 49, 52, 54, 60, 66, 70,
74, 77, 82, 87, 99, 101, 105 114,
118,126, 128,138, 153, 156, 158,
166, 169, 170, 179, 180, 183 187,
189, 198, and 209
- 232.3 Present study
Sweden 201 105, 118, 138, 153, 156, 167, and
180
552 Glynn et al.,
2003
Japan 89 74, 99, 118, 138, 146,153, 156,
163/164, 170, 180, 182/187,
194,199, 206, and 209
38 232
Inoue et al.,
2006
Romania 53 101, 99, 118, 146, 153, 105, 138,
187, 184, 156, and180
- 680 Dirtu et al.,
2009
Belgium 20 101, 99, 118, 146, 153, 105, 138,
187, 184, 156, and 180
- 595 Dirtu et al.,
2009
Poland 22 28, 52, 74, 99,101, 105, 118, 138,
153, 156, 170, 180, 183, 187, 194,
196/203 and 199
79.4 83.0 Jaraczewska
et al., 2006
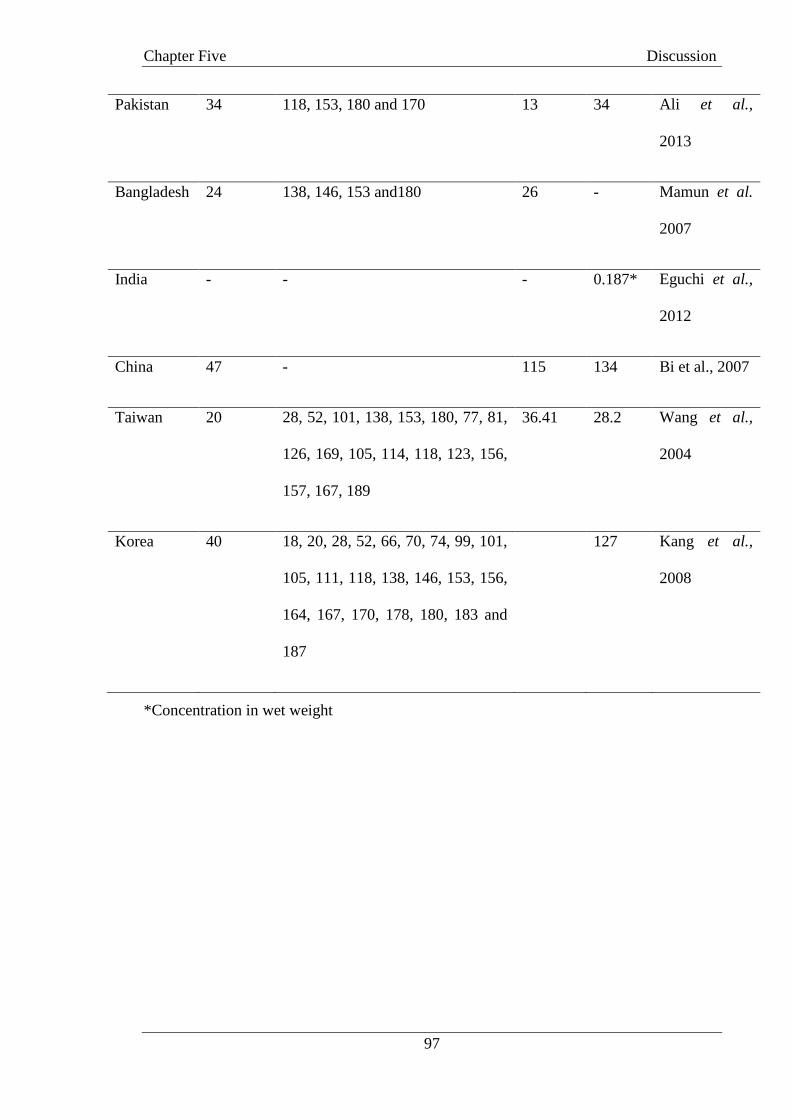
Chapter Five Discussion
97
Pakistan 34 118, 153, 180 and 170 13 34 Ali et al.,
2013
Bangladesh 24 138, 146, 153 and180 26 - Mamun et al.
2007
India - - - 0.187* Eguchi et al.,
2012
China 47 - 115 134 Bi et al., 2007
Taiwan 20 28, 52, 101, 138, 153, 180, 77, 81,
126, 169, 105, 114, 118, 123, 156,
157, 167, 189
36.41 28.2
Wang et al.,
2004
Korea 40 18, 20, 28, 52, 66, 70, 74, 99, 101,
105, 111, 118, 138, 146, 153, 156,
164, 167, 170, 178, 180, 183 and
187
127 Kang et al.,
2008
*Concentration in wet weight
Chapter Five Discussion
98
5.1.2. PCBs profile in human milk
Persistent PCB congeners were also detected in human milk samples with
following concentrations; PCB-153 (1.89 ng/g lip), PCB-138 (1.41 ng/g lip) and PCB-180
(0.75 ng/g lip). These concentrations were lower but comparable to those found in the
milk of Turkish mother viz: PCB-153 (3.36 ng/g lip), PCB-138 (1.63 ng/g lip) and PCB-
180 (1.61 ng/g lip) (Cok et al., 2012). The concentrations were found lower than previous
studies from Pakistan, which reported the concentrations of PCB-153, PCB-138 and
PCB-180 as 6.00 ng/g lip, 3.00 ng/g lip and 204.00 ng/g lip respectively. (Khawaja et al.,
2010). Moreover, the concentration of these congeners in the present study was much
lower than those reported from Eastern Siberia, Russia (Mamontova et al., 2017).
The concentration of ∑34PCBs in human milk was also compared with the values
observed in other countries (Table 5.2). The results of the PCBs in human milk from the
present study were comparable to those reported from Indian cities viz; New Delhi (23
ng/g lip), Mumbai (30 ng/g lip), Kolkata (40.0 ng/g lip) and Chennai (34 ng/g lip)
(Devanathan et al., 2009). The concentration of PCBs in human milk in the present study
was found higher than those reported from Turkey (9.91 mg/g lip). However, the ∑PCBs
levels in human milk were lower than previous studies from Pakistan (390 ng/g lip),
Canada (50 ng/g lip) Russia (240 ng/g lip), and Eastern Siberia, Russia (394.58 ng/g lip)
and Zagreb, Croatia (79 ng/g lip) (Table 5.2).
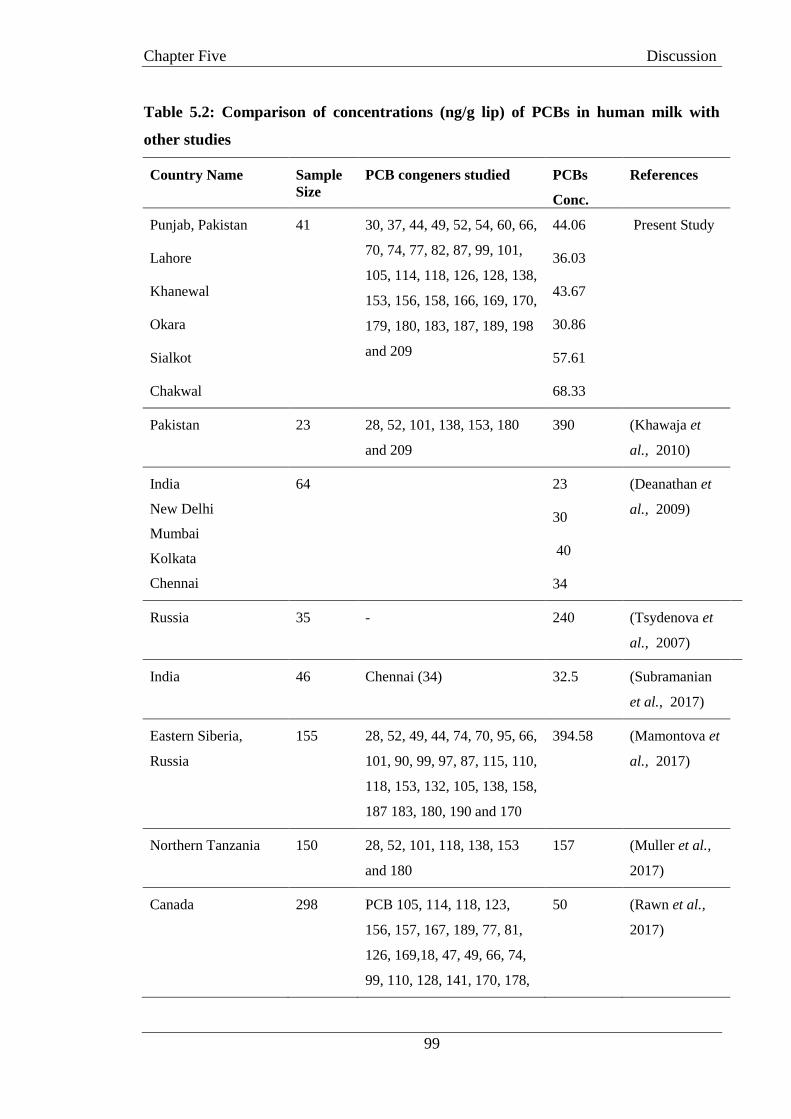
Chapter Five Discussion
99
Table 5.2: Comparison of concentrations (ng/g lip) of PCBs in human milk with
other studies
Country Name
Sample
Size
PCB congeners studied PCBs
Conc.
References
Punjab, Pakistan 41 30, 37, 44, 49, 52, 54, 60, 66,
70, 74, 77, 82, 87, 99, 101,
105, 114, 118, 126, 128, 138,
153, 156, 158, 166, 169, 170,
179, 180, 183, 187, 189, 198
and 209
44.06 Present Study
Lahore 36.03
Khanewal 43.67
Okara 30.86
Sialkot 57.61
Chakwal 68.33
Pakistan 23 28, 52, 101, 138, 153, 180
and 209
390 (Khawaja et
al., 2010)
India
New Delhi
Mumbai
Kolkata
Chennai
64
23
30
40
34
(Deanathan et
al., 2009)
Russia 35 - 240 (Tsydenova et
al., 2007)
India 46 Chennai (34) 32.5 (Subramanian
et al., 2017)
Eastern Siberia,
Russia
155 28, 52, 49, 44, 74, 70, 95, 66,
101, 90, 99, 97, 87, 115, 110,
118, 153, 132, 105, 138, 158,
187 183, 180, 190 and 170
394.58
(Mamontova et
al., 2017)
Northern Tanzania 150 28, 52, 101, 118, 138, 153
and 180
157 (Muller et al.,
2017)
Canada
298 PCB 105, 114, 118, 123,
156, 157, 167, 189, 77, 81,
126, 169,18, 47, 49, 66, 74,
99, 110, 128, 141, 170, 178,
50
(Rawn et al.,
2017)
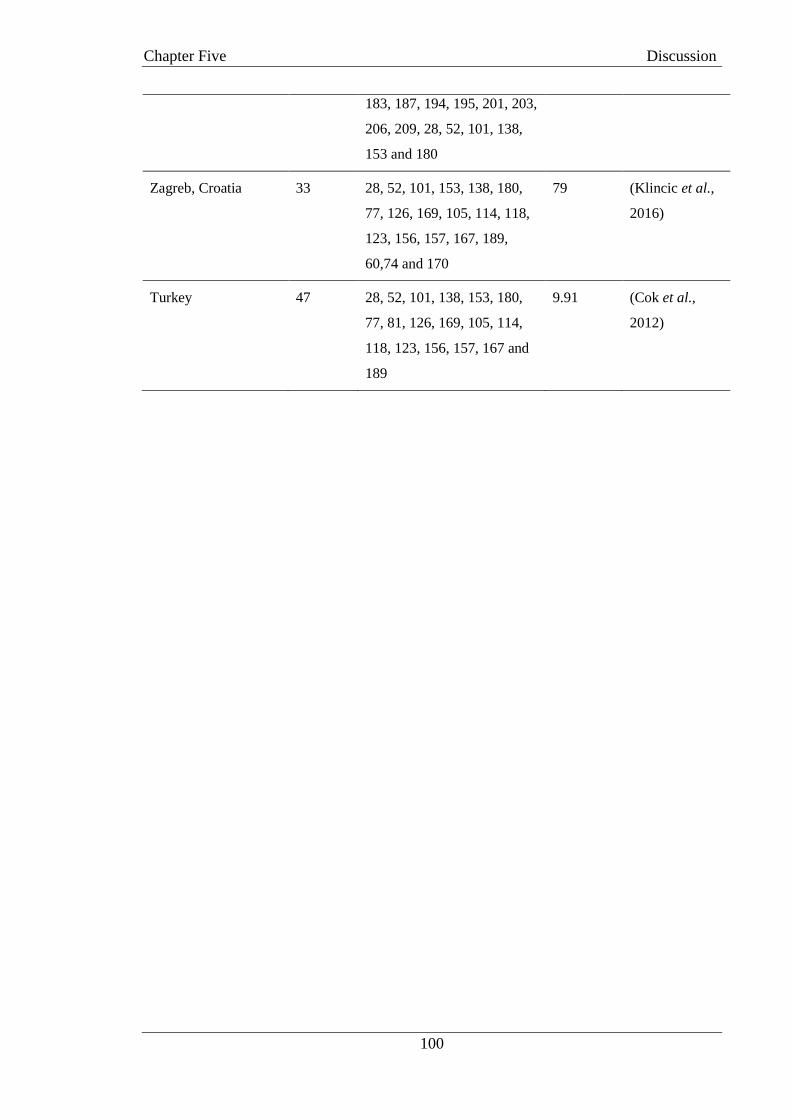
Chapter Five Discussion
100
183, 187, 194, 195, 201, 203,
206, 209, 28, 52, 101, 138,
153 and 180
Zagreb, Croatia
33 28, 52, 101, 153, 138, 180,
77, 126, 169, 105, 114, 118,
123, 156, 157, 167, 189,
60,74 and 170
79
(Klincic et al.,
2016)
Turkey
47 28, 52, 101, 138, 153, 180,
77, 81, 126, 169, 105, 114,
118, 123, 156, 157, 167 and
189
9.91 (Cok et al.,
2012)
Chapter Five Discussion
101
5.1.3. PCBs profile in placenta
The mean concentration of persistent congeners was determined in placenta
tissuesof sampling population. The concentration of these congeners was as follow; PCB-
153 (mean: 1.89 ng/g lip), PCB-138 (1.41 ng/g lip) and PCB-180 (0.75 ng/g lip). These
concentrations were lower than those reported in placentas of Italian mothers with median
concentrations of PCB-PCB-138 (18 ng/g lip), PCB-153 (26 ng/g lip), and PCB-180 (18
ng/g lip) (Bergonzi et al., 2009). Patandin (1999) reported the mean concentration of
PCBs in maternal blood plasma PCB-138 (0.6 µg/L), PCB-153 (0.91 µg/L), and PCB-180
(0.54 µg/L) from Netherland and these results are comparable to the present study. The
concentrations of these congeners were also lower than those reported from, USA with
mean values of PCB-153 (19.44 ng/g lip), PCB-138 (14.29 ng/g lip) and PCB-180 (7.12
ng/g lip ). The mean concentration of these persistent congeners was 4.07 ng/g lip which
was again found to be lower than those detected in Taiwanese mothers, i.e. 28.83 ng/g lip
by Wang et al., (2004). Several studies have highlighted the effects of PCBs on the
development and growth of the fetuses leading to intrauterine retardation, later possible
effect leading infants and childhood disease, poor cognitive development ectodermal
defects and behavioral disorder such as hyperactivity (Patandin et al., 1999).
A comparative analysis of ∑34PCBs in placenta tissues of mothers in the present
study with other countries was made that reflected comparable findings from the present
study than those in Japan (98.7 mg/g lip), Taiwan (37.74 ng/g lip) and USA (40.5 ng/g
lip) However, the current levels were lower than those reported in Spanish mothers (303
ng/g lip) and Italian mothers (98.7 ng/g lip) (Table 5.3).. This may be due to differences
in sample size, number and type of congeners studied, difference in geographic location,
changed eating habits and levels of exposure. The concentrations of PCBs in human
placenta in the present study were found higher than those detected in the placentas of
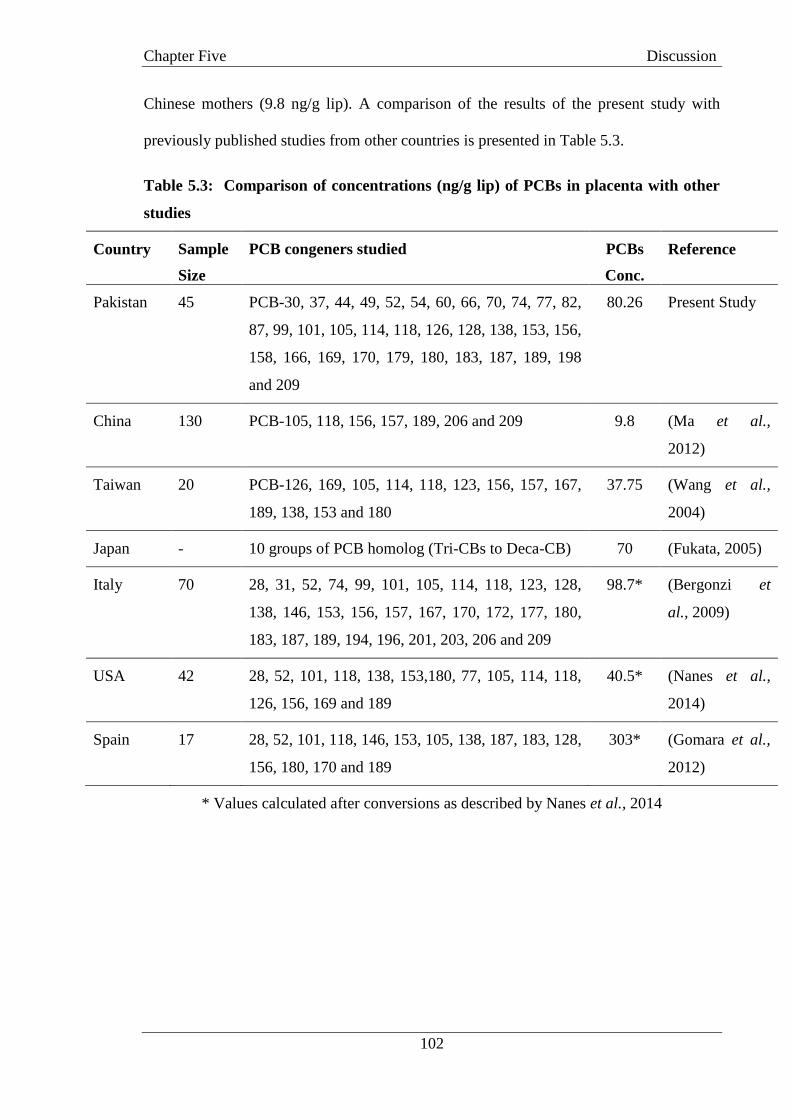
Chapter Five Discussion
102
Chinese mothers (9.8 ng/g lip). A comparison of the results of the present study with
previously published studies from other countries is presented in Table 5.3.
Table 5.3: Comparison of concentrations (ng/g lip) of PCBs in placenta with other
studies
Country Sample
Size
PCB congeners studied PCBs
Conc.
Reference
Pakistan 45 PCB-30, 37, 44, 49, 52, 54, 60, 66, 70, 74, 77, 82,
87, 99, 101, 105, 114, 118, 126, 128, 138, 153, 156,
158, 166, 169, 170, 179, 180, 183, 187, 189, 198
and 209
80.26 Present Study
China 130 PCB-105, 118, 156, 157, 189, 206 and 209 9.8 (Ma et al.,
2012)
Taiwan 20 PCB-126, 169, 105, 114, 118, 123, 156, 157, 167,
189, 138, 153 and 180
37.75 (Wang et al.,
2004)
Japan - 10 groups of PCB homolog (Tri-CBs to Deca-CB) 70 (Fukata, 2005)
Italy 70 28, 31, 52, 74, 99, 101, 105, 114, 118, 123, 128,
138, 146, 153, 156, 157, 167, 170, 172, 177, 180,
183, 187, 189, 194, 196, 201, 203, 206 and 209
98.7* (Bergonzi et
al., 2009)
USA 42 28, 52, 101, 118, 138, 153,180, 77, 105, 114, 118,
126, 156, 169 and 189
40.5* (Nanes et al.,
2014)
Spain 17 28, 52, 101, 118, 146, 153, 105, 138, 187, 183, 128,
156, 180, 170 and 189
303* (Gomara et al.,
2012)
* Values calculated after conversions as described by Nanes et al., 2014

Chapter Five Discussion
103
5.1.4. Overall PCBs trend in multiple body matrices
Biomonitoring of pollutant concentration in the human tissues such as the
placenta, breast milk, urine, blood and hair serum, umbilical cord other tissues depict a
varying degree of body burden. Quantification of PCBs in the present study showed that
the lipid adjusted concentration of PCBs varied among all three examined body matrices
and were found notably higher in blood serum than another two biomarkers examined i.e.
placenta and milk. The percentage contributions of blood serum in each class/ homolog of
PCBs were predominant in comparison to milk and placenta. These findings were
comparable to the Japanese mothers where lipid adjusted maternal serum levels were
higher than those found in cord serum and umbilical cord (Fukata, 2005). In contradiction
to this; a study from Taiwan on maternal venous serum, breast milk, cord serum and
placenta tissue showed the highest concentration of PCBs in human milk samples than
other body matrices (Wang et al., 2004).
The possible reason for higher levels in blood serum was better explained by their
pharmacokinetics in the blood as described Noren et al., (1999) that different chemicals in
blood tend to bind to albumin and lipoproteins instead of getting dissolved in the lipids
and their distribution in blood plasma varies according to the types of chemicals.
Therefore, there is a possibility that free and non-binding part of the chemicalsare evenly
distributed, whereas, distribution and transportation process of protein bound form is
somehow complicated, which might be the reason for the high concentration of PCBs in
the blood than milk and placenta (Fukata, 2005). The blood absorbs the chemicals
directly from the intestine and lungs, then liver and kidneys metabolize and excrete the
POPs with limited capacity. However, the excretion rate is the slow process and PCBs
tend to accumulate in adipose tissue and stay for longer time. From the blood, these
pollutants can cross the placenta due to lipophilic nature. In case of milk, mammary gland
Chapter Five Discussion
104
cells synthesize the milk and some amount of PCBs may transfer from blood to the milk
(Verner et al., 2008).
5.2. Spatial Trends of PCB Homolog with Potential Sources
In blood serum, the level of PCBs was highest from Chakwal followed by
industrial cities of Lahore and Sialkot, while lowest levels of PCBs were also detected in
agricultural dominant areas i.e. Khanewal and Okara. Among all the PCB homolog in
maternal serum samples, an overall prevalence of Tetra-CBs was observed at all the
sampling sites followed by Penta-CBs and Hexa-CBs. This trend was different from the
previous studies from Pakistan, Bangladesh and China on human serum, where higher
chlorinated PCBs were predominant. Although Tetra-CBs were prevailing at all the
sampling sites, their levels were higher in blood serum from Lahore.
The distribution trend of PCB homolog in human milk samples from selected
sampling sites was as follows: Chakwal > Sialkot > Khanewal > Lahore > Okara. Among
all the PCB homolog, Tetra-CBs were predominant in all the sampling sites with the
highest concentration (32.77 ng/g lip) in Sialkot city. The concentration profile of mean
Σ34PCBs in placenta samples on spatial basis was in order: Chakwal > Lahore > Sialkot>
Okara > Khanewal. The highest level of PCBs was detected in placenta samples of
mothers from Chakwal with mean Σ34PCBs value of 93.46 ng/g lip. The concentration of
PCBs in urban and industrial cities i.e. Lahore (87.80 ng/g lip) and Sialkot (84.52 ng/g
lip) were higher than Okara (74.67 ng/g lip) and Khanewal (67.46 ng/g lip). In placenta
samples, Tetra-CBs were the most dominant PCB homolog with a mean value of 43.87
ng/g lip.
Volatilization from PCBs containing building materials, incineration emissions,
vehicular emissions, combustion of PCBs contaminated waste materials and oil spills

Chapter Five Discussion
105
from industrial sites, metal recovery from e-waste burning, (Farooq et al., 2011); old
equipment, including transformers dismantling steel industry and coal combustion and
industrial waste are potential sources of PCBs in the environment (Chi et al., 2007).
Sources of Tri-CBs includes electrical appliances and particularly paints and
sealants in building material (Robson et al., 2010), whereas those of Tetra-CBs and
Penta-CBs includes combustion during the iron ore sintering process and steel
manufacturing units. Tetra-CBs were found the dominant homolog group at all the
sampling sites and in all the examined body matrices of selected mothers. Previous
regional studies have shown Tetra-CBs as dominating the configuration characteristics of
PCBs in the atmosphere of the Asia (Jaward et al., 2005; Li et al., 2012). Nevertheless,
findings of earlier studies from Pakistan on monitoring of levels of PCBs in food
commodities were also consistent with the findings of this study and reflected that Tetra-
CBs were prevalent in rice and grain cereal crops. However, some previous studied in
serum from Bangladesh and China (Mamun et al., 2007; Bi et al., 2007) showed a
different trend where higher chlorinated PCBs were predominant and identified fish as a
major source of exposure to these PCBs. In Punjab, fish is not a major and a regular diet
source in the present study population, which also can be an explanation of the reason
why higher chlorinated PCBs were not prevalent in comparison to lower chlorinated
PCBs in the study population. According to Liem et al., (2000) 95% of the human
exposure to PCBs are through consumption of fatty food. A major source of high
chlorinated PCBs is food, i.e. fish, meat, poultry and dairy product (Xing et al., 2009).
Exhaust from cement industries have been identified as pollution sources of the higher
chlorinated biphenyls (Rodriguez, 2016).
In Pakistan, PCBs have mainly been used as a technical mixture of Tetra CBs,
Penta CBs and Tri CBs (Syed et al., 2014). Therefore, higher levels of these three
Chapter Five Discussion
106
homolog in the study population have validated the ongoing usage and its subsequent
human exposure. Among the entire sampling sites, significant levels of PCBs have been
detected in sampling population from Chakwal. Levels of higher chlorinated PCBs were
also predominant in District Chakwal. A possible explanation that Chakwal is situated in
a geographic territory with major cement plants fulfilling a major portion of the country‘s
demand for cement. People living in areas with cement plants and incinerators are
categorized by ASTDR as ―special population‖ which may be highly exposed to PCBs as
compared to the general population (ASTDR, 2014). Cement industries in Pakistan have
been using tire derived fuel and refused derived fuel to overcome energy crisis and meet
the energy crisis. These releases substantial amount of dioxins and dioxin like PCBs
(Cheema & Badshah, 2013). Cement industry exhaust is one of the key exposure routes to
high chlorinated biphenyls that could lead to the PCBs contamination of food/ diet,
particularly fish, meat, oil, dairy products and water. In addition to this, studies have
highlighted Chakwal with heavy traffic load and thousands of diesel trucks passing
through it which may lead to vehicular emissions of PCBs (Aziz & Bajwa, 2008).
Therefore, higher concentrations in Chakwal may be linked to multiple sources via; food,
contaminated air coming from cement plants and vehicular load, burning of solid waste
and indoor PCBs exposure.
Lahore is a city with the increasing trend of urbanization and the hub of many
industrial activities including chemical manufacturing, paints, and dyes manufacturing
units so exposure of lower chlorinated biphenyls was higher in mothers from Lahore. In
Sialkot district, burning of plastic and leather waste, steel and surgical tool manufacturing
industries, chemical industry, transformer repairing units and many other similar
resources in urban and peri-urban could be the source of PCBs contamination (Mahmood
et al., 2014).
Chapter Five Discussion
107
Lower chlorinated PCBs are volatile in nature which might be the reason of their
abundance and long range transport in the air (Ali et al., 2015). This phenomenon,
perhaps is the possible source of PCBs exposure in Khanewal and Okara. Furthermore,
there exists a common practice of backyard burning of solid waste in general population
living in suburbs and remote areas. The incomplete waste combustion has been
recognized as an important route of exposure to PCBs (Someya et al., 2010). Punjab is
located in a geographic territory where it shares a border with India. PCBs generated are
capable of trans-boundary movement; hence PCBs may enter into the environment of the
Punjab, Pakistan through air circulations. The Province has been experiencing episodes of
smog since last two years, mainly due to transboundary movement/ advection of
pollutants from India which may also contain PCBs particles.
5.3. PCBs Trend in Urban and Rural Areas
The concentration of ∑34PCBs in blood serum was slightly higher in urban
mothers (235.66 ng/g lip) than rural mothers (231.09 ng/g lip). Whereas, in both
environmental setting levels of lower chlorinated PCBs (particularly Tetra-CBs) were
predominant among all the homolog. Similarly, the ∑34PCBs concentrations were also
higher in milk (49.31 ng/g lip) and placenta samples of urban mothers (84.62 ng/g lip) as
compared to those found in milk (36.66 ng/g lip) and placenta of rural mothers (74.30
ng/g lip), respectively. A similar trend was observed by Turci et al., (2006) in women
populations living in different environmental settings in Italy. The current findings were
also inconsistent with the results of the previous study from the neighboring country
(India), where the highest level of PCBs was observed in the milk samples of women
living in cities (Table 5.2).
Chapter Five Discussion
108
In industrial districts, significant sources of PCBs exposure in rural population
are associated with the burning of agricultural waste, cow dung, and wood fuel,
particularly in an indoor environment. In Sialkot district, industries are scattered and there
is a general practice of open burning of solid waste which might be a reason of higher
concentrations of some PCB homolog in the rural population of the area. Whereas, in
urban environment, municipal solid waste (MSW), power producing plants, transformers,
and emissions from dumping sites may attribute to high exposures to PCBs in urban areas
(FAO/WHO, 2005). The lower chlorinated biphenyls are unintentionally formed as by
products in paints and pigments industry. The disposal and decomposition of PCB
containing materials are one of their sources and it enters the human body through
inhalation (Rodriguez, 2016). These semi volatile lower chlorinated biphenyls have been
detected in substantial quantities in outdoor and indoor air in cities, and older buildings
having sealants containing PCBs (Herrick et al., 2004).
Higher levels of PCBs in mothers from industrial and urban cities reflect their
continuing exposure to PCBs sources in the urban environment (Diamond et al., 2010)
Sialkot and Lahore is an urban and industrial city having steel and surgical tools
manufacturing units, transformer repairing and pigment, industrial units and the PCBs
release from these units and incomplete burning of plastic openly may be likely sources
of PCBs in the urban environment of the region. There are waste disposal stations
(including those of electronic waste) near the urban and industrial areas which might be a
key cause of higher levels of PCBs therein. Past studies from other environmental
matrixes of the Punjab Province have also emphasized on higher environmental PCBs
levels in urban and industrial areas than rural (Syed et al., 2014).
However, still, a relative significant concentration of PCBs in rural areas of
Khanewal and Okara are apparently may be due to their volatilization, diffusive gaseous

Chapter Five Discussion
109
transport and tend to travel long distances in the environment which might lead to their
abundant occurrence in some of the rural areas (Gasic et al., 2010).
5.4. Risk Assessment of Maternal Health
5.4.1. Exposure to dl-PCBs and TEQ fluxes
Dioxin-like PCBs exhibits toxic effects in human and 90% of their exposure are
due to dietary intake, particularly animal origin food as the prime source. While other
sources of exposure i.e. uptake from various non-food and ambient sources (inhalation of
dust or air, water ingestion, and soil ingestion) only account up to 10% of the total mean
exposure (Malisch & Kotz, 2014). Mono-ortho PCBs and non-ortho PCBs have been
analyzed in various studies conducted on maternal serum, milk and placenta tissues.
Monitoring of these toxic PCB congeners is of key importance due to their dietary uptake
of adults and toxic potential of trans mammary transfer into breast feeding infants (WHO,
2003). The mean concentration of sum dioxin-like PCBs studied in maternal serum, milk
and placenta tissues were 0.24 ng/g lip, 0.06 ng/g lip and 0.08 ng/g lip, respectively. The
TEQ comparison with previous studies revealed that results for maternal serum were
higher than those reported from Taiwan (0.0045 ng/g lip) (Wang et al., 2004). For human
milk samples, the TEQ values were found to be higher than those in milk samples of
Canadian mothers (1.5 pg g-1 lip) and much lower than those from Chinese mothers (3.68
ng/g lip) (Lu et al., 2015; Rawn et al., 2017). Whereas, the TEQ concentrations in
placental tissues were higher than those reported from Taiwan (0.00291ng/g lip) and
Japan (0.0012 ng/g lip) (Suzuki et al., 2005; Wang et al., 2004).
5.4.2. Risk Assessment of dioxin like PCBs
As described earlier that PCBs are lipophilic and tend to bio-accumulate in the
food chain and exposure in human to dioxin like PCBs is of public and scientific concern
Chapter Five Discussion
110
due to their high toxicity. Exposure risks to subject women through the dietary intake in
the present study were evaluated by using WHO TEF and calculating the Estimated Daily
Intake of dl-PCBs. The EDI in all the women were found below the Tolerable Daily
Intake (TDI) of 1-4 pg TEq/ kg bw recommended by WHO. The EDI levels in blood,
milk and the placenta was 1.94 x 10⁻³
, 5.10 x 10⁻⁴
, 6.56 x 10⁻⁴
, respectively. These
indicate that at present, exposure to dl-PCBs in women through dietary exposure is quite
low in Punjab Pakistan. But their detection in the lower amount in body matrices
indicates their presence and a continuous exposure of sampling population. Therefore, if
the long term exposure continues and intake increases with industrialization and
urbanization, the study population may be at risk in future.
A study was conducted by Fromme et al., (2009) on the German population to
monitor the body burden of dl-PCBs and daily intake through food. The study findings
reflected an EDI of 0.19 pg WHO-TEQ/ kg bw indicating that the risk of exposure
through food intake was quite low in participants of that study. A similar study was
conducted in the UK by Food Standard Agency (FSA) in 2003, which revealed higher
levels (0.4 pg WHO-TEQ/ kg bw) in comparison to our study but lower than the TDI
given by WHO.
5.4.3. Risk Assessment through Physiological Characteristics
There are several factors having an influential role in the levels of PCBs
contamination in a study population, such as maternal age, body mass index, parity,
lactation and dietary intake, particularly dietary habits which vary across different areas.
In addition to these, exposure through inhalation and ingestion of dust/ dermal contact,
lifestyle and exposure time may also influence the levels of PCB in human body matrices
(Myllynen et al., 2005). Levels of PCBs were evaluated in all the three body matrices of
Chapter Five Discussion
111
the women with their demographic and physiological parameters in order to ascertain any
adverse health effect.
Through many previous studies on human serum or plasma, the personal
attributes of mothers, i.e. age, body mass index, lactation, parity, eating habits and
location have been associated with levels of PCBs in the body (Glynn et al., 2003).
However, the maternal serum samples in the present study showed no association with
maternal age, height and body mass index. These findings were consistent with a study
from China (Bi et al., 2007) where no association between serum levels of PCBs and age
was observed. However, in case of human milk samples, age of sampling mothers showed
a negative relationship with the concentration of PCBs in this study (r = -0.310, p =
0.024) which was inconsistent to a recent study on POPs levels in milk from Pakistan
(Yasmeen et al., 2017). The variations in the association between maternal age and
various body matrices could be explained by the reason that the concentration of POPs in
women body increases as age progresses because of storage within the fat, on the other
hand, women excrete POPs during mensuration, pregnancy and lactation, thereby
lowering their body burden, though no statistically significant differences can be found
(Thomsen et al., 2010).
Lactation or breastfeeding has been recognized to mobilize the PCBs from the
body, thus reducing the body burden in breastfeeding mothers (Glynn et al., 2003). A
moderate negative correlation was observed between levels of PCBs in milk and lactation
(r= -0.569, p=0.001) indicating that women who breastfed one child have relatively
higher levels of PCBs than those who have breastfed more children. These results were
similar to previous studies in Indonesia (Sudaryanto et al., 2006). Most of the sampling
women in the present study were lactating and preferred to breastfeed their infants rather
Chapter Five Discussion
112
in earlier stages of their development. Hence, this might be a reason of a significant
negative correlation between PCBs level in milk and lactation.
Food is considered as a major source of exposure to PCBs (90%) in human. The
sampling population was evaluated on the basis of eating habits such as meat, dairy,
vegetable and a combination of all of these. These eating habits were positively correlated
with levels of PCB in milk (r=0.353, p=0.012). Most of the women in the present study,
preferred to eat dairy products (34%) and vegetables (30 %) (Figure 4.11). Human milk
is rich in milk fat and PCBs being lipophilic tend to accumulate in lipid rich body part of
humans. Perhaps, this a reason why eating habits showed a significant positive correlation
with level of PCBs in human milk.
Furthermore, meat, fish, poultry and eggs are considered as a prime source of
higher chlorinated PCBs contamination in human. In the present study no significant
association could be found between body burden of PCBs in all the three body matrices
and fish consumption. These results were in contrast to previous studies conducted in
Swedish women where fish consumption was significantly correlated with serum
concentration of PCBs (Glynn et al., 2003). In the current study, fish consumption was
not a major dietary source most of the mothers were eating fish on quarterly basis in a
year. Perhaps this is a reason of difference in results when compared to Swedish and
Bangladeshi population. Also, the possible explanation for this may be regional variations
in food consumption patterns and difference in distribution of PCBs in food items of
geographically distinct areas.
The kinetics of PCBs are somehow complex in human and several factors are
attributed for reducing the body levels of PCBs in women one of these is parity i.e.
number of births. In the present study, primiparae (women with one birth) and multiparae
(women with two or more births) constituted 29% and 71% of the sampling
Chapter Five Discussion
113
population,respectively. The levels of PCBs were found higher in human milk of
primiparae and lower in multiparae and showed significant strong negative relationship
between parity and level of PCBs (r = -0.849, p =0.01). These results were similar to the
findings of an Indonesian study, which observed that primiparous women tend to have
higher level of PCBs than do multiparae women (Sudaryanto et al., 2006). However, no
association could be observed in the serum and placental concentration of PCBs and
parity.
Age and body mass index are factors that may affect the levels of PCBs and their
circulations in the human body (Muller et al., 2017). In the present study, none of the
body matrices showed any association with BMI. A study from China showed a positive
association between the serum levels of PCBs and body mass index (Lee et al., 2007).
Another study on serum of Swedish women showed positive association with age, body
mass index, change in body weight and their geographic location (Glynn et al., 2003).
This may be due to change in geographic location, genetic differences, eating habits, time
and levels of exposure. Nonetheless, placental concentration of PCBs showed a
significant positive correlation with maternal height (r= 0.323, p=0.015) and body weight
(r= 0.277, p= 0.033). This shows that women with greater height and more body weight
tend to have more PCBs in the body matrices.
5.5. Relationship of PCBs with Neonatal Anthropometric Measures
PCBs are grouped among the notorious endocrine disrupting chemicals (Shaw,
2009) and pose the serious threat to nervous system, hence; therefore, it is essential to
assess their impacts on infants. PCBs toxicity has been evaluated in developing fetus,
infants, and children due to accidental exposure episodes in Japan in 1968 and in Taiwan
in 1979 (Korrick & Altshul, 1998). Increased infant mortality and a congenital syndrome
Chapter Five Discussion
114
of low birth weight, ectodermal defects (deformed nails, natal teeth, and
hyperpigmentation), and delayed growth, including cognitive decrement and
psychological problems have been observed in children born to mothers with direct or
indirect exposure to PCB. According to Berg (2016) global monitoring study by WHO
indicated that recent human exposure to PCBs is still above the toxicologically safe level
for the fetus and breastfed infants as compared to DDT.
The potential risks to the health of infants through the trans-mammary transfer of
human milk were assessed in the present study. For this purpose, their Estimated Daily
Intake of dl-PCBs through lactation and hazard quotient was determined by using the
equation given by FAO/WHO (1995). The EDI in infants from the present study area was
lower than the values from Croatia (EDI = 50,000-700,000 pg TEQ kg-1
bw day-1
)
(Klincicet al., 2016), and Turkey (EDI = 13,000-2,010,000pg TEQ kg-1
bw day-1
) (Coket
al., 2012), but still slightly comparable and higher than the findings from Tanzanian
mothers (EDI = 200-114,000pg TEQ kg-1
bw day-1
) and Chinese mothers (mean EDI =
32.4 pg TEQ kg-1
bw day-1
), respectively. Moreover, in this study, the Hazard Quotient
was found far above the benchmark value of 1 at all the sampling sites which is
inagreement to the findings from Tanzania and China, in which HQ was above one in
most of the infants (Lu et al., 2015; Mülleret al., 2017). The hazard quotient higher than
one indicates high levels of adverse health risks to infants through breast milk
consumption from exposed mothers, and if the PCBsexposure prevails; the infants‘ health
would be susceptible to high levels of risk. However, the breast milk is a vital component
in infants‘ development so the PCBs exposure needs to be controlled at source. Also,
some evident significant effects can be assessed through correlation between the
concentration of PCBs in mother body matrices and physiological parameters as
discussed below.
Chapter Five Discussion
115
The anthropometric measures of infants were also compared with levels of PCBs
in human milk in order to evaluate any association between these two and to ascertain the
trans-mammary transfer of PCBs into infants. A significant negative relationship was
observed between the infant birth weight and level of PCBs (r= -0.732, p=0.01) reflecting
that with an increase in PCBs concentration, the birth weight of the infants decreases.
These results were similar to the studies conducted in Spain and USA (Ribas et al., 2002;
Sagiv et al., 2007). The infant birth weight was assessed for an association with maternal
serum level, but no significant relationship could be found between the two.
The placental concentration showed negative significant relationship with
neonatal birth weight and crown to heel length. These results were similar to previous
studies conducted in the USA (Wolff, 2010) and another study on European Cohort
(Govarts et al., 2012). These decrements found in neonatal growth in the present study
were also similar to previous studies conducted on other POPs in China (Wu et al., 2011),
India (Dewan et al., 2013), Saudi Arabia (Al-Saleh et al., 2012) and Singapore (Tan et
al., 2009).These findings suggested that maternal levels of PCBs negatively impact the
health of fetuses and infants.
Being lipophilic, PCBs accumulate in the food chain from the atmosphere and
enter into the human body. The results of this study indicated spatially varied maternal
exposure to PCBs and resulting transfer in infants and from the mother into the
developing fetuses and infants.Detection of PCBs in the human blood, milk and placenta
might indicate residues of previous releases into the environment or perhaps ongoing
uses.
Conclusion
116
CONCLUSION
This study was the first detailed report about the concentration of PCBs in blood
serum, milk and placentas from Punjab Province of Pakistan. The concentration of
∑34PCBs was highest in human blood serum followed by the placenta and milk,
includingeight dioxin- like and six indicator PCBs. Among different homolog of PCBs,
Tetra-CBs were higher in all the studied body matrices of mothers from selected five
districts. A significant correlation between milk and placental levels of PCBs and
physiological characteristics of mothers was observed in this study. Nevertheless, the
study also found a significant negative correlation between PCBs concentration in body
matrices of mothers and fetal growth parameters indicating the impacts of PCBs on
women health and infants.
The presence of PCBs in placenta and milk indicated the burden on women as
well as infants. These PCBs can transfer from mother to fetus through the placenta during
development and after birth through milk. The dioxin like and indicator PCBs could lead
to impaired fetal development leading to fetal abnormalities, growth retardation,
behavioral and physiological changes at later stages. An associationof anthropometric
parameters with PCBs concentration is indicating the impacts on the healthy young ones.
Though, at present, the maternal exposure to PCBs in Pakistan exerts lower risks to
neonatal health. But expansion in the industrial sector of the country which in
combination with the urban sprawl and recycling of obsolete electric equipment and/or e-
waste could be the potential source adding to the PCBs pollution in the country, hence
levels of PCBs could be higher in near future. Therefore, PCBs monitoring in human
body matrices should be a part of regular monitoring programs to assess the potential
health risks to the general public and future generations at earlier stages of their lives. The
results of this study provide the database from the country for futurtowe studies and
Conclusion
117
highlight the need for large scale assessment of PCB residues in mothers from Pakistan
and their carryover to the fetus.
Recommendations and Future Perspectives
In the light of the results of the present study, the recommendation made are hereunder:
1. The present study opened a new chapter to start the detailed study in different
human populations to know about the existing status of PCBs and POPs,
therefore, POPs monitoring in human population should be continued.
2. Long term studies should be conducted to focus on specific congeners of PCBs
and their metabolism and mechanism of action in mixture form in the human
population to make their risk assessment more reliable.
3. A regular monitoring of meat and dairy products should be conducted by the
concerned authorities to evaluate the potential PCBs contamination of food
items.
4. There is a need to identify the major sources of POPs in Pakistan to develop a
comprehensive plan for source reduction.
5. There should be proper planning for the comprehensive study of PCBs and other
POPs at the national level to make emission inventories that may be accessible
by multiple users to avoid redundancy and confusion in research.
6. Regular studies on PCBs in multiple human body matrices, wildlife, and
environmental media should be made in future for better understanding
7. There must be a comprehensive plan to raise awareness among the masses and
stakeholders to reduce the contamination of PCBs in the environment and
accumulation in the food chain.
Conclusion
118
8. A regular monitoring could help us to assess the historical trends of PCBs in the
environment, particularly, in Pakistan to evaluate the trend after Stockholm
Convention.
9. There should be more research to search the alternatives of PCBs for industrial
use and technological modifications are required to ensure the prevention of
release of complete combustion of PCBs and its safe disposal in the
environment.
10. Every industrial unit must follow the existing laws related to control and
eradication of POPs and public department and local authorities should take
effective measures for the implementation of legislative bindings on industries
and other consumer supplies to minimize the exposure to PCBs in the future.
11. There should be proper monitoring of POPs, PCBs and other contaminants in the
case of still births, aborted and abnormal babies, especially in those areas, where
POPs and other organic pollutants are high in concentration in the environment.
12. There must be awareness programs for the community on media, school,
colleges and non-govt. organizations to highlight the PCBs impacts on women
and infants
13. There should be a regulatory mechanism to phase out PCBs fromdifferent
geographical areas. Pakistan is a signatory to the Stockholm Convention and
Government of Pakistan must enforce the legislation and effective policy
making for safe disposal of persistent organic pollutants.
References
119
REFERENCES
Aguilar, A., Borrell, A., & Reijnders, P. (2002).Geographical and Temporal Variation in
Levels of Organochlorine Contaminants in Marine Mammals.Marine
Environmental Research, 53(5), 425-452.
Ahmad, S. S., Sherazi, A., & Shah, M. T. A. (2010). A Preliminary Study on Climate
Change causing Decline in Forest Cover Area in District Chakwal, Pakistan.
Pakistan Journal of Botany, 42(6), 3967-3970.
Ahmed, F. E. (2003). Analysis of Polychlorinated Biphenyls in Food Products.TrAC
Trends in Analytical Chemistry, 22(3), 170-185.
AMAP (1998). AMAP Assessment Report: Arctic Pollution Issues. Arctic Monitoring
and Assessment Programme.
Ali, M., & Athar, M. (2010).Impact of Transport and Industrial Emissions on the
Ambient Air Quality of Lahore City, Pakistan.Environmental Monitoring and
Assessment, 171(1-4), 353-363.
Ali, N., Eqani, S. A. M. A. S., Malik, R. N., Neels, H., & Covaci, A.
(2013).Organohalogenated Contaminants (OHCs) in Human Serum of Mothers
and Children from Pakistan with Urban and Rural Residential Settings.Science of
the Total Environment, 461–462, 655-662.
Ali, N., Mehdi, T., Malik, R. N., Eqani, S. A. M. A. S., Kamal, A., Dirtu, A. C., Neels,
H., & Covaci, A. (2014). Levels and Profile of Several Classes of Organic
Contaminants in Matched Indoor Dust and Serum Samples from Occupational
Settings of Pakistan.Environmental Pollution, 193, 269-276.
References
120
Ali, U., Syed, J. H., Mahmood, A., Li, J., Zhang, G., Jones, K. C., & Malik, R. N. (2015).
Influential Role of Black Carbon in the Soil–Air Partitioning of Polychlorinated
Biphenyls (PCBs) in the Indus River Basin, Pakistan.Chemosphere, 134, 172-
180.
Al-Saleh, I., Al-Doush, I., Alsabbaheen, A., Mohamed, G. E. D., & Rabbah, A.
(2012).Levels of DDT and its Metabolites in Placenta, Maternal and Cord Blood
and their Potential Influence on Neonatal Anthropometric Measures.Science of
the Total Environment, 416, 62-74.
Arrebola, J. P., Cuellar, M., Claure, E., Quevedo, M., Antelo, S. R., Mutch, E., Ramirez,
E., Fernandez, M. F., Olea, N., & Mercado, L. A. (2012).Concentrations of
Organochlorine Pesticides and Polychlorinated Biphenyls in Human Serum and
Adipose Tissue from Bolivia.Environmental Research, 112, 40-47.
Agency for Toxic Substances and Disease Registry (ASTDR). (2014). Case Studies in
Environmental Medicine, Polychlorinated Biphenyls (PCBs) Toxicity, Agency
for Toxic Substances and Disease Registry, US Department of Health and Human
Services, 1-90.
Agency for Toxic Substances and Disease Registry (ATSDR).(2000). Toxicological
Profile for Polychlorinated Biphenyls (PCBs). Atlanta, GA, US Department of
Health and Human Services,765.
Aziz, A., & Bajwa, I. U. (2008).Erroneous Mass Transit System and its Tended
Relationship with Motor Vehicular Air Pollution (An Integrated Approach for
Reduction of Urban Air Pollution in Lahore).Environmental Monitoring and
Assessment, 137(1-3), 25-33.
References
121
Aziz, F., Syed, J. H., Malik, R. N., Katsoyiannis, A., Mahmood, A., Li, J., Zhang, G., &
Jones, K. C. (2014). Occurrence of Polycyclic Aromatic Hydrocarbons in the
Soan River, Pakistan: Insights into Distribution, Composition, Sources and
Ecological Risk Assessment. Ecotoxicology and Environmental Safety, 109, 77-
84.
Azizullah, A., Khattak, M. N. K., Richter, P., & Häder, D. P. (2011).Water pollution in
Pakistan and its impact on public health-a review.Environment International,
37(2), 479-497.
Barr, D. B., Bishop, A., & Needham, L. L. (2007). Concentrations of Xenobiotic
Chemicals in the Maternal-Fetal Unit.Reproductive Toxicology, 23(3), 260-266.
Berg, V., Kraugerud, M., Nourizadeh-Lillabadi, R., Olsvik, P. A., Skåre, J. U., Alestrøm,
P., Ropstad, E., Zimmer, K.E., & Lyche, J. L. (2016). Endocrine effects of real-
life mixtures of persistent organic pollutants (POP) in experimental models and
wild fish. Journal of Toxicology and Environmental Health, Part A, 79(13-15),
538-548.
Bergonzi, R., Specchia, C., Dinolfo, M., Tomasi, C., De Palma, G., Frusca, T., &
Apostoli, P. (2009). Distribution of Persistent Organochlorine Pollutants in
Maternal and Foetal Tissues: Data from an Italian Polluted Urban Area.
Chemosphere, 76(6), 747-754.
Bi, X., Thomas, G. O., Jones, K. C., Qu, W., Sheng, G., Martin, F. L., & Fu, J. (2007).
Exposure of Electronics Dismantling Workers to Polybrominated Diphenyl
Ethers, Polychlorinated Biphenyls, and Organochlorine Pesticides in South
China.Environmental Science & Technology, 41(16), 5647-5653.
References
122
Biswas, K. F., Ghauri, B. M., & Husain, L. (2008).Gaseous and Aerosol Pollutants during
Fog and Clear Episodes in South Asian Urban Atmosphere.Atmospheric
Environment, 42(33), 7775-7785.
Biterna, M., & Voutsa, D. (2005).Polychlorinated Biphenyls in Ambient Air of NW
Greece and in Particulate Emissions.Environment International 31(5), 671-677.
Blanchet-Letrouvé, I., Zalouk-Vergnoux, A., Vénisseau, A., Couderc, M., Le Bizec, B.,
Elie, P., Herrenknecht, C., Mouneyrac, C., & Poirier, L. (2014). Dioxin-like,
Non-dioxin like PCB and PCDD/F Contamination in European Eel (Anguilla
anguilla) from the Loire Estuarine Continuum: Spatial and Biological
Variabilities. Science of the Total Environment, 472, 562-571.
Boalt, E., Nyberg, E., Bignert, A., Hedman, J., Danielson, S. (2013). Polychlorinated
Biphenyls (PCB) and Dioxins and Furans.HELCOM Core Indicator
Report.HELCOM Online.
Bordajandi, L. R., Gómez, G., Fernandez, M., Abad, E., Rivera, J., & González, M. J.
(2003).Study on PCBs, PCDD/Fs, Organochlorine Pesticides, Heavy Metals and
Arsenic Content in Freshwater Fish Species from the River Turia
(Spain).Chemosphere, 53(2), 163-171.
Breivik, K., Alcock, R., Li, Y. F., Bailey, R. E., Fiedler, H., & Pacyna, J. M. (2004).
Primary Sources of Selected POPs: Regional and Global Scale Emission
Inventories. Environmental Pollution, 128(1-2), 3-16.
Buck, G. M., Vena, J. E., Schisterman, E. F., Dmochowski, J., Mendola, P., Sever, L. E.,
Fitzgerald, E., Kostyniak, P., Greizerstein, H., & Olson, J. (2000). Parental
References
123
Consumption of Contaminated Sport Fish from Lake Ontario and Predicted
Fecundability.Epidemiology, 11(4), 388-393.
Brennan, S., & Withgott, J. (2005). Environmental systems: connections, cycles, and
feedback loops. Environment: the science behind the stories, 158-192.
Caspersen, I. H., Knutsen, H. K., Brantsæter, A. L., Haugen, M., Alexander, J., Meltzer,
H. M., & Kvalem, H. E. (2013). Dietary Exposure to Dioxins and PCBs in a
Large Cohort of Pregnant Women: Results from the Norwegian Mother and
Child Cohort Study (MoBa). Environment International, 59, 398-407.
Cheema, K., & Badshah, S. (2013). Cement Industry, Alternate Fuel and Environmental
Benefits. International Journal of Engineering Research and Technology, ESRSA
Publications.
Chi, K. H., Chang, M. B., & Kao, S. J. (2007). Historical Trends of PCDD/Fs and Dioxin-
like PCBs in Sediments Buried in a Reservoir in Northern Taiwan. Chemosphere,
68(9), 1733-1740.
Chovancova, J., Čonka, K., Fabišiková, A., Sejáková, Z. S., Dömötörová, M., Drobná, B.,
& Wimmerová, S. (2012). PCDD/PCDF, dl-PCB and PBDE Serum Levels of
Slovak General Population.Chemosphere, 88(11), 1383-1389.
Cok, I., Mazmanci, B., Mazmanci, M. A., Turgut, C., Henkelmann, B., & Schramm, K.
W. (2012).Analysis of Human Milk to Assess Exposure to PAHs, PCBs and
Organochlorine Pesticides in the Vicinity Mediterranean City Mersin,
Turkey.Environment International, 40, 63-69.
Covaci, A., & Voorspoels, S. (2005). Optimization of the Determination of
Polybrominated Diphenyl Ethers in Human Serum using Solid-Phase Extraction

References
124
and Gas Chromatography-Electron Capture Negative Ionization Mass
Spectrometry. Journal of Chromatography B, 827(2), 216-223.
Covaci, A., Jorens, P., Jacquemyn, Y., & Schepens, P. (2002).Distribution of PCBs and
Organochlorine Pesticides in Umbilical Cord and Maternal serum.Science of the
Total Environment, 298, 45-53.
Cui, J.,& Forssberg, E. (2003). Mechanical Recycling of Waste Electric and Electronic
Equipment: a Review. Journal of Hazardous Materials, 99(3), 243-263.
Daglioglu, N., Gulmen, M. K., Akcan, R., Efeoglu, P., Yener, F., & Ünal, İ.
(2010).Determination of Organochlorine Pesticides Residues in Human Adipose
Tissue, Data from Cukurova, Turkey.Bulletin of Environmental Contamination
and Toxicology, 85(1), 97-102.
Darnerud, P. O. (2003). Toxic Effects of Brominated Flame Retardants in Man and in
Wildlife.Environment International, 29(6), 841-853.
Darnerud, P. O., Atuma, S., Aune, M., Bjerselius, R., Glynn, A., Grawe, K. P., Becker,
W. (2006). Dietary Intake Estimations of Organohalogen Contaminants (Dioxins,
PCB, PBDE and Chlorinated Pesticides, eg(DDT) Based on Swedish market
Basket Data. Food and Chemical and Toxicology, 44(9), 1597–1606.
Devanathan, G., Subramanian, A., Someya, M., Sudaryanto, A., Isobe, T., Takahashi, S.,
Chakraborty, P., & Tanabe, S. (2009). Persistent Organochlorines in Human
Breast Milk from Major Metropolitan Cities in India.Environmental Pollution,
157(1), 148-154.
References
125
Dewan, P., Jain, V., Gupta, P., & Banerjee, B. D. (2013).Organochlorine Pesticide
Residues in Maternal Blood, Cord Blood, Placenta, and Breastmilk and their
Relation to Birth Size.Chemosphere, 90(5), 1704-1710.
Diamond, M. L., Melymuk, L., Csiszar, S. A., & Robson, M. (2010). Estimation of PCB
Stocks, Emissions, and Urban Fate: Will our Policies Reduce Concentrations and
Exposure? : ACS Publications.
Dijen Liem, A. K., Furst, P., & Rappe, C. (2000).Exposure of Populations to Dioxins and
Related Compounds.Food Additives and Contaminants, 17(4), 241–259.
Dirtu, A. C., Jaspers, V. L., Cernat, R., Neels, H., & Covaci, A. (2009).Distribution of
PCBs, their Hydroxylated Metabolites, and other Phenolic Contaminants in
Human Serum from Two European Countries.Environmental Science &
Technology, 44(8), 2876-2883.
Djien Liem, A., Furst, P., & Rappe, C. (2000).Exposure of Populations to Dioxins and
Related Compounds.Food Additives & Contaminants, 17(4), 241-259.
Dorea, J. G. (2008). Persistent, Bioaccumulative and Toxic Substances in Fish: Human
Health Considerations. Science of the Total Environment, 400(1-3), 93-114.
Doucet, J., Tague, B., Arnold, D. L., Cooke, G. M., Hayward, S., Goodyer, C. G. (2009).
Persistent Organic Pollutant Residues in Human Fetal Liver and Placenta from
Greater Montreal,Quebec:a Longitudinal Study from 1998 through 2006.
Environ. Health Perspectives, 117(4), 605–610.
Duarte-Davidson, R., & Jones, K. (1994). Polychlorinated Biphenyls (PCBs) in the UK
Population: Estimated Intake, Exposure and Body Burden. Science of the Total
Environment, 151(2), 131-152.
References
126
Elabbas, L. E., Westerholm, E., Roos, R., Halldin, K., Korkalainen, M., Viluksela, M., &
Håkansson, H. (2013). 10 - Non-Dioxin-Like Polychlorinated Biphenyls (NDL-
PCBs) in Foods: Exposure and Health Hazards. Persistent Organic Pollutants and
Toxic Metals in Foods: Woodhead Publishing, 215-260.
Eqani, S. A. M. A. S., Malik, R. N., & Mohammad, A. (2011).The Level and Distribution
of Selected Organochlorine Pesticides in Sediments from River Chenab,
Pakistan.Environmental Geochemistry and Health, 33(1), 33-47.
Eqani, S. A. M. A. S., Malik, R. N., Cincinelli, A., Zhang, G., Mohammad, A., Qadir, A.,
Rashid, A., Bokhari, H., Jones, K. C., & Katsoyiannis, A. (2013). Uptake of
Organochlorine Pesticides (OCPs) and Polychlorinated Biphenyls (PCBs) by
River Water Fish: The Case of River Chenab. Science of The Total Environment,
450–451, 83-91.
Eqani, S. A. M. A. S., Malik, R. N., Katsoyiannis, A., Zhang, G., Chakraborty, P.,
Mohammad, A., Jones, K. C. (2012). Distribution and Risk Assessment of
Organochlorine Contaminants in Surface Water from River Chenab,
Pakistan.Journal of Environmental Monitoring, 14(6), 1645-1654.
Erickson, M. D., & Kaley, R. G. (2011).Applications of Polychlorinated
Biphenyls.Environmental Science and Pollution Research, 18(2), 135-151.
Eriksson, P., Fischer, C., & Fredriksson, A. (2006). Polybrominated Diphenyl Ethers, a
Group of Brominated Flame Retardants, can Interact with Polychlorinated
Biphenyls in Enhancing Developmental Neurobehavioral Defects. Toxicological
Sciences, 94(2), 302-309.
References
127
Esteban, M., & Castano, A. (2009). Non-Invasive Matrices in Human Biomonitoring: a
Review. Environment International, 35(2), 438-449.
Fang, G. D., Dionysiou, D. D., Al-Abed, S. R., & Zhou, D. M. (2013). Superoxide
Radical Driving the Activation of Persulfate by Magnetite Nanoparticles:
Implications for the Degradation of PCBs. Applied Catalysis B: Environmental,
129,325-332.
FAO/WHO, 1995. Report of the Joint Meeting of the FAO panel of experts on pesticide
residues in food and the environment and a WHO expert group on pesticide
residues. FAO plant production and protection paper, 127, 1995.
FAO/WHO.(2005). Report of the Joint Meeting of the FAO Panel of Experts on Pesticide
Residues in Food and the Environment and the WHO Core Assessment
Group.FAO Plant Production and Protection Paper, 163.
Faroon, O., & Ruiz, P. (2015).Polychlorinated Biphenyls.Toxicology and Industrial
Health, 32(11), 1825-1847.
Farooq, S., Eqani, S. A. M. A. S., Malik, R. N., Katsoyiannis, A., Zhang, G., Zhang, Y.,
Li, J., Xiang, L., Jones, K. C., & Shinwari, Z. K. (2011). Occurrence, Finger
Printing and Ecological Risk Assessment of Polycyclic Aromatic Hydrocarbons
(PAHs) in the Chenab River, Pakistan.Journal of Environmental Monitoring,
13(11), 3207-3215.
Fiedler, H., Rappolder, M., Knetsch, G., & Basler, A. (2002). The German Dioxin
Database: PCDD/PCDF Concentrations in the Environment-Spatial and
Temporal Trends. Organohalogen Compounds, 57, 37-40.
Fromme, H., Albrecht, M., Boehmer, S., Büchner, K., Mayer, R., Liebl, B., ...& Bolte, G.
(2009). Intake and body burden of dioxin-like compounds in Germany: the INES
study. Chemosphere, 76(11), 1457-1463.
FSA (Food Standard Agency), (2003). Dioxin and dioxin-like PCBs in the UK diet: 2001
References
128
total diet study samples. Number: 38/03. Retrieved from <http://www.food.gov.uk>.
Fukata, H. O. M., Osada, H., Todaka, E., & Mori, C. (2005).Necessity to Measure PCBs
and Organochlorine Pesticide Concentrations in Human Umbilical Cords for
Fetal Exposure Assessment.Environmental Health Perspectives, 113(3), 297-303.
Gascon, M., Verner, M.A., Guxens, M., Grimalt, J.O., Forns, J., Ibarluzea, J., Lertxundi,
N., Ballester, F., Llop, S., Haddad, S. and Sunyer, J.(2013). Evaluating the
Neurotoxic Effects of Lactational Exposure to Persistent Organic Pollutants
(POPs) in Spanish Children.Neurotoxicology, 34, 9-15.
Gascon, M., Vrijheid, M., Martínez, D., Ballester, F., Basterrechea, M., Blarduni, E.,
Esplugues, A., Vizcaino, E., Grimalt, J. O., & Morales, E., Sunyer, J. (2012).Pre-
Natal Exposure to Dichlorodiphenyldichloroethylene and Infant Lower
Respiratory Tract Infections and Wheeze.European Respiratory Journal, 39,
1188-1196.
Gasic, B., MacLeod, M., Klanova, J., Scheringer, M., Ilic, P., Lammel, G., Pajovic, A.,
Breivik, K., Holoubek, I., & Hungerbühler, K. (2010). Quantification of Sources
of PCBs to the Atmosphere in Urban Areas: A Comparison of Cities in North
America, Western Europe and Former Yugoslavia. Environmental Pollution,
158(10), 3230-3235.
Gee, D., MacGarvin, M., Stirling, A., Keys, J., Wynne, B., Vaz, S. G. (2001). Late
Lessons from Early Warnings: The Precautionary Principle 1896-2000. P.
Harremoes (Ed.). Luxembourg: Environmental Issue Report No 22/2001. Office
for Official Publications of the European Communities Available from
References
129
http://www.eea.europa.eu/publications/environmental_issue_ report_2001_22
[Accessed on 23 March 2017].
Ghazanfar, S., Latif, A., Mirza, I. H., & Nadeem, M. A. (2011).Macro-Minerals
Concentrations of Major Fodder Tree Leaves and Shrubs of District Chakwal,
Pakistan.Pakistan Journal of Nutrition, 10(5), 480-484.
Giaginis, C., Zira, A., Theocharis, S., & Tsantili-Kakoulidou, A. (2009). Application of
Quantitative Structure–Activity Relationships for Modeling Drug and Chemical
Transport across the Human Placenta Barrier: a Multivariate Data Analysis
Approach. Journal of Applied Toxicology, 29(8), 724-733.
Gilbertson, M., Kubiak, T., Ludwig, J., & Fox, G. (1991). Great Lakes Embryo Mortality,
Edema, and Deformities Syndrome (GLEMEDS) in Colonial Fish-Eating Birds:
Similarity to Chick-Edema Disease. Journal of Toxicology and Environmental
Health, Part A Current Issues, 33(4),455-520.
Gilden, R. C., Huffling, K., & Sattler, B. (2010).Pesticides and Health Risks.Journal of
Obstetric, Gynecologic, & Neonatal Nursing, 39(1), 103-110.
Glauert, H. P., Lu, Z., Kumar, A., Bunaciu, R. P., Patel, S., Tharappel, J. C., Stemm, D.
N., Lehmler, H. J., Lee, E. Y., & Robertson, L. W. (2005). Dietary Vitamin E
Does Not Inhibit the Promotion of Liver Carcinogenesis by Polychlorinated
Biphenyls in Rats. The Journal of Nutrition, 135(2), 283-286.
Glynn, A. W., Granath, F., Aune, M., Atuma, S., Darnerud, P. O., Bjerselius, R., Vainio,
H., & Weiderpass, E. (2003). Organochlorines in Swedish Women: Determinants
of Serum Concentrations. Environmental Health Perspectives, 111(3), 349–355.

References
130
Godduhn, A., & Duffy, L. K. (2003). Multi-Generation Health Risks of Persistent
Organic Pollution in the Far North: Use of the Precautionary Approach in the
Stockholm Convention. Environmental Science & Policy, 6(4), 341-353.
Gomara, B., Athanasiadou, M., Quintanilla-Lpez, J. E., Gonzalez, M. J., & Bergman, A.
(2012).Polychlorinated Biphenyls and their Hydroxylated Metabolites in Placenta
from Madrid Mothers.Environmental Science and Pollution Research, 19(4),
139-147.
Government of the Punjab (GoP) (2016). Sialkot, Punjab Portal, All about Punjab at One
Place. https://www.punjab.gov.pk/sialkot.
Govarts, E., Den Hond, E., Schoeters, G., & Bruckers, L. (2010). Determinants of Serum
PCBs in Adolescents and Adults: Regression Tree Analysis and Linear
Regression Analysis. Human and Ecological Risk Assessment, 16(5), 1115-1132.
Govarts, E., Nieuwenhuijsen, M., Schoeters, G., Ballester, F., Bloemen, K., De Boer, M.,
Chevrier, C., Eggesbø, M., Guxens, M., & Krämer, U. (2012). Birth Weight and
Prenatal Exposure to Polychlorinated Biphenyls (PCBs) and
Dichlorodiphenyldichloroethylene (DDE): a Meta-Analysis within 12 European
Birth Cohorts. Environmental Health Perspectives, 120(2), 162-170.
Hamid, A., Zeb, M., Mehmood, A., Akhtar, S., & Saif, S. (2013).Assessment of
Wastewater Quality of Drains for Irrigation.Journal of Environmental Protection,
4(09), 937-945.
Harada, K., Inoue, K., Morikawa, A., Yoshinaga, T., Saito, N., & Koizumi, A.
(2005).Renal Clearance of Perfluorooctane Sulfonate and Perfluorooctanoate in
References
131
Humans and their Species-Specific Excretion.Environmental Research, 99(2),
253-261.
Hassine, S. B., Ameur, W. B., Gandoura, N., & Driss, M. R. (2012). Determination of
chlorinated pesticides, polychlorinated biphenyls, and polybrominated diphenyl
ethers in human milk from Bizerte (Tunisia) in 2010.Chemosphere, 89(4), 369-
377.
Helle, E., Olsson, M., & Jensen, S. (1976). PCB Levels Correlated with Pathological
Changes in Seal Uteri. Ambio, 5(5/6), 261-262.
Herrick, R. F., McClean, M. D., Meeker, J. D., Baxter, L. K., & Weymouth, G. A. (2004).
An unrecognized source of PCB contamination in schools and other
buildings.Environmental Health Perspectives, 112(10), 1051–1053.
Hites, R. A. (2004). Polybrominated Diphenyl Ethers in the Environment and in People: a
Meta-Analysis of Concentrations. Environmental Science & Technology, 38(4),
945–956.
Hsu, J. F., Guo, Y. L., Yang, S. Y., & Liao, P. C. (2005). Congener Profiles of PCBs and
PCDD/Fs in Yucheng Victims Fifteen Years after Exposure to Toxic Rice-Bran
Oils and their Implications for Epidemiologic Studies. Chemosphere, 61(9),
1231-1243.
Inoue, K., Harada, K., Takenaka, K., Uehara, S., Kono, M., Shimizu, T., Takasuga, T.,
Senthilkumar, K., Yamashita, F., & Koizumi, A. (2006). Levels and
Concentration Ratios of Polychlorinated Biphenyls and Polybrominated Diphenyl
Ethers in Serum and Breast Milk in Japanese Mothers.Environmental Health
Perspectives, 114(8), 1179-1185.
References
132
Iszatt, N., Stigum, H., Verner, M. A., White, R. A., Govarts, E., Murinova, L. P., &
Botton, J. (2015). Prenatal and Postnatal Exposure to Persistent Organic
Pollutants and InfantGrowth: A Pooled Analysis of Seven European Birth
Cohorts. Environmental Health Perspectives, 123(7), 730-736.
Iyengar, G., & Rapp, A. (2001).Human Placenta as a ‗Dual‘Biomarker for Monitoring
Fetal and Maternal environment with Special Reference to Potentially Toxic trace
Elements. Part 3: Toxic Trace Elements in Placenta and Placenta as a Biomarker
for these Elements. Science of the Total Environment, 280(1-3), 221-238.
Jain, A., 7 Sareen, R. (2006). E-waste Assessment Methodology and Validation in
India.Journal of Material Cycles and Waste Management, 8(1), 40-45.
Jalees, M. I., & Asim, Z. (2016).Statistical Modeling of Atmospheric Trace Metals in
Lahore, Pakistan for Correlation and Source Identification.Environmental Earth
Sciences, 75(9), 842.
Jaraczewska, K., Lulek, J., Covaci, A., Voorspoels, S., Kaluba-Skotarczak, A., Drews, K.,
& Schepens, P. (2006).Distribution of Polychlorinated Biphenyls,
Organochlorine Pesticides and Polybrominated Diphenyl Ethers in Human
Umbilical Cord Serum, Maternal Serum and Milk from Wielkopolska Region,
Poland.Science of the Total Environment, 372(1), 20-31.
Jaspal, Z. N., & Haider, N. (2014). Management of Chemicals in Pakistan: Concerns and
Challenges. South Asian Studies, 29(2), 497-517.
Jaward, F. M., Zhang, G., Nam, J. J., Sweetman, A. J., Obbard, J. P., Kobara, Y., &
Jones, K. C. (2005). Passive Air Sampling of Polychlorinated Biphenyls,
References
133
Organochlorine Compounds, and Polybrominated Diphenyl Ethers across
Asia.Environmental Science & Technology, 39(22), 8638-8645.
Jensen, S., Johnels, A., Olsson, M., & Otterlind, G. (1969).DDT and PCB in Marine
Animals from Swedish Waters.Nature, 224(5216), 247-250.
Jin, R., Zhan, J., Liu, G., Zhao, Y., Zheng, M., Yang, L., & Wang, M. (2017).Profiles of
Polychlorinated Biphenyls (PCBs) in Cement Kilns Co-Processing Solid
Waste.Chemosphere, 174, 165-172.
Joint FAO/WHO Expert Committee on Food Additives, Fifty-Seventh Meeting, Rome, 5-
14 June 2001. Retrieved from http://www.who.int/psc/jecfa/jecfa.html.
Jones, K. C., & De Voogt, P. (1999). Persistent Organic Pollutants (POPs): State of the
Science. Environmental Pollution, 100(1-3), 209-221.
Kang, J. H., Park, H., Chang, Y. S., & Choi, J. W. (2008).Distribution of Organochlorine
Pesticides (OCPs) and Polychlorinated Biphenyls (PCBs) in Human Serum from
Urban Areas in Korea.Chemosphere, 73(10), 1625-1631.
Karjalainen, A., Paakkonen J., & Karjalainen J. (2006).Tissue Specific and Whole Fish
Accumulation of Polychlorinated Biphenyls by Juvenile Baltic Salmon (Salmo
Salar L.)After Oral Gavage Exposure.Boreal Environment Research, 11(6), 421-
430.
Khawaja, S., Yousuf, M. J., & Khan, A. J. (2010).Polychlorinated Residues in Milk of
Lactating Women from Karachi, Pakistan.Journal of Basic & Applied Sciences,
6(2), 153-157.
References
134
Kim, S. K., & Yoon, J. (2014). Chronological Trends of Emission, Environmental Level
and Human Exposure of POPs over the Last 10 Years (1999–2010) in Korea:
Implication to Science and Policy. Science of the Total Environment, 470–471,
1346-1361.
Klincic, D., Herceg Romanić, S., Brčić Karačonji, I., Matek Sarić, M., Grzunov Letinić,
J., & Brajenović, N. (2016). Organochlorine Pesticides and PCBs (including dl-
PCBs) in Human Milk Samples Collected from Multiparae from Croatia and
Comparison with Primiparae.Environmental Toxicology and Pharmacology, 45,
74-79.
Kodavanti, P. R. S, Senthilkumar, K., & Loganathan, B. (2008).Organohalogen Pollutants
and Human Health.International Encyclopedia of Public Health, 4, 686-693.
Kodavanti, P. R. S. (2014). Polychlorinated Biphenyls (PCBs). Encyclopedia of the
Neurological Sciences (Second Edition), Oxford: Academic Press, 917-921.
Kodavanti, P. R. S., Senthilkumar, K., Loganathan, B. G. (2008). Organohalogen
Pollutants and Human Health. In: Harold Kris, Heggenhougen, Stella, Quah
(Eds.), Encyclopedia of Public Health, Academic Press, San Diego, CA, USA,
4,686–693.
Kodavanti, P. R. S., Valdez, J., Yang, J. H., Curras-Collazo, M., & Loganathan, B. G.
(2017).Chapter 39 - Polychlorinated Biphenyls, Polybrominated Biphenyls,
Polychlorinated Dibenzo-p-Dioxins, and Polychlorinated Dibenzofurans A2 -
Gupta, Ramesh C.Reproductive and Developmental Toxicology (Second Edition):
Academic Press, 711-743.
References
135
Korrick, S. A., & Altshul, L. (1998).High Breast Milk Levels of Polychlorinated
Biphenyls (PCBs) among Four Women Living Adjacent to a PCB-Contaminated
Waste Site.Environmental Health Perspectives, 106(8), 513-518.
L‘Homme, B., Scholl, G., Eppe, G., & Focant, J. F. (2015).Validation of a Gas
Chromatography–Triple Quadrupole Mass Spectrometry Method for
Confirmatory Analysis of Dioxins and Dioxin-like Polychlorobiphenyls in Feed
following New EU Regulation 709/2014.Journal of Chromatography A, 1376,
149-158.
Larsson, P., & Södergren, A. (1987).Transport of Polychlorinated Biphenyls (PCBs) in
Freshwater Mesocosms from Sediment to Water and Air.Water, Air, & Soil
Pollution,36(1), 33–46.
Lee, S. A., Dai, Q., Zheng, W., Gao, Y. T., Blair, A., Tessari, J. D., Ji, B. T., & Shu, X.
O. (2007). Association of Serum Concentration of Organochlorine Pesticides
with Dietary Intake and other Lifestyle Factors among Urban Chinese
Women.Environment International, 33(2), 157-163.
Lehmann, L. L., Esch, H. A., Kirby, P. W., Robertson, L., & Ludewig, G. (2007). 4-
Monochlorobiphenyl (PCB3) Induces Mutations in the Livers of Transgenic
Fisher 344 Rats. Carcinogenesis, 28(2), 471-478.
Leino, O., Kiviranta, H., Karjalainen, A. K., Kronberg-Kippilä, C., Sinkko, H., Larsen, E.
H., Virtanen, S., & Tuomisto, J. T. (2013).Pollutant Concentrations in
Placenta.Food and Chemical Toxicology, 54, 59-69.

References
136
Letcher, R. J., Klasson-Wehler, E., & Bergman, A. (2000).Methyl Sulfone and
Hydroxylated Metabolites of Polychlorinated Biphenyls. Volume 3
Anthropogenic Compounds Part K, pp. 315-35.Springer,Berlin, Heidelberg.
Li, Y., Geng, D., Liu, F., Wang, T., Wang, P., Zhang, Q., & Jiang, G. (2012).Study of
PCBs and PBDEs in King George Island, Antarctica, using PUF Passive Air
Sampling.Atmospheric Environment, 51, 140-145.
Lignell, S. (2013). Persistent Organic Pollutants in Swedish First-Time Mothers and
Effects on Infant Health: Institutet för miljömedicin/Institute of Environmental
Medicine.
Liu, G., Zhan, J., Zheng, M., Li, L., Li, C., Jiang, X., Wang, M., Zhao, Y., & Jin, R.
(2015).Field Pilot Study on Emissions, Formations and Distributions of PCDD/Fs
from Cement Kiln Co-Processing Fly Ash from Municipal Solid Waste
Incinerations.Journal of Hazardous Materials, 299, 471-478.
Lohmann, R., Breivik, K., Dachs, J., & Muir, D. (2007). Global Fate of POPs: Current
and Future Research Directions. Environmental Pollution, 150(1), 150-165.
Lopez-Espinosa, M. J., Granada, A., Carreno, J., Salvatierra, M., Olea-Serrano, F., &
Olea, N. (2007).Organochlorine Pesticides in Placentas from Southern Spain and
Some Related Factors.Placenta, 28(7), 631-638.
Lu, D., Lin, Y., Feng, C., Wang, D., She, J., Shen, H., Wang, G., & Zhou, Z. (2015).
Levels of Polychlorinated Dibenzo-p-Dioxins/Furans (PCDD/Fs) and Dioxin-like
Polychlorinated Biphenyls (DL-PCBs) in Breast Milk in Shanghai, China: A
Temporal Upward Trend. Chemosphere, 137, 14-24.
References
137
Ludewig, G., Lehmann, L., Esch, H., Robertson, L. W. (2008). Metabolic Activation of
PCBs to Carcinogens In Vivo—a Review. Environmental Toxicology &
Pharmacology, 25(2), 241–246.
Ma, J., Qiu, X., Ren, A., Jin, L., & Zhu, T. (2012).Using Placenta to Evaluate the
Polychlorinated Biphenyls (PCBs) and Polybrominated Diphenyl Ethers (PBDEs)
Exposure of Fetus in a Region with High Prevalence of Neural Tube
Defects.Ecotoxicology and Environmental Safety, 86, 141-146.
MacLeod, K. E. (1981). Polychlorinated Biphenyls in Indoor Air.Environmental Science
& Technology, 15(8), 926-928.
Maddox, C., Wang, B., Kirby, P. A., Wang, K., & Ludewig, G. (2008).Mutagenicity of 3-
Methylcholanthrene, PCB3, and 4-OH-PCB3 in the Lung of Transgenic
BigBlue® Rats.Environmental Toxicology and Pharmacology, 25(2), 260-266.
Mahmood, A., Syed, J. H., Malik, R. N., Zheng, Q., Cheng, Z., Li, J., & Zhang, G.
(2014). Polychlorinated biphenyls (PCBs) in Air, Soil, and Cereal Crops along
the Two Tributaries of River Chenab, Pakistan: Concentrations, Distribution, and
Screening Level Risk Assessment. Science of the Total Environment, 481, 596-
604.
Malik, R. N., Jadoon, W. A., & Husain, S. Z. (2010). Metal Contamination of Surface
Soils of Industrial City Sialkot, Pakistan: a Multivariate and GIS Approach.
Environmental Geochemistry and Health, 32(3), 179-191.
Malisch, R., & Kotz, A. (2014). Dioxins and PCBs in Feed and Food—Review from
European Perspective. Science of the Total Environment, 491-492, 2-10.
References
138
Mamontova, E. A., Tarasova, E. N., & Mamontov, A. A. (2017). PCBs and OCPs in
Human Milk in Eastern Siberia, Russia: Levels, Temporal Trends and Infant
Exposure Assessment. Chemosphere, 178, 239-248.
Mamun, M. I. R., Nahar, N., Mosihuzzaman, M., Linderholm, L., Athanasiadou, M.,
Bergman, A. (2007). Traditional Organochlorine Pollutants in Blood from
Humans Living in the Bangladesh Capital area. Organohalogen Compounds, 69,
2026-2030.
McMichael, P. (2011). Development and Social Change: A Global Perspective: A Global
Perspective. Sage Publications.
Mehmood, A., Mahmood, A., Eqani, S. A. M. A. S., Ishtiaq, M., Ashraf, A., Bibi, N.,
Qadir, A., Li, J., & Zhang, G. (2017). A Review on Emerging Persistent Organic
Pollutants: Current Scenario in Pakistan. Human and Ecological Risk
Assessment: An International Journal, 23(1), 1-13.
Meijer, S., Ockenden, W., Steinnes, E., Corrigan, B., & Jones, K. (2003). Spatial and
Temporal Trends of POPs in Norwegian and UK Background Air: Implications
for Global Cycling. Environmental Science & Technology, 37(3), 454-461.
Mirza, A. I. (2013). Systematized Traffic Pattern-Solution for Multiple Problems: A Case
Study of Traffic Pattern at Selected Roads (Shahrah-e-Quaid-e-Azam) in
Lahore.South Asian Studies, 28(2), 467.
Mitoma, C., Uchi, H., Tsukimori, K., Yamada, H., Akahane, M., Imamura, T., Utani, A.,
& Furue, M. (2015). Yusho and its Latest Findings—A Review in Studies
Conducted by the Yusho Group. Environment International, 82, 41-48.
References
139
Mohammed, A., Eklund, A., Östlund-Lindqvist, A. M., & Slanina, P. (1990).Distribution
of Toxaphene, DDT, and PCB among Lipoprotein Fractions in Rat and Human
Plasma.Archives of Toxicology, 64(7), 567-571.
Mori, C., Nakamura, N., Todaka, E., Fujisaki, T., Matsuno, Y., Nakaoka, H., & Hanazato,
M. (2014). Correlation Between Human Maternal–Fetal Placental Transfer and
Molecular Weight of PCB and Dioxin Congeners/Isomers. Chemosphere, 114,
262-267.
Mostafalou, S., & Abdollahi, M. (2013). Pesticides and Human Chronic Diseases:
Evidences, Mechanisms, and Perspectives. Toxicology and Applied
Pharmacology, 268(2), 157-177.
Muller, M. H. B., Polder, A., Brynildsrud, O. B., Karimi, M., Lie, E., Manyilizu, W. B.,
Mdegela, R. H., Mokiti, F., Murtadha, M., Nonga, H. E., Skaare, J. U., & Lyche,
J. L. (2017). Organochlorine Pesticides (OCPs) and Polychlorinated Biphenyls
(PCBs) in Human Breast Milk and Associated Health Risks to Nursing Infants in
Northern Tanzania.Environmental Research, 154, 425-434.
Mumtaz, M., Mehmood, A., Qadir, A., Mahmood, A., Malik, R. N., Sabir, A. M., Li., J.&
Zhang, G. (2016). Polychlorinated biphenyl (PCBs) in rice grains and straw; risk
surveillance, congener specific analysis, distribution and source apportionment
from selected districts of Punjab Province, Pakistan. Science of the Total
Environment, 543, 620-627.
Murata, M., Iseki, N., Masunaga, S., & Nakanishi, J. (2003). Estimation of Effects of
Dioxins and Dioxin-like PCBs on Wildlife Population––a Case Study on
Common Cormorant. Chemosphere, 53(4), 337-345.
References
140
Myllynen, P., Pasanen, M., & Pelkonen, O. (2005). Human Placenta: a Human Organ for
Developmental Toxicology Research and Biomonitoring. Placenta, 26(4), 361-
371.
Nanes, J. A., Xia, Y., Dassanayake, R. M. A. P. S., Jones, R. M., Li, A., Stodgell, C. J.,
Walker, C. K., Szabo, S., Leuthner, S., Durkin, M. S., Moye, J., & Miller, R. K.
(2014). Selected Persistent Organic Pollutants in Human Placental Tissue from
the United States.Chemosphere, 106, 20-27.
Naqvi, S., & Jahan, M. (1999). Pesticide Residues in Serum and Blood Samples of the
People of Karachi. Journal of Environmental Biology, 20(10), 241-244.
Nasir, Z. A., Colbeck, I., Bharucha, Z. P., Campos, L. C., & Ali, Z. (2014). Ethno-
Environmental Knowledge as a Tool to Combat Indoor Air Pollution in Low
Income Countries: A Case Study from Rural Communities in Pakistan. Journal of
Environment and Human, 1(2), 165-175.
NAVFAC.(2012). A Handbook for Determining the Sources of PCB Contamination in
Sediments, Technical Report, Naval Facilities Engineering Commands, pp 1-150.
Nchuchuwe, F. F., & Adejuwon, K. D. (2012). The Challenges of Agriculture and Rural
Development in Africa: the Case of Nigeria. International Journal of Academic
Research in Progressive Education and Development, 1(3), 45-61.
Needham, L. L., Grandjean, P., Heinzow, B., Jørgensen, P. J., Nielsen, F., Patterson Jr, D.
G., ...& Weihe, P. (2010). Partition of environmental chemicals between maternal
and fetal blood and tissues.Environmental Science & Technology, 45(3), 1121-
1126.
References
141
Newman 3rd, M. C. (2010). Fundamentals of Ecotoxicology 3rd Edition CRC press. Boca
Raton, FL.
Norén, K., & Meironyté, D. (2000).Certain Organochlorine and Organobromine
Contaminants in Swedish Human Milk in Perspective of Past 20–30
Years.Chemosphere, 40(9-11), 1111-1123.
Noren, K., Weistrand, C., & Karpe, F. (1999).Distribution of PCB Congeners, DDE,
Hexachlorobenzene, and Methylsulfonyl Metabolites of PCB and DDE among
Various Fractions of Human Blood Plasma.Archives of Environmental
Contamination and Toxicology, 37(3), 408-414.
Noren, K., & Meironyte, D. (2000).Certain organochlorine and organobromine
contaminants in Swedish human milk in perspective of past 20–30
years.Chemosphere, 40(9), 1111-1123.
Nost, T. H. (2014). Understanding Temporality in Human Concentrations of Organic
Contaminants-Considering Human Concentrations over Time and through Life in
Perspective of Historic Production and Use.
Onozuka, D., Yoshimura, T., Kaneko, S., & Furue, M. (2009). Mortality After Exposure
to Polychlorinated Biphenyls and Polychlorinated Dibenzofurans: A 40-Year
Follow-up Study of Yusho Patients. American Journal of Epidemiology, 169(1),
86-95.
Orta-García, S., Pérez-Vázquez, F., González-Vega, C., Varela-Silva, J. A., Hernández-
González, L., & Pérez-Maldonado, I. (2014).Concentrations of Persistent Organic
Pollutants (POPs) in Human Blood Samples from Mexico City, Mexico.Science
of the Total Environment, 472, 496-501.

References
142
Ott, W. R., Steinemann, A. C., & Wallace, L. A. (2006). Exposure analysis: Taylor &
Francis Group LLC, CRC Press, pp, 381-395.
Park, J., She, J., Holden, A., Sharp, M., Gephart, R., Sounders-Mason, G., Zhang, V.,
Chow, J., Bernice Leslie, B.,& Kim Hooper, K. (2011). High Postnatal
Exposures to Polybrominated Diphenyl Ethers (PBDEs) and Polychlorinated
Biphenyls (PCBs) via Breast Milk in California: Does BDE-209 Transfer to
Breast Milk?Environmental Science and Technology, 45 (10), pp 4579–4585
Parveen, Z., & Masud, S. Z. (2001). Studies on Pesticide Residues in Human
Blood.Pakistan Journal of Scientific and Industrial Research, 44(3), 137-141.
Patandin, S., Lanting, C. I., Mulder, P. G., Boersma, E. R., Sauer, P. J., & Weisglas-
Kuperus, N. (1999). Effects of environmental exposure to polychlorinated
biphenyls and dioxins on cognitive abilities in Dutch children at 42 months of
age.The Journal of pediatrics, 134(1), 33-41.
Porpora, M. G., Lucchini, R., Abballe, A., Ingelido, A. M., Valentini, S., Fuggetta, E.,
Cardi, V., Ticino, A., Marra, V., & Fulgenzi, A. R. (2013). Placental Transfer of
Persistent Organic Pollutants: a Preliminary Study on Mother-Newborn Pairs.
International Journal of Environmental Research and Public Health, 10(2), 699-
711.
Qadir, A., Malik, R. N., & Husain, S. Z. (2008).Spatio-Temporal Variations in Water
Quality of Nullah Aik-Tributary of the River Chenab, Pakistan.Environmental
Monitoring and Assessment, 140(1-3), 43-59.
References
143
Rawn, D. F. K., Sadler, A. R., Casey, V. A., Breton, F., Sun, W. F., Arbuckle, T. E., &
Fraser, W. D. (2017). Dioxins/Furans and PCBs in Canadian Human Milk: 2008–
2011. Science of the Total Environment, 595, 269-278.
Ribas-Fitó, N., Sala, M., Cardo, E., Mazón, C., De Muga, M. E., Verdú, A., Marco, E.,
Grimalt, J. O., & Sunyer, J. (2002). Association of Hexachlorobenzene and other
Organochlorine Compounds with Anthropometric Measures at Birth. Pediatric
Research, 52(2), 163-167.
Rice, D. C. (2001).Relationship between Measures of Exposure to PCBs/Dioxins and
Behavioral Effects in Recent Developmental Studies.Human and Ecological Risk
Assessment: An International Journal, 7(5), 1059-1077.
Richards, G., & Agranovski, I. E. (2017). Dioxin-like PCB Emissions from Cement Kilns
during the Use of Alternative Fuels. Journal of Hazardous Materials, 323, 698-
709.
Ritter, R., Scheringer, M., MacLeod, M., Moeckel, C., Jones, K. C., & Hungerbühler, K.
(2011). Intrinsic Human Elimination Half-Lives of Polychlorinated Biphenyls
Derived from the Temporal Evolution of Cross-Sectional Biomonitoring Data
from the United Kingdom. Environmental Health Perspectives, 119(2), 225.
Robertson, L. W., & Hansen, L. G. (Eds.). (2015). PCBs: Recent Advances in
Environmental Toxicology and Health Effects. University Press of Kentucky.
Robson, M., Melymuk, L., Csiszar, S. A., Giang, A., Diamond, M. L., & Helm, P. A.
(2010). Continuing Sources of PCBs: The Significance of Building
Sealants.Environment International, 36(6), 506-513.
References
144
Rodriguez, E. A. (2016). Hydroxylated and Sulfated Metabolites of Lower Chlorinated
PCBs Bind with High Affinity to Human Serum Albumin and Exhibit Selective
Toxicity to Neuronal Cells, PhD Dissertations, University of Iowa.
Ross, P. S., & Birnbaum, L. S. (2003).Integrated Human and Ecological Risk
Assessment: a Case Study of Persistent Organic Pollutants (POPs) in Humans
and Wildlife.Human and Ecological Risk Assessment, 9(1), 303-324.
Roszko, M., Jędrzejczak, R., & Szymczyk, K. (2014).Polychlorinated Biphenyls (PCBs),
Polychlorinated Diphenyl Ethers (PBDEs) and Organochlorine Pesticides in
Selected Cereals Available on the Polish Retail Market.Science of the Total
Environment, 466–467, 136-151.
Rushneck, D. R., Beliveau, A., Fowler, B., Hamilton, C., Hoover, D., Kaye, K., Berg, M.,
Smith, T., Telliard, W. A., & Roman, H. (2004). Concentrations of Dioxin-like
PCB Congeners in Unweathered Aroclors by HRGC/HRMS using EPA Method
1668A. Chemosphere, 54(1), 79-87.
Sagiv, S. K., Tolbert, P. E., Altshul, L. M., & Korrick, S. A. (2007).Organochlorine
Exposures during Pregnancy and Infant Size at Birth.Epidemiology, 18, 120-129.
Schaum, J., Schuda, L., Wu, C., Sears, R., Ferrario, J., & Andrews, K. (2003).A national
survey of persistent, bioaccumulative, and toxic (PBT) pollutants in the United
States milk supply.Journal of Exposure Science and Environmental
Epidemiology, 13(3), 177.
Schecter, A. (Ed.). (2013). Dioxins and Health: Springer Science & Business Media.
Schlumpf, M., Kypke, K., Wittassek, M., Angerer, J., Mascher, H., Mascher, D., Vokt,
C., Birchler, M., & Lichtensteiger, W. (2010). Exposure patterns of UV filters,

References
145
fragrances, parabens, phthalates, organochlor pesticides, PBDEs, and PCBs in
human milk: correlation of UV filters with use of cosmetics. Chemosphere,
81(10), 1171-1183.
Shao, C. (2001). Status and Prevention Strategies of PCBs in China.Memoirs of Seminar
on Persistent Organic Pollutants, SEPA, Beijing.
Sharma, B. M., Bharat, G. K., Tayal, S., Nizzetto, L., Čupr, P., & Larssen, T. (2014).
Environment and Human Exposure to Persistent Organic Pollutants (POPs) in
India: A Systematic Review of Recent and Historical Data. Environment
International, 66, 48-64.
Shaw, I. (Ed.). (2009). Endocrine Disrupting Chemicals in Food.Elsevier.
Shaw, I., & Chadwick, J. (1998). Principles of Environmental Toxicology: Taylor &
Francis Ltd., CRC Press, pp. 39-40.
Shoeib, M., Harner, T. M., Webster, G., & Lee, S. C. (2011). Indoor Sources of Poly-and
Perfluorinated Compounds (PFCS) in Vancouver, Canada: Implications for
Human Exposure. Environmental Science & Technology, 45(19), 7999-8005.
Silverstone, A. E. W. R., Rosenbaum, P. F., Foushee, R. S., Pavuk, M. (2009). Mono-
Ortho and Di-Ortho Substituted PCBs Congeners and Type 2 Diabetes in the
Anniston Community Health Survey. Organohalogen Compounds, 71, 001042-
001046.
Someya, M., Ohtake, M., Kunisue, T., Subramanian, A., Takahashi, S., Chakraborty, P.,
Ramachandran, R., & Tanabe, S. (2010). Persistent Organic Pollutants in Breast
Milk of Mothers Residing around an Open Dumping Site in Kolkata, India:
References
146
Specific Dioxin-like PCB Levels and Fish as a Potential Source. Environment
International, 36(1), 27-35.
Song, Q., & Li, J. (2014).A Systematic Review of the Human Body Burden of e-Waste
Exposure in China.Environment International, 68, 82-93.
Spano, M., Toft, G., Hagmar, L., Eleuteri, P., Rescia, M., Rignell-Hydbom, A., Tyrkiel,
E., Zvyezday, V., & Bonde, J. P. (2005). Exposure to PCB and p, p′-DDE in
European and Inuit populations: impact on human sperm chromatin integrity.
Human Reproduction, 20(12), 3488-3499.
Srogi, K. (2008). Levels and Congener Distributions of PCDDs, PCDFs and Dioxin-like
PCBs in Environmental and Human Samples: a Review. Environmental
Chemistry Letters, 6(1), 1-28.
Subramanian, A., Ohtake, M., Kunisue, T., & Tanabe, S. (2007).High Levels of
Organochlorines in Mother's Milk from Chennai (Madras) City,
India.Chemosphere, 68(5), 928-939.
Sudaryanto, A., Kunisue, T., Kajiwara, N., Iwata, H., Adibroto, T. A., Hartono, P., &
Tanabe, S. (2006). Specific Accumulation of Organochlorines in Human Breast
Milk from Indonesia: Levels, Distribution, Accumulation Kinetics and Infant
Health Risk. Environmental Pollution, 139, 107-117.
Suzuki, G., Nakano, M., & Nakano, S. (2005). Distribution of PCDDs/PCDFs and Co-
PCBs in Human Maternal Blood, Cord Blood, Placenta, Milk, and Adipose
Tissue: Dioxins Showing High Toxic Equivalency Factor Accumulate in the
Placenta. Bioscience, Biotechnology, and Biochemistry, 69(10), 1836-1847.
References
147
Syed, J. H., Malik, R. N., Li, J., Chaemfa, C., Zhang, G., & Jones, K. C. (2014).Status,
Distribution and Ecological Risk of Organochlorines (OCs) in the Surface
Sediments from the Ravi River, Pakistan.Science of the Total Environment, 472,
204-211.
Syed, J. H., Malik, R. N., Li, J., Zhang, G., & Jones, K. C. (2013).Levels, Distribution
and Air–Soil Exchange Fluxes of Polychlorinated Biphenyls (PCBs) in the
Environment of Punjab Province, Pakistan. Ecotoxicology and Environmental
Safety, 97, 189-195.
Tan, J., Loganath, A., Chong, Y. S., & Obbard, J. P. (2009). Exposure to Persistent
Organic Pollutants in Utero and Related Maternal Characteristics on Birth
Outcomes: A Multivariate Data Analysis Approach. Chemosphere, 74(3), 428-
433.
Tauseef, M., Ihsan, F., Nazir, W., & Farooq, J. (2012). Weed Flora and Importance Value
Index (IVI) of the Weeds in Cotton Crop Fields in the Region of Khanewal,
Pakistan. Pakistan Journal of Weed Science Research, 18(3), 319-330.
Thomas, G. O., Wilkinson, M., Hodson, S., & Jones, K. C. (2006).Organohalogen
Chemicals in Human Blood from the United Kingdom.Environmental Pollution,
141(1), 30-41.
Thomsen, C., Haug, L. S., Stigum, H., Frøshaug, M., Broadwell, S. L., & Becher, G.
(2010).Changes in Concentrations of Perfluorinated Compounds, Polybrominated
Diphenyl Ethers, and Polychlorinated Biphenyls in Norwegian Breast-Milk
during Twelve Months of Lactation.Environmental Science & Technology,
44(24), 9550-9556.
References
148
Timbrell, J. (2001). Introduction to Toxicology: Taylor & Francis, CRC Press, 3rd
edition, pp. 67,134.
Toms, L. M. L., Harden, F. A., Symons, R. K., Burniston, D., Fürst, P., & Müller, J. F.
(2007). Polybrominated diphenyl ethers (PBDEs) in human milk from
Australia.Chemosphere, 68(5), 797-803.
Tsydenova, O. V., Sudaryanto, A., Kajiwara, N., Kunisue, T., Batoev, V. B., & Tanabe,
S. (2007). Organohalogen Compounds in Human Breast Milk from Republic of
Buryatia, Russia.Environmental Pollution, 146(1), 225-232.
Turci, R., Turconi, G., Comizzoli, S., Roggi, C., & Minoia, C. (2006). Assessment of
dietary intake of polychlorinated biphenyls from a total diet study conducted in
Pavia, Northern Italy. Food additives and contaminants, 23(9), 919-938.
Tyagi, V., Garg, N., Mustafa, M., Banerjee, B., & Guleria, K. (2015). Organochlorine
Pesticide Levels in Maternal Blood and Placental Tissue with Reference to
Preterm Birth: a Recent Trend in North Indian Population. Environmental
Monitoring and Assessment, 187(7),471.
Ullah, R., Malik, R. N., Muhammad, A., Ahad, K., Tariq, M., Asghar, R., & Qadir, A.
(2016).Higher Concentrations and Ecological Risks of Selected Persistent
Organic Pollutants in Macrobrachium Lamarrei from the Streams of Sialkot,
Pakistan.J Agric Sci Technol, 6, 27-34.
United Nations Environment Program (UNEP). (1999). Guidelines for the Identification
of PCBs and Materials Containing PCBs, First Issue, August 1999. United
Nationas Environmental Program(UNEP) Chemicals Web Page: http://www.
chem. unep. ch/pops.
References
149
United Nations Environment Program (UNEP). (2011). Stockholm Convention on
Persistent Organic Pollutants (POPs). Geneva, Switzerland: Text and annexes;
[20011-64 Available from: www.unep.org].
United States Food and Drug Administration (USFDA).(2004). Total Diet Study.
http://www.fda.gov/Food/FoodSafety/FoodContaminantsAdulteration/TotalDietS
tudy/default.htm.
Vafeiadi, M., Vrijheid, M., Fthenou, E., Chalkiadaki, G., Rantakokko, P., Kiviranta, H.,
Kyrtopoulos, S. A., Chatzi, L., & Kogevinas, M. (2014). Persistent Organic
Pollutants Exposure during Pregnancy, Maternal Gestational Weight Gain, and
Birth Outcomes in the Mother–Child Cohort in Crete, Greece (RHEA study).
Environment International, 64, 116-123.
Vallack, H. W., Bakker, D. J., Brandt, I., Broström-Lundén, E., Brouwer, A., Bull, K. R.,
Gough, C., Guardans, R., Holoubek, I., & Jansson, B. (1998). Controlling
Persistent Organic Pollutants–What Next? Environmental Toxicology and
Pharmacology, 6(3), 143-175.
Van den Berg, M., Birnbaum, L. S., Denison, M., De Vito, M., Farland, W., Feeley, M.,
& Rose, M. (2006). The 2005 World Health Organization Reevaluation of
Human and Mammalian Toxic Equivalency Factors for Dioxins and Dioxin-Like
Compounds. Toxicological Sciences, 93(2), 223-241.
Van Den Berg, M., Kypke, K., Kotz, A., Tritscher, A., Lee, S. Y., Magulova, K., Fiedler,
H.,& Malisch, R. (2016). WHO/UNEP Global Surveys of PCDDs, PCDFs, PCBs
and DDTs in Human Milk and Benefit–Risk Evaluation of Breast
Feeding.Archives of Toxicology, 91(1), 83–96.
References
150
Van, Leeuwen, F. R., Feeley, M., Schrenk, D., Larsen, J. C., Farland, W., & Younes, M.
(2000). Dioxins: WHO‘s tolerable daily intake (TDI) revisited. Chemosphere,
40(9-11), 1095-1101.
Verner, M. A., Charbonneau, M., López-Carrillo, L., & Haddad, S. (2008).
Physiologically based pharmacokinetic modeling of persistent organic pollutants
for lifetime exposure assessment: a new tool in breast cancer epidemiologic
studies.Environmental Health Perspectives, 116(7), 886.
Verner, M. A., Sonneborn, D., Lancz, K., Muckle, G., Ayotte, P., Dewailly, E., Kocan,
A., PalkovicovÃ, L., Trnovec, T., & Haddad, S. (2013). Toxicokinetic Modeling
of Persistent Organic Pollutant Levels in Blood from Birth to 45 Months of Age
in Longitudinal Birth Cohort Studies.Environmental Health Perspectives, 121(1),
131-137.
Vestergren, R., & Cousins, I. T. (2009).Tracking the Pathways of Human Exposure to
Perfluorocarboxylates.Environmental Science & Technology, 43, 5565-5575.
Vizcaino, E., Grimalt, J. O., Fernandez-Somoano, A., & Tardon, A. (2014).Transport of
Persistent Organic Pollutants across the Human Placenta.Environment
International, 65,107-115.
Voogt, P., & Brinkman, U. (1989).Production, Properties and Usage of Polychlorinated
Biphenyls. Halogenated Biphenyls, Terphenyls, Naphthalenes, Dibenzodioxins
and Related Products: Elsevier Amsterdam, 3-45.
Wang, S. L., Lin, C. Y., Leon Guo, Y., Lin, L. Y., Chou, W. L., & Chang, L. W. (2004).
Infant Exposure to Polychlorinated Dibenzo-p-Dioxins, Dibenzofurans and
Biphenyls (PCDD/Fs, PCBs)––Correlation Between Prenatal and Postnatal
Exposure. Chemosphere, 54(10), 1459-1473.
References
151
Wania, F. (2003).Assessing the Potential of Persistent Organic Chemicals for Long-
Range Transport and Accumulation in Polar Regions.Environmental Science &
Technology, 37(7), 1344-1351.
Wania, F., & Mackay, D. (1993).Global Fractionation and Cold Condensation of Low
Volatility Organochlorine Compounds in Polar Regions.Ambio, 10-18.
Wei, D., Kameya, T., & Urano, K. (2007). Environmental Management of Pesticidal
POPs in China: Past, Present and Future. Environment International, 33(7), 894-
902.
Wittsiepe, J., Fobil, J. N., Till, H., Burchard, G. D., Wilhelm, M., & Feldt, T. (2015).
Levels of Polychlorinated Dibenzo-p-Dioxins, Dibenzofurans (PCDD/Fs) and
Biphenyls (PCBs) in Blood of Informal e-Waste Recycling Workers from
Agbogbloshie, Ghana, and Controls. Environment International, 79, 65-73.
Wolff, M. S. E. S., Berkowitz, G., Teitelbaum, S., Siskind, J., Barr, D. B., & Wetmur, J.
(2010).Prenatal Pesticide and PCB Exposures and Birth Outcomes.Pediatric
Research, 61(2), 243.
World Health Organization (WHO).(1993). Polychlorinated Biphenyls and Terphenyls,
2nd Edition. Geneva, World Health Organization, (Environmental Health
Criteria, No. 140).
World Health Organization (WHO). (1998). Assessment of the Health Risk of Dioxins:
Reevaluation of the Tolerable Daily Intake TDI. World Health Organization,
Geneva, Switzerland, 25-29.
World Health Organization (WHO). (2000). Air Quality Guidelines – Second Edition,
Chapter 5.10, Polychlorinated Biphenyls, World Health Organization, Regional

References
152
Office for Europe, Copenhagen, Denmark, 2000
(http://www.euro.who.int/__data/assets/pdf_file/0016/123064/AQG2ndEd_5_10
PCBs.PDF)
World Health Organization (WHO). (2007). Revised Guidelines for Developing a
National Protocol. Fourth WHO-Coordinated Survey of Human Milk for
Persistent Organic Pollutants in Cooperation with UNEP.
World Health Organization (WHO). (2003). Polychlorinated Biphenyls: Human
Health Aspects. Concise International Chemical Assessment Document,
55, 1-21.
Wu, K., Xu, X., Liu, J., Guo, Y., & Huo, X. (2011).In Utero Exposure to Polychlorinated
Biphenyls and Reduced Neonatal Physiological Development from Guiyu,
China.Ecotoxicology and Environmental Safety, 74(8), 2141-2147.
Wu, W. Z. (1999), Environmental Behavior and Ecotoxicological Impact of Persistent
Organic Pollutant (POP) in Wildlife with Special Emphasis on the Aquatic
Ecosystem. Herbert Utz Verlag.
Xing, G. H., Chan, J. K. Y., Leung, A. O. W., Wu, S. C., & Wong, M. (2009).
Environmental Impact and Human Exposure to PCBs in Guiyu, an Electronic
Waste Recycling Site in China.Environment International, 35(1), 76-82.
Yao, Y., Masunaga, S., Takada, H., & Nakanishi, J. (2002).Identification of
Polychlorinated Dibenzo-p-Dioxin, Dibenzofuran, and Coplanar Polychlorinated
Biphenyl Sources in Tokyo Bay, Japan.Environmental Toxicology and
Chemistry, 21(5), 991-998.
References
153
Yasmeen, H., Qadir, A., Mumtaz, M., Eqani, S. A. M. A. S., Syed, J. H., Mahmood,
A.,Jamil, N., Nazar, F., Ali, H., Ahmad, M. S., & Tanveer, Z. I. (2016). Risk
Profile and Health Vulnerability of Female Workers Who Pick Cotton by
Organanochlorine Pesticides from Southern Punjab, Pakistan. Environmental
Toxicology and Chemistry, 36(5), 1193-1201.
Yoshimura, T. (2003).Yusho in Japan.Industrial Health, 41(3), 139-148.
Yu, M. H. (2005). Toxicology, Environmental Toxicology, Biological and Health Effects
of Pollutants. Florida: CRC PRESS LLC:239-251.
Yu, M. H., Tsunoda, H., & Tsunoda, M. (2011). Environmental toxicology: Biological
and Health Effects of Pollutants. CRC Press.
Zhang, H., Lu, Y., Shi, Y., Wang, T., Xing, Y., & Dawson, R. W. (2005). Legal
Framework Related to Persistent Organic Pollutants (POPs) Management in
China. Environmental Science & Policy, 8(2), 153-160.
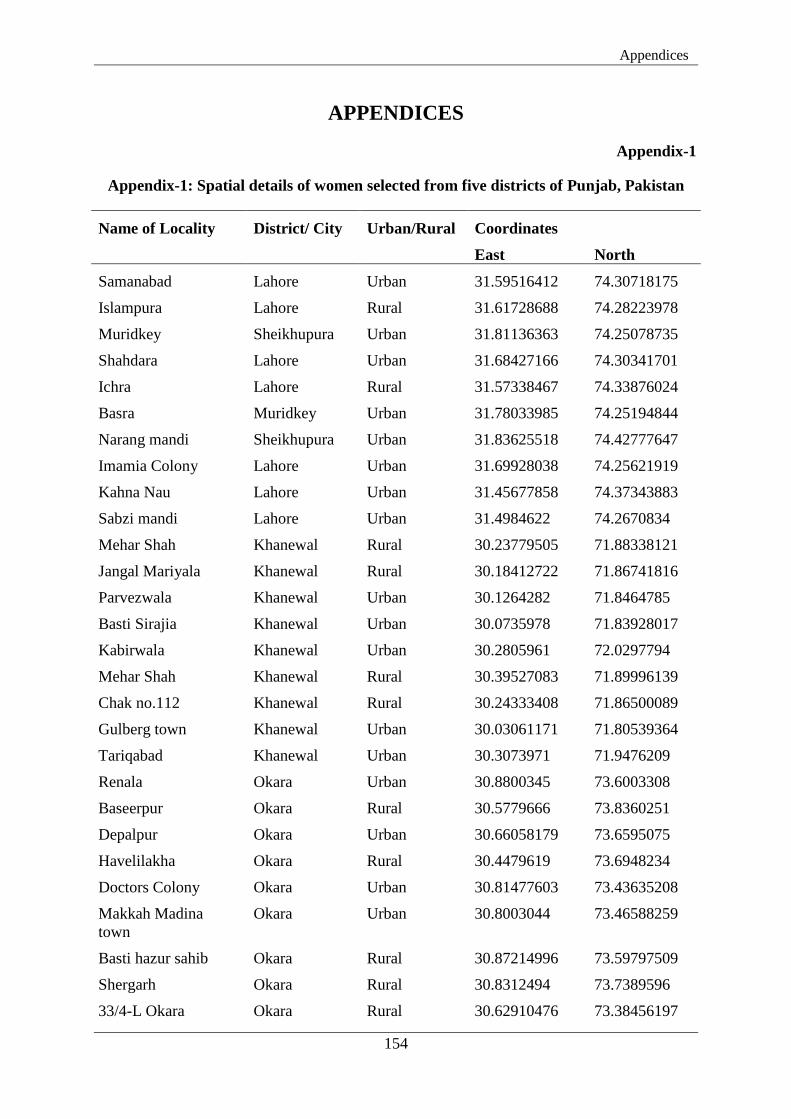
Appendices
154
APPENDICES
Appendix-1
Appendix-1: Spatial details of women selected from five districts of Punjab, Pakistan
Name of Locality District/ City Urban/Rural Coordinates
East North
Samanabad Lahore Urban 31.59516412 74.30718175
Islampura Lahore Rural 31.61728688 74.28223978
Muridkey Sheikhupura Urban 31.81136363 74.25078735
Shahdara Lahore Urban 31.68427166 74.30341701
Ichra Lahore Rural 31.57338467 74.33876024
Basra Muridkey Urban 31.78033985 74.25194844
Narang mandi Sheikhupura Urban 31.83625518 74.42777647
Imamia Colony Lahore Urban 31.69928038 74.25621919
Kahna Nau Lahore Urban 31.45677858 74.37343883
Sabzi mandi Lahore Urban 31.4984622 74.2670834
Mehar Shah Khanewal Rural 30.23779505 71.88338121
Jangal Mariyala Khanewal Rural 30.18412722 71.86741816
Parvezwala Khanewal Urban 30.1264282 71.8464785
Basti Sirajia Khanewal Urban 30.0735978 71.83928017
Kabirwala Khanewal Urban 30.2805961 72.0297794
Mehar Shah Khanewal Rural 30.39527083 71.89996139
Chak no.112 Khanewal Rural 30.24333408 71.86500089
Gulberg town Khanewal Urban 30.03061171 71.80539364
Tariqabad Khanewal Urban 30.3073971 71.9476209
Renala Okara Urban 30.8800345 73.6003308
Baseerpur Okara Rural 30.5779666 73.8360251
Depalpur Okara Urban 30.66058179 73.6595075
Havelilakha Okara Rural 30.4479619 73.6948234
Doctors Colony Okara Urban 30.81477603 73.43635208
Makkah Madina
town
Okara Urban 30.8003044 73.46588259
Basti hazur sahib Okara Rural 30.87214996 73.59797509
Shergarh Okara Rural 30.8312494 73.7389596
33/4-L Okara Okara Rural 30.62910476 73.38456197

Appendices
155
Havelilakha Okara Rural 30.46694155 73.66915037
Wazirabad Road Sialkot Urban 32.46531923 74.2482762
Sambrial Sialkot Urban 32.47060449 74.30837782
MalkaKalan Sialkot Sialkot Urban 32.49304144 74.4987617
Model town Ugoke Sialkot Rural 32.43626092 74.44557118
Sambrial Sialkot Urban 32.47175144 74.34933682
Muradpur Sialkot Sialkot Rural 32.55582297 74.52200298
Raipur Sialkot Rural 32.54486448 74.43875172
Sialkot Sialkot Urban 32.50657775 74.55333423
Sahowala Sialkot Rural 32.44572784 74.38674757
Bhagwal Chakwal Rural 33.07535174 72.59537403
Ropwal Chakwal Rural 33.0464493 72.52895293
Choa Saidaen Shah Chakwal Urban 32.72168991 72.94027169
Pichnand Chakwal Urban 32.8894416 71.9913849
Choa Saidaen Shah Chakwal Urban 32.80185735 72.96626737

Appendices
156
Appendix-2
Appendix-2: Consent Letter
I________________________________hereby declare that I am willingly giving blood
serum, milk and placenta samples for the research project titled ―Health Impacts of some
Persistent Organic Pollutants in expecting mothers from Punjab, Pakistan‖. I further declare
that I agree to participate in this research project as a volunteer subject to conditions that my
name and other personal details will be kept confidential.
Name: ________________________________
Date: ________________________________
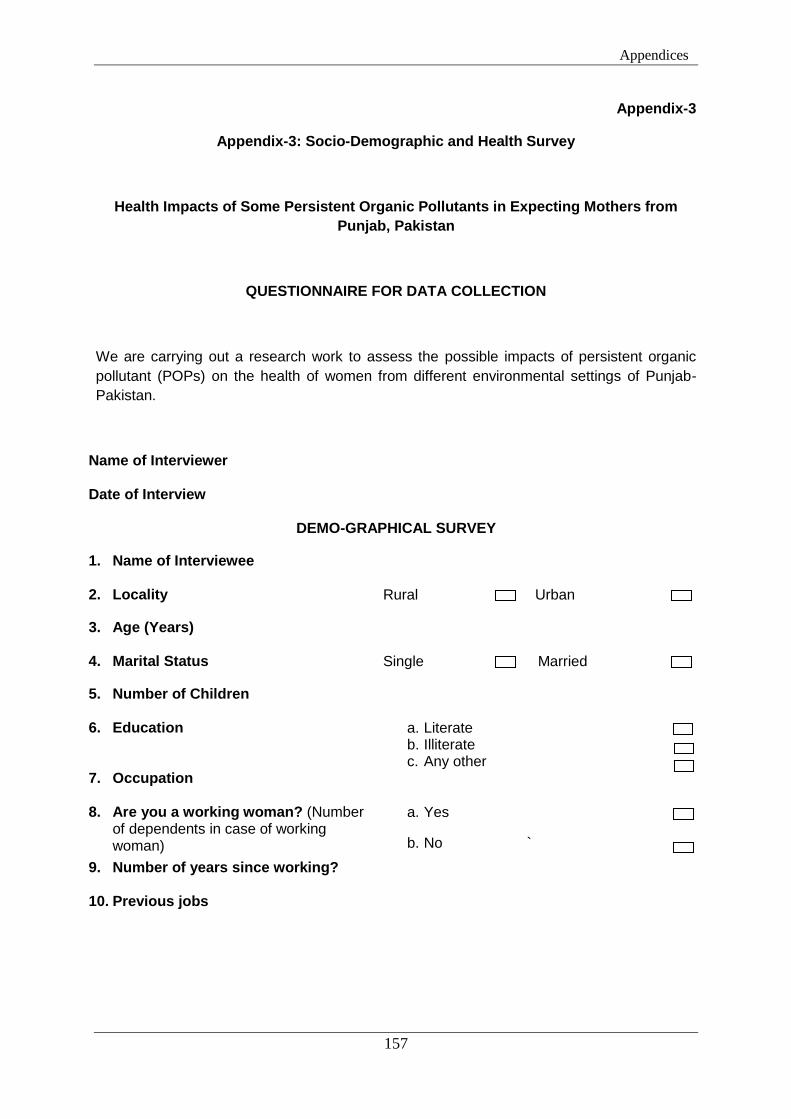
Appendices
157
Appendix-3
Appendix-3: Socio-Demographic and Health Survey
Health Impacts of Some Persistent Organic Pollutants in Expecting Mothers from
Punjab, Pakistan
QUESTIONNAIRE FOR DATA COLLECTION
We are carrying out a research work to assess the possible impacts of persistent organic
pollutant (POPs) on the health of women from different environmental settings of Punjab-
Pakistan.
Name of Interviewer
Date of Interview
DEMO-GRAPHICAL SURVEY
1. Name of Interviewee
2. Locality Rural Urban
3. Age (Years)
4. Marital Status Single Married
5. Number of Children
6. Education a. Literate b. Illiterate c. Any other
7. Occupation
8. Are you a working woman? (Number of dependents in case of working woman)
a. Yes
b. No `
9. Number of years since working?
10. Previous jobs
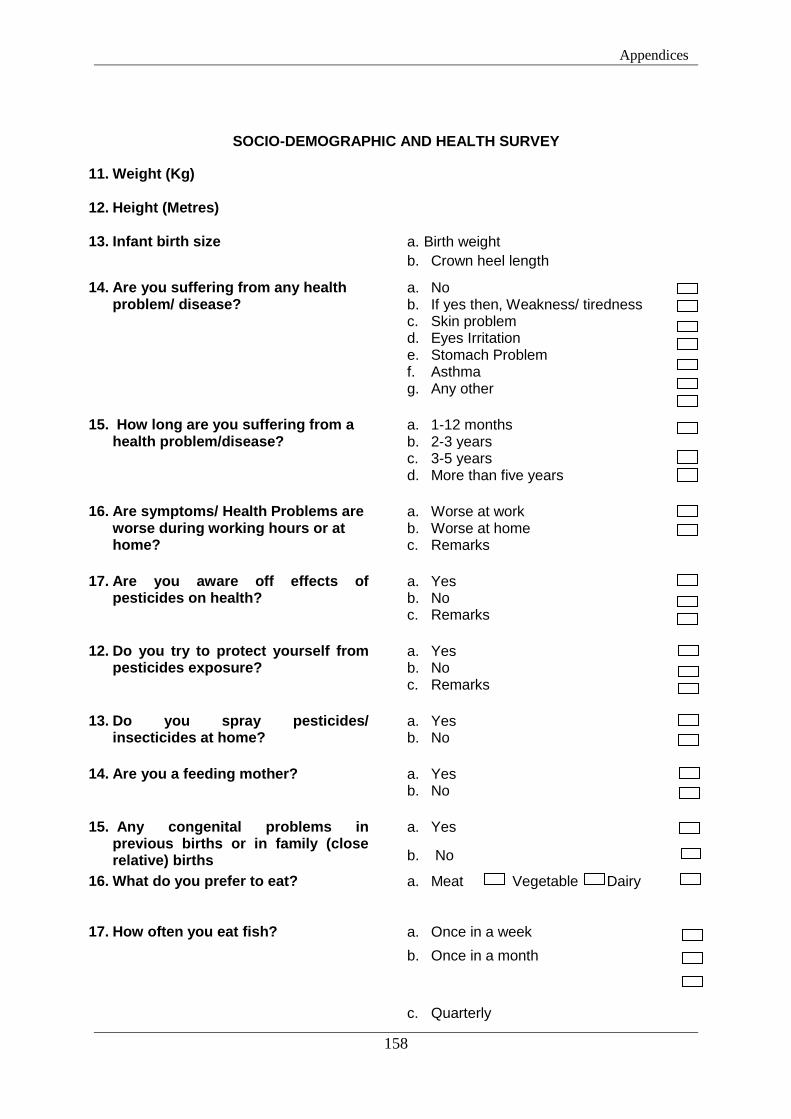
Appendices
158
SOCIO-DEMOGRAPHIC AND HEALTH SURVEY
11. Weight (Kg)
12. Height (Metres)
13. Infant birth size a. Birth weight
b. Crown heel length
14. Are you suffering from any health problem/ disease?
a. No b. If yes then, Weakness/ tiredness c. Skin problem d. Eyes Irritation e. Stomach Problem f. Asthma g. Any other
15. How long are you suffering from a health problem/disease?
a. 1-12 months b. 2-3 years c. 3-5 years d. More than five years
16. Are symptoms/ Health Problems are worse during working hours or at home?
a. Worse at work b. Worse at home c. Remarks
17. Are you aware off effects of pesticides on health?
b.
a. Yes b. No c. Remarks
12. Do you try to protect yourself from pesticides exposure?
a. Yes b. No c. Remarks
13. Do you spray pesticides/ insecticides at home?
a. Yes b. No
14. Are you a feeding mother? a. Yes b. No
15. Any congenital problems in previous births or in family (close relative) births
a. Yes
b. No
16. What do you prefer to eat?
a. Meat Vegetable Dairy
17. How often you eat fish? a. Once in a week
b. Once in a month
c. Quarterly
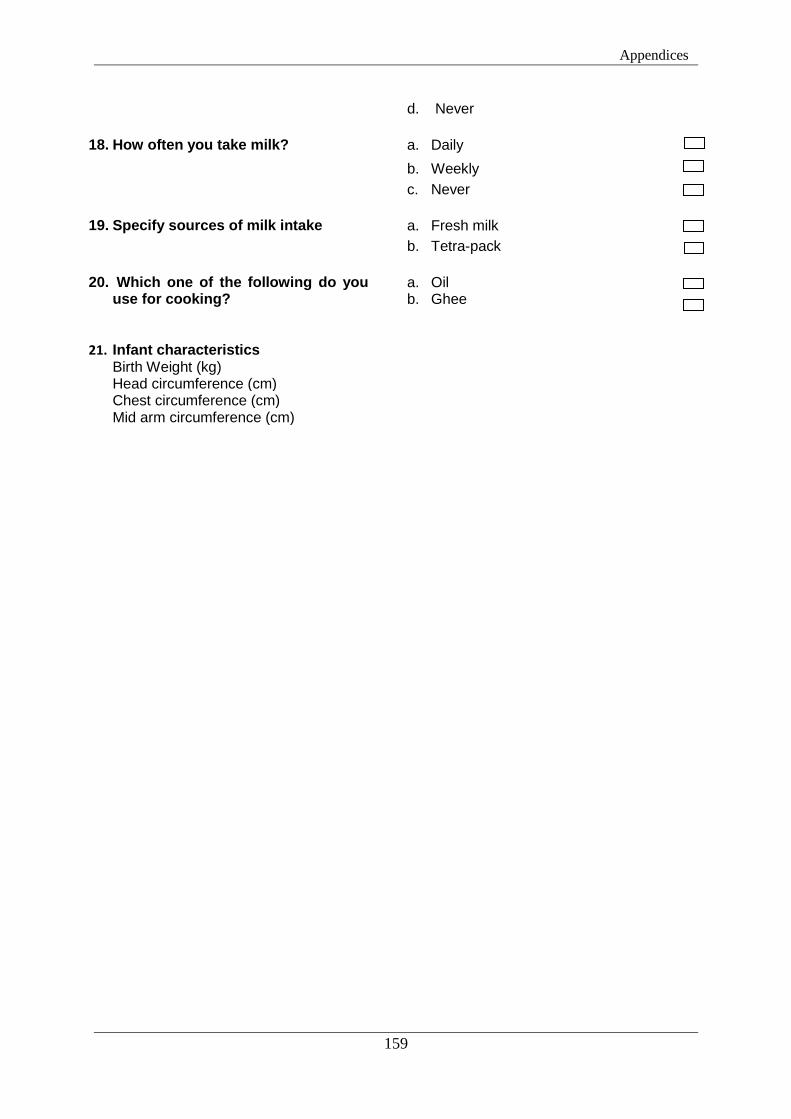
Appendices
159
d. Never
18. How often you take milk? a. Daily
b. Weekly
c. Never
19. Specify sources of milk intake a. Fresh milk
b. Tetra-pack
20. Which one of the following do you use for cooking?
a. Oil b. Ghee
21. Infant characteristics Birth Weight (kg) Head circumference (cm) Chest circumference (cm) Mid arm circumference (cm)
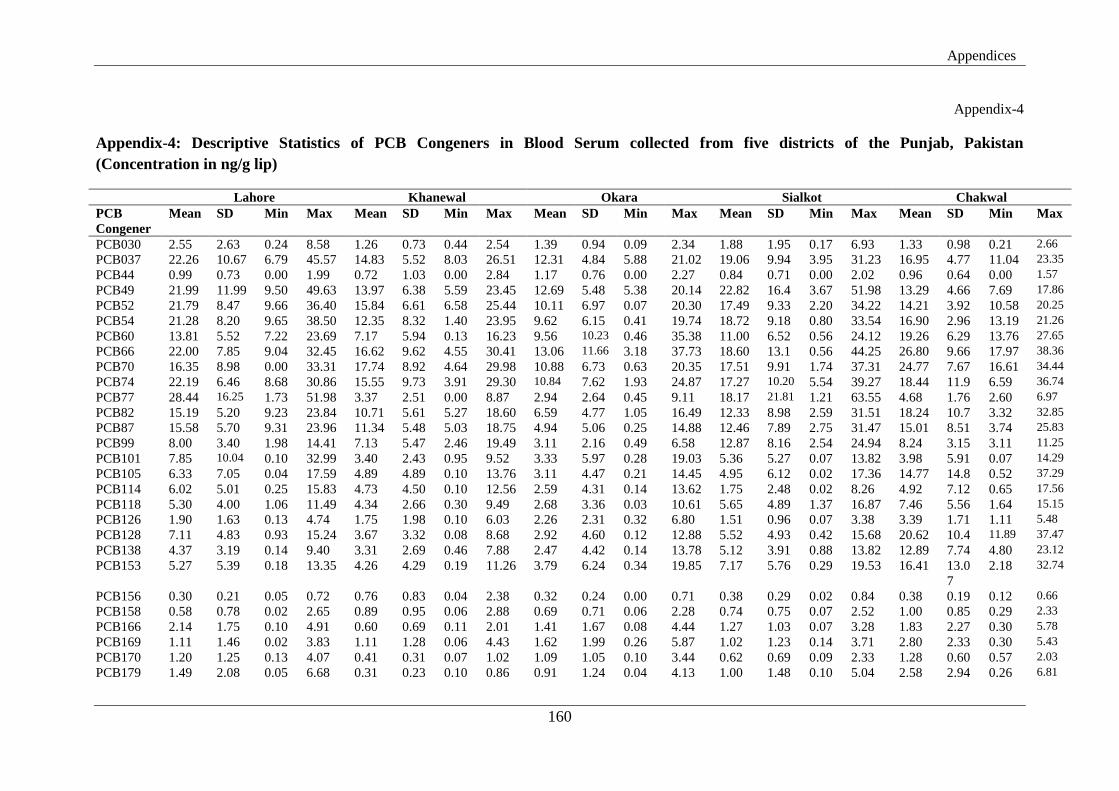
Appendices
160
Appendix-4
Appendix-4: Descriptive Statistics of PCB Congeners in Blood Serum collected from five districts of the Punjab, Pakistan
(Concentration in ng/g lip)
Lahore Khanewal Okara Sialkot Chakwal
PCB
Congener
Mean SD Min Max Mean SD Min Max Mean SD Min Max Mean SD Min Max Mean SD Min Max
PCB030 2.55 2.63 0.24 8.58 1.26 0.73 0.44 2.54 1.39 0.94 0.09 2.34 1.88 1.95 0.17 6.93 1.33 0.98 0.21 2.66
PCB037 22.26 10.67 6.79 45.57 14.83 5.52 8.03 26.51 12.31 4.84 5.88 21.02 19.06 9.94 3.95 31.23 16.95 4.77 11.04 23.35
PCB44 0.99 0.73 0.00 1.99 0.72 1.03 0.00 2.84 1.17 0.76 0.00 2.27 0.84 0.71 0.00 2.02 0.96 0.64 0.00 1.57
PCB49 21.99 11.99 9.50 49.63 13.97 6.38 5.59 23.45 12.69 5.48 5.38 20.14 22.82 16.4 3.67 51.98 13.29 4.66 7.69 17.86
PCB52 21.79 8.47 9.66 36.40 15.84 6.61 6.58 25.44 10.11 6.97 0.07 20.30 17.49 9.33 2.20 34.22 14.21 3.92 10.58 20.25
PCB54 21.28 8.20 9.65 38.50 12.35 8.32 1.40 23.95 9.62 6.15 0.41 19.74 18.72 9.18 0.80 33.54 16.90 2.96 13.19 21.26
PCB60 13.81 5.52 7.22 23.69 7.17 5.94 0.13 16.23 9.56 10.23 0.46 35.38 11.00 6.52 0.56 24.12 19.26 6.29 13.76 27.65
PCB66 22.00 7.85 9.04 32.45 16.62 9.62 4.55 30.41 13.06 11.66 3.18 37.73 18.60 13.1 0.56 44.25 26.80 9.66 17.97 38.36
PCB70 16.35 8.98 0.00 33.31 17.74 8.92 4.64 29.98 10.88 6.73 0.63 20.35 17.51 9.91 1.74 37.31 24.77 7.67 16.61 34.44
PCB74 22.19 6.46 8.68 30.86 15.55 9.73 3.91 29.30 10.84 7.62 1.93 24.87 17.27 10.20 5.54 39.27 18.44 11.9 6.59 36.74
PCB77 28.44 16.25 1.73 51.98 3.37 2.51 0.00 8.87 2.94 2.64 0.45 9.11 18.17 21.81 1.21 63.55 4.68 1.76 2.60 6.97
PCB82 15.19 5.20 9.23 23.84 10.71 5.61 5.27 18.60 6.59 4.77 1.05 16.49 12.33 8.98 2.59 31.51 18.24 10.7 3.32 32.85
PCB87 15.58 5.70 9.31 23.96 11.34 5.48 5.03 18.75 4.94 5.06 0.25 14.88 12.46 7.89 2.75 31.47 15.01 8.51 3.74 25.83
PCB99 8.00 3.40 1.98 14.41 7.13 5.47 2.46 19.49 3.11 2.16 0.49 6.58 12.87 8.16 2.54 24.94 8.24 3.15 3.11 11.25
PCB101 7.85 10.04 0.10 32.99 3.40 2.43 0.95 9.52 3.33 5.97 0.28 19.03 5.36 5.27 0.07 13.82 3.98 5.91 0.07 14.29
PCB105 6.33 7.05 0.04 17.59 4.89 4.89 0.10 13.76 3.11 4.47 0.21 14.45 4.95 6.12 0.02 17.36 14.77 14.8 0.52 37.29
PCB114 6.02 5.01 0.25 15.83 4.73 4.50 0.10 12.56 2.59 4.31 0.14 13.62 1.75 2.48 0.02 8.26 4.92 7.12 0.65 17.56
PCB118 5.30 4.00 1.06 11.49 4.34 2.66 0.30 9.49 2.68 3.36 0.03 10.61 5.65 4.89 1.37 16.87 7.46 5.56 1.64 15.15
PCB126 1.90 1.63 0.13 4.74 1.75 1.98 0.10 6.03 2.26 2.31 0.32 6.80 1.51 0.96 0.07 3.38 3.39 1.71 1.11 5.48
PCB128 7.11 4.83 0.93 15.24 3.67 3.32 0.08 8.68 2.92 4.60 0.12 12.88 5.52 4.93 0.42 15.68 20.62 10.4 11.89 37.47
PCB138 4.37 3.19 0.14 9.40 3.31 2.69 0.46 7.88 2.47 4.42 0.14 13.78 5.12 3.91 0.88 13.82 12.89 7.74 4.80 23.12
PCB153 5.27 5.39 0.18 13.35 4.26 4.29 0.19 11.26 3.79 6.24 0.34 19.85 7.17 5.76 0.29 19.53 16.41 13.0
7
2.18 32.74
PCB156 0.30 0.21 0.05 0.72 0.76 0.83 0.04 2.38 0.32 0.24 0.00 0.71 0.38 0.29 0.02 0.84 0.38 0.19 0.12 0.66
PCB158 0.58 0.78 0.02 2.65 0.89 0.95 0.06 2.88 0.69 0.71 0.06 2.28 0.74 0.75 0.07 2.52 1.00 0.85 0.29 2.33
PCB166 2.14 1.75 0.10 4.91 0.60 0.69 0.11 2.01 1.41 1.67 0.08 4.44 1.27 1.03 0.07 3.28 1.83 2.27 0.30 5.78
PCB169 1.11 1.46 0.02 3.83 1.11 1.28 0.06 4.43 1.62 1.99 0.26 5.87 1.02 1.23 0.14 3.71 2.80 2.33 0.30 5.43
PCB170 1.20 1.25 0.13 4.07 0.41 0.31 0.07 1.02 1.09 1.05 0.10 3.44 0.62 0.69 0.09 2.33 1.28 0.60 0.57 2.03
PCB179 1.49 2.08 0.05 6.68 0.31 0.23 0.10 0.86 0.91 1.24 0.04 4.13 1.00 1.48 0.10 5.04 2.58 2.94 0.26 6.81
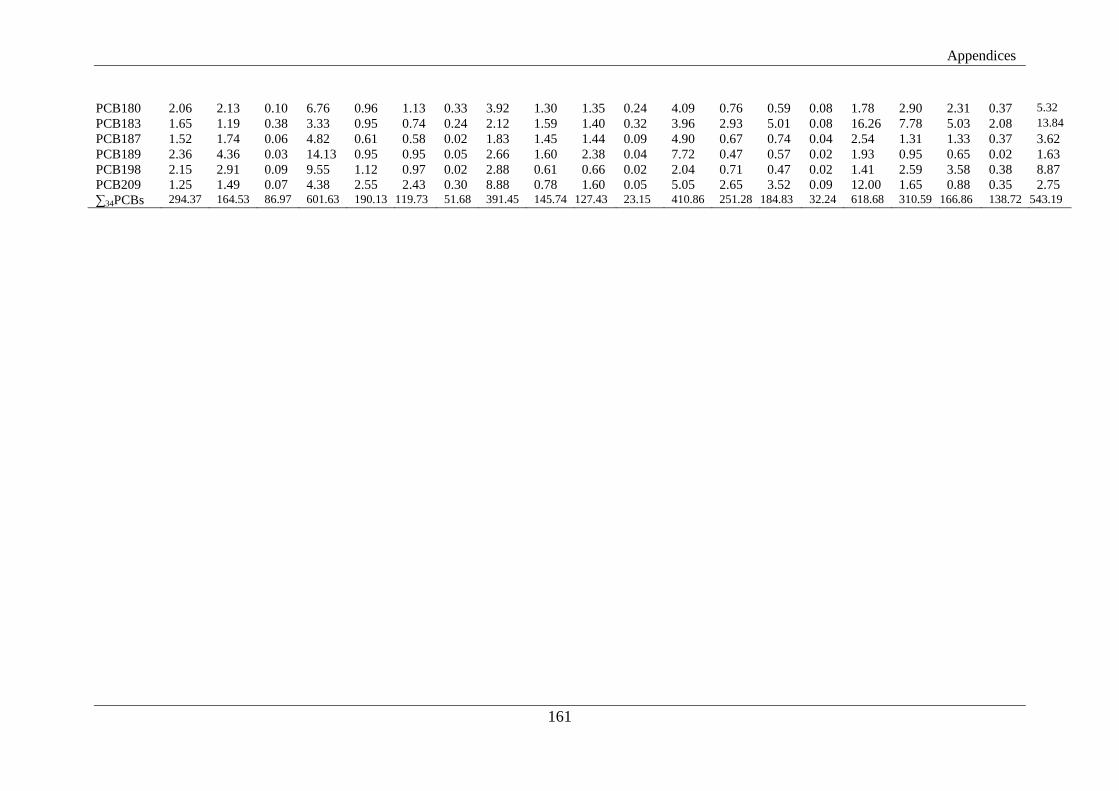
Appendices
161
PCB180 2.06 2.13 0.10 6.76 0.96 1.13 0.33 3.92 1.30 1.35 0.24 4.09 0.76 0.59 0.08 1.78 2.90 2.31 0.37 5.32
PCB183 1.65 1.19 0.38 3.33 0.95 0.74 0.24 2.12 1.59 1.40 0.32 3.96 2.93 5.01 0.08 16.26 7.78 5.03 2.08 13.84
PCB187 1.52 1.74 0.06 4.82 0.61 0.58 0.02 1.83 1.45 1.44 0.09 4.90 0.67 0.74 0.04 2.54 1.31 1.33 0.37 3.62
PCB189 2.36 4.36 0.03 14.13 0.95 0.95 0.05 2.66 1.60 2.38 0.04 7.72 0.47 0.57 0.02 1.93 0.95 0.65 0.02 1.63
PCB198 2.15 2.91 0.09 9.55 1.12 0.97 0.02 2.88 0.61 0.66 0.02 2.04 0.71 0.47 0.02 1.41 2.59 3.58 0.38 8.87
PCB209 1.25 1.49 0.07 4.38 2.55 2.43 0.30 8.88 0.78 1.60 0.05 5.05 2.65 3.52 0.09 12.00 1.65 0.88 0.35 2.75
∑34PCBs 294.37 164.53 86.97 601.63 190.13 119.73 51.68 391.45 145.74 127.43 23.15 410.86 251.28 184.83 32.24 618.68 310.59 166.86 138.72 543.19
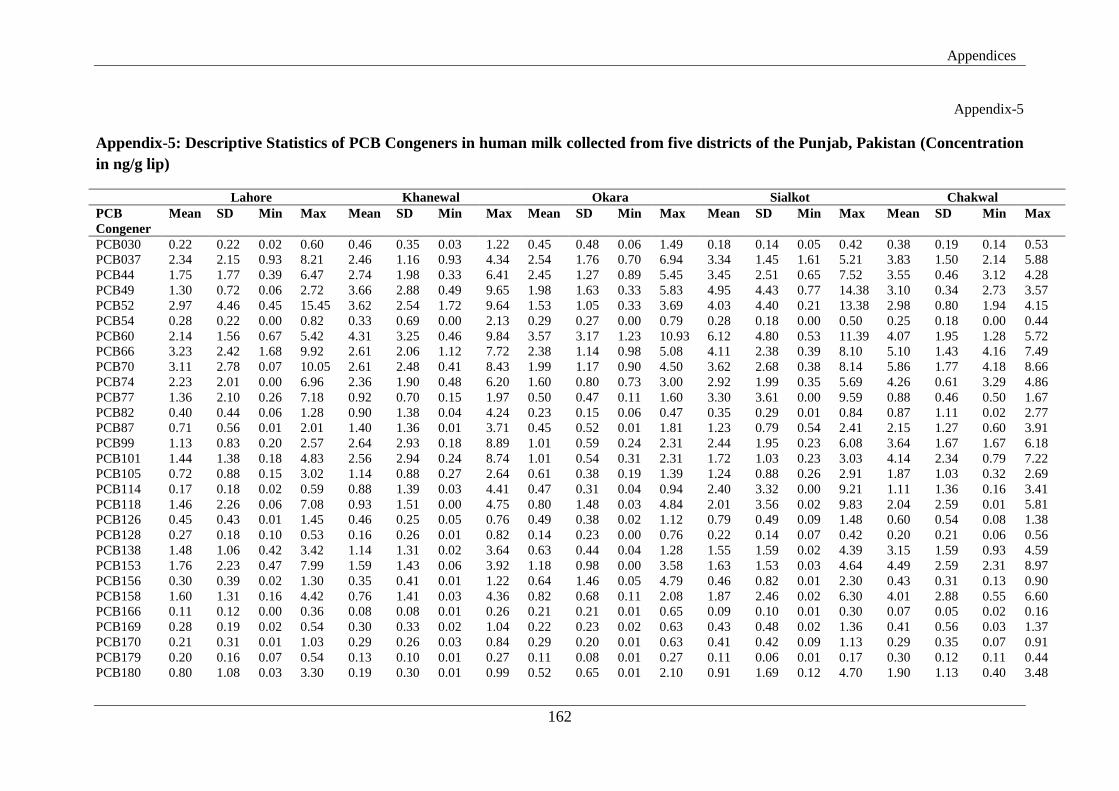
Appendices
162
Appendix-5
Appendix-5: Descriptive Statistics of PCB Congeners in human milk collected from five districts of the Punjab, Pakistan (Concentration
in ng/g lip)
Lahore Khanewal Okara Sialkot Chakwal
PCB
Congener
Mean SD Min Max Mean SD Min Max Mean SD Min Max Mean SD Min Max Mean SD Min Max
PCB030 0.22 0.22 0.02 0.60 0.46 0.35 0.03 1.22 0.45 0.48 0.06 1.49 0.18 0.14 0.05 0.42 0.38 0.19 0.14 0.53
PCB037 2.34 2.15 0.93 8.21 2.46 1.16 0.93 4.34 2.54 1.76 0.70 6.94 3.34 1.45 1.61 5.21 3.83 1.50 2.14 5.88
PCB44 1.75 1.77 0.39 6.47 2.74 1.98 0.33 6.41 2.45 1.27 0.89 5.45 3.45 2.51 0.65 7.52 3.55 0.46 3.12 4.28
PCB49 1.30 0.72 0.06 2.72 3.66 2.88 0.49 9.65 1.98 1.63 0.33 5.83 4.95 4.43 0.77 14.38 3.10 0.34 2.73 3.57
PCB52 2.97 4.46 0.45 15.45 3.62 2.54 1.72 9.64 1.53 1.05 0.33 3.69 4.03 4.40 0.21 13.38 2.98 0.80 1.94 4.15
PCB54 0.28 0.22 0.00 0.82 0.33 0.69 0.00 2.13 0.29 0.27 0.00 0.79 0.28 0.18 0.00 0.50 0.25 0.18 0.00 0.44
PCB60 2.14 1.56 0.67 5.42 4.31 3.25 0.46 9.84 3.57 3.17 1.23 10.93 6.12 4.80 0.53 11.39 4.07 1.95 1.28 5.72
PCB66 3.23 2.42 1.68 9.92 2.61 2.06 1.12 7.72 2.38 1.14 0.98 5.08 4.11 2.38 0.39 8.10 5.10 1.43 4.16 7.49
PCB70 3.11 2.78 0.07 10.05 2.61 2.48 0.41 8.43 1.99 1.17 0.90 4.50 3.62 2.68 0.38 8.14 5.86 1.77 4.18 8.66
PCB74 2.23 2.01 0.00 6.96 2.36 1.90 0.48 6.20 1.60 0.80 0.73 3.00 2.92 1.99 0.35 5.69 4.26 0.61 3.29 4.86
PCB77 1.36 2.10 0.26 7.18 0.92 0.70 0.15 1.97 0.50 0.47 0.11 1.60 3.30 3.61 0.00 9.59 0.88 0.46 0.50 1.67
PCB82 0.40 0.44 0.06 1.28 0.90 1.38 0.04 4.24 0.23 0.15 0.06 0.47 0.35 0.29 0.01 0.84 0.87 1.11 0.02 2.77
PCB87 0.71 0.56 0.01 2.01 1.40 1.36 0.01 3.71 0.45 0.52 0.01 1.81 1.23 0.79 0.54 2.41 2.15 1.27 0.60 3.91
PCB99 1.13 0.83 0.20 2.57 2.64 2.93 0.18 8.89 1.01 0.59 0.24 2.31 2.44 1.95 0.23 6.08 3.64 1.67 1.67 6.18
PCB101 1.44 1.38 0.18 4.83 2.56 2.94 0.24 8.74 1.01 0.54 0.31 2.31 1.72 1.03 0.23 3.03 4.14 2.34 0.79 7.22
PCB105 0.72 0.88 0.15 3.02 1.14 0.88 0.27 2.64 0.61 0.38 0.19 1.39 1.24 0.88 0.26 2.91 1.87 1.03 0.32 2.69
PCB114 0.17 0.18 0.02 0.59 0.88 1.39 0.03 4.41 0.47 0.31 0.04 0.94 2.40 3.32 0.00 9.21 1.11 1.36 0.16 3.41
PCB118 1.46 2.26 0.06 7.08 0.93 1.51 0.00 4.75 0.80 1.48 0.03 4.84 2.01 3.56 0.02 9.83 2.04 2.59 0.01 5.81
PCB126 0.45 0.43 0.01 1.45 0.46 0.25 0.05 0.76 0.49 0.38 0.02 1.12 0.79 0.49 0.09 1.48 0.60 0.54 0.08 1.38
PCB128 0.27 0.18 0.10 0.53 0.16 0.26 0.01 0.82 0.14 0.23 0.00 0.76 0.22 0.14 0.07 0.42 0.20 0.21 0.06 0.56
PCB138 1.48 1.06 0.42 3.42 1.14 1.31 0.02 3.64 0.63 0.44 0.04 1.28 1.55 1.59 0.02 4.39 3.15 1.59 0.93 4.59
PCB153 1.76 2.23 0.47 7.99 1.59 1.43 0.06 3.92 1.18 0.98 0.00 3.58 1.63 1.53 0.03 4.64 4.49 2.59 2.31 8.97
PCB156 0.30 0.39 0.02 1.30 0.35 0.41 0.01 1.22 0.64 1.46 0.05 4.79 0.46 0.82 0.01 2.30 0.43 0.31 0.13 0.90
PCB158 1.60 1.31 0.16 4.42 0.76 1.41 0.03 4.36 0.82 0.68 0.11 2.08 1.87 2.46 0.02 6.30 4.01 2.88 0.55 6.60
PCB166 0.11 0.12 0.00 0.36 0.08 0.08 0.01 0.26 0.21 0.21 0.01 0.65 0.09 0.10 0.01 0.30 0.07 0.05 0.02 0.16
PCB169 0.28 0.19 0.02 0.54 0.30 0.33 0.02 1.04 0.22 0.23 0.02 0.63 0.43 0.48 0.02 1.36 0.41 0.56 0.03 1.37
PCB170 0.21 0.31 0.01 1.03 0.29 0.26 0.03 0.84 0.29 0.20 0.01 0.63 0.41 0.42 0.09 1.13 0.29 0.35 0.07 0.91
PCB179 0.20 0.16 0.07 0.54 0.13 0.10 0.01 0.27 0.11 0.08 0.01 0.27 0.11 0.06 0.01 0.17 0.30 0.12 0.11 0.44
PCB180 0.80 1.08 0.03 3.30 0.19 0.30 0.01 0.99 0.52 0.65 0.01 2.10 0.91 1.69 0.12 4.70 1.90 1.13 0.40 3.48
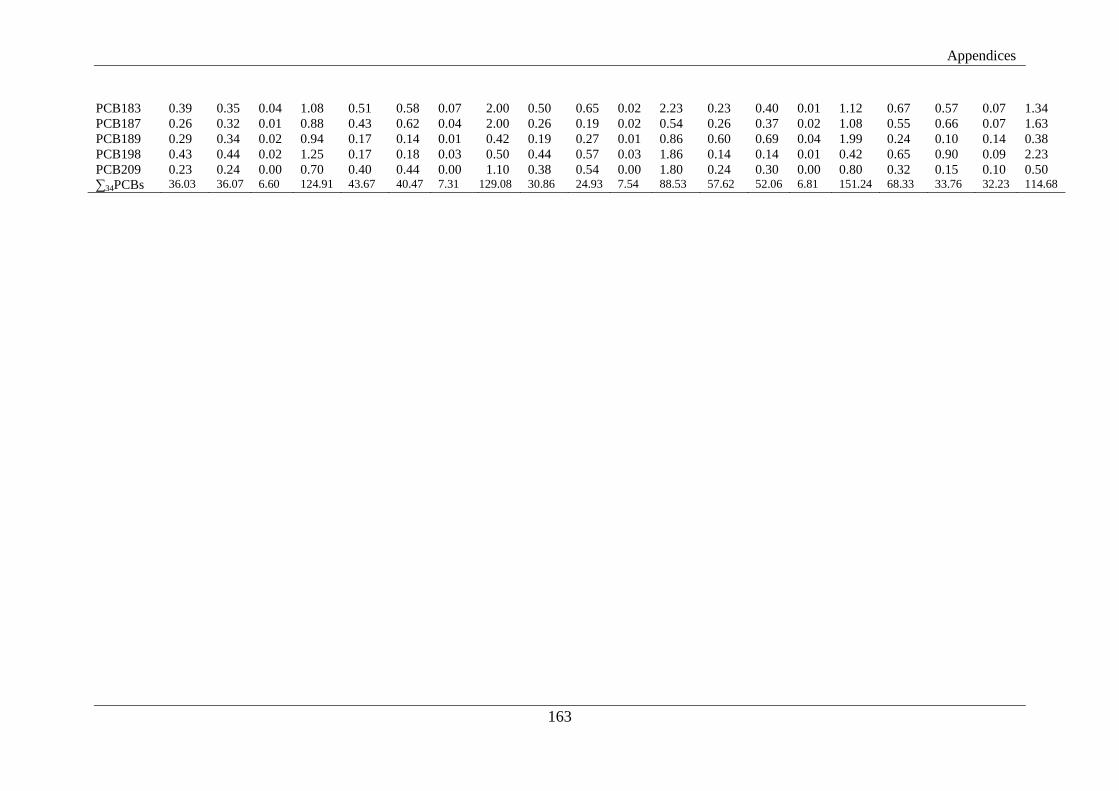
Appendices
163
PCB183 0.39 0.35 0.04 1.08 0.51 0.58 0.07 2.00 0.50 0.65 0.02 2.23 0.23 0.40 0.01 1.12 0.67 0.57 0.07 1.34
PCB187 0.26 0.32 0.01 0.88 0.43 0.62 0.04 2.00 0.26 0.19 0.02 0.54 0.26 0.37 0.02 1.08 0.55 0.66 0.07 1.63
PCB189 0.29 0.34 0.02 0.94 0.17 0.14 0.01 0.42 0.19 0.27 0.01 0.86 0.60 0.69 0.04 1.99 0.24 0.10 0.14 0.38
PCB198 0.43 0.44 0.02 1.25 0.17 0.18 0.03 0.50 0.44 0.57 0.03 1.86 0.14 0.14 0.01 0.42 0.65 0.90 0.09 2.23
PCB209 0.23 0.24 0.00 0.70 0.40 0.44 0.00 1.10 0.38 0.54 0.00 1.80 0.24 0.30 0.00 0.80 0.32 0.15 0.10 0.50
∑34PCBs 36.03 36.07 6.60 124.91 43.67 40.47 7.31 129.08 30.86 24.93 7.54 88.53 57.62 52.06 6.81 151.24 68.33 33.76 32.23 114.68
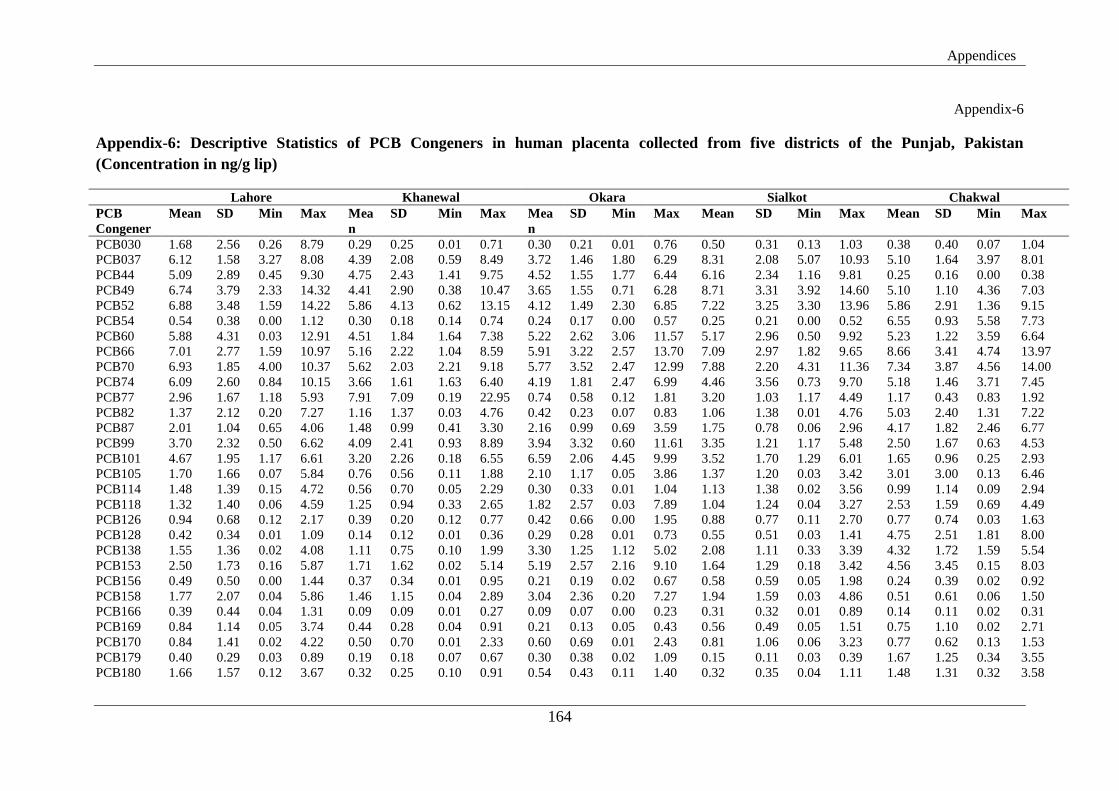
Appendices
164
Appendix-6
Appendix-6: Descriptive Statistics of PCB Congeners in human placenta collected from five districts of the Punjab, Pakistan
(Concentration in ng/g lip)
Lahore Khanewal Okara Sialkot Chakwal
PCB
Congener
Mean SD Min Max Mea
n
SD Min Max Mea
n
SD Min Max Mean SD Min Max Mean SD Min Max
PCB030 1.68 2.56 0.26 8.79 0.29 0.25 0.01 0.71 0.30 0.21 0.01 0.76 0.50 0.31 0.13 1.03 0.38 0.40 0.07 1.04
PCB037 6.12 1.58 3.27 8.08 4.39 2.08 0.59 8.49 3.72 1.46 1.80 6.29 8.31 2.08 5.07 10.93 5.10 1.64 3.97 8.01
PCB44 5.09 2.89 0.45 9.30 4.75 2.43 1.41 9.75 4.52 1.55 1.77 6.44 6.16 2.34 1.16 9.81 0.25 0.16 0.00 0.38
PCB49 6.74 3.79 2.33 14.32 4.41 2.90 0.38 10.47 3.65 1.55 0.71 6.28 8.71 3.31 3.92 14.60 5.10 1.10 4.36 7.03
PCB52 6.88 3.48 1.59 14.22 5.86 4.13 0.62 13.15 4.12 1.49 2.30 6.85 7.22 3.25 3.30 13.96 5.86 2.91 1.36 9.15
PCB54 0.54 0.38 0.00 1.12 0.30 0.18 0.14 0.74 0.24 0.17 0.00 0.57 0.25 0.21 0.00 0.52 6.55 0.93 5.58 7.73
PCB60 5.88 4.31 0.03 12.91 4.51 1.84 1.64 7.38 5.22 2.62 3.06 11.57 5.17 2.96 0.50 9.92 5.23 1.22 3.59 6.64
PCB66 7.01 2.77 1.59 10.97 5.16 2.22 1.04 8.59 5.91 3.22 2.57 13.70 7.09 2.97 1.82 9.65 8.66 3.41 4.74 13.97
PCB70 6.93 1.85 4.00 10.37 5.62 2.03 2.21 9.18 5.77 3.52 2.47 12.99 7.88 2.20 4.31 11.36 7.34 3.87 4.56 14.00
PCB74 6.09 2.60 0.84 10.15 3.66 1.61 1.63 6.40 4.19 1.81 2.47 6.99 4.46 3.56 0.73 9.70 5.18 1.46 3.71 7.45
PCB77 2.96 1.67 1.18 5.93 7.91 7.09 0.19 22.95 0.74 0.58 0.12 1.81 3.20 1.03 1.17 4.49 1.17 0.43 0.83 1.92
PCB82 1.37 2.12 0.20 7.27 1.16 1.37 0.03 4.76 0.42 0.23 0.07 0.83 1.06 1.38 0.01 4.76 5.03 2.40 1.31 7.22
PCB87 2.01 1.04 0.65 4.06 1.48 0.99 0.41 3.30 2.16 0.99 0.69 3.59 1.75 0.78 0.06 2.96 4.17 1.82 2.46 6.77
PCB99 3.70 2.32 0.50 6.62 4.09 2.41 0.93 8.89 3.94 3.32 0.60 11.61 3.35 1.21 1.17 5.48 2.50 1.67 0.63 4.53
PCB101 4.67 1.95 1.17 6.61 3.20 2.26 0.18 6.55 6.59 2.06 4.45 9.99 3.52 1.70 1.29 6.01 1.65 0.96 0.25 2.93
PCB105 1.70 1.66 0.07 5.84 0.76 0.56 0.11 1.88 2.10 1.17 0.05 3.86 1.37 1.20 0.03 3.42 3.01 3.00 0.13 6.46
PCB114 1.48 1.39 0.15 4.72 0.56 0.70 0.05 2.29 0.30 0.33 0.01 1.04 1.13 1.38 0.02 3.56 0.99 1.14 0.09 2.94
PCB118 1.32 1.40 0.06 4.59 1.25 0.94 0.33 2.65 1.82 2.57 0.03 7.89 1.04 1.24 0.04 3.27 2.53 1.59 0.69 4.49
PCB126 0.94 0.68 0.12 2.17 0.39 0.20 0.12 0.77 0.42 0.66 0.00 1.95 0.88 0.77 0.11 2.70 0.77 0.74 0.03 1.63
PCB128 0.42 0.34 0.01 1.09 0.14 0.12 0.01 0.36 0.29 0.28 0.01 0.73 0.55 0.51 0.03 1.41 4.75 2.51 1.81 8.00
PCB138 1.55 1.36 0.02 4.08 1.11 0.75 0.10 1.99 3.30 1.25 1.12 5.02 2.08 1.11 0.33 3.39 4.32 1.72 1.59 5.54
PCB153 2.50 1.73 0.16 5.87 1.71 1.62 0.02 5.14 5.19 2.57 2.16 9.10 1.64 1.29 0.18 3.42 4.56 3.45 0.15 8.03
PCB156 0.49 0.50 0.00 1.44 0.37 0.34 0.01 0.95 0.21 0.19 0.02 0.67 0.58 0.59 0.05 1.98 0.24 0.39 0.02 0.92
PCB158 1.77 2.07 0.04 5.86 1.46 1.15 0.04 2.89 3.04 2.36 0.20 7.27 1.94 1.59 0.03 4.86 0.51 0.61 0.06 1.50
PCB166 0.39 0.44 0.04 1.31 0.09 0.09 0.01 0.27 0.09 0.07 0.00 0.23 0.31 0.32 0.01 0.89 0.14 0.11 0.02 0.31
PCB169 0.84 1.14 0.05 3.74 0.44 0.28 0.04 0.91 0.21 0.13 0.05 0.43 0.56 0.49 0.05 1.51 0.75 1.10 0.02 2.71
PCB170 0.84 1.41 0.02 4.22 0.50 0.70 0.01 2.33 0.60 0.69 0.01 2.43 0.81 1.06 0.06 3.23 0.77 0.62 0.13 1.53
PCB179 0.40 0.29 0.03 0.89 0.19 0.18 0.07 0.67 0.30 0.38 0.02 1.09 0.15 0.11 0.03 0.39 1.67 1.25 0.34 3.55
PCB180 1.66 1.57 0.12 3.67 0.32 0.25 0.10 0.91 0.54 0.43 0.11 1.40 0.32 0.35 0.04 1.11 1.48 1.31 0.32 3.58

Appendices
165
PCB183 0.46 0.24 0.07 0.91 0.17 0.17 0.01 0.46 0.83 0.86 0.07 2.75 0.45 0.43 0.03 1.30 1.53 0.82 0.36 2.33
PCB187 0.38 0.27 0.04 0.85 0.14 0.14 0.01 0.45 0.77 0.58 0.05 1.62 0.38 0.39 0.05 1.04 0.33 0.23 0.05 0.67
PCB189 0.72 0.78 0.02 2.21 0.21 0.20 0.02 0.59 0.27 0.40 0.01 1.29 0.54 0.68 0.02 2.03 0.47 0.53 0.02 1.28
PCB198 1.14 1.37 0.08 4.20 0.45 0.33 0.01 0.92 2.68 7.66 0.13 24.48 0.57 0.39 0.03 1.06 0.20 0.24 0.03 0.60
PCB209 1.14 1.46 0.03 4.89 0.40 0.56 0.07 1.46 0.24 0.18 0.02 0.55 0.58 0.74 0.02 2.44 0.26 0.44 0.02 1.04
∑34PCBs 87.80 55.39 19.18 193.25 67.46 43.06 12.54 149.18 74.67 47.55 27.16 174.04 84.52 43.92 25.79 158.22 93.47 46.17 43.29 155.90
Publications
166
PUBLICATIONS
1. Quantification of polychlorinated biphenyl contamination using human placenta as
biomarker from Punjab Province, Pakistan
2. Assessment of Polychlorinated Biphenyls (PCBs) in maternal blood from selected
districts of Punjab, Pakistan, accepted for publication in Punjab University Journal of
Zoology.
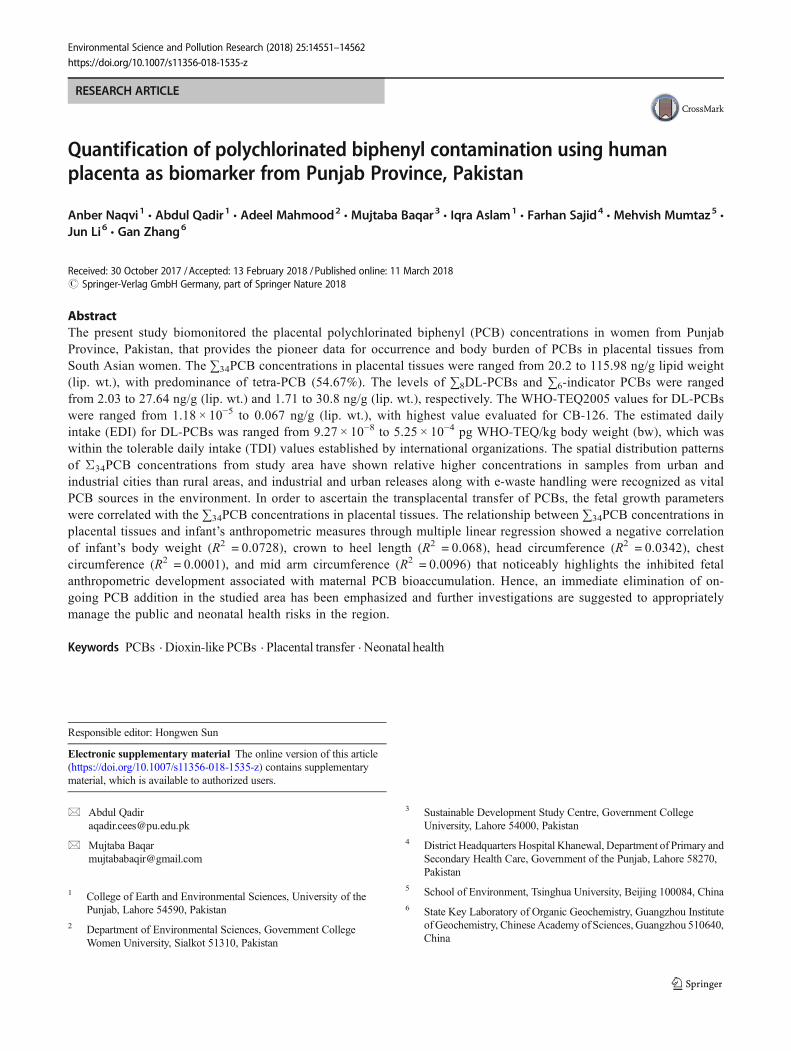
RESEARCH ARTICLE
Quantification of polychlorinated biphenyl contamination using humanplacenta as biomarker from Punjab Province, Pakistan
Anber Naqvi1 & Abdul Qadir1 & Adeel Mahmood2& Mujtaba Baqar3 & Iqra Aslam1
& Farhan Sajid4& Mehvish Mumtaz5 &
Jun Li6 & Gan Zhang6
Received: 30 October 2017 /Accepted: 13 February 2018 /Published online: 11 March 2018# Springer-Verlag GmbH Germany, part of Springer Nature 2018
AbstractThe present study biomonitored the placental polychlorinated biphenyl (PCB) concentrations in women from PunjabProvince, Pakistan, that provides the pioneer data for occurrence and body burden of PCBs in placental tissues fromSouth Asian women. The ∑34PCB concentrations in placental tissues were ranged from 20.2 to 115.98 ng/g lipid weight(lip. wt.), with predominance of tetra-PCB (54.67%). The levels of ∑8DL-PCBs and ∑6-indicator PCBs were rangedfrom 2.03 to 27.64 ng/g (lip. wt.) and 1.71 to 30.8 ng/g (lip. wt.), respectively. The WHO-TEQ2005 values for DL-PCBswere ranged from 1.18 × 10⁻⁵ to 0.067 ng/g (lip. wt.), with highest value evaluated for CB-126. The estimated dailyintake (EDI) for DL-PCBs was ranged from 9.27 × 10⁻⁸ to 5.25 × 10⁻⁴ pg WHO-TEQ/kg body weight (bw), which waswithin the tolerable daily intake (TDI) values established by international organizations. The spatial distribution patternsof Σ34PCB concentrations from study area have shown relative higher concentrations in samples from urban andindustrial cities than rural areas, and industrial and urban releases along with e-waste handling were recognized as vitalPCB sources in the environment. In order to ascertain the transplacental transfer of PCBs, the fetal growth parameterswere correlated with the ∑34PCB concentrations in placental tissues. The relationship between ∑34PCB concentrations inplacental tissues and infant’s anthropometric measures through multiple linear regression showed a negative correlationof infant’s body weight (R2 = 0.0728), crown to heel length (R2 = 0.068), head circumference (R2 = 0.0342), chestcircumference (R2 = 0.0001), and mid arm circumference (R2 = 0.0096) that noticeably highlights the inhibited fetalanthropometric development associated with maternal PCB bioaccumulation. Hence, an immediate elimination of on-going PCB addition in the studied area has been emphasized and further investigations are suggested to appropriatelymanage the public and neonatal health risks in the region.
Keywords PCBs . Dioxin-like PCBs . Placental transfer . Neonatal health
Responsible editor: Hongwen Sun
Electronic supplementary material The online version of this article(https://doi.org/10.1007/s11356-018-1535-z) contains supplementarymaterial, which is available to authorized users.
* Abdul [email protected]
* Mujtaba [email protected]
1 College of Earth and Environmental Sciences, University of thePunjab, Lahore 54590, Pakistan
2 Department of Environmental Sciences, Government CollegeWomen University, Sialkot 51310, Pakistan
3 Sustainable Development Study Centre, Government CollegeUniversity, Lahore 54000, Pakistan
4 District Headquarters Hospital Khanewal, Department of Primary andSecondary Health Care, Government of the Punjab, Lahore 58270,Pakistan
5 School of Environment, Tsinghua University, Beijing 100084, China6 State Key Laboratory of Organic Geochemistry, Guangzhou Institute
ofGeochemistry, Chinese Academy of Sciences, Guangzhou 510640,China
Environmental Science and Pollution Research (2018) 25:14551–14562https://doi.org/10.1007/s11356-018-1535-z
Introduction
Polychlorinated biphenyls (PCBs) are industrial chemicalsthat are of great global concern, owing to their persistent,lipophilic, bioaccumulative, and toxicity in various biologicaland environmental media (Kodavanti et al. 2017).On the basisof in vivo and in vitro studies, the International Agency forResearch on Cancer (IARC) has placed PCBs into group 1compounds, i.e., carcinogenic to humans (IARC 2016).Besides their carcinogenic characteristics, the PCB exposurehas been established to cause reproductive, endocrinal, neuro-logical, and immunological disorders (Letcher et al. 2010).
In recognition to the PCBs’ adverse environmental effects,its production and usage was prohibited globally under theStockholmConvention on Persistent Organic Pollutants, 2001(UNEP 2001). However, the easier availability, adaptability,and low-cost of PCBs sustain its usage in developing countries,including Pakistan (Baqar et al. 2017a). Subsequently, theyhavebeenreleasedfrommanufacturingandrepairingofelectricwares, industrial wastewater discharges, and unsafe waste dis-posal techniques (Eqani et al. 2013; Kim andYoon 2014; Syedet al. 2014). Besides, a vast human population in Pakistan haslimited earnings to purchase advanced electronic devices,which broadens the consumer market for reconditioned andused outdated devices, predominantly imported from devel-oped countries and possibly contains PCBs. These end-of-lifeproducts produce e-waste that undergone open burning andother hazardous recycling techniques to recover metals (Iqbalet al. 2015; Baqar et al. 2017b) and subsequently increases theatmospheric PCB concentrations in Asian countries (Li et al.2007; Eqani et al. 2012b; Ali et al. 2013).
In humans, principal exposure route to PCBs is the dietaryintake that accounts 90% of the total exposure (Chovancováet al. 2012); other sources include dermal exposure, ingestion,and inhalation from ambient environment (Ullah et al.2016).Once entered the human body, they persist andbioaccumulate in the body lipids (Hites 2004), and can betraced out in the blood streams and tissues (Lopez-Espinosaet al. 2007). Nevertheless, studies have suggested that thePCBs exposure originates in the uterine stage of life throughplacental transfer (Vizcaino et al. 2014; Nanes et al. 2014).The placenta is considered to be the lifeline to fetus in utero,supplying oxygen and nutrients, and waste removal from fetalenvironment (Leino et al. 2013; Nanes et al. 2014). However,the persistent and bioaccumulative compounds, includingPCBs have been reported to reach the fetus by crossing theplacental barrier through blood circulation (Covaci et al. 2002;Wang et al. 2006). The prenatal exposure to PCBs may lead topreterm birth, reduced birth weight, and intrauterine growthretardation; along with some latent effects, such as disturbedlevels of thyroid hormone, reproductive impairments, cogni-tive deficits, altered perceptual development, and adverse neu-robehavioral impacts (Covaci et al. 2002; Bergonzi et al.
2009; Kodavanti et al. 2017). The PCBs’ exposure at earlydevelopmental stages may lead to health risks in fetuses andinfants, who are more susceptible to the impacts of these en-vironmental toxins as their detoxification mechanisms are par-tially developed than adults (Vizcaino et al. 2014).
In recent years, studies had effectively biomonitored thePCB levels in human placental tissues worldwide (Myllynenet al. 2005; Gómara et al. 2012; Leino et al. 2013; Tsukimoriet al. 2013; Nanes et al. 2014; Vizcaino et al. 2014). In con-trast, though high PCB concentrations have been reportedfrom various environmental compartments in Pakistan(Eqani et al. 2012a,b, 2013; Syed et al. 2013, 2014;Mahmood et al. 2014b; Mumtaz et al. 2016; Yasmeen et al.2017); to date, no study has undertaken to assess placentaltransfer of PCBs. The present study was conducted for quan-titative screening of PCB levels in the placental tissue samplesfrom Punjab Province, Pakistan and its correlation with ma-ternal characteristics and neonatal anthropometric measures.The objectives of the study include occurrence, spatial distri-bution and source apportionment, comparative analysis, tox-icity equivalency (TEQ), and estimated daily intake (EDI)assessment for dioxin-like PCBs (DL-PCBs) that providesbaseline data on the maternal and prenatal exposure levels ofPCBs from Pakistan as well as South Asia that could be sig-nificantly valuable in future epidemiological and humanhealth risk studies.
Materials and methods
Study area and sampling strategy
The study area encompasses five districts of Punjab province(Pakistan) viz. Lahore, Sialkot, Khanewal, Okara, andChakwal (Fig. 1). The Punjab is the most populated provinceof Pakistan that is considered to be the life-line for the country;as it contains the most intensively cultivated areas, i.e.,Rechna Doab, Jech Doab, and Bari Doab, and most numberof industrial units. Urban expansion and industrialization inthe province have caused an increase in environmental pollu-tion due to vehicular emission, coal combustion, industrialemissions and effluents discharges, and municipal solid wasteburning in open dumps. Besides, the e-waste burning to re-cover valuables is also a common practice observed in mostparts of the province. However, despite of the fact thatPakistan ratifies the Stockholm Convention, 2001, yet, thecountry is experiencing PCB environmental release (Eqaniet al. 2012a; Syed et al. 2014) that led to PCB contaminationin various environmental media of the Punjab province.
Site selection criterion was based on the industrial and ag-ricultural activities and spatial diversity within these districts.The study area was further subdivided into two zones, viz.,urban and rural to make the cross-comparison between them.
14552 Environ Sci Pollut Res (2018) 25:14551–14562
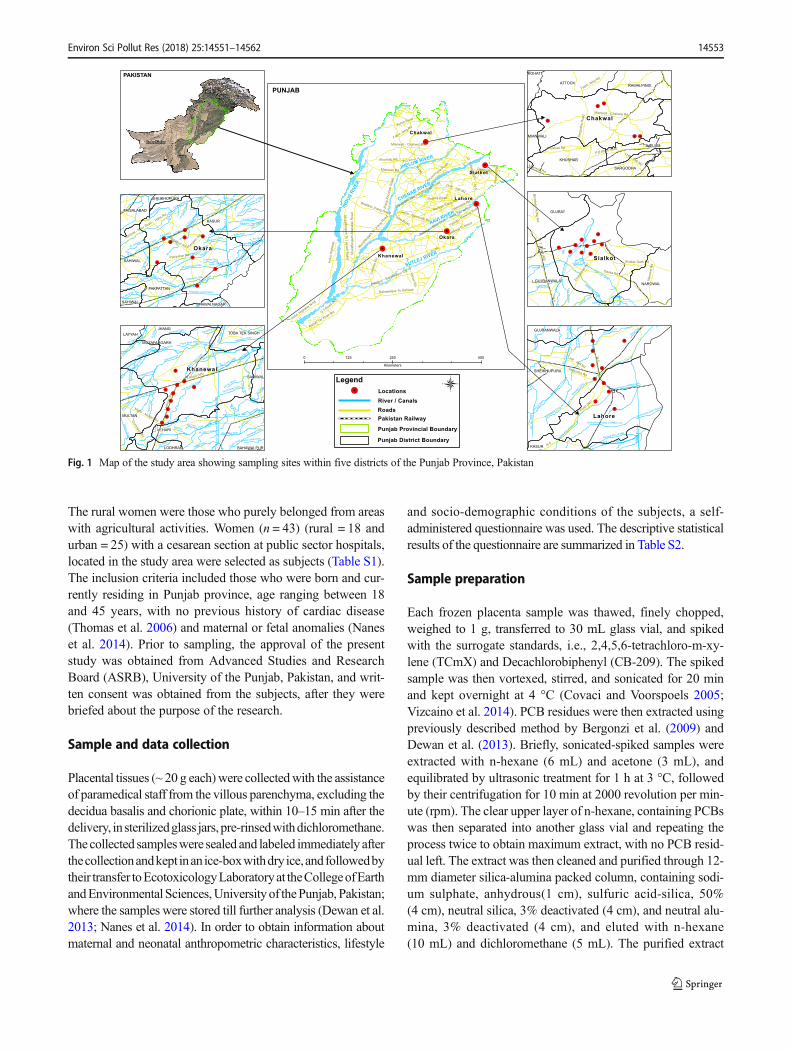
The rural women were those who purely belonged from areaswith agricultural activities. Women (n = 43) (rural = 18 andurban = 25) with a cesarean section at public sector hospitals,located in the study area were selected as subjects (Table S1).The inclusion criteria included those who were born and cur-rently residing in Punjab province, age ranging between 18and 45 years, with no previous history of cardiac disease(Thomas et al. 2006) and maternal or fetal anomalies (Naneset al. 2014). Prior to sampling, the approval of the presentstudy was obtained from Advanced Studies and ResearchBoard (ASRB), University of the Punjab, Pakistan, and writ-ten consent was obtained from the subjects, after they werebriefed about the purpose of the research.
Sample and data collection
Placental tissues (~ 20 g each)were collectedwith the assistanceof paramedical staff from the villous parenchyma, excluding thedecidua basalis and chorionic plate, within 10–15 min after thedelivery, insterilizedglass jars,pre-rinsedwithdichloromethane.The collected sampleswere sealed and labeled immediately afterthecollectionandkept inanice-boxwithdry ice,andfollowedbytheir transfer toEcotoxicologyLaboratoryat theCollegeofEarthandEnvironmental Sciences,University of thePunjab, Pakistan;where the samples were stored till further analysis (Dewan et al.2013; Nanes et al. 2014). In order to obtain information aboutmaternal and neonatal anthropometric characteristics, lifestyle
and socio-demographic conditions of the subjects, a self-administered questionnaire was used. The descriptive statisticalresults of the questionnaire are summarized in Table S2.
Sample preparation
Each frozen placenta sample was thawed, finely chopped,weighed to 1 g, transferred to 30 mL glass vial, and spikedwith the surrogate standards, i.e., 2,4,5,6-tetrachloro-m-xy-lene (TCmX) and Decachlorobiphenyl (CB-209). The spikedsample was then vortexed, stirred, and sonicated for 20 minand kept overnight at 4 °C (Covaci and Voorspoels 2005;Vizcaino et al. 2014). PCB residues were then extracted usingpreviously described method by Bergonzi et al. (2009) andDewan et al. (2013). Briefly, sonicated-spiked samples wereextracted with n-hexane (6 mL) and acetone (3 mL), andequilibrated by ultrasonic treatment for 1 h at 3 °C, followedby their centrifugation for 10 min at 2000 revolution per min-ute (rpm). The clear upper layer of n-hexane, containing PCBswas then separated into another glass vial and repeating theprocess twice to obtain maximum extract, with no PCB resid-ual left. The extract was then cleaned and purified through 12-mm diameter silica-alumina packed column, containing sodi-um sulphate, anhydrous(1 cm), sulfuric acid-silica, 50%(4 cm), neutral silica, 3% deactivated (4 cm), and neutral alu-mina, 3% deactivated (4 cm), and eluted with n-hexane(10 mL) and dichloromethane (5 mL). The purified extract
ATTOCK
KHUSHAB
JHELUM
RAWALPINDI
SARGODHA
MIANWALI
KOHAT
LHR - ISB M2
Mianwali - Chakwal Rd
Mianwali Rd
P.D.Khan RoadKhushab Rd
Fateh Jang Rd
Sarg
odha
Roa
d
G.T.Road (N
5)
LHR - ISB M2
N-5
G. T. R
oad (N5)
Kohat Road
Indus Highway N
-55
Hota Road
Muz
affa
rgar
h-M
ianw
ali R
oad
Sahiwal To Kasur
Bahawalpur To Sahiwal
Lodh
ran
Rd
Jaranwala Rd
Mianwali Rd
Rahim Yar Khan Rd.
Mianwali - Chakwal Rd
Gojra - Samundri Rd.
Muzaff
argarh
To Jh
ang R
oad
Bhakkar-Jhang Road
Jhan
g-Kh
usha
b R
oad
Hasilpur - Vehari R
d.
Chiniot-Phalia Road
Nar
owal
Rd
P.D.Khan RoadKhushab Rd
Road
Hasilpur - Bahawalpur Rd.
Jhang-Chiniot-Pindi Bhattian Road
Indu
s H
ighw
ay
Fateh Jang Rd
Muzaffargarh To Layyah R
oad
Daska Rd
Sahiwal - Noor Shah - H
alla Rd.
Jhumra Road
Pattoki - Raiwind RoadNankan Sahib Rd.
Toba Road
N-5
Chakwal
Sialkot
Lahore
Okara
Khanewal
GUJRAT
NAROWALGUJRANWALA
MR Link Canal
BRBD Link Canal
M.L
.L(U
.C.C
)
Nurpur Disty
Nokhar Branch
Main Li
ne U
pper
(UCC)
Kam
oke
Dis
ty
Sadhoke Disty Kotli Disty
Jamke Disty
Nal
a
Naddha Disty
Nar
owal
Rd
Eman
abad
Rd
G. T. R
oad (N5)
Daska Rd
N-5
Shakar Garh Rd
Pasrur Rd
Bhimber - Kotla R
d
BRBD
Lin
k C
anal
Muridke Disty
Shahd
ara D
isty
QB
Link
can
al
M.L
.L(U
.C.C
)
Sikhanwala Disty
M.B.L of BRBD Link.
Bucharkhana disty of BRBD Link.
Raiwind ditsy of MBL.
Niazbe
g disty
of La
hore
Br:
Udehra
Dist
y
Nou
sher
a D
isty H
arpoki Disty
Lahore Branch of BRBD Link.
Mangta
nwala
Feed
er
Sohal Disty
Akba
r Dis
ty
Bucherkana Disty Reverse
N-5
LHR - ISB M2
G.T.Road (N
5)
Sargodha Rd
N-5
SHEIKHUPURA
KASUR
GUJRANWALA
B.S.
Link
-I
Gugera Branch
B.S.
Lin
k-II
Lower Bari Doab Canal
Pakpattan Canal Upper
Depalpur Disty
2 L Disty
1 L D
isty
Nehranwala Disty
Attari Disty
4 L Disty
Lower Sohag Branch
NalaChunian Disty
Pakhoke Disty
Joya
Dist
y
Noor pur Disty
1-R Disty
Escape Vahn
Chunian disty
Jandraka Disty
Kanganpur Disty
Rakh disty of MBL
Bunga Hayat Disty
Chorkot Disty
Khadir Branch1-AR Disty
Haveli diksty
Lallu
ggud
ar D
isty
Vahn disty of MBL
5L G
ambe
r Dist
y
Kul Disty
4R Jhilwala Disty
Gulshah Disty
Bejanpur Disty2 R A Disty
Chhina disty of MBL
1AL F
eede
r Dist
y
Gaja Disty
Upper sohag Branch
Chuc
hack
Dist
y
Sem Nala
Gillanwala Disty
5AR Disty
Sahiwal - Noor Shah - H
alla Rd.
Depalpur Rd
Piplipahar Rd
Sherga
rh Rd
KASUR
PAKPATTAN
SAHIWAL
FAISALABAD
SAHIWAL BHAWALNAGAR
SHEIKHUPURA
Tail Disty
10R Branch& Disty
8L D
isty
Sidhnai Canal
14L
Dist
y
Shujabad Branch
15L Dulwan Disty
3R Disty
11L Disty7R Disty Lower
8R Disty
4R-Disty Kabirwala Disty
Rangp
ur ca
nal
12L Disty
Miani D
isty
Haji Upper Disty
8R Tulamba Disty
4L-D
isty
Matital
Dist
y
Harri Disty
Multan Branch
Lower Bari Doab Canal
S.M
.B.L
(Sid
hnai
Mai
lsi B
ahaw
al L
ink)
Can
al
Forest Disty
Faizpur Disty
Abdul
Hakim
Disty
Tarp
ai D
isty
9L Disty Lower
Pakpattan Canal Upper 4R Disty
Koranga Disty
Khad
il D
isty
Sher Singh Disty
Allahabad Disty9R Disty
5R Disty
3L D
isty
Fazal Shah Disty
15AL Disty
Madina Disty 3R/15L Minor
Chaupar Hatta Disty
Mungawala Disty
Dhallu Disty
Hav
eli M
ain
Line
Ghulam Wah Disty
Darkhana Disty
Sidhnai Feeder
7ER Disty
7L D
isty
Inayat Pur Disty
10AL
Dist
y
1L/15L Minor 12
L Dist
y
G.T.Road (N5)
Lodh
ran
Rd
Mailsi - Multan Rd.Dunyapur Rd
VEHARI
MULTAN
JHANGTOBA TEK SINGHLAYYAH
SAHIWAL
LODHRAN
MUZAFARGARH
BAHAWALPUR
Chakwal
Sialkot
Lahore
Khanewal
Okara
Legend
River / Canals
Punjab Provincial Boundary
Locations
Punjab District Boundary
0 250 500125
Kilometers
Sindh
Balochistan
Punjab
FATA
ICT
KPKDisputedArea
GB
AJK
PAKISTAN
PUNJAB
SUTLEJ RIVER
RAVI RIVER
CHENAB RIVER
JHELUM RIVER
INDU
S RI
VER
RoadsPakistan Railway
Fig. 1 Map of the study area showing sampling sites within five districts of the Punjab Province, Pakistan
Environ Sci Pollut Res (2018) 25:14551–14562 14553
was then concentrated through gentle nitrogen streaming, until0.2 mL of the extract obtained, followed by addition of iso-octane (50 μl) and 13C–PCB 141 as solvent keeper and inter-nal standard, respectively (Vizcaino et al. 2014).
Chromatographic analysis
In total 34 PCB congeners (IUPACNo. 30, 37, 44, 49, 52, 54,60, 66, 70, 74, 77, 82, 87, 99, 101, 105, 114, 118, 126, 128,138, 153, 156, 158, 166, 169, 170, 179, 180, 183, 187, 189,198, and 209) were analyzed at the State Key Laboratory ofOrganic Geochemistry, Guangzhou Institute of Geochemistry,Chinese Academy of Sciences, China, using a TripleQuadrupole GC/MS (Agilent 7000A) connected with GasChromatograph (Agilent 7890A) and autosampler (Agilent7693) having CP-8 capillary column (CP7481, CP-Sil 8,50 m × 0.25 mm× 0.12 μm from Netherlands). The tempera-ture of the injector was adjusted to 280 °C and temperature ofthe oven was set initially at 100 °C (for 3 min), which waslater increased to 160 °C at the rate of 20.0 °C per min andultimately to 296 °C at 8 °C per min, with holding time of5.5 min. The electron impact spectrometry per three fragmentions in selected-ion monitoring mode was employed to iden-tify the PCB congeners. The mass selective detector (MSD)source and quadruple temperatures were set at 230 and150 °C, respectively. The identification of analyte was basedupon their respective retentions time and ion chromatographsagainst the standards. Quantification was done by creating(multi-level) calibration curves and for all the concentrationranges detected in the samples, a good linearity of R2 > 0.99was achieved.
Lipid determination
Placental lipids were measured gravimetrically by taking pla-centa tissue (1 g), and thrice homogenizing it in 5-mL solutionof chloroform: methanol: hydrochloric acid (20:10:0.1 v/v/v),followed by the addition of 0.1 N HCl (10 mL) and centrifu-gation for 10 min at 3000 rpm. Organic phase containinglipids was then collected and the process was repeated to ob-tain maximum lipids. The extract was then concentrated undernitrogen stream and dry lipids were measured gravimetrically(Vizcaino et al. 2014).
Quality control and quality assurance
Quality assurance and controls were firmly followed for theentire analysis. The glassware was thoroughly rinsed withdouble-distilled water and later baked in muffle furnace for4 h at 450 °C before their usage, to prevent any contaminationto the samples. All the chemicals/reagents consumed werepurchased from Merck KGaA (Germany) and were ofHPLC grade. The internal and surrogate standards were
purchased from Dr. Ehrenstorfer GmbH (Germany) andCPA chem Ltd. (Bulgaria), respectively. For instrumental cal-ibration, standards were run every day and solvent blankswere analyzed after every 15 samples (a batch) to avoid anyrepeatability and cross-contamination in chemical analysis.For PCB peak integration, the Agilent MassHunterWorkstation Software Quantitative Analysis was used. Theprescribed procedure by Syed et al. (2014) was used to calcu-late method detection limit (MDL) and instrumental detectionlimit (IDL). The determination of congeners below the IDLwas referred as not detected (ND). The MDLs were calculatedas thrice to the standard deviation (SD) of the blank(Mahmood et al. 2014a). The calibration standards were usedon daily basis to compute the calibration curves. Mean recov-ery values were79 ± 8% for TCmX and 82 ± 9% for CB-209,respectively and all the results were adjusted to the blanks andstandards recovery ratios; for determination of CB-209 wasonly used as surrogate standard (Baqar et al. 2017b).
Statistical analysis
The Statistical Package for the Social Sciences (SPSS) version16.0 was used to test basic descriptive statistic and multipleregression analysis of PCBs with maternal and neonatal phys-iological data. The Arc GIS version 10.2.2 was employed todisplay PCB spatial distribution patterns in the study area.
Results and discussion
PCB congeners and homologs profile
Descriptive statistics of 34PCBcongeners and7PCBhomologsinplacental tissuesfromPakistanaresummarizedinTableS3andTable 1, respectively. The placental lipids values were rangedfrom 0.7% to 3.0% (mean: 1.8%). The ∑34PCB concentrationsinplacental tissuesweremeasuredbetween20.2and115.98ng/glipid weight (lip. wt.) with mean concentration of 80.26 ±19.87 ng/g (lip.wt.).All the studiedPCBcongenerswere detect-ed from placental samples. The PCB congener-specific profilehighlighted the CB-70 (mean: 6.63 ng/g (lip. wt.) as most dom-inant PCB congener, followed by CB-66 and CB-52, and leastconcentrationwasdepictedbyCB-166(mean0.21ng/g(lip.wt.).ThePCBhomologsprofile revealed thedominanceof tetra-PCBwith 54.67% contribution of the total PCBs. The overall PCBhomologs distribution trend in placental tissues from Pakistanwere in magnitude as; tetra-CB > penta-CB > hexa-CB > tri-CB > hepta-CB > octa-CB > deca-CB. In Pakistan, PCBs areprimarily used as a technical mixture of tetra-CB, penta-CB andtri-CB (Syed et al. 2014; Baqar et al. 2017b) which has beenvalidated by the prevalence of tetra-CB and penta-CB in placen-tal tissuesamplesfromthestudyarea.Thedominanceof tetra-CBand penta-CB in placental tissues were in consistent to previous
14554 Environ Sci Pollut Res (2018) 25:14551–14562
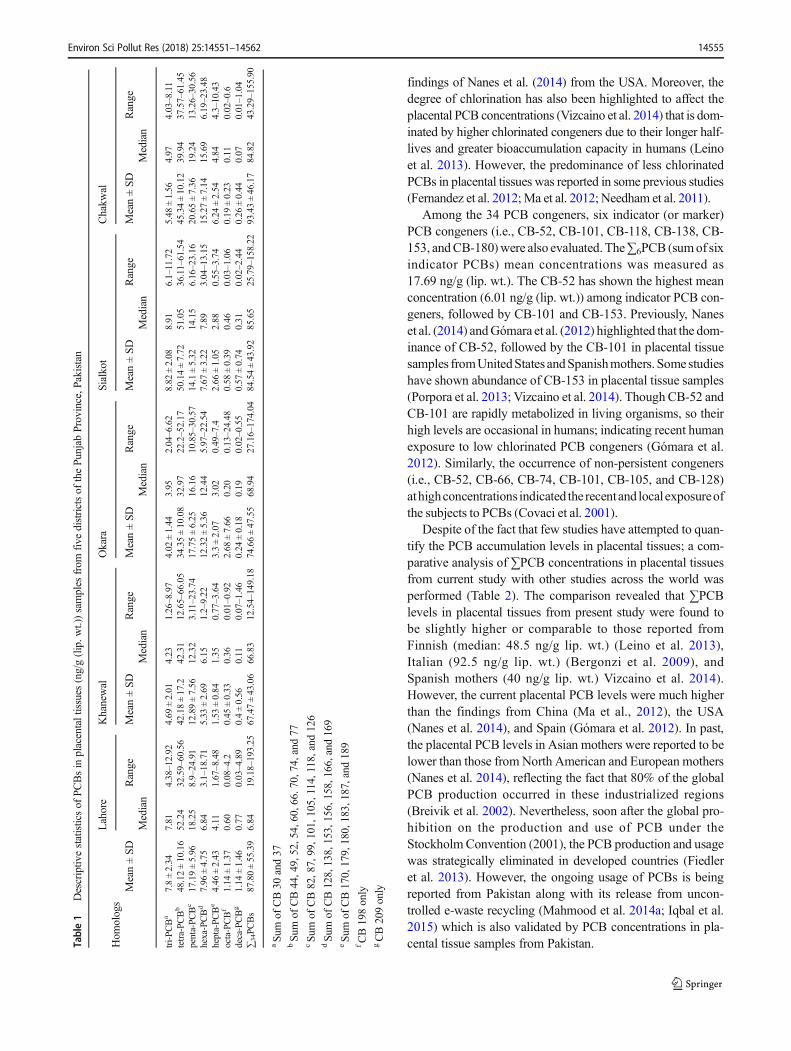
findings of Nanes et al. (2014) from the USA. Moreover, thedegree of chlorination has also been highlighted to affect theplacental PCB concentrations (Vizcaino et al. 2014) that is dom-inated by higher chlorinated congeners due to their longer half-lives and greater bioaccumulation capacity in humans (Leinoet al. 2013). However, the predominance of less chlorinatedPCBs in placental tissues was reported in some previous studies(Fernandez et al. 2012;Ma et al. 2012; Needham et al. 2011).
Among the 34 PCB congeners, six indicator (or marker)PCB congeners (i.e., CB-52, CB-101, CB-118, CB-138, CB-153, andCB-180)were also evaluated. The∑6PCB (sumof sixindicator PCBs) mean concentrations was measured as17.69 ng/g (lip. wt.). The CB-52 has shown the highest meanconcentration (6.01 ng/g (lip. wt.)) among indicator PCB con-geners, followed by CB-101 and CB-153. Previously, Naneset al. (2014) andGómara et al. (2012) highlighted that the dom-inance of CB-52, followed by the CB-101 in placental tissuesamples fromUnitedStates andSpanishmothers. Some studieshave shown abundance of CB-153 in placental tissue samples(Porpora et al. 2013; Vizcaino et al. 2014). Though CB-52 andCB-101 are rapidly metabolized in living organisms, so theirhigh levels are occasional in humans; indicating recent humanexposure to low chlorinated PCB congeners (Gómara et al.2012). Similarly, the occurrence of non-persistent congeners(i.e., CB-52, CB-66, CB-74, CB-101, CB-105, and CB-128)athighconcentrations indicated the recentand localexposureofthe subjects to PCBs (Covaci et al. 2001).
Despite of the fact that few studies have attempted to quan-tify the PCB accumulation levels in placental tissues; a com-parative analysis of ∑PCB concentrations in placental tissuesfrom current study with other studies across the world wasperformed (Table 2). The comparison revealed that ∑PCBlevels in placental tissues from present study were found tobe slightly higher or comparable to those reported fromFinnish (median: 48.5 ng/g lip. wt.) (Leino et al. 2013),Italian (92.5 ng/g lip. wt.) (Bergonzi et al. 2009), andSpanish mothers (40 ng/g lip. wt.) Vizcaino et al. 2014).However, the current placental PCB levels were much higherthan the findings from China (Ma et al., 2012), the USA(Nanes et al. 2014), and Spain (Gómara et al. 2012). In past,the placental PCB levels in Asian mothers were reported to belower than those from North American and European mothers(Nanes et al. 2014), reflecting the fact that 80% of the globalPCB production occurred in these industrialized regions(Breivik et al. 2002). Nevertheless, soon after the global pro-hibition on the production and use of PCB under theStockholmConvention (2001), the PCB production and usagewas strategically eliminated in developed countries (Fiedleret al. 2013). However, the ongoing usage of PCBs is beingreported from Pakistan along with its release from uncon-trolled e-waste recycling (Mahmood et al. 2014a; Iqbal et al.2015) which is also validated by PCB concentrations in pla-cental tissue samples from Pakistan.Ta
ble1
Descriptiv
estatisticsof
PCBsin
placentaltissues
(ng/g(lip.w
t.))samples
from
five
districtsof
thePu
njab
Province,P
akistan
Hom
ologs
Lahore
Khanewal
Okara
Sialkot
Chakw
al
Mean±SD
Median
Range
Mean±SD
Median
Range
Mean±SD
Median
Range
Mean±SD
Median
Range
Mean±SD
Median
Range
tri-PC
Ba
7.8±2.34
7.81
4.38–12.92
4.69
±2.01
4.23
1.26–8.97
4.02
±1.44
3.95
2.04–6.62
8.82
±2.08
8.91
6.1–11.72
5.48
±1.56
4.97
4.03–8.11
tetra-PC
Bb
48.12±10.16
52.24
32.59–60.56
42.18±17.2
42.31
12.65–66.05
34.35±10.08
32.97
22.2–52.17
50.14±7.72
51.05
36.11–61.54
45.34±10.12
39.94
37.57–61.45
penta-PC
Bc
17.19±5.96
18.25
8.9–24.91
12.89±7.56
12.32
3.11–23.74
17.75±6.25
16.16
10.85–30.57
14.1±5.32
14.15
6.16–23.16
20.65±7.36
19.24
13.26–30.56
hexa-PCBd
7.96
±4.75
6.84
3.1–18.71
5.33
±2.69
6.15
1.2–9.22
12.32±5.36
12.44
5.97–22.54
7.67
±3.22
7.89
3.04–13.15
15.27±7.14
15.69
6.19–23.48
hepta-PC
Be
4.46
±2.43
4.11
1.67–8.48
1.53
±0.84
1.35
0.77–3.64
3.3±2.07
3.02
0.49–7.4
2.66
±1.05
2.88
0.55–3.74
6.24
±2.54
4.84
4.3–10.43
octa-PCBf
1.14
±1.37
0.60
0.08–4.2
0.45
±0.33
0.36
0.01–0.92
2.68
±7.66
0.20
0.13–24.48
0.58
±0.39
0.46
0.03–1.06
0.19
±0.23
0.11
0.02–0.6
deca-PCBg
1.14
±1.46
0.77
0.03–4.89
0.4±0.56
0.11
0.07–1.46
0.24
±0.18
0.19
0.02–0.55
0.57
±0.74
0.31
0.02–2.44
0.26
±0.44
0.07
0.01–1.04
∑34PCBs
87.80±55.39
6.84
19.18–193.25
67.47±43.06
66.83
12.54–149.18
74.66±47.55
68.94
27.16–174.04
84.54±43.92
85.65
25.79–158.22
93.43±46.17
84.82
43.29–155.90
aSu
mof
CB30
and37
bSu
mof
CB44,49,52,54,60,66.70,74,and77
cSu
mof
CB82,87,99,101,105,114,118,and
126
dSu
mof
CB128,138,153,156,158,166,and169
eSu
mof
CB170,179,180,183,187,and189
fCB198only
gCB209only
Environ Sci Pollut Res (2018) 25:14551–14562 14555
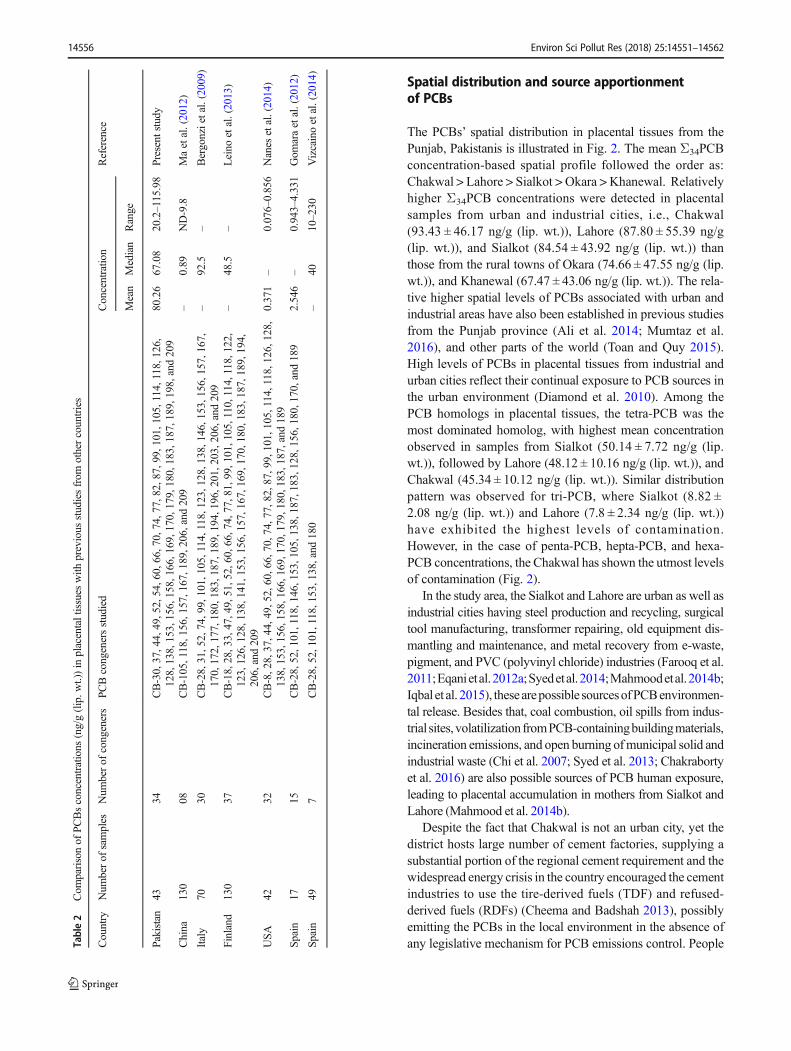
Spatial distribution and source apportionmentof PCBs
The PCBs’ spatial distribution in placental tissues from thePunjab, Pakistanis is illustrated in Fig. 2. The mean Σ34PCBconcentration-based spatial profile followed the order as:Chakwal > Lahore > Sialkot > Okara > Khanewal. Relativelyhigher Σ34PCB concentrations were detected in placentalsamples from urban and industrial cities, i.e., Chakwal(93.43 ± 46.17 ng/g (lip. wt.)), Lahore (87.80 ± 55.39 ng/g(lip. wt.)), and Sialkot (84.54 ± 43.92 ng/g (lip. wt.)) thanthose from the rural towns of Okara (74.66 ± 47.55 ng/g (lip.wt.)), and Khanewal (67.47 ± 43.06 ng/g (lip. wt.)). The rela-tive higher spatial levels of PCBs associated with urban andindustrial areas have also been established in previous studiesfrom the Punjab province (Ali et al. 2014; Mumtaz et al.2016), and other parts of the world (Toan and Quy 2015).High levels of PCBs in placental tissues from industrial andurban cities reflect their continual exposure to PCB sources inthe urban environment (Diamond et al. 2010). Among thePCB homologs in placental tissues, the tetra-PCB was themost dominated homolog, with highest mean concentrationobserved in samples from Sialkot (50.14 ± 7.72 ng/g (lip.wt.)), followed by Lahore (48.12 ± 10.16 ng/g (lip. wt.)), andChakwal (45.34 ± 10.12 ng/g (lip. wt.)). Similar distributionpattern was observed for tri-PCB, where Sialkot (8.82 ±2.08 ng/g (lip. wt.)) and Lahore (7.8 ± 2.34 ng/g (lip. wt.))have exhibited the highest levels of contamination.However, in the case of penta-PCB, hepta-PCB, and hexa-PCB concentrations, the Chakwal has shown the utmost levelsof contamination (Fig. 2).
In the study area, the Sialkot and Lahore are urban as well asindustrial cities having steel production and recycling, surgicaltool manufacturing, transformer repairing, old equipment dis-mantling and maintenance, and metal recovery from e-waste,pigment, and PVC (polyvinyl chloride) industries (Farooq et al.2011;Eqanietal.2012a;Syedetal.2014;Mahmoodetal.2014b;Iqbal et al. 2015), thesearepossible sourcesofPCBenvironmen-tal release. Besides that, coal combustion, oil spills from indus-trial sites,volatilizationfromPCB-containingbuildingmaterials,incineration emissions, and open burning ofmunicipal solid andindustrial waste (Chi et al. 2007; Syed et al. 2013; Chakrabortyet al. 2016) are also possible sources of PCB human exposure,leading to placental accumulation in mothers from Sialkot andLahore (Mahmood et al. 2014b).
Despite the fact that Chakwal is not an urban city, yet thedistrict hosts large number of cement factories, supplying asubstantial portion of the regional cement requirement and thewidespread energy crisis in the country encouraged the cementindustries to use the tire-derived fuels (TDF) and refused-derived fuels (RDFs) (Cheema and Badshah 2013), possiblyemitting the PCBs in the local environment in the absence ofany legislative mechanism for PCB emissions control. PeopleTa
ble2
Com
parisonof
PCBsconcentrations
(ng/g(lip.w
t.))in
placentaltissues
with
previous
studiesfrom
othercountries
Country
Num
berof
samples
Num
berof
congeners
PCBcongenersstudied
Concentratio
nReference
Mean
Median
Range
Pakistan
4334
CB-30,37,44,49,52,54,60,66,70,74,77,82,87,99,101,105,114,118,126,
128,138,153,156,158,166,169,170,179,180,183,187,189,198,and209
80.26
67.08
20.2–115.98
Presentstudy
China
130
08CB-105,118,156,157,167,189,206,and
209
–0.89
ND-9.8
Maetal.(2012)
Italy
7030
CB-28,31,52,74,99,101,105,114,118,123,128,138,146,153,156,157,167,
170,172,177,180,183,187,189,194,196,201,203,206,and209
–92.5
–Bergonzietal.(2009)
Finland
130
37CB-18,28,33,47,49,51,52,60,66,74,77,81,99,101,105,110,114,118,122,
123,126,128,138,141,153,156,157,167,169,170,180,183,187,189,194,
206,and209
–48.5
–Leino
etal.(2013)
USA
4232
CB-8,28,37,44,49,52,60,66,70,74,77,82,87,99,101,105,114,118,126,128,
138,153,156,158,166,169,170,179,180,183,187,and189
0.371
–0.076–0.856
Nanes
etal.(2014)
Spain
1715
CB-28,52,101,118,146,153,105,138,187,183,128,156,180,170,and
189
2.546
–0.943–4.331
Gom
araetal.(2012)
Spain
497
CB-28,52,101,118,153,138,and
180
–40
10–230
Vizcainoetal.(2014)
14556 Environ Sci Pollut Res (2018) 25:14551–14562
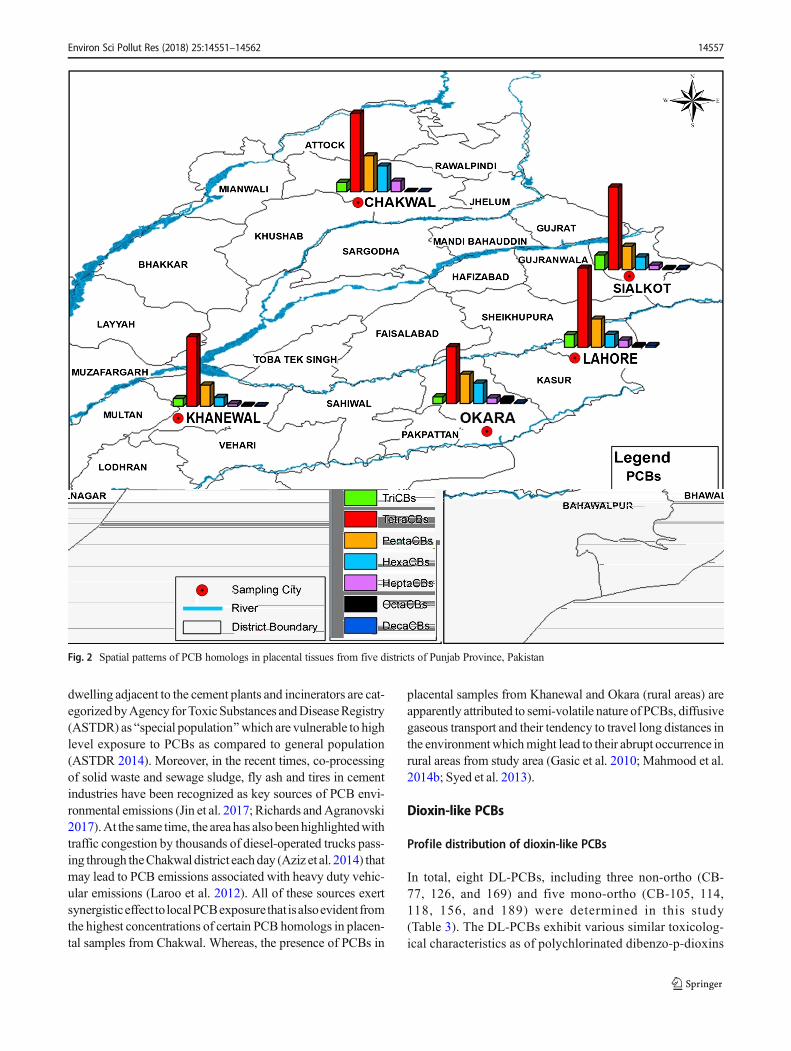
dwelling adjacent to the cement plants and incinerators are cat-egorizedbyAgency forToxicSubstances andDiseaseRegistry(ASTDR) as Bspecial population^which are vulnerable to highlevel exposure to PCBs as compared to general population(ASTDR 2014). Moreover, in the recent times, co-processingof solid waste and sewage sludge, fly ash and tires in cementindustries have been recognized as key sources of PCB envi-ronmental emissions (Jin et al. 2017; Richards andAgranovski2017).At the same time, the areahas alsobeenhighlightedwithtraffic congestion by thousands of diesel-operated trucks pass-ing through theChakwal district eachday (Aziz et al. 2014) thatmay lead to PCB emissions associated with heavy duty vehic-ular emissions (Laroo et al. 2012). All of these sources exertsynergisticeffect to localPCBexposure that isalsoevident fromthe highest concentrations of certain PCB homologs in placen-tal samples from Chakwal. Whereas, the presence of PCBs in
placental samples from Khanewal and Okara (rural areas) areapparently attributed to semi-volatile nature of PCBs, diffusivegaseous transport and their tendency to travel long distances inthe environmentwhichmight lead to their abrupt occurrence inrural areas from study area (Gasic et al. 2010; Mahmood et al.2014b; Syed et al. 2013).
Dioxin-like PCBs
Profile distribution of dioxin-like PCBs
In total, eight DL-PCBs, including three non-ortho (CB-77, 126, and 169) and five mono-ortho (CB-105, 114,118, 156, and 189) were determined in this study(Table 3). The DL-PCBs exhibit various similar toxicolog-ical characteristics as of polychlorinated dibenzo-p-dioxins
Fig. 2 Spatial patterns of PCB homologs in placental tissues from five districts of Punjab Province, Pakistan
Environ Sci Pollut Res (2018) 25:14551–14562 14557
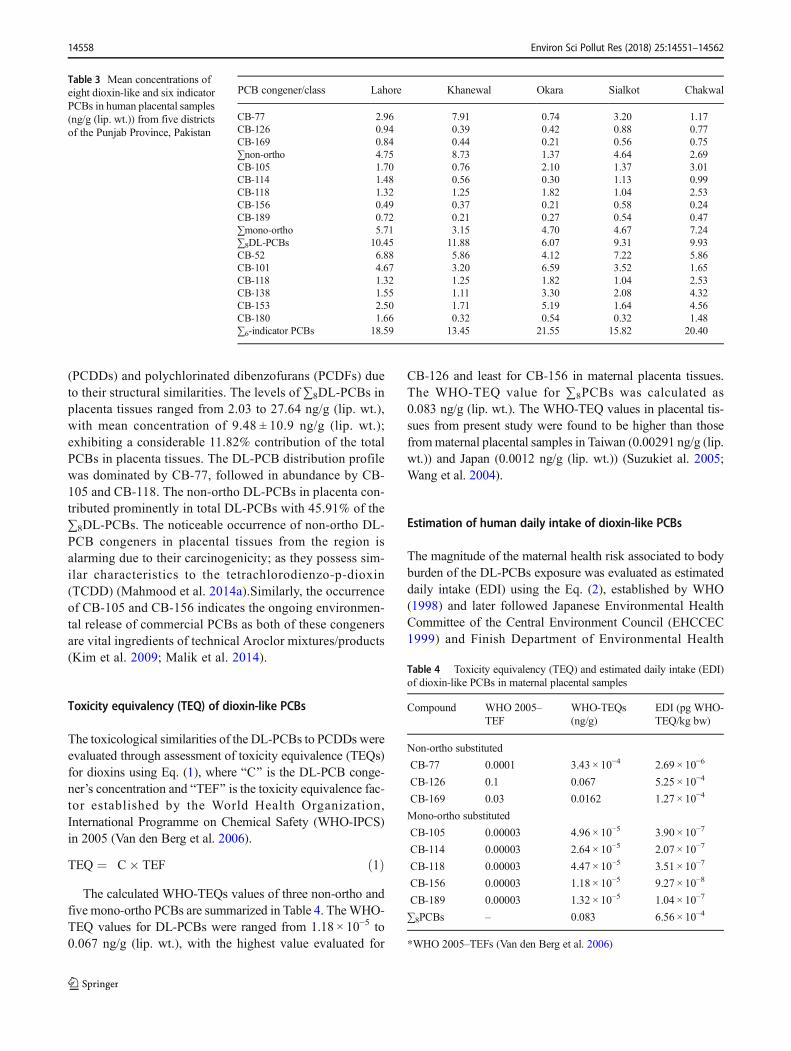
(PCDDs) and polychlorinated dibenzofurans (PCDFs) dueto their structural similarities. The levels of ∑8DL-PCBs inplacenta tissues ranged from 2.03 to 27.64 ng/g (lip. wt.),with mean concentration of 9.48 ± 10.9 ng/g (lip. wt.);exhibiting a considerable 11.82% contribution of the totalPCBs in placenta tissues. The DL-PCB distribution profilewas dominated by CB-77, followed in abundance by CB-105 and CB-118. The non-ortho DL-PCBs in placenta con-tributed prominently in total DL-PCBs with 45.91% of the∑8DL-PCBs. The noticeable occurrence of non-ortho DL-PCB congeners in placental tissues from the region isalarming due to their carcinogenicity; as they possess sim-ilar characteristics to the tetrachlorodienzo-p-dioxin(TCDD) (Mahmood et al. 2014a).Similarly, the occurrenceof CB-105 and CB-156 indicates the ongoing environmen-tal release of commercial PCBs as both of these congenersare vital ingredients of technical Aroclor mixtures/products(Kim et al. 2009; Malik et al. 2014).
Toxicity equivalency (TEQ) of dioxin-like PCBs
The toxicological similarities of the DL-PCBs to PCDDs wereevaluated through assessment of toxicity equivalence (TEQs)for dioxins using Eq. (1), where BC^ is the DL-PCB conge-ner’s concentration and BTEF^ is the toxicity equivalence fac-tor established by the World Health Organization,International Programme on Chemical Safety (WHO-IPCS)in 2005 (Van den Berg et al. 2006).
TEQ ¼ C� TEF ð1Þ
The calculated WHO-TEQs values of three non-ortho andfive mono-ortho PCBs are summarized in Table 4. TheWHO-TEQ values for DL-PCBs were ranged from 1.18 × 10⁻⁵ to0.067 ng/g (lip. wt.), with the highest value evaluated for
CB-126 and least for CB-156 in maternal placenta tissues.The WHO-TEQ value for ∑8PCBs was calculated as0.083 ng/g (lip. wt.). The WHO-TEQ values in placental tis-sues from present study were found to be higher than thosefrommaternal placental samples in Taiwan (0.00291 ng/g (lip.wt.)) and Japan (0.0012 ng/g (lip. wt.)) (Suzukiet al. 2005;Wang et al. 2004).
Estimation of human daily intake of dioxin-like PCBs
The magnitude of the maternal health risk associated to bodyburden of the DL-PCBs exposure was evaluated as estimateddaily intake (EDI) using the Eq. (2), established by WHO(1998) and later followed Japanese Environmental HealthCommittee of the Central Environment Council (EHCCEC1999) and Finish Department of Environmental Health
Table 3 Mean concentrations ofeight dioxin-like and six indicatorPCBs in human placental samples(ng/g (lip. wt.)) from five districtsof the Punjab Province, Pakistan
PCB congener/class Lahore Khanewal Okara Sialkot Chakwal
CB-77 2.96 7.91 0.74 3.20 1.17CB-126 0.94 0.39 0.42 0.88 0.77CB-169 0.84 0.44 0.21 0.56 0.75∑non-ortho 4.75 8.73 1.37 4.64 2.69CB-105 1.70 0.76 2.10 1.37 3.01CB-114 1.48 0.56 0.30 1.13 0.99CB-118 1.32 1.25 1.82 1.04 2.53CB-156 0.49 0.37 0.21 0.58 0.24CB-189 0.72 0.21 0.27 0.54 0.47∑mono-ortho 5.71 3.15 4.70 4.67 7.24∑8DL-PCBs 10.45 11.88 6.07 9.31 9.93CB-52 6.88 5.86 4.12 7.22 5.86CB-101 4.67 3.20 6.59 3.52 1.65CB-118 1.32 1.25 1.82 1.04 2.53CB-138 1.55 1.11 3.30 2.08 4.32CB-153 2.50 1.71 5.19 1.64 4.56CB-180 1.66 0.32 0.54 0.32 1.48∑6-indicator PCBs 18.59 13.45 21.55 15.82 20.40
Table 4 Toxicity equivalency (TEQ) and estimated daily intake (EDI)of dioxin-like PCBs in maternal placental samples
Compound WHO 2005–TEF
WHO-TEQs(ng/g)
EDI (pg WHO-TEQ/kg bw)
Non-ortho substituted
CB-77 0.0001 3.43 × 10⁻⁴ 2.69 × 10⁻⁶
CB-126 0.1 0.067 5.25 × 10⁻⁴
CB-169 0.03 0.0162 1.27 × 10⁻⁴
Mono-ortho substituted
CB-105 0.00003 4.96 × 10⁻⁵ 3.90 × 10⁻⁷
CB-114 0.00003 2.64 × 10⁻⁵ 2.07 × 10⁻⁷
CB-118 0.00003 4.47 × 10⁻⁵ 3.51 × 10⁻⁷
CB-156 0.00003 1.18 × 10⁻⁵ 9.27 × 10⁻⁸
CB-189 0.00003 1.32 × 10⁻⁵ 1.04 × 10⁻⁷
∑8PCBs – 0.083 6.56 × 10⁻⁴
*WHO 2005–TEFs (Van den Berg et al. 2006)
14558 Environ Sci Pollut Res (2018) 25:14551–14562

(Kiviranta 2005).
EDI ng=kg=dayð Þ ¼ Body Burden ng=kgð Þ x ln 2ð Þhalf−lifeð Þ x f
ð2Þ
where f is the absorption factor (assumed to be 50%), ln(2) =0.693,andhalf-life isassumed tobe7.5years (EHCCEC1999).
The calculated EDI for DL-PCBs was ranged from 9.27 ×10⁻⁸ to 5.25 × 10⁻⁴ pg WHO-TEQ/kg bw (body weight); withhighest and lowest EDI computed for CB-126 and CB-156, re-spectively. ThemeanEDI of∑8dl-PCBswas found to be 6.56 ×10⁻⁴ pgWHO-TEQ/kg bw. The current EDI results were foundto be much lower than the tolerable daily intake (TDI) valuesestablished by WHO (1–4 pg TEQ/kg bw), The EuropeanUnion Scientific Committee on Food (EU SCF) (2 pg TEQ/kgbw), Joint FAO/WHO Expert Committee on Food Additives(JECFA) (2.3 pg TEQ/kg bw), United States EnvironmentalProtection Agency (USEPA) (0.001–0.01 pg TEQ/ kg bw), andtheUKCommitteeonToxicityofChemicals inFood,Consumer
Products and Environment (COT) (2 pg TEQ/kg bw) (VanLeeuwen et al. 2000; European Commission 2001; WHO/FAO, 2001; USEPA 2000).
Correlation between placental PCB levelsand neonatal anthropometric measures
A prenatal POPs exposure had been reported to inhibit fetalgrowth, resulting in reduced birth weight, crown to heellength, head, mid-arm, and chest circumferences (Dewanet al. 2013; Vafeiadi et al. 2014). The relationship between∑34PCB concentrations in placental tissues and infant’s an-thropometric measures through multiple linear regression(Table S4) have shown a negative correlation of infant’s bodyweight (R2 = 0.0728) (Fig. 3), crown to heel length (R2 =0.068), head circumference (R2 = 0.0342), chest circumfer-ence (R2 = 0.0001), and mid arm circumference (R2 =0.0096) (Fig. 4). These negative correlation findings havereflected neonatal and fetal health effects associated with ma-ternal PCB exposure and its subsequent bioaccumulation. Thecurrent decrements in fetal and neonatal growth associatedwith maternal or/and neonatal PCB concentrations were inconsistent to the findings of the previous studies conductedin the USA (Sagivet al. 2007), Europe (Govarts et al. 2012),China (Wu et al. 2011), India (Dewan et al. 2013), SaudiArabia (Al-Saleh et al. 2012), and Singapore (Tan et al. 2009).
Conclusions
The occurrence, congeners profile, spatial variations, sourceapportionment, toxicity equivalence (WHO-TEQ), and esti-mated daily intake (EDI) associated to maternal exposure ofPCBs from five districts of Punjab Province, Pakistan, were
y = -0.0168x + 5.8716
R² = 0.0728
0
1
2
3
4
5
6
7
8
0.00 20.00 40.00 60.00 80.00 100.00 120.00 140.00
Infa
nt's
Body
Wei
ght (
Poun
ds)
PCB Concentration (ng/g lip. wt)
Fig. 3 Simple linear regression showing relationship between PCBs inmaternal placenta and infants body weight
y = -0.0618x + 47.364
R² = 0.068
y = -0.0219x + 35.026
R² = 0.0342
y = -0.0012x + 31.853
R² = 0.0001
y = -0.0073x + 10.467
R² = 0.0096
0.00
10.00
20.00
30.00
40.00
50.00
60.00
0.00 20.00 40.00 60.00 80.00 100.00 120.00 140.00
Infa
nt a
nthr
opom
etri
c mea
sure
s (cm
)
PCB Concentration (ng/g lip. wt.)
Crown to Heel Length
Head Circumference
Chest Circumference
Mid Arm Circumference
Linear (Crown to Heel Length)
Linear (Head Circumference)
Linear (Chest Circumference)
Linear (Mid Arm Circumference)
Fig. 4 Multiple linear regressionsshowing relationship betweenPCBs in maternal placenta andinfants anthropometric measures
Environ Sci Pollut Res (2018) 25:14551–14562 14559

assessed that they provide a pioneer data for PCBs in placentaltissues from South Asian women. Among the PCB congeners,the CB-70 was the most dominant PCB congener, followed inabundance by CB-66 and CB-52. The overall PCB homologdistribution trend in placental tissues from Pakistan were indescending order as tetra-PCB > penta-PCB > hexa-PCB >tri-PCB > hepta-PCB > octa-PCB > deca-PCB. The placentalPCB levels from study area were found to be comparable orhigher than those assessed in similar studies. The meanΣ34PCB concentration-based spatial profile followed the or-der as Chakwal > Lahore > Sialkot > Okara > Khanewal,representing relatively higher levels of contamination in urbanand industrial cities than the rural towns. The multi-regressionanalysis has shown reduction in neonatal anthropometric mea-surements associated with maternal PCB body burden. Thus,at present, the maternal exposure to PCBs in Pakistan exertsrisks to neonatal health and detailed human biomonitoring andrisk assessment studies are needed to be conducted in theregion. The present study also suggests the best pollution con-trol practices and rigid legislative actions to be opted on emer-gency grounds to prevent PCB future environmental releasesto safeguard human health risks.
Acknowledgements We express our sincere gratitude to the State KeyLaboratory of Organic Geochemistry, Guangzhou Institute ofGeochemistry, Chinese Academy of Sciences, Guangzhou, China forproviding support for laboratory analysis.
Compliance with ethical standards
The approval of the present study was obtained from Advanced Studiesand Research Board (ASRB), University of the Punjab, Pakistan, andwritten consent was obtained from the subjects, after they were briefedabout the purpose of the research.
References
Agency for Toxic Substances and Disease Registry (ASTDR) (2014)Case studies in environmental medicine, polychlorinated biphenyls(PCBs) toxicity. Agency for Toxic Substances and Disease Registry,US Department of Health and Human Services, pp 1–90
Ali N, Eqani SAMAS, Malik RN, Neels H, Covaci A (2013)Organohalogenated contaminants (OHCs) in human serum ofmothers and children from Pakistan with urban and rural residentialsettings. Sci Total Environ 461-462:655–662
Ali N, Mehdi T,Malik RN, Eqani SAMAS, Kamal A, Dirtu AC, Neels H,Covaci A (2014) Levels and profile of several classes of organiccontaminants in matched indoor dust and serum samples from oc-cupational settings of Pakistan. Environ Pollut 193:269–276
Al-Saleh I, Al-Doush I, Alsabbaheen A, Mohamed GED, Rabbah A(2012) Levels of DDT and its metabolites in placenta, maternaland cord blood and their potential influence on neonatal anthropo-metric measures. Sci Total Environ 416:62–74
AzizF,SyedJH,MalikRN,KatsoyiannisA,MahmoodA,LiJ,ZhangG,JonesKC (2014)Occurrence of polycyclic aromatic hydrocarbons in the SoanRiver, Pakistan: insights into distribution, composition, sources and eco-logical risk assessment. Ecotoxicol Environ Saf 109:77–84
Baqar M, Arslan M, Sadef Y, Mahmood A, Qadir A, Ahmad SR (2017a)Persistent organic pollutants: potential threat to ecological integritiesin term of geno-toxicity and oxidative stress. Hum Ecol Risk Assess23:1249–1271
Baqar M, Mahmood A, Sadef Y, Mahmood A, Ahmad SR, Li J, Zhang G(2017b) Occurrence, ecological risk assessment and spatio-temporalvariation of polychlorinated biphenyls (PCBs) in water and sedi-ments along River Ravi and its northern tributaries, Pakistan.Environ Sci Pollut Res 24:27913–27930. https://doi.org/10.1007/s11356-017-0182-0
Bergonzi R, Specchia C, Dinolfo M, Tomasi C, De Palma G, Frusca T,Apostoli P (2009) Distribution of persistent organochlorine pollut-ants in maternal and foetal tissues: data from an Italian pollutedurban area. Chemosphere 76:747–754
Breivik K, Sweetman A, Pacyna JM, Jones KC (2002) Towards a globalhistorical emission inventory for selected PCB congeners—a massbalance approach: 1. Global production and consumption. Sci TotalEnviron 290:181–198
Chakraborty P, Zhang G, Li J, Selvaraj S, Breivik K, Jones KC (2016)Soil concentrations, occurrence, sources and estimation of air-soilexchange of polychlorinated biphenyls in Indian cities. Sci TotalEnviron 562:928–934
Cheema, K., and Badshah, S. (2013) Cement industry, Alternate Fuel andEnvironmental Benefits. Paper presented at the International Journalof Engineering Research and Technology
Chi KH, Chang MB, Kao SJ (2007) Historical trends of PCDD/Fs anddioxin-like PCBs in sediments buried in a reservoir in NorthernTaiwan. Chemosphere 68:1733–1740
ChovancováJ,ČonkaK,FabišikováA,SejákováZS,DömötörováM,DrobnáB, Wimmerová S (2012) PCDD/PCDF, DL-PCB and PBDE serumlevels of Slovak general population. Chemosphere 88:1383–1389
Covaci A, Voorspoels S (2005) Optimization of the determination ofpolybrominateddiphenyl ethers in human serum using solid-phaseextraction and gas chromatography-electron capture negative ioni-zation mass spectrometry. J Chromatogr B 827(2):216–223
Covaci A, Hura C, Schepens P (2001) Selected persistent organochlorinepollutants in Romania. Sci Total Environ 280:143–152
Covaci A, Jorens P, Jacquemyn Y, Schepens P (2002) Distribution ofPCBs and organochlorine pesticides in umbilical cord and maternalserum. Sci Total Environ 298(1–3):45–53
Dewan P, Jain V, Gupta P, Banerjee BD (2013) Organochlorine pesticideresidues in maternal blood, cord blood, placenta, and breastmilk andtheir relation to birth size. Chemosphere 90:1704–1710
Diamond ML, Melymuk L, Csiszar SA, Robson M (2010) Estimation ofPCB stocks, emissions, and urban fate: will our policies reduceconcentrations and exposure. Environ Sci Technol 44:2777–2783
Eqani SAMAS, Malik RN, Katsoyiannis A, Zhang G, Chakraborty P,Mohammad A, Jones KC (2012a) Distribution and risk assessmentof organochlorine contaminants in surface water from RiverChenab, Pakistan. J Environ Monit 14:1645–1654
Eqani SAMAS, Malik RN, Zhang G, Mohammad A, Chakraborty P(2012b) Polychlorinated biphenyls (PCBs) in the sediments of theRiver Chenab, Pakistan. Chem Ecol 28:327–339
Eqani SAMAS, Malik RN, Zhang G, Cincinelli A, Rasheed A, Qadir A,Bokhari H, Mohammad A, Jones KC, Katsoyiannis A (2013)Uptake of organochlorine pesticides (OCPs) and polychlorinatedbiphenyls (PCBs) by river water fish: the case of River Chenab.Sci Total Environ 450–451:83–91
European Commission. (2001) Scientific committee on food. Opinion ofthe scientific committee on foodon the risk assessment ofdioxins anddioxin-likePCBs in food.Updatebasedonnewscientific informationavailable since the adoption of the SCF opinion of 22nd November2000. CS/CNTM/DIOXIN/20 final, Adopted on 30May 2001
FarooqS,EqaniSAMAS,MalikRN,KatsoyiannisA,ZhangG,ZhangY,LiJ, XiangL, JonesKC, Shinwari ZK (2011)Occurrence, finger printing
14560 Environ Sci Pollut Res (2018) 25:14551–14562
and ecological risk assessment of polycyclic aromatic hydrocarbons(PAHs) in the ChenabRiver, Pakistan. J EnvironMonit 13:3207–3215
Fernandez MF, Parera J, Arrebola JP, Marina LS, Vrijheid M, Llop S,Abalos M, Tardon A, Castaño A, Abad E, Olea N (2012) Levels ofpolychlorinated dibenzo-p-dioxins, dibenzofurans and dioxin-likepolychlorinated biphenyls in placentas from the Spanish INMAbirth cohort study. Sci Total Environ 441:49–56
Fiedler H, Abad E, van Bavel B, de Boer J, Bogdal C, Malisch R (2013)The need for capacity building and first results for the StockholmConvention Global Monitoring Plan. Trends Anal Chem 46:72–84
Gasic B, MacLeod M, Klanova J, Scheringer M, Ilic P, Lammel G,Pajovic A, Breivik K, Holoubek I, Hungerbühler K (2010)Quantification of sources of PCBs to the atmosphere in urban areas:a comparison of cities in North America, Western Europe and for-mer Yugoslavia. Environ Pollut 158:3230–3235
Gómara B, Athanasiadou M, Quintanilla-López JE, González MJ,Bergman A (2012) Polychlorinated biphenyls and their hydroxylat-ed metabolites in placenta from Madrid mothers. Environ Sci PollutRes 19:139–147
Govarts E, Nieuwenhuijsen M, Schoeters G, Ballester F, Bloemen K, DeBoerM, Chevrier C, EggesbøM,GuxensM, Krämer U (2012) Birthweight and prenatal exposure to polychlorinated biphenyls (PCBs)and dichlorodiphenyldichloroethylene (DDE): a meta-analysis with-in 12 European birth cohorts. Environ Health Perspect 120:162–170
Hites RA (2004) Polybrominateddiphenyl ethers in the environment andin people: a meta-analysis of concentrations. Environmental Science& Technology 38:945–956
International Agency for Research on Cancer (IARC) (2016). IARCmonographs on the evaluation of carcinogenic risks to humans;polychlorinated biphenyls and polybrominated biphenyls, Volume107 (2016). International Agency for Research on Cancer, Lyon
Iqbal M, Breivik K, Syed JH, Malik RN, Li J, Zhang G, Jones KC (2015)Emerging issue of e-waste in Pakistan: a review of status, researchneeds and data gaps. Environ Pollut 207:308–318
Japanese Environmental Health Committee of the Central EnvironmentCouncil (1999). Report on Tolerable Daily Intake (TDI) of Dioxinsand Related Compounds (Japan). Available at: https://www.env.go.jp/en/chemi/dioxins/tdi_report.pdf (Accessed on 03-06-2017)
Jin R, Zhan J, Liu G, Zhao Y, ZhengM, Yang L,WangM (2017) Profilesof polychlorinated biphenyls (PCBs) in cement kilns co-processingsolid waste. Chemosphere 174:165–172
KimKS, Lee SC, KimKH, ShimWJ, Hong SH, Choi KH, Yoon JH, KimJG (2009) Survey on organochlorine pesticides, PCDD/Fs, dioxin-like PCBs and HCB in sediments from the Han River, Korea.Chemosphere 75:580–587
Kim SK, Yoon J (2014) Chronological trends of emission, environmentallevel and human exposure of POPs over the last 10 years (1999–2010) in Korea: implication to science and policy. Sci Total Environ470–471:1346–1361
Kiviranta, H. (2005). Exposure and human PCDD/F and PCB body bur-den in Finland. Department of Environmental Health, NationalPublic Health Institute, Kuopio, Finland. Available at: https://core.ac.uk/download/pdf/15167498.pdf (Accessed on 21-07-2017)
Kodavanti, P.R.S., Valdez, J., Yang, J.H., Curras-Collazo, M., andLoganathan, B.G. (2017). Chapter 39—polychlorinated biphenyls,polybrominated biphenyls, polychlorinated dibenzo-p-dioxins, andpolychlorinated dibenzofurans A2-Gupta, Ramesh C reproductiveand developmental toxicology (second edition) (pp. 711–743):Academic Press
Laroo CA, Schenk CR, Sanchez LJ, McDonald J, Smith PL (2012)Emissions of PCDD/Fs, PCBs, and PAHs from legacy on-roadheavy-duty diesel engines. Chemosphere 89:1287–1294
Leino O, Kiviranta H, Karjalainen AK, Kronberg-Kippilä C, Sinkko H,Larsen EH, Virtanen S, Tuomisto JT (2013) Pollutant concentrationsin placenta. Food Chem Toxicol 54:59–69
Letcher RJ, Bustnes JO, Dietz R, Jenssen BM, Jørgensen EH, Sonne C,Verreault J, Vijayan MM, Gabrielsen GW (2010) Exposure andeffects assessment of persistent organohalogen contaminants in arc-tic wildlife and fish. Sci Total Environ 408:2995–3043
Li J, Zhang G, Guo L, Xu W, Li X, Lee CS, Ding A, Wang T (2007)Organochlorine pesticides in the atmosphere of Guangzhou andHong Kong: regional sources and long-range atmospheric transport.Atmos Environ 41:3889–3903
Lopez-Espinosa MJ, Granada A, Carreno J, Salvatierra M, Olea-SerranoF, Olea N (2007) Organochlorine pesticides in placentas from south-ern Spain and some related factors. Placenta 28:631–638
Ma J, Qiu X, Ren A, Jin L, Zhu T (2012) Using placenta to evaluate thepolychlorinated biphenyls (PCBs) and polybrominateddiphenylethers (PBDEs) exposure of fetus in a region with high prevalenceof neural tube defects. Ecotoxicol Environ Saf 86:141–146
Mahmood A, Malik RN, Li J, Zhang G (2014a) Levels, distributionprofile, and risk assessment of polychlorinated biphenyls (PCBs)in water and sediment from two tributaries of the River Chenab,Pakistan. Environ Sci Pollut Res 21:7847–7855
Mahmood A, Syed JH, Malik RN, Zheng Q, Cheng Z, Li J, Zhang G(2014b) Polychlorinated biphenyls (PCBs) in air, soil, and cerealcrops along the two tributaries of River Chenab, Pakistan: concen-trations, distribution, and screening level risk assessment. Sci TotalEnviron 481:596–604
Malik RN, Mehboob F, Ali U, Katsoyiannis A, Schuster JK, Moeckel C,JonesKC(2014)Organo-halogenatedcontaminants (OHCs) in thesed-iments from the Soan River, Pakistan: OHCs (adsorbed TOC) burialflux, status and risk assessment. Sci Total Environ 481:343–351
Mumtaz,M.,Mehmood, A., Qadir, A., Mahmood, A., Malik, R.N., Sabir,A.M., Li, J., and Zhang, G. (2016). Polychlorinated biphenyl(PCBs) in rice grains and straw; risk surveillance, congener specificanalysis, distribution and source apportionment from selected dis-tricts of Punjab Province, Pakistan. Science of the TotalEnvironment, 543, Part A, 620–627
Myllynen P, Pasanen M, Pelkonen O (2005) Human placenta: a humanorgan for developmental toxicology research and biomonitoring.Placenta 26:361–371
Nanes JA, Xia Y, Dassanayake RMAPS, Jones RM, Li A, Stodgell CJ,Walker C, Szabo S, Leuthner S, Durkin MS, Moye J, Miller RK(2014) Selected persistent organic pollutants in human placentaltissue from the United States. Chemosphere 106:20–27
Needham, L.L., Grandjean, P., Heinzow, B., Jørgensen, P.J., Nielsen, F.,Patterson, D.G. Jr, Sjödin, A., Turner, W.E., and Weihe, P. (2011).Partition of environmental chemicals betweenmaternal and fetal bloodand tissues. Environmental Science Technology, 45, 1121–1126
Porpora MG, Lucchini R, Abballe A, Ingelido AM, Valentini S, FuggettaE, Cardi V, Ticino A, Marra V, Fulgenzi AR (2013) Placental trans-fer of persistent organic pollutants: a preliminary study on mother-newborn pairs. Int J Environ Res Public Health 10:699–711
Richards G, Agranovski IE (2017) Dioxin-like PCB emissions from ce-ment kilns during the use of alternative fuels. J Hazard Mater 323:698–709
Sagiv KS, Tolbert PE, Altshul LM, Korrick SA (2007) Organochlorineexposures during pregnancy and infant size at birth. Epidemiology18:120–129
Suzuki G, NakanoM,Nakano S (2005) Distribution of PCDDs/PCDFs andCo-PCBs in human maternal blood, cord blood, placenta, milk, andadipose tissue: dioxins showing high toxic equivalency factor accumu-late in the placenta. Biosci Biotechnol Biochem 69:1836–1847
Syed JH, Malik RN, Li J, Zhang G, Jones KC (2013) Levels, distributionand air–soil exchange fluxes of polychlorinated biphenyls (PCBs) inthe environment of Punjab Province, Pakistan. Ecotoxicol EnvironSaf 97:189–195
Syed JH, Malik RN, Li J, Chaemfa C, Zhang G, Jones KC (2014) Status,distribution and ecological risk of organochlorines (OCs) in the
Environ Sci Pollut Res (2018) 25:14551–14562 14561
surface sediments from the Ravi River, Pakistan. Sci Total Environ472:204–211
Tan J, Loganath A, Chong YS, Obbard JP (2009) Exposure to persistentorganic pollutants in utero and related maternal characteristics onbirth outcomes: a multivariate data analysis approach. Chemosphere74:428–433
Thomas GO, Wilkinson M, Hodson S, Jones KC (2006) OrganohalogenChemicals in Human Blood from the United Kingdom. EnvironPollut 141:30–41
Toan VD, Quy NP (2015) Residues of polychlorinated biphenyls (PCBs)in sediment from CauBay River and their impacts on agriculturalsoil, human health risk in KieuKy Area, Vietnam. Bull EnvironContam Toxicol 95:177–182
Tsukimori K, Morokuma S, Hori T, Takahashi K, Hirata T, Otera Y,Fukushima K, Kawamoto T, Wake N (2013) Characterization ofplacental transfer of polychlorinated dibenzo-p-dioxins, dibenzofu-rans and polychlorinated biphenyls in normal pregnancy. J ObstetGynaecol Res 39:83–90
Ullah R,Malik RN,Muhammad A, Ahad K, TariqM, Asghar R, Qadir A(2016) Higher concentrations and ecological risks of selected per-sistent organic pollutants in Macrobrachium Lamarrei from thestreams of Sialkot, Pakistan. J Agric Sci Technol 6:27–34
United States Environmental Protection Agency (USEPA). (2000).Exposure and human health reassessment of 2,3,7,8-tetrachlorodibenzo-p-dioxin and related compounds. Draft final.Nat ional Center for environmental assessment , U.S.Environmental Protection Agency, Washington, DC
United Nations Environmental Programme (UNEP) (2001) Final act ofthe conference of plenipotentiaries on the Stockholm convention onpersistent organic pollutant. United Nations Environment Program,Geneva http://www.pops.int/default.htm
Vafeiadi M, Vrijheid M, Fthenou E, Chalkiadaki G, Rantakokko P,Kiviranta H, Kyrtopoulos SA, Chatzi L, Kogevinas M (2014)Persistent organic pollutants exposure during pregnancy, maternal
gestational weight gain, and birth outcomes in the mother–childcohort in Crete, Greece (RHEA study). Environ Int 64:116–123
VandenBergM,BirnbaumLS,DenisonM,DeVitoM,FarlandW,FeeleyM, Fiedler H, Hakansson H, Hanberg A, Haws L, Rose M, Safe S,SchrenkD,TohyamaC,TritscherA,Tuomisto J, TysklindM,WalkerN, Peterson RE (2006) The 2005World Health Organization reeval-uationofhumanandmammaliantoxic equivalency factors fordioxinsand dioxin-like compounds. Toxicol Sci 93:223–241
Van Leeuwen FX, Feeley M, Schrenk D, Larsen JC, Farland W, YounesM (2000) Dioxins: WHO’s tolerable daily intake (TDI) revisited.Chemosphere 40:1095–1101
Vizcaino E, Grimalt JO, Fernández-Somoano A, Tardon A (2014)Transport of persistent organic pollutants across the human placenta.Environ Int 65:107–115
Wang SL, Chang YC, Chao HR, Li CM, Li LA, Lin LY, Päpke O (2006)Body burdens of polychlorinated dibenzo-p-dioxins, dibenzofurans,and biphenyls and their relations to estrogen metabolism in pregnantwomen. Environ Health Perspect 114:740–745
Wang SL, Lin CY, Leon Guo Y, Lin LY, Chou WL, Chang LW (2004)Infant exposure to polychlorinated dibenzo-p-dioxins, dibenzofu-rans and biphenyls (PCDD/Fs, PCBs)—correlation between prena-tal and postnatal exposure. Chemosphere 54:1459–1473
WHO/FAO. 2001. Joint FAO/WHO Expert Committee on FoodAdditives. Fifty-seventh meeting. Rome, 5–14 June, 2001
World Health Organization (WHO) (1998) Assessment of the health riskof dioxins: reevaluation of the tolerable daily intake TDI. WorldHealth Organization, Geneva, pp 25–29
Wu K, Xu X, Liu J, Guo Y, Huo X (2011) In utero exposure topolychlorinated biphenyls and reduced neonatal physiological devel-opment fromGuiyu, China. Ecotoxicol Environ Saf 74:2141–2147
Yasmeen H, Qadir A, Mumtaz M, Eqani SAMAS, Syed JH, MahmoodA, Jamil N, Nazar F, Ali H, Ahmad MS, Tanveer ZI, Ahmad MS(2017) Risk profile and health vulnerability of female workers whopick cotton by organanochlorine pesticides from southern Punjab,Pakistan. Environ Toxicol Chem 36:1193–1201
14562 Environ Sci Pollut Res (2018) 25:14551–14562
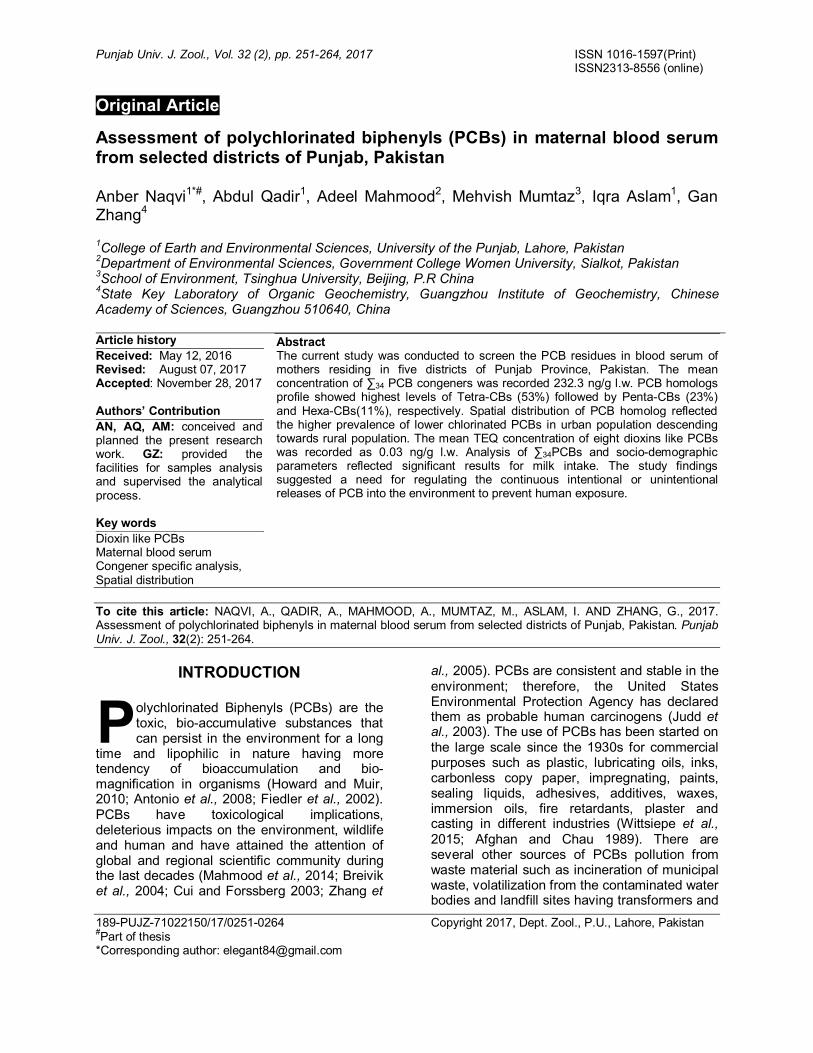
Punjab Univ. J. Zool., Vol. 32 (2), pp. 251-264, 2017 ISSN 1016-1597(Print) ISSN2313-8556 (online)
189-PUJZ-71022150/17/0251-0264 Copyright 2017, Dept. Zool., P.U., Lahore, Pakistan #Part of thesis *Corresponding author: [email protected]
Original Article Assessment of polychlorinated biphenyls (PCBs) in maternal blood serum from selected districts of Punjab, Pakistan Anber Naqvi1*#, Abdul Qadir1, Adeel Mahmood2, Mehvish Mumtaz3, Iqra Aslam1, Gan Zhang4 1College of Earth and Environmental Sciences, University of the Punjab, Lahore, Pakistan 2Department of Environmental Sciences, Government College Women University, Sialkot, Pakistan 3School of Environment, Tsinghua University, Beijing, P.R China 4State Key Laboratory of Organic Geochemistry, Guangzhou Institute of Geochemistry, Chinese Academy of Sciences, Guangzhou 510640, China Article history Received: May 12, 2016 Revised: August 07, 2017 Accepted: November 28, 2017 Authors’ Contribution AN, AQ, AM: conceived and planned the present research work. GZ: provided the facilities for samples analysis and supervised the analytical process. Key words Dioxin like PCBs Maternal blood serum Congener specific analysis, Spatial distribution
Abstract The current study was conducted to screen the PCB residues in blood serum of mothers residing in five districts of Punjab Province, Pakistan. The mean concentration of ∑34 PCB congeners was recorded 232.3 ng/g l.w. PCB homologs profile showed highest levels of Tetra-CBs (53%) followed by Penta-CBs (23%) and Hexa-CBs(11%), respectively. Spatial distribution of PCB homolog reflected the higher prevalence of lower chlorinated PCBs in urban population descending towards rural population. The mean TEQ concentration of eight dioxins like PCBs was recorded as 0.03 ng/g l.w. Analysis of ∑34PCBs and socio-demographic parameters reflected significant results for milk intake. The study findings suggested a need for regulating the continuous intentional or unintentional releases of PCB into the environment to prevent human exposure.
To cite this article: NAQVI, A., QADIR, A., MAHMOOD, A., MUMTAZ, M., ASLAM, I. AND ZHANG, G., 2017. Assessment of polychlorinated biphenyls in maternal blood serum from selected districts of Punjab, Pakistan. Punjab Univ. J. Zool., 32(2): 251-264.
INTRODUCTION
olychlorinated Biphenyls (PCBs) are the toxic, bio-accumulative substances that can persist in the environment for a long
time and lipophilic in nature having more tendency of bioaccumulation and bio-magnification in organisms (Howard and Muir, 2010; Antonio et al., 2008; Fiedler et al., 2002). PCBs have toxicological implications, deleterious impacts on the environment, wildlife and human and have attained the attention of global and regional scientific community during the last decades (Mahmood et al., 2014; Breivik et al., 2004; Cui and Forssberg 2003; Zhang et
al., 2005). PCBs are consistent and stable in the environment; therefore, the United States Environmental Protection Agency has declared them as probable human carcinogens (Judd et al., 2003). The use of PCBs has been started on the large scale since the 1930s for commercial purposes such as plastic, lubricating oils, inks, carbonless copy paper, impregnating, paints, sealing liquids, adhesives, additives, waxes, immersion oils, fire retardants, plaster and casting in different industries (Wittsiepe et al., 2015; Afghan and Chau 1989). There are several other sources of PCBs pollution from waste material such as incineration of municipal waste, volatilization from the contaminated water bodies and landfill sites having transformers and
P

A. NAQVI ET AL. 252
coolants as waste components (Mahmood et al., 2014; Wittsiepe et al., 2015; Mumtaz et al., 2016). Up till now, 209 congeners of PCB has been identified in the environment resulted from different anthropogenic activities (WHO, 2003).
Despite from a worldwide ban on PCBs production, some countries, particularly developing countries from Asia, Africa, Europe and Latin America continued their use for industrial and commercial purposes (Mamun et al., 2007). Therefore, PCBs are still detected in the environment and pose great threats to the health of the environment and human (Hernik et al., 2016; Thomas et al., 2006). The human population is generally exposed to PCBs through the air, water, and food (WHO 2003; Jensen et al., 1987; Sharma et al., 2014). Dietary intake of contaminated fish, meat, and dairy products is considered the primary exposure route of PCBs to human which pose Neuro-developmental risks (Eguchi et al., 2012; Ginsberg et al., 2015; Hernik et al., 2016; Sharma et al., 2014). Certain biomarkers have been recommended by the World Health Organization (WHO) for the assessment of pollution caused by PCBs (Osman et al.,, 2017). A positive association between PCBs levels in human serum and consumption of meat and dairy fat has also been reported in previous studies (Govart et al.,2010). The predominant target organs/tissues in human with possible higher concentrations of PCBs are liver, brain, adipose tissues and skin, blood, milk, placenta and cord blood (WHO 2003; Esteban and Castano 2009; Dirtu et al., 2009). PCBs can cause adverse health impacts to human health e.g. immunotoxicity, developmental, physiological and structural disorders and even it also causes reproductive and genetic disorders such as low birth weight, vision and hearing disorder etc. (Kodavanti et al., 2008; Tyagi et al., 2015; Darnerud, 2003; Larsen, 2006).
Limited information regarding human exposure to POPs is available in developing Asian countries (Tanabe and Kunisue, 2007). Screening of PCBs levels in the human body is the least addressed research area in Pakistan and a few studies on PCBs assessment in male human serum (Ali et al., 2014) and in maternal blood serum (Ali et al., 2013) are available from Pakistan. The negative effects of rapid urbanization and industrialization have been observed in environmental matrices of Punjab Pakistan (Azmat et al., 2016). Women are more vulnerable to PCB exposure as they have a
relatively higher proportion of fat and PCBs being lipophilic tend to accumulate in their fatty tissues. Consumption of these contaminants not only causes adverse health effects to exposed women, but pre and post natal exposure causes developmental, reproductive, behavioral disorders and neurological effects in the fetus (Daglioglu et al., 2010; De Rosa and Hicks 2001; Rice, 2012). The present study was designed to focus on the evaluation of PCBs in maternal blood serum from different environmental settings of Punjab Province, Pakistan.
MATERIALS AND METHODS
Study area and sampling strategy
This study was conducted in urban and rural areas of Lahore, Sialkot, Chakwal, Okara and Khanewal district of Punjab province, Pakistan. Punjab is the most populous province with an area of 205,344 km2 and the population of 100 million (population density = 353 persons/ km2). A higher proportion of the population of the province is living in rural areas and involved in agricultural activities, whereas, an urban population of the province is normally engaged in industrial and other service activities. These areas were selected by considering the fact that both the rural and urban environments are exposed to PCBs pollution. A map of study area representing the location of selected sampling sites is given in Figure1. The female volunteers with age between18 years to 45 years were selected from each sampling site. The maternal blood samples (n=44) were collected from women with the help of paramedical staff by visiting the hospitals (Thomas et al., 2006). After collection, the serum was separated by centrifugation and placed in the refrigerator (-20ºC) until final analysis (Inoue et al., 2006; Covaci and Schepens, 2001). Sample preparation
The blood serum samples were thawed and homogenized at room temperature. One milliliter (1 ml) of maternal blood serum was taken, spiked with the surrogate standards (5ppb) of PCB 209 and 2,4,5,6-tetrachloro-m-xylene TcmX and kept overnight at 40C (Covaci and Schepens 2001; Covaci and Voorspoels 2005). Extraction of PCBs was done by adding n-hexane (6 ml) and acetone (3 ml) into serum samples followed by homogenization through
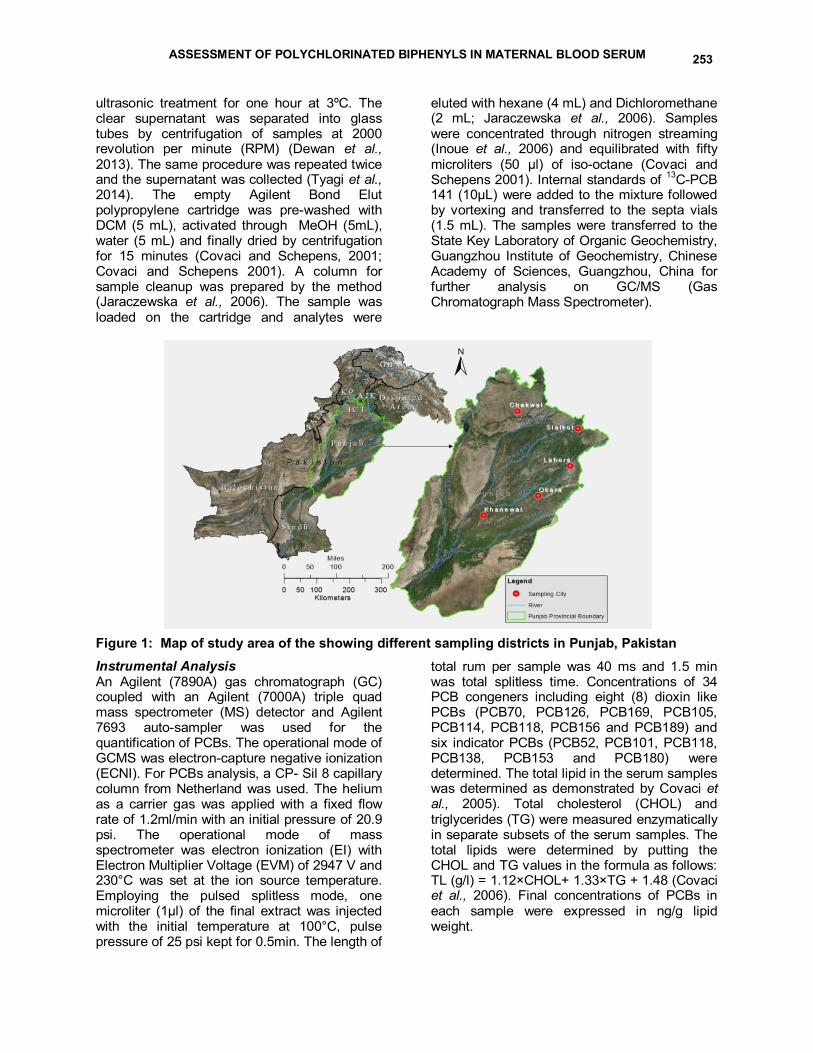
ASSESSMENT OF POLYCHLORINATED BIPHENYLS IN MATERNAL BLOOD SERUM 253
ultrasonic treatment for one hour at 3ºC. The clear supernatant was separated into glass tubes by centrifugation of samples at 2000 revolution per minute (RPM) (Dewan et al., 2013). The same procedure was repeated twice and the supernatant was collected (Tyagi et al., 2014). The empty Agilent Bond Elut polypropylene cartridge was pre-washed with DCM (5 mL), activated through MeOH (5mL), water (5 mL) and finally dried by centrifugation for 15 minutes (Covaci and Schepens, 2001; Covaci and Schepens 2001). A column for sample cleanup was prepared by the method (Jaraczewska et al., 2006). The sample was loaded on the cartridge and analytes were
eluted with hexane (4 mL) and Dichloromethane (2 mL; Jaraczewska et al., 2006). Samples were concentrated through nitrogen streaming (Inoue et al., 2006) and equilibrated with fifty microliters (50 µl) of iso-octane (Covaci and Schepens 2001). Internal standards of 13C-PCB 141 (10µL) were added to the mixture followed by vortexing and transferred to the septa vials (1.5 mL). The samples were transferred to the State Key Laboratory of Organic Geochemistry, Guangzhou Institute of Geochemistry, Chinese Academy of Sciences, Guangzhou, China for further analysis on GC/MS (Gas Chromatograph Mass Spectrometer).
Figure 1: Map of study area of the showing different sampling districts in Punjab, Pakistan Instrumental Analysis An Agilent (7890A) gas chromatograph (GC) coupled with an Agilent (7000A) triple quad mass spectrometer (MS) detector and Agilent 7693 auto-sampler was used for the quantification of PCBs. The operational mode of GCMS was electron-capture negative ionization (ECNI). For PCBs analysis, a CP- Sil 8 capillary column from Netherland was used. The helium as a carrier gas was applied with a fixed flow rate of 1.2ml/min with an initial pressure of 20.9 psi. The operational mode of mass spectrometer was electron ionization (EI) with Electron Multiplier Voltage (EVM) of 2947 V and 230°C was set at the ion source temperature. Employing the pulsed splitless mode, one microliter (1μl) of the final extract was injected with the initial temperature at 100°C, pulse pressure of 25 psi kept for 0.5min. The length of
total rum per sample was 40 ms and 1.5 min was total splitless time. Concentrations of 34 PCB congeners including eight (8) dioxin like PCBs (PCB70, PCB126, PCB169, PCB105, PCB114, PCB118, PCB156 and PCB189) and six indicator PCBs (PCB52, PCB101, PCB118, PCB138, PCB153 and PCB180) were determined. The total lipid in the serum samples was determined as demonstrated by Covaci et al., 2005). Total cholesterol (CHOL) and triglycerides (TG) were measured enzymatically in separate subsets of the serum samples. The total lipids were determined by putting the CHOL and TG values in the formula as follows: TL (g/l) = 1.12×CHOL+ 1.33×TG + 1.48 (Covaci et al., 2006). Final concentrations of PCBs in each sample were expressed in ng/g lipid weight.
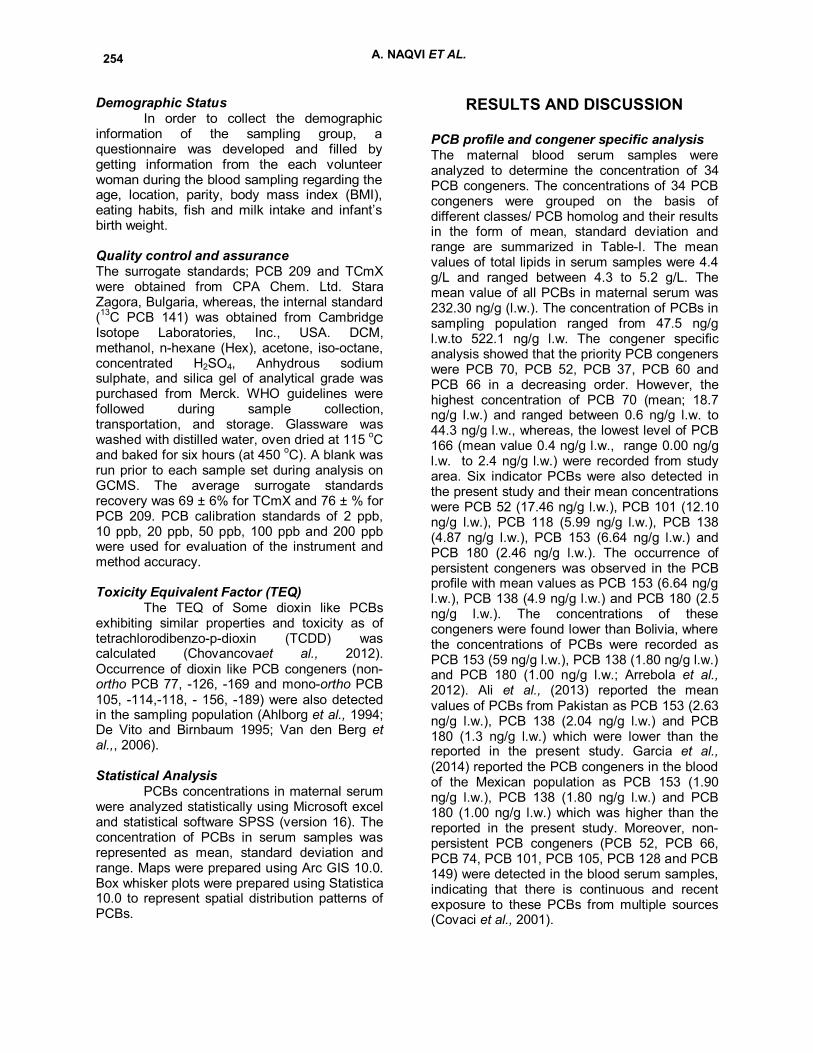
A. NAQVI ET AL. 254
Demographic Status In order to collect the demographic
information of the sampling group, a questionnaire was developed and filled by getting information from the each volunteer woman during the blood sampling regarding the age, location, parity, body mass index (BMI), eating habits, fish and milk intake and infant’s birth weight. Quality control and assurance The surrogate standards; PCB 209 and TCmX were obtained from CPA Chem. Ltd. Stara Zagora, Bulgaria, whereas, the internal standard (13C PCB 141) was obtained from Cambridge Isotope Laboratories, Inc., USA. DCM, methanol, n-hexane (Hex), acetone, iso-octane, concentrated H2SO4, Anhydrous sodium sulphate, and silica gel of analytical grade was purchased from Merck. WHO guidelines were followed during sample collection, transportation, and storage. Glassware was washed with distilled water, oven dried at 115 oC and baked for six hours (at 450 oC). A blank was run prior to each sample set during analysis on GCMS. The average surrogate standards recovery was 69 ± 6% for TCmX and 76 ± % for PCB 209. PCB calibration standards of 2 ppb, 10 ppb, 20 ppb, 50 ppb, 100 ppb and 200 ppb were used for evaluation of the instrument and method accuracy. Toxicity Equivalent Factor (TEQ)
The TEQ of Some dioxin like PCBs exhibiting similar properties and toxicity as of tetrachlorodibenzo-p-dioxin (TCDD) was calculated (Chovancovaet al., 2012). Occurrence of dioxin like PCB congeners (non-ortho PCB 77, -126, -169 and mono-ortho PCB 105, -114,-118, - 156, -189) were also detected in the sampling population (Ahlborg et al., 1994; De Vito and Birnbaum 1995; Van den Berg et al.,, 2006). Statistical Analysis
PCBs concentrations in maternal serum were analyzed statistically using Microsoft excel and statistical software SPSS (version 16). The concentration of PCBs in serum samples was represented as mean, standard deviation and range. Maps were prepared using Arc GIS 10.0. Box whisker plots were prepared using Statistica 10.0 to represent spatial distribution patterns of PCBs.
RESULTS AND DISCUSSION
PCB profile and congener specific analysis The maternal blood serum samples were analyzed to determine the concentration of 34 PCB congeners. The concentrations of 34 PCB congeners were grouped on the basis of different classes/ PCB homolog and their results in the form of mean, standard deviation and range are summarized in Table-I. The mean values of total lipids in serum samples were 4.4 g/L and ranged between 4.3 to 5.2 g/L. The mean value of all PCBs in maternal serum was 232.30 ng/g (l.w.). The concentration of PCBs in sampling population ranged from 47.5 ng/g l.w.to 522.1 ng/g l.w. The congener specific analysis showed that the priority PCB congeners were PCB 70, PCB 52, PCB 37, PCB 60 and PCB 66 in a decreasing order. However, the highest concentration of PCB 70 (mean; 18.7 ng/g l.w.) and ranged between 0.6 ng/g l.w. to 44.3 ng/g l.w., whereas, the lowest level of PCB 166 (mean value 0.4 ng/g l.w., range 0.00 ng/g l.w. to 2.4 ng/g l.w.) were recorded from study area. Six indicator PCBs were also detected in the present study and their mean concentrations were PCB 52 (17.46 ng/g l.w.), PCB 101 (12.10 ng/g l.w.), PCB 118 (5.99 ng/g l.w.), PCB 138 (4.87 ng/g l.w.), PCB 153 (6.64 ng/g l.w.) and PCB 180 (2.46 ng/g l.w.). The occurrence of persistent congeners was observed in the PCB profile with mean values as PCB 153 (6.64 ng/g l.w.), PCB 138 (4.9 ng/g l.w.) and PCB 180 (2.5 ng/g l.w.). The concentrations of these congeners were found lower than Bolivia, where the concentrations of PCBs were recorded as PCB 153 (59 ng/g l.w.), PCB 138 (1.80 ng/g l.w.) and PCB 180 (1.00 ng/g l.w.; Arrebola et al., 2012). Ali et al., (2013) reported the mean values of PCBs from Pakistan as PCB 153 (2.63 ng/g l.w.), PCB 138 (2.04 ng/g l.w.) and PCB 180 (1.3 ng/g l.w.) which were lower than the reported in the present study. Garcia et al., (2014) reported the PCB congeners in the blood of the Mexican population as PCB 153 (1.90 ng/g l.w.), PCB 138 (1.80 ng/g l.w.) and PCB 180 (1.00 ng/g l.w.) which was higher than the reported in the present study. Moreover, non-persistent PCB congeners (PCB 52, PCB 66, PCB 74, PCB 101, PCB 105, PCB 128 and PCB 149) were detected in the blood serum samples, indicating that there is continuous and recent exposure to these PCBs from multiple sources (Covaci et al., 2001).
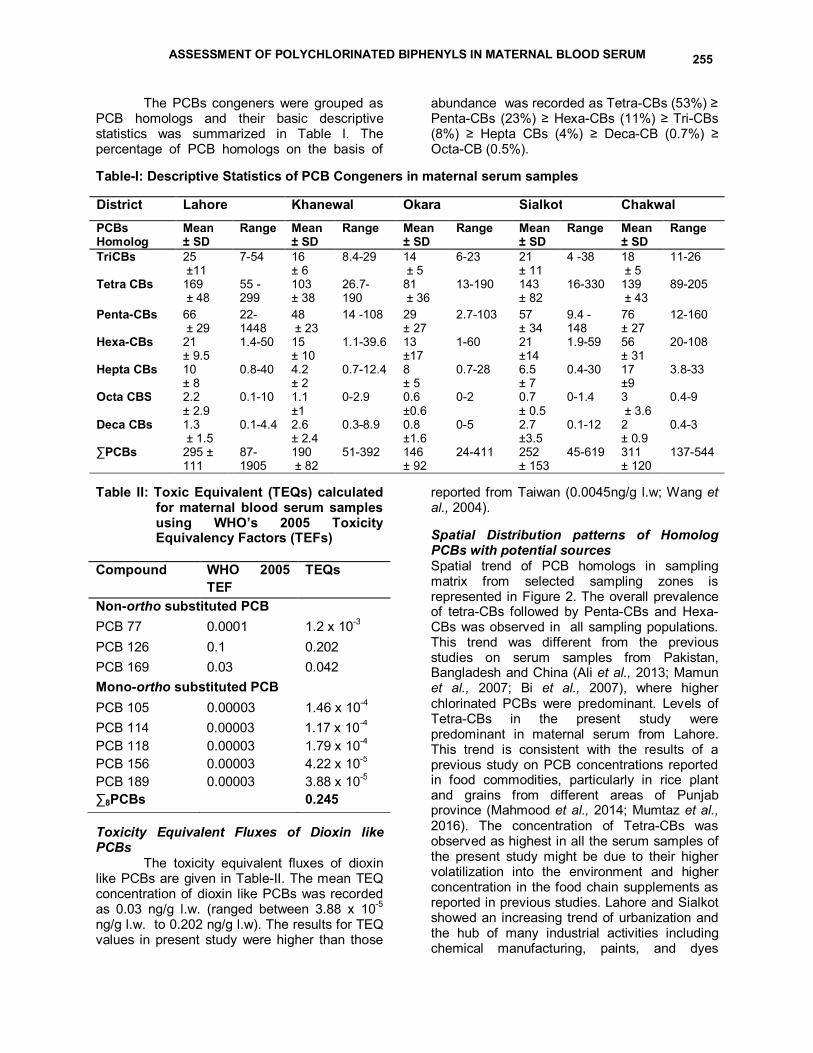
ASSESSMENT OF POLYCHLORINATED BIPHENYLS IN MATERNAL BLOOD SERUM 255
The PCBs congeners were grouped as PCB homologs and their basic descriptive statistics was summarized in Table I. The percentage of PCB homologs on the basis of
abundance was recorded as Tetra-CBs (53%) ≥ Penta-CBs (23%) ≥ Hexa-CBs (11%) ≥ Tri-CBs (8%) ≥ Hepta CBs (4%) ≥ Deca-CB (0.7%) ≥ Octa-CB (0.5%).
Table-I: Descriptive Statistics of PCB Congeners in maternal serum samples District Lahore Khanewal Okara Sialkot Chakwal PCBs Homolog
Mean ± SD
Range Mean ± SD
Range Mean ± SD
Range Mean ± SD
Range Mean ± SD
Range
TriCBs 25 ±11
7-54 16 ± 6
8.4-29 14 ± 5
6-23 21 ± 11
4 -38 18 ± 5
11-26
Tetra CBs 169 ± 48
55 -299
103 ± 38
26.7-190
81 ± 36
13-190 143 ± 82
16-330 139 ± 43
89-205
Penta-CBs 66 ± 29
22-1448
48 ± 23
14 -108 29 ± 27
2.7-103 57 ± 34
9.4 - 148
76 ± 27
12-160
Hexa-CBs 21 ± 9.5
1.4-50 15 ± 10
1.1-39.6 13 ±17
1-60 21 ±14
1.9-59 56 ± 31
20-108
Hepta CBs 10 ± 8
0.8-40 4.2 ± 2
0.7-12.4 8 ± 5
0.7-28 6.5 ± 7
0.4-30 17 ±9
3.8-33
Octa CBS 2.2 ± 2.9
0.1-10 1.1 ±1
0-2.9 0.6 ±0.6
0-2 0.7 ± 0.5
0-1.4 3 ± 3.6
0.4-9
Deca CBs 1.3 ± 1.5
0.1-4.4 2.6 ± 2.4
0.3-8.9 0.8 ±1.6
0-5 2.7 ±3.5
0.1-12 2 ± 0.9
0.4-3
∑PCBs 295 ± 111
87-1905
190 ± 82
51-392 146 ± 92
24-411 252 ± 153
45-619 311 ± 120
137-544
Table II: Toxic Equivalent (TEQs) calculated
for maternal blood serum samples using WHO’s 2005 Toxicity Equivalency Factors (TEFs)
Compound WHO 2005
TEF TEQs
Non-ortho substituted PCB PCB 77 0.0001 1.2 x 10⁻³ PCB 126 0.1 0.202 PCB 169 0.03 0.042 Mono-ortho substituted PCB PCB 105 0.00003 1.46 x 10⁻⁴ PCB 114 0.00003 1.17 x 10⁻⁴ PCB 118 0.00003 1.79 x 10⁻⁴ PCB 156 0.00003 4.22 x 10⁻⁵ PCB 189 0.00003 3.88 x 10⁻⁵ ∑8PCBs 0.245 Toxicity Equivalent Fluxes of Dioxin like PCBs
The toxicity equivalent fluxes of dioxin like PCBs are given in Table-II. The mean TEQ concentration of dioxin like PCBs was recorded as 0.03 ng/g l.w. (ranged between 3.88 x 10⁻⁵ ng/g l.w. to 0.202 ng/g l.w). The results for TEQ values in present study were higher than those
reported from Taiwan (0.0045ng/g l.w; Wang et al., 2004). Spatial Distribution patterns of Homolog PCBs with potential sources Spatial trend of PCB homologs in sampling matrix from selected sampling zones is represented in Figure 2. The overall prevalence of tetra-CBs followed by Penta-CBs and Hexa-CBs was observed in all sampling populations. This trend was different from the previous studies on serum samples from Pakistan, Bangladesh and China (Ali et al., 2013; Mamun et al., 2007; Bi et al., 2007), where higher chlorinated PCBs were predominant. Levels of Tetra-CBs in the present study were predominant in maternal serum from Lahore. This trend is consistent with the results of a previous study on PCB concentrations reported in food commodities, particularly in rice plant and grains from different areas of Punjab province (Mahmood et al., 2014; Mumtaz et al., 2016). The concentration of Tetra-CBs was observed as highest in all the serum samples of the present study might be due to their higher volatilization into the environment and higher concentration in the food chain supplements as reported in previous studies. Lahore and Sialkot showed an increasing trend of urbanization and the hub of many industrial activities including chemical manufacturing, paints, and dyes
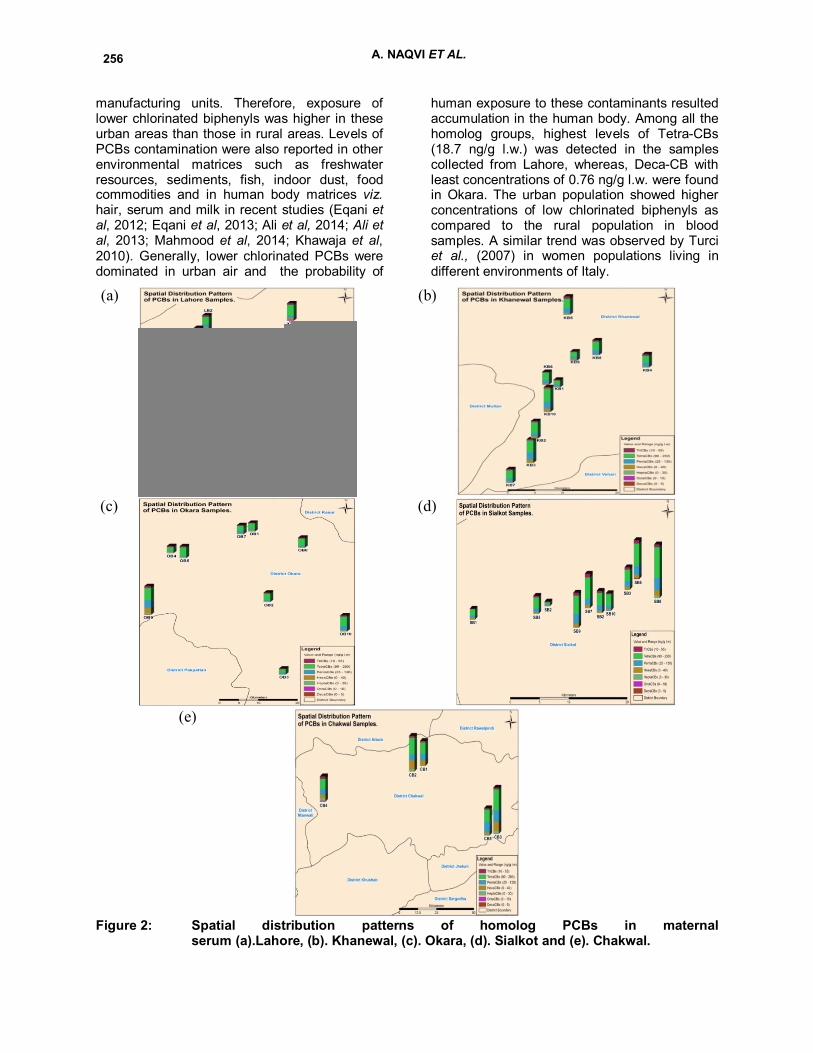
A. NAQVI ET AL. 256
manufacturing units. Therefore, exposure of lower chlorinated biphenyls was higher in these urban areas than those in rural areas. Levels of PCBs contamination were also reported in other environmental matrices such as freshwater resources, sediments, fish, indoor dust, food commodities and in human body matrices viz. hair, serum and milk in recent studies (Eqani et al, 2012; Eqani et al, 2013; Ali et al, 2014; Ali et al, 2013; Mahmood et al, 2014; Khawaja et al, 2010). Generally, lower chlorinated PCBs were dominated in urban air and the probability of
human exposure to these contaminants resulted accumulation in the human body. Among all the homolog groups, highest levels of Tetra-CBs (18.7 ng/g l.w.) was detected in the samples collected from Lahore, whereas, Deca-CB with least concentrations of 0.76 ng/g l.w. were found in Okara. The urban population showed higher concentrations of low chlorinated biphenyls as compared to the rural population in blood samples. A similar trend was observed by Turci et al., (2007) in women populations living in different environments of Italy.
(a) (b)
(c) (d)
(e)
Figure 2: Spatial distribution patterns of homolog PCBs in maternalserum (a).Lahore, (b). Khanewal, (c). Okara, (d). Sialkot and (e). Chakwal.
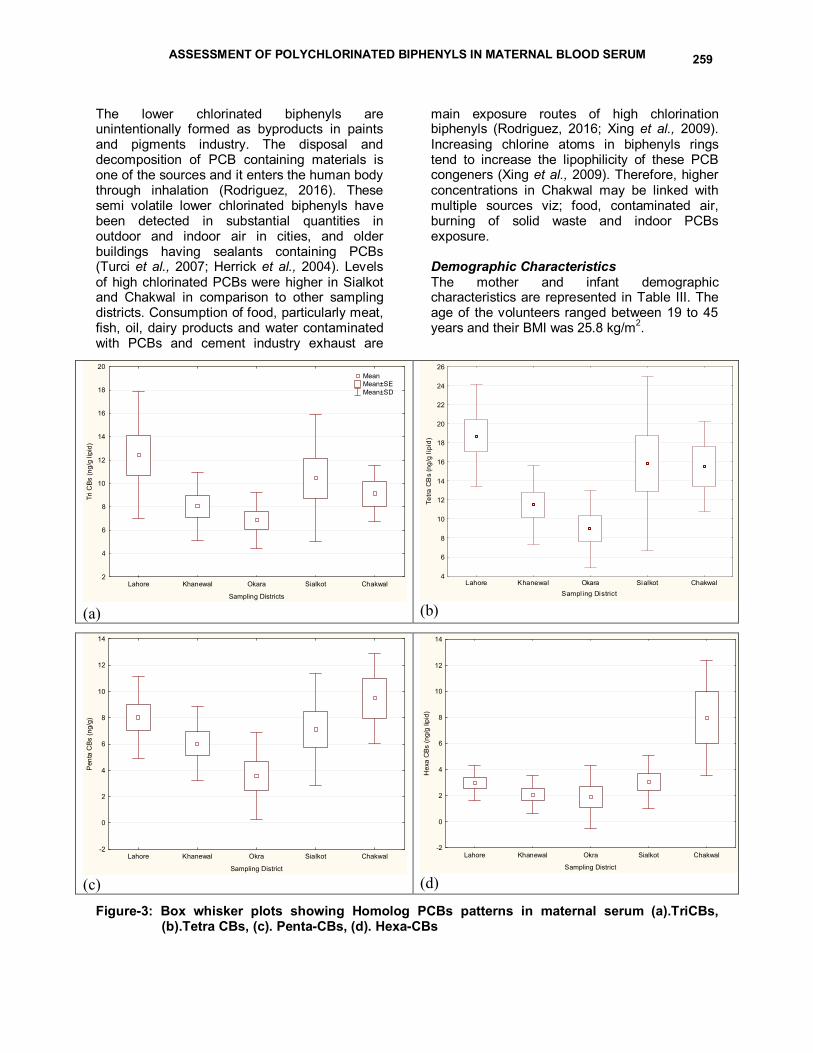
ASSESSMENT OF POLYCHLORINATED BIPHENYLS IN MATERNAL BLOOD SERUM 259
The lower chlorinated biphenyls are unintentionally formed as byproducts in paints and pigments industry. The disposal and decomposition of PCB containing materials is one of the sources and it enters the human body through inhalation (Rodriguez, 2016). These semi volatile lower chlorinated biphenyls have been detected in substantial quantities in outdoor and indoor air in cities, and older buildings having sealants containing PCBs (Turci et al., 2007; Herrick et al., 2004). Levels of high chlorinated PCBs were higher in Sialkot and Chakwal in comparison to other sampling districts. Consumption of food, particularly meat, fish, oil, dairy products and water contaminated with PCBs and cement industry exhaust are
main exposure routes of high chlorination biphenyls (Rodriguez, 2016; Xing et al., 2009). Increasing chlorine atoms in biphenyls rings tend to increase the lipophilicity of these PCB congeners (Xing et al., 2009). Therefore, higher concentrations in Chakwal may be linked with multiple sources viz; food, contaminated air, burning of solid waste and indoor PCBs exposure. Demographic Characteristics The mother and infant demographic characteristics are represented in Table III. The age of the volunteers ranged between 19 to 45 years and their BMI was 25.8 kg/m2.
Lahore Khanewal Okara Sialkot Chakwal
Sampling Districts
2
4
6
8
10
12
14
16
18
20
Tri C
Bs (n
g/g
lipid
)
Mean Mean±SE Mean±SD
(a)
Lahore Khanewal Okara Sialkot ChakwalSampl ing District
4
6
8
10
12
14
16
18
20
22
24
26
Tetra
CB
s (n
g/g
lipid
)
(b)
Lahore Khanewal Okra Sialkot Chakwal
Sampling District
-2
0
2
4
6
8
10
12
14
Pen
ta C
Bs (n
g/g)
(c)
Lahore Khanewal Okra Sialkot Chakwal
Sampling District
-2
0
2
4
6
8
10
12
14
Hex
a C
Bs (n
g/g
lipid
)
(d)
Figure-3: Box whisker plots showing Homolog PCBs patterns in maternal serum (a).TriCBs, (b).Tetra CBs, (c). Penta-CBs, (d). Hexa-CBs
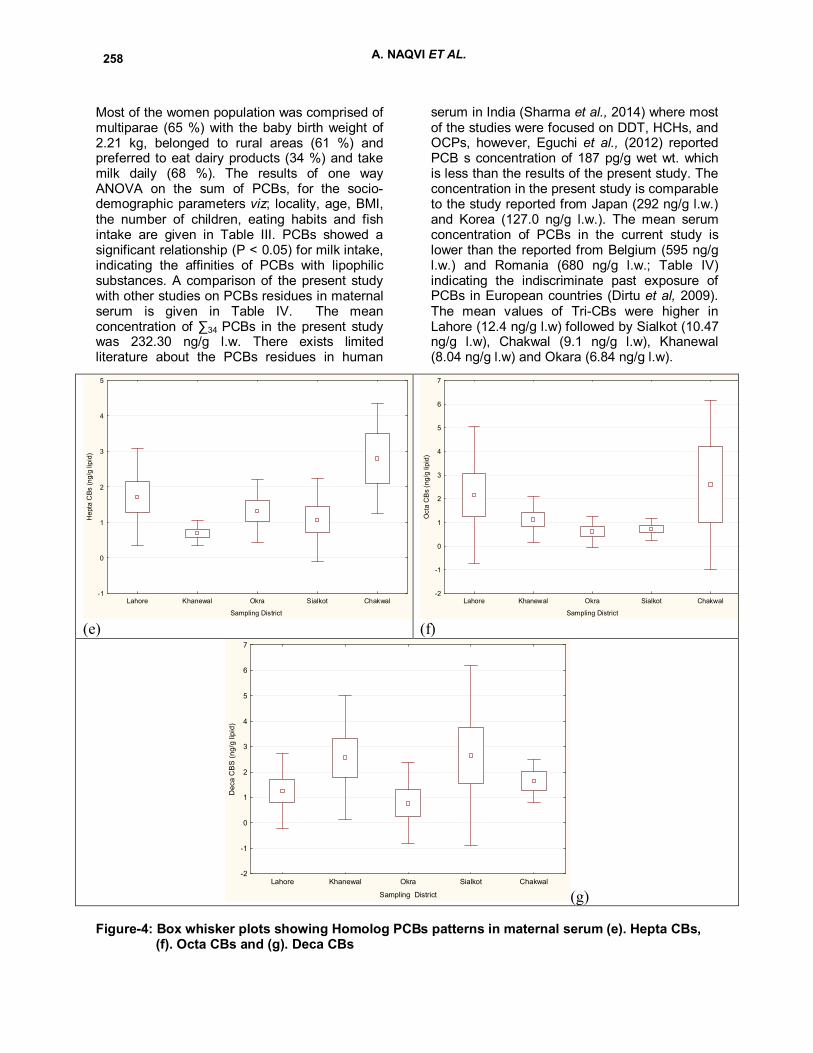
A. NAQVI ET AL. 258
Most of the women population was comprised of multiparae (65 %) with the baby birth weight of 2.21 kg, belonged to rural areas (61 %) and preferred to eat dairy products (34 %) and take milk daily (68 %). The results of one way ANOVA on the sum of PCBs, for the socio-demographic parameters viz; locality, age, BMI, the number of children, eating habits and fish intake are given in Table III. PCBs showed a significant relationship (P < 0.05) for milk intake, indicating the affinities of PCBs with lipophilic substances. A comparison of the present study with other studies on PCBs residues in maternal serum is given in Table IV. The mean concentration of ∑34 PCBs in the present study was 232.30 ng/g l.w. There exists limited literature about the PCBs residues in human
serum in India (Sharma et al., 2014) where most of the studies were focused on DDT, HCHs, and OCPs, however, Eguchi et al., (2012) reported PCB s concentration of 187 pg/g wet wt. which is less than the results of the present study. The concentration in the present study is comparable to the study reported from Japan (292 ng/g l.w.) and Korea (127.0 ng/g l.w.). The mean serum concentration of PCBs in the current study is lower than the reported from Belgium (595 ng/g l.w.) and Romania (680 ng/g l.w.; Table IV) indicating the indiscriminate past exposure of PCBs in European countries (Dirtu et al, 2009). The mean values of Tri-CBs were higher in Lahore (12.4 ng/g l.w) followed by Sialkot (10.47 ng/g l.w), Chakwal (9.1 ng/g l.w), Khanewal (8.04 ng/g l.w) and Okara (6.84 ng/g l.w).
Lahore Khanewal Okra Sialkot Chakwal
Sampling District
-1
0
1
2
3
4
5
Hep
ta C
Bs (n
g/g
lipid
)
(e)
Lahore Khanewal Okra Sialkot Chakwal
Sampling District
-2
-1
0
1
2
3
4
5
6
7
Oct
a C
Bs
(ng/
g lip
id)
(f)
Lahore Khanewal Okra Sialkot Chakwal
Sampling District
-2
-1
0
1
2
3
4
5
6
7
Dec
a C
BS
(ng/
g lip
id)
(g) Figure-4: Box whisker plots showing Homolog PCBs patterns in maternal serum (e). Hepta CBs,
(f). Octa CBs and (g). Deca CBs
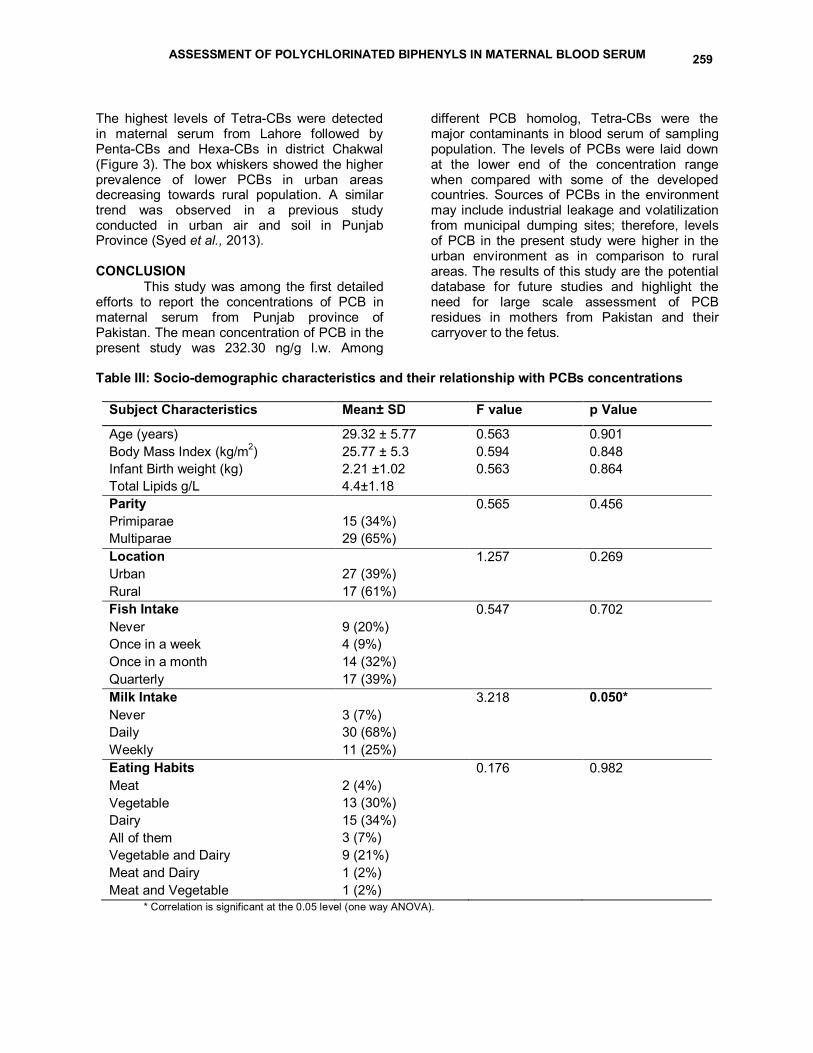
ASSESSMENT OF POLYCHLORINATED BIPHENYLS IN MATERNAL BLOOD SERUM 259
The highest levels of Tetra-CBs were detected in maternal serum from Lahore followed by Penta-CBs and Hexa-CBs in district Chakwal (Figure 3). The box whiskers showed the higher prevalence of lower PCBs in urban areas decreasing towards rural population. A similar trend was observed in a previous study conducted in urban air and soil in Punjab Province (Syed et al., 2013). CONCLUSION
This study was among the first detailed efforts to report the concentrations of PCB in maternal serum from Punjab province of Pakistan. The mean concentration of PCB in the present study was 232.30 ng/g l.w. Among
different PCB homolog, Tetra-CBs were the major contaminants in blood serum of sampling population. The levels of PCBs were laid down at the lower end of the concentration range when compared with some of the developed countries. Sources of PCBs in the environment may include industrial leakage and volatilization from municipal dumping sites; therefore, levels of PCB in the present study were higher in the urban environment as in comparison to rural areas. The results of this study are the potential database for future studies and highlight the need for large scale assessment of PCB residues in mothers from Pakistan and their carryover to the fetus.
Table III: Socio-demographic characteristics and their relationship with PCBs concentrations
Subject Characteristics Mean± SD F value p Value
Age (years) 29.32 ± 5.77 0.563 0.901 Body Mass Index (kg/m2) 25.77 ± 5.3 0.594 0.848 Infant Birth weight (kg) 2.21 ±1.02 0.563 0.864 Total Lipids g/L 4.4±1.18 Parity 0.565 0.456 Primiparae 15 (34%) Multiparae 29 (65%) Location 1.257 0.269 Urban 27 (39%) Rural 17 (61%) Fish Intake 0.547 0.702 Never 9 (20%) Once in a week 4 (9%) Once in a month 14 (32%) Quarterly 17 (39%) Milk Intake 3.218 0.050* Never 3 (7%) Daily 30 (68%) Weekly 11 (25%) Eating Habits 0.176 0.982 Meat 2 (4%) Vegetable 13 (30%) Dairy 15 (34%) All of them 3 (7%) Vegetable and Dairy 9 (21%) Meat and Dairy 1 (2%) Meat and Vegetable 1 (2%)
* Correlation is significant at the 0.05 level (one way ANOVA).

A. NAQVI ET AL. 260
Table IV: Comparison of PCBs concentrations (ng/g l.w.) in maternal blood serum with other
studies from developed and developing countries
*Concentration in wet weight
Country Name
Sample Size
PCB congeners studied PCB Concentrations
References
Median Mean Pakistan 44 30, 37, 44, 49, 52, 54, 60, 66, 70, 74,
77, 82, 87, 99, 101, 105 114, 118,126, 128,138, 153, 156, 158, 166, 169, 170, 179, 180, 183 187, 189, 198, and 209
- 232.3 Present study
Sweden 201 105, 118, 138, 153, 156, 167, and 180
552 Glynn et al., 2003
Japan 89 74, 99, 118, 138, 146,153, 156, 163/164, 170, 180, 182/187, 194,199, 206, and 209
38 232
Inoue et al., 2006
Romania 53 101, 99, 118, 146, 153, 105, 138, 187, 184, 156, and180
- 680 Dirtu et al., 2009
Belgium 20 101, 99, 118, 146, 153, 105, 138, 187, 184, 156, and 180
- 595 Dirtu et al., 2009
Poland 22 28, 52, 74, 99,101, 105, 118, 138, 153, 156, 170, 180, 183, 187, 194, 196/203 and 199
79.4 83.0 Jaraczewska et al., 2006
Pakistan 34 118, 153, 180 and 170 13 34 Ali et al., 2013 Bangladesh 24 138, 146, 153 and180 26 - Mamun et al.,
2007 India - - - 0.187* Eguchi et al.,
2012 China 47 - 115 134 Bi et al., 2007 Taiwan 20 28, 52, 101, 138, 153, 180, 77, 81,
126, 169, 105, 114, 118, 123, 156, 157, 167, 189
36.41 28.2
Wang et al., 2004
Korea 40 18, 20, 28, 52, 66, 70, 74, 99, 101, 105, 111, 118, 138, 146, 153, 156, 164, 167, 170, 178, 180, 183 and 187
127 Kang et al., 2008
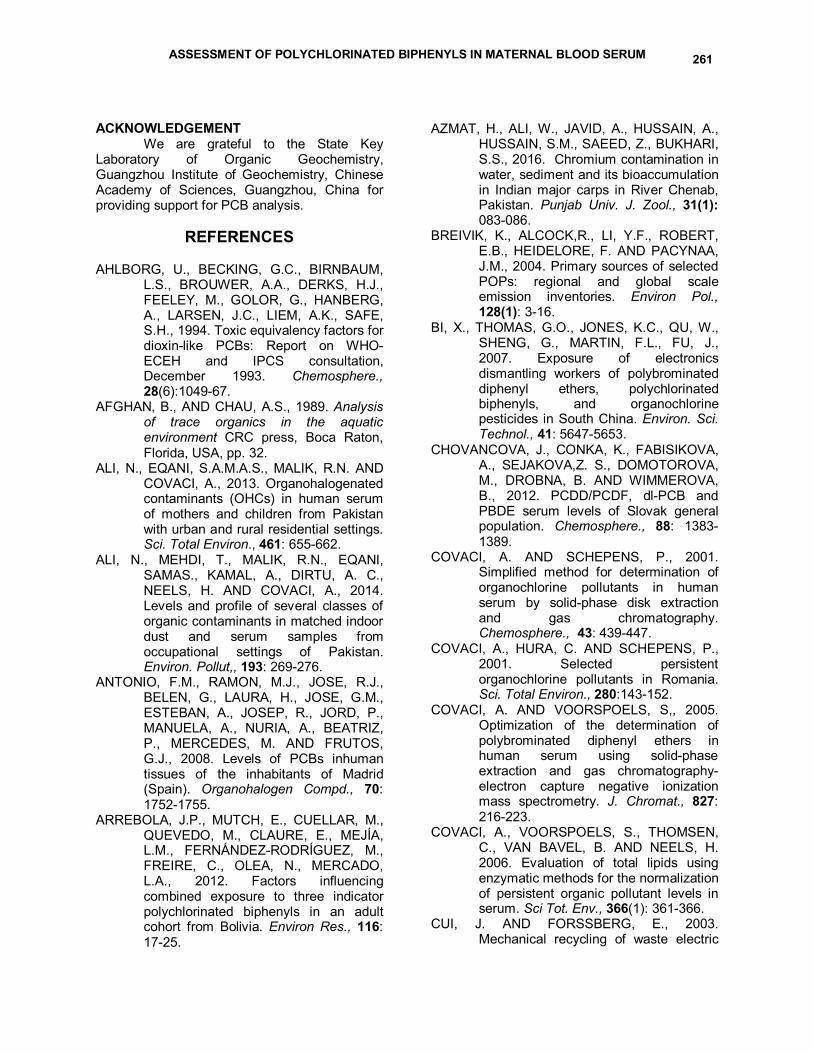
ASSESSMENT OF POLYCHLORINATED BIPHENYLS IN MATERNAL BLOOD SERUM 261
ACKNOWLEDGEMENT We are grateful to the State Key
Laboratory of Organic Geochemistry, Guangzhou Institute of Geochemistry, Chinese Academy of Sciences, Guangzhou, China for providing support for PCB analysis.
REFERENCES
AHLBORG, U., BECKING, G.C., BIRNBAUM,
L.S., BROUWER, A.A., DERKS, H.J., FEELEY, M., GOLOR, G., HANBERG, A., LARSEN, J.C., LIEM, A.K., SAFE, S.H., 1994. Toxic equivalency factors for dioxin-like PCBs: Report on WHO-ECEH and IPCS consultation, December 1993. Chemosphere., 28(6):1049-67.
AFGHAN, B., AND CHAU, A.S., 1989. Analysis of trace organics in the aquatic environment CRC press, Boca Raton, Florida, USA, pp. 32.
ALI, N., EQANI, S.A.M.A.S., MALIK, R.N. AND COVACI, A., 2013. Organohalogenated contaminants (OHCs) in human serum of mothers and children from Pakistan with urban and rural residential settings. Sci. Total Environ., 461: 655-662.
ALI, N., MEHDI, T., MALIK, R.N., EQANI, SAMAS., KAMAL, A., DIRTU, A. C., NEELS, H. AND COVACI, A., 2014. Levels and profile of several classes of organic contaminants in matched indoor dust and serum samples from occupational settings of Pakistan. Environ. Pollut,, 193: 269-276.
ANTONIO, F.M., RAMON, M.J., JOSE, R.J., BELEN, G., LAURA, H., JOSE, G.M., ESTEBAN, A., JOSEP, R., JORD, P., MANUELA, A., NURIA, A., BEATRIZ, P., MERCEDES, M. AND FRUTOS, G.J., 2008. Levels of PCBs inhuman tissues of the inhabitants of Madrid (Spain). Organohalogen Compd., 70: 1752-1755.
ARREBOLA, J.P., MUTCH, E., CUELLAR, M., QUEVEDO, M., CLAURE, E., MEJÍA, L.M., FERNÁNDEZ-RODRÍGUEZ, M., FREIRE, C., OLEA, N., MERCADO, L.A., 2012. Factors influencing combined exposure to three indicator polychlorinated biphenyls in an adult cohort from Bolivia. Environ Res., 116: 17-25.
AZMAT, H., ALI, W., JAVID, A., HUSSAIN, A., HUSSAIN, S.M., SAEED, Z., BUKHARI, S.S., 2016. Chromium contamination in water, sediment and its bioaccumulation in Indian major carps in River Chenab, Pakistan. Punjab Univ. J. Zool., 31(1): 083-086.
BREIVIK, K., ALCOCK,R., LI, Y.F., ROBERT, E.B., HEIDELORE, F. AND PACYNAA, J.M., 2004. Primary sources of selected POPs: regional and global scale emission inventories. Environ Pol., 128(1): 3-16.
BI, X., THOMAS, G.O., JONES, K.C., QU, W., SHENG, G., MARTIN, F.L., FU, J., 2007. Exposure of electronics dismantling workers of polybrominated diphenyl ethers, polychlorinated biphenyls, and organochlorine pesticides in South China. Environ. Sci. Technol., 41: 5647-5653.
CHOVANCOVA, J., CONKA, K., FABISIKOVA, A., SEJAKOVA,Z. S., DOMOTOROVA, M., DROBNA, B. AND WIMMEROVA, B., 2012. PCDD/PCDF, dl-PCB and PBDE serum levels of Slovak general population. Chemosphere., 88: 1383-1389.
COVACI, A. AND SCHEPENS, P., 2001. Simplified method for determination of organochlorine pollutants in human serum by solid-phase disk extraction and gas chromatography. Chemosphere., 43: 439-447.
COVACI, A., HURA, C. AND SCHEPENS, P., 2001. Selected persistent organochlorine pollutants in Romania. Sci. Total Environ., 280:143-152.
COVACI, A. AND VOORSPOELS, S,, 2005. Optimization of the determination of polybrominated diphenyl ethers in human serum using solid-phase extraction and gas chromatography-electron capture negative ionization mass spectrometry. J. Chromat., 827: 216-223.
COVACI, A., VOORSPOELS, S., THOMSEN, C., VAN BAVEL, B. AND NEELS, H. 2006. Evaluation of total lipids using enzymatic methods for the normalization of persistent organic pollutant levels in serum. Sci Tot. Env., 366(1): 361-366.
CUI, J. AND FORSSBERG, E., 2003. Mechanical recycling of waste electric
A. NAQVI ET AL. 262
and electronic equipment: a review. J Hazard Mater., 99(3): 243-263.
DARNERUD, P.O., 2003 Toxic effects of brominated flame retardants in man and in wildlife. Environ Int., 29: 841-853.
DAGLIOGLU, N., GULMEN, M.K., AKCAN, R., EFEOGLU, P., YENER, F. AND UNAL, I., 2010. Determination of organochlorine pesticides residues in human adipose tissue, data from Cukurova, Turkey. Bull. Environ. Contam. Toxicol., 85(1): 97–102.
DE JONGH, J.O., DE VITO, M.I., NIEBOER, R., BIRNBAUM, L. AND VAN DEN BERG, M., 1995. Induction of cytochrome P450 Isoenzymes after toxicokinetic Interactions between 2,3,7,8-Tetrachlorodibenzo-p-dioxin and 2, 2′, 4, 4′, 5, 5′-Hexachlorobiphenyl in the Liver of the Mouse. Toxicol. Sci., 25(2): 264-70.
DEWAN, P., JAIN, V., GUPTA, P. AND BANERJEE, B.D., 2013. Organochlorine pesticide residues in maternal blood, cord blood, placenta, and breastmilk and their relation to birth size. Chemosphere., 90: 1704-1710.
DIRTU, A.C., JASPERS, V.L., CERNAT, R., NEELS, H. AND COVACI, A., 2009. Distribution of PCBs, their hydroxylated metabolites, and other phenolic contaminants in human serum from two European countries. Environ. Sci. Technol., 44: 2876-2883.
EQANI, SA-M-A-S., MALIK, R.N., CINCINELLI, A., ZHANG, G., MOHAMMAD, A., QADIR, A., RASHID, A., BOKHARI, H., JONES, K.C. AND KATSOYIANNIS, A., 2013. Uptake of organochlorine pesticides (OCPs) and polychlorinated biphenyls (PCBs) by river water fish: The case of River Chenab. Sci. Total Environ., 450–451: 83-91.
EQANI, SA-M-A-S., MALIK, R.N., KATSOYIANNIS, A., ZHANG, G., CHAKRABORTY, P., MOHAMMAD, A., AND JONES, K.C., 2012. Distribution and risk assessment of organochlorine contaminants in surface water from River Chenab, Pakistan. J. Environ. Monit., 14: 1645-1654.
ESTEBAN, M. AND CASTAÑO, A., 2009. Non-invasive matrices in human biomonitoring: a review. Environ Int., 35: 438-449.
FIEDLER, H., RAPPOLDER, M., KNETSCH, G. AND BASLER, A., 2002. The German dioxin database: PCDD/PCDF concentrations in the environment – spatial and temporal trends. Organohalogen Compd., 57: 37-41.
GARCIA, S.O., VAZQUEZ, F.P., VEGA, C.G., SILVA, J.A.V., GONZALEZ, L.H. AND MALDONADO, I.P., 2014. Concentrations of persistent organic pollutants (POPs) in human blood samples from Mexico City, Mexico. Sci. Total Environ., 472: 496–501.
GOVARTS, E., HOND, E.D., SCHOETERS, G. AND BRUCKERS, L., 2010. Determinants of serum PCBs in adolescents and adults: Regression tree analysis and linear regression analysis. Hum. Ecol. Risk Assess., 16(5): 1115-1132.
GINSBERG, G.L., TOAL, B.F. AND MCCANN, P.J., 2015. Updated risk/benefit analysis of fish consumption effects on neurodevelopment: implications for setting advisories. Environ. Health Perspect., 21(7): 1810-1839.
GLYNN, A.W., GRANATH, F., AUNE, M., ATUMA, S., DARNERUD, P.O., BJERSELIUS, R., VAINIO, H. AND WEIDERPASS, E., 2003. Organochlorines in Swedish women: determinants of serum concentrations. Environ. Health Perspect., 111: 349–55.
HERNIK, A., STRUCINSKI, P., BUCKLEY, B.T., GORALCZYK, K., CZAJA, K., KORCZ, W., MATUSZAK, M., LYCZEWSKA, M., MINORCZYK, M., LISZEWSKA, M. AND LUDWICKI, J., K., 2016. Relationship between paired cord blood and milk POPs levels as a tool for assessing perinatal exposure, a pilot study. Hum. Ecol. Risk Assess., 22(7): 1456-1468.
HERRICK, R.F., MCCLEAN, M.D., MEEKER, J.D., BAXTER, L.K. AND WEYMOUTH, G.A., 2004. An unrecognized source of PCB contamination in schools and other buildings. Environ Health Perspect., 112: 1051-1053.
HOWARD, P.H. AND MUIR, D.C.G., 2010. Identifying new persistent and bioaccumulative organics among chemicals in commerce. Environ. Sci. Technol., 44: 2277-2285.
INOUE, K., HARADA, K., TAKENAKA, K., UEHARA, S., KONO, M., SHIMIZU, T.,

ASSESSMENT OF POLYCHLORINATED BIPHENYLS IN MATERNAL BLOOD SERUM 263
TAKASUGA, T., SENTHILKUMAR, K., YAMASHITA, F. AND KOIZUMI, A., 2006. Levels and concentration ratios of polychlorinated biphenyls and polybrominated diphenyl ethers in serum and breast mMilk in Japanese Mothers. Environ. Health Perspect., 114(8): 1179-1185.
JARACZEWSKA, K., LULEK, J., COVACI, A., VOORSPOELS, S,, KALUBA-SKOTARCZAK, A., DREWS, K. AND SCHEPENS, P., 2006. Distribution of polychlorinated biphenyls, organochlorine pesticides and polybrominated diphenyl ethers in human umbilical cord serum, maternal serum and milk from Wielkopolska region, Poland. Sci. Total Environ., 372(1): 20-31.
JENSEN, A.A., 1987. Polychlorobiphenyls (PCBs), polychlorodibenzo-p-dioxins (PCDDs) and polychlorodibenzofurans (PCDFs) in human milk, blood and adipose tissue.Sci. Total Environ., 64(3): 259-293.
JUDD, N., NEILL, S.M., KALMAN, D.A., 2003. Are seafood PCB data sufficient to assess health risk for high seafood consumption groups? Hum. Ecol. Risk Assess., 9(3): 691-707.
KHAWAJA, S., YOUSUF, M.J., KHAN, A.J., 2010. Polychlorinated residues in milk of lactating women from Karachi, Pakistan. J. Basic App. Sci., 6: 23-34.
KODAVANTI, P.R.S., SENTHILKUMAR, K. AND LOGANATHAN, B.G., 2008. Organohalogen pollutants and human health. In: Encyclopedia of Public Health (Eds. Harold Kris, Heggenhougen, Stella, Quah), Academic Press, San Diego, CA, USA, 4: 686–693.
KUNISUE, T., SOMEYA, M., KAYAMA, F., JIN, Y. AND TANABE, S., 2004. Persistent organochlorines in human breast milk collected from primiparae in Dalian and Shenyang, China. Environ. Pol., 131: 381–392.
LARSEN, J.C., 2006. Risk assessments of polychlorinated dibenzo- p-dioxins, polychlorinated dibenzofurans, and dioxin-like polychlorinated biphenyls in food. Mol. Nutr. Food Res., 50(10): 885-896.
MAHMOOD, A., SYED, J.H., MALIK, R.N., ZHENG, Q., CHENG, Z., LI. J. AND ZHANG, G., 2014. Polychlorinated
biphenyls (PCBs) in air, soil, and cereal crops along the two tributariesof River Chenab, Pakistan: concentrations, distribution, and screening levelrisk assessment. Sci. Total Environ., 481: 596–604.
MAMUN, M.I.R., NAHAR, N., MOSIHUZZAMAN, M., LINDERHOLM, L., ATHANASIADOU, M. AND BERGMAN, A., 2007. Traditional organochlorine pollutants in blood from humans living in the Bangladesh capital area. Organohalogen Compd., 69: 2026-2030.
MINH, N.H., SOMEYA, M., MINH, T.B., KUNISUE, T., IWATA, H., WATANABE, M., TANABE, S., VIET, P.H. AND TUYEN, B.C., 2004. Persistent organochlorine residues in human breast milk from Hanoi and Hochiminh city, Vietnam: contamination, accumulation kinetics and risk assessment for infants. Environ Pollut., 129: 431–441.
MUMTAZ, M., MEHMOOD, A., QADIR, A., MAHMOOD, A., MALIK, R.N., SABIR, A., LI., J. AND ZHANG, G., 2016. Polychlorinated biphenyl (PCBs) in rice grains and straw; risk surveillance, congener specific analysis, distribution and source apportionment from selected districts of Punjab Province, Pakistan. Sci. Total Environ., 543: 620-627.
NOST, T.H., 2014. Understanding temporality in human concentrations of organic contaminants. A dissertation for the degree of Philosophiae Doctor (PhD), 2.
OSMAN, G., GALAL, M., ABUL-EZZ, A., MOHAMMED, A., ABUL-ELA, M., AND HEGAZY, A.M., 2017. Polycyclic aromatic hydrocarbons (PAHS) accumulation and histopathological biomarkers in gills and mantle of Lanistes carinatus (Molluscs, Ampullariidae) to assess crude oil toxicity. Punjab Univ. J. Zool., 32(1): 39-50.
ROSA, D.C.T. AND HICKS, H.E., 2001. Sentinel human health indicators: A model for assessing human health status of vulnerable communities. Hum. Ecol. Risk Assess., 7(5): 1419-1435.
RICE D.C., 2012. Relationship between measures of exposure to PCBs/Dioxins and behavioral effects in recent developmental studies. Hum. Ecol. Risk Assess., 7(5): 1059-1077.
A. NAQVI ET AL. 264
RODRIGUEZ, E.A., 2016. Hydroxylated and sulfated metabolites of lower chlorinated PCBs bind with high affinity to human serum albumin and exhibit selective toxicity to neuronal cells. PhD Dissertations, University of Iowa.
SHARMA, B., BHARAT, G.K., TAYAL, S., NIZZETTO, L., ČUPR, P. AND LARSSEN, T., 2014. Environment and human exposure to persistent organic pollutants (POPs) in India: A systematic review of recent and historical data. Environ Int., 66: 48-64.
SOECHITRAM, S., ATHANASIADOU, M., HOVANDER, L., BERGMAN, A. AND SAUER, P., 2004. Fetal exposure to PCBs and their hydroxylated metabolites in a Dutch cohort. Environ. Health Perspect., 112: 1208–1212.
SUBRAMANIAN, A, OHTAKE, M., KUNISUE, T. AND TANABE, S., 2007. High levels of organochlorines in mothers’ milk from Chennai (Madras) city, India. Chemosphere., 68(5): 928-939.
SUDARYANTO, A., KUNISUE, T., TANABE, S., NIIDA, M. AND HASHIM, H., 2005. Persistent organochlorine compounds in human breast milk from mothers living in Penang and Kedah, Malaysia. Arch. Environ. Contam. Toxicol., 49: 429–437.
SYED J., MALIK, R., LI, J., ZHANG, G. AND JONES, K., 2013. Levels, distribution and air–soil exchange fluxes of poly chlorinated biphenyls (PCBs) in the environment of Punjab Province, Pakistan. Ecotoxicol. Environ. Saf., 97: 189–195.
TANABE, S. AND KUNISUE, T., 2007. Persistent organic pollutants in human breast milk from Asian countries. Environ. Pol., 146: 400–413.
THOMAS, G.O., WILKINSON, M., HODSON, S., JONES, K.C., 2006. Organohalogen chemicals in human blood from the United Kingdom. Environ. Pol., 141(1): 30-41.
TURCI, R., FINOZZI, E., CATENACCI, G., MARINACCIO, A., BALDUCCI, C., MINOIA, C., 2006. Reference values of coplanar and non-coplanar PCBs in serum samples from two Italian population groups. Toxicol. Lett., 162(2-3): 250-255.
TSYDENOVA, V.O., SUDARYANTO, A., KAJIWARA, N., KUNISUE, T., BATOEV, V.B., TANABE, S., 2007.
Organohalogen compounds in human breast milk from Republic of Buryatia, Russia. Environ. Pol., 146: 225–232.
TYAGI, V., MUSTAFA, M., BANERJEE, B.D. AND GULERIA, K., 2015. Organochlorine pesticide levels in maternal blood and placental tissue with reference to preterm birth: a recent trend in North Indian population. Environ. Monit. Assess., 187: 471.
VAN DEN BERG, M., BIRNBAUM, L.S., DENISON, M., DE VITO, M., FARLAND, W., FEELEY, M., FIEDLER, H., HAKANSSON, H., HANBERG, A. AND HAWS, L., 2006. The 2005 World Health Organization reevaluation of human and mammalian toxic equivalency factors for dioxins and dioxin-like compounds. Toxicol. Sci., 93: 223-241.
WANG, S., LIN, C.Y., GUO, Y.L., LIN, L.Y., CHOU, W.L. AND CHANG, L.W., 2004. Infant exposure to polychlorinated dibenzo-p-dioxins, dibenzofurans and biphenyls (PCDD/Fs, PCBs)––correlation between prenatal and postnatal exposure. Chemosphere, 54(10): 1459-1473.
WHO (World Health Organization). 2003. Polychlorinated Biphenyls: Human Health Aspects, Concise Int. Chem. Assess. Doc., 55: 1-64.
WITTSIEPE, J., FOBIL, J.N., TILL, H., BURCHARD, G.D., WILHELM, M. AND FELD, T., 2015. Levels of polychlorinated dibenzo-p-dioxins, dibenzofurans (PCDD/Fs) and biphenyls (PCBs) in blood of informal e-waste recycling workers from Agbogbloshie, Ghana, and controls. Environ. Int., 79: 65–73.
XING G.H., JANET K. Y.C., LEUNG, A.O.W., WU, S.C. AND WONG M.H., 2009. Environmental impact and human exposure to PCBs in Guiyu, an electronic waste recycling site in China. Environ. Int., 35: 76–82.
ZHANG, H., LU, Y., SHI, Y., WANG, T., XING, Y. AND DAWSON, R.W., 2005. Legal framework related to persistent organic pollutants (POPs) management in China. Environ. Sci. Pol., 8: 153–160.