IMPACT OF A PREVIOUS AUDIT ON TAX ...
19
JDEP Vol. 1 No. 3 (2018): hlm.15 - 34 JDEP Jurnal Dinamika Ekonomi Pembangunan https://ejournal.undip.ac.id/index.php/dinamika_pembangunan/index IMPACT OF A PREVIOUS AUDIT ON TAX AGGRESSIVENESS OF A FIRM TAXPAYER Ivan Rona Penata 1 , Diah Widyawati 2 University of Indonesia [email protected] , [email protected] Abstract This study aims to analyze the effect of a previous tax audit on tax aggressiveness of a firm taxpayer who submits Overpayment Annual Tax Return. The degree of tax aggressiveness itself uses Delta Effective Tax Rate as a proxy, generated from Annual Tax Return data from 2011 to 2016. Using multinomial logit regression as a method, this study found that a previous Tax Audit and tax audit result made a firm prefer to choose a positive Delta Effective Tax Rate. Keywords: Tax Aggressiveness, Effective Tax Rate, Tax Audit JEL Classification: H25, H26, H32 INTRODUCTION In Indonesia, tax is the most dominant source of revenue. It reaches more than 80% of the total state revenue (APBN 2017, Ministry of Finance). One of these taxes that should be paid by a firm in Indonesia is Corporate Income Tax (CIT). The amount of this tax based on the firm’s income. Therefore, every firm in Indonesia is a subject of Corporate Income Tax. Like another emerging Nation in the world, Indonesia also encounters a problem on tax compliance. From 2010 to 2016, only less than 60% of a firm taxpayers in Indonesia submitted their Tax Return (Surat Pemberitahuan Tahunan) 1 . Another indicator of this compliance problem is a fact that Indonesia is among the country with a low Tax Ratio in Southeast Asia. In annual tax return, Firm Taxpayer will declare a status in 3 categories. With a self- assessment 2 system embraced by Indonesia’s Tax Law, the estimated tax owed by a firm taxpayer, should be paid by witholding mechanism from another taxpayer and installment payment of Income Tax Article 25 by the firm itself. These three categories are: • Underpayment Status The condition where the total of installment payment of Income Tax Article 25 and witholding tax are less than the estimated tax owed in Tax Return. • Overpayment Status The condition where the total of installment payment of Income Tax Article 25 and witholding tax are more than estimated tax owed in Tax Return. 1 According to taxation general provisions, Tax Return is a letter that is used by taxpayers to report the calculation and / or payment of taxes, tax objects and / or not tax objects, and / or assets and liabilities based on the tax laws. 2 The self-assessment system is a tax collection system that gives trust to taxpayers to calculate, pay, and report their own tax owed based on tax laws and regulations.
-
Upload
khangminh22 -
Category
Documents
-
view
2 -
download
0
Transcript of IMPACT OF A PREVIOUS AUDIT ON TAX ...

JDEP Vol. 1 No. 3 (2018): hlm.15 - 34
JDEP
Jurnal Dinamika Ekonomi Pembangunan
https://ejournal.undip.ac.id/index.php/dinamika_pembangunan/index
IMPACT OF A PREVIOUS AUDIT ON TAX AGGRESSIVENESS OF
A FIRM TAXPAYER
Ivan Rona Penata
1, Diah Widyawati
2
University of Indonesia
[email protected] , [email protected]
Abstract
This study aims to analyze the effect of a previous tax audit on tax aggressiveness of a firm taxpayer
who submits Overpayment Annual Tax Return. The degree of tax aggressiveness itself uses Delta
Effective Tax Rate as a proxy, generated from Annual Tax Return data from 2011 to 2016. Using
multinomial logit regression as a method, this study found that a previous Tax Audit and tax audit
result made a firm prefer to choose a positive Delta Effective Tax Rate.
Keywords: Tax Aggressiveness, Effective Tax Rate, Tax Audit
JEL Classification: H25, H26, H32
INTRODUCTION
In Indonesia, tax is the most dominant source of revenue. It reaches more than 80% of
the total state revenue (APBN 2017, Ministry of Finance). One of these taxes that should be
paid by a firm in Indonesia is Corporate Income Tax (CIT). The amount of this tax based on
the firm’s income. Therefore, every firm in Indonesia is a subject of Corporate Income Tax.
Like another emerging Nation in the world, Indonesia also encounters a problem on
tax compliance. From 2010 to 2016, only less than 60% of a firm taxpayers in Indonesia
submitted their Tax Return (Surat Pemberitahuan Tahunan)1. Another indicator of this
compliance problem is a fact that Indonesia is among the country with a low Tax Ratio in
Southeast Asia.
In annual tax return, Firm Taxpayer will declare a status in 3 categories. With a self-
assessment2 system embraced by Indonesia’s Tax Law, the estimated tax owed by a firm
taxpayer, should be paid by witholding mechanism from another taxpayer and installment
payment of Income Tax Article 25 by the firm itself. These three categories are:
• Underpayment Status
The condition where the total of installment payment of Income Tax Article 25 and
witholding tax are less than the estimated tax owed in Tax Return.
• Overpayment Status
The condition where the total of installment payment of Income Tax Article 25 and
witholding tax are more than estimated tax owed in Tax Return.
1 According to taxation general provisions, Tax Return is a letter that is used by taxpayers to report the calculation and / or payment of taxes, tax objects and / or not tax objects, and / or assets and liabilities based on the tax laws. 2 The self-assessment system is a tax collection system that gives trust to taxpayers to calculate, pay, and report their own
tax owed based on tax laws and regulations.
JDEP Vol. 1 No. 3 (2018): hlm.15 - 34
JDEP
Jurnal Dinamika Ekonomi Pembangunan
https://ejournal.undip.ac.id/index.php/dinamika_pembangunan/index
• Nil Status
The condition where the total of installment payment of Income Tax Article 25 and
witholding tax are equal to estimated tax owed in Tax Return.
Figure 1
The Number of Annual Tax Return Submitted By Firm Taxpayers 2010-2015
Source: DGT’s Income Statement
Figure 2
Tax Ratio in South East Asian Countries 2002-2015
Source: World Development Indicators, World Bank 2016
0
5
10
15
20
25
Indonesia
Malaysia
Thailand
Vietnam
Philipina
Kamboja
Laos
Singapura

JDEP Vol. 1 No. 3 (2018): hlm.15 - 34
JDEP
Jurnal Dinamika Ekonomi Pembangunan
https://ejournal.undip.ac.id/index.php/dinamika_pembangunan/index
Directorate General of Taxation (DGT) conducts a tax audit3 to examine the
compliance of taxpayer. Before conduct a tax audit, every tax return would be analyzed first.
Overpayment Tax Return, automatically become an object of tax audit. While tax return, with
underpayment or nil status, could be an object of tax audit when they meet certain criteria.
In previous economic studies, tax aggressiveness often to be used as indicator of Tax
Compliance. Tax aggressiveness is a specific activity with a main pupose to reduce tax owed
by a taxpayer (Slemrod 2004). Another wider perspective defines tax aggressiveness as an act
to report income lower than the actual (under reported income) in tax return (Hanlon and
Heitzman 2010). Firm taxpayer commits tax aggressiveness through tax avoidance4 and tax
evasion5 activity (DeBacker et al. 2015).
The theory about tax aggressiveness originally came from Allingham, Sandmo
(1972) and Yithzaki (1974) theory about tax compliance. This theory state that tax
compliance influenced by the perception from the taxpayer of two factors, the probability of
being audited and a penalty for their non-compliant. This theory criticized by certain people.
Alm (2009) state that those two factors not only based on taxpayer perception but also based
on a lot of information. One of that information could be derived from taxpayer previous
experience for being audited (Snow and Warren 2010).
In the beginning, the studies about the impact of a previous audit on tax
aggressiveness used an experimental method. These studies were conducted by Mittone
(2006), Maciejovsky et al. (2007) and Kastlunger et al. (2009). In these research, participant
was given some information that can affect their decision to do a tax aggressiveness. For
example, In Mittone (2006) study, participant was given an information that audit would be
held with a probability 1:15. While in Kastlunger et al. (2009) study, participant was given
information that audit would be held randomly 9 times in 60 round. These experimental
studies indicate that tax aggressiveness increases after an audit.
Following the experimental method, the studies about the impact of a previous audit
on tax aggressiveness started to use econometrics. These study conduct by Niu (2011),
D’Agosto et al. (2017), Gemmel and Rato (2012) and Debacker et al. (2015). Niu (2011)
used OLS and Auto Regressive as analysis tools. While D’Agosto et al. (2017) and Gemmel
and Ratto (2012) used DID. The result of their research found that tax aggressiveness
decreases after an audit. In another case, Debacker et al. (2015) used panel data regression as
a tool and found that tax aggressiveness increases after a previous audit.
Study about tax aggressiveness should be important for a country like Indonesia for
some reasons. The main reason is a literature debate about the positive or negative impact of
a previous audit on tax aggressiveness. Hence, empirical and institutional study about tax
aggressiveness become a necessity in emerging nations who often encounter a problem of tax
compliance (Andreoni et al. 1998). The other reason is the study about the development and
behavior of tax noncompliance become necessary since it has a serious impact on equity and
effectiveness of the tax system (Hanlon 2005).
3According to tax general provisions, tax audit is a series of activities to collect and process data, information, and / or
evidence carried out objectively and professionally based on a standard audit to examine tax compliance and / or for other
purposes in order to implement the provisions of taxation laws and regulations. 4 Tax avoidance can be interpreted as an effort made by taxpayers to reduce their tax payment obligations
through legal practices by utilizing loopholes from tax regulations.. 5 Tax Evasion is an attempt made by taxpayers to reduce their tax payment obligations through an illegal
practice.

JDEP Vol. 1 No. 3 (2018): hlm.15 - 34
JDEP
Jurnal Dinamika Ekonomi Pembangunan
https://ejournal.undip.ac.id/index.php/dinamika_pembangunan/index
The thing that distinguishes this study compared to another study is the Overpayment
Tax Return as the object of the research. This becomes interesting since the Overpayment
Tax Return automatically become the object of tax audit in Indonesia. Furthermore, to
writer’s knowledge, this study becomes the first study in Indonesia that analyze the impact of
a previous audit on tax aggressiveness using firm taxpayer from all over regions in Indonesia
who submit the Overpayment Tax Return.
This study aims to achieve two goals. Generally, this study aims to analyze the impact
of a previous audit on tax aggressiveness of a firm taxpayer who submits the Overpayment
Tax Return. Specifically, this study could contribute to describe how effective the audit
strategy held by tax authority in Indonesia.
To delineate tax aggressiveness of a firm taxpayer who submits the Overpayment Tax
Return, this study uses Delta Effective Tax Rate (DETR) as a dependent variable. DETR is a
difference between Effective Tax Rate (ETR) based on a tax return with statutory tax rate6.
While Effective Tax Rate (ETR) is a ratio of taxes paid to pretax accounting income in one
fiscal year. Consequently, DETR could have a negative, zero or positive value. This study
uses DETR instead of ETR because the low value of ETR could not describe tax
aggressiveness of a firm with a loss in financial condition.
Since DETR categorized in 3 value, therefore this study uses multinomial logit
regression as an analyzing tool. Data in this research gathered from tax return from 2011 to
2016. This study does not use data from Income Statement because it is hard to obtain such
data in Indonesia.
LITERATURE REVIEW
Tax Aggressiveness and Effective Tax Rate
The definition of tax aggressiveness itself still become a debate among the researcher.
Slemrod (2004) defines Tax aggressiveness as a specific activity with the main pupose to
reduce tax owed by a taxpayer (Slemrod 2004). Another wider perspective defines tax
aggressiveness as an act to report income lower than the actual (underreported income) in a
tax return (Hanlon and Heitzman 2010). In a perspective of a firm taxpayer, they commit tax
aggressiveness through tax avoidance and tax evasion activity (DeBacker et al. 2015). Hence,
Hanlon and Heitzman (2010) conclude that there is no universal definition of tax
aggressiveness since its definition varies for every researcher.
Martinez (2017) describes classification of tax aggressiveness from legal and tax
compliance aspect. Taxpayer commit tax aggressiveness through tax planning (tax
avoidance) and tax fraud (tax evasion). From the legal perspective, tax planning (tax
avoidance) is legal activity while tax fraud (tax evasion) is not. From compliance aspect, tax
planning (tax avoidance) placed on gray area, the area between legal activity and illegal
activity and potentially could become a noncompliance. While tax fraud (tax evasion) placed
on the left area which is fully an illegal activity and noncompliance.
6 Statutory Tax Rate is a tax rate according to taxation provisions in a country. In the context of Indonesian tax law, the
Corporate Income Tax rate under the Income Tax Law is 25%.

JDEP Vol. 1 No. 3 (2018): hlm.15 - 34
JDEP
Jurnal Dinamika Ekonomi Pembangunan
https://ejournal.undip.ac.id/index.php/dinamika_pembangunan/index
Figure 3
Tax aggressiveness
Source Martinez (2017)
Tax aggressiveness can be measured to describe a degree of tax aggressiveness itself.
A legal point is a point where all activity of a taxpayer complies to any tax law applied. The
far the tax payment from the legal point, it can be concluded that the degree of tax
aggressiveness is high. And the close the payment to the legal point, it also can be concluded
that the degree of tax aggressiveness is low.
Generally, there are two proxies used to measure the degree of tax aggressiveness.
Those proxies are Effective Tax Rate (ETR) and Book-Tax Difference (BTD). Effective Tax
Rate (ETR) is a ratio of tax expense to pretax accounting income in one fiscal year. While
BTD is the difference between commercial profit/loss and fiscal profit/loss. ETR used as a
proxy for tax aggressiveness in Dyreng et al. (2008, 2010), Lanis and Richardson
(2007,2012) and De Backer et al. (2015) studies. While BTD used in Desai and Dharmapala
(2006) study.
ETR data could be obtained from Tax Return and financial statement data. Since Tax
Return data are confidential, a researcher usually obtains ETR measurement from financial
statement data (Plesko 2003). After the formula to measure ETR from tax return data
developed, many subsequent studies try to measure ETR using tax return data.
This study uses Effective Tax Rate (ETR) as a proxy of tax aggressiveness because of
its eminence comparing to another proxy. The first one that ETR could detect firms that
reduce their tax payment by keeping the level of pretax income but lower their taxable
income (Lanis and Richardson 2012). Moreover, ETR could mitigate the incomplete
detection issue in compliance empirical model (DeBacker et al. 2015).
There are two kinds of ETR that often to be used in research, General Accepted
Accounting Principle Effective Tax Rate (GAAP ETR) and Cash Effective Tax Rate (Cash
ETR). GAAP ETR is a comparison between tax expense and pretax accounting income in a
current fiscal year. While Cash ETR is a comparison between taxes paid and pretax

JDEP Vol. 1 No. 3 (2018): hlm.15 - 34
JDEP
Jurnal Dinamika Ekonomi Pembangunan
https://ejournal.undip.ac.id/index.php/dinamika_pembangunan/index
accounting income in a current fiscal year. Both method developed into a new method and
formula such as Current Effective Tax Rate (Current ETR), long-run cash ETR and ETR
differential.
Previous Empirical Studies
In the beginning, empirical studies try to explain the effect of a previous audit on tax
aggressiveness by using an experimental method. Mittone (2006) try to analyze taxpayer
psychological factors that can influence the tax evasion behavior. From his study, it could be
concluded that in every round after an audit, tax aggressiveness increases. Mittone (2006)
call this effect as a Bomb-Crater Effect7. After that study, Maciejovsky et al. (2007) try to
explain this effect by implementing a new setting in the experiment with a focus on a lag
between audit. Maciejovsky et al. (2007) found that Bomb-Crater Effect occurred through
two mechanism, misperception of chance8 and loss repair
9. Maciejovsky et al. (2007) also
found that tax aggressiveness increases after an audit. Furthermore, Kastlunger et al. (2009)
try to explain which mechanism is the dominant one in causing Bomb-Crater Effect. They
found that misperception of chance is the dominant mechanism in generate Bomb-Crater
Effect.
There are several weaknesses of experimental study about tax compliance. The first
one is the fact that the respondent is not always a taxpayer who registered administratively in
tax authority. This is not suitable in describing a tax aggressiveness of a taxpayer. The other
weakness is the information given to the participant in a round of experiment. For example,
in Mittone (2006), participant was given an information that audit was conducted randomly
with a probability 1:15. In Kastlunger et al. (2009), the information given is the audit were
conducted randomly 9 times in 60 rounds. This situation is contrary to reality where
taxpayers never know when or where audit should be conducted. All of this conditions do not
reflect the real environment of study about tax compliance (Andreoni et al., 1998).
Following the experimental study, empirical study about the effect of a previous audit
on tax aggressiveness started to use econometric model with a sample of Individual
Taxpayers. Gemmel and Rato (2012) try to explain how Individual Taxpayer behave when
they experienced a random audit. They found that Individual Taxpayers with random audit
experience, increase their tax aggressiveness, while taxpayers with no random audit
experience, decrease their tax aggressiveness. Debacker et al. (2015) try to describe
individual taxpayers behavior in reporting their income to the tax authority in long term and
short term after being audited. They found that Individual Taxpayers increase their reported
income to the tax authority after being audited. Unfortunately, both studies from Gemmel and
Rato (2012) and Debacker et al. (2015) only use randomly audited individual taxpayers as a
sample.
7 Bomb Crater Effect was taken from the term used in the second world war, where allied soldiers believed that
a good place for sheltering was in the crater of the German bomb because they believed that the enemy would
not attack again in the same place. 8Misperception of chance is an assumption from the Taxpayer that events that occur randomly, such as an audit,
will occur if the event does not take place for a long time or it will not happen again because it just had
happened. 9 Loss repair explained that Tax Evasion activities conducted by taxpayers because they tried to take revenge to
the tax authority after they were audited..

JDEP Vol. 1 No. 3 (2018): hlm.15 - 34
JDEP
Jurnal Dinamika Ekonomi Pembangunan
https://ejournal.undip.ac.id/index.php/dinamika_pembangunan/index
Different from Gemmel and Rato (2012) and Debacker et al. (2015) studies, D'Agosto
et al. (2017) try to evaluate the effectiveness of the audit strategy carried out by the Italian tax
authorities on the net production value reported to the tax authorities by entrepreneur and sole
proprietorship taxpayers. The results indicate that there is a positive effect of the audit to
deterrence effect of noncompliance. Since this study uses net production value reported as a
degree of compliance, it would be difficult to apply this study in other countries because tax
laws and systems are different from one country to another.
Empirical study about the effect of audit on tax aggressiveness also conducted on firm
taxpayers. Niu (2011) try to examine the impact of audit on a voluntary compliance of Sales
Tax Reporting. He found that after being audited, taxpayers report an increasing growth of
sales to the tax authority. Another study about a firm’s tax aggressiveness are conducted by
Debacker et al. (2015). They found that a previous audit has an effect on firm’s tax
aggressiveness. This effect shows a certain pattern of tax aggressiveness as a response of
previous audit experience. Unfortunately, both of these studies did not use a penalty as a
variable in their studies.
Conceptual Framework
The theory about tax aggressiveness originally came from Allingham, Sandmo
(1972) and Yithzaki (1974) theory about tax compliance. This theory states that tax
compliance determined by the perception from a taxpayer of two factors, the probability of
being audited and a penalty for their non-compliant. This probability of being audited is
based on taxpayer perception subjectively. In this theory, tax rate and penalty are exogenous
for a taxpayer. This model assumes that audit always detect noncompliance. Thus, taxpayers
always pay their penalty for every income evaded. In this model, when the probability of
being audited is high, the compliance would also high.
This theory criticized by certain people. Alm (2009) state that those two factors not
only based on taxpayer perception but also based on a lot of information. He also said that
audit not always detect noncompliance. This situation would affect taxpayer perception on
the probability of being audited in the future.
Snow and Warren (2010) introduce a model that can describe about how the previous
audit could affect tax aggressiveness. They developed a tax compliance model from one
period to intertemporal model. In this model, Taxpayers usually do not know when he will be
audited. He will estimate the probability of being audited subjectively based on the risk and
information gathered from past audit experience. This is known as Bayesian Updating of tax
aggressiveness. When taxpayers successful in committing tax aggressiveness, it will
encourage them to do the same thing in the future. Snow and Warren (2010) model provides
a basic theory for an empirical study to observe how taxpayers change their perception of the
probability of being audited based on their past audit experience.
Gemmel and Ratto (2012) also argue that taxpayer compliance behavior is influenced
by their perceptions after being audited and numbers of violations that were not detected
during the audit. The results of the previous audit will affect taxpayers' perceptions about
when will the next audit occur and how much evaded income detected in the future.
Taxpayers make their perception only based on information gathered from past audit
experience.
Debacker et al.(2015) describe that past audit experience could affect tax
aggressiveness through 3 mechanisms. These mechanism are Type Updating, Penalty

JDEP Vol. 1 No. 3 (2018): hlm.15 - 34
JDEP
Jurnal Dinamika Ekonomi Pembangunan
https://ejournal.undip.ac.id/index.php/dinamika_pembangunan/index
Updating, and Noncompliance Learning. Type Updating describes how taxpayers increase
their probability of being audited until the time when he has not been audited for a long time,
then they will decrease it. Penalty Updating shows that taxpayers will decrease tax
aggressiveness if a penalty for noncompliance higher than they expected, vice versa. While
Noncompliance Learning describes that taxpayers would learn from a previous audit if tax
aggressiveness not fully detected by the tax authority.
H1: There is an effect of a previous audit on tax aggressiveness.
The Determinant of Tax Aggressiveness
Firm size has an effect on tax aggressiveness. Zimmerman (1983) argues that the
political cost of the firm has an effect on aggressiveness. He used firm size as a proxy to
estimate political cost. Firm size often to be connected with the firm’s ability to commit tax
avoidance. Larger Firm usually involves more in business activity and financial transaction
than a smaller firm. Thus, larger firm has more oppurtunity to commit tax avoidance (Rego,
2003). The larger firm also has more economic and political power to reduce their tax
liability (Richardson and Lanis 2007).
H1: There is an effect of firm size on tax aggressiveness.
Duration of a firm registered in tax authority also has an effect on tax aggressiveness.
Lanis and Richardson (2012) argues that tax aggressiveness could be affected by the duration
of firm sold his stock in the capital market. There are possibilities for a firm to make a
mistake in fulfilling his obligation and report to capital market authority if that firm registered
to sell its stock not for a long time. This thing also could happen to firm taxpayers. There are
more possibilities for new-registered firm taxpayers to make a mistake in fulfilling his
obligation and report to the tax authority.
H1: There is an effect of a registered period of taxpayer on tax aggressiveness.
Firm status, whether as a local firm or foreign-owned firm, also has an effect on tax
aggressiveness. The foreign-owned firm has the advantage to increase or decrease tax
aggressiveness through tax planning with the associated firm or people abroad (Rego 2003).
H1: There is an effect of firm status on tax aggressiveness.
Tax aggressiveness is affected by trend or situation when taxpayers submit their tax
return. Lanis and Richardson (2007) found that tax reform in Australia has influenced on tax
aggressiveness of firm taxpayers.
H1: There is an effect of a year on tax aggressiveness.
Tax aggressiveness also affected by the type or characteristic of the firm. Tax
aggressiveness could fluctuate through characteristic or sector of the firm (Lanis and
Richardson 2012).
H1: There is an effect of the firm characteristic on tax aggressiveness.

JDEP Vol. 1 No. 3 (2018): hlm.15 - 34
JDEP
Jurnal Dinamika Ekonomi Pembangunan
https://ejournal.undip.ac.id/index.php/dinamika_pembangunan/index
METHODOLOGY
Empirical Strategy
Many studies have tried to identify factors that affected tax aggressiveness,
specifically those related to taxation issues (Martinez 2017). Those studies aim to understand
how specific variable could affect the level of tax avoidance and tax evasion from taxpayers.
Those studies usually use interest variables and other variables as controls obtained from
previous studies to describe their impact on tax aggressiveness. Modifications from one
research to another research are usually on how to estimate the variables.
The selection of variables in this study is strongly influenced by previous empirical
studies and the availability of data that can be obtained from the Directorate General of
Taxation (DGT). The author chooses a variable based on data that can be obtained from the
tax return data including the attachments and tax assessment data obtained from DGT. This
study does not use data from a firm's financial statements.
To understand the behavior of firm taxpayers who submitted Overpayment Tax
Return after being audited, this study uses delta ETR (DETR) as the dependent variable.
Delta ETR is the difference between ETR obtained from Overpayment Tax Return and
statutory tax rate. Hence, delta ETR value could be negative, zero and positive with criteria :
• Delta ETR is negative when its value below or less than the statutory tax rate,
• Delta ETR is zero when its value equal to the statutory tax rate
• Delta ETR is positive when its value more than the statutory tax rate.
Delta ETR will be categorized into 3 category which is negative, zero and positive. This
study prefer to use delta ETR to ETR since lower level of ETR does not reflect tax
aggressiveness when firm taxpayers gain loss in their bussiness.
Since delta ETR categorized into 3 categories, hence this study uses multinomial logit
regression as an analysis tool. Multinomial logit regression could describe the probability of
a firm to choose one of the three categories of delta ETR. Negative Category of DETR would
be a base on this estimation.
Empirical model in this study is:
Pr(𝐷𝐸𝑇𝑅 = 0) =1
1+𝑒𝑋𝛽(1)
+𝑒𝑋𝛽(2) (1)
Pr(𝐷𝐸𝑇𝑅 = 1) =𝑒𝑋𝛽
(1)
1+𝑒𝑋𝛽(1)
+𝑒𝑋𝛽(1) (2)
Pr(𝐷𝐸𝑇𝑅 = 2) =𝑒𝑋𝛽
(2)
1+𝑒𝑋𝛽(1)
+𝑒𝑋𝛽(2) (3)
where :
DETR = delta Effective Tax Rate
𝛽(1), 𝛽(2) = parameter for each category of DETR X = independent variable of this study
Consists of :
Auditxp = dummy audit experience
Auditnonpen = dummy audit result with no penalty
Auditpen = dummy audit result with penalty
lntotalasset = natural logarythm of total asset,

JDEP Vol. 1 No. 3 (2018): hlm.15 - 34
JDEP
Jurnal Dinamika Ekonomi Pembangunan
https://ejournal.undip.ac.id/index.php/dinamika_pembangunan/index
lamaterdaftar = age of firm registered on DGT as a taxpayer
lamaterdaftarsq = square of lamaterdaftar
PMAfirm = dummy status of foreign-owned firm
Tahun = dummy year
Kategori = dummy business category or sector of firm
Since magnitude or sign from the parameter of multinomial logit regression does not
have a mean directly, hence, to interpret the result of the estimation, this study uses marginal
effect.
Operational Definition of Variables
The dependent variable of this study is delta ETR. As mentioned before, delta ETR is
the difference between ETR obtained from Overpayment Tax Return and statutory tax rate.
In Indonesia’s tax law, a statutory tax rate for a firm who gain profit is 25%. While for a firm
who gain loss, this rate could not be implemented since their taxable income is zero.
Therefore, a statutory tax rate in this study is taken from how much tax should be paid by the
firm taxpayers.
Since taxes paid different between firm who gain profit and firm who gain loss,
consequently this situation affect to 3 categories of delta ETR:
• First Category (Y=0) ; this category occurred when ETR gained from Overpayment Tax
Return lower than statutory tax rate. This circumstance happened when firms gained
profit, but their ETR lower than 25%. Another condition is when firms gained loss, but
their ETR was negative. In this study, this category named as aggressive.
• The second category (Y=1) ; this category occurred when ETR gained from Overpayment
Tax Return equal to a statutory tax rate. This circumstance happened when firms gained
profit, and their ETR reach 25%. Another condition is when firms gained loss, and their
ETR was zero. In this study, this category named as neutral.
• Third Category (Y=2), this category occurred when ETR gained from Overpayment Tax
Return higher than a statutory tax rate. This circumstance happened when firms gained
profit, and their ETR higher than 25%. Another condition is when firms gained loss, but
their ETR positive. In this study, this category named as not aggressive.
In this study, Effective Tax Rate (ETR) is a ratio of taxes paid to pretax accounting
income in one fiscal year. These data gathered from form 8A-1 to 8A-8 in the special
attachment of tax return and attachment 1 of a tax return. To calculate the level of ETR, we
follow the estimation in Debacker et al.(2015).
The main independent variable of this study is auditxp. This variable is dummy which
takes value 1 if the firm had been audited before submitting Overpayment Tax Return, and 0
otherwise. This data collected from Tax Assessment data.
The second independent variable of this study is auditnopen. This variable is dummy
which takes value 1 if the firm had been audited and the result from the audit detected a
violation but not followed by a penalty for noncompliance, and 0 otherwise. This data
collected from Tax Assessment data.
The third independent variable of this study is auditpen. This variable is dummy
which takes value 1 if a firm had been audited and the result from the audit detected a
violation then followed by a penalty for noncompliance, and 0 otherwise. This data collected
from Tax Assessment data.

JDEP Vol. 1 No. 3 (2018): hlm.15 - 34
JDEP
Jurnal Dinamika Ekonomi Pembangunan
https://ejournal.undip.ac.id/index.php/dinamika_pembangunan/index
Lntotalasset describes the size of the firm obtained from the natural logarithm of the
total assets reported by the Taxpayer in the special attachment of tax return. The use of
logarithm itself is to simplify estimations since asset values can reach billions or even
trillions in rupiahs (Lanis & Richardson, 2012). Total asset / asset value data obtained from
form 8A-1 to 8-A8 in the special attachment of tax return. Debacker et al. (2015) and Lanis
and Richardson (2007, 2012) also used this variable as a control variable in their studies.
Lamaterdaftar is the age of firm registered on DGT as a taxpayer, while
lamaterdaftarsq is a square of lamaterdaftar as an interaction variable. It describes the period
of firm taxpayer registered in DGT’s administrative and system. This variable calculated by
subtracting the year when Firm Taxpayer submitted Overpayment Tax Return with the year
when firm firstly registered in DGT’s system as a taxpayer.
PMAfirm is a dummy variable valued 1 when a firm is a foreign-owned firm and 0
otherwise. This data gathered from main form and attachment 5 of a tax return. Philips
(2003), Dyreng, Hanlon and Maydew (2008, 2010) and Lanis and Richardson (2007,2012)
used this variable as a control variable in their studies.
The last variable is year dummy and business category dummy. Year dummy
represents each year from 2011 to 2016. While business category dummy represents business
sector category based on taxpayers’ Bussiness Classification (KLU) adopted from
classification made by Indonesia’s Central Bureau of Statistics (BPS). In this study, we
simplify this classification from 21 sectors into 11 sectors.
Data
The object of this study is all populations of Annual Overpayment Tax Return
(AOTR) from 2011 to 2016. In total, there are 24,921 AOTR as an object of this study. The
number of AOTR is not the same every year. The most observations is in 2015 with 7,760
AOTR, while the least in 2014 with 1,087 AOTR. Table 1
Data
Source from processed data by author
Variable Definition Formula Source
DETR difference between ETR obtained from Overpayment Tax Return and statutory tax rate
ETR-statutory tax rate Main form and attachment of AOTR
Auditxp dummy audit experience 1 for audited firms, 0 otherwise Notice of Tax Assessment
Auditnopen dummy audit result without penalty
1 for audit without a penalty, 0 otherwise
Notice of Tax Assessment
Auditpen dummy audit result with penalty 1 for audit with a penalty, 0 otherwise
Notice of Tax Assessment
lntotalasset Natural logarithm of total asset Natural logarithm of total asset Attachment of AOTR
lamaterdaftar age of firm registered on DGT as a taxpayer
Year submitting AOTR-Year Registered as taxpayer
AOTR
lamaterdaftarsq Square of lama terdaftar Square of lama terdaftar AOTR
PMAfirm dummy status for foreign-owned firm
1 for foreign-owned firm, 0 otherwise
AOTR
Year dummy for year of observations 1 for every year of observations AOTR
Kategori dummy of bussiness classification 1 for every bussiness clasifications
AOTR
JDEP Vol. 1 No. 3 (2018): hlm.15 - 34
JDEP
Jurnal Dinamika Ekonomi Pembangunan
https://ejournal.undip.ac.id/index.php/dinamika_pembangunan/index
All data in this study obtained from the main form and attachment of Annual Tax
Return combined with data from Notice of Tax Assessment for every audited taxpayer in one
fiscal year. Years 2011 to 2016 was chosen because based on information from the
Directorate of Technology and Tax Information, DGT, data for 2011-2016 is digital data
whose validity can be accounted for. According to tax regulations, these data are confidential.
Hence, the identity of the Taxpayer and the Taxpayer Identification Number (NPWP) cannot
be displayed in this study.
The data used in this study are earning/income before tax, net income, taxable
income, taxes owed, total asset value and other data obtained from the main form and
attachments of AOTR combined with data from Notice of Tax Assessment.
RESULT AND DISCUSSION
Descriptive Statistic
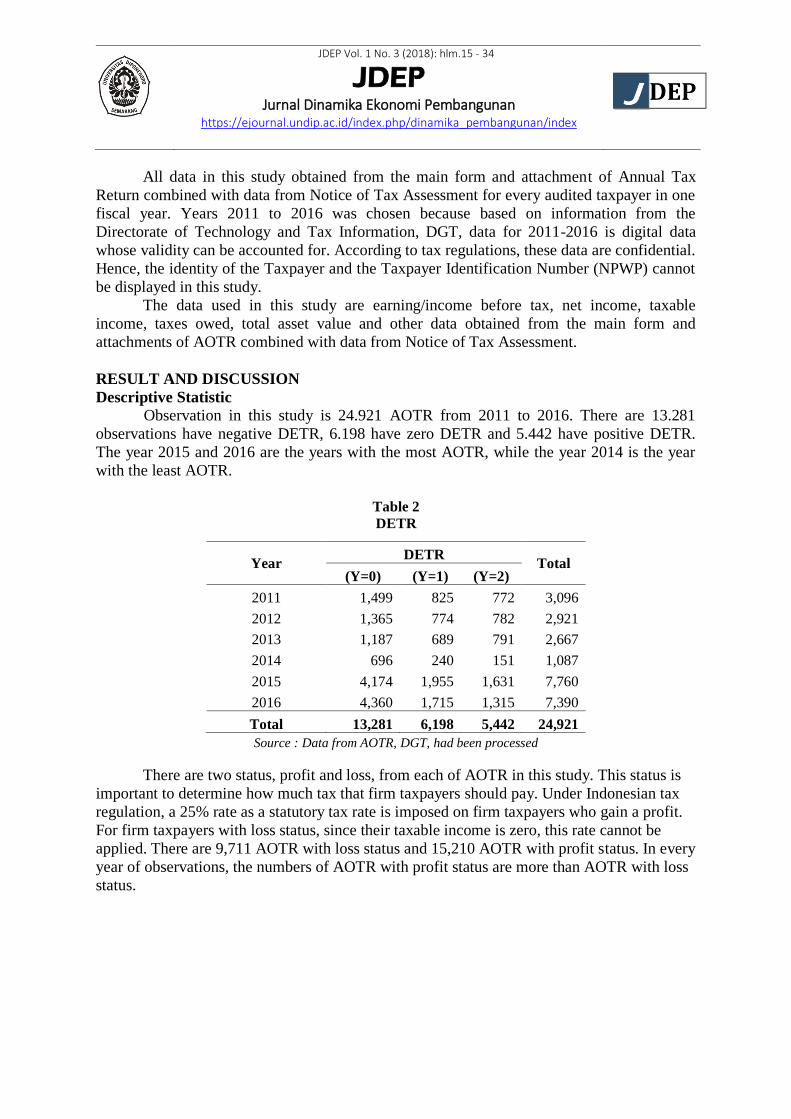
Observation in this study is 24.921 AOTR from 2011 to 2016. There are 13.281
observations have negative DETR, 6.198 have zero DETR and 5.442 have positive DETR.
The year 2015 and 2016 are the years with the most AOTR, while the year 2014 is the year
with the least AOTR.
Table 2
DETR
Source : Data from AOTR, DGT, had been processed
There are two status, profit and loss, from each of AOTR in this study. This status is
important to determine how much tax that firm taxpayers should pay. Under Indonesian tax
regulation, a 25% rate as a statutory tax rate is imposed on firm taxpayers who gain a profit.
For firm taxpayers with loss status, since their taxable income is zero, this rate cannot be
applied. There are 9,711 AOTR with loss status and 15,210 AOTR with profit status. In every
year of observations, the numbers of AOTR with profit status are more than AOTR with loss
status.
Year DETR
Total (Y=0) (Y=1) (Y=2)
2011 1,499 825 772 3,096
2012 1,365 774 782 2,921
2013 1,187 689 791 2,667
2014 696 240 151 1,087
2015 4,174 1,955 1,631 7,760
2016 4,360 1,715 1,315 7,390
Total 13,281 6,198 5,442 24,921

JDEP Vol. 1 No. 3 (2018): hlm.15 - 34
JDEP
Jurnal Dinamika Ekonomi Pembangunan
https://ejournal.undip.ac.id/index.php/dinamika_pembangunan/index
Table 3
Profit/Loss Status in AOTR
Source : Data from AOTR, DGT, had been processed
As mentioned before, there are 10 variables in this study with DETR as a dependent
variable and 9 others as independent variables. The non-dummy variables in this study are
lntotalasset, lamaterdaftar and lamaterdaftarsq. The mean of lntotalasset is 23,66, while its
maximum value is 33,41 and minimum value is 10,67. The mean of lamaterdaftar is 12,61
with maximum value 116 and minimum value is zero (0).
Table 4
Descriptive Statistic of Non-Dummy Variables
Source : Data from AOTR, DGT, had been processed
The dummy variables in this study are auditxp, auditnopen, auditpen and PMAfirm.
The number of taxpayers audited before submitting AOTR is 6,931 taxpayers. The number of
taxpayers who are audited with a non-penalty result is 3,206. While the number of taxpayers
audited with the result followed by penalty is 1,120. The number of a firm with foreign-
owned status is 2,983 firm taxpayers.
Table 5
Descriptive Statistic of Dummy Variables
Source : Data from AOTR, DGT, had been processed
Year Profit Loss Total
2011 1,242 1,854 3,096
2012 1,154 1,767 2,921
2013 1,208 1,459 2,667
2014 382 705 1,087
2015 3,127 4,633 7,760
2016 2,598 4,792 7,390
Total 9,711 15,210 24,921
Variable Obs Mean Std. Dev. Min Max
lntotalasset 24,921 23.66026 2.925212 10.67265 33.40976
lamaterdaftar 24,921 12.61322 10.56986 0 116
lamaterdaftarsq 24,921 270.8108 756.3773 0 13456
Year auditxp auditnopen auditpen PMAfirm
0 1 0 1 0 1 0 1
2011 2,165 931 2,678 418 2,960 136 2,472 624
2012 2,085 836 2,535 386 2,792 129 2,359 562
2013 1,807 860 2,270 397 2,500 167 2,174 493
2014 900 187 1,003 84 1,061 26 1,016 71
2015 5,537 2,223 6,727 1,033 7,389 371 7,076 684
2016 5,496 1,894 6,502 888 7,099 291 6,841 549
Total 17,990 6,931 21,715 3,206 23,801 1,120 21,938 2,983

JDEP Vol. 1 No. 3 (2018): hlm.15 - 34
JDEP
Jurnal Dinamika Ekonomi Pembangunan
https://ejournal.undip.ac.id/index.php/dinamika_pembangunan/index
Trade and Processing Industry are the most dominant observations with the number of
8,940 and 6,895 observations respectively. These two sectors are the most widely registered
in DGT’s database. Utility and others business classification are the least with the number of
observations are 171 and 25 observations respectively.
Table 6
Observation Distribution by Business Classification
Source : Data from AOTR, DGT, had been processed
Regression Result
As mentioned before, there are 10 variables in this study with DETR as a dependent
variable and the others as independent variables. To control for other effects on DETR, we
include 6 control variables from the previous literature. The limitation of this study is that we
could not obtain all of the control variables from the previous study. We have only used data that could be obtain from AOTR, so it would be difficult to estimate another control variables
from other sources.
Past audit experience, would encourage firm taxpayers to choose zero DETR (Y=1).
The probability of taxpayers which had been audited previously to choose zero DETR will
increase by 5.76% (α = 1%). While the probability of choosing a negative DETR (Y = 0) and
positive DETR (Y = 2) will decrease by 1.95% (α = 10%) and 3.8% (α = 1%) respectively. In
other words, audit experience in the past would encourage taxpayers to be more neutral. This
is consistent with Niu (2011) and D’Agosto et al. (2017) studies who found that audit
experience in the past has a negative effect on tax aggressiveness. Despite submitted AOTR,
taxpayers tend to reduce their tax aggressiveness if they had been audited previously.
Taxpayers who had been audited with problem detection but not followed by penalty
would prefer a positive DETR (Y = 2). The probability to choose a positive DETR would
increase by 5.53% (α = 1%). While the probability to choose zero DETR (Y = 1) would
decrease by 6.31% (α = 1%). Or it could be said that an audit which detects a problem would
still encourage taxpayers to be less aggressive. This is consistent with Niu (2011), Debacker
et al. (2015) and D'Agosto et al. (2017) studies who found that audits can have a negative
Bussiness Classification Year
Total 2011 2012 2013 2014 2015 2016
Agriculture 83 137 129 28 288 200 865
Mining 81 84 83 37 143 118 546
Processing Industry 1,114 1,147 1,061 191 1,839 1,543 6,895
Utility 12 14 15 10 52 68 171
Construction and Real Estat 119 135 116 128 635 697 1,830
Trade 882 851 720 472 3,032 2,983 8,940
Transportation and Accomodation 118 103 131 58 373 413 1,196
Information and Communication 107 62 52 15 215 183 634
Financial Services and Insurance 293 213 194 34 389 408 1,531
Services 285 175 164 112 787 765 2,288
Others 2 0 2 2 7 12 25
Total 3,096 2,921 2,667 1,087 7,760 7,390 24,921

JDEP Vol. 1 No. 3 (2018): hlm.15 - 34
JDEP
Jurnal Dinamika Ekonomi Pembangunan
https://ejournal.undip.ac.id/index.php/dinamika_pembangunan/index
impact on tax aggressiveness. Thus, it can be concluded that if audit had been held right
before taxpayers submitted AOTR and resulted in problem detection, would encourage
taxpayers to be less aggressive even if it is not followed with a penalty.
Table 7
Multinomial Logit Regression VARIABLES Y=1 Y=2
auditxp 0.272*** -0.153*** (0.0512) (0.0581)
auditnopen -0.267*** 0.268***
(0.0656) (0.0688)
auditpen -0.118 0.263*** (0.0906) (0.0905)
lntotalasset 0.0635*** 0.300***
(0.00696) (0.00813)
lamaterdaftar -0.0211*** -0.0101*** (0.00282) (0.00298)
lamaterdaftarsq 0.000191*** 9.08e-05**
(3.63e-05) (3.83e-05) PMAfirm -0.159*** 0.425***
(0.0554) (0.0500)
2012 0.00658 0.0315
(0.0642) (0.0670) 2013 0.00809 0.0515
(0.0666) (0.0679)
2014 -0.378*** -0.497***
(0.0889) (0.106) 2015 -0.0955* -0.0752
(0.0532) (0.0570)
2016 -0.242*** -0.274***
(0.0539) (0.0584) Mining 0.778*** -0.0418
(0.135) (0.141)
Processing Industry 0.660*** 0.165*
(0.0975) (0.0861)
Utilitity -0.125 -0.558**
(0.216) (0.240)
Construction&RE -0.466*** -0.353***
(0.117) (0.116) Trade 0.209** 0.0159
(0.0980) (0.0876)
Trans&Accom 0.302*** 0.0719
(0.117) (0.112) Info&Com 0.364*** 0.110
(0.134) (0.137)
Financial Serv&Ins -1.373*** -1.265***
(0.131) (0.112) Services 0.214** -0.0826
(0.107) (0.104)
Others -0.287 1.405***
(0.660) (0.456) Constant -2.160*** -7.963***
(0.197) (0.223)
Observations 24,921 24,921
Source : Data from AOTR, DGT, had been processed Notes : * significant on 10%
** significant on 5% *** significant on 1%

JDEP Vol. 1 No. 3 (2018): hlm.15 - 34
JDEP
Jurnal Dinamika Ekonomi Pembangunan
https://ejournal.undip.ac.id/index.php/dinamika_pembangunan/index
Table 8
Marginal Effect
(Y=0) (Y=1) (Y=2)
auditxp -0.0195* 0.0576*** -0.0380***
(-1.94) (6.70) (-4.65)
auditnopen 0.00777 -0.0631*** 0.0553***
(0.62) (-5.75) (5.75)
auditpen -0.0106 -0.0358** 0.0464***
(-0.62) (-2.37) (3.70)
lntotalasset -0.0373*** -0.00485*** 0.0421***
(-29.71) (-4.23) (38.50)
lamaterdaftar 0.00286*** -0.00257*** -0.000289
(7.12) (-6.93) (-0.93)
PMAfirm -0.0212** -0.0520*** 0.0731***
(-2.11) (-5.65) (10.71)
2012 -0.00394 -0.000652 0.00459
(-0.32) (-0.06) (0.47)
2013 -0.00612 -0.00159 0.00770
(-0.48) (-0.14) (0.77)
2014 0.0961*** -0.0431*** -0.0530***
(5.66) (-2.91) (-3.80)
2015 0.0196* -0.0134 -0.00622
(1.92) (-1.44) (-0.75)
2016 0.0578*** -0.0294*** -0.0283***
(5.58) (-3.14) (-3.37)
Mining -0.106*** 0.156*** -0.0504***
(-3.95) (6.26) (-2.65)
Processing Industry -0.104*** 0.116*** -0.0118
(-5.95) (7.52) (-0.91)
Utilitity 0.0731* 0.00198 -0.0751**
(1.83) (0.06) (-2.49)
Construction&RE 0.0909*** -0.0545*** -0.0364**
(4.35) (-3.20) (-2.13)
Trade -0.0273 0.0352** -0.00788
(-1.56) (2.31) (-0.59)
Trans&Accom -0.0453** 0.0494*** -0.00408
(-2.10) (2.59) (-0.24)
Info&Com -0.0575** 0.0590*** -0.00156
(-2.25) (2.61) (-0.07)
Financial Serv&Ins 0.257*** -0.128*** -0.128***
(13.60) (-8.12) (-9.10)
Services -0.0179 0.0413** -0.0234
(-0.91) (2.41) (-1.51)
Others -0.183** -0.107* 0.289***
(-2.09) (-1.87) (3.23)
N 24921 24921 24921
Source : Data from AOTR, DGT, had been processed Notes : * significant on 10%
** significant on 5%
*** significant on 1%

JDEP Vol. 1 No. 3 (2018): hlm.15 - 34
JDEP
Jurnal Dinamika Ekonomi Pembangunan
https://ejournal.undip.ac.id/index.php/dinamika_pembangunan/index
Taxpayers who had been audited with problem detection and followed by penalty
would prefer a positive DETR (Y = 2). The probability to choose a positive DETR would
increase by 4.64% (α = 1%). While the probability to choose zero DETR (Y = 1) would
decrease by 3.58% (α = 1%). Or it could be said that an audit which detects a problem and
followed by penalty would encourage taxpayers to be less aggressive. This is consistent with
Niu (2011), Debacker et al. (2015) and D'Agosto et al. (2017) studies who found that audits
could have a negative impact on tax aggressiveness.
Lntotalasset has a negative effect on tax aggressiveness. From our model, it could be
interpreted that every 1% increase in the assets, the probability of taxpayers to choose
positive DETR would increase by 4,21% (α=1%). While the probability to choose negative
DETR (Y=0) and zero DETR (Y=1) would decrease by 4,85% (α=1%) and 3,73% (α=1%)
respectively. This is consistent with Debacker et al. (2015) study who found that firm with
larger assets tends to decrease tax aggressiveness. In other words, a larger firm has a higher
probability to be less aggressive.
Lamaterdaftar has a positive effect on tax aggressiveness. It could be interpreted from
our model that every additional year for this variable, would increase the probability of
taxpayers to choose negative DETR (Y=0) by 0,29%(α=1%). While the probability to
choose zero DETR (Y=1) and positive DETR (Y=2) would decrease by 0,26%(α=1%) and
0,029%(α=1%) respectively. The long the firm registered in tax administration as taxpayer,
the higher its probability to be aggressive. It is possible for the firm to know more about the
gray area of the tax law and took advantage on it.
PMAfirm also has a negative effect on tax aggressiveness. It could be interpreted that
foreign-owned firms would increase its probability to choose positive DETR by
7,31%(α=1%). While the probability to choose negative DETR (Y=0) and zero DETR (Y=1)
would decrease by 2,12%(α=5%) and 5,2%(α=1%) respectively. This is consistent with
Debacker et al. (2015) study who found that foreign-owned status has a negative effect on tax
aggressiveness. In other words, foreign-owned firms tend to be less aggressive.
In dummy year variables, it could be seen that there is a tendency from the firms to be
more aggressive by choosing a negative DETR (Y=0) in 2014, 2015 and 2016. It is possible
to happen since the government issued Peraturan Pemerintah Nomor 46 Tahun 2013 (PP 46)
that change the tax rate for the firm, whose gross sales not more than 4,8 billion rupiahs, from
25% of profit to 1% of gross sales. Besides that, DGT also issued the rules about the removal
of administrative penalty in Tax Assessment Letter in 2015.
There ia a certain tendency of firms in same bussiness category/classification to
choose certain level of DETR. Utility;Construction and Real Estate;Financial Services and
Insurance classifications tend to be aggressive by increasing their probabilities to choose
negative DETR (statistically significant). There is special treatment for those category in
taxation. For example, almost all of construction taxes are the final tax. Meanwhile, mining,
processing industry, trade, transportation, accomodation, information and communication
sector tend to be neutral (statistically significant). The others sector are less aggressive
(statistically significant).
CONCLUSIONS This study found that previous audit experience before taxpayers submitted AOTR
has a negative effect on tax aggressiveness. It could be concluded from our model that audit
experience would encourage taxpayers to choose positive DETR (Y=2). Even though
JDEP Vol. 1 No. 3 (2018): hlm.15 - 34
JDEP
Jurnal Dinamika Ekonomi Pembangunan
https://ejournal.undip.ac.id/index.php/dinamika_pembangunan/index
taxpayers know that based on the taxation regulations in Indonesia every AOTR
automatically becomes the object of the audit, but actually taxpayers tend to reduce their tax
aggressiveness if they had been audited previously.
We also find that tax audit resulted in detection would encourage taxpayers to reduce
their tax aggressiveness. It could be concluded, audit resulted in detection whether followed
by penalty or not, gives positive impact to tax compliance. This thing corresponds to
Allingham and Sandmo (1972) theory where tax compliance determined by the perception
from the taxpayer of two factors, the probability of being audited and penalty for their non-
compliant.
For DGT, as tax authority in Indonesia, this study could give a description to
understand how effective audit strategy that had been conducted to increase firms’ tax
compliance. We found the fact that after being audited, firms usually decrease their tax
aggressiveness even if the firm submits AOTR. We hope that this study could help DGT to
update their audit strategy.
This study has several weaknesses that can provide an opportunity for further study in
the future. The first one is the time range of observation. This study limits its time range of
observation only from 2011 to 2016. The subsequent study can add the time range and even
try other methods or analytical tools that are different from this study. The second one is the
limitation of control variables. It is better for the next study can add control variables or
change the method of estimating variables to get a better result, especially variables that can
be obtained from the elements of financial statements. But on top of that, future study should
not underestimate the role of the audit in the study of tax compliance (Niu, 2011).
REFERENCES
Allingham, M. G., & Sandmo, A. (1972). Income Tax Evasion. Journal of Public Economics,
1, 323–338.
Alm, J., Jackson, B. R., & McKee, M. (2009). Getting the Word Out: Enforcement
Information Dissemination and Compliance Behaviour. Journal of Public Economics,
93(3-4), 392–402.
Andreoni, J., Erard, B., & Feinstein, J. (1998). Tax Compliance. The Journal of Economic
Literature, 36(2), 818–860.
Auerbach, A., & Feldstein, M. (2002). Tax Avoidance, Evasion and Administration. In
Handbook of Public Economics (pp. 1423–1470).
D’Agosto, E., Manzo, M., Pisani, S., & D’Arcangelo, F. M. (2017). The Effect of Audit
Activity on Tax Declaration: Evidence on Small Businesses in Italy. Public Finance
Review, 20(10), 291–324.
DeBacker, J., Heim, B. T., Tran, A., & Yuskavage, A. (2015a). Legal Enforcement and
Corporate Behavior: An Analysis of Tax aggressiveness after an Audit. Journal of Law
and Economics, 58, 291–324.
DeBacker, J., Heim, B. T., Tran, A., & Yuskavage, A. (2015b). Once Bitten, Twice Shy? The
Lasting Impact of IRS Audits on Individual Tax Reporting. Journal of Financial
Economics, 117(1), 122–138.
Desai, M. A., & Dharmapalla, D. (2006). Corporate Tax Avoidance and High Powered
Incentives. Journal of Financial Economics, 79, 145–179.
Dyreng, S. D., Hanlon, M., & Maydew, E. L. (2008). Long-Run Corporate Tax Avoidance.
Accounting Review, 83, 61–82.

JDEP Vol. 1 No. 3 (2018): hlm.15 - 34
JDEP
Jurnal Dinamika Ekonomi Pembangunan
https://ejournal.undip.ac.id/index.php/dinamika_pembangunan/index
Dyreng, S. D., Hanlon, M., & Maydew, E. L. (2010). The Effects of Executives on Corporate
Tax Avoidance. Accounting Review, 85, 1163–1189.
Gemmell, N., & Ratto, M. (2012). Behavioral Responses to Taxpayers Audits: Evidence from
Random Taxpayer Inquiries. National Tax Journal, 65, 33–58.
Hanlon, M. (2005). The Persistence and Pricing of Earnings, Accruals, and Cash Flows When
Firms Have Large Book‐Tax Differences. The Accounting Review, 80(1), 137–166.
Hanlon, M., & Heitzman, S. (2010). A Review of Tax Research. Journal of Accounting and
Economics, 50(2), 127–178.
Kastlunger, B., Kirchler, E., Mittone, L., & Pitters, J. (2009). Sequences of Audits, Tax
Compliance, and Taxpaying Strategies. Journal of Economic Psychology, 30, 405–418.
Laporan Tahunan 2016. (2017). Direktorat Jenderal Pajak.
Lanis, R., & Richardson, G. (2012). Corporate Social Responsibility and Tax aggressiveness.
Journal of Accounting Public Policy, 31, 86–108.
Maciejovsky, B., Kirchler, E., & Schwarzenberger, H. (2007). Misperception of Chance and
Loss Repair: On the Dynamics of Tax Compliance. Journal of Economic Psychology,
28, 678–691.
Martinez, A. L. (2017). Tax Aggressivenss : A Literature Survey. Revista de Educação e
Pesquisa Em Contabilidade, 11, 104–121.
Mittone, L. (2006). Dynamic Behaviour in Tax Evasion: An Experimental Approach. Journal
of Socio-Economics, 35, 813–835.
Niu, Y. (2011). Tax Audit Impact on Voluntary Compliance. Journal of Economic and Social
Measurement, 36, 237–251.
Philips, J. D. (2003). Corporate Tax-Planning Effectiveness : The Role of Compensation-
Based Incentives. The Accounting Review, 78, 847–874.
Plesko, G. A. (2003). An Evaluation of Alternative Measures of Corporate Tax Rates.
Journal of Accounting and Economics, 35, 201–226.
Rego, S. O. (2003). Tax-Avoidance Activities of U.S. Multinational Corporations.
Contemporary Accounting Research, 20(4), 805–833.
Richardson, G., & Lanis, R. (2007). Determinants of The Variability in Corporate Effective
Tax Rates and Tax Reform: Evidence from Australia. Journal of Accounting and Public
Policy, 26, 689–704.
Slemrod, J. (2004). The Economics of Corporate Tax Selfishness. National Tax Journal, 57,
877–899.
Slemrod, J. (2007). Cheating Ourselves: The Economics of Tax Evasion. Journal of
Economic Perspectives, 21(1), 25–48.
Snow, A., & Warren, Ronald S., J. (2010). Audit Uncertainty, Bayesian Updating, and Tax
Evasion. Public Finance Review. Public Finance Review, 35, 555–571.
Undang-Undang Republik Indonesia Nomor 16 tahun 2009. (n.d.). tentang Ketentuan Umum
Perpajakan.
Undang-Undang Republik Indonesia Nomor 36 tahun 2008. (n.d.). tentang Pajak
Penghasilan.
World Bank. (2015). World Development Indicators. Washington, DC: World Bank
Yithzaki, S. (1974). A Note on Income Tax Evasion: A Theoretical Analysis. Journal of
Public Economics, 3(2), 201–202.
Zimmerman, J. L. (1983). Taxes and Firm Size. Journal of Accounting and Economics, 5,
119–149.