IMPACT ASSESSMENT OF THE ACTIVE LABOUR MARKET ...
54
This project is funded by the European Union IMPACT ASSESSMENT OF THE ACTIVE LABOUR MARKET MEASURES IN NORTH MACEDONIA
-
Upload
khangminh22 -
Category
Documents
-
view
0 -
download
0
Transcript of IMPACT ASSESSMENT OF THE ACTIVE LABOUR MARKET ...

1
This project is funded by the European Union
IMPACT ASSESSMENT OF THE ACTIVE LABOUR MARKET MEASURES IN NORTH MACEDONIA
3
Title: Impact assessment of the active labour market measures in North Macedonia
Publisher: Regional Cooperation Council Trg Bosne i Hercegovine 1/V, 71000 Sarajevo Bosnia and Herzegovina
Phone: +387 33 561 700; Fax: +387 33 561 701
E-mail: [email protected]
Website: www.rcc.int
Author: Dimitar Nikoloski
Design: SamirDedić October, 2021
©RCC2021 All rights reserved.
Disclaimer: This document was prepared within the Technical Assistance (TA) instrument of the Regional Cooperation Council’s (RCC) Employment and Social Affairs Platform (ESAP 2) regional project, funded by the EU. The content, analysis and opinions contained in thedocumentaresole responsibilityof theauthoranddonotnecessarily reflect theviews of the RCC, RCC ESAP 2 project or the funding authority (EU).
Contents
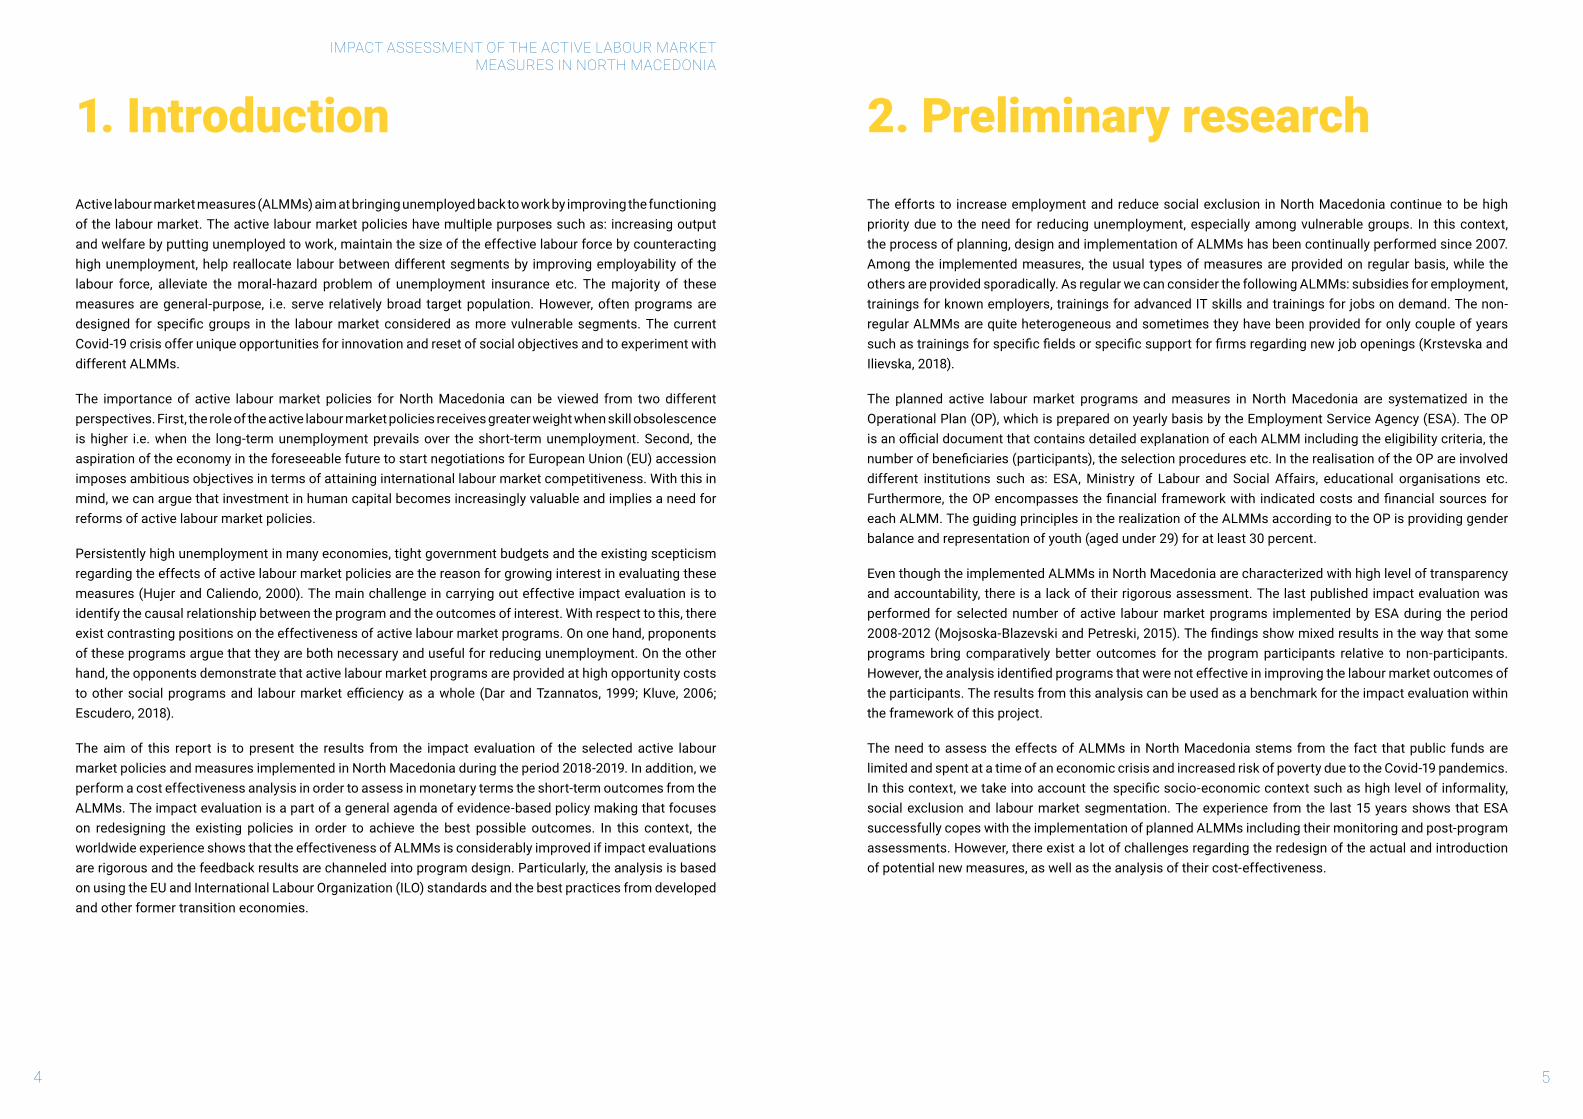
1. Introduction 4
2. Preliminary research 5
3. Scope of the assessment 6
4. Definitionoftheoutcomemeasures 8
5. Explanatory and self-assessment variables 9
6. Data and sample 10
7. Descriptive statistics 12
8. Estimation technique 21
9. Evaluation of the impact by program 23
9.1 Training for drivers (DR) 2016 24
9.2 Training for drivers (DR) 2020 29
9.3 Training for known employer (TKE) 2018 34
9.4 Training for known employer (TKE) 2019 39
9.5 Training for advanced IT skills (IT) 2017/18 44
9.6 Training for advanced IT skills (IT) 2019 49
9.7 Training for in-demand occupation (IN) 2018 54
9.8 Training for in-demand occupation (IN) 2019 59
9.9 Wage subsidy program (WS) 2018 64
9.10 Wage subsidy program (WS) 2019 69
10. Self-assessed satisfaction 75
11. The impact of Covid-19 80
12. Cost effectiveness 83
13. Conclusions 88
14. Policy implications 91
References and bibliography 93
Appendix 1a: Questionnaire for individual participants 96
Appendix 1b: Questionnaire for individual non-participants 101
IMPACT ASSESSMENT OF THE ACTIVE LABOUR MARKETMEASURES IN NORTH MACEDONIA
4 5
1. IntroductionActive labour market measures (ALMMs) aim at bringing unemployed back to work by improving the functioning of the labour market. The active labour market policies have multiple purposes such as: increasing output and welfare by putting unemployed to work, maintain the size of the effective labour force by counteracting high unemployment, help reallocate labour between different segments by improving employability of the labour force, alleviate the moral-hazard problem of unemployment insurance etc. The majority of these measures are general-purpose, i.e. serve relatively broad target population. However, often programs are designed for specificgroups in the labourmarket consideredasmore vulnerablesegments.ThecurrentCovid-19 crisis offer unique opportunities for innovation and reset of social objectives and to experiment with different ALMMs.
The importance of active labour market policies for North Macedonia can be viewed from two different perspectives. First, the role of the active labour market policies receives greater weight when skill obsolescence is higher i.e. when the long-term unemployment prevails over the short-term unemployment. Second, the aspiration of the economy in the foreseeable future to start negotiations for European Union (EU) accession imposes ambitious objectives in terms of attaining international labour market competitiveness. With this in mind, we can argue that investment in human capital becomes increasingly valuable and implies a need for reforms of active labour market policies.
Persistently high unemployment in many economies, tight government budgets and the existing scepticism regarding the effects of active labour market policies are the reason for growing interest in evaluating these measures (Hujer and Caliendo, 2000). The main challenge in carrying out effective impact evaluation is to identify the causal relationship between the program and the outcomes of interest. With respect to this, there exist contrasting positions on the effectiveness of active labour market programs. On one hand, proponents of these programs argue that they are both necessary and useful for reducing unemployment. On the other hand, the opponents demonstrate that active labour market programs are provided at high opportunity costs toothersocialprogramsand labourmarketefficiencyasawhole (DarandTzannatos,1999;Kluve,2006;Escudero, 2018).
The aim of this report is to present the results from the impact evaluation of the selected active labour market policies and measures implemented in North Macedonia during the period 2018-2019. In addition, we perform a cost effectiveness analysis in order to assess in monetary terms the short-term outcomes from the ALMMs. The impact evaluation is a part of a general agenda of evidence-based policy making that focuses on redesigning the existing policies in order to achieve the best possible outcomes. In this context, the worldwide experience shows that the effectiveness of ALMMs is considerably improved if impact evaluations are rigorous and the feedback results are channeled into program design. Particularly, the analysis is based on using the EU and International Labour Organization (ILO) standards and the best practices from developed and other former transition economies.
2. Preliminary researchThe efforts to increase employment and reduce social exclusion in North Macedonia continue to be high priority due to the need for reducing unemployment, especially among vulnerable groups. In this context, the process of planning, design and implementation of ALMMs has been continually performed since 2007. Among the implemented measures, the usual types of measures are provided on regular basis, while the others are provided sporadically. As regular we can consider the following ALMMs: subsidies for employment, trainings for known employers, trainings for advanced IT skills and trainings for jobs on demand. The non-regular ALMMs are quite heterogeneous and sometimes they have been provided for only couple of years suchastrainingsforspecificfieldsorspecificsupportforfirmsregardingnewjobopenings(KrstevskaandIlievska, 2018).
The planned active labour market programs and measures in North Macedonia are systematized in the Operational Plan (OP), which is prepared on yearly basis by the Employment Service Agency (ESA). The OP isanofficialdocumentthatcontainsdetailedexplanationofeachALMMincludingtheeligibilitycriteria,thenumberofbeneficiaries(participants),theselectionproceduresetc.IntherealisationoftheOPareinvolveddifferent institutions such as: ESA, Ministry of Labour and Social Affairs, educational organisations etc. Furthermore, theOPencompassesthefinancialframeworkwith indicatedcostsandfinancialsourcesforeach ALMM. The guiding principles in the realization of the ALMMs according to the OP is providing gender balance and representation of youth (aged under 29) for at least 30 percent.
Even though the implemented ALMMs in North Macedonia are characterized with high level of transparency and accountability, there is a lack of their rigorous assessment. The last published impact evaluation was performed for selected number of active labour market programs implemented by ESA during the period 2008-2012(Mojsoska-BlazevskiandPetreski,2015).Thefindingsshowmixedresultsinthewaythatsomeprograms bring comparatively better outcomes for the program participants relative to non-participants. However,theanalysisidentifiedprogramsthatwerenoteffectiveinimprovingthelabourmarketoutcomesofthe participants. The results from this analysis can be used as a benchmark for the impact evaluation within the framework of this project.
The need to assess the effects of ALMMs in North Macedonia stems from the fact that public funds are limited and spent at a time of an economic crisis and increased risk of poverty due to the Covid-19 pandemics. Inthiscontext,wetakeintoaccountthespecificsocio-economiccontextsuchashighlevelofinformality,social exclusion and labour market segmentation. The experience from the last 15 years shows that ESA successfully copes with the implementation of planned ALMMs including their monitoring and post-program assessments. However, there exist a lot of challenges regarding the redesign of the actual and introduction of potential new measures, as well as the analysis of their cost-effectiveness.
IMPACT ASSESSMENT OF THE ACTIVE LABOUR MARKETMEASURES IN NORTH MACEDONIA
6 7
3. Scope of the assessmentTheevaluationoftheactivelabourmarketpoliciesandmeasuresisfocusedonthefollowingfiveALMMs:
1. Training for drivers (DR) – the aim is to increase the employability of unemployed workers by providing training for the C, D and E category driving license;
2. Training for known employer (TKE) – the aim is to provide unemployed with the required skills according to the employers’ needs;
3. Training for advanced IT skills (IT) – the aim is to meet the needs for advanced IT skills among registered unemployed workers;
4. Training for in-demand occupation (IN) – the aim is to meet the needs for demanded occupations, crafts and social services that lead to opening “green jobs”;
5. Wage subsidy program (WS) – provides monetary subsidy for employed persons from the target groups for a period of 3, 6 or 12 months;
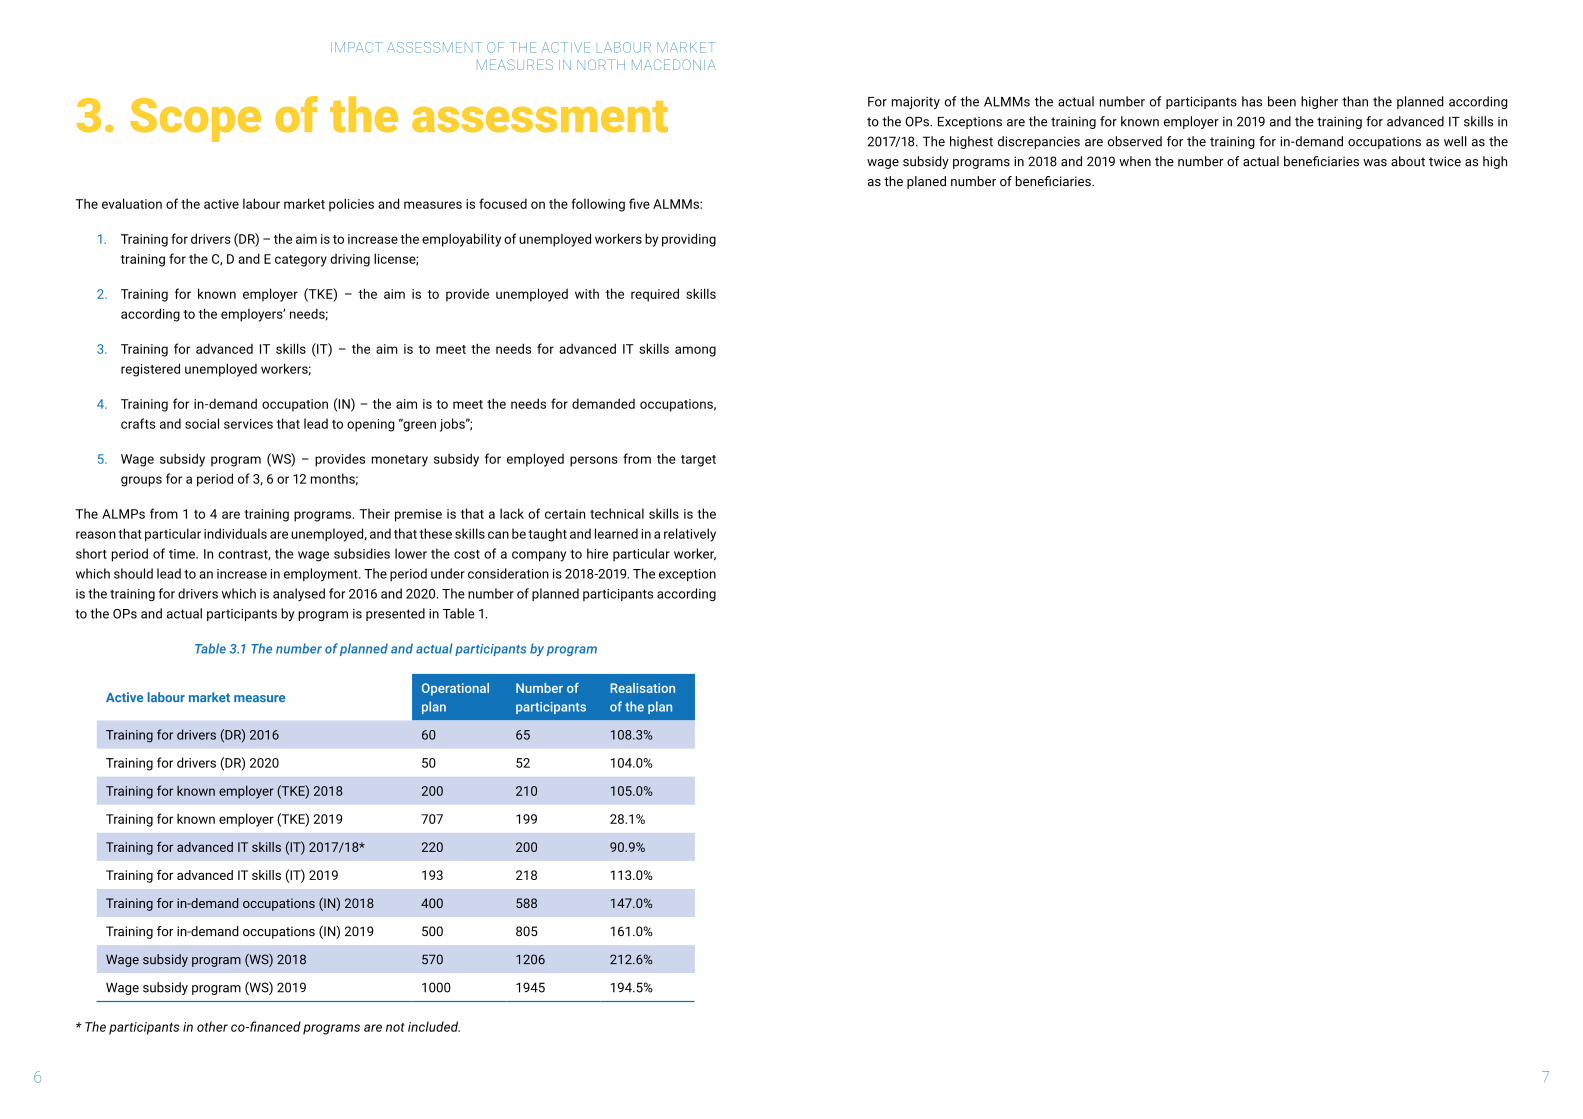
The ALMPs from 1 to 4 are training programs. Their premise is that a lack of certain technical skills is the reason that particular individuals are unemployed, and that these skills can be taught and learned in a relatively short period of time. In contrast, the wage subsidies lower the cost of a company to hire particular worker, which should lead to an increase in employment. The period under consideration is 2018-2019. The exception is the training for drivers which is analysed for 2016 and 2020. The number of planned participants according to the OPs and actual participants by program is presented in Table 1.
Table 3.1 The number of planned and actual participants by program
Active labour market measureOperational plan
Number of participants
Realisation of the plan
Training for drivers (DR) 2016 60 65 108.3%
Training for drivers (DR) 2020 50 52 104.0%
Training for known employer (TKE) 2018 200 210 105.0%
Training for known employer (TKE) 2019 707 199 28.1%
Training for advanced IT skills (IT) 2017/18* 220 200 90.9%
Training for advanced IT skills (IT) 2019 193 218 113.0%
Training for in-demand occupations (IN) 2018 400 588 147.0%
Training for in-demand occupations (IN) 2019 500 805 161.0%
Wage subsidy program (WS) 2018 570 1206 212.6%
Wage subsidy program (WS) 2019 1000 1945 194.5%
* The participants in other co-financed programs are not included.
For majority of the ALMMs the actual number of participants has been higher than the planned according to the OPs. Exceptions are the training for known employer in 2019 and the training for advanced IT skills in 2017/18. The highest discrepancies are observed for the training for in-demand occupations as well as the wagesubsidyprogramsin2018and2019whenthenumberofactualbeneficiarieswasabouttwiceashighastheplanednumberofbeneficiaries.
IMPACT ASSESSMENT OF THE ACTIVE LABOUR MARKETMEASURES IN NORTH MACEDONIA
8 9
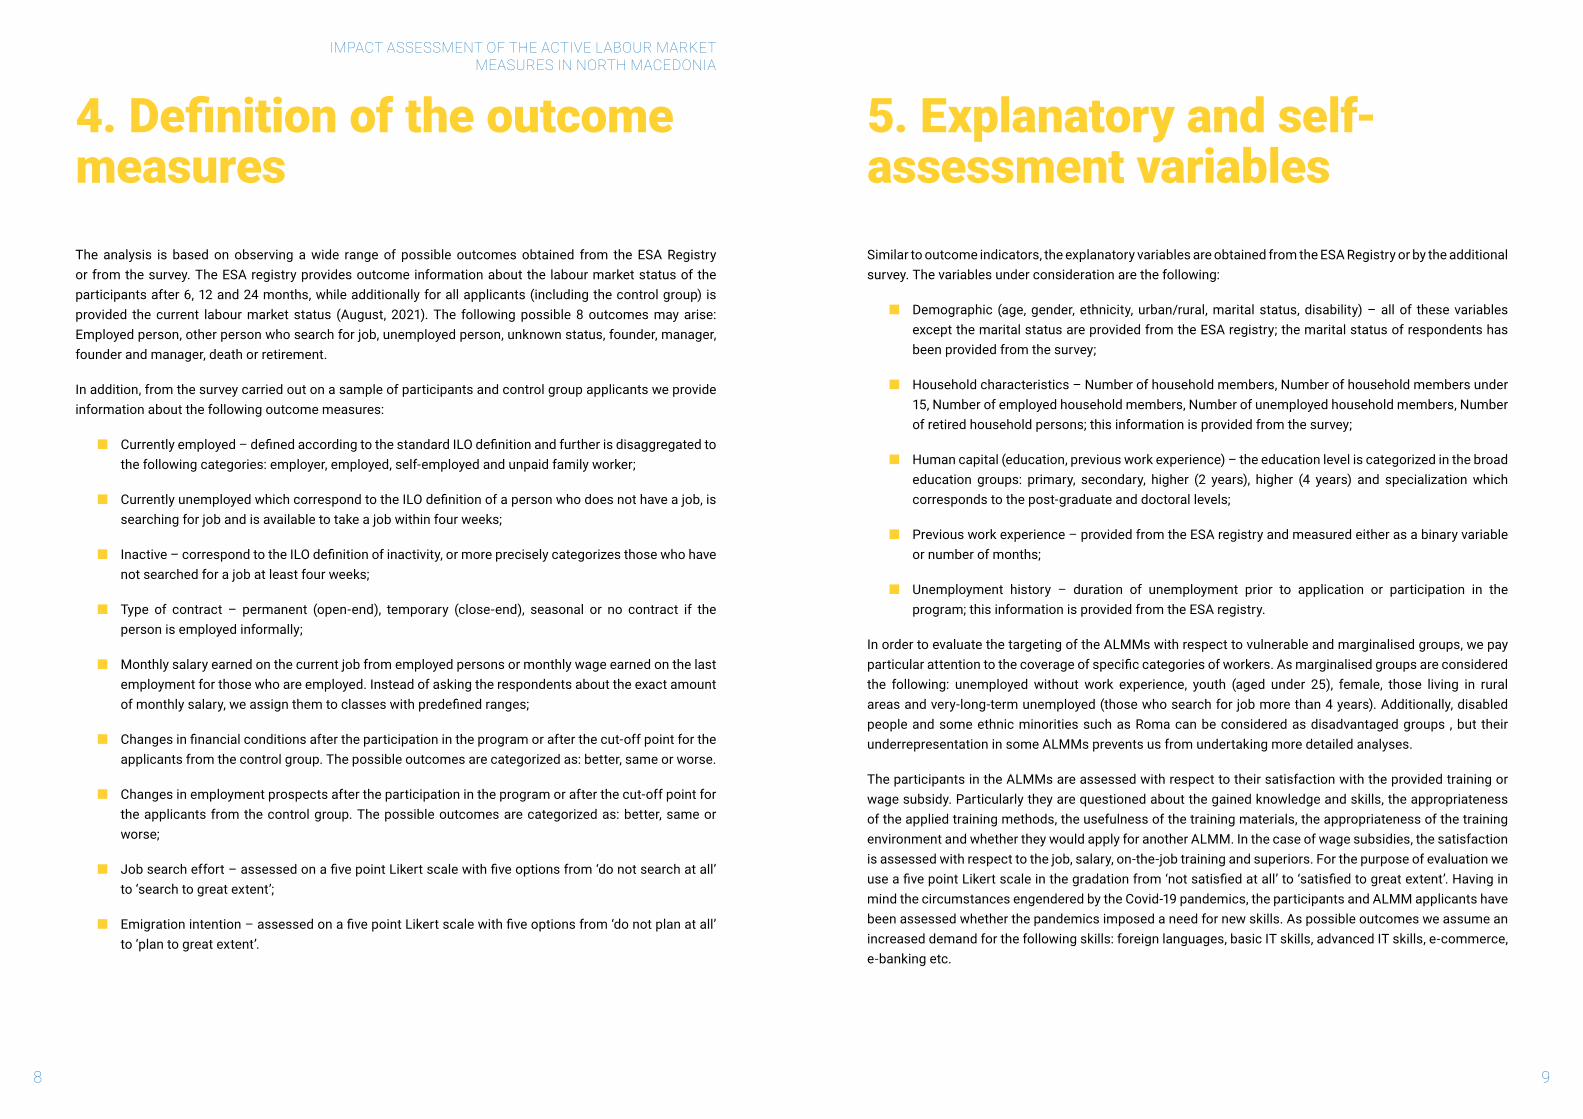
4. Definition of the outcome measuresThe analysis is based on observing a wide range of possible outcomes obtained from the ESA Registry or from the survey. The ESA registry provides outcome information about the labour market status of the participants after 6, 12 and 24 months, while additionally for all applicants (including the control group) is provided the current labour market status (August, 2021). The following possible 8 outcomes may arise: Employed person, other person who search for job, unemployed person, unknown status, founder, manager, founder and manager, death or retirement.
In addition, from the survey carried out on a sample of participants and control group applicants we provide information about the following outcome measures:
� Currentlyemployed–definedaccordingtothestandardILOdefinitionandfurtherisdisaggregatedtothe following categories: employer, employed, self-employed and unpaid family worker;
� CurrentlyunemployedwhichcorrespondtotheILOdefinitionofapersonwhodoesnothaveajob,issearching for job and is available to take a job within four weeks;
� Inactive–correspondtotheILOdefinitionofinactivity,ormorepreciselycategorizesthosewhohavenot searched for a job at least four weeks;
� Type of contract – permanent (open-end), temporary (close-end), seasonal or no contract if the person is employed informally;
� Monthly salary earned on the current job from employed persons or monthly wage earned on the last employment for those who are employed. Instead of asking the respondents about the exact amount ofmonthlysalary,weassignthemtoclasseswithpredefinedranges;
� Changesinfinancialconditionsaftertheparticipationintheprogramorafterthecut-offpointfortheapplicants from the control group. The possible outcomes are categorized as: better, same or worse.
� Changes in employment prospects after the participation in the program or after the cut-off point for the applicants from the control group. The possible outcomes are categorized as: better, same or worse;
� Jobsearcheffort–assessedonafivepointLikertscalewithfiveoptionsfrom‘donotsearchatall’to‘searchtogreatextent’;
� Emigrationintention–assessedonafivepointLikertscalewithfiveoptionsfrom‘donotplanatall’to‘plantogreatextent’.
5. Explanatory and self-assessment variablesSimilar to outcome indicators, the explanatory variables are obtained from the ESA Registry or by the additional survey. The variables under consideration are the following:
� Demographic (age, gender, ethnicity, urban/rural, marital status, disability) – all of these variables except the marital status are provided from the ESA registry; the marital status of respondents has been provided from the survey;
� Household characteristics – Number of household members, Number of household members under 15, Number of employed household members, Number of unemployed household members, Number of retired household persons; this information is provided from the survey;
� Human capital (education, previous work experience) – the education level is categorized in the broad education groups: primary, secondary, higher (2 years), higher (4 years) and specialization which corresponds to the post-graduate and doctoral levels;
� Previous work experience – provided from the ESA registry and measured either as a binary variable or number of months;
� Unemployment history – duration of unemployment prior to application or participation in the program; this information is provided from the ESA registry.
In order to evaluate the targeting of the ALMMs with respect to vulnerable and marginalised groups, we pay particularattentiontothecoverageofspecificcategoriesofworkers.Asmarginalisedgroupsareconsideredthe following: unemployed without work experience, youth (aged under 25), female, those living in rural areas and very-long-term unemployed (those who search for job more than 4 years). Additionally, disabled people and some ethnic minorities such as Roma can be considered as disadvantaged groups , but their underrepresentation in some ALMMs prevents us from undertaking more detailed analyses.
The participants in the ALMMs are assessed with respect to their satisfaction with the provided training or wage subsidy. Particularly they are questioned about the gained knowledge and skills, the appropriateness of the applied training methods, the usefulness of the training materials, the appropriateness of the training environment and whether they would apply for another ALMM. In the case of wage subsidies, the satisfaction is assessed with respect to the job, salary, on-the-job training and superiors. For the purpose of evaluation we useafivepointLikertscaleinthegradationfrom‘notsatisfiedatall’to‘satisfiedtogreatextent’.Havinginmind the circumstances engendered by the Covid-19 pandemics, the participants and ALMM applicants have been assessed whether the pandemics imposed a need for new skills. As possible outcomes we assume an increased demand for the following skills: foreign languages, basic IT skills, advanced IT skills, e-commerce, e-banking etc.

IMPACT ASSESSMENT OF THE ACTIVE LABOUR MARKETMEASURES IN NORTH MACEDONIA
10
6. Data and sampleThe data for the analyses are provided from two sources: the registry of the Employment Service Agency as administrative data and a survey carried out on a sample of ALMM participants and applicants. There are several advantages of using administrative data for policy research such as: its superior quality, exhaustive coverage, representativeness etc. (Pierre, 1999). However, the ESA registry does not contain data on all considered attributes. In order to obtain information for additional attributes that are not provided by the ESA registry, an additional survey was carried out on the samples of participants and non-participants. The questionnaires for the survey are presented in Appendix 1a and Appendix 1b.
The sample for analysis consists of treatment and control groups. The treatment group comprises persons whoparticipatedinoneofthefiveALMMs.Ontheotherhand,thecontrolgroupincludespersonswhoappliedbuthavenotbeenselected(havenotparticipated).Thefiguresregardingthesamplesizeforthetreatmentand control groups for each ALMM are reported in Table 6.1. In addition to response rate, we present the rates of unreached participants and control group applicants and the rates of rejection.
The response rate varies between 18 and 62 percent among ALMM participants, and between 15 and 41 percent among control group applicants. The most frequent reason for the low response rates is the inability to reach a person, due to lack of correct contact information. Namely, there is a quite large share of persons who could not be reached by provided mobile phones. The rate of unreached participants (attrition) varies between 23 and 55 percent, while the rate of unreached within the control groups varies between 30 and 53 percent. The rejection among ALMM participants happened in the range of 9 and 32 percent, while among control group applicants it varies between 18 and 52 percent.
This attrition is a problem because we might expect the employment outcomes of individuals who refuse to be surveyed or who cannot be found to differ from those who are interviewed. A typical approach has been to compare attrition rates in the treatment and control groups, and then do a bounding exercise if the attrition rates vary (often the control group is slightly less likely to respond). But it is easy to think of problems that can arise even when the attrition rates are the same for both groups: for example, the attritors in the treatment groupmaybepeoplewhowentthroughthetraininganddidnotfinditusefulandhavestillnotfoundjobs,whilethose in the control group could be those who are too busy to answer surveys because they are employed in good jobs. This type of differential response would bias the estimated treatment effect upwards, overstating the impact of training (McKenzie, 2017). A second issue with the use of survey measures of employment is the possibility that those in the treatment groups over-report their employment outcomes to express their appreciation for being given the program, while those in the control group potentially under-report these outcomes.
Table 6.1 Total number and sample size of the treatment and control groups
Active labour market measure
Database from ESA
Sample sizeResponse rate(percent)
Unreached rate(percent)
Rejection rate(percent)
Treat. Control Treat. Control Treat. Control Treat. Control Treat. Control
Training for drivers (DR) 2016 65 297 31 74 47.7 25.5 43.1 38.3 9.2 36.2
Training for drivers (DR) 2020 52 235 32 88 61.5 40.0 23.1 30.5 15.4 29.5
Training for known employer (TKE) 2018 210 83 61 12 29.0 14.8 44.3 33.3 26.7 51.9
Training for known employer (TKE) 2019 199 97 64 14 32.2 15.9 43.7 38.6 24.1 45.5
Training for advanced IT skills (IT) 2017/18 200 322 73 93 36.5 30.3 32.0 42.3 31.5 27.4
Training for advanced IT skills (IT) 2019 218 244 86 60 39.6 31.6 28.6 38.4 31.8 30.0
Training for in-demand occupations (IN) 2018
588 957 103 150 17.9 27.6 53.0 42.7 29.2 29.7
Training for in-demand occupations (IN) 2019
805 833 315 276 39.1 41.0 35.8 40.6 25.1 18.4
Wage subsidy program (WS) 2018 1206 531 261 121 21.7 22.8 55.6 52.5 22.7 24.7
Wage subsidy program (WS) 20191 1945 281 234 82 35.8 40.2 33.9 33.3 30.3 26.5
Total 5488 3880 1260 970 30.1 31.0 43.8 41.4 21.1 27.6
Source: Author’s calculations
1 The response, unreached and rejection rates are calculated on the base of a sample of 661 participants.
11

IMPACT ASSESSMENT OF THE ACTIVE LABOUR MARKETMEASURES IN NORTH MACEDONIA
12
13
7. Descriptive statisticsPart of the differences in labour market outcomes between ALMMs participants and the control group is due to the differences in their socio-demographic characteristics. A similar explanation could be offered for the different outcomes across the various programs (aside from the differences stemming from the characteristics and intensity of programs). Given that the treatment and control groups are likely to differ in their observable and unobservable characteristics, a comparison of their employment outcomes can bebiased.Specifically,betteremploymentoutcomescanbeexpectedfor individualswithhigherlevelsofeducation, those who have prior work experience, those with shorter unemployment spells and so on. In other words, program participants may have better employment outcomes not because of the effectiveness of the programs but because of their better characteristics. Thus, if the groups systematically differ in these characteristics, the differences in employment outcomes may be due to these differences, rather than to differences in program effects.
In this section we only present raw differences between the treatment and the control groups, while in the next section the differences in characteristics are included in the econometric analysis and their impact on outcomes examined in detail. We proceed by analyzing the differences in the main characteristics of the treatment and control groups, for each program. The main socio-demographic characteristics such as age, gender, place of living (urban/rural) and marital status are presented in Table 7.1. The descriptive statistics regarding the educational attainment of the participant and control group applicants are presented in Table 7.2. The unemployment duration categorized from short-term to very-long-term unemployment is presented in Table 7.3. The representation of disadvantaged groups (youth, older, disabled Roma and without work experience) among the participants and control group applicants are presented in Table 7.4.
The statistics regarding the motivation for application for ALMM are presented in Table 7.5. In this context, as possible motivation for application we assume the following: employment, higher wage, gaining additional skills, change of profession, emigration and other. The shares of participants and control group applicants according to the current labour market status (employed, unemployed and inactive) are presented in Table 7.6. Additionally, the statistics regarding the alternative outcomes such as: Financial condition, future employment prospects, search for job and intention for emigration are presented in Table 7.7. Finally, the average monthly salary for participants and control group applicants as an additional outcome variable is presented in Table 7.8. Having in mind the sensitivity of the question regarding the respondents’ salaries, instead of asking the exact amount of salary we asked to determine only the class with predetermined range. In this way, we assume to obtain greater response rate to this question.
Table 7.1 Socio-demographic characteristics (sample)
Active labour market measure
Age (average)
Female(percent)
Rural(percent)
Married(percent)
Treat. Control Treat. Control Treat. Control Treat. Control
TrAining for drivers (DR) 2016 31.9 34.7 - 1.3 35.5 21.6 74.2 51.3
Training for drivers (DR) 2020 34.0 34.9 - 1.1 34.4 38.6 65.6 60.2
Training for known employer (TKE) 2018 36.7 36.6 67.2 66.7 29.5 50.0 85.3 50.0
Training for known employer (TKE) 2019 36.0 31.5 35.9 78.6 31.3 28.6 62.5 35.7
Training for advanced IT skills (IT) 2017/18 29.9 28.9 30.1 51.6 8.2 11.8 42.5 66.7
Training for advanced IT skills (IT) 2019 26.4 26.4 29.1 51.7 11.6 10.0 8.1 25.0
Training for in-demand occupations (IN) 2018 36.1 35.7 72.8 74.7 18.4 18.0 50.5 62.7
Training for in-demand occupations (IN) 2019 35.1 35.1 70.8 75.0 24.8 19.6 76.2 89.5
Wage subsidy program (WS) 2018 31.4 33.8 47.1 46.3 25.7 25.6 83.1 90.9
Wage subsidy program (WS) 2019 32.2 27.0 57.7 45.1 30.8 35.4 82.0 79.3
Source: Author’s calculations
FromTable7.1wecannoticethatgenerally,thereisnosignificantlydifferencesbetweentheparticipantsandcontrolgroupapplicantswithrespecttothemainsocio-demographic characteristics such as: age, sex, place of living and nationality. Women are obviously less represented among participants and control group applicants in the training for the C, D and E category driving license, while rural population is less represented among participants and control group applicants in the training for advanced IT skills.
IMPACT ASSESSMENT OF THE ACTIVE LABOUR MARKETMEASURES IN NORTH MACEDONIA
14 15
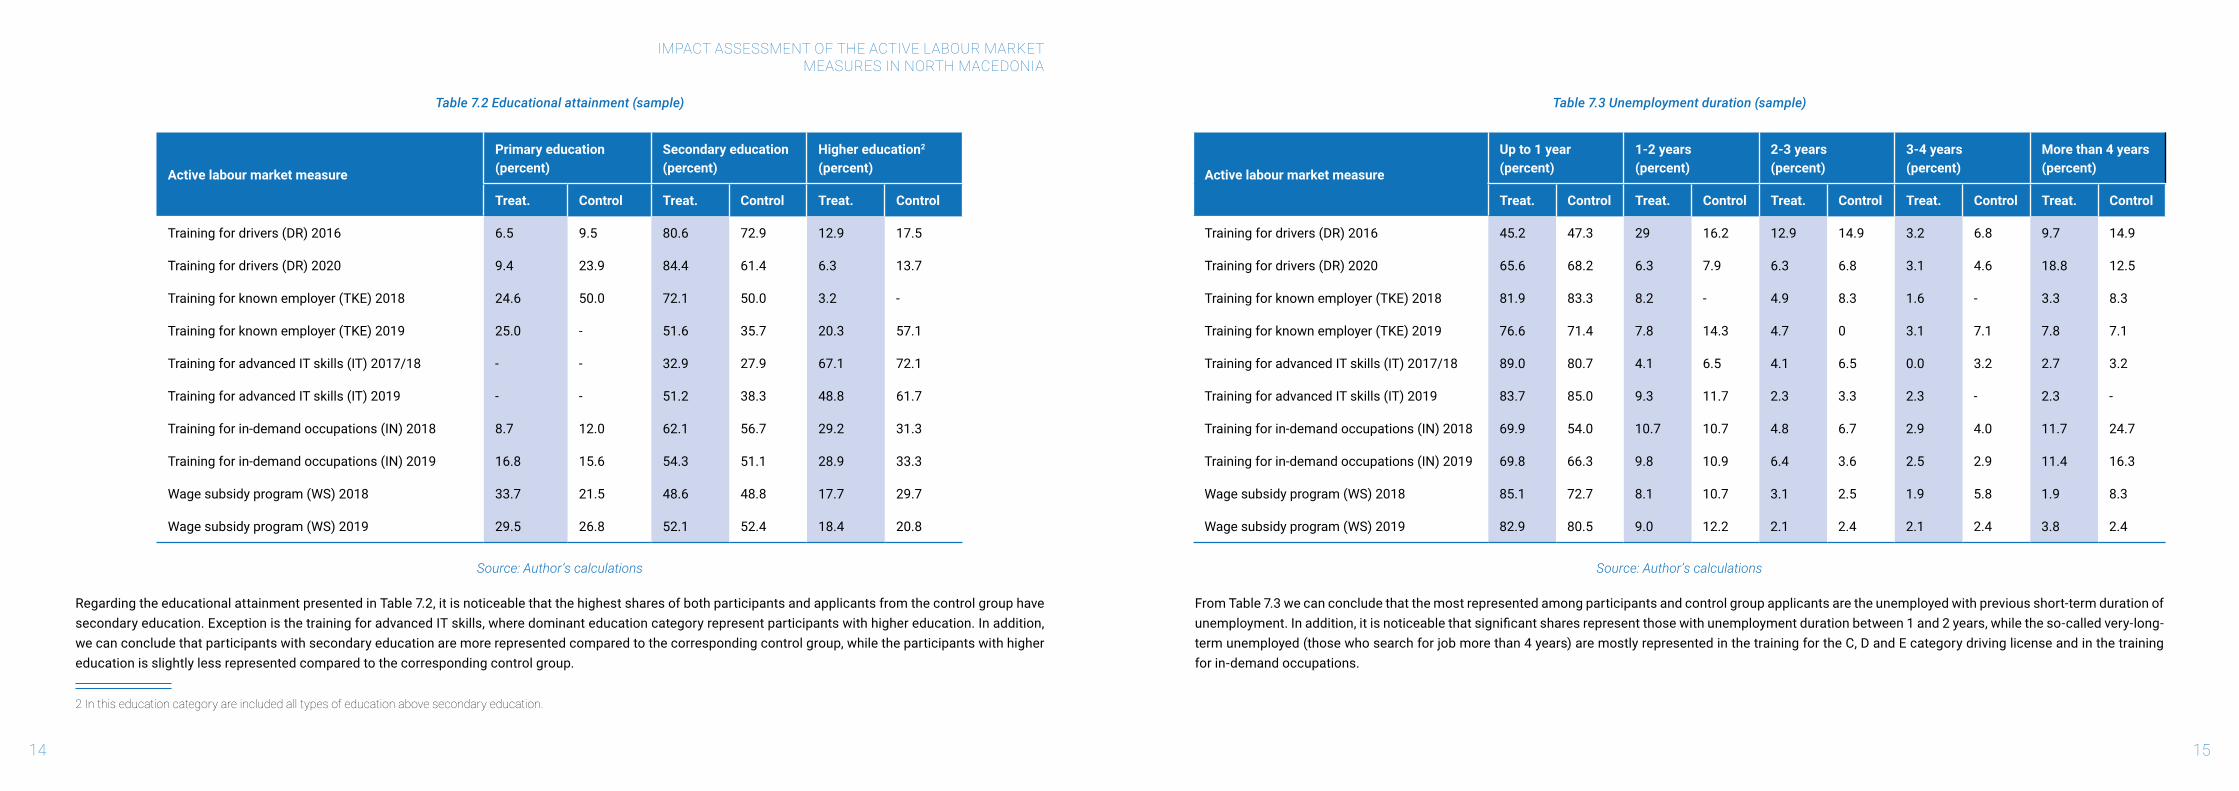
Table 7.2 Educational attainment (sample)
Active labour market measure
Primary education(percent)
Secondary education(percent)
Higher education2 (percent)
Treat. Control Treat. Control Treat. Control
Training for drivers (DR) 2016 6.5 9.5 80.6 72.9 12.9 17.5
Training for drivers (DR) 2020 9.4 23.9 84.4 61.4 6.3 13.7
Training for known employer (TKE) 2018 24.6 50.0 72.1 50.0 3.2 -
Training for known employer (TKE) 2019 25.0 - 51.6 35.7 20.3 57.1
Training for advanced IT skills (IT) 2017/18 - - 32.9 27.9 67.1 72.1
Training for advanced IT skills (IT) 2019 - - 51.2 38.3 48.8 61.7
Training for in-demand occupations (IN) 2018 8.7 12.0 62.1 56.7 29.2 31.3
Training for in-demand occupations (IN) 2019 16.8 15.6 54.3 51.1 28.9 33.3
Wage subsidy program (WS) 2018 33.7 21.5 48.6 48.8 17.7 29.7
Wage subsidy program (WS) 2019 29.5 26.8 52.1 52.4 18.4 20.8
Source: Author’s calculations
Regarding the educational attainment presented in Table 7.2, it is noticeable that the highest shares of both participants and applicants from the control group have secondary education. Exception is the training for advanced IT skills, where dominant education category represent participants with higher education. In addition, we can conclude that participants with secondary education are more represented compared to the corresponding control group, while the participants with higher education is slightly less represented compared to the corresponding control group.
2 In this education category are included all types of education above secondary education.
Table 7.3 Unemployment duration (sample)
Active labour market measure
Up to 1 year(percent)
1-2 years(percent)
2-3 years(percent)
3-4 years(percent)
More than 4 years (percent)
Treat. Control Treat. Control Treat. Control Treat. Control Treat. Control
Training for drivers (DR) 2016 45.2 47.3 29 16.2 12.9 14.9 3.2 6.8 9.7 14.9
Training for drivers (DR) 2020 65.6 68.2 6.3 7.9 6.3 6.8 3.1 4.6 18.8 12.5
Training for known employer (TKE) 2018 81.9 83.3 8.2 - 4.9 8.3 1.6 - 3.3 8.3
Training for known employer (TKE) 2019 76.6 71.4 7.8 14.3 4.7 0 3.1 7.1 7.8 7.1
Training for advanced IT skills (IT) 2017/18 89.0 80.7 4.1 6.5 4.1 6.5 0.0 3.2 2.7 3.2
Training for advanced IT skills (IT) 2019 83.7 85.0 9.3 11.7 2.3 3.3 2.3 - 2.3 -
Training for in-demand occupations (IN) 2018 69.9 54.0 10.7 10.7 4.8 6.7 2.9 4.0 11.7 24.7
Training for in-demand occupations (IN) 2019 69.8 66.3 9.8 10.9 6.4 3.6 2.5 2.9 11.4 16.3
Wage subsidy program (WS) 2018 85.1 72.7 8.1 10.7 3.1 2.5 1.9 5.8 1.9 8.3
Wage subsidy program (WS) 2019 82.9 80.5 9.0 12.2 2.1 2.4 2.1 2.4 3.8 2.4
Source: Author’s calculations
From Table 7.3 we can conclude that the most represented among participants and control group applicants are the unemployed with previous short-term duration of unemployment.Inaddition,itisnoticeablethatsignificantsharesrepresentthosewithunemploymentdurationbetween1and2years,whiletheso-calledvery-long-term unemployed (those who search for job more than 4 years) are mostly represented in the training for the C, D and E category driving license and in the training for in-demand occupations.
IMPACT ASSESSMENT OF THE ACTIVE LABOUR MARKETMEASURES IN NORTH MACEDONIA
16 17
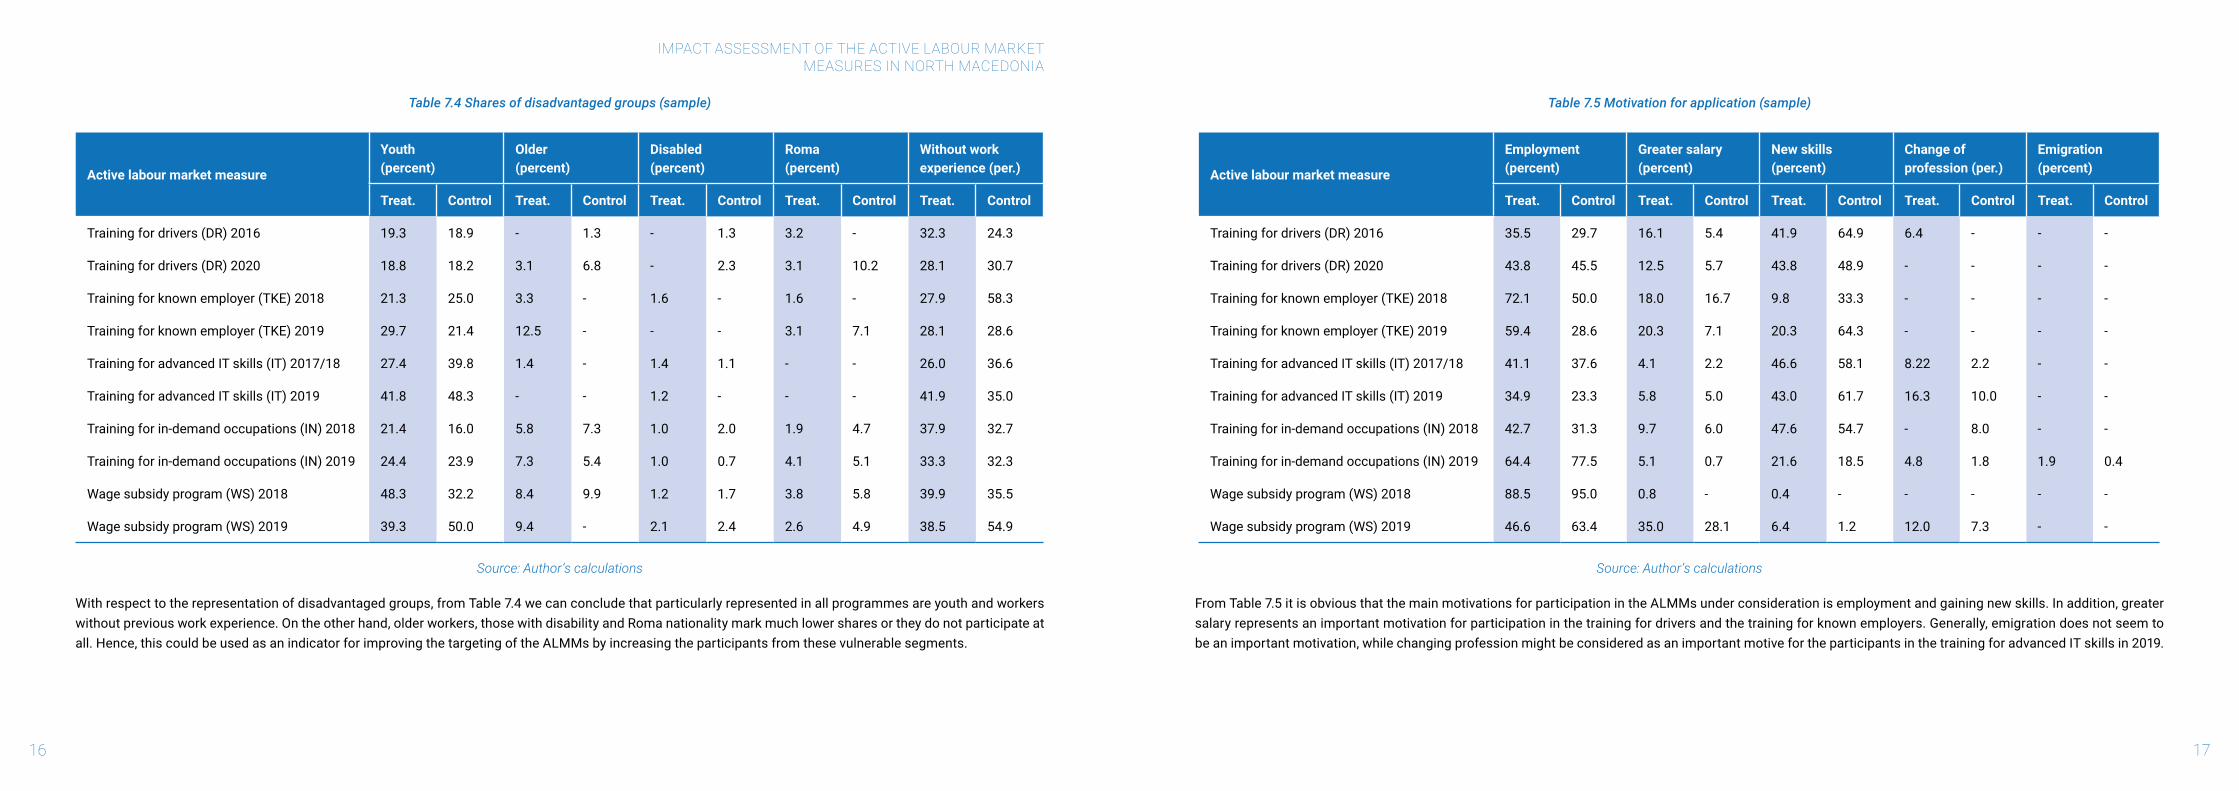
Table 7.4 Shares of disadvantaged groups (sample)
Active labour market measure
Youth (percent)
Older(percent)
Disabled(percent)
Roma (percent)
Without work experience (per.)
Treat. Control Treat. Control Treat. Control Treat. Control Treat. Control
Training for drivers (DR) 2016 19.3 18.9 - 1.3 - 1.3 3.2 - 32.3 24.3
Training for drivers (DR) 2020 18.8 18.2 3.1 6.8 - 2.3 3.1 10.2 28.1 30.7
Training for known employer (TKE) 2018 21.3 25.0 3.3 - 1.6 - 1.6 - 27.9 58.3
Training for known employer (TKE) 2019 29.7 21.4 12.5 - - - 3.1 7.1 28.1 28.6
Training for advanced IT skills (IT) 2017/18 27.4 39.8 1.4 - 1.4 1.1 - - 26.0 36.6
Training for advanced IT skills (IT) 2019 41.8 48.3 - - 1.2 - - - 41.9 35.0
Training for in-demand occupations (IN) 2018 21.4 16.0 5.8 7.3 1.0 2.0 1.9 4.7 37.9 32.7
Training for in-demand occupations (IN) 2019 24.4 23.9 7.3 5.4 1.0 0.7 4.1 5.1 33.3 32.3
Wage subsidy program (WS) 2018 48.3 32.2 8.4 9.9 1.2 1.7 3.8 5.8 39.9 35.5
Wage subsidy program (WS) 2019 39.3 50.0 9.4 - 2.1 2.4 2.6 4.9 38.5 54.9
Source: Author’s calculations
With respect to the representation of disadvantaged groups, from Table 7.4 we can conclude that particularly represented in all programmes are youth and workers without previous work experience. On the other hand, older workers, those with disability and Roma nationality mark much lower shares or they do not participate at all. Hence, this could be used as an indicator for improving the targeting of the ALMMs by increasing the participants from these vulnerable segments.
Table 7.5 Motivation for application (sample)
Active labour market measure
Employment(percent)
Greater salary(percent)
New skills(percent)
Change of profession (per.)
Emigration(percent)
Treat. Control Treat. Control Treat. Control Treat. Control Treat. Control
Training for drivers (DR) 2016 35.5 29.7 16.1 5.4 41.9 64.9 6.4 - - -
Training for drivers (DR) 2020 43.8 45.5 12.5 5.7 43.8 48.9 - - - -
Training for known employer (TKE) 2018 72.1 50.0 18.0 16.7 9.8 33.3 - - - -
Training for known employer (TKE) 2019 59.4 28.6 20.3 7.1 20.3 64.3 - - - -
Training for advanced IT skills (IT) 2017/18 41.1 37.6 4.1 2.2 46.6 58.1 8.22 2.2 - -
Training for advanced IT skills (IT) 2019 34.9 23.3 5.8 5.0 43.0 61.7 16.3 10.0 - -
Training for in-demand occupations (IN) 2018 42.7 31.3 9.7 6.0 47.6 54.7 - 8.0 - -
Training for in-demand occupations (IN) 2019 64.4 77.5 5.1 0.7 21.6 18.5 4.8 1.8 1.9 0.4
Wage subsidy program (WS) 2018 88.5 95.0 0.8 - 0.4 - - - - -
Wage subsidy program (WS) 2019 46.6 63.4 35.0 28.1 6.4 1.2 12.0 7.3 - -
Source: Author’s calculations
From Table 7.5 it is obvious that the main motivations for participation in the ALMMs under consideration is employment and gaining new skills. In addition, greater salary represents an important motivation for participation in the training for drivers and the training for known employers. Generally, emigration does not seem to be an important motivation, while changing profession might be considered as an important motive for the participants in the training for advanced IT skills in 2019.
IMPACT ASSESSMENT OF THE ACTIVE LABOUR MARKETMEASURES IN NORTH MACEDONIA
18 19
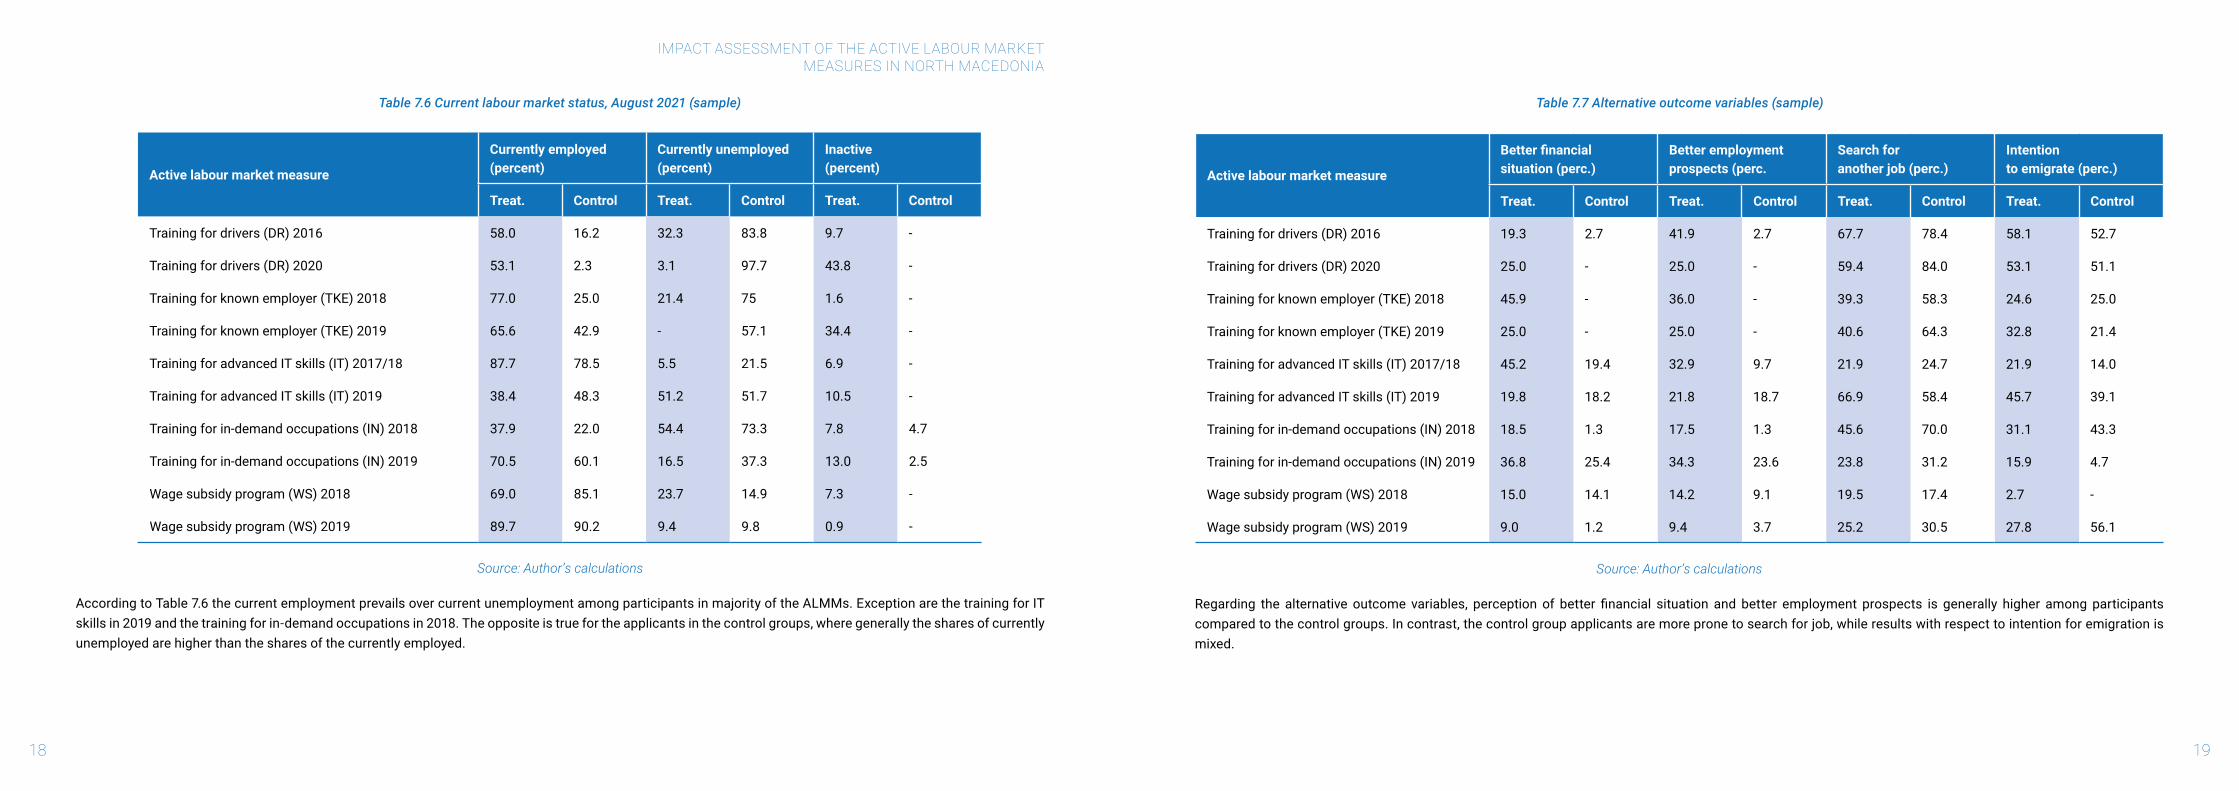
Table 7.6 Current labour market status, August 2021 (sample)
Active labour market measure
Currently employed(percent)
Currently unemployed(percent)
Inactive(percent)
Treat. Control Treat. Control Treat. Control
Training for drivers (DR) 2016 58.0 16.2 32.3 83.8 9.7 -
Training for drivers (DR) 2020 53.1 2.3 3.1 97.7 43.8 -
Training for known employer (TKE) 2018 77.0 25.0 21.4 75 1.6 -
Training for known employer (TKE) 2019 65.6 42.9 - 57.1 34.4 -
Training for advanced IT skills (IT) 2017/18 87.7 78.5 5.5 21.5 6.9 -
Training for advanced IT skills (IT) 2019 38.4 48.3 51.2 51.7 10.5 -
Training for in-demand occupations (IN) 2018 37.9 22.0 54.4 73.3 7.8 4.7
Training for in-demand occupations (IN) 2019 70.5 60.1 16.5 37.3 13.0 2.5
Wage subsidy program (WS) 2018 69.0 85.1 23.7 14.9 7.3 -
Wage subsidy program (WS) 2019 89.7 90.2 9.4 9.8 0.9 -
Source: Author’s calculations
According to Table 7.6 the current employment prevails over current unemployment among participants in majority of the ALMMs. Exception are the training for IT skills in 2019 and the training for in-demand occupations in 2018. The opposite is true for the applicants in the control groups, where generally the shares of currently unemployed are higher than the shares of the currently employed.
Table 7.7 Alternative outcome variables (sample)
Active labour market measure
Better financial situation (perc.)
Better employment prospects (perc.
Search for another job (perc.)
Intention to emigrate (perc.)
Treat. Control Treat. Control Treat. Control Treat. Control
Training for drivers (DR) 2016 19.3 2.7 41.9 2.7 67.7 78.4 58.1 52.7
Training for drivers (DR) 2020 25.0 - 25.0 - 59.4 84.0 53.1 51.1
Training for known employer (TKE) 2018 45.9 - 36.0 - 39.3 58.3 24.6 25.0
Training for known employer (TKE) 2019 25.0 - 25.0 - 40.6 64.3 32.8 21.4
Training for advanced IT skills (IT) 2017/18 45.2 19.4 32.9 9.7 21.9 24.7 21.9 14.0
Training for advanced IT skills (IT) 2019 19.8 18.2 21.8 18.7 66.9 58.4 45.7 39.1
Training for in-demand occupations (IN) 2018 18.5 1.3 17.5 1.3 45.6 70.0 31.1 43.3
Training for in-demand occupations (IN) 2019 36.8 25.4 34.3 23.6 23.8 31.2 15.9 4.7
Wage subsidy program (WS) 2018 15.0 14.1 14.2 9.1 19.5 17.4 2.7 -
Wage subsidy program (WS) 2019 9.0 1.2 9.4 3.7 25.2 30.5 27.8 56.1
Source: Author’s calculations
Regarding the alternative outcome variables, perception of better financial situation and better employment prospects is generally higher among participantscompared to the control groups. In contrast, the control group applicants are more prone to search for job, while results with respect to intention for emigration is mixed.

21
IMPACT ASSESSMENT OF THE ACTIVE LABOUR MARKETMEASURES IN NORTH MACEDONIA
20
Table 7.8 Monthly salary (sample)
Active labour market measure
0 – 14.449(percent)
15.000 – 19.999(percent)
20.000 – 24.999(percent)
25.000 – 34.999(percent)
35.000 and above(percent)
Treat. Control Treat. Control Treat. Control Treat. Control Treat. Control
Training for drivers (DR) 2016 - 8.3 44.4 58.3 33.3 33.3 11.1 - 11.1 -
Training for drivers (DR) 2020 5.9 - 52.9 50.0 23.5 50.0 17.6 - - -
Training for known employer (TKE) 2018 23.9 - 69.6 100.0 4.35 - 2.17 - - -
Training for known employer (TKE) 2019 19.5 - 65.9 - 9.8 100.0 4.9 - - -
Training for advanced IT skills (IT) 2017/18 4.5 - 25.0 20.3 45.5 65.2 25.0 14.5 - -
Training for advanced IT skills (IT) 2019 4.3 1.2 17.1 35.4 50.0 36.6 22.9 26.8 5.7 -
Training for in-demand occupations (IN) 2018 3.2 - 9.7 39.3 71.0 57.1 16.1 3.6 - -
Training for in-demand occupations (IN) 2019 8.0 4.3 8.0 26.1 40.0 34.8 32.0 34.8 12.0 -
Wage subsidy program (WS) 2018 - - 61.3 58.9 36.9 41.1 1.8 - - -
Wage subsidy program (WS) 2019 2.0 - 41.5 61.1 41.0 33.3 15.5 5.5 - -
Source: Author’s calculations
According to the data from Table 7.8, we can estimate the average monthly salary for treatment and control groups for each ALMM. Namely, the highest average monthly salary is observed among participants in the training for advanced IT skills, followed by participants in the training for drivers, the training for in-demand occupationsandthetrainingforknownemployer.Theaveragesalaryofthewagesubsidybeneficiariesaregraterthanthesalariesoftheparticipantsinthetrainingfor known employer but lower than the participants in the training for advanced IT skills.
8. Estimation techniqueThe choice of the evaluation method depends upon data availability, the nature of the program and how selectionintotreatmentoccurs.Sinceweareconfinedofusingpost-programdata,theanalysisisbebasedon quasi-experimental approach where programs are evaluated ex-post. Namely, because the control group does not exist, it must be created and matched as closely as possible to the observed characteristics of those who participated in the program. These methods are called quasi-experimental, because they attempt to recreate a situation similar to a controlled experiment. In this case there is no single method that is preferable in all circumstances, and various alternative techniques can be applied (Caliendo and Hujer, 2005; Gertler et al., 2016).
The Propensity score matching is used as a principal estimation method. This method is based on the assumption that differences between participants and non-participants that jointly determine their decision to participate and the outcome of interest are all observable in the data. Matching therefore results in comparing participants with non-participants, giving more weight to the non-participants that are most similar to participants. In this context, a logistic regression is used in order to calculate the propensity scores. The outcomes of participants and non-participants with similar propensity scores are compared to obtain the program effect. The technical aspects of estimation based on propensity score matching procedure is developed within the Roy-Rubin framework3 which is presented in Box 1.
There are several matching algorithms suggested in the literature such as: nearest-neighbour matching, radius calliper matching and Kernel matching (Loi and Rodrigues, 2012). The choice of the matching algorithm is not trivial since it involves trade-off between bias and variance. The quality of the matching procedure is evaluated on the basis of its capability in balancing the control and treatment groups with respect to the covariates used for the propensity score estimation. The basic idea is to compare the distribution of these covariates in the two groups before and after matching on the propensity score.
There are several pros and cons using the propensity score matching method. On one hand it is characterised withitssimplicityincomputingthestandardisedbiasandjointsignificanttest.Furthermore,thematchingmethod does not require any functional form assumption for the outcome equation and therefore, it is not susceptibletomisspecificationbiasalongthatdimension.However,inpracticeitmaybethecasethatsomeof the participants do not have matched counterparts in the pool of non-participants with similar propensity scores. In technical terms, it is possible a lack of common support, or lack of overlap between the propensity scores of the participants in the program and those of the pool of non-participants. Having in mind these characteristics of the propensity score matching method, for checking the robustness of the estimates alternative methods for estimation are applied as well.
3 Developed by A.D. Roy and D.B. Rubin.
IMPACT ASSESSMENT OF THE ACTIVE LABOUR MARKETMEASURES IN NORTH MACEDONIA
22 23
Box 8.1 Propensity score matching
Let denote with YT the outcome when the person gets the treatment, whereas YC denotes the outcome when person does not participate in the ALMM (comparison group).
Additionally, we introduce a binary assignment indicator D that determines whether the individual gets the treatment (D=1) or not (D=0).
Theaveragetreatmenteffectofthetreated(ATT)isdefinedasfollows:
ATT = E(YT – YC |D=1) = E(YT|D=1) – E(YC|D=1)
ATT shows the expected effect of the program for those persons who actually participated. However, we cannot observe the counterfactual E(YC|D=1) i.e. the average outcome of those persons who participated in the program had they not participated. Thus, without further assumption ATT is not identified.Butifwecanobserveallfactorsthatjointlyinfluenceoutcomesandparticipationdecision,then conditional on these factors (X), the participation decision and the outcomes are independent.
The propensity score matching method creates a comparison group from untreated observations by matching treatment observations to one or more observations from the untreated sample, based on observable characteristics. The propensity scores are used to select the comparison group for each treatment group according to the following three steps:
First, a logistic regression model is estimated for each ALMM in which the dependent variable is dichotomous, taking the value 1 for those who took part in the intervention, and 0 if they did not. The explanatory variables include all observables that may affect participation, but that are not affected by the intervention.
Second, the output from these selection models are used to estimate choice probabilities conditional on X (the so-called propensity scores) for each treatment and potential comparison group member. Hence, an individual’spropensity score is thefittedvalue from theparticipationequation.Havingcalculatedthepropensityscoresforallobservations,theregionofcommonsupportisidentified.
Third, for each treatment group member is selected potential comparison group member based on their propensity scores.
Once the matching is done, a test is performed for balance by comparing the mean characteristics of treatmentandcomparisongroups.Thereshouldbenosignificantdifferenceinaveragecharacteristicsbetween the two groups.
Finally,theimpactestimateiscalculatedbyfirstcalculatingthedifferenceinbetweentheindicatorforthe treatment individual and the average value for the matched comparison individuals, and second, by averaging over all these differences.�
9. Evaluation of the impact by programFor each type of ALMM we determine what outcome would have been for a program participant after participation in the program compared with the counterfactual outcome i.e. if the person had not participated in the program. The difference between the observed outcome and the counterfactual outcome is used as a measure of the impact of the program. One of the main issues in the sample selection is the so-called selection bias, which may affect the accuracy of the estimates. Selection bias means that a better outcome for the participants compared to the non-participants may be observed due to differences in the characteristics of the persons in the two groups and not to participation in the program.
Furthermore, we estimate the individual probabilities to participate to the program, depending on a set of observable characteristics. This is conducted through using standard Probit regression on the treated and thenon-treated individuals.Theestimatedcoefficientswillprovide insights in the factors influencingselection into treatment, but may also capture factors of attrition from the survey, i.e. factors explaining differential non-response rates in the treatment and in the control group. According to the estimated Probit model is than calculated the propensity score for each individual in the treatment and comparison group.
The propensity scores are used to match participants with comparable non-participants. For each treated individual, we look for the one individual among non-participants who is the closest neighbor in terms of the predicted probability of being treated. In other words, for each pair comprising a participant and a non-participant, the absolute difference in terms of the estimated propensity to participate in a certain treatment is minimized. To ensure that the matched pairs have reasonably similar probabilities to be treated, we exclude participants for whom the predicted probability to be in the program is larger than for any individual in the comparison group. In this way we achieve common support. Alternative matching procedures are used as robustness checks.
Moreover, we further explore the impact of ALMMs on the outcome variables for particular disadvantaged segments by disaggregation of the average treatment effect on treated individuals. In this context, particular attention is paid to youth, female, unemployed from rural areas, without work experience and being very-long-term unemployed. The disaggregation is performed only for those outcome variables where statistically significantimpacthasbeenidentified.
Finally, we conduct evaluation of the matching quality. A way to do so is to compare the standardized mean bias before matching to the standardized mean bias after matching. In addition, we also re-estimate the propensity score on the matched sample to compute the pseudo-R2 before and after matching. The number of observations that are off common support in absolute and relative term is also presented as an additional indicator of matching quality.

IMPACT ASSESSMENT OF THE ACTIVE LABOUR MARKETMEASURES IN NORTH MACEDONIA
24 25
9.1 Training for drivers (DR) 2016
Table 9.1.1 Training for drivers (DR) 2016, mean comparison
Observables Mean treated
Mean control
Difference p-value
Soci
o-de
m.
Age 31.9 34.7 -2.758 0.130
Gender (1=male) 1.000 0.986 0.013 0.520
Rural 0.355 0.216 0.139 0.141
Married 0.742 0.514 0.228 0.031**
Hou
seho
ld
Household size 4.129 2.932 1.197 0.000***
Number of members under 15 1.032 0.554 0.478 0.010***
Number of employed members 1.193 0.838 0.356 0.025**
Number of unemployed members
1.839 1.176 0.663 0.003***
Number of retired members 0.226 0.365 -0.139 0.250
Hum
an c
apita
l
Primary education 0.065 0.094 -0.030 0.619
Secondary education 0.806 0.729 0.077 0.411
Higher education 0.129 0.162 -0.033 0.670
Previous work experience 0.677 0.757 -0.079 0.407
Short-term unemployed (up to 1 year)
0.452 0.473 -0.021 0.843
Disa
dvan
tage
d
Very-long-term unemployed (more than 4)
0.097 0.149 -0.052 0.480
Youth 0.193 0.189 0.004 0.959
Older 0.000 0.014 -0.009 0.520
Disabled 0.000 0.013 -0.013 0.520
Roma 0.032 0.000 0.032 0.123
Outcome variables
Mean treated
Mean control
Difference p-value
Regi
stry
Currently employed 0.516 0.500 0.016 0.882
Currently unemployed 0.323 0.148 0.174 0.043**
Currently unknown 0.161 0.176 -0.014 0.860
Surv
ey d
ata
Employed 0.580 0.162 0.418 0.000***
Unemployed 0.322 0.837 -0.515 0.000***
Salary 23055 18958 4097 0.079*
Permanent contract 0.555 0.083 0.472 0.007***
Betterfinancialconditions 0.193 0.027 0.166 0.003***
Better employment prospects 0.419 0.027 0.392 0.000***
Search for job 0.677 0.784 -0.106 0.254
Intend to emigrate 0.580 0.527 0.054 0.619
Note: */**/*** indicate significance at 10/5/1 percent level respectively.
FromTable9.1.1wecanobservethatstatisticallysignificantdifferencebetweenthetreatmentandcontrolgroup is found for the following observables: marital status, household size, the number of members under 15, the number of employed and unemployed household members.
Table 9.1.2 Training for drivers (DR) 2016, propensity score coefficients (Probit model)
Observables Coefficient Std. error p-value
Soci
o-de
m. Age -.0242313 .0168915 0.151
Rural .1867401 .3517583 0.596
Married .0130431 .4514266 0.977
Hou
seho
ld
Household size .3036612 .2599625 0.243
Number of members under 15 .0201478 .266968 0.940
Number of employed members .2243695 .306956 0.465
Number of unemployed members
.2038273 .25358 0.422
Number of retired members -.141488 .3352984 0.673

IMPACT ASSESSMENT OF THE ACTIVE LABOUR MARKETMEASURES IN NORTH MACEDONIA
26
Hum
an c
apita
l
Primary education -1.400754 .899803 0.120
Secondary education -1.201574 .7465639 0.108
Higher education -1.315398 .765503 0.086*
Previous work experience -.2028059 .3519685 0.564
Short-term unemployed (up to 1 year)
.1358054 .2969518 0.647
Note: */**/*** indicate significance at 10/5/1 percent level respectively. According to Table 9.1.2, only having higher education appear as statistically significant observable thatexerts impact on the probability to participate in the training for drivers. Namely, unemployed with higher education are less likely to participate in this type of training.
Table 9.1.3 Training for drivers (DR) 2016, treatment effects on outcome variables
Outcome variables Difference Standard error t-statistics
Unmatch. ATT Unmatch. ATT Unmatch. ATT
Employed 0.418 0.571 0.088 0.143 4.73 4.00**
Unemployed -0.515 -0.714 0.086 0.130 -5.96 -5.48**
Salary 4097 3889 2255 2460 1.82 1.58
Permanent contract 0.472 0.444 0.163 0.176 2.90 2.53**
Betterfinancialconditions
0.166 0.190 0.166 0.190 3.03 1.61
Better empl. prospects
0.392 0.429 0.065 0.132 6.04 3.25**
Search for job -0.106 0.000 0.092 0.161 -1.15 0.00
Intend to emigrate 0.053 0.143 0.107 0.182 0.50 0.78
Note: */**/*** indicate significance at 10/5/1 percent level respectively.
AccordingtoTable9.1.3,participationinthetrainingfordrivershasstatisticallysignificantpositiveimpactonemployment, having permanent contract and enjoying better employment prospects, while its impact on the unemploymentisnegativeandstatisticallysignificant.
Table 9.1.4 Training for drivers (DR) 2020, disaggregated ATT for disadvantaged categories
Outcome variables Age Gender Place of living Work experience Unemployment
Youth Mature Female Male Rural Urban Without With Very-long
Short
Employed 0.833 0.320 - 0.387 0.091 0.550 0.300 0.476 - 0.464
Unemployed -0.833 -0.440 - -0.484 -0.182 -0.650 -0.400 -0.571 - -0.571
Permanent contract - 0.385 - 0.500 0.600 0.462 0.750 0.429 - -
Better empl. prospects 0.333 0.360 - 0.355 0.182 0.400 0.400 0.429 0.667 0.321
Note: Estimation based on nearest-neighbour matching only for statistically significant outcome variables.
According to Table 9.1.4, we can draw the following conclusions with respect to the impact of training for drivers on disadvantaged groups:
� Youth are better off than mature unemployed vis-à-vis probability of being employed and being unemployed but they perceive lower employment prospects;
� Since the female are not represented among the participants in this ALMM, we are not able to draw conclusion regarding their position compared with male participants;
� Unemployed from rural areas are better off than those from urban areas vis-à-vis probability of being employed but worse of regarding the probability of being unemployed; in addition they enjoy higher probability of having permanent employment but perceive lower employment prospects;
� Unemployed without work experience are worse off than those with work experience vis-à-vis probability of being employed and probability of being unemployed; in addition they enjoy higher probability of having permanent contract and similar perception of employment prospects as unemployed with previous work experience;
� The very-long-term unemployed are worse off compared to those with shorter spells of unemployment regarding the perception of the employment prospects.
27
IMPACT ASSESSMENT OF THE ACTIVE LABOUR MARKETMEASURES IN NORTH MACEDONIA
28 29
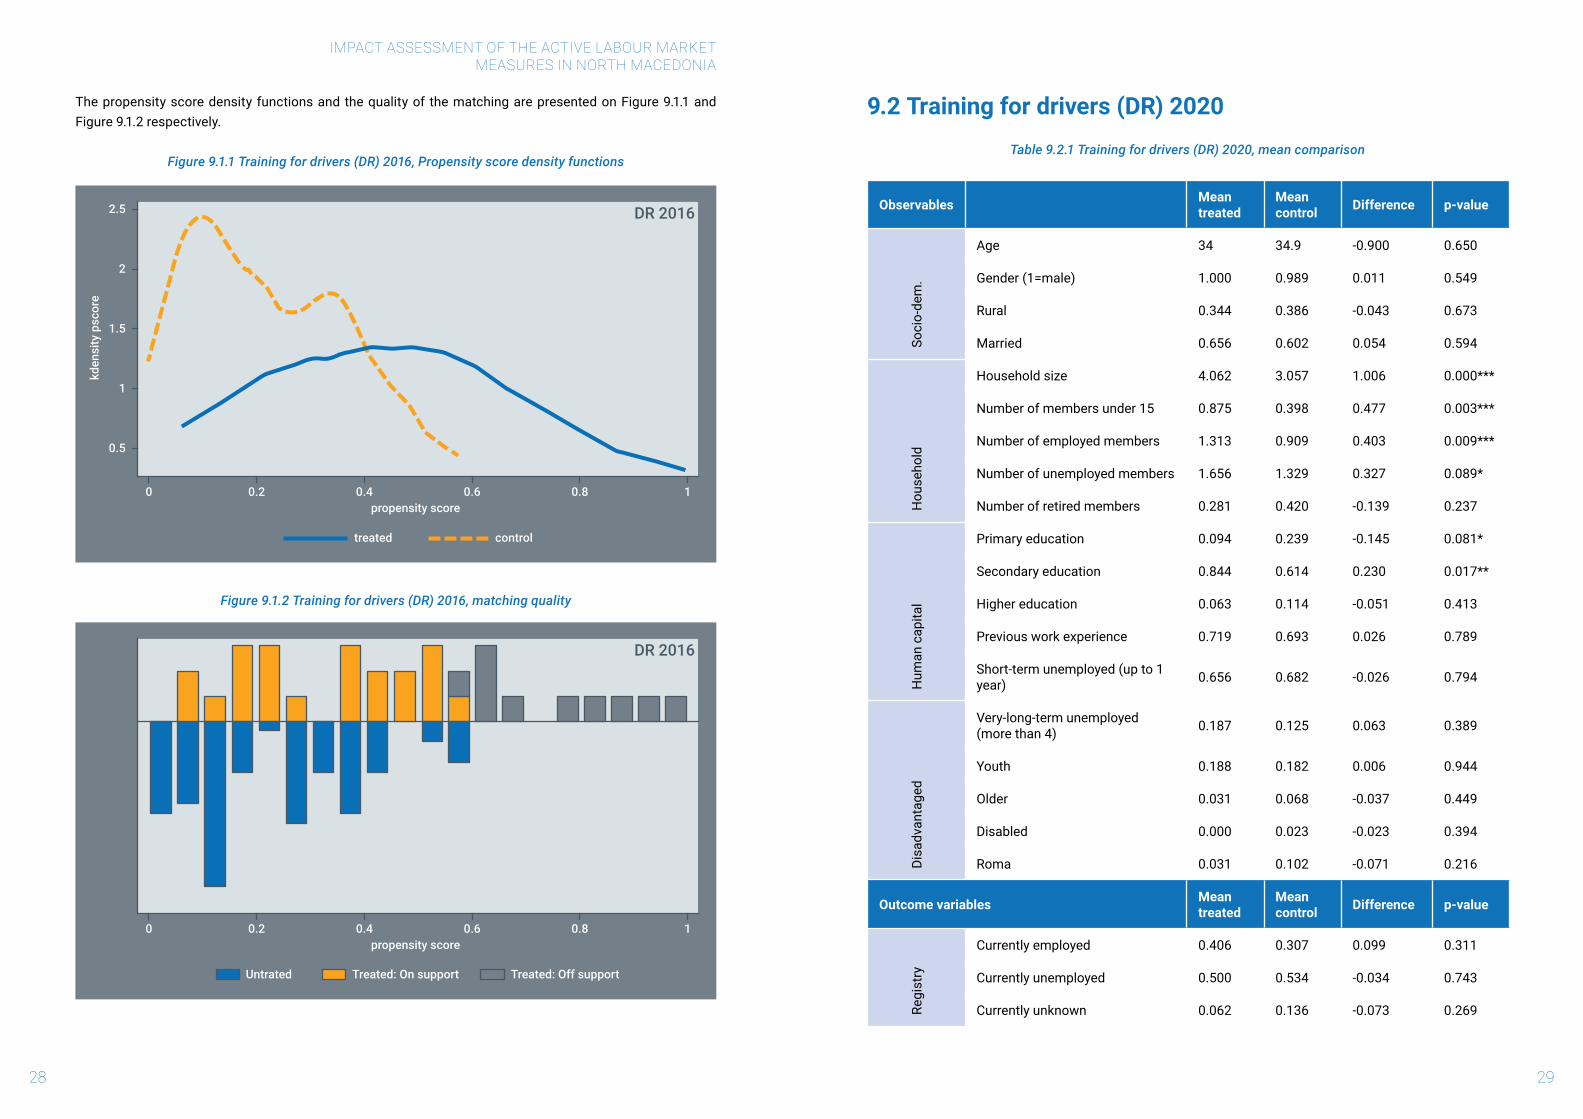
The propensity score density functions and the quality of the matching are presented on Figure 9.1.1 and Figure 9.1.2 respectively.
Figure 9.1.1 Training for drivers (DR) 2016, Propensity score density functions
Figure 9.1.2 Training for drivers (DR) 2016, matching quality
9.2 Training for drivers (DR) 2020
Table 9.2.1 Training for drivers (DR) 2020, mean comparison
Observables Mean treated
Mean control Difference p-value
Soci
o-de
m.
Age 34 34.9 -0.900 0.650
Gender (1=male) 1.000 0.989 0.011 0.549
Rural 0.344 0.386 -0.043 0.673
Married 0.656 0.602 0.054 0.594
Hou
seho
ld
Household size 4.062 3.057 1.006 0.000***
Number of members under 15 0.875 0.398 0.477 0.003***
Number of employed members 1.313 0.909 0.403 0.009***
Number of unemployed members 1.656 1.329 0.327 0.089*
Number of retired members 0.281 0.420 -0.139 0.237
Hum
an c
apita
l
Primary education 0.094 0.239 -0.145 0.081*
Secondary education 0.844 0.614 0.230 0.017**
Higher education 0.063 0.114 -0.051 0.413
Previous work experience 0.719 0.693 0.026 0.789
Short-term unemployed (up to 1 year) 0.656 0.682 -0.026 0.794
Disa
dvan
tage
d
Very-long-term unemployed (more than 4) 0.187 0.125 0.063 0.389
Youth 0.188 0.182 0.006 0.944
Older 0.031 0.068 -0.037 0.449
Disabled 0.000 0.023 -0.023 0.394
Roma 0.031 0.102 -0.071 0.216
Outcome variables Mean treated
Mean control Difference p-value
Regi
stry
Currently employed 0.406 0.307 0.099 0.311
Currently unemployed 0.500 0.534 -0.034 0.743
Currently unknown 0.062 0.136 -0.073 0.269
0
0.5
kden
sity
psc
ore
propensity score
DR 2016
treated control
1
1.5
2
2.5
0.2 0.4 0.6 0.8 1
0propensity score
DR 2016
0.2 0.4 0.6 0.8 1
Untrated Treated: On support Treated: Off support
IMPACT ASSESSMENT OF THE ACTIVE LABOUR MARKETMEASURES IN NORTH MACEDONIA
30 31
Surv
ey d
ata
Employed 0.531 0.023 0.508 0.000***
Unemployed 0.031 0.977 -0.946 0.000***
Salary 20588 20000 588 0.870
Permanent contract 0.353 0.500 -0.147 0.703
Betterfinancialconditions 0.250 0.000 0.250 0.000***
Better employment prospects 0.250 0.000 0.250 0.000***
Search for job 0.594 0.841 -0.247 0.004***
Intend to emigrate 0.531 0.511 0.019 0.849
Note: */**/*** indicate significance at 10/5/1 percent level respectively.
FromTable9.2.1wecanobservethatstatisticallysignificantdifferencebetweenthetreatmentandcontrolgroup is found for the following observables: household size, the number of household members under 15, the number of employed members, the number of unemployed members, being with primary education and being with secondary education.
Table 9.2.2 Training for drivers (DR) 2020, propensity score coefficients (Probit model)
Observables Coefficient Std. error p-value
Soci
o-de
m. Age -.0138225 .0132523 0.297
Rural -.1817992 .298983 0.543
Married -.4348596 .362445 0.230
Hou
seho
ld
Household size -.2422613 .6786035 0.721
Number of members under 15 .9418523 .6900906 0.172
Number of employed members .7594344 .6950646 0.275
Number of unemployed members .565412 .6602306 0.392
Number of retired members .0097121 .7059477 0.989
Hum
an c
apita
l
Primary education -1.318947 .7361022 0.073*
Secondary education -.8055898 .6099657 0.187
Higher education -1.016871 .7083994 0.151
Previous work experience -.1893165 .3543433 0.593
Short-term unemployed (up to 1 year) -.2077803 .2819056 0.461
Note: */**/*** indicate significance at 10/5/1 percent level respectively.
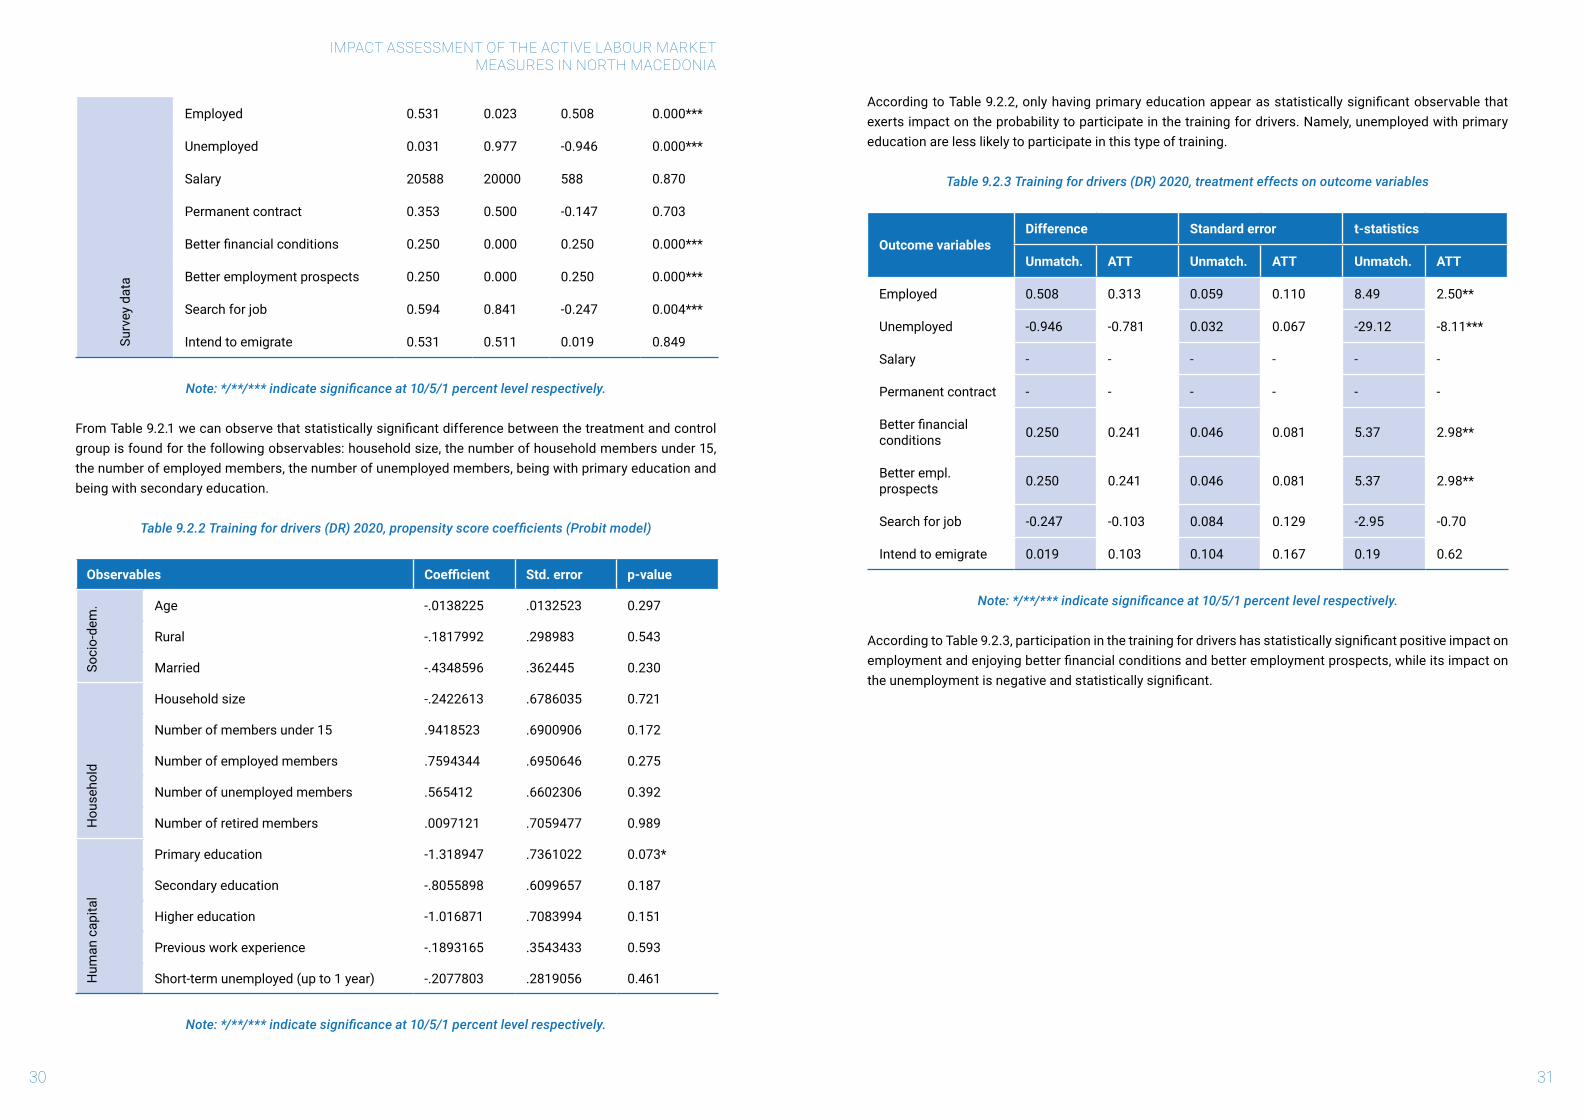
AccordingtoTable9.2.2,onlyhavingprimaryeducationappearasstatisticallysignificantobservablethatexerts impact on the probability to participate in the training for drivers. Namely, unemployed with primary education are less likely to participate in this type of training.
Table 9.2.3 Training for drivers (DR) 2020, treatment effects on outcome variables
Outcome variablesDifference Standard error t-statistics
Unmatch. ATT Unmatch. ATT Unmatch. ATT
Employed 0.508 0.313 0.059 0.110 8.49 2.50**
Unemployed -0.946 -0.781 0.032 0.067 -29.12 -8.11***
Salary - - - - - -
Permanent contract - - - - - -
Betterfinancialconditions 0.250 0.241 0.046 0.081 5.37 2.98**
Better empl. prospects 0.250 0.241 0.046 0.081 5.37 2.98**
Search for job -0.247 -0.103 0.084 0.129 -2.95 -0.70
Intend to emigrate 0.019 0.103 0.104 0.167 0.19 0.62
Note: */**/*** indicate significance at 10/5/1 percent level respectively.
AccordingtoTable9.2.3,participationinthetrainingfordrivershasstatisticallysignificantpositiveimpactonemploymentandenjoyingbetterfinancialconditionsandbetteremploymentprospects,whileitsimpactontheunemploymentisnegativeandstatisticallysignificant.

33
Table 9.2.4 Training for drivers (DR) 2020, disaggregated ATT for disadvantaged categories
Outcome variables
Age Gender Place of living Work experience Unemployment
Youth Mature Female Male Rural Urban Without With Very-long Short
Employed 0.833 0.423 - 0.469 0.364 0.619 0.667 0.435 - 0.654
Unemployed - -0.923 - -0.906 - -0.952 - -0.913 - -0.962
Betterfinancialconditions 0.833 0.115 - 0.250 0.273 0.238 0.333 0.217 - 0.308
Better empl. prospects 0.833 0.115 - 0.250 0.273 0.238 0.333 0.217 - 0.308
Note: Estimation based on nearest-neighbour matching only for statistically significant outcome variables.
According to Table 9.2.4, we can draw the following conclusions with respect to the impact of training for drivers on disadvantaged groups:
� Youtharebetteroffthanmatureunemployedvis-à-visprobabilityofbeingemployedandhaveconsiderablyhigherperceptionofbetterfinancialconditionsand better employment prospects;
� Since the female are not represented among the participants in this ALMM, we are not able to draw conclusion regarding their position compared with male participants;
� Unemployed from rural areas are worse off than those from urban areas vis-à-vis probability of being employed and have slightly higher perception of better financialconditionsandbetteremploymentprospects;
� Unemployed without work experience are better off than those with work experience vis-à-vis probability of being employed and have slightly higher perception ofbetterfinancialconditionsandbetteremploymentprospects;
� The relative position of the very-long-term unemployed is not possible to be assessed because of their low representation among participants in this ALMM.
The propensity score density functions and the quality of the matching are presented on Figure 9.2.1 and Figure 9.2.2 respectively.
Figure 9.2.1 Training for drivers (DR) 2020, Propensity score density functions
Figure 9.2.2 Training for drivers (DR) 2020, Matching quality
0
0.5
kden
sity
psc
ore
propensity score
DR 2020
treated control
1
2
3
0.2 0.4 0.6 0.8 1
0propensity score
DR 2020
0.2 0.4 0.6 0.8 1
Untrated Treated: On support Treated: Off support
IMPACT ASSESSMENT OF THE ACTIVE LABOUR MARKETMEASURES IN NORTH MACEDONIA
32
IMPACT ASSESSMENT OF THE ACTIVE LABOUR MARKETMEASURES IN NORTH MACEDONIA
34 35
9.3 Training for known employer (TKE) 2018
Table 9.3.1 Training for known employer (TKE) 2018, mean comparison
Observables Mean treated
Mean control
Difference p-value
Soci
o-de
m.
Age 36.7 36.6 0.105 0.975
Gender (1=male) 0.328 0.333 -0.005 0.971
Rural 0.295 0.500 -0.205 0.172
Married 0.852 0.500 0.352 0.005***
Hou
seho
ld
Household size 3.984 3.833 0.150 0.716
Number of members under 15 0.869 0.583 0.285 0.372
Number of employed members 1.590 1.083 0.507 0.054**
Number of unemployed members 0.885 1.916 -1.031 0.039**
Number of retired members 0.279 0.250 0.029 0.866
Hum
an c
apita
l
Primary education 0.246 0.500 -0.254 0.077*
Secondary education 0.721 0.500 0.221 0.135
Higher education 0.016 0.000 0.016 0.660
Previous work experience 0.721 0.417 0.305 0.041**
Short-term unemployed (up to 1 year) 0.820 0.833 -0.014 0.912
Disa
dvan
tage
d
Very-long-term unemployed (more than 4)
0.033 0.083 -0.050 0.427
Youth 0.213 0.250 -0.037 0.781
Older 0.033 0.000 0.033 0.531
Disabled 0.016 0.000 0.016 0.661
Roma 0.016 0.000 0.016 0.661
Outcome variables Mean treated
Mean control
Difference p-value
Regi
stry
Currently employed 0.754 0.500 0.254 0.077*
Currently unemployed 0.147 0.167 -0.019 0.868
Currently unknown 0.049 0.083 -0.034 0.640
Surv
ey d
ata
Employed 0.770 0.250 0.520 0.000***
Unemployed 0.213 0.750 -0.537 0.000***
Salary 17337 17500 -163 0.899
Permanent contract 0.674 0.333 0.341 0.238
Betterfinancialconditions 0.459 0.000 0.459 0.002***
Better employment prospects 0.361 0.000 0.361 0.012***
Search for job 0.393 0.583 -0.190 0.229
Intend to emigrate 0.246 0.250 -0.004 0.976
Note: */**/*** indicate significance at 10/5/1 percent level respectively.
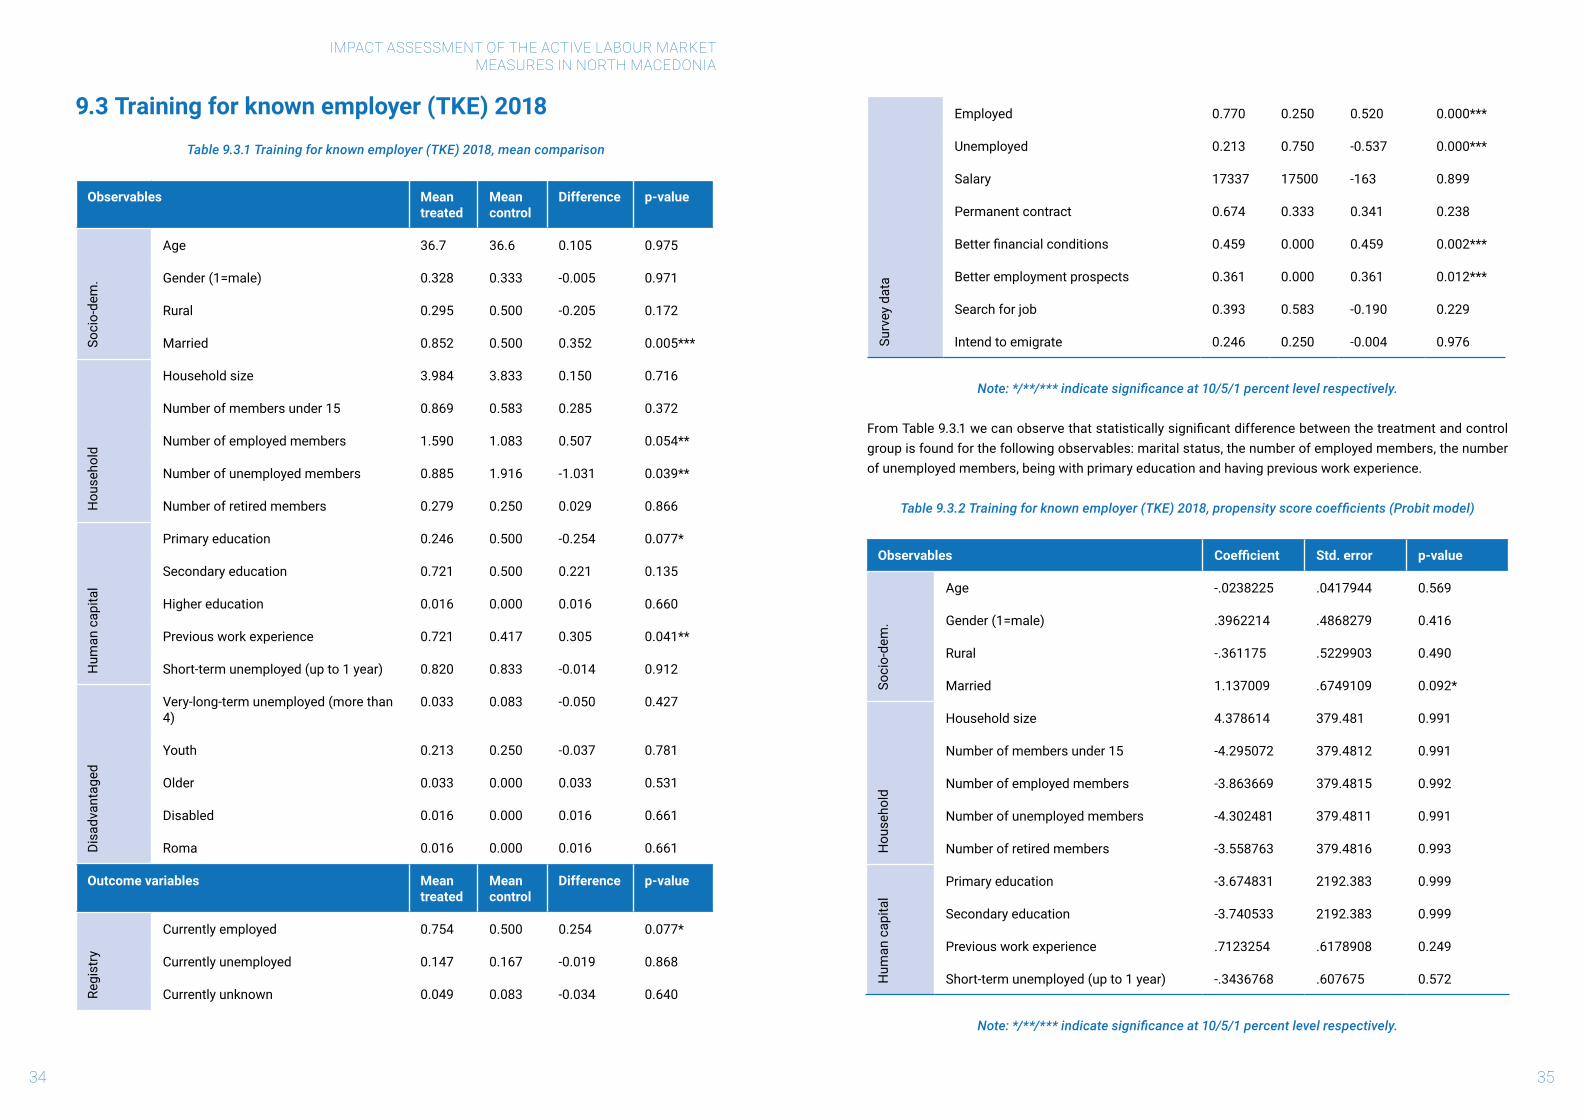
FromTable9.3.1wecanobservethatstatisticallysignificantdifferencebetweenthetreatmentandcontrolgroup is found for the following observables: marital status, the number of employed members, the number of unemployed members, being with primary education and having previous work experience.
Table 9.3.2 Training for known employer (TKE) 2018, propensity score coefficients (Probit model)
Observables Coefficient Std. error p-value
Soci
o-de
m.
Age -.0238225 .0417944 0.569
Gender (1=male) .3962214 .4868279 0.416
Rural -.361175 .5229903 0.490
Married 1.137009 .6749109 0.092*
Hou
seho
ld
Household size 4.378614 379.481 0.991
Number of members under 15 -4.295072 379.4812 0.991
Number of employed members -3.863669 379.4815 0.992
Number of unemployed members -4.302481 379.4811 0.991
Number of retired members -3.558763 379.4816 0.993
Hum
an c
apita
lPrimary education -3.674831 2192.383 0.999
Secondary education -3.740533 2192.383 0.999
Previous work experience .7123254 .6178908 0.249
Short-term unemployed (up to 1 year) -.3436768 .607675 0.572
Note: */**/*** indicate significance at 10/5/1 percent level respectively.

IMPACT ASSESSMENT OF THE ACTIVE LABOUR MARKETMEASURES IN NORTH MACEDONIA
36
AccordingtoTable9.3.2,onlymaritalstatusappearasstatisticallysignificantobservablethatexertsimpacton the probability to participate in the training for known employer. Namely, married unemployed are more likely to participate in this type of training.
Table 9.3.3 Training for known employer (TKE) 2018, treatment effects on outcome variables
Outcome variablesDifference Standard error t-statistics
Unmatch. ATT Unmatch. ATT Unmatch. ATT
Employed 0.520 0.063 0.135 0.241 3.79 0.26
Unemployed -0.537 -0.063 0.132 0.241 -4.00 -0.26
Salary - - - - - -
Permanent contract - - - - - -
Betterfinancialconditions 0.459 0.312 0.146 0.120 3.09 2.61**
Better empl. prospects 0.361 0.312 0.141 0.120 2.51 2.61**
Search for job -0.190 0.000 0.157 0.248 -1.21 0.00
Intend to emigrate -0.004 -0.188 0.138 0.228 -0.03 -0.82
Note: */**/*** indicate significance at 10/5/1 percent level respectively.
AccordingtoTable9.3.3,participationinthetrainingforknownemployerhasstatisticallysignificantpositiveimpactonenjoyingbetterfinancialconditionsandbetteremploymentprospects.
Table 9.3.4 Training for known employer (TKE) 2019, disaggregated ATT for disadvantaged categories
Outcome variables Age Gender Place of living Work experience Unemployment
Youth Mature Female Male Rural Urban Without With Very-long
Short
Betterfinancialconditions 0.385 0.479 0.439 0.500 0.222 0.558 0.353 0.500 0.458 0.500
Better empl. prospects 0.385 0.354 0.341 0.400 0.111 0.465 0.294 0.386 0.356 0.386
Note: Estimation based on nearest-neighbour matching only for statistically significant outcome variables.
According to Table 9.3.4, we can draw the following conclusions with respect to the impact of training for known employer on disadvantaged groups:
� Youthareworseoffthanmatureunemployedvis-à-vistheirperceptionoffuturefinancialconditions,buttheyareslightlybetteroffregardingtheperceptionof employment prospects;
� Femaleareworseoffthanmaleunemployedregardingtheirperceptionoffuturefinancialconditionsandemploymentprospects;
� Unemployedfromruralareasareconsiderablyworseoffthanthosefromurbanareasvis-à-vistheirperceptionoffuturefinancialconditionsandemploymentprospects;
� Unemployedwithoutworkexperienceareworseoffthanthosewithworkexperienceregardingtheirperceptionoffuturefinancialconditionsandemploymentprospects;
� Thevery-long-termunemployedareslightlyworseoffcomparedtothosewithshorterspellsofunemploymentregardingtheirperceptionoffuturefinancialconditions and employment prospects.
37

IMPACT ASSESSMENT OF THE ACTIVE LABOUR MARKETMEASURES IN NORTH MACEDONIA
38 39
The propensity score density functions and the quality of the matching are presented on Figure 9.3.1 and Figure 9.3.2 respectively.
Figure 9.3.1 Training for known employer (TKE) 2018, Propensity score density functions
Figure 9.3.2 Training for known employer (TKE) 2018, Matching quality
9.4 Training for known employer (TKE) 2019
Table 9.4.1 Training for known employer (TKE) 2019, mean comparison
Observables Mean treated
Mean control
Difference p-value
Soci
o-de
m.
Age 36.0 31.5 4.5 0.225
Gender (1=male) 0.640 0.214 0.426 0.003***
Rural 0.313 0.286 0.027 0.846
Married 0.625 0.357 0.268 0.068*
Hou
seho
ld
Household size 3.719 3.500 0.219 0.512
Number of members under 15 0.672 0.429 0.243 0.384
Number of employed members 1.687 1.643 0.045 0.881
Number of unemployed members 0.984 1.071 -0.087 0.785
Number of retired members 0.344 0.429 -0.085 0.636
Hum
an c
apita
l
Primary education 0.250 0.000 0.250 0.036**
Secondary education 0.516 0.357 0.158 0.289
Higher education 0.172 0.571 -0.399 0.001**
Previous work experience 0.719 0.714 -0.004 0.973
Short-term unemployed (up to 1 year) 0.766 0.714 0.051 0.690
Disa
dvan
tage
d
Very-long-term unemployed (more than 4) 0.078 0.071 0.007 0.933
Youth 0.297 0.214 0.083 0.540
Older 0.125 0.000 0.125 0.167
Disabled 0.000 0.000 0.000 -
Roma 0.031 0.071 -0.040 0.485
Outcome variables Mean treated
Mean control
Difference p-valueRe
gist
ry
Currently employed 0.562 0.428 0.134 0.369
Currently unemployed 0.250 0.429 -0.178 0.183
Currently unknown 0.156 0.071 0.085 0.415
0
kden
sity
psc
ore
propensity score
TKE 2018
treated control
1
2
3
4
5
0.2 0.4 0.6 0.8 1
propensity score
TKE 2018
0.2 0.4 0.6 0.8 1
Untrated Treated: On support Treated: Off support
IMPACT ASSESSMENT OF THE ACTIVE LABOUR MARKETMEASURES IN NORTH MACEDONIA
40 41
Surv
ey d
ata
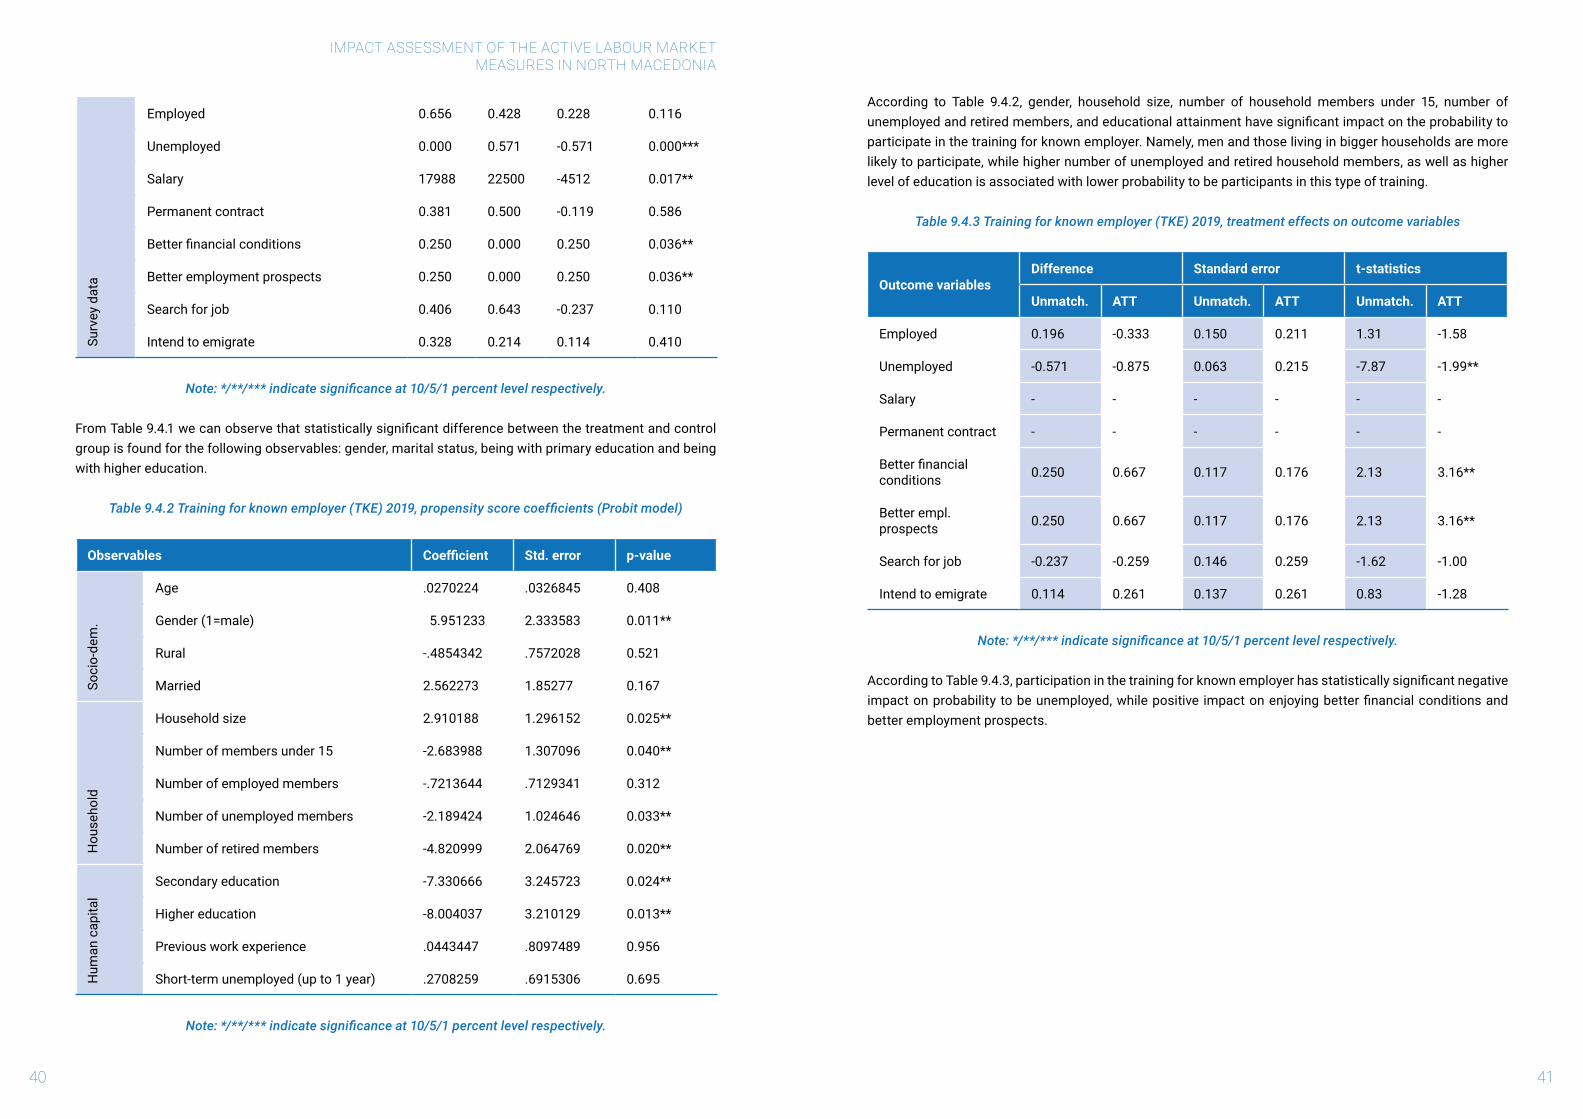
Employed 0.656 0.428 0.228 0.116
Unemployed 0.000 0.571 -0.571 0.000***
Salary 17988 22500 -4512 0.017**
Permanent contract 0.381 0.500 -0.119 0.586
Betterfinancialconditions 0.250 0.000 0.250 0.036**
Better employment prospects 0.250 0.000 0.250 0.036**
Search for job 0.406 0.643 -0.237 0.110
Intend to emigrate 0.328 0.214 0.114 0.410
Note: */**/*** indicate significance at 10/5/1 percent level respectively.
FromTable9.4.1wecanobservethatstatisticallysignificantdifferencebetweenthetreatmentandcontrolgroup is found for the following observables: gender, marital status, being with primary education and being with higher education.
Table 9.4.2 Training for known employer (TKE) 2019, propensity score coefficients (Probit model)
Observables Coefficient Std. error p-value
Soci
o-de
m.
Age .0270224 .0326845 0.408
Gender (1=male) 5.951233 2.333583 0.011**
Rural -.4854342 .7572028 0.521
Married 2.562273 1.85277 0.167
Hou
seho
ld
Household size 2.910188 1.296152 0.025**
Number of members under 15 -2.683988 1.307096 0.040**
Number of employed members -.7213644 .7129341 0.312
Number of unemployed members -2.189424 1.024646 0.033**
Number of retired members -4.820999 2.064769 0.020**
Hum
an c
apita
l
Secondary education -7.330666 3.245723 0.024**
Higher education -8.004037 3.210129 0.013**
Previous work experience .0443447 .8097489 0.956
Short-term unemployed (up to 1 year) .2708259 .6915306 0.695
Note: */**/*** indicate significance at 10/5/1 percent level respectively.
According to Table 9.4.2, gender, household size, number of household members under 15, number of unemployedandretiredmembers,andeducationalattainmenthavesignificantimpactontheprobabilitytoparticipate in the training for known employer. Namely, men and those living in bigger households are more likely to participate, while higher number of unemployed and retired household members, as well as higher level of education is associated with lower probability to be participants in this type of training.
Table 9.4.3 Training for known employer (TKE) 2019, treatment effects on outcome variables
Outcome variablesDifference Standard error t-statistics
Unmatch. ATT Unmatch. ATT Unmatch. ATT
Employed 0.196 -0.333 0.150 0.211 1.31 -1.58
Unemployed -0.571 -0.875 0.063 0.215 -7.87 -1.99**
Salary - - - - - -
Permanent contract - - - - - -
Betterfinancialconditions 0.250 0.667 0.117 0.176 2.13 3.16**
Better empl. prospects 0.250 0.667 0.117 0.176 2.13 3.16**
Search for job -0.237 -0.259 0.146 0.259 -1.62 -1.00
Intend to emigrate 0.114 0.261 0.137 0.261 0.83 -1.28
Note: */**/*** indicate significance at 10/5/1 percent level respectively.
AccordingtoTable9.4.3,participationinthetrainingforknownemployerhasstatisticallysignificantnegativeimpactonprobabilitytobeunemployed,whilepositive impactonenjoyingbetterfinancialconditionsandbetter employment prospects.

43
Table 9.4.4 Training for known employer (TKE) 2019, disaggregated ATT for disadvantaged categories
Outcome variables
Age Gender Place of living Work experience Unemployment
Youth Mature Female Male Rural Urban Without With Very-long Short
Unemployed -0.368 -0.667 -0.478 -0.634 -0.800 -0.568 -0.667 -0.608 - -0.644
Betterfinancialconditions 0.316 0.222 0.435 0.146 0.300 0.227 0.333 0.217 - 0.271
Better empl. prospects 0.316 0.222 0.435 0.146 0.435 0.146 0.333 0.217 - 0.271
Note: Estimation based on nearest-neighbour matching only for statistically significant outcome variables.
According to Table 9.4.4, we can draw the following conclusions with respect to the impact of training for known employer on disadvantaged groups:
� Youthareworseoffthanmatureunemployedvis-à-vistheprobabilityofbeingunemployed,buttheyperceivebetterfinancialconditionsandbetteremploymentprospects;
� Female are worse off than male unemployed regarding the probability of being unemployed, but they have more than twice higher perception for better financialconditionsandbetteremploymentprospects;
� Unemployedfromruralareasarebetteroffthanthosefromurbanareasvis-à-vistheprobabilityofbeing,buttheyperceivebetterfinancialconditionsandbetter employment prospects;
� Unemployed without work experience are better off than those with work experience regarding the probability of being unemployed and they perceive better financialconditionsandbetteremploymentprospects;
� The relative position of the very-long-term unemployed is not possible to be assessed because of their low representation among participants in this ALMM.
The propensity score density functions and the quality of the matching are presented on Figure 9.4.1 and Figure 9.4.2 respectively.
Figure 9.4.1 Training for known employer (TKE) 2019, Propensity score density functions
Figure 9.4.2 Training for known employer (TKE) 2019, Matching quality
0
kden
sity
psc
ore
propensity score
TKE 2019
treated control
5
10
15
20
0.20 0.4 0.6 0.8 1
propensity score
TKE 2019
0.20 0.4 0.6 0.8 1
Untrated Treated: On support Treated: Off support
IMPACT ASSESSMENT OF THE ACTIVE LABOUR MARKETMEASURES IN NORTH MACEDONIA
42

IMPACT ASSESSMENT OF THE ACTIVE LABOUR MARKETMEASURES IN NORTH MACEDONIA
44 45
9.5 Training for advanced IT skills (IT) 2017/18
Table 9.5.1 Training for advanced IT skills (IT) 2017/18, mean comparison
Observables Mean treated
Mean control Difference p-value
Soci
o-de
m.
Age 29.9 28.9 0.949 0.391
Gender (1=male) 0.699 0.484 0.215 0.005***
Rural 0.082 0.118 -0.036 0.450
Married 0.425 0.667 -0.242 0.002***
Hou
seho
ld
Household size 3.260 3.494 -0.234 0.154
Number of members under 15 0.466 0.699 -0.233 0.078*
Number of employed members 2.027 2.043 -0.016 0.921
Number of unemployed members 0.384 0.570 -0.186 0.121
Number of retired members 0.411 0.194 0.217 0.025**
Hum
an c
apita
l
Primary education - - - -
Secondary education 0.329 0.279 0.049 0.496
Higher education 0.548 0.634 -0.086 0.262
Previous work experience 0.734 0.634 0.105 0.150
Short-term unemployed (up to 1 year) 0.890 0.806 0.084 0.141
Disa
dvan
tage
d
Very-long-term unemployed (more than 4) 0.027 0.032 -0.005 0.857
Youth 0.274 0.398 -0.124 0.096*
Older 0.014 0.000 0.014 0.260
Disabled 0.014 0.011 0.003 0.864
Roma - - - -
Outcome variables Mean treated
Mean control Difference p-value
Regi
stry
Currently employed 0.767 0.688 0.079 0.262
Currently unemployed 0.137 0.140 -0.003 0.959
Currently unknown 0.041 0.140 -0.099 0.033**
Surv
ey d
ata
Employed 0.877 0.785 0.092 0.124
Unemployed 0.014 0.000 0.014 0.260
Salary 22386 22283 104 0.883
Permanent contract 0.703 0.527 0.176 0.035**
Betterfinancialconditions 0.452 0.194 0.259 0.000***
Better employment prospects 0.329 0.097 0.232 0.000***
Search for job 0.219 0.247 -0.028 0.674
Intend to emigrate 0.219 0.140 0.079 0.183
Note: */**/*** indicate significance at 10/5/1 percent level respectively.
FromTable9.5.1wecanobservethatstatisticallysignificantdifferencebetweenthetreatmentandcontrolgroup is found for the following observables: gender, marital status, the number of household members under 15, the number of retired household members and being youth.
Table 9.5.2 Training for advanced IT skills (IT) 2017/18, propensity score coefficients (Probit model)
Observables Coefficient Std. error p-value
Soci
o-de
m.
Age .0100003 .0170404 0.557
Gender (1=male) .4278441 .2274521 0.060**
Rural .0149796 .3683936 0.968
Married -.7146442 .3055843 0.019**
Hou
seho
ld
Household size -.0840098 .8962292 0.925
Number of members under 15 .1294073 .8966107 0.885
Number of employed members -.0118069 .9305418 0.990
Number of unemployed members -.3013737 .9496847 0.751
Number of retired members .1858649 .9437529 0.844
Hum
an c
apita
lSecondary education -.1080907 .3847408 0.779
Higher education -.3298191 .3517523 0.348
Previous work experience .2966857 .2513991 0.238
Short-term unemployed (up to 1 year) .6210604 .3238033 0.055*
Note: */**/*** indicate significance at 10/5/1 percent level respectively.

IMPACT ASSESSMENT OF THE ACTIVE LABOUR MARKETMEASURES IN NORTH MACEDONIA
46
AccordingtoTable9.5.2,gender,maritalstatusandunemploymenthistoryhavesignificant impactontheprobability to participate in the training for advanced IT skills. Namely, men and short-term unemployed are more likely to participate, while married unemployed have lower probability to be participants in this type of training.
Table 9.5.3 Training for advanced IT skills (IT) 2017/18, treatment effects on outcome variables
Outcome variablesDifference Standard error t-statistics
Unmatch. ATT Unmatch. ATT Unmatch. ATT
Employed 0.092 0.153 0.059 0.086 1.55 1.77
Unemployed 0.014 0.014 0.012 0.014 1.13 1.00
Salary 104 1071 705.3 964.5 0.15 1.11
Permanent contract 0.176 0.136 0.082 0.121 2.13 1.12
Betterfinancialconditions 0.259 0.314 0.070 0.093 3.71 3.37**
Better empl. prospects 0.232 0.286 0.060 0.065 3.86 4.39**
Search for job -0.028 0.057 0.067 0.091 -0.42 0.63
Intend to emigrate 0.079 -0.014 0.059 0.094 1.34 -0.15
Note: */**/*** indicate significance at 10/5/1 percent level respectively.
AccordingtoTable9.5.3,participationinthetrainingforadvancedITskillshasstatisticallysignificantpositiveimpactontheprobabilitytoenjoybetterfinancialconditionsandbetteremploymentprospects.
Table 9.5.4 Training for advanced IT skills (IT) 2017/18, disaggregated ATT for disadvantaged categories
Outcome variables
Age Gender Place of living Work experience Unemployment
Youth Mature Female Male Rural Urban Without With Very-long Short
Betterfinancialconditions 0.225 0.245 0.318 0.235 0.360 0.224 0.316 0.204 - 0.225
Better empl. prospects 0.475 0.151 0.318 0.196 0.167 0.239 0.421 0.148 - 0.225
Note: Estimation based on nearest-neighbour matching only for statistically significant outcome variables.
According to Table 9.5.4, we can draw the following conclusions with respect to the impact of training for advanced IT skills on disadvantaged groups:
� Youthareworseoffthanmatureunemployedvis-à-vistheperceptionofthefuturefinancialconditions,butworseofregardingtheperceptionofemploymentprospects;
� Femalearebetteroffthanmaleunemployedwithrespecttobothperceptionsofbetterfinancialconditionsandbetteremploymentprospects;
� Unemployedfromruralareasareworseoffthanthosefromurbanareasregardingtheperceptionofthefuturefinancialconditions,butworseofregardingthe perception of employment prospects;
� Unemployedwithoutworkexperiencearebetteroffthanthosewithworkexperiencewithrespecttobothperceptionsofbetterfinancialconditionsandbetteremployment prospects;
� The relative position of the very-long-term unemployed is not possible to be assessed because of their low representation among participants in this ALMM.
47
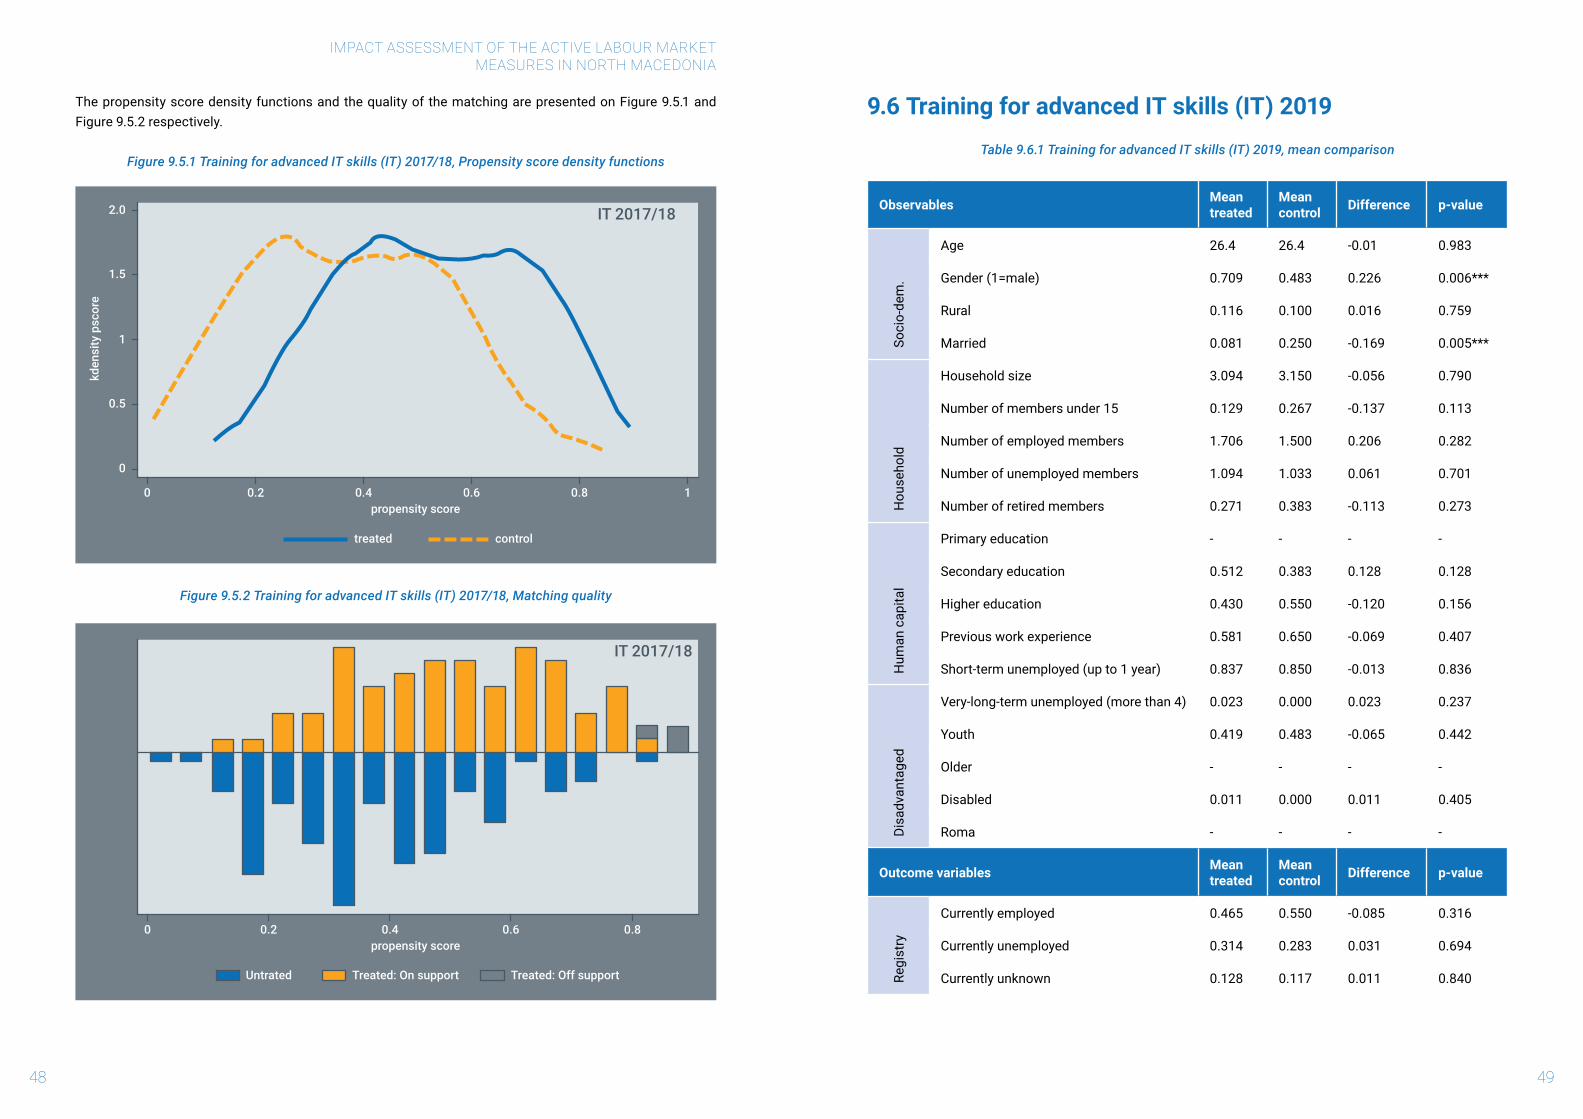
IMPACT ASSESSMENT OF THE ACTIVE LABOUR MARKETMEASURES IN NORTH MACEDONIA
48 49
The propensity score density functions and the quality of the matching are presented on Figure 9.5.1 and Figure 9.5.2 respectively.
Figure 9.5.1 Training for advanced IT skills (IT) 2017/18, Propensity score density functions
Figure 9.5.2 Training for advanced IT skills (IT) 2017/18, Matching quality
9.6 Training for advanced IT skills (IT) 2019
Table 9.6.1 Training for advanced IT skills (IT) 2019, mean comparison
Observables Mean treated
Mean control Difference p-value
Soci
o-de
m.
Age 26.4 26.4 -0.01 0.983
Gender (1=male) 0.709 0.483 0.226 0.006***
Rural 0.116 0.100 0.016 0.759
Married 0.081 0.250 -0.169 0.005***
Hou
seho
ld
Household size 3.094 3.150 -0.056 0.790
Number of members under 15 0.129 0.267 -0.137 0.113
Number of employed members 1.706 1.500 0.206 0.282
Number of unemployed members 1.094 1.033 0.061 0.701
Number of retired members 0.271 0.383 -0.113 0.273
Hum
an c
apita
l
Primary education - - - -
Secondary education 0.512 0.383 0.128 0.128
Higher education 0.430 0.550 -0.120 0.156
Previous work experience 0.581 0.650 -0.069 0.407
Short-term unemployed (up to 1 year) 0.837 0.850 -0.013 0.836
Disa
dvan
tage
d
Very-long-term unemployed (more than 4) 0.023 0.000 0.023 0.237
Youth 0.419 0.483 -0.065 0.442
Older - - - -
Disabled 0.011 0.000 0.011 0.405
Roma - - - -
Outcome variables Mean treated
Mean control Difference p-value
Regi
stry
Currently employed 0.465 0.550 -0.085 0.316
Currently unemployed 0.314 0.283 0.031 0.694
Currently unknown 0.128 0.117 0.011 0.840
0
kden
sity
psc
ore
propensity score
IT 2017/18
treated control
0.5
1
1.5
2.0
0.20 0.4 0.6 0.8 1
propensity score
IT 2017/18
0.20 0.4 0.6 0.8
Untrated Treated: On support Treated: Off support

IMPACT ASSESSMENT OF THE ACTIVE LABOUR MARKETMEASURES IN NORTH MACEDONIA
50 51
Surv
ey d
ata
Employed 0.384 0.483 -0.099 0.234
Unemployed 0.512 0.517 -0.005 0.953
Salary 25300 22608 2691 0.201
Permanent contract 0.303 0.345 -0.042 0.731
Betterfinancialconditions 0.233 0.200 0.033 0.643
Better employment prospects 0.233 0.217 0.016 0.823
Search for job 0.709 0.533 0.176 0.029**
Intend to emigrate 0.360 0.233 0.127 0.103
Note: */**/*** indicate significance at 10/5/1 percent level respectively.
FromTable9.6.1wecanobservethatstatisticallysignificantdifferencebetweenthetreatmentandcontrolgroup is found for gender and marital status, while regarding other observables there is no statistically significantdifference.
Table 9.6.2 Training for advanced IT skills (IT) 2019, propensity score coefficients (Probit model)
Observables Coefficient Std. error p-value
Soci
o-de
m.
Age .0775205 .0395544 0.050**
Gender (1=male) .5246944 .2448502 0.032**
Rural .0789775 .369883 0.831
Married -.7285525 .4405679 0.098*
Hou
seho
ld
Household size -.5913511 .3427225 0.084*
Number of members under 15 .3000602 .3730572 0.421
Number of employed members .6992011 .3738829 0.061*
Number of unemployed members .5704214 .3790802 0.132
Number of retired members .1731034 .3781468 0.647
Hum
an c
apita
l
Secondary education .2201162 .5261679 0.676
Higher education -.2068993 .4986387 0.678
Previous work experience -.4982686 .2985433 0.095*
Short-term unemployed (up to 1 year) .2469896 .3365752 0.463
Note: */**/*** indicate significance at 10/5/1 percent level respectively.
According to Table 9.6.2, age, gender, marital status, household size, number of employed members in the household and previouswork experience have significant impact on the probability to participate in thetraining for advanced IT skills. Namely, an additional year, being male, and additional employed household member increase the probability to participate, while being married, the household size and previous work experience are associated with lower probability to be participants in this type of training.
Table 9.6.3 Training for advanced IT skills (IT) 2019, treatment effects on outcome variables
Outcome variablesDifference Standard error t-statistics
Unmatch. ATT Unmatch. ATT Unmatch. ATT
Employed -0.095 -0.195 0.084 0.130 -1.14 -1.50
Unemployed 0.000 0.098 0.085 0.131 0.01 0.74
Salary 2691 5000 2074 6871 1.30 0.73
Permanent contract -0.042 0.048 0.121 0.218 -0.35 0.22
Betterfinancialconditions 0.035 0.049 0.070 0.117 0.50 0.42
Better empl. prospects 0.019 0.049 0.071 0.117 0.26 0.42
Search for job 0.173 0.232 0.080 0.130 2.14 1.78*
Intend to emigrate 0.131 0.024 0.078 0.125 1.69 0.19
Note: */**/*** indicate significance at 10/5/1 percent level respectively.
AccordingtoTable9.6.3,participationinthetrainingforadvancedITskillshasstatisticallysignificantpositiveimpact on the probability to search for job, while the impact on other outcome variables is not statistically significant.

53
Table 9.6.4 Training for advanced IT skills (IT) 2019, disaggregated ATT for disadvantaged categories
Outcome variables
Age Gender Place of living Work experience Unemployment
Youth Mature Female Male Rural Urban Without With Very-long Short
Search for job 0.083 0.184 0.250 0.180 0.600 0.160 0.167 0.082 - 0.193
Note: Estimation based on nearest-neighbour matching only for statistically significant outcome variables.
According to Table 9.6.4, we can draw the following conclusions with respect to the impact of training for advanced IT skills on disadvantaged groups:
� Youth manifest about twice as lower probability to search for job compared to mature unemployed;
� Female participant are characterized with higher probability to search for job compared to male participants;
� Unemployed from rural areas manifest almost four times higher probability to search for job compared to those from urban areas;
� Unemployed without work experience have almost twice as higher probability to search for job compared to those with work experience;
� The relative position of the very-long-term unemployed is not possible to be assessed because of their low representation among participants in this ALMM.
The propensity score density functions and the quality of the matching are presented on Figure 9.6.1 and Figure 9.6.2 respectively.
Figure 9.6.1 Training for advanced IT skills (IT) 2019, matching quality
Figure 9.6.2 Training for advanced IT skills (IT) 2019, Matching quality
0
kden
sity
psc
ore
propensity score
IT 2019
treated control
0.5
1
1.5
2.5
2.0
0.20 0.4 0.6 0.8 1
propensity score
IT 2019
0.20 0.4 0.6 0.8 1
Untrated Treated: On support Treated: Off support
IMPACT ASSESSMENT OF THE ACTIVE LABOUR MARKETMEASURES IN NORTH MACEDONIA
52

IMPACT ASSESSMENT OF THE ACTIVE LABOUR MARKETMEASURES IN NORTH MACEDONIA
54 55
9.7 Training for in-demand occupation (IN) 2018
Table 9.7.1 Training for in-demand occupations (IN) 2018, mean comparison
Observables Mean treated
Mean control Difference p-value
Soci
o-de
m.
Age 36.1 35.7 0.391 0.776
Gender (1=male) 0.272 0.253 0.018 0.743
Rural 0.184 0.180 0.004 0.928
Married 0.505 0.627 -0.122 0.054**
Hou
seho
ld
Household size 3.359 3.267 0.093 0.569
Number of members under 15 0.466 0.547 -0.081 0.437
Number of employed members 1.553 1.133 0.420 0.000***
Number of unemployed members 1.097 1.200 -0.103 0.415
Number of retired members 0.291 0.393 -0.102 0.205
Hum
an c
apita
l
Primary education 0.087 0.120 -0.033 0.411
Secondary education 0.621 0.567 0.055 0.387
Higher education 0.243 0.280 -0.037 0.511
Previous work experience 0.621 0.673 -0.052 0.396
Short-term unemployed (up to 1 year) 0.699 0.540 0.159 0.011**
Disa
dvan
tage
d
Very-long-term unemployed (more than 4) 0.117 0.247 -0.130 0.001***
Youth 0.213 0.160 0.054 0.279
Older 0.058 0.073 -0.015 0.639
Disabled 0.009 0.020 -0.010 0.521
Roma 0.019 0.047 -0.027 0.252
Outcome variables Mean treated
Mean control Difference p-value
Regi
stry
Currently employed 0.369 0.333 0.0356 0.561
Currently unemployed 0.359 0.453 -0.094 0.137
Currently unknown 0.136 0.140 -0.004 0.927
Surv
ey d
ata
Employed 0.379 0.220 0.159 0.006***
Unemployed 0.544 0.733 -0.189 0.002***
Salary 22580 20714 1866 0.015**
Permanent contract 0.333 0.273 0.061 0.584
Betterfinancialconditions 0.184 0.013 0.171 0.000***
Better employment prospects 0.175 0.013 0.161 0.000***
Search for job 0.456 0.700 -0.244 0.000***
Intend to emigrate 0.311 0.433 -0.123 0.049**
Note: */**/*** indicate significance at 10/5/1 percent level respectively.
FromTable9.7.1wecanobservethatstatisticallysignificantdifferencebetweenthetreatmentandcontrolgroup is found for the following observables: marital status, the number of employed household members, being short-term unemployed and being very-long-term unemployed.
Table 9.7.2 Training for in-demand occupations (IN) 2018, propensity score coefficients (Probit model)
Observables Coefficient Std. error p-value
Soci
o-de
m.
Age .0191154 .0093344 0.041**
Gender (1=male) -.0241643 .2002749 0.904
Rural .109756 .229615 0.633
Married -.592555 .2111202 0.005***
Hou
seho
ld
Household size -.4301338 .3529322 0.223
Number of members under 15 .5023535 .361659 0.165
Number of employed members .8054647 .3736841 0.031**
Number of unemployed members .4801134 .3649747 0.188
Number of retired members .3731522 .3656315 0.307
Hum
an c
apita
l
Primary education -.4181153 .5195246 0.421
Secondary education -.2210583 .4430059 0.618
Higher education -.2311485 .4565281 0.613
Previous work experience -.3371944 .2038212 0.098*
Short-term unemployed (up to 1 year) .5073236 .1809044 0.005***
Note: */**/*** indicate significance at 10/5/1 percent level respectively.

IMPACT ASSESSMENT OF THE ACTIVE LABOUR MARKETMEASURES IN NORTH MACEDONIA
56
According to Table 9.7.2, age, marital status, number of employed members in the household, work experience andunemploymenthistoryhavestatisticallysignificantimpactontheprobabilitytoparticipateinthetrainingfor in-demand occupations. Namely, younger unemployed, those who are not married unemployed, live in households with more employed members, have lower work experience and are short-term unemployed are more likely to be participants in this type of training.
Table 9.7.3 Training for in-demand occupations (IN) 2018, treatment effects on outcome variables
Outcome variablesDifference Standard error t-statistics
Unmatch. ATT Unmatch. ATT Unmatch. ATT
Employed 0.158 0.051 0.057 0.062 2.78 0.56
Unemployed -0.189 -0.112 0.060 0.095 -3.17 -1.18
Salary 1866 1354 746 1051 2.50 1.29
Permanent contract 0.079 0.000 0.112 0.159 0.70 0.00
Betterfinancialconditions 0.171 0.184 0.034 0.046 5.07 3.97**
Better empl. prospects 0.161 0.173 0.033 0.045 4.87 3.81**
Search for job -0.244 -0.194 0.061 0.095 -3.99 -2.03*
Intend to emigrate -0.123 -0.163 0.062 0.102 -1.98 -1.61
Note: */**/*** indicate significance at 10/5/1 percent level respectively.
AccordingtoTable9.7.3,participationinthetrainingforin-demandoccupationshasstatisticallysignificantpositive impact on the perception for better financial conditions and better employment prospects, andnegative impact on the probability to search for job.
Table 9.7.4 Training for in-demand occupations (IN) 2018, disaggregated ATT for disadvantaged categories
Outcome variables
Age Gender Place of living Work experience Unemployment
Youth Mature Female Male Rural Urban Without With Very-long Short
Betterfinancialconditions -0.182 0.197 0.227 -0.071 0.105 0.179 0.051 0.203 0.250 0.154
Better empl. prospects -0.182 0.185 0.213 -0.071 0.105 0.167 0.026 0.203 0250 0.143
Search for job -0.545 -0.309 -0.333 -0.429 -0.053 -0.357 -0.333 -0.406 -0.167 -0.297
Note: Estimation based on nearest-neighbour matching only for statistically significant outcome variables.
According to Table 9.7.4, we can draw the following conclusions with respect to the impact of training for in-demand occupations on disadvantaged groups:
� Youthperceivelowerprobabilityforbetterfinancialconditionsandbetteremploymentprospectsthanmatureparticipantsandtheymanifestlowerprobabilityto search for job;
� Femaleperceivehigherprobabilityforbetterfinancialconditionsandbetteremploymentprospects,andtheymanifestslightlyhigherprobabilitytosearchfor job;
� Unemployedfromruralareasareworseoffthanthosefromurbanareasvis-à-visfuturefinancialconditionsandemploymentprospects,andtheymanifestslightly higher probability to search for job;
� Unemployedwithoutwork experienceperceive lower probability for better financial conditionsandbetter employmentprospects than thosewithworkexperience, and they manifest slightly higher probability to search for job;
� Thevery-long-termunemployedperceivehigherprobabilityforbetterfinancialconditionsandbetteremploymentprospectscomparedtothosewithshorterspells, and they manifest slightly higher probability to search for job.
57
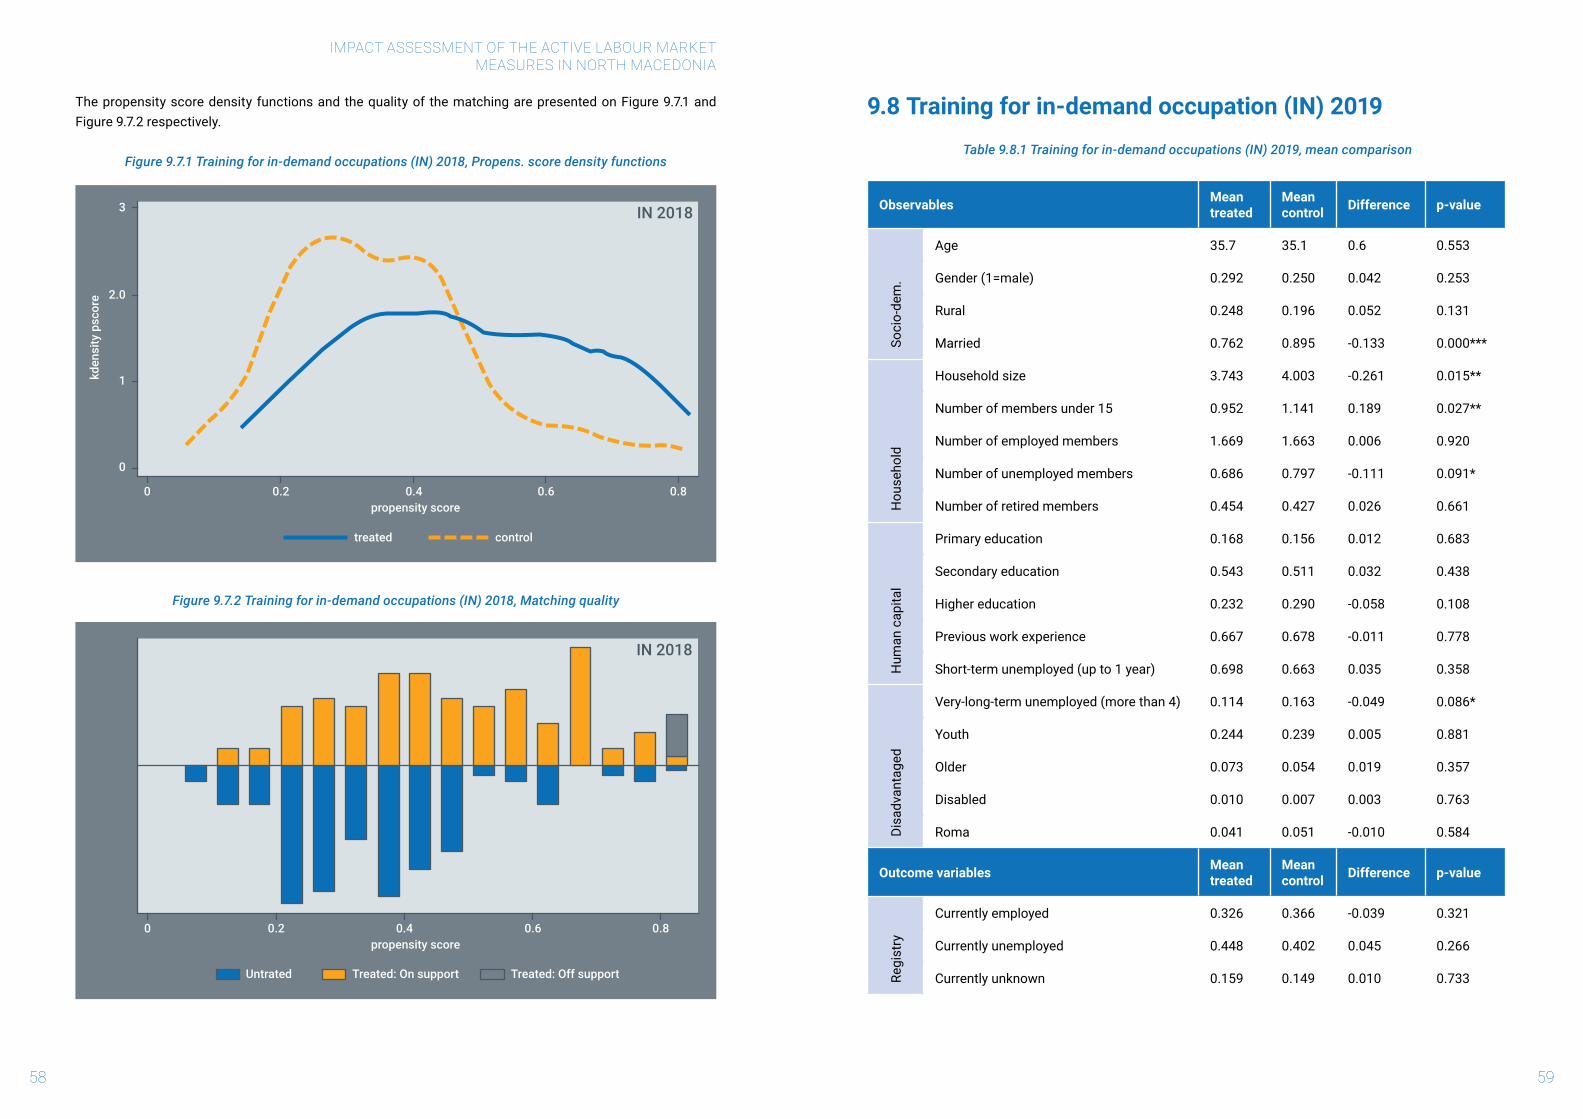
IMPACT ASSESSMENT OF THE ACTIVE LABOUR MARKETMEASURES IN NORTH MACEDONIA
58 59
The propensity score density functions and the quality of the matching are presented on Figure 9.7.1 and Figure 9.7.2 respectively.
Figure 9.7.1 Training for in-demand occupations (IN) 2018, Propens. score density functions
Figure 9.7.2 Training for in-demand occupations (IN) 2018, Matching quality
9.8 Training for in-demand occupation (IN) 2019
Table 9.8.1 Training for in-demand occupations (IN) 2019, mean comparison
Observables Mean treated
Mean control Difference p-value
Soci
o-de
m.
Age 35.7 35.1 0.6 0.553
Gender (1=male) 0.292 0.250 0.042 0.253
Rural 0.248 0.196 0.052 0.131
Married 0.762 0.895 -0.133 0.000***
Hou
seho
ld
Household size 3.743 4.003 -0.261 0.015**
Number of members under 15 0.952 1.141 0.189 0.027**
Number of employed members 1.669 1.663 0.006 0.920
Number of unemployed members 0.686 0.797 -0.111 0.091*
Number of retired members 0.454 0.427 0.026 0.661
Hum
an c
apita
l
Primary education 0.168 0.156 0.012 0.683
Secondary education 0.543 0.511 0.032 0.438
Higher education 0.232 0.290 -0.058 0.108
Previous work experience 0.667 0.678 -0.011 0.778
Short-term unemployed (up to 1 year) 0.698 0.663 0.035 0.358
Disa
dvan
tage
d
Very-long-term unemployed (more than 4) 0.114 0.163 -0.049 0.086*
Youth 0.244 0.239 0.005 0.881
Older 0.073 0.054 0.019 0.357
Disabled 0.010 0.007 0.003 0.763
Roma 0.041 0.051 -0.010 0.584
Outcome variables Mean treated
Mean control Difference p-value
Regi
stry
Currently employed 0.326 0.366 -0.039 0.321
Currently unemployed 0.448 0.402 0.045 0.266
Currently unknown 0.159 0.149 0.010 0.733
0
kden
sity
psc
ore
propensity score
IN 2018
treated control
1
3
2.0
0.20 0.4 0.6 0.8
propensity score
IN 2018
0.20 0.4 0.6 0.8
Untrated Treated: On support Treated: Off support

IMPACT ASSESSMENT OF THE ACTIVE LABOUR MARKETMEASURES IN NORTH MACEDONIA
60 61
Surv
ey d
ata
Employed 0.705 0.601 0.103 0.008***
Unemployed 0.086 0.373 -0.274 0.000***
Salary 19522 19558 -35 0.926
Permanent contract 0.559 0.626 -0.068 0.171
Betterfinancialconditions 0.368 0.254 0.115 0.003***
Better employment prospects 0.343 0.236 0.107 0.004***
Search for job 0.238 0.312 -0.073 0.045**
Intend to emigrate 0.159 0.047 0.112 0.000***
Note: */**/*** indicate significance at 10/5/1 percent level respectively.
FromTable9.8.1wecanobservethatstatisticallysignificantdifferencebetweenthetreatmentandcontrolgroup is found for the following observables: marital status, household size, the number of household members under 15, the number of unemployed household members and being very-long-term unemployed.
Table 9.8.2 Training for in-demand occupations (IN) 2019, propensity score coefficients (Probit model)
Observables Coefficient Std. error p-value
Soci
o-de
m.
Age .0094523 .0043137 0.028**
Gender (1=male) .1369876 .1192252 0.251
Rural .2546401 .1307864 0.052*
Married -.4872222 .1495507 0.001***
Hou
seho
ld
Household size -.0127266 .1042348 0.903
Number of members under 15 -.0569634 .1073674 0.596
Number of employed members -.0037004 .1175777 0.975
Number of unemployed members -.1279951 .1186959 0.281
Number of retired members -.0096071 .118405 0.935
Hum
an c
apita
l
Primary education .1903363 .2461269 0.439
Secondary education .1862323 .2008531 0.354
Higher education .0632702 .2064582 0.759
Previous work experience -.0085059 .1220964 0.944
Short-term unemployed (up to 1 year) .1820823 .1156274 0.115
Note: */**/*** indicate significance at 10/5/1 percent level respectively.
AccordingtoTable9.8.2,age,placeoflivingandmaritalstatushavestatisticallysignificantimpactontheprobability to participate in the training for in-demand occupations. Namely, younger unemployed, those who live in rural areas and not married unemployment are more likely to be participants in this type of raining.
Table 9.8.3 Training for in-demand occupations (IN) 2019, treatment effects on outcome variables
Outcome variablesDifference Standard error t-statistics
Unmatch. ATT Unmatch. ATT Unmatch. ATT
Employed 0.103 0.020 0.039 0.053 2.65 0.37
Unemployed -0.287 -0.212 0.032 0.049 -8.96 -4.35***
Salary -35.569 -177.824 381.7 421.3 -0.09 -0.35
Permanent contract -0.068 -0.004 0.049 0.057 -1.37 -0.06
Betterfinancialconditions 0.115 0.127 0.038 0.049 3.01 2.57**
Better empl. prospects 0.107 0.134 0.037 0.048 2.88 2.78**
Search for job -0.073 -0.036 0.037 0.051 -2.01 -0.70
Intend to emigrate 0.112 0.108 0.025 0.027 4.47 3.76***
Note: */**/*** indicate significance at 10/5/1 percent level respectively.
AccordingtoTable9.8.3,participationinthetrainingforin-demandoccupationshasstatisticallysignificantnegative impact on unemployment, positive impact on the perception for better financial conditions andbetter employment prospects, as well as positive impact on intention to emigrate.

63
Table 9.8.4 Training for in-demand occupations (IN) 2019, disaggregated ATT for disadvantaged categories
Outcome variables
Age Gender Place of living Work experience Unemployment
Youth Mature Female Male Rural Urban Without With Very-long Short
Unemployed -0.204 -0.344 -0.309 -0.359 -0.320 -0.304 -0.295 -0.310 -0.194 -0.326
Betterfinancialconditions 0.013 0.106 0.081 0.217 0.064 0.148 0.076 0.090 0.194 0.093
Better empl. prospects -0.039 0.113 0.067 0.196 0.077 0.122 0.067 0.071 0.167 0.097
Intend to emigrate 0.195 0.089 0.126 0.098 0.128 0.102 0.162 0.105 0.139 0.122
Note: Estimation based on nearest-neighbour matching only for statistically significant outcome variables.
According to Table 9.8.4, we can draw the following conclusions with respect to the impact of training for in-demand occupations on disadvantaged groups:
� Youthareworseoffthanmatureunemployedvis-à-visprobabilityofbeingunemployed,theyexpresslowerprobabilityforbetterfinancialconditionsandareworse off regarding the employment prospects; in addition they manifest higher probability to emigrate;
� Femaleareworseoffthanmaleunemployedvis-à-visprobabilityofbeingunemployed,theyexpresslowerprobabilityforbetterfinancialconditionsandareworse off regarding the employment prospects; in addition they manifest higher probability to emigrate;
� Unemployed from rural areas are slightly better off than those from urban areas vis-à-vis probability of being unemployed, they express higher probability for betterfinancialconditionsandarebetteroffregardingtheemploymentprospects;inadditiontheymanifesthigherprobabilitytoemigrate;
� Unemployed without work experience are slightly worse off than those with work experience vis-à-vis probability of being unemployed, they express lower probabilityforbetterfinancialconditionsandareworseoffregardingtheemploymentprospects;inadditiontheymanifesthigherprobabilitytoemigrate;
� Thevery-long-termunemployedareworseoffcomparedtothosewithshorterspellsofunemployment,theyexpresshigherprobabilityforbetterfinancialconditions and are better off regarding the employment prospects; in addition they manifest higher probability to emigrate;
The propensity score density functions and the quality of the matching are presented on Figure 9.8.1 and Figure 9.8.2 respectively.
Figure 9.8.1 Training for in-demand occupations (IN) 2019, Propens. score density functions
Figure 9.8.2 Training for in-demand occupations (IN) 2019, Matching quality
0
kden
sity
psc
ore
propensity score
IN 2019
treated control
1
2
5
3
4
0.2 0.4 0.6 0.8 1
propensity score
IN 2019
0.2 10.4 0.6 0.8
Untrated Treated: On support Treated: Off support
IMPACT ASSESSMENT OF THE ACTIVE LABOUR MARKETMEASURES IN NORTH MACEDONIA
62
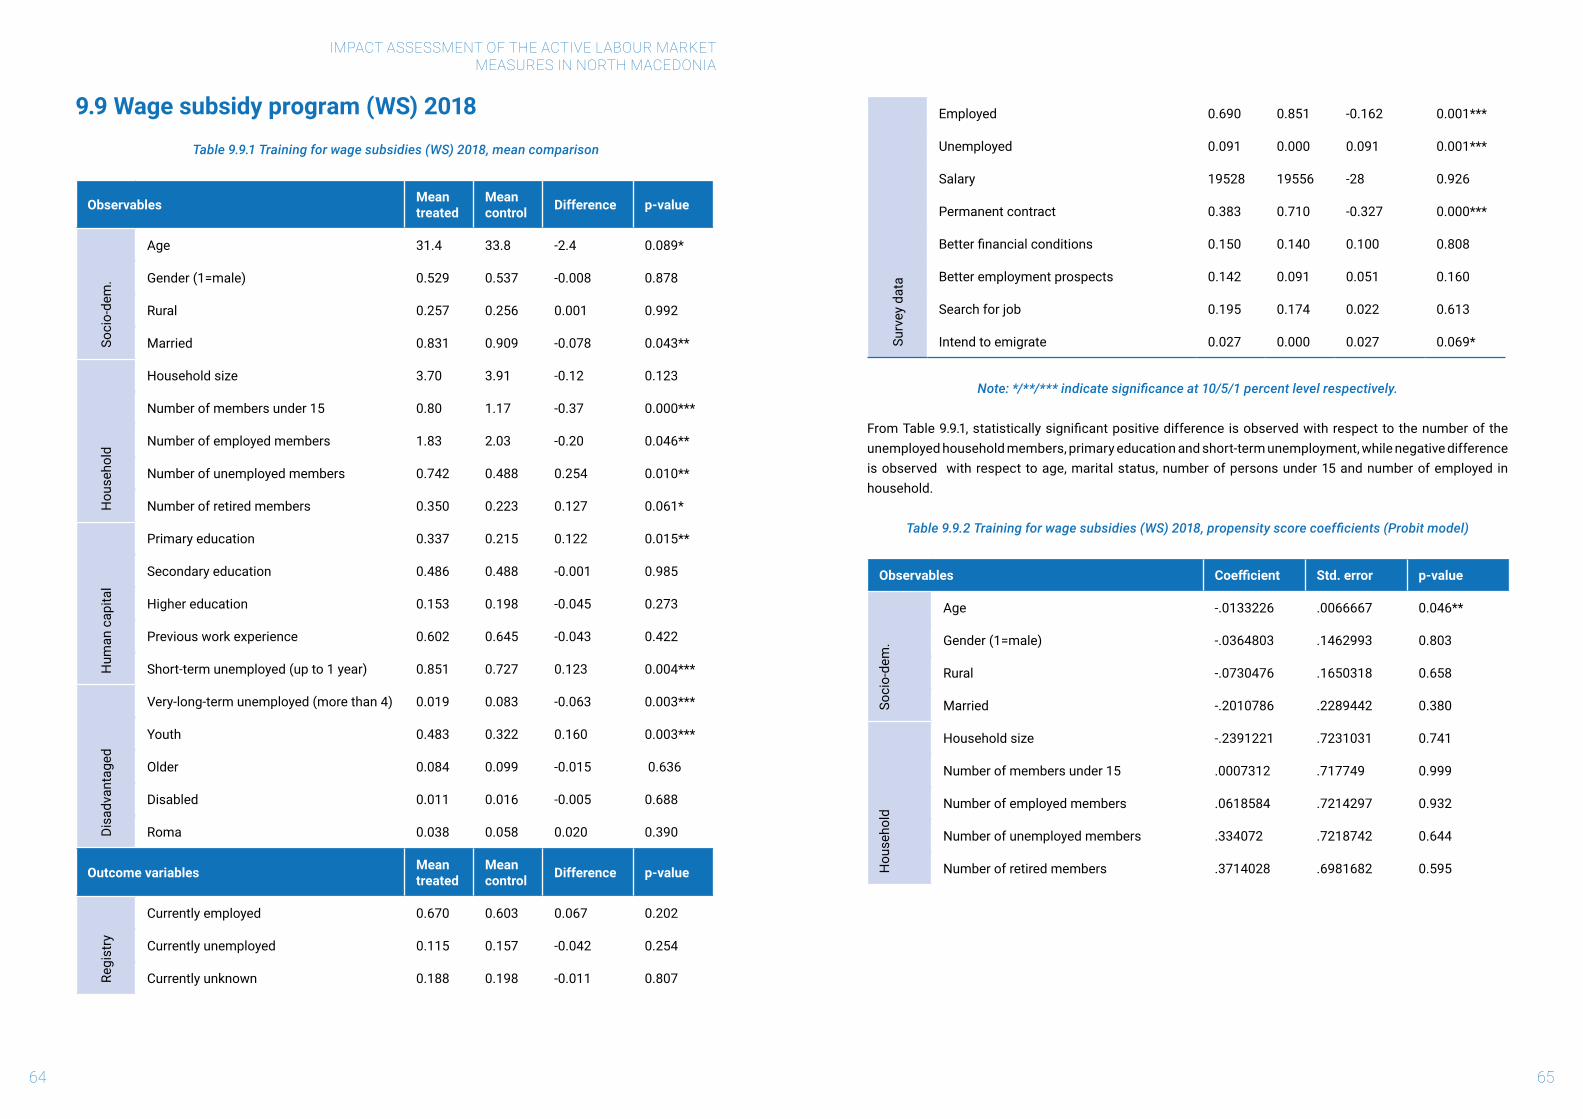
IMPACT ASSESSMENT OF THE ACTIVE LABOUR MARKETMEASURES IN NORTH MACEDONIA
64 65
9.9 Wage subsidy program (WS) 2018
Table 9.9.1 Training for wage subsidies (WS) 2018, mean comparison
Observables Mean treated
Mean control Difference p-value
Soci
o-de
m.
Age 31.4 33.8 -2.4 0.089*
Gender (1=male) 0.529 0.537 -0.008 0.878
Rural 0.257 0.256 0.001 0.992
Married 0.831 0.909 -0.078 0.043**
Hou
seho
ld
Household size 3.70 3.91 -0.12 0.123
Number of members under 15 0.80 1.17 -0.37 0.000***
Number of employed members 1.83 2.03 -0.20 0.046**
Number of unemployed members 0.742 0.488 0.254 0.010**
Number of retired members 0.350 0.223 0.127 0.061*
Hum
an c
apita
l
Primary education 0.337 0.215 0.122 0.015**
Secondary education 0.486 0.488 -0.001 0.985
Higher education 0.153 0.198 -0.045 0.273
Previous work experience 0.602 0.645 -0.043 0.422
Short-term unemployed (up to 1 year) 0.851 0.727 0.123 0.004***
Disa
dvan
tage
d
Very-long-term unemployed (more than 4) 0.019 0.083 -0.063 0.003***
Youth 0.483 0.322 0.160 0.003***
Older 0.084 0.099 -0.015 0.636
Disabled 0.011 0.016 -0.005 0.688
Roma 0.038 0.058 0.020 0.390
Outcome variables Mean treated
Mean control Difference p-value
Regi
stry
Currently employed 0.670 0.603 0.067 0.202
Currently unemployed 0.115 0.157 -0.042 0.254
Currently unknown 0.188 0.198 -0.011 0.807
Surv
ey d
ata
Employed 0.690 0.851 -0.162 0.001***
Unemployed 0.091 0.000 0.091 0.001***
Salary 19528 19556 -28 0.926
Permanent contract 0.383 0.710 -0.327 0.000***
Betterfinancialconditions 0.150 0.140 0.100 0.808
Better employment prospects 0.142 0.091 0.051 0.160
Search for job 0.195 0.174 0.022 0.613
Intend to emigrate 0.027 0.000 0.027 0.069*
Note: */**/*** indicate significance at 10/5/1 percent level respectively.
FromTable9.9.1,statisticallysignificantpositivedifferenceisobservedwithrespecttothenumberoftheunemployed household members, primary education and short-term unemployment, while negative difference is observed with respect to age, marital status, number of persons under 15 and number of employed in household.
Table 9.9.2 Training for wage subsidies (WS) 2018, propensity score coefficients (Probit model)
Observables Coefficient Std. error p-value
Soci
o-de
m.
Age -.0133226 .0066667 0.046**
Gender (1=male) -.0364803 .1462993 0.803
Rural -.0730476 .1650318 0.658
Married -.2010786 .2289442 0.380
Hou
seho
ld
Household size -.2391221 .7231031 0.741
Number of members under 15 .0007312 .717749 0.999
Number of employed members .0618584 .7214297 0.932
Number of unemployed members .334072 .7218742 0.644
Number of retired members .3714028 .6981682 0.595
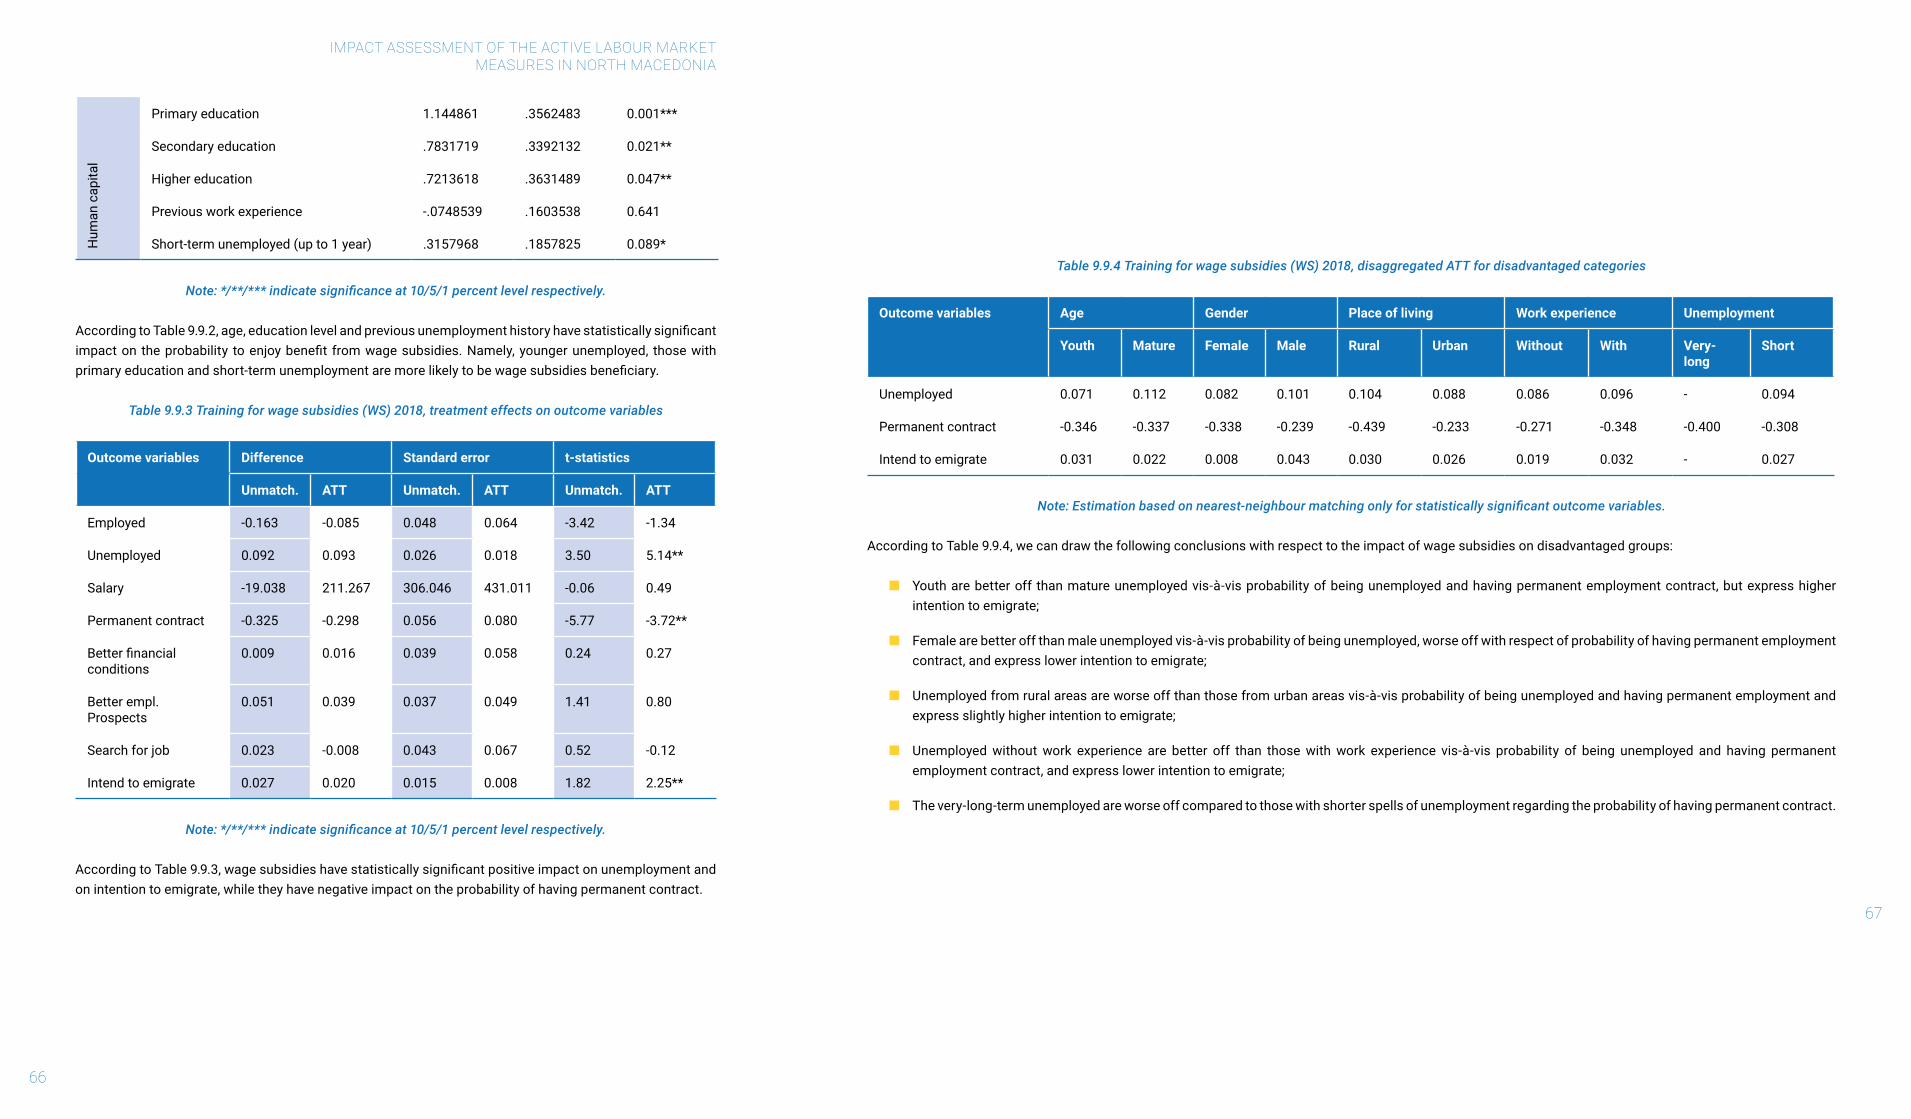
IMPACT ASSESSMENT OF THE ACTIVE LABOUR MARKETMEASURES IN NORTH MACEDONIA
66
Hum
an c
apita
l
Primary education 1.144861 .3562483 0.001***
Secondary education .7831719 .3392132 0.021**
Higher education .7213618 .3631489 0.047**
Previous work experience -.0748539 .1603538 0.641
Short-term unemployed (up to 1 year) .3157968 .1857825 0.089*
Note: */**/*** indicate significance at 10/5/1 percent level respectively.
AccordingtoTable9.9.2,age,educationlevelandpreviousunemploymenthistoryhavestatisticallysignificantimpacton theprobability toenjoybenefit fromwagesubsidies.Namely,youngerunemployed, thosewithprimaryeducationandshort-termunemploymentaremorelikelytobewagesubsidiesbeneficiary.
Table 9.9.3 Training for wage subsidies (WS) 2018, treatment effects on outcome variables
Outcome variables Difference Standard error t-statistics
Unmatch. ATT Unmatch. ATT Unmatch. ATT
Employed -0.163 -0.085 0.048 0.064 -3.42 -1.34
Unemployed 0.092 0.093 0.026 0.018 3.50 5.14**
Salary -19.038 211.267 306.046 431.011 -0.06 0.49
Permanent contract -0.325 -0.298 0.056 0.080 -5.77 -3.72**
Betterfinancialconditions
0.009 0.016 0.039 0.058 0.24 0.27
Better empl. Prospects
0.051 0.039 0.037 0.049 1.41 0.80
Search for job 0.023 -0.008 0.043 0.067 0.52 -0.12
Intend to emigrate 0.027 0.020 0.015 0.008 1.82 2.25**
Note: */**/*** indicate significance at 10/5/1 percent level respectively.
AccordingtoTable9.9.3,wagesubsidieshavestatisticallysignificantpositiveimpactonunemploymentandon intention to emigrate, while they have negative impact on the probability of having permanent contract.
Table 9.9.4 Training for wage subsidies (WS) 2018, disaggregated ATT for disadvantaged categories
Outcome variables Age Gender Place of living Work experience Unemployment
Youth Mature Female Male Rural Urban Without With Very-long
Short
Unemployed 0.071 0.112 0.082 0.101 0.104 0.088 0.086 0.096 - 0.094
Permanent contract -0.346 -0.337 -0.338 -0.239 -0.439 -0.233 -0.271 -0.348 -0.400 -0.308
Intend to emigrate 0.031 0.022 0.008 0.043 0.030 0.026 0.019 0.032 - 0.027
Note: Estimation based on nearest-neighbour matching only for statistically significant outcome variables.
According to Table 9.9.4, we can draw the following conclusions with respect to the impact of wage subsidies on disadvantaged groups:
� Youth are better off than mature unemployed vis-à-vis probability of being unemployed and having permanent employment contract, but express higher intention to emigrate;
� Female are better off than male unemployed vis-à-vis probability of being unemployed, worse off with respect of probability of having permanent employment contract, and express lower intention to emigrate;
� Unemployed from rural areas are worse off than those from urban areas vis-à-vis probability of being unemployed and having permanent employment and express slightly higher intention to emigrate;
� Unemployed without work experience are better off than those with work experience vis-à-vis probability of being unemployed and having permanent employment contract, and express lower intention to emigrate;
� The very-long-term unemployed are worse off compared to those with shorter spells of unemployment regarding the probability of having permanent contract.
67
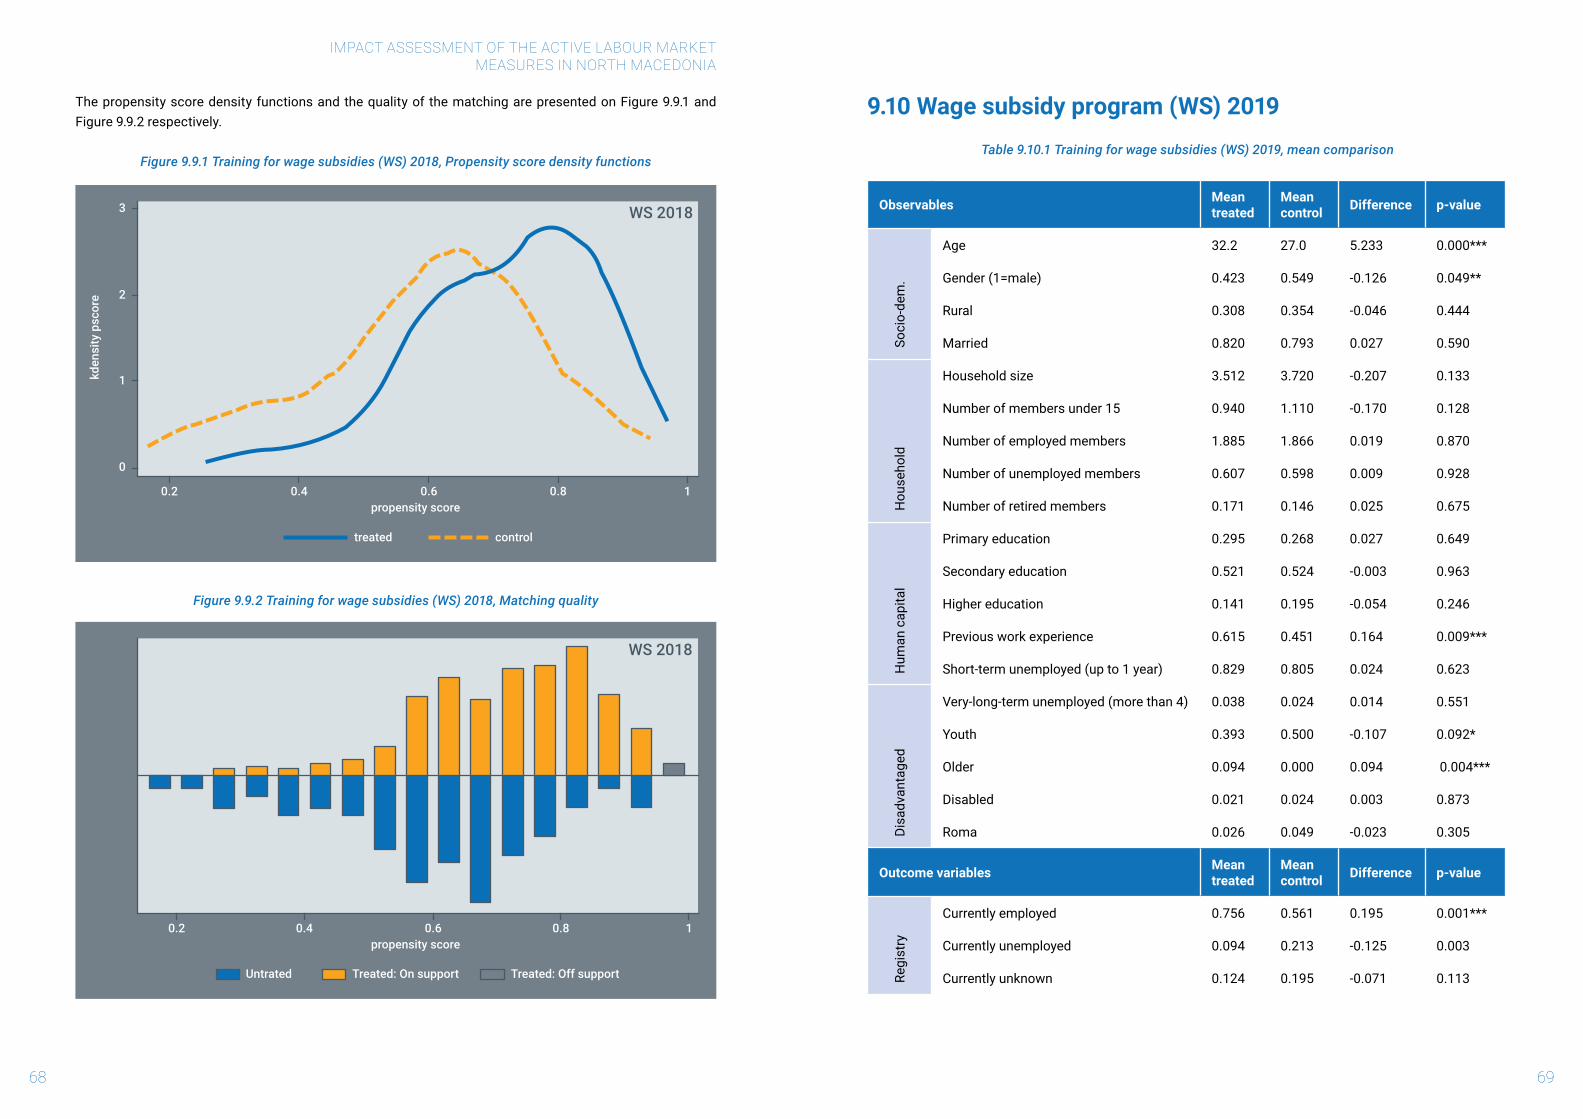
IMPACT ASSESSMENT OF THE ACTIVE LABOUR MARKETMEASURES IN NORTH MACEDONIA
68 69
The propensity score density functions and the quality of the matching are presented on Figure 9.9.1 and Figure 9.9.2 respectively.
Figure 9.9.1 Training for wage subsidies (WS) 2018, Propensity score density functions
Figure 9.9.2 Training for wage subsidies (WS) 2018, Matching quality
9.10 Wage subsidy program (WS) 2019
Table 9.10.1 Training for wage subsidies (WS) 2019, mean comparison
Observables Mean treated
Mean control Difference p-value
Soci
o-de
m.
Age 32.2 27.0 5.233 0.000***
Gender (1=male) 0.423 0.549 -0.126 0.049**
Rural 0.308 0.354 -0.046 0.444
Married 0.820 0.793 0.027 0.590
Hou
seho
ld
Household size 3.512 3.720 -0.207 0.133
Number of members under 15 0.940 1.110 -0.170 0.128
Number of employed members 1.885 1.866 0.019 0.870
Number of unemployed members 0.607 0.598 0.009 0.928
Number of retired members 0.171 0.146 0.025 0.675
Hum
an c
apita
l
Primary education 0.295 0.268 0.027 0.649
Secondary education 0.521 0.524 -0.003 0.963
Higher education 0.141 0.195 -0.054 0.246
Previous work experience 0.615 0.451 0.164 0.009***
Short-term unemployed (up to 1 year) 0.829 0.805 0.024 0.623
Disa
dvan
tage
d
Very-long-term unemployed (more than 4) 0.038 0.024 0.014 0.551
Youth 0.393 0.500 -0.107 0.092*
Older 0.094 0.000 0.094 0.004***
Disabled 0.021 0.024 0.003 0.873
Roma 0.026 0.049 -0.023 0.305
Outcome variables Mean treated
Mean control Difference p-value
Regi
stry
Currently employed 0.756 0.561 0.195 0.001***
Currently unemployed 0.094 0.213 -0.125 0.003
Currently unknown 0.124 0.195 -0.071 0.113
0
kden
sity
psc
ore
propensity score
WS 2018
treated control
1
2
3
0.2 0.4 0.6 0.8 1
propensity score
WS 2018
0.2 10.4 0.6 0.8
Untrated Treated: On support Treated: Off support
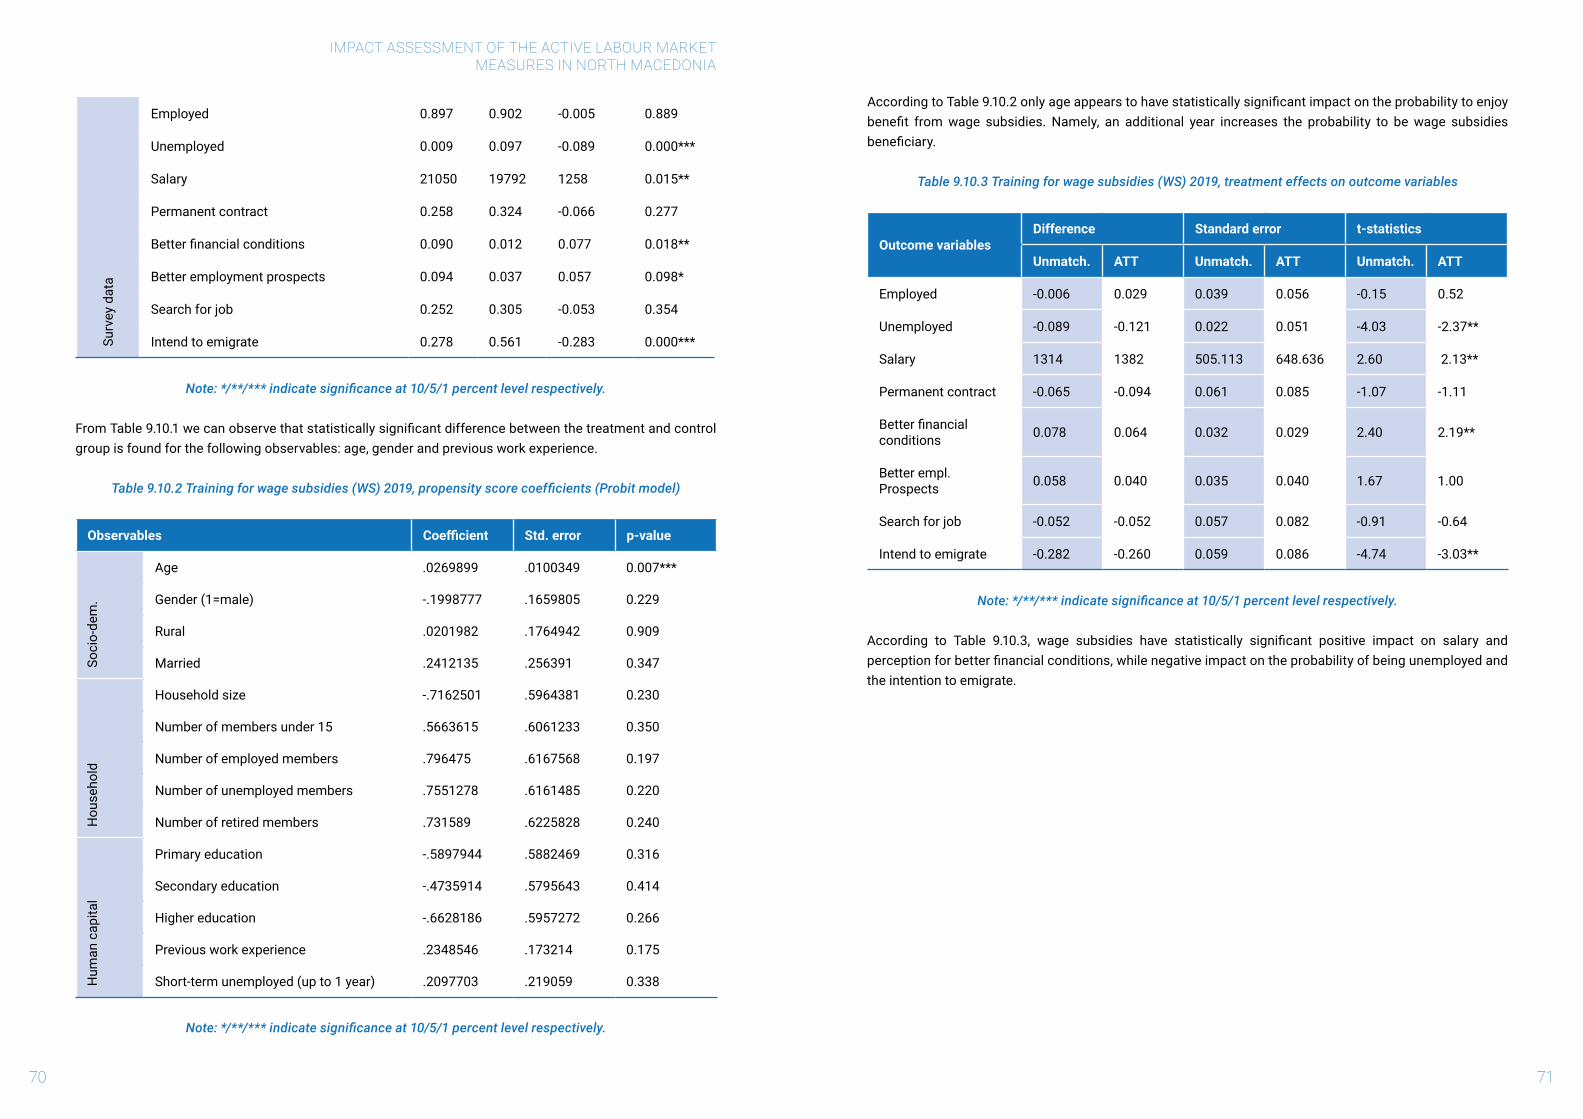
IMPACT ASSESSMENT OF THE ACTIVE LABOUR MARKETMEASURES IN NORTH MACEDONIA
70 71
Surv
ey d
ata
Employed 0.897 0.902 -0.005 0.889
Unemployed 0.009 0.097 -0.089 0.000***
Salary 21050 19792 1258 0.015**
Permanent contract 0.258 0.324 -0.066 0.277
Betterfinancialconditions 0.090 0.012 0.077 0.018**
Better employment prospects 0.094 0.037 0.057 0.098*
Search for job 0.252 0.305 -0.053 0.354
Intend to emigrate 0.278 0.561 -0.283 0.000***
Note: */**/*** indicate significance at 10/5/1 percent level respectively.
FromTable9.10.1wecanobservethatstatisticallysignificantdifferencebetweenthetreatmentandcontrolgroup is found for the following observables: age, gender and previous work experience.
Table 9.10.2 Training for wage subsidies (WS) 2019, propensity score coefficients (Probit model)
Observables Coefficient Std. error p-value
Soci
o-de
m.
Age .0269899 .0100349 0.007***
Gender (1=male) -.1998777 .1659805 0.229
Rural .0201982 .1764942 0.909
Married .2412135 .256391 0.347
Hou
seho
ld
Household size -.7162501 .5964381 0.230
Number of members under 15 .5663615 .6061233 0.350
Number of employed members .796475 .6167568 0.197
Number of unemployed members .7551278 .6161485 0.220
Number of retired members .731589 .6225828 0.240
Hum
an c
apita
l
Primary education -.5897944 .5882469 0.316
Secondary education -.4735914 .5795643 0.414
Higher education -.6628186 .5957272 0.266
Previous work experience .2348546 .173214 0.175
Short-term unemployed (up to 1 year) .2097703 .219059 0.338
Note: */**/*** indicate significance at 10/5/1 percent level respectively.
AccordingtoTable9.10.2onlyageappearstohavestatisticallysignificantimpactontheprobabilitytoenjoybenefit fromwage subsidies. Namely, an additional year increases the probability to bewage subsidiesbeneficiary.
Table 9.10.3 Training for wage subsidies (WS) 2019, treatment effects on outcome variables
Outcome variablesDifference Standard error t-statistics
Unmatch. ATT Unmatch. ATT Unmatch. ATT
Employed -0.006 0.029 0.039 0.056 -0.15 0.52
Unemployed -0.089 -0.121 0.022 0.051 -4.03 -2.37**
Salary 1314 1382 505.113 648.636 2.60 2.13**
Permanent contract -0.065 -0.094 0.061 0.085 -1.07 -1.11
Betterfinancialconditions 0.078 0.064 0.032 0.029 2.40 2.19**
Better empl. Prospects 0.058 0.040 0.035 0.040 1.67 1.00
Search for job -0.052 -0.052 0.057 0.082 -0.91 -0.64
Intend to emigrate -0.282 -0.260 0.059 0.086 -4.74 -3.03**
Note: */**/*** indicate significance at 10/5/1 percent level respectively.
According to Table 9.10.3, wage subsidies have statistically significant positive impact on salary andperceptionforbetterfinancialconditions,whilenegativeimpactontheprobabilityofbeingunemployedandthe intention to emigrate.

73
Table 9.10.4 Training for wage subsidies (WS) 2019, disaggregated ATT for disadvantaged categories
Outcome variables
Age Gender Place of living Work experience Unemployment
Youth Mature Female Male Rural Urban Without With Very-long Short
Unemployed -0.055 -0.206 -0.104 -0.010 - -0.093 -0.045 -0.083 - -0.072
Salary 886 1715 803 1989 885 1412 219 1534 - 1130
Betterfinancialconditions 0.109 0.071 0.076 0.082 0.127 0.060 0.101 0.076 - 0.085
Intend to emigrate -0.413 -0.339 -0.400 -0.495 -0.352 -0.430 -0.309 -0.514 - -0.400
Note: Estimation based on nearest-neighbour matching only for statistically significant outcome variables.
According to Table 9.10.4, we can draw the following conclusions with respect to the impact of wage subsidies on disadvantaged groups:
� Youtharebetteroffthanmatureunemployedvis-à-visprobabilityofbeingunemployedandexpectingbetterfinancialconditionbuttheyhavelowermonthlysalary and lower intention to emigrate;
� Female are better off thanmale unemployed vis-à-vis probability of being unemployed, they have similar expectations for the financial conditions andintention to emigrate, but they are worse of regarding the level of monthly salary;
� Unemployed from rural areas are worse off than those from urban areas vis-à-vis, they manifest lower intention to emigrate and they have lower level of monthly salary;
� Unemployed without work experience are worse off than those with work experience vis-à-vis probability of being unemployed, they have lower level of monthlysalaryandintentiontoemigrate,buttheyexpectbetterfinancialconditions;
� The relative position of the very-long-term unemployed is not possible to be assessed because of their low representation among participants in the wage subsidy program.
The propensity score density functions and the quality of the matching are presented on Figure 9.10.1 and Figure 9.10.2 respectively.
Figure 9.10.1 Training for wage subsidies (WS) 2019, Propensity score density functions
Figure 9.10.2 Training for wage subsidies (WS) 2019, Matching quality
0
kden
sity
psc
ore
propensity score
WS 2019
treated control
1
2
4
3
0.4 0.6 0.8 1
propensity score
WS 2019
10.4 0.6 0.8
Untrated Treated: On support Treated: Off support
IMPACT ASSESSMENT OF THE ACTIVE LABOUR MARKETMEASURES IN NORTH MACEDONIA
72
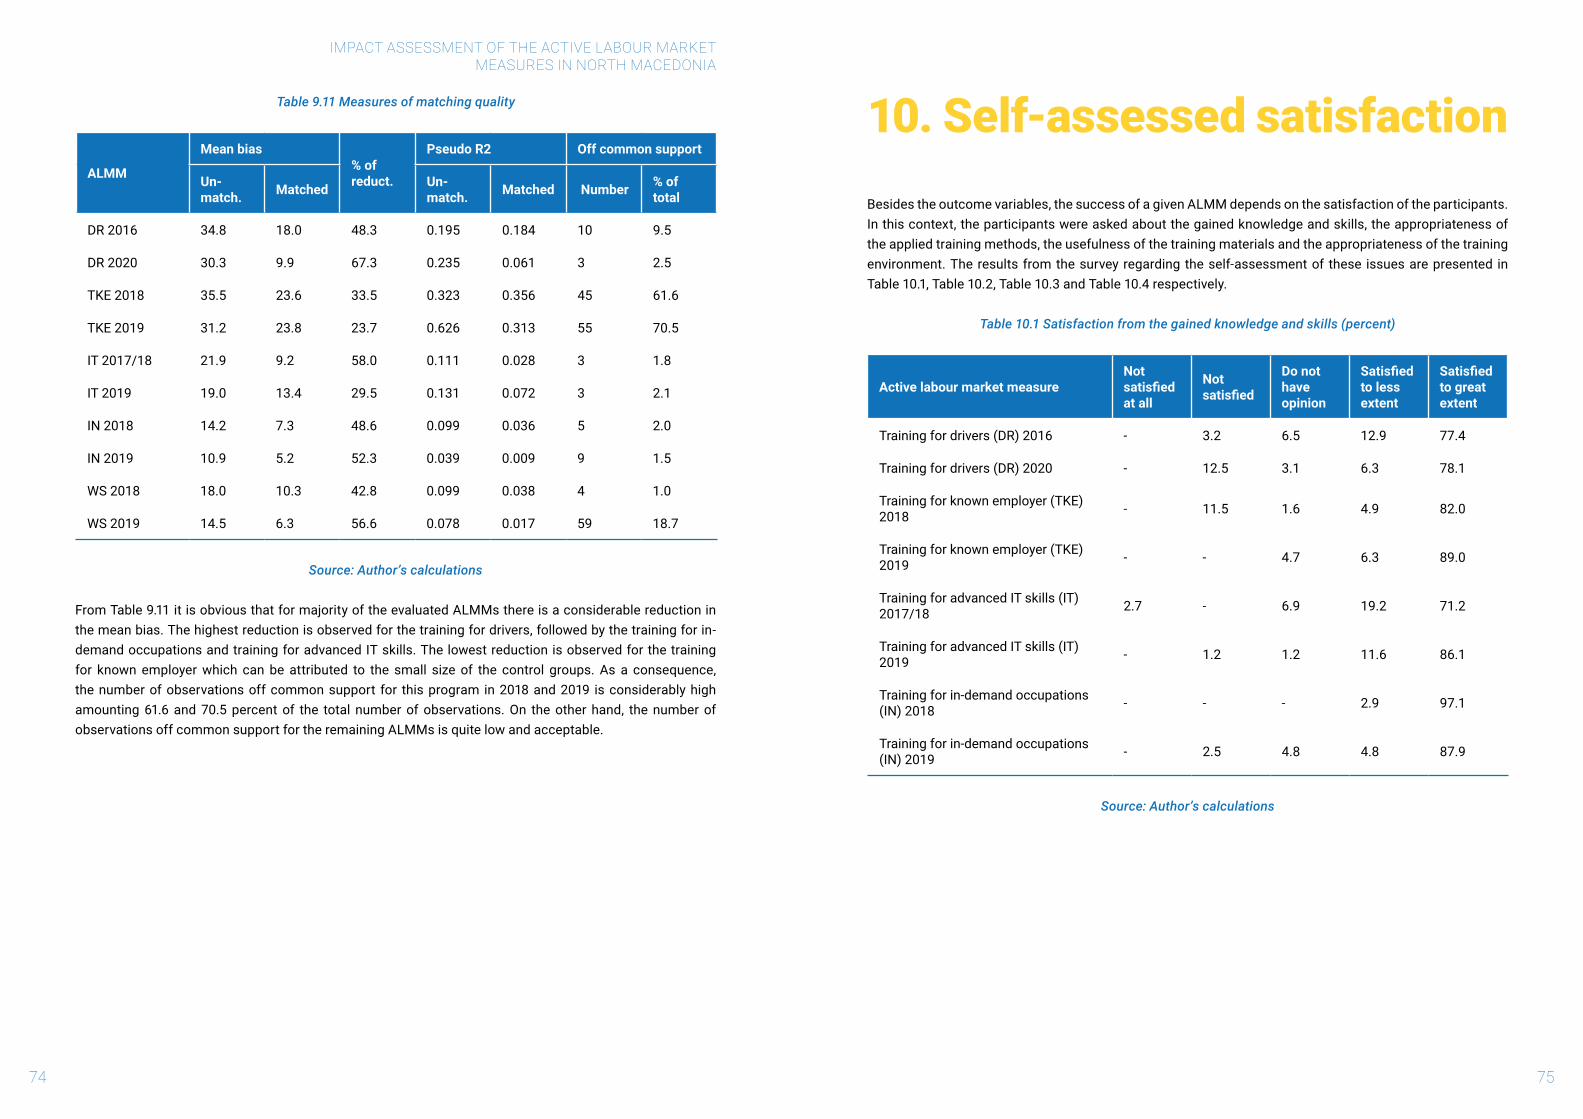
IMPACT ASSESSMENT OF THE ACTIVE LABOUR MARKETMEASURES IN NORTH MACEDONIA
74 75
Table 9.11 Measures of matching quality
ALMM
Mean bias % of reduct.
Pseudo R2 Off common support
Un-match. Matched Un-
match. Matched Number % of total
DR 2016 34.8 18.0 48.3 0.195 0.184 10 9.5
DR 2020 30.3 9.9 67.3 0.235 0.061 3 2.5
TKE 2018 35.5 23.6 33.5 0.323 0.356 45 61.6
TKE 2019 31.2 23.8 23.7 0.626 0.313 55 70.5
IT 2017/18 21.9 9.2 58.0 0.111 0.028 3 1.8
IT 2019 19.0 13.4 29.5 0.131 0.072 3 2.1
IN 2018 14.2 7.3 48.6 0.099 0.036 5 2.0
IN 2019 10.9 5.2 52.3 0.039 0.009 9 1.5
WS 2018 18.0 10.3 42.8 0.099 0.038 4 1.0
WS 2019 14.5 6.3 56.6 0.078 0.017 59 18.7
Source: Author’s calculations
From Table 9.11 it is obvious that for majority of the evaluated ALMMs there is a considerable reduction in the mean bias. The highest reduction is observed for the training for drivers, followed by the training for in-demand occupations and training for advanced IT skills. The lowest reduction is observed for the training for known employer which can be attributed to the small size of the control groups. As a consequence, the number of observations off common support for this program in 2018 and 2019 is considerably high amounting 61.6 and 70.5 percent of the total number of observations. On the other hand, the number of observations off common support for the remaining ALMMs is quite low and acceptable.
10. Self-assessed satisfactionBesides the outcome variables, the success of a given ALMM depends on the satisfaction of the participants. In this context, the participants were asked about the gained knowledge and skills, the appropriateness of the applied training methods, the usefulness of the training materials and the appropriateness of the training environment. The results from the survey regarding the self-assessment of these issues are presented in Table 10.1, Table 10.2, Table 10.3 and Table 10.4 respectively.
Table 10.1 Satisfaction from the gained knowledge and skills (percent)
Active labour market measureNot satisfied at all
Not satisfied
Do not have opinion
Satisfied to less extent
Satisfied to great extent
Training for drivers (DR) 2016 - 3.2 6.5 12.9 77.4
Training for drivers (DR) 2020 - 12.5 3.1 6.3 78.1
Training for known employer (TKE) 2018 - 11.5 1.6 4.9 82.0
Training for known employer (TKE) 2019 - - 4.7 6.3 89.0
Training for advanced IT skills (IT) 2017/18 2.7 - 6.9 19.2 71.2
Training for advanced IT skills (IT) 2019 - 1.2 1.2 11.6 86.1
Training for in-demand occupations (IN) 2018 - - - 2.9 97.1
Training for in-demand occupations (IN) 2019 - 2.5 4.8 4.8 87.9
Source: Author’s calculations

IMPACT ASSESSMENT OF THE ACTIVE LABOUR MARKETMEASURES IN NORTH MACEDONIA
76 77
Table 10.2 Appropriateness of the applied training methods (percent)
Active labour market measure
Not appropriate at all
Not appropriate
Do not have opinion
Appropriate to less extent
Appropriate to great extent
Training for drivers (DR) 2016 - 6.5 6.5 12.9 74.2
Training for drivers (DR) 2020 - 6.3 6.3 12.5 75.0
Training for known employer (TKE) 2018 - 3.3 6.6 8.2 82.0
Training for known employer (TKE) 2019 - - 4.7 6.3 89.0
Training for advanced IT skills (IT) 2017/18 2.7 2.7 5.5 8.2 80.8
Training for advanced IT skills (IT) 2019 - - 5.8 9.3 84.9
Training for in-demand occupations (IN) 2018 - - 1.9 1.9 96.2
Training for in-demand occupations (IN) 2019 - 3.2 3.5 5.7 87.6
Source: Author’s calculations
Table 10.3 Usefulness of the training materials (percent)
Active labour market measureNot useful at all
Not useful
Do not have opinion
Useful to less extent
Useful to great extent
Training for drivers (DR) 2016 - 12.9 - 9.7 77.4
Training for drivers (DR) 2020 - 3.1 15.6 - 81.3
Training for known employer (TKE) 2018 - 4.9 6.6 13.1 75.4
Training for known employer (TKE) 2019 - - 3.1 4.7 92.2
Training for advanced IT skills (IT) 2017/18 2.7 2.7 4.1 11.0 79.5
Training for advanced IT skills (IT) 2019 - - 2.3 9.3 88.4
Training for in-demand occupations (IN) 2018 - - 1.0 3.0 96.0
Training for in-demand occupations (IN) 2019 - 1.9 4.2 4.4 89.5
Source: Author’s calculations
Table 10.4 Appropriateness of the training environment (percent)
Active labour market measure
Not appropriate at all
Not appropriate
Do not have opinion
Appropriate to less extent
Appropriate to great extent
Training for drivers (DR) 2016 - 6.5 9.7 9.7 74.2
Training for drivers (DR) 2020 - 9.4 6.3 6.3 78.1
Training for known employer (TKE) 2018 1.6 - 8.2 6.6 83.6
Training for known employer (TKE) 2019 - - 6.3 1.6 92.2
Training for advanced IT skills (IT) 2017/18 4.1 - 2.7 11.0 82.2
Training for advanced IT skills (IT) 2019 - - 3.5 9.3 87.2
Training for in-demand occupations (IN) 2018 - - 1.0 1.9 97.1
Training for in-demand occupations (IN) 2019 - 0.9 3.5 2.9 92.7
Source: Author’s calculations
FromTable10.1toTable10.4wecanconcludethatmajorityoftheparticipantswheregenerallysatisfiedwiththeprovidedtrainings.Althoughthedifferencesamongtrainingprogrammesaresmall,themostsatisfiedare participants in the training for in-demand occupations in 2018 and participants in the training for known employerin2019.Ontheotherhand,theleastsatisfiedareparticipantsinthetrainingfordriversin2016and2020.
In the case of wage subsidies, the satisfaction is assessed with respect to the job, salary, on-the-job training and superiors.
Table 10.5 Satisfaction from the job (percent)
Active labour market measureNot satisfied at all
Not satisfied
Do not have opinion
Satisfied to less extent
Satisfied to great extent
Wage subsidy program (WS) 2018 - 0.5 1.4 32.7 65.5
Wage subsidy program (WS) 2019 5.3 1.0 0.5 2.4 90.8
Source: Author’s calculations
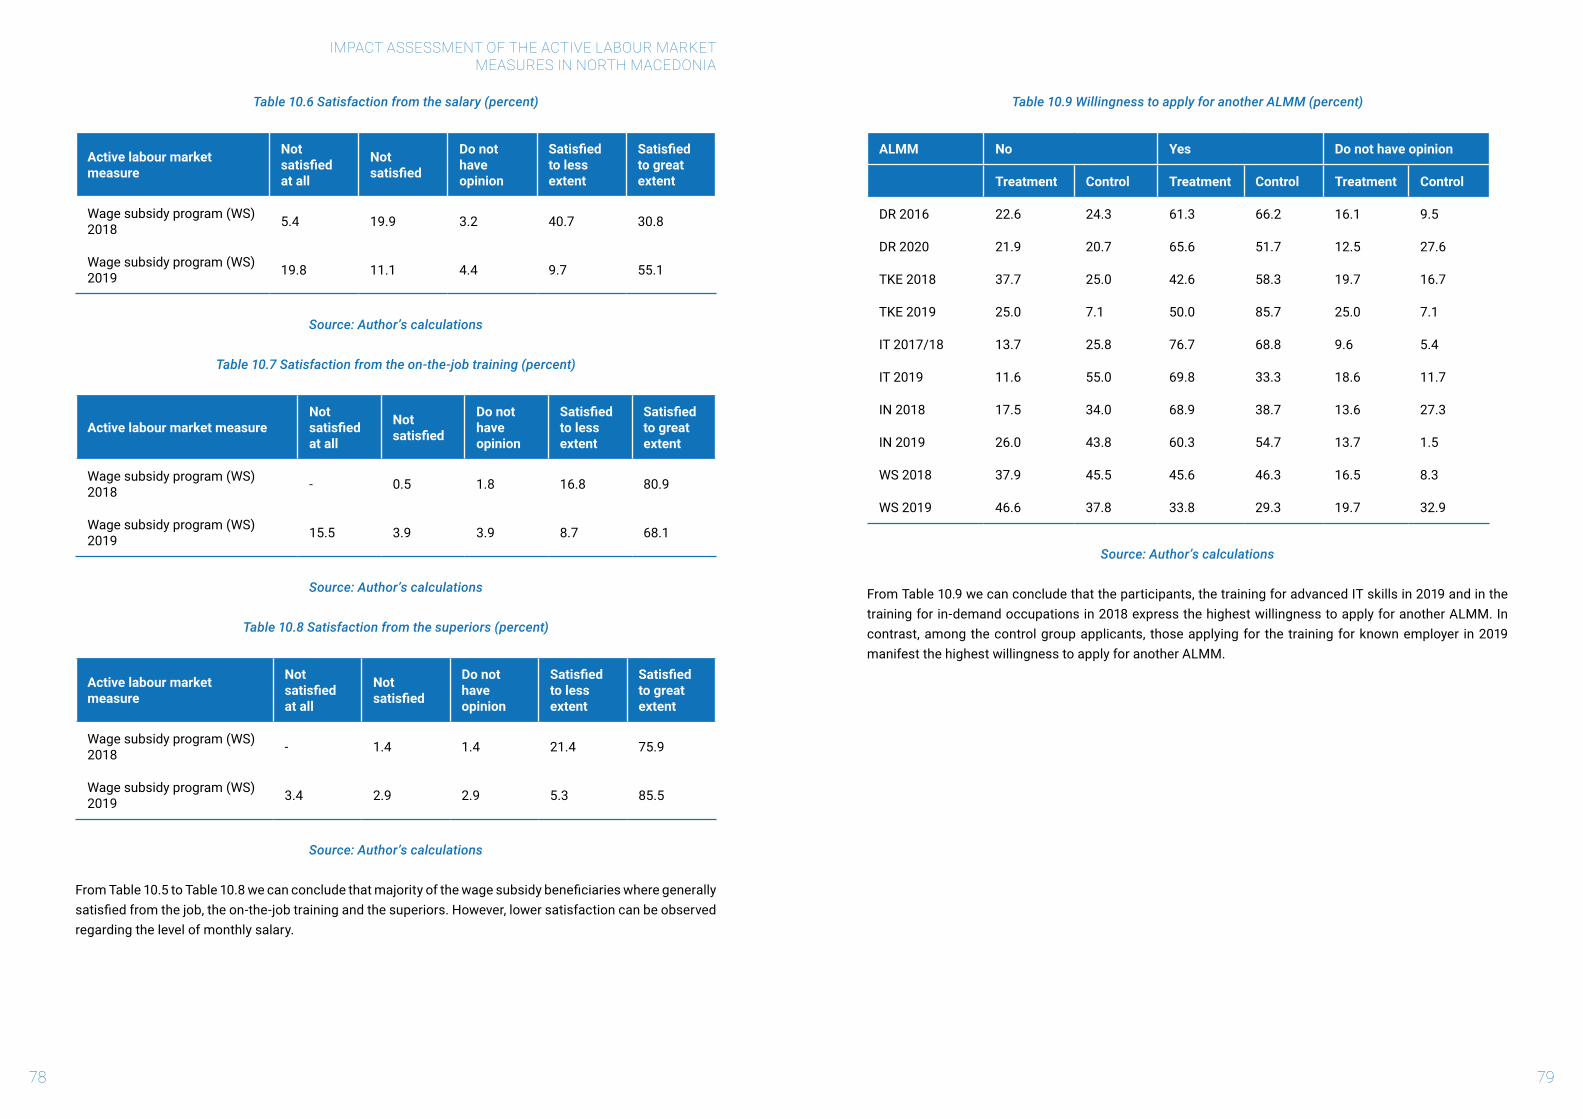
IMPACT ASSESSMENT OF THE ACTIVE LABOUR MARKETMEASURES IN NORTH MACEDONIA
78 79
Table 10.6 Satisfaction from the salary (percent)
Active labour market measure
Not satisfied at all
Not satisfied
Do not have opinion
Satisfied to less extent
Satisfied to great extent
Wage subsidy program (WS) 2018 5.4 19.9 3.2 40.7 30.8
Wage subsidy program (WS) 2019 19.8 11.1 4.4 9.7 55.1
Source: Author’s calculations
Table 10.7 Satisfaction from the on-the-job training (percent)
Active labour market measureNot satisfied at all
Not satisfied
Do not have opinion
Satisfied to less extent
Satisfied to great extent
Wage subsidy program (WS) 2018 - 0.5 1.8 16.8 80.9
Wage subsidy program (WS) 2019 15.5 3.9 3.9 8.7 68.1
Source: Author’s calculations
Table 10.8 Satisfaction from the superiors (percent)
Active labour market measure
Not satisfied at all
Not satisfied
Do not have opinion
Satisfied to less extent
Satisfied to great extent
Wage subsidy program (WS) 2018 - 1.4 1.4 21.4 75.9
Wage subsidy program (WS) 2019 3.4 2.9 2.9 5.3 85.5
Source: Author’s calculations
FromTable10.5toTable10.8wecanconcludethatmajorityofthewagesubsidybeneficiarieswheregenerallysatisfiedfromthejob,theon-the-jobtrainingandthesuperiors.However,lowersatisfactioncanbeobservedregarding the level of monthly salary.
Table 10.9 Willingness to apply for another ALMM (percent)
ALMM No Yes Do not have opinion
Treatment Control Treatment Control Treatment Control
DR 2016 22.6 24.3 61.3 66.2 16.1 9.5
DR 2020 21.9 20.7 65.6 51.7 12.5 27.6
TKE 2018 37.7 25.0 42.6 58.3 19.7 16.7
TKE 2019 25.0 7.1 50.0 85.7 25.0 7.1
IT 2017/18 13.7 25.8 76.7 68.8 9.6 5.4
IT 2019 11.6 55.0 69.8 33.3 18.6 11.7
IN 2018 17.5 34.0 68.9 38.7 13.6 27.3
IN 2019 26.0 43.8 60.3 54.7 13.7 1.5
WS 2018 37.9 45.5 45.6 46.3 16.5 8.3
WS 2019 46.6 37.8 33.8 29.3 19.7 32.9
Source: Author’s calculations
From Table 10.9 we can conclude that the participants, the training for advanced IT skills in 2019 and in the training for in-demand occupations in 2018 express the highest willingness to apply for another ALMM. In contrast, among the control group applicants, those applying for the training for known employer in 2019 manifest the highest willingness to apply for another ALMM.

IMPACT ASSESSMENT OF THE ACTIVE LABOUR MARKETMEASURES IN NORTH MACEDONIA
80
11. The impact of Covid-19The last Covid-19 crisis exerted devastating effects on the world economy as well as the functioning of the labour markets. When the pandemic spread out around the world, the governments reacted swiftly with wide-ranging containment measures. The negative impact of this crisis is manifested as structural distortions amonganumberofindustriesandprofessionsthatwillhavelonglastingeconomicconsequences.
The Covid-19 crisis has stimulated many activities in the digital gig economy4. The demand for gigs in many sectors and the expected ascension of several new forms of job calls for the employment of a comprehensive gig economy framework. Following the Covid-19 outbreak, many sectors in the economy are under pressure including home rental, design and crafting, simple tasks and renting. Others, such as software-based services, banking and investment services are expected to remain at the same level or even increase, while vital sectors such as service delivery are expected to rise considerably (Dhaini et al., 2020).
Notwithstanding, it is expected that the recovery from the Covid-19 will last longer and will need more substantial restructuring of the economy. In this context, the most affected are the vulnerable population segments such as: women, older people, immigrants and the workers with lower levels of education and they are less likely to be reached by the mitigation and job retention measures that have been adopted in response to the Covid-19 pandemic. According to the World Bank estimates, recent poverty reduction gains in anumberofeconomieswilllikelybelostbecauseofthepandemicsasfirmsresorttolaboursheddinginthemost affected sectors. In addition, the mobility limitations engendered from the pandemics has considerably restrictedthepossibilitiesforcircularmigrationandhadsignificantadverseeffectsontheemigrantswelfare.
Digitaltechnologiesnowadaysrepresentasignificantgeneratorofchangesinthedomainofemployment.In this context, the internet has opened up a wide range of opportunities for employment through providing easier access to the global labour market and developing new forms of employment. The recent studies in this domain indicate that online platforms provide job opportunities for those otherwise excluded through geographic borders, gender, or ability. Although ICTs have implied many positive effects on employment, certain studies indicate negative impacts that mainly arise from process optimization and capital-labour substitution intraditional industries.Accordingtotheseinsightsthe internet inducesspecificchangesonthe job market, such as: the end of job stability, and the rise of freelancing, self-employment and odd-jobs. However, it should be noted that arguments about net positive effects prevail indicating that new technologies generate new types of employment.
4 A gig worker is someone who is employed on a freelance basis, carrying out short-term jobs or contracts to one or more employers.
Table 11.1 The extent to which Covid-19 pandemic imposed a need for new skills (percent)
Active labour market measure
Did not impose at all
Did not imposeDo not have opinion
Imposed to less extent
Imposed to great extent
Treat. Control Treat. Control Treat. Control Treat. Control Treat. Control
Training for drivers (DR) 2016 9.7 - 32.3 90.5 25.8 4.1 9.7 - 22.6 5.4
Training for drivers (DR) 2020 - 4.6 53.1 85.2 18.8 2.3 6.3 2.3 21.9 5.7
Training for known employer (TKE) 2018 3.3 - 60.7 83.3 13.1 - 8.2 - 14.8 16.7
Training for known employer (TKE) 2019 - - 67.2 42.9 25.0 7.1 1.6 - 6.3 50.0
Training for advanced IT skills (IT) 2017/18 6.9 8.6 41.1 41.9 12.3 2.2 13.7 24.7 26.0 22.6
Training for advanced IT skills (IT) 2019 1.2 1.7 60.5 58.3 24.4 3.3 3.5 - 10.5 36.7
Training for in-demand occupations (IN) 2018 1.0 13.3 98.1 28.7 1.9 14.0 - 2.0 - 42.0
Training for in-demand occupations (IN) 2019 3.8 2.5 26.0 33.0 13.7 7.6 24.4 28.3 32.1 28.6
Wage subsidy program (WS) 2018 1.9 0.8 31.2 27.3 1.2 0.8 30.0 31.4 35.8 39.7
Wage subsidy program (WS) 2019 25.6 19.5 3.0 - 15.8 25.6 - - 55.6 54.9
Source: Author’s calculations
According to Table 11.1, the pandemic of Covid-19 imposed a need for new skills to less extent among participants in training for drivers and training for known employer. In contrast, a higher need for new skills due to the pandemic is observed among participants in the training for advanced IT skills and training for in-demand occupations.
81

83
Table 11.2 Increased demand for skills due to Covid-19 pandemic (percent)
Active labour market measureForeign languages
Basic IT skills
Advanced IT skills
E-commerce E-banking Other
Trea. Cont. Trea. Cont. Trea. Cont. Trea. Cont. Trea. Cont. Trea. Cont.
Training for drivers (DR) 2016 45.5 - - - 36.4 60.0 9.1 20.0 - 20.0 9.1 -
Training for drivers (DR) 2020 - - - - 55.6 100 33.3 - 11.1 - - -
Training for known employer (TKE) 2018 14.3 - - - 57.1 - 14.3 50.0 14.3 50.0 - -
Training for known employer (TKE) 2019 20.0 14.3 - - - 85.7 - - 60.0 - 20.0 -
Training for advanced IT skills (IT) 2017/18
- 1.4 50.0 58.1 21.7 16.2 - - 6.5 1.4 21.7 23.0
Training for advanced IT skills (IT) 2019 7.7 18.2 15.4 - 69.2 72.7 - - 7.7 9.1 - -
Training for in-demand occupations (IN) 2018
- 48.5 - 4.6 - 33.3 - 7.6 - 6.1 - -
Training for in-demand occupations (IN) 2019
8.0 1.8 30.8 34.8 8.9 3.3 1.9 0.7 1.0 2.5 49.5 56.9
Wage subsidy program (WS) 2018 2.7 - 36.2 41.3 5.4 5.0 2.3 - 0.4 1.7 53.1 52.1
Wage subsidy program (WS) 2019 39.8 31.1 1.6 - 39.1 42.2 7.0 15.6 12.5 11.1 - -
Source: Author’s calculations
From Table 11.2 we can notice that the majority of the respondents emphasised the increased demand for advanced IT skills due to the pandemic of Covid-19. The highsharesofthecategory‘Other’forsomeALMMsuchasthetrainingforin-demandoccupationsin2019,thetrainingforadvancedITskillsin2017/18andthewage subsidies in 2018 suggest a need for more detailed inspections. In particular, some other skills engendered from the social and physical distancing may have not been anticipated. The EU experience shows that the burden of the Covid-19 social distancing falls disproportionately on vulnerable workforce groups, such as: women, older employees, the lower-educated and those employed in small enterprises. As a consequence there is an urgent need for immediate and targeted policy responses to prevent ongoing job losses and widening of labour market and social inequalities due to the pandemic.5
5 Based on the Covid-19 social distancing risk index (COV19R), CEDEFOP.
12. Cost effectivenessThe cost effectiveness analysis serves as a tool of economy by calculating the cost of producing of one unite of outcome. In order to carry out a cost effectiveness analysis the outcomes from the ALMMs must be quantifiableandcompletelyattributabletotheintervention.Inaddition,costeffectivenessanalysisobviouslyrequire accurate measure of the cost of the intervention. Finally, this analysis requires the comparison of at least two interventions, one of which can be the current intervention or status quo. The costs typically include the direct costs of the ALMM or the income support costs while clients received interventions, and these usually come from administrative records.
TwoissuesarefundamentaltothemeasurementofthecosteffectivenessanalysisofALMMs:first,whatisthe outcome? and second, when should one measure the outcome: immediately after the training or over some time period? Outcomes of interest in labour market programs typically relate to some form of employment and might include increases in earnings, increases in hours worked, or change in job status from part-time to full-time. Other more indirect measures include reduction in social assistance or employment insurance use. Inaddition, timepresentsan important challenge.A follow-upsurveyafter a yearmaybesufficientto establish return to work in stable employment. Hence, choosing where to position a cost effectiveness analysis along the outcomes is an important decision for the evaluator.
The total cost and cost per participant for the ALMMs under consideration are presented in Table 12.1.
Table 12.1 Average cost per participant
ALMM Total cost Number of participants
Cost per participant (denars)
DR 2016 1678670 65 25826
DR 2020 1311100 52 25213
TKE 2018 3142551 210 14965
TKE 2019 3366720 199 16918
IT 2017/18 16800000 200 84000
IT 2019 23959920 218 109908
IN 2018 19175238 588 32611
IN 2019 35321669 805 43878
WS 2018 165186000 1206 136970
WS 2019 307344000 1945 158017
Source: Author’s calculations
IMPACT ASSESSMENT OF THE ACTIVE LABOUR MARKETMEASURES IN NORTH MACEDONIA
82
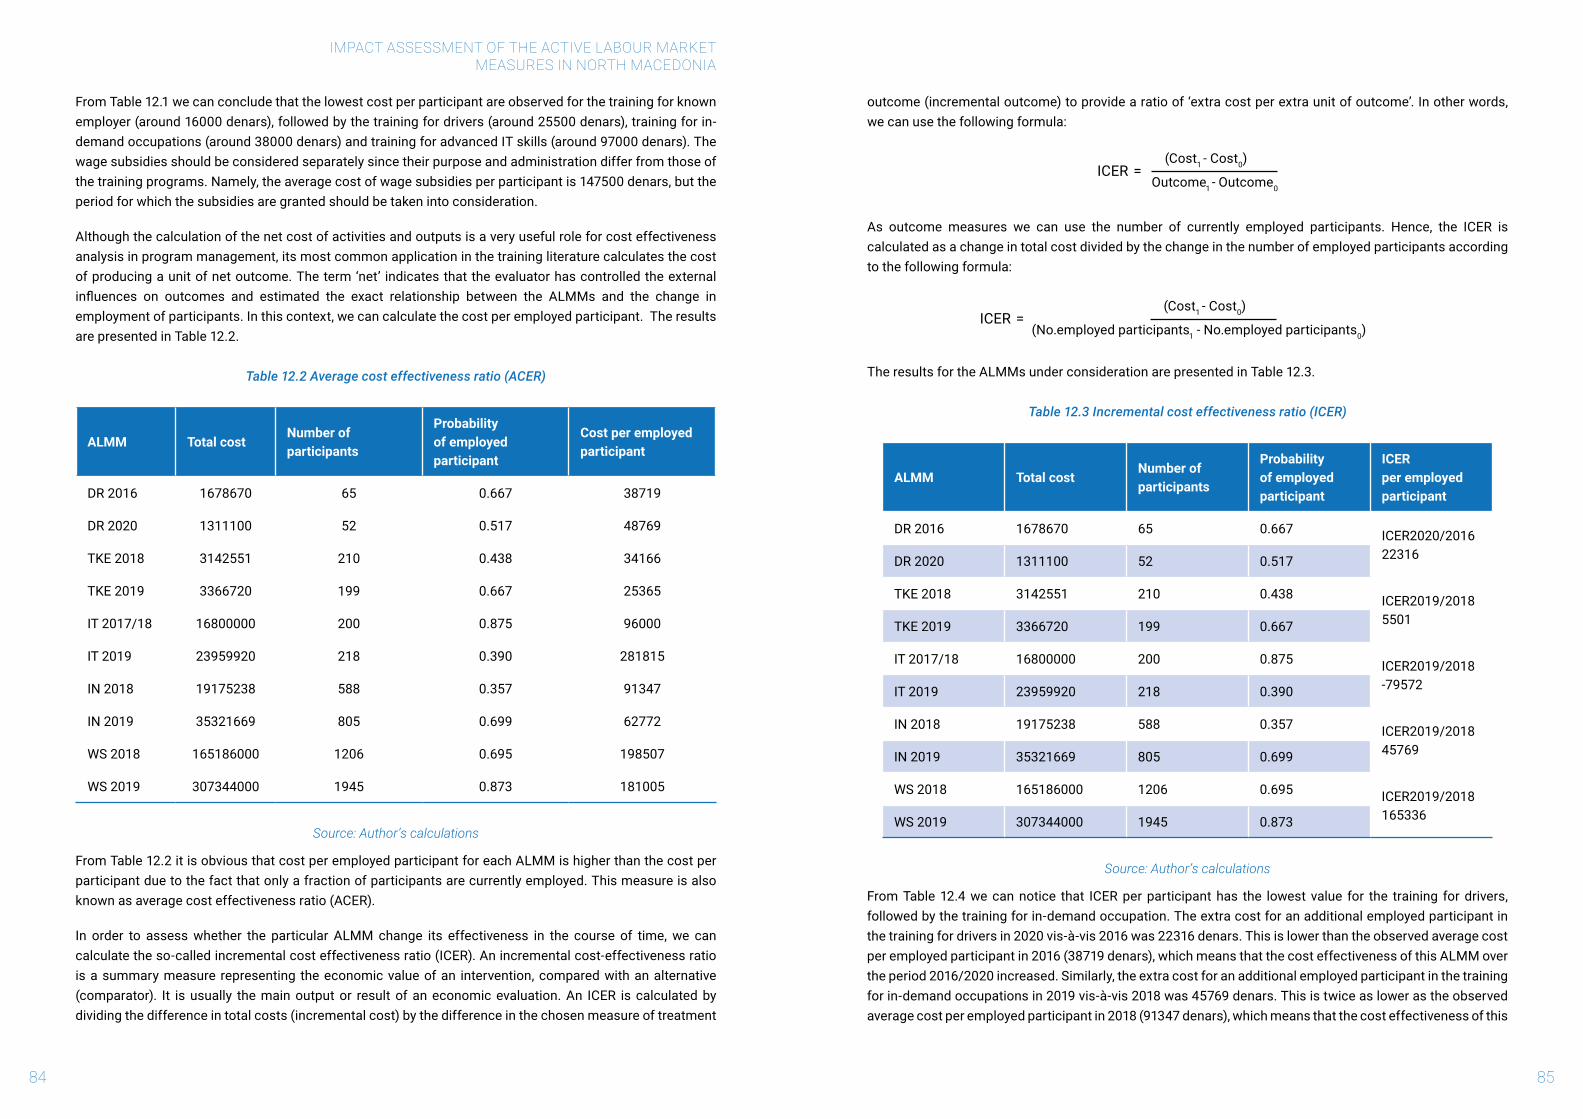
IMPACT ASSESSMENT OF THE ACTIVE LABOUR MARKETMEASURES IN NORTH MACEDONIA
84 85
From Table 12.1 we can conclude that the lowest cost per participant are observed for the training for known employer (around 16000 denars), followed by the training for drivers (around 25500 denars), training for in-demand occupations (around 38000 denars) and training for advanced IT skills (around 97000 denars). The wage subsidies should be considered separately since their purpose and administration differ from those of the training programs. Namely, the average cost of wage subsidies per participant is 147500 denars, but the period for which the subsidies are granted should be taken into consideration.
Although the calculation of the net cost of activities and outputs is a very useful role for cost effectiveness analysis in program management, its most common application in the training literature calculates the cost ofproducingaunitofnetoutcome.Theterm‘net’ indicatesthattheevaluatorhascontrolledtheexternalinfluences on outcomes and estimated the exact relationship between the ALMMs and the change inemployment of participants. In this context, we can calculate the cost per employed participant. The results are presented in Table 12.2.
Table 12.2 Average cost effectiveness ratio (ACER)
ALMM Total costNumber of participants
Probability of employed participant
Cost per employed participant
DR 2016 1678670 65 0.667 38719
DR 2020 1311100 52 0.517 48769
TKE 2018 3142551 210 0.438 34166
TKE 2019 3366720 199 0.667 25365
IT 2017/18 16800000 200 0.875 96000
IT 2019 23959920 218 0.390 281815
IN 2018 19175238 588 0.357 91347
IN 2019 35321669 805 0.699 62772
WS 2018 165186000 1206 0.695 198507
WS 2019 307344000 1945 0.873 181005
Source: Author’s calculations
From Table 12.2 it is obvious that cost per employed participant for each ALMM is higher than the cost per participant due to the fact that only a fraction of participants are currently employed. This measure is also known as average cost effectiveness ratio (ACER).
In order to assess whether the particular ALMM change its effectiveness in the course of time, we can calculate the so-called incremental cost effectiveness ratio (ICER). An incremental cost-effectiveness ratio is a summary measure representing the economic value of an intervention, compared with an alternative (comparator). It is usually the main output or result of an economic evaluation. An ICER is calculated by dividing the difference in total costs (incremental cost) by the difference in the chosen measure of treatment
outcome(incrementaloutcome)toprovidearatioof‘extracostperextraunitofoutcome’.Inotherwords,we can use the following formula:
As outcome measures we can use the number of currently employed participants. Hence, the ICER is calculated as a change in total cost divided by the change in the number of employed participants according to the following formula:
The results for the ALMMs under consideration are presented in Table 12.3.
Table 12.3 Incremental cost effectiveness ratio (ICER)
ALMM Total costNumber of participants
Probability of employed participant
ICERper employed participant
DR 2016 1678670 65 0.667 ICER2020/201622316DR 2020 1311100 52 0.517
TKE 2018 3142551 210 0.438 ICER2019/20185501TKE 2019 3366720 199 0.667
IT 2017/18 16800000 200 0.875 ICER2019/2018-79572IT 2019 23959920 218 0.390
IN 2018 19175238 588 0.357 ICER2019/201845769IN 2019 35321669 805 0.699
WS 2018 165186000 1206 0.695 ICER2019/2018165336WS 2019 307344000 1945 0.873
Source: Author’s calculations
From Table 12.4 we can notice that ICER per participant has the lowest value for the training for drivers, followed by the training for in-demand occupation. The extra cost for an additional employed participant in the training for drivers in 2020 vis-à-vis 2016 was 22316 denars. This is lower than the observed average cost per employed participant in 2016 (38719 denars), which means that the cost effectiveness of this ALMM over the period 2016/2020 increased. Similarly, the extra cost for an additional employed participant in the training for in-demand occupations in 2019 vis-à-vis 2018 was 45769 denars. This is twice as lower as the observed average cost per employed participant in 2018 (91347 denars), which means that the cost effectiveness of this
ICER(Cost1 - Cost0)
Outcome1 - Outcome0
=
ICER(Cost1 - Cost0)
(No.employed participants1 - No.employed participants0)=
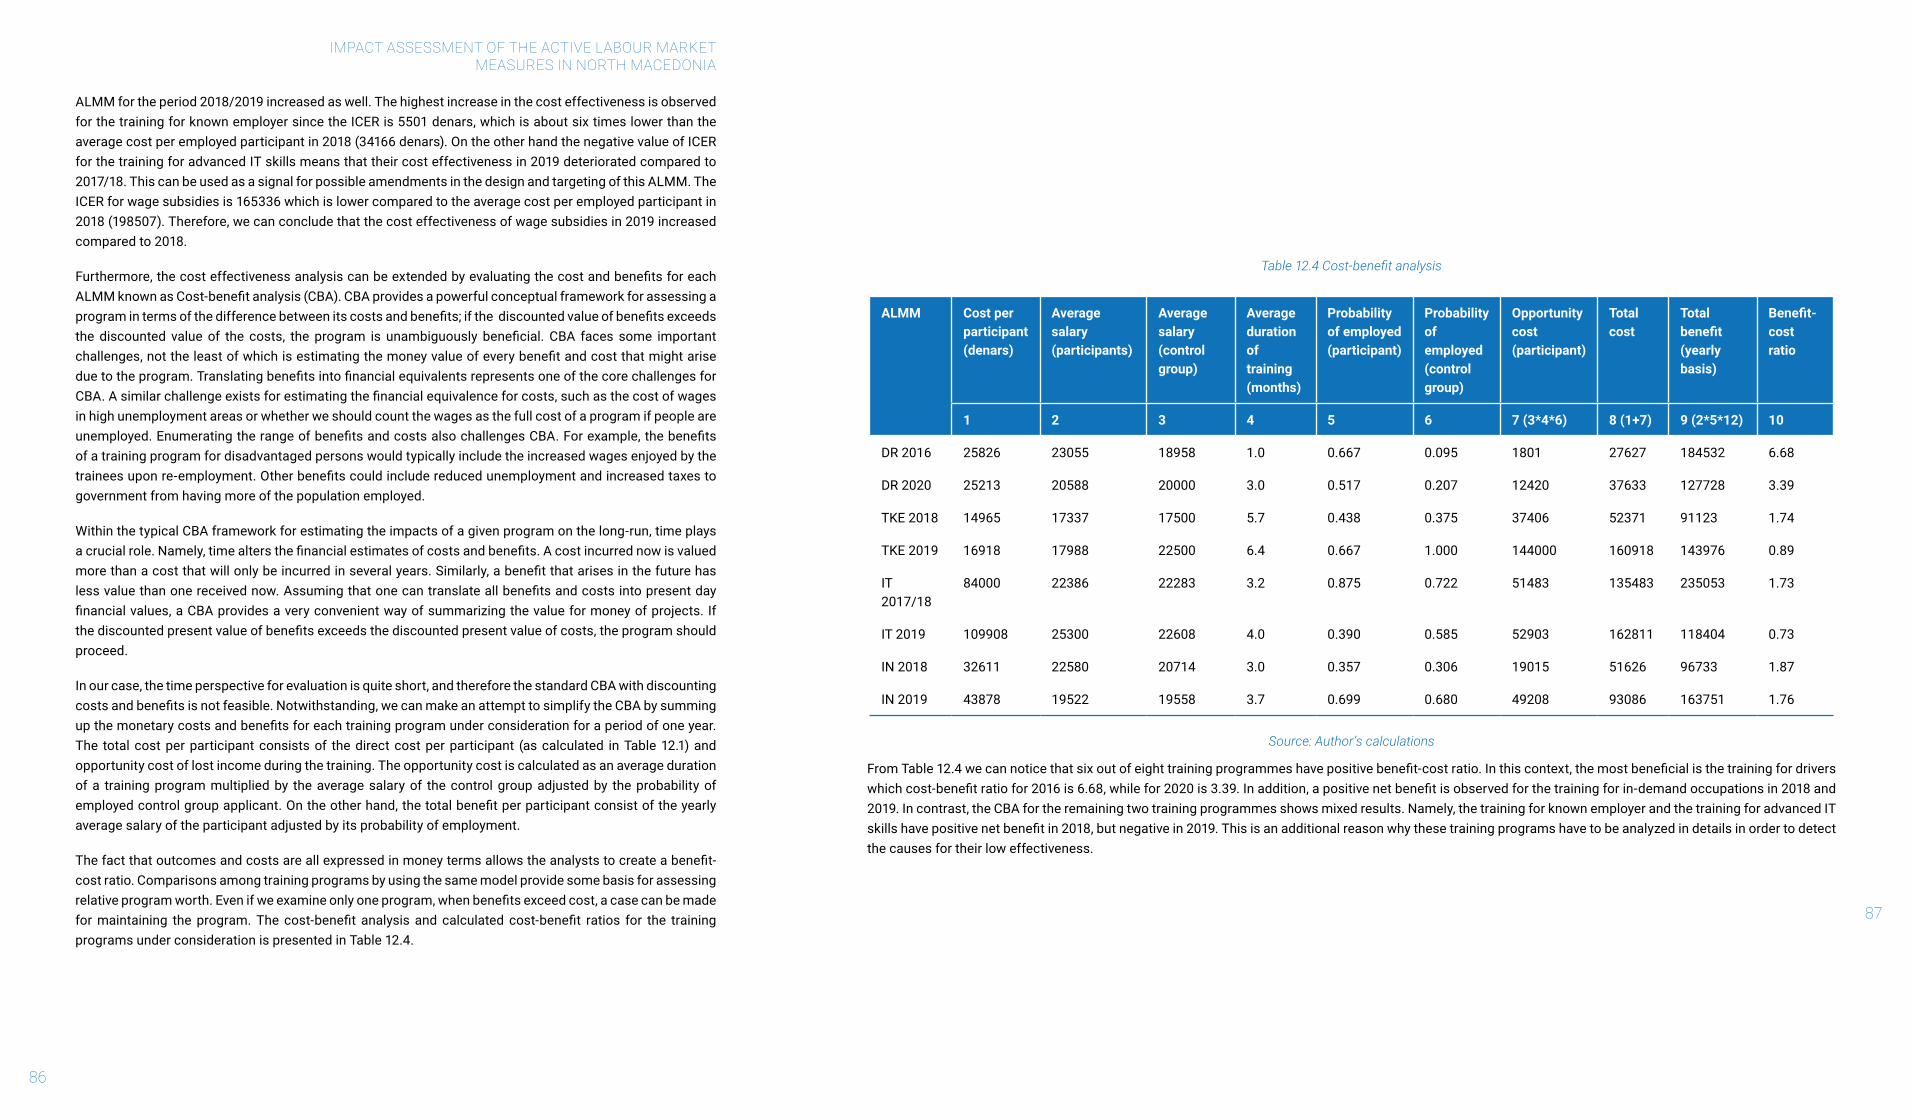
IMPACT ASSESSMENT OF THE ACTIVE LABOUR MARKETMEASURES IN NORTH MACEDONIA
86
ALMM for the period 2018/2019 increased as well. The highest increase in the cost effectiveness is observed for the training for known employer since the ICER is 5501 denars, which is about six times lower than the average cost per employed participant in 2018 (34166 denars). On the other hand the negative value of ICER for the training for advanced IT skills means that their cost effectiveness in 2019 deteriorated compared to 2017/18. This can be used as a signal for possible amendments in the design and targeting of this ALMM. The ICER for wage subsidies is 165336 which is lower compared to the average cost per employed participant in 2018 (198507). Therefore, we can conclude that the cost effectiveness of wage subsidies in 2019 increased compared to 2018.
Furthermore,thecosteffectivenessanalysiscanbeextendedbyevaluatingthecostandbenefitsforeachALMMknownasCost-benefitanalysis(CBA).CBAprovidesapowerfulconceptualframeworkforassessingaprogramintermsofthedifferencebetweenitscostsandbenefits;ifthediscountedvalueofbenefitsexceedsthe discounted value of the costs, the program is unambiguously beneficial. CBA faces some importantchallenges,nottheleastofwhichisestimatingthemoneyvalueofeverybenefitandcostthatmightariseduetotheprogram.TranslatingbenefitsintofinancialequivalentsrepresentsoneofthecorechallengesforCBA.Asimilarchallengeexistsforestimatingthefinancialequivalenceforcosts,suchasthecostofwagesin high unemployment areas or whether we should count the wages as the full cost of a program if people are unemployed.EnumeratingtherangeofbenefitsandcostsalsochallengesCBA.Forexample,thebenefitsof a training program for disadvantaged persons would typically include the increased wages enjoyed by the traineesuponre-employment.Otherbenefitscouldincludereducedunemploymentandincreasedtaxestogovernment from having more of the population employed.
Within the typical CBA framework for estimating the impacts of a given program on the long-run, time plays acrucialrole.Namely,timealtersthefinancialestimatesofcostsandbenefits.Acostincurrednowisvaluedmorethanacostthatwillonlybeincurredinseveralyears.Similarly,abenefitthatarisesinthefuturehaslessvaluethanonereceivednow.Assumingthatonecantranslateallbenefitsandcostsintopresentdayfinancialvalues,aCBAprovidesaveryconvenientwayofsummarizingthevalueformoneyofprojects.Ifthediscountedpresentvalueofbenefitsexceedsthediscountedpresentvalueofcosts,theprogramshouldproceed.
In our case, the time perspective for evaluation is quite short, and therefore the standard CBA with discounting costsandbenefitsisnotfeasible.Notwithstanding,wecanmakeanattempttosimplifytheCBAbysummingupthemonetarycostsandbenefitsforeachtrainingprogramunderconsiderationforaperiodofoneyear.The total cost per participant consists of the direct cost per participant (as calculated in Table 12.1) and opportunity cost of lost income during the training. The opportunity cost is calculated as an average duration of a training program multiplied by the average salary of the control group adjusted by the probability of employedcontrolgroupapplicant.Ontheotherhand,thetotalbenefitperparticipantconsistoftheyearlyaverage salary of the participant adjusted by its probability of employment.
Thefactthatoutcomesandcostsareallexpressedinmoneytermsallowstheanalyststocreateabenefit-cost ratio. Comparisons among training programs by using the same model provide some basis for assessing relativeprogramworth.Evenifweexamineonlyoneprogram,whenbenefitsexceedcost,acasecanbemadeformaintaining theprogram.The cost-benefit analysis and calculated cost-benefit ratios for the trainingprograms under consideration is presented in Table 12.4.
Table 12.4 Cost-benefit analysis
ALMM Cost per participant (denars)
Average salary (participants)
Average salary (control group)
Average duration of training (months)
Probability of employed (participant)
Probability of employed (control group)
Opportunity cost (participant)
Total cost
Total benefit (yearly basis)
Benefit-cost ratio
1 2 3 4 5 6 7 (3*4*6) 8 (1+7) 9 (2*5*12) 10
DR 2016 25826 23055 18958 1.0 0.667 0.095 1801 27627 184532 6.68
DR 2020 25213 20588 20000 3.0 0.517 0.207 12420 37633 127728 3.39
TKE 2018 14965 17337 17500 5.7 0.438 0.375 37406 52371 91123 1.74
TKE 2019 16918 17988 22500 6.4 0.667 1.000 144000 160918 143976 0.89
IT 2017/18
84000 22386 22283 3.2 0.875 0.722 51483 135483 235053 1.73
IT 2019 109908 25300 22608 4.0 0.390 0.585 52903 162811 118404 0.73
IN 2018 32611 22580 20714 3.0 0.357 0.306 19015 51626 96733 1.87
IN 2019 43878 19522 19558 3.7 0.699 0.680 49208 93086 163751 1.76
Source: Author’s calculations
FromTable12.4wecannoticethatsixoutofeighttrainingprogrammeshavepositivebenefit-costratio.Inthiscontext,themostbeneficialisthetrainingfordriverswhichcost-benefitratiofor2016is6.68,whilefor2020is3.39.Inaddition,apositivenetbenefitisobservedforthetrainingforin-demandoccupationsin2018and2019. In contrast, the CBA for the remaining two training programmes shows mixed results. Namely, the training for known employer and the training for advanced IT skillshavepositivenetbenefitin2018,butnegativein2019.Thisisanadditionalreasonwhythesetrainingprogramshavetobeanalyzedindetailsinordertodetectthe causes for their low effectiveness.
87

IMPACT ASSESSMENT OF THE ACTIVE LABOUR MARKETMEASURES IN NORTH MACEDONIA
88
13. ConclusionsThisreportpresentsthefindingsoftheimpactevaluationcarriedoutonselectedactivelabourmarketmeasuresimplemented by the Employment Service Agency. In this context, we evaluated the following ALMMs: The training for drivers for C, D and E category (2016 and 2020), the training for known employer (2018 and 2019), the training for advanced IT skills (2017/18 and 2019), the training for in-demand occupations (2018 and 2019) and wage subsidy program (2018 and 2019). The choice of the years was based on the intention to assess the short-term effectiveness of the programs in the circumstances of changing environment due to the Covid-19 pandemic. The key research question was whether participation in the active labour market programs increasedtheprobabilityofparticipantstofindandretaingainfulemployment.However,inadditiontothismain outcome, we included other outcome variables such as: inactivity, unemployment, salaries, changes in thefinancialsituationandemploymentprospectsaftertheprogram,searchforjobandintentiontoemigrate.
Ideally,policymakersshouldassesseffectivenessofprogramsbyfirst implementingandevaluatingpilotprojects. In this case a design should assume one group participating in a program and a similar group of non-participants. Comparing the performance of the two groups over time would reveal the effectiveness of the program. Based on these evaluations, policy makers can design and target programs more effectively. In addition, evaluations can enable policy makers to make informed decisions about which target groups benefitmostfromaparticularprogram,resultingintargetedprogramsandenhancedprogramperformance.Finally, some programs are ineffective and should be eliminated or changed, hence rigorous evaluations help policy makers to identify them and allow resources to be redirected to programs that are more cost-effective.
Data for evaluation were gathered through telephone survey that was carried out during September 2021, covering the participants (treatment group) and non-participants (control group). The total sample size was 2.230 respondents, of which 1.260 participants, and 970 control group applicants.
In order to answer the research question, we employed a post-program quasi-experimental evaluation method with an aim of achieving unbiased results. By using the propensity score matching technique the ‘net’effectsof programsontheoutcomevariableswereestimated. Inadditiontoestimatingthegeneraleffect, we disaggregated the average treatment effect on treated participants by various attributes in order to identify the particular impact of each ALMM on the vulnerable labour market segments. Finally, we conducted costeffectivenessandsimplifiedcost-benefitanalyseswithanaimtoexplorewhetherthedevotedfundsfortheALMMsareworthwithrespecttotheexpectedbenefitsfromtheirimplementation.TheresultsfromtheanalyseswithregardingthestatisticallysignificantestimationsandthetargetingarebrieflysummarisedinTable 13.1.
Table 13.1 Summary of the ALMMs impact (statistically significant estimations)
ALMM Employed Unemployed SalaryPermanent contract
Better financial condition
Better employment prospects
Search for jobIntention to emigrate
DR 2016
Positive impactPoorly targeted:rural and long-term unempl.
Negative impactPoorly targeted: long-term unemployed
Positive impactLess likely:youth and long-term unempl.
Positive impactLess likely: rural
DR 2020
Positive impactPoorly targeted:rural and long-term unempl.
Negative impactPoorly targeted:Youth, rural and without exp.
Positive impactLess likely: older and long-term unempl.
Positive impactLess likely: older and long-term unempl.
TKE2018
Positive impactLess likely: rural and without work experience
Positive impactLess likely: rural
TKE2019
Negative impactPoorly targeted:youth, female and long-term unemployed
Positive impactLess likely: male and long-term unemployed
Positive impactLess likely: male and long-term unemployed
IT2017/2018
Positive impactLess likely: older and long-term unempl.
Positive impactLess likely: older and long-term unempl.
89

91
ALMM Employed Unemployed SalaryPermanent contract
Better financial condition
Better employment prospects
Search for jobIntention to emigrate
IT 2019
Positive impactLess likely: rural and without work exp.
IN 2018
Positive impactLess likely: youth and male
Positive impactLess likely: youth and male
Negative impactLess likely: youth
IN 2019
Negative impactPoorly targeted:long-term unemployed
Positive impactLess likely: female and rural
Positive impactLess likely: youth and female
Positive impactLess likely: youth and female
WS 2018
Positive impactPoorly targeted:long-term unemployed
Negative impactLess likely: male and urban
Positive impactMore likely:Male and with work exp.
WS 2019
Negative impactPoorly targeted:youth and without work experience
Positive impactMore likely: older, male, urban, with work exp.
Positive impactLess likely: long-term unemployed
Negative impactLess likely:Male and short-term unempl.
14. Policy implicationsThe reforms of the active labour market measures should be delivered by applying integrated and partnership-based approach and should be combined with sufficient management and implementation capacity. Inaddition, the reforms of active labour market policies should account for the possible complementarities with the unemployment compensation system and the existing social assistance programs. The assessment results for each particular intervention have to be used to inform policy makers whether the program has achieved the objectives and to provide information regarding the potential continuation, re-design or termination of the program. The possibility of combining different programs such as wage subsidies and trainings may bring good synergies and can strengthen their individual impact.
ThereformsofactivelabourmarketpoliciesinNorthMacedoniahavetotakeintoaccountthespecificsocio-economic context due to the Covid-19 pandemics, as well as the ESA capacities. This study demonstrated that ALMMs do not work equally well for different individuals and further improvements of their targeting is required. Since one of the main objectives of active labour market measures is to assist the unemployed to get back into work, they require a reasonably buoyant supply of job vacancies in order to be effective. If economy of North Macedonia is generating few vacancies as a consequence of the Covid-19 crisis, one should not be surprised if active measures show to be relatively ineffective.
Having in mind the above analyses, in what follows we provide short assessment of the ALMMs under consideration and attempt to formulate some policy recommendations that should guide the future actions of the policy makers.
Training for drivers for C, D and E category (DR)
This ALMM provide strong positive results for the participants and it is run by well established providers. Althoughithasbeenundertakenonasmallscale,theestimationresultsshowsomedeficiencieswithregardto its targeting. Particularly poorly targeted are unemployed from rural areas and the long-term unemployed. Inaddition,thisprogramishighlycosteffectiveandbeneficialfortheparticipants,leadingtotheconclusionthat it has to be retained in the future.
Training for known employer (TKE)
Althoughdeliveredforspecificemployers,thistrainingprogramprovidesratheruncertainresults.Namely,weonlyidentifieddiminishingimpactontheunemploymentin2019andpositiveimpactonthesubjectiveperceptionsforbetterfinancialconditionsandemploymentprospects.Inthiscontext,somedisadvantagedsegments such as: rural and workers without work experience in 2018, and male and long-term unemployed in 2019 are less likely to enjoy these perceptions. Moreover, we should be cautious with drawing conclusions regarding this training program because of the small sample size of the control groups. Although it is reasonablycosteffective,wefounddiminishingbeneficialeffectsin2019.
Training for advanced IT skills (IT)
The advanced IT skills have been particularly praised by the respondents in the light of the newly created circumstancesduetotheCovid-19pandemic.However,inouranalysisweonlyidentifiedasignificanteffectson the subjective perception of participants in 2017/18 and on the intensity to search for job in 2019. In addition,
IMPACT ASSESSMENT OF THE ACTIVE LABOUR MARKETMEASURES IN NORTH MACEDONIA
90

IMPACT ASSESSMENT OF THE ACTIVE LABOUR MARKETMEASURES IN NORTH MACEDONIA
92 93
thenegative incrementalcosteffectivenessanddiminishingbeneficialeffectssuggest that thisprogrambecomes increasingly more expensive. Hence, we recommend its redesign by taking into consideration the changingneedsforspecificITskills.
Training for in-demand occupations (IN)
Although, the aim of this ALMM is to satisfy the increased demand for particular skills in the labour market, the analyses revealed only a diminishing impact on unemployment in 2019. Moreover, the training for in-demand occupation has generally covered short-term unemployed who face higher level of employment probability thus, indicating a possibility for substantial deadweight loss. This training program has positive impactonthesubjectiveperceptionsforbetterfinancialsituationandemploymentprospects.Inaddition,we found out negative impact on the job search effort in 2018, while positive impact on intention to emigrate in2019.Byhavinginmindtheincreasingcosteffectivenessandfairlygoodbeneficialeffectsrelativetoothertraining program, we recommend continuation of this program in the future. However, the information about the actual needs for skills on the labour market should be up to date according to the results from the ESA Survey on demanded occupations (employers’ interviews).
Wage subsidy program (WS)
The evaluation of the outcomes from the wage subsidy program reveals it improvement in 2019 relative to 2018. Namely, wage subsidies in 2018 exerted increasing unemployment associated with increasing intention to emigrate. This can be attributed to the possible job closures after the expiration of the period for receiving wagesubsidy.However,in2019wefindoutthatwagesubsidiesexertdiminishingimpactonunemploymentassociated with positive impact on salary and negative impact on the intention to emigrate. Although, the incremental cost effectiveness ration demonstrates improving effectiveness in 2019 vis-à-vis 2018, this ALMM is still considered as one of the most expensive measures. The cost-effectiveness analysis of the wage subsidyprogramneedstobeaccompaniedbycost-benefitanalysisinordertoassessitsbeneficialeffectsrelative to the costs. In this context, we recommend redesign of this measure by improving its targeting and conditions for retaining the subsidised jobs.
References and bibliography1. Atanassov, A. and Trifonova, S. (2020) “Assessment of the net effect of the active labour market policy
in Bulgaria”, Journal of Contemporary Management Issues, Vol.25, No.2, pp.263-290;
2. Blache, G. (2011) “Active Labour Market Policies in Denmark: A Comparative Analysis of Post-Program Effect”, CES Working Papers, 2011:71;
3. Boone, J. and van Ours, J. (2004) “Effective Active Labour Market Policies, IZA Discussion Paper, No.1335;
4. Borra, C., Palma, L., Gonzalez, C. and Aguado, L. (2012) “Evaluation of an Active Labour Market Programme in a Context of High Unemployment”, Revista Desarrollo y Sociedad, II semestre;
5. Brown,A.andKoettl,J.(2015)“Activelabourmarketprograms–employmentgainorfiscaldrain?”,IZA Journal of Labour Economics (2015) 4:12;
6. Caliendo, M. and Hujer, R. (2005) “The Microeconometric Estimation of Treatment Effects – An Overview”, IZA Discussion Paper, No.1653;
7. Corbanese, V. and Rosas, G. (2009) “Guide to the design, monitoring and evaluation of innovative active labour market programmes targeting individuals at risk of labour market exclusion”, International Labour Organization;
8. Crato, N. and Paruolo, P. (2019) “Data-Driven Policy Impact Evaluation, How Access to Microdata is Transforming Policy Design”, Springer;
9. Crepon, B. and van den Berg, G. (2016) “Active labour market policies”, IFAU – Office of Labour Market Policy Evaluation, Working paper 2016:17;
10. Dar, A. and Tzannatos, Z. (1999) “Active labour market programs: A review of the evidence from evaluations”, World Bank Social Policy Discussion Paper No.9901;
11. Dhaini, A., Bouchnak, C. and Dreiza, T. (2020) “Covid-19 as accelerator for digital transformation and the rise of the gig economy”, KPMG;
12. Eichhorst, W. and Konle-Seidl, R. (2016) “Evaluating Labour Market Policy”, IZA Discussion Paper, No.9966;
13. Employment Service Agency of North Macedonia, Operational Plans 2007-2021 https://av.gov.mk/operativen-plan.nspx;
14. Escudero, V. (2018) “Are active labour market policies effective in activating and integrating low-skilled individuals? An international comparison”, IZA Journal of Labour Policy 7:4;
15. European Commission (2015) “Upskilling unemployed adults (aged 25 to 64): The organization, profilingandtargetingoftrainingprovision”,European Employment Policy Observatory Review;
IMPACT ASSESSMENT OF THE ACTIVE LABOUR MARKETMEASURES IN NORTH MACEDONIA
94 95
16. European Commission (2018) “Labour market policy statistics methodology 2018”, Directorate-General for Employment Social Affairs and Inclusion;
17. European Commission (2019) “Index on quality of Active Labour Market Policy (ALMP) implementation”, European Network of Public Employment Services;
18. Fay, R. (1996) “Enhancing the Effectiveness of Active Labour Market Policies: Evidence from Programme Evaluation in OECD Countries”, OECD Labour Market and Social Policy Occasional Paper, No.18;
19. FREN (2015) “Impact Evaluation of Active Labour Market Programmes targeting disadvantaged youth in Serbia”, FREN and ILO;
20. Gaëlle, P. (1999) “A framework for active labour market policy evaluation”, International Labour Office, Employment and training papers, No.49;
21. Gertler, P., Martinez, S., Premand, P., Rawlings, R. and Vermeersch, C. (2016) “Impact Evaluation in Practice”, Second edition, World Bank Group;
22. Guijarro, F. (2018) “Economic Recovery and Effectiveness of Active Labour Market Initiatives for the Unemployed in Spain: A Gender Perspective of a Valencian Region”, Sustainability, 10, 3623;
23. Hujer, R. and Caliendo, M. (2000) “Evaluation of Active Labour Market Policy: Methodological Concepts and Empirical Estimates”, IZA Discussion Paper, No.236;
24. ILO (2016) “What works, Active labour market policies in Latin America and Caribbean”, International Labour Organization;
25. Kluve, J. (2006) “The Effectiveness of European Active Labor Market Policy”, IZA Discussion Paper, No.2018;
26. Kluve, J. (2016) “A review of the effectiveness of Active Labour Market Programmes with a focus on Latin America and Caribbean”, International Labour Office, Research department Working Paper No.9;
27. Krstevska, A. and Ilievska, M. (2018) “Developments in major labour market indicators and active labour market measures in dealing with unemployment: Evidence from Macedonia”, BIS Working Party on Monetary Policy, Zagreb;
28. Lammers, M. and Kok, L. (2021) “Are active labour market policies (cost-) effective in the long run? Evidence from the Netherlands”, Empirical Economics (2021) 60: 1719-1746;
29. Lance, P., Guilkey, D., Hattori, A. and Angels, G. (2014) “How do we know if a program made a difference? A guide to statistical methods for program impact evaluation”, Chapel Hill, North Carolina: MEASURE Evaluation;
30. Lauringson, A., Vilsaar, K., Tammik, L. and Luhavee, T. (2011) “Impact Evaluation of Labour Market Training”, Estonian Unemployment Insurance Fund;
31. Loi, M. and Rodrigues, M. (2012) “A note on the impact evaluation of public policies: the counterfactual analysis”, Joint Research Center Scientific and Policy Reports;
32. Martin, J. (2000) “What Works Among Active Labour Market Policies: Evidence from OECD Countries’ Experiences”, OECD Economic Studies No.30, 2000/I;
33. Martin, J. and Grubb, D. (2001) “What works and for whom: a review of OECD countries’ experiences with active labour market policies”, IFAU – Office of Labour Market Policy Evaluation, Working paper 2001:14;
34. Mason, G. and Tereraho, M. (2007) “Value-for-money Analysis of Active Labour Market Programs”, The Canadian Journal of Program Evaluation, Vol.22, No.1, pp.1-29;
35. McKenzie, D. (2017) “How Effective Are Active Labor Market Policies in Developing Countries? A Critical Review of Recent Evidence”, World Bank Group, Policy Research Working Paper, No.8011;
36. Mojsoska-Blazevski, N. and Petreski, M. (2015) “Impact evaluation of active labour market programs inFYRMacedonia:Keyfindings”,International Labour Organization;
37. OECD (2020) “Impact Evaluation Framework for the Spanish Ministry of Labour and Social Economy and Ministry of Inclusion, Social Security and Migrations”, November, 2020;
38. Pierre, G. (1999) “A framework for active labour market policy evaluation”, Employment and training department, International Labour Office;
39. Rodriguez-Planas, N. and Benus, J. (2006) “Evaluating Active Labour Programs in Romania”, IZA Discussion Paper, No.2464;
40. Sahnoun, M. and Abdennadher, C. (2018) “The assessment of active labour market policies: Evidence from OECD countries”, Econ Polit, February 2018;
41. Sekhon, J. (2007) “The Neyman-Rubin Model of Causal Inference and Estimation via Matching Methods”, The Oxford Handbook of Political Methodology;
42. Smith, J. (2000) “A Critical Survey of Empirical Methods for Evaluating Active Labor Market Policies”, NBER;
43. White, H. and Raitzer, D. (2017) “Impact Evaluation of Development Interventions”, Asian Development Bank;
44. Zubović,J.andDomazet,I.(2012)“OntheMethodologyofCost-BenefitAnalysisofALMP–TheCaseof Serbia”, New Challenges in Changing Labor Market, Institute of Economic Sciences, Belgrade.
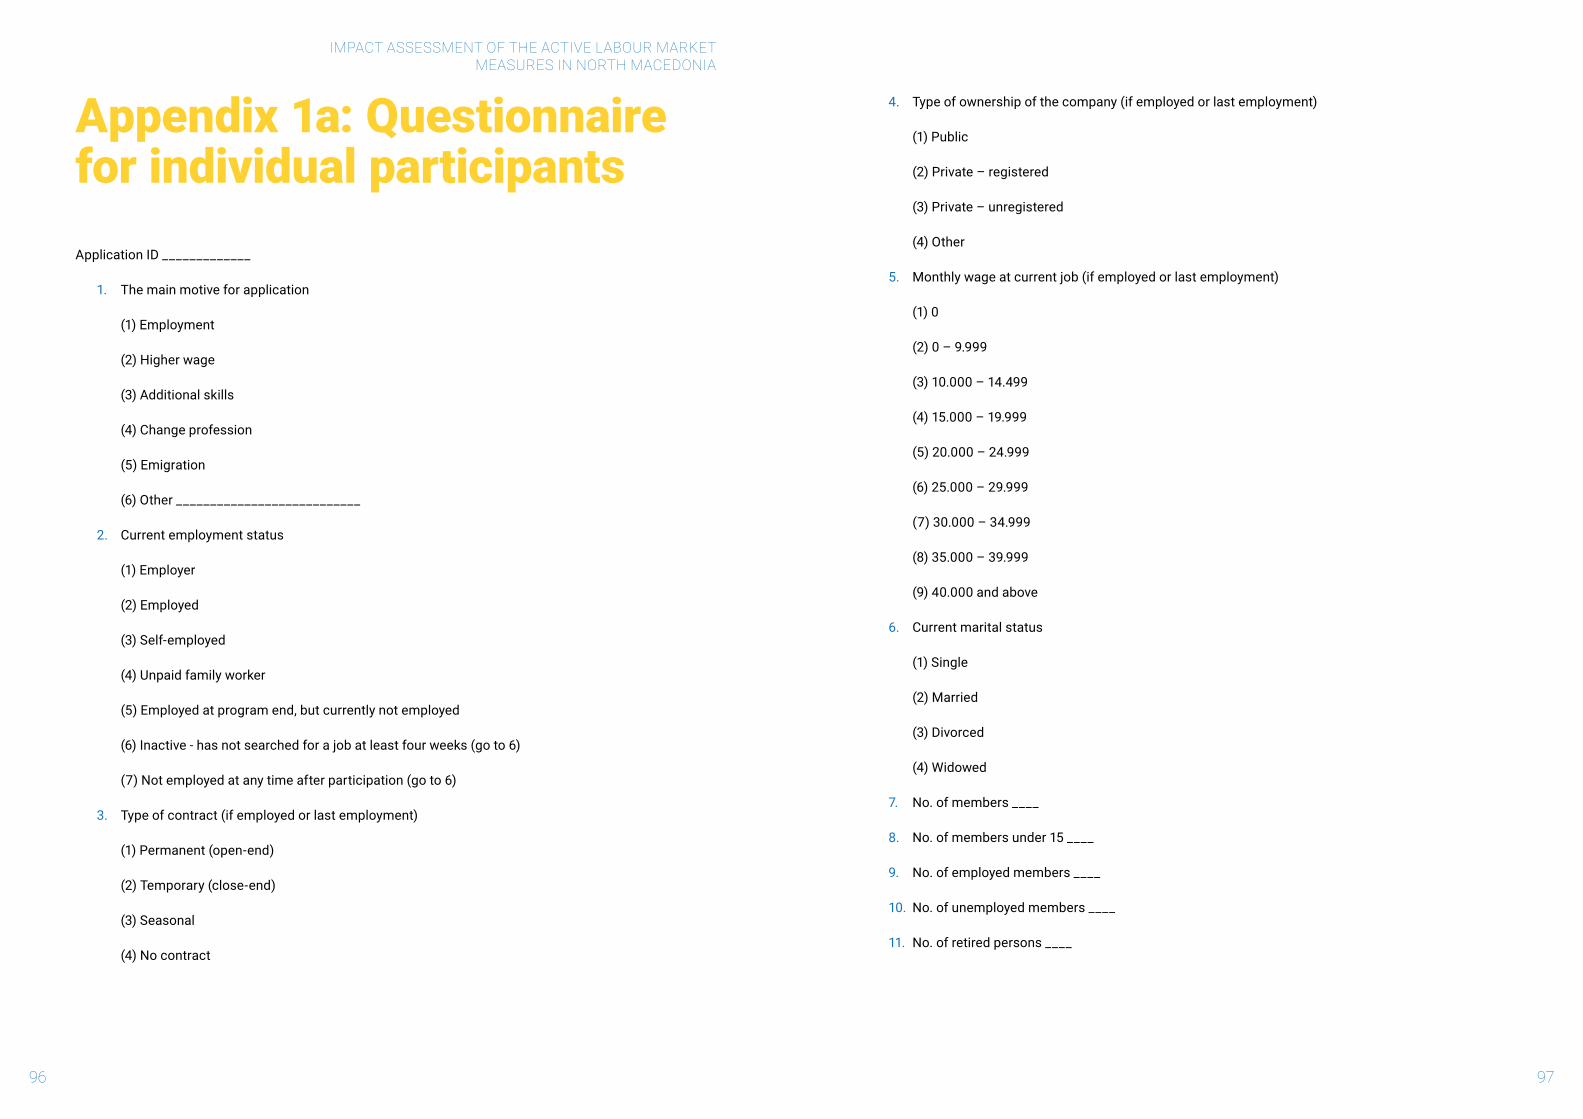
IMPACT ASSESSMENT OF THE ACTIVE LABOUR MARKETMEASURES IN NORTH MACEDONIA
96 97
Appendix 1a: Questionnaire for individual participantsApplication ID _____________
1. The main motive for application
(1) Employment
(2) Higher wage
(3) Additional skills
(4) Change profession
(5) Emigration
(6) Other ___________________________
2. Current employment status
(1) Employer
(2) Employed
(3) Self-employed
(4) Unpaid family worker
(5) Employed at program end, but currently not employed
(6) Inactive - has not searched for a job at least four weeks (go to 6)
(7) Not employed at any time after participation (go to 6)
3. Type of contract (if employed or last employment)
(1) Permanent (open-end)
(2) Temporary (close-end)
(3) Seasonal
(4) No contract
4. Type of ownership of the company (if employed or last employment)
(1) Public
(2) Private – registered
(3) Private – unregistered
(4) Other
5. Monthly wage at current job (if employed or last employment)
(1) 0
(2) 0 – 9.999
(3) 10.000 – 14.499
(4) 15.000 – 19.999
(5) 20.000 – 24.999
(6) 25.000 – 29.999
(7) 30.000 – 34.999
(8) 35.000 – 39.999
(9) 40.000 and above
6. Current marital status
(1) Single
(2) Married
(3) Divorced
(4) Widowed
7. No. of members ____
8. No. of members under 15 ____
9. No. of employed members ____
10. No. of unemployed members ____
11. No. of retired persons ____

IMPACT ASSESSMENT OF THE ACTIVE LABOUR MARKETMEASURES IN NORTH MACEDONIA
98 99
12. To what extent do you search for (new) job?
(1) Do not search at all
(2) Do not search
(3) Do not have opinion
(4) Search to less extent
(5) Search to great extent
13. To what extent do you plan to emigrate in search for job?
(1) Do not plan at all
(2) Do not plan
(3) Do not have opinion
(4) Plan to less extent
(5) Plan to great extent
14. Changeinfinancialconditions(afterprogramparticipation)
(1) Better
(2) Same
(3) Worse
15. Change in employment prospects (after program participation)
(1) Better
(2) Same
(3) Worse
16. Does the Covid-19 pandemic imposed for you a need for new skills?
(1) Did not impose at all
(2) Did not impose
(3) Do not have opinion
(4) Imposed to less extent
(5) Imposed to great extent
17. The demand for which of the following skills do you think increased due to the Covid-19 pandemic?
(1) Foreign languages
(2) Basic IT skills
(3) Advanced IT skills
(4) E-commerce
(5) E-banking
(69 Other ____________________________
Self-reported satisfaction from the training
18. Towhatextentareyousatisfiedfromthegainedknowledgeandskills?
(1)Notsatisfiedatall
(2)Notsatisfied
(3) Do not have opinion
(4)Satisfiedtolessextent
(5)Satisfiedtogreatextent
19. To what extent were appropriate the applied training methods?
(1) Not appropriate at all
(2) Not appropriate
(3) Do not have opinion
(4) Appropriate to less extent
(5) Appropriate to great extent
20. To what extent were useful the training materials?
(1) Not useful at all
(2) Not useful
(3) Do not have opinion
(4) Useful to less extent
(5) Useful to great extent

IMPACT ASSESSMENT OF THE ACTIVE LABOUR MARKETMEASURES IN NORTH MACEDONIA
100 101
21. To what extent was appropriate the training environment?
(1) Not appropriate at all
(2) Not appropriate
(3) Do not have opinion
(4) Appropriate to less extent
(5) Appropriate to great extent
22. Would you apply for another ALMM?
(1) No
(2) Yes
(3) Do not have opinion
Appendix 1b: Questionnaire for individual non-participantsApplication ID _____________
1. The main motive for application
(1) Employment
(2) Higher wage
(3) Additional skills
(4) Change profession
(5) Emigration
(6) Other ___________________________
2. Current employment status
(1) Employer
(2) Employed
(3) Self-employed
(4) Unpaid family worker
(5) Employed at program end, but currently not employed
(6) Inactive - has not searched for a job at least four weeks (go to 6)
(7) Not employed at any time after application (go to 6)
3. Type of contract (if employed or last employment)
(1) Permanent (open-end)
(2) Temporary (close-end)
(3) Seasonal
(4) No contract

IMPACT ASSESSMENT OF THE ACTIVE LABOUR MARKETMEASURES IN NORTH MACEDONIA
102 103
4. Type of ownership of the company (if employed or last employment)
(1) Public
(2) Private – registered
(3) Private – unregistered
(4) Other
5. Monthly wage at current job (if employed or last employment)
(1) 0
(2) 0 – 9.999
(3) 10.000 – 14.499
(4) 15.000 – 19.999
(5) 20.000 – 24.999
(6) 25.000 – 29.999
(7) 30.000 – 34.999
(8) 35.000 – 39.999
(9) 40.000 and above
6. Current marital status
(1) Single
(2) Married
(3) Divorced
(4) Widowed
7. No. of members ____
8. No. of members under 15 ____
9. No. of employed members ____
10. No. of unemployed members ____
11. No. of retired persons ____
12. To what extent do you search for (new) job?
(1) Do not search at all
(2) Do not search
(3) Do not have opinion
(4) Search to less extent
(5) Search to great extent
13. To what extent do you plan to emigrate in search for job?
(1) Do not plan at all
(2) Do not plan
(3) Do not have opinion
(4) Plan to less extent
(5) Plan to great extent
14. Changeinfinancialconditions(afterprogramparticipation)
(1) Better
(2) Same
(3) Worse
15. Change in employment prospects (after program participation)
(1) Better
(2) Same
(3) Worse
16. Does the Covid-19 pandemic imposed for you a need for new skills?
(1) Did not impose at all
(2) Did not impose
(3) Do not have opinion
(4) Imposed to less extent
(5) Imposed to great extent

IMPACT ASSESSMENT OF THE ACTIVE LABOUR MARKETMEASURES IN NORTH MACEDONIA
104
17. The demand for which of the following skills do you think increased due to the Covid-19 pandemic?
(1) Foreign languages
(2) Basic IT skills
(3) Advanced IT skills
(4) E-commerce
(5) E-banking
(6) Other ____________________________
18. Would you apply for another ALMM?
(1) No
(2) Yes
(3) Do not have opinion

This project is funded by the European Union
Employment and Social Affairs Platform 2 Project (#ESAP2)
www.esap.online