Syria Labour Market Report 2009 - 2010 English (Draft)
207
Ministry of Social Affairs and Labor UNDP (Study of Labor Market in Syria 2009‐2010) 1 Syrian Arab Republic Ministry of Social Affairs and Labor United Nations Development Project The Project of Database Establishment for Comprehensive Labor and Employment Policies In cooperation with The Central Bureau of Statistics The Study of Labor Market in Syria 2009 - 2010 June 2011
-
Upload
independent -
Category
Documents
-
view
3 -
download
0
Transcript of Syria Labour Market Report 2009 - 2010 English (Draft)

Ministry of Social Affairs and Labor UNDP
(Study of Labor Market in Syria 2009‐2010) 1
Syrian Arab Republic
Ministry of Social Affairs and Labor
United Nations Development Project
The Project of Database Establishment for Comprehensive Labor and
Employment Policies
In cooperation with The Central Bureau of Statistics
The Study of Labor Market in Syria 2009 - 2010
June 2011

Ministry of Social Affairs and Labor UNDP
(Study of Labor Market in Syria 2009‐2010) 2

Ministry of Social Affairs and Labor UNDP
(Study of Labor Market in Syria 2009‐2010) 3
Report Preparation Team Professor Hafez Zafaran Expert in Labor Market Studies Dr. Kinan Al-Bahnasi Project Director & Labor Market Information SpecialistMr. Ramez Muhja Project Team The Project Preparation Team would like to thank all the bodies that participated in the accomplishment of the project of “The Establishment of a Database for Comprehensive Policies for Labor and Employment in Syria” including: The parties participating in the project: - Ministry of Social Affairs and Labor - International Planning and Cooperation Commission - United Nations Development Program - Central Bureau of Statistics From the Ministry of Social Affairs and Labor:Dr. Radhwan Al-Habeeb Minister of Social Affairs and LaborDr. Diala Al-Haj Aref Ex-Minister of Social Affairs and LaborDr. Issa Maldaoun Deputy Minister of Social Affairs and Labor Dr. Hassan Hijazi Deputy Minister of Social Affairs and Labour Mrs. Rasha Harfoush Director of WorkforcePrfessor Shawki Oun Head of Industrial Inspection Department Mrs. Nazek Rhameh Head of Planning and Statistics Department Mrs. Mais Al-Aswad National Project Coordinator From the United Nations Development Program:Mrs. Faten Al-Tibi Director - Team of Business Promotion for DevelopmentMrs. Rima Al-Hussaini Director of Social Development TeamProfessor Roud Al-Sayed Program Officer - Team of Business Promotion for Development
Mrs. Roula Al-Qudsi Program Officer - Social Development Team From the Central Bureau of Statistics:Dr. Shafeeq Arbash Director of the Central Bureau of Statistics Dr. Ali Rustom Director of Social and Demographic Statistics Mr. Ihssan Amer Director of Economic Statistics
Eng. Moutasem Mohammad Associate Director of the Computer for Analysis and Programming
Eng. Shahinaz Kareem Computer Team - System Analyst The Experts who were Consulted on utilized questionnaires:Dr. Riyad Tayara Economist Dr. Nader Qabbani Expert in the Labor Market Studies Reading and Revision of the Report Mrs. Mais Al-Aswad National Project CoordinatorMrs. Linda Adsou Administrative and Financial AssistantMrs. Afraa Sulaiman Communication Officer

Ministry of Social Affairs and Labor UNDP
(Study of Labor Market in Syria 2009‐2010) 4
Ministry of Social Affairs and Labor UNDP
(Study of Labor Market in Syria 2009‐2010) 5
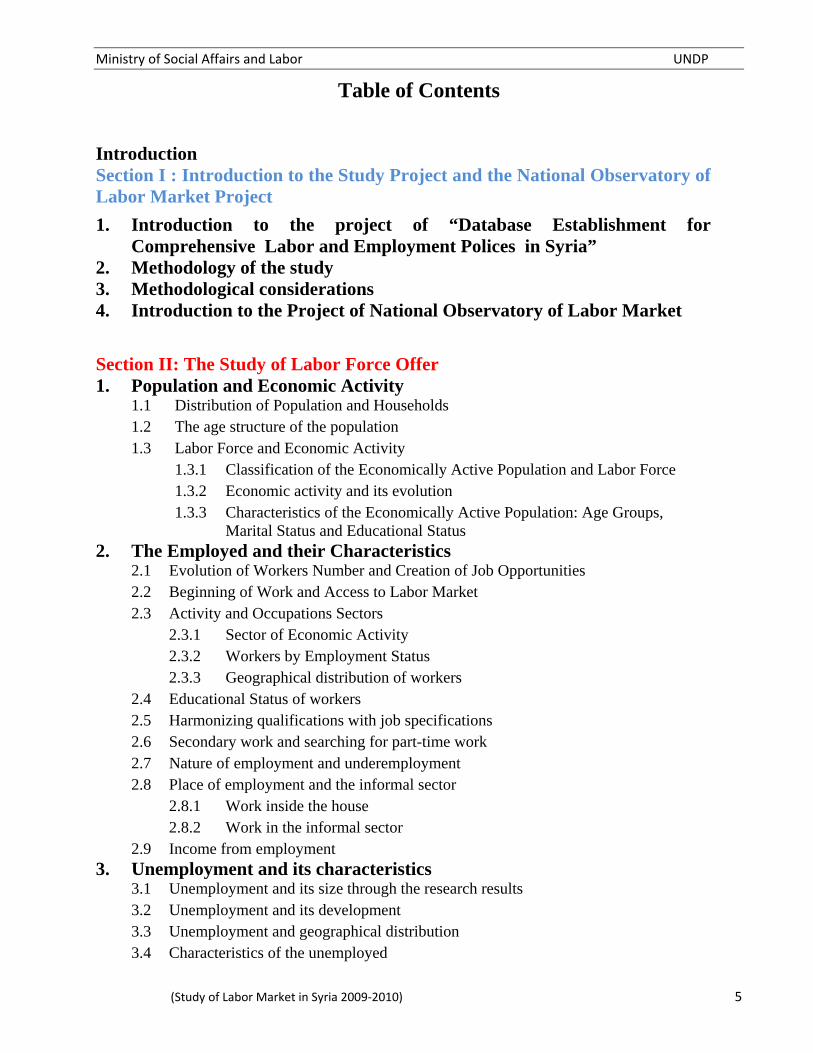
Table of Contents
Introduction Section I : Introduction to the Study Project and the National Observatory of Labor Market Project
1. Introduction to the project of “Database Establishment for Comprehensive Labor and Employment Polices in Syria”
2. Methodology of the study 3. Methodological considerations 4. Introduction to the Project of National Observatory of Labor Market
Section II: The Study of Labor Force Offer 1. Population and Economic Activity 1.1 Distribution of Population and Households 1.2 The age structure of the population 1.3 Labor Force and Economic Activity 1.3.1 Classification of the Economically Active Population and Labor Force 1.3.2 Economic activity and its evolution 1.3.3 Characteristics of the Economically Active Population: Age Groups,
Marital Status and Educational Status
2. The Employed and their Characteristics 2.1 Evolution of Workers Number and Creation of Job Opportunities 2.2 Beginning of Work and Access to Labor Market 2.3 Activity and Occupations Sectors 2.3.1 Sector of Economic Activity 2.3.2 Workers by Employment Status 2.3.3 Geographical distribution of workers 2.4 Educational Status of workers 2.5 Harmonizing qualifications with job specifications 2.6 Secondary work and searching for part-time work 2.7 Nature of employment and underemployment 2.8 Place of employment and the informal sector 2.8.1 Work inside the house 2.8.2 Work in the informal sector 2.9 Income from employment 3. Unemployment and its characteristics 3.1 Unemployment and its size through the research results 3.2 Unemployment and its development 3.3 Unemployment and geographical distribution 3.4 Characteristics of the unemployed
Ministry of Social Affairs and Labor UNDP
(Study of Labor Market in Syria 2009‐2010) 6
3.4.1 Educational Status 3.4.2 Previous work and the reason for work suspension 3.4.2.1 Newcomers to Labor Market and the previously employed 3.4.2.2 The cause of absence from work 3.4.3 Period of job searching and long-term unemployment 3.4.4 Appropriate job and the desired employer 3.4.5 Acceptable Wage 3.5 Searching for Work 3.5.1 Characteristics and methods of searching for work 3.5.2 Vocational training during the period of job search 3.6 The hard core of unemployment 3.7 Unemployment and poverty 4. Employment of young people and women 4.1 Young people between employment and unemployment 4.2 The desire to emigrate 4.3 The difficulty of women’s economic integration 4.4 Women's employment between fragility and excessive localization 4.5 Characteristics of the unemployed women 4.6 Women's employment: Untapped benefits and capabilities 4.6.1 Incentives and motivations of women's employment 4.6.2 Women's income from work: between equality and the phenomenon of
hidden discrimination
4.6.3 Women’s employment reduces poverty and improves living standards 4.6.4 Women outside the labor force: the untapped potential 4.7 Society's view of women's work
Section III : Study of Demand for Labor Force 1. Distribution of the sample and the administrative data 2. The size of demand for labor force 2.1 The change, occurred and expected, in the volume of production and labor 2.2 The change in the occurred and expected investment and export 3. Employment 3.1 The distribution of employment and it characteristics 3.2 Change of employment and workforce turnover 3.3 Occupational Classification and Salaries 3.4 skill and lack of skill 4. Vacancies and vacancies difficult to fill 4.1 Characteristics of vacancies 4.2 vacancies difficult to fill 5. Training and Development

Ministry of Social Affairs and Labor UNDP
(Study of Labor Market in Syria 2009‐2010) 7
Section IV: Key Conclusions and Recommendations 1. Key Conclusions 1.1 Study of Labor Force Supply 1.2 Study of Labor Force Demand
2. The size of demand for labor force
Ministry of Social Affairs and Labor UNDP
(Study of Labor Market in Syria 2009‐2010) 8
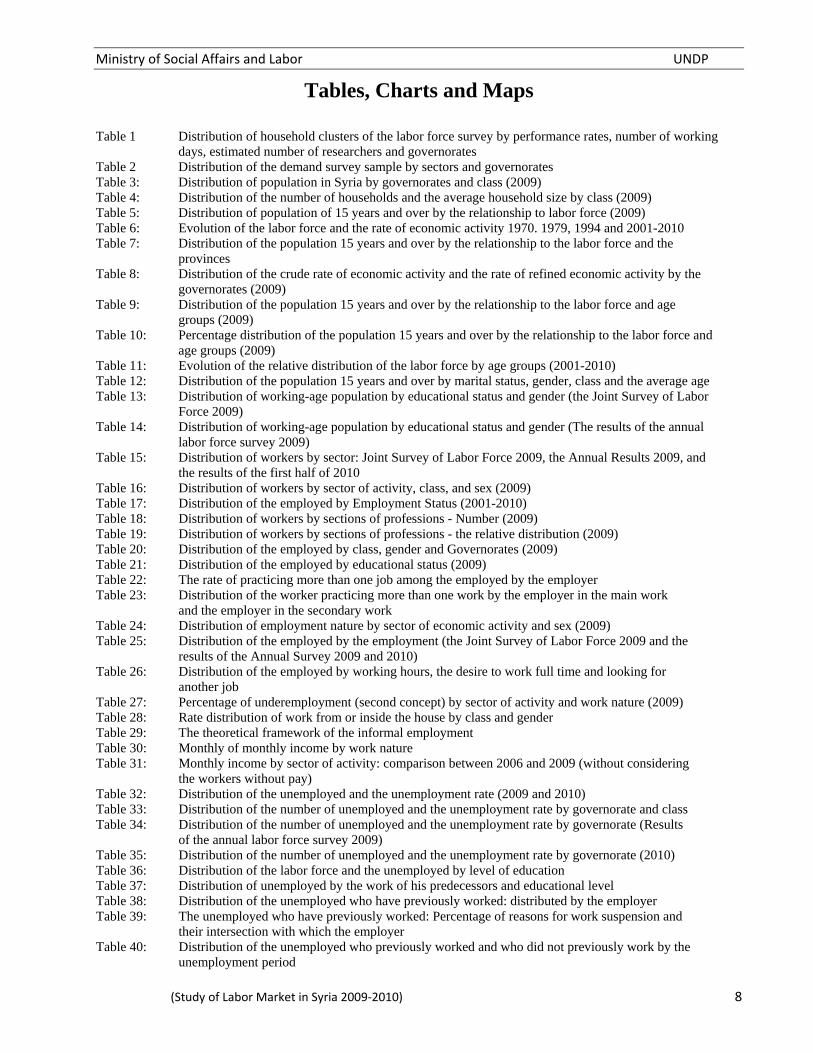
Tables, Charts and Maps Table 1 Distribution of household clusters of the labor force survey by performance rates, number of working
days, estimated number of researchers and governorates
Table 2 Distribution of the demand survey sample by sectors and governorates Table 3: Distribution of population in Syria by governorates and class (2009) Table 4: Distribution of the number of households and the average household size by class (2009) Table 5: Distribution of population of 15 years and over by the relationship to labor force (2009) Table 6: Evolution of the labor force and the rate of economic activity 1970. 1979, 1994 and 2001-2010 Table 7: Distribution of the population 15 years and over by the relationship to the labor force and the
provinces
Table 8: Distribution of the crude rate of economic activity and the rate of refined economic activity by the governorates (2009)
Table 9: Distribution of the population 15 years and over by the relationship to the labor force and age groups (2009)
Table 10: Percentage distribution of the population 15 years and over by the relationship to the labor force and age groups (2009)
Table 11: Evolution of the relative distribution of the labor force by age groups (2001-2010) Table 12: Distribution of the population 15 years and over by marital status, gender, class and the average age Table 13: Distribution of working-age population by educational status and gender (the Joint Survey of Labor
Force 2009)
Table 14: Distribution of working-age population by educational status and gender (The results of the annual labor force survey 2009)
Table 15: Distribution of workers by sector: Joint Survey of Labor Force 2009, the Annual Results 2009, and the results of the first half of 2010
Table 16: Distribution of workers by sector of activity, class, and sex (2009) Table 17: Distribution of the employed by Employment Status (2001-2010) Table 18: Distribution of workers by sections of professions - Number (2009) Table 19: Distribution of workers by sections of professions - the relative distribution (2009) Table 20: Distribution of the employed by class, gender and Governorates (2009) Table 21: Distribution of the employed by educational status (2009) Table 22: The rate of practicing more than one job among the employed by the employer Table 23: Distribution of the worker practicing more than one work by the employer in the main work
and the employer in the secondary work
Table 24: Distribution of employment nature by sector of economic activity and sex (2009) Table 25: Distribution of the employed by the employment (the Joint Survey of Labor Force 2009 and the
results of the Annual Survey 2009 and 2010)
Table 26: Distribution of the employed by working hours, the desire to work full time and looking for another job
Table 27: Percentage of underemployment (second concept) by sector of activity and work nature (2009) Table 28: Rate distribution of work from or inside the house by class and gender Table 29: The theoretical framework of the informal employment Table 30: Monthly of monthly income by work nature Table 31: Monthly income by sector of activity: comparison between 2006 and 2009 (without considering
the workers without pay)
Table 32: Distribution of the unemployed and the unemployment rate (2009 and 2010) Table 33: Distribution of the number of unemployed and the unemployment rate by governorate and class Table 34: Distribution of the number of unemployed and the unemployment rate by governorate (Results
of the annual labor force survey 2009)
Table 35: Distribution of the number of unemployed and the unemployment rate by governorate (2010) Table 36: Distribution of the labor force and the unemployed by level of education Table 37: Distribution of unemployed by the work of his predecessors and educational level Table 38: Distribution of the unemployed who have previously worked: distributed by the employer Table 39: The unemployed who have previously worked: Percentage of reasons for work suspension and
their intersection with which the employer
Table 40: Distribution of the unemployed who previously worked and who did not previously work by the unemployment period

Ministry of Social Affairs and Labor UNDP
(Study of Labor Market in Syria 2009‐2010) 9
Table 41: Type of the appropriate work by unemployment duration Table 42: Distribution of work characteristics appropriate for the individual by reasons causing him/her
to stop a work
Table 43: The lowest monthly wage acceptable to the unemployed Table 44: Distribution of job search rate according to the importance of options and by class and gender Table 45: Evolution of the number of the registered at the employment offices during the period 2007-2009 Table 46: Distribution of participation rates of the unemployed in training courses by gender and previous
engagement in work
Table 47: The specialties less favored in the labor market: the hard core Table 48: Relationship of the young people in the age group 15-24 years with the labor force Table 49: Distribution of the labor force and unemployment rates by age group (annual results 2009) Table 50: Distribution of the labor force and unemployment rates by age group (First half of 2010) Table 51: Rate of the desire to emigrate by age groups, gender and relationship to labor force Table 52: Causes for seeking emigration Table 53: Evolution of the number of the employed women and their distribution by sections of economic
activity (2001-2009)
Table 54: Distribution of the unemployed women by the marital status, relationship to the head of family, age groups and educational level:
Table 55: Distribution of the unemployed women by field of specialization Chart 1: Evolution of the population of the Syrian Arab Republic Chart 2: Evolution of the percentages of children and percentage of elderly Chart 3: Population pyramid for 15 years and over (1981) Chart 4: Population pyramid for 15 years and over (1994) Chart 5: Population pyramid for 15 years and over (2004) Chart 6: Population pyramid for 15 years and over (2009) Chart 7: Distribution of population by the relationship with labor force Chart 8: Evolution of working-age population and labor force Chart 9: Changes in the labor force: the additional demands for work (total) Chart 10: Evolution of the additional demands of the work of women and men Chart 11: The evolution of crude economic activity rate (2001-2009) Chart 12: The evolution of the refined activity rate (2001-2009) Chart 13: Distribution of labor force by age groups (2009) Chart 14: Evolution of the age rate of the work force (accounting years 2001-2010) Chart 15: Evolution of young people rate in the workforce distributed by sex between 2004 and 2010 Chart 16: Evolution of the young people rate in the labor force (2001-2009) Chart 17: Distribution of economic activity rate by sex and and age groups Chart 18: Distribution of economic activity by marital status Chart 19: Distribution of the population 15 years and above by Marital Status Chart 20: Distribution of active population by educational status and gender Chart 21: The evolution of the relative distribution of the labor force by educational level Chart 22: Distribution of illiteracy in the workforce by sex and governorates Chart 23: The evolution of the proportion of illiteracy (15 years and over) between 2004 and 2009 Chart 24: Evolution of the workers number by gender (2001-2010) Chart 25: Economic growth and development rate of job creation Chart 26: Change of the employed number between 2007 and 2009 by Governorate Chart 27: Change the number of employees between 2007 and 2009 by sector Chart 28: Change of workers number between 2009 and 2010 by sector Chart 29: Change rate of workers number between 2009 and 2010 by sector Chart 30: Distribution of workers by age at joining first main full-time work (2009) Chart 31: Distribution of workers by age at joining first main full-time work (accumulation) Chart 32: The age of first engagement of work by sectors (years) Chart 33: Distribution of the employed by the current educational status and age at joining the first main full-
time work
Chart 34: Distribution of workers who started work before reaching the age of 16 according to the current educational status
Chart 35: Population pyramid of the employed population (2004)

Ministry of Social Affairs and Labor UNDP
(Study of Labor Market in Syria 2009‐2010) 10
Chart 36: Population pyramid of the employed population (2009) Chart 37: Distribution of workers by sector of activity (2009) Chart 38: The evolution of the employed distribution by sections of economic activity (2001-2010) Chart 39: The Agricultural Sector: Evolution of its contribution to the GDP and its share of investments Chart 40: Rate of women of the total employed by sector of activity (2009) Chart 41: Distribution of workers by sector of activity and gender (2009) Chart 42: Percentage of women to the total employed by sector of activity (year 2009) Chart 43: Distribution of the employed by sector of activity and gender (Annual 2009) Chart 44: Percentage of women to the total employed by sector of activity (year 2009) Chart 45: Distribution of the employed by sector of activity and gender (Annual 2009) Chart 46: The distribution of the total employed by sector of economic activity (2009) Chart 47: Distribution of the employed by economic sector and gender (2009) Chart 48: Distribution of the employed by the employer (Total) Chart 49: Distribution of the employed by the employer (women) Chart 50: Distribution of the employed by the employer (Men) Chart 51: Evolution of the employed distribution by employment status (2001-2009) Chart 52: Percentage of employers of total workers: an international comparison Chart 53: The importance of the public sector: Rate of workers in the public sector of the total employed
(Total)
Chart 54: The importance of the public sector: Rate of workers in the public sector of the total employed (distributed by gender)
Chart 55: Structure of distribution of male and female workers by professions sections (2009) Chart 56: Distribution of the employment rate by class and gender (2009) Chart 57: Distribution of the employment rate by governorate and gender (Joint Survey of Labor Force 2009) Chart 58: Distribution of the employment rate by governorate and gender (Annual results 2009) Chart 59: Distribution of the employed by educational status and gender (2009) Chart 60: Distribution of the employed by the educational status, comparison between women and men Chart 61: Evolution of the illiteracy rate among the employed (1994, 2004, 2009) Chart 62: Evolution of the educational status of the employed (2001-2009) Chart 63: Comparison of the employed distribution by educational status (Total) Chart 64: Comparison of the employed distribution by educational status (females) Chart 65: Comparison of the employed distribution by educational status by educational status (Males) Chart 66: Rate of inappropriateness of work with qualifications by age Chart 67: Distribution of the rate of inappropriateness of work with qualifications by gender Chart 68: Distribution of the rate of work inappropriateness with qualifications by educational status and sector
of activity
Chart 69: Evolution of the rate of work inappropriateness with qualifications between 2003 and 2009 Chart 70: Percentage of practicing more than one work and rates of searching for part-time work Chart 71: Percentage of practicing more than one work among the workers: between 2003 and 2009 Chart 72: Distribution of secondary work by professions (2009) Chart 73: The rate of practicing more than work among the employed by the governorates Chart 74: Average weekly working hours of the employed: a comparison between the employed in one job and
more than a job
Chart 75: The appropriateness of the job with the qualifications and searching for another job Chart 76: Rate of the employed temporarily, intermittently or seasonally Chart 77: Distribution of underemployment by sector and Gender Chart 78: Average number of working days per week by work nature: accumulation Chart 79: Average working hours per week by gender: accumulation (2009) Chart 80: Average working hours per week by age group (2009) Chart 81: Average working hours per week by sector of activity (2009) Chart 82: Average working hours per week by sections of activity (2009) Chart 83: Average working hours per week and the percentage of urban areas by governorates (2009) Chart 84: Percentage of underemployment (second concept) by sector of activity Chart 85: Underemployment categories: first concept and second concept Chart 86: Rate distribution of work from or inside the house by sections of professions (main job and
secondary job)
Chart 87: Rate distribution of work from or inside the house by the sector of economic activity in the main job Chart 88: Rate distribution of those working from or inside the house by employer (2009)
Ministry of Social Affairs and Labor UNDP
(Study of Labor Market in Syria 2009‐2010) 11
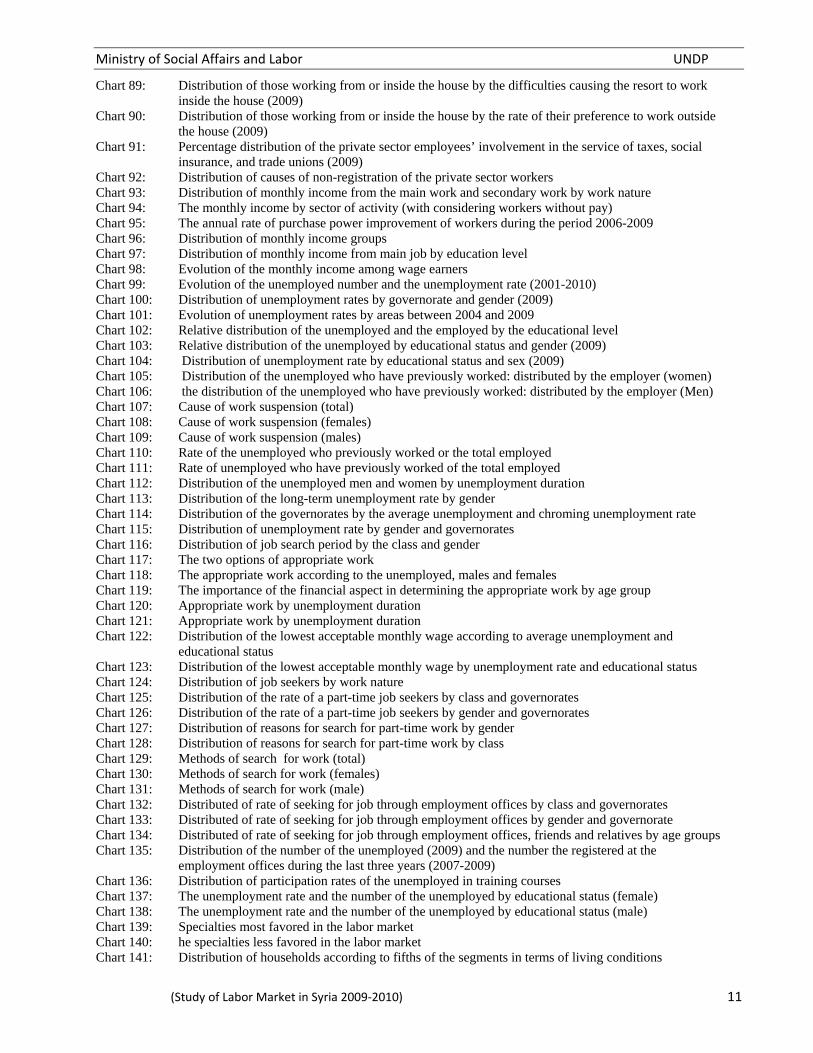
Chart 89: Distribution of those working from or inside the house by the difficulties causing the resort to work inside the house (2009)
Chart 90: Distribution of those working from or inside the house by the rate of their preference to work outside the house (2009)
Chart 91: Percentage distribution of the private sector employees’ involvement in the service of taxes, social insurance, and trade unions (2009)
Chart 92: Distribution of causes of non-registration of the private sector workers Chart 93: Distribution of monthly income from the main work and secondary work by work nature Chart 94: The monthly income by sector of activity (with considering workers without pay) Chart 95: The annual rate of purchase power improvement of workers during the period 2006-2009 Chart 96: Distribution of monthly income groups Chart 97: Distribution of monthly income from main job by education level Chart 98: Evolution of the monthly income among wage earners Chart 99: Evolution of the unemployed number and the unemployment rate (2001-2010) Chart 100: Distribution of unemployment rates by governorate and gender (2009) Chart 101: Evolution of unemployment rates by areas between 2004 and 2009 Chart 102: Relative distribution of the unemployed and the employed by the educational level Chart 103: Relative distribution of the unemployed by educational status and gender (2009) Chart 104: Distribution of unemployment rate by educational status and sex (2009) Chart 105: Distribution of the unemployed who have previously worked: distributed by the employer (women) Chart 106: the distribution of the unemployed who have previously worked: distributed by the employer (Men) Chart 107: Cause of work suspension (total) Chart 108: Cause of work suspension (females) Chart 109: Cause of work suspension (males) Chart 110: Rate of the unemployed who previously worked or the total employed Chart 111: Rate of unemployed who have previously worked of the total employed Chart 112: Distribution of the unemployed men and women by unemployment duration Chart 113: Distribution of the long-term unemployment rate by gender Chart 114: Distribution of the governorates by the average unemployment and chroming unemployment rate Chart 115: Distribution of unemployment rate by gender and governorates Chart 116: Distribution of job search period by the class and gender Chart 117: The two options of appropriate work Chart 118: The appropriate work according to the unemployed, males and females Chart 119: The importance of the financial aspect in determining the appropriate work by age group Chart 120: Appropriate work by unemployment duration Chart 121: Appropriate work by unemployment duration Chart 122: Distribution of the lowest acceptable monthly wage according to average unemployment and
educational status
Chart 123: Distribution of the lowest acceptable monthly wage by unemployment rate and educational status Chart 124: Distribution of job seekers by work nature Chart 125: Distribution of the rate of a part-time job seekers by class and governorates Chart 126: Distribution of the rate of a part-time job seekers by gender and governorates Chart 127: Distribution of reasons for search for part-time work by gender Chart 128: Distribution of reasons for search for part-time work by class Chart 129: Methods of search for work (total) Chart 130: Methods of search for work (females) Chart 131: Methods of search for work (male) Chart 132: Distributed of rate of seeking for job through employment offices by class and governorates Chart 133: Distributed of rate of seeking for job through employment offices by gender and governorate Chart 134: Distributed of rate of seeking for job through employment offices, friends and relatives by age groups Chart 135: Distribution of the number of the unemployed (2009) and the number the registered at the
employment offices during the last three years (2007-2009)
Chart 136: Distribution of participation rates of the unemployed in training courses Chart 137: The unemployment rate and the number of the unemployed by educational status (female) Chart 138: The unemployment rate and the number of the unemployed by educational status (male) Chart 139: Specialties most favored in the labor market Chart 140: he specialties less favored in the labor market Chart 141: Distribution of households according to fifths of the segments in terms of living conditions
Ministry of Social Affairs and Labor UNDP
(Study of Labor Market in Syria 2009‐2010) 12
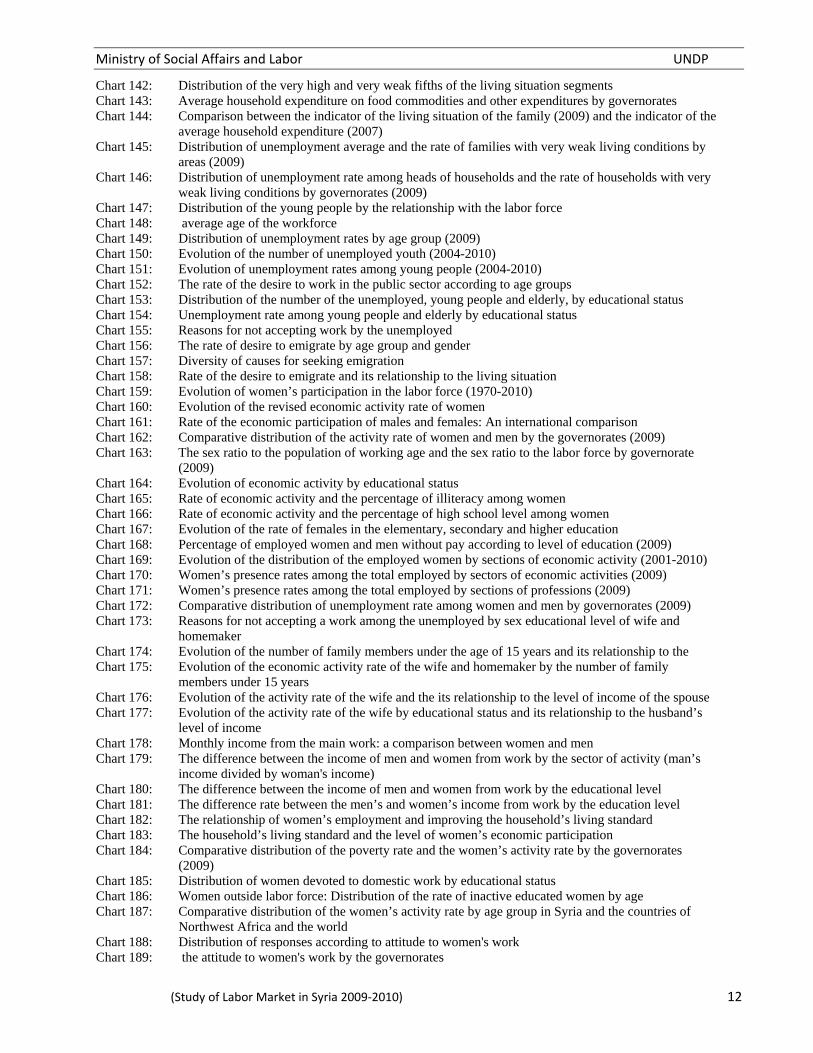
Chart 142: Distribution of the very high and very weak fifths of the living situation segments Chart 143: Average household expenditure on food commodities and other expenditures by governorates Chart 144: Comparison between the indicator of the living situation of the family (2009) and the indicator of the
average household expenditure (2007)
Chart 145: Distribution of unemployment average and the rate of families with very weak living conditions by areas (2009)
Chart 146: Distribution of unemployment rate among heads of households and the rate of households with very weak living conditions by governorates (2009)
Chart 147: Distribution of the young people by the relationship with the labor force Chart 148: average age of the workforce Chart 149: Distribution of unemployment rates by age group (2009) Chart 150: Evolution of the number of unemployed youth (2004-2010) Chart 151: Evolution of unemployment rates among young people (2004-2010) Chart 152: The rate of the desire to work in the public sector according to age groups Chart 153: Distribution of the number of the unemployed, young people and elderly, by educational status Chart 154: Unemployment rate among young people and elderly by educational status Chart 155: Reasons for not accepting work by the unemployed Chart 156: The rate of desire to emigrate by age group and gender Chart 157: Diversity of causes for seeking emigration Chart 158: Rate of the desire to emigrate and its relationship to the living situation Chart 159: Evolution of women’s participation in the labor force (1970-2010) Chart 160: Evolution of the revised economic activity rate of women Chart 161: Rate of the economic participation of males and females: An international comparison Chart 162: Comparative distribution of the activity rate of women and men by the governorates (2009) Chart 163: The sex ratio to the population of working age and the sex ratio to the labor force by governorate
(2009)
Chart 164: Evolution of economic activity by educational status Chart 165: Rate of economic activity and the percentage of illiteracy among women Chart 166: Rate of economic activity and the percentage of high school level among women Chart 167: Evolution of the rate of females in the elementary, secondary and higher education Chart 168: Percentage of employed women and men without pay according to level of education (2009) Chart 169: Evolution of the distribution of the employed women by sections of economic activity (2001-2010) Chart 170: Women’s presence rates among the total employed by sectors of economic activities (2009) Chart 171: Women’s presence rates among the total employed by sections of professions (2009) Chart 172: Comparative distribution of unemployment rate among women and men by governorates (2009) Chart 173: Reasons for not accepting a work among the unemployed by sex educational level of wife and
homemaker
Chart 174: Evolution of the number of family members under the age of 15 years and its relationship to the Chart 175: Evolution of the economic activity rate of the wife and homemaker by the number of family
members under 15 years
Chart 176: Evolution of the activity rate of the wife and the its relationship to the level of income of the spouse Chart 177: Evolution of the activity rate of the wife by educational status and its relationship to the husband’s
level of income
Chart 178: Monthly income from the main work: a comparison between women and men Chart 179: The difference between the income of men and women from work by the sector of activity (man’s
income divided by woman's income)
Chart 180: The difference between the income of men and women from work by the educational level Chart 181: The difference rate between the men’s and women’s income from work by the education level Chart 182: The relationship of women’s employment and improving the household’s living standard Chart 183: The household’s living standard and the level of women’s economic participation Chart 184: Comparative distribution of the poverty rate and the women’s activity rate by the governorates
(2009)
Chart 185: Distribution of women devoted to domestic work by educational status Chart 186: Women outside labor force: Distribution of the rate of inactive educated women by age Chart 187: Comparative distribution of the women’s activity rate by age group in Syria and the countries of
Northwest Africa and the world
Chart 188: Distribution of responses according to attitude to women's work Chart 189: the attitude to women's work by the governorates

Ministry of Social Affairs and Labor UNDP
(Study of Labor Market in Syria 2009‐2010) 13
Chart 190: The relationship between the attitude to women's work and the rate of women's economic participation
Map 1: Distribution of population density by areas and the rate of the urban by governorates (2009) Map 2: Distribution of the refined economic activity by the governorate (2009) Map 3: Distribution of the refined rate of economic activity by areas - Total (2004) Map 4: The revised rate of economic activity by region - women (2004) Map 5: The revised rate of economic activity by region - men (2004) Map 6: Distribution of the economic dependency ratio by governorates (2009) Map 7: Illiteracy rate by region (2004) Map 8: Distribution of the employed by sectors of activity and governorates (2009) Map 9: Underemployment by governorate (2009) Map 10: Unemployment rates distribution by the governorates - Total (2009) Map 11: Unemployment rates distribution by the governorates - Women (2009) Map 12: Unemployment rates distribution by the governorates - Men (2009) Map 13: Distribution of unemployment rates by governorate (Results of the Annual Labor Force Survey 2009) Map 14: Distribution of unemployment rates by governorate (Labor Force Survey first half of 2010) Map 15: Distribution of unemployment rates by governorate and gender (2009) Map 16: Distribution of unemployment rates by region (census 2004) Map 17: Distribution of unemployment rates by region (the Joint Survey of Labor Force 2009) Map 18: Rate of women's economic participation: rates of the area Map 19: Distribution of the study sample by governorates Map 20: Distribution of the number of workers in the study sample by governorates Map 21: Distribution of the number and rate of vacancies by governorates

Ministry of Social Affairs and Labor UNDP
(Study of Labor Market in Syria 2009‐2010) 14
Ministry of Social Affairs and Labor UNDP
(Study of Labor Market in Syria 2009‐2010) 15
Introduction
Syrian Arab Republic
Ministry of Social Affairs and Labor
The Ministry of Social Affairs and Labor has been, and still, seeking to bring the labor market in the Syrian Arab Republic to the stage of optimal use of work force for the advancement of the Syrian economy through the harmonization between its inputs of workforce and its current and future needs. The problems facing the management of the development process in Syria, such as the high level of unemployment especially among the youth and women groups, the decrease in work productivity and low level of wages, made the Syrian government and the Ministry of Social Affairs and Labor conscious of the importance of a package of reasonable and comprehensive policies to be in place within the field of labor and employment which would effectively address the problems experienced by the labor market.
Hence came "The Project of Database Establishment for Comprehensive Labor and Employment Policies in Syria” in collaboration with the UNDP to support the ongoing efforts to improve the labor and employment policies, and develop human resources in Syria in order to achieve the Millennial development goals and objectives represented by establishing deep-rooted foundations of appropriate and decent employment for everyone.
Based on this concept, we place this report, which is a product of the project, in the hands of decision- and policy-makers and all partners in the process of the comprehensive national development, particularly the integrated human development, to provide the data and key indicators related to analyzing and understanding the labor market variables, to open the way for the Government’s intervention through establishing economic and social policies and necessary programs to confront the problems and challenges of labor market and integrate the unemployed in the labor market and activate them in accordance with the priorities and needs that have been identified.
Finally, we cannot but extend our sincere thanks to all the national bodies that have had an active role in the project, particularly the Central Bureau of Statistics and the persons in charge thereof for their exerted efforts. We also extend our sincere thanks and gratitude to the United Nations Development Program, who represents a true and active partner in the development process, and to all those who contributed to the completion of this report, which we hope would be an important tool to design and pursue policies and programs that promote the process of balanced economic and social development.
Minister of Social Affairs and Labor
Dr. Radhwan Al-Habeeb
Ministry of Social Affairs and Labor UNDP
(Study of Labor Market in Syria 2009‐2010) 16
Preface
The Labor Market Studies are considered one of the most important tools that help decision makers plan the future visions of the labor market reality and develop policies and strategies appropriate to the actual movement of the market and its administration with the aim of limiting poverty, upgrading the level of human and institutional capacities, reducing unemployment and raising productivity under a competitive economy open to the world.
The UNDP works with the Syrian government to implement a number of national projects that contribute to the attainment of the millennium development goals by providing support and technical assistance that enable the government achieve comprehensive human, economic and social development by improving the living standard of the citizens, particularly improving the environment and productivity of the labor market in preparation for integration into the global economy.
The project of the “Establishment of a Database for Comprehensive Policies for Employment and Labor in Syria”, conducted jointly between the United Nations Development Program (UNDP) and the Ministry of Social Affairs and Labor, aimed at developing a comprehensive report considering the Syrian labor market issues related to the fundamental characteristics of the employment and unemployment to help the decision makers develop comprehensive employment policies.
This national report is of great importance being the first report that addresses the two sides of labor market, the supply and demand, and provides an opportunity for those in charge of evaluating the current situation and challenges and developing the labor market policies and programs to follow up the process of development and reform.
The report is divided into three main sections. The first section presents the results of the labor force survey at the household level, which provides a detailed explanation of the most important characteristics of the labor market components, such as the employed and unemployed, and focuses on giving importance to the explanation of the employment reality of the young people and women, and decent work in general.
The second section presents the results of the labor force survey at the level of the organization, the objectives of which are focused on identifying the size of the private sector organizations’ demand for labor force, specifying the type of vacancies with concentration on those that are difficult to fill, the skills required to enter the labor market, determining the recruitment difficulties that face the economic institutions and finally the size and type of training available in the labor market.
The third and final section presents the most important conclusions and proposed recommendations, which we hope would help provide some solutions in the process of improving the labor market environment and realize the prosperity represented by improving the living standards of the various segments of the Syrian society.
Finally, it gives me pleasure, as I place this report in your hands, to express my gratitude to the Ministry of Social Affairs and Labor, the International Planning and Cooperation Commission and the Central Bureau of Statistics of the project of "Database Establishment for Comprehensive

Ministry of Social Affairs and Labor UNDP
(Study of Labor Market in Syria 2009‐2010) 17
Policies for Labor and Employment in Syria," and their tireless follow up of the efforts exerted to issue this report. I also thank all the institutions in the private sector for their response and cooperation with the project team to fill the questionnaire pertaining to the labor force survey at the enterprise level. Finally, I would like to thank the national project team, the team of the United Nations Development Program, who prepared and revised this report, and everyone who contributed to drive forward the administrative works of the project.
Ismail Weld Al-Sheikh Ahmed The Resident Coordinator of the United Nations
The Resident Representative of the UNDP In the Syrian Arab Republic

Ministry of Social Affairs and Labor UNDP
(Study of Labor Market in Syria 2009‐2010) 18

Ministry of Social Affairs and Labor UNDP
(Study of Labor Market in Syria 2009‐2010) 19
Section I: Introduction to the Study Project and the National Observatory of Labor Market Project

Ministry of Social Affairs and Labor UNDP
(Study of Labor Market in Syria 2009‐2010) 20

Ministry of Social Affairs and Labor UNDP
(Study of Labor Market in Syria 2009‐2010) 21
1. Introduction to “The Project of Database Establishment for Comprehensive Labor and Employment Polices in Syria”
In line with the objectives of the five-year plan that focused primarily on providing more job opportunities and reducing unemployment, and based on the action plan being implemented by the Ministry of Labor and Social Affairs, “The Project of Database Establishment for Comprehensive Labor and Employment Polices” was carried out in the Ministry of Labor and Social Affairs in cooperation with the UNDP. The project studies the information related to demand and supply in respect of the labor market to provide statistical data that reflect the reality of labor force and certain properties of human resources in Syria and the distribution of these forces according to profession, activity, social type, age groups, educational status and level of wages in a way that enables recognizing the changes witnessed by the labor market in all sectors and monitoring the trends of these changes which would assist a rapid and effective intervention to counter the effects and trends of these changes.
“The Project of Database Establishment for Comprehensive Labor and Employment Polices” aims also at providing the basic data and indicators related to analyzing and understanding labor market variables to permit governmental intervention through the establishment of the economic and social policies, comprehensive and partial, and programs needed to confront the problems and challenges of labor market and to integrate the unemployed in the labor market and activate them according to pre-determine priorities and needs. This work is undertaken to support the exerted efforts towards developing the policies of labor, improving the human resources, reducing unemployment and upgrading the level of productivity in Syria which would contribute in realizing the objectives of the five-year plan and assist reaching the millennial development goals. The activities of this project are determined by conducting two surveys in cooperation with the Central Bureau of Statistics, namely:
1. Survey of the labor force on the family level:
This survey provides information on the supply side of the labor market and reflects the reality of employment, under- and part time employment in Syria with identifying both types of labor force (the employed and unemployed) and its various characteristics, and providing basic qualitative information on the volume of unemployment and its distribution according to type, educational level, age, unemployment duration, specialization, practical condition, nature of the proper job and living standard on the level of governorates and regions. These data form a fundamental structure that reflects the reality of workforces and contributes to diagnosing the phenomenon of unemployment and identifying its characteristics and types.
2. National Survey of the labor force at the enterprise level (Demand for workforce):
This survey provides information on the demand side of labor market. It aims at identifying the volume of demand for manpower among the enterprises of private sector with concentration on the various vacancies, especially those that are difficult to fill, and the decline in skills required and expected by the private sector in the near future, in a broader manner and more details than the normal surveys of the enterprises. In addition, it aims at

Ministry of Social Affairs and Labor UNDP
(Study of Labor Market in Syria 2009‐2010) 22
identifying the difficulties of employment, labor turnover and the degree of harmony between labor market needs and the outputs of educational system. It is proposed to adopt the questionnaire used in the survey as a permanent survey tool approved by the Ministry of Social Affairs and Labor and the Central Bureau of Statistics.
The labor policies based on such database address the following:
Reasons of frictional employment, through the improving the effectiveness of the labor market in particular;
Reasons of technical unemployment, through improving the harmony between the outputs of the educational system and the demand side of the labor market in particular;
Reasons of low productivity and the necessity to improve the training and rehabilitation of the workforce.
Encouraging and assisting the enterprises to secure the necessary means for the creating job opportunities and reducing unemployment and underemployment both in the formal and informal sectors.
2. Methodology of the study
This study depended on conducting two surveys carried out by “The Project of Database Establishment for Comprehensive Labor and Employment Polices” carried out by the Ministry of Social Affairs and Labor in cooperation with the UNDP and the Central Bureau for statistics. The first survey addressed the study of labor force supply and the second, the study of workforce demand.
The labor force survey is one of the important surveys that provide an essential database of the labor force for the planners, policy- makers and researchers interested in the features of workforce and the trends of its development. The survey of the work labor supply aims at the following:
a) Measuring the size of manpower and labor force and its distribution in the governorates;
b) Measuring the employment level and the size of unemployment in the country;
c) Identifying the occupational structure of labor force and its distribution among the various
economic activities;
d) Identifying the demographic, social and economic features of labor force;
e) Recognition of the workforce distribution by sector;
f) Measuring the labor market indicators with the various criteria (international and local).

Ministry of Social Affairs and Labor UNDP
(Study of Labor Market in Syria 2009‐2010) 23
However, the survey of demand for workforce aims at reaching a more accurate knowledge of the reality of employment in the private economic establishments and its development during the current period, and an identification of the size of demand for the work force and the various vacancies and skills expected in the labor market by the private sector.
The study of both supply and demand have been made through four stages:
1. Preparatory stage; 2. Field work; 3. Data input and check 4. Results output, analysis and publishing.
During the preparatory stage a questionnaire was designed; the necessary modifications on light of the previous surveys were set up; new sections were added to cope with the needs of decision-makers for data; the research team were trained on the way to fill the questionnaire; the number of forms and all requisites for every governorate were determined; as well, forms were printed and a manual for the survey definitions and instructions was established. The two forms of both surveys were annexed to this report.
Also, during the preparatory stage of both surveys samples were drawn; the sampling unit and the survey framework and scope were identified. Regarding the survey of supply, the household is considered the sampling unit in the survey. The main sample executed by the Central Bureau of Statistics in September 2007 has provided the general framework for sample draw, and the cluster sample method has been adopted to draw the enumeration units in the first stage. The sampling unit has been drawn according to the random sampling method in the second stage and it includes the urban and rural areas in the country as a whole. The sample was distributed according to the following table:
Table 1: Distribution of household clusters of the labor force survey by performance rates, number of working days, estimated number of researchers and governorates
Governorate Sample Households
Number Performance
Rates Number of Cluster Number of
Researchers Working
Days Urban Rural Total Damascus 2,520 15 168 20 17 168 ـ Damascus 3,795 15 164 89 253 26 20 Aleppo 6,780 15 281 171 452 46 20 Homs 2,580 15 93 79 172 18 20 Hama 2,340 15 65 91 156 16 20 Lattakia 1,455 15 49 48 97 10 20 Deir Ezzor 1,680 15 51 61 112 12 20 Idleb 2,100 15 40 100 140 14 20 Rakka 1,335 15 33 56 89 9 20 Hassaka 2,115 15 49 92 141 14 20 Sweida 540 15 12 24 36 4 20 Daraa 1,425 15 43 52 95 10 20 Tartous 1,185 15 23 56 79 8 20 Kuneitra 150 15 10 2 10 10 ـ Total 30, 000 15 1, 071 929 2 ,000 205 270

Ministry of Social Affairs and Labor UNDP
(Study of Labor Market in Syria 2009‐2010) 24
As for the demand survey sample, it is composed of 1,213 enterprises chosen from within the statistical framework of private sector enterprises used by the Central Bureau of Statistics according to the employment size measure identified at ten workers or more. The sample was distributed in all governorates (except Kuneitra for lack of the employment size condition in its enterprises) and more than a half of the sample concentrated in the sector of industry due to presence of large enterprises therein, and a quarter thereof in the sector of hotels, restaurants and services. The sample was distributed by sectors and governorates according to the following table:
Table 2: Distribution of the demand survey sample by sectors and governorates
Governorate Agriculture
and silviculture
Industry Building &
Construction Hotels &
Restaurants
Transport & communicati
on
Finance, Insurance & Real Estate
Services Total
Damascus 4 46 3 43 19 30 30 175
Aleppo 1 372 3 31 4 6 28 445
Damascus Countryside
1 211 0 16 1 3 22 254
Homs 0 65 0 15 3 1 18 102
Hama 0 33 0 4 0 0 3 40
Lattakia 0 14 0 17 2 5 9 47
Idleb 2 16 0 5 1 1 7 32
Rakka 1 5 0 3 4 0 8 21
Deir Ezzor 0 1 0 6 0 1 10 18
Tartous 0 16 0 11 7 0 1 35
Hassaka 0 0 0 2 0 0 5 7
Daraa 1 12 0 0 3 0 8 24
Sweida 0 7 0 1 1 0 4 13
Kuneitra 0 0 0 0 0 0 0 0
Total 10 798 6 154 45 47 153 1213
The field work of the supply survey was made during January 2009, whereas the field work of demand survey was made during June 2009. The field work of both surveys was made under the supervision of a joint team consisting of two supervisors from the Central Bureau of Statistics and the project. At the end of the field work data were processed, as the survey was collected and matched against the sample sheets, data were checked, coded and entered into the computer, then results were produced and analyzed, and the necessary proposals and recommendations were prepared.
3. Methodological considerations
This study aims present and analyze some important characteristics of the labor market based on the survey done by “The Project of Database Establishment for Comprehensive Labor and Employment Polices” in early 2009. Therefore, all the results of this survey and the discretion of their interpretation and analysis should be understood from a pure scientific prospective and that they do not acquire the characteristic of approved official indications, especially with respect to the labor market indicators because of the variety of methods and reference periods used to identify those indicators. Please consider the following points in understanding the indicators:
The indicators present the status of labor market in early 2009 and are lacking an annual span in a manner that they cannot be considered general rates for the year 2009.
The method of calculating some of the indicators fairly differed from what the Central Office of

Ministry of Social Affairs and Labor UNDP
(Study of Labor Market in Syria 2009‐2010) 25
Statistics used to adopt in the previous surveys. Annex 1 provides an analysis to this matter. The Central Bureau of Statistics considered this survey as one that covers the second half of the
year 2008 and adopted the results to be integrated with the survey results of the first half of the same year, in order to reach modified results indicative of rates covering the case during the year 2008. However, to avoid the confusion of some concepts and to maintain the consistency with the results of the previous surveys and their indicators, we adopted the following:
O The results of 2008 are presented in the same concept and calculation method adopted by the Central Bureau of Statistics.
O The results of these surveys are presented as results of the early 2009 in a way independent of the previous surveys with the proposed amendment in classifying the labor force.
O The indicators of 2009 survey presented in such way do not represent any formal aspect due
to the said variety of methods and reference periods.
O The report provides the annual indicators for 2009 recently issued by the Central Bureau of Statistics.
To prevent confusion of concepts to the reader, we shall adopt the name of “Labor Force Joint Survey 2009” for the survey conducted by “The Project of Database Establishment for Comprehensive Labor and Employment Polices” implemented by the Ministry of Social Affairs and Labor supported by the UNDP, to avoid mixing the results with other mentioned outcomes specifically related to the final results of labor force survey which gives the rates of the two surveys conducted by the Central Bureau of Statistics in 2009.
4. Introduction to the Project of National Observatory of Labor Market
An observatory unit was created in the State Planning Commission under Decision No. 346 dated 17 January, 2004 issued by the Cabinet Minister, and a directive and supervisory committee was formed headed by the chairman of the State Planning Commission. In 2010 the observatory was moved to the Ministry of Social Affairs and Labor under Decision No. 6902 date 29 December 2009 issued by the Prime Minister. To activate the proposals and recommendations concluded by the current study, and to implement an operational action plan for effectively addressing the problem of unemployment, the Ministry of Social Affairs and Labor signed a cooperation agreement in December 2010 with the United Nation Development Program (UNDP) to give effect to the observatory and operate it in the Ministry of Social Affairs and Labor over a period of three years through the project of "National Observatory of Labor Market." The National Observatory of Labor Market aims at providing all the information and indicators related to the labor market, which helps decision-makers, planners and designers of labor market policies to monitor and assess the labor market trends, and to correct the imbalance caused by the structural changes of economic activities and professions. However, the labor market information is not limited to help policy-makers only, but it also helps researchers, employers and students to make decisions in respect of the required professions and planning for the future.

Ministry of Social Affairs and Labor UNDP
(Study of Labor Market in Syria 2009‐2010) 26
The Observatory contributes to the achievement of the following:
- Supporting decision-making in the field of labor market by providing the necessary information;
- Conduction of researches and studies related to labor market; - Providing indicators and data that aligns education and vocational training with labor market
needs; - Ensuring coordination and cooperation between the public and private entities involved in
collecting data on labor market. - Establishing an information network management of the labor market, education and
vocational training through the collection of data and information from stakeholders and the classification, analysis and publication thereof.
- Publication and distribution of data and information to various sectors of society through the website and the issuance of periodical information bulletins.
- Establishment of Arab and international cooperation with similar institutions.

Ministry of Social Affairs and Labor UNDP
(Study of Labor Market in Syria 2009‐2010) 27
Section II: The Study of Labor Force Offer

Ministry of Social Affairs and Labor UNDP
(Study of Labor Market in Syria 2009‐2010) 28

Ministry of Social Affairs and Labor UNDP
(Study of Labor Market in Syria 2009‐2010) 29
1. Population and Economic Activity
1.1 Distribution of Population and Households
The number of population in the Syrian Arab Republic is 20,619 million people according to the estimates of the Central Bureau of Statistics in mid-2010 vs. less than 18 million people in 2004, i.e. with a total increase of more than 2.7 million people and a growth rate estimated at 2.14% annually during the period 2004-2010. This emphasizes the continuation of demographic growth at high rates, as it was within the range of 2.7% during the decade of 1994-2004 and 3.3% between 1981 and 1994. It should be recalled that the results of the Joint Survey of Labor Force lead to an estimation of the population at about 20.7 million people in early 2009.
Chart 1: Evolution of the population of the Syrian Arab Republic
Source: Population censuses for the years 1970, 1981, 1994, 2004, the Joint Survey of Labor Force 2009 and the estimates of the Central Bureau of Statistics 2001 and 2009
More than a half of the populations of Syria reside in four governorates, namely: Aleppo (4.6 million); Damascus Countryside (2.6); Damascus (1.8); Homs (1.7). The following table shows the distribution of population by governorate:
Table 3: Distribution of population in Syria by governorates and class (2009)
Numbers per thousan
Distribution by Age Group < or > 15 years
Percentage Distribution
Distribution by Class
N/O individuals <
15 years
N/O individuals =
> 15 years
Total N/O individuals
Urban Rural Urban Rate
Damascus 506 1 256 1 761 8,5% 1 761 100,0%
Aleppo 2 070 2 652 4 722 22,8% 2 774 1 948 58,7%
Damascus Countryside 1 035 1 644 2 679 12,9% 1 719 960 64,2%
Homs 672 1 086 1 758 8,5% 928 830 52,8%
Hama 645 944 1 589 7,7% 571 1 019 35,9% Lattakia 288 711 1 000 4,8% 523 477 52,3%
Idleb 688 764 1 452 7,0% 400 1 052 27,5%
Hasaka 595 875 1 471 7,1% 502 969 34,1%
Deir Ezzour 577 599 1 176 5,7% 493 682 42,0%
Tartous 224 570 794 3,8% 223 571 28,1%
Rakka 441 473 914 4,4% 330 584 36,1%
Daraa 434 547 981 4,7% 439 542 44,7%
Sweida 112 254 367 1,8% 114 253 31,0%
Kunaitera 36 48 84 0,4% 84 0,0%
Total 8 324 12 425 20 749 100,0% 10 777 9 972 51,9%
Source: Joint Survey of Labor Force in Syria 2009
Million
Ministry of Social Affairs and Labor UNDP
(Study of Labor Market in Syria 2009‐2010) 30
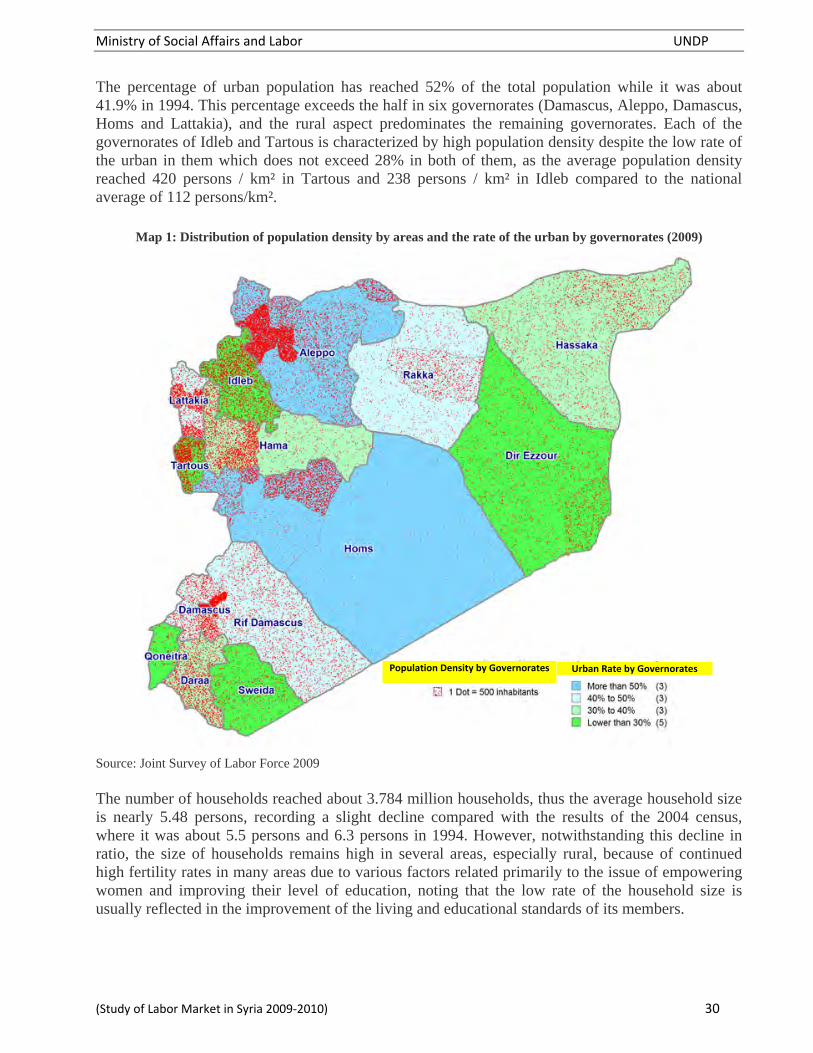
The percentage of urban population has reached 52% of the total population while it was about 41.9% in 1994. This percentage exceeds the half in six governorates (Damascus, Aleppo, Damascus, Homs and Lattakia), and the rural aspect predominates the remaining governorates. Each of the governorates of Idleb and Tartous is characterized by high population density despite the low rate of the urban in them which does not exceed 28% in both of them, as the average population density reached 420 persons / km² in Tartous and 238 persons / km² in Idleb compared to the national average of 112 persons/km².
Map 1: Distribution of population density by areas and the rate of the urban by governorates (2009)
Source: Joint Survey of Labor Force 2009 The number of households reached about 3.784 million households, thus the average household size is nearly 5.48 persons, recording a slight decline compared with the results of the 2004 census, where it was about 5.5 persons and 6.3 persons in 1994. However, notwithstanding this decline in ratio, the size of households remains high in several areas, especially rural, because of continued high fertility rates in many areas due to various factors related primarily to the issue of empowering women and improving their level of education, noting that the low rate of the household size is usually reflected in the improvement of the living and educational standards of its members.
Urban Rate by GovernoratesPopulation Density by Governorates

Ministry of Social Affairs and Labor UNDP
(Study of Labor Market in Syria 2009‐2010) 31
Table 4: Distribution of the number of households and the average of the household size by the Class (2009)
Distribution of the number of households by the (class) Average size of a household
Urvan Rural Total Urvan Rural Total Damascus 372,9 0,0 372,9 4,7 4,7
Aleppo 523,4 288,8 812,2 5,3 6,7 5,8
Damascus Countryside 364,1 186,4 550,5 4,7 5,1 4,9
Homs 182,9 144,9 327,8 5,1 5,7 5,4
Hama 103,3 169,6 272,9 5,5 6,0 5,8
Lattakia 120,2 98,3 218,5 4,3 4,9 4,6
Idleb 74,7 182,2 256,9 5,4 5,8 5,7
Hasaka 81,7 159,2 240,9 6,1 6,1 6,1
Deir Ezzour 68,7 88,3 157,0 7,2 7,7 7,5
Tartous 51,2 124,5 175,7 4,4 4,6 4,5
Rakka 50,2 91,5 141,7 6,6 6,4 6,5
Daraa 69,7 84,4 154,1 6,3 6,4 6,4
Sweida 27,9 59,8 87,7 4,1 4,2 4,2
Kunaitera 0,0 14,9 14,9 5,7 5,7
Total 2 090,9 1 692,8 3 783,7 5,2 5,9 5,5
Source: Joint Survey of Labor Force 2009 1.2 The age structure of the population
The results of 2009 survey indicated that the percentage of children of not more than 15 years exceeded 40% of the total population and this rate was relatively stable during the past ten years as it reached 45% in 1994 and 39.5% in 2004. On the other hand, a slight increase is noted in the rate of elderly people whose ages are equal to or over 65 years, which reached to 3.9% in 2009 compared to 3% in 1994. These data indicate the absence of a demographic change in the population structure due to continued rapid pace of growth, so the population structure remains characterized with youthfulness.
Chart 2: Evolution of the percentages of children and percentage of elderly
Source: Central Bureau of Statistics and the Joint Survey of Labor Force in Syria 2009
The estimates of the Central Bureau of Statistics for the mid-2009 show that the percentage of the elderly whose ages are equal to or more than 65 years amounts to 3.6%, while the percentage of children under the age of 15 years is 38% of the total population.
Rate of popula on < 15 years Rate of popula on = > 65 years
Joint SurveyCBS Estimates

Ministry of Social Affairs and Labor UNDP
(Study of Labor Market in Syria 2009‐2010) 32
Also, through analyzing the evolution of the population aged 15 years and over it appears that the percentage of young people remains dominant, as the results of the Joint Survey 2009 show that the young people aged 15-30 years represent 45% of the total population of 15 years and over, and that ratio was about 50 % in 1981, 51% in 1994 and 48% in 2004. The following Charts demonstrate the evolution of the population pyramid for the age group of 15 years and over:
Chart 3: Population pyramid for 15 years and over (1981)
Chart 4: Population pyramid for 15 years and over (1994)
Chart 5: Population pyramid for 15 years and over (2004)
Chart 6: Population pyramid for 15 years and over (2009)
1.3 Labor Force and Economic Activity
The data show that the Syrian society is primarily a young as 40% of the population have not yet reached the working age (less than 15 years), and that rate represents less than 17% in the industrialized countries, 29% in the less developed countries and about 28% globally1.
1 Source: According to the data of the United Na ons Fund for Popula on; 2009
525
385
284
227
172
164
141
151
97
80
149
494
373
277
224
175
166
139
138
85
75
140
1200 1000 800 600 400 200 0 200 400 600 800 1000 1200
19ـ 15
24ـ 20
29ـ 25
34ـ 30
39ـ 35
44ـ 40
49ـ 45
54ـ 50
59ـ 55
64ـ 60
65 - +
(1000)
إناث ذكور
814
632
527
427
332
271
202
170
135
144
222
785
622
518
420
320
256
190
171
129
133
187
1200 1000 800 600 400 200 0 200 400 600 800 1000 1200
19ـ 15
24ـ 20
29ـ 25
34ـ 30
39ـ 35
44ـ 40
49ـ 45
54ـ 50
59ـ 55
64ـ 60
65 - +
(1000)
إناث ذكور
1 072
902
673
549
523
463
372
321
226
146
377
1 025
920
718
578
508
412
307
254
175
149
280
1200 1000 800 600 400 200 0 200 400 600 800 1000 1200
19ـ 15
24ـ 20
29ـ 25
34ـ 30
39ـ 35
44ـ 40
49ـ 45
54ـ 50
59ـ 55
64ـ 60
65 - +
(1000)
إناث ذكور
966
965
825
650
604
531
408
353
242
213
338
1 040
926
809
657
579
532
431
365
286
234
471
1200 1000 800 600 400 200 0 200 400 600 800 1000 1200
19ـ 15
24ـ 20
29ـ 25
34ـ 30
39ـ 35
44ـ 40
49ـ 45
54ـ 50
59ـ 55
64ـ 60
65 - +
(1000)
إناث ذكور
MalesFemales Females Males
MalesFemales Males Females

Ministry of Social Affairs and Labor UNDP
(Study of Labor Market in Syria 2009‐2010) 33
1.3.1 Classification of the Economically Active Population and Labor Force
According to the results of the Joint Survey of Labor Force 2009, the economically active population represent 44% of the total population who are of working age (15 years and over); while more than half the population of working age (56%) remain outside the labor force for several reasons, the most important of which is the dedication to the household affairs for women (58% of the total population outside the labor force) or dedication to study (22% of the total population outside the labor force). The labor force consists of about 87% employed and 13% unemployed. The following chart demonstrates the classification of the population distributed, men and women, according to the relationship with the labor force:
Chart 7: Distribution of population by the relationship with labor force
Source: Joint Survey of Labor Force in Syria 2009
Total Population
Popula on < 15 years Popula on = >15 years
Economically active Pop. Pop. Outside labor force
Men
Employed
Work from Home
Dedicated to study
Unable to work
Satisfied, resigned, etc.
13% Un‐employed
Women (Per thousands)

Ministry of Social Affairs and Labor UNDP
(Study of Labor Market in Syria 2009‐2010) 34
In classifying the work force, the international standards and definitions have been adopted as set out by the ILO through the recommendations of the International Conference of Labor Statisticians (the most recent of which was the Eighteenth Conference, held in 2008); and because there were certain partial reservations on the definitions adopted at designing the research form, we tried to redress same in the classification of the relationship with the labor force and in the analysis of the results, as shown in Annex No. 1. (Also, we have included the remarks on this issue in the introduction to the results). The following table shows the distribution of population of 15 years and over by the relationship to the labor force.
Table 5: Distribution of population of 15 years and over by the relationship to labor force (2009)
(in thousands) Number Percentage Distribution
Female Maile Total Female Maile Total
Enployed 583,8 4 134,3 4 718,1 9,6% 65,3% 38,0%
Unemployed 265,1 464,7 729,8 4,3% 7,3% 5,9%
Unemployed previously Employed 37,9 200,1 238,0 0,6% 3,2% 1,9%
Unemploye previously unemployed 199,2 246,3 445,5 3,3% 3,9% 3,6%
Unemplyed, previous status unknown 27,9 18,3 46,2 0,5% 0,3% 0,4%
outside Labor force 5 246,0 1 731,1 6 977,1 86,1% 27,3% 56,2%
dedicated of household business 4 034,6 2,1 4 036,7 66,2% 0,0% 32,5%
dedicated to studying 727,3 841,3 1 568,6 11,9% 13,3% 12,6%
unable to work 289,9 404,6 694,6 4,8% 6,4% 5,6%
satisfied 82,3 93,5 175,8 1,4% 1,5% 1,4%
retired 35,0 281,7 316,6 0,6% 4,4% 2,5%
Others (OLF) 76,8 108,0 184,9 1,3% 1,7% 1,5%
Total 6 094,9 6 330,1 12 425,0 100,0% 100,0% 100,0%
Source: Joint Survey of the Labor Force in Syria 2009 It is clear from the Joint Survey of Labor Force that the total number of working-age population (aged 15 years and over) is estimated at 12.425 million in early 2009 which records an annual growth rate estimated at 2.78% during the preceding five years (2004-2009), while the growth rate of the labor force during the same period does not exceed 1.93%. Also, the annual results of the labor force survey 2009 show that the number of the working-age population reached 12,654 million, which represents 63% of the total population.
Chart 8: Evolution of working-age population and labor force
Source: Labor Force Surveys 2001-2009, Central Bureau of Statistics the Joint Survey of Labor Force in Syria 2009
5,27
6
5,46
0
5,01
7
4,95
2
5,09
2
5,29
2
5,40
1
5,44
2
5,44
8
5,44
2
4,68
2
4,93
8
5,58
1
5,89
4
6,28
0
6,28
3
6,63
8
6,81
8
6,97
7
7,21
1
9,95810,39810,59810,845
11,37211,57512,03812,26112,42512,654
01,0002,0003,0004,0005,0006,0007,0008,0009,00010,00011,00012,00013,000
2001200220032004200520062007200820092009
غري الناشطون اقتصاديا قوة العمل
(1000)املسح املشرتك
The inactive economically Labor force
Joint Survey

Ministry of Social Affairs and Labor UNDP
(Study of Labor Market in Syria 2009‐2010) 35
2.3.1 Economic activity and its evolution
The following table combines the indicators of labor force development and the rates of activity, un employment and dependency according to the results of the population census of 1970, 1981, 1994 and 2004, and the labor market surveys conducted during the period from 2001-2010:
Table 6: Evolution of the labor force and the rate of economic activity 1970. 1979, 1994 and 2001-2010
(Numbers in Thousan)
Labor Force Total Population
Pop. 15+ years
Economic Activity Rate
Rate of Economid
Dependency
Un-employment
Rate Employed Unemployed Total Raw Revised
1970
Males 1 311,5 91,4 1 402,9 3 233,1 2 060,0 43,4% 68,1% 2,5 6,5%
Females 158,9 9,0 167,9 3 071,6 1 979,4 5,5% 8,5% 19,3 5,4%
Total 1 470,4 100,4 1 570,8 6 304,7 4 039,4 24,9% 38,9% 4,3 6,4%
1979
Males 1 762,2 69,2 1 831,4 4 446,9 2 936,8 41,2% 62,4% 2,5 3,8%
Females 329,9 12,9 342,9 4 276,6 2 776,6 8,0% 12,3% 13,0 3,8%
Total 2 092,1 82,1 2 174,2 8 723,5 5 713,4 24,9% 38,1% 4,2 3,8%
1994
Males 2 888,8 197,6 3 086,4 7 048,9 3 869,0 43,8% 79,8% 2,4 6,4%
Females 392,0 48,8 440,8 6 733,4 3 764,2 6,5% 11,7% 17,2 11,1%
Total 3 280,9 246,3 3 527,2 13 782,3 7 633,2 25,6% 46,2% 4,2 7,0%
2001
Males 3 925,6 312,0 4 237,6 8 678,4 5 088,0 48,8% 83,3% 2,2 7,4%
Females 804,2 233,9 1 038,1 8 041,6 4 870,0 12,9% 21,3% 10,0 22,5%
Total 4 729,9 545,9 5 275,7 16 720,0 9 958,0 31,6% 53,0% 3,5 10,3%
2002
Males 3 933,4 355,8 4 289,2 8 885,0 5 357,0 48,3% 80,1% 2,3 8,3%
Females 888,4 282,0 1 170,4 8 245,0 5 041,0 14,2% 23,2% 9,3 24,1%
Total 4 821,8 637,8 5 459,6 17 130,0 10 398,0 31,9% 52,5% 3,6 11,7%
2003
Males 3 706,9 334,1 4 041,0 8 979,0 5 390,0 45,0% 75,0% 2,4 8,3%
Females 761,7 214,4 976,0 8 571,0 5 208,0 11,4% 18,7% 11,3 22,0%
Total 4 468,6 548,4 5 017,0 17 550,0 10 598,0 28,6% 47,3% 3,9 10,9%
2004
Males 3 730,7 442,3 4 173,0 9 173,3 5 550,5 45,5% 75,2% 2,5 10,6%
Females 612,4 166,2 778,6 8 701,2 5 294,8 8,9% 14,7% 14,2 21,3%
Total 4 343,1 608,5 4 951,6 17 874,6 10 845,2 27,7% 45,7% 4,1 12,3%
2005
Males 4 048,6 254,4 4 303,0 9 340,0 5 934,0 46,1% 72,5% 2,3 5,9%
Females 631,0 158,4 789,5 8 929,0 5 438,0 8,8% 14,5% 14,2 20,1%
Total 4 679,7 412,8 5 092,5 18 269,0 11 372,0 27,9% 44,8% 3,9 8,1%
2006
Males 4 229,7 235,7 4 465,4 9 563,0 6 026,2 46,7% 74,1% 2,3 5,3%
Females 630,2 196,5 826,8 9 154,0 5 548,9 9,0% 14,9% 14,5 23,8%
Total 4 859,9 432,2 5 292,2 18 717,0 11 575,1 28,3% 45,8% 3,9 8,2%
2007
Males 4 316,0 237,3 4 553,3 9 798,0 6 153,2 46,5% 74,0% 2,3 5,2%
Females 630,0 217,5 847,5 9 374,0 5 885,2 9,0% 14,4% 14,9 25,7%
Total 4 946,0 454,8 5 400,8 19 172,0 12 038,3 28,2% 44,9% 3,9 8,4%
2008
Males 4 175,4 379,9 4 555,3 10 042,0 6 230,9 45,4% 73,1% 2,4 8,3%
Females 672,5 214,6 887,1 9 602,0 6 029,7 9,2% 14,7% 14,3 24,2%
Total 4 847,9 594,5 5 442,4 19 644,0 12 260,5 27,7% 44,4% 4,1 10,9%
2009 Males 4 134,3 464,7 4 599,0 10 606,0 6 330,1 43,4% 72,7% 2,6 10,1%
Jouint Survey Females 583,8 265,1 848,8 10 143,1 6 094,9 8,4% 13,9% 17,4 31,2%
Total 4 718,1 729,8 5 447,9 20 749,2 12 425,0 26,3% 43,8% 4,4 13,4%
2009 Males 4 374,1 263,7 4 637,7 10 287,0 6 465,4 45,1% 71,7% 2,4 5,7%
Annual Females 625,2 179,3 804,5 9 838,0 6 188,2 8,2% 13,0% 15,7 22,3%
Total 4 999,2 443,0 5 442,2 20 125,0 12 653,6 27,0% 43,0% 4,0 8,1%
2010 Males 4 428,2 269,5 4 697,7 10 539,0 6 590,0 44,6% 71,3% 2,2 5,7%
First Half Females 684,1 198,5 882,6 10 080,0 6 356,0 8,8% 13,9% 11,4 22,5%
Total 5 112,3 468,0 5 580,3 20 619,0 12 946,0 27,1% 43,1% 3,7 8,4%
Source: Population censuses for the years 1970, 1994 and 2004 and labor force surveys 1979 and 2001-2010 (Central Bureau of Statistics) and the Joint Survey of Labor Force in Syria 2009.

Ministry of Social Affairs and Labor UNDP
(Study of Labor Market in Syria 2009‐2010) 36
However, the number of the active population of the age-group of 15 years and over is estimated at 5448 thousand active persons in early 2009 distributed between 849 thousand women and 4600 thousand men. This illustrates the weak presence of woman in the labor force structure representing less than 16% of the economically active population. We are going to analyze this matter in Part IV of this report devoted to the work of young people and women. In comparison with the results of the previous surveys, it is clear that there is a varying change in the number of the active population leading to unexplained results regarding the size of additional applications for work that are growing from year to year from -440 thousand to 200 thousand as shown in the following Charts. Although there are probably certain interpretive elements like the methodical changes and seasonal variables, as well as the factor of labor migration, yet such change in the size of labor force remains unusual and indicates some methodical shortages in the field work of some previous surveys.
Chart 9: Changes in the labor force: the additional demands for work (total)
Source: According to surveys of labor market data, and 2001-2009 joint survey of the labor force 2009
Chart 10: Evolution of the additional demands of the work of women and men
Source: surveys by the labor market survey 2001-2010 and the Joint Task Force 2009
Added to that are several factors that overlap in such different and varying forms and effects in determining the size of labor force that it becomes difficult to isolate each factor and reach an accurate analysis of the development of the additional applications for work. If we take into consideration the average of the past five years, it will be evident that the number of the additional application for work is about 100 thousand distributed to nearly 20 thousand for females and 80 thousand for males, and the rate of the annual growth of labor force is about 1.3%, i.e. at a lower rate than the demographic growth and the growth of population of working age. The crude economic activity rate (the percentage of labor force to the total population) reached 26.3% in 2009 distributed among women and men at 8.4% and 43.4% respectively. Whereas the refined economic activity rate (the percentage of labor force to the population 15 years and over) reached 13.9% for women, 72.7% for men and 43.8% for the total. During the past decade the refined economic activity rate recorded a decrease of 10 points reaching less than 44% in 2009 whereas it was more than 52% in 2001. The final results of the labor force survey 2009 confirm the continued decline of the refined economic activity rate. This decline is noted among women and men. This is basically because students stay at schools for long periods. The following two Charts show the evolution of the crude and refined economic activity rate since 200:
52
-248
132130162
882
4482
132
-194
-197
1137
2140
-38-83
184
-443
-65
141200
10942
50
-500
-400
-300
-200
-100
0
100
200
300
200220032004200520062007200820092009
نساء -الطلبات اإلضافية للعمل رجال -الطلبات اإلضافية للعمل
Joint Surveyاملسح املشرتك(1000)
Additional demands for work ‐Women
Additional demands for work ‐Men
Joint Survey 1st half

Ministry of Social Affairs and Labor UNDP
(Study of Labor Market in Syria 2009‐2010) 37
Chart 11: The evolution of crude economic activity rate
(2001-2009)
Source: Labor market surveys 2001-2008 and Joint Survey of Labor Force 2009
Chart 12: The evolution of the refined activity rate (2001-2009)
Source: Labor market surveys 2001-2008 and Joint Survey of Labor Force 2009
The following table shows the distribution of the population 15 years and over by the relationship to the labor force and the governorates: Table 7: Distribution of the population 15 years and over by the relationship to the labor force and the provinces
(per thousan)
Employed Unembloyed Outside Labor Force Total
Female Male Total Female Male Total Female Male Total Female Male Total
Damascus 71,6 420,5 492,1 22,1 40,9 63,0 524,2 176,6 700,7 617,8 638,0 1 255,8
Aleppo 53,1 878,3 931,3 13,1 96,1 109,2 1 224,9 386,5 1 611,5 1 291,1 1 360,9 2 652,0
Damascus Csd. 75,7 631,8 707,4 13,7 24,0 37,6 709,1 190,0 899,0 798,4 845,7 1 644,1
Homs 56,9 362,8 419,7 20,7 36,1 56,9 454,4 155,3 609,7 532,1 554,2 1 086,3
Hama 79,7 343,6 423,3 41,6 29,9 71,4 342,8 106,8 449,7 464,1 480,3 944,4
Lattakia 65,5 229,9 295,5 45,7 26,7 72,4 241,5 102,0 343,6 352,8 358,7 711,5
Idleb 26,3 261,5 287,7 6,1 24,4 30,4 342,0 104,2 446,2 374,3 390,0 764,4
Hasaka 20,6 242,5 263,1 37,2 72,6 109,8 377,7 124,8 502,6 435,5 439,9 875,4
Deir Ezzour 33,7 173,6 207,4 8,6 35,5 44,1 254,7 92,4 347,1 297,0 301,5 598,5
Tartous 51,3 171,1 222,4 42,6 33,8 76,4 187,6 83,3 270,9 281,6 288,1 569,6
Raqa 8,0 162,1 170,1 0,8 19,3 20,2 216,3 66,7 283,1 225,1 248,2 473,3
Daraa 19,8 174,0 193,8 4,3 12,2 16,5 247,3 89,4 336,7 271,4 275,6 546,9
Sweida 20,2 66,9 87,1 8,1 11,2 19,3 101,7 46,3 148,0 130,0 124,5 254,5
Kunaitera 1,4 15,7 17,1 0,5 2,1 2,7 21,7 6,8 28,4 23,6 24,6 48,2 Total 583,8 4 134,3 4 718,1 265,1 464,7 729,8 5 246,0 1 731,1 6 977,1 6 094,9 6 330,1 12 425,0
Source: Joint Survey of the Labor Force in Syria 2009 The western region is characterized by a high rate of economic activity, especially with regard to the governorates of Tartous, Hama, and Lattakia. This is attributed to the relative high rate of the economic activity of women in that region as shown in the following table and a map:
WomeMen Total WomeMen Total
Joint Survey Joint Survey

Ministry of Social Affairs and Labor UNDP
(Study of Labor Market in Syria 2009‐2010) 38
Table 8: Distribution of the crude rate of economic activity and the rate of refined economic activity by the governorates (2009)
Crude Economic Activity Rate Refined Economic Activity Rate
Female Male Total Female Male Total
Damascus 10,6% 52,4% 31,5% 15,2% 72,3% 44,2%
Aleppo 2,8% 41,2% 22,0% 5,1% 71,6% 39,2%
Damascus Csd. 6,7% 48,9% 27,8% 11,2% 77,5% 45,3%
Homs 8,8% 45,3% 27,1% 14,6% 72,0% 43,9%
Hama 15,3% 47,0% 31,1% 26,1% 77,8% 52,4%
Lattakia 22,3% 51,3% 36,8% 31,5% 71,6% 51,7%
Idleb 4,5% 39,3% 21,9% 8,6% 73,3% 41,6%
Hasaka 7,9% 42,8% 25,4% 13,3% 71,6% 42,6%
Deir Ezzour 7,2% 35,5% 21,4% 14,3% 69,4% 42,0%
Tartous 23,7% 51,6% 37,6% 33,4% 71,1% 52,5%
Raqa 1,9% 39,7% 20,8% 3,9% 73,1% 40,2%
Daraa 4,9% 37,9% 21,4% 8,9% 67,6% 38,4%
Sweida 15,4% 42,6% 29,0% 21,8% 62,8% 41,8%
Kunaitera 4,6% 42,2% 23,4% 8,3% 72,5% 41,0%
Total 8,2% 44,3% 26,3% 13,9% 72,7% 43,8%
Source: Joint Survey of the Labor Force in Syria 2009
Map 2: Distribution of the refined economic activity by the governorate (2009)
Source: Joint Survey of the Labor Force in Syria 2009
Economic Activity Rate
By Gender By Governorates

Ministry of Social Affairs and Labor UNDP
(Study of Labor Market in Syria 2009‐2010) 39
The results of the Joint Survey of Labor Force 2009 are consistent with the results of the general census of housing and population for the year 2004, which shows the rise in women's economic activity in coastal as well as agricultural areas.
Map 3: Distribution of the refined rate of economic activity by areas - Total (2004)
000 Damascus, 010 Damascus, 011 Tal, 012 Daraya, 013 Douma, 014 Zabadani, 015 Katana, 016 Kutaifa, 017 Nabek, 018 Yabroud, 020 Homs, 021 Tadmor, .022 Tal-Kalakh, 023 Rastan, 024 Kassir, 025 Makhram, 030 Hama, 031 Salamiya, 032 Skelbiyia, 033 Mharda, 034 Misyaf, 040 Tartous, 041 Banyas, 042 Dreikish, 043 Sheikh Bader, 044 Safita, 050 Lattakia, 051 Jableh, 052 Hiffa 053 Kurdaha, 060 Idleb, 061 Ariha, 062 Jisr-Eshaghour, 063 Harem, 064 Ma'arrat Numan, 070 Mount Simon, 071 Azzaz, 072 Albab, 073 Jarablus, 074 Al-Sfeira, 075 Afrin, 076 Ain Arab, 077 Manbej, 080 Rakka, 081 Tel Abyad 082 Al-Thawra, 090 Deir Eezzour, 0.091 Abu Kamal, 092 Mayadin, 100 Hassaka, 101 Ras Al Ain, 102 Kamishli, 103 Malkiya, 110 Sweida, 111 Shahba, 112 Salkhad, .120 Daraa, 121 Izraa, 122 Sanamein, 130 Kunaitra, 131 Markaz Fiq-Wazwaya
Map 4: The revised rate of economic activity by region -
women (2004) Map 5: The revised rate of economic activity by region
- men (2004)
Source: General Census for Housing and Population 2004
Refined rate of activity Refined rate of activity
Refined rate of activity

Ministry of Social Affairs and Labor UNDP
(Study of Labor Market in Syria 2009‐2010) 40
The results of the Joint Survey of Labor Force in Syria 2009 show that the demographic dependency ratio (the rate of working-age population to the total population) equals to 1.8, i.e. every person at the working age between 15 and 64 years is supposed to support a 0.8 person plus himself. The economic dependency ratio (the rate of the working population to the total population) reached 4.4, i.e. every worker supports about 3.4 persons plus himself. This ratio dramatically varies between men and women, 17.8 for women and 2.5 for men, and the variation of the economic activity distribution among women between the regions explains the variation of the economic dependency ratio shown in the following map where the economic dependency ratio changes among men at about 2.1 (in Damascus Countryside) and 3.0 (in Hassaka), while that ratio changes from 7.6 (in Lattakia) and 57.4 (in Rakka):
Map 6: Distribution of the economic dependency ratio by governorates (2009)
Source: Joint Survey of the Labor Force in Syria 2009 3.3.1 Characteristics of the Economically Active Population: Age Groups, Marital Status and Educational Status
As regards the age structure of labor force, the results of the Joint Survey of Labor Force show that the age of 40% of the economically active population does not exceed 30 years, and this confirms the youth characteristic of the workforce in Syria. The following tables and Chart demonstrate the distribution of the labor force by age group:
Chart 13: Distribution of labor force by age groups (2009)
Source: Joint Survey of the Labor Force in Syria 2009
Rate of economic dependency – Total
Rate of economic dependency for men
Rate of economic dependency for women

Ministry of Social Affairs and Labor UNDP
(Study of Labor Market in Syria 2009‐2010) 41
Table 9: Distribution of the population 15 years and over by the relationship to the labor force and age groups (2009)
(per thousand) Emmployed Unemployed Ouside Workforc Total
Female Male Total Female Male Total Female Male Total Female Male Total
15-19 years 23,7 296,2 319,9 34,7 74,2 108,9 907,2 669,6 1 576,8 965,6 1 039,9 2 005,6
20-24 69,8 527,1 596,9 95,4 135,0 230,4 799,7 263,5 1 063,2 964,9 925,6 1 890,5
25-29 93,3 639,6 732,9 62,3 104,0 166,3 669,6 65,4 735,0 825,2 809,0 1 634,2
30-34 92,8 581,4 674,2 37,2 51,8 89,1 519,8 23,8 543,6 649,8 657,0 1 306,8
35-39 93,2 526,1 619,3 18,9 35,2 54,1 492,1 17,3 509,4 604,3 578,6 1 182,8
40-44 87,9 485,8 573,7 11,2 24,5 35,7 431,6 22,0 453,6 530,7 532,3 1 063,1
45-49 58,7 386,6 445,3 2,6 16,7 19,3 346,2 27,2 373,4 407,5 430,6 838,1
50-54 36,1 299,1 335,2 1,7 10,7 12,4 315,1 55,1 370,3 352,9 364,9 717,8
55-59 20,5 207,5 227,9 0,7 6,9 7,6 220,6 71,7 292,3 241,8 286,0 527,9
60-64 4,7 96,5 101,2 0,2 3,3 3,4 207,9 134,2 342,1 212,7 234,0 446,7
=.>65 3,0 88,4 91,4 0,1 2,4 2,5 335,1 380,5 715,6 338,2 471,3 809,5
Not Stated 0,2 0,0 0,2 0,0 0,0 0,0 1,0 0,9 1,9 1,2 0,9 2,1
Total 583,8 4 134,3 4 718,1 265,1 464,7 729,8 5 246,0 1 731,1 6 977,1 6 094,9 6 330,1 12 425,0 Source: Joint Survey of the Labor Force in Syria 2009
Table 10: Percentage distribution of the population 15 years and over by the relationship to the labor force and
age groups (2009)
(per thousand)
Emmployed Unemployed Ouside Workforc Total
Female Male Total Female Male Total Female Male Total Female Male Total
15-19 years 4,1% 7,2% 6,8% 13,1% 16,0% 14,9% 17,3% 38,7% 22,6% 15,8% 16,4% 16,1%
20-24 11,9% 12,8% 12,7% 36,0% 29,0% 31,6% 15,2% 15,2% 15,2% 15,8% 14,6% 15,2%
25-29 16,0% 15,5% 15,5% 23,5% 22,4% 22,8% 12,8% 3,8% 10,5% 13,5% 12,8% 13,2%
30-34 15,9% 14,1% 14,3% 14,0% 11,2% 12,2% 9,9% 1,4% 7,8% 10,7% 10,4% 10,5%
35-39 16,0% 12,7% 13,1% 7,1% 7,6% 7,4% 9,4% 1,0% 7,3% 9,9% 9,1% 9,5%
40-44 15,1% 11,8% 12,2% 4,2% 5,3% 4,9% 8,2% 1,3% 6,5% 8,7% 8,4% 8,6%
45-49 10,1% 9,4% 9,4% 1,0% 3,6% 2,6% 6,6% 1,6% 5,4% 6,7% 6,8% 6,7%
50-54 6,2% 7,2% 7,1% 0,6% 2,3% 1,7% 6,0% 3,2% 5,3% 5,8% 5,8% 5,8%
55-59 3,5% 5,0% 4,8% 0,3% 1,5% 1,0% 4,2% 4,1% 4,2% 4,0% 4,5% 4,2%
60-64 0,8% 2,3% 2,1% 0,1% 0,7% 0,5% 4,0% 7,8% 4,9% 3,5% 3,7% 3,6%
=.>65 0,5% 2,1% 1,9% 0,0% 0,5% 0,3% 6,4% 22,0% 10,3% 5,5% 7,4% 6,5%
Not Stated 0,0% 0,0% 0,0% 0,0% 0,0% 0,0% 0,0% 0,0% 0,0% 0,0% 0,0% 0,0%
Total 100,0% 100,0% 100,0% 100,0% 100,0% 100,0% 100,0% 100,0% 100,0% 100,0% 100,0% 100,0%
In comparison with the previous surveys, the average age of workforce in Syria is witnessing a relative rise due to the change in the age structure of the Syrian society, and the increase of the age average upon entering the labor market, which is explained by the prolonged education period. The results show that the average age of the workforce in Syria increased two years during the past decade, as it rose from less than 34 years in the early decade (33.8 years in 2001) to 36 years now.
Chart 14: Evolution of the age rate of the work force (accounting years 2001-2010)
Source: Labor market surveys 2001-2010 and Joint Survey of Labor Force 2009
1st half
Annual results
Joint Survey

Ministry of Social Affairs and Labor UNDP
(Study of Labor Market in Syria 2009‐2010) 42
The findings of the surveys for the period 2004-2010 are included in the appendices. The following chart shows that the ratio of young people (15-24 years) of the total active population declined to less than a quarter, while it was more than a third in the early last decade. As well, the ratio of the active in the age group 15-30 years stabilized at about 40% in the recent years, while it was approximately 48% in the early last decade. The results also show a rise in the average age of the workforce, particularly among women as the average of their age increased by 3.5 years between 2004 and 2010 while the age of the activist men increased by 2.3 years during that period, thus the ratio of the young among the female labor force fell from 36.4% in 2004 to 22.1% in 2010. This phenomenon is explained, as will be analyzed later, by the remarkable transformation in women's work, which fell back in the agriculture sector and increased in the services sector, which requires higher scientific qualifications and therefore more advancement in age.
Chart 15: Evolution of young people rate in the workforce distributed by sex between 2004 and 2010
Source: The General Census 2004 and Labor Force Survey 2010
Chart 16: Evolution of the young people rate in the labor force (2001-2009)
Source: Surveys of labor market 2001-2010 and the Joint Task Force 2009
Table 11: Evolution of the relative distribution of the labor force by age groups (2001-2010)
2001 2002 2003 2004 2005 2006 2007 2008 2009 2009 2010
Joint Survey
Annual Results
1st half
15-19 16,5% 16,8% 13,5% 12,6% 10,1% 9,9% 9,1% 8,3% 7,9% 7,4% 8,7% 20-24 17,6% 17,9% 17,6% 18,0% 16,6% 16,1% 16,0% 15,1% 15,2% 13,7% 13,7% 25-29 13,7% 13,3% 13,8% 16,1% 15,9% 14,9% 15,5% 16,1% 16,5% 16,1% 15,4% 30-34 11,3% 11,2% 12,2% 13,5% 12,4% 13,1% 13,0% 14,0% 14,0% 14,2% 14,1% 35-39 10,9% 10,9% 11,4% 11,8% 12,7% 12,4% 12,3% 12,4% 12,4% 13,1% 12,5% 40-44 8,6% 8,9% 9,5% 9,5% 9,9% 10,9% 10,7% 10,9% 11,2% 11,3% 11,2% 45-49 6,4% 6,6% 7,2% 6,8% 8,3% 8,2% 8,2% 8,2% 8,5% 9,2% 8,8% 50-54 5,7% 5,5% 6,1% 5,0% 5,8% 6,3% 6,3% 6,4% 6,4% 6,6% 7,1% 55-59 3,2% 3,3% 3,5% 3,0% 3,9% 3,9% 4,0% 4,4% 4,3% 4,2% 4,3% 60-64 2,8% 2,4% 2,3% 1,6% 2,0% 2,1% 2,2% 2,0% 1,9% 2,1% 2,1% =.>65 3,3% 3,2% 3,0% 2,0% 2,4% 2,3% 2,6% 2,1% 1,7% 2,0% 2,1%
Not Stated 0,1% 0,0% 0,0% 0,0% 0,0% 0,0% Total 100,0% 100,0% 100,1% 100,0% 100,0% 100,0% 100,0% 100,0% 100,0% 100,0% 100,0%
Source: Labor market surveys 2001-2010 and Joint Survey of Labor Force 2009
Males Females
< 25 years
Total
= >25 years

Ministry of Social Affairs and Labor UNDP
(Study of Labor Market in Syria 2009‐2010) 43
The rate of economic participation reaches its heyday during the decades between the age of 25 years and 45 years, and the average of economic activity continues up among men to the age of retirement, while the economic activity of women decreases from the age of 45 year. We will analyze this phenomenon later in Section IV devoted to the work of young people and women.
Chart 17: Distribution of economic activity rate by sex and and age groups
Source: Joint Survey of the Labor Force in Syria 2009
Also, the results of the labor force survey show that the rate of economic participation changes by the change of the marital status, especially among women as the rate of economic participation is doubled threefold among the divorced compared with the married women (34% vs. 11%), which indicates that marriage hinders the economic participation of women, while the rate of economic activity of divorced men decreases to 77% compared with
Chart 18: Distribution of economic activity by marital status
Source: Joint Survey of the Labor Force in Syria 2009
82% of married men, and this is not attributed to the age factor (as shown in the following table) as the average age among the divorced reaches 37.5 years compared to more than 38 in respect of the married. The following chart and table demonstrate the distribution of the marital status of the working-age population by gender, class and age average.
Chart 19: Distribution of the population 15 years and above by Marital Status
60%
82%77%
19%
73%
21%
11%
34%
6%
14%
0%
10%
20%
30%
40%
50%
60%
70%
80%
90%
المجموعأرملمطلقمتزوجأعزب
ذكور
إناث
Single MarriedDivorcedWidow
SingleMarried DivorcedWidow
Total
Males
Females
Total
Males
Females
Males
Females
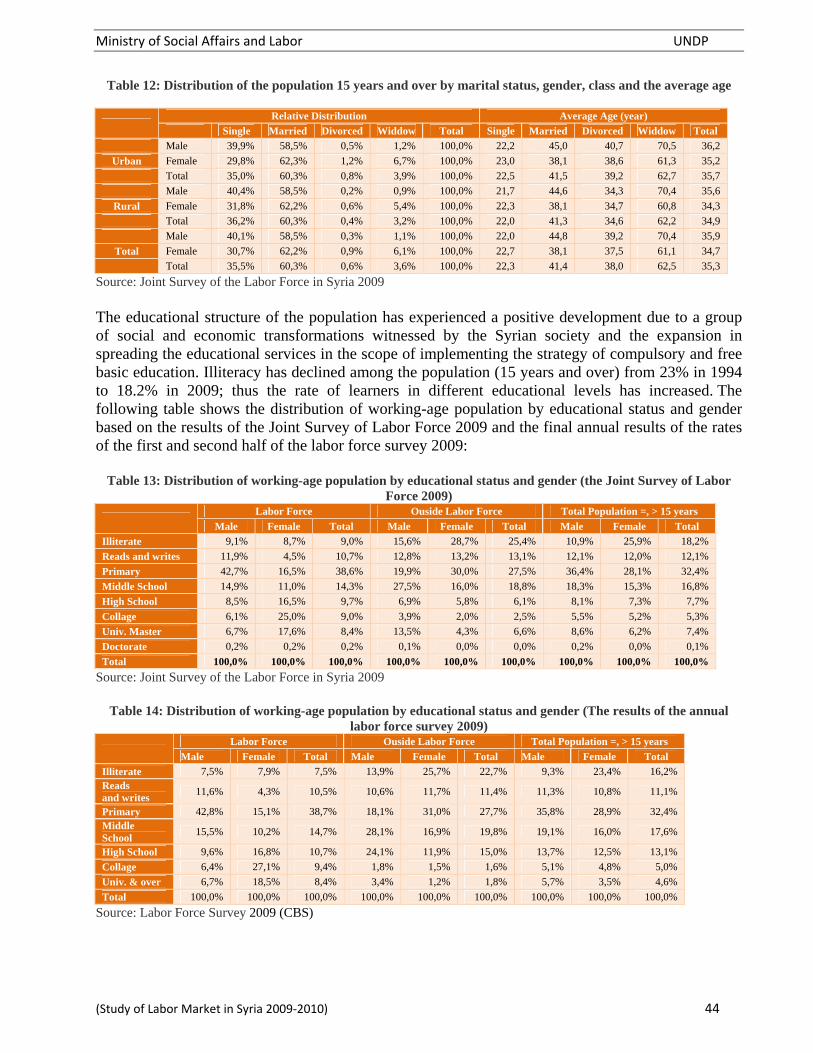
Ministry of Social Affairs and Labor UNDP
(Study of Labor Market in Syria 2009‐2010) 44
Table 12: Distribution of the population 15 years and over by marital status, gender, class and the average age
Relative Distribution Average Age (year)
Single Married Divorced Widdow Total Single Married Divorced Widdow Total
Male 39,9% 58,5% 0,5% 1,2% 100,0% 22,2 45,0 40,7 70,5 36,2
Urban Female 29,8% 62,3% 1,2% 6,7% 100,0% 23,0 38,1 38,6 61,3 35,2
Total 35,0% 60,3% 0,8% 3,9% 100,0% 22,5 41,5 39,2 62,7 35,7
Male 40,4% 58,5% 0,2% 0,9% 100,0% 21,7 44,6 34,3 70,4 35,6
Rural Female 31,8% 62,2% 0,6% 5,4% 100,0% 22,3 38,1 34,7 60,8 34,3
Total 36,2% 60,3% 0,4% 3,2% 100,0% 22,0 41,3 34,6 62,2 34,9
Male 40,1% 58,5% 0,3% 1,1% 100,0% 22,0 44,8 39,2 70,4 35,9
Total Female 30,7% 62,2% 0,9% 6,1% 100,0% 22,7 38,1 37,5 61,1 34,7
Total 35,5% 60,3% 0,6% 3,6% 100,0% 22,3 41,4 38,0 62,5 35,3
Source: Joint Survey of the Labor Force in Syria 2009 The educational structure of the population has experienced a positive development due to a group of social and economic transformations witnessed by the Syrian society and the expansion in spreading the educational services in the scope of implementing the strategy of compulsory and free basic education. Illiteracy has declined among the population (15 years and over) from 23% in 1994 to 18.2% in 2009; thus the rate of learners in different educational levels has increased. The following table shows the distribution of working-age population by educational status and gender based on the results of the Joint Survey of Labor Force 2009 and the final annual results of the rates of the first and second half of the labor force survey 2009:
Table 13: Distribution of working-age population by educational status and gender (the Joint Survey of Labor Force 2009)
Labor Force Ouside Labor Force Total Population =, > 15 years
Male Female Total Male Female Total Male Female Total
Illiterate 9,1% 8,7% 9,0% 15,6% 28,7% 25,4% 10,9% 25,9% 18,2%
Reads and writes 11,9% 4,5% 10,7% 12,8% 13,2% 13,1% 12,1% 12,0% 12,1%
Primary 42,7% 16,5% 38,6% 19,9% 30,0% 27,5% 36,4% 28,1% 32,4%
Middle School 14,9% 11,0% 14,3% 27,5% 16,0% 18,8% 18,3% 15,3% 16,8%
High School 8,5% 16,5% 9,7% 6,9% 5,8% 6,1% 8,1% 7,3% 7,7%
Collage 6,1% 25,0% 9,0% 3,9% 2,0% 2,5% 5,5% 5,2% 5,3%
Univ. Master 6,7% 17,6% 8,4% 13,5% 4,3% 6,6% 8,6% 6,2% 7,4%
Doctorate 0,2% 0,2% 0,2% 0,1% 0,0% 0,0% 0,2% 0,0% 0,1%
Total 100,0% 100,0% 100,0% 100,0% 100,0% 100,0% 100,0% 100,0% 100,0%
Source: Joint Survey of the Labor Force in Syria 2009
Table 14: Distribution of working-age population by educational status and gender (The results of the annual labor force survey 2009)
Labor Force Ouside Labor Force Total Population =, > 15 years
Male Female Total Male Female Total Male Female Total
Illiterate 7,5% 7,9% 7,5% 13,9% 25,7% 22,7% 9,3% 23,4% 16,2% Reads and writes
11,6% 4,3% 10,5% 10,6% 11,7% 11,4% 11,3% 10,8% 11,1%
Primary 42,8% 15,1% 38,7% 18,1% 31,0% 27,7% 35,8% 28,9% 32,4% Middle School
15,5% 10,2% 14,7% 28,1% 16,9% 19,8% 19,1% 16,0% 17,6%
High School 9,6% 16,8% 10,7% 24,1% 11,9% 15,0% 13,7% 12,5% 13,1%
Collage 6,4% 27,1% 9,4% 1,8% 1,5% 1,6% 5,1% 4,8% 5,0%
Univ. & over 6,7% 18,5% 8,4% 3,4% 1,2% 1,8% 5,7% 3,5% 4,6%
Total 100,0% 100,0% 100,0% 100,0% 100,0% 100,0% 100,0% 100,0% 100,0%
Source: Labor Force Survey 2009 (CBS)

Ministry of Social Affairs and Labor UNDP
(Study of Labor Market in Syria 2009‐2010) 45
It is clear from these results that the gap in the educational status is still existing between men and women as more than a quarter of women are illiterate (23.4%, according to annual results) compared to less than 11% for men (9.3%, according to annual results), and only 11.4% of them went beyond high school versus 14.2% for men. When it comes to the economic activity, the gap data are turned over as the level of education of the women workforce exceeds its counterpart of the men workforce. The rate of active women obtaining the secondary school certificate and higher is more than 43% compared to 21% among men (45.7% and 17.9%, according to the annual results ). This reflects the importance of education in the intensification of women's economic participation. The following chart presents the distribution of the active population by educational status and gender:
Chart 20: Distribution of active population by educational status and gender
Source: Joint Survey of the Labor Force in Syria 2009 Also, the results of the labor force survey 2010 (the first half) show the retreat of the illiteracy level among the workforce as its rate reaches 7.2% compared to about 12% in 2004. As well, the rate of obtainers of the high school certificate and above rose to about 30% (52% among women) compared to 22.5% (32% among women) in 2004. The following chart illustrates the evolution in the relative distribution of workforce by the educational level:
Chart 21: The evolution of the relative distribution of the labor force by educational level
Source: General Census 2004, Surveys of labor force, 2009 and 2010, and the Joint Survey of Labor Force 2009
Illiterate
Total FemalesMales
Literate PrimaryPreparatorySecondaryCollage
University and over
Doctorate
Illiterate
Literate
Primary
Preparatory
Secondary
Collage
University
1st half
Annual results
Joint Survey
General Census

Ministry of Social Affairs and Labor UNDP
(Study of Labor Market in Syria 2009‐2010) 46
The results of the Joint Survey of Labor Force 2009 show that illiteracy is still rampant at high rates among the workforce in certain governorates, as this rate reaches 23.5% in Rakka (26.0% among women and 23.4 among men) and 23.1% in Deir Ezzour (33.9% among women and 20.9 among men). This indicates some sectoral characteristics in the governorates, where illiteracy aggravates among the workforce in the agricultural areas.
Chart 22: Distribution of illiteracy in the workforce by sex and governorates
Source: Joint Surveys of Labor Force, 2009
It should be noted that the retreat of illiteracy rate during the past years has not been at the same degree in all over Syria. The following chart demonstrates the change of the illiteracy rate of the working-age population (15 years and over) between 2004 and 2009 by governorates. It is clear that the illiteracy rate dropped in most governorates except Rakka, Deir Ezzour, Aleppo and Damascus. If it is possible to explain a part of this phenomenon by the consequences of migration, this issue deserves in-depth study and investigation to understand the causes of intractability of some illiteracy cases and its rise in certain governorates.
Chart 23: The evolution of the proportion of illiteracy (15 years and over) between 2004 and 2009
Source: General Census 2004 and the Surveys of labor force 2009
The following map represents the illiteracy rate by areas based on the results of the General Census of Housing and Population for the year 2004, and it shows the rise of the illiteracy rate and its concentration in many eastern areas, where more than one third of the population cannot read and write in each of the following areas: Ras Al Ain, Ain Arab, Tel Abyad, Mayadin, Manbej, Assfera, Rakka Center, Abu Kamal Center and Hassaka.
دمشق
حلب
ريف دمشق
محصمحاه ة الالذقي
ادلب
احلسكة
دير الزور
طرطوس
الرقة
درعاالسويداء
القنيطرة
ة سوري
0%
5%
10%
15%
20%
25%
30%
35%
40%
0%5%10%15%20%25%30%35%40%
2009نسبة األمية إرتفاع نسبة األمية
إخنفاض نسبة األمية
2004نسبة األمية
Rate of illiteracy among active women
Rate of illiteracy among active men
Syria
Kuneitra
Sweida
Daraa
Rakka
Tartous
Deir Ezzour
Hassaka
Idleb
Lattakia
Hama
Homs
Damascus C.s.
Aleppo
Damascus
Illiteracy Rate 2009
Illiteracy Rate 2004
Illiteracy Rate fall
Illiteracy Rate rise
Rakka
Deir Ezzour
Hassaka
Lattakia
Aleppo
Tartous Damasc
Rif Damascus
Idleb Syria
Hama Kuneitra
Homs Daraa
Sweida

Ministry of Social Affairs and Labor UNDP
(Study of Labor Market in Syria 2009‐2010) 47
Map 7: Illiteracy rate by region (2004)
000 Damascus, 010 Damascus, 011 Tal, 012 Daraya, 013 Douma, 014 Zabadani, 015 Katana, 016 Kutaifa, 017 Nabek, 018 Yabroud, 020 Homs, 021 Tadmor, .022 Tal-Kalakh, 023 Rastan, 024 Kassir, 025 Makhram, 030 Hama, 031 Salamiya, 032 Skelbiyia, 033 Mharda, 034 Misyaf, 040 Tartous, 041 Banyas, 042 Dreikish, 043 Sheikh Bader, 044 Safita, 050 Lattakia, 051 Jableh, 052 Hiffa 053 Kurdaha, 060 Idleb, 061 Ariha, 062 Jisr-Eshaghour, 063 Harem, 064 Ma'arrat Numan, 070 Mount Simon, 071 Azzaz, 072 Albab, 073 Jarablus, 074 Al-Sfeira, 075 Afrin, 076 Ein Arab, 077 Manbej, 080 Rakka, 081 Tel Abyad 082 Al-Thawra, 090 Deir Ezzour, 0.091 Abu Kamal, 092 Mayadin, 100 Hassaka, 101 Ras Al Ain, 102 Kamishli, 103 Malkiya, 110 Sweida, 111 Shahba, 112 Salkhad, .120 Daraa, 121 Izraa, 122 Sanamein, 130 Kuneitra, 131 Markaz Fiq-Wazwaya Source: According to the results of the general census of population and housing 2004
Summarizing the above, it could be said that the educational status and educational level of the population experienced a noticeable improvement over the past years. However, the importance of addressing the local differences in promoting education and literacy in all parts of the country is highlighted. Also, an important development in the number of holders of the intermediate institution and university certificates is notices. This matter indicates the availability of qualified workforce, but the extent of consistency of the skills of this supply of the graduates of the educational and training system with the requirements of economy and the labor market must be investigated. This subject shall be addressed in the second part of this report devoted to the presentation and analysis of the results of the survey on the demand for labor force for the year 2009.
Rate of illiteracy by areas

Ministry of Social Affairs and Labor UNDP
(Study of Labor Market in Syria 2009‐2010) 48
2. The Employed and their Characteristics
2.1 Evolution of Workers Number and Creation of Job Opportunities
The results of Joint Survey of Labor Force 2009 indicate that the number of employed population of the age group 15 years and over is estimated at 4134 thousand workers. Therefore the employment rate is about 38%, recording a decrease of two points compared with 2004, where the rate was 40%. Women represent 12.4% of the total workers as their number reached 584 thousand, and the ratio of employment among them reached 9.6% compared to 65.3% among men. It should be noted that the number of working women decreased during the past five years as it was equal to 612 thousand in 2004 and the ratio of employment among women was about 11.6%. Despite this reduction in the number of women workers, the net number of the created job opportunities reached 375 thousand during the past five years, i.e. more than 75 thousand jobs a year. However, in comparison with the surveys’ results of the past three years (2006-2008) we notice a decline in the total number of workers, i.e. a net decrease in the created job opportunities. Whereas, the surveys that followed the Joint Survey of Labor Force show an increase in the number of the workers at a rate estimated by 5% annually, as the number of workers reached approximately 5 million in 2009 and more than 5.1 million in 2010. The following chart shows the evolution of the number of workers since 2001:
Chart 24: Evolution of the workers number by gender (2001-2010)
Source: General Census 2004, surveys of 2001-2010 and the Joint Survey of Labor Force 2009
It may be possible to interpret the growth in the number of created jobs opportunities by the occurrence of a parallel change in the Syrian economy during the period 2002-2006, but in the following chart a decline is noted in the job opportunities creation in recent years despite the continued economic growth at high rates exceeding 4$ annually. This issue remains a subject worthy of further research and investigation.
Chart 25: Economic growth and development rate of job creation
Source: Data of the Central Bureau of Statistics (1994-2008) and the International Monetary Fund (2009)
3,92
6
3,93
3
3,70
7
3,73
1
4,04
9
4,23
0
4,31
6
4,17
5
4,13
4
4,37
4
4,42
8
804888762612
631630630673584
6256844,7304,822
4,4694,3434,680
4,8604,9464,8484,7184,9995,112
0
500
1,000
1,500
2,000
2,500
3,000
3,500
4,000
4,500
5,000
5,500
20012002200320042005200620072008200920092010
إناث ذكور اجملموع
(1000)Joint Survey1st half
1,9%
-7,3%
-2,8%
7,7%
3,9%
1,8%
-2,0%-2,7%
7,0%
9,8%
5,0%6,8%
-3,6%
0,6%
3,4%
8,4%
0,6%
6,9%
6,2%
5,0%5,7%4,3%4,0%
-10%
-8%
-6%
-4%
-2%
0%
2%
4%
6%
8%
10%
12%
1995
1996
1997
1998
1999
2000
2001
2002
2003
2004
2005
2006
2007
2008
2009
نسبة منو صايف خلق فرص العملمعدل النمو االقتصادي
Females Males Total
Males
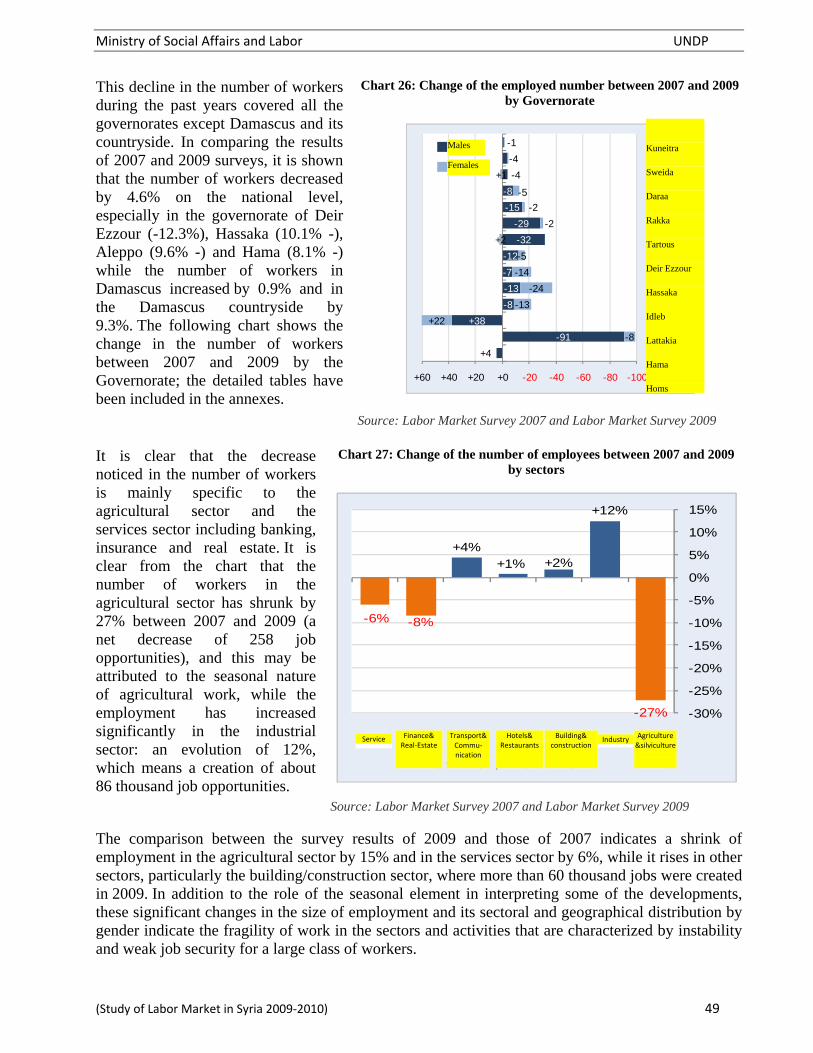
Ministry of Social Affairs and Labor UNDP
(Study of Labor Market in Syria 2009‐2010) 49
This decline in the number of workers during the past years covered all the governorates except Damascus and its countryside. In comparing the results of 2007 and 2009 surveys, it is shown that the number of workers decreased by 4.6% on the national level, especially in the governorate of Deir Ezzour (-12.3%), Hassaka (10.1% -), Aleppo (9.6% -) and Hama (8.1% -) while the number of workers in Damascus increased by 0.9% and in the Damascus countryside by 9.3%. The following chart shows the change in the number of workers between 2007 and 2009 by the Governorate; the detailed tables have been included in the annexes.
Chart 26: Change of the employed number between 2007 and 2009 by Governorate
Source: Labor Market Survey 2007 and Labor Market Survey 2009 It is clear that the decrease noticed in the number of workers is mainly specific to the agricultural sector and the services sector including banking, insurance and real estate. It is clear from the chart that the number of workers in the agricultural sector has shrunk by 27% between 2007 and 2009 (a net decrease of 258 job opportunities), and this may be attributed to the seasonal nature of agricultural work, while the employment has increased significantly in the industrial sector: an evolution of 12%, which means a creation of about 86 thousand job opportunities.
Chart 27: Change of the number of employees between 2007 and 2009 by sectors
Source: Labor Market Survey 2007 and Labor Market Survey 2009 The comparison between the survey results of 2009 and those of 2007 indicates a shrink of employment in the agricultural sector by 15% and in the services sector by 6%, while it rises in other sectors, particularly the building/construction sector, where more than 60 thousand jobs were created in 2009. In addition to the role of the seasonal element in interpreting some of the developments, these significant changes in the size of employment and its sectoral and geographical distribution by gender indicate the fragility of work in the sectors and activities that are characterized by instability and weak job security for a large class of workers.
+4
-91
+38
-8
-13
-7
-12
-32
-29
-15
-8
-4
-4
-1
-8
+22
-13
-24
-14
-5
+2
-2
-2
-5
+1
-100-80-60-40-20+0+20+40+60
دمشقحلبريف دمشقمحصمحاهالالذقيةادلباحلسكةور دير الزطرطوسالرقةدرعاالسويداءذكورالقنيطرة
إناث
-27%
+12%
+2%+1%+4%
-8%-6%
-30%
-25%
-20%
-15%
-10%
-5%
0%
5%
10%
15%
زراعة وحراجة
بناء صناعة د وتشيي
فنادق ومطاعم
نقل مواصالت
مال وعقارات
خدمات
Kuneitra
Sweida
Daraa
Rakka
Tartous
Deir Ezzour
Hassaka
Idleb
Lattakia
Hama
Homs
Females
Males
Service Industry Finance& Real‐Estate
Transport& Commu‐nication
Hotels& Restaurants
Building& construction
Agriculture &silviculture

Ministry of Social Affairs and Labor UNDP
(Study of Labor Market in Syria 2009‐2010) 50
However, the results of 2009 survey and the first half of 2010 survey, conducted by the Central Bureau of Statistics, show the good performance of the various sectors in terms of job creation during 2009 and early 2010 with the creation of more than 394 thousand job opportunity between early 2009 and the first half of 2010, which represents an increase of 8.4% in the size of employment. The most distinguishing feature of this development is the rise of women employment by 17.2% compared to 7.1% for males.
Chart 28: Change of workers number between 2009 and 2010 by sector
Source: The results of the Joint Survey of Labor Force and the labor market survey 2010, the first half
Also, the sectoral distribution of labor development show the importance of the sectors of trade, hotels and restaurant in promoting the labor market and securing work for the various classes of the society as these sectors provided more than 132 thousand additional jobs between early 2009 and the first half of 2010, and the employment increased by 16.8% during the same period. Despite this good performance, the employment in the sectors of trade, hotels and restaurants remains mostly unorganized and characterized by fragility and instability.
Chart 29: Change rate of workers number between 2009 and 2010 by sector
Source: The results of the Joint Survey of Labor Force and the labor market survey 2010, the first half
Table 15: Distribution of workers by sector: Joint Survey of Labor Force 2009, the Annual Results 2009, and the
results of the first half of 2010
Joint Survey of Labor Force 2009 Annual Results 2009 First Half 2010
Male Female Total Male Female Total Male Female Total
Agriculture and silviculture 589 444 99 514 688 958 636 095 122 191 758 286 600 270 162 959 763 229
Industry 740 554 46 963 787 517 764 870 53 338 818 208 777 809 59 322 837 131
Building & Construction 739 814 7 964 747 778 801 496 7 172 808 668 806 614 4 406 811 020
Hotels & Restaurants 757 500 32 328 789 829 780 818 38 189 819 007 874 058 48 177 922 235
Transport & communication 356 414 11 370 367 784 366 051 14 137 380 188 388 153 11 006 399 159
Finance, Insurance & Real 103 892 17 372 121 264 93 073 19 226 112 299 111 387 23 312 134 699
Services 846 445 368 247 1 214 692 931 482 370 924 1 302 406 869 878 374 939 1 244 817
Not Stated 245 0 245 169 0 169 0
Total 4134 309 583 758 4 718 067 4 374 053 625 177 4 999 230 4 428 169 684 121 5 112 290
Source: The results of the Joint Survey of Labor Force 2009, and the results of the annual labor force survey 2009, and Labor Market Survey 2010, the first half
Agriculture and silviculture
Industry
Building and Construction
Trade, Hotels and restaurants
Transport and communications
Finance, Insurance, Real estate
Services
Total
Agriculture and silvicultur
Industry
Building and Construction
Trade, Hotels and restaurants
Transport and communications
Finance, Insurance, Real estate
Services

Ministry of Social Affairs and Labor UNDP
(Study of Labor Market in Syria 2009‐2010) 51
2.2 Beginning of Work and Access to Labor Market
The results of the Joint Survey of Labor Force 2009 showed that entering employment happens, on average, at the age of 20 years and a half, and women enter the labor market at an age exceeding the age of men by three years, on average at the age of 23 years compared to 20 years for men. It is shown that 60% of male workers engaged in the work before the age of 21 years and this ratio reaches about 90% at the age of 25 years for males, whereas one third of female start working before the age of 21 years and at a ratio of more than 80% when they reach 25 years. The following two charts show the distribution of the employed by age on first employment:
Chart 30: Distribution of workers by age at joining first main full-time work (2009)
Chart 31: Distribution of workers by age at joining first main full-time work (accumulation)
The sectoral distribution shows that the age of engaging first work is lower in the activities that do not require high skills and an advanced educational level, such as the sectors of building, construction and agriculture. Whereas, the age of starting work rises in the other sectors such as the finance and insurance sector that needs cadres with high levels. The following chart shows this distribution:
Chart 32: The age of first engagement of work by sectors (years)
0%1%2%3%4%5%6%7%8%9%10%11%12%13%14%15%
101214161820222426283032343638404244464850
إناث ذكور
)بالسنة(العمر عند أول عمل
املشتغلني نسبة
30%
60%
89%
98%
10%
35%
81%
94%
0%
10%
20%
30%
40%
50%
60%
70%
80%
90%
100%
101214161820222426283032343638404244464850
رجالنساء
)بالسنة(العمر عند أول عمل
راكم(املشتغلني نسبة )ت
19.219.318.920.221.323.422.820.5
19.219.118.919.921.3
22.922.420.2
19.7
22.921.4
26.823.4
26.223.723.2
0
5
10
15
20
25
30
زراعة وحراجة
بناء صناعة وتشييد
فنادق ومطاعم
نقل و مواصالت
مال و عقارات
اجملموعخدمات
اجملموع ذكور إناث العمر باألعوام
Agriculture /silviculture
Industry Building & Constr.
Hotels /
restaurants
Transport
& comm..
Finance
& R.E.
ServicesTotal
AgeFemales Males Total
Females
Males
Rate of the employed (Accumulation)
Age on first employment
The employed rate Females Males
Age at first employment

Ministry of Social Affairs and Labor UNDP
(Study of Labor Market in Syria 2009‐2010) 52
Comparing this with the results of the Survey of Labor Force 2003, it is shown that the age of engaging the first employment rises more than one year, as it was about 19.2 for the total employed at that time (20 years for women and 19.3 for men). Such noticed rise in the age of first work engagement, especially among women (a rise of three years) is basically due to the expansion of study periods before entering the labor market. We shall address this issue when we notice the improvement of the educational level of workers, especially among women, during the past years. The following chart shows the rise in age at first work engagement with the advancement of the educational level, and it is noticeable that: a) the average age of women when they start working remains high no matter what their educational situation is, b) the average age of commencing the first work of both women and men converges among the graduates of colleges or universities, c) the male holders of doctorate are characterized by starting work at a relatively earlier age (26 years versus 29 years among females), and this is attributed to starting work in parallel with pursuing the development of their doctoral dissertation.
Chart 33: Distribution of the employed by the current educational status and age at joining the first main full-time work
Source: Joint Survey of Labor Force 2009 Through analyzing the age of first entering the work, the phenomenon of child labor can be noticed, as the results of the Joint Survey of Labor Force 2009 show that about 19% of the workers started work before reaching the specified legal age, and that ratio was 21% among males and only 7% among females. It is noticeable that these rates are not related to the status quo, but to the situation during the mid-seventies (the year of conducting the survey minus the average age of workers). In that period, about one-fifth of new entrants to the labor market were under 16 years.
Total Males Females
IlliterateLiterate Primary Preparatory SecondaryCollage student
Doctorate Diploma University student
CollageUniversity Certificate
High studies
Master Total

Ministry of Social Affairs and Labor UNDP
(Study of Labor Market in Syria 2009‐2010) 53
If the rate of child labor cannot be determined through this survey, yet many studies and field researches addressed this phenomenon and showed that it was usually associated with major factors related to decline in living standards and income of the family, school dropout and low educational level of parents. According to the results of the Labor Force Survey 2009 it is clear that the phenomenon of child labor is related to the groups that failed in the study, where many children who drop out of school resort to work in the informal and small craft sector. More than one third of workers who engage in working before the age of 16 are below the level of elementary education, and working at an early age remarkably shrinks with the progress in the stages of study as shown in the chart below:
Chart 34: Distribution of workers who started work before reaching the age of 16 according to the current educational status
Source: Joint Survey of Labor Force 2009 It should be noted that the Ministry of Social Affairs and Labor issued, in 2004, a decision (Decision No. 1736 dated 12/30/2004) providing the prevention to employ juveniles under the age of ten in any work whatsoever, and the permission to employ who is under eighteen years in production works with necessarily: a) determining the daily working hours of the juvenile with 6 hours to be punctuated by an hour to eat and rest; b) mot employing the juveniles in the evening shifts, weekends, vacations or holidays; c) subjecting the juvenile to a medical examination at the beginning of their work to ensure their fitness to work, and they must be re-examination annually until they complete the age of eighteen; d) The prevention event assigned to work on the machines or tools in addition to the dangerous and should be subject to pre-assigned to do any work to the training course or training appropriate for work; e) abstention from charging the juvenile with works involving dangerous machines or tools, as well as subjecting him to a training course or proper practice session before assigning any job; f) abstention from charging the juvenile with doing any works that are strenuous or causing future damage to their health.
Males Females
IlliterateLiterate Primary Preparatory SecondaryCollage student
Doctorate Diploma University student
CollageUniversity Certificate
High studies
Master Total

Ministry of Social Affairs and Labor UNDP
(Study of Labor Market in Syria 2009‐2010) 54
The results of the Joint Survey of Labor Force 2009 showed that the average age of the workers reached 36 years (35.5 years for women and 36 years for men), recording an increase of one year compared to the average age of workers in 2003. It is noticeable that the progress in the average age of workers increased by more than two and a half years among women in the period between 2003 and 2009, while such increase was within a half year among men. Also, the comparison with the results of the General Census of Population and Housing 2004 show that the number of workers has increased in respect of the age groups of more than 25 years and declined in respect of the young people group as shown in the following two pyramid charts:
Chart 35: Population pyramid of the employed population (2004)
Source: General Census of Population and Housing 2004
Chart 36: Population pyramid of the employed population (2009)
Source: Joint survey of the labor force 2009 2.3 Activity and Occupations Sectors
2.3.1 Sector of Economic Activity
The following table shows the distribution of workers by sector of activity, class and gender:
Table 16: Distribution of workers by sector of activity, class, and sex (2009)
Urban Rural Total
Male Female Total Male Female Total Male Female Total
Agriculture and silviculture 82 272 9 765 92 037 507 172 89 749 596 921 589 444 99 514 688 958
Industry 537 014 30 560 567 574 203 541 16 402 219 943 740 554 46 963 787 517
Building & Construction 348 303 4 583 352 886 391 511 3 381 394 892 739 814 7 964 747 778
Trade, Hotels & Restaurants 590 463 20 104 610 567 167 037 12 224 179 261 757 500 32 328 789 829
Transport & communication 212 758 6 920 219 677 143 656 4 450 148 107 356 414 11 370 367 784
Finance, Insurance & Real 79 383 15 145 94 528 24 509 2 227 26 736 103 892 17 372 121 264
Services 473 699 253 268 726 967 372 746 114 979 487 725 846 445 368 247 1 214 692
Not Stated 245 0 245 0 0 0 245 0 245
Total 2 324 138 340 345 2 664 483 1 810 170 243 413 2 053 584 4 134 309 583 758 4 718 067
Source: Joint survey of the labor force 2009
368
562
569
512
457
379
283
212
133
71
89
75
102
101
89
81
64
39
23
10
5
5
200 100 0 100 200 300 400 500 600 700
19ـ 15
24ـ 20
29ـ 25
34ـ 30
39ـ 35
44ـ 40
49ـ 45
54ـ 50
59ـ 55
64ـ 60
65 - +
(1000)
إناث ذكور
296
527
640
581
526
486
387
299
207
97
88
24
70
93
93
93
88
59
36
20
5
3
200 100 0 100 200 300 400 500 600 700
19ـ 15
24ـ 20
29ـ 25
34ـ 30
39ـ 35
44ـ 40
49ـ 45
54ـ 50
59ـ 55
64ـ 60
65 - +
(1000)
إناث MalesFemalesذكور MalesFemales

Ministry of Social Affairs and Labor UNDP
(Study of Labor Market in Syria 2009‐2010) 55
The results pertaining to the distribution of workers by the economic sector showed that more than half of the employed (53%) work in the service sector (trade, hotels and restaurants, transport, communication, finance, insurance, real estate, education, health, management and other services) and the rest of the workers are distributed between three sectors: Agriculture (14.6%), industry (16.5%) and construction (15.9%).
Chart 37: distribution of workers by sector of activity (2009)
Source: Joint Survey of Labor Force 2009
Through studying the evolution of the employed distribution by sections of economic activity over the past ten years it is shown that there is a significant shift represented in the contraction of employment in the agricultural sector, as its importance has become representing but a half of what it was in the early millennium. The results of the Joint Survey of Labor Force 2009 shows that less than 15% of the employed are working in agriculture and fishing, whereas this rate exceeded 30% in the years 2001-2002. All the other sectors have benefited from this shift as they witnessed a rise in the size and weight of employment during the past years. Also, the annual results of 2009, as well as the results of the first half of 2010 survey confirm this shift in the labor structure as shown in the chart below:
Chart 38: The evolution of the employed distribution by sections of economic activity (2001-2010)
Source: The results of surveys of the labor market 2001-2008, the Joint Survey of Labor Force 2009, the annual results
of the labor force survey 2009, and the Labor Market Survey for the first half of 2010 This development was parallel to the evolution of economic structure in Syria and the emergence of new activities leading to a shrink in the contribution of the agricultural sector in the GDP, as well as a reduction in its share of investments during the last two decades.
29.8%30.3%26.2%18.6%20.1%19.6%19.1%15.5%14.6%15.2%14.9%
13.6%13.7%13.6%
13.4%13.6%14.9%14.2%17.5%16.7%16.4%16.4%
11.9%13.2%11.2%
19.5%14.1%13.4%14.9%16.3%15.9%16.2%15.9%
14.5%15.0%15.2%12.2%15.8%15.6%15.8%18.1%
16.7%16.4%18.0%
5.4%5.5%5.9%6.1%7.1%7.3%7.1%
8.3%7.8%7.6%7.8%
24.9%22.3%27.9%30.2%29.3%29.2%28.8%24.3%28.3%28.3%27.0%
0%
10%
20%
30%
40%
50%
60%
70%
80%
90%
100%
20012002200320042005200620072008200920092010
اخلدمات االخرى
النقل واملواصالت
جتارة وفنادق ومطاعم
البناء والتشييد
الصناعة
الزراعة واحلراجة
األول النصفاملسح املشرتك
Agriculture
Industry
Services
Finance, Insurance& Real Estate
Transport &communication
Hotels & Restaurants
Building & Construction
Agriculture &silviculture
Industry
Other services
Joint Survey
Transport &communication
Trade, Hotels &Restaurants
Building &Construction
1st half

Ministry of Social Affairs and Labor UNDP
(Study of Labor Market in Syria 2009‐2010) 56
Statistics show that the contribution of the agricultural sector in the GDP has declined from more than 30% in the early nineties to about 19% currently. As well, the share of the agricultural sector of the total investments decreased by nearly 10 points between 1992 and 2008: 17.6% in 1992 vs. 7.8 % in 2008. The following chart shows these developments:
Chart 39: The Agricultural Sector: Evolution of its contribution to the GDP and its share of investments
Source: According to the data of the Central Bank of Syria
The results of the Joint Survey of Labor Force 2009 show that women represent 12.4% of the total employed, and their contribution is reduced to 1.1% in the construction sector, 3.1% in the transportation sector and 4.1% in the trade sector, hotels and restaurants; whereas, they represent about one third of those employed in the services sector; and a remainder of about 14% in each of the agricultural sector and the sector of finance, insurance and real estate.
Chart 40: Rate of women of the total employed by sector of activity (2009)
The distribution of the employed by the economic sector indicates the concentration of the women labor in the services sector which employs about two third of the working women, while the distribution of the men labor is more balanced in the in the various sectors of economic activity. The following chart shoes the distribution or workers by sector of activity and gender:
Chart 41: Distribution of workers by sector of activity and gender (2009)
17,6%
17,2%
13,6%
15,0%
14,8%
15,7%
14,7%13,9%15,7%
13,4%
16,2%
13,3%14,2%13,3%11,3%
9,2%7,8%
31,2%29,1%
27,5%28,2%
27,7%25,8%
29,4%
24,3%
24,7%
25,3%
24,9%
24,7%
22,2%20,3%20,4%
19,3%19,5%
0%
5%
10%
15%
20%
25%
30%
35%
1992
1993
1994
1995
1996
1997
1998
1999
2000
2001
2002
2003
2004
2005
2006
2007
2008
نصيب القطاع الزراعي من تكوين رأس املال الثابتمسامهة القطاع الزراعي يف الناتج احمللي االمجايل
Agriculture and silviculture
Industry
Building and Construction
Trade, Hotels and restaurants
Transport and communications
Finance, Insurance, Real estate
Agriculture and silviculture
Industry
Building and Construction
Trade, Hotels and restaurants
Transport and communications
Finance Insurance Real estate
Males
Females
Share of Agricultural Sector in fixed capital
Contribution of Agricultural Sector in GDP

Ministry of Social Affairs and Labor UNDP
(Study of Labor Market in Syria 2009‐2010) 57
Also, the annual results of 2009 survey and the survey results of the first half of 2010 show a similar distribution in the sectoral structure of labor force as women represented 12.5% and 13.4% of the labor force, as their concentration remained mainly in the services sector with observing the shrink in the importance of this sector in the woman labor (59.3% in 2009 and 54.8% in 2010). The following charts demonstrate those results:
Chart 42: Percentage of women to the total employed by sector of activity (year 2009)
Source: Annual results of the Labor Market Survey 2009
Chart 43: Distribution of the employed by sector of activity and gender (Annual 2009)
Source: annual results of the Labor Market Survey 2009
Chart 44: Percentage of women to the total employed by sector of activity (year 2009)
Source: Labor Market Survey, first half of 2010
Chart 45: Distribution of the employed by sector of activity and gender (Annual 2009)
Source: Labor Market Survey, first half of 2010
The following chart shows the distribution of the total employed by the economic activity, and highlights the importance of seven activities in the field of employment, namely: construction, trade, agriculture, industry, public administration, education, health and social services.
Agriculture and silviculture
Industry
Building and Construction
Trade, Hotels and restaurants
Transport and communications
Finance, Insurance, Real estate
Services
Total
Agriculture and silviculture
Industry
Building and Construction
Trade, Hotels and restaurants
Transport and communications
Finance, Insurance, Real estate
Services
Agriculture and silviculture
Industry
Building and Construction
Trade, Hotels and restaurants
Transport and communications
Finance, Insurance, Real estate
Services
Total
Agriculture and silviculture
Industry
Building and Construction
Trade, Hotels and restaurants
Transport and communications
Finance, Insurance, Real estate
Services
Males
Females
Males
Females

Ministry of Social Affairs and Labor UNDP
(Study of Labor Market in Syria 2009‐2010) 58
Chart 46: The distribution of the total employed by sector of economic activity (2009)
Source: Joint Survey of Labor Force 2009 The importance and weight of the various activities differ by gender, and this indicates a division of specialization and professions by gender, where Education represents 37% of female employment versus only 4.4% of the employed men. Also, about one-eighth of men work in the construction sector where only 1.4% of the working women are employed. the following chart demonstrates this distribution:
Chart 47: Distribution of the employed by economic sector and gender (2009)
Source: Joint Survey of Labor Force 2009
Females Males
Agriculture and hunting Fishing Mining and quarrying Manufacturing Electricity, gas and water Building and Construction Wholesale and Retail Hotels and restaurants Transport, storage and communications Financial intermediation Real estate brokerage and leasing Public Adm. and Defense Education Health and social work Social services Home Services International organizations
Agriculture and huntingFishing
Mining and quarryingManufacturing
Electricity, gas and waterBuilding and Construction
Wholesale and RetailHotels and restaurants
Transport, storage and communicationsFinancial intermediation
Real estate brokerage and leasingPublic Adm. and Defense
EducationHealth and social work
Social servicesHome Services
International organizations
Agriculture and hunting Fishing Mining and quarrying Manufacturing Electricity, gas and water Building and Construction Wholesale and Retail Hotels and restaurants Transport, storage and communications Financial intermediation Real estate brokerage and leasing Public Adm. and Defense Education Health and social work Social services Home Services Embassies International organizations
Agriculture and huntingFishing
Mining and quarryingManufacturing
Electricity, gas and waterBuilding and Construction
Wholesale and RetailHotels and restaurants
Transport, storage and communicationsFinancial intermediation
Real estate brokerage and leasingPublic Adm. and Defense
EducationHealth and social work
Social servicesHome Services
EmbassiesInternational organizations
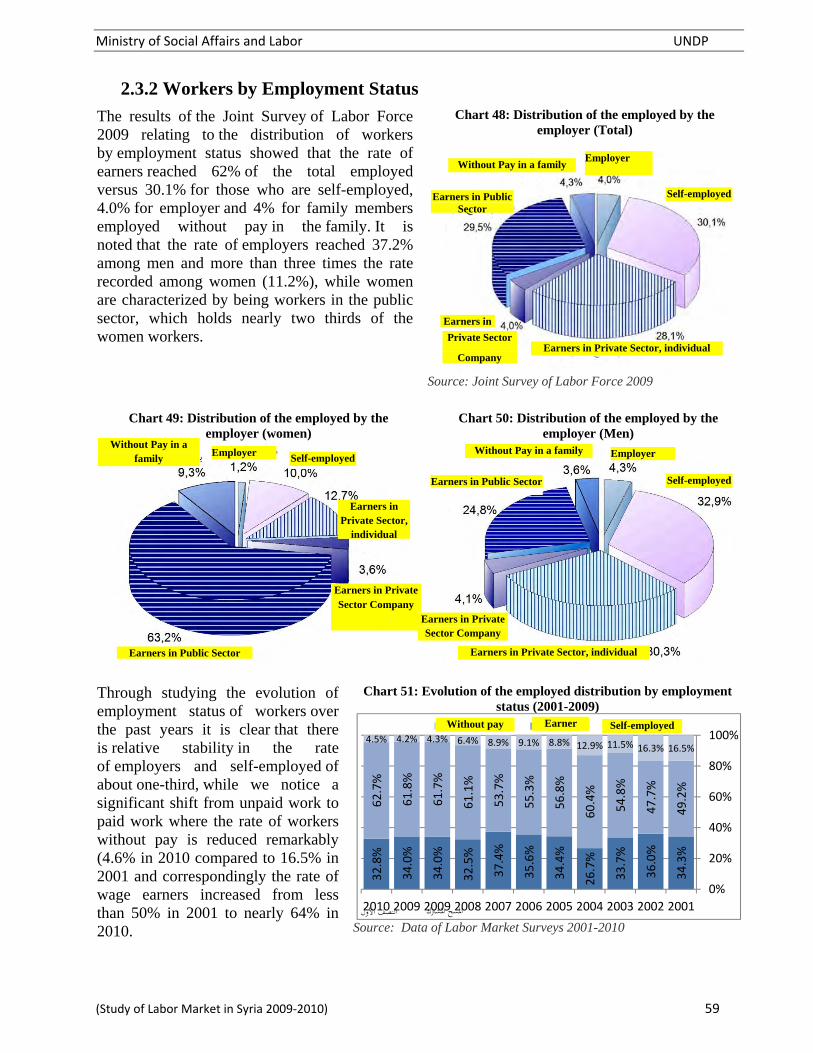
Ministry of Social Affairs and Labor UNDP
(Study of Labor Market in Syria 2009‐2010) 59
2.3.2 Workers by Employment Status
The results of the Joint Survey of Labor Force 2009 relating to the distribution of workers by employment status showed that the rate of earners reached 62% of the total employed versus 30.1% for those who are self-employed, 4.0% for employer and 4% for family members employed without pay in the family. It is noted that the rate of employers reached 37.2% among men and more than three times the rate recorded among women (11.2%), while women are characterized by being workers in the public sector, which holds nearly two thirds of the women workers.
Chart 48: Distribution of the employed by the employer (Total)
Source: Joint Survey of Labor Force 2009
Chart 49: Distribution of the employed by the
employer (women) Chart 50: Distribution of the employed by the
employer (Men)
Through studying the evolution of employment status of workers over the past years it is clear that there is relative stability in the rate of employers and self-employed of about one-third, while we notice a significant shift from unpaid work to paid work where the rate of workers without pay is reduced remarkably (4.6% in 2010 compared to 16.5% in 2001 and correspondingly the rate of wage earners increased from less than 50% in 2001 to nearly 64% in 2010.
Chart 51: Evolution of the employed distribution by employment status (2001-2009)
Source: Data of Labor Market Surveys 2001-2010
34.3%
36.0%
33.7%
26.7%
34.4%
35.6%
37.4%
32.5%
34.0%
34.0%
32.8%
49.2%
47.7%
54.8%
60.4%
56.8%
55.3%
53.7%
61.1%
61.7%
61.8%
62.7%
16.5%16.3%11.5%12.9%8.8%9.1%8.9%6.4%4.3%4.2%4.5%
0%
20%
40%
60%
80%
100%
20012002200320042005200620072008200920092010
يعمل بدون أجر يعمل بأجر يعمل لحسابه
األولالنصفاملسح املشرتك
Earners in Private Sector, individual Private Sector
Company
Employer Without Pay in a family
Earners in
Earners in Public Sector
Self-employed
Employer Employer Without Pay in a family Without Pay in a
family Self-employed
Self-employed
Earners in Private Sector, individual
Earners in Private Sector,
individual
Earners in Private Sector Company
Earners in Private Sector Company
Earners in Public Sector
Earners in Public Sector
Self-employed Earner Without pay

Ministry of Social Affairs and Labor UNDP
(Study of Labor Market in Syria 2009‐2010) 60
Table 17: Distribution of the employed by Employment Status (2001-2010)
2001 2002 2003 2004 2005 2006 2007 2008
2009 2009 2010
Joint Survey
Annual 1st Half
Emplyer
Male 9,8% 10,0% 9,2% 7,5% 9,4% 10,5% 9,4% 8,2% 4,3% 4,4% 4,7%
Female 1,4% 1,3% 2,2% 2,3% 2,6% 2,5% 2,0% 2,2% 1,2% 0,8% 1,0%
Total 8,3% 8,4% 8,0% 6,7% 8,5% 9,5% 8,5% 7,3% 4,0% 4,0% 4,3%
Self-employed
Male 29,7% 31,5% 28,4% 21,9% 28,4% 28,7% 31,6% 27,7% 32,9% 32,9% 31,1%
Female 7,8% 10,5% 12,4% 8,3% 9,4% 9,0% 10,0% 9,2% 10,0% 9,5% 1,4%
Total 26,0% 27,6% 25,7% 20,0% 25,9% 26,1% 28,9% 25,1% 30,1% 30,0% 27,5%
Wage Earner
Male 49,8% 48,0% 54,9% 58,9% 55,3% 53,2% 51,5% 59,5% 59,2% 59,5% 60,9%
Female 46,6% 46,3% 54,4% 69,2% 66,2% 69,5% 68,9% 71,3% 79,5% 78,3% 83,7%
Total 49,2% 47,7% 54,8% 60,4% 56,8% 55,3% 53,7% 61,1% 61,7% 61,8% 63,7%
Without Pay
Male 10,8% 10,5% 7,5% 11,7% 6,8% 7,6% 7,4% 4,6% 3,6% 3,2% 3,3%
Female 44,2% 41,9% 31,0% 20,2% 21,7% 19,0% 19,1% 17,3% 9,3% 11,4% 13,9%
Total 16,5% 16,3% 11,5% 12,9% 8,8% 9,1% 8,9% 6,4% 4,3% 4,2% 4,6%
Total
Male 100,0% 100,0% 100,0% 100,0% 100,0% 100,0% 100,0% 100,0% 100,0% 100,0% 100,0%
Female 100,0% 100,0% 100,0% 100,0% 100,0% 100,0% 100,0% 100,0% 100,0% 100,0% 100,0%
Total 100,0% 100,0% 100,0% 100,0% 100,0% 100,0% 100,0% 100,0% 100,0% 100,0% 100,0%
Source: Data of the labor market surveys 2001-2010 for2004, the primary results of Census 2004, Statistics group 2005 The international comparison shoes the importance of self-employment in Syria (34% compared to 24% on average for the Middle East in 2008) and this reflects the importance of individual initiative in the Syrian economy. For example, we notice that the rate of employers among men is 37.2% in Syria, whereas more than 17% in Jordan, 25% in Cyprus, 28% in Egypt, 29% in Tunisia, 30% in Algeria and 33% in Turkey. However, the rate of self-working or employer women in Syria does not differ from what is recorded in Arab countries as shown in the following chart:
Chart 52: Percentage of employers of total workers: an international comparison
Source: According to data by the International Labor Office (end of year 2003-2008) and national source for Syria (2009), Tunisia (2008) Algeria (2009) and Jordan (2008)
اجلزائر مصر
اليوناناملغرب
شيلي
عمان
قطر
ا تركي
األردن
تونس
سوريا
قربص
كوريا
جيبويت
اإلمارات
إسبانيا
فرنسا
ن إيرا
ا إيطالي
بولندا
اليابان
مالطاسنغافورة
أوكرانيا
0%
5%
10%
15%
20%
25%
30%
35%
40%
45%
0%5%10%15%20%25%30%35%
)رجال(نسبة أرباب العمل
)نساء(نسبة أرباب العمل
Turke
Singapore
KoreaTunisia Italy
AlgeriaChile
Cyprus Poland
Djibouti
FranceMalta Jordan
Ukraine
JapanOman
UAE
Qatar
Greece
Syria
Morocco
Iran
Egypt
Spain
Percentage of Employers (Women)
Percentage of Employers (Men)

Ministry of Social Affairs and Labor UNDP
(Study of Labor Market in Syria 2009‐2010) 61
The results of the labor market surveys conducted during the past decade show the importance of the public sector in the employment, where the percentage of workers in the public sector increased from less than 26% in 2001 to nearly 29% in 2009, and this is attributed mainly to the phenomenon of orientation of women towards working in the public sector, which became holding about two thirds of working women compared to about one third in the early last decade. It should be noted that the survey results of the first half of 2010 show a decline in the role of the public sector in employment as the rate of the workers in this sector reached 26.6% of the total workers with a number of less than one million employees while the that ration was about 29% in 2009. This may indicate a beginning of decline in the performance of the public sector in terms of job creation which has become basically dependent on the movement of the private sector, especially in the field of services and trade. The following two charts demonstrate such transformation: Chart 53: The importance of the public sector: Rate of
workers in the public sector of the total employed (Total)
Source: Data of labor market surveys 2001-2010
Chart 54: The importance of the public sector: Rate of workers in the public sector of the total employed
(distributed by gender)
Source: Data of labor market surveys 2001-2010
The detailed results of the employed distribution are included according to professions sections in the Annexes. The following table shows the distributed by sections of professions grouped in 10 specializations:
Table 18: Distribution of workers by sections of professions - Number (2009)
Urban Rural Total Male Female Total Male Female Total Male Femi;y Total
Legislators, senior officials an Mangers 57 298 8 889 66 188 26 636 4 003 30 639 83 935 12 892 96 827 Specialists 190 603 183 117 373 720 110 567 72 803 183 370 301 170 255 920 557 090 Technicians and assistant professionals 101 552 28 383 129 935 62 166 16 764 78 930 163 718 45 147 208 865 Clerks 148 149 51 294 199 443 90 751 20 699 111 451 238 901 71 993 310 894 Workers in services and retails 451 020 20 625 471 645 133 985 14 503 148 488 585 005 35 128 620 134 Workers in agriculture and fishing 67 463 4 585 72 048 401 692 61 365 463 057 469 155 65 949 535 104 Artisans and related crafts 793 551 15 679 809 230 491 562 10 137 501 699 1 285 113 25 816 1 310 929 Plant and machine operators and assembly workers 311 246 7 970 319 216 243 986 6 524 250 510 555 232 14 494 569 726 Workers in elementary occupations 203 117 19 614 222 731 248 453 36 616 285 069 451 570 56 230 507 800
Not Stated 138 188 326 371 0 371 509 188 697 Total 2 324 140 340 346 2 664 485 1 810 172 243 415 2 053 585 4 134 312 583 761 4 718 070
Source: Joint Survey of Labor Market 2009
25.8%
24.2%
27.2%28.1%
27.0%
27.9%27.9%28.6%
28.9%28.9%
26.6%
20%
21%
22%
23%
24%
25%
26%
27%
28%
29%
30%
20012002200320042005200620072008200920092010Joint SurveyFirst Half
◌Annual
24.1%22.5%
24.8%
25.3%
23.6%
24.0%
23.9%
24.4%
24.2%
24.3%
22.6%
34.3%31.8%
39.0%
50.7%
48.7%
54.0%
55.6%
54.6%
62.5%
60.5%52.9%
0%
10%
20%
30%
40%
50%
60%
70%
20012002200320042005200620072008200920092010Joint SurveyFirst Half
Female
Male
Annual
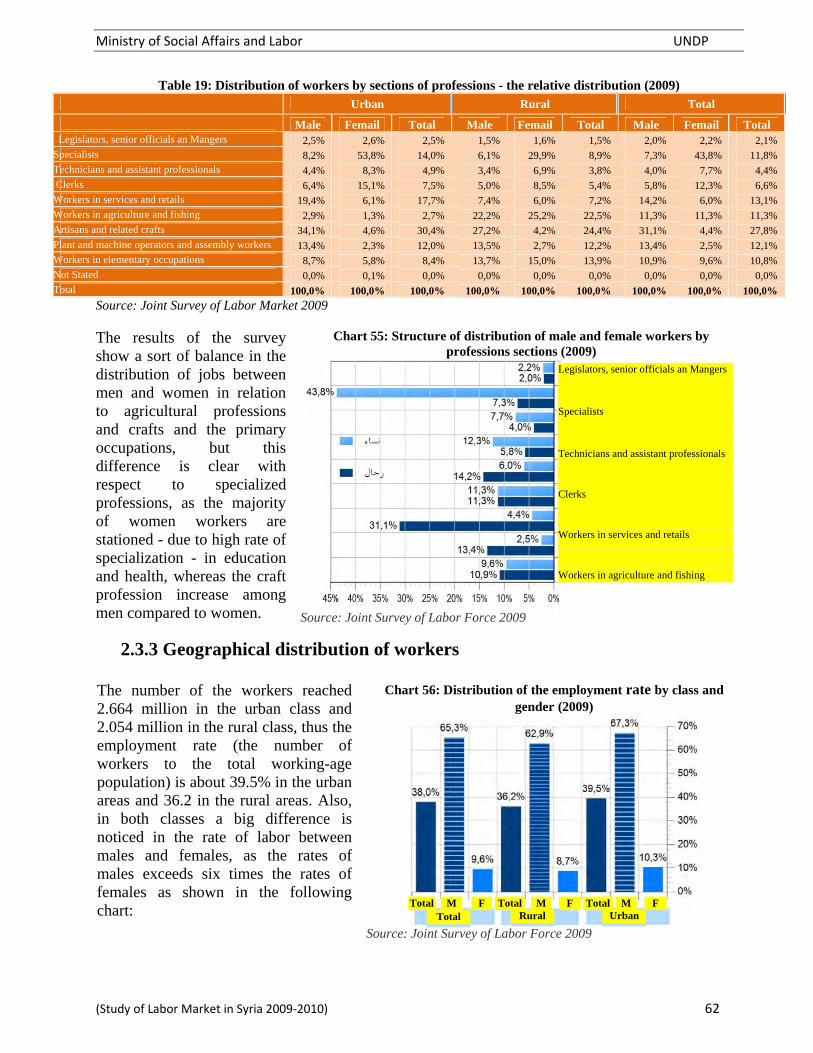
Ministry of Social Affairs and Labor UNDP
(Study of Labor Market in Syria 2009‐2010) 62
Table 19: Distribution of workers by sections of professions - the relative distribution (2009) Urban Rural Total
Male Femail Total Male Femail Total Male Femail Total Legislators, senior officials an Mangers 2,5% 2,6% 2,5% 1,5% 1,6% 1,5% 2,0% 2,2% 2,1% Specialists 8,2% 53,8% 14,0% 6,1% 29,9% 8,9% 7,3% 43,8% 11,8% Technicians and assistant professionals 4,4% 8,3% 4,9% 3,4% 6,9% 3,8% 4,0% 7,7% 4,4% Clerks 6,4% 15,1% 7,5% 5,0% 8,5% 5,4% 5,8% 12,3% 6,6% Workers in services and retails 19,4% 6,1% 17,7% 7,4% 6,0% 7,2% 14,2% 6,0% 13,1% Workers in agriculture and fishing 2,9% 1,3% 2,7% 22,2% 25,2% 22,5% 11,3% 11,3% 11,3% Artisans and related crafts 34,1% 4,6% 30,4% 27,2% 4,2% 24,4% 31,1% 4,4% 27,8% Plant and machine operators and assembly workers 13,4% 2,3% 12,0% 13,5% 2,7% 12,2% 13,4% 2,5% 12,1% Workers in elementary occupations 8,7% 5,8% 8,4% 13,7% 15,0% 13,9% 10,9% 9,6% 10,8% Not Stated 0,0% 0,1% 0,0% 0,0% 0,0% 0,0% 0,0% 0,0% 0,0% Total 100,0% 100,0% 100,0% 100,0% 100,0% 100,0% 100,0% 100,0% 100,0%
Source: Joint Survey of Labor Market 2009 The results of the survey show a sort of balance in the distribution of jobs between men and women in relation to agricultural professions and crafts and the primary occupations, but this difference is clear with respect to specialized professions, as the majority of women workers are stationed - due to high rate of specialization - in education and health, whereas the craft profession increase among men compared to women.
Chart 55: Structure of distribution of male and female workers by professions sections (2009)
Source: Joint Survey of Labor Force 2009
2.3.3 Geographical distribution of workers
The number of the workers reached 2.664 million in the urban class and 2.054 million in the rural class, thus the employment rate (the number of workers to the total working-age population) is about 39.5% in the urban areas and 36.2 in the rural areas. Also, in both classes a big difference is noticed in the rate of labor between males and females, as the rates of males exceeds six times the rates of females as shown in the following chart:
Chart 56: Distribution of the employment rate by class and gender (2009)
Source: Joint Survey of Labor Force 2009
Legislators, senior officials an Mangers
Specialists
Technicians and assistant professionals
Clerks
Workers in services and retails
Workers in agriculture and fishing
Total Total M F Total M F Total M F
Rural Urban

Ministry of Social Affairs and Labor UNDP
(Study of Labor Market in Syria 2009‐2010) 63
Table 20: Distribution of the employed by class, gender and Governorates (2009)
Governorates Urban Rural Total
Male Femail Total Male Femail Total Male Femail Total
Damascus 420 500 71 629 492 129 420 500 71 629 492 129
Aleppo 591 470 44 367 635 837 286 818 8 690 295 508 878 288 53 057 931 345
Damascus C.side 406 366 52 004 458 370 225 387 23 663 249 049 631 753 75 667 707 419
Homs 201 688 31 694 233 382 161 116 25 244 186 360 362 804 56 938 419 742
Hama 130 397 20 365 150 762 213 219 59 294 272 513 343 616 79 660 423 276
Lattakia 119 819 38 016 157 835 110 123 27 524 137 647 229 941 65 541 295 482
Idleb 78 216 12 011 90 227 183 270 14 244 197 513 261 485 26 255 287 740
Hasaka 90 373 12 350 102 723 152 133 8 239 160 372 242 506 20 590 263 096
Deir Ezzour 74 142 17 691 91 834 99 483 16 037 115 520 173 626 33 728 207 354
Tartous 49 314 17 850 67 163 121 760 33 458 155 219 171 074 51 308 222 382
Rakka 58 460 4 633 63 093 103 662 3 330 106 992 162 122 7 963 170 085
Daraa 81 068 10 431 91 499 92 909 9 359 102 268 173 977 19 789 193 767
Sweida 22 324 7 304 29 628 44 613 12 893 57 506 66 937 20 197 87 134
Kunaitera 15 678 1 436 17 115 15 678 1 436 17 115
Total 2 324 138 340 345 2 664 483 1 810 170 243 413 2 053 584 4 134 309 583 758 4 718 067
Labor rate 10,3% 67,3% 39,5% 8,7% 62,9% 36,2% 9,6% 65,3% 38,0%
Source: Joint Survey of Labor Force 2009 The following charts show the distribution of the employed by class, gender and governorate according to the results of the Joint Survey of Labor Force 2009 and the results of the Annual Survey of Labor Force 2009:
Chart 57: Distribution of the employment rate by governorate and gender (Joint Survey of Labor
Force 2009)
Chart 58: Distribution of the employment rate by governorate and gender (Annual results 2009)
The following map shows the distribution of the employed by sectors of economic activity and governorate distributed by the labor rate, and on the other side it shows the rise of labor rate in the western areas as the rate of activities rises in the sectors of industry and services. Also it shoes the relative decrease of labor rates in the eastern governorates that are more concerned with agricultural activity like Hassaka, Rakka and Deir Ezzour.
Women Men Women Men
Damascus
Aleppo
Rif Damascus
Homs
Hama
Lattakia
Idleb
Hassaka
Deir Ezzour
Tartous
Damascus
Aleppo
Rif Damascus
Homs
Hama
Lattakia
Idleb
Hassaka
Deir Ezzour
Tartous

Ministry of Social Affairs and Labor UNDP
(Study of Labor Market in Syria 2009‐2010) 64
Map 8: Distribution of the employed by sectors of activity and governorates (2009)
Source: Joint Survey of Labor Force 2009 2.4 Educational Status of workers
The following table and chart show the distribution of the employed by the education status according to the results of the Joint Survey 2009
Table 21: Distribution of the employed by educational status (2009)
Numbe Relative Distibution
Male Female Total Male Female Total
Illiterate 364 871 59 171 424 043 8,8% 10,1% 9,0%
Reads and writes 497 270 26 636 523 905 12,0% 4,6% 11,1%
Primary Schoo; 1 753 293 73 105 1 826 397 42,4% 12,5% 38,7%
Middle School 623 080 52 702 675 782 15,1% 9,0% 14,3%
High School 342 064 73 355 415 419 8,3% 12,6% 8,8%
College 252 761 171 671 424 432 6,1% 29,4% 9,0%
University or Master 291 714 125 098 416 813 7,1% 21,4% 8,8%
Doctorate 8 830 1 895 10 725 0,2% 0,3% 0,2%
Not Stated 427 126 552
Total 4 134 309 583 758 4 718 067 100,0% 100,0% 100,0%

Ministry of Social Affairs and Labor UNDP
(Study of Labor Market in Syria 2009‐2010) 65
Chart 59: Distribution of the employed by educational status and gender (2009)
Source: Joint Survey of Labor Force 2009 It is shown that about half of the employed have the level of primary education or are literate only, and that about 27% of them have the high school certificate and over (27.6 according to the results of the Annual Survey 2009 and 27.1% according to the survey of 2010). It is noticed that there is a disparity between the educational level of the employed in respect of male and female, where more than a half of the female workers (51.2% according to the Joint Survey of Labor Force 2009, 49.2% according to the Annual Survey 2009 and 44.5% according to the Survey of 2010) have had an educational level higher than the High School certificate, while that rate did not exceed 13.4% among male workers (13.1% according to the Annual results 2009 and 12.3% according to the survey of 2010). If this agrees with the nature of activities practiced by both male and females and the requirements of each activity, this phenomenon indicates the attempt of women to empower themselves through education to facilitate their access to business and entering the economic cycle.
Chart 60: Distribution of the employed by the educational status, comparison between women and men
Source: Joint survey of the labor force 2009 - to be here the university level, post-secondary level, including junior colleges and the university, diploma, master's and doctoral
Doctorate University College High School Middle School Primary Reads and writes Illiterate
Male FemalTotal
Illiterate
University Level
Literate
Literate
High School
Primary Sc.
Middle School
High School
Male Female

Ministry of Social Affairs and Labor UNDP
(Study of Labor Market in Syria 2009‐2010) 66
Same as abovementioned improvement of the educational status of the working-age population (15 years and over), the survey results indicate continued improvement of the educational level of the employed during the past years. The rate of illiteracy has shrunk among them from 16.2% in 1994 to 12.2% in 2004 down to 9% in 2009 and 7.8% in 2010. This decline in the illiteracy rate included both women and men as shown in the following chart:
Chart 61: Evolution of the illiteracy rate among the employed (1994, 2004, 2009)
Source: Census 1994 and Census 2004 and Labor Market Survey 2009
During the period between 2001 and 2010, the rate of workers having an educational level below middle school decreased by more than 6 points (66.5% vs. 59%). In parallel, the rate of the holders of high school certificate or over increased from 21.2% in 2001 to 27.1% in 2010. The following chart shows this evolution:
Chart 62: Evolution of the educational status of the employed (2001-2009)
Source: Labor market surveys 2001-2009, Joint Survey of Labor Force 2009 and survey of first half or 2010
The comparison of the employed distribution between 2004 and 2009 also reflects a significant evolution of the educational level of labor force in Syria especially among females. The rate of the workers below the primary education has declined from 46.6% in 2004 to 21.1% in 2009. Also, the rate of the working women holding certificated of higher education has increased from less than 36% in 2004 to more than 51% in 2009. The following charts show this evolution of the educational status of the employed:
Chart 63: Comparison of the employed distribution by educational status (Total)
Source: General Census of Population and Housing 2004 and 2009 Labor Force Survey
66.5%66.8%66.1%64.8%61.5%59.7%61.0%58.9%59.9%57.7%59.0%
12.3%12.5%12.3%11.3%13.5%14.6%14.0%14.6%13.2%14.7%13.9%
8.1%7.6%7.8%8.7%9.3%9.7%8.0%9.9%9.7%10.0%10.0%
6.9%6.9%7.2%8.1%8.9%8.7%10.0%8.9%9.0%9.1%8.6%
6.2%6.3%6.6%7.1%6.8%7.3%7.0%7.7%8.3%8.5%8.5%
0%
10%
20%
30%
40%
50%
60%
70%
80%
90%
100%
20012002200320042005200620072008200920092010
جامعية فأكثر معاهد متوسطة ثانوية عامة إعدادية ابتدائية وما دون
Jointا SurveyAnnual1st Half
University + > High School Middle S. Primary + < College
Total Female Male
Illiterate
University or Master
Literate
High School
Primary Sch.
Middle Sch.
College
Doctorate

Ministry of Social Affairs and Labor UNDP
(Study of Labor Market in Syria 2009‐2010) 67
Chart 64: Comparison of the employed distribution by educational status (females)
Source: General Census of Population and Housing 2004 and Labor Force Survey 2009
Chart 65: Comparison of the employed distribution by educational status by educational status (Males)
Source: General Census of Population and Housing 2004 and Labor Force Survey 2009
Harmonizing qualifications with job specifications The results of the Joint Survey of Labor Force 2009 show that about 90% of the employed are satisfied with their work in terms of its appropriateness to their qualifications, and the remaining 10.4% of the employed consider their work inappropriate with their qualifications. This percentage reaches 10.9% among males and 6.3% among females. As well, this rate decreases with age, thus with career progress, as the results show that the rate of inappropriateness of work with the qualifications reaches 12.1% among workers of 35 years versus 8.7% among the age group of 35 years and over.
Chart 66: Rate of inappropriateness of work with qualifications by age
Source: Joint survey of the labor force 2009
We also notice that the workers with education level of high school are the group that complaint more than others from the inappropriateness of work with the qualification. This phenomenon may be explained by the special status of this group that, on one side, do not have the full qualification to obtain works of medium or high functional levels and, on the other side, accept low executive works that are often temporary in the sectors of agriculture and construction, as well as trade, hotels and restaurants (red and black spots in the following chart):
Chart 67: Distribution of the rate of inappropriateness of work with qualifications by gender
Source: Joint Survey of Labor Force 2009
Illiterate
Literate
Primary Sch.
Middle Sch.
High School
College Student
College Degree
University Student
University Degree
Illiterate
University or Master
Literate
High School
Primary Sch.
Middle Sch.
College
Doctorate
Illiterate
University or Master
Literate
High School
Primary Sch.
Middle Sch.
College
Doctorate
Age groups
Males
Females

Ministry o
(Study of L
Chart 68
It is clewith the survey inappropqualificat2003 an10.4%, inappropqualificatworkers 10.9 % apoint am2003 vs.
2.5 Seco
The resu2009 shojob is noit still exthe emplof femalemployedhave stafor anothamong mThe follo
Illite
Lite
Primary S
Middle S
High Sch
College Stud
College Deg
University Stud
University Deg
Higher Stu
Diplo
Ma
Docto
T
of Social Affai
Labor Market in
: Distribution
ear from thresults of t2003 that riateness of tions has r
nd 2009 frnoting thatriateness of tions tripledas it rose
and declined mong fema6.3% in 200
ondary wo
ults of the ow that prat a widespre
xists specificloyed (3.7%es). As weld who haveated that t
her job and men and 18owing chart s
erate
erate
Sch.
Sch.
hool
dent
gree
dent
gree
dies
oma
aster
orate
Total
Agriculture Indus
rs and Labor
n Syria 2009‐20
of the rate of
he comparisthe work for
the rate work with t
risen betwerom 6.8% t the rate work with t
d among mfrom 3.5% more than o
ales: 7.4% 09.
ork and se
work forceacticing a seead phenomecally among
% of males all, about 15%e more thanthey are stheir rate i
.9% among shows this.
stry Constructio
010)
f work inappro
son rce of
the een
to of
the men
to one
in
Char
Source:
earching fo
e survey econdary enon, but
3.4% of and 1.3% % of the
n one job searching is 14.8%
women.
S
n Trade and
Tourism c
opriateness wof activity
t 69: Evolutioqualif
Labor Force S
or part-tim
Chart 70: Per
Source: Joint S
To
Transport and
communication
Fin
and
E
Mal
Yes
with qualificati
on of the rate ofications betwe
Survey 2003 jo
me work
ercentage of prates of search
Survey of Labor
otal Male
I
L
P
M
H
C
C
U
U
H
D
M
D
T
nance
d Real
Estate
Other
services
lesIs therSearch
No
ions by educat
of work inappeen 2003 and
int survey of th
practicing morhing for part-t
r Force 2009
Femalees
lliterate
Literate
Primary Sch.
Middle Sch.
High School
College Student
College Degree
University Student
University Degree
Higher Studies
Diploma
Master
Doctorate
Total
re a secondary jobhing for another jo
UN
tional status a
propriateness w2009
he labor force 2
re than one wtime work
es
Femalesb? ob?
NDP
68
and sector
with
2009
work and
s

Ministry of Social Affairs and Labor UNDP
(Study of Labor Market in Syria 2009‐2010) 69
Seeking to improve the standard of living in situations of low wages level in some sectors with respect to a certain segment of employees is considered an important motive to search for other job opportunities and to practice more than one job. The short working hours in some sectors, particularly the government sector, helped the spread of the secondary job phenomenon. The number of workers who practice a secondary job beside their main work reached more than 162 thousand workers, and this would reduce job opportunities for the unemployed and lead to worsening the problem of unemployment, as the workers who combine more than one job represent 23.6% of the unemployed total, i.e. if we assumed non-combination of jobs, the unemployment would decrease by 3 points. The results of the Labor Force Survey 2009 show that the phenomenon of secondary jobs particularly exists in the government sector where the rate of practicing more than one job among the workers of the public sector reaches 6.6% vs. 1.3% among the workers of the private sector.
Table 22: The rate of practicing more than one job among the employed by the employer
Total employed Head of a household
Male Female total Male Female total
Employer 2,4% 1,8% 2,4% 2,6% 15,8% 2,7%
Self-employed 2,7% 2,3% 2,7% 3,2% 7,7% 3,3%
Wage earner in an individual private sector 1,4% 0,8% 1,3% 2,1% 0,0% 2,1%
Wage earner in a private sector company 1,4% 2,1% 1,5% 2,3% 0,0% 2,3%
Wage earner in public or joint sector 8,6% 0,7% 6,6% 10,1% 2,3% 9,9%
Work without pay for the family 4,0% 4,4% 4,1% 9,6% 0,0% 8,7%
Total 3,7% 1,3% 3,4% 4,9% 3,6% 4,9%
Source: Joint Survey of Labor Force 2009 The rate of practicing more than one job rises among the heads of households due to their responsibility of supporting the family, where this ratio reaches about 5% among male heads of households (compared to 1.5% for singles) and 3.6% among female heads of households (compared to 0.7% for a wife who is not a head of family). In comparison with the results of the labor force survey 2003, it is clear that the rate of exercising more than one job has declined from 5.8% to 3.4%, and this decline has included all the employment cases as shown in the chart below. One of the reasons for this include: the improvement of the wages level, increased commitment to public service, the workers’ non-desire to declare having another work and the decrease of available job opportunities, which is confirmed by the high rate of unemployment between 2003 and 2009.
Chart 71: Percentage of practicing more than one work among the workers: between 2003 and 2009
Source: Labor Force Survey 2003 and the joint survey of the labor force 2009
Total
Without pay
Wage earner in a private sector
Wage earner in joint sector
Wage earner in a public sector
Self-employed

Ministry of Social Affairs and Labor UNDP
(Study of Labor Market in Syria 2009‐2010) 70
With regard to the distribution of the secondary work by the professions section, the results of the Joint Survey of Labor Force show that about a half of the secondary works are related to agriculture and fishing (49.1% among males and 42.3% among females) and the rest of the secondary works are related to crafts, trading and some specialties, particularly in the activities of education and health. It is obvious that about three-quarters of the employed having more than one work (73.4%) are self-employed or employers.
Chart 72: Distribution of secondary work by professions (2009)
Source: Labor Force Survey 2003 and the joint survey of the labor force 2009
It is worth noting that the intersection of the employer in the main work with the employer in the secondary work shows that workers usually choose their secondary work for the same employer of their main work in two situations: in the case of self-employment and the case of working for the family without pay. If the individual works in the public sector as his main job, he establishes, in 80% of the cases, a secondary work of self-employment or employers, and in 12% of the cases, he works for a wage in the individual private sector. Regarding the situation of women who work without pay for the family as their main job, even if they want to have another work (4.4% of women working without pay for the family have a secondary work), then about 80% of the secondary works they will resort to shall be also without pay for the family. The following table shows the various intersections with respect to the distribution of those practicing more than one work by the employer in the main work and the employer in the secondary work:
Senior officials an Mangers
Specialists
Technicians and assistant professionals
Clerks
Workers in services and retails
Workers in agriculture and fishing
Artisans and related crafts
Plant and machine operators andassembly workers
Females
Males

Ministry of Social Affairs and Labor UNDP
(Study of Labor Market in Syria 2009‐2010) 71
Table 23: Distribution of the worker practicing more than one work by the employer in the main work and the
employer in the secondary work
Employer of Main Job
Employer
Self-employed
Paid in public sector
Paid in Joint sector
Paid in individual
private sector
Paid in privat sectore
company
Without pay for
the family
Total
Em
plo
yer
of S
econ
dary
Job
Male
Employer 34,3% 2,7% 3,0% 0,0% 2,6% 0,0% 0,0% 3,6%
Self-employed 48,5% 77,1% 77,9% 100,0% 54,6% 76,2% 4,7% 71,6%
Paid in public sector 4,8% 4,1% 1,4% 0,0% 3,2% 0,0% 2,1% 2,3%
Paid in Joint sector 0,0% 0,5% 0,2% 0,0% 1,0% 0,0% 0,0% 0,3%
Paid in individual private sector 3,1% 9,2% 11,5% 0,0% 21,5% 7,6% 29,8% 12,4%
Paid in privat sectore company 2,8% 1,2% 2,3% 0,0% 0,0% 0,0% 0,0% 1,6%
Without pay for the family 6,5% 5,2% 3,8% 0,0% 17,2% 16,2% 63,4% 8,1%
Total 100,0% 100,0% 100,0% 100,0% 100,0% 100,0% 100,0% 100,0%
Female
Employer 0,0% 0,0% 0,0% 0,0% 0,0% 0,0% 0,0% 0,0%
Self-employed 100,0% 70,1% 49,9% 100,0% 22,4% 42,2% 0,0% 39,0%
Paid in public sector 0,0% 0,0% 8,2% 0,0% 0,0% 0,0% 0,0% 2,4%
Paid in Joint sector 0,0% 0,0% 0,0% 0,0% 0,0% 0,0% 0,0% 0,0%
Paid in individual private sector 0,0% 20,6% 17,2% 0,0% 55,2% 0,0% 21,1% 19,6%
Paid in privat sectore company 0,0% 0,0% 16,3% 0,0% 0,0% 0,0% 0,0% 4,7%
Without pay for the family 0,0% 9,3% 8,4% 0,0% 22,4% 57,8% 78,9% 34,3%
Total 100,0% 100,0% 100,0% 100,0% 100,0% 100,0% 100,0% 100,0%
Total
Employer 33,3% 2,6% 3,0% 0,0% 2,5% 0,0% 0,0% 3,4%
Self-employed 50,1% 76,9% 77,2% 100,0% 53,5% 71,1% 3,4% 70,0%
Paid in public sector 4,7% 4,0% 1,5% 0,0% 3,1% 0,0% 1,5% 2,3%
Paid in Joint sector 0,0% 0,5% 0,2% 0,0% 1,0% 0,0% 0,0% 0,3%
Paid in individual private sector 3,0% 9,6% 11,7% 0,0% 22,6% 6,4% 27,3% 12,7%
Paid in privat sectore company 2,7% 1,2% 2,6% 0,0% 0,0% 0,0% 0,0% 1,8%
Without pay for the family 6,3% 5,4% 3,9% 0,0% 17,3% 22,5% 67,8% 9,4%
Total 100,0% 100,0% 100,0% 100,0% 100,0% 100,0% 100,0% 100,0%
Source: Labor Force Survey 2009
It is noticeable also that practicing secondary works beside the main work differs by the governorates, as the rate of practicing secondary works rises in the western area, especially in the governorates of Hama (8.6%), Lattakia (5.5%), Tartous (5.2%) Deir Ezzour (3.2%) and Rakka (1.1%), and decreases in the eastern areas such as Hassaka (0.9%). This may reflect the different distribution of the job opportunities as well as the weak role played by the public sector and its establishments as a result of its geographical centralization in some governorates.
Chart 73: The rate of practicing more than work among the employed by the governorates
Source: Labor Force Surveys 2003 and the joint survey of the labor force2009
Damascus
Aleppo
Damascus C.s.
Homs
Hama
Lattakia
Idleb
Hassaka
Deir Ezzour
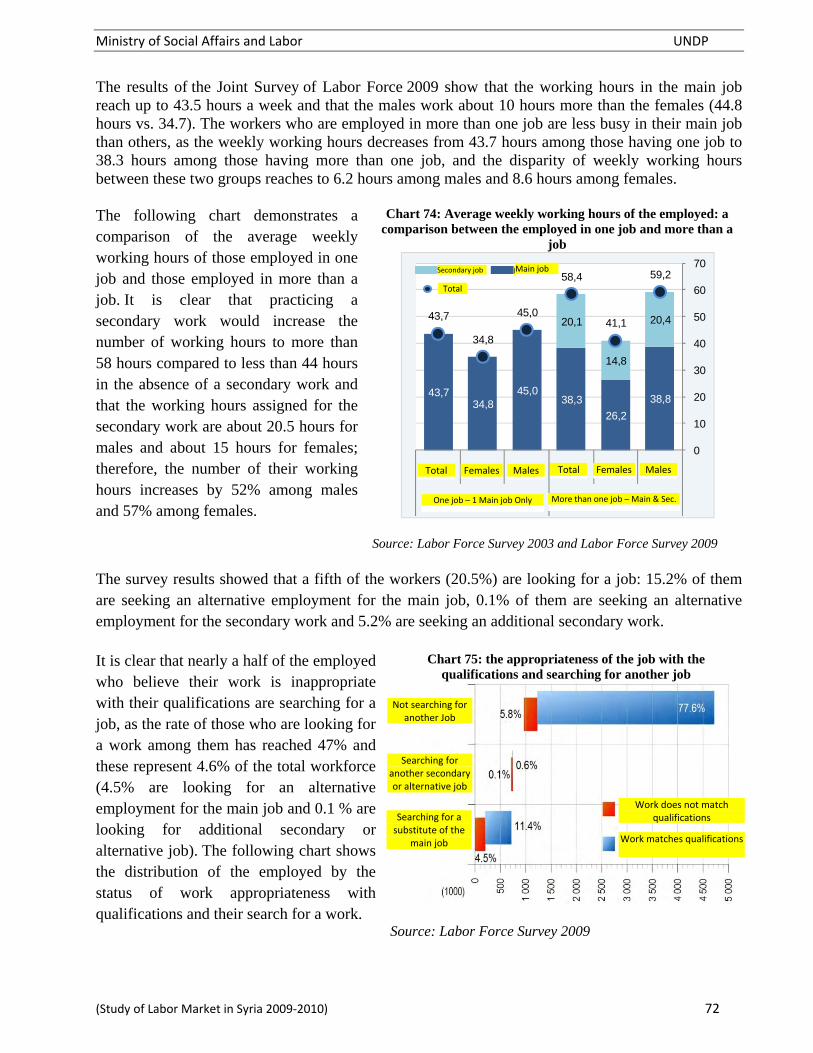
Ministry of Social Affairs and Labor UNDP
(Study of Labor Market in Syria 2009‐2010) 72
The results of the Joint Survey of Labor Force 2009 show that the working hours in the main job reach up to 43.5 hours a week and that the males work about 10 hours more than the females (44.8 hours vs. 34.7). The workers who are employed in more than one job are less busy in their main job than others, as the weekly working hours decreases from 43.7 hours among those having one job to 38.3 hours among those having more than one job, and the disparity of weekly working hours between these two groups reaches to 6.2 hours among males and 8.6 hours among females. The following chart demonstrates a comparison of the average weekly working hours of those employed in one job and those employed in more than a job. It is clear that practicing a secondary work would increase the number of working hours to more than 58 hours compared to less than 44 hours in the absence of a secondary work and that the working hours assigned for the secondary work are about 20.5 hours for males and about 15 hours for females; therefore, the number of their working hours increases by 52% among males and 57% among females.
Chart 74: Average weekly working hours of the employed: a comparison between the employed in one job and more than a
job
Source: Labor Force Survey 2003 and Labor Force Survey 2009
The survey results showed that a fifth of the workers (20.5%) are looking for a job: 15.2% of them are seeking an alternative employment for the main job, 0.1% of them are seeking an alternative employment for the secondary work and 5.2% are seeking an additional secondary work. It is clear that nearly a half of the employed who believe their work is inappropriate with their qualifications are searching for a job, as the rate of those who are looking for a work among them has reached 47% and these represent 4.6% of the total workforce (4.5% are looking for an alternative employment for the main job and 0.1 % are looking for additional secondary or alternative job). The following chart shows the distribution of the employed by the status of work appropriateness with qualifications and their search for a work.
Chart 75: the appropriateness of the job with the qualifications and searching for another job
Source: Labor Force Survey 2009
38,8
26,2
38,345,0
34,843,7
20,4
14,8
20,1
59,2
41,1
58,4
45,0
34,8
43,7
0
10
20
30
40
50
60
70
اجملموعإناثذكوراجملموعإناثذكور
وي -أكثر من عمل رئيسي فقط -عمل واحد رئيسي وثان
عمل ثانوي عمل رئيسياجملموع
Females MalesTotal Females MalesTotal
More than one job – Main & Sec.One job – 1 Main job Only
Main job Secondary job Main job
Total
Not searching for another Job
Searching for another secondary or alternative job
Searching for a substitute of the
main job
Work does not match qualifications
Work matches qualifications

Ministry of Social Affairs and Labor UNDP
(Study of Labor Market in Syria 2009‐2010) 73
2.6 Nature of employment and underemployment According to international definitions underemployment consists of all persons who work for a wage of for their own account, whether they are in work or not, and who work involuntarily for less than the hours determined for the work, and they have been looking for additional work for which they have been available during the reference period. Given this definition we consider under-employment, by the results of this research, to be the employment having the following conditions: A) The involuntary nature of working for less than the determined hours, B) Looking for additional work for which the job seeker is available. In the absence of information on the nature of voluntary or involuntary cases of temporary, seasonal or intermittent work diagnosed in the survey, and as a first entry to underemployment we consider that, in those cases, looking for work represents an evidence of dissatisfaction with underemployment, and therefore a confirmation of the involuntary nature of working for less than the hours determined for the work. Thus, that category includes the employed (temporarily, intermittently or seasonally) who are looking for another or additional job. Regarding the first condition, the results of the Joint Survey of Labor Force show that about one-third of the employed (30.6%) work temporarily, intermittently or seasonally and this ratio is about 20% fir women and 32% for men. The following table shows the distributed of the employment nature by sector of economic activity and gender:
Table 24: Distribution of employment nature by sector of economic activity and sex (2009)
Working All Year
Working Seasonally
Working intermittently
Working gemporarily Total
Total Seasonal, intermittent, temporary workers
Male
Agriculture and silviculture 30,6% 53,4% 14,7% 1,3% 100,0% 69,4%
Industry 80,3% 4,5% 11,1% 4,1% 100,0% 19,7%
Building & Construction 31,9% 4,0% 61,8% 2,2% 100,0% 68,1%
Trade, Hotels & Restaurants 85,8% 2,4% 8,7% 3,1% 100,0% 14,2%
Transport & communication 78,4% 2,0% 16,7% 2,9% 100,0% 21,6%
Finance, Insurance & Real 85,4% 1,3% 11,3% 2,0% 100,0% 14,6%
other services 91,6% 1,2% 4,7% 2,5% 100,0% 8,4%
Total 67,9% 10,0% 19,4% 2,7% 100,0% 32,1%
Female
Agriculture and silviculture 36,5% 46,0% 16,5% 1,0% 100,0% 63,5%
Industry 76,9% 3,1% 15,3% 4,7% 100,0% 23,1%
Building & Construction 71,9% 1,6% 24,8% 1,7% 100,0% 28,1%
Trade, Hotels & Restaurants 84,7% 1,2% 8,1% 5,9% 100,0% 15,3%
Transport & communication 94,4% 1,1% 1,6% 3,0% 100,0% 5,6%
Finance, Insurance & Real 86,1% 2,0% 8,0% 3,9% 100,0% 13,9%
other services 91,7% 1,1% 3,1% 4,1% 100,0% 8,3%
Total 80,3% 9,0% 7,1% 3,6% 100,0% 19,7%
Total
Agriculture and silviculture 31,5% 52,3% 15,0% 1,3% 100,0% 68,5%
Industry 80,1% 4,4% 11,4% 4,1% 100,0% 19,9%
Building & Construction 32,4% 4,0% 61,4% 2,2% 100,0% 67,6%
Trade, Hotels & Restaurants 85,8% 2,3% 8,6% 3,3% 100,0% 14,2%
Transport & communication 78,9% 2,0% 16,2% 2,9% 100,0% 21,1%
Finance, Insurance & Real 85,5% 1,4% 10,8% 2,3% 100,0% 14,5%
other services 91,7% 1,2% 4,2% 2,9% 100,0% 8,3%
Total 69,4% 9,9% 17,9% 2,8% 100,0% 30,6%
Source: Joint Survey of Labor Force 2009

Ministry of Social Affairs and Labor UNDP
(Study of Labor Market in Syria 2009‐2010) 74
The results of the Joint Survey of Labor Force 2009 show that more than two-thirds of the employed in the sectors of agriculture and construction work on a temporary or intermittent or seasonal basis, and the same case applies to more than a fifth of the employed in the transportation sector. The services sector, however, is characterized by being more stable, as nearly 92% of the employed, women and man, work throughout the year. The following chart shows the distribution of the rate of the employed on a temporary or intermittent or seasonal basis by sector:
Chart 76: Rate of the employed temporarily, intermittently or seasonally
Source: Joint Survey of Labor Force 2009
The results of surveys carried out during the years 2009 and 2010, relative stability in the distribution of male and female workers according to the nature of work as approximately 70% of the employed throughout the year and nearly 10% on a seasonal basis and about 20% in intermittent or temporary, as shown in the following table on the diffusion of the employed by nature of the work according to the results of the joint survey of the labor force as well as 2009 and the results of the annual survey of the labor force survey results 2009 and the first half of the year 2010: Table 25: Distribution of the employed by the employment (the Joint Survey of Labor Force 2009 and the results
of the Annual Survey 2009 and 2010)
Joint Survey of Labor Force
2009 Annual Results 2009 First Half 2010
Male Female Total Male Female Total Male Female Total Working All Year 67,9% 80,3% 69,4% 67,0% 79,4% 68,6% 70,0% 77,7% 71,0% Working Seasonally 10,0% 9,0% 9,9% 11,1% 11,4% 11,1% 9,0% 15,3% 9,8% Working intermittently 19,4% 7,1% 17,9% 19,7% 6,3% 18,0% 19,2% 5,0% 17,3% Workingt temporarily 2,7% 3,6% 2,8% 2,2% 2,9% 2,3% 1,8% 2,0% 1,9% Total 100,0% 100,0% 100,0% 100,0% 100,0% 100,0% 100,0% 100,0% 100,0%
Source: The results of the Joint Survey of Labor Force 2009. Annual Results of Labor Force Survey 2009 and the First Half of 2010 As a complement to the second condition of underemployment related to looking for employment among the employed on a temporary, intermittent and seasonal basis, this leads to under employment of about 12.6% distributed to 5.1% among women and 13.7% among men. The sectoral distribution, however, highlights the significance of underemployment in the construction sector, as the ratio rises to one third (32.3%) and about one quarter (24.4%) in the agricultural sector. It is noticeable that despite the seasonal nature of agricultural activity (68.5%), nearly two thirds of this employment is not considered underemployment by its voluntary nature.
Agriculture and silvicultur
Industry
Building and Construction
Trade, Hotels and restaurants
Transport and communications
Finance, Insurance, Real estate
Services
Total

Ministry of Social Affairs and Labor UNDP
(Study of Labor Market in Syria 2009‐2010) 75
Chart 77: Distribution of underemployment by sector and Gender
Source: Joint Survey of Labor Force 2009 It is worth mentioning that the rate of working days per week reaches 5.4 days for the total employed and 5.1 days for women. The work duration varies by the work nature, as 43% of those employed on a seasonal, temporary and intermittent basis work less than 4 days and nearly 21% of them work less than 3 days per week, whereas this rate reaches respectively 3.7% and 1.7% among those working throughout the year.
Chart 78: Average number of working days per week by work nature: accumulation
Source: Joint Survey of Labor Force 2009
Compared with the results of the labor force survey 2003, it is clear that the rate of people working on a seasonal or intermittent basis (the survey of 2003 did not address the employed on temporary basis) remains stable, as it was 27% in 2003 and became 28% in 2009.
0,9%5,5%
20,6%
42,6%
64,4%
94,4%100,0%
0,2%0,5%1,7%3,7%
37,5%
90,2%
0%
10%
20%
30%
40%
50%
60%
70%
80%
90%
100%
1234567
مشتغل طيلة السنةمشتغل مومسي، وقيت أو متقطع
عدد أيام العمل يف األسبوع
املشتغلني نسبة Working All Year
Working seasonally, temporarilyor intermittently
Week days
The Employed rate
Agriculture & ilvicultur
Industry Building and Construction
Hotels and restaurants
Transport & communications
Finance, Insurance, Real estate
Services Total
FemalesMalesTotal

Ministry of Social Affairs and Labor UNDP
(Study of Labor Market in Syria 2009‐2010) 76
The results of the work force survey 2009 show that the average working hours reaches 43.5 hours per week and the number of men’s working hours exceeds those of women by 20% (44.8 versus 34.7) and the percentage of those who work less than 24 hours is 16.7% for women versus 7.6% for men.
Chart 79: Average working hours per week by gender: accumulation (2009)
The number of working hours varies by age groups and by gender. The number of hours allocated for work is reduced with age especially among men as such phenomenon is not noticed with the same significance among women, and the difference of working hours between those who are less than 25 years and more than 50 years is more than 3.5 hours among men and one hour among women.
Chart 80: Average working hours per week by age group (2009
Whereas, the distribution by sector of economic activity shows that working in trade, hotels and restaurants requires more effort in terms of allocated working hours which reach 51.7 hours per week (52 hours for males and 46.2 hours for females). The agricultural sector, however, by virtue of work nature, provides less working hours: 36.6 hours divided between women and men to 28.2 hours and 38 hours respectively.
Chart 81: Average working hours per week by sector of activity (2009)
16,7%
47,8%
94,3%98,6%
7,6%
26,6%
68,7%
91,8%
98,3%99,6%99,9%
0%
10%
20%
30%
40%
50%
60%
70%
80%
90%
100%
01224364860728496
ذكورإناث
عدد ساعات العمل يف األسبوع
راكم(املشتغلني نسبة Rate of the employed (accumulation))ت
Working Hours per week
Females
Males
Agriculture and silvicultur
Industry
Building and Construction
Trade, Hotels and restaurants
Transport and communications
Finance, Insurance, Real estate
Men Women
MenWomen
15-19 years
20-24 years
25-29 years
30-34 years
35-39 years
40-44 years
45-49 years
50-54 years
55 59
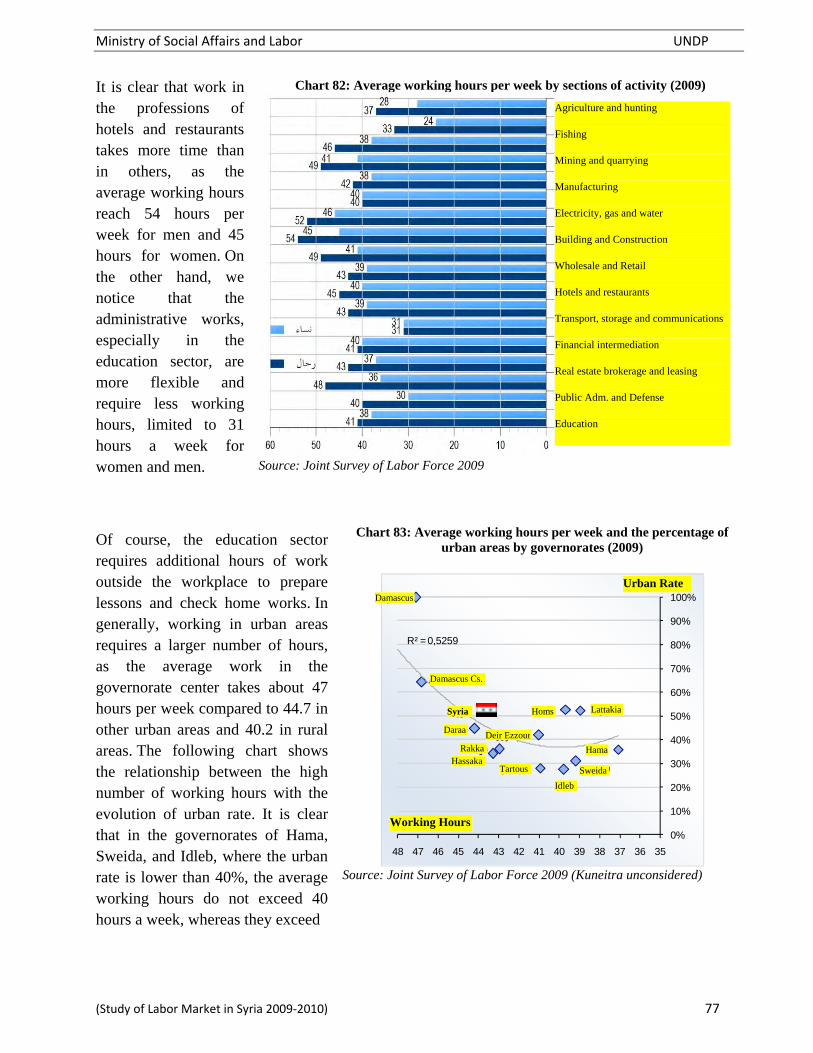
Ministry of Social Affairs and Labor UNDP
(Study of Labor Market in Syria 2009‐2010) 77
It is clear that work in the professions of hotels and restaurants takes more time than in others, as the average working hours reach 54 hours per week for men and 45 hours for women. On the other hand, we notice that the administrative works, especially in the education sector, are more flexible and require less working hours, limited to 31 hours a week for women and men.
Chart 82: Average working hours per week by sections of activity (2009)
Source: Joint Survey of Labor Force 2009
Of course, the education sector requires additional hours of work outside the workplace to prepare lessons and check home works. In generally, working in urban areas requires a larger number of hours, as the average work in the governorate center takes about 47 hours per week compared to 44.7 in other urban areas and 40.2 in rural areas. The following chart shows the relationship between the high number of working hours with the evolution of urban rate. It is clear that in the governorates of Hama, Sweida, and Idleb, where the urban rate is lower than 40%, the average working hours do not exceed 40 hours a week, whereas they exceed
Chart 83: Average working hours per week and the percentage of
urban areas by governorates (2009)
Source: Joint Survey of Labor Force 2009 (Kuneitra unconsidered)
دمشق
ريف دمشق
محص
محاه
الالذقية
ادلب
احلسكة
دير الزور
طرطوسالرقة
درعا
السويداء
ة سوري
R² = 0,5259
0%
10%
20%
30%
40%
50%
60%
70%
80%
90%
100%
3536373839404142434445464748
نسبة الحضر
عدد ساعات العمل
Agriculture and hunting
Fishing
Mining and quarrying
Manufacturing
Electricity, gas and water
Building and Construction
Wholesale and Retail
Hotels and restaurants
Transport, storage and communications
Financial intermediation
Real estate brokerage and leasing
Public Adm. and Defense
Education
HassakaHama
Idleb
Deir Ezzour
Lattakia Homs
Urban Rate Damascus
Syria
Sweida
Daraa
Rakka
Tartous
Damascus Cs.
Working Hours

Ministry of Social Affairs and Labor UNDP
(Study of Labor Market in Syria 2009‐2010) 78
45 hours in Damascus Countryside and Damascus City, where the urban rate is 60%. Also, underemployment can be calculated based on a second concept that starts with the number of working hours and considers the desire of those who work less than 24 hours per week to work full time as a confirmation element of the involuntary nature of underemployment with meeting the condition of looking for another job. The survey results show that about 9% of the employed work 24 hours or less per week and that ratio reaches about 17% among women and 7.7% among men. Table 26: Distribution of the employed by working hours, the desire to work full time and looking for another job
Number Rate compared to the total employed
Male Female Total Male Female Total
Total employed
A year-round worker 2 805 450 469 043 3 274 492 67,9% 80,3% 69,4%
Seasonal, temporary or intermittent worker 1 328 859 114 716 1 443 575 32,1% 19,7% 30,6%
Total 4 134 309 583 758 4 718 067 100,0% 100,0% 100,0%
Number of working hours per week
24 hours or less
A year-round worker 84 837 55 168 140 005 3,0% 11,8% 4,3%
Seasonal, temporary or intermittent worker 234 748 43 749 278 496 17,7% 38,1% 19,3%
Total 319 585 98 917 418 502 7,7% 16,9% 8,9%
More than 24 hours
A year-round worker 2 720 612 413 874 3 134 487 97,0% 88,2% 95,7%
Seasonal, temporary or intermittent worker 1 094 111 70 967 1 165 079 82,3% 61,9% 80,7%
Total 3 814 724 484 842 4 299 565 92,3% 83,1% 91,1%
Desire to work full-time
Desire
A year-round worker 46 327 19 397 65 724 1,7% 4,1% 2,0%
Seasonal, temporary or intermittent worker 178 730 20 440 199 170 13,4% 17,8% 13,8%
Total 225 058 39 837 264 894 5,4% 6,8% 5,6%
Does not desire
A year-round worker 38 510 35 771 74 281 1,4% 7,6% 2,3%
Seasonal, temporary or intermittent worker 56 017 23 309 79 326 4,2% 20,3% 5,5%
Total 94 527 59 080 153 607 2,3% 10,1% 3,3%
Looking for another job
Looking for another job
A year-round worker 13 696 1 455 15 151 0,5% 0,3% 0,5%
Seasonal, temporary or intermittent worker 117 933 9 392 127 326 8,9% 8,2% 8,8%
Total 131 630 10 847 142 477 3,2% 1,9% 3,0%
Not looking for another job
A year-round worker 32 631 17 942 50 573 1,2% 3,8% 1,5%
Seasonal, temporary or intermittent worker 60 797 11 047 71 844 4,6% 9,6% 5,0%
Total 93 428 28 990 122 418 2,3% 5,0% 2,6%
Source: Joint Survey of Labor Force 2009

Ministry of Social Affairs and Labor UNDP
(Study of Labor Market in Syria 2009‐2010) 79
Table 27: Percentage of underemployment (second concept) by sector of activity and work nature (2009)
A year-round worker
Seasonal worker
intermittent worker
temporary worker
Total
Male
Agriculture and silviculture 2,0% 7,5% 16,1% 5,8% 7,1%
Industry 0,2% 8,4% 6,9% 0,9% 1,4%
Building & Construction 1,2% 7,7% 10,1% 6,5% 7,1%
Hotels & Restaurants 0,5% 5,4% 7,5% 0,9% 1,2%
Transport & communication 0,2% 7,7% 10,1% 4,3% 2,1%
Finance, Insurance & Real 0,2% 18,9% 5,5% 13,9% 1,3%
Other services 0,3% 3,5% 16,2% 2,6% 1,1%
Total 0,5% 7,5% 10,4% 2,9% 3,2%
Female
Agriculture and silviculture 1,7% 4,3% 10,6% 13,5% 4,5%
Industry 0,4% 9,2% 6,4% 0,0% 1,6%
Building & Construction 2,3% 0,0% 12,7% 0,0% 4,8%
Hotels & Restaurants 0,0% 0,0% 9,8% 0,0% 0,8%
Transport & communication 0,0% 0,0% 0,0% 0,0% 0,0%
Finance, Insurance & Real 0,0% 0,0% 13,2% 0,0% 1,1%
Other services 0,2% 11,0% 16,1% 13,3% 1,3%
Total 0,3% 4,8% 11,5% 10,0% 1,9%
Total
Agriculture and silviculture 2,0% 7,1% 15,2% 6,7% 6,7%
Industry 0,2% 8,4% 6,9% 0,8% 1,4%
Building & Construction 1,2% 7,6% 10,1% 6,5% 7,0%
Hotels & Restaurants 0,5% 5,3% 7,6% 0,8% 1,2%
Transport & communication 0,2% 7,6% 10,0% 4,2% 2,1%
Finance, Insurance & Real 0,2% 15,0% 6,3% 10,4% 1,3%
Other services 0,2% 5,7% 16,1% 7,1% 1,2%
Total 0,5% 7,2% 10,5% 4,1% 3,0%
Source: Joint Survey of Labor Force 2009 The ratio of underemployment according to the second concept reaches 3% distributed to 1.9% among females and 3.2% among males, and it declines to 0.5% among those working the year-round and goes up to 10.5% among those working intermittently passing by 7.2% among seasonal workers and 4.1% among temporary workers. The following chart shows the ratio of underemployment according to the second concept, by sector of economic activity.
Chart 84: Percentage of underemployment (second concept) by sector of activity
Agriculture and silvicultre
Industry
Building & Construction
Hotels & Restaurants
Transport & communication
Finance, Insurance & Real
Services
Total
MenWomen

Ministry of Social Affairs and Labor UNDP
(Study of Labor Market in Syria 2009‐2010) 80
It should be recalled that underemployment has been analyzed through two concepts: • The first concept adopts the work nature when it is seasonal, temporary or intermittent and completes the aspect of involuntary nature of those cases with the condition of looking for another or additional job. • The second concept defines underemployment depending on the number of working hours specified at 24 hours or less with the availability of the two conditions of the desire to work full time and looking for another job. In the final analysis, it can be said that underemployment in its broad concept begins with a ratio ranging between 30.6% and 12.6%, and in its narrow concept which falls in line with the international definitions it remains within limits not exceeding 3%. The following chart shoes the sequence of underemployment categories according to both adopted concepts:
Chart 85: Underemployment categories: first concept and second concept
Total working population Seasonal, temporary or intermittent workers Round-year workers
Seasonal, temporary or intermittent workers
Work 24 hours or less per week
Desire to work full-time
Looking for another job
Seasonal, temporary or intermittent workers
First concept of under-employment
Looking for another job
Second concept of under-employment
Round-year workers
Numbers are in thousand and rates in parentheses are for the total employed

Ministry of Social Affairs and Labor UNDP
(Study of Labor Market in Syria 2009‐2010) 81
The following map shows the distribution of underemployment by the governorates based on the analysis results of both concepts adopted above:
Map 9: Underemployment by governorate (2009)
Source: Joint Survey of Labor Force 2009 2.7 Place of employment and the informal sector 2.8.1 Work inside the house The results of the Labor Force Survey 2009 show that more than 622 thousand of the employed work from or inside the house, of which about 593 thousand at their main address representing respectively 13.2% and 12.7% of the total employed. The following table shows that working from or inside the house is more common among men (14.2%) than women (5.8%), in rural areas (18.2%) compared to urban areas (9.3%) and in the secondary work (18.3%) compared to the main work (13.1 %).
Table 28: Rate distribution of work from or inside the house by class and gender
Urban Areas Rural Areas Total
Male Female Total Male Female Total Male Female Total
Home-based work in main job 10,2% 2,7% 9,2% 19,6% 9,4% 18,3% 14,2% 5,5% 13,1%
Home-based work in secondary job 14,2% 45,7% 15,4% 19,5% 28,7% 19,9% 17,5% 33,9% 18,3%
Home-based workd of the total employed 10,3% 3,0% 9,3% 19,3% 9,7% 18,2% 14,2% 5,8% 13,2%
Aleppo
IdlebLattakia
1st Concept
Damascus
Homs
Underemployment Rate
Deir Ezzour
Hama
Rakka
Tartous
Damascus Countryside
Sweida
Daraa 2nd
Concept
Labor Distribution by Governorates Qoneitra
Hassaka

Ministry of Social Affairs and Labor UNDP
(Study of Labor Market in Syria 2009‐2010) 82
It should be noted that more than one third of women (33.9%) have a secondary job which they practice from or within the house versus 17.5% among men. The rate distribution of working from or inside the house by the sections of profession in the main and secondary job shows that recourse to working from or inside the house is matter of primary importance to craftsmen (21.5%) and those working in agriculture (19.9%).
Chart 86: Rate distribution of work from or inside the house by sections of professions (main job and secondary job)
Source: Joint Survey of Labor Force 2009
The rate distribution of working from or inside the house by the sector of economic activity in the main job shows that a significant percentage of those working in the construction sector (36.8%), the transport sector (28%) and domestic services (20.6%) practice their work from or inside the house as demonstrated in the following chart which distribute those rates by gender.
Chart 87: Rate distribution of work from or inside the house by the sector of economic activity in the main job
Source: Joint Survey of Labor Force 2009
Senior officials and Mangers
Specialists
Technicians and assistant professionals
Clerks
Workers in services and retails
Workers in agriculture and fishing
Artisans and related crafts
Plant and machine operators and assembly workers
Workers in elementary occupations
Total
Agriculture and hunting
Fishing
Mining and quarrying
Manufacturing
Electricity, gas and water
Building and Construction
Wholesale and Retail
Hotels and restaurants
Transport, storage and communications
Financial intermediation
Real estate brokerage and leasing
Public Adm. and Defense
Women
Men
Women
Men

Ministry of Social Affairs and Labor UNDP
(Study of Labor Market in Syria 2009‐2010) 83
It should also be noted that more than a half of those working from or inside the house are self-employed and more than 41% of them are paid workers. These percentages vary by gender because of the high rate of unpaid work among women, as the results show that more than one third of women working from or inside the house work without pay, and this rate reaches 3.1% among men.
Chart 88: Rate distribution of those working from or inside the house by employer (2009)
Source: Joint Survey of Labor Force 2009
The customs and traditions represent the most important elements that explain the social type causing the resort to work from or inside the house, as more than 41% of women resort to working from or inside the house in compliance with such social constraints, whereas, this ratio reaches only 6.5% among men. However, the difficulty to obtain funding remains one of the most important obstacles that prevent initiating work outside the house because of the costs related to opening a commercial or industrial shop and the scarcity of self-financing. The results also show that working inside the house is not an optional situation for men, as more than 80% of them would prefer to work outside the house; whereas, about a half of women working from or inside the house have voluntarily chosen such situation which helps them harmonize between home affairs and their work. The following two charts demonstrate such results: Chart 89: Distribution of those working from or inside the house by the difficulties causing the resort to work
inside the house (2009)
Source: Joint Survey of Labor Force 2009
Chart 90: Distribution of those working from or inside the house by the rate of their preference to work
outside the house (2009)
Source: Joint Survey of Labor Force 2009
Women
Men
Total
Self-employed Employers Paid workerUnpaid worker
Difficulty to obtain funding
High taxes
Inappropriate laws
Licensing difficulty
Customs and Traditions
Health reasons
Other reasons
Women
Men
Total Women Men
Yes, for high proceeds
If not conflicting with
responsibilities
Yes, for other
reasons
Does not preferworking
outside home

Ministry of Social Affairs and Labor UNDP
(Study of Labor Market in Syria 2009‐2010) 84
2.8.2 Work in the informal sector The phenomenon of informal employment differs from one country to another and it is often difficult to be knowledgeable about all its aspects in terms of the economic and statistical side. The International Labor Office has prepared in its guidelines, in respect of the statistical definition of informal employment, at least ten cases of informal employment in view of the nature of jobs and production units as shown in the following table:
Table 29: The theoretical framework of the informal employment
Jobs by employment status
Production units by type Self-employed Employers
Household participating
workers Employees
Association productive members
Informal Formal Informal Formal Informal Formal Informal Formal Informal Formal
Formal sector enterprises 1 2
Informal sector enterprixes 3 4 5 6 7 8
Housholds 9 10
Source: According to the International Labor Office Note: The black cells indicate jobs that are not defined in the type of production unit concerned, and the uncolored cells indicate the regular jobs. The numbered cells represent the different types of irregular jobs: • Informal employment: cells from 1 to 6 and from 8 to 10 • Employment in the informal sector: Cells from 3 to 8 • Informal employment outside the informal sector: Cells 1 and 2, 9 and 10 It is difficult through the labor force survey 2009 to be knowledgeable about the various aspects of the informal employment defined above. However, the survey results show some important indicators in this field. It is clear that 83% of the employed in the private sector represent 2.593 million workers not registered in the Tax Department, and less than 11% (340 thousand) of the workers in the private sector have a social protection. These data show the large size of the informal employment in the private sector.
Chart 91: Percentage distribution of the private sector employees’ involvement in the service of taxes, social insurance, and trade unions
(2009)
Source: Joint Survey of Labor Force 2009
Tax DepartmentSocial SecuritiesTrade Unions
Total FemalesMales

Ministry of Social Affairs and Labor UNDP
(Study of Labor Market in Syria 2009‐2010) 85
It is noticeable that non-registration of workers to the tax department, social security or trade unions is not due to the complexity of administrative procedures or to the financial cost but it is pure will of the workers who do not believe that there is a need to register, and therefore a benefit in registering their work. The results show that numerable procedures lead to reluctance of only 1% of the employed to register, and the financial issues represent 1.6% of the non-registration causes. Whereas more than two thirds of unregistered workers do not see a need to register their work. This issue indicates the importance of awareness and information in reducing informal employment and the enlightenment of the importance of workers’ registration to enjoy the services of social protection and occupational membership.
Chart 92: Distribution of causes of non-registration of the private sector workers
Source: Joint Survey of Labor Force 2009 2.9 Income from employment Employment provides a monthly income of about 52.5 billion Syrian pounds for the total employed (98% from the main work and 2% of the secondary work), representing an average of 11.133 per worker. The following table shows the distribution of monthly income according to work nature:
Table 30: Monthly of monthly income by work nature
Number of the Employed Monthly Income (Million
SP) Monthly Income (SP)
Males Females Total Males Females Total Males Females Total Main Work Total Employed 4 134 309 583 758 4 718 067 45 556 5 881 51 437 11 019 10 074 10 902 salaried workers 3 984 949 529 441 4 514 390 45 555 5 880 51 435 11 432 11 106 11 394
Secondary Work Total Employed 154 873 7 493 162 367 1 063 27 1 090 6 864 3 620 6 714 salaried workers 142 137 4 923 147 060 1 063 27 1 090 7 479 5 510 7 413
Gross Total 4 134 309 583 758 4 718 067 46 619 5 908 52 527 11 276 10 120 11 133
Source: Joint Survey of Labor Force 2009
Under registration
No need for registration
Numerable procedures
High financial cost
Other reasons
Employer’s responsibility
Total
Males
Females

Ministry of Social Affairs and Labor UNDP
(Study of Labor Market in Syria 2009‐2010) 86
The monthly income varies depending on the nature of work, as the income of the employers exceeds more than twice the income of the salaried workers in the private sector or public sector. This is noticed in respect of both the main work and the secondary work as shown in the chart below. Moreover, the secondary work provides about two-thirds of what is provided by the main work, knowing that 3.4% of the employed are engaged in more than one job.
Chart 93: Distribution of monthly income from the main work and secondary work by work nature
Source: Joint Survey of Labor Force 2009 The results of the Joint Survey of Labor Force 2009 show that the average monthly income from the main work differs from one sector to another by about 20%, except the sectors of agriculture on the one hand, which is characterized by relatively low income due to the presence of unpaid work especially among women, and the sector of finance, insurance and real estate, which is characterized by an income level that exceeds the general average by about 60%.
Chart 94: The monthly income by sector of activity (with considering workers without pay)
Source: Joint Survey of Labor Force 2009

Ministry of Social Affairs and Labor UNDP
(Study of Labor Market in Syria 2009‐2010) 87
The study of the development of work-earned income during the past years shows an improvement in the workers’ purchase power. The comparison between the survey results of 2009 and the survey results of 2006 shows that the average general income development at current prices by 32% among men workers and 26% among women workers between 2006 and 2009 as demonstrated in the following table. Taking into account the evaluation of prices during the studied period, the results show that the workers’ purchasing power has improved at an annual rate equivalent to 1.9% with a difference between the sectors of activity as shown in the following chart:
Chart 95: The annual rate of purchase power improvement of workers during the period 2006-2009
Source: Labor Force Survey 2006, Labor Force Survey 2009 and the data of the Central Bank of Syria according to standard retail prices.
Table 31: Monthly income by sector of activity: comparison between 2006 and 2009 (without considering the
workers without pay)
Monthly Income byاSurvey results of 2006 (SP)
Monthly Income byاSurvey results of 2009 (SP)
Development 2006-2009
Males Females Total Males Females Total Males Females Total Agriculture and silviculture 6 915 4 838 6 523 9 685 5 499 9 309 40% 14% 43%
Industry 8 168 6 769 8 066 11 247 8 737 11 097 38% 29% 38%
Building & Construction 7 669 7 586 7 669 9 771 10 903 9 783 27% 44% 28%
Hotels & Restaurants 7 637 6 464 7 580 12 155 9 776 12 061 59% 51% 59% Transport & communication 9 820 9 720 9 815 12 152 12 383 12 159 24% 27% 24%
Finance, Insurance & Real 9 956 8 496 9 682 16 959 12 713 16 346 70% 50% 69%
Other Services 9 617 9 507 9 586 12 462 12 151 12 368 30% 28% 29%
Total 8 666 8 832 8 693 11 432 11 106 11 394 32% 26% 31%
Source: Labor Force Survey 2006 and Joint Survey of Labor Force 2009 It should be noted that the evolution of labor income results from improving the level of average wages in general in a certain sector, on one side, and the evolution of the level of professions in a particular sector on the other. The results show that two sectors benefited from a noticeable improvement in the level of labor income, these are the sector of finance, insurance and real estate and the sector of trade and tourism (hotels and restaurants) that have witnessed an annual improvement of the purchase power of the workers therein at rates of 10.8% and 8.7% respectively. Also, that rate improved by 4.8% in the agricultural sector and 3.5 in the industrial sector, whereas both sectors of construction and transport remain less developed in terms of improved labor income due to the nature of the overall work in them which is basically characterized by low qualification and skills of employees therein.

Ministry of Social Affairs and Labor UNDP
(Study of Labor Market in Syria 2009‐2010) 88
The following chart shows the distribution of categories of monthly income according to the results of the Joint Survey of Labor Force, 2009, which demonstrates that about 11% of the workers received a monthly income less than a half of the overall average, and less than 9% have an income that exceeds double the overall average. This indicates the absence of wide disparity in the distribution of labor-earned income.
Chart 96: Distribution of monthly income groups
Source: Joint Survey of Labor Force 2009
Also, the following chart shows the distribution of the monthly income earned from the main job according to the educational level and demonstrates the improvement of the income level aligned with the improvement of the educational level of the individual with the presence of noticeable disparity between the income of men and women in all segments of the educational levels.
Chart 97: Distribution of monthly income from main job by education level
Source: Joint Survey of Labor Force 2009
The results of the Annual Survey of 2009, as well as the survey results the first half of 2010 shows the continued evolution of the monthly wage of wage earners between 2009 and early 2010 by 2%. It is worth mentioning that the monthly wage of females exceeded the monthly wage of males at rates ranging between 4.8% and 7.2%, as it reached 11.779 sp versus 10.967 for males in 2009 and 11.773 versus 11.229 for males in 2010 as shown in the following chart:
Chart 98: Evolution of the monthly income among wage earners
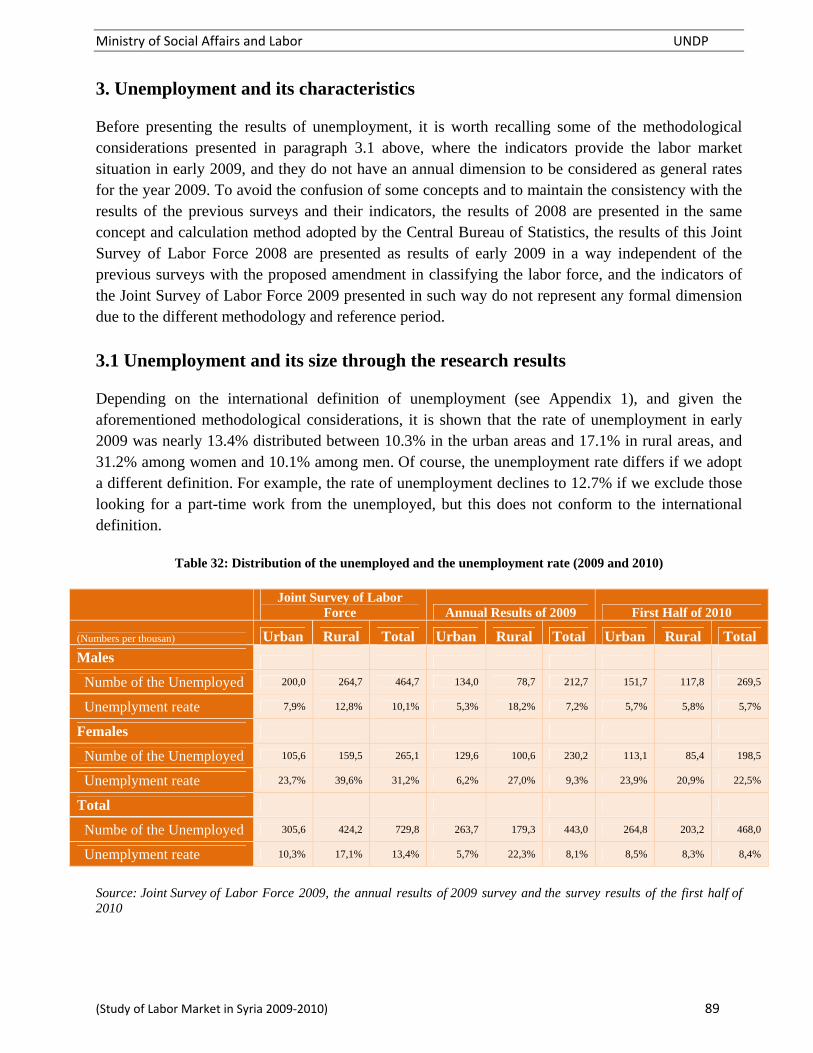
Ministry of Social Affairs and Labor UNDP
(Study of Labor Market in Syria 2009‐2010) 89
3. Unemployment and its characteristics Before presenting the results of unemployment, it is worth recalling some of the methodological considerations presented in paragraph 3.1 above, where the indicators provide the labor market situation in early 2009, and they do not have an annual dimension to be considered as general rates for the year 2009. To avoid the confusion of some concepts and to maintain the consistency with the results of the previous surveys and their indicators, the results of 2008 are presented in the same concept and calculation method adopted by the Central Bureau of Statistics, the results of this Joint Survey of Labor Force 2008 are presented as results of early 2009 in a way independent of the previous surveys with the proposed amendment in classifying the labor force, and the indicators of the Joint Survey of Labor Force 2009 presented in such way do not represent any formal dimension due to the different methodology and reference period.
3.1 Unemployment and its size through the research results Depending on the international definition of unemployment (see Appendix 1), and given the aforementioned methodological considerations, it is shown that the rate of unemployment in early 2009 was nearly 13.4% distributed between 10.3% in the urban areas and 17.1% in rural areas, and 31.2% among women and 10.1% among men. Of course, the unemployment rate differs if we adopt a different definition. For example, the rate of unemployment declines to 12.7% if we exclude those looking for a part-time work from the unemployed, but this does not conform to the international definition.
Table 32: Distribution of the unemployed and the unemployment rate (2009 and 2010)
Joint Survey of Labor
Force Annual Results of 2009 First Half of 2010
(Numbers per thousan) Urban Rural Total Urban Rural Total Urban Rural Total
Males
Numbe of the Unemployed 200,0 264,7 464,7 134,0 78,7 212,7 151,7 117,8 269,5
Unemplyment reate 7,9% 12,8% 10,1% 5,3% 18,2% 7,2% 5,7% 5,8% 5,7%
Females
Numbe of the Unemployed 105,6 159,5 265,1 129,6 100,6 230,2 113,1 85,4 198,5
Unemplyment reate 23,7% 39,6% 31,2% 6,2% 27,0% 9,3% 23,9% 20,9% 22,5%
Total
Numbe of the Unemployed 305,6 424,2 729,8 263,7 179,3 443,0 264,8 203,2 468,0
Unemplyment reate 10,3% 17,1% 13,4% 5,7% 22,3% 8,1% 8,5% 8,3% 8,4%
Source: Joint Survey of Labor Force 2009, the annual results of 2009 survey and the survey results of the first half of 2010

Ministry of Social Affairs and Labor UNDP
(Study of Labor Market in Syria 2009‐2010) 90
3.2 Unemployment and its development
Because of the aforementioned different methodology and reference period, it is difficult to compare the results of the Joint Survey of Labor Force 2009 with the preceding and subsequent surveys. With taking into consideration the mentioned precautions it is shows that there is a trend towards higher unemployment rate as of 2007 after a marked decline in 2005 (unemployment rate of about 8.1% in 2005 vs. 12.3% in 2004); thus a rise in the unemployed number up to 595 thousand in 2008 and 730 thousand in early 2009. The results of the last surveys indicate that the unemployed number declined to less than 458 thousand in 2009 and 468 thousand in 2010, and the unemployment rate dropped to 8.1% in 2009 and 8.4% in 2010.
Chart 99: Evolution of the unemployed number and the unemployment rate (2001-2010)
Source: Labor Force Surveys 2001-2010, the Joint Survey of Labor Force 2009. Note: annual data for 2008 and an isolated result of early 2009 as in paragraph 3.1.
3.3 Unemployment and geographical distribution The following table shows the distribution of the unemployed and unemployment rates by provinces on the basis of the results of the joint survey, 2009:
Table 33: distribution of the number of unemployed and the unemployment rate by governorate and class

Ministry of Social Affairs and Labor UNDP
(Study of Labor Market in Syria 2009‐2010) 91
The following maps show the distribution of the unemployment rates by governorates based on the results of the joint survey 2009 and describes the aggravating unemployment situation in each of the following governorates: Hassaka, Tartous, Lattakia, Deir Ezzour and Sweida.
Map 10: Unemployment rates distribution by the governorates - Total (2009)
Source: Joint Survey of Labor Force 2009
Map 11: Unemployment rates distribution by the governorates - Women (2009)
Source: Joint Survey of Labor Force 2009
Map 12: Unemployment rates distribution by the governorates - Men (2009)
Source: Joint Survey of Labor Force 2009
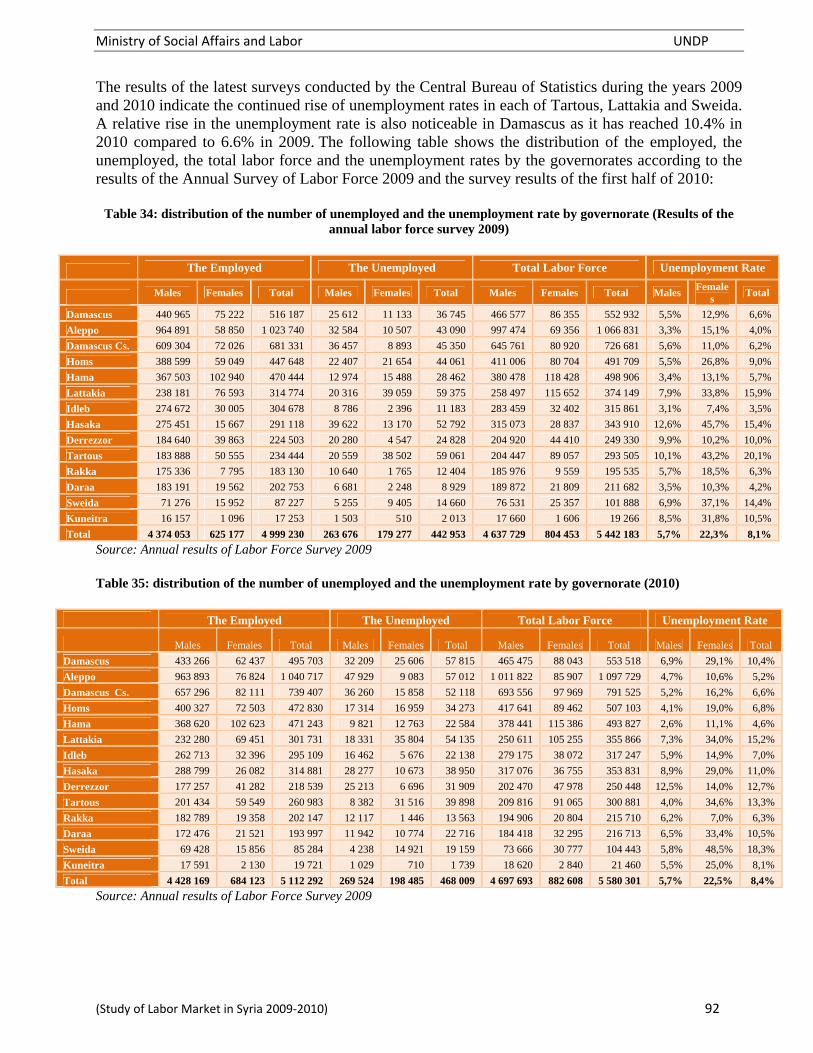
Ministry of Social Affairs and Labor UNDP
(Study of Labor Market in Syria 2009‐2010) 92
The results of the latest surveys conducted by the Central Bureau of Statistics during the years 2009 and 2010 indicate the continued rise of unemployment rates in each of Tartous, Lattakia and Sweida. A relative rise in the unemployment rate is also noticeable in Damascus as it has reached 10.4% in 2010 compared to 6.6% in 2009. The following table shows the distribution of the employed, the unemployed, the total labor force and the unemployment rates by the governorates according to the results of the Annual Survey of Labor Force 2009 and the survey results of the first half of 2010:
Table 34: distribution of the number of unemployed and the unemployment rate by governorate (Results of the annual labor force survey 2009)
The Employed The Unemployed Total Labor Force Unemployment Rate
Males Females Total Males Females Total Males Females Total Males Female
s Total
Damascus 440 965 75 222 516 187 25 612 11 133 36 745 466 577 86 355 552 932 5,5% 12,9% 6,6%
Aleppo 964 891 58 850 1 023 740 32 584 10 507 43 090 997 474 69 356 1 066 831 3,3% 15,1% 4,0%
Damascus Cs. 609 304 72 026 681 331 36 457 8 893 45 350 645 761 80 920 726 681 5,6% 11,0% 6,2%
Homs 388 599 59 049 447 648 22 407 21 654 44 061 411 006 80 704 491 709 5,5% 26,8% 9,0%
Hama 367 503 102 940 470 444 12 974 15 488 28 462 380 478 118 428 498 906 3,4% 13,1% 5,7%
Lattakia 238 181 76 593 314 774 20 316 39 059 59 375 258 497 115 652 374 149 7,9% 33,8% 15,9%
Idleb 274 672 30 005 304 678 8 786 2 396 11 183 283 459 32 402 315 861 3,1% 7,4% 3,5%
Hasaka 275 451 15 667 291 118 39 622 13 170 52 792 315 073 28 837 343 910 12,6% 45,7% 15,4%
Derrezzor 184 640 39 863 224 503 20 280 4 547 24 828 204 920 44 410 249 330 9,9% 10,2% 10,0%
Tartous 183 888 50 555 234 444 20 559 38 502 59 061 204 447 89 057 293 505 10,1% 43,2% 20,1%
Rakka 175 336 7 795 183 130 10 640 1 765 12 404 185 976 9 559 195 535 5,7% 18,5% 6,3%
Daraa 183 191 19 562 202 753 6 681 2 248 8 929 189 872 21 809 211 682 3,5% 10,3% 4,2%
Sweida 71 276 15 952 87 227 5 255 9 405 14 660 76 531 25 357 101 888 6,9% 37,1% 14,4%
Kuneitra 16 157 1 096 17 253 1 503 510 2 013 17 660 1 606 19 266 8,5% 31,8% 10,5%
Total 4 374 053 625 177 4 999 230 263 676 179 277 442 953 4 637 729 804 453 5 442 183 5,7% 22,3% 8,1%
Source: Annual results of Labor Force Survey 2009 Table 35: distribution of the number of unemployed and the unemployment rate by governorate (2010)
The Employed The Unemployed Total Labor Force Unemployment Rate
Males Females Total Males Females Total Males Females Total Males Females Total
Damascus 433 266 62 437 495 703 32 209 25 606 57 815 465 475 88 043 553 518 6,9% 29,1% 10,4%
Aleppo 963 893 76 824 1 040 717 47 929 9 083 57 012 1 011 822 85 907 1 097 729 4,7% 10,6% 5,2%
Damascus Cs. 657 296 82 111 739 407 36 260 15 858 52 118 693 556 97 969 791 525 5,2% 16,2% 6,6%
Homs 400 327 72 503 472 830 17 314 16 959 34 273 417 641 89 462 507 103 4,1% 19,0% 6,8%
Hama 368 620 102 623 471 243 9 821 12 763 22 584 378 441 115 386 493 827 2,6% 11,1% 4,6%
Lattakia 232 280 69 451 301 731 18 331 35 804 54 135 250 611 105 255 355 866 7,3% 34,0% 15,2%
Idleb 262 713 32 396 295 109 16 462 5 676 22 138 279 175 38 072 317 247 5,9% 14,9% 7,0%
Hasaka 288 799 26 082 314 881 28 277 10 673 38 950 317 076 36 755 353 831 8,9% 29,0% 11,0%
Derrezzor 177 257 41 282 218 539 25 213 6 696 31 909 202 470 47 978 250 448 12,5% 14,0% 12,7%
Tartous 201 434 59 549 260 983 8 382 31 516 39 898 209 816 91 065 300 881 4,0% 34,6% 13,3%
Rakka 182 789 19 358 202 147 12 117 1 446 13 563 194 906 20 804 215 710 6,2% 7,0% 6,3%
Daraa 172 476 21 521 193 997 11 942 10 774 22 716 184 418 32 295 216 713 6,5% 33,4% 10,5%
Sweida 69 428 15 856 85 284 4 238 14 921 19 159 73 666 30 777 104 443 5,8% 48,5% 18,3%
Kuneitra 17 591 2 130 19 721 1 029 710 1 739 18 620 2 840 21 460 5,5% 25,0% 8,1%
Total 4 428 169 684 123 5 112 292 269 524 198 485 468 009 4 697 693 882 608 5 580 301 5,7% 22,5% 8,4%
Source: Annual results of Labor Force Survey 2009

Ministry of Social Affairs and Labor UNDP
(Study of Labor Market in Syria 2009‐2010) 93
Map 13: Distribution of unemployment rates by governorate (Results of the Annual Labor Force Survey 2009)
Map 14: Distribution of unemployment rates by governorate (Labor Force Survey first half of 2010)
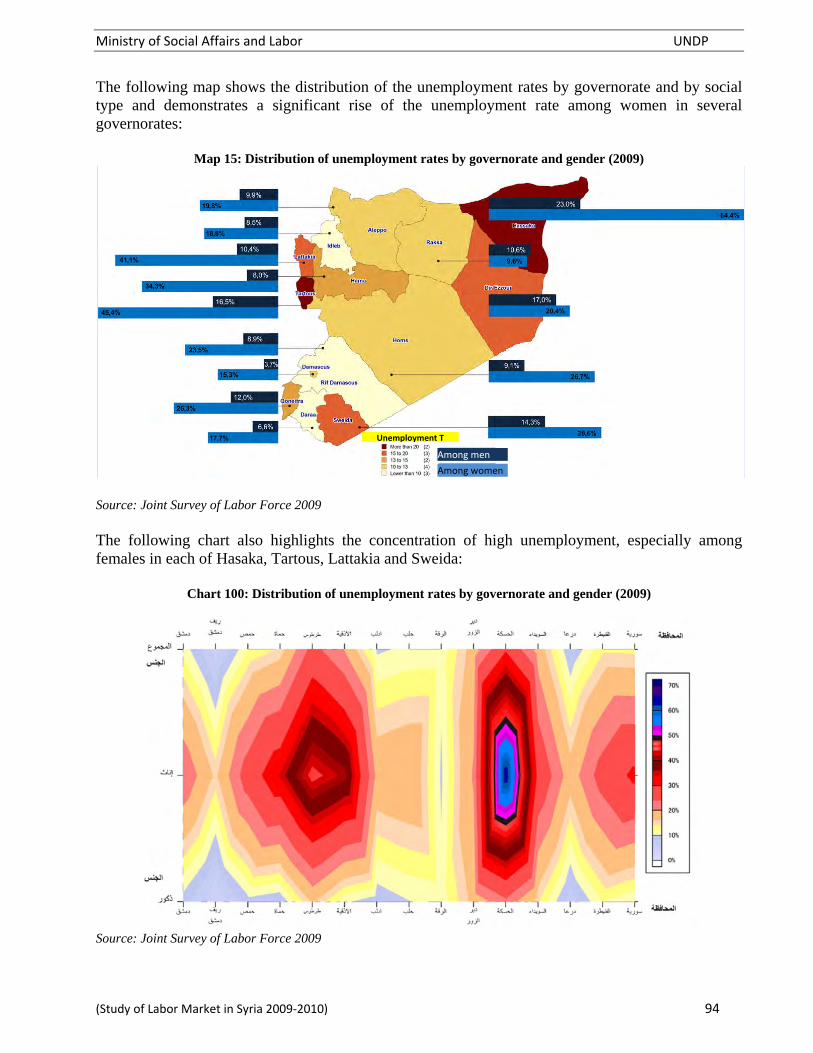
Ministry of Social Affairs and Labor UNDP
(Study of Labor Market in Syria 2009‐2010) 94
The following map shows the distribution of the unemployment rates by governorate and by social type and demonstrates a significant rise of the unemployment rate among women in several governorates:
Map 15: Distribution of unemployment rates by governorate and gender (2009)
Source: Joint Survey of Labor Force 2009 The following chart also highlights the concentration of high unemployment, especially among females in each of Hasaka, Tartous, Lattakia and Sweida:
Chart 100: Distribution of unemployment rates by governorate and gender (2009)
Source: Joint Survey of Labor Force 2009
Unemployment T
Among men
Among women

Ministry of Social Affairs and Labor UNDP
(Study of Labor Market in Syria 2009‐2010) 95
Due to the limited sample size the calculation of unemployment rates at the governorate level becomes of weak statistical significance statistically, but the comparison of the survey results of 2009 with the census results of 2004 indicates the localization of unemployment in almost the same areas as shown in both maps below:
Map 16: Distribution of unemployment rates by region (census 2004)
Map 17: Distribution of unemployment rates by region (the Joint Survey of Labor Force 2009)
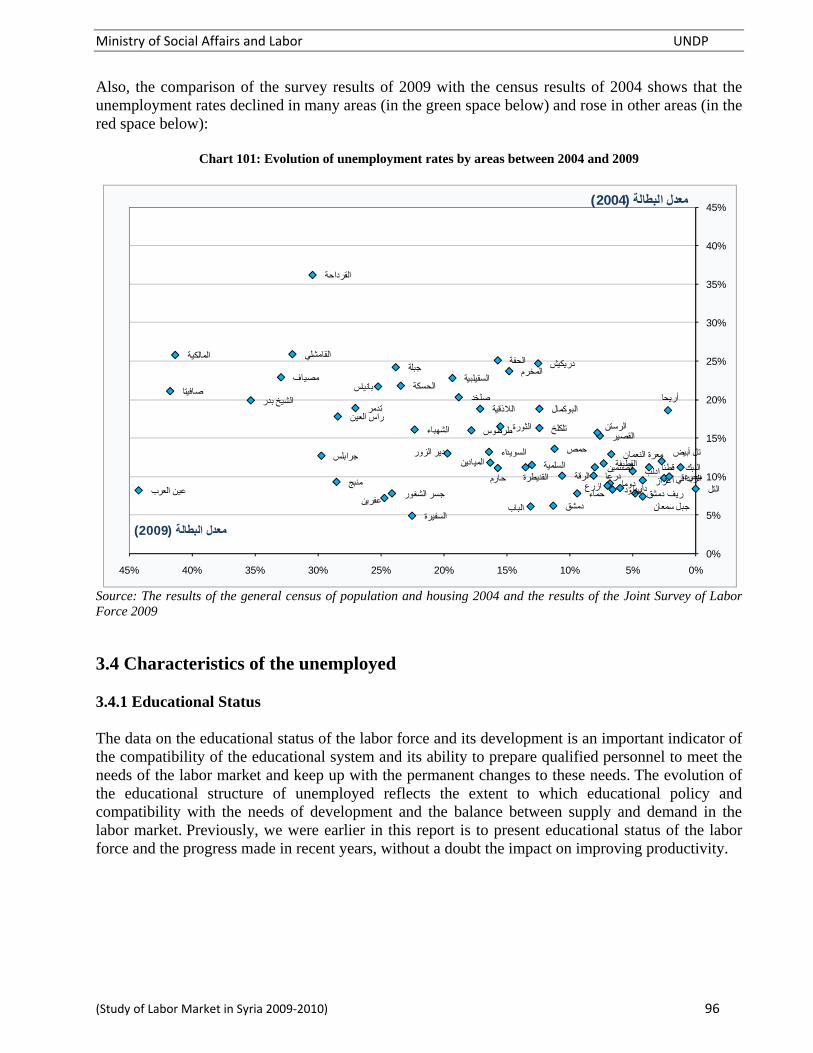
Ministry of Social Affairs and Labor UNDP
(Study of Labor Market in Syria 2009‐2010) 96
Also, the comparison of the survey results of 2009 with the census results of 2004 shows that the unemployment rates declined in many areas (in the green space below) and rose in other areas (in the red space below):
Chart 101: Evolution of unemployment rates by areas between 2004 and 2009
Source: The results of the general census of population and housing 2004 and the results of the Joint Survey of Labor Force 2009 3.4 Characteristics of the unemployed 3.4.1 Educational Status The data on the educational status of the labor force and its development is an important indicator of the compatibility of the educational system and its ability to prepare qualified personnel to meet the needs of the labor market and keep up with the permanent changes to these needs. The evolution of the educational structure of unemployed reflects the extent to which educational policy and compatibility with the needs of development and the balance between supply and demand in the labor market. Previously, we were earlier in this report is to present educational status of the labor force and the progress made in recent years, without a doubt the impact on improving productivity.
دمشق البابجبل سمعانعفرين
منبجأعزازعين العرب
السفيرة
جرابلس
ريف دمشقدوما
القطيفة
يبرودالتل
النبكالزبداني
قطنا
داريا
حمصالقصير
تلكلخ الرستن
تدمر
المخرم
حماء
السقيلبية
السلمية
مصياف
محردة
الالذقية
جبلةالحفة
القرداحة
ادلب
معرة النعمان
حارم
جسر الشغور
أريحاالحسكة
المالكيةالقامشلي
راس العين
دير الزور
البوكمال
الميادين
طرطوس
صافيتابانياس
دريكيش
الشيخ بدر
الرقة
تل أبيض
الثورة
درعاالصنمين
ازرع
السويداء
صلخد
الشھباء
القنيطرة
0%
5%
10%
15%
20%
25%
30%
35%
40%
45%
0%5%10%15%20%25%30%35%40%45%
)2004(معدل البطالة
)2009(معدل البطالة

Ministry of Social Affairs and Labor UNDP
(Study of Labor Market in Syria 2009‐2010) 97
The results of the Joint survey of Labor Force show that the educational status of the unemployed does not markedly differ from the rest categories of labor force. The following chart clarifies the comparison between the relative distribution of the unemployed and the employed by the educational level. The rates tend to be convergent, as the majority of the unemployed (59%) as well as the majority of the employed (55%) did not exceed the primary level, with some difference in the rate of high and middle school as well as the university certificate holders among the unemployed and employed.
Chart 102: Relative distribution of the unemployed and the employed by the educational level
Source: Joint Survey of Labor Force 2009
The following table shows the details of the labor force and the unemployed by the level of education according to the results of the Joint Survey of Labor Force, 2009:
Table 36: distribution of the labor force and the unemployed by level of education
Less than Primary
Primary Middle & Secondary
Post-Secondary
University Total
Pre-University & over
Labor Force (Number) Males 963 721 1 961 980 1 074 736 279 265 318 899 4 598 600
Females 112 681 139 951 232 870 211 913 151 287 848 703
Total 1 076 402 2 101 931 1 307 606 491 178 470 186 5 447 303
Labor Force (Rate)
Males 21,0% 42,7% 23,4% 6,1% 6,9% 100,0%
Females 13,3% 16,5% 27,4% 25,0% 17,8% 100,0%
Total 19,8% 38,6% 24,0% 9,0% 8,6% 100,0%
The Unemployed
Males 101 580 208 687 109 592 26 504 18 355 464 718
Females 26 874 66 846 106 813 40 242 24 294 265 070
Total 128 454 275 534 216 405 66 746 42 649 729 788
The Unemployed (rates)
Males 21,9% 44,9% 23,6% 5,7% 3,9% 100,0%
Females 10,1% 25,2% 40,3% 15,2% 9,2% 100,0%
Total 17,6% 37,8% 29,7% 9,1% 5,8% 100,0%
Unemployment Rate
Males 10,5% 10,6% 10,2% 9,5% 5,8% 10,1%
Females 23,8% 47,8% 45,9% 19,0% 16,1% 31,2%
Total 11,9% 13,1% 16,5% 13,6% 9,1% 13,4%
Source: Joint Survey of Labor Force 2009
Below primary level
Primary School
Preparatory & Secondary
Post‐secondary & Pre University
University and above Employed
Unemployed

Ministry of Social Affairs and Labor UNDP
(Study of Labor Market in Syria 2009‐2010) 98
The data indicate the difference of the educational level of the employed between males and females, as more than two thirds of males (66.8%) hold educational qualifications lower than the middle school, whereas that ratio is about one third among females (35.4%). The gender differences in terms of the educational level can be also confirmed by the rate of the unemployed holding a degree above the secondary school as this ratio reaches 9.7% among females and 24.3% among females. The following chart shows the relative distribution of the unemployed by the educational status and gender. The concentration of unemployment is particularly noticed among the men holding the primary school certificate who represent 45% of the unemployed, whereas the unemployed women are distributed more evenly between the various educational levels, as more than a half of them hold either the primary or secondary school certificate, and one third of them have either the middle school or intermediate institute certificate. Those differences confirm the general superiority observed among the economically active women compared to men in terms of the educational level, as the women who enter the labor market are more prepared with higher scientific qualifications than men.
Chart 103: Relative distribution of the unemployed by educational status and gender (2009)
Source: Joint Survey of Labor Force 2009 The results also show the decline of the unemployment rate with the progress of the educational level, and they demonstrate, on the other side, the concentration of high rates of unemployment among the holders of intermediate qualifications. The first phenomenon indicates a positive reaction of labor market to the improvement of qualifications and skills and it can be explained by the relative scarcity of the higher educational levels. However, the second phenomenon interoperates some cases of wavering observed in particular among the holders of the secondary school certificate and the students of universities and intermediate institutes who, on one side, lack the necessary technical skills and specializations that qualify them to easily access the labor market, and who are unsatisfied with what is provided by the labor market of occupational capabilities and job opportunities which they consider incompatible with their educational level on the other side. The following chart shows the distribution of the unemployment rate by the educational status and sex:
Illiterate Literate PrimaryPreparatorySecondaryIntermediateInstitute
Doctorate University
Total Male Female

Ministry of Social Affairs and Labor UNDP
(Study of Labor Market in Syria 2009‐2010) 99
Chart 104: Distribution of unemployment rate by educational status and sex (2009)
Source: Joint Survey of Labor Force 2009 3.4.2 Previous work and the reason for work suspension 3.4.2.1 Newcomers to Labor Market and the previously employed The survey results show that about two-thirds of the unemployed are new entrants to the labor market who have never worked. Most of the unemployed do not have previous professional experience which indicates the importance of vocational training systems within the enterprises that enable the unemployed to obtain professional experience and easily integrate with the labor market. The results show also that the new entrants to the labor market have more educational qualifications than the unemployed who have previously worked. The ratio of those holding the high school and above represents 38% among the unemployed who have not previously worked in comparison with less than 18% among the unemployed who have previously worked. These data indicate the importance of the training and rehabilitation programs directed to the various segments of the unemployed.
Table 37: distribution of unemployed by the work of his predecessors and educational level
Males Females Total
Unemployed previously employed
Unemployed previously
unemployed
Unemployed previously employed
Unemployed previously
unemployed
Unemployed previously employed
Unemployed previously
unemployed
Illiterate 15,4% 7,8% 8,4% 4,8% 14,3% 6,4%
Reads and writes 14,3% 7,7% 4,8% 4,7% 12,8% 6,4%
Primary 46,5% 44,4% 25,2% 25,1% 43,1% 35,8%
Middle School 11,7% 13,6% 14,4% 14,1% 12,1% 13,9%
High School 7,5% 16,2% 28,1% 29,2% 10,8% 22,0%
Collage 3,5% 7,1% 9,6% 16,4% 4,4% 11,3%
University & > 1,1% 3,2% 9,5% 5,7% 2,5% 4,3%
Total 100,0% 100,0% 100,0% 100,0% 100,0% 100,0%
Source: Joint Survey of Labor Force 2009
Illiterate LiteratePrimaryPreparatorySecondaryIntermediateInstitute
Doctorate University
MalesTotal Females

Ministry of Social Affairs and Labor UNDP
(Study of Labor Market in Syria 2009‐2010) 100
The public sector is distinguished by providing security and stability for workers compared to the private sector which depends for greater extent on temporary and seasonal work compared to the government sector. The survey results show that more than 90% of the unemployed who have previously worked come from the private sector. This rate witnessed an increase in the recent years, as it was 63.3% in 1994 and 68.2 in 2004. This may be due, on the one hand, to the increase of the private sector’s participation rate in the economy and more flexibility of the labor law and, on the other hand, to the decline of women rate among the employed and the unemployed, as most women mainly work in the public sector, as the results confirm that nearly one third of the unemployed women who have previously worked come from the public sector compared to 4.4% among men. Also, the results confirm the fragility of working in the individual sector which is dominated by the informal nature, as 57% of the unemployed who have previously worked come from the individual private sector as shown in the following table:
Table 38: Distribution of the unemployed who have previously worked: distributed by the employer
Number Relative Distribution Indifinite Relative Distribution
Males Females Total Males Females Total Males Females Total
Employer 8 877 1 225 10 102 4,4% 3,2% 4,2% 4,4% 3,3% 4,3%
Self-employed 41 147 4 319 45 466 20,6% 11,4% 19,1% 20,6% 11,6% 19,2%
slalaried in idividual private sector 118 428 16 619 135 047 59,2% 43,8% 56,7% 59,3% 44,6% 57,0%
Slalaried in private sector 14 294 2 505 16 800 7,1% 6,6% 7,1% 7,2% 6,7% 7,1%
Salaried in public sector 8 856 11 634 20 491 4,4% 30,7% 8,6% 4,4% 31,2% 8,6%
Salaried in joint sector 389 176 566 0,2% 0,5% 0,2% 0,2% 0,5% 0,2%
Unpaid in a household 7 873 763 8 636 3,9% 2,0% 3,6% 3,9% 2,0% 3,6%
Indifinite 228 698 926 0,1% 1,8% 0,4%
Total 200 093 37 940 238 033 100,0% 100,0% 100,0% 100,0% 100,0% 100,0%
Source: Joint Survey of Labor Force 2009
Chart 105: Distribution of the unemployed who have previously worked: distributed by the employer
(women)
Source: Joint Survey of Labor Force 2009
Chart 106: the distribution of the unemployed who have previously worked: distributed by the employer
(Men)
Source: Joint Survey of Labor Force 2009
Employer
Self‐employed
EmployerSelf‐employed
Salaried in Public Sector
Salaried in Joint Sector
Unpaid in a household Unpaid in a household
Salaried in Public Sector
Salaried in Joint Sector
Salaried in Private Sector Company
Salaried in Private Sector Company
Salaried in Private Sector, Individual Salaried in Private Sector, Individual
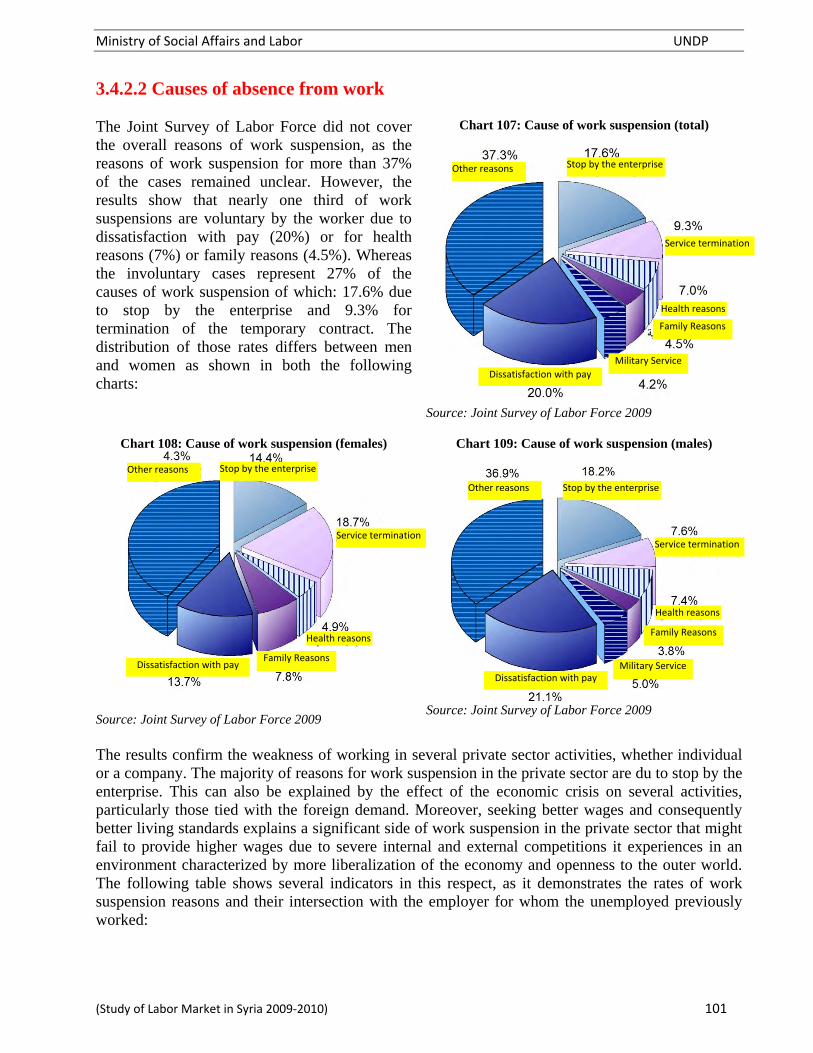
Ministry of Social Affairs and Labor UNDP
(Study of Labor Market in Syria 2009‐2010) 101
3.4.2.2 Causes of absence from work The Joint Survey of Labor Force did not cover the overall reasons of work suspension, as the reasons of work suspension for more than 37% of the cases remained unclear. However, the results show that nearly one third of work suspensions are voluntary by the worker due to dissatisfaction with pay (20%) or for health reasons (7%) or family reasons (4.5%). Whereas the involuntary cases represent 27% of the causes of work suspension of which: 17.6% due to stop by the enterprise and 9.3% for termination of the temporary contract. The distribution of those rates differs between men and women as shown in both the following charts:
Chart 107: Cause of work suspension (total)
Source: Joint Survey of Labor Force 2009
Chart 108: Cause of work suspension (females)
Source: Joint Survey of Labor Force 2009
Chart 109: Cause of work suspension (males)
Source: Joint Survey of Labor Force 2009
The results confirm the weakness of working in several private sector activities, whether individual or a company. The majority of reasons for work suspension in the private sector are du to stop by the enterprise. This can also be explained by the effect of the economic crisis on several activities, particularly those tied with the foreign demand. Moreover, seeking better wages and consequently better living standards explains a significant side of work suspension in the private sector that might fail to provide higher wages due to severe internal and external competitions it experiences in an environment characterized by more liberalization of the economy and openness to the outer world. The following table shows several indicators in this respect, as it demonstrates the rates of work suspension reasons and their intersection with the employer for whom the unemployed previously worked:
Stop by the enterprise
Service termination
Health reasons
Family Reasons
Other reasons
Military Service
Dissatisfaction with pay
Stop by the enterprise
Service termination
Health reasons
Family Reasons
Other reasons
Dissatisfaction with pay
Stop by the enterprise
Service termination
Health reasons
Family Reasons
Other reasons
Military ServiceDissatisfaction with pay
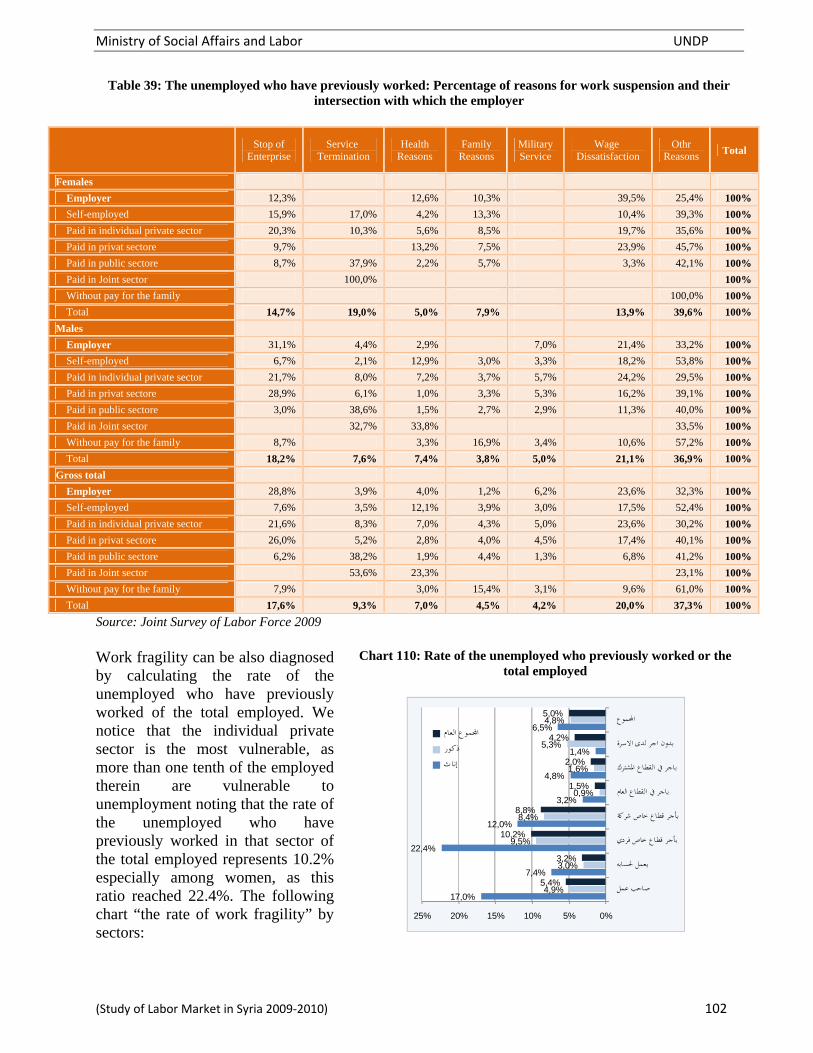
Ministry of Social Affairs and Labor UNDP
(Study of Labor Market in Syria 2009‐2010) 102
Table 39: The unemployed who have previously worked: Percentage of reasons for work suspension and their intersection with which the employer
Source: Joint Survey of Labor Force 2009 Work fragility can be also diagnosed by calculating the rate of the unemployed who have previously worked of the total employed. We notice that the individual private sector is the most vulnerable, as more than one tenth of the employed therein are vulnerable to unemployment noting that the rate of the unemployed who have previously worked in that sector of the total employed represents 10.2% especially among women, as this ratio reached 22.4%. The following chart “the rate of work fragility” by sectors:
Chart 110: Rate of the unemployed who previously worked or the total employed
17,0%
7,4%
22,4%
12,0%
3,2%
4,8%
1,4%
6,5%
4,9%
3,0%
9,5%
8,4%
0,9%
1,6%
5,3%
4,8%
5,4%
3,2%
10,2%
8,8%
1,5%
2,0%
4,2%
5,0%
0%5%10%15%20%25%
صاحب عمل
يعمل حلسابه
بأجر قطاع خاص فردي
بأجر قطاع خاص شركة
باجر يف القطاع العام
باجر يف القطاع املشترك
بدون اجر لدى االسرة
اجملموعاجملموع العامذكورإناث
Stop of
Enterprise Service
Termination Health
Reasons Family
Reasons Military Service
Wage Dissatisfaction
Othr Reasons Total
Females Employer 12,3% 12,6% 10,3% 39,5% 25,4% 100%
Self-employed 15,9% 17,0% 4,2% 13,3% 10,4% 39,3% 100%
Paid in individual private sector 20,3% 10,3% 5,6% 8,5% 19,7% 35,6% 100%
Paid in privat sectore 9,7% 13,2% 7,5% 23,9% 45,7% 100%
Paid in public sectore 8,7% 37,9% 2,2% 5,7% 3,3% 42,1% 100%
Paid in Joint sector 100,0% 100%
Without pay for the family 100,0% 100%
Total 14,7% 19,0% 5,0% 7,9% 13,9% 39,6% 100%
Males
Employer 31,1% 4,4% 2,9% 7,0% 21,4% 33,2% 100%
Self-employed 6,7% 2,1% 12,9% 3,0% 3,3% 18,2% 53,8% 100%
Paid in individual private sector 21,7% 8,0% 7,2% 3,7% 5,7% 24,2% 29,5% 100%
Paid in privat sectore 28,9% 6,1% 1,0% 3,3% 5,3% 16,2% 39,1% 100%
Paid in public sectore 3,0% 38,6% 1,5% 2,7% 2,9% 11,3% 40,0% 100%
Paid in Joint sector 32,7% 33,8% 33,5% 100%
Without pay for the family 8,7% 3,3% 16,9% 3,4% 10,6% 57,2% 100%
Total 18,2% 7,6% 7,4% 3,8% 5,0% 21,1% 36,9% 100%
Gross total
Employer 28,8% 3,9% 4,0% 1,2% 6,2% 23,6% 32,3% 100%
Self-employed 7,6% 3,5% 12,1% 3,9% 3,0% 17,5% 52,4% 100%
Paid in individual private sector 21,6% 8,3% 7,0% 4,3% 5,0% 23,6% 30,2% 100%
Paid in privat sectore 26,0% 5,2% 2,8% 4,0% 4,5% 17,4% 40,1% 100%
Paid in public sectore 6,2% 38,2% 1,9% 4,4% 1,3% 6,8% 41,2% 100%
Paid in Joint sector 53,6% 23,3% 23,1% 100%
Without pay for the family 7,9% 3,0% 15,4% 3,1% 9,6% 61,0% 100%
Total 17,6% 9,3% 7,0% 4,5% 4,2% 20,0% 37,3% 100%

Ministry of Social Affairs and Labor UNDP
(Study of Labor Market in Syria 2009‐2010) 103
3.4.3 Period of job searching and long-term unemployment The results of the labor force survey 2009 showed that the period of looking for a job takes a long time exceeding 20 months as an average, and a longer time in the case of women, 23 months vs. 19 months for men. Women have more difficulty to get a job in urban areas, as they spend about 25 months searching for a job compared to 22 months in rural areas.
Chart 111: Rate of unemployed who have previously worked of the total employed
Source: Joint Survey of Labor Force 2009
The following chart clarifies the distribution of the unemployed women and men by the duration of unemployment, and it shows that 90% of the unemployed women and 78% of the unemployed men spend six months or more looking for a job and that more than 45% of the unemployed women and 35% of the unemployed men spend a year looking for a job.
Chart 112: Distribution of the unemployed men and women by unemployment duration
Source: Joint Survey of Labor Force 2009
The long-term unemployment is defined, according to international standards, as the unemployment which lasts for a year or more. It is worth analyzing this type of unemployment according to several data. The exertion of efforts in job searching for long periods leads to frustration and failure to follow-up searching in addition to the deterioration of skills and human resources as a result of staying away from exercising the work. As well, the indicator of unemployment duration is the main measure indicative of the efficacy of intervention programs in the labor market, as the work suspension gives the unemployed the chance to refresh their capability and maintain their professional efficiency by joining specialized training programs. In this sense, the duration of unemployment helps identifying a typical indicator for the life of the unemployed, an indicator that must be supported by qualitative researches on the living status of the unemployed and the method of their interaction with their situations.
18,419,619,1
24,7
22,023,1
20,520,520,5
10
12
14
16
18
20
22
24
26
اجملموعريفحضر
ذكر أنثى اجملموع
)مدة البحث بالشهر(
90%
77%
52%
45%
27%25%
13%13%7%7%4%4%
78%
62%
41%35%
19%17%11%
0%
10%
20%
30%
40%
50%
60%
70%
80%
90%
100%
06121824303642485460667278849096
رجال نساء
)بالشهر(البطالة مدة
املتعطلني نسبة

Ministry of Social Affairs and Labor UNDP
(Study of Labor Market in Syria 2009‐2010) 104
The survey results shows that two thirds of the unemployed complain from long-term unemployment as the period of searching for a job has extended for one year or more. Such ratio reaches more than three quarters among women (77%) and 62% among men. It is also noticed that the new entrants to the labor market complain more than others from long-term unemployment as demonstrated by the following chart and table:
Chart 113: Distribution of the long-term unemployment rate by gender
Table 40: Distribution of the unemployed who previously worked and who did not previously work by the unemployment period
Unemployed previously
emplyed Unemployed previously
unemployed Total Unemployed
Women Men Total Women Men Total Women Men Total
Less than 6 months 20,3% 33,2% 31,2% 8,2% 12,6% 10,7% 10,2% 21,8% 17,8%
From 6 to 11 months 16,9% 15,9% 16,0% 11,9% 15,9% 14,1% 12,7% 15,9% 14,8%
From 1 year two 23 months 26,2% 22,6% 23,1% 33,1% 30,7% 31,8% 32,0% 27,1% 28,8%
From 2 years to 35 months 18,8% 14,4% 15,1% 20,3% 21,3% 20,9% 20,1% 18,2% 18,9%
3 years and above 17,8% 13,9% 14,5% 26,5% 19,5% 22,6% 25,1% 17,0% 19,8%
Through these data, the significance of long-tern unemployment becomes obvious as it indicates a sort of slowdown movement in the Syrian labor market. Addressing this situation requires the design and implementation of special interferences in the labor market according to the period of unemployment targeting, in particular, the long-term unemployment for the following considerations: a) the long-term unemployment leads to social exclusion in the absence of mechanisms and programs, even if temporary ones, for re-activating the unemployed; b) the long-term unemployment leads to the loss of professional capabilities of the unemployed which requires additional investments in labor force for rehabilitation; c) the long-term unemployment among the holders of technical certificates and qualifications represents a deactivation of investment in the labor force and a waste of human capabilities; and d) The long-term unemployment leads to many social evils and produces a hard core of unemployed that are difficult to reintegrate.
Women MenTotal Women MenTotal Women MenTotal Unemployed, previously
employed Unemployed, Previously
unemployed Total unemployed

Ministry of Social Affairs and Labor UNDP
(Study of Labor Market in Syria 2009‐2010) 105
The chronic unemployment represented by job searching for two years and more can be calculated. The rate of long-term unemployment reaches 38.7% distributed by 35.2% among men and 45.2% among women. These rates show the aggravation of the structural reasons of Unemployment particularly among women. Whereas, the geographical distribution of chronic unemployment reveals an obvious relation between the unemployment average and the chronic unemployment rate (correlation coefficient exceeds 0.56 if we exclude Kuneitra and Hassaka as shown in the following chart), and this confirms the deep and structural reasons of chronic unemployment. On the other hand the geographical distribution of chronic unemployment reveals a significant disparity between governorates in terms of general rates and their distribution among women and men (Chart 115) as the rate of chronic unemployment exceeds 60% among men and women in each of Kuneitra, and Tartous and it remains high in Lattakia and Daraa among women, and in Rakka and Deir Ezzor among men.
Chart 114: Distribution of the governorates by the average unemployment and chroming unemployment rate
Source: Joint Survey of Labor Force 2009 Chart 115: Distribution of unemployment rate by gender and governorates
Source: Joint Survey of Labor Force 2009
Also, the unemployment period can be demonstrated by the class (rural and urban) and by gender across the different governorates in the following chart which shows the localization of chronic unemployment in the urban and rural areas of Tartous among men and women, as well as in the urban area of Lattakia and Kuneitra especially among women (areas colored in red and blue) and it shows the decline of unemployment period in Damascus Countryside and Rakka (among women) and the rural area of Hassaka and the urban area of Sweida (areas colored in yellow).
دمشقحلب
ريف دمشق
محصمحاه
ة الالذقي
ادلباحلسكة
دير الزور
طرطوس
الرقةدرعا
السويداء
القنيطرة
ة سوري
0%
10%
20%
30%
40%
50%
60%
70%
0%5%10%15%20%25%30%
معدل البطالة املزمنة
معدل البطالة العام
دمشقحلب
ريف دمشق
محص
محاه
الالذقية
ادلب
احلسكة
دير الزور
طرطوس
الرقة
درعا السويداء
القنيطرة
ة سوري
0%
10%
20%
30%
40%
50%
60%
70%
0%20%40%60%80%100%
معدل البطالة املزمنة لدى الرجال
لدى النساءاملزمنة معدل البطالة
Hassaka
Idleb
Lattakia
Hama
Damascu
Damascus Countryside
Deir Ezzour
Rakka
Daraa Sweida
Kuneitra Tartous
SYRIA
HomsAleppo
Chronic unemployment rate among men
Chronic unemployment rate among women
Hassaka
Idleb
Lattakia
Hama Damascu
Damascus Countryside
Deir Ezzour
Rakka
Daraa Sweida
Kuneitra Tartous
SYRIA
HomsAleppo
General unemployment rate
Chronic unemployment rate

Ministry of Social Affairs and Labor UNDP
(Study of Labor Market in Syria 2009‐2010) 106
Chart 116: Distribution of job search period by the class and gender
3.4.4 Appropriate job and the desired employer In attempting to clarify the desired jobs sought by the unemployed, the survey enabled identifying two characteristics of these jobs. The results showed the importance of income expected from the job. The proper job is one that provides a higher income for 45.4% of the unemployed (as a first option), and the unemployed women are distinguished by being more balanced in choosing the merits of the appropriate or desirable job, as the importance of the financial aspect for them represents 21.7% compared to 37.1% for men (as an average for the two options), whereas women give more importance to the social and family aspects in determining the characteristics of the appropriate job. For women, the nearness of the work to home is more important than the expected income (27.2% compared to 21.7%), the same applies to the appropriateness of the work to the family status which represents 16.5% of the proper work criteria for women, compared to 8.8% for men who do not give the social and family aspects the same importance observed among women. The table and chart below shows the main results in determining the appropriate job characteristics for the unemployed:
Chart 117: The two options of appropriate work
First Option Second Option
Females Males Total Females Males Total Work secures a high income 30,9% 53,6% 45,4% 9,6% 12,4% 11,3% work is in line with competence 17,5% 9,4% 12,4% 10,5% 12,5% 11,7% Commensurate with the marital status 17,1% 5,5% 9,7% 15,7% 13,9% 14,6% Work close to home 17,2% 6,2% 10,2% 40,3% 29,7% 33,9% Provides some services 5,0% 3,8% 4,2% 15,0% 15,4% 15,2% Healthy work environment 1,0% 1,4% 1,2% 4,2% 5,0% 4,7% There is no difference 11,2% 20,2% 16,9% 4,6% 11,2% 8,6% Total 100,0% 100,0% 100,0% 100,0% 100,0% 100,0%
HassakaIdleb LattakiaDamascus Damascus Countryside
Deir Ezzour
Daraa Sweida Quneitra Tartou SYRIA Homs Aleppo Rakka Hama
HassakaIdleb LattakiaDamascus Damascus Countryside
Deir Ezzour Daraa Sweida Kunaitera Tartou SYRIA Homs Aleppo Rakka Hama
Governorate
Governorate
Females - Rural
Males - Rural
Females - Urban
Males - Urban
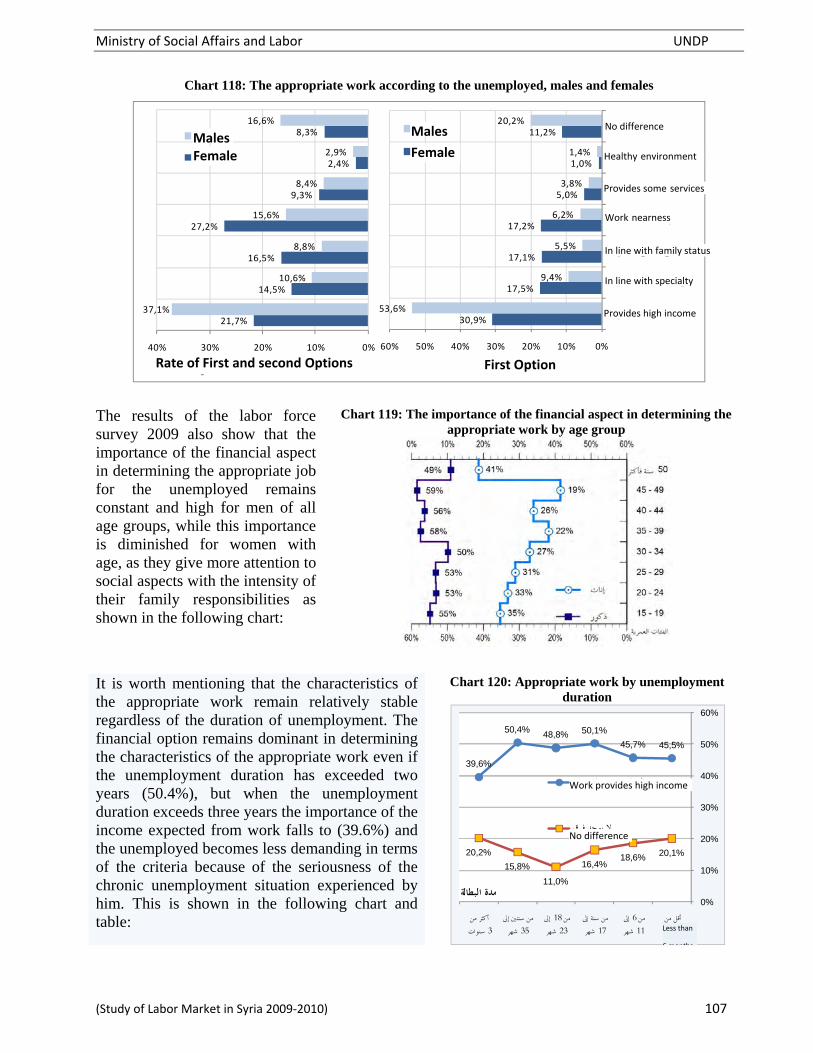
Ministry of Social Affairs and Labor UNDP
(Study of Labor Market in Syria 2009‐2010) 107
Chart 118: The appropriate work according to the unemployed, males and females
The results of the labor force survey 2009 also show that the importance of the financial aspect in determining the appropriate job for the unemployed remains constant and high for men of all age groups, while this importance is diminished for women with age, as they give more attention to social aspects with the intensity of their family responsibilities as shown in the following chart:
Chart 119: The importance of the financial aspect in determining the appropriate work by age group
It is worth mentioning that the characteristics of the appropriate work remain relatively stable regardless of the duration of unemployment. The financial option remains dominant in determining the characteristics of the appropriate work even if the unemployment duration has exceeded two years (50.4%), but when the unemployment duration exceeds three years the importance of the income expected from work falls to (39.6%) and the unemployed becomes less demanding in terms of the criteria because of the seriousness of the chronic unemployment situation experienced by him. This is shown in the following chart and table:
Chart 120: Appropriate work by unemployment duration
30,9%
17,5%
17,1%
17,2%
5,0%
1,0%
11,2%
53,6%
9,4%
5,5%
6,2%
3,8%
1,4%
20,2%
0%10%20%30%40%50%60%
العمل يؤمن دخل مرتفع
العمل يتوافق واالختصاص
الوضع العائلي اسب مع يتن
العمل قريب من املنزل
يؤمن بعض اخلدمات
ة بيئة عمل صحي
ذكورال يوجد فرق
إناث
األول والثاني معدل الخيارين األول الخيار
21,7%
14,5%
16,5%
27,2%
9,3%
2,4%
8,3%
37,1%
10,6%
8,8%
15,6%
8,4%
2,9%
16,6%
0%10%20%30%40%
ذكور
إناث
45,5%45,7%
50,1%48,8%50,4%
39,6%
20,1%18,6%16,4%
11,0%
15,8%
20,2%
0%
10%
20%
30%
40%
50%
60%
أقل من أشهر 6
إىل 6من شهر 11
من سنة إىل شهر 17
إىل 18من شهر 23
من سنتني إىل شهر 35
أكثر من سنوات 3
العمل يؤمن دخل مرتفع
ال يوجد فرق
البطالة مدة
First OptionRate of First and second Options
Males Female
Males
Female
No difference
Healthy environment
Provides some services
Work nearness
In line with family status
In line with specialty
Provides high income
Work provides high income
No difference
Less than
6 months

Ministry of Social Affairs and Labor UNDP
(Study of Labor Market in Syria 2009‐2010) 108
Table 41: Type of the appropriate work by unemployment duration
Unemployment Duration
< 6
months 6-11
months 12-17
months 18-32
months 24-35
months > 3
years
Number
Work secures a high income 54 860 45 779 77 779 19 591 64 417 53 114
work is in line with speciality 17 441 14 127 19 087 3 912 12 412 18 124
Work and marital status 5 336 6 128 9 352 5 270 10 812 18 173
Work nearness 11 943 12 223 14 978 4 695 12 132 10 253
Provides some services 4 790 2 513 6 639 1 861 5 854 6 302
Healthy environment 2 083 749 1 761 377 2 011 1 063
There is no difference 24 220 18 663 25 511 4 420 20 133 27 109
Total 120 674 100 181 155 107 40 127 127 771 134 137
Relative Distribution
Work secures a high income 45,5% 45,7% 50,1% 48,8% 50,4% 39,6%
work is in line with speciality 14,5% 14,1% 12,3% 9,8% 9,7% 13,5%
Work and marital status 4,4% 6,1% 6,0% 13,1% 8,5% 13,5%
Work nearness 9,9% 12,2% 9,7% 11,7% 9,5% 7,6%
Provides some services 4,0% 2,5% 4,3% 4,6% 4,6% 4,7%
Healthy environment 1,7% 0,7% 1,1% 0,9% 1,6% 0,8%
There is no difference 20,1% 18,6% 16,4% 11,0% 15,8% 20,2%
Total 100,0% 100,0% 100,0% 100,0% 100,0% 100,0%
Source: Joint Survey of Labor Force 2009 The survey results also confirmed the dominant culture in the desire to work in the public sector, where many young people believe that the work in the public sector includes features not available in the private sector despite the development of this sector significantly in recent years. More than 80% of the unemployed (90% of females and 76.3% male) prefer to work in the public sector as a first option. This indicates the weakness of the initiative for the majority of the unemployed, which explains the intensity of long-term unemployment.
Chart 121: Appropriate work by unemployment duration
Source: Joint Survey of Labor Force 2009

Ministry of Social Affairs and Labor UNDP
(Study of Labor Market in Syria 2009‐2010) 109
In an attempt to identify the causes of work stoppage and their relation to the characteristics of the proper work, the intersection of the appropriate work of the individual with the reason that causes him/her to leave work does not show a clear relationship between the two variables especially with regard to men. As for women, however, they are more inclined to looking for a work commensurate with the marital status and proximity to home or securing some social and health services. For example, we notice that about a quarter of women have left work for health reasons and are looking for a job that secures for them social and health services, whereas this ratio is about 4% among men. It is concluded that the unemployment situation and its severity in some cases, makes the individual, especially the man, look for a work regardless of the reasons for leaving his previous job. Table 42: Distribution of work characteristics appropriate for the individual by reasons causing him/her to stop a
work
Stop of Enterprise
Service Termination
Health Reasons
Family Reasons
Military Service
Wage Dissatisfaction
Othr Reasons
Total
Females Work secures a high income 14% 26% 13% 25% 18% 24% 20% 21% work is in line with speciality 4% 27% 13% 15% 0% 14% 13% 15%
Work and marital status 16% 18% 12% 25% 24% 10% 19% 17%
Work nearness 34% 23% 26% 16% 0% 27% 25% 25%
Provides some services 12% 3% 22% 11% 43% 11% 8% 9%
Healthy environment 7% 1% 0% 7% 0% 6% 3% 4%
There is no difference 14% 3% 15% 2% 15% 9% 11% 9%
Total 100% 100% 100% 100% 100% 100% 100% 100%
Males
Work secures a high income 40% 37% 36% 57% 49% 40% 35% 39% work is in line with speciality 10% 15% 11% 15% 13% 10% 10% 11%
Work and marital status 9% 15% 12% 7% 4% 6% 10% 9%
Work nearness 11% 11% 19% 11% 14% 17% 16% 15%
Provides some services 10% 6% 4% 1% 4% 8% 9% 8%
Healthy environment 3% 3% 5% 2% 2% 3% 3% 3%
There is no difference 18% 13% 13% 8% 14% 16% 17% 16%
Total 100% 100% 100% 100% 100% 100% 100% 100%
Gross Total
Work secures a high income 36% 33% 33% 47% 47% 38% 33% 36% work is in line with speciality 9% 19% 11% 15% 12% 11% 11% 12%
Work and marital status 10% 16% 12% 12% 5% 6% 11% 10%
Work nearness 14% 15% 20% 13% 14% 18% 17% 16%
Provides some services 10% 5% 6% 4% 5% 8% 9% 8%
Healthy environment 4% 3% 5% 3% 2% 3% 3% 3%
There is no difference 17% 9% 13% 6% 14% 15% 16% 15%
Total 100% 100% 100% 100% 100% 100% 100% 100%
Source: Joint Survey of Labor Force 2009
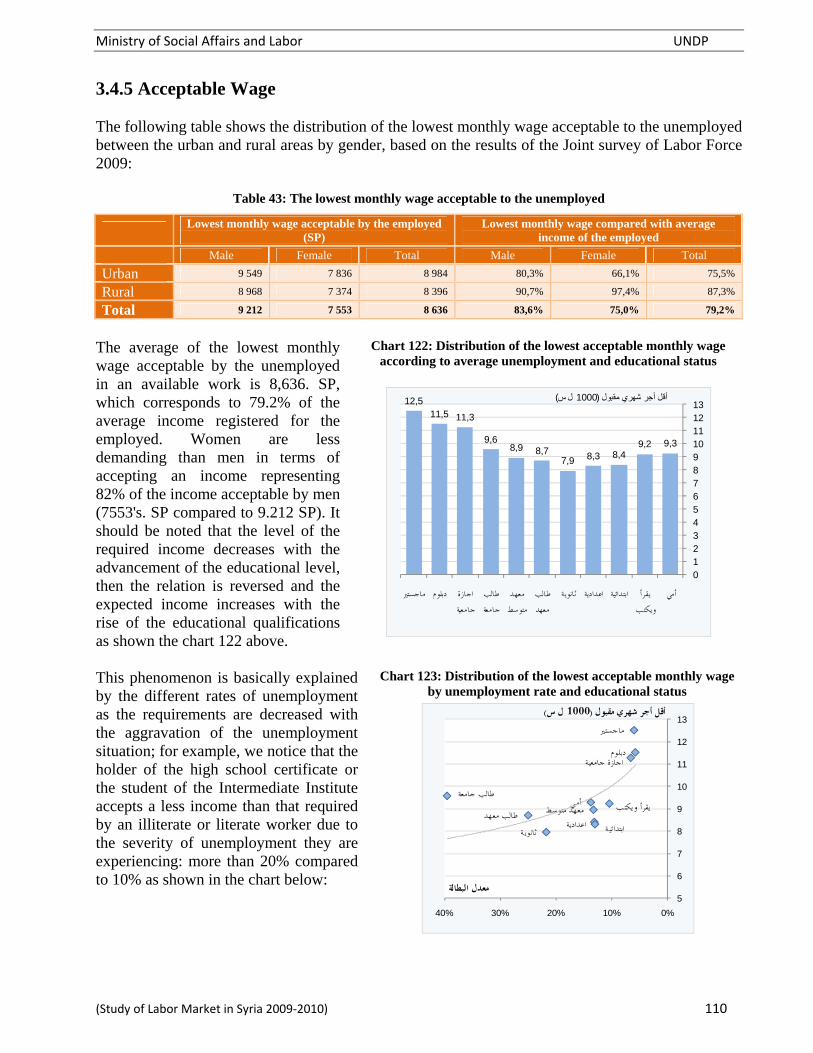
Ministry of Social Affairs and Labor UNDP
(Study of Labor Market in Syria 2009‐2010) 110
3.4.5 Acceptable Wage The following table shows the distribution of the lowest monthly wage acceptable to the unemployed between the urban and rural areas by gender, based on the results of the Joint survey of Labor Force 2009:
Table 43: The lowest monthly wage acceptable to the unemployed
Lowest monthly wage acceptable by the employed (SP)
Lowest monthly wage compared with average income of the employed
Male Female Total Male Female Total
Urban 9 549 7 836 8 984 80,3% 66,1% 75,5%
Rural 8 968 7 374 8 396 90,7% 97,4% 87,3%
Total 9 212 7 553 8 636 83,6% 75,0% 79,2%
The average of the lowest monthly wage acceptable by the unemployed in an available work is 8,636. SP, which corresponds to 79.2% of the average income registered for the employed. Women are less demanding than men in terms of accepting an income representing 82% of the income acceptable by men (7553's. SP compared to 9.212 SP). It should be noted that the level of the required income decreases with the advancement of the educational level, then the relation is reversed and the expected income increases with the rise of the educational qualifications as shown the chart 122 above.
Chart 122: Distribution of the lowest acceptable monthly wage according to average unemployment and educational status
This phenomenon is basically explained by the different rates of unemployment as the requirements are decreased with the aggravation of the unemployment situation; for example, we notice that the holder of the high school certificate or the student of the Intermediate Institute accepts a less income than that required by an illiterate or literate worker due to the severity of unemployment they are experiencing: more than 20% compared to 10% as shown in the chart below:
Chart 123: Distribution of the lowest acceptable monthly wage by unemployment rate and educational status
9,39,28,48,37,9
8,78,99,6
11,311,512,5
012345678910111213
يقرأ أميويكتب
طالب ثانويةاعداديةابتدائيةمعهد
معهد متوسط
طالب جامعة
اجازة جامعية
ماجستريدبلوم
)ل س 1000(مقبول أقل أجر شھري
أمي يقرأ ويكتب
ة ةاعداديةابتدائي ثانويطالب معهد معهد متوسط
طالب جامعة
اجازة جامعيةدبلوم
ماجستري
5
6
7
8
9
10
11
12
13
0%10%20%30%40%
)ل س 1000(مقبول أقل أجر شهري
معدل البطالة
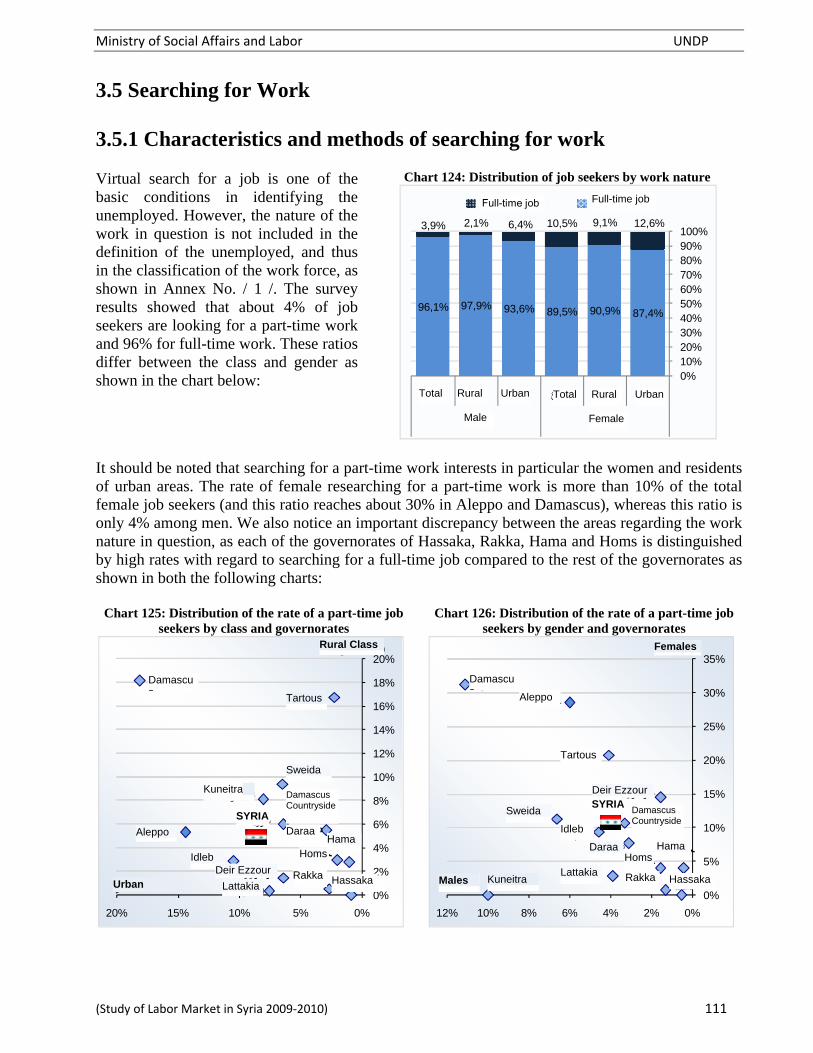
Ministry of Social Affairs and Labor UNDP
(Study of Labor Market in Syria 2009‐2010) 111
3.5 Searching for Work 3.5.1 Characteristics and methods of searching for work Virtual search for a job is one of the basic conditions in identifying the unemployed. However, the nature of the work in question is not included in the definition of the unemployed, and thus in the classification of the work force, as shown in Annex No. / 1 /. The survey results showed that about 4% of job seekers are looking for a part-time work and 96% for full-time work. These ratios differ between the class and gender as shown in the chart below:
Chart 124: Distribution of job seekers by work nature
It should be noted that searching for a part-time work interests in particular the women and residents of urban areas. The rate of female researching for a part-time work is more than 10% of the total female job seekers (and this ratio reaches about 30% in Aleppo and Damascus), whereas this ratio is only 4% among men. We also notice an important discrepancy between the areas regarding the work nature in question, as each of the governorates of Hassaka, Rakka, Hama and Homs is distinguished by high rates with regard to searching for a full-time job compared to the rest of the governorates as shown in both the following charts:
Chart 125: Distribution of the rate of a part-time job seekers by class and governorates
Chart 126: Distribution of the rate of a part-time job seekers by gender and governorates
87,4%90,9%89,5%93,6%97,9%96,1%
12,6%9,1%10,5%6,4%2,1%3,9%
0%10%20%30%40%50%60%70%80%90%100%
اجملموعريفحضراجملموعريفحضر
ذكورإناث
عمل بدوام جزئي عمل بدوام كامل
دمشق
حلبريف دمشق
محصمحاه
ة الالذقي
ادلب
احلسكةدير الزور
طرطوس
الرقة
درعا
السويداءالقنيطرة
ة سوري
0%
2%
4%
6%
8%
10%
12%
14%
16%
18%
20%
0%5%10%15%20%
وسط ريفي
وسط حضري
دمشقحلب
ريف دمشق
محصمحاه
ة الالذقي
ادلب
احلسكة
دير الزور
طرطوس
الرقة
درعا
السويداء
القنيطرة
ة سوري
0%
5%
10%
15%
20%
25%
30%
35%
0%2%4%6%8%10%12%
إناث
ذكور Hassaka
Aleppo
Idleb
Lattakia
Hama
Damascus
Damascus Countryside
Deir Ezzour
Rakka
Daraa
Sweida
Kuneitra
Tartous
Homs
SYRIA
Males
Rural Class
Urban
Females
Hassaka
Aleppo
Idleb
Lattakia
Hama
Damascus
Damascus Countryside
Deir Ezzour Rakka
Daraa
Sweida
Kuneitra
Tartous
SYRIA
Homs
Full-time job Full-time job
Rural UrbanTotal Rural UrbanTotal
Male Female

Ministry of Social Affairs and Labor UNDP
(Study of Labor Market in Syria 2009‐2010) 112
The unemployed woman looks for a part-time job in order to reconcile between the requirements of work and household affairs as this matter represents 83% of the reasons of searching for a part-time job among women compared to 12% among men who search for a part-time job basically for health reason (46%). We notice that a half of the cases in which a woman looks for a part-time job in order not to default the household affairs are when a woman is a head of a household or a wife. The following two charts show: the distribution of the reasons for part-time job search by gender and class: Chart 127: Distribution of reasons for search for part-
time work by gender
Chart 128: Distribution of reasons for search for part-time work by class
The results show that resorting to friends and relatives is the preferred way to search for work as it is used by nearly 40% of job seekers (36.4% of females and 41.2% of males), followed by registration in the employment offices, which is resorted to by more than a quarter of job seekers. The following charts and table show the different rates related to searching for a job.
Chart 129: Methods of search for work (total)
Chart 130: Methods of search for work (females)
Chart 131: Methods of search for work (male)

Ministry of Social Affairs and Labor UNDP
(Study of Labor Market in Syria 2009‐2010) 113
Table 44: Distribution of job search rate according to the importance of options and by class and gender
Employment Office
Friends and
Relatives Application
Advertise-ment
Special Project
Requistes competition Others Total
Females
1st Option
Urban 54,2% 28,5% 4,3% 3,7% 1,1% 6,1% 2,1% 100,0%
Rural 53,0% 36,1% 2,0% 0,5% 1,5% 4,2% 2,7% 100,0%
Total 53,4% 33,2% 2,9% 1,7% 1,3% 5,0% 2,5% 100,0%
2d Option
Urban 5,5% 45,4% 9,2% 13,0% 1,3% 20,4% 5,2% 100,0%
Rural 6,6% 55,0% 5,4% 8,5% 3,6% 9,3% 11,5% 100,0%
Total 6,2% 51,3% 6,9% 10,2% 2,7% 13,6% 9,0% 100,0%
3rd Option
Urban 4,3% 14,2% 17,6% 21,6% 7,9% 19,1% 15,4% 100,0%
Rural 2,8% 10,8% 14,7% 20,0% 5,9% 18,0% 27,9% 100,0%
Total 3,3% 12,1% 15,9% 20,6% 6,7% 18,4% 23,0% 100,0%
Males
1st Option
Urban 36,4% 53,7% 2,8% 1,5% 1,0% 1,7% 2,8% 100,0%
Rural 42,9% 46,0% 2,4% 0,2% 3,1% 1,1% 4,3% 100,0%
Total 40,2% 49,2% 2,6% 0,7% 2,2% 1,3% 3,7% 100,0%
2nd Option
Urban 5,3% 43,7% 12,1% 12,0% 4,9% 5,9% 16,2% 100,0%
Rural 7,5% 44,3% 8,5% 6,8% 11,5% 5,2% 16,1% 100,0%
Total 6,6% 44,0% 10,0% 8,9% 8,9% 5,5% 16,2% 100,0%
3rd Option
Urban 5,1% 8,5% 19,9% 25,0% 6,0% 11,9% 23,7% 100,0%
Rural 5,3% 9,7% 11,5% 16,6% 13,9% 14,1% 28,9% 100,0%
Total 5,2% 9,3% 14,4% 19,4% 11,2% 13,3% 27,1% 100,0%
Gross total
1st Option
Urban 42,3% 45,4% 3,3% 2,2% 1,1% 3,1% 2,6% 100,0%
Rural 46,5% 42,5% 2,3% 0,3% 2,5% 2,2% 3,7% 100,0%
Total 44,8% 43,7% 2,7% 1,1% 1,9% 2,6% 3,3% 100,0%
2nd Option
Urban 5,3% 44,3% 11,1% 12,3% 3,6% 10,9% 12,4% 100,0%
Rural 7,2% 48,1% 7,4% 7,4% 8,7% 6,7% 14,5% 100,0%
Total 6,4% 46,6% 8,9% 9,4% 6,7% 8,4% 13,6% 100,0%
3rd Option
Urban 4,8% 10,5% 19,1% 23,7% 6,7% 14,5% 20,7% 100,0%
Rural 4,5% 10,0% 12,5% 17,6% 11,4% 15,3% 28,6% 100,0%
Total 4,6% 10,2% 14,9% 19,8% 9,7% 15,0% 25,8% 100,0%
Source: Joint Survey of Labor Force 2009

Ministry of Social Affairs and Labor UNDP
(Study of Labor Market in Syria 2009‐2010) 114
The unemployed women resort to employment offices more than men who rely more on the family and relatives in their search for work. The reliance on the employment office differs by the governorates as shown in both the following charts, as the rate of resorting to the employment offices decreases in Damascus and Aleppo and rises in Lattakia, Deir Ezzour and Kuneitra. These results show the disparity of dependence on the public sector in the search for work which is noted in particular among women who prefer to work in the public sector, and on the other hand in several governorates where job opportunities in the private sector are shrinking.
Chart 132: Distributed of rate of seeking for job through employment offices by class and governorates
Source: Joint Survey of Labor Force 2009
Chart 133: Distributed of rate of seeking for job through employment offices by gender and governorate
Source: Joint Survey of Labor Force 2009
It should be noted that the methods of searching for work are changing with age, as the results show that young people rely primarily on the employment offices in their search for work and with less degree on other means such as family and friends. The image is reversed with age due to exceeding the legal age to enter public jobs, and on the other hand due to establishing a network of relationships with years which makes it easier for them to get a job. The following chart illustrates this development:
Chart 134: Distributed of rate of seeking for job through employment offices, friends and relatives by age groups
Source: Joint Survey of Labor Force 2009
دمشقحلب
ريف دمشق
محص
محاه
ة الالذقي
ادلب
احلسكة
دير الزور طرطوس
الرقة
درعا
السويداء
القنيطرة
ة سوري
10%
15%
20%
25%
30%
35%
40%
45%
10%15%20%25%30%35%40%45%
وسط ريفي
وسط حضري
دمشقحلب
محصريف دمشق
محاه
الالذقية
ادلب
احلسكة
دير الزور
طرطوس
الرقةدرعاالسويداء
القنيطرة ة سوري
10%
15%
20%
25%
30%
35%
40%
45%
10%15%20%25%30%35%40%45%
إناث
ذكور
28%
49%55%52%
43%
35%
29%10%10%
5%6%
62%
38%32%
38%
45%
57%
66%
79%76%
81%86%
0%
10%
20%
30%
40%
50%
60%
70%
80%
90%
15 - 1920 - 2425 - 2930 - 3435 - 3940 - 4445 - 4950 - 5455 - 5960 - 6465 +
البحث عن عمل عبر مكاتب التشغيل
البحث عن عمل عبر األصدقاء واألقارب
الفئة العمرية
Hassaka Aleppo
Idleb
Lattakia
Hama
Damascus
Homs Damascus Countryside
Deir Ezzour Rakka
Daraa
Sweida
Kunaitera
Tartous
SYRIA
Hassaka
Aleppo
Idleb
Lattakia
Hama
Damascus
Damascus Countryside
Deir Ezzour
Rakka
Daraa
Sweida
Kunaitera
Tartous
SYRIA
Homs
Males
Rural Class
Urban
Age group
Seeking job through Employment offices
Seeking job through friend & relatives
Females

Ministry of Social Affairs and Labor UNDP
(Study of Labor Market in Syria 2009‐2010) 115
The following table shows the evolution of the number registered in the employment offices during the period 2007-2009 and their distribution according to provinces, and shows that the number of the registered has reached more than 124 thousand in 2009 compared to 105 thousand in 2007, i.e. an increase of 9% annually. During the past three years the number of the registered exceeded 350 thousand of whom 35.2% are women.
Table 45: Evolution of the number of the registered at the employment offices during the period 2007-2009
2007 2008 2009 Total 2007 - 2009
Women Men Total Women Men Total Women Men Total Women Men Total
Damascus 4 576 6 937 11 513 8 044 6 340 14 384 5 583 8 318 13 901 18 203 21 595 39 798 Aleppo 2 182 8 856 11 038 2 947 8 786 11 733 4 803 21 788 26 591 9 932 39 430 49 362 Damascus Count. 4 017 7 634 11 651 4 355 6 792 11 147 4 010 7 461 11 471 12 382 21 887 34 269 Homs 3 589 7 602 11 191 4 972 8 109 13 081 3 885 7 058 10 943 12 446 22 769 35 215 Hama 2 946 5 499 8 445 5 052 9 169 14 221 3 414 6 027 9 441 11 412 20 695 32 107 Lattakia 3 858 4 113 7 971 5 905 5 130 11 035 5 130 5 357 10 487 14 893 14 600 29 493 Idleb 1 587 4 939 6 526 2 379 5 685 8 064 1 855 4 953 6 808 5 821 15 577 21 398 Hasaka 2 363 6 128 8 491 2 558 6 214 8 772 2 151 5 667 7 818 7 072 18 009 25 081 Derrezzor 2 021 4 055 6 076 1 982 4 906 6 888 1 902 4 280 6 182 5 905 13 241 19 146 Tartous 3 796 3 832 7 628 4 241 3 945 8 186 3 829 4 154 7 983 11 866 11 931 23 797 Raqa 1 221 4 111 5 332 1 582 4 585 6 167 1 462 3 635 5 097 4 265 12 331 16 596 Daraa 1 598 3 134 4 732 1 499 2 781 4 280 1 054 2 537 3 591 4 151 8 452 12 603 Sweida 1 386 1 847 3 233 1 509 1 554 3 063 1 416 1 657 3 073 4 311 5 058 9 369 Kunaitera 287 527 814 306 502 808 323 546 869 916 1 575 2 491
Total 35 427 69 214 104 641 47 331 74 498 121 829 40 817 83 438 124 255 123 575 227 150 350 725
Source: Ministry of Social Affairs and Labor
It may not be possible to compare the number of the registered with the number of the unemployed due to several reasons including lack of comprehensive coverage of the unemployed by the employment offices, on the one side, and the inability of the IT system to prevent duplicate registration in these offices in a controlled manner with the absence of a single identifier for every registered person, on the other. Despite these considerations, the comparison of the distribution of the unemployed with the distribution of the registered at the employment offices indicates a close statistical relation (Chart 135) which confirms the development of the employment offices system that gives a clearer picture of the unemployment situation in the country.
Chart 135: Distribution of the number of the unemployed (2009) and the number the registered at the employment
offices during the last three years (2007-2009)
Source: Joint Survey of Labor Force 2009 and Data of the Ministry of Social Affairs and Labor
دمشق
حلب
ريف دمشق
محص
محاه الالذقية
ادلب
احلسكة
دير الزور
طرطوس
الرقة درعاالسويداء
القنيطرة
R² = 0,85
0
20 000
40 000
60 000
80 000
100 000
120 000
010 00020 00030 00040 00050 00060 000
عدد المتعطلين
عدد المسجلين في مكاتب التشغيل
Number of the unemployed
Number of the registered atemployment offices
Hassaka
Aleppo
Tartous
Lattakia Hama
Damascus Homs
Damascus Countryside Deir Ezzour
Idleb
Rakka
Daraa
Sweida
Kuneitra

Ministry of Social Affairs and Labor UNDP
(Study of Labor Market in Syria 2009‐2010) 116
3.5.2 Vocational training during the period of job search The survey attempted to identify the contribution of vocational training to the reduction of unemployment through the identification of the size and quality of the unemployed who pursued training sessions during the period of their search for work, considering that the period of searching for a job could be positive if the opportunity is seized during it to attend training courses to upgrade skills and improve performance and then enter the labor market more easily than ever before.
The survey results showed that approximately 82% of the unemployed did not follow any training courses, which explains the big shortage in the unemployment treatment programs. The training of the unemployed is focused on very limited specialties, mainly including informatics and some professional fields as shown in the following chart. This situation causes the unemployed to lose their skills, the thing that necessitates increasing investment in human resources for rehabilitation.
Chart 136: Distribution of participation rates of the unemployed in training courses
Source: Joint Survey of Labor Force 2009
The results also show that the unemployed women are more interested to participate in training courses, particularly those who have been previously employed, for the purpose of rehabilitation to enter the work again. About one third of the unemployed women who have been previously employed participated in the training courses compared to less than 14% of their male counterparts.
Table 46: Distribution of participation rates of the unemployed in training courses by gender and previous engagement in work
Women Men Total
previously employed
previously unemployed
Total previously employed
previously unemployed
Total previously employed
previously unemployed
Total
Informatics 21,6% 13,1% 14,4% 4,0% 7,2% 5,8% 6,8% 9,8% 8,8%
Professional Field 5,1% 4,6% 4,7% 6,7% 7,9% 7,3% 6,4% 6,4% 6,4%
Languages 3,9% 1,5% 1,9% 1,0% 0,6% 0,8% 1,5% 1,0% 1,2%
Other fields 2,1% 1,8% 1,8% 1,7% 1,6% 1,7% 1,8% 1,7% 1,7%
Lack of Training 67,3% 79,0% 77,2% 86,6% 82,7% 84,5% 83,5% 81,1% 81,9%
Total 100,0% 100,0% 100,0% 100,0% 100,0% 100,0% 100,0% 100,0% 100,0%
Source: Joint Survey of Labor Force 2009
Informatics
Professional fields Languages
Other fields
Lack of Training

Ministry o
(Study of L
3.6 The The resuLabor Founemploybe diagnumbers high rateclear thamainly ethe prisecondarunemploycategorienumber they repunemployalso thatthe Interm(about 39 The mconcentrawith primreaches 45% ofalthough among thfrom thunemploy10.1%). show tunemployof the education
The charthe distriSurvey o(specialtithousandElectricamathema
of Social Affai
Labor Market in
e hard cor
ults of the orce indicateyment hard
gnosed throof the unem
es of unemat women's exists amongimary, prry school ceyment rat
es exceeds reaches 174
present twoyed woment a considermediate Inst9 thousand) a
male unemated mainlymary level 209 thousanf the tota
the unemhat categoryhe general yment (10.6The follow
the distribyment rates
unemplonal status of
racteristics obution of theof Labor Foies distingui
d) are the foal Engineeriatics, dentist
rs and Labor
n Syria 2009‐20
e of unem
Joint Survee the presenc
core whichough the mployed and
mployment. unemploym
g those holeparatory
ertificates, astes of t46% and
4 thousand, o thirds of . It is noticerable numbetitutes graduare unemplo
mployment y among tas their numnd, represenal unemplomployment y is not diffe
rate of m6% comparewing two chbution of
and the numoyed by f both gender
f the hard coe employed orce 2009 iished by uneollowing: claing, Mechantry, pharmac
010)
mployment
y of ce of
h can high
d the It is ment lding
and s the these their thus the
eable er of uates oyed.
C
is those mber nting oyed,
rate erent male ed to harts
the mber
the rs:
C
ore of unempand unemploit is clear temploymentassroom teacnical Engincy, political
Chart 137: Thunemp
Chart 138: Thunem
ployment canoyed by theithat the mot rate less thcher, elemen
neering / gel science, sp
he unemploymployed by edu
he unemploymmployed by ed
n be more prir specialties
ost favored han 10% anntary educateneral, agricpecialized n
ment rate and ucational statu
ment rate and ducational stat
recisely unds. Through thspecialties
nd employmetion, Civil Ecultural eng
nursing, arch
UN
the number ous (female)
the number otus (male)
derstood by ahe results of in the laboent size excEngineering,gineering, mhitectures, e
NDP
117
of the
of the
analyzing f the Joint r market
ceeding 5 , General medicine, electronic

Ministry of Social Affairs and Labor UNDP
(Study of Labor Market in Syria 2009‐2010) 118
engineering, engineering Chart, Arabic, Military Sciences, law, education, Life Sciences, Physics, Physical Geography, Sports and Physical Education, Oil and Gas Engineering, Sports Sciences, High School Nursing, public health, communications engineering / communication systems, Education Science, Civil Engineering / building, chemistry, coaches athletes training, psychology, methods of teaching physical education, mechanical engineering / thermal power and energy, natural sciences teacher, midwifery, practical nursing, computer sciences, medicine / pediatrics, engineering Chart/ Electrical, engineering Chart / Mechanical. The following chart shows this distribution:
Chart 139: Specialties most favored in the labor market
Source: Joint Survey of Labor Force 2009 The specialties less favored in the labor market, and what can be considered a hard core of unemployment, are characterized by an unemployment rate of normally not less than 10% and a size of unemployment exceeds 1.5 thousand. The results of the Joint Survey of Labor Force 2009 show that the hard core of unemployment is composed of the following specialties: General High School, Industrial High School, Feminist high school, Arts / General, Agricultural high School, Accounting, Law, English, Arabic language and literature, Economics, Commercial High School, Occupational Teacher Home Economics, Business Administration, Art Education Teacher, General Electrical Engineering, Agriculture, French, Communications High School, Banking, Mechanical Engineering / General, Industrial Engineering, Hotel Reception, History, Electrical Engineering. The following chart and table show the distribution of the hard core of unemployment and highlight the problem of the unemployed and the high school holders and the difficulty of their integration in the labor market:
78.0
54.4
32.8 31.6
22.317.3 15.8 14.7
12.5 12.2 11.6 9.9 9.7 9.6 9.2 8.6 7.5 7.3 6.8 5.9 5.9 5.7 5.3 5.3 5.2 5.2
2%1%
4%
8%7%
7%
6%
1%
2%
4%
0%
5%
0%
6%
9%
7%
0%
9% 10%
3%2%
5%5%
0%
9%
6%
0%
1%
2%
3%
4%
5%
6%
7%
8%
9%
10%
0
10
20
30
40
50
60
70
80
90
صفلم مع
ائيةبتدية اترب
دنيةة امل
دساهلن
امةة عربائي
كهسةهند
كيةكاني
امليسةهلندا
/عام
عيةلزراسة ا
هلندا
طبال
اتضيلرياا
نانألس
ب اط
دلةصيال
سيةسيام العلوال
صيصاالخت
ض امريالت
اريةملعم
سة اهلندا
ونيةكرت
االلسة
هندسي
هلندم الرسا
ربية العلغةال
كريةعسم العلوال
ريعةالش
وم عل
بية الرت
اتيةاحلي
وم العل زياءفي
عيةطبية الرافيجلغا
دنيةوالب
ضية رياربيةت
غازط و
ة نفدسهن
ضةلرياوم ا
علض متري
نويةثا
)١٠٠٠(عدد املشتغلني
Cla
ssro
om te
ache
r
Ele
men
tary
edu
cati
on
Civ
il E
ngin
eeri
ng
Gen
eral
Ele
ctri
cal E
ng.
Mec
hani
cal
Eng
./gnr
l.
Agr
icul
tura
l Eng
.
Med
icin
e
Mat
hem
atic
s
Den
tist
ry
Pha
rmac
y
Pol
itic
al S
cien
ce
Spe
cial
ized
Nur
sing
Arc
hite
ctur
es
Ele
ctro
nic
Eng
.
Eng
inee
ring
Cha
rt
Ara
bic
Mil
itar
y S
cien
ces
Leg
al S
cien
ces
Edu
cati
on
Lif
e S
cien
ces
Phy
sics
Nat
ural
Geo
grap
hy
Spor
ts a
nd P
hysi
cal E
d.
Oil
and
Gas
Eng
.
Spo
rts
Sci
ence
s
Hig
h S
choo
l Nur
sing

Ministry of Social Affairs and Labor UNDP
(Study of Labor Market in Syria 2009‐2010) 119
Chart 140: The specialties less favored in the labor market
Source: Joint Survey of Labor Force 2009
Table 47: The specialties less favored in the labor market: the hard core
Specialties Number of the Unemployed Unemployment Rate
General High School 82 193 0.22
Industrial High School 8 721 0.11
Feminist high school 7 945 0.62
Arts / General 7 866 0.49
Agricultural high School 7 665 0.36
Accounting 7 568 0.22
Law 5 411 0.11
English 5 383 0.15
Arabic language and literature 4 694 0.16
Economics 4 529 0.18
Commercial High School 4 403 0.16
Occupational Teacher 4 275 0.82
Home Economics 3 291 0.42
Business Administration 3 196 0.56
Source: Joint Survey of Labor Force 2009
82.2
8.7
7.9 7.9 7.7 7.65.4 5.4 4.7 4.5 4.4 4.3 3.3 3.2 2.6 2.5 2.0 2.0 1.8 1.7 1.6 1.5 1.5 1.4
22%
11%
62%
49%
36%
22%
11%15%16%18%
16%
82%
42%
56%
8%
16%18%22%
33%
7%11%
31%
16% 17%
0%
10%
20%
30%
40%
50%
60%
70%
80%
90%
0
10
20
30
40
50
60
70
80
90امةة عانويث
عيةصنا
وية ثان
سويةية نثانو نونالف
/عام عية زرانوية
ثاسبة
احملاوقحلقا
يزيةنكل االلغةال
ااوآد
بية لعرغة ا
اللصاد
القتا
اريةة جت
انويث
نزيلد مصا اقتهينم م
معلمال
العرة اادا
فنيةبية ترعلمم
امةة عربائي
كهسةهند راعةالز
سيةلفرنغة ا
اللالت
صاة اتانويث
رفيةملصوم ا
العلكية
كاني امليسةهلندا
/عام
عيةصنا
ة الدساهلن
دقيالفن
ال ستقب
اال ريختا
ائيةكهرب
سة هند
)١٠٠٠(عدد املتعطلني معدل البطالة G
ener
al H
igh
Sch
ool
Ind
ustr
ial H
igh
Sch
ool
Fem
inis
t hig
h sc
hool
Art
s / G
ener
al
Agr
icul
tura
l H. S
choo
l
Acc
ount
ing
Law
Eng
lish
Ara
bic
lang
uage
& li
tera
ture
Eco
nom
ics
Com
mer
cial
Hig
h S
choo
l
Occ
upat
iona
l Tea
cher
Bus
ines
s A
dmin
istr
atio
n
Art
Edu
catio
n T
each
er
Gen
. Ele
ctri
cal E
ng.
Agr
icul
ture
Fre
nch
Com
mun
icat
ions
H. S
choo
l
Ban
king
Mec
hani
cal E
ng./
Gnr
l.
Ind
ustr
ial E
ngin
eeri
ng,
Hot
el R
ecep
tion
His
tory
Ele
ctri
cal E
ngin
eeri
ng

Ministry of Social Affairs and Labor UNDP
(Study of Labor Market in Syria 2009‐2010) 120
3.7 Unemployment and poverty The Joint Survey of Labor Force 2009 was able to achieve a classification of families according to the living standard. The society was divided into five social classes based on certain criteria used in surveys related to the family income and expenditures. These social divisions aim to divide the society according to the living standard through the use of certain criteria in order to compare some indicators of labor market with the living standards of individuals. The following criteria were used: income, number of bedrooms in the house, the number of mobile phones in the house, the number of cars and the number of television sets; then, a statistical weight was ascribe to each of these criteria by importance and cost: Income 30% Number of bedrooms 20% Number of mobile phones 20% Number of cars 20% Number of television sets 10%
Also, the number of the family member was taken into consideration in all the mentioned criteria. That methodology leads to distributing households into five segments in terms of the living condition ranging from very weak, weak, medium, high, and very high. Those segments are distributed by the governorates as shown the following chart, where we notice, for example, the intensification of the rate of households with very weak level in each of the Deir Ezzour, Hassaka and Rakka compared to the rise of the rate of households with very high level in the governorates of Damascus, Damascus Countryside, Lattakia, Tartous and Sweida:
Chart 141: Distribution of households according to fifths of the segments in terms of living conditions
Source: Joint Survey of Labor Force 2009
Damascus
Aleppo
Damascus Cs.
Homs
Hama
Lattakia
Idleb
Hasaka
Deir Ezzour
Tartous
Rakka
Daraa
Sweida
Kuneitra
Very weak Weak Medium Very High High

Ministry of Social Affairs and Labor UNDP
(Study of Labor Market in Syria 2009‐2010) 121
Also, the distribution of households fifths in terms of living situation by the governorates can be illustrated through the following chart, which shows the difference existing between some governorates such as Deir Ezzour, Rakka, Hassaka, Idleb and Kuneitra, where the rate of the households with very weak living situations exceeds 30%, respectively with the conditions of each of the governorates of Damascus, Lattakia, Sweida and Damascus Countryside, where the rate of the households with very high living conditions exceeds 30%.
Chart 142: Distribution of the very high and very weak fifths of the living situation segments
To confirm the consistency of the results and the strength of their relevance to the reality, they have been compared with the results of the survey of households’ income and expenditure conducted by the Central Bureau of Statistics in 2007. The following chart provides the average household expenditure on food commodities and other expenditures by the governorates according to the results of the survey of income and expenditures of the household:
Chart 143: Average household expenditure on food commodities and other expenditures by the governorates
Source: Survey of Household’s income and expenses 2007
10,210,010,311,412,810,59,8
11,811,711,810,2
15,7
9,714,1
10,9
18,0
13,614,414,8
15,518,5
10,9
11,712,5
23,2
8,4
17,1
20,1
18,0
15,0
28,2
23,524,7
26,228,3
29,0
20,7
23,524,2
35,0
18,6
32,8
29,832,1
25,9
0
5
10
15
20
25
30
35
40
سوريةالقنيطرةالسويداءدرعاالرقةطرطوسدير الزوراحلسكةادلبالالذقيةمحاهمحصريف دمشقحلبدمشق
ة االنفاق الشهري على السلع غري الغذائية االنفاق الشهري على السلع الغذائيالكلي انفاق األسرة الشهري
)س ل 1000(
Very HighVery Weak
Kuneitra
Damascus
Aleppo
Damascus Cs.
Homs
Hama
Lattakia
Idleb
Hasaka
Tartous
Rakka
Daraa
Deir Ezzour
Sweida

Ministry of Social Affairs and Labor UNDP
(Study of Labor Market in Syria 2009‐2010) 122
The following chart shows the compatibility of the results of the methodology adopted in the classification of the households according to the living condition through the results of the labor force survey 2009 with the results of a survey of income and expenditure of the household 2007, as the indicators in the majority of the governorates harmonize: Chart 144: Comparison between the indicator of the living situation of the family (2009) and the indicator of the
average household expenditure (2007)
Source: Results of the Survey of Household’s income and expenses 2007, Joint Survey of Labor Force 2009 The distribution of the unemployed and the unemployment rates shows that the poorest families are those suffering more than others from unemployment, as the results show some sort of statistical relationship between the unemployment rates in the areas with the deterioration of the living condition of the households (Chart 127), specifically the presence of a fixed relationship between the deterioration of the living conditions of households if the head of the family is unemployed as shown in the Chart 128 below:
Chart 145: Distribution of unemployment average and the rate of families with very weak living
conditions by areas (2009)
Source: Joint Survey of Labor Force 2009
Chart 146: Distribution of unemployment rate among heads of households and the rate of households with very
weak living conditions by governorates (2009)
Source: Joint Survey of Labor Force 2009
124
94
119
10497
119
8577
65
117
68
91
116
84
100109
91
95
101109112
809194
135
72
127
115124
100
0
20
40
60
80
100
120
140
160
ريف حلبدمشقدمشق
سوريةالقنيطرةالسويداءدرعاالرقةطرطوسدير الزوراحلسكةادلبالالذقيةمحاهمحص
)2009(مؤشر احلالة املعيشية لألسرة
)2007(مؤشر متوسط إنفاق األسرة
R² = 0,2376
0%
5%
10%
15%
20%
25%
30%
35%
40%
45%
50%
0%10%20%30%40%50%
نسبة األسر ذات احلالة املعيشية ضعيفة جدا
معدل البطالة العام دمشق
حلب
ريف دمشق
محاهمحص
الالذقية
ادلباحلسكة
دير الزور
طرطوس
درعاالقنيطرة
R² = 0,5345
0%
10%
20%
30%
40%
50%
60%
0%2%4%6%8%10%
نسبة األسر ذات احلالة املعيشية ضعيفة جدا
Unemployment rate among heads of householdsرب األسرةمعدل البطالة لدى
Hasaka
Aleppo
TartousLattakia
Hama
Damascu
Homs
Damascus Countryside
Deir Ezzour
Idleb
Daraa
Kunaitera
Rate of households of very weak living conditions
Unemployment General Rate
Rate of households of very weak living conditions

Ministry of Social Affairs and Labor UNDP
(Study of Labor Market in Syria 2009‐2010) 123
4. Employment of young people and women 4.1 Young people between employment and unemployment The following table shows the relationship of the young people of the age group 15-24 years with the labor force based on the results of the Joint Survey of Labor Force, 2009:
Table 48: Relationship of the young people in the age group 15-24 years with the labor force
Number (in thousand) Relative Distribution
Males Females Total Males Females Total
Employed 823,3 93,4 916,8 42% 5% 24%
Unemployed previously employed 60,9 15,5 76,5 3% 1% 2%
Unemployed previously unemployed 142,5 104,4 246,9 7% 5% 6%
Unemployed (previous status unknown) 5,7 10,2 15,9 0% 1% 0%
Devoted to household work 1,2 927,0 928,2 0% 48% 24%
Devoted to studying 802,4 675,4 1 477,8 41% 35% 38%
Unable to work 46,6 22,5 69,1 2% 1% 2%
Satisfied 11,0 35,7 46,7 1% 2% 1%
Others outside labor force 72,0 45,8 117,8 4% 2% 3%
Total 1 965,6 1 930,1 3 895,7 100% 100% 100%
Source: Joint Survey of Labor Force 2009 The survey results show that the relative majority of the young people of the age group 15-24 years are devoted to studying, as that ratio is 38% with some difference between males and females. However, the significant difference with respect to gender is related to employment or staying at home, as we notice that 42% of the males are employed (vs. 5% among females) whereas about a half of girls (48%) are devoted to household affairs.
Chart 147: Distribution of the young people by the relationship with the labor force
Source: Survey of Labor Force 2009
EmployedUnemployed Devoted to household
Others outside labor ford
Devoted to study
Total
Females
Males
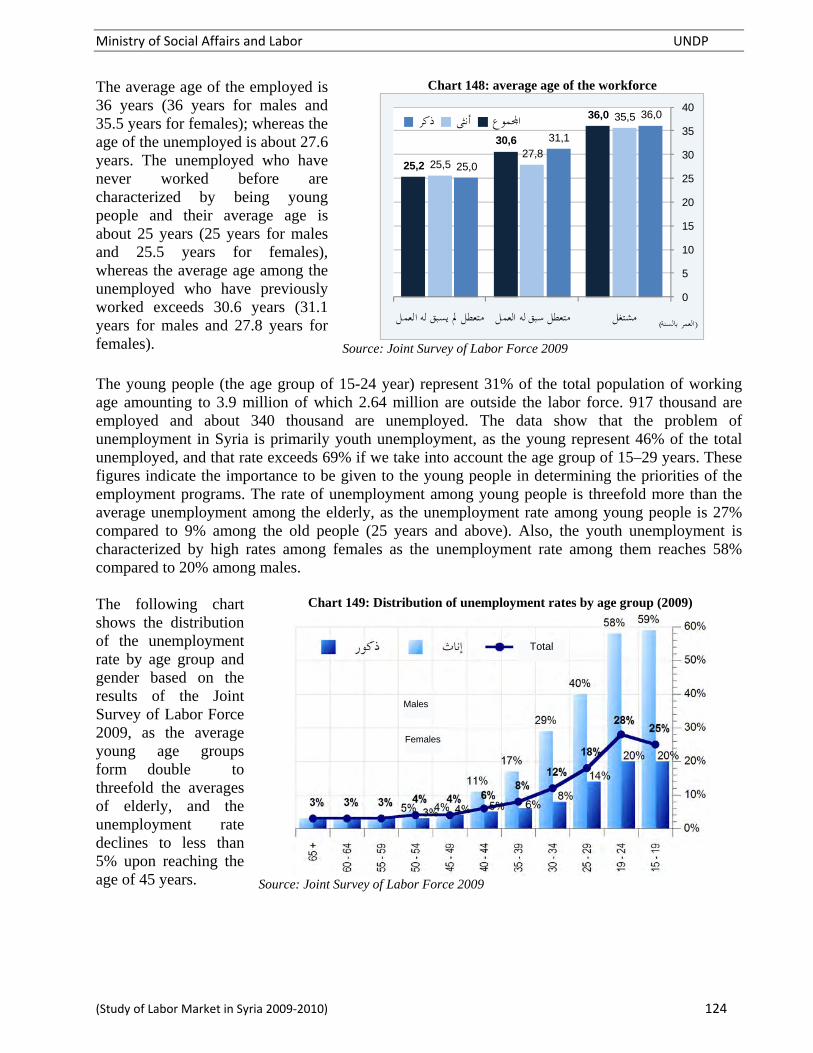
Ministry of Social Affairs and Labor UNDP
(Study of Labor Market in Syria 2009‐2010) 124
The average age of the employed is 36 years (36 years for males and 35.5 years for females); whereas the age of the unemployed is about 27.6 years. The unemployed who have never worked before are characterized by being young people and their average age is about 25 years (25 years for males and 25.5 years for females), whereas the average age among the unemployed who have previously worked exceeds 30.6 years (31.1 years for males and 27.8 years for females).
Chart 148: average age of the workforce
Source: Joint Survey of Labor Force 2009
The young people (the age group of 15-24 year) represent 31% of the total population of working age amounting to 3.9 million of which 2.64 million are outside the labor force. 917 thousand are employed and about 340 thousand are unemployed. The data show that the problem of unemployment in Syria is primarily youth unemployment, as the young represent 46% of the total unemployed, and that rate exceeds 69% if we take into account the age group of 15–29 years. These figures indicate the importance to be given to the young people in determining the priorities of the employment programs. The rate of unemployment among young people is threefold more than the average unemployment among the elderly, as the unemployment rate among young people is 27% compared to 9% among the old people (25 years and above). Also, the youth unemployment is characterized by high rates among females as the unemployment rate among them reaches 58% compared to 20% among males. The following chart shows the distribution of the unemployment rate by age group and gender based on the results of the Joint Survey of Labor Force 2009, as the average young age groups form double to threefold the averages of elderly, and the unemployment rate declines to less than 5% upon reaching the age of 45 years.
Chart 149: Distribution of unemployment rates by age group (2009)
Source: Joint Survey of Labor Force 2009
36,0
31,1
25,0
35,5
27,825,5
36,0
30,6
25,2
0
5
10
15
20
25
30
35
40
متعطل مل يسبق له العملمتعطل سبق له العملمشتغل
ذكر أنثى اجملموع
)العمر بالسنة(
Total
Females
Males

Ministry of Social Affairs and Labor UNDP
(Study of Labor Market in Syria 2009‐2010) 125
It is worth mentioning that this situation has aggravated in recent years, as the number of the unemployed youth increased from 254 thousand in 2005 to 339 thousand in 2009, and the rate of youth unemployment increased from 19% in 2005 to 27% in early 2009. The results of the annual survey for 2009, as well as the results of the first half of 2010 showing a significant decline in the volume of unemployment among young people, as the number of the unemployed of the age group 15-24 declined to 192 thousand in 2009 before rising to 240 thousand during the first half of 2010, thus the rate of unemployment among them decreased to 17% in 2009 and to 19% in 2010 compared to 27% according to the results of the Joint Survey of Labor Force 2009. The following two charts show this development:
Chart 150: Evolution of the number of unemployed youth (2004-2010)
Chart 151: Evolution of unemployment rates among young people (2004-2010)
The following two tables show the distribution of the labor force and unemployment rates by age groups according to the latest surveys conducted by the Central Bureau of Statistics:
Table 49: Distribution of the labor force and unemployment rates by age group (annual results 2009)
Source: Annual results of Labor Force Survey 2009
Employed Unemployed Total Labor Force Unemployment Rate
Males Females Total Males Females Total Males Females Total Males Females Total
From 15 to 19 years 314,1 30,9 345,1 44,1 15,8 59,8 358,2 46,7 404,9 12,3% 33,8% 14,8% From 20 to 24 years 547,1 66,9 614,0 74,0 58,1 132,1 621,2 124,9 746,1 11,9% 46,5% 17,7% From 25 to 29 years 652,2 109,7 762,0 62,7 53,3 116,0 715,0 163,0 878,0 8,8% 32,7% 13,2% From 30 to 34 years 614,8 99,1 713,9 32,5 24,6 57,1 647,3 123,7 771,0 5,0% 19,9% 7,4% From 35 to 39 years 581,0 96,3 677,3 17,0 16,9 33,9 598,1 113,2 711,3 2,8% 14,9% 4,8% From 40 to 44 years 513,4 84,7 598,1 11,7 5,7 17,3 525,1 90,3 615,4 2,2% 6,3% 2,8% From 45 to 49 years 426,2 66,4 492,5 8,4 2,4 10,7 434,5 68,7 503,3 1,9% 3,4% 2,1% From 50 to 54 years 310,9 42,8 353,7 6,5 0,8 7,3 317,4 43,6 361,0 2,1% 1,8% 2,0% From 55 to 59 years 205,3 19,7 224,9 2,9 0,3 3,2 208,2 20,0 228,1 1,4% 1,6% 1,4% From 60 to 64 years 106,9 4,6 111,5 1,2 0,3 1,5 108,0 4,9 112,9 1,1% 6,6% 1,3% From 65 an over 101,8 3,6 105,4 2,7 1,2 3,9 104,5 4,7 109,2 2,6% 24,3% 3,6% Unstated 0,4 0,6 0,9 0,0 0,0 0,0 0,4 0,6 0,9 0,0% 0,0% 0,0%
Total 4 374,1 625,2 4 999,2 263,7 179,3 443,0 4 637,7 804,5 5 442,2 5,7% 22,3% 8,1%

Ministry of Social Affairs and Labor UNDP
(Study of Labor Market in Syria 2009‐2010) 126
Table 50: Distribution of the labor force and unemployment rates by age group (First half of 2010)
Employed Unemployed Total Labor Force Unemployment Rate
Males Females Total Males Females Total Males Females Total Males Females Total
From 15 to 19 years 361,4 38,0 399,5 77,3 9,8 87,0 438,7 47,8 486,5 17,6% 20,4% 17,9%
From 20 to 24 years 531,2 78,6 609,8 83,8 68,7 152,5 614,9 147,4 762,3 13,6% 46,6% 20,0%
From 25 to 29 years 647,0 102,7 749,7 51,7 60,6 112,3 698,7 163,3 862,0 7,4% 37,1% 13,0%
From 30 to 34 years 628,9 105,9 734,8 20,7 33,8 54,5 649,7 139,7 789,3 3,2% 24,2% 6,9%
From 35 to 39 years 565,9 101,4 667,4 11,8 17,1 28,9 577,7 118,5 696,3 2,0% 14,4% 4,1%
From 40 to 44 years 513,9 97,5 611,4 6,5 5,4 11,9 520,4 102,9 623,3 1,3% 5,2% 1,9%
From 45 to 49 years 403,6 77,8 481,4 6,1 2,6 8,7 409,8 80,4 490,1 1,5% 3,2% 1,8%
From 50 to 54 years 343,6 44,6 388,2 7,3 0,6 7,9 350,9 45,2 396,1 2,1% 1,2% 2,0%
From 55 to 59 years 209,9 27,6 237,5 1,8 0,0 1,8 211,7 27,6 239,3 0,9% 0,0% 0,8%
From 60 to 64 years 110,6 5,1 115,7 1,0 0,0 1,0 111,6 5,1 116,7 0,9% 0,0% 0,9%
From 65 an over 112,1 4,9 116,9 1,4 0,0 1,4 113,5 4,9 118,4 1,3% 0,0% 1,2%
Total 4 428,2 684,1 5 112,3 269,5 198,5 468,0 4 697,7 882,6 5 580,3 5,7% 22,5% 8,4%
Also, the survey results of the Joint Survey of Labor Force show that the youth unemployment is characterized by being long-term unemployment, as it appears that 63% of the young people have been looking for work for one year or over, which sometimes leads to frustration, loss of self-confidence and the desire to emigrate. This proves the idea of scarcity of entrepreneurship among young people to search for work and their desire to work in the public sector and only register with employment offices. This reflects the weakness of the entrepreneurship culture and innovation among young people as well as the elderly. The following chart shows that the rate of the desire to work in the public sector remains very high until the age of fifty. The results also show that the majority of young people do not resort to training to improve their skills and their access to work, as only 17.6% of the unemployed young people joined training courses compared to 18.5% among the elderly.
Chart 152: The rate of the desire to work in the public sector according to age groups
Source: Joint Survey of Labor Force 2009

Ministry of Social Affairs and Labor UNDP
(Study of Labor Market in Syria 2009‐2010) 127
The survey results show that, as the elderly, the youth unemployment is concentrated among the holders of the primary and middle school as well as secondary school certificates, as these represent about three-quarters of the unemployed young people. The unemployment rises among that segment of young people up to 29% among middle school certificate holders, 51% among secondary school certificate holders and 48% among the intermediate institute certificate holders. It is also shown that one third of the young people holding the university certificate are unemployed, but they represent only 2% of the total unemployed young people.
Chart 153: Distribution of the number of the unemployed, young people and elderly, by educational status
It should be noted that 4.6% of the unemployed young people have already been offered a work but they have not accepted it due to dissatisfaction with pay (29%), or non-permanent nature of the work (17%), lack of relevance to their qualifications (15%) or hard work (12%).
Chart 154: Unemployment rate among young people and elderly by educational status
The following chart shows that those rates vary among the elderly who give priority to wage (43% of the elderly have been offered a work and they have refused it for dissatisfaction with pay) and less significance to the work nature. Also we recall that the unemployed young people accept a work that generates a wage of less than 13% of the wage required by the elderly (8.030 SP compared to 9.207 SP).
Chart 155: Reasons for not accepting work by the unemployed

Ministry of Social Affairs and Labor UNDP
(Study of Labor Market in Syria 2009‐2010) 128
4.2 The desire to emigrate
The survey results show that about a quarter of young people desire to emigrate or travel outside the country. This ratio varies dramatically between males and females, as it is 28% among males and only 5% among females. Also, the rate of the desire to emigrate or travel decreases gradually with age as shown by the following chart:
Chart 156: The rate of desire to emigrate by age group and gender
Source: Joint Survey of Labor Force 2009
The overall ratio of those having a desire to emigrate reaches 16%, of which 64% have sought seriously to it. The rate of the desire to emigrate among males is greater by four times the rate notice among females (18.2% compared to 4.4%). Also, the unemployed desire to emigrate more than the employed (26.6% compared to 14.6%). The unemployed men desire to emigrate particularly in the age group corresponding to the height economical productivity, between the age of 25 and 35 years, as we notice that 44% of that group want to emigrate due to their exposure to life pressures when searching for a work by various ways, whether inside or outside the country. The following table shows these percentages:
Table 51: Rate of the desire to emigrate by age groups, gender and relationship to labor force
Males Females Total
Employed Unemployed Labor Force Employed Unemployed Labor Force
Employed Unemployed Labor Force
From 15 to 19 years 25,0% 34,3% 26,8% 3,6% 3,4% 3,5% 23,4% 24,7% 23,7%
From 20 to 24 years 26,8% 39,0% 29,2% 5,7% 5,3% 5,5% 24,3% 25,6% 24,6%
From 25 to 29 years 24,1% 43,6% 26,8% 5,4% 5,4% 5,4% 21,7% 29,8% 23,2%
From 30 to 34 years 18,4% 44,5% 20,5% 5,1% 4,0% 4,8% 16,6% 29,0% 17,9%
From 35 to 39 years 15,0% 33,6% 16,2% 3,9% 8,4% 4,6% 13,4% 25,3% 14,3%
From 40 to 44 years 10,7% 37,8% 12,0% 2,5% 2,2% 2,5% 9,5% 28,2% 10,4%
From 45 to 49 years 7,3% 30,3% 8,2% 2,9% 5,1% 3,0% 6,7% 27,6% 7,5%
From 50 to 54 years 4,9% 19,3% 5,3% 5,5% 15,9% 5,8% 4,9% 19,0% 5,4%
From 55 to 59 years 3,8% 7,6% 3,9% 1,5% 0,0% 1,5% 3,6% 7,1% 3,7%
From 60 to 64 years 2,5% 6,4% 2,6% 0,0% 0,0% 0,0% 2,4% 6,0% 2,5%
From 65 an over 1,9% 20,3% 2,2% 4,1% 0,0% 3,9% 2,0% 19,1% 2,2%
Total 16,0% 38,1% 18,2% 4,2% 5,0% 4,4% 14,6% 26,6% 16,1%
Source: Joint Survey of Labor Force 2009

Ministry o
(Study of L
An indmainly status, asof the camong females),for job figures workers to improtheir numthousand
Improve financialstatus Search for a job
For Study Difficulty of establishing a projPaying Military Servisce substituteOther Causes
Total Source: Jo The relaconditionconfirmedistributigovernorterms of householRakka, wemigrate decreasesthe rate oliving coTartous where temigrate followingrelationshemigrate governor
of Social Affai
Labor Market in
dividual seto improv
s this motivecauses for males and , followed bopportunitieshow the seeking to e
ove their finmber reached.
Employed
81,2%
14,7%
0,7%
ject 1,3%
e 0,9%
1,2%
100,0%
oint Survey of L
ationship ben and the desed through ion, as that drates that aref the living clds like Dwhere the rat
is nearlys in the govof the house
onditions is fand Damas
the rate ofdoes not e
g chart hip of the rawith the li
rates:
rs and Labor
n Syria 2009‐20
eeks emigre his fina
e represents 7seeking (757.4% am
by the seares (24%). T
importancemigrate in
nancial statues more than
Males
Unemployed
41,1%
56,9%
0,4%
0,6%
0,5%
0,6%
100,0%
Labor Force 20
tween the lsire to emigrthe geograpdesire rises ie less fortunconditions o
Deir Ezzour te of the desy 30%, anvernorates weholds with few like Latscus Countrf the desirexceed 10%
shows ate of the desving standar
010)
ration ancial 725%
72.3% mong
rching These e of order s and n 687
Sourc
Table 52: Cau
Labor Force
E
72,3%
24,0%
0,7%
1,1%
0,8%
1,1%
100,0%
009
living rate is phical in the ate in of the
and sire to nd it where weak
ttakia, ryside re to . The
the sire to rd by
Cha
Sourc
Chart 157:
ce: Joint Surve
uses for seekin
Fe
Employed Unem
65,0%
12,7%
5,8%
0,0%
0,0%
16,5%
100,0%
art 158: Rate o
ce: Joint Surve
: Diversity of
ey of Labor Fo
ng emigration
emales
mployedLabFor
39,5% 5
56,3% 2
0,0%
0,0%
0,0%
4,2% 1
100,0% 10
of the desire toliving
ey of Labor Fo
causes for see
orce 2009
n
bor rce
Employe
57,4% 80,8
25,6% 14,7
4,1% 0,9
0,0% 1,2
0,0% 0,8
12,9% 1,6
00,0% 100,0
o emigrate ang situation
orce 2009
UN
eking emigrati
Total
ed Unemploye
8% 41,0
7% 56,8
9% 0,4
2% 0,6
8% 0,4
6% 0,8
% 100,0
d its relations
NDP
129
ion
edLabor Force
0% 71,9%
8% 24,1%
4% 0,8%
6% 1,1%
4% 0,8%
8% 1,4%
0% 100,0%
ship to the
%
%
%
%
%
%
%
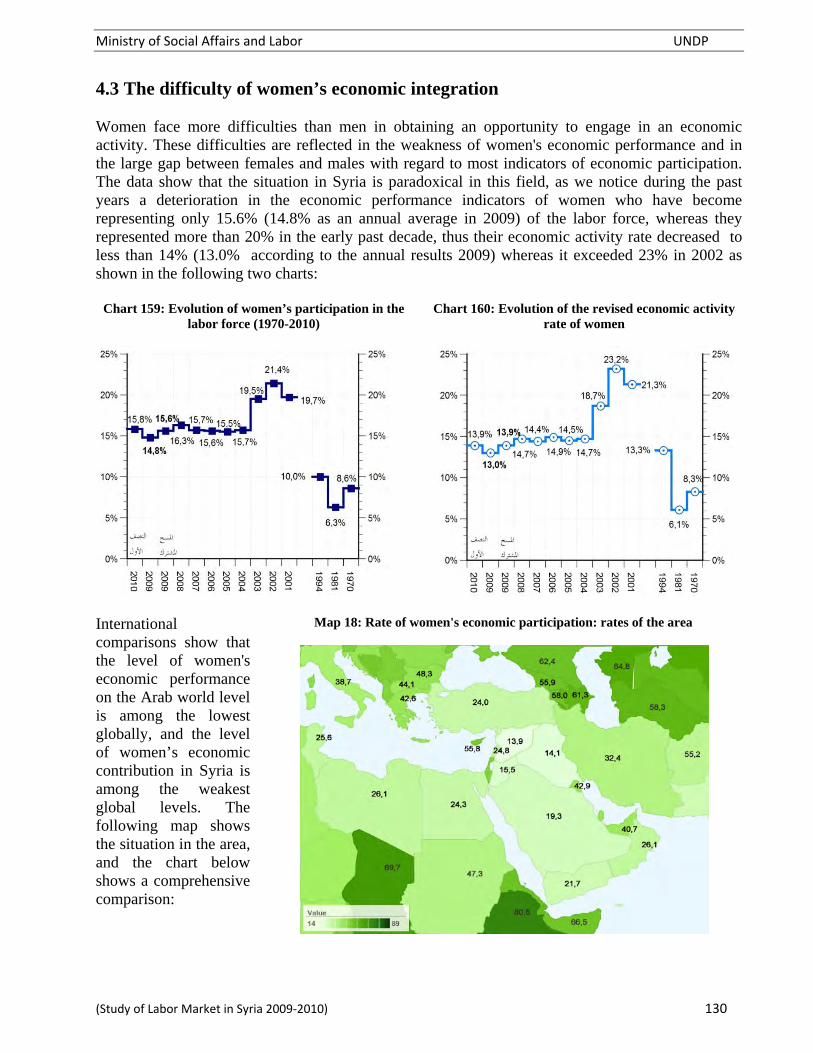
Ministry of Social Affairs and Labor UNDP
(Study of Labor Market in Syria 2009‐2010) 130
4.3 The difficulty of women’s economic integration Women face more difficulties than men in obtaining an opportunity to engage in an economic activity. These difficulties are reflected in the weakness of women's economic performance and in the large gap between females and males with regard to most indicators of economic participation. The data show that the situation in Syria is paradoxical in this field, as we notice during the past years a deterioration in the economic performance indicators of women who have become representing only 15.6% (14.8% as an annual average in 2009) of the labor force, whereas they represented more than 20% in the early past decade, thus their economic activity rate decreased to less than 14% (13.0% according to the annual results 2009) whereas it exceeded 23% in 2002 as shown in the following two charts:
Chart 159: Evolution of women’s participation in the labor force (1970-2010)
Chart 160: Evolution of the revised economic activity rate of women
International comparisons show that the level of women's economic performance on the Arab world level is among the lowest globally, and the level of women’s economic contribution in Syria is among the weakest global levels. The following map shows the situation in the area, and the chart below shows a comprehensive comparison:
Map 18: Rate of women's economic participation: rates of the area

Ministry o
(Study of L
C
Source: Da
The distactivity governorby two prelated between genders females’ times), related distributiactivity rdispersiothe femaaccordingfrom lapproximin the fol
of Social Affai
Labor Market in
hart 161: Rat
ata of the Inter
tribution of rates by g
rates is chparadoxes: tto the lthe rates o(males’ ratrate by moand the to the ha
ion of thrate compareon of the distales’ rates, wg to the goless than mately 35% llowing char
rs and Labor
n Syria 2009‐20
e of the econo
rnational Labo
economic gender and aracterized the first is large gap of the two te exceeds ore than 5 second is
armony of he male’s ed with the tribution of which vary overnorates
5% to as shown
rt:
010)
omic participa
r Bureau (end
Chart 162: C
Source: Join
ق
90
tion of males
of 2000-2008,
Comparative b
t Survey of Lab
دمشق
ب
ريف دمشق
محاه
ة الالذقي
ادلبكة
طرطوس
رقة
السويداء
القنيطرة
ة سوري
70%80%0%
and females: A
Joint Survey
distribution oby the governo
bor Force 2009
حلب
محصاحلسكدير الزور
الر
درعا
4050%60%
ء
الرجالى
خط التساوي
An internatio
of Labor Forc
of the activity orates (2009)
9
20%30%0%
النساءلدىقتصادي
تشاط االقتصادي لدى
UN
nal compariso
ce 2009 for Syr
rate of women
0%
5%
10%
15%
20%
25%
30%
35%
0%10%
التشاط االقمعدل
معدل الت
NDP
131
on
ria
n and men

Ministry of Social Affairs and Labor UNDP
(Study of Labor Market in Syria 2009‐2010) 132
The gender difference in the economic participation can be detected through the distribution of the gender rate to the labor force which reaches 542 as a general average in Syria according to the results of the Joint Survey of Labor Force 2009 compared to the gender rate to the population in the working age within 104. It should be noted that the gender rate to the labor force reached 576 according to the annual results for 2009 and 532 in the first half of 2010. The following chart shows the distribution of those rates by governorates according to the results of the Joint Survey of Labor Force 2009:
Chart 163: The sex ratio to the population of working age and the sex ratio to the labor force by governorate (2009)
Source: Joint Survey of Labor Force 2009
Women get higher education than men, and the high level of education facilitates the process of their integration in the economic cycle, but continuing education and the length of the study phase delays their entry into the labor market. The results show that, contrary to males, the progress in the level of education improves the economic performance of the females, as the attainment of the high school certificate is the main key that opens the door for women's economic participation. It is clear from the chart below that the rate of female economic participation remains very low for the levels of education less than the high school, and it radically changes when reaching that stage and keeps rising and at high levels in respect of the higher stages of education. The rate of women's economic participation reaches 7% if their level is less than high school stage, and it reaches 40% if their level hits or exceeds that stag.
Chart 164: Evolution of economic activity by educational status
Source: Joint Survey of Labor Force 2009

Ministry of Social Affairs and Labor UNDP
(Study of Labor Market in Syria 2009‐2010) 133
Also, this issue can be confirmed by examining the statistical relationship between women's economic participation and their educational status. The results of the General Census of Housing and Population 2004 show the absence of the relationship between the percentage of illiteracy and the rate of women's economic participation (Chart 165), on the one hand, and the existence of a relationship between the women’s economic participation and their educational level when it reaches the high school certificate ore above, on the other hand.
Chart 165: Rate of economic activity and the percentage of illiteracy among women
Source: General Census for Housing and Population 2004
The Chart (166) shows such relationship, as in contrast to the previous chart the rate of economic activity improving among females when they continue their education and attain the high school level and above. This confirms the importance of obtaining a high school certificate by females to be free from the several social, scientific and economic restrictions that hinder their entrance into the labor market and their economic participation.
Chart 166: Rate of economic activity and the percentage of high school level among women
Source: General Census for Housing and Population 2004
The education statistics show that the presence of girls in various stages of education is increasing steadily, as they are representing the majority in the secondary education (52.9% in 2009), as well as in higher education: 51.3% in 2009, whereas the ratio was 37% in the early eighties. The following chart shows that development. The labor market statistics in Syria show that women have not yet reaped the fruits of their progress in education in terms of economic performance, but the situations are expected to be changed significantly in the coming years, as the numbers of females who reach the high school threshold will increase, thus improving their economic performance.
R² = 0,002
0%
5%
10%
15%
20%
25%
30%
35%
40%
45%
50%
55%
0%20%40%60%80%
)إناث(معدل النشاط االقتصادي املنقح
اث( نسبة األمية )إن
R² = 0,4165
0%
5%
10%
15%
20%
25%
30%
35%
40%
45%
50%
55%
0%5%10%15%20%
)إناث(معدل النشاط االقتصادي املنقح
ة )إناث(سنة فأكثر 15نسبة الثانوي
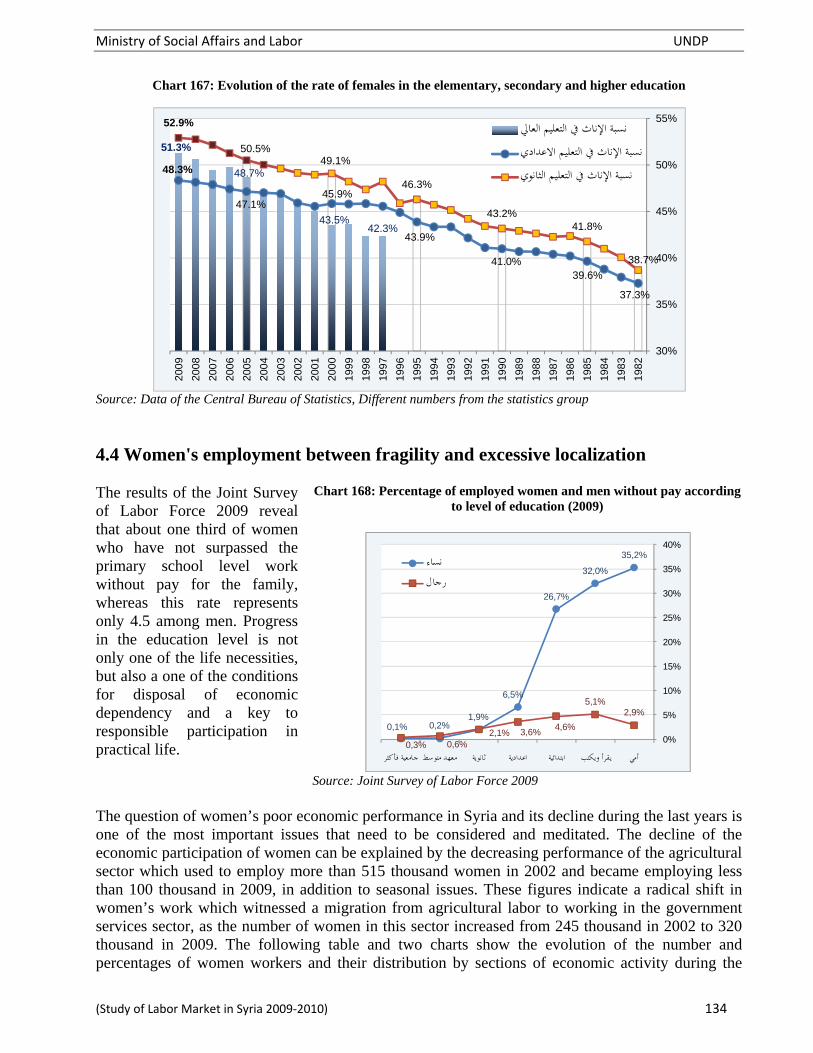
Ministry of Social Affairs and Labor UNDP
(Study of Labor Market in Syria 2009‐2010) 134
Chart 167: Evolution of the rate of females in the elementary, secondary and higher education
Source: Data of the Central Bureau of Statistics, Different numbers from the statistics group 4.4 Women's employment between fragility and excessive localization The results of the Joint Survey of Labor Force 2009 reveal that about one third of women who have not surpassed the primary school level work without pay for the family, whereas this rate represents only 4.5 among men. Progress in the education level is not only one of the life necessities, but also a one of the conditions for disposal of economic dependency and a key to responsible participation in practical life.
Chart 168: Percentage of employed women and men without pay according to level of education (2009)
Source: Joint Survey of Labor Force 2009
The question of women’s poor economic performance in Syria and its decline during the last years is one of the most important issues that need to be considered and meditated. The decline of the economic participation of women can be explained by the decreasing performance of the agricultural sector which used to employ more than 515 thousand women in 2002 and became employing less than 100 thousand in 2009, in addition to seasonal issues. These figures indicate a radical shift in women’s work which witnessed a migration from agricultural labor to working in the government services sector, as the number of women in this sector increased from 245 thousand in 2002 to 320 thousand in 2009. The following table and two charts show the evolution of the number and percentages of women workers and their distribution by sections of economic activity during the
42.3%43.5%
48.7%
51.3%
37.3%
39.6%41.0%
43.9%
45.9%47.1%
48.3%
38.7%
41.8%43.2%
46.3%
49.1%50.5%
52.9%
30%
35%
40%
45%
50%
55%
198
2
198
3
198
4
198
5
198
6
198
7
198
8
198
9
199
0
199
1
199
2
199
3
199
4
199
5
199
6
199
7
199
8
199
9
200
0
200
1
200
2
200
3
200
4
200
5
200
6
200
7
200
8
200
9
نسبة اإلناث يف التعليم العايلنسبة اإلناث يف التعليم االعدادينسبة اإلناث يف التعليم الثانوي
35,2%
32,0%
26,7%
6,5%
1,9%0,2%0,1%
2,9%5,1%
4,6%3,6%2,1%
0,6%0,3%0%
5%
10%
15%
20%
25%
30%
35%
40%
جامعية فأكثرمعهد متوسطثانويةاعداديةابتدائيةيقرأ ويكتب أمي
نساءرجال

Ministry of Social Affairs and Labor UNDP
(Study of Labor Market in Syria 2009‐2010) 135
period from 2001-2010. We notice that during that short period an important shift occurred in the women employment that changed the sector in which they were localized, as they were based in the agricultural work which employed about 58% of women labor in the early past decade, whereas now it employs only 17% of this labor. In parallel, the service sector attracts two thirds of women workers, whereas its importance was limited to one-third in the years 2001 and 2002. The results of surveys carried out by the Central Bureau of Statistics during the years 2009 and 2010 show a kind of return to women's agricultural work, which became holding about one-fifth of women in 2009 and nearly 24% in 2010 with a parallelly noticeable decline in the importance of the services sector. Table 53: Evolution of the number of the employed women and their distribution by sections of economic activity
(2001-2009)
2001 2002 2003 2004 2005 2006 2007 2008 2009 2009 2010
Joint Survey Annual First Half
Numbers (in thousand)
Agriculture and silviculture 431,0 515,8 352,1 175,6 195,4 169,7 165,6 168,4 99,5 122,2 163,0
Industry 53,0 51,7 50,4 48,4 43,1 50,2 42,7 53,3 47,0 53,3 59,3
Building & Construction 8,0 8,9 7,7 27,7 5,9 4,8 6,2 7,0 8,0 7,2 4,4
Trade, Hotels & Restaurants 20,0 21,9 26,4 20,0 26,9 28,2 29,3 38,0 32,3 38,2 48,2
Transport & communication 10,0 6,0 6,9 6,6 5,3 8,3 9,4 12,7 11,4 14,1 11,0
Finance, Insurance & Real 8,6 11,2 12,3 13,1 11,2 15,2 17,7 17,4 19,2 23,3
Other services 282,0 275,5 306,9 339,0 340,8 358,0 361,2 375,4 368,2 370,9 374,9
Total 804,0 888,4 761,7 629,5 630,4 630,2 629,6 672,5 583,8 625,2 684,1
Relative Distribution
Agriculture and silviculture 53,6% 58,1% 46,2% 27,9% 31,0% 26,9% 26,3% 25,0% 17,0% 19,5% 23,8%
Industry 6,6% 5,8% 6,6% 7,7% 6,8% 8,0% 6,8% 7,9% 8,0% 8,5% 8,7%
Building & Construction 1,0% 1,0% 1,0% 4,4% 0,9% 0,8% 1,0% 1,0% 1,4% 1,1% 0,6%
Trade, Hotels & Restaurants 2,5% 2,5% 3,5% 3,2% 4,3% 4,5% 4,7% 5,6% 5,5% 6,1% 7,0%
Transport & communication 1,2% 0,7% 0,9% 1,0% 0,8% 1,3% 1,5% 1,9% 1,9% 2,3% 1,6%
Finance, Insurance & Real 1,0% 1,5% 2,0% 2,1% 1,8% 2,4% 2,6% 3,0% 3,1% 3,4%
Other services 35,1% 31,0% 40,3% 53,8% 54,1% 56,8% 57,4% 55,8% 63,1% 59,3% 54,8%
Total 100,0% 100,0% 100,0% 100,0% 100,0% 100,0% 100,0% 100,0% 100,0% 100,0% 100,0%
Source: Labor Market Surveys 2001-2010, Central Bureau of Statistics, and Joint Survey of Labor Force 2009
Chart 169: Evolution of the distribution of the employed women by sections of economic activity (2001-2010)
Source: Labor Market Surveys 2001-2010, Central Bureau of Statistics, and Joint Survey of Labor Force 2009
53.6%58.1%46.2%
27.9%31.0%26.9%26.3%25.0%17.0%19.5%23.8%
6.6%5.8%
6.6%
7.7%6.8%8.0%6.8%7.9%
8.0%8.5%8.7%
4.4%
2.5%2.5%
3.5%
3.2%4.3%4.5%4.7%5.6%
5.5%6.1%
7.0%
35.1%32.0%41.8%
55.8%56.1%58.6%59.8%58.5%66.1%62.4%58.2%
0%
10%
20%
30%
40%
50%
60%
70%
80%
90%
100%
20012002200320042005200620072008200920092010
اخلدمات االخرى
النقل واملواصالت
جتارة وفنادق ومطاعم
البناء والتشييد
الصناعة
الزراعة واحلراجة
األول النصفاملسح املشرتك

Ministry of Social Affairs and Labor UNDP
(Study of Labor Market in Syria 2009‐2010) 136
Based on the results of the Joint Survey of Labor Force 2009 the following two charts show a detailed distribution of the women’s presence rates among the total employed by sectors of economic activities and the sections of professions. These data confirm the importance of the sector of education and health where the majority of women labor is concentrated.
Chart 170: Women’s presence rates among the total employed by sectors of economic activities (2009)
Source: Joint Survey of Labor Force 2009
Chart 171: Women’s presence rates among the total employed by sections of professions (2009)
Source: Joint Survey of Labor Force 2009

Ministry of Social Affairs and Labor UNDP
(Study of Labor Market in Syria 2009‐2010) 137
4.5 Characteristics of the unemployed women As for the characteristics of the unemployed women, the following table shows the distribution of the unemployed women by the marital status, relationship to the head of family, age groups and educational level:
Table 54: Distribution of the unemployed women by the marital status, relationship to the head of family, age groups and educational level:
Number Percentage
Marital Statussingle 189 543 71.5%married 66 960 25.3%divorced 6 392 2.4%widdow 2 079 0.8%Relation to Fanily Headhead of Family 4 781 1.8%husband - wife 53 759 20.3%sun - daughter 177 898 67.1%brother - sister 16 713 6.3%father - mother 272 0.1%grandson - granddaughter 1 089 0.4%other relatives 10 557 4.0%Age Groups (quinary)From 15 to 19 years 34 744 13.1%From 20 to 24 years 95 414 36.0%From 25 to 29 years 62 298 23.5%From 30 to 34 years 37 240 14.0%From 35 to 39 years 18 912 7.1%From 40 to 44 years 11 195 4.2%From 45 to 49 years 2 601 1.0%From 50 to 54 years 1 711 0.6%From 55 to 59 years 707 0.3%From 60 to 64 years 151 0.1%From 65 an over 95 0.0%Educational LevelIlliterate 15 011 5.7%Literate 11 864 4.5%Primary 66 846 25.2%Preparatory 40 267 15.2%Secondary 66 546 25.1%Institute Student 1 718 0.6%Intermediate Institute 38 524 14.5%University student 7 746 2.9%University degree 15 984 6.0%High studies student 0 0.0%Diploma 565 0.2%Master 0 0.0%Doctorate 0 0.0%
Source: Joint Survey of Labor Force 2009

Ministry of Social Affairs and Labor UNDP
(Study of Labor Market in Syria 2009‐2010) 138
Table 55: Distribution of the unemployed women by field of specialization
Number Percentage
General High School 50 222 38.3%
Fine Arts 8 388 6.4%
Feminist high school 7945 6.1%
Foreign Languages 7 376 5.6%
Teacher rehabilitation (ocupational bj t )
5477 4.2%
Teacher rehabilitation (Basic Education) 5285 4.0%
Accounting and Tax Duties 4 365 3.3%
Arabic 3 207 2.4%
Commercial High School 3 158 2.4%
General Administration and Business Ad i i t ti
3 134 2.4%
Agricultural high School 3 041 2.3%
Financial and Bankig sciences 1 862 1.4%
Civil Engineering and Construction 1 843 1.4%
Botanical Production 1 792 1.4%
Law 1 500 1.1%
Economic Sciences 1 489 1.1%
Secretary and office works 1 466 1.1%
Communication High School 1 305 1.0%
unspecified 1 258 1.0%
Music and acting 1 229 0.9%
History and Archeology 1 083 0.8% Source: Joint Survey of Labor Force 2009 It is clear that the unemployed woman is, in most cases, single aged between 20 and 30 years, her level of education is ranging between primary and secondary school and her current competence is focused in high school. The geographical distribution of unemployment demonstrates a disparity of unemployment rates among women between the different governorates, as the unemployment rate exceeds 40% in Tartous and Lattakia and reaches up to 60% in Hassaka, whereas it decreases to less than 20% in each of the governorates of Damascus Countryside, Daraa, Idleb, Aleppo, Deir Ezzour and Rakka which is distinguished by female unemployment rate lower than the rate of unemployment among males, whereas the case is opposite in all the other governorates, as shown in the following chart:
Chart 172: Comparative distribution of unemployment rate among women and men by governorates (2009)
Source: Joint Survey of Labor Force 2009
دمشقحلب
ريف دمشق
محصمحاه
ة الالذقي
ادلب
احلسكة
دير الزور
طرطوس
الرقة
درعا
السويداءالقنيطرة
ة سوري
0%
10%
20%
30%
40%
50%
60%
70%
0%5%10%15%20%25%
النساءمعدل البطالة لدى
الرجالمعدل البطالة لدى
خط التساوي

Ministry of Social Affairs and Labor UNDP
(Study of Labor Market in Syria 2009‐2010) 139
4.8% of the unemployed women were previously offered a work but they did not accept it. That ratio was about 5.7 among men. Despite the convergence rates between the two sexes, the reasons for non-acceptance vary, as women do not pay utmost importance to the financial issues (18% of women did not accept the offered work for inadequate of pay, compared to 46% for males), but they give importance to the nature and conditions of employment as shown in the diagram below:
Chart 173: Reasons for not accepting a work among the unemployed by sex
Source: Joint Survey of Labor Force 2009
4.6 Women's employment: Untapped benefits and 4.6.1 Incentives and motivations of women's employment Several studies have focused on the question of the economic contribution of women in the Arab world, and showed several constraints and factors that hinder the intensification of women's contribution to the economy. The situation in Syria is not different from the rest of the Arab countries. The central issue is still relevant to education, which plays the most prominent role in determining the level of women's economic performance, as the higher the educational level of women is the more likely is their opportunity to research and get a job. Education has its impact on the economic participation of women either directly through the knowledge and experience it provides to qualify her to do different businesses, or indirectly through the positive impact of education on several other variables that in turn controls the economic contribution of women. The following chart shows one of these elements that clarify the disparity in procreation between illiterate women and educated women (higher than secondary level):
Chart 174: Evolution of the number of family members under the age of 15 years and its relationship to the educational level of wife and homemaker
Source: Joint Survey of Labor Force 2009

Ministry of Social Affairs and Labor UNDP
(Study of Labor Market in Syria 2009‐2010) 140
As it is clear that the higher the educational level of the woman is, the fewer children she will have, this enables her to leave home and enter the labor market more easily. The Joint Survey of Labor Force 2009 shows that the economic activity rate of the wife and housewife shrink with the multiplication of the number of children under 15 years; thus, if such rate is approximately 17% when a woman has one child, it is reduced to less than 6% if the number of children rises to 4.
Chart 175: Evolution of the economic activity rate of the wife and homemaker by the number of family members under 15 years
Source: Joint Survey of Labor Force 2009
Despite the connection of economic performance with the social, family and marital barriers, women resort to work because of economic need, as the survey results show that the wife resorts to work if the husband’s income decreases in order to help him meet the needs of the family.
Chart 176: Evolution of the activity rate of the wife and the its relationship to the level of income of the spouse
Source: Joint Survey of Labor Force 2009
The above chart shows that the rate of economic participation of women to rises to about 18% when the husband's income is less than 3,000 SP per month, then drops to less than 7% on average if the husband's income is between 3,000 and 16,000 SP. We also notice that the economic contribution of women rises again when the husband's income exceeds 16.000 SP a month. This is due to the high level of women’s education, as women married to high income people have higher educational level than the rest of the women. the following chart shows the evolution of the economic activity rate of the wife by educational status and its relationship to the level of income of the husband, but it reaffirms the importance of educational level among women and in particular to obtain a high school certificate to enter the labor market. We notice that the work of the educated women is less tied men’s income.

Ministry of Social Affairs and Labor UNDP
(Study of Labor Market in Syria 2009‐2010) 141
Chart 177: Evolution of the activity rate of the wife by educational status and its relationship to the husband’s level of income
Source: Joint Survey of Labor Force 2009 4.6.2 Women's income from work: between equality and the phenomenon of hidden discrimination The results of the Joint Survey of Labor Force 2009 show that the average monthly wage is 11.432 SP for males and 11.106 SP for females, if the workers without pay are not considered, and 11.019 for males and 10.074 for females if workers without pay are considered. Therefore, the income of males exceeds the income of the female by 2.3% or 9.4% in both cases (whereas the results of annual survey for the year 2009 show that the average monthly income for females exceeds its counterpart for females (paragraph 9.2: Income from work), and this difference is due to the time periods when these surveys were conducted. The rates of monthly income do not significantly differ between men and women and the difference remains about 9% in favor of men. It is clear from the geographical distribution that the situation varies from one governorate to another, as the average income of women exceeds the income of men in each of Rakka, Kuneitra, Daraa, Hassaka and Aleppo, whereas the opposite situation is true in the other governorates, especially in Deir Ezzour, Hama and Tartous.
Chart 178: Monthly income from the main work: a comparison between women and men
Source: Joint Survey of Labor Force 2009
دمشقحلب
ريف دمشق
محص
محاه
ة الالذقي
ادلب
احلسكة
دير الزور
طرطوس الرقةالسويداءدرعا القنيطرة
ة سوري
6
7
8
9
10
11
12
13
678910111213
رجل -الدخل الشھري من العمل الرئيسي
مرأة -الدخل الشھري من العمل الرئيسي
)ألف ل س(
خط التساوي
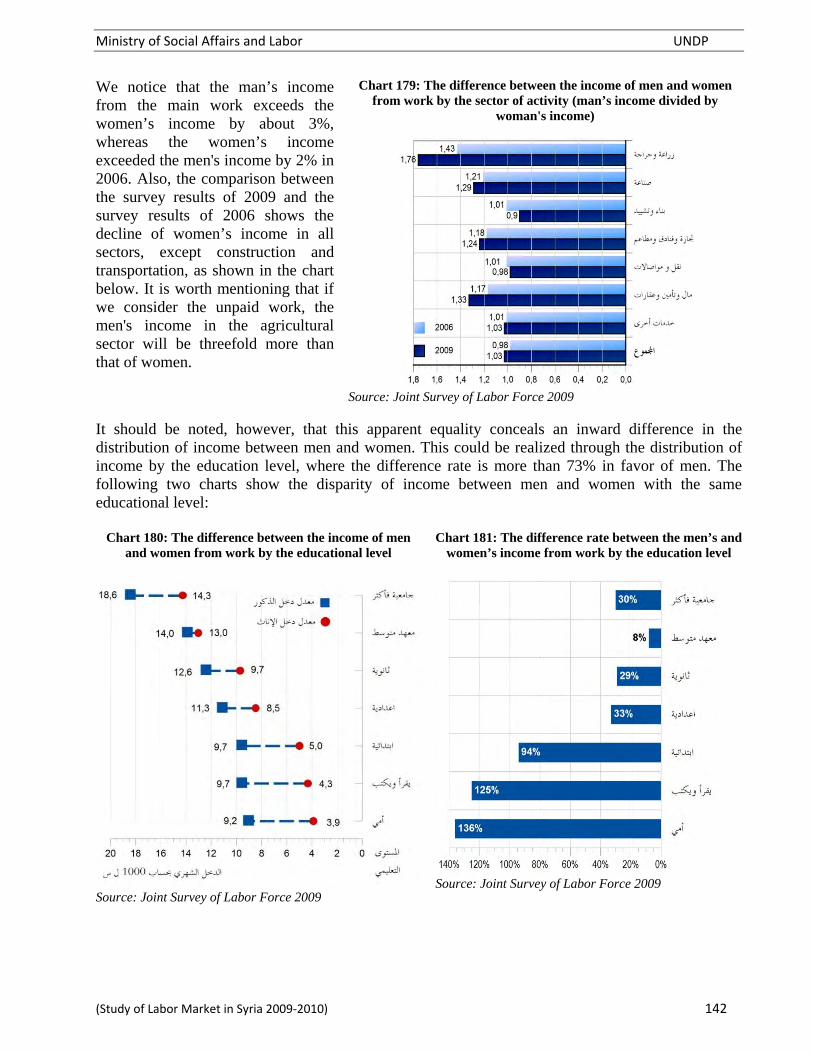
Ministry of Social Affairs and Labor UNDP
(Study of Labor Market in Syria 2009‐2010) 142
We notice that the man’s income from the main work exceeds the women’s income by about 3%, whereas the women’s income exceeded the men's income by 2% in 2006. Also, the comparison between the survey results of 2009 and the survey results of 2006 shows the decline of women’s income in all sectors, except construction and transportation, as shown in the chart below. It is worth mentioning that if we consider the unpaid work, the men's income in the agricultural sector will be threefold more than that of women.
Chart 179: The difference between the income of men and women from work by the sector of activity (man’s income divided by
woman's income)
Source: Joint Survey of Labor Force 2009
It should be noted, however, that this apparent equality conceals an inward difference in the distribution of income between men and women. This could be realized through the distribution of income by the education level, where the difference rate is more than 73% in favor of men. The following two charts show the disparity of income between men and women with the same educational level:
Chart 180: The difference between the income of men and women from work by the educational level
Source: Joint Survey of Labor Force 2009
Chart 181: The difference rate between the men’s and women’s income from work by the education level
Source: Joint Survey of Labor Force 2009

Ministry of Social Affairs and Labor UNDP
(Study of Labor Market in Syria 2009‐2010) 143
4.6.3 Women’s employment reduces poverty and improves living standards The results of the Joint Survey of Labor Force 2009 show that women's employment reduces poverty and improves the living standards of the households. Many indicators confirm such relationship, as it is evident that the families’ living standard significantly improves if women are employed. We notice that in such case the rate of households with weak and very weak level declines to 13% (compared to 41% if women are not employed). The rate of households with very high level reaches 53% compared with 17% in the absence of women's work. The following two charts show this relationship:
Chart 182: The relationship of women’s employment and improving the household’s living standard
The positive impact of women’s employment on the living condition of the household can also be confirmed through observing the improvement of such condition with the rise of the economic performance of women shown in the following chart by both the employment rate and the activity rate that exceed 25% among the households with a very high living condition compared to an employment rate of not more than 3.5% among the households suffering from low and very low living condition.
Chart 183: The household’s living standard and the level of women’s economic participation

Ministry of Social Affairs and Labor UNDP
(Study of Labor Market in Syria 2009‐2010) 144
The following chart shows the relationship between the poverty rate according to the results of General Census of 2004 and the low economic performance of women, which confirms the importance of women's employment in fighting poverty and improving the living conditions of the household: Chart 184: Comparative distribution of the poverty rate and the women’s activity rate by the governorates (2009)
All governorates
with the exclusion of Sweida, Damascus Countryside and Deir Ezzour
Source: Data of the Central Bureau of Statistics (Study of Poverty Map in Syria) and Survey of Labor Force 2009 4.6.4 Women outside the labor force: the untapped potential
A significant ratio of women remains outside the labor force, as more than 4.1 million women of working age, who are not dedicated to studying, do not contribute to the economic cycle. This group includes 2.1 million young females who are in the economically active age (15-35 years) 45% of which are holding the primary school certificate and over, as shown in the following chart:
Chart 185: Distribution of women devoted to domestic work by educational status
Source: Joint Survey of Labor Force 2009
These results confirm the importance of obtaining a high school certificate for women to be able to attain the scientific level qualifying them to enter the labor market. The rate of women holding more than the high school level, who are dedicated to domestic work, remains confined to 8.1% representing about 330 thousand women.
دمشق
حلب
ريف دمشق
محصةمحاه الالذقي
ادلباحلسكة
دير الزورطرطوس
الرقةدرعا
السويداء
القنيطرة
ة سوري
R² = 0,1471
0%
2%
4%
6%
8%
10%
12%
14%
16%
18%
20%
0%10%20%30%40%
نسبة الفقر
معدل نشاط المرأة
حلب
محصةمحاه الالذقي
ادلباحلسكة
طرطوس
الرقةدرعا
القنيطرة
ة سوري
R² = 0,5694
0%
2%
4%
6%
8%
10%
12%
14%
16%
18%
20%
0%10%20%30%40%
نسبة الفقر
معدل نشاط المرأة
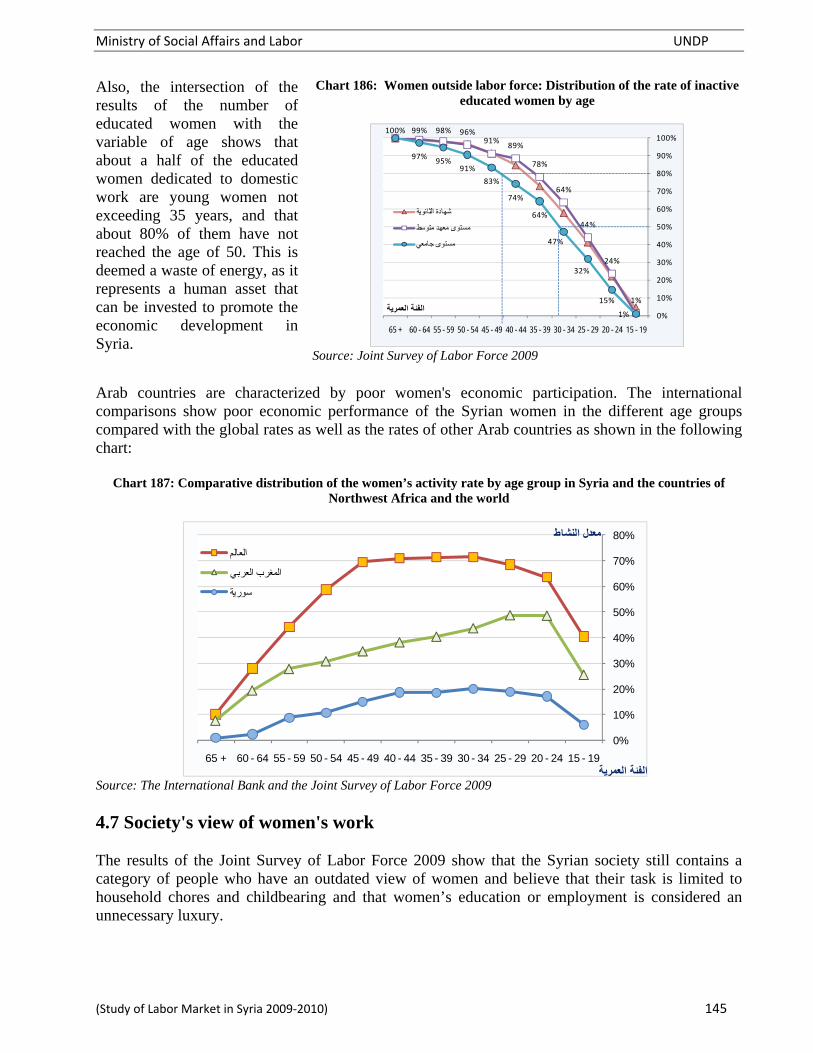
Ministry of Social Affairs and Labor UNDP
(Study of Labor Market in Syria 2009‐2010) 145
Also, the intersection of the results of the number of educated women with the variable of age shows that about a half of the educated women dedicated to domestic work are young women not exceeding 35 years, and that about 80% of them have not reached the age of 50. This is deemed a waste of energy, as it represents a human asset that can be invested to promote the economic development in Syria.
Chart 186: Women outside labor force: Distribution of the rate of inactive educated women by age
Source: Joint Survey of Labor Force 2009
Arab countries are characterized by poor women's economic participation. The international comparisons show poor economic performance of the Syrian women in the different age groups compared with the global rates as well as the rates of other Arab countries as shown in the following chart:
Chart 187: Comparative distribution of the women’s activity rate by age group in Syria and the countries of Northwest Africa and the world
Source: The International Bank and the Joint Survey of Labor Force 2009 4.7 Society's view of women's work The results of the Joint Survey of Labor Force 2009 show that the Syrian society still contains a category of people who have an outdated view of women and believe that their task is limited to household chores and childbearing and that women’s education or employment is considered an unnecessary luxury.
1%
24%
44%
64%
78%
89%91%
96%98%99%100%
1%
15%
32%
47%
64%
74%
83%
91%95%
97%
0%
10%
20%
30%
40%
50%
60%
70%
80%
90%
100%
15 - 1920 - 2425 - 2930 - 3435 - 3940 - 4445 - 4950 - 5455 - 5960 - 6465 +
شھادة الثانوية
مستوى معھد متوسط
مستوى جامعي
الفئة العمرية
0%
10%
20%
30%
40%
50%
60%
70%
80%
15 - 1920 - 2425 - 2930 - 3435 - 3940 - 4445 - 4950 - 5455 - 5960 - 6465 +
العالم
المغرب العربي
سورية
العمرية الفئة
معدل النشاط

Ministry o
(Study of L
The Joindistinguifirst timeview ofconfirmesociety iquarter women's advocateconditionthat wundesirab
The respreviouslto womeconomicsurveyedemploymexpensesdistributiwomen’sa clear dshown in
The resurelationshof womeparticipateconomicperformaconservawomen’sthe less respect. Tthe relattitude and the rparticipat
of Social Affai
Labor Market in
nt Survey ofshed by beie, with the f women's ed a conservin this fieldof the Sywork, mor
it unlens, and mor
women's wble in all cas
ults also cly addresseden’s resort c need, as
d acceptment to as. The ion of the sos employmendisparity betn the followin
ults confirmhip betweenen's work ation of wc field, as tance declinative areas s employmenconservativeThe followilationship of women’rate of womtion by the g
rs and Labor
n Syria 2009‐20
f Labor Forcing interestequestion ofwork. Th
vative situatd, as only leyrians advoe than a thiess underre than 41%
work is ses.
confirmed d issue rela
to work 19% of
t womeassist in
geographiociety’s viewnt also showtween areas ng chart:
m the obvion society's viand the act
women in their economnes in min respect nt and risese areas in tng chart shobetween s employm
men’s economgovernorates
010)
ce 2009 is ed, for the f society's he results ion of the ess than a ocate the ird do not r certain % consider
absolutely
the ated for the n’s the ical
w to wed
as
Ch
ous iew tual the
mic most
of s in this oes the
ment mic s:
Chart 1
y =
ل
Chart 188:
hart 189: the a
190: The relatthe rate
طرطوس
يداء
0.4066x + 0.044R² = 0.6618
رأة في جميع األحوال
Distribution ow
attitude to wo
tionship betwee of women's
حماه
الالذقية
عا
السوي
4
يستحبون عمل المرأ
of responses awomen's work
men's work b
een the attitudeconomic par
شق
حم
ا
لرقة
درعا
نسبة الذين ي
ي للمرأة
UN
according to at
by the governo
de to women's rticipation
دمشحمصمشق
ادلبالحسكة
ر
الالقنيطرة
سورية
ل النشاط االقتصادي
NDP
146
ttitude to
orates
work and
حلب
ريف ددير الزور
معدل

Ministry of Social Affairs and Labor UNDP
(Study of Labor Market in Syria 2009‐2010) 147
Section III: The Study of Demand for Labor Force
Ministry of Social Affairs and Labor UNDP
(Study of Labor Market in Syria 2009‐2010) 148
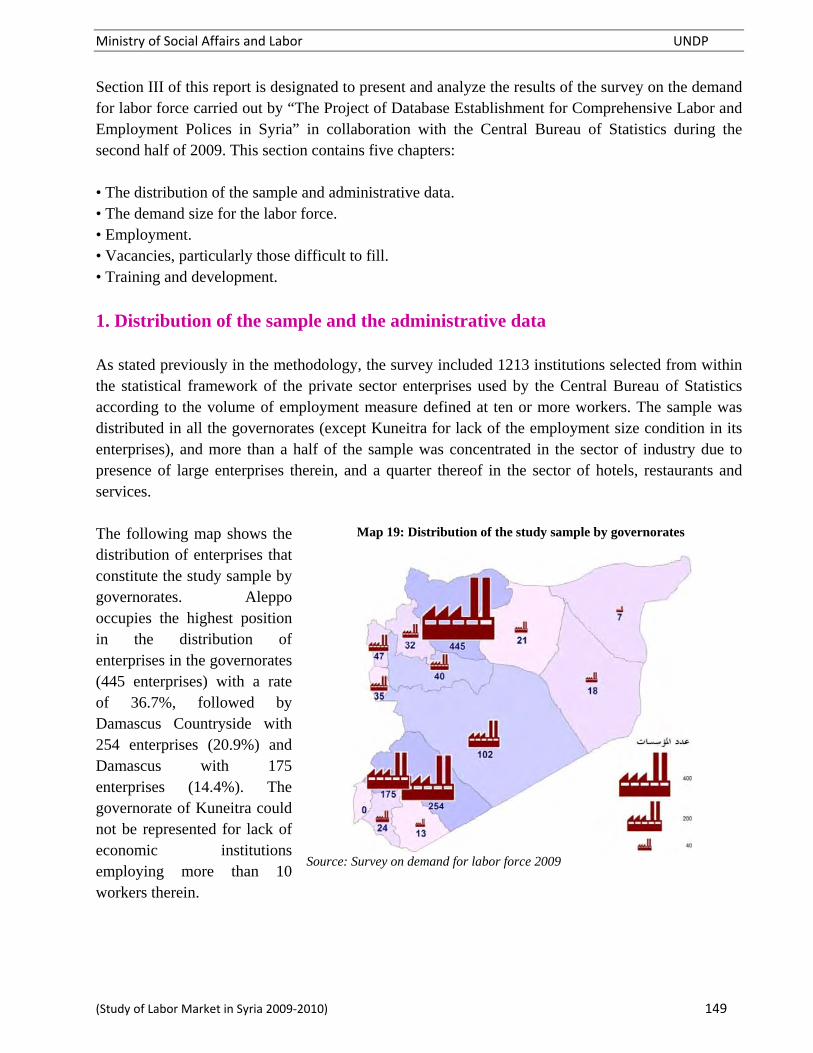
Ministry of Social Affairs and Labor UNDP
(Study of Labor Market in Syria 2009‐2010) 149
Section III of this report is designated to present and analyze the results of the survey on the demand for labor force carried out by “The Project of Database Establishment for Comprehensive Labor and Employment Polices in Syria” in collaboration with the Central Bureau of Statistics during the second half of 2009. This section contains five chapters: • The distribution of the sample and administrative data. • The demand size for the labor force. • Employment. • Vacancies, particularly those difficult to fill. • Training and development.
1. Distribution of the sample and the administrative data As stated previously in the methodology, the survey included 1213 institutions selected from within the statistical framework of the private sector enterprises used by the Central Bureau of Statistics according to the volume of employment measure defined at ten or more workers. The sample was distributed in all the governorates (except Kuneitra for lack of the employment size condition in its enterprises), and more than a half of the sample was concentrated in the sector of industry due to presence of large enterprises therein, and a quarter thereof in the sector of hotels, restaurants and services. The following map shows the distribution of enterprises that constitute the study sample by governorates. Aleppo occupies the highest position in the distribution of enterprises in the governorates (445 enterprises) with a rate of 36.7%, followed by Damascus Countryside with 254 enterprises (20.9%) and Damascus with 175 enterprises (14.4%). The governorate of Kuneitra could not be represented for lack of economic institutions employing more than 10 workers therein.
Map 19: Distribution of the study sample by governorates
Source: Survey on demand for labor force 2009
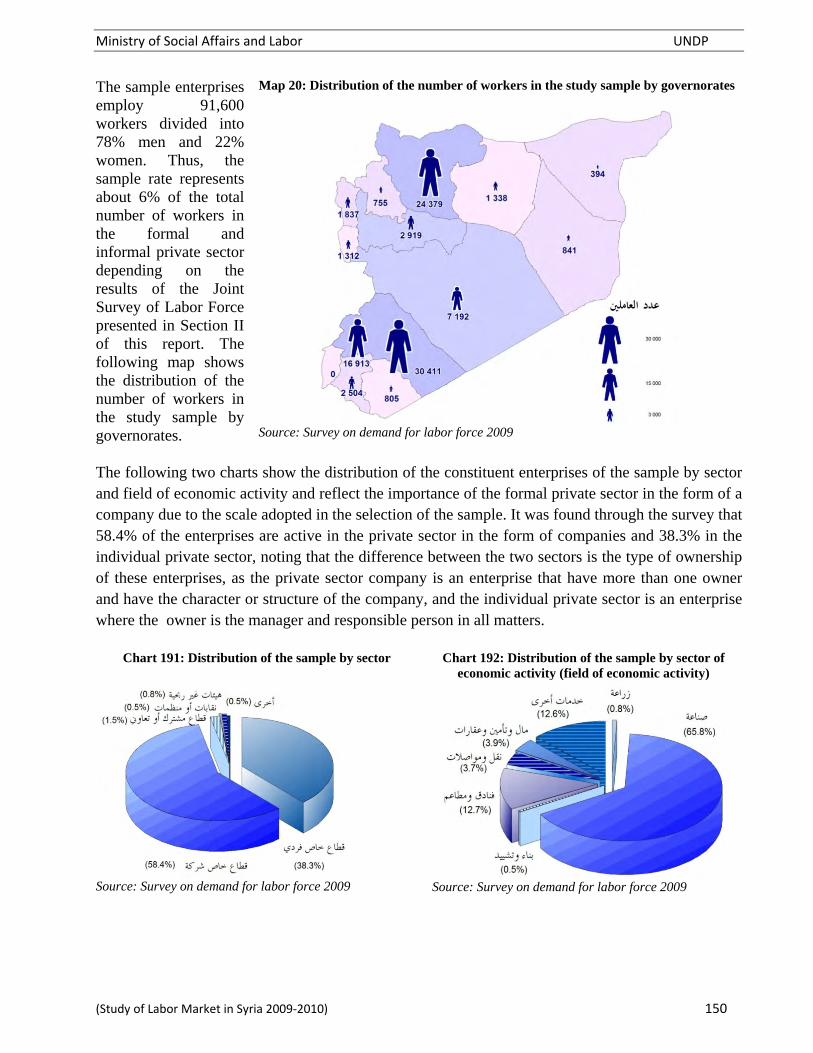
Ministry of Social Affairs and Labor UNDP
(Study of Labor Market in Syria 2009‐2010) 150
The sample enterprises employ 91,600 workers divided into 78% men and 22% women. Thus, the sample rate represents about 6% of the total number of workers in the formal and informal private sector depending on the results of the Joint Survey of Labor Force presented in Section II of this report. The following map shows the distribution of the number of workers in the study sample by governorates.
Map 20: Distribution of the number of workers in the study sample by governorates
Source: Survey on demand for labor force 2009
The following two charts show the distribution of the constituent enterprises of the sample by sector and field of economic activity and reflect the importance of the formal private sector in the form of a company due to the scale adopted in the selection of the sample. It was found through the survey that 58.4% of the enterprises are active in the private sector in the form of companies and 38.3% in the individual private sector, noting that the difference between the two sectors is the type of ownership of these enterprises, as the private sector company is an enterprise that have more than one owner and have the character or structure of the company, and the individual private sector is an enterprise where the owner is the manager and responsible person in all matters.
Chart 191: Distribution of the sample by sector
Source: Survey on demand for labor force 2009
Chart 192: Distribution of the sample by sector of economic activity (field of economic activity)
Source: Survey on demand for labor force 2009

Ministry of Social Affairs and Labor UNDP
(Study of Labor Market in Syria 2009‐2010) 151
It should be recalled that the results of the survey on labor force offer presented in Section II of this report (the Joint Survey of Labor Force 2009) show that the constituent companies of the private sector in the form of a company employ about 191 thousand workers, compared to 1.33 million in the individual private sector. On the other hand we notice the importance of the industrial sector, as two thirds of the sample belong to that sector, followed by the sector of hotels and restaurants and the services sector. Also, we recall that this distribution is normal by reference to the sample selection criteria. According to the year of starting work for the component enterprises of the sample, it is clear that their average age is no more than 18 years, noting that the enterprises operating in the agricultural sector are the oldest, as the average date of their establishment goes back to 1981, and the enterprises operating in the construction sector are the most recent, as the average year of their creation is 1998 compared with 1992 as a general average date of establishment of the constituent enterprises of the sample. The following charts show the distribution of the study sample by the average year of establishment, the activity sector and the size groups.
Chart 193: Distribution of the study sample by the average year of establishment, the activity sector and the size groups
Source: Survey on demand for labor force 2009
For more information on the scientific level of the declarer of data (people who fill out the questionnaire) it is found that 53% of them hold a university degree or more, and the rate of those obtaining the certificate of junior high or less is 16.5%, noting that the persons delivering the data are distributed between the owner of the facility (33.5%), a general manager or an official (22.6%), an employee in human resources (13.8%) or an official responsible for other administrative departments in the enterprise (30.2%).
Chart 194: Distribution of the study sample by the position of the declarer of data
Source: Survey on demand for labor force 2009
Chart 195: Distribution of the study sample by the educational status of the declarer of data
Source: Survey on demand for labor force 2009

Ministry of Social Affairs and Labor UNDP
(Study of Labor Market in Syria 2009‐2010) 152
2. The size of demand for labor force The survey cared for identifying the size of demand for labor and considered the most important factors affecting this area in terms of the results achieved during the 12 months preceding the survey, and the expected results during the 12 months following it, which represents the reference period of the survey. To simplify the presentation we sometimes use "2009" to symbolize the year preceding the date of the survey and "2010" to symbolize the year subsequent to the date of the survey. The following factors have been identified: • The size of production, sales and services in the past and in the future.
• The size of economic activity of the enterprise in the past and in the future.
• The number of full-time workers in the past and in the future.
• The new investments of the enterprise in the future.
• The rate of export in the past and in the future.
2.1 The change, occurred and expected, in the volume of production and labor The enterprises witnessed, during the year preceding the date of the survey, a relative decrease in their activity, both at the level of production volume or the labor volume which declined by 0.5%. The decline concerns in particular the enterprises employing less than 50 workers and active in the sectors of industry, transport, and construction. However, the enterprises operating in other sectors or of a size exceeding 50 workers witnessed a positive development in the labor volume. The following charts show the rates of change, occurred and expected, in the volume of labor by sectors of economic activity: Chart 196: The change of production volume during
2009 by sector of activity
Source: Survey on demand for labor force 2009
Chart 197: The change of labor during 2009 by sector of activity
Source: Survey on demand for labor force 2009
Agriculture Construction
Trade Services
Total Total
Industry
Agriculture Construction
Trade Services
Total Total
Industry
Greatly increased
Slightly increased
Remained unchanged
Greatly decreased
Slightly decreased
Greatly increased
Slightly increased
Remained unchanged
Greatly decreased
Slightly decreased

Ministry of Social Affairs and Labor UNDP
(Study of Labor Market in Syria 2009‐2010) 153
Chart 198: The change of production volume during 2010 by sector of activity
Source: Survey on demand for labor force 2009
Chart 199: The change of labor during 2010 by sector of activity
Source: Survey on demand for labor force 2009
It becomes generally clear that the enterprises expect an improvement in the volume of activity during the year following the survey date in comparison with what has been achieved during the previous year. The chart below illustrates, on the one hand, that half of the firms do not expect an increase in the volume of labor, and shows, on the other hand, that more than one third of the firms expect an increase in the number of employees, although the increase occurred only in one fifth of the enterprises during the past 12 months.
Chart 200: Distribution of enterprises by the registered and expected change in the volume of labor
Source: Survey on demand for labor force 2009
An indicator of the change, occurred and expected, in the volume of production and labor can be calculated by the five-stairs scale adopted in the survey (See the annex including the questionnaire of the demand for labor force 2009), with number 3 in the middle corresponds to unchanging status, the increase corresponds to more than 3 and the decrease to less than 3. The two charts below show the distribution of enterprises by the indicator of change, registered and expected, in the volume of labor and production and the categories of the enterprises size, on the one hand, and the sector of activity, on the other. It is clear that the most important results are the following:
• The expected change is better than the occurred change either in the volume of production (3.13 versus 2.52) or in the volume of labor (3.09 versus 2.81).
• The enterprises employing less than 50 workers experienced greater challenges than those employing more than 50 workers.
• The enterprises active in the sectors of industry, transportation and construction witnessed a decline in their activities during the 12 months preceding the date of the survey and expect a recovery of less important than that expected by the enterprises operating in the sectors of agriculture and services.
Greatly increased
Slightly increased
Remained unchanged
Greatly decreased
Slightly decreased
Greatly increased
Slightly increased
Remained unchanged
Greatly decreased
Slightly decreased
Agriculture Construction
Trade Services
TotalTotal
Industry Agriculture Construction
Trade Services
Total Total
Industry
Greatly increased
Slightly increased
Remained unchanged
Greatly decreased
Slightly decreased

Ministry of Social Affairs and Labor UNDP
(Study of Labor Market in Syria 2009‐2010) 154
Chart 201: Distribution of enterprises by the indicator of change, registrar and expected, in the volume of labor and production and the size categories of enterprises
Source: Survey on demand for labor force 2009
Chart 202: Distribution of enterprises by the indicator of change, registrar and expected, in the volume of labor,
production and sector of activity
Source: Survey on demand for labor force 2009
Expected Change in labor number
Expected Change in production size
Sector of Activity
Total
Services
Trade
Industry
Building & Construction
Agriculture
Increase Decrease
Change occurred in labor number Expected Change in labor number
Change occurred in production size Expected Change in production size
Increase Decrease
Size of enterprises
Over 500 workers
Total
201 - 500 workers
101 - 200 workers
51 - 100 workers
21 - 50 workers
10 – 20 workers
Change occurred in labor number
Expected Change in production size

Ministry of Social Affairs and Labor UNDP
(Study of Labor Market in Syria 2009‐2010) 155
The following two charts show the position of enterprise by the indicator related to the registered and expected change in the volume of production and the volume of labor by the governorates. We notice that only the enterprises existing in Rakka and Sweida experienced positive development in the volume of production during the past 12 months, and that the enterprises existing in Idleb and Deir Ezzour experienced, during the year preceding the date of the survey and will witness during the year subsequent to the survey, a decline in the volume of production.
Chart 203: Distribution of enterprises by the indicator of registered and expected change in the volume of production and the governorates
Source: Survey on demand for labor force 2009
As for the production volume of the enterprises existing in the other governorates, it is expected to increase over the past year. As well, no decline is expected in respect of the volume of labor except in the enterprises existing in Hassaka and Idleb. Despite the decline observed during the year preceding the date of the survey in each of Damascus, Aleppo, Homs, Tartous and Hama, the volume of labor is expected to increase in the enterprises existing in those governorates.
Chart 204: Distribution of enterprises by the indicator of registered and expected change in the volume of labor and the governorates
Source: Survey on demand for labor force 2009

Ministry o
(Study of L
Regardinfor decproductiofor maintwithout followingthe impissues reconomictheir impcost of pthus thestagnatio
It is clearas the rearesulting competitin additiofuel and economicproductioexplain th 2.2 The The resufor laborof the enin the voyear submodest increase)of enteinvestmedistributibetween increase investmein the following
of Social Affai
Labor Market in
ng the reacrease in on volume taining its st
increase, g chart indicortance of related to c conditionspact on the hproduction, e tendency
on and deflat
r that the ecason for the from the fi
ion basicallyon to the chasome raw m
c crisis, the on and the nhat by the ge
e change in
lts of the sur force 2009 nterprises exolume of prbsequent to
increase ). It was shoerprises plents. Thion shows
the two in productio
ents that willvolume of
g chart show
rs and Labor
n Syria 2009‐20
sons the or
tatus the
cates the the
and high and
y to tion.
C
Source
conomic condecrease in
inancial crisy. Most enteanges in ecomaterials. Ifmajority of
number of eeneral econo
n the occu
urvey on the showed tha
xpected an oduction duthe survey: and 5.9%
own also thalanned to
he geogthe rela
variables on capacity l lead to an f productio
ws such distri
010)
Chart 205: Cau
e: Survey on de
ditions playproduction
sis and then erprises suffeonomic policf such declinf the companemployees oomic climate
urred and
demand at 46.6% increase
uring the (40.7%
% large at 42.0%
make graphical ationship
as the requires increase
on. The ibution:
C
So
uses of decline
emand for labo
ed the majorvolume in 2the weak p
ered from thcies, such asne can be exnies surveye
over the nexte and compet
expected i
Chart 206: Distnew invest
p
ource: Survey
شق
ذقية
80%
جم االنتاج
e in the volum
or force 2009
r role in det2009 is attribpurchasing phe effects of s trade liberaxplained by ed will expet year, whertition intensi
investmen
tribution of entments and theproduction siz
on demand for
دمشق
ريف دمشقحمص
حماه
الالذ
الحسكةالرقة
درعا
السويداء
ورية
60%
بة توقع تزايد في حج
me of productio
termining thbuted to the power, the cf the economalization, an the effects ect an increareas those wity.
nt and exp
nterprises by e expectation
ze and the gov
r labor force 20
حلبدير الزور
طرطوسسو
2040%
نسبة
مارات جديدة
UN
on expected in
e volume ofeconomic coosts rise and
mic crisis at td the rising of the finan
ase in the vowho expect a
ort
the expectatiorates of increaernorates
009
ادلب
0
1
2
3
4
5
6
7
8
0%0%
بة توقع برمجة استثم
NDP
156
n 2010
f activity, onditions d intense that time, prices of
ncial and olume of a decline
on rates of ase in
0%
0%
20%
30%
40%
50%
60%
70%
نسب80%

Ministry of Social Affairs and Labor UNDP
(Study of Labor Market in Syria 2009‐2010) 157
The investment represents the most important elements identified for the development of labor demand. The results of a survey on the demand for labor force 2009 shows that the expected economic activity is related to the sectors of agriculture, trade and construction, as more than a half of the establishments belonging to these sectors intend to make investments contrary to both sectors of services and industry. The results also highlighted the relative recession of the small size establishment compared with the large enterprises as shown in the following chart:
Chart 207: Distribution of enterprises by the expectation rates of new investments, the sectors of activity and the volume of
enterprises
Source: Survey on demand for labor force 2009
The reasons for refraining from making new investments are mainly attributed to the state of stagnation and recession in some sectors, market tightness, intense competition and high costs. Attention should also be drawn to the poor performance of the financial and banking sector, as the lack of the financial resources represents a barrier towards investment for more than 23% of the enterprises as shown in the following chart:
Chart 211: Distribution of enterprises by the rates of reasons for the lack of new investments
Source: Survey on demand for labor force 2009
It is also clear that the human resources do not represent an obstacle neither in terms of increasing production nor in terms of making new investments because only 6.3% of the enterprises that do not intend to make investment complain of lack of skill and labor, and this is mainly related to the enterprises operating in the finance and insurance sector (13.6% complained of lack of skill and labor) as well as in the sector of restaurants and hotels (10%).

Ministry of Social Affairs and Labor UNDP
(Study of Labor Market in Syria 2009‐2010) 158
The results of the survey on the demand for labor force 2009 also addressed the prevailing ideas that the machine makes up for the labor and reduces the creation of job opportunities. It became clear that more than 39% of the enterprises in the sample invested in machinery and new technologies during the year preceding the date of the survey, and it was shown that there were a simple positive relationship between the investment in machines or new technologies and the change in the volume of labor, as when the enterprise utilized machines or new technologies, the volume of labor increased slightly as shown in the following chart:
Chart 209: The effect on the number of workers in the facility as a result of the use of machinery or new technology
Source: Survey on demand for labor force 2009
More than 44% of the enterprises in the sample export part of their products or services abroad. This rate reaches 62% in the industrial sector, 50% in the construction sector, 30% in the agricultural sector and 22% in the transportation sector. The rate of exports is about 36.5, and it is expected to rise to 38.7% during the year following the date of the survey. Such rise included all types of enterprises and all sectors except the sectors of construction and services as a slight decline is expected in the rates of export as shown by the following two charts: Chart 210: Distribution of the export rate by sector of
activity
Source: Survey on demand for labor force 2009
Chart 211: Distribution of the export rate by the enterprise size
Source: Survey on demand for labor force 2009
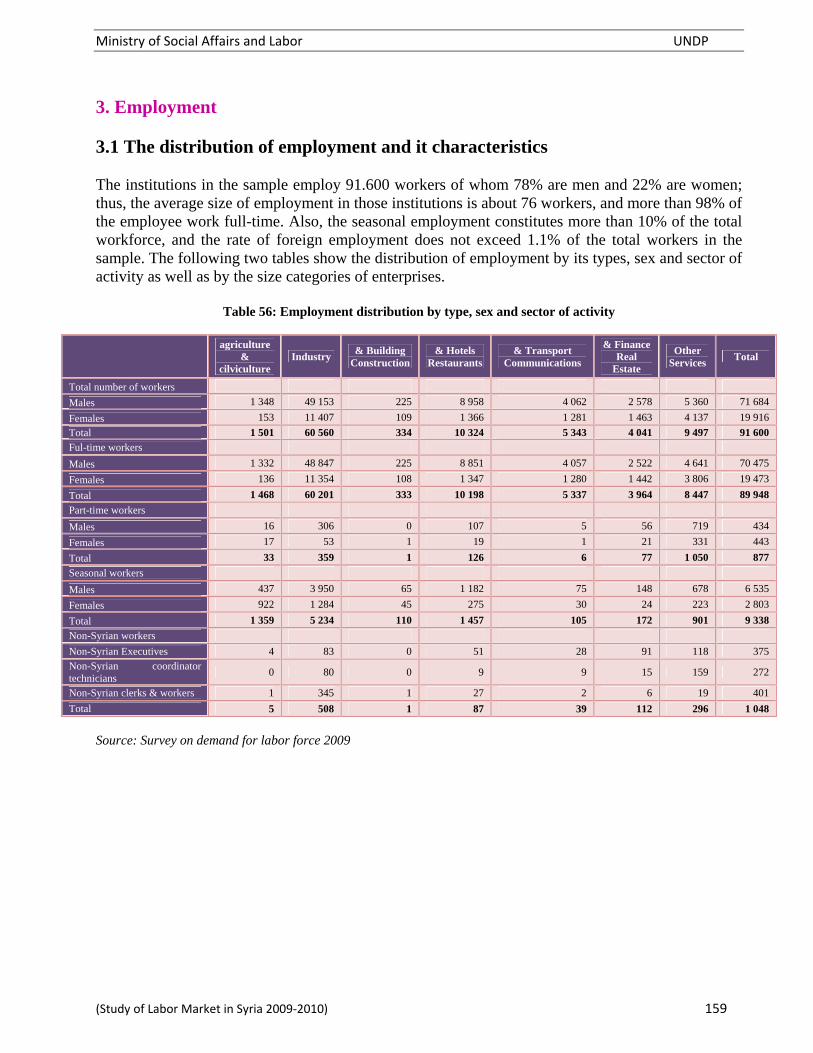
Ministry of Social Affairs and Labor UNDP
(Study of Labor Market in Syria 2009‐2010) 159
3. Employment 3.1 The distribution of employment and it characteristics The institutions in the sample employ 91.600 workers of whom 78% are men and 22% are women; thus, the average size of employment in those institutions is about 76 workers, and more than 98% of the employee work full-time. Also, the seasonal employment constitutes more than 10% of the total workforce, and the rate of foreign employment does not exceed 1.1% of the total workers in the sample. The following two tables show the distribution of employment by its types, sex and sector of activity as well as by the size categories of enterprises.
Table 56: Employment distribution by type, sex and sector of activity
agriculture
&cilviculture
Industry Building &
Construction Hotels &
Restaurants Transport &
Communications
Finance &Real
Estate
Other Services
Total
Total number of workers
Males 1 348 49 153 225 8 958 4 062 2 578 5 360 71 684
Females 153 11 407 109 1 366 1 281 1 463 4 137 19 916
Total 1 501 60 560 334 10 324 5 343 4 041 9 497 91 600
Ful-time workers
Males 1 332 48 847 225 8 851 4 057 2 522 4 641 70 475
Females 136 11 354 108 1 347 1 280 1 442 3 806 19 473
Total 1 468 60 201 333 10 198 5 337 3 964 8 447 89 948
Part-time workers
Males 16 306 0 107 5 56 719 434
Females 17 53 1 19 1 21 331 443
Total 33 359 1 126 6 77 1 050 877
Seasonal workers
Males 437 3 950 65 1 182 75 148 678 6 535
Females 922 1 284 45 275 30 24 223 2 803
Total 1 359 5 234 110 1 457 105 172 901 9 338
Non-Syrian workers
Non-Syrian Executives 4 83 0 51 28 91 118 375 Non-Syrian coordinator technicians
0 80 0 9 9 15 159 272
Non-Syrian clerks & workers 1 345 1 27 2 6 19 401
Total 5 508 1 87 39 112 296 1 048
Source: Survey on demand for labor force 2009

Ministry of Social Affairs and Labor UNDP
(Study of Labor Market in Syria 2009‐2010) 160
Table 57: Employment distribution by types, sex and the size of enterprises
10-20 W 21-50 W 51-100W 101-200 W 201-500 W Over 500 W Total
Total number of workers
Males 4 855 9 296 12 417 13 323 15 561 16 232 71 684
Females 958 2 420 3 789 4 403 4 490 3 856 19 916
Total 5 813 11 716 16 206 17 726 20 051 20 088 91 600
Ful-time workers
Males 4 694 9 003 12 093 13 014 15 440 16 231 70 475
Females 894 2 298 3 700 4 303 4 428 3 850 19 473
Total 5 588 11 301 15 793 17 317 19 868 20 081 89 948
Part-time workers
Males 161 293 324 309 121 1 1 209
Females 64 122 89 100 62 6 443
Total 225 415 413 409 183 7 1 652
Seasonal workers
Males 1 032 1 097 1 149 1 427 1 155 675 6 535
Females 271 352 661 408 1 005 106 2 803
Total 1 303 1 449 1 810 1 835 2 160 781 9 338
Non-Syrian workers
Non-Syrian Executives 7 24 39 58 133 114 375
Non-Syrian coordinator technicians 2 24 18 17 152 59 272
Non-Syrian clerks & workers 14 60 63 49 197 18 401
Total 23 108 120 124 482 191 1 048
Source: Survey on demand for labor force 2009 It is noticeable that the employment of women increases in the mid-sized establishments, as the rate of women exceeds 20% of the total workers in the establishments that employ between 50 and 500 workers, and it decreases to 16.5% in small-sized establishments and to less than 20% in the institutions whose workforce size exceeds 500 workers. We also notice more intensive presence of women in the service sector, as well as the construction sector. This issue is explained by the limited representation of the sample, which included the organized sector (6 institutions in the construction sector), which employs women especially in administrative work.
Chart 212: Distribution of the rate of female employment by sector of activity
Chart 213: Distribution of the rate of female employment by the size of enterprises

Ministry of Social Affairs and Labor UNDP
(Study of Labor Market in Syria 2009‐2010) 161
The results of the survey on the demand for labor force 2009 show that 13% of the surveyed institutions employ workers, and such employment does not exceed 1.1% of total workers in the surveyed institutions. The non-Syrian employment is particularly concentrated in the sector of services (3.1%), finance, insurance and real estate (2.8%), as well as in the group of institutions with an employment size between 200 and 500 workers. It is worth mentioning that the increase of non-Syrian employment in those sectors depends mainly on the recruitment of executives and specialists having the experience and qualifications that are rare locally. Chart 214: Distribution of the rate of non-Syrian employment by sectors of activity
Source: Survey on demand for labor force 2009
Chart 215: Distribution of the rate of non-Syrian employment by the size of enterprises
Source: Survey on demand for labor force 2009
The non-Syrian employment is distributed by the following categories: 36% executive general managers, 26% technicians and coordinators, 38% clerks and workers. Perhaps the reason for the existence of non-Syrian employment in senior positions is the scarcity of qualified local cadre to occupy those positions that usually require extensive and advanced experiences. The other positions have been replaced by Arab or foreign labor because they are, in the opinion of the enterprises, more efficient and disciplined and less expensive. The following chart shows the distribution of non-Syrian employment by governorate, as about 90% of non-Syrian employment is concentrated in four governorates: Damascus Countryside, Damascus, Daraa and Aleppo and this is due to the concentration of the industrial cities and significant investments in these cities. Perhaps the reason for the existence of a high rate non-Syrian employment in the governorate of Daraa is the presence of a large number of private companies and universities that attract non-Syrian staff, professors and specialists in higher education.
Chart 216: the distribution of non-Syrian employment by governorates
Source: Survey on demand for labor force 2009
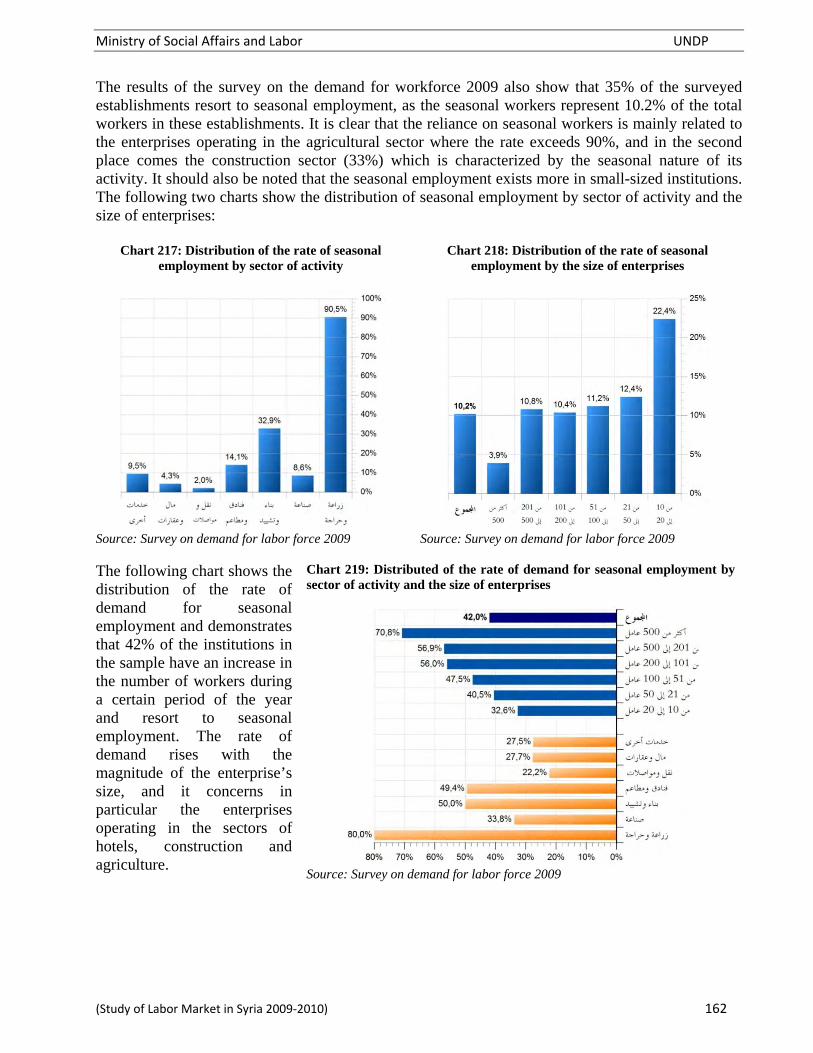
Ministry of Social Affairs and Labor UNDP
(Study of Labor Market in Syria 2009‐2010) 162
The results of the survey on the demand for workforce 2009 also show that 35% of the surveyed establishments resort to seasonal employment, as the seasonal workers represent 10.2% of the total workers in these establishments. It is clear that the reliance on seasonal workers is mainly related to the enterprises operating in the agricultural sector where the rate exceeds 90%, and in the second place comes the construction sector (33%) which is characterized by the seasonal nature of its activity. It should also be noted that the seasonal employment exists more in small-sized institutions. The following two charts show the distribution of seasonal employment by sector of activity and the size of enterprises:
Chart 217: Distribution of the rate of seasonal employment by sector of activity
Source: Survey on demand for labor force 2009
Chart 218: Distribution of the rate of seasonal employment by the size of enterprises
Source: Survey on demand for labor force 2009
The following chart shows the distribution of the rate of demand for seasonal employment and demonstrates that 42% of the institutions in the sample have an increase in the number of workers during a certain period of the year and resort to seasonal employment. The rate of demand rises with the magnitude of the enterprise’s size, and it concerns in particular the enterprises operating in the sectors of hotels, construction and agriculture.
Chart 219: Distributed of the rate of demand for seasonal employment by sector of activity and the size of enterprises
Source: Survey on demand for labor force 2009

Ministry of Social Affairs and Labor UNDP
(Study of Labor Market in Syria 2009‐2010) 163
The employment increases in the summer as a result of the rise in the productivity of some economic activities, thus the increasing demand for labor, as about 70% of the demand for seasonal labor intensifies in the summer. Resorting to seasonal employment occurs also in the month of Ramadan (7.1%) and holidays (13%) as well as when necessary owing to market demand (9%) as shown in the chart below:
Chart 220: Distribution of the demand for seasonal employment by seasons and events
Source: Survey on demand for labor force 2009
The seasonal employment is limited to about three months and a half a year as the institutions rely on seasonal employment for a period of 3.6 months in the year and this period is common among the various types of institutions and sectors except the sector of construction as it extends for five months. The following chart shows this distribution:
Chart 221: Distribution of the number of months in which the seasonal employment occurs by sector of activity and size
Source: Survey on demand for labor force 2009
3.2 Change of employment and workforce turnover The survey of the demand on labor force 2009 considered the issue of the change in workforce turnover during the year preceding the date of the survey with a view to understand the importance of this phenomenon and find out the rates of appointment and leaving work and its causes. The survey results show that about fifth of the employers care about the human resources mobility. The appointment rate (of those appointed in the last 12 months of the total workforce) is 20.1%. The following tables give the detailed results distributed by the sector of activity, size groups of enterprises and governorates:

Ministry of Social Affairs and Labor UNDP
(Study of Labor Market in Syria 2009‐2010) 164
Table 58: Distribution of employment change during the past year by types, sex, and sectors of Activity
agriculture
&silviculture
Industry Building &
Construction Hotels &
Restaurants Transport &
Communications
Finance &Real
Estate
Other Services
Total
Total Number of Employee
Males 1 348 49 153 225 8 958 4 062 2 578 5 360 71 684
Females 153 11 407 109 1 366 1 281 1 463 4 137 19 916
Total 1 501 60 560 334 10 324 5 343 4 041 9 497 91 600
Number of workers appointed during the past 12 months
Males 74 10 510 30 1 856 322 697 946 14 435
Females 10 2 390 18 395 77 471 650 4 011
Total 84 12 900 48 2 251 399 1 168 1 596 18 446
Rate of the appointed during the past 12 months of the total employee
Males 5,5% 21,4% 13,3% 20,7% 7,9% 27,0% 17,6% 20,1%
Females 6,5% 21,0% 16,5% 28,9% 6,0% 32,2% 15,7% 20,1%
Total 5,6% 21,3% 14,4% 21,8% 7,5% 28,9% 16,8% 20,1%
Number of those leaving work during the past 12 months
Males 79 11 827 45 1 863 409 386 546 15 155
Females 7 2 664 17 305 133 237 413 3 776
Total 86 14 491 62 2 168 542 623 959 18 931
Rate of those leaving work during the past 12 months of the total employee
Males 5,9% 24,1% 20,0% 20,8% 10,1% 15,0% 10,2% 21,1%
Females 4,6% 23,4% 15,6% 22,3% 10,4% 16,2% 10,0% 19,0%
Total 5,7% 23,9% 18,6% 21,0% 10,1% 15,4% 10,1% 20,7%
Net change in the number of employee during the past 12 months
Males -5 -1 317 -15 -7 -87 311 400 -720
Females 3 -274 1 90 -56 234 237 235
Total -2 -1 591 -14 83 -143 545 637 -485
Source: Survey on demand for labor force 2009
Table 59: Distribution of employment change during the past year by types, sex and size groups of enterprises
10-20 W 21-50 W 51-100W 101-200 W 201-500 W Over 500 W Total
Total Number of Employee
Males 4 855 9 296 12 417 13 323 15 561 16 232 71 684
Females 958 2 420 3 789 4 403 4 490 3 856 19 916
Total 5 813 11 716 16 206 17 726 20 051 20 088 91 600
Number of workers appointed during the past 12 months
Males 1 601 2 415 2 614 2 984 2 908 1 913 14 435
Females 255 631 794 946 824 561 4 011
Total 1 856 3 046 3 408 3 930 3 732 2 474 18 446
Rate of the appointed during the past 12 months of the total employee
Males 33,0% 26,0% 21,1% 22,4% 18,7% 11,8% 20,1%
Females 26,6% 26,1% 21,0% 21,5% 18,4% 14,5% 20,1%
Total 31,9% 26,0% 21,0% 22,2% 18,6% 12,3% 20,1%
Number of those leaving work during the past 12 months
Males 1 868 3 407 2 538 2 943 2 516 1 883 15 155
Females 272 770 627 899 689 519 3 776
Total 2 140 4 177 3 165 3 842 3 205 2 402 18 931
Rate of those leaving work during the past 12 months of the total employee
Males 38,5% 36,7% 20,4% 22,1% 16,2% 11,6% 21,1%
Females 28,4% 31,8% 16,5% 20,4% 15,3% 13,5% 19,0%
Total 36,8% 35,7% 19,5% 21,7% 16,0% 12,0% 20,7%
Net change in the number of employee during the past 12 months
Males -267 -992 76 41 392 30 -720
Females -17 -139 167 47 135 42 235
Total -284 -1 131 243 88 527 72 -485
Source: Survey on demand for labor force 2009

Ministry of Social Affairs and Labor UNDP
(Study of Labor Market in Syria 2009‐2010) 165
Table 60: Distribution of employment change during the past year by types, sex and governorates
Damascus Aleppo Rif
Damascus Homs Hama Lattakia Idleb Rakka Deir
Ezzour Tartous Hassaka Daraa Sweida Total
Total Number of Employee Males 11 956 21 230 23 897 4 711 2 511 1 442 549 1 136 743 1 024 294 1 578 613 71 684
Females 4 957 3 149 6 514 2 481 408 395 206 202 98 288 100 926 192 19 916
Total 16 913 24 379 30 411 7 192 2 919 1 837 755 1 338 841 1 312 394 2 504 805 91 600
Number of workers appointed during the past 12 months Males 1 485 5 631 4 452 765 358 455 322 198 80 262 45 329 53 14 435
Females 758 597 1 575 421 56 146 94 30 26 121 17 137 33 4 011
Total 2 243 6 228 6 027 1 186 414 601 416 228 106 383 62 466 86 18 446
Rate of the appointed during the past 12 months of the total employeeنMales 12,4% 26,5% 18,6% 16,2% 14,3% 31,6% 58,7% 17,4% 10,8% 25,6% 15,3% 20,8% 8,6% 20,1%
Females 15,3% 19,0% 24,2% 17,0% 13,7% 37,0% 45,6% 14,9% 26,5% 42,0% 17,0% 14,8% 17,2% 20,1%
Total 13,3% 25,5% 19,8% 16,5% 14,2% 32,7% 55,1% 17,0% 12,6% 29,2% 15,7% 18,6% 10,7% 20,1%
Number of those leaving work during the past 12 months Males 1 384 6 897 4 308 679 392 567 225 158 77 167 18 238 45 15 155
Females 600 670 1 580 493 50 128 70 27 16 67 5 48 22 3 776
Total 1 984 7 567 5 888 1 172 442 695 295 185 93 234 23 286 67 18 931
Rate of those leaving work during the past 12 months of the total employee Males 11,6% 32,5% 18,0% 14,4% 15,6% 39,3% 41,0% 13,9% 10,4% 16,3% 6,1% 15,1% 7,3% 21,1%
Females 12,1% 21,3% 24,3% 19,9% 12,3% 32,4% 34,0% 13,4% 16,3% 23,3% 5,0% 5,2% 11,5% 19,0%
Total 11,7% 31,0% 19,4% 16,3% 15,1% 37,8% 39,1% 13,8% 11,1% 17,8% 5,8% 11,4% 8,3% 20,7%
Net change in the number of employee during the past 12 months Males 101 -1 266 144 86 -34 -112 97 40 3 95 27 91 8 -720
Females 158 -73 -5 -72 6 18 24 3 10 54 12 89 11 235
Total 259 -1 339 139 14 -28 -94 121 43 13 149 39 180 19 -485
Source: Survey on demand for labor force 2009 The results of the survey on the demand for labor force 2009 showed that the enterprises had witnessed during the past year a relative decrease in their activity, whether at the level of production volume, or at the level of the employment volume which declined by 0.5%, as the number of those who left work (18,931) exceeded the number of workers appointed during that period (18.446). That decline was particular to the enterprises active in the sectors of industry, transport and construction, whereas the sector of services, finance and trade witnessed a positive development in the volume of employment.
Chart 222: Distribution of employment change during the past year by sectors of activity
Source: Survey on demand for labor force 2009

Ministry of Social Affairs and Labor UNDP
(Study of Labor Market in Syria 2009‐2010) 166
Also, that decline was particular to the enterprises employing less than 50 workers, whereas the enterprises of a size exceeding 50 workers witnessed a positive development in the volume of employment. If that decline could be explicable by the effect of the financial and economical crisis, then the majority of companies surveyed would expect an increase in the production volume and the number of employees during the next year. It is noticeable that male employment declined (-1.0%), while the employment of women experienced a positive development by 1.2%. The results also showed that the decline in the employee number was concentrated in the governorates of Aleppo, Hama and Lattakia, whereas the enterprises existing in the rest of governorates witnessed a positive development in the number of employee. This can be explained by the nature of the sample consisting mainly of industrial enterprises in the governorate of Aleppo that experienced difficulties during the year preceding the survey date. As for the reasons for leaving work and according to the statements by the enterprises, the statement rate represents but one third of the reasons for leaving work, which is mainly due to personal reason (54.4%) of those leaving the work and often seeking to get a better salary (43.4%) or for reasons of military service (20%), and the poor performance of the worker does not represent, according to the statement of the enterprise’s representative, but 24.4% of the reasons for leaving work.
Chart 223: Distribution of employment change during the past year by size groups of enterprises
Source: Survey on demand for labor force 2009 Chart 224: Distribution of employment change during the past year by sex and governorate
Chart 225: reasons for leaving work
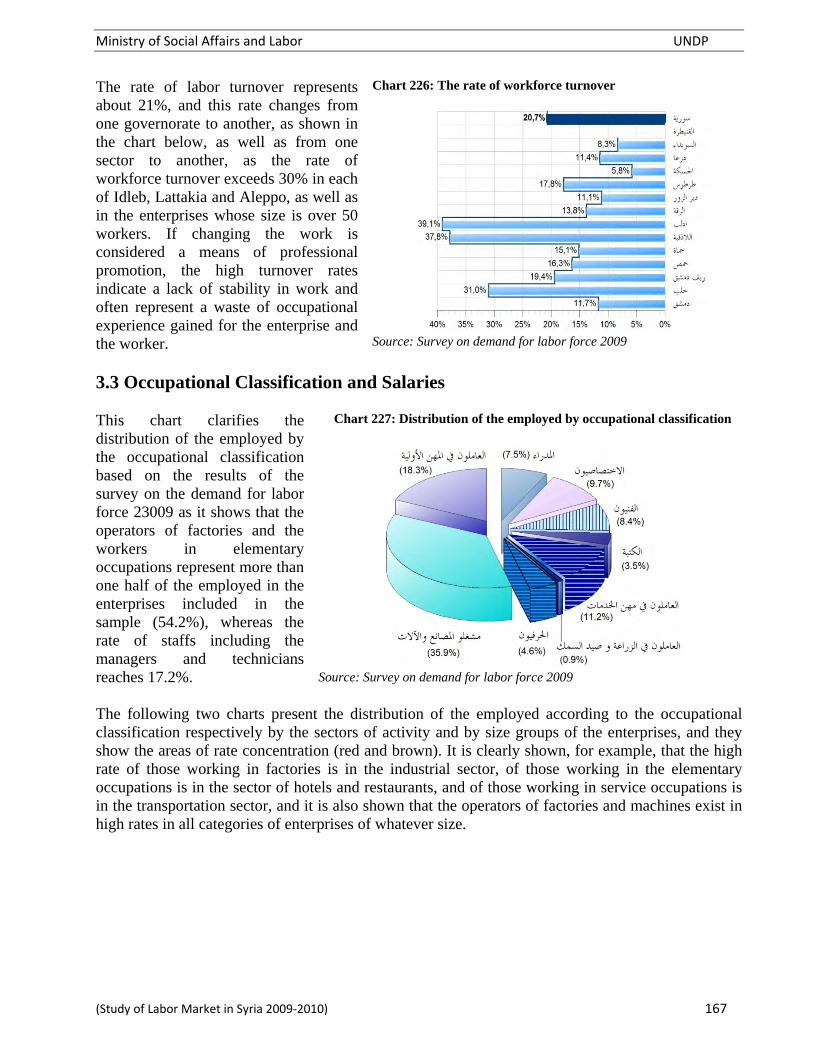
Ministry of Social Affairs and Labor UNDP
(Study of Labor Market in Syria 2009‐2010) 167
The rate of labor turnover represents about 21%, and this rate changes from one governorate to another, as shown in the chart below, as well as from one sector to another, as the rate of workforce turnover exceeds 30% in each of Idleb, Lattakia and Aleppo, as well as in the enterprises whose size is over 50 workers. If changing the work is considered a means of professional promotion, the high turnover rates indicate a lack of stability in work and often represent a waste of occupational experience gained for the enterprise and the worker.
Chart 226: The rate of workforce turnover
Source: Survey on demand for labor force 2009
3.3 Occupational Classification and Salaries This chart clarifies the distribution of the employed by the occupational classification based on the results of the survey on the demand for labor force 23009 as it shows that the operators of factories and the workers in elementary occupations represent more than one half of the employed in the enterprises included in the sample (54.2%), whereas the rate of staffs including the managers and technicians reaches 17.2%.
Chart 227: Distribution of the employed by occupational classification
Source: Survey on demand for labor force 2009
The following two charts present the distribution of the employed according to the occupational classification respectively by the sectors of activity and by size groups of the enterprises, and they show the areas of rate concentration (red and brown). It is clearly shown, for example, that the high rate of those working in factories is in the industrial sector, of those working in the elementary occupations is in the sector of hotels and restaurants, and of those working in service occupations is in the transportation sector, and it is also shown that the operators of factories and machines exist in high rates in all categories of enterprises of whatever size.

Ministry of Social Affairs and Labor UNDP
(Study of Labor Market in Syria 2009‐2010) 168
Chart 228: Distribution of workers by occupational classification by sectors of activity
Chart 229: Distribution of workers by occupational classification by size groups of the enterprises
Also, the survey results show that the supervision rate (the rate of mangers and specialists of the total employee) amounts to 17.2% which decreases relatively with the high volume of employment, and it noticeably differs by the sector of activity as shown in the following chart. It should be recalled that the general supervision rate at the country level remains within the limits of 13.9% according to the results of the Joint Survey of Labor force 2009 (16.5% in urban areas and 10.4% in rural areas).
Chart 230: Distribution of supervision rate by sectors of activity and size groups of the enterprises

Ministry of Social Affairs and Labor UNDP
(Study of Labor Market in Syria 2009‐2010) 169
The following charts illustrate the average distribution of salaries in the institutions covered by the survey on the demand for labor force 2009 by groups of salaries. It is found that more than a half of the workers are paid a monthly salary between 8.000 SP and 15,000 SP, whereas a small percentage of workers earn more than thirty thousand Syria pounds (7.9%) and it agrees with the rate of staff presence in these institutions. The results also show that the average monthly salary is approximately 15.800 SP (about 2.6 times the minimum wage), which exceeds the general average estimated at 11.000 SP in 2009 (the results of annual survey) and 11.300 SP in 2010 (first half) The following chart symbolizes the high salaries according to the progress in the categories of occupational classification and the concentration of the majority of the salaries of the middle and lower categories between 8.000 SP and 10,000 SP.
Chart 231: Distribution of average salaries by groups of job classification
Chart 132: Distribution of employment by groups of salaries
Chart 233 Distribution of salaries by occupational classification categories
Source: Survey on demand for labor force 2009

Ministry of Social Affairs and Labor UNDP
(Study of Labor Market in Syria 2009‐2010) 170
3.4 skill and lack of skill The following table shows a detailed distributed of the rates of unskilled workers by occupational classification, sectors of activity, size groups of enterprises and the governorates based on the results of survey on the demand for labor force 2009. It shows the concentration of skills gaps (dark colored fields). Table 61: Distribution of rates of unskilled workers by occupational classification, sectors of activity, size groups
of enterprises and governorates
Managers Specialists Technicians Clerks Services workers
Workers in agriculture and fishing
Artisans Plant and machine operators
Workers in elementary occupations
Total
Sectors of activity Agriculture & silviculture 15,0% 21,9% 0,7% 47,6% 20,4% 9,0% 0,0% 9,0% 0,0% 10,5%
Industry 12,8% 13,4% 11,9% 9,6% 13,3% 3,0% 9,5% 18,8% 14,7% 15,8%
Construction 25,8% 14,1% 8,9% 33,3% 0,0% 0,0% 33,3% 16,9% 3,3% 13,8%
Hotels & Rest. 27,2% 22,2% 12,2% 16,8% 22,7% 10,9% 14,1% 12,7% 19,3% 19,6%
Transport/Communication. 6,1% 4,9% 3,1% 13,7% 9,1% 0,0% 12,5% 13,8% 5,4% 8,2%
Finance, Insurance, R.E 11,1% 19,8% 23,9% 33,2% 28,4% 75,0% 0,0% 0,0% 12,5% 20,3%
Other Service 17,5% 17,6% 13,5% 23,7% 18,8% 0,0% 5,1% 18,7% 15,0% 16,4%
Size Groups of 10-20 W 10,3% 16,1% 14,8% 16,2% 19,0% 11,5% 10,0% 17,7% 13,4% 15,4%
21-50 W 14,9% 13,3% 12,7% 15,7% 26,5% 5,1% 17,3% 19,7% 11,2% 16,4%
51-100W 17,0% 14,7% 16,6% 18,2% 25,0% 21,3% 6,2% 23,3% 14,5% 18,7%
101-200 W 17,6% 20,0% 12,5% 16,8% 23,4% 0,8% 6,7% 13,5% 11,1% 14,3%
201-500 W 13,9% 20,2% 11,3% 22,2% 15,9% 2,8% 14,5% 19,4% 15,1% 17,1%
Over 500 W 12,6% 10,4% 7,4% 8,1% 9,1% 0,0% 8,6% 17,9% 24,3% 14,0%
Governorates Damascus 18,8% 18,2% 15,5% 25,0% 17,8% 5,6% 16,4% 9,4% 17,9% 17,1%
Aleppo 10,2% 10,3% 12,6% 9,4% 12,7% 27,4% 8,7% 18,2% 10,3% 14,5%
Damascus Countryside 14,5% 12,2% 11,8% 10,1% 16,8% 2,0% 11,3% 21,3% 19,9% 18,0%
Homs 13,3% 20,4% 7,1% 10,2% 23,7% 8,5% 6,9% 11,4% 11,9% 11,9%
Hama 14,9% 10,8% 7,3% 10,2% 5,7% 0,0% 0,0% 16,0% 0,7% 10,7%
Lattakia 9,7% 8,3% 6,4% 1,1% 6,1% 0,0% 13,5% 16,4% 11,2% 10,0%
Idleb 1,4% 6,1% 10,1% 5,7% 25,0% 0,0% 0,0% 6,8% 1,6% 7,7%
Rakka 3,2% 6,3% 8,8% 27,1% 23,5% 0,0% 13,1% 3,8% 2,8% 9,3%
Deir Ezzour 7,1% 11,8% 7,1% 11,8% 11,9% 0,0% 0,0% 0,0% 8,9% 6,2%
Tartous 9,6% 20,2% 6,9% 4,0% 47,8% 0,0% 9,0% 16,4% 3,9% 18,3%
Hasaka 15,8% 36,0% 8,3% 31,6% 0,0% 0,0% 0,0% 0,0% 41,3% 28,9%
Daraa 25,6% 30,4% 20,8% 48,1% 4,7% 0,0% 0,0% 56,0% 0,0% 26,0%
Sweida 34,9% 7,6% 2,1% 22,6% 83,9% 0,0% 18,2% 18,8% 0,0% 16,5%
Kuneitra
Total 14,5% 15,9% 12,1% 16,5% 17,3% 6,9% 9,8% 18,4% 14,8% 16,0%
Source: Survey on demand for labor force 2009

Ministry of Social Affairs and Labor UNDP
(Study of Labor Market in Syria 2009‐2010) 171
The following charts illustrate the distribution of unskilled workers by sector of activity, size groups of enterprises, governorates and occupational classification. The skill gap rate reaches 16% that is about one out of 6 workers does not have the skills necessary to do his work. This gap exists in the various categories of enterprises (the skill gap ranges between 14% and 18.7% by the size groups of enterprises) and varies by the sector, as it reaches its highest degree in the sector of finance and real estates (20.3%) as well as in the hotel and restaurant sector (19.6%), whereas it decreases to 8.2 % in the transport that does not require high skills. Also, the geographical distribution of the skill gap illustrates the scarcity of skills in some governorates such as Hasaka (28.9%) and Daraa (26%) as well as Damascus Countryside (18.0%) and Damascus (17.1%). The results also show the rise of the skill gap rates among the operators of factories and machinery (18.4%) and workers of service occupations (17.3%) and the lower rates among the clerks (16.5%), specialists (15.9%) and managers (14.5%), whereas it relatively decreases among farmers (6.9 %) and professionals (9.8%).
Chart 234: Distribution of unskilled workers by sector of activity and the size groups of enterprises
Source: Survey on demand for labor force 2009
Chart 235: Distribution of unskilled workers by governorates
Source: Survey on demand for labor force 2009 Chart 236: Distribution of unskilled workers by occupational classification
Source: Survey on demand for labor force 2009
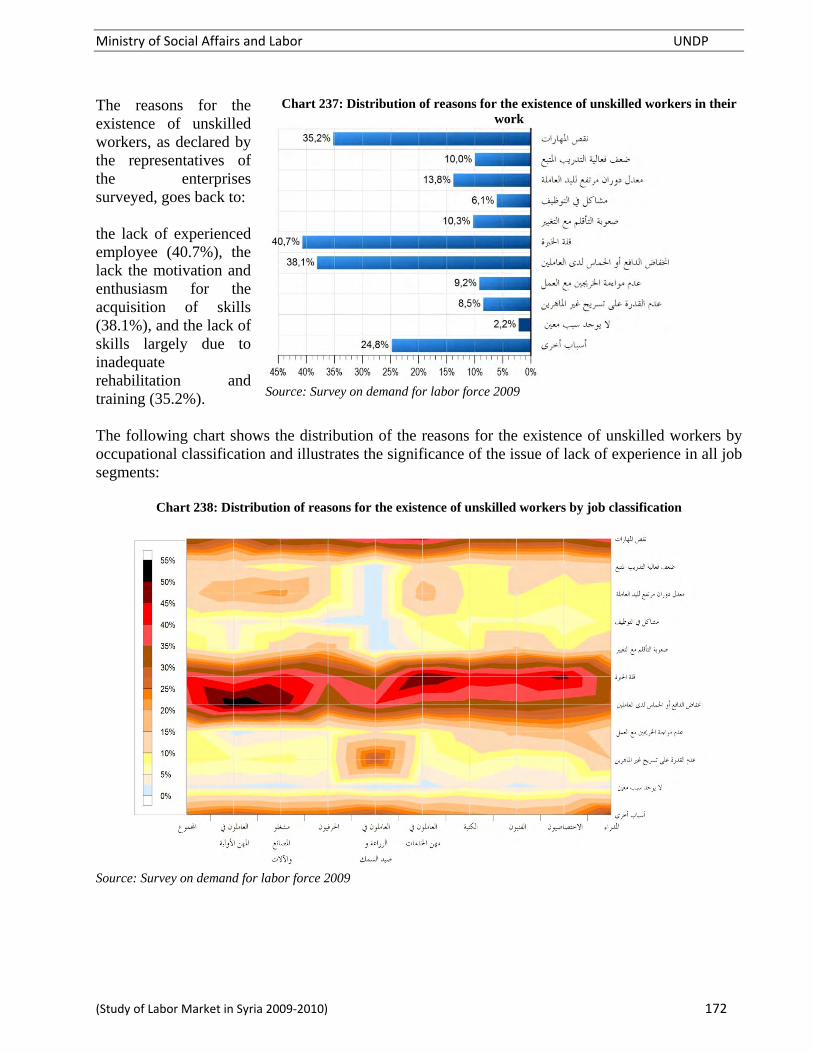
Ministry of Social Affairs and Labor UNDP
(Study of Labor Market in Syria 2009‐2010) 172
The reasons for the existence of unskilled workers, as declared by the representatives of the enterprises surveyed, goes back to: the lack of experienced employee (40.7%), the lack the motivation and enthusiasm for the acquisition of skills (38.1%), and the lack of skills largely due to inadequate rehabilitation and training (35.2%).
Chart 237: Distribution of reasons for the existence of unskilled workers in their work
Source: Survey on demand for labor force 2009
The following chart shows the distribution of the reasons for the existence of unskilled workers by occupational classification and illustrates the significance of the issue of lack of experience in all job segments:
Chart 238: Distribution of reasons for the existence of unskilled workers by job classification
Source: Survey on demand for labor force 2009

Ministry of Social Affairs and Labor UNDP
(Study of Labor Market in Syria 2009‐2010) 173
The areas of skills that need to be improved among the workers, according to the representatives of the enterprises surveyed, are mainly related to technical and specialized skills (47.5%), as well as the skills of general issues related to proficiency of foreign languages (24.1%), teamwork (23.1%) and communication (20.8%). It should be noted that these deficiencies in skills are remarkable existing in several questionnaires and surveys related to the degree of satisfaction of employers with workers in the Arab countries.
Chart 239: The skills that need improvement among the working
Source: Survey on demand for labor force 2009
The following chart shows the distribution of skills that need to be improve among employee by occupational classification and illustrates the importance of the issue of enhancing the skills of specialists, technicians, artisans, factory workers operating in technical skills, clerks in the computer technology, languages, and improving the skills of workers in service occupations on dealing with customers, team work and communication:
Chart 240: Distribution of skills considered in need for improvement among employees by occupational classification
Source: Survey on demand for labor force 2009
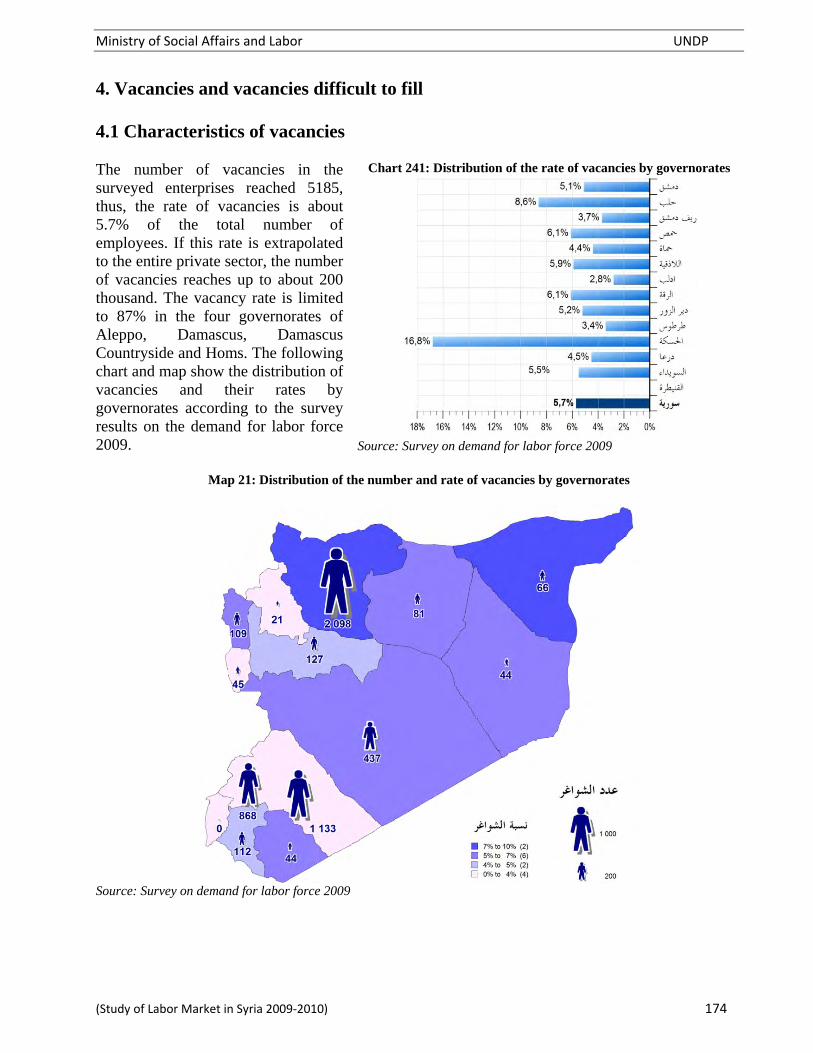
Ministry of Social Affairs and Labor UNDP
(Study of Labor Market in Syria 2009‐2010) 174
4. Vacancies and vacancies difficult to fill 4.1 Characteristics of vacancies
The number of vacancies in the surveyed enterprises reached 5185, thus, the rate of vacancies is about 5.7% of the total number of employees. If this rate is extrapolated to the entire private sector, the number of vacancies reaches up to about 200 thousand. The vacancy rate is limited to 87% in the four governorates of Aleppo, Damascus, Damascus Countryside and Homs. The following chart and map show the distribution of vacancies and their rates by governorates according to the survey results on the demand for labor force 2009.
Chart 241: Distribution of the rate of vacancies by governorates
Source: Survey on demand for labor force 2009
Map 21: Distribution of the number and rate of vacancies by governorates
Source: Survey on demand for labor force 2009

Ministry of Social Affairs and Labor UNDP
(Study of Labor Market in Syria 2009‐2010) 175
The rate of vacancies reaches 21% in the construction sector, 8.3% in the sector of finance and real estate and 6.2% in the industry sector, whereas it remains relatively low in other sectors as shown in chart 242. Survey results on the demand for labor force 2009 show also that the relative majority of demand (44%) is related to an education level lower than the secondary school level, 22% Intermediate Institute level and 20% university level and above; therefore, the general demand is less for high levels of education. Of course, these indicators can be extrapolated to the structure of demand in respect of the total economic establishments according to the characteristics of the sample which included private sector organizations (formal and informal) with a size of more than 10 employees. The results also show that the demand goes mainly to the full-time job with more than 96% of the required vacancies are related to full-time work, while less than 4% of the required vacancies are related to part-time work, and these rates do not vary by sex as shown in the chart below:
Chart 242: Distribution of the rate of vacancies by sector of activity
Source: Survey on demand for labor force 2009
Chart 243: Distribution of vacancies by educational level
Source: Survey on demand for labor force 2009
Chart 244: Distribution of the number of vacancies by the required working
time
Source: Survey on demand for labor force 2009

Ministry of Social Affairs and Labor UNDP
(Study of Labor Market in Syria 2009‐2010) 176
The results of the survey on the demand for labor force 2009 confirm that the issue of inequality of women and men with regard to the work has not been resolved and still exists. Despite the composition of the representative sample of the formal sector, nearly 58% of the demands are directed exclusively to males and only 8.7% are directed to women and about a third of vacancies are addressed to both sexes without discrimination. It should be noted that the preference rate for hiring males to fill vacancies is shrinking with the progress in the required educational level as shown in the following chart:
Chart 245: Distribution of the rate of favoring males and females recruitment to fill vacancies by the required level of education
Source: Survey on demand for labor force 2009
4.2 Vacancies difficult to fill The enterprises covered by the survey on the demand for labor force 2009 declared that nearly 57% of vacancies are characterized by being difficult to fill, i.e., the enterprise takes a long time to find the appropriate worker for such vacancies. The existence of vacancies that are difficult to fill hinders the expansion the enterprise’s business and obliges it to train the existing employees as well as accepting fewer qualifications. The vacancies difficult to fill reach high rates in many governorates as shown in the following chart:
Chart 250: Distribution of the rate of vacancies difficult to fill by governorates
Source: Survey on demand for labor force 2009

Ministry of Social Affairs and Labor UNDP
(Study of Labor Market in Syria 2009‐2010) 177
The following table details the distribution of the number of vacancies for 70% of the required jobs and the extent of considering them difficult to fill, and it illustrates the current demand for several specializations that are lacking in the economic enterprises during conducting the survey. Through these needs, the appropriate training and rehabilitation programs can be directed to be more compatible with the needs of the labor market:
Table 62: Distribution of the number of vacancies by the most important jobs and difficulty to fill
Menswear Tailors 246 48 294
Mechanical Engineering Technicians 152 78 230
Operators of spinning machines 134 92 226
Operators of industrial sewing machines 187 39 226
commercial and technical Agents and sales representatives 89 102 191
Electrical Technician 132 40 172
Reporters and porters 45 122 167
Operators of plastic products manufacturing machines 95 61 156
Sewing machines operators 21 125 146
Accountants 59 75 134
Directors of sales and marketing departments 89 26 115
Printing machines operators 99 5 104
Specialists nursing assistants 63 34 97
Assistants and cleaners in hotels and offices 46 50 96
Specialists in higher education (colleges and universities) 85 3 88
Waiters and bartenders 46 41 87
Mechanical Engineers 52 31 83
Specialists in marketing and promotion 44 38 82
Makers models (patterns) for clothes 32 45 77
Bookkeepers 15 53 68
Manufacturing workers 16 51 67
machines 12 52 64
Trainers of industrial occupations 43 20 63
Economists 55 4 59
Operators of textile machinery 19 40 59
Secretaries and assistants of administrative specialists 21 33 54
Workers of fruits and vegetables processing and canning 8 45 53
Vendors of supply materials 20 30 50
Mechanics of industrial machinery and equipment 30 20 50
Vehicles Drivers 8 41 49
Operators of dyeing and finishing machines 22 25 47
Directors of finance and administrative departments 43 1 44
Chefs (cooks) 35 8 43
Women's wear tailors 20 21 41
Tour and travel planners 40 0 40
N/O vacancies difficult to fill
N/O vacancies to fill Total
Source: Survey on demand for labor force 2009

Ministry of Social Affairs and Labor UNDP
(Study of Labor Market in Syria 2009‐2010) 178
The results of the survey on the demand for labor force 2009 show in a contradictory way that the sectors requiring a lesser level of skills are more difficult to fill their vacancies, as the rate of vacancies that are difficult to fill reaches 70% in each sector of transport and communications and construction, whereas it decreases to less than 40% in the financial sector. This phenomenon may indicate the importance of the craft skill that may not require advanced skills and a high educational level.
Chart 247: Distribution of the rate of vacancies difficult to fill by sector of activity
Source: Survey on demand for labor force 2009
The following chart includes the main reasons for the existence of vacancies difficult to fill, the most important of which is the lack of experience and good skills, that fit the needs of the institutions, in the market. The following chart presents the distribution of the reasons by sector of activity and shows as well the importance of experience in the sectors of constructions, finance and cervices, the issue of timing in the sector of transport and the scarcity of skills in the other sectors.
Chart 248: The main reasons for the existence of vacancies difficult to fill
Source: Survey on demand for labor force 2009
Chart 249: The main reasons for the existence of vacancies difficult to fill by sector of activity
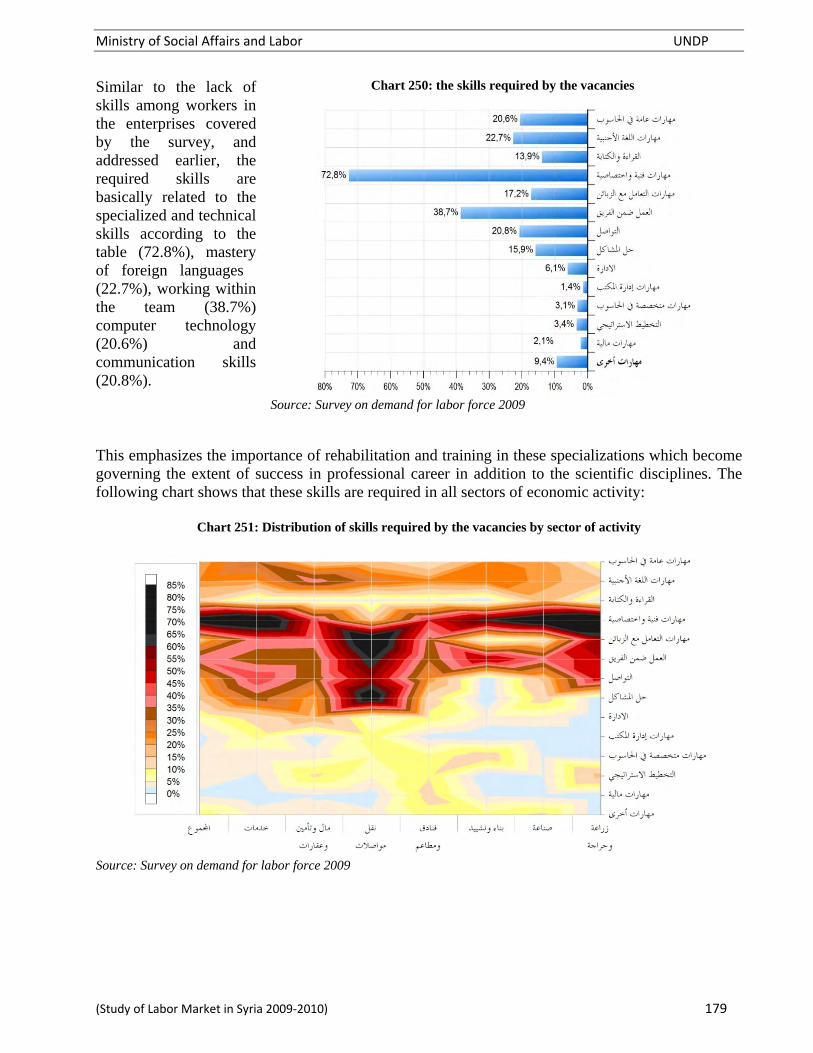
Ministry of Social Affairs and Labor UNDP
(Study of Labor Market in Syria 2009‐2010) 179
Similar to the lack of skills among workers in the enterprises covered by the survey, and addressed earlier, the required skills are basically related to the specialized and technical skills according to the table (72.8%), mastery of foreign languages (22.7%), working within the team (38.7%) computer technology (20.6%) and communication skills (20.8%).
Chart 250: the skills required by the vacancies
Source: Survey on demand for labor force 2009
This emphasizes the importance of rehabilitation and training in these specializations which become governing the extent of success in professional career in addition to the scientific disciplines. The following chart shows that these skills are required in all sectors of economic activity:
Chart 251: Distribution of skills required by the vacancies by sector of activity
Source: Survey on demand for labor force 2009

Ministry of Social Affairs and Labor UNDP
(Study of Labor Market in Syria 2009‐2010) 180
The results of the survey on the demand for labor force 2009 show that the enterprises willing to pay an average monthly salary of about 15.855 SP for the required vacancies and this exactly matches the average pay applicable to such enterprises (15.800 SP). It should also be noted that the proposed wage for the difficult-to-fill vacancies exceeds the proposed wage of the other vacancies by 28% (17.500 SP vs. 13.700 SP). The following chart shows the distribution of the average wage classified according to the nature of the required vacancies:
Chart 252: The average classified wage for the required vacancies
Source: Survey on demand for labor force 2009
The enterprises declared that in case they have difficult-to-fill vacancies, this will hinder the expansion the enterprise’s business and obliges them to train the existing employees as well as accepting fewer qualifications, thus affecting the revenue. Also, the institutions do not mind resorting to raise wages to attract people with the required experience and skills. The following chart shows the distribution of enterprises by the reflections of the difficult-to-fill vacancies existence on the business.
Chart 253: Distribution of enterprises by the reflections of the difficult-to-fill vacancies existence on the business
Source: Survey on demand for labor force 2009

Ministry of Social Affairs and Labor UNDP
(Study of Labor Market in Syria 2009‐2010) 181
To fill the vacancy the enterprises resort to friends and acquaintances as well as to placing advertisements in newspapers. Compared with the results of the study on the demand for labor force done by the Central Bureau of Statistics in 2005, it is found that the rate of resort to the friends and acquaintances is relatively high (76% compared to 82% in 2005) but it remains high.
Chart 254: Distribution of facilities by the means used to fill vacancies
Source: Survey on demand for labor force 2009
It should be recalled that the demand survey sought to represent the enterprises at the country level and it was interested in the employment situation and demand in the private sector. If we compare the results of the vacancies in the private sector with the overall unemployment real situation at the national level on the basis of the results of the Joint Survey of Labor Force, 2009, it will be clear that those demands cover only a small
Chart 255: Distributed o the vacancy rate compared with the number of unemployed by governorate
Source: Survey on demand for labor force 2009 and Joint Survey for Labor Force 2009
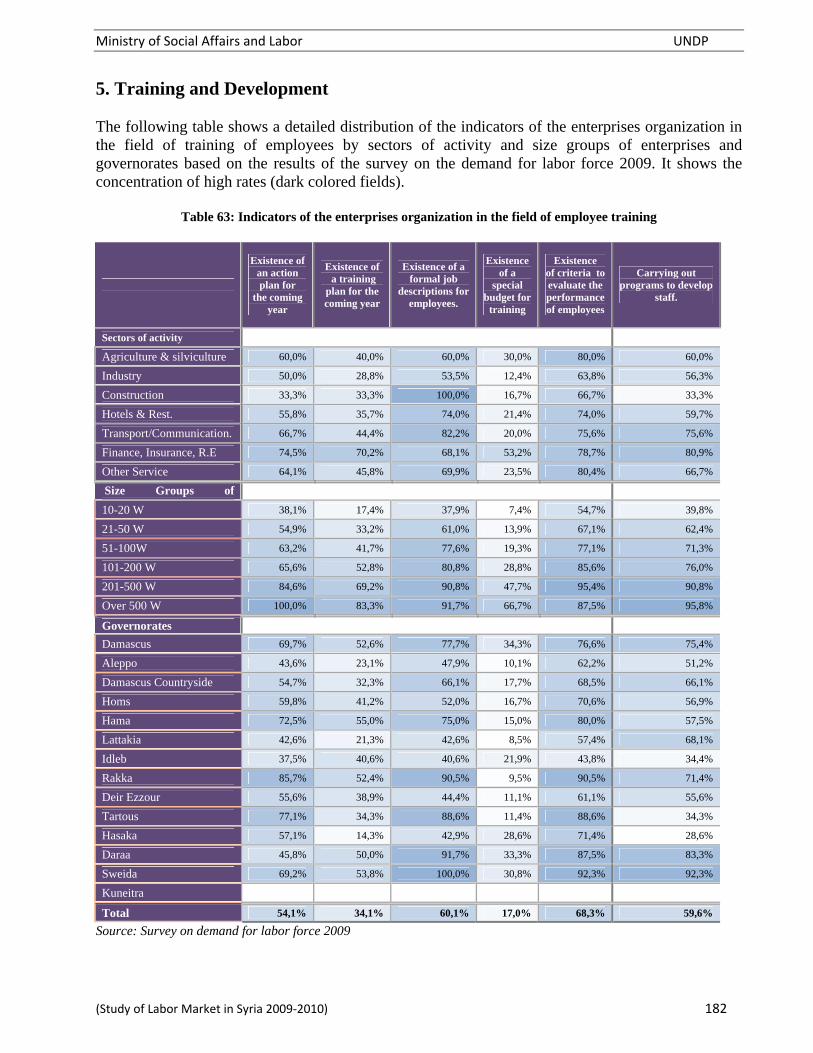
Ministry of Social Affairs and Labor UNDP
(Study of Labor Market in Syria 2009‐2010) 182
5. Training and Development The following table shows a detailed distribution of the indicators of the enterprises organization in the field of training of employees by sectors of activity and size groups of enterprises and governorates based on the results of the survey on the demand for labor force 2009. It shows the concentration of high rates (dark colored fields).
Table 63: Indicators of the enterprises organization in the field of employee training
Existence of an action plan for
the coming year
Existence of a training
plan for the coming year
Existence of a formal job
descriptions for employees.
Existence of a
special budget for
training
Existence of criteria to evaluate the performance of employees
Carrying out programs to develop
staff.
Sectors of activity Agriculture & silviculture 60,0% 40,0% 60,0% 30,0% 80,0% 60,0%
Industry 50,0% 28,8% 53,5% 12,4% 63,8% 56,3%
Construction 33,3% 33,3% 100,0% 16,7% 66,7% 33,3%
Hotels & Rest. 55,8% 35,7% 74,0% 21,4% 74,0% 59,7%
Transport/Communication. 66,7% 44,4% 82,2% 20,0% 75,6% 75,6%
Finance, Insurance, R.E 74,5% 70,2% 68,1% 53,2% 78,7% 80,9%
Other Service 64,1% 45,8% 69,9% 23,5% 80,4% 66,7%
Size Groups of 10-20 W 38,1% 17,4% 37,9% 7,4% 54,7% 39,8%
21-50 W 54,9% 33,2% 61,0% 13,9% 67,1% 62,4%
51-100W 63,2% 41,7% 77,6% 19,3% 77,1% 71,3%
101-200 W 65,6% 52,8% 80,8% 28,8% 85,6% 76,0%
201-500 W 84,6% 69,2% 90,8% 47,7% 95,4% 90,8%
Over 500 W 100,0% 83,3% 91,7% 66,7% 87,5% 95,8%
Governorates Damascus 69,7% 52,6% 77,7% 34,3% 76,6% 75,4%
Aleppo 43,6% 23,1% 47,9% 10,1% 62,2% 51,2%
Damascus Countryside 54,7% 32,3% 66,1% 17,7% 68,5% 66,1%
Homs 59,8% 41,2% 52,0% 16,7% 70,6% 56,9%
Hama 72,5% 55,0% 75,0% 15,0% 80,0% 57,5%
Lattakia 42,6% 21,3% 42,6% 8,5% 57,4% 68,1%
Idleb 37,5% 40,6% 40,6% 21,9% 43,8% 34,4%
Rakka 85,7% 52,4% 90,5% 9,5% 90,5% 71,4%
Deir Ezzour 55,6% 38,9% 44,4% 11,1% 61,1% 55,6%
Tartous 77,1% 34,3% 88,6% 11,4% 88,6% 34,3%
Hasaka 57,1% 14,3% 42,9% 28,6% 71,4% 28,6%
Daraa 45,8% 50,0% 91,7% 33,3% 87,5% 83,3%
Sweida 69,2% 53,8% 100,0% 30,8% 92,3% 92,3%
Kuneitra
Total 54,1% 34,1% 60,1% 17,0% 68,3% 59,6%
Source: Survey on demand for labor force 2009
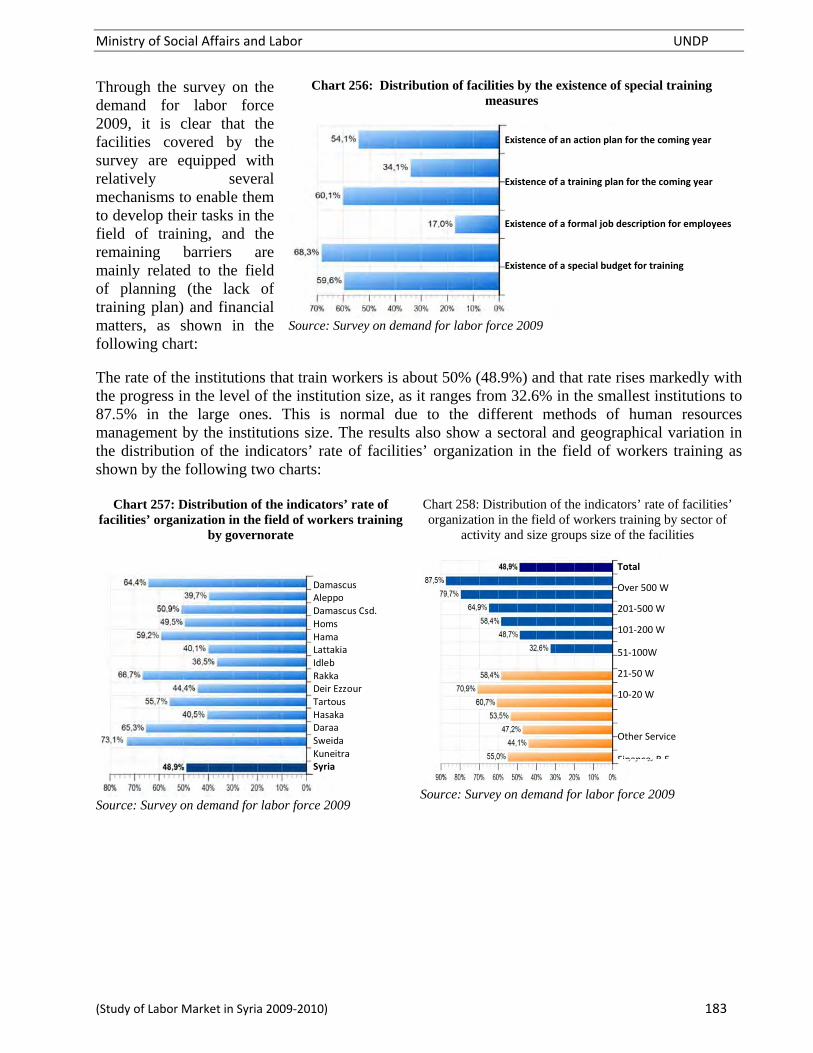
Ministry of Social Affairs and Labor UNDP
(Study of Labor Market in Syria 2009‐2010) 183
Through the survey on the demand for labor force 2009, it is clear that the facilities covered by the survey are equipped with relatively several mechanisms to enable them to develop their tasks in the field of training, and the remaining barriers are mainly related to the field of planning (the lack of training plan) and financial matters, as shown in the following chart:
Chart 256: Distribution of facilities by the existence of special training measures
Source: Survey on demand for labor force 2009
The rate of the institutions that train workers is about 50% (48.9%) and that rate rises markedly with the progress in the level of the institution size, as it ranges from 32.6% in the smallest institutions to 87.5% in the large ones. This is normal due to the different methods of human resources management by the institutions size. The results also show a sectoral and geographical variation in the distribution of the indicators’ rate of facilities’ organization in the field of workers training as shown by the following two charts:
Chart 257: Distribution of the indicators’ rate of facilities’ organization in the field of workers training
by governorate
Source: Survey on demand for labor force 2009
Chart 258: Distribution of the indicators’ rate of facilities’ organization in the field of workers training by sector of
activity and size groups size of the facilities
Source: Survey on demand for labor force 2009
Total
Over 500 W
201‐500 W
101‐200 W
51‐100W
21‐50 W
10‐20 W
Other Service
Finance R E
DamascusAleppo Damascus Csd.Homs Hama Lattakia Idleb Rakka Deir Ezzour Tartous Hasaka Daraa Sweida Kuneitra Syria
Existence of an action plan for the coming year
Existence of a training plan for the coming year
Existence of a formal job description for employees
Existence of a special budget for training

Ministry of Social Affairs and Labor UNDP
(Study of Labor Market in Syria 2009‐2010) 184
According to statements made by the enterprises included in the survey on the demand for labor force 2009 it is shows that about one-quarter (24.7%) of the employee in these institutions received training during the year preceding the survey date. The following table shows a detailed distribution of the rate of the employees trained by the enterprises by the occupational classification, sectors of activities, size groups of enterprises and governorates. It also shows the concentration of high rates (dark colored fields). Table 64: distribution of the proportion of workers who trained job classification established by sector of activity
and categories of establishment size and the provinces
Managers Specialists Technicians Clerical Workers in
service occupations
Workers in
agriculture and fishing
Artisans Plant and machine
operators
Workers in elementary occupations
Total
Sectors of activity Agriculture & silviculture 61,4% 22,6% 12,8% 9,5% 94,4% 0,9% 0,0% 73,0% 0,0% 27,3%
Industry 20,6% 27,1% 27,1% 15,1% 27,9% 9,3% 10,1% 20,3% 19,5% 20,7%
Construction 0,0% 0,0% 3,8% 33,3% 0,0% 0,0% 0,0% 0,0% 2,1%
Hotels & Rest. 38,3% 34,3% 40,8% 35,3% 48,7% 9,4% 23,6% 40,2% 18,9% 35,6%
Transport/Communication. 71,2% 32,8% 37,8% 39,1% 65,1% 0,0% 2,8% 16,1% 13,3% 46,2%
Finance, Insurance, R.E 39,6% 46,6% 48,8% 21,0% 56,4% 0,0% 0,0% 33,7% 10,1% 40,9%
Other Service 15,3% 21,3% 27,0% 18,7% 57,5% 0,0% 4,5% 2,0% 7,7% 19,8%
Size Groups of 10-20 W 10,9% 20,1% 22,4% 23,2% 25,5% 9,0% 3,4% 12,6% 15,7% 15,1%
21-50 W 14,0% 23,0% 24,3% 10,8% 26,0% 12,2% 18,8% 16,3% 17,3% 18,2%
51-100W 17,7% 35,0% 27,9% 23,0% 39,7% 6,3% 4,6% 17,9% 13,3% 21,4%
101-200 W 19,7% 24,3% 18,0% 18,8% 32,0% 0,0% 6,8% 22,0% 10,7% 19,4%
201-500 W 42,9% 32,2% 40,1% 28,1% 51,7% 2,8% 28,5% 29,8% 28,6% 33,6%
Over 500 W 49,6% 25,3% 37,9% 25,3% 63,4% 0,0% 7,6% 17,6% 16,4% 29,5%
Governorates Damascus 48,9% 33,9% 34,6% 19,9% 58,8% 2,4% 12,6% 5,5% 12,8% 34,9%
Aleppo 20,1% 28,9% 22,6% 18,5% 29,5% 0,0% 9,6% 16,6% 11,8% 17,6%
Damascus Countryside 24,9% 25,2% 28,4% 17,4% 36,0% 11,2% 8,9% 21,4% 20,6% 22,9%
Homs 20,7% 40,4% 38,3% 24,2% 55,6% 12,8% 13,5% 42,4% 28,2% 34,8%
Hama 12,8% 22,9% 27,6% 18,5% 2,2% 0,0% 35,7% 21,2% 26,8%
Lattakia 25,7% 33,5% 33,7% 21,3% 32,9% 0,0% 18,9% 25,8% 28,6% 28,6%
Idleb 13,9% 41,2% 35,4% 14,3% 2,3% 0,0% 2,3% 11,3% 0,0% 16,6%
Rakka 1,6% 25,6% 18,8% 89,9% 89,8% 9,4% 3,3% 43,9% 4,0% 35,2%
Deir Ezzour 19,0% 11,8% 11,5% 23,5% 9,5% 0,0% 0,0% 0,0% 4,2% 6,3%
Tartous 14,5% 19,3% 26,7% 34,7% 62,2% 14,3% 5,5% 7,9% 0,0% 21,6%
Hasaka 0,0% 0,5% 6,7% 0,0% 33,3% 0,0% 0,0% 0,0% 0,0% 1,8%
Daraa 11,8% 6,8% 17,9% 7,4% 63,7% 0,0% 39,6% 15,9% 5,5% 19,6%
Sweida 11,6% 36,4% 70,0% 45,2% 19,4% 0,0% 18,2% 15,3% 20,8% 28,0%
Kuneitra
Total 28,5% 27,7% 29,9% 22,2% 47,7% 4,2% 10,9% 20,9% 17,3% 24,7%
Source: Survey on demand for labor force 2009

Ministry of Social Affairs and Labor UNDP
(Study of Labor Market in Syria 2009‐2010) 185
It should be noted that the decline of the rate of workers trained by the enterprise appears in the small enterprises that lack the means of human and financial resources to develop training, as well as in the construction sector which is characterized by high turnover and seasonal nature of work. Whereas the sectors of transport and communications, finance and real estate, as well as the institutions of a size exceeding 500 workers resort more than others to train their employees as shown in the following charts:
Chart 259: Distribution of the rate of employee trained by the enterprise by
sector of activity and size groups
Source: Survey on demand for labor force 2009
The following two charts show the distribution of the rate of employee trained by the enterprises during the year preceding the survey date by governorates and occupational classification. They clarify a number of differences concerning the scarcity of the beneficiaries of the training in each of Hassaka, and Deir Ezzour, Rakka, Idleb and Aleppo, as well as the agricultural workers and artisans: Chart 260: Distribution of the rate of the employee trained
by the enterprise by governorates
Source: Survey on demand for labor force 2009
Chart 261: Distribution of the rate of the employee trained by the enterprise by the occupational
classification
Source: Survey on demand for labor force 2009
Total
Over 500 W
201‐500 W
101‐200 W
51‐100W
21‐50 W
10‐20 W
Other Service
Finance, R.E
Damascus
Aleppo
Damascus Csd.
Homs
Hama
Lattakia
Idleb
Rakka
Deir Ezzour
Tartous
Managers
Specialists.
Technicians
Clerical
Workers in service occupations
Workers in agriculture and fishing
Artisans

Ministry of Social Affairs and Labor UNDP
(Study of Labor Market in Syria 2009‐2010) 186
The survey results show that nearly 60% of the institutions carried out the processes of training and development of their employees during the year preceding the survey date whether in-house (97%) or training at training centers outside of the enterprise (36%, the total exceeds 100% due to the presence of alternatives). The following table shows the fields of training completed during the year preceding the survey date and the degree of the enterprises’ satisfaction of the training programs:
Table 65: Fields of training completed during the year preceding the survey date and the degree of the enterprises’ satisfaction of the training programs:
In-house training
Training in cooperation with training institutions
Degree of satisfaction
with training
programs N/O courses Rate Local External
Preparatory /directive training 563 24,7% 12 1 7,2
Training on occupational health and safety 407 17,9% 52 7,3
Training on administrative / supervisory skills 254 11,1% 89 23 7,7
Training on new technology or a new machine 387 17,0% 66 53 8,0
Training on social skills 182 8,0% 36 8 7,5
Training on computer systems 222 9,7% 106 2 7,6
Training in foreign languages 87 3,8% 90 1 6,8
Safety of food products 14 0,6% 5 7,2
ISO Quality Systems 10 0,4% 8 1 7,4
Production cycles 4 0,2% 1 0 8,0
Training on sewing 4 0,2% 1
Conditioning and cooling 2 0,1% 2 0 9,0
Laboratories 2 0,1% 4 0 8,0
Training on maintenance 8 0,4% 4 3 8,7
Mechanical and electrical training 4 0,2% 3 3 8,5
Financial and accounting system 9 0,4% 12 3 8,3
Secretary, marketing and selling skills 8 0,4% 8 3 8,3
Human resource management 2 0,1% 3 1 9,3
Public relations and customer service 7 0,3% 4 8,5
Welding and lathing training 4 0,2% 2 8,0
Nursing 2 0,1% 1 8,0
Development and modernization 2 0,1% 3 8,3
Training on work competence 96 4,2% 26 15 8,1
Total 2 280 100,0% 535 120 8,0
Source: Survey on demand for labor force 2009 It appears that the preparatory training (training received by the worker or the employee at the beginning of the work) is ranked first in the order of training types carried out by the companies, followed by the training on occupational safety and then the training given to the employees on the new system or technology introduced to the company, in addition to the training on the administrative and supervisory skills followed by computer training. It is noted that the degree of satisfaction with training programs is high, with an average of 8 out of 10.

Ministry of Social Affairs and Labor UNDP
(Study of Labor Market in Syria 2009‐2010) 187
Upon asking the companies about their assessment of trained employees or workers to know the extent of benefit they obtained through the training process, it is found that 22.7% of the companies that train their employees do not follow any evaluation system for the employees who have undergone the training. Among the 77.3% of the companies that evaluate the training, 2.1% undertake it before training, 41.0% after training and 56.9% before and after training. It is clear that the evaluation process more common among large-sized companies, as the evaluation rate of the employees who have undergone training exceeds 80% in the companies that employ over 100 workers compared with less than 75% in the companies of less than 100 workers. It is also shown that the process of evaluation, as declared by the institutions, is in more common in the sectors of construction, services and transport than in the other sectors.
Chart 262: Distribution of the evaluation rate of the employees who have undergone training by sector of activity and size groups of enterprises
Source: Survey on demand for labor force 2009
Some of the rates seem high, especially in some sectors, which can be explained by the attempt of the representatives of enterprises to a better picture of their organization than the reality. It is known that the processes of evaluating the performance of workers in relation to training is usually complex and is resorted to only by the institutions that enjoy a developed human resource management. The following chart shows the distribution of the evaluation rate of the employees who have undergone training by governorates and illustrates that this rate reaches 10% in several governorates.
Chart 263: Distribution of the evaluation rate of the employees who have undergone training by governorates
Source: Survey on demand for labor force 2009
Damascus
Aleppo
Damascus Csd.
Homs
Hama
Lattakia
Idleb
Rakka
Deir Ezzour
Tartous
k
Total
Over 500 W
201‐500 W
101‐200 W
51‐100W
21‐50 W
10‐20 W
Other Service
Finance R E

Ministry of Social Affairs and Labor UNDP
(Study of Labor Market in Syria 2009‐2010) 188
The survey on the demand for labor force 2009 was also interested to know the opinion of the enterprises and the extent of their agreement in respect of the harmonization between the educational and training outputs and the requirements of the labor market. The results show that the degree of agreement seems weak within 2.6 out of 5, noting that the grade 3 represents the degree of neutrality. The degree of the company’s agreement does not significantly differ regardless of its size or sectoral belonging as shown in the chart below which presents the distribution of the agreement indicator of harmonization between the education and training outputs and the companies’ requirement of workforce by sector of activity and the size groups of the enterprises.
Chart 264: Distribution of the agreement indicators to harmonization between the education and training outputs and the company’s
requirements of workforce by sector of activity and size groups of the enterprises
Source: Survey on demand for labor force 2009
The results of the survey on the demand for labor force 2009 confirm the results of the research on the demand for labor force conducted by the Central Bureau of Statistics in 2005, which shows that the agreement rate does not exceed 50%, and this may indicate the lack of significant progress in education and training sector in terms of its harmony with the requirements of the labor market. The following chart shows the distribution of the agreement indicator to harmonization between the education and training outputs and the company’s requirements of workforce by governorates. It indicates the weak indicator in some governorates as Hama, Lattakia and Rakka and its rise in Deir Ezzour and Idleb.
Chart 265: Distribution of the agreement indicators to harmonization between the education and training outputs and the company’s requirements of workforce governorates
Source: Survey on demand for labor force 2009
Agree Disagree
Damascus
Aleppo
Damascus Csd.
Homs
Hama
Lattakia
Idleb
Rakka
Deir Ezzour
Tartous
Total
Over 500 W
201‐500 W
101‐200 W
51‐100W
21‐50 W
10‐20 W
Other Service
Finance, R.E
Agree Disagree

Ministry of Social Affairs and Labor UNDP
(Study of Labor Market in Syria 2009‐2010) 189
As for the companies that see a lack of harmonization between the outputs of education and training and the companies’ requirements of workforce, they propose to concentrate on the existence of more practical applications and training opportunities in the educational stage, as well as to intensify the cooperation with the scientific bodies for developing curricula according to market needs, and to give incentives to companies for training the students.
Chart 266: Proposals for improving the harmonization between the education and training outputs and the companies’ requirement of workforce
Source: Survey on demand for labor force 2009
The results of the survey on the demand for labor force 2009 showed that about 30% of the enterprises contributed in the training staffs not working for them (students and new graduates) to support the labor market with trained workforce during the year preceding the survey date, as the number of students who received training by such companies reached 5200 person. The following two charts present the distribution of the rate of the companies that contributed in the training of staffs not working for them by sector of activity, size groups of the enterprises and governorates, and show the rise of that rate with the increase of the enterprise size, as well as in the sector of finance and real estate and in some governorates.
Chart 267: Distribution of the number of companies contributing to the training staffs not working for them by sector of activity and size
groups of the enterprises
Source: Survey on demand for labor force 2009
Chart 268: Distribution of the number of companies contributing to the training staffs not working for them by
governorates
Source: Survey on demand for labor force 2009
Damascus
Aleppo
Damascus Csd.
Homs
Hama
Lattakia
Idleb
Rakka
Deir Ezzour
Tartous
Total
Over 500 W
201‐500 W
101‐200 W
51‐100W
21‐50 W
10‐20 W
Other Service
Finance, R.E
Transport/Comm

Ministry of Social Affairs and Labor UNDP
(Study of Labor Market in Syria 2009‐2010) 190
We observe almost the same distribution with respect to the contribution of companies to employ new graduates, as the rate reaches 31.7%, and it is distributed by sector and geographically as shown in the following charts:
Chart 269: Distribution of the rate of companies contributing to the employment of new graduates by
sector of activity and size groups of enterprises
Source: Survey on demand for labor force 2009
Chart 270: Distribution of the rate of companies contributing to the employment of new graduates by
governorate
Source: Survey on demand for labor force 2009
The results of the survey on the demand for labor force 2009 also showed that 23% of the enterprises contributed to the employment of people with disabilities who are able to work during the year preceding the survey date. The following two charts show the distribution of the rate of companies that contributed in employing people with disabilities by sector of activity, size groups of the enterprises and governorates:
Chart 271: Distribution of the number of companies
contributing to the employment of people with disabilities by sector of activity and size groups of
enterprises
Source: Survey on demand for labor force 2009
Chart 272: Distribution of the number of companies contributing to the employment of people with
disabilities by governorate
Source: Survey on demand for labor force 2009
Damascus
Aleppo
Damascus Csd.
Homs
Hama
Lattakia
Idleb
Rakka
Deir Ezzour
Tartous
Total
Over 500 W
201‐500 W
101‐200 W
51‐100W
21‐50 W
10‐20 W
Other Service
Finance, R.E
Damascus
Aleppo
Damascus Csd.
Homs
Hama
Lattakia
Idleb
Rakka
Deir Ezzour
Tartous
Total
Over 500 W
201‐500 W
101‐200 W
51‐100W
21‐50 W
10‐20 W
Other Service
Finance, R.E
Ministry of Social Affairs and Labor UNDP
(Study of Labor Market in Syria 2009‐2010) 191
Section IV: Key Conclusions and Recommendations

Ministry of Social Affairs and Labor UNDP
(Study of Labor Market in Syria 2009‐2010) 192

Ministry of Social Affairs and Labor UNDP
(Study of Labor Market in Syria 2009‐2010) 193
1. Key Conclusions 1.1 Study of Labor Force Supply
“The Project of Database Establishment for Comprehensive Labor and Employment Policies” implemented in the early 2009 by the Syrian Ministry of Labor and Social Affairs in collaboration with the United Nation Development Program (UNDP) and the Central Bureau of Statistics (CBS), has developed a survey comprising a sample of about 30,000 families with a view to identify the characteristics of supply in the field of labor force. It should be noted that all the results of this survey and the discretion of their interpretation and analysis should be understood within the frame of their pure scientific significance and that they do not acquire the characteristic of approved official indications, especially with respect to the labor market indicators because of the variety of methods and reference periods used to identify those indicators. Please consider the following points in understanding the indicators: A – The indicators present the status of labor market in the early 2009 and are lacking an annual span in a manner that they cannot be considered general rates for the year 2009. B - The calculation of some of the indicators fairly differed from what the Central Office of Statistics used to adopt in the previous surveys.2 C – The Central Bureau of Statistics, (being fully authorized), considered this survey as one that covers the second half of the year 2008 and adopted the results to be integrated with the results of the first survey to attain modified results indicative of rates covering the situation during the year 2008. To avoid the confusion of some concepts and to maintain the consistency with the results of the previous surveys and their indicators, we adopted the following: o The results of 2008 are presented in the same concept and calculation method adopted by the
Central Bureau of Statistics.
o The results of these surveys are presented as results of the early 2009 in a way independent of the previous surveys with the proposed amendment in classifying the labor force.
o The indicators of 2009 survey presented in such way do not represent any formal aspect due to
the said variety of methods and reference periods.
o The report provides the annual indicators for 2009 recently issued by the Central Bureau of Statistics.
2 ‐ The form and the accompanying definitions consider that seeking a part‐time job invalidates the conditions of the unemployed as no one is deemed unemployed unless he/she seeks a full‐time job. This does not conform to the international definitions which do not specify the conditions of seeking a job with respect to the working hours. (See the recommendations of the Thirteenth International Conference of Labor Statisticians and the Fourteenth International conference of Labor Statisticians). This matter was set right by considering those searching for a part‐time job among the unemployed.

Ministry of Social Affairs and Labor UNDP
(Study of Labor Market in Syria 2009‐2010) 194
The labor power survey of 2009 enabled the comprehension of significant matters related to the features of population, the labor force and the employed and the diagnosis of the situations of the unemployed, their qualifications, capabilities, and basic needs. One can get the following key conclusions related to the most important quantitative and qualitative data of the development of the population, labor force, the employed and unemployed:
The demographic growth in Syria is still high and within the range of 2.45% in the recent
years. Although the identification of the additional requirements of labor are not evident through analyzing the results of the previous surveys, the demographic data shows that the working-age population is growing annually at a rate of more than 300 thousand. This causes a continuous pressure on the labor market, particularly through the flow of newcomers, which requires realizing high rates of economic growth associated with the creation of job opportunities on the one hand, and achieving action plans for effectively addressing unemployment and expanding the scope of economic integration for the young people on the other. If the Syrian economy is not significantly influenced by the world financial and economic crisis, the continuation of the slowdown occurring in the world economy shall most likely, as the International Labor Office expects, contribute in the decline of remittances, the available jobs, tourism, and the official grants for development, in addition to the increase of unemployment, especially among the young people.
The rate of economic dependency in Syria is high reaching up to 4.4, which means that each
of the employed supports about 3.5 persons other than himself. This is due, on the one hand, to the high ratio of demographic dependency owing to the youth nature of the Syrian population (more than 40% of the population is under 15 years old) and to the weak economic participation of women on the other (female workers account for less than one tenth of women in the working age).
The educational composition of the population and labor force witnessed a significant
positive development during the past years due to the group of social and economic transformations witnessed by the Syrian society and the wide spread of educational services within the scope of implementing the strategy of compulsory and free basic education. Illiteracy has declined among the population of 15 years and above from more than 23% in 1994 to 18.2% in 2009. Consequently, the ratio of educated people at the various levels has increased. However, this development was, on the one hand, very modest in the recent years (the illiteracy rate moved from 18.7% in 2005 to 18.2% in 2009); on the other hand, it did not obliterate the local differences or the gaps in social class. Illiteracy remains high in several regions, and a quarter of women are still illiterate compared to about one tenth among men. Although the educational level among the employed has improved, as the illiteracy ratio decreased among them from 16.2% in 1994 to 9% in 2009, the general level of labor remains modest. One half of the employed know how to read and write or at the best hold a primary certificate. This situation highlights the importance of continuous training to the employee to increase their competencies, especially against the challenges of economic transformations and the continuous improvement of production structures and methods.

Ministry of Social Affairs and Labor UNDP
(Study of Labor Market in Syria 2009‐2010) 195
The sectoral distribution of workers confirms, on one side, the decline of the agricultural sector which has lost a half of its importance in terms of operation. It currently occupies 15% of the workers compared to 30% at the beginning of the last decade, and the growing importance of the service sector which occupies more than a half of the employees, on the other side. Also, one can note the decline of unpaid labor and the importance of the public sector in employment, especially for women. Two thirds of women have become employed in the public sector compared to one third at the beginning of the last decade. It worth pointing out the importance of self-employment in Syria, which occupies more than one third of the workers compared to less than a quarter in the Middle East, the thing that reflects the importance of the individual initiative in the Syrian economy.
The inconsistency of qualifications with job descriptions is suffered of by 10% of the workers
and the rate has been increasing during the past years, especially among men whose ratio has reached 15%. This phenomenon can perhaps be explicable by the lack of the entire conditions of decent work.
Contrary to what is believed, the ratio of practicing secondary jobs, which is not a
phenomenon but do existents, is specified at 3.4% of the employed (compared to 5.8% in 2003). The results has shown that the phenomenon of secondary jobs exists particularly among those working in the public sector whose ratio reaches 6.6% compared to 1.3% of those working in the private sector.
The number of the working hours in the main job reaches 43 .5 hours per week, and males
work about 10 hours more than females (44.8 hours vs. 34.7). The number of working hours increases to more than 58 hours in the case of exercising a secondary job, which leads either to the state of fatigue or the decrease of productivity in the main job which is often in the public sector.
More than two thirds of workers in the sectors of agriculture and constructions work
temporarily, intermittently or seasonally. The same applies to more than one fifth of the workers in the transportation sector. However, the services sector is characterized by being more stable. Nearly 92% of the female and male workers in this sector work throughout the year. In its broad concept, underemployment ranges between 30.6% and 12.6%, and in the narrow concept, which conforms to the international definitions3, remain within the limits of no more than 3%. This situation is pushing governmental bodies to take into consideration the legitimate right of workers to improve their income or to search for a better job and help them to do so within the frame of ensuring flexibility in the movement of labor market.
The survey results have shown that more than 622 thousand workers work from or at home,
of which about 593 thousand at the address of their main job, representing respectively 13.2% and 12.7% of the employed total, and that the work from or at home is more common among men (14.2%) than among women (5.8%) and in the rural areas (18.2%) than in the urban areas (9.3%). The results have also shown that 83% of the workers in the private sector (representing 2,593 million workers) are not registered at the tax service and less than 11% (340 thousand) of the workers in the private sector have a social security (i.e. 2,782 thousand workers in the private
3 According to the international definition, the underemployed visibly comprise all persons in paid or self-employment, whether at work or not at work, involuntarily working less than the normal duration of work determined for the activity, who were seeking or available for additional work during the reference period.

Ministry of Social Affairs and Labor UNDP
(Study of Labor Market in Syria 2009‐2010) 196
sector do not enjoy social security). These data demonstrate the significance of unorganized employment in the private sector. It should be noted that non-registration of work at the tax service, the social security or occupational associations does not indicate the complexity of administrative procedures or considerable financial cost, but it is the pure will of the workers who do not believe that there is a need for being registered at the social security, thus the benefit of recording their work.
The results show that the multiplicity of routines leads to abstention from registration only at 1% of the unregistered employee. However, the financial issues account for 1.6% of non-registration reasons; while more than two thirds of non-registered workers do not see any need for registering their works. This matter shows the importance of awareness and information in reducing informal employment and acquainting the importance of work registration and enjoying the services of social and occupational security.
Women's weak economic participation. The rate of women’s economic activity does not
exceed 14% and the women workforce represents only 12.4% of the total workforce. It should be noted that the rate of women working without pay has declined from 44% in the beginning of the last decade to less than 10% now, which represents a radical shift of women's work and should be deeply investigated to devise and promote specialized programs geared towards developing the circumstances and elements of women's participation in the economic sectors.
This report does not intend to quantify the extent of unemployment as much as to analyze
its characteristics and distribution. It should be recalled that this survey is related to a particular period of time and that we adopted some change in determining the relationship with the workforce. Thus, the rates and percentages resulting from the analysis of this survey do not reflect the annual rates of unemployment, but they show the status of unemployment at the time of performing the research. Therefore, the comparison with the rate increase or decrease of the previous years remains inexpressive in terms of methodology. With taking this significant reservation into consideration, the survey results show that the rate of unemployment in the early 2009 was about 13.4% distributed between 10.3% in urban areas and 17.1% in rural areas, and 31.2% among women and 10.1% among men. Of course, the unemployment rate shall differ if we adopt a different definition. For example, the unemployment rate shall fall to 12.7% if we exclude those searching for part-time work from the unemployed. The results also show the aggravation of unemployment in each of the following governorates: Hassaka, Tartous, Lattakia and Deir Ezzor. It should be noted that the results of the annual survey for 2009 issued recently by the Central Bureau of Statistics identifies the unemployment rate at 8.1% apportioned to 5.7% among males and 22.3% among females, which represents a significant decline in the rate of unemployment.
The educational status of the unemployed does not significantly differ from the rest of labor
force categories. The majority of the unemployed (59%) have not surpassed the primary level, 30% of them are at the level of middle or high school and 9% are at the university level and these represent a typical category that requires developing programs for their practical rehabilitation and harmonizing their abilities with the virtual needs of the labor market. The results establish the vast difference of the educational level of the unemployed between the females and males. More than two-thirds of males (66.8%) hold less than the middle school qualification, while this ratio is about one-third among females (35.4%). Also, this crucial difference can be confirmed in respect of the educational level by the rate of the unemployed who hold degrees beyond the high school, which reaches 9.7% among males and 24.3% among females. The results also show the

Ministry of Social Affairs and Labor UNDP
(Study of Labor Market in Syria 2009‐2010) 197
decrease of the unemployment rate with the progress in the educational level. On the other hand, it shows the concentration of high rates of unemployment among the holders of middle qualifications. The first phenomenon indicates the positive reaction of labor market to the improvement of qualifications and skills, which can be explained by the relative scarcity of the high levels. The second phenomenon, however, interoperates some cases of fluctuation particularly observed among holders of the high school, the students of junior colleges and the university students who, on one side, lack the necessary technical skills and the specializations that qualify them to easily access the labor market, and on the other side, are unsatisfied with what the labor market provides of occupational capabilities and job opportunities which they consider inappropriate to their scientific level.
The survey results show that about two-thirds of the unemployed are new entrants to the
labor market who have never worked. Most of the unemployed do not have previous professional experience which indicates the importance of vocational training systems within the enterprises that enable the unemployed to obtain professional experience and easily integrate with the labor market. The results show also that the new entrants to the labor market have more educational qualifications than the unemployed who have previously worked. The ratio of those holding the high school and above represents 38% among the unemployed who have not previously worked in comparison with less than 18% among the unemployed who have previously worked. These data can enable a more successful control of the training and rehabilitation programs directed to the various segments of the unemployed.
The survey results show that more than 90% of those previously worked come from the
private sector and that one third of work suspensions are voluntary by the workers for dissatisfaction with wages or for health or family reasons. The results confirm the weakness of working in several private sector activities, whether individual or a company form. The majority of reasons for work interruption in the private sector are due to stop by the enterprise. This can also be explained by the effect of the economic crisis on several activities, particularly those tied with the foreign demand. Moreover, seeking better wages and consequently better living standards explains a significant side of work suspension in the private sector that might fail to provide higher wages due to severe internal and external competitions it experiences in an environment characterized by more liberalization of the economy and openness to the outer world.
The survey results manifested that searching for a job takes a long period exceeding an
average of 20 months, and a longer period in respect of women: 23 months vs. 19 months for men. The survey results showed that two thirds of the unemployed complain of long-term unemployment. The search period has extended to a year or more. That rated is 77% among women and 62% among men. It is noted also that the new entrants to the labor market complain more than the others from the long-term unemployment: 75% vs. 53%. Chronic unemployment represented by job searching for two years and more could be also considered. The average of chronic unemployment rates at 28.7% distributed to 35.2% among men and 45.2 among women. These rates manifest the aggravation of the structural causes of unemployment, especially among women.

Ministry of Social Affairs and Labor UNDP
(Study of Labor Market in Syria 2009‐2010) 198
Through these data, the significance of long-tern unemployment becomes obvious as it indicates a sort of slowdown dynamics in the Syrian labor market. Addressing this situation requires the design and implementation of special interferences in the labor market according to the period of unemployment targeting, in particular, the long-term unemployment for the following considerations:
(A) The long-term unemployment leads to social exclusion in the absence of mechanisms and
programs, even if temporary ones, for re-activating the unemployed.
(B) The long-term unemployment leads to the loss of capabilities and skills of the unemployed which requires additional investments in labor force for rehabilitation.
(C) The long-term unemployment among the holders of technical certificates and qualifications
represents a deactivation of investment in the labor force and a waste of human capabilities. (D) The long-term unemployment leads to many social evils and produces a hard core of
unemployed that are difficult to reintegrate. (E) The long-term unemployment quite often leads to a state of frustration, and consequently,
getting out of the labor force (especially among women) which represents a waste of social investments.
For 31.3% of the unemployed, the right job is the one that provides a higher income. The unemployed women are more sensible in choosing the right work, as the importance of the financial aspect represents 27.7% for them vs. 37.1% for men. Women give more importance to the social and familial aspects in determining the characteristics of the right work. This importance increases with age because they give more importance to the social aspects due to intensive family responsibilities. The work nearness to home is more important for them than the expected income (27.2 vs. 21.7%); as well, the suitability of the work in respect of the family situation represents 16.5% of the right work criteria for women compared to 8.8% for men who do not lend the social and family aspect the same degree of importance noticed among women. Furthermore, the survey results confirmed the prevailing culture of the desire to work in the public sector as many young people believe that the public sector provide advantages that are unavailable in the private sector despite the noticeable development of this sector in the recent years. More than 80% of the unemployed (90% of the females and 76.3% of the males) prefer working in the public sector. This indicates the weak initiatives of the unemployed which also explains the severity of the long-term unemployment.
The search for a part-time work prevails among women and the urban residents in
particular. The rate of females seeking for a part-time work exceeds 10% of the total job female seekers, while that ratio is 4% among men. The unemployed female seeks part-time job in order to harmonize between the work requirements and the house affairs, and this matter represents 83% of the causes of searching for a part-time for women compared to 12% for men who search for a part-time job for health reasons. The results show that resorting to friends and relatives represents the preferable way to seek a job, and it is used by 40% of job seekers (36.4% among
Ministry of Social Affairs and Labor UNDP
(Study of Labor Market in Syria 2009‐2010) 199
females vs. 41.2% among men), followed by registration at employment offices, which is resorted to by more than one quarter of the job seekers.
The survey results manifest that about 82% of the unemployed did not follow any training
course through the year proceeding the research date, which explains the big shortage in the programs addressing the unemployment resulting from the absence of special programs for training the unemployed and upgrading their practical abilities using particular or specific mechanisms. The training of the unemployed is focused on very limited specializations, mainly including informatics and some other professional fields. This situation leads to the loss of the capabilities and skills of the unemployed, which necessitates increasing investments in human resource for rehabilitation. The results show also that the unemployed women, particularly those who have previously worked, are more interested to participate in training courses to be re-qualified for re-joining the labor market. About one third of the unemployed females, who have previously worked, participated in training courses compared to less than 14% of their male counterparts.
The distribution of the unemployed as well as the rates of unemployment shows that the poorest
families are those who suffer more than others from unemployment. The results exhibit a sort of statistical relationship between the unemployment rates in the regions with the deterioration of the living condition of the families, and in particular, the existence of a stable relationship between the deterioration of the family living condition with the unemployment of the head of the family.
The survey carried out in the early 2009 under “The Project of Database Establishment for Comprehensive Labor and Employment Policies” implemented by the Ministry of Social Affairs and Labor in cooperation with the (UNDP) and the Central Bureau of Statistics gave special attention to the issues that consider the youth and women. The most important results of the survey showed the following:
The relative majority of young people of the age group 15-24 years are devoted to study.
The rate amounts to 38% with some variations between the males and females. However, the significant difference in social type is related to working or staying at home. It is noticed that 42% of the males work (vs. 5% of females) while about a half of the females are dedicated to house affairs. The young people (of age group 15-24 years) represent 31% of the total working age population amounting to 3.9 m. out of which 2.64 m. are outside the labor force, 917 thousand are employed and 340 thousand are unemployed. These data indicate that the problem of unemployment in Syria is primarily youth unemployment, as the youth represent 46% of the total unemployed, and the ratio exceeds 69% if we take into consideration the age group of 15-29. Moreover, these figures confirm the importance that should be given to young people in determining the priorities of the employment programs.
The rate of unemployment among the young people exceeds threefold the rate of adult
unemployment, 27% vs. 9% respectively. Also, the youth unemployment is characterized by higher rates among females, 58% vs. 20% among males. It is worth mentioning that this situation has aggravated in the recent years. The number of unemployed young people went up from 254 thousand in 2005 to 339 thousand in the early 2009, and the percentage of youth unemployment increased from 19% in 2005 to 27% in the early 2009. It should be noticed that the annual results for 2009 issued by the Central Bureau of Statistics show that the rate of the unemployment among the young people decreased to 16.7%.

Ministry of Social Affairs and Labor UNDP
(Study of Labor Market in Syria 2009‐2010) 200
The general rate of those willing to immigrate amounts to16% of the labor force, of which
64% have seriously sought to do that. The survey results demonstrated that about a quarter of young people desire to immigrate or travel outside the country, and that rate dramatically differs between males and females at 28% among males and only 5% among females. Also, the rate of this desire to immigrate or travel decreases gradually with age. The people who desire to immigrate are particularly the unemployed men at the age of the highest economic activity between 25 – 35 years, as it is noticed that 44% of this age group are willing to immigrate due to their exposure to living pressures that inspire them to seek a job in all means, whether inside or outside the country.
Women face more difficulties than men in getting the chance to engage in an economic
activity. These difficulties are represented in the weakness of women's economic performance and in the large gap between female and male in respect of the most indicators of economic participation. The data show that the situation in Syria involves a paradox in this field. We notice a deterioration, during the past years, in the economic participation indicators of the women who represent only 15.6% of the labor force, while they represented more than 20% in the beginning of the last decade, thus the rate of their economic activity fell to less than 14% whereas it was more than 23% in 2002. The international comparisons indicate that the women’s economic performance at the level of the Arab world is among the lowest, and the level of the women’s economic contribution in Syria is one of the weakest internationally.
The progress in the educational level improves the economic performance of females considering
that the acquisition of the secondary certificate represents a passport enabling the woman to enter the field of economic participation from its wide door. It is clear that the rate of females’ economic participation remains very low in respect of the pre-secondary school levels and radically changes on attaining the secondary school level. This rate reaches 7% if the woman’s level is pre-secondary and 40% for secondary or higher level. This matter confirms the importance of attaining the high school stage for females to be free from several social, scientific and economic constraints hindering their entry to the labor market and in particular to the field of economic participation. Education statistics show that girls have become predominant in the secondary and higher education after the rate was within the range of 38% in the early eighties. If women have not reaped the fruits of their educational progress in terms of the economic performance yet, the situation is expected to change remarkably in the coming years as the number of females who reach the high school will increase and consequently their economic performance will radically improve.
The issue of woman’s weak economic participation in Syria and its decline during the last
years remains one of the most important issues that deserve study and meditation. The decline of the woman’s economic participation can be explained by the retreat of the agricultural performance that used to employ over 515 thousand women in 2002 and ended with employing less than 100 thousand in 2009. In addition to the seasonal issues, these figures indicate a radical shift in the work of women that witnessed a migration from the agricultural labor to work in the government services sector. The number of women in that sector increased from 245 thousand in 2002 to 320 thousand in 2009. We notice that during the short period between 2001and 2009 a significant shift occurred in the women employment which changed its focus of activity from the agricultural sector that held up to 58% of the women employment in the early last decade and became holding only 17% of this employment. Parallelly, the services sector (basically in the

Ministry of Social Affairs and Labor UNDP
(Study of Labor Market in Syria 2009‐2010) 201
public functions) attracted two thirds of the female workers versus one third in the years 2001 and 2002.
Women enter the labor market for economic needs. The survey results indicate that a woman
works more if the husband's income becomes less, and that the lowest rate of economic activity exists among the married women (11% compared to 21% and 34% respectively of the singles and divorced). As well, the increasing number of children in the family reduces women's economic participation and increases the rate of illiteracy. The rate of economic activity exceeds 15% among wives having two children or less and does not exceed 8% if the number of children is 2. Also, the rate of illiteracy increases among the first and second categories (less than 23% among the wives having two children or less and more than 50% among the wives having more than two children).
Through the survey results it is clear that women’s work improves the living conditions of the
families, thus it represents the best ways to fight poverty. There are many statistical analyses demonstrating the relation between the woman’s work and the decline of the poverty rate. For example, the rate of the families with a very high level reaches 53% if the woman works compared by less than 20% if she does not work, and the rate of the woman’s economic participation in such families reaches about 27% compared to 4.5% if the living condition is low.
1.2 Study of Labor Force Demand “The Project of Database Establishment for Comprehensive Policies of Labor and Employment in Syria” conducted a survey on the demand for manpower in the second half of 2009 in order to recognize the status and size of the demand for workforce in the organized private sector, the employment and its characteristics in that sector and the existing vacancies. The survey singled out 1213 establishments selected from the statistical table of private sector enterprises used by the Central Bureau of Statistics according to the employment volume measure identified at ten workers or more. The sample was distributed in all the governorates (except Kunaitra for lack of the employment volume requirement in the facilities there) with more than a half of the sample is concentrated in the manufacturing sector, as many big facilities exist in it, and a quarter of them in the sector of hotels, restaurants and services. The most important findings shown are as follows:
The enterprises employ 91,600 workers apportioned to 78% men and 22% women. The
seasonal employment represents 10% concentrated in the agricultural sector and small enterprises, whereas the non-Syria labor is limited to 1.1%.
The enterprises witnessed, in the year preceding the survey, a relative decline in their activity, whether at the level of production volume or the level of labor volume which decreased by 0.5%, especially at the enterprises employing less than 50 workers and active in the sectors of industry, transport and construction. However, the enterprises operating in the other sectors or employing more than 50 workers witnessed positive development in the volume of employment. If that decline can be explained by the effects of the financial and economic crisis, the majority of companies covered by the survey expect an increase in production volume and the number of employees during the next year while those who expect a decline explain that by the general economic climate and competition severity.
Ministry of Social Affairs and Labor UNDP
(Study of Labor Market in Syria 2009‐2010) 202
The rate of labor turnover represents about 21%. According to the enterprises’ declarations, the rate of discharge represents but one third of the work-quitting reasons that are basically related to the personal reasons of those quitting who are quite often seeking a better salary.
The rate of supervision amounts to 17.2% (percentage of managers and specialists of all employees). This rate rises in the services sector and drops in the industrial sector. The average monthly salary in the enterprises of the first sample is about 15.800 sp, and the salary of the senior positions is threefold more than the lower functions. Whereas, the rate of unskilled workers is 16%, and it ranges from 8.2% in the transportation sector to more than 20% in the sectors of finance, insurance, real estate, as well as in the sector of hotels and restaurants. These high rates suggest the importance of continuous training aiming at increasing the competencies and skills of the workers. The enterprises’ executives interpret this situation by the lack of experience among workers, as well as the lack of motivation and enthusiasm despite their exerted efforts in the field of training, which benefited one-fourth of the workers. This rate rises in large-sized enterprises and in the sectors of transport, communications, finance, insurance and real estate.
According to the statements made by the executives of the surveyed companies, the lack of skills among workers, as well as most of the important skills that need support and improvement lies in the following areas: technical and specialized skills, foreign language skills, team work, communication skills, interpersonal skills with customers, problem solving and computer use.
The number of vacancies in the enterprises covered by the study amounts to 5185 vacancies. Thus the rate of vacancies is within 5.7% of the total number of employees and it reaches up to 21% in the construction sector and 8.3% in the sector of finance and real estate. It is noticeable that the relative majority of demand (44%) relates to the educational level below the secondary grade, 22% to the intermediate institute level and 20% to the university level and above.
The enterprises declared that 56% of the vacancies are difficult to fill, i.e. the companies consume a long time to find an appropriate worker for such vacancy! This is due to various reasons, most important of which is the unavailability of experience and good skills, which meet the enterprises’ requirements, in the market! The presence of vacancies that are difficult to fill hinders the expansion of the enterprise’s activity and compels it to train the existing employees and to accept less qualification. Consequently, to fill the vacancies, the enterprise resorts to friends and acquaintances as well as newspaper advertisements.
The results of the survey on the labor market demand show that the majority of the economic establishments think that the harmony between the outputs of education and training and the requirements of the labor market is unsatisfactory, and propose providing training opportunities, giving incentives to companies, intensifying the practical applications and cooperating with the scientific bodies in order to improve the harmonization of the educational and training outputs with the employment requirements of the companies.
As shown by the results of the survey, less than one third of the companies covered by the
study employ the new graduate the number of which reached 1978 person during the year preceding the survey, i.e. 11% of the total employment during that period. If this shows the tendencies of institutions to employ people with experience, this issue calls for considering to

Ministry of Social Affairs and Labor UNDP
(Study of Labor Market in Syria 2009‐2010) 203
develop mechanisms that facilitate the recruitment of the newcomers to the labor market, thereby contributing to reducing unemployment, especially youth unemployment.
2. Recommendations The current situation represented by the increasing number of the youth involves big challenges. One of these challenges is the problem of unemployment which needs be currently taken into consideration and instantly adopting policies and strategies to confront before its consequence aggravate. Therefore, we propose the following measures: First: the harmonization between the educational, professional and training syllabuses at all
levels and the needs of the labor market, the thing that will directly contribute to reducing the rates of frictional unemployment concentrated among the young people and graduates. This can be done through the following: o The development of educational, professional and training syllabuses in association with
the economic enterprises in both the public and private sectors and leading local and international educational institutions.
o Granting incentives and tax credits to the economic enterprises that train its employees
and upgrade their skills and abilities in a manner that contributes to the improvement of human resources.
o Granting incentives and tax credits to the economic enterprises that train students and
employ new graduates in a manner that contributes to the reduction of youth unemployment.
o Raising awareness of the training and rehabilitation importance on an ongoing basis,
especially among the unemployed, to improve the skill level of the workforce, so as to increase efficiency and competitiveness through supporting the programs of the Public Board for Employment and Project Development that attends the training of the unemployed and linking them with the labor market.
o Promoting investment in cutting-edge technical and vocational training programs
according to the quantitative and qualitative demand of the labor market.
Second: Accomplishment of an operational plan that effectively addresses unemployment
and adopts a new typical channel for ratification of laws, programs and mechanisms that target the unemployed according to their privacy, abilities and type, which would introduce mobility to the labor market and ensure for it more flexibility and interaction with the local and national economic environment. This operational plan aims at: o Handling unemployment by mechanisms and programs aiming at developing the capacity of
the unemployed through training and working inside the production facilities and developing the technical skills of operating small and medium enterprises to support the ability to self-employment and encourage small enterprises.

Ministry of Social Affairs and Labor UNDP
(Study of Labor Market in Syria 2009‐2010) 204
o Supporting the self-initiative of the unemployed to help them develop their capacities according to their preferences and pursue their professional career, by adopting new methods and using modern media and vocational instruction and guidance. The centers of employment guidance may undertake the implementation of this issue in the country.
o Supporting the roles of the labor market institutions like governmental, social and professional bodies and the private and joint sectors to establish a partnership for promoting the creation of jobs opportunities.
o Creating an administrative structure that attends the establishment of labor market policies in a manner that ensures the organization of changes in the structure of economic activities, adopts mechanisms to assess the impact of the current programs and policies, and develops the strategies and plans of their implementation.
o Developing and following-up the effective labor market programs and studying their impact on the labor market at the level of the governorates and regions in order to ensure a modern operation of the programs and mechanisms that help provide job opportunities.
o Creating compatibility mechanisms and programs for targeting the priority groups diagnosed in this study, namely:
a) The category of young people and new entrants to the labor market, through programs of economic integration;
b) The category of the chronically unemployed, through rehabilitation and incubation programs to raise and rebuild their abilities;
c) The category of females, through ratifying and supporting programs that would empower women and enhance their capabilities with the aim of increasing the opportunities of their employment in various sectors;
d) The category of the university graduates, through diversifying the programs of their rehabilitation and harmonizing their capabilities with the requirements of the labor force by creating mechanisms of compatibility between the labor offer and the requirements of the economic enterprises;
e) The inhabitants of underprivileged areas, where unemployment aggravates and job opportunities lessen, through the development of oriented programs complying with the requirements and characteristics of the economic and social situation of those areas; and
f) The category of the qualified who want to be self-employed, through proposing a practical system that combines complementary specialized training services in technical aspects and enterprises management, and a lending and supporting system that ensures the success of the enterprise and recovering the loan amount.
o Proposing special action programs to achieve local work plans for developing job
opportunities in the areas of priority. The work development plan in the governorates of priority depends on urgent and direct intervention programs and preventive programs to enhance the capabilities of the unemployed.
o Scheduling the task of implementing a broader survey on the labor force demand, as well
as studying the time budget of women and men in the agenda of the National Observatory of Labor Market.

Ministry of Social Affairs and Labor UNDP
(Study of Labor Market in Syria 2009‐2010) 205
o Activating the role of the National Observatory of Labor Market for monitoring and evaluating the dynamism of the labor market and its needs, analyzing the statistical data related to the work demand and supply and submitting periodical studies and reports to the decision makers. This is done through the establishment of an information system for the labor market charged with coordinating communications between the bodies producing labor market data and the bodies using them, and with feeding the system with the necessary primary data produced by the Central Bureau of Statistics to ensure the extraction, calculation and analysis of the labor market indicators, as well as the process of producing reports and providing the labor market information.
o Enhancing the role of the private sector in implementing labor-market-related programs
that would build the abilities of the young people, empower them and facilitate their integration into the labor market.
Third: Changing the culture of negative work prevailing among the employers, the youth
groups and women through the following:
o The expansion in the implementation of mentoring and occupational guidance programs in the educational institutions and employment establishments with a view to guide the job seekers and students to job opportunities that are consistent with their qualifications and skills, and to encourage the positive trend towards working in the private sector or starting to establish leading private projects.
o Promoting the culture of working in the private sector and raising the rate of participation
in the economic activity, particularly among women, by changing the desire to work in the public sector and encourage them to work in the private sector, and motivating the private sector enterprises to offer job opportunities with flexible working hours commensurate with the social status of women.
o Promoting the culture of self-employment, supporting and encouraging entrepreneurship,
securing funding, providing credit facilities and their administrative procedures, and expanding the establishment of business incubators.
o Promoting the culture of voluntary action among the young people; guiding the energies
of the youth towards voluntarism and social responsibility through simulative social upbringing undertaken by the educational, media and religious institutions, where the youth volunteers usually gain experiences and lifelike vocational skills that help them get quick access to the labor market and change from the culture of dependency on the society to the culture of initiative and self-reliance; creating education and awareness programs on the importance of volunteerism, its benefits, results and value, and on the urgent need for special training schedules capable of rehabilitating the young people, and for developing national programs that motivate them towards volunteerism and honors the creators among them. Perhaps, the organization of national awards for the volunteers realizes part of what is required, in addition to activating the role of the young people in the leadership of the associations concerned with voluntary action and enabling them to participate in decision making.
o Reinforcing the role of the private sector in the framework of social responsibility and
public service for developing their social perception toward the community through the

Ministry of Social Affairs and Labor UNDP
(Study of Labor Market in Syria 2009‐2010) 206
development of national programs that motivate and honor their social development activities.
o Increasing the awareness of the individuals, through promotion actions, of the importance
of registration with the social security.
Fourth: The issuance of special laws to support micro, small and medium-sized projects, especially in the areas where unemployment, underemployment and non-regular employment (temporary or seasonal) is prevailing, and that are more liable to low standards of living and poverty. This is done through the following:
o Encourage micro, small and medium projects towards the geographical spread, which
would help minimizing the regional disparities between the regions and governorates, reducing the rate of high unemployment in those areas, realizing balanced and sustainable development and providing services to the limited smaller markets that do not attract large projects;
o Improving the level of smaller regions and governorates and the clusters of economic
enterprises by expanding transport networks and railways as they facilitate the movement of individuals to work or to establish new projects in regions with fewer services, especially in respect of women. The transport networks and railways are considered the most important factors to achieve balanced and sustainable development between regions;
o Granting investment advantages and tax exemptions for specified periods to encourage the establishment of new projects and the creation of job opportunities that would achieve full employment;
o Enacting new laws to streamline the procedures of establishing the micro, small and
medium project and separate these procedures from those of large projects; reconsidering the procedures of obtaining the administrative license and the commercial and industrial register; and granting discounts on the incorporation fees to reduce expenses in order to encourage and accelerate the initiation of private project;
o Securing the means of adequate funding for initiating micro, small and medium projects;
granting the banks guarantees and tax benefits to stimulate them to lend with simplified bonds, acceptable permission periods and preferred interest rates; and supporting all the institutions and associations, profit and non-profit, that give loans and assist the establishment of projects;
o Coordinating between the various bodies concerned with the micro, small and medium
projects to develop general policies and laws with clearly defined goals in order to provide a legal regulatory cover for these enterprises to swiftly deal with the problems they face and provide the necessary protection through the special regulatory and legal procedures;
o Giving attention to the simple traditional industries and crafts by encouraging the
establishment of specialized civil sector institutions to support the artisans develop and promote their products, in addition to giving training and education according to the latest

Ministry of Social Affairs and Labor UNDP
(Study of Labor Market in Syria 2009‐2010) 207
technologies while maintaining the Syrian identity which is characterized by creativity and originality. This industry is one of the micro and small projects that would attract a large number of the workforce and open the door for employing young people, especially women, and for export opportunities that generate income for the national economy;
o Expanding women's empowerment and poverty reduction projects based on micro-
finance and training, and increasing appropriations for the excellent results achieved in recent times.
Fifth, the development of the social security system to secure the decent life and the good
living standard of the citizens in certain cases by establishing an anti-unemployment insurance fund for ensuring social protection for the unemployed and their families, and providing adequate income during the period of unemployment, i.e. until finding an alternative job opportunity. The idea of this fund is based on the following:
o The allocation of a savings account for each person insured, fed by the worker’s wage
and the employer, where the unemployment allowance is paid from the savings of this fund and the its investments proceeds with setting out the terms and conditions of this fund utilization to avoid its misuse;
o Allocating a part of this fund for maternity support and insurance which protects the
working woman from loss of employment due to marriage and pregnancy and provides her an adequate income during this period. Also, this insurance encourages the employers to hire women and reduces the financial burdens imposed on them in such maternity cases, and this fund gives a better chance for women to enter the labor market in the private sector;
o Allocating a part of this fund for the training and rehabilitation of the unemployed during
the period of their unemployment in order to upgrade the level of their skills, improve their performance and develop the capabilities of human resources, then integrate them in the labor market better than ever.