Impact Analysis of Medieval Weaponry
32
0 Sprin g 2014 Impact Analysis of Medieval Weaponry MAE 323, FRIDAY 9:30 MITCH JONES, THURSTON SEXTON
Transcript of Impact Analysis of Medieval Weaponry
0
Spring
2014
Impact Analysis ofMedieval WeaponryMAE 323, FRIDAY 9:30MITCH JONES, THURSTON SEXTON
Table of ContentsIntroduction..............................................................2Physical Experiment Setup.................................................2
Sword Overview and Specifications.......................................2Motion Capture Analysis.................................................3
MATLAB Calculations.....................................................3Initial Finite Element Setup..............................................4
Foundation Stiffness....................................................4Mesh and Load Setup.....................................................4
Modal Analysis..........................................................5Transient Structural Impact Analysis......................................5
Low Speed Impact........................................................5125% Speed Impact.......................................................6
175% Speed Impact.......................................................7High (True) Speed Impact................................................7
Testing Summary.........................................................8Conclusions...............................................................9
References...............................................................10Appendix 1 – Dimensions and Experiment Setup.............................11
Weapon Models..........................................................11Mesh and Load Placement................................................13
Appendix 2 – Dynamic Data................................................15Motion Capture.........................................................15
MATLAB Code and Results................................................16Appendix 3 – Results (Stress and Failure Time)...........................18
Foundation Stiffness...................................................18Low Speed Impact.......................................................19
125% Speed Impact......................................................21175% Speed Impact......................................................23
High (True) Speed Impact...............................................25
1
IntroductionIt’s a match that many history buffs have pondered over and over:
Katana vs. Claymore. Both were cutting machines; excellent at slashing a foe, cutting through armor and flesh alike. Though not equal in length or weight (one would need to look to no-dachi katanas for anything coming close to the massive claymore), their purpose in their day was similar: cut, and cut well. The Claymore relies on bulk for strength in the cut, andexcellent craftsmanship to deliver a flexible metal that can withstand the added weight. The katana hones in on a unique geometry to maximize cutting efficiency, and a high carbon steel to maintain a razor sharp edge with high yield safety. In this experiment, we subjected highly accurate models of each kind of weapon—claymore and katana—to a simulated impact, a perfectly inelastic collision, with one question: If you swing both blades exactly the same, which blade will out-perform the other?
Physical Experiment SetupSword Overview and Specifications
For both swords, the mass as well as the moment of inertia were obtained from the SolidWorks “mass properties” function. No proper handle was modeled, but a block of equivalent weight was added to capture the correct center of mass for each weapon. For complete data on weapon dimensions, see Appendix 1.
Claymore (Hand and a Half)
The Claymore is the Scottish variant of the late medieval era two-handed long sword, a sword which generally measured between 120 and 140 centimeters in length. In order to obtain a single set of dimensions to make a model of the sword in SolidWorks, the exact replica of the sword Narsil, from the movie Lord of the Rings, was used. This sword, like the Claymore, is a hand-and-a-half (not quite two handed) broad-fullered sword,and is essentially a Claymore itself. The standard steel used in this styleof Claymore was generally 1080 carbon steel1. The yield strength of this high carbon steel is 375.8 MPa2, which we will see is not quite as high as the yield strength of the steel used in the Katana.
1 (Claymore 2014)2 (AISI 1095 Carbon Steel 2013)
2

Katana (Practical XL)
The Katana is a traditional Japanese sword used during the feudal era3. Unfortunately, it was not possible to measure an exact replica of this sword and therefore dimensions were instead obtained from a website which sells classic Katanas. A modern equivalent of the steel used in ancient Katanas was very difficult to find, as the exact recipes of the different steels traditionally used have either been lost or changed so many times that it is very difficult to make an exact replica. However, after extensive research, it was determined that 1095 super high carbon steel is most like the Tamahagane used in feudal era Katanas4. This modern steel gives a yield strength of 525 MPa5, which is considerably higher thanthe yield strength of the 1080 steel used in the Claymore.
Motion Capture AnalysisBefore impact analysis could be done, we needed to first obtain a
rough estimate of the average velocity with which a sword is moving as a person is swinging it into an object. Using the Claymore replica we were able to capture a video, which can be viewed in the project file, of an average speed sword swing. This was then imported into Tracker, the motion capture analysis software from Open Source Physics. The data obtained from this gave us both translational, as well as angular, position and velocity.This allowed us to solve for kinetic energy, equivalent velocity, impact duration, and then finally force. All of these calculations can be seen in a MATLAB code in the following section. In order to obtain the data we needed, we tracked both the hilt of the sword as well as the area in between the hands on the handle using point masses. We were then able to take this data and use it to write a MATLAB code in order to solve for the variables mentioned previously.
Example frames and dynamic data can be seen in Appendix 2.
MATLAB CalculationsA simple MATLAB script calculates the required impact force for
multiple velocities. Since the real sword motion includes both rotational and translational motion, the motion capture data was linearized using energy methods. A 4th order central finite difference time derivative of theangle between the two motion capture point masses was taken as the angular 3 (Katana 2014)4 (Modern Steel equivalent to Japanese Tamahagane 2011)5 (AISI 1095 Carbon Steel 2013)
3
velocity, and the translational velocity was found using a third point massat the distance of each “sweet-spot” (see Modal Analysis). This was then linearized to an equivalent translational velocity:
12mv2+1
2Iω2=
12mveq2 .
Finally, a simple momentum change was used to determine the impact force. We assumed a perfectly inelastic collision to make approximations easier, though this is not in perfect agreement with the motion capture. With such a collision, a good approximation of the duration for momentum transfer in an impact is usually taken as the time it takes to traverse themoving object’s width at the velocity it is travelling6. Then, the force isgiven by:
Fimpact=mveq
∆t
This method was used to approximate the 4th physical experiment done in ANSYS. In order to test a variety of impact speeds, a low value speed that captured identical hand motion in each weapon was assumed, and subsequent increments of this speed (+25%, +75%). Force was then solved for using the same method described above. MATLAB code is available in Appendix 2.
6 (GSU 2014)
4
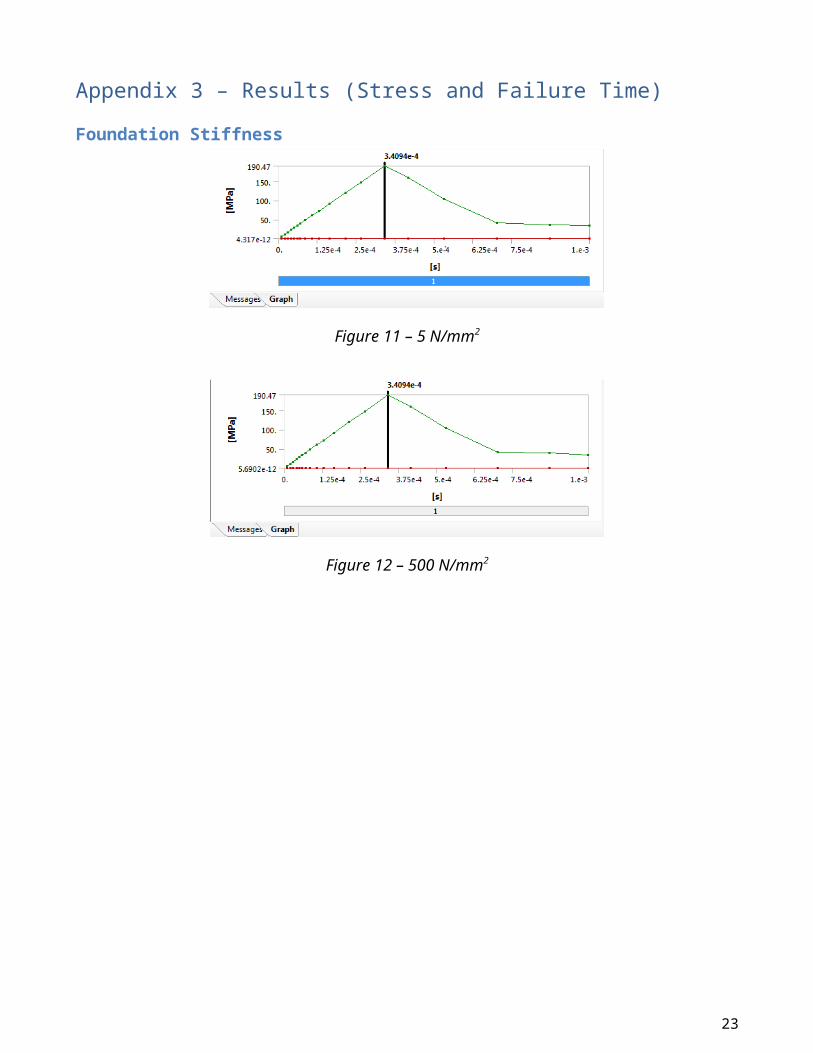
Initial Finite Element SetupFoundation Stiffness
The elastic supports used require a nonzero foundation stiffness valueto be input in order to do analysis in AutoCAD. We hypothesized that because the nodal force hits the blade for such a small amount of time, thefoundation stiffness is irrelevant in this particular case and can be set to just about any logical value. To prove this, a stress analysis was done in AutoCAD, where all values were held constant except for the foundation stiffness, which was chosen first to be 5 N/mm3 and then to be 500 N/mm3. The results, listed in the table below, show that our hypothesis was correct, and for all logical values of K there is no noticeable difference in the resulting stress.
Foundation Stiffness Analysis
K (N/mm3)Time To Max.Stress (ms)
Max.Stress
5 0.341 190.47500 0.341 190.47
Table 1
Mesh and Load SetupEach blade consisted of four geometric bodies: the blade length, the
tip, and two handle ‘blocks’ that adjusted the sword weight and marked the hand locations for reference. An additional benefit to separate meshing wasthe large number of hex-mesh elements (prisms) being used for the blade itself, while most of the irregularities in need of tet-mesh (tetrahedrons)were concentrated in the tip region. This gave a much smoother mesh in the desired impact zone. (See right; Appendix 1)
An elastic support was used on what would be the handle of the sword in order to best simulate the effect which would be had if a person were holding on to it when the impact occurred (Appendix 3). This support was used instead of a fixed or displacement support because of the greater degree of freedom that it gave the handle area of the blade. In reality, when a person strikes an object with a sword, their hands do not act as a perfectly fixed support. They instead feel some of the force of the object pushing back on the blade and will rotate up and away from the object in
5
order to compensate—much like a spring-damper system. As noted before, the value for stiffness did not measurably affect the data gathered in this experiment, so the stiffness value for the elastic supports was set to 5 N/mm3.
A nodal force was chosen, as this allowed the force to act at the exact node found from the modal analysis (see Modal Analysis below). Beginning at time 0s, the force ramped up to a determined value to simulatean impact speed at the sweet-spot. It reached this force in exactly ∆t/2 seconds, using the other half of the duration to fall back to zero.
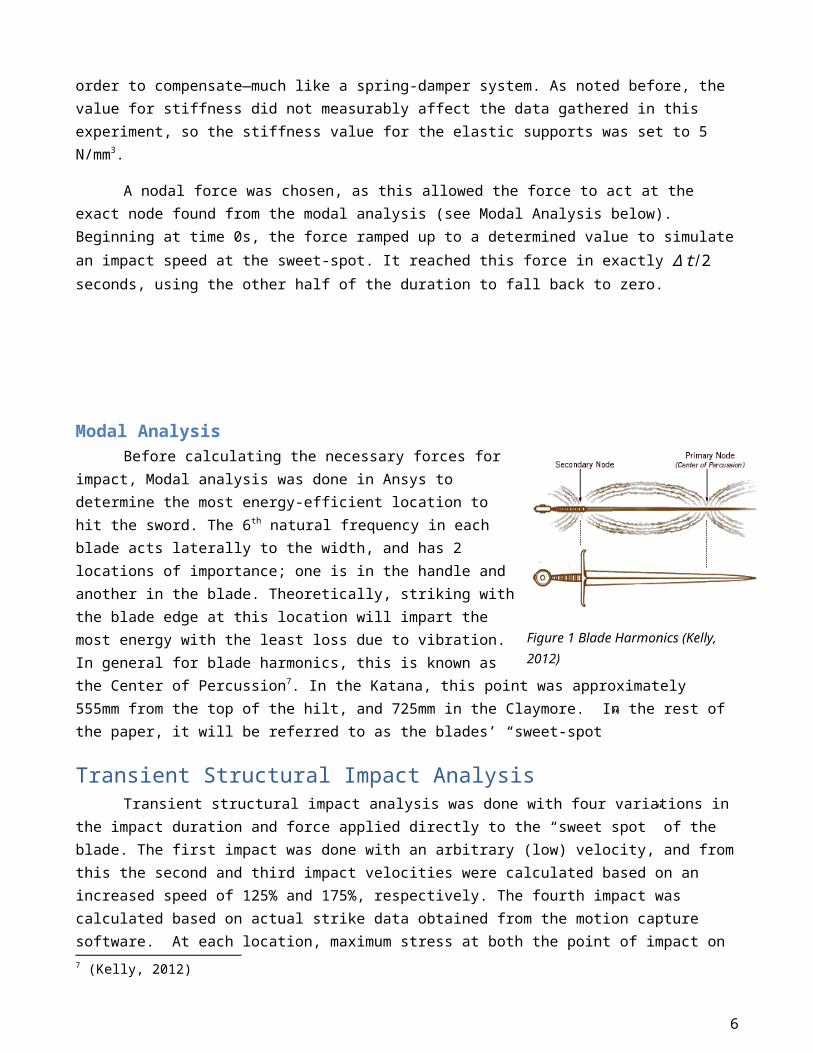
Modal AnalysisBefore calculating the necessary forces for
impact, Modal analysis was done in Ansys todetermine the most energy-efficient location tohit the sword. The 6th natural frequency in eachblade acts laterally to the width, and has 2locations of importance; one is in the handle andanother in the blade. Theoretically, striking withthe blade edge at this location will impart themost energy with the least loss due to vibration. In general for blade harmonics, this is known asthe Center of Percussion7. In the Katana, this point was approximately 555mm from the top of the hilt, and 725mm in the Claymore. In the rest of the paper, it will be referred to as the blades’ “sweet-spot”
Transient Structural Impact AnalysisTransient structural impact analysis was done with four variations in
the impact duration and force applied directly to the “sweet spot” of the blade. The first impact was done with an arbitrary (low) velocity, and fromthis the second and third impact velocities were calculated based on an increased speed of 125% and 175%, respectively. The fourth impact was calculated based on actual strike data obtained from the motion capture software. At each location, maximum stress at both the point of impact on 7 (Kelly, 2012)
6
Figure 1 Blade Harmonics (Kelly, 2012)
the blade, and the matching point on the back fiber opposite, were recorded. Since stresses in the immediate vicinity are bound to deform local metal, the blade edge yielding is taken as dent or notch creation. Onthe other hand, yielding in the back fiber would be detrimental to the entire structure of the blade, and is seen in this experiment as “catastrophic.”
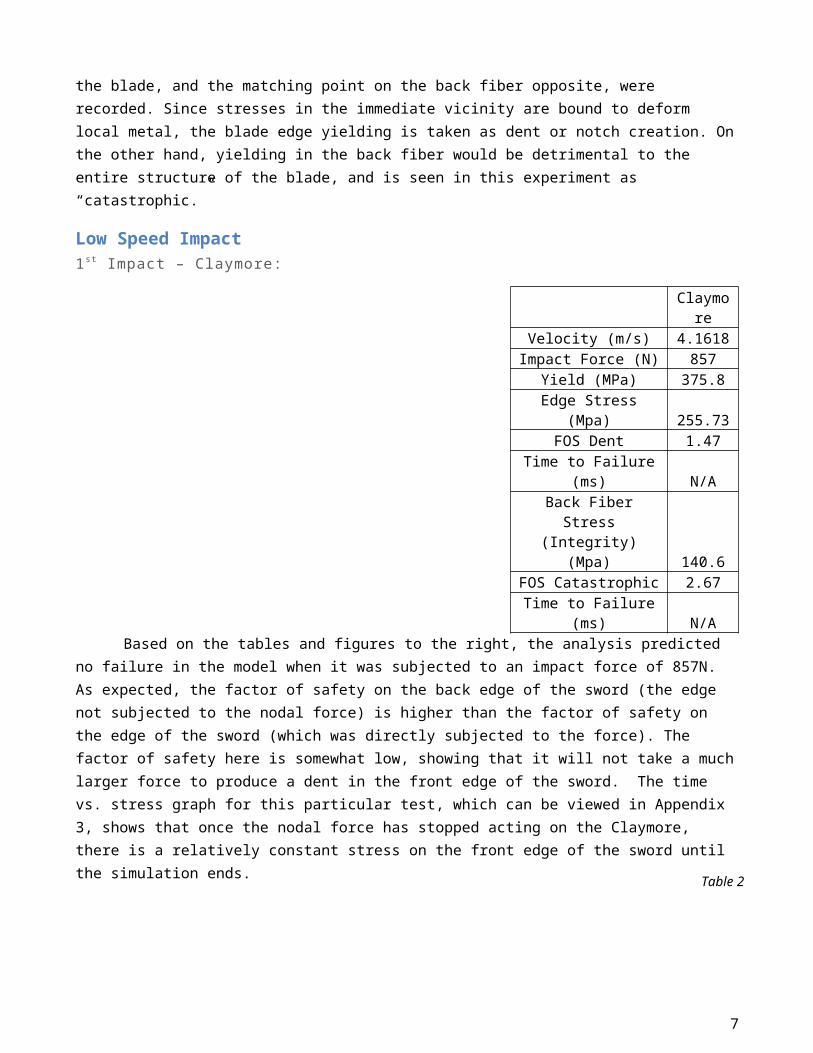
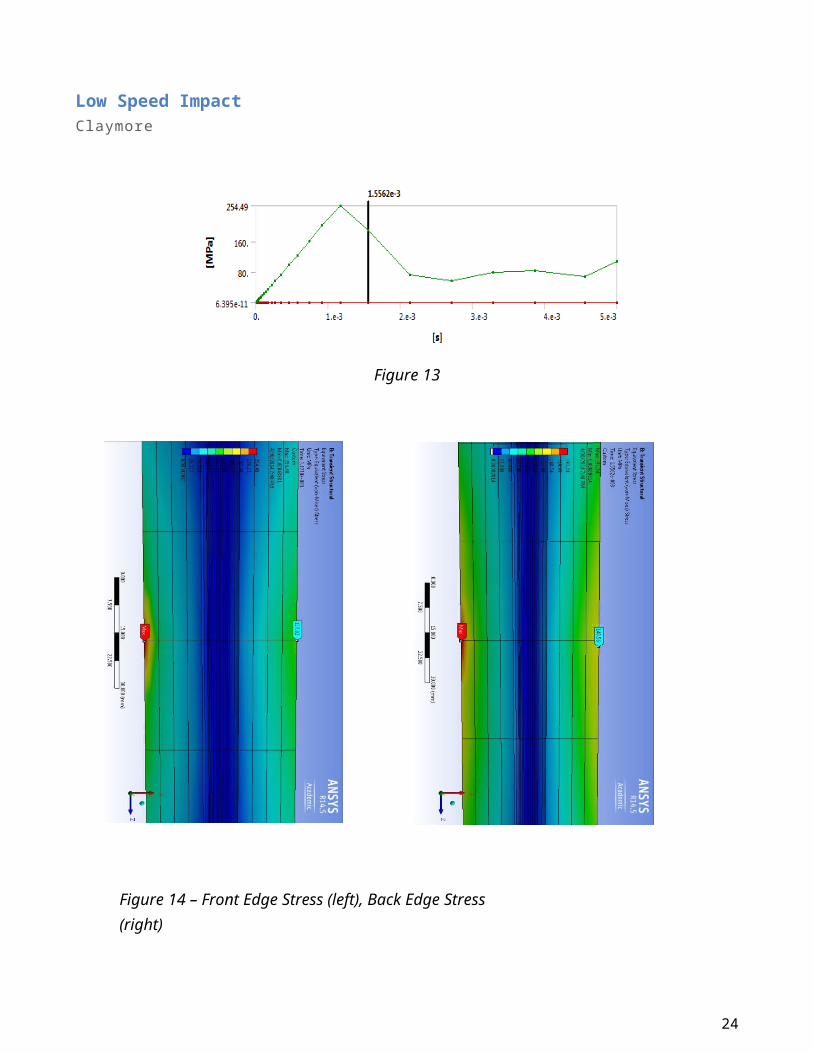
Low Speed Impact 1st Impact – Claymore:
Claymore
Velocity (m/s) 4.1618Impact Force (N) 857
Yield (MPa) 375.8Edge Stress
(Mpa) 255.73FOS Dent 1.47
Time to Failure(ms) N/A
Back FiberStress
(Integrity)(Mpa) 140.6
FOS Catastrophic 2.67Time to Failure
(ms) N/ABased on the tables and figures to the right, the analysis predicted
no failure in the model when it was subjected to an impact force of 857N. As expected, the factor of safety on the back edge of the sword (the edge not subjected to the nodal force) is higher than the factor of safety on the edge of the sword (which was directly subjected to the force). The factor of safety here is somewhat low, showing that it will not take a muchlarger force to produce a dent in the front edge of the sword. The time vs. stress graph for this particular test, which can be viewed in Appendix 3, shows that once the nodal force has stopped acting on the Claymore, there is a relatively constant stress on the front edge of the sword until the simulation ends.
7
Table 2
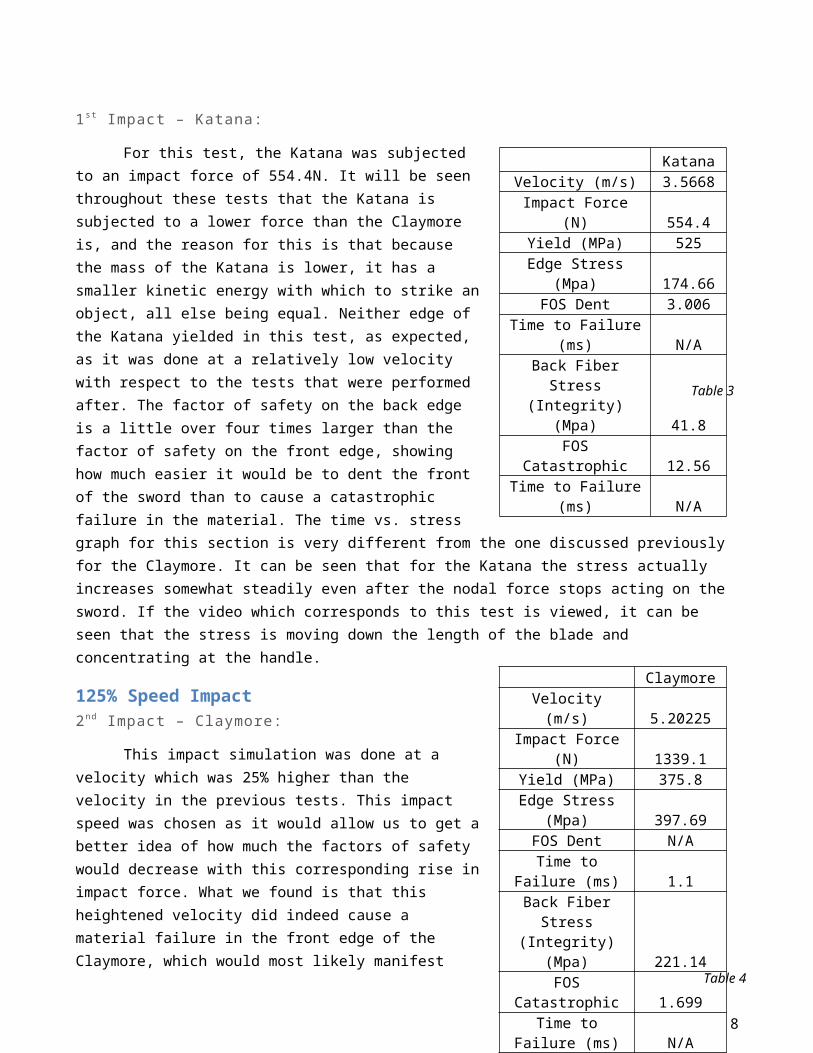
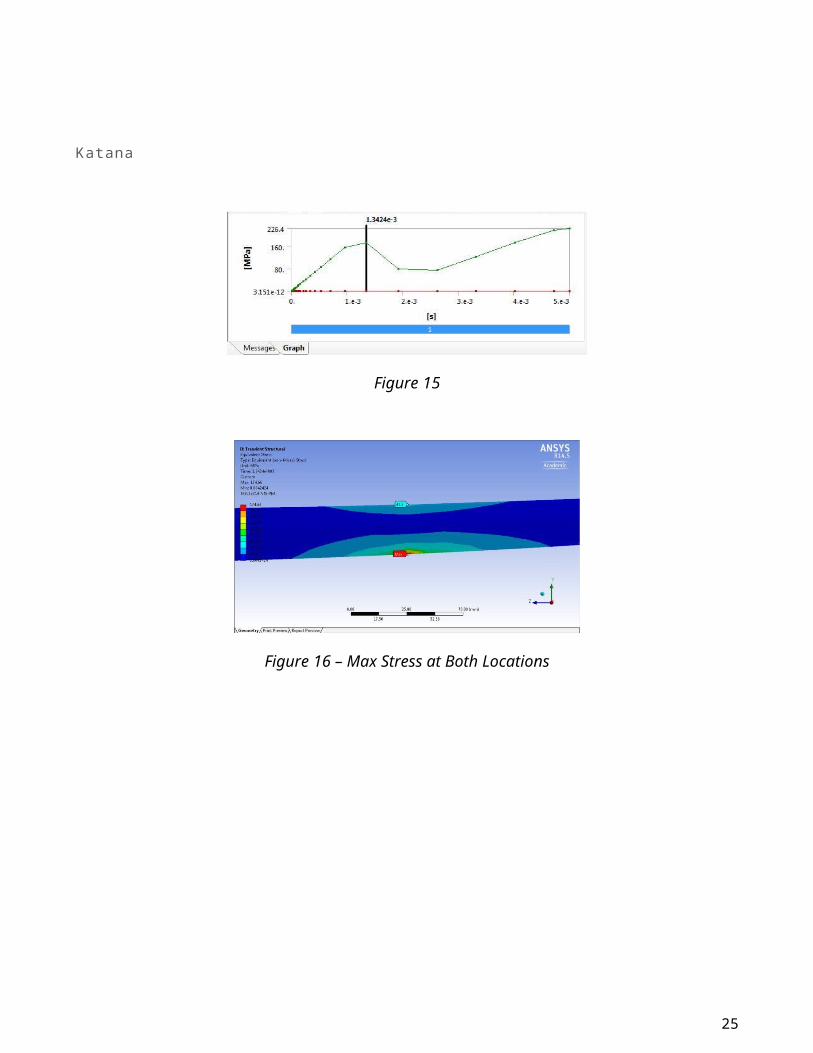
1st Impact – Katana:
For this test, the Katana was subjectedto an impact force of 554.4N. It will be seenthroughout these tests that the Katana issubjected to a lower force than the Claymoreis, and the reason for this is that becausethe mass of the Katana is lower, it has asmaller kinetic energy with which to strike anobject, all else being equal. Neither edge ofthe Katana yielded in this test, as expected,as it was done at a relatively low velocitywith respect to the tests that were performedafter. The factor of safety on the back edgeis a little over four times larger than thefactor of safety on the front edge, showinghow much easier it would be to dent the frontof the sword than to cause a catastrophicfailure in the material. The time vs. stressgraph for this section is very different from the one discussed previously for the Claymore. It can be seen that for the Katana the stress actually increases somewhat steadily even after the nodal force stops acting on the sword. If the video which corresponds to this test is viewed, it can be seen that the stress is moving down the length of the blade and concentrating at the handle.
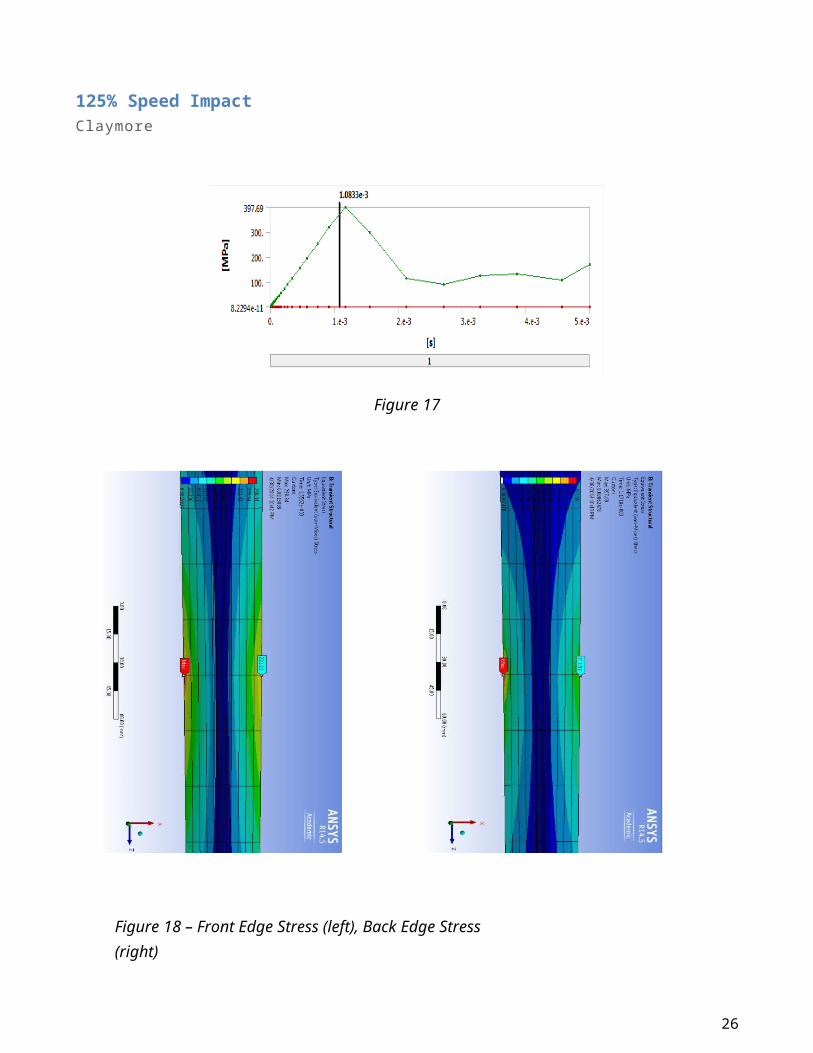
125% Speed Impact2nd Impact – Claymore:
This impact simulation was done at avelocity which was 25% higher than thevelocity in the previous tests. This impactspeed was chosen as it would allow us to get abetter idea of how much the factors of safetywould decrease with this corresponding rise inimpact force. What we found is that thisheightened velocity did indeed cause amaterial failure in the front edge of theClaymore, which would most likely manifest
8
Table 4
Table 3
KatanaVelocity (m/s) 3.5668Impact Force
(N) 554.4Yield (MPa) 525Edge Stress
(Mpa) 174.66FOS Dent 3.006
Time to Failure(ms) N/A
Back FiberStress
(Integrity)(Mpa) 41.8FOS
Catastrophic 12.56Time to Failure
(ms) N/A
ClaymoreVelocity(m/s) 5.20225
Impact Force(N) 1339.1
Yield (MPa) 375.8Edge Stress
(Mpa) 397.69FOS Dent N/ATime to
Failure (ms) 1.1Back FiberStress
(Integrity)(Mpa) 221.14FOS
Catastrophic 1.699Time to
Failure (ms) N/A
itself in the form of a dent or tear which could be seen with the naked eye. The maximum stress on the front edge was about 22 MPa higher than the yield stress, although the maximum stress on the back edge was still in a safe range, resulting in the safety factor of 1.69.
2nd Impact – Katana:
The Katana, unlike the Claymore, did not exhibit a failure on its blade edge during this test. In fact, it has a safety factor of 1.90, whichdecreased by about 1 as a result of the 25% increase in velocity. The back fiber stress is still relatively low, as it provides a safety factor of about 8.3. In both of the tests discussed up to this point, and as we will see in the following two tests, the Katana exhibits a much greater resilience to stress in its back fiber than the Claymore does.
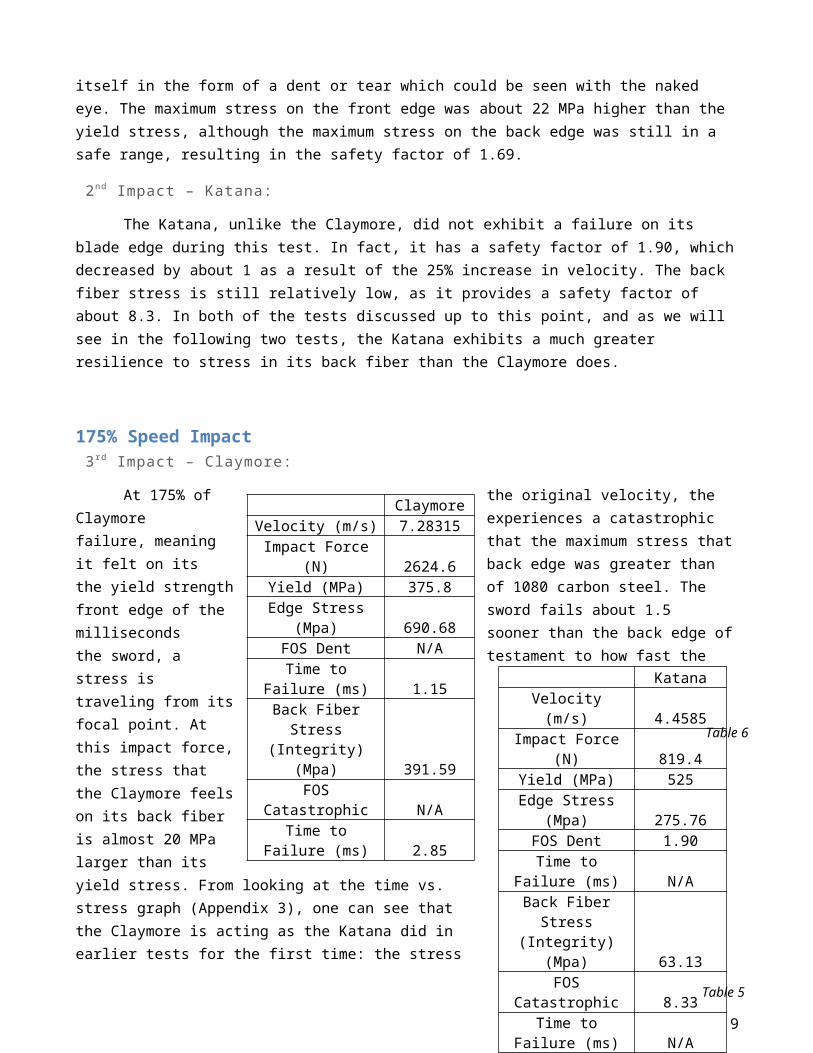
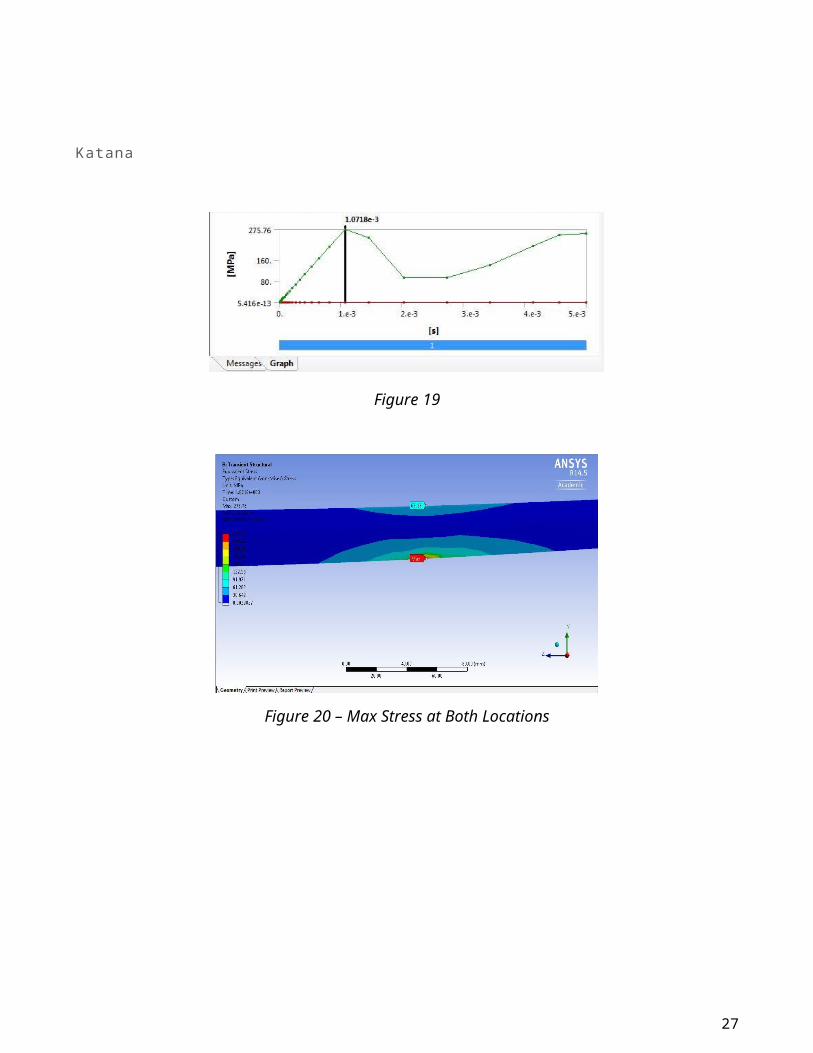
175% Speed Impact 3rd Impact – Claymore:
At 175% of the original velocity, the Claymore experiences a catastrophic failure, meaning that the maximum stress thatit felt on its back edge was greater than the yield strength of 1080 carbon steel. The front edge of the sword fails about 1.5 milliseconds sooner than the back edge ofthe sword, a testament to how fast the stress istraveling from itsfocal point. Atthis impact force,the stress thatthe Claymore feelson its back fiberis almost 20 MPalarger than itsyield stress. From looking at the time vs.stress graph (Appendix 3), one can see thatthe Claymore is acting as the Katana did inearlier tests for the first time: the stress
9
Table 5
Table 6
KatanaVelocity(m/s) 4.4585
Impact Force(N) 819.4
Yield (MPa) 525Edge Stress
(Mpa) 275.76FOS Dent 1.90Time to
Failure (ms) N/ABack Fiber
Stress(Integrity)
(Mpa) 63.13FOS
Catastrophic 8.33Time to
Failure (ms) N/A
ClaymoreVelocity (m/s) 7.28315Impact Force
(N) 2624.6Yield (MPa) 375.8Edge Stress
(Mpa) 690.68FOS Dent N/ATime to
Failure (ms) 1.15Back FiberStress
(Integrity)(Mpa) 391.59FOS
Catastrophic N/ATime to
Failure (ms) 2.85
is actually increasing towards the end of the test as it begins to concentrate around the handle of the sword.
3rd Impact – Katana:
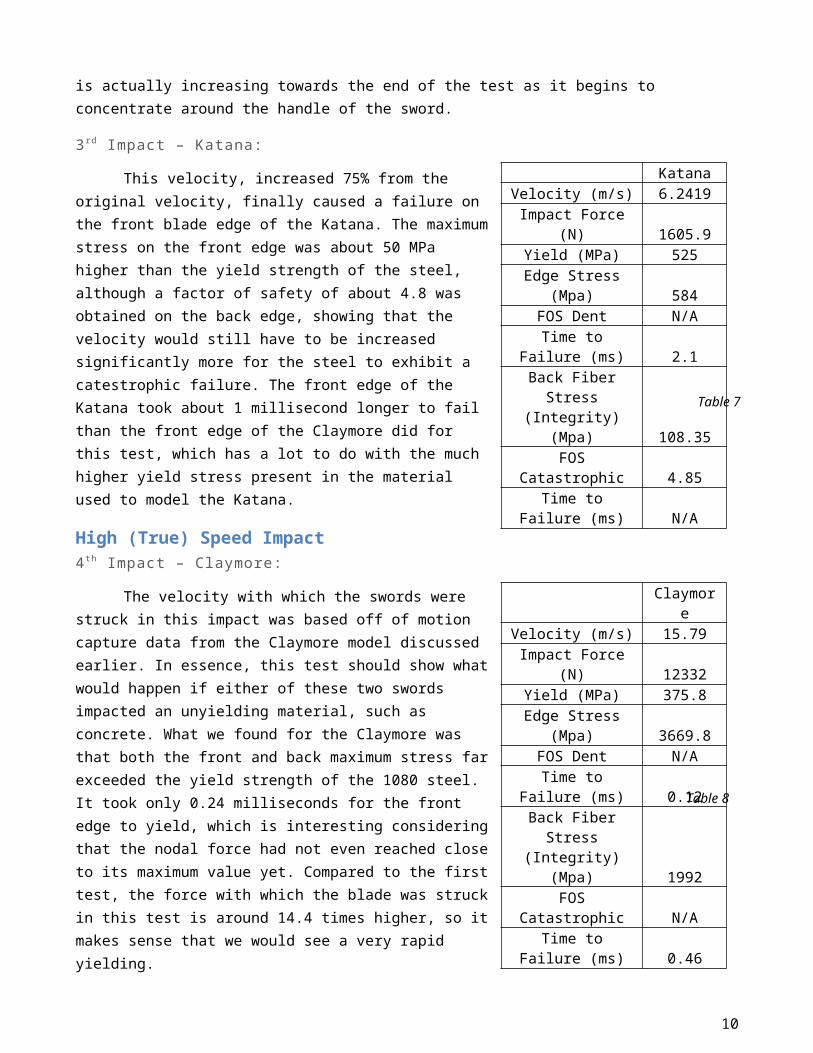
This velocity, increased 75% from theoriginal velocity, finally caused a failure onthe front blade edge of the Katana. The maximumstress on the front edge was about 50 MPahigher than the yield strength of the steel,although a factor of safety of about 4.8 wasobtained on the back edge, showing that thevelocity would still have to be increasedsignificantly more for the steel to exhibit acatestrophic failure. The front edge of theKatana took about 1 millisecond longer to failthan the front edge of the Claymore did forthis test, which has a lot to do with the muchhigher yield stress present in the materialused to model the Katana.
High (True) Speed Impact4th Impact – Claymore:
The velocity with which the swords werestruck in this impact was based off of motioncapture data from the Claymore model discussedearlier. In essence, this test should show whatwould happen if either of these two swordsimpacted an unyielding material, such asconcrete. What we found for the Claymore wasthat both the front and back maximum stress farexceeded the yield strength of the 1080 steel.It took only 0.24 milliseconds for the frontedge to yield, which is interesting consideringthat the nodal force had not even reached closeto its maximum value yet. Compared to the firsttest, the force with which the blade was struckin this test is around 14.4 times higher, so itmakes sense that we would see a very rapidyielding.
10
Table 7
Table 8
KatanaVelocity (m/s) 6.2419Impact Force
(N) 1605.9Yield (MPa) 525Edge Stress
(Mpa) 584FOS Dent N/ATime to
Failure (ms) 2.1Back FiberStress
(Integrity)(Mpa) 108.35FOS
Catastrophic 4.85Time to
Failure (ms) N/A
Claymore
Velocity (m/s) 15.79Impact Force
(N) 12332Yield (MPa) 375.8Edge Stress
(Mpa) 3669.8FOS Dent N/ATime to
Failure (ms) 0.12Back FiberStress
(Integrity)(Mpa) 1992FOS
Catastrophic N/ATime to
Failure (ms) 0.46
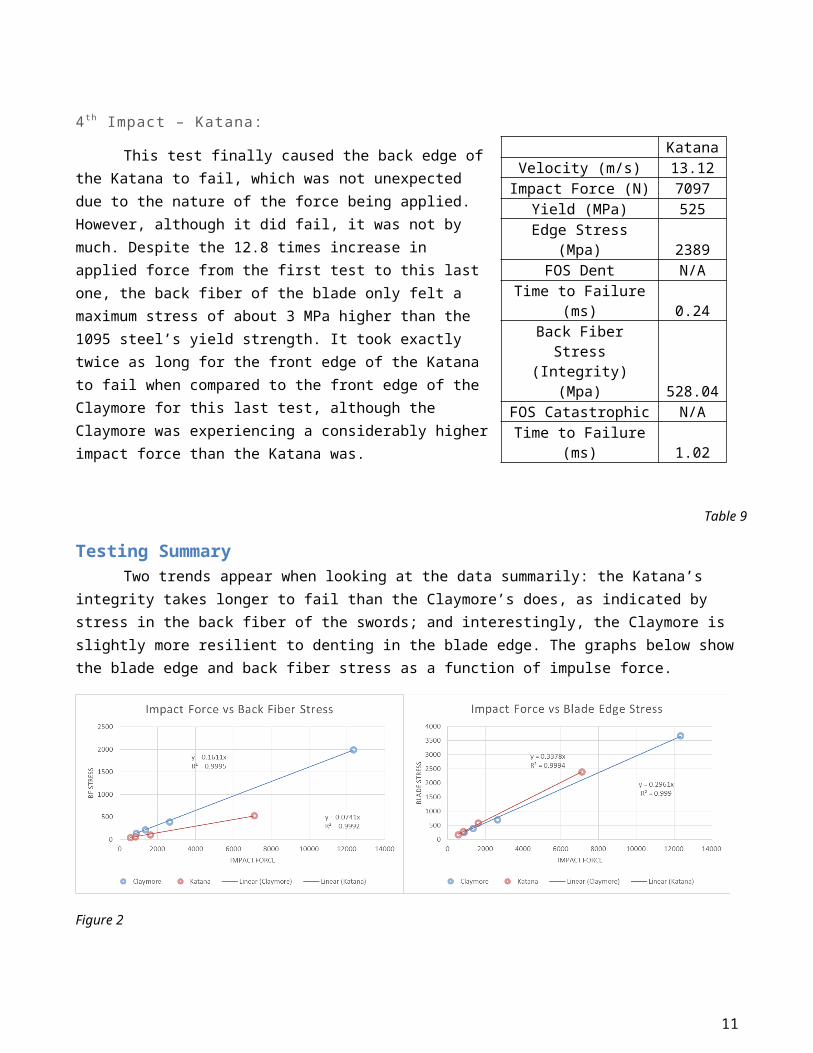
4th Impact – Katana:
This test finally caused the back edge ofthe Katana to fail, which was not unexpecteddue to the nature of the force being applied.However, although it did fail, it was not bymuch. Despite the 12.8 times increase inapplied force from the first test to this lastone, the back fiber of the blade only felt amaximum stress of about 3 MPa higher than the1095 steel’s yield strength. It took exactlytwice as long for the front edge of the Katanato fail when compared to the front edge of theClaymore for this last test, although theClaymore was experiencing a considerably higherimpact force than the Katana was.
Testing SummaryTwo trends appear when looking at the data summarily: the Katana’s
integrity takes longer to fail than the Claymore’s does, as indicated by stress in the back fiber of the swords; and interestingly, the Claymore is slightly more resilient to denting in the blade edge. The graphs below showthe blade edge and back fiber stress as a function of impulse force.
Figure 2
11
Table 9
KatanaVelocity (m/s) 13.12
Impact Force (N) 7097Yield (MPa) 525Edge Stress
(Mpa) 2389FOS Dent N/A
Time to Failure(ms) 0.24
Back FiberStress
(Integrity)(Mpa) 528.04
FOS Catastrophic N/ATime to Failure
(ms) 1.02
As these very well-fitting linear approximations show, the Katana actually has a little extra stress on the blade edge where hit. This could be due tothe geometry of the blade, or simply the inability of the 1095 steel to give as much as the 1080 steel. Either way, the idea that the Katana could take much more punishment to the overall frame/structure has been verified,but in the end the blade edge will be more difficult to maintain in good condition if poor care is taken.
12
ConclusionsThese four tests done on each sword essentially gave us an idea of
what would happen if either of them were swung into a material which exhibited no yeilding. What we found is that overall, the Katana exhibited a much greater resilience to this type of testing than did the Claymore, which can be seen in all of the tables in the above section. The back fiberof the Claymore failed on the third test, while it took a much higher forcein the fourth test to get the Katana to show signs of a catestrophic failure. However, it is worth noting that the Katana only just failed by about 3 MPa, a testament to just how strong that sword really is.
The time vs. stress graphs shown in Appendix 3 show how the blade as awhole reacted to the applied force. During each test, the Katana felt a steadily increasing and then decreasing of stress as the nodal force was turned on and then off. However, the stress began building again and concentrating at the hilt of the sword after this, a phenonenom which was not seen to as a great a degree in the Claymore at first. Once the nodal force impacting the Claymore was turned off, the stress stayed at a relatively constant level for the next few milliseconds, at least for the first two tests. However, during the third and fourth test it can be seen that the stress levels in the Claymore began rising in the same way that they were in the Katana after the nodal force had decreased. It is very probable, however, that the data obtained after the time step in which the Claymore catestrophically yielded is not accurate because in reality the sword would be in two or more pieces and would therefore likely have a verydifferent stress distribution than the one portrayed in the graph.
Historically, the Katana was designed to be a cutting weapon, rather than one used to stab. It’s blade is curved for that exact reason, as it allowed the user to draw the weapon and execute a slash attack at the same time. The Claymore was initially used as a slashing weapon as well, however, as armor became stronger, blacksmiths adapted and the swords became thinner and pointier8. This historical data seems to back up the data which we obtained while running the four tests, as the stress levels in both swords in all of the tests clearly shows that when it comes to hitting an object on the front blade edge, the Katana is clearly able to withstand a much larger blow.
8 (Kinsei1560 2010)
13

14
ReferencesAISI1095 Carbon Steel (UNS G10950). (2013, June 11). Retrieved from AZOM:
www.azom.com/article.aspx?ArticleID=656
Claymore. (2014, April 12). Retrieved from Wikipedia: http://en.wikipedia.org/wiki/Claymore
GSU, G. S. (2014). HyperPhysics. Retrieved from Impulse of Force: http://hyperphysics.phy-astr.gsu.edu/hbase/impulse.html
Katana (Japanese Sword) Dimensions. (2006). Retrieved from Toyamaryu: http://toyamaryu.org/sword_dimensions.htm
Katana. (2014, April 23). Retrieved from Wikipedia: http://en.wikipedia.org/wiki/Katana
Kelly, P. (2012). Understanding Blade Properties. Retrieved from My Armoury: http://www.myarmoury.com/feature_properties.php
kinsei1560. (2010, July 14). Japanese Katana VS European Longsword - Samurai sword VS Knight Broadsword. Retrieved from Youtube: http://www.youtube.com/watch?v=EDkoj932YFo
Modern Steel equivalent to Japanese Tamahagane. (2011, May 08). Retrieved from Kitchen Knife Forums: http://www.kitchenknifeforums.com/archive/index.php/t-1052.html
SI 1080 Carbon Steel (UNS G10800). (2014, May 1). Retrieved from AZOM: http://www.azom.com/article.aspx?ArticleID=6570
15
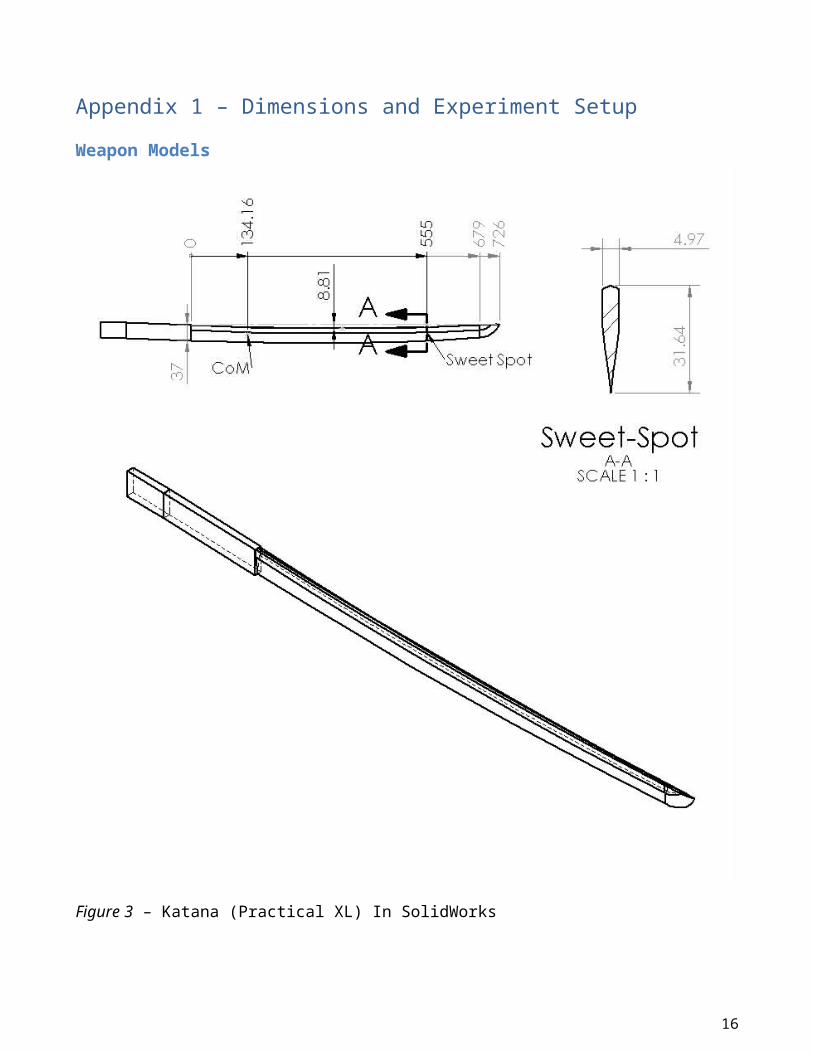
Appendix 1 – Dimensions and Experiment SetupWeapon Models
Figure 3 – Katana (Practical XL) In SolidWorks
16
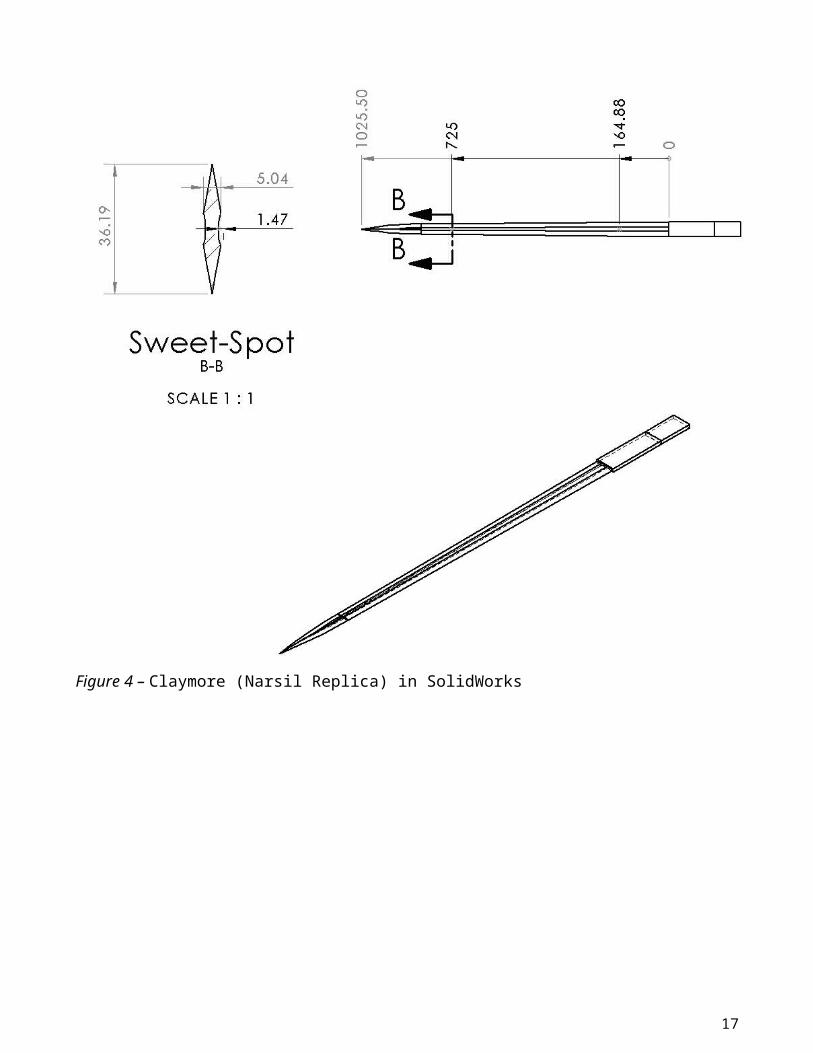
Figure 4 – Claymore (Narsil Replica) in SolidWorks
17
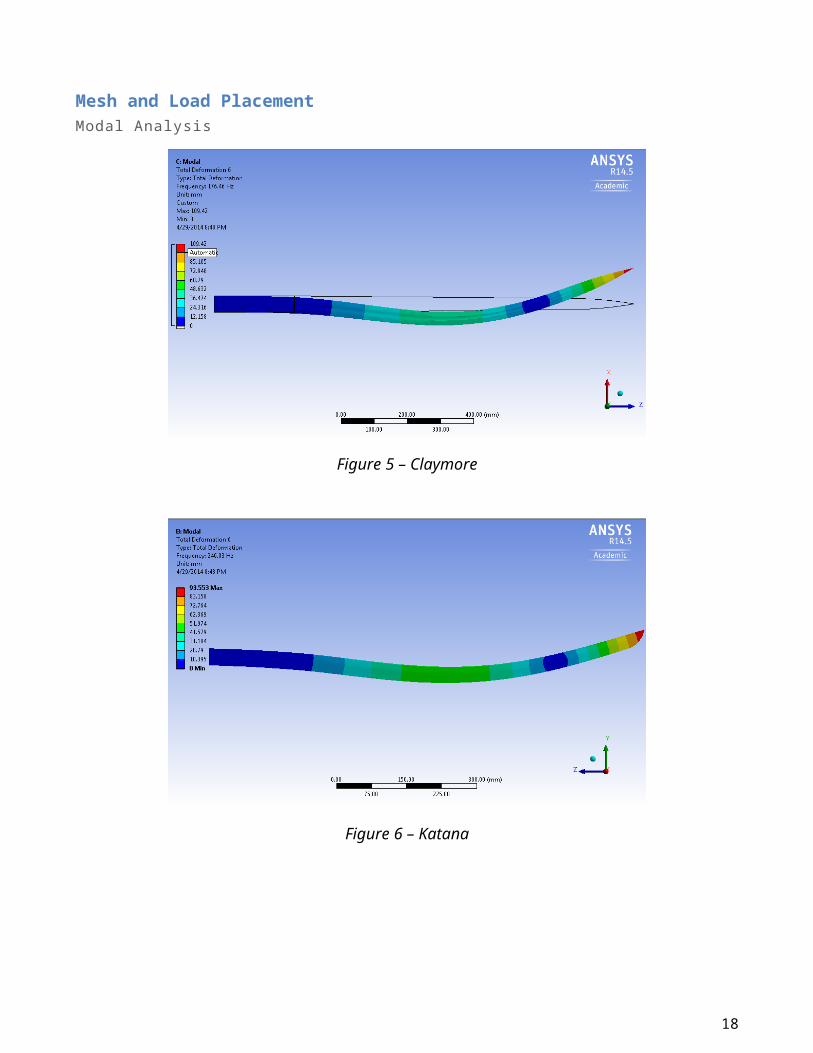
Mesh and Load PlacementModal Analysis
Figure 5 – Claymore
Figure 6 – Katana
18
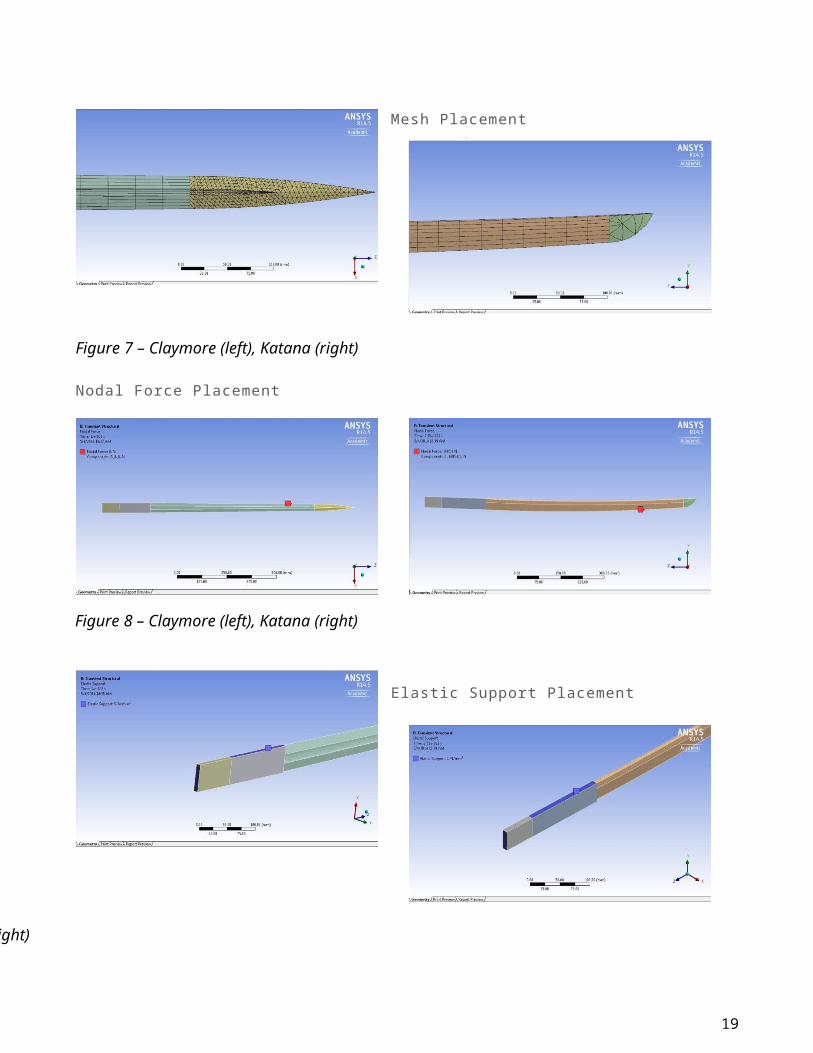
Mesh Placement
Nodal Force Placement
Elastic Support Placement
19
Figure 7 – Claymore (left), Katana (right)
Figure 8 – Claymore (left), Katana (right)
– Claymore (left), Katana (right)
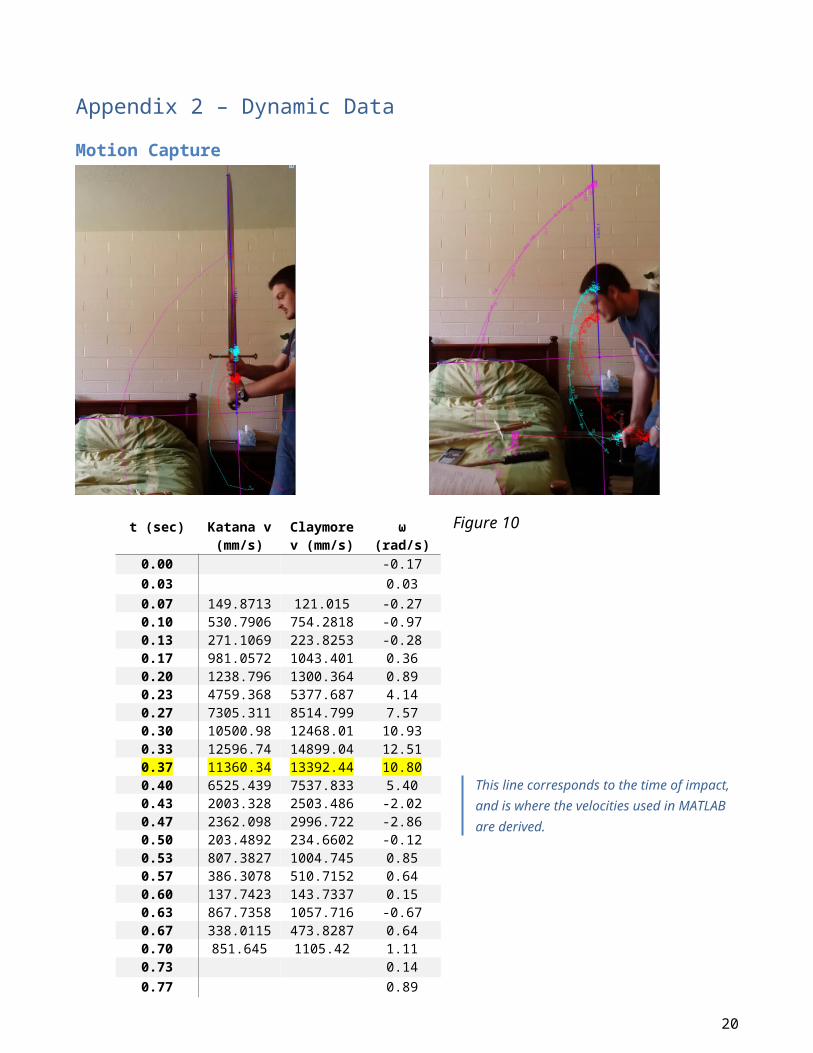
Appendix 2 – Dynamic DataMotion Capture
Figure 10
20
This line corresponds to the time of impact, and is where the velocities used in MATLAB are derived.
t (sec) Katana v(mm/s)
Claymorev (mm/s)
ω(rad/s)
0.00 -0.170.03 0.030.07 149.8713 121.015 -0.270.10 530.7906 754.2818 -0.970.13 271.1069 223.8253 -0.280.17 981.0572 1043.401 0.360.20 1238.796 1300.364 0.890.23 4759.368 5377.687 4.140.27 7305.311 8514.799 7.570.30 10500.98 12468.01 10.930.33 12596.74 14899.04 12.510.37 11360.34 13392.44 10.800.40 6525.439 7537.833 5.400.43 2003.328 2503.486 -2.020.47 2362.098 2996.722 -2.860.50 203.4892 234.6602 -0.120.53 807.3827 1004.745 0.850.57 386.3078 510.7152 0.640.60 137.7423 143.7337 0.150.63 867.7358 1057.716 -0.670.67 338.0115 473.8287 0.640.70 851.645 1105.42 1.110.73 0.140.77 0.89
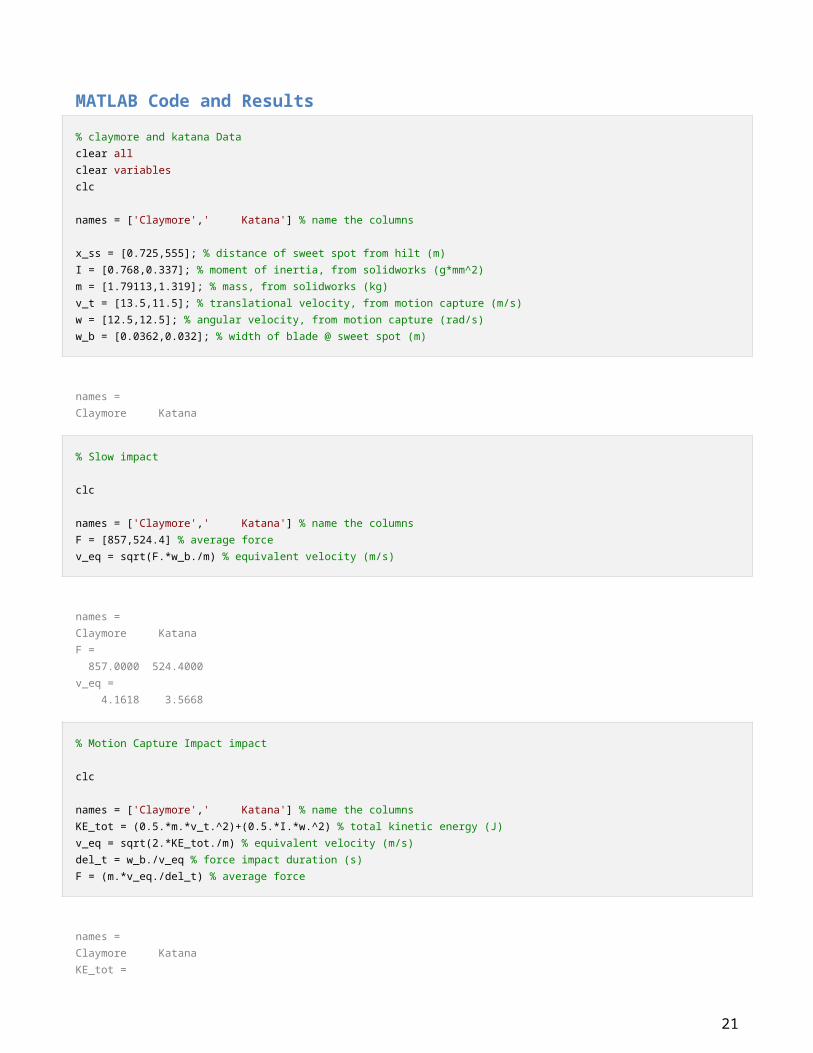
MATLAB Code and Results% claymore and katana Dataclear allclear variablesclc
names = ['Claymore',' Katana'] % name the columns
x_ss = [0.725,555]; % distance of sweet spot from hilt (m)I = [0.768,0.337]; % moment of inertia, from solidworks (g*mm^2)m = [1.79113,1.319]; % mass, from solidworks (kg)v_t = [13.5,11.5]; % translational velocity, from motion capture (m/s)w = [12.5,12.5]; % angular velocity, from motion capture (rad/s)w_b = [0.0362,0.032]; % width of blade @ sweet spot (m)
names =Claymore Katana
% Slow impact
clc
names = ['Claymore',' Katana'] % name the columnsF = [857,524.4] % average forcev_eq = sqrt(F.*w_b./m) % equivalent velocity (m/s)
names =Claymore KatanaF = 857.0000 524.4000v_eq = 4.1618 3.5668
% Motion Capture Impact impact
clc
names = ['Claymore',' Katana'] % name the columnsKE_tot = (0.5.*m.*v_t.^2)+(0.5.*I.*w.^2) % total kinetic energy (J)v_eq = sqrt(2.*KE_tot./m) % equivalent velocity (m/s)del_t = w_b./v_eq % force impact duration (s)F = (m.*v_eq./del_t) % average force
names =Claymore KatanaKE_tot =
21
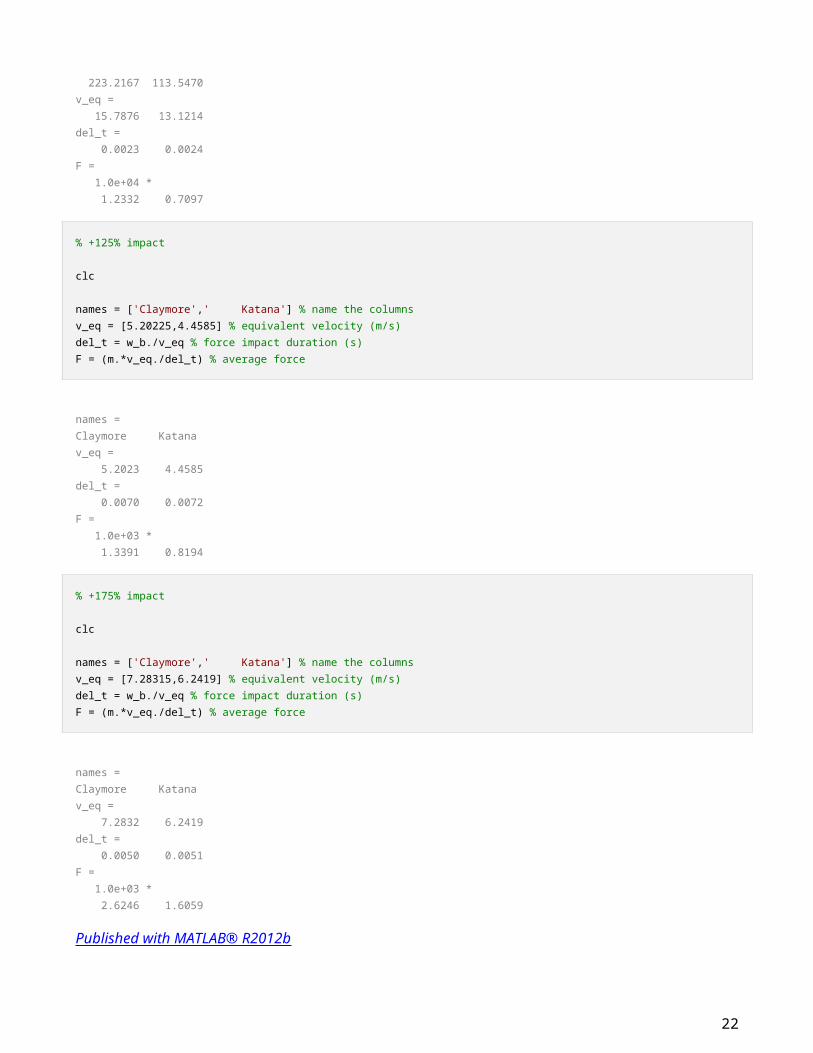
223.2167 113.5470v_eq = 15.7876 13.1214del_t = 0.0023 0.0024F = 1.0e+04 * 1.2332 0.7097
% +125% impact
clc
names = ['Claymore',' Katana'] % name the columnsv_eq = [5.20225,4.4585] % equivalent velocity (m/s)del_t = w_b./v_eq % force impact duration (s)F = (m.*v_eq./del_t) % average force
names =Claymore Katanav_eq = 5.2023 4.4585del_t = 0.0070 0.0072F = 1.0e+03 * 1.3391 0.8194
% +175% impact
clc
names = ['Claymore',' Katana'] % name the columnsv_eq = [7.28315,6.2419] % equivalent velocity (m/s)del_t = w_b./v_eq % force impact duration (s)F = (m.*v_eq./del_t) % average force
names =Claymore Katanav_eq = 7.2832 6.2419del_t = 0.0050 0.0051F = 1.0e+03 * 2.6246 1.6059
Published with MATLAB® R2012b
22
Appendix 3 – Results (Stress and Failure Time)Foundation Stiffness
Figure 11 – 5 N/mm2
Figure 12 – 500 N/mm2
23
Low Speed ImpactClaymore
Figure 13
24
Figure 14 – Front Edge Stress (left), Back Edge Stress (right)
Katana
Figure 15
Figure 16 – Max Stress at Both Locations
25
125% Speed ImpactClaymore
Figure 17
26
Figure 18 – Front Edge Stress (left), Back Edge Stress (right)
Katana
Figure 19
Figure 20 – Max Stress at Both Locations
27
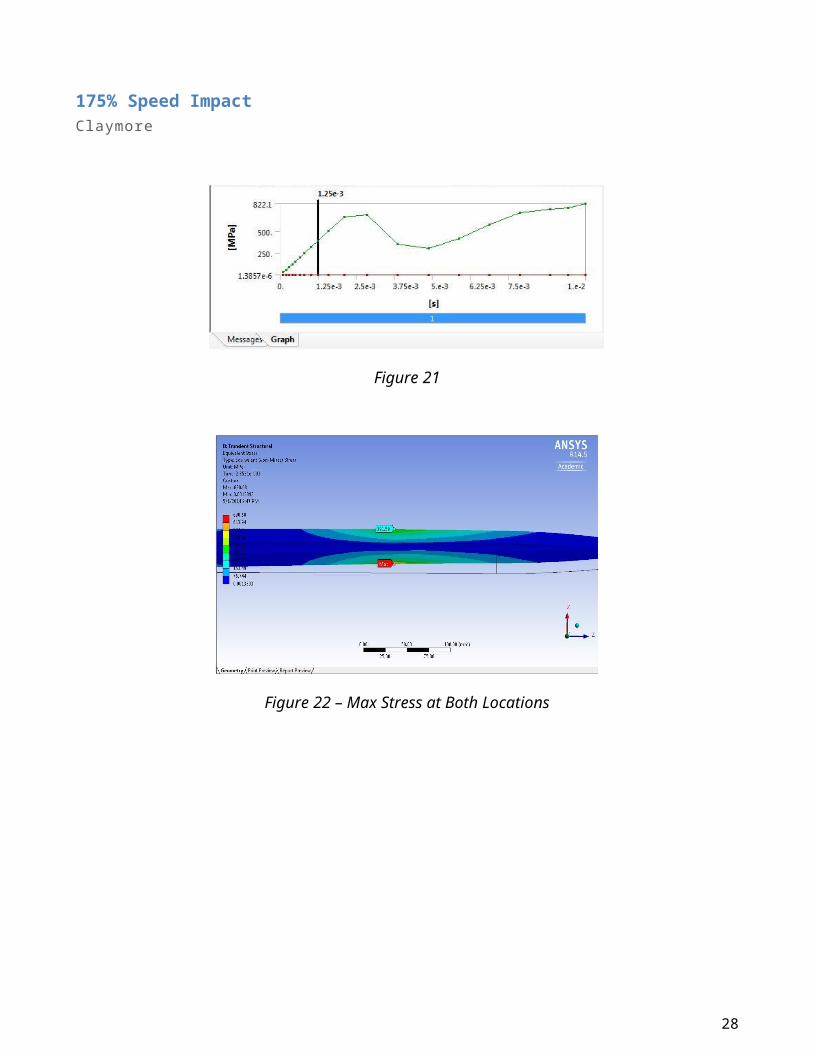
175% Speed ImpactClaymore
Figure 21
Figure 22 – Max Stress at Both Locations
28
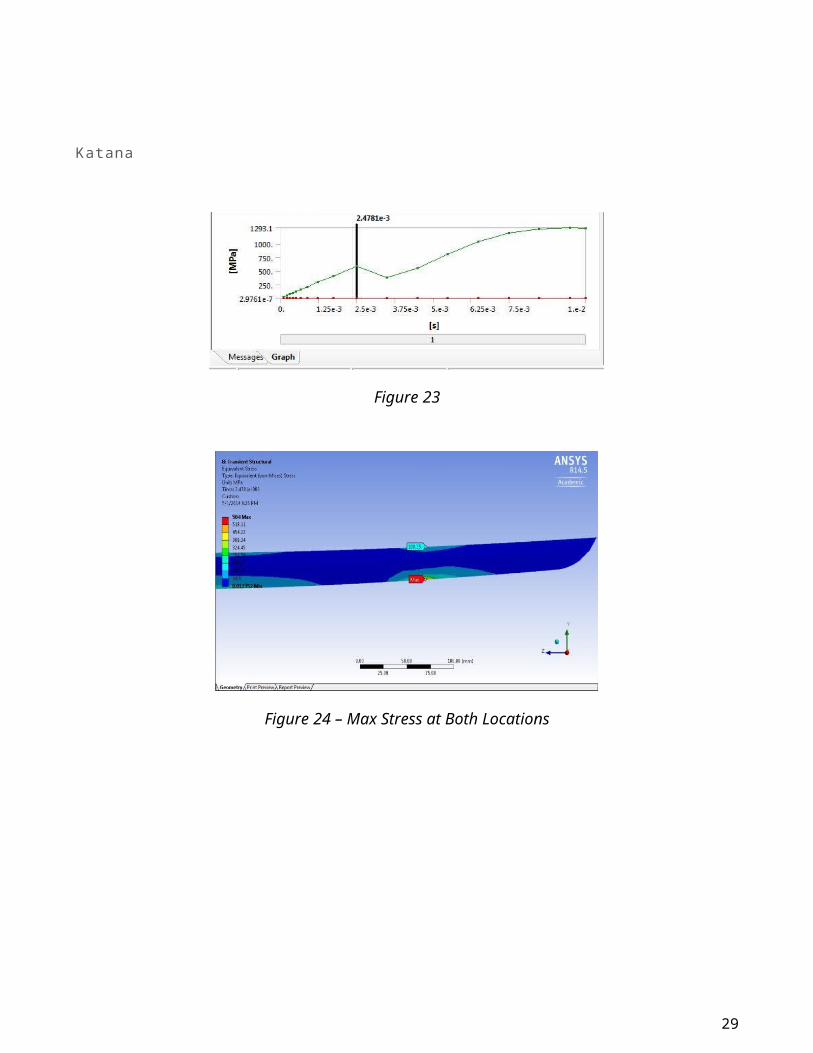
Katana
Figure 23
Figure 24 – Max Stress at Both Locations
29
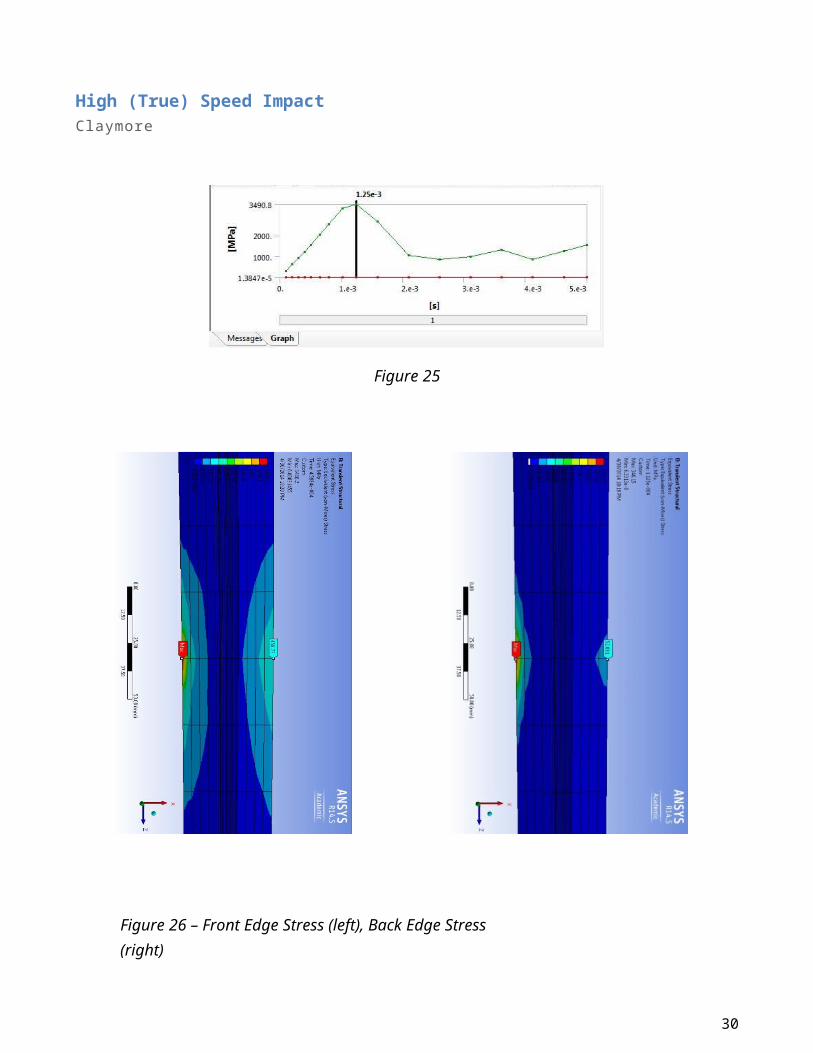
High (True) Speed ImpactClaymore
Figure 25
30
Figure 26 – Front Edge Stress (left), Back Edge Stress (right)
Katana
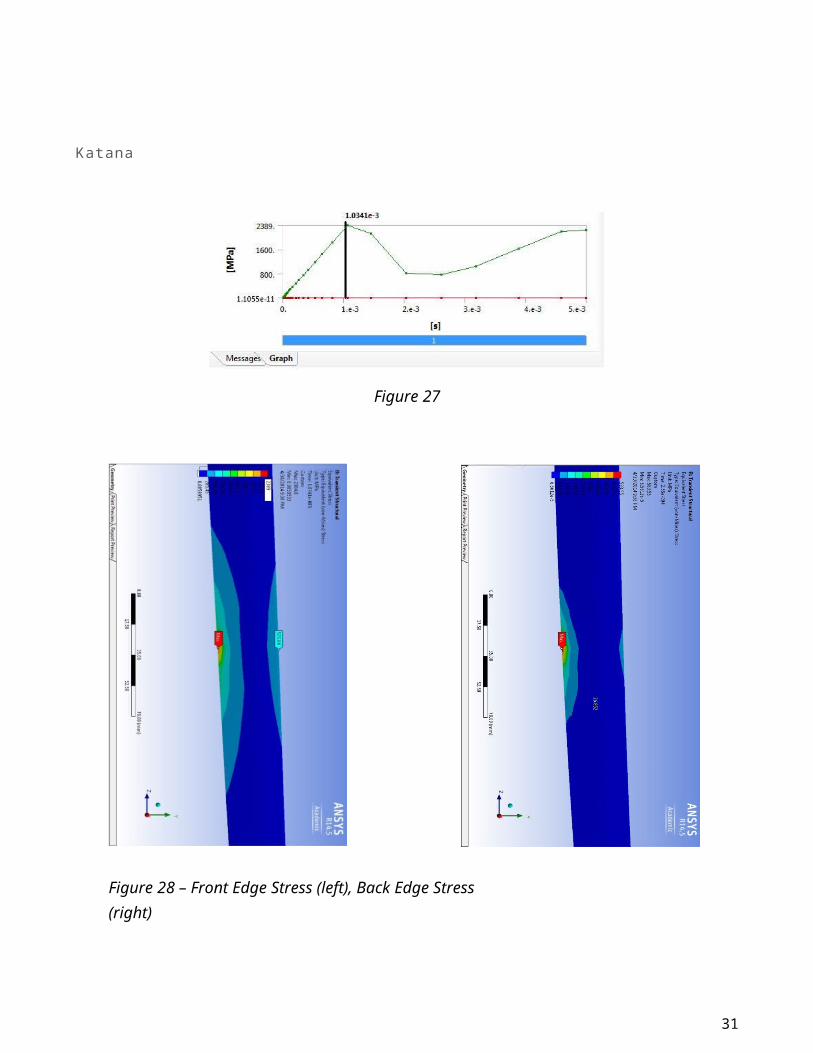
Figure 27
31
Figure 28 – Front Edge Stress (left), Back Edge Stress (right)