ON THE FEASIBILITY OF THE LINEAR SAMPLING METHOD FOR 3D GPR SURVEYS

This article was downloaded by: [Emin Ugur Ulugergerli]On: 03 August 2012, At: 19:18Publisher: Taylor & FrancisInforma Ltd Registered in England and Wales Registered Number: 1072954 Registeredoffice: Mortimer House, 37-41 Mortimer Street, London W1T 3JH, UK
Nondestructive Testing and EvaluationPublication details, including instructions for authors andsubscription information:http://www.tandfonline.com/loi/gnte20
Imaging karstic cavities in transparent3D volume of the GPR data set inAkkopru dam, Mugla, TurkeySelma Kadioglu a b & Emin U. Ulugergerli ca Department of Geophysical Engineering, Faculty of Engineering,Ankara University, 06100, Tandogan, Ankara, Turkeyb Earth Sciences Application and Research Center (YEBIM), AnkaraUniversity, 06100, Tandogan, Ankara, Turkeyc Department of Geophysical Engineering, Faculty of Engineeringand Architecture, Canakkale Onsekiz Mart University, 17100,Canakkale, Turkey
Version of record first published: 02 Aug 2012
To cite this article: Selma Kadioglu & Emin U. Ulugergerli (2012): Imaging karstic cavities intransparent 3D volume of the GPR data set in Akkopru dam, Mugla, Turkey, Nondestructive Testingand Evaluation, 27:3, 263-271
To link to this article: http://dx.doi.org/10.1080/10589759.2012.694885
PLEASE SCROLL DOWN FOR ARTICLE
Full terms and conditions of use: http://www.tandfonline.com/page/terms-and-conditions
This article may be used for research, teaching, and private study purposes. Anysubstantial or systematic reproduction, redistribution, reselling, loan, sub-licensing,systematic supply, or distribution in any form to anyone is expressly forbidden.
The publisher does not give any warranty express or implied or make any representationthat the contents will be complete or accurate or up to date. The accuracy of anyinstructions, formulae, and drug doses should be independently verified with primarysources. The publisher shall not be liable for any loss, actions, claims, proceedings,demand, or costs or damages whatsoever or howsoever caused arising directly orindirectly in connection with or arising out of the use of this material.
Imaging karstic cavities in transparent 3D volume of the GPR data setin Akkopru dam, Mugla, Turkey
Selma Kadioglua,b* and Emin U. Ulugergerlic
aDepartment of Geophysical Engineering, Faculty of Engineering, Ankara University, 06100Tandogan, Ankara, Turkey; bEarth Sciences Application and Research Center (YEBIM), AnkaraUniversity, 06100 Tandogan, Ankara, Turkey; cDepartment of Geophysical Engineering, Faculty ofEngineering and Architecture, Canakkale Onsekiz Mart University, 17100 Canakkale, Turkey
(Received 1 December 2011; final version received 18 April 2012)
The use of geophysical methods, particularly ground-penetrating radar (GPR),in the environmental sites has taken very important approximation in locating potentialenvironmental hazards such as landslides and cavities. Generally, slices of athree-dimensional (3D) GPR data set can be used to monitor changes in the surfacelocations and depth of the environmental hazards through the iterative slices. The aimof this study is to introduce volume imaging of subsurface cavities with a transparenthalf bird’s-eye view within a 3D data set. Transparency is obtained by a constructedopaque function of the amplitude–colour range. The half bird’s-eye view is achievedby observing angles of the x-, y- and z-directions to the 3D block. A GPR study wasconducted at a reservoir area (696 m £ 100 m) in Akkopru dam and hydroelectricpower station in Mugla (Turkey) to determine the existence and abundance of karsticcavities. The study revealed the presence of 283 cavities of various size and depth.Borehole data encouraged the results with given depths.
Keywords: GPR; karstic cavity; opaque; transparent 3D visualisation; half bird’s-eye view
1. Introduction
The presence of cavities or cracks beneath sites of urban or industrial construction can
influence the location, design and stability of buildings and other structures. Therefore,
the priority of engineering geologists and geophysicists is to locate these geological
features and specify their exact forms. Many researches have demonstrated that
ground-penetrating radar (GPR) is one of the most appropriate techniques to detect karstic
cavities and sinkholes [1–4,6,10–12]. They have also emphasised the characteristic
features of cavities on a GPR section. Air-filled cavities are strong reflectors and have
maximum reflection coefficients at the top of the cavity. Diffraction hyperbolas are
common patterns because of their small dimensions compared to profile length.
Accurate interpretation of subsurface cavities is often difficult when using
two-dimensional (2D) data sets because they are typically three-dimensional (3D)
complex systems; many studies have examined methods for determining the size,
continuity or extensions of such features. In addition, 3D data visualisation has been a
helpful presentation with iterative depth and profile slices to determine the locations and
depths of cavities and fractures in the study area [5–7].
ISSN 1058-9759 print/ISSN 1477-2671 online
q 2012 Taylor & Francis
http://dx.doi.org/10.1080/10589759.2012.694885
http://www.tandfonline.com
*Corresponding author. Email: [email protected]
Nondestructive Testing and Evaluation,Vol. 27, No. 3, September 2012, 263–271
Dow
nloa
ded
by [
Em
in U
gur
Ulu
gerg
erli]
at 1
9:18
03
Aug
ust 2
012
The aim of this study is to image the karstic cavities in a dam reservoir area, accurately
representing their locations, sizes and depths. The proposed method develops a transparent
3D data volume by displaying a limited amplitude range and appointing the view angle to
the x-, y- and z-directions of the 3D data volume.
2. Study area
The study area is a part of the reservoir area of Dalaman Akkopru dam and hydroelectric
power station (HEPS) on Dalaman Creek, which lies 24 km east of Koycegiz village,
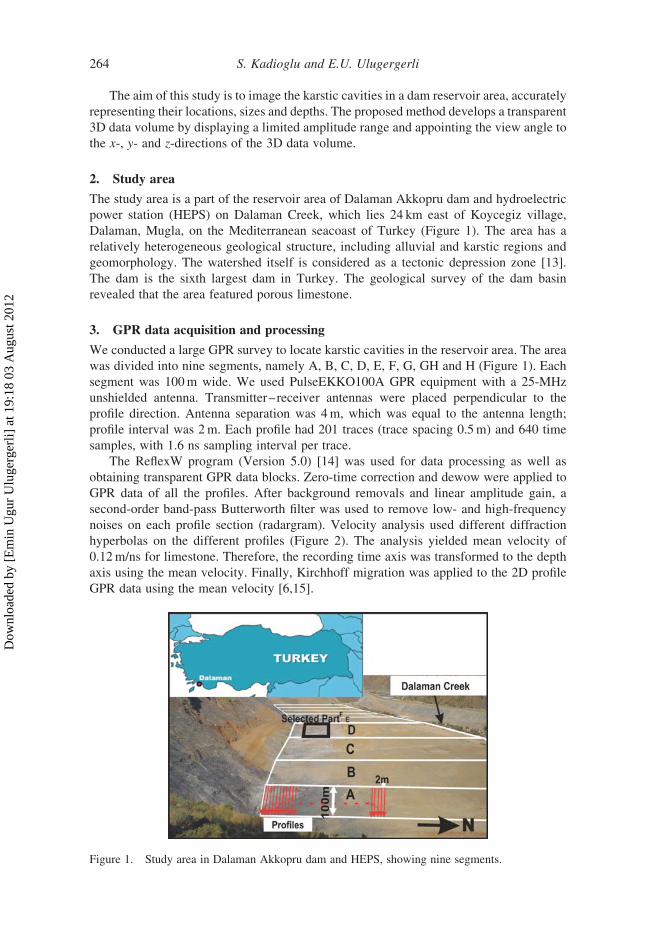
Dalaman, Mugla, on the Mediterranean seacoast of Turkey (Figure 1). The area has a
relatively heterogeneous geological structure, including alluvial and karstic regions and
geomorphology. The watershed itself is considered as a tectonic depression zone [13].
The dam is the sixth largest dam in Turkey. The geological survey of the dam basin
revealed that the area featured porous limestone.
3. GPR data acquisition and processing
We conducted a large GPR survey to locate karstic cavities in the reservoir area. The area
was divided into nine segments, namely A, B, C, D, E, F, G, GH and H (Figure 1). Each
segment was 100 m wide. We used PulseEKKO100A GPR equipment with a 25-MHz
unshielded antenna. Transmitter–receiver antennas were placed perpendicular to the
profile direction. Antenna separation was 4 m, which was equal to the antenna length;
profile interval was 2 m. Each profile had 201 traces (trace spacing 0.5 m) and 640 time
samples, with 1.6 ns sampling interval per trace.
The ReflexW program (Version 5.0) [14] was used for data processing as well as
obtaining transparent GPR data blocks. Zero-time correction and dewow were applied to
GPR data of all the profiles. After background removals and linear amplitude gain, a
second-order band-pass Butterworth filter was used to remove low- and high-frequency
noises on each profile section (radargram). Velocity analysis used different diffraction
hyperbolas on the different profiles (Figure 2). The analysis yielded mean velocity of
0.12 m/ns for limestone. Therefore, the recording time axis was transformed to the depth
axis using the mean velocity. Finally, Kirchhoff migration was applied to the 2D profile
GPR data using the mean velocity [6,15].
Figure 1. Study area in Dalaman Akkopru dam and HEPS, showing nine segments.
S. Kadioglu and E.U. Ulugergerli264
Dow
nloa
ded
by [
Em
in U
gur
Ulu
gerg
erli]
at 1
9:18
03
Aug
ust 2
012
4. Visualisation of interactive 3D sub-volumes of GPR data
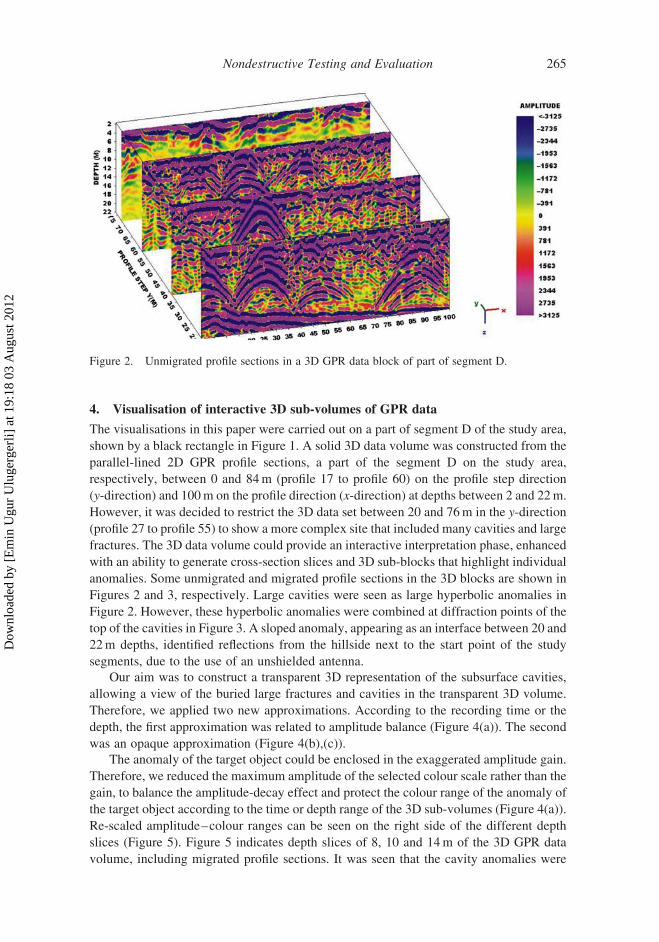
The visualisations in this paper were carried out on a part of segment D of the study area,
shown by a black rectangle in Figure 1. A solid 3D data volume was constructed from the
parallel-lined 2D GPR profile sections, a part of the segment D on the study area,
respectively, between 0 and 84 m (profile 17 to profile 60) on the profile step direction
(y-direction) and 100 m on the profile direction (x-direction) at depths between 2 and 22 m.
However, it was decided to restrict the 3D data set between 20 and 76 m in the y-direction
(profile 27 to profile 55) to show a more complex site that included many cavities and large
fractures. The 3D data volume could provide an interactive interpretation phase, enhanced
with an ability to generate cross-section slices and 3D sub-blocks that highlight individual
anomalies. Some unmigrated and migrated profile sections in the 3D blocks are shown in
Figures 2 and 3, respectively. Large cavities were seen as large hyperbolic anomalies in
Figure 2. However, these hyperbolic anomalies were combined at diffraction points of the
top of the cavities in Figure 3. A sloped anomaly, appearing as an interface between 20 and
22 m depths, identified reflections from the hillside next to the start point of the study
segments, due to the use of an unshielded antenna.
Our aim was to construct a transparent 3D representation of the subsurface cavities,
allowing a view of the buried large fractures and cavities in the transparent 3D volume.
Therefore, we applied two new approximations. According to the recording time or the
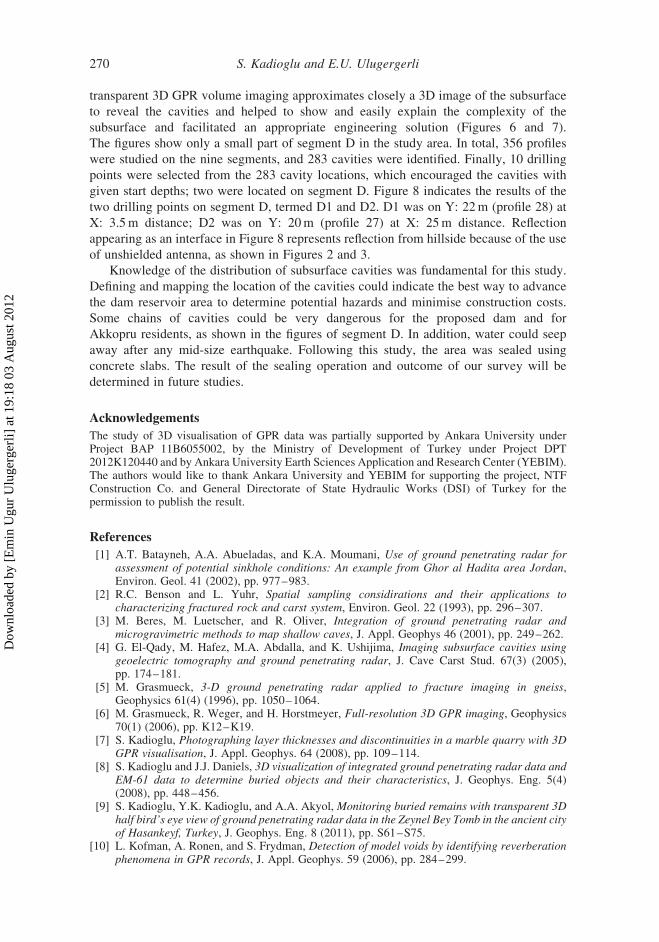
depth, the first approximation was related to amplitude balance (Figure 4(a)). The second
was an opaque approximation (Figure 4(b),(c)).
The anomaly of the target object could be enclosed in the exaggerated amplitude gain.
Therefore, we reduced the maximum amplitude of the selected colour scale rather than the
gain, to balance the amplitude-decay effect and protect the colour range of the anomaly of
the target object according to the time or depth range of the 3D sub-volumes (Figure 4(a)).
Re-scaled amplitude–colour ranges can be seen on the right side of the different depth
slices (Figure 5). Figure 5 indicates depth slices of 8, 10 and 14 m of the 3D GPR data
volume, including migrated profile sections. It was seen that the cavity anomalies were
Figure 2. Unmigrated profile sections in a 3D GPR data block of part of segment D.
Nondestructive Testing and Evaluation 265
Dow
nloa
ded
by [
Em
in U
gur
Ulu
gerg
erli]
at 1
9:18
03
Aug
ust 2
012
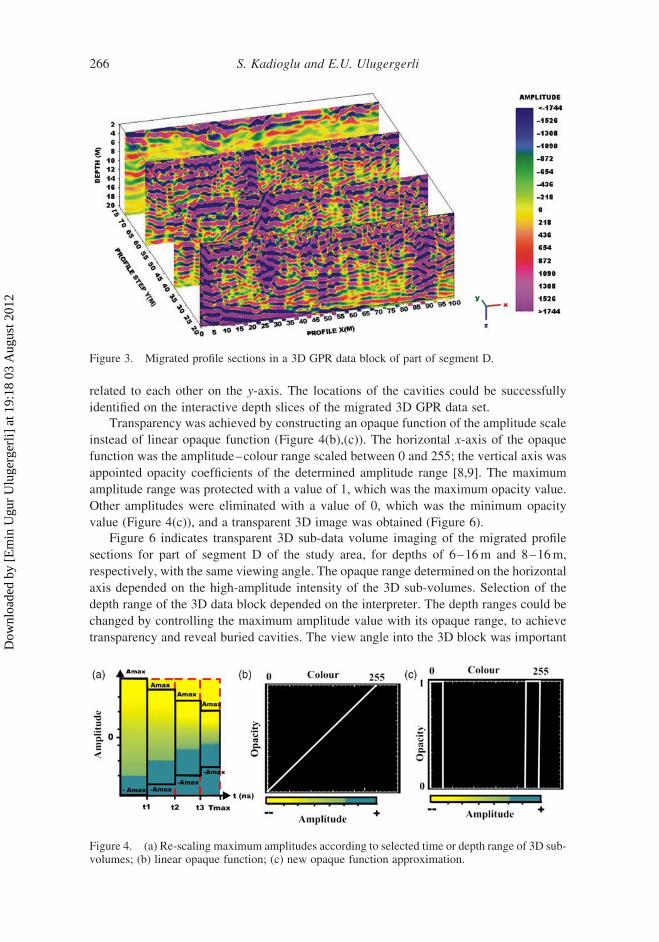
related to each other on the y-axis. The locations of the cavities could be successfully
identified on the interactive depth slices of the migrated 3D GPR data set.
Transparency was achieved by constructing an opaque function of the amplitude scale
instead of linear opaque function (Figure 4(b),(c)). The horizontal x-axis of the opaque
function was the amplitude–colour range scaled between 0 and 255; the vertical axis was
appointed opacity coefficients of the determined amplitude range [8,9]. The maximum
amplitude range was protected with a value of 1, which was the maximum opacity value.
Other amplitudes were eliminated with a value of 0, which was the minimum opacity
value (Figure 4(c)), and a transparent 3D image was obtained (Figure 6).
Figure 6 indicates transparent 3D sub-data volume imaging of the migrated profile
sections for part of segment D of the study area, for depths of 6–16 m and 8–16 m,
respectively, with the same viewing angle. The opaque range determined on the horizontal
axis depended on the high-amplitude intensity of the 3D sub-volumes. Selection of the
depth range of the 3D data block depended on the interpreter. The depth ranges could be
changed by controlling the maximum amplitude value with its opaque range, to achieve
transparency and reveal buried cavities. The view angle into the 3D block was important
Figure 4. (a) Re-scaling maximum amplitudes according to selected time or depth range of 3D sub-volumes; (b) linear opaque function; (c) new opaque function approximation.
Figure 3. Migrated profile sections in a 3D GPR data block of part of segment D.
S. Kadioglu and E.U. Ulugergerli266
Dow
nloa
ded
by [
Em
in U
gur
Ulu
gerg
erli]
at 1
9:18
03
Aug
ust 2
012
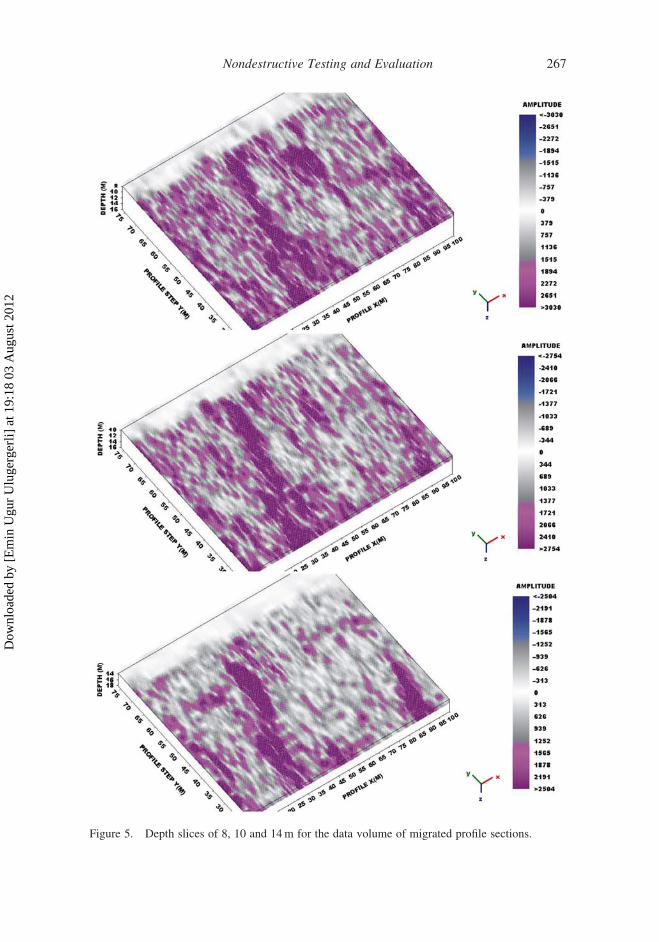
Figure 5. Depth slices of 8, 10 and 14 m for the data volume of migrated profile sections.
Nondestructive Testing and Evaluation 267
Dow
nloa
ded
by [
Em
in U
gur
Ulu
gerg
erli]
at 1
9:18
03
Aug
ust 2
012

because this affected vision capability. Figure 7 shows the same transparent 3D data
imaging as shown in Figure 6(b), but with a different viewing angle, greater amplitude
scale and more restricted amplitude–opaque range.
5. Results and discussion
We aimed to identify cavity anomalies on unmigrated and migrated profiles in the 3D GPR
data volume. Large cavities were seen as large hyperbolic anomalies on the unmigrated
profiles, as shown in Figure 2. The hyperbolas were gathered on the migrated profile
sections of Figure 3, and the directions of the branches of the cavities could be determined
according to depth. The depth slices near the surface indicated decomposed limestone
including complex fractures and cavities, as seen on the depth slices obtained at 6 m.
Below 10 m depth, the large fractures and cavities could be seen more effectively
(Figure 5). The depth slices were important to determine the location of the cavity. The
cavity could be determined on the profile sections and by their depth slices. However,
Figure 6. Transparent 3D sub-data volume imaging of migrated profile sections on part of segmentD: (a) 6–16 m depths and (b) 8–16 m depths.
S. Kadioglu and E.U. Ulugergerli268
Dow
nloa
ded
by [
Em
in U
gur
Ulu
gerg
erli]
at 1
9:18
03
Aug
ust 2
012

Figure 7. 3D data volume of Figure 6(b) with different view angle, amplitude scale and opaqueranges.
Figure 8. Two boreholes (D1 and D2) on segment D and results from profile 28.
Nondestructive Testing and Evaluation 269
Dow
nloa
ded
by [
Em
in U
gur
Ulu
gerg
erli]
at 1
9:18
03
Aug
ust 2
012
transparent 3D GPR volume imaging approximates closely a 3D image of the subsurface
to reveal the cavities and helped to show and easily explain the complexity of the
subsurface and facilitated an appropriate engineering solution (Figures 6 and 7).
The figures show only a small part of segment D in the study area. In total, 356 profiles
were studied on the nine segments, and 283 cavities were identified. Finally, 10 drilling
points were selected from the 283 cavity locations, which encouraged the cavities with
given start depths; two were located on segment D. Figure 8 indicates the results of the
two drilling points on segment D, termed D1 and D2. D1 was on Y: 22 m (profile 28) at
X: 3.5 m distance; D2 was on Y: 20 m (profile 27) at X: 25 m distance. Reflection
appearing as an interface in Figure 8 represents reflection from hillside because of the use
of unshielded antenna, as shown in Figures 2 and 3.
Knowledge of the distribution of subsurface cavities was fundamental for this study.
Defining and mapping the location of the cavities could indicate the best way to advance
the dam reservoir area to determine potential hazards and minimise construction costs.
Some chains of cavities could be very dangerous for the proposed dam and for
Akkopru residents, as shown in the figures of segment D. In addition, water could seep
away after any mid-size earthquake. Following this study, the area was sealed using
concrete slabs. The result of the sealing operation and outcome of our survey will be
determined in future studies.
Acknowledgements
The study of 3D visualisation of GPR data was partially supported by Ankara University underProject BAP 11B6055002, by the Ministry of Development of Turkey under Project DPT2012K120440 and by Ankara University Earth Sciences Application and Research Center (YEBIM).The authors would like to thank Ankara University and YEBIM for supporting the project, NTFConstruction Co. and General Directorate of State Hydraulic Works (DSI) of Turkey for thepermission to publish the result.
References
[1] A.T. Batayneh, A.A. Abueladas, and K.A. Moumani, Use of ground penetrating radar forassessment of potential sinkhole conditions: An example from Ghor al Hadita area Jordan,Environ. Geol. 41 (2002), pp. 977–983.
[2] R.C. Benson and L. Yuhr, Spatial sampling considirations and their applications tocharacterizing fractured rock and carst system, Environ. Geol. 22 (1993), pp. 296–307.
[3] M. Beres, M. Luetscher, and R. Oliver, Integration of ground penetrating radar andmicrogravimetric methods to map shallow caves, J. Appl. Geophys 46 (2001), pp. 249–262.
[4] G. El-Qady, M. Hafez, M.A. Abdalla, and K. Ushijima, Imaging subsurface cavities usinggeoelectric tomography and ground penetrating radar, J. Cave Carst Stud. 67(3) (2005),pp. 174–181.
[5] M. Grasmueck, 3-D ground penetrating radar applied to fracture imaging in gneiss,Geophysics 61(4) (1996), pp. 1050–1064.
[6] M. Grasmueck, R. Weger, and H. Horstmeyer, Full-resolution 3D GPR imaging, Geophysics70(1) (2006), pp. K12–K19.
[7] S. Kadioglu, Photographing layer thicknesses and discontinuities in a marble quarry with 3DGPR visualisation, J. Appl. Geophys. 64 (2008), pp. 109–114.
[8] S. Kadioglu and J.J. Daniels, 3D visualization of integrated ground penetrating radar data andEM-61 data to determine buried objects and their characteristics, J. Geophys. Eng. 5(4)(2008), pp. 448–456.
[9] S. Kadioglu, Y.K. Kadioglu, and A.A. Akyol, Monitoring buried remains with transparent 3Dhalf bird’s eye view of ground penetrating radar data in the Zeynel Bey Tomb in the ancient cityof Hasankeyf, Turkey, J. Geophys. Eng. 8 (2011), pp. S61–S75.
[10] L. Kofman, A. Ronen, and S. Frydman, Detection of model voids by identifying reverberationphenomena in GPR records, J. Appl. Geophys. 59 (2006), pp. 284–299.
S. Kadioglu and E.U. Ulugergerli270
Dow
nloa
ded
by [
Em
in U
gur
Ulu
gerg
erli]
at 1
9:18
03
Aug
ust 2
012

[11] J.W. Lane, M.L. Buursink, F.P. Haeni, and R.J. Versteeg, Evaluation of ground penetratingradar to detect free-space hydrocarbons in fractured rocks-results of numerical modeling andphysical experiments, Ground Water 38 (2000), pp. 929–938.
[12] L. Orlando, Ground penetrating radar in massive rock: A case history, Eur. J. Environ. Eng.Geophys. 7 (2002), pp. 265–279.
[13] A. Ozturk and A. Kocyigit, Startigraphy of Menderes massif rocks in Selimiye and Besparmakregion, Bull. Geol. Soc. Turkey (Turkish) 25 (1982), pp. 67–72.
[14] ReflexW, Sandmeier Scientifc Software, Germany, 2007.[15] O. Yilmaz, Seismic Data Analysis: Processing Inversion and Interpretation of Seismic Data,
2nd ed., Society of Exploration Geophysicists, Tulsa, OK, 2000.
Nondestructive Testing and Evaluation 271
Dow
nloa
ded
by [
Em
in U
gur
Ulu
gerg
erli]
at 1
9:18
03
Aug
ust 2
012
Copyright © 2022 FDOKUMEN