Imaging Biomarkers of Pulmonary Structure and Function
229
Western University Western University Scholarship@Western Scholarship@Western Electronic Thesis and Dissertation Repository 4-6-2018 10:00 AM Imaging Biomarkers of Pulmonary Structure and Function Imaging Biomarkers of Pulmonary Structure and Function Dante Capaldi, The University of Western Ontario Supervisor: Dr. Grace Parraga, The University of Western Ontario A thesis submitted in partial fulfillment of the requirements for the Doctor of Philosophy degree in Medical Biophysics © Dante Capaldi 2018 Follow this and additional works at: https://ir.lib.uwo.ca/etd Part of the Medical Biophysics Commons Recommended Citation Recommended Citation Capaldi, Dante, "Imaging Biomarkers of Pulmonary Structure and Function" (2018). Electronic Thesis and Dissertation Repository. 5276. https://ir.lib.uwo.ca/etd/5276 This Dissertation/Thesis is brought to you for free and open access by Scholarship@Western. It has been accepted for inclusion in Electronic Thesis and Dissertation Repository by an authorized administrator of Scholarship@Western. For more information, please contact [email protected].
-
Upload
khangminh22 -
Category
Documents
-
view
1 -
download
0
Transcript of Imaging Biomarkers of Pulmonary Structure and Function
Western University Western University
Scholarship@Western Scholarship@Western
Electronic Thesis and Dissertation Repository
4-6-2018 10:00 AM
Imaging Biomarkers of Pulmonary Structure and Function Imaging Biomarkers of Pulmonary Structure and Function
Dante Capaldi, The University of Western Ontario
Supervisor: Dr. Grace Parraga, The University of Western Ontario
A thesis submitted in partial fulfillment of the requirements for the Doctor of Philosophy degree
in Medical Biophysics
© Dante Capaldi 2018
Follow this and additional works at: https://ir.lib.uwo.ca/etd
Part of the Medical Biophysics Commons
Recommended Citation Recommended Citation Capaldi, Dante, "Imaging Biomarkers of Pulmonary Structure and Function" (2018). Electronic Thesis and Dissertation Repository. 5276. https://ir.lib.uwo.ca/etd/5276
This Dissertation/Thesis is brought to you for free and open access by Scholarship@Western. It has been accepted for inclusion in Electronic Thesis and Dissertation Repository by an authorized administrator of Scholarship@Western. For more information, please contact [email protected].
i
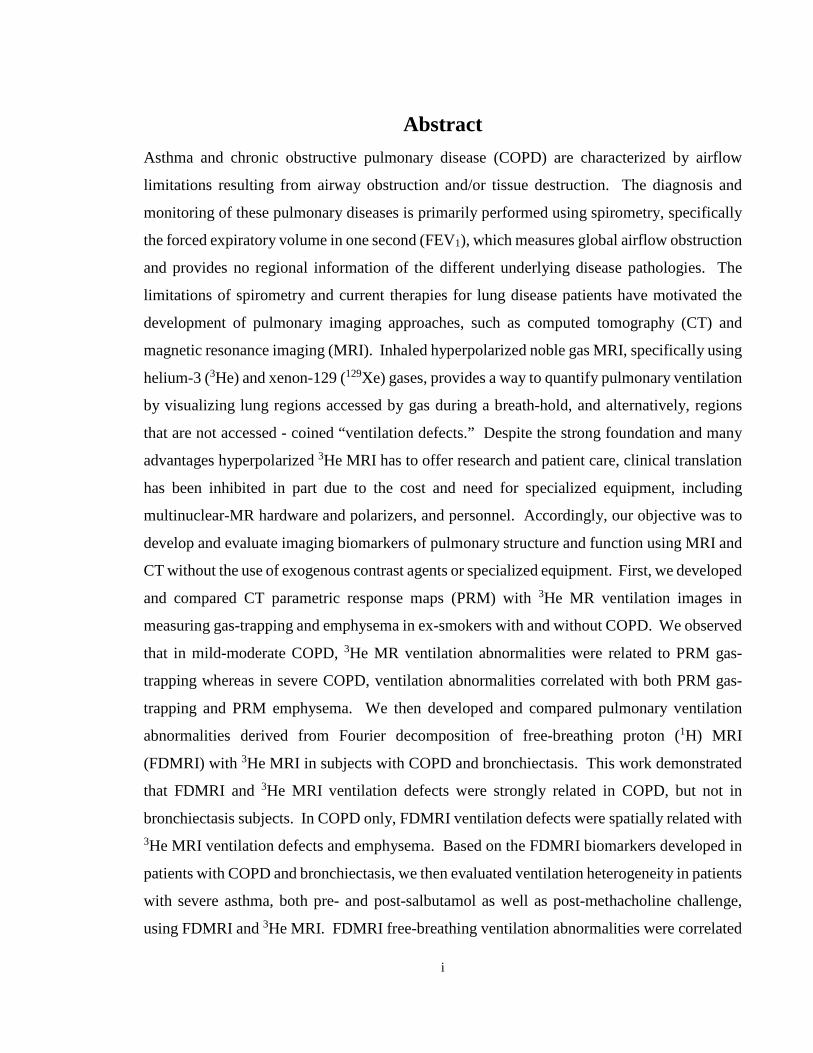
Abstract Asthma and chronic obstructive pulmonary disease (COPD) are characterized by airflow
limitations resulting from airway obstruction and/or tissue destruction. The diagnosis and
monitoring of these pulmonary diseases is primarily performed using spirometry, specifically
the forced expiratory volume in one second (FEV1), which measures global airflow obstruction
and provides no regional information of the different underlying disease pathologies. The
limitations of spirometry and current therapies for lung disease patients have motivated the
development of pulmonary imaging approaches, such as computed tomography (CT) and
magnetic resonance imaging (MRI). Inhaled hyperpolarized noble gas MRI, specifically using
helium-3 (3He) and xenon-129 (129Xe) gases, provides a way to quantify pulmonary ventilation
by visualizing lung regions accessed by gas during a breath-hold, and alternatively, regions
that are not accessed - coined “ventilation defects.” Despite the strong foundation and many
advantages hyperpolarized 3He MRI has to offer research and patient care, clinical translation
has been inhibited in part due to the cost and need for specialized equipment, including
multinuclear-MR hardware and polarizers, and personnel. Accordingly, our objective was to
develop and evaluate imaging biomarkers of pulmonary structure and function using MRI and
CT without the use of exogenous contrast agents or specialized equipment. First, we developed
and compared CT parametric response maps (PRM) with 3He MR ventilation images in
measuring gas-trapping and emphysema in ex-smokers with and without COPD. We observed
that in mild-moderate COPD, 3He MR ventilation abnormalities were related to PRM gas-
trapping whereas in severe COPD, ventilation abnormalities correlated with both PRM gas-
trapping and PRM emphysema. We then developed and compared pulmonary ventilation
abnormalities derived from Fourier decomposition of free-breathing proton (1H) MRI
(FDMRI) with 3He MRI in subjects with COPD and bronchiectasis. This work demonstrated
that FDMRI and 3He MRI ventilation defects were strongly related in COPD, but not in
bronchiectasis subjects. In COPD only, FDMRI ventilation defects were spatially related with 3He MRI ventilation defects and emphysema. Based on the FDMRI biomarkers developed in
patients with COPD and bronchiectasis, we then evaluated ventilation heterogeneity in patients
with severe asthma, both pre- and post-salbutamol as well as post-methacholine challenge,
using FDMRI and 3He MRI. FDMRI free-breathing ventilation abnormalities were correlated
ii
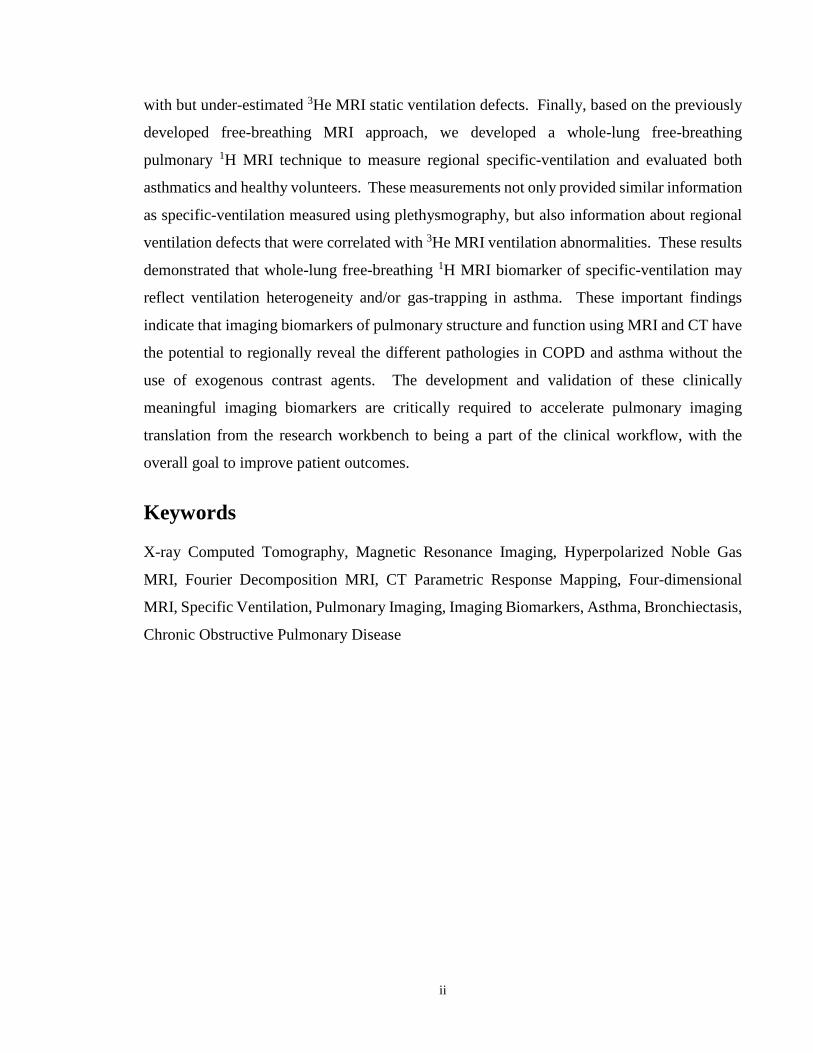
with but under-estimated 3He MRI static ventilation defects. Finally, based on the previously
developed free-breathing MRI approach, we developed a whole-lung free-breathing
pulmonary 1H MRI technique to measure regional specific-ventilation and evaluated both
asthmatics and healthy volunteers. These measurements not only provided similar information
as specific-ventilation measured using plethysmography, but also information about regional
ventilation defects that were correlated with 3He MRI ventilation abnormalities. These results
demonstrated that whole-lung free-breathing 1H MRI biomarker of specific-ventilation may
reflect ventilation heterogeneity and/or gas-trapping in asthma. These important findings
indicate that imaging biomarkers of pulmonary structure and function using MRI and CT have
the potential to regionally reveal the different pathologies in COPD and asthma without the
use of exogenous contrast agents. The development and validation of these clinically
meaningful imaging biomarkers are critically required to accelerate pulmonary imaging
translation from the research workbench to being a part of the clinical workflow, with the
overall goal to improve patient outcomes.
Keywords
X-ray Computed Tomography, Magnetic Resonance Imaging, Hyperpolarized Noble Gas
MRI, Fourier Decomposition MRI, CT Parametric Response Mapping, Four-dimensional
MRI, Specific Ventilation, Pulmonary Imaging, Imaging Biomarkers, Asthma, Bronchiectasis,
Chronic Obstructive Pulmonary Disease

iii
Co-Authorship Statement
The following thesis contains four manuscripts. Three manuscripts have been published in
scientific journals and one manuscript is in-press for publication. As first author for all these
manuscript, I significantly contributed to the manuscript preparation and submission including
all aspects of the studies performed. The specific tasks I performed include: contributing to
the study design and subject recruitment, organization and management of study visits, the
development of the CT and MRI acquisition and reconstruction protocols, and acquisition of
pulmonary function test and subject data. The tasks that were included following data
acquisition were: image analysis, database organization, statistical analysis and interpretation,
clinical/physiological interpretation of the data, drafting and final approval of the manuscripts.
Dr. Grace Parraga provided ongoing guidance and was responsible for study conception and
experimental design, data analysis and interpretation, drafting and final revisions and approval
of the manuscripts, as the Principal Investigator and Supervisor. She is also the guarantor of
integrity of the data as well as responsible for Good Clinical Practice (GCP). Study visits and
acquisition of pulmonary function data was performed under the supervision of Sandra
Blamires and Lyndsey Reid-Jones. Polarization of the 3He gas was performed by Andrew
Wheatley, Heather Young, Eric Lessard, and myself. MRI acquisition was performed by
Trevor Szekeres and David Reese. Listed below are the specific contributions for all other co-
authors for each manuscript contained in this thesis.
Chapter 2 is an original research article entitled “Pulmonary Imaging Biomarkers of Gas-
trapping and Emphysema in COPD: 3He MR Imaging and CT Parametric Response Maps”
and was published in the journal Radiology in 2016. This manuscript was co-authored by
Dante PI Capaldi, Nanxi Zha, Fumin Guo, Damien Pike, David G McCormack, Miranda Kirby,
and Grace Parraga. Nanxi Zha and Fumin Guo assisted with the algorithm design and image
analysis tools as well as interpretation of the data. Damien Pike and Miranda Kirby assisted
with the recruitment of study participants, acquisition of data, statistical analysis, and
interpretation. David G McCormack and Miranda Kirby were responsible for
clinical/physiological interpretation of the data.
Chapter 3 is an original research article entitled “Free-breathing Pulmonary 1H and
Hyperpolarized 3He MRI: Comparison in COPD and Bronchiectasis” and was published in
iv
the journal Academic Radiology in 2015. This manuscript was co-authored by Dante PI
Capaldi, Khadija Sheikh, Fumin Guo, Sarah Svenningsen, Roya Etemad-Rezai, Harvey O
Coxson, Jonathon A Leipsic, David G McCormack, and Grace Parraga. Khadija Sheikh and
Fumin Guo assisted with the algorithm design and image analysis tools as well as interpretation
of the data. Sarah Svenningsen was responsible for the recruitment of study participants, and
assisted with acquisition and interpretation of data. Roya Etemad-Rezai provided clinical
expertise and aided in interpretation of the CT images. Harvey O Coxson assisted with the
interpretation of MRI and CT data. Jonathon A Leipsic assisted with the interpretation of the
CT data. David G McCormack was responsible for clinical/physiological interpretation of the
data.
Chapter 4 is an original research article entitled “Free-breathing Functional Pulmonary MRI:
Response to Bronchodilator and Bronchoprovocation in Severe Asthma” and was published in
the journal Academic Radiology in 2017. This manuscript was co-authored by Dante PI
Capaldi, Khadija Sheikh, Rachel L Eddy, Fumin Guo, Sarah Svenningsen, Parameswaran Nair,
David G McCormack, and Grace Parraga. Khadija Sheikh and Fumin Guo assisted with the
algorithm design and image analysis tools as well as statistical analysis and interpretation of
the data. Rachel L Eddy and Sarah Svenningsen were responsible for the recruitment of study
participants, and assisted with acquisition and interpretation of data. Parameswaran Nair and
David G McCormack were responsible for clinical/physiological interpretation of the data.
Chapter 5 is an original research article entitled “Free-breathing Pulmonary MR Imaging to
Quantify Regional Ventilation” and has been accepted to the journal Radiology and is currently
in-press. This manuscript was co-authored by Dante PI Capaldi, Rachel L Eddy, Sarah
Svenningsen, Fumin Guo, John SH Baxter, A Jonathan McLeod, Parameswaran Nair, David
G McCormack, and Grace Parraga. Fumin Guo, John SH Baxter, and A Jonathan McLeod
assisted with the algorithm design and image analysis tools as well as interpretation of the data.
Rachel L Eddy and Sarah Svenningsen were responsible for the recruitment of study
participants, and assisted with acquisition and interpretation of data. Parameswaran Nair and
David G McCormack were responsible for clinical/physiological interpretation of the data.

v
To my Family and Friends: Past, Present, and Future…

vi
“My mother made me a scientist without ever intending to. Every other Jewish mother in Brooklyn would ask her child after school, ‘So? Did you learn anything today?’
But not my mother. ‘Izzy,’ she would say, ‘did you ask a good question today?’ That difference - asking good questions - made me become a scientist.”
- Isidor Isaac Rabi Nobel Prize in Physics in 1944
for his discovery of Nuclear Magnetic Resonance

vii
Acknowledgments First and foremost, I would like to thank my supervisor Dr. Grace Parraga for taking a leap of
faith in me and giving me countless opportunities throughout my journey over the past four
years. Your endless support, ever-continuing patience, dedication, and guidance have been
invaluable to me throughout my graduate career. I am truly grateful for the opportunities you
have given me and pushing me beyond my boundaries to areas that I really believed were
outside my reach. I sincerely appreciate all of the life lessons and many discussions with you,
which have broadened my understanding of research not only as a pure science, but as an art.
To my advisory committee, Dr. Ian Cunningham, Dr. Robert Bartha, and Dr. David Palma:
thank you for your guidance and support with not only my research, but my career trajectory.
To Dr. Cunningham, I am truly thankful for your guidance and mentorship -especially during
your course where you not only taught me the fundamental principles of imaging, but also to
never lose the excitement of learning something new. To Dr. Bartha, thank you for your
guidance, support with my research, and teaching me the physics behind MRI. To Dr. Palma,
thank you for providing me with clinical insight behind my research and the opportunity to
shadow you in clinic. I am grateful to Dr. David McCormack and Dr. Aaron Fenster for the
opportunity to discuss results and receive insightful comments about research that have been
very helpful.
To the Department of Medical Biophysics: thank you for providing me with the resources and
support while as a graduate student and your continual nurturing to grow professionally as a
medical physicist. To Wendy Hough and Kathleen Petts: thank you for always being available
to answer any of my questions and having a few laughs along the way. To Dr. Jerry Battista
and Dr. Rob Stodilka: thank you for the guidance you provided me during my journey in
graduate school and the wonderful music (J2B).
To the Parraga lab members: It has been wonderful working with all of you and thank you for
making my time in London so memorable. I am especially grateful for the incredible
friendships and support over the past few years. To Lyndsey Reid-Jones: thank you for
teaching me about patient care -I have never met a more caring and compassionate individual
who has taught me so much, both professionally and personally. To Andrew Wheatley: thank
you for training me and giving me the confidence to perform the technical tasks required for
viii
the lab. To David Reese and Trevor Szekeres: thank you for being MR rock stars and always
helping us acquiring superb quality data. To Dr. Alexei Ouriadov: thank you for your guidance
and teaching me the fundamentals of inhaled gas MRI. To Dr. Khadija Sheikh: thank you for
always being there for me, from the late nights at Robarts to the fun festivities like murder
mystery nights or Chaucer’s on Thursday nights (just to name a few); I couldn’t have asked
for a better friend and mentor. Thank you for always being able to put a smile on my face. To
Dr. Fumin Guo: thank you for being the computer guru when it came to image processing and
for all of the laughs; you will forever be my official roommate no matter what conference I go
to. To Tamas Lindenmaier and Gregory Paulin: we started graduate school together, we
struggled together, and most importantly, we kept each other company, if it was either at work,
or at the school’s gym or just out on the town; I couldn’t have asked for better lab mates and
friends. To Eric Lessard, Rachel Eddy, and Megan Fennema: although in my eyes all of you
will be the official lab newbies, you all have taught me so much; I can’t wait to see all of you
excel in your future endeavors. To Heather Young: your dedication while in the lab was truly
inspiring; thank you for always making me believe that team work makes the dream become
reality. To Andrew Westcott: thank you for all the laughs in my last year of graduate school
and being a rock star when running the polarizers. To Dr. Sarah Svenningsen and Dr. Damien
Pike: thank you for all the fun adventures. Thank you to all the other members of the lab who
have helped make our research possible: Dr. Nanxi Zha, Robert DiCesare, Dr. Anurag Bhalla,
Dr. Colin Adams, Michal Stankiewicz, Emma Bluemke, Matthew Schweers, Andrea Kassay,
and Janhavi Patel.
Most importantly, I would like to thank my family and friends. To my parents: thank you for
all your love, patience, and never wavering support in my dreams to better myself. Mom,
thank you for always telling me to “find what you love doing and be the very best at it.” Dad,
thank you for always forcing me to think outside the box, making me ask the right questions,
and providing me with guidance and support. André, thank you for helping me see the impact
of my work. To Tomi Nano, I can honestly say that if it wasn’t for your friendship and endless
support, I would not have succeeded; thank you for being such an amazing friend, especially
during my most difficult times. You are one of the most brilliant and driven individuals I
know. To Derek Gillies, you are a constant reminder that there are absolutely amazing people
in this world; thank you for always believing in me. Your impenetrable logic and wisdom is
ix
second to none. To Terenz Escartin, thank you for all the thought provoking discussions and
really making me think outside the box. Your creativity and ingenuity is something to admire.
Tomi, Derek, and Terenz: I can’t wait to see what the future has in-store for all of you. To
Emmanuel Rufo, Claire Vannelli, Dilraj Sanghera, Dr. Aneesh Dhar, Quinn Camlis, Anmol
Dhar, Dr. Kurtis Dekker, Jordynne Ropat, Kyle Burgers, Lisa Hur, Golafsoun Ameri, Adam
Paish, Allie Blokker, Jessica Rodgers, Justin Michael, Dr. Ian Connell, Olivia Stanley, Dickson
Wong, Amy Schranz, Yonathan Araya, Dr. Patrick Lim, Nivin Nyström, and Nolan Broeke,
thank you for your friendships and support; you truly made my time over the past few years
memorable.
Finally, I would like to express my gratitude to the various sources of funding that I have
received over the past four years. I acknowledge funding support from the Natural Sciences
and Engineering Research Council of Canada (NSERC), the Ontario Graduate Scholarship
(OGS), and the Schulich School of Medicine and Dentistry Doctoral Excellence Research
Award (DERA), as well as the Western Graduate Research Stipend (WGRS).

x
Table of Contents
Abstract ............................................................................................................................... i
Co-Authorship Statement ............................................................................................... iii
Acknowledgments ........................................................................................................... vii
Table of Contents .............................................................................................................. x
List of Tables ................................................................................................................... xv
List of Figures ................................................................................................................. xvi
List of Appendices .......................................................................................................... xix
List of Abbreviations ...................................................................................................... xx
CHAPTER 1 ...................................................................................................................... 1
1 INTRODUCTION ........................................................................................................ 1
1.1 Motivation and Overview ..................................................................................... 1
1.2 The Respiratory System: Structure and Function ............................................. 4
1.2.1 The Airways: Respiratory and Conducting Zones ...................................... 4
1.2.2 The Alveoli: Site of Gas Exchange ............................................................. 6
1.2.3 Ventilation................................................................................................... 6
1.3 Pathophysiology of Lung Disease: Asthma and COPD ..................................... 6
1.3.1 Asthma ........................................................................................................ 7
1.3.2 Chronic Obstructive Pulmonary Disease .................................................... 7
1.4 Established Clinical Measurements of Lung Function ..................................... 9
1.4.1 Spirometry................................................................................................... 9
1.4.2 Plethysmography....................................................................................... 10
1.4.3 Diffusion Capacity of the Lung ................................................................ 11
1.4.4 Multiple Breath Nitrogen Washout ........................................................... 11
1.5 Pulmonary Imaging ............................................................................................ 12
xi
1.5.1 Structural Imaging .................................................................................... 12
1.5.2 Functional Imaging ................................................................................... 18
1.6 Thesis Hypotheses and Objectives ..................................................................... 30
1.7 References ............................................................................................................ 33
CHAPTER 2 .................................................................................................................... 46
2 PULMONARY IMAGING BIOMARKERS OF GAS TRAPPING AND EMPHYSEMA IN COPD: 3HE MR IMAGING AND CT PARAMETRIC RESPONSE MAPS .................................................................................................... 46
2.1 Introduction ......................................................................................................... 46
2.2 Materials and Methods ....................................................................................... 47
2.2.1 Study Volunteers ....................................................................................... 47
2.2.2 MR Imaging .............................................................................................. 48
2.2.3 CT Imaging ............................................................................................... 48
2.2.4 MR Image Analysis .................................................................................. 49
2.2.5 CT Image Analysis ................................................................................... 49
2.2.6 Statistics .................................................................................................... 50
2.3 Results .................................................................................................................. 50
2.3.1 Participant Characteristics ........................................................................ 50
2.3.2 Qualitative Ventilation and PRM Results ................................................. 51
2.3.3 Ventilation and PRM Measurements by GOLD Severity......................... 53
2.3.4 Relationships for MR Imaging and PRM Measurements ......................... 56
2.3.5 Spatial and Regional Relationships .......................................................... 59
2.4 Discussion............................................................................................................. 62
2.5 References ............................................................................................................ 66
2.6 Supplement .......................................................................................................... 70
2.6.1 Materials and Methods .............................................................................. 70
2.6.2 Discussion ................................................................................................. 73
xii
2.6.3 References ................................................................................................. 75
CHAPTER 3 .................................................................................................................... 77
3 FREE-BREATHING PULMONARY 1H AND HYPERPOLARIZED 3HE MRI: COMPARISON IN COPD AND BRONCHIECTASIS ......................................... 77
3.1 Introduction ......................................................................................................... 77
3.2 Materials and Methods ....................................................................................... 78
3.2.1 Study Subjects ........................................................................................... 78
3.2.2 Pulmonary Function Tests ........................................................................ 79
3.2.3 Image Acquisition ..................................................................................... 79
3.2.4 Image Analysis.......................................................................................... 81
3.2.5 Statistics .................................................................................................... 82
3.3 Results .................................................................................................................. 82
3.4 Discussion............................................................................................................. 89
3.5 References ............................................................................................................ 94
CHAPTER 4 .................................................................................................................... 98
4 FREE-BREATHING FUNCTIONAL PULMONARY MRI: RESPONSE TO BRONCHODILATOR AND BRONCHOPROVOCATION IN SEVERE ASTHMA .................................................................................................................... 98
4.1 Introduction ......................................................................................................... 98
4.2 Materials and Methods ..................................................................................... 100
4.2.1 Study Logistics and Participants ............................................................. 100
4.2.2 Spirometry, Plethysmography and Multiple Breath Nitrogen Washout . 100
4.2.3 Image Acquisition ................................................................................... 101
4.2.4 Image Analysis........................................................................................ 102
4.2.5 Statistics .................................................................................................. 104
4.3 Results ................................................................................................................ 104
4.3.1 Patient Characteristics ............................................................................. 104
xiii
4.3.2 Ventilation Response to Salbutamol ....................................................... 105
4.3.3 Ventilation Response to Methacholine Challenge and Salbutamol Rescue................................................................................................................. 108
4.3.4 Relationships and Agreement ................................................................. 110
4.4 Discussion........................................................................................................... 112
4.5 References .......................................................................................................... 115
CHAPTER 5 .................................................................................................................. 119
5 FREE-BREATHING PULMONARY MR IMAGING TO QUANTIFY REGIONAL VENTILATION ................................................................................ 119
5.1 Introduction ....................................................................................................... 119
5.2 Materials and Methods ..................................................................................... 120
5.2.1 Participants and Pulmonary Function Tests ............................................ 120
5.2.2 Image Acquisition ................................................................................... 120
5.2.3 Image Analysis........................................................................................ 121
5.2.4 Statistics .................................................................................................. 123
5.3 Results ................................................................................................................ 126
5.3.1 Participants .............................................................................................. 126
5.3.2 Hyperpolarized 3He MR Imaging Ventilation and 1H MR Imaging Specific-Ventilation ................................................................................ 127
5.3.3 Correlations ............................................................................................. 130
5.4 Discussion........................................................................................................... 134
5.5 References .......................................................................................................... 138
5.6 Supplement ........................................................................................................ 142
5.6.1 Materials and Methods ............................................................................ 142
5.6.2 Results ..................................................................................................... 143
5.6.3 References ............................................................................................... 146
CHAPTER 6 .................................................................................................................. 147
xiv
6 CONCLUSIONS AND FUTURE DIRECTIONS ................................................. 147
6.1 Overview and Research Questions .................................................................. 147
6.2 Summary and Conclusions .............................................................................. 149
6.3 Limitations ......................................................................................................... 151
6.3.1 Study Specific Limitations ...................................................................... 152
6.3.2 General Limitations ................................................................................ 156
6.4 Future Directions .............................................................................................. 158
6.4.1 Regional Ventilation Heterogeneity: Three Dimensional Ventilation Clustering of Hyperpolarized Noble Gas MRI ....................................... 158
6.4.2 Free-breathing Pulmonary 1H MRI in Non-small Cell Lung Cancer: Relationships with 4DCT and Noble Gas MRI Measurements of Ventilation............................................................................................... 163
6.4.3 Pulmonary Imaging Platform - Graphical User Interface to Evaluate and Generate Lung Imaging Biomarkers ....................................................... 166
6.5 Significance and Impact ................................................................................... 167
6.6 References .......................................................................................................... 169
APPENDIX .................................................................................................................... 174
xv
List of Tables
Table 2-1 Subject Demographics ............................................................................................ 51
Table 2-2 Imaging Measurements .......................................................................................... 53
Table 2-3 Pearson Correlations and Multivariate Regressions for PRM Gas-Trapping and
Emphysema Measurements .................................................................................................... 57
Table 2-4 Quantitative Spatial Relationships for 3He MRI ventilation defects with CT-PRM
Voxels ..................................................................................................................................... 61
Table 3-1 Subject demographic and pulmonary function measurements ............................... 83
Table 3-2 Imaging measurements ........................................................................................... 85
Table 3-3 Quantitative spatial relationships for FDMRI Ventilation and Ventilation defects 87
Table 3-4 Pearson Correlations for FDMRI and 3He MRI ..................................................... 89
Table 4-1 Asthma demographics, medication, control and pulmonary function tests .......... 105
Table 4-2 Subject listing of hyperpolarized inhaled gas MRI, FDMRI and multiple breath gas
washout measurements for each time-point .......................................................................... 106
Table 4-3 Relationship for hyperpolarized inhaled gas MRI and FDMRI with pulmonary
function and LCI ................................................................................................................... 110
Table 5-1 Participant Demographics and MRI Findings ...................................................... 127
Table 5-2 3He MRI Ventilation and 1H MRI Specific-Ventilation Correlations with
Pulmonary Function .............................................................................................................. 130
xvi
List of Figures
Figure 1-1 Global Deaths Worldwide and Due To Chronic Respiratory Diseases .................. 2
Figure 1-2 Repeated Hospitalizations by Condition at First Admission .................................. 3
Figure 1-3 A Schematic of the Human Airway Tree ................................................................ 5
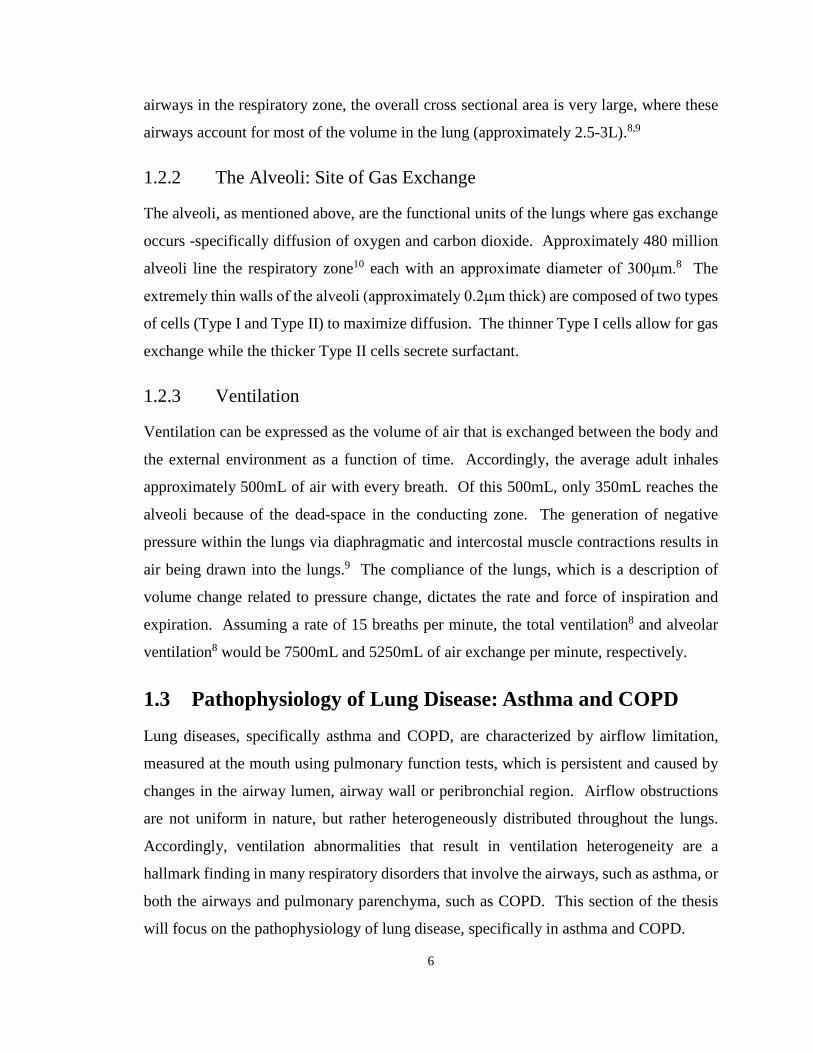
Figure 1-4 Parenchyma and Small Airways Pathologies in Asthma and COPD ...................... 8
Figure 1-5 Pulmonary Function Test - Spirometry ................................................................. 10
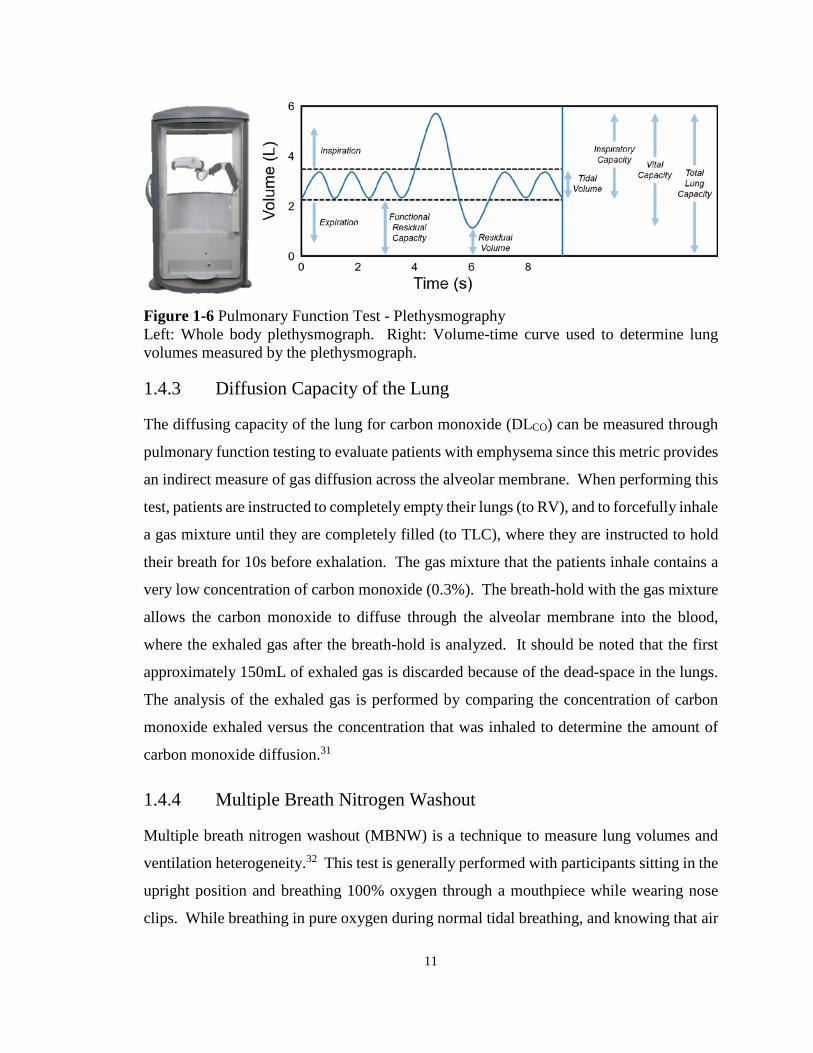
Figure 1-6 Pulmonary Function Test - Plethysmography ....................................................... 11
Figure 1-7 Chest Radiographs (Posterior-Anterior) of a Healthy, Asthmatic, and COPD
Patient ..................................................................................................................................... 14
Figure 1-8 Coronal X-ray CT Images and Corresponding Lung Density Threshold Maps for a
Healthy, Asthmatic, and COPD Subject ................................................................................. 16
Figure 1-9 Representative Conventional 1H MR Coronal Images for a Healthy, Asthmatic,
and COPD Subject .................................................................................................................. 17
Figure 1-10 Representative UTE 1H MR Coronal Images for a Healthy, Asthmatic, and
COPD Subject ......................................................................................................................... 18
Figure 1-11 Representative Hyperpolarized 3He (cyan) MR Coronal Images Co-registered to
Conventional 1H (gray) MR Coronal Images for a Healthy, Asthmatic, and COPD Subject 23
Figure 1-12 Parametric Response Mapping of Co-registered Inspiratory-Expiratory CT
Images ..................................................................................................................................... 27
Figure 1-13 Fourier Decomposition of Free-breathing Pulmonary 1H MR Images ............... 29
Figure 2-1 Ventilation and Parametric Response Maps for a representative ex-smoker and
COPD subjects ........................................................................................................................ 52
Figure 2-2 3He MRI ventilation and PRM measurements by COPD grade ........................... 55
xvii
Figure 2-3 Relationships for 3He MRI VDP and ADC with PRM-derived gas-trapping and
emphysema voxels .................................................................................................................. 58
Figure 2-4 Spatial relationship of 3He MRI ventilation defects with PRM gas-trapping and
emphysema for a representative (A) mild and (B) severe COPD subject .............................. 60
Figure 2-5 3He MRI apparent diffusion coefficient measurements spatially within PRM
regions of normal, gas-trapped, and emphysematous tissue ................................................... 62
Figure 3-1 Ventilation and CT imaging for representative COPD and bronchiectasis subjects
................................................................................................................................................. 84
Figure 3-2 Correlations for FDMRI with 3He MRI and CT RA950......................................... 86
Figure 3-3 Spatial relationship of FDMRI with 3He MRI ventilation and emphysema for
representative subjects with COPD and Bronchiectasis ......................................................... 88
Figure 4-1 FDMRI ventilation map and analysis pipelines .................................................. 103
Figure 4-2 Ventilation MRI for severe and severe-uncontrolled asthmatics ........................ 107
Figure 4-3 Methacholine Challenge ...................................................................................... 109
Figure 4-4 Relationships for FDMRI with 3He MRI ............................................................ 111
Figure 5-1 4DMR Imaging Specific-Ventilation Acquisition and Analysis Pipeline .......... 125
Figure 5-2 3He MRI and 4DMRI for a Representative Healthy Subject .............................. 128
Figure 5-3 3He MRI and 4DMRI for Representative Asthmatics......................................... 129
Figure 5-4 Relationships for 4DMRI Specific-Ventilation with 3He MRI Ventilation-Percent
and Plethysmography Specific-Ventilation .......................................................................... 131
Figure 5-5 Spatial Correspondence of free-breathing 4DMRI Specific-Ventilation and 3He
MRI Static Ventilation Maps ................................................................................................ 133
Figure 5-6 Generation of 4DMR Specific-Ventilation Images............................................. 144
xviii
Figure 5-7 Gravity-dependence Analysis in Healthy Volunteer and Patients with Asthma. 145
Figure 6-1 Ventilation defect clusters for two subjects (COPD and bronchiectasis) with the
same ventilation defect percent ............................................................................................. 161
Figure 6-2 Cluster ventilation defect percent for the same two subjects in Figure 6-1 ........ 162
Figure 6-3 MRI and 4DCT ventilations images of a representative patient with stage III non-
small-cell lung cancer ........................................................................................................... 164
Figure 6-4 Relationships for FDMRI with 3He MRI and 4DCT .......................................... 165
Figure 6-5 Pulmonary Imaging Platform (PIP™) graphical user interface .......................... 166

xix
List of Appendices
Appendix A – Permission for Reproduction of Scientific Articles ...................................... 174
Appendix B – Health Science Research Ethics Board Approval Notices ............................ 177
Appendix C – Curriculum Vitae ........................................................................................... 183
xx
List of Abbreviations AATD Alpha-1 Antitrypsin Deficiency ACQ Asthma Control Questionnaire ADC Apparent Diffusion Coefficient ANOVA Analysis of Variance Anti-IgE Anti-immunoglobulin E AQLQ Asthma Quality-of-Life Questionnaire ATS American Thoracic Society BMI Body Mass Index bSSFP Balanced Steady-State Free Precession BW Bandwidth CI Confidence Interval COPD Chronic Obstructive Pulmonary Disease CT Computed Tomography CTDIvol Volumetric CT Dose Index DLCO Diffusing Capacity of the Lung for Carbon Monoxide DPM Dynamic Proton Map DSC Dice Similarity Coefficient ERS European Respiratory Society FDMRI Fourier Decomposition Magnetic Resonance Imaging FEV1 Forced Expiratory Volume in 1 second FFT Fast Fourier Transform FGRE Fast Gradient Recalled Echo FOV Field of View FRC Functional Residual Capacity fsize Size-Dependent Conversion Factor FVC Forced Vital Capacity G Gradient amplitude GCP Good Clinical Practice GINA Global Imitative for Asthma GOLD Global Initiative for Chronic Obstructive Lung Disease GUI Graphical User Interface HIPAA Health Insurance Portability and Accountability Act HU Hounsfield Unit IC Inspiratory Capacity ICS Inhaled Corticosteroid IRB Institutional Review Board LA Lumen Area LABA Long Acting Beta-agonist LAMA Long-Acting Anticholinergic LCI Lung Clearance Index LTRA Leukotriene Receptor Antagonist MBNW Multiple Breath Nitrogen Washout MCh Methacholine Challenge MIND Modality Independent Neighbourhood Descriptor mMRC modified Medical Research Council MRI Magnetic Resonance Imaging

xxi
NEX Number of Excitations NS Number of Slices NSCLC Non-small-cell Lung Cancer OCS Oral Corticosteroid PC20 Provocative Concentration that lowered FEV1 by 20% PET Positron Emission Tomography PIP™ Pulmonary Imaging Platform PRM Parametric Response Map RA856 Relative Area under -856 HU RA950 Relative Area under -950 HU RAW Airways Resistance RF Radiofrequency RV Residual Volume SABA Short Acting Beta-agonist SAMA Short-Acting Anticholinergic SD Standard Deviation SI Signal Intensity SOC Spatial Overlap Coefficient SPECT Single Positron Emission Computed Tomography SpO2 Oxygen Saturation SSDE Size-Specific Dose Estimate ST Slice Thickness SV Specific Ventilation T1 Spin-Lattice Relaxation Time (a.k.a. longitudinal relaxation time) T2 Spin-Spin Relaxation Time (a.k.a. transverse relaxation time) TCV Thoracic Cavity Volume TLC Total Lung Capacity TE Echo Time TR Repetition Time TV Tidal Volume UTE Ultra-short Echo Time VC Vital Capacity VDP Ventilation Defect Percent VDV Ventilation Defect Volume VIF Variance Inflation Factor VP Ventilation Percent WA% Wall Area Percent WHO World Health Organization
1
CHAPTER 1
1 INTRODUCTION Lung diseases, including but not exclusive to asthma and chronic obstructive pulmonary disease (COPD), are characterized by airflow limitation resulting from airway obstruction and/or tissue destruction. In this thesis, the nature of airflow limitation is studied using non-contrast enhanced imaging biomarkers of pulmonary structure and function and compared with inhaled contrast magnetic resonance imaging (MRI) to develop a better understanding of the role of ventilation heterogeneity in the etiology and progression of lung disease.
1.1 Motivation and Overview Pulmonary diseases, such as chronic obstructive pulmonary disease (COPD) and asthma,
affect hundreds of millions of people throughout the world and account for millions of
deaths each year. According to the World Health Organization (WHO), respiratory disease
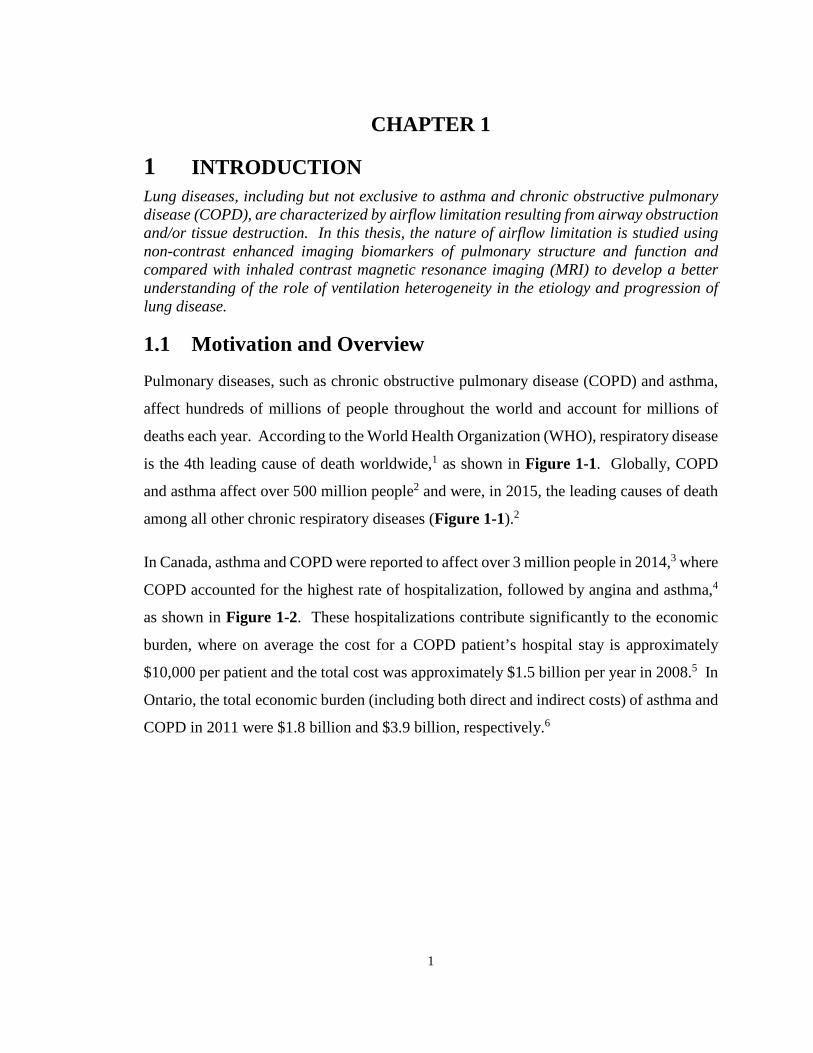
is the 4th leading cause of death worldwide,1 as shown in Figure 1-1. Globally, COPD
and asthma affect over 500 million people2 and were, in 2015, the leading causes of death
among all other chronic respiratory diseases (Figure 1-1).2
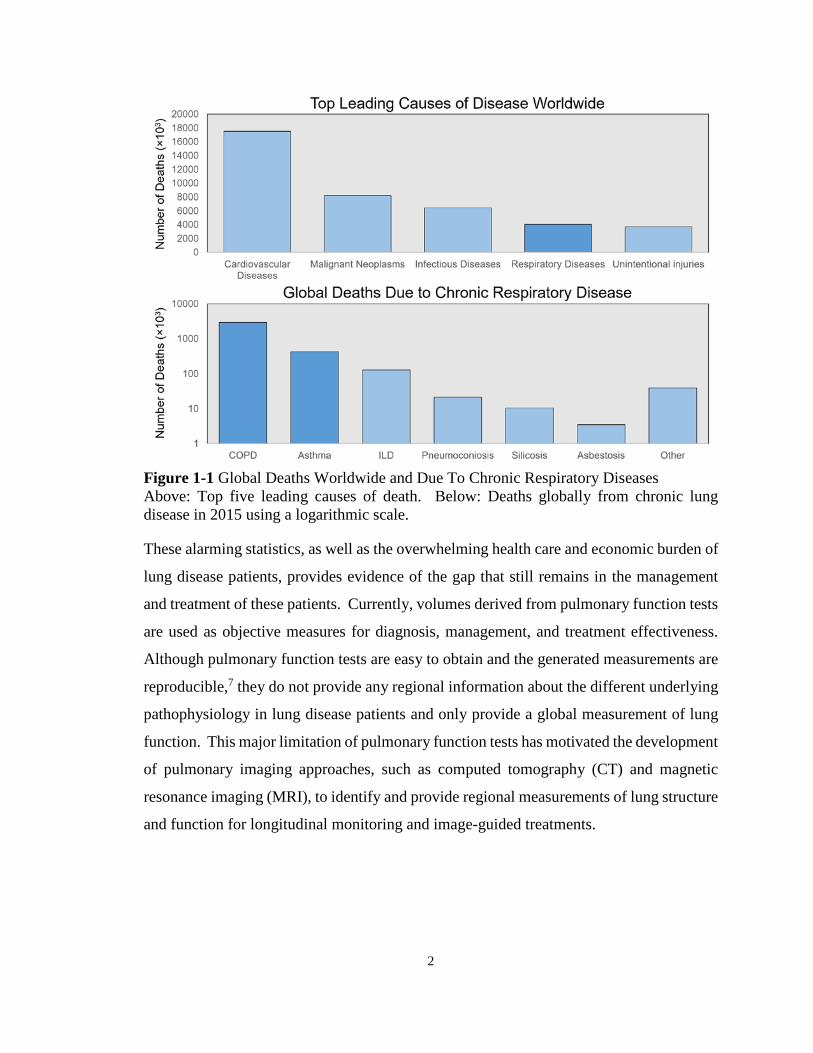
In Canada, asthma and COPD were reported to affect over 3 million people in 2014,3 where
COPD accounted for the highest rate of hospitalization, followed by angina and asthma,4
as shown in Figure 1-2. These hospitalizations contribute significantly to the economic
burden, where on average the cost for a COPD patient’s hospital stay is approximately
$10,000 per patient and the total cost was approximately $1.5 billion per year in 2008.5 In
Ontario, the total economic burden (including both direct and indirect costs) of asthma and
COPD in 2011 were $1.8 billion and $3.9 billion, respectively.6
2
Figure 1-1 Global Deaths Worldwide and Due To Chronic Respiratory Diseases Above: Top five leading causes of death. Below: Deaths globally from chronic lung disease in 2015 using a logarithmic scale.
These alarming statistics, as well as the overwhelming health care and economic burden of
lung disease patients, provides evidence of the gap that still remains in the management
and treatment of these patients. Currently, volumes derived from pulmonary function tests
are used as objective measures for diagnosis, management, and treatment effectiveness.
Although pulmonary function tests are easy to obtain and the generated measurements are
reproducible,7 they do not provide any regional information about the different underlying
pathophysiology in lung disease patients and only provide a global measurement of lung
function. This major limitation of pulmonary function tests has motivated the development
of pulmonary imaging approaches, such as computed tomography (CT) and magnetic
resonance imaging (MRI), to identify and provide regional measurements of lung structure
and function for longitudinal monitoring and image-guided treatments.
3
Figure 1-2 Repeated Hospitalizations by Condition at First Admission Number of patients (in Canada excluding Quebec) with a single, one repeat, and two or more repeat hospitalizations at first admission. This was adapted from the Canadian Institute for Health Information (2008).4
Emerging methods based on pulmonary MRI are being developed to quantify lung
structure and function regionally with the use of inhaled contrast agents. However, despite
the numerous studies demonstrating the undeniable opportunities for clinically relevant
pulmonary biomarkers, translation of these imaging approaches has been hampered due to
a number of key limitations including the relatively high cost associated with inhaled gas
contrast and requirement of multinuclear MR hardware and analysis software, restricting
these techniques to a few specialized research centres. This thesis focuses on the
development and application of imaging biomarkers of pulmonary structure and function
using MRI and CT without the use of exogenous contrast agents or specialized equipment.
These methods were used to evaluate pulmonary structure-function regionally in subjects
with COPD and asthma and validated using hyperpolarized noble gas MRI. The
development and validation of these clinically meaningful non-contrast enhanced imaging
biomarkers are critically required to accelerate translation of pulmonary imaging from the
research workbench to the clinical workflow with the overall goal to improved patient
outcomes.
In this Chapter, the background knowledge relevant to this thesis is provided in order to
motivate the original research presented in Chapters 2 to 5. A general overview of

4
structure and function in the respiratory system will be presented (1.2), followed by the
underlying disease mechanisms of asthma and COPD (1.3). The current clinical standard
to measure and evaluate lung function will be presented next (1.4) followed by a discussion
on current and developing pulmonary imaging techniques used both in clinic and in the
research setting (1.5). Lastly, the hypotheses and objectives of this thesis will be
introduced (1.6).
1.2 The Respiratory System: Structure and Function The chief responsibility of the respiratory system is to deliver air from the external
environment to the blood for gas exchange between oxygen and carbon dioxide. To
perform this task, the respiratory system is composed of nasal and oral cavities, the lungs,
the chest wall, and the diaphragm. Specifically, the lungs are composed of bronchi,
bronchioles, alveolar ducts, and alveolar sacs. All of these components function together
to deliver air from outside of the body to the alveoli in order to perform gas exchange. In
this section, the processes involved with the movement of air from the external
environment through the body to the alveoli are discussed.
1.2.1 The Airways: Respiratory and Conducting Zones
The airways can be separated into the respiratory and conducting zones within the lungs.
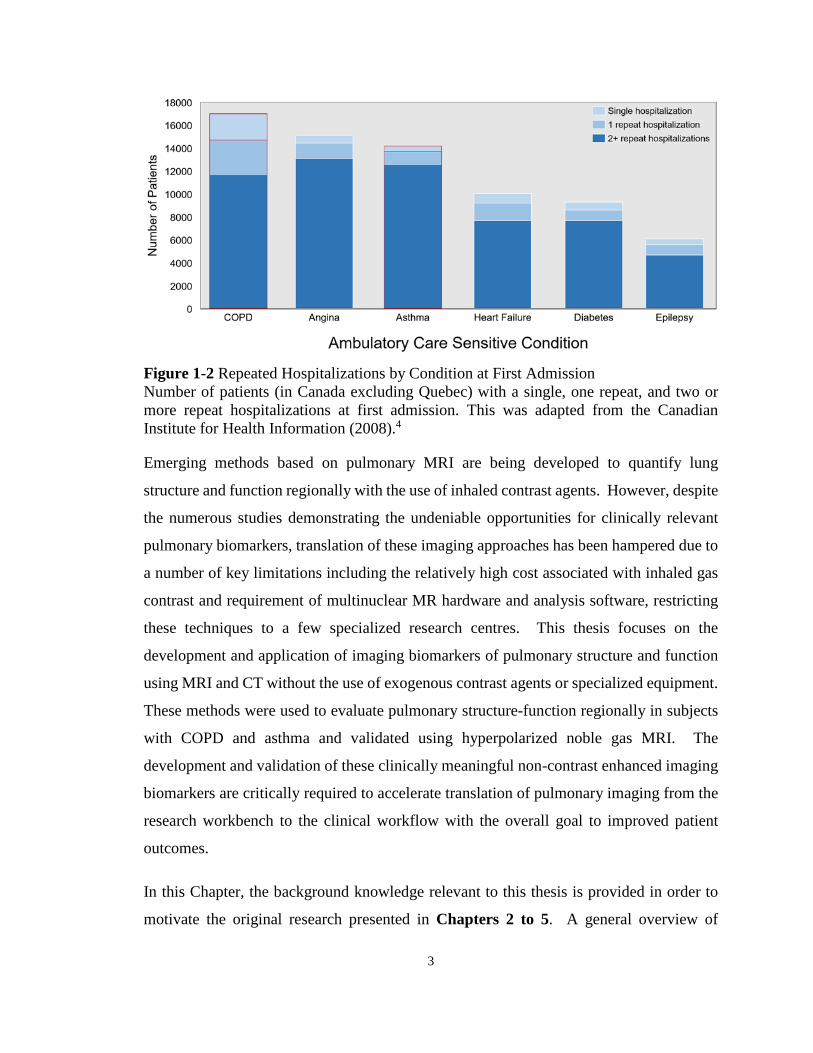
As shown in Figure 1-3, the conducting zone consist of the first 17 airway generations (0-
16), while the remaining seven generations in the airway tree make up the respiratory
zone.8 The conducting airways are responsible for guiding air from outside the body to the
locations in the lungs where gas exchange occurs. Following inspiration, air enters the
nasal and oral cavities where it travels through the pharynx, larynx, and then into the
trachea, where it enters the conducting zone. The trachea, generation 0 in the branching
structure illustration in Figure 1-3, is a hollow pipe ribbed with cartilage rings that
branches into the primary bronchi, where each bronchus feeds air into the left and right
lung. Asymmetrical branching of the airway tree continues while the bronchi decrease in
diameter, but growing geometrically in number. The branching bronchi, similar to the
trachea, are also supported by cartilage to hold open the airway tree. This bronchi
branching then leads into bronchioles that are no longer supported by cartilage and are
5
collapsible. It should be noted that the conducting zone does not participate in gas
exchange directly and that this region of the airway tree is considered the “dead-space”
(approximately 150mL).
Figure 1-3 A Schematic of the Human Airway Tree The conducting airways consist of generations 0-16, and the last 7 generations make up the respiratory zone. The conducting zone is responsible for guiding air to the alveoli, while the respiratory zone is lined with alveoli and is where gas exchange occurs. This was adapted from West, JB, Respiratory Physiology: The Essentials, Ninth Edition.8
Following the airway tree to the respiratory zone, starting at generation 17 shown in Figure
1-3, this is the region of the lung where gas exchange occurs. The airways at this point in
the airway tree start to be lined with alveoli in the respiratory bronchioles. As the airways
further divide, they start to form alveolar ducts where the number of alveoli dramatically
increase in number. The alveolar ducts are then followed by the alveolar sacs of the
terminal airways, which are completely surrounded by alveoli to provide the maximum
amount of surface area for gas exchange to occur. As a result of the dramatic number of
6
airways in the respiratory zone, the overall cross sectional area is very large, where these
airways account for most of the volume in the lung (approximately 2.5-3L).8,9
1.2.2 The Alveoli: Site of Gas Exchange
The alveoli, as mentioned above, are the functional units of the lungs where gas exchange
occurs -specifically diffusion of oxygen and carbon dioxide. Approximately 480 million
alveoli line the respiratory zone10 each with an approximate diameter of 300μm.8 The
extremely thin walls of the alveoli (approximately 0.2μm thick) are composed of two types
of cells (Type I and Type II) to maximize diffusion. The thinner Type I cells allow for gas
exchange while the thicker Type II cells secrete surfactant.
1.2.3 Ventilation
Ventilation can be expressed as the volume of air that is exchanged between the body and
the external environment as a function of time. Accordingly, the average adult inhales
approximately 500mL of air with every breath. Of this 500mL, only 350mL reaches the
alveoli because of the dead-space in the conducting zone. The generation of negative
pressure within the lungs via diaphragmatic and intercostal muscle contractions results in
air being drawn into the lungs.9 The compliance of the lungs, which is a description of
volume change related to pressure change, dictates the rate and force of inspiration and
expiration. Assuming a rate of 15 breaths per minute, the total ventilation8 and alveolar
ventilation8 would be 7500mL and 5250mL of air exchange per minute, respectively.
1.3 Pathophysiology of Lung Disease: Asthma and COPD Lung diseases, specifically asthma and COPD, are characterized by airflow limitation,
measured at the mouth using pulmonary function tests, which is persistent and caused by
changes in the airway lumen, airway wall or peribronchial region. Airflow obstructions
are not uniform in nature, but rather heterogeneously distributed throughout the lungs.
Accordingly, ventilation abnormalities that result in ventilation heterogeneity are a
hallmark finding in many respiratory disorders that involve the airways, such as asthma, or
both the airways and pulmonary parenchyma, such as COPD. This section of the thesis
will focus on the pathophysiology of lung disease, specifically in asthma and COPD.

7
1.3.1 Asthma
Asthma is a chronic and often debilitating airways disease, characterized by intermittent
worsening of breathlessness, cough, chest-tightness and wheeze, which are typically
reversible with the use of a bronchodilator.11 Airflow limitations in asthma derive from
the narrowing of the airway lumen, as illustrated in Figure 1-4, caused by increased hyper-
responsiveness of the smooth muscle lining the airways, inflammation, and the presence of
mucus due to hypersecretion.12 These affects are observed throughout both the central and
peripheral airways in an asthmatic13 and involve both cellular (i.e. infiltration of
eosinophils) and structural (i.e. airway remodeling) changes. Eosinophils in the walls of
the airways promote constriction and bronchial smooth muscle shortening. The structural
changes include increases in smooth muscle mass, bronchial wall edema, and mucous
gland hypertrophy. These all lead to remodeling of the airways towards thickened walls
that contribute to the overall airflow limitation and increased airways resistance.
Furthermore, this airways resistance contributes to difficulty in emptying the lungs,
resulting in hyperinflation (i.e. gas-trapping). The hyper-responsive nature of the airways
in an asthmatic result in sudden and rapid airway narrowing in response to an
environmental stimuli (i.e. allergens),14 which is referred to as an “asthma attack.”
1.3.2 Chronic Obstructive Pulmonary Disease
COPD is diagnosed and disease severity stratified based on not fully reversible airflow
obstruction. Irreversible airflow obstruction develops over a COPD patient’s lifetime as a
result of primarily exposure to cigarette smoke,15,16 but also can advance due to genetic
conditions, such as alpha-1 antitrypsin deficiency (AATD), as well as via exposure to
occupational chemicals and dust, air pollution. Airflow obstruction, symptoms, and
exercise capacity measurements in COPD are related to both parenchyma destruction and
airway remodeling, as shown in Figure 1-4.7,17 Specifically, obstruction in COPD occurs
in both the large (chronic bronchitis) and small airways (small airway disease), as well as
the parenchyma (emphysema). Chronic bronchitis is characterized by excessive mucus
production and airway inflammation of the large airways (greater than 4mm in diameter),
specifically the epithelium of the central airways and extending to the mucous gland
ducts.18-20 The small airways, which are the bronchioles (less than 2mm in diameter) in
8
the airway tree illustrated in Figure 1-3, are the major site of airflow obstruction in
COPD.21 As mentioned in Section 1.2.1, although each airway has a small diameter, the
number of airways increases rapidly, increasing the overall cross sectional area.
Consequently, the small airways attribute very little to the overall measured airway
resistance, where airway resistance is mainly dominated by the large airways. As a result,
small airways disease may silently accumulate over many years without being detected.22
Figure 1-4 Parenchyma and Small Airways Pathologies in Asthma and COPD Above: Healthy - normal small airways, asthmatic - muscle constriction/thickening of airway wall/increased smooth muscle mass resulting in luminal occlusion, and COPD - lumen partly filled with inflammatory exudate with airways inflamed and walls thickened. This was adapted from Hogg JC, Lancet (2004)19 and Saetta M et al. Eur Respir J (2001).12 Below: Healthy - normal lung parenchyma, and COPD - parenchymal destruction. This was adapted from Woods et al. Magnetic Resonance in Medicine (2006).23
Emphysema is the destruction of parenchymal tissue, where airspaces in the lung are
permanently enlarged, as illustrated in Figure 1-4.24,25 This permanent enlargement results
in the loss of alveolar walls and the number of small airways, as compared to a healthy
subject, and consequently reduces the overall surface area. Emphysema can be divided
into three major types: centrilobular, paraseptal, and panlobular emphysema.26
Centrilobular emphysema, mostly associated with cigarette smoking, mainly affects the
respiratory bronchioles while preserving the distal alveolar ducts and sacs. In contrast,
9
paraseptal emphysema affects the peripheral airspaces near the lung pleura and septa.
Panlobular emphysema, more common in non-smoking patients with COPD (i.e. AATD),
uniformly affects the entire distal bronchiole starting from respiratory bronchioles to the
alveoli.
1.4 Established Clinical Measurements of Lung Function Currently, the clinical standard for evaluating lung function is through the use of
pulmonary function tests, which involve patients performing a variety of breathing
maneuvers that provide global lung function and lung volume measurements. The
measurements that are generated from pulmonary function testing are used to diagnose,
monitor, and evaluate treatment effective and efficacy in patients with lung disease at in
the clinic. These tests can be divided into spirometry, plethysmography, diffusing capacity
of the lung for carbon monoxide, and multiple breath nitrogen washout. Furthermore, these
measurements are often expressed as a percent predicted value (%pred) based on the
patient’s age, height, sex, and ethnicity.27
1.4.1 Spirometry
Measurements made using spirometry can be derived from breathing maneuvers made
using a handheld device, such as the one shown in Figure 1-5. While sitting in the upright
position, patients are instructed to make a tight seal with their lips around the mouthpiece
while wearing nose plugs. As shown in the volume-time curve in Figure 1-5, patients are
instructed to start with normal tidal breathing, for approximately 3-4 breaths, and then
instructed to inhale using maximum effort, until they reach total lung capacity, followed
by a maximally forced exhalation, until they cannot expel any more air.28 The important
measurements that are acquired through spirometry are the forced vital capacity (FVC),
which is the amount of air that the patient can exhale after a full inspiration, and the forced
expiratory volume in one second (FEV1), which, as the name suggests, is the amount of air
that the patient can exhale in one second.

10
Figure 1-5 Pulmonary Function Test - Spirometry Left: Handheld spirometer. Right: Volume-time curve that is measured by the spirometer to determine the forced expiratory volume in one second (FEV1) and the forced vital capacity (FVC).
1.4.2 Plethysmography
A plethysmograph, shown in Figure 1-6, is an air-sealed chamber (or “body-box”) where
patients sit upright to perform breathing maneuvers to generate volume-time traces, as
shown in Figure 1-6. The primary volume that is measured in plethysmography is
functional residual capacity (FRC), from which residual volume (RV) and total lung
capacity (TLC) can be quantified.29 FRC is the volume of air that is within the lung after
passive expiration, RV is the volume of air after forceful expiration, and TLC is the total
volume of air within the lung after full inspiration. Other volumes that are obtained using
plethysmography are the following: inspiratory capacity (IC), vital capacity (VC), and tidal
volume (TV). IC is the volume of air that can be inhaled from the end of a normal
exhalation during a tidal breathing maneuver, VC is the volume of air expelled from total
lung capacity down to residual volume, and TV is the volume of air that is inhaled/exhaled
during the respiratory cycle.29 Furthermore, specific-ventilation (SV),30 which is the
movement of air into and out of the lungs during normal tidal breathing, is a dimensionless
quantity that measures how efficiently the lungs are being ventilated, as shown below in
Equation 1-1:
𝑆𝑆𝑆𝑆 =𝑇𝑇𝑆𝑆𝐹𝐹𝐹𝐹𝐹𝐹
(1-1)
11
Figure 1-6 Pulmonary Function Test - Plethysmography Left: Whole body plethysmograph. Right: Volume-time curve used to determine lung volumes measured by the plethysmograph.
1.4.3 Diffusion Capacity of the Lung
The diffusing capacity of the lung for carbon monoxide (DLCO) can be measured through
pulmonary function testing to evaluate patients with emphysema since this metric provides
an indirect measure of gas diffusion across the alveolar membrane. When performing this
test, patients are instructed to completely empty their lungs (to RV), and to forcefully inhale
a gas mixture until they are completely filled (to TLC), where they are instructed to hold
their breath for 10s before exhalation. The gas mixture that the patients inhale contains a
very low concentration of carbon monoxide (0.3%). The breath-hold with the gas mixture
allows the carbon monoxide to diffuse through the alveolar membrane into the blood,
where the exhaled gas after the breath-hold is analyzed. It should be noted that the first
approximately 150mL of exhaled gas is discarded because of the dead-space in the lungs.
The analysis of the exhaled gas is performed by comparing the concentration of carbon
monoxide exhaled versus the concentration that was inhaled to determine the amount of
carbon monoxide diffusion.31
1.4.4 Multiple Breath Nitrogen Washout
Multiple breath nitrogen washout (MBNW) is a technique to measure lung volumes and
ventilation heterogeneity.32 This test is generally performed with participants sitting in the
upright position and breathing 100% oxygen through a mouthpiece while wearing nose
clips. While breathing in pure oxygen during normal tidal breathing, and knowing that air
12
contains mostly nitrogen gas, after each tidal breath, there is a decrease in the concentration
of exhaled nitrogen. When the nitrogen gas concentration has decreased to 1/40th of the
starting concentration by washing-out the lungs using pure oxygen, the test is complete.
One measurement that is most commonly derived from MBNW tests is the lung clearance
index (LCI).33 LCI is calculated as the cumulative expired gas volume, based on the
number of lung turnovers needed to clear the lungs of nitrogen gas, normalized to FRC,
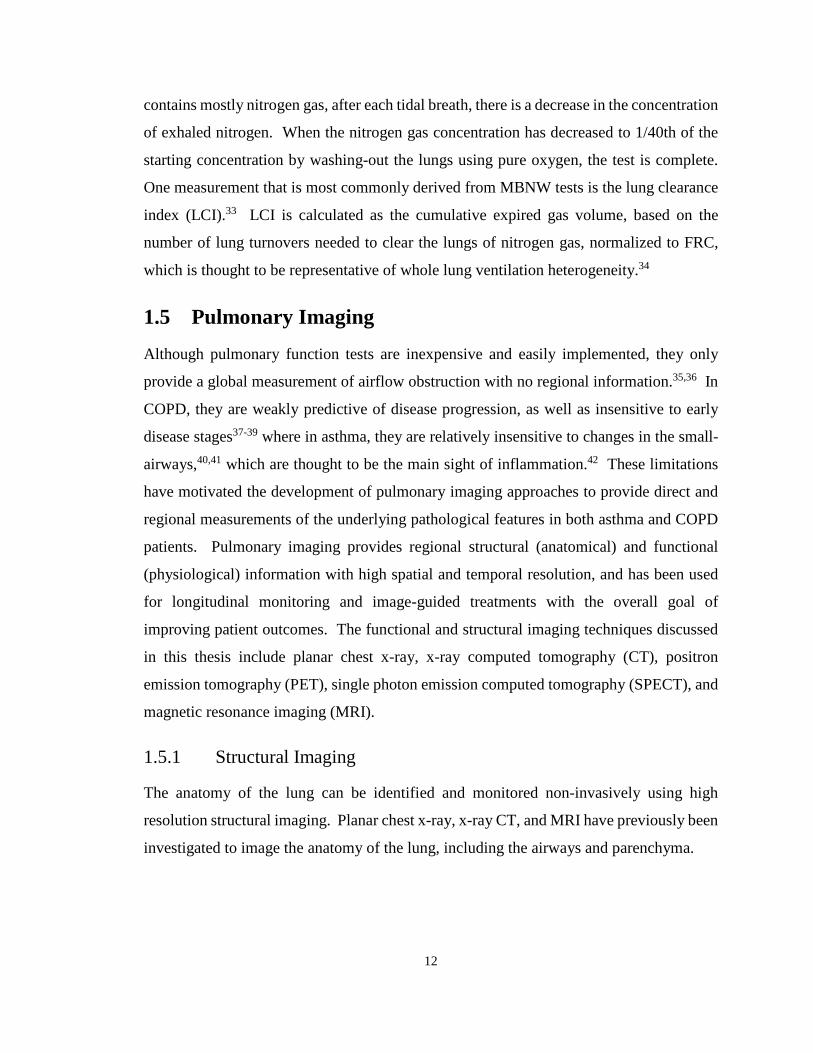
which is thought to be representative of whole lung ventilation heterogeneity.34
1.5 Pulmonary Imaging
Although pulmonary function tests are inexpensive and easily implemented, they only
provide a global measurement of airflow obstruction with no regional information.35,36 In
COPD, they are weakly predictive of disease progression, as well as insensitive to early
disease stages37-39 where in asthma, they are relatively insensitive to changes in the small-
airways,40,41 which are thought to be the main sight of inflammation.42 These limitations
have motivated the development of pulmonary imaging approaches to provide direct and
regional measurements of the underlying pathological features in both asthma and COPD
patients. Pulmonary imaging provides regional structural (anatomical) and functional
(physiological) information with high spatial and temporal resolution, and has been used
for longitudinal monitoring and image-guided treatments with the overall goal of
improving patient outcomes. The functional and structural imaging techniques discussed
in this thesis include planar chest x-ray, x-ray computed tomography (CT), positron
emission tomography (PET), single photon emission computed tomography (SPECT), and
magnetic resonance imaging (MRI).
1.5.1 Structural Imaging
The anatomy of the lung can be identified and monitored non-invasively using high
resolution structural imaging. Planar chest x-ray, x-ray CT, and MRI have previously been
investigated to image the anatomy of the lung, including the airways and parenchyma.

13
1.5.1.1 Planar Chest X-ray
Since the advent of planar x-ray imaging, in 1895 by Wilhelm Rӧntgen where he notably
captured an image of his wife’s hand, it has now become the most common imaging method
in lung disease. The broad dissemination of x-ray imaging was due in part to the low cost,
low radiation dose, and short acquisition window, making it a commanding diagnostic tool.
A typical dose associated with a chest x-ray is approximately 0.01mSv,43 where in
comparison, the average annual background radiation dose is 2-3mSv.43 Chest x-ray
images (or radiographs) are generated by having an x-ray source directed towards a
patient’s chest. The x-ray beam then travels from the source to the patient, where some of
the x-rays are absorbed by the body. The absorption (or attenuation) of x-rays by the body
depends on the path that the x-ray travels through. The x-rays that are not absorbed pass
through the body to the detector, which is located on the other side of the patient. These
x-rays are then measured by the detector to generate an x-ray image. The resulting image
is thus a superposition of all anatomy in the path of the x-ray. The contrast of the image is
related to the number of absorbed (or attenuated) x-rays along each path and is dependent
on the mass attenuation coefficient of the tissue. The mass attenuation coefficient is
dependent on the photon (x-ray) energy, atomic number, and mass density of the absorbing
material. Highly attenuating (absorbs many x-rays) material, such as bone, appears white
on an x-ray image, while low attenuating (absorbs fewer x-rays) structures, such as lung
tissue, appears black, as shown in Figure 1-7.
Lung abnormalities can be visibly identified using chest radiographs in patients with
asthma and COPD (Figure 1-7). In asthma, the most common abnormalities are associated
with increased lung volumes (hyperinflation) and bronchial wall thickening.44,45 In COPD,
radiographs are used to detect hyperinflation in moderate-to-severe emphysema46 and
appear as elongated lung volumes, change in the cardiac silhouette, and flattened
diaphragm.47 The limiting factors of planar chest radiographs, including the poor contrast
and loss of depth information, have motivated the development of three-dimensional
imaging approaches, specifically x-ray CT imaging.

14
Figure 1-7 Chest Radiographs (Posterior-Anterior) of a Healthy, Asthmatic, and COPD Patient Asthmatic: Lung appears hyperlucent and the diaphragm is flattened indicative of hyperinflation. COPD: Lung is hyperinflated, which is consistent with a flat diaphragm and secondary to emphysema. Healthy volunteer case courtesy of Dr Bruno Di Muzio, Radiopaedia.org, rID: 37906. Asthmatic case courtesy of Dr. Ian Bickle, Radiopaedia.org, rID: 33470. COPD patient case courtesy of A.Prof Frank Gaillard, Radiopaedia.org, rID: 8512.
1.5.1.2 X-ray Computed Tomography
Similar to planar x-ray imaging, x-ray CT leverages the attenuating properties of x-rays in
material, but alternatively acquires many different x-ray projections at different angles
around the patient to generate a three-dimensional volume of the anatomy. CT was first
pioneered in the 1970s, and over the past few decades, has become the modality of choice
for evaluating lung disease patients because it allows for the assessment of the airways and
parenchymal density changes, while eliminating the structural superposition inherent to
chest radiographs.48-50
X-ray CT images are acquired by having a patient lay supine on the scanner bed, where the
bed is passed through the imaging components of the scanner. The x-ray source and an
array of detector elements are positioned opposite to one another, where the source and
detector rotate around the patient to acquire multiple x-ray projections. The projections can
be reconstructed into a three-dimensional volumetric image using computational
reconstruction techniques, such as filtered back projection and iterative reconstruction.51
In the generated CT volumetric image, each voxel is represented as a relative measurement
15
of the tissue density to that of water using the Hounsfield Unit (HU),52 as shown below in
Equation 1-2:
𝐻𝐻𝐻𝐻𝐻𝐻𝐻𝐻𝐻𝐻𝐻𝐻𝐻𝐻𝐻𝐻𝐻𝐻𝐻𝐻 𝑈𝑈𝐻𝐻𝐻𝐻𝑈𝑈 = �𝜇𝜇𝑡𝑡𝑡𝑡𝑡𝑡𝑡𝑡𝑡𝑡𝑡𝑡 − 𝜇𝜇𝑤𝑤𝑤𝑤𝑡𝑡𝑡𝑡𝑤𝑤
𝜇𝜇𝑤𝑤𝑤𝑤𝑡𝑡𝑡𝑡𝑤𝑤� × 1000 [𝐻𝐻𝑈𝑈] (1-2)
where 𝜇𝜇𝑡𝑡𝑡𝑡𝑡𝑡𝑡𝑡𝑡𝑡𝑡𝑡 and 𝜇𝜇𝑤𝑤𝑤𝑤𝑡𝑡𝑡𝑡𝑤𝑤 are the linear attenuation coefficients of tissue and water,
respectively. A typical dose associated with a chest CT is approximately 7-8mSv,53 which
is approximately 3-4 times the dose received annually from natural background radiation.
More recent advancements in image reconstruction have resulted in the reduction of the
typical CT dose to approximately 0.1mSv (ultra-low-dose CT),54 although these techniques
have not yet been implemented in the clinic.55
CT imaging of the chest has been used to evaluate both airways disease and parenchymal
destruction in lung disease, such as asthma and COPD. In asthma, expiratory CT provides
regional visualization of air-trapped regions,56 while inspiratory CT has been used to
evaluate airway remodelling.57 Air-trapping can be quantified automatically based on
thresholds of the expiratory CT density histogram. CT estimates of airways disease can be
generated using measurements of airway wall area percent (WA%) and lumen area (LA)
and quantified using software, such as Pulmonary Workstation V.2.0 (VIDA Diagnostics,
Coralville, Iowa, USA), for the reconstruction of the large airways (to the fifth-sixth airway
generation) from volumetric datasets. Relative to healthy subjects, CT bronchial wall
thickness measurement in asthma are greater58 and have been shown to be associated with
airflow obstruction.59,60 In regard to the small airways, the spatial resolution limitation of
CT restricts the direct evaluation of these airways (diameter <2mm). As a result, an indirect
measurement of small airways disease can be evaluated using a densitometry threshold on
expiratory CT to measure air-trapping (relative area under <-856HU [RA856]).61 Similarly
in COPD patients, inspiratory CT can be used to visualize and quantify airways disease62,63
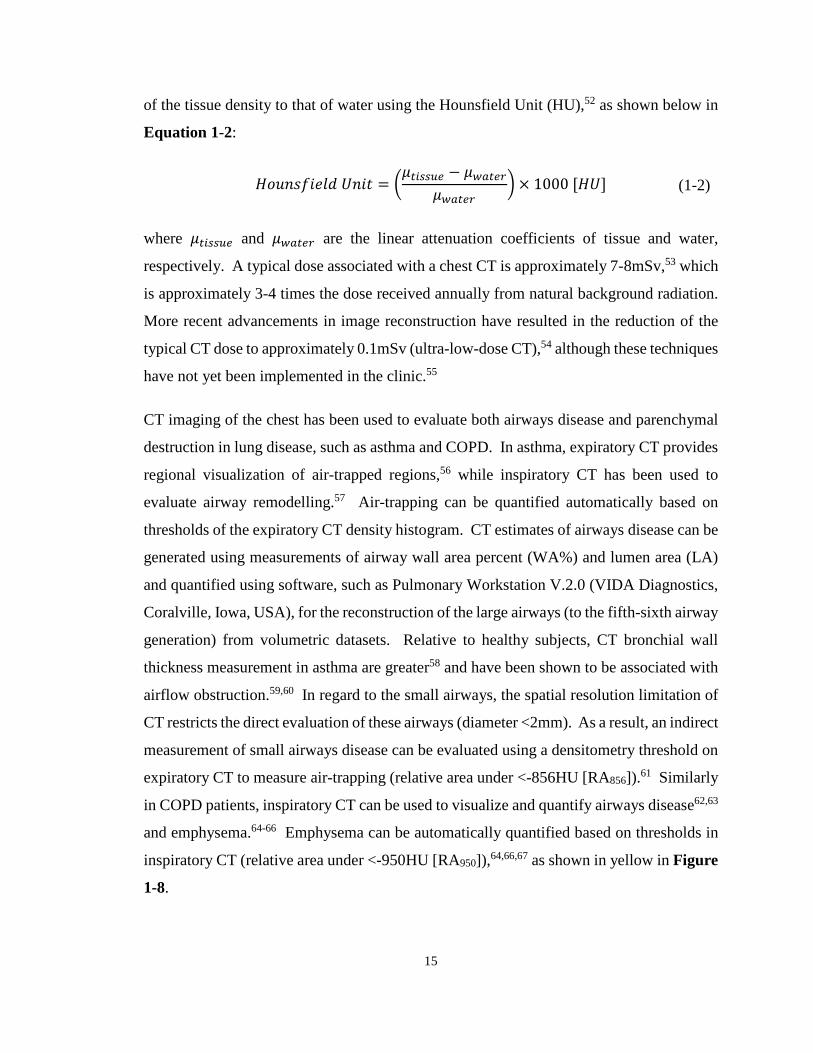
and emphysema.64-66 Emphysema can be automatically quantified based on thresholds in
inspiratory CT (relative area under <-950HU [RA950]),64,66,67 as shown in yellow in Figure
1-8.

16
Figure 1-8 Coronal X-ray CT Images and Corresponding Lung Density Threshold Maps for a Healthy, Asthmatic, and COPD Subject Shown in yellow are lung regions below -950HU.
Thoracic x-ray CT has been shown to provide a wealth of information about the anatomical
structures within the lung, but it should be noted that the use of such x-ray based methods
is limited, especially in serial studies of treatment response and longitudinal studies,
particularly in children and younger adults with chronic lung disease. This is a result of
the potential risks related to radiation doses stemming from ionizing x-ray radiation.68
1.5.1.3 Magnetic Resonance Imaging
Unlike x-ray imaging methods, magnetic resonance imaging (MRI) uses non-ionizing
radiation radiofrequency (RF) waves to manipulate nuclear spins (mainly proton [1H]
atoms) to generate images that provide excellent soft tissue contrast of the anatomy with
high spatial resolution. Conventional 1H MRI of the lung, despite all the advantages, has
been challenging to develop due to a number of limitations.
17
First, MRI signal is dependent on the number of 1H, specifically in water molecules.
Unfortunately in the lung, it is mostly air-filled and consists of only 800g of tissue across
4-6L,69 and as a result, the signal-intensity of the lung is low. Furthermore, the countless
air-tissue interfaces, as a result of the millions of alveoli within the lung, leads to local
magnetic field inhomogeneities,70,71 which are problematic for high spatial resolution MRI.
The protons at these air-tissue interfaces spin at different rates since proton spin precession
frequency is determined by the local magnetic field, which causes the transverse signal to
decay very quickly (0.4-0.9ms).72,73 As a result, this leads to increased dephasing of the
magnetization and signal loss. Additionally, cardiac and respiratory motion during tidal
breathing causes blurring artefacts in the image. The accumulative result of all these
limitations result in the lungs appearing as black holes with no information that can be
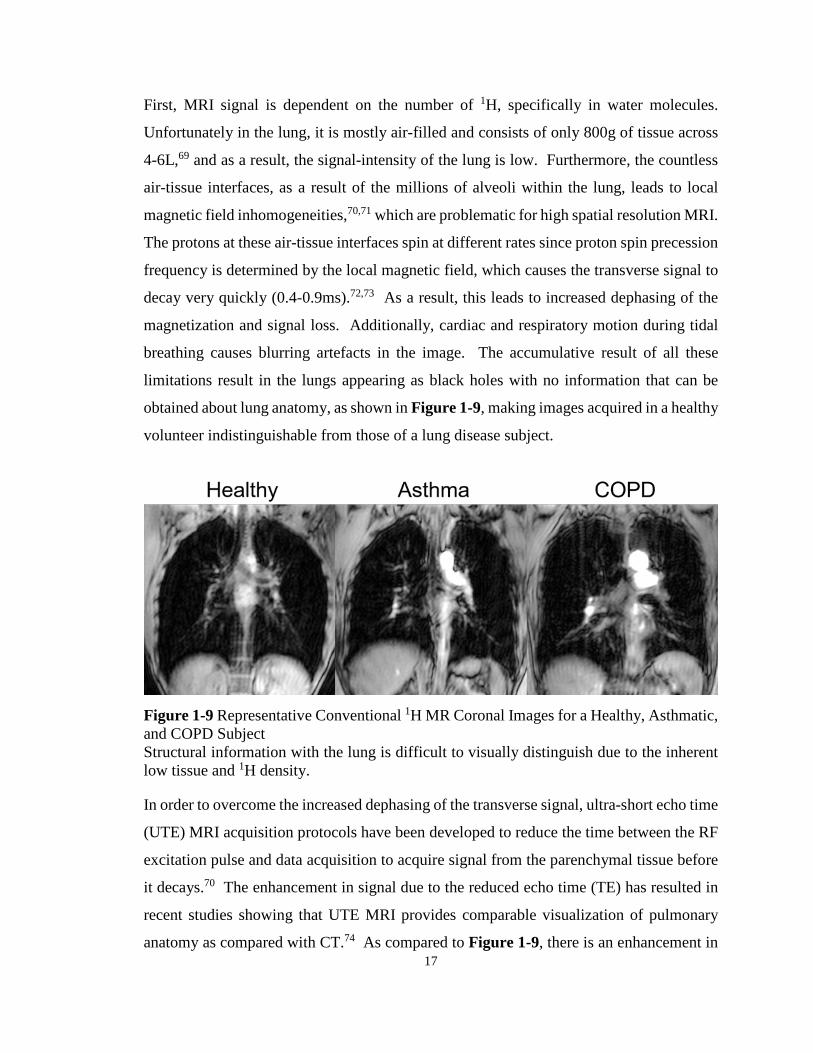
obtained about lung anatomy, as shown in Figure 1-9, making images acquired in a healthy
volunteer indistinguishable from those of a lung disease subject.
Figure 1-9 Representative Conventional 1H MR Coronal Images for a Healthy, Asthmatic, and COPD Subject Structural information with the lung is difficult to visually distinguish due to the inherent low tissue and 1H density.
In order to overcome the increased dephasing of the transverse signal, ultra-short echo time
(UTE) MRI acquisition protocols have been developed to reduce the time between the RF
excitation pulse and data acquisition to acquire signal from the parenchymal tissue before
it decays.70 The enhancement in signal due to the reduced echo time (TE) has resulted in
recent studies showing that UTE MRI provides comparable visualization of pulmonary
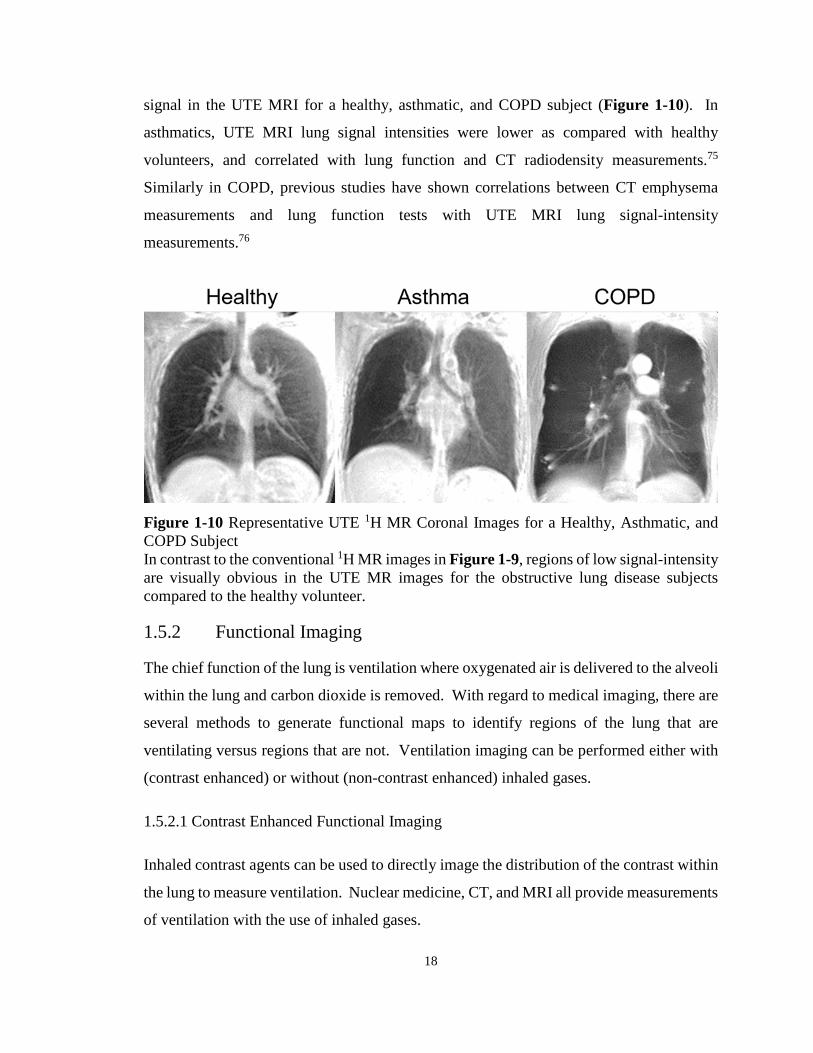
anatomy as compared with CT.74 As compared to Figure 1-9, there is an enhancement in
18
signal in the UTE MRI for a healthy, asthmatic, and COPD subject (Figure 1-10). In
asthmatics, UTE MRI lung signal intensities were lower as compared with healthy
volunteers, and correlated with lung function and CT radiodensity measurements.75
Similarly in COPD, previous studies have shown correlations between CT emphysema
measurements and lung function tests with UTE MRI lung signal-intensity
measurements.76
Figure 1-10 Representative UTE 1H MR Coronal Images for a Healthy, Asthmatic, and COPD Subject In contrast to the conventional 1H MR images in Figure 1-9, regions of low signal-intensity are visually obvious in the UTE MR images for the obstructive lung disease subjects compared to the healthy volunteer.
1.5.2 Functional Imaging
The chief function of the lung is ventilation where oxygenated air is delivered to the alveoli
within the lung and carbon dioxide is removed. With regard to medical imaging, there are
several methods to generate functional maps to identify regions of the lung that are
ventilating versus regions that are not. Ventilation imaging can be performed either with
(contrast enhanced) or without (non-contrast enhanced) inhaled gases.
1.5.2.1 Contrast Enhanced Functional Imaging
Inhaled contrast agents can be used to directly image the distribution of the contrast within
the lung to measure ventilation. Nuclear medicine, CT, and MRI all provide measurements
of ventilation with the use of inhaled gases.
19
Nuclear Medicine
Nuclear medicine methods use radioactive tracers that emit radiation. These methods
involve inhalation of the radioisotopes to the peripheral airspaces to generate functional
images of ventilation. The two nuclear medicine imaging techniques that have been
developed to generate ventilation images are single photon emission computed tomography
(SPECT) and positron emission tomography (PET).
SPECT imaging involves patients inhaling radioisotopes that emit a single gamma-ray as
they decay. Patients lay on a bed where three-dimensional tomographic images are
generated by using a ring of gamma cameras or by rotating a single or multiple gamma
cameras around the patient to acquire multiple projections at different angles. These
projections can be reassembled to provide volumetric information about the radioisotope
distribution within the lungs. Ventilation scans require gaseous radioisotopes, such as 81mKr, 133Xe, aerosolized 99mTc-diethylenetriaminepentaacetate (DTPA) or an ultrafine
dispersion of 99mTc-labeled carbon (“Technegas”), to generate regional ventilation images
by measuring the distribution of the gas within the lungs as the radionuclide decays.
In a similar manner, PET imaging involves patients inhaling a radioisotope, but in this case,
the radioisotope emits positrons as it decays through the process of beta decay. As the
radioisotope decays, a positron is ejected from the nucleus of the unstable atom. Once
ejected, the positron travels a short distance where it will encounter an electron and undergo
a process known as annihilation. The annihilation of both of these particles will result in
the generation of two photons, each with equal energy of 0.511MeV, that are emitted
approximately 180° from one another. The simultaneous creation of these gamma-rays
travelling antiparallel to each other can be detected at or very close to the same time, and
are considered to be coincident. The spatial location of the source particle can therefore
be determined from detection of the coincident gamma-rays detected by two detector
elements geometrically. The location of the radioactive decay of the radioisotope is
therefore restricted to that line, which can then be sorted out and reconstructed into a
volumetric image of the distribution of the inhaled radionuclide in the lungs. Ventilation
imaging using PET can be performed using inhaled 68Ga-carbon nanoparticles (“Galligas”)
20
or 13N isotope (either by bolus injection or inhalation). For 13N, it is not soluble in
blood/tissue,77 so following bolus injection of this radioisotope, it will travel to the lungs
via the bloodstream and cross the alveolar membrane. Accordingly, gas-trapped regions
of the lung retain the tracer while well ventilated regions of the lung quickly wash away
the tracer. Alternatively, using the inhaled methods, the tracers do not reach the poorly
ventilated regions of the lung.
SPECT imaging has been used to evaluate airway closure,78 and changes following
bronchoconstriction79,80 and bronchodilation in asthma.81 Similarly, poorly ventilated
regions post bronchoconstriction have been identified using PET imaging.82 In COPD
subjects, the evaluation of airflow limitation severity83,84 and intrabullous ventilation in
emphysema patients85 have been performed using SPECT imaging. The
ventilation/perfusion ratio that can be generated using PET imaging has been identified as
a measurement to separate the different phenotypes of COPD (i.e. emphysema “pink
puffer” versus airways disease “blue bloater”).86 Although promising, limitations of
SPECT and PET include the risk of cumulative radiation exposure for longitudinal
monitoring, low spatial resolution, and specifically for PET, the need for a cyclotron for
the production of isotopes.
X-ray Computed Tomography
CT imaging, specifically imaging at two energies (dual-energy CT), provides a way to
regionally measure ventilation using inhaled xenon.87 This method leverages the differing
x-ray attenuation properties of xenon at two separate energies. Recent developments in
CT technology, specifically dual-source CT scanners, has allowed the simultaneous
acquisition of data at different tube voltages for material differentiation. This method
involves the patient fitted with a positive pressure ventilation mask laying supine on the
CT bed, where they are instructed to breathe in a mixture of xenon and oxygen for
approximately 2-3 minutes. The images that are acquired at both the high and low energies
are then used to perform three-material decomposition, by which xenon can be
differentiated from other materials in the lung (air and soft tissue), to generate a xenon
distribution map.
21
Dual-energy CT using inhaled xenon has been used to evaluate patients with asthma where
ventilation defects that appeared in the xenon-enhanced images were related to airflow
limitation and airway wall thickening,88 and are sensitive to both bronchodilation89 and
bronchoconstriction.90 Xenon-enhanced dual-energy CT has also been used to evaluate the
regional distribution of structural and ventilation abnormalities simultaneously in patients
with COPD.91 Although this technique is promising, there are several limitations including
radiation exposure, side effects of xenon (specifically respiratory depression), and cost.
Magnetic Resonance Imaging
There are several different inhaled contrast agents that have been developed for MRI. MR
ventilation images can be generated with the use of O2, 19F, 3He, and 129Xe.
O2-enhanced MRI was first developed in the 1990s to non-invasively assess regional
ventilation in the human lung.92 This method involves measuring the change that occurs
in the longitudinal relaxation time (T1) of protons in lung tissue with differing
concentration of O2. Molecular O2 is weakly parametric magnetic and the presence of O2
accelerates the longitudinal relaxation of protons. Ventilation images using O2 are
generated by comparing T1-weighted 1H images acquired whilst breathing room air (~21%
[O2]) and pure oxygen (100% [O2]). Previous studies that have evaluated asthma patients
using O2-enhanced MRI showed that the measured O2-enhancement ratio related with
pulmonary function tests and disease severity.93,94 In COPD patients, O2-enhanced MRI
was shown to be correlated with lung diffusion capacity,95 pulmonary function tests,96 and
the presence of emphysema evaluated using CT.96
Inert 19F gas MRI involves patients inhaling fluorinated gases, such as tetrafluoromethane
(CF4), sulfur hexafluoride (SF6), hexafluoroethane (C2F6) and perfluoropropane (C3F8 or
PFP) which are nontoxic and contain multiple 19F nuclei. Despite the weak signal from
thermal equilibrium polarization, the rapid longitudinal relaxation time of 19F allows for
extensive signal averaging.97 Additionally, the presence of O2 does not have a dramatic
effect on the T1 of fluorinated gases, thus fluorinated gases can be mixed with O2 to
improve patient safety. Current imaging protocols in vivo involve patients breathing 5-7
breaths of a fluorinated gas mixture (C3F8/O2) to reach an approximate steady state gas
22
concentration in the lung and then performing a breath hold maneuver with inhalation of
1L of the same fluorinated gas mixture.98,99 Recent studies have shown the application of 19F MRI in both asthma and COPD patients where there was a visual increase in
heterogeneity of the distribution of gas within the lung as compared to a never-smoker with
normal lungs.98
Noble gas MRI, using either hyperpolarized 3He or 129Xe gases which are stable isotopes,
since its first description100,101 has provided non-invasive measurements of lung
ventilation. 3He and 129Xe nuclei, although MR visible, have a low spin density compared
with solid tissue which prohibits its detectability using MRI under thermal equilibrium
polarization, thus the process of hyperpolarization is performed. Hyperpolarization is a
process by which angular momentum is added to a system. Specifically for noble gases,
optical pumping and spin exchange is used to achieve hyperpolarization. Optical pumping
involves a circularly polarized laser, with a wavelength corresponding to the electronic
orbital transition energy of an alkali metal (i.e. Rb), which serves as the carrier of the
angular momentum. The laser is used to excite the electrons of vaporized alkali metal
where the excited vapor is within an optical cell also filled with either 3He or 129Xe. The
angular momentum of the electrons of the excited alkali metal vapour is transferred to the
noble gas nuclei through collisions; this process is known as spin-spin interaction. This
method increases the nuclear polarization of the unpaired nuclear proton of the noble gases
up to five orders of magnitude compared to thermal equilibrium polarization.102 It should
be noted that the optical cell is maintained in a constant magnetic field; this is performed
to reduce the decay rate of the polarized atoms to their ground state. Initially, lung imaging
was developed using hyperpolarized 129Xe,100 but quickly converted to 3He due to the high
signal-to-noise ratio that could be achieved because of the inherent properties of the two
noble gases. The gyromagnetic ratio of 3He is approximately three times greater than 129Xe
(gyromagnetic ratio of -32.3MHz/T for 3He versus -11.8MHz/T for 129Xe) and the
achievable polarization of 129Xe is lower than 3He (129Xe: 8-25%; 3He: 30-40%).103
However, due to the limited supply and increasing price of 3He104 and recent advances in
technology, there has been renewed interest in 129Xe where similar signal-to-noise ratios
are becoming more attainable.105
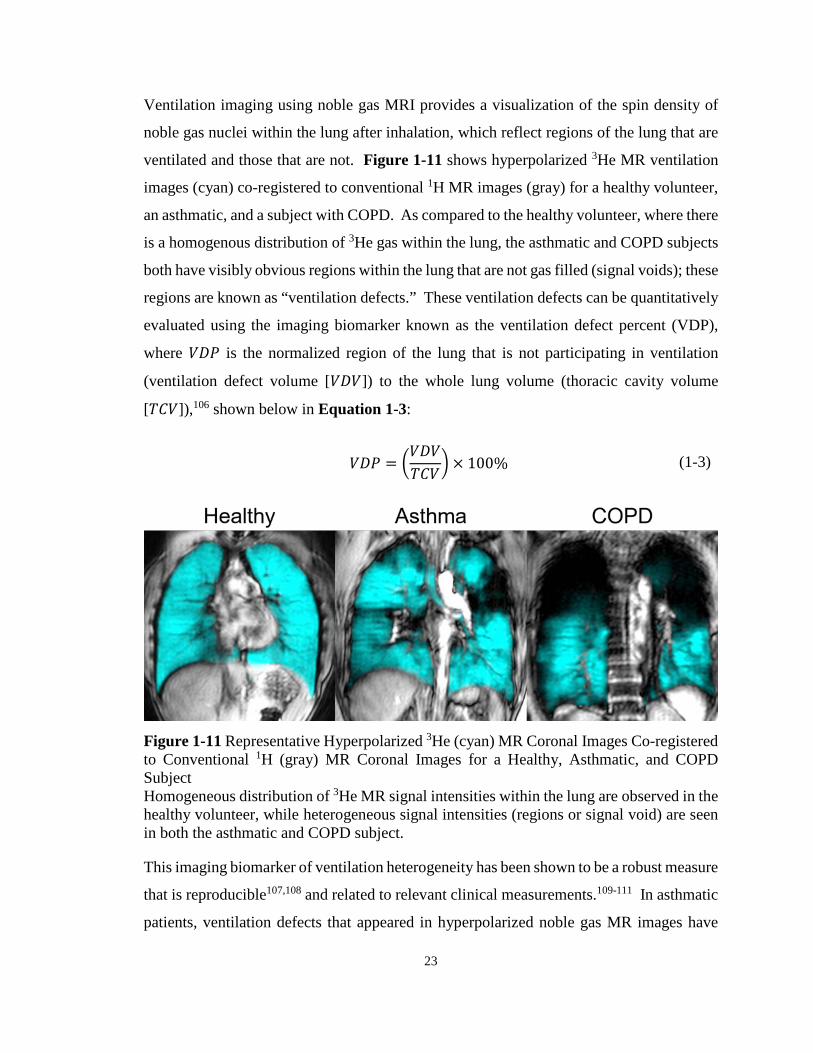
23
Ventilation imaging using noble gas MRI provides a visualization of the spin density of
noble gas nuclei within the lung after inhalation, which reflect regions of the lung that are
ventilated and those that are not. Figure 1-11 shows hyperpolarized 3He MR ventilation
images (cyan) co-registered to conventional 1H MR images (gray) for a healthy volunteer,
an asthmatic, and a subject with COPD. As compared to the healthy volunteer, where there
is a homogenous distribution of 3He gas within the lung, the asthmatic and COPD subjects
both have visibly obvious regions within the lung that are not gas filled (signal voids); these
regions are known as “ventilation defects.” These ventilation defects can be quantitatively
evaluated using the imaging biomarker known as the ventilation defect percent (VDP),
where 𝑆𝑆𝑉𝑉𝑉𝑉 is the normalized region of the lung that is not participating in ventilation
(ventilation defect volume [𝑆𝑆𝑉𝑉𝑆𝑆]) to the whole lung volume (thoracic cavity volume
[𝑇𝑇𝐹𝐹𝑆𝑆]),106 shown below in Equation 1-3:
𝑆𝑆𝑉𝑉𝑉𝑉 = �𝑆𝑆𝑉𝑉𝑆𝑆𝑇𝑇𝐹𝐹𝑆𝑆
� × 100% (1-3)
Figure 1-11 Representative Hyperpolarized 3He (cyan) MR Coronal Images Co-registered to Conventional 1H (gray) MR Coronal Images for a Healthy, Asthmatic, and COPD Subject Homogeneous distribution of 3He MR signal intensities within the lung are observed in the healthy volunteer, while heterogeneous signal intensities (regions or signal void) are seen in both the asthmatic and COPD subject.
This imaging biomarker of ventilation heterogeneity has been shown to be a robust measure
that is reproducible107,108 and related to relevant clinical measurements.109-111 In asthmatic
patients, ventilation defects that appeared in hyperpolarized noble gas MR images have

24
been shown to be significantly correlate with spirometry,110-112 disease severity110 and CT
measurements of gas trapping,111 and are spatially and temporally persistent.107,113,114
Importantly in asthmatics, ventilation is characteristically heterogeneous as compared with
healthy volunteers.110,115-117 Ventilation defects are larger and more numerous in older
asthmatic patients, with greater inflammation and worse airway remodeling118 and are also
related to quality of life and asthma control.119 In COPD patients, VDP is related to
spirometry,109 symptoms and exercise capacity,120 CT-derived emphysema
measurements,121 and exacerbations122 using hyperpolarized 3He and 129Xe gases.
Furthermore, for both asthma and COPD patients, ventilation defects are sensitive to
bronchodilation,123,124 while in asthmatics, ventilation defects are also sensitive to
bronchoconstriction.125
Another application of hyperpolarized noble gas MRI is to probe the microstructure within
the lung using diffusion imaging.126 Diffusion-weighted noble gas MRI, which is sensitive
to the self-diffusion of the gases based on the random Brownian motion of the atoms, can
be used to measure the apparent diffusion coefficients (ADC) of both hyperpolarized 3He
and 129Xe. ADC reflects the restricted diffusion of the gases within the airways and
airspaces. As a result, the diffusion time interval can be used as a surrogate measurement
of airspace dimension.127 Accordingly, an increase in ADC value reflects a greater mean
square displacement of the gas molecule or an enlarged airspace as a result of, for example,
emphysema-related airspace enlargements. ADC measured using hyperpolarized 3He MRI
have been validated using histology23 and shown to be highly reproducible.128-130
Furthermore, hyperpolarized 3He MRI ADC have been used to validate hyperpolarized 129Xe MRI ADC measurements.131 In asthma, ADC was significantly elevated in
asthmatics as compared to healthy volunteers, potentially suggesting gas-trapping,132
although other studies have reported otherwise showing no difference.133,134 3He MRI
ADC has also been used to evaluate the response to methacholine in asthmatics, where
ADC values were elevated after bronchoconstriction and decreased following
bronchodilation.135 In patients with COPD, ADC values measured using 3He and 129Xe
were elevated compared to age matched healthy volunteers,109 and correlated with age,136
lung function tests,137 smoking history,136 and CT measurements of emphysema.109
25
Furthermore, ADC measurements were also sensitive to administration of a bronchodilator,
suggesting reduction in gas-trapping in patients with COPD.138
A number of key limitations have hampered the use of hyperpolarized noble gas MRI in
the clinic, which has restricted this technique to a few specialized research centres. These
approaches incur relatively high costs due to the need for inhale contrast agents and require
access to multinuclear MR hardware and analysis software. Furthermore, except for in the
United Kingdom, hyperpolarized noble gas MRI is not yet approved for clinical use in
Asia, North America or the rest of the European Union despite numerous demonstrations
of safety and efficacy in chronic lung disease patients.139,140 With this in mind, there has
been growing interest for the development and implementation of non-contrast enhanced
pulmonary MRI approaches to overcome these challenges specifically with resource
accessibility.
1.5.2.2 Non-contrast Enhanced Functional Imaging
As mentioned above, non-contrast enhanced methods to indirectly evaluate lung function
can be performed by measuring tissue density or deformation changes as the lungs expand
and contract using structural imaging. Ventilation-weighted lung images can be extracted
via structural CT or MR images while patients free-breathe or at multiple lung volumes,
including full inspiration and full expiration. Ventilation information from structural
images is performed by exploiting the aggregate signal changes caused by density
variations in the lung during breathing.
Computed Tomography
Thoracic CT images acquired at different phases in the breathing cycle (i.e. full expiration
and full inspiration), can be used to generate and quantify the expansion of lung tissue
regionally using non-rigid or deformable image registration methods.141-144 Imaging
biomarkers of ventilation using lung deformation information include measures of local
volume change, estimates of tissue compliance and deformation biomarkers during
breathing. Local volume changes, such as during normal tidal breathing (specific-
ventilation),30 can be measured and generated using a density-based method,142 which
26
quantifies the difference in lung tissue density at different lung volumes as air enters and
leaves voxels.145 This measurement reflects the quantity of inhaled gas moving into the
lung during normal breathing. Alternatively, local lung tissue expansion can be described
using the deformation field maps that are generated from the co-registration of images.
More specifically, the determinant of the Jacobian matrix that is generated from the
deformation field vector map can be used to quantify specific volume,146 which has
previously been shown to reflect regional ventilation.147 This imaging biomarker has been
evaluated in patients with asthma148,149 and COPD,150-152 where abnormal lung
biomechanical properties were observed in severe asthmatics, which may be due to gas-
trapping.149 In COPD patients, imaging biomarkers of lung biomechanical properties were
related to clinical outcomes,151 disease severity150 and progression.152 The techniques can
also be applied to four-dimensional CT (4DCT),153-155 where images are reconstructed at
many different points during the respiratory phase, and changes in volume can be measured
throughout the entire process. This technique was used to show that deformation
throughout the respiratory cycle is nonlinear156 and that this deformation is greater in
asthmatics than in healthy subjects.148 In COPD patients, 4DCT ventilation measured
using the density and Jacobian based methods were shown to be related to emphysema.157
An alternative approach using parametric response maps (PRM) of co-registered
inspiratory-expiratory CT, which was first developed as a voxel-based method for
improving the sensitivity of diffusion-MRI data for identifying early therapeutic response
in glioma patients,158 has recently been used to evaluate COPD patients.159 In COPD, co-
registered inspiratory-expiratory CT in addition to well-established density
thresholds,61,160,161 can be used to classify lung tissue into normal, emphysematous and gas-
trapping regions.159 In other words, PRM provides a way to classify lung tissue based on
the presence of pulmonary air. To generate PRM, voxel-wise comparisons are performed,
where co-registered inspiration and expiration images are used to classify lung tissue into
four categories based on expiration and inspiration thresholds as previously described:159
1) inspiration >-950HU and expiration >-856HU (normal tissue [green]), 2) inspiration >-
950HU and expiration <-856HU (gas-trapping [yellow]), 3) inspiration <-950HU and
expiration <-856HU (emphysema [red]), and, 4) inspiration <-950HU and expiration >-

27
856HU, as shown in Figure 1-12. The fourth category of voxels was hypothesized to
reflect noise in the data due to image registration error.159 As shown in Figure 1-12, with
increasing severity of airflow limitation, regions of PRM-normal tissue are reduced while
both lung regions of PRM-gas-trapping and PRM-emphysema increase.
Figure 1-12 Parametric Response Mapping of Co-registered Inspiratory-Expiratory CT Images Above: A schematic of the generation of PRM. Below: PRM co-registered to CT images of a representative ex-smoker without COPD, mild COPD, and severe COPD subjects.
Although PRM measurements of gas trapping, suggested to be related to “functional” small
airway disease, have been shown to be reproducible over short periods of time,162
differentiated current and former smokers with and without COPD,163 correlated with
pulmonary function,159 and were associated with longitudinal changes in FEV1,164 the
28
clinical relevance and etiology of this measurement is uncertain and has not yet been
pathologically validated.
Magnetic Resonance Imaging
Similar to non-contrast enhanced CT, aggregate signals are extracted from multiple lung
volumes of free-breathing 1H MR images to detect changes in air volume regionally within
the lung, without the use of ionizing radiation. The first approach, pioneered in 2006,
involved a series of coronal images acquired over a time period of one minute during slow,
maximum amplitude respiration, where fractional ventilation weighted images of the lung
(𝐹𝐹𝑆𝑆) were generated from signal intensity differences between full inspiration (𝑆𝑆𝑆𝑆𝑡𝑡𝑖𝑖𝑡𝑡𝑖𝑖) and
full expiration (𝑆𝑆𝑆𝑆𝑡𝑡𝑒𝑒𝑖𝑖), as shown below in Equation 1-4:165
𝐹𝐹𝑆𝑆 =𝑆𝑆𝑆𝑆𝑡𝑡𝑒𝑒𝑖𝑖 − 𝑆𝑆𝑆𝑆𝑡𝑡𝑖𝑖𝑡𝑡𝑖𝑖
𝑆𝑆𝑆𝑆𝑡𝑡𝑒𝑒𝑖𝑖 (1-4)
This method was originally developed and used to evaluate healthy volunteers, asthmatics,
and cystic fibrosis patients, along with other lung disease patients. Visually obvious
ventilation defects appeared in the lung disease patients as compared to the healthy subjects
and these ventilation defects were correlated with pulmonary function tests.165
Since the original development using 1H MRI to derive surrogate measurements of
ventilation, a variety of approaches have been investigated. Multiple lung volumes breath-
hold approaches where whole lung MR images are acquired and co-registered to measure
signal intensity differences have been developed,75,166,167 using conventional 1H MRI167 or
UTE MRI.75,166 Conventional 1H MR signal intensity differences were related to
pulmonary function tests in asthma and COPD patients with emphysema, and that these
differences were related to 3He MR signal intensities.167 Furthermore, measurements of 1H MR signal differences generated from dynamic proton maps (DPM) using multi-volume
UTE MRI were greater in healthy volunteers as compared to asthma subjects, and
correlated with lung function and CT radiodensity measurements.75
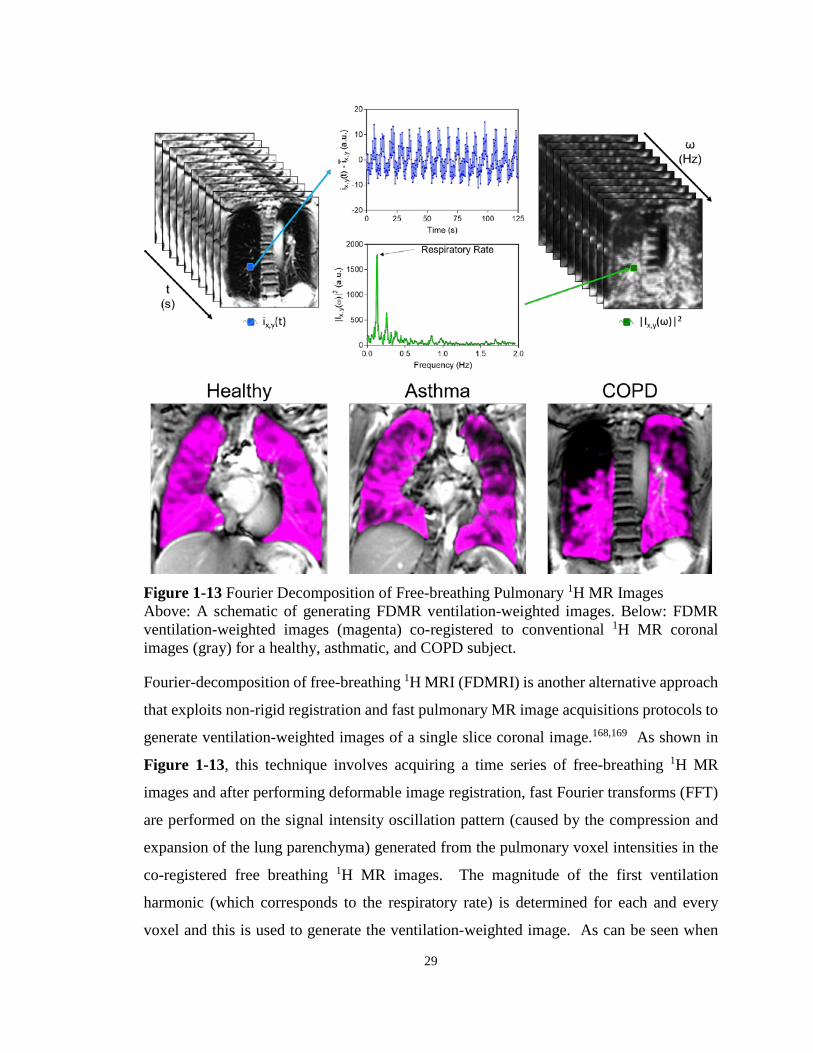
29
Figure 1-13 Fourier Decomposition of Free-breathing Pulmonary 1H MR Images Above: A schematic of generating FDMR ventilation-weighted images. Below: FDMR ventilation-weighted images (magenta) co-registered to conventional 1H MR coronal images (gray) for a healthy, asthmatic, and COPD subject.
Fourier-decomposition of free-breathing 1H MRI (FDMRI) is another alternative approach
that exploits non-rigid registration and fast pulmonary MR image acquisitions protocols to
generate ventilation-weighted images of a single slice coronal image.168,169 As shown in
Figure 1-13, this technique involves acquiring a time series of free-breathing 1H MR
images and after performing deformable image registration, fast Fourier transforms (FFT)
are performed on the signal intensity oscillation pattern (caused by the compression and
expansion of the lung parenchyma) generated from the pulmonary voxel intensities in the
co-registered free breathing 1H MR images. The magnitude of the first ventilation
harmonic (which corresponds to the respiratory rate) is determined for each and every
voxel and this is used to generate the ventilation-weighted image. As can be seen when

30
comparing Figure 1-11 and Figure 1-13, FDMRI methods can provide similar spatial
information about ventilation as compared to hyperpolarized noble gas MR methods.
Reproducibility of FDMRI has previously been investigated in healthy volunteers while
ventilation abnormalities measured using FDMRI in porcine models have shown to be
spatially localized with SPECT-CT170 and hyperpolarized 3He MRI171 ventilation defects.
Thus far, in asthma and COPD, limited work has been done using FDMRI. Furthermore,
while the MRI techniques described above acquire images in breath-hold at multiple lung
volumes166,167 or free-breathing images for a single slice,168,169 development of approaches
that provide a way to generate whole lung functional maps that probe functional
abnormalities using conventional equipment and pulse sequences while patients are free-
breathing has been limited. These methods, although requiring sophisticated post-
processing methods, open the opportunity for functional lung imaging on clinically
available MR systems for serial lung function measurements without the dependence of
inhaled gases in lung disease patients.
1.6 Thesis Hypotheses and Objectives The diagnosis and monitoring of pulmonary diseases, such as asthma and COPD, is
primarily done using pulmonary function tests. These tests, although inexpensive and
easily implemented, are limited because they only provide a measure of global airflow
obstruction and provide no regional information, potentially concealing independent
underlying pathologies. The limitations of spirometry and current therapies for lung
disease patients have motivated the development of pulmonary imaging approaches.
Pulmonary imaging has the potential to provide regional measurements of lung function
for image-guided treatments and longitudinal monitoring. Inhaled hyperpolarized noble
gas MRI has previously been shown to provide a way to quantify pulmonary ventilation
by visualizing lung regions accessed by gas during a breath-hold, and alternatively, regions
that are not accessed coined “ventilation defects.” Despite the strong foundation and many
advantages this contrast enhanced technique has to offer research and patient care, clinical
translation has been limited in part due to the need for specialized equipment, including
multinuclear-MR hardware and polarizers, and personnel. Thus, the overarching objective

31
of this thesis was to develop and evaluate imaging biomarkers of pulmonary structure and
function using MRI and CT without the use of exogenous contrast agents or specialized
equipment. The objectives and hypotheses specific to each chapter are described below.
In Chapter 2, our objective was to develop and directly compare CT parametric response
maps with 3He MRI ventilation measurements of gas-trapping and emphysema in ex-
smokers with and without COPD. We wanted to determine the quantitative and spatial
relationships of PRM gas-trapping and PRM emphysema measurements with MRI
measurements of parenchymal tissue integrity and ventilation, because these are clinically-
important imaging findings and phenotypes of COPD. We hypothesized that 3He
ventilation defects would be spatially related to PRM measurements of both gas-trapping
and emphysema.
In Chapter 3, our objective was to develop and compare pulmonary ventilation
abnormalities derived from Fourier decomposition of free-breathing 1H magnetic
resonance imaging with 3He MRI in subjects with COPD and bronchiectasis. Based on
previous work, we hypothesized that ventilation defects measured using FDMRI and 3He
MRI would be spatially and quantitatively correlated in subjects with COPD and those with
bronchiectasis.
In Chapter 4, based on the FDMR biomarkers developed in patients with COPD and
bronchiectasis, our objective was to evaluate ventilation heterogeneity in patients with
severe asthma, both pre- and post-salbutamol as well as post-methacholine challenge using
FDMRI and 3He MRI. Based on previous work, we hypothesized that FDMRI VDP would
be quantitatively related to 3He MRI VDP and show similar responses to both methacholine
and salbutamol as compared to baseline measurements in patients with severe asthma.
In Chapter 5, based on the free-breathing MR approaches previously developed, our
objective was to develop a whole-lung free breathing pulmonary 1H MRI technique to
measure regional specific-ventilation and evaluate asthmatics and healthy volunteers. We
then wanted to compare 1H MRI specific-ventilation with 3He MRI ventilation in healthy
and asthmatic participants, and, determine the relationships between 1H MRI specific-
ventilation with both 3He MRI and pulmonary function measurements. We hypothesized

32
that dynamic whole-lung MR specific-ventilation would be related to static ventilation
measurements derived from 3He MRI as well as pulmonary function tests.
In Chapter 6, an overview and summary of the important findings and conclusions of
Chapters 2-5 is provided. The study specific and general limitations of these studies will
be discussed and some potential solutions are suggested. The thesis concludes with an
outline of future studies that can build on the work presented in this thesis.
33
1.7 References (1) World Health Organization. Global Health Estimates 2014 Summary Tables: Death
by Cause, Age and Sex, 2000-2012. (2014). <http://www.who.int/healthinfo/global_burden_disease/en/>.
(2) Soriano, J. B. et al. Global, regional, and national deaths, prevalence, disability-adjusted life years, and years lived with disability for chronic obstructive pulmonary disease and asthma, 1990-2015: a systematic analysis for the Global Burden of Disease Study 2015. Lancet Respiratory Medicine 2017; 5: 691-706.
(3) Statistics Canada. (ed CANSIM) (Statistics Canada, Ottawa, Ontario, 2015).
(4) Canadian Institute for Health Information. Health Indicators 2008. (CIHI, Ottawa, 2008).
(5) Mittmann, N. et al. The cost of moderate and severe COPD exacerbations to the Canadian healthcare system. Respir Med 2008; 102: 413-421.
(6) Ontario Lung Association. Your Lungs, Your Life: Insights and Solutions to Lung Health in Ontario. (Ontario Lung Association, 2011).
(7) Pauwels, R. A. et al. Global strategy for the diagnosis, management, and prevention of chronic obstructive pulmonary disease. NHLBI/WHO Global Initiative for Chronic Obstructive Lung Disease (GOLD) Workshop summary. Am J Respir Crit Care Med 2001; 163: 1256-1276.
(8) West, J. B. Respiratory Physiology the Essentials. Ninth edn, (Lippincott Williams & Wilkins, 2012).
(9) Silverthorn, D. U. Human Physiology An Integrated Approach 6th Edition. (Pearson, 2013).
(10) Ochs, M. et al. The number of alveoli in the human lung. Am J Respir Crit Care Med 2004; 169: 120-124.
(11) Global Initiative for Asthma. Global Strategy for Asthma Management and Prevention, <www.ginasthma.org> (2016).
(12) Saetta, M. & Turato, G. Airway pathology in asthma. Eur Respir J Suppl 2001; 34: 18s-23s.
(13) Hamid, Q. et al. Inflammation of small airways in asthma. J Allergy Clin Immunol 1997; 100: 44-51.
(14) Crapo, R. O. et al. Guidelines for methacholine and exercise challenge testing-1999. This official statement of the American Thoracic Society was adopted by the

34
ATS Board of Directors, July 1999. Am J Respir Crit Care Med 2000; 161: 309-329.
(15) Health, U. D. o. & Services, H. The health consequences of smoking: a report of the Surgeon General. Atlanta, GA: US Department of Health and Human Services, Centers for Disease Control and Prevention, National Center for Chronic Disease Prevention and Health Promotion, Office on Smoking and Health 2004; 62.
(16) Fletcher, C. & Peto, R. The natural history of chronic airflow obstruction. Br Med J 1977; 1: 1645-1648.
(17) Vestbo, J. et al. Global strategy for the diagnosis, management, and prevention of chronic obstructive pulmonary disease: GOLD executive summary. Am J Respir Crit Care Med 2013; 187: 347-365.
(18) Mullen, J. B., Wright, J. L., Wiggs, B. R., Pare, P. D. & Hogg, J. C. Reassessment of inflammation of airways in chronic bronchitis. Br Med J (Clin Res Ed) 1985; 291: 1235-1239.
(19) Hogg, J. C. Pathophysiology of airflow limitation in chronic obstructive pulmonary disease. Lancet 2004; 364: 709-721.
(20) Saetta, M. et al. Inflammatory cells in the bronchial glands of smokers with chronic bronchitis. Am J Respir Crit Care Med 1997; 156: 1633-1639.
(21) Hogg, J. C., Macklem, P. T. & Thurlbeck, W. M. Site and nature of airway obstruction in chronic obstructive lung disease. N Engl J Med 1968; 278: 1355-1360.
(22) Mead, J. The lung's "quiet zone". N Engl J Med 1970; 282: 1318-1319.
(23) Woods, J. C. et al. Hyperpolarized 3He diffusion MRI and histology in pulmonary emphysema. Magn Reson Med 2006; 56: 1293-1300.
(24) Snider, G. The definition of emphysema; report of a National Heart, Lung and Blood Institute. Division of Lung Diseases. Workshop. Am Rev Respir Dis 1985; 132: 182-185.
(25) Thurlbeck, W. M. & Muller, N. L. Emphysema: definition, imaging, and quantification. AJR Am J Roentgenol 1994; 163: 1017-1025.
(26) Smith, B. M. et al. Pulmonary emphysema subtypes on computed tomography: the MESA COPD study. Am J Med 2014; 127: 94 e97-23.
(27) Clayton, N. Review Series: Lung function made easy: Assessing lung size. Chronic respiratory disease 2007; 4: 151-157.
(28) Miller, M. R. et al. Standardisation of spirometry. Eur respir J 2005; 26: 319-338.

35
(29) Wanger, J. et al. Standardisation of the measurement of lung volumes. European Respiratory Journal 2005; 26: 511.
(30) Lewis, S. M., Evans, J. W. & Jalowayski, A. A. Continuous distributions of specific ventilation recovered from inert gas washout. J Appl Physiol Respir Environ Exerc Physiol 1978; 44: 416-423.
(31) Macintyre, N. et al. Standardisation of the single-breath determination of carbon monoxide uptake in the lung. European Respiratory Journal 2005; 26: 720-735.
(32) Robertson, J. S., Siri, W. E. & Jones, H. B. Lung ventilation patterns determined by analysis of nitrogen elimination rates; use of mass spectrometer as a continuous gas analyzer. J Clin Invest 1950; 29: 577-590.
(33) Becklake, M. R. A new index of the intrapulmonary mixture of inspired air. Thorax 1952; 7: 111-116.
(34) Robinson, P. D. et al. Consensus statement for inert gas washout measurement using multiple- and single-breath tests. European Respiratory Journal 2013; 41: 507-522.
(35) Busse, W. W. Asthma diagnosis and treatment: filling in the information gaps. J Allergy Clin Immunol 2011; 128: 740-750.
(36) Celli, B. R. The importance of spirometry in COPD and asthma: effect on approach to management. Chest 2000; 117: 15S-19S.
(37) Vestbo, J. et al. Evaluation of COPD Longitudinally to Identify Predictive Surrogate End-points (ECLIPSE). Eur Respir J 2008; 31: 869-873.
(38) Cerveri, I. et al. Underestimation of airflow obstruction among young adults using FEV(1)/FVC < 70% as a fixed cut-off: a longitudinal evaluation of clinical and functional outcomes. Thorax 2008; 63: 1040-1045.
(39) Enright, P. L. & Kaminsky, D. A. Strategies for screening for chronic obstructive pulmonary disease. Respir Care 2003; 48: 1194-1201; discussion 1201-1193.
(40) Burgel, P. R. The role of small airways in obstructive airway diseases. Eur Respir Rev 2011; 20: 23-33.
(41) Macklem, P. T. & Mead, J. Resistance of central and peripheral airways measured by a retrograde catheter. J Appl Physiol 1967; 22: 395-401.
(42) Tulic, M. K., Christodoulopoulos, P. & Hamid, Q. Small airway inflammation in asthma. Respir Res 2001; 2: 333-339.
(43) Brenner, D. J. & Hall, E. J. Computed tomography--an increasing source of radiation exposure. N Engl J Med 2007; 357: 2277-2284.
36
(44) Hodson, M. E., Simon, G. & Batten, J. C. Radiology of uncomplicated asthma. Thorax 1974; 29: 296-303.
(45) Rebuck, A. S. Radiological aspects of severe asthma. Australas Radiol 1970; 14: 264-268.
(46) Thurlbeck, W. M. & Simon, G. Radiographic appearance of the chest in emphysema. AJR Am J Roentgenol 1978; 130: 429-440.
(47) Pipavath, S. N. J., Schmidt, R. A., Takasugi, J. E. & Godwin, J. D. Chronic Obstructive Pulmonary Disease: Radiology-Pathology Correlation. Journal of Thoracic Imaging 2009; 24: 171-180.
(48) Rosenblum, L. J. et al. Density patterns in the normal lung as determined by computed tomography. Radiology 1980; 137: 409-416.
(49) Haaga, J. R. & Boll, D. Computed tomography & magnetic resonance imaging of the whole body. (Elsevier Health Sciences, 2008).
(50) Litmanovich, D. E., Hartwick, K., Silva, M. & Bankier, A. A. Multidetector computed tomographic imaging in chronic obstructive pulmonary disease: emphysema and airways assessment. Radiol Clin North Am 2014; 52: 137-154.
(51) Goldman, L. W. Principles of CT and CT technology. Journal of nuclear medicine technology 2007; 35: 115-128.
(52) Houndfield, G. N. Computerized Transverse Axial Scanning (Tomography) .1. Description of System. British Journal of Radiology 1973; 46: 1016-1022.
(53) Mettler, F. A., Jr., Huda, W., Yoshizumi, T. T. & Mahesh, M. Effective doses in radiology and diagnostic nuclear medicine: a catalog. Radiology 2008; 248: 254-263.
(54) Lambert, L., Banerjee, R., Votruba, J., El-Lababidi, N. & Zeman, J. Ultra-low-dose CT Imaging of the Thorax: Decreasing the Radiation Dose by One Order of Magnitude. Indian J Pediatr 2016.
(55) Willemink, M. J. et al. Iterative reconstruction techniques for computed tomography part 2: initial results in dose reduction and image quality. Eur Radiol 2013; 23: 1632-1642.
(56) Newman, K. B., Lynch, D. A., Newman, L. S., Ellegood, D. & Newell, J. D. Quantitative Computed-Tomography Detects Air Trapping Due to Asthma. Chest 1994; 106: 105-109.
(57) Aysola, R. S. et al. Airway Remodeling Measured by Multidetector CT Is Increased in Severe Asthma and Correlates With Pathology. Chest 2008; 134: 1183-1191.
37
(58) Okazawa, M. et al. Human airway narrowing measured using high resolution computed tomography. Am J Respir Crit Care Med 1996; 154: 1557-1562.
(59) Little, S. A. et al. High resolution computed tomographic assessment of airway wall thickness in chronic asthma: reproducibility and relationship with lung function and severity. Thorax 2002; 57: 247-253.
(60) Awadh, N., Muller, N. L., Park, C. S., Abboud, R. T. & FitzGerald, J. M. Airway wall thickness in patients with near fatal asthma and control groups: assessment with high resolution computed tomographic scanning. Thorax 1998; 53: 248-253.
(61) Busacker, A. et al. A multivariate analysis of risk factors for the air-trapping asthmatic phenotype as measured by quantitative CT analysis. Chest 2009; 135: 48-56.
(62) Hackx, M., Bankier, A. A. & Gevenois, P. A. Chronic Obstructive Pulmonary Disease: CT Quantification of Airways Disease. Radiology 2012; 265: 34-48.
(63) Nakano, Y. et al. Quantitative assessment of airway remodeling using high-resolution CT. Chest 2002; 122: 271s-275s.
(64) Hayhurst, M. D. et al. Diagnosis of pulmonary emphysema by computerised tomography. Lancet 1984; 2: 320-322.
(65) Klein, J. S., Gamsu, G., Webb, W. R., Golden, J. A. & Muller, N. L. High-resolution CT diagnosis of emphysema in symptomatic patients with normal chest radiographs and isolated low diffusing capacity. Radiology 1992; 182: 817-821.
(66) Müller, N., Staples, C., Miller, R. & Abboud, R. " Density mask". An objective method to quantitate emphysema using computed tomography. Chest 1988; 94: 782.
(67) Uppaluri, R., Mitsa, T., Sonka, M., Hoffman, E. A. & McLennan, G. Quantification of pulmonary emphysema from lung computed tomography images. Am J Respir Crit Care Med 1997; 156: 248-254.
(68) Smith-Bindman, R. et al. Use of diagnostic imaging studies and associated radiation exposure for patients enrolled in large integrated health care systems, 1996-2010. JAMA 2012; 307: 2400-2409.
(69) Albertine, K. Structural organization and quantitative morphology of the lung. Application of magnetic resonance to the study of lung. Futura, Armonk, New York, USA 1996; 73-114.
(70) Bergin, C. J., Glover, G. M. & Pauly, J. Magnetic resonance imaging of lung parenchyma. J Thorac Imaging 1993; 8: 12-17.
38
(71) Bergin, C. J., Noll, D. C., Pauly, J. M., Glover, G. H. & Macovski, A. MR imaging of lung parenchyma: a solution to susceptibility. Radiology 1992; 183: 673-676.
(72) Ohno, Y. et al. T2* measurements of 3-T MRI with ultrashort TEs: capabilities of pulmonary function assessment and clinical stage classification in smokers. AJR Am J Roentgenol 2011; 197: W279-285.
(73) Ohno, Y. et al. Pulmonary MR imaging with ultra-short TEs: utility for disease severity assessment of connective tissue disease patients. Eur J Radiol 2013; 82: 1359-1365.
(74) Ohno, Y. et al. Pulmonary High-Resolution Ultrashort TE MR Imaging: Comparison With Thin-Section Standard- and Low-Dose Computed Tomography for the Assessment of Pulmonary Parenchyma Diseases. Journal of Magnetic Resonance Imaging 2016; 43: 512-532.
(75) Sheikh, K. et al. Ultrashort echo time MRI biomarkers of asthma. J Magn Reson Imaging 2017; 45: 1204-1215.
(76) Ma, W. et al. Ultra-short echo-time pulmonary MRI: evaluation and reproducibility in COPD subjects with and without bronchiectasis. J Magn Reson Imaging 2015; 41: 1465-1474.
(77) Musch, G. & Venegas, J. G. Positron emission tomography imaging of regional lung function. Minerva Anestesiologica 2006; 72: 363-367.
(78) King, G. G., Eberl, S., Salome, C. M., Meikle, S. R. & Woolcock, A. J. Airway closure measured by a technegas bolus and SPECT. Am J Respir Crit Care Med 1997; 155: 682-688.
(79) Mishkin, F. & Wagner, H. N., Jr. Regional abnormalities in pulmonary arterial blood flow during acute asthmatic attacks. Radiology 1967; 88: 142-144.
(80) Farrow, C. E. et al. Airway closure on imaging relates to airway hyperresponsiveness and peripheral airway disease in asthma. J Appl Physiol (1985) 2012; 113: 958-966.
(81) Sovijarvi, A. R., Poyhonen, L., Kellomaki, L. & Muittari, A. Effects of acute and long-term bronchodilator treatment on regional lung function in asthma assessed with krypton-81m and technetium-99m-labelled macroaggregates. Thorax 1982; 37: 516-520.
(82) Venegas, J. G. et al. Self-organized patchiness in asthma as a prelude to catastrophic shifts. Nature 2005; 434: 777-782.
(83) Bajc, M. et al. Grading obstructive lung disease using tomographic pulmonary scintigraphy in patients with chronic obstructive pulmonary disease (COPD) and long-term smokers. Ann Nucl Med 2015; 29: 91-99.
39
(84) Norberg, P. et al. Quantitative lung SPECT applied on simulated early COPD and humans with advanced COPD. EJNMMI Res 2013; 3: 28.
(85) Suga, K., Iwanaga, H., Tokuda, O., Okada, M. & Matsunaga, N. Intrabullous ventilation in pulmonary emphysema: assessment with dynamic xenon-133 gas SPECT. Nucl Med Commun 2012; 33: 371-378.
(86) Brudin, L. H. et al. Regional structure-function correlations in chronic obstructive lung disease measured with positron emission tomography. Thorax 1992; 47: 914-921.
(87) Kong, X. et al. Xenon-Enhanced Dual-Energy CT Lung Ventilation Imaging: Techniques and Clinical Applications. American Journal of Roentgenology 2014; 202: 309-317.
(88) Chae, E. J. et al. Xenon Ventilation Imaging Using Dual-Energy Computed Tomography in Asthmatics Initial Experience. Investigative Radiology 2010; 45: 354-361.
(89) Goo, H. W. & Yu, J. H. Redistributed Regional Ventilation after the Administration of a Bronchodilator Demonstrated on Xenon-Inhaled Dual-Energy CT in a Patient with Asthma. Korean Journal of Radiology 2011; 12: 386-389.
(90) Kim, W. W. et al. Xenon-Enhanced Dual-Energy CT of Patients With Asthma: Dynamic Ventilation Changes After Methacholine and Salbutamol Inhalation. American Journal of Roentgenology 2012; 199: 975-981.
(91) Park, E. A. et al. Chronic Obstructive Pulmonary Disease: Quantitative and Visual Ventilation Pattern Analysis at Xenon Ventilation CT Performed by Using a Dual-Energy Technique. Radiology 2010; 256: 985-997.
(92) Edelman, R. R., Hatabu, H., Tadamura, E., Li, W. & Prasad, P. V. Noninvasive assessment of regional ventilation in the human lung using oxygen-enhanced magnetic resonance imaging. Nature Medicine 1996; 2: 1236-1239.
(93) Ohno, Y. et al. Asthma: Comparison of Dynamic Oxygen-enhanced MR Imaging and Quantitative Thin-Section CT for Evaluation of Clinical Treatment. Radiology 2014; 273: 907-916.
(94) Ohno, Y. et al. Oxygen-enhanced MRI vs. quantitatively assessed thin-section CT: Pulmonary functional loss assessment and clinical stage classification of asthmatics. European Journal of Radiology 2011; 77: 85-91.
(95) Ohno, Y. et al. Dynamic oxygen-enhanced MRI reflects diffusing capacity of the lung. Magnetic Resonance in Medicine 2002; 47: 1139-1144.
(96) Ohno, Y. et al. Oxygen-enhanced magnetic resonance imaging versus computed tomography - Multicenter study for clinical stage classification of smoking-related

40
chronic obstructive pulmonary disease. American Journal of Respiratory and Critical Care Medicine 2008; 177: 1095-1102.
(97) Kuethe, D. O., Caprihan, A., Fukushima, E. & Waggoner, R. A. Imaging lungs using inert fluorinated gases. Magnetic Resonance in Medicine 1998; 39: 85-88.
(98) Halaweish, A. F. et al. Perfluoropropane Gas as a Magnetic Resonance Lung Imaging Contrast Agent in Humans. Chest 2013; 144: 1300-1310.
(99) Couch, M. J. et al. Pulmonary Ultrashort Echo Time F-19 MR Imaging with Inhaled Fluorinated Gas Mixtures in Healthy Volunteers: Feasibility. Radiology 2013; 269: 903-909.
(100) Albert, M. S. et al. Biological Magnetic-Resonance-Imaging Using Laser Polarized Xe-129. Nature 1994; 370: 199-201.
(101) Kauczor, H. U. et al. Normal and abnormal pulmonary ventilation: Visualization at hyperpolarized He-3 MR imaging. Radiology 1996; 201: 564-568.
(102) Saam, B. T. Magnetic resonance imaging with laser-polarized noble gases. Nat Med 1996; 2: 358-359.
(103) Kauczor, H.-U. MRI of the Lung. (2009).
(104) Shea, D. A. & Morgan, D.
(105) Stewart, N. J., Norquay, G., Griffiths, P. D. & Wild, J. M. Feasibility of human lung ventilation imaging using highly polarized naturally abundant xenon and optimized three-dimensional steady-state free precession. Magnetic Resonance in Medicine 2015; 74: 346-352.
(106) Kirby, M. et al. Hyperpolarized 3He magnetic resonance functional imaging semiautomated segmentation. Acad Radiol 2012; 19: 141-152.
(107) de Lange, E. E. et al. Changes in regional airflow obstruction over time in the lungs of patients with asthma: evaluation with 3He MR imaging. Radiology 2009; 250: 567-575.
(108) Mathew, L. et al. Hyperpolarized 3He magnetic resonance imaging of chronic obstructive pulmonary disease: reproducibility at 3.0 tesla. Acad Radiol 2008; 15: 1298-1311.
(109) Kirby, M. et al. Hyperpolarized 3He and 129Xe MR imaging in healthy volunteers and patients with chronic obstructive pulmonary disease. Radiology 2012; 265: 600-610.
(110) de Lange, E. E. et al. Evaluation of asthma with hyperpolarized helium-3 MRI: correlation with clinical severity and spirometry. Chest 2006; 130: 1055-1062.

41
(111) Fain, S. B. et al. Evaluation of structure-function relationships in asthma using multidetector CT and hyperpolarized He-3 MRI. Academic Radiology 2008; 15: 753-762.
(112) Tgavalekos, N. T. et al. Relationship between airway narrowing, patchy ventilation and lung mechanics in asthmatics. European Respiratory Journal 2007; 29: 1174-1181.
(113) de Lange, E. E. et al. The variability of regional airflow obstruction within the lungs of patients with asthma: Assessment with hyperpolarized helium-3 magnetic resonance imaging. Journal of Allergy and Clinical Immunology 2007; 119: 1072-1078.
(114) Wheatley, A. et al. Hyperpolarized helium-3 magnetic resonance imaging of asthma: Short-term reproducibility - art. no. 69161X. Medical Imaging 2008: Physiology, Function, and Structure from Medical Images 2008; 6916: X9161-X9161.
(115) Altes, T. A. et al. Hyperpolarized 3He MR lung ventilation imaging in asthmatics: preliminary findings. J Magn Reson Imaging 2001; 13: 378-384.
(116) Tzeng, Y. S., Lutchen, K. & Albert, M. The difference in ventilation heterogeneity between asthmatic and healthy subjects quantified using hyperpolarized He-3 MRI. Journal of Applied Physiology 2009; 106: 813-822.
(117) Teague, W. G., Tustison, N. J. & Altes, T. A. Ventilation heterogeneity in asthma. Journal of Asthma 2014; 51: 677-684.
(118) Svenningsen, S. et al. What are ventilation defects in asthma? Thorax 2014; 69: 63-71.
(119) Svenningsen, S., Nair, P., Guo, F., McCormack, D. G. & Parraga, G. Is ventilation heterogeneity related to asthma control? Eur Respir J 2016.
(120) Kirby, M. et al. COPD: Do Imaging Measurements of Emphysema and Airway Disease Explain Symptoms and Exercise Capacity? Radiology 2015; 277: 872-880.
(121) Kirby, M. et al. Pulmonary ventilation visualized using hyperpolarized helium-3 and xenon-129 magnetic resonance imaging: differences in COPD and relationship to emphysema. J Appl Physiol (1985) 2013; 114: 707-715.
(122) Kirby, M., Pike, D., Coxson, H. O., McCormack, D. G. & Parraga, G. Hyperpolarized (3)He ventilation defects used to predict pulmonary exacerbations in mild to moderate chronic obstructive pulmonary disease. Radiology 2014; 273: 887-896.
(123) Svenningsen, S. et al. Hyperpolarized (3) He and (129) Xe MRI: differences in asthma before bronchodilation. J Magn Reson Imaging 2013; 38: 1521-1530.

42
(124) Kirby, M. et al. Chronic obstructive pulmonary disease: quantification of bronchodilator effects by using hyperpolarized (3)He MR imaging. Radiology 2011; 261: 283-292.
(125) Samee, S. et al. Imaging the lungs in asthmatic patients by using hyperpolarized helium-3 magnetic resonance: assessment of response to methacholine and exercise challenge. J Allergy Clin Immunol 2003; 111: 1205-1211.
(126) Mugler III, J. in Proceedings of the 6th annual meeting of ISMRM, Sydney, Australia. 1904.
(127) Saam, B. T. et al. MR imaging of diffusion of He-3 gas in healthy and diseased lungs. Magnetic Resonance in Medicine 2000; 44: 174-179.
(128) Morbach, A. E. et al. Diffusion-weighted MRI of the lung with hyperpolarized helium-3: a study of reproducibility. J Magn Reson Imaging 2005; 21: 765-774.
(129) Parraga, G. et al. Hyperpolarized 3He ventilation defects and apparent diffusion coefficients in chronic obstructive pulmonary disease: preliminary results at 3.0 Tesla. Invest Radiol 2007; 42: 384-391.
(130) Diaz, S. et al. Validity of apparent diffusion coefficient hyperpolarized 3He-MRI using MSCT and pulmonary function tests as references. Eur J Radiol 2009; 71: 257-263.
(131) Kirby, M. et al. Hyperpolarized 3He and 129Xe magnetic resonance imaging apparent diffusion coefficients: physiological relevance in older never- and ex-smokers. Physiol Rep 2014; 2.
(132) Wang, C. et al. Assessment of the lung microstructure in patients with asthma using hyperpolarized 3He diffusion MRI at two time scales: comparison with healthy subjects and patients with COPD. J Magn Reson Imaging 2008; 28: 80-88.
(133) Trampel, R. et al. Diffusional kurtosis imaging in the lung using hyperpolarized 3He. Magn Reson Med 2006; 56: 733-737.
(134) Fain, S. et al. in Proc Intl Soc Mag Reson Med. 335.
(135) Costella, S. et al. Regional pulmonary response to a methacholine challenge using hyperpolarized (3)He magnetic resonance imaging. Respirology 2012; 17: 1237-1246.
(136) Fain, S. B. et al. Detection of age-dependent changes in healthy adult lungs with diffusion-weighted 3He MRI. Acad Radiol 2005; 12: 1385-1393.
(137) Salerno, M. et al. Emphysema: Hyperpolarized Helium 3 Diffusion MR Imaging of the Lungs Compared with Spirometric Indexes—Initial Experience 1. Radiology 2002; 222: 252-260.
43
(138) Kirby, M., Heydarian, M., Wheatley, A., McCormack, D. G. & Parraga, G. Evaluating bronchodilator effects in chronic obstructive pulmonary disease using diffusion-weighted hyperpolarized helium-3 magnetic resonance imaging. J Appl Physiol 2012; 112: 651-657.
(139) Lutey, B. A. et al. Hyperpolarized 3He MR imaging: physiologic monitoring observations and safety considerations in 100 consecutive subjects. Radiology 2008; 248: 655-661.
(140) Driehuys, B. et al. Chronic obstructive pulmonary disease: safety and tolerability of hyperpolarized 129Xe MR imaging in healthy volunteers and patients. Radiology 2012; 262: 279-289.
(141) Guerrero, T. et al. Dynamic ventilation imaging from four-dimensional computed tomography. Physics in medicine and biology 2006; 51: 777.
(142) Guerrero, T. et al. Quantification of regional ventilation from treatment planning CT. Int J Radiat Oncol Biol Phys 2005; 62: 630-634.
(143) Yin, Y. B., Hoffman, E. A. & Lin, C. L. Mass preserving nonrigid registration of CT lung images using cubic B-spline. Medical Physics 2009; 36: 4213-4222.
(144) Li, B. J., Christensen, G. E., Hoffman, E. A., McLennan, G. & Reinhardt, J. M. Pulmonary CT image registration and warping for tracking tissue deformation during the respiratory cycle through 3D consistent image registration. Medical Physics 2008; 35: 5575-5583.
(145) Pan, T., Lee, T. Y., Rietzel, E. & Chen, G. T. Y. 4D-CT imaging of a volume influenced by respiratory motion on multi-slice CT. Medical Physics 2004; 31: 333-340.
(146) Reinhardt, J. M. et al. Registration-based estimates of local lung tissue expansion compared to xenon CT measures of specific ventilation. Med Image Anal 2008; 12: 752-763.
(147) Fuld, M. K. et al. CT-measured regional specific volume change reflects regional ventilation in supine sheep. J Appl Physiol (1985) 2008; 104: 1177-1184.
(148) Jahani, N. et al. A four-dimensional computed tomography comparison of healthy and asthmatic human lungs. J Biomech 2017; 56: 102-110.
(149) Choi, S. et al. Registration-based assessment of regional lung function via volumetric CT images of normal subjects vs. severe asthmatics. J Appl Physiol (1985) 2013; 115: 730-742.
(150) Bodduluri, S., Newell, J. D., Jr., Hoffman, E. A. & Reinhardt, J. M. Registration-based lung mechanical analysis of chronic obstructive pulmonary disease (COPD) using a supervised machine learning framework. Acad Radiol 2013; 20: 527-536.
44
(151) Bodduluri, S. et al. Biomechanical CT metrics are associated with patient outcomes in COPD. Thorax 2017; 72: 409-414.
(152) Bhatt, S. P. et al. CT Measure of Lung At-risk and Lung Function Decline in Chronic Obstructive Pulmonary Disease. Am J Respir Crit Care Med 2017.
(153) Seco, J. et al. Dosimetric impact of motion in free-breathing and gated lung radiotherapy: a 4D Monte Carlo study of intrafraction and interfraction effects. Med Phys 2008; 35: 356-366.
(154) Vedam, S. S. et al. Acquiring a four-dimensional computed tomography dataset using an external respiratory signal. Physics in Medicine and Biology 2003; 48: 45-62.
(155) Yamamoto, T. et al. 4D CT lung ventilation images are affected by the 4D CT sorting method. Med Phys 2013; 40: 101907.
(156) Jahani, N. et al. Assessment of regional ventilation and deformation using 4D-CT imaging for healthy human lungs during tidal breathing. J Appl Physiol (1985) 2015; 119: 1064-1074.
(157) Yamamoto, T. et al. Investigation of four-dimensional computed tomography-based pulmonary ventilation imaging in patients with emphysematous lung regions. Phys Med Biol 2011; 56: 2279-2298.
(158) Moffat, B. A. et al. Functional diffusion map: a noninvasive MRI biomarker for early stratification of clinical brain tumor response. Proc Natl Acad Sci U S A 2005; 102: 5524-5529.
(159) Galban, C. J. et al. Computed tomography-based biomarker provides unique signature for diagnosis of COPD phenotypes and disease progression. Nature medicine 2012; 18: 1711-1715.
(160) Gevenois, P. A. et al. Comparison of computed density and microscopic morphometry in pulmonary emphysema. Am J Respir Crit Care Med 1996; 154: 187-192.
(161) Gevenois, P. A., de Maertelaer, V., De Vuyst, P., Zanen, J. & Yernault, J. C. Comparison of computed density and macroscopic morphometry in pulmonary emphysema. Am J Respir Crit Care Med 1995; 152: 653-657.
(162) Boes, J. L. et al. Parametric Response Mapping Monitors Temporal Changes on Lung CT Scans in the Subpopulations and Intermediate Outcome Measures in COPD Study (SPIROMICS). Academic Radiology 2015; 22: 186-194.
(163) Pompe, E. et al. Parametric Response Mapping Adds Value to Current Computed Tomography Biomarkers in Diagnosing Chronic Obstructive Pulmonary Disease.
45
American Journal of Respiratory and Critical Care Medicine 2015; 191: 1084-1086.
(164) Bhatt, S. P. et al. Association between Functional Small Airway Disease and FEV1 Decline in Chronic Obstructive Pulmonary Disease. American Journal of Respiratory and Critical Care Medicine 2016; 194: 178-184.
(165) Zapke, M. et al. Magnetic resonance lung function--a breakthrough for lung imaging and functional assessment? A phantom study and clinical trial. Respir Res 2006; 7: 106.
(166) Pusterla, O. et al. Rapid 3D in vivo 1H human lung respiratory imaging at 1.5 T using ultra-fast balanced steady-state free precession. Magn Reson Med 2017; 78: 1059-1069.
(167) Pennati, F. et al. Assessment of regional lung function with multivolume (1)H MR imaging in health and obstructive lung disease: comparison with (3)He MR imaging. Radiology 2014; 273: 580-590.
(168) Bauman, G. et al. Non‐contrast‐enhanced perfusion and ventilation assessment of the human lung by means of fourier decomposition in proton MRI. Magn Reson Med 2009; 62: 656-664.
(169) Deimling, M., Jellus, V., Geiger, B. & Chefd'Hotel, C. in Proceedings of the Sixteenth Meeting of the International Society for Magnetic Resonance in Medicine. Berkeley, CA: International Society for Magnetic Resonance in Medicine. 2639.
(170) Bauman, G. et al. Pulmonary functional imaging: qualitative comparison of Fourier decomposition MR imaging with SPECT/CT in porcine lung. Radiology 2011; 260: 551-559.
(171) Bauman, G. et al. Lung ventilation‐and perfusion‐weighted Fourier decomposition magnetic resonance imaging: In vivo validation with hyperpolarized 3He and dynamic contrast‐enhanced MRI. Magn Reson Med 2013; 69: 229-237.

46
CHAPTER 2
2 PULMONARY IMAGING BIOMARKERS OF GAS TRAPPING AND EMPHYSEMA IN COPD: 3HE MR IMAGING AND CT PARAMETRIC RESPONSE MAPS
To better understand the potential of CT parametric response maps (PRM), we directly compared the imaging biomarkers derived from CT PRM with well-established measurements of airways disease and emphysema, including MRI and pulmonary function tests, to provide for the first time a deeper understanding of the relationship between ventilation abnormalities and gas-trapping in COPD.
The contents of this chapter were previously published in the journal Radiology: DPI Capaldi, N Zha, F Guo, D Pike, DG McCormack, M Kirby, and G Parraga. Radiology 2016; 279(2):597-608. Permission to reproduce this article was granted by the Radiological Society of North America (RSNA) and is provided in Appendix A.
2.1 Introduction
Chronic obstructive pulmonary disease (COPD) is characterized by persistent airflow
limitation related to airway remodeling, inflammation and emphysematous destruction1.
These pathophysiological features can be quantified regionally using high resolution x-ray
computed tomography (CT) measurements of the airways2,3 and parenchyma.4,5 For
example, airways disease can be estimated using CT measurements of airway wall area
percent (WA%) and lumen area (LA) while emphysema may be estimated using CT density
thresholds such as -950 Hounsfield units (HU)4 or the 15th percentile value6 from
inspiratory CT. The expiratory CT density-histogram threshold of -856HU also provides
a way to estimate gas trapping7 reflecting the longer time constants for emptying the
parenchyma via obstructed airways.
Parametric response mapping (PRM)8 was recently used to evaluate COPD,9 breast cancer
treatment response10 and osteoporosis.11 In COPD patients, co-registered inspiratory and
expiratory thoracic CT can be evaluated using well-established density thresholds,12
resulting in the classification9 of normal, emphysematous and gas-trapping lung regions.
However, the relationship of PRM classified tissue with other established measurements
of airways disease and emphysema is not well-understood. Very recently PRM

47
phenotyping was used to differentiate current and former smokers with and without
COPD,13 but the clinical relevance and etiology of PRM measurements of airways disease
is yet uncertain.
Single photon emission computed tomography (SPECT)14 and positron emission
tomography (PET),15 have also been used to identify pulmonary function abnormalities in
COPD patients. In addition, hyperpolarized inhaled noble gas MRI using 3He and 129Xe
gases,16,17 as well as oxygen-enhanced18 and 19F MRI19 provide other ways to quantify both
functional and structural pulmonary biomarkers of COPD. Hyperpolarized 3He MRI
apparent diffusion coefficients (ADC) reflect the size of the lung acinar units. Such values
are abnormally elevated in smokers with and without COPD.20,21 3He MRI ventilation
defects may reflect both airways disease and emphysema in advanced COPD,22 but in mild
COPD and in asthma,23 ventilation defects reflect airways disease. Despite the potential
of 3He MRI, limited and unpredictable global quantities and high cost have hampered
clinical translation.
We wanted to determine the quantitative and spatial relationships of PRM-gas-trapping
and PRM-emphysema measurements with MRI measurements of parenchymal tissue
integrity (i.e. ADC) and ventilation, because these are clinically-important imaging
findings and phenotypes of COPD. Thus, our objective was to directly compare magnetic-
resonance-imaging and computed-tomography parametric-response-map measurements of
gas-trapping and emphysema in ex-smokers with and without chronic obstructive
pulmonary disease.
2.2 Materials and Methods
2.2.1 Study Volunteers
Participants provided written-informed-consent to a protocol approved by a local research
ethics board and Health Canada and compliant with the Health-Insurance-Portability-
Accountability-Act (HIPAA, USA) (IRB-Reg. #00000940), in a prospectively planned
study performed from March-December 2014.
48
2.2.2 MR Imaging
MRI acquisition of conventional proton (1H), 3He static ventilation, and 3He diffusion-
weighted images was performed using a whole-body 3T Discovery MR750 system
(General Electric Health Care [GEHC], Milwaukee, Wisconsin, USA), as previously
described.24 Polarization was achieved (HeliSpin; Polarean, Durham, North Carolina,
USA) to 40%, and the magnetized gas was diluted with medical-grade N2 gas to 5mL/kg
of body weight. Coronal MRI was acquired (multi-slice acquisition with no gaps) in
breath-hold from FRC after subjects inhaled a 1L gas mixture (4He/N2 mixture for 1H MRI
and 3He/N2 mixture for 3He MRI).
1H MRI was acquired using the whole-body radiofrequency coil and fast spoiled gradient-
recalled echo (FGRE) sequence with a partial echo (total-data-acquisition-time=12s;
repetition-time [TR]/echo-time [TE]/flip-angle=4.3ms/1.0ms/30°; field-of-view
[FOV]=40×40cm2; matrix=128×80 [zero-padded to 128×128]; partial-echo-
percent=62.5%; bandwidth [BW]=62.50kHz; number-of-excitations [NEX]=1; number-
of-slices=14; slice-thickness=15mm, gap=0).
3He MR static ventilation images were acquired using a fast gradient-recalled echo method
with a partial echo (total-data-acquisition-time=10s; TR/TE/flip-angle=3.8ms/1.0ms/7°;
FOV=40×40cm2; matrix=128×80 [zero-padded to 128×128]; partial-echo-percent=62.5%;
BW=62.50kHz; NEX=1; number-of-slices=14; slice-thickness=15mm, gap=0). 3He MR
diffusion-weighted images were also acquired using an FGRE sequence with centric k-
space sampling (total-data-acquisition-time=14s; TR/TE/flip-angle=6.8ms/4.5ms/8°;
FOV=40×40cm2; matrix=128×128; BW=62.50kHz; NEX=1; number-of-slices=7; slice-
thickness=30mm, gap=0) with two interleaved images (with and without additional
diffusion sensitization) (G=1.94G/cm; b=1.6s/cm2; rise-and-fall time=0.5ms; gradient
duration=0.46ms; diffusion time=1.46ms).
2.2.3 CT Imaging
CT images were acquired with subjects in the supine position, approximately 10 minutes
prior to MRI and one hour post-salbutamol administration. A 64 slice Lightspeed VCT
49
scanner (GEHC) was used to acquire breath-hold images at full-inspiration and at full-
expiration using a spiral acquisition approach (detector configuration=64×0.625mm; peak
x-ray tube voltage=120kVp; effective x-ray tube current=100mA; x-ray tube rotation
time=500ms; pitch=1.0, slice thickness=1.25mm; number of slices=200-250 [patient size
dependent]; matrix=512×512), as previously described.25 CT data were reconstructed
using a standard convolution kernel to 1.25mm. The ImPACT CT patient dosimetry
calculator (based on the Health Protection Agency [UK] NRPB-SR250) and our
manufacturer settings were used to calculate total effective dose (1.8mSv for inspiration
and 1.4mSv for expiration CT). The approach of Christener and colleagues26 was used to
calculate the size-specific dose estimate (SSDE)27 for inspiration CT using volumetric CT
dose index (CTDIvol) (4.4mGy), total effective dose of 1.8mSv, and size-dependent
conversion factor (fsize) of 1.00-2.00 and this ranged from 5-9mGy. For expiration CT, the
SSDE was 3-7mGy (CTDIvol =3.3mGy, total effective dose =1.4mSv, and fsize=1.00-2.00).
2.2.4 MR Image Analysis
3He MRI semi-automated segmentation was performed by a single observer (DP, 3 years
experience), as previously described,28 to generate ventilation defect percent (VDP) – the
ventilation defect volume (VDV) normalized to 1H MRI thoracic cavity volume (TCV). A
detailed description is provided in the Supplement.
2.2.5 CT Image Analysis
CT images were analyzed using Pulmonary Workstation 2.0 (VIDA Diagnostics Inc,
Coralville, Iowa, USA) by a single observer (DPIC, 2 years experience) for the
measurement of wall area percent and to segment the lung regions; these analyses are fully-
automated, as previously described and validated.29,30 The relative area of the CT density-
histogram <−950HU (RA950) and −856HU (RA856) were determined using MATLAB for
inspiratory and expiratory CT, respectively.
Briefly, pulmonary PRM results can be generated by co-registering inspiratory and
expiratory CT scans and then classifying voxels based on their specific thresholds into

50
normal, gas-trapping or emphysema tissue components. The specific details are provided
in the Supplement.
2.2.6 Statistics
Analysis of variance (ANOVA) with post-hoc analysis using the Tukey correction was
performed to determine differences in participant characteristics and imaging
measurements using SPSS Statistics V22.0 (SPSS Inc., Chicago, Illinois, USA). Pearson
correlation coefficients (r) were determined for MRI and PRM measurements and adjusted
using the Holm-Bonferroni correction. The agreement between CT-PRM and 3He MRI
measurements were evaluated using the Bland-Altman method using GraphPad Prism V6.0
(GraphPad Software Inc., La Jolla, California, USA). Multivariate regression models for
both PRM-gas-trapping and PRM-emphysema were determined using the step-wise
method; variables were added to the model when p<0.15, and removed when p≥0.15, using
SPSS.
2.3 Results
2.3.1 Participant Characteristics
Table 2-1 shows demographic and pulmonary function measurements for 58 participants
(73±9yrs) including 26 ex-smokers with normal spirometry (70±11yrs) and 32 ex-smokers
(74±7yrs) with COPD. The patient subgroups were significantly different with respect to
body mass index (p<.001), smoking history (pack-years, p=.01), FEV1 (p<.001),
FEV1/FVC (p<.001), and DLCO (p<.001) but not age (p=.1).

51
Table 2-1 Subject Demographics Parameter
Mean (±SD) Normal
Ex-smokers (n=26)
COPD Ex-smokers (n=32) Sig Dif p
All (n=32)
GOLD I (n=12)
GOLD II (n=13)
GOLD III/IV (n=7)
Age yrs 70 (11) 74 (7) 75 (8) 74 (8) 73 (6) .104 Male n 15 25 11 9 5 -- BMI kg/m2 30 (4) 26 (3) 26 (3) 27 (3) 26 (4) <.001 Pack years 28 (16) 43 (26) 31 (17) 50 (28) 51 (30) .012 FEV1 %pred 103 (19) 73 (27) 101 (14) 64 (10) 39 (7) <.001 FEV1/FVC % 80 (7) 55 (11) 63 (4) 55 (8) 40 (5) <.001 TLC %pred 96 (13) 110 (16)** 103 (34)* 106 (17) 115 (20) <.001 IC %pred 103 (23) 91 (27) 100 (23) 94 (32) 70 (10) .078 RV %pred 100 (21) 140 (39) 123 (16) 134 (33) 180 (53) <.001 DLCO %pred 89 (18)# 68 (23)** 73 (29)* 66 (24) 51 (15) <.001
Sig Dif: Significant difference between subgroups (p<.05) determined by ANOVA with Tukey correction; SD: standard deviation; GOLD: The Global Initiative for Chronic Obstructive Lung Disease; %pred: percent of predicted value; BMI: body mass index; FEV1: forced expiratory volume in one second; FVC: forced vital capacity; TLC: total lung capacity; IC: inspiratory capacity; RV: residual volume; DLCO: diffusing capacity for carbon monoxide; #n=25; *n=11; **n=31.
2.3.2 Qualitative Ventilation and PRM Results
Figure 2-1 shows MRI and CT for a representative ex-smoker without airflow limitation
and three COPD ex-smokers. For the two ex-smokers with more advanced COPD (GOLD
II: 84yrs-male, FEV1=52%pred, FEV1/FVC=44%; GOLD III: 67yrs-female, FEV1=33%pred,
FEV1/FVC=39%) there was more pronounced 3He ventilation defects, a greater number of
PRM voxels reflective of emphysema, and elevated ADC. Alternatively, for ex-smokers
with mild or no disease (ex-smoker: 55yrs-male, FEV1=83%pred, FEV1/FVC=77%; GOLD
I: 69yrs-male, FEV1=89%pred, FEV1/FVC=69%) there was more homogeneous ventilation
and greater number of PRM voxels reflective of normal or healthy tissue.

52
Figure 2-1 Ventilation and Parametric Response Maps for a representative ex-smoker and COPD subjects Ex-smoker: 55 yrs-male, FEV1=83%pred, FEV1/FVC=77%, RV/TLC=45%, DLCO not available; GOLD I: 69 yrs-male, FEV1=89%pred, FEV1/FVC=69%, RV/TLC=39%, DLCO=67%pred; GOLD II: 84 yrs-male, FEV1=52%pred, FEV1/FVC=44%, RV/TLC=62%, DLCO=47%pred; GOLD III: 67 yrs-female, FEV1=33%pred, FEV1/FVC=39%, RV/TLC=72%, DLCO=28%pred. Top row: 3He MRI static ventilation in blue co-registered with 1H MRI in grey-scale. Second row: 3He MRI ADC maps (0.0 cm2/s - 0.8 cm2/s). Third row: CT density masks where yellow = attenuation < -950 Hounsfield units. Last row: PRM where green=normal tissue, yellow=gas-trapping, and red=emphysema.

53
2.3.3 Ventilation and PRM Measurements by GOLD Severity
Table 2-2 summarizes MRI ventilation and emphysema measurements as well as CT-
derived gas-trapping/emphysema and PRM measurements. COPD ex-smokers reported
significantly greater VDP (p<.001), ADC (p<.001), and RA950 (p<.001) as well as PRM
gas-trapping (p<.001) and emphysema (p<.001) than ex-smokers without airflow
limitation. There were no significant differences for CT airway measurement of WA%
(p=.9).
Table 2-2 Imaging Measurements Parameter
Mean (±SD)
Normal Ex-smokers
(n=26)
COPD Ex-smokers (n=32) Sig Dif p
All (n=32)
GOLD I (n=12)
GOLD II (n=13)
GOLD III/IV (n=7)
CT RA950 % 2 (1) 10 (9) 6 (4) 10 (10) 15 (12) <.001 CT RA856 % 14 (10) 37 (18) 34 (13) 35 (20) 53 (16) <.001 CT 6th gen. WA % 65 (2) 65 (2) 65 (2) 66 (2) 66 (2) .882 3He MRI Ventilation % 92 (4) 20 (13) 88 (6) 80 (11) 63 (9) <.001 3He MRI VDP % 8 (4)# 12 (4) 12 (6) 20 (11) 37 (9) <.001 3He MRI ADC cm2/s .29 (.08)# .36 (.06)* .34 (.03)** .36 (.06)## .41 (.05) <.001 PRM Normal % 85 (11) 60 (18) 64 (13) 63 (20) 46 (17) <.001 PRM Gas-Trapping % 13 (10) 31 (12) 31 (11) 27 (14) 41 (9) <.001 PRM-Emphysema % .5 (.5) 7 (10) 3 (3) 8 (11) 13 (12) .001 Sig Dif: Significant difference between subgroups (p<.05) determined by ANOVA with Tukey correction; SD: standard deviation; GOLD: The Global Initiative for Chronic Obstructive Lung Disease; RA950: relative area of the lung with attenuation values <-950HU that is in an inspiration CT; RA856: relative area of the lung with attenuation values <-856HU that is in an expiration CT; 6th gen.: sixth generation airway; WA: wall area; VDP: ventilation defect percent; ADC: apparent diffusion coefficient; PRM: parametric response map; #n=24; ##n=12; *n=30; **n=11.
54
Figure 2-2 shows that VDP was significantly different between normal ex-smokers
(8±4%) and moderate-severe COPD subjects (GOLD II: 20±11%, p<.001; GOLD III/IV:
37±9%, p<.001), but not mild COPD (GOLD I: 11±6%, p=.5). VDP was also significantly
different between GOLD I and GOLD II (p=.04), GOLD II and GOLD II/IV (p<.001), and
GOLD I and GOLD III/IV (p<.001) ex-smokers. PRM measurements were significantly
different for normal ex-smokers (gas-trapping: 13±10%, emphysema: 0.5±0.5%) and
moderate-severe COPD subjects (gas-trapping: GOLD II: 27±14%, p=.003; GOLD III/IV:
41±8%, p<.001; emphysema: GOLD II: 8±11%, p=.003; GOLD III/IV: 13±12%, p<.001).
PRM gas-trapping was significantly different between ex-smokers and mild COPD (GOLD
I: 31±11%, p<.001). PRM emphysema was significantly different between GOLD I and
GOLD III/IV (p=.03). ADC was significantly different between normal ex-smokers
(.29±.08cm2/s) and GOLD II (.36±.06cm2/s, p=.02) GOLD III/IV (.41±.05cm2/s, p<.001),
but not GOLD I (.34±.03cm2/s, p=.2) COPD.

55
Figure 2-2 3He MRI ventilation and PRM measurements by COPD grade A) 3He MRI VDP for ex-smokers=8±4%, GOLD I=11±6%, GOLD II=20±11%, and GOLD III/IV=37±9%. Significant difference for VDP between ex-smokers and GOLD II (p<.001), ex-smokers and GOLD III/IV (p<.001), GOLD I and GOLD II (p=.04), GOLD II and GOLD III/IV (p<.001), and GOLD I and GOLD III/IV (p<.001). B) PRM-derived gas-trapping voxels for ex-smokers=13±10%, GOLD I=31±11%, GOLD II=27±14%, and GOLD III/IV=41±8%. Significant difference for PRM gas-trapping between ex-smokers and GOLD I (p<.001), ex-smokers and GOLD II (p=.003), and ex-smokers and GOLD III/IV (p<.001). C) 3He MRI ADC for ex-smokers=.29±.08cm2/s, GOLD I=.34±.03cm2/s, GOLD II=.36±.06cm2/s, and GOLD III/IV=.41±.05cm2/s. Significant difference for ADC between ex-smokers and GOLD II (p=.02), ex-smokers and GOLD III/IV (p<.001), and GOLD I and GOLD III/IV (p=.04). D) PRM-derived emphysema voxels for ex-smokers= 0.5±0.5%, GOLD I=3±3%, GOLD II=8±11%, and GOLD III/IV=13±12%. Significant difference for PRM emphysema between ex-smokers and GOLD II (p=.009), ex-smokers and GOLD III/IV (p=.001), and GOLD I and GOLD III/IV (p=.03). Significant difference between subgroups (p<.05) were determined by ANOVA with a Post-hoc Tukey analysis. Error bars represent the standard deviation of the data.
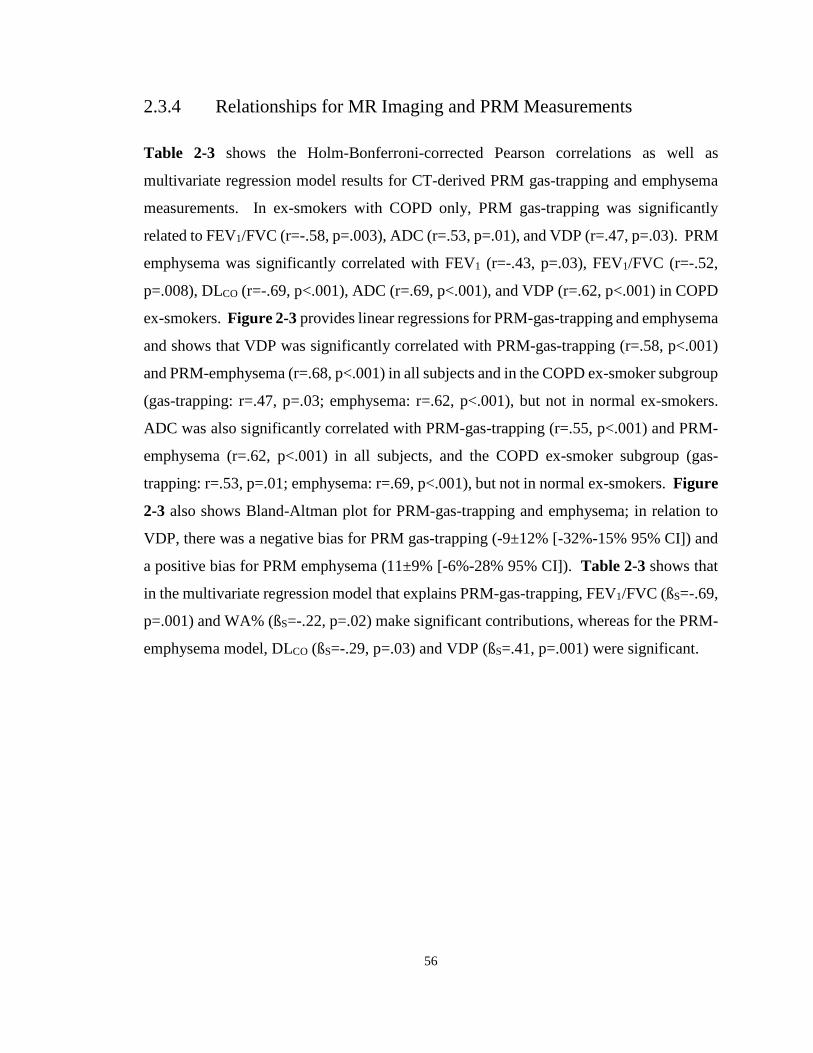
56
2.3.4 Relationships for MR Imaging and PRM Measurements
Table 2-3 shows the Holm-Bonferroni-corrected Pearson correlations as well as
multivariate regression model results for CT-derived PRM gas-trapping and emphysema
measurements. In ex-smokers with COPD only, PRM gas-trapping was significantly
related to FEV1/FVC (r=-.58, p=.003), ADC (r=.53, p=.01), and VDP (r=.47, p=.03). PRM
emphysema was significantly correlated with FEV1 (r=-.43, p=.03), FEV1/FVC (r=-.52,
p=.008), DLCO (r=-.69, p<.001), ADC (r=.69, p<.001), and VDP (r=.62, p<.001) in COPD
ex-smokers. Figure 2-3 provides linear regressions for PRM-gas-trapping and emphysema
and shows that VDP was significantly correlated with PRM-gas-trapping (r=.58, p<.001)
and PRM-emphysema (r=.68, p<.001) in all subjects and in the COPD ex-smoker subgroup
(gas-trapping: r=.47, p=.03; emphysema: r=.62, p<.001), but not in normal ex-smokers.
ADC was also significantly correlated with PRM-gas-trapping (r=.55, p<.001) and PRM-
emphysema (r=.62, p<.001) in all subjects, and the COPD ex-smoker subgroup (gas-
trapping: r=.53, p=.01; emphysema: r=.69, p<.001), but not in normal ex-smokers. Figure
2-3 also shows Bland-Altman plot for PRM-gas-trapping and emphysema; in relation to
VDP, there was a negative bias for PRM gas-trapping (-9±12% [-32%-15% 95% CI]) and
a positive bias for PRM emphysema (11±9% [-6%-28% 95% CI]). Table 2-3 shows that
in the multivariate regression model that explains PRM-gas-trapping, FEV1/FVC (ßS=-.69,
p=.001) and WA% (ßS=-.22, p=.02) make significant contributions, whereas for the PRM-
emphysema model, DLCO (ßS=-.29, p=.03) and VDP (ßS=.41, p=.001) were significant.
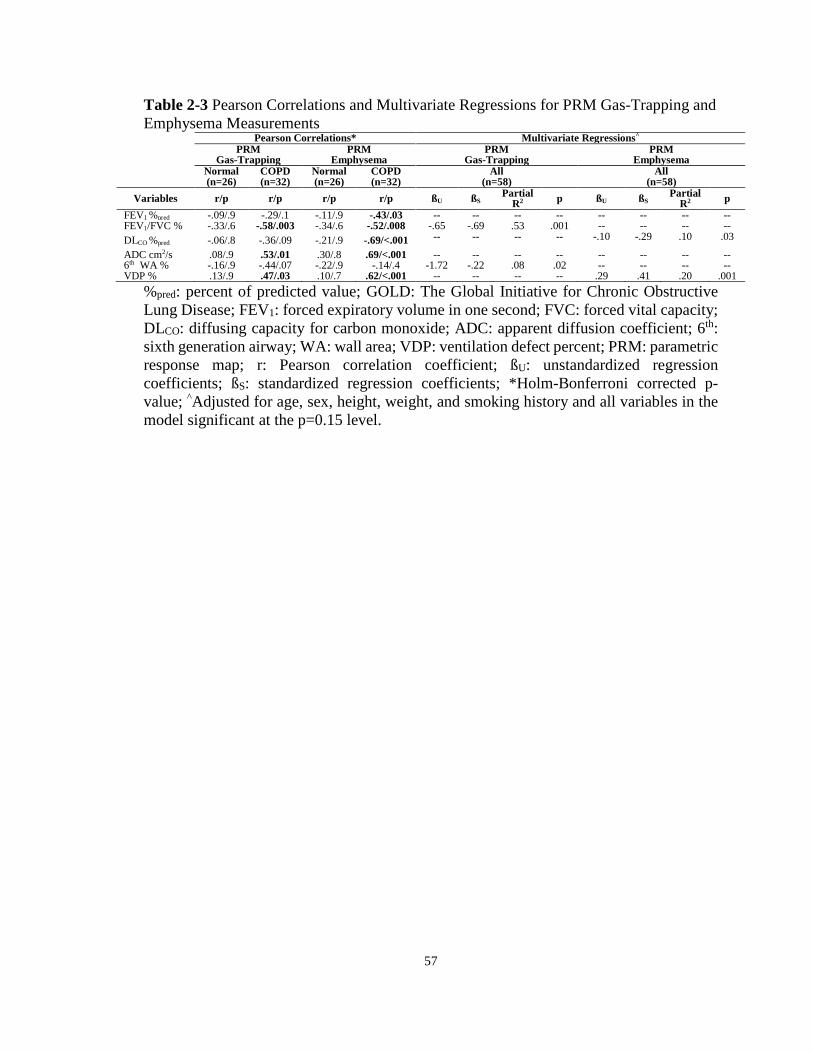
57
Table 2-3 Pearson Correlations and Multivariate Regressions for PRM Gas-Trapping and Emphysema Measurements
Pearson Correlations* Multivariate Regressions^ PRM
Gas-Trapping PRM
Emphysema PRM
Gas-Trapping PRM
Emphysema Normal
(n=26) COPD (n=32)
Normal (n=26)
COPD (n=32)
All (n=58)
All (n=58)
Variables r/p r/p r/p r/p ßU ßS Partial R2 p ßU ßS Partial
R2 p FEV1 %pred -.09/.9 -.29/.1 -.11/.9 -.43/.03 -- -- -- -- -- -- -- -- FEV1/FVC % -.33/.6 -.58/.003 -.34/.6 -.52/.008 -.65 -.69 .53 .001 -- -- -- -- DLCO %pred -.06/.8 -.36/.09 -.21/.9 -.69/<.001 -- -- -- -- -.10 -.29 .10 .03
ADC cm2/s .08/.9 .53/.01 .30/.8 .69/<.001 -- -- -- -- -- -- -- -- 6th WA % -.16/.9 -.44/.07 -.22/.9 -.14/.4 -1.72 -.22 .08 .02 -- -- -- -- VDP % .13/.9 .47/.03 .10/.7 .62/<.001 -- -- -- -- .29 .41 .20 .001
%pred: percent of predicted value; GOLD: The Global Initiative for Chronic Obstructive Lung Disease; FEV1: forced expiratory volume in one second; FVC: forced vital capacity; DLCO: diffusing capacity for carbon monoxide; ADC: apparent diffusion coefficient; 6th: sixth generation airway; WA: wall area; VDP: ventilation defect percent; PRM: parametric response map; r: Pearson correlation coefficient; ßU: unstandardized regression coefficients; ßS: standardized regression coefficients; *Holm-Bonferroni corrected p-value; ^Adjusted for age, sex, height, weight, and smoking history and all variables in the model significant at the p=0.15 level.
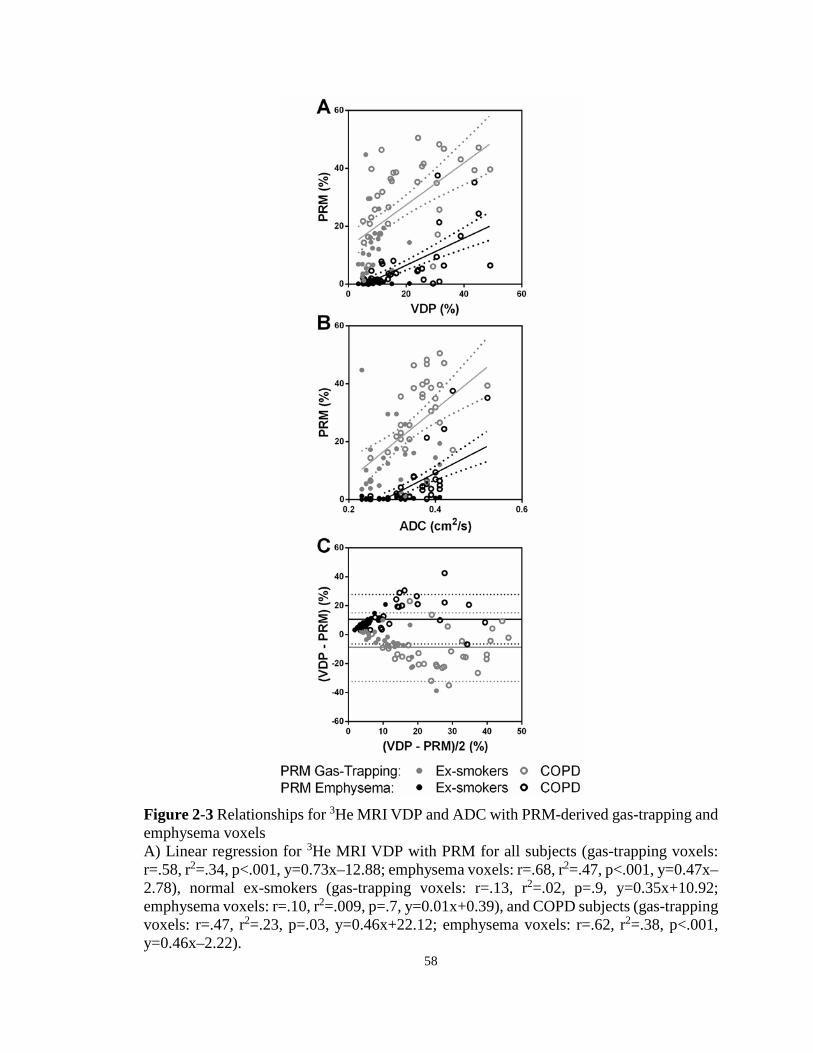
58
Figure 2-3 Relationships for 3He MRI VDP and ADC with PRM-derived gas-trapping and emphysema voxels A) Linear regression for 3He MRI VDP with PRM for all subjects (gas-trapping voxels: r=.58, r2=.34, p<.001, y=0.73x–12.88; emphysema voxels: r=.68, r2=.47, p<.001, y=0.47x–2.78), normal ex-smokers (gas-trapping voxels: r=.13, r2=.02, p=.9, y=0.35x+10.92; emphysema voxels: r=.10, r2=.009, p=.7, y=0.01x+0.39), and COPD subjects (gas-trapping voxels: r=.47, r2=.23, p=.03, y=0.46x+22.12; emphysema voxels: r=.62, r2=.38, p<.001, y=0.46x–2.22).

59
B) Linear regression for 3He MRI ADC with PRM for all subjects (gas-trapping voxels: r=.55, r2=.30, p<.001, y=122x-17; emphysema voxels: r=.62, r2=.39, p<.001, y=77x–22), normal ex-smokers (gas-trapping voxels: r=.08, r2=.006, p=.9, y=14x+10; emphysema voxels: r=.30, r2=.09, p=.8, y=2.5x–0.3), and COPD subjects (gas-trapping voxels: r=.53, r2=.28, p=.01, y=119x-12; emphysema voxels: r=.69, r2=.48, p<.001, y=121x–37). C) Bland-Altman analysis of agreement for 3He MRI VDP and PRM for all subjects (gas-trapping voxels: bias=-9±12%, lower limit=-32%, upper limit=15%; emphysema voxels: bias=11±9%, lower limit=-6%, upper limit=28%), normal ex-smokers (gas-trapping voxels: bias=-6±10%, lower limit=-26%, upper limit=15%; emphysema voxels: bias=8±4%, lower limit=1%, upper limit=15%), and COPD subjects (gas-trapping voxels: bias=-11±13%, lower limit=-36%, upper limit=14%; emphysema voxels: bias=13±10%, lower limit=-7%, upper limit=33%). Dotted lines = 95% confidence intervals.
2.3.5 Spatial and Regional Relationships
Given the significant quantitative relationships for MRI and PRM COPD measurements,
we evaluated the spatial correlations of ventilation defects with PRM measurements.
Qualitative examples are shown in Figure 2-4 for an ex-smoker with mild COPD and
another with GOLD grade III COPD. The spatial relationship for ventilation defects with
PRM gas-trapping is more obvious in the ex-smoker with mild disease whereas there is co-
localization of PRM emphysema and ventilation defects in the ex-smoker with severe
airflow limitation.

60
Figure 2-4 Spatial relationship of 3He MRI ventilation defects with PRM gas-trapping and emphysema for a representative (A) mild and (B) severe COPD subject A) GOLD I: age=69, sex=male, FEV1=89%pred, FEV1/FVC=69%, RV/TLC=39%, DLCO=67%pred; B) GOLD III: age=78, sex=male, FEV1=47%pred, FEV1/FVC=37%, RV/TLC=50%, DLCO=57%pred. 3He MRI ventilation (blue) co-registered with 1H MRI and PRM normal (green), gas-trapping (yellow) and emphysema (red) tissue co-registered with CT. Arrows show spatial relationship between ventilation defects with PRM gas-trapping and emphysema regions.

61
To explore these relationships in more detail, we quantitatively evaluated the spatial
overlap of PRM gas-trapping and emphysema voxels with ADC (Figure 2-5) and
ventilation defects (Table 2-4). As shown in Figure 2-5, 3He ADC was significantly
elevated in PRM gas-trapping as compared to normal tissue (normal ex-smoker: p=.004,
GOLD I: p=.01, GOLD II: p=.01, GOLD III/IV: p=.03). 3He ADC was also significantly
greater in the regions of PRM-emphysema as compared to regions of PRM-gas-trapping
for GOLD I (p=.03), but not for normal, GOLD II, or GOLD III/IV ex-smokers. Table
2-4 shows that in mild and moderate COPD, the spatial overlap coefficient (SOCMRI) for 3He ventilation defects with PRM-gas-trapping tissue (mild: SOCMRI=36±28%; moderate:
SOCMRI=34±28%) was significantly greater than for PRM-emphysema voxels (mild:
SOCMRI=1±2%, p=.001; moderate: SOCMRI=7±15%, p=.006). Thus for mild and moderate
COPD subjects, 3He ventilation defects showed a greater spatial relationship with PRM-
gas-trapping versus emphysema voxels. For severe COPD, SOCCT for 3He ventilation
defects with PRM-emphysema (SOCCT=64±30%) was significantly greater than for PRM-
gas-trapping voxels (SOCCT=36±18; p=.01). Therefore for severe COPD subjects, PRM-
emphysema was mainly localized within 3He ventilation defect regions. In addition, in
severe COPD, SOCMRI for 3He ventilation defects with PRM-gas-trapping voxels
(SOCMRI=62±25%) was significantly greater than with PRM-emphysema
(SOCMRI=11±20%, p=.009). Hence, in severe COPD, 3He ventilation defect regions
mostly consisted of PRM-gas-trapping voxels, although there was a mixture of PRM-gas-
trapping and emphysema.
Table 2-4 Quantitative Spatial Relationships for 3He MRI ventilation defects with CT-PRM Voxels
Mean (±SD) Normal
Ex-smokers (n=26)
COPD Ex-smokers (n=32) Sig Dif p
All (n=32)
GOLD I (n=12)
GOLD II (n=13)
GOLD III/IV (n=7)
Spatial Overlap Coefficient Normalized using CT voxels Gas-Trapping-to-VDP (%) 3 (12) 15 (16) 4 (4) 13 (13) 36 (18) <.001 Emphysema-to-VDP (%) 0 (0) 22 (32) 3 (9) 16 (27) 64 (30) <.001 Sig Dif* .2 .06 .5 .5 .01
Spatial Overlap Coefficient Normalized using MRI voxels VDP-to-Gas-Trapping (%) 3 (8) 41 (29) 36 (28) 34 (28) 62 (25) <.001 VDP-to-Emphysema (%) 0 (0) 6 (14) 1 (2) 7 (15) 11 (20) .04 Sig Dif* .09 <.001 .001 .006 .009 Sig Dif: Significant difference between groups (p<.05) using ANOVA and corrected using Tukey’s method; SD: standard deviation; GOLD: The Global Initiative for Chronic Obstructive Lung Disease; VDP: ventilation defect percent; PRM: parametric response map; *Significant difference measured using paired t-test for spatial overlap coefficients of MRI ventilation defects with PRM gas-trapping and emphysema

62
Figure 2-5 3He MRI apparent diffusion coefficient measurements spatially within PRM regions of normal, gas-trapped, and emphysematous tissue 3He ADC measurements for PRM normal tissue (ex-smokers=.27±.05cm2/s, GOLD I=.34±.03cm2/s, GOLD II=.36±.09cm2/s, GOLD III/IV=.41±.07cm2/s), gas-trapped (ex-smoker=.28±.05cm2/s, GOLD II=.35±.04cm2/s, GOLD II=.38±.11cm2/s, GOLD III/IV=.44±.08cm2/s), and emphysema tissue (ex-smoker=.29±.06cm2/s, GOLD I=.36±.05cm2/s, GOLD II=.39±.12cm2/s, GOLD III/IV=.46±.10cm2/s). Error bars represent the standard deviation of the data.
2.4 Discussion
We evaluated 58 ex-smokers in the first direct comparison of PRM and MRI measurements
of COPD. We acquired inspiration/expiration CT and noble gas MRI within an hour and
observed: 1) with increasing severity of airflow limitation, PRM-gas-trapping, PRM-
emphysema, ADC and VDP measurements were significantly greater, 2) 3He ventilation
and PRM measurements were correlated in COPD, but not in normal ex-smokers, 3) in a
multivariate model that predicted PRM-gas-trapping, WA% and FEV1/FVC were
significant, while for PRM-emphysema, VDP and DLCO were significant, and, 4) 3He ADC
was significantly elevated in regions of PRM- gas-trapping and there were quantitative and
63
spatial correlations for both PRM-gas-trapping and emphysema with 3He ventilation
defects that differed according to COPD severity.
Parametric-response-mapping9 classifies lung tissue based on the presence of pulmonary
air – either as a consequence of emphysema and gas-trapping due to airways disease and/or
emphysema.9 We were curious about the potential relationships between PRM and MRI
phenotypes of COPD, especially because both ventilation defects and PRM-gas trapping
have been suggested as biomarkers of small-airways disease. First, we observed that with
increasing severity of airflow limitation, PRM-gas-trapping, PRM-emphysema, ADC and
VDP measurements were significantly greater. We also noted that 3He VDP and PRM
measurements were correlated in COPD ex-smokers but not in ex-smokers with normal
pulmonary function. This might be expected because correlations in ex-smokers with
mainly normal pulmonary function are statistically difficult to ascertain in small sample
sizes since the range of values for normal lung function is small.31 It is also worth noting
that in this study, CT emphysema measurements for normal ex-smokers were in agreement
with previously reported values for healthy subjects.7,32 Importantly, CT may not be
adequately sensitive to very mild or subclinical parenchymal33 and obstructive disease and
this may also partially explain the negligible VDP and PRM correlations in normal ex-
smokers.
In addition to these bilateral relationships, multivariate modelling identified the parameters
that significantly added to the model for PRM-gas-trapping (WA% and FEV1/FVC) and
PRM-emphysema (VDP and DLCO). The PRM-gas-trapping model is intuitive, based on
our prior knowledge of the role of airway wall morphology in functional small airways
disease.34 This finding is also consistent with the major pulmonary imaging and clinical
phenotypes recently summarized by the Fleischner Society.35 We note, however, that while
the significant contribution of DLCO to PRM-emphysema is also consistent with a large
body of previous work,36 the contribution of PRM-emphysema to ventilation defects is a
novel and somewhat surprising result. Strong hints that ventilation defects may stem from
emphysematous bullae were previously reported in patients with advanced/severe COPD
and numerous exacerbations requiring hospitalization.22 Together, this information
64
suggests a role for pulmonary imaging to phenotype COPD patients beyond FEV1 to help
guide therapy to change exacerbations and other outcomes.
These quantitative associations and some obvious qualitative regional relationships led to
our exploration of potential spatial correlations. Notably, and unexpectedly, we observed
that 3He ADC was significantly elevated in regions of PRM-gas-trapping. This surprising
result suggested that PRM ‘functional small-airway disease’ that leads to gas-trapping may
be detected as enlarged airspaces reflected by elevated ADC. This is one of the first studies
to spatially compare 3He ADC to gas-trapping measurements. This novel finding is in
agreement with other studies that demonstrated gravitational37,38 and lung volume effects39
on pulmonary ADC values. This also suggests that abnormally elevated ADC may not
always reflect emphysematous abnormalities in COPD patients. There were also spatial
correlations in mild and moderate COPD patients in whom 3He MRI ventilation defects
were spatially related to PRM-gas-trapping. In contrast, in the small group of seven severe
COPD patients, MRI ventilation defects were spatially related to both PRM-gas-trapping
and emphysema identified using SOCCT and SOCMRI. The rationale for performing the
SOC analysis in both directions was the need to evaluate the overlap of 3He defects within
PRM regions (SOCCT) and the overlap of PRM voxels within 3He defects (SOCMRI). While
the quantitative results showed differences between the two methods, this was not due to
non-symmetry between registering from the fixed to moving image because we performed
registration in a symmetric manner to mitigate this potential bias.40,41 It was important to
perform the spatial overlap analysis in both directions because the results showed that in
severe COPD, PRM emphysema voxels were mainly occupied by ventilation defect voxels
and in contrast, ventilation defect voxels were mainly occupied by PRM gas-trapping
voxels. This means that both PRM emphysema and gas-trapping voxels are spatially
coincident with ventilation defects. This exciting result provides, for the first time, a deeper
understanding of the source of ventilation defects and gas-trapping in COPD. We think
these findings underscore the importance of phenotyping COPD patients with quantitative
imaging. Future work should aim to determine the spatial relationships between
continuous pixel wise data and PRM, as this may provide a better understanding of these
relationships.

65
Numerous studies have used paired inspiratory/expiratory lung CT-images42-44 to provide
COPD phenotypes. In COPD subjects, gas-trapping is influenced by both emphysema and
small-airways disease43,45 for which PRM attempts to differentiate. In addition, severe
small-airways disease sometimes appears on CT as emphysema, making it challenging to
delineate between the two phenotypes. Regardless, here we determined the different
relationships between MRI and CT phenotypes of COPD across GOLD grades of severity.
We think these results underscore the need to adopt multimodality approaches to deeply
phenotype COPD patients so that the independent contributions of emphysema and airways
disease may be ascertained, which may help to optimize COPD therapy and improve
outcomes.
In summary, in all ex-smokers, ventilation defects and ADC were correlated with PRM-
gas-trapping and emphysema measurements. In a subset of ex-smokers with mild-moderate
COPD, ventilation defects were quantitatively and spatially related to PRM-gas-trapping
whereas in severe COPD, there were spatial and quantitative relationships for ventilation
defects with both PRM-gas-trapping and emphysema.
66
2.5 References (1) Vestbo, J. et al. Global strategy for the diagnosis, management, and prevention of
chronic obstructive pulmonary disease: GOLD executive summary. Am J Respir Crit Care Med 2013; 187: 347-365.
(2) Hackx, M., Bankier, A. A. & Gevenois, P. A. Chronic Obstructive Pulmonary Disease: CT Quantification of Airways Disease. Radiology 2012; 265: 34-48.
(3) Nakano, Y. et al. Quantitative assessment of airway remodeling using high-resolution CT. Chest 2002; 122: 271s-275s.
(4) Hayhurst, M. D. et al. Diagnosis of pulmonary emphysema by computerised tomography. Lancet 1984; 2: 320-322.
(5) Klein, J. S., Gamsu, G., Webb, W. R., Golden, J. A. & Muller, N. L. High-resolution CT diagnosis of emphysema in symptomatic patients with normal chest radiographs and isolated low diffusing capacity. Radiology 1992; 182: 817-821.
(6) Dirksen, A. et al. A randomized clinical trial of alpha(1)-antitrypsin augmentation therapy. Am J Respir Crit Care Med 1999; 160: 1468-1472.
(7) Zach, J. A. et al. Quantitative computed tomography of the lungs and airways in healthy nonsmoking adults. Invest Radiol 2012; 47: 596-602.
(8) Moffat, B. A. et al. Functional diffusion map: a noninvasive MRI biomarker for early stratification of clinical brain tumor response. Proc Natl Acad Sci U S A 2005; 102: 5524-5529.
(9) Galban, C. J. et al. Computed tomography-based biomarker provides unique signature for diagnosis of COPD phenotypes and disease progression. Nature medicine 2012; 18: 1711-1715.
(10) Cho, N. et al. Breast cancer: early prediction of response to neoadjuvant chemotherapy using parametric response maps for MR imaging. Radiology 2014; 272: 385-396.
(11) Hoff, B. A. et al. Parametric response mapping of CT images provides early detection of local bone loss in a rat model of osteoporosis. Bone 2012; 51: 78-84.
(12) Gevenois, P. A., de Maertelaer, V., De Vuyst, P., Zanen, J. & Yernault, J. C. Comparison of computed density and macroscopic morphometry in pulmonary emphysema. Am J Respir Crit Care Med 1995; 152: 653-657.
(13) Pompe, E. et al. Parametric response mapping adds value to current computed tomography biomarkers in diagnosing chronic obstructive pulmonary disease. Am J Respir Crit Care Med 2015; 191: 1084-1086.

67
(14) Jogi, J., Ekberg, M., Jonson, B., Bozovic, G. & Bajc, M. Ventilation/perfusion SPECT in chronic obstructive pulmonary disease: an evaluation by reference to symptoms, spirometric lung function and emphysema, as assessed with HRCT. Eur J Nucl Med Mol Imaging 2011; 38: 1344-1352.
(15) Brudin, L. H. et al. Regional structure-function correlations in chronic obstructive lung disease measured with positron emission tomography. Thorax 1992; 47: 914-921.
(16) Kirby, M. et al. Chronic obstructive pulmonary disease: longitudinal hyperpolarized (3)He MR imaging. Radiology 2010; 256: 280-289.
(17) Kirby, M. et al. Hyperpolarized 3He and 129Xe MR imaging in healthy volunteers and patients with chronic obstructive pulmonary disease. Radiology 2012; 265: 600-610.
(18) Ohno, Y. et al. Oxygen-enhanced magnetic resonance imaging versus computed tomography: multicenter study for clinical stage classification of smoking-related chronic obstructive pulmonary disease. Am J Respir Crit Care Med 2008; 177: 1095-1102.
(19) Couch, M. J. et al. Inert fluorinated gas MRI: a new pulmonary imaging modality. NMR Biomed 2014; 27: 1525-1534.
(20) Fain, S. B. et al. Early emphysematous changes in asymptomatic smokers: detection with 3He MR imaging. Radiology 2006; 239: 875-883.
(21) Swift, A. J. et al. Emphysematous changes and normal variation in smokers and COPD patients using diffusion 3He MRI. Eur J Radiol 2005; 54: 352-358.
(22) Kirby, M., Pike, D., Coxson, H. O., McCormack, D. G. & Parraga, G. Hyperpolarized He Ventilation Defects Used to Predict Pulmonary Exacerbations in Mild to Moderate Chronic Obstructive Pulmonary Disease. Radiology 2014; 140161.
(23) Svenningsen, S. et al. What are ventilation defects in asthma? Thorax 2013.
(24) Parraga, G. et al. Hyperpolarized 3He ventilation defects and apparent diffusion coefficients in chronic obstructive pulmonary disease: preliminary results at 3.0 Tesla. Invest Radiol 2007; 42: 384-391.
(25) Kirby, M. et al. On the role of abnormal DLCO in ex-smokers without airflow limitation: symptoms, exercise capacity and hyperpolarised helium-3 MRI. Thorax 2013; thoraxjnl-2012-203108.
(26) Christner, J. A. et al. Size-specific Dose Estimates for Adult Patients at CT of the Torso. Radiology 2012; 265: 841-847.

68
(27) Brink, J. A. & Morin, R. L. Size-specific dose estimation for CT: how should it be used and what does it mean? Radiology 2012; 265: 666-668.
(28) Kirby, M. et al. Hyperpolarized 3He magnetic resonance functional imaging semiautomated segmentation. Acad Radiol 2012; 19: 141-152.
(29) Hu, S., Hoffman, E. A. & Reinhardt, J. M. Automatic lung segmentation for accurate quantitation of volumetric X-ray CT images. IEEE Trans Med Imaging 2001; 20: 490-498.
(30) Tschirren, J., Hoffman, E. A., McLennan, G. & Sonka, M. Intrathoracic airway trees: segmentation and airway morphology analysis from low-dose CT scans. IEEE Trans Med Imaging 2005; 24: 1529-1539.
(31) Sheikh, K. et al. Pulmonary ventilation defects in older never-smokers. J Appl Physiol (1985) 2014; 117: 297-306.
(32) Schroeder, J. D. et al. Relationships between airflow obstruction and quantitative CT measurements of emphysema, air trapping, and airways in subjects with and without chronic obstructive pulmonary disease. AJR. American journal of roentgenology 2013; 201: W460.
(33) Miller, R. R., Muller, N. L., Vedal, S., Morrison, N. J. & Staples, C. A. Limitations of computed tomography in the assessment of emphysema. Am Rev Respir Dis 1989; 139: 980-983.
(34) Nakano, Y. et al. The prediction of small airway dimensions using computed tomography. Am J Respir Crit Care Med 2005; 171: 142-146.
(35) Lynch, D. A. et al. CT-Definable Subtypes of Chronic Obstructive Pulmonary Disease: A Statement of the Fleischner Society. Radiology 2015; 141579.
(36) Nambu, A. et al. Relationships between diffusing capacity for carbon monoxide (DLCO), and quantitative computed tomography measurements and visual assessment for chronic obstructive pulmonary disease. European Journal of Radiology 2015; 84: 980-985.
(37) Evans, A. et al. Anatomical distribution of (3)He apparent diffusion coefficients in severe chronic obstructive pulmonary disease. J Magn Reson Imaging. 2007; 26: 1537-1547.
(38) Fichele, S. et al. MRI of helium-3 gas in healthy lungs: posture related variations of alveolar size. J Magn Reson Imaging 2004; 20: 331-335.
(39) Hajari, A. J. et al. Morphometric changes in the human pulmonary acinus during inflation. J Appl Physiol (1985) 2012; 112: 937-943.

69
(40) Heinrich, M. P. et al. MIND: Modality independent neighbourhood descriptor for multi-modal deformable registration. Medical Image Analysis 2012; 16: 1423-1435.
(41) Modat, M., McClelland, J. & Ourselin, S. Lung registration using the NiftyReg package. Medical Image Analysis for the Clinic-A Grand Challenge 2010; 2010: 33-42.
(42) Bommart, S. et al. Relationship between CT air trapping criteria and lung function in small airway impairment quantification. BMC Pulm Med 2014; 14: 29.
(43) Hersh, C. P. et al. Paired inspiratory-expiratory chest CT scans to assess for small airways disease in COPD. Respir Res 2013; 14: 42.
(44) Kim, E. Y. et al. Detailed analysis of the density change on chest CT of COPD using non-rigid registration of inspiration/expiration CT scans. Eur Radiol 2015; 25: 541-549.
(45) Gevenois, P. A. et al. Pulmonary emphysema: quantitative CT during expiration. Radiology 1996; 199: 825-829.

70
2.6 Supplement
2.6.1 Materials and Methods
2.6.1.1 Study Subjects
We recruited participants from a local tertiary care centre and by advertisement. Briefly,
inclusion criteria comprised ambulatory males and females with a previous clinical
diagnosis of COPD, aged 50-90 with a smoking history >10 pack-years. Exclusion criteria
included claustrophobia, current smoker, body mass index >40 and any MRI
contraindications (i.e. metal/electronic/magnetic implants). All participants were 53-88
years (mean age=73±9yrs) of age (male: mean age=73±9yrs, age range=55-88yrs; female:
mean age=71±7yrs, age range=53-84yrs; p=.4). In a single two hour visit, participants
underwent the following evaluations in the same order: 1) salbutamol administration, 2)
spirometry, 3) plethysmography and DLCO, 4) inspiration and expiration CT, and, 5) MRI.
COPD subjects were classified according to the Global Initiative for Chronic Obstructive
Lung Disease (GOLD) grades.1
2.6.1.2 Pulmonary Function
Post-bronchodilator plethysmography and spirometry were performed using a body
plethysmograph (MedGraphics Corporation, St. Paul, Minnesota, USA) to measure the
forced expiratory volume in one second (FEV1), forced vital capacity (FVC) and static lung
volumes including total lung capacity (TLC), inspiratory capacity (IC), residual volume
(RV), and functional residual capacity (FRC). The diffusing capacity of lung for carbon
monoxide (DLCO) was also determined using the attached gas analyzer. Measurements
were performed according to the American Thoracic Society (ATS) guidelines.2
2.6.1.3 MR Image Analysis
3He static ventilation images were segmented using a k-means approach that classifies
voxel intensity values into five clusters ranging from signal void (cluster 1[C1] or VDV)
and hypo-intense (cluster 2 [C2]) to hyper-intense signal (cluster 5 [C5]), therefore
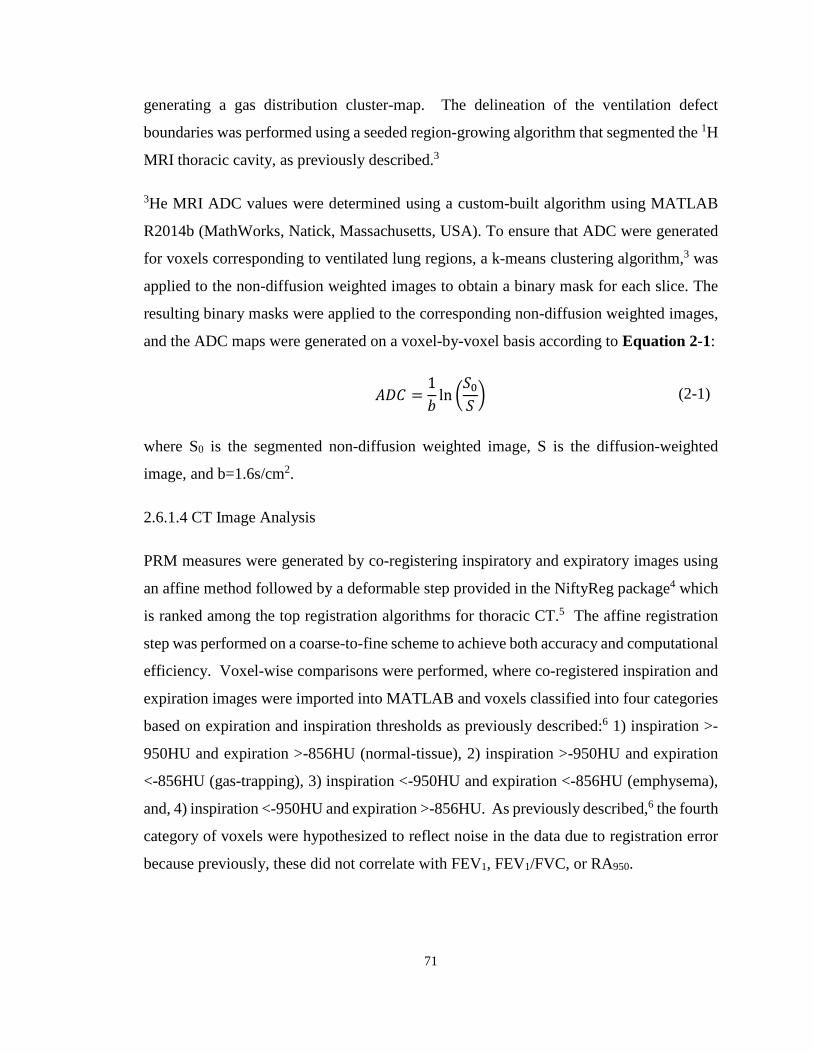
71
generating a gas distribution cluster-map. The delineation of the ventilation defect
boundaries was performed using a seeded region-growing algorithm that segmented the 1H
MRI thoracic cavity, as previously described.3
3He MRI ADC values were determined using a custom-built algorithm using MATLAB
R2014b (MathWorks, Natick, Massachusetts, USA). To ensure that ADC were generated
for voxels corresponding to ventilated lung regions, a k-means clustering algorithm,3 was
applied to the non-diffusion weighted images to obtain a binary mask for each slice. The
resulting binary masks were applied to the corresponding non-diffusion weighted images,
and the ADC maps were generated on a voxel-by-voxel basis according to Equation 2-1:
𝐴𝐴𝑉𝑉𝐹𝐹 =1𝑏𝑏
ln �𝑆𝑆0𝑆𝑆� (2-1)
where S0 is the segmented non-diffusion weighted image, S is the diffusion-weighted
image, and b=1.6s/cm2.
2.6.1.4 CT Image Analysis
PRM measures were generated by co-registering inspiratory and expiratory images using
an affine method followed by a deformable step provided in the NiftyReg package4 which
is ranked among the top registration algorithms for thoracic CT.5 The affine registration
step was performed on a coarse-to-fine scheme to achieve both accuracy and computational
efficiency. Voxel-wise comparisons were performed, where co-registered inspiration and
expiration images were imported into MATLAB and voxels classified into four categories
based on expiration and inspiration thresholds as previously described:6 1) inspiration >-
950HU and expiration >-856HU (normal-tissue), 2) inspiration >-950HU and expiration
<-856HU (gas-trapping), 3) inspiration <-950HU and expiration <-856HU (emphysema),
and, 4) inspiration <-950HU and expiration >-856HU. As previously described,6 the fourth
category of voxels were hypothesized to reflect noise in the data due to registration error
because previously, these did not correlate with FEV1, FEV1/FVC, or RA950.

72
2.6.1.5 MRI-to-CT Spatial Overlap
3He MRI was registered to 1H MRI using a landmark-based approach3 and 1H MRI was
registered to expiratory CT using deformable registration via the modality-independent-
neighbourhood-descriptor (MIND) method, previously shown suitable for cross-modality
image registration.7 The deformation field was applied to the 3He MRI slices for MRI-to-
CT co-registration. The deformable registration consisted of voxel-wise similarity
measurements of MIND of the two images, rather than the image themselves, as well as
diffusion regularization of the deformation field and optimization using the Gauss-Newton
framework. The registration was performed with three-levels (down-sampling factor of 4,
2, and 1) in a symmetric manner so that the algorithm was not dependent on the choice of
moving or fixed image.
Spatial overlap for 3He ventilation defects and PRM voxels was evaluated using the spatial
overlap coefficient (SOC), which is the intersection of 3He ventilation defect and PRM
voxels expressed as a fraction of the total number of CT PRM voxels (SOCCT) or 3He MRI
ventilation defect voxels (SOCMRI). The rationale for performing spatial overlap
measurements in this manner was to determine the contribution of 3He defect voxels within
PRM gas-trapped or emphysema regions. The spatial overlap of PRM voxels within 3He
defect regions (SOCMRI) was also evaluated to determine the contribution of PRM (gas-
trapping and/or emphysema) to 3He ventilation defects. CT and 3He images were evaluated
once because the CT analysis was fully-automated and MRI semi-automated segmentation
method was previously reported3 to provide high inter- and intra-observer reproducibility.
In total, CT and MR image analysis per subject was completed in approximately one hour.
2.6.1.6 Statistics
The variables considered were based on univariate relationships. The unstandardized ß
coefficients were reported and show how a single-unit change in the independent variable
influenced a change in the dependent variable. We also reported the standardized ß
coefficients, expressed in units of standard deviation (SD) and these showed the
independent variable with the greatest ß coefficient reflecting the greatest relative effect on
the dependent variable. Multi-co-linearity was evaluated using the variance inflation factor

73
(VIF) and deemed acceptable when <10.8 For spatial overlap coefficients, significant
differences were measured using paired t-tests. Results were considered significant when
the probability of two-tailed type I error (α) was less than 5% (p<.05).
2.6.2 Discussion
2.6.2.1 Limitations
The limitations of spirometry have motivated us and others to continue developing thoracic
imaging methods including ventilation MRI and CT-PRM measurements to better
phenotype patients using direct and regional measurements of the underlying disease.9
Spirometry measurements of FEV1 and FEV1/FVC are reproducible and inexpensive, but
these provide only a global measure of lung function that is dominated by larger airway
function. For this reason, pulmonary function tests are relatively insensitive to early
disease stages.10 In addition, FEV1 and FEV1/FVC are relatively poor surrogates of COPD
symptoms11 and other outcomes perhaps because disease heterogeneity derives from the
pathological features of COPD, including parenchyma destruction (emphysema) and
airway remodeling (airways disease), which also differ in individual patients with the same
FEV1.1,12
We recognize that this study has a number of limitations. First, this work was limited by
the relatively small study group and the fact that we mainly evaluated ex-smokers with
mildly abnormal and normal spirometry. This was prospectively planned and driven by
our interest to investigate very early or mild disease, but given our understanding of the
heterogeneity of COPD patients, we must be cautious about extrapolating our results. We
must also acknowledge that the results generated here were not compared with results
stemming from commercially available software such as Apollo Workstation 2.0 (VIDA
Diagnostics Inc., Coralville, Iowa, USA) or Lung Density Analysis software (IMBIO,
Minneapolis, Minnesota, USA). It should be noted that any potential differences would
likely stem from the different image registration/warping algorithms used because the
density thresholds used are generally the same. Registration errors pose a challenge that
has been previously reported for PRM in the liver13 and we caution that registration errors
74
would result in tissue misclassification because PRM analysis relies heavily on voxel-by-
voxel comparisons. Notably, in the parametric-response-maps generated here, there was
consistent scattering of misclassified voxels and this underscores the need for optimized
thoracic CT registration techniques to minimize these effects. We recognize that MRI-CT
registration error will certainly affect the analysis of spatial agreement. For this reason, we
used a pulmonary MRI-CT deformable registration method7 previously described as highly
suitable for cross-modality image registration and which achieved significantly better
results than other methods, such as normalized mutual information.7 Differences between
PRM and 3He may be related to the fact that PRM measurements are inherently more
indirect as these are based on the abnormal presence of air due to both emphysema and
airways disease. In contrast, inhaled gas methods provide static snapshots of regional
ventilation. In advanced COPD, ventilation defects have been previously shown to reflect
both emphysema and airways disease,9 whereas in mild asthma, ventilation defects were
shown to be directly related to abnormal airway wall thickening or airways disease.14
Similar to four-dimensional CT,15 Fourier decomposition MRI16 and paired
inspiratory/expiratory CT,17-19 PRM exploits the image signal differences from inspiration
and expiration as air moves in and out and tissue contracts and expands. All these
approaches rely on either computational or intuitive co-registration of inspiratory and
expiratory CT and assume that the abnormal presence of air can be regionally related to
emphysema and/or functional small airways disease. Finally, hyperpolarized 3He MRI is
still limited to a few research facilities worldwide and is unlikely to be translated clinically
due to the depleted global supply of 3He. However, with recent improvements in 129Xe
polarization20 and the development of 19F MRI,21 inhaled gas MRI may yet be considered
for regulatory approval and future clinical workflows.

75
2.6.3 References
(1) Vestbo, J. et al. Global strategy for the diagnosis, management, and prevention of chronic obstructive pulmonary disease: GOLD executive summary. Am J Respir Crit Care Med 2013; 187: 347-365.
(2) Miller, M. R. et al. Standardisation of spirometry. Eur Respir J 2005; 26: 319-338.
(3) Kirby, M. et al. Hyperpolarized 3He magnetic resonance functional imaging semiautomated segmentation. Acad Radiol 2012; 19: 141-152.
(4) Modat, M., McClelland, J. & Ourselin, S. Lung registration using the NiftyReg package. Medical Image Analysis for the Clinic-A Grand Challenge 2010; 2010: 33-42.
(5) Murphy, K. et al. Evaluation of registration methods on thoracic CT: the EMPIRE10 challenge. Medical Imaging, IEEE Transactions on 2011; 30: 1901-1920.
(6) Galban, C. J. et al. Computed tomography-based biomarker provides unique signature for diagnosis of COPD phenotypes and disease progression. Nature medicine 2012; 18: 1711-1715.
(7) Heinrich, M. P. et al. MIND: Modality independent neighbourhood descriptor for multi-modal deformable registration. Medical Image Analysis 2012; 16: 1423-1435.
(8) O'Brien, R. M. A caution regarding rules of thumb for variance inflation factors. Quality & Quantity 2007; 41: 673-690.
(9) Kirby, M., Pike, D., Coxson, H. O., McCormack, D. G. & Parraga, G. Hyperpolarized He Ventilation Defects Used to Predict Pulmonary Exacerbations in Mild to Moderate Chronic Obstructive Pulmonary Disease. Radiology 2014; 140161.
(10) Vestbo, J. et al. Evaluation of COPD Longitudinally to Identify Predictive Surrogate End-points (ECLIPSE). Eur Respir J 2008; 31: 869-873.
(11) Agusti, A. et al. Characterisation of COPD heterogeneity in the ECLIPSE cohort. Respir Res 2010; 11: 122.
(12) Pauwels, R. A. et al. Global strategy for the diagnosis, management, and prevention of chronic obstructive pulmonary disease. NHLBI/WHO Global Initiative for Chronic Obstructive Lung Disease (GOLD) Workshop summary. Am J Respir Crit Care Med 2001; 163: 1256-1276.

76
(13) Lausch, A. et al. An augmented parametric response map with consideration of image registration error: towards guidance of locally adaptive radiotherapy. Phys Med Biol 2014; 59: 7039-7058.
(14) Svenningsen, S. et al. What are ventilation defects in asthma? Thorax 2014; 69: 63-71.
(15) Guerrero, T. et al. Dynamic ventilation imaging from four-dimensional computed tomography. Physics in medicine and biology 2006; 51: 777.
(16) Bauman, G. et al. Non‐contrast‐enhanced perfusion and ventilation assessment of the human lung by means of fourier decomposition in proton MRI. Magn Reson Med 2009; 62: 656-664.
(17) Bommart, S. et al. Relationship between CT air trapping criteria and lung function in small airway impairment quantification. BMC Pulm Med 2014; 14: 29.
(18) Hersh, C. P. et al. Paired inspiratory-expiratory chest CT scans to assess for small airways disease in COPD. Respir Res 2013; 14: 42.
(19) Kim, E. Y. et al. Detailed analysis of the density change on chest CT of COPD using non-rigid registration of inspiration/expiration CT scans. Eur Radiol 2015; 25: 541-549.
(20) Mugler, J. P., 3rd & Altes, T. A. Hyperpolarized 129Xe MRI of the human lung. J Magn Reson Imaging 2013; 37: 313-331.
(21) Ruiz-Cabello, J., Barnett, B. P., Bottomley, P. A. & Bulte, J. W. Fluorine (19F) MRS and MRI in biomedicine. NMR Biomed 2011; 24: 114-129.

77
CHAPTER 3
3 FREE-BREATHING PULMONARY 1H AND HYPERPOLARIZED 3HE MRI: COMPARISON IN COPD AND BRONCHIECTASIS
To better understand the potential for Fourier-decomposition MRI (FDMRI) to provide quantitative endpoints for COPD and bronchiectasis subjects, we developed and evaluated pulmonary ventilation abnormalities derived from free-breathing 1H MRI. We quantitatively and qualitatively compared these measurements to those derived from 3He MRI and pulmonary function tests.
The contents of this chapter were previously published in the journal Academic Radiology: DPI Capaldi, K Sheikh, F Guo, S Svenningsen, R Etemad-Rezai, HO Coxson, JA Leipsic, DG McCormack, and G Parraga. Acad Radiol 2015; 22(3):320-329. Permission to reproduce this article was granted by Elsevier Publishing and is provided in Appendix A.
3.1 Introduction
Chronic obstructive pulmonary disease (COPD) is diagnosed and disease severity stratified
based on not fully reversible airflow obstruction measured using spirometry. Airflow
obstruction, symptoms, and exercise capacity measurements in COPD are related to both
parenchyma destruction (emphysema) and airway remodeling (airways disease and
bronchiectasis).1,2 While spirometry is relatively easy to implement, reproducible, and
inexpensive, it can only provide a global measure of lung function and is weakly predictive
of COPD progression, as well as insensitive to early disease stages.3-5 The limitations of
spirometry measurements of COPD have motivated the development of thoracic imaging
approaches to provide direct and regional measurements of the underlying pathological
features of COPD - airways disease and emphysema.
High resolution computed tomography (HRCT) is the clinical imaging tool of choice for
visualizing and quantifying airways disease6,7 and emphysema8-10 in COPD patients.
Emphysema can be quantified automatically based on thresholds of the CT density
histogram (<-950 Hounsfield units [HU]).8,10,11 Thoracic CT estimates of airways disease
can also be generated using measurements of airway wall area percent (WA%) and lumen
area (LA). Indirect measurements of airways disease include CT measurements of gas
78
trapping using densitometry thresholds (-856HU) on expiratory CT images12 or parametric
response maps (PRM) using co-registered inspiratory and expiratory CT.13 Finally,
bronchiectasis can be readily observed in thoracic CT in up to 50% of patients with severe
COPD,14,15 and this is typically identified by enlarged bronchial diameters and evidence of
significant mucous plugging.
Pulmonary magnetic resonance imaging (MRI) using inhaled hyperpolarized 3He or 129Xe
gas also provides a way to visualize regional ventilation abnormalities and lung
microstructure in subjects with COPD.16-25 Ventilation abnormalities may be quantified
using the ventilation defect percent (VDP), that represents the volume of ventilation defects
normalized to the thoracic cavity.24,26 While rapid (8-15s acquisition time) and well-
tolerated, inhaled noble gas MRI is dependent on polarized gas and multinuclear MR
hardware. An alternative approach that exploits Fourier decomposition of free-breathing
pulmonary MRI (FDMRI) was first developed by Bauman and colleagues at 1.5T.27 This
method provides a way to generate quantitative pulmonary maps of ventilation and
perfusion using fast pulmonary MRI acquisitions of free-breathing 1H MRI and non-rigid
registration.27-33 FDMRI was recently compared and validated with SPECT-CT28 and 3He
MRI30 in a porcine model.
Until now, FDMRI has not been evaluated in COPD or bronchiectasis subjects, nor at 3T
where there is diminished signal intensity at higher field strengths due to T2* effects.34
Hence, our objective was to generate FDMRI (first developed at 1.5T) and 3He MRI
ventilation measurements acquired at 3T in subjects with COPD or bronchiectasis. We
hypothesized that ventilation defects measured using FDMRI and 3He MRI would be
spatially and quantitatively correlated in subjects with COPD and those with
bronchiectasis.
3.2 Materials and Methods
3.2.1 Study Subjects
All subjects were previously diagnosed with COPD or bronchiectasis by a pulmonologist
and provided written informed consent to the study protocol approved by a local research
79
ethics board and Health Canada. COPD subjects were classified according to the Global
initiative for chronic Obstructive Lung Disease (GOLD) grades.1 COPD subjects were ex-
smokers between 50 to 80 years of age and with a smoking history of ≥ 10 pack-years (the
number of packs of cigarettes smoked per day multiplied by the number of years the patient
has smoked). Subjects with bronchiectasis were ex-smokers (n=4) and never-smokers
(n=10) between 40 to 85 years of age. An expert chest radiologist (>20y experience)
qualitatively examined CT data for evidence of bronchiectasis and emphysema.
3.2.2 Pulmonary Function Tests
Spirometry and whole body plethysmography was performed using a body plethysmograph
(MedGraphics Corporation, St. Paul, Minnesota, USA) to measure the forced expiratory
volume in one second (FEV1), forced vital capacity (FVC) and static lung volumes
including total lung capacity (TLC), inspiratory capacity (IC), residual volume (RV), and
functional residual capacity (FRC), airways resistance (RAW), and the diffusing capacity of
lung for carbon monoxide (DLCO) using the attached gas analyzer. All measurements were
performed according to the American Thoracic Society (ATS) guidelines.35
3.2.3 Image Acquisition
MRI was performed with a whole-body 3T Discovery MR750 system (General Electric
Health Care [GEHC], Milwaukee, Wisconsin, USA) capable of performing multinuclear
imaging. All MR images were acquired in the coronal slice orientation. Conventional 1H
MRI was performed 5 minutes prior to hyperpolarized 3He MRI. Subjects were instructed
to maintain normal tidal breathing and then from functional residual capacity (FRC) inhale
a 1.0L mixture of 4He/N2. For the purposes of this study and in order to aid direct
comparisons, all MRI and CT images were acquired at FRC+1.0L in order for consistency.
By having all subjects inhale 1.0L of gas after passive expiration, we ensured consistent
lung volumes across all imaging methods. We also note that in order to truly capture the
same lung volume consistently, our approach of using a measured volume for inhalation is
straightforward and easily undertaken even supine in the CT or MR scanner. 1H MRI was
acquired with subjects in breath-hold position using a whole-body radiofrequency coil and
80
a 1H fast spoiled gradient-recalled echo (FGRE) sequence with a partial echo (total data
acquisition time=12s; repetition time [TR]/echo time [TE]/flip-angle=4.3ms/1.0ms/30°;
field-of-view [FOV]=40×40cm2; matrix=128×80 [zero-padded to 128×128]; partial echo
percent=62.5%; bandwidth [BW]=62.50kHz; number of excitations [NEX]=1; number of
slices=14; slice thickness=15mm). For all MRI breath-hold maneuvers, oxygen saturation
(SPO2) was continuously monitored using a digital pulse oximeter.
Hyperpolarized 3He MRI was performed using a single channel rigid elliptical transmit-
receive chest coil (RAPID Biomedical, Rimpar, Wuerzburg, Germany). A polarizer
system (HeliSpin; Polarean, Durham, North Carolina, USA) was utilized to polarize the 3He gas, which achieved polarization levels of approximately 40%. Doses of 5mL/kg of
body weight were diluted with medical-grade N2 gas (Spectra Gases, Branchburg, New
Jersey, USA) and administered in 1.0L Tedlar bags (Jensen Inert Products, Coral Springs,
Florida, USA). Hyperpolarized 3He ventilation images were acquired with subjects in
breath-hold position after inspiration of a 1.0L 3He/N2 mixture using a fast gradient-
recalled echo method with a partial echo (total data acquisition time=10s; TR/TE/flip-
angle=3.8ms/1.0ms/7°; FOV=40×40cm2; matrix=128×80 [zero-padded to 128×128];
partial echo percent=62.5%; BW=62.50kHz; NEX=1; number of slices=14; slice
thickness=15mm). The flip angle was determined using a constant flip angle approach
where flip angle (α) depends on the number of phase encoding steps (Y-gradient steps).
Thus, 𝛼𝛼 = tan−1 �2/𝑁𝑁, where N was a number of Y-gradient steps. Therefore for this
pulse sequence, where there are 128 Y-gradient steps, a 7.12° flip angle was used.
Hyperpolarized 3He diffusion-weighted images were acquired using a FGRE sequence
with centric k-space sampling (total data acquisition time=14s; TR/TE/flip-
angle=6.8ms/4.5ms/8°; FOV=40×40cm2; matrix=128×128; BW=62.50kHz; NEX=1;
number of slices=7; slice thickness=30mm). Two interleaved images were acquired with
and without additional diffusion sensitization (G=1.94G/cm; b=1.6s/cm2; rise-and-fall
time=0.5ms; gradient duration=0.46ms; diffusion time=1.46ms).
Dynamic free tidal-breathing 1H MRI was acquired over a period of 125s at a rate of four
frames per second using an optimized balanced steady state free precession sequence
81
(bSSFP) and respiratory bellows. We used a fast imaging employing steady state pulse
sequence (FIESTA, GEHC) with total data acquisition time=125s, TE/TR/flip-
angle=0.6ms/1.9ms/15°, FOV=40×40cm, matrix = 256×256, BW=250kHz, NEX=1,
number of phases=500, slice thickness=15mm, and a 32-channel torso coil (GEHC). A
single coronal slice was obtained with slice thickness=15mm. The number of phases refers
to the number of images acquired from one specific location over time. In other words, we
acquired multiple frames of one single coronal slice over a certain time span. The slice
was prescribed on an axial localizer and was positioned slightly posterior to the cardiac
silhouette in an effort to eliminate artifacts due to cardiac motion but allow visualization
of the aorta.
CT was acquired using a 64 slice Lightspeed VCT scanner (GEHC) at FRC+1.0L of N2
gas using a spiral acquisition (detector configuration=64×0.625mm; peak x-ray tube
voltage=120kVp; effective x-ray tube current=100mA; x-ray tube rotation time=500ms;
pitch=1.0). Image reconstruction was performed using a standard convolution kernel for
1.25mm isotropic resolution.
3.2.4 Image Analysis
Segmentation of 3He MRI and FDMRI ventilation was performed using custom software
generated using MATLAB R2013a (Mathworks, Natick, Massachusetts, USA), as
previously described.26 3He MRI apparent diffusion coefficient (ADC) maps were
generated as previously described.36 The relative area of the CT density histogram with
attenuation values < -950HU (RA950) was determined using MATLAB R2013a
(Mathworks). Pulmonary Workstation 2.0 (VIDA Diagnostics Inc., Coralville, Iowa,
USA) was used to quantify WA% and lumen area LA.
Image analysis of dynamic free-breathing 1H MRI was performed using MATLAB R2013a
(Mathworks). Non-rigid registration was used to co-register the temporal series of tidal-
breathing 1H MRI slices using a modality independent neighbourhood descriptor (MIND)
deformable registration method.37 A specific reference image was used so that the
corresponding lung volume was consistent with 3He MRI volumes. Pulmonary voxel
intensities from the registered free-breathing 1H MRI were aligned along a time axis and

82
discrete Fourier transforms were performed on the signal intensity oscillation pattern. The
frequency of the first ventilation harmonic (corresponding to the respiratory rate) was
determined for every voxel, the magnitude of which was used to generate a ventilation
map.
The Dice Similarity Coefficient (DSC)38 was used to quantify the regional overlap for 3He
MRI and FDMRI ventilation as well as the spatial relationship of CT RA950 density maps
with FDMRI ventilation defect volume.
3.2.5 Statistics
Independent t-tests, tests for normality (determined with a Shapiro-Wilk test), and analysis
of variance (ANOVA) with post-hoc analysis using the Holm-Bonferroni correction were
performed using SPSS Statistics V22.0 (SPSS Inc., Chicago, Illinois, USA). Pearson
correlation coefficients (r) were used to determine the correlation between measurements
using SPSS Statistics V22.0 (SPSS Inc.). Measurement agreement was evaluated using
the Bland-Altman method using GraphPad Prism V6.0 (GraphPad Software Inc., La Jolla,
California, USA). Correlation coefficients were compared using the Fisher z′
transformation for each r value.21 Results were considered significant when the probability
of two-tailed type I error (α) was less than 5% (p<.05).
3.3 Results
Table 3-1 shows the demographic and pulmonary function test measurements for all
subjects (69±10yrs) as well as the 12 COPD (67±9yrs) and 14 bronchiectasis subjects
(70±11yrs). For COPD subjects, three were GOLD grade I, four were GOLD grade II, and
five were GOLD grades III/IV. CT evidence of emphysema only was reported in seven
COPD subjects and there was CT evidence of both emphysema and bronchiectasis in five
COPD subjects.
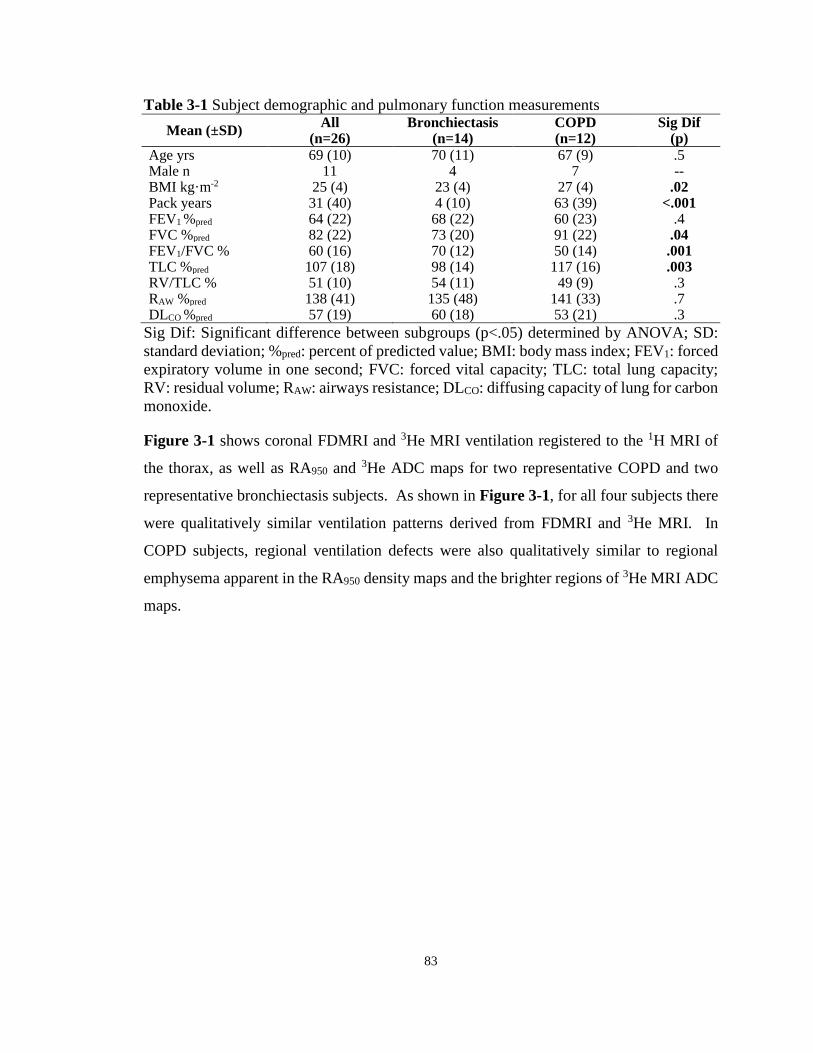
83
Table 3-1 Subject demographic and pulmonary function measurements Mean (±SD) All
(n=26) Bronchiectasis
(n=14) COPD (n=12)
Sig Dif (p)
Age yrs 69 (10) 70 (11) 67 (9) .5 Male n 11 4 7 -- BMI kg·m-2 25 (4) 23 (4) 27 (4) .02 Pack years 31 (40) 4 (10) 63 (39) <.001 FEV1 %pred 64 (22) 68 (22) 60 (23) .4 FVC %pred 82 (22) 73 (20) 91 (22) .04 FEV1/FVC % 60 (16) 70 (12) 50 (14) .001 TLC %pred 107 (18) 98 (14) 117 (16) .003 RV/TLC % 51 (10) 54 (11) 49 (9) .3 RAW %pred 138 (41) 135 (48) 141 (33) .7 DLCO %pred 57 (19) 60 (18) 53 (21) .3
Sig Dif: Significant difference between subgroups (p<.05) determined by ANOVA; SD: standard deviation; %pred: percent of predicted value; BMI: body mass index; FEV1: forced expiratory volume in one second; FVC: forced vital capacity; TLC: total lung capacity; RV: residual volume; RAW: airways resistance; DLCO: diffusing capacity of lung for carbon monoxide.
Figure 3-1 shows coronal FDMRI and 3He MRI ventilation registered to the 1H MRI of
the thorax, as well as RA950 and 3He ADC maps for two representative COPD and two
representative bronchiectasis subjects. As shown in Figure 3-1, for all four subjects there
were qualitatively similar ventilation patterns derived from FDMRI and 3He MRI. In
COPD subjects, regional ventilation defects were also qualitatively similar to regional
emphysema apparent in the RA950 density maps and the brighter regions of 3He MRI ADC
maps.
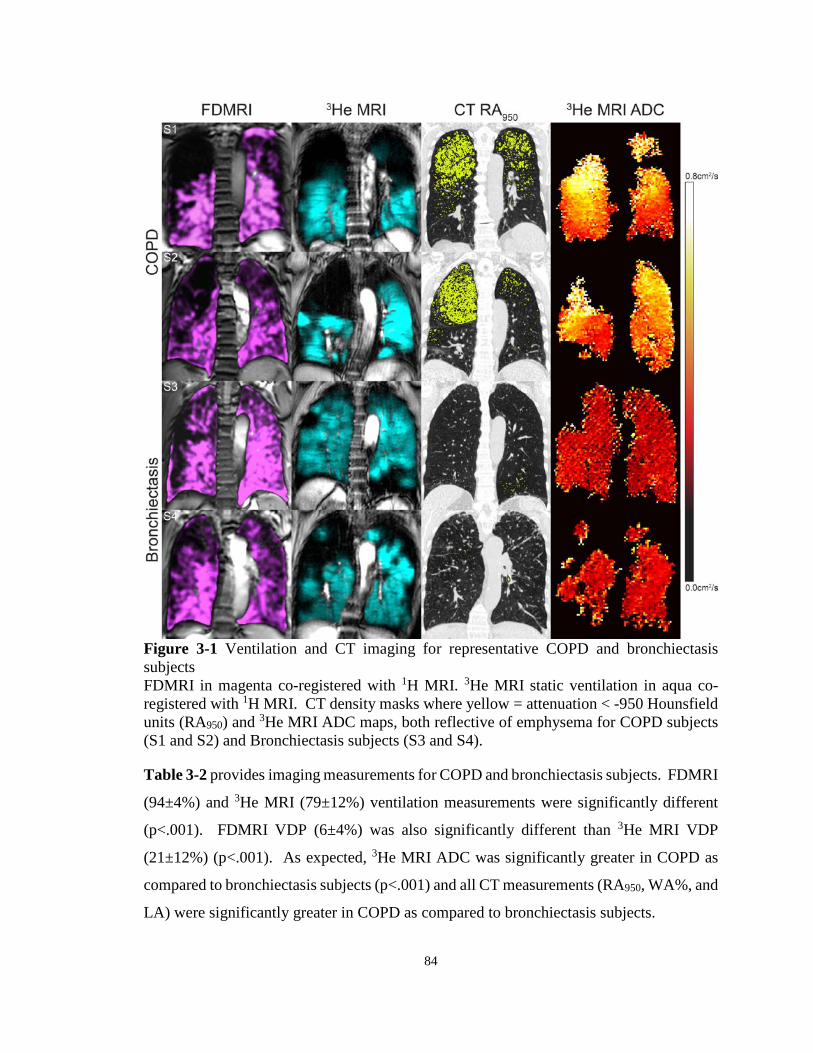
84
Figure 3-1 Ventilation and CT imaging for representative COPD and bronchiectasis subjects FDMRI in magenta co-registered with 1H MRI. 3He MRI static ventilation in aqua co-registered with 1H MRI. CT density masks where yellow = attenuation < -950 Hounsfield units (RA950) and 3He MRI ADC maps, both reflective of emphysema for COPD subjects (S1 and S2) and Bronchiectasis subjects (S3 and S4).
Table 3-2 provides imaging measurements for COPD and bronchiectasis subjects. FDMRI
(94±4%) and 3He MRI (79±12%) ventilation measurements were significantly different
(p<.001). FDMRI VDP (6±4%) was also significantly different than 3He MRI VDP
(21±12%) (p<.001). As expected, 3He MRI ADC was significantly greater in COPD as
compared to bronchiectasis subjects (p<.001) and all CT measurements (RA950, WA%, and
LA) were significantly greater in COPD as compared to bronchiectasis subjects.
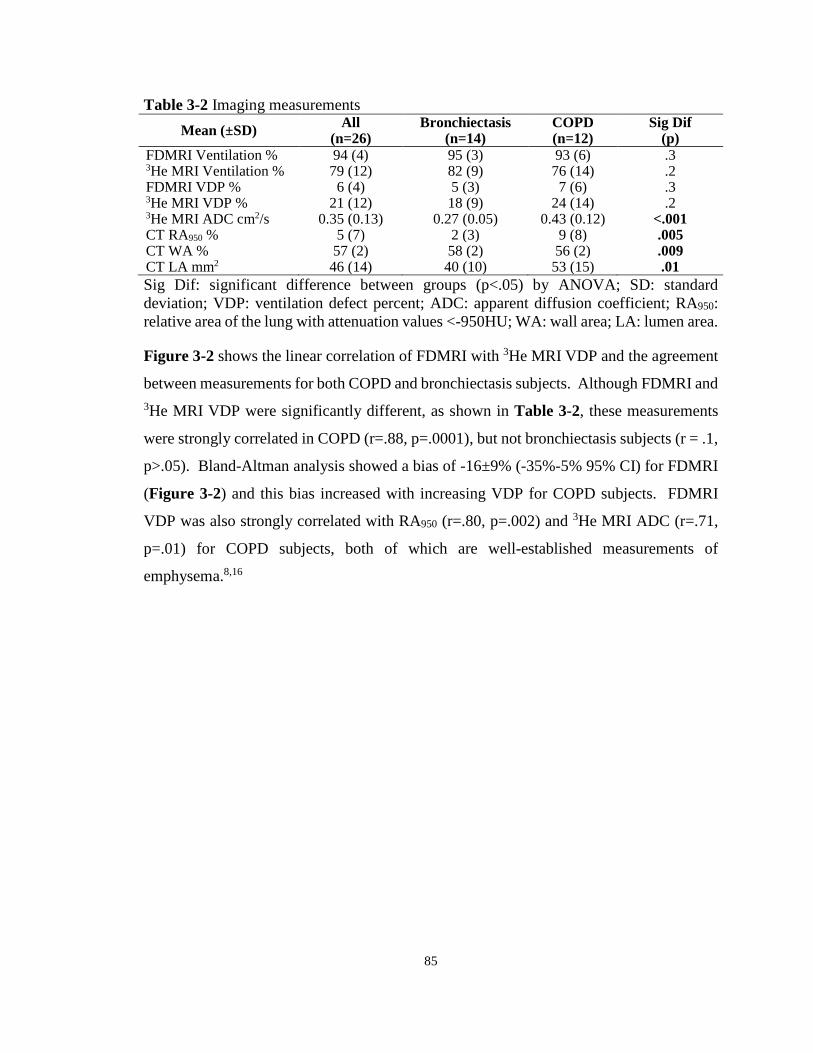
85
Table 3-2 Imaging measurements Mean (±SD) All
(n=26) Bronchiectasis
(n=14) COPD (n=12)
Sig Dif (p)
FDMRI Ventilation % 94 (4) 95 (3) 93 (6) .3 3He MRI Ventilation % 79 (12) 82 (9) 76 (14) .2 FDMRI VDP % 6 (4) 5 (3) 7 (6) .3 3He MRI VDP % 21 (12) 18 (9) 24 (14) .2 3He MRI ADC cm2/s 0.35 (0.13) 0.27 (0.05) 0.43 (0.12) <.001 CT RA950 % 5 (7) 2 (3) 9 (8) .005 CT WA % 57 (2) 58 (2) 56 (2) .009 CT LA mm2 46 (14) 40 (10) 53 (15) .01 Sig Dif: significant difference between groups (p<.05) by ANOVA; SD: standard deviation; VDP: ventilation defect percent; ADC: apparent diffusion coefficient; RA950: relative area of the lung with attenuation values <-950HU; WA: wall area; LA: lumen area.
Figure 3-2 shows the linear correlation of FDMRI with 3He MRI VDP and the agreement
between measurements for both COPD and bronchiectasis subjects. Although FDMRI and 3He MRI VDP were significantly different, as shown in Table 3-2, these measurements
were strongly correlated in COPD (r=.88, p=.0001), but not bronchiectasis subjects (r = .1,
p>.05). Bland-Altman analysis showed a bias of -16±9% (-35%-5% 95% CI) for FDMRI
(Figure 3-2) and this bias increased with increasing VDP for COPD subjects. FDMRI
VDP was also strongly correlated with RA950 (r=.80, p=.002) and 3He MRI ADC (r=.71,
p=.01) for COPD subjects, both of which are well-established measurements of
emphysema.8,16
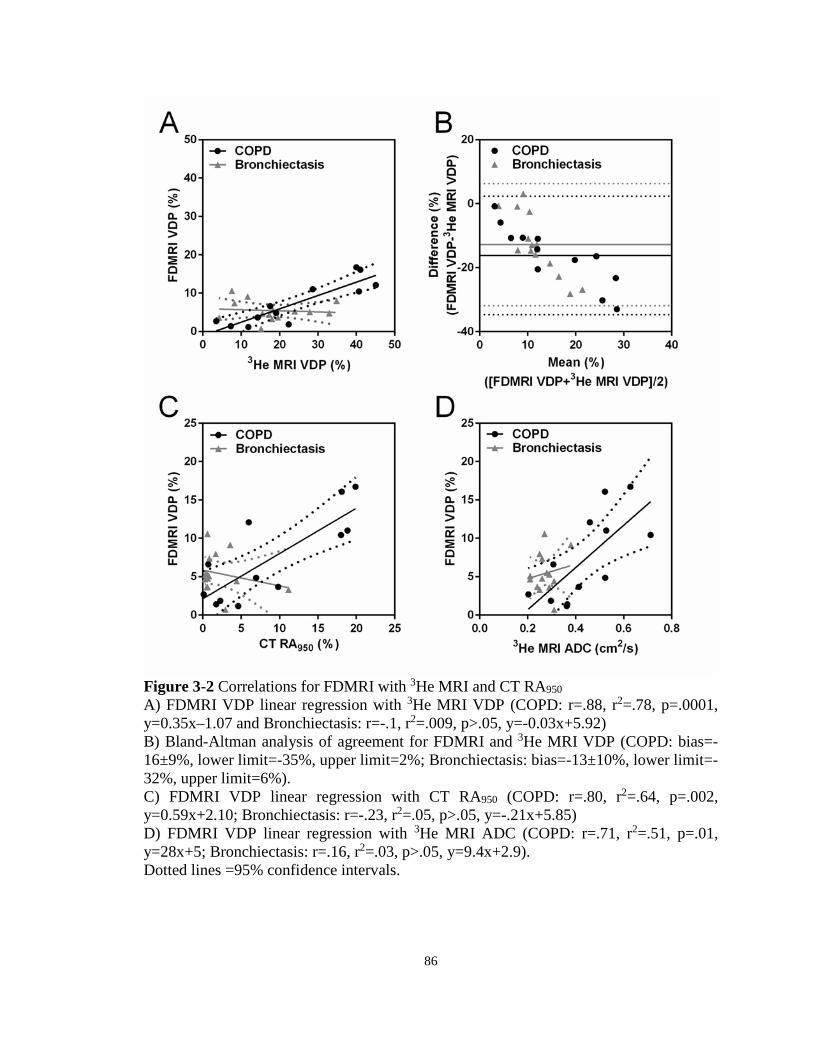
86
Figure 3-2 Correlations for FDMRI with 3He MRI and CT RA950 A) FDMRI VDP linear regression with 3He MRI VDP (COPD: r=.88, r2=.78, p=.0001, y=0.35x–1.07 and Bronchiectasis: r=-.1, r2=.009, p>.05, y=-0.03x+5.92) B) Bland-Altman analysis of agreement for FDMRI and 3He MRI VDP (COPD: bias=-16±9%, lower limit=-35%, upper limit=2%; Bronchiectasis: bias=-13±10%, lower limit=-32%, upper limit=6%). C) FDMRI VDP linear regression with CT RA950 (COPD: r=.80, r2=.64, p=.002, y=0.59x+2.10; Bronchiectasis: r=-.23, r2=.05, p>.05, y=-.21x+5.85) D) FDMRI VDP linear regression with 3He MRI ADC (COPD: r=.71, r2=.51, p=.01, y=28x+5; Bronchiectasis: r=.16, r2=.03, p>.05, y=9.4x+2.9). Dotted lines =95% confidence intervals.
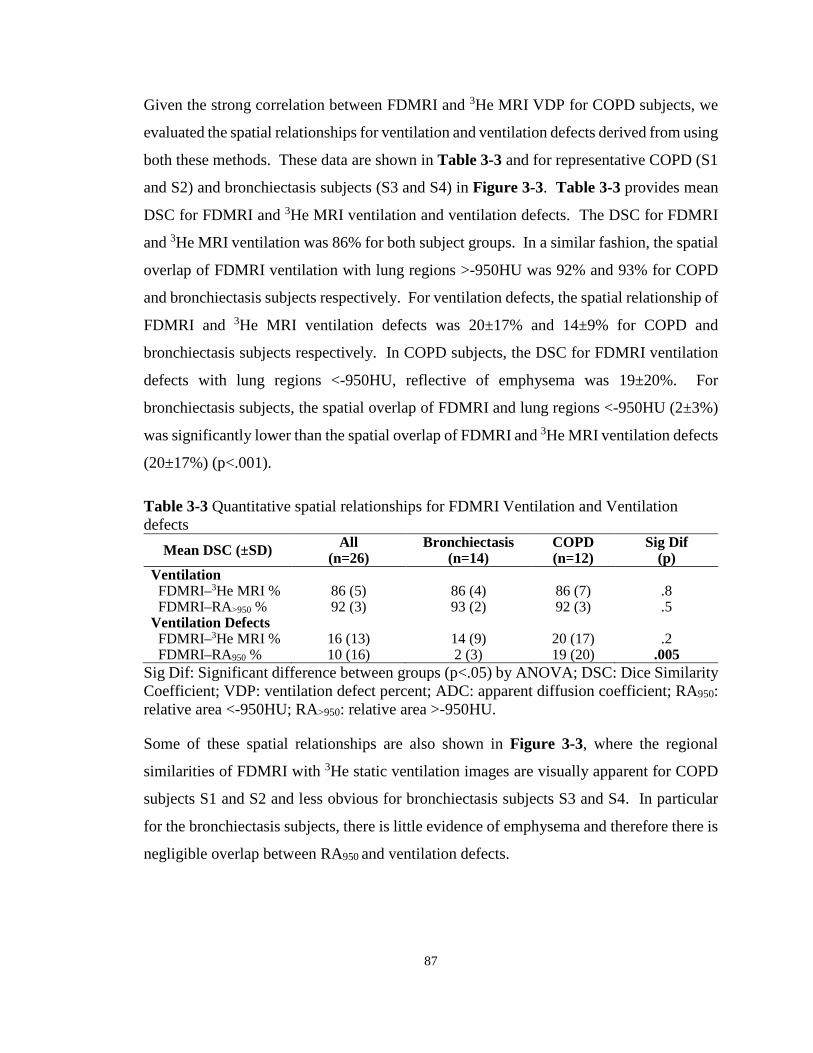
87
Given the strong correlation between FDMRI and 3He MRI VDP for COPD subjects, we
evaluated the spatial relationships for ventilation and ventilation defects derived from using
both these methods. These data are shown in Table 3-3 and for representative COPD (S1
and S2) and bronchiectasis subjects (S3 and S4) in Figure 3-3. Table 3-3 provides mean
DSC for FDMRI and 3He MRI ventilation and ventilation defects. The DSC for FDMRI
and 3He MRI ventilation was 86% for both subject groups. In a similar fashion, the spatial
overlap of FDMRI ventilation with lung regions >-950HU was 92% and 93% for COPD
and bronchiectasis subjects respectively. For ventilation defects, the spatial relationship of
FDMRI and 3He MRI ventilation defects was 20±17% and 14±9% for COPD and
bronchiectasis subjects respectively. In COPD subjects, the DSC for FDMRI ventilation
defects with lung regions <-950HU, reflective of emphysema was 19±20%. For
bronchiectasis subjects, the spatial overlap of FDMRI and lung regions <-950HU (2±3%)
was significantly lower than the spatial overlap of FDMRI and 3He MRI ventilation defects
(20±17%) (p<.001).
Table 3-3 Quantitative spatial relationships for FDMRI Ventilation and Ventilation defects
Mean DSC (±SD) All (n=26)
Bronchiectasis (n=14)
COPD (n=12)
Sig Dif (p)
Ventilation FDMRI–3He MRI % 86 (5) 86 (4) 86 (7) .8 FDMRI–RA>950 % 92 (3) 93 (2) 92 (3) .5 Ventilation Defects FDMRI–3He MRI % 16 (13) 14 (9) 20 (17) .2 FDMRI–RA950 % 10 (16) 2 (3) 19 (20) .005
Sig Dif: Significant difference between groups (p<.05) by ANOVA; DSC: Dice Similarity Coefficient; VDP: ventilation defect percent; ADC: apparent diffusion coefficient; RA950: relative area <-950HU; RA>950: relative area >-950HU.
Some of these spatial relationships are also shown in Figure 3-3, where the regional
similarities of FDMRI with 3He static ventilation images are visually apparent for COPD
subjects S1 and S2 and less obvious for bronchiectasis subjects S3 and S4. In particular
for the bronchiectasis subjects, there is little evidence of emphysema and therefore there is
negligible overlap between RA950 and ventilation defects.

88
Figure 3-3 Spatial relationship of FDMRI with 3He MRI ventilation and emphysema for representative subjects with COPD and Bronchiectasis Left panel: Spatial overlap (green) of FDMRI (purple) and 3He MRI (aqua) ventilation co-registered with 1H MRI and airway tree in brown. Right panel: Spatial overlap (green) of FDMRI (purple) ventilation defects and RA950 mask (yellow) co-registered with CT for COPD subjects S1 and S2 and Bronchiectasis subjects S3 and S4. Dice coefficients for FDMRI–3He MRI ventilation: S1=88%, S2=86%, S3=91%, S4=84% and FDMRI defects–RA950: S1=41%, S2=56%, S3=1%, S4=0%.

89
Table 3-4 summarizes the significant correlations for FDMRI VDP with 3He MRI, CT,
and pulmonary function measurements for the COPD and bronchiectasis subgroups. There
were significant correlations for FDMRI VDP with 3He MRI VDP and ADC, RAW and
RA950 (p<.05) for COPD subjects. For bronchiectasis subjects there was a significant
correlation between FDMRI VDP and LA (p<.05). For COPD subjects, the FDMRI and 3He MRI VDP correlations were not significantly different; however, for bronchiectasis
subjects, there were significant differences.
Table 3-4 Pearson Correlations for FDMRI and 3He MRI FDMRI VDP % 3He MRI VDP % Fisher z′
Bronchiectasis (n=14)
COPD (n=12)
Bronchiectasis (n=14)
COPD (n=12) B C
r/p r/p r/p r/p p p FEV1 %pred .41/.1 -.22/.5 -.73/.003 -.42/.2 .001 .6 FVC %pred .31/.3 .20/.5 -.60/.02 -.04/.9 .02 .7 RV/TLC % -.31/.3 -.19/.6 .65/.02 -.07/.8 .01 .8 RAW %pred -.23/.4 .60/.04 .47/.09 .56/.06 .08 .9 DLCO %pred .08/.8 -.57/.05 -.36/.2 -.61/.04 .3 .9 FDMRI Ventilation % ~-1/<.001 ~-1/<.001 .1/.7 -.88/<.001 <.001 <.001 FDMRI VDP % --/-- --/-- -.1/.7 .88/<.001 -- -- 3He MRI Ventilation % .1/.7 -.88/<.001 ~-1/<.001 ~-1/<.001 <.001 <.001 3He MRI VDP % -.10/.7 .88/<.001 --/-- --/-- -- -- 3He MRI ADC (cm2/s) .16/.6 .71/.01 .35/.2 .76/.004 .6 .8 CT RA950 % -.23/.4 .80/.002 -.04/.9 .72/.008 .6 .7 CT WA % -.35/.2 -.07/.8 .29/.3 -.18/.6 .1 .8 CT LA mm2 .58/.03 .43/.2 -.09/.7 .59/.04 .08 .6
r: Pearson correlation coefficients; %pred: percent of predicted value; FEV1: forced expiratory volume in one second; FVC: forced vital capacity; RV/TLC: residual volume/total lung capacity; RAW: airways resistance; DLCO: Diffusing capacity for carbon monoxide; VDP: ventilation defect percent; ADC: apparent diffusion coefficient; RA950: relative area of the lung with attenuation < -950HU; WA: wall area; LA: lumen area.
3.4 Discussion
In this proof-of-concept study, we evaluated 26 patients including 12 subjects with COPD
and another 14 with bronchiectasis and observed: 1) in all subjects, FDMRI VDP was
significantly less than 3He MRI VDP, 2) in COPD but not bronchiectasis subjects, FDMRI
and 3He MRI ventilation and VDP were quantitatively correlated and these values showed
strong spatial relationships with one another and with RA950 maps, and, 3) in COPD
subjects only there were significant and similar correlations for FDMRI and 3He MRI VDP
with pulmonary function test and CT measurements.
90
In all subjects, FDMRI VDP was significantly less than 3He MRI VDP. It is difficult to
completely understand why FDMRI VDP was significantly less and FDMRI ventilation
was significantly greater than 3He MRI measurements in all subjects. However, one
explanation may be derived from the underlying principles of the two methods and how
they generate or capture ventilation information. Inhaled contrast gas methods provide
static breath-hold snapshots of where the high contrast inhaled gas travels to and resides
during the scanning period of 8-15s. In this manner, very high contrast and signal-to-noise
ventilation images can be easily generated and processed. In contrast, but similar to four-
dimensional CT (4DCT) which produces three-dimensional image datasets through
time,39,40 FDMRI generates ventilation contrast based on image signal differences during
the breathing cycle as air enters and leaves the pulmonary system and tissue contracts and
expands. This is a more indirect approach that relies on robust and accurate image
processing methods to co-register the dynamic free tidal-breathing 1H MRI. This method
also relies on the inherent image signal intensity and signal-to-noise ratios of pulmonary
images from a system that is inherently air-filled. In CT, the attenuation values for air as
compared to tissue provide significant contrast. However, the contrast derived from the 1H signal changes are inherently weak, and this certainly necessitates that the image
processing methods used must be more complex and robust. Previous work41 explored the
spatial and quantitative relationship of 3He MRI and 4DCT ventilation measurements in a
proof of concept demonstration in a small number of non-small cell lung cancer patients.
There was excellent spatial correspondence for the ventilation maps derived using static
MRI and free-breathing CT imaging approaches with no significant differences in
ventilation. These results provided good evidence that ventilation maps and measurements
generated using vastly different image acquisition and analysis methods as well as
breathing maneuvers provided similar regional and quantitative ventilation information.
It is important to note that 3He MRI ventilation percent and VDP are not independent
measurements since these simply sum to 100%. However, because here we are directly
comparing VDP which is a relatively small volume and ventilation which is a large volume
for both FD and 3He MRI, we think it’s important to use and compare both values. This is
especially important in order to show spatial relationships such as the Dice coefficient that
91
is highly dependent on the relative size of the comparators. We think this is also important
because the 3He ventilation MRI depicts gas distribution, whereas, FDMRI ventilation
reflects the ventilation fundamental frequency and signal intensity changes related to this
value. Because of this, spatial overlap analyses were conducted for both ventilation maps
and ventilation defect maps obtained using both 3He and FDMRI.
In COPD, but not bronchiectasis subjects, FDMRI and 3He MRI ventilation were
quantitatively and spatially related. In addition, FDMRI and 3He MRI VDP were
quantitatively correlated and showed strong spatial relationships with RA950 maps – those
regions that reflected emphysematous destruction or air in CT images. We were surprised
to observe such differences in the spatial and quantitative correlations for FDMRI and 3He
MRI in COPD as compared to bronchiectasis subjects. One explanation can be derived
from the presence of thick mucus (which appears as greater 1H signal intensity relative to
that of parenchyma tissue) in the airways and parenchyma in bronchiectasis that may lead
to registration error. To generate FDMRI ventilation images, registration algorithms must
account for the movement of the diaphragm and any registration error will result in regions
of high signal intensity (e.g. mucus pooling in bronchiectasis subjects) oscillating at the
same frequency as respiration. This registration error can result in apparently increased
ventilation, which may or may not accurately reflect truly ventilated regions. Thus, in
bronchiectasis subjects, there may be regions that appear as ventilated in FDMRI that are
in fact not ventilated due to misalignment of the mucus’ boundaries via the deformable
registration process. We must acknowledge that all three imaging methods measure very
different physical parameters. For example, while CT provides a measurement of regional
lung tissue density, 3He MRI provides a functional estimate of pulmonary ventilation and
alveolar dimensions using diffusion-weighted imaging. FDMRI on the other hand,
provides an estimate of ventilation by quantifying the signal intensity contributions
throughout the compression and expansion of the lung parenchyma via the cardiac and the
respiratory cycles. However, we recently showed that in COPD subjects, 3He MRI
ventilation defects often co-localize with large emphysematous bullae.42 In fact, we
previously observed this in patients with advanced emphysema and because of this work
hypothesized that this spatial co-localization was related to the long time constants for
92
filling of emphysematous bullae and not airways disease. Here and in light of these
previous findings, we directly evaluated the spatial co-localization of emphysematous
regions with FDMRI and 3He MRI ventilation defects. The spatial relationships observed
for FDMRI and 3He MRI ventilation defects with RA950 in the current study suggest that
in patients with emphysema, ventilation defects generated using FDMRI may also be
derived to the long time-constants for lung filling. Our findings further support the notion
that these methods (i.e. FDMRI, 3He MRI, and CT), though very different, are probing and
interrogating similar functional but likely not structural information in COPD subjects. It
appears that a free-breathing method like FDMRI, shows some dependence on the very
long time constants for filling emphysematous bullae, and this finding should be considered
when using FDMRI for COPD imaging.
Finally, in COPD subjects only, there were significant and similar correlations for FDMRI
and 3He MRI VDP with pulmonary function test and CT measurements. These are
important findings that further support and suggest that both methods provide similar
functional information in COPD subjects even though they are different methods. In
contrast, for bronchiectasis subjects, there was a significant correlation between FDMRI
VDP and airway lumen area. This suggests that elevated lumen area (corresponding to
dilated airways) may be related to low proton density.
We recognize and acknowledge that this work was limited by the relatively small sample
size. In addition, we studied mainly subjects with moderate COPD (8/12 subjects with
GOLD grade II or III) and given our understanding of the heterogeneity of COPD patients,
caution should be used when extrapolating our results to a broader COPD group. Fourier
decomposition has recently emerged as a pulmonary functional MRI method, with the
promise of serial lung function measurements without a dependence on polarized or other
inhaled gases or multinuclear capabilities. This opens up the opportunity for functional
lung imaging on conventional MRI scanners - available more universally, albeit the final
measurements are dependent on more sophisticated image processing methods. It should
be noted that one of the challenges associated with pulmonary proton MRI methods, is the
weak pulmonary proton signal intensity that is further diminished at higher field strengths
because of the relationship between field-strength and T2* effects. Previous pilot and

93
development studies at 1.5T, have shown qualitative agreement for regional ventilation and
perfusion measurements with the clinical reference standard SPECT/CT.28 Moreover,
recent studies have also demonstrated the reproducibility of FDMRI ventilation- and
perfusion-weighted images in healthy volunteers.32 Finally FDMRI-to-3He MRI
comparisons in animals showed similar regional abnormalities including pulmonary
embolism, atelectasis, and air trapping.30
To our knowledge, there has been no prospective comparison of FDMRI with 3He MRI at
3T in subjects with COPD and bronchiectasis. Consistent with previous studies we showed
similar regional ventilation abnormalities using FDMRI and 3He MRI in COPD subjects
and these appear to be dominated by the presence of regional emphysematous bullae. In
summary, FDMRI and 3He MRI ventilation and VDP were strongly correlated in COPD,
but not bronchiectasis subjects. In COPD subjects only, FDMRI ventilation defects were
also spatially related with 3He MRI ventilation defects and CT measurements of
emphysema.
94
3.5 References
(1) Vestbo, J. et al. Global strategy for the diagnosis, management, and prevention of chronic obstructive pulmonary disease: GOLD executive summary. Am J Respir Crit Care Med 2013; 187: 347-365.
(2) Pauwels, R. A. et al. Global strategy for the diagnosis, management, and prevention of chronic obstructive pulmonary disease. NHLBI/WHO Global Initiative for Chronic Obstructive Lung Disease (GOLD) Workshop summary. Am J Respir Crit Care Med 2001; 163: 1256-1276.
(3) Vestbo, J. et al. Evaluation of COPD Longitudinally to Identify Predictive Surrogate End-points (ECLIPSE). Eur Respir J 2008; 31: 869-873.
(4) Cerveri, I. et al. Underestimation of airflow obstruction among young adults using FEV(1)/FVC < 70% as a fixed cut-off: a longitudinal evaluation of clinical and functional outcomes. Thorax 2008; 63: 1040-1045.
(5) Enright, P. L. & Kaminsky, D. A. Strategies for screening for chronic obstructive pulmonary disease. Respir Care 2003; 48: 1194-1201; discussion 1201-1193.
(6) Hackx, M., Bankier, A. A. & Gevenois, P. A. Chronic Obstructive Pulmonary Disease: CT Quantification of Airways Disease. Radiology 2012; 265: 34-48.
(7) Nakano, Y. et al. Quantitative assessment of airway remodeling using high-resolution CT. Chest 2002; 122: 271s-275s.
(8) Hayhurst, M. D. et al. Diagnosis of pulmonary emphysema by computerised tomography. Lancet 1984; 2: 320-322.
(9) Klein, J. S., Gamsu, G., Webb, W. R., Golden, J. A. & Muller, N. L. High-resolution CT diagnosis of emphysema in symptomatic patients with normal chest radiographs and isolated low diffusing capacity. Radiology 1992; 182: 817-821.
(10) Müller, N., Staples, C., Miller, R. & Abboud, R. " Density mask". An objective method to quantitate emphysema using computed tomography. Chest 1988; 94: 782.
(11) Uppaluri, R., Mitsa, T., Sonka, M., Hoffman, E. A. & McLennan, G. Quantification of pulmonary emphysema from lung computed tomography images. Am J Respir Crit Care Med 1997; 156: 248-254.
(12) Zach, J. A. et al. Quantitative computed tomography of the lungs and airways in healthy nonsmoking adults. Invest Radiol 2012; 47: 596-602.
95
(13) Galban, C. J. et al. Computed tomography-based biomarker provides unique signature for diagnosis of COPD phenotypes and disease progression. Nature medicine 2012; 18: 1711-1715.
(14) O'Brien, C., Guest, P. J., Hill, S. L. & Stockley, R. A. Physiological and radiological characterisation of patients diagnosed with chronic obstructive pulmonary disease in primary care. Thorax 2000; 55: 635-642.
(15) Patel, I. S. et al. Bronchiectasis, exacerbation indices, and inflammation in chronic obstructive pulmonary disease. Am J Respir Crit Care Med 2004; 170: 400-407.
(16) de Lange, E. E. et al. Lung air spaces: MR imaging evaluation with hyperpolarized 3He gas. Radiology 1999; 210: 851-857.
(17) Kauczor, H. U. et al. Normal and abnormal pulmonary ventilation: Visualization at hyperpolarized He-3 MR imaging. Radiology 1996; 201: 564-568.
(18) Albert, M. S. et al. Biological Magnetic-Resonance-Imaging Using Laser Polarized Xe-129. Nature 1994; 370: 199-201.
(19) Mathew, L. et al. Hyperpolarized (3)He magnetic resonance imaging: preliminary evaluation of phenotyping potential in chronic obstructive pulmonary disease. Eur J Radiol 2011; 79: 140-146.
(20) Kirby, M. et al. Pulmonary ventilation visualized using hyperpolarized helium-3 and xenon-129 magnetic resonance imaging: differences in COPD and relationship to emphysema. Journal of Applied Physiology 2013; 114: 707-715.
(21) Kirby, M. et al. Hyperpolarized 3He and 129Xe MR imaging in healthy volunteers and patients with chronic obstructive pulmonary disease. Radiology 2012; 265: 600-610.
(22) Driehuys, B. et al. Chronic obstructive pulmonary disease: safety and tolerability of hyperpolarized 129Xe MR imaging in healthy volunteers and patients. Radiology 2012; 262: 279-289.
(23) Kaushik, S. S. et al. Diffusion-weighted hyperpolarized 129Xe MRI in healthy volunteers and subjects with chronic obstructive pulmonary disease. Magn Reson Med 2011; 65: 1154-1165.
(24) Parraga, G. et al. Hyperpolarized 3He ventilation defects and apparent diffusion coefficients in chronic obstructive pulmonary disease: preliminary results at 3.0 Tesla. Invest Radiol 2007; 42: 384-391.
(25) Kirby, M. et al. Chronic obstructive pulmonary disease: longitudinal hyperpolarized (3)He MR imaging. Radiology 2010; 256: 280-289.
96
(26) Kirby, M. et al. Hyperpolarized 3He magnetic resonance functional imaging semiautomated segmentation. Acad Radiol 2012; 19: 141-152.
(27) Bauman, G. et al. Non‐contrast‐enhanced perfusion and ventilation assessment of the human lung by means of fourier decomposition in proton MRI. Magn Reson Med 2009; 62: 656-664.
(28) Bauman, G. et al. Pulmonary functional imaging: qualitative comparison of Fourier decomposition MR imaging with SPECT/CT in porcine lung. Radiology 2011; 260: 551-559.
(29) Bauman, G. et al. Validation of Fourier decomposition MRI with dynamic contrast-enhanced MRI using visual and automated scoring of pulmonary perfusion in young cystic fibrosis patients. European journal of radiology 2013; 82: 2371-2377.
(30) Bauman, G. et al. Lung ventilation‐and perfusion‐weighted Fourier decomposition magnetic resonance imaging: In vivo validation with hyperpolarized 3He and dynamic contrast‐enhanced MRI. Magn Reson Med 2013; 69: 229-237.
(31) Kjørstad, Å. et al. Quantitative lung perfusion evaluation using fourier decomposition perfusion MRI. Magnetic Resonance in Medicine 2013.
(32) Lederlin, M. et al. Functional MRI using Fourier decomposition of lung signal: Reproducibility of ventilation-and perfusion-weighted imaging in healthy volunteers. European journal of radiology 2013.
(33) Sommer, G. et al. Non-contrast-enhanced preoperative assessment of lung perfusion in patients with non-small-cell lung cancer using Fourier decomposition magnetic resonance imaging. Eur J Radiol 2013; 82: e879-887.
(34) Yu, J., Xue, Y. & Song, H. K. Comparison of lung T2* during free‐breathing at 1.5 T and 3.0 T with ultrashort echo time imaging. Magnetic Resonance in Medicine 2011; 66: 248-254.
(35) Miller, M. R. et al. Standardisation of spirometry. Eur Respir J 2005; 26: 319-338.
(36) Kirby, M., Heydarian, M., Wheatley, A., McCormack, D. G. & Parraga, G. Evaluating bronchodilator effects in chronic obstructive pulmonary disease using diffusion-weighted hyperpolarized helium-3 magnetic resonance imaging. J Appl Physiol (1985) 2012; 112: 651-657.
(37) Heinrich, M. P. et al. MIND: Modality independent neighbourhood descriptor for multi-modal deformable registration. Medical Image Analysis 2012; 16: 1423-1435.
(38) Dice, L. R. Measures of the Amount of Ecologic Association between Species. Ecology 1945; 26: 297-302.

97
(39) Guerrero, T. et al. Dynamic ventilation imaging from four-dimensional computed tomography. Phys Med Biol 2006; 51: 777-791.
(40) Castillo, R., Castillo, E., Martinez, J. & Guerrero, T. Ventilation from four-dimensional computed tomography: density versus Jacobian methods. Phys Med Biol 2010; 55: 4661-4685.
(41) Mathew, L. et al. Hyperpolarized (3)He magnetic resonance imaging: comparison with four-dimensional x-ray computed tomography imaging in lung cancer. Acad Radiol 2012; 19: 1546-1553.
(42) Kirby, M., Pike, D., Coxson, H. O., McCormack, D. G. & Parraga, G. Hyperpolarized He Ventilation Defects Used to Predict Pulmonary Exacerbations in Mild to Moderate Chronic Obstructive Pulmonary Disease. Radiology 2014; 140161.

98
CHAPTER 4
4 FREE-BREATHING FUNCTIONAL PULMONARY MRI: RESPONSE TO BRONCHODILATOR AND BRONCHOPROVOCATION IN SEVERE ASTHMA
Based on the free-breathing pulmonary 1H MRI approach developed in Chapter 3, we wanted to determine the potential application for Fourier-decomposition MRI in evaluating ventilation heterogeneity in patients with severe asthma, both pre- and post-salbutamol as well as post-methacholine challenge. We qualitatively and quantitatively compared these measurements to those derived from 3He MRI.
The contents of this chapter were previously published in the journal Academic Radiology: DPI Capaldi, K Sheikh, RL Eddy, F Guo, S Svenningsen, P Nair, DG McCormack, and G Parraga for the Canadian Respiratory Research Network. Acad Radiol 2017; 24(10):1268-1276. Permission to reproduce this article was granted by Elsevier Publishing and is provided in Appendix A.
4.1 Introduction
Asthma is a chronic and often debilitating airways disease, characterized by intermittent
worsening of breathlessness, cough, chest-tightness and wheeze and is typically diagnosed
based on spirometry measurements of bronchodilator reversibility1 or response to
methacholine challenge2 using the forced expiratory volume in one second (FEV1).3 While
current asthma therapies were developed based on FEV1 improvements,4 this measurement
of airflow limitation is relatively insensitive to small airway obstruction,5,6 which is
believed to be the main sight of inflammation and airway remodeling (or pre modeling) in
asthma.7 For many children and adults with asthma, disease control remains elusive and a
recent survey identified that over 90% of Canadian asthmatics reported poorly-controlled
disease and nearly half did not participate in any exercise of any type due to asthma
symptoms.8 This unacceptable disease morbidity and the large and growing number of
asthma patients of all ages has motivated the development of pulmonary imaging
approaches to generate new and more sensitive biomarkers of small airway dysfunction.
To date however, it has been complex to utilize such imaging biomarkers in the
development of new therapies in clinical trials9 or to guide therapy decisions in individual
patients.
99
In asthmatics, thoracic computed tomography (CT) can be used to provide asthma
biomarkers of gas-trapping,10 airway remodeling11 such as airway wall thickening and
lumen narrowing,12 and dynamic changes in ventilation using xenon-enhanced dual energy
CT.13 Although ultra-low dose CT methods using iterative adaptive reconstruction
methods are now under development,14 because of radiation dose concerns, the clinical use
of CT in asthmatics has been limited, especially in mild disease and in children.15-17 Other
examples include positron emission tomography (PET)18 and single photon emission
computed tomography (SPECT),19,20 both of which have been used in the research setting
to evaluate regional ventilation heterogeneity in asthmatics.18-20
Magnetic resonance imaging (MRI) methods also provide a way to measure lung structure
and function. In particular, inhaled-noble gas MRI ventilation defects21-27 were shown to
be spatially persistent over time,21 related to airway abnormalities,22 worsened in response
to bronchoconstriction23 and improve post-bronchodilator.24 Inhaled-gas MRI ventilation
defects also correlate with pulmonary function measurements,25,26 CT evidence of gas-
trapping,26 disease severity,22,25 inflammation,22 and asthma control.27 Other examples
include oxygen-enhanced T1 mapping of ventilation patterns in asthmatics28,29 and a
number of conventional 1H MRI methods.30-35 For example, 1H signal intensity at different
lung volumes may be used to estimate regional ventilation30 and was recently compared
with hyperpolarized 3He MRI.31 Fourier decomposition 1H MRI (FDMRI) is another
approach32 that generates ventilation and perfusion maps in free-breathing participants in
about two minutes using balanced steady state free precession pulse sequences without
cardiac or respiratory gating. FDMRI ventilation defects were previously observed to be
spatially related to SPECT-CT defects33 and 3He MRI ventilation defects in animal
models34 and COPD patients.35
To our knowledge, FDMRI has not been evaluated in patients with severe asthma, and this
is important because FDMRI may be an important tool for evaluating ventilation and
perfusion abnormalities in asthmatics in whom repeated CT is not clinically acceptable and
at centres where multinuclear MRI is not available. Therefore, here our objective was to
directly compare FDMRI with 3He MRI VDP in severe and poorly controlled asthmatics.
Based on previous results,24,35 we hypothesized that FDMRI VDP would be quantitatively
100
related to 3He MRI VDP and show similar responses to both methacholine and salbutamol
in patients with severe asthma.
4.2 Materials and Methods
4.2.1 Study Logistics and Participants
Sixteen asthmatics (49±10yrs) provided written informed consent to ethics board approved
and Health Insurance Portability and Accountability Act compliant protocols
(https://clinicaltrials.gov NCT02351141, NCT02263794). We enrolled patients between
18 and 70 years of age with a diagnosis of severe asthma, according to the Global Initiative
for Asthma (GINA),1 from two academic tertiary care centres (Robarts Research Institute,
Western University, London, Canada; Firestone Institute for Respiratory Health, McMaster
University, Hamilton, Canada). All participants underwent pulmonary function tests,
multiple breath gas washout, dynamic free-breathing 1H, static 1H and hyperpolarized 3He
MRI, at baseline and 20 minutes after salbutamol administration, within a single two-hour
visit. Asthmatics with FEV1 > 70%predicted also underwent methacholine challenge (MCh),
as per American Thoracic Society (ATS) guidelines2 with MRI performed at the
provocative concentration that lowered FEV1 by 20% (PC20) and 20 minutes post-
salbutamol after MCh test completion.
4.2.2 Spirometry, Plethysmography and Multiple Breath Nitrogen
Washout
Spirometry and whole body plethysmography were performed using a MedGraphics Elite
Series plethysmograph (MedGraphics Corporation, St. Paul, Minnesota, USA), according
to ATS guidelines36 before and after administration of four separate doses of 100μg of
salbutamol (Apo-Salvent CRC Free Inhalation Aerosol Apotex, Toronto, Ontario, Canada)
through a pressurized metered dose inhaler using an AeroChamber Plus spacer (Trudell
Medical International, London, Canada). Methacholine challenge was performed
according to ATS guidelines2 using the two-minute tidal breathing method up to and
including PC20 using an AeroEclipse II Breath Actuated Nebulizer (Trudell Medical
101
International). After PC20 imaging was completed, salbutamol was administered. During
MCh only, spirometry was performed using a handheld ndd EasyOne spirometer (ndd
Medizintechnik AG, Zurich, Switzerland). Multiple breath gas washout was performed
using the ndd EasyOne Pro LAB system (ndd Medizintechnik AG, Zurich, Switzerland)
equipped with an ultrasonic flow and molar mass sensor to measure the lung clearance
index (LCI), as previously described.27
4.2.3 Image Acquisition
MRI was performed in a single two-hour visit at baseline, post-MCh and post-salbutamol
in those participants in whom MCh could be safely completed; in all others, MRI was
performed at baseline and post-salbutamol. MRI was performed on a whole body 3 Tesla
Discovery MR750 (General Electric Health Care [GEHC], Milwaukee, Wisconsin, USA)
system with broadband imaging capability.37 All images were acquired in the coronal
plane. Static breath hold 1H MRI was acquired with subjects in breath hold using a whole
body radiofrequency coil38 and fast spoiled gradient recalled echo (FGRE) sequence with
a partial echo (total-acquisition-time=16s; repetition-time[TR]/echo-time[TE]/flip-
angle=4.7ms/1.2ms/30°;field-of-view [FOV]=40×40cm2, bandwidth[BW]=24.4kHz;
matrix=128×80 [zero-padded to 128×128]; partial-echo-percent=62.5%; number-of-
slices=15-17; slice-thickness=15mm, 0-gap). Hyperpolarized 3He static ventilation MRI
was performed using a single channel, rigid elliptical transmit/receive chest coil (RAPID
Biomedical GmbH, Wuerzburg, Germany) and two dimensional multi-slice FGRE
sequence with a partial echo during a single breath-hold (total-acquisition-time=10s;
TR/TE/flip-angle=3.8ms/1.0ms/7°; FOV=40×40cm2, BW=48.8kHz; matrix=128×80
[zero-padded to 128×128]; partial-echo-percent=62.5%; number-of-slices=15-17; slice-
thickness=15mm, 0-gap). Polarization was approximately 40% using a commercial
polarizer system (HeliSpin, Polarean, Durham, North Carolina, USA. All breath hold
maneuvers were performed with the subject instructed to inhale a 1.0L gas mixture from a
Tedlar® bags (Jensen Inert Products, Coral Springs, Florida, USA) after passive expiration
(functional residual capacity [FRC]).37 Hyperpolarized 3He gas was diluted with medical
grade N2 (Spectra Gases, Newark, New Jersey, USA) and delivered in a 1.0L Tedlar® bag.

102
Oxygen saturation (SPO2) was continuously monitored using a digital pulse oximeter for
all breath hold maneuvers.
Dynamic free breathing 1H MRI was acquired for a single coronal slice using a 32 channel
torso coil (GEHC) including respiratory bellows to monitor the patient’s respiratory rate
using an optimized balanced steady state free precession (bSSFP) sequence (total-
acquisition-time=125s; TR/TE/flip-angle=1.9ms/0.6ms/15°; FOV=40×40cm2;
BW=250kHz; matrix=256×256; number-of-slices=1; slice-thickness=15mm; number-of-
excitations=1; number-of-phases=500).35
4.2.4 Image Analysis
Ventilation abnormalities were quantified using the ventilation defect percent (VDP) which
is the ventilation defect volume (VDV) normalized to the thoracic cavity volume (TCV).
Hyperpolarized inhaled noble gas MR ventilation images were segmented and registered
to the 1H MRI thoracic cavity as previously described38 by a single observer with four years
segmentation experience. Briefly, 3He MR static ventilation images were segmented using
a k-means approach that classified voxel intensity values into five clusters (signal
void=cluster 1 [C1] or VDV, hypo-intense=cluster 2 [C2] to hyper-intense signal=cluster
5 [C5]) to generate cluster maps.
Figure 4-1 provides a schematic of the approach used to generate and quantify FDMR
ventilation images using MATLAB R2016a (Mathworks).35 Dynamic free breathing 1H
MR images were co-registered to a reference with lung volume consistent with inhaled-gas
MRI volume (FRC+1L) using a modality independent neighbourhood descriptor (MIND)
deformable registration method.39 Discrete fast Fourier transforms were performed on the
signal intensity oscillation pattern generated from the pulmonary voxel intensities in the
co-registered free breathing 1H images. The magnitude of the first ventilation harmonic
(which corresponded to the respiratory rate) was determined for each and every voxel and
this was used to generate the FDMR ventilation image. Figure 4-1 also shows the
schematic of FDMRI semi-automated segmentation method where the reference 1H MRI
was segmented to generate the thoracic volume using a continuous max-flow segmentation
algorithm and hierarchical k-means clustering was used to segment the FDMR ventilation

103
images into the same five clusters used to segment the hyperpolarized inhaled noble gas
ventilation images.38
Figure 4-1 FDMRI ventilation map and analysis pipelines

104
A) Schematic for FDMRI ventilation map generation: i) co-registered MRI aligned along the time axis; ii) oscillating signal intensity pattern upon which discrete fast Fourier transforms performed; iii) magnitude of the frequency of the first ventilation harmonic determined for every voxel; iv) FDMRI ventilation maps generated. B) Schematic of FDMRI VDP semi-automated segmentation: Anatomical 1H MRI segmented, k-means VDP segmentation where cluster 1 (C1) = ventilation-defects, clusters 2-to-5 (C2-C5) = hypo-intense-to-hyper-intense ventilation.
4.2.5 Statistics
The Shapiro-Wilk test was used to determine the normality of the data and when data were
not normally distributed, non-parametric tests were performed. Differences between time-
points were determined using Wilcoxon signed rank paired t-test for non-parametric data.
A repeated measures ANOVA was performed to investigate treatment (baseline, post MCh,
and post salbutamol) and measurement (3He MRI and FDMRI) effects and the Mauchly’s
test of sphericity was used to test the assumption of sphericity. Relationships were
determined using Spearman coefficients (ρ). Agreement between imaging methods were
determined using the Bland-Altman method.40 All statistics were performed using SPSS
Statistics V24.0 (SPSS Inc., Chicago, Illinois, USA). Results were considered significant
when the probability of two-tailed type I error (α) was less than 5% (p<.05)
4.3 Results
4.3.1 Patient Characteristics
Table 4-1 shows participant demographic information as well as pulmonary function test
measurements, asthma medication, and asthma control measurements for 16 asthmatics
(49±10yrs) including seven patients with severe disease (50±10yrs) and nine patients with
severe and uncontrolled1 disease (49±11yrs). For the nine patients with poorly-controlled
disease, ACQ score was significantly greater (p=.01), although they were prescribed
maximal, guideline-based therapies including long acting β2 agonists (LABA) and high-
dose inhaled corticosteroids (ICS).1

105
Table 4-1 Asthma demographics, medication, control and pulmonary function tests Mean (±SD) Asthma
All (n=16) Severe (n=7) Severe Uncontrolled (n=9) Age yrs 49 (10) 50 (10) 49 (11) Male n 6 2 4 BMI kg·m-2 28 (4) 28 (5) 28 (4) FEV1 %pred 66 (24) 64 (19) 68 (28) FVC %pred 84 (14) 85 (12) 83 (16) FEV1/FVC % 61 (15) 59 (14) 63 (17) RV %pred 140 (35) 142 (27) 139 (42) TLC %pred 106 (13) 104 (13) 108 (14) RV/TLC % 43 (10) 46 (7) 41 (11) FRC %pred 115 (25) 120 (20) 111 (29) RAW %pred 170 (61) 161 (45) 176 (74) LCI 9.2 (2.6)† 9.8 (2.6) 8.6 (3.7)~ ACQ score 2.0 ± 1.2† 1.2 (0.6) 2.6 (1.2)~ AQLQ score 5.0 ± 1.4† 5.8 (0.8) 4.4 (1.5)~ mMRC dyspnea score 0.9 ± 0.7 0.7 (0.8) 1.0 (0.8) Borg dyspnea 1.4 ± 1.5 0.6 (0.7) 2.1 (1.7) ICS n [%] 16 [100] 7 [100] 9 [100] OCS n [%] 6 [40] 2 [29] 4 [44] SABA n [%] 14 [93] 6 [86] 8 [89] LABA n [%] 16 [100] 7 [100] 9 [100] SAMA n [%] 3 [20] 1 [14] 2 [22] LAMA n [%] 4 [27] 1 [14] 3 [33] Anti-IgE n [%] 3 [20] 1 [14] 2 [22] LTRA n [%] 7 [47] 3 [43] 4 [44]
%pred=percent-of-predicted-value; BMI=body-mass-index; FEV1=forced-expiratory-volume-in-one-second; FVC=forced-vital-capacity; RV=residual-volume; TLC=total-lung-capacity; FRC=functional-residual-capacity; RAW=airways-resistance; LCI=lung-clearance-index; ICS=Inhaled Corticosteroids; OCS=Oral Corticosteroid; SABA=Short-Acting β2-Agonist; LABA=Long-Acting β2-Agonist; SAMA=Short-Acting Anticholinergic; LAMA=Long-Acting Anticholinergic; Anti-IgE=Anti-immunoglobulin E; LTRA=Leukotriene Receptor Antagonists; ACQ=Asthma Control Questionnaire; AQLQ=Asthma Quality of Life Questionnaire; mMRC=modified Medical Research Council; †n=15; ~n=8.
4.3.2 Ventilation Response to Salbutamol
Figure 4-2 shows centre coronal 3He MRI and FDMRI slices for participant S8 with severe
uncontrolled asthma (56yr old male, FEV1=37%pred) and another participant, S4 with
severe asthma (57yr old female, FEV1=52%pred). Pre-salbutamol, there were numerous and
large inhaled gas MRI and FDMRI ventilation defects in both patients and these
qualitatively improved, post-salbutamol. As shown in Table 4-2 and Figure 4-2, for all
asthmatics, VDP significantly decreased (3He MRI p=.02 and FDMRI; p=.02) post-

106
salbutamol. Table 4-2 also provides lung clearance index as well as MRI VDP
measurements for all 16 patients.
Table 4-2 Subject listing of hyperpolarized inhaled gas MRI, FDMRI and multiple breath gas washout measurements for each time-point
Pre-Salbutamol PC20 Post-Salbutamol 3He FD LCI 3He FD LCI 3He FD LCI VDP (%) VDP (%) VDP (%) Severe
S1 3.6 0.7 7.7 5.2 1.6 -- 2.6 1.5 7.3 S2 7.0 7.6 9.5 -- -- -- 3.3 5.5 10.1 S3 2.2 0.6 6.7 -- -- -- 2.4 1.7 6.1 S4 9.1 4.9 13.5 -- -- -- 7.4 2.6 13.2 S5 17.0 1.6 11.7 -- -- -- 17.5 1.2 9.7 S6 10.3 2.3 11.9 -- -- -- 9.6 1.3 10.8 S7 1.0 0.6 7.4 -- -- -- 0.5 0.7 7.7
Mean 7.2 2.6 9.8 5.2 1.6 -- 6.2 2.1 9.3 ±SD 5.6 2.7 2.6 -- -- -- 5.9 1.6 2.4 Severe-Uncontrolled
S8 27.7 7.9 17.5 -- -- -- 24.2 5.4 15.5 S9 5.2 0.2 8.6 6.0 8.1 -- 7.0 1.5 8.2
S10 1.9 0.2 7.1 8.0 5.3 -- 1.8 1.5 7.7 S11 2.9 4.9 7.1 -- -- -- 2.4 3.3 6.6 S12 2.1 1.2 6.2 15.8 5.9 -- 1.2 0.2 6.5 S13 3.2 1.5 6.4 -- -- -- 3.1 0.7 6.4 S14 32.1 4.7 -- -- -- -- 17.2 5.1 -- S15 5.7 9.0 7.5 -- -- -- 5.7 6.1 7.4 S16 14.6 1.6 8.7 -- -- -- 3.5 0.3 8.8
Mean 10.6 3.5 8.6 10.0 6.4 -- 7.4 2.7 8.4 ±SD 11.6 3.3 3.7 5.1 1.5 -- 8.0 2.3 3.0
LCI=lung-clearance-index; VDP=ventilation-defect-percent: PC20=Provocative-concentration that decreased the forced-expiratory-volume-in-one-second (FEV1) by 20%.

107
Figure 4-2 Ventilation MRI for severe and severe-uncontrolled asthmatics A) Hyperpolarized inhaled gas (cyan) and FDMRI (magenta) for a representative severe asthmatic (female, age=57yrs, baseline FEV1=52%pred, post-salbutamol FEV1=60%pred) and severe-uncontrolled asthmatic (male, age=56yrs, baseline FEV1=37%pred, post-salbutamol FEV1=36%pred) at baseline and post-salbutamol. Yellow arrows show ventilation defect spatial relationships. B) Box and whisker plot (box=25th to 75th percentile; whiskers=minimum to maximum) for VDP baseline and post-salbutamol for 3He MRI (n=12, baseline VDP=11.1±10.1%, post-salbutamol VDP=8.1±7.6%, p=.02) and FDMRI (n=12, baseline VDP=3.9±3.0%, post-salbutamol VDP=2.8±2.1%, p=.02).
108
4.3.3 Ventilation Response to Methacholine Challenge and Salbutamol
Rescue
Figure 4-3 shows centre coronal MRI slices for a representative participant S1 (45yr old
female, FEV1=95%pred, severe uncontrolled asthma) who underwent MCh. There was
qualitatively greater 3He MR and FDMR ventilation abnormalities post-MCh and these
decreased post-salbutamol. It is also important to point out that FDMRI ventilation defects
were qualitatively less visibly obvious compared to 3He MRI defects. As shown in Table
4-2, 3He VDP and FDMRI VDP significantly increased (worsened) at PC20 (n=4; baseline: 3He VDP=3±1%, FDMRI VDP=1±0.2%; methacholine: 3He VDP=9±2%, FDMRI
VDP=5±2%) and significantly decreased post-salbutamol (3He VDP=3±1%, FDMRI
VDP=2±1%, all p=.02), and there was a significant difference between imaging methods
for these VDP differences (p=.01).
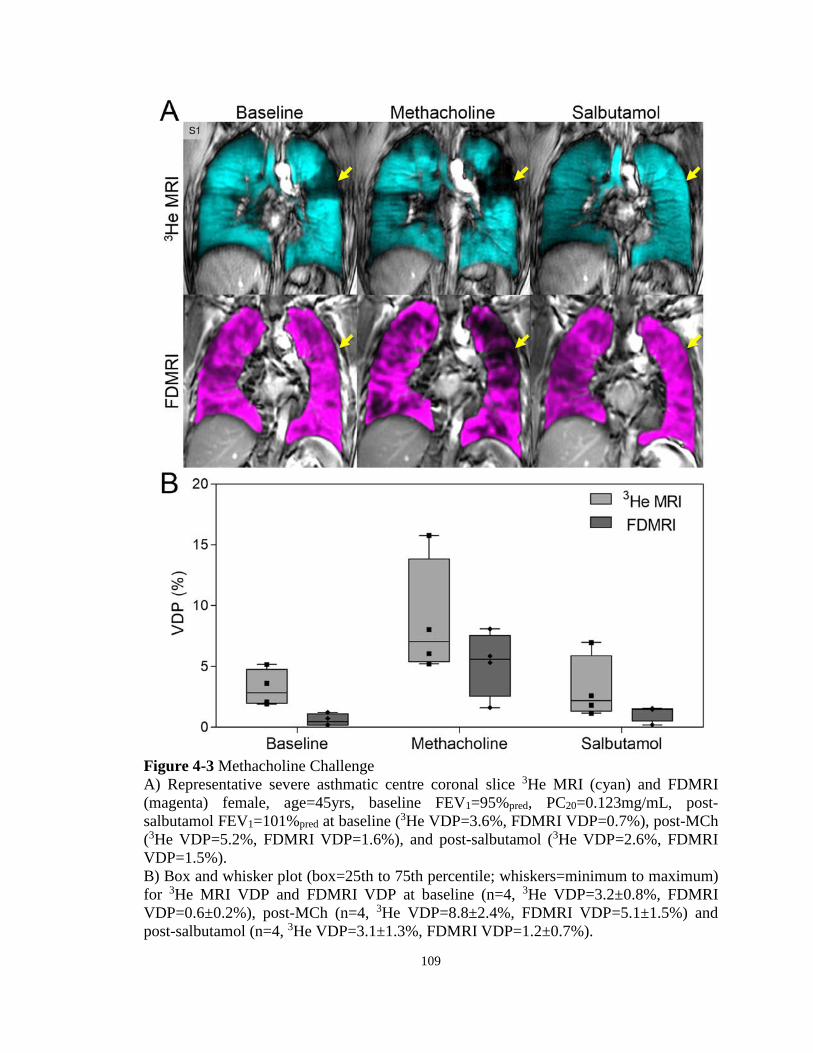
109
Figure 4-3 Methacholine Challenge A) Representative severe asthmatic centre coronal slice 3He MRI (cyan) and FDMRI (magenta) female, age=45yrs, baseline FEV1=95%pred, PC20=0.123mg/mL, post-salbutamol FEV1=101%pred at baseline (3He VDP=3.6%, FDMRI VDP=0.7%), post-MCh (3He VDP=5.2%, FDMRI VDP=1.6%), and post-salbutamol (3He VDP=2.6%, FDMRI VDP=1.5%). B) Box and whisker plot (box=25th to 75th percentile; whiskers=minimum to maximum) for 3He MRI VDP and FDMRI VDP at baseline (n=4, 3He VDP=3.2±0.8%, FDMRI VDP=0.6±0.2%), post-MCh (n=4, 3He VDP=8.8±2.4%, FDMRI VDP=5.1±1.5%) and post-salbutamol (n=4, 3He VDP=3.1±1.3%, FDMRI VDP=1.2±0.7%).

110
4.3.4 Relationships and Agreement
Figure 4-4 shows the relationships of FDMRI and 3He MRI VDP and their agreement.
While FDMRI VDP was correlated with 3He MRI VDP (ρ=.61, p=.01), Bland-Altman
analysis showed a significant bias of -6.0±8.6% (95% limit of agreement: -23% to 11%).
Table 4-3 summarizes the significant correlations for 3He MRI and FDMRI VDP with LCI
and other pulmonary function measurements. There were significant relationships for
FDMRI VDP with 3He MRI VDP (ρ=.61, p=.01) as well as with FRC (ρ=.61, p=.01), RV
(ρ=.54, p=.04), and RAW (ρ=.57, p=.02) but not with LCI (ρ=.49, p=.06), FEV1 (ρ=-.45,
p=.08), or FEV1/FVC (ρ=-.43, p=.09).
Table 4-3 Relationship for hyperpolarized inhaled gas MRI and FDMRI with pulmonary function and LCI
Spearman ρ (p) 3He MRI VDP % FDMRI VDP % (n=16) (n=16)
FEV1 %pred -.78 (.0006) -.45 (.08) FVC %pred -.53 (.03) -.43 (.09) FEV1/FVC % -.75 (.001) -.38 (.1) RV %pred .45 (.08) .51 (.04) TLC %pred .19 (.5) .35 (.2) RV/TLC % .46 (.07) .28 (.3) FRC %pred .72 (.002) .61 (.01) RAW %pred .80 (.0004) .57 (.02) LCI .85 (.0001)# .49 (.06)# 3He MRI VDP % -- .61 (.01) FDMRI VDP % .61 (.01) --
ρ=Spearman-correlation-coefficients; %pred=percent-of-predicted-value; FEV1=forced-expiratory-volume-in-one-second; FVC=forced-vital-capacity; RV=residual-volume; TLC=total-lung-capacity; FRC=functional-residual-capacity; RAW=airways-resistance; LCI=lung-clearance-index; VDP=ventilation-defect-percent; #n=15.
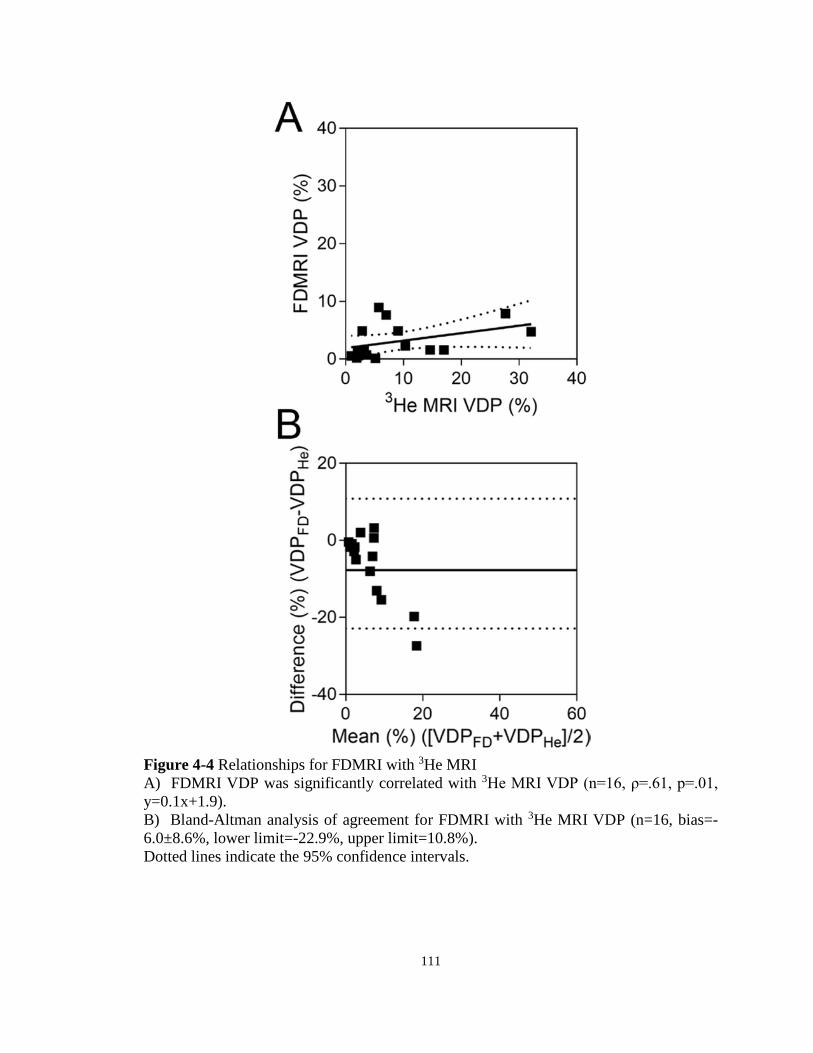
111
Figure 4-4 Relationships for FDMRI with 3He MRI A) FDMRI VDP was significantly correlated with 3He MRI VDP (n=16, ρ=.61, p=.01, y=0.1x+1.9). B) Bland-Altman analysis of agreement for FDMRI with 3He MRI VDP (n=16, bias=-6.0±8.6%, lower limit=-22.9%, upper limit=10.8%). Dotted lines indicate the 95% confidence intervals.

112
4.4 Discussion
In a recent survey,8 the vast majority of asthma patients described their asthma as poorly
controlled and nearly half reported that asthma symptom severity limited day-to-day
activities or regular exercise. This dire situation reflects a lack of sensitive and specific
asthma biomarkers that may be used to guide asthma treatment in individual patients or
used as intermediate endpoints in clinical trials of new treatments. We and others9 think
that biomarkers of ventilation heterogeneity and imaging biomarkers in particular may
provide one solution to this challenging problem. In this regard, here we evaluated
ventilation heterogeneity in a proof-of-concept study in 16 patients with severe and severe
with poorly-controlled asthma and observed: 1) FDMRI and 3He MRI VDP significantly
decreased post-salbutamol, 2) both FDMRI and 3He MRI VDP significantly increased in
response to methacholine and decreased post-bronchodilator, and, 3) FDMRI VDP was
significantly correlated with 3He MRI VDP but also significantly underestimated VDP
relative to 3He MRI VDP.
Ventilation defect measurements generated using FDMRI and 3He MRI significantly
responded to salbutamol and methacholine. Previous work also showed that 3He MRI VDP
significantly improved post-salbutamol in mild to moderate asthmatics.24 However, to our
knowledge, this is the first study to investigate FDMRI, 3He MRI and LCI measurements
of ventilation heterogeneity in asthmatics with severe disease. Salbutamol-dependent
airway smooth muscle relaxation and dilation is reflected by increased asthmatic airway
calibre and this is believed to result in decreased ventilation heterogeneity measured using
LCI and inhaled gas MRI.24 Importantly, FDMRI results observed here suggest that the
inhaled-gas MRI static ventilation maps and dynamic free breathing FDMRI ventilation
maps provide similar but not the same functional information in asthmatics. Differences
in the functional information measured using inhaled-gas MRI and FDMRI may stem from
the airway abnormalities themselves and the different time constants for lung filling that
are the consequence of these airway abnormalities. For example, in asthmatics, inhaled-
gas MRI ventilation defects reflect lung regions with long time constants for filling that are
beyond the 10-15s acquisition time of scanning. In contrast, multi-breath free-breathing
113
FDMRI ventilation defects reflect airway and parenchyma abnormalities35 that do not fill
during a much longer, two minute acquisition window, similar to previous work using
multi-breath wash-in inhaled gas MRI.41
In four patients who could safely undergo methacholine challenge, FDMRI and 3He MRI
VDP significantly changed in response to both methacholine and salbutamol. To our
knowledge, this is the first time FDMRI ventilation maps have been evaluated during
methacholine challenge and the responses were comparable with 3He MRI VDP measured
here, and previously described.23 Previous work in mild-moderate asthmatics using
diffusion-weighted 3He MRI suggested that ventilation defects captured at PC20 may be
due to air trapping induced by methacholine.42 To support this notion, in another study, air
trapping induced using a balloon catheter in a porcine model was also detected using both
FDMRI and 3He MRI.34 Based on these previous results34 and the current investigation,
FDMRI ventilation defects measured post-methacholine challenge, likely stem from hyper-
responsive and constricted airways which is an important translational finding for asthma
centres that don’t have access to inhaled-gas MRI.
While FDMRI and 3He MRI VDP were correlated, there was a bias toward lower FDMRI
VDP and this was also previously observed in COPD patients.35 Given what we know
about the time constants for lung filling and the fact that the inhaled gas methods capture
a 10-15s snapshot and free breathing MRI methods capture abnormalities over at least two
minutes of breathing, these differences are intuitively reasonable.35 The bias or
underestimate of FDMRI VDP relative to 3He MRI VDP may be a result of the differences
in how these two methods generate or capture ventilation information. Inhaled gas
methods capture a 10-15s snapshot where very high contrast and signal-to-noise ventilation
images can be easily generated. In contrast, free breathing MRI methods capture
abnormalities over at least two minutes of breathing where the ventilation contrast is
generated by the signal differences during the breathing cycle as tissue contracts and
expands due to air entering and leaving the pulmonary system. These results provide
evidence that these two different methods of generating MR ventilation maps, although
different, may probe and interrogate similar lung functional information related to regions
of airway remodeling/hyper-responsiveness and gas-trapping. Regardless, MR ventilation
114
maps, generated using different methods, provide similar lung functional information
related to regions of airway remodeling/hyper-responsiveness and gas trapping.
We recognize a number of study limitations, including the small number of patients
evaluated. We also focused on severe asthmatics and those with poor control in order to
capture information relevant to an important clinical problem and, because of this, the vast
majority of patients were unable to perform methacholine challenge. An inherent
limitation of pulmonary 1H MRI is the low signal intensity due to intrinsically low proton
density and T2* effects43 but recent research44 that exploits shorter echo times may
overcome this challenge. We also acknowledge that different imaging parameters
(FDMRI=single 2D slice time series and 3He MRI=multi-slice 2D acquisition) may limit
the generalizability of a direct comparison between methods. While complex image-
processing methods are required for FDMRI and these still require standardization and
validation, newly developed MR acquisition methods44 will enhance translational
potential.
In summary, FDMRI VDP was less sensitive to methacholine and salbutamol, and under-
estimated VDP as compared to 3He MRI. While newly improved MR acquisition
methods44 will enhance translational potential, FDMRI is currently limited to single slice
acquisitions and the complex image-processing methods needed still require
standardization and validation. Nevertheless, new functional biomarkers of asthma that
can be acquired on conventional MR scanners are crucially needed to help understand and
guide treatment decisions in those asthmatics in whom maximal, guideline based care has
not improved disease severity or control.

115
4.5 References
(1) Global Initiative for Asthma. Global Strategy for Asthma Management and Prevention, <www.ginasthma.org> (2016).
(2) Crapo, R. O. et al. Guidelines for methacholine and exercise challenge testing-1999. This official statement of the American Thoracic Society was adopted by the ATS Board of Directors, July 1999. Am J Respir Crit Care Med 2000; 161: 309-329.
(3) Busse, W. W. Asthma diagnosis and treatment: filling in the information gaps. J Allergy Clin Immunol 2011; 128: 740-750.
(4) Gjevre, J. A., Hurst, T. S., Taylor-Gjevre, R. M. & Cockcroft, D. W. The American Thoracic Society’s spirometric criteria alone is inadequate in asthma diagnosis. Can Respir J 2006; 13: 433-437.
(5) Burgel, P. R. The role of small airways in obstructive airway diseases. Eur Respir Rev 2011; 20: 23-33.
(6) Macklem, P. T. & Mead, J. Resistance of central and peripheral airways measured by a retrograde catheter. J Appl Physiol 1967; 22: 395-401.
(7) Tulic, M. K., Christodoulopoulos, P. & Hamid, Q. Small airway inflammation in asthma. Respir Res 2001; 2: 333-339.
(8) The Lung Association. Asthma Control in CanadaTM Survey 2016, <http://mb.lung.ca/file_download/2c91f259-3586-48d9-8496-63530f7f4c9a> (2016).
(9) Trivedi, A. et al. Using imaging as a biomarker for asthma. Journal of Allergy and Clinical Immunology 2017; 139: 1-10.
(10) Newman, K. B., Lynch, D. A., Newman, L. S., Ellegood, D. & Newell, J. D. Quantitative Computed-Tomography Detects Air Trapping Due to Asthma. Chest 1994; 106: 105-109.
(11) Aysola, R. S. et al. Airway Remodeling Measured by Multidetector CT Is Increased in Severe Asthma and Correlates With Pathology. Chest 2008; 134: 1183-1191.
(12) Little, S. A. et al. High resolution computed tomographic assessment of airway wall thickness in chronic asthma: reproducibility and relationship with lung function and severity. Thorax 2002; 57: 247-253.
(13) Kim, W. W. et al. Xenon-enhanced dual-energy CT of patients with asthma: dynamic ventilation changes after methacholine and salbutamol inhalation. AJR Am J Roentgenol 2012; 199: 975-981.
116
(14) Gordic, S. et al. Ultralow-dose chest computed tomography for pulmonary nodule detection: first performance evaluation of single energy scanning with spectral shaping. Invest Radiol 2014; 49: 465-473.
(15) Smith-Bindman, R. et al. Use of Diagnostic Imaging Studies and Associated Radiation Exposure for Patients Enrolled in Large Integrated Health Care Systems, 1996-2010. Jama-Journal of the American Medical Association 2012; 307: 2400-2409.
(16) de Gonzalez, A. B. et al. Projected Cancer Risks From Computed Tomographic Scans Performed in the United States in 2007. Archives of Internal Medicine 2009; 169: 2071-2077.
(17) Smith-Bindman, R. et al. Radiation Dose Associated With Common Computed Tomography Examinations and the Associated Lifetime Attributable Risk of Cancer. Archives of Internal Medicine 2009; 169: 2078-2086.
(18) Venegas, J. G. et al. Self-organized patchiness in asthma as a prelude to catastrophic shifts. Nature 2005; 434: 777-782.
(19) King, G. G., Eberl, S., Salome, C. M., Meikle, S. R. & Woolcock, A. J. Airway closure measured by a Technegas bolus and SPECT. American Journal of Respiratory and Critical Care Medicine 1997; 155: 682-688.
(20) King, G. G., Eberl, S., Salome, C. M., Young, I. H. & Woolcock, A. J. Differences in airway closure between normal and asthmatic subjects measured with single-photon emission computed tomography and technegas. American Journal of Respiratory and Critical Care Medicine 1998; 158: 1900-1906.
(21) de Lange, E. E. et al. Changes in regional airflow obstruction over time in the lungs of patients with asthma: evaluation with 3He MR imaging. Radiology 2009; 250: 567-575.
(22) Svenningsen, S. et al. What are ventilation defects in asthma? Thorax 2014; 69: 63-71.
(23) Samee, S. et al. Imaging the lungs in asthmatic patients by using hyperpolarized helium-3 magnetic resonance: assessment of response to methacholine and exercise challenge. J Allergy Clin Immunol 2003; 111: 1205-1211.
(24) Svenningsen, S. et al. Hyperpolarized (3) He and (129) Xe MRI: differences in asthma before bronchodilation. J Magn Reson Imaging 2013; 38: 1521-1530.
(25) de Lange, E. E. et al. Evaluation of asthma with hyperpolarized helium-3 MRI: correlation with clinical severity and spirometry. Chest 2006; 130: 1055-1062.
(26) Fain, S. B. et al. Evaluation of structure-function relationships in asthma using multidetector CT and hyperpolarized He-3 MRI. Acad Radiol 2008; 15: 753-762.

117
(27) Svenningsen, S., Nair, P., Guo, F., McCormack, D. G. & Parraga, G. Is ventilation heterogeneity related to asthma control? Eur Respir J 2016; 48: 370-379.
(28) Ohno, Y. et al. Oxygen-enhanced MRI vs. quantitatively assessed thin-section CT: pulmonary functional loss assessment and clinical stage classification of asthmatics. Eur J Radiol 2011; 77: 85-91.
(29) Zhang, W. J. et al. Dynamic oxygen-enhanced magnetic resonance imaging of the lung in asthma -- initial experience. Eur J Radiol 2015; 84: 318-326.
(30) Zapke, M. et al. Magnetic resonance lung function--a breakthrough for lung imaging and functional assessment? A phantom study and clinical trial. Respir Res 2006; 7: 106.
(31) Pennati, F. et al. Assessment of regional lung function with multivolume (1)H MR imaging in health and obstructive lung disease: comparison with (3)He MR imaging. Radiology 2014; 273: 580-590.
(32) Bauman, G. et al. Non‐contrast‐enhanced perfusion and ventilation assessment of the human lung by means of fourier decomposition in proton MRI. Magn Reson Med 2009; 62: 656-664.
(33) Bauman, G. et al. Pulmonary functional imaging: qualitative comparison of Fourier decomposition MR imaging with SPECT/CT in porcine lung. Radiology 2011; 260: 551-559.
(34) Bauman, G. et al. Lung ventilation‐and perfusion‐weighted Fourier decomposition magnetic resonance imaging: In vivo validation with hyperpolarized 3He and dynamic contrast‐enhanced MRI. Magn Reson Med 2013; 69: 229-237.
(35) Capaldi, D. P. et al. Free-breathing Pulmonary (1)H and Hyperpolarized (3)He MRI: Comparison in COPD and Bronchiectasis. Acad Radiol 2015; 22: 320-329.
(36) Miller, M. R. et al. Standardisation of spirometry. Eur Respir J 2005; 26: 319-338.
(37) Parraga, G. et al. Hyperpolarized 3He ventilation defects and apparent diffusion coefficients in chronic obstructive pulmonary disease: preliminary results at 3.0 Tesla. Invest Radiol 2007; 42: 384-391.
(38) Kirby, M. et al. Hyperpolarized 3He magnetic resonance functional imaging semiautomated segmentation. Acad Radiol 2012; 19: 141-152.
(39) Heinrich, M. P. et al. MIND: Modality independent neighbourhood descriptor for multi-modal deformable registration. Medical Image Analysis 2012; 16: 1423-1435.
(40) Altman, D. G. Practical statistics for medical research. (CRC press, 1990).

118
(41) Hamedani, H. et al. Regional Fractional Ventilation by Using Multibreath Wash-in (3)He MR Imaging. Radiology 2016; 279: 917-924.
(42) Costella, S. et al. Regional pulmonary response to a methacholine challenge using hyperpolarized (3)He magnetic resonance imaging. Respirology 2012; 17: 1237-1246.
(43) Yu, J., Xue, Y. & Song, H. K. Comparison of lung T2* during free‐breathing at 1.5 T and 3.0 T with ultrashort echo time imaging. Magn Reson Med 2011; 66: 248-254.
(44) Bauman, G., Pusterla, O. & Bieri, O. Ultra-fast Steady-State Free Precession Pulse Sequence for Fourier Decomposition Pulmonary MRI. Magn Reson Med 2016; 75: 1647-1653.
119
CHAPTER 5
5 FREE-BREATHING PULMONARY MR IMAGING TO QUANTIFY REGIONAL VENTILATION
To further the potential application of free-breathing 1H MRI, we developed a whole-lung free-breathing pulmonary 1H MRI technique to measure regional specific-ventilation in patients with asthma and healthy-volunteers. We compared these specific-ventilation measurements with hyperpolarized 3He MRI ventilation in healthy and asthmatic participants, and, determined the relationships between 1H MRI specific-ventilation and hyperpolarized 3He MRI and pulmonary function measurements.
The contents of this chapter have been submitted to the journal Radiology: DPI Capaldi, RL Eddy, S Svenningsen, F Guo, JSH Baxter, AJ McLeod, P Nair, DG McCormack, and G Parraga and is accepted for publication in Radiology 2018 (in-press).
5.1 Introduction
Asthma is a chronic inflammatory airway disease,1 characterized clinically by an
intermittent and unpredictable worsening of severe dyspnea and wheezing. Asthma is
diagnosed and monitored using the spirometry measurement of the forced-expiratory-
volume-in-one-second (FEV1).2 Although relatively inexpensive and straightforward to
implement, spirometry only measures global airflow-obstruction, cannot provide regional
information2,3 and it is inherently insensitive to the structural and functional abnormalities
in the small airways4 where inflammation and remodeling occur.5 These limitations have
motivated the development of pulmonary functional imaging approaches.
To overcome some of these limitations, multi-detector computed-tomography (MDCT) of
the chest has been used to quantify air-trapping6 and airway-remodeling7 in asthmatics.8-11
Four-dimensional (4D) CT has also been used to quantify specific-ventilation,12 which is
defined as tidal-volume normalized to functional-residual-capacity.13 4DCT specific-
ventilation,12 is measured based on the difference in lung-tissue-density at tidal inspiration
and expiration as air enters and leaves voxels. Magnetic resonance (MR) imaging has also
been exploited to measure both lung structure and function in asthmatics.14 For example,
hyperpolarized 3He MRI measures inhaled gas distribution15 while oxygen-enhanced 1H
MRI also provides maps of signal enhancement due to oxygen16-18 by exploiting
120
differences in T1-weighted images acquired whilst breathing pure oxygen and room air. 1H
MR imaging ventilation maps may also be generated without exogenous-contrast19-23 by
measuring differences in 1H signal intensity at different lung volumes.19,20 Free-breathing
Fourier-decomposition 1H MR imaging (FDMR imaging) is another approach that uses
deformable-registration to generate ventilation-weighted images21,22 that are sensitive to
bronchoconstriction in asthmatics.23
In this proof-of-concept investigation, our objective was to: 1) develop a way to generate
specific-ventilation measurements, based on conventional, free-breathing 1H MRI without
exogenous contrast, 2) compare 1H MRI specific-ventilation with hyperpolarized 3He MRI
ventilation in healthy and asthmatic participants, and 3) determine the relationships
between 1H MRI specific-ventilation and hyperpolarized 3He MRI and pulmonary-function
measurements.
5.2 Materials and Methods
5.2.1 Participants and Pulmonary Function Tests
Participants aged 18-85, provided written-informed-consent to an ethics-board approved
prospectively-planned investigation that was Health-Insurance-Portability-and-
Accountability-Act (HIPAA) compliant (healthy-volunteers: NCT03169673; asthmatics:
NCT02351141 and NCT02263794); participants were consecutively recruited between
January and June 2017 based on inclusion/exclusion criteria provided in the Supplement
that also provides a description of the pulmonary function tests performed.
5.2.2 Image Acquisition
All MR imaging acquisitions were performed in the coronal plane using a whole body 3.0
Tesla Discovery MR750 (General-Electric-Health-Care [GEHC], Milwaukee, WI, USA)
system as follows: 1) static breath-hold 1H MR imaging, 2) static breath-hold
hyperpolarized 3He MR imaging, and, 3) free-breathing 1H MR imaging. Static breath hold 1H MR imaging was acquired using a whole body radiofrequency coil and fast spoiled
gradient-recalled-echo (FGRE) sequence (partial-echo-acquisition; total-acquisition-
121
time=16s; TR/TE/flip-angle[FA]=4.7ms/1.2ms/30°; FOV=40×40cm2, BW=24.4kHz;
matrix=128×80 [zero-padded to 128×128]; partial-echo-percent=62.5%; number-of-
slices[NS]= 15-17; slice-thickness[ST]=15mm, 0-gap). Hyperpolarized 3He static
ventilation MR imaging was performed using a single channel, rigid elliptical
transmit/receive chest coil (RAPID Biomedical GmbH, Wuerzburg, Germany) and 2D
multi-slice FGRE sequence (partial-echo-acquisition; total-acquisition-time=10s;
TR/TE/FA=3.8ms/1.0ms/7°; FOV=40×40cm2, BW=48.8kHz; matrix=128×80 [zero-
padded to 128×128]; partial-echo-percent=62.5%; NS=15-17; ST=15mm, 0-gap). A
commercial polarizer (HeliSpin, Polarean, Durham, North Carolina, USA) was used to
polarize 3He to 40%. Participants inhaled a 1.0L gas mixture (30%/70% by volume
hyperpolarized 3He/ultrahigh pure N2) after passive expiration to FRC. As shown in Figure
5-1, free-breathing 1H MR imaging was acquired using a 32-channel torso coil (GEHC),
with respiratory bellows to monitor respiratory rate and an optimized balanced-steady-
state-free-precession sequence (total-acquisition-time=160-200s;
TE/TR/FA=0.6ms/1.9ms/15°; FOV=40×40cm2; BW=250kHz; matrix=256×256; NS=13-
15; ST=15mm; number-of-excitations=1; number-of-phases=51, 0-gap).
5.2.3 Image Analysis
Image processing was performed using MATLAB R2016a (Mathworks, Natick,
Massachusetts, USA). Hyperpolarized 3He MRI was quantified as previously described24
with details provided in the Supplement (DPIC with 4 years of experience).
As shown in Figure 5-1, the free-breathing images acquired were used to generate 1H MR
imaging specific ventilation maps, and the Hilbert transform was used to identify the
respiratory signal 𝐵𝐵(𝑈𝑈), in the respiratory bellow data with both real and imaginary
components. Using the phase component of 𝐵𝐵(𝑈𝑈), each imaging time point 𝑈𝑈 was linked to
respiratory phase (from -π to π). For each free-breathing 1H MR coronal slice time series,
a 3D dataset for a single respiratory cycle was created via weighted interpolation, where
the third dimension is respiratory phase 𝜃𝜃. Each free-breathing 1H MR image at time 𝑈𝑈
contributed to the corresponding slice in the interpolated image at phase 𝜃𝜃 with weight:

122
𝑤𝑤(𝑈𝑈,𝜃𝜃) ∝ 𝐻𝐻−𝛽𝛽|∠𝐵𝐵(𝑡𝑡)−𝜃𝜃| (5-1)
where 𝐵𝐵(𝑈𝑈) is the respiratory bellow signal and 𝛽𝛽 is the exponential decay parameter (𝛽𝛽 =𝜋𝜋10
). Ten 𝜃𝜃 values were used to reflect the number of phases, as previously described for
4DCT.25,26 Optical-flow deformable-registration was used to co-register each 2D multi-
slice interpolated dataset into coordinate space27 so that spatially corresponding voxels
were determined in the inspiration and expiration phases. Each interpolated dataset was
registered to its neighbouring interpolated dataset in the direction of increasing 𝜃𝜃, creating
a series of dense deformation fields. All images were registered to a single phase by
compounding these deformation fields, creating a dataset with lung/cardiac motion
removed. The reference phase was halfway between the tidal inspiration and expiration
volumes.21 Specific-ventilation (𝑆𝑆𝑆𝑆) is expressed without units and represents the
proportion of inhaled gas moving into the lung during normal breathing as follows:
𝑆𝑆𝑆𝑆 =
∆𝑆𝑆𝑆𝑆𝑤𝑤𝑡𝑡𝑤𝑤𝑒𝑒𝑒𝑒𝑒𝑒
=𝑆𝑆𝑤𝑤𝑡𝑡𝑤𝑤𝑖𝑖𝑖𝑖𝑖𝑖𝑒𝑒 − 𝑆𝑆𝑤𝑤𝑡𝑡𝑤𝑤𝑒𝑒𝑒𝑒𝑒𝑒
𝑆𝑆𝑤𝑤𝑡𝑡𝑤𝑤𝑒𝑒𝑒𝑒𝑒𝑒 (5-2)
where 𝑆𝑆𝑤𝑤𝑡𝑡𝑤𝑤𝑖𝑖𝑖𝑖𝑖𝑖𝑒𝑒and 𝑆𝑆𝑤𝑤𝑡𝑡𝑤𝑤𝑒𝑒𝑒𝑒𝑒𝑒are the air volume fractions at inspiration and expiration,
respectively. Since MR imaging signal-intensity (𝑆𝑆𝑆𝑆) is approximately inversely
proportional to lung air volume:19
𝑆𝑆𝑆𝑆 ∝� 1𝑆𝑆𝑤𝑤𝑡𝑡𝑤𝑤
(5-3)
We know, by substituting Equation 5-3 into Equation 5-2, that:
𝑆𝑆𝑆𝑆 ≈
𝑆𝑆𝑆𝑆𝑡𝑡𝑒𝑒𝑖𝑖 − 𝑆𝑆𝑆𝑆𝑡𝑡𝑖𝑖𝑡𝑡𝑖𝑖𝑆𝑆𝑆𝑆𝑡𝑡𝑖𝑖𝑡𝑡𝑖𝑖
(5-4)
where 𝑆𝑆𝑆𝑆𝑡𝑡𝑖𝑖𝑡𝑡𝑖𝑖and 𝑆𝑆𝑆𝑆𝑡𝑡𝑒𝑒𝑖𝑖 are the MR signal-intensities at inspiration and expiration,
respectively. Using the co-registered tidal inspiration and expiration volumes, specific-
ventilation maps were generated as shown in Figure 5-1. The reference phase used to
register the interpolated dataset was segmented using a multiregional segmentation

123
approach, as previously described.28 A primal-dual optimization technique was
implemented to solve the convex segmentation optimization problem,28 resulting in the
segmented lung. The segmented lung region was then applied to the 4DMR imaging
specific-ventilation maps and the mean value was calculated.
To interrogate the spatial relationship between specific-ventilation and hyperpolarized 3He
MR imaging ventilation, hyperpolarized 3He MR imaging was registered to 1H MR
imaging using landmarks24 and 1H MR imaging was registered via modality-independent-
neighborhood-descriptor (MIND) deformable registration29 to the reference phase of the
interpolated dataset. The deformation field was applied to hyperpolarized 3He MR imaging
using voxel-wise similarity measurements of the two images, as well as diffusion-
regularization of the deformation field and optimization using the Gauss-Newton
framework.29 Finally, the mean 1H MR imaging specific-ventilation was calculated within
well-ventilated and ventilation defected regions. Images were evaluated once because the
segmentation approaches have high reproducibility.24,28
In each subject, 4DMRI specific-ventilation was partitioned in five regions of equal vertical
extent and the mean values were computed and is provided in the Supplement. To perform
statistical analysis in larger lung regions and to evaluate regional gravitational differences,
lung maps were segmented into two equal lung regions in the anterior-posterior direction,
representing the gravitational dependent and independent regions for supine participants;
mean 4DMRI specific-ventilation was calculated in both lung regions.
5.2.4 Statistics
Non-parametric statistical tests were used due to the small sample sizes.30 Differences
between groups were determined using Mann-Whitney tests and relationships were
determined using Spearman (ρ) correlation coefficients. Significant differences for
specific-ventilation measurements in well-ventilated versus poorly ventilated lung regions
and anterior versus posterior lung regions of interest were measured using paired t-tests.
All statistics were performed using GraphPad Prism 7.00 (GraphPad Software Inc., San

124
Diego, CA, USA) and results considered significant when the probability of two-tailed type
I error (α) was less than 5% (p<.05).
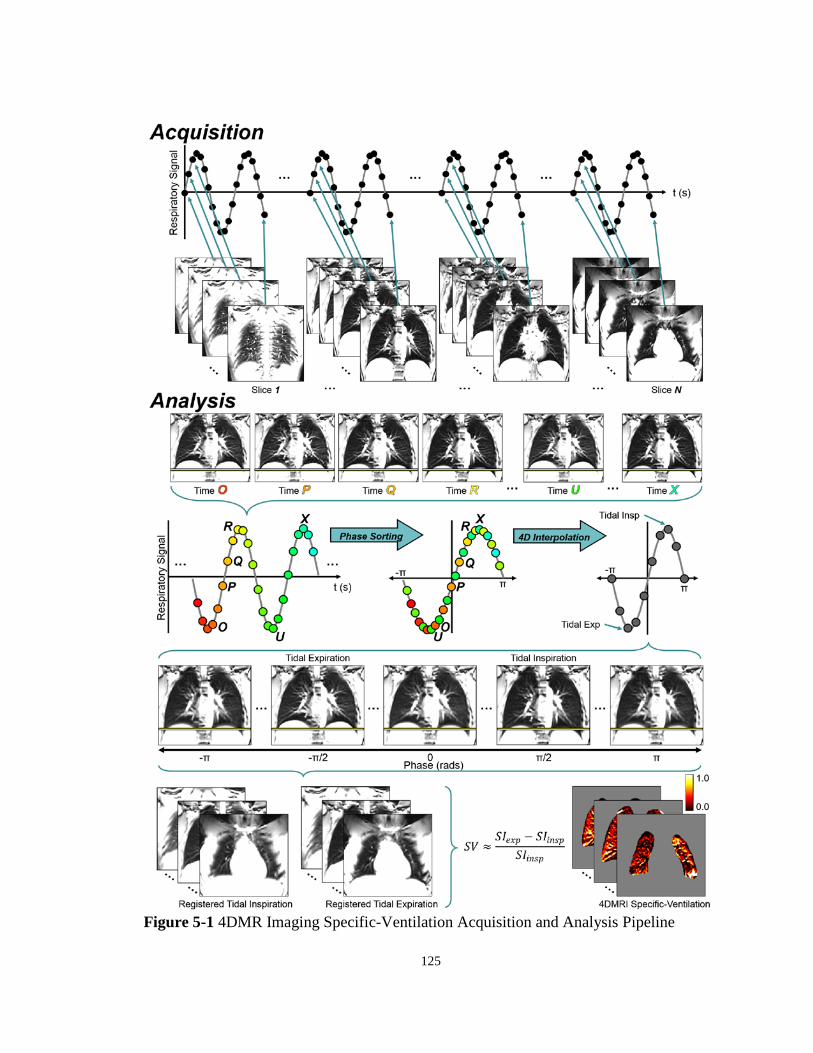
125
Figure 5-1 4DMR Imaging Specific-Ventilation Acquisition and Analysis Pipeline
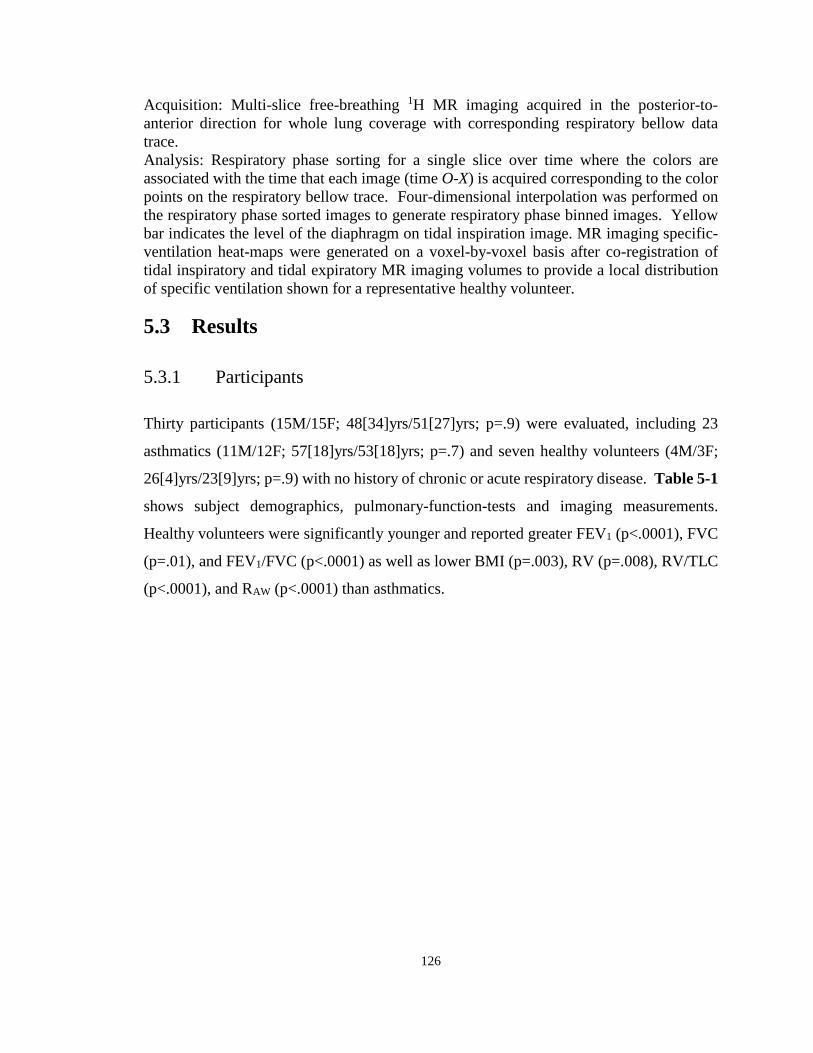
126
Acquisition: Multi-slice free-breathing 1H MR imaging acquired in the posterior-to-anterior direction for whole lung coverage with corresponding respiratory bellow data trace. Analysis: Respiratory phase sorting for a single slice over time where the colors are associated with the time that each image (time O-X) is acquired corresponding to the color points on the respiratory bellow trace. Four-dimensional interpolation was performed on the respiratory phase sorted images to generate respiratory phase binned images. Yellow bar indicates the level of the diaphragm on tidal inspiration image. MR imaging specific-ventilation heat-maps were generated on a voxel-by-voxel basis after co-registration of tidal inspiratory and tidal expiratory MR imaging volumes to provide a local distribution of specific ventilation shown for a representative healthy volunteer.
5.3 Results
5.3.1 Participants
Thirty participants (15M/15F; 48[34]yrs/51[27]yrs; p=.9) were evaluated, including 23
asthmatics (11M/12F; 57[18]yrs/53[18]yrs; p=.7) and seven healthy volunteers (4M/3F;
26[4]yrs/23[9]yrs; p=.9) with no history of chronic or acute respiratory disease. Table 5-1
shows subject demographics, pulmonary-function-tests and imaging measurements.
Healthy volunteers were significantly younger and reported greater FEV1 (p<.0001), FVC
(p=.01), and FEV1/FVC (p<.0001) as well as lower BMI (p=.003), RV (p=.008), RV/TLC
(p<.0001), and RAW (p<.0001) than asthmatics.
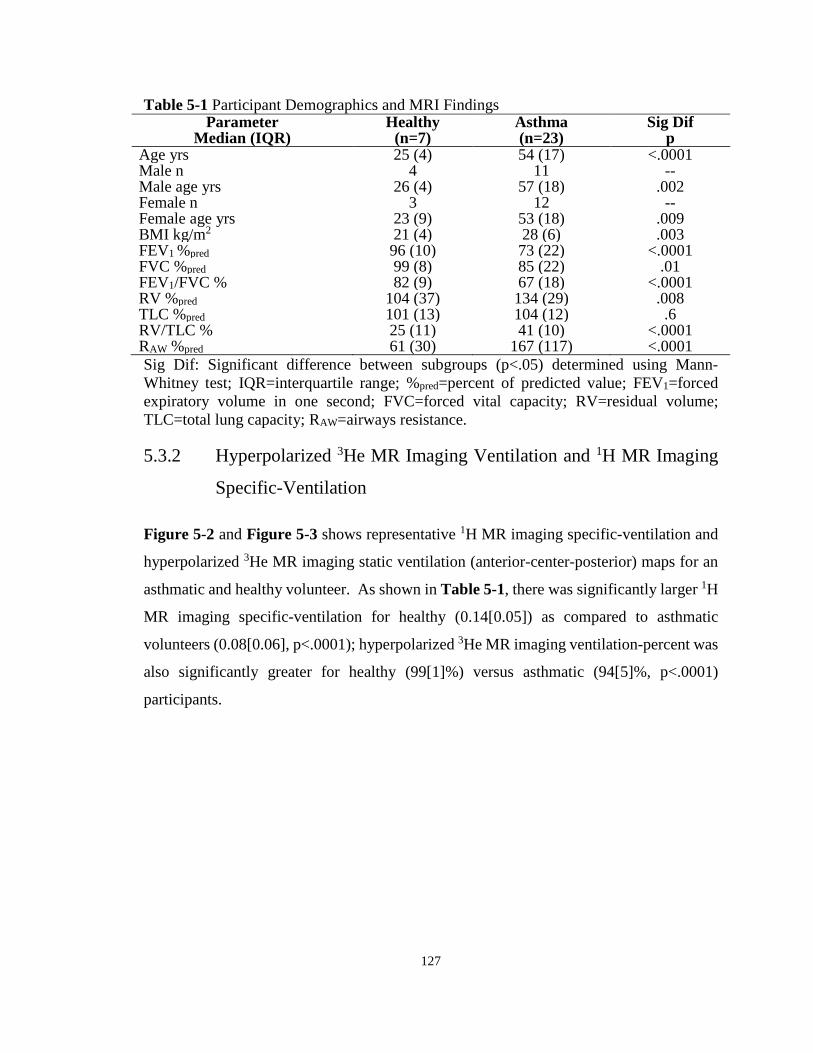
127
Table 5-1 Participant Demographics and MRI Findings Parameter
Median (IQR) Healthy
(n=7) Asthma (n=23)
Sig Dif p
Age yrs 25 (4) 54 (17) <.0001 Male n 4 11 -- Male age yrs 26 (4) 57 (18) .002 Female n 3 12 -- Female age yrs 23 (9) 53 (18) .009 BMI kg/m2 21 (4) 28 (6) .003 FEV1 %pred 96 (10) 73 (22) <.0001 FVC %pred 99 (8) 85 (22) .01 FEV1/FVC % 82 (9) 67 (18) <.0001 RV %pred 104 (37) 134 (29) .008 TLC %pred 101 (13) 104 (12) .6 RV/TLC % 25 (11) 41 (10) <.0001 RAW %pred 61 (30) 167 (117) <.0001 Sig Dif: Significant difference between subgroups (p<.05) determined using Mann-Whitney test; IQR=interquartile range; %pred=percent of predicted value; FEV1=forced expiratory volume in one second; FVC=forced vital capacity; RV=residual volume; TLC=total lung capacity; RAW=airways resistance.
5.3.2 Hyperpolarized 3He MR Imaging Ventilation and 1H MR Imaging
Specific-Ventilation
Figure 5-2 and Figure 5-3 shows representative 1H MR imaging specific-ventilation and
hyperpolarized 3He MR imaging static ventilation (anterior-center-posterior) maps for an
asthmatic and healthy volunteer. As shown in Table 5-1, there was significantly larger 1H
MR imaging specific-ventilation for healthy (0.14[0.05]) as compared to asthmatic
volunteers (0.08[0.06], p<.0001); hyperpolarized 3He MR imaging ventilation-percent was
also significantly greater for healthy (99[1]%) versus asthmatic (94[5]%, p<.0001)
participants.

128
Figure 5-2 3He MRI and 4DMRI for a Representative Healthy Subject Hyperpolarized 3He MRI static-ventilation (cyan) and 4DMRI specific-ventilation (heat-map) co-registered to anatomical 1H MRI (grey-scale) for anterior, center and posterior coronal slices for healthy female: age=22yrs, FEV1=111%pred, RV/TLC=17%, 3He MRI ventilation-percent=100%, 4DMRI specific-ventilation=0.18, plethysmography specific-ventilation=0.43.
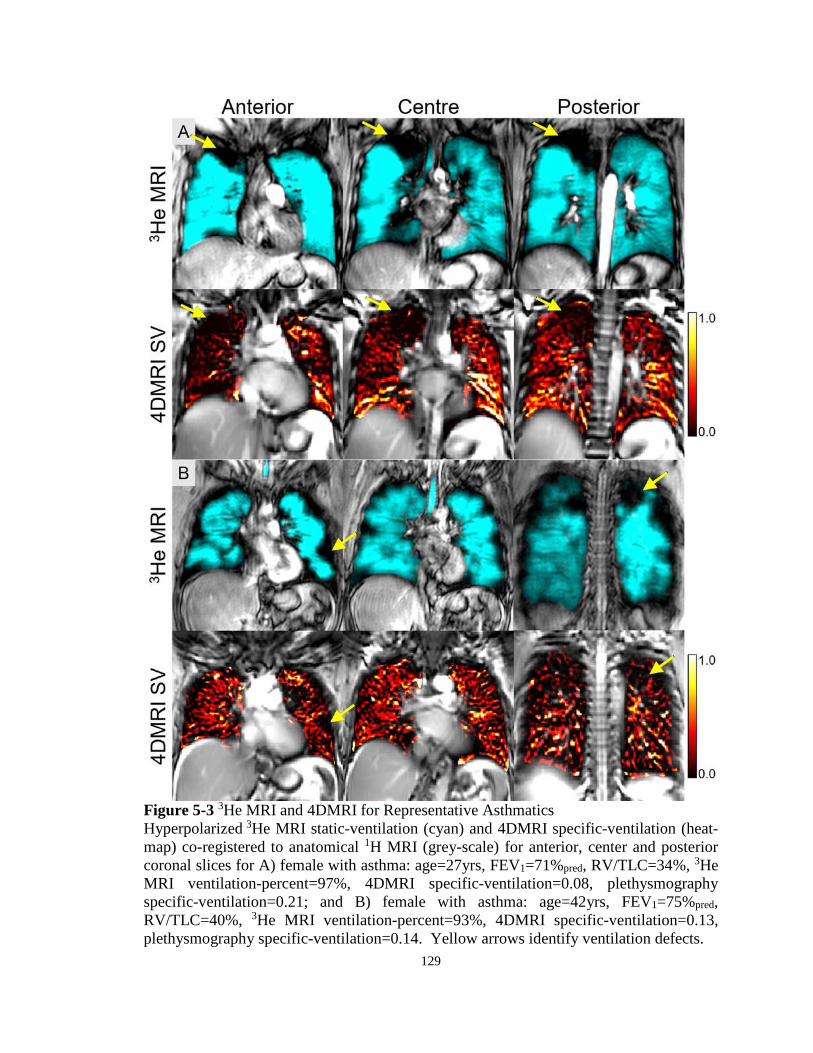
129
Figure 5-3 3He MRI and 4DMRI for Representative Asthmatics Hyperpolarized 3He MRI static-ventilation (cyan) and 4DMRI specific-ventilation (heat-map) co-registered to anatomical 1H MRI (grey-scale) for anterior, center and posterior coronal slices for A) female with asthma: age=27yrs, FEV1=71%pred, RV/TLC=34%, 3He MRI ventilation-percent=97%, 4DMRI specific-ventilation=0.08, plethysmography specific-ventilation=0.21; and B) female with asthma: age=42yrs, FEV1=75%pred, RV/TLC=40%, 3He MRI ventilation-percent=93%, 4DMRI specific-ventilation=0.13, plethysmography specific-ventilation=0.14. Yellow arrows identify ventilation defects.

130
5.3.3 Correlations
Figure 5-4 and Table 5-2 show that 1H MRI specific-ventilation was significantly
correlated with hyperpolarized 3He MRI ventilation-percent (ρ=.67, p<.0001) and
plethysmography specific-ventilation (ρ=.54, p=.002). Table 5-2 reveals that MRI
measurements were significantly correlated with FEV1 (specific-ventilation: ρ=.65,
p=.0001; ventilation-percent: ρ=.52, p=.003), FEV1/FVC (specific-ventilation: ρ=.75,
p<.0001; ventilation-percent: ρ=.64, p=.001), and RV/TLC (specific-ventilation: ρ=-.68,
p<.0001; ventilation-percent: ρ=-.66, p<.0001).
Table 5-2 3He MRI Ventilation and 1H MRI Specific-Ventilation Correlations with Pulmonary Function
Spearman Correlation Coefficient ρ (p) [CI]
3He MRI Ventilation-Percent %
4DMRI Specific-Ventilation
(n=30) (n=30) FEV1 %pred .52 (.003) [.19 - .75] .65 (.0001) [.36 - .82] FEV1/FVC % .64 (.0001) [.35 - .82] .75 (<.0001) [.52 - .88] RV %pred -.52 (.003) [-.75 - -.19] -.55 (.002) [-.77 - -.23] RV/TLC % -.66 (<.0001) [-.83 - -.39] -.68 (<.0001) [-.84 - -42] RAW %pred -.58 (.0008) [-.78 - -.27] -.51 (.004) [-.74 - -.17] Specific-Ventilation .32 (.08) [-.05 - .62] .54 (.002) [.21 - .76] 3He MRI Ventilation-Percent % -- .67 (<.0001) [.40 - .83] 4DMRI Specific-Ventilation .67 (<.0001) [.40 - .83] -- CI=confidence interval; %pred=percent of predicted value; FEV1=forced expiratory volume in one second; FVC=forced vital capacity; RV=residual volume; TLC=total lung capacity; RAW=airways resistance; Specific-Ventilation=plethysmography measurement of specific-ventilation.

131
Figure 5-4 Relationships for 4DMRI Specific-Ventilation with 3He MRI Ventilation-Percent and Plethysmography Specific-Ventilation A) 3He MRI ventilation-percent and 4DMRI specific-ventilation were significantly correlated (ρ=.67, p<.0001, y=55x+89). B) Plethysmography specific-ventilation and 4DMRI specific-ventilation were significantly correlated (ρ=.54, p=.002, y=1.09x+0.15). Dotted lines indicate the 95% confidence intervals.
132
Figure 5-5 shows co-registered hyperpolarized 3He MR imaging and 1H MR imaging for
a representative asthmatic with a focal right upper lobe ventilation defect and the spatial
relationship with a specific-ventilation void. Non-rigid co-registration of hyperpolarized 3He and 1H MR imaging maps showed that 1H MR imaging specific-ventilation was
significantly worse in hyperpolarized 3He MR imaging ventilation-defects (0.05±0.04) as
compared to well-ventilated lung regions (0.09±0.05; p<.0001) in asthmatics. Figure 5-5
also shows that specific-ventilation was significantly larger in the gravitational dependent
(0.20±0.07) versus independent (0.12±0.03; p=.02) lung regions in healthy participants,
but not in asthmatics (dependent=0.09±0.05, independent=0.07±0.05; p=.1).

133
Figure 5-5 Spatial Correspondence of free-breathing 4DMRI Specific-Ventilation and 3He MRI Static Ventilation Maps A) Three-dimensional co-registration of 4DMR imaging specific-ventilation (heat-map) and static 3He MR imaging ventilation (transparent cyan), with Coronal on left panel, Sagittal (right upper panel) and Axial views (right lower panel) showing anatomical 1H MR imaging in grey-scale (in the sagittal and coronal panels) for a female with asthma: age=27yrs, FEV1=71%pred, RV/TLC=34%, 3He MR imaging ventilation-percent=97%, specific-ventilation=0.21, 4DMR imaging specific-ventilation whole-lung/ventilated-region/ventilation-defect-region=0.08/0.08/0.02. B) 4DMR imaging specific-ventilation was significantly increased in the dependent (0.20±0.07) versus the nondependent (0.12±0.03) region of the lung (p=.02) in the healthy subjects. In the asthmatics, no gravitational dependence was observed (dependent=0.09±0.05, nondependent=0.07±0.05, p=.1). C) 4DMR imaging specific-ventilation was significantly less in the 3He MR ventilation-defects (0.05±0.04) versus the ventilated (0.09±0.05) regions of the lung (p<.0001) in the asthmatic subjects.

134
5.4 Discussion
In a proof-of-concept demonstration in 30 participants, conventional free-breathing 1H MR
imaging and retrospective respiratory phase co-registration and interpolation was used to
generate 1H MR imaging specific-ventilation measurements. Our results showed: 1) 1H
MR imaging specific-ventilation was significantly diminished in asthmatics compared to
healthy volunteers, 2) quantitative and spatial correlations with static breath-hold
hyperpolarized 3He MR imaging ventilation and a significant correlation with
plethysmography specific-ventilation, and, 3) a significant difference in 1H MR imaging
specific-ventilation in the gravitational dependent lung region in healthy volunteers but not
asthmatics.
As expected, MR imaging ventilation and specific-ventilation measurements were
significantly greater in healthy participants as compared to asthmatics. This is consistent
with static multi-volume 1H MR imaging signal-intensity measurements in asthmatic and
healthy participants.20 Diminished MR imaging specific-ventilation in the asthmatic lung
may reflect gas-trapping, airway-remodeling or inflammation, similar to previously
described studies that showed CT radio-density6 and ultra-short echo-time (UTE) MR
imaging signal intensity differences31 in asthma patients compared to healthy volunteers.
1H MR imaging specific-ventilation was significantly related to plethysmography specific-
ventilation and FEV1/FVC, indicating a relationship with airflow obstruction. Correlations
with RV and RV/TLC were consistent with the notion that gas-trapping reduced specific-
ventilation, similar to previous work that showed multi-volume UTE MR imaging was
related to pulmonary-function-tests in asthmatics.31 The relationship between 1H MR
imaging and plethysmography-measured specific-ventilation was consistent with a
previous investigation using oxygen-enhanced MR imaging with multiple-breath
washout.32
In asthmatics, 1H MR imaging specific-ventilation was significantly diminished within
ventilation defects as compared to well-ventilated regions. This suggests that different
static breath-hold and dynamic MR imaging methods may interrogate similar airway

135
abnormalities that influence the time constants for lung filling or ventilation.
Hyperpolarized 3He MR imaging measures inhaled gas distribution during a 10-15s breath-
hold, while 1H MR imaging specific-ventilation maps are generated, (like 4DCT specific-
ventilation12) over a few minutes of tidal breathing. This important difference suggests
that both methods may also reflect the different time-constants for lung filling, which we
think can be exploited clinically and in research studies. We also observed gravitational
differences in healthy participants,18,32 but not in asthmatics, similar to previous findings.20
Although other studies using static breath-hold 1H MRI observed differences in
asthmatics,20 4D modeling of airflow demonstrated differences between breath-hold and
dynamic breathing when evaluating ventilation heterogeneity in asthmatics,33 which may
explain some of our results. Gravitational differences in 3He MRI have also been observed
whereby ventilation defects were larger in posterior regions of interest in asthmatics,
suggestive of gas-trapping.34,35
We acknowledge a number of study limitations including the relatively small sample size
and modest correlations between our 1H MRI specific-ventilation measurement compared
to both the reference plethysmography specific-ventilation measurement (ρ=.54, p=.002)
and hyperpolarized 3He MRI (ρ=.67, p<.0001). We must also acknowledge that because
all of these measurements were performed in the same small subject group, caution must
be taken when extending these results to a general population. Free-breathing protocols
may be influenced by irregular breathing patterns, previously observed using 4DCT,36 so
some patients will require coaching or support.37 There was also a significant age
difference between healthy and asthmatic volunteers (p<.0001), as a result of consecutive
recruitment between January and June 2017 based on inclusion/exclusion criteria (provided
in the Supplement), which is important to consider because lung aging has been shown to
influence lung ventilation.38 Furthermore, other confounding factors, such as the
differences in the demographics, may contribute to the overall differences observed
between the two subject groups. The difference between MRI specific-ventilation and
plethysmography specific-ventilation may stem from a number of issues. For example,
MR imaging specific-ventilation is based on the difference in signal-intensities between
co-registered volumes, which may be biased by poor co-registration. Moreover,
136
differences in position are important to consider since previous studies showed the effect
of body position on lung volumes.39,40 While supine, FRC and tidal-volume are lower than
when upright but to different extents;39 this would result in greater specific-ventilation in
the supine position, which we did not observe. These measurements are also influenced
by arm position40 and may have influenced our results. 1H MRI specific-ventilation was
significantly diminished within ventilation defects as compared to well-ventilated regions,
which provides some preliminary evidence that in these patients the time constants for
filling were dominated by longer timescales, although a voxel-wise comparison may help
to better ascertain spatial differences. Unfortunately, while it is theoretically possible to
measure 3He MRI specific ventilation in free-breathing human subjects, it is not feasible
because of the exorbitant cost of 3He gas and the safety concerns related to repeated
breathing of anoxic gas mixtures (mixtures with O2 are not possible because this accelerates
polarization signal decay). 3He MRI measures gas distribution during a 10-15s breath-
hold,41 while 4DMR specific-ventilation images are generated, (like 4DCT12) over two to
three minutes of tidal breathing. As such, the two methods are not measuring the same
quantity and they likely interrogate different lung functional information related to airway
calibre that influence the time constants for lung filling and emptying. It is important to
point out that the current approach is based on the assumption that changes in signal
intensity during tidal breathing were due to air volume changes. However, both blood and
tissue contribute to the MRI signal and it is likely that heart rate/blood flow influences were
captured during the two minutes of breathing. We have not explicitly accounted for this in
our calculations because of the dominant role that the movement of air in and out of the
lungs plays in the MRI signal intensity fluctuations. We also note that here we observed
changes in signal density distributions that were very similar to what was observed using
UTE MRI42 that is a proton density sensitive method and CT43 -the clinical gold standard
for lung density measurements.
Regional specific-ventilation imaging was demonstrated in a small group of participants
using free-breathing 1H MR imaging without exogenous contrast. While other MRI
techniques acquire images in breath-hold at multiple lung volumes20,44 or free-breathing
images for a single slice,19,22,23,45 this approach provides another way to generate whole

137
lung functional maps that probe functional abnormalities using conventional equipment
and pulse sequences while patients are free-breathing. This method may be useful for
younger asthmatics who are difficult to treat and may need interventional procedures.
In summary, using conventional 1H MRI without exogenous contrast, we developed a way
to rapidly generate regional specific-ventilation measurements that correlate with
plethysmography specific-ventilation and static breath-hold hyperpolarized 3He MRI
ventilation measurements. This method may offer new diagnostic approaches for
pulmonary medicine in more typical clinical settings.
138
5.5 References
(1) Reddel, H. K. et al. A summary of the new GINA strategy: a roadmap to asthma control. The European respiratory journal 2015; 46: 622-639.
(2) Busse, W. W. Asthma diagnosis and treatment: filling in the information gaps. J Allergy Clin Immunol 2011; 128: 740-750.
(3) Celli, B. R. The importance of spirometry in COPD and asthma: effect on approach to management. Chest 2000; 117: 15S-19S.
(4) Burgel, P. R. The role of small airways in obstructive airway diseases. Eur Respir Rev 2011; 20: 23-33.
(5) Tulic, M. K., Christodoulopoulos, P. & Hamid, Q. Small airway inflammation in asthma. Respir Res 2001; 2: 333-339.
(6) Newman, K. B., Lynch, D. A., Newman, L. S., Ellegood, D. & Newell, J. D. Quantitative Computed-Tomography Detects Air Trapping Due to Asthma. Chest 1994; 106: 105-109.
(7) Awadh, N., Muller, N. L., Park, C. S., Abboud, R. T. & FitzGerald, J. M. Airway wall thickness in patients with near fatal asthma and control groups: assessment with high resolution computed tomographic scanning. Thorax 1998; 53: 248-253.
(8) Trivedi, A. et al. Using imaging as a biomarker for asthma. Journal of Allergy and Clinical Immunology 2017; 139: 1-10.
(9) Choi, S. et al. Registration-based assessment of regional lung function via volumetric CT images of normal subjects vs. severe asthmatics. J Appl Physiol (1985) 2013; 115: 730-742.
(10) Busacker, A. et al. A Multivariate Analysis of Risk Factors for the Air-Trapping Asthmatic Phenotype as Measured by Quantitative CT Analysis. Chest 2009; 135: 48-56.
(11) Aysola, R. S. et al. Airway Remodeling Measured by Multidetector CT Is Increased in Severe Asthma and Correlates With Pathology. Chest 2008; 134: 1183-1191.
(12) Guerrero, T. et al. Quantification of regional ventilation from treatment planning CT. Int J Radiat Oncol Biol Phys 2005; 62: 630-634.
(13) Lewis, S. M., Evans, J. W. & Jalowayski, A. A. Continuous distributions of specific ventilation recovered from inert gas washout. J Appl Physiol Respir Environ Exerc Physiol 1978; 44: 416-423.
139
(14) Fain, S., Schiebler, M. L., McCormack, D. G. & Parraga, G. Imaging of Lung Function Using Hyperpolarized Helium-3 Magnetic Resonance Imaging: Review of Current and Emerging Translational Methods and Applications. Journal of Magnetic Resonance Imaging 2010; 32: 1398-1408.
(15) Samee, S. et al. Imaging the lungs in asthmatic patients by using hyperpolarized helium-3 magnetic resonance: assessment of response to methacholine and exercise challenge. J Allergy Clin Immunol 2003; 111: 1205-1211.
(16) Edelman, R. R., Hatabu, H., Tadamura, E., Li, W. & Prasad, P. V. Noninvasive assessment of regional ventilation in the human lung using oxygen-enhanced magnetic resonance imaging. Nature Medicine 1996; 2: 1236-1239.
(17) Ohno, Y. et al. Oxygen-enhanced MRI vs. quantitatively assessed thin-section CT: pulmonary functional loss assessment and clinical stage classification of asthmatics. Eur J Radiol 2011; 77: 85-91.
(18) Sa, R. C. et al. Vertical distribution of specific ventilation in normal supine humans measured by oxygen-enhanced proton MRI. J Appl Physiol (1985) 2010; 109: 1950-1959.
(19) Zapke, M. et al. Magnetic resonance lung function--a breakthrough for lung imaging and functional assessment? A phantom study and clinical trial. Respir Res 2006; 7: 106.
(20) Pennati, F. et al. Assessment of regional lung function with multivolume (1)H MR imaging in health and obstructive lung disease: comparison with (3)He MR imaging. Radiology 2014; 273: 580-590.
(21) Kjorstad, A. et al. Quantitative lung ventilation using Fourier decomposition MRI; comparison and initial study. Magnetic Resonance Materials in Physics Biology and Medicine 2014; 27: 467-476.
(22) Bauman, G. et al. Non‐contrast‐enhanced perfusion and ventilation assessment of the human lung by means of fourier decomposition in proton MRI. Magn Reson Med 2009; 62: 656-664.
(23) Capaldi, D. P. I. et al. Free-breathing Functional Pulmonary MRI: Response to Bronchodilator and Bronchoprovocation in Severe Asthma. Acad Radiol 2017; 24: 1268-1276.
(24) Kirby, M. et al. Hyperpolarized 3He magnetic resonance functional imaging semiautomated segmentation. Acad Radiol 2012; 19: 141-152.
(25) Vedam, S. S. et al. Acquiring a four-dimensional computed tomography dataset using an external respiratory signal. Physics in Medicine and Biology 2003; 48: 45-62.
140
(26) Yamamoto, T. et al. 4D CT lung ventilation images are affected by the 4D CT sorting method. Med Phys 2013; 40: 101907.
(27) Lucas, B. D. & Kanade, T. An iterative image registration technique with an application to stereo vision. 1981.
(28) Guo, F. et al. Anatomical pulmonary magnetic resonance imaging segmentation for regional structure-function measurements of asthma. Med Phys 2016; 43: 2911.
(29) Heinrich, M. P. et al. MIND: Modality independent neighbourhood descriptor for multi-modal deformable registration. Medical Image Analysis 2012; 16: 1423-1435.
(30) Nahm, F. S. Nonparametric statistical tests for the continuous data: the basic concept and the practical use. Korean Journal of Anesthesiology 2016; 69: 8-14.
(31) Sheikh, K. et al. Ultrashort echo time MRI biomarkers of asthma. J Magn Reson Imaging 2017; 45: 1204-1215.
(32) Sa, R. C. et al. Validating the distribution of specific ventilation in healthy humans measured using proton MR imaging. Journal of Applied Physiology 2014; 116: 1048-1056.
(33) Jahani, N. et al. A four-dimensional computed tomography comparison of healthy and asthmatic human lungs. J Biomech 2017; 56: 102-110.
(34) Altes, T. A. et al. Hyperpolarized 3He MR lung ventilation imaging in asthmatics: preliminary findings. J Magn Reson Imaging 2001; 13: 378-384.
(35) Costella, S. et al. Regional pulmonary response to a methacholine challenge using hyperpolarized (3)He magnetic resonance imaging. Respirology 2012; 17: 1237-1246.
(36) Mutaf, Y. D., Antolak, J. A. & Brinkmann, D. H. The impact of temporal inaccuracies on 4DCT image quality. Med Phys 2007; 34: 1615-1622.
(37) Pollock, S., Kipritidis, J., Lee, D., Bernatowicz, K. & Keall, P. The impact of breathing guidance and prospective gating during thoracic 4DCT imaging: an XCAT study utilizing lung cancer patient motion. Phys Med Biol 2016; 61: 6485-6501.
(38) Fletcher, C. & Peto, R. The natural history of chronic airflow obstruction. Br Med J 1977; 1: 1645-1648.
(39) Moreno, F. & Lyons, H. A. Effect of Body Posture on Lung Volumes. Journal of Applied Physiology 1961; 16: 27-&.
141
(40) Lumb, A. B. & Nunn, J. F. Respiratory-Function and Ribcage Contribution to Ventilation in Body Positions Commonly Used during Anesthesia. Anesthesia and Analgesia 1991; 73: 422-426.
(41) Middleton, H. et al. MR imaging with hyperpolarized 3He gas. Magn Reson Med 1995; 33: 271-275.
(42) Ma, W. et al. Ultra-short echo-time pulmonary MRI: evaluation and reproducibility in COPD subjects with and without bronchiectasis. J Magn Reson Imaging 2015; 41: 1465-1474.
(43) Wegener, O. H., Koeppe, P. & Oeser, H. Measurement of lung density by computed tomography. J Comput Assist Tomogr 1978; 2: 263-273.
(44) Pusterla, O. et al. Rapid 3D in vivo 1H human lung respiratory imaging at 1.5 T using ultra-fast balanced steady-state free precession. Magn Reson Med 2017; 78: 1059-1069.
(45) Capaldi, D. P. et al. Free-breathing pulmonary 1H and Hyperpolarized 3He MRI: comparison in COPD and bronchiectasis. Acad Radiol 2015; 22: 320-329.
142
5.6 Supplement
5.6.1 Materials and Methods
5.6.1.1 Study Participants
We recruited participants from a local tertiary care center and by advertisement. For all
participants, the exclusion criteria consisted of: 1) serious claustrophobia, 2) unable to
perform spirometry, 3) body mass index >40, and, 4) any MR imaging contraindications
(i.e. metal/electronic/magnetic implants). Inclusion criteria for healthy volunteers
consisted of: 1) medical history with no chronic or acute respiratory disease and stable
health, 2) age 18-75, and, 3) smoking history <1 pack-years. Inclusion criteria for
asthmatics consisted of: 1) clinical diagnosis of asthma with β2-agonist reversibility of
FEV1>12%, or methacholine FEV1 provocative concentration that decreased FEV1 by 20%
(PC20) ≤ 8 mg/ml if not administered inhaled corticosteroid (ICS), or ≤ 16mg/ml if
administered ICS, 2) no history of other chronic disease, 3) age 18-85, and, 4) smoking
history < 1 pack-years.
5.6.1.2 Pulmonary Function Tests
Spirometry and plethysmography were performed using a MedGraphics Elite Series
plethysmograph (MedGraphics Corporation, St. Paul, Minnesota, USA) according to the
American-Thoracic-Society/European-Respiratory-Society guidelines1 to measure FEV1,
forced-vital-capacity (FVC), total-lung-capacity (TLC), residual-volume (RV), tidal-
volume (TV), functional-residual-capacity (FRC) and airways resistance (RAW).
Plethysmography-derived specific-ventilation was calculated as TV divided by FRC, as
previously described.2
5.6.1.3 Hyperpolarized 3He MR Image Processing
Hyperpolarized 3He MR static ventilation images were segmented using a k-means
approach that classified voxel intensity values into five clusters as follows: 1) signal-void
= cluster 1 (C1) or ventilation defect volume, and 2) ventilation volume = cluster 2-5.
143
Ventilation boundaries were segmented using a seeded region-growing algorithm of the 1H
MR imaging thoracic cavity, as previously described.3
5.6.2 Results
Figure 5-6 shows the 4DMRI specific-ventilation maps and signal-intensity distributions
for the two lung volumes used to generate 4DMR specific-ventilation images (tidal-
inspiration and tidal-expiration volumes) for a representative healthy-volunteer and
asthmatic. The signal-intensity distributions for the healthy volunteer demonstrated a shift
towards lower signal-intensities and narrowed distribution at the greater lung volume. For
the asthmatic, the qualitative difference between tidal inspiration and tidal expiration was
smaller.

144
Figure 5-6 Generation of 4DMR Specific-Ventilation Images 4DMRI specific-ventilation heat-maps (black=low-specific-ventilation to yellow=high-specific-ventilation), which is a dimensionless physical quantity that reflects the proportion of inhaled gas moving into the lung during normal breathing, were generated on a voxel-by-voxel basis after co-registration of tidal inspiratory and tidal expiratory MRI volumes to provide a local distribution of specific-ventilation, as shown for a representative healthy volunteer and an asthmatic. Signal intensity histograms are also shown at two lung volumes (tidal inspiration [black] and tidal expiration [gray]), and shows a shift toward lower signal intensities and narrowed distribution at a higher lung volume.
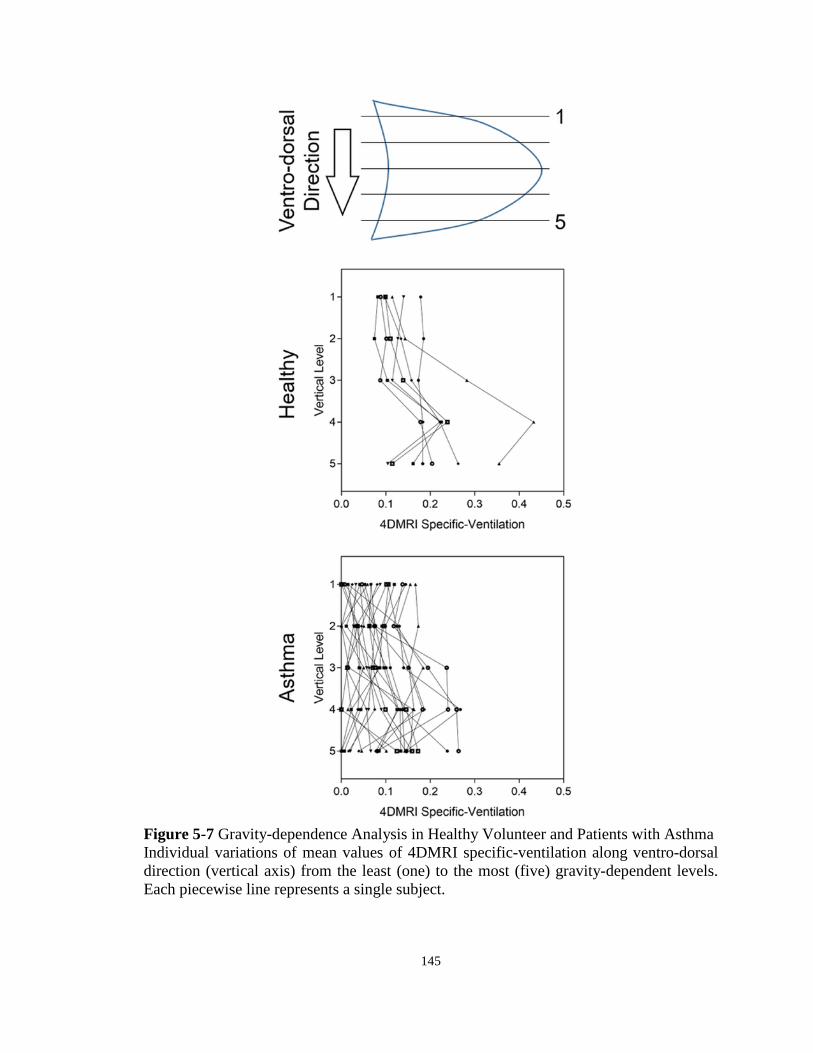
145
Figure 5-7 Gravity-dependence Analysis in Healthy Volunteer and Patients with Asthma Individual variations of mean values of 4DMRI specific-ventilation along ventro-dorsal direction (vertical axis) from the least (one) to the most (five) gravity-dependent levels. Each piecewise line represents a single subject.

146
5.6.3 References
(1) Miller, M. R. et al. Standardisation of spirometry. Eur Respir J 2005; 26: 319-338.
(2) Lewis, S. M., Evans, J. W. & Jalowayski, A. A. Continuous distributions of specific ventilation recovered from inert gas washout. J Appl Physiol Respir Environ Exerc Physiol 1978; 44: 416-423.
(3) Kirby, M. et al. Hyperpolarized 3He magnetic resonance functional imaging semiautomated segmentation. Acad Radiol 2012; 19: 141-152.

147
CHAPTER 6
6 CONCLUSIONS AND FUTURE DIRECTIONS In this final chapter, I will provide a summary and overview of the important findings and conclusions presented in Chapters 2-5. The limitations specific to each study and general limitations will also be provided with some potential solutions. Finally, I will end with some future directions based on what we observed using non-contrast enhanced pulmonary imaging.
6.1 Overview and Research Questions
COPD and asthma affect hundreds of millions of people throughout the world1 and this
number is projected to increase. Ultimately, this will overwhelm the healthcare system and
result in a substantial economic burden.2 Despite the many years of research, current
therapies are lacking,3,4 leaving patients with dismal prognoses. Clearly, the management
and treatment of lung disease patients is inadequate and this is in part due to the way in
which these patients are currently diagnosed and monitored using measurements of airflow
obstruction. Although these global measurements of airflow limitation are easy to
implement and reproducible,5 they do not provide any regional information about the
different underlying pathophysiology in lung disease patients. Accordingly, this has
motivated the development and research of other approaches to regionally evaluate lung
function using pulmonary imaging for longitudinal monitoring and image-guided
treatments.
Numerous pulmonary imaging techniques are being developed to quantify structure and
function regionally within the lungs. However, they are not all well suited for longitudinal
monitoring because of the potential risks associated with exposure to ionizing radiation,6-8
specifically for CT and nuclear medicine imaging, which is particularly concerning for
young adults and pediatric populations. In contrast, pulmonary MRI is not limited by
radiation exposure and provides regional measurements of lung function with the potential
for longitudinal monitoring of patients and image-guided treatment. Specifically with the
use of inhaled hyperpolarized noble gases (3He and 129Xe), one can regionally quantify
pulmonary ventilation by visualizing lung regions accessed by gas during a breath-hold,
148
and alternatively, regions that are not accessed. The ventilation images that appear in
hyperpolarized noble gas MRI have been shown to be reproducible,9,10 related to relevant
clinical measurements,11-13 and sensitive to treatment response,14,15 in both asthma and
COPD patients. Despite numerous studies, clinical translation of these imaging approaches
have been hampered due to a number of key limitations including: 1) relatively high cost
associated with inhaled gas contrast; and, 2) requirement of multi-nuclear MR hardware
and analysis software and specialized personal, restricting these techniques to a few
specialized research centres. With this in mind, there has been growing interest in the
development of pulmonary MRI and CT approaches that do not depend on inhaled gas
contrast agents to overcome the challenges associated with resource accessibility. The
development and validation of these clinically meaningful non-contrast enhanced
pulmonary MR and CT imaging biomarkers is critically required to accelerate pulmonary
MRI and CT translation from the research workbench to the clinical workflow for patient
care.
The overarching objective of this thesis was to develop and evaluate patients with lung
disease using MR and CT imaging biomarkers of pulmonary structure and function without
the use of inhaled exogenous contrast agents or specialized equipment. The specific
research questions addressed were: 1) Do measurements of emphysema and gas-trapping
derived from parametric response maps of co-registered inspiratory-expiratory CT images
relate to ventilation heterogeneity quantified using hyperpolarized 3He MRI? (Chapter 2);
2) Can non-contrast enhanced free-breathing pulmonary 1H MRI measurements of
ventilation heterogeneity be developed to measure ventilation abnormalities in subjects
with COPD and bronchiectasis, and are these measurements related to pulmonary function
tests and 3He MRI ventilation defects? (Chapter 3); 3) Can we apply the developed method
in Chapter 3 to patients with severe asthma to evaluate ventilation heterogeneity, both pre-
and post-salbutamol as well as post-methacholine challenge? (Chapter 4); and, 4) Can we
extend the free-breathing pulmonary 1H MRI approach developed in Chapter 3 to capture
whole-lung measurements of regional specific-ventilation in healthy volunteers and
patients with asthma? (Chapter 5)
149
6.2 Summary and Conclusions
In Chapter 2 we developed and directly compared CT PRM with 3He MRI ventilation
measurements of gas-trapping and emphysema in ex-smokers with and without COPD.
We determined the quantitative and spatial relationships of PRM gas-trapping and PRM
emphysema measurements with MRI measurements of parenchymal tissue integrity and
ventilation. We found that in 58 ex-smokers with (n=32) and without (n=26) COPD, 3He
MRI ventilation defect percent was significantly correlated with CT PRM measurements
of gas-trapping (r=.58, p<.001) and emphysema (r=.68, p<.001). 3He MRI ADC
measurements were also significantly correlated with PRM gas-trapping (r=.55, p<.001)
and PRM emphysema (r=.62, p<.001). Spatial CT-MRI relationships in all ex-smokers
showed that 3He MRI ADC was significantly elevated in regions of PRM gas-trapping as
compared to normal tissue (p<.05). In patients with mild and moderate COPD (n=25), 3He MRI ventilation defects were quantitatively and spatially related to PRM gas-trapping
(mild COPD - gas-trapping: SOC=36±28%, emphysema: SOC=1±2%, p=.001; moderate
COPD - gas-trapping: SOC=34±28%, emphysema: SOC=7±15%, p=.006), while in severe
COPD (n=7), MRI ventilation defects were quantitatively and spatially related to both
PRM-gas-trapping and emphysema (gas-trapping: SOC=36±18%, emphysema:
SOC=64±30%, p=.01). These observations are important because while 3He MRI is
unlikely to be translated clinically, this information may be used to help better understand
PRM gas-trapping measurements, which may be more widely adopted for clinical
phenotyping of COPD patients.
We then developed and compared pulmonary ventilation abnormalities derived from
FDMRI with 3He MRI in subjects with COPD and bronchiectasis in Chapter 3. We
observed that in 26 subjects, including 12 COPD subjects and 14 bronchiectasis subjects,
that for the COPD subjects, FDMRI and 3He MRI VDP was 7±6% and 24±14%,
respectively (p<.001, bias=-16±9%). In COPD subjects, FDMRI was significantly
correlated with 3He MRI VDP (r=.88, p=.0001), 3He MRI ADC (r=.71, p<.05), and RAW
(r=.60, p<.05). In subjects with bronchiectasis, FDMRI (5±3%) and 3He MRI VDP
(18±9%) were significantly different (p<.001) and not correlated (p>.05). The Dice
150
Similarity Coefficient for FDMRI and 3He MRI ventilation was 86±7% for COPD and
86±4% for bronchiectasis subjects (p>.05). This work showed similar regional ventilation
abnormalities using FDMRI and 3He MRI in COPD subjects and these appear to be
dominated by the presence of regional emphysematous bullae. This work demonstrated
that FDMRI and 3He MRI ventilation defects were strongly correlated in COPD, but not
bronchiectasis subjects.
In Chapter 4 we evaluated ventilation heterogeneity in patients with severe asthma, both
pre- and post-salbutamol as well as post-methacholine challenge, using FDMRI and 3He
MRI. We observed in 16 severe asthmatics that hyperpolarized 3He MRI (p=.02) and
FDMRI (p=.02) VDP significantly improved post-salbutamol and for four asthmatics who
could perform MCh (n=4), 3He and FDMRI VDP significantly increased at the provocative
concentration of methacholine resulting in a 20% decrease in FEV1 and decreased post-
bronchodilator (p=.02), with a significant difference between methods (p=.01). FDMRI
VDP was moderately correlated with 3He VDP (ρ=.61, p=.01), but under-estimated VDP
relative to 3He VDP (-6±9%). While 3He MRI VDP was significantly correlated with the
lung-clearance-index, FDMRI was not (ρ=.49, p=.06). This work demonstrated that
FDMRI VDP generated in free-breathing asthmatic patients was correlated with static
inspiratory breath-hold 3He MRI VDP, but under-estimated VDP relative to 3He MRI VDP.
Although less sensitive to salbutamol and MCh, FDMRI VDP may be considered for
asthma patient evaluations at centres without inhaled-gas MRI.
In Chapter 5 of this thesis, we developed a whole-lung free breathing pulmonary 1H MRI
technique to measure regional specific-ventilation and evaluated asthmatics and healthy
volunteers. We compared 1H MRI specific-ventilation with hyperpolarized 3He MRI
ventilation in healthy and asthmatic participants, and, determined the relationships between 1H MRI specific-ventilation and hyperpolarized 3He MRI and pulmonary-function
measurements. We observed in 30 participants, including seven healthy volunteers and 23
asthmatics, 1H MR imaging specific-ventilation (p<.0001) and hyperpolarized 3He MR
imaging ventilation-percent (p<.0001) were both significantly greater in healthy volunteers
as compared to asthmatics. For all subjects, 1H MRI specific-ventilation was also
correlated with plethysmography specific-ventilation (ρ=.54, p=.002) and hyperpolarized

151
3He MRI ventilation-percent (ρ=.67, p<.0001), as well as FEV1 (ρ=.65, p=.0001),
FEV1/FVC (ρ=.75, p<.0001), RV/TLC (ρ=-.68, p<.0001) and RAW (ρ=-.51, p=.004). 1H
MRI specific-ventilation was significantly greater in the gravitational-dependent versus
non-dependent lung in healthy volunteers (p=.02), but not in the asthmatics (p=.1). In
asthmatics, co-registered 1H MRI specific-ventilation and hyperpolarized 3He MRI maps
showed that specific-ventilation was diminished in corresponding 3He MRI ventilation-
defects as compared to well-ventilated regions (p<.0001). We demonstrated in this study
that using conventional 1H MRI without exogenous contrast, could rapidly generate whole-
lung regional specific-ventilation measurements, which correlated with plethysmography
specific-ventilation and static breath-hold hyperpolarized 3He MRI ventilation
measurements. This method may offer new diagnostic approaches for pulmonary medicine
in more typical clinical settings.
In summary, we provided: 1) evidence that CT parametric response maps were
quantitatively and spatially related to ventilation measurements using 3He MRI in ex-
smokers with and without airflow limitation; 2) evidence that the ventilation defect
measurements derived from non-contrast enhanced free-breathing MRI are related to
ventilation abnormalities generated from 3He MRI in patients with COPD; 3) evidence that
the measurements derived from non-contrast enhanced free-breathing MRI are sensitive to
treatment response to bronchodilation and bronchoconstriction in patients with severe
asthma; and, 4) a new non-contrast enhanced whole-lung free-breathing 1H MRI method
to evaluate regional specific-ventilation in patients with asthma.
6.3 Limitations
The significant limitations from Chapters 2-5 will be discussed in this section of the thesis.
The study specific limitations are also provided in the Discussion section of each of the
respective Chapters.
152
6.3.1 Study Specific Limitations
Chapter 2: Pulmonary Imaging Biomarkers of Gas-trapping and Emphysema in COPD: 3He MR Imaging and CT Parametric Response Maps
In the study presented in Chapter 2, we sought to better understand the quantitative and
spatial relationships between CT PRM and 3He MRI imaging biomarkers in ex-smokers
with and without COPD. This work was limited by the relatively small study group and
the fact that we mainly evaluated ex-smokers with mildly abnormal and normal spirometry,
which was prospectively planned and driven by our interest to investigate very early or
mild disease. Given our understanding of the heterogeneity of COPD patients, we must be
cautious about extrapolating our results.
Another limitation is the influence of deformable registration error on the results presented
in this study. Similar to 4DCT,16 Fourier decomposition MRI,17 and paired
inspiratory/expiratory CT,18-20 PRM exploits the image signal differences as the lung tissue
expands and contracts from inspiration to expiration. All these approaches rely on either
computational or intuitive co-registration of inspiratory and expiratory CT and assume that
the abnormal presence of air can be regionally related to emphysema and/or functional
small airways disease. Thus, deformable image registration errors pose a challenge, which
has been previously reported for PRM in the liver.21 A direct comparison of the results
generated here with results stemming from commercially available software, such as
Apollo Workstation 2.0 (VIDA Diagnostics Inc., Coralville, Iowa, USA) or Lung Density
Analysis software (IMBIO, Minneapolis, Minnesota, USA), would allow for a better
understanding on how image registration influences CT parametric response maps. Any
potential differences between the generated maps would likely stem from the different
image registration/warping algorithms used to register the inspiratory and expiratory CT
volumes since the density thresholds used are generally the same.
Finally, hyperpolarized 3He MRI is still limited to a few research facilities worldwide and
is unlikely to be translated clinically due to the depleted global supply of 3He gas.
However, with recent improvements in 129Xe polarization22 and the development of 19F
153
MRI,23 inhaled gas MRI may yet be considered for regulatory approval and future clinical
workflow.
Chapter 3: Free-breathing Pulmonary 1H and Hyperpolarized 3He MRI: Comparison in
COPD and Bronchiectasis
In the study presented in Chapter 3, we developed a free-breathing 1H MRI method to
evaluate pulmonary ventilation abnormalities in subjects with COPD and bronchiectasis.
First, we only acquired a single free-breathing 1H MR image. This limited our ability to
directly compare the ventilation measurements derived from FDMRI with those generated
from 3He MRI.
One of the challenges associated with pulmonary 1H MRI methods, is the weak pulmonary 1H signal intensity that is further diminished at higher field strengths because of the
relationship between field-strength and T2* effects. Furthermore, MR signal intensity is
dependent on positioning the patient within the RF coil, resulting in potential inter-scan
variability. Previous pilot and development studies at 1.5T have shown qualitative
agreement for regional ventilation and perfusion measurements with the SPECT/CT.24
Moreover, recent studies have also demonstrated the reproducibility of FDMRI ventilation-
and perfusion-weighted images in healthy volunteers.25
Finally, Fourier decomposition has recently emerged as a pulmonary functional MRI
method, albeit the ventilation measurements are dependent on more sophisticated image
processing methods. FDMRI generates ventilation contrast based on image signal
differences during the breathing cycle as air enters and leaves the pulmonary system and
tissue contracts and expands. This relies on robust and accurate image registration methods
to co-register the free tidal-breathing 1H MR image data. Consequently, deformable
registration error poses a challenge when generating FDMR ventilation weighted images.
To generate FDMR ventilation-weighted images, registration algorithms must account for
the movement of the diaphragm and any registration error will result in regions of high
signal intensity (e.g. mucus pooling in bronchiectasis subjects) oscillating at the same
frequency as respiration. Accordingly, this registration error can result in apparently
increased ventilation, which may or may not accurately reflect truly ventilated regions.
154
Thus, there may be regions that appear as ventilation in FDMRI that are in fact not
ventilated due to misalignment of these regions of high signal intensity via the deformable
registration process.
Chapter 4: Free-breathing Functional Pulmonary MRI: Response to Bronchodilator and
Bronchoprovocation in Severe Asthma
In Chapter 4, we applied the developed FDMRI approach in Chapter 3 in patients with
severe asthma to evaluate treatment response to bronchodilation as well as
bronchoconstriction. We also focused on severe asthmatics and those with poor control in
order to capture information relevant to an important clinical problem and, because of this,
the vast majority of patients were unable to perform methacholine challenge (n=4).
As mentioned before, an inherent limitation of pulmonary 1H MRI is the low signal
intensity due to intrinsically low proton density and T2* effects,26 but recent research27 that
exploits shorter echo times may overcome this challenge. FDMRI is also currently limited
to single slice acquisitions and this limits the generalizability of a direct comparison
between this method and hyperpolarized 3He MRI (FDMRI=single 2D slice time series
and 3He MRI=multi-slice 2D acquisition). Furthermore, there is no standardization of the
complex image-processing methods used to generate FDMR ventilation-weighted images.
Finally, inhaled hyperpolarized 3He MRI static ventilation maps and dynamic free
breathing FDMRI ventilation maps provide similar but not the same functional
information, making it challenging to perform a direct comparison between the two
imaging techniques. The differences in the functional information measured using inhaled-
gas MRI and FDMRI may stem from the different time constants for lung filling that are
the consequence of different airway abnormalities. For example, in asthmatics, 3He MRI
ventilation defects reflect lung regions with long time constants for filling that are beyond
the 10-15s acquisition time of scanning. In contrast, multi-breath free-breathing FDMRI
ventilation defects reflect airway and parenchyma abnormalities28 that do not fill during a
much longer, two minute acquisition window. A comparison between FDMRI and
previous work using multi-breath wash-in inhaled gas MRI29 may be better suited in

155
probing the relationship of inhaled noble gas MRI and non-contrast enhanced MRI
ventilation measurements.
Chapter 5: Free-breathing Pulmonary MR Imaging to Quantify Regional Ventilation
In Chapter 5, we developed a whole lung free-breathing pulmonary 1H MRI approach to
generate regional measurements of specific-ventilation and evaluated asthmatics and
healthy volunteers. There was a significant age difference between healthy and asthmatic
volunteers, as a result of consecutive recruitment between January and June 2017. This is
important to consider because lung aging has been shown to influence lung ventilation.30
Furthermore, other confounding factors, such as the differences in the demographics, may
contribute to the overall differences observed between the two subject groups.
As mentioned before, image registration error poses a challenge when measuring MRI
specific-ventilation since this imaging biomarker is based on the voxel-wise difference in
signal-intensities between co-registered volumes. It should be noted that we did not
acquire specific-ventilation measurements in the same body position using
plethysmography (sitting upright) and imaging (supine). Differences in body position, as
well as arm position, have been shown in previous studies to influence lung volumes
involved in calculating specific-ventilation (FRC and TV).31,32
Another limitation is that 3He MRI measures gas distribution during a 10-15s breath-hold,33
while 1H MR specific-ventilation images are generated, (like 4DCT34) over two to three
minutes of tidal breathing. Accordingly, the two methods are not measuring the same
quantity and they likely interrogate different lung functional information related to airway
calibre that influence the time constants for lung filling and emptying. Furthermore, free-
breathing protocols may be influenced by irregular breathing patterns, previously observed
using 4DCT,35 so some patients will require coaching or support.36
It is important to point out that we did not explicitly account for heart rate/blood flow
contribution to the MRI signal intensity in our calculations because of the dominant role
that the movement of air in and out of the lungs plays in the MRI signal intensity
fluctuations. The current approach is based on the assumption that changes in signal

156
intensity during tidal breathing were due to air volume changes. Although the observed
changes in signal density distributions were very similar to what was observed using UTE
MRI37 and CT,38 ideally, a mass correction to correct for respiratory-induced changes in
tissue perfusion (applied previously to 4DCT16) could be applied here to account for
changes in blood distribution between the exhale and inhale phases.
6.3.2 General Limitations
In Chapters 2-5, there was a small number of subjects evaluated in each study. This was
due in part because of the design of the studies and the inability to perform rigorous power
calculations since there was little prior knowledge of the imaging biomarkers generated
from non-contrast enhanced imaging data. Caution must be taken when extrapolating the
results presented in these studies to the broader population of asthmatic and COPD patients.
Regardless, these exploratory studies provide the foundation for future studies which
should be aimed in evaluating larger groups of patients to confirm the results observed.
One limitation to the studies presented in Chapters 2-5 was the use of whole lung imaging
biomarkers of signal intensity, relative areas of diseased lung, or ventilation to evaluate
pulmonary abnormalities in asthma and COPD patients. These global measurements of
lung function, although suitable for comparison and validation with other global measures
of airflow obstruction (i.e. spirometry), tend to eliminate the heterogeneity in regional
ventilation abnormalities visible on images. It is well known that static ventilation images
generated from hyperpolarized noble gas MRI are not binary (i.e. 0=non-ventilated vs
1=ventilated); they provide a gradient of signal intensities from hyper-intense to signal
void regions within the lungs, as shown in Figure 1-11. Analysis methods that were
implemented to generate the ventilation defect percent can also be used to generate clusters
of signal intensities, as shown in Figure 4-1, to quantify hyper-intense, normal, and hypo-
intense signal regions.39 Further studies should be performed to investigate these regions
in addition to the non-ventilated regions in both asthma and COPD patients. Furthermore,
threshold methods, such as those implemented in Chapter 2, either under40 or over41
estimate disease depending on the choice of threshold value. Alternative approaches have
157
been proposed that leverage principal component analysis (PCA) to overcome the use of a
single predefined threshold.42,43
Another important limitation to the studies presented in Chapters 2-5 was the use of 3He
gas and the limited availability of this gas for medical imaging. The high cost of 3He gas,
due to the depleting global supply of 3He,44 has limited hyperpolarized 3He MRI to a few
research facilities worldwide and is unlikely to be translated clinically. As mentioned in
Section 1.5.2.1, the transition to 129Xe and 19F gases has been the focus of the inhaled gas
MRI community, where with recent improvements in 129Xe polarization22 and the
development of 19F MRI,23 inhaled gas MRI may yet be considered for regulatory approval
and future clinical workflows. Regardless, future studies involving 19F and hyperpolarized 129Xe MRI are required to validate the results presented using 3He MRI and how these
results may differ when comparing to the non-contrast enhanced imaging techniques
presented in this thesis.
Finally, all the non-contrast enhanced imaging methods developed in Chapters 2-5 rely
on sophisticated image processing methods, which may limit clinical translation.
Furthermore, there is a dependence on these image analysis methods to be robust, accurate,
and reproducible. Consequently, any error in the image analysis pipeline, such as
deformable registration error, poses a challenge when generating these imaging biomarkers
of pulmonary disease. Thus, future studies should focus on the standardization and
validation of software used to analyze these images. This will be important moving
forward since the advancement of pulmonary imaging toward clinical implementations
requires large-scale and multi-centre evaluation of clinically-relevant biomarkers.

158
6.4 Future Directions
6.4.1 Regional Ventilation Heterogeneity: Three Dimensional Ventilation Clustering of Hyperpolarized Noble Gas MRI
In Chapters 2-5, we evaluated lung disease using the ventilation defect percent generated
from hyperpolarized 3He MRI. Although VDP is a robust measure that is reproducible9,10
and related to relevant clinical measurements,11-13 the ventilation defect percent does not
fully exploit the rich information and spatial content that is inherent to the hyperpolarized
noble-gas MR ventilation images, as mentioned in Section 6.3.2.45 As shown in Figure
6-1, specific cases can be identified whereby the VDP for two subjects is the same, but the
ventilation patterns are visibly different. This may suggest that there are measureable
differences in ventilation heterogeneity that are not reflected by VDP. Hence, the objective
of this proof-of-concept study was to develop an automated algorithm that quantifies the
ventilation heterogeneity readily displayed in pulmonary functional inhaled noble-gas
MRI. We hypothesize that the incorporation of both the magnitude and spatial location of
ventilation defects when analyzing inhaled noble-gas MR ventilation images could provide
further clinically relevant information that would be complementary to VDP and reflect
clinical measurements of ventilation heterogeneity, such as LCI.
The proposed three-dimensional clustering algorithm iteratively traces the non-ventilated
volumes until the maximum sphere (or multiple spheres of the same size) that can be filled
within the volume are found. Once the largest sphere (or multiple spheres of the same size)
was identified, this volume(s) was removed from the non-ventilated volume. This was
iteratively repeated until the non-ventilated volume was replaced by spheres. Thus, the
algorithm determines the minimum number of spheres of unequal sizes required to fill a
specified volume. This is similar to previous work where unequal sphere packing was
investigated in connection with radiosurgical treatment planning.46
Mathematically, this approach can be implemented using a naïve greedy algorithm.
Let 𝑆𝑆 = {𝑏𝑏1, 𝑏𝑏2, … , 𝑏𝑏𝑖𝑖}, be a set with 𝐻𝐻 elements where each element 𝑏𝑏𝑖𝑖 = 𝐵𝐵𝑖𝑖(𝑟𝑟, 𝐻𝐻) is an
open sphere of radius 𝑟𝑟 at locations 𝐻𝐻. Our goal is to determine the minimum number of
spheres of unequal sizes, thus resulting in the following minimization problem:
159
min𝑆𝑆
{‖𝑆𝑆‖0} ∶ 𝑆𝑆 ∈ 𝐑𝐑𝑖𝑖 (6-1)
where we want to minimize the cardinality of the set 𝑆𝑆 and ∀ (𝑏𝑏 ∈ 𝑆𝑆) ∃ (𝑟𝑟, 𝐻𝐻).
To insure that the spheres are filling the specified volume 𝐹𝐹, a constraint was implemented
so that the intersection between the region that is being packed with spheres 𝐹𝐹 and the
spheres 𝑏𝑏 is just 𝑏𝑏:
𝑏𝑏 ∩ 𝐹𝐹 = 𝑏𝑏 (6-2)
Furthermore, to prevent overlapping between spheres, the overlap between two spheres (𝑏𝑏
and 𝑏𝑏′) would result in the null set:
𝑏𝑏 ∩ 𝑏𝑏′ = ∅ (6-3)
A volume constraint was imposed so that the total volume of spheres is equal to the volume
of the specified region 𝐹𝐹:
�𝑆𝑆(𝑏𝑏) = 𝑆𝑆(𝐹𝐹)𝑏𝑏∈𝑆𝑆
(6-4)
To further simplify the problem, there is no location constraint with regards to where the
spheres are positioned.
Computationally, MATLAB R2016a (Mathworks) was used to solve the minimization
problem. In the discrete case, three-dimensional matrices were used to store visual
information of where the volumes are located using binary values (0=background;
1=foreground). We resampled the segmented 3He MRI from 3.125x3.125x15mm3 into
approximately 5x5x5mm3 voxel space to ensure isotropic resolution prior to
implementation. The ventilation defect regions were completely packed with spheres,
where the minimum sphere diameter was equal to one voxel.

160
Figure 6-1 shows the output from the proposed algorithm with ventilation defects and
ventilated regions being clustered for two representative subjects (COPD and
bronchiectasis) with the same VDP. For the ventilation defect clustering, ventilation is
shown in blue and ventilation defects are shown as spheres with different volumes shown
in colour (red=13-voxels-diameter to yellow=3-voxels-diameter). The COPD subject had
a large upper lobe ventilation defect that was reflected by larger sphere sizes that
corresponded to 25% of the total defect volume. In contrast, the bronchiectasis subject had
ventilation defect regions that mostly consisted of smaller spheres.
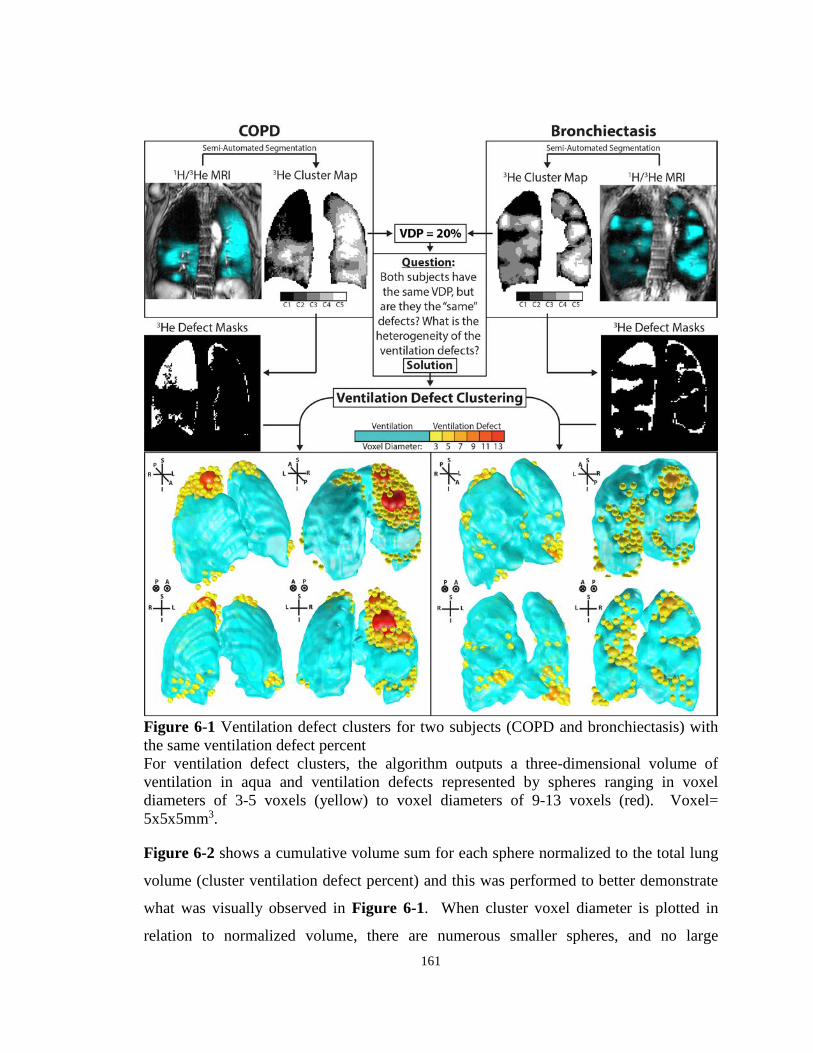
161
Figure 6-1 Ventilation defect clusters for two subjects (COPD and bronchiectasis) with the same ventilation defect percent For ventilation defect clusters, the algorithm outputs a three-dimensional volume of ventilation in aqua and ventilation defects represented by spheres ranging in voxel diameters of 3-5 voxels (yellow) to voxel diameters of 9-13 voxels (red). Voxel= 5x5x5mm3.
Figure 6-2 shows a cumulative volume sum for each sphere normalized to the total lung
volume (cluster ventilation defect percent) and this was performed to better demonstrate
what was visually observed in Figure 6-1. When cluster voxel diameter is plotted in
relation to normalized volume, there are numerous smaller spheres, and no large
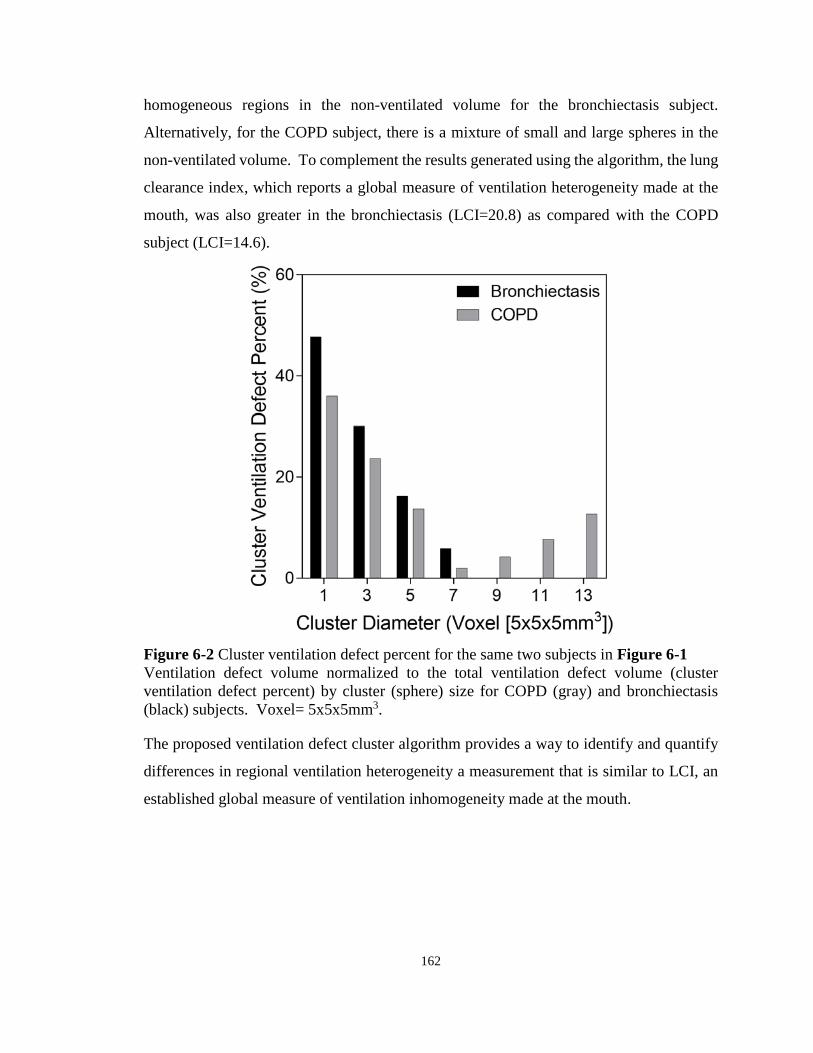
162
homogeneous regions in the non-ventilated volume for the bronchiectasis subject.
Alternatively, for the COPD subject, there is a mixture of small and large spheres in the
non-ventilated volume. To complement the results generated using the algorithm, the lung
clearance index, which reports a global measure of ventilation heterogeneity made at the
mouth, was also greater in the bronchiectasis (LCI=20.8) as compared with the COPD
subject (LCI=14.6).
Figure 6-2 Cluster ventilation defect percent for the same two subjects in Figure 6-1 Ventilation defect volume normalized to the total ventilation defect volume (cluster ventilation defect percent) by cluster (sphere) size for COPD (gray) and bronchiectasis (black) subjects. Voxel= 5x5x5mm3.
The proposed ventilation defect cluster algorithm provides a way to identify and quantify
differences in regional ventilation heterogeneity a measurement that is similar to LCI, an
established global measure of ventilation inhomogeneity made at the mouth.

163
6.4.2 Free-breathing Pulmonary 1H MRI in Non-small Cell Lung Cancer: Relationships with 4DCT and Noble Gas MRI Measurements of Ventilation
Hyperpolarized 3He MRI has previously been investigated as a way to identify well-
functioning lung regions in patients with non-small-cell lung cancer (NSCLC) for
functional avoidance targets in radiotherapy.47 For a number of reasons, the clinical
translation of this approach to guide radiotherapy planning has been limited. As an
alternative, FDMRI using clinically available MRI systems and pulse sequences provides
a non-contrast enhanced method to generate ventilation-weighted maps. Free-breathing 1H
MRI exploits Fourier decomposition of MRI signal intensity differences and non-rigid
registration to generate ventilation-weighted functional maps.17 Similarly, 4DCT has been
proposed to generate ventilation-weighted maps to serve as functional avoidance maps, and
has been implemented in clinical trials (i.e., NCT02528942). Here, our objective was to
generate free-breathing 1H MRI ventilation in patients with NSCLC as an alternative way
to guide radiation therapy, and compare it to both hyperpolarized 3He MRI and 4DCT
ventilation maps.
We have performed preliminary analysis in a small proof-of-concept study in which stage
IIIA/IIIB NSCLC patients (n=9, 67±7yr) provided written informed consent to a double-
blinded randomized controlled clinical trial (NCT02002052) that aimed to compare
outcomes related to MR image-guided versus conventional radiation therapy planning.
Hyperpolarized 3He MRI, FDMRI, and 4DCT ventilation maps were generated as
previously described,28,48,49 and semi-automated segmentation was used to generate the
VDP for all three imaging methods.39
Figure 6-3 shows FDMRI, hyperpolarized 3He MRI and 4DCT ventilation maps for a
representative NSCLC patient. There was strong qualitative spatial agreement for
ventilation defects in the left lung where the tumour mass has partially stunted the
ventilation resulting in a ventilation defect.
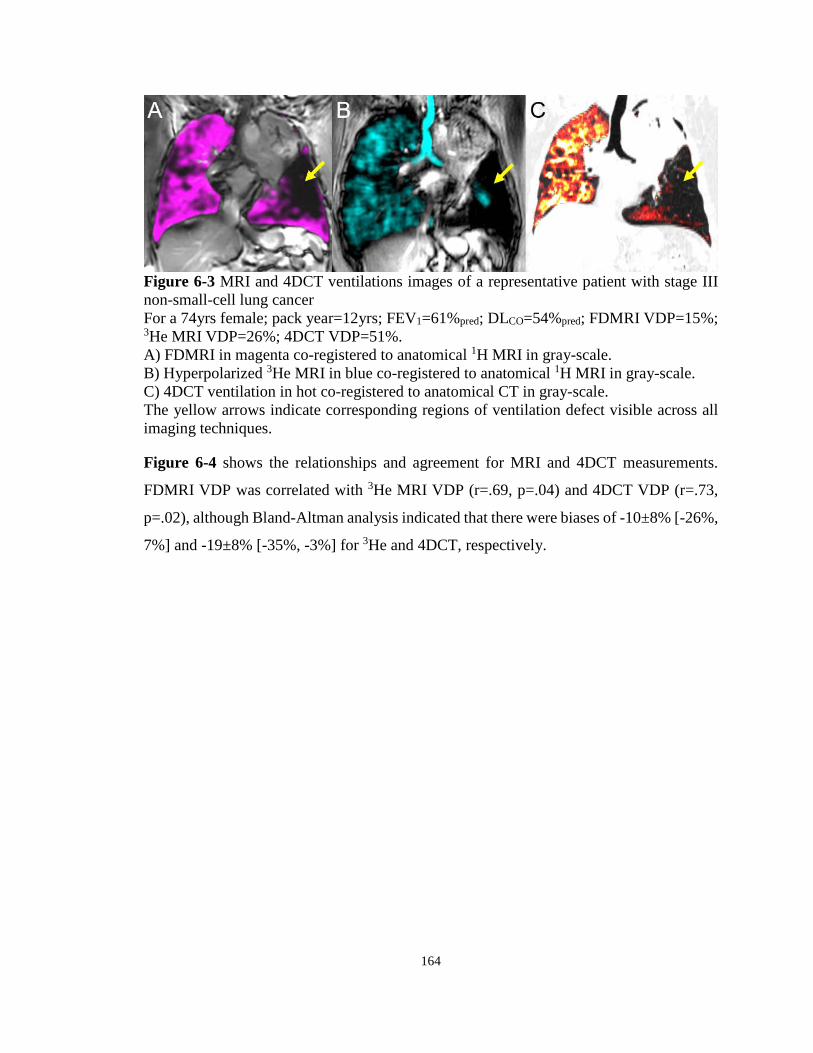
164
Figure 6-3 MRI and 4DCT ventilations images of a representative patient with stage III non-small-cell lung cancer For a 74yrs female; pack year=12yrs; FEV1=61%pred; DLCO=54%pred; FDMRI VDP=15%; 3He MRI VDP=26%; 4DCT VDP=51%. A) FDMRI in magenta co-registered to anatomical 1H MRI in gray-scale. B) Hyperpolarized 3He MRI in blue co-registered to anatomical 1H MRI in gray-scale. C) 4DCT ventilation in hot co-registered to anatomical CT in gray-scale. The yellow arrows indicate corresponding regions of ventilation defect visible across all imaging techniques.
Figure 6-4 shows the relationships and agreement for MRI and 4DCT measurements.
FDMRI VDP was correlated with 3He MRI VDP (r=.69, p=.04) and 4DCT VDP (r=.73,
p=.02), although Bland-Altman analysis indicated that there were biases of -10±8% [-26%,
7%] and -19±8% [-35%, -3%] for 3He and 4DCT, respectively.
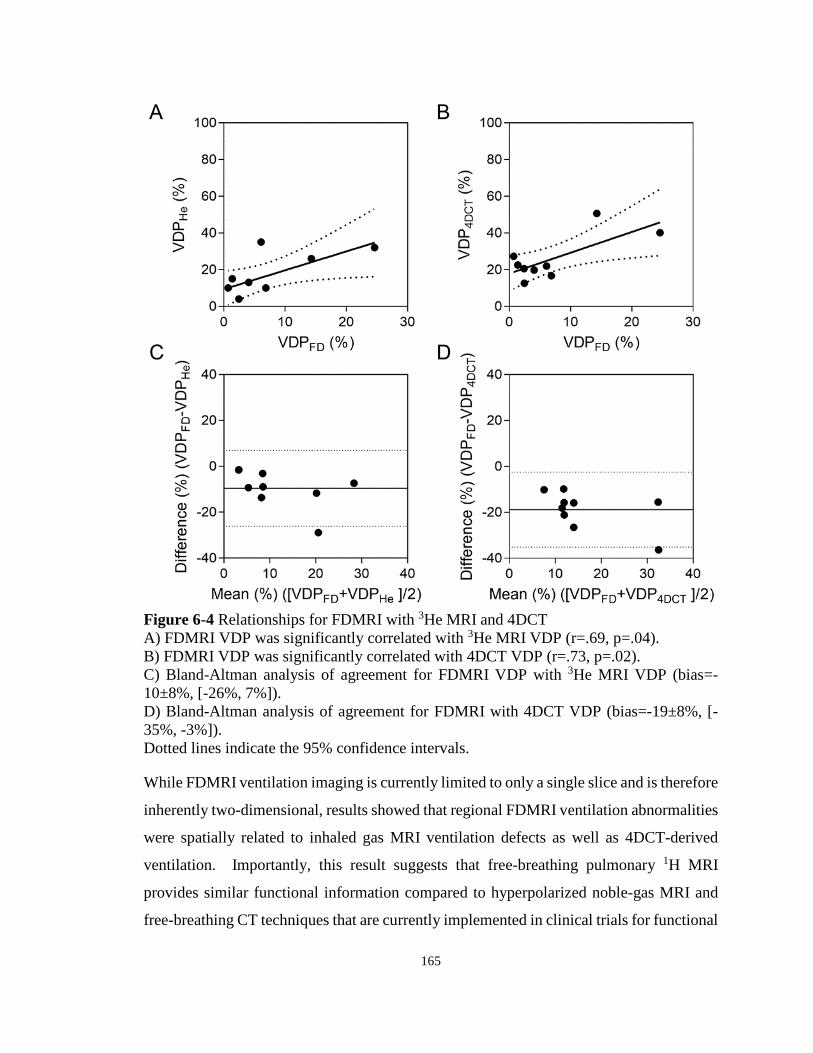
165
Figure 6-4 Relationships for FDMRI with 3He MRI and 4DCT A) FDMRI VDP was significantly correlated with 3He MRI VDP (r=.69, p=.04). B) FDMRI VDP was significantly correlated with 4DCT VDP (r=.73, p=.02). C) Bland-Altman analysis of agreement for FDMRI VDP with 3He MRI VDP (bias=-10±8%, [-26%, 7%]). D) Bland-Altman analysis of agreement for FDMRI with 4DCT VDP (bias=-19±8%, [-35%, -3%]). Dotted lines indicate the 95% confidence intervals.
While FDMRI ventilation imaging is currently limited to only a single slice and is therefore
inherently two-dimensional, results showed that regional FDMRI ventilation abnormalities
were spatially related to inhaled gas MRI ventilation defects as well as 4DCT-derived
ventilation. Importantly, this result suggests that free-breathing pulmonary 1H MRI
provides similar functional information compared to hyperpolarized noble-gas MRI and
free-breathing CT techniques that are currently implemented in clinical trials for functional

166
lung avoidance. This may allow for clinical translation of MRI-guided radiotherapy
planning since this technique does not require exogenous contrast agents and can be easily
implemented using clinically available MRI systems and pulse sequences.
6.4.3 Pulmonary Imaging Platform - Graphical User Interface to Evaluate and Generate Lung Imaging Biomarkers
In all of the studies presented in Chapters 2-5, image processing methods were developed
and evaluated to generate imaging biomarkers of pulmonary structure and function in
asthma and COPD patients. As mentioned in Section 6.3.2, the complexity of these image
processing methods may limit clinical translation. Accordingly, there is a need for an easy-
to-use, standardized, and validated pulmonary image processing and analysis toolbox for
broad research use and clinical translation.50,51 This will be important moving forward
since the advancement of pulmonary MRI and CT toward clinical implementations requires
large-scale and multi-centre evaluation of clinically-relevant biomarkers.
Figure 6-5 Pulmonary Imaging Platform (PIP™) graphical user interface Image datasets are imported into the software where users will have access to the image processing methods developed to generate the imaging biomarkers of lung structure and function.

167
As shown in Figure 6-5, the Pulmonary Imaging Platform (PIP™) is a graphical user
interface (GUI) oriented software with a number of features, including: 1) multi-view
three-dimensional volume rendering;52 2) surface rendering (using Visualization Toolkit);
3) fiducial placing; 4) image seeding; and, 5) blending/overlapping. The GUI will integrate
all of the individual image analysis processes presented in Chapters 2-5, including: 1)
inspiration-expiration CT parametric response mapping analysis (Chapter 2); 2) whole
lung and regional noble gas MRI measurements (Chapters 2-5); 3) two-dimensional free-
breathing 1H MRI ventilation weighted maps (Chapter 3 and Chapter 4); and, 4) three-
dimensional free-breathing 1H MRI specific-ventilation measurements (Chapter 5).
While PIP™ only currently provides a set of commonly used lung imaging biomarkers, the
software is flexible and sustainable to be expanded to include currently developing
analyses. Once validated, new imaging biomarkers may be easily incorporated to PIP™
and distributed to end users. Future work will involve dissemination of PIP™ to the
pulmonary imaging research community to further validate and improve the imaging
biomarkers generated from this software.
6.5 Significance and Impact
Unfortunately, hospitalization, mortality rates, and costs associated with lung disease
patients continue to rise, and health economists warn that this upward trend will continue
and will very soon overwhelm the global healthcare system.53 In light of this dire situation,
new management strategies are urgently required to combat this growing healthcare crisis.
For patients with chronic lung disease, pulmonary function tests provide a global
measurement of lung function, which are easy to implement and reproducible.5 As a result,
these tests are universally accepted for clinical use and are considered the clinical standard
for the diagnosis and evaluation of response to treatment. The limitations of spirometry,
including: 1) only providing a global measurement of lung function; 2) the relative
insensitivity to early disease stages;3 and, 3) weakly related to important clinical
outcomes,54,55 has motivated the development of alternative approaches to evaluate
pulmonary diseases. Specifically, pulmonary imaging methods, such as MRI and CT, have
been proposed to provide objective measurements of regional lung pathologies in asthma

168
and COPD. Until now, pulmonary MRI has focused on hyperpolarized noble gas MRI,
which has yet to be translated clinically and is restricted to a few specialized research
centres. To facilitate broad clinical applications of pulmonary imaging techniques, it is
urgent to develop new diagnostic approaches for pulmonary medicine using clinically
available equipment.
In this thesis, we have developed and evaluated methods of obtaining imaging biomarkers
of pulmonary structure and function without the use of exogenous contrast agents or
specialized equipment. The work presented here confirms that there are qualitative and
quantitative similarities between the non-contrast enhanced methods and those generated
from inhaled noble gas MRI in identifying regional lung disease. Armed with this
knowledge, there is enormous potential for these imaging methods to be implemented at
any imaging centre around the world and be used as intermediate endpoints in clinical trials
to evaluate novel therapies and possibly guide treatment. The development and validation
of these clinically meaningful non-contrast enhanced pulmonary MR and CT imaging
biomarkers will accelerate the translation of pulmonary imaging from “the benchtop to the
bedside” where imaging will play an integral part of the clinical workflow for patients with
lung disease.
169
6.6 References
(1) Soriano, J. B. et al. Global, regional, and national deaths, prevalence, disability-adjusted life years, and years lived with disability for chronic obstructive pulmonary disease and asthma, 1990-2015: a systematic analysis for the Global Burden of Disease Study 2015. Lancet Respiratory Medicine 2017; 5: 691-706.
(2) Louis Theriault, G. H., Danielle Goldfarb, Carole Stonebridge, Fares Bounajm. Cost Risk Analysis for Chronic Lung Disease in Canada. (Ottawa, Canada, 2012).
(3) Vestbo, J. et al. Global strategy for the diagnosis, management, and prevention of chronic obstructive pulmonary disease: GOLD executive summary. Am J Respir Crit Care Med 2013; 187: 347-365.
(4) Reddel, H. K. et al. A summary of the new GINA strategy: a roadmap to asthma control. Eur Respir J 2015; 46: 622-639.
(5) Pauwels, R. A. et al. Global strategy for the diagnosis, management, and prevention of chronic obstructive pulmonary disease. NHLBI/WHO Global Initiative for Chronic Obstructive Lung Disease (GOLD) Workshop summary. Am J Respir Crit Care Med 2001; 163: 1256-1276.
(6) Smith-Bindman, R. et al. Use of Diagnostic Imaging Studies and Associated Radiation Exposure for Patients Enrolled in Large Integrated Health Care Systems, 1996-2010. Jama-Journal of the American Medical Association 2012; 307: 2400-2409.
(7) de Gonzalez, A. B. et al. Projected Cancer Risks From Computed Tomographic Scans Performed in the United States in 2007. Archives of Internal Medicine 2009; 169: 2071-2077.
(8) Smith-Bindman, R. et al. Radiation Dose Associated With Common Computed Tomography Examinations and the Associated Lifetime Attributable Risk of Cancer. Archives of Internal Medicine 2009; 169: 2078-2086.
(9) de Lange, E. E. et al. Changes in regional airflow obstruction over time in the lungs of patients with asthma: evaluation with 3He MR imaging. Radiology 2009; 250: 567-575.
(10) Mathew, L. et al. Hyperpolarized 3He magnetic resonance imaging of chronic obstructive pulmonary disease: reproducibility at 3.0 tesla. Acad Radiol 2008; 15: 1298-1311.
(11) Kirby, M. et al. Hyperpolarized 3He and 129Xe MR imaging in healthy volunteers and patients with chronic obstructive pulmonary disease. Radiology 2012; 265: 600-610.

170
(12) de Lange, E. E. et al. Evaluation of asthma with hyperpolarized helium-3 MRI: correlation with clinical severity and spirometry. Chest 2006; 130: 1055-1062.
(13) Fain, S. B. et al. Evaluation of structure-function relationships in asthma using multidetector CT and hyperpolarized He-3 MRI. Academic Radiology 2008; 15: 753-762.
(14) Svenningsen, S. et al. Hyperpolarized (3) He and (129) Xe MRI: differences in asthma before bronchodilation. J Magn Reson Imaging 2013; 38: 1521-1530.
(15) Kirby, M. et al. Chronic obstructive pulmonary disease: quantification of bronchodilator effects by using hyperpolarized (3)He MR imaging. Radiology 2011; 261: 283-292.
(16) Guerrero, T. et al. Dynamic ventilation imaging from four-dimensional computed tomography. Physics in medicine and biology 2006; 51: 777.
(17) Bauman, G. et al. Non‐contrast‐enhanced perfusion and ventilation assessment of the human lung by means of fourier decomposition in proton MRI. Magn Reson Med 2009; 62: 656-664.
(18) Bommart, S. et al. Relationship between CT air trapping criteria and lung function in small airway impairment quantification. BMC Pulm Med 2014; 14: 29.
(19) Hersh, C. P. et al. Paired inspiratory-expiratory chest CT scans to assess for small airways disease in COPD. Respir Res 2013; 14: 42.
(20) Kim, E. Y. et al. Detailed analysis of the density change on chest CT of COPD using non-rigid registration of inspiration/expiration CT scans. Eur Radiol 2015; 25: 541-549.
(21) Lausch, A. et al. An augmented parametric response map with consideration of image registration error: towards guidance of locally adaptive radiotherapy. Phys Med Biol 2014; 59: 7039-7058.
(22) Mugler, J. P., 3rd & Altes, T. A. Hyperpolarized 129Xe MRI of the human lung. J Magn Reson Imaging 2013; 37: 313-331.
(23) Ruiz-Cabello, J., Barnett, B. P., Bottomley, P. A. & Bulte, J. W. Fluorine (19F) MRS and MRI in biomedicine. NMR Biomed 2011; 24: 114-129.
(24) Bauman, G. et al. Pulmonary functional imaging: qualitative comparison of Fourier decomposition MR imaging with SPECT/CT in porcine lung. Radiology 2011; 260: 551-559.
(25) Lederlin, M. et al. Functional MRI using Fourier decomposition of lung signal: Reproducibility of ventilation-and perfusion-weighted imaging in healthy volunteers. European journal of radiology 2013.

171
(26) Yu, J., Xue, Y. & Song, H. K. Comparison of lung T2* during free‐breathing at 1.5 T and 3.0 T with ultrashort echo time imaging. Magn Reson Med 2011; 66: 248-254.
(27) Bauman, G., Pusterla, O. & Bieri, O. Ultra-fast Steady-State Free Precession Pulse Sequence for Fourier Decomposition Pulmonary MRI. Magn Reson Med 2016; 75: 1647-1653.
(28) Capaldi, D. P. et al. Free-breathing Pulmonary (1)H and Hyperpolarized (3)He MRI: Comparison in COPD and Bronchiectasis. Acad Radiol 2015; 22: 320-329.
(29) Hamedani, H. et al. Regional Fractional Ventilation by Using Multibreath Wash-in (3)He MR Imaging. Radiology 2016; 279: 917-924.
(30) Fletcher, C. & Peto, R. The natural history of chronic airflow obstruction. Br Med J 1977; 1: 1645-1648.
(31) Moreno, F. & Lyons, H. A. Effect of Body Posture on Lung Volumes. Journal of Applied Physiology 1961; 16: 27-&.
(32) Lumb, A. B. & Nunn, J. F. Respiratory-Function and Ribcage Contribution to Ventilation in Body Positions Commonly Used during Anesthesia. Anesthesia and Analgesia 1991; 73: 422-426.
(33) Middleton, H. et al. MR imaging with hyperpolarized 3He gas. Magn Reson Med 1995; 33: 271-275.
(34) Guerrero, T. et al. Quantification of regional ventilation from treatment planning CT. Int J Radiat Oncol Biol Phys 2005; 62: 630-634.
(35) Mutaf, Y. D., Antolak, J. A. & Brinkmann, D. H. The impact of temporal inaccuracies on 4DCT image quality. Med Phys 2007; 34: 1615-1622.
(36) Pollock, S., Kipritidis, J., Lee, D., Bernatowicz, K. & Keall, P. The impact of breathing guidance and prospective gating during thoracic 4DCT imaging: an XCAT study utilizing lung cancer patient motion. Phys Med Biol 2016; 61: 6485-6501.
(37) Ma, W. et al. Ultra-short echo-time pulmonary MRI: evaluation and reproducibility in COPD subjects with and without bronchiectasis. J Magn Reson Imaging 2015; 41: 1465-1474.
(38) Wegener, O. H., Koeppe, P. & Oeser, H. Measurement of lung density by computed tomography. J Comput Assist Tomogr 1978; 2: 263-273.
(39) Kirby, M. et al. Hyperpolarized 3He magnetic resonance functional imaging semiautomated segmentation. Acad Radiol 2012; 19: 141-152.

172
(40) Muller, N. L., Staples, C. A., Miller, R. R. & Abboud, R. T. "Density mask". An objective method to quantitate emphysema using computed tomography. Chest 1988; 94: 782-787.
(41) Coxson, H. O. et al. A quantification of the lung surface area in emphysema using computed tomography. Am J Respir Crit Care Med 1999; 159: 851-856.
(42) Owrangi, A. M., Etemad-Rezai, R., McCormack, D. G., Cunningham, I. A. & Parraga, G. Computed tomography density histogram analysis to evaluate pulmonary emphysema in ex-smokers. Acad Radiol 2013; 20: 537-545.
(43) Zha, N. et al. Principal Component Analysis of the CT Density Histogram to Generate Parametric Response Maps of COPD. Medical Imaging 2015: Biomedical Applications in Molecular, Structural, and Functional Imaging 2015; 9417.
(44) Shea, D. A. & Morgan, D.
(45) Prisk, G. K. & Sa, R. C. It's about numbers, not pictures. J Appl Physiol (1985) 2014; 116: 127-128.
(46) Wang, J. Packing of unequal spheres and automated radiosurgical treatment planning. Journal of Combinatorial Optimization 1999; 3: 453-463.
(47) Hoover, D. A. et al. Functional lung avoidance for individualized radiotherapy (FLAIR): study protocol for a randomized, double-blind clinical trial. BMC Cancer 2014; 14: 934.
(48) Sheikh, K. et al. Magnetic resonance imaging biomarkers of chronic obstructive pulmonary disease prior to radiation therapy for non-small cell lung cancer. Eur J Radiol Open 2015; 2: 81-89.
(49) Castillo, R., Castillo, E., Martinez, J. & Guerrero, T. Ventilation from four-dimensional computed tomography: density versus Jacobian methods. Physics in medicine and biology 2010; 55: 4661.
(50) Hoffman, E. A., Lynch, D. A., Barr, R. G., van Beek, E. J. & Parraga, G. Pulmonary CT and MRI phenotypes that help explain chronic pulmonary obstruction disease pathophysiology and outcomes. Journal of Magnetic Resonance Imaging 2016; 43: 544-557.
(51) Capaldi, D. P., Eddy, R. L. & Parraga, G. Pulmonary MRI in Clinical Trials. 2016.
(52) Fenster, A., Dunne, S. & Larsen, J. T. (Google Patents, 1998).
(53) Khakban, A. et al. Ten-Year Trends in Direct Costs of COPD: A Population-Based Study. Chest 2015; 148: 640-646.
(54) Jones, P. W. Health status and the spiral of decline. COPD 2009; 6: 59-63.

173
(55) Agusti, A. et al. Characterisation of COPD heterogeneity in the ECLIPSE cohort. Respir Res 2010; 11: 122.

174
APPENDIX
Appendix A – Permission for Reproduction of Scientific Articles

175

176

177
Appendix B – Health Science Research Ethics Board Approval Notices

178

179

180

181
182

183
Appendix C – Curriculum Vitae
EDUCATION 2013-2018 Doctor of Philosophy in Medical Biophysics (Candidate)
Department of Medical Biophysics The University of Western Ontario, London, Canada Supervisor: Dr. Grace Parraga Thesis: Imaging Biomarkers of Pulmonary Structure and Function
2013-2018 Master of Science in Clinical Physics (Candidate)
CAMPEP accredited Department of Medical Biophysics The University of Western Ontario, London, Canada Supervisor: Dr. Grace Parraga
2009-2013 Bachelor of Science
Honours Physics [Medical Physics] with Thesis Co-op Minor in Mathematics Department of Physics University of Windsor, Windsor, Canada Supervisor: Dr. Roman G. Maev Thesis: Finite Element Analysis of Percussion Models: Modeling Different Complex Structures to Determine Acoustical Properties
POSITIONS 2017 Robarts Research Institute
Research Assistant The University of Western Ontario, London, Canada Supervisor: Dr. Grace Parraga Project: Maintenance and Management of Polarization Facility
2016 London Regional Cancer Program
Quality Assurance Internship London Health Science Centre, London, Canada Supervisor: Dr. Jerry Battista Project: Performing Weekly, Bi-Weekly, and Monthly Quality Assurance on the Linear Accelerators at Victoria Hospital
2016 Robarts Research Institute
Research Assistant The University of Western Ontario, London, Canada Supervisor: Dr. Grace Parraga Project: Maintenance and Management of Polarization Facility

184
2014 London Regional Cancer Program
Quality Assurance Internship London Health Science Centre, London, Canada Supervisor: Dr. Jerry Battista Project: Performing Weekly, Bi-Weekly, and Monthly Quality Assurance on the Linear Accelerators at Victoria Hospital
2012-2013 Institute for Diagnostic Imaging Research
Outstanding Scholar Department of Physics, University of Windsor Supervisor: Dr. Roman G. Maev Project: Portable Pulmonary Injury Diagnostic Device Testing and Development
2012 BC Cancer Agency
Coop Student Department of Medical Physics Supervisor: Dr. Parminder Basran Project: Automate the Analysis of a High Precision Image Quality Phantom Manufactured for CT Imaging
Institute for Diagnostic Imaging Research Researcher Department of Physics, University of Windsor Supervisor: Dr. Roman G. Maev Project: Finite Element Analysis of Percussion Models: Modeling Different Complex Structures to Determine Acoustical Properties Institute for Diagnostic Imaging Research Coop Student Department of Physics, University of Windsor Supervisor: Dr. Roman G. Maev Project: Investigating Experimental Approaches to Determine Attributes of the Portable Pulmonary Injury Diagnostic Device (PPIDD)
2011 Institute for Diagnostic Imaging Research
Coop Student Department of Physics, University of Windsor Supervisor: Dr. Roman G. Maev Project: Developing Input Method Editors for Medical Devices
2010 University of Windsor
Student Developer Department of Physics, University of Windsor Supervisor: Dr. Roman G. Maev

185
Project: Chest Percussion Devices: Designing, Manufacturing & Testing Prototypes
HONOURS AND AWARDS 2018-2020 Postdoctoral Fellowship (PDF)
Natural Science and Engineering Research Council of Canada (NSERC) Awarded to highly qualified Canadians with leading edge scientific and research skills for Canadian industry, government and universities National ($90,000)
2017 Radiological Society of North America (RSNA) Trainee Research Prize Radiological Society of North America Annual Scientific Meeting 2017 Awarded to honor the most outstanding scientific contribution submitted and accepted to the RSNA international meeting for presentation International (USD $1,000)
2017-2018 Doctoral Excellence Research Awards
Schulich School of Medicine and Dentistry, Western University Recognized for having a tri-agency doctoral scholarship (NSERC) Institutional ($5,000)
2017-2018 Western Graduate Research Scholarship
Department of Medical Biophysics, Western University Awarded to a full time graduate student for stipend support who has maintained an average of 80% or more Institutional ($7,600)
2017 Nellie Farthing Fellowship in the Medical Sciences
Schulich School of Medicine and Dentistry, Western University Established in 1960 with money bequeathed by Nellie Farthing to Western University to create a Fellowship for full-time doctoral students in the Medical Sciences that recognized and rewarded excellence in research Institutional ($3,000)
2017 Alfred Jay Award for Translational Research
Department of Medical Biophysics, Western University Awarded annually to a graduate student demonstrating innovation in the development of a clinical diagnostic or therapeutic procedure during their studies Institutional ($2,000)
2017 1st Place - Best Oral Presentation Award
Imaging Network of Ontario Meeting
186
Recognized for having the top oral presentation out of all participates at the annual meeting National ($350)
2017 Best Scientific Exhibition Award
International Workshop on Pulmonary Functional Imaging Meeting Selected as one of ten awardees of IWPFI 2017 for the best scientific exhibition works International
2016-2017 Western Graduate Research Scholarship
Department of Medical Biophysics, Western University Awarded to a full time graduate student for stipend support who has maintained an average of 80% or more Institutional ($7,600)
2016-2017 Doctoral Excellence Research Awards
Schulich School of Medicine and Dentistry, Western University Recognized for having a tri-agency doctoral scholarship (NSERC) Institutional ($5,000)
2016 Canadian Student Health Research Forum Funding Competition
Canadian Institutes of Health Research (CIHR) Selected by CIHR to receive funding to reimburse travel and accommodations for participation in the 2014 Canadian Student Health Research Forum National ($1,000)
2016 Publication of the Month
Schulich School of Medicine and Dentistry, Western University Recognized for having the top publication at the Schulich School of Medicine and Dentistry for the month of April 2016 Institutional
2016 Drs. Madge and Charles Macklin Fellowship for Publication Nominee
Schulich School of Medicine and Dentistry, Western University Selected by the Department of Medical Biophysics to compete for an award based on the significance of the candidate’s 1st author publication in a high impact peer reviewed journal Institutional
2016 Canadian Student Health Research Forum National Student Research
Poster Competition Participant Canadian Institutes of Health Research (CIHR) Nominated by the University of Western Ontario as being within the top 5% of doctoral students in the field of health sciences

187
National 2016 1st Place - The Lucille & Norton Wolf Trainee Publication Award
London Health Research Day 2016 Awarded to the top peer-reviewed publication from a trainee or medical residents and fellows of the Schulich School of Medicine & Dentistry working in labs across Schulich Medicine & Dentistry Regional ($2,000)
2016 Trainee (Educational) Stipend International Society for Magnetic Resonance in Medicine Annual Meeting
Awarded to support the attendance of students, postdoctoral and clinical trainees to present abstracts at the international scientific meeting held in Singapore, Singapore International (USD $475)
2015-2016 Western Graduate Research Scholarship
Department of Medical Biophysics, Western University Awarded to a full time graduate student for stipend support who has maintained an average of 80% or more Institutional ($7,600)
2015 Magna Cum Laude Merit Award
International Society for Magnetic Resonance in Medicine Annual Meeting Awarded to those whose abstract score was in the top 15% of those submitted for review to be presented at the annual international meeting International
2015 The Queen Elizabeth II Graduate Scholarship in Science and
Technology Ontario Graduate Scholarship (OGS) A merit based scholarship (based on academic standing) that encourages excellence in graduate studies and is available to students in all disciplines of academic study Provincial ($15,000) declined
2015-2018 Postgraduate Scholarship – Doctoral (PGSD3)
Natural Science and Engineering Research Council of Canada (NSERC) Awarded to high-calibre students who are engaged in doctoral programs in the natural sciences or engineering National ($63,000)
2015 Top 80 Posters: Judges’ Selection
London Health Research Day 2015 Awarded to those whose abstract score was in the top 80 abstracts submitted

188
Regional 2015 Trainee (Educational) Stipend International Society for Magnetic Resonance in Medicine Annual Meeting
Awarded to support the attendance of students, postdoctoral and clinical trainees to present abstracts at the international scientific meeting held in Toronto, Canada International (USD $360)
2014-2015 Western Graduate Research Scholarship
Department of Medical Biophysics, Western University Awarded to a full time graduate student for stipend support who has maintained an average of 80% or more Institutional ($7,800)
2014 Radiological Society of North America Trainee Research Prize Finalist
Radiological Society of North America Annual Scientific Meeting 2014 Awarded to one of the highest ranked abstracts submitted for the Trainee Research Prize International
2014 Trainee (Educational) Stipend International Society for Magnetic Resonance in Medicine Annual Meeting
Awarded to support the attendance of students, postdoctoral and clinical trainees to present abstracts at the international scientific meeting held in Milan, Italy International (USD $540)
2013-2014 Western Graduate Research Scholarship
Department of Medical Biophysics, Western University Awarded to a full time graduate student for stipend support who has maintained an average of 80% or more Institutional ($7,800)
2012-2013 University of Windsor Outstanding Scholars Award in Physics Department of Physics, University of Windsor
Awarded to students with exceptional cumulative averages who are enrolled in Physics Institutional ($4,000)
2009 University of Windsor Entrance Scholarship University of Windsor
Awarded to students with exceptional high school entrance averages Institutional ($1,250)
2009 University of Windsor Outstanding Scholars Award in Physics
189
Department of Physics, University of Windsor Awarded to students with exceptional cumulative averages who are enrolled in Physics Institutional ($2,000)
ACADEMIC RESPONSIBILITIES 2017 Graduate Research Assistant (3 term contract) Maintenance and Management of Polarization Facility Robarts Research Institute, Western University 2016 Graduate Research Assistant (1 term contract) Physics Quality Assurance Radiation therapy infrastructure London Regional Cancer Centre and Department of Oncology Western University Graduate Research Assistant (3 term contract) Maintenance and Management of Polarization Facility Robarts Research Institute, Western University Cancer Program Clinical Observership (1 term) Shadowed Radiation Oncologists in Clinic London Regional Cancer Centre and Department of Oncology Western University Medical Resident Research Trainee Supervision
Resident (PGY-2 Internal Medicine): Colin J. Adams, MD Project: A comparison of MRI and CT for targeting areas for lung volume reduction procedures Abstract: MRI Stratification of COPD Patients for Bronchoscopic Lung Volume Reduction: A Cautionary Note Manuscript: On the potential role of MRI Biomarkers of COPD to Guide Bronchoscopic Lung Volume Reduction
Undergraduate Research Project Mentoring Robert DiCesare (3rd year UG BMSc, Western University)
Project: MRI ventilation used for targeting areas for lung volume reduction procedures Ryan Yip (3rd year UG BMSc, Western University - 6 week rotation project) Project: Reproducibility of 3He MRI segmentation Matthew Schweers (1st year UG BSc, Western University) Project: Database management and clerical duties
2015 Undergraduate Research Project Mentoring Robert DiCesare (2nd year UG BMSc, Western University)
190
Project: Reproducibility of 3He MRI segmentation Nanxi Zha BEng (2nd year MD, Schulich Research Opportunities Funded Project, Western University) Project: Second order texture analysis of noble gas MRI Manuscript: Second-Order Texture Measurements of 3He Ventilation MRI: Proof of Concept Evaluation of Asthma Bronchodilator Response
2014 Graduate Research Assistant (1 term contract) Physics Quality Assurance Radiation therapy infrastructure London Regional Cancer Centre and Department of Oncology Western University Undergraduate Research Project Mentoring
Nanxi Zha BEng (1st year MD, Schulich Research Opportunities Funded Project, Western University) Project: Parametric response mapping of co-registered inspiratory/expiratory CT Conference Paper: Principal component analysis of the CT density histogram to generate parametric response maps of COPD
2013 Introductory Physics II (University of Windsor: 03-64-141)
Proctored Exams and Laboratory Instructor (3 Labs)
Introduction to Astronomy II (University of Windsor: 03-64-191) Proctored Exams
2012 Introductory Physics II (University of Windsor: 03-64-141)
Proctored Exams and Laboratory Instructor (1 Lab)
Theoretical Methods (University of Windsor: 03-64-151) Proctored Exams and Marked Assignments
PUBLICATIONS AND PRESENTATIONS Peer-Reviewed Journal Manuscripts (17 published/in-press) Published and In-Press (17 total; 8 first author) 1. D.P.I. Capaldi, R.L. Eddy, S. Svenningsen, F. Guo, J.S.H. Baxter, A.J. McLeod, P.
Nair, D.G. McCormack, G. Parraga. Free-breathing Pulmonary MR Imaging to Quantify Regional Specific-Ventilation. Radiology. February 22, 2018. doi.org/10.1148/radiol.2018171993
2. C.J. Adams*, D.P.I. Capaldi*, R. Di Cesare, D.G. McCormack, G. Parraga, CRRN Investigators. On the potential role of MRI Biomarkers of COPD to Guide
191
Bronchoscopic Lung Volume Reduction. Academic Radiology. October 2017. doi.org/10.1016/j.acra.2017.08.010 (* Co-first Author)
3. D.P.I. Capaldi, G. Parraga. Through the Looking Glass and What was Found There:
More Imaging Biomarkers of COPD. American Journal of Respiratory and Critical Care Medicine. August 2017. doi.org/10.1164/rccm.201707-1473ED
4. D.P.I. Capaldi, K. Sheikh, R.L. Eddy, F. Guo, S. Svenningsen, P. Nair, D.G.
McCormack, G. Parraga. Free-breathing Pulmonary MRI Ventilation Response to Bronchodilator and Provocation in Severe Asthma. Academic Radiology. May 2017. dx.doi.org/10.1016/j.acra.2017.04.012
5. F. Guo, S. Svenningsen, M. Kirby, D.P.I. Capaldi, K. Sheikh, A. Fenster, G. Parraga.
Thoracic CT-MRI Co-Registration for Regional Pulmonary Structure-Function Measurements of Obstructive Lung Disease. Medical Physics. February 2017. doi.org/10.1002/mp.12160. ***This manuscript was featured on the cover of the journal (May 2017)***
6. A. Dasgupta, M. Kjarsgaard, D.P.I. Capaldi, K. Radford, F. Aleman, C. Boylan, L.C.
Altman, T. Wight, G. Parraga, P.M. O’Byrne, P. Nair. A pilot randomized clinical trial of mepolizumab in COPD with eosinophilic bronchitis. European Respiratory Journal. March 2017. doi.org/10.1183/13993003.02486-2016
7. K. Sheikh, F. Guo, D.P.I Capaldi, A. Ouriadov, R.L. Eddy, S. Svenningsen, G.
Parraga, CRRN Investigators. Ultra-short Echo Time Magnetic Resonance Imaging Biomarkers of Asthma. Journal of Magnetic Resonance Imaging. October 2016. doi.org/10.1002/jmri.25503
8. F. Guo, S. Svenningsen, R.L. Eddy, D.P.I. Capaldi, K. Sheikh, A. Fenster, G. Parraga.
Anatomical Pulmonary MRI Multi-Region Segmentation using a Convex Optimization-Based Approach and Volume Proportion Prior. Medical Physics. May 2016. doi.org/10.1118/1.4948999
9. D.P.I. Capaldi, F. Guo, G. Parraga. Imaging How and Where We Breathe Oxygen:
Another Big Short? Journal of Thoracic Disease. March 2016. doi.org/10.21037/jtd.2016.01.83
10. N. Zha, D. Pike, S. Svenningsen, D.P.I. Capaldi, D.G. McCormack, G. Parraga.
Second-Order Texture Measurements of 3He Ventilation MRI: Proof of Concept Evaluation of Asthma Bronchodilator Response. Academic Radiology. February 2016. doi.org/10.1016/j.acra.2015.10.010
11. D.P.I. Capaldi, N. Zha, F. Guo, D. Pike, D.G. McCormack, M. Kirby, G. Parraga.
Pulmonary Imaging Biomarkers of Gas Trapping and Emphysema in COPD: 3He MR Imaging and CT Parametric Response Maps. Radiology. January 2016.
192
doi.org/10.1148/radiol.2015151484. ***This manuscript was featured on the cover of the journal (May 2016)***
12. D. Pike, M. Kirby, R.L. Eddy, F. Guo, D.P.I. Capaldi, A. Ouriadov, D.G. McCormack,
G. Parraga. Regional Heterogeneity of Chronic Obstructive Pulmonary Disease Phenotypes: Pulmonary 3He Magnetic Resonance Imaging and Computed Tomography. Journal of Chronic Obstructive Pulmonary Disease. January 2016. doi.org/10.3109/15412555.2015.1123682
13. K. Sheikh*, D.P.I. Capaldi*, D.A. Hoover, G. Parraga, D.A. Palma, B.P. Yaremko.
Magnetic resonance imaging biomarkers of chronic obstructive pulmonary disease prior to radiation therapy for non-small cell lung cancer. European Journal of Radiology Open. December 2015. doi.org/10.1016/j.ejro.2015.05.003 (* Co-first Author)
14. F. Guo, J. Yuan, M. Rajchl, S. Svenningsen, D.P.I. Capaldi, K. Sheikh, A. Fenster, G.
Parraga. Globally Optimal Joint Segmentation of Three-dimensional Pulmonary 1H and Hyperpolarized 3He MRI with Spatial Consistence Prior. Medical Image Analysis. July 2015. doi.org/10.1016/j.media.2015.04.001
15. D.P.I. Capaldi, K. Sheikh, F. Guo, S. Svenningsen, R. Etemad-Rezai, H.O. Coxson, J.
Leipsic, D.G. McCormack, G. Parraga. Free-breathing Pulmonary 1H and Hyperpolarized 3He MRI: Comparison in COPD and Bronchiectasis. Academic Radiology. March 2015. doi.org/10.1016/j.acra.2014.10.003
16. M. Bhuiyan, E.V. Malyarenko, M.A. Pantea, D.P.I. Capaldi, A.E. Baylor, R.G. Maev.
Time-Frequency Analysis of Clinical Percussion Signals using Matrix Pencil Method. Journal of Electrical and Computer Engineering. January 2015. doi.org/10.1155/2015/274541
17. D.A. Hoover, D.P.I. Capaldi, K. Sheikh, D.A. Palma, G.B. Rodrigues, R. Dar, E. Yu,
B. Dingle, M. Landis, W. Kocha, M. Sanatani, M. Vincent, J. Younus, S. Gaede, G. Parraga, B.P. Yaremko. Functional lung avoidance for individualized radiotherapy (FLAIR): Study protocol for a randomized, double-blind clinical trial. BMC Cancer. December 2014. doi.org/10.1186/1471-2407-14-934
Under Review (1 total) 1. F. Guo, D.P.I. Capaldi, M. Kirby, K. Sheikh, S. Svenningsen, D.G. McCormack, A.
Fenster, G. Parraga. Pulmonary Imaging Platform: A New Toolbox for Chronic Lung Disease Management using Pulmonary Magnetic Resonance Imaging. Journal of Medical Imaging. Submitted - December 12 2017 (Manuscript ID: JMI 17360)
In Preparation (3 total; 2 first author)
193
1. D.P.I. Capaldi, K. Sheikh, S. Svenningsen, D.G. McCormack, G. Parraga. Magnetic
Resonance Measurements of Regional Ventilation Heterogeneity: Three Dimensional Ventilation Clustering of Hyperpolarized Noble Gas MRI. Academic Radiology.
2. D.P.I. Capaldi, K. Sheikh, D.A. Hoover, T. Yamamoto, D.A. Palma, M. Daly, A.
Warner, S. Kabus, M. Bal, B.P. Yaremko, G. Parraga. Lung Expansion to Measure Ventilation in Non-Small Cell Lung Cancer Patients: Comparison between Fourier-Decomposition Free-breathing Pulmonary 1H MRI and Four-Dimensional CT. International Journal of Radiation Oncology • Biology • Physics.
3. A. Ouriadov, D.P.I. Capaldi, E. Lessard, F. Guo, H.M. Young, D.G. McCormack, G.
Parraga. Undersampled Diffusion-weighted 129Xe MRI Morphometry of Airspace Enlargement: Feasibility in Chronic Obstructive Pulmonary Disease. Magnetic Resonance in Medicine.
Book Chapters (1 total; 1 first author) 1. D.P.I Capaldi, R.L. Eddy, G. Parraga. Pulmonary MRI in Clinical Trials. MRI of the
Lung. 2nd Edition. Springer. November 2016. doi.org/10.1007/174_2016_81
Peer-Reviewed Conference Manuscript Proceedings (4 total; 1 first author) 1. A.J. McLeod, D.P.I. Capaldi, J.S.H. Baxter, G. Parraga, X. Luo, T.M. Peters. Analysis
of Periodicity in Video Sequences through Dynamic Linear Modeling. Medical Image Computing and Computer Assisted Intervention (MICCAI) 2017. doi.org/10.1007/978-3-319-66185-8_44
2. F. Guo, D.P.I. Capaldi, R. Di Cesare, A. Fenster, G. Parraga. Registration Pipeline
for Pulmonary Free-Breathing 1H MRI Ventilation Measurements. Proceedings of the Society for Photo-optical Instrumentation Engineers (SPIE) 2017. doi.org/10.1117/12.2253879
3. D.P.I. Capaldi, S. Svenningsen, I.A. Cunningham, G. Parraga. Fourier-Based Linear
Systems Description of Free-Breathing Pulmonary Magnetic Resonance Imaging. Proceedings of the Society for Photo-optical Instrumentation Engineers (SPIE) 2015. doi.org/10.1117/12.2081503
4. N. Zha, D.P.I. Capaldi, D. Pike, D.G. McCormack, I.A. Cunningham, G. Parraga.
Principal component analysis of the CT density histogram to generate parametric response maps of COPD. Proceedings of the Society for Photo-optical Instrumentation Engineers (SPIE) 2015. doi.org/10.1117/12.2076396

194
Peer-Reviewed Conference Abstracts (55 total; 24 first author; 5 submitted) 1. A. Ouriadov, D.P.I. Capaldi, H. Young, M. Kirby, H.O. Coxson, D.G. McCormack,
G. Parraga. Development of the Emphysema Biomarkers in COPD and Alpha-1 Antitrypsin Deficiency Based on the Accelerated 129Xe MRI Morphometry Approach. International Conference of the American Thoracic Society Meeting Proceedings 2018 (submitted)
2. S. Svenningsen, R.L. Eddy, D.P.I. Capaldi, M. Kjarsgaard, K. Radford, G. Parraga, P.
Nair. Effect of anti-Th2 Therapy on MRI Ventilation Heterogeneity in Prednisone Dependent Asthma. International Conference of the American Thoracic Society Meeting Proceedings 2018 (submitted)
3. R.L. Eddy, H. Young, A. Kassay, D.P.I. Capaldi, S. Svenningsen, D.G. McCormack,
G. Parraga. Contributions of Large Versus Small Airways to MRI Ventilation Heterogeneity in Asthmatics. International Society for Magnetic Resonance in Medicine Meeting Proceedings 2018 (submitted)
4. A. Westcott, R.L. Eddy, D.P.I. Capaldi, H. Young, D.G. McCormack, G. Parraga.
Novel Quantification of Ventilation Heterogeneity Patterns in Hyperpolarized 3He MRI. International Society for Magnetic Resonance in Medicine Meeting Proceedings 2018 (submitted)
5. A. Ouriadov, D.P.I. Capaldi, D.G. McCormack, G. Parraga. A Single Shot Whole
Lung Method of Acquiring a Complete set of the Hyperpolarized Gas MRI-based Emphysema Biomarkers. International Society for Magnetic Resonance in Medicine Meeting Proceedings 2018 (submitted)
6. B.P. Yaremko, D.A. Hoover, D.P.I. Capaldi, K. Sheikh, G.B. Rodrigues, A.R. Dar, E.
Yu, S. Gaede, J. Chen, A. Erickson, A. Warner, B. Dingle, M. Landis, W. Kocha, M. Sanatani, M. Vincent, J. Younus, S. Kuruvilla, D.A. Palma, G. Parraga. Functional Lung Avoidance for Individualized Radiotherapy (FLAIR): Results of a Randomized, Double-Blind Clinical Trial. American Society for Radiation Oncology 2017
7. D.P.I. Capaldi, J.S.H. Baxter, A.J. McLeod, R.L. Eddy, S. Svenningsen, F. Guo, D.G.
McCormack, G. Parraga. Measuring Specific Ventilation using Four-dimensional Magnetic Resonance Ventilation Imaging: A Novel Physiological Biomarker of Asthma. Radiological Society of North America Annual Meeting 2017 (Trainee Prize Winner)
8. D.A. Hoover, T. Yamamoto, K. Sheikh, D.P.I. Capaldi, G. Parraga, D.A. Palma, M.
Daly, A. Warner, S. Kabus, M. Bal, B.P. Yaremko. Comparison of Hyperpolarized 3He MRI and CT Ventilation From a Cohort of Patients On the FLAIR Double-Blind, Randomized Trial. American Association of Physicist in Medicine Proceedings 2017
195
9. D.P.I. Capaldi, K. Sheikh, R.L. Eddy, S. Svenningsen, M. Kirby, D.G. McCormack, G. Parraga, Canadian Respiratory Research Network. Asthma Ventilation Abnormalities Measured using Fourier-Decomposition Free-breathing Pulmonary 1H MRI. International Workshop for Pulmonary Functional Imaging 2017 (Best Scientific Exhibition Award)
10. D.P.I. Capaldi, K. Sheikh, R.L. Eddy, S. Svenningsen, M. Kirby, D.G. McCormack,
G. Parraga, Canadian Respiratory Research Network. Asthma Ventilation Abnormalities Measured using Fourier-Decomposition Free-breathing Pulmonary 1H MRI. Canadian Respiratory Research Network Annual General Meeting 2017
11. D.P.I. Capaldi, K. Sheikh, R.L. Eddy, S. Svenningsen, M. Kirby, D.G. McCormack,
G. Parraga, Canadian Respiratory Research Network. Asthma Ventilation Abnormalities Measured using Fourier-Decomposition Free-breathing Pulmonary Proton Magnetic Resonance Imaging. London Health Research Day 2017
12. D.P.I. Capaldi, K. Sheikh, R.L. Eddy, S. Svenningsen, M. Kirby, D.G. McCormack,
G. Parraga, Canadian Respiratory Research Network. Asthma Ventilation Abnormalities Measured using Fourier-Decomposition Free-breathing Pulmonary 1H MRI. Imaging Network Ontario Symposium 2017 (1st Place - Best Oral Presentation Award)
13. D.P.I. Capaldi, K. Sheikh, R.L. Eddy, S. Svenningsen, M. Kirby, D.G. McCormack,
G. Parraga, Canadian Respiratory Research Network. Asthma Ventilation Abnormalities Measured using Fourier-Decomposition Free-breathing Pulmonary 1H MRI. International Society for Magnetic Resonance in Medicine Meeting Proceedings 2017
14. H.M. Young, D.P.I. Capaldi, K. Sheikh, D.G. McCormack, C.M. Yamashita, G.
Parraga. Ultra-Short Echo Time MRI Quantification of Airspace Enlargement in Bronchopulmonary Dysplasia and Alpha-1 Antitrypsin Deficiency: Parenchyma Destruction, Air trapping or Both? International Society for Magnetic Resonance in Medicine Meeting Proceedings 2017
15. R.L. Eddy, D.P.I. Capaldi, K. Sheikh, S. Svenningsen, D.G. McCormack, G. Parraga.
Pulmonary MRI Ventilation Defects in Asthma: Stochastic or Deterministic? International Society for Magnetic Resonance in Medicine Meeting Proceedings 2017
16. D.P.I. Capaldi, K. Sheikh, R. Di Cesare, D.A. Palma, G. Parraga. Is Ventilation
Heterogeneity Related to Quality of Life Scores Post-Radiation Therapy in Non-Small Cell Lung Cancer Patients? International Conference of the American Thoracic Society Meeting Proceedings 2017
17. R.L. Eddy, K. Sheikh, D.P.I. Capaldi, S. Svenningsen, C. Licskai, D.G. McCormack,
G. Parraga. Ventilation Heterogeneity Reversibility: Asthma, COPD or ACOS? International Conference of the American Thoracic Society Meeting Proceedings 2017
196
18. R.L. Eddy, D.P.I. Capaldi, K. Sheikh, S. Svenningsen, D.G. McCormack, G. Parraga.
Probability Mapping of Lung Functional Abnormalities in Asthma using MRI: Lung Atlas Explorations of Non-randomness. International Conference of the American Thoracic Society Meeting Proceedings 2017
19. C.J. Adams, D.P.I. Capaldi, R. Di Cesare, D.G. McCormack, G. Parraga. MRI
Stratification of COPD Patients for Bronchoscopic Lung Volume Reduction: A Cautionary Note. International Conference of the American Thoracic Society Meeting Proceedings 2017
20. D.P.I. Capaldi, K. Sheikh, D.A. Hoover, B.P. Yaremko, D.A. Palma, G. Parraga.
Free-Breathing Proton MRI Functional Lung Avoidance Maps to Guide Radiation Therapy. American Association of Physicist in Medicine Proceedings 2016
21. K. Sheikh, D.P.I. Capaldi, D.A. Hoover, B.P. Yaremko, D.A. Palma, G. Parraga.
Pulmonary Functional Imaging Biomarkers of NSCLC to Guide and Optimize Functional Lung Avoidance Radiotherapy. American Association of Physicist in Medicine Proceedings 2016
22. D.P.I. Capaldi, N. Zha, F. Guo, D. Pike, D.G. McCormack, M. Kirby, G. Parraga.
Pulmonary Imaging Biomarkers of Gas Trapping and Emphysema in COPD: 3He MR Imaging and CT Parametric Response Maps. Canadian Student Health Research Forum 2016 (Canadian Student Health Research Forum Participant and Funding Competition Winner)
23. A. Dasgupta, M. Kjarsgaard, D.P.I. Capaldi, K. Radford, F. Aleman, G. Parraga, P.M.
O’Byrne, P. Nair. Mepolizumab in COPD with eosinophilic bronchitis: A Randomized Clinical Trial. European Respiratory Society 2016
24. F. Guo, K. Sheikh, R. Eddy, D.P.I. Capaldi, D.G. McCormack, A. Fenster, G. Parraga.
A Segmentation Pipeline for Measuring Pulmonary Ventilation Suitable for Clinical Workflows and Decision-making. International Society for Magnetic Resonance in Medicine Meeting Proceedings 2016
25. K. Sheikh, F. Guo, A. Ouriadov, D.P.I. Capaldi, S. Svenningsen, M. Kirby, D.G.
McCormack, H.O. Coxson, G. Parraga. Ventilation Estimates in Severe Uncontrolled Asthma using 3D Single breath-hold Ultra-short Echo Time MRI. International Society for Magnetic Resonance in Medicine Meeting Proceedings 2016
26. D.P.I. Capaldi, A. Lausch, K. Sheikh, F. Guo, D.G. McCormack, G. Parraga.
Pulmonary Imaging Biomarkers of COPD for Personalized Treatment and Better Outcomes. International Society for Magnetic Resonance in Medicine Meeting Proceedings 2016
197
27. D.P.I. Capaldi, K. Sheikh, S. Svenningsen, M. Kirby, H.O. Coxson, D.G. McCormack, G. Parraga. Measurement of Asthma Treatment Response using Free-breathing 1H Ventilation MRI. International Conference of the American Thoracic Society Meeting Proceedings 2016
28. E. Lessard, A. Ouriadov, D. Pike, D.P.I. Capaldi, D.G. McCormack, G. Parraga.
Novel Biomarkers of Lung Parenchyma Destruction and Emphysema Progression in COPD Using Inhaled Gas MRI Morphometry. International Conference of the American Thoracic Society Meeting Proceedings 2016
29. K. Sheikh, F. Guo, S. Svenningsen, A. Ouriadov, D.P.I. Capaldi, R.L. Eddy, D.G.
McCormack, G. Parraga. What does Magnetic Resonance Imaging Signal-Intensity mean in Asthma? International Conference of the American Thoracic Society Meeting Proceedings 2016
30. M. Fennema, D.P.I. Capaldi, K. Sheikh, S. Svenningsen, R.L. Eddy, C. Licskai, D.G.
McCormack, G. Parraga. The Abnormal Airways that Dominate Asthma Attack: New clues using ventilation MRI during Exercise- and Methacholine-Challenge. International Conference of the American Thoracic Society Meeting Proceedings 2016
31. D.P.I. Capaldi, K. Sheikh, S. Svenningsen, M. Kirby, H.O. Coxson, D.G.
McCormack, G. Parraga. Measurement of Asthma Treatment Response using Free-breathing Proton Ventilation MRI. London Health Research Day 2016
32. A. Dasgupta, M. Kjarsgaard, D.P.I. Capaldi, K. Radford, F. Aleman, G. Parraga, P.M.
O’Byrne, P. Nair. Mepolizumab in COPD with eosinophilic bronchitis: A Randomized Clinical Trial. American Academy of Allergy, Asthma & Immunology 2016
33. K. Sheikh, A. Ouriadov, F. Guo, D.P.I. Capaldi, D.G. McCormack, G. Parraga.
Functional and Structural Magnetic Resonance Imaging of an Ex-Preterm Young Adult. International Workshop for Pulmonary Functional Imaging 2015
34. S. Svenningsen, D.P.I. Capaldi, P. Nair, D.G. McCormack, G. Parraga. Linking
Ventilation Heterogeneity and Asthma Control: Out with the Old and in with the New? International Workshop for Pulmonary Functional Imaging 2015
35. D.P.I. Capaldi, K. Sheikh, D.A. Hoover, D.A. Palma, B.P. Yaremko, G. Parraga.
Free-breathing MRI Ventilation Defects in Non-Small Cell Lung Cancer: Comparison with Hyperpolarized 3He MRI and Pulmonary Function Tests. International Workshop for Pulmonary Functional Imaging 2015
36. B.P. Yaremko, D.A. Palma, G. Parraga, D.P.I. Capaldi, K. Sheikh, G.B. Rodrigues,
A.R. Dar, A.V. Louie, E. Yu, S. Gaede, D.A. Hoover. Functional Lung Avoidance Radiotherapy for Stage III Non-Small Cell Lung Cancer: A double-blind randomized phase II trial. American Society for Radiation Oncology 2015

198
37. D.P.I. Capaldi, K. Sheikh, S. Svenningsen, D. Pike, D.G. McCormack, G. Parraga. MRI Measurements of Regional Ventilation Heterogeneity: Ventilation Defect Clusters. International Society for Magnetic Resonance in Medicine Meeting Proceedings 2015
38. D.P.I. Capaldi, N. Zha, D. Pike, K. Sheikh, D.G. McCormack, G. Parraga. 3He MRI
and CT Parametric Response Mapping of Small Airways Disease: The Battle-Ground for Ground Truth. International Society for Magnetic Resonance in Medicine Meeting Proceedings 2015 (Magna Cum Laude Award)
39. K. Sheikh, D.P.I. Capaldi, S. Svenningsen, D.G. McCormack, G. Parraga. Ultra-short
echo time MRI Measurements of Emphysema using Principal Component Analysis. International Society for Magnetic Resonance in Medicine Meeting Proceedings 2015
40. D. Pike, D.P.I. Capaldi, S. Mattonen, F. Guo, A. Ward, D.G. McCormack, G. Parraga.
Second-Order Texture Analysis of Hyperpolarized 3He MRI - Beyond the Ventilation Defect. International Society for Magnetic Resonance in Medicine Meeting Proceedings 2015
41. D.P.I. Capaldi, S. Svenningsen, P. Nair, D.G. McCormack, G. Parraga. Ventilation
Heterogeneity in Severe Asthma: Effects of Prednisone and Salbutamol before Bronchial Thermoplasty. International Conference of the American Thoracic Society Meeting Proceedings 2015
42. S. Svenningsen, D.P.I. Capaldi, E. Bluemke, G. Paulin, C. Davis, K. Sheikh, D.G.
McCormack, G. Parraga. Lung Clearance Index and Hyperpolarized 3He MRI Ventilation Heterogeneity Measurements in non-CF Bronchiectasis and COPD. International Conference of the American Thoracic Society Meeting Proceedings 2015
43. D. Pike, M. Kirby, D.P.I. Capaldi, N. Zha, D.G. McCormack, H.O. Coxson, G.
Parraga. Differences in Pulmonary Ventilation in COPD Ex-smokers after Three years: Longitudinal results of the TINCan Cohort. International Conference of the American Thoracic Society Meeting Proceedings 2015
44. D.P.I. Capaldi, N. Zha, D. Pike, K. Sheikh, D.G. McCormack, G. Parraga. Pulmonary
Magnetic Resonance Imaging and CT Parametric Response Mapping Phenotypes in Ex-smokers with and without Chronic Obstructive Pulmonary Disease. London Health Research Day 2015 (Judges’ Selection)
45. N. Zha, D.P.I. Capaldi, D. Pike, D.G. McCormack, I.A. Cunningham, G. Parraga.
Principal component analysis of the CT density histogram to generate parametric response maps of COPD. London Health Research Day 2015
46. D. Pike, M. Kirby, D.P.I. Capaldi, N. Zha, D.G. McCormack, H.O. Coxson, G.
Parraga. Differences in Pulmonary Ventilation in COPD Ex-smokers after Three years: Longitudinal results of the TINCan Cohort. London Health Research Day 2015

199
47. N. Zha, D.P.I. Capaldi, D. Pike, D.G. McCormack, I.A. Cunningham, G. Parraga.
Principal component analysis of the CT density histogram to generate parametric response maps of COPD. Imaging Network Ontario Symposium 2015
48. D. Pike, M. Kirby, D.P.I. Capaldi, N. Zha, D.G. McCormack, H.O. Coxson, G.
Parraga. Differences in Pulmonary Ventilation in COPD Ex-smokers after Three years: Longitudinal results of the TINCan Cohort. Imaging Network Ontario Symposium 2015
49. D.P.I. Capaldi, K. Sheikh, S. Svenningsen, D. Pike, D.G. McCormack, G. Parraga.
Ventilation Defect Clusters: MRI Measurements of Regional Ventilation Heterogeneity. Imaging Network Ontario Symposium 2015
50. D.P.I. Capaldi, K. Sheikh, F. Guo, S. Svenningsen, D.G. McCormack, G. Parraga.
Fourier-decomposition Pulmonary Magnetic Resonance Imaging Ventilation Defects in Ex-smokers: Relationship to Emphysema and 3He ventilation defects. Radiological Society of North America Annual Meeting 2014 (Trainee Prize Finalist)
51. D.P.I. Capaldi, K. Sheikh, G. Paulin, S. Svenningsen, H.O. Coxson, D.G.
McCormack, G. Parraga. Conventional non-contrast MRI of Ventilation Abnormalities in Bronchiectasis: New Tools and Measurements for an old Disease. London Health Research Day 2014
52. D.P.I. Capaldi, K. Sheikh, G. Paulin, S. Svenningsen, H.O. Coxson, D.G.
McCormack, G. Parraga. Conventional non-contrast MRI of Ventilation Abnormalities in Bronchiectasis: New Tools and Measurements for an old Disease. Imaging Network Ontario Symposium 2014
53. D.P.I. Capaldi, K. Sheikh, G. Paulin, S. Svenningsen, H.O. Coxson, D.G.
McCormack, G. Parraga. Conventional non-contrast MRI of Ventilation Abnormalities in Bronchiectasis: New Tools and Measurements for an old Disease. International Conference of the American Thoracic Society Meeting Proceedings 2014
54. D.P.I. Capaldi, F. Guo, S. Svenningsen, W. Ma, K. Sheikh, R. Etemad-Rezai, J.
Leipsic, H.O. Coxson, D.G. McCormack, G. Parraga. Comparison of Pulmonary 1H non-contrast and Hyperpolarized 3He MRI Ventilation Abnormalities in Bronchiectasis and COPD. International Society for Magnetic Resonance in Medicine Meeting Proceedings 2014
55. P.S. Basran, D.P.I. Capaldi. On Quantitative Assessment of Deformable CT-CT
Registration. Dosimetry and Treatment Planning. Canadian association of Radiation Oncology and the Canadian Organization of Medical Physicists 2013 Joint Scientific Meeting Proceedings 2013
200
Poster Presentations (32 total; 16 first-author) *presenter 1. B.P. Yaremko*, D.A. Hoover , D.P.I. Capaldi, K. Sheikh, G.B. Rodrigues, A.R. Dar,
E. Yu, S. Gaede, J. Chen, A. Erickson, A. Warner, B. Dingle, M. Landis, W. Kocha, M. Sanatani, M. Vincent, J. Younus, S. Kuruvilla, D.A. Palma, G. Parraga. Functional Lung Avoidance for Individualized Radiotherapy (FLAIR): Results of a Randomized, Double-Blind Clinical Trial. American Society for Radiation Oncology 2017, San Diego, California, USA, September 26, 2017
2. A.J. McLeod*, D.P.I. Capaldi, J.S.H. Baxter, G. Parraga, X. Luo, T.M. Peters.
Analysis of Periodicity in Video Sequences through Dynamic Linear Modeling. Medical Image Computing and Computer Assisted Intervention (MICCAI) 2017, Quebec City, Quebec, Canada, September 12, 2017
3. D.P.I. Capaldi*, K. Sheikh, R.L. Eddy, S. Svenningsen, M. Kirby, D.G. McCormack,
G. Parraga, Canadian Respiratory Research Network. Asthma Ventilation Abnormalities Measured using Fourier-Decomposition Free-breathing Pulmonary Proton Magnetic Resonance Imaging. London Health Research Day 2017, London, Ontario, Canada, March 28, 2017 (traditional poster)
4. D.P.I. Capaldi, K. Sheikh, R.L. Eddy, S. Svenningsen, M. Kirby, D.G. McCormack,
G. Parraga*, Canadian Respiratory Research Network. Asthma Ventilation Abnormalities Measured using Fourier-Decomposition Free-breathing Pulmonary 1H MRI. International Society for Magnetic Resonance in Medicine Meeting Proceedings 2017, Honolulu, Hawaii, USA, April 26, 2017 (electronic poster)
5. H.M. Young, D.P.I. Capaldi, K. Sheikh, D.G. McCormack, C.M. Yamashita, G.
Parraga*. Ultra-Short Echo Time MRI Quantification of Airspace Enlargement in Bronchopulmonary Dysplasia and Alpha-1 Antitrypsin Deficiency: Parenchyma Destruction, Air trapping or Both? International Society for Magnetic Resonance in Medicine Meeting Proceedings 2017, Honolulu, Hawaii, USA, April 24, 2017 (electronic poster)
6. D.P.I. Capaldi, K. Sheikh, R. Di Cesare, D.A. Palma, G. Parraga*. Is Ventilation
Heterogeneity Related to Quality of Life Scores Post-Radiation Therapy in Non-Small Cell Lung Cancer Patients? International Conference of the American Thoracic Society Meeting Proceedings 2017, Washington, District of Columbia, USA, May 23, 2017 (poster discussion)
7. R.L. Eddy, K. Sheikh, D.P.I. Capaldi, S. Svenningsen, C. Licskai, D.G. McCormack,
G. Parraga*. Ventilation Heterogeneity Reversibility: Asthma, COPD or ACOS? International Conference of the American Thoracic Society Meeting Proceedings 2017, Washington, District of Columbia, USA, May 23, 2017 (poster discussion)
8. R.L. Eddy, D.P.I. Capaldi, K. Sheikh, S. Svenningsen, D.G. McCormack, G. Parraga*.
Probability Mapping of Lung Functional Abnormalities in Asthma using MRI: Lung
201
Atlas Explorations of Non-randomness. International Conference of the American Thoracic Society Meeting Proceedings 2017, Washington, District of Columbia, USA, May 23, 2017 (poster discussion)
9. C.J. Adams*, D.P.I. Capaldi, R. Di Cesare, D.G. McCormack, G. Parraga. MRI
Stratification of COPD Patients for Bronchoscopic Lung Volume Reduction: A Cautionary Note. International Conference of the American Thoracic Society Meeting Proceedings 2017, Washington, District of Columbia, USA, May 23, 2017 (poster discussion)
10. D.P.I. Capaldi*, K. Sheikh, R.L. Eddy, S. Svenningsen, M. Kirby, D.G. McCormack,
G. Parraga, Canadian Respiratory Research Network. Asthma Ventilation Abnormalities Measured using Fourier-Decomposition Free-breathing Pulmonary 1H MRI. International Workshop for Pulmonary Functional Imaging 2017, Seoul, South Korea, March 25, 2017 (electronic poster - Best Scientific Exhibition Award)
11. D.P.I. Capaldi*, N. Zha, F. Guo, D. Pike, D.G. McCormack, M. Kirby, G. Parraga.
Pulmonary Imaging Biomarkers of Gas Trapping and Emphysema in COPD: 3He MR Imaging and CT Parametric Response Maps. Canadian Student Health Research Forum, Winnipeg, Manitoba, Canada, June 7, 2016 (traditional poster - Canadian Student Health Research Forum Participant and Funding Competition Winner)
12. F. Guo, K. Sheikh, R. Eddy, D.P.I. Capaldi*, D.G. McCormack, A. Fenster, G.
Parraga. A Segmentation Pipeline for Measuring Pulmonary Ventilation Suitable for Clinical Workflows and Decision-making. International Society for Magnetic Resonance in Medicine Meeting Proceedings 2016, Singapore, Singapore, May 10, 2016 (traditional poster)
13. D.P.I. Capaldi*, A. Lausch, K. Sheikh, F. Guo, D.G. McCormack, G. Parraga.
Pulmonary Imaging Biomarkers of COPD for Personalized Treatment and Better Outcomes. International Society for Magnetic Resonance in Medicine Meeting Proceedings 2016, Singapore, Singapore, May 12, 2016 (electronic poster)
14. M. Fennema, D.P.I. Capaldi, K. Sheikh*, S. Svenningsen, R.L. Eddy, C. Licskai, D.G.
McCormack, G. Parraga. The Abnormal Airways that Dominate Asthma Attack: New clues using ventilation MRI during Exercise- and Methacholine-Challenge. International Conference of the American Thoracic Society Meeting Proceedings 2016, San Francisco, California, USA, May 18, 2016 (traditional poster)
15. D.P.I. Capaldi*, K. Sheikh, S. Svenningsen, M. Kirby, H.O. Coxson, D.G.
McCormack, G. Parraga. Measurement of Asthma Treatment Response using Free-breathing Proton Ventilation MRI. London Health Research Day 2016, London, Ontario, Canada, March 29, 2016 (traditional poster)
16. K. Sheikh, A. Ouriadov, F. Guo, D.P.I. Capaldi, D.G. McCormack, G. Parraga*.
Functional and Structural Magnetic Resonance Imaging of an Ex-Preterm Young
202
Adult. International Workshop for Pulmonary Functional Imaging 2015, Edinburgh, Scotland, September 29, 2015 (rapid fire poster)
17. D.P.I. Capaldi, K. Sheikh, D.A. Hoover, D.A. Palma, B.P. Yaremko, G. Parraga*.
Free-breathing MRI Ventilation Defects in Non-Small Cell Lung Cancer: Comparison with Hyperpolarized 3He MRI and Pulmonary Function Tests. International Workshop for Pulmonary Functional Imaging 2015, Edinburgh, Scotland, September 29, 2015 (rapid fire poster)
18. D.P.I. Capaldi*, K. Sheikh, S. Svenningsen, D. Pike, D.G. McCormack, G. Parraga.
MRI Measurements of Regional Ventilation Heterogeneity: Ventilation Defect Clusters. International Society for Magnetic Resonance in Medicine Meeting Proceedings 2015, Toronto, Ontario, Canada, June 3, 2015 (electronic poster)
19. K. Sheikh*, D.P.I. Capaldi, S. Svenningsen, D.G. McCormack, G. Parraga. Ultra-
short echo time MRI Measurements of Emphysema using Principal Component Analysis. International Society for Magnetic Resonance in Medicine Meeting Proceedings 2015, Toronto, Ontario, Canada, June 2, 2015 (traditional poster)
20. D. Pike, D.P.I. Capaldi*, S. Mattonen, F. Guo, A. Ward, D.G. McCormack, G.
Parraga. Second-Order Texture Analysis of Hyperpolarized 3He MRI - Beyond the Ventilation Defect. International Society for Magnetic Resonance in Medicine Meeting Proceedings 2015, Toronto, Ontario, Canada, June 3, 2015 (electronic poster)
21. D.P.I. Capaldi, S. Svenningsen*, P. Nair, D.G. McCormack, G. Parraga. Ventilation
Heterogeneity in Severe Asthma: Effects of Prednisone and Salbutamol before Bronchial Thermoplasty. International Conference of the American Thoracic Society Meeting Proceedings 2015, Denver, Colarado, USA, May 17, 2015 (poster discussion)
22. S. Svenningsen*, D.P.I. Capaldi, E. Bluemke, G. Paulin, C. Davis, K. Sheikh, D.G.
McCormack, G. Parraga. Lung Clearance Index and Hyperpolarized 3He MRI Ventilation Heterogeneity Measurements in non-CF Bronchiectasis and COPD. International Conference of the American Thoracic Society Meeting Proceedings 2015, Denver, Colarado, USA, May 17, 2015 (poster discussion)
23. D. Pike, M. Kirby*, D.P.I. Capaldi, N. Zha, D.G. McCormack, H.O. Coxson, G.
Parraga. Differences in Pulmonary Ventilation in COPD Ex-smokers after Three years: Longitudinal results of the TINCan Cohort. International Conference of the American Thoracic Society Meeting Proceedings 2015, Denver, Colarado, USA, May 17, 2015 (poster discussion)
24. D.P.I. Capaldi*, N. Zha, D. Pike, K. Sheikh, D.G. McCormack, G. Parraga.
Pulmonary Magnetic Resonance Imaging and CT Parametric Response Mapping Phenotypes in Ex-smokers with and without Chronic Obstructive Pulmonary Disease. London Health Research Day 2015, London, Ontario, Canada, April 1, 2015 (traditional poster - Judges' Selection)
203
25. N. Zha*, D.P.I. Capaldi, D. Pike, D.G. McCormack, I.A. Cunningham, G. Parraga.
Principal component analysis of the CT density histogram to generate parametric response maps of COPD. London Health Research Day 2015, London, Ontario, Canada, April 1, 2015 (traditional poster)
26. D. Pike*, M. Kirby, D.P.I. Capaldi, N. Zha, D.G. McCormack, H.O. Coxson, G.
Parraga. Differences in Pulmonary Ventilation in COPD Ex-smokers after Three years: Longitudinal results of the TINCan Cohort. London Health Research Day 2015, London, Ontario, Canada, April 1, 2015 (traditional poster)
27. D. Pike*, M. Kirby, D.P.I. Capaldi, N. Zha, D.G. McCormack, H.O. Coxson, G.
Parraga. Differences in Pulmonary Ventilation in COPD Ex-smokers after Three years: Longitudinal results of the TINCan Cohort. Imaging Network Ontario Symposium 2015, London, Ontario, Canada, March 30 & 31, 2015 (traditional poster)
28. D.P.I. Capaldi*, K. Sheikh, G. Paulin, S. Svenningsen, H.O. Coxson, D.G.
McCormack, G. Parraga. Conventional non-contrast MRI of Ventilation Abnormalities in Bronchiectasis: New Tools and Measurements for an old Disease. International Conference of the American Thoracic Society Meeting Proceedings 2014, San Diego, California, USA, May 18, 2014 (poster discussion)
29. D.P.I. Capaldi*, F. Guo, S. Svenningsen, W. Ma, K. Sheikh, R. Etemad-Rezai, J.
Leipsic, H.O. Coxson, D.G. McCormack, G. Parraga. Comparison of Pulmonary 1H non-contrast and Hyperpolarized 3He MRI Ventilation Abnormalities in Bronchiectasis and COPD. International Society for Magnetic Resonance in Medicine Meeting Proceedings 2014, Milan, Milan, Italy, May 14, 2014 (traditional poster)
30. D.P.I. Capaldi*, K. Sheikh, G. Paulin, S. Svenningsen, H.O. Coxson, D.G.
McCormack, G. Parraga. Conventional non-contrast MRI of Ventilation Abnormalities in Bronchiectasis: New Tools and Measurements for an old Disease. Imaging Network Ontario Symposium 2014, Toronto, Ontario, Canada, March 24, 2014 (traditional poster)
31. D.P.I. Capaldi*, K. Sheikh, G. Paulin, S. Svenningsen, H.O. Coxson, D.G.
McCormack, G. Parraga. Conventional non-contrast MRI of Ventilation Abnormalities in Bronchiectasis: New Tools and Measurements for an old Disease. London Health Research Day 2014, London, Ontario, Canada, March 18, 2014 (traditional poster)
32. D.P.I. Capaldi*. Automizing the Analysis of a High Precision Image Quality Phantom
Manufactured for CT Imaging. University of Windsor Undergraduate Student Coop Poster Presentation, Windsor, Ontario, Canada, January 29, 2013 (traditional poster)
204
Oral Presentations (25 total; 11 first-author) *presenter 1. D.P.I. Capaldi*, J.S.H. Baxter, A.J. McLeod, R.L. Eddy, S. Svenningsen, F. Guo, D.G.
McCormack, G. Parraga. Measuring Specific Ventilation using Four-dimensional Magnetic Resonance Ventilation Imaging: A Novel Physiological Biomarker of Asthma. Radiological Society of North America Annual Meeting 2017, Chicago, Illinois, USA, December 1, 2017 (Trainee Prize Winner)
2. D.A. Hoover*, T. Yamamoto, K. Sheikh, D.P.I. Capaldi, G. Parraga, D.A. Palma, M.
Daly, A. Warner, S. Kabus, M. Bal, B.P. Yaremko. Comparison of Hyperpolarized 3He MRI and CT Ventilation From a Cohort of Patients On the FLAIR Double-Blind, Randomized Trial. American Association of Physicist in Medicine Proceedings 2017, Denver, Colorado, USA, July 30, 2017 (Snap Presentation)
3. D.P.I. Capaldi*, K. Sheikh, R.L. Eddy, S. Svenningsen, M. Kirby, D.G. McCormack,
G. Parraga, Canadian Respiratory Research Network. Asthma Ventilation Abnormalities Measured using Fourier-Decomposition Free-breathing Pulmonary 1H MRI. International Workshop for Pulmonary Functional Imaging 2017, Seoul, South Korea, March 25, 2017 (3-minute power pitch - Best Scientific Exhibition Award)
4. D.P.I. Capaldi*, K. Sheikh, R.L. Eddy, S. Svenningsen, M. Kirby, D.G. McCormack,
G. Parraga, Canadian Respiratory Research Network. Asthma Ventilation Abnormalities Measured using Fourier-Decomposition Free-breathing Pulmonary 1H MRI. Imaging Network Ontario Symposium 2017, London, Ontario, Canada, March 15, 2017 (1st Place - Best Oral Presentation Award)
5. R.L. Eddy, D.P.I. Capaldi, K. Sheikh, S. Svenningsen, D.G. McCormack, G. Parraga*.
Pulmonary MRI Ventilation Defects in Asthma: Stochastic or Deterministic? International Society for Magnetic Resonance in Medicine Meeting Proceedings 2017, Honolulu, Hawaii, USA, April 27, 2017
6. F. Guo, D.P.I. Capaldi, R. Di Cesare, A. Fenster, G. Parraga*. Registration Pipeline
for Pulmonary Free-Breathing 1H MRI Ventilation Measurements. Proceedings of the Society for Photo-optical Instrumentation Engineers (SPIE) 2017, Orlando, Florida, USA, February 16, 2017
7. D.P.I. Capaldi*, K. Sheikh, R.L. Eddy, S. Svenningsen, M. Kirby, D.G. McCormack,
G. Parraga, Canadian Respiratory Research Network. Asthma Ventilation Abnormalities Measured using Fourier-Decomposition Free-breathing Pulmonary 1H MRI. Canadian Respiratory Research Network Annual General Meeting 2017, Ottawa, Ontario, Canada, January 11, 2017
8. A. Dasgupta, M. Kjarsgaard, D.P.I. Capaldi, K. Radford, F. Aleman, G. Parraga, P.M.
O’Byrne, P. Nair*. Mepolizumab in COPD with eosinophilic bronchitis: A Randomized Clinical Trial. European Respiratory Society 2016, London, United Kingdom, September 4, 2016
205
9. D.P.I. Capaldi*, K. Sheikh, D.A. Hoover, B.P. Yaremko, D.A. Palma, G. Parraga.
Free-Breathing Proton MRI Functional Lung Avoidance Maps to Guide Radiation Therapy. American Association of Physicist in Medicine Proceedings 2016, Washington, District of Columbia, USA, August 4, 2016
10. K. Sheikh, D.P.I. Capaldi*, D.A. Hoover, B.P. Yaremko, D.A. Palma, G. Parraga.
Pulmonary Functional Imaging Biomarkers of NSCLC to Guide and Optimize Functional Lung Avoidance Radiotherapy. American Association of Physicist in Medicine Proceedings 2016, Washington, District of Columbia, USA, August 3, 2016
11. K. Sheikh*, F. Guo, A. Ouriadov, D.P.I. Capaldi, S. Svenningsen, M. Kirby, D.G.
McCormack, H.O. Coxson, G. Parraga. Ventilation Estimates in Severe Uncontrolled Asthma using 3D Single breath-hold Ultra-short Echo Time MRI. International Society for Magnetic Resonance in Medicine Meeting Proceedings 2016, Singapore, Singapore, Friday, May 13, 2016
12. D.P.I. Capaldi*, K. Sheikh, S. Svenningsen, M. Kirby, H.O. Coxson, D.G.
McCormack, G. Parraga. Measurement of Asthma Treatment Response using Free-breathing 1H Ventilation MRI. International Conference of the American Thoracic Society Meeting Proceedings 2016, San Francisco, California, USA, May 15, 2016
13. E. Lessard, A. Ouriadov, D. Pike*, D.P.I. Capaldi, D.G. McCormack, G. Parraga.
Novel Biomarkers of Lung Parenchyma Destruction and Emphysema Progression in COPD Using Inhaled Gas MRI Morphometry. International Conference of the American Thoracic Society Meeting Proceedings 2016, San Francisco, California, USA, May 18, 2016
14. K. Sheikh*, F. Guo, S. Svenningsen, A. Ouriadov, D.P.I. Capaldi, R.L. Eddy, D.G.
McCormack, G. Parraga. What does Magnetic Resonance Imaging Signal-Intensity mean in Asthma? International Conference of the American Thoracic Society Meeting Proceedings 2016, San Francisco, California, USA, May 15, 2016
15. A. Dasgupta, M. Kjarsgaard, D.P.I. Capaldi, K. Radford, F. Aleman, G. Parraga, P.M.
O’Byrne, P. Nair*. Mepolizumab in COPD with eosinophilic bronchitis: A Randomized Clinical Trial. American Academy of Allergy, Asthma & Immunology 2016, Los Angeles, California, USA, March 4, 2016
16. S. Svenningsen, D.P.I. Capaldi, P. Nair, D.G. McCormack, G. Parraga*. Linking
Ventilation Heterogeneity and Asthma Control: Out with the Old and in with the New? International Workshop for Pulmonary Functional Imaging 2015, Edinburgh, Scotland, September 29, 2015
17. B.P. Yaremko*, D.A. Palma, G. Parraga, K. Sheikh, D.P.I. Capaldi, G.B. Rodrigues,
R. Dar, E. Yu, B. Dingle, M. Landis, W. Kocha, M. Sanatani, M. Vincent, J. Younus, S. Gaede, D.A. Hoover. Functional Lung Avoidance Radiotherapy for Stage III Non-
206
Small Cell Lung Cancer: A double-blind randomized phase II trial. American Society for Radiation Oncology 2015, San Antonio, Texas, USA, October 18-21, 2015
18. D.P.I. Capaldi*, N. Zha, D. Pike, K. Sheikh, D.G. McCormack, G. Parraga. 3He MRI
and CT Parametric Response Mapping of Small Airways Disease: The Battle-Ground for Ground Truth. International Society for Magnetic Resonance in Medicine Meeting Proceedings 2015, Toronto, Ontario, Canada, June 5, 2015 (Magna Cum Laude Award)
19. D.P.I. Capaldi*, K. Sheikh, S. Svenningsen, D. Pike, D.G. McCormack, G. Parraga.
Ventilation Defect Clusters: MRI Measurements of Regional Ventilation Heterogeneity. Imaging Network Ontario Symposium 2015, London, Ontario, Canada, March 30, 2015
20. N. Zha*, D.P.I. Capaldi, D. Pike, D.G. McCormack, I.A. Cunningham, G. Parraga.
Principal component analysis of the CT density histogram to generate parametric response maps of COPD. Imaging Network Ontario Symposium 2015, London, Ontario, Canada, March 30, 2015
21. D.P.I. Capaldi*, S. Svenningsen, I.A. Cunningham, G. Parraga. Fourier-Based Linear
Systems Description of Free-Breathing Pulmonary Magnetic Resonance Imaging. Proceedings of the Society for Photo-optical Instrumentation Engineers (SPIE), Orlando, Florida, USA, February 26, 2015
22. N. Zha*, D.P.I. Capaldi, D. Pike, D.G. McCormack, I.A. Cunningham, G. Parraga.
Principal component analysis of the CT density histogram to generate parametric response maps of COPD. Proceedings of the Society for Photo-optical Instrumentation Engineers (SPIE), Orlando, Florida, USA, February 26, 2015
23. D.P.I. Capaldi*, K. Sheikh, F. Guo, S. Svenningsen, D.G. McCormack, G. Parraga.
Fourier-decomposition Pulmonary Magnetic Resonance Imaging Ventilation Defects in Ex-smokers: Relationship to Emphysema and 3He ventilation defects. Radiological Society of North America Annual Meeting 2014, Chicago, Illinois, USA, December 3, 2014 (Trainee Prize Finalist)
24. P.S. Basran*, D.P.I. Capaldi. On Quantitative Assessment of Deformable CT-CT
Registration. Dosimetry and Treatment Planning. Canadian association of Radiation Oncology and the Canadian Organization of Medical Physicists 2013 Joint Scientific Meeting Proceedings 2013, Montreal, Quebec, September 19, 2013
25. D.P.I. Capaldi*, M.A. Pantea, R.G. Maev. Finite Element Analysis of Percussion
Models: Modeling Different Complex Structures to Determine Acoustical Properties. University of Windsor Undergraduate Thesis Presentation, Windsor, Ontario, July 27, 2012

207
Academic Reports (1 total; 1 first-author) 1. D.P.I. Capaldi, M.A. Pantea, R.G. Maev. Finite Element Analysis of Percussion
Models: Modeling Different Complex Structures to Determine Acoustical Properties. University of Windsor Undergraduate Thesis, Windsor, Ontario, 2012
COMMITTEES AND PROFESSIONAL ACTIVITIES 2010-2013 University of Windsor
Undergraduate Representative Department of Physics
PROFESSIONAL MEMBERSHIPS 2017- Radiological Society of North America (RSNA) Student Member 2015- American Association of Physicist in Medicine (AAPM) Student Member 2013- International Society for Magnetic Resonance in Medicine (ISMRM) Student Member 2013-2018 American Thoracic Society (ATS) Student Member 2013-2014 Canadian Organization of Medical Physicists (COMP) Student Member 2012-2013 Canadian Association of Physicists (CAP) Student Member COMMUNITY ACTIVITIES 2013 Miracle League of Amherstburg, Buddy 2012-2013 Students Orienting Students, Volunteer, University of Windsor 2010-2013 Science Rendezvous, Volunteer, University of Windsor 2011-2013 Physics Club, Vice President, University of Windsor 2009-2013 Physics Club, Member, University of Windsor