Electrochemical Impedance Spectroscopy Options for Proton ...

A Review on Electrical Impedance Tomography for
Pulmonary Perfusion Imaging
D T Nguyen1, C Jin1, A Thiagalingam2 and A L McEwan1
1 School of Electrical and Information Engineering, The University of Sydney, New
South Wales, Australia2 Department of Cardiology, Westmead Hospital, New South Wales, Australia
E-mail: [email protected]
Abstract.
Although Electrical Impedance Tomography (EIT) for ventilation monitoring is on
the verge of clinical trials, pulmonary perfusion imaging with EIT remains a challenge,
especially in spontaneously breathing subjects. In anticipation of more research on
this subject, we believe a thorough review is called for. In this article, findings related
to the physiological origins and electrical characteristics of this signal are summarised,
highlighting properties that are particularly relevant to EIT. Perfusion impedance
change signal is significantly smaller in amplitude compared with the changes due to
ventilation. Therefore, the hardware used for this purpose must be more sensitive and
more resilient to noise. In past works, some signal or image processing methods have
been required to separate these two signals. Three different techniques are reviewed
in this article, including the ECG-gating method, frequency domain filtering based
methods and a principal component analysis based method. In addition, we review a
number of experimental studies on both human and animal subjects that employed EIT
for perfusion imaging, with promising results in the diagnosis of Pulmonary Embolism
(PE) and pulmonary arterial hypertension as well as other potential applications. In
our opinion, PE is most likely to become the main focus for perfusion EIT in the future,
especially for heavily instrumented patients in the Intensive Care Unit (ICU).
Keywords: electrical impedance tomography, EIT, cardiac changes, pulmonary perfusionSubmitted to: Physiol. Meas.

EIT for Pulmonary Perfusion Imaging 2
1. Introduction
Electrical Impedance Tomography (EIT) is a promising medical imaging modality, which
typically uses a single ring of external electrodes to image the impedance changes
within the body. First developed as a method for medical imaging in 1987 (Barber &
Brown 1986), EIT has been extensively studied and shown to have the ability to detect
both physiologic and pathophysiologic changes of regional pulmonary ventilation. This
application of EIT has been described as being on the verge of clinical application for
pulmonary monitoring with medical device manufacturers offering 2D imaging systems
for trials (Bodenstein et al. 2009).
EIT is a non-invasive, radiation free and portable imaging technique, suitable
for bedside use, especially in the ICU. Nonetheless, to infer the internal impedance
distribution from limited surface measurements is a severely ill-posed inverse problem,
which is still an active research area of applied mathematics (Borcea 2002). The EIT
reconstruction problem can only be solved numerically and is very computationally
expensive. EIT has very low spatial resolution compared with other imaging
techniques such as MRI or CT. It is also prone to noise, artefacts and anatomical
distortion. Furthermore, with current technology, EIT is only capable imaging
difference in impedance and not absolute impedance (Holder 2005). Functional EIT
(fEIT) is a technique that measure the changes in impedance between the current
state and a baseline state. Consequently, two different physiological states can be
misinterpreted to be similar if measured against different baselines. A standard
for interpretation/evaluation of fEIT images has not yet been established (Moerer
et al. 2011) to avoid this problem. Besides, although three dimensional EIT has
recently become possible, most commercial EIT systems are two-dimensional, limiting
the observable changes to one (axial) plane. With its pros and cons, although EIT has
not made it to the bedside, the technique has the potential to become the much needed
portable bedside pulmonary monitoring device for critically ill patients in the ICU.
From a physiological point of view, pulmonary perfusion is as important as lung
ventilation as both elements are necessary to sufficiently describe the regional behaviour
of lung tissues for applications such as the adjustment of ventilator settings (Frerichs
et al. 2009). As the EIT signal of the thorax contains both of the ventilation and
perfusion information, it is possible to independently and concurrently detect regional
changes due to these two processes. However, the significantly smaller amplitude of
the perfusion impedance change signal compared to the respiratory impedance change
signal renders perfusion mapping very difficult.
With the recent success of ventilation EIT, we feel that it is reasonable to
expect more studies in the future dedicated to pulmonary perfusion EIT. This review
attempts to focus specifically on engineering problems that are inherent to pulmonary
perfusion EIT and its clinical applications. Regarding the general principles of EIT,
its instrumentations, procedures and challenges, we refer the readers to the excellent
reviews by Brown (2003), Holder (2005), Bodenstein et al. (2009) and Moerer et al.
EIT for Pulmonary Perfusion Imaging 3
(2011).
This review is organised as follows. Section 2 briefly looks at different aspects of the
perfusion signals. Consequently, section 3 summarises technical aspects of EIT that are
applicable to perfusion measurements and focuses on the signal processing techniques for
separating the respiratory- and perfusion-related signals. Section 4 summarises some
of the clinical studies. Finally, section 5 discusses the future of EIT for pulmonary
perfusion imaging in clinical practice and suggests the possible improvements which
may benefit pulmonary perfusion EIT.
2. The pulmonary perfusion EIT signal
Physiologically, the term “pulmonary perfusion” refers to the delivery of arterial blood
to pulmonary capillary bed. In EIT, most studies measure the impedance changes due
to the pulsatile components of pulmonary flow, which in turn, is related to cardiac
activities (Frerichs et al. 2002). The characteristics of this signal is discussed in depth
in section 2.1. The recent work by Borges et al. (2011) proposed the measurement of
another perfusion impedance signal that reflects the regional distribution of blood flow
in the lung. Their findings on this type of perfusion impedance signal is discussed in
section 2.2.
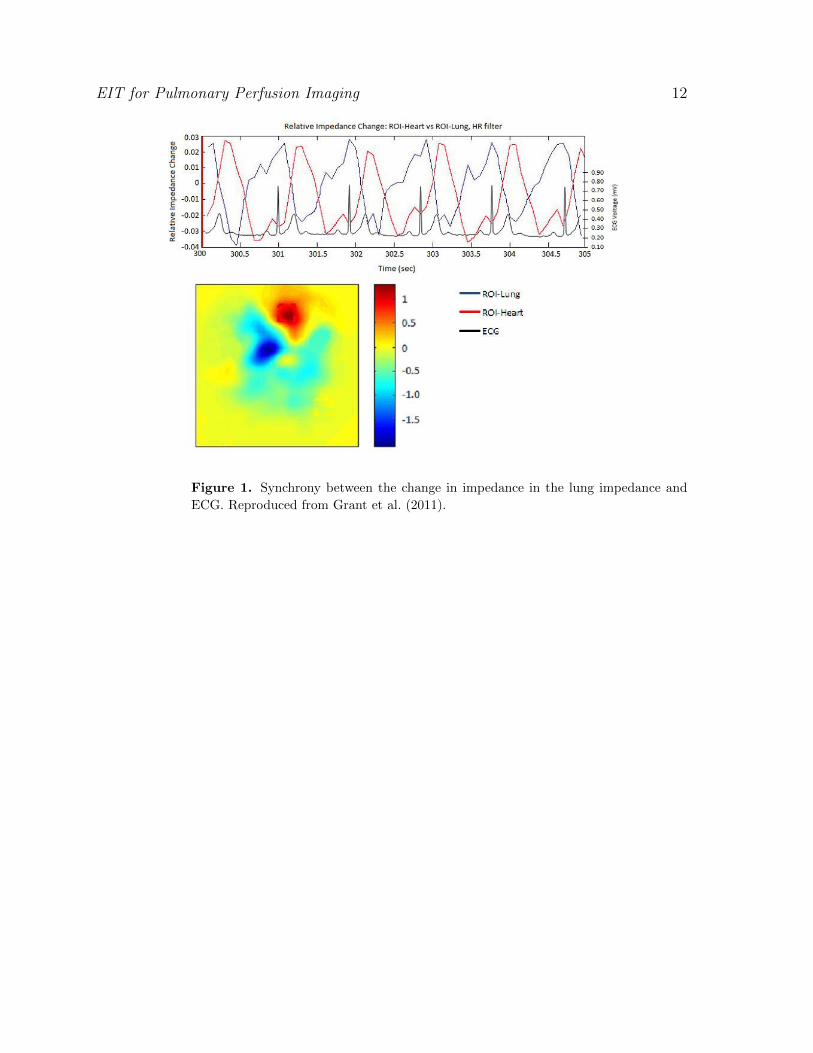
2.1. The pulsatile pulmonary perfusion impedance signal
The relationship between cardiac activities and the pulsatile pulmonary perfusion
impedance changes has been observed to be characterised by the following events. After
ventricular systole, pulmonary arteries are filled with blood, resulting in a decrease in
impedance in the lung because blood has much lower electrical impedance (1.5 Ωm)
than lung tissues (7 Ωm (expiration) and 23 Ωm (inspiration)) (Eyuboglu et al. 1989).
As venous return starts, blood volume in the pulmonary capillary drops, leading
to increase in impedance. Toward the end of diastole, blood volume in pulmonary
capillary is at its minimum while impedance is at its maximum. Following a ventricular
systole, characterised by the R wave of an ECG recording, the increase of blood in the
pulmonary vessels again marks the decrease in impedance. This pulsatile characteristics
of pulmonary perfusion can be seen in Figure 1.
Though cardiac activities are responsible for the general shape of the pulsatile
perfusion impedance changes, the magnitude of these changes was shown to be related to
the size of the pulmonary microvascular bed by Smit et al. (2004). This same study also
concluded that the strength of the perfusion signal obtained by EIT was independent of
the stroke volume (SV) or cardiac output (CO). On the contrary, later results described
by Fagerberg et al. (2009a), showed that the strength of this signal was “significantly
correlated” with a wide range of SV values. Interestingly, the latter authors made
no comments or comparisons between their findings and that of Smit et al. (2004).
The mixed results from these two studies imply more in-depth studies in this area are
EIT for Pulmonary Perfusion Imaging 4
necessary.
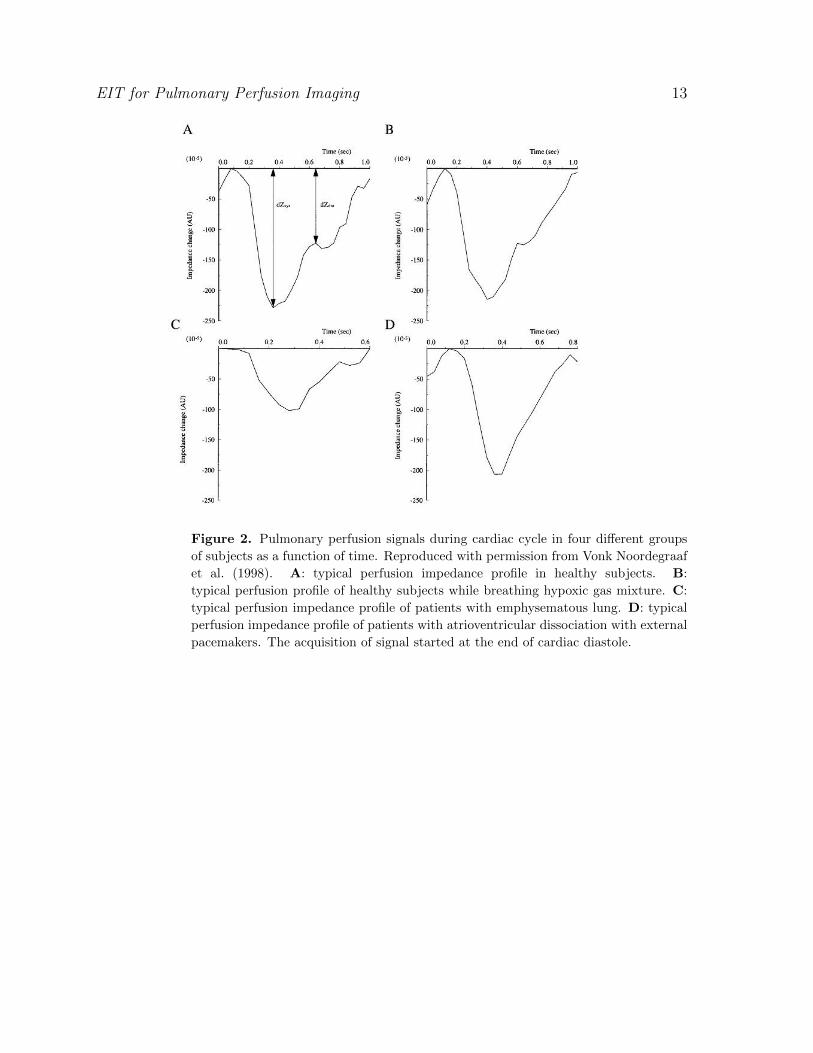
Vonk Noordegraaf et al. (1998) studied the perfusion EIT signal in four different
groups of subjects: subjects with no cardiac or respiratory history (1) under normal
conditions and (2) while breathing hypoxic gas mixture (12% O2, 5% CO2 and 83% N2),
(3) patients with emphysema and (4) patients with atrioventricular dissociation with
external pacemakers. All four groups showed different perfusion EIT signal profiles (see
Figure 2). The significantly lower amplitude of impedance changes in emphysematous
patients was, reportedly, the result of a loss of alveolar capillaries and structure changes
in muscular pulmonary arteries, both of which were confirmed with morphometrical
analysis of lung tissues acquired at autopsy. Notably, they ruled out the effect of SV
and distensibility of right pulmonary artery based on their analysis on data obtained
from MRI measurements (Vonk Noordegraaf et al. 1998). Furthermore, the lack of the
inflection point (∆Zdia) in the perfusion impedance change measured on patients with
atrioventricular dissociation suggested that the inflection point of the impedance profile
in normal subjects is due to the back flow of blood into the pulmonary artery vein caused
by the high pressure of the left ventricle during systole (Vonk Noordegraaf et al. 1998).
2.2. Perfusion impedance change due to regional blood flow
Borges et al. (2011) proposed a novel method to determine relatively determine regional
blood flow based on impedance change. They reportedly used a bolus of hypertonic
sodium chloride (20 %) as impedance contrast. An algorithm was then performed to
follow the first-pass kinetics of this impedance contrast bolus to quantitatively measure
the relative regional blood flow in the lungs and heart. In an experiment performed
on 6 piglets, the results yielded by this method was compared with SPECT scans
for pulmonary perfusion of the subjects. Regional blood flow measured by EIT using
this novel method, in both healthy and injured lung cases, is highly correlated to that
measured by SPECT.
In the same study, pulsatile pulmonary perfusion impedance EIT was also measured
on the same subjects. The perfusion images obtained with this method did not correlate
well with the SPECT scans, especially in the cases of injured lungs. This could
be because the pulsatile impedance signal is ”strongly influenced” by the size of the
pulmonary microvascular bed (Smit et al. 2004) (Borges et al. 2011) while the regional
flow of blood as measured with the first pass kinetic method is not. Nonetheless,
the pulsatile perfusion impedance change in Borges et al.’s (2011) study is acquired
by averaging over 50 cardiac cycles during a short (20s) apnea while most studies on
pulsatile perfusion impedance change averaged over more than 100 cardiac cycles (see
Section 3.1.1).
Furthermore, the choice of the contrast agent was not justified by Borges et al.
(2011). Frerichs et al. (2002) successfully used a much less concentrated solution of
sodium chloride (5.85%) as the impedance contrast agent. The authors reported that
regional perfusion measurements obtained with this method were comparable with data
EIT for Pulmonary Perfusion Imaging 5
obtained with electron beam CT (Frerichs et al. 2002). Therefore, it is questionable
why Borges et al. (2011) used such highly hypertonic solution. Additionally, the total
volume of the 20% NaCl solution was not stated by Borges et al. (2011). The use of
a large quantities of this highly hypertonic solution is likely to be a limitation of the
technique as it may precipitate heart failure.
Although promising, the first-pass kinetic method for regional blood flow
monitoring requires further confirmatory studies. The bulk of previous work was done
measuring the pulsatility of the perfusion impedance signal. Therefore in the remainder
of this review, we focus on the pulsatile impedance change as the perfusion related
signal.
3. Technical aspects of pulmonary perfusion EIT
The large majority of perfusion studies reported using 50 kHz alternating current with 5
mA peak-to-peak amplitude. Leathard et al. (1994) used 20kHz current. More recently,
Borges et al. (2011) used 5-12 mA currents at 125 kHz. Furthermore, in an in vivo
study of pulmonary perfusion and ventilation impedance changes in the human thorax
by Brown et al. (1994), it was found that the mean cardiac-related impedance changes
decreased at higher frequencies and exhibited a relaxation frequency fr of 86.8 kHz.
The respiratory impedance change also decreased in magnitude at higher frequency,
but interestingly, less than the cardiac-related impedance change. Their findings were
supported by Nopp et al.’s (1996) study. Despite the fact that multi-frequency EIT
systems have become available (McEwan et al. 2007), it has never been established
which frequency should be used for this application. It follows that the choices of
frequencies reported in published works have been seemingly arbitrary.
3.1. Signal processing techniques to separate perfusion and ventilation components in
EIT signals
Cardiac-related impedance change magnitude is reported to be as much as 3% while
the impedance of the lung changes as much as 300% between maximal expiration and
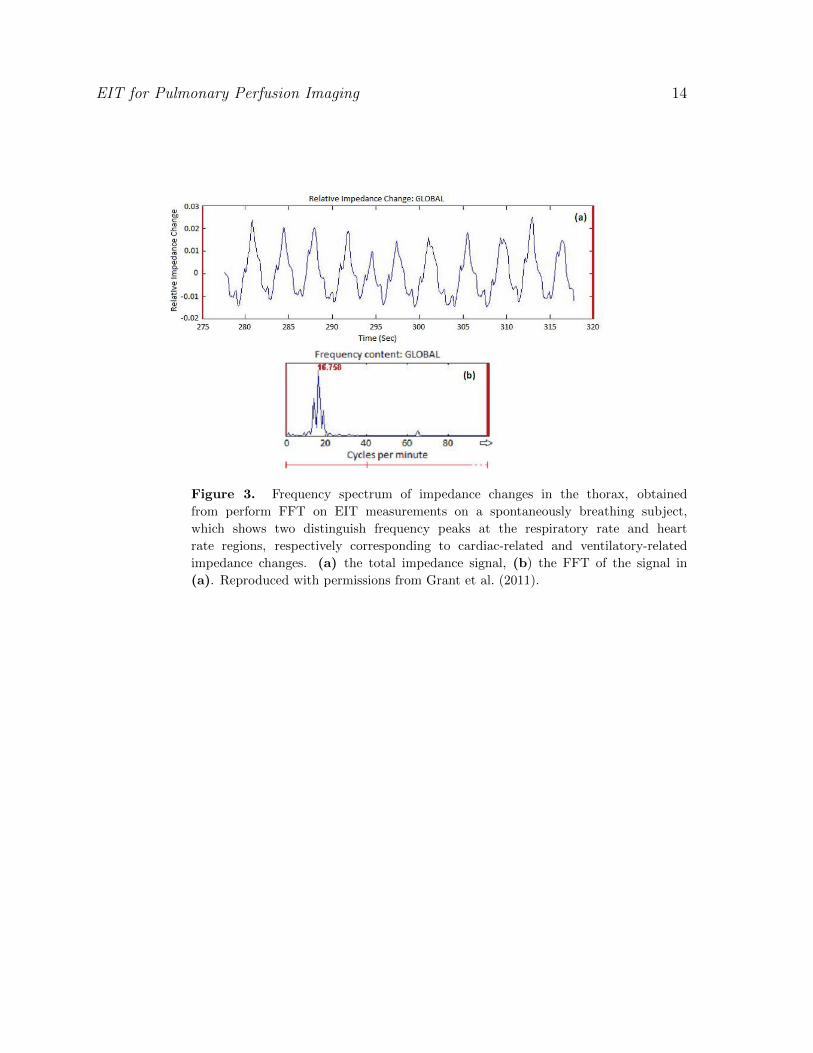
maximal inspiration in dogs (Eyuboglu et al. 1989). Since EIT is very sensitive to noise,
the lower magnitude of the cardiac-related impedance changes directly results in a lower
signal-to-noise ratio. In fact, EIT measurements on the chest of spontaneously breathing
and ventilated subjects showed only the respiratory component, as shown in Figure 3.
This motivated the development of signal and image processing techniques to separate
these two components.
The advances and flexibility of new instruments allows the development of
much more sophisticated signal processing techniques for the separation between
ventilation and perfusion signals. In order of ascending sophistication, these techniques
include ECG-gated acquisition with averaging, frequency domain filtering and principle
component analysis (PCA).
EIT for Pulmonary Perfusion Imaging 6
3.1.1. ECG-gated acquisition of EIT data This method was first suggested by McArdle
et al. (1988). It is based on two important facts. Firstly, the pulsatile component of
perfusion signal in the lung is in synchrony with cardiac activity and therefore, the
ECG. Secondly, the ventilation changes in impedance occurs at a much lower rate
compared to the ECG. Thus, by recording the changes of impedance during the cardiac
cycle, triggered by a separated ECG module, the lung perfusion signal can be recorded.
Furthermore, it has been shown in a large number of studies that averaging the results
over more than 100 cardiac cycles can reduce the interference of respiration. Eyuboglu
et al. (1989) and Smit et al. (2006) averaged their measurements over 100 cardiac cycles
while Vonk Noordegraaf et al. (1998), Kunst et al. (1998), Smit et al. (2003a) and Smit
et al. (2003b) averaged data over 200 cardiac cycles.
ECG-gated acquisition demands higher frame rates from the EIT instrument to
capture the changes within a cardiac cycle. With the new generation of EIT systems, this
is not a problem. Nonetheless, this technique suffers from several drawbacks. Firstly, the
averaging over a large number of cardiac cycles requires long duration of data acquisition
and therefore may not be suitable for continuous bedside monitoring. Furthermore, as
Deibele et al. (2008) pointed out, this averaging over a large data set could result in
“sudden changes or irregular anomalies cannot be detected.” In addition, with this
method of acquisition, the ventilation component of the signal is lost, which is certainly
not the optimal solution.
3.1.2. Frequency domain filtering based methods These methods are based on the fact
that the heart rate and the respiratory rate are very well separated in frequency. The
Fast Fourier Transform (FFT) of the global signal can provide a good approximation of
the required cut-off frequency for filtering, as shown in Figure 3. Consequently, a wide
range of FIR or IIR filters can be implemented as a high pass filter to extract the cardiac-
related component from the mixed signal. Similarly, the respiratory component of the
signal can be extracted using a low pass filter, possibly with the same cut-off frequency.
This filtration process can be carried out on the voltage signals or the reconstructed
images (Zadehkoochak et al. 1992, Leathard et al. 1994). FIR filters are preferable for
physiological measurements since it preserves the phase component while IIR filters may
distort the phase of the signal.
In spontaneously breathing subjects, the respiratory impedance changes are rarely
sinusoidal, leading to frequency components across a wider range of spectrum than
anticipated. Therefore, it is possible that some of these frequency components can
occur in the heart-rate domain of the spectrum. Consequently, after high pass filtering,
some of these respiratory components can still be observable together with the cardiac-
related signal. To solve this problem, Frerichs et al. (2009) and Grant et al. (2011)
used frequency domain filtering to first separate components in the heart-rate domain
and respiratory rate domain, followed by linear regression fit to identify the regions of
interests (ROIs). Whilst Frerichs et al. (2009) used mechanically ventilated subjects
to ensure no overlapping in the frequency spectrums of the ventilation and perfusion
EIT for Pulmonary Perfusion Imaging 7
components of the acquired signal, Grant et al. (2011) successfully separated the two
components in spontaneously breathing subjects by combining the phase component of
the signals with the algorithm suggested by Frerichs et al. (2009) .
3.1.3. Principle component analysis based method A PCA based method for separating
the respiratory and perfusion-related signal was suggested by Deibele et al. (2008). Their
method successfully separated the two signals, allowing continuous beat-to-beat updates
after a 20-second period of initiation. Time domain filtering with template functions
was used to initially separate the cardiac and ventilation signal. The results were then
combined to obtain the best fit with the original signal, computed by performing Least
Mean Square (LMS) between the approximation and the actual signal. In order to
achieve proper separation of the respiratory and cardiac-related signals, the template
functions for time domain filtering were identified by performing PCA on the original
data matrix.
A recent paper by Pikkemaat & Leonhardt (2010) provided a review on each of
the aforementioned techniques and more importantly, compared the results achieved by
each of these approaches in their experiment. Their results showed that PCA and the
frequency domain filtering methods produced highly correlated results. On the other
hand, the correlation between these two methods with the ECG-gating alternative was
reported considerably less. However, the correlations between each of these methods
and a known standard method for perfusion imaging were not computed, rendering the
results from their study inconclusive regarding as to which method is more reliable.
3.2. Perfusion signals and cardiac signals
Once separated from the ventilation impedance change, the perfusion impedance signal
suffers from interferences of the impedance change of the heart. The cardiac impedance
change is comparable in magnitude to the perfusion impedance change. However, the
heart movements, deformation of structures, etc. during a cardiac cycle makes it much
harder to remove this type of interference. In practice, the perfusion signals are usually
taken at the level of the third intercostal space with subjects lying in the supine positions
and arms lifted over their head in order to further the distance between the measurement
plane and the heart.
Nonetheless, the interference from the heart is never completely removed. This is
even more problematic in patients with enlarged hearts. Smit et al. (2003) proposed
and tested three different techniques to record perfusion impedance by defining a ROI
of whole circle (entire image), half circle to exclude the half circle that the heart signal
presents and a ”contour” ROI where the contour is the optimised separation between
the two regions of the image where impedance increases and impedance decreases. The
authors commented that the ”contour” ROI method works best to remove interferences
from the heart impedance. Frerichs et al. (2009) used implemented this idea using
regional linear regression with some success with data measured at the third intercostal
EIT for Pulmonary Perfusion Imaging 8
space and at the sixth intercostal space, where the heart lies.
Studies comparing obtained perfusion signal using EIT with other known methods
such as EBCT (Frerichs et al. 2002) and radionuclide scanning (Kunst et al. 1998)
showed well correlated results. However, these two studies analysed their results
differently, Frerichs et al. (2002) only analysed two specific pixel left and right while
Kunst et al. (1998) analysed posterior left and right regions of images obtained at the
third intercostal level. Without a gold standard method for perfusion signal analysis, it
is hard to compare results between EIT perfusion studies and results between EIT and
other imaging modalities.
4. Clinical applications of pulmonary perfusion EIT
The ability to monitor pulmonary perfusion combined with the firmly established
ability of EIT for ventilation magnitude and distribution monitoring, undoubtedly offers
many advantages in the diagnosis and treatment of pulmonary and, to some extent,
cardiovascular diseases. Pulmonary perfusion EIT has been studied for a wide range of
potential clinical applications, including the treatments and/or diagnosis of pulmonary
embolism, acute lung injury, COPD (Chronic Obstructive Pulmonary Diseases) and
PAH (Pulmonary Artery Hypertension). Smit et al. (2005) provided a good review on
the studies on potential clinical applications of EIT of the thorax, including perfusion.
A number of studies have been attempted to detect perfusion defects caused by
pulmonary embolism using EIT. Pulmonary embolism (PE) is one or multiple blockages
of the pulmonary artery or its branches by emboli travelled through the bloodstream.
Acute PE is life-threatening, requiring immediate attention of medical professionals to
begin appropriate treatment such as anticoagulant and thrombolytic therapy (Frerichs
et al. 2002). PE can be diagnosed by combining the patient’s medical history and V/Q
(Ventilation/Perfusion) scans or CT pulmonary angiography. Both of these imaging
techniques expose patients to radiation and are not preferred especially for critically
unwell patients. EIT experiments to detect PEs by McArdle et al. (1988) and Leathard
et al. (1994) showed promising results. Both studies showed that EIT was able to detect
regions of the lung where perfusion was disrupted while ventilation remained normal,
indicating PE. However, the images published in their papers showed large emboli. A
more recent study in pigs, simulated emboli by inflating or deflating a catheter balloon,
showed the with the aid of a contrast agent, NaCl, injected intravenously, perfusion
distribution acquired by EIT was comparable to results obtained from Electron Beam
CT (Frerichs et al. 2002).
Fagerberg et al. (2009b) studied EIT in endotoxinaemic acute lung injury on porcine
models and found that EIT can be used to assess the heterogeneity of regional ventilation
and perfusion, as well as V/Q matching. They concluded that EIT may be valuable in
detecting early pathophysiological changes due to acute lung injury.
Chronic Obstructive Pulmonary Diseases, especially the lung emphysema type, is
characterised by the loss of both alveolar wall and pulmonary small blood vessels. Since
EIT for Pulmonary Perfusion Imaging 9
the small vascular bed in the lung is a large reservoir of blood, it is reasonable to
expect that it is largely responsible for the impedance changes due to cardiac activity.
Hence, EIT may be valuable in assisting the diagnosis and treatment of COPDs. A
study by Vonk Noordegraaf et al. (1998) showed that emphysematous patients have
significantly lower cardiac-related impedance changes in the lung than healthy patients.
Furthermore, a study in 7 healthy and 6 emphysematous subjects showed that EIT had
high sensitivity in detecting relaxation in hypoxic pulmonary vasodilation and therefore,
can be useful in determining whether oxygen therapy would be beneficial to a patient
with emphysematous COPD (Smit et al. 2003b).
Pulmonary Artery Hypertension is a rare disease, which mainly effects young adults.
It is characterised by high blood pressure in pulmonary arteries due to the loss of small
pulmonary arteries. The cause of this loss can be many, including intima thickening,
media hypertrophy and thrombosis in small vessels. The disease can be fatal, all the
more because its early symptom is gradual shortness of breath after exercises, which
can be easily mistaken for lack of physical fitness. In a study with 21 patients with
idiopathic PAH and 30 healthy control subjects, EIT on the patients revealed lower
perfusion impedance changes signals compared to the control group (Smit et al. 2006).
This study indicated EIT could potentially be used as non-invasive technique for PAH
diagnosis, which up to date, has only been done invasively (Smit et al. 2006).
Recently, using EIT, Grant et al. (2011) and Carlisle et al. (2010) studied the
perfusion and ventilation distribution and V/Q (ventilation/perfusion) ratio in adults
and preterm infants, respectively. They showed the effect of gravity on both adult
and neonates and more importantly, the difference in the lung function of mature and
immature lungs.
5. Conclusion
In summary, the physiological origin of the perfusion impedance change signal is varied
and not completely understood. Its pulsatile characteristics have been shown to be
related and therefore synchronous with the cardiac activities. The magnitude of
the pulsatile perfusion impedance change is significantly smaller than the ventilation
signals. Therefore various signal processing techniques have been developed to separate
the perfusion signal from the respiratory signal including the ECG-gating acquisition
method, frequency filtering methods and PCA-based method as well as the use of an
impedance contrast agent. Each of these methods have their own advantages however,
they also suffer from different drawbacks. Continuous and concurrent pulmonary
perfusion/ventilation monitoring in spontaneously breathing adult subjects was achieved
in recent studies by Deibele et al. (2008) and Grant et al. (2011). With the recent
advances in digital image and signal processing algorithms and the rapidly growing
processing power of computing units, we can expect to see more developments in
this area in the future. All in all, we have to recognise that up to now, there is no
gold standard for signal separation of pulmonary perfusion that fulfils all requirements
EIT for Pulmonary Perfusion Imaging 10
necessary. This circumstance should be taken into account when interpreting the EIT
derived perfusion signals, especially if the results of different studies are compared.
Furthermore, Borges et al. (2011) showed that with the aid of 20% NaCl bolus as
impedance contrast agent, the authors were able to obtain images of the impedance
change due to regional blood flow. Their results were highly correlated with regional
blood flow acquired from SPECT images. Their work promises a new horizon for
perfusion EIT. More confirmatory studies are required to define the clinical relevance
of this type of technique. An alternative impedance contrast agent is also required to
replace 20% NaCl as it may have negative effect on patients. It would also be beneficial
to study closely the nature of ”regional blood flow” impedance signal, how it is related (if
at all) to cardiac activities, pulmonary conditions and most interestingly, its relationship
with the well studied pulsatile perfusion signal.
EIT can be used to monitor pulmonary perfusion and has been studied for clinical
application such as the diagnosis of pulmonary embolism and PAH. It can also be used
to determine the applicability of oxygen therapy for patients with COPD, especially
the lung emphysematous type. Smit et al. (2003a) showed that pulmonary perfusion
measurements obtained with EIT are sufficiently reproducible for clinical practice.
In the future, the most likely application for EIT lung perfusion is probably
the diagnosis of pulmonary embolism, especially for heavily instrumented patients in
the ICU to whom the compactness and bedside suitability of EIT is most beneficial.
Furthermore, compared with current methods for pulmonary embolism detection,
EIT has the advantage of being radiation-free and non-nephrotoxic. However, this
application requires the method to have both high sensitivity and high specificity as
both false positive and false negative diagnosis can lead to fatality.
Other recent advances of EIT such as improved electrodes, 3D EIT, new image
reconstruction methods and current injection patterns have yet to be applied for
pulmonary perfusion study. These techniques can be used to improve the resolution
of perfusion image, which would make this technique more relevant in clinical settings.
Furthermore, studies by Brown et al. (1994) and Nopp et al. (1996) showed that multi-
frequency EIT measurements could potentially improve SNR of the perfusion impedance
signal.
References
Barber D C & Brown B H 1986 Amsterdam: Nijho chapter Recent developmens in applied potential
tomography.
Bodenstein M, David M & Markstaller K 2009 Critical care medicine 37(2), 713–24.
Borcea L 2002 Inverse Problems 18, R99–R136.
Borges J B, Suarez-Sipmann F, Bohm S H, Tusman G, Melo A, Maripuu E, Sandstrom M, Park M,
Costa E L, Hedenstierna G & Amato M 2011 Journal of Applied Physiology 112, 225–236.
Brown B H 2003 Journal of medical engineering & technology 27(3), 97–108.
Brown B H, Barber D C, Morice A H & Leathard A D 1994 IEEE transactions on bio-medical
engineering 41(8), 729–34.

EIT for Pulmonary Perfusion Imaging 11
Carlisle H R, Armstrong R K, Davis P G, Schibler A, Frerichs I & Tingay D G 2010 Intensive care
medicine 36, 2101–2108.
Deibele J M, Luepschen H & Leonhardt S 2008 Physiological measurement 29(6), S1–14.
Eyuboglu B M, Brown B H & Barber D C 1989 IEEE engineering in medicine and biology magazine :
the quarterly magazine of the Engineering in Medicine & Biology Society 8(1), 39–45.
Fagerberg A, Sondergaard S, Karason S & Aneman A 2009b Acta anaesthesiologica Scandinavica
53(10), 1300–9.
Fagerberg A, Stenqvist O & Aneman A 2009a Acta anaesthesiologica Scandinavica 53(2), 152–8.
Frerichs I, Hinz J, Herrmann P, Weisser G, Hahn G, Quintel M & Hellige G 2002 IEEE transactions
on medical imaging 21(6), 646–52.
Frerichs I, Pulletz S, Elke G, Reifferscheid F, Schadler D, Scholz J & Weiler N 2009 Respiration;
international review of thoracic diseases 77(3), 282–91.
Grant C A, Pham T, Hough J, Riedel T, Stocker C & Schibler A 2011 Critical care (London, England)
15(1), R37.
Holder D 2005 Institute of Physics chapter Introduction to biomedical electrical impedance tomography,
pp. 423–449.
Kunst P, Vonk Noordegraaf A, Hoeksta O, Postmus P & Vriest P 1998 Physiological measurement 481.
Leathard A D, Brown B H, Campbell J, Zhang F, Morice a H & Tayler D 1994 Physiological
measurement 15 Suppl 2, A137–46.
McArdle F J, Suggett A J, Brown B H & Barber D C 1988 Clin. Phys. Physio. Meas 9(Suppl. A), 87–91.
McEwan A, Cusick G & Holder D S 2007 Physiological measurement 28(7), S197–215.
Moerer O, Hahn G & Quintel M 2011 Current Opinion is Critical Care 17, 260–267.
Nopp P, Zhao T X, Brown B H & Wang W 1996 Physiological measurement 213(17), A213–A225.
Pikkemaat R & Leonhardt S 2010 Journal of Physics: Conference Series 224, 012028.
Smit H J, Handoko M L, Vonk-Noordegraaf A, Faes T J C, Postmus P E, de Vries P M J M & Boonstra
A 2003a Physiological measurement 24(2), 491–9.
Smit H J, Vonk Noodegraaf A, van Genderingen H R & Kunst P W A 2005 Institute of Physics chapter
Imaging of the thorax by EIT, pp. 107–216.
Smit H J, Vonk-Noordegraaf A, Boonstra A, de Vries P M & Postmus P E 2006 Respiration;
international review of thoracic diseases 73(5), 597–602.
Smit H J, Vonk Noordegraaf A, Marcus J T, Boonstra A, de Vries P M & Postmus P E 2004 European
journal of applied physiology 92(1-2), 45–9.
Smit H J, Vonk Noordegraaf A, Marcus J T, van der Weijden S, Postmus P E, de Vries P M J M &
Boonstra A 2003b Chest 123(6), 1803–1809.
Vonk Noordegraaf A, Kunst P W, Janse A, Marcus J T, Postmus P E, Faes T J & de Vries P M 1998
Physiological measurement 19(2), 263–73.
Zadehkoochak M, Blott B H, Hames T K & George R F 1992 Clinical physics and physiological
measurement : an official journal of the Hospital Physicists’ Association, Deutsche Gesellschaft
fur Medizinische Physik and the European Federation of Organisations for Medical Physics 13
Suppl A, 191–6.
EIT for Pulmonary Perfusion Imaging 12
Figure 1. Synchrony between the change in impedance in the lung impedance and
ECG. Reproduced from Grant et al. (2011).
EIT for Pulmonary Perfusion Imaging 13
Figure 2. Pulmonary perfusion signals during cardiac cycle in four different groups
of subjects as a function of time. Reproduced with permission from Vonk Noordegraaf
et al. (1998). A: typical perfusion impedance profile in healthy subjects. B:
typical perfusion profile of healthy subjects while breathing hypoxic gas mixture. C:
typical perfusion impedance profile of patients with emphysematous lung. D: typical
perfusion impedance profile of patients with atrioventricular dissociation with external
pacemakers. The acquisition of signal started at the end of cardiac diastole.
EIT for Pulmonary Perfusion Imaging 14
Figure 3. Frequency spectrum of impedance changes in the thorax, obtained
from perform FFT on EIT measurements on a spontaneously breathing subject,
which shows two distinguish frequency peaks at the respiratory rate and heart
rate regions, respectively corresponding to cardiac-related and ventilatory-related
impedance changes. (a) the total impedance signal, (b) the FFT of the signal in
(a). Reproduced with permissions from Grant et al. (2011).
Copyright © 2022 FDOKUMEN