Phylogenomics of Ligand-Gated Ion Channels Predicts Monepantel Effect
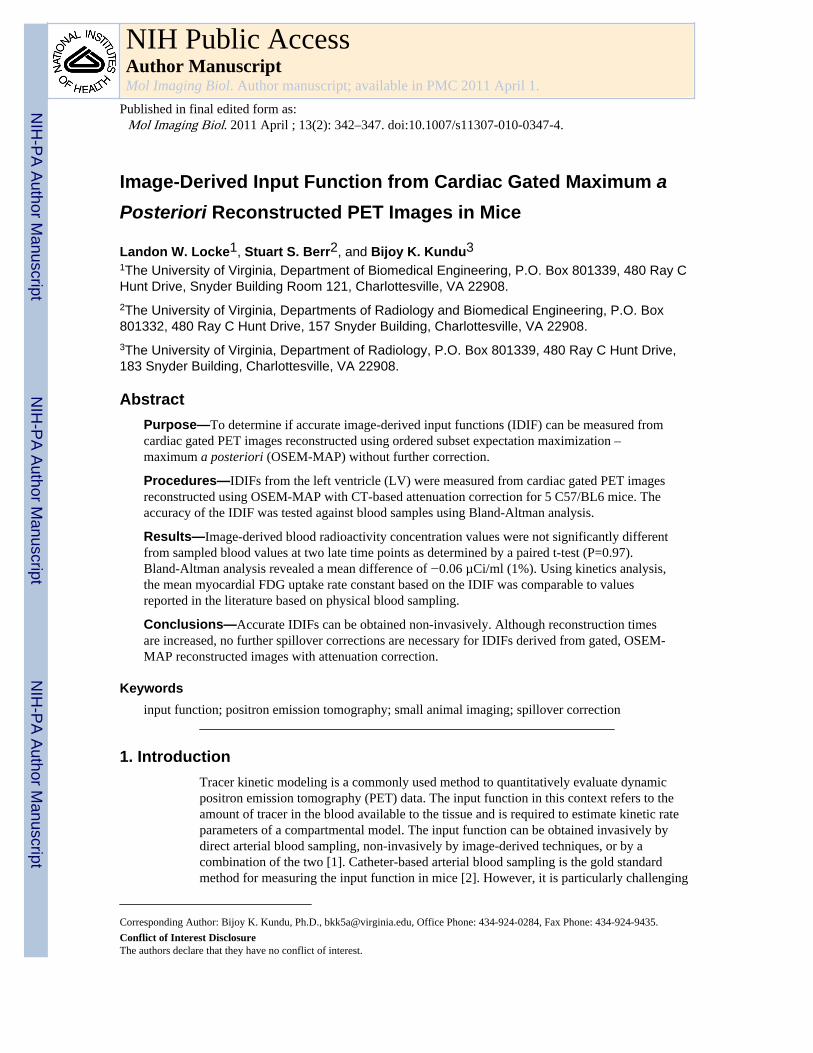
Image-Derived Input Function from Cardiac Gated Maximum aPosteriori Reconstructed PET Images in Mice
Landon W. Locke1, Stuart S. Berr2, and Bijoy K. Kundu31The University of Virginia, Department of Biomedical Engineering, P.O. Box 801339, 480 Ray CHunt Drive, Snyder Building Room 121, Charlottesville, VA 22908.2The University of Virginia, Departments of Radiology and Biomedical Engineering, P.O. Box801332, 480 Ray C Hunt Drive, 157 Snyder Building, Charlottesville, VA 22908.3The University of Virginia, Department of Radiology, P.O. Box 801339, 480 Ray C Hunt Drive,183 Snyder Building, Charlottesville, VA 22908.
AbstractPurpose—To determine if accurate image-derived input functions (IDIF) can be measured fromcardiac gated PET images reconstructed using ordered subset expectation maximization –maximum a posteriori (OSEM-MAP) without further correction.
Procedures—IDIFs from the left ventricle (LV) were measured from cardiac gated PET imagesreconstructed using OSEM-MAP with CT-based attenuation correction for 5 C57/BL6 mice. Theaccuracy of the IDIF was tested against blood samples using Bland-Altman analysis.
Results—Image-derived blood radioactivity concentration values were not significantly differentfrom sampled blood values at two late time points as determined by a paired t-test (P=0.97).Bland-Altman analysis revealed a mean difference of −0.06 µCi/ml (1%). Using kinetics analysis,the mean myocardial FDG uptake rate constant based on the IDIF was comparable to valuesreported in the literature based on physical blood sampling.
Conclusions—Accurate IDIFs can be obtained non-invasively. Although reconstruction timesare increased, no further spillover corrections are necessary for IDIFs derived from gated, OSEM-MAP reconstructed images with attenuation correction.
Keywordsinput function; positron emission tomography; small animal imaging; spillover correction
1. IntroductionTracer kinetic modeling is a commonly used method to quantitatively evaluate dynamicpositron emission tomography (PET) data. The input function in this context refers to theamount of tracer in the blood available to the tissue and is required to estimate kinetic rateparameters of a compartmental model. The input function can be obtained invasively bydirect arterial blood sampling, non-invasively by image-derived techniques, or by acombination of the two [1]. Catheter-based arterial blood sampling is the gold standardmethod for measuring the input function in mice [2]. However, it is particularly challenging
Corresponding Author: Bijoy K. Kundu, Ph.D., [email protected], Office Phone: 434-924-0284, Fax Phone: 434-924-9435.Conflict of Interest DisclosureThe authors declare that they have no conflict of interest.
NIH Public AccessAuthor ManuscriptMol Imaging Biol. Author manuscript; available in PMC 2011 April 1.
Published in final edited form as:Mol Imaging Biol. 2011 April ; 13(2): 342–347. doi:10.1007/s11307-010-0347-4.
NIH
-PA Author Manuscript
NIH
-PA Author Manuscript
NIH
-PA Author Manuscript

to obtain the input function by catheterization in mice because of their small vessel size, fastmetabolism, and small blood volume [3].
Input functions measured by region of interest (ROI) analysis of dynamic PET images areappealing because they minimize animal handling, avoid invasive catheterizationprocedures, and avoid the inherent time delay associated with arterial blood sampling.However, the intrinsic spatial resolution limitations of PET make this very challenging inmice. In particular, the partial volume (PV) effect can significantly restrict the absolutequantification of blood radioactivity measured and lead to underestimations of the image-derived input function (IDIF). Additionally, a region located close to tissue containing highactivity concentration will appear more intense than its actual value due to spillover (SP),leading to a time-dependent overestimation of the IDIF. Cardiac motion can cause imageblurring, further confounding the effects of SP on the measured IDIF. To overcome theselimitations, appropriate PV and SP corrections need to be applied.
A recently proposed method [4] attempts to overcome these limitations by simultaneouslyestimating the magnitude of SP and PV contaminating PET-derived input functions withcompartmental model parameters. Reported “model-corrected” IDIFs correlated well withblood time-activity curves (TAC) obtained from sampling. However, due to the largenumber of parameters needed to be simultaneously fitted (between 15 and 18), we were notable to reliably replicate their results. Factor analysis (FA) is another approach that attemptsto statistically separate the true blood TAC from that of the surrounding myocardium [5].However, FA-derived input functions from the left ventricle in mice overestimated themeasured input function at early time points, reflecting contamination by surroundingstructures (i.e., myocardial wall and right ventricle). Furthermore, the impact of thiscontamination on the accuracy of estimated rate constants in various tissues has not beenevaluated in mice. In this work we show that the IDIF can be extracted from a leftventricular blood pool (LVBP) ROI without any further corrections when ordered subsetexpectation maximization – maximum a posteriori (OSEM-MAP) reconstructions andphysiological gating are employed. We validate this method by comparing two late timepoint 2-deoxy-2-[18F]fluoro-D-glucose (FDG) blood radioactivity concentrations measuredfrom LVBP ROIs of five mice with venous blood samples. As an additional justification ofthe IDIF accuracy derived from gated, OSEM-MAP-reconstructed images, we performedkinetic analysis in the heart using the three-compartment FDG model[6]. The net FDGuptake constant (Ki) estimated from the IDIF in the heart was compared to Ki valuesreported in literature using non-image derived input functions.
2. Materials and Methods2.1 PET and CT Imaging
Five non-fasted C57/BL6 mice (25–30 g) were used in this study. Following the insertion ofa tail-vein catheter, ECG surface electrodes (Blue Sensor, Ambu Inc., Glen Burnie, MD)were placed on both forepaws and the left hindpaw. Anesthetized (1–2% isoflurane inoxygen) mice were placed in the prone position on a custom designed portable tray designedto reproducibly mount on both the micro CT and PET scanners, facilitating accurate imageco-registration. Sixty-minute dynamic PET scans (Focus 120, Siemens Molecular ImagingInc., Knoxville, TN) were performed where data acquisition was initiated a few secondsbefore the injection of 486–540 µCi FDG via the catheter. FDG was administered over thecourse of about 30 seconds and the catheter line was immediately flushed with 100 µL ofsaline to clear the line and maximize FDG activity in the mouse. Physiological Monitoringwas performed with a Small Animal Instruments, Inc., model 1025L for PET (SAII, Inc.,Stony Brook, NY). This device was used for continuously monitoring heart rate, respiration,and core body temperature (rectal probe) while generating gate signals to time-stamp the
Locke et al. Page 2
Mol Imaging Biol. Author manuscript; available in PMC 2011 April 1.
NIH
-PA Author Manuscript
NIH
-PA Author Manuscript
NIH
-PA Author Manuscript
PET scanner data for subsequent retrospective reordering into heart-cycle based time-bins.Following the PET scan, mice were immediately transported to the CT scanner [7], where a10-minute whole-body CT scan was acquired for attenuation correction [8].
2.2 Image ReconstructionThe list mode data were sorted into 23 dynamic frames and 3 cardiac-cycle time bins duringthe histogramming process. PET images were reconstructed with attenuation correctionusing an OSEM-MAP algorithm [9] which is part of the PET scanner software, with 12OSEM 3D subsets, 2 iterations, and 18 MAP iterations. For comparison the data were alsoreconstructed using Filtered Back Projection algorithm (FBP; ramp filter cutoff at theNyquist frequency) with the same spatial resolution. 23 dynamic frames were generated foreach cardiac bin. The initial frames were set to be short in duration in order to capturerapidly changing radioactivity concentrations. The frames consisted of eleven 8 s frames,one 12 s frame, two 1 minute frames, one 3 min frame, and eight 6 min frames. In order toobtain a sufficient number of pixels for extraction of the IDIF from the LVBP, a zoom factorof 2.16 was designated for all reconstructions. The reconstructed image was composed of 95axial slices of thickness 0.79 mm with an in-plane voxel dimension of 0.4 mm ×0.4 mm(128×128 pixels). All PET images were corrected for dead time, physical radionuclide decayof FDG, and fluctuations in crystal detection efficiency. The count rates in the reconstructedimages were converted to activity concentration (µCi/mL) using a system calibration factorobtained by PET-scanning a sealed 68Ge cylindrical phantom (Siemens Medical Solutions)which was corrected for attenuation. All PET reconstructions were done on a DellDimension E521, running at 2.61 GHz with 3.43 GB of RAM.
CT images were reconstructed with a 3D filtered back-projection algorithm using COBRAsoftware (Exxim, Inc., Pleasanton, CA). The CT reconstructed pixel size was 0.15 mm ×0.15 mm × 0.15 mm on a 320 × 320 × 384 image matrix, but was down-sampled to matchthe PET spatial resolution upon image co-registration. CT-based attenuation correction wasperformed using the microPET scanner software.
2.3 Partial volume correctionTo estimate the magnitude of the PV effect in the LVBP and in the myocardium, a JaszczakMicro Deluxe hot rod phantom (Data Spectrum Corporation, Hillsborough, North Carolina)possessing 6 different rod sizes (1.2, 1.6, 2.4, 3.2, 4.0, 4.8 mm) was filled with a knownconcentration of FDG and PET-scanned. The phantom image was reconstructed using bothOSEM-MAP and FBP and corrected for attenuation (same protocol as described above). Theaverage ROI-derived radioactivity concentrations measured for the different sized rods weredivided by the true activity concentration to obtain a recovery coefficient (RC) curvespanning the range of rod sizes. A unique RC curve was generated for each reconstructionmethod. The appropriate PV correction factor for the LVBP and myocardium wasdetermined from the RC curve and applied to their respective time activity curves.
2.4 Obtaining the IDIF from PET imagesIDIFs were measured by manually drawing small circular ROIs approximately 3 pixels indiameter (1.2 mm) on contiguous transverse planes on the last time frame of the dynamicPET dataset in the area corresponding to the LVBP and projecting these ROIs on all frames.This process was repeated on two to three transverse slices in which the LV cavity wasvisible so that an average blood TAC could be computed. All LVBP ROIs were drawn onthe last cardiac time bin, corresponding to the phase of the heart in or near diastole, tominimize the amount of radioactivity SP from the myocardium into the blood pool. Tocorrect for the PV effect in the LVBP, the IDIF was boosted by the RC obtained from the
Locke et al. Page 3
Mol Imaging Biol. Author manuscript; available in PMC 2011 April 1.
NIH
-PA Author Manuscript
NIH
-PA Author Manuscript
NIH
-PA Author Manuscript

RC curve described above. No corrections were applied to account for FDG uptake by redblood cells.
2.5 Blood SamplingPhysical blood samples were obtained at 43 and 56 minutes post FDG administration via asmall incision in the distal tail. Approximately 40 µL of blood was collected in a pre-weighed capillary tube for each time point while the anesthetized animal was being PETscanned. Excessive bleeding was prevented by applying gentle pressure for approximately 1min. Each blood sample was weighed in an analytical balance (Pinnacle Series ModelP-214, Denver Instruments, Denver, CO) and the associated radioactivity was counted in awell counter cross-calibrated against the PET scanner. Radioactivity concentrations (in µCi/g) of the blood samples were determined by dividing the decay-corrected radioactivitymeasured in the well counter by the net weight of the blood in the capillary tube. Bland-Altman analysis was used to assess the agreement between image-derived and sampledblood radioactivity concentrations [10].
2.6 Kinetic AnalysisTo further validate the accuracy of the IDIF, the net FDG influx constant (Ki) was computedin the myocardium by kinetic analysis. Kinetic transport rate constants of FDG uptake in themyocardium were estimated by the three-compartment FDG model using non-linearregression [6] by a program written in MATLAB. From these estimated rate constants, Kiwas computed in the heart and compared to values reported in the literature obtained byphysical blood sampling.
3. ResultsFigure 1 shows the hot rod phantom images reconstructed with MAP and FBP and the RCcurves generated from them. For PET reconstructions using OSEM-MAP, the RC for the LVcavity was determined to be 0.92 based on a pre-determined MRI-measured internal LVdiameter of 3.3 ± 0.2 millimeters. Our measurement of LV diameter is consistent withpreviously published values measured using ultrasound in mice of same age and backgroundstrain [11]. The RC was expected to approach one since the dimension of the LV chamber isapproximately twice the FWHM of the PET scanner [12]. For reconstructions using FBP,the RC for the LV cavity was determined to be 0.57. The RC for the myocardium at enddiastole was determined to be 0.28 (based on the pre-determined diameter of 0.9 ± 0.1measured by MRI).
Total reconstruction time using OSEM-MAP and FBP is approximately 34 hrs (30 min perframe per cardiac bin) and 8 min (7 sec per frame per cardiac bin), respectively.Representative PET images of the same mouse acquisition reconstructed using both OSEM-MAP and FBP with and without cardiac gating are depicted in Fig. 2. All images shown arethe last frame of the dynamic PET acquisition. OSEM-MAP reconstructed images (panels(a) and (b)) clearly show LVBP volumes that are well-distinguished from the myocardiumregardless of cardiac gating. FBP reconstructed images (panels (c) and (d)) are not able toachieve the same myocardium to blood pool contrast due to SP effects.
Fig. 3 shows IDIFs derived from the reconstructed images depicted in panels (a), (c), and (d)of Fig. 2. The input function derived from the image reconstructed with FBP (black curve)shows significant SP contamination compared to the MAP-derived IDIF (gray curve). TheIDIF derived from the non-gated FBP reconstruction shows the greatest amount of SP(dotted line). The peaks of the three curves are similar in magnitude due to PV correctionand a lack of SP contamination at this time. The square and circle symbols, which represent
Locke et al. Page 4
Mol Imaging Biol. Author manuscript; available in PMC 2011 April 1.
NIH
-PA Author Manuscript
NIH
-PA Author Manuscript
NIH
-PA Author Manuscript

the radioactivity concentrations of sampled blood taken at 43 and 56 minutes respectively,are in close agreement with time-matched activity concentrations of the MAP-derived inputfunction.
Fig. 4 shows the agreement between the MAP image-derived and physically sampled bloodradioactivity concentrations using a Bland-Altman plot. Bland-Altman analysis revealed amean difference of 0.06 µCi/ml, which is approximately 1% of the average of all measuredvalues. The precision (standard deviation of differences) was 0.14 µCi/ml. None ofdifferences were outside the lower and upper limits of agreement (mean ± 1.96 SD), whichwere −0.22 and 0.34, respectively. As determined by the paired t test, image-derived bloodradioactivity concentration values were not significantly different from sampled bloodvalues (P=0.97).
The mean myocardial Ki (0.11 ± 0.03) estimated from the gated, MAP-derived IDIF, agreedwell with the reported myocardial Ki (0.14 ± 0.06) [4] obtained using arterial blood samplesas the difference did not reach statistical significance on a student’s t-test (p=0.19).
4. DiscussionKinetic modeling of PET data requires an input function along with tissue time-activitycurves. Extracting the input function in mice from dynamic PET images is attractive becauseit bypasses many challenges associated with physical blood sampling. However, because thespatial resolution of PET is limited by factors such as detector size, positron range, scatter,and cardiac motion, the activity concentration in a LVBP ROI will only be a fraction of thetrue radioactivity in the region due to PV effects. SP from surrounding myocardium willfurther reduce the accuracy, especially late after injection of FDG. The degree to whichthese effects influence image-derived activity concentrations is a function of LVBPdiameter, the reconstructed image resolution, and the type of image reconstruction algorithmused [12].
Current techniques involving image-derived assessments of the input function are basedprimarily on non-cardiac gated, FBP reconstructed images. While FBP is fast and yieldsreliable quantitative results, it often results in poorer image quality and lower myocardiumto LVBP ratios compared to MAP, as shown in Fig. 2. Iterative reconstruction algorithmsoffer better resolution recovery compared to FBP by accurate modeling of the systemresponse, as shown in Fig. 2 and also demonstrated in various organ ROI measurementsreported by Stout et al [13]. However, even with iterative reconstructions, SP contaminationfrom the myocardium to the LVBP was still reported to be significant without cardiac gating[13]. It has been expressed [3,4,13], but to our knowledge never demonstrated, that usingMAP-based reconstructions and segmenting list mode data into bins based on cardiactriggers is effective in minimizing SP from the myocardium to the LVBP. We have shownhere that ROI-derived blood radioactivity concentrations agreed with physical samples takenat late time points, when SP effects are greatest. Furthermore, we have shown that the netFDG uptake (Ki) in the myocardium estimated from the three compartment FDG model withthe IDIF was not statistically different from reported values based on a physically sampledinput function.
Although it would have been ideal to sample blood at the same location used to measure theimage-derived activity concentrations (LV chamber), this would have required euthanizingthe animal. It has been previously shown [4] that radioactivity from arterial blood is wellapproximated by that of venous blood for late time points, offering a less invasivealternative to acquiring a few discrete blood samples. Therefore, we sampled venous blood
Locke et al. Page 5
Mol Imaging Biol. Author manuscript; available in PMC 2011 April 1.
NIH
-PA Author Manuscript
NIH
-PA Author Manuscript
NIH
-PA Author Manuscript

from the tail vein at two late time points to determine the accuracy of image-derived bloodactivity concentrations.
Differences between IDIFs derived from MAP and FBP reconstructions are greatest near theend of the scan (as shown in Fig. 3) due to time-dependent spillover contaminating the IDIFderived from the FBP-reconstructed image. There are appreciable differences in the earlyportion of the curves as well (around 20 min). Because we were measuring radioactivityconcentrations from sampled venous blood obtained via the tail vein, we could not use thistechnique to validate the early portion of the IDIF. However, our data show good agreementbetween the IDIF and late blood samples, when the SP from the myocardium to the LVBP ismost significant.
To avoid the effects of SP, some methods only derive the early portion of the input functionfrom the image while the latter part is obtained by blood samples [1]. Our results show thatusing OSEM-MAP with cardiac gating is effective in minimizing myocardial SPcontribution to the IDIF at late time points. Reconstructions using OSEM-MAP lead toimproved PET image spatial resolution through its advanced techniques that feature accuratesystem modeling, photon pair non-colinearity, and intercrystal scatter and penetration [9].These techniques can help recover the loss of resolution from finite detector elements anddrastically reduce both the amount of SP from the myocardium into the blood pool and alsoPV effects within the LV chamber. Eliminating cardiac motion by binning the PET data tothe ECG further contributes to the reduction of SP contamination. By “freezing” the heart inthe diastolic phase when the blood volume in the LV chamber is maximum, SP and PVeffects are reduced in LV-derived input functions. Additional gating for respiratory motiononly has a minimal effect on SP and PV effects in the LV chamber [14], thus was notemployed in this study.
Although iterative reconstruction algorithms improve image quality due to their accuratemodeling of data, they are time consuming. This technique may not be feasible forinstitutions that perform high-throughput imaging. But if the appropriate time can beinvested in the reconstruction process, this method can offer the ability to directly extract theIDIF without any further correction needed. Additionally, future versions of OSEM-MAPmay require less computation time.
Another potential limitation of this technique is its inability to correct for FDG uptake by redblood cells. Mice exhibit slower kinetics of FDG movement across the red blood cellmembrane compared to humans, thereby delaying equilibrium and reducing the accuracy ofwhole blood as a surrogate marker for FDG in plasma in murine FDG studies [15]. Toaccount for the time-dependent sequestering of FDG by red blood cells in mice, frequentblood samples must be taken, eliminating the possibility of a dynamic image basedapproach.
Fang et al. describe a technique to estimate the blood input function from an ROI-derivedone containing significant contamination with zero or one late blood sample to account forred blood cell FDG uptake. Their one blood sample model-corrected input function (1-sample MCIF) corrects for the sequestering of FDG into red blood cells, but does notaccount for any time dependence of this transport, thus assuming a constant fraction of redblood cell-associated FDG over time. Their 0-sample MCIF method does not correct for thesequestering of FDG into red blood cells. The Ki values computed in the myocardium by the0-sample or the 1-sample method were not statistically different from the value estimatedfrom invasive blood sampling with time-dependent plasma correction [4]. Our averagemyocardial Ki value estimated from IDIFs with no correction for FDG red blood cell uptakewas also not statistically different from the measured Ki value estimated from invasive blood
Locke et al. Page 6
Mol Imaging Biol. Author manuscript; available in PMC 2011 April 1.
NIH
-PA Author Manuscript
NIH
-PA Author Manuscript
NIH
-PA Author Manuscript

sampling, as indicated in the results section. Therefore, not accounting for sequestered FDGby red blood cells introduces small biases in downstream Ki values, but the magnitude ofthese biases does not exceed unreasonable amounts as demonstrated by the inability of the ttest to detect a significant difference in the myocardial Ki estimates.
5. ConclusionEmploying cardiac gating and high-resolution iterative reconstruction algorithms improvesPET image quality, reduces PV effects, and minimizes SP from the myocardium to theLVBP compared to non-gated, FBP images. We validated the ability to accurately measureblood pool radioactivity concentrations from the left ventricle in a normal mouse usingimage-derived techniques. Bland-Altman analysis revealed a negligible systematic biasbetween image-derived and physically sampled blood radioactivity concentrations for fivemice studied. Furthermore, we have shown that the net FDG uptake in the myocardiumdetermined using the IDIF with a three compartment model was not statistically differentfrom reported values obtained with a physically sampled input function. This techniqueshould appeal to investigators who want to have the ability to measure the input functiondirectly from PET images without further correction for quantitative dynamic PET studies inmice while avoiding the challenges associated with invasive blood sampling.
AcknowledgmentsThis work was supported in part by the Jeffress Grant, J-899 from the Jeffress Memorial Trust, the Partners fundfrom the University of Virginia Cardiovascular Research Center and NIH grant 1R21HL102627 to BKK. The workwas also supported in part by a gift provided by Philip Morris USA (The review and approval process was overseenby an External Advisory Committee without any affiliation with the University, PMUSA, or any other tobaccocompany. PMUSA funding for this work to SSB was based upon independent intramural and extramural reviews).The authors thank Gina Wimer for her assistance with the experiments.
References1. Shoghi KI, Welch MJ. Hybrid image and blood sampling input function for quantification of small
animal dynamic PET data. Nucl Med Biol 2007;vol. 34:989–994. [PubMed: 17998103]2. Wu HM, Sui G, Lee CC, Prins ML, Ladno W, Lin HD, Yu AS, Phelps ME, Huang SC. In vivo
quantitation of glucose metabolism in mice using small-animal PET and a microfluidic device. JNucl Med 2007;vol. 48:837–845. [PubMed: 17475972]
3. Laforest R, Sharp TL, Engelbach JA, Fettig NM, Herrero P, Kim J, Lewis JS, Rowland DJ, Tai YC,Welch MJ. Measurement of input functions in rodents: challenges and solutions. Nucl Med Biol2005;vol. 32:679–685. [PubMed: 16243642]
4. Fang YH, Muzic RF Jr. Spillover and partial-volume correction for image-derived input functionsfor small-animal 18F-FDG PET studies. J Nucl Med 2008;vol. 49:606–614. [PubMed: 18344438]
5. Kim J, Herrero P, Sharp T, Laforest R, Rowland DJ, Tai YC, Lewis JS, Welch MJ. Minimallyinvasive method of determining blood input function from PET images in rodents. J Nucl Med2006;vol. 47:330–336. [PubMed: 16455640]
6. Phelps ME, Huang SC, Hoffman EJ, Selin C, Sokoloff L, Kuhl DE. Tomographic measurement oflocal cerebral glucose metabolic rate in humans with (F-18)2-fluoro-2-deoxy-D-glucose: validationof method. Ann Neurol 1979;vol. 6:371–388. [PubMed: 117743]
7. Stolin, A.; Pole, D.; Wojcik, R.; Williams, MB. Dual-modality scanner for small animal imaging.presented at Nuclear Science Symposium Conference Record, 2006; IEEE; 2006.
8. Chow PL, Rannou FR, Chatziioannou AF. Attenuation correction for small animal PET tomographs.Phys Med Biol 2005;vol. 50:1837–1850. [PubMed: 15815099]
9. Qi J, Leahy RM, Cherry SR, Chatziioannou A, Farquhar TH. High-resolution 3D Bayesian imagereconstruction using the microPET small-animal scanner. Phys Med Biol 1998;vol. 43:1001–1113.[PubMed: 9572523]
Locke et al. Page 7
Mol Imaging Biol. Author manuscript; available in PMC 2011 April 1.
NIH
-PA Author Manuscript
NIH
-PA Author Manuscript
NIH
-PA Author Manuscript

10. Bland JM, Altman DG. Measuring agreement in method comparison studies. Stat Methods MedRes 1999;vol. 8:135–160. [PubMed: 10501650]
11. Chin BB, Metzler SD, Lemaire A, Curcio A, Vemulapalli S, Greer KL, Petry NA, Turkington TG,Coleman RE, Rockman H, Jaszczak RJ. Left ventricular functional assessment in mice: feasibilityof high spatial and temporal resolution ECG-gated blood pool SPECT. Radiology 2007;vol.245:440–448. [PubMed: 17940303]
12. Phelps, ME. ET: Molecular Imaging and Its Biological Applications. 1st ed. Springer; 2004.13. Stout, D.; Kreissl, MC.; Hsiao-Ming, W.; Schelbert, HR.; Sung-Cheng, H. Left ventricular blood
TAC quantitation with microPET imaging in mice using MAP, FBP and blood sampling.presented at Nuclear Science Symposium Conference Record, 2005; IEEE; 2005.
14. Shoghi, K.; Rowland, D.; Laforest, R.; Welch, M. Characterization of Spillover and RecoveryCoefficients in the Gated Mouse Heart for Non-Invasive Extraction of Input Function in microPETStudies: Feasibility and Sensitivity Analysis. presented at IEEE Nuclear Science SymposiumConference Record, 2006;
15. Buxton DB. Glucose permeability in nonprimate erythrocytes. J Nucl Med 1999;vol. 40:2125–2126. [PubMed: 10616896]
Locke et al. Page 8
Mol Imaging Biol. Author manuscript; available in PMC 2011 April 1.
NIH
-PA Author Manuscript
NIH
-PA Author Manuscript
NIH
-PA Author Manuscript

Fig. 1.Transaxial view of attenuation-corrected phantom images reconstructed with a) FBP and b)MAP and the recovery coefficient curves generated from them (c).
Locke et al. Page 9
Mol Imaging Biol. Author manuscript; available in PMC 2011 April 1.
NIH
-PA Author Manuscript
NIH
-PA Author Manuscript
NIH
-PA Author Manuscript
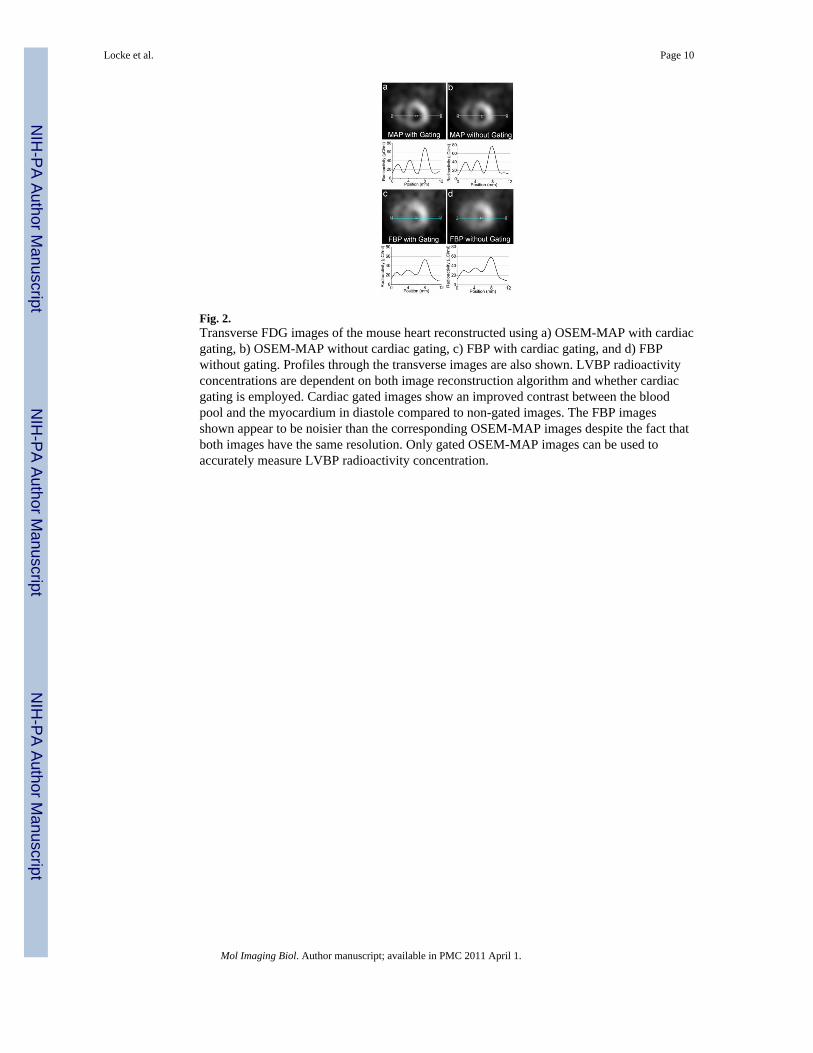
Fig. 2.Transverse FDG images of the mouse heart reconstructed using a) OSEM-MAP with cardiacgating, b) OSEM-MAP without cardiac gating, c) FBP with cardiac gating, and d) FBPwithout gating. Profiles through the transverse images are also shown. LVBP radioactivityconcentrations are dependent on both image reconstruction algorithm and whether cardiacgating is employed. Cardiac gated images show an improved contrast between the bloodpool and the myocardium in diastole compared to non-gated images. The FBP imagesshown appear to be noisier than the corresponding OSEM-MAP images despite the fact thatboth images have the same resolution. Only gated OSEM-MAP images can be used toaccurately measure LVBP radioactivity concentration.
Locke et al. Page 10
Mol Imaging Biol. Author manuscript; available in PMC 2011 April 1.
NIH
-PA Author Manuscript
NIH
-PA Author Manuscript
NIH
-PA Author Manuscript
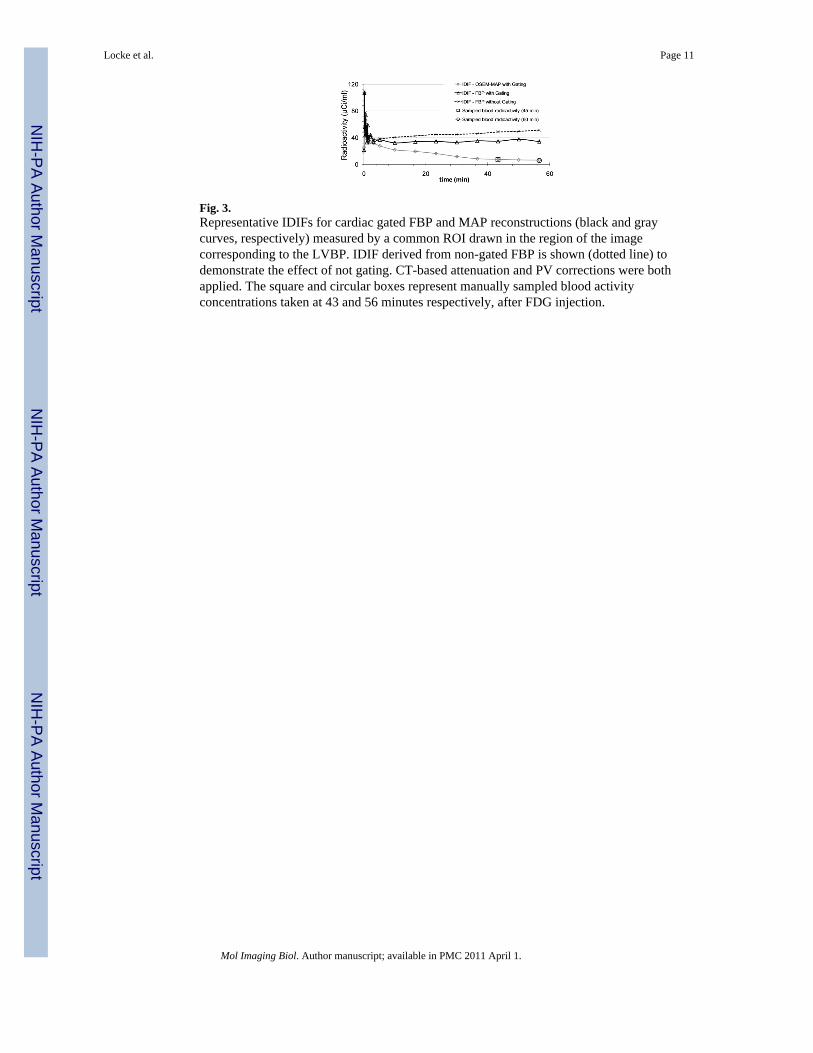
Fig. 3.Representative IDIFs for cardiac gated FBP and MAP reconstructions (black and graycurves, respectively) measured by a common ROI drawn in the region of the imagecorresponding to the LVBP. IDIF derived from non-gated FBP is shown (dotted line) todemonstrate the effect of not gating. CT-based attenuation and PV corrections were bothapplied. The square and circular boxes represent manually sampled blood activityconcentrations taken at 43 and 56 minutes respectively, after FDG injection.
Locke et al. Page 11
Mol Imaging Biol. Author manuscript; available in PMC 2011 April 1.
NIH
-PA Author Manuscript
NIH
-PA Author Manuscript
NIH
-PA Author Manuscript
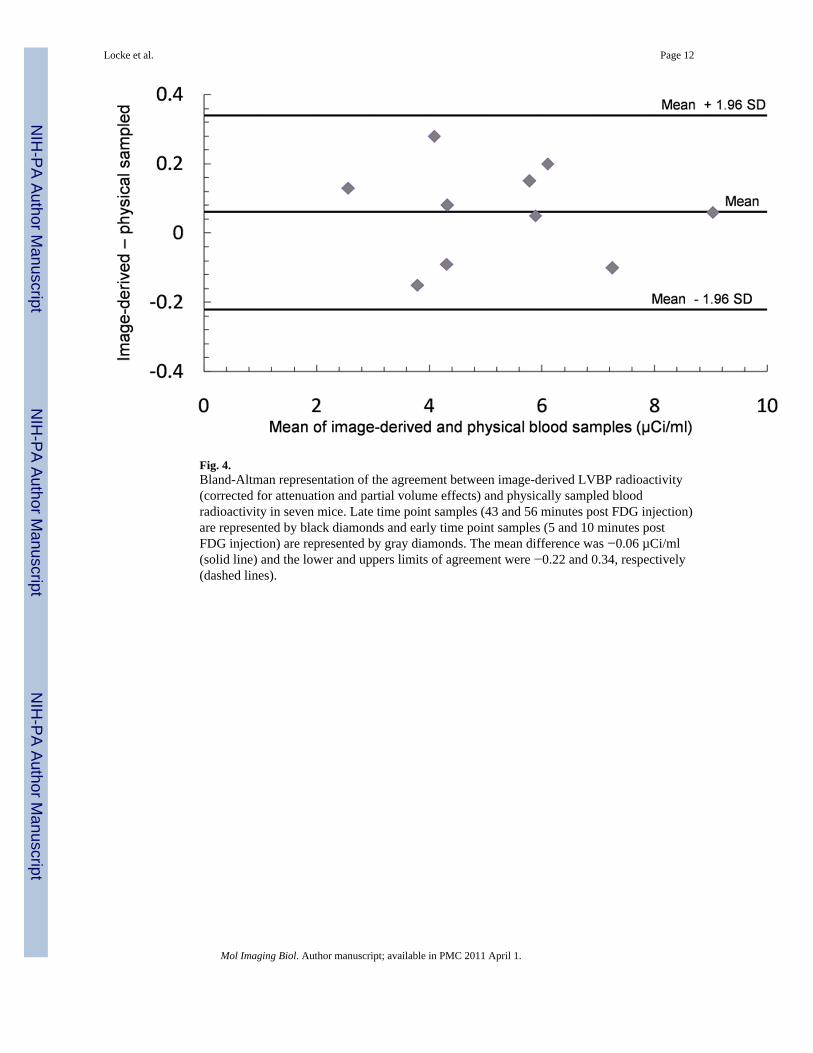
Fig. 4.Bland-Altman representation of the agreement between image-derived LVBP radioactivity(corrected for attenuation and partial volume effects) and physically sampled bloodradioactivity in seven mice. Late time point samples (43 and 56 minutes post FDG injection)are represented by black diamonds and early time point samples (5 and 10 minutes postFDG injection) are represented by gray diamonds. The mean difference was −0.06 µCi/ml(solid line) and the lower and uppers limits of agreement were −0.22 and 0.34, respectively(dashed lines).
Locke et al. Page 12
Mol Imaging Biol. Author manuscript; available in PMC 2011 April 1.
NIH
-PA Author Manuscript
NIH
-PA Author Manuscript
NIH
-PA Author Manuscript
Copyright © 2022 FDOKUMEN