Image Attributes and Quality for Evaluation of Tone Mapping Operators
10
Image Attributes and Quality for Evaluation of Tone Mapping Operators M. ˇ Cad´ ık * 1 and M. Wimmer 2 and L. Neumann 3 and A. Artusi 4 1 Department of Computer Science and Engineering, CTU in Prague, Czech Republic 2 Institute of Computer Graphics and Algorithms, Vienna University of Technology, Austria 3 ICREA, Barcelona and Graphics Group of University in Girona, Spain 4 Department of Computer Science, Intercollege, Nicosia, Cyprus Abstract The problem of reproducing high dynamic range images on devices with restricted dynamic range has gained a lot of interest in the computer graphics community. There ex- ist various approaches to this issue, which span several re- search areas including computer graphics, image process- ing, color science, physiology, neurology, psychology, etc. These approaches assume a thorough knowledge of both the objective and subjective attributes of an image. However, no comprehensive overview and analysis of such attributes has been published so far. In this paper, we present an overview of image qual- ity attributes of different tone mapping methods. Further- more, we propose a scheme of relationships between these attributes, leading to the definition of an overall image qual- ity measure. We present results of subjective psychophysical tests that we have performed to prove the proposed relation- ship scheme. We also present the evaluation of existing tone mapping methods with regard to these attributes. Our effort is not just useful to get into the tone mapping field or when implementing a tone mapping operator, but it also sets the stage for well-founded quality comparisons between tone mapping operators. By providing good defi- nitions of the different attributes, user-driven or fully auto- matic comparisons are made possible at all. 1 Introduction The dynamic range of visual stimuli in the real world is extremely large. Several different computer technologies can produce high dynamic range luminance maps (images) of synthetic graphics or real scenes, but the conventional media used to present these images can only display a lim- ited range of luminous intensity. This problem, i.e., dis- playing high contrast images on output devices with limited * [email protected] contrast, is the task of high dynamic range imaging. A num- ber of different tone mapping methods (or operators) have been proposed in history [9, 29]. However, also due to their sheer number, the advantages and disadvantages of these methods are not immanently clear, and therefore a thorough and systematic comparison is highly desirable. The field of tone mapping assumes extensive knowledge of findings from various scientific areas. In order to con- duct a comparison of tone mapping methods, it is necessary to settle upon a set of image attributes by which the images produced by the methods should be judged. These attributes are not independent, and their interrelationships and the in- fluence on the overall image quality need to be carefully an- alyzed. This is useful not just for comparing existing HDR approaches, but for evaluating of future ones as well. In this paper, we give a comprehensive list of most of im- portant attributes involved in the evaluation of a tone map- ping operator, and we show which relationships exist be- tween the basic attributes by means of two different sub- jective testing methods. The evaluation of the attributes and their relationships leads to the definition of an overall image quality. This metric can be used to judge how well a given tone mapping operator is able to produce naturally looking images. Furthermore, we present the most comprehensive comparison in terms of the number of tone mapping opera- tors considered to date, including 14 different methods. The paper is organized as follows. In Section 2, we overview the previous work on comparison of tone map- ping methods. In Section 3, we introduce and describe the term “overall image quality”. In Section 4, we give a survey of the most important image attributes for tone mapping, and we describe how different methods reproduce these at- tributes. In Section 5 we propose a new scheme of relation- ships between the image attributes. In Section 6 we describe the two applied experimental methods based on human ob- servations, and finally in Section 7, we show and discuss the results of these experiments. The survey of image attributes and the relationships (Sec. 4, 5) is extended from [3] and incorporates our new findings. In Proceedings of Pacific Graphics 2006, p.35-p.44. National Taiwan University Press, Taipei, Taiwan, 2006.
Transcript of Image Attributes and Quality for Evaluation of Tone Mapping Operators
Image Attributes and Quality for Evaluation of Tone Mapping Operators
M. Cadık∗1 and M. Wimmer2 and L. Neumann3 and A. Artusi4
1Department of Computer Science and Engineering, CTU in Prague, Czech Republic2Institute of Computer Graphics and Algorithms, Vienna University of Technology, Austria
3ICREA, Barcelona and Graphics Group of University in Girona, Spain4Department of Computer Science, Intercollege, Nicosia, Cyprus
Abstract
The problem of reproducing high dynamic range images
on devices with restricted dynamic range has gained a lot
of interest in the computer graphics community. There ex-
ist various approaches to this issue, which span several re-
search areas including computer graphics, image process-
ing, color science, physiology, neurology, psychology, etc.
These approaches assume a thorough knowledge of both the
objective and subjective attributes of an image. However,
no comprehensive overview and analysis of such attributes
has been published so far.
In this paper, we present an overview of image qual-
ity attributes of different tone mapping methods. Further-
more, we propose a scheme of relationships between these
attributes, leading to the definition of an overall image qual-
ity measure. We present results of subjective psychophysical
tests that we have performed to prove the proposed relation-
ship scheme. We also present the evaluation of existing tone
mapping methods with regard to these attributes.
Our effort is not just useful to get into the tone mapping
field or when implementing a tone mapping operator, but
it also sets the stage for well-founded quality comparisons
between tone mapping operators. By providing good defi-
nitions of the different attributes, user-driven or fully auto-
matic comparisons are made possible at all.
1 Introduction
The dynamic range of visual stimuli in the real world
is extremely large. Several different computer technologies
can produce high dynamic range luminance maps (images)
of synthetic graphics or real scenes, but the conventional
media used to present these images can only display a lim-
ited range of luminous intensity. This problem, i.e., dis-
playing high contrast images on output devices with limited
contrast, is the task of high dynamic range imaging. A num-
ber of different tone mapping methods (or operators) have
been proposed in history [9, 29]. However, also due to their
sheer number, the advantages and disadvantages of these
methods are not immanently clear, and therefore a thorough
and systematic comparison is highly desirable.
The field of tone mapping assumes extensive knowledge
of findings from various scientific areas. In order to con-
duct a comparison of tone mapping methods, it is necessary
to settle upon a set of image attributes by which the images
produced by the methods should be judged. These attributes
are not independent, and their interrelationships and the in-
fluence on the overall image quality need to be carefully an-
alyzed. This is useful not just for comparing existing HDR
approaches, but for evaluating of future ones as well.
In this paper, we give a comprehensive list of most of im-
portant attributes involved in the evaluation of a tone map-
ping operator, and we show which relationships exist be-
tween the basic attributes by means of two different sub-
jective testing methods. The evaluation of the attributes and
their relationships leads to the definition of an overall image
quality. This metric can be used to judge how well a given
tone mapping operator is able to produce naturally looking
images. Furthermore, we present the most comprehensive
comparison in terms of the number of tone mapping opera-
tors considered to date, including 14 different methods.
The paper is organized as follows. In Section 2, we
overview the previous work on comparison of tone map-
ping methods. In Section 3, we introduce and describe the
term “overall image quality”. In Section 4, we give a survey
of the most important image attributes for tone mapping,
and we describe how different methods reproduce these at-
tributes. In Section 5 we propose a new scheme of relation-
ships between the image attributes. In Section 6 we describe
the two applied experimental methods based on human ob-
servations, and finally in Section 7, we show and discuss the
results of these experiments. The survey of image attributes
and the relationships (Sec. 4, 5) is extended from [3] and
incorporates our new findings.
In Proceedings of Pacific Graphics 2006, p.35-p.44.National Taiwan University Press, Taipei, Taiwan, 2006.
2 Previous Work
The history of evaluation of tone mapping methods is
short. The following works (the only ones, to our best
knowledge) were published only in the last three years. This
due to the only recent increase in published tone mapping
operators on the hand, and by the very high time, imple-
mentation, human, and other demands involved in such an
evaluation on the other hand.
Drago et al. [10] performed a perceptual evaluation of six
tone mapping operators with regard to similarity and prefer-
ence. In their study, subjects were asked to rate a difference
for all pairwise comparisons of a set of four HDR images
tone mapped with the six tone mapping operators (24 im-
ages in total) shown on the screen. A multidimensional per-
ceptual scaling of the subjective data from 11 observers re-
vealed the two most salient stimulus space dimensions. The
authors unfolded these dimensions as naturalness and detail
and also identified the ideal preference point in the stimulus
space. These findings were then used for raking the six tone
mapping methods.
Kuang et al. [19, 18] tested eight tone mapping algo-
rithms using ten HDR images. The authors implemented
two paired comparison psychophysical experiments assess-
ing the color and grayscale tone mapping performance re-
spectively. In these tests, 30 observers were asked to choose
the preferred image for each possible pair. The subjective
data were then converted into an interval scale of prefer-
ence and this scale was used for the evaluation. The results
showed the consistency of tone mapping performance for
gray scale and color images.
In 2005, Yoshida et al. [39] compared seven tone map-
ping methods on two architectural interior scenes. The 14
observers were asked to rate basic image attributes as well
as the naturalness of the images by ratings. The results of
this perceptual study exhibited differences between global
and local tone mapping operators, the local ones showing a
better outcome.
Recently, Ledda et al. [20] run an evaluation of six tone
mapping methods by comparing to the reference scenes dis-
played on an HDR display. This HDR display allowed
authors to involve many (23) input scenes. Subjects were
presented three images at once (the reference and two tone
mapped images) and had to choose the image closest to the
reference. Statistical methods were used to process subjec-
tive data and the six examined methods were evaluated with
respect to the overall quality and to the reproduction of fea-
tures and details.
Some exciting contributions were published in the do-
main of the image quality measurement of ordinary LDR
images. See the book by Janssen [16] for an overview on
this topic. More specifically, Rogowitz et al. [30] conducted
two psychophysical scaling experiments for the evaluation
of image similarity. The subjective results were compared
to two algorithmic image similarity metrics and analyzed
using multidimensional scaling. The analysis showed that
humans use many dimensions in their evaluations of image
similarity, including overall color appearance, semantic in-
formation, etc.
Differently from the mentioned approaches, we adopt
both a direct comparison of the tone mapped images to the
real scene, and a subjective ranking of tone mapped images
without a real reference. This enables us to confront the
results from these two subjective experiments. Moreover,
we also present a methodology for evaluating tone mapping
methods using generally known image attributes. With 14
methods in total, the subjective study carried out to confirm
this methodology also contains one of the most comprehen-
sive comparison of tone mapping operators yet. We have
already presented [3] preliminary ideas of this project and
we conducted an initial pilot study to examine the testing
setup. It was observed that the overall image quality is not
determined by a single attribute, but it is rather a composi-
tion of them. Encouraged by these findings, we conducted a
full experminent, the results of which, including a thorough
discussion, new testing methodology etc. are presented in
this paper.
3 Overall Image Quality
In this section, we motivate and describe a measure
which is useful for determining the performance of a par-
ticular tone mapping operator.
The first question is whether it is really possible to find,
based on human vision, an optimal or “exact” method to
tone map an arbitrary HDR input image. Unfortunately, the
answer seems to be no. Take for example a beach scene,
where the absolute luminance is often above 50,000 lux.
A captured photograph of that scene, viewed under nor-
mal room illumination (about 200 lux), can never reproduce
the same amount of colorfulness, because this is a psycho-
physiological effect that depends on the absolute luminance
(vivid colors start to be perceived above 2000 lux). There-
fore, a natural reproduction is only possible to a limited de-
gree.
Another important question is the intent of the reproduc-
tion. The classical perceptual approach tries to simulate the
human vision process and model the tone mapping operator
accordingly. For example, a scene viewed at night would be
represented blurred and nearly monochromatic due to sco-
topic vision. However, if it is important to understand the
fine details or the structure of the visible lines in the re-
sult, i.e., the content of the image, the same scene would
be represented with full detail, which would be called the
cognitive approach. If the goal is only the pleasant appear-
ance of the image, we speak about an aesthetical approach.

Any given tone mapping operator will realize a mixture of
these three approaches, with a different weighting given to
each [23].
In this paper, we concentrate on the perceptual approach
only, and aim to characterize the overall image quality
resulting from a tone mapping technique in a perceptual
sense. In addition, we have chosen a number of impor-
tant image attributes which are typically used to character-
ize tone mapped images, and study how well tone mapping
operators reproduce these attributes: brightness, contrast,
color and detail. The chosen attributes are mostly percep-
tual, but contain cognitive and aesthetics aspects as well.
Beyond these attributes, which are related to color and spa-
tial vision, there are some other important aspects and some
“special effects” which can improve or modify the final ap-
pearance. Since some of the attributes are not independent
(as we will explain later), we propose a scheme of relation-
ships between them (Fig. 2). The goal of this work is to
investigate the influence these attributes have on overall im-
age quality, based on a subjective study.
4 Image attributes
In this section we briefly survey particular image at-
tributes for tone mapping, and we list some typical tone
mapping methods that attempt to reproduce them correctly.
4.1 Brightness
Brightness is a quantity that measures the subjective sen-
sation produced by a particular luminance, i.e., the bright-
ness is the perceived luminance [1]. Stevens [13] proposed
an expression for the apparent brightness, but although the
expression gives a convenient relationship between lumi-
nance and brightness for simple targets, the overall bright-
ness of an image is more complex.
An operator by Tumblin and Rushmeier [34] attempts to
preserve the overall impression of brightness using a map-
ping function that is based on the model by Stevens and
Stevens. This mapping function matches the brightness of
a real world luminance to the brightness of a display lumi-
nance. Recently, Krawczyk et al. [17] proposed an operator
which aims for an accurate estimation of lightness in real-
world scenes by means of the so-called anchoring theory of
lightness perception. The method is based on an automatic
decomposition of the HDR image into frameworks (consis-
tent areas). Lightness of a framework is then estimated by
the anchoring to the luminance level that is perceived as
white, and finally, the global lightness is computed.
4.2 Contrast
Image contrast is defined in different ways, but it is usu-
ally related to variations in image luminance. There exist
various basic formulae for computation of contrast, see the
thesis by Winkler [38] for an overview. Matkovic et al. [22]
proposed a complex computational global contrast measure
called Global Contrast Factor that uses contrasts at various
resolution levels in order to compute overall contrast.
Ward’s [36] initial tone mapping operator focuses on the
preservation of perceived contrast. This method transforms
input luminance to output luminance using a scaling factor.
The computation of the factor is based on Blackwell’s [7]
psychophysical contrast sensitivity model. Because Ward’s
operator scales image intensities by a constant, it does not
change scene contrasts for display. Almost the same princi-
ple of contrast preservation is exploited also in other opera-
tors [15, 37].
Advanced local tone mapping methods (e.g., the method
by Reinhard et al. [28] or by Ashikhmin [2]) are based on
a multi-resolution decomposition of the image and approx-
imate contrast in a way similar to Peli [26]. Mantiuk et
al. [21] proposed recently a framework for perceptual con-
trast processing of HDR images. The authors define con-
trast as a difference between a pixel and one of its neighbors
at a particular level of a Gaussian pyramid. This approach
resembles the gradient-domain method by Fattal et al. [14].
4.3 Reproduction of colors
The sensation of color is an important aspect of the hu-
man visual system, and a correct reproduction of colors can
increase the apparent realism of an output image. One im-
portant feature of the human visual system is the capacity to
see the level of colors in a bright environment. This ability,
measured as color sensitivity, is reduced in dark environ-
ments, as the light sensitive rods take over for the color-
sensitive cone system. As the luminance level is raised, the
cone system becomes active and colors begin to be seen.
Furthermore, the human visual system has the capability of
chromatic adaptation. Humans are able to adjust to varying
colors of illumination in order to approximately preserve
the appearance of object colors. See Fairchild’s book [13]
for more information on color appearance modeling.
The tone mapping operator by Ferwerda et al. [15] cap-
tures changes in threshold color appearance by using sep-
arate TVI functions for rods and cones and interpolation
for the mesopic luminance range. Ward et al. [37] used a
very similar approach in their work. Pattanaik et al. [25]
proposed a comprehensive multi-scale model that accounts
for changes both in threshold color discriminability and
suprathreshold colorfulness. Using opponent color process-
ing, the model is able to handle changes in chromatic and

luminance-level adaptation as well. In their recent work,
Reinhard and Devlin [27] adapted a computational model of
photoreceptor behavior that incorporates a chromatic trans-
form that allows the white point to be shifted.
4.4 Reproduction of details
The reproduction of details is an issue mainly in very
dark and very bright areas, because truncation of values oc-
curs most frequently in these areas as a result of limitations
of the output device. The simplest methods (e.g., linear
scaling or clamping) will usually reduce or destroy impor-
tant details and textures (see Fig. 1). On the other hand,
the effort to reproduce details well is a potential cause of
artifacts.
Figure 1. Reproduction of details in a verybright area. Left: global tone mapping opera-
tor exhibits the loss of details. Right: detailspreservation owing to mapping by a local op-erator.
Several tone mapping operators focus especially on the
reproduction of details. Tumblin and Turk’s LCIS opera-
tor [35] produces a high detail, low contrast image by com-
pressing only the large features and adding back all small
details. The idea of compressing just the large features and
then adding subtle non-compressed details is also used in
the operators based on the bilateral [12] and trilateral fil-
ter [6].
A different approach was presented by Ward [37].
Ward’s operator based on histogram adjustment aims to pre-
serve visibility, where visibility is said to be preserved if we
can see an object on the display if and only if we can see it in
the real scene. Ward’s operator does not strive to reproduce
all the details available, but exploits the limitations of hu-
man vision to reproduce just the visible details. Also, most
local tone mapping operators try to preserve detail along
with contrast.
4.5 Special attributes
The following image attributes show up just under spe-
cial conditions and we do not consider them in our cur-
rent experiments, in favor of the basic ones. However, we
present these attributes here to complete the survey of im-
age attributes for tone mapping and it will be an interesting
task to include them in future evaluations using all of the
components of Fig. 2.
Visual acuity is the ability of the human visual system
to resolve spatial detail. The visual acuity decreases in dark,
since cones are not responding to such low light levels. It
is interesting that simulating this phenomenon, i.e., reduc-
ing the detail in an image, actually enhances the perceptual
quality of the image.
Owing to the scattering of light in the human cornea,
lens, and retina, and due to diffraction in the cell structures
on the outer radial areas of the lens, phenomena commonly
referred to as glare effects [32] are seen around very bright
objects. Since the dynamic range of traditional output de-
vices is not sufficient to evoke such phenomena, we must
simulate the human response artificially to improve the per-
ceptual quality of the image.
As a consequence of tone mapping, artifacts may appear
in the output image. The artifacts are degrading the overall
quality of the output image. Some local tone mapping oper-
ators [5, 31] exhibit typical halo artifacts, see [29]. Another
possible artifact of tone mapping methods stems from the
superficial handling of colors. Many tone mapping meth-
ods use very simple rules in handling of the colors, i.e., do-
ing the HDR to LDR transformation just for the luminance
component with consequential restoration of the color in-
formation. Apart from poor values for the color reproduc-
tion image attribute, this can also lead to visible color ar-
tifacts like oversaturation. Closely related to color artifacts
are quantization artifacts, especially in dark regions, which
stem from applying transformations (like gamma correc-
tion) to a low-precision representation of color values.
5 Attribute relationships
In the previous sections, we have surveyed the image
attributes that are important for tone mapping and influ-
ence the overall quality of the output image. Since these
attributes are not independent, we present a description of
their interrelationships in this section.
We propose the scheme shown in Fig. 2 to illustrate the
relationships between the attributes. The overall image
quality, our measure, is determined by all the attributes.
It depends strongly on the overall perceived brightness,
i.e., highly illuminated scenes should be reproduced bright,
while dim scenes should appear dark. Apparent contrast
should also be reproduced well to make the result natural.
The reproduction of details or rather the reproduction of vis-
ibility of objects is certainly essential to make the output
image appear natural. Furthermore, since we are typically
facing a limited display gamut, the reproduction of color is

Ove
rall
Imag
e Q
ualit
y
Brightness
Contrast
GlareSimulation
ColourReproduction
Artifacts
VisualAcuity
DetailReproduction
Increase
Increase
Increase
Decrease
Decrease
Decrease
Figure 2. The relationships between image at-tributes. The attributes we did not evaluate in
subjective testing are in dashed boxes.
an important factor for perceptual quality as well. The sim-
ulation of visual acuity loss can significantly improve the
perceptual quality of dim or night scenes, while the simula-
tion of glare can enhance the perceptual quality of the dark
scenes with strong light sources. There is no doubt that the
presence of disturbing artifacts degrades perceptual qual-
ity. But there are also important interrelationships of the
attributes:
The perception of brightness is affected greatly by the
contrast arrangement (i.e., by the semantics of an image).
Fairchild [13] described the effect of image contrast on
the perceived brightness and concluded that the brightness
typically increases with contrast. It has been shown that
brightness increases as a function of chroma (Helmholtz-
Kohlrausch effect). Moreover, the simulation of color ap-
pearance at scotopic levels of illumination can substantially
change the perceived brightness. Finally, the simulation of
glare plays an important role for the brightness perception.
The glare simulation increases the apparent brightness of
light sources.
It was shown that contrast increases with the luminance
(Stevens effect, see [13]). Since we can identify the contrast
on different spatial resolutions, the perception of contrast
is obviously affected by the reproduction of details. The
experimental results of Calabria and Fairchild [4] confirmed
that the perceived contrast depends also on image lightness,
chroma and sharpness.
Colors are related to brightness, because the colorful-
ness increases with the luminance level (i.e., the Hunt ef-
fect [13]).
The reproduction of details is strongly affected by the
simulation of the visual acuity. Since there are available
data that represent the visual acuity (e.g., Shaler’s curve),
these data place limits on the reproduction of fine details,
and may also be utilized to verify the perceptual quality of
detail reproduction. Furthermore, the visibility preservation
diminishes the reproduced details using a threshold function
(e.g., the threshold versus intensity curve, TVI). The simu-
lated glare can obscure otherwise reproducible details near
strong light sources.
Using subjective testing results, Spencer et al. [32] veri-
fied that the simulation of glare can substantially increase
the apparent brightness of light sources in digital images.
In the scheme of relationships (Fig. 2), we can iden-
tify attributes that represent limitations of the human vi-
sual system: the simulation of glare, the simulation of vi-
sual acuity and (in part) the reproduction of color (in the
sense of simulation of the scotopic vision). These attributes
enhance the perceptual quality of the output image, but are
not desirable when the goal is different, for example when
we aim to reproduce as many details as possible.
6 Subjective perceptual studies
We have conducted two separate subjective perceptual
studies to encourage the proposed idea of an overall image
quality measure and to verify the correlations to and be-
tween the image attributes shown in Fig. 2. Moreover, the
execution of two principally different studies gave us the
opportunity to relate the obtained subjective results.
Prior to the main experiments we have conducted a pilot
study to examine the setup and to verify that subjects are
able to rank soft-copy images against the real scene. During
this study we have also fine-tuned the parameters of several
tone mapping operators. Preliminary ideas of the project as
well as the results of our pilot study have been presented
recently [3].
6.1 Subjective testing setup
In the first experiment, based on rating, we simultane-
ously presented an original (real) HDR scene and the appro-
priate tone mapped image of this scene to human observers.
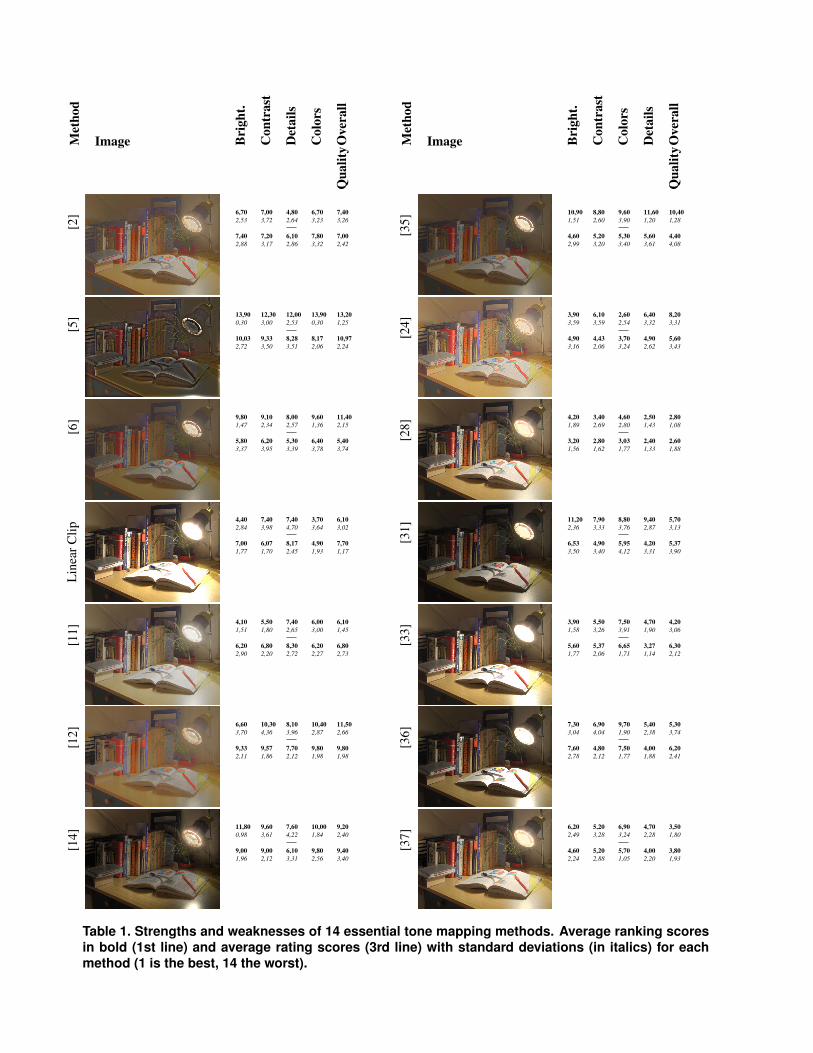
We arranged a typical real indoor HDR scene, see Tab. 1.
Then we acquired a series of 15 photos of the scene us-
ing a digital camera with varying exposition from a locked-
down tripod. The HDR radiance map was recovered from
the recorded series using the method by Debevec and Ma-
lik [8]. The dynamic range of the resulting HDR image
was about 105 : 10−1cd/m2. Afterwards, we tone mapped
this HDR image using 14 different tone mapping opera-
tors, so that we obtained 14 LDR images1 for investigation.
1All the tone mapped images as well as the original HDR image are
available on the web pages of the project: http://www.cgg.cvut.
cz/˜cadikm/tmo
We included the following operators into our experiment—
the methods proposed by: Ashikhmin [2], Chiu et al. [5],
Choudhury and Tumblin [6], Drago et al. [11], Durand and
Dorsey [12], Fattal et al. [14], Tumblin and Turk [35], Pat-
tanaik and Yee [24], Reinhard et al. [28], Schlick [31],
Tumblin and Rushmeier’s revised operator [33], Ward [36],
Ward et al. [37], and a simple linear mapping; see Tab. 1.
All the evaluated methods were implemented by the first
author with some discussions and help from the original au-
thors of these methods.
This sequence of 14 LDR images represented the input
visual stimuli for each observer; the images were shown in
random order. In the perceptual test arrangement the sub-
ject was able to observe both the real scene and a LDR
image of the scene displayed on the calibrated CRT mon-
itor. The testing was performed in a dark test room under
controlled ambient luminance level. A total number of 10
subjects aged between 26 and 52 were asked to express the
overall image quality, and the four basic attributes bright-
ness, contrast, reproduction of details, and reproduction of
colors for a particular image by ratings (on the scale 1–14,
where 1 represents the best result, while 14 is the worst)
with respect to the actual scene. Subjects had normal or
corrected-to-normal vision and were non-experts in the field
of computer graphics.
In the second experiment, based on ranking, we inves-
tigated what happens when subjects have no possibility of
directly comparing to the ground truth (or are not affected
by a previous experience with the real scene). A group of
10 observers (different ones than in the first experiment),
who have never seen the real HDR scene and had therefore
virtually no idea about the original scene attributes, was se-
lected. This group comprised persons aged between 25 and
45, male and female, and all were non-experts in computer
graphics. The task of each subject was to order (rank) im-
age printouts resulting from the 14 operators according to
the overall image quality, and the quality of overall con-
trast, brightness, color and detail reproduction. The investi-
gated printouts were high-quality color image printouts on
a glossy paper of the same 14 tone mapped images as in the
first experiment.
7 Results and discussion
The results obtained from the two different experimen-
tal approaches are summarized in Tab. 1 and Fig. 3. Our
investigations are formulated by means of these results in
four-dimensional functions, namely as the dependence of
the overall image quality on the brightness, the contrast, the
color and the detail reproduction attributes. We have com-
pared the results of rating and ranking methods. Rating
had to be chosen for the first experiment because the 14 im-
ages could not be shown simultaneously with the reference
scene. The rating scale was chosen so that the scores were
in the interval same interval ([1, 14]), as the ranking values.
The basic difference between the two approaches is that
in the case of very similar images, the rating gives very sim-
ilar non-integer numbers, while for ranking, always all in-
teger values are distributed from 1 to 14. In our case the at-
tributes have a relatively uniform distribution, thereby this
problem was not critical. However, the nature of rating is
generally more uncertain than the one of ranking, because
the pure comparison of images is subjectively easier than to
specify quantitative values.
We averaged the results of all observations for both
the ranking and rating experiments, i.e., we obtained non-
integer numbers. Fig. 3 shows these average results for
the overall image quality and for all the investigated im-
age attributes. Although the original high dynamic scene
was used for the rating, and the ranking was carried out us-
ing only the resulting images of the different tone mapping
methods, the basic trends are rather similar than contradic-
tory. For all of the attributes, except the brightness, the rat-
ing and ranking results exhibit high correlations, around 0.7,
that means that people judge the quality of tone mapped
image in both cases very similarly. On the other hand,
the brightness attribute shows correlation coefficient of 0.49
which denotes that the direct comparison with the real scene
has an important influence on the perception of the qual-
ity of brightness reproduction. The two experimental ap-
proaches together help in a more deeper understanding and
evaluation of the qualities and methods. Beyond Fig. 3, we
can observe this on Tab. 1 as well.
The results of both experiments show that the best over-
all quality is exhibited by the method of Reinhard et al. [28],
the second one is the global mapping of Ward el al. [37],
while the worst is an early local approach by Chiu et al [5].
At the bounds of the quality interval, the best and the worst
methods exhibit also the lowest variance, while the middle
zone with often uncertain judgments has higher variances.
The observers have typically the same opinion about the
best/worst question, but difficulties with the evaluation of
some similar cases. All of the values on the Fig. 3 and in
the Tab. 1 are the average values of the two independent
groups of ten and nine observers respectively.
7.1 Comparison to other studies
In this section we discuss and compare our results to
other studies. We should emphasize here that this study
was targeted to the natural reproduction of a real scene, and
with 14 involved operators presents one of the most compre-
hensive evaluations yet. Complete direct comparison of the
results is therefore not possible. Since our experimental in-
put data are bound to natural indoor scenes, the global tone
mapping methods (and local methods with a proper global
Met
hod
Image Bri
gh
t.
Con
trast
Det
ail
s
Colo
rs
Over
all
Qu
ali
ty
[2] 6,70
2,53
7,40
2,88
7,00
3,72
7,20
3,17
4,80
2,64
6,10
2,86
6,70
3,23
7,80
3,32
7,40
3,26
7,00
2,42
[5] 13,90
0,30
10,03
2,72
12,30
3,00
9,33
3,50
12,00
2,53
8,28
3,51
13,90
0,30
8,17
2,06
13,20
1,25
10,97
2,24
[6] 9,80
1,47
5,80
3,37
9,10
2,34
6,20
3,95
8,00
2,57
5,30
3,39
9,60
1,36
6,40
3,78
11,40
2,15
5,40
3,74
Lin
ear
Cli
p
4,40
2,84
7,00
1,77
7,40
3,98
6,07
1,70
7,40
4,70
8,17
2,45
3,70
3,64
4,90
1,93
6,10
3,02
7,70
1,17
[11
] 4,10
1,51
6,20
2,90
5,50
1,80
6,80
2,20
7,40
2,65
8,30
2,72
6,00
3,00
6,20
2,27
6,10
1,45
6,80
2,73
[12
] 6,60
3,70
9,33
2,11
10,30
4,36
9,57
1,86
8,10
3,96
7,70
2,12
10,40
2,87
9,80
1,98
11,50
2,66
9,80
1,98
[14
] 11,80
0,98
9,00
1,96
9,60
3,61
9,00
2,12
7,60
4,22
6,10
3,31
10,00
1,84
9,80
2,56
9,20
2,40
9,40
3,40
Met
hod
Image Bri
gh
t.
Con
trast
Colo
rs
Det
ail
s
Over
all
Qu
ali
ty
[35
] 10,90
1,51
4,60
2,99
8,80
2,60
5,20
3,20
9,60
3,90
5,30
3,40
11,60
1,20
5,60
3,61
10,40
1,28
4,40
4,08
[24
] 3,90
3,59
4,90
3,16
6,10
3,59
4,43
2,06
2,60
2,54
3,70
3,24
6,40
3,32
4,90
2,62
8,20
3,31
5,60
3,43
[28
] 4,20
1,89
3,20
1,56
3,40
2,69
2,80
1,62
4,60
2,80
3,03
1,77
2,50
1,43
2,40
1,33
2,80
1,08
2,60
1,88
[31
] 11,20
2,36
6,53
3,50
7,90
3,33
4,90
3,40
8,80
3,76
5,95
4,12
9,40
2,87
4,20
3,31
5,70
3,13
5,37
3,90
[33
] 3,90
1,58
5,60
1,77
5,50
3,26
5,37
2,06
7,50
3,91
6,65
1,71
4,70
1,90
3,27
1,14
4,20
3,06
6,30
2,12
[36
] 7,30
3,04
7,60
2,78
6,90
4,04
4,80
2,12
9,70
1,90
7,50
1,77
5,40
2,38
4,00
1,88
5,30
3,74
6,20
2,41
[37
] 6,20
2,49
4,60
2,24
5,20
3,28
5,20
2,88
6,90
3,24
5,70
1,05
4,70
2,28
4,00
2,20
3,50
1,80
3,80
1,93
Table 1. Strengths and weaknesses of 14 essential tone mapping methods. Average ranking scoresin bold (1st line) and average rating scores (3rd line) with standard deviations (in italics) for each
method (1 is the best, 14 the worst).

Overall Image Quality
1
3
5
7
9
11
13
15
Rei
nhard[2
8]
War
d[37]
Tum
blin[3
3]
War
d[36]
Schlic
k[31
]
Dra
go[11]
Linea
r Clip
Ash
ikhm
in[2
]
Patta
naik[
24]
Fatta
l[14]
LCIS
[35]
Choudhury
[6]
Dura
nd[12]
Chiu
[5]
Ratings
Ranking
Brightness
1
3
5
7
9
11
13
15
Rei
nhard[2
8]
War
d[37]
Tum
blin[3
3]
War
d[36]
Schlic
k[31
]
Dra
go[11]
Linea
r Clip
Ash
ikhm
in[2
]
Patta
naik[
24]
Fatta
l[14]
LCIS
[35]
Choudhury
[6]
Dura
nd[12]
Chiu
[5]
Ratings
Ranking
Contrast
1
3
5
7
9
11
13
15
Rei
nhard[2
8]
War
d[37]
Tum
blin[3
3]
War
d[36]
Sch
lick[
31]
Dra
go[11]
Linea
rClip
Ash
ikhm
in[2
]
Pat
tanai
k[24
]
Fatta
l[14]
LCIS
[35]
Choudhury
[6]
Dura
nd[12]
Chiu
[5]
Ratings
Ranking
Details
1
3
5
7
9
11
13
15
Rei
nhard[2
8]
War
d[37]
Tum
blin[3
3]
War
d[36]
Sch
lick[
31]
Dra
go[11]
Linea
rClip
Ash
ikhm
in[2
]
Pat
tanai
k[24
]
Fatta
l[14]
LCIS
[35]
Choudhury
[6]
Dura
nd[12]
Chiu
[5]
Ratings
Ranking
Colors
1
3
5
7
9
11
13
15
Rei
nhard[2
8]
War
d[37]
Tum
blin[3
3]
War
d[36]
Sch
lick[
31]
Dra
go[11]
Linea
rClip
Ash
ikhm
in[2
]
Pat
tanai
k[24
]
Fatta
l[14]
LCIS
[35]
Choudhury
[6]
Dura
nd[12]
Chiu
[5]
Ratings
Ranking
Figure 3. Comparison of average scores (visualization of data from Tab. 1). The charts show evident
coherence in the results obtained using the ’to the reality comparison’, expressed by ratings (green),and by the ’ordering’, ranking (red) (1 is the best, 14 the worst). Black abscissae at top of barsrepresent the values of appropriate standard deviations.
part) were generally ranked better than the ’detail-hunting’
and non human vision-aware approaches. The quality of re-
production of overall brightness, contrast and colors is more
important than the reproduction of details when naturalness
is ranked in real scenes. This observation is numerically
supported by the analysis presented in the next section.
Our results are in a good agreement with the evaluation
by Drago [10]: Reinhard’s operator is ranked the best and
Schlick’s method is ranked also very good in their study.
The difference is in Ward’s histogram-based approach,
where authors deliberately omitted the human-based ceil-
ing function and therefore the operator favours the repro-
duction of details at the expense of naturalness. The con-
sequences of Kuang [19] are also similar to ours: Fattal’s
operator was considered not very natural while the Rein-
hard’s photographic mapping was nearly the best ranked.
The difference is with the bilateral filtering operator. We
believe this is caused by the implementation of the global
part of tone mapping function. We, in accordance with the
original method description [12], have compressed the base
layer using a scale factor in the log domain. More plausi-
ble global compression (e.g., the S-shaped curve) would re-
sult in a positively better outcome, but we were targeted to
compare purely the original approaches. This supposition is
also well supported by the conclusions of Ledda et al. [20],
where the bilateral filtering approach performed the worst
and other overlapping operators show perfect agreement as
well (in the overall similarity test).
7.2 Overall image quality
Beyond the discussed general results, we analyzed the
dependencies of overall image quality on the four selected
basic perceptual image attributes. We used different meth-
ods to fit functions to the brightness, contrast, detail and
color attributes judgment values receiving the best approxi-
mation to the independently observed overall image quality.
Using the simplest approach, linear regression, we obtained
the following result:
OIQ = 0.327 ·Bri+0.267 ·Con+0.102 ·Det+0.230 ·Col,(1)
where OIQ is an overall image quality function in the in-
terval of [0, 1] (1 being the best quality), Bri is brightness,
Con is contrast, Det are details, and Col are colors, all in
the interval of [0, 1] (0 meaning the worst reproduction of
the appropriate attribute). We can observe that the over-
all brightness has the biggest weight and the detail repro-
duction the smallest one. This result may look surprising,
as one would expect details to be more important. But the
global appearance of an image seems to depend much more
on other image attributes (brightness, contrast, color).
Furthermore, it is evident that the basic categories are
very hard to separate. As we proposed in Section 5, there
are cross effects, or more complex basic factors, which are
not directly observable. However, we have not received a
deeper result or new non-trivial basic attributes from our
observations when carrying out a statistical factor analysis,
thereby we do not deal with this question here.
For a more in-depth analysis of the data, we made exper-
iments with other classes of functions. The generalization
of the above linear regression is the linear combination of
different power functions of the image attributes. With non-
linear optimization we received optimal fitting function to
the overall quality that can be expressed as:
OIQ = 2.315 · Bri0.350 + 0.855 · Con0.377 +
+ 0.065 · Det0.354 + 0.609 · Col0.354. (2)
Here, the minimal standard error of estimate was 4.162,
while in linear regression (1), which is a special case of
(2), the error was 4.492. In (2) we can observe a similar
ranking of importance of the basic attributes as in the lin-
ear case. The brightness is the most important, contrast and
color reproduction are not significantly, but evidently some-
what less important, while the smallest term is the detail
reproduction, here as well.
We looked for a good fitting also in form of a multiplica-
tive function, with unknown powers and a free calibration
multiplier. The result—obtained on a log scale with linear
regression—is as follows:
OIQ = 4.987 ·Bri0.135·Con0.021
·Det0.002·Col0.047. (3)
Since both non-linear formulas (2, 3) show a similar ten-
dency as the result of linear regression (1), we propose to
use this simplest formula.
In the future, we will take into consideration all of the
mentioned image attributes (Fig. 2), with the aim of finding
a general optimal nonlinear fitting for a wide class of HDR
images with numerous observers. However, even the analy-
sis of basic image attributes resulted in new and interesting
insights about their importance and correlation, which can
be used in future tone mapping evaluations.
8 Conclusions
In this paper, we presented an overview of image at-
tributes for tone mapping that should facilitate access to the
existing tone mapping literature. Since the attributes are
intimately related, we have proposed a scheme of relation-
ships between them. Moreover, we have proposed a mea-
sure for the overall image quality, which can be expressed
as a combination of these attributes based on psychophys-
ical experiments. We have verified the proposed ideas by
means of two different psychophysical experiments.
The presented overview of image attributes is helpful for
getting into the tone mapping field, or when implementing
or developing a new tone mapping operator. On the other
hand, the identification of the relationships between the at-
tributes is very useful for the subjective comparison of tone
mapping methods. It also simplifies the comparison process
by reducing the actual number of attributes that can be used
to evaluate a tone mapping operator. Finally, it represents
the initial effort to design a truthful, objective comparison
metric for high dynamic range images.
An interesting outcome of the two different testing
methodologies used (rating and ranking) is that almost all
of the studied image quality operators can be evaluated
without comparison to a real HDR reference. This pa-
per presents one of the most comprehensive evaluations of
tone mapping operators yet, with 14 different tone mapping
methods evaluated using the results of two different experi-
mental studies.
The question remains how to numerically assess partic-
ular image attributes. Although some approaches were pro-
posed in history [16, 22] this area deserves further inves-
tigation and subjective verification. In the future, we will
conduct consequential subjective tests targeted on individ-
ual image attributes to be able to computationally assess the
overall quality of tone mapping. Finally, since we used a
limited span of input images, more thorough and extensive
testing is needed to confirm the applicability of the outlined
results to other types of scenes.
Acknowledgements
This work has been partially supported by the Ministry of Ed-
ucation, Youth and Sports of the Czech Republic under the re-
search programs MSM 6840770014 and LC-06008, by the Kon-
takt OE/CZ grant no. 2004/20, by the Research Promotion Foun-
dation (RPF) of Cyprus IPE project PLHRO/1104/21, and by the
Austrian Science Fund under contract no. P17261-N04. Thanks
to all subjects at the CTU in Prague and the Intercollege Cyprus.
Special gratitude to J. Bittner for his help in preparing this paper.
References
[1] E. H. Adelson. Lightness perception and lightness illusions.
In M. Gazzaniga, editor, The Cognitive Neurosciences, pages
339– 351, Cambridge, MA, 1999.[2] M. Ashikhmin. A tone mapping algorithm for high contrast
images. In 13th Eurographics Workshop on Rendering. Eu-
rographics, 2002.[3] M. Cadık and P. Slavık. The Naturalness of Reproduced
High Dynamic Range Images. In Proceedings of the 9th In-

ternational Conference on Information Visualisation, pages
920–925, Los Alamitos, 2005.[4] A. J. Calabria and M. D. Fairchild. Perceived image contrast
and observer preference I: The effects of lightness, chroma,
and sharpness manipulations on contrast perception. Journal
of Imaging Science & Technology, 47:479–493, 2003.[5] K. Chiu, M. Herf, P. Shirley, S. Swamy, C. Wang, and
K. Zimmerman. Spatially nonuniform scaling functions for
high contrast images. In Proceedings of Graphics Interface
’93, pages 245– 253, 1993.[6] P. Choudhury and J. Tumblin. The trilateral filter for high
contrast images and meshes. In EGRW ’03: Proceedings of
the 14th Eurographics workshop on Rendering, pages 186–
196. Eurographics Association, 2003.[7] CIE. An Analytical Model for Describing the Influence of
Lighting Parameters upon Visual Performance, volume 1:
Technical Foundations, CIE 19/2.1. International Organiza-
tion for Standardization, 1981.[8] P. E. Debevec and J. Malik. Recovering high dynamic range
radiance maps from photographs. In T. Whitted, editor, SIG-
GRAPH 97 Conference Proceedings, volume 31 of Annual
Conference Series, pages 369–378, 1997.[9] K. Devlin, A. Chalmers, A. Wilkie, and W. Purgathofer. Star:
Tone reproduction and physically based spectral rendering.
In D. Fellner and R. Scopignio, editors, State of the Art Re-
ports, Eurographics 2002, pages 101–123, 2002.[10] F. Drago, W. L. Martens, K. Myszkowski, and H.-P. Seidel.
Perceptual evaluation of tone mapping operators. In Pro-
ceedings of the SIGGRAPH 2003 conference on Sketches &
applications, NY, USA, 2003. ACM Press.[11] F. Drago, K. Myszkowski, T. Annen, and N.Chiba. Adap-
tive logarithmic mapping for displaying high contrast scenes.
Computer Graphics Forum, 22(3), 2003.[12] F. Durand and J. Dorsey. Fast bilateral filtering for the dis-
play of high-dynamic-range images. In Proceedings of the
29th annual conference on Computer graphics and interac-
tive techniques, pages 257–266. ACM Press, 2002.[13] M. D. Fairchild. Color Appearance Models. Reading, Mass.:
Addison-Wesley, 1998.[14] R. Fattal, D. Lischinski, and M. Werman. Gradient domain
high dynamic range compression. In Proceedings of the
29th annual conference on Computer graphics and interac-
tive techniques, pages 249–256. ACM Press, 2002.[15] J. A. Ferwerda, S. N. Pattanaik, P. Shirley, and D. P.
Greenberg. A model of visual adaptation for realistic im-
age synthesis. Computer Graphics, 30(Annual Conference
Series):249–258, 1996.[16] R. Janssen. Computational Image Quality. Society of Photo-
Optical Instrumentation Engineers (SPIE), 2001.[17] G. Krawczyk, K. Myszkowski, and H.-P. Seidel. Computa-
tional model of lightness perception in high dynamic range
imaging. In B. E. Rogowitz, T. N. Pappas, and S. J. Daly,
editors, Human Vision and Electronic Imaging XI, 2006.[18] J. Kuang, G. M. Johnson, and M. D. Fairchild. Image prefer-
ence scaling for hdr image rendering. In 13th Color Imaging
Conference, pages 8–13, Scottsdale, Arizona, 2005.[19] J. Kuang, H. Yamaguchi, G. M. Johnson, and M. D.
Fairchild. Testing hdr image rendering algorithms. In Color
Imaging Conference, pages 315–320, 2004.[20] P. Ledda, A. Chalmers, T. Troscianko, and H. Seetzen. Eval-
uation of tone mapping operators using a high dynamic range
display. In ACM SIGGRAPH 2005, LA. ACM Press.
[21] R. Mantiuk, K. Myszkowski, and H.-P. Seidel. A perceptual
framework for contrast processing of high dynamic range
images. In Proceedings of the 2nd symposium on APGV,
pages 87–94, New York, NY, USA, 2005. ACM Press.[22] K. Matkovic, L. Neumann, A. Neumann, T. Psik, and W. Pur-
gathofer. Global contrast factor-a new approach to image
contrast. In L. Neumann, M. Sbert, B. Gooch, and W. Pur-
gathofer, editors, Computational Aesthetics in Graphics, Vi-
sualization and Imaging 2005, 2005.[23] L. Neumann and A. Neumann. Gradient domain imaging.
First EG Workshop on Computational Aesthetics in Graph-
ics, Imaging and Visualization, 2005.[24] S. Pattanaik and H. Yee. Adaptive gain control for high dy-
namic range image display. In SCCG ’02: Proc. of 18th
spring conference on C. G., pages 83–87. ACM Press, 2002.[25] S. N. Pattanaik, J. A. Ferwerda, M. D. Fairchild, and D. P.
Greenberg. A multiscale model of adaptation and spatial
vision for realistic image display. In Proceedings of the
25th annual conference on Computer graphics and interac-
tive techniques, pages 287–298. ACM Press, 1998.[26] E. Peli. Contrast in complex images. Journal of the Optical
Society of America A, 7(10):2032–2040, October 1990.[27] E. Reinhard and K. Devlin. Dynamic range reduction in-
spired by photoreceptor physiology. IEEE Transactions on
Visualization and Computer Graphics, 2005.[28] E. Reinhard, M. Stark, P. Shirley, and J. Ferwerda. Photo-
graphic tone reproduction for digital images. In Proceedings
of the 29th annual conference on Computer graphics and in-
teractive techniques, pages 267–276. ACM Press, 2002.[29] E. Reinhard, G. Ward, S. Pattanaik, and P. Debevec. High
Dynamic Range Imaging: Acquisition, Display, and Image-
Based Lighting. Morgan Kaufmann, 2005.[30] B. E. Rogowitz, T. Frese, J. R. Smith, C. A. Bouman, and
E. B. Kalin. Perceptual image similarity experiments. In
Proc. SPIE Vol. 3299, p. 576-590, Human Vision and Elec-
tronic Imaging III, Bernice E. Rogowitz; Thrasyvoulos N.
Pappas; Eds., pages 576–590, July 1998.[31] C. Schlick. An adaptive sampling technique for multidimen-
sional ray tracing. In Photorealistic Rendering in Computer
Graphics, Springer Verlag, pages pp. 21–29, 1994.[32] G. Spencer, P. Shirley, K. Zimmerman, and D. P. Greenberg.
Physically-based glare effects for digital images. In Proc. of
the 22nd annual conf. on Computer graphics and interactive
techniques, pages 325–334. ACM Press, 1995.[33] J. Tumblin, J. K. Hodgins, and B. K. Guenter. Two methods
for display of high contrast images. ACM Trans. Graph.,
18(1):56–94, 1999.[34] J. Tumblin and H. Rushmeier. Tone reproduction for realistic
images. IEEE Comput. Graph. Appl., 13(6):42–48, 1993.[35] J. Tumblin and G. Turk. Low curvature image simplifiers
(LCIS). In SIGGRAPH 99 Conference Proceedings, Annual
Conference Series, pages 83–90. Addison Wesley, 1999.[36] G. Ward. A contrast-based scalefactor for luminance display.
Graphics Gems IV, pages 415– 421, 1994.[37] G. Ward Larson, H. Rushmeier, and C. Piatko. A visibility
matching tone reproduction operator for high dynamic range
scenes. IEEE Transactions on Visualization and Computer
Graphics, 3(4):291–306, 1997.[38] S. Winkler. Vision models and quality metrics for image pro-
cessing applications. PhD thesis, EPFL, Decembre 2000.[39] A. Yoshida, V. Blanz, K. Myszkowski, and H.-P. Seidel. Per-
ceptual evaluation of tone mapping operators with real-world
scenes. Human Vision & Electronic Imaging X, SPIE, 2005.