Illegal pedestrian crossing at signalised junctions in urban areas: The impact of spatial factors
14
Mayeux, Lovreglio, Saleh, and Fonzone Page 1 Illegal pedestrian crossing at signalised junctions in urban areas: The impact of spatial factors Mayeux Alexandre, Transport Research Institute, Edinburgh Napier University 10 Colinton Road, Edinburgh, EH10 5DT, United Kingdom e-mail: [email protected] Phone: +33 (0)667791712 Lovreglio Ruggiero Department of Civil, Environmental, Planning, Building and Chemistry, Politecnico di Bari, Via Edoardo Orabona, 4, 70126 Bari, Italy Transport Research Institute, Edinburgh Napier University 10 Colinton Road, Edinburgh, EH10 5DT, United Kingdom e-mail: [email protected] Phone: +44 (0)770 779 6624 Saleh Wafaa Transport Research Institute, Edinburgh Napier University 10 Colinton Road, Edinburgh, EH10 5DT, United Kingdom e-mail: [email protected] Phone: +44 (0)131 455 2371 Fonzone Achille Transport Research Institute, Edinburgh Napier University 10 Colinton Road, Edinburgh, EH10 5DT, United Kingdom e-mail: [email protected] Phone: +44 (0)131 455 2898 Total words: 5590 Diagrams/Figures/Tables 5 x 250 words 1250 Equivalent word count: 6840 Re-submission Date: 15/11/2014
Transcript of Illegal pedestrian crossing at signalised junctions in urban areas: The impact of spatial factors
Mayeux, Lovreglio, Saleh, and Fonzone Page 1
Illegal pedestrian crossing at signalised junctions in urban areas: The
impact of spatial factors
Mayeux Alexandre,
Transport Research Institute, Edinburgh Napier University
10 Colinton Road, Edinburgh, EH10 5DT, United Kingdom
e-mail: [email protected]
Phone: +33 (0)667791712
Lovreglio Ruggiero
Department of Civil, Environmental, Planning, Building and Chemistry, Politecnico di Bari,
Via Edoardo Orabona, 4, 70126 Bari, Italy
Transport Research Institute, Edinburgh Napier University
10 Colinton Road, Edinburgh, EH10 5DT, United Kingdom
e-mail: [email protected]
Phone: +44 (0)770 779 6624
Saleh Wafaa
Transport Research Institute, Edinburgh Napier University
10 Colinton Road, Edinburgh, EH10 5DT, United Kingdom
e-mail: [email protected]
Phone: +44 (0)131 455 2371
Fonzone Achille
Transport Research Institute, Edinburgh Napier University
10 Colinton Road, Edinburgh, EH10 5DT, United Kingdom
e-mail: [email protected]
Phone: +44 (0)131 455 2898
Total words: 5590
Diagrams/Figures/Tables 5 x 250 words 1250
Equivalent word count: 6840
Re-submission Date: 15/11/2014
Mayeux, Lovreglio, Saleh, and Fonzone Page 2
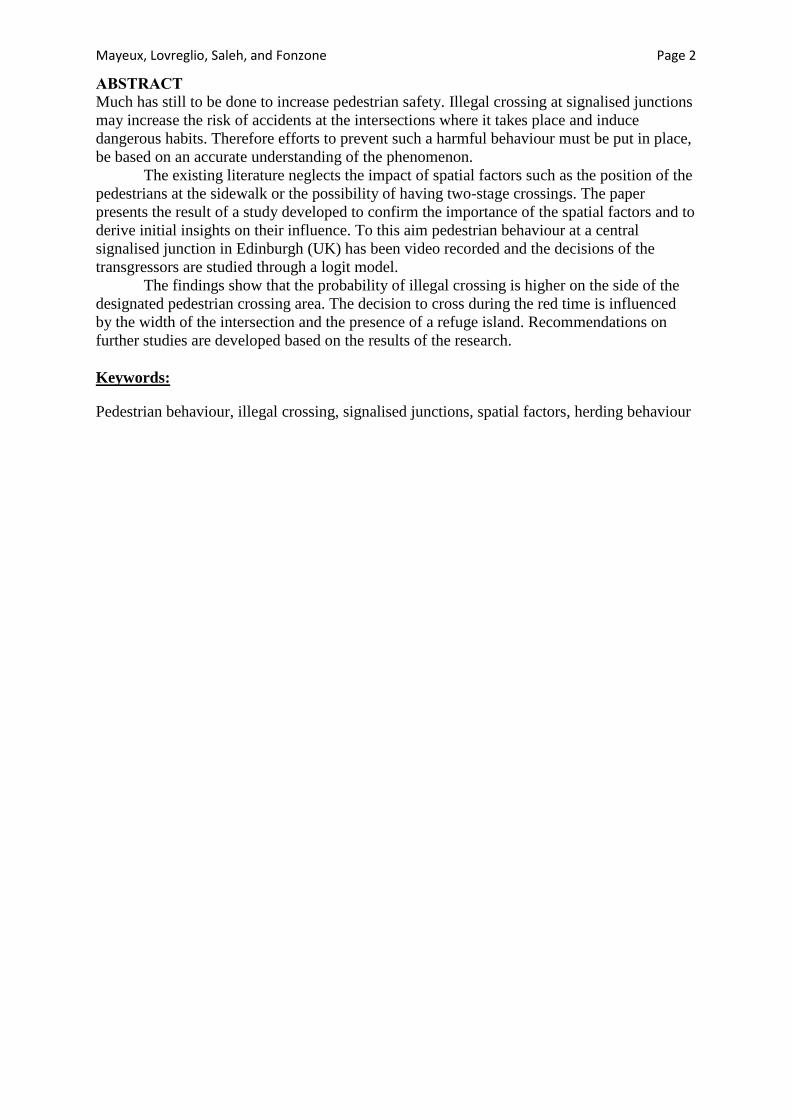
ABSTRACT
Much has still to be done to increase pedestrian safety. Illegal crossing at signalised junctions
may increase the risk of accidents at the intersections where it takes place and induce
dangerous habits. Therefore efforts to prevent such a harmful behaviour must be put in place,
be based on an accurate understanding of the phenomenon.
The existing literature neglects the impact of spatial factors such as the position of the
pedestrians at the sidewalk or the possibility of having two-stage crossings. The paper
presents the result of a study developed to confirm the importance of the spatial factors and to
derive initial insights on their influence. To this aim pedestrian behaviour at a central
signalised junction in Edinburgh (UK) has been video recorded and the decisions of the
transgressors are studied through a logit model.
The findings show that the probability of illegal crossing is higher on the side of the
designated pedestrian crossing area. The decision to cross during the red time is influenced
by the width of the intersection and the presence of a refuge island. Recommendations on
further studies are developed based on the results of the research.
Keywords:
Pedestrian behaviour, illegal crossing, signalised junctions, spatial factors, herding behaviour
Mayeux, Lovreglio, Saleh, and Fonzone Page 3
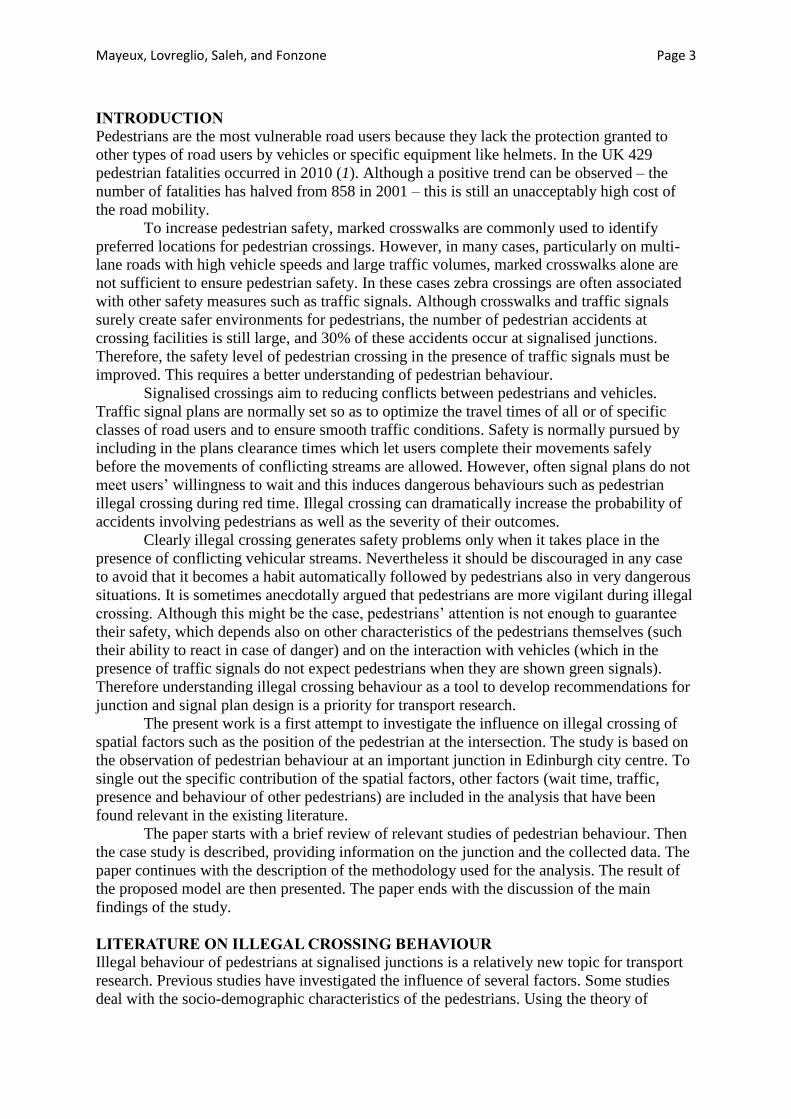
INTRODUCTION
Pedestrians are the most vulnerable road users because they lack the protection granted to
other types of road users by vehicles or specific equipment like helmets. In the UK 429
pedestrian fatalities occurred in 2010 (1). Although a positive trend can be observed – the
number of fatalities has halved from 858 in 2001 – this is still an unacceptably high cost of
the road mobility.
To increase pedestrian safety, marked crosswalks are commonly used to identify
preferred locations for pedestrian crossings. However, in many cases, particularly on multi-
lane roads with high vehicle speeds and large traffic volumes, marked crosswalks alone are
not sufficient to ensure pedestrian safety. In these cases zebra crossings are often associated
with other safety measures such as traffic signals. Although crosswalks and traffic signals
surely create safer environments for pedestrians, the number of pedestrian accidents at
crossing facilities is still large, and 30% of these accidents occur at signalised junctions.
Therefore, the safety level of pedestrian crossing in the presence of traffic signals must be
improved. This requires a better understanding of pedestrian behaviour.
Signalised crossings aim to reducing conflicts between pedestrians and vehicles.
Traffic signal plans are normally set so as to optimize the travel times of all or of specific
classes of road users and to ensure smooth traffic conditions. Safety is normally pursued by
including in the plans clearance times which let users complete their movements safely
before the movements of conflicting streams are allowed. However, often signal plans do not
meet users’ willingness to wait and this induces dangerous behaviours such as pedestrian
illegal crossing during red time. Illegal crossing can dramatically increase the probability of
accidents involving pedestrians as well as the severity of their outcomes.
Clearly illegal crossing generates safety problems only when it takes place in the
presence of conflicting vehicular streams. Nevertheless it should be discouraged in any case
to avoid that it becomes a habit automatically followed by pedestrians also in very dangerous
situations. It is sometimes anecdotally argued that pedestrians are more vigilant during illegal
crossing. Although this might be the case, pedestrians’ attention is not enough to guarantee
their safety, which depends also on other characteristics of the pedestrians themselves (such
their ability to react in case of danger) and on the interaction with vehicles (which in the
presence of traffic signals do not expect pedestrians when they are shown green signals).
Therefore understanding illegal crossing behaviour as a tool to develop recommendations for
junction and signal plan design is a priority for transport research.
The present work is a first attempt to investigate the influence on illegal crossing of
spatial factors such as the position of the pedestrian at the intersection. The study is based on
the observation of pedestrian behaviour at an important junction in Edinburgh city centre. To
single out the specific contribution of the spatial factors, other factors (wait time, traffic,
presence and behaviour of other pedestrians) are included in the analysis that have been
found relevant in the existing literature.
The paper starts with a brief review of relevant studies of pedestrian behaviour. Then
the case study is described, providing information on the junction and the collected data. The
paper continues with the description of the methodology used for the analysis. The result of
the proposed model are then presented. The paper ends with the discussion of the main
findings of the study.
LITERATURE ON ILLEGAL CROSSING BEHAVIOUR
Illegal behaviour of pedestrians at signalised junctions is a relatively new topic for transport
research. Previous studies have investigated the influence of several factors. Some studies
deal with the socio-demographic characteristics of the pedestrians. Using the theory of
Mayeux, Lovreglio, Saleh, and Fonzone Page 4
planned behaviour, it has been proven that young pedestrians have a higher attitude to
commit violations than adult (2, 3, 4). Perception of and approach to risk have also been
explored. Sueur et al (5) study how culture influences the perception of risk of pedestrians.
They find out that the Japanese pedestrians are more cautious than the French ones. Levy (6)
observes that young pedestrians accept greater risks than the older ones. Similar findings are
found by Holland and Hill (7), who report that older pedestrians seem to be more careful
before attempting to cross. A possible explanation of the greater attentiveness shown by older
pedestrians is that they cannot always assess gaps correctly (8). Several studies have been
carried out to understand the influence of gender. Most of them conclude that males are more
likely to cross illegally (3, 6, 7, 9, 10). Men seem to be more influenced by the traffic flow
conditions, while the behaviour of other pedestrians at the junction has a greater effect on
women (11, 12).
Some researchers examine the role of distraction on the behaviour of pedestrians
while crossing (e.g. 13, 14, 15). Bunghum et al (13) argue that pedestrians who perform
other activities while crossing – such as eating, drinking or talking – tend to be less vigilant
increasing their exposure to accidents.
Rosenbloom (9) and Faria et al (10) study the effect of social influences on crossing
behaviour. They show that the probability of deciding to cross illegally decreases as the
number of pedestrian waiting at the sidewalk increases. However, the two studies provide
different results concerning the importance of the influence of the pedestrians who are
already crossing. Moreover, according to Faria et al (10) pedestrian are more likely to cross if
their close neighbour tries to do it.
The influence of signal plans is studied by different authors. For instance, some
studies prove that long red cycles increase the occurrences of illegal crossing (16, 17). Many
studies agree on the positive effect of countdown displays since they contribute to improve
the pedestrian experience of waiting (17, 18, 19).
The brief literature review provided above points out that most of the research
focusing on the effects of junction setting and layout on illegal crossing deal with temporal
factors (i.e. red cycle and remaining waiting time provided by countdown displays) rather
than spatial factors (i.e. location of the pedestrian, width of the carriageway etc.).
CASE STUDY
Junction
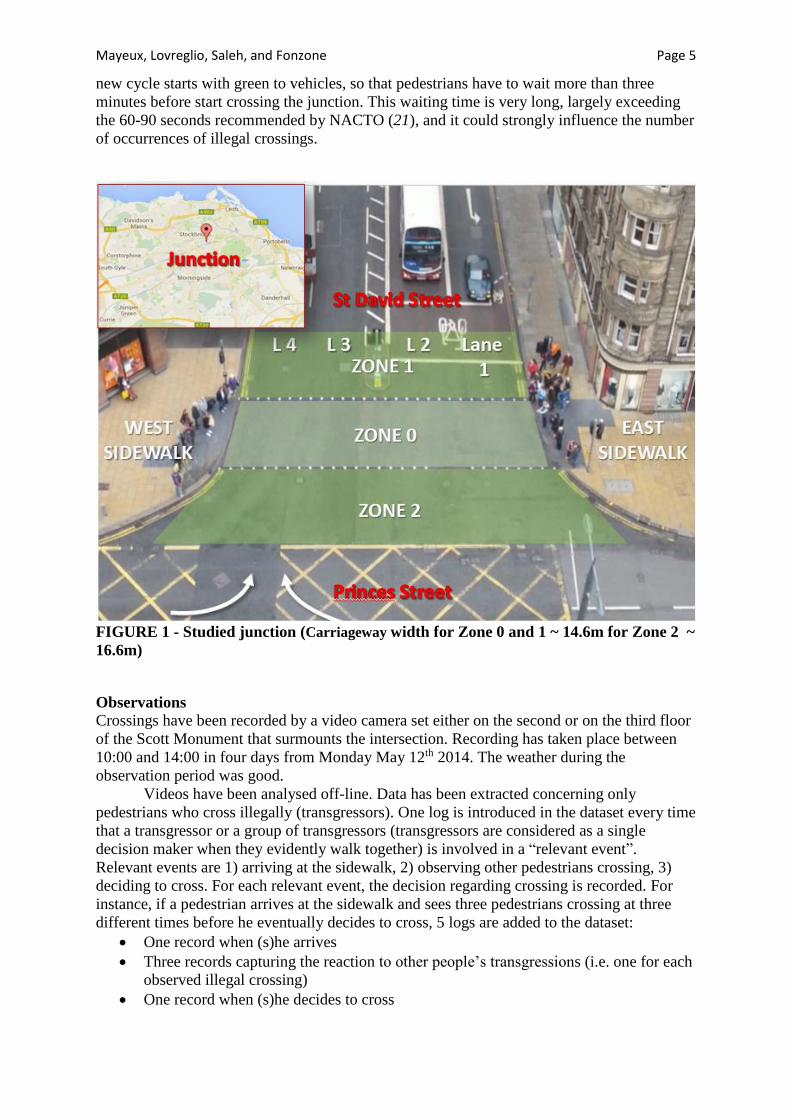
For this study, the pedestrian behaviour has been observed at the signalised T-junction
between Princes Street and St David Street in Edinburgh, UK (Figure 1. Note that being the
junction in the UK, the driving is on the left). The intersection is located in the city centre,
close to the main train station. The land use of the area is typical of CBD areas, characterised
by the presence of numerous commercial activities. There is no official statistic regarding
flows at the junction. The annual average daily flow in Princes Street is 6,591 motorised
vehicles east (where private cars are not allowed) and 5,211 west of the junction (20). Given
the configuration of the junction, pedestrians waiting at the sidewalk cannot see the aspect of
the traffic signals for vehicles in Princes Street, so they cannot easily predict whether and
from what direction vehicles turning in St David Street will arrive when the pedestrian signal
is red.
The study concerns the pedestrian flows along the West-East direction, parallel to
Princes Street. These flows are regulated by traffic signals. The length of the normal traffic
signal cycle is 112 seconds; the green for the considered pedestrian crossings lasts 10
seconds. Between the green and the red light for pedestrians, no information is shown for 3
seconds. A tram line has recently become operative along Princes Street. The signal plan is
modified when the tram passes and red is shown to all other users. At the end of the red, a
Mayeux, Lovreglio, Saleh, and Fonzone Page 5
new cycle starts with green to vehicles, so that pedestrians have to wait more than three
minutes before start crossing the junction. This waiting time is very long, largely exceeding
the 60-90 seconds recommended by NACTO (21), and it could strongly influence the number
of occurrences of illegal crossings.
FIGURE 1 - Studied junction (Carriageway width for Zone 0 and 1 ~ 14.6m for Zone 2 ~
16.6m)
Observations
Crossings have been recorded by a video camera set either on the second or on the third floor
of the Scott Monument that surmounts the intersection. Recording has taken place between
10:00 and 14:00 in four days from Monday May 12th 2014. The weather during the
observation period was good.
Videos have been analysed off-line. Data has been extracted concerning only
pedestrians who cross illegally (transgressors). One log is introduced in the dataset every time
that a transgressor or a group of transgressors (transgressors are considered as a single
decision maker when they evidently walk together) is involved in a “relevant event”.
Relevant events are 1) arriving at the sidewalk, 2) observing other pedestrians crossing, 3)
deciding to cross. For each relevant event, the decision regarding crossing is recorded. For
instance, if a pedestrian arrives at the sidewalk and sees three pedestrians crossing at three
different times before he eventually decides to cross, 5 logs are added to the dataset:
One record when (s)he arrives
Three records capturing the reaction to other people’s transgressions (i.e. one for each
observed illegal crossing)
One record when (s)he decides to cross
Mayeux, Lovreglio, Saleh, and Fonzone Page 6
Clearly the decision is “not crossing” in the first four logs and “crossing” in the last
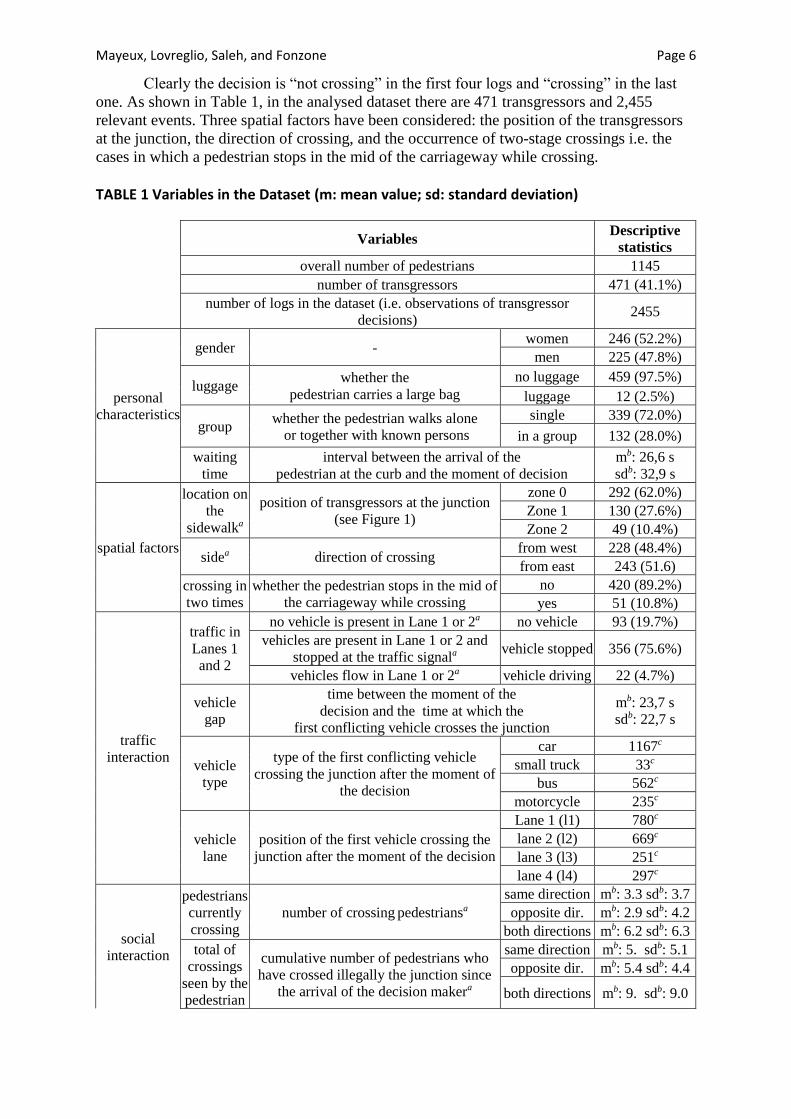
one. As shown in Table 1, in the analysed dataset there are 471 transgressors and 2,455
relevant events. Three spatial factors have been considered: the position of the transgressors
at the junction, the direction of crossing, and the occurrence of two-stage crossings i.e. the
cases in which a pedestrian stops in the mid of the carriageway while crossing.
TABLE 1 Variables in the Dataset (m: mean value; sd: standard deviation)
Variables Descriptive
statistics
overall number of pedestrians 1145
number of transgressors 471 (41.1%)
number of logs in the dataset (i.e. observations of transgressor
decisions) 2455
personal
characteristics
gender - women 246 (52.2%)
men 225 (47.8%)
luggage whether the
pedestrian carries a large bag
no luggage 459 (97.5%)
luggage 12 (2.5%)
group whether the pedestrian walks alone
or together with known persons
single 339 (72.0%)
in a group 132 (28.0%)
waiting
time
interval between the arrival of the
pedestrian at the curb and the moment of decision
mb: 26,6 s
sdb: 32,9 s
spatial factors
location on
the
sidewalka
position of transgressors at the junction
(see Figure 1)
zone 0 292 (62.0%)
Zone 1 130 (27.6%)
Zone 2 49 (10.4%)
sidea direction of crossing from west 228 (48.4%)
from east 243 (51.6)
crossing in
two times
whether the pedestrian stops in the mid of
the carriageway while crossing
no 420 (89.2%)
yes 51 (10.8%)
traffic
interaction
traffic in
Lanes 1
and 2
no vehicle is present in Lane 1 or 2a no vehicle 93 (19.7%)
vehicles are present in Lane 1 or 2 and
stopped at the traffic signala vehicle stopped 356 (75.6%)
vehicles flow in Lane 1 or 2a vehicle driving 22 (4.7%)
vehicle
gap
time between the moment of the
decision and the time at which the
first conflicting vehicle crosses the junction
mb: 23,7 s
sdb: 22,7 s
vehicle
type
type of the first conflicting vehicle
crossing the junction after the moment of
the decision
car 1167c
small truck 33c
bus 562c
motorcycle 235c
vehicle
lane
position of the first vehicle crossing the
junction after the moment of the decision
Lane 1 (l1) 780c
lane 2 (l2) 669c
lane 3 (l3) 251c
lane 4 (l4) 297c
social
interaction
pedestrians
currently
crossing
number of crossing pedestriansa
same direction mb: 3.3 sdb: 3.7
opposite dir. mb: 2.9 sdb: 4.2
both directions mb: 6.2 sdb: 6.3
total of
crossings
seen by the
pedestrian
cumulative number of pedestrians who
have crossed illegally the junction since
the arrival of the decision makera
same direction mb: 5. sdb: 5.1
opposite dir. mb: 5.4 sdb: 4.4
both directions mb: 9. sdb: 9.0
Mayeux, Lovreglio, Saleh, and Fonzone Page 7
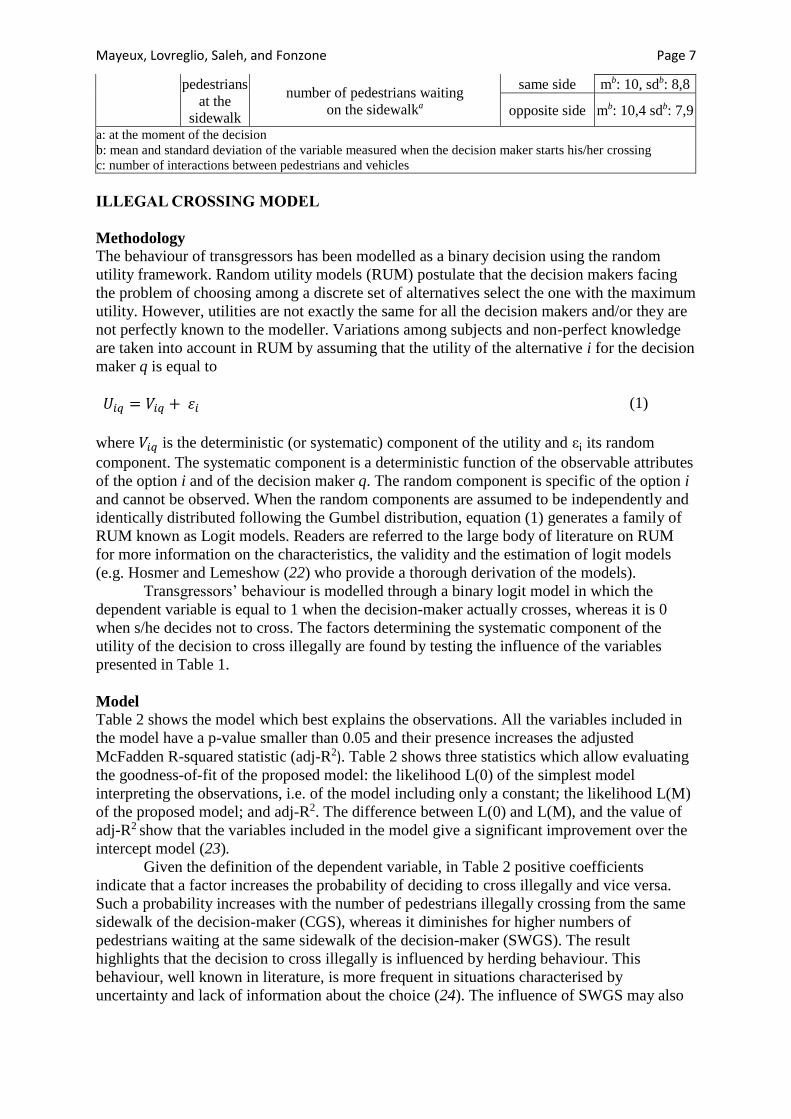
pedestrians
at the
sidewalk
number of pedestrians waiting
on the sidewalka
same side mb: 10, sdb: 8,8
opposite side mb: 10,4 sdb: 7,9
a: at the moment of the decision
b: mean and standard deviation of the variable measured when the decision maker starts his/her crossing
c: number of interactions between pedestrians and vehicles
ILLEGAL CROSSING MODEL
Methodology
The behaviour of transgressors has been modelled as a binary decision using the random
utility framework. Random utility models (RUM) postulate that the decision makers facing
the problem of choosing among a discrete set of alternatives select the one with the maximum
utility. However, utilities are not exactly the same for all the decision makers and/or they are
not perfectly known to the modeller. Variations among subjects and non-perfect knowledge
are taken into account in RUM by assuming that the utility of the alternative i for the decision
maker q is equal to
𝑈𝑖𝑞 = 𝑉𝑖𝑞 + 𝜀𝑖 (1)
where 𝑉𝑖𝑞 is the deterministic (or systematic) component of the utility and εi its random
component. The systematic component is a deterministic function of the observable attributes
of the option i and of the decision maker q. The random component is specific of the option i
and cannot be observed. When the random components are assumed to be independently and
identically distributed following the Gumbel distribution, equation (1) generates a family of
RUM known as Logit models. Readers are referred to the large body of literature on RUM
for more information on the characteristics, the validity and the estimation of logit models
(e.g. Hosmer and Lemeshow (22) who provide a thorough derivation of the models).
Transgressors’ behaviour is modelled through a binary logit model in which the
dependent variable is equal to 1 when the decision-maker actually crosses, whereas it is 0
when s/he decides not to cross. The factors determining the systematic component of the
utility of the decision to cross illegally are found by testing the influence of the variables
presented in Table 1.
Model
Table 2 shows the model which best explains the observations. All the variables included in
the model have a p-value smaller than 0.05 and their presence increases the adjusted
McFadden R-squared statistic (adj-R2). Table 2 shows three statistics which allow evaluating
the goodness-of-fit of the proposed model: the likelihood L(0) of the simplest model
interpreting the observations, i.e. of the model including only a constant; the likelihood L(M)
of the proposed model; and adj-R2. The difference between L(0) and L(M), and the value of
adj-R2 show that the variables included in the model give a significant improvement over the
intercept model (23).
Given the definition of the dependent variable, in Table 2 positive coefficients
indicate that a factor increases the probability of deciding to cross illegally and vice versa.
Such a probability increases with the number of pedestrians illegally crossing from the same
sidewalk of the decision-maker (CGS), whereas it diminishes for higher numbers of
pedestrians waiting at the same sidewalk of the decision-maker (SWGS). The result
highlights that the decision to cross illegally is influenced by herding behaviour. This
behaviour, well known in literature, is more frequent in situations characterised by
uncertainty and lack of information about the choice (24). The influence of SWGS may also
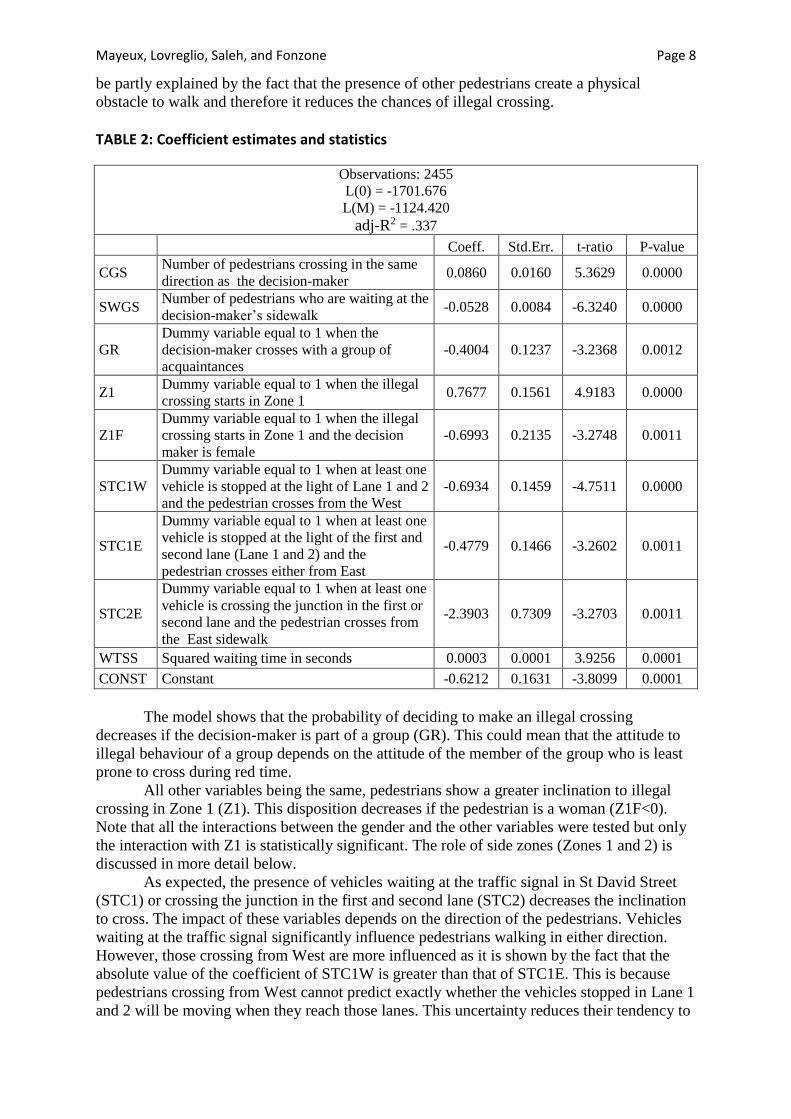
Mayeux, Lovreglio, Saleh, and Fonzone Page 8
be partly explained by the fact that the presence of other pedestrians create a physical
obstacle to walk and therefore it reduces the chances of illegal crossing.
TABLE 2: Coefficient estimates and statistics
Observations: 2455
L(0) = -1701.676
L(M) = -1124.420
adj-R2 = .337
Coeff. Std.Err. t-ratio P-value
CGS Number of pedestrians crossing in the same
direction as the decision-maker 0.0860 0.0160 5.3629 0.0000
SWGS Number of pedestrians who are waiting at the
decision-maker’s sidewalk -0.0528 0.0084 -6.3240 0.0000
GR
Dummy variable equal to 1 when the
decision-maker crosses with a group of
acquaintances
-0.4004 0.1237 -3.2368 0.0012
Z1 Dummy variable equal to 1 when the illegal
crossing starts in Zone 1 0.7677 0.1561 4.9183 0.0000
Z1F
Dummy variable equal to 1 when the illegal
crossing starts in Zone 1 and the decision
maker is female
-0.6993 0.2135 -3.2748 0.0011
STC1W
Dummy variable equal to 1 when at least one
vehicle is stopped at the light of Lane 1 and 2
and the pedestrian crosses from the West
-0.6934 0.1459 -4.7511 0.0000
STC1E
Dummy variable equal to 1 when at least one
vehicle is stopped at the light of the first and
second lane (Lane 1 and 2) and the
pedestrian crosses either from East
-0.4779 0.1466 -3.2602 0.0011
STC2E
Dummy variable equal to 1 when at least one
vehicle is crossing the junction in the first or
second lane and the pedestrian crosses from
the East sidewalk
-2.3903 0.7309 -3.2703 0.0011
WTSS Squared waiting time in seconds 0.0003 0.0001 3.9256 0.0001
CONST Constant -0.6212 0.1631 -3.8099 0.0001
The model shows that the probability of deciding to make an illegal crossing
decreases if the decision-maker is part of a group (GR). This could mean that the attitude to
illegal behaviour of a group depends on the attitude of the member of the group who is least
prone to cross during red time.
All other variables being the same, pedestrians show a greater inclination to illegal
crossing in Zone 1 (Z1). This disposition decreases if the pedestrian is a woman (Z1F<0).
Note that all the interactions between the gender and the other variables were tested but only
the interaction with Z1 is statistically significant. The role of side zones (Zones 1 and 2) is
discussed in more detail below.
As expected, the presence of vehicles waiting at the traffic signal in St David Street
(STC1) or crossing the junction in the first and second lane (STC2) decreases the inclination
to cross. The impact of these variables depends on the direction of the pedestrians. Vehicles
waiting at the traffic signal significantly influence pedestrians walking in either direction.
However, those crossing from West are more influenced as it is shown by the fact that the
absolute value of the coefficient of STC1W is greater than that of STC1E. This is because
pedestrians crossing from West cannot predict exactly whether the vehicles stopped in Lane 1
and 2 will be moving when they reach those lanes. This uncertainty reduces their tendency to
Mayeux, Lovreglio, Saleh, and Fonzone Page 9
cross. The presence of vehicles in motion in Lane 1 and 2 is a deterrent only to decision-
makers coming from East. This might be explained by the fact that in most cases west-bound
pedestrians cannot avoid crossing the trajectories of the vehicles travelling in Lane 1 and 2.
Instead the pedestrians going towards East can stop halfway if there are still vehicles in
motion in Lane 1 and 2 when they reach the middle of the junction. In addition, the vehicles
travelling when the east-bound decision-makers start crossing may have cleared the junction
when the pedestrians reach Lane 1 and 2. The value of the coefficients of STC2E and STC1E
shows that the presence of vehicles in motion discourages west-bound pedestrians from
crossing more than the presence of stopped vehicles. The influence of the vehicles coming
from Princes Street have been studied by considering several potential critical values of gaps.
No significant result has been detected.
The last variable included in the model is the squared waiting time (WTSS). The sign
of the coefficient confirms that the longer the decision-makers wait at the sidewalk, the
higher is their propensity to cross illegally.
The model includes also a constant which is the value of the utility function when all
the aforementioned variables are 0. In this particular case (the decision-maker walks alone,
has just arrived at the junction, and starts crossing from Zone 0 or 2; there is nobody else
crossing or waiting; there is no vehicle waiting or crossing the junction in Lane 1 and 2), the
probability of deciding an illegal crossing is equal to 0.30.
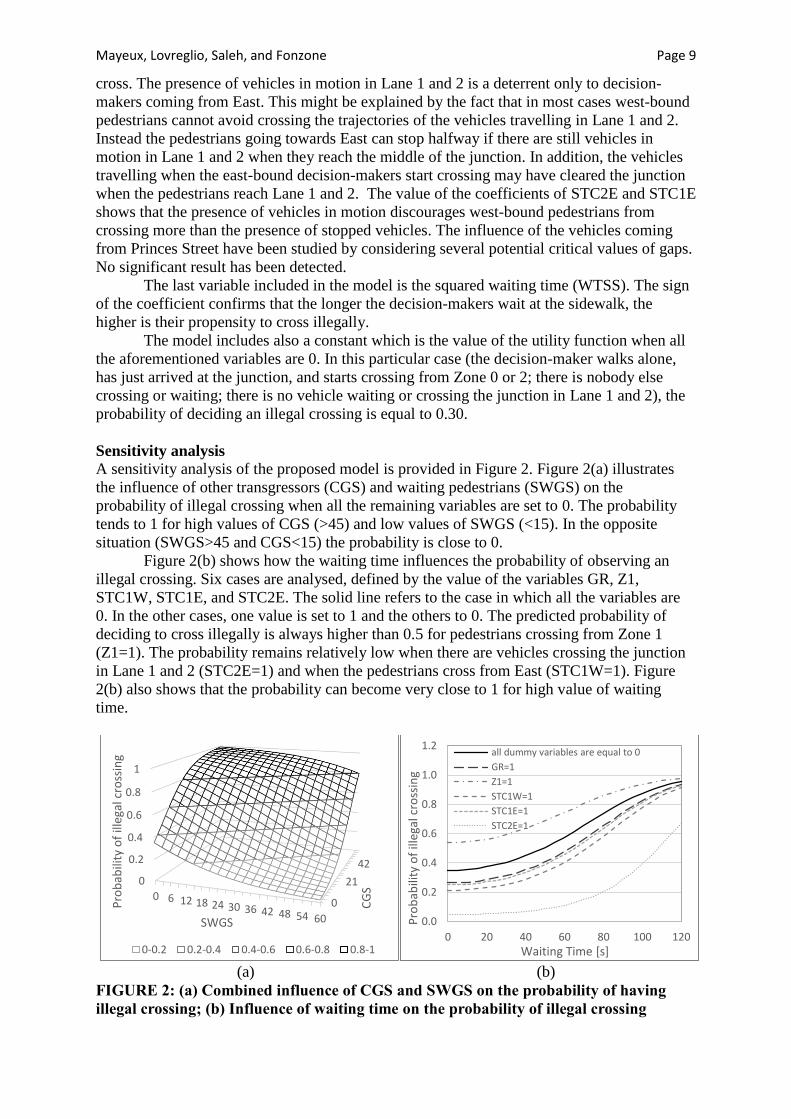
Sensitivity analysis
A sensitivity analysis of the proposed model is provided in Figure 2. Figure 2(a) illustrates
the influence of other transgressors (CGS) and waiting pedestrians (SWGS) on the
probability of illegal crossing when all the remaining variables are set to 0. The probability
tends to 1 for high values of CGS (>45) and low values of SWGS (<15). In the opposite
situation (SWGS>45 and CGS<15) the probability is close to 0.
Figure 2(b) shows how the waiting time influences the probability of observing an
illegal crossing. Six cases are analysed, defined by the value of the variables GR, Z1,
STC1W, STC1E, and STC2E. The solid line refers to the case in which all the variables are
0. In the other cases, one value is set to 1 and the others to 0. The predicted probability of
deciding to cross illegally is always higher than 0.5 for pedestrians crossing from Zone 1
(Z1=1). The probability remains relatively low when there are vehicles crossing the junction
in Lane 1 and 2 (STC2E=1) and when the pedestrians cross from East (STC1W=1). Figure
2(b) also shows that the probability can become very close to 1 for high value of waiting
time.
(a)
(b)
FIGURE 2: (a) Combined influence of CGS and SWGS on the probability of having
illegal crossing; (b) Influence of waiting time on the probability of illegal crossing
0
21
42
0
0.2
0.4
0.6
0.8
1
0 6 12 18 24 30 36 42 48 54 60
CG
S
Pro
bab
ility
of
illeg
al c
ross
ing
SWGS
0-0.2 0.2-0.4 0.4-0.6 0.6-0.8 0.8-1
0.0
0.2
0.4
0.6
0.8
1.0
1.2
0 20 40 60 80 100 120
Pro
bab
ility
of
illeg
al c
ross
ing
Waiting Time [s]
all dummy variables are equal to 0
GR=1
Z1=1
STC1W=1
STC1E=1
STC2E=1
Mayeux, Lovreglio, Saleh, and Fonzone Page 10
INFLUENCE OF THE CROSSING ZONE
As already mentioned, the probability of illegal crossing increases when the pedestrians are in
Zone 1 (Z1>0). This inclination decreases if the pedestrian is a woman (Z1F<0). This result
has two potential explanations. Firstly, it can be argued that it is due to the presence of the
pedestrian refuge between lanes 2 and 3 in Zone 1. In fact, the decision-makers might be
encouraged to cross with red by the fact that they can stop in the island if there are potentially
conflicting vehicles in Lane 1 and 2 while they cross. This hypothesis has been tested by
considering the occurrences of illegal crossings in two stages. Two-stage crossings from
Zone 1 (17 cases out of 130 crossings) have been compared to the analogous behaviour from
Zone 0 (33 cases out of 292 crossings) using a Chi-Square test. The obtained p-value of 0.602
shows that there is no significant association between crossing in two stages and the zones.
The lack of relationship can have two reasons: on the one hand, the presence of the refuge
island creates a safe enough area also in Zone 0. On the other hand, pedestrians that start
crossing from Zone 0 have always the chance to change zone while crossing to use the
pedestrian island.
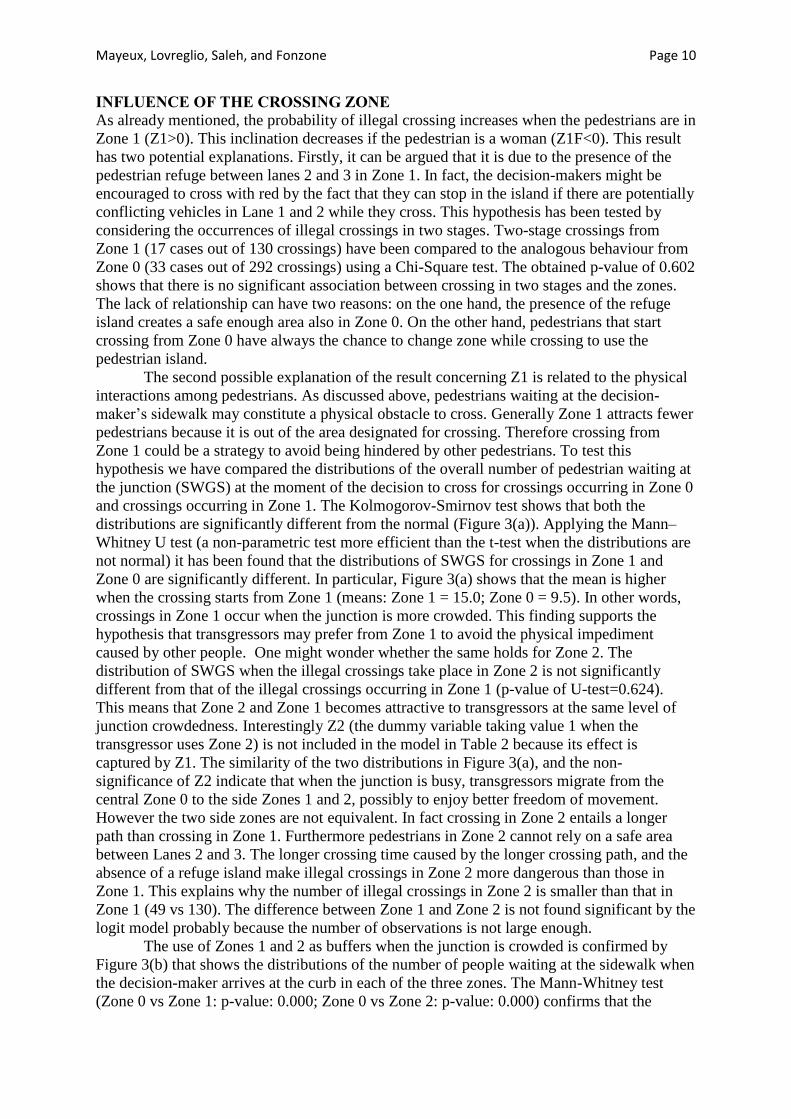
The second possible explanation of the result concerning Z1 is related to the physical
interactions among pedestrians. As discussed above, pedestrians waiting at the decision-
maker’s sidewalk may constitute a physical obstacle to cross. Generally Zone 1 attracts fewer
pedestrians because it is out of the area designated for crossing. Therefore crossing from
Zone 1 could be a strategy to avoid being hindered by other pedestrians. To test this
hypothesis we have compared the distributions of the overall number of pedestrian waiting at
the junction (SWGS) at the moment of the decision to cross for crossings occurring in Zone 0
and crossings occurring in Zone 1. The Kolmogorov-Smirnov test shows that both the
distributions are significantly different from the normal (Figure 3(a)). Applying the Mann–
Whitney U test (a non-parametric test more efficient than the t-test when the distributions are
not normal) it has been found that the distributions of SWGS for crossings in Zone 1 and
Zone 0 are significantly different. In particular, Figure 3(a) shows that the mean is higher
when the crossing starts from Zone 1 (means: Zone 1 = 15.0; Zone 0 = 9.5). In other words,
crossings in Zone 1 occur when the junction is more crowded. This finding supports the
hypothesis that transgressors may prefer from Zone 1 to avoid the physical impediment
caused by other people. One might wonder whether the same holds for Zone 2. The
distribution of SWGS when the illegal crossings take place in Zone 2 is not significantly
different from that of the illegal crossings occurring in Zone 1 (p-value of U-test=0.624).
This means that Zone 2 and Zone 1 becomes attractive to transgressors at the same level of
junction crowdedness. Interestingly Z2 (the dummy variable taking value 1 when the
transgressor uses Zone 2) is not included in the model in Table 2 because its effect is
captured by Z1. The similarity of the two distributions in Figure 3(a), and the non-
significance of Z2 indicate that when the junction is busy, transgressors migrate from the
central Zone 0 to the side Zones 1 and 2, possibly to enjoy better freedom of movement.
However the two side zones are not equivalent. In fact crossing in Zone 2 entails a longer
path than crossing in Zone 1. Furthermore pedestrians in Zone 2 cannot rely on a safe area
between Lanes 2 and 3. The longer crossing time caused by the longer crossing path, and the
absence of a refuge island make illegal crossings in Zone 2 more dangerous than those in
Zone 1. This explains why the number of illegal crossings in Zone 2 is smaller than that in
Zone 1 (49 vs 130). The difference between Zone 1 and Zone 2 is not found significant by the
logit model probably because the number of observations is not large enough.
The use of Zones 1 and 2 as buffers when the junction is crowded is confirmed by
Figure 3(b) that shows the distributions of the number of people waiting at the sidewalk when
the decision-maker arrives at the curb in each of the three zones. The Mann-Whitney test
(Zone 0 vs Zone 1: p-value: 0.000; Zone 0 vs Zone 2: p-value: 0.000) confirms that the
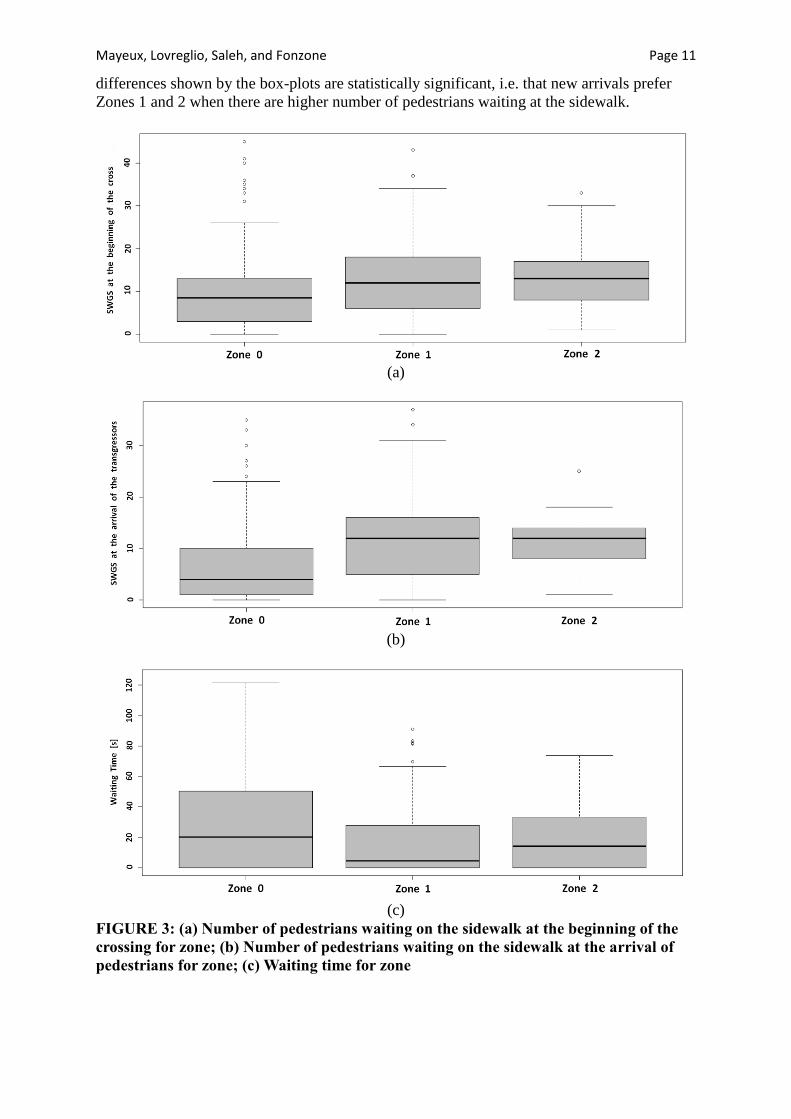
Mayeux, Lovreglio, Saleh, and Fonzone Page 11
differences shown by the box-plots are statistically significant, i.e. that new arrivals prefer
Zones 1 and 2 when there are higher number of pedestrians waiting at the sidewalk.
(a)
(b)
(c)
FIGURE 3: (a) Number of pedestrians waiting on the sidewalk at the beginning of the
crossing for zone; (b) Number of pedestrians waiting on the sidewalk at the arrival of
pedestrians for zone; (c) Waiting time for zone
Mayeux, Lovreglio, Saleh, and Fonzone Page 12
From Figure 3(c) it can be seen that transgressors tend to wait less before crossing
when they use Zone 1 (the waiting time is 17.6 sec or less for 1 transgressor out of 2) than
when they cross in the other two zones (the 50th percentiles are 30.7 and 23.5 sec for Zone 0
and 2 respectively). This confirms that Zone 1 makes illegal crossing easier. Note that the
25th percentile is 0 for all the zones, meaning that in all cases at least 1 transgressor out of 4
crosses the junction without stopping at all at the traffic signal.
DISCUSSION AND CONCLUSIONS
Although junctions have become safer for pedestrians in the UK in the recent years, they still
claim a very high cost in terms of pedestrian fatalities. Research efforts are needed to
improve the safety of crossing at signalised and non-signalised junction. This research has
focused on illegal crossing at signalised junction. While illegal crossing might not be
immediately related to larger numbers of accidents involving pedestrians, it can induce a
wrong habit leading to more hazardous pedestrian behaviour in any circumstance. Therefore
understanding and finding ways to prevent illegal crossing is an important goal for transport
research. The relation between illegal crossing, and number and severity of accidents is an
important topic for future research in the field.
Past studies of crossing at signalised junctions have identified the influence of socio-
demographic factors, distractions, herding behaviour, and wait times. This study has looked
into the impact of spatial factors such as the position of the transgressors, their direction, and
the possibility of dividing the crossings into two stages given the presence of a refuge island
in the middle of the junction. The main aim is not to provide recommendations to
practitioners but to confirm the relevance of spatial factors and to draw initial insights on
their influence to inform further research. The tendency to cross illegally has been studied by
observing the behaviour of pedestrians at a busy signalised junction in Edinburgh city centre.
The data concerning transgressors has been used to fit a binary logit model, in which the
dependent variable is equal to 1 when the decision-maker crosses illegally.
Regarding the spatial factors, the model proves that the probability of illegal
behaviour is higher in the lateral zones of the designated pedestrian crossing area. The side
areas are used as buffers by transgressors when the junction is crowded. The reaction of the
pedestrians to the presence of vehicles depends on their location. Pedestrians far from the
vehicles are less deterred to behave illegally by stopped vehicles than those on the opposite
side. On the contrary the former group of decision-makers is strongly discouraged to cross
when the vehicles are in motion but no significant impact of moving traffic has been detected
on the former group. As explained above, this difference of behaviour may be explained by
the concurrence of two factors: 1) having to cross two lanes before reaching the middle of the
junction, further pedestrians are less certain of the situation of the conflicting vehicles when
they will reach them. Hence they are more prone to expect that the stopped vehicles will be
moving and the moving ones will be stopped. 2) The presence of the refuge island encourages
crossings from the far side, because pedestrians know that they can stop there in case of
danger. It has to be noted that no significant difference has been found between crossing in
one stage and crossing in two stages. Of course this may due to the size of the sample. A
limitation of the adopted methodology is that it has provided insights only on the impacts of
the traffic coming from the road perpendicular to the crossing direction (St David Street),
while it has not been possible to draw any conclusion concerning the influence of the vehicles
coming from the parallel road (Princes Street).
Social interactions are found important as well. The probability of illegal behaviour
tends to 1 when the decision-makers observe many illegal crossings and there are few persons
waiting at their sidewalk. While the former result is surely a case of herding behaviour, the
latter is probably to be ascribed partly to the herding behaviour and partly to the greater
Mayeux, Lovreglio, Saleh, and Fonzone Page 13
freedom of movement when there are few persons at the junction. Finally the research
confirms the well-known increase in the attitude to illegal crossing due to long wait times.
The study has confirmed the relevance of spatial factors for illegal crossing behaviour
but of course a single case study is not enough to draw a complete picture of such an
influence and so to provide junction and signal plan design recommendations. Further work
should concern junctions with different layouts (number of arms, width, refuge islands,
railings), traffic signal organisations (cycle times, implementation of pedestrian actuated
signals), vehicle and pedestrian flows. The influence of whether conditions should be also
investigated. It is important to develop the methodology so that the impact of all traffic
streams conflicting with the pedestrian movements are captured. The role of two-stage
crossing should be understood better, as well as that of the attempt of avoiding physical
obstacles in crossing using side zones. Data collection techniques should be improved so that
data can be recorded about the age (although socio-demographic features of the pedestrians
might not be relevant for the definition of regular standards, their influence is important in
particular cases such as, for instance, when junctions close to schools are designed) and the
level of attention of the pedestrians while crossing.
REFERENCES
1. Brandstaetter, C. Annual Statistical Report. Deliverable D3.9 of the EC FP7 project
DaCoTA, 2012
2. Evans, D., and P. Norman. Understanding pedestrians’ road crossing decisions: an
application of the theory of planned behaviour. Health Education Research 13, 1998,
pp. 481–489.
3. Moyano Diaz, E. Theory of planned behavior and pedestrians’ intentions to violate
traffic regulations. Transportation Research Part F: Traffic. Psychology and Behaviour,
Vol. 5, 2002, pp. 169–175.
4. Zhou, R., W. J. Horrey, and R. Yu. The effect of conformity tendency on pedestrians’
road-crossing intentions in China: An application of the theory of planned behavior.
Accident Analysis and Prevention, Vol. 41, 2009, pp. 491–497.
5. Sueur, C., B. Class, C. Hamm, X. Meyer, and M. Pelé. Different risk thresholds in
pedestrian road crossing behaviour: A comparison of French and Japanese approaches.
Accident Analysis and Prevention, Vol. 58, 2013, pp. 59–63.
6. Levy, D. T. Youth and traffic safety: the effects of driving age, experience, and
education. Accident Analysis and Prevention, Vol. 22, 1990, pp. 327–334.
7. Holland, C., R. Hill. The effect of age, gender and driver status on pedestrians’
intentions to cross the road in risky situations. Accident Analysis and Prevention, Vol.
39, 2007, pp. 224–237.
8. Oxley, J., B. Fildes, E. Ihsen, J. Charlton, and R. Days, Differences in traffic
judgements between young and old adult pedestrians. Accident Analysis and Prevention,
Vol. 29, 1997, pp. 839–847.
9. Rosenbloom, T. Crossing at a red light: behaviour of individuals and groups.
Transportation Research Part F: Traffic. Psychology and Behaviour, Vol. 12, 2009, pp.
389–394.
10. Faria, J.J., S. Krause, and J. Krause. Collective behavior in road crossing pedestrians:
the role of social information. Behavioral Ecology, Vol. 21, 2010, pp. 1236–1242.
11. Yagil, D. Beliefs, motives and situational factors related to pedestrians’ self-reported
behavior at signal-controlled crossings. Transportation Research Part F, Vol. 3, 2000,
pp. 1–13.
12. Tom, A., and M. A. Granié. Gender differences in pedestrian rule compliance and visual
search at signalized and unsignalized crossroads. Accident Analysis and Prevention,
Mayeux, Lovreglio, Saleh, and Fonzone Page 14
Vol. 43, 2011, pp. 1794–1801.
13. Bunghum, T. J., C. Day, and L. J. Henry. The association of distraction and caution
displayed by pedestrians at a lighted crosswalk. Journal of Community Health, Vol. 30,
2005, pp. 269–279.
14. Hatfield, J., and S. Murphy. The effects of mobile phone use on pedestrian crossing
behaviour at signalised and unsignalised intersections. Accident Analysis and
Prevention, Vol. 39, 2007, pp. 197–205.
15. Nasar, J., P. Hecht, and R. Wener. Mobile telephones, distracted attention, and
pedestrian safety. Accident Analysis and Prevention, Vol. 40, 2008, pp. 69–75.
16. Van Houten, R., R., Ellis, and J.K., Kim. Effects of Various Minimum Green Times on
Percentage of Pedestrians Waiting for Midblock “Walk” Signal. Transportation
Research Record, Volume 2002 / 2007 Pedestrians, 2007, pp. 78-83.
17. Brosseau, M., N. Saunier, K. L. Mouel, and L. Miranda-Moreno. The impact of traffic
signals on dangerous pedestrian crossings and violations: a case study in Montreal.
Presented at 91st Annual Meeting of the Transportation Research Board, Washington,
D.C., 2012.
18. Lipovac, K., M. Vujanic, B. Maric, and M. Nesic. Pedestrians’ Behavior at Signalized
Pedestrian Crossings. Journal of Transportation Engineering, Vol. 139, 2013, pp. 165–
172.
19. Keegan, O., and M. O’Mahony. Modifying pedestrian behavior. Transportation
Research Part A, Vol. 37, 2003, pp. 889–901.
20. Government of the United Kingdom, Department for Transport. Traffic counts. http://
dft.gov.uk/traffic-counts. Accesed July 28, 2014.
21. National Association of City Transportation Officials. Urban Street Design Guide.
http://nacto.org/. 2013
22. Hosmer, D., and S. Lemeshow. Applied Logistic Regression. Wiley-Interscience, New
York, 2000.
23. Hensher, D. A., J. M. Rose, and W. H. Greene. Applied Choice Analysis: A Primer.
Cambridge University Press, New York, 2005.
24. Lovreglio, R., A. Fonzone, L. dell’Olio, D. Borri, and A. Ibeas, The Role of Herdng
Behaviour in Exit Choice during Evacuation, Presented at XI Congreso de Ingeniería
del Transporte (CIT 2014), Santander, Spain, 2014.