IDL-2844.pdf - IDRC Digital Library
164
-
Upload
khangminh22 -
Category
Documents
-
view
0 -
download
0
Transcript of IDL-2844.pdf - IDRC Digital Library


The International Development Research Centre is a public corporation created by the Parliament of Canada in 1970 to support research designed to adapt science and technology to the needs of developing countries. The Centre's activity is concentrated in six sectors: agriculture, food, and nutrition sciences; health sciences; information sciences; social sciences; earth and engineering sciences; and communications. IDRC is financed solely by the Parliament of Canada; its policies, however, are set by an international Board of Governors. The Centre's headquarters are in Ottawa, Canada. Regional offices are located in Africa, Asia, Latin America, and the Middle East.
Il existe egalement une versionfr<Jllfaise de cette publication. La edicion espafwla de esta publicacion tambien se encuentra disponible.

IDRC-277e
BASIC SENSORY METHODS
FOR FOOD EVALUATION
B. M. Watts G. L. Ylimaki L. E. Jeffery Department of Foods & Nutrition, Faculty of Human Ecology, University of Manitoba, Winnipeg, Manitoba, Canada
L. G. Elias Institute of Nutrition of Central America and Panama, Guatemala City, Guatemala, Central America
Prepared with the support of
The International Development Research Centre,
Ottawa, Canada

©International Development Research Centre 1989 PO Box 8500, Ottawa, Ontario, Canada KlG 3H9
Watts,B.M. Ylimaki, G .L. Jeffery, L.E. Elias, L.G.
IDRC-277e Basic sensory methods for food evaluation. Ottawa, Ont., IDRC, 1989. x + 160 p.: ill.
{festing/, /food technology/, /agricultural products/, /consumer behaviour/, /nutritive value/ - /planning/, /group discussion/, /work environment/, /hand tools/, /statistical analysis/, /manuals/.
UOC: 664.001.5:339.4 ISBN: 0-88936-563-6
A microfiche edition is available.
This work was carried out with the aid of a gra7JJJromJ.l}e /nJernational Developmenl Research Ce'!"e. The views expressed i~Jhif P,,u~.li~Qfion fl'"e t~se of the a~~ors and do not necessarily represenJ those of IDR9; the.DepartmenJ o'f:P,ood,s and Nutrition at the University of Manitoba, or the I nstitije of N f#r.ft~oa af r; (f.IJra(Arfu:.rica and Panama. Menlion of a proprietary name does rlbt conStitute endorsemenJ pf the product and is given only for information.

CONTENTS
FOREWORD . . . . . . . . . . . . . . . . . . . . . . . . . . . . . . . . . . . . . . . . . . . . . ix
PREFACE ................................................. 1
INTRODUCTION .......................................... 5
Chapter 1 Using Product-oriented and Consumer-oriented Testing ........................................ 7
1.1 CONSUMER-ORIENTED TESTING ............... · 8 1.2 PRODUCT-ORIENTED TESTING ................. 9
Chapter 2 Designing Sensory Testing Facilities . . . . . . . . . . . . . . 11
2.1 PERMANENT SENSORY FACILITIES ............ 11 2.1.1 Food Preparation Area . . . . . . . . . . . . . . . . . . 12 2.1.2 Panel Discussion Area . . . . . . . . . . . . . . . . . . 13 2.1.3 PanelBooth Area . . . . . . . . . . . . . . . . . . . . . . 14 2.1.4 Office Area . . . . . . . . . . . . . . . . . . . . . . . . . . . 18 2.1.5 Supplies for Sensory Testing ............. 19
2.2 TEMPORARY SENSORY FACILITIES ............ 23 2.2.1 Food Preparation Area .................. 23 2.2.2 Panel Area . . . . . . . . . . . . . . . . . . . . . . . . . . . . 25 2.2.3 Desk Area . . . . . . . . . . . . . . . . . . . . . . . . . . . . 25 2.2.4 Supplies for Sensory Testing . . . . . . . . . . . . . 25
2.3 DESIGN OF A SIMPLE SENSORY TESTING LABORATORY ............................... 26
Chapter 3 Establishing Sensory Panels . . . . . . . . . . . . . . . . . . . . . 29
3.1 RECRUITING PANELISTS ...................... 29 3.2 ORIENTING PANELISTS ....................... 30 3.3 SCREENING PANELISTS FOR TRAINED PANELS . 31 3.4 TRAINING PANELISTS ........................ 32 3.5 MONITORING PANELISTS' PERFORMANCE ..... 33 3.6 MOTIVATING PANELISTS ..................... 35
iii

Chapter 4 Conducting Sensory Tests ....................... 37
4.1 SAMPLING FOOD FOR SENSORY TESTING ...... 37 4.2 PREPARING SAMPLES FOR
SENSORY TESTING ........................... 38 4.3 PRESENTING SAMPLES FOR
SENSORY TESTING ........................... 39 4.4 USING REFERENCE SAMPLES .................. 41
Chapter 5 Reducing Panel Response Error .................. 43
5.1 EXPECTATION ERRORS ....................... 43 5.2 POSITIONAL ERRORS ......................... 44 5.3 STIMULUS ERRORS ........................... 45 5.4 CONTRAST ERRORS .......................... 45
Chapter 6 Collecting and Analyzing Sensory Data ............ 47
6.1 MEASUREMENT SCALES ...................... 47 6.1.1 Nominal Scales ........................ 48 6.1.2 Ordinal Scales ......................... 48 6.1.3 Interval Scales ......................... 49 6.1.4 Ratio Scales ........................... 51
6.2 STATISTICAL ANALYSIS ...................... 52
6.3 STATISTICAL TESTS .......................... 54 6.3.1 Statistical Tests for Scalar Data ........... 54
6.4 EXPERIMENTAL DESIGN ...................... 56 6.4.1 Randomization ........................ 57 6.4.2 Blocking ............................. 57 6.4.3 Replication . . . . . . . . . . . . . . . . . . . . . . . . . . . 58
iv
scormier
Sticky Note
None set by scormier
scormier
Sticky Note
MigrationNone set by scormier
scormier
Sticky Note
Unmarked set by scormier
scormier
Sticky Note
None set by scormier
scormier
Sticky Note
MigrationNone set by scormier
scormier
Sticky Note
Unmarked set by scormier

Chapter 7 Sensory Tests: Descriptions and Applications ....... 59
7.1 CONSUMER-ORIENTED TESTS .................. 60 7.1.1 Preference Tests ........................ 60 7.1.2 Acceptance Tests ....................... 63 7.1.3 Hedonic Tests .......................... 66
7.2 PRODUCT-ORIENTED TESTS .................... 79 7.2.1 Difference Tests ........................ 79 7.2.2 Ranking for Intensity Tests ............... 86 7.2.3 Scoring for Intensity Tests ................ 90 7.2.4 Descriptive Tests ...................... 104
Chapter 8 Planning a Sensory Experiment .................. 105
APPENDICES ............................................ 107
Appendix 1 Appendix 2 Appendix 3
Appendix 4
Appendix 5
Appendix 6
Appendix 7
Basic Taste Recognition Test ............. 109 Basic Odour Recognition Test ............ 111 Training and Monitoring a Bean Texture Panel ......................... 114 Techniques for Evaluating Textural Characteristics of Cooked Beans .......... 116 Food References Used for Bean Texture Panels ........................ 117 Line Scale Ballot Used for Bean Texture Panels ........................ 118 Statistical Tables ....................... 119
REFERENCES ........................................... 137
GLOSSARY ............................................. 145
INDEX ............................................. 157
v
scormier
Sticky Note
None set by scormier
scormier
Sticky Note
MigrationNone set by scormier
scormier
Sticky Note
Unmarked set by scormier
scormier
Sticky Note
None set by scormier
scormier
Sticky Note
MigrationNone set by scormier
scormier
Sticky Note
Unmarked set by scormier

Figure 1
Figure 2
Figure 3
Figure 4
Figure 5
Figure 6
Figure 7
Figure 8
Figure 9
Figure 10
Figure 11
Figure 12
Figure 13
vi
LIST OF FIGURES
Panel Discussion Area with Panel Booth Constructed Along One Wall ...................... 15
Panel Booths with Individual Sections for Each Panelist . . . . . . . . . . . . . . . . . . . . . . . . . . . . . . . . 16
Disposable Sample Containers ..................... 21
Reusable Sample Containers ...................... 22
Typical Sample Tray Set-up for Presentation to a Panelist . . . . . . . . . . . . . . . . . . . . . . . . . 24
Plan of a Simple Sensory Testing Laboratory Located at INCAP, Guatemala ............................ 27
Examples of Commonly Used Sensory Scales ........ 50
Ballot for Bean Puree Paired-Preference Test ......... 63
Ballot for Bean Texture Acceptability Ranking Test ................................... 64
Ballot for Bean Varieties Bedonie Test Using a 9-Point Scale ............................ 71
Ballot for Bean Storage Pretreatment Triangle Test . . . . . . . . . . . . . . . . . . . . . . . . . . . . . . . . . . . 85
Ballot for Seedcoat Toughness Ranking Test . . . . . . . . . 88
Ballot for Bean Hardness Scoring Test Using a Line Scale .............................. 92
scormier
Sticky Note
None set by scormier
scormier
Sticky Note
MigrationNone set by scormier
scormier
Sticky Note
Unmarked set by scormier
scormier
Sticky Note
None set by scormier
scormier
Sticky Note
MigrationNone set by scormier
scormier
Sticky Note
Unmarked set by scormier

Table 1
Table 2
Table 3
Table 4
Table 5
Table 6
Table 7
Table 8
Table 9
Table 10
LIST OF TABLES
Tabulated Ranking for Acceptance Test Data .......... 67
Tabulated Category Scores for the Hedonic Test ....... 73
ANOV A Table for the Hedonic Test ................. 75
Six Possible Serving Orders for a Triangle Test ........ 82
Tabulated Triangle Test Data ...................... 84
Tabulated Ranking for Intensity Test Data ............ 89
Tabulated Scoring for Hardness Test Data ............ 93
ANOV A Table I Scoring for Hardness Test ........... 98
Data Matrix of Treatment Totals for Each Panelist ................................ 98
ANOV A Table II Scoring for Hardness Test ......... 100
LIST OF STATISTICAL TABLES
Appendix Table 7.1 Random Numbers Table ......................... 121
Appendix Table 7.2 Two-Tailed Binomial Test ........................ 123
Appendix Table 7.3 Critical Absolute Rank Sum Differences for "All Treatment" Comparisons at 5% Level of Significance ................................. 124
Appendix Table 7.4 Critical Absolute Rank Sum Differences for "All Treatment" Comparisons at 1 % Level of Significance ................................. 125
vii
scormier
Sticky Note
None set by scormier
scormier
Sticky Note
MigrationNone set by scormier
scormier
Sticky Note
Unmarked set by scormier
scormier
Sticky Note
None set by scormier
scormier
Sticky Note
MigrationNone set by scormier
scormier
Sticky Note
Unmarked set by scormier

Appendix Table 7.5 F Distribution at 5% Level of Significance . . . . . . . . . . 126
Appendix Table 7.6 F Distribution at 1 % Level of Significance . . . . . . . . . . 128
Appendix Table 7.7 Qitical Values (Q Values) for Duncan's New Multiple Range Test at 5% Level of Significance . . . . . 130
Appendix Table 7.8 0-itical Values (Q Values) for Duncan's New Multiple Range Test at 1 % Level of Significance ..... 132
Appendix Table 7.9 One-Tailed Binomial Test ....................... 134
Appendix Table 7.10 Percentage Points of the Studentized Range Upper 5% Points . . . . . . . . . . . . . . . . . . . . . . . . . . . . . . . 135
Appendix Table 7.11 Percentage Points of the Studentized Range Upper 1 % Points . . . . . . . . . . . . . . . . . . . . . . . . . . . . . . . 136
viii
scormier
Sticky Note
None set by scormier
scormier
Sticky Note
MigrationNone set by scormier
scormier
Sticky Note
Unmarked set by scormier
scormier
Sticky Note
None set by scormier
scormier
Sticky Note
MigrationNone set by scormier
scormier
Sticky Note
Unmarked set by scormier

FOREWORD
This manual is intended to provide a basic technical guide to methods of sensory evaluation. It has been compiled particularly with the needs of scientists in developing countries in mind. They, unlike their counterparts in industrialized countries, often lack adequate facilities and access to information sources.
The selection of materials included in this guide has been influenced by the experience of the authors in setting up and
implementing sensory evaluation testing at the Institute of Nutrition of Central America and Panama (INCAP) in Guatemala. This experience was supported, in part, by the International Development Research Centre (IDRC) through a research project on beans that was intended to address problems of storage hardening, lengthy preparation time, and nutritional availability. The authors are to be congratulated on the production of a comprehensive, practical guide.
In supporting food- and nutrition-related research, IDRC gives
ix
scormier
Sticky Note
None set by scormier
scormier
Sticky Note
MigrationNone set by scormier
scormier
Sticky Note
Unmarked set by scormier
scormier
Sticky Note
None set by scormier
scormier
Sticky Note
MigrationNone set by scormier
scormier
Sticky Note
Unmarked set by scormier

a high priority to ensuring that any new or modified products and
processes take full account of the likes, dislikes, and preferences of
the target consumer groups, and their acceptability requirements.
The objective is to help maximize the likelihood of achieving a
positive effect, particularly on disadvantaged producers,
processors, and consumers.
It is hoped that this manual will be usful to a wide variety of
readers, including researchers, students, government control agencies, and others dealing with issues of more efficient and
effective food production and use within the context of clearly
identified consumer preferences and requirements.
Geoffrey H awtin Director Agriculture, Food and Nutrition Sciences Division IDRC
x
scormier
Sticky Note
None set by scormier
scormier
Sticky Note
MigrationNone set by scormier
scormier
Sticky Note
Unmarked set by scormier
scormier
Sticky Note
None set by scormier
scormier
Sticky Note
MigrationNone set by scormier
scormier
Sticky Note
Unmarked set by scormier

PREFACE
This manual arose from the need to provide guidelines for
sensory testing of basic agricultural products in laboratories where
personnel have minimal or no training in sensory analysis. It is the outcome of a collaborative project between the Department of
Foods and Nutrition, University of Manitoba and the Institute of
Nutrition of Central America and Panama (INCAP). Included are
discussions of sensory analysis principles, descriptions of sensory
testing facilities and procedures, and examples of statistical
treatment of sensory test data. Examples presented have been
drawn from studies of the sensory characteristics and acceptability
of black beans. These studies were conducted as part of a bean
research network, funded by the International Development
Research Centre (IDRC) to increase the availability, consumption
and nutritive value of beans, an important staple food in Latin
America. Principles discussed, however, apply to the evaluation of
many other types of food and the methods described can be used to measure and compare the sensory characteristics of both
agricultural commodities and processed foods.
scormier
Sticky Note
None set by scormier
scormier
Sticky Note
MigrationNone set by scormier
scormier
Sticky Note
Unmarked set by scormier
scormier
Sticky Note
None set by scormier
scormier
Sticky Note
MigrationNone set by scormier
scormier
Sticky Note
Unmarked set by scormier

2
This publication has been designed to provide an introduction to sensory methods. For more thorough discussions of sensory
techniques the reader is referred to recent books by Meilgaard et al.
(1987), Jellinek (1985), Stone and Sidel (1985) and Piggott (1984),
to the ASTM publications STP 758 (1981), STP 682 (1979), STP 434 (1968) and STP 433 (1968), and to the classical work on
sensory analysis by Amerine et al (1965). The concise and widely
used Laboratory Methods for Sensory Evaluation of Foods
(Larmond, 1977) is also highly recommended. Statistical methods for sensory data analysis have been explained in detail in books by
O'Mahony (1986) and Gacula and Singh (1984). Basic statistical
principles and methods are provided in many statistics books such
as those by Snedecor and Cochran (1980), and Steel and Torrie (1980).
The support of this project provided by the International
Development Research Centre, Ottawa, by the Institute of Nutrition
of Central America and Panama, Guatemala City, and by the Department of Foods and Nutrition of the University of Manitoba,
Winnipeg, is gratefully acknowledged. Thanks are due to many
individuals in each of these institutions for their encouragement
and assistance at each stage in the preparation of this work. The
authors are particularly indebted to the staff and students at the
Institute of Nutrition, and the University of Manitoba, who served
as panelists during the sensory experiments used as examples in
this book. Valuable editorial suggestions were made by Linda
Malcolmson and Marion Vaisey-Genser of the University of Manitoba, by Gabriella Mahecha of the National University of
Colombia, Bogota, and by Darien van Herpen of the Centro
International de Agricultura Tropical (CIAT), Cali, Colombia. The assistance of the Statistical Advisory Service of the
University of Manitoba is also greatly appreciated. Special thanks
are expressed to Angela Dupuis, Bill Lim, Derrick Coupland, and
scormier
Sticky Note
None set by scormier
scormier
Sticky Note
MigrationNone set by scormier
scormier
Sticky Note
Unmarked set by scormier
scormier
Sticky Note
None set by scormier
scormier
Sticky Note
MigrationNone set by scormier
scormier
Sticky Note
Unmarked set by scormier

3
Horst Weiss for typing, designing and illustrating the manuscript. Thanks are also extended to the peer reviewers of the manuscript for their useful suggestions. Support and encouragement were provided by many other colleagues and friends, who cannot be mentioned by name, but whose contributions are remembered with gratitude by the authors.
Beverly Watts
Gladys Ylimaki
Lois Jeffery
Luis G. Elias
scormier
Sticky Note
None set by scormier
scormier
Sticky Note
MigrationNone set by scormier
scormier
Sticky Note
Unmarked set by scormier
scormier
Sticky Note
None set by scormier
scormier
Sticky Note
MigrationNone set by scormier
scormier
Sticky Note
Unmarked set by scormier

INTRODUCTION
Sensory analysis is a multidisciplinary science that uses human panelists and their senses of sight, smell, taste, touch and hearing to measure the sensory characteristics and acceptability of food products, as well as many other materials. There is no one instrument that can replicate or replace the human response, making the sensory evaluation component of any food study essential. Sensory analysis is applicable to a variety of areas such as product development, product improvement, quality control, storage studies and process development.
A sensory panel must be treated as a scientific instrument if it is
to produce reliable, valid results. Tests using sensory panels must
be conducted under controlled conditions, using appropriate
experimental designs, test methods and statistical analyses. Only in
this way can sensory analysis produce consistent and reproducible
data.
scormier
Sticky Note
None set by scormier
scormier
Sticky Note
MigrationNone set by scormier
scormier
Sticky Note
Unmarked set by scormier
scormier
Sticky Note
None set by scormier
scormier
Sticky Note
MigrationNone set by scormier
scormier
Sticky Note
Unmarked set by scormier

+ Chapter 1
Using Product-oriented and Consumer-oriented Testing
Consumers' sensory impressions of food begin in the marketplace where visual, odour and tactile senses, and perhaps taste are used in food selection. During food purchasing, preparation and consumption, the product cost, packaging,
uncooked and cooked appearance, and ease of preparation
influence consumers' total impression of a food. However, sensory
factors are the major determinant of the consumer's subsequent purchasing behaviour.
Information on consumer likes and dislikes, preferences, and requirements for acceptability can be obtained using
consumer-oriented testing methods and untrained sensory panels. Information on the specific sensory characteristics of a food must be obtained by using product-oriented tests. The development of new food products or the reformulation of existing products, the identification of changes caused by processing methods, by storage or by the use of new ingredients, and the maintenance of quality
scormier
Sticky Note
None set by scormier
scormier
Sticky Note
MigrationNone set by scormier
scormier
Sticky Note
Unmarked set by scormier
scormier
Sticky Note
None set by scormier
scormier
Sticky Note
MigrationNone set by scormier
scormier
Sticky Note
Unmarked set by scormier

8
control standards all require the identification and measurement of
sensory properties. This type of product-oriented quantitative
information is obtained in the laboratory using trained sensory
panels. When food formulas are being altered or new formulas
being developed, product-oriented testing usually precedes
consumer testing.
1.1 CONSUMER-ORIENTED TESTING
In true consumer testing a large random sample of people,
representative of the target population of potential users, is selected
to obtain information on consumers' attitudes or preferences.
Consumer panelists are not trained or chosen for their sensory
acuity, but should be users of the product. For this type of testing
100 to 500 people are usually questioned or interviewed and the
results utilized to predict the attitudes of the target population.
Interviews or tests may be conducted at a central location such as a
market, school, shopping mall, or community centre, or may take
place in consumers' homes. Because a true consumer test requires
selection of a panel representative of the target population, it is
both costly and time consuming. Therefore untrained in-house
consumer panels are commonly used to provide initial information
on product acceptability and often are conducted prior to true
consumer tests. In-house panels are much easier to conduct than
true consumer tests and allow for more control of testing variables
and conditions. In-house panels are, however, meant to augment,
not replace, true consumer tests.
In-house consumer panels (pilot consumer panels) usually
consist of 30 to 50 untrained panelists selected from personnel
within the organization where the product development or research
scormier
Sticky Note
None set by scormier
scormier
Sticky Note
MigrationNone set by scormier
scormier
Sticky Note
Unmarked set by scormier
scormier
Sticky Note
None set by scormier
scormier
Sticky Note
MigrationNone set by scormier
scormier
Sticky Note
Unmarked set by scormier

9
is being conducted. A group of panelists who are similar to the target population of consumers who use the product should be
chosen. It is advantageous to use as large a panel as possible. This
type of panel can indicate the relative acceptability of products, and
can identify product defects. Results from in-house consumer testing should not be used to predict product performance in the
marketplace, however, because in-house panels may not be
representative of the actual consuming population.
1.2 PRODUCT-ORIENTED TESTING
Product-oriented testing uses small trained panels that function
as testing instruments. Trained panels are used to identify
differences among similar food products or to measure the
intensities of flavour (odour and taste), texture or appearance
characteristics. These panels usually consist of 5-15 panelists who
have been selected for their sensory acuity and have been specially
trained for the task to be done. Trained panelists should not be used
to assess food acceptability. Their special training makes them
more sensitive to small differences than the average consumer and teaches them to set aside personal likes or dislikes when measuring
sensory parameters.
scormier
Sticky Note
None set by scormier
scormier
Sticky Note
MigrationNone set by scormier
scormier
Sticky Note
Unmarked set by scormier
scormier
Sticky Note
None set by scormier
scormier
Sticky Note
MigrationNone set by scormier
scormier
Sticky Note
Unmarked set by scormier

+ Chapter2
Designing Sensory Testing Facilities
Sensory testing does not require elaborate facilities but some
basic requirements must be met if tests are to be conducted
efficiently and results are to be reliable. Although permanent
facilities, specially designed for sensory testing, will provide the
best testing environment, existing laboratory space can be adapted
for sensory use. The basic requirements for all sensory testing
facilities are (1) a food preparation area, (2) a separate panel discussion area, (3) a quiet panel booth area, (4) a desk or office
area for the panel leader, and (5) supplies for preparing and serving
samples.
2.1 PERMANENT SENSORY FACILITIES
The design of permanent sensory testing facilities and illustrations of possible layouts for sensory laboratories have been
scormier
Sticky Note
None set by scormier
scormier
Sticky Note
MigrationNone set by scormier
scormier
Sticky Note
Unmarked set by scormier
scormier
Sticky Note
None set by scormier
scormier
Sticky Note
MigrationNone set by scormier
scormier
Sticky Note
Unmarked set by scormier

presented in books by Jellinek (1985), Larmond (1977), Stone and
Sidel (1985) and ASTM publication STP 913 (1986). The types of
tests to be conducted, the amount of testing to be done, the space
and resources available, will be deciding factors in the design of
the laboratory.
Throughout the sensory area, walls should be painted in neutral
colours. Odour-free surface materials should be used in
construction of floors and counter tops. Some woods, rugs and
plastics emit odours which interfere with the sensory evaluations,
and should therefore be avoided.
2.1.1 Food Preparation Area
The area for food preparation should contain counters, sinks,
cooking and refrigeration equipment and storage space. The area
should be well lit and ventilated.
Counters. Sufficient counter area is needed to provide working
space for food preparation, and to hold prepared trays of samples
before they are given to the panelists. A counter height of
approximately 90 cm (36 inches) is comfortable for working. Standard counter depth is approximately 60 cm (or 24 inches).
Sinks. At least two sinks with hot and cold running water should be provided. It is also useful to have a source of distilled
water in the sensory laboratory. If tap water imparts odours or
flavours, distilled water should be used for panelists' rinse water,
cooking and rinsing dishes.
scormier
Sticky Note
None set by scormier
scormier
Sticky Note
MigrationNone set by scormier
scormier
Sticky Note
Unmarked set by scormier
scormier
Sticky Note
None set by scormier
scormier
Sticky Note
MigrationNone set by scormier
scormier
Sticky Note
Unmarked set by scormier

13
Cooking equipment. Gas or electric stoves or separate heating elements and ovens should be provided. Microwave ovens may
also be a useful addition to the food preparation area.
Refrigeration equipment. Refrigerated storage is essential for
keeping perishable foods and may be needed to chill samples to a
constant low temperature before serving. A separate freezer can be
useful for long term storage of ingredients, for storage of reference
samples and to enable foods prepared at different times to be stored and evaluated together.
Storage space. Cupboards or closed shelves for dish and
supply storage should be constructed under the working counters
and also over the pass-through openings to the panel area. An open
shelf over the pass-through area is useful for holding prepared trays
during panel set up. Drawers directly under the counters are
convenient for storing napkins, pencils, plastic spoons and forks
and similar panel supplies.
Ventilation. Ventilation hoods with exhaust fans should be
installed over the stoves to reduce cooking odours in the
preparation area and to prevent spreading of these odours to the
panel room.
2.1.2 Panel Discussion Area
For product-oriented testing it is necessary to have a room where the panelists can meet with the panel leader for instruction,
training and discussion. This discussion area should be completely
separate from the food preparation area so that noise and cooking
scormier
Sticky Note
None set by scormier
scormier
Sticky Note
MigrationNone set by scormier
scormier
Sticky Note
Unmarked set by scormier
scormier
Sticky Note
None set by scormier
scormier
Sticky Note
MigrationNone set by scormier
scormier
Sticky Note
Unmarked set by scormier

14
odours do not interfere with the panelists' tasks. It should be located so that there are no interruptions from other laboratory
personnel. A comfortable well lit area, with a large table and chairs
or stools to seat at least 10 people, is ideal. A large chalkboard, flip
chart, or white board should be located where it can be easily seen
by the panelists around the table. A bulletin board located close to
the entrance allows posting of notices and information about
panelists' performance. An example of a panel discussion area is
shown in Figure 1.
2.1.3 Panel Booth Area
The booth area, like the discussion area, should be completely
separate from the food preparation area. Although it is preferable to
have a self-contained panel booth room, areas can be combined by
having the booths constructed along one wall of the group discussion room, with no dividing wall between the booth and
discussion areas, as shown in Figure 1. However, group discussions
cannot then be held simultaneously with individual tasting
sessions. This arrangement could create a problem if several
sensory tasks are under way at one time.
The panel booth area should contain individual compartments
where panelists can assess samples without influence by other
panel members (Figure 2). This area may contain as few as 4
individual sections but 5 to 10 are most common. Each booth
should be equipped with a counter, a stool or chair, a pass-through
opening to the food preparation area and individual lighting and
electrical outlets. While sinks in panel booths may appear useful for expectoration, they can cause odour and sanitation problems
and are not recommended.
scormier
Sticky Note
None set by scormier
scormier
Sticky Note
MigrationNone set by scormier
scormier
Sticky Note
Unmarked set by scormier
scormier
Sticky Note
None set by scormier
scormier
Sticky Note
MigrationNone set by scormier
scormier
Sticky Note
Unmarked set by scormier

15
Figure 1 Panel discussion area with panel booth constructed along one wall
scormier
Sticky Note
None set by scormier
scormier
Sticky Note
MigrationNone set by scormier
scormier
Sticky Note
Unmarked set by scormier
scormier
Sticky Note
None set by scormier
scormier
Sticky Note
MigrationNone set by scormier
scormier
Sticky Note
Unmarked set by scormier

16
Figure 2 Panel bcxJths with individual sections for each panelist
scormier
Sticky Note
None set by scormier
scormier
Sticky Note
MigrationNone set by scormier
scormier
Sticky Note
Unmarked set by scormier
scormier
Sticky Note
None set by scormier
scormier
Sticky Note
MigrationNone set by scormier
scormier
Sticky Note
Unmarked set by scormier

17
It is useful to have the entrance to the panel area within partial
view of the food preparation facilities. The panel leader can then
see when panelists arrive and can supervise activities in both the
food preparation and panel rooms.
Panel booths. Panel booths can be constructed with permanent
dividers or can consist of a countertop with movable partitions.
Each booth should be approximately 60 cm (24") in depth and be a
minimum of 60 cm (24") in width, but the preferred width is 76-86 cm (30-34"). The booth counter should be the same height as the
counter on the food preparation side of the pass-through to allow
sample trays to be passed from one side to the other with ease. This
may be desk height, 76 cm (30") or counter height, approximately
90 cm (36"). Counter height is usually more convenient and useful
for the food preparation area. Partitions between the booths should
be at least 90 cm (36") high and should extend approximately 30
cm (12") beyond the edge of the countertop to provide privacy for
each panelist.
Chairs or stools. Chairs must be the appropriate height so that
panelists can sit comfortably at the 76 or 90 cm (30 or 36")
counter. Adequate space must be provided from the edge of the
counter to the back wall of the booth area to allow chairs to be
moved back and forth, and panelists to enter and leave while others
are doing evaluations. A minimum distari"e of 90 cm (36") is
required.
Pass-throughs. Each booth should have a pass-through from
the food preparation area to allow samples and trays to be passed to
panelists directly. The pass-through opening should be
approximately 40 cm (16") wide, 30 cm (12") high, and should be
flush with the counter top. The opening can be fixed with a sliding,
scormier
Sticky Note
None set by scormier
scormier
Sticky Note
MigrationNone set by scormier
scormier
Sticky Note
Unmarked set by scormier
scormier
Sticky Note
None set by scormier
scormier
Sticky Note
MigrationNone set by scormier
scormier
Sticky Note
Unmarked set by scormier

18
hinged or flip-up door. Sliding doors must be well fitted or they
may stick and cause problems. Hinged or flip-up doors require a lot
of clear counter space to work properly.
Lighting and electrical outlets. Each booth should have
individual overhead lighting so that the light distribution is uniform
from one booth to another. lu...;andescent or fluorescent lighting
may be used. Incandescent lighting offers a range of illumination
but is more costly to install and maintain than fluorescent lighting.
Fluorescent lights can be obtained in cool white, warm white or
simulated daylight. Day light tubes are recommended for food
testing. Lights of various colours such as red and yellow should be
installed, in addition to the conventional white lights. These can be
used to mask colour differences between food samples. Flood
lights with removable plastic coloured filters provide an
economical means of controlling light colour. Each booth should
have an electrical outlet so that warming trays can be used.
Ventilation. The panel room should be adequately ventilated
and maintained at a comfortable temperature and humidity. The
ventilation system should not draw in odours from the cooking
area. If the building in which the sensory facilities are being
installed has air conditioning, then positive air pressure may be
maintained in the panel booth area to prevent infiltration of
external odours.
2.1.4 Office Area
In addition to the space needed for the actual sensory testing, a
place where the panel leader can prepare ballots and reports,
analyze data and store results is required. This area should be
scormier
Sticky Note
None set by scormier
scormier
Sticky Note
MigrationNone set by scormier
scormier
Sticky Note
Unmarked set by scormier
scormier
Sticky Note
None set by scormier
scormier
Sticky Note
MigrationNone set by scormier
scormier
Sticky Note
Unmarked set by scormier

19
equipped with a desk, a filing cabinet, and either a statistical
calculator or a computer equipped with a statistical program for
data analysis.
2.1.5 Supplies for Sensory Testing
The sensory areas should be equipped with utensils for food
preparation and with equipment and small containers for serving samples to the panelists. All utensils should be made of materials
that will not transfer odours or flavours to the foods being prepared
or sampled. Food preparation and serving equipment, utensils and
glassware for the sensory testing area should be purchased new and used exclusively for sensory testing. Food items, sample containers
(particularly the disposable ones), rinse cups and utensils, should
be purchased in large quantities, sufficient to last throughout an
entire study.
Utensils for food preparation. An accurate balance or scale,
graduated cylinders, pipettes, volumetric flasks and glass beakers
of various sizes will be needed to make precise measurements
during food preparation and sampling. Glass (i..e. Pyrex) or glass-ceramic (i.e. Corningware) cooking pots should be selected
rather than metal cookware because glass and glass-ceramic
containers are less likely to impart flavours or odours to the foods
cooked in them. If only metal is available, then stainless steel is a better choice than aluminum, tin or cast iron cookware.
Thermometers and standard kitchen utensils such as sieves and
strainers, can openers, knives, forks, spoons, bowls, pot holders
and covered storage containers will also be needed.
scormier
Sticky Note
None set by scormier
scormier
Sticky Note
MigrationNone set by scormier
scormier
Sticky Note
Unmarked set by scormier
scormier
Sticky Note
None set by scormier
scormier
Sticky Note
MigrationNone set by scormier
scormier
Sticky Note
Unmarked set by scormier

20
Sample containers. Sample containers should be chosen
according to the sample size and characteristics. The size of the
containers will vary with the type of product being tested and with
the amount of sample to be presented. Disposable paper, plastic or
styrofoam containers of 30-60 mL (1-2 oz) size with lids
(Figure 3), disposable petri-plates and paper plates are convenient
but may prove costly. Reusable containers such as glasses, shot
glasses, glass egg cups, small beakers, glass custard cups, bottles,
glass plates or petri-plates (Figure 4) and glass jars are suitable
alternatives. Lids or covers of some sort are necessary to protect
the food samples from drying out or changing in temperature or
appearance, and to prevent dust or dirt from contaminating the
samples. Lids are particularly important when odours of the food
samples are being evaluated. Lids allow the volatiles from the
sample to build up in the container so that the panelist receives the
full impact of the odour when bringing the sample container to the
nose and lifting the lid.
When purchasing sample containers it is important to check that
the containers do not have any odours of their own which may
interfere with the evaluation of the food products. Enough
containers of one size and shape must be purchased to ensure that
identical containers can be used for all samples served during one
study.
Trays. Plastic or metal trays, to hold the samples to be served
to each panelist, should be provided. Individual electric warming
trays for each booth are recommended for samples served warm.
Placing samples in a water bath on the warming trays may
distribute the heat more evenly than placing samples directly on the
trays. Alternatively, samples may be kept warm in a thermos or
warming oven in the preparation area until just before serving. In
all cases, sample containers that will not melt or allow water into
scormier
Sticky Note
None set by scormier
scormier
Sticky Note
MigrationNone set by scormier
scormier
Sticky Note
Unmarked set by scormier
scormier
Sticky Note
None set by scormier
scormier
Sticky Note
MigrationNone set by scormier
scormier
Sticky Note
Unmarked set by scormier

21
Figure 3 Disposable sample containers
scormier
Sticky Note
None set by scormier
scormier
Sticky Note
MigrationNone set by scormier
scormier
Sticky Note
Unmarked set by scormier
scormier
Sticky Note
None set by scormier
scormier
Sticky Note
MigrationNone set by scormier
scormier
Sticky Note
Unmarked set by scormier

22
Figure 4 Reusable sa mple containers
scormier
Sticky Note
None set by scormier
scormier
Sticky Note
MigrationNone set by scormier
scormier
Sticky Note
Unmarked set by scormier
scormier
Sticky Note
None set by scormier
scormier
Sticky Note
MigrationNone set by scormier
scormier
Sticky Note
Unmarked set by scormier
23
the samples, are required. Styrofoam containers with lids provide
an inexpensive means of keeping samples warm for short periods
of time.
Additional supplies. Plastic spoons, forks and knives, napkins,
disposable or glass cups for water and expectoration, and large jugs
or pitchers, preferably glass, for drinking water will also be needed.
A typical sample tray set-up, for presentation to a panelist, is
shown in Figure 5. Odourless dishwashing detergent is suggested
for washing equipment.
2.2 TEMPORARY SENSORY FACILffiES
When an area specifically designed for sensory testing is not
available, or when panels, such as consumer panels, arc conducted
away from the permanent facility, a temporary area can be arranged
to satisfy the basic requiremcnl'> for sensory testing.
2.2.1 Food Preparation Area
Temporary cooking facilities can be set up in a laboratory using
hotplates, and styrofoam containers can be used to keep food warm
for short periods. Prepared trays can be set out on carts when
counter space is limited.
scormier
Sticky Note
None set by scormier
scormier
Sticky Note
MigrationNone set by scormier
scormier
Sticky Note
Unmarked set by scormier
scormier
Sticky Note
None set by scormier
scormier
Sticky Note
MigrationNone set by scormier
scormier
Sticky Note
Unmarked set by scormier

24
Ty . P1ca1 s arnp1e tray
set-up for Preseniat ·
ion toa fJaneJist
scormier
Sticky Note
None set by scormier
scormier
Sticky Note
MigrationNone set by scormier
scormier
Sticky Note
Unmarked set by scormier
scormier
Sticky Note
None set by scormier
scormier
Sticky Note
MigrationNone set by scormier
scormier
Sticky Note
Unmarked set by scormier

25
2.2.2 Panel Area
Samples can be presented for evaluation in any separate area
where distractions, noise and odours can be kept to a minimum. A
lunch or coffee room which is not in use at the times when sensory
tests are to be carried out might serve adequately if food odours
have cleared. To provide some privacy for the panelists, and to minimize distractions, portable partitions of light weight wood or heavy cardboard can be constructed to sit on table tops between
panelists.
2.2.3 Desk Area
The panel leader will need space for preparing ballots, planning
sensory tests, and analyzing data, and will need access to a
calculator with statistical capabilities.
2.2.4 Supplies for Sensory Testing
The same supplies will be needed as were outlined for the
permanent facility.
scormier
Sticky Note
None set by scormier
scormier
Sticky Note
MigrationNone set by scormier
scormier
Sticky Note
Unmarked set by scormier
scormier
Sticky Note
None set by scormier
scormier
Sticky Note
MigrationNone set by scormier
scormier
Sticky Note
Unmarked set by scormier

26
2.3 DESIGN OF A SIMPLE SENSORY TESTING LABORATORY
At INCAP in Guatemala City, a sensory laboratory containing
panel booths and a discussion area was built adjacent to an existing
kitchen facility (Figure 6). This food preparation area was already
well equipped with stoves, sinks, refrigerators, storage cupboards
and counter space.
In the newly designed sensory facility, panel booths are
accessible from the kitchen area via pass-throughs with horizontal
sliding doors. The five panel booths are open from the back to the
group discussion area which is equipped with a large table, and
with stools to seat 12-15 people. Each booth has individual light
fixtures and an electrical outlet. The divisions between the booths
are hinged so that they can be folded to one side if clear counter
space is needed on some occasions.
Although a separate office for the panel leader was not
available, a desk placed in the food preparation area provides space
for preparing ballots and analyzing data.
The following items were acquired to equip the sensory
laboratory at INCAP:
• l analytical balance
• glassware (graduated cylinders and beakers of various sizes)
• 5 electric warming trays with adjustable thermostats (l per panel booth)
• 8 - 3 L glass cooking pots with lids
• lO - 300 mL plastic storage containers with lids
scormier
Sticky Note
None set by scormier
scormier
Sticky Note
MigrationNone set by scormier
scormier
Sticky Note
Unmarked set by scormier
scormier
Sticky Note
None set by scormier
scormier
Sticky Note
MigrationNone set by scormier
scormier
Sticky Note
Unmarked set by scormier

-lo 0 loo ,_
-00
~
'~~ DISCUSSION AREA
c::::~ ,0,0101010 I BOOTH AREA •--1-1.._1 ...... 1 ......
~
PREPARATION AREA ~ 0
c::JO OP db ..
DD
OFFICE AREA
c:J ~
0 I 2m h I;; d
Scale
Figure 6 Plan of a simple sensory testing laboratory
located at INCAP, Guatemala
27
scormier
Sticky Note
None set by scormier
scormier
Sticky Note
MigrationNone set by scormier
scormier
Sticky Note
Unmarked set by scormier
scormier
Sticky Note
None set by scormier
scormier
Sticky Note
MigrationNone set by scormier
scormier
Sticky Note
Unmarked set by scormier

28
• 20 - 15 cm diameter styrofoam containers with lids (tortilla holders)
• 15 white plastic serving trays
• 6 large water jugs
• 48 - 50 mL red sample glasses with tin foil lids
• disposable 75 mL plastic cups for water and for expectoration
• disposable 30 mL plastic sample containers with lids
• disposable 30 mL styrofoam sample cups with lids
• disposable white plastic teaspoons
• paper napkins
• pot holders, tea towels, spoons, forks, knives, strainers, paper towels, detergent
• statistical calculator
scormier
Sticky Note
None set by scormier
scormier
Sticky Note
MigrationNone set by scormier
scormier
Sticky Note
Unmarked set by scormier
scormier
Sticky Note
None set by scormier
scormier
Sticky Note
MigrationNone set by scormier
scormier
Sticky Note
Unmarked set by scormier

+ Chapter3
Establishing Sensory Panels
The testing instrument for sensory analysis is the panel of
human judges who have been recruited and trained to carry out
specific tasks of sensory evaluation. Recruiting panelists, training them, monitoring their performance, providing leadership and
motivation is the job of the panel leader. Thorough preparation and
efficient direction of the panel by the leader are essential if the
panel is to function effectively.
3.1 RECRUITING PANELISTS
Panelists for both trained panels and untrained in-house panels
can usually be drawn from the personnel of the institution or
organization where the research is being conducted. The majority
of the people within an organization are potential panelists. They
scormier
Sticky Note
None set by scormier
scormier
Sticky Note
MigrationNone set by scormier
scormier
Sticky Note
Unmarked set by scormier
scormier
Sticky Note
None set by scormier
scormier
Sticky Note
MigrationNone set by scormier
scormier
Sticky Note
Unmarked set by scormier

30
will usually be interested in participation if they feel that their
contribution is important.
To help with panelist recruitment, all potential panelists should
be asked to complete questionnaires giving their food likes and
dislikes, indicating their level of interest in the project to be carried
out, listing any food restrictions or allergies they may have and
giving times when they would be available for panels. This
information will help the panel leader to select those individuals
appropriate for the study. In a company or institution where
sensory tests are conducted on a regular basis, it is useful to keep a
file with information on all potential panelists. Records should also
be kept on each panelist who participates in any sensory panel.
3.2 ORIENTING PANELISTS
Potential panelist~ should be invited to the sensory panel area, in
groups of no more than 10 at a time, to allow the panel leader to
explain the importance of sensory testing, show the panelists the
testing facilities, and answer questions that may arise. Individuals
participating only in in-house acceptability panels (untrained
panels) do not need to be given any subsequent training. However,
it is useful to demonstrate the way in which the ballots should be
marked, using enlarged ballots shown on an overhead projector or
a blackboard. Discussing the actual food to be tested should be
avoided. Explaining the test method and procedure will reduce
confusion and make it easier for panelists to complete the task. It is
important that all panelists understand the procedures and score
cards so they may complete the test in a similar manner.
scormier
Sticky Note
None set by scormier
scormier
Sticky Note
MigrationNone set by scormier
scormier
Sticky Note
Unmarked set by scormier
scormier
Sticky Note
None set by scormier
scormier
Sticky Note
MigrationNone set by scormier
scormier
Sticky Note
Unmarked set by scormier

31
Panelists should be advised to avoid strong odourous materials,
such as soaps, lotions and perfumes prior to participating on panels
and to avoid eating, drinking or smoking at least 30 minutes prior
to a sensory test.
3.3 SCREENING PANELISTS FOR TRAINED PANELS
Panelists who agree to serve on trained panels should be
screened for "normal" sensory acuity. This can be done by asking
panelists to identify basic tastes and common odours. Instructions
for conducting taste and odour identification tests are given in
Appendices 1 and 2.
Panelists' sensitivity, that is their ability to discriminate between
levels of a particular sensory characteristic, should also be tested.
Triangle tests, using food samples or solutions that are identical for
all but the level of one flavour or texture characteristic, are often
used to test panelists' discrimination skills. People with a poor
sense of smell or taste, or who are insensitive to differences in
flavour or texture intensities, can be identified through these
screening processes. For those who ultimately will serve on a trained panel, the screening process provides some preliminary
sensory experience.
After the initial screening, panelists should be tested for their
ability to discriminate using samples very similar or identical to
those to be studied. Some panelists are excellent discriminators for
one type of food product, but are poor discriminators for others.
scormier
Sticky Note
None set by scormier
scormier
Sticky Note
MigrationNone set by scormier
scormier
Sticky Note
Unmarked set by scormier
scormier
Sticky Note
None set by scormier
scormier
Sticky Note
MigrationNone set by scormier
scormier
Sticky Note
Unmarked set by scormier

32
Locating panelists sensitive to differences m the test food is
important.
If 20-25 people can be screened, it should be possible to select
for training, a group of 12-14 people who have demonstrated
superior performance during screening sessions. Panelists chosen should also be interested in the project, and able to participate on a
long term basis. Panel training takes approximately 1/2 hour a day,
usually 2-4 times per week. Panel training should begin with a
larger group of people than is needed for the final trained panel.
Some panelists will almost certainly drop out due to illness or
job-related priorities. The final trained panel should include at least
8 people with good discriminatory ability for the task to be done.
3.4 TRAINING PANELISTS
The performance of individual panelists, and of the panel as a whole, can be improved through suitable training exercises.
Training should be designed to help panelists make valid, reliable
judgements that are independent of personal preferences. A
discussion of results, directed by the panel leader, should
accompany each training exercise, so that the panelists as a group
can develop consistent methods of evaluation. Training a panel for
difference or ranking tests can usually be done in a few sessions.
Training for quantitative analysis may require ten to twelve sessions, or even more if a large number of sensory characteristics
are to be evaluated.
Final training should be conducted with food products similar to
those that will be used during actual testing. Panelists should
scormier
Sticky Note
None set by scormier
scormier
Sticky Note
MigrationNone set by scormier
scormier
Sticky Note
Unmarked set by scormier
scormier
Sticky Note
None set by scormier
scormier
Sticky Note
MigrationNone set by scormier
scormier
Sticky Note
Unmarked set by scormier

33
become familiar with the range of characteristic intensities that will be encountered during the study. During training the best
procedures for preparing and presenting the samples can be
established and the final score card or ballot can be designed.
Discussions should be held frequently, between the panelists
and panel leader, to ensure that all panelists understand the task,
ballot and terminology, and can distinguish the characteristics
being studied. By providing precise definitions and descriptions for
the evaluation of each characteristic, and by supplying food samples to demonstrate each characteristic wherever possible,
consistent panelist response and agreement among panelists can be
developed.
Panelists who are unsuccessful at one type of sensory task may do well on another. Their participation on subsequent panels should
be encouraged, and appreciation for their work should be expressed
by the panel leader.
3.5 MONITORING PANELISTS' PERFORMANCE
Panelists' performance must be monitored during training to
determine the progress of the training. Subsequent training should
concentrate on the samples and sample characteristics that panelists
have difficulty identifying and evaluating. Training is completed
when panelists are comfortable with the evaluation procedure, can discriminate among different samples repeatedly and can produce
scormier
Sticky Note
None set by scormier
scormier
Sticky Note
MigrationNone set by scormier
scormier
Sticky Note
Unmarked set by scormier
scormier
Sticky Note
None set by scormier
scormier
Sticky Note
MigrationNone set by scormier
scormier
Sticky Note
Unmarked set by scormier

34
reproducible results. Superior panelists can then be identified to continue throughout the sensory study.
The panel leader monitors performance by evaluating the ability
of the panel as a whole, and of the individual panelists, to
discriminate differences among the samples being tested and to reproduce results consistently. For both types of evaluation, a set of
different samples, which the panel leader knows to be different,
must be evaluated by each panelist repeatedly on several occasions
to provide the necessary data. Statistical analysis (analysis of
variance - ANOVA) is used to assess the results. The panel data is
analyzed to identify significant variation among panelists and
among samples. Significant differences among panelists, although
not unexpected, may be reduced with further training. Lack of significant differences among samples indicates the need for
further training, if the panel leader knows that differences do in fact
exist.
Individual panelist's results can also be analyzed. Panelisl-; who
are able to distinguish significant differences among the samples
with small error mean squares in the analysis should be retained on
the panel. If none of the panelists find significant differences
among samples for a particular characteristic, additional training
for that characteristic is indicated. Monitoring panelist performance
during training is described in more detail in Appendix 3.
Panelist performance can also be monitored during the sensory
study by comparing replicate judgements. This ensures that
panelists continue to perform in a reliable, consistent manner and
will indicate when additional re-training may be required or when
panelists need further motivation.
scormier
Sticky Note
None set by scormier
scormier
Sticky Note
MigrationNone set by scormier
scormier
Sticky Note
Unmarked set by scormier
scormier
Sticky Note
None set by scormier
scormier
Sticky Note
MigrationNone set by scormier
scormier
Sticky Note
Unmarked set by scormier

35
3.6 MOTIVATING PANELISTS
Panelists who are interested in sensory evaluation, the products
under evaluation and the outcome of the study will be motivated to
perform better than uninterested panelists. It is important to
maintain this interest and motivation throughout the study to ensure
and encourage optimum panelist performance.
Feedback about their performance from day to day will provide
much of the motivation for panelists, particularly during training. If there is not sufficient time during the panel sessions to discuss the
previous day's results, the data can be posted on a wall chart for the
panelists to sec at their convenience. However, it is more beneficial
if the panel leader personally discusses the results with the
panelists, individually or as a group. Posted results can be missed
or misinterpreted by the panelists. In addition, a small treat or
refreshment (ie. candies, chocolates, cookies, fruit, nuts, juice,
cheese, crackers) at the end of each day's panel session is
commonly used as a reward. At the end of a long series of panels a
larger reward such as a small party, luncheon or small gift will let
each panelist know that their contribution to the study has been
appreciated.
scormier
Sticky Note
None set by scormier
scormier
Sticky Note
MigrationNone set by scormier
scormier
Sticky Note
Unmarked set by scormier
scormier
Sticky Note
None set by scormier
scormier
Sticky Note
MigrationNone set by scormier
scormier
Sticky Note
Unmarked set by scormier

+ Chapter4
Conducting Sensory Tests
Sensory tests will produce reliable results only when good
experimental control is exercised at each step of the testing process.
Careful planning and thorough standardization of all procedures
should be done before the actual testing begins. Particular attention
should be given to techniques used for sampling food materials, for
preparing and presenting samples to the panel, and for using
reference and control samples. These techniques are discussed in the following sections of the manual.
4.1 SAMPLING FOOD FOR SENSORY TESTING
All foods presented to the panelists for testing must, of course,
be safe to eat. Panelists should not be asked to taste or eat any food
that has become moldy, or has been treated in a way that might cause microbiological or chemical contamination. If a food, or an
scormier
Sticky Note
None set by scormier
scormier
Sticky Note
MigrationNone set by scormier
scormier
Sticky Note
Unmarked set by scormier
scormier
Sticky Note
None set by scormier
scormier
Sticky Note
MigrationNone set by scormier
scormier
Sticky Note
Unmarked set by scormier

38
ingredient of the food, has been treated or stored in a way that may make it unsafe to eat, then only the odour and appearance attributes
of the food can be evaluated.
When batches of food are being sampled for sensory testing
samples taken should be representative of the total batch. If the
portions ultimately served to the panelists are not representative of
the food as a whole, results will not be valid. For a commodity
such as beans, the lot to be tested should first be thoroughly mixed,
then divided into four parts and a sample from each part extracted. These four samples should be recombined to form the test sample.
The size of the test sample should be calculated beforehand, based
on the number of portions that will be required for the panel.
4.2 PREPARING SAMPLES FOR SENSORY TESTING
Samples for sensory comparison should all be prepared by a
standardized method to eliminate the possibility of preparation
effects (unless, of course, preparation method is a variable of
interest). Preparation steps should be standardized during
preliminary testing and clearly documented before sensory testing
is begun, to ensure uniformity during each testing period. When
different types of beans, for example, are to be cooked and
prepared for sensory analysis, factors that need to be controlled
include the ratio of beans to soaking and cooking water, soaking
time, size and dimensions of the cooking container, cooking rate
and time, holding time before serving, and serving temperature. If
samples require different cooking times, starting times can be
staggered so that all samples finish cooking together. If this is not
scormier
Sticky Note
None set by scormier
scormier
Sticky Note
MigrationNone set by scormier
scormier
Sticky Note
Unmarked set by scormier
scormier
Sticky Note
None set by scormier
scormier
Sticky Note
MigrationNone set by scormier
scormier
Sticky Note
Unmarked set by scormier

39
done, variations in holding time may influence sensory assessment.
Holding samples for an extended period of time can drastically
alter their appearance, flavour and texture.
4.3 PRESENTING SAMPLES FOR SENSORY TESTING
Methods of sample presentation should also be standardized. It
is important that each panelist receive a representative portion of
the test sample. Tortillas, for instance, can be cut into wedges of
uniform size so that each panelist will rect.!ive part of both the edge
and the centre of a tortilla. Fluid products should be stirred during
portioning to maintain uniform consistency within the portions.
The end crusts of breads or baked goods and the outer surface of
meat samples may have to be discarded so that each panelist
receives a similar portion. If bread crusts are left on samples, each
panelist should receive a sample with a similar crust covering. Portions should all be of the same size. When food products consist
of a number of small pieces which may differ from piece to piece,
panelists should receive a portion large enough that they can
evaluate a number of pieces for each characteristic. When beans,
for example, are being tested for firmness, panelists should test 3-4
beans before recording their score for the firmness of the sample.
In general, at least 30 grams (1 oz) of a solid food or 15 mL (0.5
oz) of a beverage should be served (ASTM STP 434, 1968).
Samples should all be presented at the same temperature, and
this should be the temperature at which the food is usually
consumed. Milk should be served at refrigerator temperature, but
bread or cake at room temperature. Some foods require heating to
scormier
Sticky Note
None set by scormier
scormier
Sticky Note
MigrationNone set by scormier
scormier
Sticky Note
Unmarked set by scormier
scormier
Sticky Note
None set by scormier
scormier
Sticky Note
MigrationNone set by scormier
scormier
Sticky Note
Unmarked set by scormier

40
bring out their characteristic odours or flavours. Vegetable oils are often evaluated for odour after being equilibrated at 50 °C.
Panelists may prefer to evaluate some foods when they are
served with carriers. Crackers, for instance, may be used as carriers
for margarine or peanut butter. Use of carriers can present problems, however, because the carrier foods have flavour and
texture characteristics of their own which can interfere with
panelists' evaluation of the main food product.
The food samples being evaluated may be swallowed or expectorated, however, the panel should be encouraged to develop
a consistent technique. Cups with lids should be provided for expectoration.
Room temperature water is often presented to panelists so that
they can rinse their mouths before and between samples. Rinse
water can be swallowed or expectorated. If room temperature water
will not clear the mouth between tastings, warm water, lemon
water, unsalted soda crackers, white bread or apple slices may be
used. Warm water is particularly helpful when fats or oily foods are
being tested. The time between evaluation of each sample may
have to be longer than usual if the products being tested have
strong flavours. It may also be necessary to restrict to two or three
the number of samples presented at one session.
When characteristics other than colour are being evaluated it
may be necessary to mask colour differences; otherwise they may influence the panelists' judgements of other characteristics. Red, blue, green or yellow light, whichever masks the sample
differences most effectively, can be used.
scormier
Sticky Note
None set by scormier
scormier
Sticky Note
MigrationNone set by scormier
scormier
Sticky Note
Unmarked set by scormier
scormier
Sticky Note
None set by scormier
scormier
Sticky Note
MigrationNone set by scormier
scormier
Sticky Note
Unmarked set by scormier

41
4.4 USING REFERENCE SAMPLES
References are often used in sensory testing. These can be
designated reference samples, against which all other samples are
to be compared; or they can be identified samples used to mark the
points on a measurement scale; or they can be hidden references,
coded and served to panelists with the experimental samples in order to check panelist performance.
When sensory tests are conducted over several weeks or
months, or when the testing must be done at widely spaced
intervals as is the case when storage effects are being studied, then it is almost essential to use a designated reference. This can be
selected from among the actual foods or samples that are to be
tested, or can be a food product of a similiar type. When
conducting a storage study the designated reference may be the
control (a sample stored under standard conditions), or may be a
fresh sample. If the purpose of the research is to produce a product that is an improvement on a marketed product, then the product
being marketed can serve as the reference. When the testing is done
by a trained panel, this panel should evaluate the reference before
the actual testing is begun. Scores which this panel agrees are
appropriate, for each characteristic to be measured, can then be
placed on the ballot to be used during the experiment. Providing a
scored, designated reference to the panelists at each panel session
should help them score the experimental samples more
consistently.
Reference samples which are used to mark points on a scale, or to calibrate the scale, are often called standards. These references
may be of food similar to that being tested, or may be totally
different. If a number of product characteristics are being
scormier
Sticky Note
None set by scormier
scormier
Sticky Note
MigrationNone set by scormier
scormier
Sticky Note
Unmarked set by scormier
scormier
Sticky Note
None set by scormier
scormier
Sticky Note
MigrationNone set by scormier
scormier
Sticky Note
Unmarked set by scormier

42
evaluated, many references (standards) may be necessary.
Examples of food references used to identify scale endpoints for
cooked bean textural characteristics of hardness, particle size, and
seedcoat toughness, are given in Appendix 5.
Hidden references, or blind controls as they are sometimes
called, can be served to the panel at some or all of the panel
sessions, to check on the panelists' performance. The hidden
reference must be sufficiently similar to the samples being tested
that it cannot be immediately identified as the control sample. It should be coded in the same way as the experimental samples,
using a different code number each time it is presented to the panel.
If one or several panelists' scores for the hidden reference vary
unacceptably, these panelists should be given further training or
their scores may have to be excluded from the dataset.
A reference will improve panel consistency only if the reference
itself is consistent. If the reference changes, it will not serve its
intended purpose. Ideally, enough of the product reference should
be obtained initially to serve for the entire experiment, and the
product should be stored so that its sensory qualities do not change
over the testing period. If a "new" reference is introduced part way
through a study, or if the quality of the reference changes, results of
the experiment may be impossible to interpret. If the product
reference is a food that must be freshly prepared for each panel
session, then ingredients and methods of preparation should be well
standardized before the experiment begins.
scormier
Sticky Note
None set by scormier
scormier
Sticky Note
MigrationNone set by scormier
scormier
Sticky Note
Unmarked set by scormier
scormier
Sticky Note
None set by scormier
scormier
Sticky Note
MigrationNone set by scormier
scormier
Sticky Note
Unmarked set by scormier

+ Chapters
Reducing Panel Response Error
During sensory testing panelists' responses can be influenced by psychological factors. If the influence of psychological factors is
not taken into account when an experiment is planned and conducted, the error introduced can lead to false results.
Psychological factors can be responsible for a number of different types of error. Errors that result from panelists' expectations, from sample positions, and from stimulus and contrast effects will be
discussed in the following sections.
5.1 EXPECTATION ERRORS
Expectation errors can occur when panelists are given too much information about the nature of the experiment or the types of samples before tests are conducted. If the panelists expect to find
certain differences among the samples, they will try to find these
scormier
Sticky Note
None set by scormier
scormier
Sticky Note
MigrationNone set by scormier
scormier
Sticky Note
Unmarked set by scormier
scormier
Sticky Note
None set by scormier
scormier
Sticky Note
MigrationNone set by scormier
scormier
Sticky Note
Unmarked set by scormier

44
differences. Panelists should be given only the information that
they need to perform their task, and when the experiment is under
way, they should be discouraged from discussing their judgements with each other. Those conducting the experiment or whose knowledge of it leads them to expect particular results, should not participate in the panel.
Panelists may have other expectations about the test samples.
They may expect that a sample coded as A will be "better" than a sample coded as For that a sample coded as 1 will have more of a characteristic than a sample coded as 5. To prevent these expectation errors, each sample should be coded with a 3-digit
random number (such as 374 or 902). Three digit codes do not influence panelists' judgements as do single number or letter codes. Random number tables, such as the one shown in Appendix 7,
Table 7.1, are useful in choosing random numbers. Starting
anywhere on the table, btginning at a different place each time and
moving in a different direction, you can choose 3-digit numbers down a column or across a row.
5.2 POSITIONAL ERRORS
The way samples are positioned or ordered for evaluation can also influence panelists' judgements. For example, when two samples are presented, the first sample evaluated is often preferred or given a higher score. Randomizing the order of sample
presentation so that the samples are presented in different positions to each panelist can minimize positional errors.
scormier
Sticky Note
None set by scormier
scormier
Sticky Note
MigrationNone set by scormier
scormier
Sticky Note
Unmarked set by scormier
scormier
Sticky Note
None set by scormier
scormier
Sticky Note
MigrationNone set by scormier
scormier
Sticky Note
Unmarked set by scormier

45
5.3 STIMULUS ERRORS
Stimulus errors occur when panelists are influenced by
irrelevant sample differences such as differences in the size, shape
or colour of food samples presented. Greater colour intensity for
example, may lead panelists to score a food higher for flavour
intensity, even when these characteristics are unrelated to each
other. To minimize stimulus errors, the samples presented should
be as similar as possible in all characteristics but the one(s) being
evaluated. Colour differences can be masked by using coloured
lights in the panel booths, as mentioned earlier. Alternately, dark
glasses or blindfolds may be used if appropriate. Evaluating each
characteristic separately, for all samples, will also reduce the error
due to association of characteristics. When evaluating the colour,
texture and flavour of three pudding samples, the stimulus error is
reduced if the colour of all three samples is evaluated, then the
texture of all three samples, and finally the flavour of all three
samples, rather than evaluating the colour, texture and flavour of the first sample, then the colour, texture and flavour of the second
sample and then the colour, texture and flavour of the third sample.
5.4 CONTRAST ERRORS
Contrast effects between samples can also bias test results.
Panelists who evaluate a sample that is very acceptable before a
less acceptable sample may score the acceptability of the second
sample lower than they would if a less acceptable sample had been
evaluated before it. Similarly, evaluating an unacceptable sample
directly before an acceptable sample may result in amplifying the
acceptability score given to the acceptable sample. When panelists
scormier
Sticky Note
None set by scormier
scormier
Sticky Note
MigrationNone set by scormier
scormier
Sticky Note
Unmarked set by scormier
scormier
Sticky Note
None set by scormier
scormier
Sticky Note
MigrationNone set by scormier
scormier
Sticky Note
Unmarked set by scormier

46
evaluate a mildly flavoured sample after one with an intense flavour, their response will be influenced by the contrast between
the two samples. If all panelists receive samples in the same order,
contrast effects can have a marked influence on panel data.
Contrast effects cannot be eliminated during sensory testing, but if
each panelist receives samples in a different order, contrast effects
can be balanced for the panel as a whole. Samples can be presented
randomly to each panelist or all possible orders of the sample set
can be presented. For example, when four samples are presented to each panelist at one time, four samples can be arranged and
presented in 24 combinations. To ensure that a panelist evaluates
the samples in the order selected for him/her, code numbers should
be written in the appropriate order on the ballot and the panelist
instructed to evaluate samples in the order indicated on the ballot.
If possible, the coded samples on the tray should also be arranged
for presentation to each panelist in the appropriate order, so that the
evaluation can be done from left to right.
scormier
Sticky Note
None set by scormier
scormier
Sticky Note
MigrationNone set by scormier
scormier
Sticky Note
Unmarked set by scormier
scormier
Sticky Note
None set by scormier
scormier
Sticky Note
MigrationNone set by scormier
scormier
Sticky Note
Unmarked set by scormier

+ Chapter6
Collecting And Analyzing Sensory Data
Sensory data can be in the form of frequencies, rankings, or
quantitative numerical data. The form of the data depends on the
type of measurement scale used for sensory testing. To analyze the
data statistically, methods appropriate for frequency, ranked or
quantitative data must be applied. Types of scales and the statistical
methods appropriate for analysis of the data obtained will be
described briefly in the following section.
6.1 MEASUREMENT SCALES
Measurement scales are used to quantify sensory information.
Scales can be classified according to their type as nominal, ordinal,
interval or ratio scales. Because the type of scale chosen will affect
the type of statistical analysis done, the measurement scale should
be chosen only after careful consideration of the objectives of the
study.
scormier
Sticky Note
None set by scormier
scormier
Sticky Note
MigrationNone set by scormier
scormier
Sticky Note
Unmarked set by scormier
scormier
Sticky Note
None set by scormier
scormier
Sticky Note
MigrationNone set by scormier
scormier
Sticky Note
Unmarked set by scormier

48
6.1.1 Nominal Scales
Nominal scales are the simplest of all scales. In these types of scales, numbers represent labels or category names and have no
real numerical value. For example, panelists can use a nominal
scale to identify odour characteristics of tomato sauces where 1 = fruity, 2 = sweet, 3 = spicy, and 4 = pungent. Panelists record the number of each odour characteristic present in each of the samples
and the panel leader tabulates the frequency of the appearance of
each characteristic for each sample. The products are then
compared by observing the frequency of each odour characteristic
in each sample.
Names only, rather than numbers representing names, can be
used in a nominal scale. Classifications or categories can be given
names and the frequencies within each classification tabulated and compared. Food samples could be classified as acceptable or
unacceptable and the number of panelists placing a sample in the
unacceptable category compared to the number of panelists
considering it acceptable.
6.1.2 Ordinal Scales
ln ordinal scales the numbers represent ranks. Samples are
ranked in order of magnitude. Ranks do not indicate the size of the
difference between samples. Ranking is used for both
consumer-oriented and product-oriented testing. In consumer
panels, samples are ranked on the basis of preference or
acceptability. Biscuits made from three different formulations
could be ranked for preference with the sample ranked 1 as the
most preferred and the sample ranked 3 as the least preferred. In
scormier
Sticky Note
None set by scormier
scormier
Sticky Note
MigrationNone set by scormier
scormier
Sticky Note
Unmarked set by scormier
scormier
Sticky Note
None set by scormier
scormier
Sticky Note
MigrationNone set by scormier
scormier
Sticky Note
Unmarked set by scormier
49
product-oriented testing the intensities of a particular product
characteristic are ranked. A series of five chicken soup samples
could be ranked for saltiness, with the sample ranked 1 the most
salty soup and the sample ranked 5 the least salty soup.
6.1.3 Interval Scales
Interval scales allow samples to be ordered according to the
magnitude of a single product characteristic or according to
acceptability or preference. The degree of difference between
samples is indicated when interval scales are used. If chicken soups
were evaluated using an interval scale, not only would the most salty sample be identified, but the number of intervals separating
the most salty soup from the least salty soup would be known. To
provide a measurement of the degree of difference between
samples the length of the intervals on the scale must be equal.
Category scales and line scales (Figure 7) are two types of
sensory scales, commonly treated as interval scales. A category
scale is one that is divided into intervals or categories of equal size.
The categories are labelled with descriptive terms and/or numbers.
All the categories may be labelled or only a few, such as the
endpoints and/or midpoint of the scale. The total number of
categories used varies, however, 5-9 categories are common.
Pictures or diagrams illustrating the categories on the scale are
particularly useful if panelists have trouble reading or
understanding the language of the scale (Figure 7). Line scales,
with endpoints and/or midpoint of the scale labelled, are commonly
used to quantify characteristics. The length of the line scale can vary, but 15 cm is often used. Panelists may not always use
category and line scales as equal interval scales. This is particularly
scormier
Sticky Note
None set by scormier
scormier
Sticky Note
MigrationNone set by scormier
scormier
Sticky Note
Unmarked set by scormier
scormier
Sticky Note
None set by scormier
scormier
Sticky Note
MigrationNone set by scormier
scormier
Sticky Note
Unmarked set by scormier

50
weak
a) 5-Point Category Scale for the Intensity of a Characteristic
CODE
trace
slightly intense
moderately intense
very intense
extremely intense
b) Line Scale for the Intensity of a Characteristic
c) Smiley Scale for Degree of Liking
strong
®®o®O®O®O I 0 0 0 0 ~ -- ~ ~
Dislike Dislike Neither like Like Like a lot a little nor dislike a little a lot
D D 0 D 0
Figure 7
Examples of Commonly Used Sensory Scales
scormier
Sticky Note
None set by scormier
scormier
Sticky Note
MigrationNone set by scormier
scormier
Sticky Note
Unmarked set by scormier
scormier
Sticky Note
None set by scormier
scormier
Sticky Note
MigrationNone set by scormier
scormier
Sticky Note
Unmarked set by scormier

51
true of untrained consumer panelists. When in doubt about the equality of scale intervals, the panelists' scores should be converted to ranks and the category or line scales treated as ordinal scales.
Examples in this manual will, however, be based on the assumption that equal interval sizes do exist between categories and along the line scales, and both scales will be considered and analyzed as interval scales.
Interval scales are used in both consumer-oriented and
product-oriented tests. The degree of liking, the level of preference or the acceptability of the products are scored in consumer tests. The intensity of product attributes are scored in product-oriented testing.
6.1.4 Ratio Scales
Ratio scales are similar to interval scales, except that a true zero exists. On an interval scale the zero end point is chosen arbitrarily
and does not necessarily indicate the absence of the characteristic being measured. On a ratio scale the zero point indicates the complete absence of the characteristic. If a ratio scale were used to measure the five chicken soup samples, the number of saltiness intervals separating the samples would indicate how many times
more salty one sample was than another. If two of the samples, A
and B, were given scores of 3 and 6 respectively for salty flavour intensity, on a ratio scale, sample B would be twice as salty as
sample A. Ratio scales are seldom used for consumer-oriented testing, because training is required to use ratios successfully.
scormier
Sticky Note
None set by scormier
scormier
Sticky Note
MigrationNone set by scormier
scormier
Sticky Note
Unmarked set by scormier
scormier
Sticky Note
None set by scormier
scormier
Sticky Note
MigrationNone set by scormier
scormier
Sticky Note
Unmarked set by scormier

52
6.2 STATISTICALANALYSIS
Sensory results are analyzed statistically in order to allow the experimenter to make inferences or draw conclusions about
populations of people or food products on the basis of a sample
drawn from these populations. Prior to conducting the experiment,
assumptions or informed guesses, can be made about the
populations and about the expected results of the experiment.
These assumptions are called hypotheses, and can be stated in two
ways. The assumption that no difference exists between two
samples, or among several samples, is termed the null hypothesis.
This is also the statistical hypothesis which, based on statistical
analysis of experimental results, is accepted or rejected. The other
assumption that can be made is that differences do exist between or
among samples. This is the alternate hypothesis, or what is often termed the research hypothesis. For example, in an experiment to
determine whether adding salt to cooking water produces softer
beans, the null hypothesis would be that there is no difference in
softness between beans cooked with or without added salt. The alternate (or research) hypothesis might state that the beans cooked
with salt are softer than those without salt. Using the appropriate
statistical test, it is possible to determine whether the null
hypothesis should be accepted or rejected. If it is accepted, then the
conclusion is that there is no difference in softness between beans
cooked by the two methods according to this test. If it is rejected,
then the conclusion is that the beans cooked with salt are probably
softer.
Results of statistical tests are expressed by giving the probablity
that the outcome could be due to a chance occurrence rather than
being a real difference. If a result occurs 5 times out of 100, due to
chance, then the probability is said to be 0.05. A statistical result is usually considered significant only if its probability is 0.05 or less.
scormier
Sticky Note
None set by scormier
scormier
Sticky Note
MigrationNone set by scormier
scormier
Sticky Note
Unmarked set by scormier
scormier
Sticky Note
None set by scormier
scormier
Sticky Note
MigrationNone set by scormier
scormier
Sticky Note
Unmarked set by scormier

53
At this level of probability, the null hypothesis will be rejected 5
times out of 100 when in fact it should be accepted. When it is
stated that a difference is significant at the 5 percent level (a
probability of 0.05), it means that 95 times out of 100 the
difference is a real one.
The level of significance to be used in a sensory test should be
decided on before the test is carried out. This is done so that the
results of the test do not influence the decision. Usually levels of
0.05 or 0.01 are employed. Using a level of significance of 0.05
rather than 0.01 makes it more likely that a difference will be found
if one exists (i.e. the null hypothesis is more likely to be rejected).
However, it also means that there is a greater probability that the
difference identified is due to chance.
In consumer-oriented testing inferences can be made concerning
a group, such as the intended users of a food product, if the group
or population has been sampled randomly to form the consumer
panel. In product-oriented testing, panelists are not selected
randomly and no inferences can be made about a particular
population of consumers. Inferences can be made, however, about
the characteristics of the population of foods being tested. In both
types of testing the food samples should be chosen at random from
the product lots of interest, if results are to be inferred for the
product as a whole. When sampling cannot be done on a random
basis, care must be taken in generalizing the conclusion of the test
to the wider group or population.
Random sampling of a population requires that every unit of the
population has an equal chance of being selected. Obtaining a truly
random sample of a food product is seldom possible. However, it is
important that the samples to be tested are as representative of the original batch of food as possihle.
scormier
Sticky Note
None set by scormier
scormier
Sticky Note
MigrationNone set by scormier
scormier
Sticky Note
Unmarked set by scormier
scormier
Sticky Note
None set by scormier
scormier
Sticky Note
MigrationNone set by scormier
scormier
Sticky Note
Unmarked set by scormier
54
A sample lot large enough to provide for all components of the
study should be gathered initially. Subsamples from this lot should
be assigned randomly to each experimental treatment or replication
or block. At each stage of the process, subsamples or portions are
randomly chosen.
6.3 STATISTICAL TESTS
Statistical tests are used to analyze data resulting from sensory
studies. Statistical analyses are used for the following purposes:
1) to test hypotheses.
2) to find out if significant differences exist among samples,
treatments or populations and if these differences are
conditional upon other variables or parameters.
3) to monitor the consistency of trained panelists both during
training and during the actual study.
6.3.1 Statistical Tests for Scalar Data
Data from nominal and ordinal scales are analyzed usmg
non-parametric statistical tests while data from interval and ratio
scales are analyzed using parametric statistical tests.
Non-parametric methods are less discriminating than parametric
tests but do not require data to be normally and independently
scormier
Sticky Note
None set by scormier
scormier
Sticky Note
MigrationNone set by scormier
scormier
Sticky Note
Unmarked set by scormier
scormier
Sticky Note
None set by scormier
scormier
Sticky Note
MigrationNone set by scormier
scormier
Sticky Note
Unmarked set by scormier

55
distributed as do parametric tests. Parametric tests also require
interval scales to have intervals or categories that are equal both
psychologically and in size. If this is not true, then the categories
should be treated as nominal data and analyzed by non-parametric
methods. The use of parametric tests versus non-parametric tests
for the analysis of category scale data has been discussed in
numerous books and articles (0 'Mahony, 1986, 1982; McPherson
and Randall, 1985; Powers, 1984; Gacula and Singh, 1984; Daget,
1977).
Nominal sensory data is usually analyzed by binomial or
chi-square tests. Ordinal or ranked sensory data is most frequently
analyzed by the Kramer test or the Friedman test. The Kramer test,
however, has recently been found to be inappropriate (Basker,
1988; Joanes, 1985) and is not recommended. The most common
parametric test for interval or ratio scale sensory data is the
Analysis of Variance (ANOV A).
Multiple comparison of means tests are utilized to identify
samples that differ from each other, once the presence of statistical
differences has been confirmed using Analysis of Variance. Many
multiple comparison tests, such as Duncan's New Multiple Range
Test, Tukey's Test, the Least Significant Difference (LSD) Test
and Schcffe's Test, are available. Of these, the LSD test is the most
powerful and most liberal test, followed by Duncan's, Tukey 'sand
Scheffe's test. Thus, using the LSD test will make it more likely to
find significant differences between two samples. However, it may
also identify differences when none really exist. Scheffe's test, on
the other hand, is very cautious or conservative and may miss
finding differences when they do exist. Duncan's and Tukey's test
are frequently used for sensory data as they are considered neither
too liberal nor too conservative.
scormier
Sticky Note
None set by scormier
scormier
Sticky Note
MigrationNone set by scormier
scormier
Sticky Note
Unmarked set by scormier
scormier
Sticky Note
None set by scormier
scormier
Sticky Note
MigrationNone set by scormier
scormier
Sticky Note
Unmarked set by scormier

56
Multivariate analysis techniques can be used when relation
ships among a number of different measurements or tests are being
investigated. Correlation and Regression Analysis, Discriminant
Analysis, Factor Analysis and Principal Component Analysis are
types of multivariate analysis frequently used in sensory studies.
These analyses require sophisticated statistical treatment, and will
not be discussed in this manual. For further information on the use
of multivariate techniques for sensory analysis data see O'Mahony
(1986), Gacula and Singh (1984), Piggott (1984), Powers (1984,
1981), Moskowitz (1983), Ennis et al. (1982) and Stungis (1976).
Programmable calculators can be used to analyze small data sets
using the statistical tests illustrated in this manual. Computerized
statistical programs or packages are needed to carry out more
complicated statistical analyses.
6.4 EXPERIMENTAL DESIGN
Experimental designs are plans, arrangements, or a sequence of
steps for setting up, carrying out and analyzing the results of an
experiment. An appropriate and efficient experimental design must
be chosen to ensure the reliability of data and test results. The
design is selected based on the objectives of the study, the type of
product under study, the testing procedures and conditions, the
resources available and the type of statistical test to be conducted.
There are many types of experimental designs from simple,
completely randomized designs to more complicated, fractional
factorial designs. Good statistical textbooks and a statistician
scormier
Sticky Note
None set by scormier
scormier
Sticky Note
MigrationNone set by scormier
scormier
Sticky Note
Unmarked set by scormier
scormier
Sticky Note
None set by scormier
scormier
Sticky Note
MigrationNone set by scormier
scormier
Sticky Note
Unmarked set by scormier
57
should be consulted to recommend the simplest, most efficient design to meet the specific objectives of the study.
Common features of good experimental designs are
randomization, blocking and replication. These concepts are
discussed in the following sections.
6.4.1 Randomization
Randomization is introduced into an experimental design to
minimize the effects of uncontrollable sources of variation or error
and to eliminate bias. Randomization is a procedure for ordering
units or samples such that each unit has an equal chance of being chosen at each stage of the ordering process. For example, to
randomize the assignment of different cooking treatments to food
samples, one sample is chosen to be cooked by method 1, but all of
the other samples have an equal chance of being cooked by that same method. Random number tables (Appendix 7, Table 7.1) are
used for randomization in the same manner as was described for
choosing 3-digit random numbers (Section 5.1).
6.4.2 Blocking
Blocking is included in many experimental designs to control for known sources of variation and to improve efficiency. Blocks
may be growing plots, day effects, panelists, replications or sample
presentation orders; anything that is a known source of error in the
experiment. Experimental units arc grouped into blocks. Variation among the units within a block is likely to be less than the variation
among blocks. Blocking provides a truer measure of pure or
scormier
Sticky Note
None set by scormier
scormier
Sticky Note
MigrationNone set by scormier
scormier
Sticky Note
Unmarked set by scormier
scormier
Sticky Note
None set by scormier
scormier
Sticky Note
MigrationNone set by scormier
scormier
Sticky Note
Unmarked set by scormier

58
experimental error by accounting for the variance due to the blocked factors and separating it out from the uncontrollable
sources of experimental error. For instance, sensory panelists,
being human, are often a known source of variability in sensory
experiments. By blocking panelists in the experimental design and data analysis, the variation due to panelists can be removed from
the experimental error and separated out as a panelist effect. Then
the error term used to determine whether there are significant
differences among the samples, will be more indicative of pure error.
6.4.3 Replication
Replication of an experiment involves repeating the entire
experiment under identical conditions. Replication provides an
estimate of experimental error and improves the reliability and
validity of the test results. Through replication, the consistency of
both the panel and individual panelists can be determined. The
number of replications of an experiment varies and often is
determined by considering time, cost and sample restrainl~,
however, usually the more replications that are done, the better the
estimate of experimental error and the more reliable the test results.
scormier
Sticky Note
None set by scormier
scormier
Sticky Note
MigrationNone set by scormier
scormier
Sticky Note
Unmarked set by scormier
scormier
Sticky Note
None set by scormier
scormier
Sticky Note
MigrationNone set by scormier
scormier
Sticky Note
Unmarked set by scormier

+ Chapter 7
Sensory Tests: Descriptions and Applications
Sensory tests can be described or classified in several ways.
Statisticians classify tests as parametric or non-parametric according to the type of data obtained from the test. Sensory specialists and food scientists classify tests as consumer-oriented
(affective) or product-oriented (analytical), basing this
classification on the purpose of the test. Tests used to evaluate the preference for, acceptance of, or degree of liking for food products are termed consumer-oriented. Tests used to determine differences
among products or to measure sensory characteristics are termed
product-oriented.
scormier
Sticky Note
None set by scormier
scormier
Sticky Note
MigrationNone set by scormier
scormier
Sticky Note
Unmarked set by scormier
scormier
Sticky Note
None set by scormier
scormier
Sticky Note
MigrationNone set by scormier
scormier
Sticky Note
Unmarked set by scormier

60
7.1 CONSUMER-ORIENTED TESTS
Preference, acceptance and hedonic (degree of liking) tests are consumer-oriented tests. These tests are considered to be consumer
tests since they should be conducted using untrained consumer
panels. Although panelists can be asked to indicate their degree of
liking, preference or acceptance of a product directly, hedonic tests
are often used to measure preference or acceptance indirectly. In
this section preference, acceptance and hedonic tests will be
described using a paired-preference test, an acceptance ranking
scale, and a 9-point hedonic scale as examples.
7.1.1 Preference Tests
Preference tests allow consumers to express a choice between
samples; one sample is preferred and chosen over another or there
is no preference. The paired-preference test is the simplest
preference test but category scales and ranking tests are also often used to determine preference.
General Instructions for Conducting a Paired-Preference Test.
Description of panelists' task: Panelists are asked which of two
coded samples they prefer. Panelists are instructed to choose one,
even if both samples seem equal. The option of including a "no preference" choice or a "dislike both equally" is discussed in Stone
and Side! (1985), but is not recommended for panels with less than
50 panelists as it reduces the statistical power of the test (a larger
scormier
Sticky Note
None set by scormier
scormier
Sticky Note
MigrationNone set by scormier
scormier
Sticky Note
Unmarked set by scormier
scormier
Sticky Note
None set by scormier
scormier
Sticky Note
MigrationNone set by scormier
scormier
Sticky Note
Unmarked set by scormier

61
difference in preference 1s needed m order to obtain statistical
significance).
Presentation of samples: The two samples (A and B) are
presented in identical sample containers coded with 3-digit random
numbers. There are two possible orders of presentation of the
samples; A first, then B (AB) or B first, then A (BA). Each order
should be presented an equal number of times. If the panel included
20 panelists, ten would receive A first and ten, B first. When the
panel is large, the order for each panelist can be selected at random.
Since there is a 50% chance of each panelist receiving either the A
or B sample first, both orders should be presented to approximately
the same number of panelists.
The samples are presented simultaneously in the order selected
for each panelist, so that the panelists can evaluate the samples
from left to right. Retasting of the samples is allowed. An example
of a ballot for the paired-preference test is given in Figure 8. The
order in which the panelists are to evaluate the samples should be
indicated on the ballot.
Analysis of data: Results are analyzed using a 2-tailed
binomial test. The 2-tailed test is appropriate since either sample
could be preferred; and the direction of the preference cannot be
determined in advance. The number of judges preferring each
sample is totalled and the totals tested for significance using Table
7.2 (Appendix 7). In this table X represents the number of panelists
preferring a sample and 11 represents the total number of panelists
participating in the test. The table contains 3 decimal probabilities
for certain combinations of X and n. In the table, the decimal point
has been omitted to save space, therefore 625 should be read as
0.625. For example, if 17 out of 25 panelists prefer sample A, the
probability from Table 7.2 (X = 17, n = 25) would be 0.108. Since
scormier
Sticky Note
None set by scormier
scormier
Sticky Note
MigrationNone set by scormier
scormier
Sticky Note
Unmarked set by scormier
scormier
Sticky Note
None set by scormier
scormier
Sticky Note
MigrationNone set by scormier
scormier
Sticky Note
Unmarked set by scormier

62
a probability of 0.05 or less is usually required for the result to be
considered significant, it would be concluded that sample A was
not significantly preferred over sample B. Had 19 of the 25 judges
chosen sample A as being the preferred sample, the probability
would have been 0.015 and a significant preference for sample A
would have been shown.
No knowledge of the degree of preference for the preferred
sample or of the degree of difference in preference between the
samples results from the paired-preference test.
Example of a paired-preference test used by an in-house consumer panel to determine preference for pureed beans
Bean purees were prepared from two varieties of black beans, A
(631) and B(228). A paired-preference test was used to determine if
one bean puree was preferred over the other.
Forty untrained panelists were recruited from within the institute
(in-house panel). The two samples were presented to each panelist
simultaneously. Each panelist evaluated the two samples only once.
Twenty panelists received sample A (631) first, twenty panelists
received sample B (228) first. The ballot used when sample A was
presented first is shown in Figure 8.
The number of panelists who preferred each sample was
totalled. Thirty of the forty panelists preferred sample B. In Tahle
7.2 (Appendix 7) for X = 30 and n = 40, the probability is 0.002. This result was therefore statistically significant, and it was
scormier
Sticky Note
None set by scormier
scormier
Sticky Note
MigrationNone set by scormier
scormier
Sticky Note
Unmarked set by scormier
scormier
Sticky Note
None set by scormier
scormier
Sticky Note
MigrationNone set by scormier
scormier
Sticky Note
Unmarked set by scormier

63
concluded that the in-house panel preferred bean puree B over bean
puree A.
Date:-----------
Taste the two bean puree samples in front of you, starting with the sample on the left. Circle the number of the sample that you prefer. You must choose a sample. Guess if you are unsure.
631 228
Figure 8 Ballot for bean puree paired-preference test
7.1.2 Acceptance Tests
Acceptance tests are used to determine the degree of consumer
acceptance for a product. Category scales, ranking tests and the paired-comparison test can all be used to assess product
acceptance. Acceptance of a food product usually indicates actual
use of the product (purchase and eating).
General Instructions for Conducting an Acceptance Test Using Ranking.
Description of panelists' task: Panelists are asked to rank
coded samples for acceptance in order from the least acceptable to
scormier
Sticky Note
None set by scormier
scormier
Sticky Note
MigrationNone set by scormier
scormier
Sticky Note
Unmarked set by scormier
scormier
Sticky Note
None set by scormier
scormier
Sticky Note
MigrationNone set by scormier
scormier
Sticky Note
Unmarked set by scormier
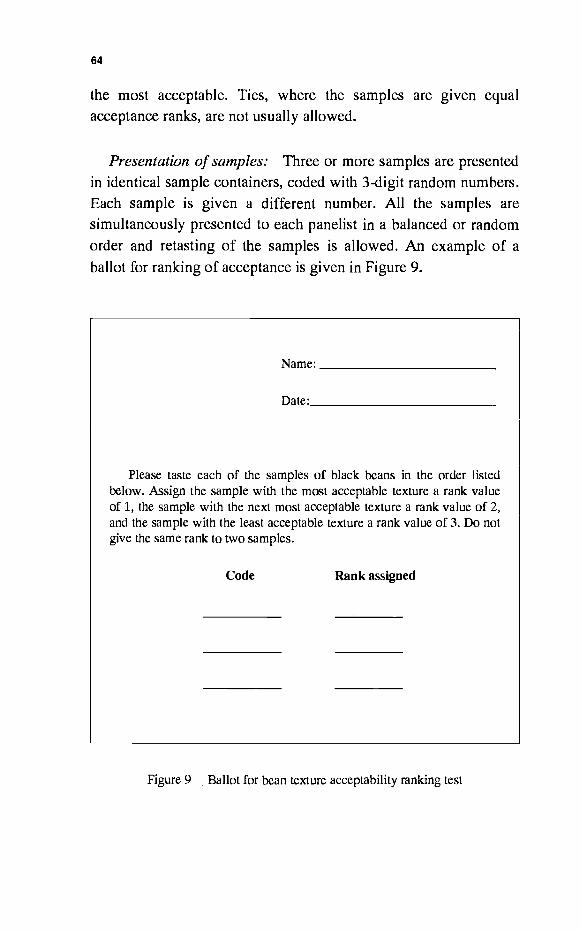
64
the most acceptable. Ties, where the samples are given equal acceptance ranks, are not usually allowed.
Presentation of samples: Three or more samples are presented
in identical sample containers, coded with 3-digit random numbers.
Each sample is given a different number. All the samples are simultaneously presented to each panelist in a balanced or random
order and retasting of the samples is allowed. An example of a
ballot for ranking of acceptance is given in Figure 9.
Date: ___________ _
Please taste each of the samples of black beans in the order listed below. Assign the sample with the most acceptable texture a rank value of 1, the sample with the next most acceptable texture a rank value of 2, and the sample with the least acceptable texture a rank value of 3. Do not give the same rank to two samples.
Code Rank assigned
Figure 9 Ballot for bean texture acceptability ranking test
scormier
Sticky Note
None set by scormier
scormier
Sticky Note
MigrationNone set by scormier
scormier
Sticky Note
Unmarked set by scormier
scormier
Sticky Note
None set by scormier
scormier
Sticky Note
MigrationNone set by scormier
scormier
Sticky Note
Unmarked set by scormier

65
Analysis of data: For data analysis, the ranks assigned to each
sample are totalled. The samples are then tested for significant differences by comparing the rank totals between all possible pairs
of samples using the Friedman Test. Tables 7.3 and 7.4 (Appendix
7) present expanded tables for this test, for 3-100 panelists and
3-12 samples (Newell and Macfarlane, 1987). The differences between all possible rank total pairs are compared to the tabulated
critical value, based on a specific significance level (5% in Table
7.3; 1 % in Table 7.4) and the number of panelists and samples
involved in the test. If the difference beween pairs of rank totals is larger than the tabulated critical value, the pair of samples are
significantly different at the chosen significance level.
Example of a ranking test used by an in-house consumer panel to determine acceptability of bean texture.
Cooked bean samples were prepared from three varieties of
black beans. A ranking test was used to obtain an indication of the
most acceptable black bean texture.
Thirty untrained panelists were recruited from within the
institution (in-house panel). All treatments were simultaneously
presented to each panelist. Each panelist evaluated the samples
only once. The three samples could be served in six possible
orders, as shown in Table 4 (Section 7.2.1 ). Since there were thirty
panelists, the order of sample presentation was balanced such that
fiVe panelists received samples in each of the six possible orders. The ballot used for ranking acceptability is shown in Figure 9.
Panelists were instructed to rank the texture of the samples for
acceptability without ties, giving each sample a different rank even
if they seemed to be similar. The sample which was ranked as
scormier
Sticky Note
None set by scormier
scormier
Sticky Note
MigrationNone set by scormier
scormier
Sticky Note
Unmarked set by scormier
scormier
Sticky Note
None set by scormier
scormier
Sticky Note
MigrationNone set by scormier
scormier
Sticky Note
Unmarked set by scormier

66
having the most acceptable texture was assigned a rank of 1, the
sample with the next most acceptable texture was assigned a rank
of 2 and the sample with the least acceptable texture was assigned a
rank of 3. The ranked values given to each sample by all 30
panelists were tabulated as shown in Table 1.
The differences between rank total pairs were:
C - A= 76-33 = 43
C - B = 76-71 = 5
B - A= 71-33 = 38
The tabulated critical value at p=0.05, for 30 panelists and three
samples, from Table 7.3, is 19. Thus, the cooked texture of bean
varieties A and C were significantly different and the cooked
texture of bean varieties A and B were significantly different.
The in-house panel found the cooked texture of black bean
varieties B and C less acceptable than the cooked texture of bean
variety A. There was no difference in texture acceptability between varieties B and C.
7.1.3 Hedonic Tests
Hedonic tests are designed to measure degree of liking for a
product. Category scales ranging from like extremely, through
neither like nor dislike, to dislike extremely, with varying numbers
of categories, are used. Panelists indicate their degree of liking for
each sample by choosing the appropriate category.
scormier
Sticky Note
None set by scormier
scormier
Sticky Note
MigrationNone set by scormier
scormier
Sticky Note
Unmarked set by scormier
scormier
Sticky Note
None set by scormier
scormier
Sticky Note
MigrationNone set by scormier
scormier
Sticky Note
Unmarked set by scormier

67
Table 1 Tabulated Ranking 1 for Acceptance Test Data
Black Bean Varieties Panelist A B c
1 1 2 3 2 1 3 2 3 1 2 3 4 2 3 5 1 3 2 6 2 3 7 1 2 3 8 1 3 2 9 1 2 3
10 2 1 3 11 1 3 2 12 1 3 2 13 1 3 2 14 1 2 3 15 1 3 2 16 1 2 3 17 1 3 2 18 1 2 3 19 1 2 3 20 1 3 2 21 1 3 2 22 1 2 3 23 1 2 3 24 1 3 2 25 1 3 2 26 2 1 3 27 1 2 3 28 1 3 2 29 3 2 30 2 1 3
Rank Total 33 71 76
1Highest rank= 1 =most acceptable texture, 3 =least acceptable texture
scormier
Sticky Note
None set by scormier
scormier
Sticky Note
MigrationNone set by scormier
scormier
Sticky Note
Unmarked set by scormier
scormier
Sticky Note
None set by scormier
scormier
Sticky Note
MigrationNone set by scormier
scormier
Sticky Note
Unmarked set by scormier

68
General Instructions for Conducting a Hedonic Test Using a 9-point Scale.
Description of panelists' task: Panelists are asked to evaluate
coded samples of several products for degree of liking, on a 9-point
scale. They do this by checking a category on the scale which
ranges from like extremely to dislike extremely. More than one
sample may fall within the same category.
Presentation of samples: The samples are presented in
identical sample containers, coded with 3-digit random numbers. Each sample must have a different number. The sample order can
be randomized for each panelist or, if possible, balanced. In a
balanced serving order each sample is served in each position (i.e.
first, second, third, etc.) an equal number of times. A good
discussion of serving orders with examples of 3, 4, 5 and 12 sample
balanced designs is given in Stone and Sidel (1985). A balanced serving order for three samples is given in Table 4 (Section 7.2.l). Samples may be presented all at once or one at a time. Presenting
the samples simultaneously is preferred as it is easier to administer
and allows panelists to re-evaluate the samples if desired and make comparisons between the samples. An example of a ballot for the
hedonic test is given in Figure 10.
Analysis of Data: For data analysis, the categories are
converted to numerical scores ranging from 1 to 9, where 1
represents dislike extremely and 9 represents like extremely. The
numerical scores for each sample are tabulated and analyzed by
analysis of variance (ANOV A) to determine whether significant
differences in mean degree of liking scores exist among the
samples. In the ANOV A, total variance is partitioned into variance
assigned to particular sources. The among-sample means variance
is compared to the within-sample variance (also called the random
scormier
Sticky Note
None set by scormier
scormier
Sticky Note
MigrationNone set by scormier
scormier
Sticky Note
Unmarked set by scormier
scormier
Sticky Note
None set by scormier
scormier
Sticky Note
MigrationNone set by scormier
scormier
Sticky Note
Unmarked set by scormier

69
experimental error)1. If the samples are not different, the
among-sample means variance will be similiar to the experimental
error. The variance due to panelists or other blocking effects can
also be tested against the random experimental error.
The measure of the total variance for the test is the total sum of
squares or SS(I). The measured variance among the sample means
is the treatment sum of squares or SS(Tr). The measure of the
variance among panelists' means is the panelist sum of squares or
SS(P). Error sum of square, SS(E), is the measure of the variance due to experimental or random error. Mean Squares (MS) for
treatment, panelist and error are calculated by dividing each SS by
its respective degrees of freedom. The ratios of the MS(fr) to the
MS(E) and the ratio of the MS(P) to the MS(E) are then calculated. These ratios are termed F ratios or F statistics. Calculated F ratios
are compared to tabulated F ratios (Tables 7.5 and 7.6, Appendix 7)
to determine whether there are any significant differences among
the treament or panelists' means. If the calculated F ratio exceeds the tabulated F ratio for the same number of degrees of freedom,
then there is evidence of significant differences. Tabulated F ratios
are given for 0.05 and 0.01 levels of significance in Tables 7.5 and
7.6, respectively.
Once a significant difference has been found, multiple
comparison tests can be carried out to determine which treatment
or population means differs from each other. Details of the
ANOVA calculations are given in the following example.
1 Since the total variance within-samples comes from pooling individual variances within-samples, a necessary assumption is that the true within-sample variances are equal. There are formal tests that can be done to test for equality of
within-sample variances (Homogeneity of Variance).
scormier
Sticky Note
None set by scormier
scormier
Sticky Note
MigrationNone set by scormier
scormier
Sticky Note
Unmarked set by scormier
scormier
Sticky Note
None set by scormier
scormier
Sticky Note
MigrationNone set by scormier
scormier
Sticky Note
Unmarked set by scormier

70
Example of a hedonic test used by an in-house consumer panel to determine degree of liking for bean varieties.
A hedonic test was conducted to determine consumers' degree of liking for five varieties (treatments) of cooked black beans using the 9-point category scale shown in Figure 10.
The beans were cooked, staggering the cooking times, so that all
five samples were done ten minutes before the panel began. Twenty-eight untrained in-house consumer panelists evaluated the
five samples once. Ten gram samples of the five varieties of beans were presented simultaneously, in styrofoam sample cups with lids,
to each panelist. For five samples, 120 serving orders were possible, however, with only 28 panelists this large number of
serving orders was impossible to balance. Therefore, the serving
order was randomized for each panelist.
After each panelist had evaluated the five samples, the descriptive categories were converted to numerical scores. The
scores were tabulated and analyzed by analysis of variance. The tabulated scores for the first seven panelists are shown in Table 2.
The analysis of variance shown was carried out using the scores for the seven panelists only.
scormier
Sticky Note
None set by scormier
scormier
Sticky Note
MigrationNone set by scormier
scormier
Sticky Note
Unmarked set by scormier
scormier
Sticky Note
None set by scormier
scormier
Sticky Note
MigrationNone set by scormier
scormier
Sticky Note
Unmarked set by scormier

Date:-------------
Please look at and taste each sample of black beans in order from left to right as shown on the ballot. Indicate how much you like or dislike each sample by checking the appropriate phrase under the sample code number.
Code __ Code --- Code --- Code __ Code
Like Like Like Like Like Extremely Extremely Extremely Extremely Extremely
Like Like Like Like Like Very Much Very much Very Much Very Much Very Much
Like Like Like Like Like Moderately Moderately Moderately Moderately Moderately
Like Like Like Like Like Slightly Slightly Slightly Slightly Slightly
71
Neither Like Neither Like Neither Like Neither Like Neither Like Nor Dislike Nor Dislike Nor Dislike Nor Dislike Nor Dislike
Dislike Dislike Dislike Dislike Dislike Slightly Slightly Slightly Slightly Slightly
Dislike Dislike Dislike Dislike Dislike Moderately Moderately Moderately Moderately Moderately
Dislike Dislike Dislike Dislike Dislike Very Much Very Much Very Much Very Much Very Much
Dislike Dislike Dislike Dislike Dislike Extremely Extremely Extremely Extremely Extremely
Comments: Comments: Comments: Comments: Comments:
Figure 10 Ballot for bean varieties hedonic test using a 9-point scale
scormier
Sticky Note
None set by scormier
scormier
Sticky Note
MigrationNone set by scormier
scormier
Sticky Note
Unmarked set by scormier
scormier
Sticky Note
None set by scormier
scormier
Sticky Note
MigrationNone set by scormier
scormier
Sticky Note
Unmarked set by scormier

72
For the analysis of variance (ANOV A), the following calculations were carried out, (where N = the total number of
individual responses, 1: =sum of):
Correction Factor:
CF = Grand Total2
N
= 759.1
Total Sum of Squares:
SS(f) = 1: (each individual response2} - CF
= (22 +12 +12 + ... +22 +32}- 759.1
= 917 - 759.1
= 157.9
Treatment Sum of Squares:
SS (Tr) = 1: (each treatment total2)
number of responses per treatment
152 + 432 + 522 + 312 + 222 - 759.1 =
= ~ - 759.1
= 889 - 759.1
= 129.9
-CF
scormier
Sticky Note
None set by scormier
scormier
Sticky Note
MigrationNone set by scormier
scormier
Sticky Note
Unmarked set by scormier
scormier
Sticky Note
None set by scormier
scormier
Sticky Note
MigrationNone set by scormier
scormier
Sticky Note
Unmarked set by scormier
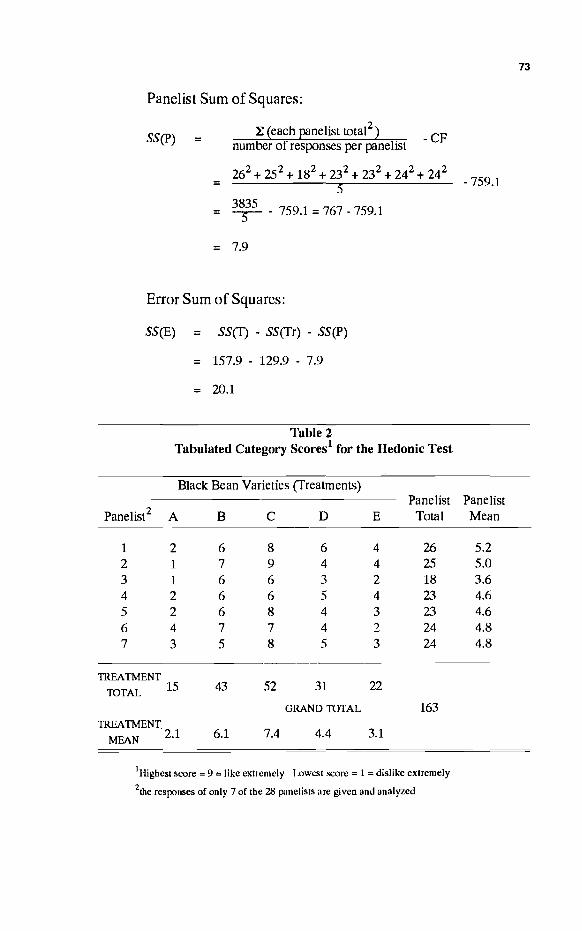
Panelist Sum of Squares:
l: (each panelist total 2)
SS(P) = -CF number of responses per panelist
=
= ¥- -759.1 = 767 - 759.1
= 7.9
Error Sum of Squares:
SS(E) = SS(f) - SS(Tr) - SS(P)
= 157.9 - 129.9 - 7.9
= 20.1
Table 2 Tabulated Category Scores1 for the Bedonie Test
Black Bean Varieties (Treatments) Panelist
Panelist2 A B c D E Total
1 2 6 8 6 4 26 2 1 7 9 4 4 25 3 1 6 6 3 2 18 4 2 6 6 5 4 23 5 2 6 8 4 3 23 6 4 7 7 4 2 24 7 3 5 8 5 3 24
TREATMENT
'IDTAL 15 43 52 31 22
GRAND TOTAL 163 TREATMENT.
MEAN 2.1 6.1 7.4 4.4 3.1
1Highest score= 9 =like extremely Lowest score= 1 =dislike extremely 2the responses of only 7 of the 28 panelists are given and analyzed
73
- 759.1
Panelist Mean
5.2 5.0 3.6 4.6 4.6 4.8 4.8
scormier
Sticky Note
None set by scormier
scormier
Sticky Note
MigrationNone set by scormier
scormier
Sticky Note
Unmarked set by scormier
scormier
Sticky Note
None set by scormier
scormier
Sticky Note
MigrationNone set by scormier
scormier
Sticky Note
Unmarked set by scormier

74
The mean square (MS) values were calculated by dividing the
SS values by their respective degrees of freedom as follows:
Total Degrees of Freedom, df(1) = Tue total number of responses - 1 = N-1 = 35 - 1 = 34
Treatment Degrees of Freedom, df(Tr) = Tue number of treatments - 1 = 5-1 = 4
Panelist Degrees of Freedom, df(P) = Tue number of panelists - 1 = 7 -1 = 6
Error Degrees of Freedom, df(E) = df(T) - df(Tr) - df(P) = 34-4-6 = 24
Treatment Mean Square, MS(Tr) = SS(Tr) I df(Tr)
129.9 = 32.48 = 4
Panelist Mean Square, MS(P) = SS(P) I df(P)
7.9 = 1.32 = 6
Error Mean Square, MS(E) = SS(E) I df(E)
= 20.1 = 0 84 24 .
scormier
Sticky Note
None set by scormier
scormier
Sticky Note
MigrationNone set by scormier
scormier
Sticky Note
Unmarked set by scormier
scormier
Sticky Note
None set by scormier
scormier
Sticky Note
MigrationNone set by scormier
scormier
Sticky Note
Unmarked set by scormier

75
The F ratios, for treatments and panelists were calculated by dividing their respective MS values by the MS for error. The tabular
F ratios were obtained from statistical tables of the F distribution
(Appendix 7, Table 7.5). For example, the tabulated F ratio for treatments with 4 degrees of freedom (df) in the numerator and 24 df in the denominator, at p s:.05, is 2.78. The F ratio for panelists
with 6 df in the numerator and 24 df in the denominator at p s:.05 is
2.51. The calculated F ratios must exceed these tabular F values in
order to be considered significant at the 5% level.
The sums of squares, mean squares, degrees of freedom and F ratios are summarized in the ANOV A table shown in Table 3.
Table 3 ANO VA Table for the Bedonie Test
F ratio Source of Calculated Tabular Variation df SS MS (ps:.05)
Total (1) 34 157.9
Treatment (Tr) 4 129.9 32.48 38.67 2.78
Panelists (P) 6 7.9 1.32 1.57 2.51
Error (E) 24 20.1 0.84
Since the calculated treatment F ratio of 38.67 exceeded the
tabulated F ratio of 2.78, it was concluded that there was a
significant (p s: .05) difference among the mean hedonic scores for the five bean varieties. The calculated panelist F ratio of 1.57, however, did not exceed the tabular F ratio of 2.51. Thus, no
significant panelist effect was present.
scormier
Sticky Note
None set by scormier
scormier
Sticky Note
MigrationNone set by scormier
scormier
Sticky Note
Unmarked set by scormier
scormier
Sticky Note
None set by scormier
scormier
Sticky Note
MigrationNone set by scormier
scormier
Sticky Note
Unmarked set by scormier

76
The ANOV A indicated that there were significant differences among the five bean varieties. To determine which bean samples
differed significantly from each other, a multiple comparison test,
Duncan's New Multiple Range Test and Tables 7.7 and 7.8,
Appendix 7, were used. This test compares the differences between
all pairs of means to calculated range values for each pair. If the
difference between pairs of means is larger than the calculated
range value, the means are significantly different at the specified
level of significance. Range values are computed based on the number of means that lie between the two means being tested,
when the means are arranged in order of size.
To carry out the Duncan's Test, treatment means were arranged
in order of magnitude as shown.
Black Bean Varieties c B D E A Treatment Means 7.4 6.1 4.4 3.1 2.1
To compare the 5 means in this example, range values for a
range of 5, 4, 3 and 2 means were calculated from the following
equation:
Range = ~ ~S(E)
The MS(E), taken from the ANOV A table (Table 3) was 0.84. The t is the number of individual responses used to calculate
each mean; in this example t = 7.
Range = ~ o.s; = Q (0.346)
scormier
Sticky Note
None set by scormier
scormier
Sticky Note
MigrationNone set by scormier
scormier
Sticky Note
Unmarked set by scormier
scormier
Sticky Note
None set by scormier
scormier
Sticky Note
MigrationNone set by scormier
scormier
Sticky Note
Unmarked set by scormier

77
Q values were obtained from Table 7.7 (Appendix 7) at the same level of significance used in the ANOV A, p~.os. The df(E), or 24 df, are also needed to determine Q values. From Table 7.7, Q
values for 24 df are:
Q value for 5 means = 3.226 Q value for 4 means = 3.160 Q value for 3 means = 3.066 Q value for 2 means = 2.919
Range values were then calculated.
Range= Q (0.346)
Range for 5 means = 3.226 (0.346) Range for 4 means = 3.160 (0.346) Range for 3 means = 3.066 (0.346) Range for 2 means = 2.919 (0.346)
= 1.12 = 1.09 = 1.06 = 1.01
The 5 mean range value was applied to the means with the
greatest difference between them, 7.4 and 2.1, since these values
covered the range over 5 means. The difference, 5.3, was greater
than 1.12. These two means, therefore, were significantly different.
The next comparison was between the means 7.4 and 3.1, using the 4 mean range value (1.09). Since the difference between the means (4.3) was greater than 1.09, these means were also
significantly different.
The three mean comparison was between means 7.4 and 4.4.
scormier
Sticky Note
None set by scormier
scormier
Sticky Note
MigrationNone set by scormier
scormier
Sticky Note
Unmarked set by scormier
scormier
Sticky Note
None set by scormier
scormier
Sticky Note
MigrationNone set by scormier
scormier
Sticky Note
Unmarked set by scormier

78
7.4 - 4.4 = 3.0 > 1.06
One two mean comparison was between 7.4 and 6.1.
7.4 - 6.1=1.3 > 1.01
The next highest mean was then compared with the lowest mean
and the difference was compared to the range value for 4 means.
6.1 - 2.1=4.0 > 1.09
This procedure was carried out as shown, until all mean comparisons had been made.
6.1 - 3.1 = 3.0 > 1.06 6.1 - 4.4 = 1.7 > 1.01 4.4 - 2.1 = 2.3 > 1.06 4.4-3.1 = 1.3 > 1.01 3.1 - 2.1 = 1.0 < 1.01
The significant differences among the means were presented by
using letters. Means followed by different letters were significantly
different at the 5% level of probability.
Black Bean Varieties c B D E A Treatment Means 7.4a 6.lb 4.4c 3.ld 2.ld
scormier
Sticky Note
None set by scormier
scormier
Sticky Note
MigrationNone set by scormier
scormier
Sticky Note
Unmarked set by scormier
scormier
Sticky Note
None set by scormier
scormier
Sticky Note
MigrationNone set by scormier
scormier
Sticky Note
Unmarked set by scormier

79
Bean variety C was liked significantly more than all other
samples; variety B was significantly more liked than varieties D, E
and A; variety D was liked more than varieties E and A; variety E
and A were equally liked.
7.2 PRODUCT-ORIENTED TESTS
Product-oriented tests commonly used m food testing
laboratories include difference, ranking for intensity, scoring for
intensity, and descriptive analysis tests. These tests are always
conducted usmg trained laboratory panels. Examples of
product-oriented tests which have been included in this manual are:
a triangle test for difference, a ranking test for intensity and a
scoring test for intensity.
7.2.1 Difference Tests
Tests for difference are designed to determine whether two
samples can be distinguished from each other by sensory analysis.
Difference tests can be used to determine whether a noticeable
change has occurred in a food's appearance, flavour, or texture as a
result of storage, of a change in processing methods, or of
alteration of an ingredient.
The triangle test is a form of difference test that is commonly
used to determine whether there are perceptible differences
between two samples. The size and direction of difference between
two samples, however, is not specified in this test. The test may
also be used to determine panelists' ability to discriminate
scormier
Sticky Note
None set by scormier
scormier
Sticky Note
MigrationNone set by scormier
scormier
Sticky Note
Unmarked set by scormier
scormier
Sticky Note
None set by scormier
scormier
Sticky Note
MigrationNone set by scormier
scormier
Sticky Note
Unmarked set by scormier

80
differences in appearance, odour, flavour or texture of foods. To
test for discrimination of differences related to one characteristic,
the samples being compared must be identical in all other
characteristics. Other tests, such as the paired-comparison or
duo-trio test can be used for similar purposes.
The paired-comparison test is similar to the paired-preference
test described in Section 7.1.1, except that panelists are asked
which of the two samples has the greater intensity of a specific
characteristic. For example, panelists may be asked "which sample
is sweeter?" or "which sample is most tender?". Using this test the
sweeter or more tender sample can be identified, but the extent of
the difference is not measured.
In the duo-trio test panelists are presented with three samples.
One sample is labelled R for reference and the other two samples
are coded with 3-digit random numbers. One of the coded samples
is identical to the reference (R) and the other is not. Panelists are
asked to taste R first, then the coded samples and identify which of
the two coded samples is the same as R (or different from R). The
duo-trio test indicates difference, but not the direction or magnitude
of the difference between samples.
The paired-comparison and duo-trio difference tests will not be
described in detail in this manual. Procedures for conducting these
tests and analyzing the data are described by O'Mahony (1986),
Stone and Side) (1985), Gacula and Singh (1984), Larmond (1977)
and ASTM Committee E-18 (1968).
scormier
Sticky Note
None set by scormier
scormier
Sticky Note
MigrationNone set by scormier
scormier
Sticky Note
Unmarked set by scormier
scormier
Sticky Note
None set by scormier
scormier
Sticky Note
MigrationNone set by scormier
scormier
Sticky Note
Unmarked set by scormier

General Instructions for Identifying a Difference Using a Triangle Test
81
Description of panelists' task: Panelists are presented with
three coded samples, one different and two the same, and asked to
select the different sample. Panelists are required to select the
different sample even if they cannot discern any differences among
the samples (Le. panelists must guess when in doubt).
Presentation of samples: The two different samples (A and B)
are presented to the panelists in sets of three. Panelists receive
either two A's and one B, or two B's and one A. The three samples
are presented in identical sample containers coded with 3-digit
random numbers. All three code numbers on the samples presented
to each panelist must be different, even though two of the samples
are identical.
There are six possible serving orders for the triangle test and
these are shown in Table 4. Each order should be presented an
equal number of times, for a balanced serving order. This is
possible, however, only if there are six, or some multiple of six,
panelists. Alternately the order can be randomized so that each
panelist has an equal chance of receiving any of the six possible
serving orders.
The samples are presented simultaneously in the order selected
for each panelist so that the panelists can evaluate the samples from
left to right. Retasting of the samples is allowed. An example of a
ballot for the triangle test is given in Figure 11. The order in which
the panelists are to evaluate the samples should be indicated on the
ballot.
scormier
Sticky Note
None set by scormier
scormier
Sticky Note
MigrationNone set by scormier
scormier
Sticky Note
Unmarked set by scormier
scormier
Sticky Note
None set by scormier
scormier
Sticky Note
MigrationNone set by scormier
scormier
Sticky Note
Unmarked set by scormier

82
Table 4 Six Possible Serving Orders for a Triangle Test
Panelist Number Order of Sample Presentation First Second Third
1 256(A) 831(A) 349(B) 2 256(A) 349(B) 831(A) 3 670(B) 256(A) 831(A) 4 349(B) 670(B) 256(A) 5 349(B) 256(A) 670(B) 6 831(A) 349(B) 670(B)
Analysis of Data: Results are analyzed using a one-tailed
binomial test for significance. The one-tailed test is appropriate
since one sample is known to be different and there is therefore
only one "correct" answer. The 2-tailed binomial test was used to
analyze the paired-preference data of Section 7.1.1. For that test
either of the two samples could have been preferred; that is, two
"correct" answers were possible, and so a 2-tailed test of
significance was used. The triangle test also differs from the paired
test in that the probability of picking the correct sample by chance
is 1/3. In the paired test the probability of picking the correct
sample by chance is 1/2. Thus the table used for the triangle test
(fable 7.9) is not the same as the one used for the paired test (Table
7.2).
In the triangle test the number of panelists correctly identifying
the different sample is totalled and the total tested for significance
using Table 7.9 (Appendix 7). In this table X represents the number
of panelists choosing the different sample correctly and n
represents the total number of panelists participating in the test.
The table contains 3 decimal probabilities for certain combinations
scormier
Sticky Note
None set by scormier
scormier
Sticky Note
MigrationNone set by scormier
scormier
Sticky Note
Unmarked set by scormier
scormier
Sticky Note
None set by scormier
scormier
Sticky Note
MigrationNone set by scormier
scormier
Sticky Note
Unmarked set by scormier

83
of X and n. In Table 7.9 the initial decimal point has been omitted
to save space, therefore 868 should be read as 0.868. For example,
if 9 out of 17 panelists correctly choose the different sample, the
probability from Table 7.9 (X=9, n=l 7) would be 0.075. Since a
probability of 0.05 or less is usually required for significance, it
would be concluded that there was no significant difference
between the samples. In this type of difference test, both reliability
and sensitivity improve when more panelists are used.
Example of a triangle test used by a trained panel to detect diff ere nee between treated and untreated samples.
A triangle test was conducted to determine whether black beans
that had received a prestorage heat treatment were noticeably
different from untreated beans, after both had been stored under the
same conditions for six months. Each bean sample was cooked to
its optimum doneness following a standard procedure.
An in-house panel of 36 panelists evaluated the cooked bean
samples. Three samples were presented simultaneously to each
panelist. Six panelists received each of the six serving orders
shown in Table 4. The appropriately coded samples were selected
for each panelist and presented accompanied by a ballot on which
code numbers were listed in the order for tasting. The ballot used is
shown in Figure 11.
When all members of the panel had completed the test, their
ballots were marked either correct ( +) when the odd sample was
correctly identified, or incorrect (-). Results were tabulated as
shown in Table 5. Using Statistical Table 7.9 (Appendix 7) the
scormier
Sticky Note
None set by scormier
scormier
Sticky Note
MigrationNone set by scormier
scormier
Sticky Note
Unmarked set by scormier
scormier
Sticky Note
None set by scormier
scormier
Sticky Note
MigrationNone set by scormier
scormier
Sticky Note
Unmarked set by scormier
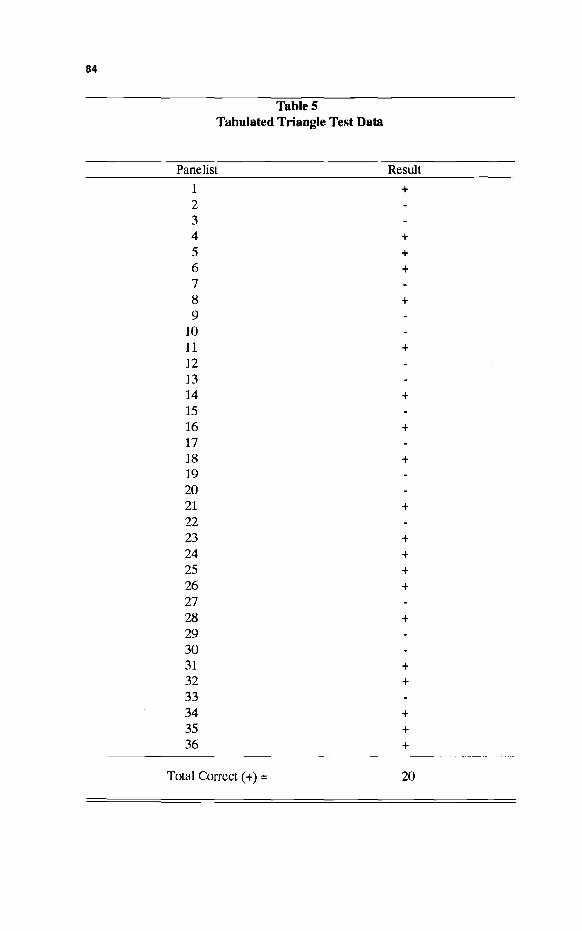
84
Table 5 Tabulated Triangle Test Data
Panelist Result
1 + 2 3 4 + 5 + 6 + 7 8 + 9
10 11 + 12 13 14 + 15 16 + 17 18 + 19 20 21 + 22 23 + 24 + 25 + 26 + 27 28 + 29 30 31 + 32 + 33 34 + 35 + 36 +
Total Correct ( +) = 20
scormier
Sticky Note
None set by scormier
scormier
Sticky Note
MigrationNone set by scormier
scormier
Sticky Note
Unmarked set by scormier
scormier
Sticky Note
None set by scormier
scormier
Sticky Note
MigrationNone set by scormier
scormier
Sticky Note
Unmarked set by scormier

Date:-----------
You have been given three samples of beans. Two of these samples are identical and one is different.
Taste the samples listed and place a check beside the code number of the sample that is different.
Code The Different Sample is:
Figure 11 Ballot for bean storage pretreatment triangle test
85
total number of panelists with correct answers (X) was compared to
the total number of panelists (n) and the significance level
determined.
From Table 7.9 (Appendix 7), it was determined that for 36
panelists and 20 correct responses, the significance level was
0.005.
It was concluded that the samples were significantly different at the 0.005 level of probability, since 20 of the 36 panelists correctly chose the different sample. The beans that had been pretreated were
scormier
Sticky Note
None set by scormier
scormier
Sticky Note
MigrationNone set by scormier
scormier
Sticky Note
Unmarked set by scormier
scormier
Sticky Note
None set by scormier
scormier
Sticky Note
MigrationNone set by scormier
scormier
Sticky Note
Unmarked set by scormier
86
therefore different from the untreated beans after 6 months of storage. The size and type of difference, however, was not known.
7.2.2 Ranking for Intensity Tests
Intensity ranking tests require panelists to order samples
according to the perceived intensity of a sensory characteristic.
This type of test can be used to obtain preliminary information on
product differences, or to screen panelists for their ability to
discriminate among samples with known differences. Ranking tests
can show where there are perceptible differences in intensity of an
attribute among samples, but ranking does not give information about the size of the difference between two samples. Samples
ranked one and two, for instance, could have a small but readily
perceived difference in intensity, while samples ranked two and
three could have a large difference in intensity of the attribute. This
would not be evident from the rankings.
General Instructions for Conducting a Ranking Test for Intensity.
Description of panelists' task: Trained panelists are asked to
rank coded samples for the intensity of a specific characteristic, by
ordering the samples from the most intense to the least intense. Tics are not usually allowed.
Presentation of samples: Three or more samples are presented
in identical sample containers, coded with 3-digit random numbers.
Each sample is given a different code number. All the samples are simultaneously presented to each panelist in a balanced or random
scormier
Sticky Note
None set by scormier
scormier
Sticky Note
MigrationNone set by scormier
scormier
Sticky Note
Unmarked set by scormier
scormier
Sticky Note
None set by scormier
scormier
Sticky Note
MigrationNone set by scormier
scormier
Sticky Note
Unmarked set by scormier

87
order. The panelists are allowed to re-evaluate the samples as
necessary to make the required comparisons among them. An
example of a ballot for ranking for intensity is given in Figure 12.
Analysis of dnta: When all panelists have ranked the samples,
the ranks assigned to each sample are totalled. The samples are
then tested for significant differences by comparing the rank totals
between all possible pairs of samples using the Friedman Test and
Statistical Tables 7.3 and 7.4 (Appendix 7). This method of data
analysis was used for the ranking for acceptability data, Section 7.1.2. That example should be reviewed for details of the test.
Example of a ranking test used by trained panel to compare bean seedcoat toughness.
A ranking test was conducted to compare the seedcoat
toughness of beans which had been stored under four different
temperature and humidity conditions for three months. Ten panelists, trained to evaluate seedcoat toughness (Appendix 4),
participated in the test. All four coded bean samples were
simultaneously presented to each panelist. Each panelist evaluated
the samples only once. Panelists were instructed to rank the
samples for seedcoat toughness without ties, giving each sample a
different rank even if the products seemed to be similar. A rank of
1 was given to the sample with the toughest seedcoat, and a rank of
4 to the sample with the least tough seedcoat. The ballot used is
shown in Figure 12.
The ranked values given to each sample were tabulated and
totalled as shown in Table 6. The differences between rank total
pairs were:
scormier
Sticky Note
None set by scormier
scormier
Sticky Note
MigrationNone set by scormier
scormier
Sticky Note
Unmarked set by scormier
scormier
Sticky Note
None set by scormier
scormier
Sticky Note
MigrationNone set by scormier
scormier
Sticky Note
Unmarked set by scormier

88
D-A = 36-18 = 18 D-B = 36-26 = 10 D-C = 36-20 = 16 C-A = 20-18 = 2 B-C = 26- 20 = 6 B-A = 26-18 = 8
Date: ___________ _
Please evaluate each cooked bean sample for seedcoat toughness. Separate the seedcoat from the cotyledon by biting the beans (2 beans) between the molar teeth and rubbing the cotyledon out between the tongue and palate. Then evaluate the force required to bite through the seedcoat with the front teeth.
Evaluate the samples in the order listed below, from top to bottom, then arrange the samples in order of their seedcoat toughness. Assign the sample with the toughest seedcoat a rank value of 1; the samples with the next toughest seedcoats rank values of 2 and 3 and the sample with the least tough seedcoat a rank of 4.
Code Rank assigned
~-----------------------------------
Figure 12 Ballot for seedcoat toughness ranking test
scormier
Sticky Note
None set by scormier
scormier
Sticky Note
MigrationNone set by scormier
scormier
Sticky Note
Unmarked set by scormier
scormier
Sticky Note
None set by scormier
scormier
Sticky Note
MigrationNone set by scormier
scormier
Sticky Note
Unmarked set by scormier

89
Table 6 Tabulated Ranking 1 for Intensity Test Data
Panelist Storage Treatment A B c D
1 1 3 2 4 2 1 2 3 4 3 2 3 1 4 4 3 1 2 4 5 1 3 2 4 6 3 1 2 4 7 2 4 1 3 8 l 2 3 4 9 3 4 2 1 10 1 3 2 4
Rank Total 18 26 20 36
11.owest rank= 1 =toughest seedcoat
Tabulated critical values for ps0.05, 10 panelists and 4 samples
from Table 7.3 is 15. Only the differences between D and A, and
D and C, were significant (i.e. larger than 15).
Therefore the seedcoats of bean samples stored under D
conditions were not as tough as the seedcoats of samples stored
under A and C conditions.
scormier
Sticky Note
None set by scormier
scormier
Sticky Note
MigrationNone set by scormier
scormier
Sticky Note
Unmarked set by scormier
scormier
Sticky Note
None set by scormier
scormier
Sticky Note
MigrationNone set by scormier
scormier
Sticky Note
Unmarked set by scormier

90
7.2.3 Scoring for Intensity Tests
Scoring tests for intensity measurements require panelists to score samples, on line scales or category scales, for the perceived
intensity of a sensory characteristic. Scoring tests measure the
amount of difference between samples, and allow samples to be
ordered by increasing or decreasing intensity of a characteristic.
General Instructions for Conducting a Scoring Test for Intensity.
Description of panelists' task: Panelists score the perceived
intensity of the specific characteristic in each coded sample on an
interval scale from low intensity to high (or strong) intensity.
Presentation of samples: Samples are presented in identical
sample containers, coded with 3-digit random numbers. Each
sample is given a different number. All samples are simultaneously
presented to each panelist in a balanced or random order. Panelists
are instructed to evaluate each sample independently. In order to
minimize intercomparison of samples, the experimenter may
present samples one at a time to each panelist, removing each
sample after testing and before presenting the next sample. In either
case, the panelists are instructed to evaluate each sample, and
indicate the intensity of the specified characteristic by checking an
appropriate category or by making a vertical mark on a line scale. An example of a category scale used for scoring intensity is shown
in Figure 7, Section 6.1.3.
Analysis of data: For analysis of category scale data, the
categories are converted to numerical scores by ass1gnmg
scormier
Sticky Note
None set by scormier
scormier
Sticky Note
MigrationNone set by scormier
scormier
Sticky Note
Unmarked set by scormier
scormier
Sticky Note
None set by scormier
scormier
Sticky Note
MigrationNone set by scormier
scormier
Sticky Note
Unmarked set by scormier

91
successive numbers to each category; usually the number 1 is given to the category of lowest intensity. For analysis of line scale results,
panelists' marks are converted to numerical scores by measuring
the distance in cm from the left or lowest intensity point on the scale to the panelists' marks, converting the scores using 0.5 cm = 1 unit score. The numerical scores for each sample are tabulated
and analyzed by analysis of variance (ANOV A) to determine if
significant differences exist among the samples. Multiple
comparison tests can then be used to determine which samples differ from each other.
The entire scoring test is usually repeated on several occasions
to obtain several replications of the data. This allows for an
accurate measure of experimental error. The use of replicated data also allows the experimenter to assess the performance of the panel
by examining the panel results from each replication to see whether
significant differences exist among means for each replication.
Example of line scale scoring used by a trained panel to determine bean hardness.
A scoring test was used to compare the hardness of beans
cooked for five different cooking times. Samples of one variety of
black bean were cooked for 30, 50, 70, 90 and 110 minutes.
Starting times were staggered such that all samples finished
cooking at the same time.
Seven panelists, who had been trained for texture evaluation of
beans, served on the panel. The five bean samples were
simultaneously presented to each panelist at each session, in a
randomized complete block design. This was repeated two more
scormier
Sticky Note
None set by scormier
scormier
Sticky Note
MigrationNone set by scormier
scormier
Sticky Note
Unmarked set by scormier
scormier
Sticky Note
None set by scormier
scormier
Sticky Note
MigrationNone set by scormier
scormier
Sticky Note
Unmarked set by scormier
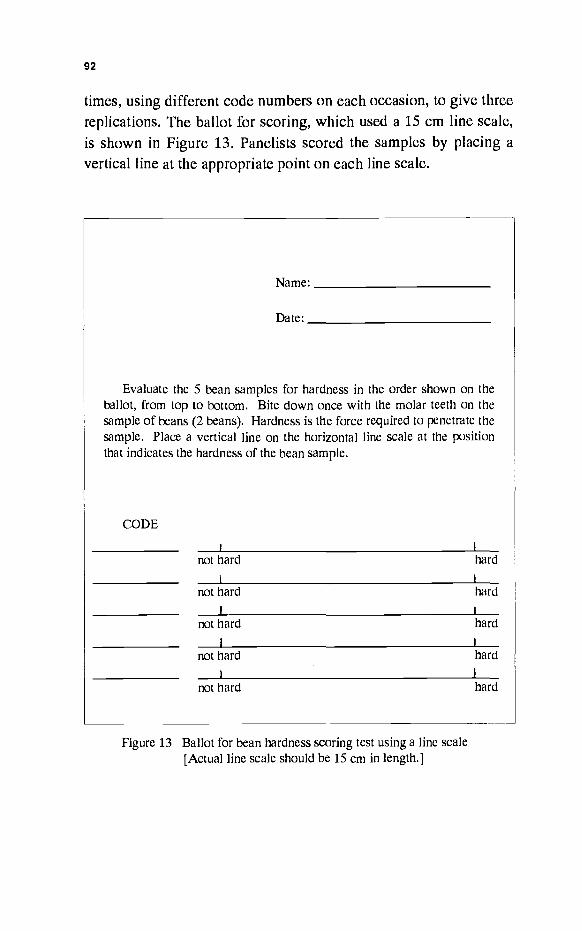
92
times, using different code numbers on each occasion, to give three replications. The ballot for scoring, which used a 15 cm line scale,
is shown in Figure 13. Panelists scored the samples by placing a vertical line at the appropriate point on each line scale.
Date:------------
Evaluate the 5 bean samples for hardness in the order shown on the ballot, from top to bottom. Bite down once with the molar teeth on the sample of beans (2 beans). Hardness is the force required to penetrate the sample. Place a vertical line on the horizontal line scale at the position that indicates the hardness of the bean sample.
CODE
not hard
not hard
not hard
not hard
not hard
Figure 13 Ballot for bean hardness scoring test using a line scale [Actual line scale should be 15 cm in length.]
hard
hard
hard
hard
hard
scormier
Sticky Note
None set by scormier
scormier
Sticky Note
MigrationNone set by scormier
scormier
Sticky Note
Unmarked set by scormier
scormier
Sticky Note
None set by scormier
scormier
Sticky Note
MigrationNone set by scormier
scormier
Sticky Note
Unmarked set by scormier

93
Table 7 Tabulated Scoring for Hardness Test Data 1
p Cooking Time Treatments (min) A N A B c D E E (30) (50) (70) (90) (110) L I Replication Replication Replication Replication Replication Totals s T , 2 3 , 2 3 , 2 3 , 2 3 , 2 3
20 24 21 15 19 15 12 18 17 8 12 11 18 16 13 239
2 18 21 22 12 14 8 6 6 8 9 6 9 3 4 6 152
3 13 19 16 6 10 7 5 5 4 5 3 2 5 3 4 107
4 19 10 15 13 6 10 8 5 3 6 4 7 5 3 4 118
5 19 18 24 4 13 9 2 10 7 7 2 7 4 6 12 144
6 20 23 19 17 20 18 8 8 15 5 18 10 14 7 7 209
7 20 16 19 11 13 6 8 6 4 6 6 5 4 4 9 137
Treatment by Replication Total 129 131 136 78 95 73 49 58 58 46 51 51 53 43 55
Grand Total 1106
Treatment Total A=396 B=246 C=165 0=148 E=151
(Mean) (18.9) (11. 7) (7.9) (7.0) (7.2)
Replication Total2 Rep 1 =355 Rep 2 = 378 Rep 3 =373 (Mean) (10.1) (10.8) (10.7)
1 Highest score = 30 = hard 2Replication totals are for each replication owr all treatments
scormier
Sticky Note
None set by scormier
scormier
Sticky Note
MigrationNone set by scormier
scormier
Sticky Note
Unmarked set by scormier
scormier
Sticky Note
None set by scormier
scormier
Sticky Note
MigrationNone set by scormier
scormier
Sticky Note
Unmarked set by scormier

94
Numerical scores were determined by measuring the distance from the left hand end of the scale to the mark, in 0.5 cm units. A
measured distance of 10 cm was therefore equal to a score of 20.
Data were tabulated as shown in Table 7 and analyzed by a
two-way analysis of variance. The effects of treatments (samples), panelists, replications and interactions were partitioned out. The
analysis was similar to that used for the hedonic test. That example
should be reviewed for details of the ANOV A (Section 7 .1.3).
For the analysis of variance the following calculations were
made:
Correction Factor:
CF = 11062
105
= 11649.87
Total Sum of Squares:
SS(T) = (202 + 242 + ... + 42 + 92)- 11649.87
= 15522 - 11649.87
= 3872.13
Treatment Sum of Squares:
2 2 2 2 2 SS(fr) = 396 + 246 + 165 + 148 + 151 _ 11649.87
21
= 13774.38 - 11649.87
= 2124.51
scormier
Sticky Note
None set by scormier
scormier
Sticky Note
MigrationNone set by scormier
scormier
Sticky Note
Unmarked set by scormier
scormier
Sticky Note
None set by scormier
scormier
Sticky Note
MigrationNone set by scormier
scormier
Sticky Note
Unmarked set by scormier

95
Panelist Sum of Squares:
SS(P) 2392 + 1522 + ... + 1372 - 11649.87 = ------.-.......----
= 12585.60 - 11649.87
= 935.73
Replication Sum of Squares:
SS(R) = I (each replication total2) -CF
number of responses in each replication total
= 3552 + 3782 + 3732
35 11649.87
= 11658.23 - 11649.87
= 8.36
Error Sum of Squares:
SS(E) = SS(I) - SS(fr) - SS(P) - SS(R)
= 3872.13 - 2124.51 - 935.73 - 8.36
= 803.53
The mean square (MS) values were calculated by dividing the
SS values by their respective degrees of freedom. Degrees of freedom (df) were as follows:
scormier
Sticky Note
None set by scormier
scormier
Sticky Note
MigrationNone set by scormier
scormier
Sticky Note
Unmarked set by scormier
scormier
Sticky Note
None set by scormier
scormier
Sticky Note
MigrationNone set by scormier
scormier
Sticky Note
Unmarked set by scormier

96
Total Degrees of Freedom, df(1) = 105 - 1 = 104
Treatment Degrees of Freedom, df(Tr) = 5-1 = 4
Panelist Degrees of Freedom, df(P) = 7-1 = 6
Replication Degrees of Freedom, df(R) = 3-1 = 2
Error Degrees of Freedom, df(E) = df(1) - df(Tr) - df(P) - df(R)
= 104-4-6-2
= 92
Mean Squares were then calculated as shown:
MS (Tr) = 2124.51 4
MS(P)
= 531.13
935.73 =~
= 155.96
MS(R) = 8.36 -2-
MS(E)
= 4.18
803.53 = 92
= 8.73
The F ratios were calculated by dividing the MS for panelists by
the MS for error, the MS for treatments by the MS for error, and the
MS for replications by the MS for error. The tabular F ratios were
scormier
Sticky Note
None set by scormier
scormier
Sticky Note
MigrationNone set by scormier
scormier
Sticky Note
Unmarked set by scormier
scormier
Sticky Note
None set by scormier
scormier
Sticky Note
MigrationNone set by scormier
scormier
Sticky Note
Unmarked set by scormier

97
obtained from Statistical Tables 7.5 and 7.6 (Appendix 7) of the F
distribution. Since actual error degrees of freedom (92) are not
listed in the table, F values for 92 df were extrapolated from those
given. In this example F ratios were compared to the tabular values
of F for a 1 % level of significance (p s .01), Table 7.6. F ratios for the main effects of panelists, treatments and replications are shown
in Table 8. Calculated F ratios for treatments and panelists were
much greater than the tabulated F ratios, indicating a highly
significant effect of both treatments and panelists. The replication main effect was not significant.
The significant panelist effect could mean that the panelists
scored the samples in the same order, but that some panelists used
different parts of the scale. Therefore, the actual scores given to
the samples differed. Since there were large significant differences
due to both panelists and treatments, it is possible that some of
these differences were due to an interaction. A significant
interaction would indicate that the panelists were not all scoring the samples in the same order. For examination of this interaction it
was necessary to calculate the sum of squares for the interaction
between panelists and treatments. Data from the original tabulated
data (Table 7) were totalled to obtain a treatment total for each
panelist combined over all three replications. These data are shown
in Table 9.
To calculate the treatment by panelist interaction the following
calculations were needed:
scormier
Sticky Note
None set by scormier
scormier
Sticky Note
MigrationNone set by scormier
scormier
Sticky Note
Unmarked set by scormier
scormier
Sticky Note
None set by scormier
scormier
Sticky Note
MigrationNone set by scormier
scormier
Sticky Note
Unmarked set by scormier

98
Table 8 ANOV A Table I Scoring for Hardness Test
Source of F Variation df SS MS Calculated Tabular
s .01
Total 104 3872.13 Treatments 4 2124.51 531.13 60.84 3.56 Panelists 6 935.73 155.96 17.86 3.03 Replications 2 8.36 4.18 0.48 4.88 Error 92 803.53 8.73
Table 9 Data Matrix of Treatment Totals for Each Panelist
Cooking Time Treatment (min}
Panelists A B c D E (30) (50) (70) (90) (110)
1 65 49 47 31 47 2 61 34 20 24 13 3 48 23 14 10 12 4 44 29 16 17 12 5 61 26 19 16 22 6 62 55 31 33 28 7 55 30 18 17 17
scormier
Sticky Note
None set by scormier
scormier
Sticky Note
MigrationNone set by scormier
scormier
Sticky Note
Unmarked set by scormier
scormier
Sticky Note
None set by scormier
scormier
Sticky Note
MigrationNone set by scormier
scormier
Sticky Note
Unmarked set by scormier

99
Treatment x Panelist Matrix, Total Sum of Squares:
SST(frxP) = l: (treatment total for each panelist2 ) _CF
number of replications
= 2 2 2 2
65 + 61 3 + ... + 28 + 17 - 11649.87
= 14931.33 - 11649.87
= 3281.46
Interaction Sum of Squares:
SS(frxP) = SST (frxP) - SS(P) - SS(fr)
= 3281.46 - 935.73 - 2124.51
= 221.22
Interaction Degrees of Freedom:
df(frxP) = df(treatments) x df(panelists) = 4x6 = 24
The degrees of freedom and the sum of squares for the
interaction between panelists and treatments were then added to the
ANOV A table and the mean square calculated (Table 10). The
main effects of treatments and panelists and the interaction effect of
panelists with treatments were tested with a new error mean square.
This new error mean square was calculated by subtracting the
Treatment SS, Panelist SS, Replication SS and the Interaction
(frxP) SS from the Total SS. The new degrees of freedom for error
were calculated by subtracting from the total df, the df for Treatments, Panelists, Replication and Interaction (TrxP). These
values were placed in the second ANOV A Table (Table 10).
scormier
Sticky Note
None set by scormier
scormier
Sticky Note
MigrationNone set by scormier
scormier
Sticky Note
Unmarked set by scormier
scormier
Sticky Note
None set by scormier
scormier
Sticky Note
MigrationNone set by scormier
scormier
Sticky Note
Unmarked set by scormier

100
Table 10 AN OVA Table II Scoring for Hardness Test
Source of F Variation df SS MS Calculated Tabular
:s;.01
Total 104 3872.13 Treatments 4 2124.51 531.13 62.05 3.63 Panelists 6 935.73 155.96 18.22 3.10 Replications 2 8.36 4.18 0.49 4.96 TrxP 24 221.22 9.22 1.08 2.10 Error 68 582.31 8.56
The treatment by panelist interaction was not significant,
therefore, the significant panelist effect indicated that the panelists
scored the treatments in the same order. Some panelists may, however, have scored the samples using different parts of the scale.
For example, one panelist may have scored all the samples using
the upper end of the scale only while others may have used the
central portion of the scale, resulting in samples which were scored
in the same order but with different numerical scores. A multiple
comparison test of the panelists' mean scores could be used to
discover where the differences among panelists exist. This would
be useful during panel training to determine which panelists were
scoring samples, or using the scale differently, from others. During
studies, however, it is usually the specific treatment differences
which are of interest. The absence of a replication effect and of a
significant treatment x panelist interaction confirmed the
consistency of the panel performance in the example.
scormier
Sticky Note
None set by scormier
scormier
Sticky Note
MigrationNone set by scormier
scormier
Sticky Note
Unmarked set by scormier
scormier
Sticky Note
None set by scormier
scormier
Sticky Note
MigrationNone set by scormier
scormier
Sticky Note
Unmarked set by scormier

101
The ANOV A indicated that there was a significant difference in the hardness of the four bean samples. To determine which
treatments differed significantly from the others, Tukey's multiple
comparison test and Tables 7.10 and 7.11 (Appendix 7) were used.
Tukey's test is similar to Duncan's test (Section 7.1.3). Pairwise comparisons between all of the means are tested against a
calculated range value. If the difference between pairs of means is
larger than the range value, the means are significantly different.
However, whereas Duncan's test involves the calculation of a
number of range values, only a single range value is computed for
Tukey's test. Any two means with a difference greater than the
range value are significantly different. To carry out this test,
treatment means were arranged in order of size as shown:
Cooking Treatments A B c E D Hardness Means 18.9 11.7 7.9 7.2 7.0
The standard error of the sample (treatment) means was
estimated by:
Standard Error = j MSn(E) (SE)
where MS(E) is taken from the final ANOVA table (Table 10) and
n is the number of responses per treatment.
scormier
Sticky Note
None set by scormier
scormier
Sticky Note
MigrationNone set by scormier
scormier
Sticky Note
Unmarked set by scormier
scormier
Sticky Note
None set by scormier
scormier
Sticky Note
MigrationNone set by scormier
scormier
Sticky Note
Unmarked set by scormier

102
SE = JM;® = Fi 1
= fG.41 = 0.64
The range value was calculated from the following equation:
Range value = Q(SE)
= Q(0.64)
The Q value was obtained from Table 7.11 (Appendix 7) with 68 df(E), 5 treatments and the same level of significance as the ANOVA (p :s; .01). Thus, Q = 4.80 (extrapolated from the table).
Range value = 4.80 (0.64)
= 3.07
Any two sample means which differed by a value greater than
the range value, 3.07, were significantly different at the 1 % level.
All sample means were compared as follows:
scormier
Sticky Note
None set by scormier
scormier
Sticky Note
MigrationNone set by scormier
scormier
Sticky Note
Unmarked set by scormier
scormier
Sticky Note
None set by scormier
scormier
Sticky Note
MigrationNone set by scormier
scormier
Sticky Note
Unmarked set by scormier

103
A-D = 18.9- 7.0 = 11.9 > 3.07
A-E = 18.9- 7.2 = 11.7 > 3.07
A-C = 18.9- 7.9 = 11.0 > 3.07
A-B = 18.9 - 11.7 = 7.2 > 3.07
B-D = 11.7 - 7.0 = 4.7 > 3.07
B-E = 11.7 - 7.2 = 4.5 > 3.07
B-C = 11.7 - 7.9 = 3.8 > 3.07
C-D = 7.9- 7.0 = 0.9 < 3.07
C-E = 7.9- 7.2 = 0.7 < 3.07
E-D = 7.2- 7.0 = 0.2 < 3.07
Samples A and B were significantly different from each other and all other samples. Samples C, E and D were not significantly
different from each other. The significant differences among the
means were shown by underlining together those means which
were not significantly different at the 1 % level of probability.
Cooking Treatments A B c E D Treatment Means 18.9 11.7 7.9 7.2 7.0
Black beans cooked for 30 min (A) were harder than beans
cooked for 50 min (B), 70 min (C), 90 min (D) or 110 min (E).
Black beans cooked for 50 min (B) were significantly harder than
beans cooked for 70 min (C), 90 min (D) or 110 min (E).
However, beans cooked for 70 (C), 90 (D) or 110 (E) minutes did
not differ in hardness.
scormier
Sticky Note
None set by scormier
scormier
Sticky Note
MigrationNone set by scormier
scormier
Sticky Note
Unmarked set by scormier
scormier
Sticky Note
None set by scormier
scormier
Sticky Note
MigrationNone set by scormier
scormier
Sticky Note
Unmarked set by scormier

104
7.2.4 Descriptive Tests
Descriptive tests are similar to scoring for intensity tests except that panelists score the intensity of a number of sample
characteristics rather than just one characteristic. Trained panelists provide a total sensory description of the sample, including
appearance, odour, flavour, texture and aftertaste. There are many types of descriptive tests including the Flavour Profile (Pangborn,
1986; Stone and Sidel, 1985; Powers, 1984; Moskowitz, 1983;
IFT, 1981; ASTM, 1968; Amerine et al., 1965; Caul, 1957;
Cairncross and Sjostrom, 1950), the Texture Profile (Pangborn, 1986; Stone and Sidel, 1985; Moskowitz, 1983; IFT, 1981; Civille
and Szczesniak, 1973; Brandt et al., 1963; Szczesniak, 1963;
Szczesniak et al., 1963) and Quantitative Descriptive Analysis (Pangborn, 1986; Moskowitz, 1983; IFT, 1981; Zook and Wessman, 1977; Stone et al., 1980, 1974). These methods will not
be described in this manual but the references listed provide
discussions and explanations of the techniques.
scormier
Sticky Note
None set by scormier
scormier
Sticky Note
MigrationNone set by scormier
scormier
Sticky Note
Unmarked set by scormier
scormier
Sticky Note
None set by scormier
scormier
Sticky Note
MigrationNone set by scormier
scormier
Sticky Note
Unmarked set by scormier

+ ChapterB
Planning A Sensory Experiment
In planning a sensory experiment, all of the factors discussed in
the previous sections of this manual should be considered carefully.
With these considerations in mind, specific tests and appropriate
methods of statistical analysis can be chosen. To facilitate planning
and conducting of sensory experiments, especially by researchers
who are new to this area, a number of tests have been described in
detail. Following the step-by-step descriptions given for each test
should assist with planning for similar types of testing.
Planning for a sensory experiment should include the steps
outlined below:
1) Define the specific objectives of the experiment. Clarify
questions to be answered (hypotheses to be tested) and state
them clearly.
2) Identify the constraints on the experiment: cost limits,
availability of materials, equipment, panelists and time.
scormier
Sticky Note
None set by scormier
scormier
Sticky Note
MigrationNone set by scormier
scormier
Sticky Note
Unmarked set by scormier
scormier
Sticky Note
None set by scormier
scormier
Sticky Note
MigrationNone set by scormier
scormier
Sticky Note
Unmarked set by scormier

106
3) Choose the type of test and panel to be used. Design the ballot.
4) Design the experimental procedures so that, wherever
possible, variables not being tested will be controlled, and
panel results will not be biased. Randomization of
experimental factors that could bias results, such as the order
of sample preparation and presentation, should be planned.
5) Decide on the statistical methods to be used, keeping in mind
the objectives of the project, the type of test and type of panel.
6) Prepare the forms to be used for recording sensory data.
Data should be recorded in a way that makes it convenient to
do the statistical analyses.
7) Plan for recruiting and orienting panelists; also, screening
and training of panelists, if required.
8) Do a trial run before proceeding with the experiment, to
check the appropriateness of sample preparation and
presentation procedures and the ballot.
scormier
Sticky Note
None set by scormier
scormier
Sticky Note
MigrationNone set by scormier
scormier
Sticky Note
Unmarked set by scormier
scormier
Sticky Note
None set by scormier
scormier
Sticky Note
MigrationNone set by scormier
scormier
Sticky Note
Unmarked set by scormier

APPENDICES
scormier
Sticky Note
None set by scormier
scormier
Sticky Note
MigrationNone set by scormier
scormier
Sticky Note
Unmarked set by scormier
scormier
Sticky Note
None set by scormier
scormier
Sticky Note
MigrationNone set by scormier
scormier
Sticky Note
Unmarked set by scormier

APPENDIX!
Basic Taste Recognition Test
The following concentrations of the four basic tastes of sweet, sour, salty, and bitter can be used for recognition tests.
Basic Taste
Sweet Salty Sour Bitter
Substance
sucrose sodium chloride
citric acid caffeine
Concentration
1.0% w/v (2.5 g/250 mL) 0.2% w/v (0.5 g/250 mL) 0.04% w/v (0.1 g/250 mL) 0.05% w/v (0.125 g/250 mL)
109
or quinine sulfate 0.00125% w/v (0.003 g/250 mL)
These solutions are prepared with distilled water and should be prepared the day before and allowed to equilibrate overnight. Approximately 25-30 mL of solution is needed per panelist. The solutions are portioned into individual coded sample cups for tasting. 1-2 water blanks are prepared and randomly placed among the 4 basic taste solutions. The coded samples should be presented in a different random order to each panelist. Panelists should be instructed to rinse the mouth with water between samples and clear the mouth with crackers if necessary. An example of a ballot is shown on the next page.
Panelists should be informed about their performance immediately following the test. Poor performers could be allowed to repeat the test on another day following some initial discussion about the basic taste sensations and how they are perceived in the tongue and mouth. Panelists who are unable to identify any of the basic taste solutions may be ageusic (lack of taste sensitivity) and would not be good candidates for taste panels.
scormier
Sticky Note
None set by scormier
scormier
Sticky Note
MigrationNone set by scormier
scormier
Sticky Note
Unmarked set by scormier
scormier
Sticky Note
None set by scormier
scormier
Sticky Note
MigrationNone set by scormier
scormier
Sticky Note
Unmarked set by scormier

110
APPENDIX 1 (cont.)
Ballot for Basic Taste Recognition Test
Date: ___________ _
Basic Taste Recognition
Plear-e taste each of the solutions in the order indicated on the ballot, from top to bottom. The solutions may taste sweet, sour, salty or bitter. There may be one or more samples of only water among the basic taste solutions. Identify the taste solution in each coded cup. Rinse your mouth with water before you begin tasting and also between each sample. Crackers are also provided to clear the mouth between samples.
Code Taste
scormier
Sticky Note
None set by scormier
scormier
Sticky Note
MigrationNone set by scormier
scormier
Sticky Note
Unmarked set by scormier
scormier
Sticky Note
None set by scormier
scormier
Sticky Note
MigrationNone set by scormier
scormier
Sticky Note
Unmarked set by scormier

111
APPENDIX2
Basic Odour Recognition Test
Common household substances can be used for odour recogmt10n testing. The odourous substances (10-15) should be placed in dark coloured (clear vials may be wrapped in aluminum foil) glass vials or test tubes to mask any visual cues, and tightly capped. Liquids may be poured onto a cotton ball in the tube, while solids can be placed directly into the tube and covered with a cotton ball or square of cheesecloth. Vials or tubes should be filled 1/4 - 1/2 full in order to leave a headspace above the sample for volatiles to concentrate.
Panelists are instructed to bring the vial to their nose, remove the lid and take 3 short sniffs. Then, they should record the name of the odour, or a related odour if they cannot identify the exact name, beside the sample code on the ballot. For example, spicy if they cannot name the exact spice. When interpreting results, the panel leader can give a full score to a correct name, and a half score to a related name. An example of a ballot is shown on the next page.
Panelists should be informed about their performance immediately following the test. Those who have difficulty identifying the substances may just need more practice and could be allowed to repeat the test on another day. Odour and flavour language, as any other language, will improve with practice. Panelists who are unable to smell many of the substances are likely anosmic or may have nasal or sinus congestion and will likely not be good candidates for odour or flavour panels.
Example of substances which have been used are listed below:
scormier
Sticky Note
None set by scormier
scormier
Sticky Note
MigrationNone set by scormier
scormier
Sticky Note
Unmarked set by scormier
scormier
Sticky Note
None set by scormier
scormier
Sticky Note
MigrationNone set by scormier
scormier
Sticky Note
Unmarked set by scormier

112
Substance Odour Possible related odours
vinegar sour, acetic acid pickles
coffee coffee roasted
onion onion sulfury
cloves cloves, eugenol spicy, cinnamon
aniseed anethol, anise liquorice
cinnamon cinnamon, eugenol spicy, cloves
vanilla vanilla sweet
black pepper pepper spicy
prepared mustard mustard pickles
acetone acetone nail polish remover
alcohol alcohol, ethanol vodka
almond extract almond sweet
garlic garlic, allicin sulfury
lemon lemon, sour, acid citrus
honey honey sweet
scormier
Sticky Note
None set by scormier
scormier
Sticky Note
MigrationNone set by scormier
scormier
Sticky Note
Unmarked set by scormier
scormier
Sticky Note
None set by scormier
scormier
Sticky Note
MigrationNone set by scormier
scormier
Sticky Note
Unmarked set by scormier

APPENDIX 2 (cont.)
Ballot for Basic Odour Recognition Test
Name: ___________ _
Date:
Basic Odour Recognition
The covered vials contain odourous substances commonly found in the home or workplace. Bring the vial to your nose, remove the cap, take 3 short sniffs and try to identify the odour. If you cannot think of the exact name of the substance, try to describe something which this odour reminds you of.
Code Odour
113
scormier
Sticky Note
None set by scormier
scormier
Sticky Note
MigrationNone set by scormier
scormier
Sticky Note
Unmarked set by scormier
scormier
Sticky Note
None set by scormier
scormier
Sticky Note
MigrationNone set by scormier
scormier
Sticky Note
Unmarked set by scormier

114
APPENDIX3
Training and Monitoring a Bean Texture Panel
A sensory panel was trained specifically for texture evaluation of cooked beans at INCAP. The textural characteristics to be evaluated and the techniques for evaluation of the beans (Appendix 4) were first developed by a trained sensory panel in the Department of Foods and Nutrition at the University of Manitoba. Bean samples were evaluated using a line scale. Food references were also selected (Appendix 5) to anchor the endpoints of the line scale for each textural characteristic, except chewiness. The INCAP panelists were trained using the techniques, ballot and the line scale food references developed in Manitoba for each characteristic. The ballot is shown in Appendix 6.
Training began by presenting panelists with the end point references for each of the texture characteristics to be examined (Appendix 5). Each panelist was then presented with a tray containing a ballot, directions for evaluating the specific textural characteristics and the reference samples. Definitions of the textural characteristics were reviewed by the panel leader and the techniques to be used in the evaluation process were illustrated. Each panelist practised the techniques using the reference samples. After discussion to ensure that the panelists understood the procedures, cooked bean samples that varied greatly in the textural parameters being examined were presented for evaluation and scored on the line scale a number of times. Thus, panelists received experience both in evaluating the intensity of the specific textural characteristics in beans and in using a line scale for scoring the samples.
After the bean samples had been evaluated, marks on the line scales were converted to numerical scores by the panelists or panel leader, measuring the distance in cm and converting the scores using 0.5cm = 1 unit score. Scores for each panelist were listed on a blackboard for discussion and comparison. Although actual scores varied from one panelist to another, most of the panelists achieved a consistent ordering of the bean samples. It is more important for the relationship between the products to be consistent (ie. sample A is always scored as being more soft than sample B) and for individual panelists to be consistent over replicate tests, than it is for all the panelists to give the samples identical scores. However, training should, ideally, bring the panelists' scores closer together. For those who had scored products in the wrong order, definitions and evaluation techniques were reviewed by the panel leader
scormier
Sticky Note
None set by scormier
scormier
Sticky Note
MigrationNone set by scormier
scormier
Sticky Note
Unmarked set by scormier
scormier
Sticky Note
None set by scormier
scormier
Sticky Note
MigrationNone set by scormier
scormier
Sticky Note
Unmarked set by scormier
115
and the panelists evaluated the samples again. The same training procedure was repeated, using comparable bean samples, for several sessions (days) until the panelists were comfortable with the techniques and the repeatability of their scores was improved.
The next step in the training of the texture panel at INCAP was to have the panel evaluate a variety of cooked black bean samples which had less obvious textural differences, along with samples with large differences in texture. For example, for hardness evaluation, samples which were obviously under-cooked (hard), optimally cooked and over-cooked (soft) were prepared and served along with samples that had varying degrees of hardness.
To monitor the panelists' performance, the same six bean samples were evaluated on four different occasions. The samples were evaluated for hardness, particle size, seedcoat toughness and chewiness, and were prepared to have a wide range of differences in each of these attributes. An analysis of variance with 6 treatments and 4 replications was used to evaluate the data for each panelist individually, for each characteristic measured. Treatment F values were calculated for each panelist's scores, and used as a measure of the panelist's ability to discriminate among the bean samples and to replicate his/her judgements for each attribute. Characteristics that required more training (ie. many panelists scored them inconsistently) were also identified. The results of these analyses were discussed with the panel to provide an incentive for panelists to improve or maintain their performance. At a later time a second panel evaluation was conducted. Panel training was complete when the majority of the panelists could discriminate between samples without difficulty and could reproduce their scores consistently. Panelists who were having problems and could not replicate their judgements were released from the panel.
scormier
Sticky Note
None set by scormier
scormier
Sticky Note
MigrationNone set by scormier
scormier
Sticky Note
Unmarked set by scormier
scormier
Sticky Note
None set by scormier
scormier
Sticky Note
MigrationNone set by scormier
scormier
Sticky Note
Unmarked set by scormier

116
APPENDIX4
Techniques for Evaluating Textural Characteristics of Cooked Beans
HARDNESS: Bite down once with the molar teeth on the sample of beans (2 beans) and evaluate the force required to penetrate the sample.
PARTICLE SIZE: Chew the sample (2 beans) for only 2-3 chews between the molar teeth, and then rub the cotyledon between the tongue and palate and assess the size of the particles which are most apparent.
SEEDCOAT TOUGHNESS: Separate the seedcoat from the cotyledon by biting the beans (2 beans) between the molar teeth and rubbing the cotyledon out between the tongue and palate. Then evaluate the force required to bite through the seedcoat with the front teeth.
CHEWINESS: Place a sample of beans (2 beans) in your mouth and chew at a constant rate (1 chew per second), counting the number of chews until the sample is ready for swallowing.
scormier
Sticky Note
None set by scormier
scormier
Sticky Note
MigrationNone set by scormier
scormier
Sticky Note
Unmarked set by scormier
scormier
Sticky Note
None set by scormier
scormier
Sticky Note
MigrationNone set by scormier
scormier
Sticky Note
Unmarked set by scormier

117
APPENDIXS
Food References Used for Bean Texture Panels
Textural
Characteristic 1
Hardness
Particle2
Size
Seedcoat
Toughness
End Points
soft
hard
smooth
chunky
tender seedcoat
tough seedcoat
Reference
cream cheese - 1 cm cube3
parmesan cheese - 1 cm cube3
butter - 1 cm cube3
coarsely chopped peanuts
black-eyed beans (cooked 2 hr)
navy beans ("Chapin brand")
(cooked 1 hr. 50 min)
1References for chewiness are not included as a chew count was used as a measure of chewiness
2Additional references of starchy (5% Wfv slurry of cornstarch in water) and grainy (cooked semolina - cream of wheat) were used during training.
3Taken directly from refrigerated storage and served. All others served at room temperature.
scormier
Sticky Note
None set by scormier
scormier
Sticky Note
MigrationNone set by scormier
scormier
Sticky Note
Unmarked set by scormier
scormier
Sticky Note
None set by scormier
scormier
Sticky Note
MigrationNone set by scormier
scormier
Sticky Note
Unmarked set by scormier

118
APPENDIX6
Line Scale Ballot Used for Bean Texture Panels
Using the techniques provided for evaluating texture, evaluate the samples according to the following parameters. First, evaluate the reference samples to establish reference points, and then evaluate the coded samples. Mark the relative intensity of the coded bean samples on each scale, placing the code number of the sample above the mark.
Hardness
Particle Size
Seedcoat Toughness
INITIAL BITE
soft
MASTICATORY PHASE
smooth
tender (barely distinguishable from cotyledons)
CHEWINESS
Code Number of chews
hard
chunky
tough (leathery)
scormier
Sticky Note
None set by scormier
scormier
Sticky Note
MigrationNone set by scormier
scormier
Sticky Note
Unmarked set by scormier
scormier
Sticky Note
None set by scormier
scormier
Sticky Note
MigrationNone set by scormier
scormier
Sticky Note
Unmarked set by scormier

119
APPENDIX7
STATISTICAL TABLES
scormier
Sticky Note
None set by scormier
scormier
Sticky Note
MigrationNone set by scormier
scormier
Sticky Note
Unmarked set by scormier
scormier
Sticky Note
None set by scormier
scormier
Sticky Note
MigrationNone set by scormier
scormier
Sticky Note
Unmarked set by scormier

120
The authors wish to thank those who have granted permission for the use of the folJowing tables:
Tables 7.2 & 7.9 Reproduced from E.B. Roessler, R.M. Pangborn, J.L. Sidel and H. Stone, "Expanded Statistical Tables for Estimating Significance in Paired-Preference, Duo-Trio and Triangle Tests". Journal of Food Science, 43:940-943,947, 1978.
Tables 7.3 & 7.4 Reproduced from G.J. Newell and J.D. MacFarlane, "Expanded Tables for Multiple Comparison Procedures in the Analysis of Ranked Data". Journal of Food Science, 52:1721-1725, 1987.
Tables 7.5 & 7.6 Reproduced from M. Merrington, C.M. Thompson and E.S. Pearson, "Tables of Percentage Points of the Inverted Beta (F) Distribution". Biometrica 33:73-88, 1943, with permission from the Biometrika Trustees.
Tables 7.7 & 7.8 Reproduced from H.L. Harter, "Critical Values for Duncan's New Multiple Range Test". Biometrics 16:671-685, 1960, with permission from The Biometrics Society.
Tables 7.10 & 7.11 - Reproduced from E.S. Pearson and N.D. Hartley (Ed.). Table 29 in "Biometrika Tables for Statisticians", Vol. 1, Third Edition (1966), with permission from the Biometrika Trustees.
scormier
Sticky Note
None set by scormier
scormier
Sticky Note
MigrationNone set by scormier
scormier
Sticky Note
Unmarked set by scormier
scormier
Sticky Note
None set by scormier
scormier
Sticky Note
MigrationNone set by scormier
scormier
Sticky Note
Unmarked set by scormier

TABLE 7.1 Random Numbers Table
92 73 3S S4 9B 26 S6 39 2B B2 91 43 06 93 24 72 00 B2 BO 7S BS 19 70 64 43 16 S1 B7 3B 01 90 16 71 SB B1 97 SB 00 77 B6 36 00 66 B3 36 01 19 S3 SB 6B 33 17 94 03 07 27 41 40 81 74 SS 96 B2 24 B3 90 41 63 36 so 4B 1B B6 67 17 27 S7 B3 36 77 07 S3 SB 09 94 24 00 21 76 21 SB SS 77 99 6S S2 3B 17 40 90 61 29 94 6S 15 91 54 01 44 49 97 49 97 99 4B 94 72 47 63 3S 36 06 6B 9S 71
B3 B1 SB 29 20 93 72 49 B3 27 06 73 46 S3 BO OS 74 62 1B 31 9S 2B 64 99 B6 19 73 59 6S 9S 16 27 S7 6S 41 36 49 07 S4 07 43 91 74 14 40 9S 2B S7 76 S1 32 47 42 S9 60 96 19 S6 32 02 16 03 06 41 9B 79 7S 1S 66 64 63 29 so 27 92 19 44 93 63 76 4S 72 47 25 60 18 69 63 00 9S BO 72 06 9B 19 73 61 99 74 OS 7S B7 OB 73 42 32 SB 61 49 91 9S 40 3B 76 23 B4 49 63 OB 97 6B 61 99 OS SS
09 BB 60 27 23 44 S3 22 40 B6 3S B7 80 47 11 40 69 B7 66 60 64 9S 99 77 03 79 67 71 OS 99 53 54 06 47 69 72 03 60 4S 24 21 42 S3 79 70 4B S2 so 77 S3 33 so B9 9B 24 19 74 34 26 41 91 S2 19 B4 90 77 32 1S 76 3S 44 71 26 06 01
S6 32 OB 70 S2 62 BS BS S3 60 00 26 26 76 BO 6B S4 SO 2S 19 3B BO 73 B9 22 63 34 31 24 12 41 46 2B 06 13 9S 62 19 3S 63 90 94 04 S9 Bl 11 91 09 OS 33 02 6B 19 97 21 67 79 26 16 91 7B 96 49 SO 26 S7 3S 4B 61 03 3B BO 07 OB 00
96 23 64 69 33 00 4B 94 B7 42 B7 1S B9 22 4S 12 11 so 40 11 91 S7 S1 20 03
43 S6 9S 7B 6S BB 2S 99 34 U 16 S7 4S 02 9B S4 10 S6 SB 61 B3 09 42 96 63
BO 49 B9 24 01 1B9B7733B1 71 BO 10 29 10 SB OB 97 BO 2S B4 44 32 90 30
20 B 1 11 2S 21 19 OB 20 74 S1 97 3S 3S 17 44 31 24 22 34 9S 4S 24 01 96 21
39 00 27 47 60 B3 4S 2S 2B 77 S7 99 02 S6 S9 9B 3B 2S B9 6S 07 91 B4 67 B1 SB OB BO 92 S6 BS 62 9B 67 67 9S 03 17 42 26 96 44 19 06 74 31 39 97 94 27 S6 B1 B7 37 10 S6 34 49 22 7B so 96 3S 4S 40 21 S1 9B 10 1B 02 06 4B 96 SB 36 3S 32 43 44 69 BB 7S S6 07 B6 01 B4 12 2S 39 71 66 B7 17 B9 23 S3 07 31 S1 93 66 36 B7 42 90 04 20 32 09 36 63 34 92 02 34 96 00 6S 37 61 22 1S 69
6B 2B 29 BB S6 S3 00 66 27 29 OB OS 73 10 47 73 21 BS 37 49 94 4B 60 B3 76 34 69 6S SB 41 02 SO OB B4 77 23 90 SO 36 16 69 B1 S3 97 43 2B 49 3S 23 70 B4 43 13 OS 94 47 13 6S 2S 13 B4 9S 64 21 30 40 B7 7S 49 77 07 S1 00 99 20
OS 21 4S 9B 77 01 01 4B 4S 39 14 79 S3 32 BB B7 69 97 BO 92 4B 06 BS 37 06 B1 00 4B 13 19 9S 29 93 6S 4S so 12 61 20 06 SS 96 12 1B 61 BO 37 92 91 91
61 67 92 67 17 03 92 42 so 7S 01 9B 4S 10 OS 7B B7 90 47 73 02 9B 19 B9 04 2S 01 6B 34 92 17 99 S9 73 B4 B2 7S 01 7B 64 10 09 07 09 S6 OB 9S B6 1B 94 20 72 90 17 09 02 61 44 6B 72 6S B3 44 44 OS 96 BS 90 SS 00 36 2B 10 04 BB 72 30 42 62 43 21 12 23 11 00 OB B4 12 22 OB 32 S6 SS 63 16 06 B6 46 2B 40 79 B9 79 S6 S6 S2 17 02 SB 37 33 20 07 40 39 3S 33 9B BO 47 S4 03 31 OB 17
41 32 02 7S 96 24 59 60 BB B1 4B S1 76 SB 1 B 27 OS 35 96 7S 19 73 4B 30 37
74 6S 72 SB 01 74 79 29 OS 29 13 46 20 67 BO B4 B1 97 94 32 11 SS B7 94 27 60 26 92 09 00 06 17 26 2B OS 31 20 79 16 72 22 73 62 B6 6B 06 92 B2 6S 10
97 26 91 36 36 142207B410 71 97 72 OS 30 27 09 62 94 26 44S4091170
20 07 46 3S 19 7S 77 1 B 14 6S 14 21 B3 99 46 06 7B S6 42 B2 91 01 26 1 S 61
10 S9 61 30 64 1B S2 97 24 BO B1 40 99 B3 02 2B 97 79 99 29 B2 37 41 79 33 06 20 64 72 63 79 92 43 S2 33 B6 12 76 4B 29 77 02 34 49 00 40 B3 62 63 94 92 42 30 97 23 74 B3 22 11 41 73 S3 4B 10 SB 00 06 97 2S S3 36 01 06 61 74 B6 79 11 1S 34 00 26 B3 B2 10 4B 32 37 41 4B 60 B9 27 SB 07 74 4B 23 9B 74 60 BB SS 02 30 S9 97 BB 69 09 OS 03 63 B4 72 26 71 02 1B S4 16 61 94 44 07
74 09 21 6S 09 32 S4 7B 17 61 41 B4 72 37 06 92 44 02 30 7B 43 S6 00 74 4B 90 7S 09 73 22 4S 70 71 03 26 14 31 B6 14 46 21 97 96 B1 73 BB 04 BB 37 99 14 72 S1 66 03 B4 60 44 03 1S 66 73 62 29 3B 49 SB B1 94 B7 9B 66 17 22 9B 23 20 32 BS 06 9B 69 6B 60 11 23 40 29 11 30 9S S7 S4 BS B3 44 B2 12 4B BO 47 71 02 6B 97 71 72 S7 so 2B 00 OS 44 94 39 01 47 2B 79 1B 60 97 B7 6S 41
121
scormier
Sticky Note
None set by scormier
scormier
Sticky Note
MigrationNone set by scormier
scormier
Sticky Note
Unmarked set by scormier
scormier
Sticky Note
None set by scormier
scormier
Sticky Note
MigrationNone set by scormier
scormier
Sticky Note
Unmarked set by scormier

122
TABLE 7.1 (cont.) Random Numbers Table
36 27 64 92 29 10 13 13 26 18 70 49 46 76 82 40 95 03 23 50 95 49 81 65 59 89 98 18 56 63 44 12 36 38 45 79 86 16 35 18 92 77 77 81 35 60 08 00 03 89 41 56 64 46 30 83 32 55 94 83 92 77 01 10 34 85 18 90 52 66 85 96 17 94 52 46 01 03 34 17 36 45 23 42 71 62 83 89 00 76 26 12 30 39 49 24 45 01 47 08 74 19 18 58 38 45 95 89 90 57 17 56 42 25 50 14 15 06 51 15 00 80 71 54 30
58 35 06 11 82 58 02 82 92 04 48 49 46 13 05 70 39 51 64 27 88 99 50 78 53 25 39 08 65 10 42 66 62 76 78 55 98 14 69 20 57 98 02 26 10 86 10 72 87 40 45 81 19 85 11 78 41 23 62 38 1s 66 65 s3 81 45 92 91 30 40 87 s1 94 oe 14 66 07 40 74 42 01 84 30 71 03 26 95 66 53 08 78 28 19 29 37 31 49 85 07 24 48 08 38 86 84 11 67 13 08 22 18 03 62 21 80 06 75 58 50 56 79 84 02 22 01
64 56 10 04 14 05 23 15 01 16 36 38 63 84 10 73 21 64 74 12 75 38 41 38 45 43 82 44 80 16 80 95 26 12 72 69 47 33 42 65 39 03 27 23 32 22 20 18 41 18 68 24 81 78 90 72 77 32 46 74 56 21 46 71 66 80 61 49 78 64 39 32 85 84 47 68 39 42 15 64 74 50 44 54 98 64 66 66 08 96 82 57 07 60 73 88 01 18 68 21 84 10 95 26 08 10 51 65 03 85 35 51 70 18 40 67 31 60 46 91 98 60 80 34 35
06 82 42 61 36 85 62 42 25 91 23 09 79 03 13 45 21 55 04 02 87 83 21 08 77 06 25 54 97 15 84 76 40 56 55 88 68 81 01 63 53 81 33 01 30 52 33 74 74 56
39 04 99 99 88 08 77 01 10 01 71 26 72 67 25 92 36 01 77 86 50 52 72 95 18 23 65 04 78 73 72 38 35 28 72 87 33 60 04 44 98 96 95 85 40 23 08 04 34 89
12 13 14 30 41 74 21 40 94 50 70 88 69 08 15 42 55 60 88 50 73 80 64 42 22 18 99 34 87 84 60 61 04 68 49 94 76 20 78 36 26 48 03 59 72 38 45 47 59 48 57 03 45 01 48 91 93 68 02 12 78 87 62 91 53 23 56 34 35 24 62 89 43 63 96
22 64 60 57 25 73 50 67 04 79 38 91 51 29 18 19 54 65 51 61 64 49 89 84 19 54 83 92 68 94 40 88 56 38 96 89 53 72 54 42 14 48 66 67 26 20 76 80 37 19 37 61 47 47 97 48 07 58 03 81 88 88 46 92 53 99 19 02 60 25 24 44 06 30 43
10 98 80 95 16 33 67 25 73 98 85 61 04 72 82 39 39 92 82 15 59 88 42 57 39 06 73 69 97 88 78 36 03 05 66 22 61 53 32 48 41 08 33 09 15 77 06 04 87 95 00 49 27 22 93 65 65 06 28 88 43 24 65 96 14 67 19 30 70 86 53 87 46 62 35 7614996359 1525449749 9774514250 3062516519 8176326978 92 17 79 45 06 87 28 87 91 10 38 13 94 23 00 75 99 63 62 71 72 71 50 44 59
81 84 00 13 70 19 32 41 38 86 21 35 51 07 72 51 18 95 67 31 64 36 88 94 08 18 89 75 41 91 71 50 12 52 67 57 98 66 78 29 43 48 79 20 82 19 92 17 17 81 18 15 54 38 69 21 09 49 46 79 12 96 88 12 82 84 14 34 49 60 61 00 64 97 75 25 67 19 45 22 38 12 15 45 16 81 99 04 02 27 92 61 27 50 95 10 50 92 28 93 so 74 03 59 58 37 11 95 42 71 59 73 50 41 56 44 28 25 37 88 57 95 44 07 53
15 37 18 71 81 88 27 91 67 77 29 54 01 17 25 05 97 46 65 22 80 66 93 02 41 58 27 81 52 71 11 31 35 35 25 77 71 63 11 20 19 38 49 10 37 12 67 47 40 60 02 70 61 10 26 57 74 71 29 69 89 14 30 80 19 62 16 62 63 42 82 19 61 55 80 36 18 22 13 05 55 97 35 51 73 98 46 20 62 13 14 65 07 76 62 32 94 60 23 27 42 30 70 57 81 67 85 97 28 63 68 71 11 44 71 13 69 22 02 86 72 33 05 61 53
77 86 84 73 38 73 00 71 55 84 40 05 62 84 23 25 06 13 79 75 11 59 73 59 61 51 32 38 45 08 73 84 75 01 65 34 49 99 21 38 85 43 74 41 83 22 39 78 24 26 57 00 03 36 50 15 57 08 41 82 62 60 59 57 15 98 97 72 35 69 67 88 05 23 33 02 89 67 41 36 20 49 73 04 57 04 84 24 58 16 46 65 45 92 44 98 38 63 50 84 05 20 98 54 89 50 70 82 03 13 45 99 78 23 57 17 03 45 52 77 34 18 29 96 08
75 09 54 90 05 H 39 32 27 14 10 96 59 97 10 16 60 93 86 21 66 99 07 16 49 34 52 52 21 56 08 54 46 65 OS 49 49 38 79 65 49 35 65 65 13 62 75 27 53 39 17 87 53 33 08 15 70 87 09 17 66 10 34 71 89 36 75 40 54 51 08 72 56 36 95 78 95 48 93 70 45 87 35 30 53 51 43 03 73 74 06 00 51 96 96 24 43 31 55 91 13 95 60 19 02 29 79 66 71 11 99 05 27 46 03 18 85 14 23 73 75 85 62 16 80
scormier
Sticky Note
None set by scormier
scormier
Sticky Note
MigrationNone set by scormier
scormier
Sticky Note
Unmarked set by scormier
scormier
Sticky Note
None set by scormier
scormier
Sticky Note
MigrationNone set by scormier
scormier
Sticky Note
Unmarked set by scormier

TABLE7.2 Two-Tailed Binomial Test
Probability of X or more agreeing judgements in n trials (p=l/2)
10 11 12 1J 14 .. 1• 11 II .. 10 21 22 2J 24 2S ,. 21 ,. 29 JO JI n JJ J4 JS Jll J7 .,. J12 061 -219 0]1 45J 115 016 121 2119 010 000
508 100 OJ9 ... 10 1S4 J44 109 021 002 11 ... 227 -011 001 12 174 Jll 146 OJ9 ... u .. I ,., 002 022 OOJ 14 ,.I 424 100 ,,., OU 002 15 001 J02 111 OJI 007 001 1& - 4S4 210 011 021 ... 001 11 .,. JJ2 14J - OU 002 18 ... .. I 2:11 - OJI 008 001 .. 641 , .. 187 ... 011 ... 001 10 124 50J ,., 115 041 012 OOJ 21 - ,., lh 079 027 007 001 n an 52l -IJ4 .. 2 011 ... 001 2J .,. -210 Oil DJS 011 OOJ 24 138 S41 J07 152 ... 02J 007 002 25 - 424 no IOI 04J 015 ... 001 26 - 167 327 1• 01• 029 ... 002 001 27 701 442 2 .. 122 .. 2 019 ... 002 21 •1 •n - 1• Ol7 - Oil ... 001
29 711 ... -""' 081 024 008 002 001 JO ... .. Jl2 200 .... 04J 011 005 001 JI 110 OJ 291 150 071 OJO 011 OOJ 001 J2 ... 597 J77 215 100 ... 020 007 002 001 Jl 729 487 - 113 080 DJS 01' 005 001 J4 -- Jl2 229 121 058 024 ... OOJ 001 JS 7Jll ... ]10 115 ... 041 017 ... 002 Jll ... 181 405 24J 1n Olli 029 011 ... 001 J7 74J 511 J24 118 099 047 010 DOI 00] 001
la 871 627 418 256 14J 07J 034 014 005 002 J9 ,.. sn ]37 :zoo IOI OSJ 024 ... OOJ 001 .. 175 6ll 4JO - IS4 081 OJI 017 ... 002 001 41 , .. 53:1 ,.. 211 117 ... 028 012 ... 001 42 878 ... .. , 2111 1S4 088 ... 020 008 00] 001 4J 761 S42 )60 222 126 ... OJ2 014 005 002 001 .. ... 162 451 291 174 ... 049 02J 010 ... 001 45 766 ... J71 2JJ 1JS 072 Ol& 016 007 002 001 46 18J .... 461 J02 184 104 ... 026 011 005 002 001 47 111 ..., J82 24J 144 010 ... 011 ... OOJ 001 .. -.... 471 J12 193 111 ... 029 OU ... 002 001 ... 775 - l92 25J 152 08S ... 021 ... ... 001 .. 888 672 ... J22 10l 110 065 OJJ 015 007 OOJ 001 ..... •NOTE lnot .. 4 oec•mal C)O•nl h•• t>Mn onuoed "' c.>
scormier
Sticky Note
None set by scormier
scormier
Sticky Note
MigrationNone set by scormier
scormier
Sticky Note
Unmarked set by scormier
scormier
Sticky Note
None set by scormier
scormier
Sticky Note
MigrationNone set by scormier
scormier
Sticky Note
Unmarked set by scormier

124
TABLE7.3 Critical Absolute Rank Sum Differences
for "AH Treatments" Comparisons at5% Level of Significance
Number of samples
Panelists 3 4 5 6 7 8 9 10 11 12 3 6 8 11 13 15 18 20 23 25 28 4 7 10 13 15 18 21 24 27 30 33 5 8 11 14 17 21 24 27 30 34 37 6 9 12 15 19 22 26 30 34 37 42 7 10 13 17 20 24 28 32 36 40 44 8 10 14 18 22 2£ 30 34 39 43 47 9 10 15 19 23 27 32 36 41 46 50
10 11 15 20 24 29 34 38 43 48 53 11 11 16 21 26 30 35 40 45 51 56 12 12 17 22 27 32 37 42 48 53 58 13 12 18 23 28 33 39 44 50 55 61 14 13 18 24 29 34 40 46 52 57 63 15 13 19 24 30 36 42 47 53 59 66 16 14 19 25 31 37 42 49 55 61 67 17 14 20 2£ 32 38 44 50 56 63 69 18 15 20 26 32 39 45 51 58 65 71 19 15 21 27 33 40 46 53 60 66 73 20 15 21 28 34 41 47 54 61 68 75 21 16 22 28 35 42 49 56 63 70 77 22 16 22 29 36 43 50 57 64 71 79 23 16 23 30 37 44 51 58 65 73 80 24 17 23 30 37 45 52 59 67 74 82 25 17 24 31 38 46 53 61 68 76 84 26 17 24 32 39 46 54 62 70 77 85 27 18 25 32 40 47 55 63 71 79 87 28 18 25 33 40 48 56 64 72 80 89 29 18 26 33 41 49 57 65 73 82 90 30 19 26 34 42 50 58 66 75 83 92 31 19 27 34 42 51 59 67 76 85 93 32 19 27 35 43 51 60 68 77 86 95 33 20 27 36 44 52 61 70 78 87 96 34 20 28 36 44 53 62 71 79 89 98 35 20 28 37 45 54 63 72 81 90 99 36 20 29 37 46 55 63 73 82 91 100 37 21 29 38 46 55 64 74 83 92 102 38 21 29 38 47 56 65 75 84 94 103 39 21 30 39 48 57 66 76 85 95 105 40 21 30 39 48 57 67 76 86 96 106 41 22 31 40 49 58 68 77 87 97 107 42 22 31 40 49 59 69 78 88 98 109 43 22 31 41 50 60 69 79 89 99 110 44 22 32 41 51 60 70 80 90 101 111 45 23 32 41 51 61 71 81 91 102 112 46 23 32 42 52 62 72 82 92 103 114 47 23 33 42 52 62 72 83 93 104 115 48 23 33 43 53 63 73 84 94 105 116 49 24 33 43 53 64 74 85 95 106 117 50 24 34 44 54 64 75 85 96 107 118 55 25 35 46 56 67 78 90 101 112 124 60 26 37 48 59 70 82 94 105 117 130 65 27 38 50 61 73 85 97 110 122 13S 70 28 40 52 64 76 88 101 114 127 140 75 29 41 53 £6 79 91 105 118 131 145 80 30 42 55 68 81 94 108 122 136 150 85 31 44 57 70 84 97 111 125 140 154 90 32 45 58 72 86 100 114 129 144 159 95 33 46 60 74 88 103 118 133 148 163
100 34 47 61 76 91 105 121 136 151 167
'Exact values adapted from Hollander and Wolle (1973) are used for up to 15 panel· ists.
blnterpolation may be used for unspecifie,:t table values involving more than SO panel-ists.
scormier
Sticky Note
None set by scormier
scormier
Sticky Note
MigrationNone set by scormier
scormier
Sticky Note
Unmarked set by scormier
scormier
Sticky Note
None set by scormier
scormier
Sticky Note
MigrationNone set by scormier
scormier
Sticky Note
Unmarked set by scormier
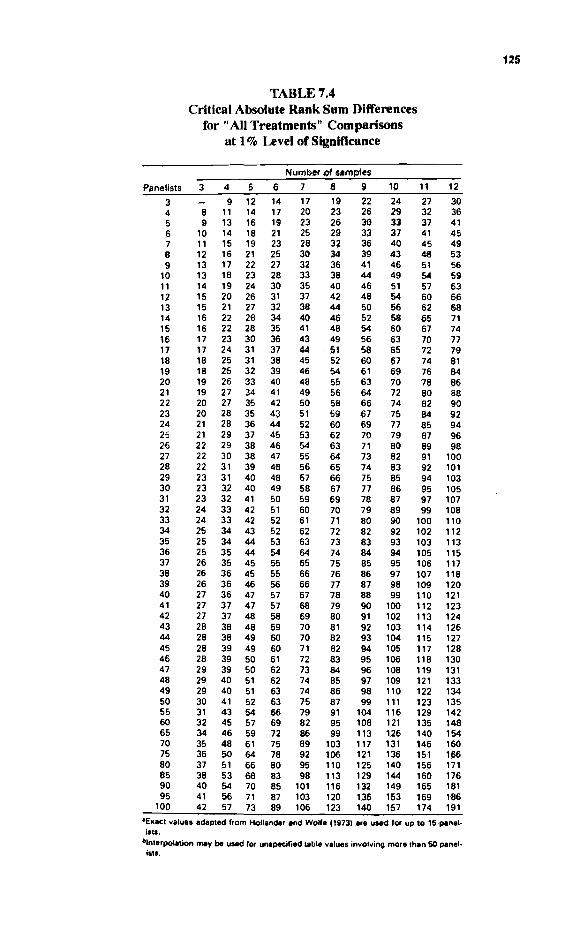
125
TABLE7.4 Critical Absolute Rank Sum Differences
for "AU Treatments" Comparisons at 1 % Level of Signiflcance
Number Qf samples
P1melists 3 4 5 6 7 s 9 10 11 12
3 9 12 14 17 19 22 24 27 30 4 8 11 14 17 20 23 26 29 32 36 5 9 13 16 19 23 26 30 33 37 41 6 10 14 18 21 25 29 33 37 41 4S 7 11 15 19 23 28 32 36 40 45 49 8 12 16 21 25 30 34 39 43 48 53 9 13 17 22 27 32 36 41 46 51 56
10 13 18 23 28 33 38 44 49 54 59 11 14 19 24 30 35 40 46 51 57 63 12 15 20 26 31 37 42 48 54 60 66 13 15 21 27 32 38 44 50 56 62 68 14 16 22 28 34 40 46 52 58 65 71 15 16 22 28 35 41 48 54 60 67 74 16 17 23 30 36 43 49 56 63 70 77 17 17 24 31 37 44 61 58 65 72 79 18 18 25 31 38 45 52 60 67 74 81 19 18 25 32 39 46 54 61 69 76 84 20 19 26 33 4-0 48 55 63 70 78 86 21 19 27 34 41 49 56 64 72 80 88 22 20 27 35 42 50 58 66 74 82 90 23 20 28 35 43 51 59 67 75 84 92 24 21 28 36 44 52 60 69 77 85 94 25 21 29 37 45 53 62 70 79 87 96 26 22 29 38 46 54 63 71 80 89 98 27 22 30 38 47 55 64 73 82 91 100 28 22 31 39 48 56 65 74 83 92 101 29 23 31 40 48 57 66 75 85 94 103 30 23 32 40 49 58 67 77 86 95 105 31 23 32 41 50 59 69 78 87 97 107 32 24 33 42 51 60 70 79 89 99 108 33 24 33 42 52 61 71 80 90 100 110 34 25 34 43 52 62 72 82 92 102 112 35 25 34 44 53 63 73 83 93 103 113 36 25 35 44 54 64 74 84 94 105 115 37 26 35 45 55 65 75 85 95 106 117 38 26 36 45 55 66 76 86 97 107 118 39 26 36 46 56 66 77 87 98 109 120 40 27 36 47 57 67 78 88 99 110 121 41 27 37 47 57 68 79 90 100 112 123 42 27 37 48 58 69 80 91 102 113 124 43 28 38 48 59 70 81 92 103 114 126 44 28 38 49 60 70 82 93 104 115 127 45 28 39 49 60 71 82 94 105 117 128 46 28 39 50 61 72 83 95 106 118 130 47 29 39 50 62 73 84 96 108 119 131 48 29 40 51 62 74 85 97 109 121 133 49 29 40 51 63 74 86 98 110 122 134 50 30 41 52 63 75 87 99 111 123 135 55 31 43 54 66 79 91 104 116 129 142 60 32 45 57 69 82 95 108 121 135 148 65 34 46 59 72 86 99 113 126 140 154 70 35 48 61 75 89 103 117 131 146 160 75 36 50 64 78 92 106 121 136 151 166 80 37 51 66 80 95 110 125 140 156 171 85 38 53 68 83 98 113 129 144 160 176 90 40 54 70 85 101 116 132 149 165 181 95 41 56 71 87 103 120 136 153 169 186
100 42 57 73 89 106 123 140 157 174 191
•Exact values adapted from Hollander and Wolfe 09731 are used for up to 15 panel-ists.
•interpolation may be used for unspecified table values involving more than 50 panel-ists.
scormier
Sticky Note
None set by scormier
scormier
Sticky Note
MigrationNone set by scormier
scormier
Sticky Note
Unmarked set by scormier
scormier
Sticky Note
None set by scormier
scormier
Sticky Note
MigrationNone set by scormier
scormier
Sticky Note
Unmarked set by scormier

126
'" v, I v, \ ---
I 161·45 2 18·513 3 10·128 4 7·7086
5 6·6079 6 5·9874 7 5·5914 8 5·3177 9 5·1174
10 4·9646 II 4·8443 12 4·7472 13 4·6672 14 4·6001
15 4·5431 16 4·4940 17 4·4513 18 4·4139 19 4·3808
20 4·3513 21 4·3248 22 4·3009 23 4·2793 24 4·2597
25 4·2417 26 4·2252 27 4·2100 28 4·1960 29 4·1830
30 4·1709 40 4·0848 60 4·0012
120 3·9201 00 3·8415
2
---
199·50 19·000
9·5521 6·9443
5·7861 5·1433 4·7374 4·4590 4·2565
4·1028 3·9823 3·8853 3·8056 3·7389
3·6823 3·6337 3·5915 3·5546 3·5219
3·4928 3·4668 3·4434 3·4221 3·4028
3·3852 3·3690 3·3541 3·3404 3·3277
3·3158 3·2317 3·1504 3·0718 2·9957
TABLE7.5 F Distribution
5% Level of Significance
3 4 5 6
215·71 224·58 230·16 233·99 19·164 19·247 19·296 19·330
9·2766 9· 1172 9·0135 8·9406 6·5914 6·3883 6·2560 6·1631
5·4095 5·1922 5·0503 4·9503 4·7571 4·5337 4·3874 4·2839 4·3468 4·1203 3·9715 3·8660 4·0662 3·8378 3·6875 3·5806 3·8626 3·6331 3·4817 3·3738
3·7083 3·4780 3·3258 3·2172 3·5874 3·3567 3·2039 3•0946 3·4!103 3·2592 3·1059 2·99!11 3·4105 3·1791 3·0254 2·0153 3·3439 3· 1122 2·9582 2·8477
3·2874 3·0556 2·9013 2·7!>05 3·2389 3·0069 2·8524 2·741:1 3·1968 2·9647 2·8100 2·fl!lK7 3·1599 2·9277 2·7729 2·6613 3·1274 2·8951 2·7401 2·6283
3·0984 2·8661 2·7100 2·5990 3·0725 2·8401 2·6848 2·5727 3·0491 2·8167 2·6613 2-.5491 3·0280 2·7965 2·6400 2·5277 3·0088 2·7763 2·6207 2·5082
2·9912 2"·7587 2·6030 2·4!104 2·9751 2·7426 2·5868 2·4741 2·9604 2·7278 2·5719 2·4591 2·9467 2·7141 2·5581 2·4453 2·9340 2·7014 2·5454 2·4324
2·9223 2·6896 2·5336 2·420.5 2·8387 2·6060 2·4495 2·3359 2·7581 2·5252 2·3683 2·2540 2·6802 2·4472 2·2900 2·1750 2·6049 2·3719 2·2141 2·0986
7 8
---236·77 238·88 19·353 19·371 8·8868 8·8452 6·0942 6·0410
4·8759 4·8183 4·2066 4·1468 3·7870 3·7257 3·!i00!) 3·4381 3·2927 3·2206
3·1355 3·0717 3·0123 2·9480 2·9134 2·8486 2·8321 2·7f>69 2·7642 2·6987
2·7066 2·6408 2·1i672 2·5911 2·6143 2·5480 2·5767 2·5102 2·/i435 2·4768
2·6140 2·4471 2·4876 2·4205 2·4638 2·3!165 2·4422 2·3748 2·4226 2·3551
2·4047 2·3371 2·3883 2·3205 2·3732 2·3053 2·3593 2·2913 2·3463 2·2782
2·3343 2·2662 2·2490 2·1802 2·1665 2·0970 2·0867 2·0164 2·0096 1·9384
This table gives the values of F for which l,.(v1 , v1) = 0·05.
9
---240·54 19·385 8·8123 5·9988
4·7725 4·0990 3·6767 3·3881 3·1789
3·0204 2·8962 2·7964 2·7144 2·6458
2·5876 2·5377 2·4943 2·4563 2·4227
2·3928 2·3661 2·3419 2·3201 2·3002
2·2821 2·2655 2·2501 2·2360 2·2229
2·2107 2·1240 2·0401 1·9588 1·8799
scormier
Sticky Note
None set by scormier
scormier
Sticky Note
MigrationNone set by scormier
scormier
Sticky Note
Unmarked set by scormier
scormier
Sticky Note
None set by scormier
scormier
Sticky Note
MigrationNone set by scormier
scormier
Sticky Note
Unmarked set by scormier

~ 10 12 15
,__,__ I 241·88 243·91 245·95 2 19·396 19·413 19·429 3 8·i855 8·7446 8·7029 4 5·9644 5·9117 5·8578
5 4·i351 4·Gi77 4·6188 6 4·0600 3·9!1~~ 3·9381 7 3·6365 3·5747 3·5108 8 3·34i2 3·2840 3·2184 9 3·13i3 3·0i29 3·0061
IO 2·97S2 2·9130 2·8450 II :!·s:.:rn 2·i871\ 2·7186 12 :.?·7!>34 2·0t\Oli 2·0IU!I 13 :.?·tii 10 2·6037 2·5331 14 2·0021 2·5342 2·41i30
15 :.?·!>437 2·475:1 2·403.'> 16 2·493.'> 2·424 7 2·3.'i22 17 2·44!1!1 2·3807 2·3077 18 2·4117 2·3421 2·2086 19 2·37i9 2·3080 2·2341
20 2·34i9 2·2770 2·2033 21 2·3210 2·2504 2·1757 22 2·2907 2·2258 2·1508 23 2·2747 2·2036 2·1282 24 2·2547 2·1834 2· 1077
25 2·2365 2·1649 2·0889 26 2·2197 2·1o&79 2·0716 27 2·2043 2·1323 2·0558 28 2·1900 2·1179 2·0411 29 2-1768 2· 1045 2·0275
30 2·1646 2·0921 2·0148 o&O 2·0772 2·0035 1·9245 60 1·9926 1·9174 1·8364
120 1·9105 1·8337 1·7506 00 1·8307 1·7522 1·666o&
TABLE 7.5 (cont.) F Distribution
5% Level of Significance
20 24 30 40
248·01 249·05 250·09 251· 14 19·446 I 9·454 19·462 19·471 8·6602 8·6385 8·6166 8·5944 5·8025 5·7744 5·7459 5·71i0
4·5581 4·5272 4·495i 4·4638 3·8742 3·8415 3·8082 3·7i43 3·4445 3·4105 3·3758 3·3404 3·1503 3·11.52 3·0794 3·0428 2·11365 2·9005 2·8637 2·82.'19
2·7740 2·7372 2·6996 2·Gli09 2·6464 2·6090 2·!>70!> 2·5309 2·5436 2·505.') 2·4003 2·42!i!J 2·4589 2·4202 2·3803 2·33!12 2·3879 2·3487 2·3082 2·2004
2·3275 2·2878 2·2408 2·204:1 2·2756 2·2354 2·1938 :.?·l.'i07 2·2304 2·1898 2·1477 2·1040 2· 1906 2· 1497 2· 1071 2·0!i29 2·1655 2· 1141 2·0712 2·0264
2·1242 2·0825 2·0391 1·9938 2·0960 2·0540 2·0102 1·9645 2·0707 2·0283 1·9842 1·9380 2·0476 2·0050 1·9605 1·9139 2·0267 1·9838 1·9390 1·8920
2·0075 1·9643 1·9192 1·8718 1·9898 1·9o&6o& 1·9010 1·8533 1·9736 1·9299 1·88o&2 1·8361 1·9686 1·91o&7 1·8687 1·8203 1·9446 1·9005 1·8543 1·8055
1·9317 1·8874 1·8o&09 1·7918 1·8389 1·7929 1·7444 1·6928 1·7"80 1·7001 1·6491 1·5943 1·6587 1·6084 1·5543 l·o&952 1·5705 1·5173 l·o&591 1·3940
127
I GO _:_1 __ 00 __
252·20 253·25 254·32 19·4i9 19·48i 19·4% 8·5720 8·5494 8·5265 5·6870 5·6581 5·628 I
4·4314 4·3984 4·36;)() 3·i39~ 3·i047 3·66S8 3·3043 3·2Gi4 3·:?~!1S
3·00!i3 2·!1f>(i!I '.!!):!-;'(i
2·7872 2·747;1 2·10Gi
2·6211 2·!>SOI 2·:i:iiH 2·4!l01 2·4.fSO 2·-tll-t ,~)
2·3o42 2-:1410 :!<!!Iii:! 2·29!iG 2·2.'"1:!4 2·::!0!i-t 2·2:!30 2· l77S :!·t:Jol
2·l!i01 2· 1141 2·00:18 2·10."iS 2·0!iS~I 2·0IJUH 2·0.'i84 2·0107 I ·!Hi04
2·01Uli l ·UOS I l·UltiH 1·9796 1·9302 l ·8780
1·9464 1·8963 1·8432 1·9165 1·8657 l ·8117 1·8895 1·8380 1·7831 1·8649 1·8128 1-7570 1·8424 1-7897 1·7331
1·8217 1·7684 1·7110 1·8027 1·7488 1·6906 1·7851 1·7307 1·6717 1·7689 1·7138 1·6541 1·7537 1·6981 1·6377
1·7396 1·6835 1·6223 1·6373 1·5766 1·5089 1·5343 1·4673 1·3893 1·4290 1·3519 1·2539 1·3180 1·2214 1·0000
scormier
Sticky Note
None set by scormier
scormier
Sticky Note
MigrationNone set by scormier
scormier
Sticky Note
Unmarked set by scormier
scormier
Sticky Note
None set by scormier
scormier
Sticky Note
MigrationNone set by scormier
scormier
Sticky Note
Unmarked set by scormier

128
~ i 1
' 1 4052·2 2 98·503 3 34· l 16 4 21· 198
r, lli·2iiS 6 13·74.'i 7 12·246 8 11 ·!?!iH 9 IO·!iGI
IO IO·OH I I
II !Hi4()0 I 12 H·3:40:! !
13 9 0738 r
14 8·861G
15 8·1i83 l 16 8·5310 17 H<ntH7 IH ~·:!854
Ill 8·18!i0
20 R·O!lfoO 21 8·0166 22 7·9454 23 7·8Rl I 24 7·8229
2u 7·7698 26 7·7213 27 7·6767 28 7·6356 29 7·5976
30 7·5625 40 7·314 l 60 7·0771
120 6·8510 00 6·6349
2
4!ln!l·.~
99·000 30·817 18·000
13·274 10·92.~
9·5466 8·6491 8·0215
i·5.5B4 7·20!i7 <i·!l:!tiH ti·iOIO
6·!il4U
ti·3!iSH 6·2262 li·l 121 11·<1129 !Hl2!i!l
[>·8489 6·7804 5·7190 5·0037 5·6136
5·MRO 5·5263 5·4881 5·4529 6·4205
5·3904 5·1785 4·9774 4·7866 4·6052
TABLE7.6 F Distribution
l % Level of Significance
3 4 5 6
--- ----5403·3 5624·6 5763·7 5859·0 99· IGO 99·249 99·299 99·332 29·457 28·710 28·237 27·911 16·694 15·977 15·522 15·207
12·060 I 1·392 10·967 10·6i2 9·7795 9·1483 8·7459 8·4661 R·45l3 7·8467 7·4004 7·1914 7·5910 7·0060 6·0318 0·3707 G-!1919 0·4221 6·0569 5·8018
6·.')!i23 !i·9943 .~·631i3 f>-38.~8
G·2W7 6·66R3 5·3WU !i·OO!l:.? 5·9526 !i-41 IH 5·064:1 4·8200 5·i394 5·20.'>3 4·81ilG 4·1i204 5·5630 6·0354 4·H!l!i0 4·4.558
5·4170 4·8932 4·.'i!i!it) 4<1183 r.·2922 4·7720 4·4374 4·21110 6· IR!iO 4·0090 4·3359 4· 101[> [>·09111 4·57110 4·2471J ·1-11146 !i·Oto3 4·5003 4·1708 3·9381i
4·9382 4·4307 4· 11127 3·8714 4·8740 4·3088 4·0421 3·RI 17 4·816-0 4·3134 3·9880 3·7583 4·7049 4·203!i 3·9392 3·7102 4·7181 4·2184 3·RU/il 3·6667
4·6755 4·1774 3·8660 3·6272 4·6366 4·1400 3·8183 3·5911 4·6009 4· 1056 3·7848 3·5580 4·5681 4·0740 3·7639 3·6276 4·5378 4·0449 3·7254 3·4096
4·6097 4·0179 3·6990 3·4736 4·3126 3·8283 3·5138 3·2910 4·1269 3·6491 3·33811 3· 1187 3·9493 3·4796 3·1736 2·9669 3·7816 3·3192 3·0173 2·8020
I i 8
5928·3 598i·6 99·356 99·374 2i·6i2 2i·4S9 14·976 14·799
10·456 10·289 8·2600 R·1016 6·9928 6·8401 6· 1776 6·0289 5·0129 5·4671
fr 2001 !'H)!i(\7
4·8861 4.7.ur. 4«i:Hl!i 4·4~Hl4
4·4410 4.;1021 4·277!1 4· 13!1~1
4· 1415 4·004.'i 4·U:!!i!I :l·KS!lli 3·112117 :1·7!1111 3·8400 :l·70!i4 3·711!i3 3·1130!i
3·111187 3·61144 3·-0398 3·6050 3·6807 3·4630 3·6300 3·40!i7 3·4060 3·3629
3·4668 3·3239 3•4210 3·2884 3·3882 3·2668 3·3581 3·2269 3·3302 3-1982
3·3046 3·1726 3·1238 2·9930 2·9530 2·8233 2·7918 2·6629 2·6393 2·1Hl3
This table givce the values of F for which l ,.(v1 , v1 ) "' 0·0 I.
9
6022·5 99·3SS 27·345 14·659
lll-158 i·9761 6·i 188 .~·9l06
f>·3!il I
4·H4:!4
4·H31!i 4-:ur;r, 4· l\111 4·02!17
3·S\141'! 3·7804 :HiS:.!2 :1·0!171 :J·ti22!i
:J·4.'ifi7 3·3981 3·3468 3·2986 3·2560
3·2172 3·1818 3·1494 3· 1195 3·0!J20
3·0665 2·8876 2·7185 2·5586 2·4073
scormier
Sticky Note
None set by scormier
scormier
Sticky Note
MigrationNone set by scormier
scormier
Sticky Note
Unmarked set by scormier
scormier
Sticky Note
None set by scormier
scormier
Sticky Note
MigrationNone set by scormier
scormier
Sticky Note
Unmarked set by scormier

~ 10 12 15 .. I U055·8 16106·3 615i·3 2 99.399 99·41G 99-432 3 27·'229 2i·052 26·8i2 4 14·54U 14·374 14·198
5 10·051 9·8883 9·i222 6 i·8i41 7·7183 7·5590 7 6·ti:?OI 6·4691 6·3143 8 .';·8143 :.·\W68 5·5151 9 5·:.!-565 6·1114 4·96:!1
10 4·8492 4·7059 4·!i!iS:.!
11 4·!i3!13 4·3!174 4·:.!509 12 4·2!HH 4· I !i!i'3 4·009ti 13 4· 1003 3·\l(;()J 3·8154 14 :1·!1:1!14 3·8001 3·U5!i7
15 3·8049 3·(;tl(l2 3·!i222 16 3·onou 3·!'>!i27 3·4089 17 :J.r.!131 3·4662 3·3117 18 3·5082 3·3706 3·2273 19 3·4338 3·2065 3·1533
20 3·3082 3·2311 3·0880 21 3·3098 3·1729 3·021111 22 3·21i76 3'1209 2·9780 23 3·2106 3·0740 2·9311 24 3· 1681 3·031(1 2·8887
25 3·1294 2·9931 2·8602 26 3·0941 2·9679 2·8150 27 3·0618 2·9256 ~M827
28 3·0320 2·8959 2·7630 29 '1·0046 2·8686 2·72&a
30 2·9791 2·8431 2·7002 40 2·8005 2·6648 2·5216 60 2·6318 2·(961 2·3523
120 2·4721 2·3363 2·1915 00 2·3209 2·1848 2·0385
TABLE 7., (cont.) F Distribution
1 % Level of Significance
20 24 30 40
6208·7 G234·ti G2H0·7 ()2~U.8
. 99.449 99.4;,s 99·41iti 99·4 74 2U·G90 26·.'i!l~ 2fr505 tu 411 14·020 13·929 13·838 13·745
9·552i 9·466:; !l·3i93 !l·:.!91:! 7·3958 7·31:!7 7·2~~5 i· 143t 6·1554 6·0i 43 5-9921 !i·!l0K4 5·35!}1 !i·:.!7!t3 5·1USt 5· 11 :.o 4·80>W 4·it!IO 4·ti-l!i(i 4-;)(itii
4·40!i4 -1<1:.!0H 4 ·:.!4H~l 4· llifl:I 4·0!1!HI 4·tl:!O\I :l·\141 I 3·S:i!Hi 3·8.'i84 :l·it:O.'i :l-700~ :l·ti I !l~ 3·liU4G :~·r1Sli~ :l·!i070 :Ht:-,:1 3·50!i:! :1·4274 :t<l47H :1·~ti!'"1li
3·371\1 :l·:!~UO :1·2141 :l·l:ll!l 3·2fi8S :I· IHOH :J·IOtli :J·OI H2 3· Iii If> :1.wn!i 3·00:l2 2·!1:!0!"1 3·0771 2·9990 2·918r. 2·8:154 3·00:11 2·9249 2·8442 :!·/(iOH
2·9377 2·8594 2·77H5 2·U94i 2·871l6 2·8011 2·7200 2'(J359 2·8274 2·7488 2·667r. 2·5831 2·780a 2·7017 2·6202 2·53!i!i 2·7380 2·U!'"1Ul 2·a773 2·4!12:1
2·6993 2·6203 2·6383 2·4530 2·6640 2·5848 2·6026 2·4170 2·6316 2·5522 2·4699 2·3840 2·6017 2·5223 2·43!17 2·35:1!i 2·6742 2·4946 2·4111! 2·32a:I
2·5487 2·4689 2·3860 2·21192 2·3689 2·2880 2·2034 2· 1142 2· 1978 2· 1164 2·0285 1·93uO 2·0346 1·9500 1·8600 I ·7628 I ·8783 I ·7908 I ·6964 1·5923
129
tiO JtO (J)
ti313·0 ti3:1!1·4 tiJG!\·O 9\l·4S:l 99·4!11 99.,,01 :?G·Jlti 2(i·:.!:.!I :?6·1:.!:J 13·U52 13·;.'is 13·463
9·20~0 9 I I IS 9 0204 7·0:.li~ (i-!lH90 U.8801 frfi:!:W fl·i1i2 fi·fi4!)!i f>·t1:11 ti 4 -~14(\(l 4·1'\tiS!4 4·4 s:11 4 <~H7 S 4·3 IO,. 4·0S I !I :~·!l~Hi.l :I·~ I ti! It l :l·i7(i I ;~-lj!I0-4 :I tiO:!ti 3.;,:1:;;, :1 11!14 :1-:lliilS
:1.;141 :1 :l·:!!"14S :.t· I ll!i4 :I IS 1:1 :Hl!14:! :t·HO .. W '.
' :HJ.171 :..! ·~I 5! 1,-1 :!·StiS4 I :!·H:l:ltl :!·1-144 '7 :!·i' :1:!S 2·1'-::14," :!·14:1!1 '.!·ti!i:IO 2·i49:1 2·U!>H7 2·!iUti0 2·G74~ 2·583!1 :!·4S!l:t
2·607i 2·51G8 2·4212 2·5484 2·45U8 2·3603 2·4951 2·4029 2·3055 2·4471 2·3a42 2·255U 2·40:lr. 2·:JOU9 2·210i
2·3037 2·2695 2·1694 2·327:1 2·2325 2·1315 2· 2!1:18 2· 1984 2·0965 2·262!1 2·16i0 2·0042 2·2:144 2· I 3i8 2·0342
2·2079 2· 1107 2·0062 2·0194 1·9172 1·8047 1·8303 I ·721i3 1·6006 1·66r.7 1·6330 1·3805 1·4730 1·3246 1·0000
scormier
Sticky Note
None set by scormier
scormier
Sticky Note
MigrationNone set by scormier
scormier
Sticky Note
Unmarked set by scormier
scormier
Sticky Note
None set by scormier
scormier
Sticky Note
MigrationNone set by scormier
scormier
Sticky Note
Unmarked set by scormier

2 3 4 5 6 7 8 9
10
11 12 13 14 15 16 17 18 19 20
24 30 40 60
120 00
v = df(Error)
2 3 4
TABLE7.7 Critical Values (Q Values) for Duncan's New Multiple Range Test
5% Level of Significance
5 6 7 8 9 10 11 12 13 14 15 16 17 18 19
17 .97 17 .97 17 .97 17 .97 17 .97 17 .97 17 .97 17 .97 17 .97 17 .97 17 .97 17 .97 17 .97 17 .97 17 .97 17 .97 17 .97 17 .97 6.085 6.085 6.085 6.085 6.085 6.085 6.085 6.085 6.085 6.085 6.085 6.085 6.085 6.085 6.085 6.085 6.085 6.085 4.501 4.516 4.516 4.516 4.516 4.516 4.516 4.516 4.516 4.516 4.516 4.516 4.516 4.516 4.516 4.516 4.516 4.516 3.927 4.013 4.033 4.033 4.033 4.033 4.033 4.033 4.033 4.033 4.033 4.033 4.033 4.033 4.033 4.033 4.033 4.033 3.635 3.749 3.797 3.814 3.814 3.814 3.814 3.814 3.814 3.814 3.814 3.814 3.814 3.814 3.814 3.814 3.814 3.8H 3.461 3.587 3.649 3.680 3.694 3.697 3.697 3.697 3.697 3.697 3.697 3.697 3.697 3.697 3.697 3.697 3.697 3.697 3.344 3.477 3.548 3.588 3.611 3.622 3.626 3.626 3.626 3.626 3.626 3.626 3.626 3.626 3.626 3.626 3.626 3.626 3.261 3.399 3.475 3.521 3.549 3.566 3.575 3.579 3.579 3.579 3.579 3.579 3.579 3.579 3.579 3.579 3.579 3.579 3.199 3.339 3.420 3.470 3.502 3.523 3.536 3.544 3.547 3.547 3.547 3.547 3.547 3.547 3.547 3.547 3.547 3.547 3.151 3.293 3.376 3.430 3.465 3.489 3.505 3.516 3.522 3.525 3.526 3.526 3.526 3.526 3.526 3.526 3.526 3.526
3.113 3.256 3.342 3.397 3.435 3.462 3.480 3.493 3.501 3.506 3.509 3.510 3.510 3.510 3.510 3.510 3.510 3.510 3.082 3.225 3.313 3.370 3.410 3.439 3.459 3.474 3.484 3.491 3.496 3.498 3.499 3.499 3.499 3.499 3.499 3.499 3.055 3.200 3.289 3.348 3.389 3.419 3.442 3.458 3.470 3.478 3.484 3.488 3.490 3.490 3.490 3.490 3.490 3.490 3.033 3.178 3.268 3.329 3.372 3.403 3.426 3.444 3.457 3.467 3.474 3.479 3.482 3.484 3.484 3.485 3.485 3.485 3.014 3.160 3.250 3.312 3.356 3.389 3.413 3.432 3.446 3.457 3.465 3.471 3.476 3.(78 3.480 3.481 3.481 3.481 2.998 3.144. 3.235 3.298 3.343 3.376 3.402 3.422 3.437 3.449 3.458 3.465 3.470 3.473 3.477 3.478 3.478 3.478 2.984 3.130 3.222 3.285 3.331 3.366 3.392 3.412 3.429 3.441 3.451 3.459 3.465 3.469 3.473 3.475 3.476 3.476 2.971 3.118 3.210 3.274 3.321 3.356 3.383 3.405 3.421 3.435 3.445 3.454 3.460 3.465 3.470 3.472 3.474 3.474 2.960 3.107 3.199 3.264 3.311 3.347 3.375 3.397 3.415 3.429 3.440 3.449 3.456 3.462 3.467 3.470 3.472 3.473 2.950 3.097 3.190 3.255 3.303 3.339 3.368 3.391 3.409 3.424 3.436 3.445 3.453 3.459 3.464 3.467 3.470 3.472
2.919 3.066 3.160 3.226 3.276 3.315 3.345 3.370 3.390 3.406 3.420 3.432 3.441 3.449 3.456 3.461 3 .465 3.469 2.888 3.035 3.131 3.199 3.250 3.290 3.322 3.349 3.371 3.389 3.405 3.418 3.430 3.439 3.44.7 3.454 3.460 3.466 2.858 3.006 3.102 3.171 3.224 3.266 3.300 3.328 3.352 3.373 3.390 3.405 3.418 3.429 3.439 3.448 3.456 3.463 2.829 2.976 3.073 3.143 3.198 3.241 3.277 3.307 3.333 3.355 3.374 3.391 3.406 3.419 3.431 3.442 3.451 3.460 2.800 2.947 3.045 3.116 3.172 3.217 3.254 3.287 3.314 3.337 3.359 3.377 3.394 3.409 3.423 3.435 3.44.6 3.457 2.772 2.918 3.017 3.089 3.1"6 3.193 3.232 3.265 3.294 3.320 3.343 3.363 3.382 3.399 3.414 3.428 3.44.2 3.454
p =number of means within range being compared
scormier
Sticky Note
None set by scormier
scormier
Sticky Note
MigrationNone set by scormier
scormier
Sticky Note
Unmarked set by scormier
scormier
Sticky Note
None set by scormier
scormier
Sticky Note
MigrationNone set by scormier
scormier
Sticky Note
Unmarked set by scormier

•
2 3 4 5 6 7 8 9
10
11 12 13 14 15 16 17 18 19 20
24 30 40 60
120 00
p 20 22
TABLE 7.7 (cont.) Critical Values (Q Values) for Duncan's New Multiple Range Test
5% Level of Significance
24 26 28 30 32 34 36 :18 40 50 60 70 80 90 100
17.97 17.97 17.97 17.97 17.97 17.97 17.97 17.97 17.97 17.97 17.97 17.97 17.97 17.97 17.97 17.97 17.97 6.085 6.085 6.085 6.085 6.085 6.085 6.085 6.085 6.085 6.085 6.085 6.085 6.085 6.085 6.085 6.085 6.085 4.516 4.516 4.516 4.!\16 4.516 4.516 4.516 4.516 4.516 4.516 4.516 4.516 4.516 4.516 4.516 4.516 4.516 4 .033 4 .033 4 .033 4 .033 4 .033 4 .033 4 .033 4 .033 4 .033 4 .033 4 .033 4 .033 4 .033 4 .033 4 .0:13 4 .033 4 .033 3.814 3.814 3.814 3.814 3.814 3.814 3.814 3.814 3.814 3.814 3.814 3.814 3.814 3.814 3.814 3.814 3.814 3.697 3.697 3.697 3.6!17 3.697 3.697 3.697 3.697 3.697 3.697 3.697 3.697 3.697 3.697 3.697 3.697 3.697 3.626 3.626 3.626 3.626 3.626 3.626 3.626 3.626 3.626 3.626 3.626 3.626 3.636 3.626 3.626 3.626 3.626 3.579 3.579 3.579 3.579 3.579 3.579 3.579 3.579 3.579 3.579 3.579 3.579 3.579 3.579 3.579 3.579 3.579 3.547 3.547 3.547 3.547 3.547 3.547 3.547 3.547 3.547 3.547 3.547 3.547 3.547 3.547 3.574 3.547 3.547 3.526 3.526 3.526 3.526 3.526 3.526 3.526 3.!\26 :l.~•26 3 . .';26 3.526 3.526 3.526 3.526 3.526 3.526 3.526
3.510 3.510 3.510 3.510 3.510 3.510 3.510 3.510 3 .. ~10 3.510 3.510 3.510 3.510 3.510 3.510 3.510 3.510 3.499 3.499 3.499 3.499 3.499 3.499 3.499 3.499 3.499 3.499 3.499 3.499 3.499 3.499 3.499 3.499 3.499 3.490 3.490 3.490 3.490 3.490 3.490 3.490 3.490 3.490 3.490 3.490 3.4!IO 3.490 3.4!10 3.490 3.490 3.490 3.485 3.485 3.485 3.485 3.485 3.4115 3.485 3.485 3.485 3.485 3.485 3.485 3.485 3.485 3.485 3.485 3.485 3.481 3.481 3.481 3.481 3.481 3.481 3.481 3.481 3.481 3.481 3.481 3.481 3.481 3.481 3.481 3.481 3.481 3.478 3.478 3.478 3.478 3.478 3.478 3.478 3.478 3.478 3.478 3.478 3.478 3.478 3.478 3.478 3.478 3.478 3.476 3.476 3.476 3.476 3.476 3.476 3.476 3.476 3.476 3.476 3.476 3.476 3.476 3.476 3.476 3.476 3.476 3.474 3.474 3.474 3.474 3.474 3.474 3.474 3.474 3.474 3.474 3.474 3.474 3.474 3.474 :1.474 3.474 3.474 3.474 3.474 3.474 3.474 3.474 3.474 3.474 3.474 3.474 3.474 3.474 3.474 3.474 3.474 :1.474 3.474 3.474 3.473 3.474 3.474 3.474 3.474 3.474 3.474 3."74 3.474 3 .474 3.474 3.474 3.474 3.474 3.474 3.474 3.474
3.471 3.475 3.477 3.477 3.477 3.477 3.477 3.477 3.477 3.477 3.477 3.477 3.477 3.477 3.477 3.477 3.477 3.470 3.477 3.481 3.484 3.486 3.486 3.486 3.486 3.486 3.486 3.486 3.486 3.486 3.486 3.486 3.486 3.486 3.469 3.479 3.486 3.492 3.497 3.500 3.503 3.504 3.504 3.504 3.504 3.504 3.504 3.504 3.504 3.~,()4 3.504 3.467 3.481 3.492 3.501 3.509 3.515 3.521 3.525 3.529 3.531 3.534 3.537 3.537 3.537 3.537 3.537 3.537 3.466 3.483 3.498 3.511 3.522 3.532 3.541 3.548 3.555 3.561 3.566 3.585 3.596 3.600 3.Wl 3.601 3.601 3.466 3.486 3.505 3.522 3.536 3.550 3.562 3.574 3.584 3.594 3.603 3.&10 3.668 3.690 3.708 3.722 3.735
..... c.> .....
scormier
Sticky Note
None set by scormier
scormier
Sticky Note
MigrationNone set by scormier
scormier
Sticky Note
Unmarked set by scormier
scormier
Sticky Note
None set by scormier
scormier
Sticky Note
MigrationNone set by scormier
scormier
Sticky Note
Unmarked set by scormier

1 2 3 4 5 6 7 8 9
JO
11 12 13 14 15 18 17 18 19 20
24 30 40 60
120
'P
v = dF(Error)
2 3 4
TABLE7.8 Critical Values (Q Values) for Duncan's New Multiple Range Test
1 % Level of Significance
5 6 7 8 II 10 11 12 13 14 15 16 17 18 19
90.03 90.03 90.03 9(1.03 90.03 90.03 110.03 90.03 110.03 90.03 110.03 90.03 90.03 90.03 90.03 90.03 90.03 90.03 14.04 14 .04 14 .04 14.04 14 .04 14 .04 14 .04 l4 .04 14 .04 14 .04 14 .04 14 .04 14 .04 14 .04 14 .04 14 .04 14 .04 14 .04 8.261 8.321 8.321 8.321 8.321 8.321 8.321 11.321 8.321 8.321 8.321 8.321 8.321 8.321 8.321 8.321 8.321 R.321 8.512 ll.677 6.740 6.756 6.756 6.756 6.756 6.756 6.756 6.756 6.756 6.756 6.756 6.756 6.756 6.756 6.7!'>6 6.756 6.702 5.893 5.989 6.040 6.065' 6.074 6.074 6.0H 6.074 6.074 6.074 6.074 6.074 6.074 6.074 6.074 6.0-14 6.074 5.243 5.439 5.549 5.614 5.6.55 5.680 5.694 5.701 5.703 5.703 5.703 5.703 5.703 5.703 5.703 5.703 5.703 5.703 4.~9 5.145 5.260 5.334 5.383 5.416 5.439 5.454 5.464 5.470 5.472 5.472 5.472 5.472 5.472 5.472 5.472 5.472 -t.746 4.939 5.057 5.135 5.189 5.227 5.258 S.276 5.291 5.302 5.309 5.314 5.316 5.317 5.317 5.317 5.317 5.317 4.5116 4.787 4.906 4.986 5.043 5.086 S.118 5.142 5.160 5.174 5.185 5.193 5.199 5.203 5.205 5.206 5.206 5.20ti t.482 4.1171 4.790 4.871 4.931 4.975 5.010 5.037 5.058 5.074 5.088 5.098 5.106 5.112 5.117 5.120 5.122 5.124
4.392 4.579 4.897 4.780 4.841 4.887 4.924 4.952 4.975 4.994 5.009 5.021 5.031 5.039 5.0-!.5 s.o;;o 5.0:H s.0:;1 4.320 4.504 4.622 4.706 4.767 4.815 4.852 4.883 4.907 4.927 4.944 4.1158 4.969 4.978 4.986 4.993 4.119!! 5.002 t.260 4.442 t.580 4.844 4.706 4.755 4.793 4.824 4.!!50 4.872 4.889 4.901 4.917 4.928 4.937 4.1144 4.950 4.956 4.210 4.391 4.508 4.591 4.654 4.704 4.743 4.775 4.802 4.824 4.843 4.8511 4.872 4.884 4.894 4.902 4.910 4.916 4.168 4.347 4.463 4.547 4.61() 4.600 4.700 4.733 4.760 4.783 4.803 4.820 4.834 4.846 4.857 4.866 4.874 4.881 4.131 4.309 4.425 4.509 4.572 4.622 4.863 4.696 4.724 4.748 4.768 4.786 4.800 4.813 4.825 4.835 4.80 4.851 4.099 4.275 4.391 4.475 4.539 4.589 4.630 4.664 4.693 4.717 4.738 4.756 4.771 4.7115 4.797 4.807 4.816 4.824 4 .071 4 .246 4 .362 4 .445 4 .. 509 4 .560 4 .601 4 .635 4 .6f>4 4 .689 4 .711 4. 729 4. 745 4 .759 4. 772 4 .783 4 .7112 4 .801 4.046 4.!!20 4.335 4.419 4.483 4.534 4.575 4.610 4.639 4.665 4.686 4.705 4.722 4.736 4.749 4.761 4.771 4.7!!0 4.024 4.197 4.312 4.395 4.459 4.510 4.552 4.587 4.617 4.642 4.664 4.684 4.701 4.716 4.729 4.741 4.751 4.761
3.956 4.126 4.239 4.322 4.386 4.437 4.480 4.516 4.546 4.573 4.596 4.616 4.63-l 4.651 4.66.'i 4.678 4.690 4.700 3.889 4.056 4.168 4.250 4.3H 4.366 4.409 4.445 4.477 4.504 4.528 4.550 4.569 4.586 4.601 4.615 4.628 4.640 3.825 3.988 4.098 4.180 4.244 4.296 4.3311 4.376 4.408 4.436 4.461 4.483 4.503 4.521 4.537 4.553 4.566 4.5711 3.762 3.922 4.031 4.111 4.174 4.226 4.270 4.307 4.340 4.368 4.39-l 4.417 4.438 4.456 4.474 4.490 4.50t 4.518 3.702 3.858 3.965 4.00 4.107 4.158 4.202 4.239 4.272 4.301 4.327 4.351 4.372 4.392 4.410 4.426 4.4U 4.456 3.643 3.796 3.900 3.978 4.0·lO 4.091 4.135 4.172 4.205 4.235 4.261 4.285 4.307 4.327 4.3-&5 4.363 4.379 4.394
p =number of means within range being compared
scormier
Sticky Note
None set by scormier
scormier
Sticky Note
MigrationNone set by scormier
scormier
Sticky Note
Unmarked set by scormier
scormier
Sticky Note
None set by scormier
scormier
Sticky Note
MigrationNone set by scormier
scormier
Sticky Note
Unmarked set by scormier

2 3 (
5 6 7 8 9
10
11 12 13 H 15 16 11 18 19 20
30 40 ti-0
l:!O
p 20 22
TABLE 7.8 (cont.) Critical Values (Q Values) for Duncan's New Multiple Range Test
1 % Level of Significance
24 26 28 30 32 34 36 3S 40 70 80 90 100
90.03 90.03 90.03 110.03 90.03 90.03 90.03 90.03 110.03 90.03 90.03 90.03 90.03 90 03 90.03 110.03 90.03 14 .04 14 .(}( 14 .O<l 14 .O<l H .(}( 14 .04 14 .(}( 14 .O<l 14 .(}( 14 .O<l 14 .04 14 .04 14 .04 14 04 14 .O<l 14 .04 14 .04 8.321 8.321 8.321 8.321 8.321 8.321 8.321 8.321 8.321 8.321 8.321 8.321 8.321 8.321 8.321 8.321 8.321 6.756 6.756 6.756 6.756 6.756 6.756 6.756 6.756 6.756 6.756 6.756 6.756 6.756 6.756 6 756 6.756 6.756 6~6.~6.~6-~6-~6-~6-~6~6.~6~6.~6.~6~6.~6~6.~6~
5.703 5.703 5.703 5.703 5.703 5.703 5.703 5.703 5.703 5.703 l>.703 5.703 5.703 5.703 5.703 5.703 5.703 5.472 5.472 5.472 5.472 l>.472 5.<l72 5.U2 5.472 5.472 5.472 5.472 5.472 5.472 5.472 5-472 5.472 5.472 5.317 5.317 5.317 5.317 5.317 5.317 5.317 5.317 l>.317 5.317 5.317 5.317 5.317 5.317 5.317 5.317 5.317 5.206 5.206 5.206 5.206 5.206 5.206 5.206 5.206 5.206 5.206 5.206 5.206 5.206 5.206 5.206 5.206 5.206 5.124 5.124 5.124 5.124 5.124 5.124 5.124 5.124 5.124 5.124 5.124 5.124 5.124 5.124 5.124 5.12-l 5.124
<. .0:,9 5 .061 5 .061 5 .061 <. .061 5 .061 5 .061 5 .061 5 .061 5 .061 5 .061 5 .061 5 .061 5 .061 5 .061 5 .061 5 .061 5.006 5.010 5.011 5.011 5.011 Ii.Oil 5.011 5.011 5.011 5.011 5.011 5.011 5.011 5.011 5.011 5.011 5.011 4.9ti0 4.1166 4.970 4.972 4.972 4.1172 (.972 4.972 4.1172 (.1172 4.972 4.972 4.972 4.972 4.972; 4.972 (.972 4.921 4.1129 4.935 4.938 (.940 4.940 (.940 (.940 4.1140 4.1140 (.940 (.940 4.940 4.1140 4.940 4.940 4.940 4.887 L897 4.9(}( 4.909 <l.1112 <l.lla 4.lla 4.lll<l 4.914 4.1114 <l.1114 4.914 4.914 4.1114 4.914 4.llH 4.914 4~4~4.~4-~4-~4-~·-~·-~4-~4-~4-~4~4~4.~4~4.~4-~
4.8:l2 4.844 4.s:.a 4.S60 4.865 4.869 4.872 <l.873 4.874 4.S74 4.874 4.871 4.874 4.SH <l.874 4.S74 4.SH 4.SOS 4.821 4.832 4.839 4.846 4.850 4.854 (.S:.6 (.8::.7 4.858 4.8.>8 4 8:.S 4.8:,g 4.858 4.8:J8 4.8:>8 4.8:.s 4.788 4.802 4.812 4.821 (.828 4.833 4.838 4.841 4.843 4.844 4.845 4.845 4.845 4.845 (.845 4.845 4.845 4.769 4.78( 4.7115 4.805 (.813 4.818 4.823 (.827 4.830 4.832 4.833 4.833 4.833 (.833 4.833 4.833 4.833
4 710 4.727 4.741 4.752 4.762 <l.770 4.777 4.783 4.788 4.791 4.794 4.S02 4.802 4.802 4.802 4.S02 4.1;o2 4.650 4.669 4.6S5 4.6\J9 4.711 (.721 (.730 (.738 4.744 4.750 4.755 4.772 4.777 4.777 4.777 4.777 4.777 4.~91 4.611 4.630 4.645 (.6.'>11 (.671 (.682 4.692 4.700 4.708 4.715 4.740 4.754 4.761 4.76-l 4.764 4.764 4.5:l0 4.553 4.573 4.591 4.607 4.620 (.6;J3 4.645 4.655 4.665 (.673 4.707 4.730 4.745 4.755 4.761 4.76.'i (.469 4.494 4.516 4.535 (.552 4.568 4.583 4.596 (.609 4.6111 <l.630 (.673 4.703 4.727 4.745 4.7!>9 4.770 4.40S 4.434 (.457 4.478 (.(97 4.514 4.530 4.545 4.559 4.572 4.584 4.635 4.675 4.707 4.734 4.756 4.776
scormier
Sticky Note
None set by scormier
scormier
Sticky Note
MigrationNone set by scormier
scormier
Sticky Note
Unmarked set by scormier
scormier
Sticky Note
None set by scormier
scormier
Sticky Note
MigrationNone set by scormier
scormier
Sticky Note
Unmarked set by scormier

x 0 4 5 6
TABLE7.9 One-Tailed Binomial Test
Probability of X or more correct judgements in n trials (p=l/3)
8 9 10 11 12 13 14 15 16 17 18 19 20 21 22 23 24 25 26 27 28 ~~~~~~~~~~~~~~~~~~~~~~~~~~~~~~~~~~~~~~~~~~~~~~~~~~~~~~~~~~~~~~·-~--~-
5 6 7 8 9
10 11 12 13 14 15 16 17 18 19 20 21 22 23 24 2~
26 27 28 29 30 31 32 33 34 35 36 )7
38 39 40 41 42 43 44 45 46 47 48 49 50
868 ~39
912 649 941 737 961 80~
974 857 983 896 988 925 992 946 995 961 997 973 998 981 998 986 999 990 999 993
995 997 998 998 999 999 999
210 045 004 320 100 018 001 429 173 045 007 532 259 088 020 003 623 350 145 042 008 001 701 441 213 077 020 003 766 527 2119 122 039 009 819 607 368 178 066 019 861 678 448 241 104 035 895 739 524 310 149 058 921 791 596 382 203 088 941 834 661 453 263 126 956 870 719 522 326 172 967 898 7f13 588 391 223 976 921 812 648 457 279 982 940 848 703 521 339 987 954 879 751 581 399 991 965 904 794 638 460 993 974 924 831 690 519 995 980 941 862 737 576 996 985 954 888 778 630 997 989 964 910 815 679 998 992 9 72 928 84 7 725 999 994 979 943 874 765 999 996 984 955 897 801 999 997 988 965 916 833
998 991 972 932 861 998 993 978 946 885 999 995 983 95 7 905 999 996 987 965 922 999 997 990 973 937
998 992 978 949 998 994 963 959 999 996 987 967 999 997 990 973 999 99 7 992 979
998 994 983 999 995 987 999 996 990 999 997 992 999 998 994
998 995 999 996 999 99~ 999 998 999 998
001 004 001 009 002 017 004 031 008 050 016 075 027 108 043 146 065 191 092 240 125 293 163 349 206 406 2!:4 462 304 518 357 572 411 623 464 670 517 714 568 754 617 789 662 821 705 849 744 873 779 895 810 913 838 928 863 941 885 952 903 961 920 968 933 974 945 980 955 984 963 987 970 990 976 992 980 994 984 995 9117
001 002 004 001 008 002 014 004 024 007 038 013 056 021 079 033 107 048 140 068 178 092 220 121 266 154 314 191 364 232 415 276 466 322 516 370 565 419 612 468 656 516 697 562 735 607 769 650 800 689 829 726 854 761 876 791 895 820 912 845 926 867 938 887 949 904 958 919 965 932 972 943
001 002 004 007 012 019 028 042 058 079 104 133 166 203 243 285 330 376 422 469 515 560 603 644 683 719 753 783 811 836 859 879 896
001 002 003 C06 010 016 025 036 050 068 090 115 144 177 213 252 293 336 381 425 470 515 558 600 639 677 713 745 776 803 829
001 G02 003 006 009 014 022 031 043 059 078 100 126 155 187 223 261 301 342 385 428 471 514 556 596 635 672 706 739
001 002 003 005 008 013 019 027 038 051 067 087 109 135 164 196 231 268 307 347 389 430 472 514 554 593 631
001 002 003 005 007 011 016 023 033 044 058 075 095 118 144 173 205 239 275 313 352 392 433 473 513
001 001 002 004 006 010 014 020 028 038 051 066 083 104 127 153 182 213 246 282 318 356 395
001 001 002 004 006 009 012 018 025 033 044 057 073 091 111 135 161 189 220 253 287
001 001 002 003 005 007 011 016 021 029 038 050 063 079 098 119 142 168 196
001 001 002 003 004 007 010 014 019 025 033 043 055 070 086 105 126
001 001 002 003 004 006 008 012 016 022 029 038 048 061 076
001 001 001 002 003 005 007 010 014 019 025 033 042
001 0Cl1 002 003 004 006 009 012 017 022
001 001 002 003 004 006 008 011
001 001 002 002 003 005
001 001 001 002 001
scormier
Sticky Note
None set by scormier
scormier
Sticky Note
MigrationNone set by scormier
scormier
Sticky Note
Unmarked set by scormier
scormier
Sticky Note
None set by scormier
scormier
Sticky Note
MigrationNone set by scormier
scormier
Sticky Note
Unmarked set by scormier

>z 2 s --- ---
1 lti·O 27·0 2 ti-O'J 8-3 s 4·50 5·91 4 3·!13 5·04
5 3·64 4-60 6 3·46 4·34 7 3·34 4·16 8 3·26 4·04 9 3·20 3·95
10 3·15 3·88 11 3·11 3·82 12 3·08 3·77 13 3·06 3·73 14 3·03 3'70
15 3·01 3·67 16 3·00 3·fi.5 17 2·98 3·63 18 2-97 3·61 19 2·96 3·59
20 2·95 3·58 24 2·92 3·53 30 2·89 3·49 40 2·86 3.44
60 2·83 3-40 120 2·80 3·36
co 2·77 3·31
4 5
--- ----
32·8 37-l 9·8 10-9 6·82 7·50 5·76 6·1!\J
5·2'.J 5·67 4·90 5·31 4·68 5·06 4·53 4·89 4·42 4-76
4·33 4·6.5 4·26 4·57 4·!l0 4·51 4·15 4-45 4·ll 4 .. u
4·08 4·37 4·05 4·33 4·02 4·30 4·00 4·28 3·98 4·25
3·96 4·23 3-!JO 4·17 3·84 4·10 3·79 4·04
3.74 3·98 3·69 3·92 3·63 3·86
TABLE7.10 Percentage Points of the Studentized Range
Upper 5% Points
6 7 8 9 10 11 12 13 14
-- --- --- ------ --------40·4 43·1 45·4 47·4 49·1 50·6 52·0 53·2 54·3 lJ.7 12 .. 1 13·0 13·5 14·0 14·4 14·7 15·1 15·4 8·04 tl-48 8·85 9·18 !1·46 9·72 9·95 10·15 10·35 6·71 7-0.5 7·35 7-60 7·83 8·03 8·21 8·37 8·52
6·03 6·33 6·58 6·80 6·99 7·17 7·32 7-47 7-60 5·tiJ 5·89 6·12 6-32 6·49 6·6.5 6·79 6·92 7·0:l 5·3(i 5·61 5·82 6-00 6· lti 6·30 6 .. J:J 6·55 6-66 5·17 5·40 5·60 5·77 5·92 6·05 6·18 6·:.'9 6·39 5·02 5·24 5·43 5·60 5·74 5·87 5·98 6·09 6·19
4·91 5·12 5·30 5-46 5·60 5·72 5·83 5·93 6·03 4·82 5·03 5·20 5·35 5·49 5·61 5·71 5·81 5·90 4·75 4·!15 5·12 5·27 5-40 5·51 5·62 5·71 5·80 4·69 4·88 5-().5 5·19 5·32 5-43 5·53 5·63 5·71 4·64 4-83 4·99 5·13 5·25 5·36 5·46 5·55 5·64
4'60 4-78 4·94 5·08 5·20 5·31 5·40 5-49 5·58 4·56 4·74 4·90 5·03 5·15 5·26 5·35 5·44 5·52 4·52 4·71 4·86 4·!19 5·ll 5·21 5·31 5·39 5·47 4·49 4·67 4·82 4·96 5·07 5·17 5·27 5·35 5·43 4·47 4-65 4-79 4·92 5·04 5·14 5·23 5·32 5·39
4.4c, 4·62 4-77 4·90 5·01 5·11 5·20 5·28 5·36 4-:17 4·54 4·68 4·81 4·92 5·01 5·10 5·18 5·25 4·30 4·46 4-60 4-72 4·83 4·!12 5·00 5·08 5·Ic> 4·23 4·39 4·52 4·63 4·74 4·82 4·91 4·98 5·05
4·16 4·31 4·44 4-55 4·6.5 4·73 4·81 4·88 4·94 4·10 4·24 4·36 4·48 4·56 4-tH 4·72 4·78 4·84 Hl3 4-17 4.29 4·39 4·47 Hi5 4·62 4·68 4·74
-
15 16 17
-- --- - ---~
55·4 56·3 ;,;·:! 15·7 15·!1 lt.i-1 10-52 10·69 IU·ll-1
8·66 t:l-79 8-!Jl
7-72 7·83 7·93 7·14 7·2-l 7·31 6-76 6·85 6·91 IH8 6·51 ti-!i;} 6-28 6·36 6·41
t;.J I 6·:.'0 6·27 5·99 6-0ti IHI 5-tl8 5·95 6-m 5·79 5·86 [>·!):~
5·72 5·79 5·b.J
5.u.; 5·72 5·79 5·59 5·tjti 5·7:.! 5-55 5·61 5-ti,'l 5·50 5·51 5·63 5·4Ai 5·53 5·59
5·43 5·4!1 5·55 5<12 5·38 5-·1-1 5-21 5·27 5·3:1 5·ll 5·16 5·i2
5·00 5-()(i .~ 11 4·90 4·!15 5-00 4·80 4·85 4·89
n. is the .size of sa1uplc fron1 which the range is oLta.incd and JI is tUc uumLcr of degree~ of frceJ01u uf :;11 •
18 19
~-·--- ---·-
58·0 .):l-8 lti-4 !ti-ti IU·!lti IJ.11 9·o:I !1·13
8·03 8·12 7 .. 1:1 7·51 7·0:! 7·0'J tVi3 ti·li!l 6-51 6·58
6<JI 6·40 6-20 6-26 tl·O'J 6-15 6-W ti-05 5·n 5·97
5-85 5-!JO 5·7U 5-8-1 5·7-1 5·1U 5-69 5·74 5·65 5·70
5·61 5·66 5·50 5-54 5·3t\ 5 .. 13 5·27 5-31
5·lti 5·20 5·0;) 5-UH 4·93 4·97
20
--f)!,H; lti-11 11·21 9·:.!:I
8·:!1 7-59 7·17 ti-87 6·64
ti-47 6·33 6·.:!l ti-IL ti-OJ
5·96 5·!JO 5·8-1 5·i9 5·75
5·71 5-59 5·48 5·36
3·24 c"13 5·01
.... w en
scormier
Sticky Note
None set by scormier
scormier
Sticky Note
MigrationNone set by scormier
scormier
Sticky Note
Unmarked set by scormier
scormier
Sticky Note
None set by scormier
scormier
Sticky Note
MigrationNone set by scormier
scormier
Sticky Note
Unmarked set by scormier

>\ 2 3
t !J0-0 135 2 14·0 19·0 3 8·26 10·6 4 6·51 8·12
5 5·70 6·97 6 5·24 6·33 7 4·95 5·92 8 4·74 5·63 9 4·60 5-43
to 4-48 5·27 tt 4.39 5·14 12 4·32 5·04 18 4·26 4·96 H 4·21 4·89
15 4·17 4·63 tG 4·13 4'78 17 4·10 4·74 18 4-07 4·70 19 4·05 4·67
20 4·02 4·64 24 3·96 4·54 30 3·89 4-45 40 3·82 4·37
60 3·76 4·28 120 J.70 4·20
IX) 3·64 4·12
4 5
164 186 22·3 24·7 12·2 13·3 9·17 9·96
7·80 8·42 7-()J 7·56 6·54 7·01 6·20 6·63 5·96 6·35
5·77 6·14 5·62 5·97 5·50 5·84 5·40 5·73 5·32 5·63
5·2.5 5·56 5·19 5.49 5·14 5-43 5-09 5·38 5-00 5·33
5·02 5·29 4·91 5·17 4·80 5·05 4·70 4·93
4-60 4·82 4·50 4·71 4·40 4·60
TABLE7.ll Percentage Points of the Studentized Range
Upper 1 % Points
6 7 8 9 10 tt 12 13 14
202 216 227 237 2-16 2:.3 200 266 272 26·6 28·2 29·5 30·7 31-7 32·6 33-4 3-1-1 31·8 14·2 15·0 15·6 16·2 16·7 17·1 17·5 17·9 HE! 10·6 11·1 11·5 11·9 12·3 12·6 12·8 1:1-1 13·3
8·91 9·32 9·67 9·97 10·24 10·48 10·70 10·89 11·08 7·97 8·32 8·61 8·87 9·10 9.30 9·49 9·65 9·81 7·37 7-68 7·94 8·17 6·37 8·55 8·71 8·86 9·00 6-96 7·24 7-47 7·68 7·87 8·03 8·18 8·31 8·44 6-66 6·91 7·13 7·32 7-49 7·6.5 7-713 7-!JI 8·03
6·4.3 6·67 6·87 7-00 7·21 7·36 7-48 7·60 7-71 6·2.5 6·48 6·67 6·84 6·99 7·13 7·2.5 7·36 7-46 6·10 6·32 6·51 6·67 6·81 6·94 7-()6 7·17 7·26 5·98 6·19 6·37 6·53 6·67 6·7!l 6·00 7·01 7·10 5·88 6·08 6·20 6·41 6·54 6·06 6·77 6·87 6·96
5·80 5·99 6·16 6·31 6·44 6·55 6·66 6·76 6·84 5·72 5·92 6·08 6·22 6-35 6·46 6·56 6·66 0·74 5·66 5·85 &01 6·15 6·27 6·38 6-48 6·57 6·6G 5·60 5·79 5·94 6·08 6·~'0 6·31 6·41 6·50 1;.55 5·55 5·73 5·89 6·02 6·14 6·2.5 6·34 tj..13 6·51
5·51 5·09 5·84 5·97 6·00 6·19 6·29 6·37 6·45 5·37 5·54 5·09 5·81 5·92 6·02 6·11 6·19 6·26 5·24 5·40 5·54 5·65 5·76 5·85 5·93 6·01 6·08 5-11 5·27 5·39 5·50 5·60 5·6.9 5·77 5·84 5·00
4·99 5·13 5·2.5 5·36 5-4.5 5·53 5·60 5-67 5.73 4·87 5·01 5·12 5·21 5·30 5·38 5·44 5·51 5·56 4·76 4·88 4·99 5·08 5·16 5·23 5·:..'9 5·3,5 5·40
15 16 17 18
277 :182 286 ~'!JO :J5·4 36·0 '56·5 37·0 18·5 18·8 l!J-1 l!l-'.l 13·5 13·7 l:l·9 11-1
11·24 I J.40 11·55 11·68 9·95 10·08 10·21 10·32 9·12 9·2l 9·3.5 9·46 8·5.5 8·66 8·76 8·85 8·13 8·2:3 8·32 8-41
7·81 7·91 7·99 8·07 7·56 7·65 7-73 7·81 7·36 7-44 7·52 7·59 7·19 7·27 7·3'l 7-42 7·05 7·12 7·20 7·27
6·93 7·00 7·07 7·14 6·82 6·00 6·97 7·03 6·73 6·80 6·87 6·94 6·6.5 6·72 6·79 6·8.5 6·58 6·6.5 6·72 6·78
6·52 6·59 6·6.5 6·71 6·33 6·39 6·45 6·51 6·14 6·20 6·26 6·31 5·96 6·02 6·07 6·12
5·79 5·84 5·89 5·93 5·61 5·66 5·71 5·75 5·45 5·49 5·M 5·57
n is the size of the s:imple from which the range is obtained and v is the number of degrees of freedom of '•·
19
291 37.5 19·5 14·2
11-BI 10·43 9.55 8·!!·1 8·49
8·15 7·88 7·66 7-48 7·33
7-20 7·09 7·00 6·91 6·84
6·76 6·56 6·36 6·17
5·98 5·79 5·61
20
298 ;17.9 l!l·8 J.1·4
11·93 10·54 9·6.5 9·03 8·57
8·22 7·95 7-73 7·55 7·39
7·26 7·15 7-()5 6·96 6·89
6·82 6·61 6·41 6·21
6·02 5·83 5·65
... w OI
scormier
Sticky Note
None set by scormier
scormier
Sticky Note
MigrationNone set by scormier
scormier
Sticky Note
Unmarked set by scormier
scormier
Sticky Note
None set by scormier
scormier
Sticky Note
MigrationNone set by scormier
scormier
Sticky Note
Unmarked set by scormier

REFERENCES
scormier
Sticky Note
None set by scormier
scormier
Sticky Note
MigrationNone set by scormier
scormier
Sticky Note
Unmarked set by scormier
scormier
Sticky Note
None set by scormier
scormier
Sticky Note
MigrationNone set by scormier
scormier
Sticky Note
Unmarked set by scormier

139
REFERENCES CITED
Amerine, M.A., Pangborn, R.M. and Roessler, E.B. 1965. "Principles of Sensory Evaluation of Food." Academic Press, New York.
ASTM Committee E-18, 1986. Physical requirement guidelines for sensory evaluation laboratories. STP 913. Am. Soc. for Testing and Materials, Philadelphia, Pa.
ASTM Committee E-18, 1981. Guidelines for the selection and training of sensory panel members. STP 758. Am. Soc. for Testing and Materials, Philadelphia, Pa.
ASTM Committee E-18, 1979. Manual on consumer sensory evaluation. STP 682. Am. Soc. for Testing and Materials, Philadelphia, Pa.
ASTM Committee E-18, 1968. Manual on sensory testing methods. STP 434. Am. Soc. for Testing and Materials, Philadelphia, Pa.
ASTM Committee E-18, 1968. Basic principles of sensory evaluation. STP 433. Am. Soc. for Testing and Materials, Philadelphia, Pa.
Easker, D. 1988. Critical values of differences among rank sums for multiple comparisons. Food Technol. 42(2):79.
Brandt, M.A., Skinner, E.Z. and Coleman, J.A. 1963. thod. J. Food Sci. 28:404.
Texture profile me-
Cairncross, S.E. and Sjostrom, L.B. 1950. Flavor profiles - A new approach to flavor problems. Food Technol. 4(8):308.
Cardello, AV. and Maller, 0. 1982 Relationships between food preferences and food acceptance ratings. J. Food Sci. 47:1553.
scormier
Sticky Note
None set by scormier
scormier
Sticky Note
MigrationNone set by scormier
scormier
Sticky Note
Unmarked set by scormier
scormier
Sticky Note
None set by scormier
scormier
Sticky Note
MigrationNone set by scormier
scormier
Sticky Note
Unmarked set by scormier

140
Caul, J.F. 1957. The profile method of flavor analysis. Adv. Food Research 7:1.
Civille, G.V. and Szczesniak, AS. 1973. Guidelines to training a texture profile panel. J. Texture Studies 4:204.
Dagel, N. 1977. Sensory evaluation or sensory measurement? In "Nestle Re-search News 1976/77". C. Boella (Ed.). Nestle Products Technical Assistance Co. Ltd., Switzerland.
Ennis, D.M., Boelens, H., Haring, H. and Bowman, P. 1982. Multivariate analysis in sensory evaluation. Food Techno/. 36(11):83.
Gacula, M.C. Jr. and Singh, J. 1984. "Statistical Methods in Food and Con-sumer Research." Academic Press, Inc., New York.
IFT Sensory Evaluation Division. 1981. Sensory evaluation guide for testing food and beverage products. Food Techno/. 35(11):50.
Jellinek, G. 1985. "Sensory Evaluation of Food. Theory and Practice." Ellis Horwood, Chichester, England.
Joanes, D.N. 1985. On a rank sum test due to Kramer. J. Food Sci. 50:1442.
Larmond, E. 1977. "Laboratory Methods for Sensory Evaluation of Food." Research Branch, Canada Department of Agriculture, Ottawa. Publication 1637.
McPherson, R.S. and Randall, E. 1985. Line length measurement as a tool for food preference research. Ecol. Food Nu tr. 17(2):149.
Meilgaard, M. C., Civille, G.V. and Carr, B.T. 1987. "Sensory Evaluation Techniques," Vols. I and II. CRC Press, Inc., Boca Raton, Florida.
Moskowitz, H.R. 1983. "Product Testing and Sensory Evaluation of Foods, Marketing and R & D Approaches." Food and Nutrition Press, Inc., Westport, Connecticut.
Newell, G.J. and Macfarlane, J.D. 1987. Expanded tables for multiple com-parison procedures in the analysis of ranked data. J. Food Sci. 52:1721.
scormier
Sticky Note
None set by scormier
scormier
Sticky Note
MigrationNone set by scormier
scormier
Sticky Note
Unmarked set by scormier
scormier
Sticky Note
None set by scormier
scormier
Sticky Note
MigrationNone set by scormier
scormier
Sticky Note
Unmarked set by scormier

141
O'Mahony, M. 1986. "Sensory Evaluation of Food. Statistical Methods and Procedures." Marcel Dekker, Inc., New York, N.Y.
O'Mahony, M. 1982. Some assumptions and difficulties with common statistics for sensory analysis. Food Technol. 36(11):75.
Pangborn, R.M.V. 1986. Sensory techniques of food analysis. In "Food Analysis Principles and Techniques. Vol. 1. Physical Characterization," D.W. Gruenwedel and J.R. Whitaker, (Ed.). Marcel Dekker, Inc., New York, N.Y.
Piggott, J.R. (Ed.), 1984. "Sensory Analysis of Foods." Elsevier Applied Science Publishers, London, England.
Powers, J.J. 1984. Using general statistical programs to evaluate sensory data. Food Technol. 38(6):74.
Powers, J.J. 1981. Multivariate procedures in sensory research: scope and limitations. MBAA Technical Quarterly 18(1):11.
Snedecor, G.W. and Cochran, W.G. 1980. "Statistical Methods," 7th ed. Iowa State University Press, Ames, Iowa.
Steel, R.G.D. and Torrie, J.H. 1980. "Principles and Procedures of Statis-tics," 2nd ed, McGraw-Hill, New York, N.Y.
Stone, H. and Sidel, J.L. 1985. "Sensory Evaluation Practices." Academic Press, Inc., New York, N.Y.
Stone, H., Sidel, J.L. and Bloomquist, J. 1980. Quantitative descriptive analysis. Cereal Foods World 25(10):642.
Stone, H., Sidel, J.L., Oliver, S., Woolsey, A and Singleton, R.C. 1974. Senso ry evaluation by quantitative descriptive analysis. Food Technol. 28(11):24.
Stungis, G.E. 1976. Overview of applied multivariate analysis. In "Cor-relating Sensory Objective Measurements - New Methods for Answering Old Problems". ASTM STP 594, Am. Soc. for Testing and Materials, Philadelphia, Pa.
scormier
Sticky Note
None set by scormier
scormier
Sticky Note
MigrationNone set by scormier
scormier
Sticky Note
Unmarked set by scormier
scormier
Sticky Note
None set by scormier
scormier
Sticky Note
MigrationNone set by scormier
scormier
Sticky Note
Unmarked set by scormier

142
Szczesniak, A.S. 1963. Classification of textural characteristics. J. Food Sci. 28:385.
Szczesniak, A.S., Brandt, M.A. and Friedman, H.H. 1963. Development of standard rating scales for mechanical parameters of texture and correlation between the objective and the sensory methods of texture evaluation. J. Food Sci. 28:397.
1.ook, K. and Wessman, C. 1977. The selection and use of judges for descriptive panels. Food Technol. 31(11):56.
ADDITIONAL REFERENCES
AMSA. 1978. Guidelines for cookery and sensory evaluation of meat. American Meat Science Association and National Live Stock and Meat Board.
Bieber, S.L. and Smith, D.V. 1986. Multivariate analysis of sensory data: A comparison of methods. Chemical Senses 11(1):19.
Bourne, M.C. 1978. Texture profile analysis. Food Technol. 32(7):62.
Cardello, AV., Maller, 0., Kapsalis, J.G., Segars, R.A., Sawyer, F.M., Murphy, C. and Moskowitz, H.R. 1982. Perception of texture by trained and consumer panelists. J. Food Sci. 47:1186.
Civille, G.V. 1978. Case studies demonstrating the role of sensory evalua-tion in product developments. Food Technol. 32(11):59.
Cross, H.R., Moen, R. and Stanfield, M.S. 1978. Training and testing of judges for sensory analysis of meat quality. Food Technol. 32(7):48.
Gatchalian, M.M. 1981. "Sensory Evaluation Methods with Statistical Analysis." College of Home Economics, University of the Philippines, Diliman, Philippines.
1.armond, E. 1973. 27(11):28.
Physical requirements for sensory testing. Food Technol.
scormier
Sticky Note
None set by scormier
scormier
Sticky Note
MigrationNone set by scormier
scormier
Sticky Note
Unmarked set by scormier
scormier
Sticky Note
None set by scormier
scormier
Sticky Note
MigrationNone set by scormier
scormier
Sticky Note
Unmarked set by scormier

143
Moskowitz, H.R. 1978. Magnitude estimation: notes on how, what, where and why to use it. J. Food Quality 1 :195.
Moskowitz, H.R. 1974. Sensory evaluation by magnitude estimation. Food Technol. 28(11):16.
Roessler, E.B., Pangborn, R.M., Side], J.L. and Stone, H. 1978. Expanded statistical tables for estimating significance in paired-preference, paired difference, duo-trio and triangle tests. J. Food Sci. 43:940.
Side], J.L. and Moskowitz, H.R. 1971. Magnitude and hedonic scales of food acceptability. J. Food Sci. 36:677.
Side], J.L. and Stone, H. 1976. Experimental design and analysis of sensory tests. Food Technol. 30(11):32.
Side], J.L., Stone, H. and Bloomquist, J. 1981. Use and misuse of sensory evaluation in research and quality control. J. Dairy Sci. 64:2296.
Szczesniak, AS., Lowe, B.J. and Skinner, E.L. 1975. profile technique. J. Food Sci. 40:1253.
Consumer textural
Wolfe, K.A. 1979. Use of reference standards for sensory evaluation of product quality. Food Technol. 33(9):43.
scormier
Sticky Note
None set by scormier
scormier
Sticky Note
MigrationNone set by scormier
scormier
Sticky Note
Unmarked set by scormier
scormier
Sticky Note
None set by scormier
scormier
Sticky Note
MigrationNone set by scormier
scormier
Sticky Note
Unmarked set by scormier

GLOSSARY
scormier
Sticky Note
None set by scormier
scormier
Sticky Note
MigrationNone set by scormier
scormier
Sticky Note
Unmarked set by scormier
scormier
Sticky Note
None set by scormier
scormier
Sticky Note
MigrationNone set by scormier
scormier
Sticky Note
Unmarked set by scormier

Explanations and definitions of terms used in this glossary were taken from the foil owing references:
147
Amerine, M.A., Pangborn, R.M. and Roessler, E.B. 1965. "Principles of Sensory Evaluation of Food." Academic Press, New York, N.Y.
Davies, P. (Ed.) 1970. "The American Heritage Dictionary of the English Language." Dell Publishing Co., Inc. New York, N.Y.
Gacula, M.C. Jr. and Singh, J. 1984. "Statistical Methods in Food and Consumer Research." Academic Press, Inc., Orlando, Florida.
Guralnik, D.B. (Ed.) 1963. "Webster's New World Dictionary." Nelson, Foster & Scott Limited, Toronto.
Hirsh, N.L. 1971. Sensory good sense. Food Product Devel. 5(6):27-29.
Huck, S.W., Cormier, W.H. and Bounds, W.G.Jr. 1974. "Reading Statistics and Research." Harper & Row Publishers, New York, N .Y.
IFf Sensory Evaluation Division. 1981. Sensory evaluation guide for testing food and beverage products. Food Technol. 35(11):50.
Kramer, A 1959. Glossary of some terms used in the sensory (panel) evaluation of foods and beverages. Food Technol. 13(12):733-736.
Linton, M. and Gallo, P.S.Jr. 1975. "The Practical Statistician: Simplified Handbook of Statistics." Brooks/Cole Publishing Company, C-alifornia.
Lowry, S.R. 1979. Statistical planning and designing of experiments to detect differences in sensory evaluation of beef loin steaks. J. Food Sci. 44:488-491.
O'Mahoney, M. 1986. "Sensory Evaluation of Food. Statistical Methods and Procedures." Marcel Dekker, Inc., New York, N.Y.
Piggott, J.R. (Ed.), 1984. "Sensory Analysis of Foods." Elsevier Applied Science Publishers, London, England.
scormier
Sticky Note
None set by scormier
scormier
Sticky Note
MigrationNone set by scormier
scormier
Sticky Note
Unmarked set by scormier
scormier
Sticky Note
None set by scormier
scormier
Sticky Note
MigrationNone set by scormier
scormier
Sticky Note
Unmarked set by scormier

148
Terms and Definitions
Acceptability (n) - Attitude towards a product, expressed by a consumer, often indicating its actual use (purchase or eating).
Accuracy (n) - Closeness with which measurements taken approach the true value; exactness; correctness.
Acuity (n) - Fineness of sensory recognition or discrimination; ability to discern or perceive small differences in stimuli; sharpness or acuteness.
Affective Test - A test used to evaluate subjective attitudes such as preference, acceptance and/or degree of liking of foods by untrained panelists.
Aftertaste (n) - The experience, which under certain conditions, follows the removal of a taste stimulus.
Ageusia (n) - Lack or impairment of sensitivity to taste stimuli.
Analysis of Variance - A mathematical procedure for segregating the sources of variability affecting a set of observations; used to test whether the means of several samples differ in some way or are the same.
Analytical Test - A test used for laboratory evaluation of products by trained panelists in terms of differences or similarities and for identification and quantification of sensory characteristics.
Anosmia (n) - Lack or impairment of sensitivity to odour stimuli.
Arbitrary (adj) - Based on or subject to personal or individual judgment.
Assess (v) - To evaluate.
Attribute (n) - A perceived characteristic; a distinctive feature, quality or aspect of a food product.
Ballot (n) - A form used by a panelist to record sample scores, decisions, comments; usually includes instructions to the panelist related to the type of test being performed.
scormier
Sticky Note
None set by scormier
scormier
Sticky Note
MigrationNone set by scormier
scormier
Sticky Note
Unmarked set by scormier
scormier
Sticky Note
None set by scormier
scormier
Sticky Note
MigrationNone set by scormier
scormier
Sticky Note
Unmarked set by scormier

Basic Taste - Sweet, sour, salty or bitter sensation.
Batch (n) - A definite quantity of some food product chosen from the population of that food, and from which samples are withdrawn.
Bias (n) - A prejudiced or influenced judgment.
Binomial Test - A test of the frequency of occurrence in two categories; used when only two possible outcomes are allowed.
Blind Control - A reference sample, whose identity is known only to the researcher, coded and presented with experimental samples.
Category (n) - A defined division in a system of classification.
Category Scale - A scale divided into numerical and/or descriptive classifications.
149
Characteristic (n) - Odour, flavour, texture or appearance property of a product.
Chi-Square Test - Non-parametric test used to determine whether a significant difference exists between an observed number and an expected number of responses falling in each category designated by the researcher; used to test hypotheses about the frequency of occurrence in any number of categories.
Classification (n) - Category.
Classify (v) - To sort into predetermined categories.
Code (v) - Assignment of symbols, usually 3-digit random numbers, to samples so that they may be presented to panelists without identification.
Conditional (adj) - Implying a condition or prerequisite.
Conservative (adj) - Moderate; cautious.
Consistency (n) - Agreement or harmony of parts; uniformity.
scormier
Sticky Note
None set by scormier
scormier
Sticky Note
MigrationNone set by scormier
scormier
Sticky Note
Unmarked set by scormier
scormier
Sticky Note
None set by scormier
scormier
Sticky Note
MigrationNone set by scormier
scormier
Sticky Note
Unmarked set by scormier

150
Consumer (n) -An individual who obtains and uses a commodity.
Consumer Panel - A group of individuals representative of a specific population whose behaviour is measured.
Conventional (adj) - Approved by or following general usage; customary.
Correlation Analysis - A method to determine the nature and degree of relationship between variables.
Critical Value - A criterion or scientific cut-off point related to the chosen level of significance.
Definition (n) - A statement of the meaning of a word, phrase or term; the act of making clear and distinct.
Descriptive Test - A test used to measure the perceived intensity of a sensory property or characteristic.
Difference Test - A test used to determine if two samples are perceptibly different.
Discriminate (v) - To perceive or detect a difference between two or more stimuli.
Effect (n) - Something brought about by a cause or agent; result.
Efficient (adj) - Acting or producing effectively with a minimum of waste or effort.
Expectorate (v) - To eject from the mouth; spit.
Experimental Error - Measure of the variation which exists among observations on samples treated alike.
Form (n) - A document printed with spaces for information to be inserted.
Frequency (n) - The number of responses falling within a specified category or interval.
Hedonic (adj) - Degree of liking or disliking.
scormier
Sticky Note
None set by scormier
scormier
Sticky Note
MigrationNone set by scormier
scormier
Sticky Note
Unmarked set by scormier
scormier
Sticky Note
None set by scormier
scormier
Sticky Note
MigrationNone set by scormier
scormier
Sticky Note
Unmarked set by scormier

151
Bedonie Scale - A scale upon which degree of liking and disliking is recorded.
Hypothesis (n) - An expression of the researcher's assumptions or expectations concerning the outcome of his research, subject to verification or proof; may be derived from a theory, may be based on past observations or may merely be a hunch.
Illustrate (v) - To clarify by use of example or comparison.
Independent (adj) - Free from the influence, guidance or control of others.
Inference (n) - Scientific guess about a population based on sample data.
Intensity (n) - Perceived strength of a stimulus.
Interaction ( n) - A measure of the extent to which the effect of changing the level of one factor depends on the level or levels of another or others.
Label (n) - Means of identification. (v) - To attach a label to.
Liberal (adj) - Tolerant; generous.
Mask (v) - Disguise or conceal.
Mean (n) - Sum of all the scores divided by the number of scores.
Molar Teeth - Teeth with a broad crown for grinding food, located behind the bicuspids.
Monitor (v) - To check, watch or keep track of.
Motivate (v) - To provide with an incentive or motive; maintain panel interest and morale.
Noticeable (adj) - Readily observed; evident.
Objective (n) - Something aimed at; goal.
Odour (n) - Characteristic that can be perceived by the olfactory organ.
scormier
Sticky Note
None set by scormier
scormier
Sticky Note
MigrationNone set by scormier
scormier
Sticky Note
Unmarked set by scormier
scormier
Sticky Note
None set by scormier
scormier
Sticky Note
MigrationNone set by scormier
scormier
Sticky Note
Unmarked set by scormier
152
Orient (v) - To familiarize participants with or adjust to a situation.
Palate (n) - The roofof the mouth.
Panel (n) - A group of assessors who have been selected or designated in some manner to participate in a sensory test.
Panel Leader - A person responsible for organizing, conducting and directing a panel.
Panelist (n)-A member ofa panel.
Perceive (v) - To become aware of a stimuli through the senses.
Perceptible (adj) - c.apable of being perceived.
Perishable (adj) - Easily destroyed or spoiled.
Portion (n) - A section or quantity within a larger amount. (v) - To divide into parts.
Precise (adj) - Ability of repeated measurements to be identical, or almost identical.
Precision (n) - Cl~eness of repeated measurements to each other.
Preference (n) - Expressed choice for a product or products rather than another product or products.
Probability (n) - The likelihood or chance of a given event happening.
Psychological Factors - Involving the mind or emotions.
Qualitative (adj) - Pertaining to quality; involved in variation in kind rather than in degree.
Quality (n) - Degree of excellence.
Quantitative (adj) - Pertaining to number or quantity.
scormier
Sticky Note
None set by scormier
scormier
Sticky Note
MigrationNone set by scormier
scormier
Sticky Note
Unmarked set by scormier
scormier
Sticky Note
None set by scormier
scormier
Sticky Note
MigrationNone set by scormier
scormier
Sticky Note
Unmarked set by scormier

Random Sample - Batch or sample chosen such that all members of the population have an equal chance of being selected.
Rank (v) - To order a series of three or more samples by the degree of some designated characteristic, such as intensity or acceptability.
Recruit (v) - To seek and enroll individuals as participants.
Reference (n) - A constant sample with which others are compared or against which descriptive terms are calibrated.
Reliability (n) - Extent to which the same characteristic can be measured consistently upon repeated occasions.
Reliable (adj) - Measuring what the experimenter expects to measure; dependable.
Replication (n) - Independent repetitions of an experiment under identical experimental conditions.
Representative (adj) - Typical of others in the same category, group or population. A representative sample of consumers should match the population distribution of users by age, sex, socio-economic group, occupation, etc.
Reproduce (v) - To make a copy of or re-create.
Sample (n) - A portion, piece or segment regarded as representative of a whole and presented for inspection. (v) - To take a sample of.
Scale (n) - A system of ordered marks or divisions at fixed intervals used in measurement, which may be graphic, descriptive or numerical.
Score (n) - Values assigned to specific responses made to a test item where the scores have a defined and demonstrated mathematical relationship to each other.
(v) - To rate the properties of a product on a scale or according to some numerically defined set of criteria.
Scorecard (n) - Card or paper on which samples are scored.
153
scormier
Sticky Note
None set by scormier
scormier
Sticky Note
MigrationNone set by scormier
scormier
Sticky Note
Unmarked set by scormier
scormier
Sticky Note
None set by scormier
scormier
Sticky Note
MigrationNone set by scormier
scormier
Sticky Note
Unmarked set by scormier

154
Screen (v) - To separate out or eliminate individuals who are completely unsuitable for sensory evaluation by testing for sensory impairment and acuity.
Sense (n)-Any of the functions of hearing, sight, smell, touch and taste.
Sensitivity (n) - Ability of individuals to detect or perceive quantitative and/or qualitative differences in sensory characteristics; acuity.
Sensory (adj) - Pertaining to the action of the sense organs.
Sensory Analysis - A scientific discipline used to evoke, measure, analyze and interpret reactions to those characteristics of foods and materials as they are perceived by the senses of sight, smell, taste, touch and hearing.
Sensory Evaluation - See sensory analysis.
Sensory Testing - See sensory analysis.
Significance (n) - Level of probability that the differences among samples or treatments are real and not due to chance variation.
Simultaneously (adj) - Happening or done at the same time.
Sniff (v) - To evaluate an odour by drawing air audibly and abruptly through the nose.
Stagger (v) - To arrange in alternating or overlapping time periods.
Statistics (n) - The mathematics of the collection, organization and interpretation of numerical data, particularly the analysis of population characteristics by inference from sampling.
Stimulus (n) - Anything causing or regarded as causing a response.
Tactile Senses - Pertaining to the sense of touch.
Tie (n)-An equality of scores between two or more samples.
scormier
Sticky Note
None set by scormier
scormier
Sticky Note
MigrationNone set by scormier
scormier
Sticky Note
Unmarked set by scormier
scormier
Sticky Note
None set by scormier
scormier
Sticky Note
MigrationNone set by scormier
scormier
Sticky Note
Unmarked set by scormier

155
Training (n) - Instruction and practice to familiarize panelists with test procedures and to increase their ability to recognize, identify and recall sensory characteristics.
Treatment (n) - Procedure whose effect is measured and compared with other treatments.
Trial Run - The process of testing, trying and timing methods and procedures through their actual use.
Valid (adj) - Drawing the proper and correct conclusions from the data.
Validity (n) - Assurance that the specific characteristic that is supposed to be measured is truly being measured. Degree to which results are consistent with the facts.
scormier
Sticky Note
None set by scormier
scormier
Sticky Note
MigrationNone set by scormier
scormier
Sticky Note
Unmarked set by scormier
scormier
Sticky Note
None set by scormier
scormier
Sticky Note
MigrationNone set by scormier
scormier
Sticky Note
Unmarked set by scormier

INDEX
scormier
Sticky Note
None set by scormier
scormier
Sticky Note
MigrationNone set by scormier
scormier
Sticky Note
Unmarked set by scormier
scormier
Sticky Note
None set by scormier
scormier
Sticky Note
MigrationNone set by scormier
scormier
Sticky Note
Unmarked set by scormier

Acceptability 7, 48, 49, 51 Acceptance 59, (j(), 63 Affective test 59 Analysis of variance 34, 55, 68, 70, 72, 91, 94, 99, 115 Analytical test 59
Binomial test 55, 61, 82 Blind control 42 Blocking 54, 57, 58, 69
Carriers 40 Category scale 49, 50, 55, 60, 63, 66, 68, 70, 90 Chi-square test 55 Consumer panel 8, 23, 48, 51, 53, (j(), 65, 70 Consumer 7, 8, 9, 51, 60, 63, 70 Consumer-oriented test 7, 8, 48, 51, 53, 59, 60 Correlation 56
Discriminant analysis 56 Duncan's multiple range test 55, 76, 101 Duo-trio test 80
Endpoints 49, 114, 117 Experimental design 5, 56, 57, 58 Experimental error 58, 68, 69, 91
Factor analysis 56 Flavour profile 104 Food preparation 7, 11, 12, 13, 14, 17, 19, 23, 26 Friedman test 55, 65, 87
Hedonic 60, 66, 68, 70, 75, 94 Hidden reference 42 In-house panel 8, 29, 30, 62, 63, 65, 66, 70, 83
Kramer test 55
Least significant difference test 55 Line scale 49, 50, 90, 91, 92, 114
Monitoring performance 14, 29, 32, 33, 34, 35, 41, 54, 114, 115 Motivating panelists 29, 35 Multiple comparison test 55, 76, 100, 101 Multivariate analysis 56, 91
159
scormier
Sticky Note
None set by scormier
scormier
Sticky Note
MigrationNone set by scormier
scormier
Sticky Note
Unmarked set by scormier
scormier
Sticky Note
None set by scormier
scormier
Sticky Note
MigrationNone set by scormier
scormier
Sticky Note
Unmarked set by scormier
160
Non-parametric test 54, 55
Objectives 47, 56, 105, 106 Orienting panelists 30, 106
Paired-comparison test 80 Paired-preference test 60, 61, 62, 63, 80, 82 Panel leader 11, 13, 17, 18, 25, 26, 29, 30, 32, 33, 34, 35, 48, 111, 114 Parametric test 54, 55 Preference 7, 8, 32, 48, 49, 51, 59, 60, 61, 62 Principal component analysis 56 Probability 52, 53, 61, 62, 78, 82, 83, 85, 103 Product-oriented test 7, 8, 9, 13, 48, 49, 51, 53, 59, 79
Quantitative descriptive analysis 104 Questionnaire 30
Random number 44, 57, 68, 81, 90 Random sample 8, 53 Randomization 44, 57, 68, 106 Recruiting panelists 29, 30, 106 Reference sample 13, 37, 41, 42, 80, 114 Regression 56 Replication 54, 57, 58, 91, 92, 94, 96, 97, 99, JOO, 115
Sampling 19, 37, 53
Scheffe's test 55 Screening 31, 86, 106 Sensory facilities 11, 18, 23 Significance 53, 61, 65, 69, 76, 77, 82, 83, 85, 97, 102 Standardization 37 Statistical analysis 5, 34, 47, 52, 54, 56, 105, 106 Statistical test 52, 54, 56 Supplies 11, 13, 19, 23, 25
Target population 8, 9 Texture profile 104 Trained panel 8, 9, 29, 31, 32, 54, 83, 86, 104 Training 9, 29, 32, 51, 106, 114 Triangle test 31, 79, 81, 82, 83 Tukey's test 55, 101
Untrained panel 7, 8, 29, 30, 62, 65, 70
scormier
Sticky Note
None set by scormier
scormier
Sticky Note
MigrationNone set by scormier
scormier
Sticky Note
Unmarked set by scormier
scormier
Sticky Note
None set by scormier
scormier
Sticky Note
MigrationNone set by scormier
scormier
Sticky Note
Unmarked set by scormier

Head Office IDRC, PO Box 8500, Ottawa, Ontario, Canada KlG 3H9
Regional Office for Southeast and East Asia IDRC, Tanglin PO Box 101, Singapore 9124, Republic of Singapore
Regional Office for South Asia IDRC, 11 Jor Bagh, New Delhi 110003, India
Regional Office for Eastern and Southern Africa IDRC, PO Box 62084, Nairobi, Kenya
Regional Office for the Middle East and North Africa IDRC/CRDI, PO Box 14 Orman, Giza, Cairo, Egypt
Regional Office for West and Central Africa CRDI, BP 11007, CD Annexe, Dakar, Senegal
Regional Office for Latin America and the Caribbean CIID, Casilla de Correos 6379, Montevideo, Uruguay
Please direct requests for information about IDRC and its activities to the IDRC office in your region.
scormier
Sticky Note
None set by scormier
scormier
Sticky Note
MigrationNone set by scormier
scormier
Sticky Note
Unmarked set by scormier
scormier
Sticky Note
None set by scormier
scormier
Sticky Note
MigrationNone set by scormier
scormier
Sticky Note
Unmarked set by scormier

IDRC
~ C A N A D A