126392.pdf - IDRC Digital Library
51
IDRC - Ub. COMPARATIVE STUDY OF CENTRAL, EAST EUROPEAN, BALTIC & TURKISH ECONOMIES WITH A VIEW TO MEMBER- SHIP IN THE EUROPEAN UNION Subiday Togan Working Paper 9629 /'CH 3vv, 15 1_/y Address correspondence to: Dr. Subiday Togan, Economics Department, Faculty of Economics & Administrative Sciences, Bilkent University, Ankara 06533, Turkey. Fax: +90312 2664137. E-mail: Togan@ Bilkent.edu.tr
-
Upload
khangminh22 -
Category
Documents
-
view
0 -
download
0
Transcript of 126392.pdf - IDRC Digital Library

IDRC - Ub.
COMPARATIVE STUDY OF CENTRAL,
EAST EUROPEAN, BALTIC & TURKISH
ECONOMIES WITH A VIEW TO MEMBER-
SHIP IN THE EUROPEAN UNION
Subiday Togan
Working Paper 9629
/'CH 3vv, 15 1_/y
Address correspondence to: Dr. Subiday Togan, Economics Department, Faculty of Economics & Administrative Sciences, Bilkent University, Ankara 06533, Turkey. Fax: +90312 2664137. E-mail: Togan@ Bilkent.edu.tr

COMPARATIVE STUDY OF CENTRAL, EAST EUROPEAN, BALTIC AND TURKISH ECONOMIES WITH A VIEW TO FUTURE
MEMBERSHIP IN THE EURPEAN UNION(*)
Siibidey Togan Bilkent University, Ankara
(') I am grateful to Bernard M. Hoekman for comments on an earlier draft of this paper. All errors are of course mine.
sbeaudry
Text Box
This report is presented as received by IDRC from project recipient(s). It has not been subjected to peer review or other review processes. This work is used with the permission of Economic Research Forum. © 1996, Economic Research Forum.

Abstract
The purpose of this paper is to comparatively study the Central European Economies (CEE), Baltic and Turkish economies and to analyse the implications of enlargement of the European Union (EU) to include them. Integration will depend on these countries' ability to make their economies responsive to market forces. Recognising international trade as an effective means to instill competition in these countries, the paper studies trade policy in the CEE and Baltic countries and in Turkey and the trade agreements concluded between the countries and the EU. In particular, the Turkey-EU Customs Union Agreement (CUA) and Europe Agreements (EA) are studied and the potential for trade between EU, CEE and Baltic countries and Turkey is considered. In a discussion of these countries' chances for EU membership, we emphasize that EU has to evaluate the budgetary outlays of membership relative to potential gains which would come in terms of increased trade and political stability.
,tti ij tSj;j j.-6t Jj4j 4iJ J1 j jt La 4;,t4e a.l, till 1,11 e.A v,° ci° fly
b,.U Jj.t.11 a:Ue =l..a.;ail -4:, J, J,.LJI o:t.e a.a,l.at &,,,y 4ttyl L"y OJA
4-at11 jj.jwl aJt* bt-i 44,.tlt b,i :ll ;Jv tqa..,;, i,p,.J1 s jdl at yl 4AZI. Ail
Ltr.:t uUW*11 J L `4;, j- 6U1 JjDj.e yl zt.tyl ZL S 14.rt,..Jl 4,11
,yl tsyl LS jr vu USj l ztsyt JLV La. Vji.LeJyl 4ayl j J j.t..ll o.L.A b 4 L.:ju.i Oij .LS-Jj j-sl .U' Ji-ai 49-:.11 L!JJj1 i,*a l fit.o:alj
L ZoLat jJyll La-.a; SS_ i I..syl i; .,,yl tsyl agate, J.lll o.lA l.;fi vonl

INTRODUCTION
During the last six years major changes have affected the future of the European Union (EU). Six
years ago, the future of EU seemed set: a gradual deepening towards real and monetary union. The breakdown of communism radically shifted the challenge from deepening to widening. First to come were the EFTA'ns. Their membership applications were a logical step. Since January 1,
1995 these countries have participated in EU decision making. Then we have the potential applicants consisting of Czech Republic, Hungary, Poland and Slovak Republic, called the Central European Economies. These countries lay a solid claim to membership. All of them have signed Association Agreements with EU. But no timetable for membership has been offered. The next group of potential applicants consist of Bulgaria and Romania. These countries, which have signed Association Agreements with EU, have to embark on reforms that will render them viable candidates. The third group of countries consist of Estonia, Latvia and Lithuania, called the Baltic countries. In addition we have Slovenia of former Yugoslavia which also lays a claim to membership and the countries consisting of Belarus, Moldava and Ukraine whose potential membership is highly uncertain. Finally, we have the Mediterranean applicants consisting of Cyprus, Malta and Turkey. Besides the last three countries Hungary and Poland have handed in formal applications for membership in EU. Several of the Central and Eastern European (CEE) and Baltic countries have probably not done so only because they have been discouraged by the knowledge that their applications could not be considered for a long while.
The purpose of this paper is to study comparatively the CEE, Baltic and Turkish economies and
analyse the implications of enlargement of the European Union so as to include the CEE and Baltic countries and Turkey in EU. Section 1 compares the economies in CEE and Baltic countries and in Turkey emphasising the trade policy in those countries and the trade agreements
concluded between the countries and EU. Section 2 is devoted to the study of Turkey-EU Customs Union Agreement (CUA) and of Europe Agreements (EA), and section 3 to consideration of the potential for trade between EU, CEE and Baltic countries and Turkey. The final section discusses the chances for EU membership of the CEE and Baltic countries and of Turkey.
1. COMPARISON OF CENTRAL AND EAST EUROPEAN, BALTIC AND TURKISH ECONOMIES
The EU, CEE, Baltic and Turkish economies are different beings. The EU countries are developed economies. Turkey is a middle income, free market economy with a relatively large public sector. On the other hand, the CEE and Baltic economies are, since 1989, in the process of transition from centrally planned to free market economies and they face all of the difficulties of transition and adjustment.
Table I provides basic data on the economies under consideration. Consideration of per capita GNP figures obtained from the World Development Report 1995, reveal that among the countries considered, Romania is the poorest country followed by Bulgaria, Lithuania, Slovak Republic,
l

Latvia, Turkey, Poland, Czech Republic, Estonia, Hungary and Slovenia. The Turkish per capita income lies between the per capita incomes of Poland and Latvia and is higher than those of the Slovak Republic, Lithuania, Bulgaria and Romania. Consideration of purchasing power parity (PPP) per capita income figures reported in Table 30 of the World Development Report 1995 reveals that the ordering is changed. The poorest country is again Romania. But Romania is followed by Lithuania, Turkey, Bulgaria, Poland, Latvia, Hungary, Slovak Republic, Estonia and Czech Republic. No figures are reported for Slovenia. Thus according to PPP per capita incomes the richest country within the group is Czech Republic, and Turkish per capita income lies between the per capita incomes of Lithuania and Bulgaria. Turkish PPP per capita income is higher than those of Lithuania and Romania. Consideration of foreign trade data shows that 1993
exports (imports) of CEE-4 countries amounts to $ 41.26 (51.26) billion, exports of CEE-6 countries to $ 50.23 (61.91) billion, and of Turkey to $ 18.11 (23.27) billion. Consideration of the structure of production reveals that by 1993 agriculture accounted for 22.6 (20.9) percent of GDP in Lithuania (Romania). The share of agriculture in Turkish GDP is 15.4 percent. The share of agriculture is 15.7 percent in Latvia, 12.8 percent in Bulgaria and 11.1 percent in Estonia. In all of the remaining countries excluding Greece the share of agriculture is less than 7.7 percent. During the period since the implementation of market oriented economic reforms, output in the region has declined sharply. Recently output started to stabilise. During 1993 output increased in Poland and Slovenia, and during 1994 output increased in all of the transition economies. In all countries under consideration inflation in 1994 did not exceed two digit figures except in Turkey where inflation measured by CPI has amounted to 106.3 percent. According to "World Economic Outlook May 1995" of IMF inflation during 1994 is running at the annual rate of 10 percent in Czech Republic, 19 percent in Hungary and 32 percent in Poland. By 1995 all countries under investigation are under stand-by agreements with the International Monetary Fund. Finally it should be noted that the population growth rate in all the countries under consideration is relatively low except in Turkey.
During the last five years all of the CEE and Baltic countries have made substantial progress in structural reform. In particular, prices in these countries are now largely market determined. Privatization has proceeded rapidly in all of the countries except Romania, Bulgaria and Slovenia. In the Czech Republic the share of the private sector in GDP has increased from 3 percent in 1989 to 65 percent in 1994. On the other hand, the share in Bulgaria has increased from 3 percent in 1989 to 40 percent in 1994. By 1994, in most of the countries more than half of GDP was generated in the private sector. In comparison, one should note that the share of State Owned Enterprises in total value added in the Turkish economy has amounted, according to "OECD Economic Surveys: Turkey 1992-1993", to 10.6 percent in 1990. The countries in transition still have to achieve macroeconomic stability, reduce economic distortions and free resources for productive activity. These countries will then be able to achieve sustainable economic growth. In the meantime the policy makers have to make the economy responsive to market forces. To this end, the countries have to foster competition. It is recognized that international trade would be the most effective means to instill competition in the economy.
Table 2 shows the territorial composition of trade of the CEE and Baltic countries and of Turkey during the years 1988 and 1994. From the table we note the following aspects:
2

The European Union has increased its share of foreign trade enormously for all of the CEE countries and Turkey during the period 1988-1994. The share of EU-15 in Czech exports (imports) has increased from 29.84 (33.3) percent in 1988 for Czechoslovakia to 59.39 (63.99) percent in 1994 for Czech Republic and to 47.84 (43.14) percent for Slovak Republic. In the case of Poland the share of EU has increased from 35.85 (33.89) percent in 1988 to 69.21 (65.31) percent in 1994. In the case of Turkey, EU accounted for 45.66 (42.88) percent of Turkish exports (imports) during 1988. The share has increased to 47.69 (46.91) percent in 1994.
The main trading partner of the CEE countries in EU is Germany. The German share in Czech exports (imports) has increased from 15.11 (17.7) percent in 1988 to 34.74 (35.09) percent in 1994. In the case of Poland, the share of exports to (imports from) Germany has increased from 12.89 (13) percent in 1988 to 35.67 (27.47) percent in 1994. In the case of Bulgaria, Germany has increased its share in Bulgarian exports from 5.63 percent in 1988 to 14.03 percent in 1994. Germany has decreased its share in Bulgarian imports from 16.75 percent in 1988 to 14.24 percent in 1994. In the case of Turkey, Germany has increased its share in Turkish exports (imports) from 18.28 (14.3) percent in 1988 to 21.73 (15.67) percent in 1994. The main trading partners of CEE and Baltic countries among the new EU members are Austria and Finland. The share of Austria in Hungarian exports (imports) has increased from 5.7 (7.2) percent in 1988 to 9.9 (10.51) percent in 1994. Trade among the CEE countries has decreased during the period. The share of exports to (imports from) CEE countries has decreased in the case of Hungary from 11.7 (12.3) percent in 1988 to 7.04 (6.03) percent in 1994, and in the case of Poland from 11.6 (12) percent in 1988 to 5.27 (4.39) percent in 1994.
Trade between CEE countries and the former Soviet Union has decreased substantially over the period 1988-1994. The share of former Soviet Union in Polish exports has decreased from 24.3 (28.2) percent in 1988 to 8.27 (9.32) percent in 1994.
With regards to Turkey, the most important trading partner is, as in the case of CEE countries, the European Union. During 1994, the EU accounted for 47.69 percent of all exports and 46.91 percent of all imports. Again, as in the case of CEE countries, Germany is the most important trading partner within the EU. During 1994, Turkish exports accounted for 2.12 percent of Romanian and 1.8 percent of Bulgarian imports. In the case of Romania, Turkish share in Romanian exports was 4.09 percent and in the case of Bulgaria 3.67 percent.
Using the 2-digit SITC foreign trade data supplied by the Statistical Office of the European Communities we obtain Table 3 where we have aggregated the commodities into 16 commodity groups. From the table the following results can be derived:
For Turkey, CEE and Baltic countries, an important export item to the EU is "Textiles and clothing". During 1994 the share of the commodity amounted to 49.83 percent in Turkey, 33.46 percent in Romania, 18.24 percent in Bulgaria, 17.97 percent in Slovenia and 17.91 percent in Slovak Republic.
3

The share of "machinery and transport equipment" exports in total exports to EU has amounted to 28.79 percent in Hungary, 25.62 percent in Czech Republic and 20.98 percent in Slovak Republic. The share of "food" exports in total exports to EU has amounted to 17.45 percent in Turkey, 12.71 percent in Hungary and 8.52 percent in Poland.
The share of "iron and steel" exports in total exports to EU has amounted to 19.63 percent in Bulgaria, 15.88 percent in Slovak Republic and 12.07 percent in Poland. For Turkey, the most important export item is "textiles and clothing" accounting for 49.83 percent of exports to EU during 1994. Other items of importance are "food" and "machinery and transport equipment", respectively accounting for 17.45 and 9.9 percent of all exports to EU during 1994. In "textiles and clothing" and "machinery and transport equipment" Turkey faces considerable competition from the countries in transition
The lower part of Table 3 shows the commodity composition of imports from EU. The figures show that, besides "machinery and transport equipment" and "chemicals and rubber products" imports, an important import item of the countries under consideration is "textiles and clothing". The share of "textiles and clothing" in total imports from EU amounts to 21.35 percent in the case of Romania, 12.92 percent in the case of Poland and 12.29 percent in the case of Slovenia. "Food" accounts for 21.46 percent of Estonian, 14.43 percent of Latvian and 10.26 percent of Lithuanian imports from EU. In the case of Turkey the most important import items from EU are "machinery and transport equipment" and "chemicals and rubber products".
Table 4 shows index numbers for similarity of Turkish exports and imports with those of the countries in transition. Denoting by X; the j-th country's export of commodity i,; Xi total exports of country j, M; j-th country's import of commodity i, MM total imports of country j, x,?
= (X; /Xi) share of commodity i in country j's total exports, m; = (M; /M') share of commodity i in country j's total imports, xd = (x11 , .., xn') country j's export share vector, and by m' = (m, ..,m) country j's import share vector we compare the trade vector x with the trade vector m by using the formula for the cosine between two vectors
As long as the two vectors are exactly the same, the coefficient of conformity will equal unity. Conversely, if for each commodity exported the import of commodity equals zero, and for each commodity imported the export of commodity equals zero, then the vectors are said to be orthogonal and the value of the coefficient of conformity equals zero. Table 4 derived using the 2- digit SITC trade data on trade with the European Union shows that:
Turkish exports to EU are similar to the exports of Romania, Poland, Bulgaria and Hungary to EU. The resemblance between Turkish exports to EU, on the one hand, and Baltic countries exports to EU, on the other, is relatively low.
4

Turkish exports to EU are not similar to the imports of CEE countries from EU. Turkish imports from EU are similar to the exports of Czech Republic to EU. The resemblance between Turkish imports from EU and exports of Latvia, Romania and Lithuania is relatively small.
Turkish imports from EU are similar to the imports of CEE and Baltic countries imports from EU.
To analyse sectors in which countries have comparative advantage, we consider the index values
of revealed comparative advantage (RCA) calculated as:
(X; /X) RCA; _ ((XI". /xe")
where X; denotes export of commodity i by the country considered, X total exports of the country considered, X;e" total imports of commodity i by EU excluding the exports of commodity i of the country under consideration and Xeu total imports of EU excluding the total exports of the country considered. The equation considers the share of commodity i in total exports of the country relative to the share of the commodity i by the rest of the world excluding the country under consideration to total world exports excluding again the exports of thef country considered. In general, if this ratio is greater than one, then the natural logarithm of the variable will be positive. In that case the country is said to have comparative advantage in producing that product relative to the rest of the world. Using the index of revealed comparative advantage, it is
possible to determine in which product categories each of the CEE and Baltic countries and
Turkey have the greatest comparative advantage. Table 5a shows the thirteen 2-digit SITC divisions (see the Appendix for a description of the 2-digit SITC divisions) with highest RCA values in 1994. As such these can be considered as the sectors with comparative advantage. The table reveals the following aspects:
Czech Republic has comparative advantage in the production of "sanitary, plumbing and
heating" (SITC 81), "coal" (SITC 32) and "cork and wood" (SITC 24).
Hungary has comparative advantage in the production of "live animals chiefly for food" (SITC 00), "meat and meat preparations" (SITC 01) and "footwear" (SITC 85).
Poland has comparative advantage in "coal" (SITC 32), "furniture" (SITC 82) and "cork and
wood manufactures" (SITC 63).
Bulgaria has comparative advantage in "manufactured fertilisers" (SITC 56), "non-ferrous metals" (SITC 68) and "footwear" (SITC 85).
Romania has comparative advantage in "footwear" (SITC 85), "furniture" (SITC 82) and
"clothing" (SITC 84).
Turkey has comparative advantage in "clothing" (SITC 84), "vegetables and fruit" (SITC 5)
and "textiles" (SITC 65).
Comparison of the sectors in which CEE countries have comparative advantage with those in which Turkey has comparative advantage reveals that Czech Republic and Turkey have
comparative advantage in the production of the commodities "sanitary, plumbing and heating"
5

(SITC 81), "non-metallic mineral manufactures" (SITC 66) and "manufactured fertilisers" (SITC 56); that Hungary and Turkey have comparative advantage in "clothing" (SITC 84) and "sanitary, plumbing and heating" (SITC 81); that Poland and Turkey have comparative advantage in "manufactured fertilisers" (SITC 56), "clothing" (SITC 84) and "crude fertilisers" (SITC 27); that Bulgaria and Turkey have comparative advantage in "manufactured fertilisers" (SITC 56), "travel goods" (SITC 83), and "inorganic chemicals"; and that Romania and Turkey have comparative advantage in the production of "clothing" (SITC 84), "manufactured fertilisers" (SITC 56), and "non-metallic mineral manufactures" (SITC 66).
Table 5b, on the other hand, shows the winning sectors in each of the countries under consideration. The table is based on the ordering achieved from the ratio of the share of the commodity in country's total exports in 1994 to the share of the commodity in exports in 1989. As such the numbers indicate by how much the shares have increased over the years. From the table it follows that the winning sectors for Turkey are "coal" (SITC 32) and "paper" (SITC 64), for Hungary "power generating machinery" (SITC 71) and ""office machines" (SITC 75), and for Bulgaria "non-ferrous metals" (SITC 68) and "other transport equipment" (SITC 79).
Table 5 shows that Turkey will face increased competition from the CEE and Baltic countries in the export of these products to EU.
Table 6 shows the trade relations between CEE and Baltic countries, on the one hand, and Turkey on the other, over the period 1985-1994. The table reveals that Turkish exports to CEE and Baltic countries have increased from $ 107.2 million in 1985 to $ 723 million in 1994. But trade is still minuscule. By 1994, the share of exports to CEE and Baltic countries in total Turkish exports was only 4 percent. Similarly, Turkish imports from CEE countries have increased from $ 304.2 million in 1985 to $ 715.7 million in 1994. As a result of this increase, the share of imports from CEE countries in total Turkish imports has increased from 2.7 percent in 1985 to 3.1 percent in 1994. Table 7 gives the commodity composition of trade between CEE countries and Turkey during 1994. From the table the following results emerge:
The main export items from Turkey to Poland are "textiles and clothing", "hides and leather" and "chemicals and rubber products". These commodities account for 91.84 percent of all
exports to Poland. On the other hand, the main import items are "machinery and transport equipment", "energy" and "textiles and clothing". These commodities account for 69.71 percent of all imports from Poland. The main export items from Turkey to Romania are "food", "machinery and transport equipment" and "chemicals and rubber products". These commodities account for 75.02 percent of total Turkish exports to Romania. On the other hand, the main import items are "chemicals and rubber products", "energy" and "food". These commodities account for 37.51 percent of all imports from Romania. The main export items from Turkey to Czech Republic are "textiles and clothing", "food" and "hides and leather". These commodities account for 69.4 percent of total Turkish exports to Czech Republic. On the other hand, the main import items from Czech Republic are
6

"machinery and transport equipment", "chemicals and rubber products" and "iron and steel and non-ferrous metals". These three commodities account for 85.74 percent of all imports from Czech Republic.
2. TURKEY-EU CUSTOMS UNION AGREEMENT AND THE EUROPE AGREEMENTS
The integration of a particular set of countries into the international trading system depends on the ability of these countries to expand trade links with other countries. In this context the link with OECD countries is of prime importance. OECD countries can offer the countries under consideration increased access to their markets, and vice versa. These actions usually take the form of granting Most-Favoured-Nation (MFN) status, extending GSP, removing quantitative restrictions, increasing quota levels, and concluding trade agreements. The Turkey-EU Customs Union Agreement (CUA) and the Europe Agreements (EA) represent major contributions to the integration process of CEE and Turkish economies within Europe. The implications of the Agreements are far reaching, going beyond trade related aspects. Their objective is the progressive adaptation of the legal framework in the CEE countries and Turkey to EC legislation. In the following we first consider the CUA and then the EAs.
2.1 Turkey-EU Customs Union
Turkey's application to join the European Economic Community (EEC) was made on July 31, 1959. Following difficult and protracted negotiations, the application ultimately resulted in the signing in Ankara on September 12, 1963 of the Association Treaty. The stated objective of the Agreement was to promote the continuous and balanced strengthening of trade and economic relations between the parties, while taking full account of the need to ensure accelerated development of the Turkish economy and the need to improve the level of employment and
living conditions of the Turkish people. According to the Ankara Treaty, the association was to be implemented in three phases: a preparatory phase, a transition phase and a final phase. During the preparatory period, the EEC granted unilateral concessions to Turkey in the form of financial assistance and preferential tariffs on Turkey's traditional exports. In the meantime, Turkey didn't have to change its trade regime. On May 16, 1967 in Brussels, Turkey lodged its application for negotiations on entering the transition phase. The Additional Protocol to the Ankara Treaty was signed on November 23, 1970, and became effective on January 1, 1973. The basic aim of the Additional Protocol was the eventual establishment of a customs union. Following the stipulations of the Customs Union Agreement with the European Union, concluded on March 6, 1995, the customs union and hence the final phase of the association process became effective after ratification by the European Parliament oii January 1, 1996.
According to the stipulations of the CUA, as of January 1, 1996, goods are circulating freely between the parties. Furthermore, as of January 1, 1996, Turkey has implemented the Community's common external tariff on goods from third parties and it will adopt by the year 2001 all of the preferential trade agreements EU has concluded over time. Table 8 provides estimates of nominal protection rates for the year 1994 as well as for the year 2001, where 1994 refers to the year before the formation of the Customs Union (CU) and the year 2001 to the year
7

when all the adjustments required by the CU have been completed. From the table it follows that, when weighted by the sectoral import values, the economy wide nominal protection rate (NPR) in 1994 for trade with EU and with third countries amounted to 10.22 percent and 22.14 percent respectively. Examination of the characteristics of structure of protection in trade with EU during 1994 reveals that the highest Turkish NPRs in trade with EU were in the sectors of "fruits and vegetables" with the input-output (1-0) code 12 (72.49 percent), "alcoholic beverages" with the 1-0 code 17 (72.1 percent) and "non-alcoholic beverages" with the 1-0 code 18 (56.92 percent). In the case of trade with third countries we note that during 1994 the highest NPRs were in the sectors "processed tobacco" with the 1-0 code 19 (99.91 percent), "alcoholic beverages" with the 1-0 code 17 (94.28 percent) and "fruits and vegetables" with the 1-0 code 12 (72.62 percent).
According to the stipulations of the Additional Protocol to the Ankara Treaty signed on November 23, 1970 Turkish imports from the Community were divided into two lists. Those industrial products in which it was thought that Turkey could achieve international competitiveness relatively early were placed on the 12-year list. Other manufactured products were put on a 22-year list, for which a CU would not be achieved until 1995. With the formation of CU with EU, Turkey has reduced the NPRs for all of the commodities belonging to the 12- year and 22-year lists to zero. Besides these commodities there are basically two other types of commodities: (i) agricultural products and (ii) products within the province of the "European Coal and Steel Community" (ECSC). In order to establish freedom of movement of agricultural products, Turkey according to CUA will have to adjust its policy in such a way as to adopt the common agricultural policy (CAP). But as will be explained in more detail it is most unlikely that the freedom of movement of agricultural products will be achieved in the near future. Therefore, we expect the NPR's on agricultural products to remain unchanged over the next few years. On the other hand, a "Free Trade Agreement" (FTA) was signed in December 1995 between Turkey and EU regarding the ECSC products. The agreement envisions gradual liberalisation of trade in ECSC products over a period of three years. Therefore, by the year 2001, the NPRs for products in the 12 and 22-year lists and for ECSC products will be zero in trade with EU. The results of these calculations are reported in column 2 of Table 8. From the table it follows that in 38 industries the NPRs will be zero. After the formation of the customs union the average nominal protection rate in trade with. EU will be reduced to 1.34 percent. Furthermore we note that the highest NPR in trade with EU will be granted to the sectors "fruits and vegetables" with the input-output (1-0) code 12 (68.01 percent), "fishery" with the 1-0 code 4 (47.84 percent) and "agriculture" with the 1-0 code 1 (41.26 percent).
In the case of trade with third parties a distinction has to be introduced for trade with EFTA countries, the Mediterranean countries, the Central and East European (CEE) countries, the Baltic countries, developing countries having GSP treatment and the Lome Convention countries. With each of these country groups EU has concluded preferential trade agreements. After the formation of the CU, Turkey will have to apply, at the latest by 2001, the Community's CCT and accept all of the preferential agreements concluded by EU over time. This being so, Turkey will be faced in five years time with different sets of tariff rates for different groups of countries. In the year 2001, the nominal tariff rates applied by Turkey on imports from EFTA countries, Central and East European (CEE) countries, Baltic countries and Israel (which have free trade
8

agreements with EU) will be identical to those applied on imports from EU. Thus the NPRs given in column 2 of Table 8 will have to apply to about 53.77 percent of imports, which is the average share of Turkish imports from EU, EFTA, CEE and Baltic countries and Israel in total imports during the 1991-1993 period. For these countries the average tariff rates will, 'decrease
from 22.14 percent to 1.34 percent. On the other hand, the share of developing countries having GSP treatment in Turkish imports is around 27.54 percent. Finally, the share in Turkish imports of countries like USA, Japan and Canada, for which EU applies the Common Customs Tariff, is 18.46 percent. Columns 4 of Table 8 shows the average MFN tariff rates obtained under the assumption that Turkey does not change the NPRs on agricultural commodities. Similarly column 5 of Table 8 shows, under the same assumptions, the average tariff rates for GSP beneficiaries. Thus, we assume that the tariff rates Turkey will apply by 2001 will be as shown in columns 2,
4 and 5 of Table 8. Note that average NPR for EU countries and for countries EU has free trade agreements with will be 1.34 percent, for countries like USA, Japan and Canada 6.92 percent and
for GSP beneficiaries 2.71.
The above considerations reveal that as a result of the formation of CU all countries will benefit from the reduction in nominal protection rates in Turkey. Table 9 shows the average share of imports from different country groups in total Turkish imports as well as the corresponding Turkish NPRs applicable on imports from these country groups before and after formation of the customs union with EU. Thus for products exported from EU to Turkey, forming 46.02 percent of Turkish imports, the Turkish NPRs will go down from 10.22 percent to 1.34 percent. For products imported from Mediterranean countries and forming 1.6 percent of Turkish imports, the Turkish NPRs could go down from 22.14 percent to 2.71 percent as GSP beneficiaries and
further to 1.34 percent once these countries form a free trade area with EU. Regarding market access for Turkish exports in EU, we note that EU had abolished the nominal tariff rates on imports of industrial goods from Turkey on September 1, 1971. However, certain exceptions were made. The Community retained the right to charge import duties on some oil products over a fixed quota, and to implement a phased reduction of duties on imports of particular textile products from Turkey. On the other hand, trade in products within the province of the ECSC have been protected by the Community through application of non-tariff barriers and anti- dumping measures. After the year 2001 the NPRs applied by EU on imports of all industrial goods from Turkey, including textile and steel products, will be reduced to zero so long as
Turkey fulfills all of the obligations stated in the CUA. For this to happen, Turkey has to effectively implement the measures regarding "intellectual, industrial and commercial property rights" and "competition policy" including measures regarding "public aid". Furthermore, Turkey had to adopt EU garments and textile agreements with third countries. As emphasised above the market access conditions of the Agreement do not cover agricultural commodities. Finally, one
should note that in the event of non-fulfilment of obligations by Turkey by the year 2001, the country will still be faced with anti-dumping and countervailing duty measures. In this case, by 2001 market access restrictions will extend from agricultural commodities to sensitive products such as textiles, clothing, iron and steel products.
The CUA offers rapid liberalisation of trade. But there are loopholes in the liberalisation provided through countervailing duties, antidumping procedures and safeguard measures which
9

are mentioned in Articles 36, 42, 61 of the CUA. Article 36 specifies that as long as a particular practice is incompatible with the competition rules of the CU, as specified in Articles 30-32 of the CUA, and "in the absence of such rules if such practice causes or threatens to cause serious prejudice to the interest of the other Party or material injury to its domestic industry", the Community or Turkey may take appropriate measures. Article 42 allows anti-dumping actions as long as Turkey fails to implement effectively the competition rules of the CU and other relevant parts of the acquis communautaire. In those cases Article 47 of the Additional Protocol signed in 1970 between Turkey and the EC will remain in force. Finally Article 61 is about safeguards which offer another loophole in the liberalisation. The Article states that safeguard measures as specified in Article 60 of the Additional Protocol will remain valid. According to Article 60, the Community (Turkey) may take necessary protective measures if serious disturbances occur in a sector of the economy of the Community (Turkey) that prejudice the external financial stability of one or more Member States (Turkey) , or if difficulties arise which adversely affect the economic situation in a region of the Community (Turkey).
2.2 Europe Agreements
During the 1990's the CEE and Baltic countries introduced sweeping reforms which changed the nature of their trade system and set the stage for strengthened integration into the world economy. The packages comprised three elements. First, the system of compulsory import and export licenses of the period before 1990's was abolished and with it the state monopoly of foreign trade. Second, current account convertibility of the currencies was introduced. Finally, nearly all quantitative restrictions on exports and imports were lifted. As a result the customs tariff has become the primary instrument of foreign trade policy. There were frequent tariff adjustments during the period. Table 10 summarises the developments in the trade regimes of the countries in transition.
Right after the political upheaval in CEE countries in the late 1980s, the CEE countries looked towards the EC for support. Support came in the form of Trade and Co-operation Agreements signed during 1988-1990. Negotiations for the Association Agreements called the "Europe Agreements" (EA) between the European Union, on the one hand, and CSFR, Hungary and
Poland on the other, started in December 1990 and were signed on December 16, 1991. The Interim Agreements which cover the trade aspects of the Europe Agreements entered into force on March 1, 1992. Similar Agreements with Romania and Bulgaria have been signed during 1993
and the Interim Agreement with Romania became effective starting May 1, 1993 and in the case
of Bulgaria starting February 1, 1994. In the meantime, all of the Agreements have been ratified by national parliaments and the European Parliament. Lately negotiations for Europe Agreements with Baltic countries were concluded and Agreements are to be signed. Negotiations for an
association agreement with Slovenia are nearing completion.
For the CEE and Baltic countries association is a tangible means of coming back into Europe. The Agreements have been concluded for an unspecified period. They include, besides the aspects related to commercial and economic co-operation, the political dialogue dimension as well as a
cultural co-operation section. The Agreements aim at the establishment of a free trade area. They
10

form part of the goal of integrating these three countries into the Community. In the preamble to the agreements, the parties recognise that the ultimate objective of the associated countries is to become members of the Community and association is designed to help them achieve this. The preamble introduces a sort of conditionality for the Agreements by reaffirming commitments to pluralistic democracy based on the rule of law and to the market economy.
All EAs have a similar structure and contain between 122 and 124 Articles. Articles 1-6 deal with political dialogue and general principles. Articles 7-36 refer to movement of goods, and Articles 37-58 to movements of workers, establishment and supply of services. Articles 59-69 cover issues related with movements of capital, competition and approximation of laws. Articles 70- 103 refer to economic, cultural and financial co-operation. Articles 104-124 contain institutional, general and final provisions. Each EA is accompanied by a set of Annexes and Protocols.
According to the stipulations of the Interim Agreements the free trade area is to be established at the end of a transitional period of a maximum duration of ten years divided into two successive stages of five years each, starting from the entry into force of the agreement (March 1992). Thus by March 2002, the countries consisting of Czech Republic, Hungary, Poland, Slovak Republic and the EU Member States will form a free trade area. On the Community side, the Association Agreements consolidate all the previous unilateral trade concessions, while laying the ground for the complete removal of all trade obstacles by the end of transitional period. The trade provisions involve the immediate removal of all quotas on industrial commodities except for textiles and ESCS products, while import tariffs will be progressively eliminated over a period ranging between 2 and 5 years. The CEE countries will reciprocate more slowly by phasing out tariffs and quotas over 4 to 9 years. To qualify for concessions under the EA, products must originate in CEE countries. The EAs recognise mineral and agricultural products exported from the CEE countries as commodities originating in CEE countries. For all other commodities the condition for origin requires that imported materials from outside CEE countries not exceed 40 percent or 50 percent of the value of the output. Rephrased this is a 60 percent local content requirement, which is rather strict. Finally it should be stressed that the provisions of EAs provide for a cumulation of origin among the CEE countries which allows a product exported from one associate CEE country to another associate CEE country and which has undergone no, or only a limited working or processing in the importing CEE country to be considered as originating in the importing CEE country.
The critical issue considered in the Agreements is access to EC markets that is granted to countries in transition. For most products defined in the international trade classifications, the Agreements offer access to the EU markets free of tariffs and quantitative restrictions (QR) within one year. The process of trade liberalisation excludes agricultural products. In the case of agricultural products the Agreements affect five main product groups: meat, live animals, fruit, vegetables and processed agricultural commodities. Trade in grain is not covered by the Agreements. Agricultural exports from CEE countries will be permitted to increase by 10 percent in each of the next five years. Variable levies will decrease by 30-60 percent over a three year period. Quantities exported by CEE countries above the quota limits will be subject to full tariffs and levies.
11

Kaminski (1994) considers the industrial commodities covered by the EAs. He states that these
commodities account for more than three quarters of EC imports from the CEE countries. Only Bulgaria and Hungary, with strong specialisation in agricultural products, have relatively low shares as shown in Table 11. The table shows the average tariff rates applied by EU on industrial imports from CEE countries during the pre-Agreement period. Thus, the average tariff rate was 0.1 percent for Poland a GSP beneficiary country, and 6.9 percent for Bulgaria, a country that did not have GSP status. But besides tariffs the CEE countries faced non-tariff barriers (NTB), which had become the major instrument of protection in EU. The level of vulnerability to NTBs, as measured by the share of imports subject to NTBs, has varied among the CEE countries. It is highest in the case of Romania and lowest in the case of Bulgaria. Kaminski (1994) divides the industrial commodities into six groups: immediate free trade group, textiles and clothing group, ECSC group, the quota/five year delayed group, the one-year delayed free trade group, and the four-year delayed free trade group. The "quota/five year delayed" group, including organic and inorganic chemicals, some leather products, cork and wood products, glass, electric machinery, optical goods, plastics, footwear, furniture, motor vehicles and toys is quite large in terms of CEE imports into the EC accounting for between one fourth and one third of their industrial imports. The trade liberalising measures for this group are a mixture of cuts in custom duties and increases
in tariff quotas and ceilings. Custom duties are suspended within the limits of tariff quotas which will be increased annually by about 20 percent. Custom duties on imports in excess of quotas are
to be reduced progressively to zero by the end of the fifth year. By 1997, there will be no longer any quotas and no tariffs. For products within the province of the "European Coal and Steel Community" (ECSC) specific provisions will apply. In particular customs duties on imports applicable in the EC on steel products will be completely eliminated by the beginning of the fifth year. Quantitative restrictions on iron and steel products were eliminated with the entry into force of the Interim Agreements. In the case of coal products, the time required for liberalisation of trade is four years. The Community will abolish quantitative restrictions in one year. Certain product imports will be liberalised by Spain and Germany within four years. Kaminski (1994) estimates that in the case of "steel ECSC sub-group" the MFN tariffs are in the range of 5.4-5.6 percent, and the GSP tariffs 0.1-0.0 percent. The NTB coverage ratios vary between 57.4 and 74.6 percent. The share of this group in industrial exports was 11.4 percent in the case of Bulgaria and 3.6 percent in the case of Romania. On the other hand, import duties on textile and
clothing by the EC will be abolished over five years and those on outward processing trade immediately. Quantitative restrictions will be removed in not less than five years. Finally one should note that in accordance with the asymmetry principle custom duties on most industrial products originating in the EC are to be progressively reduced to zero. The time schedule for Poland is five and for Czech Republic, Hungary and Slovak Republic nine years.
The above considerations reveal that by the end of the century the NTB coverage ratios, the average tariff rates and their standard deviation will be reduced to zero for all groups of industrial imports from CEE countries to EU. Similarly, in the case of EU industrial imports to CEE
countries, the NTB coverage ratios, the average tariff rates and their standard deviation will be
reduced to zero by the year 2002. Thus, the EAs offer rapid liberalisation of trade. But there are,
as in the case of CUA, loopholes in the liberalisation provided through antidumping procedures, countervailing duties and safeguard measures which are mentioned in Articles 29-31, 33 and 62-
12

64 of the EAs. Article 29 allows anti-dumping actions. It is well known that EU antidumping practices are biased against exporters. The Agreements specify that antidumping actions must accord with Article VI of the GATT, but most EU practice is GATT-consistent. Hence there is little comfort for CEE producers. However, the EU has made a major concession in this field. Immediately after the signing of the European Agreements, the EC committed itself to treating the CEE countries as "market" rather than "non-market" economies. This is of prime importance for CEE countries as the manner in which anti-dumping investigations are carried out depend on the type of country. The "state trading country" arrangements which the Community applied with respect to dumping were replaced on March 1, 1992 by the normal GATT arrangements.
Countervailing duties are dealt with in Article 62.3 of EA with Hungary. According to Articles 62-63 countervailing duties could be undertaken if they are GATT-consistent. Safeguards offer another loophole in the liberalisation. The general safeguard clause contained in the Agreements ties in perfectly with GATT rules. The Community has allowed the CEE countries to protect their incipient industries during the transition period. Another derogation enables them to deal with balance of payments difficulties. From the point of view of EU, the Agreement allows for unspecified safeguard measures. Following Article 30 safeguard measures are permitted if imports from CEE countries cause either "serious injury to domestic producers of like or directly competitive products" or "serious disturbances... or difficulties which could bring about serious deterioration in the economic situation of a region". Article 21 is a special safeguard provision for agricultural goods allowing discretionary contingent protection when imports originating in one party cause serious disturbance to the markets in the other party. Following the bilateral consultation procedures provided for in the agreements in the context of the Association Council for antidumping and safeguard measures, greater importance is attached to consultations and conciliation than to unilateral action.
Regarding the movement of workers, establishment and services, the Agreements do not guarantee any access to workers from CEE countries to the Community's labour market beyond what is guaranteed bilateraly by the member states. They guarantee CEE countries workers non- discrimination and certain rights in the EC so long as they are `legally employed'. In General the parties agree to give the other's enterprises the same treatment as its own companies or nationals. Freedom of establishment is, however, limited by restriction on the Community side placed on the free movement of labour e.g. a Hungarian firm can be established in the Community but must employ, with only few exceptions, staff recruited within the Community.
2.3 Effects of Turkey-EU Customs Union and of Europe Agreements
Turkey by signing the Customs Union Agreement and the CEE countries by signing the EAs have agreed to fulfil Herculean tasks. These tasks include harmonisation of commercial legislation as regards competition policy, state aids, intellectual and industrial property rights, and adoption of new rules on customs classification, valuation, rules of origin, technical regulations, standards and government procurements. Since the new rules and regulations are expected to effect the functioning of markets in the relevant countries this section will concentrate on determining what these rules and regulations entail for the countries considered.
13

We first consider the case of competition policies within the framework of the Turkish economy. Turkey during the 1980s and 1990s has intensively used three different tools of industrial policy. These tools are the investment incentives, the export incentives and the policy regarding state owned enterprises. In each case the government tried to obtain a preferred allocation of resources through the use of subsidies. But subsidies are no longer compatible with the rules of the Turkey- EU CUA. Articles 30-41 of the CUA require that Turkey adopt the EU competition rules, including measures regarding public aid within two years, that its legislation in the field of competition rules is made comparable with that of the Community and that the legislation is applied effectively. Consideration of the system of production incentives in Turkey reveals that the government, in order to promote investment in activities and areas regarded as desirable, has granted a number of incentives since 1967. The incentives, regulated by laws and decrees, have been directed to reducing the cost of investment, reducing the need for external financing, and increasing profitability. The various types of investment incentives used until lately can be summarised under the following headings: customs exemptions; low interest credit for investment; exemption on taxes, fees and duties; premium from Resource Utilisation Support Fund; postponement of the value added tax and exemption from construction fee; allocation of foreign exchange for investment purposes; investment incentive allowance; support from Investment Finance Fund; real estate tax exemption; accelerated depreciation and re-evaluation; incentive premium; land allocation; incentive for additional employment; and special incentives for scientific R&D. The Turkish government through the use of these measures has been able to increase the profitability of investments. According to Commission of the European Communities (1989) the investment incentives in Turkey can lead to very high aid levels. It has been estimated that the aid level may go up to 77 percent of the investment cost of a project in developed regions and to more in regions enjoying priority in development. On the export side the various types of export incentives provided by the government during the 1980's and 1990's can be summarised under the headings: export tax rebates; foreign exchange allocations;' payments from the "Support and Price Stabilisation Fund"; duty free imports of intermediates; exemption from corporate income tax; payments from "Resource Utilisation Support Fund"; rebates on freight charges; exemption from various taxes; fuel oil and electricity subsidy; and deduction system. Through the use of these measures the government has been able to increase the profitability in export activities. Togan (1994) shows that average economy wide export subsidy rate has decreased from 32 percent in 1983 to 13 percent in 1990. Finally, regarding the policy on state owned enterprises in Turkey, we note that the Turkish public enterprise sector is very large. The state had, for a long time, monopolies on tobacco, war weapons, railways, air- transportation, air and sea-port administration, post and telecommunication and sugar production. In the manufacturing sector, the state-owned enterprises were heavily concentrated on basic metals, chemicals, petrochemicals, fertilisers, newsprint, paper, oil refineries, cement and textile production. The state-owned enterprises have shown, in general, poor economic performance due to the soft-budget constraint they faced. These firms are not submitted to a commercial code and as such they escape bankruptcy laws. The state economic enterprises receive subsidies from the government in the form of direct transfers, equity injections and debt consolidation. There are also barriers to exit in Turkey. Public firms are often not allowed to go
bankrupt.
.14

The purpose of investment incentive schemes in Turkey was to encourage investment. The aim was not to increase competition in the country. The credit incentives, which were supposed to promote entry, have often turned into instruments that reinforced the position of large
incumbents. Furthermore the government with its large share in the banking system has directly controlled the allocation of credit. Credit from public banks have often been extended not on a
commercial basis but based on other considerations. For a long time there was no specific competition legislation or competition policy enforced in Turkey. To promote competition within the country, Turkey during the 1980's eliminated quantitative restrictions on foreign trade and substantially decreased the level of nominal and effective protection rates. But the reduction of nominal and effective protection rates was not sufficient to ensure proper functioning of the markets. There was a need for competition policies which aim, by removing barriers to entry and
exit from the industry, at freer markets in the economy. Because of these considerations, in December 1994, Turkey adopted its own competition policy, the "Law on the Protection of Competition", modelled largely on EU practice. Regarding the export regime, we note that Turkey joined the GATT Subsidies Code in 1985 agreeing to eliminate export subsidies by 1989.
Since Turkey is a member of the World Trade Organisation it accepts the GATT 1994 Agreement on Subsidies and Countervailing Measures (SCM) which prohibits the governments from granting subsidies contingent upon either export performance or the use of domestic products. Turkey has recently eliminated most of the investment and export incentive§. Within this context, GATT legal subsidies such as research and development subsidies and subsidies to facilitate the adaptation of plants to new environmental regulations have been introduced in 1995. It is stressed that in the future export subsidies will be restricted to subsidies provided for R&D activities, environmental projects, and financial assistance for export promotion activities directed at participation in trade fairs, the contracting of market research and the organisation of educational activities such as seminars and conferences. Although considerable progress has been
achieved in the fields of investment and export incentives, similar progress has not been achieved in the case of public enterprises. Although privatisation has become a prominent part of the Turkish structural adjustment program since 1983, it could not gain momentum because of the various difficulties encountered.
The above considerations reveal that Turkey has adapted its export incentive system to the requirements of the GATT 1994 Agreement on Subsidies and Countervailing Measures (SCM). Furthermore the Turkish competition law modelled largely on EU practice has been introduced during December 1994. By effectively applying the competition law in the future, Turkey will remove the barriers to entry into and to exit from the industry. Finally, Turkey recognises that state aid, as far as it will distort trade between Turkey and EU, may lead to disputes between the Parties. To comply with the rules of the CUA, Turkey will have to stop subsidising its public enterprises at the prevailing rates, align its state aid policies to those of EU, apply the same
competition policies to all firms whether private or public. This adjustment will certainly be
costly, but unless the system of state aids is aligned to those in EU and unless competition rules are applied effectively to all private and public firms, EU could use commercial defence instruments (anti-dumping and countervailing duties) against Turkey.
15

The CU rules on subsidies will increase competition in the economy. When faced with intensified competition, domestic industries, which may have reaped monopoly and oligopoly profits in a
relatively protected domestic market, will be forced to behave competitively. The concentration ratios in Turkey which are relatively high are expected to decline over time. Furthermore we expect the price-marginal cost markups to decline in the private sector after effective implementation of competition policies. In the public sector we expect public firms, for which the profit maximising framework was inappropriate, to behave more competitively in the future after the effective implementation and enforcement of competition policies.
Similar considerations apply in the cases of EAs. Consider the EA signed between Hungary and EU. The competition provisions are covered in Articles 62-67. The Articles 62.1, 62.2 , 62.4 (a) and 64 read as follows:
"62.1: The following are incompatible with the proper functioning of the Agreement, in so far as
they may affect trade between the Community and Hungary:
(i) all agreements between undertakings, decisions by associations of undertakings and concerted practices between undertakings which have as their object or effect the prevention, restriction or distortion of competition;
(ii) abuse by one or more undertakings of a dominant position in the territories of the Community or of Hungary as a whole or in substantial part thereof;
(iii) any public aid which distorts or threatens to distort competition by favouring certain undertakings or the production of certain goods.
62.2 Any practices contrary to this Article shall be assessed on the basis of criteria arising from the application of the rules of Articles 85, 86 and 92 of the Treaty establishing European Economic Community.
62.4 (a): For the purposes of applying the provisions of paragraph 1 (iii), the Parties recognise that during the first five years after the entry into force of this Agreement, any public aid granted by Hungary shall be assessed taking into account the fact that Hungary shall be regarded as an area identical to those areas of the Community described in Article 92 (3) of the Treaty establishing the European Economic Community. The Association Council shall, taking into account the economic situation of Hungary, decide whether that period should be extended by a
further five year period.
64: With regard to public undertakings, and undertakings to which special or exclusive rights have been granted, the Association Council shall ensure that as from the third year following the date of entry into force of this Agreement, the principles of the Treaty establishing the European Economic Community, in particular Article 90, and the principles of the concluding document of the April 1990 Bonn meeting of the Conference on Security and Co-operation in Europe, in particular entrepreneurs' freedom of decision, are upheld.
16

Thus EA rules on competition relate to agreements between firms restricting competition, abuse of dominant power, the behaviour of public undertakings and competition distorting state aids. The rules are concerned with the behaviour of governments as well as firms. According to Article 64 public undertakings and undertakings to which special or exclusive rights have been granted are to be subject to principles of Article 90 EEC within three years of the entry into force of the association agreement. Article 62.4 (a) states that state aid, compatible with EU rules for disadvantaged regions (Article 92.3 (a) Treaty of Rome) can be applied to entire territories during the first five years. Since the EA competition rules are similar to those specified in Articles 30.1, 31.1, 32.1 and 33 of the Turkey-EU CUA considerations similar to those expressed in the case of Turkey will apply. In the meantime all of the CEE countries have introduced competition legislation. The CEE laws have been modelled on the EU approach to competition policy.
The success of the transition from situations, where antidumping measures are used as in the cases of Turkey-EU and CEE-EU trade, to a situation where commercial relations are governed by competition rules, depends on the evolution of the level of integration between States. This integration will be accelerated as stressed by Marceu (1995) as long as markets are harmonised through stronger competition enforcement and the phasing out of antidumping measures. Thus the success depends on the effective implementation of competition policies by the national governments in Turkey and CEE countries.
Besides competition policies the CUA has clauses on intellectual, industrial and commercial property rights. The Agreement requires that Turkey ensure adequate and effective protection and enforcement of intellectual property rights and that it will implement the Uruguay Round Agreement on "Trade Related Aspects of Intellectual Property Rights" (TRIPS) by 1999. Furthermore, Turkey will have to adopt by January 1, 1998 legislation to secure the patentability of pharmaceutical products and processes. Regarding copyright, the Agreement requires that piracy such as counterfeiting or boot-legging be effectively banned and that the terms of protection in cases of translation should not be inferior to fifty years in those cases in which the term is calculated on a basis other than the life of the person. Turkey by now has a new Copyright Law and a new Patent Law which are in conformity with the EU conditions. Similar considerations apply in the context of EAs. Article 63-64 of EA with Hungary states that in five years time, Hungary will provide a level of protection of intellectual, industrial and commercial property rights similar to those existing in Community, including comparable means of enforcing such rights.
As is well known, the economic rationale for the protection of inteilectual property rights is framed in terms of costs and benefits (Hoekman (1995)). The costs include increase in payments for propriety knowledge, price increases associated with greater market power for knowledge producers, the costs of displacement of pirate activities, the costs of additional R&D and the costs associated with administrative and enforcement of intellectual property rights protection. Potential benefits include new inventions fostered by higher levels of R&D, greater technology, increased foreign trade, increased foreign direct investment flows and hence increases in per capita income of the country. Within this context, the main task facing Turkey and the CEE countries
17

is the transformation of their intellectual property rights regime into an effective instrument for the promotion of innovation, and hence increases in income.
Article 26 of the CUA requires that Turkey adopts EU's customs provisions in the fields of (i) origin of goods, (ii) customs value of goods, (iii) introduction of goods into the territory of the customs union, (iv) customs declaration, (v) release for free circulation, (vi) movement of goods, (vii) customs debt and (viii) right of appeal. Article 8 of the CUA states that, within five years, Turkey shall incorporate into its internal legal order the Community instruments relating to the removal of technical barriers to trade. Furthermore, Article 46 of the Customs Union Agreement specifies that negotiations aiming at the mutual opening of Contracting Parties' respective government procurement markets be initiated as soon as possible after January 1, 1996. Furthermore, for the effective functioning of the customs union the Turkish customs system had to be modernised. A new draft customs law has been prepared replacing the customs law. The new draft customs law aims for speedy customs release, simplified procedures and full automation of customs procedures. Recently the customs administration has been going through extensive training programs. The Turkish customs will start using the computer systems and will introduce on line declaration systems. Furthermore the computer will make it possible to have, at each customs point, not only the relevant information for the collection of customs duties but also information on preferential agreements and anti-dumping regulations that will be required to determine the correct amount of taxes to be collected.
The above considerations reveal that the new rules and disciplines imposed by the CUA and EAs will improve the functioning of markets in the economies under consideration. During the transition period until about 2002 each of the economies under consideration can be considered as moving from an inefficient production point within the society's production possibility frontier (PPF) towards an efficient production point on the PPF. Furthermore, the new rules and disciplines such as the rules on intellectual property rights will shift over time the PPF outward as a result of technical progress that will be achieved during the adjustment period.
Until now we have tried to study the effects of new rules and regulations imposed by the CUA and the EAs. We now turn to consideration of the effect of tariff changes on resource allocation. As nominal protection rates change domestic prices will change leading to movements along the production possibility frontier. There will be winners and losers among the sectors. The purpose is to determine the winning and loosing sector. To study the winners and losers in Turkey we determine the effective protection rates (EPR) for the years 1994 and 2001 and subtract from the value of EPR for the year 2001 the value of EPR for the year 1994. The results are reported in Table 12. From the table it follows that the formation of the customs union will lead to an increase in value added of the sectors "grain mill products" (1-0 code 14), "sugar refining" (1-0 code 15) and "clothing" (1-0 code 22), and to a decrease in value added of the sectors "processed tobacco" (1-0 code 19), "petroleum refining" (1-0 code 32) and "non-alcoholic beverages" (1-0 code 18). The table indicates that the most sensitive ten sectors in the Turkish economy consists of the following sectors: processed tobacco with 1-0 code 19, petroleum refining with I-O code 32, non-alcoholic beverages with 1-0 code 18, alcoholic beverages with 1-0 code 17, wood
18

furniture with I-O code 26, footwear with 1-0 code 24, plastic products with 1-0 code 35, cement with 1-0 code 37, motor vehicles with 1-0 code 47 and wood products with 1-0 code 25.
3. POTENTIAL FOR TRADE BETWEEN EU, CEE AND BALTIC COUNTRIES AND TURKEY
As the CEE and Baltic countries complete their transition to market economies and as they continue to have increased market access to Community markets, the geographic distribution of trade will change. A critical question is: What is the potential for trade between EU, CEE and Baltic countries and Turkey. This question has been answered by various economists including Winters and Wang (1994) and R.E. Baldwin (1994) for the CEE and Baltic countries. They show that potential trade with EU is much larger than the actual. Thus, trade between CEE and Baltic countries, on the one hand, and EU on the other will increase once the CEE and Baltic countries complete their transition to market economies, are integrated into the world trading system and have market access to the Community's markets achieved through the Europe Agreements and Free Trade Agreements. The numbers in Tables 3.2 and 3.3 of Baldwin (1994) guesstimate how much trade would have occurred in 1989 if the CEE and Baltic countries had never been under communist regime, but did have the same level of income as they did in 1989 and if the countries did not face any market access restrictions. The ratio of potential to actual trade of the EU-12 to the CEE countries would have been twice as large as the actual figures. Similarly the ratio of potential to actual exports of CEE countries to EU-12 varies from 1.2 for Romania to 5.2 for Bulgaria. But these estimates ignore an important point. The old planning regime depressed trade as well as incomes. As trading partners get richer, bilateral trade flows will tend to rise. The reason for this is apparent. As a country grows richer, it buys and sells more abroad. As income levels will increase in the CEE and Baltic countries trade will grow with EU.
We now turn to estimation of potential Turkish trade with CEE and Baltic countries. For this purpose we consider as in Baldwin (1994) the gravity model of Bergstrandt (1985). In the gravity model a country's total purchases from foreign countries increase with per capita income and size
of population. Thus a particular country tends to import more with increases in its per capita income, in the per capita income of the partner country as well as with increases in the size of populations. Finally, distance dampens trade since it is generally more convenient and cheaper to buy from nearby countries. Using bilateral trade data for trade between 20 industrial countries over the period 1990-1992, consisting of 1200 observations, we estimate the coefficients in the following equation:
1nXab=a+a,ln(GNPa/POP,)+a2In (GNPb/POP,)+a31nPOf +a4InPO!'b +a5lnDISTub
where Xab denotes the exports of country a to country b, GNPa the income of country a, GNPb the income of country b, POPa the population of country a, POPb the population of country b, DISTab the distance between countries a and b and "In" the natural logarithm. We consider the trade data for industrialised countries and find that the coefficients are given by:
19

In Xab = - 27.881+1.051 In (GNPs /POPa )+ 0.422 In (GNPb /POPb )- 0.8391n DISTab (-33.875) (18.633) (8.894) (-47.457)
+ 0.8241nPOPa + 0.8121nPOPb (41.75) (50.207)
n = 1200, R2 = 0.8772; r = 0.183; DW = 2.067 (6.411)
In the estimation of the equation we use data on the GNP levels of the industrial and semi industrial countries given in the various issues of "World Development Report" prepared by the World Bank for the period 1990-1992 deflated by the GNP deflators. The data on bilateral trade flows are obtained from "Direction of Trade Statistics" and have been converted to real trade data using the export unit values reported in the "International Financial Statistics" of the International Monetary Fund. Finally distance refers for countries on the continent road distances between the capital cities in kilometres. For countries between continents, sea distances have been converted to road distance equivalents. The equation estimated using the above variables for the period 1990-1992 shows that bilateral trade flows are increasing in per capita incomes, populations and decreasing in distance.
The gravity model, which was estimated on data that does not include the CEE and Baltic countries and Turkey, gives a relationship between GNP, distance and bilateral trade flows for a
"normal" country, i.e. one that is integrated into the world trade system as the average of industrial countries sample. The "normal" country is supposed to face no restrictions on market access. With this equation estimated we can predict the trade flows between Turkey and CEE and Baltic countries once the latter set of countries become "normal" countries. That is to say, once they complete their transition to market economies, are integrated in the world trading system and face no major market access problems. The mechanics of the projection is simple. Estimates for the relevant countries' per capita GNP, population and distance are plugged into the equation which generates the import and export pattern for trade between concerned countries.
Table 13 shows the potential values of exports and imports for trade between Turkey and CEE and Baltic countries for the year 1992. It is clear from Table 13 that potential trade with CEE and Baltic countries is much larger than the actual. The data reveal that Turkey's exports to CEE and
Baltic countries could increase by about 150 percent above its 1993 level and that Turkish imports from CEE and Baltic countries would increase by 45 percent. The above considerations reveal that under normal circumstances the Turkey-CEE and Turkey-Baltic countries trade will increase considerably over the coming decades.
20
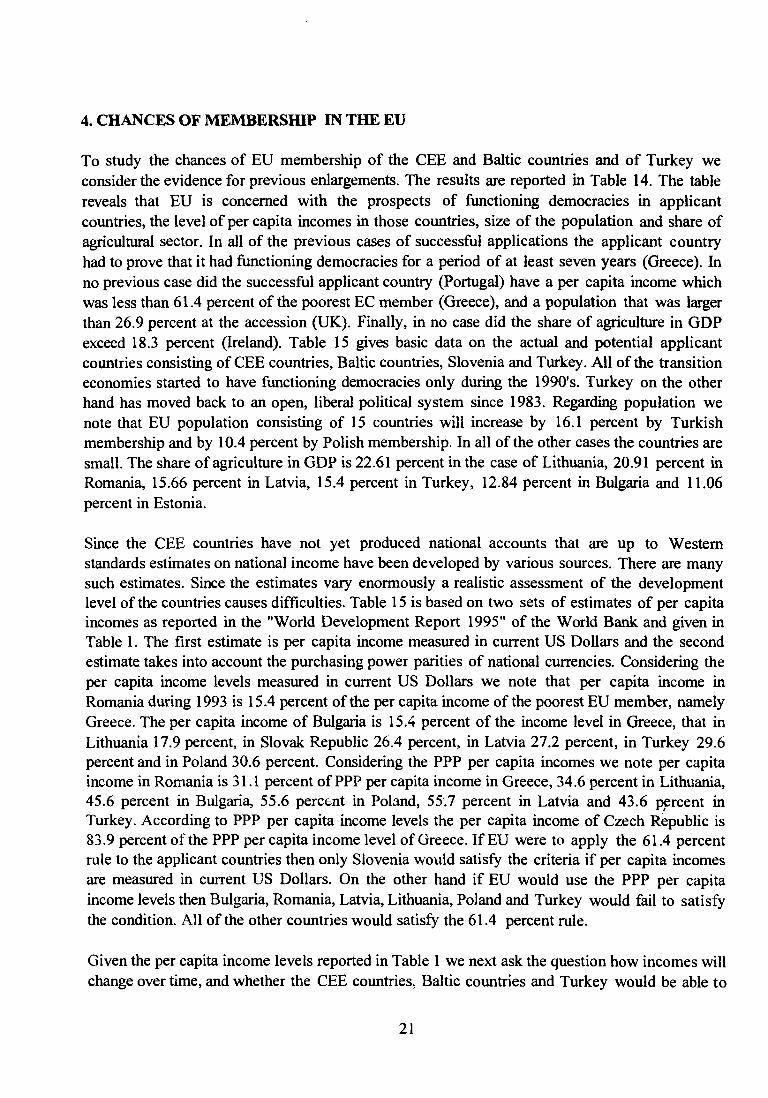
4. CHANCES OF MEMBERSHIP IN THE EU
To study the chances of EU membership of the CEE and Baltic countries and of Turkey we consider the evidence for previous enlargements. The results are reported in Table 14. The table reveals that EU is concerned with the prospects of functioning democracies in applicant countries, the level of per capita incomes in those countries, size of the population and share of agricultural sector. In all of the previous cases of successful applications the applicant country had to prove that it had functioning democracies for a period of at least seven years (Greece). In no previous case did the successful applicant country (Portugal) have a per capita income which was less than 61.4 percent of the poorest EC member (Greece), and a population that was larger
than 26.9 percent at the accession (UK). Finally, in no case did the share of agriculture in GDP exceed 18.3 percent (Ireland). Table 15 gives basic data on the actual and potential applicant countries consisting of CEE countries, Baltic countries, Slovenia and Turkey. All of the transition economies started to have functioning democracies only during the 1990's. Turkey on the other hand has moved back to an open, liberal political system since 1983. Regarding population we note that EU population consisting of 15 countries will increase by 16.1 percent by Turkish membership and by 10.4 percent by Polish membership. In all of the other cases the countries are small. The share of agriculture in GDP is 22.61 percent in the case of Lithuania, 20.91 percent in Romania, 15.66 percent in Latvia, 15.4 percent in Turkey, 12.84 percent in Bulgaria and 11.06 percent in Estonia.
Since the CEE countries have not yet produced national accounts that are up to Western standards estimates on national income have been developed by various sources. There are many such estimates. Since the estimates vary enormously a realistic assessment of the development level of the countries causes difficulties. Table 15 is based on two sets of estimates of per capita incomes as reported in the "World Development Report 1995" of the World Bank and given in Table 1. The first estimate is per capita income measured in current US Dollars and the second estimate takes into account the purchasing power parities of national currencies. Considering the per capita income levels measured in current US Dollars we note that per capita income in Romania during 1993 is 15.4 percent of the per capita income of the poorest EU member, namely Greece. The per capita income of Bulgaria is 15.4 percent of the income level in Greece, that in Lithuania 17.9 percent, in Slovak Republic 26.4 percent, in Latvia 27.2 percent, in Turkey 29.6 percent and in Poland 30.6 percent. Considering the PPP per capita incomes we note per capita income in Romania is 31.1 percent of PPP per capita income in Greece, 34.6 percent in Lithuania, 45.6 percent in Bulgaria, 55.6 percent in Poland, 55.7 percent in Latvia and 43.6 percent in Turkey. According to PPP per capita income levels the per capita income of Czech Republic is 83.9 percent of the PPP per capita income level of Greece. If EU were to apply the 61.4 percent rule to the applicant countries then only Slovenia would satisfy the criteria if per capita incomes are measured in current US Dollars. On the other hand if EU would use the PPP per capita income levels then Bulgaria, Romania, Latvia, Lithuania, Poland and Turkey would fail to satisfy the condition. All of the other countries would satisfy the 61.4 percent rule.
Given the per capita income levels reported in Table 1 we next ask the question how incomes will change over time, and whether the CEE countries, Baltic countries and Turkey would be able to
21

catch up with the 61.4 percent per capita income level of the poorest EU member in the near future. Table 16 contains data on the growth rates of population projected by the World Bank for the period 1992-2000 and reported in the "World Development Report 1994" (WDR). During the period 1970-1992 Greece's GNP has grown at the annual rate of 3.1 percent and Turkish GNP at the annual rate of 5.4 percent. In the following we shall consider the potential developments in CEE, Baltic countries' and Turkey's per capita GNP in comparison to the potential developments in Greek per capita GNP. We assume that the Greek GNP will grow in the future at the same growth rate that has been achieved over the period 1970-1992. The assumed annual growth rate of Greek GNP is thus 3.1 percent. Furthermore, we assume that Greek population will grow at the annual rate of 0.5 percent. Table 16 has been prepared for different values of the growth rate of real GNP for the CEE, Baltic countries and Turkey. We assume following Sheehy (1994) that the CEE and Baltic economies can grow at either the pessimistic rate of 3 percent, or at the probable rate of 5 percent or at the optimistic rate of 6 percent. Regarding Turkish GNP the pessimistic rate is assumed to be 4.4 percent, the probable rate 5.4 percent and the optimistic rate 7 percent. Table 16 based on current US Dollar values of per capita incomes reveals the following aspects:
When the CEE and Baltic countries' GNP grow at the pessimistic growth rate of 3 percent and Turkish GNP at the rate of 4.4 percent none of the countries except Slovenia will reach 61.4 percent of the Greek per capita income level over the next 25 years. When the CEE and Baltic countries' GNP grow at the probable rate of 5 percent and Turkish GNP. at the rate of 5.4 percent, Hungary will reach the 61.4 percent Greek per capita income level after 15 and Estonia after 21 years. The 61.4 percent condition will not be satisfied by none of the remaining countries excluding Slovenia. Thus after 25 years the Czech per capita income will amount to 57.89 percent, the Slovak to 41.65 percent, the Polish to 48.28 percent, the Romanian to 24.35, the Bulgarian to 24.35, the Latvian to 42.94 percent, the Lithuanian 28.2 percent and the Turkish to 51.3 percent of the Greek per capita income. When the CEE and Baltic countries' GNP grow at the rate of 6 percent and Turkish GNP at the rate of 7 percent Czech Republic will satisfy the 61.4 percent rule after 19, Hungary after 12, Poland after 25, Estonia after 14 and Turkey after 19 years. In Slovak Republic 'Rornania, Latvia and Lithuania the condition will not be satisfied even after 25 years.
Baldwin (1994) summarises the conditions for EU membership under six headings: (i) free movement of goods, services and factors of productions within the Union, (ii) adoption of EU's common external tariff and trade policy vis-a-vis the third countries, (iii) harmonisation of commercial legislation, (iv) participation in the European Monetary System and future monetary system, (v) adoption of EU's Common Agricultural Policy, (vi) supranational appellate system to enforce consistent application of Community law throughout the Union, (vii) open government procurement and (viii) common policy promoting the disadvantaged regions by structural spending. As emphasised above Turkey by forming the CU with EU will satisfy the first condition partially, but the second and third components of membership completely by the year 2001. In the case of the first component, the customs union agreement does not cover the free movement of services nor of labour. The agreement is silent on movements of capital. The
22

fourth component (participation in EMU) is not a requirement for membership. The Agreement considers condition 5, but it does not seem to be possible for Turkey to adopt the CAP in the near future. External assistance would be essential for the implementation of the condition 5. In the case of CEE countries the countries will satisfy in the near future the third condition of membership completely. The first condition will be satisfied partially as the Agreements do not cover the free movement of labour. The Europe Agreements contain sections on services and on capital movements. Since Europe Agreements are free trade agreements the CEE countries will not satisfy condition 2 of membership. The countries are free to determine the level of tariffs against third countries. Regarding the CAP, considerations similar to those in the Turkish case
will apply to condition 5 of EU membership. Again, as in the Turkish case the fourth component (participation in EMU) is not a requirement for membership.
The components that are of real concern to EU are the fifth (CAP) and seventh (structural funds) components related to funds to be received by the country from the Community budget. The net cost of membership to EU is the important variable. The net cost should not threaten the prospect of receiving more transfers than the richer EU countries can reasonably be expected to finance. To determine the net cost of membership of CEE and Baltic countries and of Turkey we make use of the results obtained and of the approach developed by Centre for Economic Policy Research (CEPR(1992)) and Baldwin (1994). The net cost is defined as the difference of the sum of structural funds and the Common Agricultural Policy price support received by the countries and of the national budgetary contribution to EU.
Consider first the problems associated with the adoption of CAP by the countries concerned using the example of Turkey, where agriculture has economy wide importance. During 1994, it accounted for about 15.4 percent of GDP and 44.2 percent of total employment in the economy. These shares have been falling over time, but compared to other EU countries the shares are still relatively high. According to OECD (1994b) value added per agricultural worker in Turkish agriculture amounts to only 21 percent of the value added per non-agricultural worker in Turkish non-agricultural sector. The low productivity in agriculture is associated with a farm structure characterised by small, fragmented farms, a poor level of education and training of farmers leading to low farm household incomes. Furthermore nearly half of the Turkish population still lives in rural areas. In Turkey population growth rates have exceeded 2 percent annually. The highest fertility rates are found in rural areas, with out-migration from these areas also tending to be high. Although migration abroad has slowed down, internal migration towards urban areas continues at a fast pace. The objectives of Turkish agricultural policy are stated as ensuring adequate levels of nutrition and food supplies at reasonable prices to consumers, raising production levels and yields while reducing the vulnerability of production to adverse weather conditions, raising levels of self-sufficiency, increasing farm incomes and improving their stability, increasing exports, and developing rural areas. In pursuit of these objectives the government has implemented a set of measures based essentially on the support of producer prices, complemented by trade related measures, the subsidisation of farm inputs, and transfers related to investments in infrastructural projects. In order to measure the total support provided to agriculture, OECD (1994b) determines the Producer Subsidy Equivalents (PSE) which measure the value of monetary transfers to producers from consumers of agricultural products and from taxpayers resulting from
23

a given set of agricultural policies in a given year. According to OECD (1994b) total support as measured by the percentage PSE is estimated to have risen during 1991-93 to around 40 percent - double the rate in the period 1979-81, and the share of total agricultural transfers in total GDP has amounted to 13.7 percent in 1991, 11.5 percent in 1992 and 11.1 in 1993. Thus the average annual amount of total transfers to agriculture over the 1991-1993 period is about $ 14 billion. At this point it should be noted that agriculture, besides being subsidised, has also been heavily protected as one can see from columns 1 and 3 of Table 8.
During the last few decades Europe on the other hand has experienced a dramatic decline in agriculture. The gradual but massive transfer of labour from farms in Europe has created severe economic and social problems especially for uprooted families and their dependants. This is the prime justification for ambitious agricultural policies introduced under the name "Common Agricultural Policy" (CAP) intended to alleviate the burden of relocation from farm to city. According to the Treaty of Rome the major goals of the CAP are to increase agricultural productivity, insure a fair standard of living for farm community, stabilise farm product markets, provide food security and secure supplies to consumers at reasonable prices. The CAP is based on three guiding principles: (i) unity of the market, (ii) Community preference, and (iii) financial solidarity. According to the first principle free movement of agricultural commodities is achieved through the common market order. According to the second principle agricultural markets are protected from foreign competition through market interventions, and according to the third principle agricultural support program is financed from the EU budget mainly through the European Agricultural Guidance and Guarantee Fund (FEOGA). Kirmani (1994) reports that a high level of support is provided to agriculture in EU. EU had a PSE ratio of 46 percent in 1990, 47 percent in 1992 and 48 percent in 1993. The support has significantly reduced the EU's net food imports since the 1970's and substantially increased self-sufficiency ratios in EU. But the CAP has been under great pressure to reduce the drain on the EU budget. The 1992 MacSharry reform of CAP aimed at curbing excess production of cereals by means of set-asides of arable land and reductions in guaranteed prices, with compensation to farmers in the form of a fixed payment per hectare under cultivation. The reforms are an important step towards the market oriented system. It is expected that by the end of 1995/96 marketing season intervention prices will be reduced to world prices (European Economy (1994)). If successful this implies that there will be no need for export subsidies or import taxes starting from 1996 onwards. This would not imply that the PSE ratio in EU would decline to zero. The system of regionally calculated `compensatory' area payments tied to set-aside schemes will insure that the decline in agricultural incomes is reduced substantially over time. Thus in EU the "market price support" would decline to zero but positive amounts of "direct payments" would still be paid. As a result the PSE ratio could be held at its present levels.
According to Articles 22-25 of the CUA, in order to establish the freedom of movement of agricultural products, Turkey will have to adjust its agricultural policy in such a way as to adopt the CAP measures. But is this possible? What does the adoption of CAP measures mean for Turkey. At current domestic prices, Turkey is a net exporter of some and net importer of other farm products. But those domestic prices when converted at equilibrium exchange rates are below the EU domestic prices. Should Turkey be given preferential, tariff free access to EU agricultural
24

markets at existing EU prices then supply could be expected to increase in Turkey. The output of all farm products in Turkey will be higher. The aggregate level of food self-sufficiency will rise. Turkish consumers would face higher prices costing them a certain amount annually. Anderson and Tyers (1993) have determined that Visegrad farmers would be better off by $ 52.5 billion annually. Thus allowing Visegrad countries into the CAP would involve a massive transfer from EU taxpayers and Visegrad consumers to Visegrad farmers. Anderson and Tyers (1993) estimate that the total extra cost to the EU budget would amount to $ 47 billion each year. This cost would bankrupt the CAP. Since similar results would be obtained in the Turkish case the problem faced by Turkey is who is going to provide the necessary funds? Since Turkey cannot devote an amount similar to the figures given above from its own resources for the support of Turkish agricultural sector and since EU would be unwilling to bear the cost, the idea of establishing a fund similar to FEOGA in Turkey would have to be abandoned. As a result it seems that freedom of movement of agricultural products between Turkey and EU cannot be
achieved in the near future. Furthermore the adoption of CAP might also involve the equalisation of PSE ratios and also the equalisation of farm incomes. Can Turkey raise the standard of living of Turkish farm population to that of EU? At this point it should be noted that the average yields of wheat and Barley in Turkey are 2.01 tonnes/hectare, whereas the same yields in France
are 6.4 and 5.9 tonnes/hectare respectively (OECD (1994a)) . Thus, even if Turkish and EU commodity prices were equalised and all kinds of subsidies in the -form of direct payments to producers, subsidies to capital and other inputs, subsidies in the form of general services, regional subsidies and tax concessions were eliminated, agricultural incomes in Turkey would be lower than those in France because of the large productivity differential. In order to raise its agricultural income levels to those in France, Turkey would also have to increase agricultural productivity through additional investments in agriculture, which will probably take a long time. All these arguments lead to the conclusion that the freedom of movement of agricultural products between Turkey and EU cannot be achieved in the near future. Similar arguments would hold in the case of CEE and Baltic countries.
Next consider the issues related with structural funds. These are transfers from Brussels to poorer member states and regions. The funds are aimed at encouraging greater economic and social cohesion. About half of structural funds is channelled into low income regions defined as the regions with per capita incomes less than 75 percent of the EU average. The funds are used to improve infrastructure in the low income regions and to provide local training. A recent study for the EC Commission published in European Economy (1993) asserts that Portugal and Greece are likely to receive ECU 400 per capita in the future. Using this approach the Visegrad-4 would receive 32.5 billion US $.
The budget revenue of EU consists of receipts based on national VAT receipts, tariff revenues, variable duties and GNP contributions. Currently the EU budget amounts to about 1.2 percent of the Union's total GDP. This fraction is set to go up to 1.3 percent by the year 2000. Using the 1.3 percent figure the contribution of Visegrad countries is determined as US $ 6.9 billion. Hence the net budgetary cost to EU of admitting Visegrad-4 as members would amount to US $ 72.6 (47 + 32.5 - 6.9) billion. Baldwin admits that the figure is too large. His own estimates of the net cost of membership are shown in Table 17. From the table it follows that admitting Czech Republic,
25

Hungary and Slovenia as new member states of the Union would cost EU US $ 5.63 billion. Admitting, in addition, Poland as a new member would increase the cost to US $ 13.75 billion. Admitting, in addition, the Baltic countries, Slovak Republic, Bulgaria and Romania would increase the annual cost to US $ 33.38 billion.
The estimates presented are rather rough. But one aspect is clear. The CEE and Baltic countries and Turkey would impose a large burden on the EU taxpayers if they were to enter now and the EU applied its current rules on CAP and structural funds. Note that the 1994 EU budget amounted to ECU 72.3565 billion ECU. Hence the burden of admitting Czech Republic, Hungary, Poland and Slovenia into EU would constitute about 15.2 percent of the EU budget. Admitting the remaining CEE and Baltic countries to the Community would increase the cost to 36.9 percent. The figures are large sums for the Community. If EU intends to admit these countries as new members then either the budget has to be increased considerably or the rules on "structural funds" and "price support under CAP" has to change.
The budgetary outlays to EU have to be evaluated relative to potential gains which would come
in the form of increased trade and political stability. Estimates of potential EU trade with CEE and Baltic countries and with Turkey, using the Gravity type of analysis, reveals that CEE, Baltic and Turkish trade with EU would increase considerably over the coming decades. Politically there are gains to be derived from a future stable central and eastern Europe and Asia Minor. It seems that sustainable high growth of GNP by potential candidates is a prerequisite for membership to EU. But the whole question boils down to how much EU would be willing to spend for integration of the countries into EU.
26

REFERENCES
Anderson, K. and R. Tyers (1993) "Implications of EC Expansion for European Agricultural Polices, Trade and Welfare", Centre for Economic Policy Research Discussion Paper Series No. 829, London.
Baldwin, R.E., Towards and Integrated Europe, Centre for Economic Policy Research, London, 1994
Bergstrandt, J.H. (1985) "The Gravity Equation in International Trade: Some Microeconomics Foundations and Empirical Evidence", Review of Economic Studies, pp. 474-478.
Centre for Economic Policy Research (1992), Is Bigger Better? The Economics of EC Enlargement, London, 1992
Commission of the European Communities (1991), The Community Budget: The Facts in Figures, Office for Official Publications of the European Communities, Brussels, 1991
Commission Of The European Communities, Statistical Office, Trade Statistics provided on Diskettes, Luxembourg
Commission Of The European Communities (1993), "Stable Money - Sound Finances: Community Public Finance in the Perspective of EMU", European Economy, No 53
Economist Intelligence Unit, Country Reports and Country Profiles on CEE Countries, Baltic Countries and on Former Yugoslavia, various issues
European Bank For Reconstruction And Development (1994), Transition Report, London, 1994 Hoekman, B.M. and P.C. Mavroidis (1994) "Linking Competition and Trade Policies in Central
and Eastern European Countries", World Bank Policy Research Working Paper 1346 International Monetary Fund, (IMF (1995)), Direction of Trade Statistics Yearbook, Washington,
D.C. 1995 Kaminski, B. (1994) "The Significance of the "Europe Agreements" for Central European
Industrial Exports", World Bank Policy Research Paper 1314, Washington, D.C. Kirmani, N., N. Calika and others (1994) International Trade Policies: The Uruguay Round and
Beyond: Volume I. Principal Issues, International Monetary Fund, Washington, D.C. Marceu, G. (1995) "The Full Potential of the Europe Agreements: Trade and Competition Issues:
The Case of Poland", World Competition, pp. 35-69 Mastropasqua, C. and V. Rolli (1994) "Industrial Countries' Protectionism with Respect to
Eastern Europe: The Impact of the Association Agreements Concluded with the EC on the Exports of Poland, Czech Republic and Hungary", World Economy, 1994, pp. 151- 169
Organisation For Economic Co-operation And Development, Economic Surveys. Turkey 1991- 1992, Paris, 1992.
------- , National Policies and Agricultural Trade: Country Study Turkey, OECD, Paris 1994 Togan, S. (1994) Foreign Trade Regime and Trade Liberalisation in Turkey during 1980's,
Avebury Press, London Winters, L.A. and Z. K. Wang, Eastern Europe's International Trade, Manchester University
Press, Manchester and New York, 1994 World Bank (IBRD (1995)), World Development Report 1995, World Bank, Washington, D.C.,
1995
27

Tab
le 1
: B
asic
Dat
a on
CE
E,
Bal
tic,
EU
and
Tur
kish
Eco
nom
ies
Ave
rage
E
stim
ated
1993
19
93
1993
P
PP
Est
imat
e of
19
93
1993
S
hare
of
Agr
icul
tura
l R
eal G
DP
A
vera
ge
Pop
ulat
ion
Pop
ulat
ion
GD
P
Are
a G
NP
/Pop
G
NP
/Pop
E
xpor
ts
Impo
rts
Val
ue A
dded
in
Gro
wth
Rat
e In
flatio
n R
ate
Gro
wth
Rat
e
jmill
ion)
__(S
bill
ion)
_(10
00 k
m2)
____
(S)_
_ _(
1993
,.$)
_( S
billi
on)_
-"lio
n)--
- G
DP
(°4)
_ 19
91-9
4 19
91-9
4 19
93-2
000
CE
E C
ount
ries
Cze
ch
Rep
ublic
10
.3
31.6
1 79
27
10
7550
12
.93
13.4
9 5.
3 -5
.7
25.2
0.
1
Hun
gary
10
.2
38.1
0 93
33
50
6050
8.
89
12.6
0 7.
7 -3
.4
24.6
-0
.4
Pol
and
38.3
85
.85
313
2260
50
00
14.0
0 18
.83
7.0
1.4
45.2
0.
2
Slov
ak R
epub
lic
5.3
11.0
8 49
19
50
6290
5.
45
6.35
6.
4 -5
.9
26.6
0.
4
CE
E-0
64
.1
166.
64
534
2574
58
10
41.2
6 51
.26
6.8
-1.5
35
.5
0.1
Bul
garia
8.
9 10
.37
111
1140
41
00
4.07
4.
24
12.8
-5
.0
146.
1 -0
.5
Rom
ania
22
.8
25.9
7 23
8 11
40
2800
4.
89
6.40
20
.9
-4.2
19
1.1
-0.1
CE
E-6
95
.8
202.
98
883
2317
53
37
50.2
3 61
.91
8.9
-2.0
61
.0
0.0
For
mer
Yug
osla
via
Slo
veni
a 1.
9 10
.34
20
6490
..
6.09
6.
50
5.1
3.2
26.1
0.
1
Bal
tic C
ount
ries
Est
onia
1.
6 5.
09
45
3080
65
02
0.46
0.
62
11.1
-7
.5
354.
1 -0
.5
Latv
ia
2.6
4.60
65
20
10
5010
0.
46
0.34
15
.7
-14.
8 30
5.1
-0.8
Lith
uani
a 3.
7 4.
34
65
1320
31
10
0.70
0.
49
22.6
-2
3.1
431.
9 -0
.1
Bal
tic C
ount
ries
7.9
14.0
3 17
5 21
85
4964
1.
62
1.44
16
.5
-14.
7 36
2.1
-0.4
Eur
opea
n U
nion
Aus
tria
7.
9 18
2.07
84
23
510
1943
0 40
.17
48.5
8 2.
7 1.
9 0.
5
Bel
gium
10
.0
210.
58
31
2165
0 19
640
112.
51
125.
06
1.8
0.8
2.5
0.3
Den
mar
k 5.
2 11
7.59
43
26
730
1956
0 35
.91
29.5
2 3.
1 1.
8 2.
0 0.
1
Fin
land
5.
1 74
.12
338
1930
0 15
530
23.4
5 18
.03
2.4
-2.1
0.
4
Fra
nce
57.5
12
51.6
9 55
2 22
490
1900
0 20
6.26
20
2.27
2.
6 0.
8 2.
3 0.
4
Ger
man
y 80
.7
1910
.76
357
2356
0 16
850
380.
15
348.
63
1.0
1.7
3.5
0.2
Gre
ece
10.4
63
.24
132
7390
90
00
7.96
20
.54
12.5
1.
2 14
.3
0.3
Irel
and
3.5
42.9
6 70
13
000
1349
0 28
.61
21.3
9 6.
6 3.
5 2.
4 0.
3
Italy
57
.1
991.
39
301
1984
0 17
830
168.
46
146.
79
3.2
0.7
5.3
0.0
Luxe
mbo
urg
0.4
14.7
8 3
3732
0 29
510
1.2
1.7
3.1
Net
herla
nds
15.3
30
9.23
37
20
950
1733
0 13
9.08
12
6.56
3.
6 1.
3 2.
7 0.
6 Portugal
9.8
85.67
92
9130
10710
15.43
24.60
3.5
0.8
8.3
0.0
Spa
in
39.5
47
8.58
50
5 13
590
1351
0 62
.87
78.6
3 3.
5 0.
8 5.
7 0.
1
Sw
eden
8.
7 16
6.75
45
0 24
740
1720
0 49
.86
42.6
8 0.
6 -0
.8
0.5
United Kingdom
57.9
81
9.04
245
18060
17210
180.
58
206.32
2.0
0.4
4.8
0.3
EU
-12
369.
0 67
18.4
3 32
40
1968
5 17
276
1451
.30
1439
.59
2.4
1.1
4.1
0.2
Tur
key
59.5
13
2.30
77
9 21
84
3920
18
.11
23.2
7 15
.4
2.3
77.1
1.
8
Sou
rce:
Wor
ld D
evel
opm
ent
Rep
ort
1995
, W
orld
Ban
k; v
ario
us i
ssue
s of
th
e "E
cono
mis
t In
telli
genc
e U
nit
Cou
ntry
Rep
orts
" on
CE
E e
cono
mie
s; O
EC
D in
Fig
ures
, 19
94 e
ditio
n, O
EC
D;
vario
us i
ssue
s of
E
urop
ean
Eco
nom
y, a
nd W
orld
Eco
nom
ic O
utlo
ok,
Oct
199
5, I
MF
Not
e: T
urki
sh d
ata
on G
NP
, pe
r ca
pita
inco
me,
exp
orts
and
im
port
s re
fer
to t
he y
ear
1994
.

Tab
le 2
: T
erri
tori
al C
ompo
sitio
n of
Tra
de o
f the
CE
E a
nd B
altic
Cou
ntri
es a
nd o
f Tur
key
duri
ng 1
988
and
1994
Bul
garia
B
ulga
ria
Cze
chos
lova
kia
Cze
ch R
epub
lic
Est
onia
H
unga
ry
Hun
gary
La
tvia
Li
thua
nia
Pol
and
Pol
and
l R
oman
ia
Rom
ania
S
lova
kia
Slo
veni
a T
urke
y T
urke
y
Par
tner
Gro
up
1988
19
94
1988
19
94
1994
19
88
1994
19
94
1994
19
88
1994
19
88
1994
19
94
1994
19
88
1994
TO
TA
L E
XP
OR
TS
10
0 10
0 10
0 10
0 10
0 10
0 10
0 10
0 10
0 10
0 10
0 10
0 10
0 10
0 10
0 10
0 10
0
EU
-15
19.1
3 48
.36
29.8
4 59
.39
49.2
3 30
.34
60.6
7 39
.33
30.1
1 35
.85
69.2
1 29
.23
48.2
1 47
.84
65.5
4 45
.66
47.6
9
Ger
man
y 5.
63
14.0
3 15
.11
34.7
4 7.
56
10.9
1 28
.04
10.5
2 11
.43
12.8
9 35
.67
9.37
16
.04
25.0
7 30
.26
18.2
8 21
.73
Aus
tria
0.85
1.90
4.23
7.
03
0.14
5.
70
9.90
2.
12
0.30
3.
02
2.20
1.
67
1.57
6.
71
5.48
1.
53
1.38
Fin
land
0.37
4.74
0.70
2.
41
0.61
0.
93
3.34
1,
42
1.18
1.
40
4.00
0.
11
5.13
2.
33
8.59
0.
15
0.17
CE
E &
Bal
tic C
ount
ries
and
Slo
veni
a 31
.71
5.11
16
.80
24.7
5 13
.49
11.7
0 7.
04
10.8
2 18
.14
11.6
0 5.
27
12.8
0 6.
27
43.2
8 4.
89
1.80
4.
00
For
mer
Sov
iet
Uni
on
na
10.7
9 34
.20
4.90
29
.35
27.7
0 14
.63
36.8
0 46
.67
24.3
0 8.
27
24.4
0 6.
25
3.83
4.
63
2.30
7.
80
Tur
key
0.47
3.
67
0.56
0.
41
0.19
1.
04
0.38
0.
10
0.20
0.
74
0.20
2.
10
4.09
0.
30
0.12
TO
TA
LIM
PO
RT
S
100
100
100
100
100
100
100
100
100
100
100
100
100
100
100
100
100
EU
-15
1 36
.42 )
45.3
5 1
14.2
4
33.3
0 63
.99
1
17 7
0
63.6
2
9.64
1 34
.67
13.9
0
56.3
5
23.5
6
1 40
.66
1
1
32.2
1 1
33.8
9 65
.31
1
27.4
7 13
.00
7.08
48
.18
i
2.50
17
.96
43.1
4 i
68.4
2 i
23.5
5
42.8
8 46
.91
4
0
15.6
7
1
.
Al ra
F
inla
nd
3.69
3.
05
5.30
7.
40
I
0
1
7 .2
0 30
.5
1
0.72
0.
62
1
257
2 4.
1
.57
0.80
2.
74
0.04
5.
09
I 6.
10
I
1
0.27
8
1 0
CE
E &
Bal
tic C
ount
ries
and
Slo
veni
a 19.33
5.30
16.8
0 17
.73
5.48
12
.30
6.03
12
.88
11.6
6 12
.00
4.39
17
.60
5.12
33
.04
6.79
2.
80
3.10
F
orm
er S
ovie
t U
nion
na
24
.48
31.4
0 10
.31
21.5
3 25
.10
22.9
6 30
.35
50.2
9 28
.20
9.32
35
.40
17.8
9 12
.50
2.24
3.
10
7.80
T
urke
y 0.
53
1.80
0.
34
0.28
0.
03
0.32
0.
24
0.16
0.
08
0.44
0.
43
0.44
2.
12
0.08
0.
29
Not
e:
Tra
de d
urin
g 19
88 b
etw
een
each
of t
he C
EE
cou
ntrie
s an
d 'C
EE
&B
altic
Cou
ntrie
s an
d S
love
nia'
re
fers
onl
y to
tra
de b
etw
een
thos
e co
untr
ies
and
CE
E c
ount
ries
Sou
rce:
D
irect
ion
of T
rade
Sta
tistic
s, I
MF
, 19
95

Tab
le 3
: C
omm
odity
Com
posi
tion
of E
xpor
ts a
nd I
mpo
rts
of C
EE
and
Bal
tic C
ount
ries
and
of
Tur
key
in th
eir
trad
e w
ith E
U
EX
PO
RT
S
Bul
garia
C
zech
R
epub
lic
Est
onia
H
unga
ry
Latv
ia
Lith
uani
a P
olan
d R
oman
ia
Slo
veni
a S
lova
kia
Tur
key
SIT
C
CO
MM
OD
ITY
1 0-
08+
41+
42 F
ood
8.35
2.
67
5.67
12
.71
1.22
3.
76
8.52
3.
16
1.64
2.
02
17.4
5
2 1
Bev
erag
es a
nd Tobacco
4.51
0.50
0.07
0.58
0.05
0.03
0.09
0.38
0.18
0.02
1.45
3
08+22+43
Other Food Items
1.10
0.64
0.78
1.73
0.05
0.63
0.43
0.23
0.13
0.51
0.18
4 2-
22-2
7-28
Agr
icul
tura
l R
aw
Mat
eria
ls
4.36
4.
30
14.1
8 2.
93
16.7
9 6.
22
3.78
1.
68
2.07
3.
01
2.37
5 27
+28
C
rude
F
ertil
izer
s an
d M
etal
lic F
erro
us
ore
3.63
2.
65
9.93
1.
96
5.57
11
.07
1.64
0.
97
0.40
1.
80
2.06
6
3
Energy
1.64
2.86
13.30
1.19
43.51
35.09
7.81
2.99
0.00
0.39
2.
16
7 67
+68
Ir
on
and
Ste
el
and
Non
-Fer
rous
M
etal
s 19
.63
8.21
8.
72
6.65
9.
25
4.96
12
.07
14.2
6 6.
65
15.8
8 2.
46
8 65
+84
T
extil
es
and
Clo
thin
g 18
.24
11.4
0 12
.74
15.4
7 8.
61
14.5
0 17
.87
33.4
6 17
.97
17.9
1 49
.83
9
61+83+85
Hides and Lather
6.24
2.97
2.59
4.47
1.42
2.46
1.99
9.
53
3.55
3.96
0.
59
10
63+
82
Woo
d M
anuf
actu
res
and
Fur
nitu
re
1.88
5.
23
9.15
3.
19
5.47
3.
34
10.2
2 10
.89
9.36
4.
66
0.58
11
64
Pap
er
0.32
1.
59
0.16
0.
72
0.10
0.
27
1.26
0.
32
3.40
3.
90
0.34
12
66
Non
-Met
a'ic
M
iner
al M
anuf
actu
es
1.90
5.
95
2.64
1.
79
0.44
0.
63
3.46
2.
88
2.24
5.
63
2.44
13
5+62
C
hem
ical
s an
d R
ubbe
r P
rodu
cts
11.6
9 9.
54
11.5
6 8.
93
3.37
10
.66
5.65
5.
81
6.04
10
.52
4.14
14
69
Met
al
Pro
duct
s 1.
54
6.23
1.
34
3.30
0.
31
1.02
4.
56
1.71
4.
84
3.92
1.
21
15
7
Machinery and Transportation Equipment
12.06
25.6
2 1.
95
28.79
1.62
3.58
16
.58
8.63
33
.81
20.9
8 9.
90
16
81+
86+
89+
9 M
isce
llane
ous
Man
ufac
ture
d A
rtic
les
2.89
9.
64
5.22
5.
60
2.21
1.
79
4.07
3.
09
7.71
4.
90
2.83
Firs
t th
ree
sect
ors
with
hi
ghes
t sh
ares
7,
8,
15
15
, 8,
16
4,
6,
8 15
, 8,
1
6, 4
, 7
6, 8
, 5
8,
15,
7 8,
7,
10
15
, 8,
10
15
, 8,
7
8,
1,
15
IMP
OR
TS
B
ulga
ria
Cze
ch
Rep
ublic
E
ston
ia
Hun
gary
La
tvia
Li
thua
nia
Pol
and
Rom
ania
S
love
nia
Slo
vaki
a T
urke
y
SIT
C
CO
MM
OD
ITY
1 0-
08+
41+
42 F
ood
9.52
5.
16
21.4
6 5.
12
14.4
3 10
.26
7.45
5.
06
5.23
5.
05
1.55
2 1
Bev
erag
es a
nd T
obac
co
3.47
0.78
5.07
0.49
10.74
11.51
0.51
0.74
1.31
0.63
0.57
3
08+22+43 Other Food
Item
s 0.36
0.87
0.74
0.79
0.39
0.67
1.44
0.64
0.26
1.16
0.19
4 2-
22-2
7-28
Agr
icul
tura
l R
aw
Mat
eria
ls
2.68
1.
38
1.18
1.
76
1.03
1.
37
1.89
1.
28
2.38
1.
82
2.63
5 27
+28
C
rude
F
ertil
izer
s an
d M
etal
lic
Fer
rous
Ore
0.
39
0.43
0.
08
0.22
0.
03
0.03
0.
38
0.67
0.
98
0.22
4.
66
6 3
Ene
rgy
3.39
0.
82
1.44
0.
58
2.01
0.
49
1.84
2.
52
2.02
0.
48
1.70
7 67
+68
Ir
on
and
Ste
el
and
Non
-Fer
rous
M
etal
s 2.
00
3.85
1.
03
2.78
0.
69
1.23
2.
69
1.60
4.
88
4.61
5.
27
8 65
+84
T
extil
es
and
Clo
thin
g 10
.75
6.99
6.
38
10.7
5 8.
77
9.60
12
.92
21.3
5 12
.29
9.87
5.
26
9
61+83+85
Hides and Lather
3.13
1.76
1.94
3.58
2.47
1.45
1.
28
6.28
2.71
2.69
1.
27
10
63+
82
Woo
d M
anuf
actu
res
and
Fur
nitu
re
1.63
1.
78
1.27
1.
89
2.07
1.
87
1.01
1.
06
2.01
1.
75
0.63
11
64
Pap
er
1.80
1.
49
0.86
1.
90
1.18
0.
89
2.27
1.
18
1.81
1.
10
1.26
12
66
Non
-Met
alic
M
iner
al M
anuf
actu
es
1.56
2.
07
1.28
1.
96
1.46
1.
06
1.95
1.
22
1.81
1.
82
1.22
13
5+62
Chemicals
and
Rub
ber Products
16.3
9 12.06
9.91
13.43
7.87
10.3
9 15
.24
9.04
11
.33
12.1
9 15
.82
14
69
Met
al
Pro
duct
s 1.
86
4.19
1.
91
3.40
1.
61
1.60
3.
09
2.31
3.
06
2.92
1.
88
15
7
Machinery and Transportation
Equ
ipm
ent
32.4
9 44
.21
34.33
41.30
34.5
4 36
.48
34.8
5 35
.94
39.6
0 44
.35
44.2
9
16
81+
86+
89+
9 M
isce
llane
ous
Man
ufac
ture
d A
rtic
les
8.59
12
.15
11.1
2 10
.06
10.7
2 11
.09
11.1
8 9.
08
8.33
9.
33
11.8
0
First three
sect
ors
with
hi
ghes
t sh
ares
15, 13,
8 15
, 16
, 13
15
, 1.
16
15
, 13,
8 15
, 1,
2
15,
2,
16
15,
13,
8 15
, 8,
16
15,
8,
13
15,
13,
8 15
, 13
, 16
Sou
rce:
O
wn
Cal
cula
tions

Table 4: Indexes of Similarity for Turkish Exports to and Turkish Imports from
European Union with CEECs Trade with European Union
Turkish Exports Turkish Imports Bulgaria
Exports 0.6896 0.3757
Imports 0.3768 0.7884
Czech Rep. Exports 0.4808 0.7157
Imports 0.2831 0.8769
Estonia Exports 0.3668 0.3247
Imports 0.2288 0.7143
Hungary Exports 0.6814 0.5442 Imports 0.3341 0.8595
Latvia Exports 0.1879 0.1768 Imports 0.3391 0.6542
Lithuania Exports 0.3512 0.2308
Imports 0.3096 0.7464
Poland Exports 0.7221 0.4004
Imports 0.3353 0.8442
Romania Exports 0.8221 0.2164
Imports 0.4073 0.7588
Slovakia Exports 0.5981 0.5728 Imports 0.2886 0.8923
Slovenia Exports 0.5993 0.5909 Imports 0.3178 0.7874
Level of Aggregation: 2-digit SITC Source: Own calculation
31
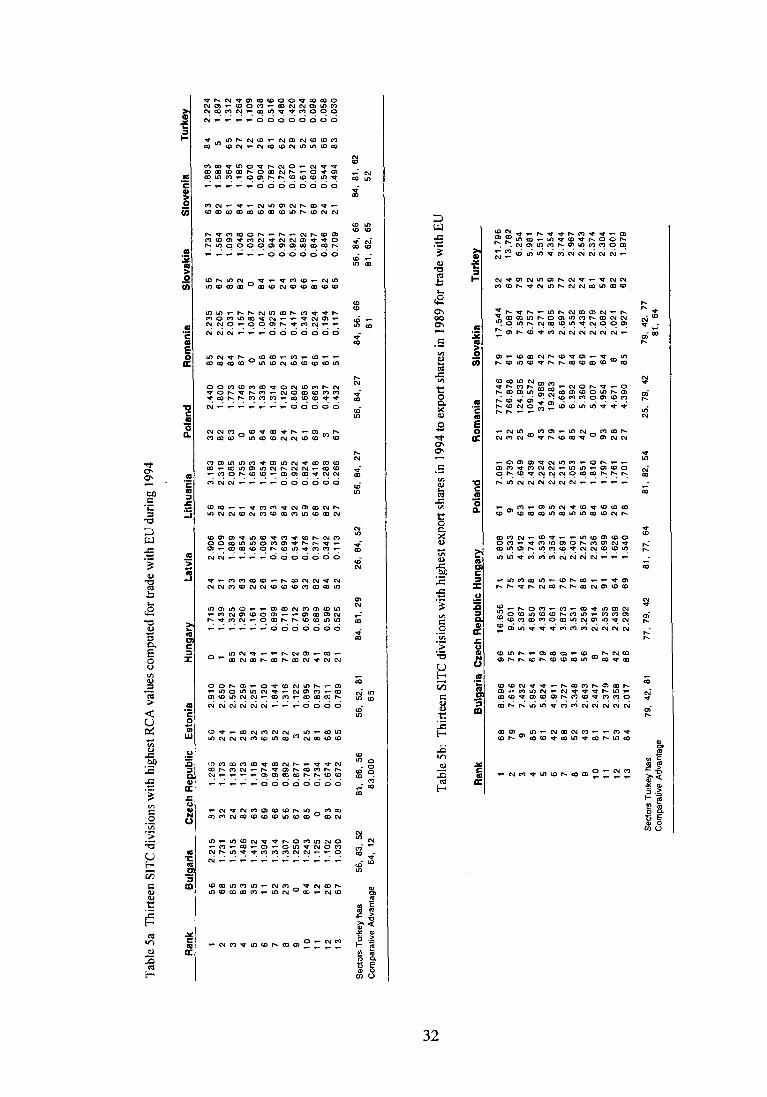
Tab
le 5
a T
hirt
een
SIT
C d
ivis
ions
with
hig
hest
RC
A v
alue
s co
mpu
ted
for t
rade
with
EU
dur
ing
1994
Ran
k B
ulga
ria
Cze
ch R
epub
lic
Est
onia
H
unga
ry
Latv
ia
Lith
uani
a P
olan
d R
oman
ia
Slo
vaki
a S
love
nia
Tur
key
1 56
2.
215
81
1.28
5 56
2.
910
0 1.
715
24
2.90
6 56
3.
183
32
2.44
0 85
2.
235
56
1.73
7 63
1.
883
84
2.22
4
2 68
1.
731
32
1.17
3 24
2.
650
1 1.
439
21
2.10
9 28
2.
319
82
1.80
0 82
2.
205
67
1.56
4 82
1.
588
5 1.
897
3 85
1.
515
24
1.13
8 21
2.
507
85
1.32
5 33
1.
889
21
2.08
5 63
1.
773
84
2.03
1 85
1.
093
61
1.36
4 65
1.
312
4 83
1.
486
82
1.12
3 28
2.
259
22
1.29
6 63
1.
854
61
1.75
5 0
1.74
6 67
1.
157
82
1.04
8 84
1.
185
27
1.26
4
5 35
1.
412
63
1.11
8 32
2.
251
84
1.16
1 28
1.
655
24
1.69
3 56
1.
373
0 1.
087
0 1.
030
81
1.07
0 12
1.
109
6 11
1.
394
69
0.97
4 63
2.
120
71
1.00
1 26
1.
006
33
1.65
4 84
1.
338
56
1.04
2 84
1.
027
62
0.90
4 26
0.
838
7 52
1.
314
66
0.94
8 52
1.
844
81
0.89
9 61
0.
734
63
1.12
9 68
1.
314
68
0.92
5 61
0.
941
85
0.78
7 81
0.
516
8 23
1.
307
56
0.89
2 82
1.
316
77
0.71
8 67
0.
693
84
0.97
5 24
1.
120
21
0.71
8 24
0.
927
69
0.72
2 62
0.
480
9 0
1.25
0 67
0.
877
3 1.
122
82
0.71
2 66
0.
544
32
0.92
2 27
0.
802
63
0.41
7 63
0.
921
52
0.67
0 29
0.
420
10
84
1.24
3 85
0.
781
25
0.89
5 29
0.
693
32
0.47
6 59
0.
824
61
0.68
6 61
0.
343
66
0.89
2 77
0.
611
52
0.32
4
11
12
1.12
5 0
0.73
4 81
0.
837
41
0.68
9 82
0.
377
68
0.41
8 69
0.
663
66
0.22
4 81
0.
847
68
0.60
2 56
0.
098
12
28
1.10
2 83
0.
674
68
0.81
1 28
0.
596
84
0.34
2 82
0.
288
3 0.
437
81
0.19
4 62
0.
846
24
0.54
4 66
0.
058
13
67
1.03
0 28
0.
672
65
0.78
9 21
0.
525
52
0.11
3 27
0.
266
67
0.43
2 51
0.
117
65
0.70
9 21
0.
494
83
0.03
0
Sec
tors
Tur
key
has
56,
83,
52
81,
66,
56
56,
52,
81
84,
81,
29
26,
84,
52
56,
84,
27
56, 84,
27
84,
56,
66
56,
84,
66
84,
81,
62
Com
para
tive
Adv
anta
ge
84,
12
83.0
00
65
81
81,
62,
65
52
Tab
le 5
b:
Thi
rtee
n S
ITC
div
isio
ns w
ith h
ighe
st e
xpor
t sh
ares
in 1
994
to e
xpor
t sh
ares
in 1
989
for
trad
e w
ith E
U
1 68
8.
896
96
16.6
56
71
5.80
8 61
7.091
21
777.
746
79
17.5
44
32
21.7
96
2
79
7.61
6 75
9.
601
75
5.53
3 9
5.73
0 32
76
6.87
8 61
9.
087
64
13.7
82
3 9
7.43
2 77
5.
367
43
4.91
2 63
2.
649
25
124.
935
56
7.58
4 79
6.
254
4 85
5.
954
61
4.85
0 78
3.
741
81
2.43
9 8
109.
572
68
6.757
42
5.98
1
5 61
5.
624
79
4.36
3 25
3.
536
89
2.22
4 43
34
.989
42
4.
271
25
5.51
7 6
42
4.91
1 68
4.
061
81
3.35
4 55
2.
222
79
19.2
83
77
3.80
5 59
4.
354
7 88
3.
727
69
3.87
3 76
2.
691
82
2.21
5 61
6.
681
76
2.69
7 77
3.
744
8 52
3.
348
81
3.53
1 77
2.401
54
2.05
3 85
6.
392
84
2.55
2 22
2.
967
9 43
2.
643
56
3.25
8 88
2.
275
56
1.85
1 42
5.
360
69
2.43
6 24
2.
543
10
81
2.44
7 8
2.91
4 21
2.
236
84
1.81
0 0
5.00
7 81
2.
279
81
2.37
4 11
71
2.
379
87
2.53
5 91
1.
699
66
1.79
7 93
4.
954
64
2.08
2 54
2.
304
12
53
2.35
8 42
2.
439
64
1.62
6 26
1.
761
28
4.67
1 8
2.02
1 82
2.
001
13
84
2.01
7 88
2.
292
69
1.54
0 78
1.701
27
4.39
0 85
1.
927
62
1.97
9
Ran
k B
ulga
ria
Cze
ch R
epub
lic H
unga
ry
Pol
and
Rom
ania
S
lova
kia
Tur
key
Sec
tors
Turkey h
as
79, 42, 81
77, 79, 42
81, 77,
64
81,
82,
54
25. 79, 42
79, 42, 77
Com
para
tive
Adv
anta
ge
81,
64

Tab
le 6
: T
rade
bet
wee
n T
urke
y an
d C
EE
and
Bal
tic C
ount
ries
dur
ing
1985
-199
4 (M
illio
n U
S $)
EX
POR
TS
Bul
garia
C
zech
osla
vaki
a C
zech
Rep
. S
lova
kia
Est
onia
H
unga
ry
Latv
ia
Lith
uani
a P
olan
d R
oman
ia
Slo
veni
a T
otal
CE
E
and
Bal
tic T
rade
Tot
al
Tur
kish
E
xpor
ts
Sha
re o
f E
xpor
ts t
o C
EE
and
Bal
tic
in T
urki
sh
Exp
orts
ries
1985
19
86
7.7
14.9
14
.4
23.9
3.
7 12
5
34.4
47
.0
107.
2 79
58
1.3
1987
14
.5
27.1
.
18
1
41.0
39
.9
132.
2 74
57
1.8
1988
28.1
35.3
. 25
.7
48.7
13
4.1
1019
0 1
3 24.8
77.6
76 0
.
1989
26
.7
39.2
24
5
.
241.
8 11
662
2.1
1990
10
.4
64.4
.
71.4
52
.8
214.
6 11
625
1.8
30.6
10
3 4
83 2
19
91
76.1
64
.1
34 6
.
. 29
2.0
1295
9 2.
3 1992
72.2
52 3 3
. 14
1.3
109.
4 42
5.5
1359
3 3
1 .
.
27.0
186 3
173
1
.
1993
86.2
58
4 15
7
.
.
510.9
14715
3.5
1994
13
3.7
.
62 2
. 0.
3 37
.5
2.9
4.0
234.
8 15
1.7
30.2
62
1.7
1534
5 4
1 .
12.8
0.
8 58
.3
2.1
8.3
249.
5 17
5.3
19.9
72
3.0
1810
6 .
4.0
IMP
OR
TS
Bul
garia
C
zech
osla
vaki
a C
zech
Rep
. S
lova
kia
Est
onia
H
unga
ry
Latv
ia
Lith
uani
a P
olan
d R
oman
ia
Slo
veny
a T
otal
B
altic
Tra
de
and
Tot
al
ImT
urki
sh
port
s
Sha
re o
f Im
port
s fr
om
CE
In T
urki
sh
Impo
rtsC
ount
ries
1985
1986
98.7
41.2
39.0
67.3
53.6
38 2
49.3
127 9
63.6
304.2
11343
2.7
1987
19
88
1989
9.4
15.7
3.
3
45.9
27
.8
72.1
.
70.6
92
.9
.
62.5
78
.6
109.
6 22
9.4
197.
9
384.
2 41
7.8
412.
9
1110
5 14
158
1433
5
3.5
3.0
2.9
1990
31.9
143.4
87.2
110 4
98.1
23
8.5
499.
2 15
792
3.2
1991
13
9.9
155.
4 .
210.3
202.
5 698.5
22302
3.1
1992
22
4 5
183
7 13
3.6
150.
6 19
8.6
778.1
21047
3 7
1993
.
243.
2 .
223.
0 21
9
3 4
1
86 7
2
7 1
.6
1 84
8.0
2287
0 .
3.7
1994
19
5.5
94.7
.
26.4
.
1 9
.
55
5
.
4 4
3.8
7 7
91.1
30
0.8
45.9
10
32.6
29
429
3. 5
.
. .
. 69
.1
228.
9 31
.6
715.
7 23
270
1
Sou
rce:
For
eign
Tra
de S
tatis
tics,
Sta
te I
nstit
ute
of S
tatis
tics,
Ank
ara

Tab
le 7
: C
omm
odity
Com
posi
tion
of T
urki
sh E
xpor
ts to
and
Im
port
s fr
om C
EE
and
Bal
tic C
ount
ries
dur
ing
1994
RT
S
Bul
garia
C
zech
Rep
ublic
E
ston
ia
Hun
gary
La
tvia
Li
thua
nia
Pol
and
Rom
ania
S
lova
kia
Slo
veni
a S
ITC
C
OM
MO
DIT
Y
1 0-08+41+42 Food
29.9
6 13
.49
19.2
3 9.
02
13.9
7 41
.38
2.36
43
.36
22.0
5 20
.57
2 1
Bev
erag
es a
nd T
obac
co
0.26
3.
55
0.00
4.
96
0.00
0.
41
1.20
0.
05
1.79
0.
00
3 08
+22
+43
O
ther
Foo
d Ite
ms
1.56
0.
12
0.00
0.
05
0.00
0.
71
0.08
1.
53
0.00
0.
00
4 2-
22-2
7-28
A
gric
ultu
ral
Raw
Mat
eria
ls
1.14
0.
70
0.00
0.
24
0.00
0.
02
0.37
0.
08
0.00
2.
65
5 27
+28
C
rude
Fer
tiliz
ers
and
Met
allic
Fer
rous
Ore
2.
66
0.02
0.
00
0.28
0.
00
0.01
0.
40
2.61
0.
03
17.0
9 6
3
Energy
0.11
1.
29
0.00
0.
00
0.01
0.
00
0.00
0.
07
0.00
0.
00
7 67
+68
Ir
on a
nd S
teel
and
Non
-Fer
rous
Met
als
2.18
0.
05
0.00
1.
06
1.33
0.
94
0.01
0.
43
16.4
8 0.
00
8 65
+84
T
extil
es a
nd
Clo
thin
g 8.
86
57.9
6 67
.07
47.9
2 50
.33
18.7
5 80
.99
11.2
0 22
.34
38.4
3 9
61+
83+
85
Hid
es a
nd L
athe
r 8.
54
9.29
1.
63
7.81
3.
54
1.81
5.
54
0.79
10
.66
0.59
10
63
+82
W
ood
Man
ufac
ture
s an
d F
urni
ture
1.
75
0.10
0.
00
0.03
2.
32
1.04
0.
00
0.32
0.
06
0.30
11
64
P
aper
2.
39
0.04
0.
00
1.26
0.
49
2.26
0.
07
1.96
0.
09
0.01
12
66
N
on-M
etal
ic M
iner
al M
anuf
actu
es
5.51
0.
28
0.83
1.
07
5.71
1.
16
0.28
1.
11
0.34
0.
01
13
5+62
C
hem
ical
s an
d R
ubbe
r P
rodu
cts
15.8
2 4.
65
4.15
7.
50
4.88
8.
83
5.31
13
.95
16.2
3 3.
57
14
69
Met
al P
rodu
cts
1.77
0.
84
0.00
0.
29
5.25
3.
04
0.35
0.
71
0.15
8.
40
15
7 M
achi
nery
and
Tra
nspo
rtat
ion
Equ
ipm
ent
12.1
0 2.
93
7.09
15
.55
9.18
16
.97
2.04
17
.71
6.95
6.
44
16
81+
86+
89+
9 M
isce
llane
ous
Man
ufac
ture
d A
rtic
les
5.38
4.
69
0.00
2.
94
3.02
2.
68
1.01
4.
12
2.82
1.
92
Firs
t th
ree
sect
ors
with
hig
hest
sha
res
1,
13,
15
8,
1,
9 8,
1,
15
8,
15
, 1
8,
1,
15
1,
8,
15
8,
9,
13
1,
15,
13
8,
1, 7
8,
1,
5
IMP
OR
TS
Bul
garia
C
zech
Rep
ublic
E
ston
ia
Hun
gary
La
tvia
Li
thua
nia
Pol
and
Rom
ania
S
lova
kia
Slo
veni
a S
ITC
C
OM
MO
DfY
1 0-
08+
41+
42 F
ood
3.15
3.
65
17.2
2 16
.71
0.00
11
.37
1.66
17
.48
3.97
9.
91
2 1
Bev
erag
es a
nd T
obac
co
0.00
0.
00
0.00
0.
01
0.00
0.
00
0.00
0.
00
0.00
0.
00
3 08
+22
+43
O
ther
Foo
d Ite
ms
5.33
0.
00
0.00
0.
33
0.00
0.
00
0.01
0.
04
0.00
0.
02
4 2-
22-2
7-28
A
gric
ultu
ral
Raw
Mat
eria
ls
9.44
2.
93
81.7
8 2.
42
54.7
7 33
.67
5.88
6.
22
0.57
0.
17
5 27
+28
C
rude
Fer
tiliz
ers
and
Met
allic
Fer
rous
Ore
0.
50
0.02
0.
00
0.03
0.
00
0.00
9.
54
0.40
0.
00
0.00
6
3 E
nerg
y 14
.74
0.00
0.
43
0.05
0.
00
0.58
19
.61
20.0
3 0.
00
0.00
7
67+
68
Iron
and
Ste
el a
nd N
on-F
erro
us
Met
als
34.4
8 5.
99
0.00
7.
52
41.6
5 0.
00
1.43
13
.99
34.4
3 20
.64
8 65
+84
T
extil
es a
nd C
loth
ing
3.44
2.
96
0.00
1.
66
0.00
5.
59
14.5
3 5.
16
28.7
3 24
.96
3 61
+83
+85
H
ides
and
Lat
her
0.38
0.
00
0.00
0.
36
0.00
0.
00
0.03
0.
19
0.13
1.
82
10
63+
82
Woo
d M
anuf
actu
res
and
Fur
nitu
re
0.22
0.
02
0.00
0.
14
0.00
0.
00
0.00
0.
22
0.04
0.
16
11
64
Pap
er
0.26
0.
66
0.00
3.
88
2.97
0.
00
2.26
0.
20
1.76
1.
36
12
66
Non
-Met
alic
Min
eral
Man
ufac
tues
1.
37
2.14
0.
00
1.09
0.
00
2.10
1.
57
2.69
0.
87
0.07
13
5+
62
Che
mic
als
and
Rub
ber
Pro
duct
s 22
.24
6.81
0.
00
19.7
6 0.
00
0.00
6.
64
28.7
9 7.
68
4.75
14
69
M
etal
Pro
duct
s 0.
28
0.50
0.
00
2.89
0.
00
- 0.
00
0.58
0.
51
0.06
1.
17
15
7 M
achi
nery
and
Tra
nspo
rtat
ion
Equ
ipm
ent
2.78
68
.65
0.00
41
.31
' ..0
.61
43.3
2 35
.57
3.69
21
.64
30.9
2 16
81
+86
+89
+9
Mis
cella
neou
s M
anuf
actu
red
Art
icle
s 1.
37
5.66
0.
57
1.83
0.
00
3.37
0.
67
0.41
0.
14
4.04
Firs
t th
ree
sect
ors
with
hig
hest
sha
res
7,
13,
6 15
, 13
, 7
4,
1,
16
15,
13,
1 4
7, 1
1 15
, 4,
1
15,
6,
8 13
, 6,
1
7, 8
, 15
15
, 8,
7

Table 8: Turkish Nominal Protection Rates before and after the Customs Union with EU
1-0 CODE SECTOR NAME
NPR with EU in 1994
NPR with EU NPR with Third After Customs Countries in
Union 1994
Average MFN Tariff Rates
after Customs Union
Average Tariff Rates for GSP Beneficiaries after Customs
Union
I Agriculture 41.27 41.26 41.65 41.26 41.26 2 Animal husbandry 3.48 1.37 4.18 1.37 1.37 3 Forestry 0.01 0.01 0.10 0.01 0.01 4 Fishery 47.92 47.84 54.08 47.84 47.84 5 Coal mining 3.33 0.00 3.33 4.00 0.00 6 Crude petroleum 0.00 0.00 0.00 0.00 0.00 7 Iron ore mining 0.00 0.00 2.22 0.00 . 0.00 8 Other metalic ore mining 0.13 0.00 1.21 0.00 0.00 9 Non-metallic mining 9.09 0.00 11.02 0.95 0.95 10 Stone quarying 1.95 0.00 2.18 0.02 0.00 I I Slaughtering and meat 10.21 10.21 10.21 10.21 10.21 12 Fruits and vegetables 72.49 68.01 72.62 68.01 68.01 13 Vegetable and animal oil 16.31 16.31 16.38 16.29 16.29 14 Grain mill products 41.33 41.02 41.33 41.02 41.02 15 Sugar refining 28.79 28.79 28.79 28.79 28.79 16 Other food processing 26.47 18.31 28.99 18.31 18.31 17 Alcoholic beverages 72.10 5.25 94.28 11.28 7.35 18 Non-alcholic beverages 56.92 0.00 69.81 14.83 0.00 19 Processed tobacco 44.40 0.00 99.91 9.40 0.00 20 Ginning 0.00 0.00 2.22 0.72 0.72 21 Textiles 21.19 0.00 27.10 17.30 7.60 22 Clothing 14.75 0.00 20.65 19.90 9.30 23 Leather and fur production 7.85 0.00 12.57 10.20 2.80 24 Footwear 24.40 0.00 35.70 22.50 9.10 25 Wood products 15.25 0.00 18.97 2.00 0.05 26 Wood furniture 26.22 0.00 32.64 5.50 0.00 27 Paper and paper products 13.59 0.00 17.58 2.70 0.00 28 Printing and publishing 8.23 0.00 10.79 4.52 0.00 29 Fertilizers 8.22 0.00 16.38 8.10 0.00 30 Pharmaceutical production 3.33 0.00 8.99 5.30 0.00 3 I Other chemical production 10.79 0.00 17.62 8.71 0.04 32 Petroleum refining 22.54 0.00 24.35 2.70 0.00 33 Petroleum and coal products 5.62 0.00 7.52 2.15 0.00 34 Rubber products 19.57 0.00 23.91 5.60 0.03 35 Plastic products 24.61 0.00 31.68 9.90 0.00 36 Glass and glass production 16.85 0.00 21.94 5.76 0.00 37 Cement 30.45 0.00 32.88 3.14 0.00 38 Non-metallic mineral 18.33 0.00 23.21 5.47 0.00 39 Iron and steel 8.00 0.00 10.70 5.50 3.30 40 Non-ferrous metals 4.52 0.00 8.43 3.20 0.50 41 Fabricated metal products 18.36 0.00 25.29 6.00 0.11 42 Non-electrical machinery 7.36 0.00 12.50 4.40 0.00 43 Agricultural machinery 6.98 0.00 12.18 3.50 0.00 44 Electrical machinery 9.69 0.00 16.64 8.30 0.00 45 Shipbuilding and repairing 6.13 0.00 12.89 0.50 0.00 46 Railroad equipment 0.00 0.00 4.61 4.04 0.00 47 Motor vehicles 27.33 0.00 33.10 9.40 0.00 49 Other transport equipment 0.01 0.00 1.76 1.60 0.00 49 Other manufacturing industries 2.92 0.00 8.19 2.95 0.00
MEAN 10.22 1.34 22.14 6.92 2.71 STANDARD DEVIATION 17.68 14.48 15.36 13.79 14.51
Source: Own calculations for all sectors in columns 1, 2 and 3 NPR's for sectors 21, 22, 23, 24, 39 and 40 in column 4 have been obtained from Laird and Yeats (1990); for sectors
25, 26, 27, 30, 34, 35, 42, 44, 45 and 47 from GATT (1993) ; and own calculations for remaining sectors. NPR's for sectors 21, 22, 23, 24, 39 and 40 in column 5 have been obtained from Laird and Yeats (1990); own calculations for remaining sectors.
own calculations for remaining sectors.
35

Table 9: Share of Different Country Groups' Imports in Total Turkish Imports (1991-1993 Averages) and Corresponding Turkish NPR's before and after the formation of Customs Union with EU
Share in Imports
NPR 1994
NPR 2001
EU Countries 46.02 10.22 1.34
Countries EU has FTA with 7.75 22.14 1.34 GSP Countries 27.54 22.14 2.71 Countries EU applies the MFN Tariffs 18.46 22.14 6.92 Mediterrenean Countries 1.60 22.14 2.71
36

Tab
le 1
0: T
rade
Reg
imes
of t
he C
ount
ries
in T
rans
ition
CE
E C
ount
ries
----
Tar
iff a
n4 N
on-T
ariff
Impo
rt_B
arrie
rs
Cze
ch
Rep
ublic
A
vera
ge w
eigh
ted
tarif
f 5.7
% in
199
3. Q
uant
itativ
e im
port
re
stric
tions
on
som
e ag
ricul
tura
l pr
oduc
ts,
text
iles,
clo
thin
g,
stee
l an
d co
al;
licen
ces
for
oil
, ga
s an
d w
eapo
ns.
Slo
vak
Rep
ublic
A
10
% s
urch
arge
on
impo
rts
esta
blis
hed
in M
arch
19
94 w
as
rem
oved
in
Aug
ust.
Ave
rage
wei
ghte
d ta
riff
in
1993
was
5.7
%
Q
uant
itativ
e im
port
res
tric
tions
on
som
e ag
ricul
tura
l pr
oduc
ts,
text
iles,
clo
thin
g, s
teel
and
coa
l; im
port
lic
ense
s fo
r oi
l, ga
s an
d w
eapo
ns.
Hun
gary
A
bout
10
% o
f im
port
s su
bjec
t to
quo
ta o
r lic
ensi
ng re
stric
tions
, w
ith n
umbe
r in
crea
sing
in
1994
. A
vera
ge u
nwei
ghte
d ta
riff
chan
ged
from
13
%
(19
89)
to 1
1 %
(19
91)
to
16 %
(19
92);
fur
ther
in
crea
se i
n 19
94
Pol
and
Ave
rage
w
eigh
ted
tari
ff II
% o
n in
dust
rial
prod
ucts
and
18
%
on
agr
icul
tura
l pr
oduc
ts (
1993
).
Mos
t qu
antit
ativ
e re
stric
tions
el
imin
ated
in 1
990.
Quo
tas
on w
heat
, ca
rs,
alco
hol,
ciga
rs,
ciga
rette
s, e
ngin
e oi
l an
d pe
trol
. R
oman
ia
Mos
t lic
ensi
ng r
equi
rem
ents
elim
inat
ed i
n M
ay 1
992.
Wei
ghte
d av
erag
e ta
riff
11.7
%
(19
93).
Res
tric
tions
onl
y fo
r ar
ms,
dru
gs a
nd
item
s af
fect
ing
natio
nal
heal
th.
30 %
ant
i-dum
ping
dut
y on
alc
ohol
, ve
hicl
es, T
Vs
and
vide
o-re
cord
ers
impo
sed
betw
een
May
-Oct
. 19
93
Bul
garia
A
vera
ge ta
riff f
rom
13
% (
1989
) to
11
% (
1991
) to
16 %
(19
92).
22
%
aver
age
tarif
f on
indu
stria
l go
ods
repo
rted
in
1994
. M
inim
um p
rices
fo
t ty
res
and
stee
l pi
pes.
Res
tric
tive
impo
rt li
cenc
es f
or a
lim
ited
num
ber
of p
rodu
cts.
Som
e ta
riff q
uota
s on
pro
cess
ed f
oods
and
ag
ricul
tura
l pr
oduc
ts.
For
mer
Yug
osla
via
Slo
veni
a G
ener
ally
tarif
f fre
e. W
here
tar
iffs
are
appl
ied
rate
s ra
nge
up to
a
max
imum
of 2
5 %
. C
usto
ms
form
aliti
es ta
x of
I
%.
Som
e qu
otas
on
agric
ultu
ral
and
text
ile p
rodu
cts
(96
% o
f pro
duct
s fr
ee o
f quo
tas)
.
Bal
tic C
ount
ries
Est
onia
O
nly
14 %
of i
mpo
rts
are
subj
ect
to d
utie
s (1
0 %
for
furs
, se
a an
d ro
ad v
ehic
les)
, av
erag
e w
eigh
ted
tarif
f 1.4
% (
1993
). L
icen
ces
for
alco
hol
and
toba
cco.
No
quan
titat
ive
rest
rictio
ns.
Impo
rt s
ubsi
dies
ab
olis
hed
begi
nnin
g of
199
2.
Latv
ia
Bas
ic t
ariff
15
% (
as o
f M
arch
199
4),
but
man
y ex
cept
ions
at
0.5
%
(raw
mat
eria
ls, f
ood
prod
ucts
); s
ome
high
agr
icul
tura
l tar
iffs.
Im
port
lic
ensi
ng a
nd q
uota
s fo
r m
ilita
ry p
rodu
cts
and
toba
cco.
No
impo
rt
subs
idie
s.
Lith
uani
a Im
port
tarif
fs 5
-15
%;
high
er f
or f
ood
prod
ucts
, al
coho
l, to
bacc
o
and
abou
t a
doze
n m
anuf
actu
red
good
s (c
aryi
ng t
ariff
s up
to 2
5 %
).
No
quot
as s
ince
Oct
. 19
93 e
xcep
t fo
r he
alth
and
saf
ety
reas
ons
Sou
rce:
E
urop
ean
Ban
k fo
r R
econ
stru
ctio
n an
d D
evel
opm
ent,
Tra
nsiti
on R
epor
t, O
ctob
er
1994
Exp
ortQ
u_ot
as a
nd o
ther
_Exp
ort
Bar
riers
-
20 p
erce
nt of
exp
orts
req
uire
d lic
ensi
ng i
n 19
92.
Exp
ort
tax
of 1
00 %
app
lies
only
to
antiq
ues
and
art
wor
ks.
Exp
ort
licen
sing
for
liv
esto
ck a
nd p
lant
s, s
ome
natu
ral
reso
urce
s, a
nd p
rodu
cts
such
as
text
iles
and
stee
l whi
ch
are
subj
ect
to
quot
as i
n ot
her
coun
trie
s E
xpor
t lic
ensi
ng f
or l
ives
tock
and
pla
nts,
som
e na
tura
l re
sour
ces,
and
pr
oduc
ts s
uch
as t
extil
es a
nd s
teel
whi
ch
are
subj
ect
to q
uota
s in
oth
er c
ount
ries
Exp
ort of
fuel
s, w
heat
and
ind
ustr
ial
raw
mat
eria
ls s
ubje
ct
to li
cenc
es (
a lit
tle l
ess
than
25
% o
f exp
orts
). 8
0 %
of t
he
agric
ultu
ral
budg
et in
199
3 de
vote
d to
exp
ort
subs
idie
s.
In
1992
the
se a
mou
nted
to
an
estim
ated
13
% o
f exp
ort
valu
e M
inim
al e
xpor
t re
stric
tions
. M
ost
expo
rt s
ubsi
dies
wer
e el
imin
ated
in
1990
.
Exp
ort
quot
as o
n ra
w m
ater
ials
for
con
serv
atio
n re
ason
s
and
drug
s fo
r pr
ice
supp
ort
reas
ons.
Occ
asio
nal
expo
rt
bans
on
food
, fr
uits
and
woo
d pr
oduc
ts.
Red
uced
exp
ort
licen
sing
req
uire
men
ts s
ince
Jun
e 19
93.
Exp
ort
taxe
s on
30
ite
ms,
mai
nly
food
stuf
fs,
have
rep
lace
d m
ost
expo
rt q
uota
s. E
xpor
t qu
otas
on
six
prim
ary
com
mod
ities
. O
ccas
iona
l ex
port
ban
s on
agr
icul
tura
l pr
oduc
ts.
Reg
istr
atio
n an
d lic
ensi
ng r
estr
ictio
ns s
till
oper
ativ
e.
Tem
pora
ry e
xpor
t du
ties
of 1
0-25
% o
n ra
w m
ater
ials
. Pe
rmit
for
expo
rt o
f su
scep
tible
goo
ds.
Min
imal
exp
ort
barr
iers
. 10
0 %
exp
ort
tax
on a
ntiq
ues
and
art w
orks
. Q
uota
s re
mov
ed e
xcep
t fo
r ex
port
ban
on
grav
el a
nd s
peci
alis
ed c
lay.
Mos
t lic
ensi
ng r
equi
rem
ents
re
mov
ed O
ct.
1991
. N
o ex
port
sub
sidi
es.
Exp
ort t
axes
on
raw
mat
eria
ls, p
reci
ous
met
als
and
antiq
ues.
Few
qua
ntita
tive
rest
rictio
ns, m
ostly
for
hea
lth
and
natio
nal
secu
rity
reas
ons.
N
o ex
port
sub
sidi
es.
Som
e ex
port
tax
es o
n ra
w m
ater
ials
and
foo
dstu
ffs.
No
expo
rt s
ubsi
dies
. S
ome
quan
titat
ive
rest
rictio
ns.
Exp
ort
licen
sing
sys
tem
abo
lishe
d in
Jul
y 19
93.
Eac
hang
e_R
egim
e
Cur
rent
acc
ount
con
vert
ibili
ty f
or e
nter
pris
es,
som
e ca
pita
l co
ntro
ls.
Peg
ro
DM
/US
D b
aske
t.
Cur
rent
acc
ount
con
vert
ibili
ty f
or e
nter
pris
es,
som
e ca
pita
l co
ntro
ls.
Peg
to
DM
/US
D b
aske
t.
Cur
rent
acc
ount
con
vert
ibili
ty (
exce
pt t
ouris
m).
S
ome
rest
rictio
ns re
mai
n on
cap
ital
acco
unt.
Peg
to U
SD/E
CU
bas
ket.
Larg
ely
curr
ent
acco
unt
conv
ertib
ility
, lim
its
on r
esid
ent'
capi
tal
acco
unt
tran
sact
ions
. P
rean
noun
ced
craw
ling
peg
regi
me.
Virt
ual
curr
ent
acco
unt
conv
ertib
ility
(ex
cept
to
uris
m),
but
cap
ital
cont
rols
. F
loat
ing
exch
ange
ra
te.
Few
res
tric
tions
on
curr
ent
acco
unt,
heav
y co
ntro
ls o
n ca
pita
l ac
coun
t. F
loat
ing
rate
.
Ful
l cu
rren
t ac
coun
t co
nver
tibili
ty, s
ome
rest
rictio
ns o
n ca
pita
l ac
coun
t. F
loat
ing
exch
angt
ra
te.
Ful
l cu
rren
t ac
coun
t, vi
rtua
l cap
ital
acco
unt
conv
ertib
ility
. Cur
renc
y bo
ard
with
rat
e fix
ed
to D
M.
Ful
l cu
rren
t an
d ca
pita
l ac
coun
t co
nver
tibili
ty.
Info
rmal
peg
to
SD
R.
Ful
l cu
rren
t and
(vi
rtua
lly)
capi
tal
acco
unt
conv
eritb
ility
. C
urre
ncy
boar
d, w
ith r
ate
fixed
to
US
D.

Table 11: Importance of Industrial Products in CEE Exports to EU and Pre-Agreement Market Access for Different Industrial Commodity Groups
Share of Industrial Commodities in
T l E t EU t t
Simple Average Tariff Rate NTB Coverage Ratio
xpor o o a s during 1991 Industrial Other Industrial Other
Bulgaria 73.0 6.9 11.6 22.5 48.3 Czechoslovakia 92.0 7.0 11.7 24.0 52.5 Hungary 73.0 0.1 9.4 24.2 57.7 Poland 81.0 0.1 10.5 23.6 48.6 Romania 94.0 0.0 8.6 28.4 59.8
Immediate Free Trade Group
Simple Share in Average Industrial Tariff Exports Rate
NTB Coverage
Ratio
Bulgaria 43.0 5.6 3.6 Czechoslovakia 44.0 5.7 3.8 Hungary 50.0 0.0 3.7 Poland 41.0 0.1 3.8 Romania 32.0 0.0 3.4
Textiles and Clothing Group
Bulgaria 20.9 10.8 90.6 Czechoslovakia 13.6 10.7 87.6 Hungary 21.4 0.1 85.1 Poland 17.6 0.0 88.8 Romania 28.2 0.1 86.2
The Steel ECSC Sub-Group
Bulgaria 11.4 5.4 74.6 Czechoslovakia 10.5 5.6 64.4 Hungary 4.2 0.0 58.2 Poland 4.5 0.1 57.4 Romania 3.6 0.0 68.2
The Quota/Five Year Delayed Free Trade Group
Bulgaria 16.3 8.6 18.8 Czechoslovakia 26.5 8.7 20.6 Hungary 24.3 0.0 21.0 Poland 23.6 0.0 21.7 Romania 31.4 0.0 23.7
Source: Kaminski (1994)
38

Table 12: Turkish Effective Protection Rates before and After the Customs Union with EU and Sensitive Sectors in the Turkish Economy
I-O CODE SECTOR NAME
EPR 1994
EPR 2001
Effects of the Customs Union
19 Processed tobacco 159.71 -84.25 -243.96
32 Petroleum refining 180.44 3.75 -176.69 18 Non-alcholic beverages 128.03 -40.69 -168.72
17 Alcoholic beverages 145.43 -13.57 -159.00 26 Wood furniture 62.67 1.67 -61.00
24 Footwear 67.17 15.12 -52.05
35 Plastic products 48.45 2.22 -46.24
37 Cement 46.02 0.65 -45.37
47 Motor vehicles 46.21 1.97 -44.24
25 Wood products 37.28 0.67 -36.61
41 Fabricated metal products 35.90 0.66 -35.24 34 Rubber products 33.95 1.29 -32.66 21 Textiles 28.79 2.68 -26.11
38 Non-metallic mineral 26.79 1.30 -25.49
36 Glass and glass production 25.54 1.26 -24.28 16 Other food processing 29.37 5.33 -24.04 27 Paper and paper products 19.20 -0.04 -19.24 44 Electrical machinery 16.83 1.97 -14.87 29 Fertilizers 13.63 1.78 -11.85
31 Other chemical production 12.61 1.45 -11.16 23 Leather and fur production 10.73 0.43 -10.30 9 Non-metallic mining 9.91 0.47 -9.45
39 Iron and steel 11.10 2.88 -8.22 42 Non-electrical machinery 8.37 0.45 -7.92 45 Shipbuilding and repairing 6.51 -0.83 -7.34 43 Agricultural machinery 6.82 0.03 -6.79 12 Fruits and vegetables 291.43 285.80 -5.63
40 Non-ferrous metals 6.11 0.85 -5.27 30 Pharmaceutical production 4.52 0.50 -4.02 28 Printing and publishing 4.42 1.04 -3.39 2 Animal husbandry -18.61 -21.65 -3.04
49 Other manufacturing industries 1.91 -0.04 -1.95 20 Ginning -138.12 -139.98 -1.86
5 Coal mining 1.81 0.71 -1.10 10 Stone quarying 0.29 -0.09 -0.37 3 Forestry -0.28 -0.01 0.26
6 Crude petroleum -0.78 -0.06 0.72 46 Railroad equipment -0.21 0.57 0.78
48 Other transport equipment -0.84 0.23 1.07
1 Agriculture 44.41 45.60 1.19
4 Fishery 56.58 58.10 1.52
8 Other metalic ore mining -1.68 -0.13 1.54 13 Vegetable and animal oil 6.62 8.76 2.14 7 Iron ore mining 2.74 -0.21 2.53 11 Slaughtering and meat 16.82 21.36 4.55
33 Petroleum and coal products -6.14 0.08 6.23 22 Clothing 7.44 17.35 9.91
15 Sugar refining -54.25 -35.98 18.27 14 Grain mill products 281.46 301.45 19.99
MEAN 18.44 1.12 STANDARD DEVIATION 72.32 65.39
Source: Own Calculations
39

Table 13: Actual and Potential Trade between EU, CEE and Baltic Countries and Turkey during 1992
Actual Exports from
Turkey
Potential Exports
from Turkey
Ratio of Potential to
Actual Exports
Actual Imports
into Turkey
Potential Imports
into Turkey
Ratio of Potential to
Actual Exports
Country (US$ million) (US$ million US$ million) (US$ million
Bulgaria 86.22 235.23 2.73 243.24 178.98 0.74 Czech Republic 58.45 134.01 2.29 222.99 150.13 0.67 Estonia 0.30 20.58 69.29 3.44 24.29 7.07 Hungary 37.51 196.40 5.24 86.68 248.35 2.87 Latvia 2.89 29.45 10.18 2.75 27.93 10.16 Lithuania 3.95 35.25 8.92 13.82 26.31 1.90 Poland 234.80 342.83 1.46 91.10 333.48 3.66 Romania 151.65 408.19 2.69 300.78 283.59 0.94 Slovak Republic 15.74 82.46 5.24 21.91 78.87 3.60 Slovenia 30.21 70.54 2.34 45.88 143.79 3.13
621.72 1554.94 2.50 1032.57 1495.72 1.45
Note: The actual trade figures refer to the year 1993
40

Tab
le 1
4: P
revi
ous
EC
Enl
arge
men
ts
UK
Ir
elan
d D
enm
ark
Gre
ece
Spa
in
Por
tuga
l A
ustr
ia
Fin
land
S
wed
en
Dem
ocra
cy R
esto
red
1974
19
77
1974
EC Accession
1973
1973
1973
1981
1986
1986
1995
1995
1995
Per
Cap
ita I
ncom
e at
Acc
essi
on
% o
f EC
Ave
rage
82
.0
53.5
12
2.9
40.7
49
.5
22.8
11
8.6
97.3
12
7.4
% o
f po
ores
t EC
Mem
ber
113.
4 74
.1
170.
2 75
.7
133.
5 61
.4
312.
9 25
6.7
336.
0
Pop
ulat
ion
at A
cces
sion
% o
f EC
Tot
al a
t A
cces
sion
26
.9
1.5
2.4
3.5
13.3
3.
5 2.
3 1.
5 2.
5
Sha
re o
f Agr
icul
tura
l VA
in G
DP
at A
cces
sion
3.
0 18
.3
7.1
16.1
5.
6 7.
4 2.
7 2.
4 0.
6

Tab
le 1
5: B
asic
Dat
a on
Act
ual a
nd P
oten
tial A
pplic
ants
for
Mem
bers
hip
in E
U
Bul
garia
C
zech
R.
Est
onia
H
unga
ry
Latv
ia
Lith
uani
a P
olan
d R
oman
ia
Slo
vak
R.
Slo
veni
a T
urke
y
Dem
ocra
cy R
esto
red
1990
1990
1992
1990
1993
1992
1990
1990
1990
1992
1983
Per
Cap
ita In
com
e re
lativ
e to
EU
inco
me
in 1
993
% o
f E
C A
vera
ge
5.8
13.7
15
.6
16.9
10
.2
6.7
11.4
5.
8 9.
9 32
.8
11.0
% o
f po
ores
t E
C M
embe
r 15
.4
36.7
41
.7
45.3
27
.2
17.9
30
.6
15.4
26
.4
87.8
29
.6
Per
Cap
ita P
PP
Inco
me
rela
tive
to P
PP
EU
inc
ome
in 1
993
% o
f EC
Ave
rage
24
.4
44.9
38
.7
36.0
29
.8
18.5
29
.8
16.7
37
.4
23,3
% o
f po
ores
t EC
Mem
ber
45.6
83
.9
72.2
67
.2
55.7
34
.6
55.6
31
.1
69.9
43
,6
Pop
ulat
ion
rela
tive
to E
U p
opul
atio
n in
199
3
% o
f EC
Tot
al
2.3
2.8
0.4
2.8
0.7
1.0
10.4
6.
2 1.
5 0.
5 16
.1
Sha
re o
f Agr
icul
tura
l VA
in G
DP
dur
ing
1993
("r
o)
13.2
5.
5 15
.2
8.2
15.0
24
.8
7.4
21.6
6.
6 5.
0 15
.4
Sha
re o
f Agr
icul
tura
l Lab
or in
Tot
al C
ivili
an E
mpl
oym
ent (
%)
17.4
6.
5 15
.4
8.1
18.4
19
.0
26.9
32
.2
10.3
42
.8

Table 16: Expected Developments in CEE, Baltic Countries' and Turkey's Per Capita GNP
Assumed Assumed YEARS ELAPSED Per Capita Annual Growth Annual Growth
Income of GNP of Population 5 10 15 20 25
PESSIMISTIC SCENARIO
CEE Countries
Czech Republic 2710 3.0 0.2 36.49 36.32 36.14 35.97 35.79
Slovak Repulic 1950 3.0 0.6 26.26 26.13 26.01 25.88 25.75
Hungary 3350 3.0 -0.4 45.11 44.89 44.68 44.46 44.25
Poland 2260 3.0 0.2 30.43 30.29 30.14 29.99 29.85
Romania 1140 3.0 0.0 15.35 15.28 15.20 15.13 15.06
Bulgaria 1140 3.0 -0.4 15.35 15.28 15.20 15.13 15.06
Baltic Countries
Estonia 3080 3.0 -0.3 41.48 41.28 41.08 46.88 40.68
Latvia 2010 3.0 -0.4 27.07 26.94 26.81 26.68 26.55 Lithuania 1320 3.0 0.0 17.78 17.69 17.60 17.52 17.43
Slovenia 6490 3.0 0.1 87.40 86.97 86.55 86.13 85.72
Turkey 2184 4.4 1.9 31.46 33.50 35.66 37.97 40.43
Greece 7390 3.1 0.5
PROBABLE CASE
CEE Countries
Czech Republic 2710 5.0 0.2 40.18 44.02 48.23 52.84 57.89 Slovak Repulic 1950 5.0 0.6 28.91 31.67 34.70 38.02 41.65
Hungary 3350 5.0 -0.4 49.67 54.41 59.62 65.32 71.56 Poland 2260 5.0 0.2 33.51 36.71 40.22 44.06 48.28 Romania 1140 5.0 0.0 16.90 18.52 20.29 22.23 24.35
Bulgaria 1140 5.0 -0.4 16.90 18.52 20.29 22.23 24.35
Baltic Countries
Estonia 3080 5.0 -0.3 45.66 50.03 54.81 60.05 65.79 Latvia 2010 5.0 -0.4 29.80 32.65 35.77 39.19 42.94 Lithuania 1320 5.0 0.0 19.57 21.44 23.49 25.74 28.20
Slovenia 6490 5.0 0.1 96.22 105.42 115.49 126.54 138.63
Turkey 2184 5.4 1.9 33.00 36.85 41.15 45.95 51.30
OPTIMISTIC SCENARIO
CEE Countries
Czech Republic 2710 6.0 0.2 42.13 48.39 55.59 63.87 73.37 Slovak Repulic 1950 6.0 0.6 30.31 34.82 40.00 45.96 52.79 Hungary 3350 6.0 -0.4 52.08 59.82 68.72 78.95 90.69 Poland 2260 6.0 0.2 35.13 40.36 46.36 53.26 61.18 Romania 1110 6.0 0.0 17.72 20.36 23.39 26.87 30.86 Bulgaria 1140 6.0 -0.4 17.72 20.36 23.39 26.87 30.86
Baltic Countries
Estonia 3080 6.0 -0.3 47.88 55.00 63.19 72.59 83.38 Latvia 2010 6.0 -04 31.25 35.89 41.23 47.37 54.42 Lithuania 1320 6.0 0.0 20.52 23.57 27.08 31.11 35.74
Sl ovenia 6490 6.0 0.1 100.89 115.90 133.14 152.95 175.70
Tu rkey 2184 7.0 1.9 35.58 42.84 51.58 62.10 74.77
43

Table 17: Total Budget Cost of EU Membership (billion US $)
Czech Republic 2.50 Hungary 2.88 Slovenia 0.25
Sub-Total 5.63
Poland 8.13
Sub-Total 13.75
Estonia 0.75 Latvia 1.50 Lithuania 1.75
Sub-Total 17.75
Bulgaria 2.88 Romania 11.63
Slovak Republic 1.13
Sub-Total 33.38
44

Appendix
Classification Scheme for Revised SITC, Revision 2
SITC COMMODITY SITC COMMODITY
00
Food and Live Animals Chiefly for Food Live-Animals chiefly for Food 61
Manufactured Goods Classified Chiefly by Material Leather Manufactures
01 Meat and Meat Preparations 62 Rubber Manufactures 02 Dairy Producs 63 Cork and Wood Manufactures 03 Fish and Fish Preparations 64 Paper
04 Cereals and Cereal Preparations 65 Textiles 05 Vegetables and Fruit 66 Non-metallic Mineral Manufactures
06 Sugar and Sugar Preparations 67 Iron and Steel
07 Coffe, Tea, Cocoa, Spices 68 Non-ferrous Metals 08 Freeding Stuff for Animals 69 Manufactures of Metal 09 Miscellaneous Edible Products
Beverages and Tobacco 71
Machinery and Transport Equipment Power Generating Machinery and Equipment
11 Beverages 72 Machinery specialized for particular industries 12 Tobacco and Tobacco Manufactures 73 Metalworking Machinery
74 General industrial machinery and equipment Crude Materials, Inedible, Except Fuels 75 Office Machines
21 Hides, Skins and Furskins, Raw 76 Telecommunications appartus
22 Oil Seeds and Oleaginous Friut 77 Electrical Machinery 23 Crude Rubber 78 Road vehicles 24 Cork and Wood 79 Other transport equipment 25 Pulp and Waste Paper 26 Textile Fibres and their Wastes Miscellaneous Manufactured Articles 27 Crude Fertilizers and Crude Minerals 81 Sanitary, Plumbing, Heating 28 Metalliferous Ores and Metal Scrap 82 Furniture 29 Crude Animal and Vegetable Metarials 83 Travel Goods
84 Clothing Mineral Fuels, Lubricans and Related Materials 85 Footwear
32 Coal 87 Scientific Instruments and Optical Goods 33 Petroleum and Petroleum Products 88 Photographic apparatus and optical goods 34 Gas, Natural and Manufactured 89 Miscellaneous Manufactured Articles 35 Electric Current
41
Animal and Vegetable Oils, Fats and Waxes Animal Oils and Fats 91
Commodities and transactions not classified elsewhere in the SITC
Postal packages 42 Fixed Vegetable Oils and Fats 93 Special transactions 43 Animal and Vegetable Oils and Fats, Proc. 94 Animals, live
95 Armoured fighting vehicles Chemicals and Related Products 96 Coin
51 Organic Chemicals 97 Gold, non monetary 52 Inorganic Chemicals 53 Dyeing, Tanning, and Colouring Materials 54 Medicinal and Pharmaceutical Products 55 Essential Oils and Perfume Materials 56 Fertilizers, manufactured 57 Explosives 58 Plastic Metarials 59 Chemical Materials and Products, N.E.S.
45

LIST OF ABBREVIATIONS
CEE Central and Eastern European CU Customs Union CUA Customs Union Agreement EAs Europe Agreements EC European Community ECSC European Coal and Steel Community EFTA European Free Trade Association MFN Most Favoured Nation QR Quantitative Restrictions
46

The Economic Research Forum for the Arab Countries, Iran and Turkey (ERF) was established in June 1993 as an independent, non-profitmaking regional networking organization. Its mission is to promote policy-relevant economic research with a broad representation of views, and to help activate the policy-formulation debate in the region - by encouraging and funding quality research, and disseminating results of research activities to economists and policy-makers.
The ERF Working Papers Series disseminates the findings of research work in progress to pro- mote the exchange of ideas, and encourage discussion and comment among researchers for time- ly revision and application by the author(s).
The Working Papers are a prepublication outlet intended to make preliminary research results available with the least possible delay. They are therefore subject to light editing only when strictly necessary, and ERF accepts no responsibility for errors.
The views expressed in the Working Papers are those of the author(s) and not those of ERF. Requests for permission to quote their contents should be addressed directly to the author(s). ERF retains the rights to first publication unless mutually agreed to the contrary.

ECONOMIC RESEARCH F DRUM
FOR THE ARAB COUNTRIES, IRAN & TURKEY
7 Boulos Hanna Street, Dokki, Cairo, Egypt Tel : (202) 3370810 - (202) 3485553 - (202) 3602882. Fax : (202) 3616042 or (202) 3602882 E-mail : HANDOUSA @ AUC-ACS.EUN.EG or ERF @ IDSC.GOV.EG