"Cognitive development across different age ranges in late adulthood "
Upload
independentCategory
view
0download
0
Iuf
Aa
b
c
a
A
R
R
3
A
P
K
P
H
S
1
Laeat
0d
e c o l o g i c a l m o d e l l i n g 2 0 8 ( 2 0 0 7 ) 307–316
avai lab le at www.sc iencedi rec t .com
journa l homepage: www.e lsev ier .com/ locate /eco lmodel
dentifying mechanistic models of spatial behavioursing pattern-based modelling: An example
rom lizard home ranges
ndrew Tyrea,∗, Gregory D. Kerrb, Brigitte Tenhumbergc, C. Michael Bull b
School of Natural Resources, University of Nebraska-Lincoln, 416 Hardin Hall, East Campus, Lincoln, NE 68583-0974, United StatesFlinders University of South Australia, School of Biological Sciences, GPO 2100 Adelaide, SA 5001, AustraliaUniversity of Nebraska-Lincoln, School of Biological Sciences, Lincoln NE 68583, United States
r t i c l e i n f o
rticle history:
eceived 7 February 2006
eceived in revised form
0 May 2007
ccepted 12 June 2007
ublished on line 19 July 2007
eywords:
attern based modelling
ome range analysis
pace use
a b s t r a c t
Landscape and population level patterns form through the aggregation of responses of indi-
vidual organisms to heterogeneity. Spatial organisation within a population can range from
random overlap of individual home ranges, to completely exclusive territories, with most
populations falling somewhere between these two extremes. A fundamental question in
behavioural ecology concerns the factors that influence the degree of spatial overlap of
home ranges, and the processes that determine how likely it is that an individual will access
resources over its home range. However, traditional experimental methods are not always
practical or possible. Pattern-based modelling is an alternative, non-intrusive technique for
explaining observed patterns. We explored behavioral mechanisms for home range overlap
in a Scincid lizard, Tiliqua rugosa, by constructing a spatially explicit individual based model.
We tested two mechanisms, one that used refuge sites randomly and one that included a
behavioural component. The random use model, the fixed total range model, incorporated
all refuge sites within a circle of radius h. The behavioural model, the variable total range
model, probabilistically incorporated refuge sites based on nearest neighbour distances and
use by conspecifics. Comparisons between the simulated patterns and the observed pat-
terns of range overlap provided evidence that the variable total range model was a better
approximation of lizard space use than the fixed total range model. Pattern-based modelling
showed substantial promise as a means for identifying behavioral mechanisms underlying
observed patterns.
small scale process to reproduce the larger scale patterns. For
. Introduction
andscape and population level patterns form through theggregation of responses of individual organisms to het-
rogeneity. In general, when making broad predictions, wessume that small-scale responses can be characterizedhrough their asymptotic properties, such as the mean and∗ Corresponding author. Tel.: +1 402 472 4054; fax: +1 402 472 2946.E-mail addresses: [email protected], [email protected] (A. Tyre
304-3800/$ – see front matter © 2007 Elsevier B.V. All rights reserved.oi:10.1016/j.ecolmodel.2007.06.004
© 2007 Elsevier B.V. All rights reserved.
variance. However, if there is evidence that a simple represen-tation of the small scale process is incorrect, then we need todevelop biologically more sophisticated models faithful to the
).
example, the distribution of home ranges may be controlledby spatial constraints or by small scale interactions with con-specifics. This paper examines the effect of different small
i n g
308 e c o l o g i c a l m o d e l lscale biological processes on the generation of the pattern ofhome range overlap and refuge use of the Australian sleepylizards, Tiliqua rugosa using “pattern-based modelling” (Grimmet al., 1996, 2005; Wiegand et al., 2003).
Spatial organisation within a population can range fromrandom overlap of individual home ranges, to completelyexclusive territories, with most populations falling some-where between these two extremes. A fundamental questionin behavioral ecology concerns the factors that influence thedegree of spatial overlap of home ranges, and the processesthat determine how likely it is that an individual will accessresources over its home range. There are two traditional waysthat have been used to address these questions. One methodhas been to compare observations made at different times orplaces with variable levels of one or more factors that mightinfluence the process. Thus, when we compare among sur-veys, if higher population densities are associated with greaterhome range overlap, we might deduce that density relatedinteractions have an important role. A second method hasbeen to conduct experimental manipulations, for instanceof population density, to investigate the importance of themanipulated factor. However, these traditional methods arenot always available, or are sometimes logistically difficult toachieve, for instance among large vertebrates with small pop-ulations. When a simple experiment is the object of prediction,for example, comparing trap selection by female Drosophila(Stamps et al., 2005), then it is often possible to exactlycalculate the likelihood of an observation under differentmechanistic models and use the powerful methods developedfor comparison of likelihoods (Burnham and Anderson, 1998).However, when the patterns and mechanisms are complexand/or measured at large spatial and temporal scales, suchas range overlaps among troops of chimpanzees (Lehmannand Boesch, 2003), then calculating the likelihood becomesdifficult or impossible.
Pattern-based modelling is an alternative, non-intrusivetechnique, that can explore existing hypotheses, identifymodels that are not realistic representations of the biologicalprocesses, and indicate directions that more detailed obser-vation or experimentation should focus on (Grimm et al.,1996, 2005; Wiegand et al., 2003). The pattern-based modellingapproach appears to work even with “weak” patterns that canbe produced by many different possible mechanisms. By com-bining several weak patterns, strong inferences about modelparameters and structure can be generated (Grimm et al., 1996,2005). For instance, pattern-based modelling has been used toidentify demographic and movement parameters in invadingspecies from genetic data (Estoup et al., 2004).
Pattern-based modelling begins by identifying and quan-tifying biological patterns, essentially any non-randomrelationship in the data. A mechanistic model with a specificset of parameters can then simulate the same type of data,and the generated pattern can be compared with the empiri-cally observed pattern. Multiple simulations can be generatedusing a range of values for each of the model parameters. Thecloser the fit of the model to the empirically derived pattern,
the more realistic the assumptions of the model are assumedto be. Pattern-based modelling allows insights into which ofa large number of alternative parameter values most closelyresembles the real biological situation. In addition, the pat-2 0 8 ( 2 0 0 7 ) 307–316
terns generated from a series of structurally different modelscan be included in the comparison, providing a decision cri-terion on the degree of model complexity that is sufficient tocapture the relevant ecology. Close resemblance between real-ity and model outputs does not, of course, imply the modelis correct, but lack of resemblance would be stronger evi-dence against a model. Like all model selection procedures(e.g. information theoretic methods Burnham and Anderson,1998) pattern-based modelling cannot determine if an alter-native model structure that has not been considered, woulddo better.
The pattern of home range overlap and refuge use of theAustralian sleepy lizard (Tiliqua rugosa) influences the popula-tion dynamics of its ticks (Bull, 1978), and is an example wheresmall scale processes influencing the opportunities for sur-vival and transmission of parasites can have broader influenceon the larger scale populations of both host and parasite. InSouth Australia, sleepy lizards are active during the day time,but will generally seek a shelter refuge for the night (Kerr etal., 2003). They also use those refuges during the day whentemperatures are too cold or too hot for normal activity. Forlizards in this habitat, refuges include bushes, hollow logs,large tussocks of grass, and burrows dug by rabbits or wom-bats (Kerr et al., 2003). The number of days before a refuge siteis revisited by a lizard is critical for tick population dynam-ics, because ticks wait in lizard refuges to find new hosts, andtheir survival decreases with increased time spent waiting.Thus, the distribution of return times to refuge sites influencesthe transmission rates of parasites between host individu-als. Recent observations have suggested that not all potentialrefuge sites are equally likely to be used by lizards (Kerr etal., 2003), and that there is significant internal structure in thehome ranges of sleepy lizards (Kerr and Bull, 2006a). Lizardsmaintain core areas around high quality refuge sites that arerarely entered by conspecifics of the same sex. High qual-ity refuges are large bushes with foliage in contact with theground that are highly efficient in protecting lizards againsthigh temperatures (Kerr et al., 2003).
In this paper, we combined these observations to iden-tify a model of lizard refuge use that reproduces patternsof home range internal structure and overlap, and can beincorporated into individual based models of lizard and tickdynamics. We used pattern-based modelling to compare sim-ulated lizard behaviours with observed consequences of lizardbehaviour. Our results suggested that local constraints inrefuge choices by individual lizards (identified by a mini-mum nearest neighbor distance) were critical in generatingthe pattern of home range overlap. In contrast, interactionswith conspecifics appeared to weakly influence this pattern.Although we used a specific lizard social system, the broadprinciple we illustrate is that fine scale detail of the behaviourand ecology of a species can be incorporated into models toprovide deeper insights and greater predictive power.
2. Methods
This paper aimed to explore behavioral mechanisms thatmight generate observed spatial patterns of home range over-lap. Sleepy lizards form monogamous partnerships and share
g 2 0 8 ( 2 0 0 7 ) 307–316 309
hwortcttbtTtisarIc
2
Ts1pB(eoomtuiwrd(t(ais
icrclrwir(a
2
Il
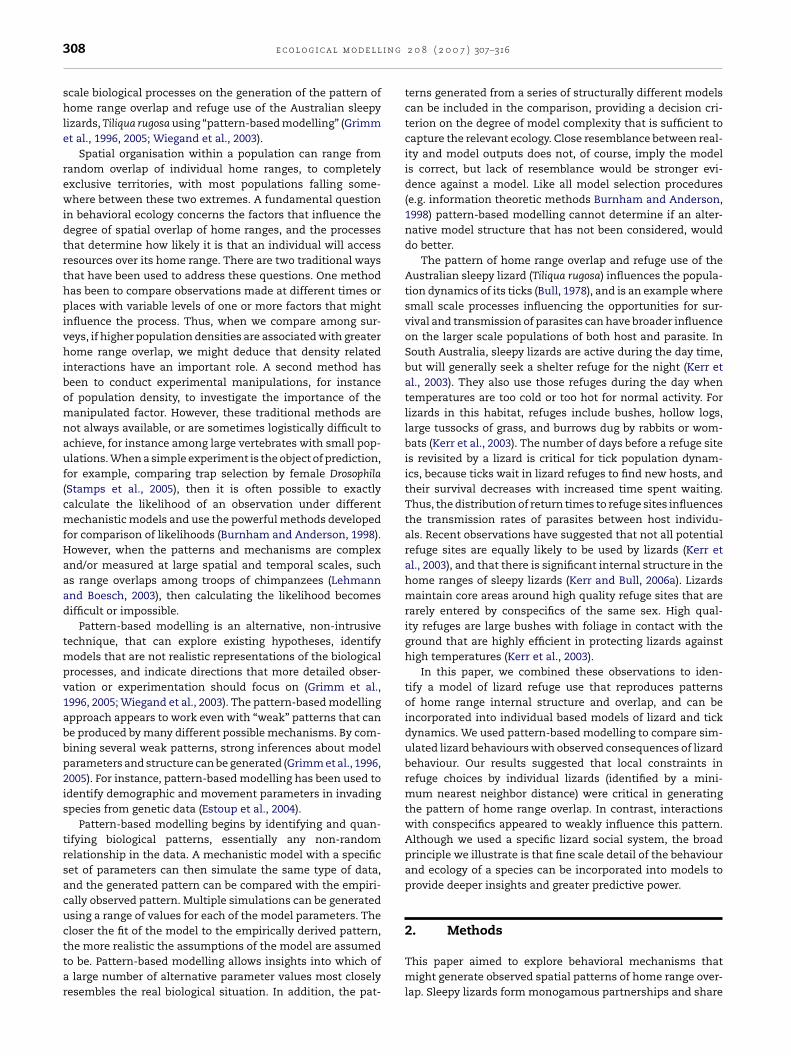
Fig. 1 – 95% (solid lines) and 80% (dotted lines) rangepolygons calculated using hierarchical cluster analysis for a
e c o l o g i c a l m o d e l l i n
ome ranges and refuges over much of the spring seasonhen they are most active (Bull, 1988; Bull et al., 1998). Males
verlapped extensively with other males in their total homeanges, but overlapped little or not at all with other males inheir core areas (Kerr, 2005). These core areas are closely asso-iated with refuge sites. In this paper we restricted our focuso observations of male–male overlap. We derived the spa-ial organisation of male lizards in a number of simulationsased on various rules of refuge site use, and then comparedhose simulated results with the empirically observed pattern.he basis for this study was that the set of model conditions
hat generated patterns closest to reality, might give importantnsights into the biological processes in the population. In ourimulations we considered two classes of models. In the first,lizard occupied a home range with a number of overnight
efuge sites, and selected those refuges at random each night.n the second, spatial constraints and interactions with otheronspecific males influenced refuge site use.
.1. The patterns
he empirical data used in this analysis were derived from atudy of movement patterns of radio-tagged sleepy lizards in a.5 km2 area of homogeneous chenopod shrubland composedredominantly of the blue-bush (Maireana sedifolia) at theundey Bore study site north of Mt. Mary, SA (33◦55′S, 139◦21′E)
Kerr et al., 2003; Kerr and Bull, 2004a,b; Kerr et al., 2004b). Inach of four years (2000–2003) each of 30–50 lizards was locatedn usually four days a week throughout the four-month periodf maximum lizard activity (September–December). All per-anent resident lizards within the study area were included in
he analysis, and each lizard was located at least 20 times, butsually over 60 times in a year. Each lizard total home range
ncluded many potential refuge sites, and individual lizardsere observed using between 1 and 56 (median = 16) overnight
efuges within this home range over a season. Ranges wereetermined using hierarchical incremental cluster polygons
ICP) (Kenward, 2001). The mean range area, estimated fromhe ICP core area containing 90% of observations, was 14426 m2
95% CI [12 850, 16 001], n = 88) in climatically normal years. Inyear of exceptionally low rainfall (2002) activity was dimin-
shed (Kerr et al., 2004a; Kerr and Bull, 2006b), and ranges weremaller (Kerr and Bull, 2006a).
Kerr and Bull (2006a) used hierarchical cluster analysisn Ranges6 (Kenward et al., 2003), to identify multi-nucleateore areas (Kenward, 2001; Kenward et al., 2001) within lizardanges. This analysis sequentially adds locations that arelosest to locations already included, leading to clusters ofocations in areas most commonly used within the homeange. A single large cluster of locations generally formedhen 90–100% of all location fixes of a lizard were included
n the analysis. As the proportion of available fixes used waseduced the range fragmented into a series of smaller clustersFig. 1), which were interpreted as core areas (sensu Samuel etl., 1985) within the home range.
.2. Pattern analysis
n this paper we derived home ranges from simulated lizardocations using hierarchical cluster analysis implemented in
single female lizard with overnight refuge fixes in all yearsincluded. The 95% polygon covers 16 488 m2.
the statistical software R (Version 1.8.0; Ihaka and Gentleman,1996). Our analysis differed slightly from that in the Ranges6software, most notably in the absence of a boundary strip (thelizard fixes were 95% accurate to <2 m in this case). In a fewcases the exact order in which clusters were merged, as morelocation fixes were included differed between the two pro-grams. However, visual comparisons of home range polygonsshowed high congruence between the two implementations.For consistency, all analyses in this paper were carried outusing the R software (available from 1st author) for both empir-ical and simulated data.
Kerr and Bull (2006a) reported an empirical pattern inwhich both the number of neighbouring lizards with over-lapping home ranges, and the area of home range overlapdecreased hyperbolically as the percentage of available fixesused decreased (i.e. as the home range area was more closelyrestricted to the core of activity; Fig. 2). We quantified thispattern by fitting generalised linear models (GLM) of the form
log(y) = a + b log(x) (1)
where x is the proportion of fixes used to generate the homerange, and y is either the total area of overlap or the number oflizards with home ranges that overlap that of a focal lizard. Weestimated parameters for this model using the GLM functionin R. We used a Poisson error distribution for the number ofoverlapping home ranges, and a quasi-likelihood distributionwith variance proportional to the mean, for the area of overlap.In both cases we used a log link function. The parameter a canbe interpreted as the logarithm of overlap in either numbers of
overlapping home ranges, or total area of overlap when 100%of fixes are used. The parameter b describes the decrease inlog overlap as the proportion of fixes included is reduced from100% to ∼37% (log(0.37) = −1).
310 e c o l o g i c a l m o d e l l i n g
Fig. 2 – Examples of empirical patterns of male–maleoverlap in 2000: (A) # of individual lizards overlapping witha focal lizard as a function of the proportion of GPS fixesincluded for male–male interactions; individual points are“jittered” to prevent overlap. The curve is the predictedmean from the GLM; the estimated intercept (SE) was 0.77(0.14) and the slope (SE) was 6.13 (0.86). (B) Total areaoverlapping (m2) between a focal lizard and all other lizardsas a function of the proportion of fixes included formale–male interactions. The estimated intercept (SE) was
10.7 (0.17) and the slope (SE) was 23.6 (5.10).Note that this analysis is distinctly different from the com-mon practice of plotting estimated range area against theabsolute number of fixes that have been obtained as a methodof identifying a minimum sufficient number of fixes (e.g.Gautestad and Mysterud, 1993, 1995). In our case the totalnumber of fixes of lizard position is set to 100%, and then wesearch for the tightest cluster or clusters of locations aroundsmaller percentages of those fixes to identify core areas.
2.3. Simulation models
We derived parameters for the model using data from thestudied sleepy lizard population in the Mt. Mary region, whereindividual home ranges are approximately 200 m across.Tyre (1999) calculated Jolly-Seber estimates of lizard densityfrom random capture data described in Bull (1995), rangingfrom 15 to 420 lizards/km2. The median lizard density was100 lizards/km2. The model operates in two phases. Duringthe initial “setup” phase, each lizard identifies its “total rangeset”, the set of refuges it will use during the year. In the second“activity” phase, lizards move among the refuges in their total
range set and the virtual ecologist records their locations. Thetime scale of the activity phase was 210 days, 1st Septemberto 31st March, over a normal lizard activity season. Movementof lizards was modelled each day. For the rest of the year, late2 0 8 ( 2 0 0 7 ) 307–316
autumn and winter, the lizards were assumed to be completelyinactive.
The simulated landscape consisted of the lizards and theirnocturnal refuge sites. There were N randomly distributedrefuges in a 1 km × 1 km, used by L lizards. The range of eachlizard was initiated with a randomly chosen refuge. Each lizarduses a subset of the N available refuges; we referred to thissubset of refuge sites that a lizard might use as the “totalrange set” of refuges. In alternative models we used two algo-rithms to allocate refuge sites to total range sets during thesetup phase, the fixed total range and variable total range. Wedescribe these in detail below.
In all models, at the beginning of each model day, all lizardswere in the overnight refuges in which they had spent theprevious night. In the next step of the daily cycle each lizardmoved around its range before choosing a new refuge forthe next night; only the nighttime refuges are tracked in themodel. Lizards moved from one overnight refuge to anotherovernight refuge chosen randomly with equal probability fromamong those in their total range set. Note that this meantthey could spend consecutive nights in the same refuge, andthat more than one lizard could occupy a refuge overnight. Weassumed that individual lizards could move over their entirerange during the day, and that there was no systematic biaseither toward or away from particular kinds of refuges, orfrom their previously occupied refuge. To match the patternof collection of empirical data, we assumed a virtual ecologistsampled the location of lizards once each six days, or 35 times,over the activity season. Recommended minimum sample sizerequired in order for ICP range size to stabilize is 30 fixes orgreater (Kenward, 2001). All lizards whose total ranges wereinitiated more than 100 m from the boundary of the simu-lated 1 km × 1 km study area were sampled. This ensured thatsampled home ranges were not influenced by the edge of thesimulated landscape. The actual location of each simulatedovernight refuge site was sampled with normally distributedindependent error in both x and y coordinates with a stan-dard deviation of 1 m. This corresponded to the average errorin empirical GPS fix locations estimated at the study site forthe GPS unit used.
We varied the parameters in the fixed and variable totalrange models, described below, by forming a Latin hyper-cube (Blower and Dowlatabadi, 1994; Tenhumberg et al., 2004).Briefly, this approach assumes that uncertainty in a parame-ter follows a specific probability distribution. Each distributionis divided into K equi-probable segments. A set of parame-ters for a single run of the model is created by sampling fromthese distributions without replacement resulting in K uniqueparameter combinations. We set K = 100 for this initial test ofthe model, well over the empirical rule of K > 4M/3, where Mis the number of parameters for Latin hypercube sensitivityanalysis (Mckay et al., 1979). For example, for the fixed totalrange model we generated a series of 100 alternative valuesfor range radius, number of lizards occupying the study area,and the number of refuges in the study area (Table 1); the Latinhypercube procedure then effectively shuffles these sets of
parameter values. This ensures that regardless of how manyparameters are in each model, the multidimensional param-eter space is thoroughly sampled. In general, we assumedparameter uncertainty followed uniform distributions across
e c o l o g i c a l m o d e l l i n g 2 0
Table 1 – Ranges of parameter estimates used togenerate the simulated patterns for the fixed andvariable range models
Variable Minimum Maximum Integer
Fixed range modelLizards 25 200
√Numrefuges 2500 7500
√H 50 200
Variable range modelLizards 25 100
√Numrefuges 5000 15000
√r 1 10s 35 200� 0.005 0.1H 0 10
aa
2Idrtq
2Tdatipb
p
opsrnatnn
2IasmErd
Variables with a check in the integer column were always roundedto nearest integer values.
broad range of reasonable parameters (Table 1). We assumedll parameters varied independently.
.3.1. Fixed total range modeln the fixed total range (FTR) model all refuges within a fixedistance h of the initial refuge site were included in the totalange set during the setup phase. This is the simplest scenariohat can be implemented and assumes no effect of refugeuality, refuge location, or interaction with conspecifics.
.3.2. Variable total range modelshe variable total range (VTR) model included an algorithmetermining the size of the total range set. This algorithm waspplied iteratively during the setup phase, adding one refugeo the range of each lizard in the population before proceed-ng to add the next refuge for each lizard. Each lizard had arobability of stopping the increase in total range size giveny
(stopping) = 1 − e−(t/r)s (2)
n iteration t. Note that t here is the iteration during the setuphase, not the day within the activity phase. The parameterwas inversely proportional to the variance in the number of
efuge sites included in a home range, while r was the averageumber of refuges in a range set. If a new refuge was to bedded, which refuge was selected depended on both the dis-ance of the refuge from the existing total range set, and theumber of other conspecifics using each refuge. Both mecha-isms are described in detail below.
.3.3. Varying effects of refuge locationn the FTR model, home ranges were constructed to includell refuge sites within a fixed radius h of an initial, randomlyelected refuge site. The VTR model assumed that lizards were
ore likely to choose refuge sites that are close to each other.ach lizard had a randomly selected first refuge site, but newefuge sites were added to the total range with a probabilityetermined by the distance to the nearest other refuge site
8 ( 2 0 0 7 ) 307–316 311
already in the home range
p(i) = e−�dij (3)
where i is the current refuge considered for inclusion, j is theindex of the refuge nearest to i already in the home range,and dij is the distance between refuges i and j. � is a posi-tive constant describing the relative effect of distance. Thus,the probability that a refuge was included decreased with thedistance to all refuges in the current total range set.
The random model corresponded to p(i) = 1 for di0 < h, wherej = 0 is the first refuge in the home range set. At each step,a refuge was randomly selected from the landscape andaccepted with probability p(i). If that refuge was rejected (prob-ability 1 − p(i)) another refuge was selected at random. Thiscontinued until a refuge was selected, or 1000 attempts weremade. The algorithm selected the refuge with the smallestnearest neighbor distance if no refuge had been selected after1000 attempts.
2.3.4. Varying the effect of conspecific use of refugesUse of refuges by conspecifics also influenced the selectionof refuge sites in the VTR model. We incorporated this effectby modifying (3) to include a negative effect of the number ofother conspecific males that had already selected that refugewithin their total range set:
p(i) = e−�dij−�ni (4)
where � is a positive constant indicating the relative influenceof conspecific use on refuge selection. The ratio �/� was theincrease in nearest neighbour distance that is equivalent tothe effect of an additional competitor including that refuge.
2.4. Pattern comparisons
The empirical observations of the total ranges of male lizardsshowed decreasing number of home ranges that overlappedwith a focal lizard, as the proportion of available fixes wasreduced (Fig. 2). From these observations, we derived parame-ters defining intercept (a) and slope (b) of the curves describingthat relationship. We derived equivalent parameters from thespatial patterns that were sampled from each of the 100 FTRmodel simulations, and each of the 100 VTR model simula-tions.
We then plotted slope against intercept for each of the200 models and for the one empirical data point (Fig. 3). Theempirical data point was represented with an approximate95% confidence ellipse. In Fig. 3, and subsequent analyses, wediscuss the data that were derived from considering the areaof other male total ranges that overlay the focal male lizard’stotal range. Similar patterns were found when we consideredthe number of overlapping ranges, but those were highly cor-related with the area of overlap, so we use only one pattern.Piou et al. (2007) used a similar pattern based on a regressionof population size versus time, but focused on the predicted
response as the point of comparison, rather than the regres-sion parameters.We compared simulated and empirical observations by cal-culating discrepancies. The unscaled discrepancy D for a given
312 e c o l o g i c a l m o d e l l i n g
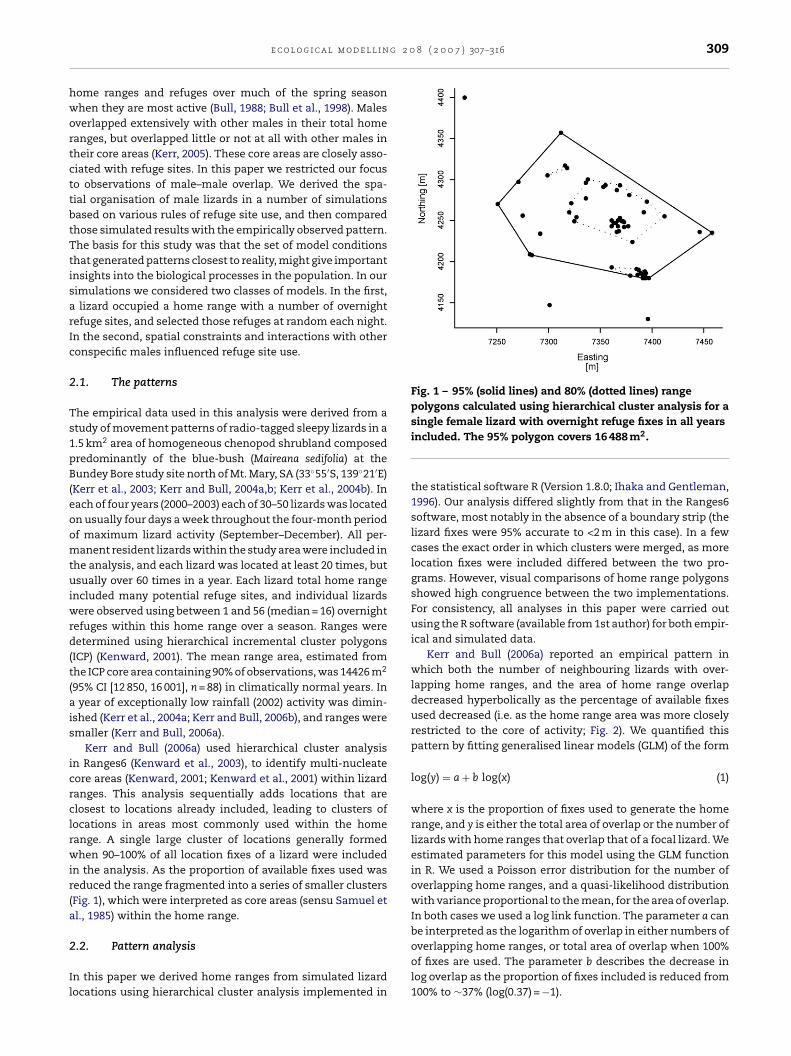
Fig. 3 – Direct plot of the empirical pattern for area ofoverlap with simulated patterns. Open circles: FTR model;filled circles: VTR. The empirical pattern was marked with
a cross; ellipse indicates an approximate 95% confidenceellipse on the empirical pattern.pattern and parameter combination was simply the Euclideandistance between the observed intercept (a) and slope (b), andthe simulated intercept and slope
D =√
(a − a)2 + (b − b)2
(5)
These unscaled discrepancies did not account for the factthat our target pattern (the empirical observation) was not pre-cisely observed. The parameters a and b were also estimates,and the uncertainty in these estimates was described with avariance–covariance matrix V. We chose to scale the discrep-ancies by the magnitude of a 95% confidence ellipse aroundour target pattern
˘ =(
P√2f
)L−1 (6)
where P is a matrix of the observed and simulated pat-terns, f is the 95th quantile from an F distribution with theappropriate degrees of freedom (2, 142; the size of covari-ance matrix, and the number of datapoints in the pattern: 1),and L−1 is the inverse of the Cholesky decomposition of thevariance–covariance matrix V obtained from the GLM fit of(1). This transformation of the coordinate system convertedthe 95% confidence ellipse into a unit circle. � was then amatrix of the scaled patterns; the scaled discrepancies � werethe Euclidean distances between the scaled observed patternand each scaled simulated pattern. If the scaled discrepancy
for a parameter combination was less than one, it fell insidethe 95% confidence ellipse around the observed pattern. Ifthe scaled discrepancy was larger than one it fell outsidethe confidence ellipse. We could combine the discrepancies2 0 8 ( 2 0 0 7 ) 307–316
using the geometric mean, because the discrepancies werescaled such that one was the dividing line for “close”. Thegeometric mean placed greater weight on small discrepancies.Thus, in this analysis lower scaled discrepancy values signi-fied parameter values that produced range patterns closer tothe empirically observed pattern. Although we only have onetwo-dimensional pattern (intercept and slope), the approachis naturally extensible to both multiple patterns and multidi-mensional patterns (e.g. Steele et al., 2006).
3. Results
The target empirical patterns (intercept a, and slope b) showedstrong decreases in both area of overlap and the number ofindividuals overlapping with decreasing proportion of fixesincluded (Fig. 2). The discrepancies calculated for the num-ber of individuals overlapping and total overlapping area werehighly correlated (r = 0.87), indicating that the informationcontained in the two patterns was not independent. There-fore we used only the pattern of total overlapping area for theremainder of our results. This had smaller discrepancies forboth FTR and VTR models.
Fig. 3 illustrates the performance of the simulations inreproducing the empirical data point. Points inside the ellipse,close to a vertical line through the empirical point, were sim-ulations that replicated the intercept. Similarly, points insidethe ellipse close to a horizontal line through the empiricalpoint replicated the slope well. Most parameter combinationsof the FTR model were poor at replicating the target patterns(Fig. 3), but they were best at replicating the area of overlap at100% of GPS fixes (the intercept). The drop-off in overlap (slope)as the percent of fixes was reduced was never as steep in theFTR models as that observed in the real data. In addition, therewas little variation in the slope among the different parame-ter combinations. This reflects the random placement of totalranges in these models yielding a relatively constant reduc-tion. The VTR models were considerably better at replicatingthe target pattern, with many points inside the confidenceellipse scattered across a range of both slope and intercept(Fig. 3).
In the next step, we plotted the effect of varying specificparameter values on the discrepancies with the empirical datapoint. A systematic pattern of discrepancies along a parame-ter range would indicate that this parameter was importantin reproducing the pattern of total range overlap. On the con-trary, if there was no relationship between discrepancy and theparameter, the pattern would reveal little information aboutthe parameter. For the FTR models, we plotted the discrepancyversus number of lizards, number of refuges, total range radiusand lizards per refuge (Fig. 4). The discrepancies relative to theempirical pattern were generally large and erratic indicatingthat the pattern of total range overlap provided little informa-tion about the actual number of lizards and refuges on thelandscape. Intermediate values of total range radius providedthe best overlap (smallest discrepancies), and the discrepan-
cies increased with the ratio of lizards to numbers of refugesites.For VTR models, the discrepancy plots (Fig. 5) indicatedthat the patterns of total range overlap contained information

e c o l o g i c a l m o d e l l i n g 2 0 8 ( 2 0 0 7 ) 307–316 313
F ed tow cles i
am(amtitardamtlotrre�
e
4
Lc
ig. 4 – Scaled discrepancies between empirical and simulateighted regression smooths to indicate the trend; filled cir
bout some components of the alternate models. The infor-ation in the pattern about the ratio of lizards to refuges
Fig. 5A) was higher compared to either of the parameterslone (individual parameters not shown). As with the FTRodels the discrepancies increased with the ratio of lizards
o refuges, but the range of lizards to refuge ratios includedn the VTR models was smaller. Of the parameters controllinghe number of refuge sites incorporated into the total range (rnd s: Fig. 5B and C) only r had an effect; the discrepancy waseduced at small values of the exponent r. Nearest neighboristance (�, Fig. 5D) had the strongest effect on the discrep-ncies. The discrepancies were smallest for � > 0.05, whicheans refuges more than ∼20 m (1/�) from refuges already in
he set have low probabilities of inclusion. There was relativelyittle scatter around the smooth line, indicating that the effectf this parameter likely overrode variation in other parame-ers. The pattern for conspecific effect on inclusion of newefuges, �, appeared weak, with smaller discrepancies occur-ing at higher values (Fig. 5E). However, we saw the oppositeffect when scaling � by the magnitude of the distance effect. Conspecific effects that were large compared to distanceffects were not consistent with the observed patterns (Fig. 5F).
. Discussion
izards make choices about range size and location. Thesehoices may be influenced by spatial variation in predator
tal area of overlap for the FTR model. Solid lines are locallyndicate points with scaled discrepancies <1.
(Bauwens et al., 1999) and parasite density (Duffield and Bull,1996), interspecific competition (Patterson, 1992; Grover, 1996;Howard and Hailey, 1999; Vitt et al., 2000), and habitat require-ments (Cooper and Whiting, 2000). This paper examinedwhether the distribution of overnight refuges in the environ-ment and the interactions with conspecifics influences rangesize and overlap of the Australian sleepy lizard.
In the simplest case lizard’s refuge choice was random.However, the results of this work indicate that the perfor-mance of random models in reproducing the pattern of rangeoverlap found in empirical observations of lizard movement ispoor compared to models that construct ranges using nearestneighbor linkage and incorporating a weak effect of conspe-cific interference. We would not have been able to come tothis conclusion by comparing a random model to the data inisolation. For example, Austin et al. (2004) compared grey sealmovements to correlated random walk models. They foundthat some seals fitted the model, while others were over- orunder-predicted. They were able to account for some of thesedepartures by using a Levy flight model for the movementlength distributions. Similarly, Burns and Thomson (2005)used a Monte Carlo simulation to measure the performance offoraging honeybees. Performance in excess of the simulationwas taken as evidence that the bees were using spatial mem-
ory. These comparison would have been significantly morepowerful if multiple mechanisms were simulated and com-pared to the observed patterns, as done by Zhang et al. (2007).These examples, and our own, reinforce recent (Stamps et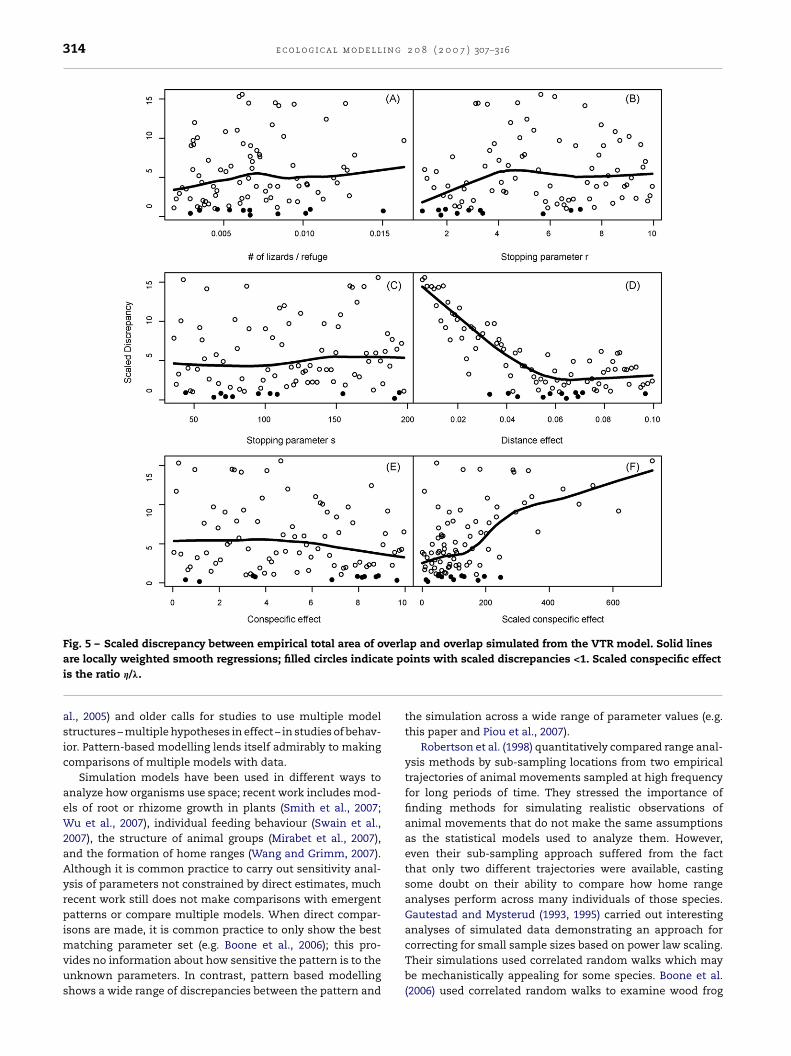
314 e c o l o g i c a l m o d e l l i n g 2 0 8 ( 2 0 0 7 ) 307–316
Fig. 5 – Scaled discrepancy between empirical total area of overlap and overlap simulated from the VTR model. Solid lineste po
are locally weighted smooth regressions; filled circles indicais the ratio �/�.
al., 2005) and older calls for studies to use multiple modelstructures – multiple hypotheses in effect – in studies of behav-ior. Pattern-based modelling lends itself admirably to makingcomparisons of multiple models with data.
Simulation models have been used in different ways toanalyze how organisms use space; recent work includes mod-els of root or rhizome growth in plants (Smith et al., 2007;Wu et al., 2007), individual feeding behaviour (Swain et al.,2007), the structure of animal groups (Mirabet et al., 2007),and the formation of home ranges (Wang and Grimm, 2007).Although it is common practice to carry out sensitivity anal-ysis of parameters not constrained by direct estimates, muchrecent work still does not make comparisons with emergentpatterns or compare multiple models. When direct compar-isons are made, it is common practice to only show the best
matching parameter set (e.g. Boone et al., 2006); this pro-vides no information about how sensitive the pattern is to theunknown parameters. In contrast, pattern based modellingshows a wide range of discrepancies between the pattern andints with scaled discrepancies <1. Scaled conspecific effect
the simulation across a wide range of parameter values (e.g.this paper and Piou et al., 2007).
Robertson et al. (1998) quantitatively compared range anal-ysis methods by sub-sampling locations from two empiricaltrajectories of animal movements sampled at high frequencyfor long periods of time. They stressed the importance offinding methods for simulating realistic observations ofanimal movements that do not make the same assumptionsas the statistical models used to analyze them. However,even their sub-sampling approach suffered from the factthat only two different trajectories were available, castingsome doubt on their ability to compare how home rangeanalyses perform across many individuals of those species.Gautestad and Mysterud (1993, 1995) carried out interestinganalyses of simulated data demonstrating an approach for
correcting for small sample sizes based on power law scaling.Their simulations used correlated random walks which maybe mechanistically appealing for some species. Boone et al.(2006) used correlated random walks to examine wood frog
g 2 0
msab
mwtOfsbtian
tcsapprrrasttw
aRgdsOpue
r
A
B
B
B
B
e c o l o g i c a l m o d e l l i n
ovements. However, partially territorial species such as theleepy lizards will dramatically violate the assumptions of
correlated random walk which does not incorporate theoundary conditions of a territory.
Our approach circumvented these issues by calibratingechanistic models against real observational patterns. Itould then be straightforward to use the calibrated simula-
ion to generate test data for comparing home range analyses.ne potential area of concern is that using one range analysis
or the calibration may predispose the model to generate datauited for that method. This is readily circumvented by cali-rating the model using different methods to see if this affectshe performance of the home range models. The key points that our mechanistic simulation did not make the samessumptions (e.g. those locations are a sample from a bivariateormal distribution) as the ICP range analysis method.
A given biological pattern may provide little or no informa-ion about some parameters of a mechanistic model. However,ombining multiple independent patterns can provide con-iderable support for choosing the “best” model. The rangenalyses presented in this paper revealed that the patternsroduced from the VTR model were consistent with empiricalatterns of conspecific interactions, the spatial distribution ofefuges (nearest neighbor distance) and the ratio of lizards toefuges. This is consistent with previous work where patternselated to the dynamics of parasitic ticks using sleepy lizardss hosts were little influenced by either refuge or lizard den-ity alone, but were strongly affected by the ratio of lizardso refuges (Tyre et al., 2006). Combining the range patterns ofhe host with the parasite population patterns may provide usith considerable information on all parameters.
The analysis of individual locations over time is a commonpproach to understanding how animals use their habitat.ecent work (Kenward et al., 2001) makes it clear that whilereat strides in developing methods for understanding suchata have occurred, connecting the results of those analy-es to biological hypotheses remains fraught with difficulty.ur work here provides an alternative for comparing multi-le, biologically realistic models with observations of spacese. Pattern-based modelling has considerable promise forxtracting useful insights from space use data.
e f e r e n c e s
ustin, D., Bowen, W., McMillan, J., 2004. Intraspecific variation inmovement patterns: modeling individual behaviour in a largemarine predator. Oikos 105, 15–30.
auwens, D., Castilla, A.M., Mouton, P.L.N., 1999. Field bodytemperatures, activity levels and opportunities forthermoregulation in an extreme microhabitat specialist, thegirdled lizard (Cordylus macropholis). J. Zool. 249, 11–18.
lower, S.M., Dowlatabadi, H., 1994. Sensitivity and uncertaintyanalysis of complex-models of disease transmission—an Hivmodel, as an example. Int. Statist. Rev. 62, 229–243.
oone, R.B., Johnson, C.M., Johnson, L.B., 2006. Simulating woodfrog movement in central Minnesota, USA using a diffusionmodel. Ecol. Model. 199, 255–262.
ull, C.M., 1978. Dispersal of the Australian reptile tick Aponommahydrosauri by host movement. Aust. J. Zool. 26, 689–697.
8 ( 2 0 0 7 ) 307–316 315
Bull, C.M., 1988. Mate fidelity in an Australian lizardTrachydosaurus rugosus. Behav. Ecol. Sociobiol. 23, 45–50.
Bull, C.M., 1995. Population ecology of the sleepy lizard, Tiliquarugosa, at Mt. Mary, South Australia. Aust. J. Ecol. 20, 393–402.
Bull, C.M., Cooper, S.J.B., Baghurst, B.C., 1998. Social monogamyand extra-pair fertilization in an Australian lizard, Tiliquarugosa. Behav. Ecol. Sociobiol. 44, 63–72.
Burnham, K.P., Anderson, D.R., 1998. Model Selection andInference: A Practical Information-Theoretic Approach.Springer, New York.
Burns, J.G., Thomson, J.D., 2005. A test of spatial memory andmovement patterns of bumblebees at multiple spatial andtemporal scales. Behav. Ecol. 17, 48–55.
Cooper, W.E., Whiting, M.J., 2000. Ambush and active foragingmodes both occur in the scincid genus Mabuya. Copeia,112–118.
Duffield, G.A., Bull, C.M., 1996. Host location by larvae of thereptile tick Amblyomma vikirri (Acari: Ixodidae). Exp. Appl.Acarol. 20, 575–582.
Estoup, A., Beaumont, M., Sennedot, F., Moritz, C., Cornuet, J.M.,2004. Genetic analysis of complex demographic scenarios:spatially expanding populations of the cane toad, Bufomarinus. Evolution 58, 2021–2036.
Gautestad, A., Mysterud, I., 1993. Physical and biologicalmechanisms in animal movement processes. J. Appl. Ecol. 30,523–535.
Gautestad, A., Mysterud, I., 1995. The home range ghost. Oikos74, 195–204.
Grimm, V., Frank, K., Jeltsch, F., Brandl, R., Uchmanski, J., Wissel,C., 1996. Pattern-oriented modelling in population ecology.Sci. Tot. Environ. 183, 151–166.
Grimm, V., Revilla, E., Berger, U., Jeltsch, F., Mooij, W.M., Railsback,S.F., Thulke, H.H., Weiner, J., Wiegand, T., DeAngelis, D.L.,2005. Pattern-oriented modeling of agent-based complexsystems: lessons from ecology. Science 310, 987–991.
Grover, M.C., 1996. Microhabitat use and thermal ecology of twonarrowly sympatric Sceloporus (Phrynosomatidae) lizards. J.Herpetol. 30, 152–160.
Howard, K.E., Hailey, A., 1999. Microhabitat separation amongdiurnal saxicolous lizards in Zimbabwe. J. Trop. Ecol. 15,367–378.
Ihaka, R., Gentleman, R., 1996. R: a language for data analysis andgraphics. J. Computat. Graph. Statist. 5, 299–314.
Kenward, R.E., 2001. A Manual for Wildlife Radio Tagging.Academic Press, San Diego.
Kenward, R.E., Clarke, R.T., Hodder, K.H., Walls, S.S., 2001. Densityand linkage estimators of home range: nearest-neighborclustering defines multi-nuclear cores. Ecology 82,1905–1920.
Kenward, R.E., South, A.B., Walls, S.S., 2003. Ranges6 v1.2: for theanalysis of tracking and location data. Online manual.Anatrack Ltd., Wareham, UK.
Kerr, G.D., 2005. Space utilization and activity pattern in thesleepy lizard Tiliqua rugosa: implications for host–parasiteinteractions. Flinders University of South Australia, Adelaide,South Australia.
Kerr, G.D., Bull, C.M., 2004a. Field observations of extendedlocomotor activity at sub-optimal body temperatures in adiurnal heliothermic lizard (Tiliqua rugosa). J. Zool. 264,179–188.
Kerr, G.D., Bull, C.M., 2004b. Microhabitat use by the scincid lizardTiliqua rugosa: exploiting natural temperature gradientsbeneath plant canopies. J. Herpetol. 38, 536–545.
Kerr, G.D., Bull, C.M., 2006a. Exclusive core areas in overlappingranges of the sleepy lizard. Behav. Ecol. 17 (3), 380–391.
Kerr, G.D., Bull, C.M., 2006b. Movement patterns in themonogamous sleepy lizard (Tiliqua rugosa): effects of gender,drought, time of year and time of day. J. Zool. (Lond.) 269,137–147.

i n g
description. Ecol. Model. 200, 343–359.
316 e c o l o g i c a l m o d e l l
Kerr, G.D., Bull, C.M., Burzacott, D., 2003. Refuge sites used by thescincid lizard Tiliqua rugosa. Aust. Ecol. 28, 152–160.
Kerr, G.D., Bull, C.M., Cottrell, G.R., 2004a. Use of an ‘on board’datalogger to determine lizard activity patterns, bodytemperature and microhabitat use for extended periods in thefield. Wildlife Res. 31, 171–176.
Kerr, G.D., Bull, C.M., Mackay, D.A., 2004b. Human disturbanceand stride frequency in the sleepy lizard (Tiliqua rugosa):implications for behaviour studies. J. Herpetol. 38, 519–552.
Lehmann, J., Boesch, C., 2003. Social influences on rangingpatterns among chimpanzees (Pan troglodytes verus) in the TaiNational Park, Cote d’Ivoire. Behav. Ecol. 14, 642–649.
Mckay, M., Conover, W., Beckman, R., 1979. A comparison of threemethods for selecting values of input variables in the analysisof output from a computer code. Technometrics 21, 239–245.
Mirabet, V., Auger, P., Lett, C., 2007. Spatial structures insimulations of animal grouping. Ecol. Model. 201, 468–476.
Patterson, G.B., 1992. The ecology of a New Zealand grasslandlizard guild. J. Roy. Soc. N. Z. 22, 91–106.
Piou, C., Berger, U., Hildenbrandt, H., Grimm, V., Diele, K., D’Lima,C., 2007. Simulating cryptic movements of a mangrove crab:recovery phenomena after small scale fishery. Ecol. Model.205, 110–122.
Robertson, P.A., Aebischer, N.J., Kenward, R.E., Hanski, I.K.,Williams, N.P., 1998. Simulation and jack-knifing assessmentof home-range indices based on underlying trajectories. J.Appl. Ecol. 35, 928–940.
Samuel, M.D., Pierce, D., Garton, E.O., 1985. Identifying areas ofconcentrated use within the home range. J. Anim. Ecol. 54,11–19.
Smith, J.M.D., Ward, J.P., Child, L.E., Owen, M.R., 2007. Asimulation model of rhizome networks for Fallopia japonica
(Japanese knotweed) in the United Kingdom. Ecol. Model. 200,421–432.Stamps, J., McElreath, R., Eason, P., 2005. Alternative models ofconspecific attraction in flies and crabs. Behav. Ecol. 16,974–980.
2 0 8 ( 2 0 0 7 ) 307–316
Steele, B.M., Reddy, S.K., Keane, R.E., 2006. A methodology forassessing departure of current plant communities fromhistorical conditions over large landscapes. Ecol. Model. 199,53–63.
Swain, D.L., Hutchings, M.R., Marion, G., 2007. Using a spatiallyexplicit model to understand the impact of search rate andsearch distance on spatial heterogeneity within an herbivoregrazing system. Ecol. Model. 203, 319–326.
Tenhumberg, B., Tyre, A.J., Pople, A., Possingham, H.P., 2004.Do harvest refuges buffer Kangaroos against evolutionaryresponses to selective harvesting. Ecology 85,2003–2017.
Tyre, A.J., 1999. Spatial population dynamics: enter the virtualecologist. Ph.D. dissertation, University of Adelaide, Adelaide,South Australia.
Tyre, A.J., Tenhumberg, B., Bull, C.M., 2006. Identifying landscapescale patterns from individual scale processes. Ecol. Model.199, 442–450.
Vitt, L.J., Sartorius, S.S., Avila-Pires, T.C.S., Esposito, M.C., Miles,D.B., 2000. Niche segregation among sympatric Amazonianteiid lizards. Oecologia 122, 410–420.
Wang, M., Grimm, V., 2007. Home range dynamics and populationregulation: an individual-based model of the common shrewSorex araneus. Ecol. Model. 205, 397–409.
Wiegand, T., Jeltsch, F., Hanski, I., Grimm, V., 2003. Usingpattern-oriented modeling for revealing hidden information:a key for reconciling ecological theory and application. Oikos100, 209–222.
Wu, L., McGechan, M.B., McRoberts, N., Baddeley, J.A., Watson,C.A., 2007. SPACSYS: integration of a 3D root architecturecomponent to carbon, nitrogen and water cycling – model
Zhang, X., Johnson, S.N., Crawford, J.W., Gregory, P.J., Young, I.M.,2007. A general random walk model for the leptokurticdistribution of organism movement: theory and application.Ecol. Model. 200, 79–88.
Copyright © 2022 FDOKUMEN