Morphological Differentiation and Genetic Structure in Island Lizard Populations
10
¤ 2008 Zoological Society of Japan ZOOLOGICAL SCIENCE 25: 465–474 (2008) Morphological Differentiation and Genetic Structure in Island Lizard Populations Domenico Fulgione 1 * , Serena Guglielmi 2 , Gaetano Odierna 1 , Daniela Rippa 2 , Maria F. Caliendo 2 and Rakesh K. Rastogi 1 1 Department of Structural and Functional Biology, University of Naples Federico II, Naples, Italy 2 Department of Biological Sciences, University of Naples Federico II, Naples, Italy Only some island populations of Podarcis sicula are hyperchromatic. The study of this phenome- non and its relationship with the lizards of the mainland and other islands, exhibiting a “normal” coloration, provides useful hints in our understanding of evolutionary mechanisms that have cre- ated the observed morphological variation. We performed a comparative morphological and genetic analysis of a hyperchromatic lizard population from Licosa Island, and compared the data with that obtained from normal-colored lizard populations both from Ustica and Cirella islands in the Tyrrhenian sea and from nearby mainland Italy. Morphological and microsatellite gene differentiation in the hyperchromatic Licosa population appears to have been much more rapid than the molecular evolution of the mtDNA. We discuss herein that the comparison of hyperchromatism and other types of morphological variation with molecular data in island populations of lizards may provide useful hints as to evolutionary mechanisms. Key words: Podarcis sicula, hyperchromatism, molecular analysis, island population, evolution INTRODUCTION Of the 16 species of Lacertidae living in Italy, the most widely known is the common lizard, Podarcis sicula. It is ubiquitous on the Italian peninsula and is also found in a few sites outside this region (Böhme and Corti, 1993). This spe- cies is considered to possess a broad ecological tolerance owing to its occurrence in a variety of terrestrial niches (Arnold, 1998). The taxonomic and ecological diversity of the lacertid liz- ards of the Mediterranean region makes them useful models for a variety of evolutionary studies. Less than two decades have passed since attention was focused on P. sicula’s intraspecific morphological variability (Arnold, 1993; Lanza et al., 1993), enzymatic polymorphism (Gorman et al., 1975; Clover, 1979; Capula et al., 1988, 1990), chromosomes and satellite DNA (Cardone et al., 1990), microsatellites (Fulgione et al., 2005), and mitochondrial genes (Oliverio et al., 1998, 2000; 2001; Podnar et al., 2005). So far, 48 subspecies of P. sicula have been described, almost 50% of which have been identified within insular populations (Corti and Lo Cascio, 2002; Corti, 2006). Some island populations exhibit a top level of variability with clear morphological differentiation. A typical example is the lizard population from Licosa Island, with all individuals showing intense hyperchromatic coloration in the ventral region. The coloration is displayed in various shades of blue, which has led some authors to define the island population as a subspecies (Podarcis sicula klemmeri Lanza and Capolongo 1972; Fig. 2a). Hyperchromatism is not displayed as a regular phenom- enon across the entire island distributional range of P. sicula. Indeed, on most islands there are different morpho colors and there are obvious differences in some environ- mental parameters, and it is unclear as to how the varying morpho colors are related to the differing environmental vari- ables. Several authors have offered interpretations on the origin of hyperchromatism and its selective advantages in insular populations of the Italian common lizard. As far back as 1874, Eimer inferred that the existing chromatic traits in the lizard population of Capri Island were the consequence of environmental selective pressures (mimicry functions on the rocky substrate). Much later, Kramer (1949) interpreted that hyperchromatism serves as protection from sunstroke in hot microclimate conditions. Whereas Eisentraut (1950) pointed out that hyperchromatism could also be the conse- quence of a prevalently vegetarian feeding regimen on the islands, with a relative increase in pigment cells. Mertens (1963) and Lanza (1979) emphasized that hyperchromatic skin can play a thermoregulatory role enabling the lizards to optimize the time budget during the day. This allows a consideration of the nature of some mor- phological variants (such as hyperchromatism), which can be either be the result of natural selection (see Bagnara et al., 2007) or simply a consequence of the history of the liz- ards, i.e., how they reached the island (Castilla et al., 1998; * Corresponding author. Phone: +39-081-679178; Fax : +39-081-679233; E-mail : [email protected] doi:10.2108/zsj.25.465
-
Upload
independent -
Category
Documents
-
view
2 -
download
0
Transcript of Morphological Differentiation and Genetic Structure in Island Lizard Populations

2008 Zoological Society of JapanZOOLOGICAL SCIENCE 25: 465–474 (2008)
Morphological Differentiation and Genetic Structurein Island Lizard Populations
Domenico Fulgione1*, Serena Guglielmi2, Gaetano Odierna1,Daniela Rippa2, Maria F. Caliendo2 and Rakesh K. Rastogi1
1Department of Structural and Functional Biology, University of NaplesFederico II, Naples, Italy
2Department of Biological Sciences, University of NaplesFederico II, Naples, Italy
Only some island populations of Podarcis sicula are hyperchromatic. The study of this phenome-non and its relationship with the lizards of the mainland and other islands, exhibiting a “normal” coloration, provides useful hints in our understanding of evolutionary mechanisms that have cre-ated the observed morphological variation. We performed a comparative morphological and genetic analysis of a hyperchromatic lizard population from Licosa Island, and compared the data with that obtained from normal-colored lizard populations both from Ustica and Cirella islands in the Tyrrhenian sea and from nearby mainland Italy. Morphological and microsatellite gene differentiation in the hyperchromatic Licosa population appears to have been much more rapid than the molecular evolution of the mtDNA. We discuss herein that the comparison of hyperchromatism and other types of morphological variation with molecular data in island populations of lizards may provide useful hints as to evolutionary mechanisms.
Key words: Podarcis sicula, hyperchromatism, molecular analysis, island population, evolution
INTRODUCTION
Of the 16 species of Lacertidae living in Italy, the most widely known is the common lizard, Podarcis sicula. It is ubiquitous on the Italian peninsula and is also found in a few sites outside this region (Böhme and Corti, 1993). This spe-cies is considered to possess a broad ecological tolerance owing to its occurrence in a variety of terrestrial niches (Arnold, 1998).
The taxonomic and ecological diversity of the lacertid liz-ards of the Mediterranean region makes them useful models for a variety of evolutionary studies. Less than two decades have passed since attention was focused on P. sicula’s intraspecific morphological variability (Arnold, 1993; Lanza et al., 1993), enzymatic polymorphism (Gorman et al., 1975; Clover, 1979; Capula et al., 1988, 1990), chromosomes and satellite DNA (Cardone et al., 1990), microsatellites (Fulgione et al., 2005), and mitochondrial genes (Oliverio et al., 1998, 2000; 2001; Podnar et al., 2005). So far, 48 subspecies of P. sicula have been described, almost 50% of which have been identified within insular populations (Corti and Lo Cascio, 2002; Corti, 2006).
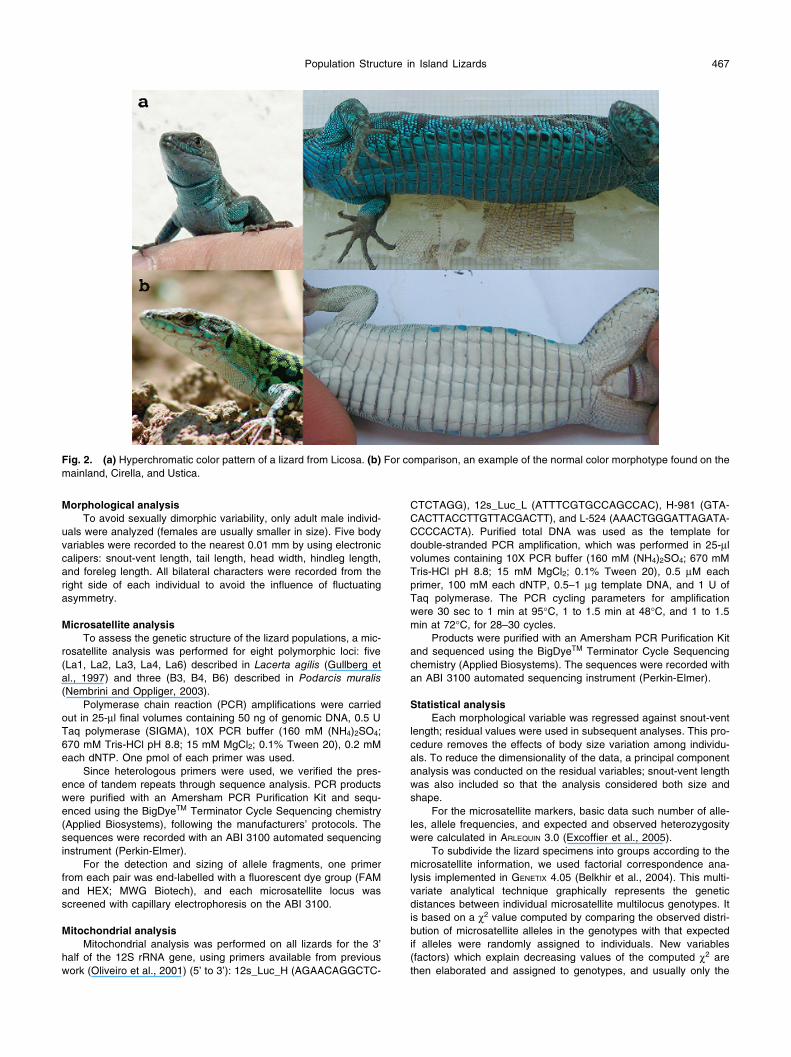
Some island populations exhibit a top level of variability with clear morphological differentiation. A typical example is the lizard population from Licosa Island, with all individuals showing intense hyperchromatic coloration in the ventral
region. The coloration is displayed in various shades of blue, which has led some authors to define the island population as a subspecies (Podarcis sicula klemmeri Lanza and Capolongo 1972; Fig. 2a).
Hyperchromatism is not displayed as a regular phenom-enon across the entire island distributional range of P. sicula. Indeed, on most islands there are different morpho colors and there are obvious differences in some environ-mental parameters, and it is unclear as to how the varying morpho colors are related to the differing environmental vari-ables.
Several authors have offered interpretations on the origin of hyperchromatism and its selective advantages in insular populations of the Italian common lizard. As far back as 1874, Eimer inferred that the existing chromatic traits in the lizard population of Capri Island were the consequence of environmental selective pressures (mimicry functions on the rocky substrate). Much later, Kramer (1949) interpreted that hyperchromatism serves as protection from sunstroke in hot microclimate conditions. Whereas Eisentraut (1950) pointed out that hyperchromatism could also be the conse-quence of a prevalently vegetarian feeding regimen on the islands, with a relative increase in pigment cells. Mertens (1963) and Lanza (1979) emphasized that hyperchromatic skin can play a thermoregulatory role enabling the lizards to optimize the time budget during the day.
This allows a consideration of the nature of some mor-phological variants (such as hyperchromatism), which can be either be the result of natural selection (see Bagnara et al., 2007) or simply a consequence of the history of the liz-ards, i.e., how they reached the island (Castilla et al., 1998;
* Corresponding author. Phone: +39-081-679178;Fax : +39-081-679233;E-mail : [email protected]
doi:10.2108/zsj.25.465
D. Fulgione et al.466
Emerson, 2002). Furthermore, the nature and extent of phe-netic variation among local populations can be attributed to gene flow, genetic drift, or natural selection. Yet, it is difficult to distinguish the relative importance of these forces in determining patterns of geographic variation in natural pop-ulations (Gould and Johnston, 1972; Thorpe and Stenson, 2003; McGuigan et al., 2005).
The size and defined geographical boundaries of islands have engendered the term “evolutionary laboratories,” and in this context, useful insights into theories of evolution have been gained (Schoener et al., 2005). In fact, the study of hyperchromatic island populations of lizards and their rela-tionships to normal-colored populations on the mainland and other islands can provide useful elements for understanding evolutionary mechanisms responsible for the observed morphological variation (Jackman et al., 1999; Langerhans et al., 2006).
With this in mind, we performed a comparative morpho-logical and genetic analysis of the P. sicula klemmeri hyper-chromatic population endemic on Licosa Island, and two normal populations (P. s. sicula) from Ustica and Cirella Islands. This analysis also comprised some nearby main-land populations from South Italy.
This study defines the population-genetic structure of Licosa lizards in relation to the morphological variants exam-ined. An attempt is also made to estimate the demographic/biogeographic history of the lizards on the three islands and
its relative importance in genetic drift and selection.
MATERIALS AND METHODS
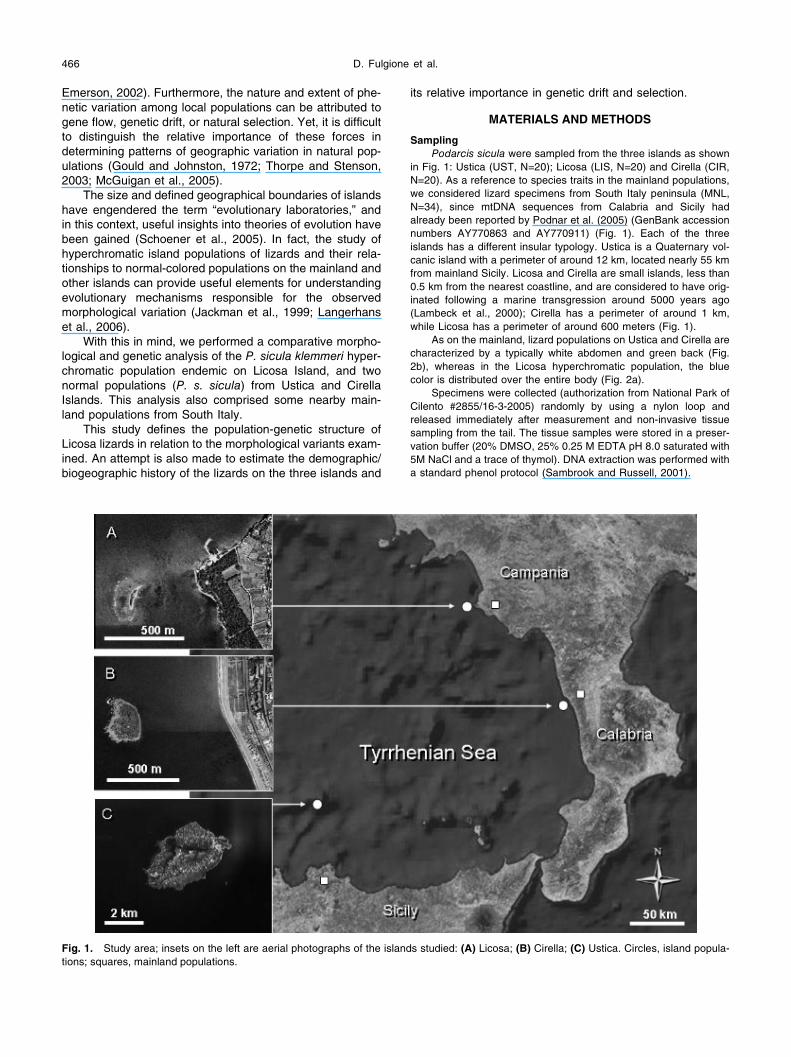
SamplingPodarcis sicula were sampled from the three islands as shown
in Fig. 1: Ustica (UST, N=20); Licosa (LIS, N=20) and Cirella (CIR, N=20). As a reference to species traits in the mainland populations, we considered lizard specimens from South Italy peninsula (MNL, N=34), since mtDNA sequences from Calabria and Sicily had already been reported by Podnar et al. (2005) (GenBank accession numbers AY770863 and AY770911) (Fig. 1). Each of the three islands has a different insular typology. Ustica is a Quaternary vol-canic island with a perimeter of around 12 km, located nearly 55 km from mainland Sicily. Licosa and Cirella are small islands, less than 0.5 km from the nearest coastline, and are considered to have orig-inated following a marine transgression around 5000 years ago (Lambeck et al., 2000); Cirella has a perimeter of around 1 km, while Licosa has a perimeter of around 600 meters (Fig. 1).
As on the mainland, lizard populations on Ustica and Cirella are characterized by a typically white abdomen and green back (Fig. 2b), whereas in the Licosa hyperchromatic population, the blue color is distributed over the entire body (Fig. 2a).
Specimens were collected (authorization from National Park of Cilento #2855/16-3-2005) randomly by using a nylon loop and released immediately after measurement and non-invasive tissue sampling from the tail. The tissue samples were stored in a preser-vation buffer (20% DMSO, 25% 0.25 M EDTA pH 8.0 saturated with 5M NaCl and a trace of thymol). DNA extraction was performed with a standard phenol protocol (Sambrook and Russell, 2001).
Fig. 1. Study area; insets on the left are aerial photographs of the islands studied: (A) Licosa; (B) Cirella; (C) Ustica. Circles, island popula-tions; squares, mainland populations.
Population Structure in Island Lizards 467
Morphological analysisTo avoid sexually dimorphic variability, only adult male individ-
uals were analyzed (females are usually smaller in size). Five body variables were recorded to the nearest 0.01 mm by using electronic calipers: snout-vent length, tail length, head width, hindleg length, and foreleg length. All bilateral characters were recorded from the right side of each individual to avoid the influence of fluctuating asymmetry.
Microsatellite analysisTo assess the genetic structure of the lizard populations, a mic-
rosatellite analysis was performed for eight polymorphic loci: five (La1, La2, La3, La4, La6) described in Lacerta agilis (Gullberg et al., 1997) and three (B3, B4, B6) described in Podarcis muralis(Nembrini and Oppliger, 2003).
Polymerase chain reaction (PCR) amplifications were carried out in 25-µl final volumes containing 50 ng of genomic DNA, 0.5 U Taq polymerase (SIGMA), 10X PCR buffer (160 mM (NH4)2SO4; 670 mM Tris-HCl pH 8.8; 15 mM MgCl2; 0.1% Tween 20), 0.2 mM each dNTP. One pmol of each primer was used.
Since heterologous primers were used, we verified the pres-ence of tandem repeats through sequence analysis. PCR products were purified with an Amersham PCR Purification Kit and sequ-enced using the BigDyeTM Terminator Cycle Sequencing chemistry (Applied Biosystems), following the manufacturers’ protocols. The sequences were recorded with an ABI 3100 automated sequencing instrument (Perkin-Elmer).
For the detection and sizing of allele fragments, one primer from each pair was end-labelled with a fluorescent dye group (FAM and HEX; MWG Biotech), and each microsatellite locus was screened with capillary electrophoresis on the ABI 3100.
Mitochondrial analysisMitochondrial analysis was performed on all lizards for the 3’
half of the 12S rRNA gene, using primers available from previous work (Oliveiro et al., 2001) (5’ to 3’): 12s_Luc_H (AGAACAGGCTC-
CTCTAGG), 12s_Luc_L (ATTTCGTGCCAGCCAC), H-981 (GTA-CACTTACCTTGTTACGACTT), and L-524 (AAACTGGGATTAGATA-CCCCACTA). Purified total DNA was used as the template for double-stranded PCR amplification, which was performed in 25-µl volumes containing 10X PCR buffer (160 mM (NH4)2SO4; 670 mM Tris-HCl pH 8.8; 15 mM MgCl2; 0.1% Tween 20), 0.5 µM each primer, 100 mM each dNTP, 0.5–1 µg template DNA, and 1 U of Taq polymerase. The PCR cycling parameters for amplification were 30 sec to 1 min at 95°C, 1 to 1.5 min at 48°C, and 1 to 1.5 min at 72°C, for 28–30 cycles.
Products were purified with an Amersham PCR Purification Kit and sequenced using the BigDyeTM Terminator Cycle Sequencing chemistry (Applied Biosystems). The sequences were recorded with an ABI 3100 automated sequencing instrument (Perkin-Elmer).
Statistical analysisEach morphological variable was regressed against snout-vent
length; residual values were used in subsequent analyses. This pro-cedure removes the effects of body size variation among individu-als. To reduce the dimensionality of the data, a principal component analysis was conducted on the residual variables; snout-vent length was also included so that the analysis considered both size and shape.
For the microsatellite markers, basic data such number of alle-les, allele frequencies, and expected and observed heterozygosity were calculated in ARLEQUIN 3.0 (Excoffier et al., 2005).
To subdivide the lizard specimens into groups according to the microsatellite information, we used factorial correspondence ana-lysis implemented in GENETIX 4.05 (Belkhir et al., 2004). This multi-variate analytical technique graphically represents the genetic distances between individual microsatellite multilocus genotypes. It is based on a !2 value computed by comparing the observed distri-bution of microsatellite alleles in the genotypes with that expected if alleles were randomly assigned to individuals. New variables (factors) which explain decreasing values of the computed !2 are then elaborated and assigned to genotypes, and usually only the
Fig. 2. (a) Hyperchromatic color pattern of a lizard from Licosa. (b) For comparison, an example of the normal color morphotype found on the mainland, Cirella, and Ustica.
D. Fulgione et al.468
first three variables are plotted.To identify the population affinities of individual samples, we
used STRUCTURE 2.1 (Pritchard et al., 2000; Evanno et al., 2005), assuming no prior information, the admixture model with correlated alleles, and a burn-in phase of 10,000 iterations followed by a run phase of 100,000 iterations. The number of populations (K) ranging from 2 to 10 was tested in three independent runs to establish con-sistency. The posterior probability was then calculated for each value of K to choose the most likely K. We also used a model with essentially the same parameters as above to identify immigrants or individuals who have a recent immigrant ancestry (testing for immi-grants over the last two generations; Pritchard et al., 2000).
To make inferences about population history, we employed the method of Cornuet and Luikart (1996) through the BOTTLENECK pro-gram. This method is based on the premises that populations that have recently experienced a reduction in size also display a reduced number of alleles (k) and expected heterozygosity (HE) at polymorphic loci. Strictly speaking, this has been demonstrated only for loci evolving under the infinite allele model (IAM) by Maruyama and Fuerst (1985). If the locus evolves under the strict stepwise mutation model (SMM), there can be situations where this heterozy-gosity excess is not observed (Cornuet and Luikart, 1996). How-ever, few loci follow the strict SMM, and as soon as they depart slightly from this mutation model towards the IAM, they will exhibit a heterozygosity excess as a consequence of a genetic bottleneck. Here, the two alternative mutation models, IAM and SMM, were assumed and the Wilcoxon signed-rank test was used to test for any systematic excess of heterozygosity across loci.
On the basis of microsatellite data, we estimated divergence times for the Licosa and the nearest mainland (Campania) popula-tions. This method is based on the coancestry coefficient "(Reynolds et al., 1983), which estimates divergence time for short-term genetic distances.
Mitochondrial 12S rDNA partial sequences were aligned by using ClustalX (Thompson et al., 1997) and manually corrected. Data analyses were performed by using ARLEQUIN 3.0. The nucle-otide composition, number of transitions/transversions/indels, number of haplotypes, and nucleotide diversity (#) (Nei, 1987) were calculated for all sequences, and the Kimura 2-parameter genetic distance was calculated between each pair of haplotypes, by using MEGA 3.1 (Kumar et al., 2004). All new sequences from the insular populations are deposited in GenBank under accession numbers EF535878, EF535879, and EF535880).
To estimate a phylogeny based on the gene sequences, the neighbor-joining (NJ; Saitou and Nei, 1987) method was applied using genetic distances calculated under the Tamura-Nei model (Tamura and Nei, 1993). Support for nodes was estimated using the bootstrap technique (Felsenstein, 1985; 1000 pseudoreplicates). To further examine the robustness of conclusions drawn from the NJ tree, we also performed a maximum-parsimony (MP) analysis, with the most-parsimonious trees established by using the close-neighbor-interchange method (Nei and Kumar, 2000). We con-densed all equally shortest trees into a majority-rule consensus tree. Gaps were treated as a fifth character. All characters were weighted equally.
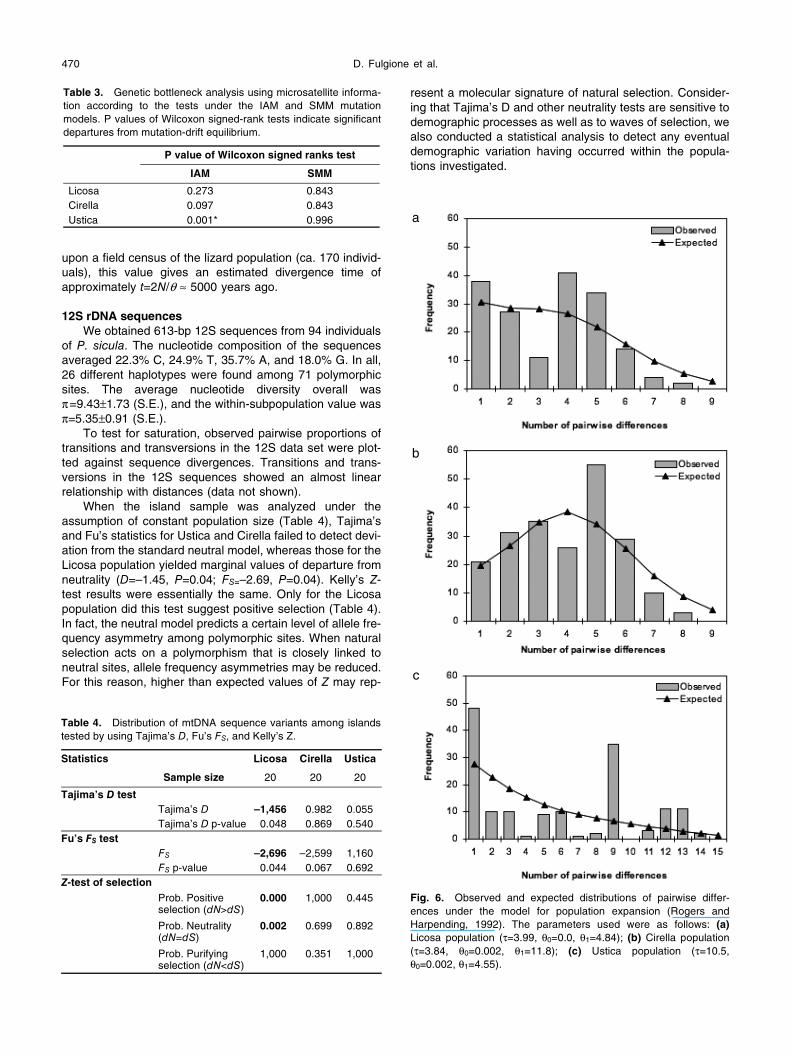
To determine the historical demography of the populations, we analyzed the mismatch distribution (i.e., the frequency distribution of pairwise differences among all haplotypes) with the model of Rog-ers and Harpending (1992) and Rogers (1995). We assessed the fit of the mismatch distribution to the theoretical distribution in an expansion scenario by Monte Carlo simulations of 1000 random samples. The relation $=2ut (Rogers and Harpending, 1992) was used to estimate the approximate time of expansion in generations (t) for P. sicula populations, where $ is as defined above and u is the mutation rate per sequence and per generation. The value of uwas calculated from u=2µk, where µ is the mutation rate per nucle-otide and k is the number of nucleotides of the analyzed fragment.
The approximate mutation rate for vertebrate mtDNA has been reported to be around 3% per million years (Avise, 1994).
Finally, Tajima’s D test (Tajima, 1989) and Fu’s FS test, which is more powerful in detecting demographic expansions (Fu, 1997), were calculated to test for the selective neutrality of the sequences. A Z test (Kelly, 1997) was also performed; this is based on the squared correlation of allelic identity at pairs of polymorphic sites. These tests were done by using ARLEQUIN 3.0 and Mega 3.0.
RESULTS
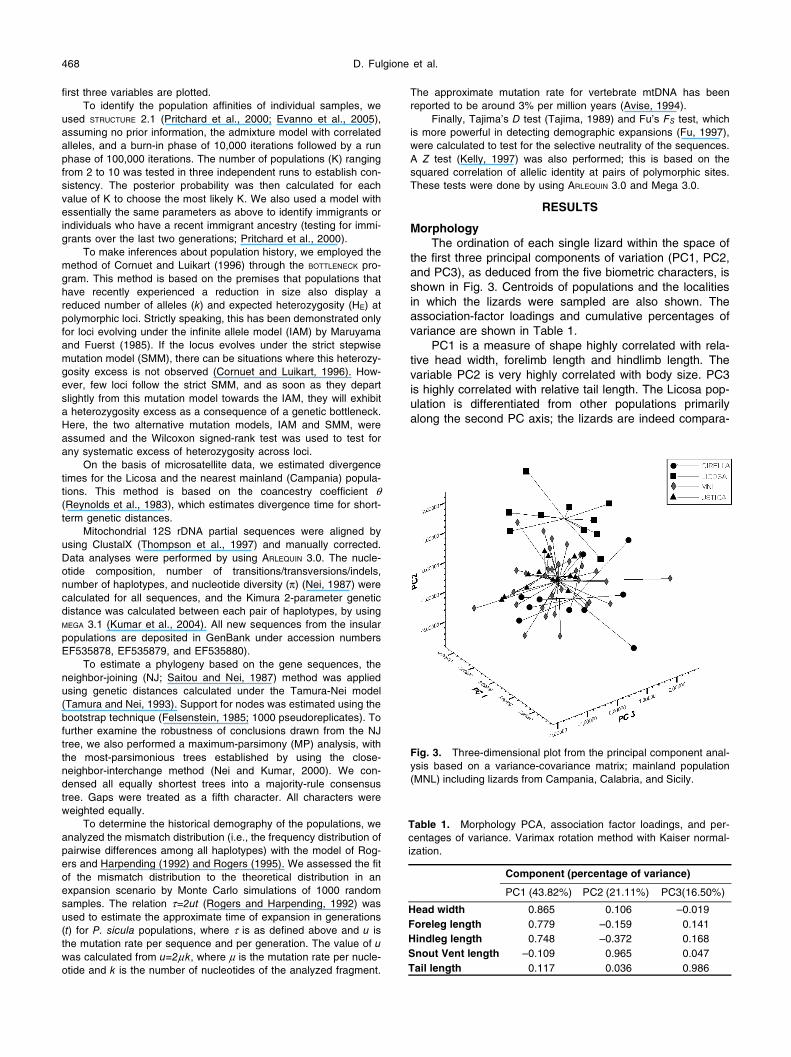
MorphologyThe ordination of each single lizard within the space of
the first three principal components of variation (PC1, PC2, and PC3), as deduced from the five biometric characters, is shown in Fig. 3. Centroids of populations and the localities in which the lizards were sampled are also shown. The association-factor loadings and cumulative percentages of variance are shown in Table 1.
PC1 is a measure of shape highly correlated with rela-tive head width, forelimb length and hindlimb length. The variable PC2 is very highly correlated with body size. PC3 is highly correlated with relative tail length. The Licosa pop-ulation is differentiated from other populations primarily along the second PC axis; the lizards are indeed compara-
Fig. 3. Three-dimensional plot from the principal component anal-ysis based on a variance-covariance matrix; mainland population (MNL) including lizards from Campania, Calabria, and Sicily.
Table 1. Morphology PCA, association factor loadings, and per-centages of variance. Varimax rotation method with Kaiser normal-ization.
Component (percentage of variance)
PC1 (43.82%) PC2 (21.11%) PC3(16.50%)
Head width 0.865 0.106 –0.019Foreleg length 0.779 –0.159 0.141Hindleg length 0.748 –0.372 0.168Snout Vent length –0.109 0.965 0.047Tail length 0.117 0.036 0.986
Population Structure in Island Lizards 469
tively bigger in size.The cumulative percentage of the first three principal
components is 81.43%. A clear separation of morphological traits is evident only for the Licosa lizards; the other popula-tions exhibit a large overlap in individual biometric projec-tions with mainland and island lizards.
MicrosatellitesHeterologous primers (obtained from P. muralis and
Lacerta agilis) work efficiently in amplifying microsatellite tandem repeats in P. sicula. For all the examined loci, tandem repeats were found and proved their usefulness in the successive allelism microsatellite analyses (data not shown). In all, 109 alleles across eight loci and areas were detected. The mean number of alleles, over the range of loci in the hyperchromatic island population (LIS), is lower than that observed in the nearby mainland population (MNL, Campania). This is sustained by the expected and observed heterozygosity (Table 2). Because of the occurrence of a certainly higher magnitude of inbreeding on islands, a deficit of heterozygotes in our three island populations becomes highly plausible.
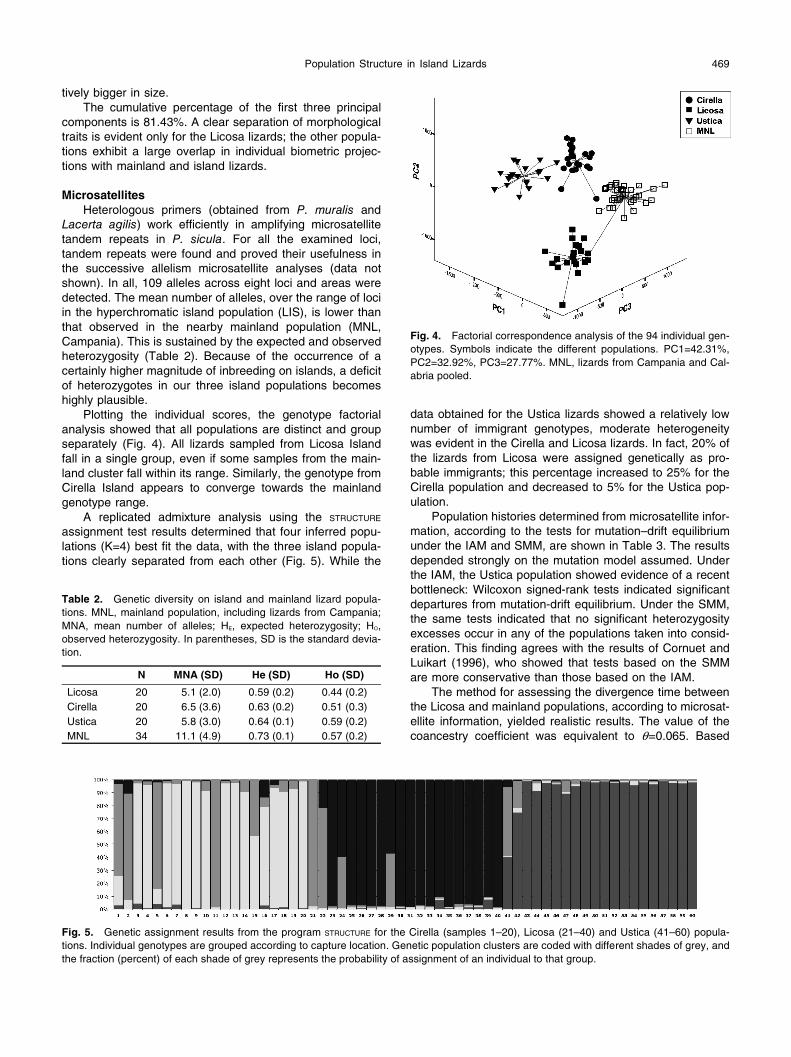
Plotting the individual scores, the genotype factorial analysis showed that all populations are distinct and group separately (Fig. 4). All lizards sampled from Licosa Island fall in a single group, even if some samples from the main-land cluster fall within its range. Similarly, the genotype from Cirella Island appears to converge towards the mainland genotype range.
A replicated admixture analysis using the STRUCTURE
assignment test results determined that four inferred popu-lations (K=4) best fit the data, with the three island popula-tions clearly separated from each other (Fig. 5). While the
data obtained for the Ustica lizards showed a relatively low number of immigrant genotypes, moderate heterogeneity was evident in the Cirella and Licosa lizards. In fact, 20% of the lizards from Licosa were assigned genetically as pro-bable immigrants; this percentage increased to 25% for the Cirella population and decreased to 5% for the Ustica pop-ulation.
Population histories determined from microsatellite infor-mation, according to the tests for mutation–drift equilibrium under the IAM and SMM, are shown in Table 3. The results depended strongly on the mutation model assumed. Under the IAM, the Ustica population showed evidence of a recent bottleneck: Wilcoxon signed-rank tests indicated significant departures from mutation-drift equilibrium. Under the SMM, the same tests indicated that no significant heterozygosity excesses occur in any of the populations taken into consid-eration. This finding agrees with the results of Cornuet and Luikart (1996), who showed that tests based on the SMM are more conservative than those based on the IAM.
The method for assessing the divergence time between the Licosa and mainland populations, according to microsat-ellite information, yielded realistic results. The value of the coancestry coefficient was equivalent to "=0.065. Based
Table 2. Genetic diversity on island and mainland lizard popula-tions. MNL, mainland population, including lizards from Campania; MNA, mean number of alleles; HE, expected heterozygosity; HO, observed heterozygosity. In parentheses, SD is the standard devia-tion.
N MNA (SD) He (SD) Ho (SD)
Licosa 20 5.1 (2.0) 0.59 (0.2) 0.44 (0.2)Cirella 20 6.5 (3.6) 0.63 (0.2) 0.51 (0.3)Ustica 20 5.8 (3.0) 0.64 (0.1) 0.59 (0.2)MNL 34 11.1 (4.9) 0.73 (0.1) 0.57 (0.2)
Fig. 4. Factorial correspondence analysis of the 94 individual gen-otypes. Symbols indicate the different populations. PC1=42.31%, PC2=32.92%, PC3=27.77%. MNL, lizards from Campania and Cal-abria pooled.
Fig. 5. Genetic assignment results from the program STRUCTURE for the Cirella (samples 1–20), Licosa (21–40) and Ustica (41–60) popula-tions. Individual genotypes are grouped according to capture location. Genetic population clusters are coded with different shades of grey, and the fraction (percent) of each shade of grey represents the probability of assignment of an individual to that group.
D. Fulgione et al.470
upon a field census of the lizard population (ca. 170 individ-uals), this value gives an estimated divergence time of approximately t=2N/" % 5000 years ago.
12S rDNA sequencesWe obtained 613-bp 12S sequences from 94 individuals
of P. sicula. The nucleotide composition of the sequences averaged 22.3% C, 24.9% T, 35.7% A, and 18.0% G. In all, 26 different haplotypes were found among 71 polymorphic sites. The average nucleotide diversity overall was #=9.43±1.73 (S.E.), and the within-subpopulation value was #=5.35±0.91 (S.E.).
To test for saturation, observed pairwise proportions of transitions and transversions in the 12S data set were plot-ted against sequence divergences. Transitions and trans-versions in the 12S sequences showed an almost linear relationship with distances (data not shown).
When the island sample was analyzed under the assumption of constant population size (Table 4), Tajima’s and Fu’s statistics for Ustica and Cirella failed to detect devi-ation from the standard neutral model, whereas those for the Licosa population yielded marginal values of departure from neutrality (D=–1.45, P=0.04; FS=–2.69, P=0.04). Kelly’s Z-test results were essentially the same. Only for the Licosa population did this test suggest positive selection (Table 4). In fact, the neutral model predicts a certain level of allele fre-quency asymmetry among polymorphic sites. When natural selection acts on a polymorphism that is closely linked to neutral sites, allele frequency asymmetries may be reduced. For this reason, higher than expected values of Z may rep-
resent a molecular signature of natural selection. Consider-ing that Tajima’s D and other neutrality tests are sensitive to demographic processes as well as to waves of selection, we also conducted a statistical analysis to detect any eventual demographic variation having occurred within the popula-tions investigated.
Table 3. Genetic bottleneck analysis using microsatellite informa-tion according to the tests under the IAM and SMM mutation models. P values of Wilcoxon signed-rank tests indicate significant departures from mutation-drift equilibrium.
P value of Wilcoxon signed ranks test
IAM SMM
Licosa 0.273 0.843Cirella 0.097 0.843Ustica 0.001* 0.996
Table 4. Distribution of mtDNA sequence variants among islands tested by using Tajima’s D, Fu’s FS, and Kelly’s Z.
Statistics
Sample size
Licosa Cirella Ustica
20 20 20
Tajima’s D testTajima’s D –1,456 0.982 0.055Tajima’s D p-value 0.048 0.869 0.540
Fu’s FS testFS –2,696 –2,599 1,160FS p-value 0.044 0.067 0.692
Z-test of selectionProb. Positive selection (dN>dS)
0.000 1,000 0.445
Prob. Neutrality (dN=dS)
0.002 0.699 0.892
Prob. Purifying selection (dN<dS)
1,000 0.351 1,000
a
b
c
Fig. 6. Observed and expected distributions of pairwise differ-ences under the model for population expansion (Rogers and Harpending, 1992). The parameters used were as follows: (a)Licosa population ($=3.99, "0=0.0, "1=4.84); (b) Cirella population ($=3.84, "0=0.002, "1=11.8); (c) Ustica population ($=10.5, "0=0.002, "1=4.55).

Population Structure in Island Lizards 471
The mismatch distribution of pairwise differences between P. sicula haplotypes is shown in Fig. 6. Sequences from Cirella are modally distributed, representing one event of sudden expansion of the population. In contrast, in the Licosa and Ustica populations, mismatch analysis revealed a strong signal of demographic equilibrium, even though the observed values suggest more than one colonization event for the former (Fig. 6b).
The average diversity found within the Licosa and Cam-pania populations could be larger than that observed between the two populations. This situation might have determined the divergence times, though not really signifi-cant, observed for these sister populations.
We also analyzed the 12S sequences to construct neighbor-joining and maximum-parsimony trees. The trees were congruent in several aspects and showed many group-ings that included haplotypes from the same population (Fig. 7). In the NJ tree (Fig. 7a), three separate clusters are evi-dent, supported by high bootstrap values: one includes the mainland Campania and Cirella/Licosa Island populations, with some haplotypes from Cirella that cluster separately; the other includes the Calabria/Sicily and Ustica Island pop-ulations. The MP topology (Fig. 7b) similarly groups the Calabria/Sicily with some haplotypes found in the Ustica Island populations; Campania with Licosa/Cirella; and some Cirella haplotypes that tend to create a well-supported sep-arate cluster.
In addition, the genetic distance among the mainland Campania and the Licosa/Cirella Island populations is always smaller than the distance between Ustica and main-land Calabria/Sicily (Table 5). A lower, though evident, geo-graphical structuring was observed within the Ustica and Cirella populations; this is evident in both the NJ and MP trees which, regarding the haplotypes of these islands, seem to represent a model of an expanding population.
DISCUSSION
The nature of geographic variation becomes more com-prehensible by a combination of molecular and morpho-logical studies (Thorpe and Malhotra, 1996; Arnold et al., 2007). Within the framework of this concept, in the present study we observed that the Licosa lizards are significantly different morphologically from other insular and mainland conspecifics. This variation is related not only to a well-displayed hyperchromatism but also to body size. Gigantism is widespread among insular populations of Podarcis, e.g., in P. lilfordi, P. muralis, P. pityusensis, and P. tiliguerta(Cirer, 1981; Salvador, 1986). Podarcis sicula is another
(a)
(b)
Fig. 7. (a) Unrooted Neighbor-Joining tree based on Tamura-Nei distances among sampling locations. The length of tree branches is relative to the genetic distances (note scale=2 substitutions). Boot-strap values (1000 pseudoreplicates) are indicated near nodes. (b)Maximum-parsimony tree established by a heuristic search using the close-neighbor-interchange method. Numbers represent the percentage of 1000 bootstrap replicates where a given node appeared. Only bootstrap values >50% are shown. Circles indicate haplotypes from Cirella; triangles, haplotypes from Ustica; squares, haplotypes from Licosa.
Table 5. Population pairwise Kimura 2-parameter genetic distance estimates among mtDNA haplotypes.
Campania Sicily Calabria Licosa Cirella
CampaniaSicily 0.0254Calabria 0.0288 0.0049Licosa 0.0017 0.0305 0.0340Cirella 0.0038 0.0320 0.0355 0.0061Ustica 0.0222 0.0137 0.0153 0.0270 0.0283
D. Fulgione et al.472
example. Lizards tend to show a size increase and a greater morphological homogeneity on smaller and older islands (Cheylan, 1988; Cirer and Martinez-Rica, 1990). According to some authors (Thorpe, 1985; Cheylan, 1988; Vicente, 1989; Cirer and Martinez-Rica, 1990; Case and Schwaner, 1993) and our recent unpublished data, a reduction in pre-dation pressure and the simultaneous occurrence of a high population density of insular lizards lead to a shortage of resources and a consequent increase in intraspecific com-petition (Palkovacs, 2003; Lomolino, 2005).
Feeding specializations such as a herbivorous diet are often cited as causative of convergent and adaptive evolu-tion (Herrel et al., 2004). However, in the Licosa hyperchro-matism, a similar effect of a prevalently vegetarian feeding regimen (Eisentraut, 1950) can be excluded, as deduced from our recent observations involving some insular sam-ples. Indeed, several hyperchromatic island samples (six adult males and females) maintained in captivity for over 6 months and fed ad libitum exclusively with insect larvae did not exhibit any chromatic variation from the free-living native Licosa lizards (Fulgione et al., unpublished).
Genetic traits confirm the morphological variations in Licosa lizards. The microsatellite analysis seems broadly congruent with the morphological data. Since morphological and microsatellite DNA characters are essentially indepen-dent, these two sources of inference evidently potentiate each other. In contrast, the low genetic discrimination between the Licosa mtDNA haplotypes and those in conspe-cifics on the nearest mainland (Campania) indicates that these populations are closely related, have recently diverged, and have not had a long history of genetic isola-tion. Both the maximum-parsimony and Tamura-Nei dis-tance analyses of the 12S sequence data produced trees that differ from that derived from morphology. Morphological stasis can occur despite extensive molecular divergence among populations and species [e.g., plethodontid sala-manders (Larson, 1989)] or morphological evolution may be quite rapid and accompanied by little divergence at the molecular level [e.g., cichlid fishes (Meyer, 2005) and echi-noids (Smith et al., 1995)]. Morphological differentiation in the Licosa population appears to have been quite rapid compared to mitochondrial molecular evolution. Moreover, geological data indicate that Licosa Island became discon-nected from the mainland relatively recently, with a marine transgression raising the sea over the ancient peninsula about 5000 years ago (Lambeck et al., 2004). While it can-not be ignored that molecular clocks are problematical (Hillis et al., 1996), sometimes spatial correlations provide strong evidence of a relationship between phylogenesis and geol-ogy. Divergence time, as inferred by our analysis of micro-satellite gene variation is perfectly in line with the geological data.
Neither the microsatellite nor 12S sequence analyses detected any signature of a bottleneck or of a demographic expansion for the Licosa population. In contrast, the lizard populations of the other two islands (Cirella and Ustica) have apparently experienced founder effects. Indeed, according to the star-like phylogenetic radiation shown in the parsimony and NJ cluster (Fig. 7), on Ustica and Cirella there are only a few haplotypes, all quite closely related to the most common haplotype. Probably, when P. sicula was
first introduced onto these islands, the species could rapidly radiate to occupy the ecological niches available, and the population sizes increased. The phylogenetic analyses indi-cate that the Licosa haplotype is nested within other main-land P. sicula haplotypes.
For the Cirella population, this consideration is consis-tent with the mtDNA mismatch distribution pattern. The pat-tern of a pairwise mismatch distribution can distinguish between sudden expansion and the effects of selection, and in the Licosa population the pattern suggests demographic equilibrium (Fig. 6).
For the Licosa population, furthermore, significant values of Tajima’s and Fu’s tests reject population stasis/neutrality, indicating population expansion and/or selection. If the neutrality analysis suggests a significant departure from equilibrium, and the mismatch distribution analysis excludes demographic expansion, we are inclined to believe that the Licosa population underwent significant directional selective pressure. The selective pressure(s) acting on the lizards of Licosa would produce rapid morphological adapta-tions in size and color. If the mitochondrial gene tree is rep-resentative of the history of Podarcis populations, then the morphological divergence of the Licosa population is a derived feature. In some lacertid species of North America, intraspecific color variation has been associated with sub-strate color variation and/or thermal environments, which is consistent with recent selection (Rosenblum et al., 2004).
The microsatellites also show the non-homogeneity of the Licosa population and suggest that an intermittent flow (at least two main waves of colonization) of immigrants adding to the resident population might have occurred. Indeed, the two discrete clusters, observed in the structural analysis, of individuals in the Licosa population indicate either that there is gene flow from the mainland or that the Licosa Island was colonized by two different founder popu-lations. The latter seems more realistic; in fact, a hint of bimodality in Fig. 6a additionally support this idea. This could be possible (e.g., Perez-Mellado and Casas, 1997), considering that Licosa Island can be easily reached by a variety of floating wooden and/or plastic debris, and also by tourists coming from the nearby mainland. The presence of immigrants was found principally on the two islands closer to the mainland, Cirella and Licosa. Despite these immi-grants, the lizard population of Licosa remains substantially uniform morphologically: in all our visits we observed and captured only blue lizards.
Morphological variations displayed by some insular pop-ulations may provide clues to the performance advantage to individuals, strengthening the hypothesis of morphological evolution in these lizards.
Our data do not provide support for the concept of a molecular phylogenetic history. They point rather to a con-sideration of natural selection as expressed by several authors on lizard populations from small islands (Clover, 1979; Thorpe and Malhotra, 1996; Thorpe and Stenson, 2003). However, we should not forget the relevance of hab-itat to induct morphological changes in lacertids (Vanhooy-donck et al., 2000; Van Damme and Vanhooydonck, 2002; Vanhooydonck and Van Damme, 2003; Verwaijen et al., 2002; Wei-Guo, 2006).
Analysis of intraspecific geographic variation in selec-
Population Structure in Island Lizards 473
tively neutral genetic markers has provided insights into many aspects of population biology, including historical demographic events, colonization history, and phylogeo-graphy, and has allowed the identification of conservation units (Avise, 1994, 2000). An evaluation of the basic cause of character evolution thus requires the integration of mor-phological, ethological, ecological, and phylogenetic data to test hypotheses on the origin and maintenance of adaptation (Báez and Brown, 1997; Baum and Larson, 1991; Forsman, 1995).
ACKNOWEDGMENTS
The authors are thankful to Stazione Faunistica di Punta Licosa, situated in the Parco Nazionale del Cilento e Vallo di Diano, for providing logistical facilities for the collection of material.
REFERNCES
Arnold EN (1993) Phylogeny and the Lacertidae. In “Lacertids of the Mediterranean Region” Ed by ED Valakos, W Bôhme, V Perez Mellado, P Maragou, Hellenic Zoological Society, Athens, pp 1–16
Arnold EN (1998) Structural niche, limb morphology and locomotion in lacertid lizards (Squamata, Lacertidae); a preliminary survey. Bull Brit Mus Nat Hist Zool 64: 63–89
Arnold EN, Arribas O, Carranza S (2007) Systematics of the Palae-arctic and Oriental lizard tribe Lacertini (Squamata: Lacertidae: Lacertinae), with descriptions of eight new genera. Zootaxa 1430: 1–86
Avise JC (1994) Molecular Markers, Natural History and Evolution. Chapman and Hall, New York
Avise JC (2000) Phylogeography. The History and Formation of Species. Harvard University Press, Cambridge, MA
Bagnara JT, Fernandez PJ (2007) On the blue coloration of verte-brates. Pigment Cell Res 20: 14–26
Baum DA, Larson A (1991) Adaptation reviewed: a phylogenetic methodology for studying character macroevolution. Syst Zool 40: 1–18
Belkhir K, Borsa P, Chikhi L, Raufaste N, Bonhomme F (1996) GENETIX 4.05, Logiciel sous Windows TM pour la génétique des populations. Laboratoire Génome, Populations, Interac-tions, CNRS UMR 5000, Université de Montpellier II, Montpel-lier (France)
Báez M, Brown RP (1997) Testing multivariate patterns of within-island differentiation in Podarcis dugesii from Madeira. J Evol Biol 10: 575–587
Böhme W, Corti C (1993) Zoogeography of the lacertid lizards of the western Mediterranean basin. In “Lacertids of the Mediterra-nean Region” Ed by E Valakos, W Bôhme, V Përez Mellado, P Maragou, Hellenic Zoological Society, Athens, pp 17–33
Capula M (1994) Population genetics of a colonizing lizard: loss of variability in introduced populations of Podarcis sicula. Cell Mol Life Sci 50: 691–696
Capula M, Nascetti G, Bullini L (1988) Genetic differentiation among species of the genus Podarcis (Reptilia, Lacertidae). Bol Zool 55 Suppl: 49 [in Italian]
Capula M, Nascetti G, Bullini L (1990) Genetic structure of P. siculaand P. wagleriana (Reptilia: Lacertidae) from Sicily, Egadi and Aeolian Islands. Atti Congr UZI Palermo 53: 321–322 [in Italian]
Cardone A, Capriglione T, Odierna G, Redi CA, Garagna S (1990) Genomic intraspecific variations in some populations of Podarcis s. sicula Raf. In “Cytogenetics of Amphibians and Reptiles” Ed by E Olmo, Birkhauser Verlag, Basel, pp 247–254
Case TJ, Schwaner TD (1993) Island/mainland body size differ-ences in Australian varanid lizards. Oecologia 94: 102–109
Castilla AM, Fernández-Pedrosa V, Backeljau T, González A,
Latorre A, Moya A (1998) Conservation genetics of insular Podarcis lizards using partial cytochrome b sequences. Mol Ecol 7: 1407–1411
Cirer AM (1981) La Lagartija Ibicenca y su Circulo de Razas. Con-sell Insular d’Eivissa y Formentera, Ibiza
Cirer AM, Martinez-Rica JP (1990) The polymorphism of Podarcis pityusensis and its adaptative evolution in Mediterranean Isles. Herpet J 1: 465–473
Clover RC (1979) Phenetic relationships among populations of Podarcis sicula and P. melisellensis (Sauria: Lacertidae) from islands in the Adriatic Sea. Syst Zool 28: 284–298
Cornuet JM, Luikart G (1996) Description and power analysis of two tests for detecting recent population bottlenecks from allele fre-quency data. Genetics 144: 2001–2014
Corti C (2006) Podarcis sicula. In “Atlas of Italian Amphibians and Reptiles” Ed by R Sindaco, G Doria, E Razzetti, F Bernini, Soci-etas Herpetologia Italica, Edizioni Polistampa, Firenze, pp 486–489
Corti C, Lo Cascio P (2002) The Lizards of Italy and Adjacent Areas. Chimaira, Frankfurt am Main
Eimer T (1874) Zoologische studien auf Capri. II. Lacerta muralis coerulea, ein Beitrag zur Darwinischen Lebre Leipzig, Verlag von Wilhelm Engelmann, IV
Eisentraut M (1950) Die Eidechsen der spanischen Mittelmeerinseln und ibre Rassenaufspaltung im Litchte der Evolution. Mitt Zool Mus Berlin 26: 1–228
Emerson BC (2002) Evolution on oceanic islands: molecular phylo-genetic approaches to understanding pattern and process. Mol Ecol 11: 951–966
Evanno G, Regnaut S, Goudet J (2005) Detecting the number of clusters of individuals using the software STRUCTURE: a simula-tion study. Mol Ecol 14: 2611–2620
Excoffier L, Laval G, Schneider S (2005) ARLEQUIN (version 30): an inte-grated software package for population genetics data analysis. Evol Bioinform Online 1: 47–50 (http://lgbunigech/arlequin/)
Felsenstein J (1985) Confidence limits on phylogenies: An approach using the bootstrap. Evolution 39: 783–791
Forsman A (1995) Opposing fitness consequences of colour pattern in male and female snakes. J Evol Biol 8: 53–70
Fu YX (1997) Statistical tests of neutrality of mutations against pop-ulation growth, hitchhiking and background selection. Genetics 147: 915–925
Fulgione D, Milone M, Rippa D, Capriglione T, Guarino FM, Odierna G (2004) Genetic analysis in a main land melanic lizard (Podarcis sicula) population from South Italy (Cilento and Vallo di Diano National Park). Ital J Zool 2: 25–28
Gaggiotti OE, Excoffier L (2000) A simple method to remove the effect of unequal population sizes and bottleneck in pairwise genetic distances. Proc R Soc Lond Biol 267: 81–88
Gorman CG, Soulé M, Yang SY, Nevo E (1975) Evolutionary gene-tics of insular Adriatic lizards. Evolution 29: 52–71
Gould SF, Johnston RF (1972) Geographic variation. Annu Rev Ecol Syst 3: 457–498
Gullberg A, Tegelstrom H, Olsson M (1997) Microsatellites in the sand lizard (Lacerta agilis): description, variation, inheritance and applicability. Biochem Genet 35: 281–295
Herrel A, Vanhooydonck B, Van Damme R (2004) Omnivory in lac-ertid lizards: adaptive evolution or constraint? J Evol Biol 17: 974–984
Hillis DM, Moritz C, Mable BK (1996) Molecular Systematics, 2nd ed, Sinauer Associates, Sunderland, MA
Jackman TR, Larson A, De Queiroz K, Losos JB (1999) Phyloge-netic relationships and time of early diversification in Anolis liz-ards. Syst Biol 48: 254–285
Kelly KJ (1997) A test of neutrality based on interlocus associations. Genetics 146: 1197–1206
Kramer G (1949) Uber inselmelanismus bei eidechsen. Z Indukt
D. Fulgione et al.474
Abstamm Ver 83: 157–164Kumar S, Tamura K, Nei M (2004) MEGA3: integrated software for
molecular evolutionary genetics analysis and sequence align-ment. Brief Bioinform 5: 150–163
Lambeck K, Antonioli F, Purcell A, Silenzi S (2004) Sea level change along the Italian coast for the past 10,000 yrs. Quater-nary Sci Rev 23: 1567–1598
Langerhans RB, Knouft JH, Losos JB (2006) Shared and unique features of diversification in greater antillean Anolis ecomorphs. Evolution 60: 362–369
Lanza B (1979) Universo in miniatura attorno alla Corsica. Geos 1: 34–51
Lanza B, Garavelli P, Corti C (1993) Clinal variation in some meristic characters of the Italian wall lizard Podarcis sicula (Rafinesque-Schmaltz, 1810). In “Lacertids of the Mediterranean Region” Ed by ED Valakos, W Bôhme, V Përez Mellado, P Maragou, Hel-lenic Zoological Society, Athens, pp 43–49
Larson A (1998) The comparison of morphological and molecular data in phylogenetic systematics. In “Molecular Approaches to Ecology and Evolution” Ed by R DeSalle, B Schierwater, Birkhauser, Basel, pp 275–296
Lomolino MV (2005) Body size evolution in insular vertebrates: gen-erality of the island rule. J Biogeogr 32: 1683–1699
Maruyama T, Fuerst PA (1985) Population bottlenecks and non-equilibrium models in population genetics. II. Number of alleles in a small population that was formed by a recent bottleneck. Genetics 111: 675–689
McGuigan K, Chenoweth SF, Blows MW (2005) Phenotypic diver-gente along lines of genetic variance. Am Nat 165: 32–43
Mertens R (1963) Wie entstand das dunkle Farkleid der Inseleidech-sen? Umsch Wiss Techn 6: 180–192
Meyer A (2005) Evolutionary biology: cichlid species flocks of the past and present. Heredity 95: 419–420
Nei M (1987) Molecular Evolutionary Genetics. Columbia University Press, New York
Nei M, Kumar S (2000) Molecular Evolution and Phylogenetics. Oxford University Press, New York
Nembrini M, Oppliger A (2003) Characterization of microsatellite loci in the wall lizard Podarcis muralis (Sauria: Lacertidae). Mol Ecol Notes 3: 123
Oliveiro M, Bologna MA, Manciotti A, Annesi M, Mariottini P (1998) Molecular phylogenetics of the Italian Podarcis lizards (Reptilia, Lacertidae). Ital J Zool 65: 315–324
Oliveiro M, Bologna MA, Mariottini P (2000) Molecular biogeography of the Mediterranean lizards Podarcis Wagler, 1830 and TeiraGray, 1838 (Reptilia, Lacertidae). J Biogeogr 27: 1403–1420
Oliveiro M, Burke R, Bologna MA, Wirz A, Mariottini P (2001) Molec-ular characterization of native (Italy) and introduced (USA) Podarcis sicula populations (Reptilia, Lacertidae) Ital J Zool 68: 121–124
Palkovacs EP (2003) Explaining adaptive shifts in body size on islands: a life history approach. Oikos 103: 37–44
Perez-Mellado J, Casas L (1997) Pollination by a lizard on a Medi-terranean island. Copeia 3: 593–595
Podnar M, Mayer W, Tvrtkovi N (2005) Phylogeography of the Italian wall lizard, Podarcis sicula, as revealed by mitochondrial DNA sequences. Mol Ecol 14: 575–588
Pritchard JK, Stephens M, Donnelly P (2000) Inference of popula-tion structure using multilocus genotype data. Genetics 155: 945–959
Reynolds J, Weir BS, Cockerham CC (1983) Estimation of the coancestry coefficient: basis for a short-term genetic distance. Genetics 105: 767–779
Rogers AR (1995) Genetic evidence for a Pleistocene population explosion. Evolution 49: 608–615
Rogers AR, Harpending H (1992) Population growth makes waves in the distribution of pairwise genetic differences. Mol Biol Evol 9: 552–569
Rosenblum EB, Hoekstra HE, Nachman MW (2004) Adaptive reptile color variation and the evolution of the Mc1r gene. Evolution 58: 1794–1808
Saitou N, Nei M (1987) The neighbor-joining method: a new method for reconstructing phylogenetic trees. Mol Biol Evol 4: 406–425
Salvador A (1986) Podarcis pityusensis (Boscà, 1883) Pityusen-Eidechse. In “Handbuch der Reptilien und Amphibien Europas Echsen III (Podarcis)” Ed by W Böhme, Aula-Verlag, pp 231–253
Sambrook J, Russell DW (2001) Molecular Cloning: A Laboratory Manual. 3rd ed, Cold Spring Harbor Laboratory Press, New York
Schoener TW, Losos JB, Spiller DA (2005) Island biogeography of populations: an introduced species transforms survival pat-terns. Science 310: 1807–1809
Smith AB, Littlewood DTJ, Wray GA (1995) Comparing patterns of evolution: larval and adult life history stages and ribosomal RNA of post-Palaeozoic echinoids. Philos Trans R Soc Lond B 349: 11–18
Tamura K, Nei M (1993) Estimation of the number of nucleotide sub-stitutions in the control region of mitochondrial DNA in humans and chimpanzees. Mol Biol Evol 10: 512–526
Thompson JD, Gibson TJ, Plewniak F, Jeanmougin F, Higgins DG (1997) The ClustalX windows interface: flexible strategies for multiple sequence alignment aided by quality analysis tools. Nucleic Acids Res 25: 4876–4882
Thorpe RS (1985) Clines — character number and the multivariate-analysis of simple patterns of geographic-variation. Biol J Linn Soc 26: 201–214
Thorpe RS, Malhotra A (1996) Molecular and morphological evolu-tion within small islands. Philos Trans R Soc Lond B 1341: 815–822
Thorpe RS, Stenson AG (2003) Phylogeny, paraphyly and eco-logical adaptation of colour and pattern in the Anolis roquet complex on Martinique. Mol Ecol 12: 117–132
Van Damme R, Vanhooydonck B (2002) Speed versus maneuver-ability: association between vertebral number and habitat struc-ture in lacertid lizards. J Zool 258: 327–334
Vanhooydonck B, Van Damme R (2003) Relationships between locomotor performance, microhabitat use and antipredator behaviour in lacertid lizards. Funct Ecol 17: 160–169
Vanhooydonck B, Van Damme R, Aerts P (2000) Ecomorphological correlates of habitat partitioning in Corsican lacertid lizards. Funct Ecol 14: 358–368
Verwaijen D, Van Damme R, Herrel A (2002) Relationships between head size, bite force, prey handling efficiency and diet in two sympatric lacertid lizards. Funct Ecol 16: 842–850
Vicente LA (1989) Sobre a Historia natural dos Répteis da Ilha Ber-lenga a Sindrome de Insulandade. PhD Thesis, University de Lisboa, Lisboa
Wei-Guo D (2006) Phenotypic plasticity in reproductive traits induced by food availability in a lacertid lizard, Takydromus septentrionalis. Oikos 112: 363–369
(Received September 3, 2007 / Accepted February 12, 2008)