Morphological Differentiation and Genetic Structure in Island Lizard Populations
Upload
independentCategory
view
0download
0
RESEARCH ARTICLE Open Access
The blue lizard spandrel and the island syndromePasquale Raia1, Fabio M Guarino2, Mimmo Turano2, Gianluca Polese2, Daniela Rippa2, Francesco Carotenuto1,Daria M Monti2, Manuela Cardi2, Domenico Fulgione2*
Abstract
Background: Many small vertebrates on islands grow larger, mature later, lay smaller clutches/litters, and are lesssexually dimorphic and aggressive than their mainland relatives. This set of observations is referred to as the ‘IslandSyndrome’. The syndrome is linked to high population density on islands. We predicted that when populationdensity is low and/or fluctuating insular vertebrates may evolve correlated trait shifts running opposite to theIsland Syndrome, which we collectively refer to as the ‘reversed island syndrome’ (RIS) hypothesis. On theproximate level, we hypothesized that RIS is caused by increased activity levels in melanocortin receptors.Melanocortins are postranslational products of the proopiomelanocortin gene, which controls pleiotropicallypigmentation, aggressiveness, sexual activity, and food intake in vertebrates.
Results: We tested the RIS hypothesis performing a number of behavioral, genetic, and ontogenetic tests on ablue colored insular variant of the Italian Wall lizard Podarcis sicula, living on a small island off the Southern Italiancoast. The population density of this blue-colored variant was generally low and highly fluctuating from one yearto the next.In keeping with our predictions, insular lizards were more aggressive and sexually dimorphic than their mainlandrelatives. Insular males had wide, peramorphic heads. The growth rate of insular females was slower than growthrates of mainland individuals of both sexes, and of insular males. Consequently, size and shape dimorphism arehigher on the Island. As predicted, melanocortin receptors were much more active in individuals of the insularpopulation. Insular lizards have a higher food intake rate than mainland individuals, which is consistent with theincreased activity of melanocortin receptors. This may be adaptive in an unpredictable environment such as LicosaIsland. Insular lizards of both sexes spent less time basking than their mainland relatives. We suspect this is aby-product (spandrel) of the positive selection for increased activity of melanocortins receptors.
Conclusions: We contend that when population density is either low or fluctuating annually as a result ofenvironmental unpredictability, it may be advantageous to individuals to behave more aggressively, to raise theirrate of food intake, and allocate more energy into reproduction.
BackgroundPopulations of organisms confined to islands oftenevolve extensive morphological and behavioral changesoften over a short time [1]. The best known of thesechanges are gigantism in small vertebrates and dwarfismin larger species, the so-called Island Rule [2]. In addi-tion there are changes in body shape. Insular mammalsoften have reduced limb lengths and enlarged cheekteeth [3]. Many insular birds evolve flightlessness [4,5],dull plumage coloration [[6-8], but see [9,10]], and
larger bills [11,12]. Insular rodents exhibit an “IslandSyndrome” [13] involving the co-occurrence of most(and often all) of these traits: reduced aggressiveness,gigantism, reduced litter size, greater life expectancy,and delayed sexual maturity. McNab [14] further notedthat organisms affected by the syndrome have a reducedbasal metabolic rate, and a propensity to enter torpor,which entails reduced energy expenditure [14]. Adlerand Levins [13] linked the emergence of the island syn-drome to the reduced interspecific competition and pre-dation pressure that, they claimed, are typical of islands,and to the size and degree of isolation of the islanditself. When predation pressure is low insular populationsize increases rapidly (= density compensation and
* Correspondence: [email protected] of Structural and Functional Biology, University of NaplesFederico II. Via Cinthia MSA, Naples, ItalyFull list of author information is available at the end of the article
Raia et al. BMC Evolutionary Biology 2010, 10:289http://www.biomedcentral.com/1471-2148/10/289
© 2010 Raia et al; licensee BioMed Central Ltd. This is an Open Access article distributed under the terms of the Creative CommonsAttribution License (http://creativecommons.org/licenses/by/2.0), which permits unrestricted use, distribution, and reproduction inany medium, provided the original work is properly cited.

overcompensation). This makes it adaptive to investmore in somatic growth and less in reproduction, layingsmaller litters/clutches of larger offspring [15-19]. Incrowded conditions larger adults and larger offspringusually have higher fitness and better survival [20-24].Since Adler and Levins’s seminal work, it has been
suggested that a similar “syndrome” occurs in insularpasserine birds (reviewed in [25]). According to this the-ory these birds tend to evolve larger body size, grow lar-ger bills, are less sexually dimorphic and less aggressivetowards conspecifics, reach sexual maturity later in life,lay smaller clutches of larger offspring, live at higherdensity, and have higher habitat fidelity than their main-land relatives. It is apparent that when living at highand stable population density, many insular vertebratesshow a number of correlated trait shifts including, atleast, decreased sexual dimorphism, decreased energyallocation to reproduction, and decreased aggressivenesstoward conspecifics. Here we refer to these trait shiftsas the “Island Syndrome” expanding upon the originaldefinition given for rodents [13].Similar observations have been made for reptiles. For
instance, lizards on islands show a host of trait changesincluding melanism, modified limb lengths and headshapes, size change (i.e. dwarfism or gigantism), smallerclutch size, frequent shifts to herbivorous diets, andreduced aggressiveness [22,26-37]. Buckley and Jetz [38]reported that insular lizards often live at very high den-sities (ca. 1900 individuals per Ha-1) hence density com-pensation probably takes place in many insular lizardpopulations.Under the Island Syndrome fecundity, aggressiveness
and sexual dimorphism decrease because the populationdensity is high and stable, and the environment is pre-dictable. Here we hypothesize that when the environ-ment is highly unpredictable and there are strongfluctuations in population size, investment of moreresources into reproduction, aggressive behavior, andsexual competition are favored [28]. Sexual dimorphismis expected to increase because of the greater emphasison sexual selection [24]. The same set of trait shiftsshould theoretically occur when predators are presentand keep the population density low. We name thishypothesis the “Reversed Island Syndrome” (RIS, seeTable 1).In mammals, clutch size generally decreases with
increasing body size [21], thus gigantism is likely to beassociated with lower reproductive effort/fewer off-spring. In reptiles, on the other hand, large size isassociated with larger clutch and litter sizes [39].Moreover, large insular reptiles may have simply livedfor longer [40]. Consequently, we predict RIS appliesmay apply to dwarf insular mammals and to largeinsular reptiles.
We provide explicit tests of the RIS-predicted pheno-typic and behavioral trait shifts (Table 1), by using theLicosa Island Wall lizard Podarcis sicula klemmeri as amodel. This is a large-sized, melanistic variant of theItalian Wall lizard P. sicula from mainland Italy [41,42].P. s. klemmeri population size fluctuates yearly by up to40% (Tables 2 and Additional file 1: Table S11).Individuals of both sexes from the insular population
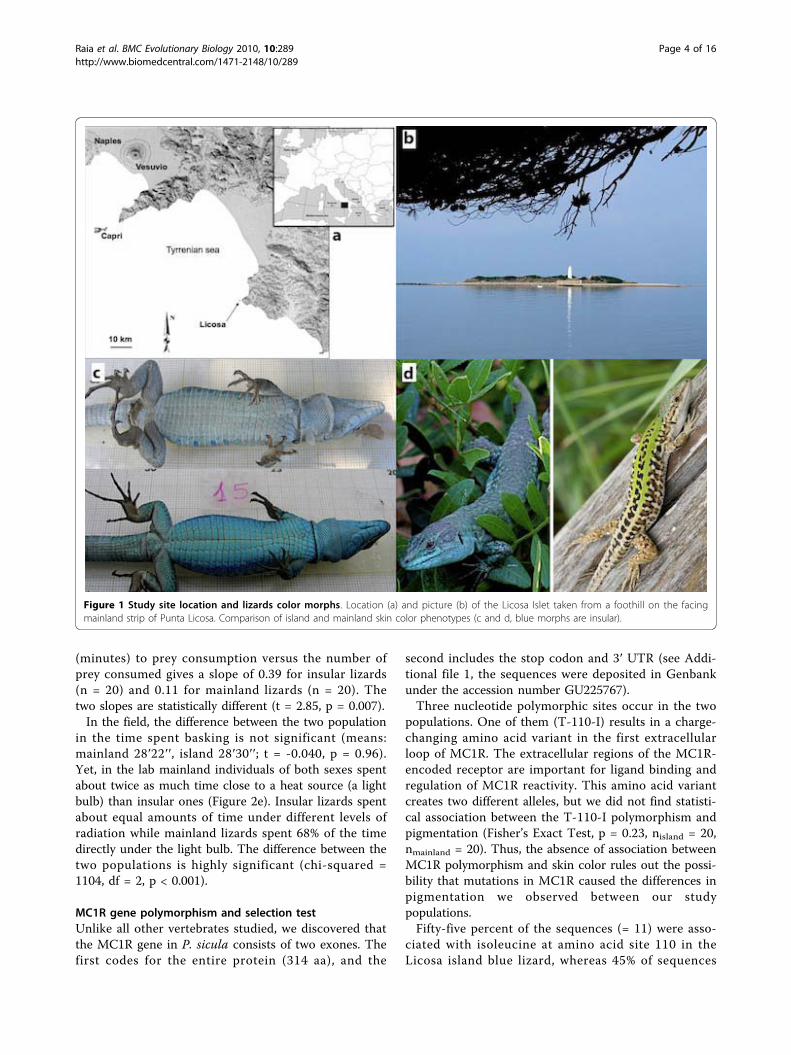
are bright blue and no normal colored lizard (with agreen back and pale undersides) has ever been observedon Licosa (Figure 1). We predicted that P. s. klemmeriwould be more aggressive, more sexually dimorphic, anddevelop faster than mainland P. sicula.We investigated the genetic basis of P. s. klemmeri
body coloration. The blue color is a form of melanismin reptiles [43]. In vertebrates, melanistic coloration isoften associated with increased aggressiveness and sex-ual activity [44-46]. In a recent review Ducrest et al.[46] suggest the existence of a behavioral syndromeresulting from the pleiotropic effects of the proopio-melanocortin (POMC) gene, the products of whichregulate genes for melanocortin receptors, MCRs.POMC produces the melanocortins a-, b- and g-MSHand ACTH, which bind to five melanocortin receptors(MC1-5R). In vertebrates, POMC and the five MCRgenes are highly conserved and their tissue distributionand functions are similar across species [47]. MCRsare involved in the regulation of pigmentation, aggres-siveness, food intake, energy expenditure, sexual activ-ity, and immunological responses to stress factors.Since these coordinated traits partly overlap with thetrait-shifts we predicted to occur under RIS (Table 1),we predicted that increased MCR expression levelscould be the proximal, physiological causes of the RIS.We tested this hypothesis by comparing levels ofexpression of three different melanocortin receptors:MC1R, 3R, and 4R; which directly influence skin pig-mentation (MC1R), food intake rate, body size, andenergy expenditure (MC3R and MC4R), and sexualactivity (MC4R) (see [46]).These predictions hold only if there are no mutations
in MCR genes [46]. Therefore, we sequenced and com-pared the MC1R locus in the two populations in orderto rule out the possibility that the striking difference inpigmentation in our lizards populations is due tomutation in MC1R in the island population. We pre-dict that activity for all of these MCRs is higher in theinsular lizards. Increased aggressiveness and sexualactivity are expected to occur if an over-expression ofthe melanocortin system is the molecular basis of theRIS, whereas changes in food intake rate and darkerpigmentation are expected to occur irrespective of RIS,as a consequence of the pleiotropy in the melanocortinsystem (Table 1).
Raia et al. BMC Evolutionary Biology 2010, 10:289http://www.biomedcentral.com/1471-2148/10/289
Page 2 of 16

Finally, we investigated head shape ontogeny in Licosaand mainland P. sicula to test for differences in develop-mental and growth rates. Ontogeny is particularly rele-vant here because life history theory predicts a tradeoffbetween growth and reproduction [21]. Changes inontogeny may be reflected in adult shape differencesbecause individuals that mature earlier may appear pae-domorphic [48]. Paedomorphosis is linked to increasedreproductive investment in ephemeral habitats inamphibians [49], and was proposed to drive gigantismin Canary Island lizards Gallotia stehlini and G. simonyi[50] and dwarfism in sauropod dinosaurs [51] and dwarfelephants [52]. On the other hand, positive selection forsexually-selected traits may produce peramorphosis,since sexually selected traits usually appear later inontogeny [53]. Under RIS, we predicted that the insularlizard (1) develops faster in order to mature early, (2) ismore sexually dimorphic as a consequence of strongsexual selection, and (3) has slower growth rate as aconsequence of re-allocation of resources from growthinto reproduction [21].
ResultsBehavioral traits shiftsInsular lizards were much more aggressive, spent lesstime basking and had higher food intake rate (Figure 2).In the field (Figure 2a), we observed island lizards eitherthreatening or attacking other individuals, on average,1.95 times per hour, compared to 1.05 times on themainland. A randomization test indicates this differencein attack rate (0.90) is highly significant (random sets,mean difference of the means = 0.385, p = 0.004). In thelab (Figures 2b and 2c), insular males were nearly fourtimes as likely to attack other males as mainland males(randomization test: mean difference = 0.210, p <0.001). Attacks towards the same sex were significantlymore common for insular than for mainland females(1.2 versus 0.4 attacks per hour; randomization test:mean difference = 0.80, p = 0.010).Sexual interactions in the lab were quite rare (Figure
2d). We counted just three interactions in mainlandlizards and five in insular lizards. The difference is notsignificant (p = 0.208). Plainly, though, the power of thetest is very low given the small numbers.Lab experiments revealed that insular lizards had
higher food intake rate than mainland lizards. Mainlandlizards ate wax worms, on average, at 7′45” minuteintervals, insular lizards at 3′ 2” intervals. On average,insular lizards attacked their first prey after 4′ 6′′ onaverage (range 3′15′′ to 7′01”), whereas mainland lizardsdid not begin feeding until, on average, 12′ 26′′ (range 9′34” to 21′00”). All insular lizards consumed all the waxworms they were given within 12 to 20 minutes whilenone of the mainland lizards consumed all the waxworms, and the 4th wax worm was consumed after 28 to43 minutes (Figures 2f and 2g). Regressing time
Table 1 Phenotypic traits shifts expected to occur in insular populations as compared to their mainland relativesaccording to the Island Syndrome and to the RIS
trait Islandsyndrome
Reversed Island syndrome (RIS) Trait changes mediated by increased POMC activity (the involvedMCR is indicated)
Populationdensity
high Low or inconstant -
Aggressiveness low high high, MC5R
Body size usually large small in endotherms, either small or largein ectotherms
small, MC3-4Rs
Energyexpenditure
low high high, MC3,4R
Sexualdimorphism
small high -
Development - faster, or anticipated -
Voracity* low high Either low or high, depending on the balance between MC3R and 4R
Pigmentation* irrelevant darker, but may occur in non-melanisticspecies as well
darker, MC1R
Shifts in food intake rate and pigmentation (indicated with an asterisk) are not directly predicted by the RIS hypothesis and are only true if RIS is triggered bychanges in melanocortin receptors activity, and these are not polymorphic. In the last column we report the trait shifts mediated by increase in POMC expressionand their relationship with RIS.
Table 2 Lizards’ density estimates on both the LicosaIsland and on the facing mainland strip of Punta Licosa,over a 5-years survey (see Additional file 1: Table S11 forfurther details)
Estimated population density
Year Licosa (island) Punta Licosa (mainland)
2004 148.1 355.3
2005 246.2 341.1
2006 231.2 360.9
2007 241.7 388.0
2008 159.4 350.9
Raia et al. BMC Evolutionary Biology 2010, 10:289http://www.biomedcentral.com/1471-2148/10/289
Page 3 of 16
(minutes) to prey consumption versus the number ofprey consumed gives a slope of 0.39 for insular lizards(n = 20) and 0.11 for mainland lizards (n = 20). Thetwo slopes are statistically different (t = 2.85, p = 0.007).In the field, the difference between the two population
in the time spent basking is not significant (means:mainland 28′22′′, island 28′30′′; t = -0.040, p = 0.96).Yet, in the lab mainland individuals of both sexes spentabout twice as much time close to a heat source (a lightbulb) than insular ones (Figure 2e). Insular lizards spentabout equal amounts of time under different levels ofradiation while mainland lizards spent 68% of the timedirectly under the light bulb. The difference between thetwo populations is highly significant (chi-squared =1104, df = 2, p < 0.001).
MC1R gene polymorphism and selection testUnlike all other vertebrates studied, we discovered thatthe MC1R gene in P. sicula consists of two exones. Thefirst codes for the entire protein (314 aa), and the
second includes the stop codon and 3′ UTR (see Addi-tional file 1, the sequences were deposited in Genbankunder the accession number GU225767).Three nucleotide polymorphic sites occur in the two
populations. One of them (T-110-I) results in a charge-changing amino acid variant in the first extracellularloop of MC1R. The extracellular regions of the MC1R-encoded receptor are important for ligand binding andregulation of MC1R reactivity. This amino acid variantcreates two different alleles, but we did not find statisti-cal association between the T-110-I polymorphism andpigmentation (Fisher’s Exact Test, p = 0.23, nisland = 20,nmainland = 20). Thus, the absence of association betweenMC1R polymorphism and skin color rules out the possi-bility that mutations in MC1R caused the differences inpigmentation we observed between our studypopulations.Fifty-five percent of the sequences (= 11) were asso-
ciated with isoleucine at amino acid site 110 in theLicosa island blue lizard, whereas 45% of sequences
Figure 1 Study site location and lizards color morphs. Location (a) and picture (b) of the Licosa Islet taken from a foothill on the facingmainland strip of Punta Licosa. Comparison of island and mainland skin color phenotypes (c and d, blue morphs are insular).
Raia et al. BMC Evolutionary Biology 2010, 10:289http://www.biomedcentral.com/1471-2148/10/289
Page 4 of 16

were associated with threonine at this position. The cor-responding figures in the mainland population were 25%and 75%, respectively (see Additional file 1: Table S12).Patterns of nucleotide variation within lizard popula-
tions were consistent with a neutral model of molecularevolution: the distribution of allele frequencies at MC1Ras reflected in Tajima’s D is generally consistent withneutral expectations for mainland and island popula-tions. For the island population we found Tajima D =0.70, number of segregating sites S = 2, nucleotidediversity π = 0.00082; for mainland Tajima D = 1.05,number of segregating sites S = 2, nucleotide diversity π= 0.00091.
Differences in MCRs expressionMC1R expression varied between the populations withthe insular population showing a roughly four-fold
greater gene expression compared to the mainlandpopulation (Figure 3a) (t-testone-tailed, t = 3.51, p =0.0012, df = 19), suggesting that Podarcis MC1R geneexpression could be involved in skin pigmentation.Western blot analyses showed significant differences
in the expression of MC3R and MC4R in the lizards’brain and testes, using actin as an internal standard(Figures 3b and 3c). MC3R protein expression in thebrain of insular lizards was about three times higherthan in mainland lizards’ brains (range: 1.5-5.3, n = 5; t-test: t = 4.506, p = 0.001). No appreciable difference inMC3R density was noted in male testes between thetwo populations (t-test: t = 0.355, p = 0.730).We found that MC4R expression in testes of insular
male lizards was almost twice that observed in mainlandlizards (range: 1.4-3, t-test: t = 2.445, p = 0.037). Brainexpression of MC4R was not significantly different
Figure 2 Behavioral trait differences between mainland and insular lizards. Mean number of aggressive interactions in the field (a), and inthe lab (partitioned per sex, b, c). Mean number of sexual interactions per hour (d) percent differences in exposure to heat between the twopopulations (e). Mean time to prey consumption is reported in (f) Licosa and (g) Punta Licosa, over one hour of observation. Grey shades referto the insular populations; black shades refer to mainland populations. Bars in histogram plots indicate 1st and 3rd quartile.
Raia et al. BMC Evolutionary Biology 2010, 10:289http://www.biomedcentral.com/1471-2148/10/289
Page 5 of 16

between the two populations (Figure. 3c, t-test: t =0.402, p = 0.697).
Growth and developmentAge, size, and growthInsular lizards had larger maximum SVL (islandSVLmean = 71.84, n = 80; mainland SVLmean = 65.54, n= 92; t = 2.644, p = 0.009). All three lizards > 80 mm
SVL belonged to the insular population, and they werealso the only lizards in our sample bearing 4 lines ofarrested growth (LAGs, we assumed 1 LAG = 1 year ofage) in their long bones. Island lizards were a littleolder, on average (Licosa: mean number of LAGs =2.21; median = 3; Punta Licosa mean number of LAGs= 1.52, median = 1, Wilkoxon test, p = 0.001). In addi-tion, the sex ratio was different, being nearly 1:1 on the
Figure 3 The melanocortin system. Top, the proopiomelanocortin (POMC) gene produces the melanocortins (a-, b- and g-MSH and ACTH)which bind to melanocortin receptors. Amino acid sequences of the melanocortin peptide and core heptapeptide aminoacids are highlighted(a). The tissues were we have localized three MCRs receptors are shown, along with the functions they control; upward arrow means “increasedfunction”. Total RNA screened for MC1R mRNA transcripts by real-time RT-PCR, much increased expression of MC1R transcripts is evident in theskin of island lizards (b). Brain and testis expression of the melanocortins receptors as evidenced by western blotting with anti-MC3R and anti-MC4R antibodies: c and d respectively. T, lizard testis; B, lizard brain; SH, human neuronal cells. Actin and SH were used as controls.
Raia et al. BMC Evolutionary Biology 2010, 10:289http://www.biomedcentral.com/1471-2148/10/289
Page 6 of 16
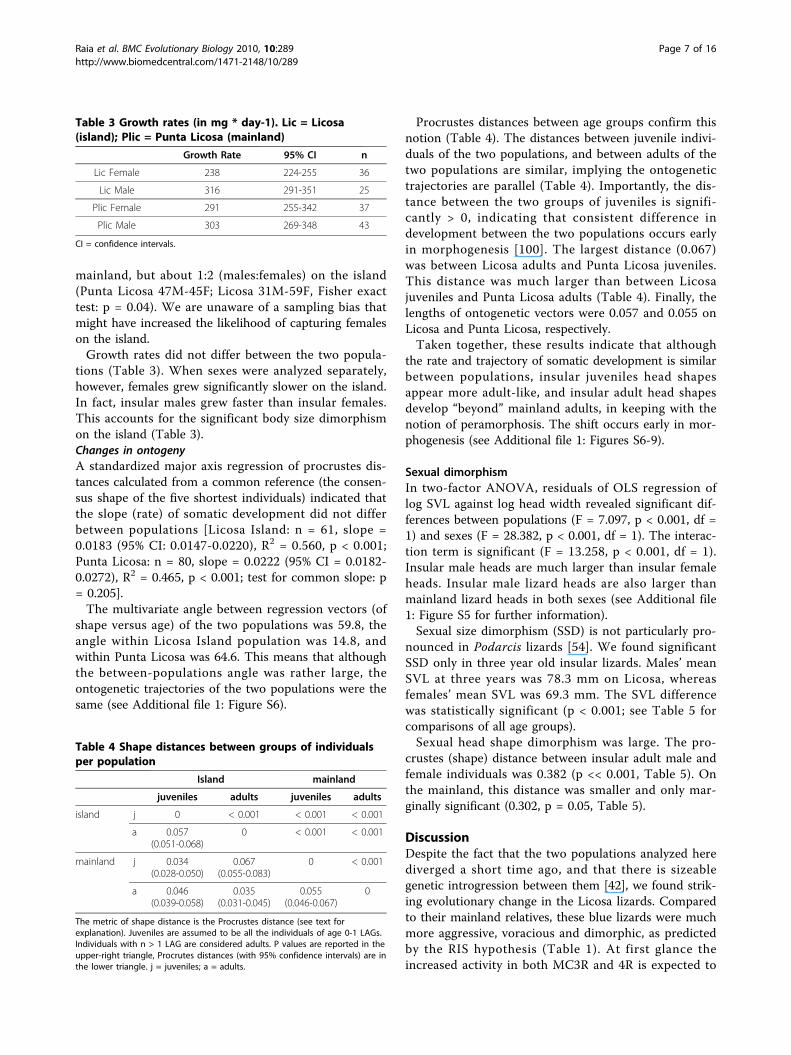
mainland, but about 1:2 (males:females) on the island(Punta Licosa 47M-45F; Licosa 31M-59F, Fisher exacttest: p = 0.04). We are unaware of a sampling bias thatmight have increased the likelihood of capturing femaleson the island.Growth rates did not differ between the two popula-
tions (Table 3). When sexes were analyzed separately,however, females grew significantly slower on the island.In fact, insular males grew faster than insular females.This accounts for the significant body size dimorphismon the island (Table 3).Changes in ontogenyA standardized major axis regression of procrustes dis-tances calculated from a common reference (the consen-sus shape of the five shortest individuals) indicated thatthe slope (rate) of somatic development did not differbetween populations [Licosa Island: n = 61, slope =0.0183 (95% CI: 0.0147-0.0220), R2 = 0.560, p < 0.001;Punta Licosa: n = 80, slope = 0.0222 (95% CI = 0.0182-0.0272), R2 = 0.465, p < 0.001; test for common slope: p= 0.205].The multivariate angle between regression vectors (of
shape versus age) of the two populations was 59.8, theangle within Licosa Island population was 14.8, andwithin Punta Licosa was 64.6. This means that althoughthe between-populations angle was rather large, theontogenetic trajectories of the two populations were thesame (see Additional file 1: Figure S6).
Procrustes distances between age groups confirm thisnotion (Table 4). The distances between juvenile indivi-duals of the two populations, and between adults of thetwo populations are similar, implying the ontogenetictrajectories are parallel (Table 4). Importantly, the dis-tance between the two groups of juveniles is signifi-cantly > 0, indicating that consistent difference indevelopment between the two populations occurs earlyin morphogenesis [100]. The largest distance (0.067)was between Licosa adults and Punta Licosa juveniles.This distance was much larger than between Licosajuveniles and Punta Licosa adults (Table 4). Finally, thelengths of ontogenetic vectors were 0.057 and 0.055 onLicosa and Punta Licosa, respectively.Taken together, these results indicate that although
the rate and trajectory of somatic development is similarbetween populations, insular juveniles head shapesappear more adult-like, and insular adult head shapesdevelop “beyond” mainland adults, in keeping with thenotion of peramorphosis. The shift occurs early in mor-phogenesis (see Additional file 1: Figures S6-9).
Sexual dimorphismIn two-factor ANOVA, residuals of OLS regression oflog SVL against log head width revealed significant dif-ferences between populations (F = 7.097, p < 0.001, df =1) and sexes (F = 28.382, p < 0.001, df = 1). The interac-tion term is significant (F = 13.258, p < 0.001, df = 1).Insular male heads are much larger than insular femaleheads. Insular male lizard heads are also larger thanmainland lizard heads in both sexes (see Additional file1: Figure S5 for further information).Sexual size dimorphism (SSD) is not particularly pro-
nounced in Podarcis lizards [54]. We found significantSSD only in three year old insular lizards. Males’ meanSVL at three years was 78.3 mm on Licosa, whereasfemales’ mean SVL was 69.3 mm. The SVL differencewas statistically significant (p < 0.001; see Table 5 forcomparisons of all age groups).Sexual head shape dimorphism was large. The pro-
crustes (shape) distance between insular adult male andfemale individuals was 0.382 (p << 0.001, Table 5). Onthe mainland, this distance was smaller and only mar-ginally significant (0.302, p = 0.05, Table 5).
DiscussionDespite the fact that the two populations analyzed herediverged a short time ago, and that there is sizeablegenetic introgression between them [42], we found strik-ing evolutionary change in the Licosa lizards. Comparedto their mainland relatives, these blue lizards were muchmore aggressive, voracious and dimorphic, as predictedby the RIS hypothesis (Table 1). At first glance theincreased activity in both MC3R and 4R is expected to
Table 3 Growth rates (in mg * day-1). Lic = Licosa(island); Plic = Punta Licosa (mainland)
Growth Rate 95% CI n
Lic Female 238 224-255 36
Lic Male 316 291-351 25
Plic Female 291 255-342 37
Plic Male 303 269-348 43
CI = confidence intervals.
Table 4 Shape distances between groups of individualsper population
Island mainland
juveniles adults juveniles adults
island j 0 < 0.001 < 0.001 < 0.001
a 0.057(0.051-0.068)
0 < 0.001 < 0.001
mainland j 0.034(0.028-0.050)
0.067(0.055-0.083)
0 < 0.001
a 0.046(0.039-0.058)
0.035(0.031-0.045)
0.055(0.046-0.067)
0
The metric of shape distance is the Procrustes distance (see text forexplanation). Juveniles are assumed to be all the individuals of age 0-1 LAGs.Individuals with n > 1 LAG are considered adults. P values are reported in theupper-right triangle, Procrutes distances (with 95% confidence intervals) are inthe lower triangle. j = juveniles; a = adults.
Raia et al. BMC Evolutionary Biology 2010, 10:289http://www.biomedcentral.com/1471-2148/10/289
Page 7 of 16

decrease food intake. Yet, MC3R is believed to functionas an inhibitory autoreceptor on POMC neurons:experimental injections of MC3R-specific agonists sti-mulate feeding in mice [55]. Moreover, food deprivationincreases MC4R expression in the liver of barfin floun-der Verasper moseri [56]. In our insular lizards, thecomplex pathways that regulate food intake via modifi-cation of MC3R and 4R activity deserve further investi-gation. However this is beyond the scope of the presentstudy.The Island syndrome predicts that sexual selection
should be less intense in insular vertebrates living athigh and stable population density, because mates are anon-limited resource in this condition [24]. Conversely,with either low or strongly fluctuating population size,as with the RIS hypothesis, higher investment in (early)reproduction should favor positive selection of sexually-selected traits, due to an unpredictable mortality sche-dule [21,24]. In keeping with this, insular males had lar-ger heads, and sexual size and shape dimorphism wereincreased on the island (Table 4, Additional file 1: Fig-ures S5, S7, and S8). Moreover, in insular females bodysize growth rate was low (Table 3), which is expectedwhen energy allocation toward reproduction isincreased. As predicted, somatic development proceededat a faster rate early in insular lizards’ ontogeny, as indi-cated by head morphogenesis (Additional file 1: FigureS9).The notion that the Licosa lizard is a large-sized var-
iant of mainland Podarcis sicula [41,42] was confirmedby our data. However, insular lizards were, on average,older, and the higher mean SVL on the island could bea result of different age structure (perhaps related tolower predation) rather than the result of direct selec-tion on size.The increased density of MCR receptors in insular
lizard tissues provides a proximate explanation for thephenotypic trait shifts we observed in these organisms(Figure 3). It is remarkable that we found neutral selec-tion on the MC1R gene both in insular and mainland
individuals. This suggests that selection for color per seprobably does not occur. Although we found some evi-dence that the darker coloration of insular lizardsdecrease the time spent basking the blue color may sim-ply be a by-product of concerted increase in MCR activ-ity levels. Consequently, we argue the blue colorationmay have been recruited adaptively for better thermore-gulatory activity, as a ‘spandrel’ [57].We argue that increased aggressiveness and food
intake rates are the likely targets of natural selection inour insular lizards. Aggressive individuals are very oftenthe most successful (in terms of fitness) in natural popu-lations, although they incur a greater risk of injury andgreater exposure to predators. However, the risk ofbecoming prey is very low on Licosa. Behaving aggres-sively and increasing food intake rate should be veryadvantageous in a restricted habitat with limited andprobably inconstant access to both resources and mates,as is the case with Licosa.In lizards, color morphs are quite common [58-60]
and often underlie differences in life history traits andreproductive strategies even in the same population[60-67]. In insular lizards, black and blue morphs arefrequent (e.g. the Sombrero black lizard Ameiva corvina,the Brusnik black lizard Podarcis melisellensis pomoen-sis, dark Podarcis lilfordi on Isla del Rey, and a numberof blue-colored Podarcis distributed in many Mediterra-nean islands), and evolutionary mechanisms similar towhat we describe for P. s. klemmeri may have beenworking in many of them. Bauwens and Castilla [68]noted that all the largest Podarcis lilfordi males on Cab-rera island have black or deep blue skin, and indicatedthat this change in coloration is ontogenetic, occurringat SVL of 64 mm. Furthermore, they noted that the lar-gest adults of all of the 18 islets surrounding Cabreraare black.Males of Bonaire island whiptail Cnemidophorus muri-
nus occur in two color morphs, brown and blue. Bairdet al. [69] found that blue males are far more aggressivethan browns. Their sexual activity is much increased,
Table 5 Sexual shape and size (SSD) dimorphisms.
sexual shape dimorphism
island p mainland p
d 0.0382 (0.0347-0.0504) < 0.001 0.0309 (0.0278-0.0513) 0.05
sexual size dimorphism Mean SVL: Females/Males (# of individuals)
Years (LAGs) island mainland
1 42.02(6)/40.19(5) 47.40(14)/45.36(7)
2 57.85(6)/62.02(5) 59.95(9)/59.85(13)
3 69.71(11)/78.28(8)* 72.55(7)/76.90(6)
d = Procrustes distances. Number of individuals is reported in parentheses. For SSD we report the mean SVL of females (left) and the mean SVL of males (right).*t = 4.26, p < 0.001.
Raia et al. BMC Evolutionary Biology 2010, 10:289http://www.biomedcentral.com/1471-2148/10/289
Page 8 of 16
and their testes are larger. Of all the courtship encoun-ters they observed 85.7% were initiated by blue males,vs. 7.1% initiated by brown males and 7.2% initiated byfemales. Individuals of a translocated population of St.Lucia whiptail Cnemidophorus vanzoi on Praslin Island[70] evolved increased growth rates, and high intensityof intraspecific competition (see also [37,71,72] onBalearic Podarcis lilfordi and on Skyros archipelagoPodarcis gaigeae). Praslin whiptails also have increasedsexual size dimorphism and sexual dichromatism. More-over, very surprisingly, Praslin whiptails are territorialalthough Cnemidophorus belongs to a family (Teiidae)of typically non-territorial lizards [70]. Some adult malesalso maintain juvenile colors [70].In practice, these studies suggest that the occurrence
of the ‘reversed island syndrome’ in insular lizards maywell extend to other melanistic forms. However, weemphasize, that the link between RIS and melanism isnot necessary (see Table 1). The mechanism behind theemergence of RIS is the reallocation of energy fromgrowth to reproduction. This reallocation is expected totake place when resource supply and/or mortality riskare unpredictable, thereby favoring aggressiveness andvoracity to secure resources and mates in the short term[21].For example, the Okada broad-headed skink Plestio-
don okadae occurs in a number of islands of the IzuArchipelago, Japan. Hasegawa [28,73,74] noted thatsome P. okadae populations have: “a suite of traitsincluding small body size, early maturity, production ofsmall and many eggs, low frequency of failure in follicledevelopment, annual reproduction, high relative clutchmass and low post-reproductive mass of females.Whereas others have a suite of the opposite characterstates”. Fast life histories occur on the island with thelargest predator fauna (Ohshima), whereas slow life his-tories characterize islands with higher density and thelowest mortality of hatchlings (Miyakejima and Aoga-shima). Still, fast-living Ohshima skinks are the smallestand the most dimorphic, with males having dispropor-tionately large heads with a distinctive color pattern[73].Hasegawa manipulated lizard density in Miyakejima
[74], removing adults in order to simulate increasedmortality. As expected, after the experiment, both malesand females started reproducing at a younger age, andfemales laid larger clutches, whereas egg size and bodysize at first reproduction went almost unaltered. Thisexperiment demonstrates how decreasing survival ratesignited RIS-like changes in life history traits. Plestiodonokadae from different islands may well represent boththe Island Syndrome and RIS. A similar pattern of varia-tion has been shown for Canary Islands Gallotia[75-78].
Island Syndrome and RIS describe a number of phe-notypic traits that often, but by no means always,change together in insular species. We think one shouldnot expect that all these traits co-occur. For instance,the most obvious trait shift linked to the Island Syn-drome (and we argue, to RIS as well) is change in bodysize. Taking into account possible changes in ontogeny(in the insular species), the relationship between bodysize and the Island Syndrome may in fact appear weak.Ontogenetic shifts may produce early-maturing, fast-growing small individuals via paedomorphosis. This issuggested to occur in the extinct dwarf elephant Elephasfalconeri [52] and in dwarf dinosaurs (e.g. Europasaurusholgeri [79]). Slow growth was found to occur in NewZealand’s gigantic moas [80,81], extinct giant lemurs ofMadagascar [82], females of the Licosa Island lizard(this study), and extinct dwarf Balearic goats [[83], butsee ref. [84]]. Bunce et al. [85], however, showed thatDinornis Moas were exceptionally dimorphic, and sug-gested that these birds invested a great deal of energyinto egg production. This goes against the Island Syn-drome predictions, despite Dinornis being huge even bymoa standards.Lancaster et al. [86] correctly noted that resource allo-
cation trade-offs are best understood at multiple levels,and pointed out that “the more resources are available,the less trade-offs will be observed on any level. Thisoccurs over an individual’s lifespan for plastic resourceallocation traits (e.g. [87]) and over evolutionary timefor those mediated by antagonistic pleiotropy or othergenetic mechanisms”. This means that looking at oneaspect alone (e.g. body size, population density, clutchsize, etc.) when comparing an insular species to itsmainland relative may be misleading.Spencer et al. [88] emphasized that although growth is
expected to be slow when population density is high,rapid growth beyond a critical size reduces predationrisk and could be favored (see [22] on Sauromalus).Roth [89,90] argued that density compensation mightexplain dwarfism in insular pigmy elephants. Bonairewhiptails live at huge population density, yet the bluemorph males allocate a great deal of resources to repro-duction, which is consistent with RIS hypothesis [69].Bonaire whiptails are herbivorous, and so food is not alimiting factor on Bonaire [91]. We remark once morethat it is not density (or body size) per se, but the set ofecological conditions favoring either small or large allo-cation of available resources toward reproduction thatproduces the Island Syndrome or the RIS, respectively.RIS is most likely to occur on small islets where envir-
onmental variation (in terms of resource supply and theimpact of natural accidents) from one year to the nextcan be high. The possible instances of RIS describedabove all relate to species living alone or almost alone
Raia et al. BMC Evolutionary Biology 2010, 10:289http://www.biomedcentral.com/1471-2148/10/289
Page 9 of 16

on islets and cliffs such as Licosa, Brusnik, Praslin, Islade la Reya, the islets off the main island in the CabreraArchipelago, Sombrero, the Faraglioni cliffs off theisland of Capri and Vetara islet (the two latter cases arealso blue-colored Podarcis sicula off the Western coastof Southern Italy).We showed that the RIS is linked to increased activity
of melanocortin receptors in our insular study popula-tion. Melanocortins pleiotropically regulate a number ofprocesses including pigmentation, sexual activity, aggres-siveness, bodily growth, and food intake. We find ithighly likely that the same pattern of change in MCRactivity occurs in other melanistic insular organisms.We believe that shifts in growth rate, body size, age
and size at maturity, and clutch size will depend on howthese traits trade off with each other [86]. Furthermore,an insular species may well express the RIS withoutbeing melanistic.Despite all of the evidence we present in favor of RIS,
there are drawbacks to two-taxon comparative studies[92]. In these studies, it is possible to interpret as adap-tation what really is the phenotypic difference betweentaxa due to other factors or even to genetic drift. In thisstudy, we did not demonstrate that RIS applies to otherinsular populations/species. However, blue Podarcissicula are common on other islands, and it would bevery surprising if the basis for this coloration changedfrom one island to another. Roulin and Salamin [93]recently demonstrated that insular barn owls Tyto albaof the world have lighter pheomelanic coloration andare less sexually dimorphic than continental barn owls.They interpreted this observation as a component of theIsland Syndrome, mediated by changes in melanocortinexpression. This suggests that, exactly as we predict inour study, POMC involvement in the Island Syndromeand its opposite, the RIS, is common in insularvertebrates.
ConclusionsWe predicted that insular vertebrates facing unpredict-able resource supply and mortality schedules shouldevolve aggressive behavior, high food intake rate, andincreased energy allocation to reproduction as a meanto increase fitness. We refer to these predictions as theReversed Island Syndrome (RIS) hypothesis, in contrastto the Island Syndrome [13]. On the proximate level, wedemonstrated that the increased activity of melanocortinreceptors underlies RIS in our study organism, the insu-lar wall lizard Podarcis sicula klemmeri.Although much study is needed to fully understand
patterns of trait evolution and covariation in insular ver-tebrates, we hope to have shed some light on this com-plex issue, by showing how disparate factors must be
taken into account in order to gain a meaningful depic-tion of the evolution of life on islands [94].
MethodsStudy site and organismThe study population of the Italian Wall Lizard Podarcissicula klemmeri is confined to the small islet of Licosa(ca. 0.8 ha in surface area, geographical coordinates: 40°15′04.23"N, 14°54′01.64"E) [95]. This islet is 400 metersaway from the mainland. The island’s vegetation isdominated by Pistacia lentiscus. Vegetation is nearlyabsent along the coast.The Licosa lizard population lives at low (for an
island) and fluctuating density. We estimated a maxi-mum population size of only 250 individuals (see Addi-tional file 1: Table S11), that is lizard density is some300 lizards per Ha (one-sixth of the average for lizard inislands around the world [38]). In five years of field cen-suses (2001-2006) we noted the number of individualsmay change by up to 40% from one year to the next(range: 148.1-246.7, mean: 205.3, see also [42]). Since nofreshwater source is present on the islet, mortality canbe intense in drought years. Summer drought in oneyear is significantly correlated to population crash in thenext year on Licosa, but not on the mainland (Addi-tional file 1: Table S11).There are no resident predatory mammals, reptiles or
birds on Licosa. Gulls (Larus michahellis and Larus ridi-bundus) may be present, principally during the winter.We noted that lizards supplement their diet with gulls’regurgitates even in the presence of gulls. Individuals ofmigratory herons (Ardea purpurea, Ardea cinerea andEgretta garzetta) occasionally visit the islet during latesummer, before their winter migration. Kestrels, Falcotinnunculus, were very rarely observed on Licosa duringour field surveys.These observations suggest that although some preda-
tion on Licosa lizards is possible, it was minimal duringour 5-year census. In contrast, mainland lizards areintensively preyed upon by kestrels, grass snakes (Natrixnatrix), western whip snakes (Hierophis viridiflavus),and feral cats.Podarcis sicula klemmeri is bright blue (Figure 1c and
1d). Melanism is common in Mediterranean islandlizards [95]. Our mainland populations, just opposite theisland on Punta Licosa (40°15′06.15"N 14°54′19.68"E) areinvariably normally-colored with the usual green backwith white undersides and little blue dots running alongthe trunk sides that appear brighter during the breedingseason. We sampled lizards from Punta Licosa as thereference (mainland) population to compare with theinsular population (Figure 1). All experiments describedbelow were performed in accordance with local and
Raia et al. BMC Evolutionary Biology 2010, 10:289http://www.biomedcentral.com/1471-2148/10/289
Page 10 of 16

national guidelines governing animal experiments (86/609/CEE and its modifications).
Behavioral shifts in Podarcis sicula klemmeriWe predicted that Licosa island lizards should be moreaggressive, sexually dimorphic, and voracious than theirmainland counterparts. Change in voracity (food intakerate) is not directly predicted by RIS, but we expected itto occur if increased MCR expression triggers RIS, aswe hypothesize.To test these predictions we conducted both field
observations and lab experiments. Field observationswere performed during the warmer months, from Feb-ruary until November, when Podarcis sicula lizards areactive in Southern Italy [96]. During 2006 we performedtwo sets of observations, in the field and in the labora-tory, under controlled conditions. In the field, observa-tions were arranged as follows: we observed, for 1 hour,all individuals from a fixed position, surveying some 10square meters, in 40 different and non adjacent plotschosen as to maximize inter-plot distance in order toreduce the potential for pseudoreplication. Each plotwas visited once. A total of 5 days of observations wereperformed over a 9 month period. During each observa-tion trial we counted i) instances of intraspecific aggres-sion, including both fights and aggressive displays, andii) breeding attempts and copulations.In the field we recorded the total time individuals
spent either in full sun or in the shade. Observations ofindividual lizards were included in the analyses if theylasted for no less than 20 minutes (> 40 hours of obser-vations in total). The mean percentage of time lizardsspent in the shade or in the sun, for each observation,was our index of exposure to heat.Our field observations may be severely affected by
incomplete data due to the difficulty of monitoring indi-vidual lizards over a sufficiently long time span. Wetherefore conducted a lab experiment in terraria (mea-suring 1000 × 1000 × 500 mm) under controlled condi-tions. Forty adult individuals per population (20 malesand 20 females) were kept in laboratory at 25°C tem-perature. To avoid pseudoreplication, these individualswere collected before field observations began.We artificially created habitat decorations including
wood branches and rocks at the center of the terraria,to allow the lizards either to move close to a heat sourceor to hide under the rock shelters. The heat source wasa 150 watt light bulb hanging 5 cm from the roof of theterrarium and above the branches. We considered threeordinal heating regimes: “low”, when the lizard hidunder the rocks; “medium”, when the lizard stood onthe ground exposed to radiation; and “high”, when thelizard perched on the branch, close to the heat source.Individual lizards were observed for one hour: we
recorded the time spent in each distance class. Then, wecomputed the average percentage of time spent at eachirradiation level and performed a chi-square test to seeif the two populations differed.The experiments on intraspecific interactions and
exposure to heat were conducted in June 2006 for bothpopulations. The experiments started 15 days later forPunta Licosa (mainland) lizards because mating occurs2 weeks later on Punta Licosa than on the island. Bothexperiments were repeated in June 2007 on a smallersample to test if differences in population density overyears affect the results. Because no significant differencewas detected, only the results of the 2006 experimentsare reported here.To study food intake rate in the lab we placed twenty
captive individuals (10 males and 10 females) from eachpopulation alone in terraria (measuring 500 × 500 × 500mm) and fed them ad libitum for 5 days. After this per-iod, these individuals were held for 5 days on empty sto-mach and then presented with 5 prey itemssimultaneously (caterpillars of Honeycomb Moth Gal-leria mellonella). We video recorded each trial for onehour (the experimenter left the room immediately afterthe beginning of video recording). We recorded thetime elapsed from the beginning of the experiment tothe moment each prey item was consumed).To study intrasexual behavior we held, 10 individuals
of each population together in two separate terrariums(5 individuals per 1000 × 1000 × 500 mm terrarium,either all males or all females) fed ad libitum, and videorecorded them (in the absence of the experimenter) forone hour them between h8.00 and h18.00 each day, for20 consecutive days. From each recording session weretrieved the number of intrasexual contests. Threaten-ing displays of the head (e.g. head bobs) were consideredsigns of aggressiveness toward conspecifics, as were fullcontests that escalated to fights.Finally, we studied intersexual activity in two addi-
tional terraria (one for each population), by placing 10individuals per population (5 males and 5 females)together. Individuals in these terraria were video-recorded and observed for one-hour as described above.Instances of intersexual interactions were then countedby examining the films. Chasing of females by malesand mating attempts were considered intersexual inter-actions (regardless of whether they ended up in copula-tion). Total number of interactions per population andper sex was then computed.To test for differences between populations in intras-
pecific activities we performed a randomization test,shuffling data between populations. For number of sex-ual interactions and aggressive interactions: i) the datawere portioned by sex, ii) the number of interactionsper individual was shuffled (without replacement) 1000
Raia et al. BMC Evolutionary Biology 2010, 10:289http://www.biomedcentral.com/1471-2148/10/289
Page 11 of 16

times at random between populations, iii) for each ran-dom set the difference in mean number of interactionsper population was computed and iv) real mean differ-ence was compared to the random distribution. Rando-mization tests were performed both for field and labobservations, although in the field the sex of individuallizards was not discernible by eye; hence field data onaggressive interactions were not partitioned per sex. Theuse of the randomization test is advisable here since thelow number of observations per experiment (see below)makes parametric tests inappropriate.To test for difference in voracity we first computed
the least squares regressions of the (consumed) preynumber against the total time since the beginning of theexperiment for insular and mainland populations. Wethen tested for differences in slope between the tworegressions lines using a t-test.All lizard individuals tested in the lab belong to the
same size class: 55-65 mm in SVL for females and 60-70mm SVL for males. These size classes include mostadult individuals. A few very large individuals and juve-niles were excluded to avoid possible biases introducedby age- and size-specific behavioral and/or physiologicaldifferences.
MC1R polymorphismWe examined the contribution of the melanocortin-1receptor gene (MC1R) to the skin color pattern in P.sicula. In the literature, all known mutations in theMC1R locus, many of which are adaptive, occur in thecoding region, either as amino-acid changes or smalldeletions [97]. However, it is important to note that lit-tle is known about the regulatory mechanisms that gov-ern the expression of MC1R at the intracellular level.The complete MC1R locus was sequenced in seven
phylogenetically diverse squamate species with melanis-tic or normally-colored forms finding that patterns ofamino acid substitution across different regions of thereceptor are similar, suggesting a conserved function forMC1R in reptiles [97]. Here we cloned the Podarcissicula MC1R gene. We amplified its most conservedregion developing the primers by alignment analysis ofHomo sapiens (AF514787) and Sceloporus undulatus(AY586162) sequences. The entire sequence of the genewas then obtained by 3′ and 5′ RACE experiments.Rapid Amplification of cDNA Ends (RACE) is a proce-dure for amplification of nucleic acid sequences from amessenger RNA template between a defined internalsite and unknown sequences at either the 3′ or the 5′-end of the mRNA.We amplified and sequenced the codogenic MC1R
from 20 individuals of each color morph in each popula-tion to look for associations between genotype and colorphenotype. In a previous study we demonstrated
selection was operating on a mtDNA gene sequence ofLicosa lizard [42].We performed Tajima tests for selection on the cod-
ing region of the nuclear gene for MC1R. Tajima’s D isthe difference between two estimates of the expectedamount of genetic variation per nucleotide, based on thenumber of segregating sites S, and on average numberof pairwise differences ∏, respectively [98]. Under neu-tral selection, the two estimates of θ should be thesame. Therefore, the expected value of Tajima’s D forboth populations conforming to a standard neutralmodel of selection is zero. Significant deviations fromzero indicate a skew in the allele frequency distributionrelative to neutral expectations. Positive values of Taji-ma’s D occur with an excess of intermediate frequencyalleles and can result from population bottlenecks, and/or balancing selection. Negative values of Tajima’s Dindicate an excess of low frequency alleles and canresult from population expansions or directional selec-tion. We estimated Tajima’s D using DNASP [99].One way to determine the effect of genetic variation
on pigmentation is to analyze the genetic polymorphismaffecting receptor function. There are also many com-plex regulatory mechanisms that govern the expressionof MC1R at the intra-cellular level, from gene transcrip-tion in response to an external stimulus to the expres-sion of the mature receptor on the melanocyte surface.To examine whether differences in expression level ofMC1R influence color patterning, we conducted geneexpression assays (reverse transcriptase PCR [RT-PCR]and quantitative-PCR [q-PCR]) on adult skin samplestaken from abdominal and neck areas. Specifically, weperformed parallel expression analyses for MC1RmRNAs in the two lizard population (n = 5 males and 5females for each population, see Additional files for fulldetails).
Western blottingWe tested differential expression of MC3R and MC4Rbetween island and mainland populations by westernblotting of testis and brain lysates (n = 10 males perpopulation) and used lysates from human neuroblas-toma cells (SH-SY5Y) as a control. Protein concentra-tions were determined chromometrically with theBradford assay (Sigma). Samples of equal amounts ofprotein (100 μg) were subject to SDS/PAGE and thentransferred onto PVDF membranes and tested with theappropriate antibody. Mouse polyclonal antibodies anti-MC3R (Sigma™) and human polyclonal antibodies anti-MC4R (Santa Cruz) were used at a 1/2,000 dilution.Rabbit anti-actin polyclonal antibody (Sigma) was usedat a 1/1,000 dilution. Secondary antibodies were fromPierce and used at a 1/20,000 dilution. Detection wasperformed with the peroxidase-based Super Signal
Raia et al. BMC Evolutionary Biology 2010, 10:289http://www.biomedcentral.com/1471-2148/10/289
Page 12 of 16

West-Pico procedure (Pierce) according to the manufac-turer’s instructions.
Growth and developmentAge determinationAge data are of fundamental importance for the study ofontogenetic trajectories, because the correlation betweensize and age is rarely linear [21,100]. We obtained agedata by applying skeletochronologic standard protocolsfor other reptiles [101,102]. Skeletochronology was per-formed both on phalanges and femora of euthanizedanimals. Bones were decalcified with 3% nitric acid for atime ranging between 1h30′ and 3 h depending on theirsize, rinsed in tap water and cross sectioned using acryostat. Diaphyseal cross sections (12 μm thick) werestained with Ehrlich’s haematoxylin (20′) and mountedin aqueous resin. Periosteal lines of arrested growth(LAGs) were then counted by using a light microscopeequipped with an image analyzer. As with other reptilesliving in temperate regions, we assumed that each LAGcorresponds to an annual arrest of individual growth. Asa consequence, a lizard’s age in years equals the numberof visible LAGs. We caution, though, that it is possibleto underestimate LAG number because of endostealresorption (see Additional file 1: Figure S1).Growth rateGrowth rate (in mg/day) was estimated for each sex andpopulation using least squares regression of bodyweights of individuals versus the number of LAGs trans-formed into days by assuming each LAG represents a365 day interval. Individuals with shed tails and gravidor suspected-to-be gravid females (only for the bodyweight-based growth rate calculation), and individuals inevidently poor conditions (either badly wounded orloaded with parasites) were excluded from the analysis.Geometric morphometricsHead pictures of sacrificed specimens of known age (=number of LAGs) from post-hatchlings to full adultswere analyzed by means of geometric morphometrics.Fifteen landmarks were placed on all head pictures atscale joints, in keeping with the protocol used inKaliontzopoulou et al. [54] (see Additional file 1: FigureS2 and Table S3). We did not use bilateral landmarks toavoid inclusion of shape variability due to asymmetry.We assessed measurement error by replicating digita-tions of landmarks on a single specimen ten times.Then, we performed single group analysis of variancewith 100 bootstraps. This way we calculated the propor-tion of variance contributed by measurement error tothe variance obtained by using all individuals. This testindicates that only 5.56% of total variance may be dueto measurement error (95% CI 4.02-6.91).Landmark configurations for all individuals were
rotated, translated and scaled to unit size via the
Generalized Procrustes Analysis (GPA, [103]). Residualshape differences (partial warps) were analyzed via rela-tive warp analysis and thin plate spline (TPS) visualiza-tion. Landmark digitation was carried out with thesoftware tpsDig2 [104]. GPA was performed with thesoftware tpsRelw [105]. All the remaining shape analyseswere performed with the IMP software suite [106].The shape data matrix (partial warp scores plus uni-
form components) of each population was regressedagainst age (number of LAGs) of each individual toassess head shape ontogeny, taking a single commonreference configuration for both populations (the con-sensus shape between the two smallest individual perpopulation, which were all hatchlings) and then calculat-ing the procrustes distance (the square root of the sumof squared differences in the positions of the landmarks)between each individual and the reference. The tworesulting ontogenetic shape vectors (whose length repre-sents the total amount of shape change through onto-geny [100]) were then compared to each other bytesting for differences in slopes. The slope representsthe rate of somatic development. Data were fitted byreduced major axis regression in the Smatr software[107]. The angle between the two ontogenetic shapevectors (the dot product the regression coefficients ofeach partial warp component on age) represents thebetween-vector correlation. When the angle is 0° thevector correlation between them is 1, when the angle is90° the correlation between them is 0. To test for thestatistical significance of the angle, shape residuals wereresampled (by means of bootstrap) 999 times withineach population to generate 95% confidence intervalsfor each population (see [98] for details). If the between-populations angle is smaller than the within populationrange the two ontogenetic trajectories do not differ indirection, but might still differ in length (a case for het-erochrony). Otherwise, the two ontogenies are not paral-lel (a case for ontogenetic allometry, see [100]).We inspected the length of the ontogenetic vector to
quantify the extent of shape change during ontogeny. Ifthis length is shorter in insular lizards and the twoontogenies do not differ in direction (angle) we con-clude that insular lizards are paedomorphic. Otherwise,a longer ontogenetic vector would indicate adult shapesgrow beyond the shape of mainland adults, indicatingperamorphosis. Finally, we computed shape distances(the procrustes distance between group means) for eachpopulation. The groups being compared were juveniles(individuals with 0 to 1 LAG), and adults (individualswith >1 LAG) of both populations.
Sexual selection and dimorphismWe predicted stronger sexual selection on the island. Inlizards, sexual selection is deemed to increase head
Raia et al. BMC Evolutionary Biology 2010, 10:289http://www.biomedcentral.com/1471-2148/10/289
Page 13 of 16

width in males. This trait is correlated with male perfor-mance in male-male contests over mates, since maleswith wider heads have more muscle mass in the headand a higher associated bite force [[54,108-110] onPodarcis). We measured head widths of adults duringthe 2006-2008 period (Licosa Island: n = 80, PuntaLicosa, n = 92). Then, we regressed log head widthsagainst log SVL to factor out potential allometric effects,and compared residuals between the two populations(further partitioned by sex) by means of two-factorANOVA taking sex, population, and the interaction ofthese two variables in the model.Sexual size dimorphism was investigated as well by
taking SVL ratio of males/females. We used SVL of indi-viduals of known age and then compared size dimorph-ism between the two populations. SVL is a very goodproxy for body size in lizards [111]. In addition, sexualshape dimorphism was investigated by using head widthdata. We repeated the tests using year of collection as afactor. No significant differences between years werefound, and we therefore present an analysis of pooleddata here.
Additional material
Additional file 1: Supplementary materials. The additional data filecontains illustrative material, methodological details about field work,shape analysis, LAG analysis, and genetic analyses.
AcknowledgementsWe are grateful to Shai Meiri for discussing and commenting with us mostof the ideas presented here. Louise Roth, and Panayotis Pafilis provided veryvaluable comments on a draft version of this manuscript that greatlyimproved its quality. Rachael Black and one anonymous reviewer patientlyhelped us edit the English of the manuscript. We are grateful to CostabileMontone who uncomplainingly carried us on the Licosa islet with his boatfor years. Valeria Maselli, Giuliana Russo, Daniele Mennella, and GiuseppePavarese shared some of the field work with us. Francesco Angelini,Salvatore Cozzolino and Rakesh Rastogi gave us precious advice both on thestudy organism and data treatment. We are grateful to the personnel ofCilento and Vallo di Diano National Park for their kind assistance during ourstudy period.
Author details1Department of Earth Science, University of Naples Federico II, Naples, L.goSan Marcellino 10, 80138 Naples, Italy. 2Department of Structural andFunctional Biology, University of Naples Federico II. Via Cinthia MSA, Naples,Italy.
Authors’ contributionsPR and DF conceived the experiments. PR and FC performed shape analyses.FMG performed LAG analyses. MT, DF, DMM, GP, and CM performed MCRssequencing, polymorphism and quantitative assay analyses. DF, DR, GP andFC performed lab and field work. All authors participated in writing, readingand approving the manuscript.
Received: 14 December 2009 Accepted: 20 September 2010Published: 20 September 2010
References1. Lister AM: Rapid dwarfing of red deer on Jersey in the Last Interglacial.
Nature 1989, 342:539-542.2. Van Valen LM: A new evolutionary law. Evol Theory 1973, 1:1-30.3. Gould SJ: Allometry in primates, with emphasis on scaling and the
evolution of the brain. In Approaches to Primate Paleobiology Contributionsto Primatology. Edited by: Szalay F. Basel, Krager; 1975:5:244-292.
4. Roff DA: The evolution of flightlessness: is history important? Evol Ecol1994, 8:639-657.
5. McNab BK: Energy conservation and the evolution of flightlessness inbirds. Am Nat 1994, 144:628-642.
6. Grant PR: Plumage and the evolution of birds on islands. Syst Zool 1965,14:47-52.
7. Butcher GS, Rohwer S: The evolution of conspicuous and distinctivecoloration for communication in birds. Curr Ornithology 1989, 6:51-108.
8. Omland KE: Examining two standard assumptions of ancestralreconstructions: repeated loss of dichromatism in dabbling ducks(Anatini). Evolution 1997, 51:1636-1646.
9. Peterson AT: Geographic variation in sexual dichromatism in birds. Bull BrOrnithol Club 1996, 116:156-172.
10. Bennett PM, Owens IPF: Evolutionary ecology of birds: life histories, matingsystems and extinction New York: Oxford University Press 2002.
11. Grant PR: Ecology and evolution of Darwin’s finches Princeton: PrincetonUniversity Press 1999.
12. Grant PR: Reconstructing the evolution of birds on islands: 100 years ofresearch. Oikos 2001, 92:385-403.
13. Adler GH, Levins R: The Island Syndrome in Rodent Populations. QuartRev Biol 1994, 69:473-490.
14. McNab BK: Minimizing energy expenditure facilitates vertebratepersistence on oceanic islands. Ecol Lett 2002, 5:693-704.
15. MacArthur RH, Diamond JM, Karr JR: Density compensation in islandfaunas. Ecology 1975, 53:330-342.
16. Tamarin RH: Dispersal, population regulation and K-selection in fieldmice. Am Nat 1978, 112:545-555.
17. Olsson M, Shine R: The seasonal timing of oviposition in sand lizards(Lacerta agilis): Why early clutches are better. J Evol Biol 1997, 10:369-381.
18. Pianka ER: Evolutionary Ecology San Francisco: Addison-Wesley-Longman2000.
19. Sinervo B, Svensson E, Comendant T: Density cycles and an offspringquantity and quality game driven by natural selection. Nature 2000,406:985-988.
20. Sinervo B, Doughty P, Huey RB, Zamudio K: Allometric engineering: acausal analysis of natural selection on offspring size. Science 1992,285:1927-1930.
21. Roff DA: Life History Evolution Sunderland, MA: Sinauer Associates 2002.22. Case TJ: On the evolution and adaptive significance of postnatal growth
rates in the terrestrial vertebrates. Quart Rev Biol 1978, 53:243-282.23. Stamps JA, Buechner M: The territorial defence hypothesis and the
ecology of insular vertebrates. Quart Rev Biol 1985, 60:155-181.24. Shuster SM, Wade MJ: Mating systems and strategies Princeton, NJ: Princeton
University Press 2003.25. Blondel J: Evolution and ecology of birds on islands: trends and
perspectives. Vie Et Milieu 2000, 50:205-220.26. Vanzolini PE, Rebouças-Spieker R: Distribution and differentiation of
animals along the coast and in continental islands of the state of SãoPaulo, Brazil 3 Reproductive differences between Mabuya caissara andMabuya macrorhyncha (Sauria, Scincidae). Pap Avul Zool 1973, 29:95-109.
27. Schall JJ: Small clutch size in a tropical whiptail lizard (Cnemidophorusarubensis). J Herpet 1983, 17:406-408.
28. Hasegawa M: Density effects on life history traits of an island lizardpopulation. Ecol Res 1997, 12:111-118.
29. Delibes M, Blázquez MC: Tameness of insular lizards and loss of biologicaldiversity. Cons Biol 1998, 12(5):1142-1143.
30. Van Damme R: Evolution of herbivory in lacertid lizards: effects ofinsularity and body size. J Herpet 1999, 33:663-674.
31. Schoener TW, Losos JB, Spiller DA: Island Biogeography of Populations:An Introduced Species Transforms Survival Patterns. Science 2005,310(5755):1807-1809.
32. Nicholson KE, Harmon LJ, Losos JB: Evolution of Anolis Lizard DewlapDiversity. PLoSONE 2007, 2(3):e274.
Raia et al. BMC Evolutionary Biology 2010, 10:289http://www.biomedcentral.com/1471-2148/10/289
Page 14 of 16

33. Vervust B, Grbac I, VanDamme R: Differences in morphology, performanceand behaviour between recently diverged populations of Podarcis siculamirror differences in predation pressure. Oikos 2007, 116:1343-1352.
34. Herrel A, Huyghe K, Vanhooydonck B, Backeljau T, Breugelmans K, Grbac I,Van Damme R, Irschick DJ: Rapid large-scale evolutionary divergence inmorphology and performance associated with exploitation of a differentdietary resource. PNAS 2008, 105:4792-4795.
35. Meiri S, Dayan T, Simberloff D: The generality of the island rule re-examined. J Biogeog 2006, 33:1571-1577.
36. Cooper WE Jr, Hawlena D, Pérez-Mellado V: Islet tameness: escapebehavior and refuge use in populations of the Balearic lizard (Podarcislilfordi) exposed to differing predation pressure. Can J Zool 2009,87(10):912-919.
37. Meiri S, Foufopoulos J, Valakos E: Intraspecific competition and high foodavailability are associated with insular gigantism in a lizard.Naturwissenschaften 2009, 96:1107-1113.
38. Buckley LB, Jetz W: Insularity and the determinants of lizard populationdensity. Ecol Lett 2007, 10:481-489.
39. Bauwens D, Díaz-Uriarte R: Covariation of life-history traits in lacertidlizards: a comparative study. Am Nat 1997, 149:91-111.
40. Meiri S: Size evolution in island lizards. Glob Ecol Biogeog 2007, 16:702-708.41. Lanza B, Capolongo D: Die blaue Ruineneidechseder tyrrhenischen Insel
Licosa (Salerno). Salamandra 1972, 8:21-26.42. Fulgione D, Guglielmi S, Odierna G, Rippa D, Caliendo MF, Rastogi RK:
Morphological differentiation and genetic structure in island lizardpopulations. Zool Sci 2008, 25:465-474.
43. Bagnara JT, Fernandez PJ, Fujii R: On the blue coloration of vertebrates.Pigment Cell Res 2007, 20:14-26.
44. West PM, Packer C: Sexual selection, temperature, and the lion’s mane.Science 2002, 297:1339-1343.
45. Roulin A: The evolution, maintenance and adaptive function of geneticcolour polymorphism in birds. Biol Rev 2004, 79:815-848.
46. Ducrest AL, Keller L, Roulin A: Pleiotropy in the melanocortin system,coloration and behavioural syndromes. TREE 2008, 23:502-510.
47. Schiöth HB, Haitina T, Ling MK, Ringholm A, Fredriksson R, Cerda-Reverter JM, Klovins J: Evolutionary conservation of the structural,pharmacological, and genomic characteristics of the melanocortinreceptor subtypes. Peptides 2005, 26:1886-1900.
48. Gould SJ: Ontogeny and Phylogeny Cambridge, MA: Harvard University Press1977.
49. Ryan TJ, Semlitsch RD: Intraspecific heterochrony and life historyevolution: decoupling somatic and sexual development in a facultativelypaedomorphic salamander. PNAS 1998, 95:5643-5648.
50. Barahona F, Evans SE, Mateo JA, Garcia-Marquez M, Lopez-Jurado LF:Endemism, gigantism and extinction in island lizards: the genus Gallotiaon the Canary Islands. J Zool 2000, 250:373-388.
51. Benton MJ, Minter NJ, Posmosanu E: Dwarfing in ornithopod dinosaursfrom the Early Cretaceous of Romania. In Mesozoic and Cenozoicvertebrates and paleoenvironments; tributes to the career of Prof DanGrigorescu, Ars Docendi, Bucharest Edited by: Csiki Z 2006, 79-87.
52. Raia P, Barbera C, Conte M: The fast life of a dwarfed giant. Evol Ecol 2003,17:293-312.
53. Bonduriansky RT, Day T: The evolution of static allometry in sexuallyselected traits. Evolution 2003, 57:2450-2458.
54. Kaliontzopoulou A, Carretero MA, Llorente GA: Multivariate and geometricmorphometrics in the analysis of sexual dimorphism variation inPodarcis lizards. J Morph 2007, 268:152-165.
55. Marks DL, Hruby V, Brookhart G, Cone RD: The regulation of food intakeby selective stimulation of the type 3 melanocortin receptor (MC3R).Peptides 2006, 27:259-264.
56. Kobayashi Y, Tsuchiya K, Yamanome T, Schiöth HB, Kawauchi H,Takahashi A: Food deprivation increases the expression of melanocortin-4 receptor in the liver of barfin flounder, Veraspermoseri. Gen CompEndocrin 2008, 155:280-287.
57. Gould SJ, Lewontin RC: The spandrels of San Marco and the and thePanglossian paradigm: a critique of the adaptationist programme. Proc RSoc B 1979, 205:581-598.
58. Sinervo B, Lively CM: The rock-paper-scissors game and the evolution ofalternative male strategies. Nature 1996, 380:240-243.
59. Sacchi R, Scali S, Pupin F, Gentilli A, Galeotti P, Fasola M: Microgeographicvariation of colour morph frequency and biometry of common walllizards. J Zool 2007, 273:389-396.
60. Vercken E, Massot M, Sinervo B, Clobert J: Colour variation and alternativereproductive strategies in females of the common lizard Lacertavivipara. J Evol Biol 2007, 20:221-232.
61. Calsbeek R, Alonzo SH, Zamudio K, Sinervo B: Sexual selection andalternative mating behaviours generate demographic stochasticity insmall populations. Proc R Soc B Biol Sci 2001, 269:157-164, 61 Svensson E,Sinervo B, Comendant T: Condition, genotype-by-environment interactionand correlational selection in lizard life-history morphs. Evolution 2001,55:2053-2069..
62. Svensson EI, Sinervo B, Comendant T: Mechanistic and experimentalanalysis of condition and reproduction in a polymorphic lizard. J EvolBiol 2002, 15:1034-1047.
63. Svensson E, Abbott J, Hardling R: Female polymorphism, frequencydependence, and rapid evolutionary dynamics in natural populations.Am Nat 2005, 165:567-576.
64. Sinervo B, Miles DB, Frankino WA, Klukowski M, DeNardo DF: Testosterone,endurance, and darwinian fitness: Natural and sexual selection on thephysiological bases of alternative male behaviours in side-blotchedlizards. Horm Behav 2000, 38:222-233.
65. Sinervo B, Bleay C, Adamopoulou C: Social causes of correlationalselection and the resolution of a heritable throat colour polymorphismin a lizard. Evolution 2001, 55:2040-2052.
66. Sinervo B, Heulin B, Surget-Groba Y, Clobert J, Miles DB, Corl A, Chaine A,Davis A: Models of density-dependent genic selection and a new rock-paper-scissors social system. Am Nat 2007, 170:663-680.
67. Sinervo B, Clobert J: Morphs, dispersal behaviour, genetic similarity, andthe evolution of cooperation. Science 2003, 300:1949-1951.
68. Bauwens D, Castilla AM: Ontogenetic, sexual, and microgeographicvariation in colour pattern within a population of the lizard Podarcislilfordi. J Herpetol 1998, 32(4):581-586.
69. Baird TA, DK Timanus, Sloan CL: Intra- and intersexual variation in socialbehaviour: effects of ontogeny, phenotype, resources, and season inLizard social behaviour.Edited by: Fox SF, McCoy JK, Baird TA. JohnsHopkins University Press, Baltimore (MD); 2003:7-46.
70. Dickinson HC, Fa JE: Abundance, demographics and body condition of atranslocated population of St Lucia whiptail lizards (Cnemidophorusvanzoi). J Zool 2000, 251:187-197.
71. Pafilis P, Pérez-Mellado V, Valakos ED: Post autotomy tail activity inBalearic wall lizard, Podarcis lilfordi. Naturwissenschaften 2008, 95:217-221.
72. Pafilis P, Foufopoulos J, Poulakakis N, Lymberakis P, Valakos ED: Tailshedding in island lizards (Lacertidae, Reptilia): Decline of antipredatordefenses in relaxed predation environments. Evolution 2009,63:1262-1278.
73. Hasegawa M: Ecological diversification of insular terrestrial reptiles: areview of the studies on the lizard and snakes of the Izu Islands. GlobEnviron Res 2003, 7:59-67.
74. Hasegawa M: Demography of an island population of the lizard, Eumecesokadae, on Miyake-jima, Izu Islands. Res Pop Ecol 1990, 32:119-133.
75. Castanet J, Baez M: Adaptation and evolution in Gallotia lizards from theCanary Islands: age, growth, maturity and longevity. Amphibia-Reptilia1991, 12:81-102.
76. Thorpe RS, Brown RP: Testing hypothesized causes of within-islandgeographic variation in the colour of lizards. Experientia 1989, 45:397-400.
77. Herrel A, O’Reilly JC, Richmond AM: Evolution of bite performance inturtles. J Evol Biol 2002, 15:1083-1094.
78. Molina Borja M, Rodríguez-Domínguez MA: Evolution of biometric andlife-history traits in lizards (Gallotia) from the Canary Islands. J Zool SystEvol Res 2004, 42:44-53.
79. Sander PM, Mateus O, Laven T, Knótschke N: Bone histology indicatesinsular dwarfism in a new Late Jurassic sauropod dinosaur. Nature 2006,441:739-741.
80. Turvey ST, Green OR, Holdaway RN: Cortical growth marks revealextended juvenile development in New Zealand moa. Nature 2005,435:940-943.
81. Turvey ST, Holdaway RN: Postnatal ontogeny, population structure, andextinction of the giant moa Dinornis. J Morph 2005, 265:70-86.
Raia et al. BMC Evolutionary Biology 2010, 10:289http://www.biomedcentral.com/1471-2148/10/289
Page 15 of 16
82. Schwartz GT, Karen E, Samonds LRG, William LJ, Simons EL: Dentalmicrostructure and life history in subfossil Malagasy lemurs. PNAS 2002,99:6124-6129.
83. Köhler M, Moyà-Solà S: Physiological and life history strategies of a fossillarge mammal in a resource-limited environment. PNAS 2010,106:20354-20358.
84. Meiri S, Raia P: Reptilian all the way? PNAS 2010, 107:E27.85. Bunce M, Worthy TH, Ford T, Hoppitt W, Willerslev E, Drummond A,
Cooper A: Extreme reversed sexual size dimorphism in the extinct NewZealand moa Dinornis. Nature 2003, 425:172-175.
86. Lancaster LT, Hazard LC, Clobert J, Sinervo BR: Corticosteronemanipulation reveals differences in hierarchical organization ofmultidimensional reproductive trade-offs in r-strategist and K-strategistfemales. J Evol Biol 2008, 21:556-565.
87. Tatar M, Carey CR: Genetics of mortality in the bean beetle,Callosobruchus maculates. Evolution 1994, 48:1371-1376.
88. Spencer RJ, Fredric JJ, Thompson MB: Counterintuitive density-dependentgrowth in a long-lived vertebrate after removal of nest predators.Ecology 2006, 87:3109-3118.
89. Roth VL: Insular dwarf elephants: A case study in body mass estimationand ecological inference. In Body size in mammalian paleobiology:Estimation and biological implications. Edited by: Damuth J, MacFadden BJ.Cambridge, Cambridge University; 1990:151-179.
90. Roth VL: Inferences from allometry and fossils: dwarfing of elephants onislands. In Oxford surveys in Evolutionary Biology. Edited by: Futuyma D,Antonovics J. New York: Oxford University Press; 1992:8:259-288.
91. Dearing MD: An alimentary specialization for herbivory in the tropicalwhiptail lizard, Cnemidophorus murinus. J Herpethol 1993, 27:111-114.
92. Garland T Jr, Adolph SC: Why Not to Do Two-Species ComparativeStudies: Limitations on Inferring Adaptation. Physiol Zool 1994, 67:797-828.
93. Roulin A, Salamin N: Insularity and the evolution of melanism, sexualdichromatism and body size in the worldwide-distributed barn owl. JEvol Biol 2010, 23:925-934.
94. Raia P, Meiri S: The island rule in large mammals: Paleontology meetsEcology. Evolution 2006, 60:1731-1742.
95. Corti C, Lo Cascio P, Razzetti E: Erpetofauna delle isole italiane. In Atlantedegli Anfibi e dei Rettili d’Italia. Edited by: Sindaco R, Doria G, Razzetti E,Bernini F. Societas Herpetologica Italica/Edizioni Polistampa; 2006:612-643.
96. Foà A, Monteforti G, Minutini L, Innocenti A, Quaglieri C, Flamini M:Seasonal changes of locomotor activity patterns in ruin lizards Podarcissicula I Endogenous control by the circadian system. Behav Ecol Sociobiol1994, 34:267-274.
97. Rosenblum EB, Hoekstra HE, Nachman MW: Adaptive reptile colourvariation and the evolution of the Mc1r gene. Evolution 2004,58:1794-1808.
98. Tajima F: Statistical methods to test for nucleotide mutation hypothesisby DNA polymorphism. Genetics 1989, 123:585-595.
99. Rozas J, Rozas R: DnaSP version 3: an integrated program for molecularpopulation genetics and molecular evolution analysis. Bioinformatics1999, 15:174-175.
100. Zelditch ML, Swiderski D, Sheets DH, Fink W: Geometric Morphometrics forBiologists New York, Elsevier Academic Press 2004.
101. Andreone F, Guarino FM: Giant and long-lived: age structure inMacroscincus coctei, an extinct skink from Cape Verde. Amphibia-Reptilia2003, 24:459-470.
102. Guarino FM, Lunardi S, Carlomagno M, Mazzotti S: A skeletochronologicalstudy of growth, longevity, and age at sexual maturity in a populationof Rana latastei (Amphibia, Anura). J Biosci 2003, 28:775-782.
103. Rohlf FJ, Slice DE: Extensions of the Procrustes method for the optimalsuperimposition. Syst Biol 1990, 39:40-59.
104. Rohlf FJ: TpsDigVer 2.10. digitalized landmarks and outlines Dept of Ecologyand Evolution, State Univ of New York at Stony Brook 2006.
105. Rohlf FJ: tps series softwares. 2004 [http://life.bio.sunysb.edu/morph/].106. Sheets HD: IMP Software Series, New York. 2006 [http://www3.canisius.
edu/~sheets/morphsoft.html].107. Falster DS, Warton DI, Wright IJ: User’s guide to SMATR: standardized
major axis tests and routines, version 20. 2006 [http://www.bio.mq.edu.au/ecology/SMATR/].
108. Stamps JA, Losos JB, Andrews RM: A comparative study of populationdensity and sexual size dimorphism in lizards. Am Nat 1997, 149:64-90.
109. Olsson M, Wapstra E, Olofsson C: Offspring size-number strategies:experimental manipulation of offspring size in a viviparous lizard(Lacerta vivipara). Funct Ecol 2002, 16:135-140.
110. Cox RM, Skelly SL, John-Alder HB: A comparative test of adaptivehypotheses for sexual size dimorphism in lizards. Evolution 2003,57:1653-1669.
111. Meiri S: Length-weight allometries in lizards. J Zool 2010, 281:218-226.
doi:10.1186/1471-2148-10-289Cite this article as: Raia et al.: The blue lizard spandrel and the islandsyndrome. BMC Evolutionary Biology 2010 10:289.
Submit your next manuscript to BioMed Centraland take full advantage of:
• Convenient online submission
• Thorough peer review
• No space constraints or color figure charges
• Immediate publication on acceptance
• Inclusion in PubMed, CAS, Scopus and Google Scholar
• Research which is freely available for redistribution
Submit your manuscript at www.biomedcentral.com/submit
Raia et al. BMC Evolutionary Biology 2010, 10:289http://www.biomedcentral.com/1471-2148/10/289
Page 16 of 16
Copyright © 2022 FDOKUMEN