Identifying Best Practices in Hydraulic Fracturing Using Virtual Intelligence Techniques
11
Copyright 2001, Society of Petroleum Engineers Inc. This paper was prepared for presentation at the SPE Eastern Regional Meeting held in Canton, Ohio, 17–19 October 2001. This paper was selected for presentation by an SPE Program Committee following review of information contained in an abstract submitted by the author(s). Contents of the paper, as presented, have not been reviewed by the Society of Petroleum Engineers and are subject to correction by the author(s). The material, as presented, does not necessarily reflect any position of the Society of Petroleum Engineers, its officers, or members. Papers presented at SPE meetings are subject to publication review by Editorial Committees of the Society of Petroleum Engineers. Electronic reproduction, distribution, or storage of any part of this paper for commercial purposes without the written consent of the Society of Petroleum Engineers is prohibited. Permission to reproduce in print is restricted to an abstract of not more than 300 words; illustrations may not be copied. The abstract must contain conspicuous acknowledgment of where and by whom the paper was presented. Write Librarian, SPE, P.O. Box 833836, Richardson, TX 75083-3836, U.S.A., fax 01-972-952-9435. Abstract Hydraulic fracturing is an economic way of increasing gas well productivity. Hydraulic fracturing is routinely performed on many gas wells in fields that contain hundreds of wells. Companies have developed databases that include information such as methods and materials used during the fracturing process of their wells. These databases usually include general information such as date of the job, name of the service company performing the job, fluid type and fluid amount, proppant type and proppant amount, and pumped rate. Sometimes more detail information may be available such as breakers, amount of nitrogen, and ISIP, to name a few. These data usually is of little use if some of the complex 3-D hydraulic fracture simulators are used to analyze them. But valuable information can be deduced from such data using virtual intelligence tools. The process covered in this paper takes the available data and couples it with general information from each well (things like latitude, longitude and elevation), any information available from log analysis and production data and uses a data mining and knowledge discovery process to identify a set of best practices for the particular field. The technique is capable of patching the data in places that certain information is missing. Complex virtual intelligence routines are used to insure that the information content of the database is not compromised during the data patching process. The conclusion of analysis is a set of best practices that has been implemented in a particular field on a well or on a group of wells basis. Since the entire process is mostly data driven we let the data “speak for itself” and “tell us” what has “worked” and what “has not worked” in that particular field and how the process can be enhanced on a single well basis. In this paper the results of applying this process to Medina formation in New York State will be presented. This data set was furnished by Belden & Blake during a GRI / NYSERDA sponsored projects. This process provides an important step toward achieving a comprehensive set of tools and processes for data mining, knowledge discovery, and data-knowledge fusion from data sets in oil and gas industry. Background Medina and Whirlpool sands of southwest New York State are considered to be tight gas sands. Most wells in the Northeast of the United States, including the wells that are drilled into the Medina and Whirlpool sands, are fractured upon completion to provide economic amounts of gas. A database that included about 100 Medina and Whirlpool wells was obtained from an operator in the region. This database included information on each well such as well location, reservoir quality, completion data, stimulation data and production data. Table 1 shows the data available on each well in the database. The goal of the study was to use the available information in the database in order to identify the best practices in completion and hydraulic fracturing in this field. Furthermore, the objective of this study was to recommend locations, completion and stimulation practices for the future wells based on the findings of the study. The methodology incorporated in this study, with some minor modifications, can be used to identify best practices from any oil and gas database. Generally, the methodology used in this study is categorized as data mining, and knowledge discovery. Methodology The methodology that has been used to analyze the dataset in this study is known as data mining and knowledge discovery. Although the terms data mining and knowledge discovery are not new, the combination of the integrated tools used in this study to achieve the objectives of this data mining study are quite new and innovative. This methodology is a step-by-step process that starts with routine statistical analysis to identify any obvious and readily noticeable trends in the data set as well as performing a process of quality control on the data. The second step of the process involves a proprietary process SPE 72385 Identifying Best Practices in Hydraulic Fracturing Using Virtual Intelligence Techniques Mohaghegh, S. D., Gaskari, R., Popa, A., Ameri, S. West Virginia University, Wolhart, S. and Siegfried, R. Hill, D. GTI
Transcript of Identifying Best Practices in Hydraulic Fracturing Using Virtual Intelligence Techniques

Copyright 2001, Society of Petroleum Engineers Inc. This paper was prepared for presentation at the SPE Eastern Regional Meeting held in Canton, Ohio, 17–19 October 2001. This paper was selected for presentation by an SPE Program Committee following review of information contained in an abstract submitted by the author(s). Contents of the paper, as presented, have not been reviewed by the Society of Petroleum Engineers and are subject to correction by the author(s). The material, as presented, does not necessarily reflect any position of the Society of Petroleum Engineers, its officers, or members. Papers presented at SPE meetings are subject to publication review by Editorial Committees of the Society of Petroleum Engineers. Electronic reproduction, distribution, or storage of any part of this paper for commercial purposes without the written consent of the Society of Petroleum Engineers is prohibited. Permission to reproduce in print is restricted to an abstract of not more than 300 words; illustrations may not be copied. The abstract must contain conspicuous acknowledgment of where and by whom the paper was presented. Write Librarian, SPE, P.O. Box 833836, Richardson, TX 75083-3836, U.S.A., fax 01-972-952-9435.
Abstract Hydraulic fracturing is an economic way of increasing gas well productivity. Hydraulic fracturing is routinely performed on many gas wells in fields that contain hundreds of wells. Companies have developed databases that include information such as methods and materials used during the fracturing process of their wells. These databases usually include general information such as date of the job, name of the service company performing the job, fluid type and fluid amount, proppant type and proppant amount, and pumped rate. Sometimes more detail information may be available such as breakers, amount of nitrogen, and ISIP, to name a few. These data usually is of little use if some of the complex 3-D hydraulic fracture simulators are used to analyze them. But valuable information can be deduced from such data using virtual intelligence tools. The process covered in this paper takes the available data and couples it with general information from each well (things like latitude, longitude and elevation), any information available from log analysis and production data and uses a data mining and knowledge discovery process to identify a set of best practices for the particular field. The technique is capable of patching the data in places that certain information is missing. Complex virtual intelligence routines are used to insure that the information content of the database is not compromised during the data patching process. The conclusion of analysis is a set of best practices that has been implemented in a particular field on a well or on a group of wells basis. Since the entire process is mostly data driven we let the data “speak for itself” and “tell us” what has “worked” and what “has not worked” in that particular field and how the process can be enhanced on a single well basis. In this paper the results of applying this
process to Medina formation in New York State will be presented. This data set was furnished by Belden & Blake during a GRI / NYSERDA sponsored projects. This process provides an important step toward achieving a comprehensive set of tools and processes for data mining, knowledge discovery, and data-knowledge fusion from data sets in oil and gas industry. Background Medina and Whirlpool sands of southwest New York State are considered to be tight gas sands. Most wells in the Northeast of the United States, including the wells that are drilled into the Medina and Whirlpool sands, are fractured upon completion to provide economic amounts of gas. A database that included about 100 Medina and Whirlpool wells was obtained from an operator in the region. This database included information on each well such as well location, reservoir quality, completion data, stimulation data and production data. Table 1 shows the data available on each well in the database. The goal of the study was to use the available information in the database in order to identify the best practices in completion and hydraulic fracturing in this field. Furthermore, the objective of this study was to recommend locations, completion and stimulation practices for the future wells based on the findings of the study. The methodology incorporated in this study, with some minor modifications, can be used to identify best practices from any oil and gas database. Generally, the methodology used in this study is categorized as data mining, and knowledge discovery. Methodology The methodology that has been used to analyze the dataset in this study is known as data mining and knowledge discovery. Although the terms data mining and knowledge discovery are not new, the combination of the integrated tools used in this study to achieve the objectives of this data mining study are quite new and innovative. This methodology is a step-by-step process that starts with routine statistical analysis to identify any obvious and readily noticeable trends in the data set as well as performing a process of quality control on the data. The second step of the process involves a proprietary process
SPE 72385
Identifying Best Practices in Hydraulic Fracturing Using Virtual Intelligence Techniques Mohaghegh, S. D., Gaskari, R., Popa, A., Ameri, S. West Virginia University, Wolhart, S. and Siegfried, R. Hill, D. GTI

2 SHAHAB D. MOHAGHEGH, ET. AL. SPE 72385
named “Fuzzy Combinatorial Analysis” that helps user to identify the most influential variables in a dataset. This process accomplishes this task by analyzing each variable’s contribution and influence on the process outcome in several steps. First each variable’s influence is analyzed as an individual on the process outcome. Then each variable is analyzed as a member of a group of two variables and their collective influence and contribution on the process outcome is evaluated. Next the group is increased to three and each variables influence is analyzed. This process continues until all the variables available in the database are used. This is a long and tedious process but its importance and contribution to the analysis as a whole cannot be emphasized enough. The logic behind this process is quite intuitive. Influence of variables and their contribution to the process outcome may, and usually are, altered in the presence of other variables. Presence and influence of other variables may exaggerate of dampen the influence of the variable being studied. Therefore the variable must be studied in collections to reveal their true contribution and influence to the process outcome. The methodology used here will take this important factor into account. The “Fuzzy Combinatorial Analysis” assists the user to identify and rank the most influential variables. This analysis is also capable of identifying the ranges within a variable’s minimum and maximum values that influences the outcome of the process in a negative or a positive manner. Furthermore, this analysis can identify the range of the variable that the outcome is most sensitive to and the ranges at which the sensitivity of the outcome is minimal. Such analysis provides valuable information during the knowledge discovery from the data set. Once the “Fuzzy Combinatorial Analysis” is completed, the next step of the methodology calls for building a representative model of the process based on the dataset. The model-building step is multi-step non-trivial process. It involves a set of tools that allows the engineer to use several analytical methods “in concert” to achieve the best representative model from a dataset. These tools include but are not limited to “Hard Clustering”, “Fuzzy Clustering”, “Forward Selection and Backward Elimination Neural Network” analysis, and a set different neural network architectures using several learning algorithms. Once the representative model of the dataset is constructed and exhaustively tested for accuracy, a multi-step process will assist the engineer in identifying the best practices based on the representative model developed. The multi-step process includes analysis based on single wells, analysis based on groups (or clusters) of wells, and finally analysis based on the entire field. One may observe that the conclusions and recommendations that can be offered during this analysis may be quite detailed for a single well while it would be more general as the analysis moves from a single well analysis to a group of wells and then to the entire field.
The results shown in this paper includes a set of single well analysis and a glimpse of analysis when applied to a group of wells. The more detail analysis of groups or clusters of wells and the full field analysis will be offered in a separate article. Results and Discussion As was mentioned in the previous section the analysis is divided into several components. In this section each component will be visited and the results are presented. The components being covered in this section are Fuzzy Combinatorial Analysis, Neural Modeling, and Best Practices Analysis that include some single well analysis followed by a preliminary analysis on groups of wells. Fuzzy Combinatorial Analysis The process starts by “Fuzzy Combinatorial Analysis” to rank the most influential parameters in the dataset. As was mentioned before this process takes into account the influence of the parameters on each other as well as on the process outcome that has chosen to be the 5-year cumulative gas production for this dataset. Table 2 shows the ranking of the parameters that resulted from the “Fuzzy Combinatorial Analysis”. Since production parameters are directly related to the process output in this dataset, they were left out of the analysis. It is interesting to note that “Net Phi-H Whirlpool” which is the product of the porosity and the net thickness of the Whirlpool formation has turned out to be the most influential parameter in the process. This suggests that the wells that demonstrate high productivity are somehow draining from the Whirlpool formation. If these wells are actually completed in the Whirlpool then the commingled production must be allocated to Whirlpool more than it can be allocated to Medina, on the other hand if these wells are not completed in the Whirlpool then there must be some kind of communication between the two formation (Whirlpool and Medina) either in the reservoir or behind the pipe. The next three high-ranking parameters are location of each well. This simply indicates that the geology is playing a significant role in this field. It further points to the fact that we might be able to locate sweet spots in the field if in the future an infill drilling program is initiated. The ranking of the influential parameters is continued by the average treating rate of Medina as the fifth influential parameter followed by the number of the perforations as the sixth parameter. Then three stimulation parameters, and a completion parameter follow next in the ranking. Number of the perforations is the most influential completion parameter although in the overall ranking it ranks number six. And the other two completion parameters, namely perforation diameter and the perforation thickness are ranked ten and 15. Moreover, amount of nitrogen used during the stimulation process seems to have negligible influence on the productivity of the wells in this field.

SPE 72385 IDENTIFYING BEST PRACTICES IN HYDRAULIC FRACTURING USING VIRTUAL INTELLIGENCE TECHNIQUES 3
In order to identify the most influential categories in this field an average value of the influence for each category was calculated. The result is demonstrated in Figure 1. Please note that in this figure the inverse of the influence (as a score) is being plotted. This is a byproduct of the “Fuzzy Combinatorial Analysis” and might seem counter intuitive from an engineer’s point of view. But the lower the value of the score (hence shorter the bar in the Figure 1) the more influential is the category. This figure shows that this field is behaving quite conventionally by reservoir quality being the most influential category followed by the location that is a direct indicator of the geology. Furthermore, this figure indicates that stimulation practices in this field are slightly more influential than the completion practices. Table 3 shows the actual scores that were used to plot the Figure 1. This table shows that the stimulation score is lower (hence more influential) than the completion. The “Fuzzy Combinatorial Analysis” provides a graphical representation of the ranges of each parameter as a function of their influence on the process outcome (5-year cum.). Since X and Y have been indicated as two influential parameters, an attempt was made to use the information provided by the graphical representation of “Fuzzy Combinatorial Analysis” in order to identify the sweet spots in this field. Figure 2 shows the result of this analysis. In this figure the “Fuzzy Combinatorial Analysis” identifies the regions of high and low productivities as well as regions that the productivity is quite sensitive to a change in either of the variables, in this case X and Y. Once the areas of high productivity (sweet spots) and low productivity from each direction are superimposed upon each other, an indication of the sweet spots may emerge. In this figure the area indicated by number 1 seems to be the most productive area of the field followed by the area indicated by number 2. The least attractive area of the field with regard to the potential for productivity seems to be the area indicated by number 3. One may argue that areas 1 and 2 are identified as sweet spots simply because they are at the flanks of the field and have the opportunity to drain from a larger area. But there must be more to it than that, since the same argument can be made for all the wells that are located at the four edges of the field. Once we complete the modeling process of this data set and perform single well analysis (presented in this paper), we will use the genetic optimization module and try to understand more about these areas that we have identified at this stage (more detail will be presented in future articles). Representation of the influence of the most influential parameters in this dataset, namely “Net Phi-H Whirlpool” is provided in Figure 3. In this figure a color bar is also shown on the bottom of the figure. The darker the bar, the higher is the sensitivity of the process outcome to a change in the variable. In order to show the non-influential characteristics of the parameter that has scored the lowest in this analysis, Figure 4 displays the influence of the perforation thickness (ranked 15 – last in the analysis) on the process outcome. It
should be noted that the color bars in the two figures couldn’t be compared to one another. They only represent the sensitivity of the process outcome to a certain range of the variable as it compares to the other ranges of the same variable. Neural Modeling Next step in the identification of best practices is the modeling. The modeling of the process behavior is accomplished using a series of processes (including forward selection and backward elimination neural analysis, fuzzy cluster analysis together with the results of the fuzzy combinatorial analysis) that is concluded by using a neural network. In this phase of the analysis the dataset is divided into three sets. These sets are known as training set, calibration set and verification set. The training set is used to train the neural network; the calibration set is used to track the training process and identifying the maturity of the neural network in learning the intricacies of the dataset and making sure that no memorization is taking place. The data in the calibration set is not used directly during the training process; rather it is used to see if the network has been trained well or if it has been over trained. The verification dataset is used as a blind dataset at the end of the training process to see if the trained neural network can perform reasonably well on a “blind” (never seen before) dataset. There were 100 wells included in the dataset. The training data set included 65 wells, the calibration dataset included 20 wells and the verification dataset contained the remaining 15 wells. A random number generator was used to assist us to partition the original dataset into the aforementioned datasets. Table 4 shows the statistics of all three datasets upon completion of the training. Given the fact that all three datasets have an R2 that is above 0.8, the modeling phase of the process is considered to be successfully completed. Figure 5 and 6 show the scatter plots for the calibration and verification datasets. Best Practices Analysis As was mentioned earlier, identification of best practices for a particular process can be performed on a single well basis, on the basis of groups or clusters of wells or on a full field basis. In this paper we present the analysis that has been performed on a single well basis and provide a preliminary view of the analysis when performed on groups or clusters of wells. A more detail analysis on best practices on groups of wells and analysis on a full field basis is currently underway and will be published in a separate article.
Single Well Analysis The single well analysis uses the developed neural model and performs a parametric study on a well-by-well basis. In order to accomplish this task three of the stimulation parameters were selected to be studied. These parameters were amount of water injected, number of perforations in Medina, and the rate of injection. Once a well is selected for this analysis, all the variables in the model (all but the three mentioned above) are

4 SHAHAB D. MOHAGHEGH, ET. AL. SPE 72385
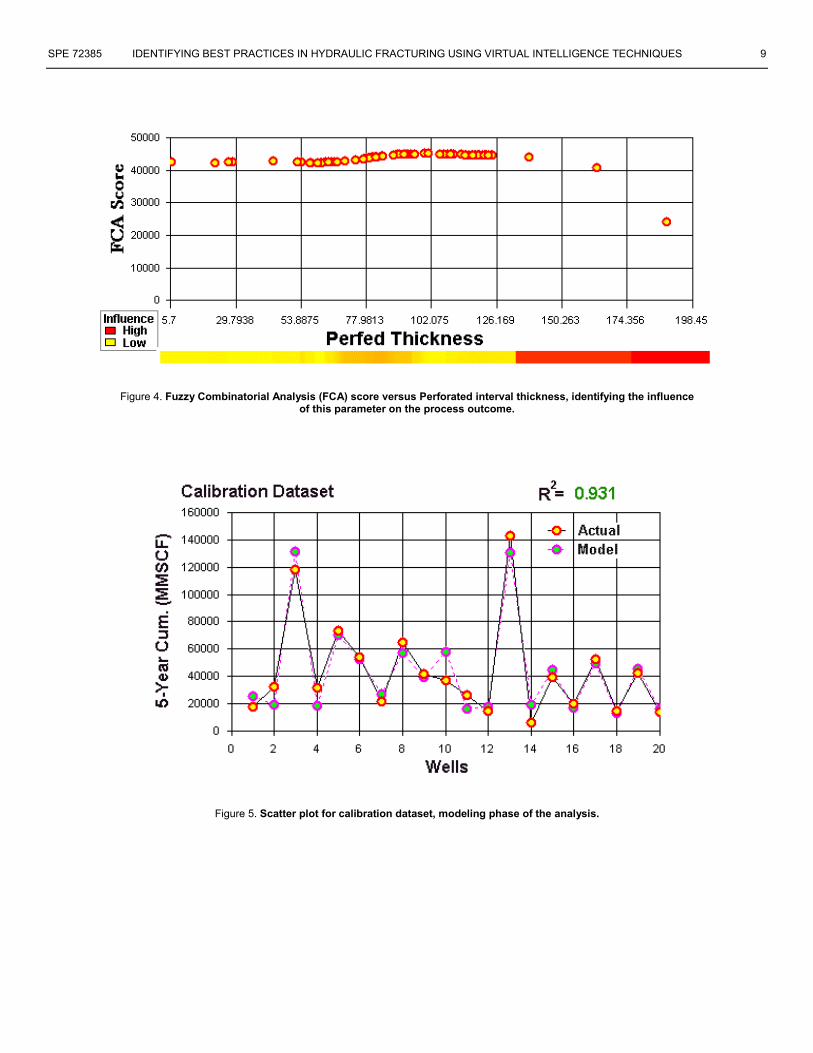
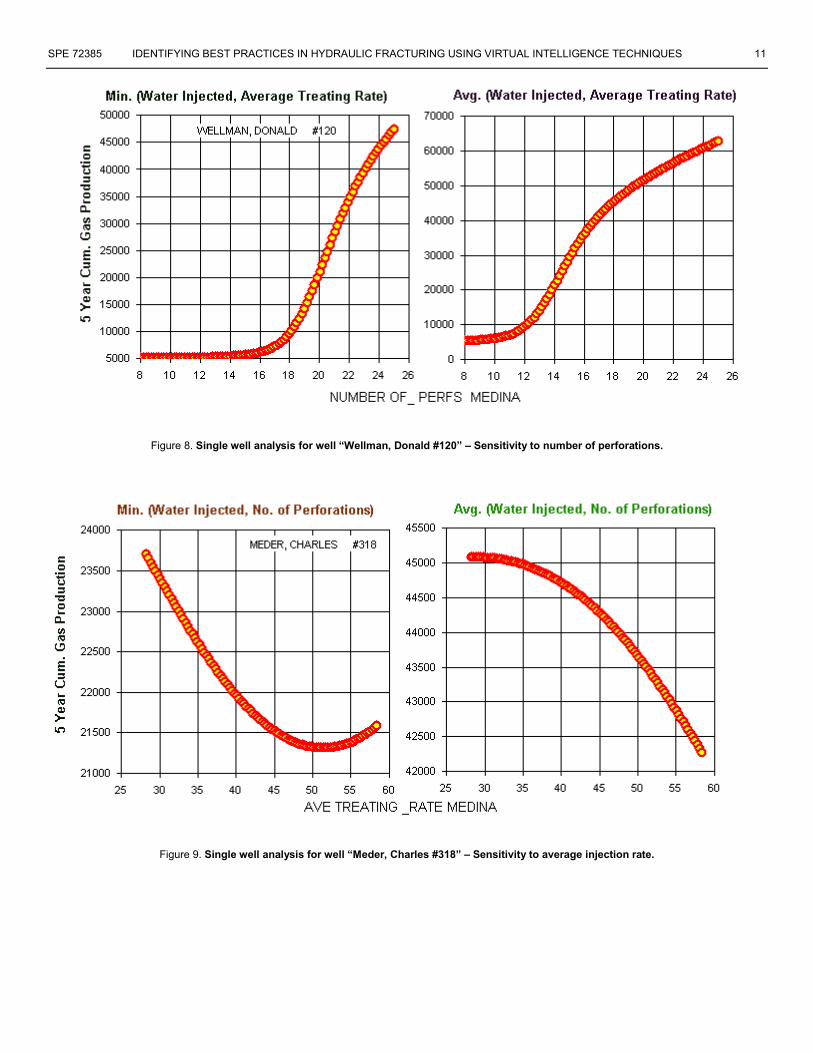
kept constant using the values corresponding to the selected well. Then two out of the three selected variables are kept constant at a minimum, average, or maximum value and the third variable is changed through its entire range starting from the minimum to maximum. Throughout this process the respond of the model is recorded as the predicted 5-year cumulative gas production. Obviously the engineer is looking for an increase in the 5-year cumulative gas production and can use the graphs that are generated during this process to identify the best combination of parameters that optimizes the 5-year cumulative gas production. Moreover, the profile that is generated during this process (examples are shown in Figures 7, 8, and 9) is of interest to the engineer, since it identifies the best practices (as far as these parameters are concerned) for this particular well. The same process can be repeated for any controllable parameter in the model. The value of the 5-year cumulative gas production can be identified for any particular value of each parameter as well as fixing the parameters at a predetermined values such as their minimum, average, or maximum. Figure 7 is such a graph that has been generated for well “Carlson, Thomas #075”. This well belongs to the cluster of wells identified by number 2 in Figure 2. In this figure the 5-year cumulative gas production is plotted against the amount of water injected in the formation during a hydraulic fracture treatment while number of perforations and the rate of injection is kept constant. In the left hand side graph these parameters are kept at their minimum values (25 bbls/min for injection rate and 8 perforations) in the data set and in the right hand side they are kept at their maximum values (60 bbls/min for injection rate and 26 perforations) as represented in the dataset. While these parameters are kept at their minimum the highest 5-year cumulative gas production (57,050 MSCF) is achieved at 690 barrels of water, on the other hand when these values are kept at their maximum the highest 5-year cumulative gas production (63,400 MSCF) is achieved at about 710 barrels of water injected. The conclusion may be that for this well the ideal water injection volume is about 700 barrels. Figure 8 demonstrate the single well, best practices analysis for the well “Wellman, Donald #120”. This well is located at cluster number 3 in Figure 2. For this well the number of perforation was varied while the amount of water injected and the rate of injection were kept constant at the minimum value (graph on the left hand side) and the average value (graph on the right hand side) of the dataset. The conclusion that can be drawn form these graphs is that a total number of perforations higher than 16 is recommended for this well. Figure 9 shows the single well, best practices analysis for the well “Meder, Charles #318”. This well too, is located at cluster number 3 in Figure 2. For this well the amount of injected water and the number of perforations were kept constant (Minimum for the graph on the left and average for
the graph on the right) and the injection rate is varied from a minimum value of 25 bbls/min to the maximum values of 60 bbls/min. The general conclusion about this well is that the lower injection rates seem to provide better overall results.
Groups of Wells To apply the methodology presented in this study to a group or cluster of wells, genetic optimization is used. The genetic optimization routines, in the fashion employed here will deduce the best hydraulic fracturing practices in this field for different cluster of wells. As it was mentioned before, since the hydraulic fracturing procedures that have been performed in this field are not of a high variety (most of the procedures are quite similar) this dataset might not be the ideal dataset to use in order to demonstrate the power of this process. But even in situations such as this field, it can be shown that this process is capable of discovering and extracting some interesting and valuable knowledge from the dataset. The genetic optimization results are shown in Table 5. The groups or clusters of wells shown in Figure 2 are used for this analysis. As demonstrated in this figure several wells are grouped based on the Fuzzy Combinatorial Analysis. We numbered the groups of the wells as group one for the wells located at the sweet spot of the field, group two for the wells located at an “almost” sweet spot (not the best location in the field but a good location for future development) and group three for the wells located at the relatively poor location of the field. Similar to the last section, three parameters, namely number of perforations in Medina, amount of water used and average injection rate have been chosen as parameters that would be studied in order to achieve a optimize the hydraulic fractures in this field. The analysis shows that the number of perforations in the Medina for an average well in all three groups is between 15 to 19 shots. The optimization routine recommends about 25 shots as the best practices in this field for all three groups of wells. The injection rate is in the range of 43 to 50 bbls/min for the three groups. The analyses show that while the optimum injection rate is lower for the wells in groups one and three it would be slightly higher for wells in group two. The analyses recommend higher volumes of water to be injected for all three groups. As shown in Table 5 the average (on a per well basis) ultimate gas in place for the wells that belong to group one is about 177 MMSCF, and is about 136 MMSCF for group two while it is only 69 MMSCF for wells belonging to group three. Moreover, the average five-years cumulative gas production for a well in group one and two is about 71 MMSCF and 48 MMSCF; respectively while the average five-years cumulative gas production for a typical well in group three is only 22 MMSCF. Upon optimization of all the wells in the field using the best practices the average five-years cumulative gas

SPE 72385 IDENTIFYING BEST PRACTICES IN HYDRAULIC FRACTURING USING VIRTUAL INTELLIGENCE TECHNIQUES 5
production for a well in group one and two are 92 and 64 MMSCF, respectively. This translates to 23 and 26 percent increase, while the average five-years cumulative gas production increase for a typical well in group three is about 56 percent or 50 MMSCF. It can be seen that the wells in the sweet spot are good wells (remember that reservoir quality and location were the most influential parameters in this field and the influence of completion and stimulation were limited) and can be enhanced moderately (about 23%) by optimizing the hydraulic fracturing procedure or completion practices. The wells in group two can be enhanced slightly more (up to 26%) and this increase translates to a reasonably large production enhancement that can be economically viable since their original productions are not poor. On the other hand the wells in group three, although can be enhanced the most (about 56%) may not be attractive target since even with this kind of enhancement their production may not justify their cost. The information compiled in Table 5 emphasizes the merits of the identification of the sweet spots. This is done by showing that the five-years cumulative gas production of the wells in these locations as well as the calculated ultimate gas in place supports this hypothesis. Furthermore, the results of the optimization study confirm the recommendation of where to place the future Conclusions A new process has been introduced that employs data mining and knowledge discovery methodologies to identify the best practices during the hydraulic fracturing process in the Medina and Whirlpool sands of southwest New York State. The results provided by this process demonstrate the potential of these methodologies in identifying the best practices in oil and gas industry.
Table 1. Parameters available in the dataset.
Category ParameterLocation X
YTop of Upper Grimsby
Reservoir Quality Net Phi-H Total GrimsbyNet Phi-H Whirlpool
Completion Perf ThicknessNumber of Perfs MedinaPerf Diameter
Stimulation BBLs of Water MedinaMMCF N2 MedinaSacks of Sand MedinaBreakdown Pressure MedinaISIP MedinaAvg. Treating Rate MedinaTreating Pressure Medina
Production Remaining GasUltimate GasGas Months ProdGas Last 1 MonthsGas Date of First ProductionGas Date of Last Production
OUTPUT Gas 5 Year Cumulative

6 SHAHAB D. MOHAGHEGH, ET. AL. SPE 72385
Inverse of
Rank Category Parameter Relative Influence1 Reservoir Quality Net Phi-H Whirlpool 02 Location X 2.42963 Location Y 3.53944 Location Top of Upper Grimsby 3.88785 Stimulation Avg. Treating Rate Medina 3.97476 Completion Number of Perfs Medina 4.14977 Stimulation Treating Pressure Medina 4.15438 Stimulation Sacks of Sand Medina 4.3679 Stimulation ISIP Medina 4.369410 Completion Perf Diameter 4.43411 Stimulation Breakdown Pressure Medina 4.509312 Reservoir Quality Net Phi-H Total Grimsby 4.62913 Stimulation BBLs of Water Medina 4.662814 Stimulation MMCF N2 Medina 4.682315 Completion Perf Thickness 4.7257
Table 2. Ranking of the parameters using the “Fuzzy Combinatorial Analysis”.
Table 3. Category scores from the “Fuzzy Combinatorial Analysis”.
Dataset R SquaredTraining 0.848
Calibration 0.931Verification 0.847
Table 4. Statistics of the modeling phase.
Category ScoreLocation 2.31Reservoir Quality 3.28Stimulation 4.39Completion 4.47

SPE 72385 IDENTIFYING BEST PRACTICES IN HYDRAULIC FRACTURING USING VIRTUAL INTELLIGENCE TECHNIQUES 7
Parameters Optimized Actual Optimized Actual Optimized Actual NUMBER OF PERFS MEDINA 25 19 25 15 25 15AVERAGE INJECTION RATE 38.5 46.0 47.8 43.4 45.6 50.6
BBL WATER MEDINA 625 557 717 645 819 575Ultimate Gas
Gas_5-Yr_Cum 91,746 70,657 64,117 47,688 50,142 21,954% increase due to optimization
177,574 136,317 68,859
23% 26% 56%
Average Values Per Group of WellsGroup ONE Group TWO Group THREE
Table 5. Results from the genetic optimization process for the wells in groups 1, 2, and 3.
Figure 1. Influence of categories of parameters on 5-year cumulative gas production.

8 SHAHAB D. MOHAGHEGH, ET. AL. SPE 72385
Figure 2. Identification of sweet spots in the field base on the results of “Fuzzy Combinatorial Analysis”.
Figure 3. Fuzzy Combinatorial Analysis (FCA) score versus Net Phi-H Whirlpool, identifying the influence of this parameter on the process outcome.
SPE 72385 IDENTIFYING BEST PRACTICES IN HYDRAULIC FRACTURING USING VIRTUAL INTELLIGENCE TECHNIQUES 9
Figure 4. Fuzzy Combinatorial Analysis (FCA) score versus Perforated interval thickness, identifying the influence of this parameter on the process outcome.
Figure 5. Scatter plot for calibration dataset, modeling phase of the analysis.

10 SHAHAB D. MOHAGHEGH, ET. AL. SPE 72385
Figure 6. Scatter plot for verification dataset, modeling phase of the analysis.
Figure 7. Single well analysis for well “Carlson, Thomas #075” – Sensitivity to amount of water injected.
SPE 72385 IDENTIFYING BEST PRACTICES IN HYDRAULIC FRACTURING USING VIRTUAL INTELLIGENCE TECHNIQUES 11
Figure 8. Single well analysis for well “Wellman, Donald #120” – Sensitivity to number of perforations.
Figure 9. Single well analysis for well “Meder, Charles #318” – Sensitivity to average injection rate.