Identifying and illustrating urban traffic congestion, mobility ...
226
UNLV Retrospective Theses & Dissertations 1-1-1996 Identifying and illustrating urban traffic congestion, mobility, and Identifying and illustrating urban traffic congestion, mobility, and accessibility using a Gis accessibility using a Gis Jeffrey James Jensen University of Nevada, Las Vegas Follow this and additional works at: https://digitalscholarship.unlv.edu/rtds Repository Citation Repository Citation Jensen, Jeffrey James, "Identifying and illustrating urban traffic congestion, mobility, and accessibility using a Gis" (1996). UNLV Retrospective Theses & Dissertations. 3280. http://dx.doi.org/10.25669/hc06-8cm1 processed, response: 201 This Thesis is protected by copyright and/or related rights. It has been brought to you by Digital Scholarship@UNLV with permission from the rights-holder(s). You are free to use this Thesis in any way that is permitted by the copyright and related rights legislation that applies to your use. For other uses you need to obtain permission from the rights-holder(s) directly, unless additional rights are indicated by a Creative Commons license in the record and/ or on the work itself. This Thesis has been accepted for inclusion in UNLV Retrospective Theses & Dissertations by an authorized administrator of Digital Scholarship@UNLV. For more information, please contact [email protected].
-
Upload
khangminh22 -
Category
Documents
-
view
0 -
download
0
Transcript of Identifying and illustrating urban traffic congestion, mobility ...

UNLV Retrospective Theses & Dissertations
1-1-1996
Identifying and illustrating urban traffic congestion, mobility, and Identifying and illustrating urban traffic congestion, mobility, and
accessibility using a Gis accessibility using a Gis
Jeffrey James Jensen University of Nevada, Las Vegas
Follow this and additional works at: https://digitalscholarship.unlv.edu/rtds
Repository Citation Repository Citation Jensen, Jeffrey James, "Identifying and illustrating urban traffic congestion, mobility, and accessibility using a Gis" (1996). UNLV Retrospective Theses & Dissertations. 3280. http://dx.doi.org/10.25669/hc06-8cm1 processed, response: 201
This Thesis is protected by copyright and/or related rights. It has been brought to you by Digital Scholarship@UNLV with permission from the rights-holder(s). You are free to use this Thesis in any way that is permitted by the copyright and related rights legislation that applies to your use. For other uses you need to obtain permission from the rights-holder(s) directly, unless additional rights are indicated by a Creative Commons license in the record and/or on the work itself. This Thesis has been accepted for inclusion in UNLV Retrospective Theses & Dissertations by an authorized administrator of Digital Scholarship@UNLV. For more information, please contact [email protected].

INFORMATION TO USERS
This manuscript has been reproduced from the microfilm master. UMI
films the text directly from the original or copy submitted. Thus, some
thesis and dissertation copies are in typewriter face, while others may be
from any type o f computer printer.
The quality of this reproduction is dependent upon the quality o f the
copy submitted. Broken or indistinct print, colored or poor quality
illustrations and photographs, print bleedthrough, substandard margins,
and improper alignment can adversely afreet reproduction.
In the unlikely event that the author did not send UMI a complete
manuscript and there are missing pages, these will be noted. Also, if
unauthorized copyright material had to be removed, a note will indicate
the deletion.
Oversize materials (e.g., maps, drawings, charts) are reproduced by
sectioning the original, beginning at the upper left-hand comer and
continuing from left to right in equal sections with small overlaps. Each
original is also photographed in one exposure and is included in reduced
form at the back o f the book.
Photographs included in the original manuscript have been reproduced
xerographically in this copy. Higher quality 6” x 9” black and white
photographic prints are available for any photographs or illustrations
appearing in this copy for an additional charge. Contact UMI directly to
order.
UMIA Bell & Howell Information Company
300 North Zed) Road, Arm Arbor MI 48106-1346 USA 313/761-4700 800/521-0600
R eproduced with perm ission of the copyright owner. Further reproduction prohibited without perm ission.

Reproduced with permission of the copyright owner. Further reproduction prohibited without permission.

Identifying and Illustrating Urban Traffic Congestion,
Mobility, and Accessibility Using a GIS
by
Jeffery J. Jensen
A thesis submitted in partial fulfillment of the requirements for the degree of
Master of Science
m
Engineering
Department of Civil and Environmental Engineering
University of Nevada, Las Vegas
May 1997
R eproduced with perm ission of the copyright owner. Further reproduction prohibited without perm ission.

UMI Number: 1385178
UMI Microform 1385178 Copyright 1997, by UMI Company. All rights reserved.
This microform edition is protected against unauthorized copying under Title 17, United States Code.
UMI300 North Zeeb Road Ann Arbor, MI 48103
R eproduced with perm ission of the copyright owner. Further reproduction prohibited without perm ission.

©1997 Jeffery J. Jensen
All Rights Reserved
R eproduced with perm ission of the copyright owner. Further reproduction prohibited without perm ission.

The Thesis o f Jeffery J. Jensen for the degree of Master o f Science in Engineering is approved.
Chairperson, Shashi K. Sathisan, Ph.D.
Examining Committee Member, Edward S. Neumann, Ph.D.
Examining Committee Member, Mohamed Kaseko, Ph.D.
\
Graduate Facul^r-R^resentative, Chih-Hsiang Ho, Ph.D.
Dean o f the Graduate College, Ronald W. Smith, Ph D.
University of Nevada, Las Vegas May 1997
R eproduced with perm ission of the copyright owner. Further reproduction prohibited without perm ission.
ABSTRACT
Urban congestion, accessibility, and mobility are important concerns affecting the quality
of life in metropolitan areas. It is important that accessibility and mobility should not be
compromised while developing strategies to alleviate congestion. The effects o f traffic
congestion include not only increase travel delays, which result in the increase o f travel
times, but also impacts energy consumption and air quality. All of these have detrimental
effects on the quality of life. In order to develop strategies to alleviate urban congestion, it
is necessary to first identify where and when congestion occurs - i.e., the spatial and
temporal distribution of congestion. The objective of this research is to demonstrate the
application of a geographic information system (GIS) to help identify and illustrate urban
congestion, accessibility, and mobility. Definitions of mobility, accessibility, and
congestion are presented as well as the advantages of using a GIS. A list of performance
measures which are typically used to quantify these transportation functions are discussed.
Data required to quantify the performance measures, their sources and integration within a
GIS are discussed. Lastly GIS analyses used to quantify the performance measure are
discussed. The performance measures used are: I) non-recurring delay, 2) average vehicle
occupancy, 3) business and employee accessibility to transit routes, 4) residential
accessibility to transit routes, 5) Transit accessibility to areas of low automobile
ownership, and finally 6) travel time. Specific example are presented to illustrate the
application of GIS to evaluate the performance measures identified. In turn, these can be
used to develop policies and operational strategies to address congestion (and potential
congestion), mobility, and accessibility issues in urban areas. Conclusions are the GIS is a
R eproduced with perm ission of the copyright owner. Further reproduction prohibited without perm ission.

viable tool to assist planners and engineers to identify problem areas using already existing
data sources.
Ill
R eproduced with perm ission of the copyright owner. Further reproduction prohibited without perm ission.

TABLE OF CONTENTS
ABSTRACT................................................................................................................................ ii
TABLE OF CONTENTS........................................................................................................ iv
LIST OF FIGURES................................................................................................................ vii
LIST OF TABLES................................................................................................................. viii
ACKNOWLEDGEMENTS..................................................................................................... ix
CHAPTER 1: INTRODUCTION.............................................................................................1Thesis Research Objective.....................................................................................................2Definitions................................................................................................................................3
Congestion........................................................................................................................... 3Mobility................................................................................................................................4Accessibility.........................................................................................................................6
Comparison o f Mobility, Accessibility, and Congestion...................................................... 7Why GIS?................................................................................................................................8
Data Management...............................................................................................................8Data Analysis.......................................................................................................................9Display of D ata ................................................................................................................... 9
CHAPTER 2: LITERATURE REVIEW OF PERFORMANCE MEASURES................. 10Performance Measures.........................................................................................................10Data Requirements for Performance Measures..................................................................11Delay......................................................................................................................................11
Recurring Delay................................................................................................................ 11Non-Recurring Delay....................................................................................................... 12
Accident Locations....................................................................................................... 12Identification of Accident Locations.............................................................................13Accident Delay per Incident......................................................................................... 13Accident Delay by Severity...........................................................................................14
Person Movement; Average Vehicle Occupancy............................................................... 14Average Vehicle Occupancy (AVO)................................................................................15Methods o f Collection...................................................................................................... 15
Stationary Field Observation........................................................................................ 15Surveys............................................................................................................................16Probe Vehicle Observation............................................................................................16Video Surveillance.........................................................................................................17Accident Records...........................................................................................................17
Transit Accessibility.............................................................................................................17Ambulance Data................................................................................................................ 19
iv
R eproduced with perm ission of the copyright owner. Further reproduction prohibited without perm ission.

Travel Time............................................................................................................................20Travel Time Contours.......................................................................................................20
Speed......................................................................................................................................20
CHAPTER 3 : METHODOLOGY......................................................................................... 22Delay......................................................................................................................................22Person Movement.................................................................................................................23Transit Accessibility............................................................................................................. 23
Employee Accessibility..................................................................................................... 24Business Accessibility........................................................................................................24Residential Population Bus Accessibility.........................................................................25Bus Accessibility by Auto Ownership............................................................................. 26
Travel Time............................................................................................................................26Speed......................................................................................................................................27
Euclidean Path...................................................................................................................27Manhattan Path..................................................................................................................28Network Path..................................................................................................................... 28
Vehicle Speed Assignment........................................................................................... 29
CHAPTER 4: DATA SOURCES & INTEGRATION PROCEDURES............................33Accident Records..................................................................................................................33
AVO Source: Accident Records...................................................................................... 34Data Items...................................................................................................................... 34Conversion Procedures to GIS.....................................................................................35
Vehicle Delay due to Non-recurring Congestion............................................................... 36Average Vehicle Occupancy................................................................................................36
AVO Source: NDOT Monitoring....................................................................................36Data Items...................................................................................................................... 36Conversion Procedures to GIS.....................................................................................37Data Limitations............................................................................................................ 38
Population..............................................................................................................................38Conversion Procedures to GIS..................................................................................... 39Data Limitations............................................................................................................ 39
Vehicle Registration............................................................................................................. 40Data Items...................................................................................................................... 40Conversion Procedures to GIS.....................................................................................40Data Limitations............................................................................................................40
Bus Routes.............................................................................................................................41Data Limitations............................................................................................................41
Business Locations............................................................................................................... 41Data Items...................................................................................................................... 42Conversion Procedures to GIS.....................................................................................42Data Limitations............................................................................................................42
Ambulance Data....................................................................................................................43Data Items...................................................................................................................... 43
R eproduced with perm ission of the copyright owner. Further reproduction prohibited without perm ission.

Conversion Procedures to GIS.................................................................................... 43Data Limitations............................................................................................................44
CHAPTER 5; GIS ANALYSIS............................................................................................. 45Illustrations........................................................................................................................... 45
Accident Locations by Severity.......................................................................................45AVO...................................................................................................................................48Business & Employee Accessibility................................................................................ 50Residential Accessibility................................................................................................... 53Bus Accessibility by Auto Ownership............................................................................. 54Number of Automobiles per Person................................................................................ 54Ambulance Data................................................................................................................ 57
Identification of Origins and Destinations................................................................... 58Spatial Statistics: Inverse Distance Weighted.............................................................58Problem Hospital Accessibility Areas..........................................................................59Travel Time Contours................................................................................................... 63Travel Speed...................................................................................................................65Shortest Network Distance Path Assumption.............................................................68Hypothetical Manhattan Path Assumption.................................................................. 68
CHAPTER 6: CONCLUSIONS............................................................................................ 69Recommendations................................................................................................................ 70
Accident Records.............................................................................................................. 70Ambulance Data................................................................................................................ 72Business Locations............................................................................................................ 73
REFERENCES........................................................................................................................ 74
Appendix A ............................................................................................................................A-1
Appendix B ............................................................................................................................B-1
Appendix C ............................................................................................................................C-1
VI
R eproduced with perm ission of the copyright owner. Further reproduction prohibited without perm ission.

LIST OF FIGURES
Figure 1: Comparison of Mobility, Accessibility, & Congestion.............................................8Figure 2: Possible Paths used by a vehicle..............................................................................27Figure 3: Ambulance Trip Link Assignment.......................................................................... 30Figure 4: Accident Locations by Severity...............................................................................47Figure 5: AVO Monitoring Sites.............................................................................................49Figure 6: Transit Accessibility to Employment Centers....................................................... 51Figure 7: Employee Accessibility............................................................................................52Figure 8: Accessibility to Transit Based on Population Density.......................................... 53Figure 9: Average Number of Vehicles per Person............................................................... 56Figure 10: Ambulance Demand by hour of day......................................................................57Figure 11 : Problem Accessibility Areas.................................................................................. 62Figure 12: Ambulance Travel Time Contours........................................................................ 64Figure 13 : Travel Speeds on Major Corridors.......................................................................66Figure 14: Comparison of Calculated Speed with Posted Speed Limit............................... 67
VII
R eproduced with perm ission of the copyright owner. Further reproduction prohibited without perm ission.

LIST OF TABLES
Table 1: Total Vehicle Delay, 1986 to 1990.............................................................................1Table 2: Descriptive Measures of Accessibility...................................................................... 19Table 3: Estimated Delay by Crash Severity..........................................................................23Table 4: Degree of Congestion...............................................................................................32Table 5; Data items collected by County Demographer........................................................39Table 6; Total Number of GRID cells at a given travel time to UMC for a certain hour in
the day................................................................................................................................ 60
Vlll
R eproduced with perm ission of the copyright owner. Further reproduction prohibited without perm ission.

ACKNOWLEDGEMENTS
I’m greatly indebted to my academic advisor Dr. Shashi Sathisan for all his help,
encouragement, and assistance during the course of my graduate work. I am also grateful
to my committee members. Dr. Edward S. Neumann, Dr. Mohamed Kaseko, and Dr. Ho.
Staff members at the UNLV Transportation Research Center are thanked for the review of
this paper and assistance in various data elements within this thesis. They include, Justin
Rasas, Sandeep Burli, Ande Murali, Vinod Siva Subramani, and Srinivas Pulgurtha.
I would also like to thank Don Hales of Mercy Medical Services for his assistance in
working with the emergency vehicle data. Professor Keith Schwer and Bob Potts of the
Center for Business and Economic Research for the use of their Nevada Business
Directory. Eileen Letizia of the Nevada Department of Transportation for her expertise
and assistant in working with the accident records. Thanks also to Rich Romer of the
Clark County Traffic Management Division for his assistance with obtaining, processing,
and analyzing data. Additionally, I would like to thank the staff members of the Dwight D.
Eisenhower Program for the excellent project I was able to work on. They include Dr.
Ilene Payne and Judith Turner of National Highway Institute for the administration of the
project, and Christopher Fleet and Brian Gardner of the Federal Highway Administration
(FHWA) as sponsors of this thesis. Lastly, I cannot state enough the assistance,
understanding, and guidance provided by Brian Gardner of FHWA and Shashi Sathisan,
without which this research would not have been developed.
IX
R eproduced with perm ission of the copyright owner. Further reproduction prohibited without perm ission.

Lastly I need to thank my wife, Cindy and daughters, Brittany and Raquel, for their
patience and support while I worked on finishing this thesis. Credit must also be given to
our Heavenly Father for the inspiration and comfort I’ve received from His hands during
my continued sojourn on earth.
R eproduced with perm ission of the copyright owner. Further reproduction prohibited without perm ission.

CHAPTER 1: INTRODUCTION
Urban congestion, accessibility, and mobility are important concerns affecting the quality
of life in metropolitan areas. It is important that accessibility and mobility should not be
compromised while developing strategies to alleviate congestion. In fact, it is estimated
that the cost o f congestion in 50 urban areas exceeded $43.2 billion in 1990 [Schrank 93,
p. 66]. This congestion is intuitively related to population. As the population of large
urban centers increases, the ability of the transportation network to facilitate the
movement o f this population decreases. A comparison of total vehicle delay, which is a
direct measure o f congestion, for a few major U.S. cities was made between 1986 to
1990.
Table 1: Total Vehicle Delay, 1986 to 1990
TOTAL DELAY (1000 VEH-HOURS)
Urban Area Year
1986 1987 1988 1989 1990 % change
1986-1990
Washington DC 440 475 495 540 555 26
Cincinnati OH 25 30 40 40 40 60
Denver CO 110 110 115 120 135 23
San Diego CA 95 125 145 155 155 63
Source: [Schrank 93, p. 35]
The Intermodal Surface Transportation Efficiency Act (ISTEA) recognized the increase in
the level of congestion in urban areas and directed the development of a congestion
1
R eproduced with perm ission of the copyright owner. Further reproduction prohibited without perm ission.

management system (CMS). At the onset this CMS was mandatory for all metropolitan
areas (MPOs), but has since been relaxed. Many metropolitan areas are faced with severe
congestion related problems. The effects o f traffic congestion include not only increase
travel delays, which result in the increase o f travel times, but also impacts energy
consumption and air quality. All o f these have detrimental effects on the quality of life. In
order to develop strategies to alleviate urban congestion, it is necessary to first identify
where and when congestion occurs - i.e., the spatial and temporal distribution o f
congestion.
Thesis Research Objective
The objective of this research is to demonstrate the application of a geographic
information system (GIS) to help identify and illustrate urban congestion, accessibility, and
mobility. This is the first step in developing a congestion management system (CMS) for
an urban area. Once this is completed, alternative measures and strategies can be modeled
to evaluate their effect in reducing congestion and maintaining or enhancing accessibility
and mobility. This thesis will cover the following topics; 1) define congestion, mobility,
and accessibility, 2), perform a literature review 3) identify performance measures, 4)
identify data requirements and find sources o f data for quantifying the performance
measures, 5) demonstrate procedures and methodology of integrating such data into a
GIS, 6) demonstrate the quantification of the performance measures with the assistance of
a GIS, and 6) provide recommendations.
R eproduced with perm ission of the copyright owner. Further reproduction prohibited without perm ission.

Definitions
In defining congestion, mobility, and accessibility, it became apparent that the three items
are not independent o f one another. There is some overlap where the same performance
measure can be used to define congestion, mobility, or accessibility. The following
definitions obtained fi"om the literature review are cited and new ones are proposed.
Congestion
The Interim Final Rule for congestion management system defines congestion to be "...
the level at which transportation systems performance is no longer acceptable due to
traffic interference. The level of acceptable system performance may vary by type of
transportation facility, geographic location (metropolitan area, sub area, or rural area)
and/or time o f day” [Fed Register. 93, Section 500.503 CMS Definitions]. It is also
defined as the difference between actual travel time and expected/desired travel time to
travel from an origin to a destination [Hamm 93]. Delay is an excellent measure of
congestion. It keeps the negative aspect of congestion in tack; it focuses on the cost or
wasted time from using the network, while also being a separate measure from mobility.
Safety is also affected by congestion. It is perceived that a relationship exists between
vehicle operating speeds and safety. Higher operating speeds are believed to be less safe
than lower operating speeds-at least with respect to fatal crashes. Congestion tends to
lower operating speeds and thus could be considered to influence safety. But reduced
operating speeds result in decreased mobility. Conversely an increase in travel speed
R eproduced with perm ission of the copyright owner. Further reproduction prohibited without perm ission.

increases the risk for harmful crashes but it also increases the mobility of the person
[Evans 91, p. 363-6],
Congestion is an undesirable phenomenon that occurs when demand for usage of a
transportation network in a given time period exceeds the capacity o f that network during
the same time period. The primary focus of a congestion management system (CMS)
should not be to solely solve congestion. If that is the focus, planning will be reactive
instead of proactive. The goal of a CMS should be to increase the mobility and
accessibility of all people within the transportation management area. If the primary focus
is to reduce congestion, it can be eliminated overnight by banning all private vehicles from
using the network. By doing so, the problem congestion is solved but a new and bigger
problem replaces it, that o f decreased or eliminated mobility. Such a mistake will not
occur if the goal is focused on the positive aspects of increasing the mobility and
accessibility of the network. That is, as congestion increases, mobility decreases, but the
converse is not necessarily true (e.g. if a person doesn’t have access to a vehicle, then that
persons mobility won’t be altered by a reduction in congestion).Therefore, congestion
impedes mobility and the focus of a CMS should be on the positive aspects of mobility and
not limited to the negative ones of congestion.
Mobility
Mobility is a difficult measure to quantify and is often used interchangeably with
accessibility [Hamburg 95, p. 53]. What is mobility? From a review o f the literature, the
following definition of mobility were obtained, “mobility is the ability to move people and
R eproduced with perm ission of the copyright owner. Further reproduction prohibited without perm ission.

goods quickly to where they are destined” [Pratt 94, p. 10]. In other instances travel time
is used to define mobility. “Mobility is the achievement o f travel objectives within time
limits regarded as acceptable” [Lomax 92, p. 14]. “Mobility equals the product o f travel
distance and speed during a unit o f time (say an hour or a day)” [Zahavi 80, p. 14]. This
definition implies the units of mobility are distance squared divided by time. Further
investigation is needed to verify the accuracy of this and it wasn’t used in the analysis of
performance measures. Mobility is a function of mode choice; a personal automobile often
provides better mobility for a user than a bus, and for long intercity trips a plane provides
a higher level of mobility than an automobile. Mobility is also a function of time. For
example, it is possible to arrive at a destination faster in a vehicle then in a bus (assuming
equal accessibility) and a plane or vehicle can transport a person faster than walking the
distance.
The measures that define mobility can be grouped into a dynamic classification (e.g. time)
whereas accessibility measures are in a static category (e.g. distance). The availability of
vehicles to persons increases their mobility. Driver license restrictions/laws decreases the
mobility of some (e.g. under the minimum driving age or loss of license for failure to
comply with the law). For public transit, more frequent service/schedule improvements
increases the users mobility, while at the same time keeping accessibility constant (i.e. the
location of a bus stop doesn’t change with the increase of service to that stop).
R eproduced with perm ission of the copyright owner. Further reproduction prohibited without perm ission.

Accessibility
“Accessibility is an ambiguous term which has been defined and measured in a variety of
ways. It has been used in transportation planning as a measure of the ease with which one
can travel to various areas of interest. In terms of systems level transportation planning, it
can be defined as the ease with which one can travel from a zone of origin to activities
located in destination zones or a relationship between travel time and opportunities
available within that travel time.” [Cohen 72, p. 2]. Accessibility is a measure of
opportunity that the transportation system provides for people to utilize the system. In
simple terms it is a measure of how easy it is to get from an origin to a destination [Al-
Sahili 92, p. 3 and Cervero 90, p. 135]. The graphical measure of accessibility developed
by Al-Sahili is used in this thesis to determine the areas that are served by transit. In order
for accessibility to be a meaningful measure, some type of population information must be
included. A hypothetical example would be a city that claims to have an 80% accessibility
coverage by its transit facilities to the public. Such a claim cannot be used for regional
comparison unless the data are normalized. This is accomplished by including population
information. 80% accessibility to areas that have a population density of 10 or more
persons per acre, normalizes this measure which in turn makes it more descriptive and
useful.
The number o f potential destinations or choices that the person has is a key component of
accessibility. The more choices the higher the accessibility to the transportation network
[Handy 93, p. 21]. Accessibility can be measured by distance from an origin to a
R eproduced with perm ission of the copyright owner. Further reproduction prohibited without perm ission.
destination. The denominator o f the gravity model, which is used for trip distribution,
serves as an index of accessibility [Cohen 72, p. 2].
Comparison of Mobility, Accessibility, and Congestion
Consider the scenario presented in figure I . For Origin A, the person is trying to reach
destination point D. The person has access to an uncongested roadway that directly
connects the two points. Unfortunately the lack of access to a vehicle or transit service
severely restricts the mobility. Having high accessibility and low congestion is almost
useless without the access to a mode of transportation (e.g. vehicle or bus). For Origin B,
a vehicle is provided, but access to a road is not. So the mobility is still limited because
accessibility is zero. These two cases show the dependency of the traveler on having
access to both mobility (i.e. mode of travel) and accessibility (i.e., a street network).
Preferably, accessibility is provided before mobility. That is, the road is built before the
vehicle is purchased. Origin C demonstrates that even having both mobility (i.e. transit
service) and accessibility (i.e. transit route) doesn’t ensure a quick trip because of the
congestion which delays the travel time. The best trip would provide high accessibility and
mobility, while having low congestion impedance.
R eproduced with perm ission of the copyright owner. Further reproduction prohibited without perm ission.

Origin "A"
Route
Destination \
Congestion
Origin "C"
No Route
LOrigin "B" |
Figure 1: Comparison of Mobility, Accessibility, & Congestion
Why GIS?
Why is a GIS a preferable tool to use to identify and illustrate congestion? The answer to
this question is addressed by discussing the advantages of a GIS. These advantages
include data management, data analysis, and the ability to display the data. For example,
data related to the transportation network are spatial in nature which and can be integrated
into a GIS. Also a GIS provides a powerful environment to capture, manage, analyze, and
display the data and results of analyses.
Data Management
Before any analysis can be started, data need to be collected or acquired. As the data
collection effort increases, the need to manage and store it increases. A GIS assists in the
organization and integration of the data into one common format. This provides greater
accessibility to use the data collected while also cutting down the duplication of similar
collection efforts.
R eproduced with perm ission of the copyright owner. Further reproduction prohibited without perm ission.

Data Analysis
The primary advantage o f a GIS over a database is the ability to perform spatial and
temporal queries. These queries allow the user to find the relationship of the geographic
location of which the data were collected and also the time period that they relate to. The
ability to integrate several data sets based on a common spatial referencing system and
perform analysis that require overlaying the data sets is a significant advantage provided
by a GIS. Examples of such analyses include the application of principles from Boolean
algebra and buffering overlays.
Display of Data
The ability to identify congestion problems will be greatly enhanced by the ability to
display the data in an easily comprehensible manner. A GIS has built in features that allow
this to be done. Such displays are necessary to quickly demonstrate problem areas and
assist in the understanding of complicated issues. Graphical display of data also facilitates
identification of problems with the data.
R eproduced with perm ission of the copyright owner. Further reproduction prohibited without perm ission.

CHAPTER 2: LITERATURE REVIEW OF PERFORMANCE MEASURES
The application of a GIS to identify accessibility, mobility, and congestion problems will
be the primary focus o f this chapter. Literature review information on each performance
measure is given below.
Performance Measures
Performance measures are measures used to quantify congestion. They are needed to
measure the extent o f congestion, to evaluate the effectiveness of a congestion reduction
strategy prior to and following implementation, and to acquire the consent of all officials
and stakeholders involved [FHWA 94, p. 5-5]. The performance measures are expected to
be multimodal in nature and useful for regional and subregional analysis, instead o f being
used merely for identification of spot problems [FHWA 94, 5-7]. They have been used at
the regional level to monitor performance and provide an indication o f the relative severity
of congestion among geographic areas, thereby allowing a prioritization process [FHWA
94, p. 5-9].
Ideally, performance measures should: 1) Measure the extent of congestion, 2) Evaluate
the effectiveness of the strategy, and 3) Be established cooperatively [FHWA 94, p. 5-4].
Clarified further, FHWA states “the measures used to identify congestion do not have to
be the same as the measures used to evaluate the effectiveness of congestion management
strategies” [FFIWA94, p. 5-5].
10
R eproduced with perm ission of the copyright owner. Further reproduction prohibited without perm ission.

11
Additional components o f an ideal performance measure would include the following; “ 1)
be readily understandable; 2) clearly define congestion (i.e., unambiguous); 3) be accurate;
4) be able to describe existing conditions and assess future conditions; 5) be able to reflect
different geographic settings, time fixâmes, and levels of detail; and 6) be applicable to
different urban travel modes (both individually and simultaneously)” [Lomax 92, p. 57].
Data Requirements for Performance Measures
There are two different approaches that can be used to evaluate transportation facilities.
These are to use the performance measures to drive what data are collected, or to let data
availability drive the selection of the performance measure. In this research, access to data,
and data availability dictated the selection of performance measures. This is considered to
be the best approach given the high cost and time consuming effort needed to gather data.
Delay
Delay is a time based measure that works well in defining congestion. It can be separated
into two categories, recurring and non-recurring delay. Delays occur when, in a given time
interval, demand exceeds capacity. The following is a detailed discussion o f these
categories:
Recurring Delay
Recurring Delay (i.e.. Recurring Congestion) occurs at bottlenecks, and/or any other
location where demand exceeds capacity. The difficulty in quantifying recurring delay is in
determining what is a normal travel time and at what point delay starts. Using the
Highway Capacity Software (HCS), it is envisioned that HCS will be run in batch mode to
R eproduced with perm ission of the copyright owner. Further reproduction prohibited without perm ission.

12
calculated the delays caused at intersections. The formula and procedure can be found in
the reference [HCS 95].
Non-Recurring Delay
Non-recurring delay/congestion occurs somewhat randomly on the transportation
network. The primary cause o f this delay is when a vehicle gets involved in an accident
and the capacity o f the network is reduced. Even if the accident doesn’t block a trafiBc
lane, just being on the shoulder of the road will reduce capacity because of the friction it
causes from onlookers. The measures used to look at this concern include accident
locations and average delay per incident.
The typical source of data used to identify vehicle crash locations is the traffic accident
report filed by the responding police officer. This information is vital in addressing non
recurring congestion, which accounts for over half of all delay experienced by motorists
[FHWA 94, p. 2-7]. Other measures that are typically used to quantify crashes are
location(s) of the highest frequency of accidents, accident rates, and accident severity
[Bretherton 94, p. 18].
Accident Locations
This measure just identifies the area where a vehicle crash occurred but is a vital first step
and must be performed before other measures can be calculated. For example, knowing
the location of the incident doesn’t shed much light on the delay experienced, just that a
crash occurred there. By using the amount of time it took to clear the incident from the
R eproduced with perm ission of the copyright owner. Further reproduction prohibited without perm ission.

13
roadway, in conjunction with its location, non-recurring congestion is better defined.
Another example is to determine the frequency of accidents for a given area. This can be
used to identify high crash locations and could not have been accomplished if the accident
locations were not known. And lastly, traffic volume information can also be used with
accident locations to calculate accident rates for that portion of the network. These
examples show the importance of knowing the location of vehicle crash.
Identification o f Accident Locations
The convention of using a GIS to identify accident locations has been employed for some
time. A recent study discussed the application of a GIS with an expert system to determine
high accident locations [Bayapureddy 96, p. 2]. That particular study focused more on
safety analysis (i.e. identifying high accident locations) than on non-recurring congestion
problems.
Accident Delay per Incident
Accident delay per incident is a measure o f the time elapsed from the occurrence of the
incident to the time that it was cleared and normality was restored to the traffic flow on
the network. It can be used to predict the average delay experienced by the motorist if a
crash occurs in that area again or on another road that has similar characteristics.
^ delay^accident delay per incident^ = --------
1=1 ^
R eproduced with perm ission of the copyright owner. Further reproduction prohibited without perm ission.

14
where % is a selected area such as an intersection and n is number of crashes that occurred
at X. The delay could be the time when the incident was cleared from the lane or the time
that it was removed from the scene.
Accident Delay by Severity
Accident delay by severity could be used when delay information isn’t collected on the
accident report by the police department. By using time estimates of how long it takes to
clear a crash and knowing the severity, a look up table could be used to calculate the
delay. In general, it is expected that delay increases with an increase in accident severity. A
study would have to take place to verify this. There was a study found that determined the
time it took for the police officer to fill out the crash report. For personal damage only, the
medians ranged between 16 and 26 minutes, where as for severe injury crashes the
medians range between 37 and 62 minutes [Raub 96, p. 7]. This information could then be
used to develop descriptive measures and delay ranges that can be applied to all accidents.
Person Movement: Average Vehicle Occupancy
The Average Vehicle Occupancy (AVO) is basically a secondary measure. AVO is
required in order to calculate other performance measures such as Person Hours of Travel
(PHT), Person Hours of Delay, Throughput, and Person Miles Traveled (PMT). This is
similar to how accident locations are used as a stepping block for other measures. AVO
focuses attention on the movement of the person instead of the vehicle. It is o f great
assistance in measuring the effectiveness of travel demand management (TDM) strategies
R eproduced with perm ission of the copyright owner. Further reproduction prohibited without perm ission.

15
such as carpooling, park-and-ride facilities, and High Occupancy Vehicle (HOV) lanes
[Fisher 80, p. 27].
AVO is a function of the trip purpose/characteristics and time. For example AVO rates are
higher on weekends and during the AM and PM weekday rush hours than at other times in
the day [Crush 95, p. iii].
Average Vehicle Occupancy (A VO)
Several papers discussing the collection, display, and use of vehicle occupancy information
were reviewed from the literature. Vital information on the application o f accident records
to estimate AVO was also found. A discussion of these references will follow in the
performance measures chapter.
Methods o f Collection
Methods used to collect AVO data include; stationary field observations, mail surveys,
video surveillance, probe vehicle observation, and accident data extraction. Each method
has its advantages and disadvantages and will be discussed below. AVO studies are
typically performed in conjunction with safety belt usage studies.
Stationary Field Observation
The most common method of collection is to have an observer watch vehicles driving by
and record the number of people in the vehicle [Ulberg 88, p. 36].
R eproduced with perm ission of the copyright owner. Further reproduction prohibited without perm ission.

1 6
Surveys
An excellent benefit of travel surveys is the ability to capture the trip purpose and possibly
origin-destination locations. This information can’t be collected by the other methods. The
disadvantages of surveys include the cost and the low response/mail back percentages
which are received. The U.S. Census Bureau performs a survey every 10 years which
identifies vehicle occupancy data and trip purpose (limited to joumey-to-work trips)
[Asante 96, p. 2] but this is quickly outdated for rapidly growing urban areas.
Probe Vehicle Observation
Probe vehicle observation, also known as the Carousel Method, uses two persons and a
motor vehicle to drive within the traffic stream and count the number of occupants in
neighboring vehicles [Heidtman 96]. The advantage of this method is that the data
collector is placed closer to the vehicles to observe the number of occupants, but the
disadvantage is that the AVO estimates are generated for the link/route instead of a point
location. Also the possibility o f duplicate counting exists, which for the stationary
observations, is not as likely. The carousel name comes from the fact that the probe
vehicle drives in one direction on the link/route, turns around, and then collects data on
the opposite side of the link, thus getting AVO estimates for both directions of travel.
From a GIS stand point, point data are easier to store and perform analysis on than link
data which requires the assistance of dynamic segmentation.
R eproduced with perm ission of the copyright owner. Further reproduction prohibited without perm ission.

17
Video Surveillance
Video surveillance is an attempt to reduce the need of a field observer to collect the AVO
data by having the person view (i.e. surveillance) the area with a video camera from their
office to determine the AVO. This can done using commercial products such as
AutoScope. Typical problems include the inability to see the occupants due to
weather/environmental conditions (e.g., night time, sun glare, rain, etc.), and setup cost
and time to install the system.
The other approach is to tape the vehicles using a video camera, then view the film back at
the office. This works well for high volume links when it is difficult to accurately record
every vehicle by a single observer in the field.
Accident Records
Accident record data extraction has the advantage that the data are already collected, and
typically spatially well distributed throughout a city, and gives vehicle classification. The
primary disadvantage is the small sample size/number of accidents for a given intersection.
Transit Accessibility
This performance measure looks at how well the transit (i.e., bus) facility is serving the
business and residential areas within the urban area. Transit accessibility indicates how
available transit service is to the area population [Lomax 93, p.32]. Socio-economic
characteristics such as population density and motor vehicle ownership are also used to
R eproduced with perm ission of the copyright owner. Further reproduction prohibited without perm ission.

18
identify areas that need transit service more than others. The accessibility measures that
were researched are for walking to or from a bus stop location. Multimodal applications
such as bike-and-ride, park-and-ride, and or kiss-and-ride to the bus stop were not
considered. The primary difference between walking and riding is the distance that is able
to be covered in a certain amount o f time. The acceptable distance used for walking in the
analysis is a 'A, 16, and 1 mile radius around the bus stop. The larger the acceptable
walking distance, and therefore the service area, the higher the accessibility value.
Transit accessibility is a measuring stick that defines the proximity of a transit system (e.g.,
bus route) to a housing unit or business. Locations not witfiin the transit accessibility
distance are candidate areas for future bus routes if the population warrants transit service.
By improving the accessibility, dependence on automobiles as the primary mode of
transportation could be reduced. Thus congestion is reduced by the transfer o f modes
from auto to transit.
Transit accessibility is only a subset of the land use accessibility used by trip generation.
This accessibility is based on a weighted average of trip types (e.g. residential, retail, non
retail) and their interaction with land use [Marshall 93]. In fact, another definition of
accessibility is the “intensity of possibility of interaction” [Hansen 59]. Because areas tend
to develop faster around highway or transit facilities, this accessibility is a vital component
of travel demand forecasting and the reason why land use and transportation planning
models are often linked together.
R eproduced with perm ission of the copyright owner. Further reproduction prohibited without perm ission.

19
Descriptive labels can be given based upon the percentage from the performance measure.
The following table is reproduced from Al-Sahili (1992) for convenience.
Table 2: Descriptive Measures of Accessibility
ACCESSIBILITY RANGE OF COVERAGE
Completely Served 90% or more of the area is covered by transit
Partially Served 60-90% of the area is covered by transit
Nearly Unserved 20-60% of the area is covered by transit
Completely Unserved 20% or less o f the area is covered by transit
(source; Al-Sahili, 1992)
One o f the goals of the accessibility based performance measures is to help reduce
automobile based travel, and therefore congestion, by coordinating land use with transit
facilities [Verroen 92, p. 81]. This can be achieved by placing transit facilities near
employment centers or allocating land near transit facilities to high employment density
landuse. Employee Accessibility, Business Accessibility, and Residential Population Bus
Accessibility are three measures which can be used to identify the location of these areas,
but no direct information on this was found in the literature.
Ambulance Data
Some different applications of ambulance data were found. These include the optimal
sitting o f ambulance stations [ReVelle 91] and the study of ambulance response times to
R eproduced with perm ission of the copyright owner. Further reproduction prohibited without perm ission.

20
the scene of the incident [Brodsky 90]. But no studies were found on the application of
ambulance travel time data to identify congestion and accessibility problem areas.
Travel Time
Travel time performance measures have the advantage of being multimodal and easy to
understand. Typically travel time studies are trip based, that is the time take to travel from
an origin to a destination. For corridor or freeway based travel times, a probe vehicle is
used to travel within the traffic stream to measure to the travel time.
Travel Time Contours
This performance measure identifies accessibility and congestion problems for a corridor.
The primary limitation is that is can only address a single origin at a time [Hamm 93, p.
59]. With the aid of a GIS and some spatial analysis techniques, the sample travel time
data can be interpolated over regions with no data to estimate travel time contours over an
urban area. If such a process isn’t done, a localization effect takes place and the contours
won’t be generated around the destination.
Speed
Speed based performance measures complement travel time measures. For example, if a
travel time comparison is made between two people, one lives in an urban area and other
in a suburban area and both have the same travel times, one could imply that they have
similar travel characteristics. Such an error isn’t made if the speed measure is used in
conjunction with travel time. For the example, the suburban person travel 30 miles to
R eproduced with perm ission of the copyright owner. Further reproduction prohibited without perm ission.

21
work while the urban person only travels 10 miles. Travel speed has the advantage of
being able to compare different regions, which as the previous example showed, travel
time cannot do.
R eproduced with perm ission of the copyright owner. Further reproduction prohibited without perm ission.

CHAPTERS: METHODOLOGY
The specific strategies proposed to identify and evaluate congestion and accessibility will
be discussed in this chapter. The primary focus of the methodology is on delay, person
movement, transit accessibility, travel time, and speed.
Delay
If the actual time it takes to clear an automobile crash fi"om the roadway isn’t collected,
the following methodology can be used. Table 3 is a lookup table that is used to establish
and assign an impedance time to all crashes based upon severity. That is, the assumption is
the cleanup/removal time is a function of the severity of the accident. Table 3 is just an
estimate of the amount o f time it takes to remove and clear a crash from the roadway.
Again, this table is necessary only if detailed information about the crash characteristics is
missing from the report. These characteristics include the number of lanes blocked due to
the crash, time taken to remove the vehicles from the incident, and time the traffic flow
resumed to normal operating conditions. An in-depth analysis of the time assigned for the
severity of the crash is beyond the scope of this thesis and is only used for demonstration
and illustration purposes.
22
R eproduced with perm ission of the copyright owner. Further reproduction prohibited without perm ission.

22
CHAPTERS; METHODOLOGY
The specific strategies proposed to identify and evaluate congestion and accessibility will
be discussed in this chapter. The primary focus o f the methodology is on delay, person
movement, transit accessibility, travel time, and speed.
Delay
If the actual time it takes to clear an automobile crash from the roadway isn’t collected,
the following methodology can be used. Table 3 is a lookup table that is used to establish
and assign an impedance time to all crashes based upon severity. That is, the assumption is
the cleanup/removal time is a function of the severity of the accident. Table 3 is just an
estimate of the amount of time it takes to remove and clear a crash from the roadway.
Again, this table is necessary only if detailed information about the crash characteristics is
missing from the report. These characteristics include the number o f lanes blocked due to
the crash, time taken to remove the vehicles from the incident, and time the traffic flow
resumed to normal operating conditions. An in-depth analysis of the time assigned for the
severity of the crash is beyond the scope of this thesis and is only used for demonstration
and illustration purposes.
R eproduced with perm ission of the copyright owner. Further reproduction prohibited without perm ission.

2 3
Table 3: Estimated Delay by Crash Severity
CRASH SEVERITY DELAY ESTIMATE (MINUTES)
Pedestrian Fatal 90
Auto Fatal 120
Auto Severe Injury 90
Auto Injury 60
Person Movement
The average vehicle occupancy will be estimated from accident records. Typically the
traffic accident report filed by a police officer contains a variety o f information. Included
on this is a field for the number of occupants in the vehicle. This can be used to identify
average vehicle occupancy, (AVO). The AVO estimates must state the time period that is
being averaged to ensure the proper use of the measure.
number o f persons in vehicle,average vehicle occupancy, = -------------------:— :— : > 1
number o f vehicles,
where i is the time period over which the sample was collected. Since AVO is collected
for moving vehicles only, the value will never be less the one (driver of vehicle).
Transit Accessibility
Transit accessibility may be categorized as: a) employee accessibility, b) business
accessibility, c) residential population bus accessibility, and d) bus accessibility by auto
ownership.
R eproduced with perm ission of the copyright owner. Further reproduction prohibited without perm ission.

2 4
Employee Accessibility
The employee accessibility measure identifies the percentage of employees in a given area,
y, that are being served (i.e., have access) by a bus stop for a certain walking distance. A
high employee accessibility implies that a large number of the working population has
convenient access to a bus stop. Conversely, a low accessibility implies few of the working
population has access to a bus stop. Employee accessibility is a function of walking
distance to the bus stop and the urban area selected. The larger the acceptable walking
distance, the better the employee accessibility. The urban area should not be defined
smaller than the transit service area and not so large as to make the possibility of transit
service to those outlying areas impractical.
number of employees served^employee accessibility^ = ------- x 100 <100% ;
total number o f employees^
where x is the service area (i.e., defined by walking distance to the bus stop) and y is the
urban area for the city or cities.
Business Accessibility
The business accessibility measure identifies the percentage of businesses in a given area,
y, that are being served by transit. This is very similar to employee accessibility but is
based on a more stable variable of a business location instead of the variable number of
employees (e.g., this changes when a person is hired/fired, season work, etc.). Business
accessibility could be classified by the number o f employees, that is the business
R eproduced with perm ission of the copyright owner. Further reproduction prohibited without perm ission.

25
accessibility of all businesses that have a 100 or more employees. This will then give the
accessibility of transit to employment centers.
, , number of BUSINESSES served.BUSINESS location accessibility = -------- x 100 < 100%
total number o f BUSINESS
where x is the service area of the bus stop and y is the urban area for the city or cities. For
this measure, x < y will always be the case, that is for perfect accessibility, the transit will
service the entire city of cities.
Residential Population Bus Accessibility
This measure identifies the transit population served, that is the percentage o f residents
(e.g., night time population) in a given area, y, that are being served by transit.
, , number of people served.residential popidation bus accessibility = ------ ----------------------------x 100 < 100%
total number of people y
where x is the service area of the bus stop and y is the urban area for the city or cities. For
this measure, x < y will always be the case, that is for perfect accessibility, the transit will
service the entire city or cities. For this project, y was defined as the areas that have a
certain population density (e.g., one person per acre, 10 people per acre, etc.).
R eproduced with perm ission of the copyright owner. Further reproduction prohibited without perm ission.
2 6
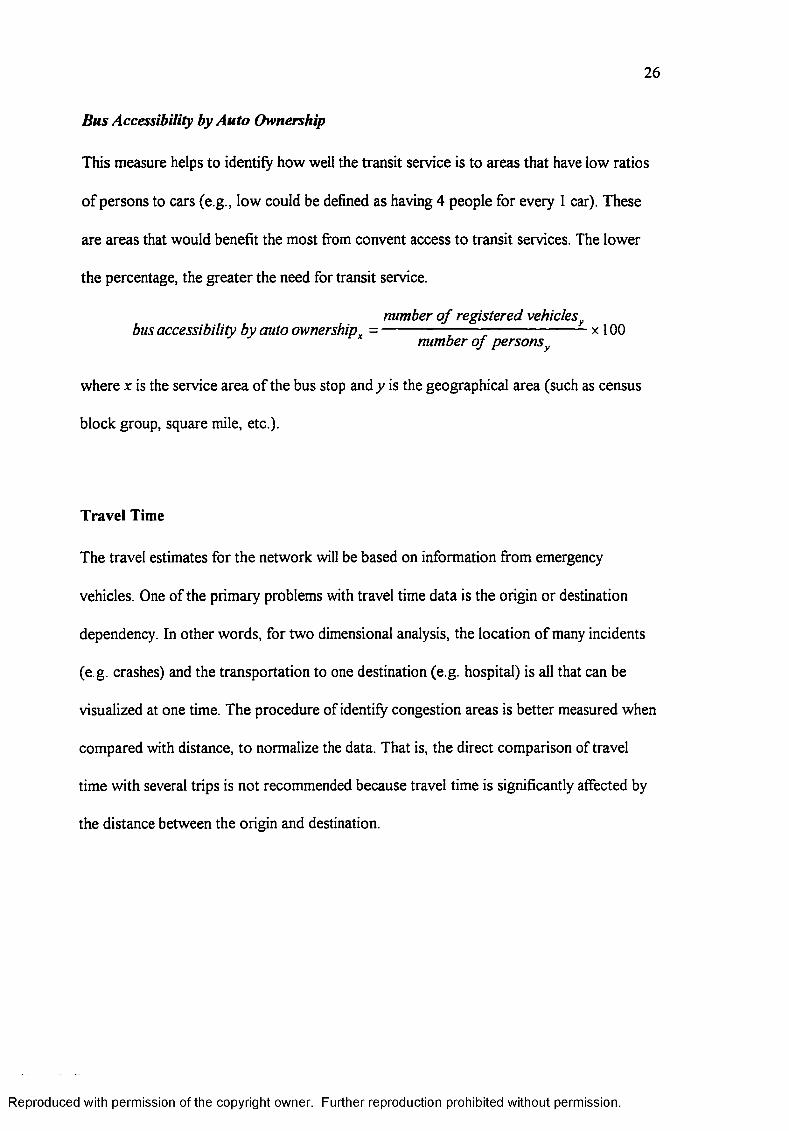
Bus Accessibility by Auto Ownership
This measure helps to identify how well the transit service is to areas that have low ratios
of persons to cars (e.g., low could be defined as having 4 people for every 1 car). These
are areas that would benefit the most from convent access to transit services. The lower
the percentage, the greater the need for transit service.
number o f registered vehicles ybus accessibility by auto ownership^ = -------------- x 100
number o f persons y
where x is the service area of the bus stop and y is the geographical area (such as census
block group, square mile, etc.).
Travel Time
The travel estimates for the network will be based on information from emergency
vehicles. One of the primary problems with travel time data is the origin or destination
dependency. In other words, for two dimensional analysis, the location of many incidents
(e g. crashes) and the transportation to one destination (e.g. hospital) is all that can be
visualized at one time. The procedure of identify congestion areas is better measured when
compared with distance, to normalize the data. That is, the direct comparison of travel
time with several trips is not recommended because travel time is significantly affected by
the distance between the origin and destination.
R eproduced with perm ission of the copyright owner. Further reproduction prohibited without perm ission.

27
Speed
The general procedure to calculate the travel speed when given emergency vehicle data is
discussed here. The first step is to determine the origin and destination locations, that is
where the incident occurred and the location of the hospital where the patient was taken.
If the path is known, then stop here and calculate the speed, else some possible path
assumptions must be made. Figure 2 gives a dramatization of what the possible paths
could look like.
Destination:Hospital
^ Origia: < Incident
Network Path
Manhattan Path
Figure 2: Possible Paths used by a vehicle
Euclidean Path
In two dimensions, the short distance between two points is a straight line. This is what
the Euclidean or ‘as the crow files’ path represents. This distance typically gives the lower
R eproduced with perm ission of the copyright owner. Further reproduction prohibited without perm ission.

2 8
bound of travel distance and represents the shortest path. When the travel time is fixed, in
the case with the emergency vehicle data, this path gives the lower bound of speed. That
is, with a constant travel time, the longer the distance traversed, the higher the average
travel speed. So in this case the distance is the shortest and therefore it gives the lowest
speed.
Manhattan Path
The Manhattan path is typically the upper bound when defining possible travel paths.
When looking at a right triangle, the Manhattan path is equal to the sum of the opposite
and adjacent sides of the triangle. The hypotenuse represents the Euclidean path. Since the
Manhattan path yields the greatest travel distance, the corresponding travel speed would
be the highest when travel time is fixed. Thus, speeds that are derived from the Manhattan
path represent the upper bound of travel speeds.
Network Path
The network path will lie within the boundary of the two Euclidean and Manhattan paths.
This is an existing path on the network that can be used by the emergency vehicle. The
network path can be further divided into shortest and quickest path depending upon the
impedance. The shortest path uses link distance as the impedance and is based on travel
time. The, quickest path could be defined by either posted speed limit (via a functional
class assumption), or those links which have lower volume to capacity ratios, or the
R eproduced with perm ission of the copyright owner. Further reproduction prohibited without perm ission.

2 9
shortest distance (same has shortest path) if the travel speeds on all the links were
identical.
Vehicle Speed Assignment
Once the paths are determined, travel speeds can be calculated based on travel distances.
With just one travel time and three assumed paths, three different travel speeds are
calculated. For each trip and for each path, the travel speed can only be assigned to all the
links on the path. The travel speed is assumed to be uniform for the entire trip. Therefore
all links on the path will be assigned the same speeds. A counter is assigned to the link to
determine how many times that link has been traversed when all the trips have been
assigned for each scenario (e.g.. Euclidean path. Shortest path, or Quickest path). Once all
the ambulance trips are processed, the link speed is calculated as the average of the speeds
assigned to the link (the sum of travel speeds by the number of trips). In this case the
travel speed is based upon the shortest network distance. If the Manhattan or Euclidean
speed was displayed instead, the arcs on those paths would be selected, and the
corresponding travel speeds would be displayed. Since the ambulance database also
contains information pertaining to the time of the day, and the date of the trip, it is easy to
obtain travel speed estimates on a link for specified time windows.
Since this method only gives speeds on a limited amount of links, those links that have
similar functional classification, number of lanes, and area type (e.g., rural, urban, etc.) it
can be assumed that the travel speeds are also similar [Guo 95, p. 8].
R eproduced with perm ission of the copyright owner. Further reproduction prohibited without perm ission.
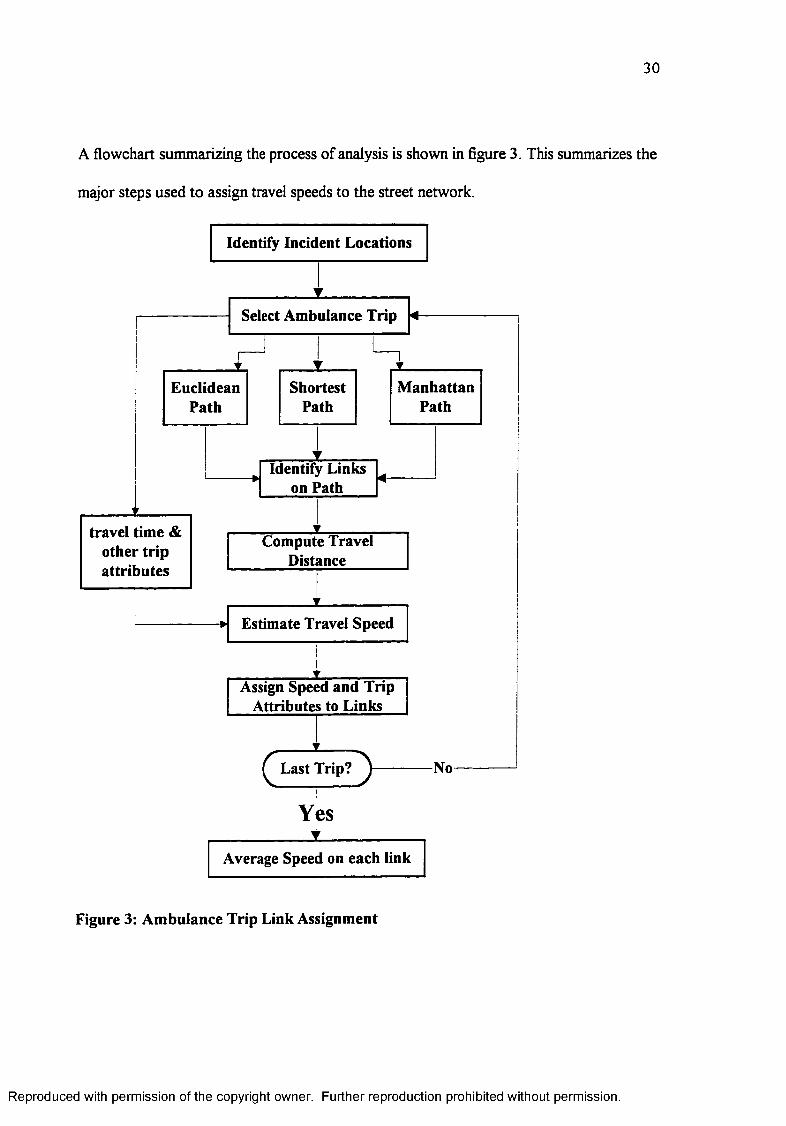
30
A flowchart summarizing the process of analysis is shown in figure 3. This summarizes the
major steps used to assign travel speeds to the street network.
NoLast Trip?
ShortestPath
Identify Links on Path
EuclideanPath
ManhattanPath
Compute Travel Distance
Assign Speed and Trip Attributes to Links
Estimate Travel Speed
Select Ambulance Trip
travel time & other trip attributes
Identify Incident Locations
Yes
Average Speed on each link
Figure 3: Ambulance Trip Link Assignment
R eproduced with perm ission of the copyright owner. Further reproduction prohibited without perm ission.

31
While methodology was defined to quantify congestion, the lack of data on posted speed
limits (for all the links on the network) in a GIS environment, prevented the illustration of
the same.
Obtaining estimates of travel speeds (and their upper and lower bounds), is the first step in
identifying the spatial and temporal distribution o f congestion. In order to identify the
locations and magnitude of congestion, it is first necessary to define a measure to be used
for this purpose. If it is assumed that fi’ee flow or ideal travel speeds are equal to the
posted speed limits, then the difference between the posted speed limit and actual travel
speed provides a measure to evaluate congestion. Greater the difference between the two,
greater is the degree of congestion. Thus, it is possible to quantify congestion in absolute
terms for each link. Alternatively, degrees of congestion may be defined as a function of
the ratios of the speed differential to the posted speed.
congestion = speed differential = 0 / / < v, or
congestion = speed differential = -v ^ i f < v, where is the posted speed
limit (mph or km/hr) and v, is the travel speed (mph or km/hr).
V —The degree of congestion, c^ = — if > v, and is equal to zero if < v,
^ P
It is possible to categorize the degree of congestion in many ways. One possible scheme is
shown in table 4.
R eproduced with perm ission of the copyright owner. Further reproduction prohibited without perm ission.

3 2
Table 4: Degree of Congestion
DEGREE DEFINITION
A c ,< 0 .1
B 0.1 < c ^ <0.2
C 0.2 < C j < 0.3
D 0.3 <Cj < 0.4
E 0.4 < C j < 0.5
F 0.5 <
R eproduced with perm ission of the copyright owner. Further reproduction prohibited without perm ission.

CHAPTER 4; DATA SOURCES & INTEGRATION PROCEDURES
With most projects or analysis procedures using a GIS, the data collection effort takes a
significant amount of the project resources. The first step is to determine what data are
already collected and how to obtain them. This ensures that the data are not recreated or
collected a second time, thereby saving both time and money. This chapter will discuss
some o f the entities that collect data applicable to a CMS design and if it wasn’t available
in a GIS format, the procedure used to gather it.
Accident Records
The accident records for Clark County will be used to define two performance measures,
non-recurring congestion (e.g., vehicle delay) and person movement (e.g., AVO). These
measures cannot be calculated directly from the raw accident records, but must be
determined indirectly with the aid of several programs. If information was recorded on
how long the vehicle was blocking trafiBc and the number of persons in the vehicle at the
time of the crash, then these programs would not be necessary. This is not the case for
Nevada so the following procedures and assumptions were used to incorporate this data
into a format that will facilitate the determination of person movement (e.g., AVO) and
vehicle delay.
The Nevada Department of Transportation uses the accident reports recorded by the
police officer at the scene of the incident to create a database o f all the reported vehicle
accidents in Nevada. The highway patrol and/or the local police department sends a copy
of the accident report to the NDOT staff. Their data entry personnel then use this report
33
R eproduced with perm ission of the copyright owner. Further reproduction prohibited without perm ission.

3 4
to create a database of the vehicle accidents. Currently, the database isn’t in a convenient
format to geocode in a GIS. Therefore, a program (an AWK script) was written to
reformat the database into an acceptable format that will facilitate geocoding.
A VO Source: Accident Records
To enhance the existing AVO monitoring program, accident records were used to estimate
AVO at crash locations. The assumption is that crashes that occur on similar roadways
(e.g. the same functional classification) will also be transporting similar drivers during a
specified time interval. So, a crash on a major arterial will that contained 2 persons in it, it
is assumed that other major arterials will have a similar AVO characteristic. This a major
limitation, but in the absence of other data, it is a viable means of estimating AVO. Also,
since crashes can occur anywhere on the network, this data can be used to estimate AVO
at locations that are not continuously monitored.
Data Items
A complete listing and description of all data items is given in Appendix C. The primary
items of interest are the location of the crash, the severity, and the seat belt information.
The seat belt information is used to derive the AVO since there isn’t a direct field that
collects it.
R eproduced with perm ission of the copyright owner. Further reproduction prohibited without perm ission.
35
Conversion Procedures to GIS
To identify the crash locations, it is first necessary to understand how the crashes are
referenced. There are three different ways that a crash is referenced in Nevada by the
police officer. The first is if the crash occurred at a street intersection. Typically a street
intersection is defined with a radius of 1/100* o f a mile (i.e., 52.80 ft). The next method is
a distance offset from the intersection. This is used when crash occurs outside the defined
area of an intersection (e.g., 100 ft north of the intersection of Oakey and Torrey Pines).
Finally the last method uses a linear milepost referencing. Typically for rural areas on
either an interstate or state highway.
A program (GAWK preprocessor) was written to modify the original data into the
appropriate format to facilitate the geocoding procedure. This procedure is a very
laborious one that took several months to complete.
Data Limitations
There are several coding error in this database and the biggest problem was how to
address and rectify them. It was easy to identify a majority o f the errors but there was no
procedure in place to correct them if adequate resources were available. The other
limitations was the lack of consistency for seat belt data collection, that is not all recorded
crashes had seat belt information.
R eproduced with perm ission of the copyright owner. Further reproduction prohibited without perm ission.

3 6
Vehicle Delay due to Non-recurring Congestion
Estimates o f vehicle delay are necessary due to the fact that it isn’t directly measured by
the police officer. The assumption is the more severe the vehicle crash, the longer it will
take the clean up crew to clear the roadway. The procedure to add this data to the GIS
has already been discussed and accomplished in determining AVO from accident records.
Average Vehicle Occupancy
Two data sources were found that had information on the number of persons riding in a
vehicle. NDOT has an ongoing monitoring effort to collect this data and the other data
source is accident records. A discussion of these data sources will follow next.
A VO Source: NDOT Monitoring
The staff members of NDOT count the number of vehicles and its occupants that drive
past specified fixed field locations. For the Las Vegas Valley there are 20 monitoring sites
setup where NDOT collect this data. Items collected include the number of vehicles (i.e.,
volume), whether the license plate is from Nevada or another state (used to identify
visitors), and occupancy [Quintero 95].
Data Items
The highway classification, location, number of vehicles, license plate registration location
(e.g., Nevada or non-Nevada), and number of occupants is collected at each monitoring
site. From this data, NDOT can then compute the AVO for that location and time.
R eproduced with perm ission of the copyright owner. Further reproduction prohibited without perm ission.

37
Conversion Procedures to GIS
The monitoring locations were referenced by either a distance from an intersection name
(e.g.. Las Vegas Blvd, 200 ft. North of Convention Center Drive) or milepost reading
(e.g. US 95 Milepost CL-78.85). Thus, different geocoding procedures where used to
import the data into a GIS.
The nearest street address to the distance from the intersection was used to geocode those
monitoring sites. Using the ARCPLOT module within ARC/INFO, addresses were entered
into the system interactively. The distance from these points to the intersection was
measured. The address that had measured the closest distance to the given offset distance
was used to locate the monitoring site location. It took about 5 address guesses to
determine the best one and took about 10 minutes to complete for each location. Once the
spatial locations were found, the AVO data had to be entered into the INFO database.
This was accomplished by first entering the data into a comma delimited ASCII file, then
using the ADD FROM INFO command the data were imported into the INFO database.
Lastly, a JOINITEM was performed to join the point coverage with the INFO data.
The monitoring sites that were referenced by milepost required the use of dynamic
segmentation (dynseg) to determine the geographic location. This procedure requires that
a measured route be created for each highway referenced by a milepost. Fortunately this
was already done for the accident locations. The same procedure was used to get the data
into INFO as the intersections. Once completed, the data are linked to the route by using
R eproduced with perm ission of the copyright owner. Further reproduction prohibited without perm ission.

3 8
the linear reference (very similar to address matching but using a distance instead). This
data was then converted to points and place in the same coverage has the intersection
offset monitoring sites.
Data Limitations
The limitations in the data include the accuracy of correctly identifying the monitoring
location and lack of access to the complete data set collected. The true location could
easily be recorded with a GPS instead of using the nearest address approach. The other
side o f the argument is what difference does it make if the AVO site was collect here or
200 ft away on the same link. The AVO values will remain the same as long as the flow
isn’t altered (e.g. due to on or off ramps). The other limitation is that NDOT only reports
data summaries (e.g. mean AVO) instead o f providing the actual data. If this data was
accessible, statistical comparisons could be made with the accident based AVO estimates.
Thus it could be determined if the AVO values from the accident records are from the
same population as those collected in the field.
Population
The two primary sources of population estimates for Clark County are the U.S. Census
and the County demographer. The U.S. Census estimates are typically used due to their
easy accessibility. However, it was not used because of the rapid growth in the county
which makes the estimates outdated. Table 5 lists the different items used by the County
R eproduced with perm ission of the copyright owner. Further reproduction prohibited without perm ission.

3 9
Demographer to estimate population. The POP TOTAL item give the total population
dwelling within each respective square mile section.
Table 5: Data items collected by County Demographer
POPULATION CATEGORIES
Types of Dwelling Units Housing Units Occupied House Units Fopulation Estimates
Single Family HU_SINGLEFAMILY OHU_SINGLEFAMILY FOF_SINGELFAMILY
Flex HU_FLEX OHU_FLEX FOF_FLEX
Mobile Horae HU_M0B1LE_H0ME OHU_MOBILE_HOME FOF_MOBILE_HOME
Townhouse HU_TOWNHOUSE OHU_TOWNHOUSE FOF_TOWNHOUSE
Condo HU_CONDO OHU_CONDO FOF_CONDO
Total HU_TOTAL OHU_TOTAL FOF_TOTAL
Conversion Procedures to GIS
The conversion procedure consisted of an awk script that altered the format output by the
demographer’s FORTRAN program into a format that can be read by ARC/INFO. Then
the data are added to a INFO template and joined to the township, section, range polygon
coverage. This ami is located in Appendix A, called pop2info.aml.
Data Limitations
Since the smallest aggregation of the population estimates is down to a square mile, this is
the primary limitation. The U.S. Census estimates is are aggregated town to the block
group, which allows for more detailed microscopic analysis.
R eproduced with perm ission of the copyright owner. Further reproduction prohibited without perm ission.

40
Vehicle Registration
The Nevada Department o f Motor Vehicles maintains the database on registration
information for all vehicles. The data were obtained via 9-track tapes.
Data Items
The most vital and also prone to the most errors is the address/location of where the
vehicle is registered. The other data items include information about the vehicle (e.g.,
make, model, year, etc.) and license plate number for that vehicle.
Conversion Procedures to GIS
Once the data are loaded onto the University’s UNIX computers, the data manipulation
was straight forward. The dmv2info.aml (see Appendix A) was written using awk, sed,
and AML scripts to import the data into ARC/INFO. The next step was to
ADDRESSMATCH this data using the County’s Street Centerline cover. After this ami
was executed, the user was left with a point coverage of all the locations that were
successfully addressmatched along with associated data items.
Data Limitations
A fundamental problem with the DMV data is the lack of knowledge on where the vehicle
is physically based. That is, the DMV database only gives the address of where to send
registration information, not necessarily the exact location of the vehicle. This is easily
demonstrated by address containing PO Boxes. It is very unlikely that the owner of the
R eproduced with perm ission of the copyright owner. Further reproduction prohibited without perm ission.

41
vehicle lives at the post office, which is the assumption that must be made when using this
data for the thesis.
Bus Routes
The Regional Transportation Commission already created the bus routes in an ARC/INFO
format. A copy o f this data was obtained.
Data Limitations
Some of the limitations with the bus route GIS coverage are not the fault of the RTC but
that o f the street centerline. For example, a portion of the routes use private driveways to
make their turnarounds at the end/beginning of the route (e.g., the Temple at the end of
the Bonanza route). The street centerline doesn’t maintain information on privately owned
parking lots and driveways so an educated guess is made on where the route goes for the
those locations. This problem is only of concern when trying to created accurate linear
referencing of the route.
Business Locations
The data on business locations comes directly from the business license that each company
is required to obtain. This licensing varies from depending upon whether ones’ business is
located in Clark County, City of Las Vegas, City of North Las Vegas, or the City o f
Henderson. The University of Nevada, Las Vegas Center for Business and Economic
Research has compiled the business license database for all the public entities, except
Reproduced with permission of the copyright owner. Further reproduction prohibited without permission.

4 2
North Las Vegas, for 1994 year. This is known as the Southern Nevada Business
Directory 1994 which can be obtained from them [Schwer 94]. They provided a copy of
this in a digital format which greatly facilitated the ability to import the data into
ARC/INFO.
Data Items
The data items o f interest for this research only include the number of employees and
business location. The other items such as business name were imported into ARC/TNFO
but not used in any of the analysis.
Conversion Procedures to GIS
With the business license records already in a digital format, the procedure to enter it into
a GIS is straight forward. Using the addressmatching capabilities within ARC/INFO a
majority of the business locations were geocoded. Effort could have been spent on
geocoding all the records, but the time necessary to do so would not drastically change the
output accessibility.
Data Limitations
The primary problem with the business license data is that the assumption that the
employees work at the location of where the business is licensed isn’t always true. For
example, a construction contractor has his office at some location in town, but his
employees don’t work there. That is, they work at the construction job site which varies
Reproduced with permission of the copyright owner. Further reproduction prohibited without permission.

4 3
with time. So analysis that shows the business accessibility to transit service could be
overestimated due to this limitation in the data.
Ambulance Data
Mercy Medical Service in Las Vegas currently records extensive amount of data for each
and every call that their paramedics respond to [Hales]. This data set could be used for a
good many research projects, but the application of it to determine urban congestion,
mobility, and accessibility is only discussed here.
Data Items
Information on the entire database used by the Mercy Ambulance company wasn’t
received. The sample database received included data items for the location of the
incident, time when the ambulance left the incident, priority of the incident, location o f the
destination, and time when the ambulance arrived at the destination. The other items were
date of call and a unique identifier for each record.
Conversion Procedures to GIS
The ambulance data was downloaded from Mercy’s mainframe and imported into FoxPro
on a PC. The staff member then did an ASCII export of the data. This is what was pre-
processed into a format that could be imported into ARC/INFO. The addressmatching
capabilities o f ARC/INFO were used to geocode the origin and destination of the trips.
Reproduced with permission of the copyright owner. Further reproduction prohibited without permission.

4 4
Data Limitations
In using the ambulance data to calculate speed, several assumptions were made. It should
be noted that the travel times are one directional, that is, the travel times are from the
origin to the destination and does that imply that destination to origin will have the same
travel time. Other problems include the path taken by the ambulance is unknown as well as
the location o f the ambulance when it received the call.
Reproduced with permission of the copyright owner. Further reproduction prohibited without permission.

CHAPTER 5: GIS ANALYSIS
Alternative approaches for evaluating and quantifying congestion, mobility, and
accessibility have been presented in the preceding chapters. These discussions included
issues pertaining to performance measures and data. The potential for the use o f GIS to
assist such analysis was also presented. This chapter focuses on the illustration of such
GIS based analyses. The analyses illustrated are: I) identification of accident locations, 2)
estimation o f Average Vehicle Occupancy (AVO), 3) evaluation of employee accessibility,
4) evaluation o f business accessibility, 5) evaluation of residential accessibility, and 5)
estimation o f travel time and speed from ambulance data.
Dlustrations
Accident Locations by Severity
With the accident records converted into an ARC/INFO point coverage, it is possible to
display that data on a map. Figure 4 shows a subset of accidents by severity (i.e., fatal
crashes). Due to the lack of delay information in the accident report, assumptions had to
be made on how long it took to clear the crash from the roadway. It is assumed that the
more severe the accident, the longer the delay experienced by the motorists driving by.
Assigning values o f delay by severity is the procedure used to identify and illustrate non
recurring congestion. One problem with the display is on overlaying points (e.g., several
accidents occurring over time at the same intersection). Solutions to this problem is to
stager/offset the marker symbol for each accident. This works well if the plot is for a small
area but becomes messy when plotting the entire region. Another solution is to increase
45
Reproduced with permission of the copyright owner. Further reproduction prohibited without permission.

4 6
the marker size for each increase in the number of accidents at the same location. These
solutions were not implemented in this thesis because the focus of the thesis is on the
application and not the detailed procedures.
Reproduced with permission of the copyright owner. Further reproduction prohibited without permission.

4 7
I
I . I Fatal Vahicio Crash Locations, 0.24
I - I Psdastrian Fatality Location», 0.06
I /V I Stroat Cantartlnecovaraaa
scala 1:270000
0 1 2 3 4 milesCLARK COUNTY NEVADAVEHICLE CRASH LOCATIONS FROM 1 9 8 7 -1 9 9 4 REFERENCED BY INTERSECTION DATA W AS ADDRESSM ATCHED USING ARC/INFO
Praparad by the UNLV TransDortahon Rasaarch Center (TRG)
«fSM sfssFigure 4: Accident Locations by Severity
Reproduced with permission of the copyright owner. Further reproduction prohibited without permission.

4 8
AVO
The display of AVO monitoring locations is a relatively easy task. Figure 5 shows the
AVO values at each site. The desired analysis is to compare the AVO values from the
monitoring sites with accident in that location. If information on the spread o f the data
was available, the following procedure could be implemented. The primary problem with
the accident data is there is typically not enough data points to create a viable sample. To
over come this, the time interval used for the analysis must be enlarged as well as the size
of area around the monitoring location. For example, there are not any crashes in the
database that occurred at the exact monitoring location during the specified time. So the
procedure is to select accidents that occurred an hour before and after the collection
period. Then the day of week is lumped into weekday for crashes that occurred at that
time on a Monday, Tuesday, Wednesday, or Thursday. Friday, Saturday, and Sunday are
considered the weekend. Weekday or weekend selection is dependent upon what day the
AVO study was performed. Then it is assumed that the AVO characteristics are similar for
1990 through 1995. The location assumption is that a mile is the upper bound of distance
from the monitoring site, on the same street, for which AVO values remain constant. Each
monitoring site is buffered to a 1 mile radius. All accidents within that circle and that
occurred on the monitoring site street, will be used for the statistical comparison. Again
this is the procedure to follow and it would have been carried out if variance data were
available from NDOT.
Reproduced with permission of the copyright owner. Further reproduction prohibited without permission.

4 9
3M.S0
NDOT AVO Monitoring S its
l / v / l Claric County Straat Csntsrilns
seals 1:310000
0 1 2 3 4m llssVEHICLE OCCUPANCY MONITORING LOCATIONS CLARK COUNTY, LAS VEGAS NEVADA AVO DATA COLLECTED BY NDOT, OCT 94-SE P T 9 5 AVO VALUES FOR BOTH RESIDENT AND NON-RESIDENT V E H I C L % ^ ^
Praparad by tha UNLV Transportation Raaaarch C an tsr (TRC]
Figure 5: AVO M onitoring Sites
Reproduced with permission of the copyright owner. Further reproduction prohibited without permission.

50
Business & Employee Accessibility
Since employee accessibility is a function of population density, a buffer analysis is needed
to determine the number o f employees who have access to a bus stop. A choice between
Vz, or 1 mile Euclidean buffer distance used in this analysis. The “point in poly overlay”
determined the number of business locations within and outside the selected walking
distance. The problem accessibility locations are those areas that lie outside the buffer.
Possible solutions to this accessibility problem is to add a bus stop at that location. Those
areas that are within the buffer distance can be labeled as having good transit accessibility.
This is just a planning tool to identify problem areas and doesn’t replace the need to
perform a field investigation to verify accessibility problem areas. For example, the
placement of a bus stop may not be desired by residents in a particular area, even though
this analysis shows it would be of benefit there.
These measures all require a polygon overlay to perform the calculations. The walking
distance assumes that the person at the boundary can take the shortest (Euclidean)
distance to the bus stop. Since this is not always possible, it is believed that this buffer will
represent the upper bound o f the service area (i.e., the actual walking distance). Another
method, which will provide the lower bound, is based on the street network for walking
distances. This assumes that the pedestrian can only walk on the network, which is also
not always the case. To perform this operation in ARC/INFO, all the bus stop points must
be converted to nodes and then run the “ALLOCATE OUT” command in the
“NETWORK” module to find the network walking distance. The true service area walking
boundary will most likely lie within these two bounds.
Reproduced with permission of the copyright owner. Further reproduction prohibited without permission.

51
Employee accessibility is also shown on figure 6. The analysis procedure is the same but
instead of calculating the ratio of business to all businesses in the area, the number of
employees at each location is used. By using the employment code fi'om the business
license records, the number of employees that have access to a bus stop may be calculate.
Employee Accessibility to Transit
@ 0.25 mile walking distance ■ 0.5 mile walking distance □ 1 mile walking distance
1 50 100
Locations with x number of employees or more
Figure 6: Transit Accessibility to Employment Centers
Reproduced witti permission of ttie copyrigfit owner. Furtfier reproduction profiibited witfiout permission.

5 2
LAS VEGAS, NV CAT BUS ROUTES
I
iI
f ”i r i Q ' D n,Ch‘a-|7À. -*•-------•
— f4^ a o ^
I 1 O . C 3 .
I . I B u d n a is locations within 0.25 milof o< a bus routs
I I Business locations NOT within 0.25 miles of a bus route
\ / \ / \ Buffer Q{ 0.25 miles around each Bus Route
£ )
T-^
• \ • * ■ —" ——. * . m
m
scale 1:325000
%
I0 1 2 3 4 milesBUSINESS ACCESSIBILITY TO BUS = 8 1 .6 6 %
FOR A EMPLOYEE DENSITY OF 4 9 OR MORE PE R SO N (S) PER BU SIN E SS & MAXIMUM EUCLIDEAN WALKING DISTANCE TO A BUS ROUTE IS 0 .2 ^ MILES 8 4 .8 0 % OF THE EMPLOYEE POPULATION HAS AC CESS TO BUS ROUTES, USED UPPER RANGE VALUE OF NUM BER EMPLOYEES
Prepared by the UNLV Transportation Research Center (TRCt______________________
M.':IFigure 7: Employee Accessibility
Reproduced with permission of the copyright owner. Further reproduction prohibited without permission.

53
Residential Accessibility
The analysis procedure is similar to the business employee accessibility, but instead of
performing a “point in poly” overlay a “poly in poly” overlay is performed. The residential
population polygon coverage must contain a population density item. The assumption is
made that the population is uniformly distributed in the given area. This is inadequate but
will help demonstrate the procedure. A more accurate assumption is that the population is
uniformly distributed along a street. This because residential homes are built with a
convenient access to a street. For the overlay analysis, the portion of area that lies within
the buffer will be identified as having good accessibility to a bus stop and the area outside
is lacking in convenient accessibility. The residential accessibility is the ratio of area within
the buffer divided by the total area of the zone then multiplied by the population
density.
Residential Population Accessibility to Transit
5 M 100 u) c
o Q) 40
■ 0.25 mile walking distance■ 0.5 mile walking distance □ 1 mile walking distance
Population Density with x number of persons per Acre
Figure 8: Accessibility to Transit Based on Population Density
Reproduced with permission of the copyright owner. Further reproduction prohibited without permission.

54
Bus Accessibility by Auto Ownership
Again the analysis procedure is similar to the others but instead o f using employee or
residential populations, auto ownership is used. The vehicle registration data are address
matched to determine where vehicles are registered. The assumption is made that the trip
origin o f the vehicle is at the same location of where it is registered. This assumption
generally fails for business, particularly those which allow their employees to take the
vehicle home.
Number of Automobiles per Person
A “point in poly” buffer analysis is performed with the County population coverage and
the number of registered vehicles. The number of registered vehicles per person in each
square mile grid is used to define mobility. Those areas that have low vehicle per person
ratios can be identified as having problem accessibility areas. Possible solutions to this
problem include strategies to ensure that transit is properly serving those areas. Erroneous
results are possible for those areas that have vehicles registered but no residential
population (e.g. business centers). In such cases the performance measure would return
infinity because the denominator in the ratio is zero (no population). Another approach is
to use the employment population. This method works well but if comparisons are made
with residential population estimates, a double count of the person would be encountered.
That is, the same individual lives in the residential area but also works in the employee
population.
Reproduced with permission of the copyright owner. Further reproduction prohibited without permission.

5 5
Figure 7 shows the township, range, and sections that have a population of one person or
more per acre. The population coverage is then intersected with the vehicle registration
point coverage to display the number of vehicles per person. This percentage should be
higher because not all of the addresses from the vehicle registration database were
matched to a geographic location. On the other hand, the percentage should be lower
when taking into account the high amount of cars owned by car rental agencies. The
usefulness o f this measure to identify mobility at a regional level is questionable. It is
possible that city residents are divided into two economical groups, a portion of the people
with no vehicles and another portion that has two vehicles per person. If the population is
the same in both, then the measure would give the impression that the city doesn’t have a
mobility problem for its residents, which is incorrect because half the population doesn’t
have a vehicle.
Reproduced with permission of the copyright owner. Further reproduction prohibited without permission.

5 6
I.
Sections with no vehicles registered orO population
Greater than Q and less than 0.25 average vehicles per person in a square mile a
Greater than 0.25 and le ss than 1 5 average vehicles per person In a square mile
Greater than 1 5 and le ss than 1 7 5 average vehicles per person in a square mile
Greater than 0.75 and le ss than 1.0 average vehicles per person In a square mile
Greater than 1.0 average vehicles per person In a square mile area , EXCELLENT
Clark County Street Centerline
scale 1:325000
MOBILITY M EASURE: AVERAGE VEHICLES PER PERSO N 0 1 2 3 4miies IDENTIFIES AREAS THAT EXPERIENCE MOBILITY VIA AUTOMOBILE 1 9 9 4 VEHICLE REGISTRATION AND POPULATION DATA USED POSSIBLE ERRORS FOR VEHICLES REGISTERED TO B U SIN E SSE S..
Prepared by the UNLV Transportation Research Center (IRC)
Figure 9: Average Number of Vehicles per Person
Reproduced with permission of the copyright owner. Further reproduction prohibited without permission.

5 7
Ambulance Data
The ambulance data section discusses the procedures used to analyze the ambulance data
in the GIS environment. This will then facilitate the analysis of area wide travel times
around hospitals, and the calculation and assignment o f travel speeds to each link o f the
traveled path.
Figure 8 displays the average daily number o f transports by hour of day that the
ambulances made to the University Medical Center (UMC) hospital from Nov. 1, 1995 to
June 6, 1996. This shows the demand for ambulances is concentrated in the day time
hours, which also coincides with travel congestion periods and peak between 3-9pm.
Frequency of Ambulance Trips to UMC by hour of day
! B frequency I
Figure 10: Ambulance Demand by hour of day
Reproduced with permission of the copyright owner. Further reproduction prohibited without permission.

5 8
Identification o f Origins and Destinations
There are two individual trips created for each incident. The first is the trip from the
ambulance station or base to the accident scene and the second is from the scene of the
incident to the hospital. Since there isn’t a fixed location for all the ambulance stations (for
example the ambulance could be on patrol, coming back from a transport to the hospital,
etc.) that portion of the trip was neglected. The incident location is typically referenced by
a street address or intersection (e.g., 123 Main St.). The destination is just given a label or
code, such as Sahara Medical Center or H6, for UMC Hospital. By looking up the name in
the phone book, street addresses were found. A possible enhancement to the ambulance
database would be to create a lookup table for all the primary destinations. It was
observed that as many as 10 different labels were given for the same address locations.
Some of these were spelling errors, but if a lookup table were used, such errors would be
reduced. Using the address matching capabilities of ARC/INFO, the origin/incident and
destination/hospital locations were identified. Two separate point coverages were created,
one for the incident origins and the other for the incident destinations. The next step is to
then determine a possible path the ambulance could have taken.
Spatial Statistics: Inverse Distance Weighted
Since the incident origins are not uniformly dispersed though out the valley (i.e., they
cluster around residential areas) a method of interpolation is required to estimate travel
times for areas of no data. This type of analysis is referred to as spatial statistics, where
adjoining points are not independent of one another, that is they are correlated to each
Reproduced with permission of the copyright owner. Further reproduction prohibited without permission.

5 9
other [Ingram], The model used is the inverse distance weight (IDW), which is also
known as the gravity model. The IDW is a location dependent variable, which fits well
with travel times because the closer/shorter the travel distance the smaller the travel time.
The parameters of using the IDW function in ARC/INFO’s GRID module requires
information on the area o f influence and the power o f the function [ESRI92, p. 6-98]. The
desire was to have a smooth grid that travel time information could easily be displayed.
After several iterations o f changing the power from 0.5 to 3 and the radius for the area o f
influence from Vz mile to 1 mile, the value of power equal to 1 and area of influence equal
to 1 mile was used. It was felt that this yielded the most realistic contour display.
Problem Hospital Accessibility Areas
By comparing the travel time areas of coverage for different time intervals (e.g. 1:00-
5:59am, 6:00 to 9:59am, etc.) locations that are not as accessible to the hospital as the
region with the greatest area can be identified. A word of caution, these problem
accessibility areas are not areas of congestion. The reason for the higher travel time
(delay) is most likely due to congestion, but this congestion could appear anywhere along
the path and assuming that it occurs at the starting point of the trip would be incorrect.
The first step necessary to identify problem accessibility areas is to determine the areas for
each time period. The cell size for each grid is 500 ft. The condition statement (CON) is
used within GRID to find the frequency/count of all cells that have a value less than or
equal to 5 minutes, greater than 5 minutes and less than or equal to 10 minutes, etc. for
each different time period grid (e.g. 1:00-5:59am). This count value can be multiplied by a
Reproduced with permission of the copyright owner. Further reproduction prohibited without permission.

60
constant value (i.e. cell size squared (500 ft)^2) to determine the area of coverage. Table 7
gives the frequency/count values for five different periods in the day.
Table 6: Total Number of GRID cells at a given travel time to UMC for a certain hour in the day
TRAVEL TIME FROM ORIGIN TO UMC HOSPITAL
DESTINATION (MINUTES)
TRANSPORT
TIME
5 10 15 20 25 30
1:00-5:59 AM 583 3,509 10,293 9,273 1,454 270
6:00-9:59 AM 115 1,522 9,023 9,799 5,279 1,072
10:00-2:59 PM 317 1,564 6,324 11,890 9,390 1,308
4:00-7:59 PM 80 1,452 7,769 13,900 4,055 920
8:00-12:59 PM 91 2,948 9,126 10,819 3,533 397
The larger the count, and therefore the area, the better the accessibility that location has to
medical services (i.e., UMC). Comparisons can be between different time periods. For
example, the P.M. peak period has the smallest area for 5 and 10 minute travel time
intervals. This also coincides with the peak traffic congestion period and is the primary
reason why the accessibility is so small. For the higher travel time periods, it is believed
that the results may be noisy due to their boundary location.
Reproduced with permission of the copyright owner. Further reproduction prohibited without permission.

61
A comparison between the AM (i.e., 6-9:59 am) and PM peak (i.e., 4-7:59 pm) was done
using ARC/INFO’s GRID module. The purpose was to identify the areas where the travel
time was the same (which implies no accessibility problems) with those that are different
(implies accessibility problems). Figure 9 graphically identifies the AM and PM peak
periods where accessibility is a problem for 5 and 10 minute ambulance travel times to the
hospital. Note that these areas will change depending upon the parameters used in the
EDW spatial statistical analysis. If a radius of influence of Vi mile were used instead of 1
mile and power of 3 instead of 1, the travel time areas would be much smaller and
therefore smaller areas that have accessibility problems.
Reproduced with permission of the copyright owner. Further reproduction prohibited without permission.

6 2
PM 5 MIN ACCESSIBILITY PROBLEM ARE PM 10 MIN ACCESSIBILITY PROBLEM / AM 5 MIN ACCESSIBILITY PROBLEM ARE
□ AM 10 MIN ACCESSIBILITY PROBLEM i□ GOOD ACGESSIBLITYFORS & 10 MIN
seals 1:270000
PROBLEM ACCESSIBILITY AREASDESTINATION: UNIVERSITY MEDICAL CENTER #COMPARSION OF 6-9A M TO 4-7PM TRAVEL TIME GRIDS SAMPLE DATE PERIOD: 1 1 /0 1 /9 5 TO 0 6 /0 6 /9 6 , GELLSIZE: 5 0 0 FT SPATIAL STATISTICS: INVERSE DISTANCE WEIGHT, POW ER: 1
0 1 2 3 4 miiss
Prsoarsd by the UNLV Transportation Rasaarch Cantar fTRC)
Figure 11: Problem Accessibility Areas
Reproduced with permission of the copyright owner. Further reproduction prohibited without permission.

6 3
Travel Time Contours
With the IDW function calculated for each grid, the development o f travel time contours
can be easily accomplished as shown in figure 10. Without the IDW grid, such contours
could not easily be created, in fact a localization effect would take place where the travel
time contours would just be developed for areas of data and not surround the hospital.
Reproduced with permission of the copyright owner. Further reproduction prohibited without permission.

. 6 4
XL.
c
-X%
MERCY AMBULANCE TRAVEL TIMESDESTINATION: UNIVERSITY MEDICAL CENTER #TIME PERIOD: W EEKDAY 8 :0 0 PM TO 1 2 :5 9 AM SAMPLE DATE PERIOD: 1 1 /0 1 /9 5 TO 0 6 /0 6 /9 6 , GELLSIZE SPATIAL STATISTICS: INVERSE DISTANCE WEIGHT, POW ER
PraparBd by dia UNLV Tranaportallon Rasaarch Cantar (TRC)_______
scala 1:270000
4 mllas
:500 F T ^ ^ 1/ER: 1
Figure 12: Ambulance Travel Time Contours
Reproduced with permission of the copyright owner. Further reproduction prohibited without permission.

6 5
Travel Speed
To calculate the travel speed for each trip, the distance from origin to destination must be
determined. Using the NEAR command within ARC/INFO, the shortest, hypothetical
distance (i.e. Euclidean path) from the incident to the hospital was determined. The true
distance would be an odometer reading of the ambulance vehicle itself. The result would
be the true average travel speed for the trip. But having this data still doesn’t solve the
problem regarding which path the ambulance used to complete the trip. This is addressed
in the next section.
When the travel times have all been assigned to the network links, displays of travel speed
can be done. In figure 12 is a display of travel speed on some of the major corridors. The
network shortest distance path was used in the calculation o f speed for the weekday AM
peak period (7:00 am - 9:00 am). Those sections that have speeds less than 20 mph are
flagged as congested areas.
Reproduced with permission of the copyright owner. Further reproduction prohibited without permission.
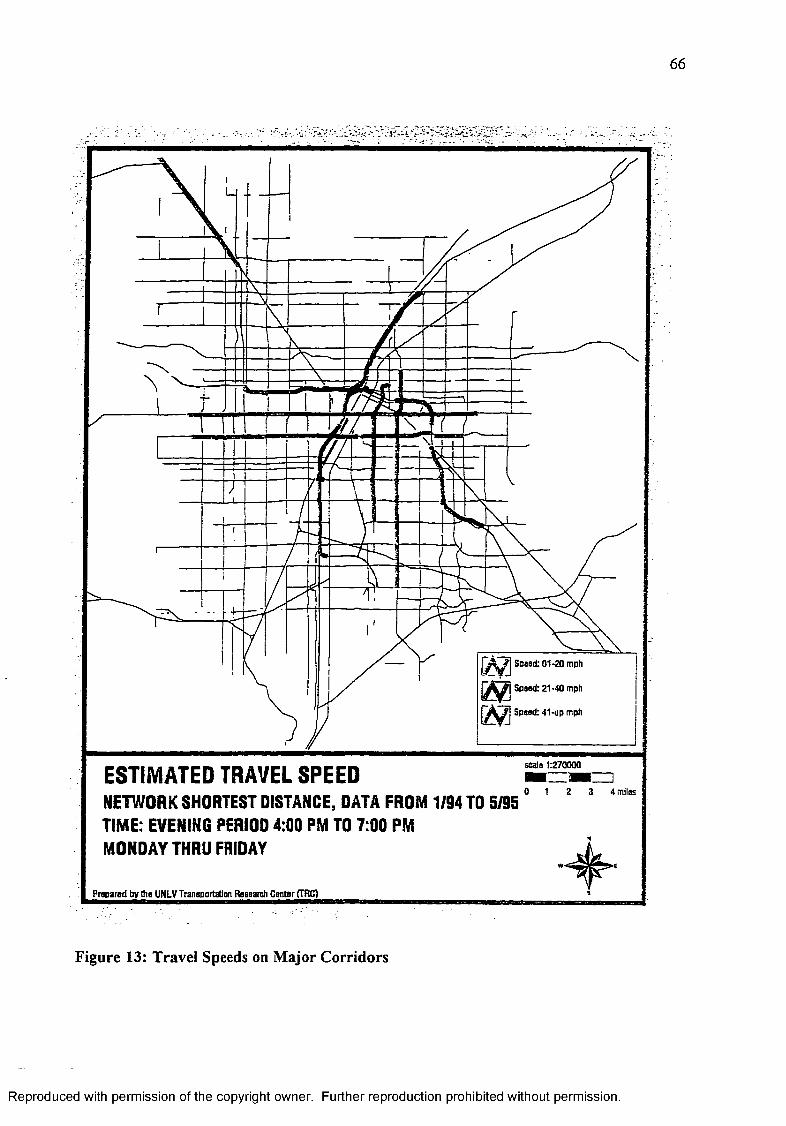
66
TTTTT
Soaed: 01-20 mph
ESTIMATED TRAVEL SPEEDNETW ORK SHORTEST DISTANCE, DATA FROM 1 /9 4 TO 5 /9 5 TIME: EVENING PERIOD 4 :0 0 PM TO 7 :0 0 PM M ONDAY THRU FRIDAY
4 mllas
Prapaffld by iha UNLV Tranaportallon Rasaarch Cantar (TRC)
Figure 13: Travel Speeds on M ajor Corridors
Reproduced with permission of the copyright owner. Further reproduction prohibited without permission.

6 7
A comparison of evening and morning travel speed between calculated and posted speed
limit is given in figure 12. In all cases the posted speed limit is greater than the calculated
travel speed which is based on the shortest path between origin and destination.
Conclusions on which time period (e.g., evening or morning) experiences the most
congestion isn’t clear. Interstate 15, Eastern, and Maryland corridors show congestion
occurring in the evening hours (i.e., lower speeds) while US 95, Sahara, and Charleston
show congestion occurring in the morning hours.
Comparison of Network Shortest Path Calculated Speed to Posted Speed Limit
Ü Evening j ■ Morning | □ S p eed Limit |
Name of Arterial or Highway
Figure 14: Comparison of Calculated Speed with Posted Speed Limit
Reproduced with permission of the copyright owner. Further reproduction prohibited without permission.

68
Shortest Network Distcmce Path Assumption
The shortest path uses the link distance as an impedance in determining the shortest route.
This was easily calculated by using the ARC/INFO network module. The network distance
requires the starting and the ending points to be a node. This results in a problem because
the data are represented as points, not nodes on a network.
Hypothetical Manhattan Path Assumption
The Manhattan distance is typically used for grid based street networks (similar to what
exists in Manhattan NY and Salt Lake City UT). The Manhattan path represents the sum
of the adjacent and opposite sides of a right triangle. The hypotenuse side is the Euclidean
distance. The assumption is made that the actually traveled distance will lie within these
two boundaries.
Reproduced with permission of the copyright owner. Further reproduction prohibited without permission.
CHAPTER 6: CONCLUSIONS
The potential application of a GIS to identify and illustrate mobility, congestion, and
accessibility have been presented in this thesis. This was illustrated with: 1) identification
of accident locations, 2) estimation of Average Vehicle Occupancy (AVO), 3) evaluation
of employee accessibility, 4) evaluation of business accessibility, and 5) evaluation of
residential accessibility, and 5) estimation of travel time and speed from ambulance data.
The accident locations were used to identify areas which experienced non-recurring
congestion. With a significant amount of the delay experienced by motorists being caused
by non-recurring congestion, knowing areas where this has occurred is beneficial in
developing strategies for managing congestion.
The basic objective o f providing transportation is to move persons or goods from one
location to another. The focus should not be on how many vehicles travel through an
intersection, or at a point on a roadway, but on how many persons or volume/quantity of
goods moved. Average vehicle occupancy is needed to facilitate the conversion of vehicle
miles traveled to person miles of travel. This thesis demonstrated the application of two
sources of data for this, existing vehicle occupancy monitoring program done by NDOT
and accident data records. The vehicle occupancy monitoring program gives the true
occupancy but is limited to just that location and specified time. Another draw back is the
time required to collect this data. The application of average vehicle occupancy estimates
from crash records can help fill in this gap. This thesis discussed this application.
69
Reproduced with permission of the copyright owner. Further reproduction prohibited without permission.

70
If network delay is reduced and person movement is increased, not all the aspects o f
transportation are solved. This other function of transportation is accessibility. The
evaluation of employee, business, and residential accessibility was discussed in this thesis.
This information is vital in site location of bus stops. That is, targeting the areas that have
low automobile ownership to population and high employment centers.
The last analysis results dealt with travel time and speed. The thesis procedures used
identified congested corridors and travel time patterns surrounding hospitals. This was
done by using basic traffic assignment techniques used in travel demand forecasting
models. Data from ambulance vehicles were used to facilitate this analysis. It was found
that improvements could be made (see recommendations) but congestion was able to be
identified with the existing data.
Recommendations
Accident Records
The recommendations would require additional information to be collected at the scene of
the incident, but it is felt this extra delay would be worth rich the data source
improvement. It is desired that a mandatory occupancy field be added to the data.
Currently vehicle occupancy is determined from seat belt usage which is voluntarily
collected. So the problem is that not all crashes has occupancy information. By making it
mandatory, one is ensured that the occupancy data will be collected. Another data item is
Reproduced with permission of the copyright owner. Further reproduction prohibited without permission.
71
to ask the driver their familiarity with the area. This will assist in determining if non
recurring congestion is caused by visitors. If true, then an education effort can be
undertaken in familiarizing drivers with unknown areas. This could be done by improving
signage, maps, etc.
To achieve an accurate estimate o f delay caused by auto crashes, the time vehicle crash
occurred, if it obstructed a traffic lane the time when it was removed, and finally the time
when everyone (e.g., police, ambulance, towing truck, etc.) has left the scene need to be
recorded. Then a relationship between accident severity and delay can be made. Then
knowing the delay, steps can be developed to decrease this time and therefore the delay
experienced by the motorist.
In an effort to reduce the repeated entry of the same data and remove errors from illegible
handwriting, the Office o f Technology Applications in partnership with the National
Highway Traffic Safety Administration (NHTSA) has developed a computer-based system
to help police officers collect accident information [Smith 96]. Such a system can be
implemented in Nevada to eliminate the coding errors and therefore the accuracy o f the
accident records. This system, called ALERT (Advanced Law Enforcement Response
Technology), also has the means of determining the Latitude and Longitude via a Global
Positioning System (GPS) for the accident location. This feature would then give the true
location of the crash, which is currently just estimated (e.g., roadway intersection).
Reproduced with permission of the copyright owner. Further reproduction prohibited without permission.

72
Ambulance Data
The following contains improvements in the data collection would help better identify
congestion. If information on the odometer reading was given, then accurate average
travel speeds could be calculated. Then comparison could be made to determine which of
the path assumptions (e.g., Network, Euclidean, or Manhattan) is the most representative
to vehicle flow. Other improvements would be information on the location of where the
ambulance left to response to the incident call. Then travel time estimates would be
dispersed at many locations instead off just a few (e.g. Hospitals, Nursing Homes, etc.).
This would take more work on the part of the paramedics, where they would know have
to login the location of where their responding from.
The metropolitan area of Montreal, Canada has developed a system which integrates
computer-aided dispatching and GIS functionality to help reduce overall emergency
response time [Beauregard 95, p. 23]. It uses ARC/INFO to optimize fleet deployment of
the emergency vehicles. The system uses GPS units for its automatic vehicle location
(AVL). This will give the actual route/path taken by the emergency vehicle as well as
actual travel speed. Accurate identification of congested areas would then known. The
biggest draw back is the cost of such a system and it is difficult to justify when it only
promises a decrease in response time between 0-3 minutes.
Reproduced with permission of the copyright owner. Further reproduction prohibited without permission.

73
Business Locations
The data on the location and number o f employees for each business was obtained from
the 1994 business license records. This data set is outdated and also doesn’t contain any
information from the City of North Las Vegas. The recommendation is to update the data
set with current business license records while also obtaining data from North Las Vegas.
The benefit is a more accurate estimate o f employment accessibility.
Reproduced with permission of the copyright owner. Further reproduction prohibited without permission.

REFERENCES
[Al-Sahili 92] Al-Sahili, Khaled and Mohammad Aboul-Ella. Accessibility o f Public
Services in Irbid, Jordan. Journal of Urban Planning and Development.
Vol. 118, No. l,Mar. 1992.
[Asante 96] Asante, Seth A , Louis H. Adams, John J. Shufon, and Joseph P. McClean.
Estimating Average Automobile Occupancy from Accident Data in New
York. Transportation Research Board Preprint Paper No. 960300.
Presented at the 75* Annual Meeting, January 7-11, 1996. Washington,
D C.
[Bayapureddy 96] Bayapureddy, Dwarakanath and Mohammad Azmi. Accident Analysis
Using GIS and Expert Systems. Transportation Research Board Preprint
Paper No.960418. Presented at the 75* Annual Meeting, January 7-11,
1996. Washington, D C.
[Beauregard 95] Alain Beauregard. ARC/INFO Used In Ambulance Dispatching System.
ARC News, Vol. 17 No. 14, Winter 1995, p. 23. Environmental Systems
Research Institute, Inc. Redlands California. Alain is with ESRI Canada
Limited (tel.: 514-875-8568)
74
Reproduced with permission of the copyright owner. Further reproduction prohibited without permission.

75
[Bretherton 94] Bretherton, W. Martin Jr. Accident Record Systems in Georgia. ITE
Journal Vol. 64, No. 1, January 1994, p. 16-21.
[Brodsky 90] Brodsky, Harold. Emergency Medical Service Rescue Time in Fatal Road
Accidents. Transportation Research Record 1270. Safety Research;
Accident Studies, Enforcement, EMS, Management, and Simulation 1990.
TE 5.3 H5A31 no. 1270.pp. 89-96.
[Cervero 90] Cervero, Robert. Accessibility and Third World Rural Development: A
Case Study o f Sumatra. Reprint No. 108. Review of Urban and Regional
Development Studies, Vol. 2, pp. 125-138. The University o f California
Transportation Center, University of California at Berkeley. 415-643-7378.
[Cohen 72] Cohen, Daniel S. and Charles Basner. Accessibility-Its Use As An
Evaluation Criterion in Testing and Evaluating Alternative
Transportation Systems. Highway Planning Technical Report, No. 28, July
1972, Network Analysis Series No. 3. U.S. Department of Transportation,
Federal Highway Administration, Washington, D C. Network Evaluation
Branch, Office of Highway Planning, Urban Planning Division.
[ESRI 92] Environmental Systems Research Institute, Inc. ARC/INFO User's Guide:
Cell-based Modeling with GRID. Version 6.0, 1992. 380 New York St.
Redlands, CA 92373-8100.
Reproduced with permission of the copyright owner. Further reproduction prohibited without permission.

76
[Evans 91] Evans, Leonard. Traffic Safety and the Driver. Published by Van Nostrand
Reinhold. HE5614.2.E93 1991.
[Federal Reg. 93] Federal Register, Vol. 58, No. 229 Part H, Department of
Transportation, Federal Highway Administration 23 CFR Parts 500 and
626, Federal Transit Administration 49 CFR Part 614 Management and
Monitoring Systems; Interim Final Rule. Wed. Dec. 1, 1993. Rules and
Regulations 63442-63485.
[FHWA 94] Federal Highway Administration. Congestion Management fo r Technical
Staff, Participant's Workbook. National Highway Institute (NHI) Course
No. 15259. April 1994. FHWA-HI-94-046.
[Fisher 80] Fisher, R. Fred, G. Jack Williams, and J. Phillip Boyd. Atlanta Vehicle
Occupancy Monitoring. Transportation Research Record 779,
Transportation Information Systems; Applications and Uses. Washington,
DC 1980, pp. 27-32.
[Grush 95] Grush, W. and B. Gross. Vehicle Occupancy, A comparison o f household
survey data and roadside observation data. Sept. 1995. Federal Highway
Administration, Office of Highway Information Management. Washington,
D C
Reproduced with permission of the copyright owner. Further reproduction prohibited without permission.

7 7
[Guo 95] Guo, Bo and Allen Poling. A GIS/GPS System Design for Network Travel
Time Study. Transportation Research Board 74* Annual Meeting.
Washington, D.C. January 1995. Preprint No. 950332.
[Hales] Hales, Don. Mercy Medical Services. 1130 S. Martin L. King Blvd. Las
Vegas, NV 89102. Voice: (702) 386-9985, Fax: (702) 386-2683.
[Hamburg 95] Hamburg, John R., Larry Blair, and David Albright. Mobility as a Right.
Transportation Research Record No. 1499 Planning and Administration.
TRB National Academy Press. Washington D C , 1995, pp. 52-55.
[Hamm 93] Hamm, Robert A , Donald L. Woods, Vergil G. Stover, and Patrick E.
Hawley. Congestion Management Systems State-of-the-Practice Review.
August 1993. Research Report 563-lF. Texas Transportation Institute.
The Texas A&M University System. College Station, Texas 77843-3135.
[Handy 93] Handy, Susan. A Cycle o f Dependence: Automobiles, Accessibility, and
the Evolution o f the Transportation and Retail Hierarchies. Berkeley
Planning Journal. Vol. 8 (1993), pp. 21-43. Reprint UCTC No. 233. The
University of California Transportation Center. University o f California
Berkeley, CA 94720.
Reproduced with permission of the copyright owner. Further reproduction prohibited without permission.

78
[Hansen 59] Hansen, Walter, 1959. How Accessibility Shapes Land Use. Journal of the
American Institute of Planners. Vol. 15, pp. 73-76.
[Heidtman 96] Heidtman, Kurt and Bradley O. Skarpness. Improved Vehicle Occupancy
Data Collection Procedures. Presented at the National Traffic Data
Acquisition Conference (NATDAC). Albuquerque, New Mexico. May 8,
1996. Battelle, 505 King Avenue, Columbus, Ohio 43201-2693. Email:
[HCS 95] Highway Capacity Software. Release 2, Users Guide, March 1995.
Transportation Research Center, University of Florida. 512 Weil Hall,
Gainesville, FL 32611-6585. Phone: 904-392-0378.
[Ingram] Ingram, Phillip. An Introduction to Geostatistics. Macquarie University,
Sidney, NSW, 2109, Australia. Document found at following web address:
Http ://atlas.es.mq.edu.au/users/pingram/pingram.html
[Lomax 92] Lomax, Timothy J. Quantifying Congestion, Interim Report. October
1992. National Cooperative Highway Research Program (NCHRP) Project
7-13. Texas Transportation Institute.
Reproduced with permission of the copyright owner. Further reproduction prohibited without permission.
7 9
[Lomax 93] Lomax, Timothy J. Performance Measures fo r Congestion Management
Systems. Integrating Transportation Management Systems into
Transportation Planning and Operations National Conference Proceedings.
Nashville, Tennessee Nov. 7-10, 1993, pp. 297-303. Sponsored by
Vanderbilt Engineering Center for Transportation Operations and
Research, Vanderbilt University (VECTOR).
[Marshall 93] Marshall, Norman L. and Stephen J. C. Lawe. Latrd Use Allocation
Models fo r Multi-County Urban and Suburbatr Areas. 4* National
Conference on Transportation Planning Methods Applications-Vol. II. A
Compendium of Papers Based on a Conference Held in Daytona Beach,
Florida. May 1993. Editor Jerry M Faris, p. 711-722 (1-11).
[Pratt 94] Pratt, Richard H. and Timothy J. Lomax. Performance Measures fo r
Multimodal Transportation Systems. Presented at session 214 of The 73"*
Annual Meeting, Transportation Research Board. Washington D C.,
January 1994.
[Quintero 95] Quintero, Michael. State o f Nevada Annual Vehicle Occupancy
Monitoring Program Report, October I, 1994-September 30, 1995.
NDOT Transportation Analyst, Phone: 702-888-7221. Nevada Department
of Transportation Planning Research Division. 1263 S. Stewart Street.
Carson City, Nevada 89712.
Reproduced with permission of the copyright owner. Further reproduction prohibited without permission.

80
[Raub 96] Raub, Richard A., Ronald C. Pfefer, and Roy E. Lucke. Time Required by
Police to Handle a Traffic Crash and Record Safety Data. Northwestern
University Traffic Institute. Transportation Research Board Preprint Paper
No. 960059. Presented at the 75* Annual Meeting, January 7-11, 1996.
Washington, D.C.
[ReVelle 91] ReVelle, Charles. Siting Ambulance and Fire Companies New Tools fo r
Planners. Journal of the American Planning Association, Vol. 57, No. 4,
Autumn 1991. American Planning Association, Chicago, IL. pp. 471-484.
[Schwer 94] Schwer, R. Keith. Southern Nevada Business Directory 1994. University
of Nevada, Las Vegas Center for Business and Economic Research. Voice:
(702) 895-3191, Fax: (702) 895-3606, and Email: [email protected]
[Schrank 93] Schrank, David L., Shawn M. Turner, and Timothy J. Lomax. Estimates o f
Urban Roadway Congestion - 1990. Texas Transportation Institute. Texas
A&M University System. College Station, Texas 77843-3135. Research
Report 1131-5. Report Date March 1993.
[Smith 96] Smith, Dave. Advanced Technologies Explored to Assist Law Enforcement
in Collecting Accident Data. Research & Technology Transporter,
Reproduced with permission of the copyright owner. Further reproduction prohibited without permission.

81
October 1996. U.S. Dept, o f Transportation, Federal Highway
Administration. FHWA-RD-96-205. Email: [email protected]
[Ulberg 88] Ulberg, Cy and Edward McCormack. Accuracy and Other Factors
Affecting a Continuous Vehicle Occupancy Monitoring Program.
Transportation Research Record 1206, Transportation Organization and
Systems Planning. TRB. National Research Council. Washington, D.C.
1988, pp. 35-47.
[Verroen 92] Verroen, Erik J. and Gijsbertus R. M. Jansen. Location Planning fo r
Companies and Public Facilities: A Promising Policy to Reduce Car Use.
Transportation Research Record No. 1364: Transportation Planning,
Programming, Land Use, and Applications of Geographic Information
Systems. National Academy Press. Washington, DC 1992, pp. 81-88.
[Zahavi 80] Zahavi, Yacov and Gabriel Roth. Measuring the Effectiveness of Priority
Schemes for High-Occupancy Vehicles. Transportation Research Record
770, Urban Systems and Traffic Evaluations. TRB National Academy of
Sciences. Washington, D.C. 1980, pp. 13-21.
Reproduced with permission of the copyright owner. Further reproduction prohibited without permission.

Appendix A
Pop2info.amlUNLV TRANSPORTATION RESEARCH CENTER
/ » P r o gr a m: I ' P u r p o s e :
p o p 2 i n f o . amiM o d i f y a n d i m p o r t p o p u l a t i o n e s t i m a t e s f r o m DCP ( J e f f H a r d c a s t l e )
/ " R e q u i r e d i n p u t s a n d o u t p u t s need t o r u n t h i s AML
/ * I n p u t s : /*• O u t p u t s :
j l 8 5 t r s . d a t t o j l 9 5 t r s . d a t , f i l e s f t p f rom DCP GIPINK ARC/INFO P o i n t c o v e r a g e a nd INFO f i l e f o r y e a r s e l e c t e d d c p _ p o p j 185
/ - U s a g e : / ” A r g u m e n t s : / * G l o b a l s :
S r p o p 2 i n f o . a m l
/ * C a l l s : w r i t e s 2 gawk p r o g r a m
/ * N o t e s :
/ * H i s t o r y : J e f f J e n s e n ( j e n s e n f @ t r c . u n l v . e d u ) m o d i f i e d on 4 - 2 0 - 9 5 J e f f J e n s e n ( j j e n s e n S c o . d a r k . n v . u s ) m o d i f i e d on 8 - 3 1 - 9 6
s e c h o Son St e r r a 9999
S c a l l s e t _ v a r i a b l e s s c a l l c r e a c e _ a w k _ p r g s c a l l c o n v e r t _ d a t . a 2 i n f o S c a l l a a d _ f r o m _ i n f o S c a l l c r e a c e _ c r s _ r e l a t e/ * uncoirraenb w h i c h m e t h o d j o i n f i l e s o r r e l a t e f i l e s , b u t n o t b o t h S c a l l j o i n 2 c o v e r a g e / * s c a l l s e t _ r e l a t e
Se c ho S o f f S r e t u r n
s r o u t i n e s e t _ v a r i a b l e s
Ss p o p _ p a t h = SWORK/pop I ' / t r c / g i s m o / d c pSs p o p _ d a t a = [ e n t r y n a m e [ g e t f i l e -
[ q u o t e î p o p _ p a t h % [ u n q u o t e ' / * ' I . d a t ] -FILE - ' S e l e c t d a t a f i l e t o c o n v e r t e d t o INFO f o r m a t ' ] ]
s s p o p _ f i l e = [ s u b s t %pop_data% d a t t x t ]Ss y e a r = [ s u b s t r %pop_data% 1 4]Ss i n f o _ t e m p _ p a t h = % p o p _ p a t h % / i n f o ! a r c ! s s i n f c _ t e m p l a t e = D C? _PO P[ upc as e %year%] s s r e j e c t _ c u t = RES’ECT_POP
s s gawk _pr g = d c p _ a m l . a w k
Ss t s r _ p a t h - / g i s d a t a / c r g e n / c o m m o n / /■• / t r c / g i s m o /Ss t s r _ c o v = c l a r k t r s / * t s r Ss r e l _ n a m e = t r s
Ss c u t p u t _ t r s = ADD_TRS Ss ga wk_pr q2 = a d d _ t r s . a w k Ss j o i n _ t r s = j o i n _ t r s
Appendix A-1
Reproduced with permission of the copyright owner. Further reproduction prohibited without permission.
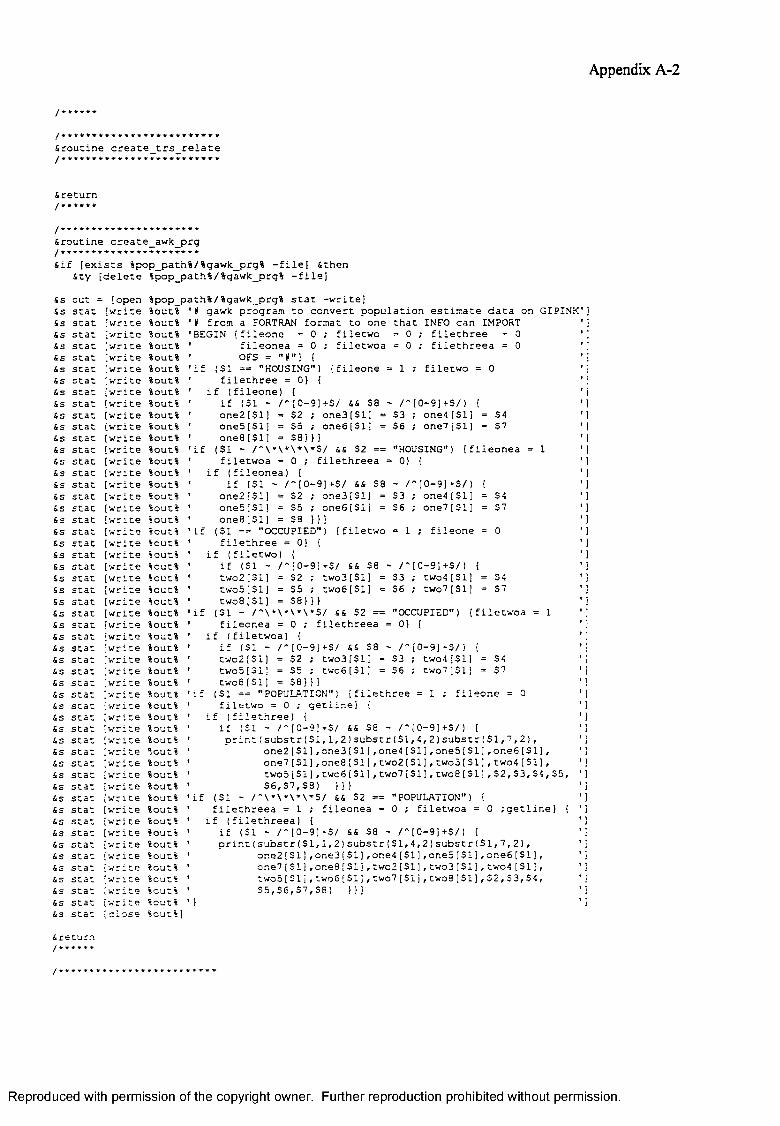
Appendix A-2
r o u t i n e c r e a t e t r s r e l a t e
r e t u r n
r o u t i n e c r e a t e _ a w k _ p r g
i f [ e x i s t s %pop_path%/%gawk_prg% - f i l e ] S t h e ns t y [ d e l e t e %pop_|
&s o u t = [ op e n %pop_!i s s t a t [ w r i t e %o ut î&5 s t a t [ w r i t e ïouc%&S s t a t [ w r i t e %ouc%&S s t a t [ w r i t e %out%&s s t a t [ w r i t e %out%& s s t a t [ w r i t e %out%& s s t a t [ w r i t e %out%& s s t a t [ w r i t e %out%&5 s t a t [ w r i t e %ouc%& s s t a t [ w r i t e %out%&s s t a t [ w r i t e %ouc%&5 s t a t [ w r i t e %out%&S s t a t [ w r i t e %out%i s s t a t [ w r i t e Sout%&S s t a t [ w r i t e %out%&5 s t a t [ w r i t e %out%&S s t a t [ w r i t e %out%&£ s t a t [ w r i t e %out%&S s t a t [ w r i t e %ouc%& s s t a t [ w r i t e %out%&s s t a t [ w r i t e Sout%
s t a t [ w r i t e %out%&s s t a t [ w r i t e %ouc%&5 s t a t [ w r i t e %outS&S s t a t [ w r i t e %out%Ss s t a t [ w r i t e %ouc%Ss s t a t [ w r i t e %out%Ss s t a t [ w r i t e %ouc%Ss s t a t [ w r i t e %out îSs s t a t [ w r i t e îou t%Ss s t a t [ w r i t e %out%s s s t a t [ w r i t e %OUC%Ss s t a t [ w r i t e %oun%Ss s t a t [ w r i t e %ouc*Ss s t a t [ w r i t e %cut%Ss s c a t [ w r i t e S o u t îs s s c a t [ w r i t e %out%Ss s t a t [ w r i t e %ouc%s s s c a t [ w r i t e 3oun%Ss s t a t [ w r i t e %ouc%Ss s t a t [ w r i t e %ouc%s s s t a t [ w r i t e %ouc%Ss s t a t [ w r i t e î o u t Ss s s t a t [ w r i t e l ou t %s s s t a t [ w r i t e %out%Ss s t a t [ w r i t e %ou" iSs s t a t [ w r i t e %out%s s s t a t [ w r i t e %outSSs s t a t [ w r i t e lou t%Ss s t a t [ w r i t e lou t%Ss s t a t [ w r i t e Sout%Ss s c a t [ w r i t e %ou t lSs s t a t [ c l o s e %out%]
Sre■turn
f i l e t h r e e f i l e t h r e e a
( f i l e o p . e = 1 ; f i l e t w o = 0
' / • ' [ 0 - 9 ] + S / ] S3 ; o n e 4 [ S I ] S6 ; o n e ? [ S I ]
(= S4 = S?
( f i l e o n e a = 1
' ) (
I t
S4S7
S4S7
p a th%/ %gawk_pr g% s t a t - w r i t e ]# gawk p r o g r a m t o c o n v e r t p o p u l a t i o n e s t i m a t e d a t a on GIPINK (f f r o m a FORTRAN f o r m a t t o o n e t h a t INFO c a n IMPORT BEGIN ( f i l e o n e = 0 ; f i l e t w o = 0
f i l e o n e a = 0 ; f i l e t w o a = 0 OFS = " # " ) (
i f ( S I == "HOUSING") f i l e t h r e e = 0} (
i f ( f i l e o n e ) {i f (SI - / " [ o - 9 ] + s / SS s a o n e 2 [ S l ] = S2 ; o n e 3 [ S I ]o n e S [ S I ] = So ; o n e 6 [ S l jo n e s [ S I ] = S 8 ) ) )
i f ( S I - / " \ ’' \ ‘ \ ' ' \ * S / s s S2 == "HOUSING") f i l e t w o a = 0 ; f i l e t h r e e a = 0) (
i f ( f i l e o n e a ) [i f ( S I - / " [ 0 - 9 ] + S / SS S8 - / " [ 0 - 9 ] + S /
o n e 2 [ S I ] = S2 ; o n e 3 [ S l ] = S3o n e S [ S l ] = S5 ; o n e 6 [ S l ] = S6o n e S [ S I ] = s a }) ]
( S I == "OCCUPIED") ( f i l e t w o = f i l e t h r e e = 0} (
i f ( f i l e t w o ) (i f (SI - / " [ 0 - 9 ] +S/ SS S8 ' / t w o 2 [ S l ] = S2 ; t w o 3 [ S i ] = S3t w o 5 [ S 1] = S5 ; t w o6 [ S1] = S6t w o 8 [ S l ] = S 8 ] }}
( S I - / " \ * \ * \ * \ * S / s s S2 == "OCCUPIED") f i l e o n e a = 0 ; f i l e t h r e e a = 0] [
i f ( f i l e t w o a ) (i f (SI - / " [ G - 9 ] + S / SS S8 ' / " [ 0 - 9 ] + S / ) { t w o 2 [ S l ] = S2 ; t w o 3 [ S l ] = S3 ; t w o 4 [ S l ] = S4t w o 5 [ 3 1 ] = S5 ; t wo6 [ S1] = S5 ; t w o ? [ S I ] = S?two 8 [ S 1] = S8}]1
( S I == "POPULATION") ( f i l e t h r e e = 1 ; f i l e o n e = 0 f i l e t w o = 0 ; g e t l i n e ] [
i f ( f i l e t h r e e ) (i f (SI - / ' [ 0 - 9 ] - S / s s S8 - / " [ 0 - 9 ] + S / ) (
p r i n t ( s u b s t r ( S I , 1 , 2 ) s u b s t r (S I , 4, 2 ) s u b s t r ( S I , ? , 2 ) ,o n e 2 [ S I ] , o n e 3 [ S I ] , o n e 4 [ S I ] , o n e S [ S I ] , o n e 6 [ S 1 ] , o n e ? [ S I ] , o n e 8 [ S I ] , t w o2 [SI ] , t w o 3 [ S I ] , t w o 4 [ S I ] , t w o 5 [ S I ] , t w o 6 [ S l ] , t w o ? [ S l ] , t w o 8 [ S l ] , S 2 , S 3 , S 4 , S 5 , S 6 , S ? , S 8 ) ] )}
( S I - / " \ ' \ ' \ ' \ * S / SS S2 == "POPULATION") { f i l e t h r e e a = 1 ; f i l e o n e a = 0 ; f i l e t w o a = 0 ; g e t l i n e ) (
i f ( f i l e t h r e e a ) (i f ( SI - / " [ 0 - 9 ] +S/ SS S8 - / " [ 0 - 9 ] + S / l { p r i n t ( s u b s t r (S I , 1 , 2 ) s u b s t r ( S I , 4, 2 ) s u b s t r (S I , ? , 2 ) ,
o n e 2 [ S l ] , o n e 3 [ S l ] , o n e 4 [ S l ] , o n e 5 [ S l ] , o n e 6 [ S l ] , o n e ? [ S I ] , o n e s [ S I ] , t w o 2 [ S I ] , t w o 3 [ S I ] , t w o 4 [ S I ] , t w o 5 [ S l ] , t w o 5 [ S l ] , t w o ? [ S l j , t w o B [ S I ] , S 2 , S 3 , S 4 , S 5 , S 6 , S ? , S 8 ) }}]
o n e 4 [ S I ] o n e ? [ S l ]
; f i l e o n e
[ 0 - 9 ] + S / ): t w o 4 [ S I ] ; t w o ? [ S I ]
I t ( f i l e t w o a = 1
i f
Reproduced with permission of the copyright owner. Further reproduction prohibited without permission.
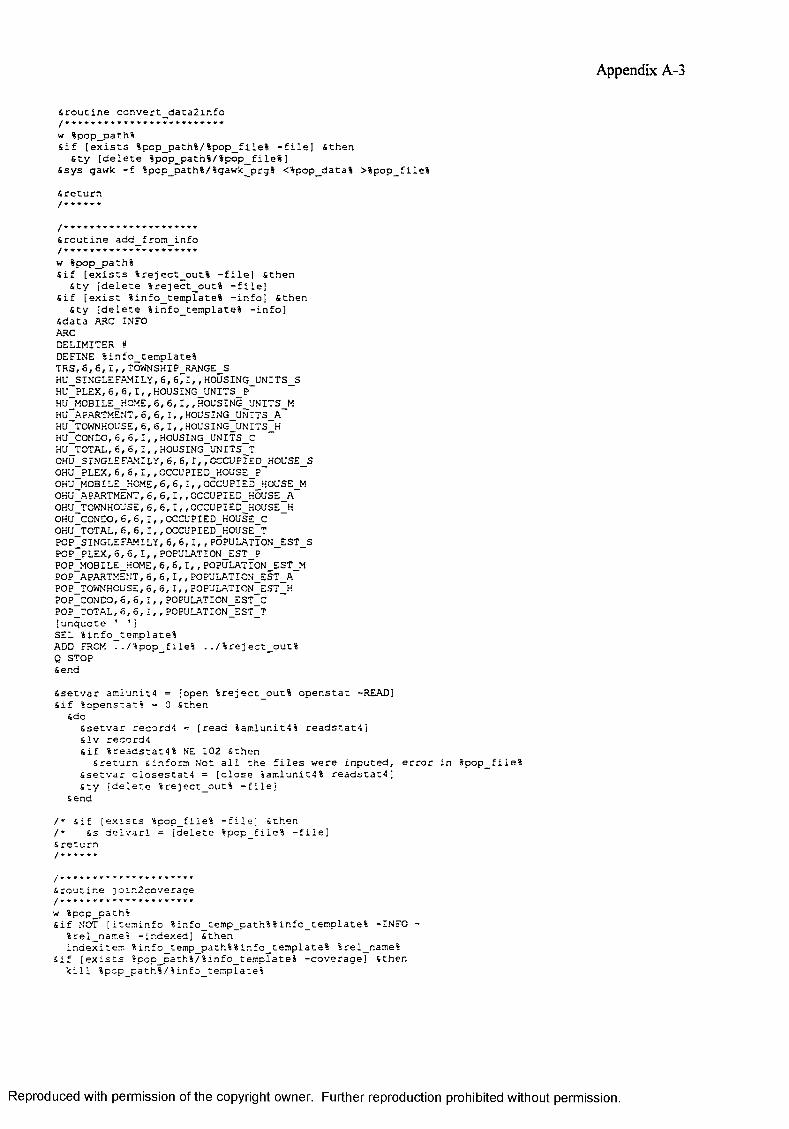
Appendix A-3
S r o u t i n e c o n v e r t _ d a t a 2 i n f o
w %pop_path%S i f [ e x i s t s % p o p _ p a t h % / % p o p _ f i l e * - f i l e ] s t h e n
s t y [ d e l e t e % p o p _ p a t h î / % p o p _ f i l e * ]S s y s gawk - f % p o p _ p a t h % / î g a w k _ p r g ï <%pop_data% > % p o p _ f l i e *
S r e t u r n
s r o u t i n e a d d _ f r o m _ i n f o
w %pop_path%S i f [ e x i s t s % r e j e c t _ o u t % - f i l e ] S t h e n
S t y [ d e l e t e S r e j e c t _ o u t % - f i l e ]S i f [ e x i s t % i n f o _ t e m p l a t e % - i n f o ] S t h e n
S t y [ d e l e t e % i n f o _ t e m p l a t e % - i n f o ]S d a t a AJkC INFO ARCDELIMITER #DEFINE % i n f o _ t e m p l a t e %T R S , 6 , 6 , I , ,TOWNSHIP_RAJiGE_S HU_SINGLEFAMILY,6 , 6 , 1 , , HOUSING_UNITS_S HU_PLEX,6 , 6 , 1 , , HOUSING_UNITS_P HU_MOBILE_HOME,6 , 6 , 1 , , HOUSING_UNITS_M HU_APARTMENT,6 , 6 , 1 , , HOUSING_UMITS_A HU_TOWiHOUSE, 6, 6 , 1 , , HOUSING_UNITS_H KU_CONDO, 6 , 6 , 1 , , HOUSING_UNITS_C HU_TOTAL,6 , 6 , 1 , , HOUSING_UNITS_T 0HU_5INGLEFAMILY, 6, 6 , 1, , CCCUPIED_HOUSE_S OHU_PLEX,6 , 6 , I, ,OCCUPIED_KOUSE_P OHU_MOBILE_HOME,6 , 6 , 1 , , OCCUPIED_HOUSE_M OHU_AP.ARTM£NT, 6, 6 , 1 , , OCCUPIED_HOUSE_A OH'J_TOWNKOUSE, 6 , 6 , 1 , , OCCUPIED_HOUSE_H OHU_CONDO,6 , 6 , 1 , , OCCUPIED_KOUSE_C OHU_TOTAL,6 , 6 , 1 , , OCCUPIED_HOUSE_T POP_SINGLEFAMILY,6 , 6 , 1 , , POPULATION_EST_S POP_PLEX,6 , 6 , 1 , , POPULATION_EST_P POP_MOBILE_H.OME, 6 , 6 , 1 , , POPULATION_EST_M POP_APARTMEMT,6 , 6 , 1 , , PO PULATION_EST_A POP_TOWNHCUSE,6 , 6 , I , , ?OPULATION_EST_K POP_CONCO, 6 , 5 , 1 , , POPULATION_EST_C POP_TOTAL,6 , 6 , 1 , , POPULATION_EST_T [ u n q u o t e ' ' ]SEL 4 i n f o _ t e m p l a t e %ADD FROM . . / 4 p o p _ f i l e S . . / % r e j e c t _ o u t %Q STOP Send
S s e t v a r a m l u n i t 4 = [ open % r e j e c t _ o u t % o p e n s t a t -READ] s i f % op e n s t a t % - 0 s t h e n
SdoS s e t v a r r e c o r d 4 = [ r e a d i a m l u n i t 4 4 r e a d s t a t 4 ]S l v r e c o r d 4S i f 4 r e a d s t a t 4 4 NE 102 S t h e n
S r e t u r n s i n f o r m Not a l l t h e f i l e s w e r e i n p u t e d , e r r o r i n 4 p o p _ f i l e % S s e t v a r c l o s e s t a t 4 = [ c l o s e 4 a m l u n i t 4 4 r e a d s t a t 4 ] s t y [ d e l e t e 4 r e j e c t _ o u t 4 - f i l e ]
Send
/ ' s i f [ e x i s t s 4 p o p _ f i l e 4 - f i l e ] s t h e n / ' Ss d e l v a r l = [ d e l e t e 4 p c p _ f i l e 4 - f i l e ]S r e t u r n
.....................................S r o u t i n e j o t n l c o v e r a g e
w 4 po p_ pa th%S i f NOT [ i t e m i n f o 4 i n f o _ t e m p _ p a t h 4 4 i n f o _ t e m p l a t e 4 - INFO -
4 r e l _ n a m e 4 - i n d e x e d ] S t h e ni n d e x i t e m 4 i n f o _ t e m p _ p a t h 4 4 i n f o _ t e m p l a t e % 4 r e l _ n a m e 4
S i f [ e x i s t s 4 p o p _ p a t h 4 / 4 i n f o _ t e m p l a t e 4 - c o v e r a g e ] s t h e n k i l l 4pcD p a t h 4 / 4 i n f o t e m p l a t e 4
Reproduced with permission of the copyright owner. Further reproduction prohibited without permission.
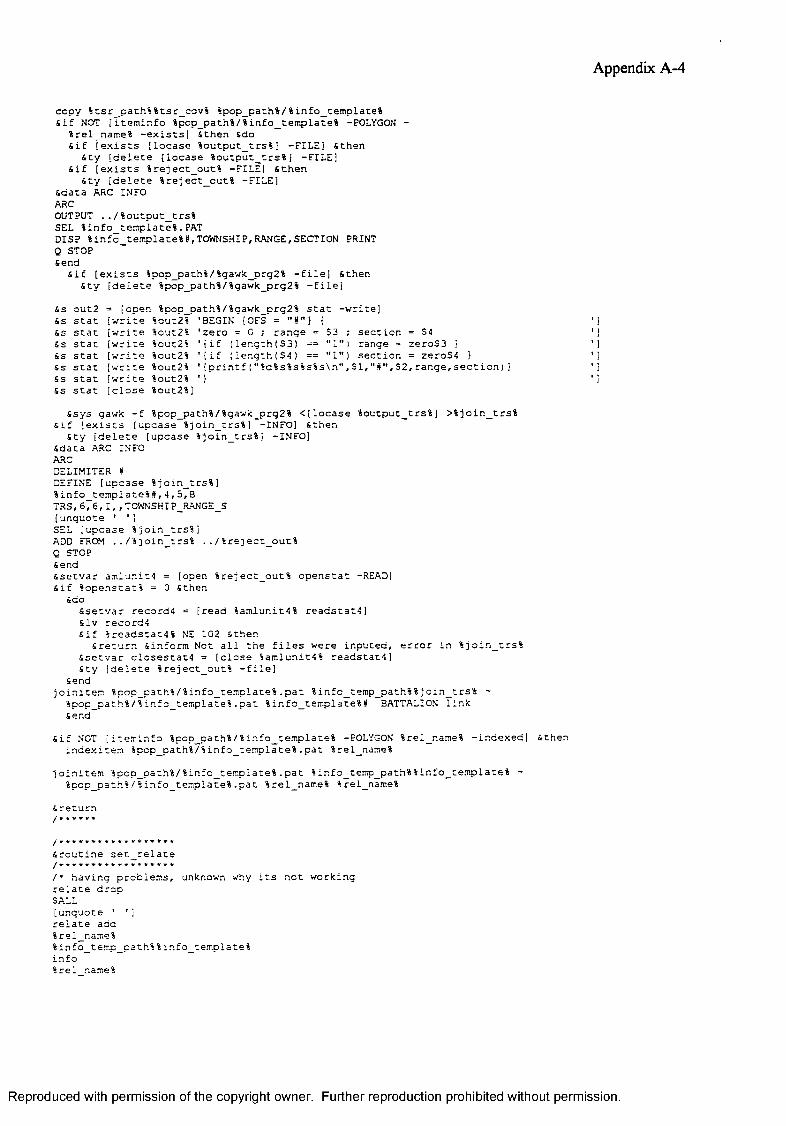
Appendix A-4
c o p y % t s r _ p a ' h % % t s r _ c o v % % p o p _ p a t h % / %i n f o _ c e i r p l a t e % s i f NOT [ i t e n i r . f o % p o p _ p a t h % / 4 i n £ o _ c e m p l a t e l -POLYGON -
%rei_name% - e x i s t s ] S t h e n sdoS i f [ e x i s t s [ l o c a s e î o u t p u t _ t r s % I - F I L E] S t h e n
S t y [ d e l e t e [ l o c a s e % o u t p u t _ t r s % ] - FI LE]S i f [ e x i s t s % r e j e c t _ o u t % - FI LE] S t h e n
S t y [ d e l e t e % r e j e c t _ o u t % - FI LE]S d a t a ARC INFO ARCOUTPUT . . / % o u t p u t _ t r s %SEL % i n f o _ t e n p l a t e 4 . PATDISP %info_templa te%#,TOWNSHIP,RANGE,SECTION PRINTQ STOPSend
s i f [ e x i s t s %pop_path%/%gawlc_prg2% - f i l e ] s t h e n S t y [ d e l e t e %pop_path%/%gawk_prg2% - f i l e ]
Ss c u t 2 - [ o p e n %pop_path%/%gawk_prg2% s t a t - w r i t e ]Ss s t a t [ w r i t e » o u t 2 S 'BEGIN ( O F s ' = " « " } {s s s t a t [ w r i t e %out2% ' z e r o = C ; r a n g e = S3 ; s e c t i o n = S4Ss s t a t [ w r i t e %out2% ' { i f ( l e n g t h (S3] == " 1 " ) r a n g e = z e r o S 3 }Ss s t a t [ w r i t e %out2% ' { i f {l e n g t h ( S 4 ) == " 1 " I s e c t i o n = z e r o S 4 }Ss s t a t [ w r i t e %out2% ' ( p r i n t f ( " 4 d % s % s S s % s \ n " , S I , S 2 , r a n g e , s e c t i o n )1Ss s t a t [ w r i t e %out2% ' )Ss s t a t [ c l o s e %out2%]
S s y s gawk - f %pop_path%/%gawk_prg2% < [ l o c a s e % o u t p u t _ t r s % ] > % j o i n _ t r s %s i f [ e x i s t s | o p c a s e % j o i n _ t r s % ] - INFO] S t h e n
S t y [ d e l e t e [ u p c a s e % j o i n _ t r s % ] - INFO]S d a t a ARC INFO ARCDELIMITER *DEFINE [ u p c a s e % j o i n _ t r s % ]% i n f o _ t e m p i a te% S, 4 , 5 , 8 TRS, 6 , 6 , 1,,TOWNSHIP_RANGE_S [ u n q u o t e ' ' ]SEL [ u p c a s e % j o i n _ t r s S ]ADD FROM . . / % j o i n _ t r s % . . / % r e j e c t _ o u t %Q STOP Sends s e t v a r ami u n i t 4 = [open % r e j e c t _ o u t % o p e n s t a t -READ]S i f % o p e n s t a t % = 0 s t h e n
sdoS s e t v a r r e c o r d 4 = [ r e a d %amluni t4% r e a d s t a t 4 ] s l v r e c o r d 4S i f % r e a d s t a t 4 î NE 102 s t h e n
S r e t u r n s i n f o r m Not a l l t h e f i l e s w e r e i n p u t e d , e r r o r i n % j o i n _ t r s %S s e t v a r c l o s e s t a t 4 = [ c l o s e %aml uni t4% r e a d s t a t 4 ]S t y [ d e l e t e % r e j e c t _ c u t % - f i l e ]
s e n dj o i n i t e m % p o p _ p a t h % / % i n f o _ t e m p l a t e % . p a t % i n f c _ t e m p _ p a t h % % j o i n _ t r s % -
% p o p _ p a t h ï / % i n f o _ t e m p l a t e % . p a t %i n f o _ t e m p l a t e % # BATTALION l i n k s e n d
S i f NOT [ i t e m i n f o % p o p _ p a t h % / î i n f o _ t e m p l a t e % -POLYGON %rel_name% - i n d e x e d ] s t h e n i n d e x i t e m i p c p _ p a t h 4 / % i n f o _ t e m p l a t e % . p a t %rel_name%
i o i n i t e m % p c p _ p a t h % / % i n f o _ t e m p i a t e % . p a t % i n f o _ t e m p _ p a t h l % i n f o _ t e m p l a t e % ~ % p o p _ p a t h % / % i n f o _ t e m p l a t e % . p a t %rel_name% %rel_name%
S r e t u r n
S r o u t i n e s e t _ r e l a t e
/ * h a v i n g p r o b l e m s , unknown why i t s n o t w o r k i n gr e l a t e d r o pSALL[ u n q u o t e ' '1r e l a t e add %rel_name%% i n f o _ t e m p _ p a t h % % i n f o _ t e m p l a t e % i n f o%r e l name%
Reproduced with permission of the copyright owner. Further reproduction prohibited without permission.

Appendix A-5
%rel_naT.eJ l i n e a r / * l i n k rw[ u n q u o t e ' ' ]
a pc l e a r s e lr e s e l % t s r _ p a t h % % t s r _ c o v % p o l y g o n 4 r e l _ n a m e % / / p o p _ t o t a l g t 2l i s t % t s r _ p a t h % % t s r _ c o v % p o l y g o nS r e t u r n
dmv2mfo.aml/ * = = = = = = = = = = = = = = = = = = = = = = = = = = = = = = = = = = = = = = = = = = = = = = = = = = = = = = = = = = = = = = = = = = = = = = = =
/ ' UNLV TRANSPORTATION RESEARCH CENTER/»-------------------------------------------------------------------------------------------------------------/ ' P r og ra m: d m v 2 i n f o . a mi/ ' P u r p o s e : c r e a t e ARC/INFO p o i n t c o v e r a g e o f V e h i c l e r e g i s t r a t i o n l o c a t i o n s/ ' --------------------------------------------------------------------------------------------------------------------------------------------------------------------------------------------------------------------------
/*■ R e q u i r e d i n p u t s a n d o u t p u t s n e e d t o r u n t h i s AML/ ' --------------------------------------------------------------------------------------------------------------------------------------------------------------------------------------------------------------------------
/ * I n p u t s : d m v _ r e c o r d s . t x t ( o b t a i n e d f r om Sue W u l f f r o m DMV)I ' O u t p u t s : REG_VEH_LOCAT p o i n t c o v e r a g e/*-------------------------------------------------------------------------------------------------------------/ * Us age : S r d m v 2 i n f o . ami
A r g u m e n t s : n one / * G l c b a l s : none/♦-------------------------------------------------------------------------------------------------------------/ • C a l l s : n on e/ . -------------------------------------------------------------------------------------------------------------/ ' N o t e s : t h i s ami w r i t e s t h e s e d a nd awk s c r i p t s n e c e s s a r y t o r e f o r m a t/ * t h e d a t a ./ " --------------------------------------------------------------------------------------------------------------------------------------------------------------------------------------------------------------------------/ * H i s t o r y : l a s t u p d a t e 9 - 2 - 9 6 by J e f f J e n s e n ( j j e n s e n S c o . d a r k . n v . u s )/ . = = = = = = = = = = = = = = = = = = = = = = = = = = = = = = = = = = = = = = = = = = = = = = = = = = = = = = = = = = = = = = = = = = = = = = = = = = =
/ *Se c h o Sons i f [ show p r o g r a m ] ne ARC S t h e n
q u i t S c a l l s e t u p S c a l l a l t e r _ a s c i i S c a l l a d d _ f r c m _ i n f o S c a l l a cdmat ch_dmv
Se c ho S o f f S r e t u r n
S r o u t i n e s e t u p
Ss i n f o _ t e m p l a t e = DMV_INFO.TMP Ss add_dmv = d m v 4 i n f o . t x t Ss r e j e o t _ o u t = r e j e c t . o u t Ss d m v _ t e x t = d m v _ r e c o r d s . t x t Ss dm.v_path = SWORK/dmv Ss g a w k _p r g = d m v 2 i n f o . a w k Ss a d d _ m a t c h _ c o v = r e g _ v e h _ l o c a t Ss a d d r e s s i t e m = a d d r e s s Ss s c l _ p a t h = / g i s d a t a / c r s c l / s o u r c e /Ss s c l = s c lSs m i n _ i n = 3.ARCH0ME/tempi a t e / a d d r e s s / m i n s c o r e . t x t Ss m i n _ c u t = % d m v _ p a t h % / m i n s c o r e . t x t
S r e t u r n
& r o u t i n e a l t e r _ a s c i i
S i f [ e x i s t s %d m v _ p a t h %/%add_dmv% - f i l e ] S t h e n s t y [ d e l e t e %dmv_path%/ %add_d.mv% - f i l e ]
S s y s s e d ' s / \ 4 / / g ' <%dmv_path%/ l dmv_t ex t% > / t m p / t r a s h l
Reproduced with permission of the copyright owner. Further reproduction prohibited without permission.

Appendix A-6
s i f [ e x i s t s Scmv_path%/%gawk_prg% - f i l e ] S t h e n S t y [ d e l e t e % d m v _ p a t h l / %gawk_prg% - f i l e ]
Ss o u t = [open %dmv_path%/%gawk_prg% s t a t - w r i t e ]s s s t a t [ w r i t e %out» 'BEGIN [ EIELDWIDTHS = "B 30 30 23 2 5 6 6 2 3 2 2 17 i 3" ; OFS = " # " ] {Ss s t a t [ w r i t e %out% ' i f (S14 == "B")Ss s t a t [ w r i t e %out% ' ( p r i n t N R , S I , S 2 , S 3 , S 4 , S S , $ 6 , 3 7 , S B , S 9 , S I O , S l l , 3 1 2 , S 1 3 , 3 1 4 , "CLARK"1 }Ss s t a t [ c l o s e %out%]
S s y s gawk - f %dmv_path%/%gawk_prg% < / t m p / t r a s h l > % d m v _ p a t h % / t r a s h 2 s i f [ e x i s t s l dmv _pa th%/%ga wk_prg% - f i l e ] s t h e n
s t y [ d e l e t e *dmv_pat h%/ %gawk_prg% - f i l e ]
S s y s rm / t m p / t r a s h lS s y s s e d " s / \ ' / / g " < % d m v _ p a t h % / t r a s h 2 > / t m p / t r a s h 3 S s y s rm % d m v _ p a t h 4 / t r a s h 2S s y s s e d ' s / \ , / / g ' < / t m p / t r a s h 3 >%d mv _pa th%/ t r as h4 S s y s rm / t m p / t r a s h 3S s y s s e d ' s / / / g ' < % d m v _ p a t h % / t r a s h 4 > / t m p / t r a s h 5S s y s rm % d m v _ pa th % / t ra s h4S s y s s e d ' s / / / g ' < / t m p / t r a s h S > % d m v _ p a t h i / t r a s h 6 S s y s rm / t m p / t r a s h SS s y s s e d ' s / / / g ' < % d m v _ p a t h î / t r a s h 6 > / t m p / t r a s h 7 S s y s rm % d m v _ p a t h % / t r a s h 6S s y s s e d ' s / / / g ' < / t m p / t r a s h 7 >%dmv_path%/%add_dmv%S s y s rm / t m p / t r a s h 7
s r e t u r n
S r o u t i n e a d d _ f r o m _ i n f o
w %dmv_path%s i f [ e x i s t s % i n f o _ t e m p l a t e % - i n f o ] S t he n
S t y [ d e l e t e %i n f o _ t e m p l a t e % - i n f o ] s i f [ e x i s t s î d m v _ p a t h % / % r e j e c t _ o u t î - f i l e ] S t h e n
S t y [ d e l e t e % d m v _ p a t h l / % r e j e c t _ o u t % - f i l e ]S d a t a ARC INFO ARCDELIMITER 4DEFINE %i n f o _ t e m p l a t e ' iRECNUM,7,7, ILICENSE_PLATE«, 8 , B, COWNERS_NAME, 3 0 , 3 0 , C[ u p c a s e î a d d r e s s i t e m % ] , 3 0 , 3 0 , CC I T Y , 2 3 , 2 3 , CSTATE,2 , 2 , CZIPCODE, 5, 5 , CTRANSACT_DATE , 6 , 6 , 1EXPI RE_DATE,6 , 6 , IVEH_YEAR,2 , 2 , IVEH_MAKE,3,3,CVEK_BODY_TY P E , 2 , 2 , CVEH_CYLINDERS,2,2,XVEK_YIN_NDM,17, 1 7 , CCOUNTY_RESIDENCE, 1 0 , 1 0 , 0
SEL % i n f o _ t e m p l a t e %ADD FROM . . / l a d d _ d m v i . . / % r e j e c t _ o u t %Q STOP SendS s e t v a r a m i u n i t 4 = [ o pe n % r e j e c t _ o u t % o p e n s t a t -READ]S i f %opens t at % = 0 s t h e n
Sdos s e t v a r r e c o r d 4 = [ r e a d %amluni t4% r e a d s t a t 4 ]S l v r e c c r d 4S i f %r e a d s t a t 4 % NE 102 S t h e n
S r e t u r n Sinform. Not a l l t h e f i l e s we re i n p u t e d , e r r o r i n % a d d _ s t r e e t %S s e t v a r c l o s e s t a t 4 = [ c l o s e %am.lunit4% r e a d s t a t 4 ]
Sends i f [ e x i s t s %add_dmv% - f i l e ] s t h e n
s t y [ d e l e t e %add_dm.v% - f i l e ]S r e t u r n
Reproduced with permission of the copyright owner. Further reproduction prohibited without permission.

Appendix A-7
S r o u t i n e addir’. a t ch_dmv
S i f [ e x i s t %dmv_pa t hî %add_mat ch_cov% - p o i n t ] S t h e n k i l l %dmy_pat h%î add_mat ch_cov% a l l
Ss s c o r e = 95/*■ comment s k i p _ x i f r u n n i n g Xwindows S g o t o s k i p x S t e r m 9999S s e t v a r s c o r e = [ g e t c h o i c e 1 0 0 , 99, 98, 97 , 96, 95, 9 4 , 9 3 , 9 2 , 9 1 , 9 0 , 8 9 , 3 3 , 8 7 , 8 6 ,
8 5 , 8 4 , 8 3 , 8 2 , 8 1 , 8 0 , 7 9 , 7 8 , 7 7 , 7 6 , 7 5 , 7 4 , 7 3 , 7 2 , 7 1 , 7 0 - p r o m p t - ' S e l e c t t h e Minimum s c o r e n e e d e d f o r a m a t c h ' - n o s o r t - n o n e ]
S i f [ n u l l î s c o r e % ] S t h e n s r e t u r n
S l i s t v a r s c o r e S l a b e l s k i p _ x
S d a t a / b i n / c s h s e t c s c or e= % sc o re % s e t I g r e p c s c o r egawk 'SO ( g s u b ( 1 0 0 , ' S c s c o r e ' , S I ) ; p r i n t SO }' <%min_in% >%min_out%Senda d d r e s s m a t c h % i n f o _ t e m p l a t e % % a d d re s s i t e m % %scl_path%%scl% -
%dmv_path%/%add_match_cov% # ft n o r e j e c t s r e j e c t _ s c o r e m a t c h _ s c o r e S i f [ e x i s t s %min_out% - f i l e ] s t h e n
s t y [ d e l e t e %min_out% - f i l e ]S i f [ e x i s t % dm v_ p at h %% in fo _ t e mp l a t e% - i n f o ] S t h e n
S t y [ d e l e t e %d mv _p a t h %%i nf o_ t emp l a t e% - i n f o ]S r e t u r n
Reproduced with permission of the copyright owner. Further reproduction prohibited without permission.

Appendix B
Department of Motor Vehicles and Public Safety Vehicle Registration Data Dictionary
Appendix B -1
Reproduced with permission of the copyright owner. Further reproduction prohibited without permission.

Appendix B-2
Appendix B Table of Contents
Appendix B ............................................................................................................................................... 1Table o f Contents.....................................................................................................................................2CONTACT LIST.....................................................................................................................................3INTRODUCTION.................................................................................................................................. 4FUTURE WORK.....................................................................................................................................5Figure 1 : Pie Chart o f Address Matching Results.................................................................................6COLUMNS 001-007: RECORD_NUMBER....................................................................................... 7COLUMNS 008-016: LICENSE_PLATE#..........................................................................................7COLUMNS 017-046: REGISTERED_OWNER.................................................................................7COLUMNS 047-076: ADDRESS.........................................................................................................7COLUMNS 077-099: CITY...................................................................................................................7COLUMNS 100-102: STATE............................................................................................................... 7COLUMNS 103-107: ZIPCODE..........................................................................................................7COLUMNS 107-112: TRANSACTION_DATE.................................................................................7COLUMNS 113-118: EXPIRATION_DATE..................................................................................... 8COLUMNS 119-121: VEfflCLE_YEAR.............................................................................................8COLUMNS 121-123: VEfflCLE_MAKE............................................................................................9COLUMNS 121-123: VEfflCLE_MAKE (Continued)..................................................................... 10COLUMNS 121-123: VEHICLE_MAKE (Continued)..................................................................... 11COLUMNS 121-123: VEHICLE_MAKE (Continued)..................................................................... 12COLUMNS 121-123: VEfflCLE_MAKE (Continued)..................................................................... 13COLUMNS 121-123: VEfflCLE_MAKE (Continued)..................................................................... 14COLUMNS 121-123: VEHICLE_MAKE (Continued)..................................................................... 15COLUMNS 121-123: VEHICLE_MAKE (Continued).....................................................................16COLUMNS 121-123: VEfflCLE_MAKE (Continued)..................................................................... 17COLUMNS 121-123: VEfflCLE_MAKE (Continued)..................................................................... 18COLUMNS 121-123: VEHICLE_MAKE (Continued)..................................................................... 19COLUMNS 121-123: VEfflCLE_BODY_TYPE............................................................................. 20COLUMNS 121-123: VEfflCLE_BODY_TYPE (Continued).......................................................21COLUMNS 124-126: VEHICLE CYLINDERS................................................................................21COLUMNS 128-144: VEHICLE YIN NUMBER............................................................................ 22COLUMNS 145-145: OWNERS COUNTY OF RESIDENCE......................................................23APPENDIX........................................................................................................................................... 24AML....................................................................................................................................................... 25
Reproduced with permission of the copyright owner. Further reproduction prohibited without permission.

Appendix B-3
CONTACT LIST
Sue Wulf (702-687-5509) is the contact person to order the Department Vehicle Registration database. She takes lunch from l:00p to 2:00p. The University cost is $150 which they accepted from a purchase order (PC). The data was transferred to the University on a 9-track tape. Information on who extracts the data from the mainframe was not gathered but it was found that Joyce Fogliani (702-687-5505) is the Supervisor over Sue Wulf.
Reproduced with permission of the copyright owner. Further reproduction prohibited without permission.

Appendix B-4
INTRODUCTION
This data dictionary was created by Jeff Jensen of the Transportation Research Center in September 1995. It is felt that this dictionary will supply the history and needed information on importing this database to an ARC/INFO coverage. This introduction will contain the steps used to meet this end. After ordering and receiving the data fi-om Sue Wulf (see contact list). Bob Thorson at nye read the 9 tract tape into an ASCII file. Then a awk script was written to filter the data into a format that INFO can read, while at the same time remove those records that cannot be ADDRESSMATCHed (i.e. PC BOX addresses). Once this data is within INFO, I used the supplied AML to convert the database into a PAT. The vehicle registration database was ADDRESSMATCHed against the Sept. 1995 version of GISMO's street centerline (scl) coverage.
Reproduced with permission of the copyright owner. Further reproduction prohibited without permission.

Appendix B-5
FUTURE WORK
One could modify the data to get a better addressmatch rate. The 1995 data I received contained 1,185,481 records for Nevada, of which 672,638 are in Clark County. A pre-processor/filter was used to remove PO BOX addresses. This gave 634,974 records to addressmatch. 455,313 were match and 179,661 rejected (see pie chart). The matched records could be increased by writing a pre-processor to separate the apartment number from the address. From a causal look at the records that were parsed and matched by ARC/INFO (e.g. ADDRES SPARSE is ARC/INFOs method to standarized the address), none of the records contained apartment numbers. This leads me to suspect that addresses that contained apartment numbers were automatically rejected.
The data obtained from the Department of Motor Vehicles was for May 7, 1995. A total of 1185481 records were received for vehicles registered in the State of Nevada, excluding motor carrier vehicles (e.g. 18 wheeler trucks). Of those, 672638 are for Clark County. A preprocessor/filter was written using GAWK to remove the PO Box addresses, which addresses cannot be addressmatched (unless the Post Ofiice releases this information to the public). This resulted in 634974 records to can be addressmatched. After running ARC/INFO, 455313 were geocoded while 179661 were rejected. An increase in matched records could be obtained if another pre-processor was written to remove those records that contained apartment numbers.The following figures give the break down of the data in a pie chart.
Reproduced with permission of the copyright owner. Further reproduction prohibited without permission.

Appendix B-6
Results of Creating an ARC/INFO Coverage from the DMV Vehicle Registration Records for Nevada
4: Rejected addressmatch
(179,661 records) for Clark County
3: Addressmatched (455,313 records) for
Clark County 38%
1: All other Counties (512,843 records)
44%
2: P.O. Box addresses (37664 records) for Clark
County
Figure 1: Pie Chart of Address Matching Results
Reproduced with permission of the copyright owner. Further reproduction prohibited without permission.

Appendix B-7
COLUMNS 001-007: RECORD_NUMBER
A unique interger item that can be used to relate the ARC/INFO database to the DMV vehicle registration database. A gawk script was written that add the line number (i.e. record number) to the beginning of each record in the database.
COLUMNS 008-016: LICENSE PLATE#
A unique 8 character field that matches the license plate number on each vehicle.
COLUMNS 017-046: REGISTERED OWNER
Name of person, business, or trust fimd that the vehicle is registered under.
COLUMNS 047-076: ADDRESS
Post office mailing address. Place were to send vehicle registration renewal notices.
COLUMNS 077-099: CITY
City in Nevada where the vehicle registration renewal can be sent.
COLUMNS 100-102: STATE
One of the States in the United States of American where the vehicle registration renewal form can be sent.
COLUMNS 103-107: ZIPCODE
U.S. Post Office region
COLUMNS 107-112: TRANSACTION_DATE
A 6 character field formatted by month, day, and year.
Example:
010195 = January 1, 1995 A.D. (in the year of our Lord)
Reproduced with permission of the copyright owner. Further reproduction prohibited without permission.

Appendix B-8
COLUMNS 113-118; EXPIRATION_DATE
A 6 character field formatted by month, day, and year.
Example:
010195 = January 1, 1995 A.D. (in the year of our Lord)
COLUMNS 119-121: VEfflCLE_YEAR
Model year when the vehicle was manufactured.
Reproduced with permission of the copyright owner. Further reproduction prohibited without permission.

Appendix B-9
COLUMNS 121-123: VEHICLE MAKE
Automobile Make Abbreviation Codes Automobile Make Abbreviation Codes
Abarth ABC AC ACCobra COB Acadian ACAAcura ACU Adette ADEAerocar AER Aeta AETAlfa Romeo ALF All State ALSAllard ALL Alma ALMAlpine ALP Alta ALTAlvis ALV Ambassador AMSAmericar AMP AMX AMXArgonaut ARG Arista ARSArmstrong Siddeley ARM Amolt-Bristol ARNASA ASA Ascort ASCAshley ASH Aston-Martin ASTAuburn AUB Audi AUDAustin AUS Austin-Healey AHAuto Union ATU Autobianchi AUBAutobleau AUT Autocar ATCAutocarrier ATR Avanti AVNAvenger AYE Avia AVIBantam BAN Beaumont BEABedford BED Bentley BENBergantin BER Bizzarrini BIZBMC BMC BMW BMWBobbi-Kar BOB Bocar BOCBond BON Borgward BORBradley GT BRA Brastinca BRSBricklin BRI Bristol BRSBugatti BUG Buick BUIButterfield Muskateer BUT Cadillac CADCapri CAP Chaika CHAChallenger CHL Checker CHKChevrolet CHE Ching-man-shan CMSChrysler CHR Cisitalia CISCitroen CIT CLUA CLUConnaughty CON Contessa CNTCooper COO Cord CORCrofton Cub CRO Crosley CRSCubster CUB Cunningham CUNDaf DAF Daihatsu DAHDaimler DAI Datsun DAT
Reproduced with permission of the copyright owner. Further reproduction prohibited without permission.

Appendix B-10
COLUMNS 121-123: VEHICLE MAKE (Continued)
Automobile Make Abbreviation Codes Automobile Make Codes
Davis DAV DB D BDebonair DEB Deep Sanderson DEEDellow * DEL Delorean* DELDenzel DEN Desoto DESDetomaso DET Di Telia DITDiva DIV DKW DKWDodge DOD Dong Peng DONDuel DUL Duesenberg DUEDurant DUR Edsel EDSElva ELV Emw EMWEnglish Ford E F Envoy ENVEnzmann ENZ Erskine ERSEshelman ESH Essex ESSExcalibur EXC Facxellia FACFagel-Vega FAV Fairthorpe FAIFalcon (British) FAL Felber FELFerrari FER Fiat FIAFiesta FIE Ford FORFranklin FRA Frazer FRZFrench Ford F F Frisky FRIGaz GAZ Giannini GIAGilbem GIL Ginetta GINGitane GIT Glas GLAClassic GLC Goggomobil GOGGoliath GOL Gordon GORGraciela GRA Graham GRHGraham-Paige G P Gremlin GREGriffith GRI Gsm GSMHeinkel HEI Henry J HENHickey Trail-Blazer HTB Hillman HILHindustan HIN Hino moHolden HOL Honda HONHongki HOG Horch Limousine HOCHornet HOR Hotchkiss HOTHrg HRG Hudson HUDHumbee Surrey HUM Humber HUBHupmobile HUP Hyundai HYUlame lAM Ika IKAIMP IP Imperial IMPInnocenti INN Intermeccanica INM
Reproduced with permission of the copyright owner. Further reproduction prohibited without permission.

Appendix B-11
COLUMNS 121-123: VEfflCLE_MAKE (Continued)
Automobile Make Abbreviation Codes Automobile Make Codes
International INT Isetta ISEIso ISO Isuzu ISUItalian Ford ITF Jaguar JAGJavelin JAV Jeep JEEJensen JEN Jensen Healey JHJetmobile JET Jowett JOWKaiser KAI King Midget KINKurtis Kraft KUR Lada LADLagonda LAG Lamborghini LMBLanchester LAC Lancia LANLasalle LAL Laser LASLea-Francis LEF Lincoln LINLloyd LLO Locomobile LOGLola LOL Loodcraft LOOLotus LOT Marcos MACMarelin MAR Maserati MASMatador MAT Matra MAAMaxwell MAX Mazda MAZMbm MBM Mean MEAMercede-Benz MEB Mercury MERMerkur MKR Messerschmitt MESMeteor MEE Metropolitan METMG M G Mikasa MIKMikrus MKS Mistral MISMitsubishi MIT Monarch MONMoretti MOE Morgan MOGMorris MOR Moskvitch MOSMuntz MUN Murena MURMzma MZM Nardi-Danese NARNash NAS Nash-Healey N HNeckar NEC Nissan NISNsu NSU Oakland OAKOgle OGL Ohta OHTOldsmobile OLD Opel OPLOsca OSC Osi OSIOtosan OTO Overland OVEPacer PAC Packard PAKPallister PAL Panhard PANPantera PNT Peace PEAPeel PEE Peerless PER
Reproduced with permission of the copyright owner. Further reproduction prohibited without permission.

Appendix B-12
COLUMNS 121-123: VEHICLE MAKE (Continued)
Automobile Make Abbreviation Codes Automobile Make Abbreviation Codes
Pegaso PEG Peugeot PEUPierce Arrow PIE Pininfarina PINPlayboy PLA Plymouth PLYPoirier POI Pontiac PONPorsche POR Prairie Schooner PRAPrince Motors PRM Progress PROPtv PTV Puch PUGRamses RMS Rebel REBReliant REL Renault RENReo REO Riley RILRoadster ROA Rochdale RCCRockne ROK Rolls Royce ROLRootes ROC Rover ROVRycsa RYC Saab SAASabra SAB Sapporo SAPSeat SEA Sera SERShelby American S A Siata SIASilaA SIL Simca SIMSinger SIN Skoda SKOSovam SOV Standard STAStar STR Sterling STLSteyr-Puch STE Strale SRLStudebaker STU Stutz STZSubaru SUB Sunbeam SUNSuper Two SUP Suzuki suzSuzulight SU, SUU Syrena SYRTama TAM Tatra TATTaunus TAU Tchaika TCHTerraplane TRP Tjaarda TJATornado (British) TOR Toyota TOYTrabant TRA Triumph TRITrojan TRO Tucker TUGTurner TUR Tvr TVRTz TZ Unicar UNIUnipower UNP Val VALValkrie VLK Vanden Plas VNDVanguard VAN Vauxhall VAUVeritas VER Vespa VESVolga VOG Volkswagen VOLVolvo VLV Warezawa WAR
Reproduced with permission of the copyright owner. Further reproduction prohibited without permission.

Appendix B-13
COLUMNS 121-123: VEfflCLE_MAKE (Continued)
Automobile Make Abbreviation Codes Automobile Make Abbreviation Codes
Wartburg WRT Warwick WRTWatford WAT Wendax WENWhippet WHI Willys Knight WYKWilson WIL Wolseley WOLWoodill Wildfire WOO Worthingtom Champ WORYenko YEN Yin YENYugo YUG Zagato ZAGZapopazhets ZAP Zar Car ZARZeta ZET Zil ZILZim ZIM Zundapp ZUNZwickau ZWI
Reproduced with permission of the copyright owner. Further reproduction prohibited without permission.

Appendix B-14
COLUMNS 121-123: VEHICLE MAKE (Continued)
Motorcycle Make Abbreviationi Motorcycle Make Abbreviation Code
Ajs AJS Ajw AJWAlexander-Reynolds ALE Allied ALIAllstate ALL Aloutte ALOAlsport/Steen ALS Ambassador AMBAmen AME American Eagle AEAAmphicat AMP Arco AROArgyle AGY Ariel ARIArtie Cat ARC Artie ARTAtlas ATA Attex ATEAugustana AUG Auranthetic Charger AURBajaj America BAJ Balkan BALBantam BAN Batavis Mo-ped BATBebe BEB Bender-Florin BEFBenelli BEN Bianchi BIABimota BIM Bingham BGHBird BIR Black Knight BKKBlazer BLZ BMW BMWBombardier BOM Bonanza BNZBond BON Borella BRLBreak BRE Bridgestone BRIBroncco BRO Brutt BRUBSA BSA Bug BUGBultaco BUL Burrito BURCampus Bike CBK Can Am CANCaper Cycle CPC Capri CAPCapriolo CPL Carabela CARCat CAT Ccm/Clews CMCCentaur CEN Cezetta CEZChaparral CHA Charger CHRCheetah CHT Chibi cmChuio CHU Cimatti CIMColeman COL Colt CLTCondor CON Continental CTLCooper COO Corbin Electric CRECotton COT Craftsman CRACushman eus Cyclescoot CYSCZ CZ Dalesman DALDanuvia DAN Darwin DARDerbi DER Dkr DKRDkw DKW Dmp DMP
Reproduced with permission of the copyright owner. Further reproduction prohibited without permission.

Appendix B-15
COLUMNS 121-123: VEHICLE MAKE (Continued)
Motorcycle Make Abbreviation Motorcycle Make Abbreviation
Dot DOT Ducati DUCDynacycle DYN Eagle EGLEco-Bike ELC, ECO Edwins EDWElectric Cycle ELC Eml EMLEssix ESS Excelsior EXCExplorer EXP Fantic Motors FNTFhl FHL FN FNFormost FOR Fox FOXFrancis-Bamett FRB Fruin FRUFuju Robbt Jr FUJ Garelli GARGemini GEM Gilera FILGilson GLS Globe GLOGo Kart GKT Gogomobile GOGGolfmobile GLM Greeves GREGrm GRM Grove it 58 rough term GRVGuazzoni GUZ Guizzo GUIHagon HGN Hansa HANHarley-Davidson H D Hawthorne HAWHeathkit HEA Heinkel HEIHercules HER Herter HRTHiawatha HIA Hodaka HODHoffman HOF Holandia Holder HOLHomemade HOM Honda HONHorex HRX Hummel HUMHusky HUK Husqvama HUSIndian IND Italjet ITAItom ITO J C Penny PENJames JMS Jawa/Cz JAWJb JB Jet JETJonny Lightning JOL Jupiter JPTKama KAM Kami KMIKawasaki KAW King Scorpion KNSKitty Cat KIT Komar KOMKreidler KRD Ktm KTMLambretta LAM Lancer LANLaverda LAV Lectracan LEGLil Indian LLI Lilac LILLombard LOM Lucky LUKM V Augusta MVA Maico MAIMalyette MAL Manet MAN
Reproduced with permission of the copyright owner. Further reproduction prohibited without permission.

Appendix B-16
COLUMNS 121-123: VEHICLE MAKE (Continued)
Motorcycle Make Abbreviation Motorcycle Make Abbreviation
Marco MAR Marusho MRUMassey MAS Matchless MTCMatrette MTR Maverick MAVMB MB Mds MDSMinelli MEN Mini-Marcellino MMCMiniscooter MNS Mobylette MBYMojave MOJ Monarch MONMonark MNK Mondial MNDMonte MNT Montessa MTSMontgomery Ward (Riverside) RIV Moto Beta MTBMoto Guzzi MTG Moto Morini M MMoto Rumi MRU Motobecane Moped MOTMotobic MBI Motocross MTCMotom MTM Motorette MRTMuhlberg MUH Mustang MUSMZ MZ Norman NRMNorton NOR NSU NSUNumber One NUO Omega OMEOpel OPL Ossa OSSPacemaker PCM Pacesetter PCSPannonia PAN Panther PNTParilla PAR Paris PRSPdv PDV Pederson PDSPegaso PEG Penton PENPeugeot PEU Phoenix PHNPiazio PIA Pointer PNTPonycycle PNY Powell POWPower Dyne PWD Premier PRMProgress PRO Puch PUCRabbit RAB Rabbit Jr RBJRaider RDR Revcon RVCRex REX Rickman RICRiverside RIV Rockford ROCRockwell RKW Rokon ROKRollfast ROL Royal Enfield R ERoyal Sovereign RS Rumi RUMRupp RUP Rutt RUTRuttman RTM Sachs SACSafti SAP Salsbury SALSanto SAN Saracen SAR
Reproduced with permission of the copyright owner. Further reproduction prohibited without permission.

Appendix B-17
COLUMNS 121-123: VEHICLE MAKE (Continued)
Motorcycle Make Abbreviation Motorcycle Make Abbreviation
Scootalong SCAScott SCTScrambler SRMSensation SNSSfin SFMSilver Pigeon S PSimson SIMSnow Tri Scat STCSolo Electra SLESpeed SPESperry Rand SPDSportsman SPGSprite SPISun SUNSuper Flea SUFSuzuki SUZTacquito TCQTempo TEMTesti TSTTohatsu TOHTote Gote TGTrail Blazer T BTrail Breaker TBRTrail Flight TRFTrail Horse THRTrans-sport TRSTri-rod TRRTrike TRITule Trooper TUTTwn TWNUral URAVan Tech VANVelosolex Moped VLM Vespa VESVilliers VUWasp WAS
ScorpionScoutSearsServicycleShiSimplexSkatSolexSpartaSpeedwaySpirit EagleSpringcycleSteen (Al/SportSunbeanSuper GlideSwmTecumsethTessyThompsonTorrotToyocoTrail BossTrail BroncTrail HawkTrail TrampTravisTri-sportTriumphTwisterTyranValiantVelocetteqVenusVictoriaVincentWatsonian
SCOsouSEA SRV SHE SPX SKA SOL SPR SPW SPE SPC
Steen) ALS SNB SUG SWM TEC TES THN TOR TYC TRB TBO TRH TRT TRA TST TPH TWS TYR VAL VEL VEN VIC VIN WTS
Reproduced with permission of the copyright owner. Further reproduction prohibited without permission.

Appendix B-18
COLUMNS 121-123: VEHICLE MAKE (Continued)
Truck Make Abbreviation Truck Make Abbreviation
Alfa Romero ALF Allis-Chalmers ALIAmerican Economobile AMH Arrow ARRAtlas ATL Austin AUSAutocar AUT Automatic ATTAvailable AVA Barrett BARBendbc Mobile BDX Biederman BIEBMC BMC Bolens BOLBriggs Stratton BST Brock BCKBrockway BRC Bros BRSBrown BWN Buckner BKRBuffalo Springfield BFS Bug BUGBuick BUI Cameo CAMCase CAS Caterpiller CATCaveman CAY Chevrolet CHEChrysler CHR Clark CLAClark-wilson CLW Coleman COLColt CLT Commer COMCony Truck CON Cook COOCorbitt COR Craftsman CRACrane CRN Crane Carrier CNCCrosley CRO Cushman eusDaf DAF Dart DARDatsun DAT David Brown Tractor DBTDeutz Tractor DEU Diamond Reo DIADiamond T DIT Divco DIVDkw DKW Dodge DODDuplex DUP Dynahoe DYNEconomy-Wisconsin ECO Elec-trac ELEEnglish Ford EFD Establishment ESTEuclid EUC Fabco FABFageol FGL Fargo FARFederal FED Fiat FIAFirestone FIR Flexible FLEFord FOR Freightliner FRGFwd FWD Galion GALGmc GMC Goggomobile GOGGoliath GOL Gradall GRDGreat Escape GEE Hackney HACHaflinger HAF Hahn HAHHayes Log Truck HAY Hendrickson HEN
Reproduced with permission of the copyright owner. Further reproduction prohibited without permission.

Appendix B-19
COLUMNS 121-123: VEHICLE MAKE (Continued)
Truck Make Abbreviation Truck Make Abbreviation
Hillman HIL Holmes HOLHough HOU Huber-Warco HUBHudson HUD Huffy HUFHyster HYS Ihc IHCIndiana IDI International Harvest INTIsuzu ISU Iveco IVEJacobsen JAG Jeep JEEJohn Deer DEE Kaiser Jeep KAIKassborh KAS Kenworth KENKubota KUB LaFrance LAFLand Rover LND Lewis-Shepard LEWLeyland LEY Linn LINLloyd LOY Lynn-Towtruck LYNMack MCK Marmon Harrington MAHMassey-Ferguson MAS Mazada MAZMelroe MEL Mercedes-Benz MEBMichigan MIC Monibus MOBMurray MUR Nash NASNash Rambler RAM New Holland NEWNissan NIS Northwest NOROliver OLI Oshkosh OSHPace Arrow PCA Peterbuilt PBTPlymouth PLY Pontiac PONReo REO Roof ROORover ROV Sabra SABScania SCA Snapper SNAStartrek STA Sterling STEStewart STW Steyr-Diamler-Puch SDPStudebaker STU Subaru SUBSuzuki SUZ Texoma Inc. TEXThames THA Toro TORToyota TOY Trojan TROVolkswagen VOL Volvo VLVWagner WAG Walter WALWard La France WLF Western Star WSSWhattoff WHT White WHIWhite Freightliner WHI Willy-overland WLOWillys WIL Wizzard WIZYale YAL Yazco YAZ
Reproduced with permission of the copyright owner. Further reproduction prohibited without permission.
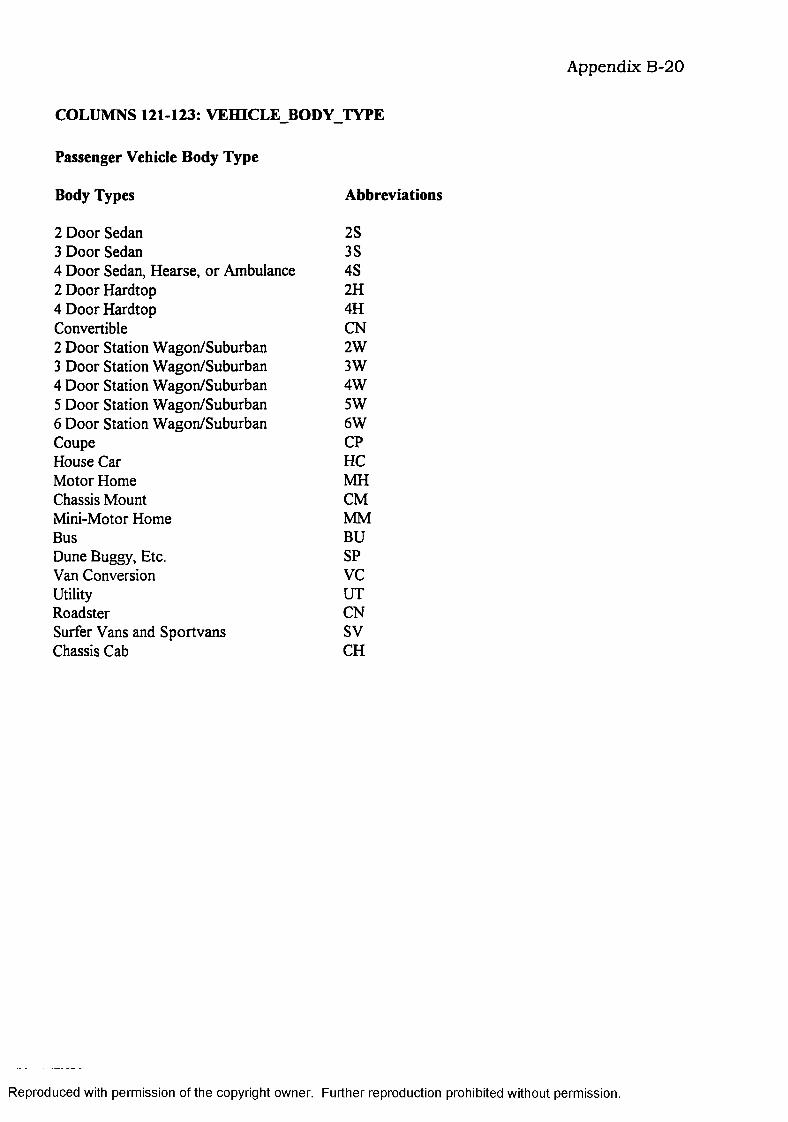
Appendix B-20
COLUMNS 121-123: VEfflCLE_BODY_TYPE
Passenger Vehicle Body Type
Body Types Abbreviations
2 Door Sedan 2S3 Door Sedan 3S4 Door Sedan, Hearse, or Ambulance 4S2 Door Hardtop 2H4 Door Hardtop 4HConvertible CN2 Door Station Wagon/Suburban 2W3 Door Station Wagon/Suburban 3W4 Door Station Wagon/Suburban 4W5 Door Station Wagon/Suburban 5W6 Door Station Wagon/Suburban 6WCoupe CPHouse Car HCMotor Home MHChassis Mount CMMini-Motor Home MMBus BUDune Buggy, Etc. SPVan Conversion VCUtility UTRoadster CNSurfer Vans and Sportvans SVChassis Cab CH
Reproduced with permission of the copyright owner. Further reproduction prohibited without permission.

Appendix B -21
COLUMNS 121-123: VEHICLE_BODY_TYPE (Continued)
Truck Vehicle Body Type
Body Types
T ravelall/Carryall/Panel/Express Pickup (Insl., El Camino, Ranchero)VanFlat BedStakeDumpCab & Chassis (includes tow, mixer, wrecker)DeliveryTractorTankerSpecial
Abbreviations
PNPUVAFBSTDUCHDLTRTKSP
Mobile Home & Travel Trailers Vehicle Body Types
Body Types Abbreviations
House Trailer Tent/Travel Trailer
HSTT
Non-Commercial Trailer Body Types
Body Types
One Wheel Two Wheel Four Wheel Six Wheel Eight Wheel
Abbreviations
OWTWFWSWEW
COLUMNS 124-126: VEHICLE CYLINDERS
Integer field, 2 width.
Reproduced with permission of the copyright owner. Further reproduction prohibited without permission.

Appendix B-22
COLUMNS 128-144: VEHICLE VIN NUMBER
The tenth position of the YIN (Vehicle Identification Number) is the model year. The VIN is usually located on the dashboard near the lower left comer of the windshield. Example
1G1JE1119HJ162212
Where H indicates a 1987 automobile.
LETTER YEAR LETTER YEARB 1981 I 1988C 1982 K 1989D 1983 L 1990E 1984 M 1991F 1985 N 1992G 1986 P 1993H 1987 Q 1994
[soxxrcQ Edmund’s Used Cars Prices & Ratings, Spring 1995. p. 13]
Example VIN: 1GCDK14ZXLZ231725 [source VINASSIST Version 1.04 ©by NICE 1991 Law Enforcement Edition}
DIGIT DESCRIPTION MEANING1 Country of Origin United StatesG Manufacturer Chev General MotorsC Vehicle Type TmckD Gross Vehicle Weight 5001-6000 GVWRK Line Conventional Cab 4x41 Series •/2 Ton4 Body Style 2 Door CabZ Engine 4.3L V6 FIX Check Digit Check Digit ValidL Year 1990Z Assembly Plant Fort Wayne, IN231725 Sequence Number In Range
Reproduced with permission of the copyright owner. Further reproduction prohibited without permission.

Appendix B-23
COLUMNS 145-145: OWNERS COUNTY OF RESIDENCE
CODE COUNTY in Nevada
A ChurchillB ClarkC DouglasD ElkoE EsmeraldaF EurekaG HumboldtH LanderJ LyonK MineralL NyeM Carson CityN Pershing0 StoreyP WashoeQ White Pine
Reproduced with permission of the copyright owner. Further reproduction prohibited without permission.
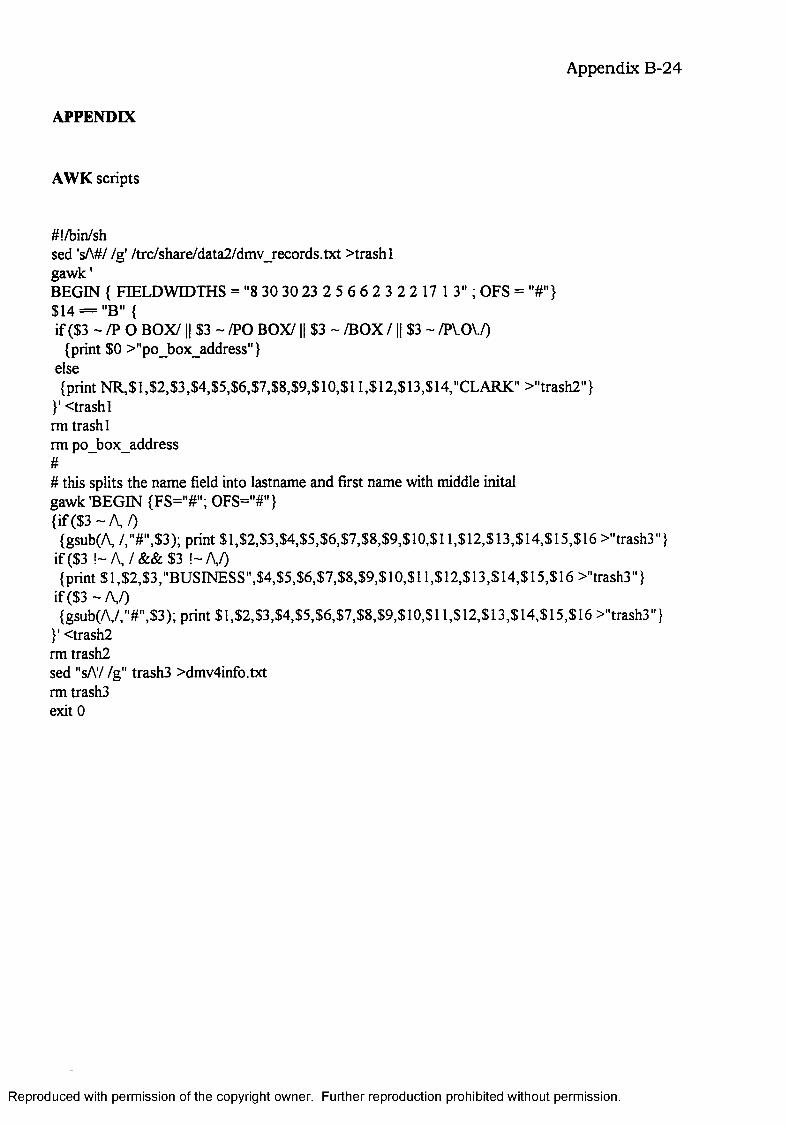
Appendix B-24
APPENDIX
AWK scripts
#!/bin/shsed 'sA#/ /g' /trc/share/data2/dmv_records.txt >trashl gawk 'BEGIN { FIELDWIDTHS = "8 30 30 23 2 5 6 6 2 3 2 2 17 I 3" ; OPS = "#"}$14 = "B" {if ($3 ~ /? O BOX/ II $3 ~ /PO BOX/1| $3 ~ /BOX / 1| $3 ~ /P\.0\./)
(print $0 >"po_box_address"} else(print NR,$1,$2,$3,$4,$5,$6,$7,$8,$9,S10,$11,$12,$13,S14,"CLARK" >"trash2"}
}' <trashl rm trash 1rm p o b o x ad d ress## this splits the name field into lastname and first name with middle inital gawk "BEGIN (FS="#"; OFS="#"}( if ($ 3 -A ,/)
(gsub(A,/,"#",$3); print$l,$2,$3,$4,$5,$6,$7,$8,$9,S10,$ll,$12,$13,$14,S15,$16>"trash3"} if ($3 !~A ,/& & $3 \ ~ M(print$l,$2,$3,"BUSINESS",$4,$5,$6,$7,$8,$9,$10,$ll,$12,$13,$14,$15,$16>"trash3"}
if($3~A ,/)(gsub(A,/,"#",S3); print $1,$2,$3,$4,$5,S6,S7,$8,$9,$10,S11,S12,S13,$14,$15,$16 >"trash3"}
}' <trash2 rm trash2sed "sA7 /g" trash3 >dmv4info.txt rm trash3 exit 0
Reproduced with permission of the copyright owner. Further reproduction prohibited without permission.

Appendix B-25
AML
&echo &on&s info_tempIate = DMVINFO.TMP &s adddm v = dmv4info.txt &s rejectout = reject, out &s dmv_path = /trc/share/datal/dmv/&s ad d m atch co v = reg v eh lo cat &s addressitem = address &s scl_path = /trc/share/datal/gismo/&s sci = scl
&if [exists %info_template% -info] &then &s X = [delete %info_template% -info]
&if [exists %reject_out% -file] &then &s X = [delete %reject_out% -file]
&call add_ffom_info/* data can't be address matched&call addmatch dmv
&echo &off &retum
y * * * * * * * * * * * * * * * * * * * * *
&routine add_ffom_infoy * * * * * * * * * * * * * * * * * * * * *
&data ARC INFO ARCDELIMITER #DEFINE %info_template%RECNUM,7,7,ILICENSE_PLATE#,8,8,COWNER_LAST_NAME,30,30,COWNER_FIRST_NAME,30,30,CADDRESS,30,30,CCITY,23,23,CSTATE,2,2,CZIPCODE,5,5,CTRANSACT_DATE,6,6,CEXPIRE_DATE,6,6,CVEH_YEAR,2,2,IVEH_MAKE,3,3,CVEH BODY TYPE,2,2,C
Reproduced with permission of the copyright owner. Further reproduction prohibited without permission.

Appendix B-26
VEH_CYLINDERS,2,2,I VEH_VIN_NUM, 17,17,C C0UNTY_C0DE,1,1,C COUNTY_RESIDENCE, 10,10,C
SEL %info_tempIate%ADD FROM ../%add_dmv% ../%reject_out%Q STOP &end&setvar amlunit4 = [open %reject_out% openstat -READ]&if %openstat% = 0 &then
&do&setvar record4 = [read %amlunit4% readstat4]&lv record4&if %readstat4% NE 102 &then
&retum &inform Not all the files were inputed, error in %add_dmv% &setvar closestat4 = [close %amlunit4% readstat4]
&end&if [exists %add_dmv% -file] &then
&s delvarl = [delete %add_dmv% -file]&retumy * * * * * *
y * * * * * * * * * * * * * * * * * * *
&routine addmatchdmv y * * * * * * * * * * * * * * * * * * *
&setvar minin = SARCHOME/template/address/minscore.txt &setvar minout = %dmv_path%minscore.txt &if [exist %dmv_path%%add_match_cov% -point] &then
kill %dmv_path%%add_match_cov% all &s score = 95/* comment skip x if running Xwindows &goto skip x &term 9999&setvar score = [getchoice 100,99,98,97,96,95,94,93,92,91,90,89,88,87,86, ~
85,84,83,82,81,80,79,78,77,76,75,74,73,72,71,70 -prompt ~'Select the Minimum score needed for a match' -nosort -none]
&if [null %score%] &then &retum
&listvar score &label skip_x &data /bin/csh set cscore=%score% set I grep cscore
Reproduced with permission of the copyright owner. Further reproduction prohibited without permission.

Appendix B-27
gawk '$0 { gsub(100,'$cscore', $1); print $0 }' <%min_in% >%min_out% &endaddressparse %info_tempIate% %addressitem% 1addressend
addressmatch %info_tempIate% %addressitsm% %scl_path%%scl% ~ %dmv_path%%add_match_cov% # # norejects reject_score match score
&if [exists %min_out% -file] &then &s X = [delete %min_out% -file]
&if [exist %dmv_path%%info_template% -info] &then &s X = [delete %dmv_path%%info_template% -info]
&retumy * * * * * *
Reproduced with permission of the copyright owner. Further reproduction prohibited without permission.

Appendix C
Data Dictionary of Accident Records for the Nevada Department o f Transportation
Appendix C-1
Reproduced with permission of the copyright owner. Further reproduction prohibited without permission.

A ppendix C-2TABLE OF CONTENTS
COLUMNS 001-005; SERIAL NUMBER.............................................................................................5COLUMNS 006-007: COUNTY CODE..................... 5COLUMNS 008-009: ACCIDENT MONTH......................................................................................... 6COLUMNS 010-010: DELETE CODE..................................................................................................6COLUMNS 011-014: NULL ITEM 1.....................................................................................................7COLUMNS 015-016: FUNCTIONAL CLASSMCATION.................................................................. 7COLUMNS 017-018: REPORTING AGENCY.................................................................................... 8COLUMNS 019-025: STREET OCCURRED ON................................................................................ 9COLUMNS 026-032: REFERENCE STREET.....................................................................................10COLUMNS 033-033: REVERSAL CODE........................................................................................... 11COLUMNS 034-036: DISTRICT NUMBER....................................................................................... 12COLUMNS 037-037: ENGINEERING D IST O C f.............................................................................13COLUMNS 038-038: NULL ITEM 2 ................................................................................................... 15COLUMNS 039-039: ROAD CLASS................................................................................................... 15COLUMNS 040-041: HIGHWAY SYSTEM....................................................................................... 16COLUMNS 042-046: DISTANCE........................................................................................................ 18COLUMNS 047-047: FEET OR MILE................................................................................................. 19COLUMNS 048-048: DIRECTION FROM REFERÎËNCË STREET................................................. 20COLUMNS 049-053: MILEPOST NUMBER..................................................................................... 21COLUMNS 054-054: DIRECTION OF MILEPOST.......................................................................... 22COLUMNS 055-055: TYPE OF STRUCTURE.................................................................................. 23COLUMNS 056-057: NULL ITEM 3 ...................................................................................................23COLUMNS 058-058: RAMP NUMBER..............................................................................................23COLUMNS 059-060: ACCIDENT DAY..............................................................................................24COLUMNS 061-062: ACCIDENT YEAR...........................................................................................24COLUMNS 063-063: ACCIDENT DAY OF THE VÆEK................................................................. 25COLUMNS 064-065: ACCIDENT HOUR...........................................................................................26COLUMNS 066-067: ACCIDENT MINUTE...................................................................................... 27COLUMNS 068-068: LIGHT CONDITION........................................................................................27COLUMNS 069-070: NUMBER OF VEHICLES............................................................................... 27COLUMNS 071-072: AGE - DRIVER 1..............................................................................................28COLUMNS 073-074: DRIVER 1 RESIDENCE................................................................................. 29COLUMNS 075-075: SEX - DRIVER 1...............................................................................................30COLUMNS 076-077: AGE - DRIVER 2 ..............................................................................................30COLUMNS 078-079: DRIVER 2 RESIDENCE................................................................................. 31COLUMNS 080-080: SEX - DRIVER 2...............................................................................................32COLUMNS 081-082: VEHICLE 1 TYPE..........................................................................................33COLUMNS 083-084: VEHICLE 1 DIRECTION OF TRAVEL....................................................... 34COLUMNS 085-086: VEHICLE 2 TYPE............................................................................................35COLUMNS 087-088: VEHICLE 2 DIRECTION OF TRAVEL......................................................... 36COLUMNS 089-089: SEVERITY OF ACCIDENT............................................................................ 37COLUMNS 090-090: VEHICLE 1 MALE FATALITIES.................................................................37COLUMNS 091-091 : VEHICLE 1 FEMALE FATALITIES 38
Reproduced with permission of the copyright owner. Further reproduction prohibited without permission.

A p p e n d ix C-3COLUMNS 092-092: VEHICLE 1 "A" TYPE INJURIES (NUMBER OF PERSONS)................... 39COLUMNS 093-093: VEHICLE I "B" TYPE INJURIES (NUMBER OF PERSONS)................... 40COLUMNS 094-094: VEHICLE 1 "C" TYPE INJURIES (NUMBER OF PERSONS)................... 41COLUMNS 095-095: VEHICLE 2 MALE FATALITIES..................................................................42COLUMNS 096-096: VEHICLE 2 FEMALE FATALITIES..............................................................42COLUMNS 097-097: VEHICLE 2 "A" TYPE INJURIES ( N U ^ H l OF PERSONS)................... 43COLUMNS 098-098: VEHICLE 2 "B" TYPE INJURIES (NUMBER OF PERSONS)................... 44COLUMNS 099-099: VEHICLE 2 "C" TYPE INJURIES (NUMBER OF PERSONS)................... 45COLUMNS 100-101 : OTHER THAN VEHICLE 1 OR 2 MALE FATALITIES..............................46COLUMNS 102-103: OTHER THAN VEHICLE 1 OR 2 FEMALE FATALITIES......................... 46COLUMNS 104-105: OTHER VEHICLE THAN 1 OR 2 "A" TYPE INJURIES (NUMBER
OF PERSONS)..........................................................................................................................47COLUMNS 106-107: OTHER VEHICLE T H ^ 1 OR 2 "B" TYPE INJURIES (NUMBER
OF PERSONS)..........................................................................................................................48COLUMNS 108-109: OTHER VEHICLE THAN 1 OR 2 "C" TYPE INJURIES (NUMBER
OF PERSONS)..........................................................................................................................49COLUMNS 110-111 : TOTAL MALE FATALITIES..........................................................................49COLUMNS 112-113: TOTAL FEMALE FATALITIES..................................................................... 50COLUMNS 114-115: TOTAL "A" TYPE INJURIES (NUMBER OÎF PERSONS)...........................51COLUMNS 116-117: TOTAL "B" TYPE INJURIES (NUMBER OF PERSONS)...........................52COLUMNS 118-119: TOTAL "C" TYPE INJURIES (NUMBER OF PERSONS)...........................53COLUMNS 120-121: PEDESTRIAN 1 AGE.......................................................................................53COLUMNS 122-122: PEDESTRIAN 1 SEX.......................................................................................54COLUMNS 123-124: PEDESTRIAN 2 AGE.......................................................................................54COLUMNS 125-125: PEDESTRIAN 2 SEX.......................................................................................54COLUMNS 126-127: PEDESTRIAN ACTION.................................................................................. 55COLUMNS 128-129: PEDESTRIAN PHYSICAL COMJITION...................................................... 56COLUMNS 130-131 : PEDESTRIAN SOBRIETY............................................................................. 56COLUMNS 132-132: WEATHER....................................................................................................... 57COLUMNS 133-133: CONSTRUCTION STATUS........................................................................... 57COLUMNS 134-135: TYPE OF ACCIDENT......................................................................................58COLUMNS 136-136: DAMAGE TO STATE PROPERTY...............................................................60COLUMNS 137-138: FIXED OBJECT............................................................................................... 61COLUMNS 139-139: DAMAGE TO VEHICLE 1 ............................................................................. 63COLUMNS 140-140: DAMAGE TO VEHICLE 2 ............................................................................. 63COLUMNS 141-142: CONTRIBUTING FACTOR VEHICLE 1 .....................................................64COLUMNS 143-144: CONTRIBUTING FACTOR VEHICLE 2 .....................................................66COLUMNS 145-145: RESPONSIBLE DRIVER................................................................................ 68COLUMNS 146-147: DRIVER CONDITION, VEHICLE 1..............................................................68COLUMNS 148-149: DRIVER CONDITION, VEHICLE 2 ..............................................................69COLUMNS 150-151: ROAD SURFACE CONDITIONS...................................................................70COLUMNS 152-153: TRAFFIC CONTROL...................................................................................... 71COLUMNS 154-155: SPEED VEHICLE 1......................................................................................... 72COLUMNS 156-157: SPEED VEHICLE 2 .7 2
Reproduced with permission of the copyright owner. Further reproduction prohibited without permission.

A ppendix C-4COLUMNS 158-159; POSTED SPEED LIMIT.................................................................................. 73COLUMNS 160-160: HELMET USED............................................................................................... 73COLUMNS 161-200: SEATBELT INFORMATION VEHICLES 1 & 2...........................................74APPENDDC 77
Reproduced with permission of the copyright owner. Further reproduction prohibited without permission.

Appendix C-5
COLUMNS 001-005: SERIAL NUMBER
The serial number is a five digit sequence number assigned to the accident report form. Not a unique code by itself.
COLUMNS 006-007: COUNTY CODE
Code as follows;
01 = Carson City02 = Churchill03 = Clark04 = Douglas05 = Elko06 = Esmeralda07 = Eureka08 = Humboldt09 = Lander10 = Lincoln11 = Lyon12 = Mineral13 =Nye14 = Pershing15 = Storey16 = Washoe17 = White pine
99 = Unknown
Reproduced with permission of the copyright owner. Further reproduction prohibited without permission.

A ppendix C-6
COLUMNS 008-009: ACCIDENT MONTH
Code as follows:
01 = January02 = February03 = March04 = April05 = May06 = June07 = July08 = August09 = September10 = October11 = November12 = December
99 = Unknown
NOTES:Concatenate serial number, county code, accident month, and accident year to obtain a unique ID.
COLUMNS 010-010: DELETE CODE
Coded as follows :
contains a "D" if this record is to be deleted from the accident master file.
REASON:In case you have duplicate or mistake in serial # cannot just change but create new record. Also months can have errors
Reproduced with permission of the copyright owner. Further reproduction prohibited without permission.

Appendix C-7
COLUMNS 011-014: NULL ITEM 1
UNKNOWN WHY THIS ITEM WAS LEFT BLANK.
COLUMNS 015-016: FUNCTIONAL CLASSIFICATION
This field will indicate the highway functional classification for the road or street on which the accident occurred. Codes and description for highway function are as follows:
0 1 interstate rural (blue)02 interstate urban (blue)03 principal arterial rural (red)04 principal arterial urban (red)05 minor arterial rural (green)06 minor arterial urban (green)07 major collector rural (purple)08 minor collector rural (yellow)09 collector urban (yellow)10 local rural11 local urban12 principal arterial - fi-eeway/expressway urban (brown)
99 unknown
Reproduced with permission of the copyright owner. Further reproduction prohibited without permission.

Appendix C-8
COLUMNS 017-018: REPORTING AGENCY
Code at follows:
01 = Nevada highway patrol, zone 102 = Nevada highway patrol, zone 203 = Nevada highway patrol, zone 304 = County sheriffs office ( all counties)05 = Clark co. - Las vegas metro police dept.05 = Washoe co. - Reno police dept.05 = Churchill co. - Fallon police dept.05 = Elko CO. - Elko police dept.05 = Humboldt co. - Winnemucca police dept.05 = Lincoln co. - Caliente police dept.05 = Lyon co. - Yerington police dept.05 = Pershing co. - Lovelock police dept.06 = Clark co. - North las vegas police dept.06 = Washoe co. - Sparks police dept.06 = Elko CO. - Carlin police dept.07 = Clark co - henderson police dept.07 = Elko CO. - Wells police dept.07 = Washoe co. - Unr police dept.08 = Clark co. - Boulder city police dept.08 = Elko CO. - West wendover police dept.08 = Washoe co. - Pyramid lake police dept.09 = Other10 = Mesquite police dept.
99 = Unknown
Refer to highway patrol zone map for zone boundaries
NOTES:There is no such map that shows this data. Code of 00 occurs for just one record in the database.
Reproduced with permission of the copyright owner. Further reproduction prohibited without permission.

Appendix C-9
COLUMNS 019-025: STREET OCCURRED ON
This field will indicate the street number o f the road or street on which the accident occurred. A frontage road is coded here instead of a street number if the accident occurred on a frontage road.
BACKGROUND FOR STREETS AND ROADS.
System routes will be prefixed with the letter "h" to distinguish a road or street number that has been assigned by the nevada department of transportation. Many non-system roads in rural areas will not have an assigned road-street number due to being low-type facilities and low-traffic volume roads. If an accident occurs on such a facility, a street number will be assigned and entered in proper sequence, by county, in the "statewide street index." In some cases, there may be a problem locating the street on which the accident occurred in an intersection (lefr-tum, angle, etc.). In this case, if a "system route" is involved, it will be coded as the street on which the accident occurred. If a "system route" is not involved, the major street or road will be coded. System routes are those streets and roads that are on the federal-aid interstate, federal-aid primary, federal-aid secondary, federal-aid urban or designated state routes.
BACKGROUND FOR FRONTAGE ROAD, INTERCHANGE AND STRUCTURE NUMBERING:
Accidents occurring on a frontage road, interchange or structure will be given a special number corresponding to the milepost panel as posted in the field (e.g. FR 403 CL). Refer to the "statewide street index" for the proper code to be used.
EXAMPLES:
COLUMN CODE
Street Name 19 20 21 22 23 24 25
Interstate 15 H 0 0 1 5
Maple Street 0 0 2 1 6
Canyon Road 2 1 6 1 7
Frontage road west of Tropicana interchange
F R 4 0 3 C L
NOTES:If the frontage road has been mileposted every mile, reference the milepost number in columns 49-53. Refer to the "statewide street index" for the proper street number to be coded. The street number will be coded in columns 19-25. Prefix with lead zeros to fill the field.
Reproduced with permission of the copyright owner. Further reproduction prohibited without permission.

Appendix C-10
COLUMNS 026-032: REFERENCE STREET
THIS FIELD WILL BE USED TO IDENTIFY:
1. A street or road nearest the accident location. Numbers will be found, by county, in the "statewide street index".
EXAMPLE Column Numbers in Accident Database
Description 26 27 28 29 30 31 32
An accident occurred at the intersection of Brown Str and Green Str. Was coded in columns 19-25 so Green Str will be the Reference str. (statewide street index # 21652)
2 1 6 5 2
Notes: If rev code = 1 the milepost # is for REF STR If rev code = blank nothing applies to REF STR If reference street is blank: Distance, ft or mile, direction from reference st will be blank else coding error.
Reproduced with permission of the copyright owner. Further reproduction prohibited without permission.
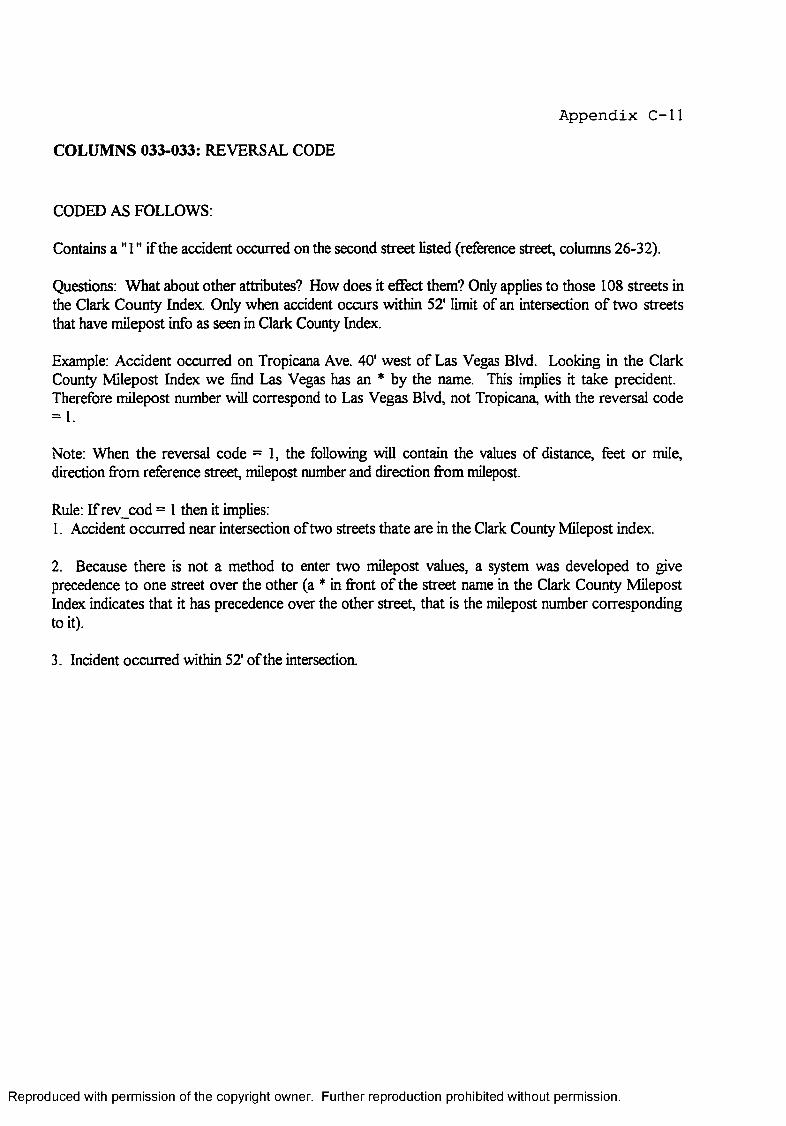
A ppendix C-11
COLUMNS 033-033: REVERSAL CODE
CODED AS FOLLOWS:
Contains a " 1" if the accident occurred on the second street listed (reference street, columns 26-32).
Questions: What about other attributes? How does it effect them? Only applies to those 108 streets in the Clark County Index. Only when accident occurs within 52' limit of an intersection of two streets that have milepost info as seen in Clark County Index.
Example: Accident occurred on Tropicana Ave. 40' west of Las Vegas Blvd. Looking in the Clark County Milepost Index we find Las Vegas has an * by the name. This implies it take precident. Therefore milepost number will correspond to Las Vegas Blvd, not Tropicana, with the reversal code = 1.
Note: When the reversal code = 1, the following will contain the values of distance, feet or mile, direction from reference street, milepost number and direction from milepost.
Rule: If rev cod = 1 then it implies:1. Accident occurred near intersection of two streets thate are in the Clark County Milepost index.
2. Because there is not a method to enter two milepost values, a system was developed to give precedence to one street over the other (a * in front of the street name in the Clark County Milepost Index indicates that it has precedence over the other street, that is the milepost number corresponding to it).
3. Incident occurred within 52' of the intersection.
Reproduced with permission of the copyright owner. Further reproduction prohibited without permission.

A ppendix C-12
COLUMNS 034-036: DISTRICT NUMBER
(1) For complete Washoe co. District listing see the Reno-Sparlcs street directory and district maps.
(2) For complete Clark co. District listing see the Las Vegas street directory and district maps.
(3) For statewide districts see statewide district descriptions and maps.
NOTES:Possible Code Values. There is a district code of 193, which county is belongs to is unknown.
County District
01 153,009, 151, 152,046, 15002 016, 157, 155, 154, 15603 005, 006, 104,023, 026, 033, 105, 100, 103, 025
027, 030, 097,102, 034, 096, 041, 10104 010, 160, 019, 020, 158, 032, 159, 044, 047, 05605 008, 013, 053, 162, 164, 161, 16306 165, 021, 16607 167,015, 16808 169, 054, 170, 17109 001, 003, 172, 174, 175, 17310 176, 007, 178, 036, 037, 17711 055, 011, 017, 194, 042, 043, 180, 179, 195, 05212 002, 181,022, 031,040, 18213 004, 186, 018, 183, 035, 184, 185, 04814 188, 028, 18715 189,05016 066, 038, 045, 078, 061, 024, 069, 064, 074, 076
071, 070, 067, 075, 060, 098, 072, 049, 081, 051 077, 063, 073
17 012, 014, 196, 191, 029, 190, 039, 192
Reproduced with permission of the copyright owner. Further reproduction prohibited without permission.

Appendix C-13
COLUMNS 037-037: ENGINEERING DISTRICT
CODE VALUES: SEE MAP
1 = Clark County2 =
3 =4 =5 =6 =
9 =
Reproduced with permission of the copyright owner. Further reproduction prohibited without permission.

Appendix C-14INSERT MAP HERE
Reproduced with permission of the copyright owner. Further reproduction prohibited without permission.
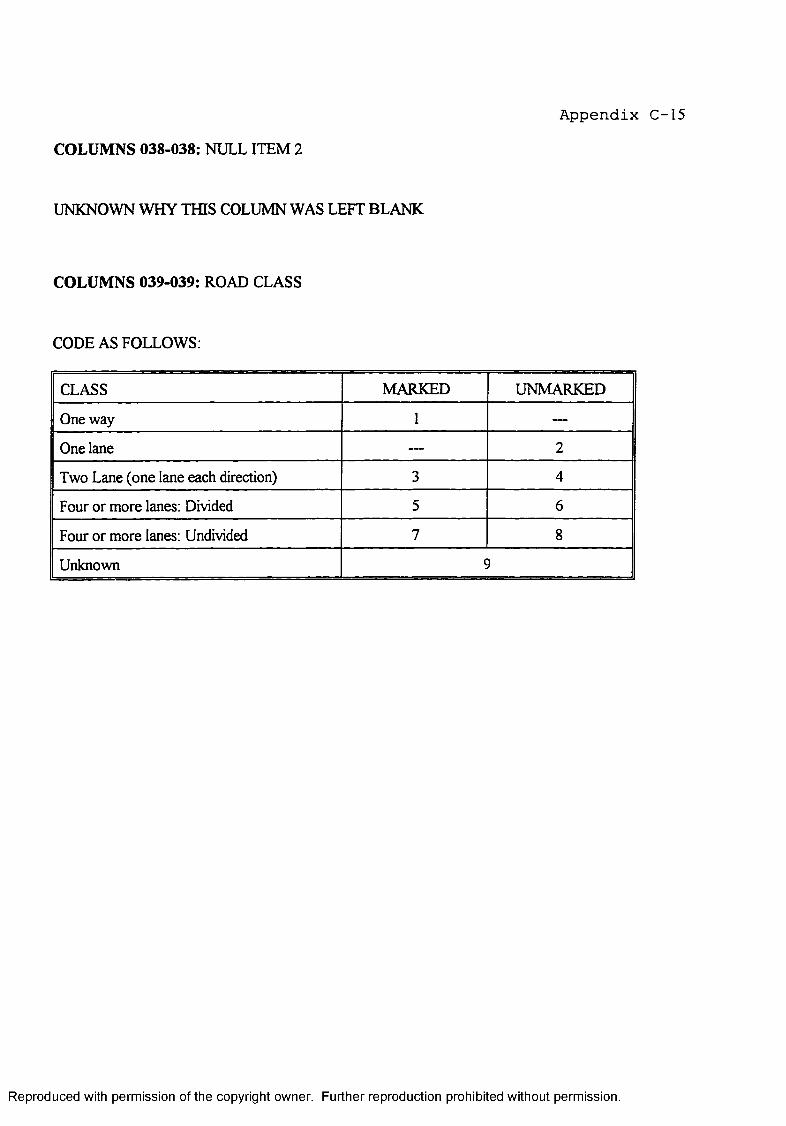
A ppendix C-15
COLUMNS 038-038: NULL ITEM 2
UNKNOWN WHY THIS COLUMN WAS LEFT BLANK
COLUMNS 039-039: ROAD CLASS
CODE AS FOLLOWS;
CLASS MARKED UNMARKED
One way 1 —
One lane — 2
Two Lane (one lane each direction) 3 4
Four or more lanes: Divided 5 6
Four or more lanes: Undivided 7 8
Unknown 9
Reproduced with permission of the copyright owner. Further reproduction prohibited without permission.

Appendix C-16
COLUMNS 040-041: HIGHWAY SYSTEM
This field will indicate the highway system classification for the road or street on which the accident occurred.I. check the urban area boundaries when coding in or near the following cities
A Carson, N.Las Vegas, Elko, Reno, Henderson, Sparks, Las Vegas, Boulder City B. Within the urban boundaries of the cities in "A" above
1. All systems will be coded urban a. 02, 03, 06, 08, 10, 12
n. When the city limits extend b^ond the urban boundary A. All systems will be coded rural
1.01,03,05, 07, 09, 11m . Within the following communities, system roads will be considered mral. All non-system streets and roads will be coded 11
A. Caliente, Ely, McGill, Babbitt, Fallon, Sun Valley, Battle Mountain, Hawthorne, Tonopah, Carlin, Gabbs, Wells, East Ely, Lovelock, Winnemucca, Yerington rV. For all other communities not listed previously
A. System roads will remain rural1.01,03, 05,07,09
B. Non-system streets and roads will be coded 11V. Codes and descriptions for highway systems are as follows
01. Interstate Rural - Completed (Purple)02. Interstate Urban - Completed (Purple)03. Other Federal-aid Primary-Rural (Green)04. Other Federal-aid Primary-Urban (Green)05. Federal-aid Secondary (Rural Only) (Red)06. Federal-aid Urban (Orange)07. Non-Federal-aid Arterials-Rural (Y ellow)08. Non-Federal-aid Arterials-Urban (Yellow)09. Non-Federal-aid CoUectors-Rural (Brown)10. Non-Federal-aid CoUectors-Urban (Brown)11. Non-Federal-aid Local-Rural12. Non-Federal-aid Local-Urban13. Federal-aid Collector (Orange with Brown Line)99. Unknown
NOTES:: 18 records had these characters, and were subsequently removed in EMACS with the command "M- X replace-string C-q C-s". These characters were only visible in EMACS. GAWK would not display any of the before mentioned characters.1994 Data Set Some files still have this designator coded in, that is, it has a value other than . Therefore, EMACS was used to replace these values with 77. Ctrl-S is an indication of
Reproduced with permission of the copyright owner. Further reproduction prohibited without permission.

Appendix C-17UNINTENTIONAL exclusion. 1993 was the last year that the system was encoded.
Reproduced with permission of the copyright owner. Further reproduction prohibited without permission.

A ppendix C-18
COLUMNS 042-046: DISTANCE
This field will be used to indicate the distance, in feet or miles, fi'om the nearest intersecting street or road. Milepost numbers will not be referenced in this field.
EXAMPLE;The accident occurred 123.6 Ft. South ofbrown street. This would be coded as follows:
Column 42 43 44 45 46
Coded Value 1 2 3 6
Decimal Place 1 GOG'S lOO's lO's I's 0.1's
The tenths place always resides in column 44. All other positions to the left of the decimal point will be placed as shown above. Leave unused columns blank.
NOTES:(1) If an intersection accident is being referenced to a milepost number (col. 49-53), Leave the field blank.
(2) Leave the field blank if the accident occurred within an interchange or structure.
Reproduced with permission of the copyright owner. Further reproduction prohibited without permission.

A ppendix C-19
COLUMNS 047-047: FEET OR MILE
This field will be used to identify the distance given in col. 42-46. If the number given was in measurement of feet, "I" will be entered into column 47 if the measurement was given by mile, "2" would be entered into column 47.
EXAMPLE 1;If the accident was 123.6 ft south of Brown street this would be coded "1".
EXAMPLE 2:If the accident occurred 1.6 miles north of Brown street, this would be coded as "2".
Example 1 Example 2
Code Value 1 2
Column Number 47 47
NOTES:(1) If an intersection accident or reference to a milepost number (col. 49-53), Leave this field blank.
(2) Leave this field blank if the accident occurred within an interchange or structure.
Reproduced with permission of the copyright owner. Further reproduction prohibited without permission.

Appendix C-20
COLUMNS 048-048: DIRECTION FROM REFERENCE STREET
THIS FIELD WILL BE USED TO;
1. Reference the distance (col. 42-46) With a direction from a street or road as follows :
1= NORTH OF 2 = SOUTH OF 3 = EAST OF4 = WEST OF5 = AT INTERSECT 9 = UNKNOWN
EXAMPLE I:The accident occurred 123.6 Feet south of Brown street. The direction would be coded:
EXAMPLE 2:The accident occurred at the intersection of Brown street and Green street.
Example 1 Example 2
Code Value 1 5
Column Number 48 48
NOTES:(1) All directions (north, south, east and west) will be entered as shown in example 1.
(2) Always enter an intersection accident as shown in example 2.
(3) If the accident is to be referenced to a milepost number (col. 49-53), Leave this field blank.
If the field = 5, then the distance should equal 0 but isn't always coded that way. The range of distance that is considered for an incident to be coded as an intersection is frizzy, that is unknown.
Reproduced with permission of the copyright owner. Further reproduction prohibited without permission.

A ppendix C-21
COLUMNS 049-053: MILEPOST NUMBER
EXAMPLE 1:The accident occurred 0.2 miles east of milepost 25 (add the 0.2 mile to 25)
EXAMPLE 2:The accident occurred 0.2 miles west of milepost 25 (subtract the 0.2 miles from 25)
Column Number 49 50 51 52 53
Example 1 : Coded Value 2 5 2 0
Example 2: Coded Value 2 4 8 0
Decimal Place lOO's lO’s I's 0.1's 0.01's
Notes;The value of 0.0 implies there is a start of milepost If blank, the direction from milepost also will be blank.The value always corresponds to the street occurred on, no matter what the reversal code says.If the milepost number = 999.99 then it is impossible to locate accident location.A value of 888.88 for the milepost number serves as a flag for NDOT stafiFto field check the data.
Reproduced with permission of the copyright owner. Further reproduction prohibited without permission.

Appendix C-22
COLUMNS 054-054: DIRECTION OF MILEPOST
CODE AS FOLLOWS: DESIGNATES THE AREA THE MILEPOST IS IN
NOTE: REFER TO THE URBAN MILEPOST INDEX
1 = NORTH * scaled mielpost from AAA map of milepost 0.02 = SOUTH * scaled mielpost from AAA map of milepost 0.03 = EAST * scaled mielpost from AAA map of milepost 0.04 = WEST * scaled mielpost from AAA map of milepost 0.05 = X SYSTEM Panels are in place, only on Interstates. See Clark County
Milepost. Will have an X on it.9 = UNKNOWN approximately 40 roads in Clark County
NOTES:Always applies to milepost number.If the reference street is outside 52' limit of intersection and is one of the 40 X system roads, then direction of milepost will not be 5. If street occurred on is one of the 40 X system roads and reversal code is blank, then direction of milepost will always be 5.
Rules:Ifdir mile = 5 then; 1) Accident occurred on a street with an X on it in Clark County Milepost Index.
Reproduced with permission of the copyright owner. Further reproduction prohibited without permission.

Appendix C-23
COLUMNS 055-055: TYPE OF STRUCTURE
This field will be used when the trafBc accident occurs at a structure.
CODE AS FOLLOWS:
CODED VALUE TYPE OF STRUCTURE
1 Interchange
2 Grade Separation
3 Bridge
NOTE: If an interchange or structure is not involved leave blank. If blank, colums 19-25 will not contain F R ,...
COLUMNS 056-057: NULL ITEM 3
UNKNOWN WHY THIS ITEM WAS LEFT BLANK
COLUMNS 058-058: RAMP NUMBER
CODE AS FOLLOWS
CODE THE RAMP NUMBER AS SHOWN IN THE MILEPOST & INTERCHANGE BOOK
USE 1 thru 8
9 = NO RAMP INVOLVED
Note: If ramp number is 1-8 then type of structure = 1
Reproduced with permission of the copyright owner. Further reproduction prohibited without permission.

Appendix C-24
COLUMNS 059-060: ACCIDENT DAY
CODE AS FOLLOWS;
Code the day of the month as shown on accident report form.
Prefix with zero for days 1 -9 (e.g. 01,02,03, etc.)
Unknown days will be coded 99.
COLUMNS 061-062: ACCIDENT YEAR
CODE AS FOLLOWS:
Code the last two digits of the year as shown on the accident report form.
EXAMPLE 1:Accident occurred in 1972. Columns 61-62 would be coded as 72. Same applies for 1973 would be coded as 73 and so forth.
NOTES:Unknown year will bs coded as 99.
Reproduced with permission of the copyright owner. Further reproduction prohibited without permission.

Appendix C-25
COLUMNS 063-063: ACCIDENT DAY OF THE WEEK
CODE AS FOLLOWS;
1 = SUNDAY 2 = MONDAY 3 = TUESDAY4 = WEDNESDAY5 = THURSDAY6 = FRIDAY7 = SATURDAY
9 = UNKNOWN
Reproduced with permission of the copyright owner. Further reproduction prohibited without permission.

COLUMNS 064-065: ACCIDENT HOUR
CODE AS FOLLOWS:
Appendix C-26
CODED VALUE TIME ACTUAL TIME RANGE
00 12 Midniaht 00:00-00:59
01 1 AM 01:00-01:5902 2AM 02:00-02:5903 3 AM 03:00-03:5904 4 AM 04:00-04:5905 5 AM 05:00-05:5906 6 AM 06:00-06:5907 7 AM 07:00-07:5908 8 AM 08:00-08:5909 9 AM 09:00-09:5910 10 AM 10:00-10:5911 11 AM 11:00-11:5912 12 AM 12:00-12:59 PM13 1 PM 01:00-01:5914 2 PM 02:00-02:5915 3 PM 03:00-03:5916 4 PM 04:00-04:5917 5 PM 05:00-05:5918 6 PM 06:00-06:5919 7 PM 07:00-07:5920 8 PM 08:00-08:59
21 9 PM 09:00-09:5922 10 PM 10:00-10:5923 11 PM 11:00-11:5999 UNKNOWN —
Reproduced with permission of the copyright owner. Further reproduction prohibited without permission.

A ppendix C-27
COLUMNS 066-067: ACCIDENT MINUTE
CODE AS FOLLOWS:
01-59 = Code exact minute as contained in the accident report
99 = UNKNOWN
COLUMNS 068-068: LIGHT CONDITION
CODE AS FOLLOWS:
1= DAYLIGHT
2=DARK
9 = UNKNOWN
COLUMNS 069-070: NUMBER OF VEHICLES
CODE AS FOLLOWS:
Code the total number vehicles involved in the accident as shown on the accident report form.
99 = UNKNOWN
NOTES:If 01, then columns 76-80, 85-88, 95-109, 140, 148-149, 156-157,201-240 will be blank.If 02, then columns 101-109 will be blank.
Reproduced with permission of the copyright owner. Further reproduction prohibited without permission.

COLUMNS 071-072: AGE - DRIVER 1
CODE AS FOLLOWS:
A ppendix C-28
CODED VALUE ACTUAL AGE OF DRIVER
01-97 Ages from 1 year old to 97 years old
98 Ages 98 and older
99 UNKNOWN
00 No Driver
Reproduced with permission of the copyright owner. Further reproduction prohibited without permission.

Appendix C-29
COLUMNS 073-074: DRIVER 1 RESIDENCE
CODE AS FOLLOWS:
AK Alaska AL AlabamaAR Arkansas AS American SamoaAZ Arizona CA CaliforniaCO Colorado CT Connecticut
CZ Canal Zone DC District of Columbia
DE Deleware FL FlordiaFR Foreign GA GeorgiaGU Guam HI HawaiilA Iowa ID IdahoIL Illinois IN IndianaKS Kansas KY KentuckyLA Louisiana MA MassachusettsMD Maryland ME MaineMI Michigan MN MinnesotaMO Missouri MS MississipoiMT Montana NC North CarolinaND North Dakota NE NebraskaNH New Hamshire NJ New JerseyNM New Mexico NO No DriverNV Nevada NY New YorkOH Ohio OK OklahomaOR Oregon OT OtherPA Pennsylvania PR Puerto RicoRI Rhode Island SC South CarolineSD South Dakota TN TennesseeTT Trust Territories TX Texas
-U N - TTnknawn
Reproduced with permission of the copyright owner. Further reproduction prohibited without permission.

COLUMNS 075-075: SEX - DRIVER 1
CODE AS FOLLOWS:
A ppendix C-30
NDOT Coded Value Description
1 Male
2 Female
3 No Driver
9 Unknown
COLUMNS 076-077: AGE - DRIVER 2
CODE AS FOLLOWS:
CODED VALUE ACTUAL AGE OF DRIVER
01-97 Ages from 1 year old to 97 years old
98 Ages 98 and older
99 UNKNOWN
00 No Driver
Reproduced with permission of the copyright owner. Further reproduction prohibited without permission.

Appendix C-31
COLUMNS 078-079: DRIVER 2 RESIDENCE
CODE AS FOLLOWS:
AK Alaska AL AlabamaAR Arkansas AS American SamoaAZ Arizona CA CaliforniaCO Colorado CT ConnecticutCZ Canal Zone DC District of Columbia
DE Deleware FL FlordiaFR Foreign GA GeorgiaGU Guam HI HawaiilA Iowa ID IdahoEL Illinois IN IndianaKS Kansas KY KentuckyLA Louisiana MA MassachusettsMD Maryland ME MaineMI Michigan MN Minnesota
MO Missouri MS MississinoiMT Montana NC North CarolinaND North Dakota NE NebraskaNH New Hamshire NJ New JerseyNM New Mexico NO No DriverNV Nevada NY New YorkOH Ohio OK OklahomaOR Oregon OT Other
PA Pennsylvania PR Puerto RicoRI Rhode Island SC South CarolineSD South Dakota TN TennesseeTT Trust Territories TX Texas
-UN— Unknown-----------------
Reproduced with permission of the copyright owner. Further reproduction prohibited without permission.

Appendix C-32
COLUMNS 080-080: SEX - DRIVER 2
CODE AS FOLLOWS:
NDOT Coded Value Description
1 Male
2 Female
3 No Driver
9 Unknown
Reproduced with permission of the copyright owner. Further reproduction prohibited without permission.

A ppendix C-33
COLUMNS 081-082: VEHICLE 1 TYPE
01 = standard passenger02 = small passenger car03 = pickup04 = motorcycle05 = single unit truck06 = truck w/one trailer07 = truck w/two trailers08 = truck w/three trailers09 = other10 = farm implement11 = mobile home (pulled by another vehicle)12 = motor home13 = bus "commercial"14 = bus "school"15 = pickup & small trailer (horse)16 = passenger car & small trailer17 = moped18 = law enforcement vehicle19 = ambulance20 = fire equipment21 = construction vehicle22 = taxi/limo-rented (1990)23 = motorcycle with sidecar or trailer (1991)24 = motorhome with trailing unit
See Appendix for additional information
Reproduced with permission of the copyright owner. Further reproduction prohibited without permission.

COLUMNS 083-084: VEHICLE 1 DIRECTION OF TRAVEL
Prior to collision, code as follows
A ppendix C-34
NDOT Coded Value Direction Movement
01 Northbound
02 Southbound
03 Eastbound
04 Westbound
05 Northbound Turning Left
06 Southbound Turning Left
07 Eastbound Turning Left
08 Westbound Turning Left
09 Northbound Turning Right
10 Southbound Turning Right
11 Eastbound Turning Right
12 Westbound Turning Right
13 Northbound Backing South
14 Southbound Backing North
15 Eastbound Backing West
16 Westbound Backing East
17 Northbound Parked
18 Southbound Parked
19 Eastbound Parked
20 Westbound Parked
21 Other
22 Unknown
Reproduced with permission of the copyright owner. Further reproduction prohibited without permission.

Appendix C-35
COLUMNS 085-086: VEHICLE 2 TYPE
01 = standard passenger02 = small passenger car03 = pickup04 = motorcycle05 = single unit truck06 = truck w/one trailer07 = truck w/two trailers08 = truck w/three trailers09 = other10 = farm implement11 = mobile home (pulled by another vehicle)12 = motor home13 = bus "commercial"14 = bus "school"15 = pickup & small trailer (horse)16 = passenger car & small trailer17 = moped18 = law enforcement vehicle19 = ambulance20 = fire equipment21 = construction vehicle22 = taxi/limo-rented (1990)23 = motorcycle with sidecar or trailer (1991)24 = motorhome with trailing unit
See Appendix for additional information
Reproduced with permission of the copyright owner. Further reproduction prohibited without permission.

COLUMNS 087-088: VEHICLE 2 DIRECTION OF TRAVEL
Prior to collision, code as follows ;
Appendix C-36
NDOT Coded Value Direction Movement
01 Northbound
02 Southbound
03 Eastbound
04 Westbound
05 Northbound Turning Left
06 Southbound Turning Left
07 Eastbound Turning Left
08 Westbound Turning Left
09 Northbound Turning Right
10 Southbound Turning Right
11 Eastbound Turning Right
12 Westbound Turning Right
13 Northbound Backing South
14 Southbound Backing North
15 Eastbound Backing West
16 Westbound Backing East
17 Northbound Parked
18 Southbound Parked
19 Eastbound Parked
20 Westbound Parked
21 Other
22 Unknown
Reproduced with permission of the copyright owner. Further reproduction prohibited without permission.

Appendix C-37
COLUMNS 089-089: SEVERITY OF ACCIDENT
CODE AS FOLLOWS, ENTER THE PROPER CODE REPRESENTING THE SEVERITY OF EACH ACCIDENT.
NDOT Codes Descriptions
* I Fatal Accident
*1 Pedestrian Fatality
3 Injury Only Accident
4 Pedestrian Injury
5 Property Damage Only
6 Pedalcycle Injury
* "1" and "2" are not used unless you are assigned coding fatal. Accidents, in which case additional instructions will be given.
COLUMNS 090-090: VEHICLE 1 MALE FATALITIES
CODE AS FOLLOWS, code the total number of male fatalities as shown on the accident report form.
NDOT Codes Description
1 One Fatality
2 Two Fatalities
3 Three Fatalities
8 Eight or more Fatalities
9 Unknown
NOTES;if no male fatalities, leave blank.
Reproduced with permission of the copyright owner. Further reproduction prohibited without permission.

A ppendix C-38
COLUMNS 091-091: VEHICLE 1 FEMALE FATALITIES
CODE AS FOLLOWS, code the total number of male fatalities as shown on the accident report form.
NDOT Codes Description
1 One Fatality
2 Two Fatalities
3 Three Fatalities
8 Eight or more Fatalities
9 Unknown
NOTES;if no female fatalities, leave blank.
Reproduced with permission of the copyright owner. Further reproduction prohibited without permission.

Appendix C-39
COLUMNS 092-092: VEHICLE I "A" TYPE INJURIES (NUMBER OF PERSONS)
CODE AS FOLLOWS:Enter the total number of persons with "Class A" injuries.
NDOT Coded Value Description
1 One Injury
2 Two Injuries
etc. etc.
8 Eight or more Injuries
9 Unknown
Definitions of a "Class A" injury is as follows:
Serious visible injury-bleeding wound, distorted member, or any condition that requires the victim to be carried from the scene of the accident. Consider the injury to be visible if symptoms are present even though the injury is not visible (clothing saturated with blood, for example.)
"Bleeding wound" is a cut or laceration of skin or flesh fromwhich blood flows or drops freely or saturates clothing. It is not an injury that merely oozes blood. A "distorted member" is a hand, foot, arm, leg, or finger that is out of shape or position usually because of a fracture or a serious sprain. "Had to be carried from the "scene" is a condition in which a person is unable to walk or drive away from the scene of the accident. It does not include persons who were carried away but could have walked or driven.
NOTES:If no type "A" injuries, leave blank.
Reproduced with permission of the copyright owner. Further reproduction prohibited without permission.

Appendix C-40
COLUMNS 093-093: VEHICLE 1 "B" TYPE INJURIES (NUMBER OF PERSONS)
CODE AS FOLLOWS:Enter the total number o f persons with "Class B" injuries.
NDOT Coded Value Description
1 One Injury
2 Two Injuries
etc. etc.
8 Eight or more Injuries
9 Unknown
Definitions of a "Class B" injury is as follows:
Minor visible injury - other visible injury such as a bruise, abrasion, swelling, limping, or obviously painful movement. "Bruises" are discolored or swollen places where the body has received a blow. Bruises include black eyes and bloody noses.
"Abrasions" are areas o f the skin where the surface is roughened or broken by scratches or rubbing. A little blood generally oozes fi"om abrasions. Skinned shins, knuckles, knees, and elbows are abrasions. "Swelling" is any lump, bump or distended area often combined with a bruise or abrasion. "Limping" is the inability to move a limb without sign of pain. It does not include mere complaint of pain.
NOTES:If no type "B" injuries, leave blank.
Reproduced with permission of the copyright owner. Further reproduction prohibited without permission.

A ppendix C-41
COLUMNS 094-094: VEHICLE I "C" TYPE INJURIES (NUMBER OF PERSONS)
CODE AS FOLLOWS:Enter the total number of persons with "Class C" injuries.
NDOT Coded Value Description
1 One Injury
2 Two Injuries
etc. etc.
S Eight or more Injuries
9 Unknown
Definitions of a "Class C" injury is as follows:
Nonvisible injury - Complaint of pain without visible signs of injury or momentary unconsciousness.
NOTES:If no type "C" injuries leave blank.
Reproduced with permission of the copyright owner. Further reproduction prohibited without permission.

Appendix C-42
COLUMNS 095-095: VEHICLE 2 MALE FATALITIES
CODE AS FOLLOWS, code the total number of male fatalities as shown on the accident report form.
NDOT Codes Description
I One Fatality
2 Two Fatalities
3 Three Fatalities
8 Eight or more Fatalities
9 Unknown
NOTES;If no male fatalities, leave blank.
COLUMNS 096-096: VEHICLE 2 FEMALE FATALITIES
CODE AS FOLLOWS, code the total number of male fatalities as shown on the accident report form.
NDOT Codes Description
1 One Fatality
2 Two Fatalities
3 Three Fatalities
8 Eight or more Fatalities
9 Unknown
NOTES:If no female fatalities, leave blank.
Reproduced with permission of the copyright owner. Further reproduction prohibited without permission.

Appendix C-43
COLUMNS 097-097: VEHICLE 2 "A" TYPE INJURIES (NUMBER OF PERSONS)
CODE AS FOLLOWS:Enter the total number of persons with "Class A" injuries.
NDOT Coded Value Description
1 One Injury
2 Two Injuries
etc. etc.
8 Eight or more Injuries
9 Unknown
Definitions of a "Class A" injury is as follows:
Serious visible injury-bleeding wound, distorted member, or any condition that requires the victim to be carried fi’om the scene of the accident. Consider the injury to be visible if symptoms are present even though the injury is not visible (clothing saturated with blood, for example.)
"Bleeding wound" is a cut or laceration of skin or flesh fi-omwhich blood flows or drops fl-eely or saturates clothing. It is not an injury that merely oozes blood. A "distorted member" is a hand, foot, arm, leg, or finger that is out o f shape or position usually because of a fl-acture or a serious sprain. "Had to be carried fi-om the "scene" is a condition in which a person is unable to walk or drive away fi-om the scene of the accident. It does not include persons who were carried away but could have walked or driven.
NOTES:If no type "A" injuries, leave blank.
Reproduced with permission of the copyright owner. Further reproduction prohibited without permission.
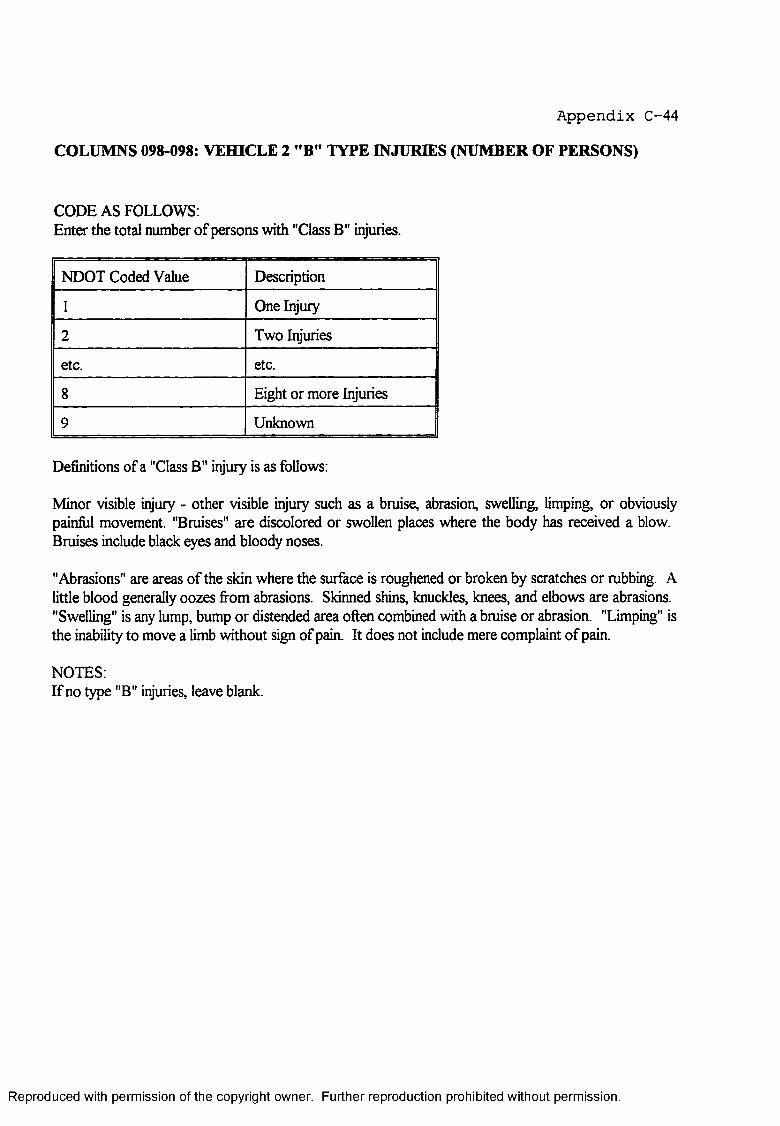
Appendix C-44
COLUMNS 098-098: VEHICLE 2 "B” TYPE INJURIES (NUMBER OF PERSONS)
CODE AS FOLLOWS;Enter the total number of persons with "Class B" injuries.
NDOT Coded Value Description
1 One Injury
2 Two Injuries
etc. etc.
8 Eight or more Injuries
9 Unknown
Definitions of a "Class B" injury is as follows:
Minor visible injury - other visible injury such as a bruise, abrasion, swelling, limping, or obviously painfiil movement. "Bruises" are discolored or swollen places where the body has received a blow. Bruises include black eyes and bloody noses.
"Abrasions" are areas of the skin where the surface is roughened or broken by scratches or rubbing. A little blood generally oozes fi-om abrasions. Skinned shins, knuckles, knees, and elbows are abrasions. "Swelling" is any lump, bump or distended area often combined with a bruise or abrasion. "Limping" is the inability to move a limb without sign of pain. It does not include mere complaint of pain.
NOTES:If no type "B" injuries, leave blank.
Reproduced with permission of the copyright owner. Further reproduction prohibited without permission.

Appendix C-45
COLUMNS 099-099: VEHICLE 2 "C" TYPE INJURIES (NUMBER OF PERSONS)
CODE AS FOLLOWS:Enter the total number of persons with "Class C" injuries.
NDOT Coded Value Description
1 One Injury
2 Two Injuries
etc. etc.
8 Eight or more Injuries
9 Unknown
Definitions of a "Class C" injury is as follows:
Nonvisible injury - Complaint of pain without visible signs of injury or momentary unconsciousness.
NOTES:If no type "C" injuries leave blank.
Reproduced with permission of the copyright owner. Further reproduction prohibited without permission.

A ppendix C-46
COLUMNS 100-101: OTHER THAN VEHICLE 1 OR 2 MALE FATALITIES
CODE AS FOLLOWS, code the total number of male fatalities as shown on the accident report form.
NDOT Codes Description
1 One Fatality
2 Two Fatalities
3 Three Fatalities
8 Eight or more Fatalities
9 Unknown
NOTES:If no male fatalities, leave blank.
COLUMNS 102-103: OTHER THAN VEHICLE 1 OR 2 FEMALE FATALITIES
CODE AS FOLLOWS, code the total number of male fatalities as shown on the accident report form.
NDOT Codes Description
1 One Fatality
2 Two Fatalities
3 Three Fatalities
8 Eight or more Fatalities
9 Unknown
NOTES:If no female fatalities, leave blank.
Reproduced with permission of the copyright owner. Further reproduction prohibited without permission.

Appendix C-47
COLUMNS 104-105: OTHER VEHICLE THAN 1 OR 2 "A" TYPE INJURIES(NUMBER OF PERSONS)
CODE AS FOLLOWS;Enter the total number o f persons with "Class A" injuries.
NDOT Coded Value Description
1 One Injury
2 Two Injuries
etc. etc.
8 Eight or more Injuries
9 Unknown
Definitions of a "Class A" injury is as follows:
Serious visible injury-bleeding wound, distorted member, or any condition that requires the victim to be carried fi"om the scene o f the accident. Consider the injury to be visible if symptoms are present even though the injury is not visible (clothing saturated with blood, for example.)
"Bleeding wound" is a cut or laceration of skin or flesh fi-omwhich blood flows or drops fi'eely or saturates clothing. It is not an injury that merely oozes blood. A "distorted member" is a hand, foot, arm, leg, or finger that is out of shape or position usually because of a fi-acture or a serious sprain. "Had to be carried fi"om the "scene" is a condition in which a person is unable to walk or drive away fi-om the scene of the accident. It does not include persons who were carried away but could have walked or driven.
NOTES:If no type "A" injuries, leave blank.
Reproduced with permission of the copyright owner. Further reproduction prohibited without permission.

Appendix C-48
COLUMNS 106-107: OTHER VEHICLE THAN 1 OR 2 "B " TYPE INJURIES(NUMBER OF PERSONS)
CODE AS FOLLOWS:Enter the total number o f persons with "Class B" injuries.
NDOT Coded Value Description
1 One Injury
2 Two Injuries
etc. etc.
8 Eight or more Injuries
9 Unknown
Definitions of a "Class B" injury is as follows:
Minor visible injury - other visible injury such as a bruise, abrasion, swelling, limping, or obviously painful movement. "Bruises" are discolored or swollen places where the body has received a blow. Bruises include black eyes and bloody noses.
"Abrasions" are areas of the skin where the surface is roughened or broken by scratches or rubbing. A little blood generally oozes fi-om abrasions. Skinned shins, knuckles, knees, and elbows are abrasions. "Swelling" is any lump, bump or distended area often combined with a bruise or abrasion. "Limping" is the inability to move a limb without sign of pain. It does not include mere complaint of pain.
NOTES:If no type "B" injuries, leave blank.
Reproduced with permission of the copyright owner. Further reproduction prohibited without permission.

Appendix C-49
COLUMNS 108-109: OTHER VEHICLE THAN 1 OR 2 "C" TYPE INJURIES(NUMBER OF PERSONS)
CODE AS FOLLOWS:Enter the total number of persons with "Class C" injuries.
NDOT Coded Value Description
1 One Injury
2 Two Injuries
etc. etc.
8 Eight or more Injuries
9 Unknown
Definitions of a "Class C" injury is as follows:
Nonvisible injury - Complaint of pain without visible signs of injury or momentary unconsciousness.
NOTES:If no type "C" injuries leave blank.
COLUMNS 110-111: TOTAL MALE FATALITIES
CODE AS FOLLOWS, CODE THE TOTAL NUMBER OF MALE FATALITIES AS SHOWN ON THE ACCIDENT REPORT FORM.
01 = ONE MALE FATALITY
02 = TWO MALE FATALITIES
etc.
99 = UNKNOWN
NOTE: IF NO MALE FATALITIES, LEAVE BLANK.
Reproduced with permission of the copyright owner. Further reproduction prohibited without permission.

Appendix C-50
COLUMNS 112-113: TOTAL FEMALE FATALITIES
CODE AS FOLLOWS, CODE THE TOTAL NUMBER OF FEMALE FATALITIES AS SHOWN ON THE ACCIDENT REPORT FORM.
01= ONE FATALITY
02 = TWO FATALITIES
etc.
99 = UNKNOWN
NOTE; IF NO FEMALE FATALITIES, LEAVE BLANK.
Reproduced with permission of the copyright owner. Further reproduction prohibited without permission.

Appendix C-51
COLUMNS 114-115: TOTAL "A" TYPE INJURIES (NUMBER OF PERSONS)
CODE AS FOLLOWS;Enter the total number of persons with "Class A" injuries.
NDOT Coded Value Description
1 One Injury
2 Two Injuries
etc. etc.
8 Eight or more Injuries
9 Unknown
Definitions of a "Class A" injury is as follows;
Serious visible injury-bleeding wound, distorted member, or any condition that requires the victim to be carried fi"om the scene of the accident. Consider the injury to be visible if symptoms are present even though the injury is not visible (clothing saturated with blood, for example.)
"Bleeding wound" is a cut or laceration o f skin or flesh fi-omwhich blood flows or drops fi-eely or saturates clothing. It is not an injury that merely oozes blood. A "distorted member" is a hand, foot, arm, leg, or finger that is out o f shape or position usually because of a fi-acture or a serious sprain. "Had to be carried fi-om the "scene" is a condition in which a person is unable to walk or drive away fi-om the scene of the accident. It does not include persons who were carried away but could have walked or driven.
NOTES;If no type "A" injuries, leave blank.
Reproduced with permission of the copyright owner. Further reproduction prohibited without permission.

Appendix C-52
COLUMNS 116-117: TOTAL "B" TYPE INJURIES (NUMBER OF PERSONS)
CODE AS FOLLOWS;Enter the total number of persons with "Class B" injuries.
NDOT Coded Value Description
1 One Injury
2 Two Injuries
etc. etc.
8 Eight or more Injuries
9 Unknown
Definitions of a "Class B" injury is as follows:
Minor visible injury - other visible injury such as a bruise, abrasion, swelling, limping, or obviously painful movement. "Bruises" are discolored or swollen places where the body has received a blow. Bruises include black eyes and bloody noses.
"Abrasions" are areas of the skin where the surface is roughened or broken by scratches or rubbing. A little blood generally oozes fi-om abrasions. Skinned shins, knuckles, knees, and elbows are abrasions. "Swelling" is any lump, bump or distended area often combined with a bruise or abrasion. "Limping" is the inability to move a limb without sign of pain. It does not include mere complaint of pain.
NOTES:If no type "B" injuries, leave blank.
Reproduced with permission of the copyright owner. Further reproduction prohibited without permission.

Appendix C-53
COLUMNS 118-119: TOTAL "C" TYPE INJURIES (NUMBER OF PERSONS)
CODE AS FOLLOWS:Enter the total number of persons with "Class C" injuries.
NDOT Coded Value Description
I One Injury
2 Two Injuries
etc. etc.
8 Eight or more Injuries
9 Unknown
Definitions of a "Class C" injury is as follows:
Nonvisible injury - Complaint of pain without visible signs of injury or momentary unconsciousness.
NOTES:If no type "C" injuries leave blank.
COLUMNS 120-121: PEDESTRIAN 1 AGE
CODE AS FOLLOWS
CODE THE ACTUAL AGE
UP TO 98
98 = 98 OVER
99 = UNKNOWN
Reproduced with permission of the copyright owner. Further reproduction prohibited without permission.

Appendix C-54
COLUMNS 122-122: PEDESTRIAN 1 SEX
CODE AS FOLLOWS
1=MALE
2 = FEMALE
9 = UNKNOWN
COLUMNS 123-124: PEDESTRIAN 2 AGE
CODE AS FOLLOWS
CODE THE ACTUAL AGE
UP TO
98 = 98 & OVER
99 = UNKNOWN
COLUMNS 125-125: PEDESTRIAN 2 SEX
CODE AS FOLLOWS
1 = MALE
2 = FEMALE
9 = UNKNOWN
Reproduced with permission of the copyright owner. Further reproduction prohibited without permission.
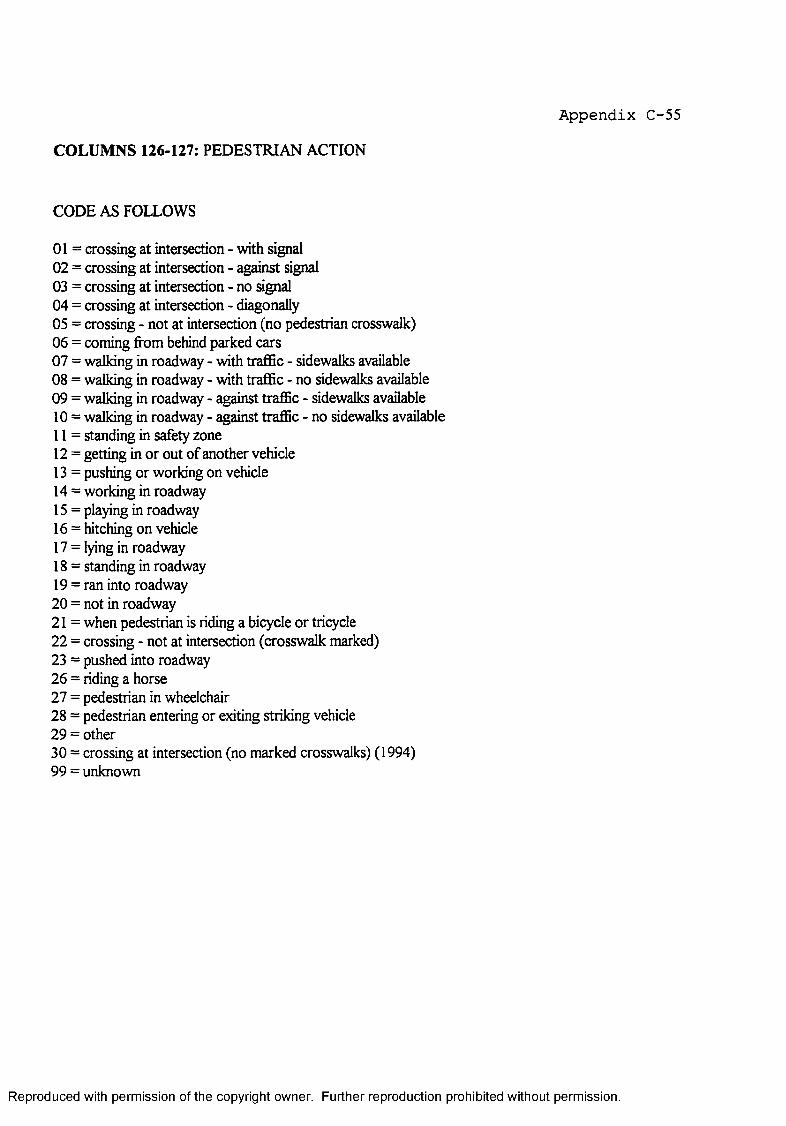
Appendix C-55
COLUMNS 126-127: PEDESTRIAN ACTION
CODE AS FOLLOWS
01 = crossing at intersection - with signal02 = crossing at intersection - against signal03 = crossing at intersection - no signal04 = crossing at intersection - diagonally05 = crossing - not at intersection (no pedestrian crosswalk)06 = coming from behind parked cars07 = walking in roadway - with trafiSc - sidewalks available08 = walking in roadway - with trafiBc - no sidewalks available09 = walking in roadway - against trafBc - sidewalks available10 = walking in roadway - against trafiBc - no sidewalks available 11= standing in safety zone12 = getting in or out of another vehicle13 = pushing or working on vehicle14 = working in roadway15 = playing in roadway16 = hitching on vehicle17 = lying in roadway18 = standing in roadway19 = ran into roadway20 = not in roadway21 = when pedestrian is riding a bicycle or tricycle22 = crossing - not at intersection (crosswalk marked)23 = pushed into roadway26 = riding a horse27 = pedestrian in wheelchair28 = pedestrian entering or exiting striking vehicle29 = other30 = crossing at intersection (no marked crosswalks) (1994)99 = unknown
Reproduced with permission of the copyright owner. Further reproduction prohibited without permission.

A ppendix C-56
COLUMNS 128-129: PEDESTRIAN PHYSICAL CONDITION
Code as follows:
01 = normal physical condition02 = ill03 = fatigued04 = asleep05 = eyesight defective06 = hearing defective07 = one or more extremities missing or defective08 = other defects
99 = unknown physical conditions
NOTES:Leave blank if no pedestrian is involved.
COLUMNS 130-131: PEDESTRIAN SOBRIETY
Code as follows:
01 = had not been drinking02 = had been drinking - under the influence03 = had been drinking - not under the influence04 = had been drinking - influence not known05 = crossing - not at intersection (no pedestrian crosswalk)06 = under influence o f drugs
99 = unknown
NOTES:Leave blank if no pedestrian is involved.
Reproduced with permission of the copyright owner. Further reproduction prohibited without permission.

Appendix C-57
COLUMNS 132-132: WEATHER
Code as follows:
1 = clear2 = cloudy3 = raining4 = snowing5 = foggy6 = dust or sand storm7 = high winds8 = other
9 = unknown
COLUMNS 133-133: CONSTRUCTION STATUS
This field will reflect the construction status of the roadway, code as follows:
NDOT Coded Value
Description
1 Roadway under construction
2 Roadway is a detour or a temporary road, while the main travel way is being repaired or constructed
3 Roadway is a transition section, i.e. that section of roadway which connects a two-lane facility to four-lane and conversely
4 Roadway is serving two-directional traflSc on one side of a divided highway, i.e. an east-west fi-eeway is under construction and the westbound traffic is diverted to the eastbound travel lanes making them two-directional
5 Roadway under repair
NOTES:If construction is not involved, leave blank.
Reproduced with permission of the copyright owner. Further reproduction prohibited without permission.

COLUMNS 134-135: TYPE OF ACCIDENT
A ppendix C-58
NDOTCollisionCode#
Collision Description NDOT non-CollisionCode#
Non-Collision Accident
01 Angle Collision 21 Overturned in roadway
02 Rear-End Collision 22 Ran off roadway
03 Left-Tum Collision 23 Ran off roadway and overturned
04 Right-Tum Collision 24 Ran off roadway and struck guardrail, sign, etc.
05 Head-On Collision 25 Ran off roadway and struck culvert, abutment, etc.
06 Sideswipe Collision (Same Direction)
26 Ran off roadway and struck embankment
07 Sideswipe Collision (Opposite Direction)
27 Ran off roadway and other combinations
08 Parked Vehicle 29 Ran off roadway at railroad crossing
09 Collision with out of control vehicle
30 other
10 Collision with protruding part of vehicle (e.g. open door)
31 unknown
11 Chain reaction collision (3 or more vehicles and multi-type collision)
34 Jackknife in roadway
12 Other type collision 35 Ran off roadway into river
13 Unknown 36 Overturn down cliff or embankment
33 Hit parked vehicle off roadway 37 Struck RR xing gate across road
Reproduced with permission of the copyright owner. Further reproduction prohibited without permission.

Appendix C-59
COLUMNS 134-135: TYPE OF ACCIDENT (cont.)
CODE AS FOLLOWS:
NDOT Code Non-Motor Vehicle Accident
NDOT non-CoUision code#
Non-Collision Accident cont.
14 Animal 38 Ran off roadway into median
15 Pedalcycle 39 Ran off roadway & stmck median fixed object
16 Object in Roadway 40 Ran off roadway into median & overturned
17 Pedestrian 41 Trailing unit disconnects from vehicle
18 Train
19 Other
20 Unknown
42 Object thrown from vehicle
Reproduced with permission of the copyright owner. Further reproduction prohibited without permission.

A ppendix C-60
COLUMNS 136-136: DAMAGE TO STATE PROPERTY
Code as follows:
1 = highway marker (not considered fixed object)2 = guard rail3 = fence4 = sign5 = pavement (not considered a fixed object)6 = signal light7 = light pole8 = other
9 = unknown
NOTES:(1) If damage is done to two or more of the above items, select the one with the most damage in terms of cost and replacement.
(2) If no damage to state property leave blank
Reproduced with permission of the copyright owner. Further reproduction prohibited without permission.

Appendix C-61
COLUMNS 137-138: FIXED OBJECT
This field wiU deal with a vehicle that leaves the travelway and strikes a fixed object. The consideration here will be to determine:VT. What type of fixed object VU. The Location of the fixed object
A. Adjacent to the travelwayB. In the median
v m . Whether or not the fixed object had a break-away base
Type Fixed Object Adjacent:NO
Adjacent:YES
Median: NO Median:YES
Sign support 01 02 03 04
Light Standard 05 06 07 08
Abutment 09 10
Culvert 11 12
Embankment 13 14
Guard Rail 15 16
Utility Pole 17 18
Bridge 19 20
Fence 21 22
Building 23 24
Fire Hydrant 25 26
Traffic Signal Light 27 28
Reproduced with permission of the copyright owner. Further reproduction prohibited without permission.

COLUMNS 137-138: FIXED OBJECT (cont.)
Appendix C-62
Adjacent:NO
Adjacent:YES
Median: NOType Fixed Object Median:YES
Tree
Guard Post
Other
Unknown
Barricade
Con. Bar. Rail
Impact Attenuators
Ditch
Rocks (Boulders)
Cattle Guard
Block Wall
Mailbox
Railroad Crossing Gate
Raised Median
Bushes
Overhead Obstacles
NOTES:Leave blank if no fixed objects were involved
Reproduced with permission of the copyright owner. Further reproduction prohibited without permission.

COLUMNS 139-139: DAMAGE TO VEHICLE 1
Appendix C-63
Code as follows;
NDOT Coded Value Description Cost Range
1 Minor Damage $0-$250
2 Moderate Damage $250-$500
3 Major Damage $500 and over
4 Total
5 No Damage
9 Unknown Damage
NOTES:In analyzing you should keep in mind the year and type of vehicle involved. If the damage would cost more than the vehicle is worth consider it a total.
COLUMNS 140-140; DAMAGE TO VEHICLE 2
Code as follows:
NDOT Coded Value Description Cost Range
1 Minor Damage S0-$250
2 Moderate Damage $250-5500
3 Major Damage $500 and over
4 Total
5 No Damage
9 Unknown Damage
NOTES:In analyzing you should keep in mind the year and type of vehicle involved. If the damage would cost more than the vehicle is worth consider it a total.
Reproduced with permission of the copyright owner. Further reproduction prohibited without permission.

A ppendix C-64
COLUMNS 141-142: CONTRIBUTING FACTOR, VEHICLE 1
enter the code representing the major contributing factor:
codes:01 = d.U.I. Alcohol (citation issued)02 = excessive speed - not necessarily over the speed limit03 = following too close04 = mountain driving - cutting comers, etc.05 = On wrong side of rdwy (not in the process of passing)06 = improper passing - on curve, over yellow line, etc.07 = Improper lane change - 4 lane hwy and includes passing08 = improper turn - wide, from wrong lane,etc.09 = Failure to yield - ran stop sign, etc.10 = Failure to give signal or improper signal11 = improper starting from parked position (or entering)12 = improper parking location - on travelway, etc.13 = Objects in roadway - rocks, etc. (Other than animals )14 = pedestrian in roadway15 = animal in roadway16 = non-contact vehicle (trying to miss another vehicle)17 = defective roadway - ruts, holes, etc.18 = Weather - snow, rain, icy, etc.19 = Defective vehicle20 = physical driver defect - blacked out, etc.21 = Fatigued driver - asleep or suspected of being asleep22 = driver vision obscured - sun, building, etc.23 = Opening door into moving trafBc24 = driving in other than designated travel lane25 = improper backing26 = driver in other than careful and prudent manner27 = disregard temporary trafiBc control sign (chain control, etc.)28 = Improper action on pedalcycle29 = unoccupied moving vehicle30 = inattentive driving31 = prior accident (cars and/or debris on roadway)
Reproduced with permission of the copyright owner. Further reproduction prohibited without permission.

A ppendix C-65
COLUMNS 141-142: CONTRIBUTING FACTORS (CONT.)
32 = design factor (lip at edge of travelway and shoulder, etc.)33 = Hit & run34 = other36 = d.U.I. Of drugs37 = inexperienced driver38 = animal in roadway (cow)39 = animal in roadway (horse)40 = animal in roadway (deer)41 = animal in roadway (burro )42 = loose material on surface43 = infant or small child at wheel44 = lights not on45 = failure to yield to emergency vehicle46 = defective steering47 = defective brakes48 = defective tires49 = speed too fast for conditions50 = rocks in roadway51= improper use of turn lane52 = wrong way on one way53 = stalled in travel lane54 = defective trailing unit55 = vehicle too high56 = unsafe load57 = failure to reduce speed, 199158 = IT xing malfimction, 1991 99 = unknown
Reproduced with permission of the copyright owner. Further reproduction prohibited without permission.

Appendix C-66
COLUMNS 143-144: CONTRIBUTING FACTOR, VEHICLE 2
enter the code representing the major contributing factor:
codes:01= d.U.I. Alcohol (citation issued)02 = excessive speed - not necessarily over the speed limit03 = following too close04 = mountain driving - cutting comers, etc.05 = On wrong side o f rdwy (not in the process of passing)06 = improper passing - on curve, over yellow line, etc.07 = Improper lane change - 4 lane hwy and includes passing08 = improper tum - wide, from wrong lane,etc.09 = Failure to yield - ran stop sign, etc.10 = Failure to give signal or improper signal11 = improper starting from parked position (or entering)12 = improper parking location - on travelway, etc.13 = Objects in roadway - rocks, etc. (Other than animals )14 = pedestrian in roadway 15= animal in roadway16 = non-contact vehicle (trying to miss another vehicle)17 = defective roadway - ruts, holes, etc.18 = Weather - snow, rain, icy, etc.19 = Defective vehicle20 = physical driver defect - blacked out, etc.21 = Fatigued driver - asleep or suspected of being asleep22 = driver vision obscured - sun, building, etc.23 = Opening door into moving trafiBc24 = driving in other than designated travel lane25 = improper backing26 = driver in other than careful and prudent manner27 = disregard temporary trafiBc control sign (chain control, etc.)28 = Improper action on pedalcycle29 = unoccupied moving vehicle30 = inattentive driving31 = prior accident (cars and/or debris on roadway)
Reproduced with permission of the copyright owner. Further reproduction prohibited without permission.
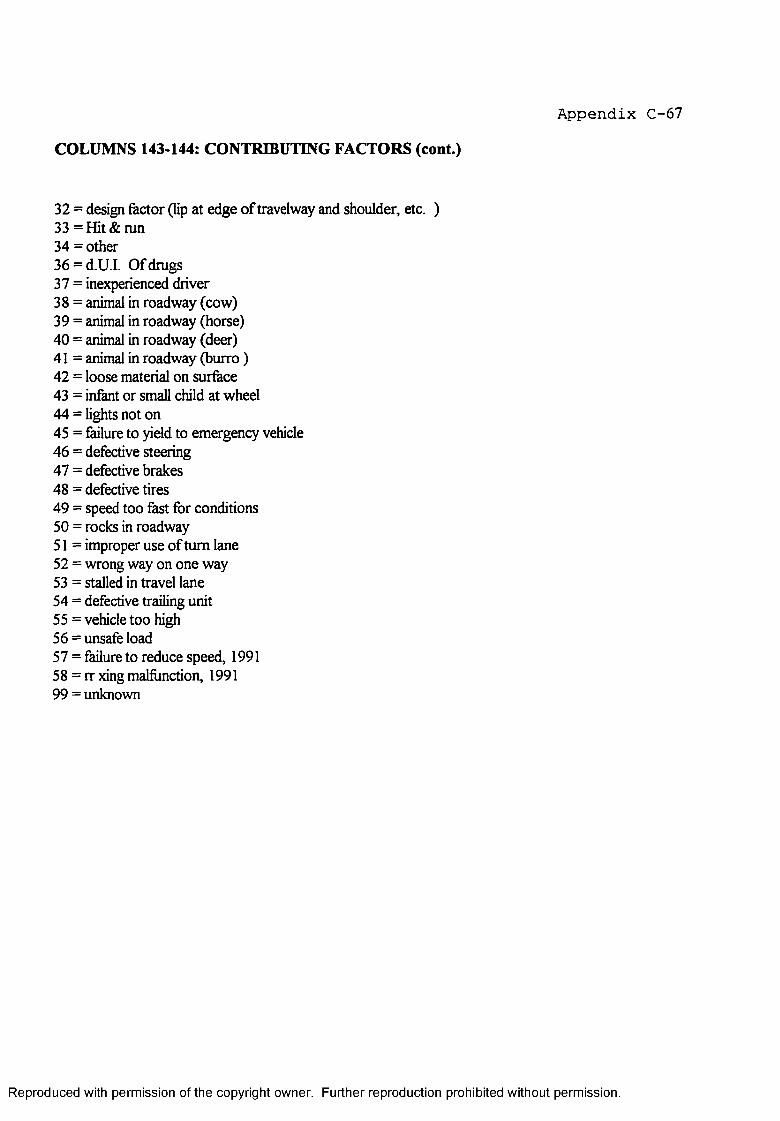
A ppendix C-67
COLUMNS 143-144: CONTRIBUTING FACTORS (cont.)
32 = design factor (lip at edge of travelway and shoulder, etc. )33 = Hit & run34 = other36 = d.U.I. Of drugs37 = inexperienced driver38 = animal in roadway (cow)39 = animal in roadway (horse)40 = animal in roadway (deer)41 = animal in roadway (burro )42 = loose material on surface43 = infant or small child at wheel44 = lights not on45 = failure to yield to emergency vehicle46 = defective steering47 = defective brakes48 = defective tires49 = speed too fast for conditions50 = rocks in roadway51 = improper use of tum lane52 = wrong way on one way53 = stalled in travel lane54 = defective trailing unit55 = vehicle too high56 = unsafe load57 = failure to reduce speed, 199158 = rr xing malfunction, 1991 99 = unknown
Reproduced with permission of the copyright owner. Further reproduction prohibited without permission.

Appendix C-68
COLUMNS 145-145: RESPONSIBLE DRIVER
CODE AS FOLLOWS:
NDOT Coded Value Description
1,2,3,4,5,6,7, or 8 Responsible Driver
9 Unknown
0 Non-Contact Vehicle
COLUMNS 146-147: DRIVER CONDITION, VEHICLE 1
CODE AS FOLLOWS:
01 = legally dmnk = B.A. As proof - over .100 Or cited for DUI02 = under the influence of drugs03 = ability impaired*06 = not known whether impaired (alcohol) H.B.D. Impairment unknown**07 = B.A. Pending08 = no driver09 = alcohol not involved - had not been drinking10 = not known whether impaired (drugs)99 = unknown
* .05 And above = code 03 (ability impaired)** Below .05 = Code 06 h.B.D. Impairment unknown)
Reproduced with permission of the copyright owner. Further reproduction prohibited without permission.

A ppendix C-69
COLUMNS 148-149: DRIVER CONDITION, VEHICLE 2
CODE AS FOLLOWS:
01 = legally dmnk = B.A. As proof - over. 100 Or cited for DUI02 = under the influence of dmgs03 = ability impaired*06 = not known whether impaired (alcohol) H.B.D. Impairment unknown**07 = B.A. Pending08 = no driver09 = alcohol not involved - had not been drinking10 = not known whether impaired (dmgs)99 = unknown
* .05 And above = code 03 (ability impaired)** Below .05 = Code 06 h.B.D. Impairment unknown)
Reproduced with permission of the copyright owner. Further reproduction prohibited without permission.

Appendix C-70
COLUMNS 150-151: ROAD SURFACE CONDITIONS
CODE AS FOLLOWS:No defective loose material, holes-mts, surfece defects, shoulder on surface bumps.
NDOT Coded Values
Surface NoDefects
DefectiveShoulder
Loose Material on Surface
Holes-Rutes-Bumps
Asphalt-Dry 01 02 03 04
Asphalt-Wet 05 06 07 08
Asphalt-Muddy 09 10 11 12
Asphalt-Snow 13 14 15 16
Asphalt-Ice 17 18 19 20
Concrete-Dry 21 22 23 24
Concrete-Wet 25 26 27 28
Concrete-Snow 29 30 31 32
Concrete-Ice 37 38 39 40
Gravel or Dirt-Dry 41 42 43 44
Gravel or Dirt-Wet 45 46 47 48
Gravel or Dirt-Muddy 49 50 51 52
Gravel or Dirt-Snow 53 54 55 56
Gravel or Dirt-Ice 57 58 59 60
Unknown 99
Reproduced with permission of the copyright owner. Further reproduction prohibited without permission.
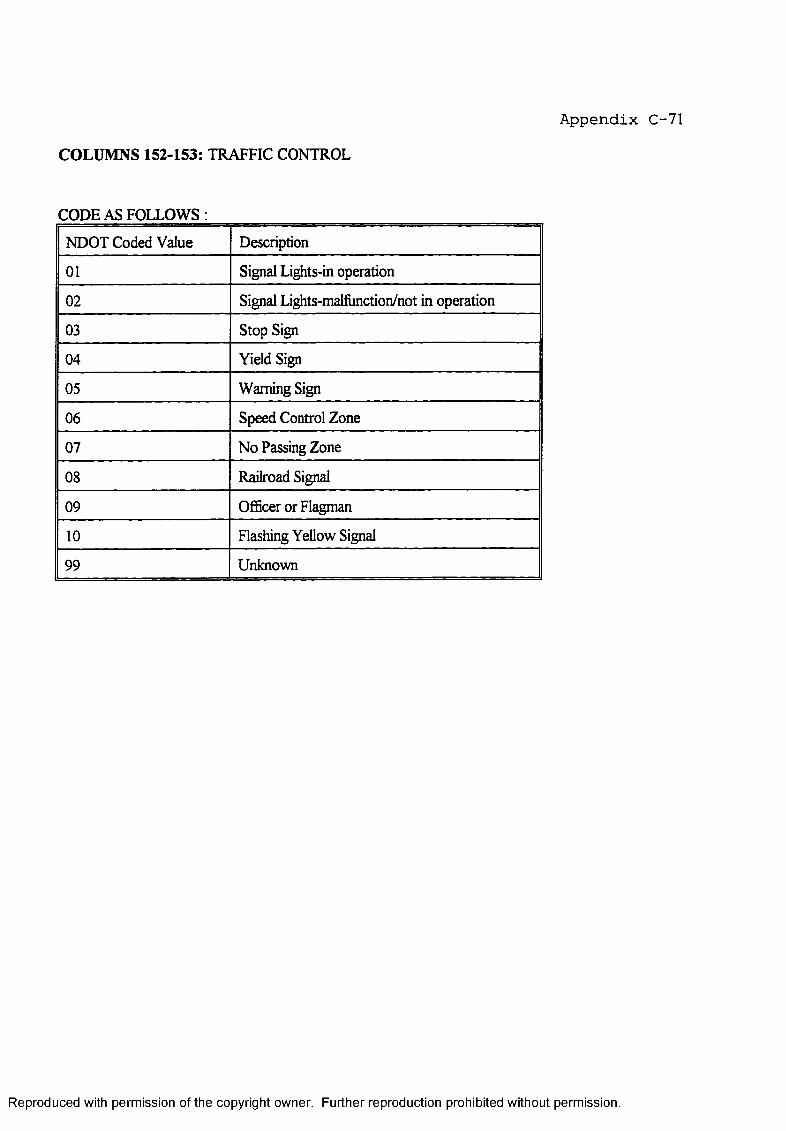
Appendix C-71
COLUMNS 152-153: TRAFFIC CONTROL
CODE AS FOLLOWS
NDOT Coded Value Description
01 Signal Lights-in operation
02 Signal Lights-malfianction/not in operation
03 Stop Sign
04 Yield Sign
05 Warning Sign
06 Speed Control Zone
07 No Passing Zone
08 Railroad Signal
09 OflBcer or Flagman
10 Flashing Yellow Signal
99 Unknown
Reproduced with permission of the copyright owner. Further reproduction prohibited without permission.

Appendix C-72
COLUMNS 154-155: SPEED VEHICLE 1
Code as follows;
actual speed of vehicle #198 = 98 and above99 = unknown
if speed is estimated - round to average (high) examples
25-35 should be 30 mph 25-30 should be 28 mph
COLUMNS 156-157: SPEED VEHICLE 2
Code as follows:
actual speed of vehicle #198 = 98 and above99 = unknown
if speed is estimated - round to average (high) examples
25-35 should be 30 mph 25-30 should be 28 mph
Reproduced with permission of the copyright owner. Further reproduction prohibited without permission.
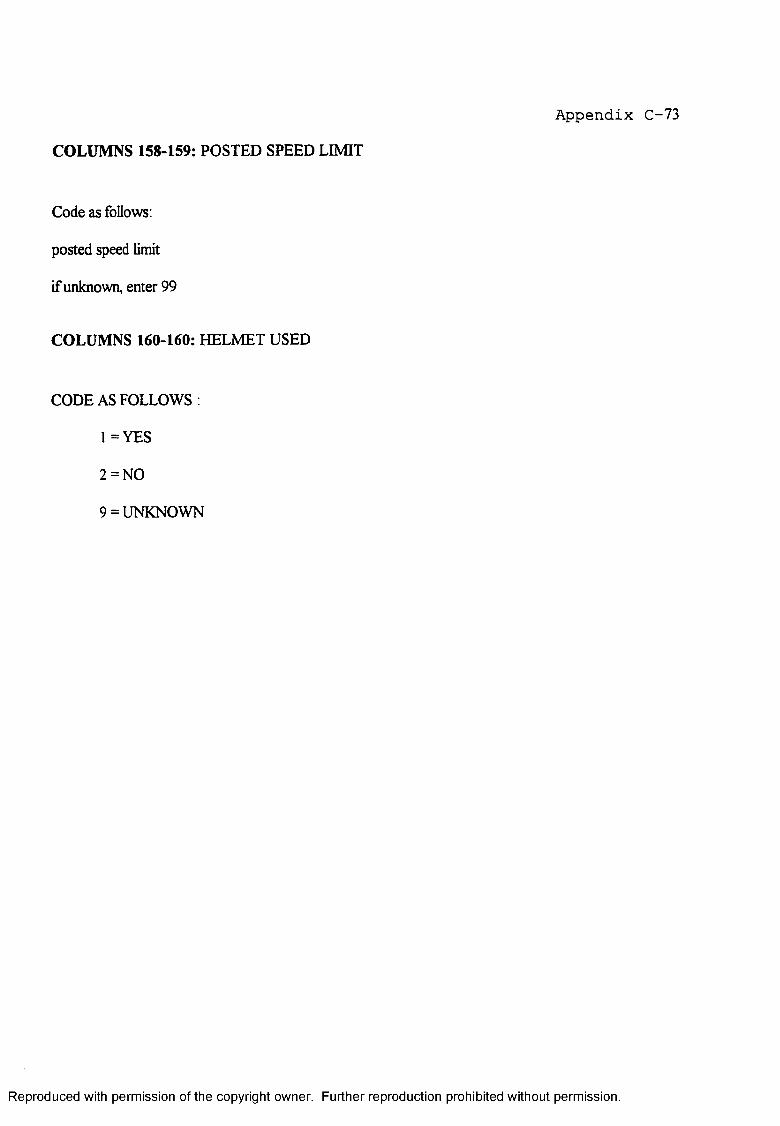
Appendix C-73
COLUMNS 158-159: POSTED SPEED LIMIT
Code as follows:
posted speed limit
if unknown, enter 99
COLUMNS 160-160: HELMET USED
CODE AS FOLLOWS :
1=YES
2 = N0
9 = UNKNOWN
Reproduced with permission of the copyright owner. Further reproduction prohibited without permission.

Appendix C-74
COLUMNS 161-200: SEATBELT INFORMATION VEHICLES 1 & 2
Condensed table;
Vehicle 1 Position
Column Number Description l=Yes, 2=No
l,2,3,4,5,6,other 161,166,171,176,181,186,191-192 Seatbelt Installed 1 or 2
1,2,3,4,5,6,other 162,167,172,177,182,187,193-194 Seatbelt Used 1 or 2
l,2,3,4,5,6,other 163,168,173,178,183,188,195-196 Ejected 1 or 2
l,2,3,4,5,6,other 164,169,174,179,184,189,197-198 Injury A, B, or C
l,2,3,4,5,6,other 165,170,175,180,185,190,199-200 Fatality 1
Vehicle 2 Position
Column Number Description l=Yes, 2=No
l,2,3,4,5,6,other 201,206,211,216,221,226,231-232 Seatbelt Installed 1 or 2
I,2,3,4,5,6,other 202,207,212,217,222,227,233-234 Seatbelt Used 1 or 2
l,2,3,4,5,6,other 203,208,213,218,223,228,235-236 Ejected 1 or 2
l,2,3,4,5,6,other 204,209,214,219,224,229,237-238 Injury A, B, or C
l,2,3,4,5,6,other 205,210,215,220,225,230,238-240 Fatality 1
Reproduced with permission of the copyright owner. Further reproduction prohibited without permission.

Appendix C-75
COLUMNS 161-200: SEATBELT INFORMATION VEHICLES 1 & 2 (cont.)
coding information:
vehicle 1 position 1
vehicle I position 2
vehicle 1 position 3
vehicle 1 position 4
vehicle 1 position 5
vehicle 1 position 6
vehicle 1 position other
1 = yes 2 = no 0 = unknown null = empty position
161 = seatbelt installed162 = seatbelt used163 = ejected164 = injury (a, b or c )165 = fatality (1)166 = seatbelt installed167 = seatbelt used168 = ejected169 = injury (a, b, or c )170 = fatality ( 1 )171 = seatbelt installed172 = seatbelt used173 = ejected174 = injury (a, b, or c )175 = fatality ( 1 )176 = seatbelt installed177 = seatbelt used178 = ejected179 = injury (a, b, or c )180 = fatality ( 1 )181 = seatbelt installed182 = seatbelt used183 = ejected184 = injury (a, b, or e)185 = fatality ( 1 )186 = seatbelt installed187 = seatbelt used188 = ejected189 = injury (a, b, o r e)190 = fatality ( 1 )191-192 = seatbelt installed (# of people in position) 193-194 = seatbelt used (# of people using seatbelt) 195-196 = ejected (# of people)197-198 = injury (a, b, or c ) (# of people)199-200 = fatality ( 1 )
Reproduced with permission of the copyright owner. Further reproduction prohibited without permission.

A ppendix C-76
COLUMNS 161-200: SEATBELT INFORMATION VEHICLES 1 & 2 (cont.)
vehicle 2 position 1
vehicle 2 position 2
vehicle 2 position 3
vehicle 2 position 4
vehicle 2 position 5
vehicle 2 position 6
vehicle 2 position other
201 = seatbelt installed202 = seatbelt used203 = ejected204 = injury (a, b or c )205 = fetality (1)206 = seatbelt installed207 = seatbelt used208 = ejected209 = injury (a, b, or c )210 = fatality ( 1 )211 = seatbelt installed212 = seatbelt used213 = ejected214 = injury (a, b, or c )215 = fatality ( 1 )216 = seatbelt installed217 = seatbelt used218 = ejected219 = injury (a, b, or c )220 = fatality ( 1 )221 = seatbelt installed222 = seatbelt used223 = ejected224 = injury (a, b, or c )225 = fatality ( 1 )226 = seatbelt installed227 = seatbelt used228 = ejected229 = injury (a, b, or c )230 = fatality ( 1 )231-232 = seatbelt installed (# of people in position) 233-234 = seatbelt used (# of people using seatbelt) 235-236 = ejected (# of people)237-238 = injury (a, b, or c ) (# of people)239-240 = fatality ( 1 )
Reproduced with permission of the copyright owner. Further reproduction prohibited without permission.

A ppendix C-77
NDOT ACCIDENT RECORDS APPENDIX
COLUMNS 081-082: VEHICLE 1 & 2 TYPE (continued)
DESCRIPTIONS:
MOTORCYCLE = Includes any Power Driven Cycle usually with two wheels
SINGLE UNIT TRUCK = Includes all Single Unit Trucks "Other" than Pickups and Panels. (Delivery Vans, Dump Trucks, Tractors, etc.)
TRUCK W/ONE TRAILER = Includes all Trucks pulling a Single Trailing Unit. (Truck and Full Trailer, Tractor Truck and one Semitrailer).
TRUCK W/TWO TRAILER = Includes all Trucks pulling Two Trailing Units.
OVER LENGTH TRUCK = Includes all Trucks over 70' in Over-all Length. Tractor Truck and Two Full Trailers, Tractor Truck and One 40' and One 27' Trailer, Tractor Truck and Three 27' Trailers, Tractor Truck and Two 40' Trailers.
OTHER TYPE VEHICLE = Includes U-Haul Trailers, Tractors, Special Construction and Farm Equipment.
MOBILE HOME (PULLED BY VEHICLE) = Includes Mobile Home Trailers (12 Wide, 14 Wide, etc) that must be pulled by another vehicle.
MOTOR HOME = Includes Winebago, Open Road, etc. that are capable of powering themselves.
BUS = Includes Greyhound Lines, City Bus, School, Bus, etc.
FARM VEHICLE = Includes Tractor, Back Hoe, Harvester, etc.
Reproduced with permission of the copyright owner. Further reproduction prohibited without permission.

Appendix C-78COLUMNS 081-082: VEHICLE I & 2 TYPE (cont.) REGISTRATION DIVISION
REGISTRATION DIVISION: VEHICLE BODY TYPES - ABBREVIATIONS FOR PASSENGER
Abbreviation NDOT code Body Type
CN 01-02 Convertible
CP 01-02 Coupe
SL Special - Dune Buggy, etc.
sv 01 Surfer Van - Sportsvan
UT 01 Utility
VC 01 Van Conversion
2H 01-02 Two Door Sedan
4H 01-02 Four Door Hardtop
2S 01-02 Two Door Sedan
3S 01-02 Three Door Sedan
4S 01-02 Four Door Sedan
8S 01 Eight Door Sedan (Limo)
2W 01-02 Two Door Wagon
3W 01-02 Three Door Wagon
4W 01-02 Four Door Wagon
5W 01-02 Five Door Wagon
6W 01 Six Door Wagon (Limo)
8W 01 Eight Door Wagon (Limo)
Reproduced with permission of the copyright owner. Further reproduction prohibited without permission.

Appendix C-79COLUMNS 081-082: VEHICLE 1 & 2 TYPE (cont.) REGISTRATION DIVISION
REGISTRATION DIVISION: VEHICLE BODY TYPES - ABBREVIATIONS FOR MOTOR HOMES
Abbreviations NDOT code Body Type
MH Motor Home
CM Chassis Mount
MM Mini Motor Home
Reproduced with permission of the copyright owner. Further reproduction prohibited without permission.

Appendix C-80COLUMNS 081-082; VEHICLE 1 & 2 TYPE (cont.) REGISTRATION DIVISION
REGISTRATION DIVISION: VEHICLE BODY TYPES - ABBREVIATIONS FOR TRUCKS
Abbreviations NDOT code Body Type
BU 13 BUS
CH 05 Cab and Chassis, includes tow, mixer, and wrecher
DL 05 Delivery
DU 05 Dump Truck
FB 05 Flat Bed
PN 05 Panel
PU 03 Pickup
SP 05 Special
ST 05 Stake
TK 05 Tanker
TR 05 Tractor
VA 01 Van
Reproduced with permission of the copyright owner. Further reproduction prohibited without permission.

Appendix C-81COLUMNS 081-082: VEHICLE 1 & 2 TYPE (cont.) REGISTRATION DIVISION
REGISTRATION DIVISION: VEHICLE BODY TYPES - ABBREVIATIONS FOR TRAILERS
Abbreviations NDOT code Body Type
OW One Wheel
TW Two Wheel
FW Four Wheel
SW Six Wheel
EW Eight Wheel
TT Travel/Tent Trailer
Reproduced with permission of the copyright owner. Further reproduction prohibited without permission.

A ppendix C-82COLUMNS 081-082; VEHICLE 1 & 2 TYPE (cont.) REGISTRATION DIVISION
REGISTRATION DIVISION: VEHICLE BODY TYPES - ABBREVIATIONS FOR MOTORCYCLES
Abbreviations NDOT code Body Type
MC Motorcycle
SM Special
TM Trimobile-Trike
Reproduced with permission of the copyright owner. Further reproduction prohibited without permission.

Appendix C-83COLUMNS 081-082: VEHICLE 1 & 2 TYPE (cont.) NCIC CODE MANUAL
VEHICLE DATA CODES: SECTION 5 - VEHICLE MODEL CODES
5.13 Trailer VMO Code
The two character code "TL" must be entered in the VMO Field of all trailer entries. This will distinguish trailer entries from all other types o f entries. Trailer length, if available, should be entered in the MIS Field.
5.14 Truck VMO Code (including buses, motorized homes, etc.)
The two character code "TK" must be entered in the VDO Field of all truck entries. This will distinguish truck entries from all other types o f vehicle entries.
Reproduced with permission of the copyright owner. Further reproduction prohibited without permission.

6.1 Aircraft VST CodesA ppendix C-84
Airplane Engine Description
Single-Engine Twin- Engine Tri- Engine Multi- Engine Other Aircraft
Jet
IJ2J31Ml
Propeller
IP2P3PMP
Blimp Helicopter Hot Air Balloon SailplaneUltralight(includes hang gliders)
BPHPHASAUL
6.2 All Terrain Vehicle, Dune Buggy, Go-Cart, Golf Cart, and Motorized Wheelchair VST Codes
Style
Enclosed Body, Removable Enclosure Enclosed Body, Nonremovable Enclosure Multi-wheeled vehicle (manufactured for off-road use, but licensed as street-legal, e.g., 3-wheel motorcycle)Open Body
6.3 Automobile VST Code
Code
EBEN
MVOP
*
* *
* *
* *
* * *
StyleAmbulanceCoachConvertibleCoupeHardtopHardtop, 2 doorHardtop, 4 doorHatchback/FastbackHatchback, 2 doorHatchback, 4 doorHearseLimousine
CodeAMCHCVCPHT2T4THB2H4HHRLM
Reproduced with permission of the copyright owner. Further reproduction prohibited without permission.

Appendix C-85* Use code "CP" only when unable to determine if vehicle is a two door sedan or two doorhard top.** A hardtop is a vehicle with a pillar separating the front and rear side windows and nowindow frames on the door. Use code "HT" only when the number of doors is unknown.*** Code "HB" is only for a vehicle that has a rear door and the number of side doors is unknown.
6.3 Automobile VST Code (Continued)
Style Code
Retractable HardtopRoadsterSedanSedan, 2 door Sedan, 4 door Station Wagon Touring Car
RHRDSD2D4DSWTO
* A sedan is a vehicle that has a pillar separating the front and rear side windows and door window frames that remain visible when the windows are rolled down. Also referred to as a pillared hardtop; code as a two- or four-door sedan. Use code "SD" only when the number o f doors is unknown.
6.4 Construction Equipment VST Codes
Style Code CommentsAerial Platform AEAir Compressor AIAsphalt Distributor ADBackhoe BHBackhoe/Loader BKBrush Chipper BCBuggy, Concrete BG also known as a power cartBulldozer BDCrane CRDrill, Rock DR also known as a drifter drillExcavator EX also known as a diggerFork Lift FL also known as a lift truckGenerator GE enter as a part, if not permanently mounted.Grader GDHammer HMHydraulic Dump HD also knovra as a pile driverLift Boom LF also known as a cherry picker
Reproduced with permission of the copyright owner. Further reproduction prohibited without permission.

Appendix C-86Loader LDLog Skidder LK also known as a grappler skidderPaver PV also known as a finisher road surfacerPrime Mover PR also known as a road packerRoller RO also known as a compactorSaw SZ used in cutting asphalt, concrete, or masonry.Shovel SH also known as a power or steam shovelSnowblower SOStriper SISweeper SS also known as a power broom used to clean streets ;
parking lots.Tractor, Track Type TCTractor, Wheel Type TFTrencher TH also known as a ditcher
Unpublished style o f Construction Equipment CEVacuum Cleaner VA heavy duty ride-on type enter as a part.Welder WE if not permanently mounted
irm and Garden Equipment VST Codes
Style Code Comments
Backhoe BHBackhoe/Loader BKBrush Chipper BCBulldozer BDCombine CO also known as a grain harvesterCom Picker ClCotton Picker CKCotton Stripper czDetasseling Equipment DEFertilizer Spreader FSField Chopper FD also known as a silage cutterFlotation Chassis FC also known as implement carrierForklift FLGenerator GEGrader GDHarvester HVHay Bale Loader HLHay Baler HYHydraulic Dump HD
Reproduced with permission of the copyright owner. Further reproduction prohibited without permission.

Lift Room (Personnel) LFLoader LDLog Skidder LKMower, Riding or GardenTractor MOMower-ConditionerGrass or Hay MRPotato Digger DIScraper SCSpayer SYTractor, Track-type TCTractor, Wheel-type TFTree Harvester TATrencher THUnpublished Style o fFarm Equipment MFWelder WEWindrower WN
Appendix also known as orchard or cherry picker
C-87
also known as a feller-buncher
6.6 Motorcycle VST Code
Style Code
MK
Comments
Minibike MK Any motor-powered cycle with one Minibike or more of thefollowing characteristics; Less than ten inch nominal wheel rim size; less than forty inch wheel base; a height of twenty-five inches or seat height of twenty-five inches or less, measured from the ground to the top of the seat cushion.Minicycle MY A small motor-powered cycle with all capabilities,characteristics, and equipment of a motorcycle, with an engine size of less than 90 cubic centimeters (usually 70 or 75 c.c.s).Moped MD
Motorcycle
Motorscooter
Multi-wheel
MC
MS
MV
A motor-powered cycle with or without pedals, with a 50 c.c. Piston displacement engine, capable o f two brake horsepower, or a speed not exceeding 30 m.p.h. Moterbike MB A motor-powered cycle with or without pedals with a 50 c.c. Cylinder capacity engine capable o f 1.5 brake horsepower, but not exceeding five brake horsepower.A motor-powered cycle, generally powered by a 90 c.c. or large engine, having one or two saddles or seats.A low, two- or three-wheeled motor-powered cycle, having smaller wheels and less power than a motorcycle, characterized by floor boards and a seat placed so that the operator does not straddle the engine.A three- or four-wheeled vehicle that was manufactured for off road use, but has been licensed as street legal.
Reproduced with permission of the copyright owner. Further reproduction prohibited without permission.

Appendix C-88
6.7 Snowmobile VST Codes
StyleEnclosed Body, Removable Enclosure Enclosed Body, Nonremovable Enclosure Open Body
CodeEBENOP
6.8 Trailer VST Code
Style Code Comments
Auto Carrier ACAuxiliary Dolly DYBoat BTCamping CTConverter Gear CG
Flatbed or Platform FB Hopper HOHorse HEHouse HSLowboy or Lowbed LB Motorcycle MTPole LP
Refrigerated Van RFSemi SE
Snowmobile SMStake or Rack STTanker TNTravel CTUtility UTVan VNWagon GA
also known as camper or travel trailer a single axle unit that converts twin axle tractor trucks into tri-axle.
also known as logging trailer-used to transport logs and pipesalso known as reeferuse only when the specific body style of the semi- trailer is unknown
includes open or closed top box trailers also as Gondola, Cart, or Container
6.9 Truck VST Codes
Style Code Comments
Reproduced with permission of the copyright owner. Further reproduction prohibited without permission.

Appendix C-89
Ambulance AMArmored Truck ARBeverage Rack BRBus BUCarry-all LL rugged trail and pleasure vehicles, (e.g.. Blazer,
Bronco, Jeep, etc. )Chassis and Cab CBConcrete Mixer CMDump DPFire Truck FTFlatbed or Platform FBFlatrack FRGarbage or Refuse GGGlass Rack GRGrain GNHopper (Bottom Dump) HO Livestock Rack LSLunch Wagon LWMotorized Home MHPallet PLPickup PKPickup with mounted camper PM Refrigerated Van RFStake or Rack STTanker TNTow Truck/Wrecker TTTractor Truck, Diesel DSTractor Truck, Gasoline TRVan Camper VCVanette VTVan VNWell Driller WD
6.10 VST Codes Alphabetically by Code
This listing is provided as an easy reference list to define VSTs that may be a part o f an NCIC record. This list is for reference purposes and should not be used in making an NCIC entry.
Code Style Comments
AC Auto Carrier AD Asphalt Distributor
Reproduced with permission of the copyright owner. Further reproduction prohibited without permission.

A ppendix C-90AE Aerial PlatformAI Air Compressor should be entered as a Part, if not permanently mountedAM AmbulanceAR Armored TruckBC Brush ChipperBD BulldozerBG Buggy, ConcreteBH Backhoe/LoaderBP BlimpBR Beverage RackBT Boat TrailerBU BusCB Chassis and Cab (Utility Truck)CE Unpublished Construction Equipment explain style in MIS Field CG Converter Gear TrailerCH CoachCl Com Picker
* CK Cotton Picker* CL Cable Reel should be entered as a Part
CM Concrete or Transit MixerCO Self propelled combineCP CoupeCR CraneCT Camping or Travel TrailerCV ConvertibleCZ Cotton StripperDE Detasseling EquipmentDI Potato DiggerDP Dump TruckDR Drill, Rock rockdrillDS Diesel Tractor TruckDY Auxiliary DollyEB Enclosed body. Removable EnclosureEN Enclosed body. Nonremovable EnclosureEX ExcavatorFB Flatbed or Platform TrailerFC Flotation Chassis Implement CarrierFD Field Chopper Silage Cutter
6.10 VST Codes Alphabetically by Code (Continued)Code Style Comments
FL ForkliftFR Flatrack Truck
Reproduced with permission of the copyright owner. Further reproduction prohibited without permission.
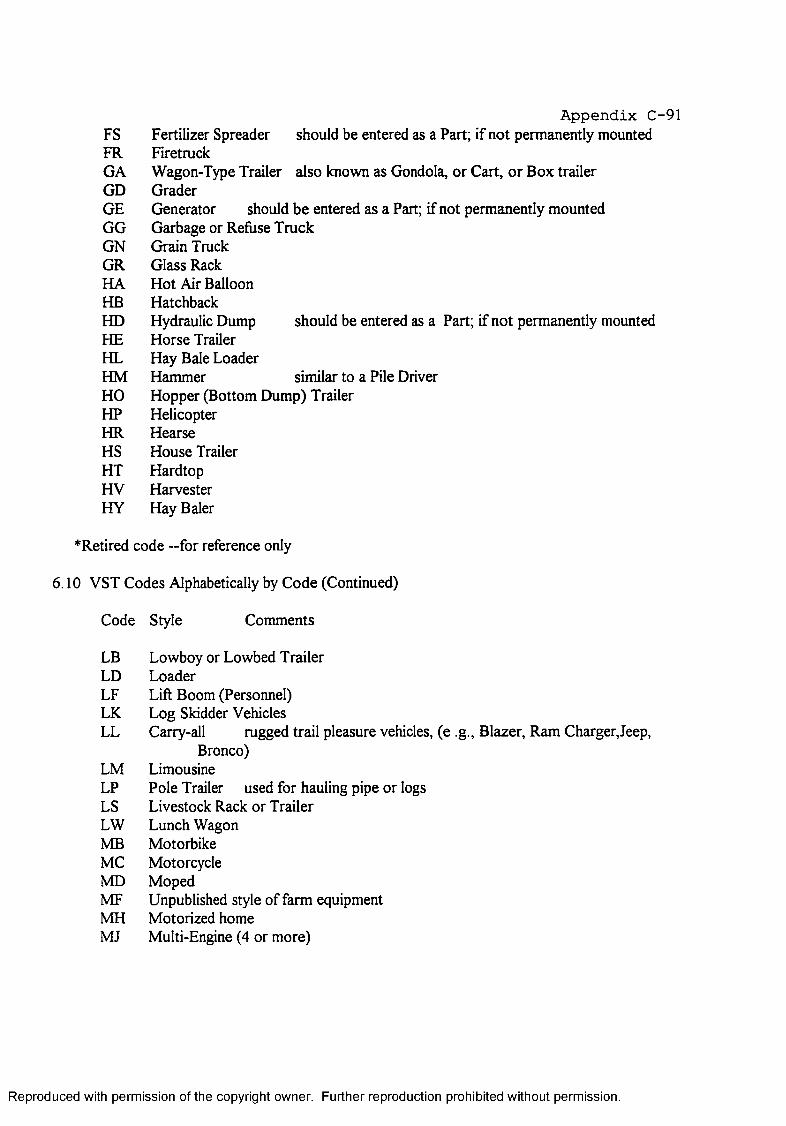
Appendix C-91FS Fertilizer Spreader should be entered as a Part; if not permanently mountedFR FiretruckGA Wagon-Type Trailer also known as Gondola, or Cart, or Box trailerGD GraderGE Generator should be entered as a Part; if not permanently mountedGG Garbage or Refuse TruckGN Grain TruckGR Glass RackHA Hot Air BalloonHB HatchbackHD Hydraulic Dump should be entered as a Part; if not permanently mountedHE Horse TrailerHL Hay Bale LoaderHM Hammer similar to a Pile DriverHO Hopper (Bottom Dump) TrailerHP HelicopterHR HearseHS House TrailerHT HardtopHV HarvesterHY Hay Baler
* Retired code —for reference only
6.10 VST Codes Alphabetically by Code (Continued)
Code Style Comments
LB Lowboy or Lowbed TrailerLD LoaderLF Lift Boom (Personnel)LK Log Skidder VehiclesLL Carry-all rugged trail pleasure vehicles, (e .g.. Blazer, Ram Charger,Jeep,
Bronco)LM LimousineLP Pole Trailer used for hauling pipe or logsLS Livestock Rack or TrailerLW Lunch WagonMB MotorbikeMC MotorcycleMD MopedMF Unpublished style of farm equipmentMH Motorized homeMJ Multi-Engine (4 or more)
Reproduced with permission of the copyright owner. Further reproduction prohibited without permission.

A ppendix C-92MK Minibike MO MowerMP Multi-Engine (4 or more) Propeller Aircraft MR Mower/Conditioner for grass or hayMS Motorscooter MT Motorcycle TrailerMV Multi-wheeled vehicle manufactured for ofif-road use, but licensed asstreet legal MY Minicycle OP Open body PK Pickup PL PalletPM Pickup with mounted camper PR Prime Mover PV Paver RD Roadster RF Refrigerated Van RH Retractable Hardtop RO Roller
6.10 VST Codes Alphabetically by Code (Continued)
Code Style Comments
SA SailplaneSC ScraperSD SedanSE Semi-TrailerSH Shovel Steam ShovelSI StriperSM Snowmobile TrailerSO SnowblowerSP Shipping Container should be entered as a Part using Category Code SPSR Service Trailer nondescript, use the code which accurately describes the
trailerSS Street SweeperST Stake or Rack TrailerSW Station WagonSY SprayerSZ Saw used in cutting asphalt, concrete, or masonryTA Tree HarvesterTC Tractor, Track TypeTE Tent TrailerTF Tractor, Wheel TypeTH Trencher
Reproduced with permission of the copyright owner. Further reproduction prohibited without permission.

Appendix C-93TM Camper, Truck Mount enter as a part or add-on partTN Tank TrailerTO Touring CarTR Tractor Truck, GasolineTT Tow Truck/WreckerTV Travel Trailer see as Camping Trailer UL Ultralight (includes hang gliders)UT Utility TrailerVA Vacuum CleanerVC Van CamperVN Van Trailer Panel or Sports VanVT VanetteWD Well Driller
6.10 VST Codes Alphabetically by Code (Continued)
Code Style Comments
WE Welder should be entered as a Part, if not permanently mountedWN Wind RowerWS Wood Splitter2D 2 Door Automobile4D 4 Door Automobile2H 2 Door Hatchback4H 4 Door Hatchback1J Single-Engine Jet2J Twin-Engine Jet3J Tri-Engine JetIP Single-Engine Propeller2P Twin-Engine Propeller3P Tri-Engine Propeller2T 2 Door Hardtop4T 4 Door Hardtop
* IW 1 Wheeled Trailer nondescript, use the code which most accurately describesthe trailer
* 2W 2 Wheeled Trailer nondescript, use the code which most accurately describesthe trailer
*Retired code—For reference only
Reproduced with permission of the copyright owner. Further reproduction prohibited without permission.

Appendix C-94
7. The Engine Power or Displacement (EPD) Field can only befilled if the Category (CAT) Field code is EN or OB. The EPD Field must contain one to four numerics followed by one of the alphabetic characters listed below indicating the unit of measure.
Unit of Measure Code
Cubic inches ICubic centimeters CLiter LHorsepower HPounds of Thrust (or voltage)(includes trolling motors) P
U.S. GOVERNMENT PRINTING OFFICE : 1987-188-900/66444
Reproduced with permission of the copyright owner. Further reproduction prohibited without permission.