Identification of the honey bee swarming process by analysing the time course of hive vibrations
7
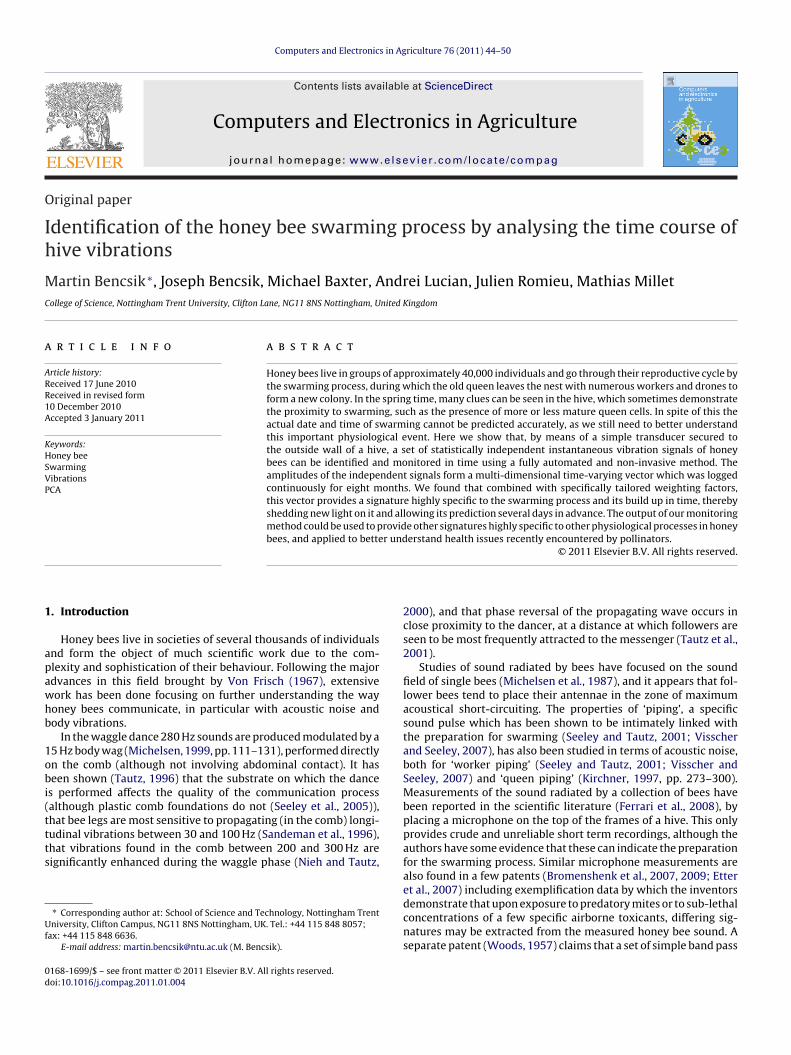
Computers and Electronics in Agriculture 76 (2011) 44–50 Contents lists available at ScienceDirect Computers and Electronics in Agriculture journal homepage: www.elsevier.com/locate/compag Original paper Identification of the honey bee swarming process by analysing the time course of hive vibrations Martin Bencsik ∗ , Joseph Bencsik, Michael Baxter, Andrei Lucian, Julien Romieu, Mathias Millet College of Science, Nottingham Trent University, Clifton Lane, NG11 8NS Nottingham, United Kingdom article info Article history: Received 17 June 2010 Received in revised form 10 December 2010 Accepted 3 January 2011 Keywords: Honey bee Swarming Vibrations PCA abstract Honey bees live in groups of approximately 40,000 individuals and go through their reproductive cycle by the swarming process, during which the old queen leaves the nest with numerous workers and drones to form a new colony. In the spring time, many clues can be seen in the hive, which sometimes demonstrate the proximity to swarming, such as the presence of more or less mature queen cells. In spite of this the actual date and time of swarming cannot be predicted accurately, as we still need to better understand this important physiological event. Here we show that, by means of a simple transducer secured to the outside wall of a hive, a set of statistically independent instantaneous vibration signals of honey bees can be identified and monitored in time using a fully automated and non-invasive method. The amplitudes of the independent signals form a multi-dimensional time-varying vector which was logged continuously for eight months. We found that combined with specifically tailored weighting factors, this vector provides a signature highly specific to the swarming process and its build up in time, thereby shedding new light on it and allowing its prediction several days in advance. The output of our monitoring method could be used to provide other signatures highly specific to other physiological processes in honey bees, and applied to better understand health issues recently encountered by pollinators. © 2011 Elsevier B.V. All rights reserved. 1. Introduction Honey bees live in societies of several thousands of individuals and form the object of much scientific work due to the com- plexity and sophistication of their behaviour. Following the major advances in this field brought by Von Frisch (1967), extensive work has been done focusing on further understanding the way honey bees communicate, in particular with acoustic noise and body vibrations. In the waggle dance 280 Hz sounds are produced modulated by a 15 Hz body wag (Michelsen, 1999, pp. 111–131), performed directly on the comb (although not involving abdominal contact). It has been shown (Tautz, 1996) that the substrate on which the dance is performed affects the quality of the communication process (although plastic comb foundations do not (Seeley et al., 2005)), that bee legs are most sensitive to propagating (in the comb) longi- tudinal vibrations between 30 and 100 Hz (Sandeman et al., 1996), that vibrations found in the comb between 200 and 300 Hz are significantly enhanced during the waggle phase (Nieh and Tautz, ∗ Corresponding author at: School of Science and Technology, Nottingham Trent University, Clifton Campus, NG11 8NS Nottingham, UK. Tel.: +44 115 848 8057; fax: +44 115 848 6636. E-mail address: [email protected] (M. Bencsik). 2000), and that phase reversal of the propagating wave occurs in close proximity to the dancer, at a distance at which followers are seen to be most frequently attracted to the messenger (Tautz et al., 2001). Studies of sound radiated by bees have focused on the sound field of single bees (Michelsen et al., 1987), and it appears that fol- lower bees tend to place their antennae in the zone of maximum acoustical short-circuiting. The properties of ‘piping’, a specific sound pulse which has been shown to be intimately linked with the preparation for swarming (Seeley and Tautz, 2001; Visscher and Seeley, 2007), has also been studied in terms of acoustic noise, both for ‘worker piping’ (Seeley and Tautz, 2001; Visscher and Seeley, 2007) and ‘queen piping’ (Kirchner, 1997, pp. 273–300). Measurements of the sound radiated by a collection of bees have been reported in the scientific literature (Ferrari et al., 2008), by placing a microphone on the top of the frames of a hive. This only provides crude and unreliable short term recordings, although the authors have some evidence that these can indicate the preparation for the swarming process. Similar microphone measurements are also found in a few patents (Bromenshenk et al., 2007, 2009; Etter et al., 2007) including exemplification data by which the inventors demonstrate that upon exposure to predatory mites or to sub-lethal concentrations of a few specific airborne toxicants, differing sig- natures may be extracted from the measured honey bee sound. A separate patent (Woods, 1957) claims that a set of simple band pass 0168-1699/$ – see front matter © 2011 Elsevier B.V. All rights reserved. doi:10.1016/j.compag.2011.01.004
-
Upload
independent -
Category
Documents
-
view
1 -
download
0
Transcript of Identification of the honey bee swarming process by analysing the time course of hive vibrations
O
Ih
MC
a
ARR1A
KHSVP
1
apawhb
1obi(ttts
Uf
0d
Computers and Electronics in Agriculture 76 (2011) 44–50
Contents lists available at ScienceDirect
Computers and Electronics in Agriculture
journa l homepage: www.e lsev ier .com/ locate /compag
riginal paper
dentification of the honey bee swarming process by analysing the time course ofive vibrations
artin Bencsik ∗, Joseph Bencsik, Michael Baxter, Andrei Lucian, Julien Romieu, Mathias Milletollege of Science, Nottingham Trent University, Clifton Lane, NG11 8NS Nottingham, United Kingdom
r t i c l e i n f o
rticle history:eceived 17 June 2010eceived in revised form0 December 2010ccepted 3 January 2011
eywords:oney bee
a b s t r a c t
Honey bees live in groups of approximately 40,000 individuals and go through their reproductive cycle bythe swarming process, during which the old queen leaves the nest with numerous workers and drones toform a new colony. In the spring time, many clues can be seen in the hive, which sometimes demonstratethe proximity to swarming, such as the presence of more or less mature queen cells. In spite of this theactual date and time of swarming cannot be predicted accurately, as we still need to better understandthis important physiological event. Here we show that, by means of a simple transducer secured tothe outside wall of a hive, a set of statistically independent instantaneous vibration signals of honey
warmingibrationsCA
bees can be identified and monitored in time using a fully automated and non-invasive method. Theamplitudes of the independent signals form a multi-dimensional time-varying vector which was loggedcontinuously for eight months. We found that combined with specifically tailored weighting factors,this vector provides a signature highly specific to the swarming process and its build up in time, therebyshedding new light on it and allowing its prediction several days in advance. The output of our monitoringmethod could be used to provide other signatures highly specific to other physiological processes in honeybees, and applied to better understand health issues recently encountered by pollinators.
. Introduction
Honey bees live in societies of several thousands of individualsnd form the object of much scientific work due to the com-lexity and sophistication of their behaviour. Following the majordvances in this field brought by Von Frisch (1967), extensiveork has been done focusing on further understanding the wayoney bees communicate, in particular with acoustic noise andody vibrations.
In the waggle dance 280 Hz sounds are produced modulated by a5 Hz body wag (Michelsen, 1999, pp. 111–131), performed directlyn the comb (although not involving abdominal contact). It haseen shown (Tautz, 1996) that the substrate on which the dance
s performed affects the quality of the communication processalthough plastic comb foundations do not (Seeley et al., 2005)),
hat bee legs are most sensitive to propagating (in the comb) longi-udinal vibrations between 30 and 100 Hz (Sandeman et al., 1996),hat vibrations found in the comb between 200 and 300 Hz areignificantly enhanced during the waggle phase (Nieh and Tautz,∗ Corresponding author at: School of Science and Technology, Nottingham Trentniversity, Clifton Campus, NG11 8NS Nottingham, UK. Tel.: +44 115 848 8057;
ax: +44 115 848 6636.E-mail address: [email protected] (M. Bencsik).
168-1699/$ – see front matter © 2011 Elsevier B.V. All rights reserved.oi:10.1016/j.compag.2011.01.004
© 2011 Elsevier B.V. All rights reserved.
2000), and that phase reversal of the propagating wave occurs inclose proximity to the dancer, at a distance at which followers areseen to be most frequently attracted to the messenger (Tautz et al.,2001).
Studies of sound radiated by bees have focused on the soundfield of single bees (Michelsen et al., 1987), and it appears that fol-lower bees tend to place their antennae in the zone of maximumacoustical short-circuiting. The properties of ‘piping’, a specificsound pulse which has been shown to be intimately linked withthe preparation for swarming (Seeley and Tautz, 2001; Visscherand Seeley, 2007), has also been studied in terms of acoustic noise,both for ‘worker piping’ (Seeley and Tautz, 2001; Visscher andSeeley, 2007) and ‘queen piping’ (Kirchner, 1997, pp. 273–300).Measurements of the sound radiated by a collection of bees havebeen reported in the scientific literature (Ferrari et al., 2008), byplacing a microphone on the top of the frames of a hive. This onlyprovides crude and unreliable short term recordings, although theauthors have some evidence that these can indicate the preparationfor the swarming process. Similar microphone measurements arealso found in a few patents (Bromenshenk et al., 2007, 2009; Etter
et al., 2007) including exemplification data by which the inventorsdemonstrate that upon exposure to predatory mites or to sub-lethalconcentrations of a few specific airborne toxicants, differing sig-natures may be extracted from the measured honey bee sound. Aseparate patent (Woods, 1957) claims that a set of simple band pass
lectron
fioi
fd
whac
s3Apge
tpi
2
2
t2pLifiwMaeswo(w
2
eaJ(tmntp8h
wwiko
M. Bencsik et al. / Computers and E
lters applied to the acoustic noise of bees may be a good indicatorf the vicinity of the swarming process but no exemplification datas made available to the reader to substantiate the claim.
Very recently, a device for the long term logging of importanteatures of honey bee sounds in a hive has also been successfullyeveloped (Atauri and Llorente, 2009).
Those honey bees that are managed by humans often live inooden hives, and these emit acoustic noise that can clearly beeard if the ear is located near enough to it. In periods of very highctivity, the mechanical vibrations sustained in the hive’s outer boxan also be sensed simply by placing the hand on the wood.
In our work these vibrations were sensed by two accelerometersecured onto the outer wall of two separate hives, approximatelym away from one other, each comprising of a healthy colony ofpis mellifera honey bees. We are focusing on analysing this ‘by-roduct’ of honey bee activity, to show that it comprises of complexlobal information, rather than taking the microscopic approach ofxploring the insect’s individual communication process.
We present one method for processing this raw data in ordero extract a specific time varying signature comprising 10 inde-endent components, and demonstrate that this can be applied to
dentify and predict the swarming process several days in advance.
. Materials and methods
.1. Honey bees under investigation
Two Langstroth hives were monitored in Jarnioux, France (lati-ude (DMS) 45◦58′0N longitude (DMS) 4◦37′60E altitude (meters)71). They were located in close (10 m) proximity to a house com-rising a computer indoors (Pentium III 800 MHz CPU running ainux operating system). A simple roof was placed above the mon-tored hives to prevent vibrations caused by rain drops directlyalling onto them. The two colonies were looked after with minimalnterference, although they were fed during the winter. Swarming
as witnessed by one of the authors on several occasions: 3rd ofay for hive 1 (11:30 am) and hive 2 (5:30 pm), 30th of April, 2nd
nd 11th of May for hive 2. We found out that by mistake a queenxcluder had been placed at the bottom of the broodbox of theecond hive. This caused six unsuccessful swarms (three of whichere witnessed) for that hive until the queen was left to go by
pening a hole in the front wall, generating a final seventh swarmalso witnessed). The first hive swarmed twice, one of which wasitnessed.
.2. Vibration data collection
A 5 mm deep cavity was drilled in the wood of the back ofach hive, in the centre, with a diameter causing a tight fit to theccelerometers. The transducers (Isotron 7259B-10, Endevco, Sanuan Capistrano, USA) were connected to a dual channel conditionerNexus, Brüel and Kjær; Nærum, Denmark) residing between thewo hives, and encased in a water tight acrylic box to minimise
oisture ingress into the electronics. Having checked that the sig-al above 4000 Hz was negligible, the analogue output channels ofhe conditioner were fed into the sound card of the indoors com-uter, by means of individual shielded coaxial cables, for 16 bit,000 Hz sampling rate digitisation and storage on a 500 GB externalard disk.
Four very gentle knocks were supplied by hand to each hive, and
e could not measure any crosstalk from the two resulting digitisedaves, although both hives sat on the same wooden beams, approx-mately one meter above the ground. The waves recorded from thenocks were additionally used to estimate the resonant frequenciesf the hives under investigation. We also checked that large exter-
ics in Agriculture 76 (2011) 44–50 45
nal acoustic noise such as lorries passing nearby (∼100 m away)did not induce measurable signal in our recordings. The vibrations(i.e. a deformation wave propagating in wood/wax) that are sensedare therefore mainly coming from (i) the acoustic noise (a pressurewave propagating in air) from the honey bees inducing vibrationsinto the structure of the hive and (ii) the body motion of the indi-vidual bees inducing vibrations through their legs residing on thewax/wood.
The computer started logging the vibrations in individual files oftime duration of one hour each, from the 1st of November 2008 untilthe 9th of April 2009, when a power cut interrupted the recording(well before the swarming season). It was launched again on the11th of April 2009 until a second power cut stopped and damagedthe computer on the 17th of June 2009.
2.3. Data processing
The time course of the measured vibrations mostly comes fromseveral thousands of honey bee individuals which may be seenas a collection of transient pulsed oscillators with random indi-vidual phases. The raw signal is therefore too noisy for directanalysis. By computing short frequency spectra that are averagedtogether, a very clear curve with pronounced peaks may be rapidlyobtained, which suggests that the vibrations induced by the oscil-lators have similar spectral features in spite of their lack of phasecoherence. The time duration of an individual sample for computingone instantaneous spectrum determines its frequency resolutionwhilst the time duration over which it is averaged dictates the sig-nal to noise ratio of the signal. A good compromise was found for afrequency resolution of 20 Hz and an averaging time of 510 s.
Using a purpose-built computer script (in matlab®, as is for allsoftware presented in this work), these averaged spectra were com-puted for the entire data set, and stacked in one day long imagescalled spectrograms for visual inspection.
The next processing task consisted in extracting an instanta-neous ‘feature’ that one can use as a ‘signature’ of a specific state ofactivity of the honey bee hive. To date we have used (Baxter, 2003)principal component analysis (PCA).
Given n observations on p variables Xi, i = 1, . . ., p, PCA as mostcommonly used involves a linear transformation to p orthogonalvariables, Zi, the principal components, If X is the original n by pdata matrix then Z, the n by p matrix of principal component scores,contains exactly the same information as X. A major use of PCA isas a dimension reduction technique, whereby the first r columns ofZ can be used to ‘approximate’ X, where r is much less than p. This,allied to the orthogonality of the Zi, allows patterns in the data to beexplored much more readily in r or fewer dimensions than with theoriginal data matrix. It is sometimes possible to assign a ‘meaning’to the components, but this is not essential for the method to beuseful.
Specialising to our application, the rows and columns of X cor-respond to frequency and time, and can be interchanged. Entriesin the data matrix correspond to (averaged) amplitudes. Both fre-quency and time have a natural ordering that can be exploited ininterpreting the principal components, which we call ‘eigenspectra’in this study. Often, as is the case for our data, relatively few com-ponents are needed to explain most of the variation in the data, andtime plots based on the first few components can identify normalhive activity that changes when, for example swarming is aboutto occur. The entire time series of n = 37,856 spectra for each hivewas analysed by PCA on centred but unstandardised data, using
a separate script which takes 53 ms to converge (for one hive) ona 2.4 GHz CPU computer. Following this, any averaged spectrumcan be expressed as a linear combination of the Zi eigenspectra,to which the mean spectrum (over the entire data set) must beadded. The weighting factors required for a specific ‘reconstruction’
46 M. Bencsik et al. / Computers and Electronics in Agriculture 76 (2011) 44–50
Fig. 1. Honey bee hive vibrations. One day long spectrogram of the data collected onhcfc
atcapiomrt
3
3
icdciiot
3
odatva
3
ae
Fig. 2. PCA filtering of hive vibrations. The data from hive 1 on the 15th of April2009 is projected onto its set of eigenspectra. On the top, all of the 200 scores areused to reconstruct the data, ending up in the same spectrogram as seen in Fig. 1.
amplitudes (corresponding to the strength of the vibration at agiven frequency) or width (corresponding to the time duration ofthe pulsed oscillators causing the vibrations). Comparison with thespectrum of the hive resonances shows marked discrepancies, but
Fig. 3. Eigenspectra of honey bee hive vibrations. When comparing the two hives,some strong features are found to be common to the two sets of eigenspectra: (i) theyexhibit oscillations around zero except for the first one which corresponds to theoverall amplitude of vibrations, (ii) four peaks are clearly identified around 500 Hz,750 Hz, 2000 Hz and 3200 Hz, (iii) a pair of eigenspectra (here, Nos. 3 and 5) causesa shift of the frequency in two peaks in the same (No. 3) or in opposite directions(No. 5), whilst (iv) another pair (here, Nos. 2 and 4) allow the respective amplitudesof the peaks to be adjusted independently. Some mild differences are also seen,probably due to a combination of the hive natural resonances and the signature
ive one (top) and hive two (bottom) on the 15th of April 2009. The colour linearlyodes the amplitude of the acceleration (in arbitrary units, but identically scaledor both data sets), for a time and a frequency given by the horizontal and verticaloordinates.
re called scores, and at any point in time an instantaneous spec-rum can be perfectly described by the linear combination of theorresponding p instantaneous scores and p eigenspectra (whichre valid for the entire data set), where p is the number of digitaloints in one spectrum (p = 200 for the compromise that we chose
n this study. Higher p requires longer spectral averaging time, inrder to keep the same signal to noise). Alternatively, an approxi-ate description of an instantaneous spectrum may be obtained by
educing the number of scores and eigenspectra (e.g. from p = 200o r = 10) used in the linear combination.
. Results
.1. Spectrograms
The one day-long spectrograms of the two hives are shownn Fig. 1 for a specific day. For both hives four to five ‘bands’ arelearly seen, the strongest being around 2000 Hz. Small frequencyifferences can be seen between the two hives, resulting from aombination of different hives and, perhaps, from differences com-ng from the honey bee colonies themselves. Continuous activityn the night can be seen as well as amplitude variations over tworders of magnitudes. The second hive provides approximatelywice more signal than the first one.
.2. PCA filtering of honey bee signal
We established that at any point in time the linear combinationf the first ten scores and eigenspectra gives an excellent repro-uction of the original spectrum (Fig. 2). The eigenspectra werelso inspected visually and those corresponding to orders higherhan ten essentially contain noise. In our data the information rele-ant to honey bee activity can be approximated very well by a PCAnalysis using r = 10.
.3. Eigenspectra
The eigenspectra for both hives exhibit remarkable similarities,nd those of hive 1 are shown in Fig. 3. Fortunately, the effect ofigenspectra with order higher than one can often be interpreted
On the bottom plot, 10 scores (and associated spectograms) only are used. The PCAfiltering process removes unwanted noise, simplifies the analysis of the extracteddata, and preserves excellent temporal and frequency resolutions, unlike Fourier orspatial convolution types of filtering.
in terms of three majors features: shifting specific peaks (corre-sponding to a change in signal frequency), changing their relative
of the vibrations of a colony being specific to a particular colony (those spectrashown here come from hive 1). The entire data set (37856 spectra each averagedover 8.5 min) was supplied to our software to extract this data. The dotted line givesan idea of the mechanical resonances of the hive ensemble, obtained by Fouriertransformation of the pulses recorded with the hand knocks, although frequency-dependent attenuation coefficients also participate in the shape of that curve.

M. Bencsik et al. / Computers and Electronics in Agriculture 76 (2011) 44–50 47
Fig. 4. Spectrogram and scores. On the top, the one day long spectrogram of the data collected on hive 2 on the 6th of May 2009 is shown, together with the time-courseof the six most important scores (bottom) corresponding to the same day of activity. The first order score spans much larger values than the others, and has been scaleddown (see text). A score taking a value of zero means that the corresponding eigenspectrum is not needed at that time, as its contribution exactly matches that of the mean( e valuw to a st ectra
w‘v
3
vccotht
ivttTatfi
3
tbttwcat
over the entire data set) spectrum. A score with, respectively, a positive or negativeaker than that required for the mean spectrum. One score does not correspond
otal signal that is statistically independent from any other score, since the eigensp
e have not attempted at compensating our data for the naturaltransfer function’ that the hive provides between the honey beeibrations and our measurements.
.4. Scores
Visual inspection of the spectrograms mostly reveals very largeariations of the signal’s overall amplitude. These variations areaptured in the time course of the scores on the first order principalomponent (PC), or eigenspectrum. The PC scores with a higherrder (two and above) reveal subtle variations in the signal (Fig. 4)hat are not obvious to the naked eye on the spectrograms, butighly relevant to honey bee activity, as will be demonstrated inhis work.
To allow suitable visualisation of the results, the first order scoren Fig. 4 has been scaled down so as to reach the same maximumalue as the second one, whilst the others have not been scaled. Forhe first hive and second hive, respectively, on average, the ratio ofhe first to the second order score is found to be six and twenty.his is in good agreement with the visual inspection of the hives,s by opening them prior and following the study it was quite clearhat the second one was more populated and ‘stronger’ than therst one.
.5. Identification of the swarming process
The relevance of the time course of the scores was specificallyested on the process of swarming. The swarming events that haveeen witnessed were first inspected on the spectrograms and onhe time course of the scores. These plots were also inspected after
he 11th of May and before the 3rd of May, where no swarming wasitnessed or possible (winter time). When described by the timeourse of the scores, the swarming events were found to exhibitunique set of combined features (Fig. 5) never seen together in
he winter days or those following the 11th of May: a gradual,
e indicates that the corresponding eigenspectrum provides a contribution larger orpecific honey bee vibrational activity, but any score provides a contribution to thehave been ensured to be all orthogonal to one another by PCA.
exponential-like divergence of most of the scores over approxi-mately 5–10 h, followed by a peaked amplitude over a single pointin time (i.e. over 8.5 min), followed by a reversal of polarity of somescores and an extremely low set of amplitudes thereafter (exceptfor scores directly expressing frequency shifts).
A simple quantitative study of the vibrational measurementsof the building-up of the swarming event was undertaken for thefirst hive, which swarmed “naturally”. The second hive’s swarmingdata is affected by the misplaced queen excluder, and is thereforebiased. For hive 1, the witnessed swarming was selected, and the5 h of spectrogram immediately preceding the highest vibrationat the end of the divergence of the data was selected. The cross-correlation function between this section of data and the entiredata set was calculated as a function of time, and this did not yieldspecific peaks in the vicinity of the swarming. The cross-correlationfunction was then calculated for each individual score of the samesection of data. A clear build-up of the amplitude of the functionwas seen within several days preceding swarming for the scores oforder 5, 9 and 10 (Fig. 6), whilst those maxima seen elsewhere forthe scores with other orders did not seem to relate to the swarming.
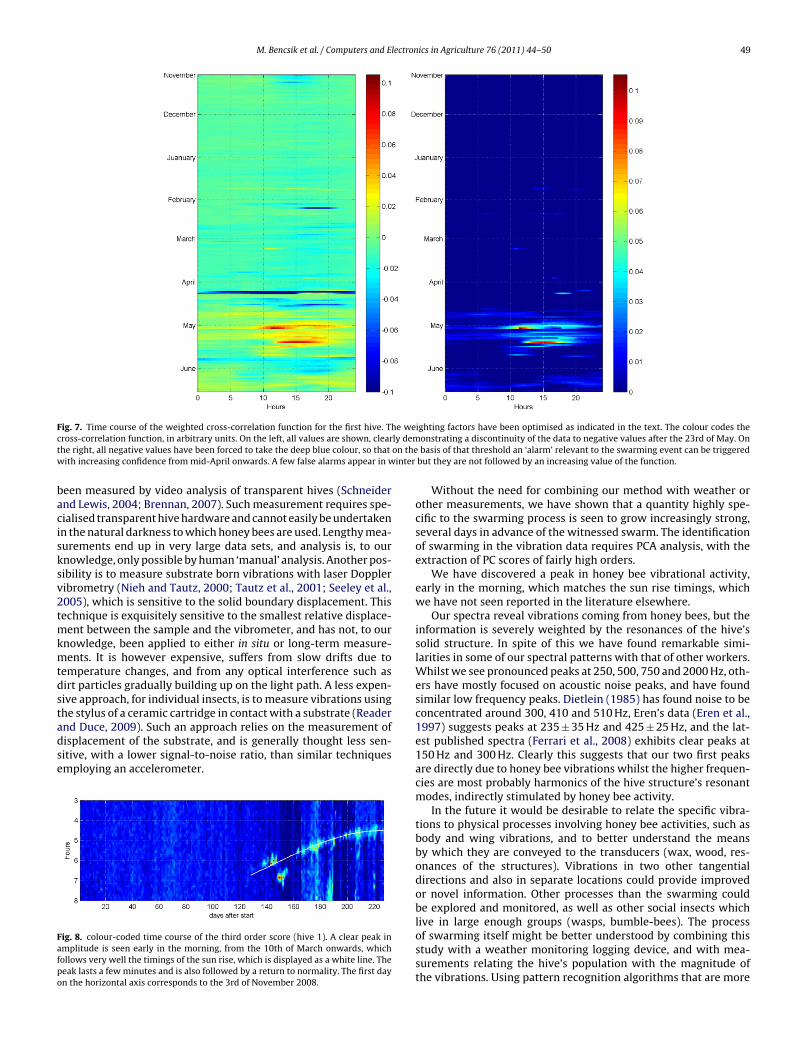
We then investigated the relative importance of specific scores,with regards to detecting the swarming event from our data. Ascript was written to compute a cross-correlation function com-bining each of the ten scores with independent weighting factors.The script uses the “fminsearch” Matlab® algorithm and attemptsat maximising and minimising the function when using a sectionrespectively during swarming and outside swarming. The sectionthat we selected to maximise the function was limited at the endof the witnessed swarm, and its start can be chosen at any timebetween 1 and 10 days prior to it, without changing the result.
The selected section for minimisation was limited by the end ofthe data, and can be started at any time between two to ten daysbefore, which correspond to 45 days and 35 days after the first andsecond peak of the function. The results shown in Fig. 7 suggestthat swarming can be detected several days in advance and that a
48 M. Bencsik et al. / Computers and Electronics in Agriculture 76 (2011) 44–50
Fig. 5. Time course of scores on six different days. The four witnessed swarms for hive 2 are shown from A to D, that witnessed for hive 1 is shown in E, whilst a ‘normal’ day’sd et of fs ng seat ng lat‘
so1
3
ta
Fshcueat1tl
ata well after the swarming season in shown in F, for comparison purposes. The swarming events (irrespective of the hive), and are never seen outside the swarmihe same time in the day, between 11 am and 1 pm), whilst those in C and D, occurritrapped’ in the hive. For all plots the first score has been scaled here as in Fig. 4.
econdary swarm (not witnessed) emerged ten days after the firstne, as is often seen in hives that are not interfered with (Winston,987).
.6. Sunrise activity
For both hives on most of our spectrograms acquired afterhe 10th of March (see Figs. 1 and 2) a clear peak of vibrationalctivity can be seen in the early hours of the morning. This was
ig. 6. Time course of the swarming cross-correlation function for the 9th ordercore of the first hive. The red line indicates the day of the swarming event thatas been witnessed, which also comprises the 5 h of data used for computing theross-correlation function. The function is negative at any time in the recordingntil 11 days before swarming where it becomes positive. The first maximum isxtremely close to the swarming event, the second one occurs 10 days later wheresecondary swarm might have occurred. The curve is remarkably insensitive to the
ime duration of the selected swarming section, provided that it is between 2 and0 h, and demonstrates the emergence of a vibrational ‘pattern’ highly specific tohe swarming process. (For interpretation of the references to color in this figureegend, the reader is referred to the web version of the article.)
eatures (see text) seen for the swarming events are common to all five witnessedson. The swarming signatures in A, B and E are remarkably similar (and happen ater in the day (between 4 pm and 5 pm), are probably strongly affected by the queen
further investigated by looking at the time course of individualscores (Fig. 8), which we superimposed with the time course ofthe sunrise.1
4. Discussion and further work
We have shown that a non-invasive and automated method canprovide to be a useful monitoring device, by analysis of the timecourse of the normal vibrations recorded on the wall of a honeybee hive. We chose to use accelerometers in our work, which, toour knowledge, have never been tried as hive monitoring sensors.Although not published in the professional literature, we knowfrom our own experience and that of others (Michelsen, 2005)that microphone measurements are only sensitive to a few bees inthe close vicinity of the microphone, that bees passing nearby cancause huge transient signals, that unwanted external noises such asbird singing or airplanes or motorcars can often be picked up, andthat long-term monitoring is severely restricted due to the naturalpropensity bees exhibit to coat with propolis any body that is aliento their natural habitat. The published work that involves micro-phone measurements is restricted to relatively short sequences(Bromenshenk et al., 2007, 2009; Etter et al., 2007), and/or single
bee measurements (Michelsen et al., 1987), and/or measurementsdone in a hive which probably senses a few hundred bees (Ferrariet al., 2008), which are continuously moving in and out of the vol-ume to which the microphone is sensitive. Vibrational data has also1 See acknowledgements.
M. Bencsik et al. / Computers and Electronics in Agriculture 76 (2011) 44–50 49
F he wec ly demt on thew inter
bacisksv2tmkmtdstadse
Fafpo
ig. 7. Time course of the weighted cross-correlation function for the first hive. Tross-correlation function, in arbitrary units. On the left, all values are shown, clearhe right, all negative values have been forced to take the deep blue colour, so thatith increasing confidence from mid-April onwards. A few false alarms appear in w
een measured by video analysis of transparent hives (Schneidernd Lewis, 2004; Brennan, 2007). Such measurement requires spe-ialised transparent hive hardware and cannot easily be undertakenn the natural darkness to which honey bees are used. Lengthy mea-urements end up in very large data sets, and analysis is, to ournowledge, only possible by human ‘manual’ analysis. Another pos-ibility is to measure substrate born vibrations with laser Doppleribrometry (Nieh and Tautz, 2000; Tautz et al., 2001; Seeley et al.,005), which is sensitive to the solid boundary displacement. Thisechnique is exquisitely sensitive to the smallest relative displace-
ent between the sample and the vibrometer, and has not, to ournowledge, been applied to either in situ or long-term measure-ents. It is however expensive, suffers from slow drifts due to
emperature changes, and from any optical interference such asirt particles gradually building up on the light path. A less expen-ive approach, for individual insects, is to measure vibrations using
he stylus of a ceramic cartridge in contact with a substrate (Readernd Duce, 2009). Such an approach relies on the measurement ofisplacement of the substrate, and is generally thought less sen-itive, with a lower signal-to-noise ratio, than similar techniquesmploying an accelerometer.ig. 8. colour-coded time course of the third order score (hive 1). A clear peak inmplitude is seen early in the morning, from the 10th of March onwards, whichollows very well the timings of the sun rise, which is displayed as a white line. Theeak lasts a few minutes and is also followed by a return to normality. The first dayn the horizontal axis corresponds to the 3rd of November 2008.
ighting factors have been optimised as indicated in the text. The colour codes theonstrating a discontinuity of the data to negative values after the 23rd of May. Onbasis of that threshold an ‘alarm’ relevant to the swarming event can be triggered
but they are not followed by an increasing value of the function.
Without the need for combining our method with weather orother measurements, we have shown that a quantity highly spe-cific to the swarming process is seen to grow increasingly strong,several days in advance of the witnessed swarm. The identificationof swarming in the vibration data requires PCA analysis, with theextraction of PC scores of fairly high orders.
We have discovered a peak in honey bee vibrational activity,early in the morning, which matches the sun rise timings, whichwe have not seen reported in the literature elsewhere.
Our spectra reveal vibrations coming from honey bees, but theinformation is severely weighted by the resonances of the hive’ssolid structure. In spite of this we have found remarkable simi-larities in some of our spectral patterns with that of other workers.Whilst we see pronounced peaks at 250, 500, 750 and 2000 Hz, oth-ers have mostly focused on acoustic noise peaks, and have foundsimilar low frequency peaks. Dietlein (1985) has found noise to beconcentrated around 300, 410 and 510 Hz, Eren’s data (Eren et al.,1997) suggests peaks at 235 ± 35 Hz and 425 ± 25 Hz, and the lat-est published spectra (Ferrari et al., 2008) exhibits clear peaks at150 Hz and 300 Hz. Clearly this suggests that our two first peaksare directly due to honey bee vibrations whilst the higher frequen-cies are most probably harmonics of the hive structure’s resonantmodes, indirectly stimulated by honey bee activity.
In the future it would be desirable to relate the specific vibra-tions to physical processes involving honey bee activities, such asbody and wing vibrations, and to better understand the meansby which they are conveyed to the transducers (wax, wood, res-onances of the structures). Vibrations in two other tangentialdirections and also in separate locations could provide improvedor novel information. Other processes than the swarming couldbe explored and monitored, as well as other social insects which
live in large enough groups (wasps, bumble-bees). The processof swarming itself might be better understood by combining thisstudy with a weather monitoring logging device, and with mea-surements relating the hive’s population with the magnitude ofthe vibrations. Using pattern recognition algorithms that are more
5 ectron
swar1t(
A
sfiflww
R
A
BB
BBD
E
E
0 M. Bencsik et al. / Computers and El
ophisticated than the simple cross-correlation function is also aay forward when corroborative measurements are available such
s video monitoring. Finally, by using hives in well-controlled labo-atory environment, very low frequencies (frequencies lower than20 Hz have been dismissed in this study) could be sensed, such ashose used for other important processes clarified by other workersSchneider, 2007).
cknowledgements
We are grateful to Dr. Robert Morris, NTU, who wrote the Linuxcript continuously storing the digitised data in individual shortles, to Dr. Daniel Brown, NTU, who worked out the sun rise times
rom the location of the hives, to Antoine and Joseph Bencsik Jr. forooking after the 8-month long continuous recording, and to NTU
ho partly funded this work through a SPUR summer work bursaryhich Andrei Lucian benefited from.
eferences
tauri, D., Llorente, J., 2009. Platform for bee-hives monitoring based on soundanalysis. A perpetual warehouse for swarm’s daily activity. Spanish Journal ofAgricultural Research 7 (4), 824–828.
axter, M., 2003. Statistics in Archeology. John Wiley and Sons.rennan, B., 2007. Abdominal wagging in the social paper wasp Polistes dominulus:
behavior and substrate vibrations. Ethology 113, 692–702.romenshenk et al. US 2007/0224914 A1, 2007.romenshenk et al. US 7549907 B2, 2009.
ietlein, D.G., 1985. A method for remote monitoring of activity of honeybeecoloniess by sound analysis. Journal of Apicultural Research 24 (3), 176–183.ren H. et al., 1997. Electronic sensing and identification of queen bees in honey-
bee colonies. IEEE Instrumentation and Measurement Technology Conference,1052–1055.
tter, R., et al. CA 2 573 049, 2007.
ics in Agriculture 76 (2011) 44–50
Ferrari, S., et al., 2008. Monitoring of swarming sounds in bee hives for early detec-tion of the swarming period. Computers and Electronics in Agriculture 64, 72–77.
Kirchner, W.H., 1997. In: Lehrer, M. (Ed.), Orientation and Communication in Arthro-pods. Birkenhäuser Verlag, Basel.
Michelsen, A., et al., 1987. The acoustic near-field of a dancing honeybee. Journal ofComparative Physiology A 161, 633–643.
Michelsen, A., 1999. The dance language of honeybees: recent findings and problems.In: Hauser, M.D., Konishi, M. (Eds.), The Design of Animal Communication. MITPress.
Michelsen, A. Personal communication, 2005.Nieh, J., Tautz, J., 2000. Behaviour-locked signal analysis reveals weak 200–300 Hz
comb vibrations during the honeybee waggle dance. Journal of ExperimentalBiology 203, 1573–1579.
Reader, T., Duce, I.R., 2009. Intraguild interactions promote assortative mating andaffect sexual attractiveness in a phytophagous fly. Biological Journal of the Lin-nean Society 98, 171–180.
Sandeman, D.C., et al., 1996. Transmission of vibration across honeycombs and itsdetection by bee leg receptors. Journal of Experimental Biology 199, 2585–2594.
Schneider, S.S., Lewis, L.L., 2004. The vibration signal, modulatory communicationand the organisation of labour in honey bees, Apis mellifera. Apidologie 35,117–131.
Schneider, S., 2007. Vibration signals and the organisation of labour in honey beecolonies. Bee Craft, 20–25.
Seeley, T.D., Tautz, J., 2001. Worker piping in honey bee swarms and its role inpreparing for liftoff. Journal of Comparative Physiology A 187, 667–676.
Seeley, T.D., et al., 2005. Does plastic comb foundation hinder waggle dance com-munication? Apidologie 36, 513–521.
Tautz, J., 1996. Transmission of vibration across honeycombs and its detection bybee leg receptors. Journal of Experimental Biology 199, 1375–1381.
Tautz, J., et al., 2001. Phase reversal of vibratory signals in honeycomb may assistdancing honeybees to attract their audience. Journal of Experimental Biology204, 3737–3746.
Visscher, P.K., Seeley, T.D., 2007. Coordinating a group departure: who produces thepiping signals on honeybee swarms? Behavioral Ecology and Sociobiology 61,
1615–1621.Von Frisch, K., 1967. The Dance Language and Orientation of Bees. The Belknap Pressof Harvard University Press, Cambridge, Mass.
Winston, M.L., 1987. The Biology of the Honey Bee. Harvard University Press, Cam-bridge.
Woods E.F. US 2,806,082, 1957.