Identification of syllables in noise: electrophysiological and behavioral correlates
8
Identification of syllables in noise: Electrophysiological and behavioral correlates Ricky Kaplan-Neeman, a Liat Kishon-Rabin, Yael Henkin, and Chava Muchnik Department of Communication Disorders, Sackler Faculty of Medicine, Tel-Aviv University, Israel Received 19 July 2005; revised 31 May 2006; accepted 2 June 2006 This study was designed to characterize the effect of background noise on the identification of syllables using behavioral and electrophysiological measures. Twenty normal-hearing adults 18–30 years performed an identification task in a two-alternative forced-choice paradigm. Stimuli consisted of naturally produced syllables /da/ and /ga/ embedded in white noise. The noise was initiated 1000 ms before the onset of the speech stimuli in order to separate the auditory event related potentials AERP response to noise onset from that to the speech. Syllables were presented in quiet and in five SNRs: +15, +3, 0, -3, and -6 dB. Results show that 1 performance accuracy, d, and reaction time were affected by the noise, more so for reaction time; 2 both N1 and P3 latency were prolonged as noise levels increased, more so for P3; 3 /ga/ was better identified than /da/, in all noise conditions; and 4 P3 latency was longer for /da/ than for /ga/ for SNR 0 through -6 dB, while N1 latency was longer for /ga/ than for /da/ in most listening conditions. In conclusion, the unique stimuli structure utilized in this study demonstrated the effects of noise on speech recognition at both the physical and the perceptual processing levels. © 2006 Acoustical Society of America. DOI: 10.1121/1.2217567 PACS numbers: 43.64.Sj, 43.72.Dv, 43.71.Gv ALF Pages: 926–933 I. INTRODUCTION Verbal communication most commonly takes place in background noise. This communication is known to be dis- rupted when the energy of the noise and that of the speech signal interact at the same frequency bands, resulting in re- duced speech recognition Rosen and Fourcin, 1986; Moore, 1997. The use of auditory event related potentials (AERPs) for studying manifestations of speech perception in noise allows for additional insight to this speech perception pro- cess Whiting et al., 1998; Martin et al., 1997, 1999; Martin and Stapells, 2005. In general, AERP studies demonstrated that discriminating speech in noise resulted in slower and less efficient processing. Interestingly, this was evident also when speech recognition scores were high. Whiting et al., 1998; Martin et al., 1997, 1999; Martin and Stapells, 2005. For example, the discrimination between /ba/ and /da/ in various background noises resulted in prolongation of AERP components as well as in reduced amplitudes. This effect was found more pronounced in AERPs that are believed to reflect the closure and completion of the speech perception process i.e., P3 in attended and nonattended tasks Kutas and Dale, 1997. One major outcome common to these studies was the difficulty in obtaining AERP peaks at a SNR of zero and below despite high recognition scores Martin et al., 1997, 1999; Whiting et al., 1998, Martin and Stapells, 2005. Ex- amination of the methodology suggests that one possible rea- son for this difficulty may be related to the fact that both the speech signal and the noise were initiated at the same time. This in turn produced overlapping onset responses that did not allow separating the AERPs elicited by the noise from those elicited by the speech-plus-noise. Therefore, when ex- ploring the neurophysiologic manifestations of speech per- ception in background noise, it is important to identify the optimal time period between the onsets of the noise and the speech-plus-noise that will elicit separate prominent and identifiable waveforms. Preliminary investigations conducted in our lab showed that when the noise was initiated 1 s be- fore that of the speech signal a full separation of the wave- forms was obtained. This is illustrated in Fig. 1. It can be seen that when noise was initiated 50 ms prior to the speech stimulus, the overlapping waveforms did not permit clear identification of all AERP components especially N1 and P2Fig. 1a. In contrast, when noise was initiated 1 s be- fore that of the speech stimulus, clear identifiable AERPs were evident, separately for the noise and for the speech- plus-noise Fig. 1b. The main purpose of the present study was to investigate the process of speech recognition in difficult and easy noisy conditions, by normal-hearing adults, using electrophysi- ological measures while implementing stimuli structure that allows separating AERPs to the noise from those of the speech-plus-noise. Behavioral measures were obtained as well in order to supplement the electrophysiological data and provide a quantative measure for the “end-product” of the speech recognition process. In order to reduce the effect of linguistic information on the identification process, and thus limit the parameter under study to acoustic-phonetic, stimuli included /da/ and /ga/. These syllables differ by one signifi- cant phonetic feature, place of articulation, known to be sus- ceptible to noise Miller and Nicely, 1955; Boothroyd, 1984; Hornsby et al., 2005. a Address for correspondence: Department of Communication Disorders, Sheba Medical Center, Tel Hashomer, 52621 Israel. Electronic mail: [email protected] 926 J. Acoust. Soc. Am. 120 2, August 2006 © 2006 Acoustical Society of America 0001-4966/2006/1202/926/8/$22.50
Transcript of Identification of syllables in noise: electrophysiological and behavioral correlates
Identification of syllables in noise: Electrophysiologicaland behavioral correlates
Ricky Kaplan-Neeman,a� Liat Kishon-Rabin, Yael Henkin, and Chava MuchnikDepartment of Communication Disorders, Sackler Faculty of Medicine, Tel-Aviv University, Israel
�Received 19 July 2005; revised 31 May 2006; accepted 2 June 2006�
This study was designed to characterize the effect of background noise on the identification ofsyllables using behavioral and electrophysiological measures. Twenty normal-hearing adults�18–30 years� performed an identification task in a two-alternative forced-choice paradigm. Stimuliconsisted of naturally produced syllables /da/ and /ga/ embedded in white noise. The noise wasinitiated 1000 ms before the onset of the speech stimuli in order to separate the auditory eventrelated potentials �AERP� response to noise onset from that to the speech. Syllables were presentedin quiet and in five SNRs: +15, +3, 0, −3, and −6 dB. Results show that �1� performance accuracy,d�, and reaction time were affected by the noise, more so for reaction time; �2� both N1 and P3latency were prolonged as noise levels increased, more so for P3; �3� /ga/ was better identified than/da/, in all noise conditions; and �4� P3 latency was longer for /da/ than for /ga/ for SNR 0 through−6 dB, while N1 latency was longer for /ga/ than for /da/ in most listening conditions. In conclusion,the unique stimuli structure utilized in this study demonstrated the effects of noise on speechrecognition at both the physical and the perceptual processing levels.© 2006 Acoustical Society of America. �DOI: 10.1121/1.2217567�
PACS number�s�: 43.64.Sj, 43.72.Dv, 43.71.Gv �ALF� Pages: 926–933
I. INTRODUCTION
Verbal communication most commonly takes place inbackground noise. This communication is known to be dis-rupted when the energy of the noise and that of the speechsignal interact at the same frequency bands, resulting in re-duced speech recognition �Rosen and Fourcin, 1986; Moore,1997�. The use of auditory event related potentials (AERPs)for studying manifestations of speech perception in noiseallows for additional insight to this speech perception pro-cess �Whiting et al., 1998; Martin et al., 1997, 1999; Martinand Stapells, 2005�. In general, AERP studies demonstratedthat discriminating speech in noise resulted in slower andless efficient processing. Interestingly, this was evident alsowhen speech recognition scores were high. �Whiting et al.,1998; Martin et al., 1997, 1999; Martin and Stapells, 2005�.For example, the discrimination between /ba/ and /da/ invarious background noises resulted in prolongation of AERPcomponents as well as in reduced amplitudes. This effectwas found more pronounced in AERPs that are believed toreflect the closure and completion of the speech perceptionprocess �i.e., P3� in attended and nonattended tasks �Kutasand Dale, 1997�.
One major outcome common to these studies was thedifficulty in obtaining AERP peaks at a SNR of zero andbelow despite high recognition scores �Martin et al., 1997,1999; Whiting et al., 1998, Martin and Stapells, 2005�. Ex-amination of the methodology suggests that one possible rea-son for this difficulty may be related to the fact that both thespeech signal and the noise were initiated at the same time.
a�Address for correspondence: Department of Communication Disorders,Sheba Medical Center, Tel Hashomer, 52621 Israel. Electronic mail:
[email protected]926 J. Acoust. Soc. Am. 120 �2�, August 2006 0001-4966/2006/1
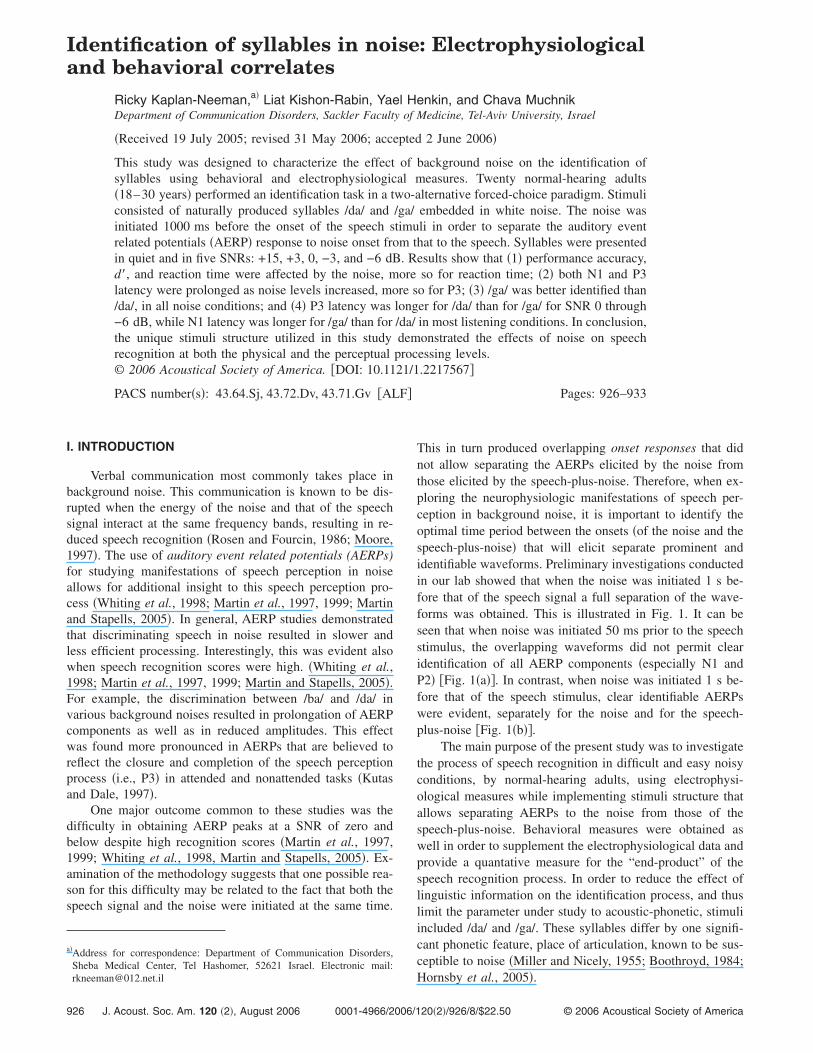
This in turn produced overlapping onset responses that didnot allow separating the AERPs elicited by the noise fromthose elicited by the speech-plus-noise. Therefore, when ex-ploring the neurophysiologic manifestations of speech per-ception in background noise, it is important to identify theoptimal time period between the onsets �of the noise and thespeech-plus-noise� that will elicit separate prominent andidentifiable waveforms. Preliminary investigations conductedin our lab showed that when the noise was initiated 1 s be-fore that of the speech signal a full separation of the wave-forms was obtained. This is illustrated in Fig. 1. It can beseen that when noise was initiated 50 ms prior to the speechstimulus, the overlapping waveforms did not permit clearidentification of all AERP components �especially N1 andP2� �Fig. 1�a��. In contrast, when noise was initiated 1 s be-fore that of the speech stimulus, clear identifiable AERPswere evident, separately for the noise and for the speech-plus-noise �Fig. 1�b��.
The main purpose of the present study was to investigatethe process of speech recognition in difficult and easy noisyconditions, by normal-hearing adults, using electrophysi-ological measures while implementing stimuli structure thatallows separating AERPs to the noise from those of thespeech-plus-noise. Behavioral measures were obtained aswell in order to supplement the electrophysiological data andprovide a quantative measure for the “end-product” of thespeech recognition process. In order to reduce the effect oflinguistic information on the identification process, and thuslimit the parameter under study to acoustic-phonetic, stimuliincluded /da/ and /ga/. These syllables differ by one signifi-cant phonetic feature, place of articulation, known to be sus-ceptible to noise �Miller and Nicely, 1955; Boothroyd, 1984;
Hornsby et al., 2005�.© 2006 Acoustical Society of America20�2�/926/8/$22.50
II. METHODS
A. Subjects
Twenty young adult females �mean age 21.5 years;range 18–30� were paid to participate in the study. All wereright-handed, native Hebrew speakers, with normal hearingsensitivity ��15 dBHL� within the frequency range of250 to 8000 Hz �ANSI, 1996�.
B. Stimuli
Stimuli consisted of naturally spoken consonants-vowel�CV� syllables, /da/ and /ga/. The two consonants /d,g/ werechosen since they differ by the phonetic feature place ofarticulation which is prone to be affected by noise �Millerand Nicely, 1955; Boothroyd, 1984; Hornsby et al., 2005�.Moreover, spectral differences between them are evidentmainly in the steepness of the second and third formant tran-sitions of the consonant burst to the steady state of thevowel, with the transition of /ga/ steeper than that of /da/ inHebrew natural speech stimuli �Kishon-Rabin et al., 2003�.Thus, the distinction between the two phonemes in noisemay be difficult, even for normal-hearing young adults.
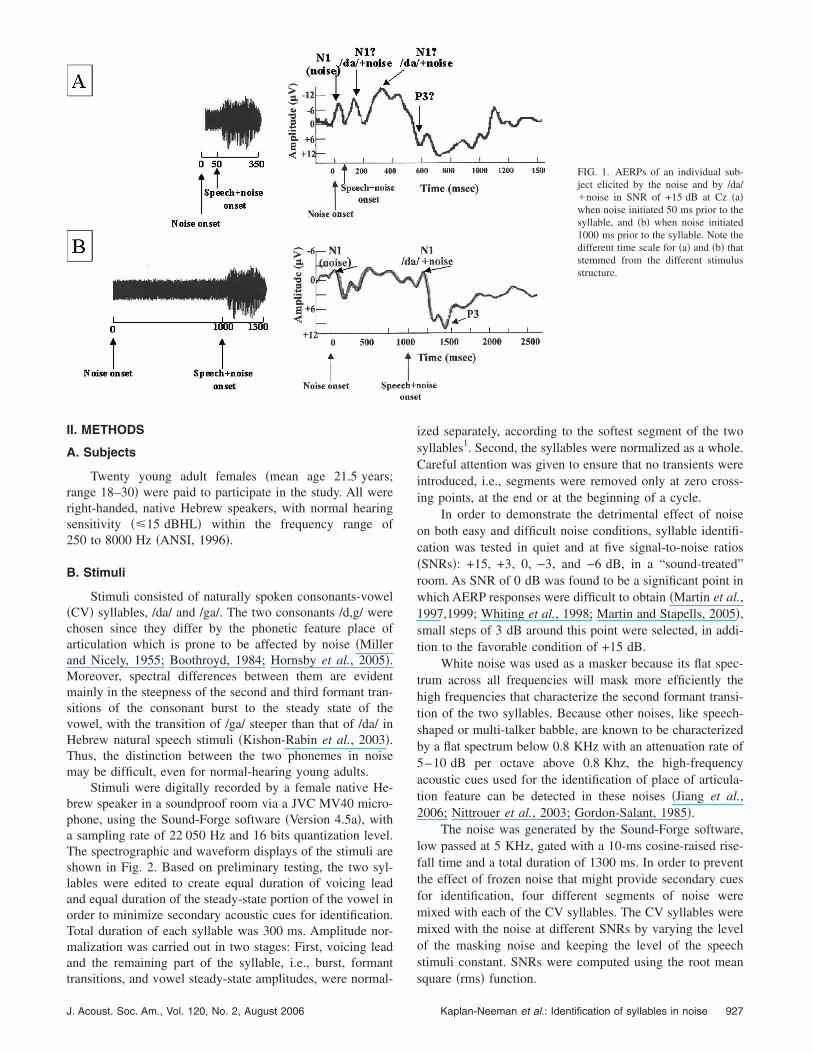
Stimuli were digitally recorded by a female native He-brew speaker in a soundproof room via a JVC MV40 micro-phone, using the Sound-Forge software �Version 4.5a�, witha sampling rate of 22 050 Hz and 16 bits quantization level.The spectrographic and waveform displays of the stimuli areshown in Fig. 2. Based on preliminary testing, the two syl-lables were edited to create equal duration of voicing leadand equal duration of the steady-state portion of the vowel inorder to minimize secondary acoustic cues for identification.Total duration of each syllable was 300 ms. Amplitude nor-malization was carried out in two stages: First, voicing leadand the remaining part of the syllable, i.e., burst, formant
transitions, and vowel steady-state amplitudes, were normal-J. Acoust. Soc. Am., Vol. 120, No. 2, August 2006
ized separately, according to the softest segment of the twosyllables1. Second, the syllables were normalized as a whole.Careful attention was given to ensure that no transients wereintroduced, i.e., segments were removed only at zero cross-ing points, at the end or at the beginning of a cycle.
In order to demonstrate the detrimental effect of noiseon both easy and difficult noise conditions, syllable identifi-cation was tested in quiet and at five signal-to-noise ratios�SNRs�: +15, +3, 0, −3, and −6 dB, in a “sound-treated”room. As SNR of 0 dB was found to be a significant point inwhich AERP responses were difficult to obtain �Martin et al.,1997,1999; Whiting et al., 1998; Martin and Stapells, 2005�,small steps of 3 dB around this point were selected, in addi-tion to the favorable condition of +15 dB.
White noise was used as a masker because its flat spec-trum across all frequencies will mask more efficiently thehigh frequencies that characterize the second formant transi-tion of the two syllables. Because other noises, like speech-shaped or multi-talker babble, are known to be characterizedby a flat spectrum below 0.8 KHz with an attenuation rate of5–10 dB per octave above 0.8 Khz, the high-frequencyacoustic cues used for the identification of place of articula-tion feature can be detected in these noises �Jiang et al.,2006; Nittrouer et al., 2003; Gordon-Salant, 1985�.
The noise was generated by the Sound-Forge software,low passed at 5 KHz, gated with a 10-ms cosine-raised rise-fall time and a total duration of 1300 ms. In order to preventthe effect of frozen noise that might provide secondary cuesfor identification, four different segments of noise weremixed with each of the CV syllables. The CV syllables weremixed with the noise at different SNRs by varying the levelof the masking noise and keeping the level of the speechstimuli constant. SNRs were computed using the root mean
FIG. 1. AERPs of an individual sub-ject elicited by the noise and by /da/�noise in SNR of +15 dB at Cz �a�when noise initiated 50 ms prior to thesyllable, and �b� when noise initiated1000 ms prior to the syllable. Note thedifferent time scale for �a� and �b� thatstemmed from the different stimulusstructure.
square �rms� function.
Kaplan-Neeman et al.: Identification of syllables in noise 927
C. AERP recording
Brain electrical activity was recorded from 11 sites onthe scalp via electrocap tin electrodes referenced to the chin.Recording locations were standard international 10-20-system location: F3, Fz, F4, T3, C3, Cz, C4, T4, P3, Pz, P4.Electrodes impedances were kept under 5 k�. A groundelectrode was placed on the left mastoid, and electrodesabove and below the left eye monitored eye movements.
An Orgil™ Brain Performance Measurement �BPM�System sampled the brain electrical activity at 256 Hz. A/Dresolution was 0.1 �V per bit, and the band pass was0.1–100 Hz. Single-trial waveforms were saved for off-lineeye-movement correction, base-line correction, averaging,and digital filtering.
D. Procedure
Subjects were seated in a comfortable armchair. Afterelectrode application they were instructed to fixate their eyeson a colored spot on the wall in front of them and refrainfrom blinking during a recording block. The stimuli werepresented using a Grason-Stadler GSI-16 audiometer viaTDH-50 headphones at 65 dBHL in a semi-random order:the “quiet” �i.e., syllables without noise� condition was al-ways the first to be presented and the succeeding SNR waschosen randomly. Note, however, that the SNR=−6 did notfollow the quiet condition in order to allow some accommo-dation to the noise. Subjects performed a two-alternativeforced-choice identification task, labeling the syllables eitheras /da/ or /ga/. They were instructed to press one of twobuttons corresponding to the appropriate syllable, placingequal emphasis on speed and accuracy. Each block consistedof 300 single trials, 150 tokens of each syllable. The inter-stimulus interval between two consecutive stimuli from off-set to onset was 2000 ms. Short breaks were provided be-tween blocks, upon subjects’ request. The AERP recordinglasted approximately 2.5 h for each subject. Single-trial
waveforms were saved for off-line analysis in the Orgil™928 J. Acoust. Soc. Am., Vol. 120, No. 2, August 2006
system computer, which also provided measures of behav-ioral reaction time and percent-correct identification.
The Institutional Review Board of the Tel-Aviv Univer-sity approved experimentation. Participants signed an in-formed consent form for their participation in the study.
E. Data analysis
The latency and amplitude of the AERP components N1,P2, N2, and P3 were obtained from each subject in quiet andin the different SNRs. Peak latency was defined as the timefrom stimulus onset to the point of the most negative orpositive peak in a preselected time window, based on grand-averaged waveforms across subjects. Thus, N1 was definedas the most negative peak in the 160–228-ms time window,P2 as the most positive peak in the 230–374-ms time win-dow, N2 was the most negative peak in the 280–574-mstime window, and P3 was the most positive peak in the380–843-ms time window. Amplitude was defined as thevoltage difference between the peak and the average voltageover the 200-ms preceding stimulus onset.
Multivariate analysis of variance for repeated measureswith two levels of task �/da/, /ga/� and six levels of condition�quiet, +15, +3, 0, −3, −6� was performed on the AERPcomponents latency and amplitude as well as on the behav-ioral measures: accuracy �percent correct� and reaction time.The level of significance was set to p�0.05. Contrast analy-sis was employed when significant differences among tasksand conditions were found.
III. RESULTS
A. Behavioral measures
1. Accuracy
Word identification accuracy in the different listeningconditions �quiet and the different SNRs� for the two syl-lables �/da/, /ga/� are presented in Fig. 3�a�. A MANOVA test
FIG. 2. Waveforms and spectrogramanalysis for /da/ and /ga/. Note thevoicing lead portion that includesminimal energy, and the different burstduration of each syllable.
was conducted to separate the main effects of syllable, lis-
Kaplan-Neeman et al.: Identification of syllables in noise
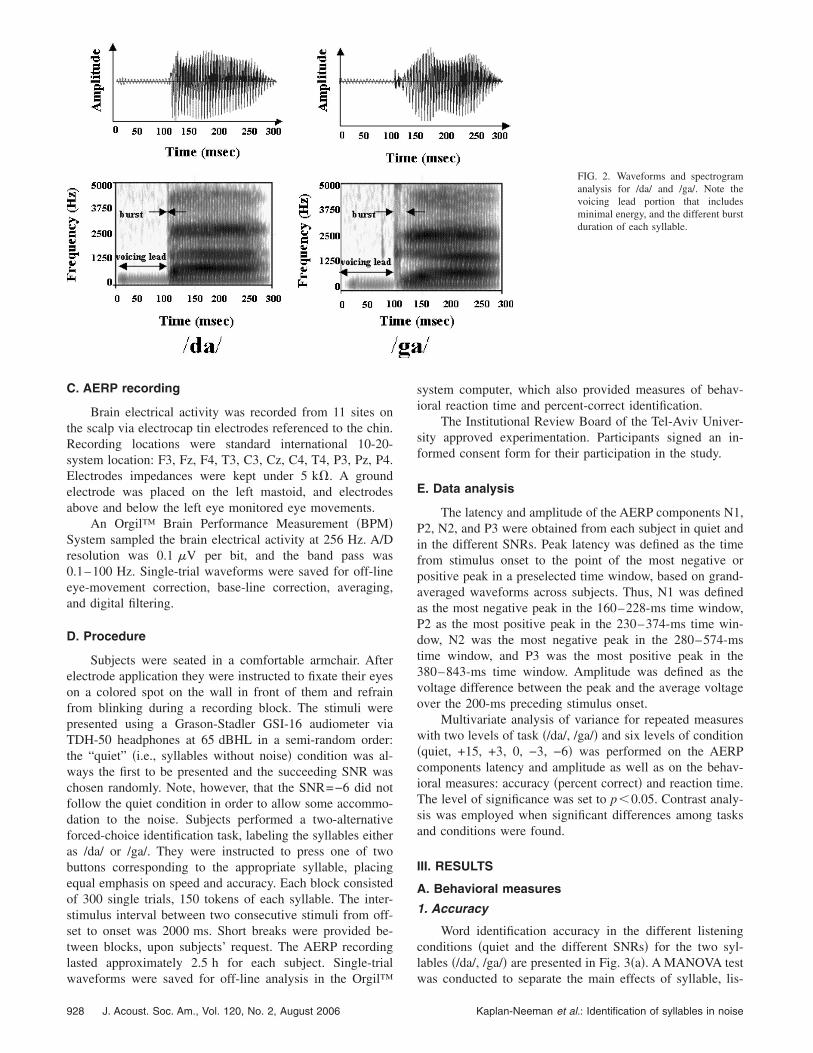
tening condition, and their interaction: syllable� listeningcondition. The results revealed that both main effects andinteraction were significant �F�1,19�=10.42, p=0.004;F�5,15�=31.96, p�0.0001; F�5,15�=2.95, p=0.04; for syl-lable, listening condition and syllable� listening condition,respectively�. Specifically, the average identification of thesyllable /ga/ �90.87%� was better than /da/ �83.66%�. A ten-dency of better identification of /ga/ was manifested in al-most all SNRs. Contrast analysis of the listening conditionrevealed significant differences �p�0.02� among each of theSNRs and the quiet condition �with the exception of SNR= +15 dB�.
The decrease in performance with decreasing SNR wasdifferent for /da/ than for /ga/. This interaction is illustratedin Fig. 3�a�. Contrast analysis revealed that for quiet and themore favorable listening conditions �SNR= +15, +3 dB�,identification was similar for both syllables. At SNR of 0,however, it was more difficult to identify /da/ than /ga/, adifference of 5.66 percentage points �F�1,19�=16.61, p�0.0006�. This difference increased to 16.27 percentagepoints at SNR of −6 dB, but did not reach statistical signifi-cance.
Performance accuracy in a two-alternative-forced-choicetask can be described by a hit and false-alarm rate, which inturn can be reduced to a single measure of sensitivity. Thesensitivity measure, d�, proposed by signal detection theory�Macmillan and Creelman, 2005�, was calculated andshowed decreased sensitivity to the recognition in noise asSNR decreased from −3 to −6 �1.58 and 0.61, respectively,t�18�=5, p�0.001�, as can be seen in Fig. 3�c�. Further-more, a � calculation, a measure of bias, suggests relativelyunchanged � with decrease of SNR from −3 to −6 �1.69 and1.35, respectively, t�18�=1.15, p�0.05�. Thus, while sensi-tivity to performance decreased, no “bias,”2 or favoritismtowards one syllable was demonstrated and the better recog-nition of /ga/ was not due to listeners’ preference of this
syllable.J. Acoust. Soc. Am., Vol. 120, No. 2, August 2006
2. Reaction time
Figure 3�b� shows the means �±1 SE� of reaction timesin the listening conditions: quiet and the different SNRs foreach of the syllables. While the effect of listening conditionwas significant �F�5,15�=44.19, p�0.0001�, the effects ofsyllable as well as the interaction syllable� listening condi-tion were not found to be significant. Specifically, it wasfound that reaction time was the shortest in the quiet condi-tion and was prolonged significantly between each succes-sive condition �p�0.01� �RT=676.2, 705.7, 749, 809, and817.4 ms for SNR= +15, +3, 0, −3, and −6 dB, respec-tively�.
B. Auditory event related potentials
For the purpose of this study the latencies and ampli-tudes of AERPs from the midline electrodes �Fz, Cz, Pz�,which yielded the largest amplitudes, were analyzed. Theparadigm used in the present study resulted in two distin-guishable sets of AERP peaks: N1 and P2 elicited by thenoise alone, with minor changes of latency and amplituderegardless of noise intensity, and N1, P2, N2 and P3 elicitedby the syllables in noise that were prolonged in latency anddecreased or increased in amplitude as noise level increased.
1. Latency
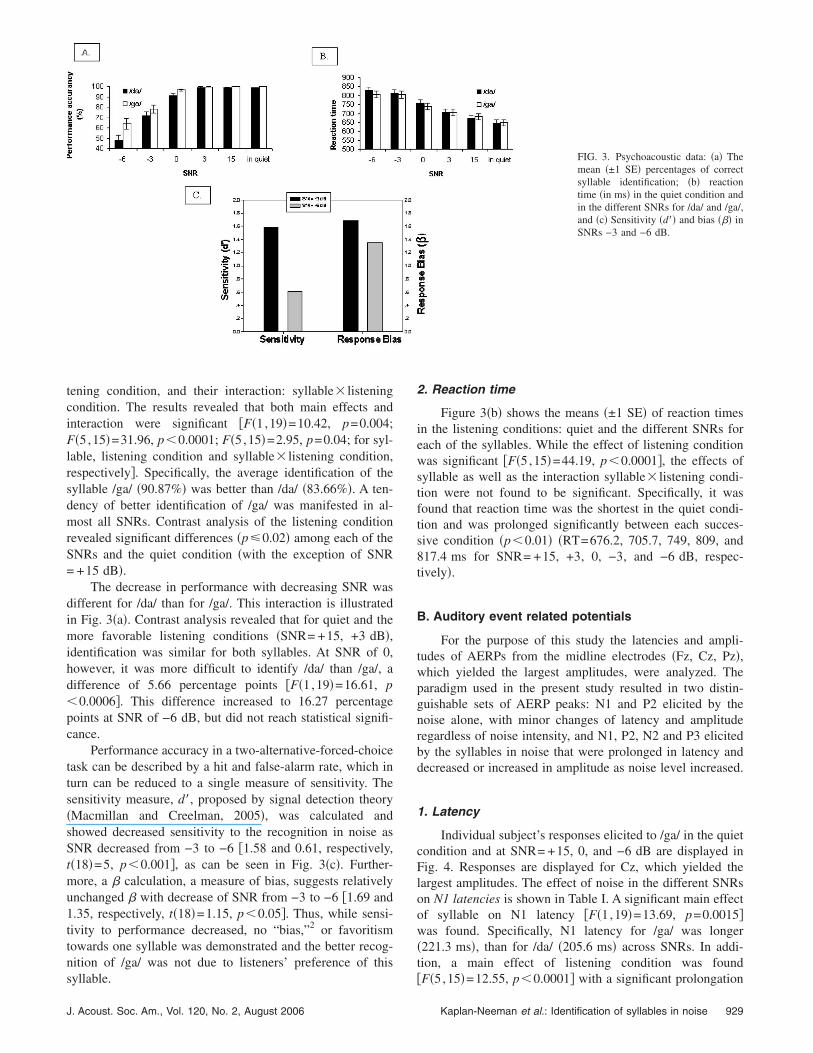
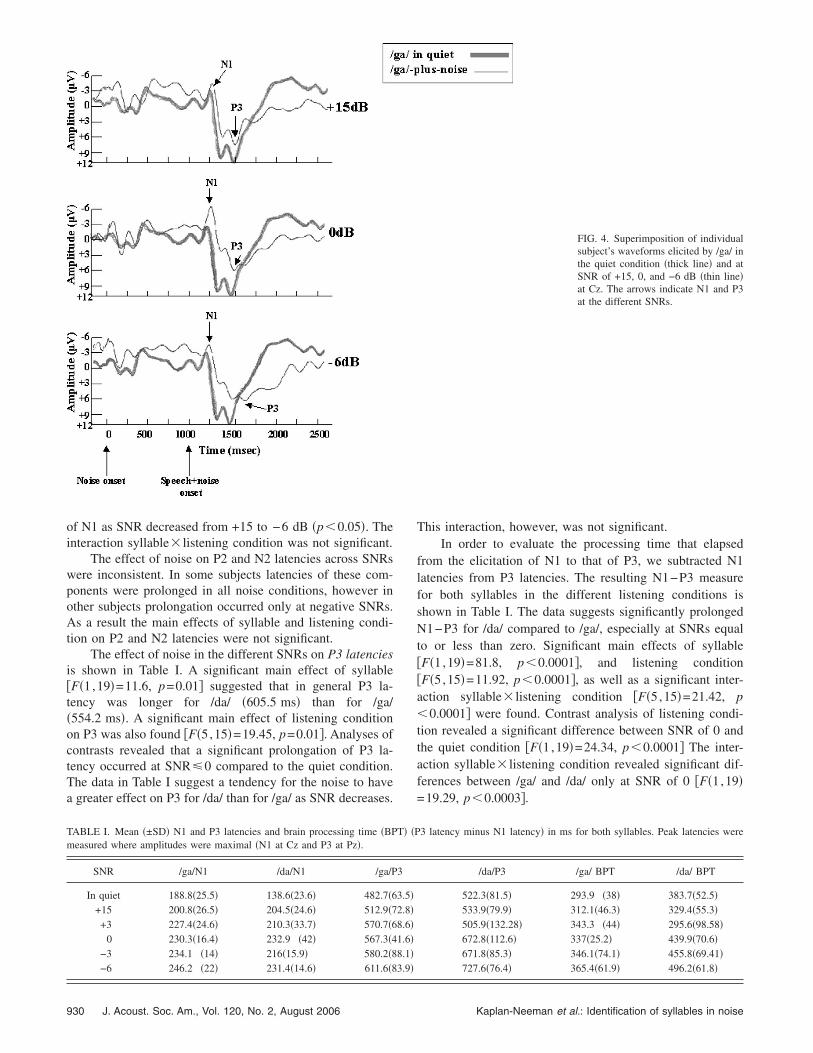
Individual subject’s responses elicited to /ga/ in the quietcondition and at SNR= +15, 0, and −6 dB are displayed inFig. 4. Responses are displayed for Cz, which yielded thelargest amplitudes. The effect of noise in the different SNRson N1 latencies is shown in Table I. A significant main effectof syllable on N1 latency �F�1,19�=13.69, p=0.0015�was found. Specifically, N1 latency for /ga/ was longer�221.3 ms�, than for /da/ �205.6 ms� across SNRs. In addi-tion, a main effect of listening condition was found
FIG. 3. Psychoacoustic data: �a� Themean �±1 SE� percentages of correctsyllable identification; �b� reactiontime �in ms� in the quiet condition andin the different SNRs for /da/ and /ga/,and �c� Sensitivity �d�� and bias ��� inSNRs −3 and −6 dB.
�F�5,15�=12.55, p�0.0001� with a significant prolongation
Kaplan-Neeman et al.: Identification of syllables in noise 929
of N1 as SNR decreased from +15 to −6 dB �p�0.05�. Theinteraction syllable� listening condition was not significant.
The effect of noise on P2 and N2 latencies across SNRswere inconsistent. In some subjects latencies of these com-ponents were prolonged in all noise conditions, however inother subjects prolongation occurred only at negative SNRs.As a result the main effects of syllable and listening condi-tion on P2 and N2 latencies were not significant.
The effect of noise in the different SNRs on P3 latenciesis shown in Table I. A significant main effect of syllable�F�1,19�=11.6, p=0.01� suggested that in general P3 la-tency was longer for /da/ �605.5 ms� than for /ga/�554.2 ms�. A significant main effect of listening conditionon P3 was also found �F�5,15�=19.45, p=0.01�. Analyses ofcontrasts revealed that a significant prolongation of P3 la-tency occurred at SNR�0 compared to the quiet condition.The data in Table I suggest a tendency for the noise to havea greater effect on P3 for /da/ than for /ga/ as SNR decreases.
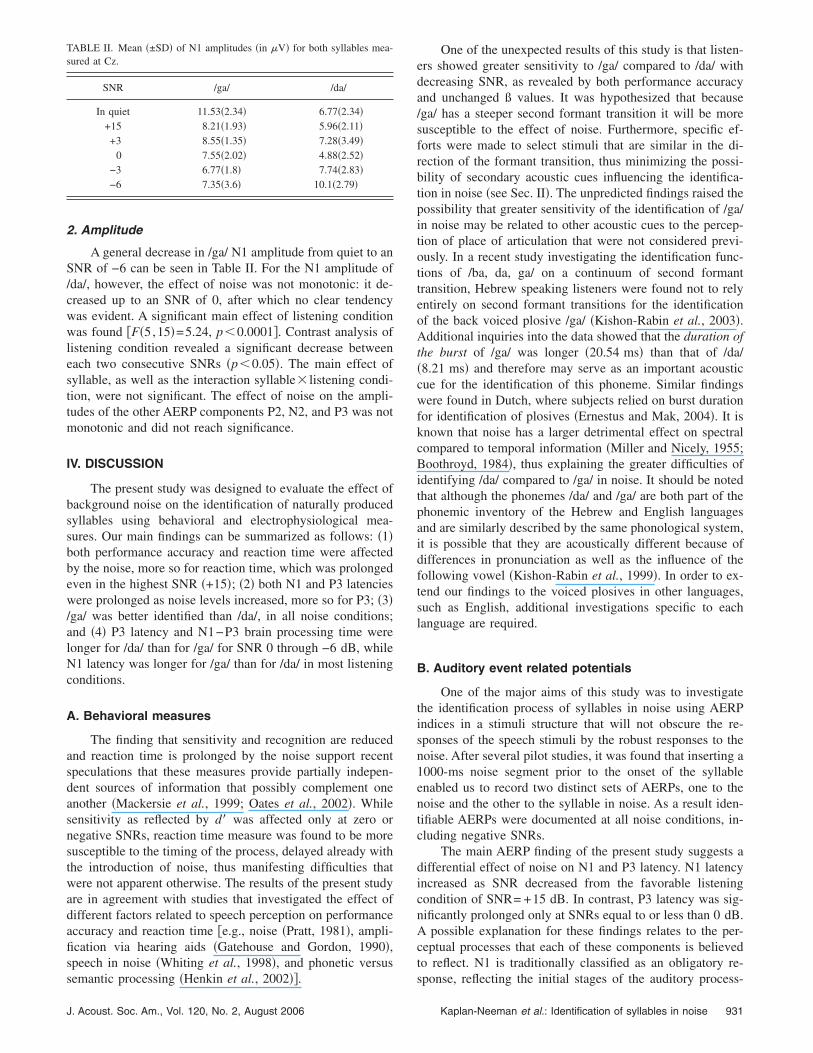
TABLE I. Mean �±SD� N1 and P3 latencies and brain processing time �BPmeasured where amplitudes were maximal �N1 at Cz and P3 at Pz�.
SNR /ga/N1 /da/N1 /ga/P
In quiet 188.8�25.5� 138.6�23.6� 482.7�6+15 200.8�26.5� 204.5�24.6� 512.9�7+3 227.4�24.6� 210.3�33.7� 570.7�6
0 230.3�16.4� 232.9 �42� 567.3�4−3 234.1 �14� 216�15.9� 580.2�8−6 246.2 �22� 231.4�14.6� 611.6�8
930 J. Acoust. Soc. Am., Vol. 120, No. 2, August 2006
This interaction, however, was not significant.In order to evaluate the processing time that elapsed
from the elicitation of N1 to that of P3, we subtracted N1latencies from P3 latencies. The resulting N1−P3 measurefor both syllables in the different listening conditions isshown in Table I. The data suggests significantly prolongedN1−P3 for /da/ compared to /ga/, especially at SNRs equalto or less than zero. Significant main effects of syllable�F�1,19�=81.8, p�0.0001�, and listening condition�F�5,15�=11.92, p�0.0001�, as well as a significant inter-action syllable� listening condition �F�5,15�=21.42, p�0.0001� were found. Contrast analysis of listening condi-tion revealed a significant difference between SNR of 0 andthe quiet condition �F�1,19�=24.34, p�0.0001� The inter-action syllable� listening condition revealed significant dif-ferences between /ga/ and /da/ only at SNR of 0 �F�1,19�=19.29, p�0.0003�.
FIG. 4. Superimposition of individualsubject’s waveforms elicited by /ga/ inthe quiet condition �thick line� and atSNR of +15, 0, and −6 dB �thin line�at Cz. The arrows indicate N1 and P3at the different SNRs.
3 latency minus N1 latency� in ms for both syllables. Peak latencies were
/da/P3 /ga/ BPT /da/ BPT
522.3�81.5� 293.9 �38� 383.7�52.5�533.9�79.9� 312.1�46.3� 329.4�55.3�505.9�132.28� 343.3 �44� 295.6�98.58�672.8�112.6� 337�25.2� 439.9�70.6�671.8�85.3� 346.1�74.1� 455.8�69.41�727.6�76.4� 365.4�61.9� 496.2�61.8�
T� �P
3
3.5�2.8�8.6�1.6�8.1�3.9�
Kaplan-Neeman et al.: Identification of syllables in noise
2. Amplitude
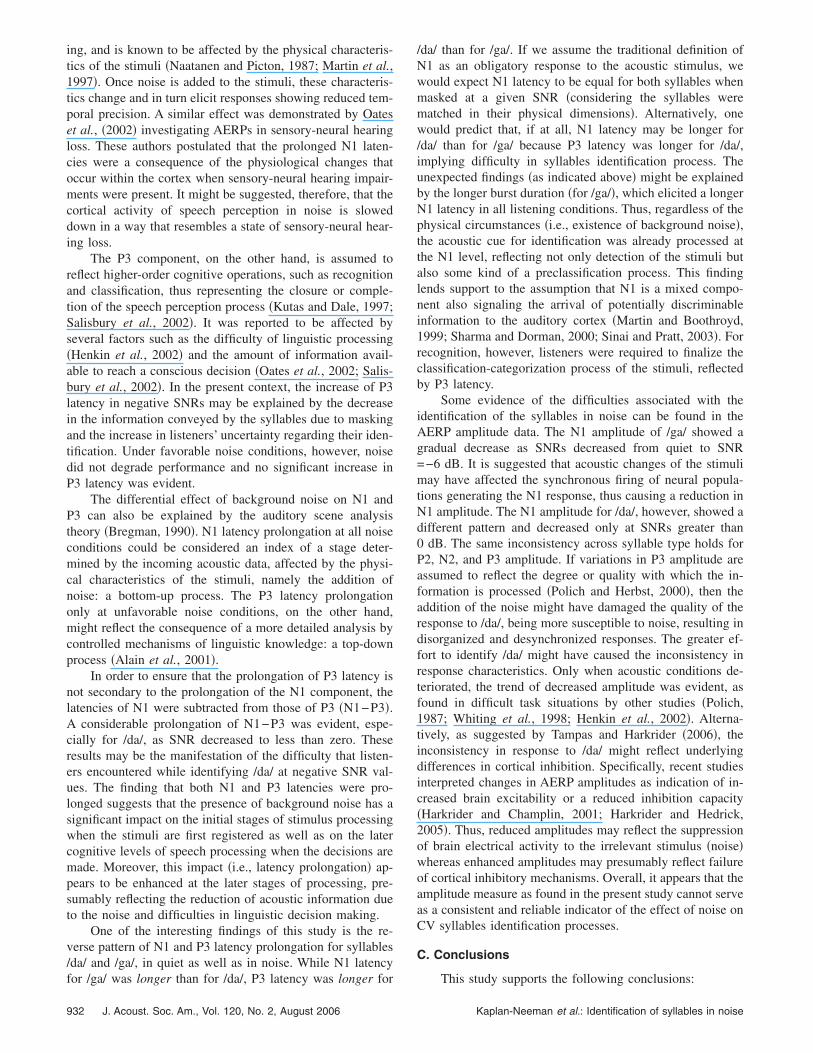
A general decrease in /ga/ N1 amplitude from quiet to anSNR of −6 can be seen in Table II. For the N1 amplitude of/da/, however, the effect of noise was not monotonic: it de-creased up to an SNR of 0, after which no clear tendencywas evident. A significant main effect of listening conditionwas found �F�5,15�=5.24, p�0.0001�. Contrast analysis oflistening condition revealed a significant decrease betweeneach two consecutive SNRs �p�0.05�. The main effect ofsyllable, as well as the interaction syllable� listening condi-tion, were not significant. The effect of noise on the ampli-tudes of the other AERP components P2, N2, and P3 was notmonotonic and did not reach significance.
IV. DISCUSSION
The present study was designed to evaluate the effect ofbackground noise on the identification of naturally producedsyllables using behavioral and electrophysiological mea-sures. Our main findings can be summarized as follows: �1�both performance accuracy and reaction time were affectedby the noise, more so for reaction time, which was prolongedeven in the highest SNR �+15�; �2� both N1 and P3 latencieswere prolonged as noise levels increased, more so for P3; �3�/ga/ was better identified than /da/, in all noise conditions;and �4� P3 latency and N1−P3 brain processing time werelonger for /da/ than for /ga/ for SNR 0 through −6 dB, whileN1 latency was longer for /ga/ than for /da/ in most listeningconditions.
A. Behavioral measures
The finding that sensitivity and recognition are reducedand reaction time is prolonged by the noise support recentspeculations that these measures provide partially indepen-dent sources of information that possibly complement oneanother �Mackersie et al., 1999; Oates et al., 2002�. Whilesensitivity as reflected by d� was affected only at zero ornegative SNRs, reaction time measure was found to be moresusceptible to the timing of the process, delayed already withthe introduction of noise, thus manifesting difficulties thatwere not apparent otherwise. The results of the present studyare in agreement with studies that investigated the effect ofdifferent factors related to speech perception on performanceaccuracy and reaction time �e.g., noise �Pratt, 1981�, ampli-fication via hearing aids �Gatehouse and Gordon, 1990�,speech in noise �Whiting et al., 1998�, and phonetic versus
TABLE II. Mean �±SD� of N1 amplitudes �in �V� for both syllables mea-sured at Cz.
SNR /ga/ /da/
In quiet 11.53�2.34� 6.77�2.34�+15 8.21�1.93� 5.96�2.11�+3 8.55�1.35� 7.28�3.49�
0 7.55�2.02� 4.88�2.52�−3 6.77�1.8� 7.74�2.83�−6 7.35�3.6� 10.1�2.79�
semantic processing �Henkin et al., 2002��.
J. Acoust. Soc. Am., Vol. 120, No. 2, August 2006
One of the unexpected results of this study is that listen-ers showed greater sensitivity to /ga/ compared to /da/ withdecreasing SNR, as revealed by both performance accuracyand unchanged ß values. It was hypothesized that because/ga/ has a steeper second formant transition it will be moresusceptible to the effect of noise. Furthermore, specific ef-forts were made to select stimuli that are similar in the di-rection of the formant transition, thus minimizing the possi-bility of secondary acoustic cues influencing the identifica-tion in noise �see Sec. II�. The unpredicted findings raised thepossibility that greater sensitivity of the identification of /ga/in noise may be related to other acoustic cues to the percep-tion of place of articulation that were not considered previ-ously. In a recent study investigating the identification func-tions of /ba, da, ga/ on a continuum of second formanttransition, Hebrew speaking listeners were found not to relyentirely on second formant transitions for the identificationof the back voiced plosive /ga/ �Kishon-Rabin et al., 2003�.Additional inquiries into the data showed that the duration ofthe burst of /ga/ was longer �20.54 ms� than that of /da/�8.21 ms� and therefore may serve as an important acousticcue for the identification of this phoneme. Similar findingswere found in Dutch, where subjects relied on burst durationfor identification of plosives �Ernestus and Mak, 2004�. It isknown that noise has a larger detrimental effect on spectralcompared to temporal information �Miller and Nicely, 1955;Boothroyd, 1984�, thus explaining the greater difficulties ofidentifying /da/ compared to /ga/ in noise. It should be notedthat although the phonemes /da/ and /ga/ are both part of thephonemic inventory of the Hebrew and English languagesand are similarly described by the same phonological system,it is possible that they are acoustically different because ofdifferences in pronunciation as well as the influence of thefollowing vowel �Kishon-Rabin et al., 1999�. In order to ex-tend our findings to the voiced plosives in other languages,such as English, additional investigations specific to eachlanguage are required.
B. Auditory event related potentials
One of the major aims of this study was to investigatethe identification process of syllables in noise using AERPindices in a stimuli structure that will not obscure the re-sponses of the speech stimuli by the robust responses to thenoise. After several pilot studies, it was found that inserting a1000-ms noise segment prior to the onset of the syllableenabled us to record two distinct sets of AERPs, one to thenoise and the other to the syllable in noise. As a result iden-tifiable AERPs were documented at all noise conditions, in-cluding negative SNRs.
The main AERP finding of the present study suggests adifferential effect of noise on N1 and P3 latency. N1 latencyincreased as SNR decreased from the favorable listeningcondition of SNR= +15 dB. In contrast, P3 latency was sig-nificantly prolonged only at SNRs equal to or less than 0 dB.A possible explanation for these findings relates to the per-ceptual processes that each of these components is believedto reflect. N1 is traditionally classified as an obligatory re-
sponse, reflecting the initial stages of the auditory process-Kaplan-Neeman et al.: Identification of syllables in noise 931
ing, and is known to be affected by the physical characteris-tics of the stimuli �Naatanen and Picton, 1987; Martin et al.,1997�. Once noise is added to the stimuli, these characteris-tics change and in turn elicit responses showing reduced tem-poral precision. A similar effect was demonstrated by Oateset al., �2002� investigating AERPs in sensory-neural hearingloss. These authors postulated that the prolonged N1 laten-cies were a consequence of the physiological changes thatoccur within the cortex when sensory-neural hearing impair-ments were present. It might be suggested, therefore, that thecortical activity of speech perception in noise is sloweddown in a way that resembles a state of sensory-neural hear-ing loss.
The P3 component, on the other hand, is assumed toreflect higher-order cognitive operations, such as recognitionand classification, thus representing the closure or comple-tion of the speech perception process �Kutas and Dale, 1997;Salisbury et al., 2002�. It was reported to be affected byseveral factors such as the difficulty of linguistic processing�Henkin et al., 2002� and the amount of information avail-able to reach a conscious decision �Oates et al., 2002; Salis-bury et al., 2002�. In the present context, the increase of P3latency in negative SNRs may be explained by the decreasein the information conveyed by the syllables due to maskingand the increase in listeners’ uncertainty regarding their iden-tification. Under favorable noise conditions, however, noisedid not degrade performance and no significant increase inP3 latency was evident.
The differential effect of background noise on N1 andP3 can also be explained by the auditory scene analysistheory �Bregman, 1990�. N1 latency prolongation at all noiseconditions could be considered an index of a stage deter-mined by the incoming acoustic data, affected by the physi-cal characteristics of the stimuli, namely the addition ofnoise: a bottom-up process. The P3 latency prolongationonly at unfavorable noise conditions, on the other hand,might reflect the consequence of a more detailed analysis bycontrolled mechanisms of linguistic knowledge: a top-downprocess �Alain et al., 2001�.
In order to ensure that the prolongation of P3 latency isnot secondary to the prolongation of the N1 component, thelatencies of N1 were subtracted from those of P3 �N1−P3�.A considerable prolongation of N1−P3 was evident, espe-cially for /da/, as SNR decreased to less than zero. Theseresults may be the manifestation of the difficulty that listen-ers encountered while identifying /da/ at negative SNR val-ues. The finding that both N1 and P3 latencies were pro-longed suggests that the presence of background noise has asignificant impact on the initial stages of stimulus processingwhen the stimuli are first registered as well as on the latercognitive levels of speech processing when the decisions aremade. Moreover, this impact �i.e., latency prolongation� ap-pears to be enhanced at the later stages of processing, pre-sumably reflecting the reduction of acoustic information dueto the noise and difficulties in linguistic decision making.
One of the interesting findings of this study is the re-verse pattern of N1 and P3 latency prolongation for syllables/da/ and /ga/, in quiet as well as in noise. While N1 latency
for /ga/ was longer than for /da/, P3 latency was longer for932 J. Acoust. Soc. Am., Vol. 120, No. 2, August 2006
/da/ than for /ga/. If we assume the traditional definition ofN1 as an obligatory response to the acoustic stimulus, wewould expect N1 latency to be equal for both syllables whenmasked at a given SNR �considering the syllables werematched in their physical dimensions�. Alternatively, onewould predict that, if at all, N1 latency may be longer for/da/ than for /ga/ because P3 latency was longer for /da/,implying difficulty in syllables identification process. Theunexpected findings �as indicated above� might be explainedby the longer burst duration �for /ga/�, which elicited a longerN1 latency in all listening conditions. Thus, regardless of thephysical circumstances �i.e., existence of background noise�,the acoustic cue for identification was already processed atthe N1 level, reflecting not only detection of the stimuli butalso some kind of a preclassification process. This findinglends support to the assumption that N1 is a mixed compo-nent also signaling the arrival of potentially discriminableinformation to the auditory cortex �Martin and Boothroyd,1999; Sharma and Dorman, 2000; Sinai and Pratt, 2003�. Forrecognition, however, listeners were required to finalize theclassification-categorization process of the stimuli, reflectedby P3 latency.
Some evidence of the difficulties associated with theidentification of the syllables in noise can be found in theAERP amplitude data. The N1 amplitude of /ga/ showed agradual decrease as SNRs decreased from quiet to SNR=−6 dB. It is suggested that acoustic changes of the stimulimay have affected the synchronous firing of neural popula-tions generating the N1 response, thus causing a reduction inN1 amplitude. The N1 amplitude for /da/, however, showed adifferent pattern and decreased only at SNRs greater than0 dB. The same inconsistency across syllable type holds forP2, N2, and P3 amplitude. If variations in P3 amplitude areassumed to reflect the degree or quality with which the in-formation is processed �Polich and Herbst, 2000�, then theaddition of the noise might have damaged the quality of theresponse to /da/, being more susceptible to noise, resulting indisorganized and desynchronized responses. The greater ef-fort to identify /da/ might have caused the inconsistency inresponse characteristics. Only when acoustic conditions de-teriorated, the trend of decreased amplitude was evident, asfound in difficult task situations by other studies �Polich,1987; Whiting et al., 1998; Henkin et al., 2002�. Alterna-tively, as suggested by Tampas and Harkrider �2006�, theinconsistency in response to /da/ might reflect underlyingdifferences in cortical inhibition. Specifically, recent studiesinterpreted changes in AERP amplitudes as indication of in-creased brain excitability or a reduced inhibition capacity�Harkrider and Champlin, 2001; Harkrider and Hedrick,2005�. Thus, reduced amplitudes may reflect the suppressionof brain electrical activity to the irrelevant stimulus �noise�whereas enhanced amplitudes may presumably reflect failureof cortical inhibitory mechanisms. Overall, it appears that theamplitude measure as found in the present study cannot serveas a consistent and reliable indicator of the effect of noise onCV syllables identification processes.
C. Conclusions
This study supports the following conclusions:
Kaplan-Neeman et al.: Identification of syllables in noise
�1� The novel stimuli structure used here enabled the sepa-ration of AERP responses to the noise from those elicitedwhen identifying speech-plus-noise.
�2� Reaction time measure was found to be more sensitivethan performance accuracy to the introduction of back-ground noise, demonstrating the slowing down of theidentification process despite high recognition scores.
�3� Multiple temporal and spectral cues are probably in-volved in phoneme identification. Phonemes cued bytemporal information, however, appear to be more resil-ient to noise than those cued spectrally. This finding maybe language dependent and requires further investiga-tion.
�4� AERPs delineated the effect of noise on the identifica-tion process from the initial stages of detection and pre-classification �N1� to the completion of the stimulievaluation process �P3�.
ACKNOWLEDGMENTS
This research was partially supported by the Tel-AvivUniversity and the Yairi Fund. The authors also wish to thankProfessor Hillel Pratt for his insightful comments, EstherShabtay for the statistical analysis, and Dr. Shlomo Gilat fortechnical assistance.
1Syllables were normalized in two parts because the 100-ms voicing leadhas very little energy, being practically unheard, as opposed to the secondpart of the syllable, composed of burst, transitions, and vowel, containingmost of the syllable’s energy. Because syllables were normalized accordingto the softest segment, it was necessary to separate the voicing lead partfrom the other part, otherwise the overall intensity would have been re-duced markedly.
2Beta- the index that describes the location of a criterion that divides thedecision axis between values that lead to “yes” and “no” responses �Mac-millan and Creelman, 2005, p. 47�.
Alain, C., Arnott, S. R., and Picton, T. W. �2001�. “Bottom-up and top-downinfluence on Auditory Scene Analysis: Evidence from event-related brainpotentials,” J. Exp. Psychol. Hum. Percept. Perform. 27, 1072–1089.
ANSI �1996�. American National Standard Specification for AudiometersANSI S3.6-1996 �American National Standards Institute, New York�.
Boothroyd, A. �1984�. “Auditory perception of speech contrasts by subjectswith sensorineural hearing loss,” J. Speech Hear. Res. 27, 134–144.
Bregman, A. S. �1990�. Auditory Scene Analysis: The Perceptual Organiza-tion of Sound �Bradford Books, MIT, Cambridge, Ma�.
Ernestus, M. and Mak, W. M. �2004�. “Distinctive phonological featuresdiffer in relevance for both spoken and written word recognition,” BrainLang 90, 378–392.
Gatehouse, S. and Gordon, J. �1990�. “Response times to speech stimuli asmeasures of benefit from amplification,” Br. J. Audiol. 24, 63–68.
Gordon-Salant, S. �1985�. “Recognition of digitized CV syllables in multi-talker babble,” Audiology 24, 241–253.
Harkrider, A. W. and Champlin, C. A. �2001�. “Acute effect of nicotine onnon-smokers: III. LLRs and EEGs,” Hear. Res. 160, 99–110.
Harkrider, A. W. and Hedrick, M. S. �2005�. “Acute effect of nicotine onauditory gating in smokers and non-smokers,” Hear. Res. 202, 114–128.
Henkin, Y., Kishon-Rabin, L., Gadoth, N., and Pratt, H. �2002�. “Auditoryevent-related potentials during phonetic and semantic processing in chil-dren,” Audiol. Neuro-Otol. 7, 228–239.
Hornsby, B. W. Y., Trine, T. D., and Ohde, R. N. �2005�. “The effect of highpresentation levels on consonants feature transmission,” J. Acoust. Soc.Am. 118, 1719–1729.
J. Acoust. Soc. Am., Vol. 120, No. 2, August 2006
Jiang, J., Chen, M., and Alwan, A. �2006� “On the perception of voicing insyllable-initial plosives in noise,” J. Acoust. Soc. Am. 119, 1092–1105.
Kishon-Rabin, L., Dayan, M., and Michaeli, O. �2003�. “Effect of second-formant transitions on the perception of Hebrew voiced stop consonants,”J. Basic Clin. Physiol. Pharmacol. 14, 151–164.
Kishon-Rabin, L., Taitelbaum, R., Tobin, Y., and Hildesheimer, M. �1999�.“The effect of partially restored hearing on speech production of postlin-gually deafened adults with multi channel cochlear implants,” J. Acoust.Soc. Am. 106, 2843–2857.
Kutas, M. and Dale, A. �1997�. “Electrical and magnetic readings of mentalfunctions,” in Cognitive Neuroscience, edited by M. D. Rugg �PsychologyPress, UK� pp. 197–242.
Mackersie, C., Neuman, A. C., and Levitt, H. �1999�. “Response time andword recognition using a modified-rhyme monitoring task: list equiva-lency and time-order effects,” Ear Hear. 20, 515–520.
Macmillan, N. A. and Creelman, C. D. �2005�. Detection Theory: A User’sGuide �Erlbaum, London�, pp 3–47.
Martin, B. A. and Boothroyd, A. �1999�. “Cortical, auditory, event-relatedpotentials in response to periodic and aperiodic stimuli with the samespectral envelope,” Ear Hear. 20, 33–44.
Martin, B. A. and Stapells, D. R. �2005�. “Effects of low-pass noise maskingon auditory event-related potentials to speech,” Ear Hear. 26, 195–213.
Martin, B. A., Kurtzberg, D., and Stapells, D. R. �1999�. “The effects ofdecreased audibility produced by high-pass noise masking on N1 and themismatch negativity to speech sounds /ba/ and /da/,” J. Speech Lang.Hear. Res. 42, 271–286.
Martin, B. A., Sigal, A., Kurtzberg, D., and Stapells, D. R. �1997�. “Theeffects of decreased audibility by high-pass noise masking on corticalevent-related potentials to speech sounds /ba/ and /da/,” J. Acoust. Soc.Am. 101, 1585–1599.
Miller, G. A. and Nicely, P. E. �1955�. “An analysis of perceptual confusionsamong some English consonants,” J. Acoust. Soc. Am. 27, 338–352.
Moore, B. C. J. �1997�. An Introduction to the Psychology of Hearing �Aca-demic, London�, pp. 272–305.
Naatanen, R., and Picton, T. W. �1987�. “The N1 wave of human electricand magnetic response to sound: A review and an analysis of the compo-nent structure,” Psychophysiology 24, 375–425.
Nittrouer, S., Wilhelmsen, M., Shapely, K., Bodily, K., and Creutz, T.�2003� “Two reasons not to bring your children to cocktail parties,” J.Acoust. Soc. Am. 113, 2254.
Oates, P. A., Kurtzberg, D., and Stapells, D. R. �2002�. “Effects of senso-rineural hearing loss on cortical event-related potential and behavioralmeasures of speech-sound processing,” Ear Hear. 23, 399–415.
Polich, J. �1987�. “Task difficulty, probability, and inter-stimulus interval asdeterminants of P300 from auditory stimuli,” Electromyogr. Clin. Neuro-physiol. 68, 311–320.
Polich, J., and Herbst, K. L. �2000�. “P300 as a clinical assay: rationale,evaluation, and findings,” Int. J. Psychophysiol 38, 3–19.
Pratt, R. L. �1981�. “On the use of reaction time as a measure of intelligi-bility,” Br. J. Audiol. 15, 253–255.
Rosen, S. and Fourcin, A. �1986�. “Frequency selectivity and the perceptionof speech,” in Frequency Selectivity in Hearing, edited by B. C. J. Moore�Academic, London�.
Salisbury, D. F., Desantis, M. A., Shenton, M. E., and McCarley, R. W.�2002�. “The effect of background noise on P300 to suprathresholdstimuli,” Psychophysiology 39, 111–115.
Sharma, A. and Dorman, M. F. �2000�. “Neurophysiologic correlates ofcross-language phonetic perception,” J. Acoust. Soc. Am. 107, 2697–2703.
Sinai, A. and Pratt, H. �2003�. “Semantic processing of unattended wordsand pseudowords in first and second language: an ERP study,” J. BasicClin. Physiol. Pharmacol. 14, 177–190.
Tampas, J. W. and Harkrider, A. W. �2006�. “Auditory evoked potentials infemales with high and low acceptance of background noise when listeningto speech,” J. Acoust. Soc. Am. 119, 1548–1561.
Whiting, K. A., Martin, B. A., and Stapells, D. R. �1998�. “The effects ofbroadband noise masking on cortical event-related potentials to speechsounds /ba/ and /da/,” Ear Hear. 19, 218–231.
Kaplan-Neeman et al.: Identification of syllables in noise 933