
Identification of Serum Amyloid A as a Biomarker to Distinguish Prostate Cancer Patients with Bone...
13
Identification of Serum Amyloid A as a Biomarker to Distinguish Prostate Cancer Patients with Bone Lesions Lyly Le, 1 Kim Chi, 1 Scott Tyldesley, 1 Stephane Flibotte, 1 Deborah L. Diamond, 2 Michael A. Kuzyk, 1 and Marianne D. Sadar 1* Background: Prostate cancer has a propensity to metas- tasize to the bone. Currently, there are no curative treatments for this stage of the disease. Sensitive bio- markers that can be monitored in the blood to indicate the presence or development of bone metastases and/or response to therapies are lacking. Surface-enhanced laser desorption/ionization time-of-flight mass spec- trometry (SELDI-TOF MS) is an affinity-based approach that allows sensitive and high-throughput protein pro- filing and screening of biological samples. Methods: We used SELDI-TOF MS for protein profiling of sera from prostate cancer patients (n 38) with and without bone metastases in our effort to identify indi- vidual or multiple serum markers that may be of added benefit to those in current use. Serum was applied to ProteinChip ® surfaces (H4 and IMAC) to quickly screen samples and detect peaks predominating in the samples obtained from patients with bone metastases. Unique proteins in the bone metastasis cohort observed by SELDI-TOF MS were identified by two-dimensional gel electrophoresis, in-gel trypsin digestion, and tandem MS. The identities of the proteins were confirmed by ELISA and immunodepletion assays. Results: The cluster of unique proteins in the sera of patients with bone metastases was identified as iso- forms of serum amyloid A. Machine-learning algo- rithms were also used to identify patients with bone metastases with a sensitivity and specificity of 89.5%. Conclusions: SELDI-TOF MS protein profiling in com- bination with other proteomic approaches may provide diagnostic tools with potential clinical applications and serve as tools to aid in the discovery of biomarkers associated with various diseases. © 2005 American Association for Clinical Chemistry Prostate cancer is the second-leading cause of death from cancer in American males (1). Hormonal therapy, radio- therapy, and chemotherapy for metastatic disease have limited durations of efficacy, and men diagnosed with metastatic disease succumb over a period of several months to a few years (2). The predominant site of metastases for hormone-refractory prostate cancer is bone, occurring in 90% of patients, with 20% of patients having clinically demonstrable soft tissue in- volvement (3, 4). Bone metastases tend to be solely blastic (bone forming) in an individual, but 20% of cases exhibit a combination of blastic and lytic (bone destroying) le- sions. Lytic lesions occur in 15–30% of patients (5). Bone metastases are associated with a poor prognosis and with the development of hormone-refractory disease, for which there is currently no effective treatment (6–9). Once the disease is hormone refractory, the typical sur- vival time is 2 years. Bone tissue is dynamically maintained by two tightly coupled processes of resorption and formation, which are controlled by osteoclasts and osteoblasts, respectively. Bone remodeling liberates potential biomarkers. Exam- ples of biomarkers for resorption are associated with collagen degradation, such as the carboxy-terminal te- lopeptides of type I collagen, pyridinoline, and deoxypyr- idinoline. Markers for bone formation, or osteogenesis, include the carboxy-terminal propeptide of type I colla- gen, which is cleaved from procollagen molecules during the formation of type I collagen; alkaline phosphatase; and osteocalcin. Bone formation involves three steps: The first is synthesis of collagen, which is associated with 1 British Columbia Cancer Agency, Vancouver, British Columbia, Canada. 2 Ciphergen Biosystems, Inc., Fremont, CA. *Address correspondence to this author at: Genomics Sciences Centre, British Columbia Cancer Agency, 600 West 10th Ave., Vancouver, British Columbia, V5Z 4E6 Canada. Fax 604-877-6011; e-mail [email protected]. Received August 2, 2004; accepted January 12, 2005. Previously published online at DOI: 10.1373/clinchem.2004.041087 Clinical Chemistry 51:4 695–707 (2005) Proteomics and Protein Markers 695
-
Upload
independent -
Category
Documents
-
view
1 -
download
0
Transcript of Identification of Serum Amyloid A as a Biomarker to Distinguish Prostate Cancer Patients with Bone...
Identification of Serum Amyloid A as a Biomarkerto Distinguish Prostate Cancer Patients with
Bone LesionsLyly Le,1 Kim Chi,1 Scott Tyldesley,1 Stephane Flibotte,1 Deborah L. Diamond,2
Michael A. Kuzyk,1 and Marianne D. Sadar1*
Background: Prostate cancer has a propensity to metas-tasize to the bone. Currently, there are no curativetreatments for this stage of the disease. Sensitive bio-markers that can be monitored in the blood to indicatethe presence or development of bone metastases and/orresponse to therapies are lacking. Surface-enhancedlaser desorption/ionization time-of-flight mass spec-trometry (SELDI-TOF MS) is an affinity-based approachthat allows sensitive and high-throughput protein pro-filing and screening of biological samples.Methods: We used SELDI-TOF MS for protein profilingof sera from prostate cancer patients (n � 38) with andwithout bone metastases in our effort to identify indi-vidual or multiple serum markers that may be of addedbenefit to those in current use. Serum was applied toProteinChip® surfaces (H4 and IMAC) to quickly screensamples and detect peaks predominating in the samplesobtained from patients with bone metastases. Uniqueproteins in the bone metastasis cohort observed bySELDI-TOF MS were identified by two-dimensional gelelectrophoresis, in-gel trypsin digestion, and tandemMS. The identities of the proteins were confirmed byELISA and immunodepletion assays.Results: The cluster of unique proteins in the sera ofpatients with bone metastases was identified as iso-forms of serum amyloid A. Machine-learning algo-rithms were also used to identify patients with bonemetastases with a sensitivity and specificity of 89.5%.
Conclusions: SELDI-TOF MS protein profiling in com-bination with other proteomic approaches may providediagnostic tools with potential clinical applications andserve as tools to aid in the discovery of biomarkersassociated with various diseases.© 2005 American Association for Clinical Chemistry
Prostate cancer is the second-leading cause of death fromcancer in American males (1 ). Hormonal therapy, radio-therapy, and chemotherapy for metastatic disease havelimited durations of efficacy, and men diagnosed withmetastatic disease succumb over a period of severalmonths to a few years (2 ). The predominant site ofmetastases for hormone-refractory prostate cancer isbone, occurring in �90% of patients, with �20% ofpatients having clinically demonstrable soft tissue in-volvement (3, 4). Bone metastases tend to be solely blastic(bone forming) in an individual, but �20% of cases exhibita combination of blastic and lytic (bone destroying) le-sions. Lytic lesions occur in 15–30% of patients (5 ). Bonemetastases are associated with a poor prognosis and withthe development of hormone-refractory disease, forwhich there is currently no effective treatment (6–9).Once the disease is hormone refractory, the typical sur-vival time is �2 years.
Bone tissue is dynamically maintained by two tightlycoupled processes of resorption and formation, which arecontrolled by osteoclasts and osteoblasts, respectively.Bone remodeling liberates potential biomarkers. Exam-ples of biomarkers for resorption are associated withcollagen degradation, such as the carboxy-terminal te-lopeptides of type I collagen, pyridinoline, and deoxypyr-idinoline. Markers for bone formation, or osteogenesis,include the carboxy-terminal propeptide of type I colla-gen, which is cleaved from procollagen molecules duringthe formation of type I collagen; alkaline phosphatase;and osteocalcin. Bone formation involves three steps: Thefirst is synthesis of collagen, which is associated with
1 British Columbia Cancer Agency, Vancouver, British Columbia, Canada.2 Ciphergen Biosystems, Inc., Fremont, CA.*Address correspondence to this author at: Genomics Sciences Centre,
British Columbia Cancer Agency, 600 West 10th Ave., Vancouver, BritishColumbia, V5Z 4E6 Canada. Fax 604-877-6011; e-mail [email protected].
Received August 2, 2004; accepted January 12, 2005.Previously published online at DOI: 10.1373/clinchem.2004.041087
Clinical Chemistry 51:4695–707 (2005) Proteomics and
Protein Markers
695
increased proliferation and increased concentrations ofcarboxy-terminal propeptide of type I collagen. The sec-ond phase involves matrix maturation, at which timeconcentrations of alkaline phosphatase increase. The thirdphase involves mineralization, which is marked by in-creased concentrations of osteocalcin. Studies examiningthe potential usefulness of biochemical markers for thedetection of bone metastasis have generally focused onmarkers for bone turnover in prostate cancer patients andhave shown a lack of sensitivity compared with bonescintigraphy scans.
Serum concentrations of prostate-specific antigen(PSA)3 are useful in combination with a physical exami-nation for the initial diagnosis of prostate cancer, butwhen used alone, PSA is associated with a high degree offalse positives. Increased PSA concentrations in the serumof men with prostate cancer have been suggested to bedirectly correlated to the tumor volume (10, 11). One ofthe best applications of serum PSA measurements is forthe monitoring of treatment response and relapse inprostate cancer patients. However, serum PSA concentra-tions cannot predict the presence of bone or soft tissuemetastases (12 ). At the molecular level, PSA gene expres-sion is regulated by the androgen receptor via androgenresponse elements (13 ). Immunohistochemical studiesconfirmed the presence of an androgen receptor in meta-static prostate cancer biopsies (14, 15).
Bone-derived factors such as interleukin-6 (IL-6) (16–20) and insulin-like growth factor-I (21 ) have been shownto stimulate androgen-responsive reporters or PSA geneexpression in the absence of androgen [for a review, seeRef. (22 )]. IL-6 is also increased in the sera of patients withmetastatic prostate cancer (23–25) and hormone-refrac-tory disease (26 ), and may be a surrogate marker forandrogen-independent disease. Other potential markersof prostate cancer currently being investigated includecadherin (27 ), human kallikrein 2 (28 ), and chromograninA (29 ).
Despite a growing list of potential markers of prostatecancer, sensitive assays to detect, and ultimately predictsusceptibility to, metastases by use of a blood test are stillurgently required. Serum concentrations of markers forbone turnover, such as alkaline phosphatase, becomeincreased in response to systemic therapy (30 ), reducingthe clinical application of this biomarker for the monitor-ing of prostate cancer patients, particularly in the case ofthose patients potentially receiving intermittent androgensuppression. Detection of bone lesions is generally madeby clinical symptoms and bone scans, but the latter maynot reflect response to therapy (31 ). Identification of a
biomarker for bone or other metastatic lesions that couldbe measured concurrently with PSA in the blood ofpatients would enable more accurate clinical assessmentof the stage of the disease and may also be of use in thestratification of patients with respect to anticipated oractual response to therapy where current methods lackreliability. We applied surface-enhanced laser desorp-tion/ionization time-of-flight mass spectrometry (SELDI-TOF MS) profiling to sera from prostate cancer patientswith and without positive bone scans in our effort toidentify individual or multiple serum markers that maybe complementary to those in current use as well as toprovide further insights into the mechanisms governingthe apparent prostate/bone symbiosis. Here we show thatrapid SELDI-TOF MS profiling, combined with MS iden-tification of proteins that were isolated by two-dimen-sional polyacrylamide gel electrophoresis designed toresolve the observed cluster seen with SELDI-TOF MS,correlated with the bone metastases cohort. The cluster ofproteins were identified as isoforms of serum amyloid A(SAA). Immunologic quantification validated a correla-tion of SAA within the bone metastasis group. Machine-learning algorithms were used to identify patients withbone metastases. To our knowledge, this is the first studythat compares SELDI-TOF MS spectra, ELISA, and ma-chine-learning algorithms to differentiate metastatic disease.
Materials and Methodsstudy participantsSerum samples from each group were collected simulta-neously dependent on the patient’s availability in theclinic between July 2001 and May 2002. These volunteerpatients had prostate cancer and were being treated at theVancouver Cancer Centre of the British Columbia CancerAgency in Vancouver, Canada. A 10-mL sample of bloodwas collected into a serum separator tube (red-top Vacu-tainer; BD-Canada), clotted for 30 min at room tempera-ture, and centrifuged (10 min at 1000g), and the superna-tant serum was aliquoted (250 �L) and flash frozen at�80 °C. A total of 38 serum samples were collected from19 patients considered not to have bone metastases andfrom 19 patients with confirmed bone metastases asindicated by a positive bone scan. The demographics ofthese patients are provided in Table 1 with the Gleasonscores, initial and/or current PSA values, and serumalkaline phosphatase values. All patients had histologi-cally confirmed adenocarcinoma of the prostate and gavesigned informed consent. For patients with PSA �10�g/L, Gleason score of 7, or T3 disease, a bone scan wasperformed to confirm no bone metastases. No clinicalsymptoms were present to suggest bone involvement,and/or serum alkaline phosphatase was within the refer-ence interval. All patients considered to have bone metas-tases were selected based on a positive bone scan. Exclu-sion criteria for both groups of patients included (a) anyprevious malignancy, unless the previous malignancywas diagnosed and definitively treated at least 5 years
3 Nonstandard abbreviations: PSA, prostate-specific antigen; IL-6, interleu-kin-6; SELDI-TOF MS, surface-enhanced laser desorption/ionization time-of-flight mass spectrometry; SAA, serum amyloid A; TFA, trifluoroacetic acid;SDS, sodium dodecyl sulfate; MALDI, matrix-assisted laser desorption/ion-ization; MS/MS, tandem mass spectrometry; SVM, support vector machine;and PMF, peptide mass fingerprinting.
696 Le et al.: Biomarker for Bone Metastasis in Prostate Cancer Patients
previously and there had never been any evidence ofrecurrence; and (b) history of significant medical or psy-chiatric disorder that would impair the ability to obtaininformed consent. The study was approved by the re-search ethics board of the University of British Columbia.
seldi-tof ms analysis of serum proteinsAliquots of serum samples were thawed on ice, andprotein concentrations were measured using the bicincho-ninic acid assay (Pierce). All samples for MS analysis werediluted to a final concentration of 1 g/L in HEPES (pH7.4), 30 mmol/L NaCl. Diluted serum samples wereanalyzed on both reversed-phase (hydrophobic surface)H4 and Immobilized Metal Affinity Capture (IMAC)ProteinChip Arrays (Ciphergen Biosystems, Inc.).
Reversed-phase (acyl chains of 16 methylene groups)H4 ProteinChip Arrays were preactivated with 2 �L ofacetonitrile (500 mL/L) in a humidity chamber for 5 minat room temperature. The acetonitrile was removed, andspots were allowed to briefly air dry before application ofdiluted serum samples (2 �L). Samples were allowed todry on the spot, thereby forcing an interaction with thereversed-phase surface. Spots were then washed twicewith 2 �L of acetonitrile (300 mL/L). A saturated solutionof sinapinic acid in acetonitrile (500 mL/L)–trifluoroaceticacid (TFA; 5 mL/L) was then applied twice (0.5 �L eachtime) as the chemical matrix and allowed to air drybetween applications.
IMAC3 (nitrilotriacetic acid functional group) Protein-Chip Arrays were assembled into a bioprocessor (Cipher-gen Biosystems), a device that holds 12 ProteinChipArrays and allows application of sample volumes up to350 �L, before spots were charged with 100 �L of CuSO4
(50 mmol/L) for 5 min. The ProteinChip Arrays were thenwashed four times with 100 �L of water, fixed with 100�L of 100 mmol/L sodium acetate, 200 mmol/L NaCl,and equilibrated with three 100-�L volumes of phos-
phate-buffered saline, pH 7.2. Diluted serum samples (20�L) were denatured with 30 �L of 8 mol/L urea, 10 g/LCHAPS and vortex-mixed for 15 min at 4 °C. To lower theurea concentration, we added 100 �L of 1 mol/L urea,1.25 g/L CHAPS and vortex-mixed the sample. Finally,we added 600 �L of binding buffer (phosphate-bufferedsaline) to the denatured serum samples and loaded 50 �Lper spot. The sample was allowed to bind to the Protein-Chip Array for 30 min with shaking at room temperature.A 30-min binding time has previously been found to beoptimal with no statistically significant gain in informa-tion obtained when binding times are increased up to 2 hin length (data not shown).
The spots were washed with three 50-�L volumes ofphosphate-buffered saline to remove proteins interactingnonspecifically with the IMAC-Cu�� surface, followed byfive 50-�L washes with water to remove salts. Arrayswere then air-dried, and two 0.5-�L volumes of sinapinicacid (prepared as described previously) were added toeach spot and allowed to air dry before mass analysisusing a ProteinChip Reader (Ciphergen Biosystems).
The ProteinChip reader, or linear SELDI-TOF MS, hasdelayed extraction (time lag focusing) and a mass analysisrange from �0.1 to �500 kDa. The sensitivity is betterthan 700:1 mean signal-to-noise ratio on analysis of 150fmol of bovine IgG when digitally smoothed with a (0.2times peak width) sliding window average. Mass accu-racy with internal calibration is better than � 200 ppm(0.02%) at m/z 1000–10 000 and better than � 500 ppm(0.05%) at m/z 10 000–300 000. The mass accuracy withexternal calibration is better than �1000 ppm (0.1%) at m/z1000–10 000 and better than �2000 ppm (0.2%) at m/z10 000–300 000. Spectra were generated by use, on aver-age, of 90–105 laser shots using laser intensities of 215with a sensitivity of 8 (IMAC-Cu��) or laser of 250 with asensitivity of 9 (H4). The instrument was externally cali-brated by use of bovine ubiquitin, cytochrome C, super-
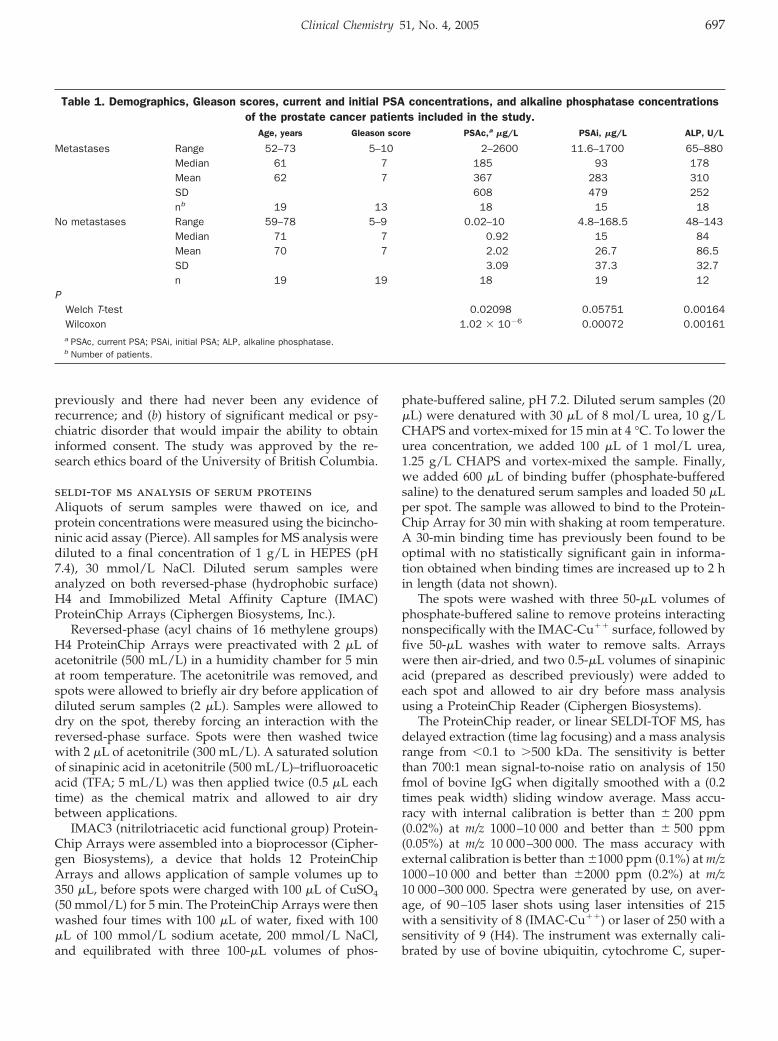
Table 1. Demographics, Gleason scores, current and initial PSA concentrations, and alkaline phosphatase concentrationsof the prostate cancer patients included in the study.
Age, years Gleason score PSAc,a �g/L PSAi, �g/L ALP, U/L
Metastases Range 52–73 5–10 2–2600 11.6–1700 65–880Median 61 7 185 93 178Mean 62 7 367 283 310SD 608 479 252nb 19 13 18 15 18
No metastases Range 59–78 5–9 0.02–10 4.8–168.5 48–143Median 71 7 0.92 15 84Mean 70 7 2.02 26.7 86.5SD 3.09 37.3 32.7n 19 19 18 19 12
PWelch T-test 0.02098 0.05751 0.00164Wilcoxon 1.02 � 10�6 0.00072 0.00161a PSAc, current PSA; PSAi, initial PSA; ALP, alkaline phosphatase.b Number of patients.
Clinical Chemistry 51, No. 4, 2005 697

oxide dismutase, �-lactoglobulin, and horseradish perox-idase (Ciphergen Biosystems) with matrix applicationidentical to that for the serum samples. Before dataanalysis, spectra were baseline subtracted by use of amodified piecewise convex-hull algorithm, which at-tempts find the bottom of the spectrum and correct thepeak height and area, and normalized by use of total ioncurrent.
two-dimensional gel electrophoresisEach serum sample (500 �g of protein) was solubilized in8 mol/L urea, 40 mL/L CHAPS, 40 mmol/L Tris, 2 mL/LBio-Lyte 3/10 ampholytes (Sequential Extraction Buffer 2;Bio-Rad) with 5 mmol/L tris(2-carboxyethyl)phosphinereducing agent and incubated for 1 h at room tempera-ture. The samples were loaded on 7-cm immobilized pHgradient strips (ReadyStrip IPG strips; linear gradient, pH3–10; Bio-Rad). Isoelectric focusing of samples (Bio-RadProtean Cell) was carried out as follows: 250 V for 15 min,followed by a slow voltage ramp over 8000 V-h to 4000 V,with a maximum of 50 �A per strip. Voltage was held at4000 V, with a maximum of 50 �A per strip, for 20 000V-h, followed by a 500-V hold. Before the second dimen-sion, the strips were reduced and alkylated for 20 min in62.5 mmol/L Tris (pH 8.45), 5 mmol/L tris(2-carboxyeth-yl)phosphine, 25 g/L acrylamide, 200 mL/L glycerol, 20g/L sodium dodecyl sulfate (SDS), 6 mol/L urea. Thesecond dimension consisted of a 16.5% Separation Gel (4.5cm), 10% spacer gel (1 cm), and a 4% stacking gel (32 ). TheIPG strips were held in place with 1% agarose in 62.5mmol/L Tris (pH 8.45), 2 g/L SDS. The second dimensionwas run at 150 V for �60 min with 100 mmol/L Tris, 100mmol/L tricine, 10 g/L SDS as cathode buffer (pH 8.3)and 200 mmol/L Tris (pH 8.9) as the anode buffer. Thegels were fixed in 500 mL/L ethanol, 30 mL/L phosphoricacid for 2 h, followed by washes with MilliQ water (3–20min). The gels were equilibrated for 1 h in Neuhoffsolution (33 ) (250 mL/L methanol, 50 mL/L phosphoricacid, 160 g/L ammonium sulfate) before addition of 0.1 gof Serva Blue G per 100 mL and stained for 24 h. Gels werestored in 200 g/L ammonium sulfate at 4 °C until bandswere excised.
identification of proteins by msProtein bands plus a blank region from the edge of the gelwere excised from two-dimensional gels. Individual spotswere washed several times for at least 2 h with 500 mL/Lmethanol, 50 mL/L acetic acid, reduced with 10 mmol/Ldithiothreitol, and alkylated with 100 mmol/L iodoacet-amide before in-gel trypsin digestion with 10 �L of 20�g/L trypsin (Boehringer) overnight at 37 °C. Superna-tants were then collected and gel pieces extracted withadditional ammonium bicarbonate (10 �L of a 25 mmol/Lsolution) for 15 min, which was pooled with the originalsupernatant (sample). The samples were zip-tipped (Mil-lipore uC18); washed with 1 mL/L TFA in water; elutedwith 2 �L of 500 mL/L acetonitrile, 2,5-dihydroxybenzoic
acid, 1 mL/L TFA onto a 100-well stainless steel plate(Applied Biosystems); and analyzed via matrix-assistedlaser desorption/ionization (MALDI) on a QStar Pulsar I(Applied Biosystems/MDS SCIEX) equipped with aMALDI I ion source. The QStar was calibrated by use oftwo tandem MS (MS/MS) fragments of Glu-fibrinogenpeptide (Sigma) with [M�H]� masses of 175.11195 and1570.6774. After manual inspection of the survey scan toprevent the selection of keratin and trypsin autolysispeaks, the most intense ions were selected for MS/MSfragmentation with an operator-controlled collision en-ergy. All spectra were acquired in positive-ion mode. Allproduct ion scans were acquired from 100 m/z to an upperrange that included the peptide mass selected for MS/MSfragmentation. The most intense peptide peaks wereselected for fragmentation, and analysis of the resultingdata was carried out with the Mascot search engine.
psa, alkaline phosphatase, il-6, and saaPSA was detected with the enzymatic immunoassay(Abbott IMx). Alkaline phosphatase was measured by anabsorbance assay using the Dimension® clinical chemistrysystem (Dade Behring). SAA concentrations in dilutedserum samples were measured in triplicate by ELISA(Biosource International), according to the manufacturer’sinstructions. The detection limit of the assay is 5 �g/L,and all SAA isoforms were detected. IL-6 concentrationsin serum were measured in triplicate by ELISA accordingto the manufacturer’s instructions (Biosource Interna-tional). The detection limit of the assay is �2 ng/L. Theassay detects both free and receptor-associated IL-6.
western blot analysis and immunodepletion assayA representative sample from each group was separatedby 20% Tris-tricine-SDS–polyacrylamide electrophoresisand transferred to an Immobilon-P membrane (Millipore)in 25 mmol/L Tris, 192 mmol/L glycine, 100 mL/Lmethanol. Western blotting was performed on 31 �g/lane. The immunoblot was blocked with 50 g/L milk in20 mmol/L Tris, 500 mmol/L NaCl, 3 mL/L Tween 20(Tris-buffered saline–Tween) for 1 h and then incubatedovernight at 4 °C with 0.83 �g/L antibody to SAA (Bio-source International). The immunoblot was washed andincubated for 1 h with a 1:5000 dilution of secondaryantibody (SC-2006; Santa Cruz Biotechnology). The anti-bodies were diluted in 50 g/L milk in Tris-bufferedsaline–Tween. All incubations were performed at roomtemperature unless otherwise stated. The SAA proteinwas detected by enhanced chemiluminescence (Amer-sham).
A sample from each patient group was depleted ofSAA by immunoprecipitation using the Seize PrimaryImmunoprecipitation Kit (Pierce Endogen). Each samplewas immunodepleted with an 8 molar excess of anti-SAA(Biosource International) coupled to AminoLink PlusCoupling Gel (Pierce Endogen), according to manu-facturer instructions. The eluate (depleted serum) and
698 Le et al.: Biomarker for Bone Metastasis in Prostate Cancer Patients
washes were collected and subsequently analyzed bySELDI-TOF MS using a WCX2 (weak cation-exchangesurface) ProteinChip Array.
support vector machine analysisSpectra obtained from IMAC-Cu�� ProteinChip Arrayswere analyzed by mapping the raw (nonfiltered andnon-baseline-subtracted) TOF spectra to mass spectraconsisting of 16 384 channels with a mass calibrationgiven by m/z � aC2, where C is the channel number anda � 0.0001 Da. Masses above 26.8 kDa were not consid-ered in the analysis. All mass spectra were then normal-ized to the same total area. An automated procedure tofind and fit the significant peaks in the mass spectra wasdeveloped and implemented in the C language. Theresulting open-source X Windows application, namedNonprofit (for nonlinear protein fit), should compile andrun on any UNIX operating system. It is freely availableand can be obtained by contacting one of the authors([email protected]). In brief, a spectrum representing theaverage of all samples was first divided in several sec-tions, the width and position of each section being auto-matically selected by the software, by use of a heuristicapproach to obtain the best possible fits in the followingstep. Each section was then fitted with the appropriatenumber of gaussian peaks superimposed on a quadraticbackground, the number of peaks producing the best fitbeing found with an iterative procedure. The positions,widths, and heights of the peaks were fitted at the sametime as the background parameters. The relative peakwidth was fixed, which means that all peaks in a givensection had the same width but that this width wasallowed to vary in the fitting procedure. For each section,the result of the fit of the average spectrum was then usedas a template to set the initial parameters for fitting allspectra in the data set, the number peaks and the relativepositions of the peaks being fixed. This procedure as-sumed that all peaks to be fitted appeared in the averagespectrum, which is a reasonable assumption because it isunlikely that a peak appearing in only a few spectrawould be useful in a classification scheme. This procedurecorrected for an imperfect gain matching between spectrabecause the absolute positions of the peaks were free tovary during the fit; only their relative positions werefixed. For each spectrum, the position and area of eachgaussian peak were saved for subsequent analysis anddata mining. Such a fitting procedure has the advantageof being able to extract meaningful abundance even forproteins associated with mass peaks that were not com-pletely resolved. Examples of fits obtained with the Non-profit software are shown in Fig. s1 of the Data Supple-ment that accompanies this article at http://www.clinchem.org/content/vol51/issue4/.
Support vector machines (SVMs) were used to deter-mine whether machine-learning algorithms could differ-entiate prostate cancer patients with bone lesions fromthose without bone lesions. Peaks under m/z 975 were not
fitted because many of them showed obvious signs ofsaturation. The automated procedure applied divided thespectra into 39 sections for fitting, and a total of 270 peakswere fitted for each spectrum, to give �10 000 gaussianpeaks. With the help of the fitted peak areas, a classifierwas built to distinguish between the spectra associatedwith the patients who tested positive for bone metastasisand those who did not. SVM was chosen because thislearning scheme performed very well as a classifier inassociation with our peak-fitting procedure on largerSELDI-TOF MS data sets publicly available (data notshown). Furthermore, SVMs are known to perform well inthe challenging situation in which the number of samplesin the data set is not large compared with the number ofattributes. For example, SVMs have been successfullyused as a classification scheme in microarray experiments(34 ). In our case, the attributes were the peak areas.Suppose that n attributes are being considered to build aclassifier; each sample (or instance in the machine-learn-ing terminology) can then be represented by a point in ann-dimensional space. SVMs find the maximum marginhyperplane, which is the hyperplane separating the twoclasses of samples in this n-dimensional space whilemaximizing the distance between the hyperplane and theclosest training point. With our fitting procedure onSELDI-TOF MS data, we found that it is not usuallynecessary to select the attributes to reduce the dimension-ality before building a good classifier with SVM. Wetherefore do not have to select which type of attributefilter or wrapper would be the most efficient. In practice,we have used the sequential minimal optimization algo-rithm as implemented in the Weka machine-learningsoftware (35 ). To maximize the use of this relatively smalldata set, we have assessed the performance of the classi-fier with a leave-one-out cross-validation scheme. In otherwords, 37 of the samples were used to build a classifierand predict the class of the remaining sample, and thisprocedure was repeated 38 times, leaving out each sampleone at a time.
statistical analysisFor our purposes, specificity is defined as the ratio of thepatients who do not have the protein peak (or above-normal concentrations) and do not have bone metastasesto the total number of patients that do not have bonemetastases. Sensitivity is defined as the ratio of thepatients with bone metastases who had the biomarker (orabove-normal concentrations) to the total number of pa-tients with bone metastases. Comparisons between pa-tients with and without bone metastases were performedwith the Welch T-test and the nonparametric Wilcoxontest. The latter test does not assume that the variablesfollow gaussian distributions. Statistical significance wasassumed when P was �0.05.
Univariate statistical analysis of SELDI-TOF MS peakmasses and relative intensity values was conducted withthe nonparametric Mann–Whitney U-test.
Clinical Chemistry 51, No. 4, 2005 699
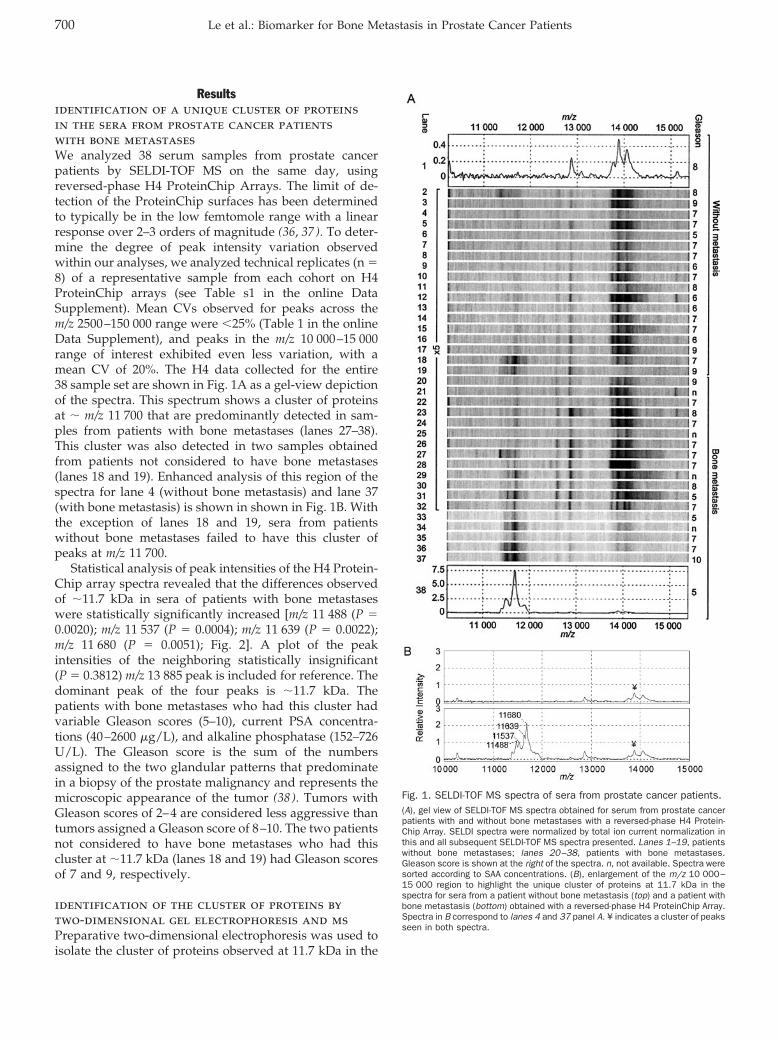
Resultsidentification of a unique cluster of proteinsin the sera from prostate cancer patientswith bone metastasesWe analyzed 38 serum samples from prostate cancerpatients by SELDI-TOF MS on the same day, usingreversed-phase H4 ProteinChip Arrays. The limit of de-tection of the ProteinChip surfaces has been determinedto typically be in the low femtomole range with a linearresponse over 2–3 orders of magnitude (36, 37). To deter-mine the degree of peak intensity variation observedwithin our analyses, we analyzed technical replicates (n �8) of a representative sample from each cohort on H4ProteinChip arrays (see Table s1 in the online DataSupplement). Mean CVs observed for peaks across them/z 2500–150 000 range were �25% (Table 1 in the onlineData Supplement), and peaks in the m/z 10 000–15 000range of interest exhibited even less variation, with amean CV of 20%. The H4 data collected for the entire38 sample set are shown in Fig. 1A as a gel-view depictionof the spectra. This spectrum shows a cluster of proteinsat � m/z 11 700 that are predominantly detected in sam-ples from patients with bone metastases (lanes 27–38).This cluster was also detected in two samples obtainedfrom patients not considered to have bone metastases(lanes 18 and 19). Enhanced analysis of this region of thespectra for lane 4 (without bone metastasis) and lane 37(with bone metastasis) is shown in shown in Fig. 1B. Withthe exception of lanes 18 and 19, sera from patientswithout bone metastases failed to have this cluster ofpeaks at m/z 11 700.
Statistical analysis of peak intensities of the H4 Protein-Chip array spectra revealed that the differences observedof �11.7 kDa in sera of patients with bone metastaseswere statistically significantly increased [m/z 11 488 (P �0.0020); m/z 11 537 (P � 0.0004); m/z 11 639 (P � 0.0022);m/z 11 680 (P � 0.0051); Fig. 2]. A plot of the peakintensities of the neighboring statistically insignificant(P � 0.3812) m/z 13 885 peak is included for reference. Thedominant peak of the four peaks is �11.7 kDa. Thepatients with bone metastases who had this cluster hadvariable Gleason scores (5–10), current PSA concentra-tions (40–2600 �g/L), and alkaline phosphatase (152–726U/L). The Gleason score is the sum of the numbersassigned to the two glandular patterns that predominatein a biopsy of the prostate malignancy and represents themicroscopic appearance of the tumor (38 ). Tumors withGleason scores of 2–4 are considered less aggressive thantumors assigned a Gleason score of 8–10. The two patientsnot considered to have bone metastases who had thiscluster at �11.7 kDa (lanes 18 and 19) had Gleason scoresof 7 and 9, respectively.
identification of the cluster of proteins bytwo-dimensional gel electrophoresis and msPreparative two-dimensional electrophoresis was used toisolate the cluster of proteins observed at 11.7 kDa in the
Fig. 1. SELDI-TOF MS spectra of sera from prostate cancer patients.(A), gel view of SELDI-TOF MS spectra obtained for serum from prostate cancerpatients with and without bone metastases with a reversed-phase H4 Protein-Chip Array. SELDI spectra were normalized by total ion current normalization inthis and all subsequent SELDI-TOF MS spectra presented. Lanes 1–19, patientswithout bone metastases; lanes 20–38, patients with bone metastases.Gleason score is shown at the right of the spectra. n, not available. Spectra weresorted according to SAA concentrations. (B), enlargement of the m/z 10 000–15 000 region to highlight the unique cluster of proteins at 11.7 kDa in thespectra for sera from a patient without bone metastasis (top) and a patient withbone metastasis (bottom) obtained with a reversed-phase H4 ProteinChip Array.Spectra in B correspond to lanes 4 and 37 panel A. ¥ indicates a cluster of peaksseen in both spectra.
700 Le et al.: Biomarker for Bone Metastasis in Prostate Cancer Patients

SELDI-TOF MS spectra. Serum samples chosen for thisexperiment were from one patient not considered to havebone metastases and from one who did have bone metas-tasis. The samples correspond to lanes 8 and 37 in Fig. 1.The gels are shown in Fig. s2A of the online DataSupplement and exhibited four differences in the mass
region �11.7 kDa when we compared the serum from thepatient with bone metastases with the serum obtainedfrom the patient who did not have bone metastases. Theseprotein spots, plus a blank region at the edge of the gel,were excised and subjected to an in-gel trypsin digestionprotocol. The resulting trypsin fragments from each spotwere analyzed in a QStar Pulsar I with the MALDI I ionsource to identify the unknown proteins, which wereidentified to be variants of SAA. The amino acid sequenceof unprocessed SAA is shown in Fig. s2B of the onlineData Supplement, with the variable amino acids boxed. AMALDI-TOF mass spectrum of peptides derived fromspot 4 of the two-dimensional gel is shown in Fig. s2C ofthe online Data Supplement. A Mascot search using thepeptide mass fingerprinting (PMF) data indicated thatfour peptides matched with peptides for SAA, givinga sequence coverage of 40%. Significant confidence (P�0.05) in the identity was indicated by a Mascot score ashigh as 80. Further confirmation of protein identificationwas provided by MS/MS fragmentation analysis, whichprovided a sequence tag for database searching. Identifi-cation of the m/z 2178 ion confirmed its identity as a SAApeptide with a Mascot score of 131 (Fig. s2D in the onlineData Supplement). MS/MS analysis of m/z 2178 detectedmost b and y ions (Fig. s2D in the online Data Supple-ment). Combined with PMF data, all four spots from thetwo-dimensional gel yielded very high confidence hitswith SAA variants.
western blot analysis and immunodepletionassaysA representative sample from each group was selected forWestern blot analysis based on whether the SELDI spec-trum was negative or positive for what we putativelyidentified as SAA proteins. For this analysis, the samplescorresponded to lanes 8 and 37 of Fig. 1 (negative andpositive for SAA, respectively). Western blot analysis withan antibody against SAA detected a single band at amolecular mass of �12 kDa in sample 37, whereas noth-ing was detected in serum from a patient not consideredto have bone metastases (Fig. 3). Only one band could bedetected in serum from a patient with confirmed bonemetastases by Western blot when using a 20% tricine gel.Although the antibody used recognizes all four isoformsof SAA, these isoforms could not be resolved by Westernblot analysis.
To confirm that the peaks detected by SELDI-TOF MS(Fig. 1) were indeed isoforms of SAA, we next analyzedserum from a representative sample of each cohort (lanes7 and 35 in Fig. 1) both before and after immunodepletionof SAA. Selection of samples was based on the samerationale as described above. The spectrum obtained forserum from the patient with bone metastases had thecluster of peaks at 11.7 kDa, with intensities ranging from�5 to 13 (Fig. 4). After immunodepletion, the intensitiesfor these peaks were all �1 (compare panels A and B inFig. 4). The spectra obtained with serum from the patient
Fig. 2. Scatter plots of peak intensities for the four peaks of interest.Biological replicates with the mean intensities of the four peaks in serumsamples from patients with bone metastasis (BM) that were found to bestatistically significantly increased [m/z 11 488 (P � 0.0020); m/z 11 537 (P �0.0004); m/z 11 639 (P � 0.0022); m/z 11 680 (P � 0.0051)]. A plot of thepeak intensities of the neighboring statistically insignificant (P � 0.3812) m/z13 885 peak (bottom panel) is included for reference. WO, patients without bonemetastases.
Clinical Chemistry 51, No. 4, 2005 701
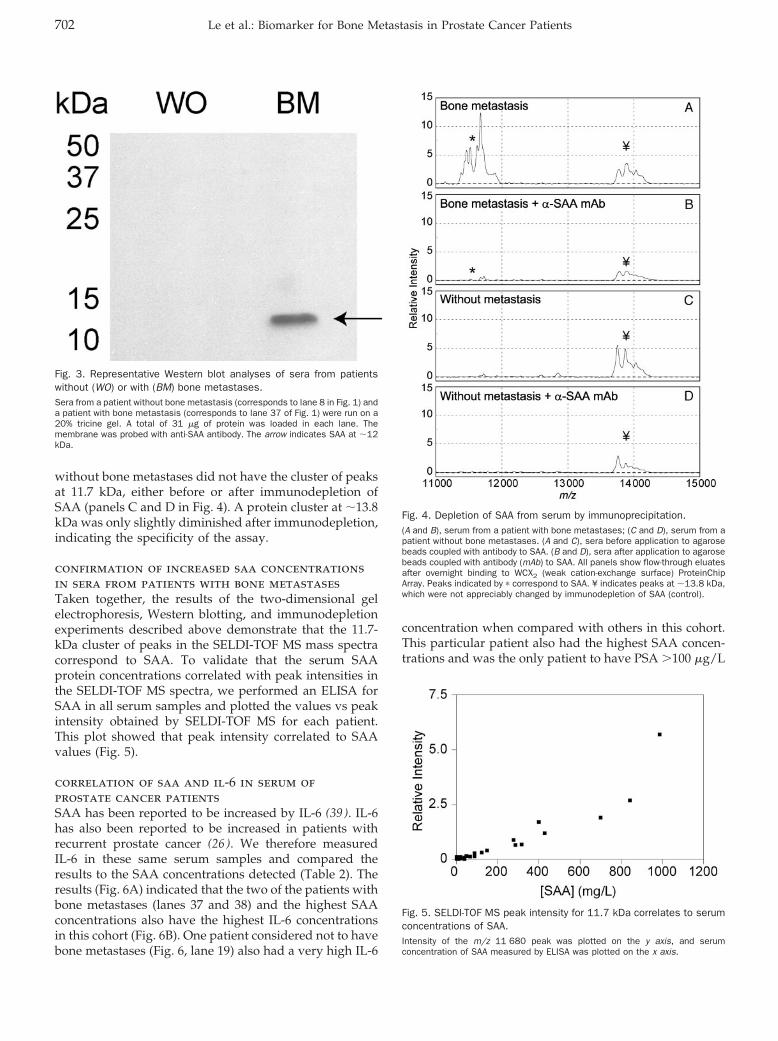
without bone metastases did not have the cluster of peaksat 11.7 kDa, either before or after immunodepletion ofSAA (panels C and D in Fig. 4). A protein cluster at �13.8kDa was only slightly diminished after immunodepletion,indicating the specificity of the assay.
confirmation of increased saa concentrationsin sera from patients with bone metastasesTaken together, the results of the two-dimensional gelelectrophoresis, Western blotting, and immunodepletionexperiments described above demonstrate that the 11.7-kDa cluster of peaks in the SELDI-TOF MS mass spectracorrespond to SAA. To validate that the serum SAAprotein concentrations correlated with peak intensities inthe SELDI-TOF MS spectra, we performed an ELISA forSAA in all serum samples and plotted the values vs peakintensity obtained by SELDI-TOF MS for each patient.This plot showed that peak intensity correlated to SAAvalues (Fig. 5).
correlation of saa and il-6 in serum ofprostate cancer patientsSAA has been reported to be increased by IL-6 (39 ). IL-6has also been reported to be increased in patients withrecurrent prostate cancer (26 ). We therefore measuredIL-6 in these same serum samples and compared theresults to the SAA concentrations detected (Table 2). Theresults (Fig. 6A) indicated that the two of the patients withbone metastases (lanes 37 and 38) and the highest SAAconcentrations also have the highest IL-6 concentrationsin this cohort (Fig. 6B). One patient considered not to havebone metastases (Fig. 6, lane 19) also had a very high IL-6
concentration when compared with others in this cohort.This particular patient also had the highest SAA concen-trations and was the only patient to have PSA �100 �g/L
Fig. 3. Representative Western blot analyses of sera from patientswithout (WO) or with (BM) bone metastases.Sera from a patient without bone metastasis (corresponds to lane 8 in Fig. 1) anda patient with bone metastasis (corresponds to lane 37 of Fig. 1) were run on a20% tricine gel. A total of 31 �g of protein was loaded in each lane. Themembrane was probed with anti-SAA antibody. The arrow indicates SAA at �12kDa.
Fig. 4. Depletion of SAA from serum by immunoprecipitation.(A and B), serum from a patient with bone metastases; (C and D), serum from apatient without bone metastases. (A and C), sera before application to agarosebeads coupled with antibody to SAA. (B and D), sera after application to agarosebeads coupled with antibody (mAb) to SAA. All panels show flow-through eluatesafter overnight binding to WCX2 (weak cation-exchange surface) ProteinChipArray. Peaks indicated by � correspond to SAA. ¥ indicates peaks at �13.8 kDa,which were not appreciably changed by immunodepletion of SAA (control).
Fig. 5. SELDI-TOF MS peak intensity for 11.7 kDa correlates to serumconcentrations of SAA.Intensity of the m/z 11 680 peak was plotted on the y axis, and serumconcentration of SAA measured by ELISA was plotted on the x axis.
702 Le et al.: Biomarker for Bone Metastasis in Prostate Cancer Patients
at the time of diagnosis in the cohort with no bonemetastases. The probability of metastatic disease increaseswith increasing PSA concentrations. No specific trendcould be readily observed between SAA and IL-6; somepatients with very high SAA concentrations did not havehigh IL-6 concentrations (e.g., Fig. 6, lane 35).
Serum alkaline phosphatase is a marker for osteoblas-tic lesions (40 ); however, in patients with confirmed bonemetastases, it was increased to above-normal concentra-tions (�200 U/L) in only 44% (8 of 18) of the samples.Serum concentrations of alkaline phosphatase were gen-erally higher in patients with positive bone scans (Fig. 6C,lanes 20–38), but there was no obvious trend relatingthese concentrations to SAA (Fig. 6A), IL-6 (Fig. 6B), orPSA (Fig. 6, D and E; see Tables 1 and 2).
svmUsing linear class boundaries and a leave-one-out cross-validation scheme with spectra obtained from IMACsurfaces, SVMs correctly classified 34 of 38 samples, for aclassification accuracy of 89.5%. Two samples associatedwith a positive test for bone metastasis and two samplesassociated with a negative test were misclassified. Thiscorresponds to a sensitivity and specificity of 89.5%. Theanalysis pipeline described was applied to data obtainedfrom other ProteinChip surfaces, but the best classifica-tion accuracy was obtained with the IMAC data. Thesimultaneous use of all data from various ProteinChipsurfaces did not improve classification accuracy. No ob-vious unique peaks for bone metastases samples could bemanually detected with IMAC-Cu�� ProteinChip Arrays.
DiscussionNoninvasive tools for the diagnosis, prognosis, and mon-itoring of cancer are required. Biomarkers that can bemeasured in the blood of patients provide a convenient,relatively noninvasive approach to diagnosing and mon-itoring patients. The ideal biomarker should have low
false-positive and -negative rates and be sensitive, spe-cific, quantifiable, and capable of detecting tumors at anearly stage to allow appropriate therapy and prognosticreference and to predict the likelihood of recurrence(41, 42). Serum PSA is a good biomarker for monitoringprogression of hormone-refractory prostate cancer, but itcannot distinguish bone metastases from local recurrenceor soft tissue secondary lesions (12, 43 ). Absolute PSAconcentrations in recurrent disease have not consistentlybeen shown to be prognostic for survival or predictive ofresponse. Serum alkaline phosphatase is routinely moni-tored as a marker for bone turnover, but it lacks sensitiv-ity and is associated with a transient flare in response tosystemic therapy such as androgen ablation (44 ). Appli-cation of genomic and proteomic high-throughput ap-proaches holds the promise of identifying new biomark-ers.
SELDI-TOF MS is a high-throughput proteomic ap-proach that has been successfully applied for proteomicprofiling in a variety of clinical samples, including serum(45–47) and laser-capture-microdissected tissues (48–50).These profiling studies have shown the ability of SELDI-TOF MS to produce spectra that can be analyzed byvarious machine-learning algorithms to differentiate can-cer cases from noncancer cases. Only one report exists onthe application of SELDI-TOF MS profiling of clinicalsamples for metastatic disease (49 ). The authors of thatreport used serum from patients with hepatocellularcarcinoma but did not go on to identify potential biomar-kers associated with the protein profile for metastasis. Inthe current study, we first applied SELDI-TOF MS tech-nology, using reversed-phase H4 ProteinChip Arrays torapidly screen unfractionated serum samples obtainedfrom prostate cancer patients both with and with out bonemetastases. On identification of a cluster of proteins thatpredominated in the spectra obtained from patients withbone metastases we used preparative two-dimensionalgel electrophoresis followed by in-gel trypsin digestion,peptide mapping, and MS/MS to identify this cluster ofproteins as isoforms of SAA. Evidence that these proteinsdetected in the SELDI-TOF MS spectra were indeedcorrectly identified as SAA was obtained by immu-nodepletion assay. Validation that SAA concentrationswere increased in the sera obtained from patients withbone metastases was confirmed by ELISA. Spectra ob-tained from a different ProteinChip Array (IMAC-Cu��)with the same samples were analyzed by SVM, and thisanalysis was able to distinguish prostate cancer patientswith bone metastases from those without metastases witha sensitivity of 89.5%.
SAA is an acute-phase protein [for a review, see Ref.(51 )]. Circulating concentrations of SAA are transientlyincreased as much as 1000-fold in response to inflamma-tion (52 ). SAA is produced predominantly in the liver aswell as in other epithelial tissue, including prostate tissue(53 ). It is unlikely that the increased SAA concentrationsdetected here were attributable to enhanced production in
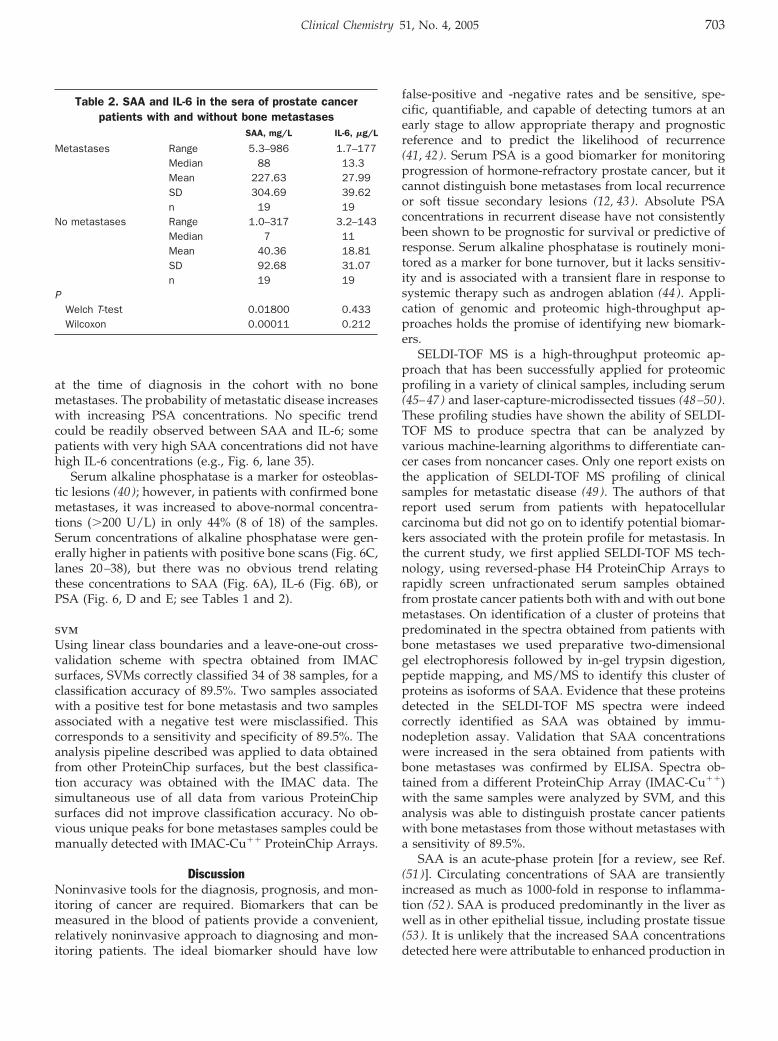
Table 2. SAA and IL-6 in the sera of prostate cancerpatients with and without bone metastases
SAA, mg/L IL-6, �g/L
Metastases Range 5.3–986 1.7–177Median 88 13.3Mean 227.63 27.99SD 304.69 39.62n 19 19
No metastases Range 1.0–317 3.2–143Median 7 11Mean 40.36 18.81SD 92.68 31.07n 19 19
PWelch T-test 0.01800 0.433Wilcoxon 0.00011 0.212
Clinical Chemistry 51, No. 4, 2005 703
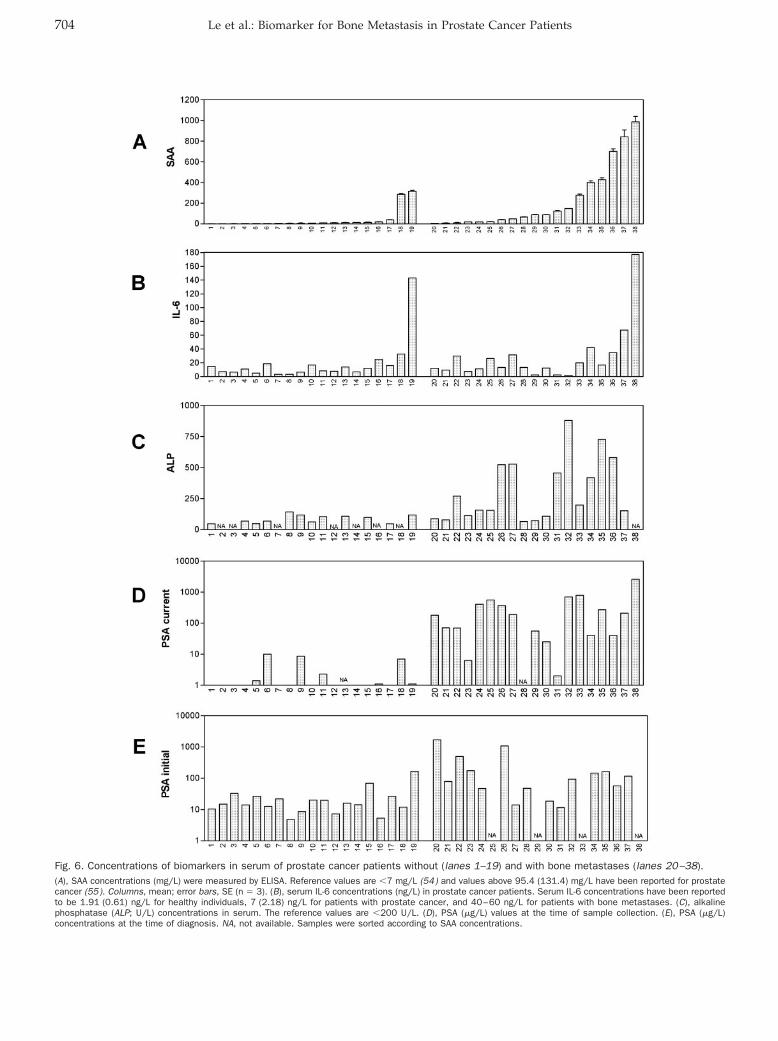
Fig. 6. Concentrations of biomarkers in serum of prostate cancer patients without (lanes 1–19) and with bone metastases (lanes 20–38).(A), SAA concentrations (mg/L) were measured by ELISA. Reference values are �7 mg/L (54) and values above 95.4 (131.4) mg/L have been reported for prostatecancer (55). Columns, mean; error bars, SE (n � 3). (B), serum IL-6 concentrations (ng/L) in prostate cancer patients. Serum IL-6 concentrations have been reportedto be 1.91 (0.61) ng/L for healthy individuals, 7 (2.18) ng/L for patients with prostate cancer, and 40–60 ng/L for patients with bone metastases. (C), alkalinephosphatase (ALP; U/L) concentrations in serum. The reference values are �200 U/L. (D), PSA (�g/L) values at the time of sample collection. (E), PSA (�g/L)concentrations at the time of diagnosis. NA, not available. Samples were sorted according to SAA concentrations.
704 Le et al.: Biomarker for Bone Metastasis in Prostate Cancer Patients
prostatic tissue. There is an inherent lack of specificity forSAA; it is generally increased in patients with a broadspectrum of primary and disseminated diseases (54, 55).SAA has received considerable attention for being apotential marker for neoplastic activity, however, becauseof its inverse correlation with patient survival in spite ofthe lack of elucidation of its role in metastatic processes[for a review see Ref. (51 )]. SAA is induced by IL-6 (39 ),and although IL-6 is reported to be increased in patientswith metastatic prostate cancer, we were unable to con-firm this finding in our samples (see Fig. 6, A and B),thereby negating a possible mechanistic role correlatingIL-6 to increased serum concentrations of SAA in prostatecancer patients with bone metastases. In 1984, SAA wasproposed for use in the monitoring of active prostatecancer that was not in remission (56 ). Since that initialpublication, SAA has not been reported for monitoring ofprostate cancer, probably because of its lack of specificityand the successful emergence of PSA as a biomarker forthis disease.
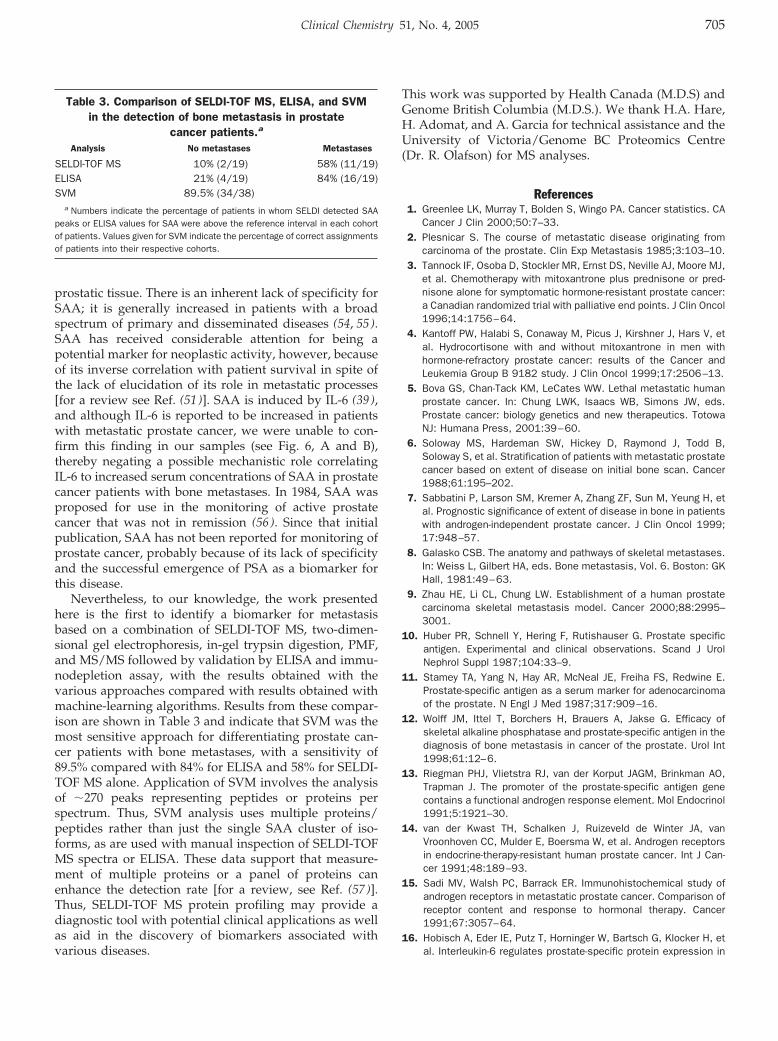
Nevertheless, to our knowledge, the work presentedhere is the first to identify a biomarker for metastasisbased on a combination of SELDI-TOF MS, two-dimen-sional gel electrophoresis, in-gel trypsin digestion, PMF,and MS/MS followed by validation by ELISA and immu-nodepletion assay, with the results obtained with thevarious approaches compared with results obtained withmachine-learning algorithms. Results from these compar-ison are shown in Table 3 and indicate that SVM was themost sensitive approach for differentiating prostate can-cer patients with bone metastases, with a sensitivity of89.5% compared with 84% for ELISA and 58% for SELDI-TOF MS alone. Application of SVM involves the analysisof �270 peaks representing peptides or proteins perspectrum. Thus, SVM analysis uses multiple proteins/peptides rather than just the single SAA cluster of iso-forms, as are used with manual inspection of SELDI-TOFMS spectra or ELISA. These data support that measure-ment of multiple proteins or a panel of proteins canenhance the detection rate [for a review, see Ref. (57 )].Thus, SELDI-TOF MS protein profiling may provide adiagnostic tool with potential clinical applications as wellas aid in the discovery of biomarkers associated withvarious diseases.
This work was supported by Health Canada (M.D.S) andGenome British Columbia (M.D.S.). We thank H.A. Hare,H. Adomat, and A. Garcia for technical assistance and theUniversity of Victoria/Genome BC Proteomics Centre(Dr. R. Olafson) for MS analyses.
References1. Greenlee LK, Murray T, Bolden S, Wingo PA. Cancer statistics. CA
Cancer J Clin 2000;50:7–33.2. Plesnicar S. The course of metastatic disease originating from
carcinoma of the prostate. Clin Exp Metastasis 1985;3:103–10.3. Tannock IF, Osoba D, Stockler MR, Ernst DS, Neville AJ, Moore MJ,
et al. Chemotherapy with mitoxantrone plus prednisone or pred-nisone alone for symptomatic hormone-resistant prostate cancer:a Canadian randomized trial with palliative end points. J Clin Oncol1996;14:1756–64.
4. Kantoff PW, Halabi S, Conaway M, Picus J, Kirshner J, Hars V, etal. Hydrocortisone with and without mitoxantrone in men withhormone-refractory prostate cancer: results of the Cancer andLeukemia Group B 9182 study. J Clin Oncol 1999;17:2506–13.
5. Bova GS, Chan-Tack KM, LeCates WW. Lethal metastatic humanprostate cancer. In: Chung LWK, Isaacs WB, Simons JW, eds.Prostate cancer: biology genetics and new therapeutics. TotowaNJ: Humana Press, 2001:39–60.
6. Soloway MS, Hardeman SW, Hickey D, Raymond J, Todd B,Soloway S, et al. Stratification of patients with metastatic prostatecancer based on extent of disease on initial bone scan. Cancer1988;61:195–202.
7. Sabbatini P, Larson SM, Kremer A, Zhang ZF, Sun M, Yeung H, etal. Prognostic significance of extent of disease in bone in patientswith androgen-independent prostate cancer. J Clin Oncol 1999;17:948–57.
8. Galasko CSB. The anatomy and pathways of skeletal metastases.In: Weiss L, Gilbert HA, eds. Bone metastasis, Vol. 6. Boston: GKHall, 1981:49–63.
9. Zhau HE, Li CL, Chung LW. Establishment of a human prostatecarcinoma skeletal metastasis model. Cancer 2000;88:2995–3001.
10. Huber PR, Schnell Y, Hering F, Rutishauser G. Prostate specificantigen. Experimental and clinical observations. Scand J UrolNephrol Suppl 1987;104:33–9.
11. Stamey TA, Yang N, Hay AR, McNeal JE, Freiha FS, Redwine E.Prostate-specific antigen as a serum marker for adenocarcinomaof the prostate. N Engl J Med 1987;317:909–16.
12. Wolff JM, Ittel T, Borchers H, Brauers A, Jakse G. Efficacy ofskeletal alkaline phosphatase and prostate-specific antigen in thediagnosis of bone metastasis in cancer of the prostate. Urol Int1998;61:12–6.
13. Riegman PHJ, Vlietstra RJ, van der Korput JAGM, Brinkman AO,Trapman J. The promoter of the prostate-specific antigen genecontains a functional androgen response element. Mol Endocrinol1991;5:1921–30.
14. van der Kwast TH, Schalken J, Ruizeveld de Winter JA, vanVroonhoven CC, Mulder E, Boersma W, et al. Androgen receptorsin endocrine-therapy-resistant human prostate cancer. Int J Can-cer 1991;48:189–93.
15. Sadi MV, Walsh PC, Barrack ER. Immunohistochemical study ofandrogen receptors in metastatic prostate cancer. Comparison ofreceptor content and response to hormonal therapy. Cancer1991;67:3057–64.
16. Hobisch A, Eder IE, Putz T, Horninger W, Bartsch G, Klocker H, etal. Interleukin-6 regulates prostate-specific protein expression in
Table 3. Comparison of SELDI-TOF MS, ELISA, and SVMin the detection of bone metastasis in prostate
cancer patients.a
Analysis No metastases Metastases
SELDI-TOF MS 10% (2/19) 58% (11/19)ELISA 21% (4/19) 84% (16/19)SVM 89.5% (34/38)
a Numbers indicate the percentage of patients in whom SELDI detected SAApeaks or ELISA values for SAA were above the reference interval in each cohortof patients. Values given for SVM indicate the percentage of correct assignmentsof patients into their respective cohorts.
Clinical Chemistry 51, No. 4, 2005 705

prostate carcinoma cells by activation of the androgen receptor.Cancer Res 1998;58:4640–5.
17. Haq M, Goltzman D, Tremblay G, Brodt P. Rat prostate adenocar-cinoma cells disseminate to bone and adhere preferentially tobone marrow-derived endothelial cells. Cancer Res 1992;52:4613–9.
18. Ueda T, Bruchovsky N, Sadar MD. Activation of the N-terminus ofthe androgen receptor by interleukin-6 via MAPK and STAT3 signaltransduction pathways cells. J Biol Chem 2002;277:7076–85.
19. Ueda T, Mawji NR, Bruchovsky N, Sadar MD. Ligand-independentactivation of the androgen receptor by interleukin-6 and the role ofsteroid receptor coactivator-1 in prostate cancer cells. J Biol Chem2002;277:38087–94.
20. Blaszczyk N, Masri B, Mawji NR, Ueda T, McAlinden G, Duncan CP,et al. Osteoblast-derived factors induce androgen-independentproliferation and expression of prostate-specific antigen in humanprostate cancer cells. Clin Cancer Res 2004;10:1860–9.
21. Culig Z, Hobisch A, Cronauer MV, Radmayr C, Trapman J, HittmairA, et al. Androgen receptor activation in prostatic tumor cell linesby insulin-like growth factor-I, keratinocyte growth factor andepidermal growth factor. Cancer Res 1994;54:5474–8.
22. Sadar MD, Hussain M, Bruchovsky N. Prostate cancer: molecularbiology of early progression to androgen independence. EndocrRelat Cancer 1999;6:487–502.
23. Adler HL, McCurdy MA, Kattan MW, Timme TL, Scardino PT,Thompson TC. Elevated levels of circulating interleukin-6 andtransforming growth factor-�1 in patients with metastatic pros-tatic carcinoma. J Urol 1999;161:181–7.
24. Hoosein N, Abdul M, McCabe R, Gero E, Deftos L, Banks M, et al.Clinical significance of elevation in neuroendocrine factors andinterleukin-6 in metastatic prostatic carcinoma. Urol Oncol 1995;1:246–51.
25. Twillie DA, Eisenberger MA, Carducci MA, Hseih WS, Kim WY,Simons JW. Interleukin-6: a candidate mediator of human pros-tate cancer morbidity. Urology 1995;45:542–9.
26. Drachenberg DE, Elgamal AA, Rowbotham R, Peterson M, MurphyGP. Circulating levels of interleukin-6 in patients with hormonerefractory prostate cancer. Prostate 1999;41:127–33.
27. Wehbi NK, Dugger AL, Bonner RB, Pitha JV, Hurst RE, HemstreetGP. Pan-cadherin as a high level phenotypic biomarker for prostatecancer. J Urol 2002;167:2215–21.
28. Stenman U, Finne P, Zhang W, Leinonen J. Prostate-specificantigen and other prostate cancer markers. Urology 2000;56:893–8.
29. Berruti A, Dogliotti L, Mosca A, Gorzegno G, Bollito E, Mari M, etal. Potential clinical value of circulating chromogranin A in patientswith prostate carcinoma. Ann Oncol 2001;12:S153–7.
30. Mackintosh J, Simes J, Raghavan D, Pearson B. Prostatic cancerwith bone metastases: serum alkaline phosphatase (SAP) as apredictor of response and the significance of the SAP “flare”. Br JUrol 1990;66:88–93.
31. Coleman RE. Monitoring of bone metastases. Eur J Cancer1998;34:252–9.
32. Schagger H, von Jagow G. Tricine-sodium dodecyl sulfate-polyac-rylamide gel electrophoresis for the separation of proteins in therange from 1 to 100 kDa. Anal Biochem 1987;166:368–79.
33. Neuhoff V, Arold N, Taube D, Ehrhardt W. Improved staining ofproteins in polyacrylamide gels including isoelectric focusing gelswith clear background at nanogram sensitivity using CoomassieBrilliant Blue G-250 and R-250. Electrophoresis 1988;9:255–62.
34. Furey TS, Cristianini N, Duffy N, Bednarski DW, Schummer M,Haussler D. Support vector machine classification and validationof cancer tissue samples using microarray expression data.Bioinformatics 2000;16:906–14.
35. Witten IH, Frank E. Data mining: practical machine learning toolswith Java implementations. San Francisco: Morgan Kaufmann,2000:371pp.
36. Xiao Z, Jiang X, Beckett M, Wright GL Jr. Generation of abaculovirus recombinant prostate-specific membrane antigen andits use in the development of a novel protein biochip quantitativeimmunoassay. Prot Expression Purif 2000;19:12–21.
37. Diamond DL, Kimball JR, Krisanaprakornkit S, Ganz T, Dale BA.Detection of �-defensins secreted by human oral epithelial cells.J Immunol Methods 2001;256:65–76.
38. Gleason DF. Classification of prostatic carcinomas. Cancer Che-mother Rep 1966;50:125–8.
39. Raynes JG, Eagling S, McAdam KP. Acute-phase protein synthesisin human hepatoma cells: differential regulation of serum amyloidA (SAA) and haptoglobin by interleukin-1 and interleukin-6. ClinExp Immunol 1991;83:488–91.
40. Urwin GH, Percival RC, Yates AJ, Watson ME, Couch M, McDonaldB, et al. Biochemical markers and skeletal metabolism in carci-noma of the prostate. Use of decision matrix theory and ROCanalysis. Br J Urol 1985;57:711–4.
41. van Delft JH, Baan RA, Roza L. Biological effect markers forexposure to carcinogenic compound and their relevance for riskassessment. Crit Rev Toxicol 1998;28:477–510.
42. Collins AR. Molecular epidemiology in cancer research. Mol As-pects Med 1998;19:359–432.
43. Oesterling JE. Prostate specific antigen: a critical assessment ofthe most useful tumor marker for adenocarcinoma of the prostate.J Urol 1991;145:907–23.
44. Berruti A, Cerutti S, Fasolis G, Sperone P, Tarabuzzi R, Bertetto O,et al. Osteoblastic flare assessed by serum alkaline phosphataseactivity is an index of short duration of response in prostatecancer patients with bone metastases submitted to systemictherapy. Gruppo Onco Urologico Piemontese (G.O.U.P). AnticancerRes 1997;17:4697–702.
45. Petricoin EF, Ardekani AM, Hitt BA, Levine PJ, Fusaro VA, SteinbergSM, et al. Use of proteomic patterns in serum to identify ovariancancer. Lancet 2002;359:572–7.
46. Qu Y, Adam BL, Yasui Y, Ward MD, Cazares LH, Schellhammer PF,et al. Boosted decision tree analysis of surface-enhanced laserdesorption/ionization mass spectral serum profiles discriminatesprostate cancer from noncancer patients. Clin Chem 2002;48:1835–43.
47. Li J, Zhang Z, Rosenzweig J, Wang YY, Chan DW. Proteomics andbioinformatics approaches for identification of serum biomarkersto detect breast cancer. Clin Chem 2002;48:1296–304.
48. Jr GW, Cazares LH, Leung SM, Nasim S, Adam BL, Yip TT, et al.Proteinchip(R) surface enhanced laser desorption/ionization(SELDI) mass spectrometry: a novel protein biochip technology fordetection of prostate cancer biomarkers in complex protein mix-tures. Prostate Cancer Prostatic Dis 1999;2:264–76.
49. Poon TC, Yip TT, Chan AT, Yip C, Yip V, Mok TS, et al. Compre-hensive proteomic profiling identifies serum proteomic signaturesfor detection of hepatocellular carcinoma and its subtypes. ClinChem 2003;49:752–60.
50. Zhukov TA, Johanson RA, Cantor AB, Clark RA, Tockman MS.Discovery of distinct protein profiles specific for lung tumors andpre-malignant lung lesions by SELDI mass spectrometry. LungCancer 2003;40:267–79.
51. Urieli-Shoval S, Linke RP, Matzner Y. Expression and function ofserum amyloid A, a major acute-phase protein in normal anddisease states. Curr Opin Hematol 2000;7:64–9.
52. Weinstein PS, Skinner M, Sipe JD, Lokich JJ, Zamcheck N, CohenAS. Acute-phase proteins or tumour markers: the role of SAA, SAP,CRP and CEA as indicators of metastasis in a broad spectrum ofneoplastic diseases. Scand J Immunol 1984;19:193–8.
706 Le et al.: Biomarker for Bone Metastasis in Prostate Cancer Patients

53. Urieli-Shoval S, Cohen P, Eisenberg S, Matzner Y. Widespreadexpression of serum amyloid A in histologically normal humantissues. Predominant localization to the epithelium. J HistochemCytochem 1998;46:1377–84.
54. Rosenthal CJ, Sullivan LM. Serum amyloid A to monitor cancerdissemination. Ann Intern Med 1979;91:383–90.
55. Biran H, Friedman N, Neumann L, Pras M, Shainkin-KestenbaumR. Serum amyloid A (SAA) variations in patients with cancer:
correlation with disease activity stage primary site and prognosis.J Clin Pathol 1986;39:794–7.
56. Kaneti J, Winikoff Y, Zimlichman S, Shainkin-Kestenbaum R.Importance of serum amyloid A (SAA) level in monitoring diseaseactivity and response to therapy in patients with prostate cancer.Urol Res 1984;12:239–41.
57. Srinivas PR, Srivastava S, Hanash S, Wright GL. Proteomics inearly detection of cancer. Clin Chem 2001;47:1901–11.
Clinical Chemistry 51, No. 4, 2005 707