Identification of novel TMPRSS2:ERG mechanisms in prostate ...
59
HAL Id: hal-02353391 https://hal.archives-ouvertes.fr/hal-02353391 Submitted on 8 Nov 2019 HAL is a multi-disciplinary open access archive for the deposit and dissemination of sci- entific research documents, whether they are pub- lished or not. The documents may come from teaching and research institutions in France or abroad, or from public or private research centers. L’archive ouverte pluridisciplinaire HAL, est destinée au dépôt et à la diffusion de documents scientifiques de niveau recherche, publiés ou non, émanant des établissements d’enseignement et de recherche français ou étrangers, des laboratoires publics ou privés. Identification of novel TMPRSS2:ERG mechanisms in prostate cancer metastasis: involvement of MMP9 and PLXNA2 T Tian, N Tomavo, L Huot, A Flourens, E Bonnelye, S Flajollet, D. Hot, X Leroy, Y de Launoit, M. Duterque-Coquillaud To cite this version: T Tian, N Tomavo, L Huot, A Flourens, E Bonnelye, et al.. Identification of novel TMPRSS2:ERG mechanisms in prostate cancer metastasis: involvement of MMP9 and PLXNA2. Oncogene, Nature Publishing Group, 2014, 33 (17), pp.2204-2214. 10.1038/onc.2013.176. hal-02353391
-
Upload
khangminh22 -
Category
Documents
-
view
0 -
download
0
Transcript of Identification of novel TMPRSS2:ERG mechanisms in prostate ...

HAL Id: hal-02353391https://hal.archives-ouvertes.fr/hal-02353391
Submitted on 8 Nov 2019
HAL is a multi-disciplinary open accessarchive for the deposit and dissemination of sci-entific research documents, whether they are pub-lished or not. The documents may come fromteaching and research institutions in France orabroad, or from public or private research centers.
L’archive ouverte pluridisciplinaire HAL, estdestinée au dépôt et à la diffusion de documentsscientifiques de niveau recherche, publiés ou non,émanant des établissements d’enseignement et derecherche français ou étrangers, des laboratoirespublics ou privés.
Identification of novel TMPRSS2:ERG mechanisms inprostate cancer metastasis: involvement of MMP9 and
PLXNA2T Tian, N Tomavo, L Huot, A Flourens, E Bonnelye, S Flajollet, D. Hot, X
Leroy, Y de Launoit, M. Duterque-Coquillaud
To cite this version:T Tian, N Tomavo, L Huot, A Flourens, E Bonnelye, et al.. Identification of novel TMPRSS2:ERGmechanisms in prostate cancer metastasis: involvement of MMP9 and PLXNA2. Oncogene, NaturePublishing Group, 2014, 33 (17), pp.2204-2214. �10.1038/onc.2013.176�. �hal-02353391�

1
Identification of novel TMPRSS2:ERG mechanisms in prostate cancer metastasis:
involvement of MMP9 and PLXNA2
Tian V. Tian1,2,3,4, Nathalie Tomavo1,2,3, Ludovic Huot2,3,5, Anne Flourens1,2,3, Edith
Bonnelye6, Sébastien Flajollet1,2,3, David Hot2,3,5, Xavier Leroy3,4,7, Yvan de Launoit1,2,3,
Martine Duterque-Coquillaud1,2,3
1Institut de Biologie de Lille, CNRS UMR8161, Lille, France; 2Institut Pasteur de Lille /
IFR142, Lille, France; 3Université de Lille Nord de France, Lille, France; 4Faculté de
Médecine Henri Warembourg, Université du Droit et de la Santé Lille II, Lille, France;
5Centre d’Infection et d’Immunité de Lille (CIIL), INSERM U1019, CNRS UMR8204, Lille,
France; 6INSERM U1033, Lyon, France; 7Centre hospitalier régional et universitaire de Lille,
Institut de Pathologie, Lille, France
Correspondance: Dr. Martine Duterque-Coquillaud, Institut de Biologie de Lille, CNRS
UMR8161, 1 rue du Professeur Calmette, F59021, France
Email: [email protected]
Telephone: +33 3 20 87 10 95
Fax: +33 3 20 87 11 11
Running title: TMPRSS2:ERG regulates MMP9 and PLXNA2

2
ABSTRACT
Prostate cancer (PCa) is one of the major public health problems in Western countries.
Recently, the TMPRSS2:ERG gene fusion, which results in the aberrant expression of the
transcription factor ERG, has been shown to be the most common gene rearrangement in PCa.
Previous studies have determined the contributions of this fusion in PCa disease initiation
and/or progression in vitro and in vivo. In this study on TMPRSS2:ERG regulation in PCa, we
used an androgen receptor (AR) and TMPRSS2:ERG fusion double-negative prostate cancer
cell model: PC3c. In three cell clones with different TMPRSS2:ERG expression levels,
ectopic expression of the fusion resulted in significant induction of cell migration and
invasion in a dose-dependent manner. In agreement with this phenotype, high-throughput
microarray analysis revealed that a set of genes, functionally associated with cell motility and
invasiveness, were deregulated in a dose-dependent manner in TMPRSS2:ERG-expressing
cells. Importantly, we identified increased MMP9 and PLXNA2 expression in
TMPRSS2:ERG-positive PCa samples, and their expression levels were significantly
correlated with ERG expression in a PCa cohort. In line with these findings, there was
evidence that TMPRSS2:ERG directly and positively regulates MMP9 and PLXNA2
expression in PC3c cells. Moreover, PLXNA2 upregulation contributed to TMPRSS2:ERG-
mediated enhancements of PC3c cell migration and invasion. Furthermore, and importantly,
PLXNA2 expression was upregulated in metastatic PCa tumors compared to localized primary
PCa tumors. This study provides novel insights into the role of the TMPRSS2:ERG fusion in
PCa metastasis.
Key words: Prostate cancer, TMPRSS2:ERG fusion, Migration, Invasion, MMP9, PLXNA2.

3
INTRODUCTION
Prostate cancer (PCa) is one of the most prevalent malignancies and a leading cause of
cancer-related deaths affecting men in Western countries (1). Recent PCa cytogenetic and
genomic studies have highlighted several critical genomic alterations involved in disease
onset and/or progression (2). Of these, genomic rearrangements leading to the aberrant
expression of the E-twenty-six (ETS) family of transcription factors in PCa is considered as a
hallmark (3, 4). The most frequent genomic rearrangement in PCa is the fusion of the ETS-
related gene (ERG) with 5' regulatory elements of the androgen receptor (AR)-responsive
transmembrane protease serine 2 (TMPRSS2), which has been identified in 40% to 70% of
PCa patient samples (3). The TMPRSS2:ERG gene fusion leads to aberrant expression of full
length and/or N-terminal-truncated ERG transcription factors in PCa (referred to as
TMPRSS2:ERG protein in this study) (5).
The association between TMPRSS2:ERG fusion and PCa clinical outcome has not yet been
clearly established. Some studies have shown that this gene fusion is not significantly
associated with PCa disease progression or prognosis (6-8); however, other studies have
demonstrated that it is associated with favorable (9, 10) or poor clinical outcomes (11-16).
Functional studies on the role of TMPRSS2:ERG in PCa have been performed using PCa cell
lines as well as mouse models. Although some reports have demonstrated that ectopic
TMPRSS2:ERG expression in the prostate is sufficient to induce prostatic intraepithelial
neoplasia (PIN) in mice, a pre-malignancy form of PCa (17, 18), others have highlighted how
TMPRSS2:ERG expression cooperates with other genomic alterations, such as PTEN
haploinsufficiency, constitutive PI3K/AKT activation or AR signaling, to promote PCa cell
migration, invasion and disease progression (19-21). Using next-generation sequencing
technologies, recent studies aiming to identify TMPRSS2:ERG direct target genes in
established PCa cell models have provided further evidence that ERG can modulate the
4
output of AR target genes (22-24). These studies provide functional insights into the role of
TMPRSS2:ERG in PCa initiation and/or progression.
Nevertheless, PCa is considered as a multifocal disease, because primary PCa tumors are
mainly composed of multiple, genetically distinct cancer cells (2, 25-27). Regarding
TMPRSS2:ERG status and the corresponding TMPRSS2:ERG protein expression profile, a
significant prevalence of inter- and/or intra-focal heterogeneity has been also observed in
several PCa cohorts (28-31). This raises the possibility that the differentially expressed
TMPRSS2:ERG protein can control variable transcriptional programs in genetically distinct
PCa cells. It is therefore necessary to perform studies on different PCa cell models.
In this study, we examined the role of TMPRSS2:ERG using an established PCa cell model,
PC3c, which was previously isolated from AR and TMPRSS2:ERG double-negative PC3 cells
(32). In vivo studies have revealed that PC3c cells can induce mixed lesions in bone (32), a
commonly observed complication in PCa patients with advanced disease (33). Here, we
demonstrate that ectopic expression of TMPRSS2:ERG fusion increases PC3c cell migration
and invasion in a dose-dependent manner. High-throughput transcriptomic studies revealed
that a set of genes related to cell motility and invasiveness is deregulated in TMPRSS2:ERG-
expressing cells in a dose-dependent manner. We further demonstrate that TMPRSS2:ERG
directly and positively regulates MMP9 (Metalloproteinase 9) and PLXNA2 (Plexin A2)
expression in PC3c cells, and that PLXNA2 upregulation contributes to the TMPRSS2:ERG-
mediated PC3c cell migration and invasion.

5
RESULTS
Ectopic TMPRSS2:ERG expression leads to phenotype changes in PC3c cells.
Previous studies have identified diverse TMPRSS2:ERG fusion transcripts in human PCa
samples, and the most frequent variant is composed of exon 1 of the TMPRSS2 gene
(NM_005656) fused to exon 4 of the ERG gene (NM_004449) (5, 34). In addition, the
presence of a 72bp exon in fusion gene transcripts may contribute to a more aggressive
phenotype (35). We therefore used the TMPRSS2:ERG fusion isoform that includes exon 1 of
TMPRSS2 fused to exon 4 of ERG with the presence of the 72bp exon (Figure 1a).
Three TMPRSS2:ERG-expressing clones were included in this study, designated as H clone
(high), M clone (moderate) and L clone (low), according to their ERG mRNA expression
levels (Figure 1b). ERG mRNA levels in H cells were 2-fold and 10-fold higher than in M
cells and in L cells respectively, whereas no endogenous ERG mRNA was found in pcDNA
control cells or in parental PC3c cells. In particular, ERG expression in H cells was only about
50% of that in VCaP cells (endogenous TMPRSS2:ERG-expressing PCa cells), and
comparable to endogenous full-length ERG expression in HUVEC cells, suggesting that
TMPRSS2:ERG expression levels in our cell models were not excessive. As expected, high,
moderate and low expression levels of TMPRSS2:ERG protein were only found respectively
in H, M and L cells, and not in control cells or in parental PC3c cells (Figure 1c). In addition,
compared to VCaP cells, TMPRSS2:ERG expression in H cells was lower (Supplementary
Figure S1).
A comparison of H, M and L cell morphology to that of control cells showed that, where
control cells were round and clustered, H cells were more elongated and scattered (Figure 2a).
This morphological change was also observed, to a lesser extent, in M cells, but nearly absent
in L cells (Figure 2a). Next, we examined whether the ectopic TMPRSS2:ERG expression
could have an impact on PC3c cell proliferation. Surprisingly, no significant cell proliferation

6
changes were observed in H, M and L cells compared to control cells (Figure 2b), suggesting
that TMPRSS2:ERG fusion contributes to PCa initiation and/or progression in a different way.
Accordingly, ectopic TMPRSS2:ERG expression significantly increased PC3c cell migration
in a membrane-based assay system (Figure 2c), as well as its invasiveness in a Matrigel-based
system (Figure 2d). Interestingly, among H, M and L cells, the enhancements of cell motility
and invasiveness seemed to depend on TMPRSS2:ERG expression levels: compared to control
cells, H cells showed the most significant induction of cell migration (3.5 fold) and invasion
(7.5 fold); whereas M cell migration (1.7 fold) and invasion (3.4 fold) were higher than those
of L cells (migration: 1.2 fold; invasion: 1.2 fold) (Figure 2c and 2d). These results provide in
vitro evidence that TMPRSS2:ERG promotes, in a dose-dependent manner, PC3c cell
migration and invasion, two crucial attributes of cancer cell metastasis.
Genome-wide expression analysis reveals potential TMPRSS2:ERG target genes and their
associated cell motility and invasiveness functions.
To decipher the molecular mechanisms that underlie TMPRSS2:ERG-mediated PC3c cell
migration and invasion enhancements, we investigated global gene expression changes in H,
M and L cells using Agilent 44k Whole Human Genome Expression arrays. Compared to
control cells, 1673 genes showed significant differential expression (adjusted P-value <0.01)
in H cells (809 upregulated genes and 864 downregulated genes) (Figure 3a), and 446 genes
were differentially expressed in M cells (267 upregulated genes and 179 downregulated
genes), whereas only 191 genes with differential expression were identified in L cells (101
upregulated genes and 90 downregulated genes). Therefore, the quantity of deregulated genes
identified in H, M and L cells also appeared to rely on TMPRSS2:ERG expression levels in
PC3c cells.
A comparison of H, M and L cell transcriptomic profiles revealed that 126 genes were
commonly deregulated in H, M and L cells (hereafter referred to as “common deregulated

7
genes”), including 64 common upregulated genes and 62 common downregulated genes
(Figure 3b, Supplementary Table S2 and S3). In particular, about 50% of these 126 common
deregulated genes showed high, moderate and low expression levels in TMPRSS2:ERG-
expressing H, M, L cells, respectively (Figure 3b and Supplementary Table S2 and S3). The
“dose-dependent” expression profile of these genes suggested that they could be direct target
genes of TMPRSS2:ERG. Among these genes, we noted the striking upregulation of PLAT
(Tissue-type plasminogen activator), a well-known TMPRSS2:ERG target gene in PCa (4, 36,
37). Moreover, the over-expression of some of these genes has been shown to be associated
with PCa progression and poor clinical outcomes, such as CD44 (38), MMP9 (39) and FSCN1
(Fascin homolog 1) (40). To understand the overall functional significance of these common
126 deregulated genes, we used the DAVID gene ontology analysis (41). Among the top
Gene Ontology (GO) terms, we noted that “cell motion”, “cell migration” and
“metalloendopeptidase activity”, were upregulated, whereas “transcription” and “regulation
of apoptosis” were downregulated (Figure 3c). Taken together, these transcriptomic studies
were in agreement with the observed enhancements of PC3c cell migration and invasion, and
further highlighted the TMPRSS2:ERG role in the PCa cell metastasis process.
Turning to the identification of TMPRSS2:ERG direct target genes in PCa, we focused on
two candidate target genes in the following studies. The first one was MMP9, also known as
Gelatinase B, which has been shown to be associated with PCa progression (39), and also
regulated by other ETS transcription factors in diverse types of cancer cells including PCa (42,
43). However, it was not clear whether TMPRSS2:ERG could directly regulate MMP9
expression in PCa. The second potential target gene was PLXNA2, a type I trans-membrane
glycoprotein that functions as a receptor for Semaphorins. Together with other Plexins, it was
initially considered to mediate axon guidance during development (44). However, recent
studies have revealed Semaphorin-Plexin signaling outside of the nervous system, providing

8
additional information about this signaling in cancer (45). For instance, PLXNB1 (Plexin B1)
gene mutations in human PCa samples have been shown to be associated with PCa cell
motility and invasion enhancements (46). These findings, together with the phenotype
observed in H, M and L cells, prompted us to further investigate whether TMPRSS2:ERG
could directly control MMP9 and PLXNA2 expression to increase PCa cell migration and
invasion.
MMP9 and PLXNA2 expression levels were associated with TMPRSS2:ERG expression in
human PCa samples
To investigate whether MMP9 and PLXNA2 are genuine target genes of TMPRSS2:ERG in
PCa, we first examined their expression in human PCa samples. We used RNA from a PCa
cohort composed of 52 human prostatectomy specimens from the Tumor Tissue Bank, C2RC,
Lille University Hospital (CHRU Lille) (Supplementary Table S4). Among these PCa
samples, we found, using TMPRSS2:ERG-specific primers (4), 32 samples that showed
detectable TMPRSS2:ERG fusion transcripts (61.5%). In this PCa cohort, MMP9 and
PLXNA2 expression levels were significantly higher in TMPRSS2:ERG-positive PCa samples
than in TMPRSS2:ERG-negative samples (P=0.0055 and P<0.0001 respectively) (Figures 4a
and 4b).
To further examine the associations between TMPRSS2:ERG and its potential targets, MMP9
and PLXNA2, we performed a two-tailed non-parametric Spearman correlation analysis.
Given the heterogeneity of TMPRSS2:ERG transcripts detected in PCa samples (5, 34), it is
difficult to design universal specific primers to accurately quantify total TMPRSS2:ERG
expression. We therefore used ERG-specific primers that could detect not only ERG
transcripts, but also TMPRSS2:ERG transcripts. Importantly, high ERG expression was
detected only in TMPRSS2:ERG-positive PCa samples, whereas ERG expression in fusion
negative PCa samples was very low (Supplementary Figure S2), suggesting that, in this PCa

9
cohort, high-level ERG transcripts may be a direct consequence of the presence of
TMPRSS2:ERG fusion. Spearman correlation analysis showed that MMP9 expression was
significantly correlated with ERG expression (R=0.4287, P=0.0015) (Figure 4c), as was
PLXNA2 expression (R=0.6178, P<0.001) (Figure 4d). Thus, MMP9 and PLXNA2 expression
levels were upregulated in TMPRSS2:ERG-positive PCa specimens, and their expression
levels were correlated with ERG expression in PCa samples.
TMPRSS2:ERG directly and positively regulates MMP9 expression in PCa cells
To determine whether MMP9 gene expression was directly controlled by TMPRSS2:ERG in
PCa cells, we first performed a chromatin immunoprecipitation assay (ChIP) in H cells and
control cells. By analyzing the promoter region of the MMP9 gene, we found a putative ETS-
binding site (EBS) within 1 kb from the MMP9 transcription start site (TSS) (Figure 5a, top
panel). ChIP assay showed significant binding of TMPRSS2:ERG on this EBS in H cells
(Figure 5a, bottom panel), whereas no TMPRSS2:ERG binding was found on this EBS in
control cells, or in the promoter region of GAPDH gene which does not contain any
functional EBS, suggesting direct and specific TMPRSS2:ERG binding to the MMP9
promoter region in PC3c cells.
Next, dose-dependent upregulation of MMP9 gene expression was confirmed by RT-qPCR in
H, M and L cells (Figure 5b). In addition, we found that ectopic expression of
TMPRSS2:ERG in DU145 cells, another AR and fusion double-negative PCa cell model, also
resulted in increased MMP9 expression (Figure 5c and Supplementary Figure S3). Because it
has been shown that secreted MMP9 has an important role in extracellular matrix remodeling
during cancer progression (47), we further investigated secreted MMP9 levels in
TMPRSS2:ERG-expressing cells using a gelatin zymography assay. As expected, compared to
control cells, more secreted MMP9 was found in TMPRSS2:ERG-expressing H and M cell
conditioned mediums (Figure 5d). In particular, the cell gelatin degradation assay highlighted

10
the association between increased MMP9 secretion and the enhancement of gelatin matrix
degradation in TMPRSS2:ERG-expressing H cells (Figure 5e and Supplementary Figure S4).
Moreover, the knockdown of TMPRSS2:ERG in H cells using pooled ERG siRNA
(Supplementary Figure S5) led to over 40% reduction of MMP9 expression (Figure 5f), as
well as decreased MMP9 secretion (Figure 5g). Similar results were also observed in M cells
(Supplementary Figure S6) as well as in TMPRSS2:ERG-expressing DU145 cells
(Supplementary Figure S7). Taken together, these results indicate that TMPRSS2:ERG is
capable to directly and positively regulate MMP9 in PCa cells.
PLXNA2 is directly and positively regulated by TMPRSS2:ERG in PCa cells
Plexin A2 (PLXNA2) is another candidate TMPRSS2:ERG target gene identified by our
transcriptomic studies (Figure 3b), and its expression was found to be upregulated in
TMPRSS2:ERG-positive PCa samples and correlated with ERG expression in PCa specimens.
A putative EBS, located within 1 kb from the PLXNA2 gene TSS, was found in the PLXNA2
promoter region (Figure 6a, top panel). The ChIP assay showed significant TMPRSS2:ERG
binding on this EBS in H cells, but not in control cells (Figure 6a, bottom panel). Moreover,
this binding was absent in the irrelevant GAPDH promoter region, indicating TMPRSS2:ERG
directly and specifically binds to the PLXNA2 promoter in PC3c cells.
The dose-dependent increase of PLXNA2 expression was then confirmed in TMPRSS2:ERG-
expressing H, M and L cells compared to control cells (Figure 6b). In addition, PLXNA2
upregulation was also observed in TMPRSS2:ERG-expressing DU145 cells (Figure 6c and
Supplementary Figure S3). An immunofluoresence assay also showed PLXNA2 protein
induction in TMPRSS2:ERG-expressing H cells (Figure 6e, left panel). Importantly,
TMPRSS2:ERG knockdown in H cells resulted in about 50% reduction of PLXNA2 mRNA
levels (Figure 6d), as well as PLXNA2 protein immunostaining (Figure 6e, right panel).
Similar results were observed in M cells (Supplementary Figure S6) and TMPRSS2:ERG-

11
expressing DU145 cells (Supplementary Figure S7). These results therefore highlight that
TMPRSS2:ERG can directly and positively regulate PLXNA2 expression in PCa cells.
PLXNA2, but not MMP9, contributes to TMPRSS2:ERG-induced PC3c cell migration and
invasion in vitro.
To further explore whether MMP9 and PLXNA2 were direct mediators of TMPRSS2:ERG-
induced pro-motility and pro-invasion phenotypes observed in PCa cells, we performed
migration and invasion assays using H cells in which ERG, MMP9 and PLXNA2 were
knocked down, respectively. The pooled MMP9 siRNA efficiently knocked down MMP9
expression (Supplementary Figure S8a) as well as MMP9 secretion in H cells (Supplementary
Figure S8b). Efficient PLXNA2 knockdown effects were as well observed using pooled
PLXNA2 siRNA in H cells (Figure 7a and 7b).
In H cells, ERG knockdown dramatically decreased cell migration by over 50% (Figure 7c),
and cell invasion by 70% (Figure 7d), indicating that the inductions of cell migration and
invasion are specific to ectopic TMPRSS2:ERG expression. Surprisingly, MMP9 knockdown
had no significant effect on cell migration or invasion in H cells (Supplementary Figure S8c
and S8d), whereas PLXNA2 knockdown in H cells resulted in a 30% decrease in cell
migration (Figure 7c) and a 20% decrease in cell invasion (Figure 7d). Hence, these findings
demonstrate that PLXNA2 upregulation, but not MMP9 upregulation, may contribute, at least
in part, to TMPRSS2:ERG-mediated induction of PC3c cell migration and invasion in vitro.
Furthermore, increased cell motility and invasiveness are considered as attributes commonly
acquired by PCa cells during metastatic progression (48). Whether PLXNA2 expression is
associated with metastatic PCa remains unclear. We therefore analyzed PLXNA2 expression
in microarray datasets from three independent PCa cohorts (49-51). As shown in Figures 7e,
7f and 7g, compared to primary PCa samples, PLXNA2 expression levels were significantly
higher in the metastatic PCa, substantiating its potential role in PCa metastasis.
12
DISCUSSION
Although the presence of chromosomal abnormalities have commonly been observed in
hematologic malignancies and sarcomas (52), it was only in 2005, using conceptually new
bioinformatics approaches, that the first gene fusions were identified in a large proportion of
PCa (4). While the gene fusions initially found in PCa were ETS transcription factors (ERG
and ETV1) fused to the 5' part of the prostate-specific gene TMPRSS2, it is now clear that they
may involve other ETS family members (i.e., Fli-1, ELK4), novel 5’ partners and a class of
non-ETS-based fusions (3). However, the TMPRSS2:ERG fusion remains the most prevalent
chromosomal rearrangement in PCa (3). To date, this fusion has been identified not only in
androgen-responsive PCa, but also in androgen-refractory PCa (16).
Here, using three AR-negative PC3c cell clones with different TMPRSS2:ERG expression
levels, we demonstrated that ectopic expression of TMPRSS2:ERG can induce, in a dose-
dependent manner, PC3c cell motility and invasiveness. These findings are in agreement with
the role of the TMPRSS2:ERG fusion as revealed using various PCa cell models (4, 18, 21, 35,
53). Importantly, inhibition of endogenous TMPRSS2:ERG expression in AR-positive VCaP
cells significantly reduced cell invasiveness (17, 18). Given the diverse genetic backgrounds
of PCa cell models used in studies, the common function of TMPRSS2:ERG fusion is to
improve PCa cell motility and invasiveness. Furthermore, since TMPRSS2:ERG-induced cell
migration and invasion have been shown in AR-positive and -negative PCa cells, this function
does not seem to be associated with the AR status of PCa cells. Increased cell motility and
invasiveness are the essential hallmarks of cancer, as well as prerequisites for local tumor
progression and metastasis (48). Interestingly, recent clinical studies also revealed the
presence of TMPRSS2:ERG fusion in circulating tumor cells isolated from PCa patients with
metastatic disease and in castration-resistant PCa patients (54, 55). In addition,
TMPRSS2:ERG-positive foci in multifocal PCa have a greater predilection for lymph node

13
metastasis (56, 57). These clinical findings highlight the potential role of TMPRSS2:ERG in
PCa metastasis.
Increased cell motility and invasiveness are also associated with cells adopting a
mesenchymal phenotype (58). The epithelial-to-mesenchymal transition (EMT) is considered
to be one of key steps for cells to acquire metastatic adaptation (59). Three previous studies
have also demonstrated that EMT is one of the consequences of TMPRSS2:ERG expression in
PCa cell models (37, 53, 60). Accordingly, PC3c cells with high TMPRSS2:ERG expression
(H cells) demonstrated a more elongated and scattered mesenchymal morphology. However,
the absence of differential expression of EMT markers, such as E-Cadherin, Vimentin, Twist1
and Snail in our cell models (Supplementary Figure S9), raised two questions that need to be
addressed in future studies: 1) Among our cell models (H, M and L cells), the highest
TMPRSS2:ERG expression was only 50% of that found in VCaP cells; is there a threshold of
ERG expression necessary to induce EMT in PCa cells? 2) Is TMPRSS2:ERG-induced EMT
independent of AR signaling?
MMP9 expression has been shown to be correlated with increased invasive and metastatic
phenotypes in various tumor types including prostate cancer (39, 61, 62). Here, we showed
that MMP9 was positively and directly regulated by TMPRSS2:ERG in PC3c cells and its
expression was correlated with ERG expression in PCa samples. In fact, several transcription
factors, such as NF-κB, SP-1, AP-1 and ETS have been shown to control MMP9 expression
in physiological and pathological conditions (63-65). Although it has been reported that ETS-
1 promotes the invasiveness of paclitaxel-resistant and hormone-refractory PCa cells by
increasing MMP9 expression (66), a recent study reported that SPDEF, another ETS
transcription factor, suppresses prostate cancer cell invasion through the repression of MMP9
expression (42). Together with our results, these findings highlight the importance of the
functional specificity of ETS transcription factors in controlling MMP9 expression in PCa.

14
Furthermore, although increased secretion of MMP9 and corresponding gelatin matrix
degradation were observed in our cell model, MMP9 knockdown did not impair
TMPRSS2:ERG-induced cell migration or invasion in the membrane-based transwell assays.
Similar results have also been observed in TMPRSS2:ERG or ERG-expressing RWPE-1 and
BPH-1 cells treated with the pan-MMP inhibitor or a MMP2/9 specific inhibitor (4, 18),
suggesting that, under membrane-based transwell assay systems, increased MMP9 expression
is not essential for TMPRSS2:ERG-induced cell migration and invasion. Of particular interest,
MMP9 has been shown to trigger the release of the matrix-bound VEGF, thus promoting
tumor angiogenesis (67), and remodeling the pro-metastatic microenvironment of the
metastatic niche (47, 68). Therefore, future studies are required to determine the role of
MMP9 in TMPRSS2:ERG-positive PCa cells using in vivo models.
Plexin receptors and their Semaphorin ligands were initially identified as evolutionarily
conserved axon-guidance cues in the nervous system (69). However, increasing evidence
highlights their role outside the nervous system, and particularly in cancer metastasis and
progression (45). In particular, there is supporting evidence that somatic aberrations of
Plexins and Semaphorins are involved in pancreatic carcinogenesis (70). Although their
functions are poorly understood in PCa, Plexin receptors and its Semaphorin ligands have
been shown to be expressed in diverse PCa cell lines and tissues (71). The overexpression of
PLXNB1 with somatic missense mutations is functionally associated with increased PCa cell
motility and invasiveness, as well as disease metastatic progression (46, 72). We showed in
the present study that that TMPRSS2:ERG positively and directly regulates PLXNA2
expression in PC3c cells. Interestingly, during mouse (73, 74) and chicken development (75,
76), the Erg expression profile overlaps with that of Plxna2 in migrating neural crest cells and
aorta, suggesting the possible direct regulation of Plxna2 by the Erg transcription factor in
development process. Moreover, other transcription factors may also control PLXNA2

15
expression. For example, GATA6 has been shown to directly regulate PLXNA2 expression
during human cardiac outflow tract development (77). Furthermore, the pleiotropic signals
mediated by Semaphorin-Plexin have been shown to positively or negatively control multiple
functions in tumor cells, including their migration and invasion abilities (45). We showed that
the upregulation of PLXNA2 contributes, at least in part, to TMPRSS2:ERG-induced PC3c
cell migration and invasion. In agreement with these findings in vitro, analysis of microarray
datasets provided evidence that PLXNA2 expression is up-regulated in metastatic PCa,
supporting the potential involvement of PLXNA2 in PCa metastatic spread.
In summary, using an AR-negative PCa model, we confirmed the important role of
TMPRSS2:ERG in PCa cell migration and invasion, and identified two “cell motility”- and
“invasiveness”-related direct target genes, MMP9 and PLXNA2, providing novel insights into
the role of TMPRSS2:ERG in PCa metastasis.

16
MATERIALS AND METHODS
Cell culture and Chemical reagents
PC3c cells (32) and DU145 cells (ATCC) were cultured in DMEM supplemented with 10%
fetal bovine serum and sub-cultured every 3-4 days. Unless otherwise stated, all chemical
reagents were from Sigma-Aldrich.
Generation of plasmids and retrovirus constructs
The TMPRSS2:ERG cDNA was isolated from a fusion-positive PCa patient sample, and sub-
cloned into a pcDNA3.1(+) (Invitrogen) or retrovirus pLPCX vector (Clontech). The primers
used for cloning are listed in Supplementary Table S1. Amplified plasmids were purified on
NucleoBond Xtra Midi endotoxin-free columns (Macherey-Nagel) and sequenced prior to use.
Generation of TMPRSS2:ERG-expressing cells
Low passage PC3c cells were transfected with a TMPRSS2:ERG expression vector or empty
pcDNA vector using FuGENE® 6 Reagent (Roche) according to the manufacturer’s
instruction, then selected in routine culture medium containing 400 mg/mL G418 antibiotic
(Life Technologies) for 3 weeks. The pLPCX- or pLPCX/TMPRSS2:ERG-containing
retroviruses were transduced into DU145 cells to generate TMPRSS2:ERG-expressing cells
according to the manufacturer’s instructions (Clontech).
Short interfering RNAs (siRNA) transfection
Pre-designed pooled siRNA were obtained from Dharmaco-Termo Scientific. Cells were
transfected with the siRNA (50 nM) using Lipofectamine 2000 reagent (Invitrogen) according
to the manufacturer’s instructions. Gene knockdown effects were evaluated after 72 h of
transfection. The siRNA used in this study were siERG (ON-TARGETplus SMARTpool L-
003886-00), siMMP9 (ON-TARGETplus SMARTpool L-005970-00), siPLXNA2 (ON-
TARGETplus SMARTpool L-021532-01) and the control siRNA (ON-TARGETplus Non-
targeting Pool D-001810-10).

17
Protein extraction and immunoblotting
Proteins were extracted and immunoblotted (Western Blotting) as described previously (78).
Antibodies used in immunoblotting were: rabbit monoclonal anti-ERG (Epitomics 2085,
dilution 1:1 000), mouse monoclonal anti β-ACTIN (Sigma Clone AC-15, dilution 1:10 000),
rabbit polyclonal anti HPRT (Santa Cruz sc-20975, dilution 1:1 000), Rabbit IgG-HRP (GE
Healthcare NA934V, dilution 1:10 000) and Mouse IgG-HRP (Santa Cruz, 1:10 000).
Cell proliferation, migration and invasion assay
Cell proliferation assays were performed in quadruplicate using CellTiter-Glo® kit (Promega)
in 96-well plate (2 500 cells/well) according to the manufacturer’s recommendations, and
luminescence was measured using a Centro LB 960 microplate luminometer (Berthold) at
indicated times.
Cell migration assays and cell invasion assays were performed with 100 000 cells in triplicate
using a FluoroBlok™ 8 µm pores 24-well insert system (BD Biosciences) and 24-well
BioCoat™ Tumor Invasion System (BD Biosciences) according to the manufacturer’s
instructions. After 16 h of incubation, cells were labeled with 10 µg/mL DilC12(3) fluorescent
dye (BD Biosciences), and the migrated or invaded cells were measured using a FLUOstar
OPTIMA lecturer (BMG Labtech).
Gelatin degradation assay and gelatin zymography analysis
Gelatin degradation assay was performed as described previously (79). To perform the gelatin
zymography assay, cells were rinsed and incubated with medium without FBS for 24 h. Then
the conditioned mediums (CM) were collected, and total protein concentrations were
measured and used to adjust loading quantity of CM. Equal amount of CMs were mixed with
non-denaturing Laemmli blue loading dye, then loaded on a 7% SDS-PAGE gel containing
0.1% (w/v) gelatin. After migration, the gel was incubated with zymogram renaturing buffer
and zymogram developing buffer. Finally, the gel was stained with 0.5% (w/v) Coomassie

18
Blue R-250 and destained with a solution containing 40% (v/v) ethanol and 10% (v/v) acetic
acid.
Cell total RNA preparation and RT-qPCR
Cell total RNA was purified using the NucleoSpin® RNA II kit (Macherey Nagel) according
to the manufacturer’s instructions. Then, 1 µg total RNA was used to generate cDNA strand
using the High Capacity RNA-to-cDNA kit (Applied Biosystems). Quantitative polymerase
chain reactions (qPCRs) were performed using the Power SYBR Green PCR Master kit
(Applied Biosystems) on a Stratagene Mx3005P qPCR System according to manufacturer’s
instructions. Individual gene relative expression level was calculated using the 2-ΔΔCT method
and normalized to that of the housekeeping gene 18S. Optimal primer specificity and
efficiency were validated according to the Mx3005P qPCR System user’s guide. The primers
used in this study can be found in Supplementary Table S1.
Immunofluorescence
Immunofluorescence (IF) assays were performed as described (78). The antibodies used in
this study were monoclonal rabbit anti-ERG (Epitomics 2805, dilution 1:200), monoclonal rat
anti-PLXNA2 (R&D Systems, MAB5486, 10 µg/mL), Alexa Fluo®-488 conjugated anti-
rabbit IgG (Invitrogen, dilution 1:500) and Alexa Fluo®-555 anti-rat IgG (Invitrogen, dilution
1:500). Images were acquired using an LSM 710 confocal microscopy system and ZEN 2010
software (Carl Zeiss).
Microarray analysis
Microarray analyses were conducted following the Two-Color Microarray-Based Expression
Analysis Protocol (Agilent Technologies). For each sample, 1 µg of total RNA was divided
into two equal aliquots to enable technical replication known as “dye-swap hybridization”.
The reverse transcription and the labeling procedure were performed using the protocol
recommended by Agilent Technologies (Low RNA Input Fluorescent Linear Amplification

19
Kit). Hybridizations were performed on Agilent Whole Human Genome 44K microarrays for
17 hours at 65°C using the Agilent Gene Expression Hybridization kit. Arrays were washed
and scanned using Innoscan 700 (Innopsys) and the raw data were processed and normalized
using the Limma package (Linear Models for Microarray Data) running under the R
environment. Gene Ontology analysis was performed using the DAVID program as described
(41).
Chromatin immunoprecipitation (ChIP)
ChIP assay was performed as described (80). Antibodies used were polyclonal rabbit anti
ERG antibody (Santa Cruz sc-353) or control rabbit IgG antibody (Santa Cruz). The genomic
DNA was purified using NucleoSpin® Clean-up columns (Macherey-Nagel) according to
protocol recommended by the manufacturer. Immunopreciptated genomic DNA was analyzed
by PCR and details of the primers used can be found in Supplementary Table S1.
Human PCa samples
Human PCa samples (n=52) were obtained from the local tumor tissue bank, C2RC (Lille,
France) after approval by the internal review board (CSTMT-042, 27/07/2009). Sampled and
subsequently frozen tumor tissues originated from radical prostatectomies or trans-urethral
prostatic resections performed at Lille University Hospitals (CHRU de Lille). All patients
were informed and consent was obtained by the referring physician. To extract RNA, tissue
samples were first homogenized in TRIzol® (Invitrogen), and total RNA was prepared using
NucleoSpin® RNA II columns (Macherey-Nagel). The RNA quality and quantity were
accessed by the Agilent 2100 Bioanalyser system. Pathological findings of these PCa samples
can be found in Supplementary Table S4.
Image treatment and Statistical analysis
All images treatments were carried out using Image J or Photoshop CS software. Statistical
analysis was performed using GraphPad Prism software. Statistical methods used in this study

20
are indicated in the corresponding figure legends. Unless otherwise indicated, all values in the
figures are expressed as means ± SEM.

21
CONFLICT OF INTEREST
The authors declare no conflict of interest.

22
ACKNOWLEDGEMENTS
The authors would like to thank A. Fradet, M. Le Jeune, M. Holder, C. Delliaux, G. Boulay,
M. Dubuissez, I. Loison, Z. Kherrouche and N. Malaquin and for their excellent technical
advices; D. Lacorre, E. Werkmeister from the BioImaging Center Lille Nord de France for
their technical assistance; E. Lelièvre and D. Leprince for their stimulating discussions; C.
Engel-Gautier for her critical reading of the manuscript. The authors thank the local Tumor
Tissue Bank (Tumorothèque), Regional Reference Oncology Center (CRRC) (Head, Pr. M.C.
Copin) in Lille, France. This work was supported by grants from the Centre national de la
recherche scientifique (CNRS), La Ligue contre le Cancer (Comité du Pas-de-Calais) and the
Institut national du cancer (INCa_4419). T.V. Tian is a recipient of Ph.D. fellowships from
the Institut Pasteur of Lille/Nord-Pas-de-Calais Regional Council (Région Nord-Pas-de Calais)
and the Association pour la recherche sur le cancer (ARC).

23
REFERENCES
1. Siegel R, Naishadham D, Jemal A. Cancer statistics, 2012. CA Cancer J Clin. 2012 Jan-
Feb;62(1):10-29.
2. Squire JA, Park PC, Yoshimoto M, Alami J, Williams JL, Evans A, et al. Prostate cancer as a
model system for genetic diversity in tumors. Adv Cancer Res. 2011;112:183-216.
3. Rubin MA, Maher CA, Chinnaiyan AM. Common gene rearrangements in prostate cancer. J
Clin Oncol. 2011 Sep 20;29(27):3659-68.
4. Tomlins SA, Rhodes DR, Perner S, Dhanasekaran SM, Mehra R, Sun XW, et al. Recurrent
fusion of TMPRSS2 and ETS transcription factor genes in prostate cancer. Science. 2005 Oct
28;310(5748):644-8.
5. Wang J, Cai Y, Ren C, Ittmann M. Expression of variant TMPRSS2/ERG fusion messenger
RNAs is associated with aggressive prostate cancer. Cancer Res. 2006 Sep 1;66(17):8347-51.
6. FitzGerald LM, Agalliu I, Johnson K, Miller MA, Kwon EM, Hurtado-Coll A, et al.
Association of TMPRSS2-ERG gene fusion with clinical characteristics and outcomes: results from a
population-based study of prostate cancer. BMC Cancer. 2008;8:230.
7. Gopalan A, Leversha MA, Satagopan JM, Zhou Q, Al-Ahmadie HA, Fine SW, et al.
TMPRSS2-ERG gene fusion is not associated with outcome in patients treated by prostatectomy.
Cancer Res. 2009 Feb 15;69(4):1400-6.
8. Hoogland AM, Jenster G, van Weerden WM, Trapman J, van der Kwast T, Roobol MJ, et al.
ERG immunohistochemistry is not predictive for PSA recurrence, local recurrence or overall survival
after radical prostatectomy for prostate cancer. Modern pathology : an official journal of the United
States and Canadian Academy of Pathology, Inc. 2012 Mar;25(3):471-9.
9. Hermans KG, Boormans JL, Gasi D, van Leenders GJ, Jenster G, Verhagen PC, et al.
Overexpression of prostate-specific TMPRSS2(exon 0)-ERG fusion transcripts corresponds with
favorable prognosis of prostate cancer. Clinical cancer research : an official journal of the American
Association for Cancer Research. 2009 Oct 15;15(20):6398-403.
10. Saramaki OR, Harjula AE, Martikainen PM, Vessella RL, Tammela TL, Visakorpi T.
TMPRSS2:ERG fusion identifies a subgroup of prostate cancers with a favorable prognosis. Clinical

24
cancer research : an official journal of the American Association for Cancer Research. 2008 Jun
1;14(11):3395-400.
11. Attard G, Clark J, Ambroisine L, Fisher G, Kovacs G, Flohr P, et al. Duplication of the fusion
of TMPRSS2 to ERG sequences identifies fatal human prostate cancer. Oncogene. 2008 Jan
10;27(3):253-63.
12. Demichelis F, Fall K, Perner S, Andren O, Schmidt F, Setlur SR, et al. TMPRSS2:ERG gene
fusion associated with lethal prostate cancer in a watchful waiting cohort. Oncogene. 2007 Jul
5;26(31):4596-9.
13. Nam RK, Sugar L, Wang Z, Yang W, Kitching R, Klotz LH, et al. Expression of
TMPRSS2:ERG gene fusion in prostate cancer cells is an important prognostic factor for cancer
progression. Cancer Biol Ther. 2007 Jan;6(1):40-5.
14. Nam RK, Sugar L, Yang W, Srivastava S, Klotz LH, Yang LY, et al. Expression of the
TMPRSS2:ERG fusion gene predicts cancer recurrence after surgery for localised prostate cancer.
British journal of cancer. 2007 Dec 17;97(12):1690-5.
15. Perner S, Demichelis F, Beroukhim R, Schmidt FH, Mosquera JM, Setlur S, et al.
TMPRSS2:ERG fusion-associated deletions provide insight into the heterogeneity of prostate cancer.
Cancer Res. 2006 Sep 1;66(17):8337-41.
16. Mehra R, Tomlins SA, Yu J, Cao X, Wang L, Menon A, et al. Characterization of TMPRSS2-
ETS gene aberrations in androgen-independent metastatic prostate cancer. Cancer Res. 2008 May
15;68(10):3584-90.
17. Tomlins SA, Laxman B, Varambally S, Cao X, Yu J, Helgeson BE, et al. Role of the
TMPRSS2-ERG gene fusion in prostate cancer. Neoplasia. 2008 Feb;10(2):177-88.
18. Klezovitch O, Risk M, Coleman I, Lucas JM, Null M, True LD, et al. A causal role for ERG in
neoplastic transformation of prostate epithelium. Proc Natl Acad Sci U S A. 2008 Feb 12;105(6):2105-
10.
19. Zong Y, Xin L, Goldstein AS, Lawson DA, Teitell MA, Witte ON. ETS family transcription
factors collaborate with alternative signaling pathways to induce carcinoma from adult murine prostate
cells. Proc Natl Acad Sci U S A. 2009 Jul 28;106(30):12465-70.

25
20. King JC, Xu J, Wongvipat J, Hieronymus H, Carver BS, Leung DH, et al. Cooperativity of
TMPRSS2-ERG with PI3-kinase pathway activation in prostate oncogenesis. Nature genetics. 2009
May;41(5):524-6.
21. Carver BS, Tran J, Gopalan A, Chen Z, Shaikh S, Carracedo A, et al. Aberrant ERG
expression cooperates with loss of PTEN to promote cancer progression in the prostate. Nature
genetics. 2009 May;41(5):619-24.
22. Yu J, Yu J, Mani RS, Cao Q, Brenner CJ, Cao X, et al. An integrated network of androgen
receptor, polycomb, and TMPRSS2-ERG gene fusions in prostate cancer progression. Cancer Cell.
2010 May 18;17(5):443-54.
23. Wei GH, Badis G, Berger MF, Kivioja T, Palin K, Enge M, et al. Genome-wide analysis of
ETS-family DNA-binding in vitro and in vivo. Embo J. 2010 Jul 7;29(13):2147-60.
24. Chng KR, Chang CW, Tan SK, Yang C, Hong SZ, Sng NY, et al. A transcriptional repressor
co-regulatory network governing androgen response in prostate cancers. Embo J. 2011 Jun
13;31(12):2810-23.
25. Macintosh CA, Stower M, Reid N, Maitland NJ. Precise microdissection of human prostate
cancers reveals genotypic heterogeneity. Cancer Res. 1998 Jan 1;58(1):23-8.
26. Cheng L, Song SY, Pretlow TG, Abdul-Karim FW, Kung HJ, Dawson DV, et al. Evidence of
independent origin of multiple tumors from patients with prostate cancer. J Natl Cancer Inst. 1998 Feb
4;90(3):233-7.
27. Andreoiu M, Cheng L. Multifocal prostate cancer: biologic, prognostic, and therapeutic
implications. Hum Pathol. 2010 Jun;41(6):781-93.
28. Mehra R, Han B, Tomlins SA, Wang L, Menon A, Wasco MJ, et al. Heterogeneity of
TMPRSS2 gene rearrangements in multifocal prostate adenocarcinoma: molecular evidence for an
independent group of diseases. Cancer Res. 2007 Sep 1;67(17):7991-5.
29. Barry M, Perner S, Demichelis F, Rubin MA. TMPRSS2-ERG fusion heterogeneity in
multifocal prostate cancer: clinical and biologic implications. Urology. 2007 Oct;70(4):630-3.

26
30. Minner S, Gartner M, Freudenthaler F, Bauer M, Kluth M, Salomon G, et al. Marked
heterogeneity of ERG expression in large primary prostate cancers. Modern pathology : an official
journal of the United States and Canadian Academy of Pathology, Inc. 2012 Aug 17.
31. Furusato B, Tan SH, Young D, Dobi A, Sun C, Mohamed AA, et al. ERG oncoprotein
expression in prostate cancer: clonal progression of ERG-positive tumor cells and potential for ERG-
based stratification. Prostate Cancer Prostatic Dis. 2010 Sep;13(3):228-37.
32. Fradet A, Sorel H, Deux B, Clézardin P, Bonnelye E. A new murine model of
osteoblastic/osteolytic lesions from human androgen-resistant prostate cancer. Bone. 2010;47(Special
Issue):S289.
33. Scher HI, Morris MJ, Basch E, Heller G. End points and outcomes in castration-resistant
prostate cancer: from clinical trials to clinical practice. J Clin Oncol. 2011 Sep 20;29(27):3695-704.
34. Clark J, Merson S, Jhavar S, Flohr P, Edwards S, Foster CS, et al. Diversity of TMPRSS2-
ERG fusion transcripts in the human prostate. Oncogene. 2007 Apr 19;26(18):2667-73.
35. Wang J, Cai Y, Yu W, Ren C, Spencer DM, Ittmann M. Pleiotropic biological activities of
alternatively spliced TMPRSS2/ERG fusion gene transcripts. Cancer Res. 2008 Oct 15;68(20):8516-
24.
36. Kunderfranco P, Mello-Grand M, Cangemi R, Pellini S, Mensah A, Albertini V, et al. ETS
transcription factors control transcription of EZH2 and epigenetic silencing of the tumor suppressor
gene Nkx3.1 in prostate cancer. PLoS One. 2010;5(5):e10547.
37. Gupta S, Iljin K, Sara H, Mpindi JP, Mirtti T, Vainio P, et al. FZD4 as a mediator of ERG
oncogene-induced WNT signaling and epithelial-to-mesenchymal transition in human prostate cancer
cells. Cancer Res. 2010 Sep 1;70(17):6735-45.
38. Patrawala L, Calhoun T, Schneider-Broussard R, Li H, Bhatia B, Tang S, et al. Highly purified
CD44+ prostate cancer cells from xenograft human tumors are enriched in tumorigenic and metastatic
progenitor cells. Oncogene. 2006 Mar 16;25(12):1696-708.
39. Castellano G, Malaponte G, Mazzarino MC, Figini M, Marchese F, Gangemi P, et al.
Activation of the osteopontin/matrix metalloproteinase-9 pathway correlates with prostate cancer
27
progression. Clinical cancer research : an official journal of the American Association for Cancer
Research. 2008 Nov 15;14(22):7470-80.
40. Nese N, Kandiloglu AR, Simsek G, Lekili M, Ozdamar A, Catalkaya A, et al. Comparison of
the desmoplastic reaction and invading ability in invasive ductal carcinoma of the breast and prostatic
adenocarcinoma based on the expression of heat shock protein 47 and fascin. Anal Quant Cytol Histol.
2010 Apr;32(2):90-101.
41. Huang da W, Sherman BT, Lempicki RA. Systematic and integrative analysis of large gene
lists using DAVID bioinformatics resources. Nat Protoc. 2009;4(1):44-57.
42. Steffan JJ, Koul S, Meacham RB, Koul HK. The Transcription Factor SPDEF Suppresses
Prostate Tumor Metastasis. J Biol Chem. 2012 Aug 24;287(35):29968-78.
43. Himelstein BP, Lee EJ, Sato H, Seiki M, Muschel RJ. Transcriptional activation of the matrix
metalloproteinase-9 gene in an H-ras and v-myc transformed rat embryo cell line. Oncogene. 1997
Apr 24;14(16):1995-8.
44. Franco M, Tamagnone L. Tyrosine phosphorylation in semaphorin signalling: shifting into
overdrive. EMBO Rep. 2008 Sep;9(9):865-71.
45. Capparuccia L, Tamagnone L. Semaphorin signaling in cancer cells and in cells of the tumor
microenvironment--two sides of a coin. J Cell Sci. 2009 Jun 1;122(Pt 11):1723-36.
46. Wong OG, Nitkunan T, Oinuma I, Zhou C, Blanc V, Brown RS, et al. Plexin-B1 mutations in
prostate cancer. Proc Natl Acad Sci U S A. 2007 Nov 27;104(48):19040-5.
47. Deryugina EI, Quigley JP. Matrix metalloproteinases and tumor metastasis. Cancer Metastasis
Rev. 2006 Mar;25(1):9-34.
48. Hanahan D, Weinberg RA. Hallmarks of cancer: the next generation. Cell. 2011 Mar
4;144(5):646-74.
49. Dhanasekaran SM, Barrette TR, Ghosh D, Shah R, Varambally S, Kurachi K, et al.
Delineation of prognostic biomarkers in prostate cancer. Nature. 2001 Aug 23;412(6849):822-6.
50. Grasso CS, Wu YM, Robinson DR, Cao X, Dhanasekaran SM, Khan AP, et al. The mutational
landscape of lethal castration-resistant prostate cancer. Nature. 2012 Jul 12;487(7406):239-43.

28
51. Varambally S, Yu J, Laxman B, Rhodes DR, Mehra R, Tomlins SA, et al. Integrative genomic
and proteomic analysis of prostate cancer reveals signatures of metastatic progression. Cancer Cell.
2005 Nov;8(5):393-406.
52. Mitelman F, Johansson B, Mertens F. The impact of translocations and gene fusions on cancer
causation. Nat Rev Cancer. 2007 Apr;7(4):233-45.
53. Leshem O, Madar S, Kogan-Sakin I, Kamer I, Goldstein I, Brosh R, et al. TMPRSS2/ERG
promotes epithelial to mesenchymal transition through the ZEB1/ZEB2 axis in a prostate cancer
model. PLoS One. 2011;6(7):e21650.
54. Attard G, Swennenhuis JF, Olmos D, Reid AH, Vickers E, A'Hern R, et al. Characterization of
ERG, AR and PTEN gene status in circulating tumor cells from patients with castration-resistant
prostate cancer. Cancer Res. 2009 Apr 1;69(7):2912-8.
55. Stott SL, Lee RJ, Nagrath S, Yu M, Miyamoto DT, Ulkus L, et al. Isolation and
characterization of circulating tumor cells from patients with localized and metastatic prostate cancer.
Sci Transl Med. 2010 Mar 31;2(25):25ra3.
56. Guo CC, Wang Y, Xiao L, Troncoso P, Czerniak BA. The relationship of TMPRSS2-ERG
gene fusion between primary and metastatic prostate cancers. Hum Pathol. 2012 May;43(5):644-9.
57. Perner S, Svensson MA, Hossain RR, Day JR, Groskopf J, Slaughter RC, et al. ERG
rearrangement metastasis patterns in locally advanced prostate cancer. Urology. 2010 Apr;75(4):762-7.
58. Polyak K, Weinberg RA. Transitions between epithelial and mesenchymal states: acquisition
of malignant and stem cell traits. Nat Rev Cancer. 2009 Apr;9(4):265-73.
59. Valastyan S, Weinberg RA. Tumor metastasis: molecular insights and evolving paradigms.
Cell. 2012 Oct 14;147(2):275-92.
60. Becker-Santos DD, Guo Y, Ghaffari M, Vickers ED, Lehman M, Altamirano-Dimas M, et al.
Integrin-linked kinase as a target for ERG-mediated invasive properties in prostate cancer models.
Carcinogenesis. 2012 Dec;33(12):2558-67.
61. Kessenbrock K, Plaks V, Werb Z. Matrix metalloproteinases: regulators of the tumor
microenvironment. Cell. 2010 Apr 2;141(1):52-67.

29
62. Dos Reis ST, Pontes J, Jr., Villanova FE, Borra PM, Antunes AA, Dall'oglio MF, et al.
Genetic polymorphisms of matrix metalloproteinases: susceptibility and prognostic implications for
prostate cancer. J Urol. 2009 May;181(5):2320-5.
63. Nakamura Y, Esnault S, Maeda T, Kelly EA, Malter JS, Jarjour NN. Ets-1 regulates TNF-
alpha-induced matrix metalloproteinase-9 and tenascin expression in primary bronchial fibroblasts. J
Immunol. 2004 Feb 1;172(3):1945-52.
64. Hanzawa M, Shindoh M, Higashino F, Yasuda M, Inoue N, Hida K, et al. Hepatocyte growth
factor upregulates E1AF that induces oral squamous cell carcinoma cell invasion by activating matrix
metalloproteinase genes. Carcinogenesis. 2000 Jun;21(6):1079-85.
65. Hance MW, Dole K, Gopal U, Bohonowych JE, Jezierska-Drutel A, Neumann CA, et al.
Secreted Hsp90 is a novel regulator of the epithelial to mesenchymal transition (EMT) in prostate
cancer. J Biol Chem. 2012 Sep 18.
66. Kato T, Fujita Y, Nakane K, Kojima T, Nozawa Y, Deguchi T, et al. ETS1 promotes
chemoresistance and invasion of paclitaxel-resistant, hormone-refractory PC3 prostate cancer cells by
up-regulating MDR1 and MMP9 expression. Biochem Biophys Res Commun. 2012 Jan
20;417(3):966-71.
67. Bergers G, Brekken R, McMahon G, Vu TH, Itoh T, Tamaki K, et al. Matrix
metalloproteinase-9 triggers the angiogenic switch during carcinogenesis. Nat Cell Biol. 2000
Oct;2(10):737-44.
68. Hiratsuka S, Nakamura K, Iwai S, Murakami M, Itoh T, Kijima H, et al. MMP9 induction by
vascular endothelial growth factor receptor-1 is involved in lung-specific metastasis. Cancer Cell.
2002 Oct;2(4):289-300.
69. Kolodkin AL, Matthes DJ, Goodman CS. The semaphorin genes encode a family of
transmembrane and secreted growth cone guidance molecules. Cell. 1993 Dec 31;75(7):1389-99.
70. Biankin AV, Waddell N, Kassahn KS, Gingras MC, Muthuswamy LB, Johns AL, et al.
Pancreatic cancer genomes reveal aberrations in axon guidance pathway genes. Nature. 2012 Nov
15;491(7424):399-405.

30
71. Blanc V, Nariculam J, Munson P, Freeman A, Klocker H, Masters J, et al. A role for class 3
semaphorins in prostate cancer. Prostate. 2011 May;71(6):649-58.
72. Zhou C, Wong OG, Masters JR, Williamson M. Effect of cancer-associated mutations in the
PlexinB1 gene. Mol Cancer. 2012;11:11.
73. Vlaeminck-Guillem V, Carrere S, Dewitte F, Stehelin D, Desbiens X, Duterque-Coquillaud M.
The Ets family member Erg gene is expressed in mesodermal tissues and neural crests at fundamental
steps during mouse embryogenesis. Mech Dev. 2000 Mar 1;91(1-2):331-5.
74. Brown CB, Feiner L, Lu MM, Li J, Ma X, Webber AL, et al. PlexinA2 and semaphorin
signaling during cardiac neural crest development. Development. 2001 Aug;128(16):3071-80.
75. Toyofuku T, Yoshida J, Sugimoto T, Yamamoto M, Makino N, Takamatsu H, et al. Repulsive
and attractive semaphorins cooperate to direct the navigation of cardiac neural crest cells. Dev Biol.
2008 Sep 1;321(1):251-62.
76. Dhordain P, Dewitte F, Desbiens X, Stehelin D, Duterque-Coquillaud M. Mesodermal
expression of the chicken erg gene associated with precartilaginous condensation and cartilage
differentiation. Mech Dev. 1995 Mar;50(1):17-28.
77. Kodo K, Nishizawa T, Furutani M, Arai S, Yamamura E, Joo K, et al. GATA6 mutations
cause human cardiac outflow tract defects by disrupting semaphorin-plexin signaling. Proc Natl Acad
Sci U S A. 2009 Aug 18;106(33):13933-8.
78. Le Jeune M, Tomavo N, Tian TV, Flourens A, Marchand N, Camuzeaux B, et al.
Identification of four alternatively spliced transcripts of the Ucma/GRP gene, encoding a new Gla-
containing protein. Exp Cell Res. 2010 Jan 15;316(2):203-15.
79. Sakurai-Yageta M, Recchi C, Le Dez G, Sibarita JB, Daviet L, Camonis J, et al. The
interaction of IQGAP1 with the exocyst complex is required for tumor cell invasion downstream of
Cdc42 and RhoA. J Cell Biol. 2008 Jun 16;181(6):985-98.
80. Flajollet S, Poras I, Carosella ED, Moreau P. RREB-1 is a transcriptional repressor of HLA-G.
J Immunol. 2009 Dec 1;183(11):6948-59.

31
FIGURE LEGENDS
Figure 1 Stable ectopic expression of the TMPRSS2:ERG gene fusion in PC3c cells. (a)
Schematic illustration of the TMPRSS2:ERG gene fusion expression plasmid construction. (b)
Relative ERG expression was evaluated using qPCR in three TMPRSS2:ERG-expressing
PC3c clone cells (H: PC3c cells with high ERG expression, M: PC3c cells with medium ERG
expression and L: PC3c cells with low ERG expression), in control pcDNA clone cells, in
HUVEC cells, as well as in VCaP cells. The expression levels of ERG in VCaP cells were
normalized to 1. Results were obtained from three independent triplicate experiments. (c)
Detection of TMPRSS2:ERG protein products (N-terminal-truncated ERG protein < 55 kDa)
in H, M, L cells, control cells and parental PC3c cells. Total cell lysates were analyzed using
Western blotting with ERG antibody, and human HPRT immunoblotting was used as a
loading control.
Figure 2 Phenotype characterization of PC3c cells with ectopic TMPRSS2:ERG
expression. (a) Phase contrast micrographs of H, M, L cells and control cells. Scale bar, 50
µm. (b) Cell proliferation assays were performed using the CellTiter-Glo kit (Promega) in
quadruplicate for 5 days. Three independent experiments were performed and results are
presented as relative luminescence unit (RLU) fold change compared to the RLU measured
on Day 0. (c) Cell migration assays were performed using the FluoroBlok™ 8 µm pore 24-
well insert system (BD Biosciences) in triplicate according to the manufacture’s
recommendations. Results are presented as relative fluorescence unit (RFU) fold change
compared to control cells after 16 h. ***P<0.001, *P<0.05, one-way analysis of variance
(ANOVA) with Dunnett’s multiple comparison test. (d) Cell invasion assays were performed
in triplicate using the 8 µm pore 24-well BioCoat™ Tumor Invasion system (BD Biosciences)
according to the manufacturer’s instructions. Results are presented as RFU fold change

32
compared to control cells measured after 16 hours. ***P<0.001, one-way analysis of variance
(ANOVA) with Dunnett’s multiple comparison test.
Figure 3 Transcriptomic studies of PC3c H, M and L cells. (a) Red Venn diagram shows
809 genes, 267 genes and 101 genes are upregulated in TMPRSS2:ERG-expressing H, M and
L cells, respectively (left panel). Comparison of upregulated genes in three clones shows an
overlap of 64 genes commonly upregulated in TMPRSS2:ERG-expressing PC3c cells
compared to control cells. Green Venn diagram illustrates 864 genes, 179 genes and 90 genes
downregulated in H, M and L cells, respectively (right panel). The 62 genes located in the
overlap are common downregulated genes in TMPRSS2:ERG-expressing PC3c cells
compared to control cells. (b) Common genes associated with TMPRSS2:ERG ectopic
expression in H, M, and L cells. Left panel: 64 upregulated genes; right panel: 62
downregulated genes. The gene expression level is presented in color and average linkage
hierarchical clustering was used to ordinate profiles. (c) Top-ranked Gene Ontology (GO)
terms analyzed using the DAVID algorithm. GO term significances are presented as
histograms. Red: GO terms of the 64 common upregulated genes in H, M and L cells; Green:
GO terms of the 62 common downregulated genes in H, M and L cells.
Figure 4 Upregulation of MMP9 and PLXNA2 in TMPRSS2:ERG-positive human PCa
samples. (a) MMP9 mRNA expression in TMPRSS2:ERG-positive (n=32) and -negative
(n=20) PCa samples was evaluated using RT-qPCR in triplicate. Two independent
experiments were performed. P=0.0055, two-tailed Mann-Whitney test. (b) PLXNA2 mRNA
expression in TMPRSS2:ERG-positive (n=32) or -negative (n=20) PCa samples using RT-
qPCR. Two independent triplicate experiments were performed. P<0.0001, two-tailed Mann-
Whitney test. (c) Scatter-plot showing relative MMP9 mRNA expression and its
corresponding ERG mRNA expression in primary PCa samples. n=52, R=0.4287, P=0.0015,
two-tailed non-parametric Spearman correlation test with alpha=0.05. (d) Scatter-plot

33
showing the relative PLXNA2 mRNA expression and its corresponding ERG mRNA
expression in primary PCa samples. n=52, R=0.6178, P<0.0001, two-tailed non-parametric
Spearman correlation test with alpha=0.05.
Figure 5 TMPRSS2:ERG directly and positively regulates MMP9 expression in PCa
cells. (a) A putative ETS binding site (EBS) (black oval) was identified in the MMP9 gene
promoter region (top panel), and ChIP assays were performed to examine ERG binding in H
cells and in control cells. The irrelevant GAPDH gene promoter (without EBS) was used for
negative controls (bottom panel). The positions of primers used in ChIP assay are represented
by black arrows in the top panel. (b) MMP9 expression was analyzed in the PC3c clone cells
using RT-qPCR. (c) MMP9 gene expression was analyzed using RT-qPCR in DU145 cells
with ectopic TMPRSS2:ERG expression. (d) Gelatin zymography was performed to analyze
secreted MMP9 levels in PC3c clone cell conditioned mediums. Loading quantity was
adjusted to total conditioned medium concentration. Three independent experiments were
performed and a representative experiment is shown. (e) Gelatin degradation assays were
performed on coverslips pre-coated with FITC-gelatin for 6 h. Ten images were taken of each
coverslip and degradation surfaces were analyzed by Image J, then divided by cell number
after counting DAPI- and F-Actin-positive cells to calculate relative degradation surface per
cell. Results are presented as fold change of the degradation surface per cell relative to control
pcDNA cells set to equal 1. Mean and SEM were calculated from two independent
experiments with two coverslips each. ***P<0.001, two-tailed Mann-Whitney test. (f) MMP9
gene expression was analyzed in H cells treated with control or ERG siRNA. The expression
level in cells treated with control siRNA was normalized to 1. (g) Gelatin zymography
showing a reduction of secreted MMP9 levels in the conditioned medium of H cells treated
with ERG siRNA. Two independent experiments were performed and a representative
experiment is shown.

34
Figure 6 PLXNA2 is directly and positively regulated by TMPRSS2:ERG in PCa cells.
(a) A putative EBS was identified in the PLXNA2 gene promoter (black oval) (top panel).
ChIP assay was performed to examine ERG binding on this EBS in TMPRSS2:ERG-
expressing H cells or in TMPRSS2:ERG-negative control cells. The irrelevant GAPDH gene
promoter (without EBS) was used for negative controls (bottom panel). The positions of
primers used in ChIP assay are represented by black arrows in the top panel. (b) Real-time
PCR detection of PLXNA2 expression in PC3c clone cells. (c) PLXNA2 expression was
analyzed in DU145 with ectopic TMPRSS2:ERG expression. (d) Analysis of PLXNA2
expression in H cells treated with either pooled control or pooled ERG siRNA. The
expression level in H cells treated with control siRNA was normalized to 1. (e)
Immunofluorescent analysis (IF) of ERG and PLXNA2 expression in H cells or control cells
(left panel), and in H cells treated with either pooled control siRNA or pooled ERG siRNA
(right panel). Scale bar, 20 µm.
Figure 7 PLXNA2 contributes to TMPRSS2:ERG-induced PC3c migration and
invasion. (a) H cells were treated with pooled control or PLXNA2-specific siRNA, and
PLXNA2 gene expression was analyzed by RT-qPCR. The expression level in H cells treated
with control siRNA was normalized to 1. (b) IF analysis showing ERG and PLXNA2
expression in H cells transfected with control or PLXNA2 siRNA. Scale bar, 20 µm. (c) Cell
migration assays were performed using the FluoroBlok™ 8 µm pore 24-well insert system
(BD Biosciences) in triplicate. TMPRSS2:ERG-expressing H cells were treated with control,
ERG or PLXNA2 siRNA for 48 h, then migration was analyzed by measuring fluorescence 16
h later. Results are presented as RFU fold change compared to cells treated with control
siRNA. ***P<0.001, One-way analysis of variance (ANOVA) with Dunnett’s multiple
comparison test. (d) Cell invasion assays were performed in triplicate on H cells, pre-treated
with control, ERG or PLXNA2 siRNA for 48 h, using the 8 µm pore 24 well BioCoat™

35
Tumor Invasion System (BD Bioscience). Results are also presented as RFU fold change
compared to cells treated with control siRNA measured at 16 h later. ***P<0.001, **P<0.01,
one-way analysis of variance (ANOVA) with Dunnett’s multiple comparison test. (e)
Comparison of PLXNA2 expression profile in primary PCa (n=13) and in metastatic PCa
(n=20) using the dataset from Dhanasekaran et al. P=0.0002, two-tailed Mann-Whitney test.
(f) Comparison of PLXNA2 expression profile in primary PCa (n=7) and in metastatic PCa
(n=6) using the GDS1439 dataset. P=0.0082, two-tailed Mann-Whitney test. (g) Comparison
of PLXNA2 expression profile in primary PCa (n=59) and metastatic PCa (n=35) using the
GSE35988 dataset. P<0.0001, two-tailed Mann-Whitney test.

Rel
ativ
e Ex
pres
sion
(PLX
NA
2)
0.0
0.5
1.0
1.5PLXNA2TMPRSS2:ERG-H
Mock Control PLXNA2
siRNA
ba
c d
RFU
Fol
d C
hang
e
0.0
0.5
1.0
1.5TMPRSS2:ERG-H Migration
Mock Control ERG
siRNA
PLXNA2ERG
******
RFU
Fol
d C
hang
e
0.0
0.5
1.0
1.5TMPRSS2:ERG-H Invasion
Mock Control ERG
siRNA
PLXNA2ERG
***
**
e f
Rel
ativ
e Ex
pres
sion
(PLX
NA
2)
Primary PCa Metastatic PCa0
1
2
3
4
n=13 n=20
P=0.0002
Microarray AnalysisDhanasekaran et al.
Rel
ativ
e Ex
pres
sion
(PLX
NA
2)
Primary PCa Metastatic PCa0
200
400
600
800
n=7 n=6
P=0.0082
Microarray AnalysisGDS 1439
MER
GE
DAPI ERG PLXNA2
siRNA-Control siRNA-PLXNA2PC3c/TMPRSS2:ERG-H
Rel
ativ
e Ex
pres
sion
(PLX
NA
2)
Primary PCa Metastatic CRPCa0
5
10
15
n=59 n=35
P<0.0001
Microarray AnalysisGSE 35988g

Rel
ativ
e Ex
pres
sion
(PLX
NA
2)
0.0
0.5
1.0
1.5PLXNA2
Mock Control ERG
siRNA
TMPRSS2:ERG-H
Rel
ativ
e Ex
pres
sion
(PLX
NA
2)
0
1
2
3 PLXNA2DU145
Mock pLPCX TMPRSS2:ERG
Rel
ativ
e Ex
pres
sion
(PLX
NA
2)
0
5
10
15PLXNA2PC3c
TMPRSS2:ERGpcDNA H M L
a b
c d
e
PLXNA2
GAPDH
Inpu
t
IgG
ERG
pcDNA TMPRSS2:ERG-H
Inpu
t
IgG
ERG
ChIP:
PLXNA2
-1000
-981
TSS
DAPI ERG PLXNA2
MER
GE
pcDNA TMPRSS2:ERG-H
PC3c PC3c/TMPRSS2:ERG-H
siRNA-Control siRNA-ERG

Inpu
t
IgG
ERG
MMP9
GAPDH
pcDNA TMPRSS2:ERG-H
Inpu
t
IgG
ERGChIP:
MMP9-1000 -543 TSS
Rel
ativ
e E
xpre
ssio
n (M
MP9
)
0
10
20
30
40
50MMP9
TMPRSS2:ERGpcDNA H M L
PC3c
Rel
ativ
e Ex
pres
sion
(MM
P9)
0
1
2
3 MMP9DU145
Mock pLPCX TMPRSS2:ERG
pcD
NA
HMTMPRSS2:ERG
90 kDaZymo:MMP9
PC3c
0
1
2
3
4
TMPRSS2:ERG-HpcDNA
***
Rel
ativ
e D
egra
datio
n Su
rfac
e pe
r C
ell
Fold
Cha
nge
Gelatin Degradation Assay
Rel
ativ
e Ex
pres
sion
(MM
P9)
0.0
0.5
1.0
1.5MMP9
Mock Control ERG
siRNA
TMPRSS2:ERG-H
Zymo:MMP9
siRNA
90 kDa
TMPRSS2:ERG-H
a
b c
de
f g

a b
c d
Rel
ativ
e Ex
pres
sion
(PLX
NA
2)
TMPRSS2:ERG Positive TMPRSS2:ERG Negative0
5
10P < 0.0001
n=32 n=20
PLXNA2
Rel
ativ
e Ex
pres
sion
(MM
P9)
TMPRSS2:ERG Positive TMPRSS2:ERG Negative0
2
4
6P = 0.0055
n=32 n=20
MMP9
ERG Expression
MM
P9Ex
pres
sion
0.0 0.5 1.0 1.50
1
2
3
4
5Spearman R = 0.4287
P = 0.0015
ERG Expression
PLX
NA2
Exp
ress
ion
0.0 0.5 1.0 1.50
2
4
6
8
10Spearman R = 0.6178
P < 0.0001

64
H:809
M:267 L:10162
H:864
M:179 L:90
Upregulation Downregulationa
c0 2 4 6
GO:0005576~extracellular region GO:0006928~cell motion
GO:0016477~cell migration GO:0004222~metalloendopeptidase activity
GO:0005518~collagen binding GO:0007565~female pregnancy
GO:0009070~serine family amino acid biosynthetic process GO:0006351~transcription
GO:0043065~positive regulation of apoptosis GO:0005576~extracellular region
-Log P
bH M LH M L <3.00.0>3.0
MMP9
PLXNA2
PLAT
CD44
FSCN1

b c d
a
RFU
Fol
d C
hang
e
0
1
2
3
4
TMPRSS2:ERG
PC3c clones
PC3ccells
pcDNA H M L
***
***
*
Migration
RFU
Fol
d C
hang
e
0
2
4
6
8
10
***
***
Invasion
TMPRSS2:ERG
PC3c clones
PC3ccells
pcDNA H M L
pcDNA H M L
TMPRSS2:ERGR
LU F
old
Cha
nge
Day 0 Day 1 Day 3 Day 50
2
4
6
8
10Proliferation
pcDNAH M L
TMPRSS2:ERG
PC3c cells

c
55 kDa
25 kDa
pcD
NA
H M L
TMPRSS2:ERG
PC3c
Cel
ls
ERG
HPRT
PC3c clones
WB
:b
Rel
ativ
e Ex
pres
sion
(ER
G)
0.0
0.5
1.0
PC3c clones
ERG
VCaP
HUVEC H M LpcD
NA
PC3c ce
lls
TMPRSS2:ERG
1 71
226
81CMV1647
TMPRSS2 NM_005656
ERG NM_004449
72
a

T N M 1 T2 N0 M0 4+3 7.7 -2 T2 N0 M0 3+3 4.51 +3 T2 N0 M0 3+3 2.7 +4 T2 N0 M0 3+4 4.4 +5 T2 N0 M0 3+4 7.5 +6 T2 N0 M0 3+4 7.21 +7 T2 N0 M0 4+3 6.54 +8 T2 N0 M0 3+4 9.5 +9 T2 N0 M0 3+4 5.4 +
10 T2 N0 M0 3+3 5.38 +11 T2 N0 M0 3+4 9.65 -12 T2 N0 M0 3+4 7.48 +13 T2 N0 M0 3+3 7.35 +14 T2 N0 M0 3+3 6.26 +15 T2 N0 M0 3+3 2.13 +16 T2 N0 M0 3+3 5.5 -17 T2 N0 M0 3+3 5.5 +18 T2 N0 M0 3+3 6 +19 T2 N0 M0 3+3 2.3 -20 T2 N1 M0 3+3 4.79 -21 T2 N0 M0 4+5 45.1 +22 T3 N0 M0 4+3 6.54 +23 T3 N0 M0 4+3 5.5 +24 T3 N0 M0 4+5 13.1 +25 T3 N0 M0 5+3 5.9 +26 T3 N0 M0 3+4 224 -27 T3 N0 M0 3+4 10 +28 T3 N0 M0 4+3 6.9 +29 T3 N0 M0 4+3 5 -30 T3 N0 M0 3+4 27 -31 T3 N0 M0 4+3 7.86 +32 T3 N0 M0 3+4 5.9 +33 T3 N0 M0 3+4 7.5 -34 T3 N0 M0 3+4 5.4 +35 T3 N0 M0 3+4 4.8 +36 T3 N1 M1 4+5 120 -37 T3 N1 MX 5+4 125 +38 T3 N1 M1 5+5 563 -39 T3 N1 M1 4+4 432 +40 T3 N0 M0 3+3 4.72 +41 T3 N0 M0 4+4 8.2 +42 T3 N1 M0 4+5 169 +43 T3 N0 M0 4+5 101 -44 T3 N0 M0 4+5 60 -45 T3 N1 M0 4+5 80.1 -46 T3 N0 M0 4+5 59.2 -47 T3 N0 M0 4+5 66.1 +48 T3 N0 M0 4+5 101 -49 T3 N0 M0 4+5 34 -50 T4 N0 M0 4+5 429 -51 T4 N1 M1 4+5 50 -52 T4 N0 M0 5+5 79.1 -
Gleason Score Pre-surgery PSA (ng/mL) TMPRSS2:ERG fusionPCa Samples TNM classificationSupplementary Table S4: Histo-pathological Characterization of PCa Samples (n=52)

Log 2 FC P value Log 2 FC P value Log 2 FC P value
BF210146 A_32_P158376 LOC389652 BF210146 ‐1,41791868 7,54E‐05 ‐1,35322104 1,24E‐03 ‐1,38671454 8,74E‐03CR606969 A_32_P150040 CR606969 CR606969 ‐1,2314649 2,66E‐04 ‐1,44763614 4,24E‐04 ‐1,17659944 6,79E‐03NM_032523 A_32_P220762 OSBPL6 Oxysterol Binding protein-like 6 ‐1,12058145 2,04E‐03 ‐1,28085046 2,33E‐03 ‐1,23966881 9,11E‐03ENST0000036 A_24_P101651 ENST0000036 ENST00000361201 ‐1,10286513 2,13E‐03 ‐1,75148013 1,48E‐04 ‐1,41629755 2,88E‐03NM_002781 A_32_P219970 PSG6 pregnancy specific beta-1-glycoprotein 5 ‐2,47159202 8,91E‐05 ‐1,14207606 1,63E‐03 ‐1,09511648 7,84E‐03ENST0000051 A_32_P49284 ENST0000051 ENST00000518311 ‐1,58372159 1,52E‐04 ‐1,58382846 2,74E‐04 ‐1,27794328 4,25E‐03NM_000101 A_23_P163506 CYBA cytochrome b-245, alpha polypeptide ‐2,44913037 7,14E‐06 ‐2,4178692 1,31E‐05 ‐2,36437005 3,98E‐04NM_000110 A_23_P135548 DPYD dihydropyrimidine dehydrogenase ‐3,03162486 3,29E‐06 ‐1,69897541 3,16E‐04 ‐1,05290523 9,43E‐03NM_000237 A_23_P146233 LPL lipoprotein lipase ‐1,06797162 2,24E‐04 ‐1,12289186 1,81E‐03 ‐1,28554578 3,96E‐03NM_00101000A_24_P579356 ARHGAP28 Rho GTPase activating protein 28 ‐2,43072177 1,33E‐05 ‐1,89550863 1,77E‐04 ‐1,36599581 4,48E‐03NM_0010424 A_24_P270728 NUPR1 nuclear protein, transcriptional regulator, 1 ‐2,29528964 1,07E‐04 ‐2,25895311 4,80E‐05 ‐2,29344887 2,35E‐03NM_00108084A_24_P79529 CSAG2 CSAG family, member 2; CSAG family, member 3; similar to CSAG family, member 2 ‐1,01216228 3,60E‐03 ‐1,5151696 4,19E‐04 ‐1,54606854 4,05E‐03NM_0011950 A_23_P257497 C6orf99 Homo sapiens chromosome 6 open reading frame 99 ‐1,85372067 3,74E‐05 ‐1,11099989 2,04E‐03 ‐1,09733037 8,08E‐03NM_001206 A_23_P415401 KLF9 Kruppel-like factor 9 ‐1,4574446 2,88E‐05 ‐1,3958477 5,18E‐04 ‐1,48405439 2,58E‐03NM_001432 A_23_P41344 EREG epiregulin ‐2,55901413 1,70E‐05 ‐1,90571418 1,10E‐04 ‐1,41329737 4,51E‐03NM_001657 A_23_P259071 AREG amphiregulin; amphiregulin B ‐1,62107875 2,37E‐05 ‐1,33552944 1,18E‐03 ‐1,12549374 8,48E‐03NM_001740 A_23_P21092 CALB2 calbindin 2 ‐2,92119518 4,78E‐06 ‐1,85880197 1,16E‐04 ‐1,72202989 1,66E‐03NM_001902 A_23_P126103 CTH cystathionase (cystathionine gamma-lyase) ‐1,32233196 3,58E‐05 ‐1,4561616 4,15E‐04 ‐1,11619076 7,13E‐03NM_002467 A_23_P215956 MYC v-myc myelocytomatosis viral oncogene homolog (avian) ‐0,63748745 1,47E‐02 ‐0,88129184 7,71E‐03 ‐1,02104782 1,18E‐02NM_002782 A_23_P108170 PSG6 pregnancy specific beta-1-glycoprotein 6 ‐2,49631972 5,45E‐06 ‐1,44671338 4,25E‐04 ‐1,22506964 6,07E‐03NM_002784 A_23_P39309 PSG9 pregnancy specific beta-1-glycoprotein 9 ‐2,57434014 7,45E‐06 ‐1,41470487 1,05E‐03 ‐1,25086787 5,20E‐03NM_003196 A_24_P327886 TCEA3 transcription elongation factor A (SII), 3 ‐1,54030146 1,13E‐04 ‐1,26681864 9,45E‐04 ‐1,38941773 4,47E‐03NM_003280 A_23_P166823 TNNC1 troponin C type 1 (slow) ‐3,17514396 1,17E‐06 ‐1,72710138 3,69E‐04 ‐1,22870263 5,73E‐03NM_003597 A_23_P44505 KLF11 Kruppel-like factor 11 ‐1,22256751 7,22E‐04 ‐1,20407056 1,22E‐03 ‐1,13637723 7,18E‐03NM_003714 A_23_P110686 STC2 stanniocalcin 2 ‐1,10457472 2,16E‐04 ‐1,43759507 4,65E‐04 ‐1,14723848 7,13E‐03NM_004080 A_23_P61919 DGKB diacylglycerol kinase, beta 90kDa ‐4,03766126 1,87E‐06 ‐1,23710948 1,02E‐03 ‐1,07648412 9,22E‐03NM_004083 A_23_P21134 DDIT3 DNA-damage-inducible transcript 3 ‐1,3660376 7,93E‐04 ‐1,85167646 2,16E‐04 ‐1,48448283 2,99E‐03NM_004420 A_23_P390528 DUSP8 dual specificity phosphatase 8 ‐1,25972708 3,35E‐03 ‐1,01322655 3,26E‐03 ‐1,38583012 4,30E‐03NM_004563 A_23_P140207 PCK2 phosphoenolpyruvate carboxykinase 2 (mitochondrial) ‐1,18098063 6,73E‐04 ‐1,37479311 5,52E‐04 ‐1,35664248 3,35E‐03NM_004577 A_23_P251984 PSPH phosphoserine phosphatase-like; phosphoserine phosphatase ‐1,2359542 2,30E‐04 ‐1,35077206 6,05E‐04 ‐1,1716885 5,79E‐03NM_004864 A_23_P16523 GDF15 growth differentiation factor 15 ‐2,42366784 8,20E‐05 ‐1,69858499 4,38E‐04 ‐2,39238588 4,29E‐04NM_005194 A_23_P411296 CEBPB CCAAT/enhancer binding protein (C/EBP), beta ‐0,87343114 2,89E‐03 ‐1,10199141 2,75E‐03 ‐1,12832902 7,56E‐03NM_005213 A_23_P170233 CSTA cystatin A (stefin A) ‐2,28500829 3,30E‐05 ‐2,66372862 8,38E‐06 ‐1,78687604 1,39E‐03NM_005367 A_23_P252928 MAGEA12 melanoma antigen family A, 12 ‐1,35694933 1,31E‐03 ‐1,64465938 3,13E‐04 ‐2,00564759 5,07E‐04NM_005557 A_23_P38537 KRT16 keratin 16; keratin type 16-like ‐2,35504973 1,18E‐05 ‐1,65904918 3,56E‐04 ‐1,63495607 2,17E‐03NM_006905 A_23_P50697 PSG1 pregnancy specific beta-1-glycoprotein 1 ‐2,84056045 3,20E‐06 ‐1,69333899 1,85E‐04 ‐1,2473813 4,48E‐03NM_007173 A_24_P937405 PRSS23 protease, serine, 23 ‐1,76082169 1,96E‐05 ‐1,03313193 2,87E‐03 ‐1,17759475 5,71E‐03NM_007350 A_23_P76450 PHLDA1 pleckstrin homology-like domain, family A, member 1 ‐1,69903751 3,40E‐05 ‐1,4769497 3,89E‐04 ‐1,4811118 2,35E‐03NM_014331 A_32_P165477 SLC7A11 solute carrier family 7, (cationic amino acid transporter, y+ system) member 11 ‐2,08047468 6,45E‐06 ‐2,14489415 3,86E‐05 ‐1,23562508 4,67E‐03NM_014417 A_23_P382775 BBC3 BCL2 binding component 3 ‐1,00732159 4,17E‐04 ‐1,33654378 6,77E‐04 ‐1,23073552 4,85E‐03NM_015515 A_23_P78248 KRT23 keratin 23 (histone deacetylase inducible) ‐1,83350968 1,85E‐05 ‐1,32441993 6,83E‐04 ‐1,26026537 4,35E‐03NM_019050 A_24_P137522 USP53 ubiquitin specific peptidase 53 ‐1,35699793 1,87E‐04 ‐1,29991961 8,52E‐04 ‐1,09717863 9,11E‐03NM_019058 A_23_P104318 DDIT4 DNA-damage-inducible transcript 4 ‐0,92606048 3,03E‐04 ‐1,3922176 5,19E‐04 ‐1,19533261 5,31E‐03NM_021158 A_24_P305541 TRIB3 tribbles homolog 3 (Drosophila) ‐1,26830874 3,14E‐03 ‐2,22619136 1,48E‐04 ‐1,99878018 1,79E‐03
Supplementary Table S3: 62 common downregulated genes in TMPRSS2:ERG‐expressing PC3c cellsL
Gene Name ProbeGene Symbol Annotation
H M

Log 2 FC P value Log 2 FC P value Log 2 FC P value
Supplementary Table S3: 62 common downregulated genes in TMPRSS2:ERG‐expressing PC3c cellsL
Gene Name ProbeGene Symbol Annotation
H M
NM_023037 A_23_P105862 FRY furry homolog (Drosophila) ‐1,58604354 1,74E‐04 ‐1,15620552 1,97E‐03 ‐1,14045508 7,02E‐03NM_024111 A_23_P14863 CHAC1 ChaC, cation transport regulator homolog 1 (E. coli) ‐1,23800755 9,10E‐05 ‐1,14978915 1,88E‐03 ‐1,14312725 6,96E‐03NM_032621 A_23_P22735 BEX2 brain expressed X-linked 2 ‐1,43746385 1,97E‐05 ‐1,33027821 6,84E‐04 ‐1,46674838 2,53E‐03NM_032772 A_23_P202484 ZNF503 zinc finger protein 503 ‐1,46634134 3,01E‐04 ‐1,2218935 1,21E‐03 ‐1,14919162 6,32E‐03NM_058179 A_23_P259692 PSAT1 chromosome 8 open reading frame 62; phosphoserine aminotransferase 1 ‐1,09216315 3,70E‐04 ‐1,2851445 1,33E‐03 ‐1,06783684 9,49E‐03NM_144505 A_23_P369343 KLK8 kallikrein-related peptidase 8 ‐2,3099324 7,71E‐04 ‐1,23426937 1,08E‐03 ‐1,54530491 2,88E‐03NM_148898 A_24_P38316 FOXP2 forkhead box P2 ‐1,16257205 3,45E‐04 ‐1,46460559 4,79E‐04 ‐1,27051843 5,70E‐03NM_153478 A_24_P11061 CSAG1 chondrosarcoma associated gene 1 ‐2,00142153 1,89E‐04 ‐2,09838797 3,03E‐04 ‐2,23168982 2,25E‐04NM_171998 A_24_P408603 RAB39B RAB39B, member RAS oncogene family ‐1,52450725 2,86E‐04 ‐1,09278857 2,07E‐03 ‐1,45376668 2,98E‐03NM_173698 A_23_P345808 FAM133A family with sequence similarity 133, member A ‐4,08705351 1,87E‐06 ‐5,63321118 8,88E‐06 ‐1,64580833 1,77E‐03NM_182707 A_24_P392110 PSG8 pregnancy specific beta-1-glycoprotein 7; pregnancy specific beta-1-glycoprotein 8; pregnancy specific be ‐2,52811923 4,24E‐06 ‐1,47525321 4,15E‐04 ‐1,2884775 3,96E‐03NM_182757 A_24_P406060 RNF144B ring finger protein 144B ‐3,98861218 1,23E‐06 ‐1,88007321 1,21E‐04 ‐1,25415931 7,31E‐03NM_183376 A_23_P339818 ARRDC4 arrestin domain containing 4 ‐1,6682404 1,67E‐03 ‐1,93675889 7,42E‐05 ‐1,68108966 2,36E‐03NM_198461 A_32_P190303 LONRF2 LON peptidase N-terminal domain and ring finger 2 ‐1,16022619 1,47E‐03 ‐1,86532483 1,88E‐04 ‐1,77632568 1,17E‐03NM_203403 A_23_P83007 C9orf150 chromosome 9 open reading frame 150 ‐2,51188422 3,88E‐04 ‐2,60612569 9,67E‐06 ‐1,9019306 1,29E‐03NM_207446 A_23_P100001 LOC400451 family with sequence similarity 174, member B ‐4,1202078 7,05E‐06 ‐3,04001545 5,89E‐06 ‐3,07287002 5,25E‐05NR_015370 A_23_P58538 chromosome 5chromosome 5 open reading frame 26 ‐1,05905921 1,95E‐04 ‐1,17500604 1,40E‐03 ‐1,24873723 4,90E‐03NR_033888 A_24_P882959 LOC284344 Homo sapiens uncharacterized LOC284344 (LOC284344), non-coding RNA ‐1,81421343 7,95E‐05 ‐1,26512158 1,25E‐03 ‐1,18898504 9,21E‐03

Log 2 FC P value Log 2 FC P value Log 2 FC P value
ENST0000024 A_24_P535256 ENST0000024 ENST00000242208 3,4495517 9,72E‐06 2,75864448 1,05E‐05 1,82524492 0,00217015NM_005012 A_32_P4018 ROR1 receptor tyrosine kinase-like orphan receptor 1 1,30283884 0,0010761 1,4226011 0,00084521 1,32838946 0,0034485NM_032554 A_23_P394246 HCAR1 hydroxycarboxylic acid receptor 1 3,13840381 1,40E‐05 2,27924136 7,35E‐05 1,74639699 0,00119794NM_032888 A_23_P158096 COL27A1 collagen, type XXVII, alpha 1 2,81024944 3,29E‐06 2,12891847 5,87E‐05 1,63171763 0,00252617NM_000093 A_23_P158593 COL5A1 collagen, type V, alpha 1 1,64029408 0,00014023 2,26156607 2,37E‐05 1,44663007 0,00334751NM_000358 A_23_P156327 TGFBI transforming growth factor, beta-induced, 68kDa 2,80880325 3,68E‐05 3,81845776 3,82E‐06 2,3140582 0,00021414NM_000428 A_23_P218144 LTBP2 latent transforming growth factor beta binding protein 2 2,193703 0,00032987 1,36893566 0,0006058 1,50946873 0,00447424NM_000575 A_23_P72096 IL1A interleukin 1, alpha 4,86449141 1,87E‐06 2,52702853 1,05E‐05 0,49369335 0,2022043NM_000610 A_23_P24870 CD44 CD44 molecule (Indian blood group) 1,82579518 4,54E‐05 1,29534947 0,00079437 1,06257404 0,00973226NM_000676 A_23_P55477 ADORA2B hypothetical LOC100131909; adenosine A2b receptor 2,15785283 7,05E‐06 1,27540873 0,00117234 1,21517596 0,00497849NM_000852 A_23_P202658 GSTP1 glutathione S-transferase pi 1 3,20785566 3,34E‐05 2,89560413 1,15E‐05 5,56786645 6,37E‐06NM_000930 A_23_P82868 PLAT plasminogen activator, tissue 2,92014795 2,23E‐06 2,86176488 5,44E‐06 1,26695125 0,00445263NM_0010401 A_23_P8452 LFNG LFNG O-fucosylpeptide 3-beta-N-acetylglucosaminyltransferase 2,14012398 1,47E‐05 2,36719695 1,70E‐05 1,70620911 0,00132041NM_0010805 A_32_P52414 LOC644943 Ras association (RalGDS/AF-6) domain family (N-terminal) member 10 2,01940409 0,00123561 2,90719901 1,06E‐05 3,4273124 5,12E‐05NM_001409 A_24_P926960 MEGF6 multiple EGF-like-domains 6 1,1308263 0,00118809 1,38102082 0,00074941 0,74476166 0,04080211NM_002165 A_23_P252306 ID1 inhibitor of DNA binding 1, dominant negative helix-loop-helix protein 1,85010354 1,62E‐05 1,4674131 0,00047408 1,40446158 0,00295129NM_002167 A_23_P137381 ID3 inhibitor of DNA binding 3, dominant negative helix-loop-helix protein 1,13698227 0,00014229 1,17194042 0,00168606 1,13781983 0,00659747NM_002178 A_23_P139912 IGFBP6 insulin-like growth factor binding protein 6 2,17737016 4,40E‐06 2,08349049 5,67E‐05 1,42906818 0,00312489NM_002192 A_23_P122924 INHBA inhibin, beta A 3,34695573 4,45E‐06 2,91142459 5,44E‐06 1,55485994 0,0020654NM_002318 A_23_P111995 LOXL2 lysyl oxidase-like 2 1,57115991 3,56E‐05 1,48596967 0,00039221 1,16303028 0,00597385NM_002341 A_23_P93348 LTB lymphotoxin beta (TNF superfamily, member 3) 4,38910213 2,83E‐06 3,43222314 5,44E‐06 1,50379139 0,00306967NM_002751 A_23_P502274 MAPK11 mitogen-activated protein kinase 11 2,06921509 1,64E‐05 1,46188256 0,00041398 1,26296329 0,00593456NM_003012 A_23_P10127 SFRP1 secreted frizzled-related protein 1 3,38233813 7,65E‐06 3,29062341 5,44E‐06 5,14603198 6,37E‐06NM_003088 A_23_P168531 FSCN1 fascin homolog 1, actin-bundling protein (Strongylocentrotus purpuratus) 2,50677701 3,46E‐05 1,62291075 0,00035597 1,09130434 0,00876387NM_003246 A_23_P206212 THBS1 thrombospondin 1 3,37607996 1,95E‐05 2,91622092 5,44E‐06 1,22455685 0,0063206NM_003264 A_23_P92499 TLR2 toll-like receptor 2 2,904175 3,24E‐05 2,08635311 0,00013044 1,21870916 0,00489826NM_003494 A_23_P39925 DYSF dysferlin, limb girdle muscular dystrophy 2B (autosomal recessive) 2,1937892 1,40E‐05 1,63096776 0,00025711 1,49991476 0,00236278NM_003588 A_23_P422178 CUL4B cullin 4B 0,64342805 0,00745917 1,62356929 0,00028589 1,3598221 0,00312222NM_003733 A_23_P139786 OASL 2'-5'-oligoadenylate synthetase-like 2,57422695 8,44E‐05 2,54860934 9,02E‐06 1,91915364 0,00095544NM_004460 A_23_P56746 FAP fibroblast activation protein, alpha 5,39496843 9,05E‐07 4,77699852 2,16E‐06 4,02339409 1,85E‐05NM_004753 A_23_P33759 DHRS3 dehydrogenase/reductase (SDR family) member 3 2,20445645 3,34E‐05 1,60821553 0,00027451 1,27020485 0,00428201NM_004994 A_23_P40174 MMP9 matrix metallopeptidase 9 (gelatinase B, 92kDa gelatinase, 92kDa type IV collagenase) 2,24730803 2,83E‐06 1,77389168 0,00015004 1,04873192 0,00940379NM_005429 A_23_P167096 VEGFC vascular endothelial growth factor C 3,1671143 2,71E‐06 2,00963852 0,00024478 1,52382508 0,00285125NM_005725 A_23_P201193 TSPAN2 tetraspanin 2 1,90595797 5,32E‐05 2,10056978 5,06E‐05 1,31110511 0,00370411NM_005823 A_23_P77529 MSLN mesothelin 0,80726104 0,00547454 1,8557777 0,00013593 1,48933316 0,00283113NM_006417 A_23_P23074 IFI44 interferon-induced protein 44 2,87859612 1,06E‐05 2,79779509 5,89E‐06 2,03208076 0,00044277NM_006897 A_23_P25150 HOXC9 homeobox C9 1,94806845 0,00023853 1,80660472 0,0002962 1,63448271 0,0036561NM_006936 A_23_P102937 SUMO3 SMT3 suppressor of mif two 3 homolog 2 (S. cerevisiae) pseudogene; SMT3 suppressor of mif two 3 0,8361159 0,00410646 1,01719451 0,00367611 1,117685 0,00712696NM_007289 A_24_P260101 MME membrane metallo-endopeptidase 0,8168381 0,00693129 1,24306003 0,00105343 0,7019343 0,05419134NM_014256 A_23_P78980 B3GNT3 UDP-GlcNAc:betaGal beta-1,3-N-acetylglucosaminyltransferase 3 2,39803785 7,14E‐06 1,21272689 0,00125079 1,77586456 0,00121201NM_014350 A_32_P219520 TNFAIP8 tumor necrosis factor, alpha-induced protein 8 1,06953295 0,00114313 1,09599389 0,00331229 1,05042516 0,00941858NM_016235 A_23_P324327 GPRC5B G protein-coupled receptor, family C, group 5, member B 2,32040176 3,83E‐05 1,92159657 7,94E‐05 1,6169327 0,00543052NM_017654 A_23_P355244 SAMD9 sterile alpha motif domain containing 9 1,15433736 0,00031326 1,27265962 0,00087128 1,2459451 0,00629024NM_018602 A_23_P206140 DNAJA4 DnaJ (Hsp40) homolog, subfamily A, member 4 1,90273976 0,00250654 4,03422988 3,13E‐06 2,96510379 0,00015874
Supplementary Table S2: 64 common upregulated genes in TMPRSS2:ERG‐expressing PC3c cellsH M L
Gene Name ProbeGene Symbol Annotation

Log 2 FC P value Log 2 FC P value Log 2 FC P value
Supplementary Table S2: 64 common upregulated genes in TMPRSS2:ERG‐expressing PC3c cellsH M L
Gene Name ProbeGene Symbol Annotation
NM_020134 A_23_P210224 DPYSL5 dihydropyrimidinase-like 5 1,84146402 1,64E‐05 1,22727201 0,00111669 1,47884867 0,00234838NM_021071 A_23_P116902 ART4 ADP-ribosyltransferase 4 (Dombrock blood group) 1,849363 0,00787111 1,77604652 0,00031777 1,53876511 0,00306597NM_021629 A_32_P171313 GNB4 guanine nucleotide binding protein (G protein), beta polypeptide 4 2,18971734 1,85E‐05 1,87336873 0,00010921 1,2461904 0,00447424NM_022370 A_23_P356581 ROBO3 roundabout, axon guidance receptor, homolog 3 (Drosophila) 2,4008704 4,54E‐05 1,64022292 0,00047275 1,33342014 0,00343007NM_025135 A_32_P34444 FHOD3 formin homology 2 domain containing 3 4,10351737 1,07E‐05 3,86856762 5,44E‐06 2,15478103 0,00166461NM_025179 A_23_P46618 PLXNA2 plexin A2 3,19528483 5,96E‐06 1,96905162 6,77E‐05 1,61377018 0,00287726NM_030775 A_23_P53588 WNT5B wingless-type MMTV integration site family, member 5B 2,03949498 0,00055932 1,74557366 0,00038816 1,61532611 0,0016596NM_030955 A_32_P103220 ADAMTS12 ADAM metallopeptidase with thrombospondin type 1 motif, 12 2,44605665 2,05E‐05 2,74427443 5,93E‐06 2,21406233 0,00022686NM_032413 A_23_P26024 C15orf48 chromosome 15 open reading frame 48 5,8889039 9,05E‐07 4,59532803 2,16E‐06 2,95210513 5,25E‐05NM_032587 A_23_P41854 CARD6 caspase recruitment domain family, member 6 1,63727421 7,72E‐05 1,59568454 0,00038816 1,26003906 0,0063206NM_138711 A_23_P252062 PPARG peroxisome proliferator-activated receptor gamma 2,178288 1,14E‐05 1,60375259 0,00038238 1,32264733 0,00376812NM_138768 A_23_P360240 MYEOV myeloma overexpressed (in a subset of t(11;14) positive multiple myelomas) 1,6338799 0,00027 1,78456231 0,00013592 1,5658368 0,00267157NM_152703 A_23_P145874 SAMD9L sterile alpha motif domain containing 9-like 2,40778834 8,87E‐06 1,5074545 0,00037234 1,34942225 0,00699606NM_172229 A_23_P77612 KREMEN2 kringle containing transmembrane protein 2 1,68625263 1,81E‐05 1,21097049 0,00114599 1,27440774 0,00543052NM_176072 A_23_P24903 P2RY2 purinergic receptor P2Y, G-protein coupled, 2 1,47009792 4,60E‐05 1,1897628 0,00125637 1,06418491 0,00917063NM_182755 A_23_P161156 ZNF438 zinc finger protein 438 2,47978681 5,85E‐05 2,72025567 0,00013848 2,83450713 6,26E‐05NM_198129 A_24_P687302 LAMA3 laminin, alpha 3 2,51712884 2,07E‐05 1,58203896 0,00099137 1,22698646 0,01184986NM_206967 A_24_P289178 C16orf74 chromosome 16 open reading frame 74 2,50235533 2,32E‐06 1,51491943 0,000344 1,27585318 0,00478496NR_015379 A_32_P200238 UCA1 urothelial cancer associated 1 1,2258268 8,12E‐05 1,45323115 0,00041949 1,28564612 0,00412749XR_110477 A_32_P158019 LOC10050594PREDICTED: Homo sapiens uncharacterized LOC100505940 1,3192231 0,00046213 1,83220714 0,0002962 1,29626969 0,00643079

Supplementary Table S1: Oligonucleotide Primers
Primer Direction Sequence Reference
TMPRSS2 :ERG (Cloning)
Forward 5’- CGCGAGCTAAGCAGGAGGC -3’
This study
Reverse 5’- CCTCCGCCAGGTCTTTAGTA -3’
TMPRSS2:ERG (Classical PCR)
Forward 5’- CGCGAGCTAAGCAGGAGGC -3’
(1)
Reverse 5’- GTAGGCACACTCAAACAACGACTGG- 3’
ERG (qPCR) Forward 5’- AACGAGCGCAGAGTTATCGT -3’ This study
(Effeciency: 99.8%) Reverse 5’- GTGAGCCTCTGGAAGTCGTC -3’
MMP9 (qPCR) Forward 5’- AAGTGGCACCACCACAACATC -3’ (2)
(Effeciency: 98.3%) Reverse 5’- CAAAGGCGTCGTCAATCACC -3’
PLXNA2 (qPCR) Forward 5’-GGAGCCACTCTTCATGCTATACTGT-3’ (3)
(Effeciency: 99.1%) Reverse 5’- GTTGACGCAGTTCAGGATCA-3’
18s (qPCR) Forward 5’- CAGCTTCCGGGAAACCAAAGTC-3’
(4)
Reverse 5’- AATTAAGCCGCAGGCTCCACTC-3’
pMMP9 (ChIP) Forward 5’- TGCGGACTTACAACCTACAGTG-3’
(5)
Reverse 5’- TCTTTGACTCAGCTTCCTCTCC-3’
pPLXNA2 (ChIP) Forward 5’- CCGCTTCCGGAAAGCCGTGT-3’
This study
Reverse 5’- GTCCCGACTTGCATGGGGGC-3’
pGAPDH (ChIP) Forward 5’- GCGTGCCCAGTTGAACCA-3’
(6)
Reverse 5’- CGCCCGTAAAACCGCTAGT-3’
CHD1 (qPCR) Forward 5’- CCCACCACGTACAAGGGTC-3’
* (Effeciency: 99.3%)
Reverse 5’- CTGGGGTATTGGGGGCAT-3’
VIM (qPCR) Forward 5’- GAGAACTTTGCCGTTGAAGC-3’
* (Effeciency: 97.6%)
Reverse 5’- GCTTCCTGTAGGTGGCAATC-3’
TWIST1 (qPCR) Forward 5’-GCAGGACGTGTCCAGCTC-3’
* (Effeciency: 99.1%)
Reverse 5’- CTGGCTCTTCCTCGCTGTT-3’

Primer Direction Sequence Reference
SNAI1/SNAIL (qPCR)
Forward 5’- AATCGGAAGCCTAACTACAGCG-3’
* (Effeciency: 96.3%)
Reverse 5’- GTCCCAGATGAGCATTGGCAA-3’
SNAI2/SLUG (qPCR)
Forward 5’- ATACCACAACCAGAGATCCTCA-3’
* (Effeciency: 99.8%)
Reverse 5’- GACTCACTCGCCCCAAAGATG-3’
* These primers have been cited by multiple publications.
1. Tomlins SA, Rhodes DR, Perner S, Dhanasekaran SM, Mehra R, Sun XW, et al. Recurrent fusion of TMPRSS2 and ETS transcription factor genes in prostate cancer. Science. 2005 Oct 28;310(5748):644-8. 2. Kato T, Fujita Y, Nakane K, Kojima T, Nozawa Y, Deguchi T, et al. ETS1 promotes chemoresistance and invasion of paclitaxel-resistant, hormone-refractory PC3 prostate cancer cells by up-regulating MDR1 and MMP9 expression. Biochem Biophys Res Commun. 2012 Jan 20;417(3):966-71. 3. Gabrovska PN, Smith RA, Tiang T, Weinstein SR, Haupt LM, Griffiths LR. Semaphorin-plexin signalling genes associated with human breast tumourigenesis. Gene. 2011 Dec 10;489(2):63-9. 4. Monet M, Lehen'kyi V, Gackiere F, Firlej V, Vandenberghe M, Roudbaraki M, et al. Role of cationic channel TRPV2 in promoting prostate cancer migration and progression to androgen resistance. Cancer Res. 2009 Feb 1;70(3):1225-35. 5. Cowden Dahl KD, Zeineldin R, Hudson LG. PEA3 is necessary for optimal epidermal growth factor receptor-stimulated matrix metalloproteinase expression and invasion of ovarian tumor cells. Mol Cancer Res. 2007 May;5(5):413-21. 6. Boulay G, Dubuissez M, Van Rechem C, Forget A, Helin K, Ayrault O, et al. Hypermethylated in cancer 1 (HIC1) recruits polycomb repressive complex 2 (PRC2) to a subset of its target genes through interaction with human polycomb-like (hPCL) proteins. J Biol Chem. 2011 Mar 23;287(13):10509-24.

Rela
tive
Expr
essi
on
CDH1 VIM TWIST1 SNAI1 SNAI20
1
2
3
4
5pcDNATMPRSS2:ERG-HTMPRSS2:ERG-MTMPRSS2:ERG-L
PC3c
Supplementary Figure S9 Tian et al.

Rel
ativ
e Ex
pres
sion
(MM
P9)
0.0
0.5
1.0
1.5MMP9TMPRSS2:ERG-H
Mock Control MMP9
siRNA
ab
RFU
Fol
d C
hang
e
0.0
0.5
1.0
1.5TMPRSS2:ERG-H Migration
Mock Control MMP9
siRNA
c d
RFU
Fol
d C
hang
e
0.0
0.5
1.0
1.5TMPRSS2:ERG-H Invasion
Mock Control MMP9
siRNA
Supplementary Figure S8 Tian et al.
siRNA
Zymo:MMP9
Moc
k
Con
trol
MM
P9
90 kDa

a b
c d
Rel
ativ
e Ex
pres
sion
(ER
G)
0.0
0.5
1.0
1.5
2.0DU145-TMPRSS2:ERG ERG
Mock Control ERG
siRNA
Rel
ativ
e Ex
pres
sion
(MM
P9)
0.0
0.5
1.0
1.5
2.0
Mock Control ERG
siRNA
DU145-TMPRSS2:ERG MMP9
Rel
ativ
e Ex
pres
sion
(PLX
NA
2)
0.0
0.5
1.0
1.5
2.0
Mock Control ERG
siRNA
DU145-TMPRSS2:ERG PLXNA2
Supplementary Figure S7 Tian et al.
ACTIN
ERG
40 kDa
55 kDa
siRNA
WB
:
DU145-TMPRSS2:ERG

Rel
ativ
e Ex
pres
sion
(ER
G)
0.0
0.5
1.0
1.5ERGTMPRSS2:ERG-M
Mock Control ERG
siRNAR
elat
ive
Expr
essi
on (P
LXN
A2)
0.0
0.5
1.0
1.5PLXNA2TMPRSS2:ERG-M
Mock Control ERG
siRNA
Rel
ativ
e Ex
pres
sion
(MM
P9)
0.0
0.5
1.0
1.5MMP9TMPRSS2:ERG-M
Mock Control ERG
siRNA
HPRT
ERG
25 kDa
55 kDa
siRNA
WB
:
TMPRSS2:ERG-Ma b
c d
Supplementary Figure S6 Tian et al.

Rel
ativ
e Ex
pres
sion
(ER
G)
0.0
0.5
1.0
1.5ERGTMPRSS2:ERG-H
Mock Control ERG
siRNA
HPRT
ERG
25 kDa
55 kDa
siRNA
WB
:
TMPRSS2:ERG-Ha b
Supplementary Figure S5 Tian et al.

DAPI Gelatin-FITC F-Actin MERGE
pcDNA
TMPR
SS2:ER
G‐HPC3c
Supplementary Figure S4 Tian et al.
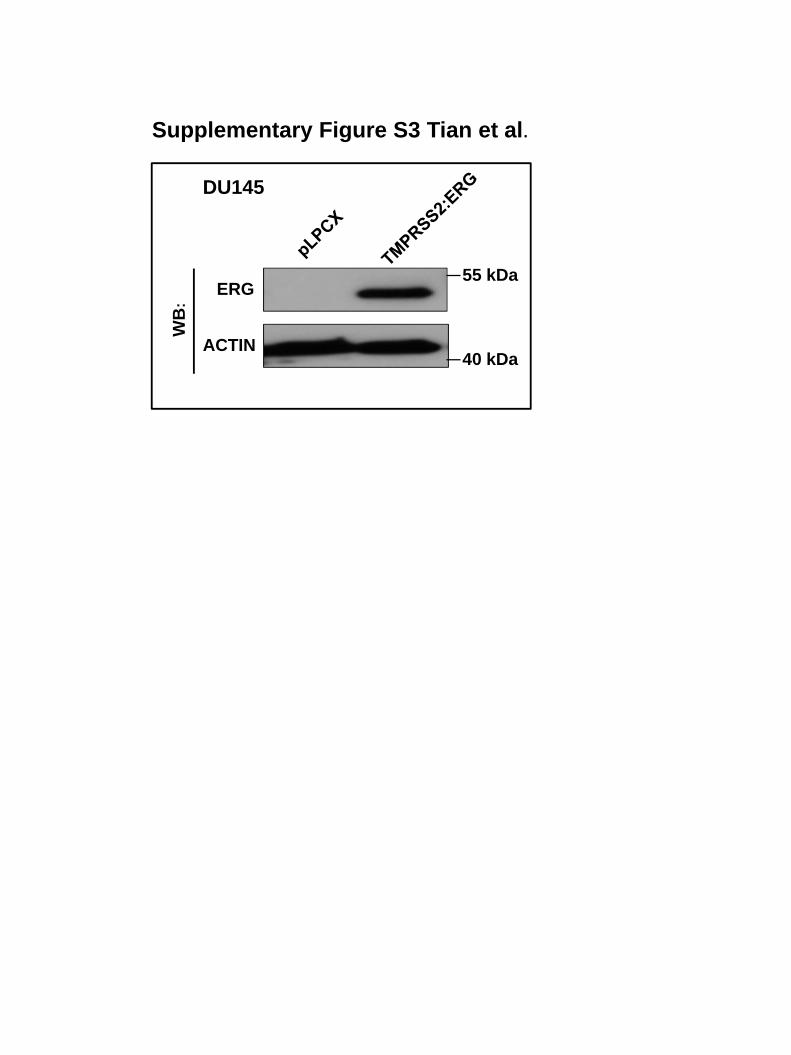
DU145
ERG
ACTIN
55 kDa
40 kDa
WB
:
Supplementary Figure S3 Tian et al.

Supplementary Figure S2 Tian et al.
0.0
0.5
1.0
1.5
Rel
ativ
e Ex
pres
sion
(ER
G)
TMPRSS2:ERG positive TMPRSS2:ERG negative

ERG
HPRT
WB
:55 kDa
25 kDa
Supplementary Figure S1 Tian et al.