Identification of genes induced in proteoid roots of white lupin under nitrogen and phosphorus...
14
REGULAR ARTICLE Identification of genes induced in proteoid roots of white lupin under nitrogen and phosphorus deprivation, with functional characterization of a formamidase Mousumi Rath & Jay Salas & Bandita Parhy & Robert Norton & Himabindu Menakuru & Monika Sommerhalter & Greg Hatlstad & Jaimyoung Kwon & Deborah L. Allan & Carroll P. Vance & Claudia Uhde-Stone Received: 11 November 2009 / Accepted: 30 March 2010 / Published online: 15 April 2010 # Springer Science+Business Media B.V. 2010 Abstract White lupin (Lupinus albus L.) is considered a model system for understanding plant acclimation to nutrient deficiency. It acclimates to phosphorus (P) and iron (Fe) deficiency by the development of short, densely clustered lateral roots called proteoid (or cluster) roots; proteoid-root development is further influenced by nitrogen (N) supply. In an effort to better understand proteoid root function under various nutrient deficiencies, we used nylon filter arrays to analyze 2,102 expressed sequence tags (ESTs) from proteoid roots of P-deficient white lupin. These have been previously analyzed for up-regulation in −P proteoid roots, and were here analyzed for up- regulation in proteoid roots of N-deprived plants. We identified a total of 19 genes that displayed up- regulation in proteoid roots under both P and N Plant Soil (2010) 334:137–150 DOI 10.1007/s11104-010-0373-7 Responsible Editor: Michael Denis Cramer. Mousumi Rath, Jay Salas, Bandita Parhy and Robert Norton contributed equally to this work. Electronic supplementary material The online version of this article (doi:10.1007/s11104-010-0373-7) contains supplementary material, which is available to authorized users. M. Rath : J. Salas : B. Parhy : R. Norton : H. Menakuru : C. Uhde-Stone (*) Department of Biological Sciences, California State University, East Bay, 25800 Carlos Bee Blvd., Hayward, CA 94542, USA e-mail: [email protected] R. Norton : J. Kwon Department of Statistics, California State University, East Bay, Hayward, CA 94542, USA M. Sommerhalter Department of Chemistry & Biochemistry, California State University, East Bay, Hayward, CA 94542, USA G. Hatlstad : C. P. Vance Department of Agronomy and Plant Genetics, University of Minnesota, St Paul, MN 55108, USA D. L. Allan Department of Soil, Water, and Climate, University of Minnesota, 1991 Upper Buford Circle, St Paul, MN 55108, USA C. P. Vance USDA-ARS, Plant Science Research Unit, 1991 Upper Buford Circle, St Paul, MN 55108, USA
-
Upload
independent -
Category
Documents
-
view
1 -
download
0
Transcript of Identification of genes induced in proteoid roots of white lupin under nitrogen and phosphorus...

REGULAR ARTICLE
Identification of genes induced in proteoid roots of whitelupin under nitrogen and phosphorus deprivation,with functional characterization of a formamidase
Mousumi Rath & Jay Salas & Bandita Parhy & Robert Norton &
Himabindu Menakuru & Monika Sommerhalter & Greg Hatlstad &
Jaimyoung Kwon & Deborah L. Allan & Carroll P. Vance & Claudia Uhde-Stone
Received: 11 November 2009 /Accepted: 30 March 2010 /Published online: 15 April 2010# Springer Science+Business Media B.V. 2010
Abstract White lupin (Lupinus albus L.) is considereda model system for understanding plant acclimation tonutrient deficiency. It acclimates to phosphorus (P) andiron (Fe) deficiency by the development of short,densely clustered lateral roots called proteoid (orcluster) roots; proteoid-root development is furtherinfluenced by nitrogen (N) supply. In an effort tobetter understand proteoid root function under various
nutrient deficiencies, we used nylon filter arrays toanalyze 2,102 expressed sequence tags (ESTs) fromproteoid roots of P-deficient white lupin. These havebeen previously analyzed for up-regulation in −Pproteoid roots, and were here analyzed for up-regulation in proteoid roots of N-deprived plants. Weidentified a total of 19 genes that displayed up-regulation in proteoid roots under both P and N
Plant Soil (2010) 334:137–150DOI 10.1007/s11104-010-0373-7
Responsible Editor: Michael Denis Cramer.
Mousumi Rath, Jay Salas, Bandita Parhy and Robert Nortoncontributed equally to this work.
Electronic supplementary material The online version of thisarticle (doi:10.1007/s11104-010-0373-7) containssupplementary material, which is available to authorized users.
M. Rath : J. Salas : B. Parhy :R. Norton :H. Menakuru :C. Uhde-Stone (*)Department of Biological Sciences,California State University, East Bay,25800 Carlos Bee Blvd.,Hayward, CA 94542, USAe-mail: [email protected]
R. Norton : J. KwonDepartment of Statistics,California State University, East Bay,Hayward, CA 94542, USA
M. SommerhalterDepartment of Chemistry & Biochemistry,California State University, East Bay,Hayward, CA 94542, USA
G. Hatlstad :C. P. VanceDepartment of Agronomy and Plant Genetics,University of Minnesota,St Paul, MN 55108, USA
D. L. AllanDepartment of Soil, Water, and Climate,University of Minnesota,1991 Upper Buford Circle,St Paul, MN 55108, USA
C. P. VanceUSDA-ARS, Plant Science Research Unit,1991 Upper Buford Circle,St Paul, MN 55108, USA

deprivation. One of these genes showed homology toputative formamidases. The corresponding open read-ing frame was cloned, overexpressed in E. coli, and theencoded protein was purified; functional characteriza-tion of the recombinant protein confirmed formamidaseactivity. Though many homologues of bacterial andfungal formamidases have been identified in plants, toour knowledge, this is the first report of a functionalcharacterization of a plant formamidase.
Keywords Proteoid roots . Cluster roots . Phosphorusdeprivation . Nitrogen deprivation . Formamidase .
Formate dehydrogenase .White lupin
Introduction
Nitrogen (N) and phosphorus (P) are the two mostlimiting nutrients for plant growth and development(Vance 2001). Loading of agricultural land with N andP fertilizers has devastating ecological consequences,such as eutrophication of salt- and fresh-water systems.P and iron (Fe) are often present in soils, but in formsunavailable for uptake by most crop plants (Marschner1995). Improvement of nutrient acquisition and abioticstress resistance in crops is considered critical foreconomic, humanitarian, and environmental reasons(Vance 2001; Welch and Graham 2004).
The well-characterized legume white lupin (Lupinusalbus L.) has become an illuminating model system forunderstanding plant adaptations to nutrient deficiency,particularly to low P (Neumann and Martinoia 2002;Shane and Lambers 2005; Vance et al. 2003). Whitelupin’s adaptation to P and Fe deficiency is a highlycoordinated modification of root development andbiochemistry, resulting in proteoid roots, which aredensely clustered lateral roots, also called cluster roots(Dinkelaker et al. 1995; Hagström et al. 2001; Johnsonet al. 1996b; Neumann and Römheld 1999; Shane andLambers 2005). Transcript abundance of genes encod-ing phosphate transporters (Liu et al. 2001), acidphosphatase (Gilbert et al. 1999; Miller et al.2001), or proteins related to organic acid synthesis(Massonneau et al. 2001; Peñaloza et al. 2002;Uhde-Stone et al. 2003) have been reported to beinduced in proteoid roots of P-deficient white lupin.It has been shown that P deficiency increases protonextrusion by roots, and enhances the exudation ofcitrate and malate by white lupin plants (Dinkelaker
et al. 1995; Johnson et al. 1996a; Sas et al. 2001).Localized rhizosphere acidification and organicanion extrusion not only mobilizes P, but also othernutrients like Fe, manganese (Mn) and zinc (Zn) inthe rhizosphere, and increases their rates of uptake(Lamont 2003; Lu and Zhang 1995; Marschner1995). Dinkelaker et al. (1995) reported that lowlevels of N enhance formation of proteoid rootsunder P deficiency, while high N levels exhibit aninhibitory effect. In contrast, Sas et al. (2002)reported that addition of ammonium sources stimu-late proteoid root formation and proton excretionunder P deficiency. This apparent contradictionindicates a need for a better understanding of theinfluence of N on proteoid root formation andfunction. In addition to white lupin’s exceptionalability to acquire P and Fe, it is also capable ofsymbiotic N fixation. In contrast to other legumes,white lupin’s ability to fix N is less prone toinhibition by P deficiency (Schulze et al. 2006).
Not much is known about the gene network thatallows white lupin to adapt well to a combination ofnutrient stresses. Several microarray-based studieshave assessed plant responses to nutrient stresses,such as N deficiency (Bi et al. 2007; Scheible et al.2004), Fe deficiency (O’Rourke et al. 2009; Thimmet al. 2001) and P deficiency (Calderon-Vazquez et al.2008; Misson et al. 2005; Peñaloza et al. 2002). Theselarge-scale analyses of gene expression identifiedseveral hundred nutrient-responsive genes.
Nylon filter arrays have been used previously toanalyze the expression of 2102 ESTs from white lupinproteoid roots to identify genes up-regulated under P-deprivation (Uhde-Stone et al. 2003). This approach hasled to the identification of 35 genes that displayedsignificantly increased expression under P deprivation,including genes involved in carbon metabolism, sec-ondary metabolism, P scavenging and remobilization,plant hormone metabolism, and signal transduction. Ofspecial interest to us among these 35 genes were aputative formamidase and formate dehydrogenase, asboth enzymes may function in the same pathway.Formamidases catalyze the conversion of formamide toformate and ammonia; formate dehydrogenases furtheroxidize formate to CO2. Formate dehydrogenases havebeen previously reported to show induced expressionunder Fe deprivation in barley (Suzuki et al. 1998).Though many genes with homology to bacterial andfungal formamidases exist in plants, to our knowledge,
138 Plant Soil (2010) 334:137–150

formamidase activity has not yet been confirmed forany of these plant homologues.
In the current study, the 2102 white lupin ESTswere used to analyze gene expression in proteoidroots of white lupin in response to N deprivation. Theobjectives of this research were 1) to use nylon filterarrays to identify a possible overlap of gene responsesin proteoid roots under P and N deprivation, and 2) tofunctionally characterize formamidase, encoded by agene that displayed induced transcript abundance inproteoid roots under, P, N, and Fe deprivation.
Materials and methods
Plant material and growth conditions
Lupinus albus L. var Ultra plants were grown in agrowth chamber at 20/15°C and 16-/8-h day/nightcycles, 300 μmol photons m−2 s−l at shoot height,and 70% relative humidity. Plants were grown insilica sand culture watered with Hoagland nutrientsolution, which was replenished every other day, asdescribed previously (Johnson et al. 1996b). Thecomplete nutrient solution (control) consisted of3.0 mM KNO3, 2.5 mM Ca(NO3)2, 0.5 mM Ca(H2PO4)2, 1.0 mM MgSO4, 12.0 μM Fe (asFeEDTA), 4.0 μM MnCl2, 22.0 μM H3BO3,0.4 μM ZnSO4, 0.05 μM NaMoO4, and 1.6 μMCuSO4. N deprivation was defined by the presenceof KCl (3 mM) and CaSO4 (0.5 mM) substituting for3 mM KNO3 and 2.5 mM Ca(NO3)2. P deprivationwas imposed by the presence of 0.5 mM CaSO4,substituting for 0.5 mM Ca (H2PO4)2 in the nutrientsolution. Fe deprivation was imposed by withholdingFe-EDTA from the nutrient solution. For validationexperiments, white lupin was grown hydroponically in agrowth chamber using the same settings and nutrientsolutions as described above for silica sand culture.About four plants per container were grown in 1 Laerated nutrient solution, which was replenished everytwo days. To reduce any effect of diurnal changes ongene expression, all samples were collected during themiddle of the day.
Nylon filter array spotting and hybridization
Nylon filter array spotting, using an automated Q-bot spotting protocol, and hybridization of arrays
were performed as previously described (Uhde-Stone et al. 2003). The nylon filter arrays includedtwo independent biological replicates for eachexperimental condition. In addition, each EST wasspotted twice per filter, resulting in a total number of4 replicates per EST and condition.
Statistical analysis for the identificationof differentially expressed genes
For nylon filter array analysis, background noise wassubtracted from individual filter spot intensities usingArray Pro Analyzer software (Media Cybernetics;Carlsbad, CA, USA). Data were normalized (Dudoitet al. 2002; Ness 2007; Watson et al. 2007) using Rstatistical software (http://www.r-project.org/). Thedata were centered about independent array means(Element Intensity—Array Mean Intensity = ArrayMean Normalized Intensity (AMNI)). Next thesearray-normalized intensities were corrected for gene-specific variation attributable to the replicate number(AMNI—Replicate Median = Replicate Median Nor-malized AMNI (RMNI)). Analysis of Variance(ANOVA) tests were performed on the RMNI datacomparing control with both N and Fe deficiency todetermine statistical significance of differential geneexpression. A one-way ANOVA in R was completedutilizing a Benjamini-Hochberg method to furtherreduce the chance of a Type I Error (a). For genesdiscussed in this paper, a conclusion of statisticalsignificance for array data compared by ANOVAtesting means that significant variation can be foundbetween the treatment groups, and this variation isattributable to the different nutrient conditions. Aftersubtracting the array and replicate specific values, asmall constant was added to all expression values (asapplied in Orzack and Gladstone 1994) to ensurepositive values (RMNI + 100 = Constant AddedNormalized Intensities (CANI)). Ratios of geneexpression between nutrient-stress conditions werecalculated from the Constant Added NormalizedIntensities (CANI).
RNA preparation
Total RNA was extracted using an RNeasy Mini kit(Qiagen, Valencia, CA, USA). To eliminate ge-nomic DNA contamination in RNA, the RNA wastreated with Turbo-DNase followed by DNase
Plant Soil (2010) 334:137–150 139

inactivation, as per the manufacturer’s instructions(Ambion, Foster City, CA, USA). Quantification ofRNA was done using the RiboGreen (Invitrogen,Carlsbad, CA, USA) protocol for the NanodropND-3300 Fluorospectrometer (Nanodrop, Wilming-ton, Delaware, USA), following the manufacturer’sinstructions.
Reverse-transcription quantitative PCR (RT-qPCR)
SuperScript III Platinum Two-Step qRT-PCR Kitwith SYBR Green (Invitrogen) was used for theRT-qPCR reaction. First strand cDNA was synthe-sized according to manufacturer’s instructions,using premixed random hexamer and poly-d(T)primers supplied with the kit. A no-ReverseTranscriptase (no-RT) control reaction was includedto control for genomic DNA contamination.
Quantitative (real-time) PCR was performed onthe Opticon™2 system (MJ research, San Fran-cisco, CA, USA). The primer pairs used are listedin Table 1. Four reference genes were analyzedusing geNORM (Vandesompele et al. 2002), namelygamma-tubulin, cyclophilin, aquaporin, and ubiqui-tin; ubiquitin was chosen as the main reference genefor RT-qPCR analysis. As some ubiquitins andaquaporins showed high differential expression in
the array, L#1223 (40S ribosomal protein S8), a genewith fairly even expression level throughout thearray, was used as additional reference gene. Deltaamplification efficiency between target and referencegenes was <0.2 for each primer pair.
For quantitative PCR, Platinum® SYBR® GreenqPCR SuperMix-UDG (Invitrogen) was used fol-lowing manufacturer’s instructions and the followingprotocol: 50°C 2 min, denaturation at 94°C for2 min, amplification and quantification for 40 cyclesof 94°C for 40 s, 60°C for 45 s, 72°C for 45 s with asingle fluorescence measurement, followed by melt-ing curve determination (50–95°C) with a heatingrate of 0.5°C per 0.5 s and a continuous fluorescencemeasurement.
All samples were amplified in triplicate. Standardcurves were determined for sample and referencegenes. Fold changes, normalized to the referencegenes, and corrections for differences in amplificationefficiencies, were determined by using the Q-Geneprogram (Simon 2003).
Cloning and expression of recombinant formamidase
For cloning and expression of recombinant formami-dase, the champion pET200/D-TOPO Expression kit(Invitrogen) was used to generate an N-terminal His-tag,
Gene Primer sequence Amplicon size
Sucrose synthase Forward: TGACACGAGGGGTGCTTTT 103 bpReverse: ATTGGAAGTGGCGAAGGTT
GAPDH Forward: CGATCCTTTCATCACCACTG 157 bpReverse: CTCCTCAGGGTTCCTGTGTC
Formate dehydrogenase Forward: CCGTTCGATCCATCACTTCT 152 bpReverse: GATTCCTTCAACAGAGCCTA
Formamidase Forward:TCACCAGTGCTGAGATTTGC 157 bpReverse: AAAAAGGCACTG CTGAATGG
L#315 “unknown” Forward: TGGGAAAACGATGCCTATCT 158 bpReverse: CCTTGGCTTGGACAGAGTG
Ubiquitina Forward: TCTTTGTGAAGACCCTCACC 400 bpReverse: CTGCTGGTCCGGAGGAATG
40 S ribosomal protein S8a Forward: AGGGCATTGAGATTGGACAC 157 bpReverse: GAGCAGCATCAA CCTGAAC
Aquaporinb Forward: CAGCACCAGAAGGTTTCCAT 152 bpReverse: CTTGCAGGTTTGACCCAGAT
Gamma tubulinb Forward: CTCGAACATGGAATCAGCAA 144 bpReverse: AATAACCCTCGGCTCCAAGT
Cyclophilinb Forward: AATGAACGGTGAGGGACAT 139 bpReverse: GACACAGATCAGAGCCACCA
Table 1 Primer pairs oftarget and reference genesused for RT-qPCR
a Reference genesused in this studyb Reference genes testedwith geNorm, but not usedin this study fornormalization
140 Plant Soil (2010) 334:137–150

following manufacturer’s instructions. The kit isdesigned for directional insertion of blunt end PCRproducts into the vector and high levels of inducibleprotein production. Amplification was performed withthe proofreading Pfu DNA polymerase (Stratagene, LaJolla, CA, USA) to generate error-free blunt end PCRproducts. The primers for amplification of the forma-midase ORF were: CACC ATG GCA CCA CAA ACTCCA AAA (forward), and TCA TTG TGT AGC ACTAAGATT C (reverse). Transformants were analyzed bycolony PCR, and by NheI and SacI double digest toconfirm the presence of the insert in the plasmidpET200. Sequencing was used to confirm error-freeamplification and correct insertion into the vector.
Protein expression and purification
Expression of recombinant formamidase in BL21Star™ (DE3) E. coli was done following theInvitrogen protocol. In short, pET200/D-TOPOplasmid was used for transformation of BL21 Star™(DE3) One Shot® cells. Transformed BL21 Star™(DE3) cells were grown in LB medium, andexpression of formamidase was induced with IPTG(final concentration of 1 mM). Cultures withoutIPTG induction with (for repression of proteinexpression) and without added glucose were grownas controls. Cultures were incubated at 37°C withshaking for 4 h.
The recombinant formamidase protein was isolatedvia its N-terminal His-tag, using the MagneHistm
Protein purification system (Promega, Madison, WI,USA), following manufacturer’s instructions. This kitcontains all reagents needed for cell lysis, proteinbinding, washing and elution. The concentration ofpurified protein was determined via Bradford assay(Bradford 1976).
Total protein for crude extract measurements wasisolated using the P-PER protein isolation kit(Pierce, Rockford, IL, USA). Proteoid roots fromwhite lupin grown without N were collected 21DAE (days after emergence). About 500 mg offresh tissue were lysed in a mesh bag; extracts wereprepared according to manufacturer’s instructionswith the following modification: 50 μl proteaseinhibitor cocktail (EDTA-free; Pierce, Rockford, IL)and 0.2 mM PMSF (prepared freshly on the day ofextraction) were added. The nuclear protein extractwas then stored at −70°C.
Growth of E. coli overexpressing LaFmdon formamide as only N-source
M9 minimal medium (Sambrook and Russell 2001) wasused to test the ability of BL21 Star™ (DE3) cellsoverexpressing recombinant LaFmd to use formamideas only N source. IPTG-induced BL21 Star™ (DE3)overexpressing LaFmd or vector control (inserted LacZgene; provided with pT200 kit, Invitrogen) were platedon M9 medium containing 50 mg/ml kanamycin andeither 0.1% NH4Cl (regular M9 medium) or 0.1%formamide (modified M9 medium) as only N-source.Colony size was analyzed visually after 2 days ofincubation at 37°C.
Formamidase enzyme assay
An enzyme assay for formamidase activity was usedas described by (Skouloubris et al. 1997); the assaywas performed in the dark to avoid a rapid photo-chemical side reaction that interferes with the assay(Gravitz and Gleye 1975). In essence, 10–50 µl ofpurified protein or 50 µl crude extract were added to200 µl formamide in substrate solution of differentconcentrations, ranging from 1 mM to 600 mM, inPEB (PEB = 100 mM Phosphate buffer pH 7.4,10 mM EDTA). The reaction mixture was incubatedat 30°C for 30 min. 400 µl of phenol-nitroprusside(Sigma, St. Louis, MO, USA) and 400 µl of alkalinehypochlorite solution (Sigma, St. Louis, MO) wereadded to the sample. Samples were incubated at 50°Cfor 6 min, and absorbance was measured at 625 nm.The amount of ammonia was determined with thehelp of a standard curve (Skouloubris et al. 1997). Forthe standard curve, known amounts of NH4Cl wereadded to hypochlorite solution. The standard curvesamples were treated as the reaction samples, with theexception that incubation at 30°C was shortened to10 min, as dissociation did not change further withprolonged incubation.
Characterization of formamidase
Enzyme activity was measured at different concen-trations of formamide, propionamide, and nicotin-amide, respectively, and the Vmax and Km werecalculated, using the program EnzFitter (Biosoft,Cambridge, United Kingdom). To determine thetemperature and pH optima of formamidase, the
Plant Soil (2010) 334:137–150 141
enzyme was mixed with formamide in saturatedsubstrate concentration and incubated at varioustemperatures and pH, respectively.
Results
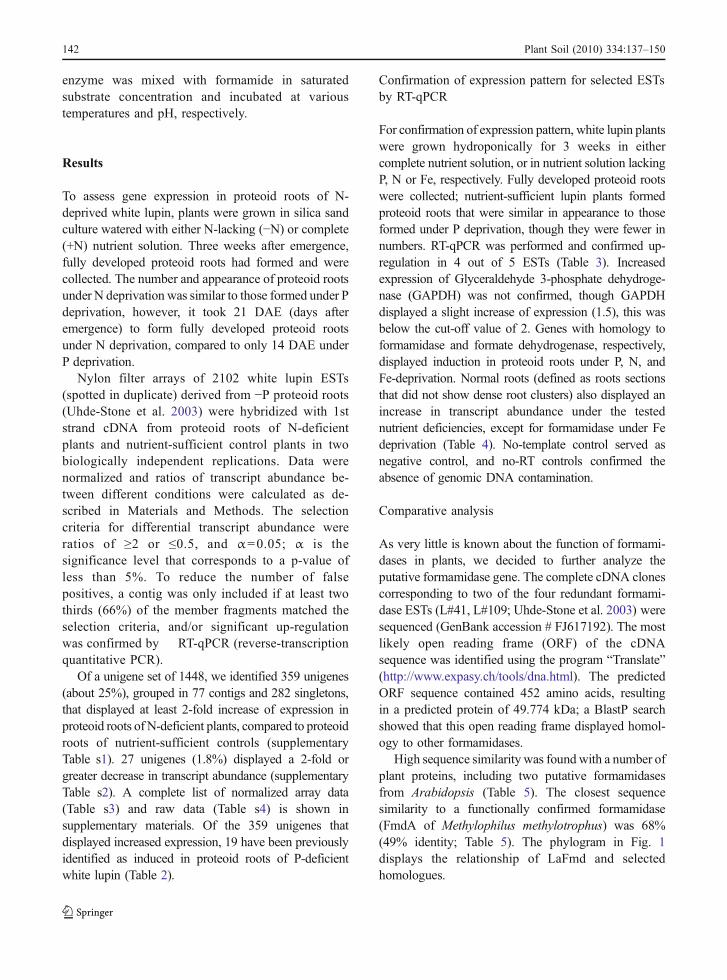
To assess gene expression in proteoid roots of N-deprived white lupin, plants were grown in silica sandculture watered with either N-lacking (−N) or complete(+N) nutrient solution. Three weeks after emergence,fully developed proteoid roots had formed and werecollected. The number and appearance of proteoid rootsunder N deprivation was similar to those formed under Pdeprivation, however, it took 21 DAE (days afteremergence) to form fully developed proteoid rootsunder N deprivation, compared to only 14 DAE underP deprivation.
Nylon filter arrays of 2102 white lupin ESTs(spotted in duplicate) derived from −P proteoid roots(Uhde-Stone et al. 2003) were hybridized with 1ststrand cDNA from proteoid roots of N-deficientplants and nutrient-sufficient control plants in twobiologically independent replications. Data werenormalized and ratios of transcript abundance be-tween different conditions were calculated as de-scribed in Materials and Methods. The selectioncriteria for differential transcript abundance wereratios of ≥2 or ≤0.5, and α=0.05; α is thesignificance level that corresponds to a p-value ofless than 5%. To reduce the number of falsepositives, a contig was only included if at least twothirds (66%) of the member fragments matched theselection criteria, and/or significant up-regulationwas confirmed by RT-qPCR (reverse-transcriptionquantitative PCR).
Of a unigene set of 1448, we identified 359 unigenes(about 25%), grouped in 77 contigs and 282 singletons,that displayed at least 2-fold increase of expression inproteoid roots of N-deficient plants, compared to proteoidroots of nutrient-sufficient controls (supplementaryTable s1). 27 unigenes (1.8%) displayed a 2-fold orgreater decrease in transcript abundance (supplementaryTable s2). A complete list of normalized array data(Table s3) and raw data (Table s4) is shown insupplementary materials. Of the 359 unigenes thatdisplayed increased expression, 19 have been previouslyidentified as induced in proteoid roots of P-deficientwhite lupin (Table 2).
Confirmation of expression pattern for selected ESTsby RT-qPCR
For confirmation of expression pattern, white lupin plantswere grown hydroponically for 3 weeks in eithercomplete nutrient solution, or in nutrient solution lackingP, N or Fe, respectively. Fully developed proteoid rootswere collected; nutrient-sufficient lupin plants formedproteoid roots that were similar in appearance to thoseformed under P deprivation, though they were fewer innumbers. RT-qPCR was performed and confirmed up-regulation in 4 out of 5 ESTs (Table 3). Increasedexpression of Glyceraldehyde 3-phosphate dehydroge-nase (GAPDH) was not confirmed, though GAPDHdisplayed a slight increase of expression (1.5), this wasbelow the cut-off value of 2. Genes with homology toformamidase and formate dehydrogenase, respectively,displayed induction in proteoid roots under P, N, andFe-deprivation. Normal roots (defined as roots sectionsthat did not show dense root clusters) also displayed anincrease in transcript abundance under the testednutrient deficiencies, except for formamidase under Fedeprivation (Table 4). No-template control served asnegative control, and no-RT controls confirmed theabsence of genomic DNA contamination.
Comparative analysis
As very little is known about the function of formami-dases in plants, we decided to further analyze theputative formamidase gene. The complete cDNA clonescorresponding to two of the four redundant formami-dase ESTs (L#41, L#109; Uhde-Stone et al. 2003) weresequenced (GenBank accession # FJ617192). The mostlikely open reading frame (ORF) of the cDNAsequence was identified using the program “Translate”(http://www.expasy.ch/tools/dna.html). The predictedORF sequence contained 452 amino acids, resultingin a predicted protein of 49.774 kDa; a BlastP searchshowed that this open reading frame displayed homol-ogy to other formamidases.
High sequence similarity was found with a number ofplant proteins, including two putative formamidasesfrom Arabidopsis (Table 5). The closest sequencesimilarity to a functionally confirmed formamidase(FmdA of Methylophilus methylotrophus) was 68%(49% identity; Table 5). The phylogram in Fig. 1displays the relationship of LaFmd and selectedhomologues.
142 Plant Soil (2010) 334:137–150

A Blastn search with the LaFmd sequenceagainst the Arabidopsis genome at TAIR (www.arabidopsis.org) and the rice genome at Rice Ge-nome Annotation (http://rice.plantbiology.msu.edu),respectively, identified a total of 2 formamidasehomologues in the Arabidopsis genome located intandem (AT4G37550, AT4G37560), both annotatedas putative formamidases, and 2 homologues in theOryza sativa genome (Os01g076490, annotated asputative formamidase, and LOC_Os01g55950, an-notated as putative acetamidase).
As LaFmd displayed high sequence similarity to bothputative formamidases in Arabidopsis, we assessed theexpression of both Arabidopsis homologues via elec-
tronic northern, using Genevestigator (https://www.genevestigator.ethz.ch/gvs/index.jsp). Arabidopsishomologue At4g37550 displayed 3-fold higher,At4g37560 15-fold higher transcript abundance inleaves than in roots, and both homologues did not showany induction under P or N deprivation. We werefurther interested in assessing formamidase homologuesin Medicago truncatula, as this legume is more closelyrelated to white lupin. We searched the M. truncatulagene index (MtGI; http://compbio.dfci.harvard.edu/tgi)for ESTs with homology to LaFmd, and identified atentative consensus (TC123775) of 29 ESTs (84%identity, 92% similarity). An electronic northern usingthe expression report tool of MtGI revealed relatively
Table 2 ESTs that show an at least 2-fold induction in proteoid roots under N deprivation, and have been previously identified as 2-fold ormore induced in −P proteoid roots, compared to +P normal roots (Uhde-Stone et al. 2003)
Identifier/ GenBankaccession
Annotationa E-value Possible function Ratio proteoidroot −N/+N
p-value
L#470/ CA410203 Glyceraldehyde-3P-dehydrogenase(NAD)
1E-28 Glycolysis 15.2 2E-7
L#471/ CA410204 LaMATE 0 Transport of smallorganic molecules
10.6 0.008
L#350/ CA410092 Fructose-biphosphate aldolase,cytoplasmic
5E-44 Glycolysis 9.9 2E-5
L#315/ CA410054 Unknown 2E-11 5.9 2E-5
L#626/ CA410354 Malate dehydrogenase 9E-59 Organic acidmetabolism
5.1 8E-7
L#374/ CA410116 Cytochrome P450/ferrulate-5-hydroxylase
5E-28 Flavonoidbiosynthesis
5.1 2E-5
L#33/ CA410080 Phosphoglycerate kinase,cytosolic
3E-33 Glycolysis 4.9 6E-7
E#711/CA411412 Unknown 6E-58 4.1 6E-5
L#103/ CA840666 Phosphofructokinasefamily protein
5E-14 Glycolysis 3.8 9E-4
L#197/ CA409931 Sucrose synthase 8E-55 Sugar metabolism;signaling
3.3 5E-4
E#81/CA410808 Putative senescence-associatedprotein
2E-26 Unknown 3.3 2E-4
L#65/ CA410389 Unknown 9E-14 2.7 8E-4
L#723/ CA410456 Xyloglucan endo-1,4-beta-D-glucanase
1E-31 Root hair development 2.7 4E-4
L#771/ CA410506 Malate synthase,glyoxysomal
1E-38 Glyoxysomal pathway 2.4 3E-3
L#1098/ CA409560 Triosephosphateisomerase cytosolic
4E-56 Glycolysis 2.3 1E-3
E#241/CA410959 2,3-bisphosphoglycerate-independentphosphoglycerate mutase
1E-34 Glycolysis 2.9 6E-5
L#41/ CA410157 Formamidase-like protein 1E-81 Conversion offormamide
2.3 4E-4
L#218/ CA409954 Formate dehydrogenase,NAD
8E-55 Anaerobicmetabolism
2.1 6E-3
L#210/ CA409946 Calcium binding protein 6E-21 Signal transduction 2.0 1E-3
a BlastX search October 2009
Plant Soil (2010) 334:137–150 143

low transcript abundance of the corresponding gene inP-starved roots (0.04% of total library) and leaves(0.01% of total library). Highest expression was foundin virus-infected leaves and aphid-infected stems (eachrepresenting 0.06% of total library).
Computational analysis using the tool WoLF PSORT(Horton et al. 2007) indicated that LaFmd and its closehomologue in Vitis vinifera (CAN78133.1) are likelylocalized in the cytosol. WoLF PSORT analysis wasinconclusive in regard to cellular localization predictionof the Arabidopsis, M. truncatula and O. sativaformamidase homologues. ChloroP (Emanuelsson etal. 1999) predicted no chloroplast signal for any of theanalyzed plant formamidase homologues. MitoProt II(Claros and Vincens 1996) predicted putative mitochon-drial signal peptides for the M. truncatula homologue,as well as for one of the two Arabidopsis homologues(At4G37550).
Expression and purification of recombinantformamidase
Computational analysis had identified many formami-dase homologues in plants, but a literature searchrevealed no evidence for functional characterization ofany plant formamidase. In order to confirm formami-dase activity of LaFmd, the LaFmd ORF was amplifiedfrom the cDNA clone corresponding to EST L#109(Uhde-Stone et al. 2003), cloned into an expressionvector containing an N-terminal His tag (pET200/D-TOPO), and overexpressed in E. coli. The purifiedformamidase was detected on an SDS-PAGE after
induction with IPTG, while no or only minimalexpression was seen in the uninduced sample (Fig. 2).The SDS-PAGE indicated a molecular weight of therecombinant formamidase (including the His-tag) ofabout 52 kDa.
Growth of E. coli overexpressing LaFmdon formamide as only N-source
E. coli overexpressing recombinant LaFmd weregrown on 0.1% formamide as only N source as aninitial test for formamidase activity. E. coli strainBL21 Star™ (DE3) overexpressing LaFmd was ableto grow on selective medium containing formamideas only N source, while E. coli BL21 Star™ carryinga vector control (expressing lacZ instead of LaFmd)displayed only marginal growth (Fig. 3). As control,both strains were grown on minimal mediumcontaining 0.1% NH4Cl as only N source, resultingin similar colony size (data not shown).
Formamidase activity assay
Formamidase activity of LaFmd was further assessedusing an ammonium assay (Skouloubris et al. 1997);enzyme characteristics are shown in Fig. 4. A Km of71±15 mM was determined for the substrate form-amide for the recombinant formamidase (Fig. 4a, b).To confirm that this is truly the Km of native LaFmd,and not an artifact of heterologous expression of arecombinant protein, we tested formamidase activityin protein crude extract from proteoid roots of N-deprived white lupin. These measurements indicate a
Table 4 Assessment of relative transcript abundance by RT-qPCR analysis of formamidase and formate dehydrogenase in−P proteoid roots, compared to +P proteoid roots, and in −P,−N and −Fe normal roots, compared to nutrient-sufficientnormal roots
Annotation Proteoidroot foldchange
Normalroot foldchange
Normalroot foldchange
Normalroot foldchange
−P/+P1 −P/+P1 −N/+N1 −Fe/+Fe1
Formamidase 19.7±0.5 2.6±0.6 6±0.5 1±0.1
Formatedehydrogenase
3±2.5 3.2±0.5 7±1 2.5±0.1
1 Shown are averages of three experimental replications ± SEMof a representative from at least two biological replications
Table 3 RT-qPCR validation of selected ESTs that showed atleast 2-fold induction in proteoid roots under −N (this study)and −P (Uhde-Stone et al. 2003)
Identifier Annotation Proteoid rootfold change−N1
Proteoid rootfold change−Fe1
L#197 Sucrose synthase 3.4±0.8 4±0.3
L#470 Glyceraldehyde-3P dehydrogenase
1.5±0.1 1.7±0.2
L#41 Formamidase 72.3±7.3 39.8±1.8
L#218 Formatedehydrogenase
35±4.4 32±0.5
L#315 Unknown 3.2±0.7 2.7±0.1
1 Shown are mean-normalized expressions of three experimen-tal replications ± SEM (standard error of the mean) of arepresentative from at least two biological replications
144 Plant Soil (2010) 334:137–150

Km of 56±7 mM (Fig. 4b, c), which falls within thesame range as that determined for the recombinantenzyme. Two additional potential substrates, propiona-mide and nicotinamide were tested, and displayed Km
values of about 120 mM for propionamide, and noactivity for nicotinamide. The enzyme activity usingformamide as substrate was measured at differenttemperatures (namely 20°C, 30°C, 40°C, 50°C, 60°Cand 70°C). The optimum temperature was identified tobe in the 30°C to 50°C range for recombinantformamidase (Fig. 4e). To confirm this result and tonarrow down the optimal temperature range, totalprotein crude extract was tested at 35°C, 40°C, 45°C(data not shown) and displayed optimal formamidaseactivity between 35°C and 45°C. The formamidaseactivity was further tested at different pH, namely pH 6,7, 8 and 9. The enzyme was found to be active in the pH6–9 range; the maximum enzyme activity was obtainedbetween pH 6 and pH 8 (Fig. 4f).
Discussion
In this report, we have advanced our understanding ofwhite lupin proteoid root responses to nutrientdeficiencies by (a) identifying genes induced in
proteoid roots under both −P and −N deprivation,and b) cloning and overexpression of the LaFmdgene, which displayed increased transcript abundancein proteoid roots under −N, −P, and −Fe, andpurification and functional characterization of theencoded protein.
The number of genes showing increased expres-sion in this study is much higher than what has beenfound previously in a microarray study of chronic N-deficient Arabidopsis by Bi et al. (2007), whoidentified 271 genes (about 1%) showing increasedand 190 genes (about 0.7%) showing decreasedexpression, compared to nutrient-sufficient plants.The higher number of genes displaying increasedexpression, and the relatively low number of genesshowing reduced expression in our study may beexplained by the focus of this study on proteoid roots,and the source of cDNA used as probes (spotted onthe arrays), as these were isolated from −P proteoidroots, and were thus enriched for genes with increasedexpression in nutrient-stressed proteoid roots.
The LaMATE gene was found among the 10 mosthighly expressed unigenes in this study. As LaMATEhas been previously identified as being induced inproteoid roots under various nutrient deficiencies(Uhde-Stone et al. 2005), LaMATE can be regarded
Table 5 Selected homologues of LaFmd
GenBank accession # Sequence identity/similarity
Annotation Organism
CAN78133.1 88%/95% Hypothetical protein Vitis vinifera (grapevine)
NP_568029.1 82%/90% Formamidase, putative Arabidopsis At4G37560
ACF87318.1 79%/90% Unknown Zea mays
NP_001044346.1 79%/90% – Oryza sativa Os01g0764900
NP_568028.1 81%/90% Formamidase, putative Arabidopsis AT4G37550
ABK21753 73%/83% Unknown Picea sitchensis (Sitka spruce)
XP_001699344.1 75%/84% Formamidase Chlamydomonas reinhardtii (greenalga)
XP_001775936.1 73%/85% Predicted protein Physcomitrella patens (moss)
YP_001520245.1 58%/73% Formamidase Acaryochloris marina(Cyanobacterium)
YP_475820.1 58%/73% Acetamidase/formamidase family protein Synechococcus sp.(Cyanobacterium)
YP_001832114.1 55%/69% Formamidase Beijerinckia indica(Proteobacterium)
sp|Q50228|FMDA_METME
49%/68% Formamidase FmdA (Silman et al. 1991;Wyborn et al. 1996)
Methylophilus methylotrophus(Proteobacterium)
AFUA_2G02020 51%/61% Formamidase FmdS Aspergillus fumigatus (Fungus)
Plant Soil (2010) 334:137–150 145

as a positive control to assess if the nylon filter arraydetects differential transcript abundance. 9 out of 10members of the LaMATE contig displayed relativeexpression ratios above 2, and thus confirmed thearray analysis. The fact that one member of theLaMATE contig was not revealed by the array ashaving differential transcript abundance, however,
indicates the existence of false negatives. This couldbe due to low amplification of individual cDNAs orcDNA degradation before or during spotting.
We compared the 359 unigenes identified as inducedunder −N with ESTs previously identified as induced in
Fig. 3 E.coli BL21 StarTM (DE3) cells overexpressing LaFmddisplayed growth, visible as colonies (left), compared to E.coliBL21 StarTM (DE3) control, expressing the lacZ gene (right),when grown on M9 minimal medium with formamide as onlyN source
Fig. 2 SDS PAGE displaying a protein of correct size (about∼52 kD) after IPTG induction. In contrast, no purified proteinwas obtained from uninduced culture (–IPTG)
LaFMD
Vitis_vinifera
M_truncatula_TC123775
Arabidopsis_At4G37560
Arabidopsis_AtG37550
Zea_mays
Oryza_sativa
Picea_sitchensis
Chlamydomonas_reinhardtii
Physcomitrella_patens
FmdA_Methylophilus
Beijerinckia
Acaryochloris_marina
Synechococcus
FmdS_Aspergillus
AmiF_Helicobacter
0.1
Phylogenetic tree
Fig. 1 Phylogram of deduced amino-acid sequences from selected formamidase genes and functionally uncharacterized homologues. Thephylogram was derived using the CLUSTALW program at the European Bioinformatics Institute (EBI; http://www.ebi.ac.uk/clustalw)
146 Plant Soil (2010) 334:137–150

proteoid roots of P deficient white lupin (Uhde-Stone etal. 2003). 19 out of the 35 unigenes (54%) previouslyidentified as induced in −P proteoid roots were alsoinduced in proteoid roots under N deprivation. Thislarge overlap of genes differentially expressed inproteoid roots under N and P deprivation indicatesthat a large number of genes involved in proteoid rootfunction may not be specific to a particular nutrientstress. This conclusion is further supported by thefinding that 4 out of 5 genes analyzed by RT-qPCR
displayed increased expression in proteoid roots notonly under −N, but also under −Fe (Table 3).
Based on homology comparison, 9/19 genes (47%)that displayed increased expression in proteoid rootsof both −N and −P plants are involved in carbonmetabolism. The finding that sucrose synthase dis-played an increase in expression in proteoid rootsunder N, P and Fe deprivation is of special interest, assugar signaling has been shown to mediate plantresponses to −N, −P, and possibly other biotic stresses
100
200
300
400
500
600
700
0.001
0.002
0.003
0.004
0.005
0.006
0.007
00.010.020.030.040.050.060.070.080.09
0 40 80 120 160 200Formamide concentration (mM)S
pec
ific
act
ivit
y (µ
mo
le/(
min
*mg
)
0
10
20
30
40
50
0 0.01 0.02 0.03 0.04 0.05 0.061/Formamide concentration (1/mM)1/
Sp
ecif
ic a
ctiv
ity
(min
*mg
/µm
ole
)
BA
DC
0
100
0 0.02 0.04 0.06
1/Formamide concentration (1/mM)
00 100 200 300 400
Formamide concentration (mM)Sec
ific
act
ivit
y (µ
mo
le/(
min
*mg
)
1/S
pec
ifiic
act
ivit
y (m
in*m
g/µ
mo
le)
00.010.020.030.040.050.060.070.080.09
5 6 7 8 9 10pHS
pec
ific
act
ivit
y (µ
mo
le/(
min
*mg
)
00.020.040.060.080.1
0.120.140.16
0 20 40 60 80Temperature oCS
pec
ific
act
ivit
y (µ
mo
le/(
min
*mg
)
FE
Fig. 4 Enzyme kinetics of recombinant LaFmd expressed in E.coli (a, b) and in total protein crude extract of L. albus proteoidroots (c, d), calculated using the program EnzFitter. a–d displayresults of 3 independent replications e. Determination of
temperature optimum and f. pH optimum for recombinantLaFmd. Formamide was used as substrate (a–f). E and F showrepresentative measurements of 2 independent replications
Plant Soil (2010) 334:137–150 147

(Hammond and White 2008; Liu et al. 2005; Price etal. 2004), and has been demonstrated to be involvedin the formation of proteoid roots (Zhou et al. 2008).In addition, several enzymes involved in glycolysisdisplayed increased expression under both N and Pstress, possibly as a result of the higher sugarallocation to nutrient-stressed roots, and the organicacid excretion observed in proteoid roots in responseto nutrient deficiencies. Other genes that may havemore specific functions in Pi acquisition and uptake,such as acid phosphatases and Pi transporter, wereonly induced in proteoid roots of P-deficient, but notof N-deprived plants. Interestingly, genes with ho-mology to formamidase and formate dehydrogenase,two enzymes possibly acting in the same metabolicpathway, were both induced in proteoid roots under P,N and Fe deprivation.
The enzymatic activity of formamidases has beencharacterized in bacteria and fungi, but (to our knowl-edge) not in plants. Thus, we focused on the character-ization of formamidase (LaFmd). Computational analysisrevealed highest expression of formamidase homologuesin Arabidopsis and M. truncatula in pathogen-infectedshoots, while LaFmd expression in leaves of whitelupin. has previously been shown to be below detection(Uhde-Stone et al. 2003). These strikingly differenttranscript accumulation patterns in M. truncatula andArabidopsis, compared to LaFmd, may indicate differ-ent roles of the corresponding proteins.
SDS-PAGE indicated a molecular weight of about52 KDa (including the His-tag), which correlates tothe predicted molecular weight of ∼49.8 kDa(Expasy) of the native protein. In comparison,molecular weights of formamidases in other speciesare 44.5 kDa for FmdA in Methylophilus metophilus(Wyborn et al. 1996), 44 kDa for FmdS in Aspergillusnidulans (Hynes 1975) and ∼37 kDa for AmiF inHelicobacter pylori (Skouloubris et al. 2001). Com-pared to most fungal and bacterial formamidases, thepredicted molecular weights of putative formamidasesin plants, algae and cyanobacteria are generally larger,due to additional sequences at the C-terminus.
LaFmd had a high Km of about 71±15 mMmeasured for the recombinant protein. Kineticmeasurements using protein crude extract resultedin a Km of within the same range (56±7 mM),indicating that the high Km value is not an artifactcaused by the His-tag, or the expression in aheterologous system. In comparison, the Km value
for the substrate formamide was 2.1 mM for FmdF inM. metophilus (Silman et al. 1991), and 32 mM forAmiF in Helicobacter pylori (Skouloubris et al.2001). The biochemical properties of similar ami-dases have been described in a number of bacteria(Fournand and Arnaud 2001), including Pseudomo-nas, Rhodococcus, Mycobacterium, Bacillus andBrevibacterium, and most expressed much higheractivities with short-chain aliphatic amides than withformamide. Thus, we tested the short-chain amidepropionamide as possible substrate for LaFmd,however, this resulted in an even higher Km of120 mM, indicating that short-chain amides are not alikely substrate. Of course, the possibility remainsthat LaFmd prefers yet another substrate that wehave not identified. Despite the high Km, the fact thatE. coli overexpressing LaFmd gained the ability togrow on formamide as only N-source confirmedformamidase activity of LaFmd.
Formamidase catalyzes the conversion of formamideto formate and ammonia. The up-regulation of theformamidase gene under −N deprivation suggests thatformamidase is involved in providing an alternativesource of N in form of ammonia cleaved off fromformamide and possibly other substrates. Formamidehas been shown to be a degradation product of bothhistidine and cyanide in various microorganisms (Ferberet al. 1988; Kunz et al. 1994). It has been speculatedthat formamidase may play a role in detoxification ofcyanides in plants (Fraser et al. 2001).
The up-regulation of LaFmd under P and Fedeprivation is difficult to explain. Formamidase activityproduces formate, a major C1 unit source (Cossins andChen 1997). Formate can be further metabolized by theenzyme formate dehydrogenase. Interestingly, we alsoidentified a putative formate dehydrogenase (FDH) asup-regulated in proteoid roots under P, N, and Fedeprivation. FDH catalyzes oxidation of formate toCO2, and is thought to play a role in anaerobicrespiration (Suzuki et al. 1998). Fe deprivation, astress that mimics anaerobiosis due to the central roleof Fe in many redox-active enzymes of the respiratorychain, has been shown to induce the accumulation ofFDH transcripts in barley roots (Suzuki et al. 1998).
To further elucidate the role of formamidase andformate dehydrogenase in white lupin’s adaptation toP, N, and Fe deprivation, we are currently generatingRNAi-based mutants. In addition, we have sequencedthe formamidase promoter, and are using promoter::
148 Plant Soil (2010) 334:137–150

reporter gene fusions and electrophoretic mobilityshift assays to assess regulatory cis-acting elements ofthis nutrient stress-responsive gene.
Acknowledgements Funding for this project has been pro-vided by the National Institutes of Health MBRS-Score GrantSO6 GM48135. The authors wish to thank the 2008 FunctionalGenomics class at California State University East Bay for theirhelp in RT-qPCR confirmation of selected genes, and ChrisBaysdorfer (Department of Biological Sciences, CSU East Bay)for critical reading of the manuscript.
References
Bi Y, Wang R, Zhu T, Rothstein S (2007) Global transcriptionprofiling reveals differential responses to chronic nitrogenstress and putative nitrogen regulatory components inArabidopsis. BMC Genom 8:281
Bradford M (1976) A rapid and sensitive method for thequantitation of microgram quantities of protein utilizing theprinciple of protein-dye binding. Anal Biochem 72:248–254
Calderon-Vazquez C, Ibarra-Laclette E, Caballero-Perez J,Herrera-Estrella L (2008) Transcript profiling of Zea maysroots reveals gene responses to phosphate deficiency at theplant- and species-specific levels. J Exp Bot 59:2479–2497
Claros MG, Vincens P (1996) Computational method to predictmitochondrially imported proteins and their targetingsequences. Eur J Biochem 241:779–786
Cossins E, Chen L (1997) Folates and one-carbon metabolismin plants and fungi. J Phytochem 45:437–452
Dinkelaker B, Hengeler C and Marschner H 1995 Distributionand function of proteoid roots and other root clusters. BotActa 183–200
Dudoit S, Yang Y, Callow M, Speed T (2002) Statistical methodsfor identifying differentially expressed genes in replicatedcDNA microarray experiments. Stat Sin 12:111–140
EmanuelssonO,Nielsen H, von Heijne G (1999) ChloroP, a neuralnetwork-based method for predicting chloroplast transitpeptides and their cleavage sites. Prot Sci 8:978–984
Ferber D, Khambaty F, ELY B (1988) Utilization of histidineby Caulobacter crescentus. J Gen Microbiol 134:2149
Fournand D, Arnaud A (2001) Aliphatic and enantioselectiveamidases: from hydrolysis to acyl transfer activity. J ApplMicrobiol 91:381–393
Fraser J, Davis M, Hynes M (2001) The formamidase gene ofAspergillus nidulans: regulation by nitrogen metaboliterepression and transcriptional interference by an over-lapping upstream gene. Genetics 157:119–131
Gilbert G, Knight J, Vance C, Allan D (1999) Acid phosphataseactivity in phosphorus-deficient white lupin roots. PlantCell Environ 22:801–810
Gravitz N, Gleye L (1975) A photochemical side reaction thatinterferes with the phenolhypochlorite assay for ammonia.Limno Oceanogr 20:1015–1017
Hagström J, James W, Skene K (2001) A comparison ofstructure, development and function in cluster roots ofLupinus albus L. under phosphate and iron stress. PlantSoil 232:81–90
Hammond J, White P (2008) Sucrose transport in the phloem:integrating root responses to phosphorus starvation. J ExpBot 59:93–109
Horton P, Park K, Obayashi T, Fujita N, Harada H, Adams-Collier C, Nakai K (2007) WoLF PSORT: proteinlocalization predictor. Nucleic Acids Res 35:W585–587
Hynes M (1975) Amide utilization in Aspergillus nidulans:evidence for a third amidase enzyme. J Gen Microbiol91:99–109
Johnson J, Allan D, Vance C, Weiblen G (1996a) Root carbondioxide fixation by phosphorus-deficient Lupinus albus.Plant Physiol 112:19–30
Johnson J, Vance C, Allan D (1996b) Phosphorus deficiency inLupinus albus. Altered lateral root development andenhanced expression of phosphoenolpyruvate carboxylase.Plant Physiol 112:31–41
Kunz D, Wang C, Chen J (1994) Alternative routes of enzymiccyanide metabolism in Pseudomonas fluorescens NCIMB11764. Microbiol 140:1705–1712
Lamont B (2003) Structure, ecology and physiology of rootclusters – a review. Plant Soil 248:1–19
Liu J, Uhde-Stone C, Li A, Vance C, Allan D (2001) Aphosphate transporter with enhanced expression in pro-teoid roots of white lupin (Lupinus albus L.). Plant Soil237:257–266
Liu J, Samac D, Bucciarelli B, Allan D, Vance C (2005)Signaling of phosphorus deficiency-induced gene expres-sion in white lupin requires sugar and phloem transport.Plant J 41:257–268
Lu P, Zhang F (1995) Mechanism of manganese toxicityinduced by P-or Fe-deficiency in Lupinus albus L. ActaPhyt Sin 21:289–294
Marschner H (1995) Mineral nutrition of higher plants.Academic Press Inc, San Diego
Massonneau A, Langlade N, Léon S, Smutny J, Vogt E, NeumannG, Martinoia E (2001) Metabolic changes associated withcluster root development in white lupin (Lupinus albus L.):relationship between organic acid excretion, sucrose metab-olism and energy status. Planta 213:534–542
Miller S, Liu J, Allan D, Menzhuber C, Fedorova M, VanceC (2001) Molecular control of acid phosphatasesecretion into the rhizosphere of proteoid roots fromphosphorus-stressed white lupin. Plant Physiol127:594–606
Misson J, Raghothama K, Jain A, Jouhet J, Block M, Bligny R,Ortet P, Creff A, Somerville S, Rolland N, Doumas P,Nacry P, Herrerra-Estrella L, Nussaume L, Thibaud M(2005) A genome-wide transcriptional analysis usingArabidopsis thaliana Affymetrix gene chips determinedplant responses to phosphate deprivation. Proc Natl AcadSci USA 102:11934–11939
Ness S (2007) Microarray analysis: basic strategies forsuccessful experiments. Mol Biotech 36:205–219
Neumann G, Martinoia E (2002) Cluster roots – an under-ground adaptation for survival in extreme environments.Trens Plant Sci 7:162–167
Neumann G, Römheld V (1999) Root excretion of carboxylicacids and protons in phosphorus-deficient plants. J PlantNutr 211:121–130
O’Rourke J, Nelson R, Grant D, Schmutz J, Grimwood J,Cannon S, Vance C, Graham M, Shoemaker R (2009)
Plant Soil (2010) 334:137–150 149

Integrating microarray analysis and the soybean genome tounderstand the soybeans iron deficiency response. BMCGenom 10:376
Orzack S, Gladstone J (1994) Quantitative genetics of sex ratiotraits in the parasitic wasp, Nasonia vitripennis. Genetics137:211–220
Peñaloza E, Corcuera L, Martinez J (2002) Spatial andtemporal variation in citrate and malate exudation andtissue concentration as affected by P stress in roots ofwhite lupin. Plant Soil 241:209–221
Price J, Laxmi A, St Martin S, Jang J (2004) Globaltranscription profiling reveals multiple sugar signal trans-duction mechanisms in Arabidopsis. Plant Cell 16:2128–2150
Sambrook J, Russell D (2001) Molecular cloning: a laboratorymanual. CSHL press
Sas L, Rengel Z, Tang C (2001) Excess cation uptake, andextrusion of protons and organic acid anions by Lupinusalbus under phosphorus deficiency. Plant Sci 160:1191–1198
Sas L, Rengel Z, Tang C (2002) The effect of nitrogen nutritionon cluster root formation and proton extrusion by Lupinusalbus. Ann Bot 89:435–442
Scheible W, Morcuende R, Czechowski T, Fritz C, Osuna D,Palacios-Rojas N, Schindelasch D, Thimm O, Udvardi M,Stitt M (2004) Genome-wide reprogramming of primaryand secondary metabolism, protein synthesis, cellulargrowth processes, and the regulatory infrastructure ofArabidopsis in response to nitrogen 1. Plant Physiol136:2483–2499
Schulze J, Temple G, Temple S, Beschow H, Vance C (2006)Nitrogen fixation by white lupin under phosphorusdeficiency. Ann Bot 98:731–740
Shane M, Lambers H (2005) Cluster roots: a curiosity incontext. Plant Soil 274:101–125
Silman N, Carver M, Jones C (1991) Directed evolution ofamidase in Methylophilus methylotrophus; purification andproperties of amidases from wild-type and mutant strains.J Gen Microbiol 137:169
Simon P (2003) Q-Gene: processing quantitative real-time RT-PCR data. Bioinformatics 19:1439–1440
Skouloubris S, Labigne A, De Reuse H (1997) Identificationand characterization of an aliphatic amidase in Helico-bacter pylori. Mol Microbiol 25:989–998
Skouloubris S, Labigne A, De Reuse H (2001) The AmiEaliphatic amidase and AmiF formamidase of Helicobacterpylori: natural evolution of two enzyme paralogues. MolMicrobiol 40:596–609
Suzuki K, Itai R, Nakanishi H, Nishizawa N, Yoshimura E,Mori S (1998) Formate dehydrogenase, an enzyme ofanaerobic metabolism, is induced by iron deficiency inbarley roots. Plant Physiol 116:725–732
Thimm O, Essigmann B, Kloska S, Altmann T, Buckhout T(2001) Response of Arabidopsis to iron deficiency stressas revealed by microarray analysis. Plant Physiol127:1030–1043
Uhde-Stone C, Zinn K, Ramirez-Yáñez M, Li A, Vance C,Allan D (2003) Nylon filter arrays reveal differential geneexpression in proteoid roots of white lupin in response tophosphorus deficiency. Plant Physiol 131:1064–1079
Uhde-Stone C, Liu J, Zinn K, Allan D, Vance C (2005)Transgenic proteoid roots of white lupin: a vehicle forcharacterizing and silencing root genes involved inadaptation to P stress. Plant J 44:840–853
Vance C (2001) Symbiotic nitrogen fixation and phosphorusacquisition. Plant nutrition in a world of decliningrenewable resources. Plant Physiol 127:390–397
Vance CP, Uhde-Stone C, Allan DL (2003) Phosphorus acquisi-tion and use: critical adaptations by plants for securing anonrenewable resourse. New Phytol 157:423–447
Vandesompele J, De Preter K, Pattyn F, Poppe B, Van Roy N, DePaepe A, Speleman F (2002) Accurate normalization of real-time quantitative RT-PCR data by geometric averaging ofmultiple internal control genes. Genome Biol 3:0034
Watson M, Dukes J, Abu-Median A, King D, Britton P (2007)DetectiV: visualization, normalization and significancetesting for pathogen-detection microarray data. GenomeBiol 8:R190
Welch R, Graham R (2004) Breeding for micronutrients instaple food crops from a human nutrition perspective. JExp Bot 55:353–364
Wyborn N, Mills J, Williams S, Jones C (1996) Molecularcharacterisation of formamidase from Methylophilus meth-ylotrophus. Eur J Biochem 240:314–322
Zhou K, Yamagishi M, Osaki M, Masuda K (2008) Sugarsignalling mediates cluster root formation and phosphorusstarvation-induced gene expression in white lupin. J ExpBot 59:2749–2756
150 Plant Soil (2010) 334:137–150