Yeast species associated with spontaneous fermentation of ...
Upload
khangminh22Category
view
3download
0
1
Isolation of bacteria and yeast strains from lupin beans
wastewater: assessing lupanine catabolization
Joana Veloso da Silva
Thesis to obtain the Master of Science Degree in
Biotechnology
Supervisors:
Prof. Frederico Castelo Alves Ferreira
Dr. Marisa Andreia Viegas dos Santos
Examination Committee Chairperson: Prof. Ana Cristina Anjinho Madeira Viegas
Supervisor: Prof. Frederico Castelo Alves Ferreira
Members of the Comittee: Dr. Cláudia Sofia Pires Godinho
Dr. Margarida Isabel Rosa Bento Palma
November 2019

2
Preface
The work presented in this thesis was performed at Institute for Bioengineering and Biosciences (iBB) of Instituto Superior Técnico (Lisbon, Portugal) in BioEngineering Research Group (BERG) and Biological Sciences Research Group (BSRG), during the period February-July 2019, under the supervision of Prof. Frederico Castelo Ferreira (BERG-iBB) and guidance of Prof. Isabel Sá-Correia (BSRG-iBB) and Dr. Margarida Isabel Rosa Bento Palma (BSRG-iBB). The work performed in isolation and identification of bacteria and yeast species has been designed by and executed with supervision of Prof. Isabel Sá-Correia and Dr. Margarida Palma. Dr. Margarida Palma was crucial, not only on the design and execution of the work, but on my daily supervision, training and education. The work on isolation and identification of fungi was designed by and executed under supervision of Dr. Marisa Andreia Viegas dos Santos. The analytics in FT-IR, TLC, NMR and enantiomer excess were performed at Faculty of Pharmacy of University of Lisbon (Lisboa, Portugal), under guidance of Prof. Carlos Afonso. The work on this thesis was funded by Fundação para a Ciência e Tecnologia on the scope of the project WaterWorks 2014 ERA-NET ID 278 – Biorg4WasteWaterVal+ (FCT references WaterJPI/0001/2014, WaterJPI/0002/2014 and WaterJPI/0003/2014) and iBB (UID/BIO/04565/2013).
I declare that this document is an original work of my own authorship and that it fulfills all the requirements of the Code of Conduct and Good Practices of the Universidade de Lisboa.

3
Acknowledgements
Quero agradecer ao meu orientador Frederico Ferreira por todo o apoio ao longo deste ano, pela
dedicação, experiência e orientação que me foram transmitidos durante a tese.
À professora Isabel Sá-Correia, pelo interesse no tema da tese, por me ter dado a oportunidade de
desenvolver o trabalho de investigação no seu laboratório e pelos seus sábios conselhos ao longo dos
desenvolvimentos. À Carla Coutinho que participou nos primeiros passos da investigação no laboratório
da professora Isabel, e à Margarida Palma por ter dado apoio e supervisão durante a principal
investigação do trabalho, pela sua amizade, paciência, partilha de conhecimentos, constante ajuda e
total disponibilidade, que foram fulcrais nos desenvolvimentos da tese. Aos restantes membros do
grupo de investigação da professora Isabel, que se mostrou sempre disponível em ajudar em qualquer
situação.
Á Teresa Esteves e à Marisa, pela paciência, dedicação e preocupação com o desenvolvimento da
minha tese. Ao professor Carlos Afonso e à Késsia da Faculdade de Farmácia, que se disponibilizaram
na última fase da tese para ajudar na investigação e compreensão de resultados.
À Ana, que durante o ano sempre me ouviu e me ajudou em tudo aquilo que precisei, sempre
disponível para me dar apoio e em ensinar aquilo que precisava. Ao Flávio, que da mesma forma
sempre se revelou uma pessoa disponível ajudando nos momentos críticos, sempre transmitindo
sabedoria. À Rita e ao resto do grupo de investigação do professor Frederico, que estiveram sempre
presente na resolução de problemas.
Especialmente, um obrigado à minha família que proporcionou que toda esta experiência fosse
possível de acontecer. Ao André, aos meus amigos, aos colegas que levo do mestrado para a minha
vida, e a tudo aquilo que me ensinaram. Foi sem dúvida uma experiência enriquecedora que me fez
crescer enquanto pessoa com tudo o que aprendi e pelas dificuldades ultrapassadas.
Ao projeto WaterWorks 2014 ERA-NET ID 278 – Biorg4WasteWaterVal+, e à Fundação para a
Ciência e Tecnologia (FCT) pelos projetos Water JPI0001/2014, Water JPI0002/2014 e Water
JPI0003/2014. Ao grupo IBB- Institute for Bioengineering and Biosciences (UID/BIO/04565/2019).

4
Abstract
Lupinus albus is known by the commercial potential of their seeds in the food sector, given the high
protein (around 32%) and fiber content (around 16%). Lupin beans are also comprised of quinolizidine
alkaloids (QAs) responsible for a characteristic bitter taste. Hence, to become appropriate for human
consumption, lupin beans require an industrial debittering process to remove QAs, with a huge consume
and discard of water. Lupanine is a QA present in this wastewater at significant concentrations. As a
chiral compound, lupanine can be used to synthesize other added-value alkaloids. Given this, the
identification of novel microorganisms capable of catabolizing lupanine and to reduce chemical oxygen
demand (COD) from lupin beans wastewater (LBW) is a key point in this research. For this aim,
enrichment cultures using LBW or a superficial organic-rich layer formed during summer in LBW were
performed. It was possible to isolate and identify four bacterial (Ochrobactrum anthropi,
Sphingobacterium siyangense, Stenotrophomonas maltophilia, Cellulosimicrobium funkei), two yeasts
(Pichia kudriavzevii, Rhodotorula mucilaginosa) and two filamentous fungal species (Aspergillus
fumigatus, Galactomyces geotrichum). Lupanine-catabolizing capacity was studied in liquid culture
using 1.5 g/L of lupanine. Additionally, microorganisms were grown in sterilized LBW for lupanine and
COD removal studies. The results show that only O. anthropi revealed lupanine removal capacity in
synthetic growth medium (66.7% removal), as well as the highest COD consumption (58.7%) from LBW
culture. Sub-products formation can be further studied, to evaluate if any compound of interest derived
from COD consumption of LBW is formed.
Keywords
Bacteria, bioconversion, enrichment culture, fungi, HPLC, lupin beans wastewater, yeast

5
Resumo
Lupinus albus é conhecido pelo valor nutricional das suas sementes - os tremoços - ricos em
proteína (cerca de 32%) e fibras (cerca 16%). Os tremoços contêm naturalmente alcaloides de
quinolizidina, que em concentrações altas são tóxicos. Assim, antes de consumidos os tremoços são
submetidos a um processo industrial que assegura a remoção destes compostos, envolvendo grande
consumo de água e descarte do efluente gerado. A lupanina é o alcaloide de quinolizidina presente
neste efluente em concentrações significativas. Sendo um composto quiral, a lupanina pode ser usada
para sintetizar outros alcaloides de valor acrescentado. O presente estudo tem como objetivo identificar
novos microrganismos capazes de catabolizar a lupanina e reduzir o conteúdo em matéria orgânica do
efluente gerado. Para este objetivo, foram realizados enriquecimentos em cultura usando como inóculo
amostras de efluente ou de uma camada superficial, rica em matéria orgânica, formada na superfície
deste efluente durante o verão. Foi possível isolar e identificar quatro bactérias (Ochrobactrum anthropi,
Sphingobacterium siyangense, Stenotrophomonas maltophilia, Cellulosimicrobium funkei), duas
leveduras (Pichia kudriavzevii, Rhodotorula mucilaginosa), e dois fungos filamentosos (Aspergillus
fumigatus, Galactomyces geotrichum). A capacidade de catabolizar a lupanina foi estudada em cultura
líquida contendo 1.5 g/L de lupanina. Adicionalmente, os microrganismos foram também cultivados em
efluente estéril. Os resultados mostram que O. anthropi tem a capacidade de catabolizar lupanina, (66.7
% decréscimo de concentração), e reduzir o teor em matéria orgânica no efluente (58.7%). A análise
de subprodutos derivados deste efluente pode ser futuramente estudada, de forma a identificar
compostos de interesse.
Palavras-chave
Água residual de tremoço, bactéria, bioconversão, enriquecimento, fungo, levedura

6
Table of contents
Acknowledgements ............................................................................................................................ 3
Abstract .............................................................................................................................................. 4
Resumo .............................................................................................................................................. 5
List of Tables ...................................................................................................................................... 9
List of Figures ................................................................................................................................... 11
List of Abbreviations ......................................................................................................................... 16
1. Aim of thesis & Research strategy ........................................................................................ 17
1.1. Aim of thesis ...................................................................................................................... 17
1.2. Research strategy.............................................................................................................. 17
2. Introduction ............................................................................................................................ 20
2.1. Lupinus albus ..................................................................................................................... 20
2.1.1. Quinolizidine alkaloids ............................................................................................... 21
2.1.2. Biosynthetic Pathway ................................................................................................. 22
2.1.3. Industrial Debittering Process .................................................................................... 23
2.1.4. Lupanine industrial interest ........................................................................................ 24
2.2 Membrane processes: a focus on Nanofiltration ............................................................... 25
2.2.1. Lupanine Recovery Processes .................................................................................. 27
2.3. Quinolizidine Alkaloid Quantification Methods .................................................................. 28
2.4. Quinolizidine alkaloid conversion processes ..................................................................... 30
2.4.1. Chemical conversion of lupanine in sparteine ........................................................... 31
2.4.2. Biological conversion of lupanine .............................................................................. 32
2.5. Bioreactors for bioconversion processes .......................................................................... 34
2.6. Biorefinery concept ............................................................................................................ 35
3. Materials and Methods .......................................................................................................... 37
3.1. Nanofiltration .................................................................................................................. 37
3.2. Bacteria .............................................................................................................................. 37
3.2.1. Culture enrichments and isolation of pure strains ..................................................... 37
3.2.2. Gram staining, DNA extraction and strain identification by 16S rDNA amplification . 39
3.2.3. Bacteria cultivation in synthetic growth medium ........................................................ 40

7
3.2.4. Bacteria cultivation in lupin beans wastewater .......................................................... 40
3.3. Yeast .................................................................................................................................. 41
3.3.1. Culture enrichment and isolation of pure strains ....................................................... 41
3.3.2. DNA extraction and strain identification by 26S rDNA amplification ......................... 42
3.3.3. Yeast cultivation in synthetic culture medium ............................................................ 43
3.3.4. Yeast cultivation in lupin beans wastewater .............................................................. 44
3.4. Filamentous fungi: a complementary approach ................................................................ 44
3.4.1. Isolation and identification ......................................................................................... 44
3.4.2. Filamentous fungi culture: synthetic culture medium ................................................ 45
3.4.3. Filamentous fungi culture: assessment of using filamentous fungi for lupin beans
wastewater treatment .................................................................................................................... 45
3.5. Determination of lupanine derived-products ...................................................................... 45
3.6. Lupanine quantification by HPLC ...................................................................................... 46
3.7. Chemical Oxygen Demand (COD) measurements ........................................................... 46
3.8. Total reducing sugars determination by colorimetric method (DNS) ................................. 47
4. Results ................................................................................................................................... 48
4.1. Nanofiltration ...................................................................................................................... 48
4.2. Bacteria .............................................................................................................................. 49
4.2.1. Culture enrichments and isolation of pure strains ..................................................... 49
4.2.2. Gram staining, DNA extraction and strain identification by 16S rDNA amplification . 51
4.2.3. Bacteria cultivation in synthetic growth medium ........................................................ 53
4.2.4. Bacteria cultivation in lupin beans wastewater (LBW)............................................... 57
4.3. Yeast .................................................................................................................................. 60
4.3.1. Culture enrichment and isolation of pure strains ....................................................... 60
4.3.2. DNA extraction and strain identification by 26S rDNA amplification ......................... 61
4.3.3. Yeast cultivation in synthetic culture medium ............................................................ 61
4.3.4. Yeast cultivation in lupin beans wastewater (LBW) ................................................... 63
4.4. Filamentous fungi: a complementary approach ................................................................ 65
4.4.1. Isolation and identification ......................................................................................... 65
4.4.2. Growth of isolates in rich mediums............................................................................ 66
4.4.3. Growth of isolates: assessment of using filamentous fungi for lupin beans
wastewater (LBW) treatment ......................................................................................................... 67
4.5. Determination of lupanine derived-products ...................................................................... 69
5. Discussion ............................................................................................................................. 75
5.1. Nanofiltration ...................................................................................................................... 75

8
5.2. Bacteria .............................................................................................................................. 75
5.3. Yeast .................................................................................................................................. 83
5.4. Filamentous fungi .............................................................................................................. 86
6. Conclusion ............................................................................................................................. 89
7. References ................................................................................................................................... 90
Annex ............................................................................................................................................. 104
A. Microbial cultures ................................................................................................................. 104
A1. Filter interference in culture ..................................................................................................... 104
A2. OD values of microbial cultures ............................................................................................... 104

9
List of Tables
Table 1 - White lupin (L. albus) composition [6]. .............................................................................. 21
Table 2 - Main quinolizidine alkaloids (QAs) identified in seeds of lupin species [16].................... 21
Table 3 – Types of fouling and their main causes. .......................................................................... 27
Table 4 – Limit of detection (LOD) and limit of quantification (LOQ) values of lupanine and sparteine
in lupin grain and lupin-based foods for quinolizidine alkaloid quantification by gas-chromatography
mass-spectrometry [72]. ........................................................................................................................ 30
Table 5 - PCR conditions of 16S rDNA gene amplification. ............................................................ 39
Table 6 - PCR conditions of D1/D2 region amplification. ................................................................ 43
Table 7 – Concentration of lupanine and COD in the feed of wastewater solution, permeate and
retentate of the nanofiltration. ................................................................................................................ 48
Table 8 – Values of pH of the supernatant of the four bacteria isolates: O. anthropi, S. siyangense,
S. maltophilia and C. funkei, measured at different time points during cultivation. ............................... 57
Table 9 – Percentages of COD removal from LBW for the four bacterial strain isolates: O. anthropi,
S. siyangense, S. maltophilia and C. funkei. ......................................................................................... 59
Table 10 – Reducing sugar concentration determined through DNS method for the initial LBW
medium and after 7 days of cultivation of the four bacteria isolates: O. anthropi, S. siyangense, S.
maltophilia and C. funkei. ...................................................................................................................... 59
Table 11 – pH values of LBW + H2O measured in supernatant at different time points, during
cultivation of the four bacteria isolates: O. anthropi, S. siyangense, S. maltophilia and C. funkei. ...... 59
Table 12 - pH values of YNB medium measured in the supernatant at different time points, during
cultivation of the two yeast isolates: R. mucilaginosa and P. kudriavzevii yeast strain isolates. .......... 63
Table 13 – Percentages of COD removal from LBW for the two yeast strain isolates: R. mucilaginosa
and P. kudriavzevii. ............................................................................................................................... 64
Table 14 – Reducing sugars concentration determined through DNS method for the initial LBW
medium and after 7 days of cultivation of the two yeast isolates: R. mucilaginosa and P. kudriavzevii.
............................................................................................................................................................... 65
Table 15 – pH values of LBW medium measured in the supernatant at different time points, during
cultivation of the two yeast isolates: R. mucilaginosa and P. kudriavzevii. .......................................... 65
Table 16 – Lupanine concentration in LBW medium during cultivation of P. kudriavzevii, A. fumigatus
and G. geotrichum ................................................................................................................................. 68
Table 17 – Percentages of COD removal from LBW for the fungi strain isolates. n.a. - COD increased
from 30.83 to 44.71 g O2/L.................................................................................................................... 68
Table 18 – Specific growth rates (µ) of O. anthropi cultures in each growth condition. .................. 78
Table 19 – Some of the carbon and nitrogen sources used by the four bacterial species isolated. (*)
indicates two carbon sources that may be present in LBW. ................................................................. 83
Table 20 – Specific growth rates for both yeasts and culture conditions in LBW. ........................... 85
Table 21 - Some of the carbon sources used by the yeast species isolated. (*) indicates two carbon
sources that may be present in LBW. ................................................................................................... 86
10
Table 22 – OD values measured during O. anthropi culture in M9 synthetic medium. (1) And (2) are
the biological replicates. ...................................................................................................................... 105
Table 23 – OD values measured during S. siyangense culture in M9 synthetic medium. (1) And (2)
are the biological replicates. ................................................................................................................ 105
Table 24 – OD values measured during S. maltophilia culture in M9 synthetic medium. (1) And (2)
are the biological replicates. ................................................................................................................ 106
Table 25 – OD values measured during C. funkei culture in M9 synthetic medium. (1) And (2) are
the biological replicates. ...................................................................................................................... 106
Table 26 – OD values measured during O. anthropi culture in LBW diluted in water. (1), (2) and (3)
are the biological replicates. ................................................................................................................ 106
Table 27 – OD values measured during S. siyangense culture in LBW diluted in water. (1), (2) and
(3) are the biological replicates. .......................................................................................................... 107
Table 28 – OD values measured during S. maltophilia culture in LBW diluted in water. (1), (2) and
(3) are the biological replicates. .......................................................................................................... 107
Table 29 – OD values measured during C. funkei culture in LBW diluted in water. (1), (2) and (3) are
the biological replicates. ...................................................................................................................... 107
Table 30 – OD values measured during R. mucilaginosa culture in YNB synthetic medium. (1) And
(2) are the biological replicates. .......................................................................................................... 108
Table 31 - OD values measured during P. kudriavzevii culture in YNB synthetic medium. (1) And (2)
are the biological replicates. ................................................................................................................ 108
Table 32 - OD values measured during R. mucilaginosa culture in LBW diluted in water and in YNB
medium. (1), (2) and (3) are the biological replicates. ......................................................................... 108
Table 33 - OD values measured during P. kudriavzevii culture in LBW diluted in water and in YNB
medium. (1), (2) and (3) are the biological replicates. ......................................................................... 109

11
List of Figures
Figure 1 – Schematic representation of the work strategy followed in this master thesis............... 19
Figure 2 - Chemical structures of lupanine, sparteine, angustifoline and multiflorine, the main QAs
present in lupinus species. Adapted from [2]. ....................................................................................... 22
Figure 3 - Quinolizidine alkaloids biosynthetic pathway. Acyltransferase enzymes involved:
Lysine/Ornithine decarboxylase (L/ODC); Copper amine oxidase (CuAO); (+)-epilupinine/(−)-lupinine O-
coumaroyl/feruloyltransferase (ECT/EFT-LCT/LFT); and (−)-13α-hydroxymultiflorine/(+)-13α-
hydroxylupanine O-tigloyltransferase (HMT-HLT). Dotted lines stand for enzyme reactions not
characterized. Adapted from [225]. ....................................................................................................... 23
Figure 4 - Lupanine concentration of lupin beans wastewater in g/L for the different phases of the
industrial debittering process, according to published research work, in relation with the strategy of this
thesis [29]. .............................................................................................................................................. 24
Figure 5 - Lupanine enantiomers: (+) and (-) [10]. .......................................................................... 25
Figure 6 – Membrane processes with correspondent pore sizes and molecules retained. Adapted
from [36]................................................................................................................................................. 25
Figure 7 - Representation of the interaction between the molecules and the pores. Some will adhere
to the membrane surface (1); others will block the pore (2, 4); and the smaller ones will pass through
the pore (3) [44] ..................................................................................................................................... 26
Figure 8 – Conversion of lupanine into sparteine, through NaBH4 and I2 reducing agents and THF
organic solvent [84] ............................................................................................................................... 32
Figure 9 – Lupanine chemical structure (on the left) and chemical structures of novel end products
A and B, resulting from lupanine bioconversion [87] ............................................................................. 34
Figure 10 - illustration of a biorefinery concept [97]. ....................................................................... 35
Figure 11 - Representation of pyramid of biomass for a biorefinery system [107]. ......................... 36
Figure 12 - Schematic representation of the assays for bacterial isolation on (i) 2 g/L glucose; (ii)
0.75 g/L lupanine or (iii) 2 g/L glucose + 0.75 g/L lupanine, with three sequential lupanine enrichments
in 50 mL working volume. Cultures were inoculated with 5% (v/v) of the former enriched culture. The
microcentrifuge 1.5 mL tubes illustrate the key points of sample collections: day 0, 3 and 7 of each
enrichment, for HPLC analysis; and day 7 of the third enrichment for plating on M9 supplemented with
2 g/L glucose and 1.5 g/L lupanine. ...................................................................................................... 38
Figure 13 - Schematic representation of the assays for bacterial isolation on (i) 2 g/L glucose; (ii) 1.5
g/L lupanine or (iii) 2 g/L glucose + 1.5 g/L lupanine, with three sequential lupanine enrichments in 50
mL working volume. Cultures were inoculated with 5% (v/v) of the former enriched culture. The
microcentrifuge 1.5 mL tubes illustrate the key points of sample collections: day 0 and 7 of each
enrichment, for HPLC analysis; and day 7 of the third enrichment for plating on M9 supplemented with
2 g/L glucose and 1.5 g/L lupanine. ...................................................................................................... 38
Figure 14 - Schematic representation of bacterial isolates growth assays on (i) 2 g/L glucose (G); (ii)
1.5 g/L lupanine (L) or (iii) 2 g/L glucose + 1.5 g/L lupanine (G+L). Pre-cultures were inoculated with
isolates and used for the inoculation of main cultures. Pre-culture flasks contained 25 mL working

12
volume in 50 mL flasks, and culture flasks 50 mL working volume in 100 mL flasks. Cultivations were
performed during 7 days at 30°C and 250 rpm. .................................................................................... 40
Figure 15 - Schematic representation of bacterial isolates growth assays on lupin beans wastewater
(LBW) diluted at 1/2 in sterilized water. Pre-cultures were inoculated with isolates and used for
inoculation of main cultures. Pre-culture flasks contained 25 mL working volume in 50 mL flasks, and
culture flasks 50 mL working volume in 100 mL flasks. Cultivations were performed during 7 days at
30°C and 250 rpm. ................................................................................................................................ 41
Figure 16 - Schematic representation of the assays for yeast isolation on (i) 2 g/L glucose; (ii) 1.5
g/L lupanine or (iii) 2 g/L glucose + 1.5 g/L lupanine, with three sequential lupanine enrichments in 50
mL working volume. Cultures were inoculated with 5% (v/v) of LBW in the first enrichment. Inoculations
of the second and third enrichments were performed with 5% (v/v) of the former enriched culture. The
eppendorf’s illustrate the key points of sample collections: day 0 and 7 of each enrichment, for HPLC
analysis; and day 7 of the third enrichment for plating on YNB supplemented with 1.5 g/L lupanine and
30 µg/mL CAM. ...................................................................................................................................... 42
Figure 17 - Schematic representation of yeast isolates growth assays on (i) 2 g/L glucose (G); (ii)
1.5 g/L lupanine (L) or (iii) 2 g/L glucose + 1.5 g/L lupanine (G+L). Pre-cultures were inoculated with
isolates and used for the inoculation of main cultures. Pre-culture flasks contained 25 mL working
volume in 50 mL flasks, and culture flasks 50 mL working volume in 100 mL flasks. Cultivations
performed during 7 days at 30°C and 250 rpm. .................................................................................... 44
Figure 18 - Schematic representation of yeast isolates growth assays on lupin beans wastewater
(LBW) diluted at 1/2 in sterilized water and 1/2 in YNB medium. Pre-cultures were inoculated with
isolates and used for inoculation of main cultures. Pre-culture flasks contained 25 mL working volume
in 50 mL flasks, and culture flasks 50 mL working volume in 100 mL flasks. Cultivations performed during
7 days at 30°C and 250 rpm. ................................................................................................................. 44
Figure 19 – Values of flux through the membrane during the nanofiltration in function of the
percentage of concentration. Nanofiltration was operated in a concentration mode. The cross in the
curve represent the overnight time when the nanofiltration was stopped. ............................................ 48
Figure 20 – Cultivation assays for bacteria isolation with three sequential lupanine or glucose +
lupanine mixture enrichments. Cultures were inoculated with 5% (v/v) of lupin beans wastewater (LBW)
superficial layer in the first enrichment. Inoculations of the second and third enrichments performed with
5% (v/v) of the former enriched culture. (A) 0.75 g/L lupanine; (B) 2 g/L glucose + 0.75 g/L lupanine. 49
Figure 21 – M9 solid medium supplemented with 1.5 g/L lupanine plated with a sample from culture
with lupanine as carbon source, at the end of third enrichment, representing the enriched population
provenient from lupin beans wastewater (LBW) superficial organic-rich layer. .................................... 50
Figure 22 – Cultivation assays for bacteria isolation with three sequential lupanine enrichments.
Cultures were inoculated with 5% (v/v) of lupin beans wastewater (LBW) in the first enrichment.
Inoculations of the second and third enrichments performed with 5% (v/v) of the former enriched culture.
(A) 1.5 g/L lupanine; (B) 2 g/L glucose + 1.5 g/L lupanine. ................................................................... 50

13
Figure 23 - M9 solid medium supplemented with 1.5 g/L lupanine plated with a sample from culture
with lupanine as carbon source, at the end of third enrichment, representing the enriched population
provenient from LBW. ............................................................................................................................ 51
Figure 24 – Agarose gel electrophoresis of PCR products obtained for the three gram-negative
bacterial strains. Agarose gel (0.8%) electrophoresis was run during 40 minutes at 90 V with 50x TAE
buffer. PCR products were loaded in the gel in triplicate. (L) Molecular marker NZY DNA ladder III (1kb);
(1)-(3), (4)-(6) and (8)-(10) are the PCR product corresponding to three gram-negative isolates; (7)
negative control of the reaction. ............................................................................................................ 52
Figure 25 – Agarose gel electrophoresis of PCR products obtained for the gram-positive bacterial
strain, for sonication efficiency testing. Agarose gel (0.8%) electrophoresis was run during 40 minutes
at 90 V with 50x TAE buffer. (L) Molecular marker NZY DNA ladder III; (1) DNA with 3 minutes
sonication; (2) DNA with 5 minutes sonication; (3) positive control of the reaction with known DNA; (4)
negative control of the reaction. ............................................................................................................ 52
Figure 26 - Agarose gel electrophoresis of PCR products obtained for the gram-positive bacterial
strain, sonicated for 3 minutes. Agarose gel (0.8%) electrophoresis was run during 40 minutes at 90 V
with 50x TAE buffer. PCR products were loaded in the gel in quadriplicate. (L) Molecular marker NZY
DNA ladder III; (1)-(4) is the PCR product corresponding to gram positive isolate; (5) is the negative
control of the reaction. ........................................................................................................................... 53
Figure 27 – O. anthropi cultures in M9 liquid medium. Pre-cultures of 48 hours in 1.5 g/L of lupanine
were used as inoculum of the main cultures (A) in 1.5 g/L lupanine and 2 g/L glucose + 1.5 g/L lupanine.
Pre-cultures of 48 hours in 1.5 g/L of lupanine with 2 g/L glucose mixture were used as inoculum of the
main cultures (B) in 1.5 g/L lupanine and 2 g/L glucose + 1.5 g/L lupanine. Pre-culture of 48 hours in 2
g/L glucose were used as inoculum of the main culture (C) used as a positive control of the experiment.
Growth curves are represented in (A1), (B1) and C, and lupanine concentration in (A2), (B2),
respectively. Error bars represent the respective standard deviation of biological triplicate assays. ... 54
Figure 28 – S. siyangense culture in M9 liquid medium. Pre-cultures of 48 hours in 1.5 g/L of lupanine
with 2 g/L glucose mixture were used as inoculum of the main culture (A) in 1.5 g/L lupanine and 2 g/L
glucose + 1.5 g/L lupanine. Pre-culture of 48 hours in 2 g/L glucose were used as inoculum of the main
culture (B) used as a positive control of the experiment. Growth curves are represented in (A1) and (B),
and lupanine concentration in (A2), respectively. Error bars represent the respective standard deviation
of biological duplicate assays. ............................................................................................................... 55
Figure 29 – S. maltophilia culture in M9 liquid medium. Pre-cultures of 48 hours in 1.5 g/L of lupanine
with 2 g/L glucose mixture were used as inoculum of the main culture (A) in 1.5 g/L lupanine and 2 g/L
glucose + 1.5 g/L lupanine. Pre-culture of 48 hours in 2 g/L glucose were used as inoculum of the main
culture (B) used as a positive control of the experiment. Growth curve is represented in (A1) and (B),
and lupanine concentration in (A2), respectively. Error bars represent the respective standard deviation
of biological duplicate assays. ............................................................................................................... 55
Figure 30 – C. funkei culture in M9 liquid medium. Pre-cultures of 48 hours in 1.5 g/L of lupanine
with 2 g/L glucose mixture were used as inoculum of the main culture (A) in 1.5 g/L lupanine and 2 g/L
glucose + 1.5 g/L lupanine. Pre-culture of 48 hours in 2 g/L glucose were used as inoculum of the main

14
culture (B) used as a positive control of the experiment. Growth curve is represented in (A1) and (B),
and lupanine concentration in (A2), respectively. Error bars represent the respective standard deviation
of biological duplicate assays. ............................................................................................................... 56
Figure 31 - Control flask with, separately, M9 culture medium supplemented with 1.5 g/L lupanine
and another flask with 2 g/L glucose + 1.5 g/L lupanine. ...................................................................... 57
Figure 32 – Growth curves (left column) and lupanine concentration (right column) for 7-day cultures
of O. anthropi, S. siyangense, S. maltophilia, C. funkei in LBW medium diluted 1/2 in water. Error bars
represent the respective standard deviation of biological triplicate assays. ......................................... 58
Figure 33 – Cultivation assays for yeast isolation with three sequential lupanine enrichments.
Cultures were inoculated with 5% (v/v) of lupin beans wastewater (LBW) in the first enrichment.
Inoculations of the second and third enrichments performed with 5% (v/v) of the former enriched culture.
(A) 0.75 g/L lupanine; (B) 2 g/L glucose + 0.75 g/L lupanine. ............................................................... 60
Figure 34 – YNB solid media supplemented with 1.5 g/L lupanine and CAM, plated with sample from
culture at the end of third enrichment. ................................................................................................... 60
Figure 35 – Agarose gel electrophoresis of PCR products obtained for the two yeast strains. Agarose
gel (0.8%) electrophoresis was run during 40 minutes at 90 V with 50x TAE buffer. PCR products were
loaded in the gel in triplicate. (M) Molecular marker NZY DNA ladder III; (1)-(3) and (4)-(6) are the PCR
products corresponding to two yeast isolates; (7) negative control of the reaction. ............................. 61
Figure 36 – P. kudriavzevii cultures in YNB liquid medium. Pre-culture of 24 hours in 2 g/L of glucose
was used as inoculum of the main cultures (A) in 2 g/L glucose, 1.5 g/L lupanine and 2 g/L glucose +
1.5 g/L lupanine. Pre-culture of 24 hours in 1.5 g/L of lupanine with 2 g/L glucose mixture was used as
inoculum of the main cultures (B) in 2 g/L glucose, 1.5 g/L lupanine and 2 g/L glucose + 1.5 g/L lupanine.
Growth curves are represented in (A1) and (B1), and lupanine concentration in (A2), (B2), respectively.
Error bars represent the respective standard deviation of biological duplicate assays. ....................... 62
Figure 37 – R. mucilaginosa cultures in YNB liquid medium. Pre-culture of 24 hours in 2 g/L of
glucose was used as inoculum of the main cultures (A) in 2 g/L glucose, 1.5 g/L lupanine and 2 g/L
glucose + 1.5 g/L lupanine. Pre-culture of 24 hours in 1.5 g/L of lupanine with 2 g/L glucose mixture was
used as inoculum of the main cultures (B) in 2 g/L glucose, 1.5 g/L lupanine and 2 g/L glucose + 1.5 g/L
lupanine. Growth curves are represented in (A1) and (B1), and lupanine concentration in (A2), (B2),
respectively. Error bars represent the respective standard deviation of biological duplicate assays. .. 62
Figure 38 – Control flask for YNB medium supplemented with 1.5 g/L lupanine or 2 g/L glucose +
1.5 g/L lupanine. .................................................................................................................................... 63
Figure 39 – Growth curves (left column) and lupanine concentration (right column) for 7-day cultures
of P. kudriavzevii and R. mucilaginosa in LBW medium diluted 1:2 in water or in YNB medium. Error
bars represent the respective standard deviation of biological triplicate assays. ................................. 64
Figure 40 - Agarose gel electrophoresis of gDNA obtained for the four filamentous fungi strains.
Agarose gel (1%) electrophoresis was run during 90 minutes at 120 V with 1x TAE buffer. (L) Molecular
marker NZY DNA ladder III; (1)-(4) gDNA corresponding to the four fungi isolates. ............................ 66

15
Figure 41 – Dry weight values (left column) and lupanine concentration (right column) for 186 hours
cultures of P. kudriavzevii, A. fumigatus and G. geotrichum in ME medium supplemented with 40 g/L
glucose, 1.5 g/L lupanine or 40 g/L glucose + 1.5 g/L lupanine. Data shown from single assays. ....... 67
Figure 42 – Growth curves in cell dry weight (A) for 192 hours cultures of P. kudriavzevii, A.
fumigatus and G. geotrichum, in LBW medium. Data shown from single assays................................. 68
Figure 43 - Spectra obtained from FT-IR ATR of O. anthropi cultures among time. Pink line
represents the pure sample of lupanine, while the other coloured lines represent the different time points
of culture (0 h, 3 h, 6 h, 12 h and 24 h) being all superimposable. ....................................................... 69
Figure 44 - Spectra obtained from FT-IR ATR of C. funkei culture among time. Violet line represents
the pure sample of lupanine, while the other coloured lines represent the different time points of culture
(0 h in yellow, 48 h in blue, and 120 h in green). .................................................................................. 70
Figure 45 - TLC plate with two elutions in MTBE/hexane (8:2) and 1% diethylamine (DEA) with
phosphomolybdic acid staining. (L) is pure lupanine; (1)-(5) are the samples corresponding to 0 h, 3 h,
6 h, 12 h and 24 h of O. anthropi culture and (6)-(8) are the samples corresponding to 0 h, 48 h and 120
h of C. funkei culture. ............................................................................................................................. 70
Figure 46 - 13C NMR spectrum of a pure lupanine sample in CDCL3 [29]. ...................................... 71
Figure 47 - 1H NMR spectrum of a pure lupanine sample in CDCL3 [29]. ...................................... 71
Figure 48 - 13C NMR spectra of the samples corresponding to O. anthropi and C. funkei cultures. (A)
is the culture of C. funkei at 48 h; (B) is the culture of C. funkei at 120 h; (C) is the culture of O. anthropi
at 3 h; (D) is the culture of O. anthropi at 24 h; (E) is the pure lupanine sample. ................................. 72
Figure 49 – 1H NMR spectra of the samples corresponding to O. anthropi and C. funkei cultures. (A)
is the culture of C. funkei at 48 h; (B) is the culture of C. funkei at 120 h; (C) is the culture of O. anthropi
at 3 h; (D) is the culture of O. anthropi at 24 h; (E) is the pure lupanine sample. ................................. 72
Figure 50 – Chromatogram obtained from 0 h of O. anthropi culture, showing racemic lupanine in a
proportion of 53% of D-(+)-lupanine and 47% of L-(-)-lupanine. .......................................................... 73
Figure 51- Chromatogram obtained from 12 h of O. anthropi culture, showing racemic lupanine in a
proportion of 43% of D-(+)-lupanine and 57% of L-(-)-lupanine. ........................................................... 73
Figure 52 – Chromatograms obtained from 24 h O. anthropi culture, showing 100% of L-(-)-lupanine.
............................................................................................................................................................... 74
Figure 53 - Chromatograms obtained from C. funkei cultures. (A) is the result obtained from 0 h of
culture, with racemic lupanine in a proportion of 53% of D-(+)-lupanine and 47% of L-(-)-lupanine; (B) is
the result obtained from 120 h of culture, with a proportion of 53% of D-(+)-lupanine and 47% of L-(-)-
lupanine. ................................................................................................................................................ 74
Figure 54 – Reaction catalysed by lupanine 17-hydroxylase. ......................................................... 80
Figure 55 – Protonated and deprotonated forms of lupanine, according with the pH of solutions.
Adapted from [29]. ................................................................................................................................. 82
Figure 56 – Lupanine concentration values obtained when filters were used in the inoculum of the
culture. The result is from the S. siyangense culture. ......................................................................... 104

16
List of Abbreviations
ACN Acetonitrile
CQO Carência química de oxigénio
COD Chemical oxygen demand
CuAO Copper amine oxidase
DNS 3,5-dinitrosalicylic acid
ECT/EFT-LCT/LFT (+)-epilupinine/(−)-lupinine O-coumaroyl/feruloyltransferase
GC Gas chromatography
GC-MS Gas liquid chromatography-mass spectrometry
HMT-HLT (−)-13α-hydroxymultiflorine/(+)-13α-hydroxylupanine O-tigloyltransferase
HPLC High-performance liquid chromatography
IER Ion exchange resins
LBW lupin beans wastewater
L/ODC Lysine/Ornithine decarboxylase
LOD Limit of detection
LOQ Limit of quantification
MEA Malt extract agar
MF Microfiltration
MIPs Molecularly imprinted polymers
MTBE Methyl tert-butyl ether
MWCO Molecular weight cut off
NF Nanofiltration
NMR Nuclear magnetic resonance
OD Optical density
PCR Polimerase chain reaction
PDA Potato dextrose agar
QAs Quinolizidine alkaloids
RO reverse osmosis
TLC Thin-layer chromatography
UF Ultrafiltration
YNB yeast nitrogen base

17
1. Aim of thesis & Research strategy
1.1. Aim of thesis
This research work aimed at the isolation and identification of living bacterial, yeast and fungal
species from lupin beans wastewater in liquid medium, following a sequential enrichment culture method
using lupanine or lupanine + glucose as carbon sources. For this, the inoculum used was either a sample
of lupin beans wastewater or an organic-rich layer formed in the surface of this wastewater during
summer time. After the identification of the microorganisms of interest, the main objective was to
evaluate lupanine catabolizing capacity using synthetic culture medium’s in three growth conditions: i)
glucose, ii) lupanine, iii) glucose mixed with lupanine. Microbial catabolization of lupanine can either be
complete leading to the complete mineralization of the substrate or result on intermediate structures,
eventually conserving the core quinolizidine structure, but allowing further molecular modifications. The
industrial debittering process of lupin beans involves discarding high volumes of wastewater rich in
lupanine and organic matter. The study of an alternative process to reduce this waste and further
valorise it would be of high interest for this industry sustainability. In this research work, the isolated
microorganism were also grown in the lupin beans wastewater to evaluate lupanine removal and
reduction of wastewater organic content.
1.2. Research strategy
The higher volumes of wastewater in lupin beans debittering process are generated on the
sweetening phase (Section 2.1.2.), therefore to have a sample representative of the total wastewater
generated in that phase a composite solution was prepared (Section 3.1.). To reduce the volume of the
water needed and wastewater generated on the sweeting phase it is envisaged the use of nanofiltration
to yield a permeate, free of organic matter and lupanine, that can be recycled back on the sweetening
phase, and a retentate rich in lupanine and organic matter, but of a smaller volume. This retentate
fraction of the nanofiltration obtained using the composite sample of the sweetening phase has a
lupanine concentration and COD on the same range of values. Therefore, cooking wastewater was used
to assess the presence of microorganisms, and also as a representative of the retentate that would be
obtained after a nanofiltration of the sweetening phase.
For bacteria isolation, a sample of LBW surface organic-rich layer and from LBW was enriched in
three sequential enrichments in three conditions using M9 liquid culture: (i) glucose; (ii) lupanine and
(iii) glucose with lupanine mixture. Dilutions of the third enrichments were plated in M9 solid medium
(with lupanine) for the bacterial isolation. Gram staining was performed to four pure cultures, to assess
the most efficient DNA extraction protocol. PCR was used to amplify 16S rDNA gene and the sequencing
step was performed by STABVIDA. After species identification, the four strains were individually grown

18
in M9 liquid medium in (i), (ii) and (iii) to measure lupanine concentration by HPLC, OD600 nm and pH
values. Additionally, the four isolates were also grown in sterilized LBW diluted 1/2 times in sterilized
water to asses COD and lupanine values, OD600 nm, and total reducing sugars.
For yeast isolation, a sample of LBW was enriched in three sequential enrichments in the three
mentioned conditions using YNB liquid culture: (i), (ii) and (iii). Dilutions of the third enrichments were
plated in YNB solid medium (with lupanine) for the isolation of yeast colonies. DNA of pure cultures was
extracted and PCR was used to amplify 26S rDNA gene, the sequencing step was performed by
STABVIDA. The two yeast isolates were grown in liquid YNB in (i), (ii) and (iii) to measure lupanine
concentration by HPLC, OD600 nm and pH values. Additionally, the two isolates were also grown in
sterilized LBW diluted 1/2 in sterilized water and in 1/2 YNB culture medium, to asses COD and lupanine
values, OD600 nm, and total reducing sugars.
Filamentous fungi isolation started with dilutions of LBW and its surface organic-rich layer in PDA
and MEA solid culture medium to obtain single colonies. DNA was extracted from pure solid cultures
and sequencing by STABVIDA. After species identification, the isolates were grown in synthetic growth
medium ME in (i), (ii) and (iii) conditions for cell dry weight assessment and lupanine concentration by
HPLC. Additionally, the isolates were also cultivated in LBW for assessment of cell dry weight, lupanine
concentration by HPLC and COD.
The schematic representation of the work strategy is shown below (Figure 1).

19
Figure 1 – Schematic representation of the work strategy followed in this master thesis.

20
2. Introduction
2.1. Lupinus albus
Plant species of the genus Lupinus belong to the Fabaceae (or Leguminosae) family. The name of
the genus “Lupinus” arises from the Latin word ‘’Lupus’’, which means wolf, since Romans thought that
lupin beans took nutrients from the soil in the same way that a wolf can capture domestic animals [1].
Among the 400 Lupinus species already known, only four are characterized by their agronomic and
commercial potential: Lupinus albus (white lupin), Lupinus angustifolius (blue lupin), Lupinus luteus
(yellow lupin), and Lupinus mutabilis (Andean lupin). Lupinus plants have been cultivated for over 3000
years, initially in the Mediterranean, Australia, North Africa and North and South America. Nowadays,
lupin beans are predominantly distributed in South and North America, with a few species in Europe and
North Africa [2], and a wide distribution of L. albus in Mediterranean regions [3], [4]
Lupin seeds are produced in pods, which are structures on the main stem of the plant. Depending
on the species of lupin, pods can vary between three and seven seeds with different sizes, colours,
appearances and compositions. Among them, Lupinus albus seeds are the larger ones, with a circular
flattened shape and a creamed colour [5]. The life cycle of lupins is composed of three phases: i)
vegetative; ii) floral and iii) pod and seed growth phase. The progression of the plant among the different
phases is dependent on temperature and day length. However, in 14 to 20 weeks, the flowering phase
halts and all nutrients of the plant are redirected from growth to seed filling [6]. The lupin beans can be
incorporated into variety of food products as supplement for human food (in bakery, pastry, crisps, yogurt
analogues) thus providing functional properties such as nutritional value, aroma and texture. Due to the
high biomass above the ground and deep roots – recurrently down to 2 meters – of Lupinus albus, the
plant is also important in the soil aeration for oxygen and water supply (supporting the growth and
survival of other plants), and can be harnessed for i) livestock forage and ii) green manure, a fertilizer
consisting of growing plants [5], [7].
Lupinus albus seeds are rich sources of protein and dietary fibre, with around 32% and 16%,
respectively percentages that can vary with genetic and environmental differences [4], [3]. They also
contain vitamins and antioxidants such as tocopherols, carotenoids, B-vitamins and phenolic
compounds [4], [5]. For these reasons, lupin seeds are suitable for the food sector, and given their
composition (See Table 1), they can be applied as a food supplement either for animal feed, or for
human diet. Although, L. albus varieties are also comprised of quinolizidine alkaloids (QAs), which
confer a characteristic bitter taste to lupin beans. To make these beans appropriate for consumption, it
is required a treatment process for their fast removal [10].

21
Table 1 - White lupin (L. albus) composition [6].
Components Mean Value (%)
Moisture
8.32±0.03
Crude protein 32.20±1.10
Crude fibre 16.20±1.51
Oil 5.95±0.09
Ash 2.65±0.18
Acidity 0.13±0.02
2.1.1. Quinolizidine alkaloids
Quinolizidine alkaloids (QAs) are toxic compounds composed of nitrogenous bases in a heterocyclic
ring, more specifically a quinolizidine ring. They are secondary metabolites produced by Leguminosae
plants to protect them against insects [7]. These compounds, in high concentrations, are also dangerous
for human consumption, causing adverse health effects like acute anticholinergic toxicity, blurry vision,
nausea, headache or weakness [11]. The symptoms indicate that alkaloids can have negative
neurological impacts, resulting in loss of muscular control and coordination, effects that are usually
reversible [2]. QAs exert a blocking effect on the nicotinic cholinergic receptor, being weak antagonists
at the muscarinic cholinergic receptor [12]. Their neurotoxicity has been assessed by intravenous
administration of sparteine and lupanine, with observed inhibition of ganglionic transmissions of the
sympathetic nervous system [13]. Previous studies indicated that QAs content of wild Lupinus species
is up to 2.7 mg/100mg dry matter [14], a value above the limit traced by the health authorities of UK,
Australia, France and New Zealand of 200 mg/kg of food product [15].
The composition and content of QAs varies among lupin species (See Table 2). According to the
genetic varieties, environmental conditions or soil characteristics, the QAs content may also differ,
nevertheless, lupanine seems to be the most abundant. Moreover, the alkaloids present and their
concentrations can vary in different parts of the plant: seeds, leaves, roots or flowers [2].
Table 2 - Main quinolizidine alkaloids (QAs) identified in seeds of lupin species [16].
Lupin species Major grain QAs (% of total alkaloids) References
L. angustifolius
Lupanine (70%), 13α-hydroxylupanine (12%), angustifoline (10%) Lupanine (50.6%), 13α-hydroxylupanine (32.6%), angustifoline
(10.4%), isolupanine (6.4%; average values) [17], [18]
L. albus
Lupanine (70%), albine (15%), 13α-hydroxylupanine (8%), multiflorine (3%)
[17]
L. luteus
Lupanine (60%), sparteine (30%), unknown alkaloids (1%) Gramine (10-89%), lupinine (3-60%), sparteine (1-20%), isosparteine
(1-5%) [17], [19]
L. mutabilis
Lupanine (46%), sparteine (16%), 3β-hydroxylupanine (12%), 13α-hydroxylupanine (7%), ammodendrine (2%), 13-angeloyloxylupanine
(2%), tetrahydrorhombifoline (2%), 11-12-dehydrosparteine (1%), angustifoline (1%), 13-tigoyloxylupanine (1%)
[17]

22
Among the QAs present in lupinus species, sparteine and lupanine are considered the two molecules
with higher toxicity [20]. The main chemical structures of these QAs are represented in Figure 2.
Some beneficial properties of L. albus seeds have also been described. In folk medicine, the seeds
are boiled and the resulting water can be used as a diuretic agent or antiparasitic drug. They may be
used for treatments of liver disorders, haemorrhoids, diabetes or eczema [21]. The QAs also present
interesting pharmacological properties such as cytotoxic, antipyretic, antibacterial, antiviral and
hypoglycemic activities, as showed in studies for in vivo pharmacological screenings [22]. Particularly,
lupin leaves extract showed antibacterial and antifungal activities against microorganism species such
as, Bacillus subtilis, Staphylococcus aureus, Pseudomonas aeruginosa and Candida albicans [21].
2.1.2. Biosynthetic Pathway
In the past decades, biosynthetic ways to obtain the QAs have been studied. In the research works
conducted, a variety of genes, transcription factors or transporters, enzymes and intermediates
associated with alkaloid biosynthesis were discovered [23], [24]. For synthesis of QAs, the first step is
L-Lysine decarboxylation, with cadaverine formation, which is the first intermediate of the biosynthetic
pathway [2]. Afterwards, the cadaverine is deaminated, originating a piperidine Schiff base that is
involved in hydrolysis, oxidative deamination and coupling reactions. This results in the major structure
of QAs [25], the diiminium cation, which is an intermediate in the biosynthesis of tetracyclic alkaloids
(e.g., lupanine, multiflorine, sparteine) (Figure 3). Once these QAs are formed, additional modifying
steps like dehydrogenation, oxygenation, glycosylation, hydroxylation or esterification can occur,
originating a range of structurally related QAs [26], [27].
Figure 2 - Chemical structures of lupanine, sparteine, angustifoline and multiflorine, the main QAs present in
lupinus species. Adapted from [2].

23
2.1.3. Industrial Debittering Process
As referred above, alkaloid-rich lupin beans require a debittering process previously to human
consumption. This process involves the soaking, cooking, and washing of the lupin beans. Since QAs
are water-soluble, they are released from the lupin beans to the water [15]. Hundreds of tons of L. albus
beans are processed per year, this debittering process allows to reduce the contents of alkaloids in the
beans from almost 3% (27 g/kg) to less than 0.02% (0.2 g/kg) [28]. The main concern with this process
is the high volumes of wastewater generated that implies the high volume of water consumed per batch.
These wastewater effluents are rich in lupanine, the most abundant QA in L. albus beans.
The industrial debittering process applied is composed by three stages: i) hydration (phase 1); ii)
cooking (phase 2); iii) sweetening (phase 3). In the first phase, the beans are submerged in water and
they increase in volume. In the second phase, the soaked beans are baked in water at high temperature
together with water vapour, and the QAs start to be released into the boiling water. In the second phase,
the temperature of the cooked beans decreases and they stay in a fresh water tank, resulting in the
phase with a higher concentration of lupanine (Figure 4). In the third phase, the beans are sweetened,
which involves washing with high volumes of fresh water [29].
For food industry applications of lupin beans, the debittering process has the disadvantage of
removing part of the soluble protein, oligosaccharides and mineral salts present in the beans, together
with the lupanine [30].
Figure 3 - Quinolizidine alkaloids biosynthetic pathway. Acyltransferase enzymes involved: Lysine/Ornithine
decarboxylase (L/ODC); Copper amine oxidase (CuAO); (+)-epilupinine/(−)-lupinine O-
coumaroyl/feruloyltransferase (ECT/EFT-LCT/LFT); and (−)-13α-hydroxymultiflorine/(+)-13α-hydroxylupanine O-
tigloyltransferase (HMT-HLT). Dotted lines stand for enzyme reactions not characterized. Adapted from [225].

24
Figure 4 - Lupanine concentration of lupin beans wastewater in g/L for the different phases of the industrial
debittering process, according to published research work, in relation with the strategy of this thesis [29].
At the industrial scale there is interest in the recovery, purification and valorisation of lupanine, from
the enriched wastewater effluent. In this study, it is used membrane technology for the recovery and
concentration of lupanine in the retentate.
2.1.4. Lupanine industrial interest
In general, alkaloids have the potential to be used in the treatment of a variety of medical conditions,
either as anticancer agents, or analgesics and as drugs to regulate hypertension and manage central
nervous system disorders [31]. Wiedemann et al. (2015) studied the effect of lupanine on type-2
diabetes mellitus, using an animal model. [32]. In rats with hyperglycemia induced by using 15 mmol/L
glucose, the presence of 0.5 mmol/L lupanine contributed to enhance the secretion of insulin, while for
the same conditions with lower glucose concentrations no insulin secretion was observed. The effect
observed is correlated with membrane depolarization and frequency increase of Ca2+ action potentials.
Additionally, lupanine inhibited the ATP-dependent K+ channel and triggered glucose-stimulated insulin
release through ATP-dependent K+ channels, increasing insulin gene expression. Therefore, the
antidiabetic potential of lupanine is evidenced by the improvement of glucose tolerance in rats with
induced hyperglycemia, which can be advantageous for the supportive treatment of type-2 diabetes
mellitus [32].
Lupanine is a tetracyclic QA with a chiral symmetric structure (Figure 5), with the potential of being
useful for pharmaceutical industries as a starting material for the synthesis of a variety of other added-
value alkaloids, such as sparteine [33]. Molecules that are non-superimposable mirror images of one
another are defined as enantiomers, and result from the chirality of organic compounds [34]. However,
the presence of stable amine groups in lupanine can difficult target chemical modifications [35]. 3.

25
Figure 5 - Lupanine enantiomers: (+) and (-) [10].
2.2 Membrane processes: a focus on Nanofiltration
Membrane technologies are currently applied in water and wastewater treatments due to stringent
water quality standards, with varied membrane processes available. There are four categories,
according with the membrane pore size: microfiltration (MF), ultrafiltration (UF), nanofiltration (NF) and
reverse osmosis (RO). Each one of these processes require different membrane types, meaning that
for instance a reverse osmosis membrane is essentially non-porous, retaining the majority of the solutes
including ions, and operating at high pressure: 20-100 bar. The NF membranes are capable of retaining
ions and organic molecules with low molecular weight. These membranes have a considerably higher
water permeability, and lower operating pressure, usually from 7 to 30 bar, in comparison with the RO
membranes. UF membranes retain colloids, macromolecules and microorganisms, with operating
pressures ranging from 1 to 10 bar [36]. Figure 6 illustrates the different filtration categories and
associates them with the corresponding applications and pore sizes.
Figure 6 – Membrane processes with correspondent pore sizes and molecules retained. Adapted from [36]
Potable water can be obtained through RO processes in sufficient amount to be used for domestic
or industrial applications [37]. NF, a pressure-driven membrane process commonly used for liquid-phase
separations and presenting higher flow rates with lower energy requirements [36], [38]. The membranes
used in this separation process have properties between RO membranes (where the separations are
conducted by a mechanism of solution-diffusion), and UF membranes (in which separation occurs

26
according to size exclusion and charge effects). The NF membranes commercially available are usually
made of polymers exhibiting surface charge, according with the matrix or surface groups e.g. amide,
sulphonated or carboxylic acid groups. Thus, NF membranes are able to separate ions through a
combination of molecule size and ion interaction mechanisms [39]. For these reasons, they are useful
in the selection and fractionation of solutes from complex process streams, which makes them a viable
option for different industries, such as: pharmaceutical, biotechnological and food engineering [40].
Additionally, nanofiltration proved to be a promising technique for the treatment of water with natural
organic matter and pollutants, being a process used in wastewater treatment [36]. In the case of natural
organic compounds removal from water surfaces, sieving mechanisms occur, due to the larger size of
the molecules present when compared to the membrane pore size (Figure 7) [41], [42]. Therefore, it is
important to select the membrane considering its molecular weight cut off (MWCO), and according to
the desired application. The MWCO, defined as the minimal molecular weight at which a solute of known
molecular weight is 90% rejected by the membrane, can be obtained by determining the membrane
rejection for different molecular weight solutes [43].
Figure 7 - Representation of the interaction between the molecules and the pores. Some will adhere to the
membrane surface (1); others will block the pore (2, 4); and the smaller ones will pass through the pore (3) [44]
Like other membrane separation processes, NF main problem associated is the fouling. The fouling
is related with the size of the particles and membrane pores, occurring when the accumulation of these
particles on the membrane surface blocks the passage of other molecules [45]. Although, other factors
besides the pore size can affect the fouling. Some studies state that the fouling may also be related with
membrane properties such as hydrophobicity and permeability [46] or roughness, where particles are
favourably transported to the membrane valleys, resulting in “valley clogging” [47]. There are four
different forms of fouling: i) adsorption – interaction between membrane and solutes on the membrane
surface or in the pores; ii) pore blocking – obstruction of membrane pores with solute particles, due to
their size; iii) cake layer formation – sedimentation on the membrane surface of particles larger than the
pores; and iv) gel layer formation – formation of a gel layer in the membrane surface [48]. It is also
possible to characterize fouling in function of the type of molecules that participate in this phenomenon,
as summarized in Table 3. Fouling has a direct influence in the NF process, leading to flux decline (with
decreased productivity), consequently increasing the process costs due to higher operation time, energy
demand and membrane degradation and replacement [49].

27
Table 3 – Types of fouling and their main causes.
2.2.1. Lupanine Recovery Processes
Carmali et al. (2010) have demonstrated an experimental procedure for the recovery of lupanine
from Lupinus albus leaching waters through a membrane process of osmotic evaporation [10]. The
concentration occurs through a porous hydrophobic membrane separating a diluted aqueous solution
from a concentrated osmotic one. Since the membrane is hydrophobic, it establishes vapour-liquid
interfaces within the pores. A water flux that crosses this interface of air in the pore is caused by water
vapour pressure differences, which is induced by the concentration between both solutions. Therefore,
evaporation occurs in one side of the membrane and condensation occurs in the other [10].
Concentrated osmotic solutions are commonly saline, creating high osmotic pressure differences. In
general, sodium chloride (NaCl) is used, but other electrolytes such as magnesium chloride (MgCl2),
calcium chlorie (CaCl2) or magnesium sulfate (MgSO4) can be applied [54]. Although the low water
fluxes obtained represent a process limitation, the use of mass transfer equipment with enhanced
surface area may minimize this issue [55]. Carmali et al. (2010), successfully obtained a 10-fold
concentrated wastewater, using a calcium chloride solution with lupanine recovery from the
concentrated effluent through ethyl ether extraction. A fraction of 740 g of lupanine was recovered from
3 tons of a leaching batch of L. albus seeds, corresponding to a recovery of 18.5 % of the lupanine
present in the concentrate. Taking into account that a case study where a specific operation would
process 280 tons of L. albus per year through debittering process, this implies that 70 kg of lupanine
could be obtained with 90% purity, representing only 18.5% recovery [10].
Type of fouling Definition References
Organic Fouling
Particles like proteins, polysaccharides or organic
matter deposition on the membrane surface.
[52], [50]
Colloidal Fouling
Minerals, metal oxides, salt precipitates accumulation
on the membrane surface.
[51]
Scaling
Precipitation of ionic products like calcium acetate or
calcium carbonate, among others.
[52]
Biofouling
Adhesion or growth of microorganisms (bacteria, fungi) on the membrane surface, with possible agglomeration
of extracellular products.
[53]

28
Previous studies from BERG-IBB group at IST demonstrated other approaches for the water
treatment, such as: ultrafiltration and subsequent nanofiltration (previously described) with lupanine
recovery of around 99% [29], followed by purification using resins or liquid-liquid extractions. Another
approach tested the use of molecularly imprinted polymers (MIPs), using lupanine as the template and
enabling its isolation [29], [56].
Resins can be classified as either ion exchangers resins (IER) or polymeric adsorbents, and can be
used for the removal of impurities from mixtures, leading to increased selectivity of the desired product
[57]. IER selection occurs through an exchange of ions that can be cationic or anionic, according with
the ionic form of the product, thus being attached to the resin [58]. Previous studies demonstrated that
IER presents promising results for an efficient removal of metal ions from wastewaters, and their
recovery without toxic sludge production [59]. IER already proved to be effective in the treatment of
textile dye wastewaters, leading to increased quality of the treated wastewater effluent and enabling its
reuse in the textile industry [60]. Adsorbent resins are useful for pharmaceutical industries in the
purification of amino-acids, vitamins, antibiotics or peptides [61]. In general, these resins are cheap with
simple steps of binding and regeneration. For lupanine binding, both IER and adsorbent resins were
tested with the cooking phase of the industrial debittering process resulted in similar results for both
resins, around 70% of lupanine recovery from the wastewater [56].
In the case of liquid-liquid extractions, it involves the separation through transfer of a solute from one
solvent to another, where both are immiscible and form two different phases. This type of extraction is
composed by a mixing step, followed by separation of the two liquid phases. Downstream recovery of
fermentation products or wastewater treatments are examples of applications that use these extractions
[62], [63]. For the case of lupin beans wastewater, values close to 100% of lupanine can be extracted
with solvents like dichloromethane (DCM), toluene, 1-octanol, 1-butanol and methyl tert-butyl ether
(MTBE) [56].
The molecular imprinting approach aims to create specific binding sites for a given target molecule.
There are three key components in this technique: a template, a monomer and a cross-linking agent.
The target molecule that acts as a template interacts with cross-linked monomers that together form a
unique structure. The stability of this structure is dependent on the link between the template and
functional groups of the monomer. Therefore, the basic principle of this process is the ability of the
receptors to recognize their targets and bind to them [64]. The study of the most appropriate monomer
to obtain a MIP using racemic lupanine as template as already been studied. This experimental
approach enabled around 60% recovery [56].
As seen, it is possible to conclude that in comparison with Carmali et al. (2010) process for lupanine
recovery, the studies from BERG-IBB group at IST using either resins, liquid-liquid extractions or MIPs
revealed higher lupanine recovery percentages.
2.3. Quinolizidine Alkaloid Quantification Methods
Nowadays, a wide variety of known alkaloid determination methods is kwown. Examples of
qualitative tests are the taste testing, the Dragenforff test, fluorescence assays, thin-layer
chromatography (TLC) and nuclear magnetic resonance (NMR). While others such as, high-

29
performance liquid chromatography (HPLC), gas chromatography (GC), gas liquid chromatography-
mass spectrometry (GC-MS), are quantitative [65].
The taste testing was first used in lupin beans and relies on the bitter taste characteristic of QAs,
where tasters have to taste lupin beans seeds [65].
Dragendorff’s test involves the use of a reagent that is able to detect alkaloids, heterocyclic nitrogen
compounds and quaternary amines, in vegetal samples of Lupinus species like seeds, leaves or pods.
The Dragendorff reagent reacts with high QAs patterns (higher than 0.5%) present in lupins [66],
enabling visualization of the existing alkaloids.
Thin-layer chromatography is a qualitative and semi-quantitative analysis widely adopted for analysis
of alkaloids. The extracted metabolite samples are applied to a TLC plate and migrate with the help of
an eluent system, allowing the separation of different compounds. Here, the main problem is to separate
alkaloids with varying polarity, being necessary specific TLC systems [67].
Fourier Transform Infrared Spectrometer (FT-IR) is commonly used in a variety of fields such as
organic synthesis, polymer science, petrochemical engineering and pharmaceutical industries. The
mechanism of FTIR technique is in relation with transitions between vibrational energy states. The
absorption of IR radiation occurs when a proton transfers to a molecule and excites it to a higher energy
state, resulting in the vibrations of molecular bonds at different wavelengths in the IR region of the
spectrum [68]. Each IR absorbance peak has a specific wavenumber determined by the
physicochemical properties of the respective molecule, being like a fingerprint of that functional group
(e.g. C=O, O-H, etc). FITR techniques are divided in potassium bromide (KBr)-pellet FTIR, attenuated
total reflection (ATR)-FTIR and diffuse reflection infrared Fourier Transform (DRIFT) spectroscopies.
ATR-FTIR provides chemical information’s on functional groups without the need of preparing a pellet
[69]. Previous studies have already demonstrated the possibility to detect QAs using ATR-FTIR [70].
Nuclear magnetic resonance is mainly a qualitative technique that focus on the interaction between
matter and electromagnetic forces, subjecting a sample to two magnetic fields: one stationary and the
other in variation with a specific radio frequency. Energy is absorbed by the sample at specific
combinations of fields. In QAs identification, there are two NMR spectra: one for the carbon, 13C isotope,
and the other for the hydrogen, the proton. Other technique for QA characterization is X-ray, in which
the three-dimensional structure of a molecule is obtained in this technique, giving a precise
characterization of the compound. Here, X-rays are absorbed by the sample and an absorption spectra
is given, contributing to the identification of the alkaloid [65].
In terms of quantitative techniques, high-performance liquid chromatography is highly sensitive and
is used for alkaloid analysis, being especially useful when pure standards are available. It is composed
of a stationary phase that can have surface absorption or ion exchange interactions [71], and a mobile
phase that transports the sample.
Nowadays, the most common and accurate method for QAs quantification, is gas-chromatography,
many times combined with mass spectrometry [72]. Gas chromatography, similarly to HPLC, is a quick
technique for the determination of alkaloids in a mixture. This technique requires temperature stability
for maintaining the sample in the gaseous state [73]. Depending on the nature of the stationary phase,
gas chromatography is divided into two subclasses: gas-solid chromatography or gas-liquid
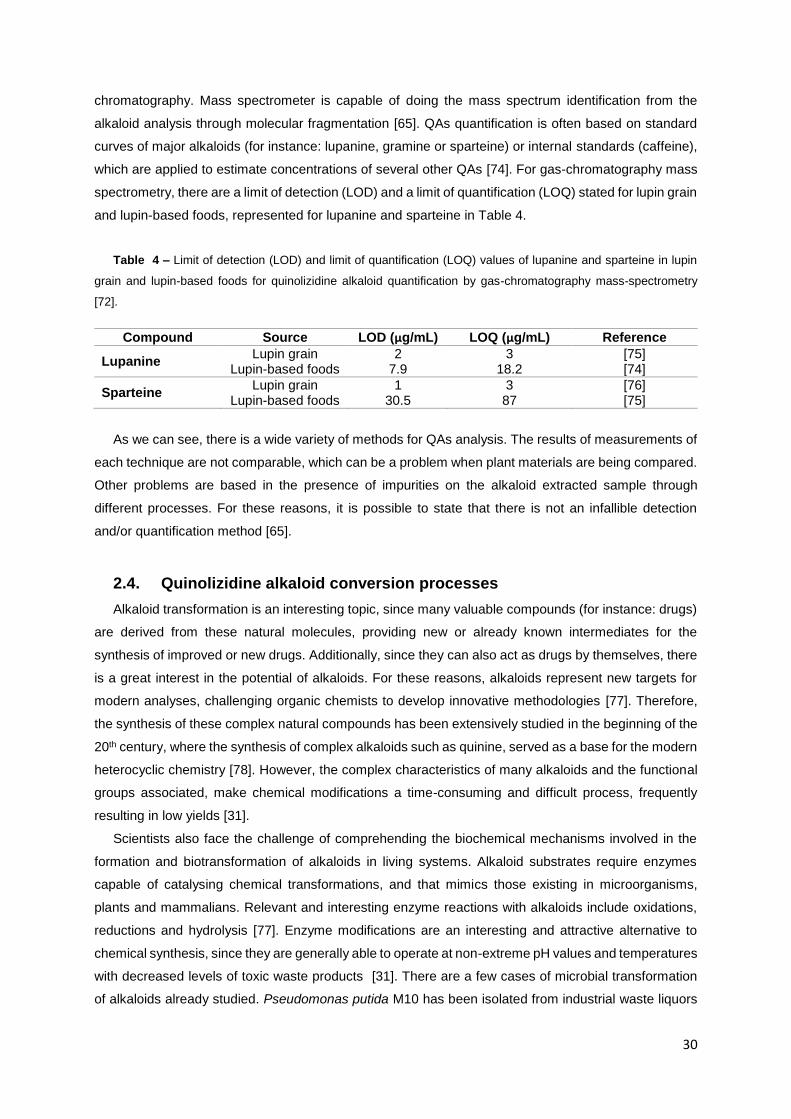
30
chromatography. Mass spectrometer is capable of doing the mass spectrum identification from the
alkaloid analysis through molecular fragmentation [65]. QAs quantification is often based on standard
curves of major alkaloids (for instance: lupanine, gramine or sparteine) or internal standards (caffeine),
which are applied to estimate concentrations of several other QAs [74]. For gas-chromatography mass
spectrometry, there are a limit of detection (LOD) and a limit of quantification (LOQ) stated for lupin grain
and lupin-based foods, represented for lupanine and sparteine in Table 4.
Table 4 – Limit of detection (LOD) and limit of quantification (LOQ) values of lupanine and sparteine in lupin
grain and lupin-based foods for quinolizidine alkaloid quantification by gas-chromatography mass-spectrometry
[72].
Compound Source LOD (µg/mL) LOQ (µg/mL) Reference
Lupanine Lupin grain
Lupin-based foods 2
7.9 3
18.2 [75] [74]
Sparteine Lupin grain
Lupin-based foods
1 30.5
3 87
[76] [75]
As we can see, there is a wide variety of methods for QAs analysis. The results of measurements of
each technique are not comparable, which can be a problem when plant materials are being compared.
Other problems are based in the presence of impurities on the alkaloid extracted sample through
different processes. For these reasons, it is possible to state that there is not an infallible detection
and/or quantification method [65].
2.4. Quinolizidine alkaloid conversion processes
Alkaloid transformation is an interesting topic, since many valuable compounds (for instance: drugs)
are derived from these natural molecules, providing new or already known intermediates for the
synthesis of improved or new drugs. Additionally, since they can also act as drugs by themselves, there
is a great interest in the potential of alkaloids. For these reasons, alkaloids represent new targets for
modern analyses, challenging organic chemists to develop innovative methodologies [77]. Therefore,
the synthesis of these complex natural compounds has been extensively studied in the beginning of the
20th century, where the synthesis of complex alkaloids such as quinine, served as a base for the modern
heterocyclic chemistry [78]. However, the complex characteristics of many alkaloids and the functional
groups associated, make chemical modifications a time-consuming and difficult process, frequently
resulting in low yields [31].
Scientists also face the challenge of comprehending the biochemical mechanisms involved in the
formation and biotransformation of alkaloids in living systems. Alkaloid substrates require enzymes
capable of catalysing chemical transformations, and that mimics those existing in microorganisms,
plants and mammalians. Relevant and interesting enzyme reactions with alkaloids include oxidations,
reductions and hydrolysis [77]. Enzyme modifications are an interesting and attractive alternative to
chemical synthesis, since they are generally able to operate at non-extreme pH values and temperatures
with decreased levels of toxic waste products [31]. There are a few cases of microbial transformation
of alkaloids already studied. Pseudomonas putida M10 has been isolated from industrial waste liquors

31
at an opiate-processing plant and apparently, this strain is able to use morphine to support its growth
[79]. In this study, hydroxylation of morphine alkaloids occurred, representing an industrially important
conversion since a small change in the alkaloid structure can have a large impact in its activity. The
hydroxylation resulted in significantly enhanced analgesic capacity that is chemically hard to obtain, due
to an unreactive tertiary carbon [79]. Another example is based in ergot alkaloids, in which conversion
by the bacterial strain Rhodococcus equi A4 yields lysergic acid, with a large spectrum of
pharmacological activities, commonly produced by alkaline hydrolysis of peptide ergots. From these
cases, it is possible to state that despite the complex structure of some alkaloids, microorganism
systems are able to transform or degrade them, giving rise to interesting products and applications [31].
In the context of wastewater treatments, the complete biological degradation of the alkaloid content is
also interesting.
The identification of new biological catalysts, able to transform alkaloids, has been a topic of interest
for research. In this field, microbial transformation systems are advantageous over other systems, since
biomass production is fast. These systems may lead to the production of interesting intermediates or
metabolites in sufficient quantities for their identification and further assessment as drugs concerning
their clinical potential. Additionally, in microbial systems, it is possible to express enzymes involved in
alkaloid biosynthesis in heterologous hosts, thus enabling the study of unknown catalytic mechanisms
beyond this process. Boonstra et al., (2001) have developed a recombinant bacterial morphine alkaloid
transformation system using genes from Pseudomonas putida M10 to clone and express in E. coli [79].
In this study, a whole-cell system was comprised of constitutively expressed NADP+-dependent
morphine dehydrogenase and NADH-dependent morphinone reductase. The recombinant system
generated is able to transform morphine or codeine into hydromorphone or hydrocone, respectively.
2.4.1. Chemical conversion of lupanine in sparteine
Sparteine is an alkaloid that can activate a muscarinergic acetylcholine receptor and inhibit N+
channels and Na+ ion flux. When used in small dosages, this alkaloid acts as a stimulant, but high
dosages lead to a paralyzing effect on the autonomic ganglia. An example of a sparteine medical
application is the correction of cardiac arrhythmias [80]. The enantiomer L-(-)-sparteine is widely used
as a ligand or inducer for several asymmetric reactions [81].
Lupanine and sparteine are both tetracyclic quinolizidine alkaloids (Figure 1), and two important
pharmaceutical compounds. The chemical preparation of pure lupanine and the enantiomer D-
(+)sparteine has been reported, however, since it requires multi steps, these approaches are not
practical. In 1931, the resolution of lupanine with a chiral acid (L-camphorsuphonic acid and D-
camphorsulphonic acid) was demonstrated, yielding 9.4 % of L-(-)-lupanine and 13% D-(+)-lupanine,
with subsequent reduction with red phosphorus, giving rise to both D-(+)-sparteine and L-(-)-sparteine
[82]. Przybył and Kubicki (2011), performed an optimization of the previous process using
dibenzoyltartaric acid and a nontoxic reductant [83]. Nevertheless, safety and post treatment issues
regarding the high solvent manipulation and the large amount of reductant used are the major

32
drawbacks in this process [83]. Thus, the need for a practical and economic process to obtain
enantiopure lupanine and sparteine remains an important issue.
More recently, a process for converting lupanine into sparteine was patented by Nuno Maulide, Bo
Peng, Carlos Afonso and Raquel Frade [84]. In this process, raw lupin seeds were subjected to an
alkaline solution, with a lupanine extraction step and treatment with pure enantiomers of tartaric acid,
which is a simple chiral acid. Through this process, it was possible to achieve pure lupanine
enantiomers. The enantiopure sparteine was obtained by reduction of lupanine with the catalytic agent
NaBH4. The advantage of this process is the reduced amount of organic solvents and halogenates used.
The resolution procedure with tartaric acid yielded 29% D-(+)-lupanine and 30% L-(-)-lupanine. The
highest percentage of conversion of lupanine enantiomer (88%) in sparteine was obtained using NaBH4
and I2 as reducing agents and THF as organic solvent, as illustrated in Figure 8.
In this reaction, if the temperature is further enhanced to 80 °C, only 16 hours are required to obtain
a yield of 88%. Therefore, this is considered a convenient and economic process to obtain the two
alkaloids, particularly sparteine [84].
2.4.2. Biological conversion of lupanine
The Industrial debittering process described in section 2.1.2, showed that the removal of alkaloids
from lupin beans imply a huge amount of water use and industrial wastewater being discarded. This
wastewater, rich in lupanine, has a negative environmental impact, calling for an economically viable
wastewater detoxification process successfully implemented. Bitter lupin extracts can be used either as
biological growth stimulator in agriculture or for pharmacological purposes [85], [86].
As seen in Section 2.1.3., due to stable groups in its structure, lupanine is not easily chemically
modified to originate other added-value alkaloids. For this reason, bioconversion of lupanine using
different microorganism has been studied in the last years [30], [87], [88].
In 1996, Santana et al. isolated bacterial strains capable of using lupanine as a carbon and energy
source [30]. These strains were isolated from the soil where L. albus and L. luteus species were
cultivated. Among the fifteen different strains obtained, IST20B and IST40D (from L. luteus) were the
ones with higher maximum specific growth rates when tested in the presence of medium supplemented
with lupanine (2 g/L), with a value of 0.13 h-1. In this growth media, the strains were able to remove
around 99% of the lupanine in the stationary phase, according to the gas-liquid chromatography results.
However, IST40D had slightly lower biomass yield (0.33 g dry biomass/g lupanine removed) in
comparison with IST20B (0.4 g dry biomass/g lupanine removed), indicating that the strains must
Figure 8 – Conversion of lupanine into sparteine, through NaBH4 and I2 reducing agents and THF organic
solvent [84]

33
catabolize lupanine in a different manner. Metabolic fingerprints of the bacterial isolates were performed,
demonstrating that both species catabolized the majority of the amino acids, amines, alcohols and a
considerable number of carboxylic acids. For species identification, Microlog and BIOLOG systems
(metabolic profile systems) were applied, but the results showed that none of the species was
successfully identified in the study, despite the similar metabolic fingerprint among them. IST20B strain
was also grown in a lupin aqueous extract obtained from batch leaching of portions of 50 g og L. albus
flour in 200 mL of water for 4 h (45°C) with stirring, having 7.9% total alkaloids (lupanine equivalents)
and 4.3% total nitrogen. The authors assessed the content of alkaloids and proteins during IST20B
growth, concluding that when stationary phase was reached (after 32h at 27°C) the concentration of
soluble proteins was only reduced in 8%, while alkaloids were removed in 85% [30].
Later, in 2002, Santana et al published another research article regarding bacterial removal of
quinolizidine alkaloids either in synthetic medium as well as in a Lupinus albus aqueous extract [88].
When grown in synthetic medium, both strains IST40D and IST20B showed 99% of lupanine removal,
similar to the previous study. Additionally, distinct QA as intermediate metabolites were detected during
exponential growth by gas chromatography and gas chromatography-mass spectrometry. The results
evidenced the presence of 3-hydroxylupanine, 13-hydroxylupanine and 17-oxosparteine as the major
lupanine intermediate metabolites in IST20B culture. For IST40D growth, 3,4-dehydrolupanine and α-
isolupanine were identified. It was also observed that the concentrations of the intermediate metabolites
has increased during first 8h of exponential growth and further decreases to undetectable
concentrations, with the exception of α-isolupanine that reached maximal concentrations in the early
stationary phase. Additionally, the behaviour of the two bacterial strains previously studied was tested
with lupin seeds extract complex medium (LPX), prepared from the dilution of 1:10 of an aqueous L.
albus seed extract provided by Mittex Anlagenbau GmbH in a buffered solution with pH 7. Lupanine and
total alkaloid final concentrations of LPX was 2 g/L and 3 g/L, respectively. During bacterial growth, the
determination of soluble protein, amino acids, total carbohydrates, total QA and lupanine concentrations
were performed. The total alkaloid and lupanine concentrations decreased after the inoculation of
bacteria in LPX medium, with a a complete metabolization of amino acids, decrease of 77% in the case
of lupanine, maintaining the levels of soluble proteins. From these results, the authors stated that both
bacterial strains are capable of reducing alkaloids and other organic compounds from the LPX medium.
However, further investigations are needed for the process optimization at an industrial scale [88].
Recently, Parmaki et al. (2018) studied the bioconversion of alkaloids into added-value chemicals by
comparative analysis of newly isolated lupanine degrading strains [87]. The authors isolated microbial
strains capable of using lupanine as carbon source from the wastewater of a L. albus processing plant
in Portugal, among other sources. Samples were enriched with 1.5 g/L of lupanine as the carbon source,
with three further sequential enrichments performed. One bacterial strain that revealed the ability to use
lupanine was isolated from L. albus processing wastewater and identified and classified as
Pseudomonas putida LPK411 [87]. When inoculated with growth media supplemented with 1.5 g/L of
lupanine, this microorganism was able to degrade 80% of the lupanine following 36h of cultivation. At
the end of the experiment, the resulting molecules were studied through NMR, to search for different
molecular structures. If microorganisms can convert lupanine into modified structures that are more

34
favourable to chemical modifications, conversion processes for the production of pharmaceutical drugs
can be more effective. In this study, two novel structures of end products resulting from lupanine
bioconversion, were observed for the first time (Figure 9) [87].
This study demonstrated that lupanine based structures can be obtained through P. putida LPK411
bioconversion, and can serve as a base for valorisation of lupanine in L. albus wastewater [87].
2.5. Bioreactors for bioconversion processes
In general, bioconversion processes are characterized by lower yields, when compared to chemical
synthesis reactions. The design, characterization and optimization of a bioconversion process, is crucial
for an effective process. There are some restrictive factors that make these processes less efficient,
such as, the low solubility of several organic substrates in aqueous solution and consequent inhibitory
effects of the reaction [89]. To overcome these difficulties and enhance bioconversion, it is important to
evaluate which is the best concentration of substrates to feed the reaction to reach optimal
microorganism activity in a certain period of time. For this, a continuous addition of substrates and a
selective removal of the desirable product can be applied [90].
One experimental approach to obtain an effective recovery of the product of interest is the
combination of liquid-liquid extractions and membrane permeation processes. Here, the microorganism
and the product to be extracted are immiscible, and between them there is a membrane that is
responsible for the reduction in the contact [91]. Specific membrane-based extractive bioreactors have
been applied in fermentations yielding end products that are continuously extracted to avoid their
accumulation and their toxicity to the microorganism [92]. These two-phase partitioning bioreactors
seem to have great potential in bioconversion processes. This type of process has been widely explored,
for the recovery of low-molecular weight volatile products like ethanol or acetone-butanol, and organic
compounds such as, acetic, lactic, propionic or butyric acids [93]. Xudong et al. (2004) performed a
bioconversion process of acrylonitrile to acrylamide using a hollow-fiber membrane bioreactor system
[94]. The authors designed a poly-sulfone hollow-fiber membrane bioreactor system to test the
bioconversion process with a new strategy of membrane separation. Before this approach, acrylamine
was bio-converted in fed-batch mode with immobilized cells. The fed-batch process presented several
disadvantages, as the presence of impurities, instability of product quality and relatively low productivity.
The hollow-fiber membrane bioreactor alternative, allowed to overcome these barriers and replace the
conventional process, with a continuous process using free cells as the biocatalyst and separation of
Figure 9 – Lupanine chemical structure (on the left) and chemical structures of novel end
products A and B, resulting from lupanine bioconversion [87]

35
the acrylamide product from the cells. This approach was tested in laboratory and at industrial scale,
with enhanced productivity yields in comparison with the previous approach [94].
Previous studies state that the use of small-scale vessels (with a maximum of 100 mL) are adequate
to investigate the biotransformation processes, providing cost savings, due to lower reagent (solid
media, for instance) and space requirements, compared with conventional bioreactors [95]. However,
independently of the system applied, the experimental set-up (mass transfer features, mixing conditions,
oxygen demand) should be designed in a way that enables the scale-up [96]. In addition to the low
costs associated, they facilitate the processing of different parallel test conditions, to evaluate their
effects at the same time on a given bioprocess [95].
Waste materials bioconversion into economically or ecologically beneficial materials would solve the
environmental concerns related to discarded untreated waters. A proper bioreactor for these
bioconversion processes should be studied, in order to use living systems with bacteria, yeasts or fungi
to specifically exploit their capability to achieve bioconversion of waste materials.
2.6. Biorefinery concept
Inspired in traditional oil refineries for petrol production, biorefineries enable the production of fuels,
power, chemicals and products from biomass with valorisation of a natural resource through biomass
conversion [97]. Here, renewable biomass or waste materials are used as the raw material feedstock,
where subsequent conversion processes are applied for treatment and processing of these raw
materials [98]. Biorefinery concept is in conformity with the notion of sustainable development, since the
biomass used is treated and valorised with the help of different unit operations to create added-value
compounds in an economic and eco-friendly strategy [97]. A unique raw material source can generate
a wide range of products, as illustrated in the Figure 10. To guarantee the sustainable use of biomass,
the process should promote first the development of the highest added-value product, followed by the
second highest and so on [99]. Assuming that all bioresources in a biorefinery are used, including
biological leftovers, zero waste production should be achieved.
Figure 10 - illustration of a biorefinery concept [97].

36
In the last decades, this concept of biorefinery has been applied in some industries such as the corn
wet milling, the pulp, paper and the paper industries [100], [101]. Currently, this concept mostly includes
terrestrial biomass like plants, with a small part devoted to marine resources such as seaweeds [102].
Liquid biofuels production has been affecting the economy, due to the competition with the food
sector, since first generation biofuels are derived from sugars, starch, animal fats and vegetable oil. To
overcome this issue, the second generation biofuels based in natural lignocellulosic resources, arised
as more environmentally friendly in order to minimize the impacts on the food market [102]. Hence,
biorefineries success depend on several factors as, the physical and chemical nature of the raw material
and on the economic interest of the process [103], [104].
Biomass conversion processes and the resulting biobased products are highly important for several
industries. Nevertheless, some technical, strategic and commercial barriers need to be overcome before
the large-scale industrial commercialization occurs. Here, the adequate technologies for the processes
should be applied to the projected biorefinery, e.g. chemical conversion, gasification, fermentation and
also pre-treatment and storage [105]. In fermentation processes, microorganisms are used to convert
substrates into recoverable products like alcohols or organic acids.
In the recent past years, biorefinery optimization is becoming more significant, since it allows the
identification of bottlenecks and pathway improvement in the process, thus increasing biomass
conversion yield and reducing carbon footprint, reducing water disposal, fossil energy use and thus
increasing net economic value (Figure 11) [106].
Figure 11 - Representation of pyramid of biomass for a biorefinery system [107].

37
3. Materials and Methods
3.1. Nanofiltration
A representative sample of 1L composed of different fractions from sweetening phase of the
industrial debittering process was used for nanofiltration in concentration mode. This sample was
obtained by homogenization of volumes collected at different time points of sweetening phase from
Tremoceira Estrela da Piedade. The sample was centrifuged at 6000 rpm for 30 minutes at 20°C and
the supernatant was collected for the nanofiltration. A polyamide NF270 (Dow FILMTEC) membrane
was used in this experiment. A total volume of 640 mL of supernatant previously collected was added
to the filtration cell and the gear pump flow rate set to 420 mL/min. Two samples of the initial feed were
collected for lupanine quantification and COD measurements, representing time zero of the
nanofiltration. The system was closed and a pressure of 20 bar was applied to the system. Samples of
the permeate and retentate were collected over time to quantify lupanine and COD, and the flux values
registered.
3.2. Bacteria
3.2.1. Culture enrichments and isolation of pure strains
Cultivations with defined M9 liquid medium were performed, for the isolation and selection of
bacterial strains from the lupin beans wastewater (LBW) surface organic-rich layer and from the LBW.
For this, two assays were done using the LBW superficial layer (Figure 12) or the LBW (Figure 13) as
inoculum at 5% (v/v) for the first enrichment of three sequential lupanine enriched cultures, respectively.
The inoculations of the second and third enrichments were performed with 5% (v/v) of the former
enriched culture. Both assays were performed in 100 mL shake-flasks with 50 mL working volume. Cells
were cultured using minimal microbial growth medium (M9), composed of (g/L): Na2HPO4.2H2O 8.5,
KH2PO4 3, NaCl 0.5, NH4Cl 0.5, MgSO4 0.24. Three cultivation conditions were tested with three
sequential enrichments in 7-day cultures, and maintained at 30°C and 100 rpm. For the assay with LBW
superficial layer inoculum, the carbon sources used were (g/L): (i) glucose 2; (ii) lupanine 0.75; (iii)
glucose 2 and lupanine 0.75 mixtures (Figure 12). For the assays with LBW inoculum, were used (g/L):
(i) glucose 2; (ii) lupanine 1.5; (iii) glucose 2 and lupanine 1.5 mixtures (Figure 13). Lupanine
concentrated solutions were prepared, filtered with 0.22 µm filters at vacuum, and added to culture
medium to achieve the referred concentrations.
At day 0 and at day 7 of each enrichment, samples of 1 mL were collected for lupanine quantification
by HPLC. Samples were also collected for isolation of the microorganisms in culture, from the third
enrichment culture at day 7, and stored at -80°C with 1 mL of glycerol 85% (v/v). Several dilutions of the
final culture were done in NaCl 0.9% (w/v), and plated in M9 agar media supplemented with lupanine at

38
1.5 g/L. The colonies with distinct morphotypes were streaked onto new M9 agar plates with 1.5 g/L
lupanine and incubated at 30°C for seven days, for strain isolation.
Figure 12 - Schematic representation of the assays for bacterial isolation on (i) 2 g/L glucose; (ii) 0.75 g/L
lupanine or (iii) 2 g/L glucose + 0.75 g/L lupanine, with three sequential lupanine enrichments in 50 mL working
volume. Cultures were inoculated with 5% (v/v) of the former enriched culture. The microcentrifuge 1.5 mL tubes
illustrate the key points of sample collections: day 0, 3 and 7 of each enrichment, for HPLC analysis; and day 7 of
the third enrichment for plating on M9 supplemented with 2 g/L glucose and 1.5 g/L lupanine.
Figure 13 - Schematic representation of the assays for bacterial isolation on (i) 2 g/L glucose; (ii) 1.5 g/L
lupanine or (iii) 2 g/L glucose + 1.5 g/L lupanine, with three sequential lupanine enrichments in 50 mL working
volume. Cultures were inoculated with 5% (v/v) of the former enriched culture. The microcentrifuge 1.5 mL tubes
illustrate the key points of sample collections: day 0 and 7 of each enrichment, for HPLC analysis; and day 7 of the
third enrichment for plating on M9 supplemented with 2 g/L glucose and 1.5 g/L lupanine.

39
3.2.2. Gram staining, DNA extraction and strain identification by 16S rDNA amplification
Gram coloration was done in four bacteria isolates, according to Seeley Jr, H. W. et al. (1991) [108],
followed by microscopic observation in an Hitech Zeiss Axioplan with the camera Axiocam 503 color.
DNA extraction of three gram-negative bacteria was performed according to the instructions of
PureGene: Genomic DNA Purification kit (protocol for gram-negative). The cells were resuspended in
300 µL of Cell Lysis Solution and incubated at 80°C for 5 minutes. An RNase treatment was done to cell
lysate by adding 1.5 µL RNase A Solution, and samples were mixed by inverting the tubes 25 times,
with a subsequent incubation step at 37°C for 45 minutes. For protein precipitation, samples were cooled
to room temperature by placing tubes on ice for 1 minute. Then, 100 µL of Protein Precipitation Solution
were added to the cell lysates and vigorously vortexed for 20 seconds to homogenize the mixture.
Samples were centrifuged at 13000 rpm for 3 minutes and the pellet containing precipitated proteins
was discarded. The supernatant containing DNA was transferred to a clean Eppendorf with 300 µL of
100% Isopropanol for protein precipitation and the tubes were gently homogenized. Samples were
centrifuged at 13000 rpm for 1 minute and after this step DNA was visible as a small white pellet.
Supernatant was discarded and 300 µL of 70% ethanol were added to wash the DNA from residual
protein precipitates or other impurities. A final centrifugation was done at 13000 rpm for 1 minute.
Ethanol was carefully removed and the DNA was resuspended in 50 µL of nuclease-free water. The
purity and concentration of the DNA was measured in Nanodrop. Pure DNA was stored at -20°C for
further use in polymerase chain reaction (PCR).
The DNA extraction protocol used for gram-positive was followed according to Fykse et al. (2003).
One gram-positive bacteria was cultured overnight in LB medium at 30°C and 250 rpm. Then, 2 tubes
of 2 mL of bacteria suspension were centrifuged at 6000 rpm for 3 minutes at room temperature. The
supernatants were discarded and the cells were washed in 1 mL ice-cold 10 mM Tris-HCl pH8, and
sonicated in Branson Sonifier 250 under 50 W, 20 kHz for 3 minutes or 5 minutes to assess the efficiency
of the process. For PCR, 2 µL of lysed cells were directly used without a DNA purification step.
A master mix was prepared with Phusion Buffer (1x), MgCl2 (2.5 mM), dNTPs (200 µM), Forward
(27F 5’-AGAGTTTGATCMTGGCTCAG-3’) and Reverse (1492R 5’-CGGTTACCTTGTTACGACTT-3’)
Primers (0.5 µM), DNA (1 µL for gram-negative bacteria DNA and 2 µL from cell lysates), DMSO (3%),
Phusion DNA Polymerase (1 U/50 µL) and nuclease-free water to complete the volume up to 50 µL.
One sample without DNA was included as the negative control of the reaction. PCR conditions were set
for both gram-positive or gram-negative bacteria in the thermocycler Cleaver Scientific Ltd GTC96S as
described in Table 5:
Table 5 - PCR conditions of 16S rDNA gene amplification.
Temperature Time Number of Cycles
Initial Denaturation 98°C 30 seconds 1
Denaturation 98°C 10 seconds
Annealing 50°C 20 seconds 35

40
Extension 72°C 1 minute
Final Extension 72°C 10 minutes 1
In this reaction, the full-length 16S rDNA gene, a constituent of the small subunit of prokaryotic
ribosomes, was amplified [109]. The sequence of this gene is highly efficient for species identification,
since it is a very conserved region [110], [111]. Amplified PCR products were visualized in an agarose
gel (0.8%) with TAE buffer (1%). NZY DNA loading dye (1x) was added to DNA sample and the NZY
DNA ladder III was used as reference. Agarose gel was run in an electrophoresis with 90 V during 40
minutes with TAE buffer 50x. NZY Tech NZY Gel Pure purification kit was used for DNA extraction and
purification from the agarose gel. The concentration of pure DNA was measured by Nanodrop ND-1000
Spectrophotometer and DNA samples sequenced by STABVIDA. The identification of the species is
given by a BLAST that compares the sequence to be identified with biological sequences that are in the
database.
3.2.3. Bacteria cultivation in synthetic growth medium
All bacteria isolates were pre-grown during 48h at 30°C and 250 rpm in M9 containing either (g/L):
glucose 2; lupanine 1.5; or mixture of glucose 2 and lupanine 1.5, in triplicates for one isolate and
duplicates for the others (Figure 13). Lupanine concentrated solutions were prepared, filtered with 0.22
µm filters at vacuum, and added to M9 culture medium to achieve the referred concentrations.
The optical densities (OD) of the pre-cultures were measured at 600 nm on a UV/VIS
spectrophotometer (Hitachi V2001). Cells from pre-culture were harvested (centrifuged for 3 minutes at
6000 rpm, for cell concentration) and resuspendend in M9 growth medium for an initial OD600nm of 0.1,
in a working volume of 50 mL in 100 mL flasks (Figure 14). Cellular growth was followed by measuring
culture OD600 nm at regular intervals of 24h during seven days. Additionally, samples were collected every
day for quantification of lupanine concentration by HPLC. A control flask in the same conditions and
without the addition of cells was maintained to assess if lupanine consumption was due to microbial
action or degradation.
Figure 14 - Schematic representation of bacterial isolates growth assays on (i) 2 g/L glucose (G); (ii) 1.5 g/L
lupanine (L) or (iii) 2 g/L glucose + 1.5 g/L lupanine (G+L). Pre-cultures were inoculated with isolates and used for
the inoculation of main cultures. Pre-culture flasks contained 25 mL working volume in 50 mL flasks, and culture
flasks 50 mL working volume in 100 mL flasks. Cultivations were performed during 7 days at 30°C and 250 rpm.
3.2.4. Bacteria cultivation in lupin beans wastewater
Lupin beans wastewater (LBW) provenient from cooking phase of the industrial debittering process
was tested as a culture medium. For this, 1 L of the LBW from Tremoceira Estrela da Piedade (Charneca
da Caparica, Portugal) was centrifuged (20 min, 6000 rpm, 20°C) to remove solids in suspension. For

41
bacterial growth, the pH of LBW was adjusted to 7.0-7.5 with NaOH 1M. The obtained supernatant was
filtered three times with 0.22 µm filters (Whatman, ME24/21ST) under sterile conditions. The LBW
medium was diluted 1/2 times in sterilized water and used for bacteria cultivations without further
supplementations, with lupanine quantification by HPLC. The isolates were pre-cultured for 24h at 30°C
and 250 rpm in 25 mL of diluted LBW media, in triplicates. The OD of the pre-cultures was measured at
600 nm and cells were harvested (centrifuged for 3 minutes at 6000 rpm, for cell concentration) and
resuspendend in LBW + H2O growth medium for an initial OD600nm of 0.1, in a working volume of 50 mL
in 100 mL flasks (Figure 15). Cell growth was followed by measuring culture OD600 nm at regular intervals
of 24h during seven days. Samples were collected for lupanine quantification by HPLC, in periods of
24h. The COD level and the total amount of reducing sugars (DNS) were measured at day zero and day
seven of cultures.
Figure 15 - Schematic representation of bacterial isolates growth assays on lupin beans wastewater (LBW)
diluted at 1/2 in sterilized water. Pre-cultures were inoculated with isolates and used for inoculation of main cultures.
Pre-culture flasks contained 25 mL working volume in 50 mL flasks, and culture flasks 50 mL working volume in
100 mL flasks. Cultivations were performed during 7 days at 30°C and 250 rpm.
3.3. Yeast
3.3.1. Culture enrichment and isolation of pure strains
Cultivations with defined YNB liquid medium were performed, for the selection and isolation of yeast
strains from the LBW. LBW was used as inoculum at 5% (v/v) for the first enrichment of three sequential
lupanine enriched cultures. The inoculations of the second and third enrichments were started with 5%
(v/v) of the former enriched culture. Both assays were performed in 100 mL shake-flasks with 50 mL
working volume. Cells were cultured using complete yeast nitrogen base (YNB) (Difco) at 6.7 g/L. Three
cultivation conditions were tested with three sequential enrichments in 7-day cultures, and maintained
at 30°C and 100 rpm. The carbon sources used were (g/L): (i) glucose 2; (ii) lupanine 1.5; (iii) glucose
2 and lupanine 1.5 mixtures (Figure 15). Lupanine concentrated solutions were prepared, filtered with
0.22 µm filters at vacuum, and added to culture medium to achieve the referred concentrations.
At day 0 and day 7 of enrichment, samples of 1 mL were collected for lupanine quantification by
HPLC. Samples were also collected for isolation of the microorganisms in culture, from the third
enrichment culture at day 7, diluted and plated in YNB agar plates with lupanine at 1.5 g/L and glucose
at 2 g/L mixed with lupanine (1.5 g/L). To evaluate if other yeast species might be present, samples
were diluted and also plated in yeast peptone dextrose agar (YPDA) composed of Glucose 20 g, Agar
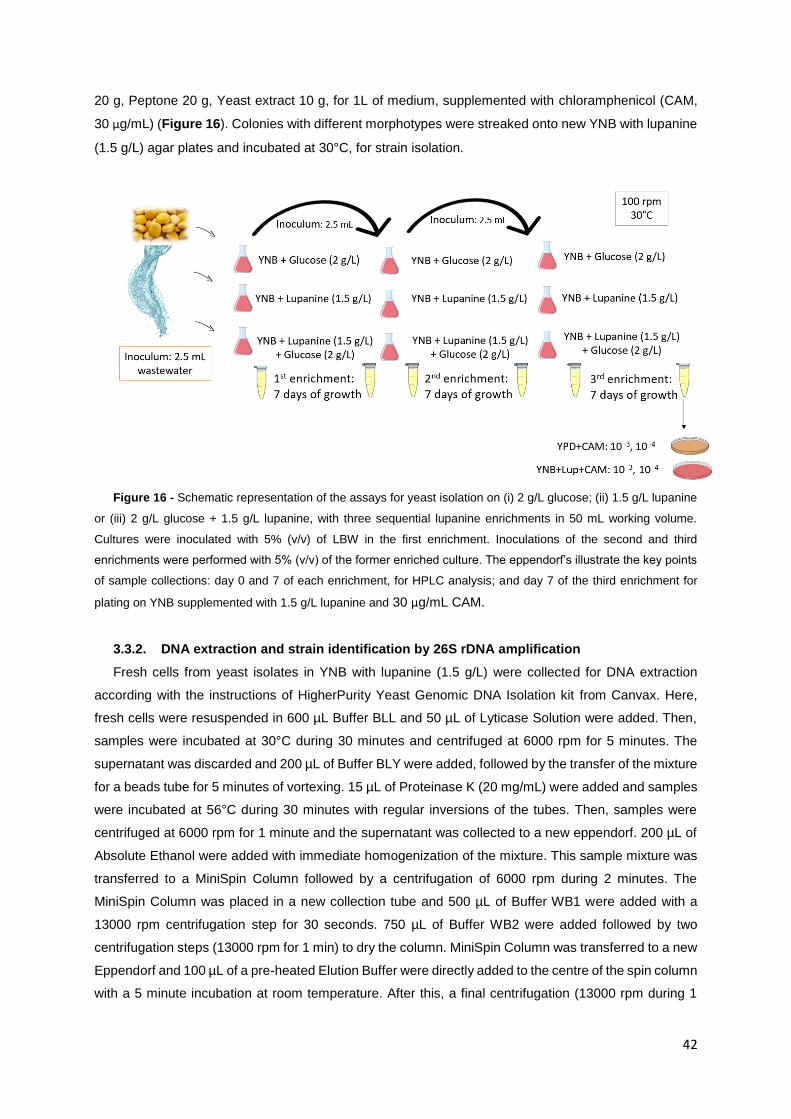
42
20 g, Peptone 20 g, Yeast extract 10 g, for 1L of medium, supplemented with chloramphenicol (CAM,
30 µg/mL) (Figure 16). Colonies with different morphotypes were streaked onto new YNB with lupanine
(1.5 g/L) agar plates and incubated at 30°C, for strain isolation.
Figure 16 - Schematic representation of the assays for yeast isolation on (i) 2 g/L glucose; (ii) 1.5 g/L lupanine
or (iii) 2 g/L glucose + 1.5 g/L lupanine, with three sequential lupanine enrichments in 50 mL working volume.
Cultures were inoculated with 5% (v/v) of LBW in the first enrichment. Inoculations of the second and third
enrichments were performed with 5% (v/v) of the former enriched culture. The eppendorf’s illustrate the key points
of sample collections: day 0 and 7 of each enrichment, for HPLC analysis; and day 7 of the third enrichment for
plating on YNB supplemented with 1.5 g/L lupanine and 30 µg/mL CAM.
3.3.2. DNA extraction and strain identification by 26S rDNA amplification
Fresh cells from yeast isolates in YNB with lupanine (1.5 g/L) were collected for DNA extraction
according with the instructions of HigherPurity Yeast Genomic DNA Isolation kit from Canvax. Here,
fresh cells were resuspended in 600 µL Buffer BLL and 50 µL of Lyticase Solution were added. Then,
samples were incubated at 30°C during 30 minutes and centrifuged at 6000 rpm for 5 minutes. The
supernatant was discarded and 200 µL of Buffer BLY were added, followed by the transfer of the mixture
for a beads tube for 5 minutes of vortexing. 15 µL of Proteinase K (20 mg/mL) were added and samples
were incubated at 56°C during 30 minutes with regular inversions of the tubes. Then, samples were
centrifuged at 6000 rpm for 1 minute and the supernatant was collected to a new eppendorf. 200 µL of
Absolute Ethanol were added with immediate homogenization of the mixture. This sample mixture was
transferred to a MiniSpin Column followed by a centrifugation of 6000 rpm during 2 minutes. The
MiniSpin Column was placed in a new collection tube and 500 µL of Buffer WB1 were added with a
13000 rpm centrifugation step for 30 seconds. 750 µL of Buffer WB2 were added followed by two
centrifugation steps (13000 rpm for 1 min) to dry the column. MiniSpin Column was transferred to a new
Eppendorf and 100 µL of a pre-heated Elution Buffer were directly added to the centre of the spin column
with a 5 minute incubation at room temperature. After this, a final centrifugation (13000 rpm during 1

43
minute) was done to elute purified genomic DNA. The spin column was discarded. DNA concentration
was measured by Nanodrop and was directly used for PCR, being stored at -20°C.
For PCR, a master mix was prepared with Phusion Buffer (1x), MgCl2 (2.5 mM), dNTPs (200 µM),
Forward (NL1 5’-GCA TAT CAA TAA GCG GAG GAA AAG-3’) and Reverse (NL4 5’-GGT CCG TGT
TTC AAG ACG G-3’) Primers [112] (0.5 µM), DNA (1 µL), DMSO (3%), Phusion DNA Polymerase (1
U/50 µL) and nuclease-free water to complete the volume up to 50 µL. One sample without DNA was
included as a negative control of the reaction. The conditions for the reaction were set as described in
Table 6:
Table 6 - PCR conditions of D1/D2 region amplification.
Temperature Time Number of Cycles
Initial Denaturation 98°C 30 seconds 1
Denaturation 98°C 10 seconds
Annealing 50°C 20 seconds 30
Extension 72°C 30 seconds
Final Extension 72°C 10 minutes 1
Here, D1/D2 region of the large subunit of the 26S ribosomal DNA was amplified. This region is
frequently used for species identification of yeasts, due to the variability within these regions [113], [114].
Amplified PCR products were visualized in an agarose gel (0.8%) with TAE buffer (1%). NZY DNA
loading dye (1x) was added to DNA samples and the NZY DNA ladder III was used as reference.
Agarose gel was run in an electrophoresis with 90 V during 40 minutes with TAE buffer 50x. NZY Tech
NZY Gel Pure purification kit was used for DNA extraction and purification from the agarose gel. The
concentration of pure DNA was measured by Nanodrop and DNA samples were sequenced by
STABVIDA.
3.3.3. Yeast cultivation in synthetic culture medium
Yeast isolates were pre-grown during 24h at 30°C and 250 rpm in YNB containing either (g/L):
glucose 2, lupanine 1.5 or glucose 2 mixed with lupanine 1.5, in duplicates (Figure 17). Lupanine
concentrated solutions were prepared, filtered with 0.22 µm filters at vacuum, and added to YNB culture
medium to achieve the referred concentrations. The OD of the pre-cultures were measured at 600 nm
on a UV/VIS spectrophotometer (Hitachi V2001). Cells from pre-culture were harvested (centrifuged for
3 minutes at 6000 rpm, for cell concentration) and resuspendend in YNB growth medium for an initial
OD600nm of 0.1, in a working volume of 50 mL in 100 mL flasks. Growth was followed by measuring
culture OD600 nm at regular intervals of 24h during seven days. Samples were withdrawn every day of
culture for quantification of lupanine concentration by HPLC. A control flask in the same conditions
without the addition of cells was maintained to assess if lupanine concentration consumption was due
to microbial action or degradation.
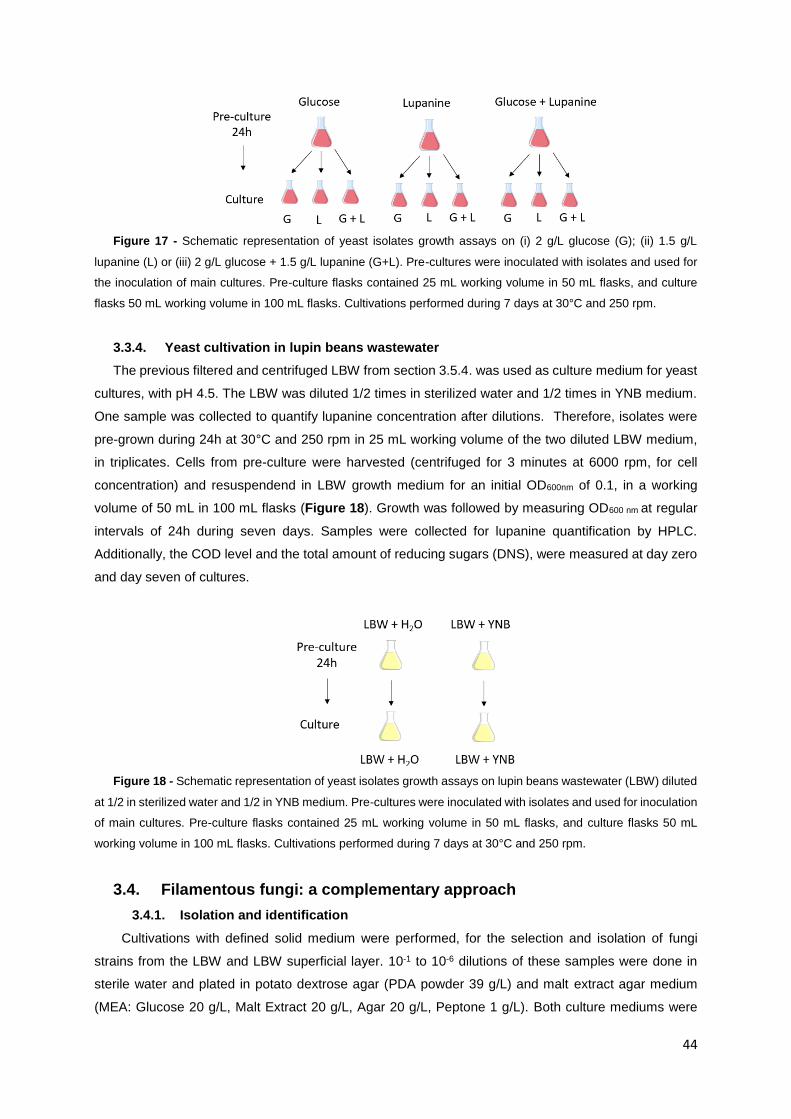
44
Figure 17 - Schematic representation of yeast isolates growth assays on (i) 2 g/L glucose (G); (ii) 1.5 g/L
lupanine (L) or (iii) 2 g/L glucose + 1.5 g/L lupanine (G+L). Pre-cultures were inoculated with isolates and used for
the inoculation of main cultures. Pre-culture flasks contained 25 mL working volume in 50 mL flasks, and culture
flasks 50 mL working volume in 100 mL flasks. Cultivations performed during 7 days at 30°C and 250 rpm.
3.3.4. Yeast cultivation in lupin beans wastewater
The previous filtered and centrifuged LBW from section 3.5.4. was used as culture medium for yeast
cultures, with pH 4.5. The LBW was diluted 1/2 times in sterilized water and 1/2 times in YNB medium.
One sample was collected to quantify lupanine concentration after dilutions. Therefore, isolates were
pre-grown during 24h at 30°C and 250 rpm in 25 mL working volume of the two diluted LBW medium,
in triplicates. Cells from pre-culture were harvested (centrifuged for 3 minutes at 6000 rpm, for cell
concentration) and resuspendend in LBW growth medium for an initial OD600nm of 0.1, in a working
volume of 50 mL in 100 mL flasks (Figure 18). Growth was followed by measuring OD600 nm at regular
intervals of 24h during seven days. Samples were collected for lupanine quantification by HPLC.
Additionally, the COD level and the total amount of reducing sugars (DNS), were measured at day zero
and day seven of cultures.
Figure 18 - Schematic representation of yeast isolates growth assays on lupin beans wastewater (LBW) diluted
at 1/2 in sterilized water and 1/2 in YNB medium. Pre-cultures were inoculated with isolates and used for inoculation
of main cultures. Pre-culture flasks contained 25 mL working volume in 50 mL flasks, and culture flasks 50 mL
working volume in 100 mL flasks. Cultivations performed during 7 days at 30°C and 250 rpm.
3.4. Filamentous fungi: a complementary approach
3.4.1. Isolation and identification
Cultivations with defined solid medium were performed, for the selection and isolation of fungi
strains from the LBW and LBW superficial layer. 10-1 to 10-6 dilutions of these samples were done in
sterile water and plated in potato dextrose agar (PDA powder 39 g/L) and malt extract agar medium
(MEA: Glucose 20 g/L, Malt Extract 20 g/L, Agar 20 g/L, Peptone 1 g/L). Both culture mediums were

45
sterilized in an autoclave for 15 min at 121°C. MEA medium was supplemented with, (i) 25 mg/L CAM
and (ii) 20 mg/L rose bengal, separately. Colonies with different morphotypes were streaked onto new
PDA and MEA agar plates for strain isolation.
ZR Fungal/Bacterial DNA MiniPrep extraction kit was used for DNA extraction of fungi isolates. The
experimental procedure was performed according to the kit instructions. The concentration of pure DNA
was measured by Nanodrop. Extracted DNA was visualised in an agarose gel (1%) with TAE buffer (1x)
for visual assessment of DNA quality. The loading buffer (1x) was added to DNA samples, NZY Ladder
III 1000 pb was used as the molecular weight marker. Agarose gel was run in an electrophoresis with
120 V for 90 minutes. DNA samples were sent to STABVIDA for PCR and sequencing.
3.4.2. Filamentous fungi culture: synthetic culture medium
Isolated fungi strains were cultured at 27°C and 250 rpm in malt extract (ME) culture medium
composed of 17 g/L malt extract and 3 g/L mycological peptone, sterilized by autoclave for 20 min at
121ºC and supplemented with: (i) 40 g/L glucose, (ii) 40 g/L glucose and 1.5 g/L lupanine, and (ii) 1.5
g/L lupanine. Lupanine solution was sterilized by filtration with nylon 0.22 µm pore size filters. Samples
were collected during culture for quantification of cellular growth (as previously described) and lupanine
concentration.
3.4.3. Filamentous fungi culture: assessment of using filamentous fungi for lupin beans
wastewater treatment
LBW provenient from cooking phase of the industrial debittering process was tested as a culture
medium. For this, fungi isolates were inoculated in 50 mL working volume of sterile LBW in 250 mL
flasks. The cultures were incubated at 27°C and 250 rpm during 192h. Samples of 1 mL were collected
for lupanine quantification by HPLC. Cellular growth was measured by cell dry weight assessment
involving: cell centrifugation at 10000 rpm for 5 minutes followed by two washing steps of the cell pellet
in mili-Q water, and cells were dried for 48h at 30°C. The COD level was measured at day 0 (zero)
andday 7 (seven) of cultures.
3.5. Determination of lupanine derived-products
Work section performed in collaboration with researchers from Faculty of Pharmacy of University of
Lisbon). Cultures of O. anthropi were performed until 24 h, with 50 mL samples collected at time points
0 h, 3 h, 6 h, 12 h and 24 h after inoculation of cells. In the case of C. funkei, cultures were performed
at 120 h with 50 mL samples collection at 0 h, 48 h and 120 h after inoculation. Both experiments were
performed in biological duplicates in M9 liquid medium. All samples were lyophilized (Labocene Scanvac
Coolsafe) for further characterization studies.
After lyophilization, the obtained samples were directly analysed by Fourier-transform infrared
spectroscopy (FT-IR) (Bruker Alpha II Platinum – ATR), to assess the presence of functional
characteristic groups of lupanine molecule (e.g. C=O at 1600-1800 cm-1 range), as well as another ones
corresponding to eventual intermediates that might be present [115]. A pure lupanine sample was also
analysed to compare the results.

46
To complement the previous technique, thin layer chromatography (TLC) was also performed, in
silica plates. Here, the samples were dissolved in water and applied in the plates with a Pasteur pipette,
with two steps of elution in MTBE/hexane (8:2) and 1% diethylamine (DEA). The result was observed
after phosphomolybdic acid staining of the plates. Here, the compounds of the sample will migrate and
separate according with their polarity, enabling the observation of lupanine and other intermediates
present in the samples. A pure lupanine sample was also applied to compare the results.
Nuclear Magnetic Resonance (NMR) spectroscopy was also performed. Here, the samples were
pre-treated by dissolving in 10 mL of water and basifying with NaOH 1 M until pH 12-14, followed by two
extractions with 2 x 10 mL DCM. The combined organic phase was dried with MgSO4, filtered (using
paper filter) and the solvent was removed under reduced pressure at 40 °C. The residue was
reconstituted in 0.4 mL of deuterated chloroform (CDCl3) and analysed by 1H and 13C NMR.
The capacity of these bacterial species to consume preferably one lupanine enantiomer over the
other was investigated. Here, dried samples were diluted in DCM and filtered in a mini-column made of
celite (to retain impurities). The solvent was evaporated under reduced pressure and 1 mg of the dry
residue was diluted in 1 mL of a solution comprised of hexane (80%) and isopropanol (20%). Then,
samples were analysed in a HPLC system with an IC Chiralpak column (5 μm particle size, 4.6 x 250
mm). A sample volume of 20 µL was injected and the enantiomers were detected at 230 nm. The method
was isocratic for 40 min with a mobile phase composed of hexane with 0.1% diethylamine (DEA) (25%),
isopropanol (22%) and hexane (53%), and a 1 mL/min flux.
3.6. Lupanine quantification by HPLC
A calibration curve was done for lupanine, with concentrations ranging from 0.0016 g/L to 8 g/L. The
samples containing lupanine, pure or provenientprovenient from the lupin seeds debittering water, were
centrifuged at 10000 rpm for 3 minutes (Sigma 1-15P), the supernatant filtered with nylon syringe filters
(pore size 0.22 µm) and the pH adjusted to 13-13.5 with potassium hydroxide pellets (KOH, Panreac).
All samples and standards were analysed in a HPLC system from Hitachi LaChrom, equipped with a
core-shell organo-silica LC column from Kinetex (5 μm EVO C18 100 Å, 250 x 4.6 mm) and a pre-
column also from Kinetex, coupled to a UV detector (Hitachi LaChrom). A sample volume of 20 µL was
injected and lupanine was measured at 220 nm, during 24 minutes. The mobile phase used was
composed of 15% acetonitrile (ACN) and 85% sodium hydrogen phosphate (Na2HPO4) buffer (0.01 M
and pH adjusted to 10.5 with sodium hydroxide (NaOH) 1.25M).
3.7. Chemical Oxygen Demand (COD) measurements
For measurement of the chemical oxygen demand (COD), organic compounds are oxidized with
potassium dichromate (K2Cr2O7) under acidic conditions in presence of sulfuric acid (H2SO4), at 150°C.
Carbon dioxide (CO2) and water (H2O) result from oxidation reactions, and dichromate is reduced to
chromium. Ferrous ammonium sulfate [Fe(NH4)2(SO4)2] is used for titration of the remaining
dichromate. The amount of oxidant consumed is converted into grams of oxygen per litre of sample (g
O2/L) [116]. For COD quantification four solutions were used; i) potassium dichromate digestion solution.
An aqueous solution of dried potassium dichromate (K2Cr2O7) was prepared at 10.216 g/L, with further

47
addiction of 167 mL of H2SO4 and 33.3 g/L of mercuric sulphate HgSO4, under agitation in a final volume
of 1 L; ii) 10 g/L commercial solution of silver sulphate (Ag2SO4) in sulphuric acid (H2SO4); iii) ferrous
ammonium sulphate [Fe(NH4)2(SO4)2] titrant solution at 0.0125 M iv) a commercial ferroin indicator
solution (1, 10-phenanthroline and ferrous ammonium sulphate) [116].
For the analysis, 1 mL of solution (i) and 2 mL of solution (ii) were added to 1.5 mL of culture samples
after removing cells by centrifugation (5 minutes, 10000 rpm). Blanks were prepared in parallel using
the same volume of distilled water instead of sample. The samples were digested for 2 hours at 150°C,
and then transferred into 50 mL Erlenmeyer’s. One drop of solution (iv) was added and the dichromate
in excess was determined by titration with solution (iii), under agitation. When an orange colour was
reached, the titration was stopped and the volume of solution (iii) used was registered.
3.8. Total reducing sugars determination by colorimetric method (DNS)
DNS method is a colorimetric technique that enables to do an estimation of the concentration of
reducing sugars in a sample through a redox reaction between 3,5-dinitrosalicylic acid (DNS) and
reducing sugars. These sugars contain a free carbonyl group, with the reducing capacity of many
reagents. Therefore, DNS is reduced to 3-amino-5-nitrosalicylic acid with a visible orange colour
measurable by spectrophotometry at 540 nm [117]. Colour intensity is proportional to reducing sugars
concentration. DNS Solution is prepared by dissolving 25 g of DNS in 50 mL NaOH (2 N) and 125 mL
of distilled water. After this, 75 g of tartrate sodium phosphate and 250 mL of water are added and
dissolved under agitation and 50-100°C. Solution must be kept in a dark flask and used after 48h of
storage. Experimental procedure evolved the centrifugation of cells (6000 rpm, 3 minutes) with the
following subsequent steps: 400 µL of supernatant was mixed with 600 µL of DNS solution and the tubes
were placed in a water bath at 100°C for 5 minutes. A blank sample with only water was performed in
parallel. Samples were cooled to room temperature and 200 µL of the samples were transferred to 96
microplate well and absorbance measured at 540 nm.

48
4. Results
4.1. Nanofiltration
A nanofiltration was performed using a 640 mL representative sample of the sweetening phase of
lupin beans debittering process. The objective was to recover part of the water in the permeate and
concentrate lupanine in the retentate. The results of the filtration are presented in Figure 19 and
represent the relation between the flux through the membrane and the percentage of concentration.
From Figure 19, it is possible to observe that the flux was constant during the experiment. This
indicates that the membrane used is suitable for the nanofiltration of this wastewater and to be used at
an industrial scale.
The concentrations of lupanine and COD in the initial sample of wastewater and in the permeate and
in the retentate during nanofiltration are represented in Table 7.
Table 7 – Concentration of lupanine and COD in the feed of wastewater solution, permeate and retentate of the
nanofiltration.
Sample Lupanine (g/L) COD (g O2/L)
Initial 0.40 ± 0.01 5.31 ± 0.55
Permeate 0.15 ± 0.01 0.87 ± 0.00
Retentate 2.12 ± 0.13 26.67 ± 1.10
From Table 7, lupanine concentration increases in the retentate and decreases in the permeate, wich
is in concordance with the low and higher COD values obtained in these nanofiltration fractions. From
here, it is possible to conclude that lupanine contributes as organic matter for the COD measurements.
0
200
400
600
800
1000
0 20 40 60 80 100
Flu
x (
mL/m
in/m
2)
Concentration (%)
Figure 19 – Values of flux through the membrane during the nanofiltration in function of the percentage of
concentration. Nanofiltration was operated in a concentration mode. The cross in the curve represent the overnight
time when the nanofiltration was stopped.

49
4.2. Bacteria
4.2.1. Culture enrichments and isolation of pure strains
Both enrichments with defined M9 liquid medium aimed to favour the growth of a group of bacterial
organisms, under certain conditions. Here, the objective was to select bacterial strains with the ability to
specifically catabolize lupanine, using the superficial organic-rich layer formed during the summer in the
lupin beans wastewater from the debittering process. Cultures were performed with three sequential
lupanine enrichments, in M9 medium with glucose, lupanine or mixtures of glucose/lupanine. The
lupanine concentration results during the three enrichments for the two conditions with lupanine in the
medium are shown in Figure 20.
Figure 20 – Cultivation assays for bacteria isolation with three sequential lupanine or glucose + lupanine
mixture enrichments. Cultures were inoculated with 5% (v/v) of lupin beans wastewater (LBW) superficial layer in
the first enrichment. Inoculations of the second and third enrichments performed with 5% (v/v) of the former enriched
culture. (A) 0.75 g/L lupanine; (B) 2 g/L glucose + 0.75 g/L lupanine.
Additionally, it was observed that this superficial layer had, by nature, a small lupanine
concentration of 0.16 g/L, which can justify the values of around 1 g/L of lupanine obtained at the time
point 0h in the first enrichment. Figure 20 shows that lupanine decreases in both conditions with lupanine
or glucose mixed with lupanine, evidencing that the bacterial consortium that comes from LBW
superficial organic layer has the ability to consume lupanine until the end of the third enrichment.
Furthermore, when diluted samples of the third enrichments were plated in M9 solid medium with
1.5 g/L lupanine, it was possible to observe different types of colonies provenient from the condition
containing only lupanine as carbon source (Figure 21).

50
Figure 21 – M9 solid medium supplemented with 1.5 g/L lupanine plated with a sample from culture with
lupanine as carbon source, at the end of third enrichment, representing the enriched population provenient from
lupin beans wastewater (LBW) superficial organic-rich layer.
The observed colony growth at the end of the third enrichments confirms that some species
remained viable after successive enrichments with lupanine as carbon source, enabling further isolation
and identification.
For the second enrichment assay, the inoculation was performed with LBW (from cooking phase),
aiming to search different bacteria that might have the ability to catabolize lupanine (Figure 22).
Figure 22 – Cultivation assays for bacteria isolation with three sequential lupanine enrichments. Cultures
were inoculated with 5% (v/v) of lupin beans wastewater (LBW) in the first enrichment. Inoculations of the second
and third enrichments performed with 5% (v/v) of the former enriched culture. (A) 1.5 g/L lupanine; (B) 2 g/L glucose
+ 1.5 g/L lupanine.
From Figure 22, no lupanine consumption was observed in both conditions with sole lupanine and
glucose mixed with lupanine. This indicates that the bacterial consortium obtained from lupin beans
wastewater of cooking phase is apparently not able to consume lupanine as carbon source.
Inspite of lupanine consumption was not observed in liquid culture, when samples of the third
enrichment were plated onto M9 solid medium with 1.5 g/L lupanine, it was also observed the growth of
the bacterial colonies in lupanine as carbon source (Figure 23).

51
Figure 23 - M9 solid medium supplemented with 1.5 g/L lupanine plated with a sample from culture with
lupanine as carbon source, at the end of third enrichment, representing the enriched population provenient from
LBW.
This indicates that there were species maintained viable after three successive enrichments with
lupanine as carbon source, enabling further isolation and identification steps.
4.2.2. Gram staining, DNA extraction and strain identification by 16S rDNA amplification
In order to assess which protocol should be applied for DNA extraction of the isolated bacteria, a
gram staining was performed, since it is a rapid method to distinguish gram-negative from gram-positive
bacteria species [118]. While gram-negative bacteria strains have an outer membrane located above a
thin peptidoglycan layer, the gram-positive present a relatively simple structure [119]. The gram staining
results from the four bacterial strains isolated revealed that three bacteria were gram-negative and one
was gram-positive, given the pink and violet colours observed, respectively. The DNA extraction protocol
for three gram-negative bacteria yielded 3971.7 ng/µL, 1439.1 ng/µL and 1425.1 ng/µL of genomic DNA.
The DNA sample from the first bacteria was diluted 1:100 times and the other two were diluted 1:50
times for the PCR reaction. The PCR products of gram-negative bacteria are shown in Figure 24.

52
Figure 24 – Agarose gel electrophoresis of PCR products obtained for the three gram-negative bacterial strains.
Agarose gel (0.8%) electrophoresis was run during 40 minutes at 90 V with 50x TAE buffer. PCR products were
loaded in the gel in triplicate. (L) Molecular marker NZY DNA ladder III (1kb); (1)-(3), (4)-(6) and (8)-(10) are the
PCR product corresponding to three gram-negative isolates; (7) negative control of the reaction.
The DNA bands in the gel were cut under UV light and purified, resulting in products with a final DNA
concentration of 46.5 ng/µL, 37.2 ng/µL, and 29.4 ng/µL, respectively. Based on sequencing results, the
three gram-negative isolates were identified as Stenotrophomonas maltophilia (with 98.3% identity and
98.08% query coverage), Sphingobacterium siyangense (with 99.3% identity and 99.61% query
coverage) and Ochrobactrum anthropi (with 98.5% identity and 99.2% query coverage), respectively.
The protocol for DNA extraction of gram-positive bacteria involved a sonication step to lyse the cells.
To assess the efficacy of the protocol, the sonication step was tested during 3 and 5 minutes, separately.
The PCR was performed for both conditions, using directly 2 µL of lysed cells for reaction, as well as a
positive and a negative control of the reaction. The PCR results can be observed in Figure 25.
Figure 25 – Agarose gel electrophoresis of PCR products obtained for the gram-positive bacterial strain, for
sonication efficiency testing. Agarose gel (0.8%) electrophoresis was run during 40 minutes at 90 V with 50x TAE
buffer. (L) Molecular marker NZY DNA ladder III; (1) DNA with 3 minutes sonication; (2) DNA with 5 minutes
sonication; (3) positive control of the reaction with known DNA; (4) negative control of the reaction.
L 1 2 3 4 5 6 7
8 9 10
L 1 2 3 4

53
As demonstrated, both sonication times tested have successfully lysed the cells and the DNA
was released from the cells. The PCR for sequencing was performed with the DNA provenient from the
sample sonicated for 3 minutes (Figure 26).
Figure 26 - Agarose gel electrophoresis of PCR products obtained for the gram-positive bacterial strain,
sonicated for 3 minutes. Agarose gel (0.8%) electrophoresis was run during 40 minutes at 90 V with 50x TAE buffer.
PCR products were loaded in the gel in quadriplicate. (L) Molecular marker NZY DNA ladder III; (1)-(4) is the PCR
product corresponding to gram positive isolate; (5) is the negative control of the reaction.
The DNA bands were cut and purified, resulting in products with a final concentration of 28.5 ng/µL.
Based on sequencing results, this gram-positive isolate was identified as Cellulosimicrobium funkei (with
99.4% identity and 100% query coverage).
4.2.3. Bacteria cultivation in synthetic growth medium
After identification of the four bacterial strains (Ochrobactrum anthropi, Stenotrophomonas
maltophilia, Sphingobacterium siyangense and Cellulosimicrobium funkei), isolated from the LBW and
its surface layer, the main objective was the study of the ability of each one of them to catabolize
lupanine. For this, cultivations in M9 medium supplemented with 2 g/L glucose, 1.5 g/L lupanine or with
mixtures of 2 g/L glucose and 1.5 g/L of lupanine were performed. Parallel cultures in glucose were
maintained as a positive control of the experiment, to evaluate how the isolates grow in sole presence
of a preferred carbon source, in comparison to lupanine. The growth of the different isolates was
followed through OD600nm measurements at every hour during first 6 hours and every 24h until day 7.
Furthermore, lupanine was quantified at time point 0 (0h, after cell inoculation) and subsequently in
periods of 24h, as shown in Figures 27-30. Besides this, the pH was also monitored in regular times of
culture (Table 8).
L 1 2 3 4 5

54
Figure 27 – O. anthropi cultures in M9 liquid medium. Pre-cultures of 48 hours in 1.5 g/L of lupanine were used
as inoculum of the main cultures (A) in 1.5 g/L lupanine and 2 g/L glucose + 1.5 g/L lupanine. Pre-cultures of 48
hours in 1.5 g/L of lupanine with 2 g/L glucose mixture were used as inoculum of the main cultures (B) in 1.5 g/L
lupanine and 2 g/L glucose + 1.5 g/L lupanine. Pre-culture of 48 hours in 2 g/L glucose were used as inoculum of
the main culture (C) used as a positive control of the experiment. Growth curves are represented in (A1), (B1) and
C, and lupanine concentration in (A2), (B2), respectively. Error bars represent the respective standard deviation of
biological triplicate assays.
From Figure 27 it is possible to observe a decrease of 66.7% in lupanine concentration at 24h, with
constant values until 168h of culture. This result indicates that O. anthropi has the ability to catabolize
lupanine as carbon source for growth.
The results for S. maltophilia, S. siyangense and C. funkei are shown below.

55
Figure 28 – S. siyangense culture in M9 liquid medium. Pre-cultures of 48 hours in 1.5 g/L of lupanine with
2 g/L glucose mixture were used as inoculum of the main culture (A) in 1.5 g/L lupanine and 2 g/L glucose + 1.5 g/L
lupanine. Pre-culture of 48 hours in 2 g/L glucose were used as inoculum of the main culture (B) used as a positive
control of the experiment. Growth curves are represented in (A1) and (B), and lupanine concentration in (A2),
respectively. Error bars represent the respective standard deviation of biological duplicate assays.
Figure 29 – S. maltophilia culture in M9 liquid medium. Pre-cultures of 48 hours in 1.5 g/L of lupanine with 2 g/L
glucose mixture were used as inoculum of the main culture (A) in 1.5 g/L lupanine and 2 g/L glucose + 1.5 g/L
lupanine. Pre-culture of 48 hours in 2 g/L glucose were used as inoculum of the main culture (B) used as a positive

56
control of the experiment. Growth curve is represented in (A1) and (B), and lupanine concentration in (A2),
respectively. Error bars represent the respective standard deviation of biological duplicate assays.
Figure 30 – C. funkei culture in M9 liquid medium. Pre-cultures of 48 hours in 1.5 g/L of lupanine with 2 g/L
glucose mixture were used as inoculum of the main culture (A) in 1.5 g/L lupanine and 2 g/L glucose + 1.5 g/L
lupanine. Pre-culture of 48 hours in 2 g/L glucose were used as inoculum of the main culture (B) used as a positive
control of the experiment. Growth curve is represented in (A1) and (B), and lupanine concentration in (A2),
respectively. Error bars represent the respective standard deviation of biological duplicate assays.
These set of results indicate that among all four bacterial strains identified, O. anthropi is the most
interesting isolate concerning lupanine catabolization, since it demonstrated the ability to grow
exponentially in lupanine presence, consuming lupanine after 24h of culture. The remaining bacterial
isolates were not able to grow in the pre-culture containing lupanine as sole carbon source, which can
explain the use of glucose + lupanine condition for the inoculum of the main culture. In the main culture,
lupanine consumption was not observed.

57
Table 8 – Values of pH of the supernatant of the four bacteria isolates: O. anthropi, S. siyangense, S. maltophilia
and C. funkei, measured at different time points during cultivation.
Culture Pre-inoculum Inoculum Day 0 Day 1 Day 2 Day 5 Day 6 Day 7
O. anthropi
Glucose Glucose 7.30±0.71 7.25±0.78 7.80±0.27 7.90±0.23 7.85±0.16 7.90±0.07
Lupanine Lupanine 7.30±0.28 7.40±0.57 7.90±0.28 7.80±0.14 7.75±0.07 7.60±0.13
Glucose/lupanine 7.45±0.49 7.25±0.49 8.08±0.11 7.85±0.21 7.80±0.28 8.00±0.15
Glucose/Lupanine Lupanine 7.50±0.42 7.45±0.49 7.85±0.21 8.05±0.49 7.85±0.21 7.70±0.04
Glucose/lupanine 7.20±0.23 7.00±0.15 7.85±0.07 7.80±0.28 7.90±0.08 7.90±0.09
S. siyangense
Glucose Glucose 7.20±0.12 7.00±0.13 7.50±0.12 7.80±0.10 7.70±0.04 8.00±0.06
Glucose/Lupanine Lupanine 7.40±0.14 7.50±0.42 8.20±0.57 7.80±0.28 7.70±0.14 8.00±0.12
Glucose/lupanine 7.60±0.42 7.60±0.57 8.00±0.42 7.90±0.42 7.85±0.21 8.00±0.04
S. maltophilia
Glucose Glucose 7.20±0.13 7.30±0.11 7.80±0.05 7.85±0.07 7.90±0.14 7.90±0.10
Glucose/Lupanine Lupanine 7.40±0.28 7.55±0.64 8.00±0.28 7.65±0.07 7.75±0.07 7.70±0.06
Glucose/lupanine 7.45±0.35 7.65±0.92 7.75±0.07 7.90±0.42 8.00±0.42 8.20±0.14
C. funkei
Glucose Glucose 7.20±0.26 7.00±0.17 7.45±0.10 7.70±0.03 7.90±0.13 8.10±0.18
Glucose/Lupanine Lupanine 7.40±0.14 7.30±0.71 7.85±0.21 7.70±0.00 7.70±0.14 7.70±0.09
Glucose/lupanine 7.50±0.28 7.55±0.64 7.60±0.28 7.70±0.42 7.85±0.49 8.00±0.10
Results from control flasks prepared under the same conditions and without the addition of cells are
represented in Figure 31.
Figure 31 - Control flask with, separately, M9 culture medium supplemented with 1.5 g/L lupanine and
another flask with 2 g/L glucose + 1.5 g/L lupanine.
Control flasks demonstrated that lupanine was maintained constant during all the experiment,
indicating that when lupanine concentration decrease in culture, it may be due to microbial action and
not by degradation of lupanine itself.
4.2.4. Bacteria cultivation in lupin beans wastewater (LBW)
The four isolated bacterial strains were used to assess the catabolism of lupanine and organic matter
removal from LBW. For this, the LBW pH was adjusted to 7 for optimal bacterial growth and given the
high concentration of lupanine in this wastewater – 3.3 g/L, in comparison with previous assays using
1.5 g/L –, it was diluted 1/2 times in water. Additionally, COD levels and total reducing sugars were
measured after inoculation and after 7 days, while pH values were measured at 24h regular times
(Tables 9, 10 and 11, respectively). Growth curves and lupanine concentration results for the different
strains are represented in Figure 32.
0.0
0.4
0.8
1.2
1.6
0 24 48 72 96 120 144 168
Lupanin
e (
g/L
)
Time (h)M9 + Lupanine M9 Glucose + Lupanine

58
Figure 32 – Growth curves (left column) and lupanine concentration (right column) for 7-day cultures of O.
anthropi, S. siyangense, S. maltophilia, C. funkei in LBW medium diluted 1/2 in water. Error bars represent the
respective standard deviation of biological triplicate assays.
From the previous figure it is possible to conclude that all bacterial isolates are able to grow
exponential in LBW diluted in water. However, lupanine concentration levels were constant during 168h
of culture, which can be explained most probably due to the presence of other p referable carbon
sources in this wastewater.

59
Table 9 – Percentages of COD removal from LBW for the four bacterial strain isolates: O. anthropi, S.
siyangense, S. maltophilia and C. funkei.
Bacterial culture in LBW COD removal (%)
O. anthropi 58.7 ± 2.5
S. siyangense 51.1 ± 2.1
S. maltophilia 42.6 ± 3.5
C. funkei 15.8 ± 2.8
COD measurements demonstrated that all four isolates were capable to reduce organic matter
from lupin beans wastewater. As seen in Table 9, O. anthropi was the one with the ability to remove the
higher percentage of COD from LBW, with 58.7% removal. S. siyangense also demonstrated an
interesting result, with 51.1% removal, followed by S. maltophilia with 42.6%.
Table 10 – Reducing sugar concentration determined through DNS method for the initial LBW medium
and after 7 days of cultivation of the four bacteria isolates: O. anthropi, S. siyangense, S. maltophilia and C.
funkei.
Culture Reducing sugars (g/L)
LBW + H2O 0.62 ± 0.00
O. anthropi 0.54 ± 0.09
S. siyangense 0.47 ± 0.01 S. maltophilia 0.53 ± 0.00
C. funkei 0.52 ± 0.09
The total reducing sugar determination at day 0 and day 7 revealed that there was sugar
consumption. This confirms that the bacterial isolates are in fact using reducing sugars to support their
growth.
Table 11 – pH values of LBW + H2O measured in supernatant at different time points, during cultivation of
the four bacteria isolates: O. anthropi, S. siyangense, S. maltophilia and C. funkei.
From Table 11, it is possible to observe that pH values are increasing during culture in the four
isolates. At day 0 the pH was around 7.4 and at day 7 the pH had increased to 9.4 approximately,
evidencing that a basification of the LBW culture medium is occurring.
Days Culture
0 1 2 3 6 7
O. anthropi 7.30±0.28 7.65±0.35 8.17±0.23 8.43±0.32 9.30±0.69 9.30±0.69
S. siyangense 7.40±0.28 8.05±0.07 8.27±0.06 8.43±0.31 9.40±0.61 9.43±0.64
S. maltophilia 7.45±0.21 7.90±0.14 8.30±0.20 8.73±0.38 9.10±0.10 9.50±0.44
C. funkei 7.45±0.21 7.90±0.14 8.33±0.06 8.47±0.15 9.23±0.40 9.23±0.50

60
4.3. Yeast
4.3.1. Culture enrichment and isolation of pure strains
As mentioned in 4.2.1. Section, culture enrichment aims to isolate strains adapted to a certain
condition. In this study, the objective was to select and isolate yeast strains with the ability to catabolize
lupanine, provenient from LBW. For this, three sequential enrichment cultures were performed in YNB
defined medium, with lupanine enrichments of 0.75 g/L lupanine or 2.0 g/L glucose and 0.75 g/L lupanine
mixture. The results from lupanine quantification are presented in Figure 33.
Figure 33 – Cultivation assays for yeast isolation with three sequential lupanine enrichments. Cultures were
inoculated with 5% (v/v) of lupin beans wastewater (LBW) in the first enrichment. Inoculations of the second and
third enrichments performed with 5% (v/v) of the former enriched culture. (A) 0.75 g/L lupanine; (B) 2 g/L glucose +
0.75 g/L lupanine.
Enrichment cultures for yeast isolation revealed that there was no lupanine comsumption. However,
when diluted samples from the third enrichment were plated in YNB solid medium supplemented with
lupanine and CAM (antibiotic to avoid bacterial growth), in the growth of several colonies of two different
morphotypes was observed (Figure 34). This indicates that the two isolates remained viable until the
end of the third enrichment under lupanine as carbon source.
Figure 34 – YNB solid media supplemented with 1.5 g/L lupanine and CAM, plated with sample from culture at
the end of third enrichment.

61
4.3.2. DNA extraction and strain identification by 26S rDNA amplification
From the yeast strain isolation from LBW, pure colonies of two different morphotypes were
obtained in YNB solid medium supplemented with 1.5 g/L lupanine. Fresh cells were collected from this
growth medium and the DNA was extracted, yielding 31.3 ng/µL and 378 ng/µL, for the two strains. PCR
product results are shown in Figure 35.
Figure 35 – Agarose gel electrophoresis of PCR products obtained for the two yeast strains. Agarose gel (0.8%)
electrophoresis was run during 40 minutes at 90 V with 50x TAE buffer. PCR products were loaded in the gel in
triplicate. (M) Molecular marker NZY DNA ladder III; (1)-(3) and (4)-(6) are the PCR products corresponding to two
yeast isolates; (7) negative control of the reaction.
DNA bands were cut under UV light and purified, with a final concentration of 39.1 ng/µL and 122.1
ng/µL obtained, respectively. Based on sequencing results, the two yeast strains isolates were identified
as Pichia kudriavzevii (with 99.5% identity and 99.65% query coverage) and Rhodotorula mucilaginosa
(with 99.7% identity and 99.3% query coverage).
4.3.3. Yeast cultivation in synthetic culture medium
Firstly, the catabolizing capacity of lupanine was studied in the two yeast isolates, Pichia kudriavzevii
and Rhodotorula mucilaginosa. For this aim, both strains were individually grown in YNB medium
supplemented with 1.5 g/L lupanine. Samples for lupanine quantification were collected at time point 0
(0h, after inoculation) and in 24h periods until the end of the culture (at day 7) (Figures 36 and 37). The
cell growth was followed by measuring OD600 nm every hour during first 6 hours of culture, and then every
24h until 168h, for cultures with 2 g/L glucose, 1.5 g/L lupanine and 2 g/L glucose mixed with 1.5 g/L
lupanine. Besides this, the pH was also monitored during cultivation time (Table 12). The culture
condition with glucose was used as a positive control of the experiment, to evaluate how the isolates
grow under a preferred carbon source, in comparison with growth in lupanine.
M 1 2 3 4 5 6 7

62
Figure 36 – P. kudriavzevii cultures in YNB liquid medium. Pre-culture of 24 hours in 2 g/L of glucose was used
as inoculum of the main cultures (A) in 2 g/L glucose, 1.5 g/L lupanine and 2 g/L glucose + 1.5 g/L lupanine. Pre-
culture of 24 hours in 1.5 g/L of lupanine with 2 g/L glucose mixture was used as inoculum of the main cultures (B)
in 2 g/L glucose, 1.5 g/L lupanine and 2 g/L glucose + 1.5 g/L lupanine. Growth curves are represented in (A1) and
(B1), and lupanine concentration in (A2), (B2), respectively. Error bars represent the respective standard deviation
of biological duplicate assays.
Figure 37 – R. mucilaginosa cultures in YNB liquid medium. Pre-culture of 24 hours in 2 g/L of glucose was
used as inoculum of the main cultures (A) in 2 g/L glucose, 1.5 g/L lupanine and 2 g/L glucose + 1.5 g/L lupanine.

63
Pre-culture of 24 hours in 1.5 g/L of lupanine with 2 g/L glucose mixture was used as inoculum of the main cultures
(B) in 2 g/L glucose, 1.5 g/L lupanine and 2 g/L glucose + 1.5 g/L lupanine. Growth curves are represented in (A1)
and (B1), and lupanine concentration in (A2), (B2), respectively. Error bars represent the respective standard
deviation of biological duplicate assays.
From these results, it is possible to observe that none of the yeast isolates was able to grow when
lupanine is the only carbon source. Additionally, when yeast isolates were cultured in presence of
glucose and lupanine mixtures, although growth was observed, no lupanine consumption was observed.
Results from control flasks prepared under the same conditions and without the addition of cells are
represented in Figure 38.
Table 12 - pH values of YNB medium measured in the supernatant at different time points, during cultivation of
the two yeast isolates: R. mucilaginosa and P. kudriavzevii yeast strain isolates.
Cultures Pre-inoculum Inoculum Day 0 Day 1 Day 2 Day 3 Day 6 Day 7
R. mucilaginosa
Glucose 5.6±0.2 3.1±0.1 3.4±0.1 3.3±0.3 3.4±0.4 3.3±0.2
Glucose Lupanine 6.3±0.1 6.3±0.1 5.5±0.3 5.7±0.2 6.0±0.4 6.7±0.5
Glucose/lupanine 6.3±0.3 5.1±0.2 5.3±0.3 5.5±0.2 6.2±0.5 6.4±0.6
Glucose 5.8±0.1 3.3±0.3 3.3±0.2 3.4±0.1 3.3±0.3 3.3±0.4
Glucose/Lupanine Lupanine 6.4±0.2 5.7±0.4 5.4±0.3 5.8±0.4 6.4±0.1 6.7±0.3
Glucose/lupanine 6.6±0.2 5.6±0.1 5.3±0.1 5.5±0.4 6.1±0.5 6.3±0.2
P. kudriavzevii
Glucose 5.6±0.3 3.6±0.2 3.3±0.4 3.4±0.5 3.5±0.2 3.3±0.3
Glucose Lupanine 6.5±0.2 5.6±0.1 5.4±0.1 6.3±0.3 6.7±0.6 7.0±0.5
Glucose/lupanine 6.2±0.2 5.1±0.2 5.2±0.3 5.9±0.1 6.1±0.4 6.2±0.4
Glucose 5.8±0.3 3.5±0.2 4.0±0.5 3.7±0.4 3.5±0.1 3.4±0.5
Glucose/Lupanine Lupanine 6.3±0.1 5.7±0.1 5.5±0.2 5.9±0.4 6.3±0.5 6.5±0.6
Glucose/lupanine 5.8±0.2 5.4±0.3 5.3±0.5 5.7±0.1 6.3±0.2 6.0±0.4
Figure 38 – Control flask for YNB medium supplemented with 1.5 g/L lupanine or 2 g/L glucose + 1.5 g/L
lupanine.
4.3.4. Yeast cultivation in lupin beans wastewater (LBW)
Since the yeast isolates identified were not able to consume lupanine, the hypothesis of COD
reduction from LBW was investigated. For this, LBW was filtered and used as culture medium in two
conditions: i) diluted in sterilized water at 1/2 and ii) diluted in YNB medium at 1/2, to assess if yeasts
need any compound of YNB medium to grow that may not be present in LBW. The dilutions to LBW
medium were performed due to the high initial concentration of lupanine in this wastewater – 3.3 g/L –,
compared to the concentration of 1.5 g/L lupanine used in previous assays. Additionally, COD levels
0.0
0.4
0.8
1.2
1.6
0 24 48 72 96 120 144 168
Lupanin
e (
g/L
)
Time (h)YNB + Lupanine YNB Glucose + Lupanine

64
and total reducing sugars were measured after inoculation and after 7 days, while pH values were
measured at 24h regular times (Tables 13, 14 and 15 respectively).
Growth curves and lupanine concentration results are represented in Figure 39.
Figure 39 – Growth curves (left column) and lupanine concentration (right column) for 7-day cultures of P.
kudriavzevii and R. mucilaginosa in LBW medium diluted 1:2 in water or in YNB medium. Error bars represent the
respective standard deviation of biological triplicate assays.
The results from Figure 39 show that both isolates were able to grow exponentially without any
significant differences between the dilutions in YNB or water. However, lupanine concentration values
were maintained approximately constant during culture, indicating that most probably these yeast
isolates are consuming other preferable carbon sources instead of lupanine.
Table 13 – Percentages of COD removal from LBW for the two yeast strain isolates: R. mucilaginosa and P.
kudriavzevii.
Bacterial culture with LBW
COD removal (%) in H2O
COD removal (%) in YNB
R. mucilaginosa 47.4 ± 1.5 14.2 ± 0.5
P. kudriavzevii 21.81 ± 2.0 33.1 ± 1.6

65
Inspite of lupanine was not consumed, positive results arised from COD removal in LBW either
diluted in water or in YNB. Rhodotorula mucilaginosa was the yeast isolate able to reduce the higher
percentage of organic matter at the end of the culture.
Table 14 – Reducing sugars concentration determined through DNS method for the initial LBW medium and
after 7 days of cultivation of the two yeast isolates: R. mucilaginosa and P. kudriavzevii.
Culture Medium Reducing
sugars (g/L)
LBW (H2O) LBW (YNB)
LBW+H2O 1.04 ± 0.00
LBW+YNB 1.00 ± 0.00
R. mucilaginosa
LBW+H2O 0.61 ± 0.12
LBW+YNB 0.50 ± 0.02
P. kudriavzevii
LBW+H2O 0.71 ± 0.22
LBW+YNB 0.54 ± 0.05
As previously mentioned, it is speculated that yeast isolates might consumed other carbon sources
instead of lupanine. The total reducing sugar values obtained are confirming this evidence. Table 14
shows that occurred reducing sugar consumption either in LBW diluted in water and in YNB.
Table 15 – pH values of LBW medium measured in the supernatant at different time points, during cultivation
of the two yeast isolates: R. mucilaginosa and P. kudriavzevii.
Culture Medium 0h 24h 48h 72h 144h 168h
R. mucilaginosa
LBW+ YNB 4.75±0.35 5.90±0.42 6.93±0.21 6.97±0.38 8.53±0.81 8.47±0.40
LBW+ H2O 4.85±0.49 6.10±0.85 7.53±0.35 7.57±0.21 8.47±0.40 8.03±0.45
P. kudriavzevii
LBW+ YNB 4.65±0.21 7.25±0.07 7.67±0.15 7.63±0.15 8.33±0.06 8.17±0.21
LBW+ H2O 4.75±0.49 7.55±0.07 7.87±0.15 7.77±0.25 8.57±0.23 8.23±0.06
The initial pH value was around 4.75, and similarly to bacteria, it was also observed a basification
of the LBW culture medium in the two tested dilutions.
4.4. Filamentous fungi: a complementary approach
4.4.1. Isolation and identification
Fungi screenings were performed by plating different dilutions of LBW and its surface organic-rich
layer, in PDA and MEA solid media, supplemented with CAM to avoid bacterial growth. It was possible
to isolate four fungi strains with apparent different morphologies. The genomic DNA extraction was
performed according to the extraction kit protocol and yielded for the different strains 102.5 ng/µL, 44
ng/µL, 59 ng/µL and 23.5 ng/µL of gDNA. The integrity of gDNA was assessed in an agarose gel
electrophoresis (Figure 40), with 200 ng of gDNA loaded for each sample.

66
Figure 40 - Agarose gel electrophoresis of gDNA obtained for the four filamentous fungi strains. Agarose gel
(1%) electrophoresis was run during 90 minutes at 120 V with 1x TAE buffer. (L) Molecular marker NZY DNA ladder
III; (1)-(4) gDNA corresponding to the four fungi isolates.
The gDNA samples obtained were amplified by PCR and sequenced, by STABVIDA. Based on the
sequencing results, the isolates were identified as Pichia kudriavzevii (99.92% identity), Aspergillus
fumigatus (99.93% identity) which represented two of the strains, and Galactomyces geotrichum
(99.64% identity).
4.4.2. Growth of isolates in rich mediums
After identification of the strains, with one of them, Pichia kudriavzevii, already identified in section
4.3.2., the main objective was to study the strains ability to catabolize lupanine. For this, cultures were
performed in ME medium supplemented with 40 g/L glucose, 1.5 g/L lupanine or 40 g/L glucose mixed
with 1.5 g/L lupanine. Glucose growth condition was used as a positive control of the experiment, to
evaluate how the isolates grow with a preferred carbon source, in comparison with growth in lupanine.
During the cultivation, cellular growth was measured through cell dry weight and the lupanine was
quantified, at time point 0 (0h, after inoculation) and subsequently in periods of 24h until 192h, as shown
in Figure 41.
L 1 2 3 4 4

67
Figure 41 – Dry weight values (left column) and lupanine concentration (right column) for 186 hours cultures of
P. kudriavzevii, A. fumigatus and G. geotrichum in ME medium supplemented with 40 g/L glucose, 1.5 g/L lupanine
or 40 g/L glucose + 1.5 g/L lupanine. Data shown from single assays.
In the results from Figure 41, none of the isolates showed lupanine catabolization capacity either
with glucose and lupanine mixtures or only with lupanine as carbon source.
4.4.3. Growth of isolates: assessment of using filamentous fungi for lupin beans wastewater
(LBW) treatment
Similar to the experiments previously performed for bacteria and yeast, the capability of fungi strains
to reduce COD from LBW was investigated. For this, LBW pH was corrected to 6 and sterilized to be
used as a culture medium. A sample was taken before cell inoculation to assess lupanine concentration
and COD level at the beginning and at the end of culture (192h). The results are shown in Table 16 and
17, respectively. Lupanine was also quantified at time point 0h and at 192h (Figure 42).

68
Figure 42 – Growth curves in cell dry weight (A) for 192 hours cultures of P. kudriavzevii, A. fumigatus and
G. geotrichum, in LBW medium. Data shown from single assays.
Figure 42 evidences that all isolates were able to grow according with their cell dry weight. A.
fumigatus cell dry weight decrease after 144h because this filamentous fungi grows in aggregates
and it was not possible to collect homogenized samples after this time point.
Table 16 – Lupanine concentration in LBW medium during cultivation of P. kudriavzevii, A. fumigatus and G.
geotrichum
Culture
Lupanine (g/L)
0h 192h
Pichia kudriavzevii 1.07 1.23
Aspergillus fumigatus 1.07 0.94
Galactomyces geotrichum 1.07 0.87
Lupanine concentrations at day 0 and day 7 did not showed significant reductions. For further
investigations, it can be suggested the use of basal culture mediums without any other carbon source
present besides lupanine, since the culture mediums used are rich mediums.
Samples were collected at the end of the assay, to measure the COD for the cultures with the
different fungi strains, and evaluate the ability of the fungi isolates to detoxify the water, as shown in
Table 15. COD level at time point 0 was 30.83 g O2/L).
Table 17 – Percentages of COD removal from LBW for the fungi strain isolates. n.a. - COD increased from
30.83 to 44.71 g O2/L.
Culture COD (% removal)
Pichia kudriavzevii 5
Aspergillus fumigatus 40
Galactomyces geotrichum n.a
COD removal percentages show that A. fumigatus was able to remove 40% of the organic matter
present. However, since LBW was sterilized by autoclave, the values are not comparable to the ones
obtained from bacterial and yeast growth where LBW was sterilized by filtration.
0
2
4
6
8
0 24 48 72 96 120 144 168 192
Dry
weig
ht
(g/L
)Time (h)
P. kudriavzevii Aspergillus fumigatus
Galactomyces geotrichum
A

69
4.5. Determination of lupanine derived-products
The bioconversion of lupanine in O. anthropi and C. funkei cultures was investigated given the
decrease of 66.7% of lupanine concentration by the action of O. anthropi (Figure 27), and the decrease
of 33.3% at 24 h observed in C. funkei (Figure 30) cultures.
FT-IR ATR was the first spectroscopy test to evaluate lupanine derived-product formation. The
obtained results from FT-IR ATR of O. anthropi cultures for the different time points of culture in
comparison with a pure sample of lupanine are shown in Figure 43.
Figure 43 - Spectra obtained from FT-IR ATR of O. anthropi cultures among time. Pink line represents the
pure sample of lupanine, while the other coloured lines represent the different time points of culture (0 h, 3 h, 6 h,
12 h and 24 h) being all superimposable.
The results from C. funkei cultures for different time points of culture in comparison with a pure
sample of lupanine are shown in Figure 44.
C=O

70
Figure 44 - Spectra obtained from FT-IR ATR of C. funkei culture among time. Violet line represents the pure
sample of lupanine, while the other coloured lines represent the different time points of culture (0 h in yellow, 48 h
in blue, and 120 h in green).
Unfortunately, given the interference of the culture medium compounds (Na2HPO4·2H2O, KH2PO4,
NaCl, NH4Cl, MgSO4), the obtained results were not conclusive, and the observation of other functional
groups was not possible.
To complement the previous technique, thin layer chromatography (TLC) was also performed, in
silica plates. The TLC silica plate obtained from application and elution of samples is illustrated in Figure
45.
Figure 45 - TLC plate with two elutions in MTBE/hexane (8:2) and 1% diethylamine (DEA) with
phosphomolybdic acid staining. (L) is pure lupanine; (1)-(5) are the samples corresponding to 0 h, 3 h, 6 h, 12 h
and 24 h of O. anthropi culture and (6)-(8) are the samples corresponding to 0 h, 48 h and 120 h of C. funkei culture.
Observing Figure 35, the results demonstrate that lupanine presented a small impurity, shown by
the bands with lower retention factor (Rf) than lupanine in the pure sample that are also present in further
culture samples. Given this, it is not possible to observe other compounds besides lupanine with different
polarities.
To confirm the obtained results, NMR spectroscopy was also performed. For demonstration, the 13C
and 1H spectra from a pure lupanine sample are shown in Figures 46 and 47, respectively. In these
figures, it is possible to observe peaks distribution according with literature [29]. In Figures 48 and 49
C=O

71
the 13C and 1H spectra obtained with the samples of O. anthropi and C. funkei cultures are presented,
in comparison with a pure lupanine sample.
Figure 46 - 13C NMR spectrum of a pure lupanine sample in CDCL3 [29].
Figure 47 - 1H NMR spectrum of a pure lupanine sample in CDCL3 [29].

72
Figure 48 - 13C NMR spectra of the samples corresponding to O. anthropi and C. funkei cultures. (A) is the
culture of C. funkei at 48 h; (B) is the culture of C. funkei at 120 h; (C) is the culture of O. anthropi at 3 h; (D) is the
culture of O. anthropi at 24 h; (E) is the pure lupanine sample.
Figure 49 – 1H NMR spectra of the samples corresponding to O. anthropi and C. funkei cultures. (A) is the
culture of C. funkei at 48 h; (B) is the culture of C. funkei at 120 h; (C) is the culture of O. anthropi at 3 h; (D) is the
culture of O. anthropi at 24 h; (E) is the pure lupanine sample.

73
Given these results, the capacity of these bacterial species to consume preferably one lupanine
enantiomer over the other was investigated by HPLC determination of enantiomeric excess. Results
from HPLC are shown in Figures 50-53.
Figure 50 – Chromatogram obtained from 0 h of O. anthropi culture, showing racemic lupanine in a proportion
of 53% of D-(+)-lupanine and 47% of L-(-)-lupanine.
Figure 51- Chromatogram obtained from 12 h of O. anthropi culture, showing racemic lupanine in a proportion
of 43% of D-(+)-lupanine and 57% of L-(-)-lupanine.
10.0 12.5 15.0 17.5 20.0 22.5 25.0 27.5 min
-10
-5
0
5
10
15
20
25
30
35
40
45
50
55
mAU240nm,4nm (1.00)
19.4
84/1
719981
21.4
42/1
550146
12.5 15.0 17.5 20.0 22.5 25.0 27.5 min
-7.5
-5.0
-2.5
0.0
2.5
5.0
7.5
10.0
12.5
15.0
17.5
20.0
22.5
25.0
27.5
mAU240nm,4nm (1.00)
20.0
99/7
71841
21.9
92/1
036018
D-(+)-lupanine
L-(-)-lupanine
D-(+)-lupanine
L-(-)-lupanine

74
Figure 52 – Chromatograms obtained from 24 h O. anthropi culture, showing 100% of L-(-)-lupanine.
The results show that after 12 h of culture, D-(+)-lupanine starts decreasing approximately 10 %,
and at 24 h it is only observed the enantiomer L-(-)-lupanine in culture. This suggests that between 12
h and 24 h of culture, a higher consumption occurs. With this result, it can be concluded that O. anthropi
uses D-(+)-lupanine as carbon source to produce energy for growth. C. funkei culture results revealed
that this specie is not able to consume none of the two enantiomers. Thus, the proportion of 53% D-(+)-
lupanine and 47% L-(-)-lupanine of racemic lupanine was maintained constant until 120 h of culture
(Figure 43).
Figure 53 - Chromatograms obtained from C. funkei cultures. (A) is the result obtained from 0 h of culture, with
racemic lupanine in a proportion of 53% of D-(+)-lupanine and 47% of L-(-)-lupanine; (B) is the result obtained from
120 h of culture, with a proportion of 53% of D-(+)-lupanine and 47% of L-(-)-lupanine.
12.5 15.0 17.5 20.0 22.5 25.0 27.5 min
-10
-5
0
5
10
15
20
25
30
35
40
45
50
55
60
mAU240nm,4nm (1.00)
21.3
98/2
163283
10.0 12.5 15.0 17.5 20.0 22.5 25.0 27.5 min
-15.0
-12.5
-10.0
-7.5
-5.0
-2.5
0.0
2.5
5.0
7.5
10.0
12.5
15.0
17.5
20.0
22.5
25.0
27.5
30.0
32.5
35.0
mAU240nm,4nm (1.00)
19.6
74/9
96289
21.6
46/8
92180
10.0 12.5 15.0 17.5 20.0 22.5 25.0 27.5 min
-10
-5
0
5
10
15
20
25
30
35
40
45
50
55
60
mAU240nm,4nm (1.00)
20.4
18/2
006809
22.4
47/1
845754
L-(-)-lupanine
A B D-(+)-lupanine
L-(-)-lupanine
D-(+)-lupanine
L-(-)-lupanine

75
5. Discussion
5.1. Nanofiltration
The nanofiltration experiment was used to obtain a retentate fraction rich in lupanine and a
permeated fraction composed of water. As observed in Figure 19, after the initial 10% concentration
where the flux decreases from 48.12 to 34.98 L/h/m2, the nanofiltration flux was constant during time,
indicating that the membrane is adequate and the nanofiltration process may be feasible at an industrial
scale. The results indicate that the nanofiltration process was successful with high rejection of lupanine
and COD by the membrane. With this process was possible to obtain a concentrated fraction of 150 mL,
of 2.12 g/L of lupanine in concentration mode. The COD values are in aggreement with the increased
lupanine concentrations on the retentate, contrary to the permeate that presents a low concentration of
lupanine and COD, as expected.
Further experiments could include permeated water characterization to ensure that it complies with
the required quality parameters to be recycled back to the industrial debittering process. These
improvements to the process would decrease the amount of fresh water consumed, enable the effluent
treatment and consequently reduce the environmental impact of the wastewaters.
5.2. Bacteria
The present work aimed at the isolation and identification of microorganisms with potential to
catabolize lupanine. For this, the working strategy was, first, to isolate bacteria, yeast and fungi strains
from the LBW and a superficial organic-rich layer formed during the summer, both rich sources in
biodiversity, using media containing lupanine as carbon source. This isolation technique called
enrichment culture consists in using particular growth conditions designed to favour growth of a
microorganism of interest. Here, culture conditions are set to increase small populations of desired
microorganisms to detectable levels, illustrating natural selection in vitro [120]. These cultures are set
in liquid media, with the inoculation of a sample containing natural material with the mixed microbial
population. This sample is collected from environmental habitats in which the desired microorganism is
expected to occur [121].
In the current study, wastewater from cooking phase of industrial debittering process of lupin beans
was used as inoculum, as well as the organic-rich layer formed on the LBW surface. These samples
were enriched using liquid cultures supplemented with lupanine, glucose and lupanine/glucose mixture
as carbon sources. Figure 20 evidences that lupanine concentration decrease after 7 days of
enrichment for glucose/lupanine mixture conditions, reaching unmeasurable values by HPLC when a
sample of the superficial layer was used as inoculum. When lupanine was the sole carbon source, a
decrease was also shown in the second and third enrichments. In the end, it was possible to distinguish
three different gram-negative bacterial morphotypes, identified as Ochrobactrum anthropi,
Stenotrophonomas maltophilia and Sphingobacterium siyangense. All isolates were identified with more
than 98% of identity. Until this date, none of these strains had been isolated from LBW surface layer.
Otherwise, when LBW was used as inoculum, lupanine concentrations remained approximately
constant (Figure 22), despite the increasing visible turbidity observed in the cultures (indicating cellular
growth). From the enrichment with LBW, a fourth bacteria was identified, the gram-positive

76
Cellulosimicrobium funkei. However, given that bacterial isolation was performed according to the
different morphotypes, it is possible that very similar colonies had not been successfully isolated.
Additionally, in culture enrichments, there is continuous variation of culture conditions, with nutrient
consumption and excretion of metabolic products according to each individual microorganism growth,
which is a disadvantage of this technique since these changes may favour the growth of certain
microorganisms that become prevalent over others. Meaning that, a culture medium with apparently no
selectivity may become highly selective depending on chemical changes promoted by the developing
organisms. In this case, natural selection depends on the growth rates of each individual from the
population for given conditions [121].
According to the literature, strains of Ochrobactrum genus are part of the family Brucellaceae and
are well adapted to a wide range of ecological niches. Ochrobactrum anthropi, formerly “Achromobacter”
was proposed as a new strain in 1988 by Holmes et al. [122]. The species in this group are potential
human pathogens, with a frequent isolation from hospital water sources, sinks, seawage and soil [123].
Ochrobactrum anthropi MP3 strain is able to produce an exopolysaccharide and degrade hydrocarbons
in a petroleum refinery wastewater, which are highly toxic to the environment and must be treated before
discharge [124]. Here, the authors concluded that this strain is an efficient degrader of diesel oil, and
that the exopolysaccharide produced increased the uptake of oil as a carbon source [124]. The ability
of this bacteria to degrade various polycyclic aromatic hydrocarbons such as phenanthrene, hexane,
heptane, hexadecane and pesticides has also been documented [125]–[127].
Recent research works demonstrated that Ochrobactrum lupini and Ochrobactrum anthropi are
strains that share high similarity in phylogenetic markers, evidencing 100% for 16S rRNA, 99.9% for
dnaK and 99.35% for rpoB [128]. RNA polymerase beta subunit (rpoB) and 70-kDa heat shock protein
(HSP70, gene dnaK) are other stable marker genes used as complementary tools for the 16S gene.
Gene rpoB typically occurs in a single copy, while most bacterial genomes have 16S rRNA gene in
multiple copies (with copy number differing with species), representing a disadvantage for species
identification since there are sequence variations between different gene copies in some genomes [129],
[130]. Single-copy genes favour an accurate measurement of diversity and phylogenetic relationships,
avoiding biases and loss of phylogenetic resolution caused by intragenomic heterogeneity [131].
Therefore, 16S rRNA may not be always suitable for distinguish closely related species. Gene HSP70
is another alternative marker for phylogenetic studies, since it is one of the most conserved proteins
found in all biota [132]. Given this, molecular microbial ecology is not limited to 16S rRNA gene, although
this is by far the most frequently used gene. O. lupini is a bacterial strain isolated from Lupinus albus
plant root nodules [133], that is closely related in phylogenies with O. anthropi strain. These two strains
do not have pronounced differences at phenotypic, phylogenetic, chemotaxonomic and genomic levels.
Given this, O. lupini may be considered a later heterotypic synonym of O. anthropi [134]. Therefore, it is
reasonable that O. anthropi appears in LBW.
Yabuuchi et al. (1983) [135], proposed the genus Sphingobacterium as a group of aerobic gram-
negative bacilli with high concentrations of cellular lipid components – sphingophospholipids – in the
cell membrane [136]. So far, about 50 species have already been identified as belonging to this genus
[137], either in natural environments: sandy soils, activated sludge, farm and forest soils, or in water

77
sources (including those in hospitals) [138]–[143]. Sphingobacterium siyangense has been isolated from
farm soil, with optimal conditions for its growth described as the following: 30-37°C, pH 6.0-8.0 and 0-
2% NaCl, in nutrient agar. From a biotechnological perspective, there are evidences that
Sphingobacterium sp. is capable of producing a biosurfactant mixture [144], which is interesting due to
the potential applications in different sectors: foods, cosmetics, agriculture and pharmaceutics. And,
since the stricter legal control and health regulations from industrial activities have been favouring the
replacement of chemical surfactants by their biodegradable substitutes [144]. There are no published
findings of this bacteria isolated from lupin beans wastewater, neither the study of its lupanine
catabolizing capacity or growth under LBW. However, due to the isolation and identification of this
species in farm soils as well as in water sources, which is in concordance with lupin beans plant
environment, its presence is foreseen.
Stenotrophomonas maltophilia was classified in 1993 [145], [146] as a gram-negative bacillus,
aerobe, considered an environmental global emerging multiple-drug-resistant organism commonly
related with respiratory infections in humans, and their incidence is particularly increasing in
immunocompromised patients [147]. This pathogen has been isolated from aqueous-associated
sources either inside or outside the clinical setting of hospitals: in soils and plant roots [148], wastewater
plants [149], biofilms in aquifers [150], bottled water [151], haemodialysis water [152] among others.
Additionally, S. maltophilia has also been associated with a few plants, such as oat, cucumber, maize
oilseed rape, potato and the rhizosphere of wheat [148], [153], [154]. One particular feature of S.
maltophilia is its potential to adhere to plastics and form bacterial films – biofilms. Therefore, this bacteria
has been isolated from surfaces of intravenous materials like prosthetic devices or dental unit waterlines
(e.g.) [155], [156]. This bacterial species has demonstrated potential in the biotechnology field, since it
is involved in several studies in: bioremediation capacity for copper removal from aqueous solution [157];
biodegradation of two petrochemical hydrocarbons: diesel oil and engine oil [158]; production of
enzymes with an important role in synthesis of compounds with medical applications e. g. anti-
inflammatory analgesics using lipase obtained from this bacteria [159]. To our best knowledge, the work
developed in this thesis is the first study describing the presence of S. maltophilia in LBW, as well as
the first study to test lupanine catabolization capacity and the growth under LBW (topics further
discussed in this thesis). Neverthless, this bacteria had previously been isolated from plant roots and
wastewater plants [148], [149], what can explain its presence in lupin beans wastewater for the first time.
Schumann et al.(2001), referred Cellulosimicrobium species as gram-positive bacteria widely
distributed in soil and water [160]. Bacteria from this species are uncommon opportunistic pathogens
that can cause infection in immunocompromised patients [161]. Cellulosimicrobium funkei is able to
grow at 35 and 45 °C, forming substrate hyphae visible in solid medium. In 2017, a novel bacterial strain
of C. funkei was identified in soil contaminated with leather industrial effluent and distinguished due to
its high tolerance to Cr(VI) (the most toxic form) and ability to reduce it to Cr(III) [162]. Besides this,
other studies have demonstrated that C. funkei has also potential to detoxify aflatoxin B1, a secondary
fungal metabolite considered a toxic mycotoxin with mutagenic and carcinogenic effects on living
species [163]. This secondary metabolite can easily contaminate maize-based food and feed around
the world, leading to significantly economic losses [164]. Until date, there are no published research

78
works concerning the isolation and identification of this bacterial species from LBW, nor lupanine
catabolization capacity studies. However, since it is commonly isolated from soil and water, it is
reasonable that this species occur in lupin beans wastewater.
Considering cultures of the characterized bacterial species in synthetic growth medium M9, it is
possible to assume that only O. anthropi revealed clear lupanine catabolizing capacity.Here, initial
lupanine concentration of around 1.2 g/L, decreases to values of around 0.4 g/L, which is a 66.7%
reduction, in both lupanine and glucose + lupanine conditions. The results from the control cultures
(Figure 31) indicate that lupanine decrease levels are due to microbial activity, since no variations were
observed. Specific growth rates (µ) calculated for the first 6h revealed the following values for the
different conditions (Table 18):
Table 18 – Specific growth rates (µ) of O. anthropi cultures in each growth condition.
Pre-culture Culture Specific growth rate (h-1)
Glucose Glucose 0.13 ± 0.05
Lupanine Lupanine 0.10 ± 0.03
Glucose + Lupanine 0.11 ± 0.03
Glucose + Lupanine
Lupanine 0.08 ± 0.03
Glucose + Lupanine 0.12 ± 0.02
It is possible to see that when lupanine is present as carbon source, the specific growth rate is
lower in comparison with glucose and glucose with lupanine mixtures.
Additional assays were performed for FT-IR, TLC and NMR of lupanine at different time points to
evaluate possible by-product formation. FT-IR is here used as a comparative and qualitative technique,
since it demonstrates the difference in functional groups and not exactly their location in the molecule.
Unfortunately, given the interference of the culture medium compounds the obtained results were not
conclusive, and the observation of other functional groups was not possible (Figure 33). In a similar way,
TLC only indicates the presence or absence of other compounds besides lupanine, without any other
information about the resulting structure of these molecules. Observing Figure 35, the Rf of the pure
sample of lupanine is higher than the culture samples, evidencing a higher lupanine concentration with
a bigger stain for the applied sample. Given this, it is not possible to observe other compounds besides
lupanine with different polarities.
NMR results (Figures 38-39) showed that only lupanine was present in the culture, indicating that
there by-product formation did not occurred by comparison with the spectra obtained for a pure lupanine
sample (Figures 36-37).
When enantiomeric excess was determined, The results show that after 12 h of culture, D-(+)-
lupanine starts decreasing approximately 10 %, and at 24 h it is only observed the enantiomer L-(-)-
lupanine in culture. This suggests that between 12 h and 24 h of culture, a higher consumption occurs,
which is in agreement with the increase in the OD600 nm value measured at 12 h (0.14) and 24 h (0.80),
respectively. With this result, it can be concluded that O. anthropi uses 100% of D-(+)-lupanine as carbon
source to produce energy for growth (Figures 40-42). Further experiments to verify this assumption

79
could include more hours of culture, to assess if the remaining enantiomer (L-(-)-lupanine) is consumed
after the tested 24 h.
The HPLC quantification of the enantiomers in C. funkei cultures revealed that this specie is not
able to consume none of the two enantiomers. Thus, the proportion of 53% D-(+)-lupanine and 47% L-
(-)-lupanine of racemic lupanine was maintained constant until 120 h of culture (Figure 43).
Until date, there are no studies with O. anthropi strain and its ability to catabolize lupanine. However,
there are former studies related with gram-negative bacterial strains capable of using lupanine as sole
carbon and energy source [30], [87], [88]. In 1996, Santana et al., isolated seven strains from soil of L.
albus and L. luteus growth, with specific growth rates ranging from 0.05 to 0.13 h-1 in the presence of 2
g/L lupanine, which are similar values to the ones obtained for the O. anthropi strain isolated in the
present study. In 2018, Parmaki et al., published results from four isolates with ability to use lupanine
as sole carbon source, grown in M9 with 1.5 g/L of lupanine, in conditions identical to those used in this
work. The four isolates were identified as Rhodococcus rhodochrous LPK211, Rhodococcus ruber
LPK222, Rhodococcus sp. LPK311 and Pseudomonas putida LPK411, with 81% (in 36h), 66% (42h),
71% (36h) and 80% (36h) of lupanine removal, respectively. Final OD600 nm measurements of sample
cultures from these isolates were 1.2, 1.3, 1.2 and 0.6, respectively. In the present work for O. anthropi
show a similar lupanine removal percentage was obtained (66.7%), and a higher final value of OD600 nm
of 1.73 for the condition with lupanine as sole carbon source. There is no published information
regarding O. anthropi ability to degrade lupanine. However, related studies reported Ochrobactrum
intermedium DN2 as a strain with 99.5% homology with O. anthropi and with nicotine-degrading
capacity, which is another alkaloid. This strain has totally degraded nicotine in basal medium containing
between 500-4000 mgnicotine/L. Biomass produced was affected by initial concentration of nicotine,
meaning that high concentrations of nicotine (5000 mg/L) restrict cellular growth, evidencing substrate
inhibition. The authors state that this behaviour was similar to the growth of Pseudomonas putida when
nicotine is used as carbon source [165]. Additionally, it was concluded that enzymes involved in the
degradation of nicotine by O. intermedium were allocated in the cell-wall membrane, enabling the direct
transferring of electrons from the substrate to components of the respiratory chain during enzymatic
reaction [166]. However, nicotine catabolic pathway of O. intermedium is likely to differ from other
bacterial strains like Artrobacter nicotinovorans that produces a blue pigment in result of nicotine
metabolization, which is not observed in O. intermedium [167].
To investigate the lupanine catabolizing capacity of P. putida, Detheridge et al. (2018), analysed
the genome sequence of one strain capable of growing in lupanine named Psp-LUP. Previous
investigations on the lupanine degradation mechanism by Psp-LUP demonstrated that the first step in
degradation of the heterocyclic ring containing tertiary nitrogen atoms comprise the hydroxylation in the
17- position to give rise to 17-hydroxylupanine (Figure 43) [168].
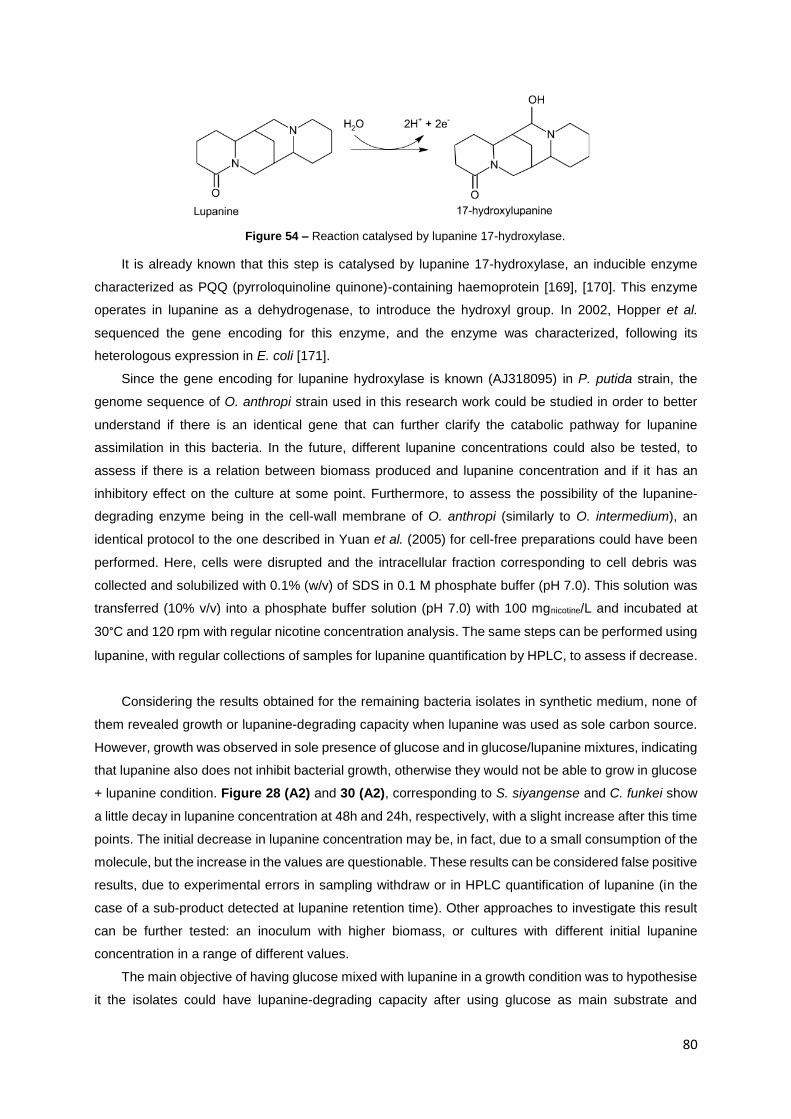
80
Figure 54 – Reaction catalysed by lupanine 17-hydroxylase.
It is already known that this step is catalysed by lupanine 17-hydroxylase, an inducible enzyme
characterized as PQQ (pyrroloquinoline quinone)-containing haemoprotein [169], [170]. This enzyme
operates in lupanine as a dehydrogenase, to introduce the hydroxyl group. In 2002, Hopper et al.
sequenced the gene encoding for this enzyme, and the enzyme was characterized, following its
heterologous expression in E. coli [171].
Since the gene encoding for lupanine hydroxylase is known (AJ318095) in P. putida strain, the
genome sequence of O. anthropi strain used in this research work could be studied in order to better
understand if there is an identical gene that can further clarify the catabolic pathway for lupanine
assimilation in this bacteria. In the future, different lupanine concentrations could also be tested, to
assess if there is a relation between biomass produced and lupanine concentration and if it has an
inhibitory effect on the culture at some point. Furthermore, to assess the possibility of the lupanine-
degrading enzyme being in the cell-wall membrane of O. anthropi (similarly to O. intermedium), an
identical protocol to the one described in Yuan et al. (2005) for cell-free preparations could have been
performed. Here, cells were disrupted and the intracellular fraction corresponding to cell debris was
collected and solubilized with 0.1% (w/v) of SDS in 0.1 M phosphate buffer (pH 7.0). This solution was
transferred (10% v/v) into a phosphate buffer solution (pH 7.0) with 100 mgnicotine/L and incubated at
30°C and 120 rpm with regular nicotine concentration analysis. The same steps can be performed using
lupanine, with regular collections of samples for lupanine quantification by HPLC, to assess if decrease.
Considering the results obtained for the remaining bacteria isolates in synthetic medium, none of
them revealed growth or lupanine-degrading capacity when lupanine was used as sole carbon source.
However, growth was observed in sole presence of glucose and in glucose/lupanine mixtures, indicating
that lupanine also does not inhibit bacterial growth, otherwise they would not be able to grow in glucose
+ lupanine condition. Figure 28 (A2) and 30 (A2), corresponding to S. siyangense and C. funkei show
a little decay in lupanine concentration at 48h and 24h, respectively, with a slight increase after this time
points. The initial decrease in lupanine concentration may be, in fact, due to a small consumption of the
molecule, but the increase in the values are questionable. These results can be considered false positive
results, due to experimental errors in sampling withdraw or in HPLC quantification of lupanine (in the
case of a sub-product detected at lupanine retention time). Other approaches to investigate this result
can be further tested: an inoculum with higher biomass, or cultures with different initial lupanine
concentration in a range of different values.
The main objective of having glucose mixed with lupanine in a growth condition was to hypothesise
it the isolates could have lupanine-degrading capacity after using glucose as main substrate and

81
reaching stationary phase. In this case, glucose would be used as substrate and lupanine as a reagent
to give rise to sub-products. The metabolism of a growing bacteria is divided in two categories: primary
and secondary. Primary metabolites are intracellular molecules that enable growth and proliferation of
the bacteria and participate in exponential growth phase, while secondary metabolites are mainly
extracellular molecules that facilitate the interaction of the bacteria with its environment, and are
produced throughout late-exponential and stationary phase growths [172]. However, the research
developed during the past century revealed a detailed, quantitative and holistic characterization of
primary metabolism [173], [174], and the same is not yet applied for secondary metabolism. The
biochemical processes behind metabolism can be classified into catabolism (break down of complex
molecules into simpler ones, releasing energy) or anabolism (synthesis of complex molecules from
simpler ones, requiring energy). Metabolites are the end-products of these reactions, and are used for
the formation of intermediates and substrates for other metabolic pathways. These metabolites can have
several biological properties of pharmaceutical, nutritional or agricultural importance. Secondary
metabolites usually serve as a survival strategy for the microorganism during adverse conditions, and
its production is triggered during exhaustion of nutrients, environmental stress or limited growth
conditions [175]. For these reasons, consumption of lupanine after glucose depletion was studied, but
the results evidence that during 168h of culture and only with 2 g/L of glucose, lupanine concentrations
remained constant.
The pH homeostasis of the culture is important for cell metabolism, since the function of biological
macromolecules (especially proteins, enzymes), as well as chemical reactions, depend on these values.
Bacteria can live at different ranges of pH values, being classified as acidophiles (pH 1-3), alkalophiles
(pH 10-13) or neutrophils (pH 5.5-9). Bacterial strains found in this work are classified as neutrophiles,
with optimum pH values comprehended in an interval of 6-8 (pH 7 for O. anthropi; pH 6.0 - 8.0 for S.
siyangense; pH 6.0 for S. maltophilia) [141], [166], [176], [177]. Extracellular pH can be changed during
culture due to the metabolism itself, medium composition, the growth phase, and the physiology of the
bacteria [178]. Table 8 demonstrates an initial pH around 7.3-7.5 and a final pH of 7.7-8.2, indicating a
small increase in these values. Usually, microorganisms can change the environment through the
uptake of resources and the excretion of metabolites, which can affect the own growth. Variations in
environmental pH is common during cultures. This parameter can decrease or increase, leading to
beneficial or deleterious effects on its growth [179]. In the results obtained from the bacterial cultures,
since the pH during the culture did not vary significantly, the growth of each bacteria was not apparently
affected by this parameter. Different initial pH values of the culture could have been tested, to evaluate
if lupanine consumption by O. anthropi might be affected. Additionally, the optimum pH values for each
bacteria could have been used to evaluate if a different behaviour would be observed.
Lupanine charge can vary according to the pH of the culture. Since it has a pKa of 9.1, bellow this
pH it has a positive charge, being protonated, and above this pH it is deprotonated (Figure 44). The pH
changes during the culture may influence lupanine transporter, which has not yet been identified.

82
Figure 55 – Protonated and deprotonated forms of lupanine, according with the pH of solutions. Adapted from
[29].
In 2002, Santana et al. investigated the potential of two lupanine-catabolizing strains (IST20B and
IST40D) to remove quinolizidine alkaloids (at 20°C, 27°C and 34°C), from a lupin seeds extract [88].
This extract was diluted in a buffered solution with a final lupanine concentration of 2 g/L and final total
alkaloid concentration of 3 g/L. Here, the authors verified the levels of soluble protein, amino acids, total
carbohydrates, total QA and lupanine concentrations after removing cells by centrifugation. They verified
that the initial concentration of QA, especially lupanine, decreased after cell inoculation, as well as the
initial concentration of amino acids. However, the concentration of carbohydrates remained stable
during the active catabolism of amino acids and QAs. This first period of bacterial growth corresponded
to a first phase of exponential growth, followed by a second slower phase of growth, evidencing a diauxic
profile. The second phase of growth apparently corresponded to partial utilization of the carbohydrates
present. IST20B and IST40D presented specific growth rates of 0.37 h-1 and 0.26 h-1 at 27°C, which were
higher values compared with the µ obtained in synthetic medium for the same temperature (0.14 h-1 for
IST20B and 0.17 h-1 for IST40D). The three temperatures tested have demonstrated that this
environmental parameter can significantly affect growth kinetics and by consequence the bacterial
catabolic performance. The metabolic fingerprints of these two strains revealed that they are able to
grow using the following common amino acids: glutamic acid, alanine, leucine, phenylalanine, proline,
serine and threonine. All of these amino acids are present in lupin seeds [30], [180], [181].
In the present research work, none of the isolates demonstrated lupanine-catabolizing capacity with
LBW as growth medium, despite the high growth observed (Figure 32). O. anthropi showed lupanine-
catabolizing capacity in synthetic medium M9. However, when using LBW as medium, lupanine
concentrations were maintained during the culture, despite the high specific growth rate of 0.31 h-1 ±0.03
observed (a similar result to the one obtained for IST40D), higher than µ obtained in synthetic medium
with lupanine as sole carbon source. LBW lupanine concentrations remained constant probably because
of other available carbon sources used preferably over lupanine. Although, besides the unobserved
variation of lupanine, Table 9 results show that all isolates were able to reduce the COD, and that O.
anthropi was the strain presenting higher removal percentage (58.7%), enabling partial organic matter
removal of LBW. It would be interesting to assess if the isolates are able to remove the total amount of
COD from LBW extending the culture time or will eventually start consuming lupanine as other carbon
sources are depleted. Additionally, the analysis of sub-products during these fermentations can be
further studied, to understand if the isolates produce any compound of interest derived from the COD
consumed of LBW. From the pH values obtained in Table 11, it is clear an increase in the pH, which
can be due to protein or amino acid decomposition, since ammonia is formed by many bacteria as an

83
end product of this decomposition. Bacteria can cleave ammonia from the amino acids and since reacts
with water recruiting a proton, ammonium is formed in aqueous solution, increasing the pH [182].
In this work, total reducing sugars were measured by the DNS method. This method can only be
used to quantify the presence of a free carbonyl group (C=O), having as basis the oxidation of the
aldehyde or ketone functional groups from reducing sugars like glucose or fructose. However, this
method has some limitations, since it is not very suitable for determination of sugar contents in complex
mixtures (as it is the case of LBW) and can be either preferably used for accurate measurements of
pure solutions. Non-reducing sugars like sucrose or others cannot be determined by DNS since they do
not participate in the carbonyl reactions used in DNS. Here, HPLC-MS would be the more accurate,
sensitive and reliable method for quantification of the different sugars present in LBW [117].
There are a few common carbon and nitrogen sources used by the four bacterial species, as
illustrated in Table 19.
Table 19 – Some of the carbon and nitrogen sources used by the four bacterial species isolated. (*) indicates
two carbon sources that may be present in LBW.
Species Threonine Proline Trehalose Arabinose Glucose Fructose Galactose*
Maltose Sucrose*
O. anthropi [122]
S. siyangense [141]
- -
S. maltophilia [151]
- - - -
C. funkei [183]
- -
In 2015, Fritsch et al., evaluated the fermentation performance of lactic acid bacteria in different
lupin substrates [184]. One of the substrates tested was the flour of the alkaloid-rich Lupinus
angustifolius, in which carbohydrate composition determination by high performance anion exchange
chromatography gave rise to the following results (g of carbohydrates/kg bitter lupin flour): galactose
0.5, sucrose 37.1, raffinose 8.0, stachyose 34.4 and verbascose 17.3. Given this information, it is
possible to do a speculation about some compounds that may be present in LBW.
Further investigations in this field could include the study of different growth temperatures, to asses
if temperature can affect substrate consumption, as well as different LBW dilutions in sterilized water
and the measurement of initial and final soluble proteins, amino acids and total quinolizidine alkaloids.
This way, it would be possible to clarify which substrates are preferred for bacterial consumption.
5.3. Yeast
Considering enrichment cultures for yeast isolation, a sample of LBW was enriched in lupanine (1.5
g/L), glucose (2 g/L) and lupanine (1.5 g/L) mixed with glucose (2 g/L) aiming to isolate yeast species
that are more adapted to lupanine in culture. As observed in Figure 33, lupanine concentration levels
did not provide a constant concentration, indicating an experimental error in the collection of the sample
84
for HPLC, or in the preparation of lupanine solution. Still, at the end of the third enrichment, yeast
colonies from two different morphotypes were observed in YNB solid media supplemented with lupanine
(1.5 g/L). Both yeast strains (Pichia kudriavzevii and Rhodotorula mucilaginosa) were identified with
more than 99% of identity, and until date none of them had been isolated from LBW. For this case,
enrichment assays were not performed using the superficial layer of the LBW, however, it was done an
isolation step with dilutions of this sample and the identification revealed the presence of Pichia
kudriavzevii and Diutina (candida) rugosa. The work with the last yeast isolate was not followed, since
was observed very low population density and low growth (1 colony in a 10-5 dilution of the LBW
superficial organic layer) in YNB supplemented with lupanine (1.5 g/L).
According to the literature, Pichia kudriavzevii was initially described as Issatchenkia orientalis by
Kudryavtsev (1960), and was reclassified as Pichia kudriavzevii some years later by Boidin et al. (1965)
[185]. This yeast has been isolated from a variety of sources: cocoa bean fermentation, mango pulp
peel compost, cereal-based beverage, fermented butter, sugar cane juice, sweet sorghum stalk and rice
straw [186]–[189]. P. kudriavzevii is characterized by their robust physiology due to the tolerance to
fermentation inhibitory compounds that are relevant to second-generation bioethanol production, e. g.
acetic acid, formic acid or vanillin [186], [188], [190]. Additionally, P. kudriavzevii is able to grow at
extremely low pH conditions (around pH 2) and it has more potential for ethanol production at
temperatures higher than 35°C compared with S. cerevisiae, being able to ferment at up to 45°C [190].
To our best knowledge, the work developed in this thesis is the first study involving the isolation and
identification of this yeast from LBW. Additionally, there are no published results relating P. kudriavzevii
with lupanine catabolizing consumption. However, since this species had already been isolated from
different types of plants or foods (as mentioned above), is likely that it can be found in lupin beans plant.
The first systematic study on the genus Rhodotorula was published in 1922 by Saito [191], where
red and yellow-colored Torulas were classified. A few years later, these coloured yeasts in Rhodotorula
and Chromotorula, in which carotenoid pigments producers where part of Rhodotorula genus [192].
Rhodotorula yeasts are pink basidiomycetes forming rudimentary hyphae and small capsules [193].
These yeasts were considered non-pathogenic, widespread in nature and isolated from environmental
sources [194]. However, those organisms had emerged as opportunistic pathogens, particularly
infecting immunocompromised patients, causing fungemia associated with catheters, endocarditis,
peritonitis, meningitis as the most common infections in the literature [194], [195]. R. mucilaginosa is the
most common species isolated from clinical patients, with a high physiological variability among strains
[196], [197]. Until date, there are no published results regarding R. mucilaginosa isolation and
identification from LBW nor lupanine catabolizing capacity.
Considering microbial cultures (Figures 36 and 37), both yeast strains, Pichia kudriavzevii and
Rhodotorula mucilaginosa, were uncapable of grow in lupanine as sole carbon source. When glucose
is present in the medium, exponential curves are followed, indicating that lupanine also does not inhibit
yeasts growth, otherwise they would not be able to grow in glucose + lupanine condition. Lupanine
concentration levels remained constant, with small oscillations that can be due to experimental errors in
the collection and preparing of samples for HPLC. Until date, there are no published works with both P.
kudriavzevii and R. mucilaginosa yeasts involved in lupanine conversion or consumption for energy, nor

85
other alkaloid. It can be concluded that R. mucilaginosa and P. kudriavzevii do not have the ability to
grow when lupanine is the sole carbon source.
The variation of pH in yeast cultures is presented in Table 12. It is clear that here yeasts grow at
pH values lower than bacteria. This is because yeasts grow better in a range of pH 4.5 – 7.0, preferring
acid environments [198]. Fermenting yeasts, usually acidify their growth environment by a combination
of proton secretion during nutrient transport (in this case glucose transport) by the action of the plasma
membrane proton-pumping ATPase. Yeasts can directly secrete organic acids (succinic or acetic acids),
which leads to a decrease in the pH [199]. In Table 12, it is possible to observe a decrease in pH under
glucose as carbon source, while in lupanine growth conditions, the pH values remain approximately
constant.
These two yeast species were cultured in LBW as medium to evaluate possible COD or lupanine
removal, as well as total reducing sugar consumption. Two growth conditions for each yeast isolate were
tested: i) growth in LBW diluted in water, ii) growth in LBW diluted in YNB medium, to assess if LBW
could lack essential nutrients for yeast growth. In Figure 39, the growth curves presented show that
both yeasts grown without any difference between exponential phases in both LBW+H2O and
LBW+YNB, which mean that LBW comprises all necessary nutrients for yeast growth. This can also be
confirmed by the results of specific growth rates (Table 20).
Table 20 – Specific growth rates for both yeasts and culture conditions in LBW.
Yeast strain LBW + H2O LBW + YNB
P. kudriavzevii 0.41 h-1 ± 0.03 0.40 h-1 ± 0.01
R. mucilaginosa 0.17 h-1 ± 0.01 0.17 h-1 ± 0.01
P. kudriavzevii has grown with higher specific growth rate than R. mucilaginosa, however, both
strains reached values of around 7.5 in the OD600 nm measurements at 24 hours.
Lupanine concentration graphs revealed that lupanine was not consumed during the culture of P.
kudriavzevii and R. mucilaginosa. However, in Table 13 the COD results demonstrate that both yeasts
were able to remove part of the COD from LBW diluted in water, with a higher removal of 47.1% ± 1.5
by R. mucilaginosa than the 21.81% ± 2.0 removed by P. kudriavzevii. Previous studies revealed the
ability of R. mucilaginosa to degrade six phenolic compounds (protocatechuic, vanilic, p-coumaric acids,
tyrosol, gallic acid and catechol) present in olive mill wastewater [200]. These compounds are highly
toxic and characterized by their stability and bioaccumulation capacity, thus remaining in the
environment for a long time [201]. Additionally, in this study, it was verified that using olive mill
wastewater as culture medium, R. mucilaginosa was able to reduce 38.38%, 47.69% and 56.91% of
COD and 5.84%, 27.89% and 34.81% of phenol content, respectively, for initial COD concentrations of
26700, 14400 and 6500 mg/L. Here, yeast biomass was influenced by the COD concentration, and the
biodegradation reaction was intense in the first 3 days, meaning that this yeast can easily metabolize
olive mill wastewater components (sugars, proteins and phenolic compounds). The authors have
verified that an increase in the pH occurred during the culture, and mention that this can be indicative
of the deamination of amino acids leading to subsequent ammonia production, similarly to what was

86
explained previously for the case of the increase in bacterial pH in LBW. This hypothesis was also
mentioned by Welthagen et al. (1999) [202]. Other studies state that R. rubra (which is a synonym of
mucilaginosa) was able to reduce 50% and 90% of COD and biological oxygen demand, respectively,
as well as to degrade some aromatic compounds of hydrocarbon refinery wastewater [203]. The authors
were able to conclude that this yeast has potential to produce a red pigment and an antioxidant while it
purifies olive mill wastewater [200]. Curiously, P. kudriavzevii has also been involved in a study with
olive mill wastewater [204]. Here, the authors explored the feasibility of producing bioethanol during a
bioremediation process that reduces the polluting charge of this wastewater through aerobic yeast
fermentation. Biological treatment of olive mill wastewater originated bioethanol as a co-product using
selected yeasts, such as P. kudriavzevii. Polyphenolic compounds from olive mill wastewater were used
for ethanol production during the bioremediation process. In a biotechnological perspective, Koutinas et
al (2015) has exploited a citrus peel based biorefinary with this yeast, showing favourable technological
features for ethanol production by means of utilization of this food waste [205]. Here, the isolated strain
revealed to be highly thermotolerant and used hexoses (glucose, sucrose, fructose and galactose) and
pentoses (xylose) for ethanol production. Besides bioethanol production, P. kudriavzevii strain M12 has
also demonstrated to have a potential to produce valuable enzymes in food processing and agriculture,
named phytases [206].
There are a few common carbon sources used by the two yeast species, as illustrated in Table 21.
Table 21 - Some of the carbon sources used by the yeast species isolated. (*) indicates two carbon sources
that may be present in LBW.
Glucose Ethanol Glycerol Succinate Glucosamine Sucrose* Trehalose Raffinose*
P. kudriavzevii [207]
- - - -
R. mucilaginosa [198]
-
Given this information, it is possible to conclude that R. mucilaginosa might have used sucrose or
raffinose for the growth under LBW.
Similar to the LBW cultures with bacterial species, further investigations in this field could include
different growth temperatures testing, to assess its effect on substrate consumption, as well as different
dilutions in sterilized water and the measurement of initial and final soluble proteins, amino acids and
total quinolizidine alkaloids. In this way, it would be possible to clarify which carbon sources are yeast
strains consuming.
5.4. Filamentous fungi
Given the difficulties in working with liquid microbial culture with filamentous fungi strains (due to
the high aggregates formed), this was a complementary approach and an additional characterization of
biodiversity in LBW. Here, three different morphotypes of isolates were identified as Pichia kudriavzevii,
Aspergillus fumigatus and Galactomyces geotrichum. As seen in this research, Pichia kudriavzevii was

87
identified by the second time (similarly to Yeast section), which confirms the prevalence of this yeast in
LBW.
According with the literature, Aspergillus fumigatus is considered a saprophytic fungus (gets energy
from dead and decaying organic matter) that plays a key role in recycling environmental carbon and
nitrogen [208]. It is commonly found in the soil, where it survives and grows on organic debris, playing
an important role in carbon and nitrogen recycling in nature. This fungus sporulates abundantly with
every conidial head producing thousands of conidia. This fungal strain has become the most prevalent
airborne fungal pathogen, causing severe and sometimes fatal invasive infections in
immunocompromised patients from developed countries [209]. A. fumigatus is a thermotolerant, with
efficient growth and germination at 37°C with nutritional versatility and the ability to grow under various
carbon and nitrogen sources [210]. This species can grow under a variety of carbon and nitrogen
sources like glucose, mannose, maltose, fructose, sucrose, arabinose, trehalose, lactose, peptone,
alanine, proline as examples [211]. In the present work, cultures either in synthetic growth medium or
LBW revealed that this fungus is not able to catabolize lupanine (Figure 41, Table 16).
The growth results, quantified in terms of cell dry weight are presented in Figure 41, showing that at
some point there is no measurement in glucose growth condition, due to the aggregation state of
biomass that was observed after 48hours of culture. It was also observed growth in lupanine condition
around 1.5 g/L, which can be because of the composition of the ME culture medium, once it has 17 g/L
of malt extract and 3 g/L mycological peptone, and these compounds were probably used as energy
sources. To better evaluate lupanine consumption levels, further experiments need to readjust culture
medium concentrations, by reducing glucose and malt extract concentrations. When grown in LBW, A.
fumigatus was able to remove 40% of COD, which indicates a positive result. However, similarly to
previous experiments, the concentrations of total amount of amino acids, proteins and total QA could
have been measured to better investigate the growth of the isolate in LBW medium. Cell dry weight
results from Figure 42 are not representative from real cell growth, since this fungus grown in
aggregates as well. There are some studies with A. fumigatus that demonstrated the ability of this strain
to efficiently treat wastewater effluent from dyeing industry [212]. Here, the authors observed that this
fungus had decolorized a dye from an industry effluent, by degrading azo dyes that have a complex
structure and synthetic nature, which makes them difficult to remove [213]. Additionally, other studies
also state the decolourization of molasses wastewater accompanied by 51% of COD removal in a
molasses melanoidin solution and 75% of decolourization [214].
Galactomyces geotrichum is a mould widely used in biotechnology, since it has been isolated from
several types of cheeses, milk and alcoholic beverage [215]–[217]. Literature information state that this
species is able to grow on glucose, galactose, sucrose, and xylose. However, no growth was observed
on cellobiose, maltose, raffinose, mannitol and erythritol [217]. Microbial cultures revealed no lupanine-
degrading catabolization ability, and the percentage of COD obtained for the final culture was higher
than the initial, which indicates release of organic compounds into the LBW, meaning that it is not an
adequate species for purification of this wastewater. From the biotechnology perspective, this species
is used in cheese production since it is able to reduce the bitterness in the cheese due to the breakdown
of bitter peptides (by proteolysis) [218]. Additionally, G. geotrichum has also been found as the dominant

88
fungus among the identified ones from a Chinese liquor preparation. Here, the authors state that this
species can affect the flavour of the liquor due to their protein and lipid-degrading capacity into
precursors of volatile compounds [219]. One of the harmful substances that this species is able to
degrade is an organochlorine pollutant that contaminates the environment affecting humans and
animals, since it exists in the soil, sediment, water or air and it has been used since World War II in pest
control for agriculture [220]. Other example is the case of the azo dyes, similarly to A. fumigatus, in
which G. geotrichum revealed the ability to decolorize the toxic Methyl red azo dye [221]. Given this
information, it is possible to conclude that although this species can have potential applications in other
fields, it was not that relevant in lupanine and COD removal.
In 2013, the degradation of quinolizidine alkaloids of lupin by Rhizopus oligosporus was
investigated [222]. Here, the authors state that this species demonstrated positive results for
detoxification of lupin seeds. They investigated that the fermentation process was mainly affected by
initial pH values in growth medium, in which pH of 5.5 was directly related with detoxification and fungal
development. Lupin flour was used in cultures of lupin agar, and the results showed that detoxification
levels achieved were 16.58 and 62.23% at pH 3.5 and 5.5, respectively. At pH 5.5, total alkaloid content
changed from 0.228 to 0.084 mg/cm2 of agar after 48 h. Lupanine, specifically, was degraded up to
70.82% with a reduction of 0.160 to 0.047 mg/cm2 of agar, corresponding to a degradation of 16.46%.
Here, alkaloids were possibly used to produce energy with the carbon atoms and/or to obtain nitrogen
for protein synthesis. Hydroxylation reactions are the first reactions commonly performed in
biodegradation processes of cyclic molecules, like aromatic rings, pesticides or others [223]. Hydroxyl
groups addiction increase the reactivity of stable molecules and enables the opening of the cyclic
structure until destruction. Rhizopus produces a glucoamylase enzyme that is used in food industry that
can perform the first stage of degradation reaction of lupanine [168], [224].

89
6. Conclusion
The identification of novel microorganisms capable of catabolizing lupanine is an opportunity for
the development of an alternative microbial debittering process and/or to further treat the wastewater
for re-use purposes in the industry. The need of this process development is expected to attenuate the
environmental problem associated with the alkaloid concentration in lupine beans wastewater. For this
purpose, in the present work, four bacteria, two yeasts and two filamentous fungi species were isolated
and identified for the first time, from lupin beans wastewater. Among the identified microorganisms, the
Ochrobactrum anthropi bacteria revealed to be the most promising and interesting, due to its lupanine-
catabolizing capacity and at the same time highest COD removal from the LBW, with more than 50%
removal. Further investigations on the catabolism of this bacteria should be performed, since the
catabolism in natural processes of degradation is specific of each organism. However, it is possible that
lupanine was used to produce energy with the carbon atoms and/or to obtain nitrogen for the synthesis
of proteins. In general, alkaloid degradation is performed by enzymes capable of producing changes in
molecules. Hydroxylation is the main step for lupanine degradation, and the intermediate stages may
be used as carbon and nitrogen sources for growth and energy support.
The other remaining microorganisms isolated, did not showed lupanine removal. However, most
strains were able to remove part of the COD from liquid culture medium of LBW, which is a positive and
promising result if other valuable compounds may result from this removal capacity. Moreover, once the
gene encoding lupanine hydroxylase is known and sequenced, these species can be used as basis for
genetic engineering assays, for the artificial manipulation or modification of the DNA to alter a certain
characteristic, in this case lupanine catabolizing capacity.
The results presented in this work provide important information for the design and development of
future works in the bioremediation field, with further valorisation of lupin beans wastewater.

90
7. References
[1] M. Yorgancilar, M. Babaoglu, E. E. Hakki, and E. Atalay, “Determination of the relationship
among Old World Lupin (Lupinus sp.) species using RAPD and ISSR markers,” African J.
Biotechnol., vol. 8, pp. 3524–3530, 2009.
[2] G. Boschin and D. Resta, “Alkaloids Derived from Lysine: Quinolizidine (a Focus on Lupin
Alkaloids),” in Natural Products, pp. 381–403, 2013.
[3] C. B. J. Villarino et al., “Nutritional, Health, and Technological Functionality of Lupin Flour
Addition to Bread and Other Baked Products: Benefits and Challenges Nutritional, Health, and
Technological Functionality of Lupin Flour Addition to Bread and Other Baked Products: Benefit,”
Crit. Rev. Food Sci. Nutr., vol. 8398, pp. 835-357, 2016.
[4] M. Erbas, M. Certel, and M. K. Uslu, “Some chemical properties of white lupin seeds (Lupinus
albus L.),” Food Chem., vol. 89, pp. 341–345, 2005.
[5] P. Getachew, “Chemical composition and the effects of traditional processing on nutritional
composition of gibto (Lupinus albus L.) grown in Gojam area,” MSc Thesis, Addis Ababa Univ.
Addis Ababa, Ethiop., 2009.
[6] K. F. Kettel, B. Tuck, W. Payne, C. Chen, S. Machado, and R. Karow, “Narrow-leaf lupin,” Dryl.
Copping Syst., 2003.
[7] E. Small, “Lupins–benefit and harm potentials,” Biodiversity, vol. 13, pp. 54–64, 2012.
[8] S. Wang, S. Errington, and H. H. Yap, “Studies on carotenoids from lupin seeds,” in Lupins for
Health and Wealth’ Proceedings of the 12th International Lupin Conference, vol. 1, pp. 14–18,
2008.
[9] G. Boschin and A. Arnoldi, “Legumes are valuable sources of tocopherols,” Food Chem., vol.
127, pp. 1199–1203, 2011.
[10] S. Carmali, V. D. Alves, I. M. Coelhoso, L. M. Ferreira, and A. M. Lourenc, “Recovery of lupanine
from Lupinus albus L. leaching waters,” Sep. Purif. Technol., vol. 74, pp. 38–43, 2010.
[11] M. Daverio, M. E. Cavicchiolo, P. Grotto, D. Lonati, M. Cananzi, and L. Da Dalt, “Bitter lupine
beans ingestion in a child: a disregarded cause of acute anticholinergic toxicity,” Eur. J. Pediatr.,
vol. 173, pp. 1549–1551, 2014.
[12] D. S. Petterson et al., “Disposition of lupanine and 13-hydroxylupanine in man,” Xenobiotica, vol.
24, pp. 933–941, 1994.
[13] A. N. Z. F. Authority, “Lupin alkaloids in food. A toxicological review and risk assessment,” Techn.
Rep., vol. 3, pp. 1–21, 2009.
[14] M. Muzquiz, C. Cuadrado, G. Ayet, C. de la Cuadra, C. Burbano, and A. Osagie, “Variation of
alkaloid components of lupin seeds in 49 genotypes of Lupinus albus from different countries
and locations.,” J. Agric. Food Chem., vol. 42, pp. 1447–1450, 1994.
[15] K. Pilegaard and J. Gry, “Alkaloids in edible lupin seeds: A toxicological review and
recommendations.,” Copenhagen Nord. Counc. Minist., 2009.
[16] K. M. Frick, L. G. Kamphuis, K. H. M. Siddique, K. B. Singh, and R. C. Foley, “Quinolizidine
Alkaloid Biosynthesis in Lupins and Prospects for Grain Quality Improvement,” Front. Plant Sci.,
vol. 8, p. 87, 2017.

91
[17] M. Wink, C. Meißner, and L. Witte, “Patterns of quinolizidine alkaloids in 56 species of the genus
Lupinus,” Phytochemistry, vol. 38, pp. 139–153, 1995.
[18] C. R. Priddis, “Capillary gas chromatography of lupin alkaloids,” J. Chromatogr. A, vol. 261, pp.
95–101, 1983.
[19] K. N. Adhikari, O. R. Edwards, S. Wang, T. J. Ridsdill-Smith, and B. Buirchell, “The role of
alkaloids in conferring aphid resistance in yellow lupin (Lupinus luteus L.),” Crop Pasture Sci.,
vol. 63, pp. 444–451, 2012.
[20] J. S. Gladstones, C. A. Atkins, and J. Hamblin, Lupins as crop plants: biology, production, and
utilization. Wallingford, Oxon, UK, 1998.
[21] N. Kucukboyaci, S. Ozkan, and F. Tosun, Alkaloid profile and antimicrobial activity of Lupinus
angustifolius L. alkaloid extract, vol. 6., pp 197-201, 2007.
[22] K. Saito and I. Murakoshi, “Chemistry, biochemistry and chemotaxonomy of lupine alkaloids in
the leguminosae,” in Structure and chemistry (Part C), vol. 15, B. T.-S. in N. P. C. Atta-ur-
Rahman, Ed. Elsevier, pp. 519–549, 1995.
[23] Q. Pan, N. Mustafa, K. Tang, Y. Hae Choi, and R. Verpoorte, Monoterpenoid indole alkaloids
biosynthesis and its regulation in Catharanthus roseus: a literature review from genes to
metabolites, vol. 15, pp 221-250, 2015.
[24] G. A. W. Beaudoin and P. J. Facchini, “Benzylisoquinoline alkaloid biosynthesis in opium poppy,”
Planta, vol. 240, pp. 19–32, 2014.
[25] P. M. Dewick, Medicinal natural products: a biosynthetic approach. John Wiley & Sons, 2002.
[26] K. Saito, Y. Koike, H. Suzuki, and I. Murakoshi, “Biogenetic implication of lupin alkaloid
biosynthesis in bitter and sweet forms of Lupinus luteus and L. albus,” Phytochemistry, vol. 34,
pp. 1041–1044, 1993.
[27] M. Wink and T. Hartmann, “Enzymatic synthesis of quinolizidine alkaloid esters: a tigloyl-CoA:
13-hydroxylupanine O-tigloyltransferase from Lupinus albus L.,” Planta, vol. 156, pp. 560–565,
1982.
[28] Authority, A. N. Z. F. “Lupin alkaloids in food, a toxicological review and risk assessment.,” Tech.
Rep., vol. 3, pp. 1–21, 2001 Avalaible from: http://www. foodstandards. gov. au/_src files/TR3.
pdf.
[29] C. Barbeitos, “Towards the development of a process for lupin beans detoxification wastewater
with lupanine recovery,” Master thesis Biol. Eng. Inst. Super. Técnico, 2016.
[30] F. M. C. Santana, A. M. Fialho, and J. M. A. Empis, “Isolation of bacterial strains capable of using
lupanine, the predominant quinolizidine alkaloid in white lupin, as sole carbon and energy
source,” J. Ind. Microbiol., vol. 17, pp. 110–115, 1996.
[31] D. A. Rathbone and N. C. Bruce, “Microbial transformation of alkaloids,” Curr. Opin. Microbiol.,
vol. 5, pp. 274–281, 2002.
[32] M. Wiedemann, C. M. Gurrola-díaz, B. Vargas-guerrero, M. Wink, P. M. García-lópez, and M.
Düfer, “Lupanine Improves Glucose Homeostasis by Influencing KATP Channels and Insulin
Gene Expression,” Molecules, vol. 20, pp. 19085–19100, 2015.
[33] F. Villalpando-Vargas and L. Medina-Ceja, “Sparteine as an anticonvulsant drug: Evidence and

92
possible mechanism of action,” Seizure, vol. 39, pp. 49–55, 2016.
[34] Jonas, “enantiomers. (n. d.),” Mosby’s Dict. Complement. Altern. Med.
[35] B. T. Smith, J. A. Wendt, and J. Aubé, “First Asymmetric Total Synthesis of (+)-Sparteine,” Org.
Lett., vol. 4, pp. 2577–2579, 2002.
[36] H. K. Shon, S. Phuntsho, D. S. Chaudhary, S. Vigneswaran, and J. Cho, “Nanofiltration for water
and wastewater treatment – a mini review,” Drink Water Eng. Sci., vol. 6, pp. 47–53, 2013.
[37] A. Ahsan and M. Imteaz, Nanofiltration Membrane Technology Providing Quality Drinking Water.
Elsevier Inc., 2019.
[38] J. M. Gozalvez, J. Lora, J. A. Mendoza, and M. Sancho, “Modelling of a low-pressure reverse
osmosis system with concentrate recirculation to obtain high recovery levels,” Desalination, vol.
144, pp. 341–345, 2002.
[39] W. R. Bowen and J. S. Welfoot, “Modelling the performance of membrane nanofiltration—critical
assessment and model development,” Chem. Eng. Sci., vol. 57, pp. 1121–1137, 2002.
[40] D. L. Oatley-radcli, M. Walters, T. J. Ainscough, P. M. Williams, A. Wahab, and N. Hilal,
“Nanofiltration membranes and processes: A review of research trends over the past decade,”
J. Water Process Eng., vol. 19, pp. 164–171, 2017.
[41] M. Thanuttamavong, K. Yamamoto, J. Ik Oh, K. Ho Choo, and S. June Choi, “Rejection
characteristics of organic and inorganic pollutants by ultra low-pressure nanofiltration of surface
water for drinking water treatment,” Desalination, vol. 145, pp. 257–264, 2002.
[42] J. Han, J. Fu, and R. B. Schoch, “Molecular sieving using nanofilters: past, present and future,”
Lab Chip, vol. 8, pp. 23–33, 2008.
[43] E. Drioli, C. A. Quist-Jensen, and L. Giorno, “Molecular Weight Cutoff,” in Encyclopedia of
Membranes, Springer, pp. 1–2, 2015.
[44] S. Kosvintsev, I. Cumming, R. Holdich, D. Lloyd, and V. Starov, “Sieve mechanism of
microfiltration separation,” Colloids Surfaces A Physicochem. Eng. Asp., vol. 230, pp. 167–182,
2003.
[45] X. Zhu and M. Elimelech, “Colloidal fouling of reverse osmosis membranes: measurements and
fouling mechanisms,” Environ. Sci. Technol., vol. 31, pp. 3654–3662, 1997.
[46] M. Zhang and L. Song, “Mechanisms and parameters affecting flux decline in cross-flow
microfiltration and ultrafiltration of colloids,” Environ. Sci. Technol., vol. 34, pp. 3767–3773, 2000.
[47] E. M. Vrijenhoek, S. Hong, and M. Elimelech, “Influence of membrane surface properties on
initial rate of colloidal fouling of reverse osmosis and nanofiltration membranes,” J. Memb. Sci.,
vol. 188, pp. 115–128, 2001.
[48] R. Field, “Fundamentals of fouling'', Membranes for Water Treatment, vol. 4, pp 1-23, 2010.
[49] A. W. Mohammad, Y. H. Teow, W. L. Ang, Y. T. Chung, D. L. Oatley-radcliffe, and N. Hilal,
“Nanofiltration membranes review: Recent advances and future prospects,” Desalination, vol.
356, pp. 226–254, 2015.
[50] B. Kwon, J. Cho, N. Park, and J. Pellegrino, “Organic nanocolloid fouling in UF membranes,” J.
Memb. Sci., vol. 279, pp. 209–219, 2006.
[51] K. Boussu et al., “Influence of membrane and colloid characteristics on fouling of nanofiltration

93
membranes,” J. Memb. Sci., vol. 289, pp. 220–230, 2007.
[52] K. D. Cobry, Z. Yuan, J. Gilron, V. M. Bright, W. B. Krantz, and A. R. Greenberg, “Comprehensive
experimental studies of early-stage membrane scaling during nanofiltration,” Desalination, vol.
283, pp. 40–51, 2011.
[53] H. Ivnitsky et al., “Characterization of membrane biofouling in nanofiltration processes of
wastewater treatment,” Desalination, vol. 185, pp. 255–268, 2005.
[54] P. A. Hogan, R. P. Canning, P. A. Peterson, R. A. Johnson, and A. S. Michaels, “A new option:
osmotic distillation,” Chem. Eng. Prog., vol. 94, pp. 49–61, 1998.
[55] A. Gabelman and S.-T. Hwang, “Hollow fiber membrane contactors,” J. Memb. Sci., vol. 159, pp.
61–106, 1999.
[56] A. T. A. P. Mota, “Membrane/adsorption hybrid processes for water purification and lupanine
isolation from lupin beans debittering wastewater,” Master thesis Bioeng. Nanosyst. Inst. Super.
Técnico, 2017.
[57] E. S. P. B. V, A. Chakrabarti, and M. M. Sharma, “Cationic ion exchange resins as catalyst,”
State-of-the-Art Rep., vol. 20, pp. 1–45, 1993.
[58] V. Anand, R. Kandarapu, and S. Garg, “Ion-exchange resins: carrying drug delivery forward,”
DDT, vol. 6, pp. 905–914, 2001.
[59] S. A. Cavaco, S. Fernandes, M. M. Quina, and L. M. Ferreira, “Removal of chromium from
electroplating industry effluents by ion exchange resins,” J. Hazard. Mater., vol. 144, pp. 634–
638, 2007.
[60] S. Raghu and C. Ahmed Basha, “Chemical or electrochemical techniques, followed by ion
exchange, for recycle of textile dye wastewater,” J. Hazard. Mater., vol. 149, pp. 324–330, 2007.
[61] P. Gogoi, “Adsorption of catechin from aqueous solutions on polymeric resins and activated
carbon,” Indian J. Chem. Technol., vol. 17, pp. 337–345, 2010.
[62] Z. Berk, “Chapter 11 - Extraction,” in Food Science and Technology, Z. B. T.-F. P. E. and T.
(Second E. Berk, Ed. San Diego: Academic Press, pp. 287–309, 2013.
[63] P. R. Kiezyk and D. Mackay, “Waste water treatment by solvent extraction,” Can. J. Chem. Eng.,
vol. 49, pp. 747–752,1971.
[64] K. Haupt, “Peer reviewed: molecularly imprinted Polymers: the next generation,” Anal. Chem.,
vol. 75, pp. 377–383, 2003.
[65] T. Aniszewski, Alkaloids: chemistry, biology, ecology, and applications. Elsevier, 2015.
[66] J. E. M. Harrison and W. Williams, “Genetical control of alkaloids in Lupinus albus,” Euphytica,
vol. 31, pp. 357–364, 1982.
[67] S. Baerheim and R. Verpoorte, “Chapter 3 TLC Separation and Identification of Alkaloids in
General,” in Chromatography of alkaloids, vol. 23, A. B. Svendsen and R. B. T.-J. of C. L.
Verpoorte, Eds. Elsevier, pp. 19–49, 1983.
[68] P. R. Griffiths and J. A. Haseth de, Fourier Transform Infrared Spectrometry, John Wiley &
Sons, 2007.
[69] Y. Chen, C. Zou, M. Mastalerz, S. Hu, and C. Gasaway, “Applications of Micro-Fourier Transform
Infrared Spectroscopy (FTIR) in the Geological Sciences — A Review,” Int. J. Mol. Sci., pp.

94
30223–30250, 2015.
[70] E. Korir, J. J. Kiplimo, N. R. Crouch, N. Moodley, and N. A. Koorbanally, “Quinolizidine Alkaloids
from Sophora velutina subsp. zimbabweensis (Fabaceae: Sophoreae),” Nat. Prod. Commun.,
vol. 7, p. 1934578-1200700810, 2012.
[71] T. Aniszewski, “From iodine to enzyme: A critical review of chemical and biological methods of
lupine alkaloids analysis,” Sci Legum, vol. 1, pp. 25–36, 1994.
[72] K. M. Frick, L. G. Kamphuis, K. H. M. Siddique, K. B. Singh, and R. C. Foley, “Quinolizidine
Alkaloid Biosynthesis in Lupins and Prospects for Grain Quality Improvement,” Front. Plant Sci.,
vol. 8, pp. 1–12, 2017.
[73] G. W. Ewing, “Instrumental Methods of Chemical Analysis,” Tokyo: McGraw-Hill Kogakusha,
1975.
[74] D. Resta, G. Boschin, A. D’Agostina, and A. Arnoldi, “Evaluation of total quinolizidine alkaloids
content in lupin flours, lupin-based ingredients, and foods,” Mol. Nutr. Food Res., vol. 52, pp.
490–495, 2008.
[75] G. Boschin, P. Annicchiarico, D. Resta, A. D’Agostina, and A. Arnoldi, “Quinolizidine Alkaloids in
Seeds of Lupin Genotypes of Different Origins,” J. Agric. Food Chem., vol. 56, pp. 3657–3663,
2008.
[76] M. Ganzera, A. Krüger, and M. Wink, “Determination of quinolizidine alkaloids in different Lupinus
species by NACE using UV and MS detection,” J. Pharm. Biomed. Anal., vol. 53, pp. 1231–1235,
2010.
[77] A. Brossi, The alkaloids: Chemistry and pharmacology, vol. 25. Academic Press, 1985.
[78] K. C. Nicolaou and T. Montagnon, “Molecules that Changed the World,” Wiley, vol. 6, p. 366,
2008.
[79] B. Boonstra, D. A. Rathbone, and N. C. Bruce, “Engineering novel biocatalytic routes for
production of semisynthetic opiate drugs,” Biomol. Eng., vol. 18, pp. 41–47, 2001.
[80] Plautus, “CHAPTER 4 - Applications,” T. B. T.-A.-S. of L. Aniszewski, Ed. Amsterdam: Elsevier,
pp. 181–204, 2007.
[81] S. Ritter K., “Where has all the sparteine gone?,” Chem. Eng. News, vol. 95, pp. 18–20, 2017.
[82] G. R. Clemo, R. Raper, and C. R. S. Tenniswood, “LVIII.—The lupin alkaloids. Part III,” J. Chem.
Soc., pp. 429–437, 1931.
[83] A. K. Przybył and M. Kubicki, “Simple and highly efficient preparation and characterization of (−)-
lupanine and (+)-sparteine,” Tetrahedron, vol. 67, pp. 7787–7793, 2011.
[84] N. Maulide, B. Peng, C. A. M. Afonso, and R. F. M. Frade, “Process for converting Lupanine into
Sparteine,” Patent, 2017.
[85] G. Kahnt and L. A. Hijazi, “Effect of bitter lupin extract on growth and yield of different crops,” J.
Agron. Crop Sci., vol. 159, pp. 320–328, 1987.
[86] K. Yovo, F. Huguet, J. Pothier, M. Durand, M. Breteau, and G. Narcisse, “Comparative
pharmacological study of sparteine and its ketonic derivative lupanine from seeds of Lupinus
albus,” Planta Med., vol. 50, pp. 420–424, 1984.
[87] S. Parmaki et al., “Bioconversion of alkaloids to high-value chemicals: Comparative analysis of
95
newly isolated lupanine degrading strains,” Chemosphere, vol. 193, pp. 50–59, 2018.
[88] F. M. C. Santana, T. Pinto, A. M. Fialho, I. Sá-Correia, and J. M. A. Empis, “Bacterial Removal
of Quinolizidine Alkaloids and Other Carbon Sources from a Lupinus albus Aqueous Extract,” J.
Agric. Food Chem., vol. 50, pp. 2318–2323, 2002.
[89] F. Molinari, F. Aragozzini, J. M. S. Cabral, D. M. F. Prazeres, and S. Microbiologia, “Continuous
production of isovaleraldehyde through extractive bioconversion in a hollow-fiber membrane
bioreactor,” Enzyme Microb. Technol., vol. 0229, pp. 604–611, 1997.
[90] J. M. Cabral, “Extractive removal of product by biocatalysis.,” Bioprocess Technol., vol. 11, p.
207, 1991.
[91] H. M. Van Sonsbeek, H. H. Beeftink, and J. Tramper, “Two-liquid-phase bioreactors,” Enzyme
Microb. Technol., vol. 15, pp. 722–729, 1993.
[92] S. L. Matson and J. A. Quinn, “Membrane Reactors in Bioprocessing,” Ann. N. Y. Acad. Sci., vol.
469, pp. 152–165, 1986.
[93] J. J. Malinowski, “Two-phase partitioning bioreactors in fermentation technology,” Biotechnol.
Adv., vol. 19, pp. 525–538, 2001.
[94] S. Xudong, S. Yue, Y. Huimin, and S. Zhongyao, “Bioconversion of acrylnitrile to acrylamide
using hollow-fiber membrane bioreactor system,” Biochem. Eng. J. 18, vol. 18, pp. 239–243,
2004.
[95] P. Fernandes, “Microlitre/millilitre shaken bioreactors in fermentative and biotransformation
processes – a review,” Biocatal. Biotransformation, vol. 24, pp. 237–252, 2009.
[96] S. Kumar, C. Wittmann, and E. Heinzle, “Minibioreactors,” Biotechnol. Lett., vol. 26, pp. 1–10,
2004.
[97] L. Vernès, Y. Li, F. Chemat, and M. Abert-vian, Biorefinery Concept as a Key for Sustainable
Future to Green Chemistry — The Case of Microalgae. Springer Singapore, 2019.
[98] A. F. Ferreira, “Biorefinery Concept,” in Biorefineries, pp. 1–20, 2017.
[99] M. S. Celiktas and F. M. Alptekin, “Biorefinery concept: Current status and future prospects,” Int.
Conf. Eng. Technol., vol. 20, pp 1727-1737, 2006.
[100] L. R. Lynd, C. Wyman, M. Laser, D. Johnson, and R. Landucci, “Strategic Biorefinery Analysis:
Review of Existing Biorefinery Examples; 24 January 2002--1 July 2002,” National Renewable
Energy Lab.(NREL), Golden, CO (United States), 2005.
[101] M. Janssen, “Market potential of biorefinery products,” pp 26-35, 2012.
[102] K. Balina, F. Romagnoli, and D. Blumberga, “Seaweed biorefinery concept for sustainable use
of marine resources,” Energy Procedia, vol. 128, pp. 504–511, 2017.
[103] H. Lyko, G. Deerberg, and E. Weidner, “Coupled production in biorefineries—combined use of
biomass as a source of energy, fuels and materials,” J. Biotechnol., vol. 142, pp. 78–86, 2009.
[104] J. Moncada, M. M. El-Halwagi, and C. A. Cardona, “Techno-economic analysis for a sugarcane
biorefinery: Colombian case,” Bioresour. Technol., vol. 135, pp. 533–543, 2013.
[105] K. Loffler, N. Gillman, R. W. Leen, T. Van Schafer, and A. Faaij, “The future of industrial
bioferineries,” vol. 40, 2010.
[106] J. F. Peters, F. Petrakopoulou, and J. Dufour, “Exergy analysis of synthetic biofuel production

96
via fast pyrolysis and hydroupgrading,” Energy, vol. 79, pp. 325–336, 2015.
[107] R. Van Ree and A. Van Zeeland, “No Title,” IEA Bioenergy Task 42, pp. 1–66, 2014.
[108] H. W. Seeley, P. J. VanDemark, and J. J. Lee, “Microbes in Action,” in Freeman & Company.
New york: chapter 8 & 9 DIFCO, pp. 4–16, 1991.
[109] C. S. Miller, K. M. Handley, K. C. Wrighton, K. R. Frischkorn, B. C. Thomas, and J. F. Banfield,
“Short-Read Assembly of Full-Length 16S Amplicons Reveals Bacterial Diversity in Subsurface
Sediments,” PLoS One, vol. 8, pp. 1–11, 2013.
[110] EzBioCloud, “16S rRNA and 16S rRNA Gene,” February, 2019. Acessed online at October 2019.
[111] B. Project, “16S rDNA Sequencing to Identify unknown microorganisms,”
http://biotech.bio5.org/sites/default/files/pdf/16s%20rDNA%20SeqAnal.pdf Acessed 3rd
October 2019. .
[112] B. W. Jarvis, B. L. Wickes, and L. M. Hoffman, “Direct Genomic DNA Sequencing of the D1/D2
Region of 26S rDNA of Basidiomycota and Ascomycota: No DNA Amplification Necessary for
Cultured Samples,” Tebu-Bio. Com, vol. 8474, 2014.
[113] P. C. Iwen, S. H. Hinrichs, and M. E. Rupp, “Utilization of the internal transcribed spacer regions
as molecular targets to detect and identify human fungal pathogens,” Med. Mycol., vol. 40, pp.
87–109, 2002.
[114] D. H. Pincus, S. Orenga, and S. Chatellier, “Yeast identification—past, present, and future
methods,” Med. Mycol., vol. 45, pp. 97–121, 2007.
[115] Beauchamp, “Infrared Tables (short summary of common absorption frequencies),”
Spectroscopy Tables. .
[116] R. R. Himebaugh and M. J. Smith, “Semi-micro tube method for chemical oxygen demand,” Anal.
Chem., vol. 51, pp. 1085–1087, 1979.
[117] M. Garriga, M. Almaraz, and A. Marchiaro, “Determination of reducing sugars in extracts of
Undaria pinnatifida (harvey) algae by UV-visible spectrophotometry (DNS method),” Actas Ing.,
vol. 3, pp. 173–179, 2017.
[118] T. Gregersen, “Rapid method for distinction of gram-negative from gram-positive bacteria,” Eur.
J. Appl. Microbiol. Biotechnol., vol. 5, pp. 123–127, 1978.
[119] T. J. Beveridge, “Structures of Gram-Negative Cell Walls and Their Derived Membrane Vesicles,”
J. Bacteriol., vol. 181, pp. 4725 LP – 4733, Aug. 1999.
[120] M. Approach, R. J. Madhuri, and M. Saraswathi, Recent Approaches in the Production of Novel
Enzymes From Environmental Samples by Enrichment Culture and. Elsevier Inc., 2019.
[121] M. P. Starr, H. Stolp, H. G. Trüper, A. Balows, and H. G. Schlegel, The prokaryotes: a handbook
on habitats, isolation and identification of bacteria. Springer Science & Business Media, 2013.
[122] B. Holmes, M. Popoff, M. Kiredjian, and K. Kersters, “Ochrobactrum anthropi gen . nov ., sp. nov.
from Human Clinical Specimens and Previously Known as Group Vd,” Int. J. Syst. Bacteriol., vol.
38, pp. 406–416, 1988.
[123] W. V. Kern, M. Oethinger, A. Kaufhold, E. Rozdzinski, and R. Marre, “Ochrobactrum anthropi
Bacteremia: Report of Four Cases and Short Review,” Infection, vol. 21, pp. 32–36, 1993.
[124] S. Ramasamy et al., “Characterization and optimization of EPS- producing and diesel oil-

97
degrading Ochrobactrum anthropi MP3 isolated from refinary wastewater,” Pet. Sci., vol. 11, pp.
439–445, 2014.
[125] A. P. Mariano, D. M. Bonotto, D. de F. de Angelis, M. P. S. Pirôllo, and J. Contiero,
“Biodegradability of commercial and weathered diesel oils,” Brazilian J. Microbiol., vol. 39, pp.
133–142, 2008.
[126] N. Yang, R. Zhang, Z. Xiang, J. Guo, and L. Zhang, “Study the optimal condition of fenpropathrin
degradation by Ochrobactrum anthropi based on bacteria microscopic image detection method,”
Adv. J. Food Sci. Technol., vol. 5, pp. 688–694, 2013.
[127] D. Ghosal, J. Chakraborty, P. Khara, and T. K. Dutta, “Degradation of phenanthrene via meta-
cleavage of 2-hydroxy-1-naphthoic acid by Ochrobactrum sp. strain PWTJD,” FEMS Microbiol.
Lett., vol. 313, pp. 103–110, 2010.
[128] C. Gazolla Volpiano, F. Hayashi Sant'Anna, A. Ambrosini, B. Brito Lisboa, L. Kayser
Vargas, and L. M. P. Passaglia, “Reclassification of Ochrobactrum lupini as a later heterotypic
synonym of Ochrobactrum anthropi based on whole-genome sequence analysis,” Int. J. Syst.
Evol. Microbiol., vol. 69, pp. 2312–2314, 2019.
[129] A. Y. Pei et al., “Diversity of 16S rRNA genes within individual prokaryotic genomes,” Appl.
Environ. Microbiol., vol. 76, pp. 3886–3897, 2010.
[130] D. A. Walsh, E. Bapteste, M. Kamekura, and W. F. Doolittle, “Evolution of the RNA polymerase
B′ subunit gene (rpoB′) in Halobacteriales: a complementary molecular marker to the SSU rRNA
gene,” Mol. Biol. Evol., vol. 21, pp. 2340–2351, 2004.
[131] R. J. Case, Y. Boucher, I. Dahllo, C. Holmstro, W. F. Doolittle, and S. Kjelleberg, “Use of 16S
rRNA and rpoB Genes as Molecular Markers for Microbial Ecology Studies ᰔ,” Appl. Environ.
Microbiol., vol. 73, pp. 278–288, 2007.
[132] J. P. Gogarten, “Which is the most conserved group of proteins? Homology-orthology, paralogy,
xenology, and the fusion of independent lineages,” J. Mol. Evol., vol. 39, pp. 541–543, 1994.
[133] M. E. Trujillo, A. Willems, A. Abril, D. Luden, P. F. Mateos, and E. Martı, “Nodulation of Lupinus
albus by Strains of Ochrobactrum lupini sp . nov .,” Appl. Environ. Microbiol., vol. 71, pp. 1318–
1327, 2005.
[134] C. G. Volpiano et al., “Reclassification of Ochrobactrum lupini as a later heterotypic synonym of
Ochrobactrum anthropi based on whole-genome sequence analysis,” Int. J. Syst. Evol.
Microbiol., vol. 69, pp. 9–10, 2019.
[135] E. Yabuuchi, T. Kaneko, I. Yano, C. W. Moss, and N. Miyoshi, “Sphingobacterium gen. nov.,
Sphingobacterium spiritivorum comb. nov., Sphingobacterium multivorum comb. nov.,
Sphingobacterium mizutae sp. nov., and Flavobacterium indologenes sp. nov.: glucose-
nonfermenting gram-negative rods in CDC groups IIK-2 and IIb,” Int. J. Syst. Evol. Microbiol.,
vol. 33, pp. 580–598, 1983.
[136] J. P. Steinberg, “Other gram-negative and gram-variable bacilli,” Mand. Douglas, Bennett’s Princ.
Pract. Infect. Dis., vol. 3023, 2009.
[137] Http://www.bacterio.net/, “acessed September 17, 2019.” .
[138] P. C. Schreckenberger, M. I. Daneshvar, and R. S. Weyant, “Acinetobacter, achromobacter,

98
chryseobacterium, moraxella, and other nonfermentative gram-negative rods, manual of clinical
microbiology.” 8thed. Washinston, DC: American Society for Microbiology, 2003.
[139] P. Kämpfer, S. Engelhart, M. Rolke, and J. Sennekamp, “Extrinsic allergic alveolitis
(hypersensitivity pneumonitis) caused by Sphingobacterium spiritivorum from the water reservoir
of a steam iron,” J. Clin. Microbiol., vol. 43, pp. 4908–4910, 2005.
[140] S. Jiang et al., “Sphingobacterium arenae sp . nov ., isolated from sandy soil,” Int. J. Syst. Evol.
Microbiol., vol. 64, pp. 248–253, 2014.
[141] R. Liu et al., “Sphingobacterium siyangense sp. nov., isolated from farm soil,” vol. 58, pp. 1458–
1462, 2008.
[142] D. Nemoto, S. Hitomi, and Y. Moriyama, “Cellulitis Complicated with Bacteremia Due to
Sphingobacterium Species: A Report of Two Cases and a Literature Review,” Japanese Soc.
Intern. Med., pp. 1–4, 2019.
[143] A. M. Marque, F. Jose, A. Ortiz, M. Farfa, and A. Teruel, “Sphingobacterium detergens sp . nov
., a surfactant- producing bacterium isolated from soil,” pp. 3036–3041, 2012.
[144] C. Burgos-díaz et al., “Isolation and partial characterization of a biosurfactant mixture produced
by Sphingobacterium sp. isolated from soil,” J. Colloid Interface Sci., vol. 361, pp. 195–204,
2011.
[145] M. Denton and K. G. Kerr, “Microbiological and clinical aspects of infection associated with
Stenotrophomonas maltophilia,” Clin. Microbiol. Rev., vol. 11, pp. 57–80, 1998.
[146] P. H. Gilligan, “Burkholderia, Stenotrophomonas. Rastonia, Brevundimonas, Comamonas,
Delftia, Pandoraea, and Acidovorax,” Man. Clin. Microbiol., 2003.
[147] J. S. Brooke, “Stenotrophomonas maltophilia: an Emerging Global Opportunistic Pathogen,”
Clin. Microbiol. Rev. p., pp. 2–41, 2012.
[148] G. Berg, L. Eberl, and A. Hartmann, “The rhizosphere as a reservoir for opportunistic human
pathogenic bacteria,” Environ. Microbiol., vol. 7, pp. 1673–1685, 2005.
[149] V. Ivanov, V. Stabnikov, W. Q. Zhuang, J. H. Tay, and S. T. L. Tay, “Phosphate removal from
the returned liquor of municipal wastewater treatment plant using iron‐reducing bacteria,” J. Appl.
Microbiol., vol. 98, pp. 1152–1161, 2005.
[150] S. Jägevall, L. Rabe, and K. Pedersen, “Abundance and diversity of biofilms in natural and
artificial aquifers of the Äspö Hard Rock Laboratory, Sweden,” Microb. Ecol., vol. 61, pp. 410–
422, 2011.
[151] M. Denton, N. J. Todd, K. G. Kerr, P. M. Hawkey, and J. M. Littlewood, “Molecular epidemiology
of Stenotrophomonas maltophilia isolated from clinical specimens from patients with cystic
fibrosis and associated environmental samples,” J. Clin. Microbiol., vol. 36, pp. 1953–1958,
1998.
[152] M. Arvanitidou, A. Vayona, N. Spanakis, and A. Tsakris, “Occurrence and antimicrobial
resistance of Gram‐negative bacteria isolated in haemodialysis water and dialysate of renal units:
results of a Greek multicentre study,” J. Appl. Microbiol., vol. 95, pp. 180–185, 2003.
[153] B. Lambert and H. Joos, “Fundamental aspects of rhizobacterial plant growth promotion
research,” Trends Biotechnol., vol. 7, pp. 215–219, 1989.
99
[154] H. Heuer and K. Smalla, “Bacterial phyllosphere communities of Solanum tuberosum L. and T4-
lysozyme-producing transgenic variants,” FEMS Microbiol. Ecol., vol. 28, pp. 357–371, 1999.
[155] M. J. O’Donnell, C. M. Tuttlebee, F. R. Falkiner, and D. C. Coleman, “Bacterial contamination of
dental chair units in a modern dental hospital caused by leakage from suction system hoses
containing extensive biofilm,” J. Hosp. Infect., vol. 59, pp. 348–360, 2005.
[156] G. Metan, M. Hayran, G. Hascelik, and O. Uzun, “Which patient is a candidate for empirical
therapy against Stenotrophomonas maltophilia bacteraemia? An analysis of associated risk
factors in a tertiary care hospital,” Scand. J. Infect. Dis., vol. 38, pp. 527–531, 2006.
[157] A. Ghosh and P. Das, “Journal of Environmental Chemical Engineering Optimization of copper
bioremediation by Stenotrophomonas maltophilia PD2,” Biochem. Pharmacol., vol. 1, pp. 159–
163, 2013.
[158] I. A. L. M. A. Qazi, A. H. P. A. Haleem, and S. A. N. A. Kanhar, “Stenotrophomonas maltophilia
strain 5DMD : an efficient biosurfactant ‐ producing bacterium for biodegradation of diesel oil and
used engine oil,” Int. J. Environ. Sci. Technol., 2018.
[159] R. Sharma, Y. Chisti, and U. C. Banerjee, “Production, purification, characterization, and
applications of lipases,” Biotechnol. Adv., vol. 19, pp. 627–662, 2001.
[160] O. Prauser and M. P. Lechevalier, “Description of a New Species, Oerskovia xanthineolytica,
and Emendation of Oerskovia,” Int. J. Syst. Bacteriol., vol. 22, pp. 260–264, 1972.
[161] H. Petkar, A. Li, N. Bunce, K. Duffy, H. Malnick, and J. J. Shah, “Cellulosimicrobium funkei: First
Report of Infection in a Nonimmunocompromised Patient and Useful Phenotypic Tests for
Differentiation from Cellulosimicrobium cellulans and Cellulosimicrobium terreum,” J. Clin.
Microbiol., vol. 49, pp. 1175–1178, 2011.
[162] C. Karthik, V. S. Ramkumar, A. Pugazhendhi, K. Gopalakrishnan, and P. I. Arulselvi, “Biosorption
and biotransformation of Cr (VI) by novel Cellulosimicrobium funkei strain AR6,” J. Taiwan Inst.
Chem. Eng., vol. 70, pp. 282–290, 2017.
[163] L. Sun, N. Zhang, R. Sun, C. Gu, C. S. Krumm, and D. Qi, “A novel strain of Cellulosimicrobium
funkei can biologically detoxify aflatoxin B 1 in ducklings,” 2015.
[164] F. Wu and H. Guclu, “Aflatoxin regulations in a network of global maize trade,” PLoS One, vol.
7, p. e45151, 2012.
[165] L. E. Gravely, V. L. Geiss, and C. F. Gregory, “Process for reduction of nitrate and nicotine
content of tobacco by microbial treatment.” Google Patents, 1985.
[166] Y. J. Yuan, Z. X. Ã. Lu, N. Wu, L. J. Huang, F. X. Lu, and X. M. Bie, “Isolation and preliminary
characterization of a novel nicotine-degrading bacterium , Ochrobactrum intermedium DN2,” Int.
Biodeterior. Biodegradation, vol. 56, pp. 45–50, 2005.
[167] W. Freudenberg, K. König, and J. R. Andreesen, “Nicotine dehydrogenase from Arthrobacter
oxidans: a molybdenum-containing hydroxylase,” FEMS Microbiol. Lett., vol. 52, pp. 13–17,
1988.
[168] M. Toczko, W. Brzeski, and A. Kakolewska-Baniuk, “Microbial degradation of lupanine. V.
Identification of 17-hydroxylupanine,” Bull Acad Pol Sci Cl II, vol. 11, pp. 161–164, 1963.
[169] J. Rogoziński, “Molecular properties of the inducible lupanine hydroxylase from growing cultures

100
of Pseudomonas lupanini,” Acta Biochim. Pol., vol. 22, p. 57—66, 1975.
[170] D. J. Hopper, J. Rogozinskit, and M. Toczkot, “Lupanine hydroxylase, a quinocytochrome c from
an alkaloid-degrading Pseudomonas sp.,” Biochem. J., vol. 279, pp. 105–109, 1991.
[171] D. J. Hopper, M. A. Kaderbhai, S. A. Marriott, M. Young, and J. Rogozinski, “Cloning, sequencing
and heterologous expression of the gene for lupanine hydroxylase, a quinocytochrome c from a
Pseudomonas sp.,” vol. 489, pp. 483–489, 2002.
[172] M. R. Seyedsayamdost, “Toward a global picture of bacterial secondary metabolism,” J. Ind.
Microbiol. Biotechnol., 2019.
[173] M. Heinemann and U. Sauer, “Systems biology of microbial metabolism,” Curr. Opin. Microbiol.,
vol. 13, pp. 337–343, 2010.
[174] M. L. Reaves and J. D. Rabinowitz, “Metabolomics in systems microbiology,” Curr. Opin.
Biotechnol., vol. 22, pp. 17–25, 2011.
[175] K. Gokulan, U. S. Food, and S. Khare, “Metabolic Pathways : Production of Secondary
Metabolites of Bacteria,” Encycl. Food Microbiol., pp. 561–569, 2014.
[176] C. Karthik, M. Oves, and R. Thangabalu, “Cellulosimicrobium funkei -like enhances the growth
of Phaseolus vulgaris by modulating oxidative damage under Chromium (VI) toxicity,” J. Adv.
Res., vol. 7, pp. 839–850, 2016.
[177] J. Yoon, Y. Park, F. Kawai, H. Kim, D. Lee, and K. Kang, “Identification of Stenotrophomonas
maltophilia LK-24 and its Degradability of Crystal Violet,” J. Microbiol. Biotechnol., vol. 12, pp.
437–443, 2002.
[178] R. Sánchez-clemente, M. I. Igeño, A. G. Población, M. I. Guijo, F. Merchán, and R. Blasco,
“Study of pH Changes in Media during Bacterial Growth of Several Environmental Strains †,”
Proceedings, pp. 1–5, 2018.
[179] C. Ratzke and J. Gore, “Modifying and reacting to the environmental pH drives bacterial
interactions,” bioRxiv, 2017.
[180] A. Chango, C. Villaume, H. M. Bau, J. P. Nicolas, and L. Méjean, “Fractionation by thermal
coagulation of lupin proteins: physicochemical characteristics,” Food Res. Int., vol. 28, pp. 91–
99, 1995.
[181] G. D. Hill, The composition and nutritive value of lupin seed. Lincoln College, 1977.
[182] S. Henry Ayers and P. Rupp, “Simultaneous Acid and Alkaline Bacterial Fermentations from
Dextrose and the Salts of Organic Acids Respectively,” J. Infect. Dis., vol. 23, pp. 188–216, 2019.
[183] J. M. Brown, A. G. Steigerwalt, R. E. Morey, M. I. Daneshvar, L. Romero, and M. M. Mcneil,
“Characterization of clinical isolates previously identified as Oerskovia turbata: proposal of
Cellulosimicrobium funkei sp. nov. and emended description of the genus Cellulosimicrobium,”
Int. J. Syst. Evol. Microbiol., vol. 56, pp. 801–804, 2006.
[184] C. Fritsch, R. F. Vogel, and S. Toelstede, “Fermentation performance of lactic acid bacteria in
different lupin substrates — influence and degradation ability of antinutritives and secondary
plant metabolites,” J. Appl. Microbiol., vol. 119, pp. 1075–1088, 2015.
[185] J. Boidin, M. C. Pignal, and M. Besson, “Le genre Pichia sensu lato (quatrieme contribution),”
Bull. Soc. Mycol. Fr, vol. 81, pp. 566–606, 1965.

101
[186] N. D. Dandi, B. N. Dandi, and A. B. Chaudhari, “Bioprospecting of thermo-and osmo-tolerant
fungi from mango pulp–peel compost for bioethanol production,” Antonie Van Leeuwenhoek, vol.
103, pp. 723–736, 2013.
[187] G. F. Chan, H. M. Gan, H. L. Ling, and N. A. A. Rashid, “Genome sequence of Pichia kudriavzevii
M12, a potential producer of bioethanol and phytase.” Am Soc Microbiol, 2012.
[188] Y.-J. Kwon, A.-Z. Ma, Q. Li, F. Wang, G.-Q. Zhuang, and C.-Z. Liu, “Effect of lignocellulosic
inhibitory compounds on growth and ethanol fermentation of newly-isolated thermotolerant
Issatchenkiaorientalis,” Bioresour. Technol., vol. 102, pp. 8099–8104, 2011.
[189] T. R. Osorio-Cadavid E, Chaves-L Lopez C, “Detection and identification of wild yeasts in
Champus, a fermented Colombian maize beverage,” Food Microbiol., vol. 25, pp. 771–7, 2008.
[190] S. S. Dhaliwal, H. S. Oberoi, S. K. Sandhu, D. Nanda, D. Kumar, and S. K. Uppal, “Enhanced
ethanol production from sugarcane juice by galactose adaptation of a newly isolated
thermotolerant strain of Pichiakudriavzevii,” Bioresour. Technol., vol. 102, pp. 5968–5975, 2011.
[191] K. Saito, “No Title,” Japanese J. Bot., vol. 1, 1922.
[192] C. P. Kurtzman, J. W. Fell, and T. Boekhout, “Chapter 155 - Rhodotorula,” in The Yeasts (Fifth
Edition), Fifth Edit., C. P. Kurtzman, J. W. Fell, and T. Boekhout, Eds. London: Elsevier, 2011,
pp. 1873–1927.
[193] G. S. de Hoog, J. Guarro, J. Gené, and M. J. Figueras, Atlas of clinical fungi., no. Ed. 2.
Centraalbureau voor Schimmelcultures (CBS), 2000.
[194] T. Nagahama, M. Hamamoto, T. Nakase, and K. Horikoshi, “Rhodotorula lamellibrachii sp. nov.,
a new yeast species from a tubeworm collected at the deep-sea floor in Sagami Bay and its
phylogenetic analysis,” Antonie Van Leeuwenhoek, vol. 80, pp. 317–323, 2001.
[195] G. Samonis, M. Anatoliotaki, H. Apostolakou, S. Maraki, D. Mavroudis, and V. Georgoulias,
“Transient fungemia due to Rhodotorula rubra in a cancer patient: case report and review of the
literature,” Infection, vol. 29, pp. 173–176, 2001.
[196] S. Tsiodras et al., “Rhodotorula mucilaginosa associacted meningitis: A subacute entity with high
mortality. Case report and review,” Med. Mycol. Case Rep., vol. 6, pp. 46–50, 2014.
[197] V. P. Baradkar and S. Kumar, “Meningitis caused by Rhodotorula mucilaginosa in human
immunodeficiency virus seropositive patient,” Ann. Indian Acad. Neurol., vol. 11, p. 245, 2008.
[198] C. Kurtzman, J. W. Fell, and T. Boekhout, The yeasts: a taxonomic study. Elsevier, 2011.
[199] G. M. Walker and G. G. Stewart, “Saccharomyces cerevisiae in the Production of Fermented
Beverages,” Beverages, pp. 1–12, 2016.
[200] R. Jarboui, H. Baati, F. Fetoui, A. Gargouri, and N. Gharsallah, “Yeast performance in
wastewater treatment: case study of Rhodotorula mucilaginosa,” Environ. Technol., vol. 3330,
2012.
[201] Y. Li, J. Li, C. Wang, and P. Wang, “Growth kinetics and phenol biodegradation of psychrotrophic
Pseudomonas putida LY1,” Bioresour. Technol., vol. 101, pp. 6740–6744, 2010.
[202] J. J. Welthagen and B. C. Viljoen, “The isolation and identification of yeasts obtained during the
manufacture and ripening of Cheddar cheese,” Food Microbiol., vol. 16, pp. 63–73, 1999.
[203] K. Shailubhai, N. N. Rao, and V. V Modi, “Degradation of petroleum industry oil sludge by

102
Rhodotorula rubra and Pseudomonas aeruginosa,” Oil Petrochemical Pollut., vol. 2, pp. 133–
136, 1985.
[204] L. Jamai and M. Ettayebi, “Production of Bioethanol during the Bioremediation of Olive Mill
Wastewater at High Temperatures,” in 3rd International Renewable and Sustainable Energy
Conference (IRSEC), vol. 7, 2015.
[205] M. Koutinas, M. Patsalou, S. Stavrinou, and I. Vyrides, “High temperature alcoholic fermentation
of orange peel by the newly isolated thermotolerant Pichia kudriavzevii,” Appl. Microbiol., vol. 62,
pp. 75–83, 2015.
[206] G. F. Chan, M. Gan, L. Ling, N. Aini, and A. Rashid, “Genome Sequence of Pichia kudriavzevii
M12 , a Potential Producer of Bioethanol and Phytase,” Eukaryot. Cell, vol. 11, pp. 1300–1301,
2012.
[207] T. Schnierda, F. F. Bauer, B. Divol, E. Van Rensburg, and J. F. Görgens, “Optimization of carbon
and nitrogen medium components for biomass production using non‐S accharomyces wine
yeasts,” Lett. Appl. Microbiol., vol. 58, pp. 478–485, 2014.
[208] J. Haines, “Aspergillus in compost: Straw man or fatal law?,” BioCycle (USA), 1995.
[209] V. T. Andriole, “Infections with Aspergillus Species,” Clin. Infect. Dis., vol. 17, pp. S481–S486,
1993.
[210] J. C. Rhodes, “Aspergillus fumigatus: Growth and virulence,” Med. Mycol., pp. 77–81, 2006.
[211] I. M. Association, “Aspergillus fumigatus,” 2016.
[212] X. Jin, G. Liu, and Z. Xu, “Decolorization of a dye industry effluent by Aspergillus fumigatus XC6,”
pp. 239–243, 2007.
[213] J. Swamy and J. A. Ramsay, “The evaluation of white rot fungi in the decoloration of textile dyes,”
Enzyme Microb. Technol., vol. 24, pp. 130–137, 1999.
[214] A. G--, S. Ohmomo, Y. Kaneko, S. Sirianuntapiboon, P. Somchai, and P. Atthasampunna,
“Decolorization of Molasses Waste Water by a Thermophilic at various levels , especially strains
of than Aspergillus) and,” Agric. Biol. Chem., vol. 51, pp. 3339–3346, 1987.
[215] A. Osimani, C. Garofalo, L. Aquilanti, V. Milanović, and F. Clementi, “Unpasteurised commercial
boza as a source of microbial diversity,” Int. J. Food Microbiol., vol. 194, pp. 62–70, 2015.
[216] A. S. Polonorum, A. Grygier, and K. Myszka, “Galactomyces geotrichum - Moulds from dairy
products with high biotechnological potential,” Acta Sci. Pol. Technol. Aliment., 2017.
[217] L. Chen, Y. Ma, J.-L. Maubois, L.-J. Chen, Q.-H. Liu, and J.-P. Guo, “Identifcation of yeasts from
raw milk and selection for some specific antioxidant properties,” Int. J. Dairy Technol., vol. 63,
pp. 47–54, 2010.
[218] M.-T. Wyder, H.-P. Bachmann, and Z. Puhan, “Role of selected yeasts in cheese ripening: an
evaluation in foil wrapped Raclette cheese,” LWT-Food Sci. Technol., vol. 32, pp. 333–343,
1999.
[219] L. Zhang, C. Wu, X. Ding, J. Zheng, and R. Zhou, “Characterisation of microbial communities in
Chinese liquor fermentation starters Daqu using nested PCR-DGGE,” World J. Microbiol.
Biotechnol., vol. 30, pp. 3055–3063, 2014.
[220] H. Tian, J. Chen, J. He, and F. Liu, “Pd-loaded magnetic mesoporous nanocomposites: A
103
magnetically recoverable catalyst with effective enrichment and high activity for DDT and DDE
removal under mild conditions,” J. Colloid Interface Sci., vol. 457, pp. 195–202, 2015.
[221] S. U. Jadhav, S. D. Kalme, and S. P. Govindwar, “Biodegradation of methyl red by Galactomyces
geotrichum MTCC 1360,” Int. Biodeterior. Biodegradation, vol. 62, pp. 135–142, 2008.
[222] E. Ortega-david and A. Rodríguez-stouvenel, “Degradation of quinolizidine alkaloids of lupin by
Rhizopus oligosporus,” Appl. Microbiol. Biotechnol., pp. 4799–4810, 2013.
[223] H. Wojtasek and W. S. Leal, “Degradation of an alkaloid pheromone from the pale‐brown chafer,
Phyllopertha diversa (Coleoptera: Scarabaeidae), by an insect olfactory cytochrome P450,”
FEBS Lett., vol. 458, pp. 333–336, 1999.
[224] P. Manjunath, B. C. Shenoy, and M. R. R. Raghavendra, “Fungal glucoamylases.,” J. Appl.
Biochem., vol. 5, pp. 235–260, 1983.
[225] S. Bunsupa, M. Yamazaki, and K. Saito, “Quinolizidine alkaloid biosynthesis: recent advances
and future prospects,” Front. Plant Sci., vol. 3, pp. 1–7, 2012.

104
Annex
A. Microbial cultures
A1. Filter interference in culture
In bacterial and yeast cultures, it was observed that the filters Membrane filters, 0.2 µm, Whatman,
ME24/21ST affected lupanine concentration in solution. This was observed when bacterial and yeast
isolates were pre-grown during 48 and 24 h in the same conditions shown in Figures 14 and 17,
respectively, and the inoculum of the main culture was performed by re-inoculating cells by filtration
under sterile conditions. In this experiment, the filter remained in culture during 168h of the experiment.
Lupanine measurements were not consistent, with concentration levels oscillating in higher and lower
values as shown in e.g. in Figure 56.
Figure 56 – Lupanine concentration values obtained when filters were used in the inoculum of the culture. The
result is from the S. siyangense culture.
Given the high range of values measured, a different methodology was tested. Lupanine was
prepared in a concentration solution and filtered with the same filters has above. After filtration, the filter
was collected and submerged in 30 mL of distilled water for 24 h and lupanine concentration was
measured at 0 h and 24 h. The results indicated that around 100 mg of lupanine remained in the filter.
When the inoculum of the main culture was performed by centrifuging pre-grown cells and
resuspending in culture medium, lupanine results were constant, as shown from the results in this
research.
A2. OD values of microbial cultures
- Bacterial cultures
The OD values in M9 synthetic medium and LBW are shown in Tables 22-25 and Tables 26-29,
respectively.
0.00
0.20
0.40
0.60
0.80
1.00
1.20
1.40
0 24 48 72 96 120 144 168
Lupanin
e
(g/L
)
Time (h)Lupanine Glucose + Lupanine

105
Table 22 – OD values measured during O. anthropi culture in M9 synthetic medium. (1) And (2) are the biological
replicates.
Pre-culture: Glucose Lupanine Glucose + Lupanine
Culture: Glucose Lupanine Glucose + Lupanine Lupanine Glucose + Lupanine
Time (h) (1) (2) (1) (2) (3) (1) (2) (3) (1) (2) (3) (1) (2) (3)
0 0.09 0.10 0.08 0.13 0.10 0.08 0.11 0.09 0.09 0.11 0.12 0.09 0.10 0.15
2 0.11 0.12 0.06 0.07 0.11 0.07 0.09 0.13 0.06 0.07 0.10 0.06 0.06 0.12
4 0.20 0.18 0.10 0.07 0.14 0.11 0.07 0.16 0.11 0.06 0.11 0.11 0.05 0.15
6 0.13 0.25 0.07 0.09 0.20 0.07 0.09 0.25 0.08 0.05 0.15 0.08 0.07 0.22
24 1.04 1.06 1.08 1.42 1.66 1.90 1.68 2.28 1.08 0.64 1.22 2.62 1.24 1.20
48 1.28 1.10 1.56 2.22 1.70 2.64 2.38 3.52 1.80 1.46 1.66 1.76 1.24 1.82
120 1.02 1.12 1.10 1.76 1.46 4.60 2.92 3.94 1.74 1.64 1.52 3.84 1.10 3.12
144 0.92 1.06 1.68 1.82 1.44 5.08 3.08 3.96 1.98 1.54 1.56 3.96 1.02 3.40
168 1.02 0.90 1.58 2.10 1.50 4.80 2.96 3.92 2.40 1.90 1.58 3.80 1.24 3.24
Table 23 – OD values measured during S. siyangense culture in M9 synthetic medium. (1) And (2) are the
biological replicates.
Pre-Culture: Glucose Glucose + Lupanine
Culture: Glucose Lupanine Glucose + Lupanine
Time (h) (1) (2) (1) (2) (1) (2)
0 0.12 0.09 0.09 0.11 0.10 0.09
2 0.09 0.10 0.09 0.11 0.11 0.11
4 0.12 0.12 0.09 0.10 0.14 0.16
6 0.08 0.15 0.05 0.11 0.20 0.23
24 0.72 0.54 0.09 0.09 1.04 1.12
48 1.22 1.12 0.09 0.09 1.48 1.04
120 0.96 1.12 0.07 0.09 1.24 0.84
144 1.02 1.00 0.07 0.08 2.34 0.88
168 0.96 1.14 0.07 0.09 1.38 0.80

106
Table 24 – OD values measured during S. maltophilia culture in M9 synthetic medium. (1) And (2) are the
biological replicates.
Pre-Culture: Glucose Glucose + Lupanine
Culture: Glucose Lupanine Glucose + Lupanine
Time (h) (1) (2) (1) (2) (1) (2)
0 0.08 0.08 0.09 0.12 0.09 0.11
2 0.09 0.09 0.09 0.11 0.11 0.12
4 0.11 0.08 0.10 0.11 0.15 0.14
6 0.14 0.08 0.05 0.11 0.10 0.17
24 0.40 0.10 0.09 0.10 0.90 1.16
48 0.47 0.99 0.09 0.09 1.24 1.04
120 0.61 0.10 0.08 0.09 1.22 0.96
144 0.66 0.95 0.08 0.09 1.20 0.92
168 0.65 0.10 0.08 0.09 1.30 0.98
Table 25 – OD values measured during C. funkei culture in M9 synthetic medium. (1) And (2) are the biological
replicates.
Pre-Culture: Glucose Glucose + Lupanine
Culture: Glucose Lupanine Glucose + Lupanine
Time (h) (1) (2) (1) (2) (1) (2)
0 0.09 0.09 0.11 0.12 0.12 0.11
2 0.09 0.11 0.10 0.12 0.13 0.13
4 0.14 0.16 0.09 0.11 0.16 0.15
6 0.11 0.23 0.05 0.11 0.11 0.18
24 1.04 1.36 0.10 0.10 1.24 1.88
48 1.32 1.76 0.09 0.10 2.54 2.46
120 1.12 1.44 0.09 0.10 3.06 2.58
144 1.00 1.98 0.09 0.09 2.76 2.54
168 1.14 1.70 0.10 0.10 3.06 2.42
Table 26 – OD values measured during O. anthropi culture in LBW diluted in water. (1), (2) and (3) are the
biological replicates.
Culture LBW+H2O
Time (h) (1) (2) (3)
0 0.11 0.14 0.15
2 0.21 0.27 0.25
4 0.42 0.47 0.29
6 0.84 0.82 0.43
24 2.54 2.66 4.46
48 3.80 2.48 5.4
120 3.36 2.08 5.4
144 2.96 1.08 3.76
168 3.16 2.32 3.4

107
Table 27 – OD values measured during S. siyangense culture in LBW diluted in water. (1), (2) and (3) are the
biological replicates.
Culture LBW+H2O
Time (h) (1) (2) (3)
0 0.12 0.15 0.18
2 0.27 0.27 0.44
4 0.58 0.58 0.72
6 1.24 1.05 1.14
24 2.00 3.24 4.42
48 2.56 4.16 5.12
120 2.84 3.64 4.52
144 2.52 2.80 4.6
168 2.40 3.2 4.36
Table 28 – OD values measured during S. maltophilia culture in LBW diluted in water. (1), (2) and (3) are
the biological replicates.
Culture LBW+H2O
Time (h) (1) (2) (3)
0 0.13 0.12 0.15
2 0.21 0.21 0.34
4 0.40 0.38 0.51
6 1.00 0.07 0.94
24 2.20 1.86 2.88
48 2.28 2.78 3.28
120 2.40 3.28 2.72
144 1.40 3.00 2.36
168 2.00 4.52 2.32
Table 29 – OD values measured during C. funkei culture in LBW diluted in water. (1), (2) and (3) are the
biological replicates.
Culture LBW+H2O
Time (h) (1) (2) (3)
0 0.12 0.13 0.15
2 0.20 0.21 0.29
4 0.38 0.35 0.40
6 0.60 0.48 0.56
24 2.10 1.64 2.00
48 2.74 2.76 3.08
120 3.04 2.8 4.24
144 2.92 2.16 4.24
168 3.00 5.72 3.88
- Yeast cultures
The OD values in YNB synthetic medium and LBW are shown in Tables 30-31 and Tables 32-33.

108
Table 30 – OD values measured during R. mucilaginosa culture in YNB synthetic medium. (1) And (2) are the
biological replicates.
Pre-Culture: Glucose Glucose + Lupanine
Culture: Glucose Lupanine Glucose + Lupanine Glucose Lupanine
Glucose + Lupanine
Time (h) (1) (2) (1) (2) (1) (2) (1) (2) (1) (2) (1) (2)
0 0.10 0.11 0.13 0.08 0.12 0.10 0.11 0.09 0.12 0.09 0.13 0.11
2 0.07 0.11 0.04 0.03 0.06 0.06 0.14 0.05 0.05 0.04 0.13 0.05
4 0.27 0.23 0.04 0.03 0.20 0.13 0.16 0.12 0.07 0.05 0.14 0.08
6 0.60 0.41 0.11 0.05 0.23 0.31 0.38 0.26 0.06 0.06 0.34 0.18
24 3.48 3.92 0.05 0.03 4.04 4.62 3.44 3.70 0.07 0.05 3.96 4.70
48 3.24 4.06 0.05 0.04 3.86 4.66 3.56 4.00 0.08 0.05 3.94 4.74
120 2.86 3.56 0.06 0.04 3.28 4.52 2.80 3.78 0.06 0.04 3.28 4.28
144 3.20 3.48 0.06 0.04 3.64 4.42 3.24 3.54 0.08 0.04 3.54 4.42
168 2.68 3.28 0.04 0.04 3.22 4.08 2.48 3.32 0.06 0.04 3.08 4.10
Table 31 - OD values measured during P. kudriavzevii culture in YNB synthetic medium. (1) And (2) are the
biological replicates.
Pre-Culture: Glucose Glucose + Lupanine
Culture: Glucose Lupanine Glucose + Lupanine Glucose Lupanine
Glucose + Lupanine
Time (h) (1) (2) (1) (2) (1) (2) (1) (2) (1) (2) (1) (2)
0 0.13 0.08 0.14 0.08 0.13 0.09 0.11 0.10 0.13 0.10 0.13 0.10
2 0.10 0.05 0.04 0.03 0.07 0.05 0.06 0.07 0.07 0.05 0.07 0.09
4 0.11 0.07 0.05 0.03 0.13 0.08 0.13 0.14 0.08 0.05 0.38 0.24
6 0.40 0.21 0.04 0.07 0.36 0.14 0.39 0.44 0.05 0.08 0.54 0.40
24 3.30 2.30 0.03 0.03 2.84 2.38 3.02 2.68 0.04 0.06 3.00 2.04
48 2.78 2.76 0.02 0.03 2.70 2.52 3.02 2.84 0.06 0.07 2.52 2.40
120 2.40 2.82 0.03 0.05 2.04 3.32 2.24 3.04 0.05 0.07 2.32 2.50
144 2.98 2.96 0.02 0.05 2.92 2.44 3.04 3.34 0.06 0.06 2.60 2.54
168 3.08 2.78 0.02 0.05 2.60 2.02 3.00 2.88 0.05 0.06 2.70 2.40
Table 32 - OD values measured during R. mucilaginosa culture in LBW diluted in water and in YNB medium.
(1), (2) and (3) are the biological replicates.
Culture LBW+YNB LBW+H2O Time (h) (1) (2) (3) (1) (2) (3)
0 0.12 0.17 0.16 0.14 0.18 0.13
2 0.16 0.23 0.21 0.19 0.23 0.13
4 0.24 0.34 0.24 0.32 0.33 0.14
6 0.44 0.46 0.31 0.48 0.51 0.15
24 8.10 7.32 7.92 9.60 7.02 6.64
48 12.96 11.00 9.00 10.44 10.08 9.04
120 12.60 12.08 7.92 9.36 10.04 8.88
144 11.88 11.16 9.88 11.40 12.00 12.52
168 12.36 14.60 10.12 11.80 10.96 10.16

109
Table 33 - OD values measured during P. kudriavzevii culture in LBW diluted in water and in YNB medium. (1),
(2) and (3) are the biological replicates.
Culture LBW+YNB LBW+H2O
Time (h) (1) (2) (3) (1) (2) (3)
0 0.18 0.18 0.19 0.12 0.16 0.19
2 0.31 0.28 0.51 0.13 0.21 0.45
4 0.92 0.82 1.10 0.40 0.51 0.76
6 2.58 1.84 2.34 1.58 1.71 2.21
24 8.56 9.20 8.46 6.12 9.32 7.32
48 9.52 8.56 9.20 7.60 6.52 6.88
120 10.48 7.64 9.08 9.12 8.04 7.08
144 9.80 5.36 11.32 8.80 7.56 7.20
168 11.28 6.44 12.08 9.48 7.52 7.08
Copyright © 2022 FDOKUMEN