Identification and quantification of uncertainties in river models using expert elicitation
22
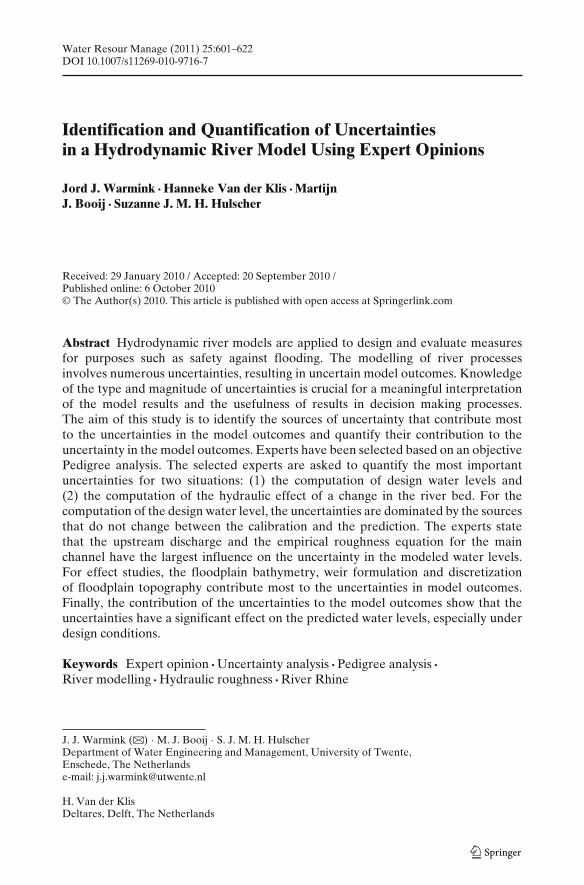
Water Resour Manage (2011) 25:601–622 DOI 10.1007/s11269-010-9716-7 Identification and Quantification of Uncertainties in a Hydrodynamic River Model Using Expert Opinions Jord J. Warmink · Hanneke Van der Klis · Martijn J. Booij · Suzanne J. M. H. Hulscher Received: 29 January 2010 / Accepted: 20 September 2010 / Published online: 6 October 2010 © The Author(s) 2010. This article is published with open access at Springerlink.com Abstract Hydrodynamic river models are applied to design and evaluate measures for purposes such as safety against flooding. The modelling of river processes involves numerous uncertainties, resulting in uncertain model outcomes. Knowledge of the type and magnitude of uncertainties is crucial for a meaningful interpretation of the model results and the usefulness of results in decision making processes. The aim of this study is to identify the sources of uncertainty that contribute most to the uncertainties in the model outcomes and quantify their contribution to the uncertainty in the model outcomes. Experts have been selected based on an objective Pedigree analysis. The selected experts are asked to quantify the most important uncertainties for two situations: (1) the computation of design water levels and (2) the computation of the hydraulic effect of a change in the river bed. For the computation of the design water level, the uncertainties are dominated by the sources that do not change between the calibration and the prediction. The experts state that the upstream discharge and the empirical roughness equation for the main channel have the largest influence on the uncertainty in the modeled water levels. For effect studies, the floodplain bathymetry, weir formulation and discretization of floodplain topography contribute most to the uncertainties in model outcomes. Finally, the contribution of the uncertainties to the model outcomes show that the uncertainties have a significant effect on the predicted water levels, especially under design conditions. Keywords Expert opinion · Uncertainty analysis · Pedigree analysis · River modelling · Hydraulic roughness · River Rhine J. J. Warmink (B ) · M. J. Booij · S. J. M. H. Hulscher Department of Water Engineering and Management, University of Twente, Enschede, The Netherlands e-mail: [email protected] H. Van der Klis Deltares, Delft, The Netherlands
Transcript of Identification and quantification of uncertainties in river models using expert elicitation
Water Resour Manage (2011) 25:601–622DOI 10.1007/s11269-010-9716-7
Identification and Quantification of Uncertaintiesin a Hydrodynamic River Model Using Expert Opinions
Jord J. Warmink · Hanneke Van der Klis · MartijnJ. Booij · Suzanne J. M. H. Hulscher
Received: 29 January 2010 / Accepted: 20 September 2010 /Published online: 6 October 2010© The Author(s) 2010. This article is published with open access at Springerlink.com
Abstract Hydrodynamic river models are applied to design and evaluate measuresfor purposes such as safety against flooding. The modelling of river processesinvolves numerous uncertainties, resulting in uncertain model outcomes. Knowledgeof the type and magnitude of uncertainties is crucial for a meaningful interpretationof the model results and the usefulness of results in decision making processes.The aim of this study is to identify the sources of uncertainty that contribute mostto the uncertainties in the model outcomes and quantify their contribution to theuncertainty in the model outcomes. Experts have been selected based on an objectivePedigree analysis. The selected experts are asked to quantify the most importantuncertainties for two situations: (1) the computation of design water levels and(2) the computation of the hydraulic effect of a change in the river bed. For thecomputation of the design water level, the uncertainties are dominated by the sourcesthat do not change between the calibration and the prediction. The experts statethat the upstream discharge and the empirical roughness equation for the mainchannel have the largest influence on the uncertainty in the modeled water levels.For effect studies, the floodplain bathymetry, weir formulation and discretizationof floodplain topography contribute most to the uncertainties in model outcomes.Finally, the contribution of the uncertainties to the model outcomes show that theuncertainties have a significant effect on the predicted water levels, especially underdesign conditions.
Keywords Expert opinion · Uncertainty analysis · Pedigree analysis ·River modelling · Hydraulic roughness · River Rhine
J. J. Warmink (B) · M. J. Booij · S. J. M. H. HulscherDepartment of Water Engineering and Management, University of Twente,Enschede, The Netherlandse-mail: [email protected]
H. Van der KlisDeltares, Delft, The Netherlands
602 J.J. Warmink et al.
1 Introduction
Hydraulic-morphological river models are applied to design and evaluate measuresfor purposes such as safety against flooding. These numerical models are all basedon a deterministic approach. However, the modelling of river processes involvesnumerous uncertainties, resulting in uncertain model outcomes. Knowledge of thetype and magnitude of uncertainties is crucial for a meaningful interpretation of themodel results and the usefulness of results in decision making processes.
Uncertainty is defined by Walker et al. (2003) as “any deviation of the unachiev-able ideal of complete determinism”. Uncertainty consists of inaccuracy and impre-cision. Inaccuracy refers to the difference of a model outcome with reality, whileimprecision deals with the variation around the model outcome and observations.Model uncertainty can be classified according to Walker et al. (2003) along threedimensions: the location, level and nature of an uncertainty.
The uncertainty in model outcomes can be quantified by propagation of thequantified uncertainty in all parts of the model. Monte Carlo simulation is acommonly used method for uncertainty propagation (Morgan and Henrion 1990),especially for highly non-linear models (Van der Klis 2003). Monte Carlo simulationrequires a quantification of the uncertainties in all parts of the model as input.Therefore, to determine the total uncertainty in the model outcomes, a structuralanalysis and quantification of the sources of uncertainty in a model is required. Manyuncertainty studies are based on strong assumptions of the variation of the underlyinguncertainties. However, the reliability of the uncertainty analysis is very sensitive tothe assumed coefficient of variation (Johnson 1996). The problem is that informationabout the magnitude and probability distribution functions of this input is usuallynot available or insufficient (Johnson 1996; Van der Sluijs 2007). Furthermore, theuncertainty in the underlying uncertainty strongly depends on the case study and themodel under consideration (Warmink et al. 2010).
In recent uncertainty analysis studies about river modelling, uncertainties haveoften been studied in isolation. Often, only uncertainties that can easily be quantifiedare taken into account, such as uncertainties in model input and model parameters(e.g. Refsgaard et al. 2006a; Hall et al. 2005; Bates et al. 2004). In such a case, it islikely that the model outcome uncertainty is underestimated. The uncertainties in themodel context and model structure are often neglected. Although, Refsgaard et al.(2006b) present a method to deal with uncertainties in model structure, the authorsdo not consider other sources of uncertainty.
Pappenberger et al. (2005) and Hunter et al. (2007) give a structured overview ofuncertainties in river models. They review the recent developments in reduced com-plexity of river models to determine the extent to which such techniques are capableof reliable and practical application. However, they only focus on uncertainties inthe input, parameters and model structure of river models. They do not include theuncertainties in the context and application of the model in the review. Hall andSolomatine (2008) and Van der Keur et al. (2008, 2010) describe and identify theindividual sources of uncertainty in a broader context. They focus on uncertainties inwater resources management, including flood risk management. However, they donot quantify the sources of uncertainty, nor do they quantify the uncertainty in themodel outcomes.

Identification and Quantification of Uncertainties in a Hydrodynamic River Model 603
A substitute for the information about the magnitude and probability distributionfunctions of the input for an uncertainty analysis is the use of subjective probabilityfunctions, which can be obtained by the systematic combination of expert judgments(Van der Sluijs 1997; Cooke and Goossens 2000; Ayyub 2001). In environmentalmodelling, especially for health risk analysis, expert opinion has been used for theidentification and quantification of uncertainties (Krayer von Krauss et al. 2004; Vander Sluijs et al. 2005a; Refsgaard et al. 2006b).
Krayer von Krauss et al. (2004) conducted detailed expert interviews to formallyexplore the uncertainty in the risk assessment on genetically modified crops. Theyinterviewed seven leading experts in this research field to obtain qualitative andquantitative information from their understanding of the uncertainties associatedwith the risks. Van der Sluijs et al. (2005b) studied the emission of volatile or-ganic compounds (VOC) from paint in The Netherlands. The authors used expertelicitation to identify key sources of error, critical assumptions and bias in themonitoring process. Both these studies by Krayer von Krauss et al. (2004) and Vander Sluijs et al. (2005b) comprise an uncertainty assessment, combining quantitativeand qualitative data, in a risk assessment. In our study we assess the uncertainty inthe outcomes of a hydrodynamic river model, thereby focusing on quantification ofthe uncertainties in the model outcomes.
In this study we want to identify and quantify the uncertainties in a two dimen-sional river model used for flood safety computations in a structured manner. Expertopinion elicitation has been used, to identify the most important uncertainties in theriver model, which will be used in a future study as the first step in a Monte Carloanalysis. The reliability of the outcomes of a Monte Carlo analysis depend on thereliability of the identified sources of uncertainty. Therefore, the aim of this studyis to identify the sources of uncertainty that contribute most to the uncertainties inthe model outcomes and quantify their contribution to the uncertainty in the modeloutcomes using expert opinion elicitation.
This paper is organized as follows. Section 2 describes the case study used. Themethod for the selection of the experts and the approach for the interviews ispresented in Section 3. In Section 4 the results are given and discussed in Section 5.Finally, conclusions are drawn in Section 6.
2 Case Study
River flooding is a serious threat in the Netherlands. Strong dikes have beenconstructed to protect the land from flooding. After the 1993 and 1995 near floodevents of the rivers Rhine and Meuse, the Dutch government laid down that every 5years the safety of the primary dikes has to be evaluated (Ministry of Transport,Public Works and Water Management 1995). The Ministry of Transport, PublicWorks and Water Management publishes every five year the Hydraulic Boundaryconditions. These comprise the water levels that are used in the safety assessment.They are determined using statistical and deterministic models.
The design water levels in the main rivers in The Netherlands are computed basedon a design discharge (Ministry of Transport, Public Works and Water Management1995). This design discharge is based on the statistical analysis of historical discharge
604 J.J. Warmink et al.
series. Subsequently, the heights of the dikes are compared to the computed designwater levels in the river. These design water levels are the main components of thedike safety evaluation.
The design water levels in the upper part of the Dutch Rhine branches arecalculated using the two-dimensional, depth-averaged river model WAQUA. TheWAQUA model has been developed in the late sixties, based on the work ofLeendertse (1967). WAQUA is used for two-dimensional hydrodynamic and waterquality simulation of well-mixed estuaries, coastal seas and lowland rivers. TheWAQUA model is used and maintained by the Road and Hydraulic EngineeringInstitute of the Directorate General of Public Works and Water Management incooperation with Deltares (former WL | Delft Hydraulic). WAQUA accounts forflooding and drying of individual cells and can account for energy losses due toweirs. These features are essential for channelized rivers, such as the river Rhine.The model is applied mainly to the Dutch Rhine tributaries and for several studiesof the river Rhine in Germany.
WAQUA consists of: 1) the program environment SIMONA (Rijkswaterstaat2009) which holds the discretized shallow water equations to simulate the water flowand the empirical equations to approximate energy losses, and 2) a schematizationof the upper river Rhine region for a certain period with corresponding input pa-rameters (e.g. stage-discharge relations, river bed roughnesses, upstream discharge,etc.). The schematization consists of a computational grid, the bathymetry of theriver bed and mapped characteristics of the flow channel (e.g. grain size, vegetation,and other objects such as houses, bridges, barriers, spillways, etc.). The vegetationis represented by a hydraulic roughness that is calibrated for different classes ofvegetation types (Van Velzen et al. 2003). Aerial photography is used to determinethe vegetation type for each polygon in the floodplain area. Subsequently, these dataare converted onto the computational grid. In this study, the 2006 version of theWAQUA model (HR2006_4) was used, which has grid sizes of approximately 40 m(Rijkswaterstaat 2007). The time required to simulate one full day for the Dutchdistributaries is approximately one hour using a time step of 15 s.
The WAQUA model is used for two different applications. Firstly, for thecomputation of the design water levels (DWL) as described above. Secondly, themodel is used for the computation of the effect of measures taken in the floodplainareas that change the geometry of the cross section, so called effect studies. Thisis the case if, for example, someone wants to exploit the floodplain for building orclay excavations. In this case the changes in the floodplain region are not allowedto result in a rise in the water level in the river. Therefore, the plans are testedusing the WAQUA model by schematizing the plans in the model and computingthe effect. Another example of effect studies is that the Ministry of Transport,Public Works and Water Management wants to lower the design water levels inthe Dutch rivers by increasing the discharge capacity of the floodplains. Therefore,the effect of different measures on the design water levels are compared using theWAQUA model.
The main differences between DWL computations and effect studies are thatthe DWL case uses a design discharge wave as input, while the effect studiesuse a constant discharge as upstream input. Furthermore, the result from a DWLcomputation is an absolute water level in the river, while for the effect studies case,the result is a difference in water levels. This means that for effect studies, two
Identification and Quantification of Uncertainties in a Hydrodynamic River Model 605
model runs are subtracted, which has large implications for the uncertainties. Forboth applications the effect at the river axis (the center line of the main channel) andnear the dike are computed.
Calibration of the WAQUA model has been carried out using the measureddischarge peak of 1995, with corresponding schematization and measured waterlevels at several locations along the River Rhine (Van den Brink et al. 2006). The1995 peak is used as it is the highest measured discharge peak in the River Rhinein recent history and is, therefore, closest to the design discharge of 16,000 m3/s.The 1995 peak had a maximum discharge of 12,000 m3/s at Lobith (the locationwhere the Rhine enters The Netherlands). During this calibration only one linearparameter in the equation that relates the hydraulic roughness of the main channelto the water level is adapted so that the computed water levels of the seven stationsalong the river Waal match the measured water levels. In the setup of the model,also optimal values for several other parameters, such as the eddy viscosity aredetermined.
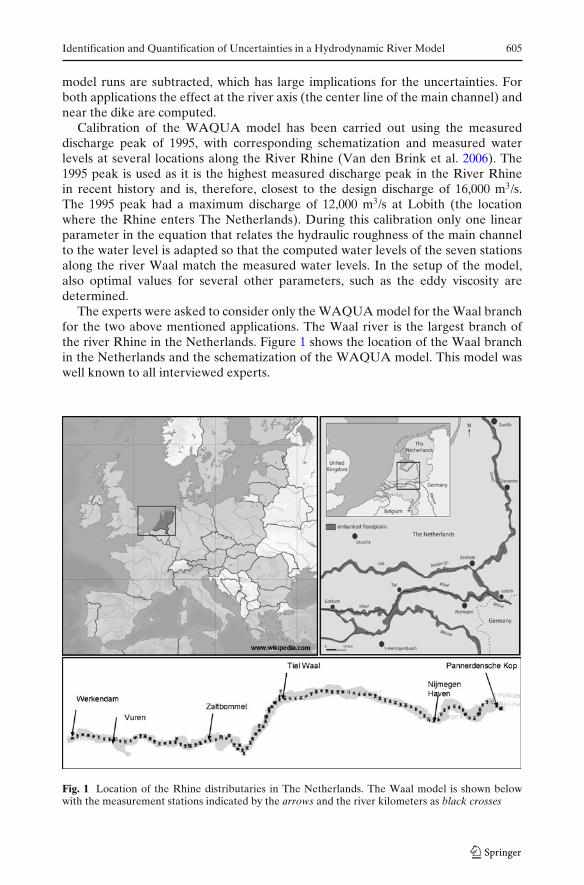
The experts were asked to consider only the WAQUA model for the Waal branchfor the two above mentioned applications. The Waal river is the largest branch ofthe river Rhine in the Netherlands. Figure 1 shows the location of the Waal branchin the Netherlands and the schematization of the WAQUA model. This model waswell known to all interviewed experts.
Fig. 1 Location of the Rhine distributaries in The Netherlands. The Waal model is shown belowwith the measurement stations indicated by the arrows and the river kilometers as black crosses
606 J.J. Warmink et al.
3 Method
The first step in an expert opinion study is to select the experts. Van der Sluijs (1997)notes that the results of an expert opinion study are sensitive to the selection of theexperts whose estimates are gathered. In this study, the experts have been selectedbased on their expertise that has been measured using a Pedigree analysis. Next,eleven face-to-face interviews have been conducted with the selected experts andthe experts’ opinions have been aggregated.
3.1 Pedigree Analysis
In this study the experts are selected using objective criteria in a Pedigree analysis.Pedigree is a method to convey an evaluative account of the production processof information and indicates different aspects of the underpinning of the numbersand scientific status of the knowledge used (Funtowicz and Ravetz 1990). Pedigreeis expressed by means of a set of pedigree criteria to assess these different aspects(Van der Sluijs et al. 2005b).
Pedigree analysis is used in uncertainty analysis, commonly as part of the NUSAPmethodology (Van der Sluijs et al. 2004). NUSAP is a notational system proposedby Funtowicz and Ravetz (1990), which aims to provide an analysis and diagnosisof uncertainty in science for policy. It captures both quantitative and qualitativedimensions of uncertainty and enables one to display these in a standardized way.The basis idea is to qualify quantities using the five qualifiers of the NUSAPacronym: Numerical, Unit, Spread, Assessment and Pedigree. By well describingand framing the uncertainties (Numerical and Unit) and adding expert judgmentof reliability (Assessment) and systematic multi-criteria of the production processof numbers (Pedigree), NUSAP has extended the statistical approach (Spread)(Van der Sluijs et al. 2004). The Pedigree part of NUSAP is developed to describeand quantify the background of different types of information.
Pedigree is used to assess the ‘strength’ of an assumption, input or parameter. Thestrength means that the assumption underlying the quantity is ‘weak’ or ‘strong’.Different criteria are defined on which this strength is evaluated. To minimizearbitrariness and subjectivity in measuring strength, a Pedigree matrix is used to codequalitative expert judgments for different criteria into a discrete numerical scale from0 (weak) to 4 (strong) with linguistic descriptions (the criteria) of each level on thescale. Each special sort of information has its own aspects that are key to its Pedigree(Van der Sluijs et al. 2004). The criteria may vary, depending on the audience andcase at hand. Common criteria include: quality of proxy, empirical basis, theoreticalunderstanding, methodological rigor, validation, and value-ladenness (Wardekkeret al. 2008). Assessment of Pedigree involves qualitative expert judgment and istherefore commonly used in combination with expert opinion elicitation.
Pedigree has been applied in several uncertainty analysis studies in combinationwith expert opinion elicitation. Groenenberg and Van der Sluijs (2005) used Pedigreeanalysis for determining the strength of uncertain assumptions, input and parametersin an emission reduction targets model as an addition to a sensitivity analysis. Theyconcluded that in the identification of the major uncertainties in their model, oneshould not only consider the variance in the outcome, but also to pay attention tothe strength of various inputs. This means that the values of the parameters with

Identification and Quantification of Uncertainties in a Hydrodynamic River Model 607
the lowest strength need to be chosen based on maximal research and consultationof stakeholders (Groenenberg and Van der Sluijs 2005), because a quantitativesensitivity analysis might show that these parameters only have little influence onthe model outcomes. However, a low strength indicates that the background of theseparameters is potentially highly uncertain. Therefore, they may have a large effecton the uncertainty in the model outcomes, which is not revealed by the quantitativeanalysis only.
Van der Sluijs (2002) showed the experiences in applying Pedigree, as an additionto quantitative methods in an uncertainty analysis to four cases: a policy case, acomplex model case, a chain of models and an interactive assessment of uncertaintyin environmental health risk science and policy. In both model cases they used expertopinions to assess Pedigree scores to determine the strength of the underlying as-sumptions and model input and parameters. They concluded that Pedigree is a usefuladdition to quantitative sensitivity analysis to prioritize uncertainties. Wardekkeret al. (2008) analyzed a series of experiments evaluating uncertainty communicationin the yearly reports that describe the state of the (Dutch) environment and evaluatepolicy influences. They show that policy advisors find qualitative information onuncertainty presented by Pedigree scores useful to put the presented data in per-spective. In this study, we used Pedigree to determine the strength of the experts andassess their level of expertise.
3.2 Application of Pedigree for Expert Selection
The first reason to select an expert was its familiarity with the case study. Initially42 possible experts have been selected who were familiar with the WAQUA model.All experts have been either involved in research activities related to the WAQUAmodel or in WAQUA project execution. Most experts had “hands-on” experiencewith the WAQUA model, that is they have been working on setting up and runningthe model personally.
From these 42 initially selected experts we needed to select between 10 and 15experts for a face-to-face interview given the available time. Expert opinions aresensitive to the selection of experts (Van der Sluijs 1997), therefore, an objectivemethod to select the experts was required. We used the Pedigree method to measurethe expertise of the experts and selected the experts with the highest expertise. APedigree matrix has been developed for measuring the expertise for this particularcase. We chose four different criteria that we considered most appropriate to deter-mine the experts’ expertise. Subsequently, for each criterion five possible answershave been prepared ranging from 0 (low expertise) to 4 (large expertise). A shortquestionnaire has been send to the experts to get the input for the Pedigree analysis.
The four criteria in the Pedigree matrix are: 1) number of years experience withresearch and consultancy projects regarding the WAQUA model, 2) the number ofyears experience with the WAQUA model applied to the rivers Rhine or Meuse,3) experience with code development of the WAQUA model and 4) number andtype of publications about research projects with the WAQUA model concerningthe rivers Rhine or Meuse. The Pedigree matrix is shown in Table 1.
We gave the criteria within the Pedigree matrix a relative weight, because notall criteria are considered equally important. The criteria have been given a weightbetween 1 and 4. We considered experience with code development the most
608 J.J. Warmink et al.
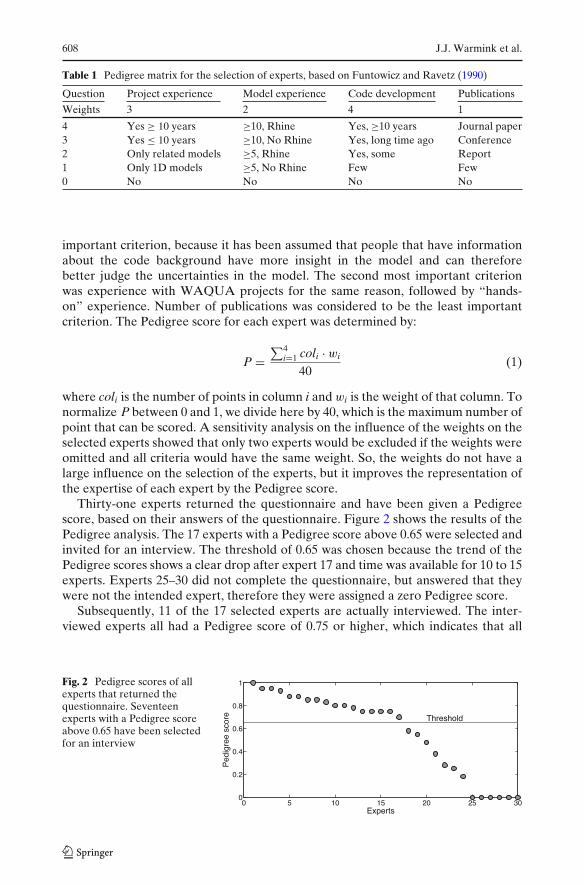
Table 1 Pedigree matrix for the selection of experts, based on Funtowicz and Ravetz (1990)
Question Project experience Model experience Code development Publications
Weights 3 2 4 1
4 Yes ≥ 10 years ≥10, Rhine Yes, ≥10 years Journal paper3 Yes ≤ 10 years ≥10, No Rhine Yes, long time ago Conference2 Only related models ≥5, Rhine Yes, some Report1 Only 1D models ≥5, No Rhine Few Few0 No No No No
important criterion, because it has been assumed that people that have informationabout the code background have more insight in the model and can thereforebetter judge the uncertainties in the model. The second most important criterionwas experience with WAQUA projects for the same reason, followed by “hands-on” experience. Number of publications was considered to be the least importantcriterion. The Pedigree score for each expert was determined by:
P =∑4
i=1 coli · wi
40(1)
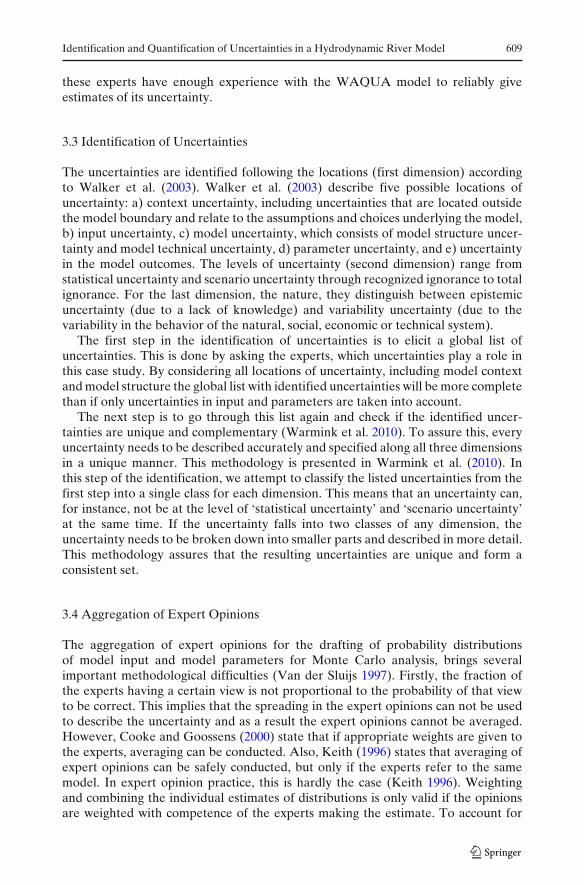
where coli is the number of points in column i and wi is the weight of that column. Tonormalize P between 0 and 1, we divide here by 40, which is the maximum number ofpoint that can be scored. A sensitivity analysis on the influence of the weights on theselected experts showed that only two experts would be excluded if the weights wereomitted and all criteria would have the same weight. So, the weights do not have alarge influence on the selection of the experts, but it improves the representation ofthe expertise of each expert by the Pedigree score.
Thirty-one experts returned the questionnaire and have been given a Pedigreescore, based on their answers of the questionnaire. Figure 2 shows the results of thePedigree analysis. The 17 experts with a Pedigree score above 0.65 were selected andinvited for an interview. The threshold of 0.65 was chosen because the trend of thePedigree scores shows a clear drop after expert 17 and time was available for 10 to 15experts. Experts 25–30 did not complete the questionnaire, but answered that theywere not the intended expert, therefore they were assigned a zero Pedigree score.
Subsequently, 11 of the 17 selected experts are actually interviewed. The inter-viewed experts all had a Pedigree score of 0.75 or higher, which indicates that all
Fig. 2 Pedigree scores of allexperts that returned thequestionnaire. Seventeenexperts with a Pedigree scoreabove 0.65 have been selectedfor an interview
0 5 10 15 20 25 300
0.2
0.4
0.6
0.8
1
Threshold
Experts
Ped
igre
e sc
ore
Identification and Quantification of Uncertainties in a Hydrodynamic River Model 609
these experts have enough experience with the WAQUA model to reliably giveestimates of its uncertainty.
3.3 Identification of Uncertainties
The uncertainties are identified following the locations (first dimension) accordingto Walker et al. (2003). Walker et al. (2003) describe five possible locations ofuncertainty: a) context uncertainty, including uncertainties that are located outsidethe model boundary and relate to the assumptions and choices underlying the model,b) input uncertainty, c) model uncertainty, which consists of model structure uncer-tainty and model technical uncertainty, d) parameter uncertainty, and e) uncertaintyin the model outcomes. The levels of uncertainty (second dimension) range fromstatistical uncertainty and scenario uncertainty through recognized ignorance to totalignorance. For the last dimension, the nature, they distinguish between epistemicuncertainty (due to a lack of knowledge) and variability uncertainty (due to thevariability in the behavior of the natural, social, economic or technical system).
The first step in the identification of uncertainties is to elicit a global list ofuncertainties. This is done by asking the experts, which uncertainties play a role inthis case study. By considering all locations of uncertainty, including model contextand model structure the global list with identified uncertainties will be more completethan if only uncertainties in input and parameters are taken into account.
The next step is to go through this list again and check if the identified uncer-tainties are unique and complementary (Warmink et al. 2010). To assure this, everyuncertainty needs to be described accurately and specified along all three dimensionsin a unique manner. This methodology is presented in Warmink et al. (2010). Inthis step of the identification, we attempt to classify the listed uncertainties from thefirst step into a single class for each dimension. This means that an uncertainty can,for instance, not be at the level of ‘statistical uncertainty’ and ‘scenario uncertainty’at the same time. If the uncertainty falls into two classes of any dimension, theuncertainty needs to be broken down into smaller parts and described in more detail.This methodology assures that the resulting uncertainties are unique and form aconsistent set.
3.4 Aggregation of Expert Opinions
The aggregation of expert opinions for the drafting of probability distributionsof model input and model parameters for Monte Carlo analysis, brings severalimportant methodological difficulties (Van der Sluijs 1997). Firstly, the fraction ofthe experts having a certain view is not proportional to the probability of that viewto be correct. This implies that the spreading in the expert opinions can not be usedto describe the uncertainty and as a result the expert opinions cannot be averaged.However, Cooke and Goossens (2000) state that if appropriate weights are given tothe experts, averaging can be conducted. Also, Keith (1996) states that averaging ofexpert opinions can be safely conducted, but only if the experts refer to the samemodel. In expert opinion practice, this is hardly the case (Keith 1996). Weightingand combining the individual estimates of distributions is only valid if the opinionsare weighted with competence of the experts making the estimate. To account for
610 J.J. Warmink et al.
the above mentioned difficulties, the experts are given a weight using the Pedigreescores to be able to average the experts estimates.
3.5 Interviews
In a face-to-face interview of approximately one hour, the experts were asked toindicate the parts of the model that had the most influence on the uncertainty ofthe model outcomes. This means that either an uncertainty has a high degree ofuncertainty itself, or it has a large influence on the model outcomes, or both. Thisquestion was asked for the computation of the design water levels (DWL), and forthe computation of the effects of measures taken in the river bed. This resulted intwo (partly overlapping) lists with uncertainties.
For each list, the uncertainties were broken down into uncertainties with anequal level of detail, using the classification matrix by Walker et al. (2003). Next,the experts have been asked to identify the major sources of uncertainty. In manycases these uncertainties overlapped between the different experts. However theselists were not comparable, because some experts mentioned the small (negligible)uncertainties, while other experts omitted these uncertainties. Therefore, it was notpossible to compare the number of times a source of uncertainty was mentioned.
Furthermore, the experts were asked to comment on each uncertainty and togive a value for the contribution of that uncertainty to the uncertainty in modeloutcomes in terms of water levels. The uncertainty is therefore expressed as a valuethat represents the maximum uncertainty range, which ranges from plus or minus thegiven value. For an effect study the uncertainty was expressed as a percentage of theeffect. For example, if a floodplain excavation of 1 m has an effect of 10 cm on thewater level on the river axis and the uncertainty was chosen to be 50%, this meansthat the effect of this excavation lies between 5 and 15 cm.
In many cases the experts were not able to give a single number for the un-certainty. Sometimes a range was given or an order of magnitude (millimeters,centimeters, or decimeters). In case an expert mentioned a range in which the valueof the uncertainty was located, the average of that range was taken for furtheranalysis. If the experts were not able to give a numerical value, sometimes theyexpressed the uncertainty in qualitative terms, such as “small” and “large”. Otherexperts were not able to give any value at all. No guidance was given how to interpretthe terms “large” or “small”, so the experts made their own subjective judgmentin this respect. The experts identified 16 different sources of uncertainty for bothapplications of the WAQUA model. For each source of uncertainty, a maximum of5 experts were able to quantify the uncertainty.
4 Results
4.1 Identification of Uncertainties in Design Water Levels
Each expert identified at least seven different uncertainties. The identified uncertain-ties are shown in Table 2. The uncertainties in this table are sorted with decreasingimportance according to the weighted average of the expert opinions. The termsmeasurements, schematization, discretization and formulation are used to denote the

Identification and Quantification of Uncertainties in a Hydrodynamic River Model 611
Table 2 Identified sources of uncertainty in design water levels
ID Short name Description
1 Upstream discharge Discharge that is imposed as upstream discharge. The designdischarge is derived by extrapolation of a historicaldischarge series. Subsequently, a design discharge waveis constructed with a return period of 1250 years
2 MC roughness predictor The empirical roughness predictor for the main channel3 Vegetation schematization The schematization of the vegetation in the floodplain area4 Weir formulation The formulation of the energy losses, due to acceleration and
deceleration of the water flow over weirs, embankments orslopes in the landscape
5 Calibration data The data used for the calibration of the model. This dataconsists of measured water levels and discharges, both ofwhich are uncertain
6 MC bathymetry discretization Discretization of the measurements of the main channelbathymetry onto the computational grid
7 FP roughness predictor Empirical roughness equation for the floodplain vegetationand other objects in the floodplain area
8 FP vegetation measurements Measurements of the floodplain vegetation. This representsthe variability within the floodplain ecotopes and theaccuracy of the classification
9 Weir discretization The discretization of the weirs on the computational grid10 MC bathymetry measurements Measurements of the bathymetry of the main channel11 FP bathymetry measurements Measurements of the bathymetry of the floodplain area12 Eddy viscosity Eddy viscosity parameter that accounts for energy losses
due to velocity differences13 SWE discretization Numerical method to discretize the shallow water equations14 Discharge distribution Distribution of the discharge over the three branches of the
river Rhine15 Groyne formulation The method that is used to compute the energy losses due
to groynes16 Season of peak discharge Currently, it is assumed that a peak discharge will occur in
winter when the vegetation has no leafs. However, if a peakdischarge occurs in spring the circumstances, especially ofthe vegetation, are different
FP represents floodplain and MC represents main channel. The uncertainties are sorted by decreas-ing uncertainty according to the average quantified expert opinions
different steps in the setup of the model. Firstly, the uncertainty due to measurementsis caused by the measurement instrument and measurement method in the field.Secondly, the schematization represents the method that is used to translate themeasurements to different classes that are used in the model. For example, theschematization of the vegetation is the decision in which of the three classes of forestan observed forest would fit best. This depends on the type of trees, the averagetree-height and the density of the trees in the forest. Next to these data, also theactual average density of the trees in the forest is an input parameter. The vegetationmanual (Van Velzen et al. 2003) is used as the guideline to discriminate the differentvegetation classes. Thirdly, the discretization represents the method that is used todiscretize, for example, the vegetation classes onto a grid. The uncertainty is causedby the delineation of these observed vegetation patches and depends on the grid size.
612 J.J. Warmink et al.
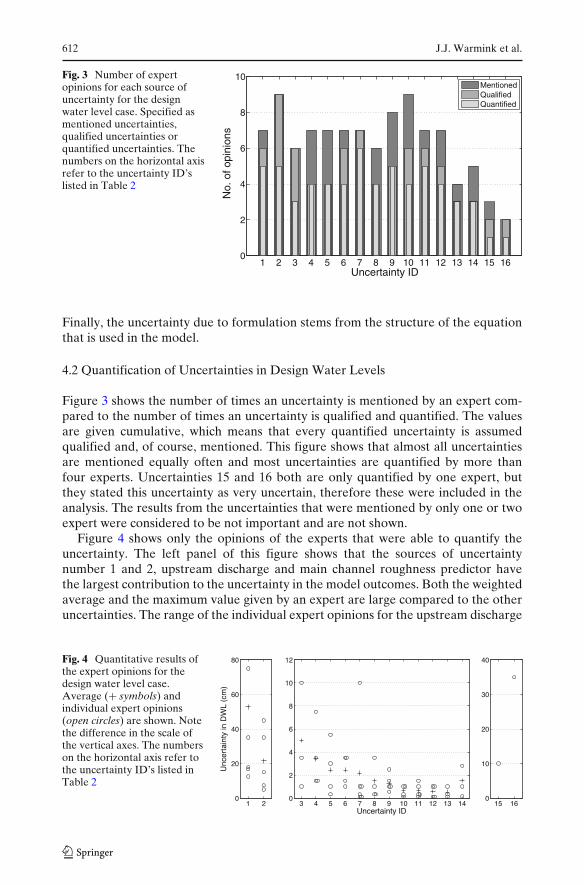
Fig. 3 Number of expertopinions for each source ofuncertainty for the designwater level case. Specified asmentioned uncertainties,qualified uncertainties orquantified uncertainties. Thenumbers on the horizontal axisrefer to the uncertainty ID’slisted in Table 2
1 2 3 4 5 6 7 8 9 10 11 12 13 14 15 160
2
4
6
8
10
Uncertainty ID
No.
of o
pini
ons
MentionedQualifiedQuantified
Finally, the uncertainty due to formulation stems from the structure of the equationthat is used in the model.
4.2 Quantification of Uncertainties in Design Water Levels
Figure 3 shows the number of times an uncertainty is mentioned by an expert com-pared to the number of times an uncertainty is qualified and quantified. The valuesare given cumulative, which means that every quantified uncertainty is assumedqualified and, of course, mentioned. This figure shows that almost all uncertaintiesare mentioned equally often and most uncertainties are quantified by more thanfour experts. Uncertainties 15 and 16 both are only quantified by one expert, butthey stated this uncertainty as very uncertain, therefore these were included in theanalysis. The results from the uncertainties that were mentioned by only one or twoexpert were considered to be not important and are not shown.
Figure 4 shows only the opinions of the experts that were able to quantify theuncertainty. The left panel of this figure shows that the sources of uncertaintynumber 1 and 2, upstream discharge and main channel roughness predictor havethe largest contribution to the uncertainty in the model outcomes. Both the weightedaverage and the maximum value given by an expert are large compared to the otheruncertainties. The range of the individual expert opinions for the upstream discharge
Fig. 4 Quantitative results ofthe expert opinions for thedesign water level case.Average (+ symbols) andindividual expert opinions(open circles) are shown. Notethe difference in the scale ofthe vertical axes. The numberson the horizontal axis refer tothe uncertainty ID’s listed inTable 2
1 20
20
40
60
80
3 4 5 6 7 8 9 10 11 12 13 140
2
4
6
8
10
12
Uncertainty ID15 16
0
10
20
30
40
Identification and Quantification of Uncertainties in a Hydrodynamic River Model 613
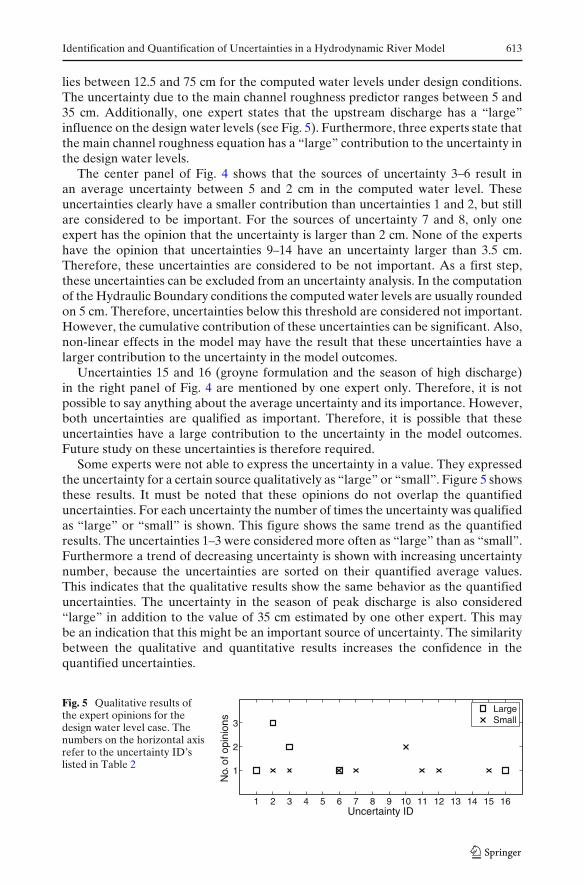
lies between 12.5 and 75 cm for the computed water levels under design conditions.The uncertainty due to the main channel roughness predictor ranges between 5 and35 cm. Additionally, one expert states that the upstream discharge has a “large”influence on the design water levels (see Fig. 5). Furthermore, three experts state thatthe main channel roughness equation has a “large” contribution to the uncertainty inthe design water levels.
The center panel of Fig. 4 shows that the sources of uncertainty 3–6 result inan average uncertainty between 5 and 2 cm in the computed water level. Theseuncertainties clearly have a smaller contribution than uncertainties 1 and 2, but stillare considered to be important. For the sources of uncertainty 7 and 8, only oneexpert has the opinion that the uncertainty is larger than 2 cm. None of the expertshave the opinion that uncertainties 9–14 have an uncertainty larger than 3.5 cm.Therefore, these uncertainties are considered to be not important. As a first step,these uncertainties can be excluded from an uncertainty analysis. In the computationof the Hydraulic Boundary conditions the computed water levels are usually roundedon 5 cm. Therefore, uncertainties below this threshold are considered not important.However, the cumulative contribution of these uncertainties can be significant. Also,non-linear effects in the model may have the result that these uncertainties have alarger contribution to the uncertainty in the model outcomes.
Uncertainties 15 and 16 (groyne formulation and the season of high discharge)in the right panel of Fig. 4 are mentioned by one expert only. Therefore, it is notpossible to say anything about the average uncertainty and its importance. However,both uncertainties are qualified as important. Therefore, it is possible that theseuncertainties have a large contribution to the uncertainty in the model outcomes.Future study on these uncertainties is therefore required.
Some experts were not able to express the uncertainty in a value. They expressedthe uncertainty for a certain source qualitatively as “large” or “small”. Figure 5 showsthese results. It must be noted that these opinions do not overlap the quantifieduncertainties. For each uncertainty the number of times the uncertainty was qualifiedas “large” or “small” is shown. This figure shows the same trend as the quantifiedresults. The uncertainties 1–3 were considered more often as “large” than as “small”.Furthermore a trend of decreasing uncertainty is shown with increasing uncertaintynumber, because the uncertainties are sorted on their quantified average values.This indicates that the qualitative results show the same behavior as the quantifieduncertainties. The uncertainty in the season of peak discharge is also considered“large” in addition to the value of 35 cm estimated by one other expert. This maybe an indication that this might be an important source of uncertainty. The similaritybetween the qualitative and quantitative results increases the confidence in thequantified uncertainties.
Fig. 5 Qualitative results ofthe expert opinions for thedesign water level case. Thenumbers on the horizontal axisrefer to the uncertainty ID’slisted in Table 2
1 2 3 4 5 6 7 8 9 10 11 12 13 14 15 16
1
2
3
Uncertainty ID
LargeSmall

614 J.J. Warmink et al.
4.3 Identification of Uncertainties in Effect Studies
Table 3 summarizes the identified uncertainties in the computation of effect studies.Only the largest eight uncertainties are shown. The experts identified in total 18different uncertainties. Next to the uncertainties in Table 3 they mentioned, forexample, the choices made by the modeller, the eddy viscosity parameter and themeasurements of the main channel bathymetry as uncertainties. However, theseuncertainties could not be quantified and only qualified by one or two experts. Forclarity, these results are not shown in the analysis. However, in addition to theseuncertainties the natural succession of vegetation is mentioned by four experts as alarge uncertainty. This uncertainty however could not be quantified and is thereforeomitted from this list as well.
4.4 Quantification of Uncertainties in Effect Studies
Figure 6 shows that about half of the experts that mentioned an uncertainty wereable to quantify it. Furthermore, more uncertainties are mentioned and quantified
Table 3 Identified sources of uncertainty in effect studies
ID Short name Description
1 Schematization FP vegetation The schematization of the vegetation in the floodplain area.This source of uncertainty comprises the uncertaintyin the measurements and the uncertainty due to thevariability within each class of vegetation
2 Groyne formulation The groyne formulation is uncertain, because groynesare modeled as weirs. Therefore, amongst others, the3D effects around the tip of the groynes are ignored
3 FP bathymetry measurements Measurements of the bathymetry in the floodplain area4 Weir schematization The schematization of the weirs is uncertain. This is caused
by the uncertainties in the measurements in the heights ofthe weirs. Also, steep slopes in the floodplain area arecomputed by means of a weir formulation if the slopeis above a certain threshold. This causes that energy lossesdue to some slopes are computed as weirs, while energylosses due to smaller slopes in the landscape are omittedFurthermore, the slopes classified as weirs are thenassumed to have a fixed slope
5 Weir formulation Formulation of the energy losses, due to acceleration anddeceleration of the water flow over weirs. The equationused for these weirs is empirically derived
6 FP roughness equation Empirical roughness equation that computes the energylosses due to vegetation and other objects in thefloodplain area
7 Discretization FP bathymetry Discretization of the bathymetry and vegetation onto a gridand vegetation
8 Discharge distribution FP–MC The discharge distribution between the floodplain an themain channel
FP represents floodplain and MC represents main channel. The uncertainties are sorted by decreas-ing uncertainty according to the average quantified expert opinions
Identification and Quantification of Uncertainties in a Hydrodynamic River Model 615
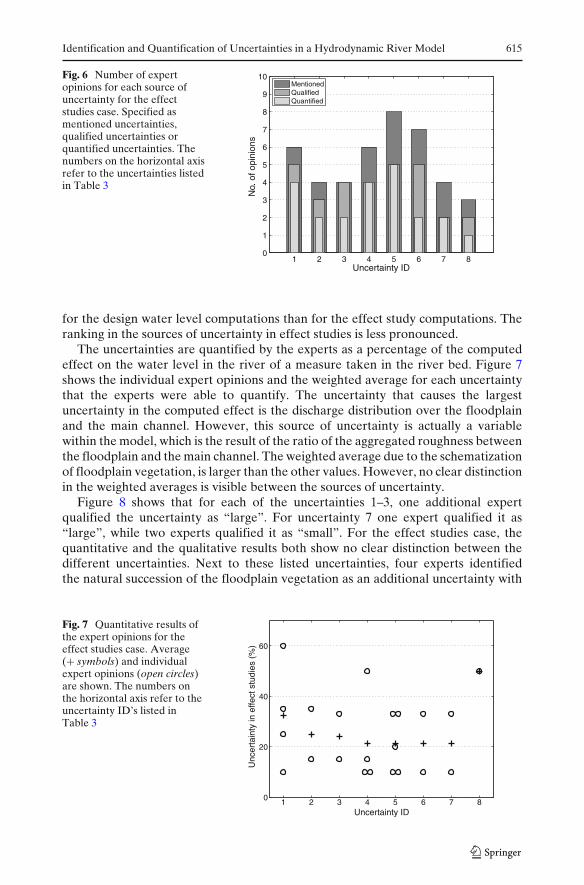
Fig. 6 Number of expertopinions for each source ofuncertainty for the effectstudies case. Specified asmentioned uncertainties,qualified uncertainties orquantified uncertainties. Thenumbers on the horizontal axisrefer to the uncertainties listedin Table 3
1 2 3 4 5 6 7 80
1
2
3
4
5
6
7
8
9
10
Uncertainty ID
MentionedQualifiedQuantified
for the design water level computations than for the effect study computations. Theranking in the sources of uncertainty in effect studies is less pronounced.
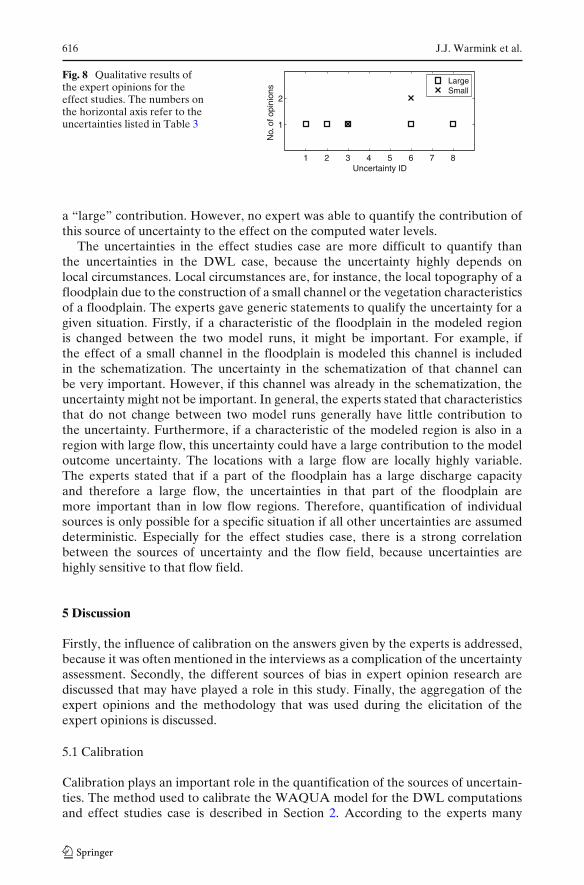
The uncertainties are quantified by the experts as a percentage of the computedeffect on the water level in the river of a measure taken in the river bed. Figure 7shows the individual expert opinions and the weighted average for each uncertaintythat the experts were able to quantify. The uncertainty that causes the largestuncertainty in the computed effect is the discharge distribution over the floodplainand the main channel. However, this source of uncertainty is actually a variablewithin the model, which is the result of the ratio of the aggregated roughness betweenthe floodplain and the main channel. The weighted average due to the schematizationof floodplain vegetation, is larger than the other values. However, no clear distinctionin the weighted averages is visible between the sources of uncertainty.
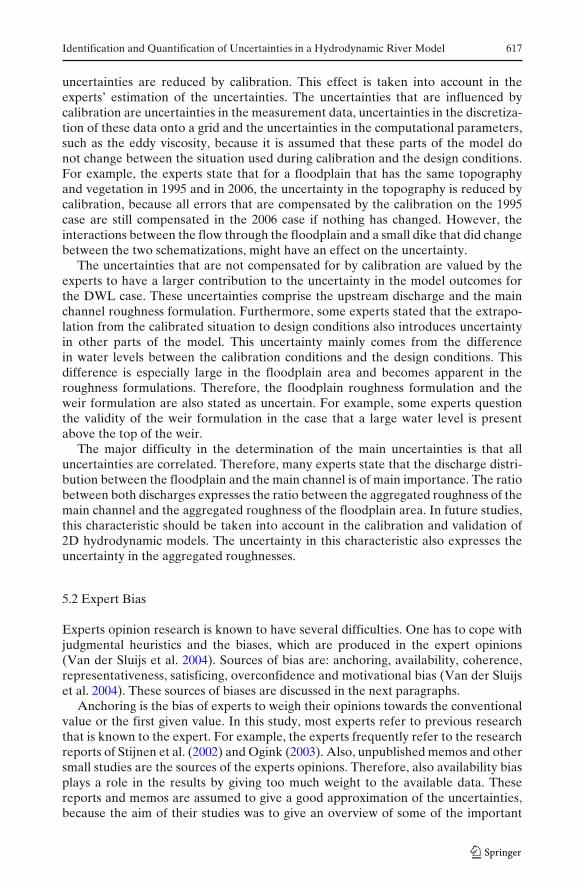
Figure 8 shows that for each of the uncertainties 1–3, one additional expertqualified the uncertainty as “large”. For uncertainty 7 one expert qualified it as“large”, while two experts qualified it as “small”. For the effect studies case, thequantitative and the qualitative results both show no clear distinction between thedifferent uncertainties. Next to these listed uncertainties, four experts identifiedthe natural succession of the floodplain vegetation as an additional uncertainty with
Fig. 7 Quantitative results ofthe expert opinions for theeffect studies case. Average(+ symbols) and individualexpert opinions (open circles)are shown. The numbers onthe horizontal axis refer to theuncertainty ID’s listed inTable 3
1 2 3 4 5 6 7 80
20
40
60
Uncertainty ID
616 J.J. Warmink et al.
Fig. 8 Qualitative results ofthe expert opinions for theeffect studies. The numbers onthe horizontal axis refer to theuncertainties listed in Table 3
1 2 3 4 5 6 7 8
1
2
Uncertainty ID
LargeSmall
a “large” contribution. However, no expert was able to quantify the contribution ofthis source of uncertainty to the effect on the computed water levels.
The uncertainties in the effect studies case are more difficult to quantify thanthe uncertainties in the DWL case, because the uncertainty highly depends onlocal circumstances. Local circumstances are, for instance, the local topography of afloodplain due to the construction of a small channel or the vegetation characteristicsof a floodplain. The experts gave generic statements to qualify the uncertainty for agiven situation. Firstly, if a characteristic of the floodplain in the modeled regionis changed between the two model runs, it might be important. For example, ifthe effect of a small channel in the floodplain is modeled this channel is includedin the schematization. The uncertainty in the schematization of that channel canbe very important. However, if this channel was already in the schematization, theuncertainty might not be important. In general, the experts stated that characteristicsthat do not change between two model runs generally have little contribution tothe uncertainty. Furthermore, if a characteristic of the modeled region is also in aregion with large flow, this uncertainty could have a large contribution to the modeloutcome uncertainty. The locations with a large flow are locally highly variable.The experts stated that if a part of the floodplain has a large discharge capacityand therefore a large flow, the uncertainties in that part of the floodplain aremore important than in low flow regions. Therefore, quantification of individualsources is only possible for a specific situation if all other uncertainties are assumeddeterministic. Especially for the effect studies case, there is a strong correlationbetween the sources of uncertainty and the flow field, because uncertainties arehighly sensitive to that flow field.
5 Discussion
Firstly, the influence of calibration on the answers given by the experts is addressed,because it was often mentioned in the interviews as a complication of the uncertaintyassessment. Secondly, the different sources of bias in expert opinion research arediscussed that may have played a role in this study. Finally, the aggregation of theexpert opinions and the methodology that was used during the elicitation of theexpert opinions is discussed.
5.1 Calibration
Calibration plays an important role in the quantification of the sources of uncertain-ties. The method used to calibrate the WAQUA model for the DWL computationsand effect studies case is described in Section 2. According to the experts many
Identification and Quantification of Uncertainties in a Hydrodynamic River Model 617
uncertainties are reduced by calibration. This effect is taken into account in theexperts’ estimation of the uncertainties. The uncertainties that are influenced bycalibration are uncertainties in the measurement data, uncertainties in the discretiza-tion of these data onto a grid and the uncertainties in the computational parameters,such as the eddy viscosity, because it is assumed that these parts of the model donot change between the situation used during calibration and the design conditions.For example, the experts state that for a floodplain that has the same topographyand vegetation in 1995 and in 2006, the uncertainty in the topography is reduced bycalibration, because all errors that are compensated by the calibration on the 1995case are still compensated in the 2006 case if nothing has changed. However, theinteractions between the flow through the floodplain and a small dike that did changebetween the two schematizations, might have an effect on the uncertainty.
The uncertainties that are not compensated for by calibration are valued by theexperts to have a larger contribution to the uncertainty in the model outcomes forthe DWL case. These uncertainties comprise the upstream discharge and the mainchannel roughness formulation. Furthermore, some experts stated that the extrapo-lation from the calibrated situation to design conditions also introduces uncertaintyin other parts of the model. This uncertainty mainly comes from the differencein water levels between the calibration conditions and the design conditions. Thisdifference is especially large in the floodplain area and becomes apparent in theroughness formulations. Therefore, the floodplain roughness formulation and theweir formulation are also stated as uncertain. For example, some experts questionthe validity of the weir formulation in the case that a large water level is presentabove the top of the weir.
The major difficulty in the determination of the main uncertainties is that alluncertainties are correlated. Therefore, many experts state that the discharge distri-bution between the floodplain and the main channel is of main importance. The ratiobetween both discharges expresses the ratio between the aggregated roughness of themain channel and the aggregated roughness of the floodplain area. In future studies,this characteristic should be taken into account in the calibration and validation of2D hydrodynamic models. The uncertainty in this characteristic also expresses theuncertainty in the aggregated roughnesses.
5.2 Expert Bias
Experts opinion research is known to have several difficulties. One has to cope withjudgmental heuristics and the biases, which are produced in the expert opinions(Van der Sluijs et al. 2004). Sources of bias are: anchoring, availability, coherence,representativeness, satisficing, overconfidence and motivational bias (Van der Sluijset al. 2004). These sources of biases are discussed in the next paragraphs.
Anchoring is the bias of experts to weigh their opinions towards the conventionalvalue or the first given value. In this study, most experts refer to previous researchthat is known to the expert. For example, the experts frequently refer to the researchreports of Stijnen et al. (2002) and Ogink (2003). Also, unpublished memos and othersmall studies are the sources of the experts opinions. Therefore, also availability biasplays a role in the results by giving too much weight to the available data. Thesereports and memos are assumed to give a good approximation of the uncertainties,because the aim of their studies was to give an overview of some of the important
618 J.J. Warmink et al.
uncertainties. However, these reports and memos only focused on a limited numberof uncertainties. Also, these documents are not easily available and only the involvedexperts know of their existence.
Coherence bias means that events are considered more likely if many scenarioscan be created that lead to an event, or if some scenarios are particularly coherent(Van der Sluijs et al. 2004). In this study coherence bias did not play a role, becauseonly a single scenario was considered. Representativeness bias is caused by placingconfidence in a single piece of information that is considered to represent a largerprocess and satisficing bias refers to the tendency to search through a limited numberof solutions and select the most appropriate. In this study these sources of biashave little influence on the results, because the case study was strongly framed bythe specific model and the experts were asked to indicate which part of this modelwas uncertain and to quantify this uncertainty. Therefore, the list of options wasconsidered equal for all experts.
Overconfidence is that experts tend to over estimate their ability to make quan-titative judgments. This bias is difficult for an individual to guard against (Van derSluijs et al. 2004) and probably played a role in this study. Overconfidence may resultin too narrow uncertainty bands (Cooke 1991). The effect of overconfidence in thisstudy is that the stated uncertainties may be smaller than the actual uncertainties.The uncertainties are therefore considered to be on the lower end of the “true”uncertainty.
Motivational bias probably was important during the interviews. The experts allhad their own area of expertise. For example, some experts had most experiencewith the input data used for the model. These experts had the tendency to give mostuncertainty to the part of the model with which they were most familiar. In thisstudy, there is no indication that a certain part of the model is better representedby the experts than other model parts. This gives confidence that most importantuncertainties are represented by several of the experts. This is shown in Figs. 3and 6 in which uncertainties 1–12 for the DWL are mentioned all approximatelyseven times, also the uncertainties for the effect studies are mentioned approximatelyseven times. Thereby, it is assumed that experts who were not familiar with a certaintopic omitted the uncertainty or stated a small value. This also has the effect that theaverage uncertainties are biased towards the lower end.
Furthermore, analysis of the results shows that there is a weak correlation(R2 = 0.22) between the Pedigree scores of the experts and the average quantifieduncertainty. This indicates that the experts with more expertise do not give higheror lower estimates of the uncertainty. Also, a weak correlation was found betweenthe high uncertainties and the experts. So, we may safely state that high values of theuncertainty cannot be attributed to one or a few experts only. The maximum valuesfor the uncertainties are stated by different experts, which means that most expertsdo not agree, which uncertainty is most important. However, the weighted averagevalues for the DWL case show that some uncertainties are more important.
5.3 Aggregation of Expert Opinions
Aggregations of expert opinions are prone to bias from the selection of experts andto the creation of the impression of consensus where none exists (Krayer von Krausset al. 2004). However, to facilitate the comparison of experts the weighted average of

Identification and Quantification of Uncertainties in a Hydrodynamic River Model 619
the values given by the experts is taken. It is not attempted to present the values assingle truth, but merely as an order of magnitude, which is similar to the significanceof the experts opinions. Nor is it attempted to give the impression of consensusamong experts. However, the discussion of biases in expert opinion elicitation aboveindicates that the the elicited uncertainties are more likely to be on the lower end ofthe “true” uncertainty.
The discussion of the appropriateness of aggregating expert opinions has a longhistory; see for example Cooke (1991) and Rowe (1992). In the discussion there aretwo camps, those who consider aggregation of expert opinion absurd and those whodo not. Krayer von Krauss et al. (2004) and Keith (1996) have the opinion that theappropriateness depends on the individual circumstances and what is meant to beaccomplished. Due to the objective selection of experts, the equal levels of detail ofthe uncertainties, the framed case study, and the aim to compare the uncertaintiesrelatively to each other, we argue that in this case, averaging of expert opinionsis valid.
We have shown that in accordance with Van der Sluijs et al. (2005b) and Krayervon Krauss et al. (2004) expert opinion elicitation can be a good method to identifyand, to a certain degree, quantify uncertainties. Including expert opinions in anuncertainty analysis is valuable in the first steps of an uncertainty analysis. Expertswere able to identify, rank and quantify to a certain degree the uncertainties in themodel outcomes of the WAQUA model. The main difference with the studies byVan der Sluijs et al. (2005b) and Krayer von Krauss et al. (2004) is that we use anobjective method to select the experts. This gives confidence that the outcomes ofthe expert interviews are reliable, because the results of an expert opinion study aresensitive to the selection of the experts (Van der Sluijs 1997).
The interviews with the experts have been conducted individually, which givesa good representation of the expert opinions and is good for the identification ofthe uncertainties by the experts. It is recommended to organize a workshop withall elicited experts to discuss the results and try to reach a consensus. However, inthis study it was not possible to organize the workshop, due to time limitations. Ifconsensus is reached during a workshop that will make the results more reliableand it can be used to further specify and quantify the uncertainties in the modeloutcomes.
The first objective of this study was to identify the different uncertainties theWAQUA model for the DWL and effect studies case. Tables 2 and 3 show that forboth cases the uncertainties are identified. By comparing the uncertainties statedby the different experts to each other clearly identified sources of uncertaintybecome clear. The distinction between the different uncertainties is strengthenedby the quantification, because for the quantification the uncertainties need to bewell-framed and unambiguous. The ranking of the uncertainties from important toless important is strengthened by the combination of qualitative and quantitativeinformation about the uncertainties.
Figure 4 shows that the weighted average values of the uncertainties have the sametrend as the maximum values. Also, the relative spreading in the expert opinions(the maximum minus the minimum divided by the average) has a constant valueof approximately 2 with a decrease in the average value for the uncertainty. Thissuggests that the weighted average value gives the correct trend in the expertsopinions. Therefore, we argue that it is valid to use the weighted average to aggregate
620 J.J. Warmink et al.
the expert opinions with the note that the average values can only be comparedrelatively and no consensus among the experts is suggested.
For the effect studies case, the quantitative and the qualitative results (Figs. 7and 8) both show no clear distinction between the different uncertainties. This isbecause for effect studies the uncertainties are dominated by local circumstancesand the local flow field. However, the experts stated that all uncertainties are in theorder of magnitude of 25% of the computed effect. Therefore, this can be considereda good approximation of the uncertainties in effect studies computations. Further-more, the uncertainties are dominated by the method to formulate, schematize anddiscretize weirs, bathymetry and vegetation. Therefore, to reduce the uncertaintiesin effect studies, these uncertainties need to be further addressed.
In this study we quantified the uncertainties in the outcomes of a two dimensionalriver model for different sources of uncertainties in the model. Although it is notpossible to give exact values for the uncertainty, the order of magnitude of theuncertainty due to different sources can be determined. We want to stress that itis not attempted to present the values as single truth, but merely as an order ofmagnitude, which is similar to the significance of the experts opinions.
We attempted to quantify the uncertainty of the different sources themselves,which is needed as input for an uncertainty propagation analysis. However, theexperts were not able to give a reliable estimate for the uncertainty of the differentsources. Therefore, in a future study, the uncertainties in the DWL and effect studiescase that have a large influence on the model outcomes, need to be quantified. Forexample, the experts were not able to give an uncertainty range for the roughnessin the main channel. This is due to the fact that the hydraulic roughness is not atruly physical parameter, but it is lumped and therefore, the experts cannot givereliable estimates. In a future study we will address this issue and try to quantify theuncertainty in the most important parts of the model. Subsequently, this uncertaintyis propagated through the model to yield the uncertainty of the computed waterlevels. These results will be compared to the experts opinions.
6 Conclusion
The aim of this study was to identify the sources of uncertainty that contributemost to the uncertainties in the model outcomes and quantify their contributionto the uncertainty in the model outcomes. The experts stated that the sourcesof uncertainties are different for the computation of the design water levels andeffect studies. In the design water level computations case, the uncertainties weredominated by the sources that do not change between the calibration and theprediction. The results from the experts opinions showed that the upstream dischargeand the empirical roughness equation for the main channel contribute most to theuncertainty in the design water levels. It was not possible to give exact values forthe uncertainty, however, the order of magnitude of the uncertainty due to differentsources of uncertainty could be determined.
Furthermore, the ranking of the uncertainties from important to less importantwas strengthened by the combination of qualitative and quantitative informationabout the uncertainties. For effect studies, the floodplain bathymetry, weir formu-lation and discretization of floodplain topography induces the largest uncertainty.
Identification and Quantification of Uncertainties in a Hydrodynamic River Model 621
However, the ranking for the effect studies case was less clear than for the designwater level case, because the uncertainties for effect computations are dominated bythe local flow field. The use of a Pedigree analysis assures an objective selection ofexperts and gives confidence that the outcomes of the expert interviews are reliable.
The contribution of the uncertainties to the model outcomes show that theuncertainties have a significant effect on the predicted water levels under designdischarge conditions and for effect studies. The experts were not able to quantifythe uncertainties themselves, only the contribution to the model outcomes. Futureresearch focuses on the quantification of the most important uncertainties and onthe propagation of these uncertainties to the model outcomes.
Acknowledgements This research is supported by the Technology Foundation STW, and thetechnology program of the Ministry of Economic Affairs. The authors thank all experts for theirtime and constructive input in the preparation stage and during the interviews.
Open Access This article is distributed under the terms of the Creative Commons AttributionNoncommercial License which permits any noncommercial use, distribution, and reproduction inany medium, provided the original author(s) and source are credited.
References
Ayyub BM (2001) Elicitation of expert opinions for uncertainty and risks. CRC Press, Florida, USA,ISBN 0-8493-1087-3
Bates PD, Horritt MS, Aronica G, Beven KJ (2004) Bayesian updating of flood inundation likeli-hoods conditioned on flood extent data. Hydrol Process 18(17):3347–3370. doi:10.1002/hyp.1499
Cooke RM (1991) Experts in uncertainty. Oxford University Press, Oxford, UK, ISBN 0-19-506465-8Cooke RM, Goossens LHJ (2000) Procedures guide for structured expert judgement in accident
consequence modelling. Radiat Prot Dosim 90(3):303–309Funtowicz SO, Ravetz JR (1990) Uncertainty and quality in science for policy. Theory and decision
library, series A, philosophy and methodology of the social sciences. Kluwer, Dordrecht, TheNetherlands, ISBN 0-7923-0799-2
Groenenberg H, Van der Sluijs JP (2005) Valueloading and uncertainty in a sector-baseddifferentiation scheme for emission allowances. Clim Change 71(1–2):75–115. doi:10.1007/s10584-005-5376-7
Hall JW, Solomatine D (2008) A framework for uncertainty analysis in flood risk managementdecisions. Journal of River Basin Management 6(2):85–98
Hall JW, Tarantola S, Bates PD, Horritt MS (2005) Distributed sensitivity analysis of floodInundation model calibration. J Hydraul Eng 131(2):117–126. doi:10.1061/(ASCE)0733-9429(2005)131:2(117)
Hunter NM, Bates PD, Horritt MS, Wilson MD (2007) Simple spatially-distributed modelsfor predicting flood inundation: a review. Geomorphology 90(3–4):208–225. doi:10.1016/j.geomorph.2006.10.021
Johnson PA (1996) Uncertainty in hydraulic parameters. J Hydraul Eng 122(2):112–114Keith DW (1996) When is it appropriate to combine expert judgements? Clim Change 33(2):139–144.
doi:10.1007/BF00140244Krayer von Krauss MP, Casman EA, Small MJ (2004) Elicitation of expert judgments of uncer-
tainty in the risk assessment of herbicide-tolerant oilseed crops. Risk Anal 24(6):1515–1527.doi:10.1111/j.0272-4332.2004.00546.x
Leendertse JJ (1967) Aspects of a computational model for long-period water-wave propagation.Ph.D. thesis, RM-5294-RR, Rand Corporation, Santa Monica, USA
Ministry of Transport, Public Works and Water Management (1995) Flood protection act. Ministryof Transport, Public Works and Water Management, The Hague, The Netherlands (in Dutch)
Morgan MG, Henrion M (1990) Uncertainty: a guide to dealing with uncertainty in quantitative riskand policy analysis. Cambridge University Press, Cambridge, UK, ISBN 0-521-36542-2
622 J.J. Warmink et al.
Ogink HJM (2003) Nauwkeurigheid toetspeilen. Tech. rep. Q3634, WL | Delft Hydraulics, Delft,The Netherlands (in Dutch)
Pappenberger F, Beven KJ, Horritt MS, Blazkova S (2005) Uncertainty in the calibration of effectiveroughness parameters in HEC-RAS using inundation and downstream level observations.J Hydrol 302(1–4):46–69. doi:10.1016/j.jhydrol.2004.06.036
Refsgaard JC, Van der Keur P, Nilsson B, Müller-Wohlfeil D, Brown J (2006a) Uncertainties in riverbasin data at various support scales - example from Odense pilot river basin. Hydrol Earth SystSci Discuss 3(4):1943–1985
Refsgaard JC, Van der Sluijs JP, Brown J, Van der Keur P (2006b) A framework for deal-ing with uncertainty due to model structure error. Adv Water Resour 29(11):1586–1597.doi:10.1016/j.advwatres.2005.11.013
Rijkswaterstaat (2007) Hydraulische randvoorwaarden primaire waterkeringen, voor de derdetoetsronde 2006–2011 (HR 2006). Tech. rep., Ministry of Transport, Public Works and WaterManagement, The Netherlands (in Dutch)
Rijkswaterstaat (2009) User’s Manual WAQUA, versie 10.97. Rijkswaterstaat, The Netherlands(in Dutch)
Rowe G (1992) Perspectives on expertise in the aggregation of judgments. Springer, US, Chap 7,pp 155–180, ISBN 978-0-306-43862-2
Stijnen JW, Kok M, Duits MT (2002) Onzekerheidsanalyse hoogwaterbescherming Rijntakken.Tech. rep. PR464, HKV Lijn in water/Rijkswaterstaat, The Netherlands (in Dutch)
Van den Brink NGM, Beyer D, Scholten MJM, Van Velzen EH (2006) Onderbouwing hydraulis-che randvoorwaarden 2001 voor de Rijn en zijn takken. Tech. rep. 2002.015, Rijkswaterstaat,The Netherlands ISBN 90-3695-322-7 (in Dutch)
Van der Keur P, Henriksen HJ, Refsgaard JC, Brugnach M, Pahl-Wostl C, Dewulf A, Buiteveld H(2008) Identification of major sources of uncertainty in current IWRM practice. Illustrated forthe Rhine basin. Water Resour Manage 22(11):1677–1708. doi:10.1007/s11269-008-9248-6
Van der Keur P, Brugnach M, DeWulf A, Refsgaard JC, Zorilla P, Poolman M, Isendahl N,Raadgever GT, Henriksen HJ, Warmink JJ, Lamers M, Mysiak J (2010) Identifying uncertaintyguidelines for supporting policy making in water management illustrated for Upper Guadianaand Rhine basins. Water Resour Manage. doi:10.1007/s11269-010-9640-x
Van der Klis H (2003) Uncertainty analysis applied to numerical models of bed morphology. Ph.D.thesis, Delft University of Technology, Delft, The Netherlands
Van der Sluijs JP (1997) Anchoring amid uncertainty, on the management of uncertainties in riskassessment of anthropogenic climate change. Ph.D. thesis, Utrecht University, Utrecht, TheNetherlands
Van der Sluijs JP (2002) A way out of the credibility crisis of models used in integrated environmentalassessment. Futures 34(2):133–146. doi:10.1016/S0016-3287(01)00051-9
Van der Sluijs JP (2007) Uncertainty and precaution in environmental management: insights fromthe UPEM conference. Environ Model Softw 22(5):590–598. doi:10.1016/j.envsoft.2005.12.020
Van der Sluijs JP, Janssen PHM, Petersen AC, Kloprogge P, Risbev JS, Tuinstra W, RavetzJR (2004) RIVM/MNP guidance for uncertainty assessment and communication: tool cata-logue for uncertainty assessment. Tech. Rep. NWS-E-2004-37, Copernicus Institute and RIVM,Utrecht/Bilthoven, The Netherlands, ISBN 90-393-3797-7
Van der Sluijs JP, Craye M, Funtowicz S, Kloprogge P, Ravetz J, Risbey J (2005a) Combiningquantitative and qualitative measures of uncertainty in model-based environmental assessment:the NUSAP system. Risk Anal 25(2):481–492. doi:10.1111/j.1539-6924.2005.00604.x
Van der Sluijs JP, Risbey JS, Ravetz J (2005b) Uncertainty assessment of VOC emissions frompaint in the Netherlands using the NUSAP system. Environ Monit Assess 105(1–3):229–259.doi:10.1007/s10661-005-3697-7
Van Velzen EH, Jesse P, Cornelissen P, Coops H (2003) Stromingsweerstand vegetatie in uiterwaar-den: deel 1 handboek versie–1 2003. RIZA report 2003.028, RIZA, The Netherlands (in Dutch)
Walker WE, Harremoës P, Rotmans J, Van der Sluijs JP, van Asselt MBA, Janssen PHM, Krayervon Kraus MP (2003) Defining uncertainty, a conceptual basis for uncertainty management inmodel–based decision support. Integr Assess 4(1):5–17
Wardekker JA, Van der Sluijs JP, Janssen PHM, Kloprogge P, Petersen AC (2008) Uncertaintycommunication in environmental assessments: views from the Dutch science-policy interface.Environ Sci Policy 11(7):627–641. doi:10.1016/j.envsci.2008.05.005
Warmink JJ, Janssen JAEB, Booij MJ, Krol MS (2010) Identification and classification of uncer-tainties in the application of environmental models. Environ Model Softw 25(12):1518–1527.doi:10.1016/j.envsoft.2010.04.011