
Expert judgement and re-elicitation for prion disease risk uncertainties
Upload
khangminh22Category
view
0download
0
A New Approach for Complex Problem Solving:
The Independent Systems Dynamics Elicitation Method
by
Elizabeth Byrd Holmberg
Department of Psychology
Duke University
Date:_______________________
Approved:
___________________________
Phil Costanzo, Co-Supervisor
___________________________
Blair Sheppard, Co-Supervisor
___________________________
Martha Putallaz
___________________________
Tim Strauman
___________________________
John Payne
Dissertation submitted in partial fulfillment of
the requirements for the degree of
Doctor of Philosophy in the Department of Psychology
in the Graduate School of Duke University
2010

ABSTRACT
A New Approach for Complex Problem Solving:
The Independent Systems Dynamics Elicitation Method
by
Elizabeth Byrd Holmberg
Department of Psychology
Duke University
Date:_______________________
Approved:
___________________________
Phil Costanzo, Co-Supervisor
___________________________
Blair Sheppard, Co-Supervisor
___________________________
Martha Putallaz
___________________________
Tim Strauman
___________________________
John Payne
An abstract of a dissertation submitted in partial fulfillment of
the requirements for the degree of
Doctor of Philosophy in the Department of Psychology
in the Graduate School of Duke University
2010

Copyright by
Elizabeth Byrd Holmberg
2010
iv
Abstract
The Systems Dynamics literature demonstrates that individuals have difficulty
understanding and working with systems concepts. To model Systems Dynamics (SD),
researchers suggest that clients contract with a modeling team to formulate the problem,
elicit the mental models of employees at the client, and use software-based simulation
tools. This approach is both time-intensive and costly, limiting its use by organizations.
This two-part study piloted the Independent Systems Dynamics Elicitation Method
(ISDEM), a new method that may be self-administered by teams to reveal individuals’
mental models. The first study, a between-subjects design, compared undergraduate
participants’ responses on the Systems-Based Inquiry Protocol (S-BI) to the ISDEM.
Participants reported more relationships and feedback loops using the ISDEM, and
obtained significantly higher Systemic Reasoning Level scores. In Study Two, groups of
undergraduate participants were asked to brainstorm and develop a collective model of
an issue of university interest, using either their typical brainstorming methods, or the
ISDEM. Independent coders rated the ISDEM significantly more informative, clear and
useful than the control models. In sum, the ISDEM did a significantly better job eliciting
individuals’ mental models of systems dynamics than traditional measures, and is a
valuable new tool for organizations to use to map systemic phenomenon.

v
Dedication
This is dedicated to my family. Thank you for your unending support and love.
vi
Contents
Abstract ......................................................................................................................................... iv
List of Tables .............................................................................................................................. viii
List of Figures ............................................................................................................................... ix
Acknowledgements ..................................................................................................................... xi
1. Introduction ............................................................................................................................... 1
1.1 Overview of Systems Thinking ...................................................................................... 1
1.2 Systems Dynamics and Corporate Strategy ................................................................. 8
1.3 Group Decision Making ................................................................................................ 11
1.4 Knowledge Elicitation and Mental Models ................................................................ 16
1.5 Development of the ISDEM .......................................................................................... 22
1.5.1 Example: Profit Margin vs. Asset Turnover .......................................................... 30
1.6 Validating the ISDEM .................................................................................................... 33
2. Study One ................................................................................................................................. 43
2.1 Methods ........................................................................................................................... 43
2.2 Procedure ......................................................................................................................... 43
2.3 Analyses ........................................................................................................................... 47
2.4 Results .............................................................................................................................. 49
2.5 Discussion ........................................................................................................................ 60
3. Study Two ................................................................................................................................ 71
3.1 Methods ........................................................................................................................... 71
vii
3.2 Procedure ......................................................................................................................... 71
3.3 Analyses ........................................................................................................................... 75
3.4 Results .............................................................................................................................. 76
3.5 Discussion ........................................................................................................................ 88
Conclusion ................................................................................................................................... 95
Appendix A................................................................................................................................ 104
Appendix B ................................................................................................................................ 108
Appendix C ................................................................................................................................ 109
1. Tables from Study One ................................................................................................. 109
2. Tables from Study Two................................................................................................. 110
Appendix D................................................................................................................................ 112
1. Models Coded at Level 0 .............................................................................................. 112
2. Models Coded at Level 1 .............................................................................................. 115
3. Models Coded at Level 2 .............................................................................................. 117
References .................................................................................................................................. 119
Biography ................................................................................................................................... 127

viii
List of Tables
Table 1: Means (Standard Deviations) for Difficulty, Engagement & Representativeness
of Knowledge Elicitation Methods ........................................................................................... 59
Table 2: Study Two Means (Standard Deviations) & T-Tests for Participant Ratings on
Group Dynamics ......................................................................................................................... 86
Table 3: Means (Standard Deviations) for Difficulty, Engagement & Representativeness
of Knowledge Elicitation Methods ........................................................................................... 92
Table 4: Means (Standard Deviations) and T-Tests for Variables, Relationships, Feedback
Loops, & Systemic Reasoning Levels ..................................................................................... 109
Table 5: Means (Standard Deviations) and T-Tests for Participant Ratings of Model
Performance ............................................................................................................................... 109
Table 6: Means (Standard Deviations) & T-Tests for Variables, Relationships & Behaviors
Not Represented in Models ..................................................................................................... 109
Table 7: Means (Standard Deviations) and T-Tests for Variables, Relationships, Feedback
Loops, & Systemic Reasoning Levels ..................................................................................... 110
Table 8: Means (Standard Deviations) and T-Tests for Participant Ratings of Model
Performance ............................................................................................................................... 110
Table 9: Means (Standard Deviations) & T-Tests for Variables, Relationships & Behaviors
Not Represented in Models ..................................................................................................... 110
Table 10: Means (Standard Deviations) & T-Tests for Model Quality Items .................... 111

ix
List of Figures
Figure 1: Sections 1 & 2 of the ISDEM ...................................................................................... 25
Figure 2: Section 3 of the ISDEM .............................................................................................. 26
Figure 3: Section 4 of the ISDEM: SD Notation & Example .................................................. 28
Figure 4: Section 1 and 2 of the Profit Margin/Asset Turnover Example ........................... 31
Figure 5: Section 3 of the Profit Margin/Asset Turnover Example ...................................... 31
Figure 6: Section 5 of the Profit Margin/Asset Turnover Example ...................................... 31
Figure 7: Coding Protocol for Systemic Reasoning Levels .................................................... 36
Figure 8: Coding Protocol for Quality of Models ................................................................... 41
Figure 9: Study One: Variables, Relationships & Feedback Loops Generated ................... 51
Figure 10: Study One: Mean Systemic Reasoning Level ....................................................... 52
Figure 11: Study One: Frequency of Systemic Reasoning Level by Condition .................. 52
Figure 12: Study One Participant Ratings: Thought Processes & Inner Models ................ 56
Figure 13: Study One Participant Ratings: Variables, Relationships & Behaviors Not
Represented ................................................................................................................................. 57
Figure 14: Study One Participant Ratings: Engagement ....................................................... 58
Figure 15: Study One Participant Ratings: Difficulty............................................................. 58
Figure 16: Percentage of Participants who achieved Systemic Reasoning Levels 3 & 4 in
the Booth Sweeney & Sterman (2007) Study & Current Study ............................................ 65
Figure 17: Study Two: Variables, Relationships & Feedback Loops Generated ................ 77
Figure 18: Study Two: Mean Systemic Reasoning Levels ..................................................... 78
Figure 19: Study Two: Frequency of Systemic Reasoning Level by Condition ................. 79

x
Figure 20: Study Two Participant Ratings: Thought Processes & Inner Models ............... 81
Figure 21: Study Two Participant Ratings; Engagement & Difficulty ................................. 82
Figure 22: Study Two Participant Ratings: Variables, Relationships & Behaviors Not
Represented ................................................................................................................................. 83
Figure 23: Study Two: Overall Model Quality ........................................................................ 84
Figure 24: Study Two: Informativeness, Clarity & Understandability of Models ............. 84
Figure 25: Study Two: Usefulness & Effectiveness of Models .............................................. 85

xi
Acknowledgements
To Phil Costanzo, thank you for being a constant source of support for the past
decade. You fostered my education and research: I would not be where I am today if
not for you. I will be forever impressed by your vast knowledge base and grateful for
your thoughtful perspective.
To Blair Sheppard, thank you for being the thought leadership on this project.
You continually challenged my thinking, and pushed me to consider things in novel
ways. You are a role model and inspiration, and I am honored that you took the time to
play such a critical role in my graduate experience.
For my other committee members, Martha Putallaz, Tim Strauman and John
Payne: you let me pursue the field in which I was most interested, and were excellent at
engaging in an off-beat topic. I appreciate this more than words can say.
Jean Bostick and Eugenia Wu: you were my anchors. Thank you for enriching
my life with joy.

1
1. Introduction
1.1 Overview of Systems Thinking
The Systems Thinking movement provides a critical counterpart to traditional linear
and scientific thought. In the face of complexity, we are taught to distill the whole into its
parts and examine each one independently (Booth Sweeney & Sterman, 2007). The scientific
method, the overarching protocol by which all natural and social sciences are conducted,
instructs experimenters to establish a main factor of interest, the dependent variable, and to
hold all other factors constant. In this way, the dependent variable may be systematically
varied and studied in isolation (Myers, 2004). While this method has provided for
incredible scientific advancement, its limitations are grossly apparent: the world does not
work this way. Variables do not function independently: they influence and are influenced
by the other dimensions of the system (Senge, 1990). Scientists have struggled to adapt the
scientific method to account for this hard truth. We now have statistical methods that may
model mediation and moderation, or the influence of multiple variables on a single
relationship and longitudinal designs that explore how relationships between variables
change over time, like time series analyses (Shadish, Cook, & Campbell, 2001). There is
even structural equation modeling, that allows multiple factors to be integrated into a single
construct (Hoyle, 1995). Methodologically, replication attempts to demonstrate that the
same relationship between variables exists across different environments and time periods
(Shadish, Cook, & Campbell, 2001), while the promulgation of efficacy versus effectiveness
2
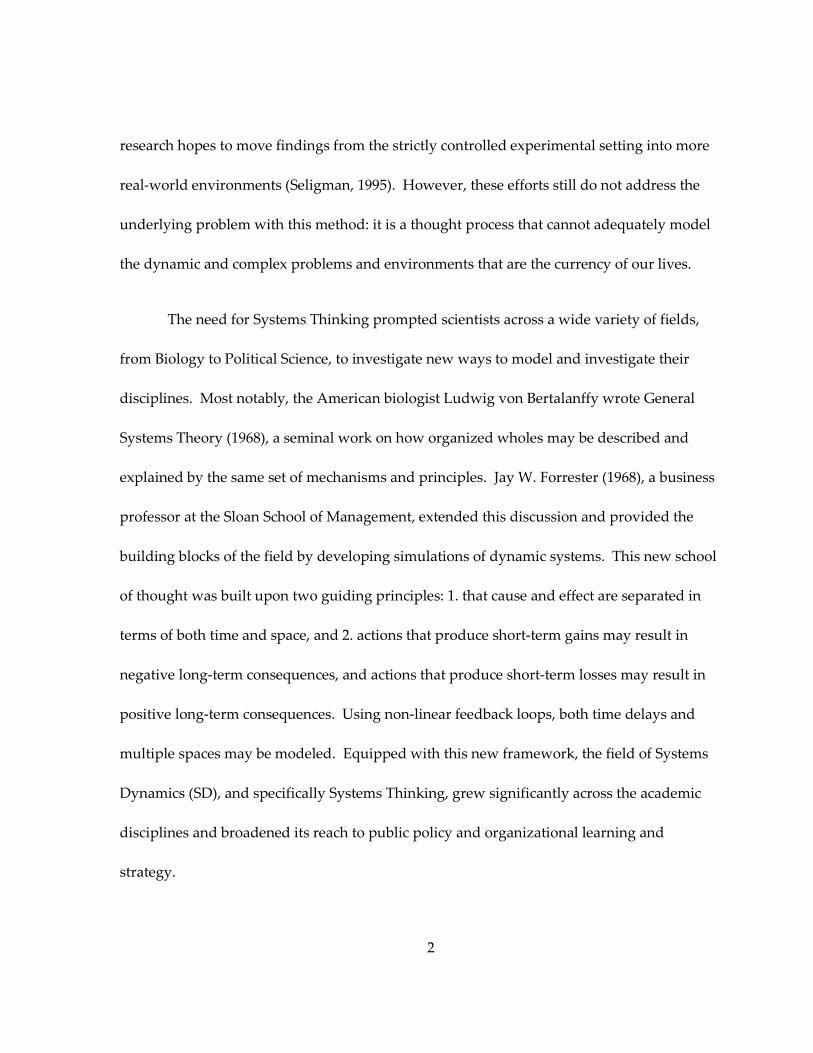
research hopes to move findings from the strictly controlled experimental setting into more
real-world environments (Seligman, 1995). However, these efforts still do not address the
underlying problem with this method: it is a thought process that cannot adequately model
the dynamic and complex problems and environments that are the currency of our lives.
The need for Systems Thinking prompted scientists across a wide variety of fields,
from Biology to Political Science, to investigate new ways to model and investigate their
disciplines. Most notably, the American biologist Ludwig von Bertalanffy wrote General
Systems Theory (1968), a seminal work on how organized wholes may be described and
explained by the same set of mechanisms and principles. Jay W. Forrester (1968), a business
professor at the Sloan School of Management, extended this discussion and provided the
building blocks of the field by developing simulations of dynamic systems. This new school
of thought was built upon two guiding principles: 1. that cause and effect are separated in
terms of both time and space, and 2. actions that produce short-term gains may result in
negative long-term consequences, and actions that produce short-term losses may result in
positive long-term consequences. Using non-linear feedback loops, both time delays and
multiple spaces may be modeled. Equipped with this new framework, the field of Systems
Dynamics (SD), and specifically Systems Thinking, grew significantly across the academic
disciplines and broadened its reach to public policy and organizational learning and
strategy.

3
Since its inception, leaders of the Systems Thinking movement have agreed that
people do not inherently possess Systems Thinking skills. Forrester (1971) originally opined
that the behavior of dynamic systems may only be fully understood with the use of
prescribed techniques and technological tools such as computer-generated simulations.
This judgment has since been empirically validated; specifically, in simulations of complex
environments, subjects with no experience in Systems Thinking demonstrated a complete
lack of its use in their decision-making behavior (Dorner, 1996). On problems specifically
designed to test Systems Thinking skills, business school students at an elite university did
not perceive or utilize simple systems concepts, such as time delays, stocks and flows, and
the changing levels of factors over time (Booth Sweeney & Sterman, 2000): these results
were then replicated in a sample of Australian business school students (Ossimitz, 2002).
To mitigate individual error in using Systems Dynamics, Sterman (2000) developed a
modeling process by which a team, in conjunction with SD experts, may both create and
implement an SD simulation model. He identifies six key steps to the process: 1. problem
articulation, 2. formulation of a dynamic hypothesis, 3. formation of a simulation model, 4.
testing, and 5. policy design and evaluation. To begin, a team must make clear the purpose
and question of the model. What is the problem? Identifying a specific question enables the
team to set boundaries on the model, in terms of the variables included, time horizon
evaluated, etc. The second stage, formulating a dynamic hypothesis, entails each individual
on the team expressing his/her own hypotheses. Through this method, mental models are

4
exposed and the team may generate a more complete picture of the interrelationships of
variables at play. In the third and fourth steps, the team develops and tests a simulation
model, going through several iterations as parameters are identified and scenarios are run to
produce a more refined, valid, and ultimately useful model. Then, based on the results from
this process, current policies may be evaluated and modified.
This method yields robust simulation models and rich insights (see Richardson,
1996; Cavana & Martin, 2008; Otto, 2008). Undertaken by a team of SD consultants working
collaboratively with a client organization, these projects can take anywhere from a few
months to a few years, contingent on the complexity of the original problem and the
thoroughness of the team (amount of data collection, number of iterations during simulation
development, etc.) (Sterman, 2000). As is imaginable, this is a costly and time-intensive
endeavor: one that is hard to justify and impractical in a business environment driven by
time-based competition.
This formative work was grounded in two assumptions: 1. that individuals are not
capable of thinking systemically, and 2. they require formal modeling methods conducted
by SD experts to use this type of inquiry. However, in the past several decades major
advancements in both cognitive and social psychology demonstrate the malleability of
human behavior and performance, and the powerful role that situational and environmental
factors play in the expression of a wide range of capabilities, both beneficent and maleficent.
For instance, in a well-recognized and powerful example, Stanley Milgram’s (1963)
5
controversial and compelling obedience experiments sought to understand the role of
explicit and implicit authority in individuals’ ability to create harm. Was obedience the
factor driving the horrific acts of violence and cruelty committed in Nazi Germany? The
study consisted of a confederate (the learner), the experimenter (the scientist) and a naïve
participant (the teacher). Under the auspices of a learning paradigm, the participant was to
help the ‘scientist,’ an experimenter dressed in a lab coat, teach the ‘learner’ on basic tasks,
using shocks to indicate when the learner was wrong. As the ‘lesson’ progressed, the
experimenter ordered that the shocks become more severe. The striking result was that 65%
of participants administered a life threatening shock to the learner when asked to do so by
the experimenter, whereas less than 2% of respondents polled believed that the participant
would do so. Thus, individuals are capable of actions far outside their realm of possibility
when given the appropriate environmental cues.
The field of cognitive –behavior therapy, and specifically its experimentally-
validated therapeutic techniques, have yielded similar insights. During the process of
cognitive therapy, clients examine thoughts and feelings that they experience in conjunction
with different stimuli. Together, the therapist and client examine the validity of these
thoughts and feelings, and when they are discovered to be exaggerated or unfounded, the
therapist and client create new thoughts and feelings that more appropriately match the
situation. Then, the next time the situation occurs, or the old thought or feeling pops up in
another unrelated situation, the client notices it, stops, and actively thinks the new thoughts

6
discussed in therapy (Beck, Rush, Shaw & Emery, 1979). Cognitive therapy has been
empirically validated for the treatment of depression (Dobson, 1989), obsessive-compulsive
disorder (van Oppen et al., 1995) and opiate dependence (Carroll et al., 1994), among other
disorders, and is a powerful tool for helping people change the way they approach
situations in their lives. Let us look at an example.
A hypothetical client states that his voice does not count and he feels worthless
because his boss passes over his comments in meetings. Through therapy, the therapist asks
him to recall other times that this boss has disregarded individuals, and the client talks
about how he took credit for another individual’s work and how he dismissed certain
questions during a company presentation. Together the client and therapist agree that a
more appropriate thought is probably ‘my boss does this to everyone.’ In the next meeting
then, when the client experiences the same rude behavior from the boss, he thinks back to
the conversation in therapy and reminds himself that, ‘my boss does this to everyone. I am
a valuable part of this team.’ This simple example demonstrates the power of cognitive
therapy to alter the way individuals interpret situations and problems. When the new
thought pattern takes hold in our hypothetical client, his thoughts may change as far as to
recognize the rudeness in another, and question from where that rudeness could have come
(problems at home, deadline at work, etc.). In conclusion, cognitive therapy provides the
tools for changing intrusive negative thoughts and feeling patterns into adaptive and
positive ones, and demonstrates that individuals can change the way they approach
7
problems. It is the purpose of this dissertation to apply psychological findings like these to
Systems Dynamics phenomena, to learn if there are similar mechanisms or cues that might
enhance individuals’ ability to approach complex problems from a systems perspective, as
cognitive therapy clients learn to approach their daily situations from a new, broader
perspective.
The literature reviewed above supports the hypothesis that perhaps SD capabilities
may be worked with instead of worked around, and this dissertation tests this hypothesis
through two studies. First, a knowledge elicitation method was designed to provide
individuals appropriate cues and questions to evoke their understanding of systemic
behavior. This method draws from several literatures, including cognitive neuroscience and
the knowledge elicitation subfield of the organization literature. To assess its ability to
accurately and coherently represent individuals’ understanding of systems phenomenon,
this method was piloted with Duke undergraduate students, and compared to the primary
knowledge elicitation technique used in the SD literature: the Systems-Based Inquiry
Protocol (S-BI) (Booth Sweeney & Sterman, 2007). The second study assessed the ISDEM’s
performance eliciting systemic behavior of a real world issue with a sample of university
undergraduates. Participants were split into groups of four: the control groups examined
the issue using their typical brainstorming and group decision processes, and the
experimental groups used the ISDEM and its guidelines for discussion. The issue was of
strategic import to the school, identified by talking with the Deans of Undergraduate

8
Education. The researchers decided to focus primarily on the use of this method for
strategy development, given the positioning of Systems Dynamics in the business literature
as a subfield of Corporate Strategy (see Sterman, 2000). This reasoning is described in
greater detail in the section below.
1.2 Systems Dynamics and Corporate Strategy
The 1990s saw the advent of a ‘New Economy:’ rapid technological innovation and
globalization that produced changes in markets and organizations (Hitt et al., 1998).
Alongside these events, strategy researchers began exploring critical factors for
organizational success that relate to both the efficiency of technology, and the complexity of
globalization (Volberda, 1998; Brown & Eisenhardt, 1998). Time-based competition
emphasized speed as a source of competitive advantage: the company that could minimize
the amount of time from product innovation to distribution would carry the lion’s share of
the market (Chung, 1999; Stalk, 1988). Through the construct of ‘dynamic capabilities’
(Teece et al., 1997; Zollo & Winter, 2002), the importance of time was applied to the
traditional, resource-based framework in which a firm is described as a unique collection of
capabilities (Barney, 1991; Mahoney & Pandian, 1992; Peterlaf, 1993). Whereas traditional
capabilities relate to processes like product design or client relationship management,
dynamic capabilities entail “adapting, integrating, and reconfiguring integrated clusters of
resources and capabilities to match the requirements of a changing environment”

9
(Schreyogg & Kliesch-Eberl, 2007). Essentially, dynamic capabilities seek to develop
alongside altering consumer preferences, industry trends and changes in the marketplace.
With increased emphasis on the dynamism of the business environment and the
trend towards globalization of companies and industries, researchers began exploring a
systems approach to strategy (Miles & Snow, 1992). Milgrom and Roberts (1995) coined the
popular notion of ‘complementarities,’ or the related, interdependent nature of
organizational phenomena. In this model, organizational performance is driven by changes
in many, complementary processes, and should be approached as thus. For example, the
success of a product innovation relies not only on its own design, but on manufacturing
variables like processing time and quality, and sales and marketing practices. Real Options
theory advanced this framework by integrating the external environment into the model,
and examining it over time, as described in the example below. Leslie and Michaels (1997)
urged the business community to move past traditional valuation models for assessing
capital investments and other strategic initiatives, such as Net Present Value and Internal
Rate of Return. They proposed that an investment needs to be considered in terms of the
opportunity that it will afford in the future.
For example, an oil company considering whether or not to sell a plot of land would
traditionally conduct a Net Present Value analysis whereby the current revenues and costs
of mining, determined by current industry demand and mining technology, are projected
out several years and discounted for the rate that the money could have returned were it to
10
be invested in the financial markets (Ross, Westerfield & Jordan, 2003). Real Options
Theory argues that the valuation needs to include the projected demand of oil, and
prospects for technological advancements that may enhance the operating efficiency of
mining: both of which will increase the profitability of the land over the years. Thus,
companies may choose to invest in the ‘option’ to mine the oil at a later date. Integral to this
analysis are the interdependencies between these different aspects of business, from R&D to
market analysis to current operations, the presence of time delays and the opportunities
they may afford (Kogut & Kulatilaka, 2001).
It was during this time that strategy researchers began exploring the use of Systems
Dynamics Modeling, a methodology for identifying and graphically representing
interdependent relationships among variables over time (Forrester, 1968), to model the
strategy concepts of Complementarities, Real Options and Dynamic Capabilities (Sterman,
2000). Peter Senge (1990) brought the notion of systemic behavior to the general public with
his publication of the national bestseller, The Fifth Discipline. Currently, most of the major
business schools, from MIT Sloan School of Management to the London Business School,
offer SD coursework as part of their Strategy curricula. Given this placement of Systems
Dynamics in the business literature, it was critical to test new methods of eliciting SD
information on strategic issues. The second study of this dissertation conducted these
analyses.

11
It is our empirical viewpoint that to understand how a knowledge elicitation method
might work, one must acknowledge and account for the factors implicated in its use. For
example, organizational strategy work is inherently a team process: whether brainstorming
scenarios or vetting an innovative new idea, strategy decisions are most often made in
groups (Child, 1972; Hambrick & Mason, 1984). Thus, the group decision making literature
was reviewed to learn the situational factors that influence decision making. Given the
scope of this inquiry, only the two primary, overarching theoretical frameworks were
reviewed: these focus specifically on when, how and under what circumstances group
decision making fails. This literature then informed the design of the new knowledge
elicitation method, to mitigate these empirically-demonstrated negative effects through
structural or procedural means.
1.3 Group Decision Making
The causes of poor problem solving outcomes may be split into two constructs: 1.
error, whereby the intended outcome is not achieved, and 2. bias, whereby decision making
deviates from what normative decision making models would suggest (Duffy, 1993). Error
may result from any stage of the problem solving process: data collection, analysis, group
discussion, the drawing of conclusions and planning of next steps. Researchers point to the
bounded rationality theory (Simon, 1955), defined as the limited information processing
capabilities of individuals and their reliance on heuristics, as a main driver of problem
solving error. Another significant and related factor driving error are biases, when
12
individual or group judgments, behaviors and/or attitudes are altered as a result of the real
or implied presence of others (see Baron, 1994). In the real presence of others, biases occur
when the behavior of the group influences an individual’s perspective. This is termed social
influence bias. The implied presence of others relates to social projection bias, or the need to
make assumptions about the opinions and ideas of other team members and implicated
groups (Jones & Roelofsma, 2000). The next section explores the most common examples of
social influence and social projection bias, and assesses the implications of this work for the
development of the ISDEM. A fundamental aim of the instrument is to address the negative
effects demonstrated in group problem solving scenarios, mitigating them through an
innovative design and administration structure.
The most widely cited example of social influence bias, groupthink (Janis, 1972), was a
ground-breaking contribution to the decision making literature. This theory identifies the
“mode of thinking that people engage in when they are deeply involved in a cohesive in-group,
when the members’ striving for unanimity override their motivation to realistically appraise
alternative courses of action.” A substantial body of research has identified the underlying
mechanisms of groupthink, including cohesiveness and insulation from experts (Moorhead,
1982). Sundstrom and colleagues (1990) demonstrated that group autonomy, or making
decisions with little outside help, is characteristic of high-ranking teams in organizations and
corporate governance boards, and significantly contributes to the experience of groupthink.
Symptoms of groupthink include: a sense of invulnerability, or the willingness to take increased
13
risks, rationalization, or the discounting of negative feedback, pressure on those who dissent,
self-censorship among team members and the illusion of unanimity (Moorhead, Ference &
Neck, 1991). These symptoms result in the negative effects of groupthink, including the
consideration of few alternatives, no re-examination of alternatives, rejection of negative
information or expert opinion, and a lack of contingency plan development, since there is little
discussion of possible consequences. Two other factors moderate the outcome of groupthink
scenarios: time and leadership style. Under time constraints groups are more likely to engage
in groupthink behavior (Neck & Moorhead, 1995), and leaders may use reward and punishment
to bias the opinions and recommendations of team members, or use the voice of others in power
to support their opinion and pressure the group to acquiesce (Flower, 1977). Thus, social
influence bias is a very real and powerful factor in organizational problem solving that can
yield significant negative effects.
Unlike social influence bias, that occurs when individuals interact, social projection
bias entails perceiving and inferring how other individuals or target groups think, and why.
The most widely cited example of social projection bias is the False Consensus Effect (FCE;
Ross, Greene & House, 1977), defined as the propensity for individuals to overestimate the
degree of similarity between the self and others. This similarity manifests in the definition
of popular concepts, like ambiguous terms such as risk or benefit, interpretations of the
problem and the problem space, and the appropriate actions and conclusions. The construct
is measured relatively, as the mean percentage of votes for Position A made by individuals

14
espousing Position A minus the mean percentage of votes for Position A made by
individuals espousing Position B. This calculation does not indicate whether the Position is
accurate or inaccurate, or if the direction of the bias is negative or positive. A meta-analysis
of 115 studies demonstrates that this effect is highly reliable and moderate in size (Mullen et
al., 1985).
Predictors of the False Consensus Effect are informational and psychological in
nature. Psychologically, individuals tend to perceive others as having similar views when
the issue involves a threat to self (Sherman et al., 1984). For example, individuals who live
with a same-sex partner may overestimate the number of others who support legalizing
same-sex marriage. Individuals are also motivated to assume that liked others are like-
minded, and that they have areas of shared understanding (van der Pligt, 1984). From an
information perspective, having insufficient or partial information increases the likelihood
of FCE, as do time demands that require immediate action. These are oftentimes the
circumstances that problem solving groups encounter, and it is logical that discussion and
sharing of actual opinions and beliefs among team members would help to dispel the
prevalence and strength of social projection biases.
Though their discussion is outside the scope of this inquiry, other critical factors to
the successful functioning of teams are group norms, or habituated ways of interaction and
performance (Moorhead, 1982), task characteristics, or the set-up and conducting of the
problem solving task (Callaway & Esser, 1984), and the stage of group development (Leana,
15
1985). The findings on group development are equivocal: some research demonstrates that
well developed groups experience more cohesiveness and greater shared attitudes and
views, whereas other studies show that individuals in well developed groups exhibit a level
of comfort that enables them to offer and discuss dissenting points of view (see Leana, 1985).
Others have studied group behavior at the individual level: Packer (2009) revealed that
strongly identified members of the group were more willing to dissent and raise concerns
than weakly identified members, who tended to remain silent. Thus, many psychological,
informational and structural factors contribute to the experience of bias and error in group
decision making.
Several overarching principles become apparent through this brief review of the
group decision making literature. First, biases, and consequently error, arise from the
processing of limited information, at both the individual and group level. There is an
interpretive element to personal experience and data analysis, and these interpretations may
be grossly flawed. Second, errors tend to arise when groups fail to explore alternative
hypotheses and outcomes. This effect is especially apparent in groups for which the leader
takes a power position, seeking to influence team members’ opinions and limiting the
amount of conversation on ideas other than his/her preferred theory (Moorhead, Ference &
Neck, 1991). Third, it is possible to manipulate structural factors in a way to mitigate error.
For example, Bruggink (1985) analyzed 23 fatal aircraft accidents to learn that 65% were
caused by policy procedures. Many studies demonstrate that small groups (3-4 individuals)

16
share more information and divide resources more equitably than large groups (8-12
individuals) (Cruz, Boster, & Rodriguez, 1997; Allison, McQueen, & Schaerfl, 1992). These
principles were taken into consideration in the development of the ISDEM.
1.4 Knowledge Elicitation and Mental Models
The next section of this dissertation reviews the mental model and knowledge
elicitation literatures that guide the main structure and process of the ISDEM. Findings
from the group decision making and cognitive neuroscience literatures also informs the
methodology to mitigate negative group effects and maximize individuals’ ability to discern
factors and their relationships. It was a goal of the research group to apply and use
empirically-validated knowledge elicitation procedures in the development of this new
method, such that this inquiry builds upon these existing literatures, capitalizing on
previously validated techniques and advancing the literature to include SD knowledge
elicitation.
The prevailing definition of ‘mental model’ is a mental representation of the factors
and relations in a problem or situation, that the reasoner develops using their general
knowledge and experience (Johnson-Laird, 1983; 2001). These models are spatial rather than
visual, meaning that they are structured as diagrams instead of images, and may be static or
kinematic, depending on the problem. In the strategy literature, mental models related to
an organization and its functions are described as ‘business models,’ and represent
managers’ innate understanding of how different business factors relate to each other

17
(Merchant, 2007). As Henry Mintzberg (1990) recalls, “thus the strategic data bank of the
organization is not in the memory of its computers but in the minds of its managers.”
Along with research and financial data, business models serve a primary role in strategy
analysis, for the creation and development of strategic initiatives, and in the cross-checking
and validation of the operations involved and their forecasted effects (Franco-Santos et al.,
2007). Since organizations typically use teams to develop organizational strategy, it follows
that a majority of models are revealed and discussed in group settings. The group decision
making literature was reviewed earlier to expose the critical factors involved in how mental
models are explored, discussed and manipulated in group settings.
Knowledge elicitation techniques have been designed at both the individual and
group level. A standard example of group knowledge elicitation is ‘brainstorming,’
whereby team members share ideas, discuss each other’s thinking and collaborate on a
common output (Bryson, Ackerman, Eden & Finn, 2004). Individual knowledge elicitation
techniques, also referred to as noninteracting, or ‘nominal’ group techniques, entail
individuals articulating their mental models independently, via interviews or
questionnaires (Richmond, 1987). Substantial research demonstrates that the quality and
variety of ideas generated through nominal techniques are significantly higher than those
generated through structured group processes (Lamm & Trommsdorf, 1973; Diehl &
Stroebe, 1987). Based on these findings, several researchers have developed paradigms by

18
which Systems Dynamics modelers may engage a client team to create collective, causal
maps, as reviewed below.
Dalkey (1969) designed the earliest methodology described, Delphi, to capitalize on
the collective knowledge of a group of experts, while mitigating the negative effects of
interacting groups, including groupthink (Janis, 1972). Traditionally used in technology
forecasting and policy issues (Linstone & Turoff, 1975), this method is a three step process:
1. individuals complete a standard questionnaire testing their understanding of key
operants in a policy issue or industry, 2. the modelers collect and synthesize the data from
the questionnaires, and 3. the aggregated data are presented to the individuals for
comments, reflections and reactions. This iterative process continues until a level of
consensus or stability of response patterns has been achieved. The Nominal Group
Technique (NGT; Delbecq & Van de Ven, 1971) differs from the Delphi in that it is
conducted in a group setting. Formal questionnaires are usually not developed for an NGT
session: typically, individuals write down their free-form ideas on pieces of paper. Each
member then shares their ideas and rationale, and these are recorded on flip charts or wipe
boards in the room. Every idea is then discussed by the group for clarification and
evaluation, and rank-ordered for importance. The Nominal Group technique outperforms
the Delphi in idea generation and participant satisfaction (Van de Ven & Delbecq, 1974);
however, it is much more expensive. The participants put in far less work, resulting in the
modeling team having to do most of the heavy lifting. Indeed, it takes participants half to a
19
third less time to complete the NGT compared to the Delphi, and the amount of time it takes
the modeling team is twice as high, thereby doubling the cost (Delbecq, Van de Ven &
Gustafson, 1975).
A similar approach called Social Judgment Analysis builds off of these processes by
incorporating a step in which individuals discuss the differences in their ideas and thought
processes in the group setting (Gustasfon et al., 1973). In this manner, the group
consensually arrives at a collective outcome, and no rank ordering or ratings scales need to
be used. These procedures significantly advanced the knowledge elicitation literature,
bringing structure to standard brainstorming sessions and providing a basis on which to
evaluate the relative merits of different methodologies. They were the hallmarks of
knowledge elicitation for several decades, before advancements in technology, statistics and
data collection, propelled the field forward. With the tools to quantitatively model causal
relations, such as time-series analyses and structural equation modeling, causal map
diagramming became more common, and the knowledge elicitation field sought to develop
techniques to elicit this information.
In the first and most comprehensive effort of its kind, Vennix and Gubbels (1992)
constructed a process whereby an SD team may work collaboratively with a client group to
create a collective, causal map diagram. First, the SD team meets with key members from
the client group to develop a preliminary causal model that incorporates key factors of the
issue and their hypothesized interrelationships. This meeting entails a quick description of

20
causal map diagramming and the format, and then the SD team leads the client through the
process step-by-step, from generation of the variables and discussion of their
interrelationships, to creating the associated diagram. Second, the SD team develops a
questionnaire that uses this initial model to assess client group participants’ understanding
of the relationships in the initial model, and queries them for any other additional factors
not yet articulated. For example, a hypothetical item may be: “When the number of
suppliers increases the bargaining power of the manufacturer increases.” Participants
indicate on a three-point scale whether they agree, partially agree, or disagree, and then
describe why. It is in this section that other factors may be revealed, such as the relative
importance of the manufacturer as a client for suppliers, the commoditization of their
goods, and so forth. These questionnaires are returned and the SD modeling team
aggregates the information, developing a causal map diagram that reflects the newly
acquired information. Third, participants are invited to comment on this model: altering or
building upon it. They then attend a workshop during which they discuss their most recent
comments and together develop a collective causal map that integrates the individuals’
perspectives. While the authors indicate that this process requires participants to devote 8-
10 hours of time to complete the questionnaires and workshop, they also confess that the
modeling team’s responsibilities took several years to complete (Vennix et al., 1990). As
with the Nominal Group Technique, this method seeks to minimize the amount of time
required of the client participants; as a consequence, it draws heavily on the time and

21
investment of the modeling team, resulting in costly consulting fees. Thus far, no
independent research groups have evaluated this method, or compared it to other
techniques.
The next two techniques stem from the causal mapping literature, and focus
specifically on eliciting an individual’s causal map diagrams using a paper-based or
computer-program format. In the pairwise comparisons approach (Markoczy, 1995, 1997),
individuals examine a list of variables and describe the causal relationship between these
variables, in terms of direction (X to Y/Y to X), form (positive/negative) and strength (weak,
moderate, strong). Though not queried directly, it is possible to derive a graphical causal
map diagram based on an individual’s response set. In the second technique, freehand
mapping (Green & McManus, 1995; Hodgkinson & Maule, 2002), individuals consider a list
of provided variables, and then create a diagram of the causal relationships between them
using a standardized format. Evaluative studies indicate that pairwise comparisons result
in complex maps: this technique yielded five times more causal links between nodes than
diagrams generated through freehand mapping (Hodgkinson, Maule & Bowne, 2004).
However, participants rated freehand mapping more engaging, less difficult and more
representative of their implicit models than the pairwise approach. These methods are
applied to build the primary components of the ISDEM, as explained below.

22
1.5 Development of the ISDEM
Several criteria structured the development of the Independent Systems Dynamics
Elicitation Method (ISDEM). First, it must be possible for an organizational team to
implement the ISDEM directly, without the facilitation of a SD modeling group. It should
be structured in a way that mitigates the influence the team leader has; put differently, the
development and expression of individual’s causal maps should happen freely and openly.
For causal map diagramming to be used systematically across an organization, it needs to be
widely accessible, adaptable to a wide range of tasks, and easy to administer and conduct.
Employees should view it as a standard operational framework, rather than a project
entailing significant financial resources and approval from senior management to execute.
The second criterion for the ISDEM is to incorporate findings on attention and
information processing from the cognitive neuroscience literature to form its structure and
process. Specifically, researchers in cognitive neuroscience have advanced theories and
methodologies to study how the brain processes cognitive tasks. Studies demonstrate that
the brain engages in both parallel and serial processing, whereby tasks are conducted
simultaneously or one at a time, respectively. Examined using behavioral experiments, the
‘bottleneck theory’ (Paschler, 1994) suggests that perceptual and response operations occur
in parallel, and a centralized decision stage, that coordinates sensory and motor operations
and engages in information processing, functions serially, creating a ‘bottleneck’ of
information and outputs. This theory has been explored using functional magnetic

23
resonance imaging (Dux et al., 2006; Kim et al., 2007), to demonstrate that a key area of
delayed activity is the prefrontal cortex. Since this area is greatly implicated in complex
problem solving, the researchers conclude that their results represent an information
processing bottleneck (Goel & Dolan 2001; Knauff et al., 2002). It is hypothesized that given
serial processing constraints, it is beneficial for individuals to engage in complex problem
solving tasks in a step-by-step, logical manner that enables them to focus specifically on
each component of the problem, integrating this knowledge into a complete model only
after every variable and relationship has been considered singularly. This finding also
explains the relative effectiveness of the pairwise comparison approach to the freehand
mapping approach in yielding more complete maps, with more causal links between nodes
(Hodgkinson, Maule & Brown 2004). It capitalizes on the serial nature of information
processing, asking individuals to evaluate each variable, relationship and their
characteristics, individually.
The third criterion for ISDEM development is to develop a measure that builds from
advancements in the knowledge elicitation literature, as opposed to simply repeating them.
It is important not to reinvent the wheel, especially given the robust empirical literature on
the effectiveness of different methods, as reviewed earlier. When breaking down the
process of Systems Dynamics modeling, many researchers use a two step process (see
Vennix & Gubbels, 1992): 1. the problem is defined, information collected, and a rough
model is built using a causal map diagram, and 2. the diagram is translated into a computer-

24
based simulation, that is run through iterations of scenarios to assure its validity and
robustness. In this context, a causal map diagram is a simple, graphical depiction of the
causal relationships between variables using arrows and a plus or minus sign designation to
represent positive or negative causality, respectively (Evans, 2005). Researchers
demonstrate that a majority of the learning achieved during this two-step process occurs
during the first, when key stakeholders expose and explore their mental models, and
develop a causal map diagram to represent the problem space (De Geus, 1988; Vennix,
1990). Since the purpose of the ISDEM is to stand as a valuable, adaptive and cost-effective
alternative to traditional SD modeling, this method focuses specifically on Step One, or the
creation of causal map diagrams.
Now we will outline the measure, and the reasoning behind the steps. Given the
benefits of eliciting information nominally (Lamm & Trommsdorf, 1973; Diehl & Stroebe,
1987), and the effectiveness of the pairwise comparison approach for generating variables
and relationships, the first component of the ISDEM is a nominal measure that employs the
pairwise comparison approach to assess the factors and relationships implicated in the
issue. First, participants are asked to write the principle research question at the top of the
page (see Figure 1). This step is critical in that it offers an opportunity for the group to
clarify the exact question that they would like to answer. The sociobiologist E. O. Wilson
(1998) put it succinctly when he said: “The right answer to a trivial question is also trivial,
but the right question, even when insoluble in exact form, is a guide to major discovery.” If

25
the group does not confirm the question, much can be discerned from the differing
questions inscribed at the top of the page. From the wording used by participants,
differences in opinion about the problem space and the appropriate domains to be
examined are exposed, and these points may yield fruitful conversation as participants
explore and integrate individuals’ perceptions of the problem at hand.
Second, individuals independently brainstorm and list all variables they perceive to
be related to the issue. This section maps to the preliminary brainstorm sessions conducted
in the knowledge elicitation approaches described above, and a truncated version of this
section is provided in Figure 1. The next section asks participants to pair the variables, and
indicate the direction, form and strength of the associations between them (see Figure 2).
This task completes the first part of the paradigm.
THE PROBLEM:
Name as many variables as you can that influence or are influenced by the above
situation:
__________________________________ __________________________________
__________________________________ __________________________________
__________________________________ __________________________________
Figure 1: Sections 1 & 2 of the ISDEM
26
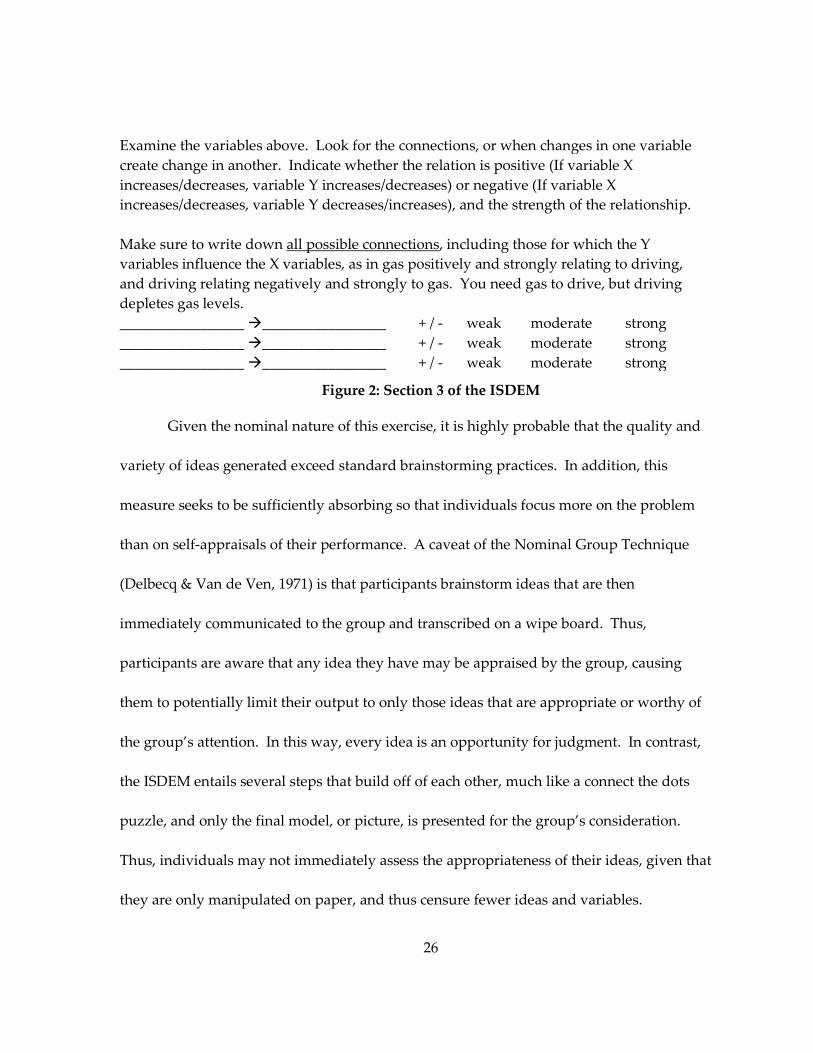
Examine the variables above. Look for the connections, or when changes in one variable
create change in another. Indicate whether the relation is positive (If variable X
increases/decreases, variable Y increases/decreases) or negative (If variable X
increases/decreases, variable Y decreases/increases), and the strength of the relationship.
Make sure to write down all possible connections, including those for which the Y
variables influence the X variables, as in gas positively and strongly relating to driving,
and driving relating negatively and strongly to gas. You need gas to drive, but driving
depletes gas levels.
_________________ �_________________ + / - weak moderate strong
_________________ �_________________ + / - weak moderate strong
_________________ �_________________ + / - weak moderate strong
Figure 2: Section 3 of the ISDEM
Given the nominal nature of this exercise, it is highly probable that the quality and
variety of ideas generated exceed standard brainstorming practices. In addition, this
measure seeks to be sufficiently absorbing so that individuals focus more on the problem
than on self-appraisals of their performance. A caveat of the Nominal Group Technique
(Delbecq & Van de Ven, 1971) is that participants brainstorm ideas that are then
immediately communicated to the group and transcribed on a wipe board. Thus,
participants are aware that any idea they have may be appraised by the group, causing
them to potentially limit their output to only those ideas that are appropriate or worthy of
the group’s attention. In this way, every idea is an opportunity for judgment. In contrast,
the ISDEM entails several steps that build off of each other, much like a connect the dots
puzzle, and only the final model, or picture, is presented for the group’s consideration.
Thus, individuals may not immediately assess the appropriateness of their ideas, given that
they are only manipulated on paper, and thus censure fewer ideas and variables.
27
This approach also enables individuals to thoughtfully consider each of the
relationships at hand. Crafting systems diagrams is difficult due to their sheer complexity
and detail: this method provides individuals a step-by-step approach to thinking through
the relationships. Participants record each relationship independently and spend time
considering their strength and direction. It is hoped that this logical, easy-to-follow process
ultimately results in more accurate, thorough and well conceptualized depictions of an
individuals’ knowledge than standard brainstorming or freehand mapping approaches.
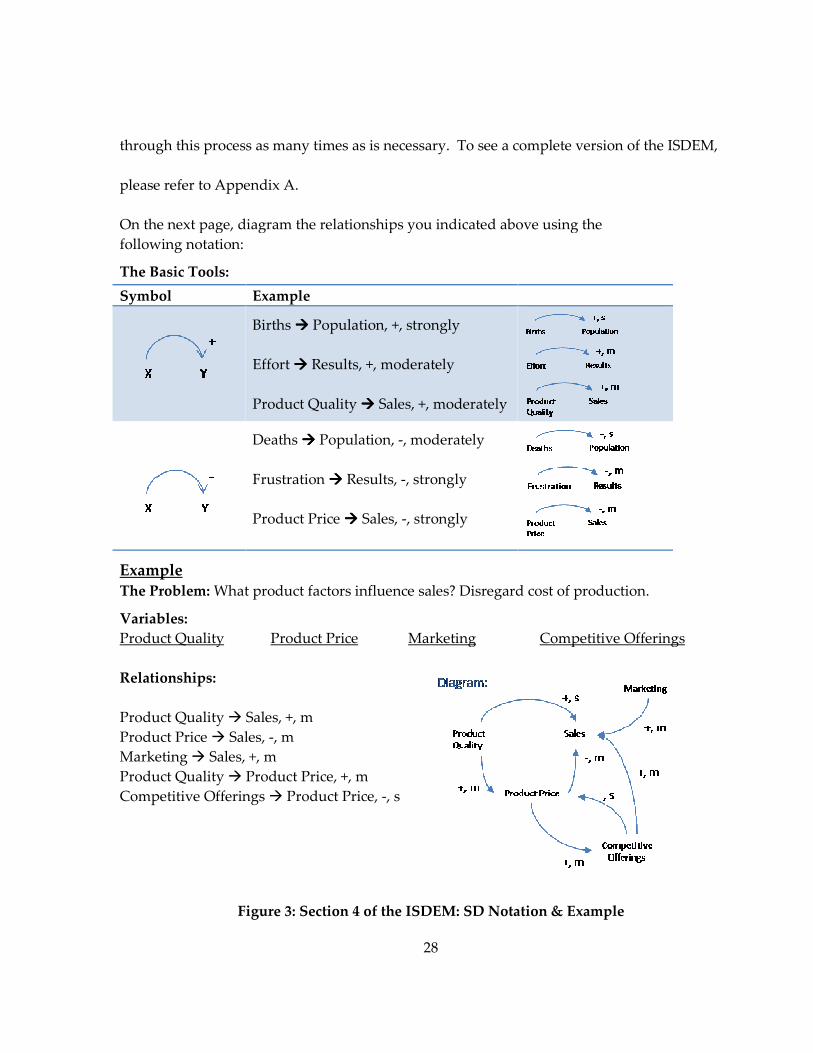
The second component of the ISDEM draws from the freehand mapping technique:
participants use their pairwise comparison results to create a graphical description of the
problem space. The page begins with a brief description of the notation of causal map
diagramming, to which participants may refer back as they make their own. Second, the
description includes an example that demonstrates how a completed model might look (see
Figure 3). Participants then translate the associations they generated in the previous section
to create their own causal maps, adding additional variables/relationships as these insights
occur. This process is mainly transcription: changing the form of knowledge from a table to
a systems diagram. Yet, it offers the added benefit of a second look at the problem. For
individuals who are visual learners, this step may be critical to their assessment of the
output. Upon viewing their answer in diagram form, individuals may realize that an entire
second set of variables should be included. Then, they may go back to work through the
ISDEM process with these new variables and incorporate them into the diagram, iterating
28
through this process as many times as is necessary. To see a complete version of the ISDEM,
please refer to Appendix A.
On the next page, diagram the relationships you indicated above using the
following notation:
The Basic Tools:
Symbol Example
Births ���� Population, +, strongly
Effort ���� Results, +, moderately
Product Quality ���� Sales, +, moderately
Deaths ���� Population, -, moderately
Frustration ���� Results, -, strongly
Product Price ���� Sales, -, strongly
Example
The Problem: What product factors influence sales? Disregard cost of production.
Variables:
Product Quality Product Price Marketing Competitive Offerings
Relationships:
Product Quality � Sales, +, m
Product Price � Sales, -, m
Marketing � Sales, +, m
Product Quality � Product Price, +, m
Competitive Offerings � Product Price, -, s
Figure 3: Section 4 of the ISDEM: SD Notation & Example

29
To adapt this tool for use in organizations, appropriate supporting structural
guidelines are necessary to enable a team of individuals to lead themselves through the
process. For example, after individuals have completed their causal map diagrams using
the ISDEM, it is important for them to discuss the similarities and discrepancies between
models, and move to a common understanding that can be used for the strategic question at
hand. The Nominal Group Technique (Delbecq, Van de Ven & Gustafson, 1975) offers a
logical and effective methodology for engaging in this discussion, and the principles of this
work have been adapted for use with the ISDEM (see Appendix B). These Guidelines for
Discussion provide participants an outline of the structure used in the Nominal Group
Technique such that they may be easily self-administered and embedded into standard
organizational practices.
This inquiry now revisits the group decision making literature to ensure that the
ISDEM addresses and mitigates the factors that result in poor decision outcomes. To
prevent social influence bias and the consequent examination of few alternatives and
minimal ideas, the ISDEM is structured as a nominal approach, in which all individuals in
the group brainstorm the many factors and relationships implicated in the issue. This
brainstorming, and the resulting sharing of the mental models, ensures: 1. that many ideas
are brought to the table and discussed, and 2. that alternatives or consequences are
considered, given the process nature of the diagrams. By the maps’ very structure,

30
participants reveal their understanding of what will happen, and how the variables will relate
over time.
It is a good step in the minimization of social influence bias to have individuals
delineate about their mental models on paper prior to group discussion. Another social
influence bias implicated in group decision making is that the leader may dominate or quiet
opposing opinions, either directly (‘We will pursue this direction’) or indirectly, through
group members perceiving that their views will not be heard or appreciated. The structure
and step-by-step nature of the ISDEM minimizes the leader’s power, ensuring that every
group member is heard and that all ideas, opposing or not, are reviewed. This technique
also mitigates social projection or false consensus bias in that every individual must share
his or her model of the problem space. Thus, discrepancies between models uncover
differences in the operationalization of constructs, and provoke individuals to work through
differences of opinion - as opposed to implicitly assuming that one’s own view is shared by
the group. Many of the other factors, such as group cohesiveness, are outside the scope of
this inquiry. It is hoped that future researchers will supplement this work by providing
empirically-validated suggestions for group composition, task timing and more to enhance
the effectiveness and validity of group problem solving techniques.
1.5.1 Example: Profit Margin vs. Asset Turnover
To become familiar with the ISDEM, a simple business question is explored using
this methodology: how come you need to choose between high profit margins and high
31
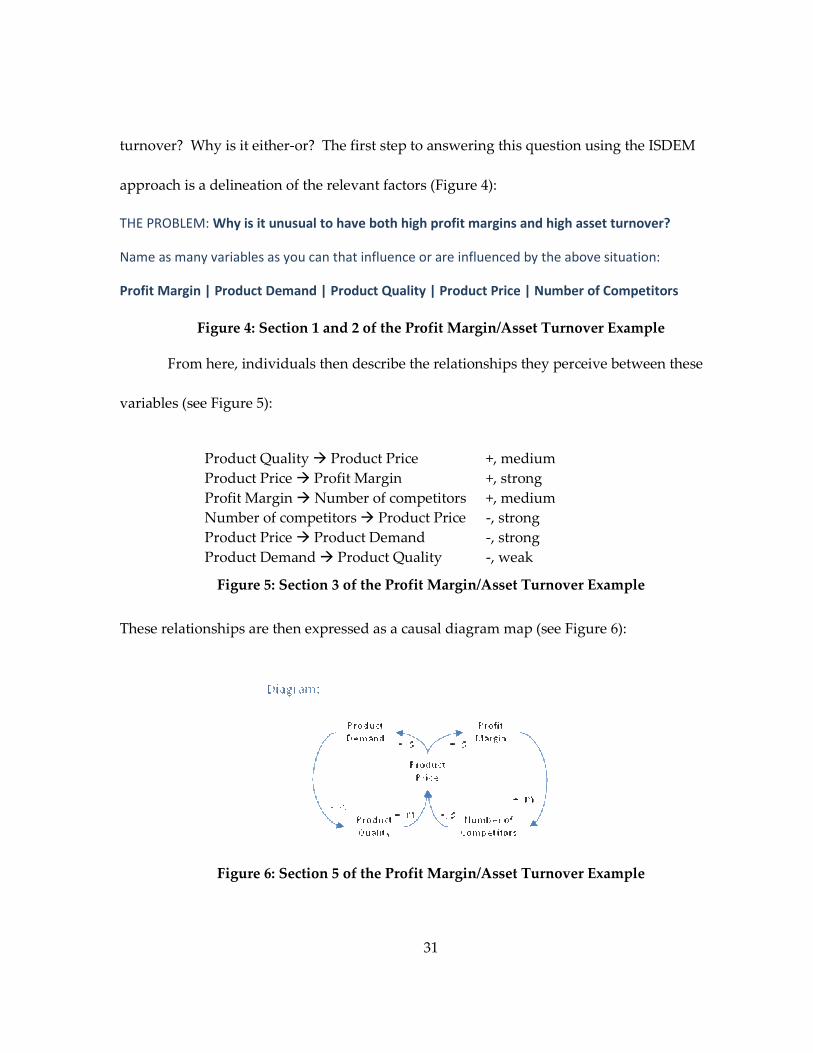
turnover? Why is it either-or? The first step to answering this question using the ISDEM
approach is a delineation of the relevant factors (Figure 4):
THE PROBLEM: Why is it unusual to have both high profit margins and high asset turnover?
Name as many variables as you can that influence or are influenced by the above situation:
Profit Margin | Product Demand | Product Quality | Product Price | Number of Competitors
Figure 4: Section 1 and 2 of the Profit Margin/Asset Turnover Example
From here, individuals then describe the relationships they perceive between these
variables (see Figure 5):
Product Quality � Product Price
Product Price � Profit Margin
Profit Margin � Number of competitors
Number of competitors � Product Price
Product Price � Product Demand
Product Demand � Product Quality
+, medium
+, strong
+, medium
-, strong
-, strong
-, weak
Figure 5: Section 3 of the Profit Margin/Asset Turnover Example
These relationships are then expressed as a causal diagram map (see Figure 6):
Figure 6: Section 5 of the Profit Margin/Asset Turnover Example

32
From this map, it is easy to discern the two positive feedback loops that make up this
question. First, higher prices command higher profit margins, and high profit margins
attract competitors to the space, looking for a share of those profits. Additional competitors
mean additional products competing for the same customers, causing companies drive
down the price of the product, just to compete. This is a self-reinforcing feedback loop: one
we see play out with products as diverse as electronics, groceries, and financial services.
The second feedback loop is also self-reinforcing: higher quality products require higher
pricing, limiting demand to only those who will pay. These consumers are willing to pay
more money since they are seeking out a higher quality product, so it is in the company’s
best interest to maintain the product quality. Thus, high profit margins follow directly from
higher quality products, and the market saturates quickly given the low demand. Lower
quality products, or commodities, experience low profit margins and high sales because
demand is high. There is more room for competing companies, but the profit margins are
low. These positive feedback loops play out across all industries in a free market economy,
and companies spend significant money and resources to understand these dynamics as
they relate to a particular product or service. It is interesting to note how much information
is contained in this simple, system diagram. The two positive feedback loops capture the
entire previous description on pricing dynamics, with few words and minimal space. This
is a significant benefit of using Systems Diagrams in regular academic and corporate
contexts.

33
1.6 Validating the ISDEM
The purpose of the ISDEM is to elicit individuals’ mental models of systemic
behavior, enabling them to create coherent diagrams that may be communicated or used by
others to understand a problem space. Thus, validation of the instrument entails self-
assessment of how well the method captures participants’ mental models, and how
understandable and interpretable these models were to others. If the approach does not
foster greater communication and understanding between individuals in a group, then it
may be deemed ineffective and unworthy of application. This dissertation validated the
ISDEM in a two-step process using a sample of undergraduate participants: Study One
using the measure to elicit generic systems, and Study Two using the measure to elicit real-
world systems. The details for these studies may be found below.
The intent of Study One was to compare the ISDEM to the most widely used
systems-elicitation method in the field, the Systems-Based Inquiry Protocol (S-BI; Booth
Sweeney & Sterman, 2007), to determine if participants were able to convey their
understanding of these simple, generic systems more fully using the ISDEM than the S-BI.
The ISDEM was modified to reflect the exact questions and wording of the S-BI, such that
comparisons of their performance may be made. The dependent variables collected capture
the behavior of these measures on two levels. First, the models were compared at the
surface level: how many variables and relationships did each method yield? How many
feedback loops were generated? This information was obtained by counting the number of

34
variables, relationships and feedback loops for each problem, and then calculating their
averages across the measure. Differences between conditions were determined using
standard independent, two-sample t-tests. We hypothesized that the number of variables
and relationships would be similar between the two methods, and that the number of
feedback loops generated by the ISDEM would be significantly greater than the amount
generated by the S-BI. Given the simplicity of these scenarios, it would be hard to
demonstrate differences in the number of variables and relationships described. However,
the purpose of the ISDEM is to enable participants to describe feedback loops, by following
very clear-cut steps, and it was hypothesized that this tool would perform better at
generating feedback loops than the more general and less explicit S-BI.
The two measures were also compared at the comprehension level, or how well
participants were able to describe and explain systemic phenomenon. The standard
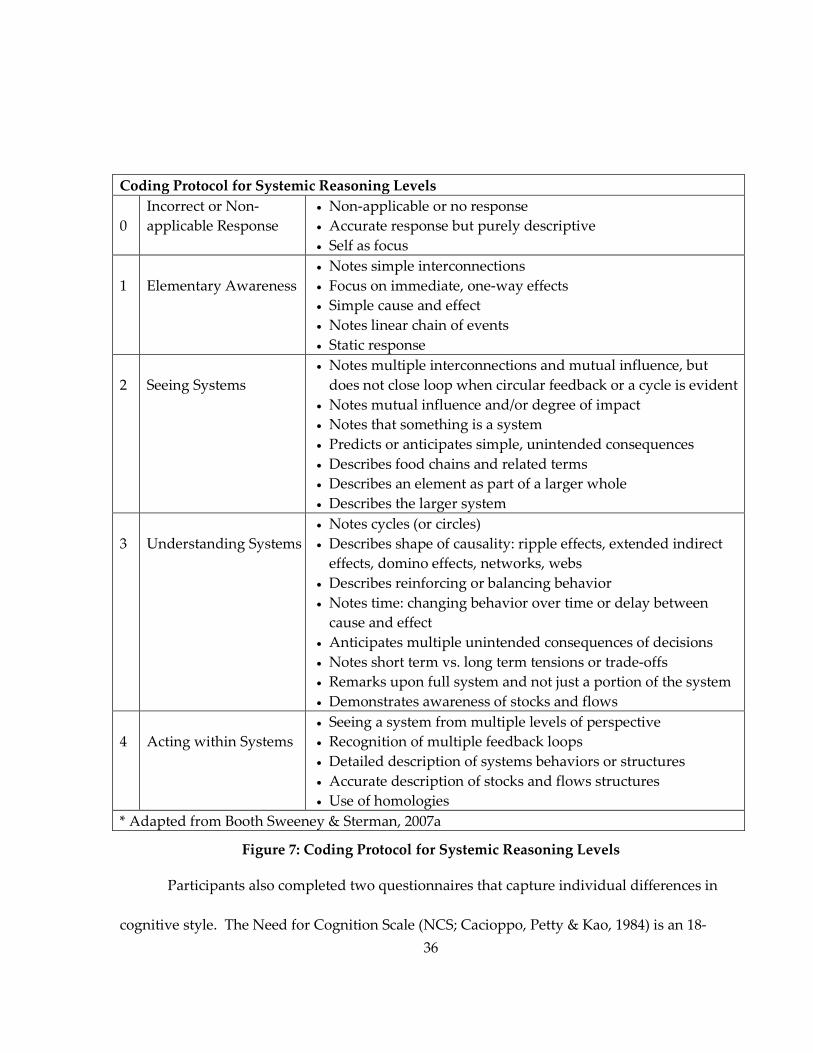
operational variable to measure comprehension is called Systemic Reasoning Level.
Created by Booth Sweeney and Sterman (2007), there are 5 levels that represent increasing
expression of systems understanding. To code these levels, independent coders were
provided a description of what each level entails and what responses might look like for
each level, and then were asked to rate responses based on this information (see Figure 7 for
the coding protocol). For example, Level 0 responses are inapplicable, or there is no
response (“I don’t know”). Level 1 responses describe relationships that are linear and
static; i.e., the levels of factors are not recognized to change over time, and no
35
interrelationships are demonstrated. Level 2 responses reveal some interconnections
between variables and feedback mechanisms and Level 3 responses consistently
demonstrate the cyclical and dynamic nature of interconnections between variables. Level 4
entails the description of multiple levels of feedback loops and interrelationships between
variables, fully encapsulating the systemic nature of the phenomenon. Both measures were
coded using this standard S-BI protocol. They were then analyzed by condition to
determine if there were overall differences in the performance of the two measures. Given
the ISDEM was explicitly structured to walk participants through relationships and how
they interconnect, it was hypothesized that this method would yield significant higher
levels of systemic reasoning than the S-BI.
36
Coding Protocol for Systemic Reasoning Levels
0
Incorrect or Non-
applicable Response
• Non-applicable or no response
• Accurate response but purely descriptive
• Self as focus
1
Elementary Awareness
• Notes simple interconnections
• Focus on immediate, one-way effects
• Simple cause and effect
• Notes linear chain of events
• Static response
2
Seeing Systems
• Notes multiple interconnections and mutual influence, but
does not close loop when circular feedback or a cycle is evident
• Notes mutual influence and/or degree of impact
• Notes that something is a system
• Predicts or anticipates simple, unintended consequences
• Describes food chains and related terms
• Describes an element as part of a larger whole
• Describes the larger system
3
Understanding Systems
• Notes cycles (or circles)
• Describes shape of causality: ripple effects, extended indirect
effects, domino effects, networks, webs
• Describes reinforcing or balancing behavior
• Notes time: changing behavior over time or delay between
cause and effect
• Anticipates multiple unintended consequences of decisions
• Notes short term vs. long term tensions or trade-offs
• Remarks upon full system and not just a portion of the system
• Demonstrates awareness of stocks and flows
4
Acting within Systems
• Seeing a system from multiple levels of perspective
• Recognition of multiple feedback loops
• Detailed description of systems behaviors or structures
• Accurate description of stocks and flows structures
• Use of homologies
* Adapted from Booth Sweeney & Sterman, 2007a
Figure 7: Coding Protocol for Systemic Reasoning Levels
Participants also completed two questionnaires that capture individual differences in
cognitive style. The Need for Cognition Scale (NCS; Cacioppo, Petty & Kao, 1984) is an 18-
37
item measure assessing individuals’ predilection for and enjoyment of effortful cognitive
tasks. When engaging in a cognitive task, individuals who score high on need for cognition
tend to focus on the principle arguments, facts or stimuli, whereas those who score low on
need for cognition tend to focus on indirect cues, such as the attractiveness of the speaker
(Cacioppo, Petty, Kao & Rodriguez, 1986). This scale served as an indirect measure of
participants’ engagement with the task, with those who scored high on the NCS focusing
more on the problem solving process than those who scored low. It was hypothesized that
participants who scored higher on the NCS would perform better on the measures than
individuals who scored lower, and it may be important to control for these individual
differences in the analyses described above. The second questionnaire administered was the
Analysis-Holism Scale (AHS; Choi, Koo & Choi, 2007), a 24-item inventory that measures
individuals’ predisposition to think analytically versus holistically. The authors split these
constructs into 4 distinct factors: causality (interactional v. dispositional attributions),
attitude toward contradictions (formal logic v. dialectics), perception of change (cyclical v.
linear) and locus of attention (field v. parts). It was hypothesized that individuals who
exhibited high holistic thinking would perform better on the systems problems than those
who exhibited high analytic thinking, and it again may be important to control for this
cognitive style in assessing the efficacy of the ISDEM. To determine if there were systematic
differences between the conditions on these measures, multiple regression analyses were
conducted, with participants’ NCS and AHS scores regressed on their Systemic Reasoning

38
Level scores. The inclusion of these instruments enabled further analysis into how, why and
for whom the ISDEM may serve as a viable tool for mapping the problem space of an issue.
These analyses compared the ISDEM to the most widely used measure in the field,
to learn which is more effective at eliciting individuals’ understanding of systemic
phenomenon. The results of Study One then qualified our approach to Study Two. For
example, if we had learned that there were particular questions or tasks with which
participants consistently struggled, their wording or format would be modified. Also,
power analyses based on the findings of Study One determined the desired sample size for
Study Two. The structure of this dissertation is such that the measure was tested first
experimentally, comparing it to a common measure using generic systems scenarios, and
then in an applied situation, in which the scenarios were relevant to the individual
participants. The value of the ISDEM is negligible if it does not translate to the real-world
scenarios in which it was designed to be used.
Study Two was essentially an effectiveness study. Individuals in both conditions
were split into small groups (three to four individuals), led through Informed Consent, and
then learned the issue they were to explore. This question was chosen through close
consultation with the Deans of Undergraduate Education: what is the process by which a
student gets integrated into the Duke community? The study proctor explained that this
related to the factors and experiences that cause a person to love it at Duke and not want to

39
leave, or hate it here and wish to transfer. She explained that we were most interested in the
process, and how these different factors/experiences related over time. Administrators were
interested in learning students’ feedback on this process, and this is an issue relevant to all
students. Experimental groups would use the ISDEM, and engage in a group discussion
structured by the guidelines outlined earlier (see Appendix B). Control groups would be
asked to use their standard brainstorming techniques, as if they were brainstorming for a
class project. They would receive no further instruction, so that they relied on their usual
routines. When this process was complete, participants would complete the Scale
Engagement Questionnaire to learn their impressions of the problem solving method used,
as in Study One. Additional questions were included that relate to group dynamics.
Participants were asked if they expressed oppositional ideas, if any one individual
dominated the conversation, if alternative viewpoints were considered, and more. These
relate directly to the group problem solving literature reviewed in Section 1.3, to learn if the
ISDEM acts as an effective measure for mitigating group biases. It was hypothesized that
the ISDEM models would include more factors and relationships than the control models,
painting a more complex, nuanced picture of the scenario than would typically result from a
normal group discussion.
Many of the hypotheses and dependent variables discussed in Study One carried
over to Study Two, and new analyses were conducted to discern the usefulness of the
resulting models (these analyses are described in detail below). An important clarifying
40
point is that unlike the last study, in which there were several problems, participants only
modeled one issue. Therefore, the analyses were simplified greatly. Since groups were
used across both conditions, only group models were assessed. Individual models
produced using the ISDEM were not examined since there was no control group
comparison.
The dependent variables and hypotheses for Study Two were as follows. First,
surface characteristics of the models, the number of variables, relationships and feedback
loops, were counted. These were analyzed using standard independent two-sample t-tests
to determine if there were differences between the groups. We hypothesized that the
groups would exhibit similarities in the number of variables discussed, but that the number
of relationships and feedback loops generated in the experimental condition would be
significantly greater than in the control condition. The two conditions were also compared
on comprehension, or how well groups were able to describe and explain systemic
phenomenon. Again, models were coded using the Systemic Reasoning Level coding
protocol (Booth Sweeney and Sterman, 2007), and analyzed using independent two sample
t-tests. It was hypothesized that the experimental group would demonstrate significantly
higher Systemic Reasoning Levels than the control group.
Lastly, a set of analyses was conducted at the informational level: how
understandable and useful do independent coders find the models? Coders were

41
administrators identified through the Provost’s Office who were interested in learning
students’ feedback on the integration process. They examined each of the models and rated
them on several different domains (see Figure 8 for the complete coding protocol).
Coding Protocol for Quality of Models
On a scale from 0 to 100, for which 0 is not at all and 100 is highly, please rate the
models on the following items:
1. Overall Model Rating:
This is at the discretion of the coder. How do you perceive the model in terms of
the factors that are important to you?
2. How informative is it? How much information is conveyed in the model? 3. Clear?
Is it visually clear? Is it parsimonious?
4. Understandable?
Are there gaps? Is there information missing? As a reader, do you understand
what the modelers were trying to convey?
5. If you had to base a decision off of the model, how useful would you find it?
How useful is the model? How helpful is it for shaping your point of view on
integration?
6. How likely would you be to bring it to a meeting on study integration?
Would this model be helpful in a group discussion on the issue, capturing the
perspectives of individuals not in the room? Would this model be an effective aid?
Figure 8: Coding Protocol for Quality of Models
The responses of the coders were normed, so that every group had an average score
on each item. These item scores were then compared across the conditions to determine if
there were significant differences in the informativeness, clarity, understandability and
usefulness of the two methods, and the results were analyzed using independent two
sample t-tests. There were several hypotheses associated with this section of the analyses.
First, it was hypothesized that overall, groups using the ISDEM would generate higher
42
quality models than the control groups (Item 1). However, it was possible that there were
no significant differences between the two methods on informativeness (Item 2), or even
that the control groups would score higher. Given the flexibility of approaches control
participants could have used, there was room for them to richly describe the situation in
terms of explanations, experiences, examples, etc. This may result in coders perceiving that
more information was being conveyed than in the experimental condition, in which
participants followed set guidelines to create clear, usable models. As for clarity and
understandability (Items 3 and 4), it was hypothesized that the ISDEM would yield
significantly clearer and more understandable models than the control groups did. The
structure and guidelines of the measure provided participants a way to represent
information uniformly, through diagrams, and we believed that the coders would find this
approach far simpler to interpret than the various models generated in the control
condition. Therefore, we believed that this format would also cause coders to perceive the
models as more useful (Items 5 and 6). If our hypotheses hold, a potential benefit of the
ISDEM is that individuals could take the process that they learned and then apply it to
future situations, clarifying the variables involved in a problem and how they relate, and
diagramming these relationships clearly so that they may be meaningfully interpreted by
another individual.
This concludes our review of the two studies. Their methods and procedures are
detailed below.
43
2. Study One
2.1 Methods
Undergraduate participants were recruited through the Duke University Subject
Pool until 64 completed protocols were collected. An a priori power analysis was
conducted to determine this sample size: for power of .80, at a .05 level of significance,
the necessary sample size to detect medium effect sizes (d = .50) is 64 participants
(Cohen, 1992). The inclusion criteria for participants were delineated on the Study Pool
website, and were as follows: participants must 1) be over 18 years of age, 2) be a
student at Duke University, 3) speak English, and 4) be able to complete paper-and-
pencil questionnaires. They received a brief description of the tasks and time
requirements associated with the study, and if they chose to participate, offered several
administration times from which to choose. By relying on the Study Pool population,
this recruitment process sought to form two conditions that were similar in their
composition across several demographic variables, including gender, age, ethnicity and
socio-economic status.
2.2 Procedure
Participants arrived for their scheduled study appointments at a classroom on
campus. Participants in the experimental condition were run several participants at a
time since they could work independently, whereas those in the control condition were
run individually, in interview format. When all participants arrived or ten minutes
44
passed, whichever occurred first, they received two copies of the informed consent
materials, and were verbally led through the sections by the study proctor. They were
asked if they had any questions about the material covered or the study procedures, and
when all questions were answered, participants signed one copy of the form, returning it
to the study proctor, keeping the second copy for their records.
Participants then completed the following paper-and-pencil based measures:
1. Demographic Questionnaire: This measure queried basic demographic information,
including age, sex, ethnicity, level of education and socio-economic status.
2. Need for Cognition Scale (NCS; Cacioppo, Petty & Kao, 1984): This 18-item measure
assessed individuals’ predilection for and enjoyment of effortful cognitive tasks. Scored
on a 5-point Likert scale, the NCS correlates strongly with the longer, 34-item version of
the instrument (r = .95), and exhibits a Cronbach’s alpha of .90.
3. Analysis-Holism Scale (AHS; Choi, Koo & Choi, 2007): This 24-item inventory
measured individuals’ predisposition to think analytically versus holistically. The
authors split these constructs into 4 distinct factors: causality, attitude toward
contradictions, perception of change and locus of attention. The AHS demonstrates
moderate reliability (.74), and its developers point out that measures assessing broad
constructs, such as the Self-Construal Scale (SCS; Singelis, 1994), typically exhibit
reliabilities in the high .60s to mid .70s. Convergent and discriminant validity are also
adequate.

45
When finished with these measures, the experimental condition had 45 minutes
to complete the ISDEM and Scale Engagement Questionnaire:
2. Independent Systems Dynamics Elicitation Method (ISDEM; Holmberg,
unpublished): The ISDEM is a paper-and-pencil based knowledge elicitation method.
Individuals write down a problem to be explored, and record all relevant variables to
the problem. Participants then pair the variables, indicating the strength and direction
of the relationships, until all possible combinations have been exhausted. This section
maps most closely to the pairwise comparison approach developed by Markoczy (1995,
1997). The second section asks the individuals to diagram the relationships transcribed
in the first section, using causal map diagramming notation (Evans, 2005), as delineated
in Section 3 of the ISDEM. This task draws from the freehand mapping method (Green
& McManus, 1995; Hodgkinson & Maule, 2002).
For this measure to be comparable to the S-BI, it was adapted to reflect the
structure and content of the S-BI. First, the problems to be explored were written into
the questionnaire. Second, participants were provided space underneath their diagrams
to describe the behavior of the system they just mapped. The information yielded in this
section parallels the information collected through the dialogue in the S-BI interview,
providing coders a better understanding of the participants’ reasoning.

46
3. Scale Engagement Questionnaire: Participants then completed several Likert-scale
items that rated their engagement with the ISDEM, in terms of how closely their
responses reflected their mental models of the issue, and their engagement and difficulty
with the process.
This concludes the study for the experimental condition. We will now outline
the protocol for the control condition.
After the first measures were finished, the control participants were notified that
the tape recorder was being started. They then completed the following:
2. Systems-Based Inquiry Protocol (S-BI; Booth Sweeney & Sterman, 2007): The S-BI is a
semi-structured interview that tests individuals’ understanding of feedback loops, or the
interrelationships between factors over time.
The S-BI demonstrates good psychometric properties in a classical item analysis,
factor analysis, and Rasch analysis, and has a Cronbach’s alpha of 0.94. The entire set of
questions takes no longer than one hour to complete. The interviews were conducted
with a trained research personnel who underwent training in S-BI administration using
supplementary materials provided by Booth Sweeney & Sterman (2007a).
3. Scale Engagement Questionnaire. Participants then completed several Likert-scale
items that rated their experience of the S-BI, in terms of how closely their responses
47
reflected their mental models of the issue, and their engagement and difficulty with the
process.
A study proctor collected the questionnaires as they were completed.
Participants in both conditions received a debriefing handout upon completion of the
study, and were provided contact information for the Lead Investigators should they
have had any questions or concerns following the administration. They were then
thanked for their time.
2.3 Analyses
To begin, independent two sample t-tests and Chi Square tests were conducted
to assess for statistically significant differences between the conditions on demographic
variables including age, ethnicity, gender and year at Duke. The results of these
analyses determined whether individual difference factors needed to be evaluated as
potential mediators, moderators, and/or predictors of scores on the ISDEM and S-BI. To
learn if the psychosocial factors of Need for Cognition and the four aspects of
Analytic/Holistic Thinking also needed to be evaluated, regression analyses were
conducted, with NCS and AHS scores regressed on Systemic Reasoning Levels. These
results were explored in projects led by other members of the project.
To code the S-BI, research personnel transcribed participants’ responses from the
tape recorded interviews. The staff then used these transcripts to collect the dependent
48
variables. First, they counted the number of variables, relationships and feedback loops
generated in each scenario, and then rated the responses using the S-BI coding protocol
as delineated in the appendices to the Booth Sweeney & Sterman (2007a) article. Coders
used the same coding method to rate responses on the ISDEM, using information from
the participants’ list of variables, the number of relationships recorded, the causal map
diagrams, and the corresponding written descriptions of the behavior of the systems.
These four variables (number of variables, number of relationships, number of feedback
loops, and systemic reasoning level) were averaged across all six items, and mean scores
were compared across the conditions using independent two sample t-tests. P-plots and
frequencies were also conducted, to learn the percentage of responses that fall at the
different Systemic Reasoning Levels by condition. This data corresponded to results
from the S-BI validation studies (Booth Sweeney & Sterman, 2007), enabling us to assess
whether the author’s results may be replicated using a different population.
Descriptive statistics were conducted on items from the Scale Engagement
Questionnaire, and differences between the two samples on scores were assessed using
independent two sample t-tests. These analyses yielded information on participant self-
reported engagement and difficulty with the methods, and the extent to which the
models generated conformed to participants’ thought processes. These items were
similar to those given by Hodgkinson, Maule and Bowne (2004), in a study testing the
relative efficacy of the pairwise comparison and freehand mapping approaches. In their

49
paradigm, business school students used these methods to map the problem space of a
business case. We compared their results to our own, to draw inferences on the relative
performance of these measures on participant-reported engagement, difficulty, and
representativeness of their internal models. It is important to note that these
comparisons were solely exploratory in nature: the differences between the procedures
conducted, the issues assessed and the populations sampled qualify the comparisons
generated.
2.4 Results
We first examined the characteristics of the sample using Chi Square and t-tests
to learn if there were significant differences between the conditions on demographic
variables. No significant differences were found, strengthening the soundness of the
following analyses. Regression analyses, in which NCS scores and AHS subscale scores
were regressed on Systemic Reasoning Levels, were conducted to learn how key
personality traits, specifically, an individuals’ propensity to focus on facts instead of
situational cues (measured using the NCS) and predilection for examining problems
analytically or holistically (measured using the AHS), moderated performance on the
Systems tasks. No predictor reached significance, indicating that none of these
individual difference factors moderated performance on the S-BI and ISDEM.
Discussion of these results were the primary focus of papers written by other members
of the research staff, and thus outside the scope of this work. In short, since the

50
plausible individual difference factors assessed did not play a role in task performance,
our observed effects are most likely attributable to the situational induction, or the task.
The mean number of variables, relationships and feedback loops were calculated
for each participant. Contrary to our hypotheses, the differences in the mean number of
variables across conditions reached significance (S-BI: m=2.31; ISDEM: m=2.56; t=2.73,
p=.008). However, this mean difference of .25 variables is slight when examined from a
practical perspective. Even though the conditions worked with approximately the same
number of variables, the experimental condition created significantly more relationships
(S-BI: m=1.90; ISDEM: m=2.91; t=6.98, p<.001) and feedback loops (S-BI: m=0.27; ISDEM:
m=1.20; t=9.50, p<.001) than the control condition. See Figure 9 for a diagram of these
results, and Table 4 of Appendix C. All results, for both studies, are available in tabular
format in Appendix C, and will be referenced by Table Number in the analyses. The t-
tests conducted above are robust, given the normality of the data, independence of the
factors, lack of outliers and the equal sample sizes between the conditions.

51
Figure 9: Study One: Variables, Relationships & Feedback Loops Generated
All t-tests reached significance, though it is important to note the practical
significance of the results. For example, a mean difference of .25 in the number of
variables is negligible, whereas a mean difference of one relationship or one feedback
loop is significant. Using the ISDEM, participants created on average one additional
relationship - even though there are only two defined variables per scenario - and then
created a feedback loop, linking those two relationships together. Examining multiple
relationships and organizing them into feedback loops were two of the primary aims of
the ISDEM.
Systemic Reasoning Levels were also compared, and the mean SRLs for the S-BI
and the ISDEM were 1.63 and 3.19, respectively (see Figure 10; Table 4). Participants
using the ISDEM scored almost two times higher than participants using the S-BI. Since
the data were kurtotic (k=-1.28), a logarithmic transformation was performed, and the
resulting t-tests were highly significant (t=9.91, p<.001). These results indicate that the

52
ISDEM produced meaningful shifts in the capacity of participants to represent systemic
phenomena. The frequency of Systemic Reasoning Level by group is also displayed as
percentages in Figure 11.
Figure 10: Study One: Mean Systemic Reasoning Level
Figure 11: Study One: Frequency of Systemic Reasoning Level by Condition
To better understand the nature and quality of participants’ responses, the
researchers coded an additional, binary factor: the use of cycle-related language in
participants’ responses. Words like feedback, cycle, loop, back and forth behavior,

53
balancing forces, mutually reinforcing relationship, etc., suggest an innate
understanding of the dynamic behavior between variables. To clarify, an example of a
Level 3 response using cycle-related language comes from a control participant on the
first scenario: “Wolves are predators; rabbits are prey. There is an interplay between the
two. The size of the rabbit population influences the size of the wolf population, since
the more food there is, the easier wolves will find it to reproduce. Wolves eating rabbits
decreases the rabbit population. This matters most. At the end of the day, the wolves
will eat all the rabbits and both populations will die out.” In this scenario, the
participant appreciated that there is an interplay between the variables, and that each
population affects the level of the other. S/he ‘closed the loop.’ However, s/he failed to
recognize an important facet of the feedback loop: when the wolf population decreases,
it provides an opportunity for the rabbit population to increase. This balances out the
variables such that their levels remain constant over time. Without this dynamic, the
loop does appear to be a self-reinforcing one, and both populations ultimately die out.
Therefore, s/he represented a closed loop system, yet did not fully capture the multiple
dynamics at play, resulting in both an incomplete description of the system, and a
Systemic Reasoning Level of 3. An example of a Level 4 response that does not include
cycle-related language comes from an experimental participant: “Over time, as the wolf
population increases, the rabbit population decreases. As the rabbit population
decreases, the wolf population also decreases. When the wolf population decreases, the

54
rabbit population increases. The wolf population will be able to remain high if it is able
to secure another food source, like, if the duck returned. The duck and wolves have the
same type of relationship as the rabbits and wolves do. The wolf population could
remain higher than if it just relied on rabbits, and this would take some pressure off the
rabbit population. You’d have to consider other things too, like geography and weather
patterns, that could kill off both populations.” In this response, the participant
accurately captures the dynamics between the factors, even though no cycle-related
language was used. The participant scored a 4 because they also included outside
factors, including other food sources and the environment. Thus, even without the
standard language of the field, some participants accurately described the dynamic
nature of systemic phenomenon.
Forty-four percent (44%) of individuals in both conditions employed cycle-related
language, even though there were significant discrepancies in their Systemic Reasoning
Levels, with 56% of control participants achieving at least one Level 3 or 4, compared to
96% of the experimental participants. These data have compelling implications. They
suggest that around half of the individuals in our sample, across both conditions, did
have an innate understanding of Systems Dynamics. They employed the conceptual
building blocks of the field: words like cycle, feedback loop, balance, etc., reveal an easy,
inherent knowledge of the dynamics present in relationships. However, while only 12%
of control participants described systemic phenomenon without using this language, an

55
additional 52% of the experimental participants did. We may conclude that the ISDEM
did act as an effective knowledge elicitation technique, drawing out a participants’
understanding of systemic phenomenon even when they did not have the language to
aid them. These findings are discussed in greater detail in the next section.
Participants provided input on their impressions of the process, and some of
these results are reported in terms of frequencies, as they do a better job displaying the
nature of this data. P-plots revealed generally higher variances across the experimental
group than the control condition, so we used Levene’s test for equality of variances to
determine the tests for which it was appropriate to assume equal variances.
Participants indicated that the S-BI did a significantly better job capturing their thought
processes than the ISDEM (S-BI: m=3.63 ; ISDEM: m=2.88 ; t=2.93, p=.005), though no
significant differences were found on how well the measures captured their inner
models (S-BI: m= 3.84; ISDEM: m=3.56 ; t=1.73, p=.088) (see Figure 12; Table 5).
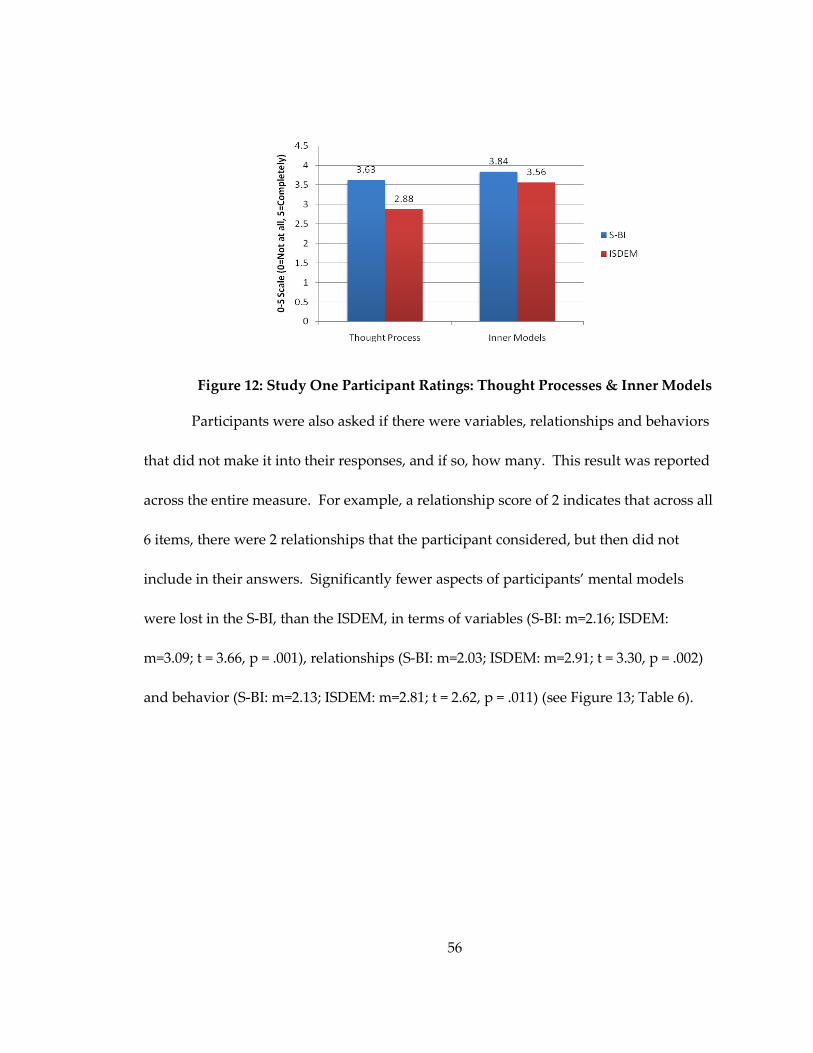
56
Figure 12: Study One Participant Ratings: Thought Processes & Inner Models
Participants were also asked if there were variables, relationships and behaviors
that did not make it into their responses, and if so, how many. This result was reported
across the entire measure. For example, a relationship score of 2 indicates that across all
6 items, there were 2 relationships that the participant considered, but then did not
include in their answers. Significantly fewer aspects of participants’ mental models
were lost in the S-BI, than the ISDEM, in terms of variables (S-BI: m=2.16; ISDEM:
m=3.09; t = 3.66, p = .001), relationships (S-BI: m=2.03; ISDEM: m=2.91; t = 3.30, p = .002)
and behavior (S-BI: m=2.13; ISDEM: m=2.81; t = 2.62, p = .011) (see Figure 13; Table 6).
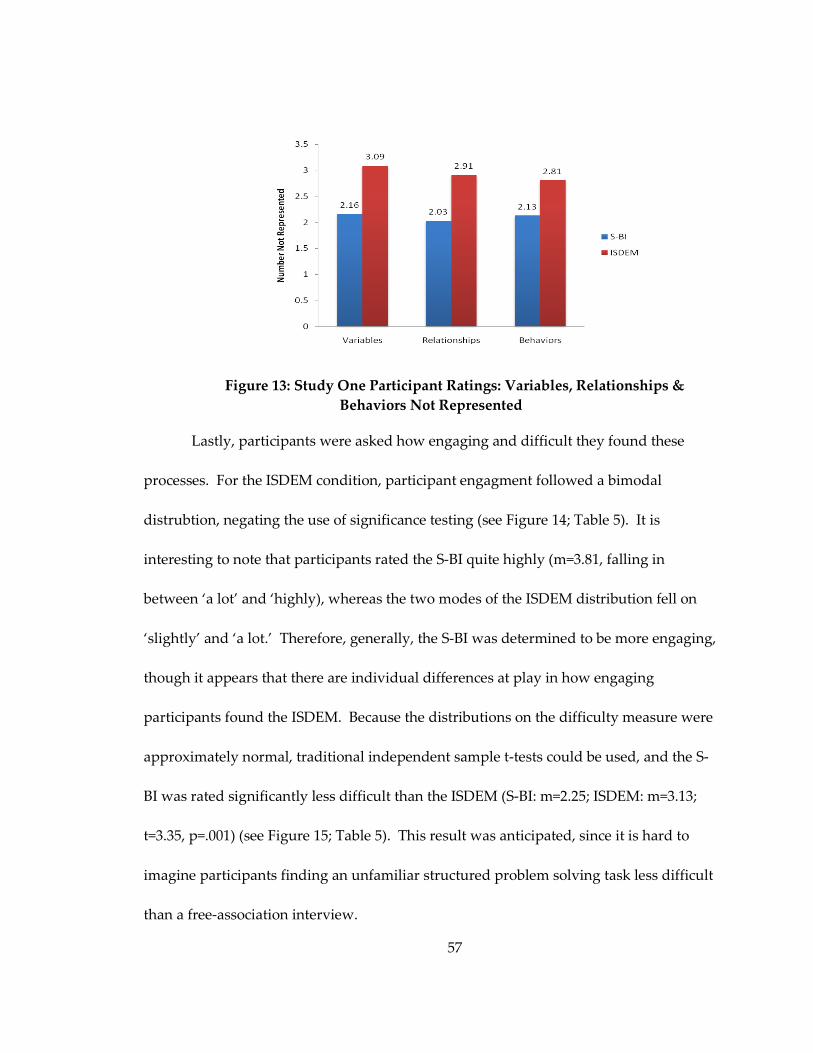
57
Figure 13: Study One Participant Ratings: Variables, Relationships &
Behaviors Not Represented
Lastly, participants were asked how engaging and difficult they found these
processes. For the ISDEM condition, participant engagment followed a bimodal
distrubtion, negating the use of significance testing (see Figure 14; Table 5). It is
interesting to note that participants rated the S-BI quite highly (m=3.81, falling in
between ‘a lot’ and ‘highly), whereas the two modes of the ISDEM distribution fell on
‘slightly’ and ‘a lot.’ Therefore, generally, the S-BI was determined to be more engaging,
though it appears that there are individual differences at play in how engaging
participants found the ISDEM. Because the distributions on the difficulty measure were
approximately normal, traditional independent sample t-tests could be used, and the S-
BI was rated significantly less difficult than the ISDEM (S-BI: m=2.25; ISDEM: m=3.13;
t=3.35, p=.001) (see Figure 15; Table 5). This result was anticipated, since it is hard to
imagine participants finding an unfamiliar structured problem solving task less difficult
than a free-association interview.

58
Figure 14: Study One Participant Ratings: Engagement
Figure 15: Study One Participant Ratings: Difficulty
As explained in the Introduction, these results were also compared to the
Hodgkinson, Maule and Bowne (2004) results on participants’ ratings of the pairwise
comparison and freehand mapping approaches. In this study, business school students
rated these methods on three of the same domains: how engaging they found the
measure, how difficult, and how representative the method was of their thought
process. They also used a 5-point Likert scale, enhancing the comparability of the
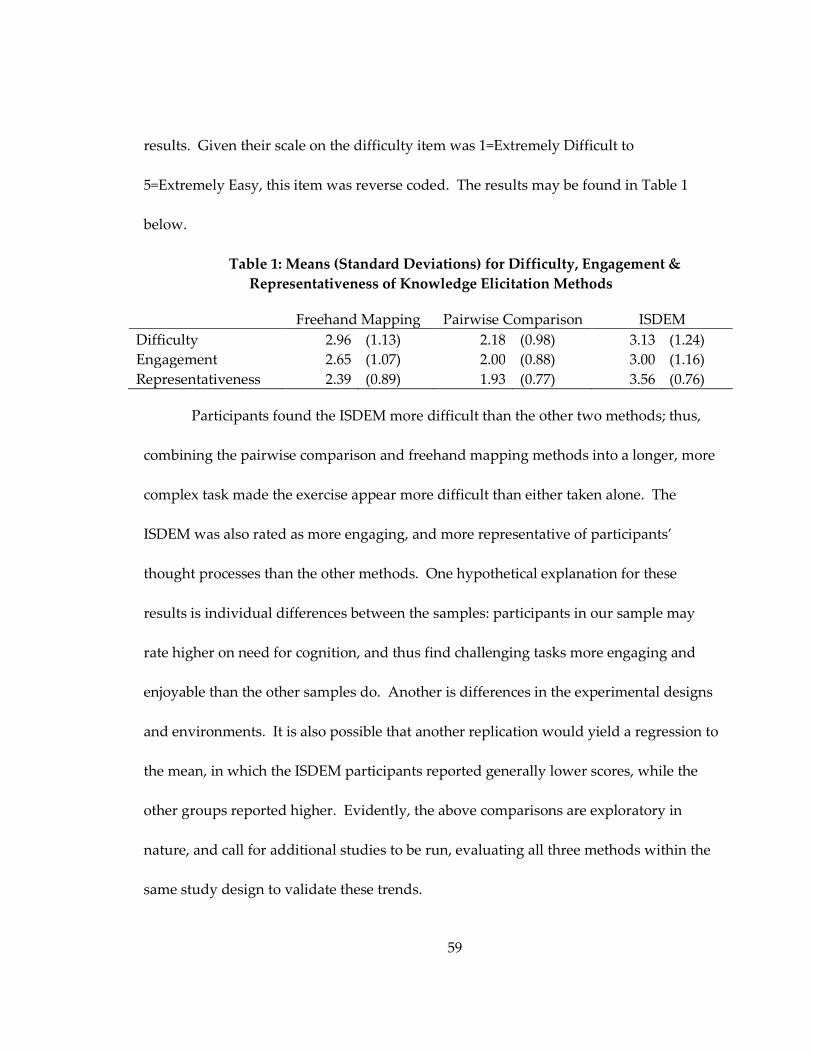
59
results. Given their scale on the difficulty item was 1=Extremely Difficult to
5=Extremely Easy, this item was reverse coded. The results may be found in Table 1
below.
Table 1: Means (Standard Deviations) for Difficulty, Engagement &
Representativeness of Knowledge Elicitation Methods
Freehand Mapping Pairwise Comparison ISDEM
Difficulty 2.96 (1.13) 2.18 (0.98) 3.13 (1.24)
Engagement 2.65 (1.07) 2.00 (0.88) 3.00 (1.16)
Representativeness 2.39 (0.89) 1.93 (0.77) 3.56 (0.76)
Participants found the ISDEM more difficult than the other two methods; thus,
combining the pairwise comparison and freehand mapping methods into a longer, more
complex task made the exercise appear more difficult than either taken alone. The
ISDEM was also rated as more engaging, and more representative of participants’
thought processes than the other methods. One hypothetical explanation for these
results is individual differences between the samples: participants in our sample may
rate higher on need for cognition, and thus find challenging tasks more engaging and
enjoyable than the other samples do. Another is differences in the experimental designs
and environments. It is also possible that another replication would yield a regression to
the mean, in which the ISDEM participants reported generally lower scores, while the
other groups reported higher. Evidently, the above comparisons are exploratory in
nature, and call for additional studies to be run, evaluating all three methods within the
same study design to validate these trends.

60
Though the cognitive difference variables did not predict performance, it is
probable that they influenced participants’ perceptions of the experience. Regression
analyses were conducted, with need for cognition, and the AHS subscale scores
regressed on participant-rated difficulty, revealing that Need for Cognition was a
significant predictor of difficulty ratings (β=.303; t=2.42, p=.019). Individuals’ propensity
to focus on the principle arguments of the issue, instead of indirect cues like the tone of
the interviewer, predicted how easy they found the exercise – a logical finding. Also, the
Causality subscale approached significance (β=.238; t=1.84, p=.072). As a refresher, the
Causality subscale represents the propensity to attribute causality to qualities of the
instigating variable, versus the interaction, between both variables. Put plainly,
individuals who made interactional attributions for causality found the exercise easier
than those who attributed causality to the disposition of the variables. These paradigms
were developed to test system dynamics, so it follows that those who think in terms of
interactions would find the task easier than those who did not. The implications of these
results are discussed in the next section.
2.5 Discussion
The purpose of this study was to develop and test a new method for evoking
systemic reasoning, the Independent Systems Dynamics Elicitation Method. Previous
research suggests that individuals have poor systemic reasoning skills, and this study
sought to evaluate whether a newly developed method may be more effective at

61
eliciting systems knowledge than previously tested methods. The ISDEM yielded
significantly more variables, relationships and feedback loops than the S-BI, even
though the questions entailed simple two-variable systems. Participants using the
ISDEM achieved significantly higher Systemic Reasoning Level scores than participants
using the S-BI - a result that calls into question the conclusions researchers have
previously drawn about individuals’ ability to think systemically. These findings
suggest that individuals do have the capacity and knowledge to recognize dynamic
relationships between variables, and that they only require a method to show them how.
As hypothesized, individuals reported that the S-BI was more effective at
eliciting their thought processes than the ISDEM. An interview allows you to convey
your thinking directly, whereas a structured instrument constrains your thought process
to a series of steps. However, no significant differences were found on how well the
measures captured participants’ mental models of the issues, suggesting that both
methods served as valid knowledge elicitation techniques, as rated by participants.
Perhaps individuals reviewed the models they generated and determined that the
ISDEM accurately captured their ideas, though in a novel way.
We also assessed how well the measures captured individuals’ internal models
of the scenarios. Participants reported that the S-BI more fully captured the variables,
relationships and behaviors that they considered, even though individuals using the
ISDEM actually outlined more variables, relationships and feedback loops than their S-
62
BI counterparts. Put differently, ISDEM participants built significantly more complete
models, but control participants perceived that they did. These participants exhibited an
overconfidence bias (Kahneman & Tversky, 1973), in that they perceived their
performance to be more thorough and complete than it was (the ‘illusion of validity’).
The S-BI participants considering fewer factors than their ISDEM counterparts recall our
earlier discussion on the pitfalls of groupthink, and specifically the errors that arise from
the consideration of few alternatives. It is promising that the overconfidence bias was
attenuated in the ISDEM condition, and provides preliminary evidence that the ISDEM
mitigates these negative effects. Additional studies are required to substantiate the
effectiveness of the ISDEM, and the second study in this inquiry begins the process.
Lastly, participants rated the S-BI and ISDEM in terms of how engaging and
difficult they found the methods: the ISDEM was found to be more difficult than the S-
BI, and less engaging, though there was a bimodal distribution to the ISDEM ratings.
These results corroborated our hypotheses, since it is far more engaging to speak
directly with an individual, describing your understanding of a system, than to
complete a paper and pencil based measure. It is impossible to determine how much of
the engagement effect relates to this interpersonal context, versus the actual content of
the interview. It is also understandable that the ISDEM would rate as more difficult,
since it entails structured steps, use of both sequential and spatial processing, and a
63
foreign diagramming approach, instead of the free association speech of the S-BI
interview.
These questions were written to be comparable to a previous assessment of
knowledge elicitation techniques, specifically the freehand mapping and pairwise
comparison appraoches as tested by Hodgkinson, Maule and Bowne (2004). These
comparisons show that the ISDEM was rated as more difficult than both the freehand
mapping and pairwise comparison methods: given the ISDEM combines these two
approaches, and entails the shift from sequential to spatial reasoning, it makes sense that
it would be judged as more difficult to complete. Interestingly, the ISDEM was also
deemed more engaging than either of the other measures. Lastly, the three measures
were scored on their representativeness of participants’ thought processes, and again the
ISDEM outperformed the other two methods. Since the ISDEM combines the
thoroughness of pairwise comparisons with the logical structure of the causal diagram
map, it is not surprising that the ISDEM outperforms either method used alone.
It is important to note that these results could be driven by factors other than the
measure, and its design. For example, if the students in our sample rated higher on
need for cognition than the students from the other sample, they may have found the
challenge of the ISDEM more engaging than their counterparts found the other methods.
Since individual differences were not assessed in the earlier study, we may only
conjecture. There are other factors to consider in the interpretation of these
64
comparisons, including study administration differences. The Hodgkinson, Maule and
Bowne (2004) study was conducted as an exercise in a strategic management course, and
entailed the discussion of an investment decision – whether or not to invest in entering a
new market. The current inquiry entails study pool participants describing more
generic systems. Study differences, including the classroom setting versus the study
setting and the discussion of a business case versus generic systems, may have
influenced the results. It is also important to note that participants in the current inquiry
consistently used more extreme ratings than participants in the previous study: it is
possible that a retest of either of these samples would demonstrate a regression to the
mean that brings it closer to the other. In sum, the ISDEM proved to be more difficult,
engaging and representative of internal models than either the freehand mapping or
pairwise comparison approaches alone, though these results are qualified by differences
between the samples, study designs and characteristics of the study environment.
In the validation study for the S-BI, Booth Sweeney and Sterman (2007) reported
the percentage of individuals who responded at the two highest levels, 3 or 4: three
relates to describing simple closed loop system behavior over time, and 4 relates to
describing detailed dynamics of the system over time. Only 10% (n=3) of middle school
students and 55% (n=6) of their teachers demonstrated at least one Level 3 response, and
0% achieved a Level 4 response. In the current study, the percentage of control and
experimental participants that achieved a Level 3 response were both 34% (n=11), and a
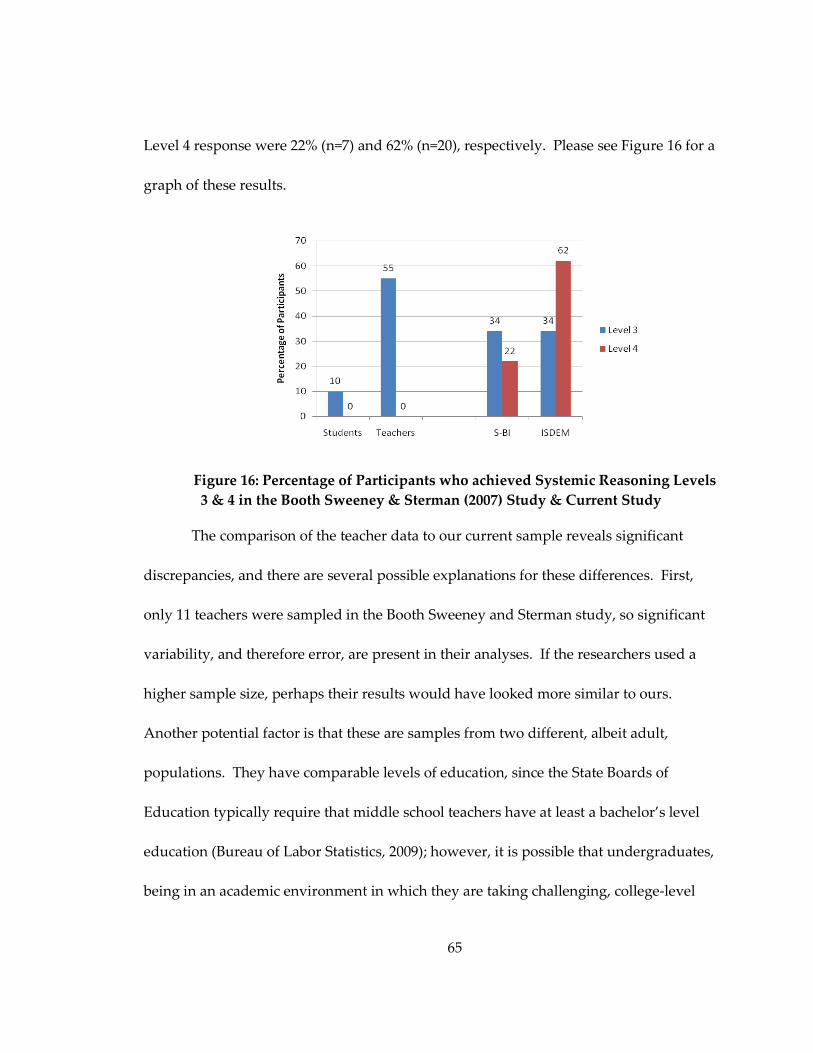
65
Level 4 response were 22% (n=7) and 62% (n=20), respectively. Please see Figure 16 for a
graph of these results.
Figure 16: Percentage of Participants who achieved Systemic Reasoning Levels
3 & 4 in the Booth Sweeney & Sterman (2007) Study & Current Study
The comparison of the teacher data to our current sample reveals significant
discrepancies, and there are several possible explanations for these differences. First,
only 11 teachers were sampled in the Booth Sweeney and Sterman study, so significant
variability, and therefore error, are present in their analyses. If the researchers used a
higher sample size, perhaps their results would have looked more similar to ours.
Another potential factor is that these are samples from two different, albeit adult,
populations. They have comparable levels of education, since the State Boards of
Education typically require that middle school teachers have at least a bachelor’s level
education (Bureau of Labor Statistics, 2009); however, it is possible that undergraduates,
being in an academic environment in which they are taking challenging, college-level
66
courses, are learning about complex dynamics between variables, across many
disciplines. Having this material current in their minds may increase the cognitive
availability of dynamic models for describing behavior. These individuals are also from
a highly selective university, and may differ from the teachers in other ways, such as
motivation, need for cognition, and intelligence.
To gain further insight into how the ISDEM helped individuals describe systems
behavior, the researchers coded participant responses for the presence of cycle-related
language. This binary variable, as defined previously, represents a participants’ facility
with thinking in terms of system dynamics. Almost half of the sample (44%), across
both conditions, possessed both the knowledge and vocabulary necessary to
competently describe the dynamic relationships queried. When taken in conjunction
with participants’ Systemic Reasoning Level scores, we may determine how many
participants were able to competently describe systems behavior, defined as a Systemic
Reasoning Level score of 3 or 4, even when they did not use systems vocabulary. A
small percentage of control participants (12%) were able to describe system dynamics
without ‘closing the loop,’ compared to 52% of the experimental participants. Thus the
ISDEM does a better job at eliciting individuals’ understanding of systems when they do
not have the language readily available, than previously tested methods.
To understand the nature of these results more clearly, the researcher also
explored the individual differences between those who naturally ‘closed the loop,’ and

67
those who did not. Preliminary analyses were run on this dataset, to learn if cognitive
style differences or demographics played a role in individuals’ propensity to use SD
terminology. Independent samples t-tests revealed no significant differences between
the conditions on their need for cognition, or propensity to think analytically or
holistically. One way ANOVA analyses revealed no significant differences on
performance across ethnicity or gender. Thus, in this inquiry, neither demographics nor
individual differences in cognitive style helped to predict individuals’ ability to
competently use SD vocabulary and principles in their responses. Additional analyses
are merited to understand what factors, individual differences or otherwise, contribute
to the use of SD terminology.
These findings speak to a widespread debate in the field. What are the factors at
play in the expression, or lack thereof, of systems knowledge? Do individuals
inherently understand systems dynamics, but lack the vocabulary and experience to
explain them? Or, is the principle of bounded rationality at play, whereby individuals
can only focus on a few variables/relationships at a time, not having the bandwith to
consider the dynamics as well? The former hypothesis supports the promotion of SD
curricula in education, whereas the latter demonstrates the need for instruments, like the
one designed here, to help individuals draw out what they know, examining the results
to appreciate the dynamics at play. This inquiry yields support for both sides. First, an
surprising 44% of our sample used systems terminology accurately. These results
68
suggests that individuals do have the bandwith to consider the dynamics of a situation,
and even the language to express those dynamics simply and competently. What
occurred with the other half of the sample lends support to the need for elicitation
methods. Of those who did not readily have the systems language available, 50% were
able to competently describe the dynamics of the situation over time using the ISDEM.
Therefore, the position of these researchers is that there is validity to both sides, and
important implications for each.
Teaching systems dynamics in schools may increase the number of individuals
who have the experience and vocabulary to recognize and describe dynamic systems -
an asset in our complex world. However, for those who do not have this information
readily available, using a tool like the ISDEM is an effective means for individuals to
report what they do know, examine it, and then interpret the dynamics that they see.
These results support the conclusion that individuals do have access to Systems
Thinking skills – whether it be naturally or through an elicitation method – and that the
decision lies in which technique is appropriate for the particular situation and
individuals involved.
It was important to test the ISDEM with students from a rigorous university,
since they comprise the target population for the measure. The ISDEM was designed as
a method strategy planning groups can use to model their strategic questions: given the
constraints of this work, we were not able to access this population. These students have
69
the qualifications and credentials to assume these leadership positions later in their
careers, and thus are a good substitute population from which to draw. Their
performance on a school-related issue will most likely resemble the performance of
upper management on a strategy question. However, these results may not be
generalizable to other populations, though the findings are intruging enough to merit
further inquiry. Given the potential implications of these results, for both education
policy and academic and corporate applications, an examination of its generalizability to
other populations is greatly warranted.
In sum, this study refutes the conclusion that many researchers in the area have
drawn, that few people possess Systems Thinking skills. Indeed, in our sample, almost
half of the participants could describe dynamic systems using SD terminology. The
other half were able to effecitvely use the ISDEM, creating systems diagrams based on
their own brainstorms of the variables and relationships at play. These results support
the argument that, when given the right tools, individuals can learn and apply Systems
Dynamics. The next study extended this inquiry to examine how useful the ISDEM
would be for helping groups of individuals to expose their understanding of the
dynamics of a situation, potentially enabling them to create more thorough group
models than they could using standard brainstorming techniques. It was hypothesized
that this technique would also mitigate several negative effects of group decision
making, as reviewed earlier, such as a lack of consideration of conflicting viewpoints,

70
and little discussion of alternative outcomes. These phenomenon were queried through
several items added to the Scale Engagement Questionnaire, and are reviewed in the
next section.

71
3. Study Two
3.1 Methods
The Lead Investigator met with the Deans of Undergraduate Education to
discuss the study design and its proposed outcomes. These meetings accomplished
several things: to define the issues to be explored by the undergraduate sample, discuss
data collection logistics and obtain their approval, and discuss post-data collection
coding of the quality of the models.
The results from Study One were used to run power analyses for Study Two.
Taking two main variables, mean Systemic Reasoning Level scores by condition and
participant-reported Difficulty by condition, the mean differences and standard
deviations of the groups were inputted to determine that a sample of 25 groups per
condition would be effective for demonstrating medium effect sizes (d ≥ .50).
3.2 Procedure
Participants were collected through the Duke Psychology Study Pool. Inclusion
criteria for participation were that individuals must be: 1) over 18 years of age, 2) able to
speak English, and 3) able to complete paper-and-pencil questionnaires. Participants
received a brief description of the study and signed up for administration sessions using
an online experimental scheduling program. Study slots accommodated four
participants each, though groups were run if only three people showed up. Since
groups of three, four or five participants were found to be equally effective at solving

72
complex problems (Laughlin, Hatch, Silver & Boh, 2006), we thought it best to run three
person groups when they arose.
The study was held in a private conference room in Bostock Library. When all
scheduled participants arrived, or when ten minutes passed, whichever occurred first,
the study proctor distributed two copies of the informed consent materials to each
participant, and lead them through the information. Participants were asked if they
have any questions, and when all questions were answered, they signed one copy of the
form, returning it to the study proctor, keeping the second copy for their records.
The groups then completed the following measures. The only difference in the
paradigms was that the experimental group completed the ISDEM, and the control
group completed the Brainstorming Exercise.
1. Independent Systems Dynamics Elicitation Method (ISDEM; Holmberg,
unpublished): Completed by the experimental group, the ISDEM is a paper-and-pencil
based knowledge elicitation method. To set up this exercise, the study proctor wrote the
strategic issue to be discussed on the board, and handed out instructions that included
the timing for the exercise, the order of activities, and guidelines for discussion. When
all questions were answered, the proctor handed out the rest of the study materials, with
the ISDEM on top. First, participants were asked to record all relevant variables to the
problem. Participants then paired the variables, indicating the strength and direction of

73
the relationships, until all possible combinations were exhausted. Participants then
diagrammed the relationships transcribed in the first section (for details please see the
ISDEM description in Study One).
When they completed the ISDEM, the group self-directed through the
development of a collective model, using the following guidelines: 1. each group
member shared his/her model, providing an explanation, 2. the group then discussed
the similarities and differences between the models, and 3. the group synthesized their
collective understanding of the issue into a single model. They had 15 minutes to
complete the ISDEM, and 45 minutes to complete the discussion, such that the entire
exercise took 60 minutes in total.
1. Brainstorming Exercise: Completed by the control group, the Brainstorming Exercise
asked participants to brainstorm and model the issue as they would for any typical
group project or class assignment. The instructions were purposefully general: 1.
brainstorm the issue, to arrive at a collective view, or ‘model,’ 2. approach this as you
would any typical group project or class assignment, and 3. take no more than 60
minutes to complete the exercise.
2. Demographic Questionnaire: Upon completion of the ISDEM or the Brainstorming
Exercise, all participants filled out this paper-and-pencil based measure that queried
basic demographic information: age, sex, ethnicity and level of education.

74
3. Scale Engagement Questionnaire. All participants also completed several Likert-scale
items that rated their engagement and difficulty with the process. Additional items
were added to the scale, as used in Study One, to query the group dynamics of the
method, including the percentage of their ideas that they shared, whether they
considered alternative viewpoints in the discussion, and the extent to which they
perceived the group was dominated by one or two individuals. These items relate
directly to the group decision making factors that were used in the development of the
ISDEM.
The study proctor collected all questionnaires and other materials used during
the study, provided the participants a debriefing handout and thanked them for their
time.
In meetings with the Dean and Vice Provost of Undergraduate Education, we
determined the group of administrators who were to use the information collected. The
Lead Investigator scheduled meetings with these individuals, either as a group or
separately, depending on which was most convenient for them, to describe the study
and the issue explored. Each individual was then asked to review the models collected
in the study, rating them on Model Quality as discussed earlier (see Figure 5 for the
coding protocol). Time was also left to discuss generalized findings and implications for
their work. The Lead Investigator added any additional insights yielded through the
collection of the data.

75
3.3 Analyses
Many of the analyses conducted in Study One were also employed in Study Two.
Independent two sample t-tests and Chi Square tests were conducted to assess for
statistically significant differences between the groups on demographic variables
including age, ethnicity, gender and year at Duke. Each group generated a collective
model of the issue, and these models were coded for the dependent variables described
earlier. Research personnel counted the number of variables, relationships and feedback
loops in the models, and then rated their Systemic Reasoning Levels as delineated in the
appendix of the Booth Sweeney & Sterman (2007a) article. These four variables were
compared across conditions using independent two sample t-tests. The models were
also rated by independent coders, using a set of items assessing the informativeness,
clarity, usefulness, understandability and overall model quality (see Figure 8). Several
coders rated each model and these ratings were averaged. The scores were compared
across conditions using independent two sample t-tests.
Participants also completed a questionnaire to learn their impressions of the
process. As in Study One, they rated how well the method captured their inner models
and thought processes. They recorded how many variables, relationships and behaviors
they thought about, but did not include, in the collective models, and lastly how
engaging and difficult the methods were. In addition, several new items explored group
characteristics. These were developed in line with the research described earlier, to

76
learn if group dynamics depended on the method used. They included: how much they
expressed oppositional ideas, whether one individual dominated the conversation, how
well they represented alternative viewpoints, and whether they thought their collective
model was a good representation of the issue. They also were asked for feedback on
how they would improve the process.
3.4 Results
We first examined the characteristics of the sample using Chi Square and t-tests
to learn if there were significant differences between the groups on demographic
variables. No significant differences were found. The surface characteristics of the
models were assessed using the number of variables, relationships and feedback loops.
As in Study One, p-plots revealed generally higher variances across the experimental
group than the control group, so we used Levene’s test for equality of variances to
determine the tests for which it was appropriate to assume equal variances. Contrary to
our hypothesis, the control models tended to have more variables than the ISDEM
models, though this difference did not reach significance (Control: m=15.24; ISDEM;
m=12.52; t=1.87, p=.068). In line with our hypotheses, ISDEM models included
significantly more relationships (Control: m=2.12; ISDEM; m=19.84; t=8.38, p<.001) and
feedback loops (Control: m=0.04; ISDEM; m=4.08; t=2.85, p=.009) than their control
counterparts (see Figure 17; Table 7).

77
Figure 17: Study Two: Variables, Relationships & Feedback Loops Generated
From these results we see that though both groups were working with
comparable numbers of variables, the control groups described significantly fewer
relationships and feedback loops than their experimental counterparts. The mean
number of relationships in the control models was 2: a paltry number given that on
average 15 variables were present. These results are due in large part to the descriptive
natures of the models. Control groups tended to outline a timeline of experiences that
students have, providing no indication as to how or why those experiences are
meaningful (see Appendix D for examples of models coded at Levels 0, 1, and 2). This
also accounts for the lack of feedback loops demonstrated. A model that only lists
experiences may be helpful as an aid in a talk, in which the speaker may elucidate the
role of each experience, but as a stand-alone model, it says very little.
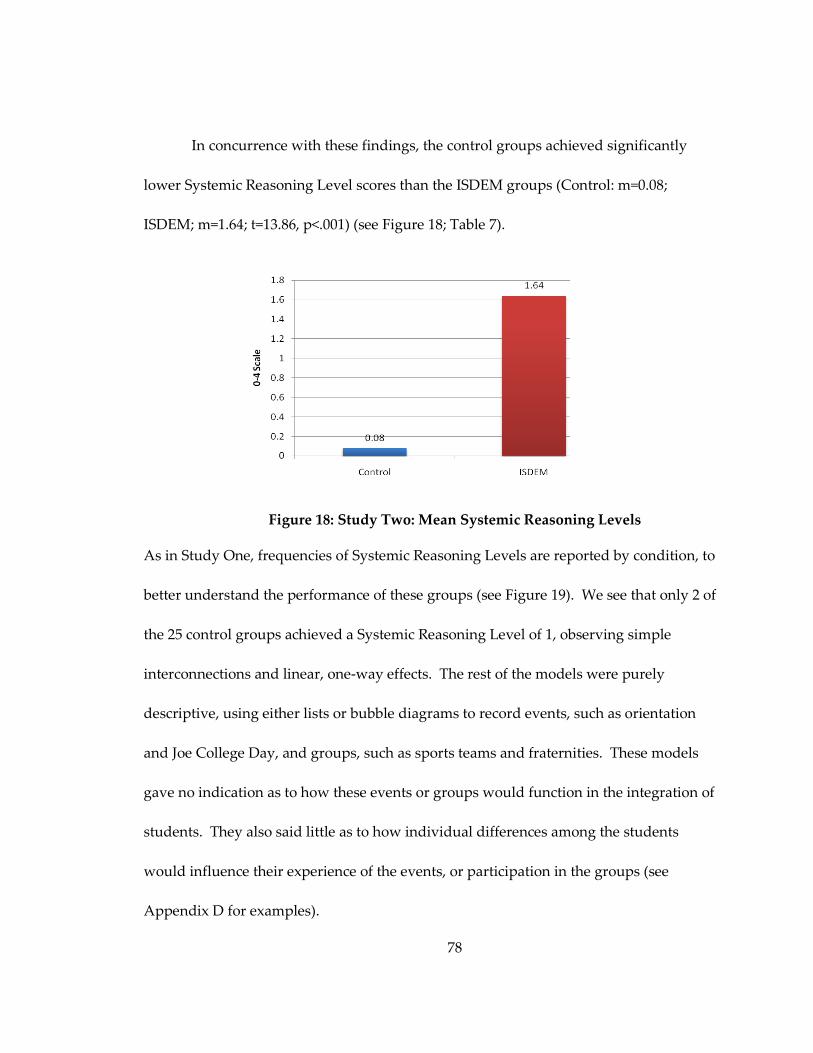
78
In concurrence with these findings, the control groups achieved significantly
lower Systemic Reasoning Level scores than the ISDEM groups (Control: m=0.08;
ISDEM; m=1.64; t=13.86, p<.001) (see Figure 18; Table 7).
Figure 18: Study Two: Mean Systemic Reasoning Levels
As in Study One, frequencies of Systemic Reasoning Levels are reported by condition, to
better understand the performance of these groups (see Figure 19). We see that only 2 of
the 25 control groups achieved a Systemic Reasoning Level of 1, observing simple
interconnections and linear, one-way effects. The rest of the models were purely
descriptive, using either lists or bubble diagrams to record events, such as orientation
and Joe College Day, and groups, such as sports teams and fraternities. These models
gave no indication as to how these events or groups would function in the integration of
students. They also said little as to how individual differences among the students
would influence their experience of the events, or participation in the groups (see
Appendix D for examples).
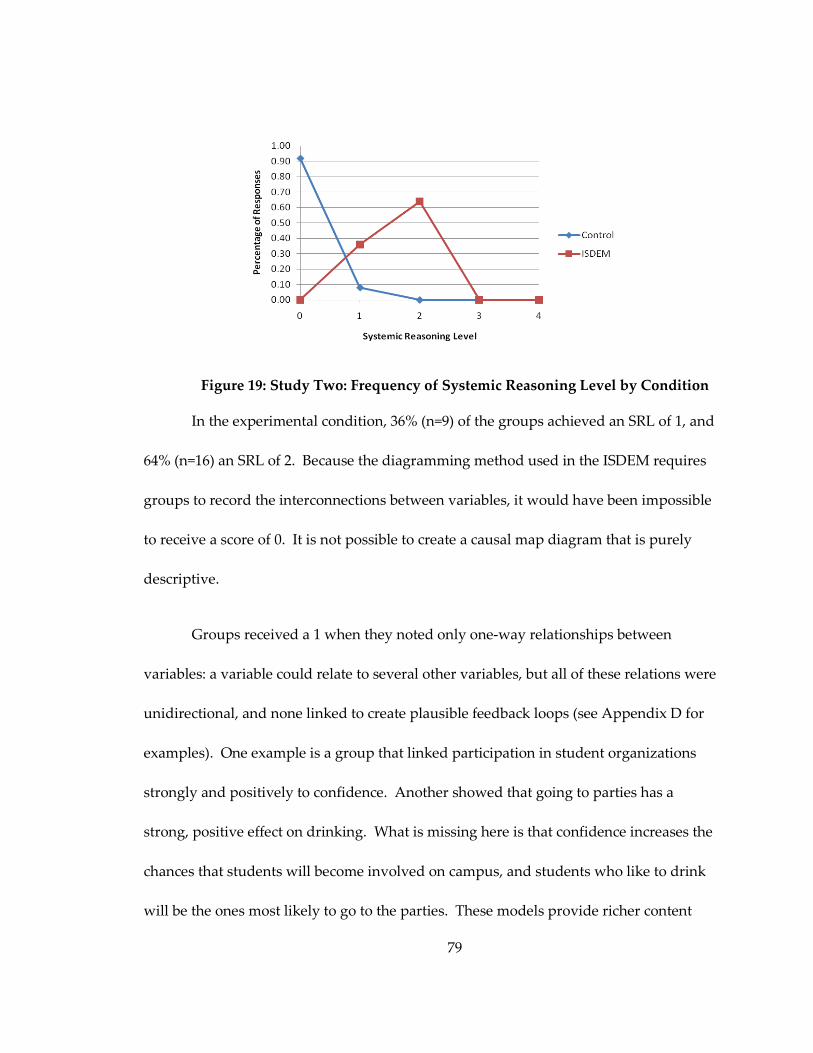
79
Figure 19: Study Two: Frequency of Systemic Reasoning Level by Condition
In the experimental condition, 36% (n=9) of the groups achieved an SRL of 1, and
64% (n=16) an SRL of 2. Because the diagramming method used in the ISDEM requires
groups to record the interconnections between variables, it would have been impossible
to receive a score of 0. It is not possible to create a causal map diagram that is purely
descriptive.
Groups received a 1 when they noted only one-way relationships between
variables: a variable could relate to several other variables, but all of these relations were
unidirectional, and none linked to create plausible feedback loops (see Appendix D for
examples). One example is a group that linked participation in student organizations
strongly and positively to confidence. Another showed that going to parties has a
strong, positive effect on drinking. What is missing here is that confidence increases the
chances that students will become involved on campus, and students who like to drink
will be the ones most likely to go to the parties. These models provide richer content
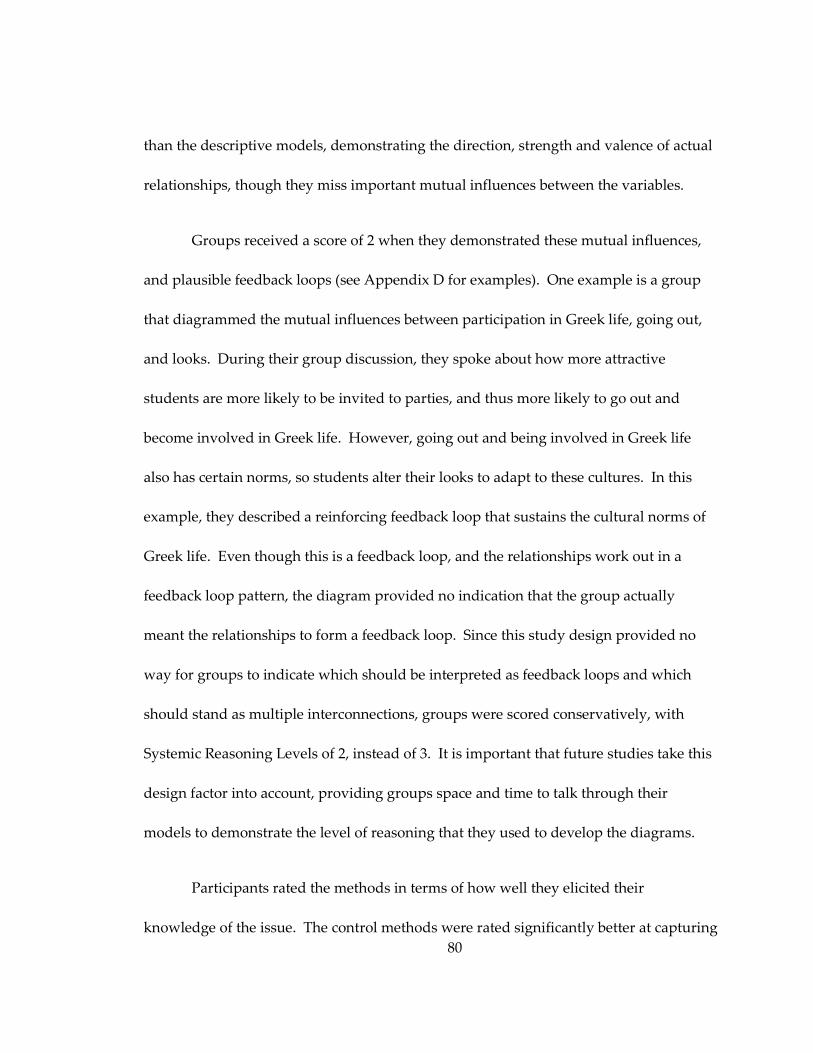
80
than the descriptive models, demonstrating the direction, strength and valence of actual
relationships, though they miss important mutual influences between the variables.
Groups received a score of 2 when they demonstrated these mutual influences,
and plausible feedback loops (see Appendix D for examples). One example is a group
that diagrammed the mutual influences between participation in Greek life, going out,
and looks. During their group discussion, they spoke about how more attractive
students are more likely to be invited to parties, and thus more likely to go out and
become involved in Greek life. However, going out and being involved in Greek life
also has certain norms, so students alter their looks to adapt to these cultures. In this
example, they described a reinforcing feedback loop that sustains the cultural norms of
Greek life. Even though this is a feedback loop, and the relationships work out in a
feedback loop pattern, the diagram provided no indication that the group actually
meant the relationships to form a feedback loop. Since this study design provided no
way for groups to indicate which should be interpreted as feedback loops and which
should stand as multiple interconnections, groups were scored conservatively, with
Systemic Reasoning Levels of 2, instead of 3. It is important that future studies take this
design factor into account, providing groups space and time to talk through their
models to demonstrate the level of reasoning that they used to develop the diagrams.
Participants rated the methods in terms of how well they elicited their
knowledge of the issue. The control methods were rated significantly better at capturing
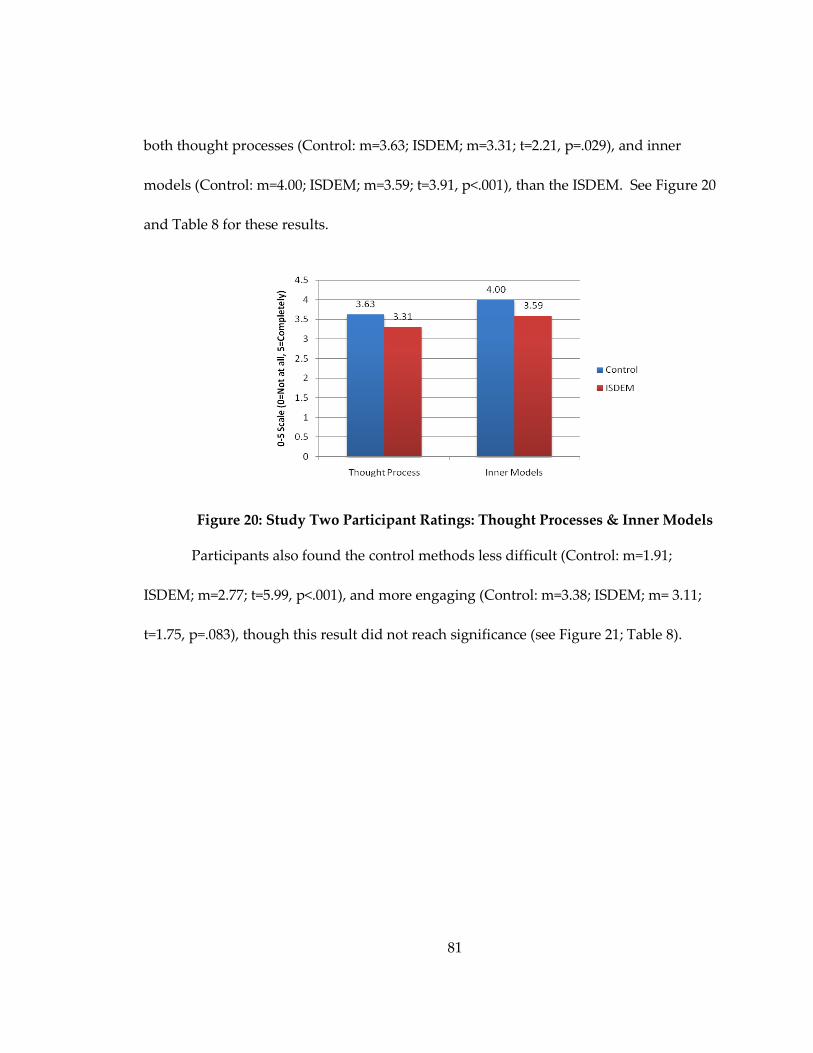
81
both thought processes (Control: m=3.63; ISDEM; m=3.31; t=2.21, p=.029), and inner
models (Control: m=4.00; ISDEM; m=3.59; t=3.91, p<.001), than the ISDEM. See Figure 20
and Table 8 for these results.
Figure 20: Study Two Participant Ratings: Thought Processes & Inner Models
Participants also found the control methods less difficult (Control: m=1.91;
ISDEM; m=2.77; t=5.99, p<.001), and more engaging (Control: m=3.38; ISDEM; m= 3.11;
t=1.75, p=.083), though this result did not reach significance (see Figure 21; Table 8).

82
Figure 21: Study Two Participant Ratings; Engagement & Difficulty
Lastly, participants were asked how much information from their inner models
was not included in the diagrams. They reported that using the ISDEM, they were not
able to represent as many variables (Control: m=1.97; ISDEM; m=2.77; t=4.93, p<.001),
relationships (Control: m=1.89; ISDEM; m=2.80; t=5.38, p<.001) or behaviors (Control:
m=1.92; ISDEM; m=2.39 ; t=2.70, p=.008) as they could using the control method (See
Figure 22; Table 9), even though the ISDEM models contained significantly more
relationships and feedback loops than their control counterparts, as described earlier.
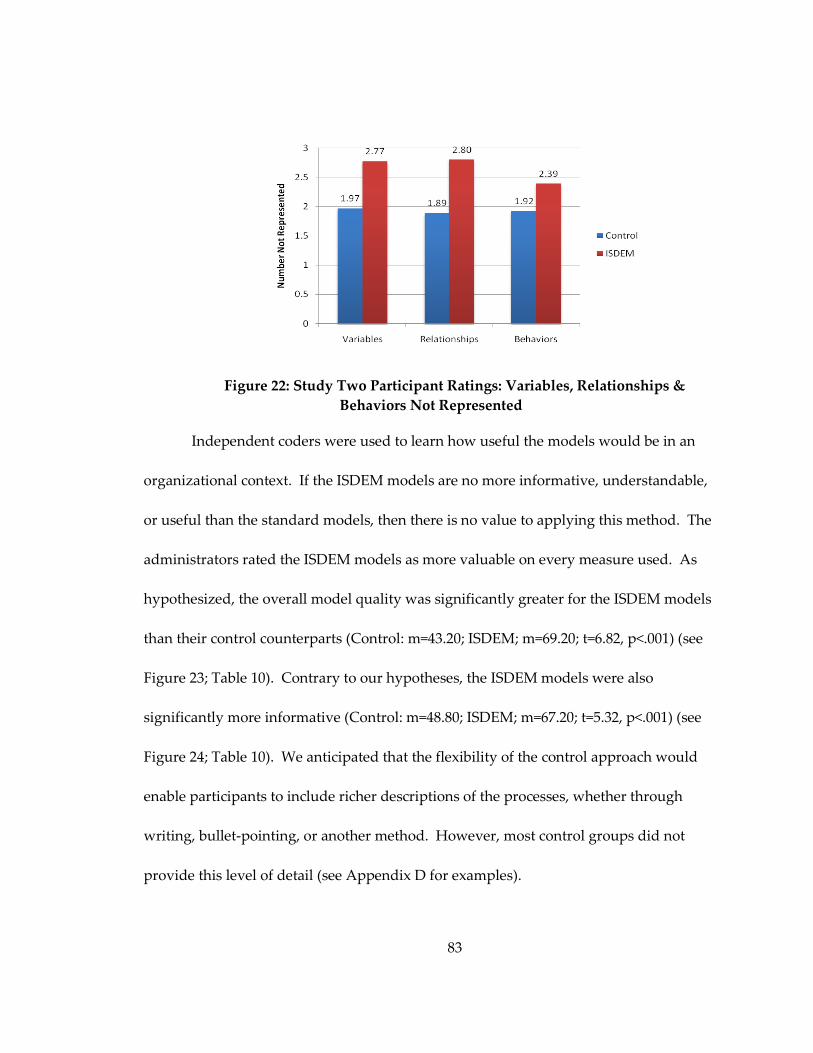
83
Figure 22: Study Two Participant Ratings: Variables, Relationships &
Behaviors Not Represented
Independent coders were used to learn how useful the models would be in an
organizational context. If the ISDEM models are no more informative, understandable,
or useful than the standard models, then there is no value to applying this method. The
administrators rated the ISDEM models as more valuable on every measure used. As
hypothesized, the overall model quality was significantly greater for the ISDEM models
than their control counterparts (Control: m=43.20; ISDEM; m=69.20; t=6.82, p<.001) (see
Figure 23; Table 10). Contrary to our hypotheses, the ISDEM models were also
significantly more informative (Control: m=48.80; ISDEM; m=67.20; t=5.32, p<.001) (see
Figure 24; Table 10). We anticipated that the flexibility of the control approach would
enable participants to include richer descriptions of the processes, whether through
writing, bullet-pointing, or another method. However, most control groups did not
provide this level of detail (see Appendix D for examples).
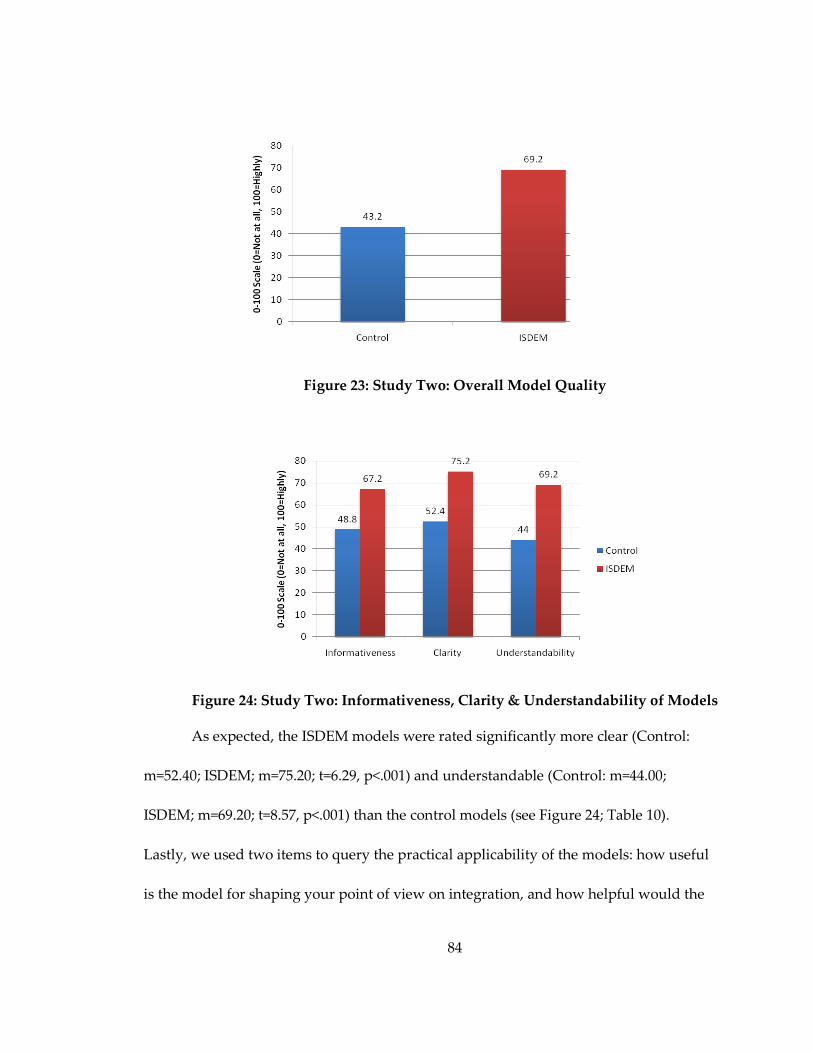
84
Figure 23: Study Two: Overall Model Quality
Figure 24: Study Two: Informativeness, Clarity & Understandability of Models
As expected, the ISDEM models were rated significantly more clear (Control:
m=52.40; ISDEM; m=75.20; t=6.29, p<.001) and understandable (Control: m=44.00;
ISDEM; m=69.20; t=8.57, p<.001) than the control models (see Figure 24; Table 10).
Lastly, we used two items to query the practical applicability of the models: how useful
is the model for shaping your point of view on integration, and how helpful would the
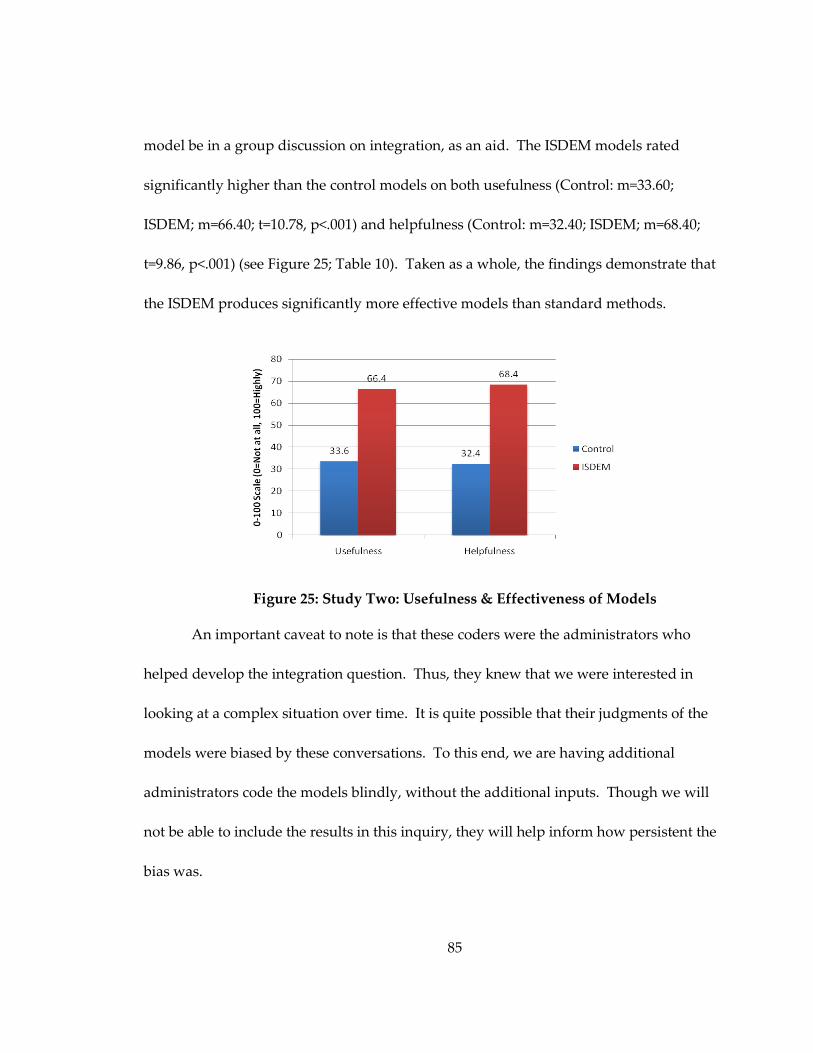
85
model be in a group discussion on integration, as an aid. The ISDEM models rated
significantly higher than the control models on both usefulness (Control: m=33.60;
ISDEM; m=66.40; t=10.78, p<.001) and helpfulness (Control: m=32.40; ISDEM; m=68.40;
t=9.86, p<.001) (see Figure 25; Table 10). Taken as a whole, the findings demonstrate that
the ISDEM produces significantly more effective models than standard methods.
Figure 25: Study Two: Usefulness & Effectiveness of Models
An important caveat to note is that these coders were the administrators who
helped develop the integration question. Thus, they knew that we were interested in
looking at a complex situation over time. It is quite possible that their judgments of the
models were biased by these conversations. To this end, we are having additional
administrators code the models blindly, without the additional inputs. Though we will
not be able to include the results in this inquiry, they will help inform how persistent the
bias was.

86
Interestingly, though the ISDEM was developed using theoretical and empirical
findings on group dynamics, no significant differences were found between the
conditions on these items. The results are depicted in Table 2. The structure of the
ISDEM did not increase the number of opposing ideas shared, nor did it inhibit one
person from dominating the groups’ conversations. In both conditions, groups deemed
their models good representations of the scenarios, and on average groups reported that
they ‘somewhat’ represented alternative viewpoints. The percentage of ideas that
people reported sharing were comparable across the conditions, and participants found
the methods equally helpful for describing the issue, even though no method was
provided in the control condition. In sum, the ISDEM did no better job at mitigating
group dynamic problems than standard brainstorming techniques.
Table 2: Study Two Means (Standard Deviations) & T-Tests for Participant Ratings on
Group Dynamics
Control ISDEM t p-value
Express Opposite Ideas 2.73 (1.07) 2.56 (0.94) 0.96 0.34
One Person Dominate 1.09 (1.06) 0.95 (0.95) 0.79 0.43
Good Representation 2.89 (0.59) 2.84 (0.78) 0.38 0.70
Alternative Viewpoints 2.69 (0.87) 2.77 (0.75) 0.54 0.59
% Ideas Shared 73.74 (29.56) 75.14 (22.30) 0.30 0.76
How Helpful 74.28 (19.34) 71.28 (19.59) 0.87 0.39
There are several caveats to report. First, since the study sought to learn how the
ISDEM could be applied as a self-administered method, participants guided themselves
through the process. Therefore, there was significant variation in how closely groups

87
followed the instructions. We observed the experimental groups as they conducted the
group discussion, recording how they chose to share their models. The instructions told
participants to “Show your individual model (the diagram) to the group, explaining the
variables, relationships, and your rationale” (see Appendix B). However, 23 of the 25
groups (92%) did not follow this. Fifteen of the groups (60%) went around in a circle
and said what variables they thought were important, while 8 (32%) of the groups
mentioned how those variables influenced the other variables, or student integration
more generally. An example of a variable response is: “I chose orientation events, your
dorm, and involvement in fraternities, sororities and selective living groups.” An
example of a relationship response is: “I put down that attending a pre-orientation event
is important, because it means you already have a group of friends when you arrive on
campus.” Only two groups (8%) actually used their models to talk through their
thoughts. The second step of the instructions was for groups to discuss the similarities
and dissimilarities between their models; however, neither of the groups followed this
step, choosing to jump directly into making the group model instead.
Since this was an effectiveness study, it lacked experimental control. Groups
tended to follow directions poorly, using their own judgments on how to conduct the
procedure. The process of group members sharing their individually-developed models
was the principle mechanism hypothesized to mitigate negative group dynamics; thus,
the results found here give no indication as to whether that mechanism worked. For
88
example, when participants shared their models, they chose which variables to mention,
and which variables to exclude. They chose whether to share relationships, or just the
variables. Thus, there is a high likelihood that social influence bias occurred while
sharing, with participants censuring their models to align with the general position of
the group. Our hypotheses stand, that with a more controlled experiment, the ISDEM
would demonstrate group dynamic effects.
Also, these data were collected from a group of undergraduate students
obtaining course credit for research. What would differ in how this is used more
generally is that groups would either be incentivized (i.e., their boss wants them to do
it), or self-motivated (i.e., this will land us the client) to work through the problem and
learn the results. Therefore, groups may take the instructions more seriously, and follow
them more closely. Replicating this paradigm with other populations, particularly
incentivized groups, would elucidate this question.
3.5 Discussion
This study demonstrates the effectiveness of the ISDEM, as it is intended to be
used: by groups tackling a complex issue. At the surface level, the ISDEM yielded more
detailed models, in terms of relationships and feedback loops generated. On the
comprehension level, independent coders found the ISDEM models more informative,
clear, understandable, and useful. They would also be more likely to use the ISDEM as
a group discussion aid, to represent the perspectives of those not in the room. Thus, the

89
ISDEM enabled groups to create more thorough, nuanced models than if they had been
left to their own modeling techniques.
To begin to understand the meaning of these results, we will review the
independent coders’ results in detail. First, they were asked their personal impressions
of the models: ‘how do you perceive the model in terms of factors that are important to
you’? This Overall Model Quality question sought to encapsulate the gestalt of the
model, and the aspects that a coder could not otherwise articulate. They were then
asked how much information is conveyed in the model, and how visually clear and
parsimonious it is. The fact that the ISDEM models were rated both more parsimonious
and more complex suggests that the coders found the modeling style highly effective.
This is corroborated by their rating the Overall Model Quality of the ISDEM
significantly higher than the control models.
The item on understandability captured two dimensions of the model: is there
information missing, and do you understand what the modelers were trying to convey.
Both speak to how interpretable the models were, and the ISDEM significantly
outperformed the control models. It is possible that seeing models that show the
strength and direction of relationships made clear to the coders how little a simple
bubble diagram conveys. Lastly, the independent coders rated the models on
applicability. First, they were asked how helpful the model was for shaping their point
of view, and then how helpful it would be in a group discussion on the issue, acting as

90
an aid that represents the perspectives of those not in the room. Again, the ISDEM
outperformed the control models, indicating that the structure and content of the ISDEM
models would be significantly more useful in strategy discussions than the other
models. Taken together, these results speak powerfully to the usefulness and
applicability of the ISDEM.
Those working with the method have a different perspective, suggesting that
quality doesn’t come cheaply. Replicating Study One, the ISDEM was deemed less
engaging and more difficult than the control methods, and less representative of
participants’ thought processes. In Study One, we saw this as a logical result of
methodological differences: a free association interview will be considered far easier and
more interesting than a complicated, structured problem solving task. In this study, the
same applies: control participants could shape their experience as they saw fit, making it
more enjoyable and less arduous than the ISDEM. This flexibility in both paradigms
also enabled participants to make their output directly reflect their thought processes.
Comparing these results to the Hodgkinson, Maul and Bowne (2004) findings,
the ISDEM was rated more engaging and representative than either the freehand
mapping or pairwise comparison approaches, but less difficult than the freehand
mapping approach (see Table 3). In Study One, the ISDEM rated higher on all three
items: we originally conjectured that our results were due to generally higher ratings on
the part of our participants, but these results suggest that other factors were at play.
91
Comparing the performance of the ISDEM across both studies, we see that it was rated
less difficult and more engaging in the group paradigm (Study Two) than in the
individual paradigm (Study One) (see Table 3). The three main experimental differences
that could drive these effects are the nature of the question, the individual/group
difference, and the level of experimental control. Thus, a more personally relevant
question may be deemed less difficult/more engaging than the random, simple systems
queried in the first study. Or, it could feel easier to work through a complex problem in
a group than alone. Similarly, talking with a group of your peers is far more engaging
than completing a paper-and-pencil based measure. Lastly, as discussed earlier, most
participant groups did not follow the ISDEM instructions exactly, so this increased
flexibility could have made the process less difficult, and more engaging. Any
combination of these factors, and their interactions, could have driven the results.
Finally, participants in Study Two found their group models less representative
of their internal models than participants in Study One did, when rating their own
individual models, though more representative of either the freehand mapping or
pairwise comparison approaches. These results are logical: whereas an individual
model expresses exactly how that person perceives the scenario, a group model takes
into account two to three other opinions. In sum, though Study One participants rated
all items higher than the Hodgkinson, Maule & Bowne (2004) sample did, putting into
question the comparability of our results, the varied effects in Study Two suggest that
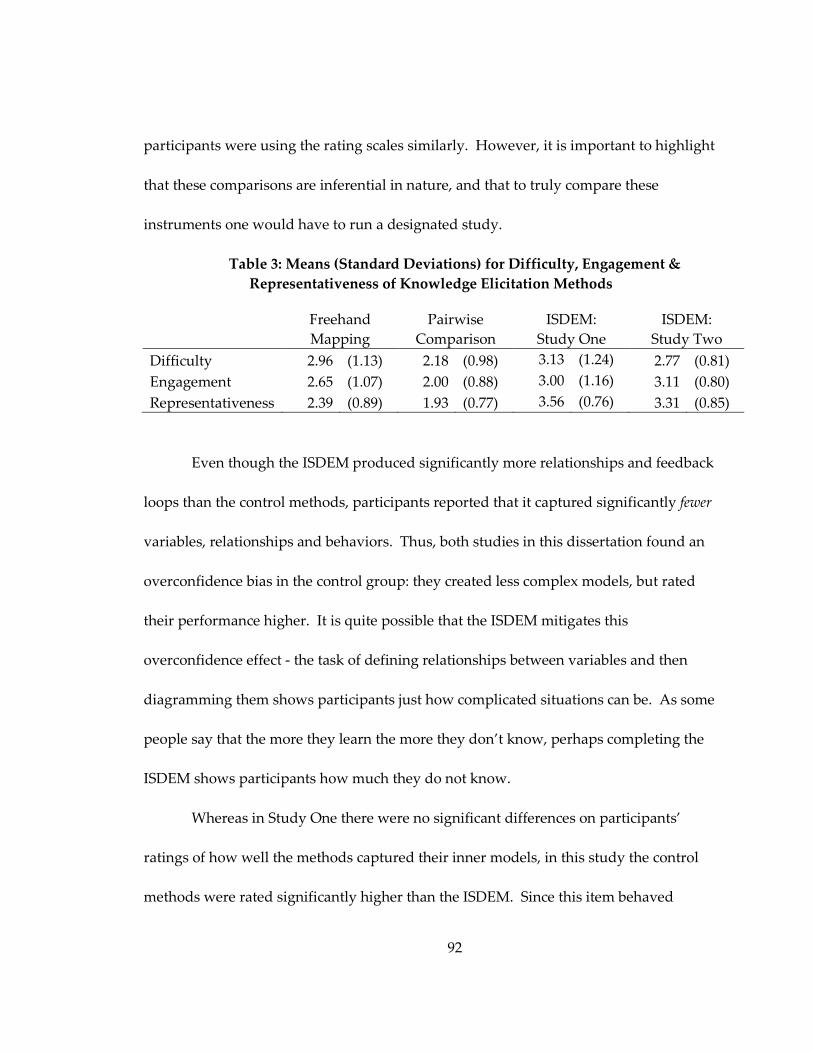
92
participants were using the rating scales similarly. However, it is important to highlight
that these comparisons are inferential in nature, and that to truly compare these
instruments one would have to run a designated study.
Table 3: Means (Standard Deviations) for Difficulty, Engagement &
Representativeness of Knowledge Elicitation Methods
Freehand
Mapping
Pairwise
Comparison
ISDEM:
Study One
ISDEM:
Study Two
Difficulty 2.96 (1.13) 2.18 (0.98) 3.13 (1.24) 2.77 (0.81)
Engagement 2.65 (1.07) 2.00 (0.88) 3.00 (1.16) 3.11 (0.80)
Representativeness 2.39 (0.89) 1.93 (0.77) 3.56 (0.76) 3.31 (0.85)
Even though the ISDEM produced significantly more relationships and feedback
loops than the control methods, participants reported that it captured significantly fewer
variables, relationships and behaviors. Thus, both studies in this dissertation found an
overconfidence bias in the control group: they created less complex models, but rated
their performance higher. It is quite possible that the ISDEM mitigates this
overconfidence effect - the task of defining relationships between variables and then
diagramming them shows participants just how complicated situations can be. As some
people say that the more they learn the more they don’t know, perhaps completing the
ISDEM shows participants how much they do not know.
Whereas in Study One there were no significant differences on participants’
ratings of how well the methods captured their inner models, in this study the control
methods were rated significantly higher than the ISDEM. Since this item behaved

93
discrepantly from all of the other items in Study One that measured similar constructs, it
is most likely that we experienced a Type 2, statistical error in Study One. There are
many other possible explanations for these results. Perhaps the discrepancy is a
function of the complexity of the system queried: for simple systems, the ISDEM may
seem similar to participants’ mental models, whereas for complex systems, the final
product appears discrepant from their personal ideas. It is also possible that individuals
related far more strongly to their models of student integration than to a question about
wolves and rabbits. The strength of these opinions may have made them look more
critically at the integration models than they did the arbitrary, simple ones. Further
empirical testing needs to be done to elucidate this effect.
Even though substantial literature informed the development of the ISDEM
group discussion process, it did not mitigate any group biases. On all group dynamics
tested, from consideration of alternative viewpoints to sharing contradicting ideas, the
ISDEM and control methods rated similarly. However, a large majority of the ISDEM
groups did not follow the directions correctly, so this study did not have adequate
experimental control to detect these effects. This study group hypothesizes that group
biases are driven by more pervasive factors than the set-up of the problem solving
environment. The corporate culture, relationships between employees, and individuals’
understanding of their working style all play into the expression of group biases, and
these must be addressed directly before any change may be demonstrated in the

94
problem solving scenario. Given the ISDEM was developed using empirical knowledge
on group biases in decision making, it is hoped that the measure does not evoke
additional biases, above and beyond groups’ typical ones. To test this, a study design
could put two groups from the same corporate environment through executive
education, working with the group on its dynamics. Then one group could receive the
ISDEM, and the other could use their standard brainstorming techniques. Performance
on group dynamics measures would then demonstrate if the ISDEM served as a
reinforcement for keeping biases at bay, or not.
In sum, this study demonstrates that the ISDEM is a valuable tool for groups to
use to represent systems scenarios. Sterman (2000) recommends that those seeking to
understand systemic phenomenon should hire consultants to map the problem space
and create quantitative simulations. However, this level of analysis is incredibly fine-
grained. For those who just want a general picture of how forces may interact, or what
variables are involved, a simple causal map is the most effective approach. In this study,
small groups were capable of creating informative, clear and understandable diagrams
through a self-administered problem solving process. Thus, this work qualifies
Sterman’s (2000) recommendations. For those problems that call for detailed,
quantitative analysis, outside consultants should be hired. For more macro-level,
qualitative problems, the ISDEM is a valid and effective tool.
95
Conclusion
Do people lack innate knowledge of systems? Can thinking this way be helpful
for exploring a problem or situation? Does the method used to evoke individuals’
knowledge matter? Can we create a method to mitigate group biases using
psychological findings? These were the questions that we explored in this inquiry. In a
sample of undergraduates at an elite university, we discovered that individuals do have
an innate knowledge of systems, and many even have the language to describe them.
We also learned that with the help of the ISDEM, most individuals could competently
describe systemic phenomenon, even when they did not have the language available.
These findings reflect an important distinction that has not yet been addressed in the
literature: are these abilities innate, manifesting naturally, or inborn, requiring
elicitation? Individuals who expressed cycle-related language most likely had had some
exposure to dynamic situations in school, causing them to be familiar enough with these
principles to use them freely. For those who did not have this experience, or did not
have the facility to apply it to another domain/task, the elicitation method worked. Put
together, these findings suggest that thinking systemically is inborn, and not innate.
However, much more research needs to be conducted to substantiate this conclusion.
When given to groups, the method yielded models that were informative and
understandable, and better represented the interconnecting nature of relationships, as
compared to standard methods. Not surprisingly, they were deemed significantly more

96
useful by independent coders. Though we took into account group decision making
findings in the development of the group method, it did little to influence the biases that
groups experience. Since the method is intended to be self-administered, groups were
allowed to direct themselves through the instructions, unsuccessfully, in this case. A
great majority of the groups did not follow the instructions correctly, with many
modifying them significantly. Thus, this study lacked the experimental control to
adequately test these effects. However, we would not be surprised if, even with
adequate experimental control, group dynamic effects were not found. These dynamics
may be so embedded in the culture and behavior of the institution that they must be
addressed independently, before any problem solving manipulation may be applied.
Future studies may address this question. It is hypothesized that the ISDEM would
stand as a powerful problem solving manipulation when done in conjunction with other
exercises that directly focus on group biases.
This set of studies rests in a critical gap in the Systems Thinking literature.
On the one hand, researchers purport that children have innate Systems Thinking skills,
and that from our experiences in school and the world, we learn to emphasize linear,
cause-and-effect thinking (Senge, 1990). They have used case studies and simple
interviews to suggest that the principles of Systems Dynamics are available even to
children, and are currently developing methods for teaching Systems Thinking in
elementary school classrooms. On the other hand, researchers claim that people lack

97
Systems Thinking skills, demonstrated through studies with business school students
(Booth Sweeney & Sterman, 2000; Ossimitz, 2002). The students were tested using
sophisticated mathematical problems. Their performance on these analytical questions
was coded to represent their understanding of stocks and flows, time delays, and
multiple influences. Several confounding variables play a role in these results though -
especially participants’ facility with math and their understanding of calculus. Given
the difficulty the students had with quantitatively representing systemic phenomenon,
the researchers recommended that firms enlist Systems Consultants to help them walk
through the modeling process, to create complex simulations.
These studies represent the middle ground. Study Two moved past the simple
systems tested with elementary school students (Senge, 1990) and the arbitrary,
analytical questions of the Booth Sweeney and Sterman (2000) inquiry. We used a real,
complex issue that touches the lives of each participant. Every student has their own
experience of integrating onto campus, and they have watched the integration process of
their peers. We tested the participants in a way that enables them to express their
understanding, through diagrams, or in the control group, in any way that they chose.
Our method stayed true to its purpose, for knowledge elicitation, whereas the
right/wrong nature of mathematical problems does not. Thus, these studies provided
critical input into the debate.

98
Our participants did demonstrate an innate understanding of systems, albeit a
simplistic one. Some were able to describe the dynamics between variables on their
own, while others were aided by the ISDEM process. Participants could also diagram
complex systems, though our study methods did not elicit either written or verbal
descriptions. It is unclear whether the complex models were a collection of linear
relationships, or truly a system. These results corroborate the work of the early-age
researchers, since college-age students do demonstrate innate understanding of
simplistic systemic phenomenon. However, it qualifies the business school researchers:
if undergraduates demonstrate these systems skills, they have some understanding of
systems. Though they may not be able to quantitatively model the rates and quantities
associated with stocks and flows diagrams, they can describe how variables interrelate.
To explore this area further, a follow-on study could have participants complete
interviews or the ISDEM on the questions used in the Booth Sweeney and Sterman
(2000) study. A within-subject study design testing the exact questions in these studies
both quantitatively, as they did, and qualitatively, as we did, would be effective at
piecing out whether participants have difficulty with these items generally, or just
quantitatively. In sum, the current research suggests that Booth Sweeney and Sterman
(2000) and others reached too far when they concluded that individuals do not possess
Systems Thinking skills. This work suggests that individuals have a general, innate
understanding of systems, though not at the level of quantitative analysis. While they

99
may not be able to compute the rates and quantities of variables, they can describe the
general pattern of the variables’ behavior.
Based on these findings, we can also qualify the recommendations provided by
Sterman (2000). Groups that require in-depth, quantitative analysis of a system should
enlist the help of SD consultants. They will use simulation software that numerically
models how a change in any of the variables may influence the entire system. This work
is beyond the capabilities of a strategy planning committee; however, this is often not
the work asked of them. Perhaps a strategy planning group only seeks to understand
the problem space, before they ask more specific questions. A practical example would
be a marketing group who wants to understand how a new advertising space works.
Companies frequently seek information on the ‘customer experience,’ or the feelings,
actions and inputs a customer experiences while buying, assembling and using their
product. For these types of questions, hiring outside consultants to develop a simulation
is a waste of resources. Serving these types of situations and problems, the ISDEM fills a
critical hole in the Systems Dynamics toolkit.
Though the ISDEM is generally a more unpleasant process than standard
approaches, being rated as less engaging and more difficult, it yields models that are
more clear and informative. Independent coders indicated that ISDEM models are
generally more useful, and serve as more effective aids for group discussion than
standard models. Due to technological innovations, groups are working with more and
100
more data. Our results suggest that it may be beneficial for companies to systematize
their diagramming approaches. When it comes to a process problem, or mapping a
situation space, groups should be encouraged to use this approach. Perhaps a
recommendation system could be extended to other types of problems (i.e., for balance
sheet items, a specific tabular format would be indicated). Providing clear, uniform
methods for distilling different types of information could be an efficient and effective
way of coping with the limitless data available to corporations today.
Throughout this dissertation, many directions for future research have been
suggested. Some have related to study design. For example, providing participants an
opportunity to describe their group models in Study Two would enhance both the
validity and accuracy of the Systemic Reasoning Level scores. Other directions would
serve as extensions of our work, such as testing the ISDEM with its target population,
strategy planning committees in organizations. Researchers seeking to understand the
prevalence of cycle-related language and awareness of systems in the general
population could use our protocol with other samples, from trade schools and unions to
Parent-Teacher Associations.
This research group is most interesting in validating the ISDEM for its intended
use: in corporations, to solve strategy problems. There are three main directions that
could be pursued. As stated above, a paradigm that works on group biases prior to the
problem solving manipulation would be powerful for understanding the true effects of

101
the manipulation. Second, it would be beneficial to learn what level of control is
necessary to achieve the intended effects. For example, how closely do groups follow
the ISDEM process when they are directed by a colleague versus an outside consultant?
Do the directions/materials need to be handed out in a step-by-step process, or can it be
all at once? Third, an important question that was outside the scope of the current
inquiry is that our observed effects could have been due to introducing discipline to the
problem solving process, instead of the ISDEM itself. Perhaps it was not the ISDEM
process, but the fact that we introduced discipline into the problem solving process, that
yielded the more clear and complex models. For example, the instructions enabled
groups to focus on the variables and relationships at hand, instead of wasting time
deciding how they wanted to approach the problem, how they wanted to present the
results, etc. By imposing structure, richer discussion on the content may occur. Future
studies should examine the effects of the ISDEM, above and beyond imposed discipline
to the problem solving scenario.
We are also interested in how that information is handled, once it has been
created. What factors lead to its application, versus its shelving? Companies experience
inertia, whereby their ways of showing, talking and acting on information become
routinized and engrained (Miller, 1994). This serves a valuable purpose, letting people
focus on the information, instead of the presentation style. However, it makes it difficult
for new ways of thinking to be accepted and integrated. What difficulties arise in

102
applying the ISDEM in an organization? How can we counteract these difficulties? It is
probable that this work will begin on an ad hoc, individualistic basis, with teams
creating on-the-spot solutions or enlisting the help of executive coaches. With enough
experience, patterns will emerge that can be codified, with recommendations based on
what worked, and what didn’t. These areas of study will demonstrate the true benefit of
this work - for those who use it.
The other area of interest for this study team is to advance the theory on Systems
Thinking. To better qualify what people understand, and what they don’t, there are
several mechanisms we could use, that when taken together would paint a much more
sophisticated picture than the one available today. Can individuals distinguish real
systems from fake ones (discrimination)? When they learn systems principles in one
domain, are they able to apply them to a different domain (transferability)? Does
complexity moderate performance (difficulty)? At what level between the qualitative
questions asked here and the quantitative questions posed by Booth Sweeney and
Sterman (2000) do our abilities break down? These questions and others would help
elucidate the nature of individuals’ knowledge of systems, and advance our empirical
work considerably.
In summary, the ISDEM yields informative, clear, and useful models. Though
the process is less engaging and more difficult than standard techniques, the output is
worthwhile. Companies interested in understanding systemic phenomenon can use the
103
ISDEM to evoke their employees’ knowledge to map the problem space, and its general
behavior. Many strategic questions do not require fine-grained analyses: anytime a
brainstorm might be used, the ISDEM would work more effectively. Future studies
should extend this work by testing the ISDEM in corporate settings, and other
populations that would benefit from thinking in terms of systems, such as health care
teams and government task forces. Systems Dynamics should no longer be the purview
of a few, expensive consulting firms. Anyone can access this type of knowledge, and it
is time that we provide people with the tools to help them do so.

104
Appendix A
The Independent Systems Dynamics Elicitation Method
THE PROBLEM:
Name as many variables as you can that influence or are influenced by the above
situation:
_____________________________________ _____________________________________
_____________________________________ _____________________________________
_____________________________________ _____________________________________
_____________________________________ _____________________________________
_____________________________________ _____________________________________
_____________________________________ _____________________________________
_____________________________________ _____________________________________
_____________________________________ _____________________________________
_____________________________________ _____________________________________
Examine the variables above. Look for the connections, or when changes in one variable
create change in another. Indicate whether the relation is positive (If variable X
increases/decreases, variable Y increases/decreases) or negative (If variable X
increases/decreases, variable Y decreases/increases), and the strength of the relationship.
Make sure to write down all possible connections, including those for which the Y
variables influence the X variables, as in gas positively and strongly relating to driving,
and driving relating negatively and strongly to gas. You need gas to drive, but driving
depletes gas levels.
_____________________ �_____________________ + / - weak moderate strong

105
_____________________ �_____________________ + / - weak moderate strong
_____________________ �_____________________ + / - weak moderate strong
_____________________ �_____________________ + / - weak moderate strong
_____________________ �_____________________ + / - weak moderate strong
_____________________ �_____________________ + / - weak moderate strong
_____________________ �_____________________ + / - weak moderate strong
_____________________ �_____________________ + / - weak moderate strong
_____________________ �_____________________ + / - weak moderate strong
_____________________ �_____________________ + / - weak moderate strong
_____________________ �_____________________ + / - weak moderate strong
_____________________ �_____________________ + / - weak moderate strong
_____________________ �_____________________ + / - weak moderate strong
Notes:
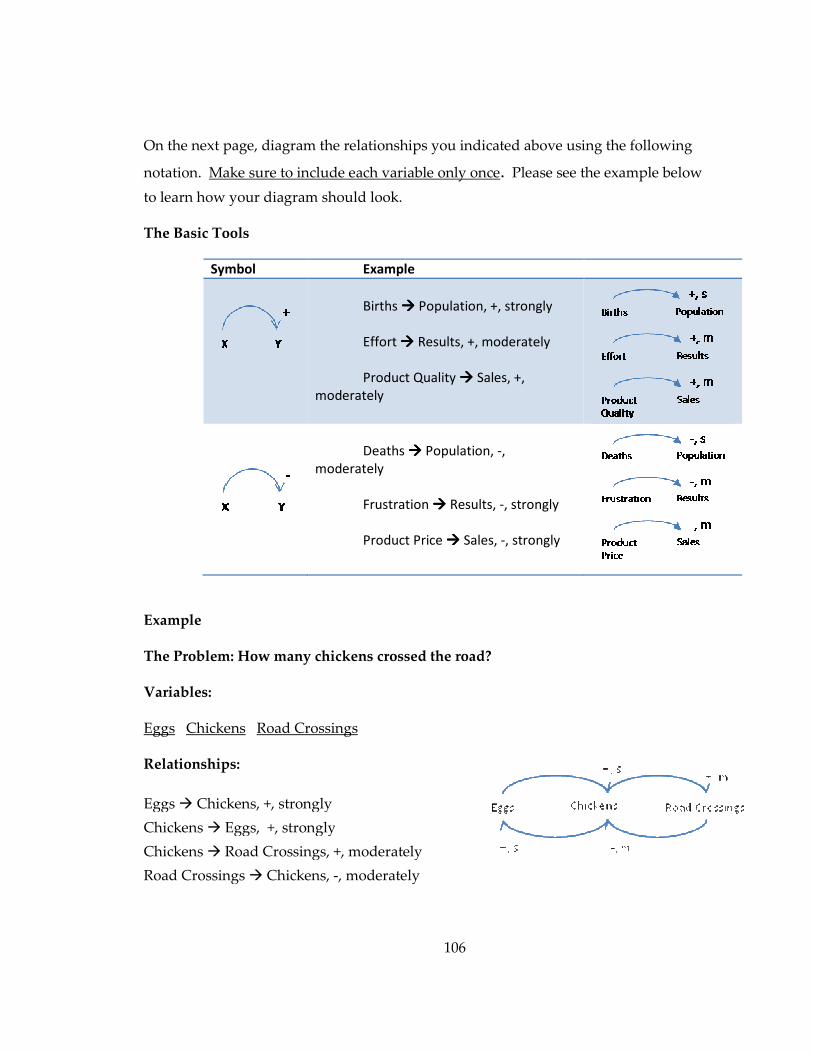
106
On the next page, diagram the relationships you indicated above using the following
notation. Make sure to include each variable only once. Please see the example below
to learn how your diagram should look.
The Basic Tools
Symbol Example
Births ���� Population, +, strongly
Effort ���� Results, +, moderately
Product Quality ���� Sales, +,
moderately
Deaths ���� Population, -,
moderately
Frustration ���� Results, -, strongly
Product Price ���� Sales, -, strongly
Example
The Problem: How many chickens crossed the road?
Variables:
Eggs Chickens Road Crossings
Relationships:
Eggs � Chickens, +, strongly
Chickens � Eggs, +, strongly
Chickens � Road Crossings, +, moderately
Road Crossings � Chickens, -, moderately

107
Diagram:

108
Appendix B
Guidelines for Discussion
Please complete the ISDEM questionnaires provided individually. You will have 15
minutes for this portion of the task.
Next, take 45 minutes to:
1. Show your individual model (the diagram) to the group, explaining the variables, relationships, and your rationale.
2. Discuss similarities and discrepancies between the models. Focus on:
a. What similarities exist between the models? Use these as the starting point for your collective model.
b. What discrepancies exist between the models? Are there variables or relationships missing that explain the different behavior demonstrated in these models? Include these additional variables/relationships in your collective model.
c. Are there some situations for which one model is valid, and others for
which it is not? Add more information into the collective model to account for these situational differences.
3. Based on this conversation, draw a causal map diagram on the provided paper that reflects your collective understanding of the issue. You may also offer recommendations for potential courses of action based on your results.
Good luck!
Guidelines for Discussion adapted from: Delbecq, A. L., & Van de Ven, A. H. (1971). A group process model
for problem identification and program planning. Journal Of Applied Behavioral Science, 7, 466-491.

109
Appendix C
1. Tables from Study One
Table 4: Means (Standard Deviations) and T-Tests for Variables, Relationships,
Feedback Loops, & Systemic Reasoning Levels
S-BI ISDEM t p-value
Variables 2.31 (0.29) 2.56 (0.42) 2.73 0.008
Relationships 1.90 (0.35) 2.91 (0.74) 6.98 <.001
Feedback Loops 0.27 (0.26) 1.20 (0.49) 9.50 <.001
Systemic Reasoning Level 1.63 (0.52) 3.19 (0.61) 9.91 <.001
Table 5: Means (Standard Deviations) and T-Tests for Participant Ratings of
Model Performance
S-BI ISDEM t p-value
Thought Process 3.63 (0.94) 2.88 (1.10) 2.93 0.005
Inner model 3.84 (0.52) 3.56 (0.76) 1.73 0.088
Engagement 3.81 (0.93) 3.00 (1.16) --- ---
Difficulty 2.25 (0.80) 3.13 (1.24) 3.35 0.001
Table 6: Means (Standard Deviations) & T-Tests for Variables, Relationships &
Behaviors Not Represented in Models
S-BI ISDEM t p-value
Variables 2.16 (0.78) 3.09 (1.23) 3.66 0.001
Relationships 2.03 (0.86) 2.91 (1.23) 3.30 0.002
Behaviors 2.13 (0.98) 2.81 (1.12) 2.62 0.011

110
2. Tables from Study Two
Table 7: Means (Standard Deviations) and T-Tests for Variables, Relationships,
Feedback Loops, & Systemic Reasoning Levels
Control ISDEM t p-value
Variables 15.24 (5.64) 12.52 (4.59) 1.87 0.068
Relationships 2.12 (3.30) 19.84 (10.04) 8.38 <.001
Feedback Loops 0.04 (0.20) 4.08 (7.06) 2.85 0.009
Systemic Reasoning Level 0.08 (0.28) 1.64 (0.49) 13.86 <.001
Table 8: Means (Standard Deviations) and T-Tests for Participant Ratings of
Model Performance
Control ISDEM t p-value
Thought Process 3.63 (0.75) 3.31 (0.85) 2.21 0.029
Inner model 4.00 (0.56) 3.59 (0.61) 3.91 <.001
Engagement 3.38 (0.92) 3.11 (0.80) 1.75 0.083
Difficulty 1.91 (0.81) 2.77 (0.81) 5.99 <.001
Table 9: Means (Standard Deviations) & T-Tests for Variables, Relationships &
Behaviors Not Represented in Models
Control ISDEM t p-value
Variables 1.97 (0.78) 2.77 (1.23) 4.93 <.001
Relationships 1.89 (0.86) 2.80 (1.23) 5.38 <.001
Behaviors 1.92 (0.98) 2.39 (1.12) 2.70 0.008
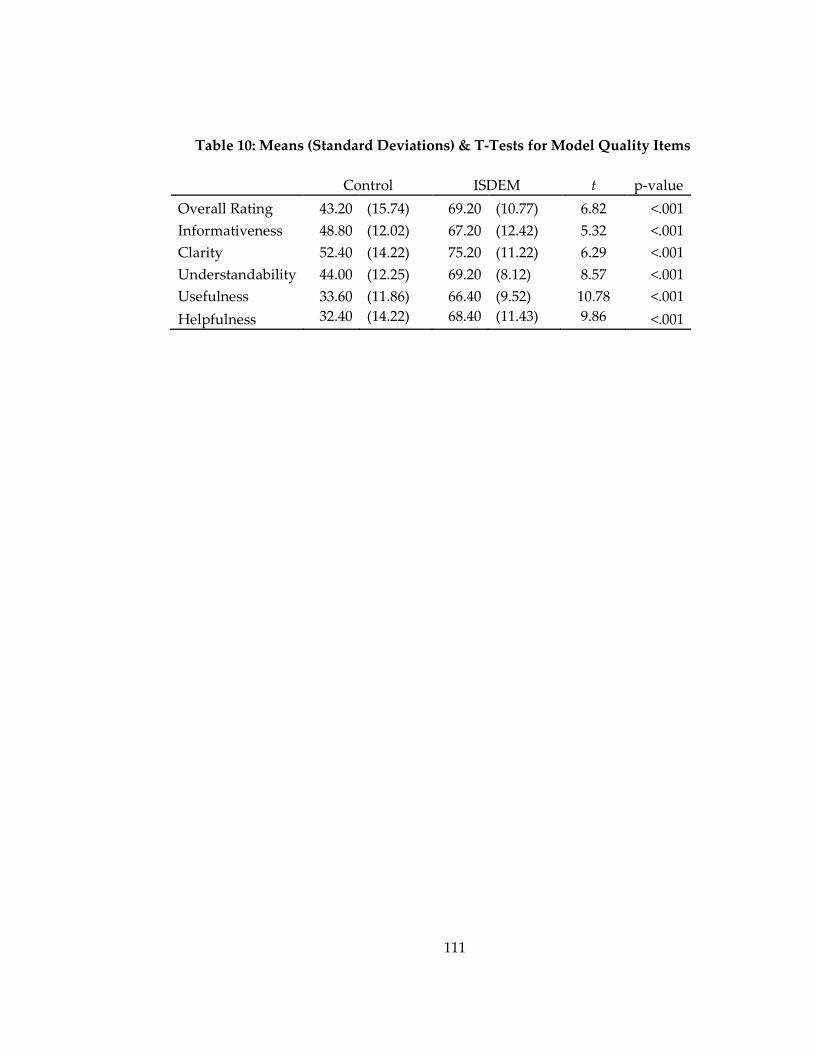
111
Table 10: Means (Standard Deviations) & T-Tests for Model Quality Items
Control ISDEM t p-value
Overall Rating 43.20 (15.74) 69.20 (10.77) 6.82 <.001
Informativeness 48.80 (12.02) 67.20 (12.42) 5.32 <.001
Clarity 52.40 (14.22) 75.20 (11.22) 6.29 <.001
Understandability 44.00 (12.25) 69.20 (8.12) 8.57 <.001
Usefulness 33.60 (11.86) 66.40 (9.52) 10.78 <.001
Helpfulness 32.40 (14.22) 68.40 (11.43) 9.86 <.001

112
Appendix D
1. Models Coded at Level 0
1.
2.

113
3.
4.

114
5.
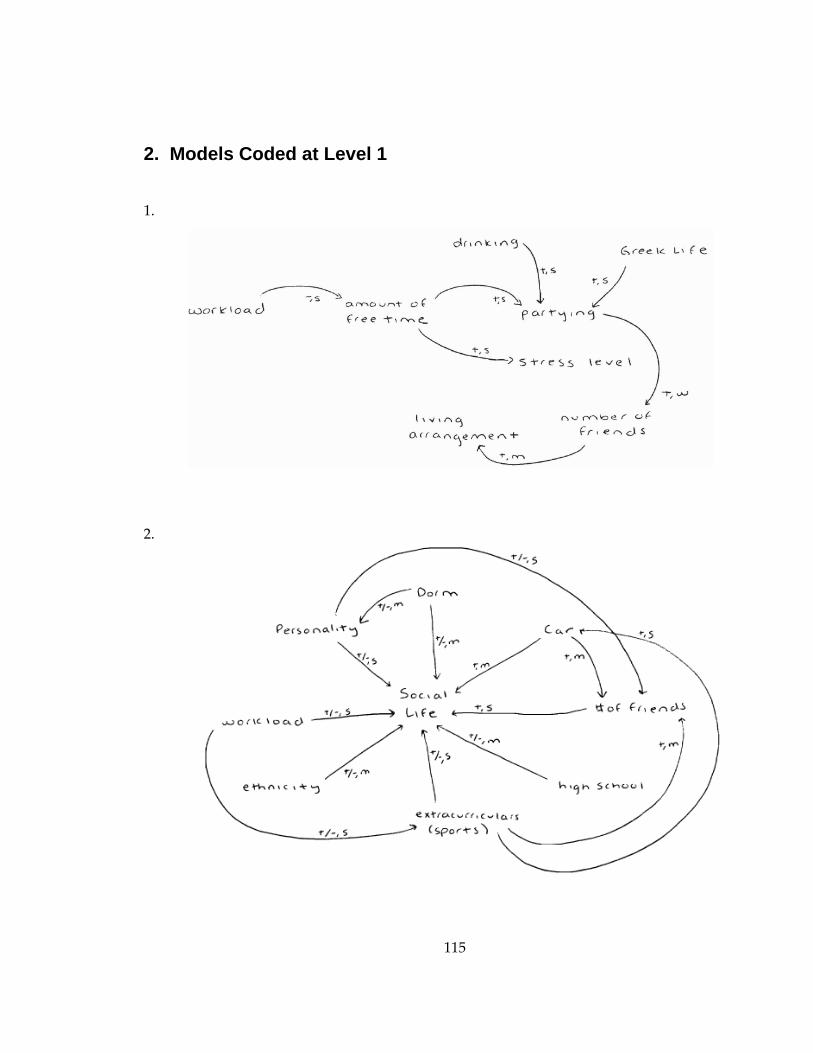
115
2. Models Coded at Level 1
1.
2.

116
3.
4.
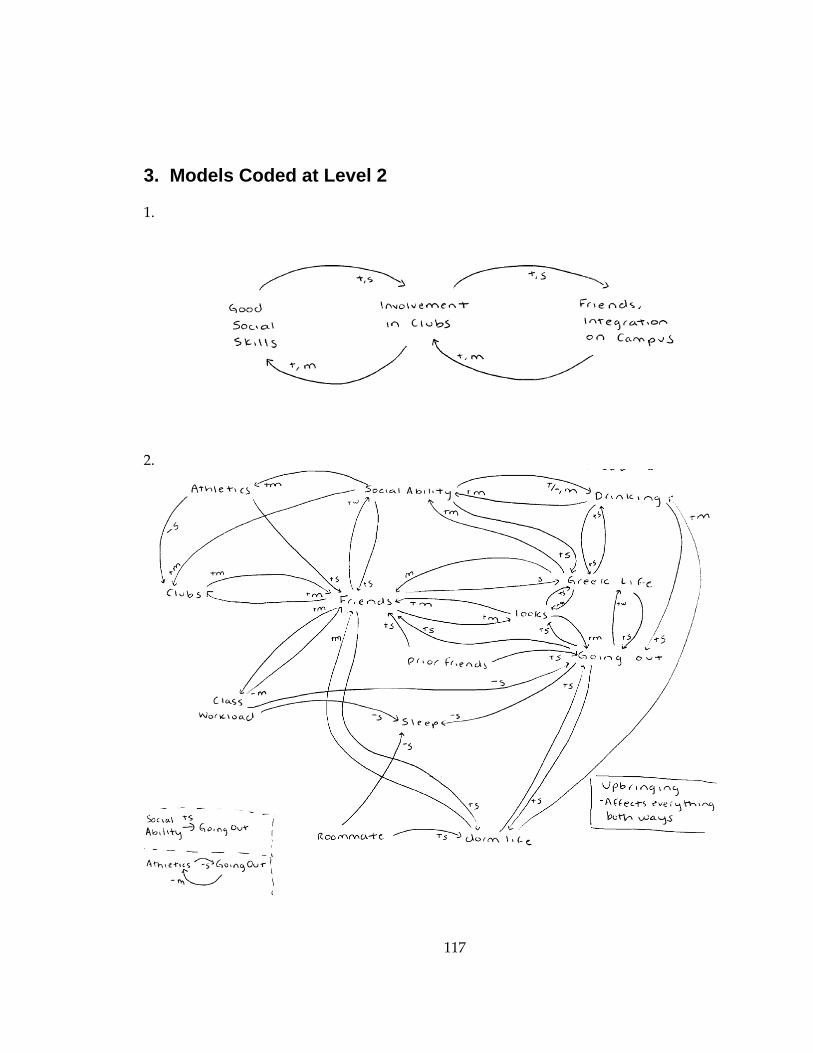
117
3. Models Coded at Level 2
1.
2.
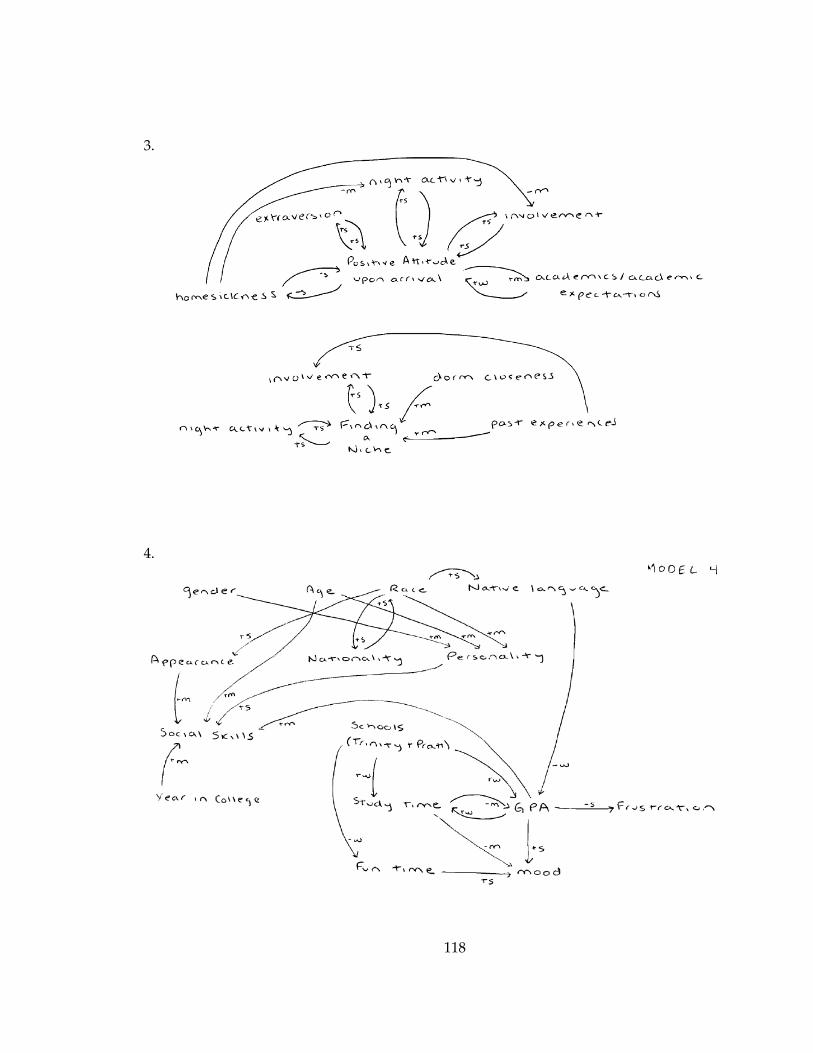
118
3.
4.

119
References
Allison, S. T., McQueen, L. R., & Schaerfl, L. M. (1992). Social decision making processes
and the equal partitionment of shared resources. Journal of Experimental Social
Psychology, 28, 23-42.
Barney, J. B. (1991). Firm resources and sustained competitive advantage. Journal of
Management, 17, 99-120.
Baron, J. (1994). Thinking and Deciding (2nd Ed.). Cambridge, MA: Cambridge University
Press.
Beck, A. T., Rush, A. J., Shaw, B. F., & Emery, G. (1979). Cognitive therapy of depression.
New York, NY: Guilford Press.
Booth Sweeney, L., & Sterman, J. D. (2000). Bathtub dynamics: Initial results of a systems
thinking inventory. System Dynamics Review, 16, 249-286.
Booth Sweeney, L., & Sterman, J. D. (2007). Thinking about systems: Student and teacher
conceptions of natural and social systems. System Dynamics Review, 23, 285-312.
Booth Sweeney, L., & Sterman, J. D. (2007a). Thinking about systems: Student and
teacher conceptions of natural and social systems: Appendices, V. 6.4. System
Dynamics Review, 23. Retrieved from:
http://www3.interscience.wiley.com/cgibin/fulltext/116836764/sm001.pdf?PLA
EBO=IE.pdf.
Brown, S. L., & Eisenhardt, K. M. (1998). Competing on the Edge: Strategy as Structured
Chaos. Boston, MA: Harvard Business School Press.
Bruggink, G. M. (1985). Uncovering the policy factors in accidents. Air Line Pilot, May,
22-25.
Bureau of Labor Statistics (2009). Occupational Outlook Handbook, 2010-11 Edition.
Retrieved from: http://www.bls.gov/oco/ocos318.htm.
Bryson, J. M., Ackermann, F., Eden, C., & Finn, C. B. (2004). Visible thinking: Unlocking
causal mapping for practical business results. San Francisco, CA: Wiley.
Cacioppo, J. T., Petty, R. E., & Kao, C. F. (1984). The efficient assessment of need for
cognition. Journal of Personality Assessment, 48, 306-307.
120
Cacioppo, J. T., Petty, R. E., Kao, C. F., & Rodriguez, R. (1986). Central and peripheral
routes to persuasion: An individual difference perspective. Journal of Personality
and Social Psychology, 51, 1032-1043.
Callaway, M. R., & Esser, J. K. (1984). Groupthink: Effects of cohesiveness and problem
solving procedures on group decision making. Social Behavior and Personality, 49,
949-952.
Carroll, K. M., Rounsaville, B. J., Gordon, L. T., Nich, C., Jatlow, P., Bisighini, R. M., &
Gawin, F. H. (1994). Psychotherapy and pharmacology for ambulatory cocaine
abusers. Archives of General Psychiatry, 51, 177-187.
Cavana, R. Y., & Martin, T. (2008). Integrative system dynamics: Analysis of policy
options for tobacco control in New Zealand. Systems Research & Behavioral Science,
25, 675-694.
Child, J. (1972). Organization structure, environment, and performance: The role of
strategic choice. Sociology, 6, 1-22.
Choi, I., Koo, M., & Choi, J. A. (2007). Individual differences in analytic versus holistic
thinking. Personality and Social Psychology Bulletin, 33, 691-705.
Chung, C. H. (1999). Balancing the two dimensions of time for time-based competition.
Journal of Managerial Issues, 11, 299-314.
Cohen, J. (1992). A Power Primer. Psychological Bulletin, 112, 155-159.
Cruz, M. G., Boster, F. J., & Rodriguez, J. I. (1997). The impact of group size and
proportion of shared information on the exchange and integration of
information in groups. Communication Research, 24, 291-313.
Dalkey, N. (1969). An experimental study of group opinion: The Delphi method. Futures,
1, 408-426.
Delbecq, A. L., & Van de Ven, A. H. (1971). A group process model for problem
identification and program planning. Journal Of Applied Behavioral Science, 7, 466-
491.
Delbecq, A. L., Van de Ven, A .H., & Gustafson, D. H. (1975). Group Techniques for
Program Planning: A Guide to Nominal Group and Delphi Processes. Glenview, IL:
Scott, Foresman.
121
Diehl, M., & Stroebe, W. (1987). Productivity loss in brainstorming groups: Toward the
solution of a riddle. Journal of Personality and Social Psychology, 53, 497-509.
Dobson, K. S. (1989). A meta-analysis of the efficacy of cognitive therapy for depression.
Journal of Consulting and Clinical Psychology, 57, 414-419.
Dorner, D. (1996). The logic of failure: Recognizing and avoiding error in complex situations.
New York, NY: Basic Books.
Hambrick, D. C., & Mason, P. A. (1984). Upper echelons: The organization as a reflection
of its top managers. Academy of Management Review, 9, 193-206.
Hodgkinson, G. P., & Maule, A. J. (2002). The individual in the strategy process: Insights
from behavioral decision research and cognitive mapping. In A. S. Huff, & M.
Jenkins (Eds.), Mapping strategic knowledge (pp. 196-219). London, UK: Sage
Publications.
Duffy, L. (1993). Team decision making biases: An information processing perspective.
In G. A. Klein, J. Orasanu, R. Calderwood, & C. E. Zsambok, (Eds.), Decision
Making in Action: Models and Methods (pp. 346-359). Norwood, NJ: Ablex.
Evans, J. R. (2005). Total quality management, organization, and strategy (4th ed.). Mason,
OH: Thomson South-Western.
Flowers, M. L. (1977). A laboratory test of some implications of Janis’s groupthink
hypothesis. Journal of Personality and Social Psychology, 33, 888-895.
Forrester, J. W. (1968). Principles of Systems. Cambridge, MA: MIT Press.
Forrester, J. W. (1971). The counterintuitive behavior of social systems. Technology
Review, 73, 52-68.
Franco-Santos, M., Kennerley, M., Micheli, P., Martinez, V., Mason, S., Marr, B., Gray, D.,
& Neely, A. (2007). Towards a definition of a business performance measurement
system. International Journal of Operations & Production Management, 27, 784-801.
Goel, V., & Dolan, R. J. (2001). Functional neuroanatomy of three-term relational
reasoning. Neuropsychologia, 39, 901-909.
Green, D. W., & McManus, I. C. (1995). Cognitive structural models: The perception of
risk and prevention in coronary heart disease. British Journal of Psychology, 86,
321-336.

122
Greenwald, A. G., McGhee, D. E., & Schwarz, J. L. K. (1998). Measuring individual
differences in implicit cognition: The Implicit Association Test. Journal of
Personality and Social Psychology, 74, 1464-1480.
Gustasfon, D. H., Shukla, R. K., Delbecq, A., & Walster, G. W. (1973). A comparative
study of differences in subjective likelihood estimates made by individuals,
interacting groups, Delphi groups and nominal groups. Organizational Behavior
and Human Performance, 9, 280-291.
Hitt, M. A., Keats, B., DeMarie, S. M. (1998). Navigating in the new competitive
landscape: Building strategic flexibility and competitive advantage in the 21st
century. Academy of Management Executive, 12, 22-42.
Hodgkinson, G. P., & Maule, A. J. (2002). The individual in the strategy process: Insights
from behavioral decision research and cognitive mapping. In A. S. Huff, & M.
Jenkins (Eds.), Mapping strategic knowledge (pp. 196-219). London, UK: Sage
Publications.
Hodgkinson, G. P., Maule, A. J., & Bowne, N. J. (2004). Causal cognitive mapping in the
organizational strategy field: A comparison of alternative elicitation procedures.
Organizational Research Methods, 7, 3-26.
Hoyle, R. (1995). Structural Equation Modeling: Concepts, Issues, and Applications.
Thousand Oaks, CA: Sage Publications, Inc.
Janis, I. L. (1972). Victims of Groupthink. Boston, MA: Houghton Mifflin Company.
Johnson-Laird, P. N. (1983). Mental Models: Towards a Cognitive Science of Language,
Inference, and Consciousness. Cambridge, UK: Cambridge University Press.
Johnson-Laird, P. N. (2001). Mental models and deduction. Trends in Cognitive Sciences, 5,
434-442.
Jones, P. E., & Roelosfma, P. H. M. P. (2000). The potential for social contextual and
group biases in team decision-making: biases, conditions and psychological
mechanisms. Ergonomics, 43, 1129-1152.
Kahneman, D., & Tversky, A. (1973). On the psychology of prediction. Psychological
Review, 80, 237-241.

123
Knauff, M., Mulack, T., Kassubek, J., Salih, H. R., & Greenlee, M. W. (2002). Spatial
imagery in deductive reasoning: A functional MRI study. Cognitive Brain
Research, 13, 203-212.
Kogut, B., & Kulatilaka, N. (2001). Capabilities as real options. Organization Science, 12,
744-758.
Lamm, H., & Trommsdorf, G. (1973). Group versus individual performance on tasks
requiring ideation proficiency (brainstorming): A review. European Journal of
Social Psychology, 3, 361-388.
Laughlin, P., Hatch, E., Silver, J., & Boh, L. (2006). Groups perform better than the best
individuals on letters-to-numbers problems: Effects of group size. Journal of
Personality and Social Psychology, 90, 644-651.
Leana, C. R. (1985). A partial test of Janis’ groupthink model: Effects of group
cohesiveness and leader behavior on defective decision making. Journal of
Management, 11, 5-17.
Leslie, K. J., & Michaels, M. P. (1997). The real power of real options. The McKinsey
Quarterly, 3, 4-22.
Linstone, H., & Turoff, M. (1975). The Delphi Method: Techniques and Applications. New
York, NY: Wiley.
Mahoney, J., & Pandian, J. R. (1992). The resource-based view within the conversation of
strategic management. Strategic Management Journal, 13, 363-380.
Markoczy, L. (1995). States and belief states. International Journal of Human Resource
Management, 6, 249-270.
Markoczy, L. (1997). Measuring beliefs: Accept no substitutes. Academy of Management
Journal, 40, 1228-1242.
Merchant, K. A. (2007). Evaluating general managers’ performances. Strategic Finance, 88,
12-16.
Miles, R. E., & Snow, C. C. (1992). Causes of failure in network organizations. California
Management Review, 34, 53-72.
Milgram, S. (1963). Behavioral study of obedience. Journal of Abnormal and Social
Psychology, 67, 371-378.
124
Miller, D. (1994). What happens after success: The perils of excellence. Journal of
Management Studies, 31, 325-358.
Mintzberg, H. (1990). The manager’s job: Folklore and fact. Harvard Business Review, 68,
163-176.
Milgrom, P., & Roberts, J. (1995). Complementarities and fit: Strategy, structure and
organizational change in manufacturing. Journal of Accounting and Economics, 19,
179-208.
Moorhead, G. (1982). Groupthink: Hypothesis in need of testing. Group and
Organisational Studies, 7, 429-444.
Moorhead, G., Ference, R., & Neck, C. P. (1991). Group decision fiascoes continue: Space
shuttle challenger and revised groupthink framework. Human Relations, 44, 539-
550.
Myers, D. G. (2004). Psychology. New York, NY: Worth Publishers.
Neck, C. P., & Moorhead, G. (1995). Groupthink remodeled: The importance of
leadership, time pressure, and methodical decision-making procedures. Human
Relations, 48, 537-557.
Ossimitz, G. (2002). Stock-flow-thinking and reading stock-flow-related graphs: An
empirical investigation in dynamic thinking abilities. Proceedings of the 20th
International Conference of the System Dynamics Society. Polermo, Italy.
Otto, P. (2008). A system dynamics model as a decision aid in evaluating and
communicating complex market entry strategies. Journal of Business Research, 61,
1173-1181.
Packer, D. J. (submitted). Avoiding groupthink: Whereas weakly identified members
remain silent, strongly identified members dissent about collective problems.
Psychological Science.
Peterlaf, M. A. (1993). The cornerstones of competitive advantage: A resource-based
view. Strategic Management Journal, 14, 179-192.
Raczynski, J. M., Thompson, J. K., & Sturgis, E. T. (1982). An evaluation of biofeedback
assessment and training paradigms. Clinical Psychology Review, 2, 337-348.
Richardson, G. (1996). Modeling for Management. Aldershot, UK: Dartmouth
Publishing Co.

125
Richmond, B. (1987). The Strategic Forum. Lyme, NH: High Performance Systems.
Ross, L., Greene, D., & House, P. (1977). The ‘false consensus effect’: an egocentric bias in
social perception and attribution process. Journal of Experimental Social Psychology,
13, 279-301.
Ross, S. A., Westerfield, R. W., Jordan, B. D. (2003). Fundamental of Corporate Finance
Standard Edition. New York, NY: Irwin/McGraw-Hill.
Schreyogg, G., & Kliesch-Eberl, M. (2007). How dynamic can organizational capabilities
be? Towards a dual-process of capability dynamization. Strategic Management
Journal, 28, 913-933.
Seligman, M. (1995). The effectiveness of psychotherapy: The Consumer Reports study.
American Psychologist, 50, 965-974.
Senge, P. (1990). The Fifth Discipline: The Art and Practice of the Learning Organization. New
York, NY: Doubleday Books.
Shadish, W. R., Cook, T. D., & Campbell, D. T. (2001). Experimental and Quasi-
Experimental Designs for Generalized Causal Inference. Boston, MA: Houghton
Mifflin Company.
Sherman, S. J., Presson, C. C., & Chassin, L. (1984). Mechanisms underlying the false
consensus effect: The special role of threats to the self. Journal of Personality and
Social Psychology Bulletin, 9, 197-207.
Simon, H. A. (1955). A Behavioral Model of Rational Choice. Quarterly Journal of
Economics, 69, 7-19.
Singelis, T. M. (1994). The measurement of independent and interdependent self
construals. Personality and Social Psychology Bulletin, 20, 580-591.
Sniezek, J. A. (1990). A comparison of techniques for judgmental forecasting by groups
with common information. Group & Organization Studies, 15, 5-19.
Stalk, G. (1988). Time – the next source of competitive advantage. Harvard Business
Review, 66, 41-51.
Sterman, J. D. (2000). Business Dynamics: Systems Thinking and Modeling for a Complex
World. New York, NY: Irwin/McGraw-Hill.

126
Stewart, T. R. (1987). The Delphi technique and judgmental forecasting. Climatic Change,
11, 97-113.
Sundstrom, E., De Meuse, K. P., & Futrell, D. (1990). Work teams: Applications and
effectiveness. American Psychologist, 45, 120-133.
Teece, D. J., Pisano, G., & Shuen, A. (1997). Dynamic capabilities and strategic
management. Strategic Management Journal, 18, 509-533.
Van de Ven, A. H., & Delbecq, A. L. (1974). The effectiveness of nominal, Delphi and
interacting group decision making processes. Academy of Management Journal, 17,
605-621.
Van der Pligt, J. (1984). Attributions, false consensus and valence. Journal of Personality
and Social Psychology, 46, 57-68.
Van Oppen, P., de Haan, E., van Balkom, A.J.L.M., Spinhoven, P., Hoogduin, K., & van
Dyck, R. (1995). Cognitive therapy and exposure in vivo in the treatment of
obsessive compulsive disorder. Behaviour Research and Therapy, 33, 379-390.
Vennix, J. A. M., & Gubbels, J. W. (1992). Knowledge elicitation in conceptual model
building: A case study in modeling a regional Dutch health care system. European
Journal of Operational Research, 59, 85-101.
Vennix, J. A. M., Gubbels, J. W., Post, D., & Poppen, H. J. (1990). A structured approach
to knowledge elicitation in conceptual model-building. System Dynamics Review,
6, 194-208.
Volberda, H. W. (1998). Building the Flexible Firm. Oxford, England: Oxford University
Press.
von Bertalanffy, L. (1968). General System Theory. New York, NY: Braziller.
Wilson, E. O. (1998). Consilience: The Unity of Knowledge. New York, NY: Alfred A. Knopf,
Inc.
Yucha, C. & Gilbert, C. (2004). Evidence-based practice in biofeedback and neurofeedback.
Association for Applied Psychophysiology and Biofeedback. Colorado Springs,
CO.
Zollo, M., & Winter, S. G. (2002). Deliberate learning and the evolution of dynamic
capabilities. Organization Science, 13, 339-351.

127
Biography
Elizabeth Holmberg received her bachelor’s and doctorate from Duke University.
She currently lives in Chicago, and works for McKinsey and Company.
Copyright © 2022 FDOKUMEN