An Integrative Meta-analysis of MicroRNAs in Hepatocellular Carcinoma
Upload
independentCategory
view
1download
0
Identification and functional screening of
microRNAs highly deregulated in colorectal cancer
Petra Faltejskova a, c, Marek Svoboda a, c, Klara Srutova c, Jitka Mlcochova c, Andrej Besse a, c,Jana Nekvindova d, Lenka Radova e, Pavel Fabian b, Katerina Slaba a, Igor Kiss a,
Rostislav Vyzula a, Ondrej Slaby a, c, *
a Department of Comprehensive Cancer Care, Masaryk Memorial Cancer Institute (MMCI), Brno, Czech Republicb Department of Oncological and Experimental Pathology, Masaryk Memorial Cancer Institute (MMCI), Brno, Czech Republic
c Central European Institute of Technology (CEITEC), Brno, Czech Republicd Institute of Clinical Biochemistry and Diagnostics, Faculty of Medicine and Faculty Hospital in Hradec Kralove,
Charles University, Hradec Kralove, Czech Republice Laboratory of Experimental Medicine, Institute of Molecular and Translational Medicine, Faculty of Medicine and Dentistry,
Palacky University, Olomouc, Czech Republic
Received: January 21, 2012; Accepted: March 27, 2012
Abstract
MicroRNAs (miRNAs) constitute a robust regulatory network with post-transcriptional regulatory efficiency for almost one half of human codinggenes, including oncogenes and tumour suppressors. We determined the expression profile of 667 miRNAs in colorectal cancer (CRC) tissuesand paired non-tumoural tissues and identified 42 differentially expressed miRNAs. We chose miR-215, miR-375, miR-378, miR-422a and miR-135b for further validation on an independent cohort of 125 clinically characterized CRC patients and for in vitro analyses. MiR-215, miR-375,miR-378 and miR-422a were significantly decreased, whereas miR-135b was increased in CRC tumour tissues. Levels of miR-215 and miR-422acorrelated with clinical stage. MiR-135b was associated with higher pre-operative serum levels of CEA and CA19-9. In vitro analyses showed thatectopic expression of miR-215 decreases viability and migration, increases apoptosis and promotes cell cycle arrest in DLD-1 and HCT-116 coloncancer cell lines. Similarly, overexpression of miR-375 and inhibition of miR-135b led to decreased viability. Finally, restoration of miR-378, miR-422a and miR-375 inhibited G1/S transition. These findings indicate that miR-378, miR-375, miR-422a and miR-215 play an important role inCRC as tumour suppressors, whereas miR-135b functions as an oncogene; both groups of miRNA contribute to CRC pathogenesis.
Keywords: colorectal cancer�microRNA� expression profiling� apoptosis�migration
Introduction
Colorectal cancer (CRC) is the third most common cancer in westerncountries and the third leading cause of cancer-related death world-wide [1]. CRC carcinogenesis is associated with multiple alterationsof tumour suppressor genes and oncogenes. However, clinical utilityof these genes as markers for early diagnosis and determination ofprognosis and prediction is limited. Therefore, several efforts have
been made to find new biomarkers for early detection of asymptom-atic disease, accurate differentiation between particular clinical stagesof CRC and better individualization of therapy.
MicroRNAs (miRNAs) are small, non-coding, single-strandedRNAs, 18–25 nucleotides in length. They are endogenouslyexpressed and post-transcriptionally regulate gene expression bybinding to 3′ untranslated region (3′ UTR) of target mRNAs [2]. Thereis increasing evidence that miRNAs can function as tumour suppres-sors as well as oncogenes [3] and therefore are important in regula-tion of many biological processes, such as cell cycle, proliferation,differentiation, apoptosis or invasiveness [4].
A growing number of studies have addressed miRNA expressionin CRC [5–9]. Nevertheless, different profiling platforms, methodol-ogy and lacking clinicopathological data resulted in discrepancies
*Correspondence to: Dr Ondrej SLABY, Ph.D.,
Department of Comprehensive Cancer Care, Masaryk Memorial Cancer
Institute, Zluty kopec 7, 656 53 Brno, Czech Republic.
Tel.: +420543136902Fax: +420543136902
E-mail: [email protected]
ª 2012 The Authorsdoi: 10.1111/j.1582-4934.2012.01579.x
Journal of Cellular and Molecular Medicine ª 2012 Foundation for Cellular and Molecular Medicine/Blackwell Publishing Ltd
J. Cell. Mol. Med. Vol 16, No 11, 2012 pp. 2655-2666
across miRNAs identified in these studies. Therefore, only a smallfraction of miRNAs identified this way may be further used as diag-nostic and prognostic markers or therapeutics targets. miR-143,miR-145, miR-21, miR-31, miR-183 and miR-17-92 cluster areamong miRNAs most consistently reported to have deregulatedexpression in CRC [5, 9–11]. While miR-143 and miR-145 function astumour suppressors, miR-21, miR-31, miR-183 and miR-17-92 arereported to be oncogenes. Moreover, association between miRNAexpression, prognosis and therapy response prediction in CRCpatients was repeatedly described [5, 8, 12]. Recently, several studieshave indicated that circulating miRNAs could be used as new non-invasive biomarkers for CRC [13–15]. Although miRNA profiling sig-nificantly contributes to a better understanding of CRC pathogenesis,only little is known about miRNAs target molecules and signallingpathways in which they are involved.
The aim of our study was to identify and validate new miRNAsthat are deregulated in CRC using highly standardized qRT-PCR-based TaqMan Low Density miRNA arrays (TLDAs). Further-more, we screened effects of selected miRNAs on cell viability,migration, cell cycle and apoptosis of DLD-1 and HCT-116 colon can-cer cell lines.
Materials and methods
Patients and tissue samples
Eight tumour tissues from patients diagnosed with colorectal carcinoma
at Masaryk Memorial Cancer Institute (MMCI, Brno, Czech Republic)between 2003 and 2008 (four men, four women; one stage II, four
stage III, three stage IV) and eight paired adjacent non-tumoural tissues
were used for profiling analyses. Patients’ age ranged from 45 to
76 years with a median of 63.5 years. Validation was performed on acohort of 125 patients (78 men, 47 women) with histologically con-
firmed colorectal adenocarcinoma undergoing surgery at MMCI between
2009 and 2011; their age ranged from 30 to 92 with median 68 years.
Native tumour and paired non-tumoural colon tissues were obtainedafter surgical resection and immediately placed in liquid nitrogen.
Informed consent was obtained from all patients, and the local Ethical
Board approved the study protocol. Clinicopathological features of thevalidation cohort are summarized in Table 1.
Tissue sample preparation and miRNA isolation
All analysed tissues were homogenized and total RNA enriched for small
RNAs was isolated using mirVana miRNA Isolation Kit (Ambion, Austin,
TX, USA). Concentration and purity of RNA were determined spectro-photometrically by measuring optical density (A260/280 >2.0; A260/230>1.8) using Nanodrop ND-1000 (Thermo Scientific, Rockford, IL, USA).
Large-scale miRNA profiling
Expression profiling of miRNAs was performed using TLDAs. A set of
two cards (TaqMan® Array Human MicroRNA Card Set v2.0; Applied
Biosystems, Foster City, CA., USA) enabling quantification of 667human miRNAs and 3 endogenous controls for data normalization was
used. Two sets of megaplex miRNA RT primers with special stem-loop
structure allowed synthesis of all cDNAs in two separate reactions. Each
reverse transcriptase mixture consisted of 700 ng of RNA sample,0.67 mM of each dNTPs, 6.67 U/ll of MultiScribe reverse transcriptase,
1 9 Megaplex RT primers, 1 9 RT buffer, 0.27 U/ll RNase inhibitor
and 3 mM MgCl2 (all part of TaqMan MicroRNA Reverse Transcriptionkit; Applied Biosystems). Reaction mixtures were incubated for 2 min at
16°C, 1 min. at 42 °C and 1 sec. at 50°C for 40 cycles, then 5 min. at
85°C and finally held at 4°C (TGradient thermal cycler; Biotherma, Bio-
metra, Goettingen, Germany). Real-time PCR was performed using theApplied Biosystems 7900 HT Version 2.3 Sequence Detection System.
Each 800 ll PCR reaction mixture consisted of 5.3 ll of RT product,
1 9 TaqMan (NoUmpErase UNG) Universal PCR Master Mix and
394.7 ll of nuclease free water. 100 ll of each PCR reaction mix wasdispensed into each port of the TaqMan MicroRNA Array. Reactions
were run at 50°C for 2 min., 95°C for 10 min., followed by 40 cycles at
95°C for 30 sec. and 60°C for 1 min.
Reverse transcription and qRT-PCR for validationassays
cDNA was synthesized using gene-specific primers according to the
TaqMan MicroRNA Assay protocol (Applied Biosystems). For reverse
transcription, 10 ng of RNA sample, 0.25 mM of each dNTPs, 3.33 U/llof MultiScribe reverse transcriptase, 50 nM of stem–loop RT primer,
1 9 RT buffer and 0.25 U/ll of RNase inhibitor (all from TaqMan
MicroRNA Reverse Transcription kit; Applied Biosystems) were used.Reaction mixtures were incubated for 30 min. at 16°C, 30 min. at 42°C,5 min. at 85°C and then held at 4°C (TGradient thermal cycler; Bio-
therma). Real-time PCR was performed using the Applied Biosystems
7500 Sequence Detection System. The 20-ll PCR reaction mixture con-sisted of 1.33 ll of RT product, 1 9 TaqMan (NoUmpErase UNG) Uni-
versal PCR Master Mix and 1 ll of primer and probe mix of the
TaqMan MicroRNA Assay kit (Applied Biosystems). Reactions were run
in a 96-well optical plate at 95°C for 10 min., followed by 40 cycles at95°C for 15 sec. and 60°C for 10 min.
Data normalization and statistical analysis
The CT values (CT) were calculated by SDS 2.0.1 software (Applied Biosys-tems) using the manual threshold settings (threshold = 0.2). All real-time
PCR reactions were run in triplicates, and average threshold cycles and S.
D. values were calculated. The average expression levels of all analysed
miRNAs were normalized using RNU48 (Assay No. 4427975; Applied Bio-systems) as a reference gene and subsequently the 2�DCT method was
applied. Acquired ΔCT values were analysed in R using the Bioconductor
package LIMMA concerning miRNA profiling [16]. RNU48 was selected as
reference gene through combination of standard geneNorm and Norm-Finder algorithms from six reference genes on the TLDAs. In case of vali-
dation cohort, statistical differences between miRNAs levels in CRCs and
non-tumoural tissues were evaluated by the two-tailed non-parametric
Wilcoxon test for 125 paired samples. Furthermore, two-tailed Mann-Whitney U-test and Kruskal-Wallis test were used to analyse the correla-
tion between the miRNA expression levels and clinical–pathologicalfeatures of the patients. All calculations were performed using MedCalc
2656 ª 2012 The Authors
Journal of Cellular and Molecular Medicine ª 2012 Foundation for Cellular and Molecular Medicine/Blackwell Publishing Ltd
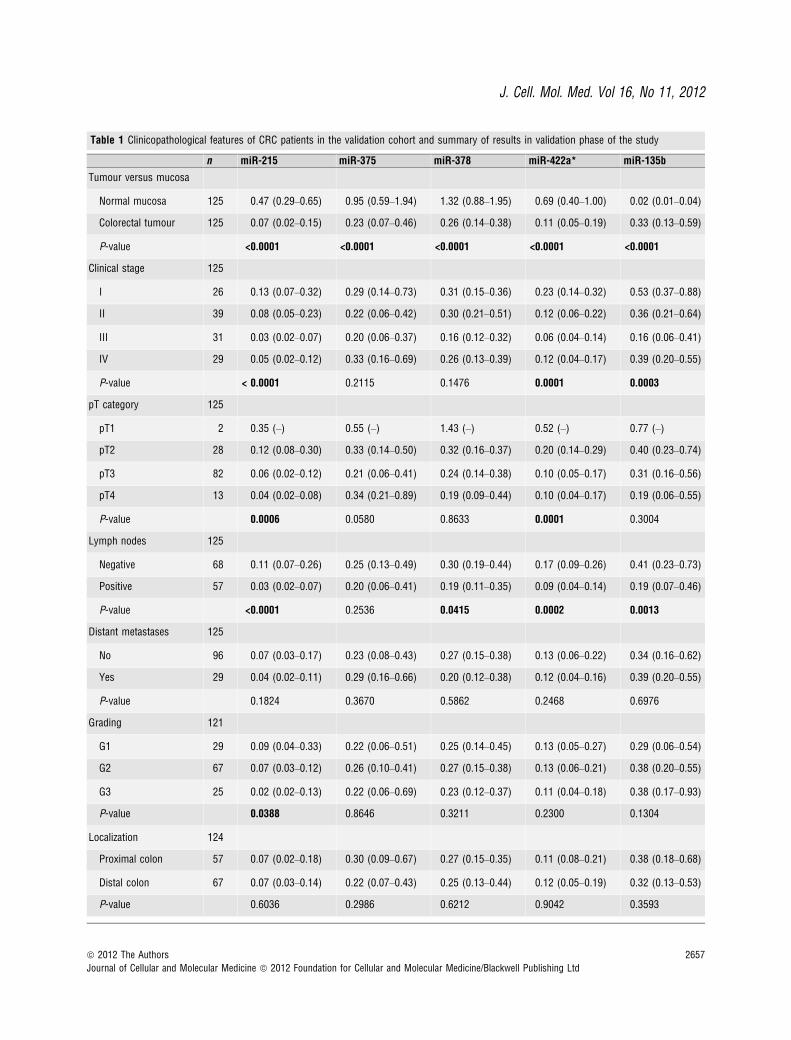
Table 1 Clinicopathological features of CRC patients in the validation cohort and summary of results in validation phase of the study
n miR-215 miR-375 miR-378 miR-422a* miR-135b
Tumour versus mucosa
Normal mucosa 125 0.47 (0.29–0.65) 0.95 (0.59–1.94) 1.32 (0.88–1.95) 0.69 (0.40–1.00) 0.02 (0.01–0.04)
Colorectal tumour 125 0.07 (0.02–0.15) 0.23 (0.07–0.46) 0.26 (0.14–0.38) 0.11 (0.05–0.19) 0.33 (0.13–0.59)
P-value <0.0001 <0.0001 <0.0001 <0.0001 <0.0001
Clinical stage 125
I 26 0.13 (0.07–0.32) 0.29 (0.14–0.73) 0.31 (0.15–0.36) 0.23 (0.14–0.32) 0.53 (0.37–0.88)
II 39 0.08 (0.05–0.23) 0.22 (0.06–0.42) 0.30 (0.21–0.51) 0.12 (0.06–0.22) 0.36 (0.21–0.64)
III 31 0.03 (0.02–0.07) 0.20 (0.06–0.37) 0.16 (0.12–0.32) 0.06 (0.04–0.14) 0.16 (0.06–0.41)
IV 29 0.05 (0.02–0.12) 0.33 (0.16–0.69) 0.26 (0.13–0.39) 0.12 (0.04–0.17) 0.39 (0.20–0.55)
P-value < 0.0001 0.2115 0.1476 0.0001 0.0003
pT category 125
pT1 2 0.35 (–) 0.55 (–) 1.43 (–) 0.52 (–) 0.77 (–)
pT2 28 0.12 (0.08–0.30) 0.33 (0.14–0.50) 0.32 (0.16–0.37) 0.20 (0.14–0.29) 0.40 (0.23–0.74)
pT3 82 0.06 (0.02–0.12) 0.21 (0.06–0.41) 0.24 (0.14–0.38) 0.10 (0.05–0.17) 0.31 (0.16–0.56)
pT4 13 0.04 (0.02–0.08) 0.34 (0.21–0.89) 0.19 (0.09–0.44) 0.10 (0.04–0.17) 0.19 (0.06–0.55)
P-value 0.0006 0.0580 0.8633 0.0001 0.3004
Lymph nodes 125
Negative 68 0.11 (0.07–0.26) 0.25 (0.13–0.49) 0.30 (0.19–0.44) 0.17 (0.09–0.26) 0.41 (0.23–0.73)
Positive 57 0.03 (0.02–0.07) 0.20 (0.06–0.41) 0.19 (0.11–0.35) 0.09 (0.04–0.14) 0.19 (0.07–0.46)
P-value <0.0001 0.2536 0.0415 0.0002 0.0013
Distant metastases 125
No 96 0.07 (0.03–0.17) 0.23 (0.08–0.43) 0.27 (0.15–0.38) 0.13 (0.06–0.22) 0.34 (0.16–0.62)
Yes 29 0.04 (0.02–0.11) 0.29 (0.16–0.66) 0.20 (0.12–0.38) 0.12 (0.04–0.16) 0.39 (0.20–0.55)
P-value 0.1824 0.3670 0.5862 0.2468 0.6976
Grading 121
G1 29 0.09 (0.04–0.33) 0.22 (0.06–0.51) 0.25 (0.14–0.45) 0.13 (0.05–0.27) 0.29 (0.06–0.54)
G2 67 0.07 (0.03–0.12) 0.26 (0.10–0.41) 0.27 (0.15–0.38) 0.13 (0.06–0.21) 0.38 (0.20–0.55)
G3 25 0.02 (0.02–0.13) 0.22 (0.06–0.69) 0.23 (0.12–0.37) 0.11 (0.04–0.18) 0.38 (0.17–0.93)
P-value 0.0388 0.8646 0.3211 0.2300 0.1304
Localization 124
Proximal colon 57 0.07 (0.02–0.18) 0.30 (0.09–0.67) 0.27 (0.15–0.35) 0.11 (0.08–0.21) 0.38 (0.18–0.68)
Distal colon 67 0.07 (0.03–0.14) 0.22 (0.07–0.43) 0.25 (0.13–0.44) 0.12 (0.05–0.19) 0.32 (0.13–0.53)
P-value 0.6036 0.2986 0.6212 0.9042 0.3593
ª 2012 The Authors 2657
Journal of Cellular and Molecular Medicine ª 2012 Foundation for Cellular and Molecular Medicine/Blackwell Publishing Ltd
J. Cell. Mol. Med. Vol 16, No 11, 2012
software version 11.2.1. P-values lower than 0.05 were considered statis-tically significant.
Cell lines and growth conditions
Two human colon carcinoma cell lines were used in this study: HCT-116
(Dukes’ type D colon cancer, CCL-247TM) and DLD-1 (Dukes’ type C
colon cancer, CCL–221TM). Both cell lines were obtained from the Ameri-can Type Culture Collection (ATCC). Cells were cultured in Dulbecco’s
Modified Eagle Medium (DMEM) supplemented with 10% FBS, 100 lg/ml of penicillin, 100 lg/ml of streptomycin, 0.1 mM non-essential amino
acids, 2 mM L–glutamin, 1 mM sodium pyruvate (all purchased fromInvitrogen, Carlsbad, CA, USA, Gibco) in 10% CO2 at 37°C.
Cell transfection
Both cell lines were transfected with 10 nM of pre-miR-215, pre-miR-
375, pre-miR-378, pre-miR-422a or pre-miRNA negative control pre-
cursors, resp. or with 30 nM of anti-miR-135b and anti-miRNA nega-tive control inhibitors, resp. (Ambion) using Lipofectamine RNAiMAX
transfection reagent (Invitrogen) according to the manufacturer’s proto-
col. Transfection efficiency was evaluated by qRT-PCR as described
above.
Detection of apoptosis
Cells were seeded in 60 mm plates at a density of 1 9 106 cells per plate,
incubated for 24 hrs and transfected with 10 nM precursors or 30 nM
inhibitors of analysed miRNAs. Forty-eight hours after transfection, thecells were trypsinized and apoptosis was measured using Annexin V–FITCkit (Miltenyi Biotec Inc., Cambridge, MA, USA) according to the manufac-
turer’s protocol. All measurements were repeated three times.
Cell cycle analysis
Cells were seeded in 60 mm plates at a density of 1 9 106 cells perplate, incubated for 24 hrs and transfected with 10 nM precursors or
30 nM inhibitors of analysed miRNAs, resp. After 48 hrs, the cells
were trypsinized and fixed in 70% ethanol. Subsequently, cells werewashed in PBS and treated with 0.1 mg/ml of RNase for 30 min. at
37°C. Finally, 1 mg/ml of propidium iodide was added and another
10 min. incubation at room temperature was performed. Cell cycle
analysis was measured using BD Facs Canto II (BD, San Jose, CA,USA). The data were analysed by FlowJo v 7.6.5. All measurements
were repeated three times.
MTT assay
Cell viability was measured using the 3-(4,5-dimethyl-2-thiazolyl)-2,5-
diphenyl-2H-tetrazolium bromide assay (MTT; Sigma Aldrich, St. Louis,
MO, USA). Cells were seeded in 96-well plate at a density of7.5 9 103 cells per well, 24 hrs before transfection. Subsequently, the
cells were transfected with 10 nM precursors or 30 nM inhibitors of
analysed miRNAs. To each well, 20 ll of 5 mg/ml MTT solution in
PBS was added 24 and 48 hrs after transfection. The plates were incu-bated for 3 hrs at 37°C. The precipitate was solubilized in 100%
DMSO (200 ll per well), and absorbance was measured on Elisa
reader Multi–Detection Microplate Reader (BIO-TEK, USA) at wave
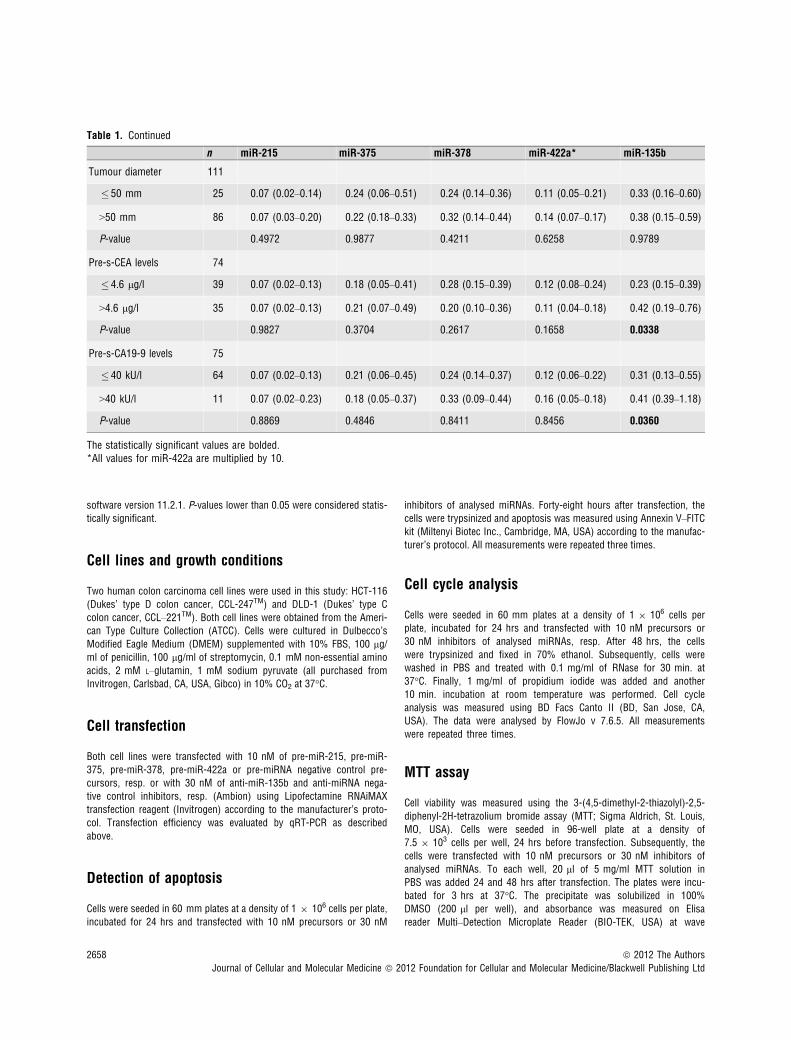
Table 1. Continued
n miR-215 miR-375 miR-378 miR-422a* miR-135b
Tumour diameter 111
� 50 mm 25 0.07 (0.02–0.14) 0.24 (0.06–0.51) 0.24 (0.14–0.36) 0.11 (0.05–0.21) 0.33 (0.16–0.60)
>50 mm 86 0.07 (0.03–0.20) 0.22 (0.18–0.33) 0.32 (0.14–0.44) 0.14 (0.07–0.17) 0.38 (0.15–0.59)
P-value 0.4972 0.9877 0.4211 0.6258 0.9789
Pre-s-CEA levels 74
� 4.6 lg/l 39 0.07 (0.02–0.13) 0.18 (0.05–0.41) 0.28 (0.15–0.39) 0.12 (0.08–0.24) 0.23 (0.15–0.39)
>4.6 lg/l 35 0.07 (0.02–0.13) 0.21 (0.07–0.49) 0.20 (0.10–0.36) 0.11 (0.04–0.18) 0.42 (0.19–0.76)
P-value 0.9827 0.3704 0.2617 0.1658 0.0338
Pre-s-CA19-9 levels 75
� 40 kU/l 64 0.07 (0.02–0.13) 0.21 (0.06–0.45) 0.24 (0.14–0.37) 0.12 (0.06–0.22) 0.31 (0.13–0.55)
>40 kU/l 11 0.07 (0.02–0.23) 0.18 (0.05–0.37) 0.33 (0.09–0.44) 0.16 (0.05–0.18) 0.41 (0.39–1.18)
P-value 0.8869 0.4846 0.8411 0.8456 0.0360
The statistically significant values are bolded.*All values for miR-422a are multiplied by 10.
2658 ª 2012 The Authors
Journal of Cellular and Molecular Medicine ª 2012 Foundation for Cellular and Molecular Medicine/Blackwell Publishing Ltd
lengths of 490 and 650 nm (background). Each measurement wasperformed in six plicates, and all experiments were repeated three
times.
Scratch wound migration assay
Cells were seeded in 6-well plates at a density of 4 9 105 cells per
well 24 hrs before they were transfected with 10 nM precursors or30 nM inhibitors of analysed miRNAs. The cell monolayer was
wounded with a sterile pipette tip 24 hrs after transfection and then
rinsed twice with PBS to remove cellular debris. Subsequently, warm
fresh medium was added. Migration was measured at time 0 and24 hrs after wounding using microscope Nikon Diaphod 300 INV
(109) and camera Canon Power shot A95. Images were analysed by
the Tscratch software (CSE, Switzerland). All measurements were
repeated three times.
Results
MiRNAs differentially expressed in CRC tissue
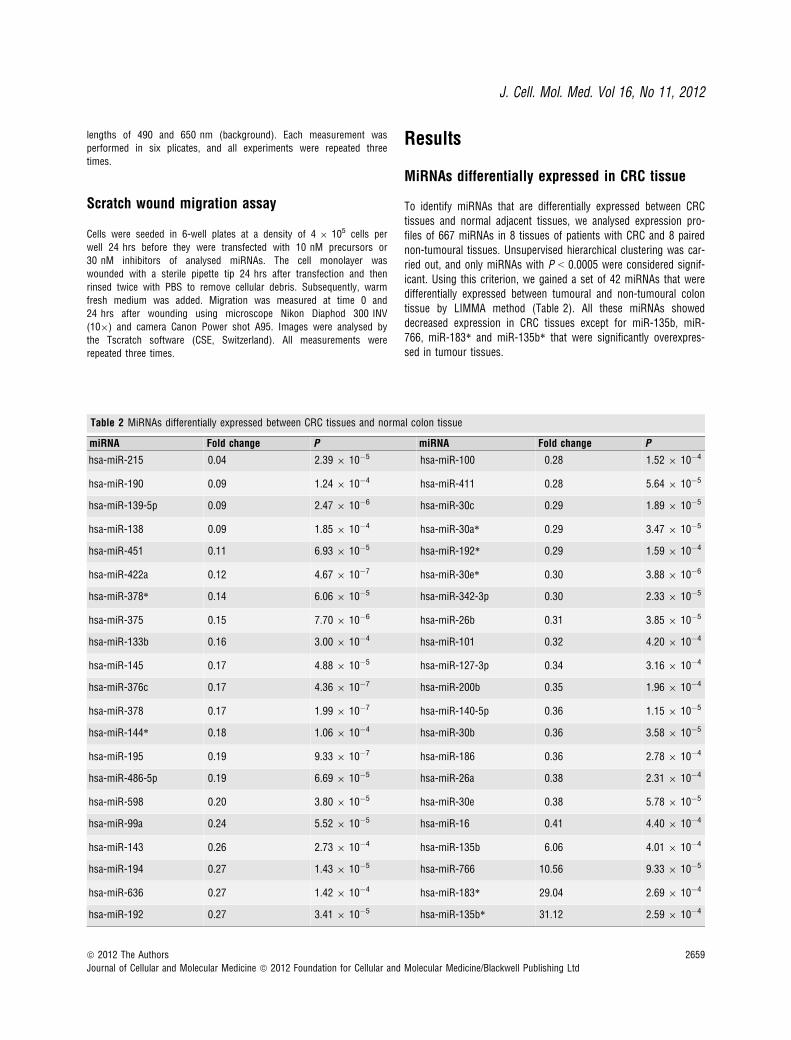
To identify miRNAs that are differentially expressed between CRCtissues and normal adjacent tissues, we analysed expression pro-files of 667 miRNAs in 8 tissues of patients with CRC and 8 pairednon-tumoural tissues. Unsupervised hierarchical clustering was car-ried out, and only miRNAs with P < 0.0005 were considered signif-icant. Using this criterion, we gained a set of 42 miRNAs that weredifferentially expressed between tumoural and non-tumoural colontissue by LIMMA method (Table 2). All these miRNAs showeddecreased expression in CRC tissues except for miR-135b, miR-766, miR-183* and miR-135b* that were significantly overexpres-sed in tumour tissues.
Table 2 MiRNAs differentially expressed between CRC tissues and normal colon tissue
miRNA Fold change P miRNA Fold change P
hsa-miR-215 0.04 2.39 9 10�5 hsa-miR-100 0.28 1.52 9 10�4
hsa-miR-190 0.09 1.24 9 10�4 hsa-miR-411 0.28 5.64 9 10�5
hsa-miR-139-5p 0.09 2.47 9 10�6 hsa-miR-30c 0.29 1.89 9 10�5
hsa-miR-138 0.09 1.85 9 10�4 hsa-miR-30a* 0.29 3.47 9 10�5
hsa-miR-451 0.11 6.93 9 10�5 hsa-miR-192* 0.29 1.59 9 10�4
hsa-miR-422a 0.12 4.67 9 10�7 hsa-miR-30e* 0.30 3.88 9 10�6
hsa-miR-378* 0.14 6.06 9 10�5 hsa-miR-342-3p 0.30 2.33 9 10�5
hsa-miR-375 0.15 7.70 9 10�6 hsa-miR-26b 0.31 3.85 9 10�5
hsa-miR-133b 0.16 3.00 9 10�4 hsa-miR-101 0.32 4.20 9 10�4
hsa-miR-145 0.17 4.88 9 10�5 hsa-miR-127-3p 0.34 3.16 9 10�4
hsa-miR-376c 0.17 4.36 9 10�7 hsa-miR-200b 0.35 1.96 9 10�4
hsa-miR-378 0.17 1.99 9 10�7 hsa-miR-140-5p 0.36 1.15 9 10�5
hsa-miR-144* 0.18 1.06 9 10�4 hsa-miR-30b 0.36 3.58 9 10�5
hsa-miR-195 0.19 9.33 9 10�7 hsa-miR-186 0.36 2.78 9 10�4
hsa-miR-486-5p 0.19 6.69 9 10�5 hsa-miR-26a 0.38 2.31 9 10�4
hsa-miR-598 0.20 3.80 9 10�5 hsa-miR-30e 0.38 5.78 9 10�5
hsa-miR-99a 0.24 5.52 9 10�5 hsa-miR-16 0.41 4.40 9 10�4
hsa-miR-143 0.26 2.73 9 10�4 hsa-miR-135b 6.06 4.01 9 10�4
hsa-miR-194 0.27 1.43 9 10�5 hsa-miR-766 10.56 9.33 9 10�5
hsa-miR-636 0.27 1.42 9 10�4 hsa-miR-183* 29.04 2.69 9 10�4
hsa-miR-192 0.27 3.41 9 10�5 hsa-miR-135b* 31.12 2.59 9 10�4
ª 2012 The Authors 2659
Journal of Cellular and Molecular Medicine ª 2012 Foundation for Cellular and Molecular Medicine/Blackwell Publishing Ltd
J. Cell. Mol. Med. Vol 16, No 11, 2012
Validation of selected miRNAs by qRT-PCR
Based on the significance of the difference (fold change, P-value),previous observations and biological plausibility (according toputative miRNA targets and/or Pubmed hits when particular miR-NA is combined with keyword ‘cancer’), and favourable expressionlevels (Ct < 30), we chose five miRNAs for further validation.MiR-215, miR-375, miR-378 and miR-422a were down-regulated,whereas miR-135b was up-regulated. For validation, we used inde-pendent collection of 125 paired samples of tumoural tissue andadjacent non-tumoural mucosa. To determine the differencesbetween these two groups, we used two-tailed non-parametric Wil-coxon test. Furthermore, two-tailed Mann–Whitney U-test andKruskal–Wallis test were used to analyse the correlation betweenthe miRNA expression levels and clinical–pathological features ofthe patients.
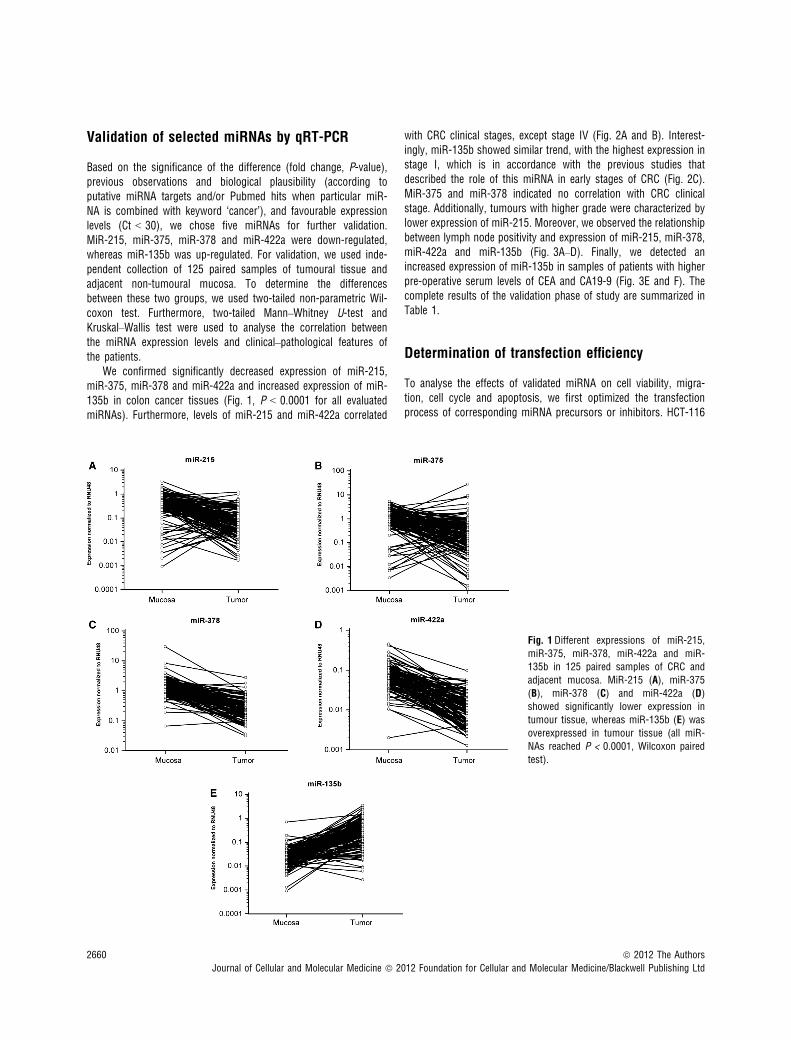
We confirmed significantly decreased expression of miR-215,miR-375, miR-378 and miR-422a and increased expression of miR-135b in colon cancer tissues (Fig. 1, P < 0.0001 for all evaluatedmiRNAs). Furthermore, levels of miR-215 and miR-422a correlated
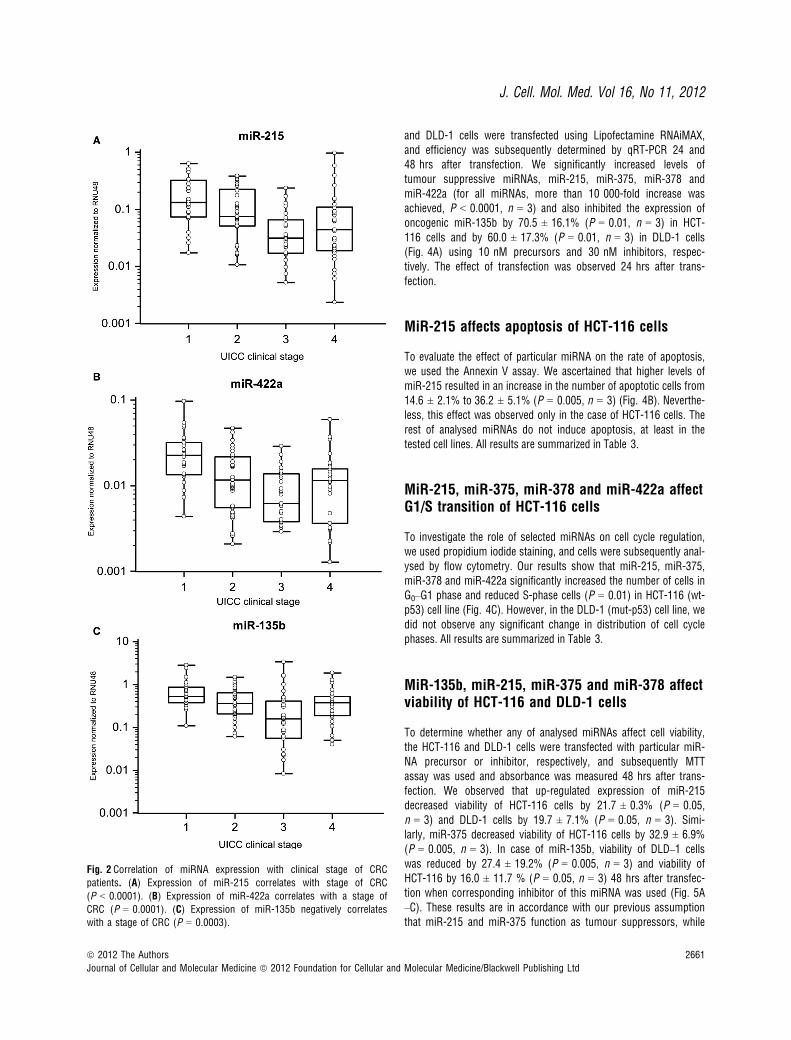
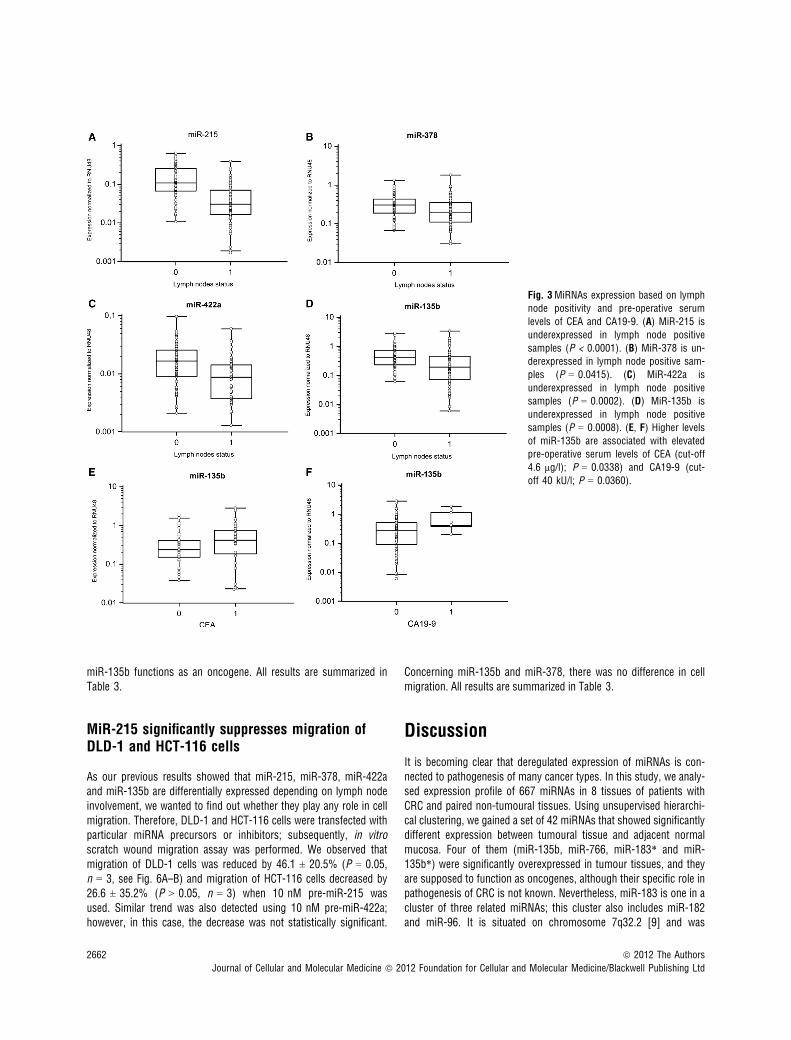
with CRC clinical stages, except stage IV (Fig. 2A and B). Interest-ingly, miR-135b showed similar trend, with the highest expression instage I, which is in accordance with the previous studies thatdescribed the role of this miRNA in early stages of CRC (Fig. 2C).MiR-375 and miR-378 indicated no correlation with CRC clinicalstage. Additionally, tumours with higher grade were characterized bylower expression of miR-215. Moreover, we observed the relationshipbetween lymph node positivity and expression of miR-215, miR-378,miR-422a and miR-135b (Fig. 3A–D). Finally, we detected anincreased expression of miR-135b in samples of patients with higherpre-operative serum levels of CEA and CA19-9 (Fig. 3E and F). Thecomplete results of the validation phase of study are summarized inTable 1.
Determination of transfection efficiency
To analyse the effects of validated miRNA on cell viability, migra-tion, cell cycle and apoptosis, we first optimized the transfectionprocess of corresponding miRNA precursors or inhibitors. HCT-116
Fig. 1 Different expressions of miR-215,
miR-375, miR-378, miR-422a and miR-135b in 125 paired samples of CRC and
adjacent mucosa. MiR-215 (A), miR-375
(B), miR-378 (C) and miR-422a (D)showed significantly lower expression in
tumour tissue, whereas miR-135b (E) wasoverexpressed in tumour tissue (all miR-
NAs reached P < 0.0001, Wilcoxon pairedtest).
2660 ª 2012 The Authors
Journal of Cellular and Molecular Medicine ª 2012 Foundation for Cellular and Molecular Medicine/Blackwell Publishing Ltd
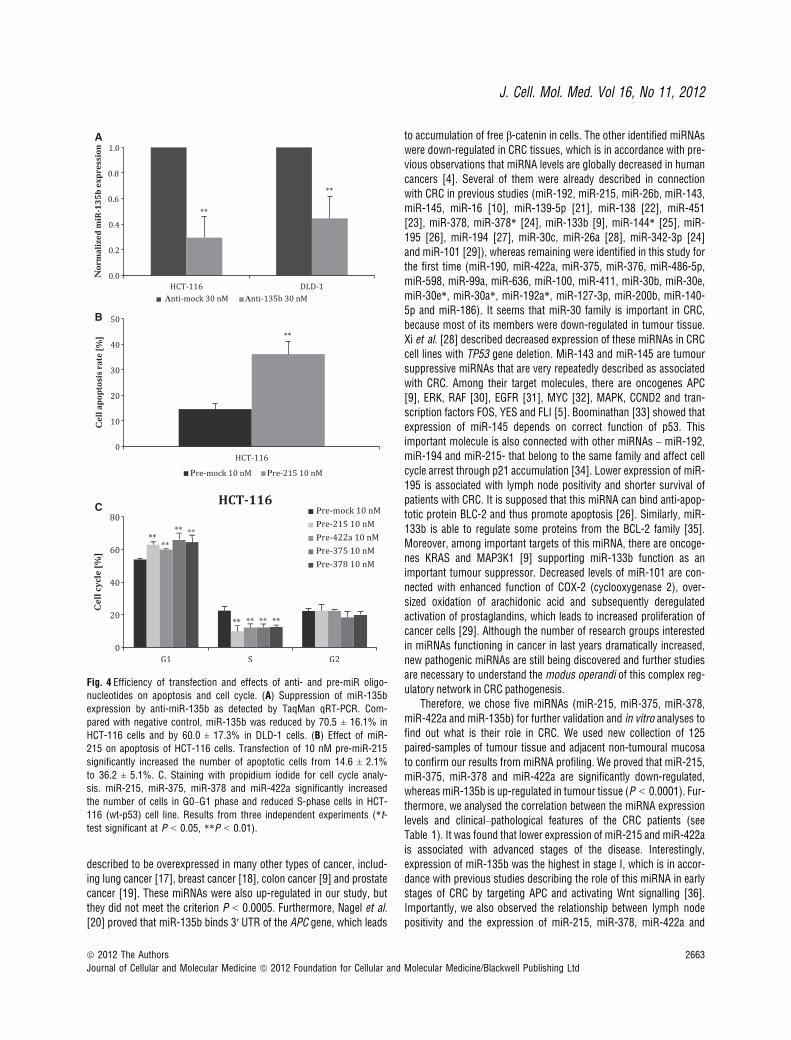
and DLD-1 cells were transfected using Lipofectamine RNAiMAX,and efficiency was subsequently determined by qRT-PCR 24 and48 hrs after transfection. We significantly increased levels oftumour suppressive miRNAs, miR-215, miR-375, miR-378 andmiR-422a (for all miRNAs, more than 10 000-fold increase wasachieved, P < 0.0001, n = 3) and also inhibited the expression ofoncogenic miR-135b by 70.5 ± 16.1% (P = 0.01, n = 3) in HCT-116 cells and by 60.0 ± 17.3% (P = 0.01, n = 3) in DLD-1 cells(Fig. 4A) using 10 nM precursors and 30 nM inhibitors, respec-tively. The effect of transfection was observed 24 hrs after trans-fection.
MiR-215 affects apoptosis of HCT-116 cells
To evaluate the effect of particular miRNA on the rate of apoptosis,we used the Annexin V assay. We ascertained that higher levels ofmiR-215 resulted in an increase in the number of apoptotic cells from14.6 ± 2.1% to 36.2 ± 5.1% (P = 0.005, n = 3) (Fig. 4B). Neverthe-less, this effect was observed only in the case of HCT-116 cells. Therest of analysed miRNAs do not induce apoptosis, at least in thetested cell lines. All results are summarized in Table 3.
MiR-215, miR-375, miR-378 and miR-422a affectG1/S transition of HCT-116 cells
To investigate the role of selected miRNAs on cell cycle regulation,we used propidium iodide staining, and cells were subsequently anal-ysed by flow cytometry. Our results show that miR-215, miR-375,miR-378 and miR-422a significantly increased the number of cells inG0–G1 phase and reduced S-phase cells (P = 0.01) in HCT-116 (wt-p53) cell line (Fig. 4C). However, in the DLD-1 (mut-p53) cell line, wedid not observe any significant change in distribution of cell cyclephases. All results are summarized in Table 3.
MiR-135b, miR-215, miR-375 and miR-378 affectviability of HCT-116 and DLD-1 cells
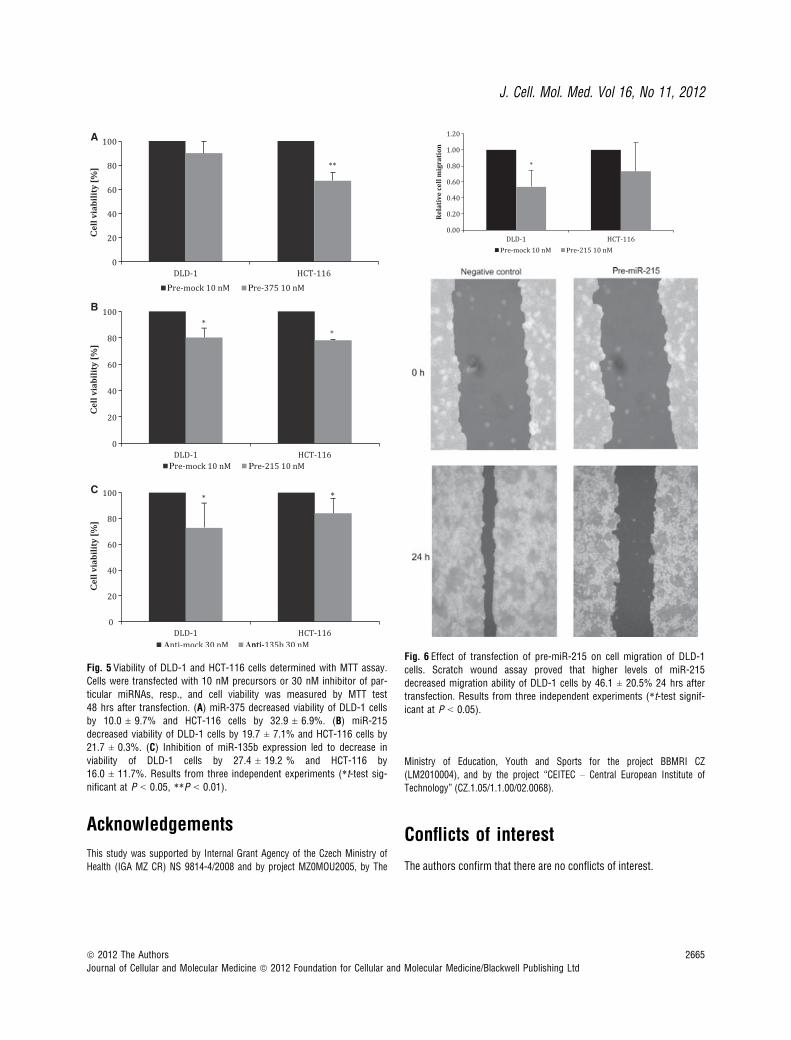
To determine whether any of analysed miRNAs affect cell viability,the HCT-116 and DLD-1 cells were transfected with particular miR-NA precursor or inhibitor, respectively, and subsequently MTTassay was used and absorbance was measured 48 hrs after trans-fection. We observed that up-regulated expression of miR-215decreased viability of HCT-116 cells by 21.7 ± 0.3% (P = 0.05,n = 3) and DLD-1 cells by 19.7 ± 7.1% (P = 0.05, n = 3). Simi-larly, miR-375 decreased viability of HCT-116 cells by 32.9 ± 6.9%(P = 0.005, n = 3). In case of miR-135b, viability of DLD–1 cellswas reduced by 27.4 ± 19.2% (P = 0.005, n = 3) and viability ofHCT-116 by 16.0 ± 11.7 % (P = 0.05, n = 3) 48 hrs after transfec-tion when corresponding inhibitor of this miRNA was used (Fig. 5A–C). These results are in accordance with our previous assumptionthat miR-215 and miR-375 function as tumour suppressors, while
Fig. 2 Correlation of miRNA expression with clinical stage of CRC
patients. (A) Expression of miR-215 correlates with stage of CRC
(P < 0.0001). (B) Expression of miR-422a correlates with a stage of
CRC (P = 0.0001). (C) Expression of miR-135b negatively correlateswith a stage of CRC (P = 0.0003).
ª 2012 The Authors 2661
Journal of Cellular and Molecular Medicine ª 2012 Foundation for Cellular and Molecular Medicine/Blackwell Publishing Ltd
J. Cell. Mol. Med. Vol 16, No 11, 2012
miR-135b functions as an oncogene. All results are summarized inTable 3.
MiR-215 significantly suppresses migration ofDLD-1 and HCT-116 cells
As our previous results showed that miR-215, miR-378, miR-422aand miR-135b are differentially expressed depending on lymph nodeinvolvement, we wanted to find out whether they play any role in cellmigration. Therefore, DLD-1 and HCT-116 cells were transfected withparticular miRNA precursors or inhibitors; subsequently, in vitroscratch wound migration assay was performed. We observed thatmigration of DLD-1 cells was reduced by 46.1 ± 20.5% (P = 0.05,n = 3, see Fig. 6A–B) and migration of HCT-116 cells decreased by26.6 ± 35.2% (P > 0.05, n = 3) when 10 nM pre-miR-215 wasused. Similar trend was also detected using 10 nM pre-miR-422a;however, in this case, the decrease was not statistically significant.
Concerning miR-135b and miR-378, there was no difference in cellmigration. All results are summarized in Table 3.
Discussion
It is becoming clear that deregulated expression of miRNAs is con-nected to pathogenesis of many cancer types. In this study, we analy-sed expression profile of 667 miRNAs in 8 tissues of patients withCRC and paired non-tumoural tissues. Using unsupervised hierarchi-cal clustering, we gained a set of 42 miRNAs that showed significantlydifferent expression between tumoural tissue and adjacent normalmucosa. Four of them (miR-135b, miR-766, miR-183* and miR-135b*) were significantly overexpressed in tumour tissues, and theyare supposed to function as oncogenes, although their specific role inpathogenesis of CRC is not known. Nevertheless, miR-183 is one in acluster of three related miRNAs; this cluster also includes miR-182and miR-96. It is situated on chromosome 7q32.2 [9] and was
Fig. 3MiRNAs expression based on lymphnode positivity and pre-operative serum
levels of CEA and CA19-9. (A) MiR-215 is
underexpressed in lymph node positive
samples (P < 0.0001). (B) MiR-378 is un-derexpressed in lymph node positive sam-
ples (P = 0.0415). (C) MiR-422a is
underexpressed in lymph node positivesamples (P = 0.0002). (D) MiR-135b is
underexpressed in lymph node positive
samples (P = 0.0008). (E, F) Higher levelsof miR-135b are associated with elevatedpre-operative serum levels of CEA (cut-off
4.6 lg/l); P = 0.0338) and CA19-9 (cut-
off 40 kU/l; P = 0.0360).
2662 ª 2012 The Authors
Journal of Cellular and Molecular Medicine ª 2012 Foundation for Cellular and Molecular Medicine/Blackwell Publishing Ltd
described to be overexpressed in many other types of cancer, includ-ing lung cancer [17], breast cancer [18], colon cancer [9] and prostatecancer [19]. These miRNAs were also up-regulated in our study, butthey did not meet the criterion P < 0.0005. Furthermore, Nagel et al.[20] proved that miR-135b binds 3′ UTR of the APC gene, which leads
to accumulation of free b-catenin in cells. The other identified miRNAswere down-regulated in CRC tissues, which is in accordance with pre-vious observations that miRNA levels are globally decreased in humancancers [4]. Several of them were already described in connectionwith CRC in previous studies (miR-192, miR-215, miR-26b, miR-143,miR-145, miR-16 [10], miR-139-5p [21], miR-138 [22], miR-451[23], miR-378, miR-378* [24], miR-133b [9], miR-144* [25], miR-195 [26], miR-194 [27], miR-30c, miR-26a [28], miR-342-3p [24]and miR-101 [29]), whereas remaining were identified in this study forthe first time (miR-190, miR-422a, miR-375, miR-376, miR-486-5p,miR-598, miR-99a, miR-636, miR-100, miR-411, miR-30b, miR-30e,miR-30e*, miR-30a*, miR-192a*, miR-127-3p, miR-200b, miR-140-5p and miR-186). It seems that miR-30 family is important in CRC,because most of its members were down-regulated in tumour tissue.Xi et al. [28] described decreased expression of these miRNAs in CRCcell lines with TP53 gene deletion. MiR-143 and miR-145 are tumoursuppressive miRNAs that are very repeatedly described as associatedwith CRC. Among their target molecules, there are oncogenes APC[9], ERK, RAF [30], EGFR [31], MYC [32], MAPK, CCND2 and tran-scription factors FOS, YES and FLI [5]. Boominathan [33] showed thatexpression of miR-145 depends on correct function of p53. Thisimportant molecule is also connected with other miRNAs – miR-192,miR-194 and miR-215- that belong to the same family and affect cellcycle arrest through p21 accumulation [34]. Lower expression of miR-195 is associated with lymph node positivity and shorter survival ofpatients with CRC. It is supposed that this miRNA can bind anti-apop-totic protein BLC-2 and thus promote apoptosis [26]. Similarly, miR-133b is able to regulate some proteins from the BCL-2 family [35].Moreover, among important targets of this miRNA, there are oncoge-nes KRAS and MAP3K1 [9] supporting miR-133b function as animportant tumour suppressor. Decreased levels of miR-101 are con-nected with enhanced function of COX-2 (cyclooxygenase 2), over-sized oxidation of arachidonic acid and subsequently deregulatedactivation of prostaglandins, which leads to increased proliferation ofcancer cells [29]. Although the number of research groups interestedin miRNAs functioning in cancer in last years dramatically increased,new pathogenic miRNAs are still being discovered and further studiesare necessary to understand the modus operandi of this complex reg-ulatory network in CRC pathogenesis.
Therefore, we chose five miRNAs (miR-215, miR-375, miR-378,miR-422a and miR-135b) for further validation and in vitro analyses tofind out what is their role in CRC. We used new collection of 125paired-samples of tumour tissue and adjacent non-tumoural mucosato confirm our results from miRNA profiling. We proved that miR-215,miR-375, miR-378 and miR-422a are significantly down-regulated,whereas miR-135b is up-regulated in tumour tissue (P < 0.0001). Fur-thermore, we analysed the correlation between the miRNA expressionlevels and clinical–pathological features of the CRC patients (seeTable 1). It was found that lower expression of miR-215 and miR-422ais associated with advanced stages of the disease. Interestingly,expression of miR-135b was the highest in stage I, which is in accor-dance with previous studies describing the role of this miRNA in earlystages of CRC by targeting APC and activating Wnt signalling [36].Importantly, we also observed the relationship between lymph nodepositivity and the expression of miR-215, miR-378, miR-422a and
A
B
C
Fig. 4 Efficiency of transfection and effects of anti- and pre-miR oligo-nucleotides on apoptosis and cell cycle. (A) Suppression of miR-135b
expression by anti-miR-135b as detected by TaqMan qRT-PCR. Com-
pared with negative control, miR-135b was reduced by 70.5 ± 16.1% in
HCT-116 cells and by 60.0 ± 17.3% in DLD-1 cells. (B) Effect of miR-215 on apoptosis of HCT-116 cells. Transfection of 10 nM pre-miR-215
significantly increased the number of apoptotic cells from 14.6 ± 2.1%
to 36.2 ± 5.1%. C. Staining with propidium iodide for cell cycle analy-sis. miR-215, miR-375, miR-378 and miR-422a significantly increased
the number of cells in G0–G1 phase and reduced S-phase cells in HCT-
116 (wt-p53) cell line. Results from three independent experiments (*t-test significant at P < 0.05, **P < 0.01).
ª 2012 The Authors 2663
Journal of Cellular and Molecular Medicine ª 2012 Foundation for Cellular and Molecular Medicine/Blackwell Publishing Ltd
J. Cell. Mol. Med. Vol 16, No 11, 2012
miR-135b. This fact indicates a possible role of these miRNAs inmigration of colon cancer cells, which was also analysed in thisstudy. Moreover, expression of these miRNAs could contribute tobetter differentiation between clinical stages II and III, which is cur-rently based on examination of lymph node positivity. Unfortunately,this approach is not precise enough, because about 25% of patientswith lymph node involvement are not detected due to insufficientnumber of examined lymph nodes. Subsequently, these patients donot receive adjuvant systemic therapy increasing probability ofrelapse. Finally, we detected increased expression of miR-135b insamples of patients with higher pre-operative serum levels of CAEand CA19-9. This is in agreement with previous observationsdescribing higher levels of miR-135b also in plasma of CRC patients,indicating its potential usage as circulating biomarker in CRC [13].
To explore the function of validated miRNAs in pathogenesis ofCRC, DLD-1 and HCT-116 colon cancer cells were transfected withparticular miRNA precursors or inhibitors. The functional analyses ofmiR-215 showed that overexpression of this miRNA leads to cellcycle arrest and enhanced apoptosis of HCT–116 cells carrying wt-p53, but no effect was observed in the case of DLD–1 cells containingmut-p53. These results are in accordance with previous studies thatdescribe direct connection between miR-215 function and p53 status.Braun et al.[34] found out not only p53-responsive induction of miR-215 but also direct feedback of this miRNA on the activity of p53,which results in activation of apoptosis and cell cycle arrest in cellswith wild-type p53, but not in cells with mutated p53. Moreover, wedetected significantly decreased migration of cells transfected withpre-miR-215, supporting our observation that expression of thismiRNA is lower in primary tumours with lymph node positivity. Kara-ayvaz et al. (2011) observed prognostic potential of miR-215 in the
small cohort of 34 CRC patients of II and III clinical stages. Expres-sion levels of miR-215 were decreased in tumours, but, interestingly,higher levels of miR-215 were associated with worse survival(P = 0.025). Differences in miR-215 levels between tumour of clinicalstages II and III were not evaluated [35]. These results together indi-cate that miR-215 is important in pathogenesis of CRC and could beused not only as a new biomarker of the disease but also as a poten-tial therapeutic target for prevention of metastases.
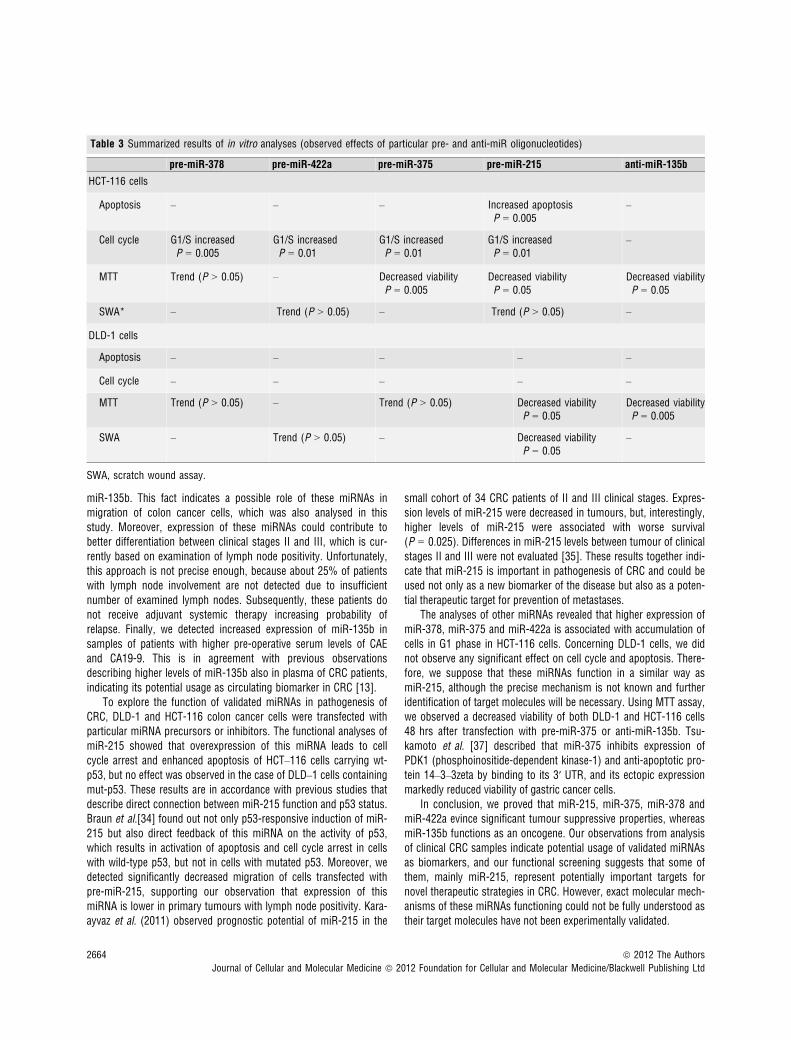
The analyses of other miRNAs revealed that higher expression ofmiR-378, miR-375 and miR-422a is associated with accumulation ofcells in G1 phase in HCT-116 cells. Concerning DLD-1 cells, we didnot observe any significant effect on cell cycle and apoptosis. There-fore, we suppose that these miRNAs function in a similar way asmiR-215, although the precise mechanism is not known and furtheridentification of target molecules will be necessary. Using MTT assay,we observed a decreased viability of both DLD-1 and HCT-116 cells48 hrs after transfection with pre-miR-375 or anti-miR-135b. Tsu-kamoto et al. [37] described that miR-375 inhibits expression ofPDK1 (phosphoinositide-dependent kinase-1) and anti-apoptotic pro-tein 14–3–3zeta by binding to its 3′ UTR, and its ectopic expressionmarkedly reduced viability of gastric cancer cells.
In conclusion, we proved that miR-215, miR-375, miR-378 andmiR-422a evince significant tumour suppressive properties, whereasmiR-135b functions as an oncogene. Our observations from analysisof clinical CRC samples indicate potential usage of validated miRNAsas biomarkers, and our functional screening suggests that some ofthem, mainly miR-215, represent potentially important targets fornovel therapeutic strategies in CRC. However, exact molecular mech-anisms of these miRNAs functioning could not be fully understood astheir target molecules have not been experimentally validated.
Table 3 Summarized results of in vitro analyses (observed effects of particular pre- and anti-miR oligonucleotides)
pre-miR-378 pre-miR-422a pre-miR-375 pre-miR-215 anti-miR-135b
HCT-116 cells
Apoptosis – – – Increased apoptosisP = 0.005
–
Cell cycle G1/S increasedP = 0.005
G1/S increasedP = 0.01
G1/S increasedP = 0.01
G1/S increasedP = 0.01
–
MTT Trend (P > 0.05) – Decreased viabilityP = 0.005
Decreased viabilityP = 0.05
Decreased viabilityP = 0.05
SWA* – Trend (P > 0.05) – Trend (P > 0.05) –
DLD-1 cells
Apoptosis – – – – –
Cell cycle – – – – –
MTT Trend (P > 0.05) – Trend (P > 0.05) Decreased viabilityP = 0.05
Decreased viabilityP = 0.005
SWA – Trend (P > 0.05) – Decreased viabilityP = 0.05
–
SWA, scratch wound assay.
2664 ª 2012 The Authors
Journal of Cellular and Molecular Medicine ª 2012 Foundation for Cellular and Molecular Medicine/Blackwell Publishing Ltd
Acknowledgements
This study was supported by Internal Grant Agency of the Czech Ministry of
Health (IGA MZ CR) NS 9814-4/2008 and by project MZ0MOU2005, by The
Ministry of Education, Youth and Sports for the project BBMRI CZ(LM2010004), and by the project “CEITEC – Central European Institute of
Technology” (CZ.1.05/1.1.00/02.0068).
Conflicts of interest
The authors confirm that there are no conflicts of interest.
A
B
C
Fig. 5 Viability of DLD-1 and HCT-116 cells determined with MTT assay.
Cells were transfected with 10 nM precursors or 30 nM inhibitor of par-
ticular miRNAs, resp., and cell viability was measured by MTT test
48 hrs after transfection. (A) miR-375 decreased viability of DLD-1 cellsby 10.0 ± 9.7% and HCT-116 cells by 32.9 ± 6.9%. (B) miR-215
decreased viability of DLD-1 cells by 19.7 ± 7.1% and HCT-116 cells by
21.7 ± 0.3%. (C) Inhibition of miR-135b expression led to decrease in
viability of DLD-1 cells by 27.4 ± 19.2 % and HCT-116 by16.0 ± 11.7%. Results from three independent experiments (*t-test sig-nificant at P < 0.05, **P < 0.01).
Fig. 6 Effect of transfection of pre-miR-215 on cell migration of DLD-1
cells. Scratch wound assay proved that higher levels of miR-215
decreased migration ability of DLD-1 cells by 46.1 ± 20.5% 24 hrs aftertransfection. Results from three independent experiments (*t-test signif-icant at P < 0.05).
ª 2012 The Authors 2665
Journal of Cellular and Molecular Medicine ª 2012 Foundation for Cellular and Molecular Medicine/Blackwell Publishing Ltd
J. Cell. Mol. Med. Vol 16, No 11, 2012
References
1. Siegel R, Ward E, Brawley O, et al. Cancerstatistics, 2011. CA Cancer J Clin. 2011; 61:
212–36.2. Janga SC, Vallabhaneni S. MicroRNAs as
post-transcriptional machines and their
interplay with cellular networks. Adv ExpMed Biol. 2011; 722: 59–74.
3. Wang Y, Lee CG. MicroRNA and cancer –focus on apoptosis. J Cell Mol Med. 2009;
13: 12–23.4. Slaby O, Svoboda M, Michalek J, et al. Mi-
croRNAs in colorectal cancer: translation of
molecular biology into clinical application.
Mol Cancer. 2009; 8: 102.5. Slaby O, Svoboda M, Fabian P, et al.
Altered expression of miR-21, miR-31,
miR-143 and miR-145 is related to clinico-
pathologic features of colorectal cancer.Oncology. 2007; 72: 397–402.
6. Schepeler T, Reinert JT, Ostenfeld MS,et al. Diagnostic and prognostic microRNAsin stage II colon cancer. Cancer Res. 2008;
68: 6416–24.7. Sarver AL, French AJ, Borralho PM, et al.
Human colon cancer profiles show differen-tial microRNA expression depending on mis-
match repair status and are characteristic of
undifferentiated proliferative states. BMC
Cancer. 2009; 9: 401.8. Schetter AJ, Leung SY, Sohn JJ, et al.
MicroRNA expression profiles associated
with prognosis and therapeutic outcome incolon adenocarcinoma. JAMA. 2008; 299:
425–36.9. Bandres E, Cubedo E, Agirre X, et al. Identi-
fication by real-time PCR of 13 mature mi-croRNAs differentially expressed in
colorectal cancer and non-tumoral tissues.
Mol Cancer. 2006; 5: 29.
10. Earle JSL, Luthra R, Romans A, et al. Asso-ciation of microRNA expression with micro-
satellite instability status in colorectal
adenocarcinoma. J Mol Diagn. 2010; 12:433–40.
11. Koga Y, Yasunaga M, Takahashi A, et al.MicroRNA expression profiling of exfoliated
colonocytes isolated from feces for colorec-tal cancer screening. Cancer Prev Res. 2010;
3: 1435–42.12. Dıaz R, Silva J, Garcıa JM, et al. Deregulat-
ed expression of miR-106a predicts survivalin human colon cancer patients. Genes
Chromosom Cancer. 2008; 47: 794–802.13. Ng EKO, Chong WWS, Jin H, et al. Differen-
tial expression of microRNAs in plasma of
patients with colorectal cancer: a potential
marker for colorectal cancer screening. Gut.
2009; 58: 1375–81.14. Pu X-xiang, Huang G-liang, Guo H-qiang,
et al. Circulating miR-221 directly amplified
from plasma is a potential diagnostic andprognostic marker of colorectal cancer and
is correlated with p53 expression. J Gastro-
enterol Hepatol. 2010; 25: 1674–80.15. Wang L-G, Gu J. Serum microRNA-29a is a
promising novel marker for early detection of
colorectal liver metastasis. Cancer Epidemiol.
2011; doi:10.1016/j.canep.2011.05.002
16. Reimers M, Carey VJ. Bioconductor: anopen source framework for bioinformatics
and computational biology. Methods Enzy-
mol. 2006; 411: 119–134.17. Miko E, Czimmerer Z, Csanky E, et al. Dif-
ferentially expressed microRNAs in small
cell lung cancer. Exp Lung Res. 2009; 35:
646–64.18. Hannafon BN, Sebastiani P, de las Morenas
A, et al. Expression of microRNA and their
gene targets are dysregulated in preinvasive
breast cancer. Breast Cancer Res. 2011; 13:R24.
19. Schaefer A, Jung M, Mollenkopf H-J, et al.Diagnostic and prognostic implications of
microRNA profiling in prostate carcinoma.Int J Cancer. 2010; 126: 1166–76.
20. Nagel R, le Sage C, Diosdado B, et al.Regulation of the adenomatous polyposiscoli gene by the miR-135 family in colo-
rectal cancer. Cancer Res. 2008; 68: 5795–802.
21. Chang KH, Miller N, Kheirelseid EAH, et al.MicroRNA signature analysis in colorectal
cancer: identification of expression profiles
in stage II tumors associated with aggres-
sive disease. Int J Colorectal Dis. 2011; 26:1415–22.
22. Paun BC, Cheng Y, Leggett BA, et al.Screening for microsatellite instability identi-fies frequent 3′-untranslated region mutation
of the RB1-inducible coiled-coil 1 gene in
colon tumors. PLoS One. 2009; 4: e7715.
23. Bitarte N, Bandres E, Boni V, et al. Micro-RNA-451 is involved in the self-renewal,
tumorigenicity, and chemoresistance of
colorectal cancer stem cells. Stem Cells.
2011; 29: 1661–71.24. Wang YX, Zhang XY, Zhang BF, et al. Initial
study of microRNA expression profiles of
colonic cancer without lymph node metasta-
sis. J Dig Dis. 2010; 11: 50–4.
25. Kalimutho M, Del Vecchio Blanco G, DiCecilia S, et al. Differential expression of
miR-144* as a novel fecal-based diagnosticmarker for colorectal cancer. J Gastroenter-
ol. 2011; 46: 1391–402.26. Liu L, Chen L, Xu Y, et al. MicroRNA-195
promotes apoptosis and suppresses tumori-
genicity of human colorectal cancer cells.
Biochem Biophys Res Commun. 2010; 400:
236–40.27. Sundaram P, Hultine S, Smith LM, et al.
p53-responsive miR-194 inhibits thrombo-
spondin-1 and promotes angiogenesis in
colon cancers. Cancer Res. 2011; 71:7490–501.
28. Xi Y, Formentini A, Chien M, et al. Prog-nostic values of microRNAs in colorectal
cancer. Biomark Insights. 2006; 2: 113–21.29. Strillacci A, Griffoni C, Sansone P, et al.
MiR-101 downregulation is involved in cy-
clooxygenase-2 overexpression in humancolon cancer cells. Exp Cell Res. 2009; 315:
1439–47.30. Michael MZ, O’ Connor SM, van Holst Pel-
lekaan NG, et al. Reduced accumulation ofspecific microRNAs in colorectal neoplasia.
Mol Cancer Res. 2003; 1: 882–91.31. Cho WCS, Chow ASC, Au JSK. MiR-145
inhibits cell proliferation of human lung ade-nocarcinoma by targeting EGFR and NUDT1.
RNA Biol. 2011; 8: 125–31.32. Sachdeva M, Mo Y-Y. miR-145-mediated
suppression of cell growth, invasion andmeta
stasis.AmJTransl Res. 2010; 2:170–80.33. Boominathan L. The guardians of the gen-
ome (p53, TA-p73, and TA-p63) are regula-tors of tumor suppressor miRNAs network.
Cancer Metastasis Rev. 2010; 29: 613–39.34. Braun CJ, Zhang X, Savelyeva I, et al. p53-
responsive microRNAs 192 and 215 arecapable of inducing cell cycle arrest. Cancer
Res. 2008; 68:10094–104.35. Karaayvaz M, Pal T, Song B, et al. Prognos-
tic significance of miR-215 in colon cancer.
Clin Colorectal Cancer. 2011; 10: 340–7.36. Necela BM, Carr JM, Asmann YW, Thomp-
son EA. Differential expression of micro-RNAs in tumours from chronically inflamed
or genetic (APC(Min/+)) models of colon
cancer. PLoS One. 2011; 6: e18501.
37. Tsukamoto Y, Nakada C, Noguchi T, et al.MicroRNA-375 is downregulated in gastric
carcinomas and regulates cell survival by
targeting PDK1 and 14-3-3zeta. Cancer Res.
2010; 70: 2339–49.
2666 ª 2012 The Authors
Journal of Cellular and Molecular Medicine ª 2012 Foundation for Cellular and Molecular Medicine/Blackwell Publishing Ltd
Copyright © 2022 FDOKUMEN