Idaho Percentile Results for the 2015 and 2016 ISAT ... - ERIC
24
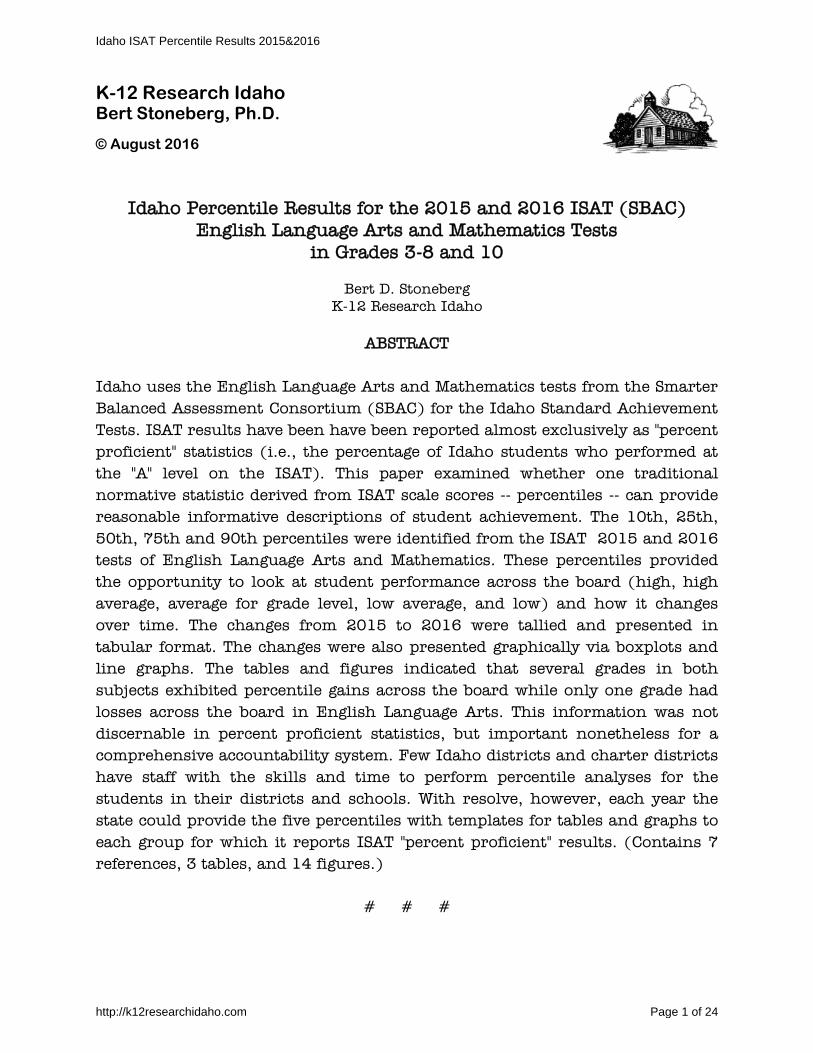
K-12 Research Idaho Bert Stoneberg, Ph.D. © August 2016 Idaho Percentile Results for the 2015 and 2016 ISAT (SBAC) English Language Arts and Mathematics Tests in Grades 3-8 and 10 Bert D. Stoneberg K-12 Research Idaho ABSTRACT Idaho uses the English Language Arts and Mathematics tests from the Smarter Balanced Assessment Consortium (SBAC) for the Idaho Standard Achievement Tests. ISAT results have been have been reported almost exclusively as "percent proficient" statistics (i.e., the percentage of Idaho students who performed at the "A" level on the ISAT). This paper examined whether one traditional normative statistic derived from ISAT scale scores -- percentiles -- can provide reasonable informative descriptions of student achievement. The 10th, 25th, 50th, 75th and 90th percentiles were identified from the ISAT 2015 and 2016 tests of English Language Arts and Mathematics. These percentiles provided the opportunity to look at student performance across the board (high, high average, average for grade level, low average, and low) and how it changes over time. The changes from 2015 to 2016 were tallied and presented in tabular format. The changes were also presented graphically via boxplots and line graphs. The tables and figures indicated that several grades in both subjects exhibited percentile gains across the board while only one grade had losses across the board in English Language Arts. This information was not discernable in percent proficient statistics, but important nonetheless for a comprehensive accountability system. Few Idaho districts and charter districts have staff with the skills and time to perform percentile analyses for the students in their districts and schools. With resolve, however, each year the state could provide the five percentiles with templates for tables and graphs to each group for which it reports ISAT "percent proficient" results. (Contains 7 references, 3 tables, and 14 figures.) # # # Idaho ISAT Percentile Results 2015&2016 http://k12researchidaho.com Page 1 of 24
-
Upload
khangminh22 -
Category
Documents
-
view
0 -
download
0
Transcript of Idaho Percentile Results for the 2015 and 2016 ISAT ... - ERIC
K-12 Research Idaho Bert Stoneberg, Ph.D.
© August 2016
Idaho Percentile Results for the 2015 and 2016 ISAT (SBAC)
English Language Arts and Mathematics Tests in Grades 3-8 and 10
Bert D. Stoneberg
K-12 Research Idaho
ABSTRACT Idaho uses the English Language Arts and Mathematics tests from the Smarter Balanced Assessment Consortium (SBAC) for the Idaho Standard Achievement Tests. ISAT results have been have been reported almost exclusively as "percent proficient" statistics (i.e., the percentage of Idaho students who performed at the "A" level on the ISAT). This paper examined whether one traditional normative statistic derived from ISAT scale scores -- percentiles -- can provide reasonable informative descriptions of student achievement. The 10th, 25th, 50th, 75th and 90th percentiles were identified from the ISAT 2015 and 2016 tests of English Language Arts and Mathematics. These percentiles provided the opportunity to look at student performance across the board (high, high average, average for grade level, low average, and low) and how it changes over time. The changes from 2015 to 2016 were tallied and presented in tabular format. The changes were also presented graphically via boxplots and line graphs. The tables and figures indicated that several grades in both subjects exhibited percentile gains across the board while only one grade had losses across the board in English Language Arts. This information was not discernable in percent proficient statistics, but important nonetheless for a comprehensive accountability system. Few Idaho districts and charter districts have staff with the skills and time to perform percentile analyses for the students in their districts and schools. With resolve, however, each year the state could provide the five percentiles with templates for tables and graphs to each group for which it reports ISAT "percent proficient" results. (Contains 7 references, 3 tables, and 14 figures.)
# # #
Idaho ISAT Percentile Results 2015&2016
http://k12researchidaho.com Page 1 of 24
Idaho Percentile Results for the 2015 and 2016 ISAT (SBAC) English Language Arts and Mathematics Tests in
Grades 3-8 and 10
Bert D. Stoneberg K-12 Research Idaho
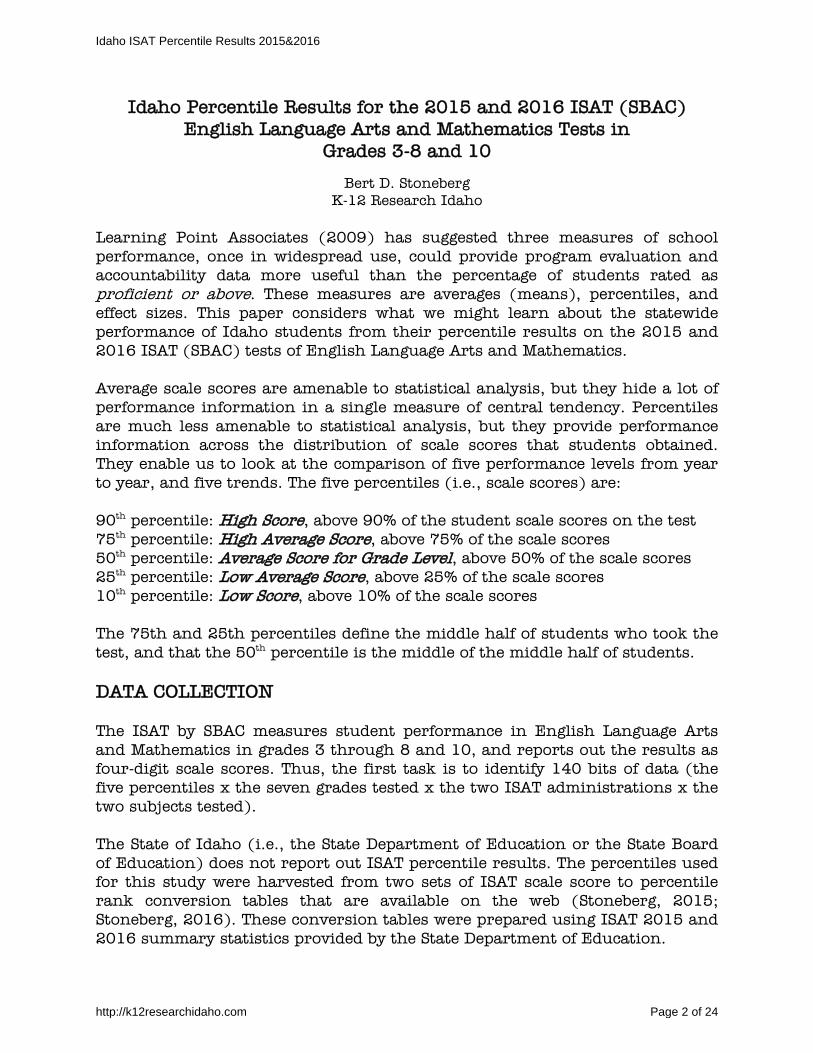
Learning Point Associates (2009) has suggested three measures of school performance, once in widespread use, could provide program evaluation and accountability data more useful than the percentage of students rated as proficient or above. These measures are averages (means), percentiles, and effect sizes. This paper considers what we might learn about the statewide performance of Idaho students from their percentile results on the 2015 and 2016 ISAT (SBAC) tests of English Language Arts and Mathematics. Average scale scores are amenable to statistical analysis, but they hide a lot of performance information in a single measure of central tendency. Percentiles are much less amenable to statistical analysis, but they provide performance information across the distribution of scale scores that students obtained. They enable us to look at the comparison of five performance levels from year to year, and five trends. The five percentiles (i.e., scale scores) are: 90th percentile: High Score, above 90% of the student scale scores on the test 75th percentile: High Average Score, above 75% of the scale scores 50th percentile: Average Score for Grade Level, above 50% of the scale scores 25th percentile: Low Average Score, above 25% of the scale scores 10th percentile: Low Score, above 10% of the scale scores The 75th and 25th percentiles define the middle half of students who took the test, and that the 50th percentile is the middle of the middle half of students. DATA COLLECTION The ISAT by SBAC measures student performance in English Language Arts and Mathematics in grades 3 through 8 and 10, and reports out the results as four-digit scale scores. Thus, the first task is to identify 140 bits of data (the five percentiles x the seven grades tested x the two ISAT administrations x the two subjects tested). The State of Idaho (i.e., the State Department of Education or the State Board of Education) does not report out ISAT percentile results. The percentiles used for this study were harvested from two sets of ISAT scale score to percentile rank conversion tables that are available on the web (Stoneberg, 2015; Stoneberg, 2016). These conversion tables were prepared using ISAT 2015 and 2016 summary statistics provided by the State Department of Education.
Idaho ISAT Percentile Results 2015&2016
http://k12researchidaho.com Page 2 of 24
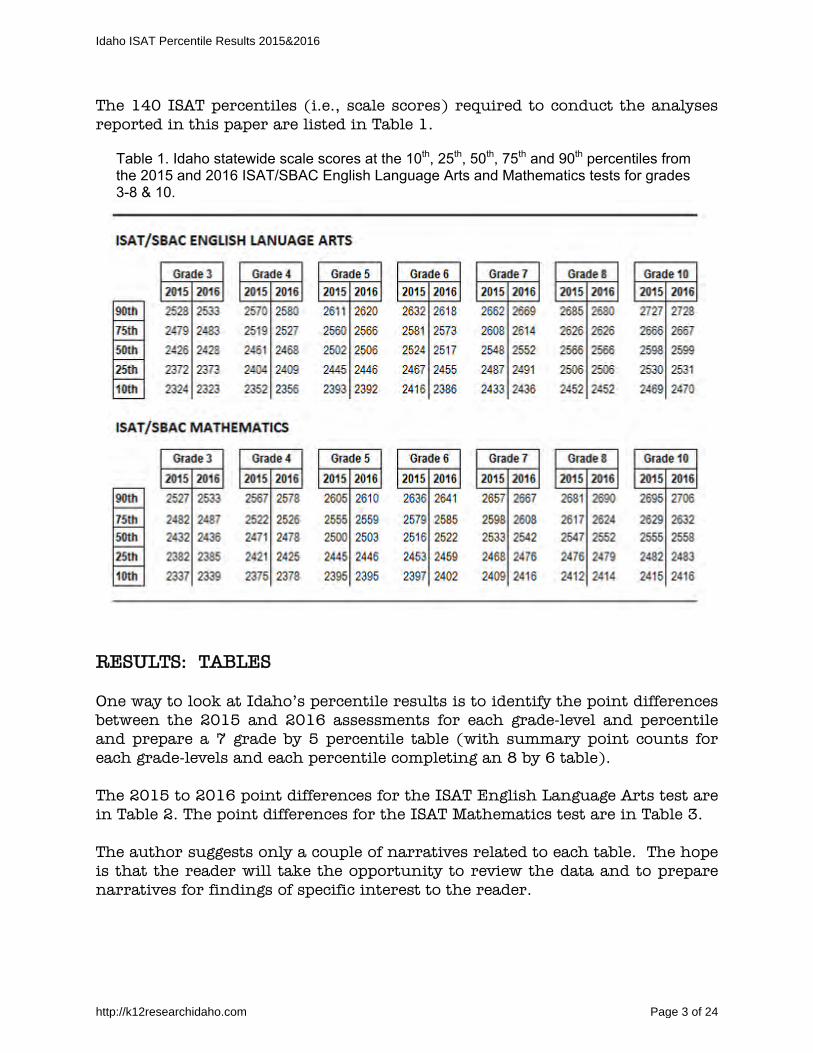
The 140 ISAT percentiles (i.e., scale scores) required to conduct the analyses reported in this paper are listed in Table 1. Table 1. Idaho statewide scale scores at the 10th, 25th, 50th, 75th and 90th percentiles from the 2015 and 2016 ISAT/SBAC English Language Arts and Mathematics tests for grades 3-8 & 10.
RESULTS: TABLES One way to look at Idaho’s percentile results is to identify the point differences between the 2015 and 2016 assessments for each grade-level and percentile and prepare a 7 grade by 5 percentile table (with summary point counts for each grade-levels and each percentile completing an 8 by 6 table). The 2015 to 2016 point differences for the ISAT English Language Arts test are in Table 2. The point differences for the ISAT Mathematics test are in Table 3. The author suggests only a couple of narratives related to each table. The hope is that the reader will take the opportunity to review the data and to prepare narratives for findings of specific interest to the reader.
Idaho ISAT Percentile Results 2015&2016
http://k12researchidaho.com Page 3 of 24
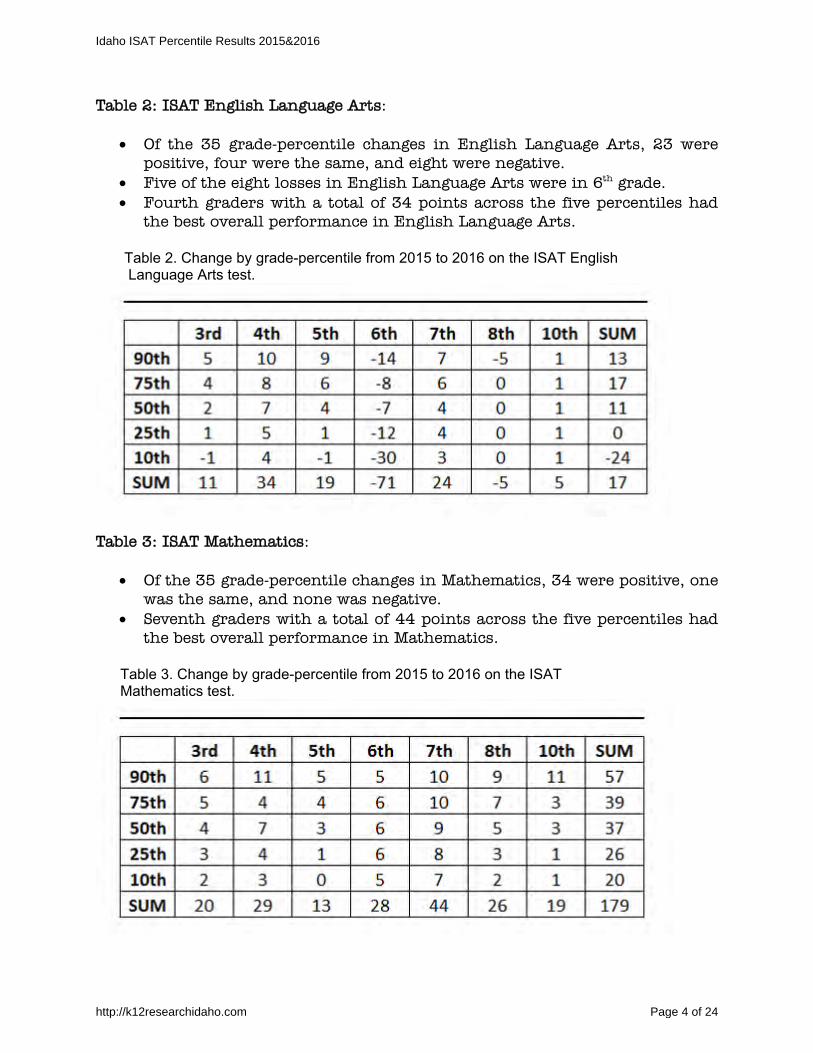
Table 2: ISAT English Language Arts:
Of the 35 grade-percentile changes in English Language Arts, 23 were positive, four were the same, and eight were negative.
Five of the eight losses in English Language Arts were in 6th grade. Fourth graders with a total of 34 points across the five percentiles had
the best overall performance in English Language Arts. Table 2. Change by grade-percentile from 2015 to 2016 on the ISAT English Language Arts test.
Table 3: ISAT Mathematics:
Of the 35 grade-percentile changes in Mathematics, 34 were positive, one was the same, and none was negative.
Seventh graders with a total of 44 points across the five percentiles had the best overall performance in Mathematics.
Table 3. Change by grade-percentile from 2015 to 2016 on the ISAT Mathematics test.
Idaho ISAT Percentile Results 2015&2016
http://k12researchidaho.com Page 4 of 24
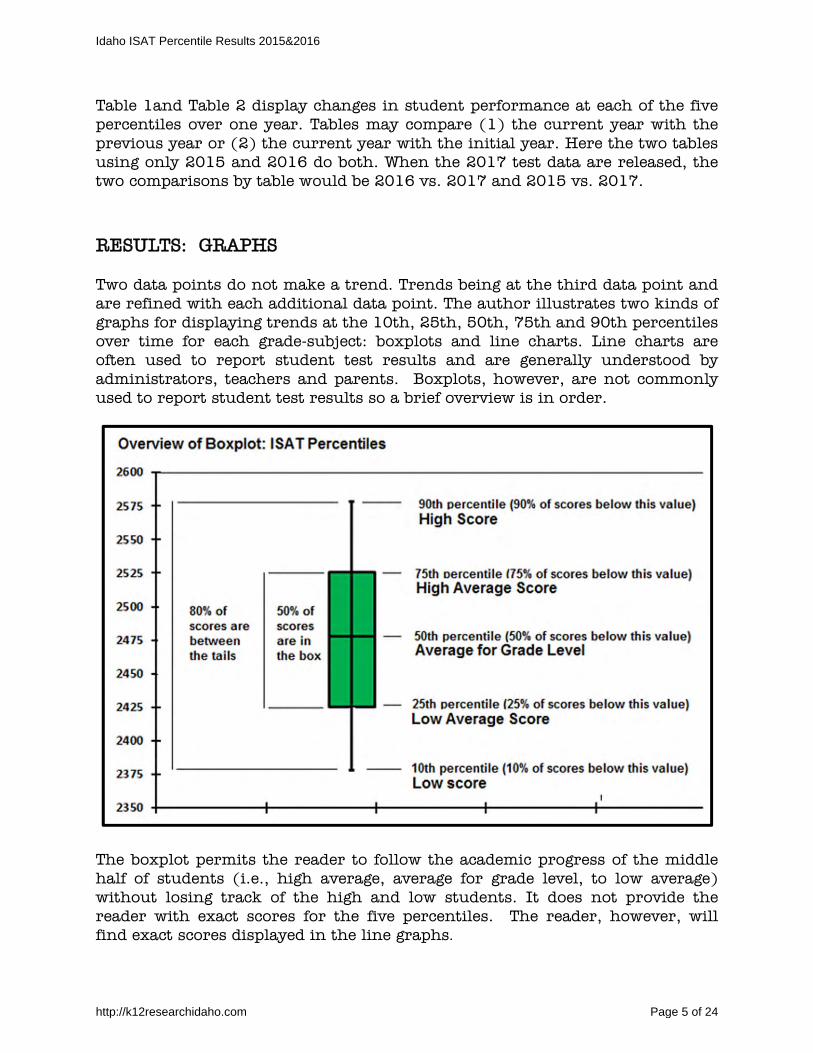
Table 1and Table 2 display changes in student performance at each of the five percentiles over one year. Tables may compare (1) the current year with the previous year or (2) the current year with the initial year. Here the two tables using only 2015 and 2016 do both. When the 2017 test data are released, the two comparisons by table would be 2016 vs. 2017 and 2015 vs. 2017. RESULTS: GRAPHS Two data points do not make a trend. Trends being at the third data point and are refined with each additional data point. The author illustrates two kinds of graphs for displaying trends at the 10th, 25th, 50th, 75th and 90th percentiles over time for each grade-subject: boxplots and line charts. Line charts are often used to report student test results and are generally understood by administrators, teachers and parents. Boxplots, however, are not commonly used to report student test results so a brief overview is in order.
The boxplot permits the reader to follow the academic progress of the middle half of students (i.e., high average, average for grade level, to low average) without losing track of the high and low students. It does not provide the reader with exact scores for the five percentiles. The reader, however, will find exact scores displayed in the line graphs.
Idaho ISAT Percentile Results 2015&2016
http://k12researchidaho.com Page 5 of 24
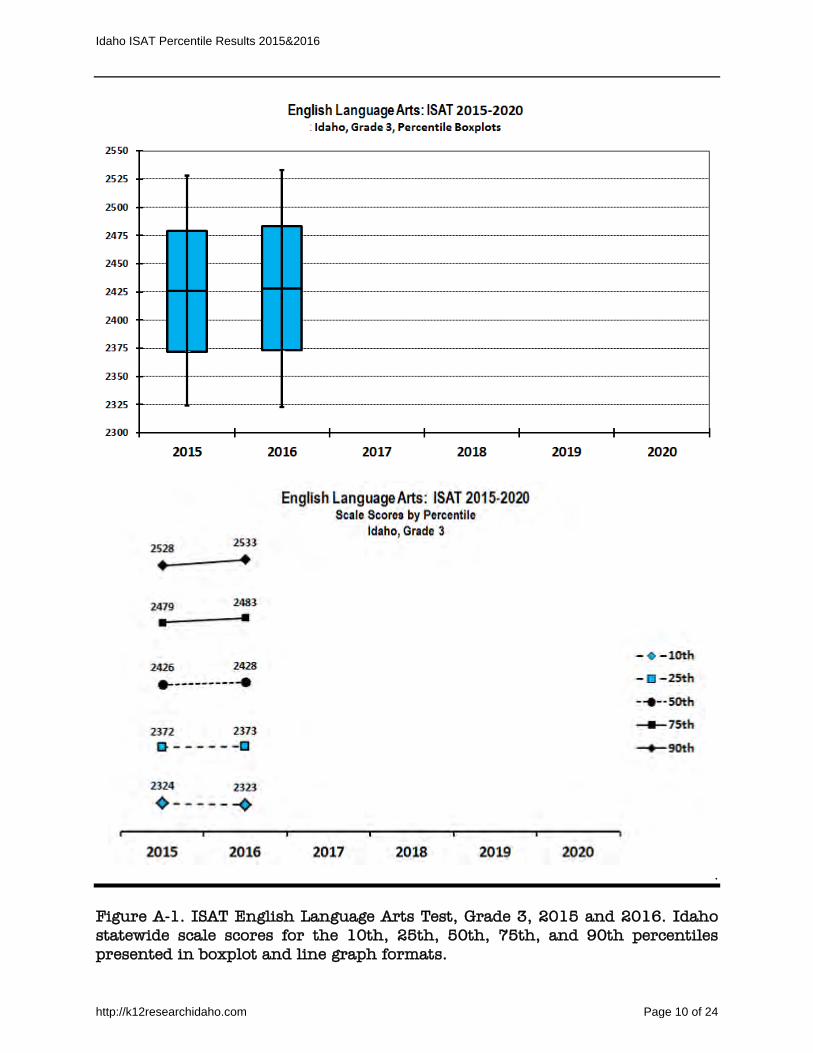
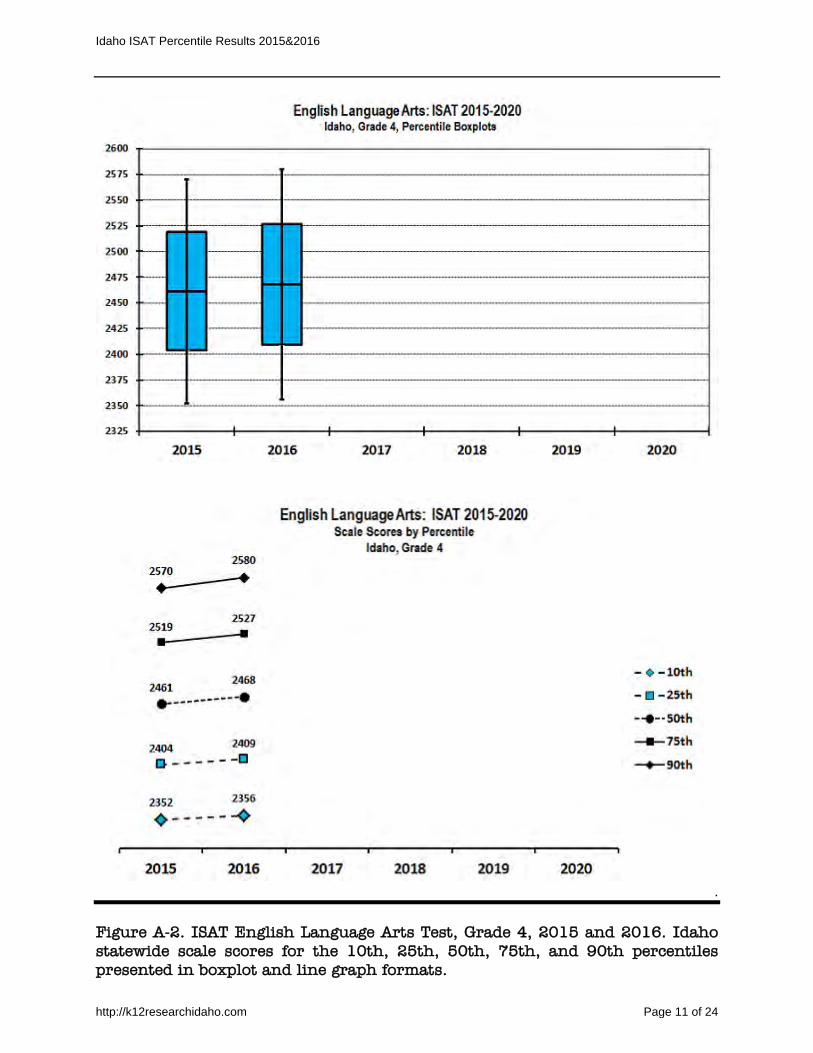
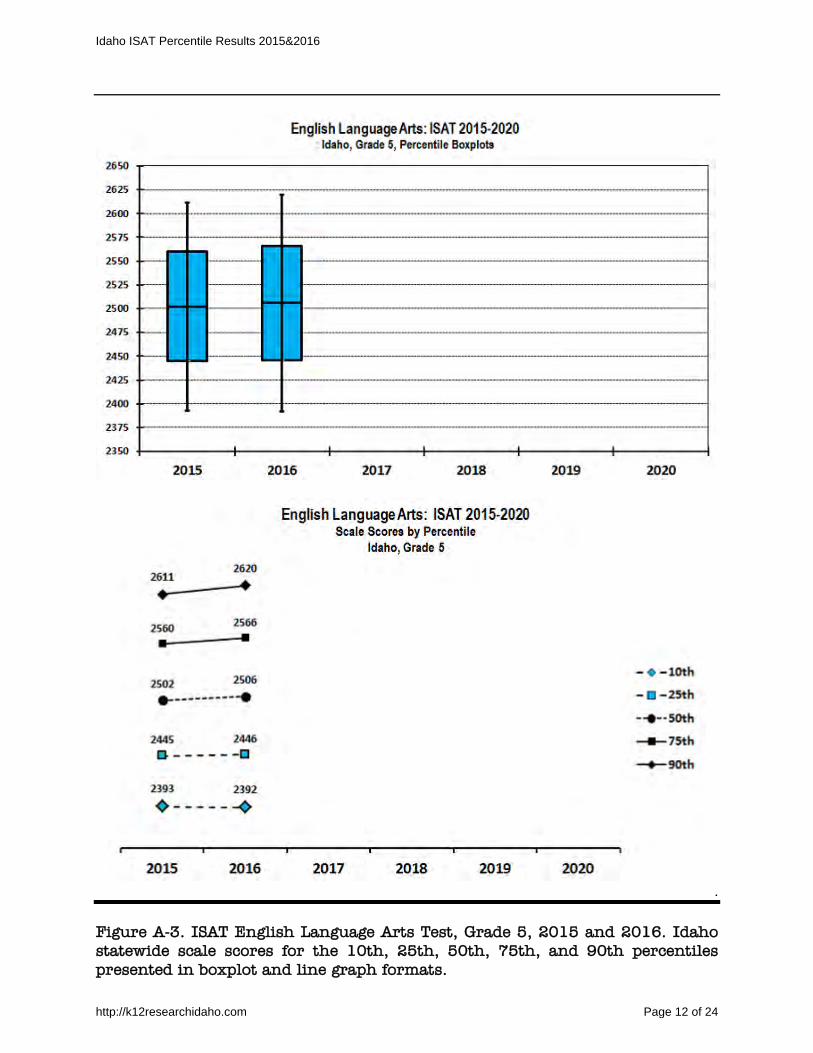
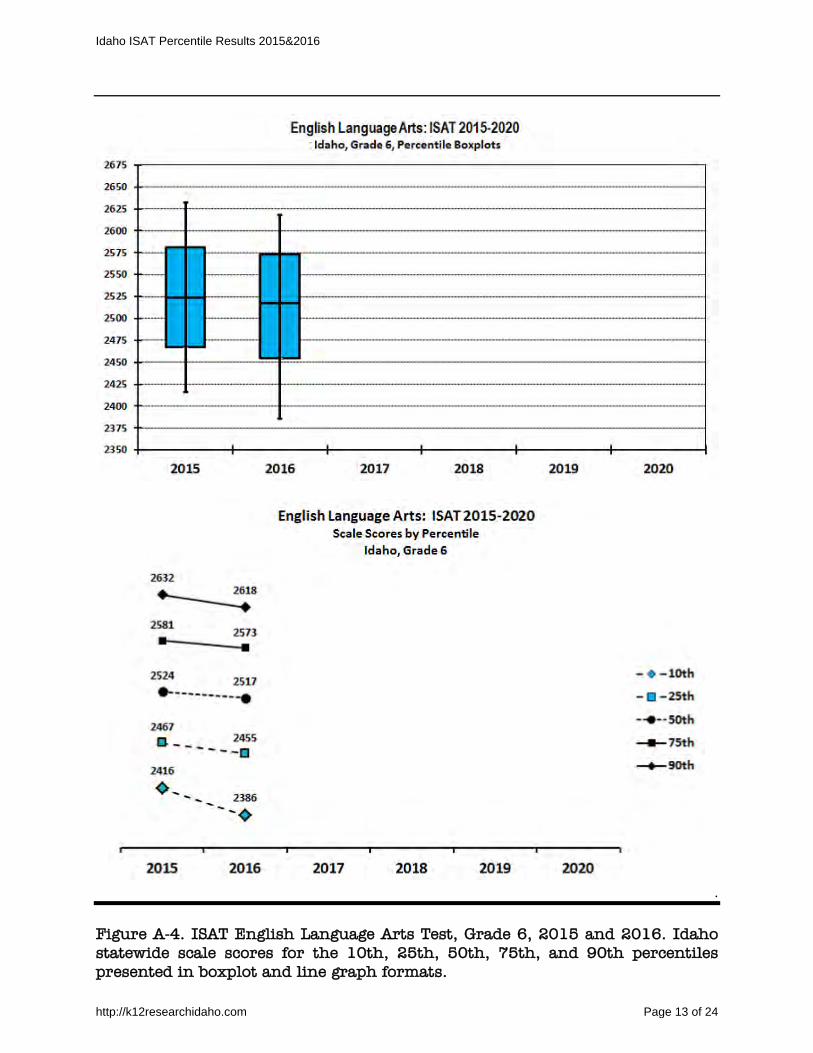
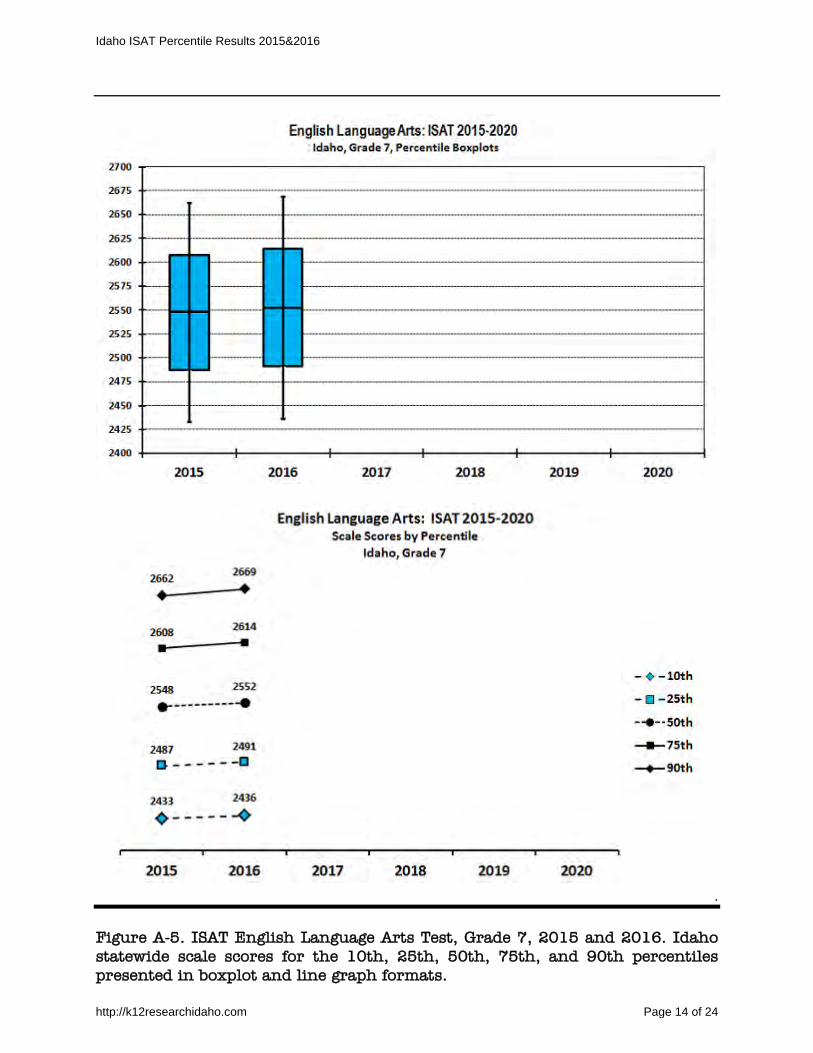
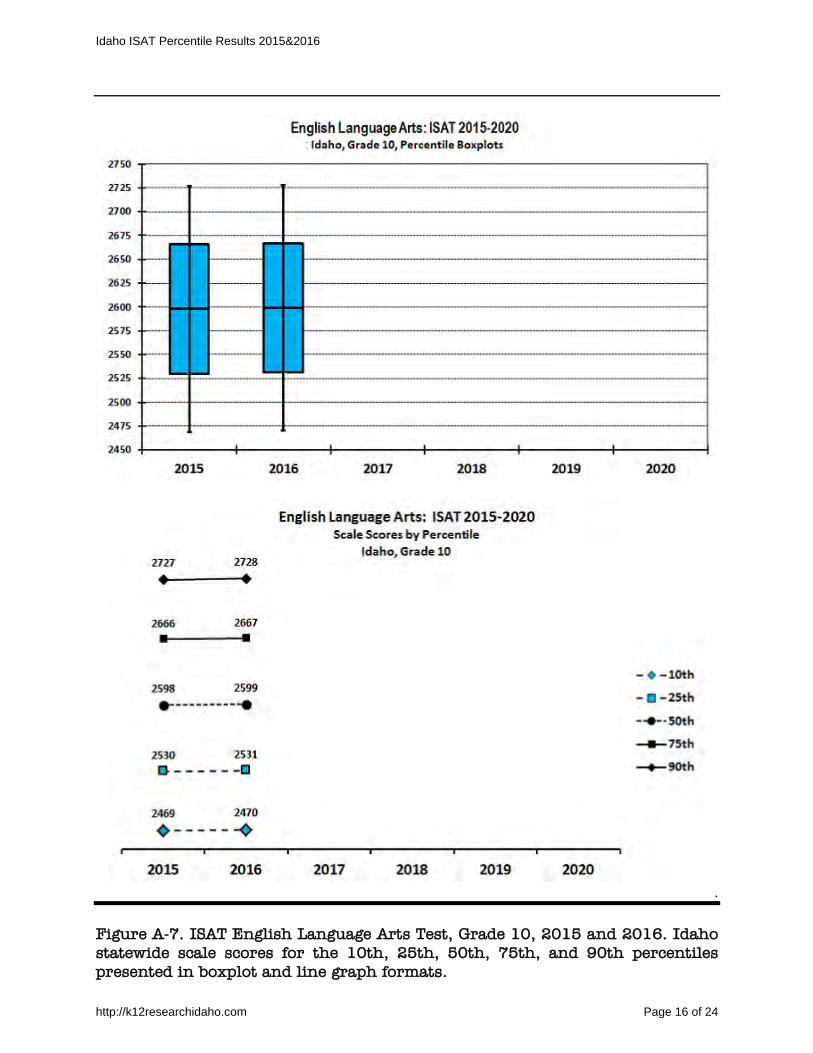
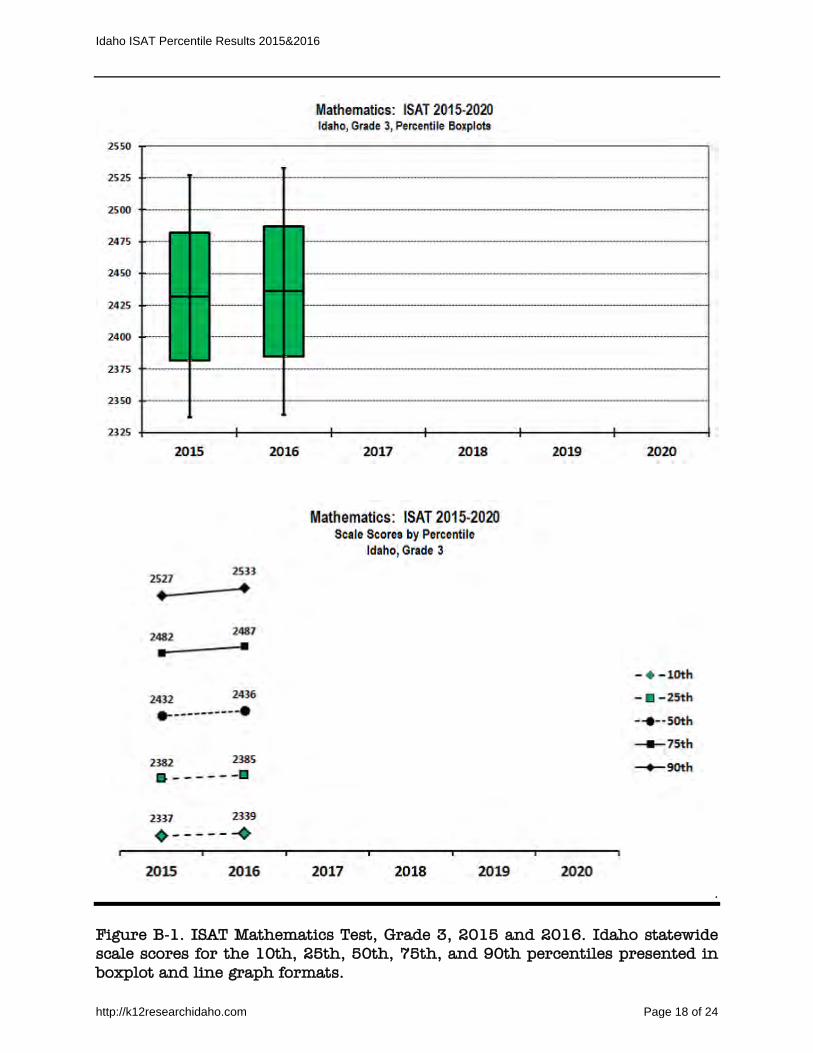
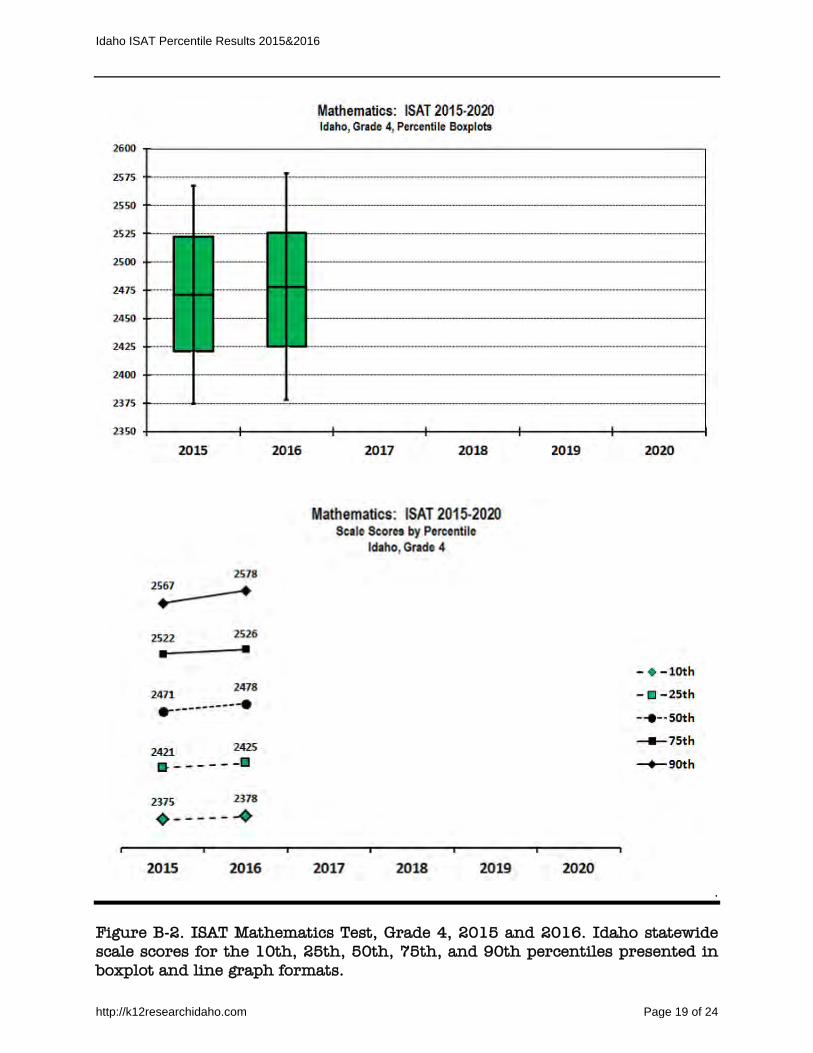
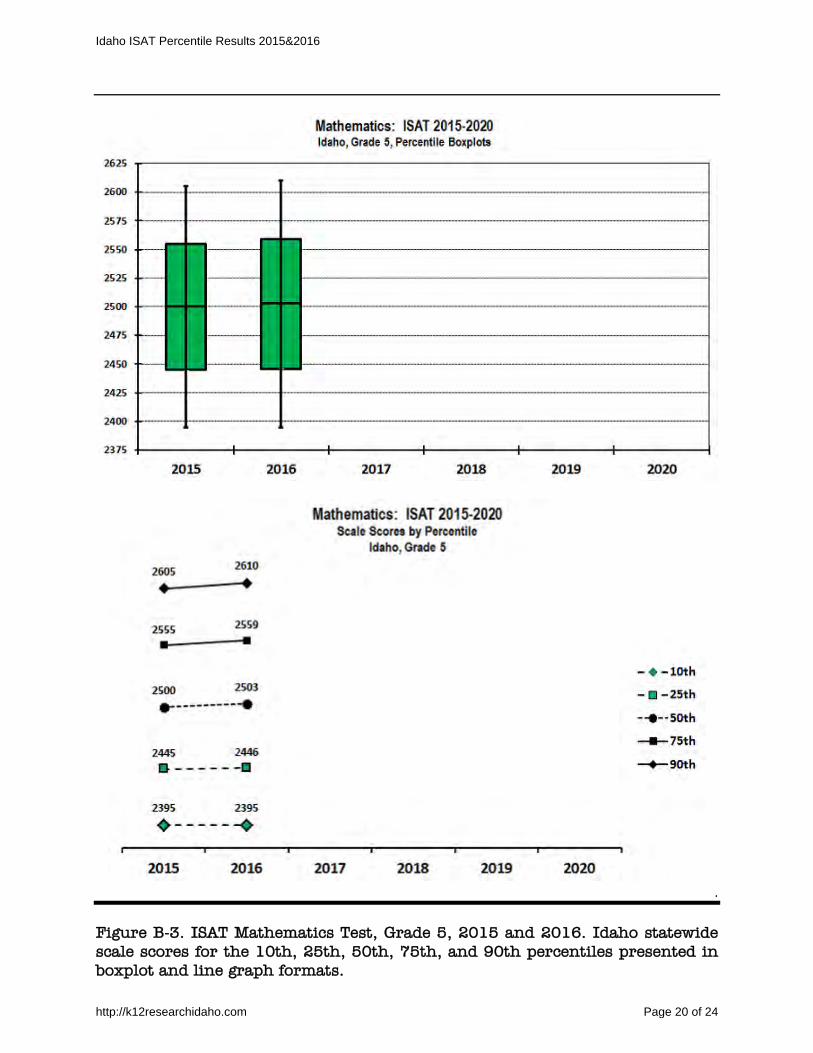
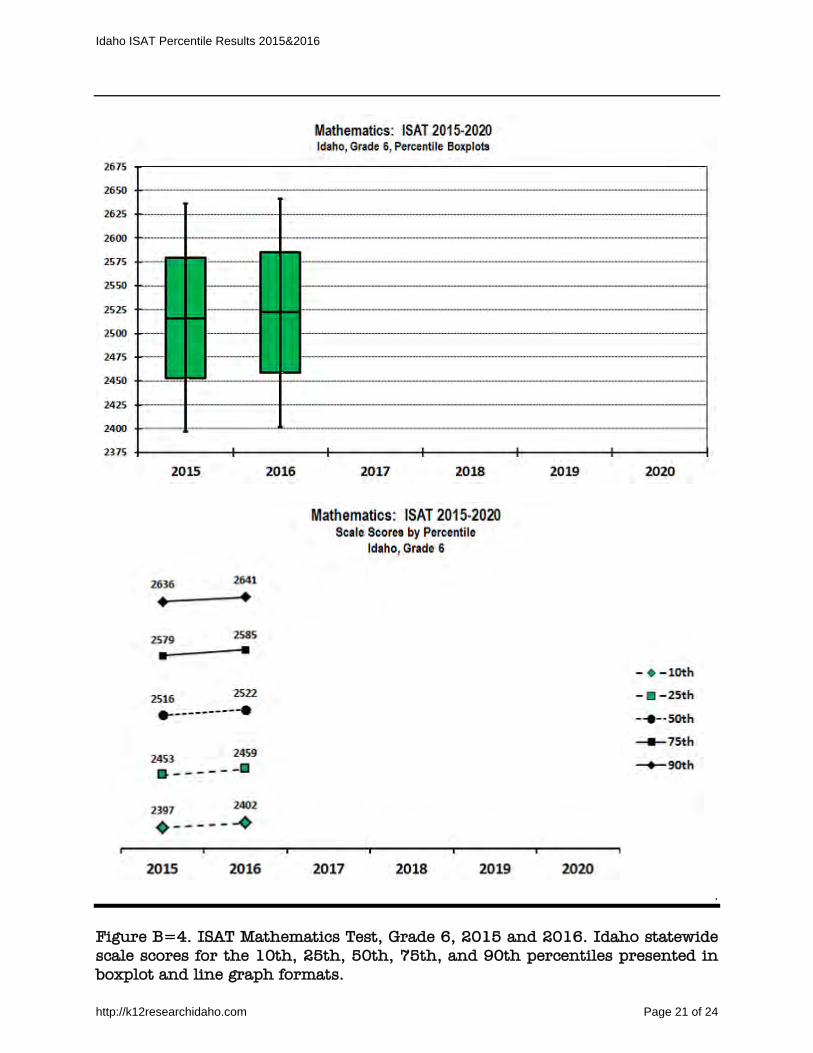
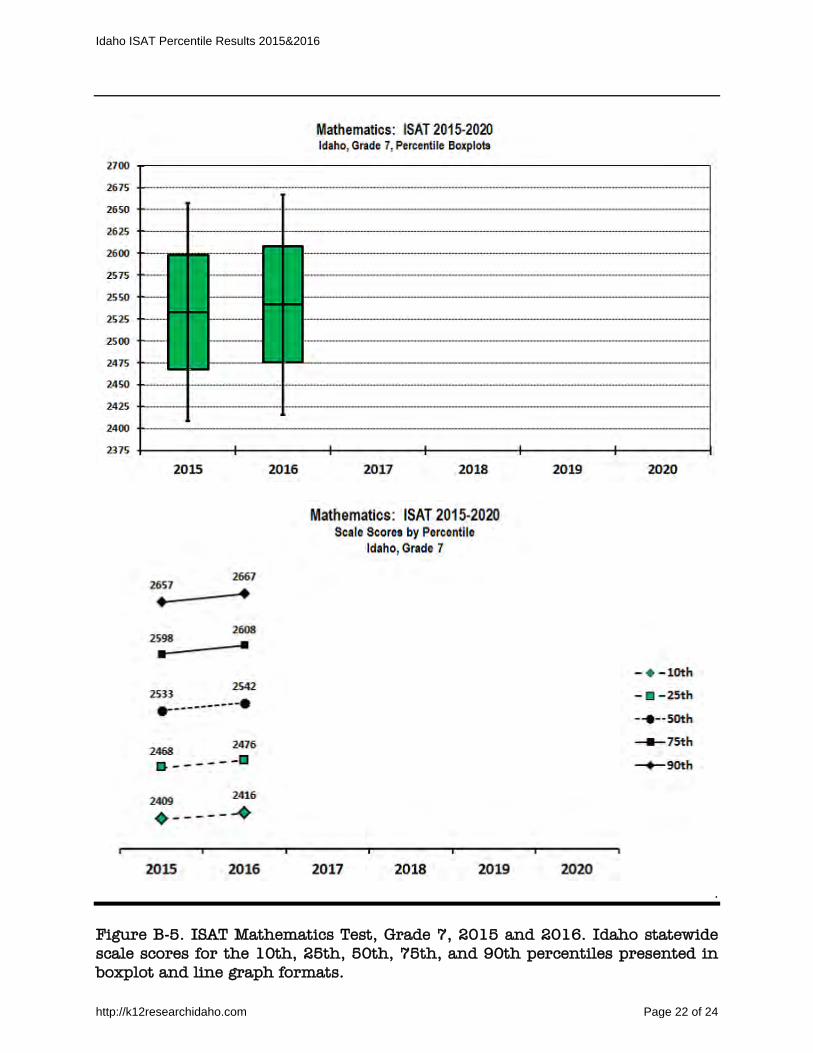
The figure for each grade-subject (third grade English Language Arts, eighth grade Mathematics, etc.) displays both the boxplot and the line graph for the ISAT 2015 and 2016 statewide percentiles. English Language Arts. The percentiles for the 2015 and 2016 ISAT English Language Arts tests are in Figures A-1 through Figure A-7 in Appendix A. Figure A-1 displays third grade results, Figure A-2 displays fourth grade results, etc. Fourth graders had the best percentile performance in English Language Arts with students at all five percentiles posting a gain from 2015 to 2016 (see Figure A-2). Sixth graders did not do well in English Language Arts; sixth graders at all five percentiles posted a loss (see Figure A-4). Mathematics. The percentiles for the 2015 and 2016 ISAT Mathematics tests are in Figures B-1 through Figure B-7 in Appendix B. Figure B-1 displays third grade results, Figure B-2 displays fourth grade results, etc. Seventh graders had the best percentile performance in Mathematics with students at all five percentiles posting a gain from 2015 to 2016 (see Figure B-5). In Mathematics, fifth graders at the 25th, 50th, 75th and 90th percentiles posted a gain between 2015 and 2016, but posted a loss at the 10th percentile (see Figure B-3). DISCUSSION Percent Proficient. Each year Idaho spends a considerable sum to administer and score the Idaho Standards Achievement Tests. A search for ISAT results on the State Department of Education and the State Board of Education website yielded some information about the test itself and the administration logistics that districts must follow, but there were little to no English and mathematics results to find. IdEdNews.org (2016), and an EdWeek blog (Ujifusa, 2015) displayed limited ISAT results, but only as “percent proficient” statistics. Percent proficient scores are a measurement and accountability nightmare. They are achievement level (performance level) scores. There has been a decade long orchestrated political campaign by school “reformers” to force higher performance standards on the states, to bring them in line with the NAEP performance standards. ISAT/SBAC standards do approach the NAEP standards, especially in mathematics. This political (i.e., non-psychometric) campaign has two major problems. The first problem is that there is little to no relationship (i.e., correlation) between the rigor of a state’s performance standard and student achievement in the state (Stoneberg, 2015). The focus must be on student achievement, not on the rigor of the standard.
Idaho ISAT Percentile Results 2015&2016
http://k12researchidaho.com Page 6 of 24
The second problem with percent proficient scores can be best illustrated by reference to NAEP’s achievement levels. Federal law requires that NAEP achievement levels shall be used only on a trial basis until the Commissioner for Education Statistics determines, as a result of an evaluation that such levels are reasonable, valid, and informative to the public. (National Assessment Governing Board, 2002). None of the congressionally mandated evaluations of NAEP to date has found achievement levels to be “reasonable, valid, and informative to the public” and no Commissioner has declared NAEP achievement levels to be “reasonable, valid and informative to the public.” It is nonsense to make accountability decisions about educational programs and student achievement based on “trial data.” Percentiles. This study was initiated to determine whether ISAT percentiles could provide data to Idaho government officials, educators, parents and patrons about changes in statewide student achievement that are reasonable, valid and informative. The author suggests analysis presented in this paper indeed has established that looking at percentiles, a time-proven methodology, can provide useful ISAT information for individuals interested in student achievement in Idaho’s public schools. Information that is not available in an ESSA accountability model focused solely on “percent proficient.” Some districts in Idaho, perhaps some schools, might appreciate similar percentile results for their students. The percentiles used in this paper, however, are state level data. State percentiles cannot be used to report district or school percentile results. A district or school percentiles can look very different than the state. A complete, separate, set of percentile data (similar to Table 1) would have to be prepared for each district or school. Only a handful of Idaho school districts and charter districts have staff with the skills and time to generate the percentiles and to display them is tabular and graphic format. The State Board of Education or the State Department of Education could come to their aid by annually calculating “eight statistics” for each district, and for each school, namely the number of students, the mean (i.e., average), the standard deviation, and the 10th, 25th, 50th, 75th, and 90th percentiles. The state could also provide templates for graphing the district or school percentiles over time. After the major one-time effort to develop software to calculate the “eight statistics” and to prepare graphing templates, the state’s annual preparation and distribution of these ISAT statistics could become routine.
# # #
Idaho ISAT Percentile Results 2015&2016
http://k12researchidaho.com Page 7 of 24
References IdEdNews.org. (2016), Explore and Compare: Data about Public Schools in Idaho. Retrieved July 23, 2016, from http://www.idahoedtrends.org Learning Point Associates. (2009, August). Connecting Research to Practice: Knowing Who Is Proficient Isn't Always Sufficient. Retrieved July 14, 2016, from http://files.eric.ed.gov/fulltext/ED509965.pdf National Assessment Governing Board. (2002). National Assessment of Educational Progress Authorization Act (P.L. 107–279, Section 303). Available online: https://www.nagb.org/naep/naep-law.html Stoneberg, B.D. (2015, August). The relationship between the rigor of a state's proficiency standard and student achievement in the state. Available online: http://files.eric.ed.gov/fulltext/ED558198.pdf Stoneberg, B.D. (2015, September). Scale Score to Percentile Rank Conversion Tables for the 2015 Idaho Standards Achievement Tests. Retrieved July 19, 2016, from http://k12researchidaho.com/pdf/isat2015percentileranks.pdf Stoneberg, B.D. (2016, July). Scale Score to Percentile Rank Conversion Tables for the 2016 Idaho Standards Achievement Tests. Retrieved July 19, 2016, from http://k12researchidaho.com/pdf/isat2016percentileranks.pdf Ujifusa, A. (2015, July 2). Idaho Smarter Balanced Test Scores Largely Beat State's Projections. Retrieved July 23, 2016, from http://blogs.edweek.org/edweek/state_edwatch/2015%20ISAT%20SBAC%20Projected%20vs%20Actual%20Preliminary%20Performance%20at%20Level%20-%207.1.2015.xlsx
Idaho ISAT Percentile Results 2015&2016
http://k12researchidaho.com Page 8 of 24
APPENDIX A ISAT English Language Arts 2015 and 2016
Idaho statewide scale scores at the 10th, 25th, 50th, 75th, and 90th percentiles
Boxplot and line graph by grade
Table A-1: Grade 3 Table A-2: Grade 4 Table A-3: Grade 5 Table A-4: Grade 6 Table A-5: Grade 7 Table A-6: Grade 8 Table A-7: Grade 10
Idaho ISAT Percentile Results 2015&2016
http://k12researchidaho.com Page 9 of 24
.
Figure A-1. ISAT English Language Arts Test, Grade 3, 2015 and 2016. Idaho statewide scale scores for the 10th, 25th, 50th, 75th, and 90th percentiles presented in boxplot and line graph formats.
Idaho ISAT Percentile Results 2015&2016
http://k12researchidaho.com Page 10 of 24
.
Figure A-2. ISAT English Language Arts Test, Grade 4, 2015 and 2016. Idaho statewide scale scores for the 10th, 25th, 50th, 75th, and 90th percentiles presented in boxplot and line graph formats.
Idaho ISAT Percentile Results 2015&2016
http://k12researchidaho.com Page 11 of 24
.
Figure A-3. ISAT English Language Arts Test, Grade 5, 2015 and 2016. Idaho statewide scale scores for the 10th, 25th, 50th, 75th, and 90th percentiles presented in boxplot and line graph formats.
Idaho ISAT Percentile Results 2015&2016
http://k12researchidaho.com Page 12 of 24
.
Figure A-4. ISAT English Language Arts Test, Grade 6, 2015 and 2016. Idaho statewide scale scores for the 10th, 25th, 50th, 75th, and 90th percentiles presented in boxplot and line graph formats.
Idaho ISAT Percentile Results 2015&2016
http://k12researchidaho.com Page 13 of 24
.
Figure A-5. ISAT English Language Arts Test, Grade 7, 2015 and 2016. Idaho statewide scale scores for the 10th, 25th, 50th, 75th, and 90th percentiles presented in boxplot and line graph formats.
Idaho ISAT Percentile Results 2015&2016
http://k12researchidaho.com Page 14 of 24

.
Figure A-6. ISAT English Language Arts Test, Grade 8, 2015 and 2016. Idaho statewide scale scores for the 10th, 25th, 50th, 75th, and 90th percentiles presented in boxplot and line graph formats.
Idaho ISAT Percentile Results 2015&2016
http://k12researchidaho.com Page 15 of 24
.
Figure A-7. ISAT English Language Arts Test, Grade 10, 2015 and 2016. Idaho statewide scale scores for the 10th, 25th, 50th, 75th, and 90th percentiles presented in boxplot and line graph formats.
Idaho ISAT Percentile Results 2015&2016
http://k12researchidaho.com Page 16 of 24
APPENDIX B ISAT Mathematics 2015 and 2016
Idaho statewide scale scores at the 10th, 25th, 50th, 75th, and 90th percentiles
Boxplot and line graph by grade
Table B-1: Grade 3 Table B-2: Grade 4 Table B-3: Grade 5 Table B-4: Grade 6 Table B-5: Grade 7 Table B-6: Grade 8 Table B-7: Grade 10
Idaho ISAT Percentile Results 2015&2016
http://k12researchidaho.com Page 17 of 24
.
Figure B-1. ISAT Mathematics Test, Grade 3, 2015 and 2016. Idaho statewide scale scores for the 10th, 25th, 50th, 75th, and 90th percentiles presented in boxplot and line graph formats.
Idaho ISAT Percentile Results 2015&2016
http://k12researchidaho.com Page 18 of 24
.
Figure B-2. ISAT Mathematics Test, Grade 4, 2015 and 2016. Idaho statewide scale scores for the 10th, 25th, 50th, 75th, and 90th percentiles presented in boxplot and line graph formats.
Idaho ISAT Percentile Results 2015&2016
http://k12researchidaho.com Page 19 of 24
.
Figure B-3. ISAT Mathematics Test, Grade 5, 2015 and 2016. Idaho statewide scale scores for the 10th, 25th, 50th, 75th, and 90th percentiles presented in boxplot and line graph formats.
Idaho ISAT Percentile Results 2015&2016
http://k12researchidaho.com Page 20 of 24
.
Figure B=4. ISAT Mathematics Test, Grade 6, 2015 and 2016. Idaho statewide scale scores for the 10th, 25th, 50th, 75th, and 90th percentiles presented in boxplot and line graph formats.
Idaho ISAT Percentile Results 2015&2016
http://k12researchidaho.com Page 21 of 24
.
Figure B-5. ISAT Mathematics Test, Grade 7, 2015 and 2016. Idaho statewide scale scores for the 10th, 25th, 50th, 75th, and 90th percentiles presented in boxplot and line graph formats.
Idaho ISAT Percentile Results 2015&2016
http://k12researchidaho.com Page 22 of 24
.
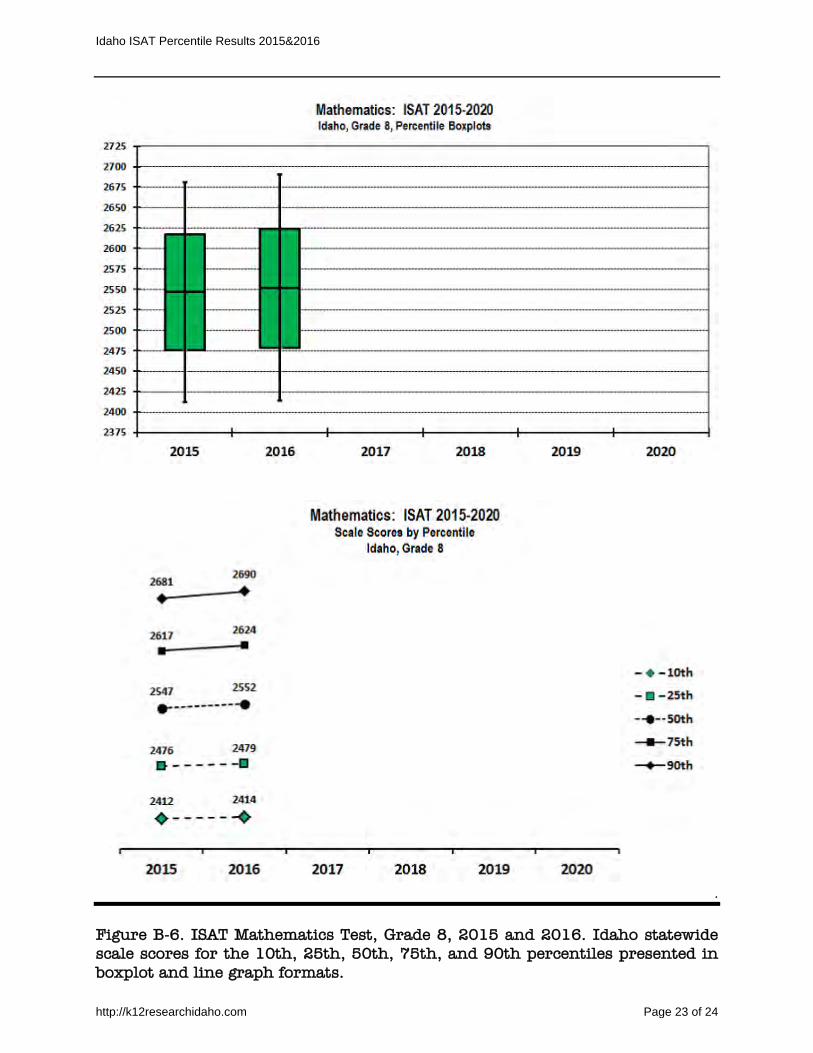
Figure B-6. ISAT Mathematics Test, Grade 8, 2015 and 2016. Idaho statewide scale scores for the 10th, 25th, 50th, 75th, and 90th percentiles presented in boxplot and line graph formats.
Idaho ISAT Percentile Results 2015&2016
http://k12researchidaho.com Page 23 of 24

.
Figure B-7. ISAT Mathematics Test, Grade 10, 2015 and 2016. Idaho statewide scale scores for the 10th, 25th, 50th, 75th, and 90th percentiles presented in boxplot and line graph formats.
Idaho ISAT Percentile Results 2015&2016
http://k12researchidaho.com Page 24 of 24