2022annual report.pdf - Idaho Public Utilities Commission
217
AVISTA UTILITIES SELECTED RESEARCH AND DEVELOPMENT EFFICENCY PROJECTS - IDAHO Annual Report November 5, 2021 AVU-E RECEIVED 2022 FEB 09 PM 3:42 IDAHO PUBLIC UTILITIES COMMISSION
-
Upload
khangminh22 -
Category
Documents
-
view
0 -
download
0
Transcript of 2022annual report.pdf - Idaho Public Utilities Commission

AVISTA UTILITIES
SELECTED RESEARCH AND DEVELOPMENT EFFICENCY PROJECTS - IDAHO
Annual Report
November 5, 2021
AVU-E
RECEIVED
2022 FEB 09 PM 3:42
IDAHO PUBLIC UTILITIES COMMISSION

Avista Research and Development Projects Annual Report November 5, 2021
THE FOLLOWING REPORT WAS
PREPARED IN CONFORMANCE WITH
IDAHO PUBLIC UTILITIES COMMISSION (IPUC)
CASE NO. AVU-E-13-08
ORDER NO. 32918
November 5, 2021

Avista Research and Development Projects Annual Report November 5, 2021
ANNUAL REPORT SELECTED RESEARCH AND DEVELOPMENT EFFICENCY PROJECTS
IPUC CASE NO. 32918
TABLE OF CONTENTS
I. SCOPE OF WORK ............................................................................................................................ 1 A. Introduction ....................................................................................................................................... 1 B. Background ....................................................................................................................................... 1
II. KEY EVENTS ..................................................................................................................................... 1 A. Request for Proposal ....................................................................................................................... 1 B. Selection of Projects ........................................................................................................................ 3 C. Description of Selected Projects .................................................................................................... 4 D. Project Manager and Related Communications .......................................................................... 5 E. Agreements ....................................................................................................................................... 5 F. Project Milestones ............................................................................................................................ 6
III. ACCOUNTING ................................................................................................................................... 8 A. Schedule 91 Available Funds ......................................................................................................... 8 B. Funds Authorized for R&D Projects in 2020/2021 ...................................................................... 8 C. Funds Expended and Remaining Balance ................................................................................... 9 D. Cost-Recovery .................................................................................................................................. 9
IV. PROJECT BENEFITS ....................................................................................................................... 9 A. Gamification of Energy Use Feedback Phase II .......................................................................... 9 B. Energy Trading Phase III .............................................................................................................. 10 C. Automating Predictive Maintenance for Energy Efficiency ...................................................... 10
V. RESEARCH IN-PROGRESS ......................................................................................................... 10
LIST OF APPENDICES
APPENDIX A Two-Page Reports from FY 20-21
APPENDIX B Request for Proposal
APPENDIX C University of Idaho Agreements
APPENDIX D Idaho State University Agreement
APPENDIX E Final Report: Gamification of Energy Use Feedback Phase II
APPENDIX F Final Report: Energy Trading System Phase III
APPENDIX G Final Report: Automating Predictive Maintenance for Energy Efficiency

Avista Research and Development Projects Annual Report November 5, 2021
THIS PAGE INTENTIONALLY LEFT BLANK

Avista Research and Development Projects Annual Report November 5, 2021
Page | 1
I. SCOPE OF WORK
This report is prepared in conformance with Idaho Public Utilities Commission (IPUC or Commission) Order No. 32918 in Case No. AVU-E-13-08; it includes key events during the reporting period and accounting for related expenditures. On August 30, 2013, Avista applied for an order authorizing it to accumulate and account for customer revenues that will provide funding for selected electric energy efficiency research and development (R&D) projects, proposed and implemented by the State of Idaho’s four-year Universities. On October 31, 2013, per Order No. 32918, the Commission granted Avista’s request, thereby allowing the Company to recover up to $300,000 annually from the Company’s Schedule 91 Energy Efficiency Rider tariff in support of these R&D efforts. This program provides a stable base of research and development funding, allowing research institutions to sustain quality research programs that benefit customers. It is also consistent with the former Idaho Governor’s Global Entrepreneurial Mission (IGEM) initiative in which industry would provide R&D funding to supplement funding provided by the State of Idaho.
In the 1990s, with the prospect of electric deregulation, utilities reduced or eliminated budgets that would increase costs not included by third-party marketers for sales of power to end-users. R&D was one of those costs. This has led to the utility industry having the lowest R&D share of net sales among all US industries.
In 2010, the former Governor announced Idaho would support university research as a policy initiative with some funding provided by the state and supplemental funding expected from other sources. This project provides additional funding to selected research. For Order No. 32318, R&D is defined as applied research and development that could yield benefits to customers in the next one to four years.
II. KEY EVENTS
The Request for Proposal (RFP) for projects funded in the 2020/2021 academic year was prepared and distributed to three Idaho Universities in March 2020. A full copy of the RFP is included in Appendix B.

Avista Research and Development Projects Annual Report November 5, 2021
Page | 2
On May 18, 2020, Avista received 10 proposals from the University of Idaho, one proposal from Boise State University, and one proposal from Idaho State University. Following is a list of the proposals received:

Avista Research and Development Projects Annual Report November 5, 2021
Page | 3
University of Idaho 1. Evaluating the Effects of Energy Storage and Real-Time Demand Response
within an Enhanced Avista® Energy Trading Platform Prototype - Selected 2. A Low-cost and Rechargeable Iron-air Battery for Power Buffering 3. Energy Microgrid Project 4. Microload Monitoring 5. Robust Energy Efficient Hybrid-Aerogel Window Frames for Residential
Buildings’ Envelopes: Impact on Avista Customers 6. Smart Asset Management for Avista System 7. Gamification of Energy Use Feedback-2 - Selected 8. Evaluation of Nanotechnology Coatings as Thermal Insulators for Buildings
and Windows 9. Bringing the IR Thermostat to Market Readiness – Phase III 10. New Energy Saving Strategy: A Novel and Low-cost Air Circulation System
to Mitigate Thermal Stratification in Residential Buildings Boise State University
11. Alternative Load Modeling Techniques for the Evaluation of Distribution Energy Savings in CVR Applications
Idaho State University 12. Automating Predictive Maintenance for Energy Efficiency via Machine
Learning and IoT Sensors – Selected
Avista prepared an evaluation matrix for the 12 proposed projects. A team of individuals representing Distribution, Transmission Planning, Generation and Demand Side Management, co-filled out the matrix to rank each of the projects. The following criteria, in no particular order, were considered in the ranking process.
• Research Areas Already Being Done (EPRI, WSU, AVA) Complement/Redundant/New
• Potential Value to Customers kwh/KW/$ (1-10)
• CO2 Emission Reduction (Y/N)
• Market Potential (1-10)
• Are Results Measurable (Y/N)
• Aligned with Avista Business Functions (Y/N)
• New or Novel (Y/N)
• Ranking (1 -10)

Avista Research and Development Projects Annual Report November 5, 2021
Page | 4
Following is a brief description of each of the three selected projects from the 2020/2021 academic year. Project teams compiled “Two-Page Reports” which summarized and highlighted project details. These Two-Page Reports are included in Appendix A. Additional details are included in the final project reports in Appendix E, Appendix F, and Appendix G. Gamification of Energy Use Feedback Phase II This project was Phase 2 in the development of a program designed to motivate residential energy customers to reduce, or become more efficient, in their energy usage. Customer data from Avista indicates that customers are typically not paying attention to usage data, and this was confirmed by our own test subjects. Awareness of performance, i.e., performance feedback, is essential to understanding the relationship between actions and outcomes. Gamification, the use of the entertaining aspects of games to produce behavior change, was proposed as a tool to encourage attention to usage information. The team proposed two levels of gameplay. First, brief “little games” to attract customers to view their usage data. Second, and obviously more important, the “Big Game”, in which the goal was to have customers, once aware of their usage, take action to lower their energy “score”. In Phase 1, the team explored ways of trying to enhance the attraction potential of the Little Games by tying usage to them as game components, and began user testing the games and that capability. In Phase 2, the team continued game development and added a third game. They highlighted the notion that the games themselves can serve different purposes and have different relationships with usage data. In Phase 1, the team saw potential in developing a game interface, or Dashboard, that would link the little and Big Games together, but could serve several other purposes as well. In particular, it could serve as a home base for accessing actions to complete the feedback loop in the Big Game. In Phase 2, they explored the potential of the Dashboard, investigated Dashboard best practices, and created a working mockup. The team linked both game levels to the mockup, and made usage data a very salient feature, a feature that made access to the detailed usage page in customer’s accounts simple and quick. Then, rather than creating a list of Big Game actions on the Dashboard, the actions were consolidated into an energy Self Audit. The Dashboard display for the audit showed how much of the audit was complete and, with a click, revealed tasks that needed attention. Deeper exploration with the Self Audit could take customers to useful and informative places within the Avista site. The audit itself could be tailored to customers’ housing circumstances and values to further encourage attention. The team user-tested the little games with individual participants and tested the overall system with Focus Groups. The results of that testing indicated that (1) the little games were attractants to a segment of the customer base (i.e., not to all), (2) the information about usage integrated into the games was discoverable and useful,

Avista Research and Development Projects Annual Report November 5, 2021
Page | 5
(3) participants in the groups were motivated to pay closer attention to their usage and were drawn to the Big Game. Finally, the Self Audit, though not originally a subject of the investigation, emerged as a very popular potential tool. Energy Trading System Phase III The team developed a prototype software system with the objectives of supporting the creation and management of a market that enables prosumers and consumers to trade electric power between themselves or with the utility, with utility oversight. This prototype software system supports creating and managing electric power transaction agreements between prosumers, integrating power flow analysis, and calculating distribution locational marginal prices (DLMP) and demand response. The proposed prototype enables the study of approaches to create a transactive energy market while ensuring a feasible, secure, and economical distribution grid operation. Automating Predictive Maintenance for Energy Efficiency
The arise of maintenance issues in mechanical systems is cause for decreased energy efficiency and higher operating costs for many small- to medium-sized businesses. The sooner such issues can be identified and addressed, the greater the energy savings. The team designed and implemented an automated predictive maintenance system that uses machine learning models to predict maintenance needs from data collected via data sensors attached to mechanical systems. As a proof of concept, we demonstrate the effectiveness of the system by predicting several operating states for a standard clothes dryer.
On September 26, 2014, Avista entered into an agreement with T-O Engineers, hired as an independent third-party Project Manager responsible for the oversight of Avista’s R&D efforts. T-O Engineers is an engineering consulting company based in Idaho, with offices in Boise, Coeur d’Alene, Meridian and Nampa, Idaho, as well as Cody, Wyoming; Cheyenne, Wyoming; Heber City, Utah; and Spokane, Washington. T-O is tasked with providing project management, organizational structure, milestone setup, milestone tracking, and incidental administrative services. The Project Manager for T-O Engineers is JR Norvell, PE and the Deputy Project Manager is Natasha Jostad, PE. JR and Natasha are based out of the Coeur d’Alene and Spokane offices, respectively.
By August 2020 Avista executed individual task orders for each of the University of Idaho and Idaho State University research projects selected. The agreements are included in Appendix C and D, respectively.

Avista Research and Development Projects Annual Report November 5, 2021
Page | 6
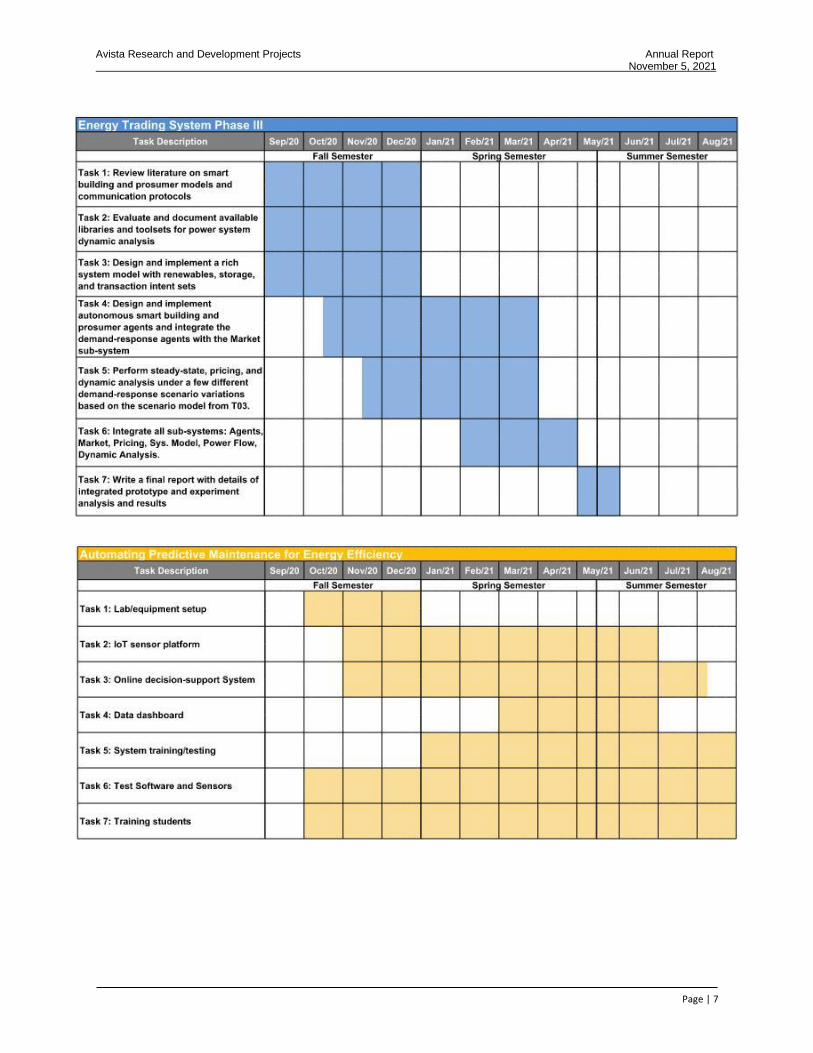
The following graphics identify the overall research and development milestones, as well as the milestones for each project. Final reports from each Principal Investigator were submitted in the fall of 2021. In addition to the written final report, each research team presented their findings to Avista via web conference, as the COVID-19 pandemic did not permit in-person presentations. The Energy Trading System team presented their findings to Avista on May 20, 2021. The Gamification of Energy Use Feedback team presented on August 18, 2021, and the Predictive Maintenance team presented on August 27, 2021.
Avista Research and Development Projects Annual Report November 5, 2021
Page | 7

Avista Research and Development Projects Annual Report November 5, 2021
Page | 8
III. ACCOUNTING
Pursuant to Order No. 32918, beginning November 1, 2013, Avista was allowed to fund up to $300,000 per year of R&D from revenue collected through Avista’s Schedule 91, Energy Efficiency Rider tariff. At the end of each year, any monies not allocated toward payment on R&D projects roll over as available resources for the next year. A summary of these R&D balances are shown in the table below, reported by academic year (September-September).
Academic Year
New Funding
Balance from
Previous Year
Total Funds
Available
Contracted Amount
Actual Expenditures
Balance
2014/2015 $300,000.00 $0.00 $300,000.00 $287,941.00 $243,467.32 $56,532.68
2015/2016 $300,000.00 $56,532.68 $356,532.68 $252,493.00 $235,809.03 $120,723.65
2016/2017 $300,000.00 $120,723.65 $420,723.65 $372,665.16 $358,641.82 $62,081.83
2017/2018 $300,000.00 $62,081.83 $362,081.83 $317,074.89 $313,757.29 $48,324.54
2018/2019 $300,000.00 $48,324.54 $348,324.54 $299,463.00 $265,826.86 $82,497.68
2019/2020 $300,000.00 $82,497.68 $382,497.68 $287,400.00 $267,519.42 $114,978.26
2020/2021 $300,000.00 $114,978.26 $414,978.26 $252,622.00 $225,512.39 $189,465.87
Contracts for 2020/2021 are as follows:
Agency Project Contract Amount
Point of Contact
University of Idaho Gamification of Energy Use Phase II
$ 63,483.00 Richard Reardon
University of Idaho Energy Trading Phase III $ 77,027.00 Dr. Yacine Chakhchoukh
Idaho State University Automating Predictive Maintenance for Energy Efficiency
$ 82,112.00 Dr. Paul Bodily
T-O Engineers Project Manager $ 30,000.00 Natasha Jostad
Total $ 252,622.00

Avista Research and Development Projects Annual Report November 5, 2021
Page | 9
Following is the final budget summary for 2020/2021 FY R&D Projects.
Agency Project Contract Amount
Total Expended
Budget Remaining
University of Idaho Gamification of Energy Use Phase II
$ 63,483.00 $ 55,985.87 $ 7,497.13
University of Idaho Energy Trading Phase III $ 77,027.00 $ 77,027.00 $ 0
Idaho State University
Automating Predictive Maintenance for Energy Efficiency
$ 82,112.00 $ 69,747.02 $ 12,364.98
T-O Engineers Project Manager $ 30,000.00 $ 22,752.50 $ 7,247.50
Totals $ 252,622.00 $ 225,512.39 $ 27,109.61
The costs associated with R&D are funded from revenue collected through Avista’s Schedule 91 – Energy Efficiency Rider Adjustment. The outstanding balance was rolled over to the current year’s R&D budget, as seen in the table in Section III A. All R&D projects are invoiced on a time and materials basis with an amount not to exceed. The costs would be included in Avista’s annual tariff filing in June if the rider balance requires a true-up.
IV. PROJECT BENEFITS
Gamification is the use of the entertaining aspects of games to motivate desired behaviors. With this project, the team proposed gamification as a means to motivate customers to pay closer attention to their energy usage. Data on such usage is now commonly available through their online accounts. If customers pay closer attention, and have readily available actions, then they can engage in conservation behavior, thus completing a feedback loop: Attention to usage followed by a conservation action, then re-attention to usage data. The team suggests that there are two game levels. Brief, fun “little games” attract customers to their accounts where, they suggest, usage data is made salient. Thus aware, customers can choose actions that reduce usage, then they can check on the outcome of those efforts. They are now playing the “Big Game” of “keep your usage score as low as possible”. The benefits of such a system are many: it takes advantage of information that is already available; it offers actions that can be taken in response to that information (actions that are often already detailed in the company’s web site); it is low cost (i.e., basically programming), and no hardware add-ons or specialized devices are needed; the actions offered to customers when they check their usage data can also be linked to other desirable activities within

Avista Research and Development Projects Annual Report November 5, 2021
Page | 10
the utility website (e.g., shopping for energy-saving appliances, viewing educational text and videos, getting guidance on how to hire a contractor for major efforts, and so on); and finally, the game interface, or Dashboard, can consolidate potential actions in the form of an energy Self Audit. The Self Audit is dynamic in that completions are tied to tasks, and it can be customized to cover not only basic concerns like filter replacement and insulation, but to concerns unique to customers’ values (e.g., donations, green energy programs, etc.).
The team developed a prototype software system with the objectives of supporting the
creation and management of a market that enables prosumers and consumers to
trade electric power between themselves or with the utility, with utility oversight. This
prototype software system supports the creation and management of electric power
transaction agreements between prosumers, integrating smart buildings and demand
response, power flow analysis and calculating distribution locational marginal prices
(DLMP). The proposed prototype shows the possibility for smart buildings and
consumers to save on their costs of operation by deferring and rescheduling their
consumption in time and ratepayers benefit from actively participating in the market
by selling their PV-generated electricity back to the grid.
The value of the research conducted is that by developing an IoT-platform of sensors connected to a smart, cloud decision system, predictive maintenance needs can be detected and assessed in real-time. The system is able to alert maintenance personnel in a timely manner in order to decrease expenses and energy usage resulting from prolonged periods of energy inefficiencies. The system is designed to identify issues across a spectrum of mechanical devices regardless of whether such issues are manifesting as unnecessary increases in energy usage or as decreased output per energy unit. The system is designed to be easy to install and affordable for use by small- to medium-sized businesses, which constitute the vast majority of businesses in the service region.
V. RESEARCH IN-PROGRESS
In its Final Order No. 35129 in Case Nos. AVU-E-20-13/AVU-G-20-08, the Commission stated the following regarding Avista’s R&D:
We agree that the intent of the program is to produce “near-term, practical benefits for Idaho ratepayers,” which the Company’s program has not done. Despite this, we find R&D is critical to continuing to provide reliable electric and natural gas services to customers in Idaho. We remain optimistic that the Company’s R&D program can deliver the
Avista Research and Development Projects Annual Report November 5, 2021
Page | 11
intended results. Instead of discontinuing the R&D program, we direct the Company to propose an updated R&D program that includes metrics and targets that can be met and monitored. We realize that R&D alone does not guarantee short- or long-term benefits, but we would like to see the Company prioritize results that can generate benefits for Idaho customers. The Company may continue the R&D it has already committed to funding, but before any additional R&D is funded—for which the Company will seek to recover as a prudently incurred expense from Idaho customers—we direct the Company to file a proposed updated R&D program that includes measurable targets and metrics.
In accordance with this IPUC directive, projects selected for FY 20-21 funding were completed in Fall 2021 and no additional research projects by the Universities are in-progress at this time. Instead, on September 9, 2021, Avista filed an application requesting authorization to use these allocated R&D funds to implement pilot programs for electric transportation (Case No. AVU-E-21-13). As this case is still ongoing, Avista anticipates that further R&D reporting will be handled within the confines of AVU-E-21-13 and will no longer be submitted in AVU-E-13-08.

Avista Corp. 1411 East Mission, P.O. Box 3727 Spokane, Washington 99220-0500 Telephone 509-489-0500 Toll Free 800-727-9170 Jan Noriyuki, Secretary Idaho Public Utilities Commission 11331 W. Chinden Blvd Building 8, Suite 201-A Boise, ID 83714 RE: Avista Utilities 2021 Annual Report Regarding Selected Research and Development
(R&D) Efficiency Projects Dear Ms. Noriyuki: Enclosed for filing with the Commission is an electronic copy of Avista Corporation’s dba Avista Utilities (“Avista or the Company”) Report on the Company’s selected electric energy efficiency research and development (R&D) projects, implemented by the state of Idaho’s four-year Universities. Please direct any questions regarding this report to Randy Gnaedinger at (509) 495-2047 or myself at 509-495-4584. Sincerely, /s/Paul Kimball Paul Kimball Manager of Compliance & Discovery Avista Utilities 509-495-4584 [email protected] Enclosure

APPENDIX ATwo-Page Reports from FY 20-21

Gamification of Energy Use Feedback- Phase 2Project Duration: 12 months Project Cost: Total Funding $63,483
OBJECTIVE
The objective of the project is to create and test a gamification system that will motivate utility customers to attend to their energy usage data. This attention turns energy usage into a feedback system in which usage is viewed as a performance problem. We assumed, and the literature suggests, that conservation is a generally held value. When given the opportunity to conserve, and information that tells them that they are, or are not conserving, people will act to conserve (sometimes called the “Prius Effect”). Feedback systems require available actions; our system offers those actions.
BUSINESS VALUEGamification is an inexpensive way to encourage conservation behaviors by stimulating greater attentiveness to energy use data. Moreover, in Phase 1 we discussed some side benefits; those are clearer now. Our system offers the opportunity to educate customers (through tips, videos, etc.) to make product recommendations, to direct self-audits, and to contribute to branding/marketing efforts. Side benefits can be nudged through the action sets offered.
INDUSTRY NEED
The needs we noted in Phase 1 are still pressing: There are increasing (and sometimes unpredictable) demands on energy, as well as increasing costs. A utility will benefit when customers monitor their energy usage more carefully and more often. As meter systems become “smarter”, information available to customers is already becoming more granular (both in terms of time intervals and, soon, in terms of individual appliances and devices)
and thus more actionable. With appropriate direction and motivation, we believe customers will take actions that lead to optimization of their usage. A highlight of our project is that customers will be explicitly aware of the benefits to themselves as well as the utility (and society as a whole).
BACKGROUND
In Phase 1, we sought information about previous attempts to use gamification in utility settings. These attempts tended to be unsuccessful, unsustainable, disappointing, or overly coercive. We have tried to avoid the issues that plagued those attempts while also learning from them. We conducted a survey in Phase 1 that helped us understand a number of matters, and we are incorporating what we have learned into this year’s efforts. For example, the games we are developing (and recommend for the future) are shorter and tend to fall into three categories: action games, puzzle games, and word games. This helped us streamline development, focusing only on whether the games were entertaining, and whether they invited repeated play. We learned that the strongest motivation for conservation is personal savings and, fortunately, that the appeal of personal savings did not overwhelm coexisting prosocial motivations (e,g., donations of savings to favored causes).
On the technical side, we advanced two game prototypes. Testing of these games indicated that they were enjoyable. Importantly, we were able to settle on a programming platform that would allow Avista to easily incorporate the games, and a controlling dashboard, into its existing web presence. Our survey suggested that smart phones will be the device

The information contained in this document is proprietary and confidential.
of choice for most customers. We will build our system around that device.
SCOPEMuch of the work this year involves user testing of the games, assessing the impact of the games on customer understanding of their usage, and identification of actions taken as a result. Guided by our outcomes in Phase 1, we have set the following tasks for 2020-21.
Task 1: --- In order to formally test users (customers), we completed the Human Subjects review process that is required by every university. Avista itself has customer privacy protections in place. We met both standards (the university review is complete and approval is in place).
Task 2: -- We need to identify a sample of customers that will agree to be tested. This will require access to the Avista Customer Experience system. We have a screening process in place for that moment when access is granted, and will identify a testing sample soon afterward.
Task 3: -- We will continue to user test the aesthetics and playability of the two games developed in Phase 1. As we add a third game, it too will be tested. This testing can be performed with samples of convenience and does not rely on access to the Avista Customer Experience System.
Task 4: Overall customer testing of the entire system will take place. A testing protocol will be developed. Our intent during Phase 1 was to conduct testing in person at an Avista facility. The pandemic has forced us to shift to online user testing. We are using remote testing software.
Task 5: A major function of research universities is to disseminate the results of the research. We committed to publication of what we learned about gaming, about incentives, about smart phone use (in our utility context) and other devices. These matters are likely of interest to others, but do not cover the essence of the gamification project.
DELIVERABLES
1) We will have three working game prototypes. We will have a dashboard gateway that shows usage data, and has links to the games and to an array of actions.
2) We will prepare a final report that details the results of formal user testing of the gamification system.
3) We will conduct a final review of relevant literature, including newer, or newly discovered, literature encountered since our Phase 1 report.
4) We will submit research reports to the professional literature on gamification and electronic commerce (with funding credit to Avista).
PROJECT TEAMPRINCIPAL INVESTIGATOR(S)
Name Richard Reardon, Ph.D.Organization University of Idaho, Dept. Psychology/CommContact # 208-292-2523Email [email protected] Julie Beeston, Ph.D.Organization University of Idaho, Dept. of Computer ScienceContact # 208-292-2671Email [email protected]
RESEARCH TEAM
Name Mary McInnis, B.S (ME), M.S. (Hum Factors)Organization Univ. of Idaho & Hum Factors ConsultantEmail [email protected] Jode Keehr, M.S., Ph.D.(candidate)Organization Univ. of Idaho, Psyc (Human Factors) Email [email protected] Kellen Probert, M.S., Ph.D. (candidate)Organization Univ. of Idaho, Psyc (Human Factors)Email [email protected] UI Students (2-3 to be named)Organization Univ. of Idaho, Dept. of Psychology Email tba
SCHEDULE
TASKTIME
ALLOCATEDSTART
DATE
FINISH
DATE
1. Human User Privacy Clearances 3 months 9/20 12/20
2. Identify User Testing Customer sample 3 months 12/20 3/21
3. Prototypes developed and tested 5 months 12/20 7/20
4. User testing of full system 5 months 2/21 5/21
5. Research reports 4 months 10/20 2/21
i
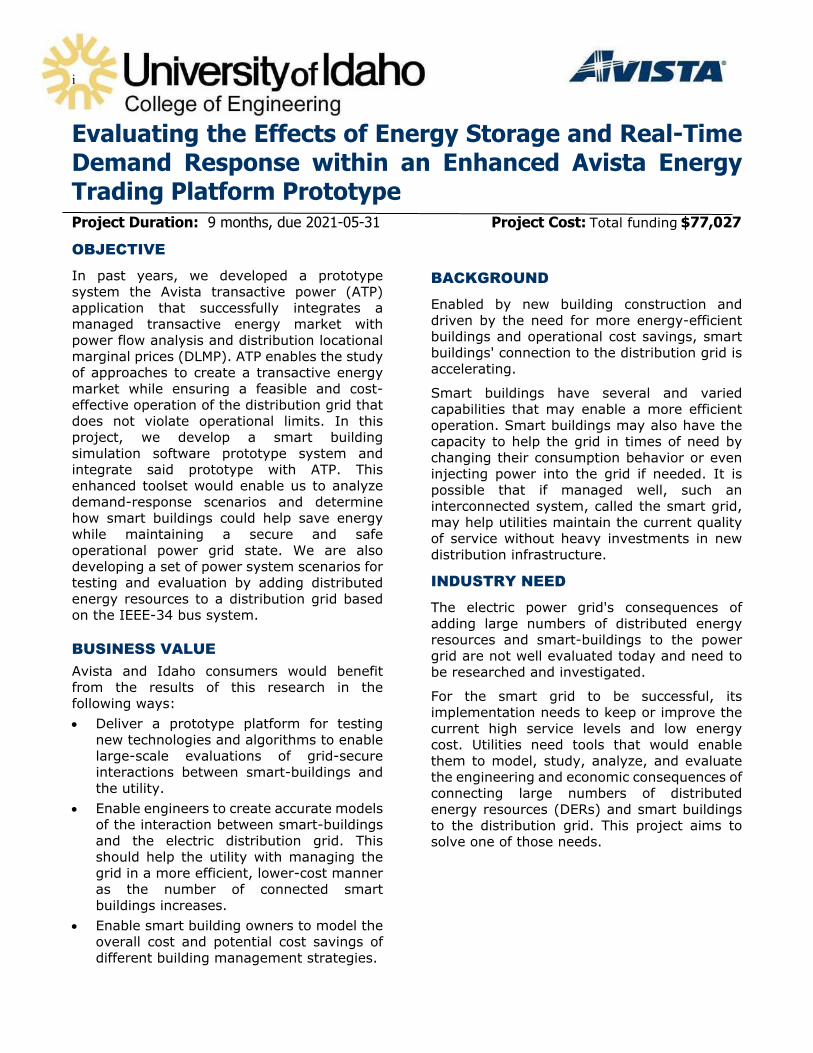
Evaluating the Effects of Energy Storage and Real-Time Demand Response within an Enhanced Avista Energy Trading Platform Prototype Project Duration: 9 months, due 2021-05-31 Project Cost: Total funding $77,027
OBJECTIVE
In past years, we developed a prototype system the Avista transactive power (ATP) application that successfully integrates a managed transactive energy market with power flow analysis and distribution locational marginal prices (DLMP). ATP enables the study of approaches to create a transactive energy market while ensuring a feasible and cost-effective operation of the distribution grid that does not violate operational limits. In this project, we develop a smart building simulation software prototype system and integrate said prototype with ATP. This enhanced toolset would enable us to analyze demand-response scenarios and determine how smart buildings could help save energy while maintaining a secure and safe operational power grid state. We are also developing a set of power system scenarios for testing and evaluation by adding distributed energy resources to a distribution grid based on the IEEE-34 bus system.
BUSINESS VALUEAvista and Idaho consumers would benefit from the results of this research in the following ways: Deliver a prototype platform for testing
new technologies and algorithms to enable large-scale evaluations of grid-secure interactions between smart-buildings and the utility.
Enable engineers to create accurate models of the interaction between smart-buildings and the electric distribution grid. This should help the utility with managing the grid in a more efficient, lower-cost manner as the number of connected smart buildings increases.
Enable smart building owners to model the overall cost and potential cost savings of different building management strategies.
BACKGROUND
Enabled by new building construction and driven by the need for more energy-efficient buildings and operational cost savings, smart buildings' connection to the distribution grid is accelerating.
Smart buildings have several and varied capabilities that may enable a more efficient operation. Smart buildings may also have the capacity to help the grid in times of need by changing their consumption behavior or even injecting power into the grid if needed. It is possible that if managed well, such an interconnected system, called the smart grid, may help utilities maintain the current quality of service without heavy investments in new distribution infrastructure.
INDUSTRY NEED
The electric power grid's consequences of adding large numbers of distributed energy resources and smart-buildings to the power grid are not well evaluated today and need to be researched and investigated.
For the smart grid to be successful, its implementation needs to keep or improve the current high service levels and low energy cost. Utilities need tools that would enable them to model, study, analyze, and evaluate the engineering and economic consequences of connecting large numbers of distributed energy resources (DERs) and smart buildings to the distribution grid. This project aims to solve one of those needs.

SCOPE:Task 1: Review literature on smart building and prosumer models and communication protocols.We evaluated and tested using OpenADR for building to utility communications and found that OpenADR is not well-suited for the type of information exchange needed. We now began to develop our own protocol implementation.
Task 2: Evaluate and document available libraries and toolsets for power system dynamic analysis.Research has been conducted on available libraries and toolsets for power system dynamic analysis.
Task 3: Design and implement a rich system model with renewables, storage, and transaction intent-setThe model developed within the Phase I section of the project has been successfully enhanced from the IEEE 13 bus system to the IEEE 34 Bus system. This IEEE 34 Bus system has been modified to incorporate smart buildings
Task 4: Design and implement autonomous smart building and prosumer agents and integrate the demand-response agents with the market sub-systemThe design and implementation of a software system to simulate smart buildings with demand-response capabilities are currently in progress.
Task 5: Perform steady-state, pricing, and dynamic analysis under a few different demand-response scenario variations based on the scenario model from Task 3Different scenarios will be designed to study the impact of varying model power system prices and operating points. This task is currently ongoing.
Task 6: Integrate all sub-systems: Agents, Market, Pricing, Sys. Model, Power Flow, Dynamic Analysis.The integration of all sub-systems will commence once Tasks 4 and 5 are complete.
Task 7: Write a final report with details of integrated prototype and experiment analysis and resultsThis task will be completed once Task 8 has been completed.
DELIVERABLESThe deliverables upon successful completion ofthis project, including the software prototypes, will be:
Written final report of the results of these studies in the format approved by Avista.
Interim reports and online conferences with Avista. Mid-term report.
Proof-of-concept software toolset and documentation.
Evaluation using an enhanced IEEE-34 bus model and results.
PROJECT TEAMPRINCIPAL INVESTIGATOR
Name Dr. Yacine ChakhchoukhContact # (208)-885-1550Email [email protected] INVESTIGATORName Dr. Daniel Conte De LeonContact # (208)-885-6520Email [email protected] Dr. Herbert L. HessContact # (208)-885-4341Email [email protected] Dr. Brian JohnsonContact # (208)-885-6902Email [email protected]
SCHEDULE
Task Item
Start Date Finish Date
% Completion
Task 1 09/06/20 10/15/20 100%Task 2 09/06/20 10/15/20 100%Task 3 09/06/20 12/07/20 100%Task 4 10/11/20 02/15/21 15%Task 5 11/11/20 02/15/21 50%Task 6 02/01/21 04/30/21 0%Task 7 04/30/21 05/31/21 0%

Automating Predictive Maintenance for Energy Efficiency via Machine Learning and IoT Sensors Project Duration: 12 months Project Cost: Total Funding $82,112
OBJECTIVE
Our goal is to develop an energy
management decision support tool aimed at
helping small-to-medium size businesses. The
purpose of the tool is to leverage sensors
attached to mechanical systems to automate
prediction and optimization of energy
efficiency and reduce operational costs. We
plan to accomplish this using a commodity
Internet of Things (IoT) platform and machine
learning to automate the prediction and
optimization procedures.
BUSINESS VALUE
The keys to saving energy include the
implementation of energy management
techniques, specifically equipment
maintenance and monitoring techniques1. In
addition, predictive maintenance uses
equipment sensors (manually or automatically
operated) that indicate and predict when
maintenance will be required.
INDUSTRY NEED
Large businesses and corporations benefit
from the use of virtual energy assessment
and energy modeling provided by
commercially available third party tools2. For
the remainder of the business sector, current
energy consumption, usage, and loss
assessment are labor intensive, lack
automation, lack an incorporated learning
mechanism, and usually depend on costly
sensors. Yet, when these same companies
follow general strategies for preventative and
predictive maintenance, they can improve
1Bucklund S., Thollander P., Palm J. and Ottosson M., “Extending the energy efficiency gap,” Energy Policy 51, pp 392--96, 2012. 2https://www.inversenergy.com/, accessed April 22, 2020.
energy efficiency by up to 30%3. Using the
system we develop, small to medium sized
businesses will be enabled to automatically
monitor the energy efficiency and
maintenance needs of mechanical equipment.
Connecting their systems to our online,
data-driven, decision-support tool, business
owners can make more informed decisions to
optimize energy efficiency and reduce costs.
BACKGROUND
Both sensors and a commodity IoT platform
that can serve as the basis for these sensors
are readily available. Additionally, machine
learning has been shown to be highly
effective at predictive modeling4. Combined,
these are capable of automatically collecting,
propagating, and assessing underlying
maintenance data, all of which are necessary
to develop the tools required by managers to
effectively plan and manage energy efficient
maintenance5.
SCOPE
Task 1: Identification and procurement of equipment items to monitor and lab setup We identified motors, pumps, etc., that could
be monitored for predictive maintenance. We
have identified and procured: 2 dryers (w/
motors), 1 blender (w/ motor), 1 water
pump, and 1 free-standing motor. We also
procured sensors, Raspberry Pis, a server,
3Firdaus N. et al, “Maintenance for Energy Efficiency: A Review,” Proceedings of the IOP Conference Series: Materials Science and Engineering, 2019. 4Mosavi A., Bahamani A., “Energy consumption prediction using machine learning; a review,” 5Lewis A., Elmualim A. and Riley D., “Linking energy and maintenance management for sustainability through three American case studies.” Facilities. 29 Issue: 5/6, pp. 243--254, 2011.

and internet connectivity for system
development. Task 2: Development of a cost effective, general IoT-based sensor platform for automated collection of operational data for predictive maintenance We have built an IoT-based sensor platform
consisting of a Raspberry Pi connected to 6
mechanical sensors, each measuring a
different aspect of the monitored equipment.
Software has been implemented to read and
transfer sensor data to the data server.
Task 3: Development of an online, data-driven, decision-support tool for improved energy efficiency We have completed development of a server
portal housed on a data server hosted at
ISU’s Research Data Center. Once completed,
the server receives and aggregates data from
all connected IoT-based sensor platforms. The
aggregated data will then be automatically
and regularly analyzed using machine
learning algorithms to predict energy
efficiency and maintenance needs for the
equipment associated with each sensor
platform.
Task 4: Development of a mobile-friendly web data dashboard We will implement a dashboard to allow users
to monitor performance of mechanical
systems. The dashboard will show both data
collected as well as predicted efficiency and
maintenance needs in a user-friendly format
that can be accessed via web interface on
mobile or desktop devices.
Task 5: Training and testing of completed IoT and predictive maintenance platform We plan to train an instance of the online,
data-driven, decision-support system (task 3)
using data collected from mechanical systems
(task 1) via the implemented IoT sensor
platform (task 2) in order to test the
functionality of the developed systems.
Experiments will be conducted to simulate
failed mechanical systems so that the system
is able to generalize from data patterns
stemming both from operational and
underperforming machines. Task 6: Training of students in the development of smart energy efficiency tools, providing hands-on industrial experience and reinforcing classroom learning.
We recruited 2 mechanical engineering and 1
computer science undergraduate senior
students who, under the guidance and
supervision of faculty researchers, have
developed the software and hardware
solutions necessary for the predictive
maintenance system. In doing so they have
developed niche expertise, working in a team
setting, in the domain of predictive
maintenance technology.
DELIVERABLES
1. Software representing a cost effective,
general IoT-based sensor platform for
automated collection of operational data
for predictive maintenance
2. Software representing an online,
data-driven, decision-support tool for
improved energy efficiency in maintenance
practices at small-to-medium businesses
3. Software representing a web dashboard for
data collection and analytics for monitored
systems
4. Experimental results demonstrating the
effectiveness of the combined system at
predicting energy efficiency and
maintenance needs
PROJECT TEAM
SCHEDULE
PRINCIPAL INVESTIGATOR(S)
Name Paul Bodily, Isaac Griffith
Organization Computer Science Dept, Idaho State University
Contact # 208-282-4932 (Paul)
Email [email protected], [email protected]
Name Marco Schoen, Mary Hofle, Anish Sebastian,
Kelly Wilson, Omid Heidari
Organization Mech Engineering Dept, Idaho State University
Contact # 208 282-4377 (Marco)
[email protected], [email protected], [email protected], [email protected], [email protected]
RESEARCH ASSISTANTS
Name Andrew Christiansen
Organization Computer Science Dept, Idaho State University
Email [email protected]
Name Avery Conlin, Safal Lama
Organization Mech Engineering Dept, Idaho State University
Email [email protected], [email protected]
TASK TIME
ALLOCATED
START
DATE
FINISH
DATE
Mech Sys Procurement 2 months Oct 2020 Nov 2020
IoT Sensor Platform Dev 4 months Nov 2020 Feb 2021
Online decision-sup Dev 6 months Nov 2020 Apr 2021
Data Dashboard 4 months Mar 2021 Jun 2021
System training/testing 4 months Apr 2021 Aug 2021
Training students 10 months Oct 2020 Aug 2021

APPENDIX BRequest for Proposal

Avista CorporationEast 1411 Mission Ave.Spokane, WA 99202
Request for Proposal (RFP)Contract No. R-43127
for
Avista Energy Research (AER) Initiative
INSTRUCTIONS AND REQUIREMENTS
Proposals are due by 4:00 p.m. Pacific Prevailing Time (PPT), , May 18, 2020 (the “Due Date”)
Avista Corporation is an energy company involved in the production, transmission and distribution of energy as well as other energy-related businesses. Avista Utilities is our operating division that provides electric service to 378,000 customers and natural gas to 342,000 customers. Its service territory covers 30,000 square miles in eastern Washington, northern Idaho and parts of southern and eastern Oregon, with a population of 1.6 million. Alaska Energy and Resources Company is an Avista subsidiary that provides retail electric service in the city and borough of Juneau, Alaska, through its subsidiary Alaska Electric Light and Power Company. Avista stock is traded under the ticker symbol "AVA." For more information about Avista, please visit www.myavista.com.

Avista CorporationEast 1411 Mission Ave.Spokane, WA 99202
RFP No. R-43127 Page 2 of 9
Avista Corporation (“Avista”)RFP Confidentiality Notice
This Request for Proposal (“RFP”) may contain information that is marked as confidential and proprietary to Avista (“Confidential Information” or “Information”). Under no circumstances may the potential Bidder receiving this RFP use the Confidential Information for any purpose other than to evaluate the requirements of this RFP and prepare a responsive proposal (“Proposal”). Further, Bidder must limit distribution of the Information to only those people involved in preparing Bidder’s Proposal.
If Bidder determines that they do not wish to submit a Proposal, Bidder must provide a letter to Avista certifying that they have destroyed the Confidential Information, or return such Information to Avista and certify in writing that they have not retained any copies or made any unauthorized use or disclosure of such information.
If Bidder submits a Proposal, a copy of the RFP documents may be retained until Bidder has received notice of Avista’s decision regarding this RFP. If Bidder has not been selected by Avista, Bidder must either return the Information or destroy such Information and provide a letter to Avista certifying such destruction.
Avista and Bidder will employ the same degree of care with each other’s Confidential Information as they use to protect their own Information and inform their employees of such confidentiality obligations.

Avista CorporationEast 1411 Mission Ave.Spokane, WA 99202
RFP No. R-43127 Page 3 of 9
Instructions and Requirements1.0 PURPOSE in response to the Idaho Public Utilities Commission Order No. 32918, Avista Corporation will fund up to $300,000 per year of applied research that will further promote broad conservation goals of energy efficiency and curtailment. Specifically, Avista is seeking a qualified four year institution in the state of Idaho to provide such applied research (the “Services”). In light of the rapidly changing utility landscape, Avista would be interested in funding research projects which are forward thinking and would assist the utility in the development of product and services which provide an energy efficient commodity to its customers. The applied research and development projects can be one or multiple years and can be used to support university research programs, facility and studies.
The following institutions are eligible to submit Avista Energy Research (AER) initiative proposals.
1. University of Idaho 2. Boise State University 3. Idaho State University
Persons or institutions submitting a Proposal will be referred to as “Bidder” in this RFP; after execution of a contract, the Bidder to whom a contract is awarded, if any, will be the name of the university (“Institution”).
2.0 STATEMENT OF WORK The attached Statement of Work (“SOW”) specifies the activities, deliverables and/or services sought by Avista. This SOW will be the primary basis for the final SOW to be included under a formal contract, if a contract is awarded.
3.0 RFP DOCUMENTSAttached are the following RFP Documents:
Appendix A – Proposal Cover Sheet Appendix B – Sponsored Research and Development Project Agreement
4.0 CONTACTS / SUBMITTALS / SCHEDULE 4.1 All communications with Avista, including questions (see Section 5.1), regarding this RFP must be
directed to Avista’s Sole Point of Contact (“SPC”): Russ FeistAvista Corporation1411 East Mission AvenuePO Box 3727, MSC-33Spokane, WA 99220-3727Telephone: (509) 495-4567Fax: (509) 495-8033E-Mail: [email protected]
4.2 Proposals must be received no later than 4:00 PM Pacific Prevailing Time (“PPT”), on May 18, 2020 (“Due Date”). Bidders should submit an electronic copy of their Proposal to [email protected]. In addition to an electronic copy, Bidders may also fax their Proposal to 509-495-8033, or submit a hard copy to the following address:
Avista CorporationAttn: Greg Yedinak Supply Chain Management (MSC 33)1411 E. Mission AvePO Box 3727Spokane, WA 99220-3727

Avista CorporationEast 1411 Mission Ave.Spokane, WA 99202
RFP No. R-43127 Page 4 of 9
No verbal or telephone Proposals will be considered and Proposals received after the Due Date may not be evaluated.
4.3 RFP Proposed Project Schedule March 31, 2020 Avista issues RFP April 29, 2020 Bidder’s Questions/Requests for Clarification Due May 6, 2020 Avista’s Responses to Clarifications Due DateMay 18, 2020 Proposals Due June 1, 2020 Successful Bidder selection and announcementJune 29, 2020 Contract and Statement of Work Executed
5.0 RFP PROCESS 5.1 Pre-proposal Questions Relating to this RFP
Questions about the RFP documents (including without limitation, specifications, contract terms or the RFP process) must be submitted to the SPC (see Section 4.1), in writing (e-mailed, faxed, or addressed in accordance with Section 4.2, by the Due Date. Notification of any substantive clarifications provided in response to questions will be provided via email to all Bidders.
5.2 Requests for ExceptionsBidder must comply with all of the requirements set forth in the documents provided by Avista as part of this RFP (including all submittals, contract documents, exhibits or attachments). Any exceptions to these requirements must be: (i) stated separately, (ii) clearly identify the exceptions (including the document name and section), and (iii) include any proposed alternate language, etc. Failure by Bidder to provide any exceptions in its Proposal will constitute full acceptance of all documents provided by Avista as part of this RFP. While Avista will not consider alternate language, etc. that materially conflicts with the intent of this RFP, Avista may consider and negotiate the inclusion of terms that would be supplemental to the specific document if such terms reasonably relate to the scope of this RFP.
5.3 Modification and/or Withdrawal of Proposal5.3.1 By Bidder: Bidder may withdraw its Proposal at any time. Bidder may modify a submitted
Proposal by written request provided that such request is received by Avista prior to the Due Date. Following withdrawal or modification of its Proposal, Bidder may submit a new Proposal provided that such new Proposal is received by Avista prior to the Due Date and includes a statement that Bidder’s new Proposal amends and supersedes the prior Proposal.
5.3.2 By Avista: Avista may modify any of the RFP documents at any time prior to the Due Date. Such modifications will be issued simultaneously to all participating Bidders.
5.4 Proposal Processing 5.4.1 Confidentiality: It is Avista’s policy to maintain the confidentiality of all Proposals
received in response to an RFP and the basis for the selection of a Bidder to negotiate a definitive agreement.
5.4.2 Basis of Any Award: This RFP is not an offer to enter into an agreement with any party. The contract, if awarded, will be awarded on the basis of Proposals received after consideration of Bidder’s ability to provide the services/work, quality of personnel, extent and quality of relevant experience, price and/or any other factors deemed pertinent by Avista, including Bidder’s ability to meet any schedules specified in the Statement of Work.
5.4.3 Pre-award Expenses: All expenses incurred by Bidder to prepare its Proposal and participate in any required pre-bid and/or pre-award meetings, visits and/or interviews will be Bidder’s responsibility.
Avista CorporationEast 1411 Mission Ave.Spokane, WA 99202
RFP No. R-43127 Page 5 of 9
5.4.4 Proposal Acceptance Term: Bidder acknowledges that its Proposal will remain valid for a period of 90 days following the Due Date unless otherwise extended by Avista.
5.5 Contract ExecutionThe successful Bidder shall enter into a contract that is substantially the same as the Sponsored Research and Development Project Agreement governing the performance of the Services/Work applicable under this RFP included as Appendix B.
6.0 PROPOSAL REQUIREMENTS AND SUBMITTALSBidder’s Proposal must conform to the following outline and address all of the specified content to facilitate Avista’s evaluation of Bidder’s qualifications; approach to performing the requested Services/Work; and other requirements in the SOW. Proposals will be evaluated on overall quality of content and responsiveness to the purpose and specifications of this RFP, including the information set forth in Section 6.5 below.
6.1 Proposal ProcessEach eligible institution will be limited to TEN specific proposal submittals. One representative of the eligible institutions will be responsible for submitting all of the proposals.
The proposal must not exceed 6 pages not including the appendices. The proposal shall be in 11 point font, 1.5 spaced and one inch margins. The original and one electronic copy of the proposal (PDF – Form) must be provided to Avista’s point of contact listed herein.
6.2 Proposal Submittals The following items are required with Bidder’s Proposal. Each proposal shall contain the following project elements.
1. Name of Idaho public institution;2. Name of principal investigator directing the project;3. Project objective and total amount requested (A general narrative summarizing the approach
to be utilized to provide the required services);4. Resource commitments, (number of individuals and possible hours for services);5. Specific project plan (An outline of work procedures, technical comments, clarifications
and any additional information deemed necessary to perform the services);6. Potential market path;7. Criteria for measuring success;8. Budget Price Sheet / Rate Schedule;9. Proposal Exceptions to this RFP (if any);
10. Appendix A – Proposal Cover Sheet (last 2 pages of this document)
11. Appendix C: Facilities and Equipment
12. Appendix D: Biographical Sketches and Experience of the principle investigators and / or primary research personnel for each project (if different individuals for each project submitted)
6.3 Proposal Cover Sheet

Avista CorporationEast 1411 Mission Ave.Spokane, WA 99202
RFP No. R-43127 Page 6 of 9
Bidder must fill out, sign and date the attached Proposal Cover Sheet. The signatory must be a person authorized to legally bind Bidder’s company to a contractual relationship (e.g. an officer of the company).
6.4 Institution Information Institution Qualifications
Bidder shall provide information on projects of similar size and scope that Bidder has undertaken and completed within the last five years. Please include a list of references on Appendix A that could be contacted to discuss Bidders involvement in these projects.
Institution Resources
Identify any unique or special equipment, intellect, hardware, and software or personnel resources relevant to the proposed Services that Bidder’s firm possesses(list in Appendix D).
Project Personnel QualificationsProvide a proposed organization chart or staffing list for a project of this size and scope and identify the personnel who will fill these positions. If applicable, identify project managers who will be overseeing the Services and submit their resume identifying their work history, (please see Section 6.2, question #4).
Approach to Subcontracting If Bidder’s approach to performing the Services will require the use of subcontractors, include for each subcontractor: (a) a description of their areas of responsibility, (b) identification of the assigned subcontractor personnel, (c) resumes of key subcontractor personnel, (d) a summary of the experience and qualifications of the proposed subcontracting firms in work similar to that proposed, and (e) a list of references for such work.
6.5 Evaluation CriteriaAvista will evaluate each proposal based upon the following criteria:
6.5.1 Project Requirements Strength of Proposal Responsiveness to the RFP Creativity in Leveraging Resources Samples of Work Products Overall Proposal (Complete, Clear, Professional)
6.5.2 Strength & Cohesiveness of the Project Team Overall ability to manage the project Technical ability to execute the Services Research/analysis ability Project milestones with clear stage and gates (annually) Overall team cohesiveness
6.5.3 Qualifications and Experience Experience working with electric utilities Project management and multi-disciplined approaches Experience working with organizations in a team atmosphere
7.0 RESERVATION OF AVISTA RIGHTS:

Avista CorporationEast 1411 Mission Ave.Spokane, WA 99202
RFP No. R-43127 Page 7 of 9
Avista may, in its sole discretion, exercise one or more of the following rights and options with respect to this RFP: Modify, extend, or cancel this RFP at any time to obtain additional proposals or for any other reason
Avista determines to be in its best interest; Issue a new RFP with terms and conditions that are the same, similar or substantially different as
those set forth in this or a previous RFP in order to obtain additional proposals or for any other reason Avista determines to be in its best interest;
Waive any defect or deficiency in any proposal, if in Avista’s sole judgment, the defect or deficiency is not material in response to this RFP;
Evaluate and reject proposals at any time, for any reason including without limitation, whether or not Bidder’s proposal contains Requested Exceptions to Contract Terms;
Negotiate with one or more Bidders regarding price, or any other term of Bidders’ proposals, and such other contractual terms as Avista may require, at any time prior to execution of a final contract, whether or not a notice of intent to contract has been issued to any Bidder and without reissuing this RFP;
Discontinue negotiations with any Bidder at any time prior to execution of a final contract, whether or not a notice of intent to contract has been issued to Bidder, and to enter into negotiations with any other Bidder, if Avista, in its sole discretion, determines it is in Avista’s best interest to do so;
Rescind, at any time prior to the execution of a final contract, any notice of intent to contract issued to Bidder.
[END OF REQUEST FOR PROPOSAL INSTRUCTIONS AND REQUIREMENTS]

Avista CorporationEast 1411 Mission Ave.Spokane, WA 99202
RFP No. R-43127 Page 8 of 9
APPENDIX A - Proposal Cover SheetBidder Information
Organization Name:
Organization Form: (sole proprietorship, partnership, Limited Liability Company, Corporation, etc.)
Primary Contact Person: ____________________________ Title: __________________________________
Address:
City, State, Zip:
Telephone: Fax: Federal Tax ID#
E-mail Address:
Name and title of the person(s) authorized to represent Bidder in any negotiations and sign any contract that may result (“Authorized Representative”):
Name: Title:
If classified as a contractor, provide contractor registration/license number applicable to the state in which Services are to be performed. ____________________________________
Provide at least three references with telephone numbers (please verify numbers) that Avista may contact to verify the quality of Bidder’s previous work in the proposed area of Work.
REFERENCE No. 1:Organization Name:
Contact Person:
Project Title:
Telephone:
Fax:
Email:
REFERENCE No. 2:Organization Name:
Contact Person:
Project Title:
Telephone:
Fax:
Email:
REFERENCE No. 3:Organization Name: Telephone:
Fax:

Avista CorporationEast 1411 Mission Ave.Spokane, WA 99202
RFP No. R-43127 Page 9 of 9
Contact Person:
Project Title:
Email:
By signing this page and submitting a Proposal, the Authorized Representative certifies that the following statements are true:
1. They are authorized to bind Bidder’s organization.
2. No attempt has been made or will be made by Bidder to induce any other person or organization to submit or not submit a Proposal.
3. Bidder does not discriminate in its employment practices with regard to race, creed, age, religious affiliation, sex, disability, sexual orientation or national origin.
4. Bidder has not discriminated and will not discriminate against any minority, women or emerging small business enterprise in obtaining any subcontracts, if required.
5. Bidder will enter into a contract with Avista and understands that the final Agreement and General Conditions applicable to the Scope of Work under this RFP will be sent for signature under separate cover.
6. The statements contained in this Proposal are true and complete to the best of the Authorized Representative’s knowledge.
7. If awarded a contract under this RFP, Bidder:(i) Accepts the obligation to comply with all applicable state and federal requirements, policies, standards and regulations including appropriate invoicing of state and local sales/use taxes (if any) as separate line items;
(ii) Acknowledges its responsibility for transmittal of such sales tax payments to the taxing authority;
(iii) Agrees to provide at least the minimum liability insurance coverage specified in Avista’s attached sample Agreement, if awarded a contract under this RFP.
8. If there are any exceptions to Avista’s RFP requirements or the conditions set forth in any of the RFP documents, such exceptions have been described in detail in Bidder’s Proposal.
9. Bidder has read the “Confidentiality Notice” set forth on the second page of these “INSTRUCTIONS AND REQUIREMENTS” and agrees to be bound by the terms of same.
Signature: Date:
*** THIS PAGE MUST BE THE TOP PAGE OF BIDDER’S PROPOSAL ***

APPENDIX CUniversity of Idaho Agreements

PROJECT TASK ORDER for SERVICES
Master Agreement No. Task Order No. Modification No. Modification DateMA, UI/Avista R-39872 2020-V200688 This Task Order is made and entered into this 12th day of August 2020, by and between Avista Corporation, herein called SPONSOR, and the Regents of the University of Idaho, herein called UNIVERSITY. The Task Order describes activities to be conducted by UNIVERSITY for SPONSOR. Any deviation from the work outlined in this Task Order and Attachment A must first be approved in writing by SPONSOR. In addition, work performed under this Task Order is subject to the provisions of the Master Services Agreement. The Master Agreement, and this Task Order and Attachment A constitute the entire agreement for the Work/ Services applicable under this Task Order. The terms and conditions of this Task Order may not be modified or amended without the express written agreement of both parties. Title of Services: Gamification of Energy Use Feedback Start Date: 09/01/2020
Duration (number of months)
12 months Estimated completion date: 08/31/2021
UI PI: Richard Reardon
SPONSOR Representative: Randy Gnaedinger
Consideration and Payment: UI agrees to perform the Services set forth in Attachment A, Scope of Services, and SPONSOR agrees to pay for said Services listed as budgeted amounts upon performance by UI. The obligation and rights of the parties to this Task Order shall be subject to and governed by terms and conditions of this Task Order and the Master Agreement.Funding Amount ($): (Per Attachment A,
Budget) $63,483 Deliverables:
Progress Report Date: Final Report Date: Other: 2 week progress updates
IN WITNESS WHEREOF, the parties hereto have set their hands on the day and year first written above: UI Representative Signature Agency Representative Signature
Deborah Shaver, AVP Research Administration Date:
Heather Rosentrater VP Date:
X8/31/2021
2/28/2021XX
DocuSign Envelope ID: 5C347E5A-B169-4DFC-A85B-4DA0873D9298
Sep-21-2020 | 7:58 AM PDT
DocuSign Envelope ID: FC62C062-7F09-480F-95A1-331FACC60827
Sep-29-2020 | 11:09 AM PDT

University of Idaho, Coeur d’Alene Gamification of Energy Use Feedback-2
1
1. Name of Idaho public institution;
University of Idaho, Coeur d’Alene Center
2. Name of principal investigator directing the
project; Richard Reardon, Ph.D.
3. Project Objectives and Approach
Objectives
1) Identify the utility data collection capabilities that would allow feedback to customers. E.g., what
information can be made available (taking into account security concerns)? What are the incoming
vectors for that information, the utility itself or a local home device or a combination? How often can
the information be provided? Real time is ideal, but may not be possible. 2) Review past attempts to use
feedback-based systems. These attempts have been well-crafted, but could not be sustained. We want to
learn from those attempts without repeating the mistakes. 3) Review the literature on successful
incentive strategies. Then, sample customers to create a user profile system that will be the basis of
customer gamification choices. 4) Provide evidence of concept: To match the incentive profiles to
existing gamification capabilities in mobile and home devices, and to demonstrate a sample
gamification coding application for such devices that encourages conservation.
Project TOTAL: $63,483
Approach
At Avista’s request, a project submitted last year (2019) was reorganized and spread over two
years. With this proposal, the investigators are requesting funding for the second year. The overall
objectives, as stated above, are unchanged. We will have delivered what we proposed for the first year
by August, 2020. Importantly, based on our experience in 2019-2020, we believe a substantially lower
budget request is appropriate. We will be brief here because we have offered rationale in our 2019-2020
proposal. However, it may be useful to highlight the important issues, and so we will paraphrase and
repeat some content from 2019-2020.
Our target is to offer the utility a means to reduce overall energy consumption by incentivizing
conservation. University of Dayton engineering professor Kevin Hallinan, suggests that behavioral
changes alone could reduce consumption by a third (http://adigaskell.org/2014/01/06/the-gamification-
of-energy-conservation/).
Feedback is a basic mechanism in most complex systems, certainly including human ones. In
human systems, feedback is essential to understanding the relationship between effort, error, and
optimal (or at least successful) performance. The evidence is quite clear that if human users can be
made explicitly aware of the essential elements of their performance, they can modify that performance
in the service of improvement. However, this is only the case if they actually see the feedback, attend to
it, understand it, and have a readily available response.
DocuSign Envelope ID: 5C347E5A-B169-4DFC-A85B-4DA0873D9298DocuSign Envelope ID: FC62C062-7F09-480F-95A1-331FACC60827
University of Idaho, Coeur d’Alene Gamification of Energy Use Feedback-2
2
Avista’s stated goal is to reduce overall energy consumption. This benefits the customer in the
form of savings on their energy bills; it benefits the utility because it can then satisfy more customers
with reliable, uninterrupted service. Energy use reduction can be framed as a human performance
problem (Boehm-Davis, Durso, & Lee, 2015). Like golf and speed events, the key is to reduce the
score—lower scores indicate better performance.
A gaming metaphor, sometimes referred to as “gamification”, has been briefly explored to help
sustain user attention to feedback. In our final report for 2019-2020, we will discuss previous attempts
to use the metaphor, and offer reasons why these have been largely unsuccessful. We will also offer
some reasons for why we believe our approach might be more successful and sustainable.
Here are research issues we have explored, and expect to explore, in the search for a
gamification solution:
What is the nature of the feedback? Can users select the complexity level/format as
individual preferences for information? Does feedback have to get down to the home appliance level,
or is an overall indicator sufficient. Is the feedback pushed to them, or must they seek it?
The gaming literature suggests that there may be differences in game style preferences. Some games are
tactical, some strategic. In some, play is team versus team (e.g., neighborhood versus neighborhood, or
alumni group versus alumni group), in others play is individual versus individual, in still others, play is
against the AI system. As of this writing, we have a much better feel for the data that can be made
available via smart-metering, and we are working with the utility to see how our gaming system might
interact with that data. The 2019-2020 survey is complete, and wee also have a better understanding of
customers preferred game types and incentives.
Is the user able to tailor feedback to match his/her preferences? We suspect the system we
develop will be adaptive. Users will be able to try various “games” to arrive at the one that interests
them. Will users be able to respond in a timely way to the gaming data they receive? Research
indicates that the ability to take a timely action is an important part of any incentive system.
Apart from the feedback mechanism, do other incentives exist that compel attention?
There are likely differences in what makes “winning” rewarding. Some would like to see savings
returned to them (as discounts, as additional services) while others might want their savings to go to a
school event or other prosocial cause or low-income consumers. Moment to moment savings are not a
strong incentive to attend to feedback for some. Our survey addresses this, and we will have additional
information from Avista.
What is the best vector for feedback? The prevalence of smart phones is wider than many
might have anticipated a decade ago, but usage patterns vary depending on many factors, such as age
of users, or professional versus personal usage. Many people still prefer a desktop or laptop for their
DocuSign Envelope ID: 5C347E5A-B169-4DFC-A85B-4DA0873D9298DocuSign Envelope ID: FC62C062-7F09-480F-95A1-331FACC60827

University of Idaho, Coeur d’Alene Gamification of Energy Use Feedback-2
3
day-to-day personal financial activities. Our experience in 2019-2020 suggests that we need to
prepare for multi-platform availability, but that the primary pathway will be smart phones.
Is there a motivational advantage to encourage off-peak versus overall reduction in usage?
We have learned much about this from Avista; we will take advantage of the information to
provide “best times” information and incentives through the gaming system. This can be made adaptive
so the utility can adjust to seasonal and other conditions.
What are some side benefits of a gamification? There are many possibilities: Customers who
elect to game are already in contact with a system that can inform them of outages, inadvertent or risky
use (e.g., a spike in usage when they are not home; it may also give consumers the ability and incentive to
spot-control usage). The system could be used to provide community utility public service information or
market Avista services. One of our prototype games, for example, includes the opportunity to embed
educational pieces and savings tips into game play.
4. Research Plan
In 2019-2020, we constructed and completed a customer survey with over 800 respondents.
The data set is available to our team and Avista. Analytics have been reported and will be updated
continuously through August, 2020. We have sampled the relevant literature on gamification and will
provide pointed summary information on that. We have developed four prototype games, and are in
the process of preparing them for usability testing (starting May, 2020). The current proposal is for
the final phase of our project. The final phase includes incorporating into the games motivational
strategies from our literature searches, and connecting the games to the Avista’s online presence. A
starting strategy will be selected as a test bed.
2020-2021 Deliverables: 1) We will have an understanding of how to incorporate user data into
games, and how to return game performance information to the utility in the form of savings or
prosocial action. An analysis of differences in responsiveness to incentive strategies will be prepared.
Usability testing should reveal the way that usage patterns are affected by income and other
demographic variable. Prototypes developed in 2019-2020 prototype system from the first year will
be enhanced with the additional incentive strategy capabilities (and other useful messaging
possibilities as identified by the utility). The system should be deployable for beta-testing with
customers.
Time commitments
The time needed will occur in bursts of 10-15 hours per week, but the overall average for the
DocuSign Envelope ID: 5C347E5A-B169-4DFC-A85B-4DA0873D9298DocuSign Envelope ID: FC62C062-7F09-480F-95A1-331FACC60827

University of Idaho, Coeur d’Alene Gamification of Energy Use Feedback-2
4
PI and Co-PI will be calculated on 2-3 hours per week (for R. Reardon) or 4-5 hours per week (for J.
Beeston) through fall and spring. The work will be more heavily technical, thus the greater load on J.
Beeston. Again, there will be heavy and light workloads in summer, but we our budget request is for 5
or 10 hours per week, on average (for R. Reardon and J. Beeston, respectively). The PI will assume
more managerial responsibility, and so the position of Graduate assistant Project manager will be
eliminated. What will be needed is advanced undergraduate and graduate student help to perform the
usability testing under PI and Co-PI supervision. The 2020-2021 budget thus reflects more funds for
student help than proposed in 2019-2020, and at a higher pay rate to allow us to include graduate-
level help. We are proposing 300 hours of help. Our current Graduate Assistant/Project Manager,
Kellen Probert, will continue with the project but will be paid through other sources.
Technical consultant (D. Beeston) contributed much in 2019-2020, but his expertise is less
relevant in 2020-2021. He will be available for occasional unpaid consultation. Our second consultant
(J. Keehr) will not be paid by this project (she is fully compensated by other means) but will be
available ad hoc (she has committed to 25 hours per year).
5. Commercialization Prospects
Our outcomes are expected to be very close to commercialization. (1) We will present a set of
incentive profiles that can be used with feedback systems such as we propose, or with other incentive
systems that may be of interest to the utility. (2) We will have game prototypes that are usability-
tested. (3) The system we propose could be tasked to other purposes of use to the utility and
customers (notification of inadvertent power use/spikes, or unexpected power outages).
6. Leveraged resources
The University is well-equipped for the research proposed, and the Human Factors and
Computer Science programs are staffed with exceptional collaborative faculty.
7. Strength and Credentials of the team
PI Richard Reardon is a specialist in social cognition and organizational behavior. He has
a number of refereed publications and a successful record of external funding. His Vitae is
appended. His most recent large-project funding:
2019-2020: Avista Energy Conservation Program-$108,736 (with J. Beeston)
2016-2017: Idaho Millennium Fund Grant-$397,722.
2003-2005: North Idaho Center for Disabilities Evaluation-$120,000.
DocuSign Envelope ID: 5C347E5A-B169-4DFC-A85B-4DA0873D9298DocuSign Envelope ID: FC62C062-7F09-480F-95A1-331FACC60827

University of Idaho, Coeur d’Alene Gamification of Energy Use Feedback-2
5
Co-PI Julie Beeston is a recent Ph.D., but she has extensive work experience (15 years)
as a software designer/software architect. Her Vitae is appended.
Consultant David Beeston has many years of experience as a systems manager for
utilities and other companies. He has experience in IT product development and delivery. His
resume is appended. His assistance is at no cost to the project.
Consultant Jode Keehr is a long-time web developer and marketer. She returned to the UI
for graduate education, is completing her M.S. in Human Factors Psychology and is a doctoral
degree candidate. Her compensation is covered by other sources and will not be charged to this
project. Her vitae is appended.
Kellen Probert is a doctoral student in Human Factors at UI. He has extensive experience
with technical system (training simulators, aircraft operations and mishap investigation, human
performance in technical environments). His Vitae is appended, and his assistance is at no cost to
the project.
8. Criteria for measuring success;
Direct measures will be usage patterns under various motivations and incentives among
our focus samples. Additional indirect measures are satisfaction with the user experience, and
the utility. The key measures for this final phase are: Do customers play/ do they enjoy the
games? Do they respond to the incentive with changes in usage?
9. Proposal Exceptions to this RFP (if any); Per section 5.2 of the RFP, the University
has described exceptions to RFP requirements and conditions in the letter dated 5/11/20 and
included with Appendix A.
8. Proposed Budget, 2020-2021
Continued on next page
Notes:
Text References and Preliminary List of Additional Leveraged Resources: Existing Consumer Incentive
Programs and Tools are appended to the 2019-2020 proposal.
As described in the 2019-2020 proposal, the home departments of the Principal Investigators are well-
equipped, have adequate space, and have excellent technical and clerical support for this project.
DocuSign Envelope ID: 5C347E5A-B169-4DFC-A85B-4DA0873D9298DocuSign Envelope ID: FC62C062-7F09-480F-95A1-331FACC60827

Page 6
University of Idaho, Coeur d’Alene Avista Research Initiative Proposal
Gamification of Energy Use Feedback-2 (RReardon, JBeeston)
Expense Year 2 (if funded) Justification
PI/Faculty Salaries (Richard Reardon, PhD) $9,338 Avg. 2-3 hours/week fall-spring, 5 hours/week summer);
Total hours 142 per year.
PI/Faculty Fringe (Richard Reardon, PhD) $2,885 30.90% rate
Co-PI/Staff Salaries (Julie Beeston, Ph.D.) $16,134 Avg. 4-5 hours/week fall-spring, 10 hours/week summer);
Total hours 286 per year
Co-PI/Staff Fringe (Julie Beeston, Ph.D.) $4,986 30.90% rate
Graduate/Undergraduate Student Interns $5,700
Interns will perform usability testing, data collection and analysis, and other duties as needed; approx. 300 hours per year; pay rate: $19/hour
Undergrad. Intern/Asst Fringe $194 3.4% rate
Software Licensing/Subscription $3,000 For development software (e.g., Unity)
F&A/Overhead $21,245 50.3% of direct costs above
Project TOTAL $63,483
DocuSign Envelope ID: 5C347E5A-B169-4DFC-A85B-4DA0873D9298DocuSign Envelope ID: FC62C062-7F09-480F-95A1-331FACC60827

PROJECT TASK ORDER for SERVICES
Master Agreement No. Task Order No. Modification No. Modification DateMA, UI/Avista R-39872 2020-V200630This Task Order is made and entered into this 12th day of August 2020, by and between Avista Corporation, herein called SPONSOR, and the Regents of the University of Idaho, herein called UNIVERSITY. The Task Order describes activities to be conducted by UNIVERSITY for SPONSOR. Any deviation from the work outlined in this Task Order and Attachment A must first be approved in writing by SPONSOR. In addition, work performed under this Task Order is subject to the provisions of the Master Services Agreement. The Master Agreement, and this Task Order and Attachment A constitute the entire agreement for the Work/ Services applicable under this Task Order. The terms and conditions of this Task Order may not be modified or amended without the express written agreement of both parties. Title of Services: Evaluating the Effects of Energy Storage & Real-time Demand-Reponse Start Date: 08/23/2020
Duration (number of months)
12 months Estimated completion date: 08/31/2021
UI PI: Yacine Chakhchoukh
SPONSOR Representative: Randy Gnaedinger
Consideration and Payment: UI agrees to perform the Services set forth in Attachment A, Scope of Services, and SPONSOR agrees to pay for said Services listed as budgeted amounts upon performance by UI. The obligation and rights of the parties to this Task Order shall be subject to and governed by terms and conditions of this Task Order and the Master Agreement.Funding Amount ($): (Per Attachment A,
Budget) $77,027 Deliverables:
Progress Report Date: 2/28/2021 Final Report Date: 8/31/2021 Other: bi-weekly updates
IN WITNESS WHEREOF, the parties hereto have set their hands on the day and year first written above: UI Representative Signature Agency Representative Signature
Deborah Shaver, AVP Research Administration Date:
Heather Rosentrater VP Date:
DocuSign Envelope ID: 5C347E5A-B169-4DFC-A85B-4DA0873D9298
Sep-21-2020 | 7:58 AM PDT
DocuSign Envelope ID: FC62C062-7F09-480F-95A1-331FACC60827
Sep-29-2020 | 11:09 AM PDT

Page 1
Project Title: Evaluating the Effects of Energy Storage and Real-Time Demand
Response within an Enhanced Avista® Energy Trading Platform Prototype (version 2)
1 Name of Idaho Public Institution University of Idaho.
2 Principal Investigators and Project Director Principal investigator and project director: Dr. Yacine Chakhchoukh.
Co-principal investigators: Dr. Daniel Conte de Leon, Dr. Brian Johnson, Dr. Herbert L. Hess.
Project Manager: Ms. Arvilla Daffin.
3 Project Objective and Total Amount Requested.
3.1 Total Amount Requested: $77,027.
3.2 Summary of Objectives
We have developed a prototype system that successfully integrates a managed transactive energy market
with power flow analysis and distribution locational marginal prices (DLMP). Said prototype enables the
study of approaches to create a transactive energy market while ensuring a feasible and efficient operation
of the distribution grid that does not violate limits. We propose to enhance this prototype by adding the
following new functionality (B) Simulated Smart Building and Prosumer Agents (for Demand-
Response), (C) Near Real-time Integration of A and B with the Market Management and the
Integrated Power System Model Management modules.
3.3 Work Developed in Phases I and II
A year ago, (end of phase I), we completed the analysis, design, and implementation of an integrated
energy market management and grid power flow analysis prototype software system. Such prototype
supports the creation and management of prosumer-enabled transaction intents and determining whether
such transactions could be supported by a distribution grid model, based on voltage. We used a distributed
renewables-enhanced 13-bus system model with added realistic and hourly configurable load and
generation profiles. This system fully supported voltage-based energy transaction feasibility analysis
Results of the voltage feasibility analysis were used to enable/disable transactions on the market application.
In the current year (phase II), we have enhanced the prototype and integrated it with an algorithm for
energy price calculation. This algorithm calculates the Distribution Locational Marginal Pricing (DLMP)
for each bus in the system and determines dispatch schedules for dispatchable generation. The estimated
power flow, dispatch schedule, and DLMPs are calculated after all information from the prosumer's usage
and generation profiles and all transaction intents have been considered within each hourly window and for
any selected time window. In addition, the system prototype has been enhanced with a transaction intent
DocuSign Envelope ID: 5C347E5A-B169-4DFC-A85B-4DA0873D9298DocuSign Envelope ID: FC62C062-7F09-480F-95A1-331FACC60827

Page 2
prioritization algorithm that enables the selection of transactions based on priority and DLMP Price, in
addition to voltage feasibility. One case study, based on a renewable enhanced 13-Bus model, has been
developed and implemented as analysis scenario. A richer analysis scenario, based on a 34-Bus model, is
currently being developed and implemented. Scenarios include a full dist. system model (13- or 34-bus),
classic and renewable generation, hourly generation and loads profiles, and example transaction intents.
Transactions are enabled/disabled depending on voltage, DLMP, and priority.
3.4 Objectives of this Project
Based on creating two new modules (1,2), enhancing the current prototype to ensure full integration
(3,4), and evaluating the resulting system under new scenarios (5), the objectives of this project are:
1: Simulated Smart Building and Prosumer Agents for Real-Time Demand Response (new): The
simulation platform will include software-based agents simulating smart buildings and prosumers. These
agents will interact with the Market Management sub-system (3) in real-time and in an autonomous
manner. Simulated smart building behavior will be based, as closely as feasible, on real building data
from University of Idaho buildings. Changes in building behavior will be accounted for in the Market
Management sub-system and used to generate power flow, DLMP, and dynamic analysis models.
2: Market Management (enhancement): The resulting system prototype will also include the ability
to support, manage, and account for, in near real-time, prosumer energy trading intents and other energy
transaction attributes such as Customer, Site, Power, Duration, Priority, and also calculated attribute
values, such as transaction intent value, negotiated price (based on DLMP), and transaction feasibility.
3: Power System Modeling and Management (enhancement): The resulting system prototype will
also include the ability to manage and edit, through a Web interface, an accurate power system model of
the distribution grid. Such model will be used to generate the models enabling grid power flow, dynamic
and transient analysis, and DLMP price calculations. Changes in the model will be reflected on the power
flow, dynamic analysis, and DLMP price calculations and outputs.
3.5 Estimated Benefits to Sponsor
Avista® Corp. will benefit from an integrated transactive energy market and power system analysis
prototype system, such as the one being proposed, in the following ways: (1) The system would provide a
platform for testing new approaches, applications, and algorithms that would enable large-scale feasible
implementations of such customer-driven and demand-response-enabled trading markets, (2) Enable the
initial collection of data on prosumer sites, building, and consumer behaviors and resulting trading patterns,
(3) Enable data analytics that may lead to increased efficiency and resiliency in the distribution system, (4)
Spearhead the implementation of a full-scale integrated grid management system that supports a customer-
driven transactive energy market that supports renewables, demand-response, and dynamic pricing.
DocuSign Envelope ID: 5C347E5A-B169-4DFC-A85B-4DA0873D9298DocuSign Envelope ID: FC62C062-7F09-480F-95A1-331FACC60827

Page 3
The results of this project will contribute to the concretization of the “transactive energy” vision where
power flows directions are bidirectional (i.e., customer-grid and grid-customer). In such system, the utility
is paid for enabling the power flow through its distribution and transmission systems in addition to the
generation. Avista® Corp. has interest in making this happen among many of its customers. In fact, when
one of this project’s PIs presented Avista® Corp. engineers with an idea that addressed only the electrical
issues of such a system, the engineers suggested adding the customer-initiated transactions and demand
response to the project.
4 Resource Commitment Resource commitments for this project include the following:
• 4 PIs with expertise and student mentoring time as part of their normal academic duties.
• 1 graduate student in Electrical Eng. as a funded Research Assistant (890 hrs. in budget request).
• 1 graduate student in Computer Science as a funded Research Assistant (890 hrs. in budget request).
• Cost of needed yearly software licenses and one trip to Spokane (in budget request).
• Use of University of Idaho space, facilities, IT and financial support personnel time, and
laboratories, including computing and network resources as needed and reasonable (as F&A). This project proposes to involve students in every aspect of the research and project implementation.
We have successfully employed student-based faculty-led teams in many projects of similar scope.
Furthermore, having Avista® Corp. as a project sponsor would enhance student engagement and
performance and greatly benefit the student's careers. We are planning to hire the two graduate students
that worked on phase I and phase II of this project. They conducted phase I and phase II with enthusiasm
gaining knowledge while developing the system prototype.
5 Specific Project Plan
5.1 Application Usage Scenario
The following is a potential usage scenario that the proposed system should support: (1) A grid-
connected smart building or prosumer, from an Avista® Corp. customer, expects to need (or to have excess
of) electricity. (2) Said prosumer of smart building, based on internal and/or external signals, will
autonomously determine its future energy input/output. (3) Then, it will post to the Market (using machine-
to-machine comm.) a set of new transaction intents. (4) Then the integrated system prototype will,
considering all transaction intents and grid model, perform a power flow and dynamic analysis and forecast
DLMPs and other grid state attributes. (5) Then, based on forecasted results, and customer, site, and
transaction priorities, plus DLMPs, transaction intents are accepted or rejected by the Market. Then
prosumer or smart building agents will adjust usage schedule and/or post new transaction intents.
DocuSign Envelope ID: 5C347E5A-B169-4DFC-A85B-4DA0873D9298DocuSign Envelope ID: FC62C062-7F09-480F-95A1-331FACC60827

Page 4
5.2 Technical Approach
Here, we describe approaches and technologies that we intend to apply to achieve each objective:
1: Simulated Smart Building Agents for Real-Time Demand Response: We plan on using Python to
create and replicate autonomous Smart Building and Prosumer agents. These agents will use simulated or
stored signals such as insolation, temperature, energy plan, and price as input. Then they will request
transactions to the Market using modern machine-to-machine communication protocols.
2: Market Management: The Market management sub-system is built using the latest Web
technologies for seamless human interface and transactional database data storage. It will be enhanced to
support machine-to-machine communication with Smart Building and Prosumer agents. This module will
also be enhanced to support near real-time DLMP data visualization.
3: Power System Model Management: The Distribution Power System Model sub-system already
provides an easy-to-use web-based human interface. A new sub-system will be designed and implemented
using Python to support translation of the distribution model into the selected dynamic analysis library or
toolset. This will also integrate transaction intent data from the Market.
5.3 Project Tasks
The proposed tasks for this project are:
T1: Review literature on smart building and prosumer models and communication protocols.
T2: Evaluate AND DOCUMENT available libraries and toolsets for power system dynamic analysis.
T3: Design and implement a rich system model with renewables, storage, and transaction intent sets.
T4: Design and implement autonomous smart building and prosumer agents and integrate the
demand-response agents with the Market sub-system.
T5: Perform steady-state, pricing, and dynamic analysis under a few different demand-response
scenario variations based on the scenario model from T03.
T6: Integrate all sub-systems: Agents, Market, Pricing, Sys. Model, Power Flow, Dynamic Analysis.
T7: Write final report with details of integrated prototype and experiment analysis and results.
5.4 Proposed Project Schedule
23 August 2020 T1, T2, T3 start. Literature, toolset, and library evaluation stage.
01 October 2020 T1 and T2 complete. T4 starts. Scenario enrichment and agent dev. stage.
15 November 2020 T3 complete. T5 starts. Scenario evaluation and agent integration stage.
01 February 2021 T4 and T5 complete. T6 starts. Full integration and testing stage.
30 April 2021 T6 complete. Integrated evaluation and analysis stage.
31 May 2021 T7 complete and Final report. Visit to Avista Corp.
DocuSign Envelope ID: 5C347E5A-B169-4DFC-A85B-4DA0873D9298DocuSign Envelope ID: FC62C062-7F09-480F-95A1-331FACC60827

Page 5
6 Potential Market Path This project will develop the technology and evaluation platforms to enable individuals and
organizations entering the business of producing, selling, and purchasing electric energy. Results from this
project will create new technology and provide answers to the sponsor on the optimal path forward for how
to create and implement a transactive energy market within the utility areas of service. Based on the
technologies created and research questions answered, we hope that it should be feasible to engage in a full
production-scale implementation, for example, through US Department of Energy, State of Idaho, and/or
Private innovation and entrepreneurial funding within the next two years. It is reasonable to estimate that,
based on the results of this and related projects (past and future) and their new discovered technologies, a
working system could be implemented within a few years if funding for full-scale development and testing
can be secured. Such system would enable the creation of a new very high value energy trading market
while helping manage and ensure the voltage stability of the sponsor's power grid. It is a goal that such
market would promote and increase energy competitiveness, renewable energy production, and help ensure
low energy prices and high energy availability.
7 Criteria for Measuring Success Success of this project will be measured in two ways: (1) Tracking the on-time achievement and level-
of-completion of each of the tasks on the project schedule and (2) Informal feedback provided on the
reported progress during the biweekly project status report meetings with the sponsor.
8 Budget Price Sheet and Budget Justification Line Expense Category Cost Estimate 1 Project Director and Principal Investigators Salaries $ 2,171 2 Project Director and Principal Investigators Fringe Benefits
$ 667 3 Graduate Student Researcher Salaries $31,820 4 Graduate Student Researchers Fringe Benefits $ 668 5 Software Licenses and Computing Equipment Rental $ 0 6 Travel to Avista® Corp. Headquarters in Spokane, WA
$ 250
7 Graduate Student Tuition and Health Insurance $23,556
MTDC Modified Total Direct Cost (MTDC) (Rows 1 to 6) $35,576 F&A Facilities and Administrative Costs (50.30% on MTDC)
$17,895 Other Other Direct Costs, no F&A: (Row 7: Tuition and Health Ins.) $23,556 Total
Total Amount of Request (MTDC+F&A+Other) $77,027
Budget Justification: Senior Personnel Salaries and Fringe Benefits: Salaries $2,171 + Fringe benefits
$667: Senior personnel roles are: design, manage, and direct project, and mentor students. Student Salaries
and Fringe Benefits: Salaries: $31,820 + Fringe benefits $668: Two graduate student research assistants
(one PhD, one MS) at average of $21.50/hour for 20 hours/week * 37 weeks during the academic year (740
DocuSign Envelope ID: 5C347E5A-B169-4DFC-A85B-4DA0873D9298DocuSign Envelope ID: FC62C062-7F09-480F-95A1-331FACC60827
Page 6
hrs.) Software licensing and hardware services: $0; Travel: $250: One trip to Avista® Corp. in Spokane to
present results. Student tuition and health insurance for graduate research assistants: Academic year in-
state tuition for one graduate student is $9,876; health insurance is $1,902; Total for two students: $23,556.
Tuition and health insurance not subject to facilities and administrative costs (F&A).
9 Proposal Exceptions to this RFP Per section 5.2 of the RFP, the University has described exceptions to RFP requirements and
conditions in the letter dated May 11, 2020, and included with Appendix A.
10 Appendix A: Proposal Cover Sheet A completed and signed cover sheet is included as part of the RFP response from the U. Idaho.
11 Appendix C: Facilities and Equipment This proposal if awarded will be carried out at the University of Idaho and through remote access to
servers provided by one or more of the laboratories described below housed at the University of Idaho
Campus in Moscow, ID. Laboratories and facilities available to the proposed project are described below.
11.1 RADICL-Moscow: A Hands-On Instructional and Research Computing Laboratory
The University of Idaho’s Cybersecurity Lab or RADICL is the “Reconfigurable Attack-Defend
Instructional Computing Laboratory.” The goal of this special purpose laboratory is to enable hands-on
teaching and research in the areas of cybersecurity, cyber-defense, and modern computing platforms and
networks. Since RADICL’s inception, its computing and software infrastructure has gone through several
improvements. The latest improvements, implemented in 2014, were funded by the State of Idaho under
the Idaho Global Entrepreneurial Mission (IGEM). The current configuration of RADICL makes full use
of virtualization features built into modern computing environments.
RADICL enables teams of students and researchers to create and deploy multiple independent
experiments that are quick to set-up and modify. Within the context of these isolated experiments, students
and researchers design, implement, examine, explore, and develop a detail-oriented and hands-on view of
modern computing infrastructures, along with their associated applications and protocols, and their
strengths, weaknesses, and vulnerabilities. In addition, in RADICL, students and researchers develop a
clear, detail-oriented, and hands-on understanding of the approaches, techniques, and tools used to protect
today’s computing systems and applications. RADICL also provides a dedicated and isolated platform that
enables students to prepare and practice for cyber defense competitions, such as the Pacific Rim Collegiate
Cyber Defense Competition (PR-CCDC) and the CSAW Capture the Flag Competition.
DocuSign Envelope ID: 5C347E5A-B169-4DFC-A85B-4DA0873D9298DocuSign Envelope ID: FC62C062-7F09-480F-95A1-331FACC60827

Page 7
RADICL is a world-class and state-of-the-art computing laboratory that enables hands-on and student-
oriented instruction and hands-on graduate and undergraduate research. It is one of the bases for the
computer laboratory and classroom design in this proposal.
11.2 Power Applications Laboratory
The University of Idaho’s Power Applications Research Group facilities in Moscow include educational
and research laboratory facilities and office space for students.
The Power Applications Laboratory has a cyber-physical system test-bed centered on two real- time
digital simulator with a combination of commercial protection and control equipment, phasor measurement
units and SCADA equipment. The Power Applications Laboratory includes an analog model power system
that is capable of simulating interaction of control and protection hardware in a network with up to five
lines of up to 300 miles length that can be arbitrarily cut and connected. Our system protection hosts a full
complement of commercial protective relays and a fault generator capable of any type of common fault
with any fault impedance and any duration from balance of cycle to two weeks at a 50usec tolerance on
fault initiation. Multiple generation sources can be interfaced with the system including synchronous
machines, a doubly fed induction generator and power electronically coupled generation. Our laboratory
floor in this lab has 1500 square feet of space for experiments. The Power Applications Laboratory also
includes an electric power laboratory with DC power sources rated 125V / 250V DC at 400/200 Amps. Our
AC is 120V, 240V three phase at 50kVA each. We have three other individual DC generation sets at 120V,
100A each and two synchronous and three induction machines at 10hp, each with its own dynamometer
capability. Our five individual DC electronic power supplies are 120V, 7A. We have a full complement of
instruments to support measurements at these levels. Our laboratory floor in this lab has 4681 square feet
of available space in a main open bay and three separate secure rooms to set up experiments. Available
software tools include the following general-purpose tools: Matlab, Mathcad, and LABView, in addition to
power system specific software tools such as Powerworld, DSATools, ATP, EMTP-RV, and
PSCAD/EMTDC.
11.3 Center for Secure and Dependable Systems (CSDS)
The Idaho State Board of Education established the Center for Secure and Dependable Systems (CSDS)
at the University of Idaho in response to the overwhelming need for computer-related security education
and research. CSDS comprises faculty in the areas of Computer Science, Business, Electrical and Computer
Engineering, Civil Engineering, Mathematics, and Sociology, including associates at Idaho National
Laboratory (INL) and Pacific Northwest National Laboratory (PNNL), over 30 students, and 3,000 square
feet of laboratory and office space.
DocuSign Envelope ID: 5C347E5A-B169-4DFC-A85B-4DA0873D9298DocuSign Envelope ID: FC62C062-7F09-480F-95A1-331FACC60827

Page 8
11.4 The University of Idaho College of Engineering
The University of Idaho's College of Engineering is composed of 6 academic departments and 5
research and development centers. The college has about 200 faculty and staff and a student body of 1500
undergraduate student and 350 graduate students. The College of Engineering has several full-time
dedicated Information Technology personnel. Our research infrastructure includes many fully virtualized
modern servers, large storage arrays, a supercomputer, and supporting high-speed fiber-based network
infrastructure, among other specialized computing equipment.
DocuSign Envelope ID: 5C347E5A-B169-4DFC-A85B-4DA0873D9298DocuSign Envelope ID: FC62C062-7F09-480F-95A1-331FACC60827

Page 9
12 Appendix D: Biographical Sketches
12.1 Biographical Sketch: Chakhchoukh
Yacine Chakhchoukh, Ph.D.
Assistant Professor of Electrical Engineering
University of Idaho, GJL 213, Moscow, Idaho 83844-1023
Phone: (208) 885-1550; Email: [email protected]
Professional Preparation National Polytechnic School of Algiers, Algeria Electrical Engineering BSEE, 2004.
University of Paris-Sud XI, Paris, France Electrical Engineering MSEE, 2005.
University of Paris-Sud XI, Paris, France Electrical Engineering PhD, 2010.
Appointments 2016-present: Assistant Professor, Electrical Engineering, University of Idaho.
2015–2016: Project Assistant Prof., Electrical Eng., Tokyo Institute of Technology, Japan.
2013-2015: Postdoctoral Fellow, Electrical Eng., Tokyo Institute of Technology, Japan.
2011-2013: Postdoctoral Fellow, Electrical Engineering, Arizona State University, AZ, USA.
2009–2011: Postdoctoral Fellow, Electrical Eng., Technical University Darmstadt, Germany.
2006–2009: Research Engineer, French Transmission System Operator, RTE-France.
Products: Five related to this proposal 01. Y. Chakhchoukh, V. Vittal, G. T. Heydt and H. Ishii, “LTS-based Robust Hybrid SE Integrating
Correlation”, IEEE Transactions on Power Systems, Vol. 32, No. 4, pp. 3127-3135, July 2017.
02. Y. Chakhchoukh and H. Ishii, “Enhancing Robustness to Cyber-Attacks in Power Systems Through
Multiple Least Trimmed Squares State Estimations,” IEEE Transactions on Power Systems, Vol. 31,
No. 6, pp. 4395-4405, Nov. 2016.
03. Y. Chakhchoukh and H. Ishii, “Coordinated Cyber-Attacks on the Measurement Function in Hybrid
State Estimation,” IEEE Transactions on Power Systems, Vol. 30, No. 5, pp. 2487-2497, Sept. 2015.
04. Y. Chakhchoukh, P. Panciatici and L. Mili, “Electric load forecasting based on statistical robust
methods”, IEEE Transactions on Power Systems, Vol. 26, No. 3, pp. 982-991, Aug. 2011.
05. A. M. Zoubir, V. Koivunen, Y. Chakhchoukh and M. Muma, "Robust Estimation in Signal Processing:
A Tutorial-Style Treatment of Fundamental Concepts," IEEE Signal Processing Magazine, Vol. 29,
No. 4, pp. 61-80, July 2012. Best paper award in 2017.
DocuSign Envelope ID: 5C347E5A-B169-4DFC-A85B-4DA0873D9298DocuSign Envelope ID: FC62C062-7F09-480F-95A1-331FACC60827

Page 10
Products: Five other significant
01. Y. Chakhchoukh, V. Vittal and G. Heydt, “PMU based State Estimation by Integrating correlation”,
IEEE Transactions on Power Systems, Vol. 29, No. 2, pp. 617-626, March 2014.
02. J. Quintero, H. Zhang, Y. Chakhchoukh, V. Vittal and G. Heydt, “Next Generation Transmission
Expansion Planning Framework: Models, Tools, And Educational Opportunities”, IEEE Transactions
on Power Systems, Vol. 29, No. 4, pp. 1911-1918, July 2014.
03. Y. Chakhchoukh, S. Liu, M. Sugiyama and H. Ishii, “Statistical Outlier Detection for Diagnosis of
Cyber Attacks in Power State Estimation”, Proceedings of the 2016 IEEE Power and Energy Society
General Meeting, Boston, MA, July 17-21, 2016.
04. V. Murugessen, Y. Chakhchoukh, V. Vittal, G. T. Heydt, N. Logic and S. Sturgill, “PMU data Buffering
for Power System State Estimators”, IEEE Power and Energy Technology Systems Journal, Vol. 2, No.
3, pp. 94-102, Sep. 2015.
05. Q. Zhang, Y. Chakhchoukh, V. Vittal, G. Heydt, N. Logic and S. Sturgill, “Impact of PMU
Measurement Buffer Length on State Estimation and its Optimization,” IEEE Transactions on Power
Systems, Vol. 28, No. 2, pp. 1657-1665, May 2013.
Synergistic Activities
1. IEEE Power and Energy Society (PES) Member
2. Chair of the panel session: “Addressing Uncertainty, Data Quality and Accuracy in State
Estimation” at the 2018 IEEE General meeting: http://pes-gm.org/2018/
3. Reviewer for several journal and conferences in power systems, smart grid, signal processing and
control theory.
DocuSign Envelope ID: 5C347E5A-B169-4DFC-A85B-4DA0873D9298DocuSign Envelope ID: FC62C062-7F09-480F-95A1-331FACC60827
Page 11
12.2 Biographical Sketch: Conte de Leon
Daniel Conte de Leon, PhD.
Associate Professor of Computer Science and Cybersecurity,
Center for Secure and Dependable Systems and Computer Science Department,
University of Idaho, JEB 233, Moscow, Idaho, 83844-1010, U.S.A.
Phone (208) 885-6520; Email: [email protected]
Professional Preparation UCUDAL, Montevideo, Uruguay, Major: CS, Degree: Informatic Systems Analyst, Year: 1998.
Univ. of Idaho, Moscow, Idaho, Major: Computer Science, Degree: Masters of Sci., Year: 2002.
Univ. of Idaho, Moscow, Idaho, Major: Computer Science, Degree: Doctor of Phil., Year: 2006.
Appointments 2019-Aug.-Present: Associate Professor of Computer Science, University of Idaho (UI).
2013-2019: Assistant Professor of Computer Science, University of Idaho (UI).
2007-2013: Associate Professor of Computer Science, Lewis-Clark State College.
Selected Publications
01. Oyewumi, Ibukun A.*; Jillepalli, Ananth A.*; Richardson, Phillip*; Ashrafuzzaman, Mohammad*;
Johnson, Brian K.; Chakhchoukh, Yacine; Haney, Michael A.; Sheldon, Frederick T.; Conte de Leon,
Daniel;, “ISAAC: The Idaho CPS Smart Grid Cybersecurity Testbed,” Proceedings of the 3rd IEEE
Texas Power and Energy Conference (TPEC-2019), (IEEE), Feb. 2019. DOI: https:
//doi.org/10.1109/TPEC.2019.8662189.
02. Jillepalli, Ananth A.*; Conte de Leon, Daniel; Oyewumi, Ibukun A.*; Alves-Foss, James; Johnson,
Brian K.; Jeffery, Clint L.; Chakhchoukh, Yacine; Haney, Michael A.; Sheldon, Frederick T.,
“Formalizing an Automated, Adversary-aware Risk Assessment Process for Critical Infrastructure,”
Proceedings of the 3rd IEEE Texas Power and Energy Conference (TPEC-2019), (IEEE), Feb. 2019.
DOI: https://doi.org/10.1109/TPEC.2019.8662167.
03. Jillepalli, Ananth A.; Conte de Leon, Daniel; Chakhchoukh, Yacine; Ashrafuzzaman, Mohammad;
Johnson, Brian K.; Sheldon, Frederick T.; Alves-Foss, Jim; Tosic, Predrag T.; Haney, Michael A.
"An architecture for HESTIA: High-level and Extensible System for Training and Infrastructure Risk
Assessment," International Journal of Internet of Things and Cyber-Assurance, Indersience, 2018.
04. Conte de Leon, Daniel; Goes, Christopher E.; Jillepalli, Ananth A.; Haney, Michael A.; Krings, Axel.
"ADLES: Specifying, Deploying, and Sharing Hands-On Cyber-Exercises", Computers and
Security (C&S-Elsevier), 2018. License: CC-BY. DOI: https://doi.org/10.1016/j.cose.2017.12.007.
Link: https://www.sciencedirect.com/science/article/pii/S0167404817302742.
DocuSign Envelope ID: 5C347E5A-B169-4DFC-A85B-4DA0873D9298DocuSign Envelope ID: FC62C062-7F09-480F-95A1-331FACC60827

Page 12
05. Conte de Leon, Daniel; Stalick, Antonius Q.; Jillepalli, Ananth A.; Haney, Michael A.; Sheldon,
Frederick T. "Blockchain: Properties and Misconceptions", Asia Pacific Journal of Innovation and
Entrepreneurship, Vol: 11 Issue: 3, pp. 286-300, December 2017. CC-BY. DOI: https://doi.org/
10.1108/APJIE-12-2017-034. https://www.emeraldinsight.com/doi/abs/10.1108/APJIE-12-2017-034.
06. Conte de Leon, Daniel; Brown, Matthew G.; Jillepalli, Ananth A.; Stalick, Antonius Q.; Alves-Foss,
Jim. "High Level and Formal Router Policy Verification," The Journal of Computing Sciences in
Colleges, Volume 33, Number 1, pp. 118, October 2017. CCSC and ACM 2017. DOI: None. Link:
https://dl.acm.org/citation.cfm?id=3144631.
07. Ananth A. Jillepalli, Daniel Conte de Leon, Stuart Steiner, and Frederick Sheldon, “HERMES: A
High-Level Policy Language for High-Granularity Enterprise-wide Secure Browser Configuration
Management,” Proceedings of the 2016 IEEE Symposium Series on Computational Intelligence
(SSCI-2016), 06-09 December 2016, Athens, Greece, IEEE Computer Society, 2016.
http://dx.doi.org/10.1109/SSCI.2016.TBD
08. Ananth A. Jillepalli and Daniel Conte de Leon, “An Architecture for a Policy-Oriented Web Browser
Management System: HiFiPol: Browser,” Proceedings of the 40th Annual IEEE Computer
Software and Applications Conference (COMPSAC-2016), June 2016, Atlanta, GA, U.S.A. IEEE
Computer Society, 2016. http://dx.doi.org/10.1109/COMPSAC.2016.50
09. Daniel Conte de Leon and Jim Alves-Foss, “Hidden Implementation Dependencies in High Assurance
and Critical Computer Systems,” IEEE Transactions on Software Engineering (IEEE-TSE),
Volume 32, Number 10, October 2006, pages 342-349, IEEE Computer Society, Los Alamitos, CA,
U.S.A. http://dx.doi.org/10.1109/TSE.2006.103
10. Paul W. Oman, Axel Krings, Daniel Conte de Leon, and Jim Alves-Foss, “Analyzing the Security and
Survivability of Real-time Control Systems,” Proceedings of the 5th Annual IEEE Information
Assurance Workshop (IAW’04), 10-11 June 2004, U.S. Military Academy, West Point, NY, U.S.A.
IEEE Computer Society, 2004. http://dx.doi.org/10.1109/IAW.2004.1437837
11. Ananth A. Jillepalli and Daniel Conte de Leon and Sanjeev Shrestha, “Requirements are the New
Code,” Proceedings of the 40th Annual IEEE Computer Software and Applications Conference
(COMPSAC-2016), June 2016, Atlanta, GA, U.S.A. IEEE Computer Society, 2016.
http://dx.doi.org/10.1109/COMPSAC.2016.265
12. Luay A. Whasheh, Daniel Conte de Leon, and Jim Alves-Foss, “Formal Verification and
Visualization of Security Policies,” Journal of Computers (JCP), Volume 3, Issue 6, June 2008,
Academy Publisher, Oulu, Finland. http://academypublisher.com/jcp/vol03/no06/jcp03062231.html
DocuSign Envelope ID: 5C347E5A-B169-4DFC-A85B-4DA0873D9298DocuSign Envelope ID: FC62C062-7F09-480F-95A1-331FACC60827

Page 13
13. Daniel Conte de Leon, Jim Alves-Foss, and Paul W. Oman, “Implementation-Oriented Secure
Architectures,” Proceedings of the 40th Hawaii International Conference on System Sciences
(HICSS-40), 03-06 January 2007, Big Island, HI, U.S.A. IEEE Computer Society, 2007.
http://dx.doi.org/10.1109/HICSS.2007.264.
14. Daniel Conte de Leon and Jim Alves-Foss, “Experiments on Processing and Linking Semantically
Augmented Requirement Specifications,” Proceedings of the 37th Hawaii International
Conference on System Sciences (HICSS-37), 05-08 January 2004, Big Island, HI, U.S.A. IEEE
Computer Society, 2004. http://dx.doi.org/10.1109/HICSS.2004.1265657
15. Jim Alves-Foss, Daniel Conte de Leon, and Paul. W. Oman, “Experiments in the Use of XML to
Enhance Traceability between Object-Oriented Design Specifications and Source Code,”
Proceedings of the 35th Hawaii International Conference on System Sciences (HICSS-35), 05-08
January 2002, HI, U.S.A. IEEE, 2002. Cited by 3 U.S. Patents.
http://dx.doi.org/10.1109/HICSS.2002.994466
Synergistic Activities 1. ISAAC: Idaho Industrial Control Systems Cybersecurity Testbed: I collaborate on the design and
implementation of a state-wide testbed for cybersecurity research. When completed this testbed will
connect five laboratories at the University of Idaho including Power Lab, Visualization and Analytics,
Cybersecurity, Industrial Control Cybersecurity, and IoT Labs. This testbed will enable world-class
research on power, ICS, and cybersecurity including adversarial and attack-defend scenarios.
2. Hands-On Cybersecurity Tutorials: I lead the development and publication of complete and self-
contained Hands-On Tutorials for Cybersecurity Education.
3. ACM/IEEE Computer Science Curricula 2013: I participated in the development of the ACM/IEEE
Comp. Sci. Curricula 2013. Available: https://www.acm.org/education/CS2013-final-report.pdf
4. IEEE Standards Association Voting Member: I have carefully reviewed and voted on more than 10
IEEE standards. Two examples are: “ISO/IEC/IEEE Systems and Software Engineering -
Architecture Description” and “IEEE Draft Recommended Practice for the Use of Probability
Methods for Conducting a Reliability Analysis of Industrial and Commercial Power Systems.”
5. Hands-On Instructional Computing Laboratory: I manage the Reconfigurable Attack-Defend
Instructional Computing Laboratory (RADICL-Moscow). RADICL is a specialized computing
laboratory that enables hands-on teaching and research in cybersecurity.
DocuSign Envelope ID: 5C347E5A-B169-4DFC-A85B-4DA0873D9298DocuSign Envelope ID: FC62C062-7F09-480F-95A1-331FACC60827

Page 14
12.3 Biographical Sketch: Johnson
Brian K. Johnson, Ph.D., P.E.
Distinguished Professor of Electrical Engineering
Schweitzer Engineering Laboratories Endowed Chair in Power Engineering
University of Idaho, GJL 201, Moscow, Idaho 83844-1023
Phone: (208) 885-6902; Email: [email protected]
Professional Preparation University of Wisconsin-Madison, Madison, WI Electrical Engineering BSEE, 1987.
University of Wisconsin-Madison, Madison, WI Electrical Engineering MSEE, 1989.
University of Wisconsin-Madison, Madison, WI Electrical Engineering PhD, 1992.
Appointments 2004–present: Professor Electrical Engineering, University of Idaho.
2006-2012: Chair, Department of Electrical and Computer Engineering.
1997–2004: Associate Professor, Electrical Engineering, University of Idaho.
1992–1997: Assistant Professor, Electrical Engineering, University of Idaho.
Professional Registration Registered Professional Engineer (Idaho #8368)
Recent Publications 01. Taylor, D.I., J.D. Law, B.K. Johnson, and N. Fischer. “Single-Phase Transformer Inrush Current
Reduction Using Prefluxing,” IEEE Transactions on Power Delivery, Vol. 27, No. 1, January 2012,
pp. 245-252.
02. K. Eshghi, B.K. Johnson, C.G. Rieger, “Power System Protection and Resilient Metrics” Proceedings
of the 2015 Resilience Week, Philadelphia, PA, August 18-20, 2015.
03. R. Jain, B. Johnson, H. Hess, “Performance of Line Protection and Supervisory Elements for Doubly
Fed Wind Turbines” Proceedings of the 2015 IEEE Power and Energy Society General Meeting,
Denver, Colorado, July 27-31, 2015.
04. A. Guzmán, V. Skendzic, M. V. Mynam, S. Marx, B. K. Johnson, “Traveling Wave Fault Location
Experience at Bonneville Power Administration,” Proceedings of the International Conference on
Power Systems Transients (IPST2015), Dubrovnik, Croatia, July 15-18, 2015.
06. B. K. Johnson, S. Jadid, “Synchrophasors for Validation of Distance Relay Settings: Real Time
Digital Simulation and Field Results,” Proceedings of the International Conference on Power Systems
Transients (IPST2015), Dubrovnik, Croatia, July 15-18, 2015.
DocuSign Envelope ID: 5C347E5A-B169-4DFC-A85B-4DA0873D9298DocuSign Envelope ID: FC62C062-7F09-480F-95A1-331FACC60827

Page 15
07. H. Li, G. Parker, B.K. Johnson, J.D. Law, K. Morse, D.F. Elger, “Modeling and Simulation of a High-
Head Pumped Hydro System,” 2014 IEEE Transmission and Distribution Conf. & Expo, April 2014.
08. Y. Xia, B.K. Johnson, H. Xia, N. Fischer, “Application of Modern Techniques for Detecting
Subsynchronous Oscillations in Power Systems.” Proceedings of the 2013 IEEE Power and Energy
Society General Meeting, Vancouver Canada, July 21-25, 2013.
09. Y. Xia, B.K. Johnson, N. Fischer, H. Xia, “A Comparison of Different Signal Selection Options and
Signal Processing Techniques for Subsynchronous Resonance Detection,” Proceedings of the
International Conf. on Power Systems Transients (IPST2013), Vancouver, Canada July 1820, 2013.
10. M.P. Bahrman and B.K. Johnson, “The ABCs of HVDC Transmission Technologies,” IEEE Power
and Energy. Vol. 5, No. 2, pp. 32-44, March-April 2007.
Related Research Projects 01. B.K. Johnson and J. Alves-Foss, “TWC: Small: Securing Smart Power Grids Under Data
Measurement Cyber Threats”, Syracuse University (subcontract of NSF funding). August 16, 2015-
August 15, 2018, $210,696.
02. B.K. Johnson and H.L. Hess, “Smart Wires for Increasing Transmission and Distribution Efficiency,”
Avista® Corporation, August 23, 2015 – August 22, 2016, $75,044.
03. H.L. Hess and B.K. Johnson, “Critical Load Serving Capability by Optimizing Microgrid Operation,”
Avista® Corporation, Oct 1-2015 – Sept 30, 2016, $79,856.
04. B.K. Johnson, “Online Synchronous Machine Parameter Identification,” Schweitzer Engineering
Laboratories, Inc. August 1, 2014-July 31, 2016, $155,037.
05. B.K. Johnson and H.L. Hess, “Modeling and Design Options for an All Superconducting Shipboard
Electric Power Architecture,” Office of Naval Research, October 2013-September, 2015, $56,894
06. Johnson, B.K, J.D. Law, and D.F. Elger, “Renewable Energy Balancing,” Shell Energy North
America, June 11, 2012-March 31, 2013, $75,000.
07. Johnson, B.K. and J.D. Law. “Subsynchronous Resonance Risk Assessment and Countermeasures,”
Laboratory for Applied Scientific Research (subcontract from Schweitzer Engineering Laboratories,
Inc.), March 31, 2012-January 31, 2013, $35,881.
08. Johnson, B.K. and Hess, H.L, “Modeling of Harmonic Injections and Their Impacts,” Idaho Power
Corporation, $48,674, June 1, 2006-August 15, 2007.
DocuSign Envelope ID: 5C347E5A-B169-4DFC-A85B-4DA0873D9298DocuSign Envelope ID: FC62C062-7F09-480F-95A1-331FACC60827

Page 16
12.4 Biographical Sketch: Hess
Dr. Herbert L. Hess
Professor of Electrical Engineering
University of Idaho, GJL 205, Moscow, Idaho 83844-1023
Phone: (208) 885-4341; Email: [email protected]
Education Ph.D., Electrical and Computer Engineering, Univ. of Wisconsin-Madison, 22 August 1993.
S.M., Electrical and Computer Engineering, Mass. Institute of Technology, 15 September 1982.
B.S., Applied Science and Engineering, United States Military Academy, 8 June 1977.
Experience 2006-Present: Professor, University of Idaho.
1999-2006: Associate Professor, University of Idaho.
1993-1999: Assistant Professor, University of Idaho.
2001-2005: Reserve Research Engineer, US Army RDECOM.
2001-2002: Electrical Engineer, US Army RDECOM.
1989-2000: Reserve Professor, United States Military Academy.
1983-1988: Assistant Professor, United States Military Academy.
Research Interests
Power electronic converters, great and small: on-chip architectures for switching power electronic
converters and their constituent transistors, motor drives, power supplies, battery chargers and
monitors, large switching power converters, power quality.
Professional Memberships IEEE (Societies: IES, IAS, PELS, PES, EDS)
ASEE (Divisions: ECE, ECCD, Instrumentation).
The Honor Society of Phi Kappa Phi (University of Idaho Chapter Past President).
DocuSign Envelope ID: 5C347E5A-B169-4DFC-A85B-4DA0873D9298DocuSign Envelope ID: FC62C062-7F09-480F-95A1-331FACC60827

Page 17
Publications and Patents 01. Wiegers, R.*, D. Blackketter, and H. Hess, “A Method for Balancing Ultracapacitor Voltage Arrays
in an Electric Vehicle Braking System,” International Journal of Vehicle Design, accepted for
publication.
02. Samineni, S.*, B. Johnson, H. Hess, and J. Law, “Modeling and Analysis of a Flywheel Energy
Storage System for Voltage Sag Correction, IEEE Transactions on Industry Applications, XLII, 1,
January/February 2006, pp. 1-11.
03. Martinez, J., B. Johnson, and H. Hess, “Power Semiconductors,” IEEE Transactions on Power
Delivery, XX, 3, July 2005, pp. 2086-2094.
04. Alahmad, M.*, M. Braley*, J. Nance*, V. Sukumar*, K. Buck*, H. Hess, and H. Li, “Microprocessor
Based Battery Power Management System Enhances Charging, Monitoring, and Protection Features,”
Battery Power Products and Technology, VIII, 6, November 2004, pp. 17-19.
05. Muljadi, E, H.L. Hess, and K. Thomas*, “Zero Sequence Method for Energy Recovery from a
Variable- Speed Wind Turbine Generator,” IEEE Transactions on Energy Conversion, XVI, 1, March
2001, pp. 99-103.
06. Johnson, B.K., and H.L. Hess. “Active Damping for Electromagnetic Transients in Superconducting
Systems.” IEEE Transactions on Applied Superconductivity, IX, 6, June 1999, pp. 318-321.
07. Hess, H.L., D.M. Divan, and Y.H. Xue*. “Modulation Strategies for a New SCR-Based Induction
Motor Drive System with a Wide Speed Range.” IEEE Transactions on Industry Applications, XXX,
6, November-December 1994, pp. 1156-1163.
08. Umans, S.D., and H.L. Hess. “Modeling and Analysis of the Wanlass Three Phase Motor
Configuration.” IEEE Transactions on Power Apparatus and Systems, CII, 9, September 1983, pp.
2912-2921.
09. Padaca, V.F., and H. Hess. “Voltage Sags Plague a Food Processing Facility.” Power Quality
Assurance, VII, 1, January-February 1997, pp. 1-5 (invited technical article).
10. Peterson, J.N., and HL Hess, “Feasibility, Design and Construction of a Small Hydroelectric Power
Generation Station as a Student Design Project," American Society for Engineering Education 1999
Annual Conference, July 1999, Session 2633. Best Paper Overall Conference.
11. Mentze, E.*, K. Buck*, H. Hess, D. Cox, H. Li, and M. Mojarradi, Patent Pending, “High Voltage to
Low Voltage Level Shifter,” US Patent #7,061,298, 13 June 2006.
12. Hess, H.L., and D.M. Divan, “Thyristor Based DC Link Current Source Power Conversion System for
Motor Driven Operation,” U.S. Patent 5,483,140, 09 January 1996.
DocuSign Envelope ID: 5C347E5A-B169-4DFC-A85B-4DA0873D9298DocuSign Envelope ID: FC62C062-7F09-480F-95A1-331FACC60827

APPENDIX DIdaho State University Agreement


$33(1',;$3URSRVDO&RYHU6KHHW%LGGHU,QIRUPDWLRQ
2UJDQL]DWLRQ1DPH,GDKR6WDWH8QLYHUVLW\2UJDQL]DWLRQ)RUP6WDWH,QVWLWXWLRQQRQSURILW3ULPDU\&RQWDFW3HUVRQ3DXO%RGLO\3URJUDPPDWLF'DYH%+DUULV$GPLQLVWUDWLYH 7LWOH$VVLVWDQW3URIHVVRU3URJUDPPDWLF$VVLVWDQW9LFH3UHVLGHQWIRU5HVHDUFK$GPLQLVWUDWLYH $GGUHVV6RXWKWK$YHQXH6WRS&LW\6WDWH=LS3RFDWHOOR,'7HOHSKRQH3URJUDPPDWLF$GPLQLVWUDWLYH)D[ )HGHUDO7D[,'(PDLO$GGUHVVERGLSDXO#LVXHGX3URJUDPPDWLFUHVGHY#LVXHGX$GPLQLVWUDWLYH1DPH DQG WLWOH RI WKH SHUVRQV DXWKRUL]HG WR UHSUHVHQW %LGGHU LQ DQ\ QHJRWLDWLRQV DQG VLJQ DQ\ FRQWUDFWWKDWPD\UHVXOW³$XWKRUL]HG5HSUHVHQWDWLYH´1DPH 'DYH+DUULV 7LWOH$VVLVWDQW9LFH3UHVLGHQWIRU5HVHDUFK
,I FODVVLILHG DV D FRQWUDFWRU SURYLGH FRQWUDFWRU UHJLVWUDWLRQOLFHQVH QXPEHU DSSOLFDEOH WR WKH VWDWH LQ ZKLFK6HUYLFHVDUHWREHSHUIRUPHG1$3URYLGH DW OHDVW WKUHH UHIHUHQFHV ZLWK WHOHSKRQH QXPEHUV SOHDVH YHULI\ QXPEHUV WKDW $YLVWD PD\FRQWDFWWRYHULI\WKHTXDOLW\RI%LGGHU¶VSUHYLRXVZRUNLQWKHSURSRVHGDUHDRI:RUN 5()(5(1&(1R2UJDQL]DWLRQ1DPH%RLVH6WDWH8QLYHUVLW\&RQWDFW3HUVRQ-RKQ*DUGQHU3URMHFW7LWOH&((5,,$&(QHUJ\$VVHVVPHQW'2(
7HOHSKRQH )D[ (PDLOMJDUGQHU#ERLVHVWDWHHGX
5()(5(1&(1R2UJDQL]DWLRQ1DPH0RQWDQD6WDWH8QLYHUVLW\&RQWDFW3HUVRQ&OHPHQWH,]XUHLWD3URMHFW7LWOH6066RIWZDUH4XDOLW\$QDO\VLVDQG$VVXUDQFH3URMHFW
7HOHSKRQH )D[ (PDLOFOHPHQWHL]XULHWD#PRQWDQDHGX
5()(5(1&(1R
DocuSign Envelope ID: 7CC689CE-B496-41AE-A9B1-5AEA49BCC614

2UJDQL]DWLRQ1DPH%ULJKDP<RXQJ8QLYHUVLW\&RQWDFW3HUVRQ'DQ9HQWXUD3URMHFW7LWOH0DFKLQH/HDUQLQJIRU,QVSLUHG6WUXFWXUHG/\ULFDO0XVLF&RPSRVLWLRQ
7HOHSKRQH )D[ (PDLOYHQWXUD#FVLVXHGX
%\ VLJQLQJ WKLV SDJH DQG VXEPLWWLQJ D 3URSRVDO WKH $XWKRUL]HG 5HSUHVHQWDWLYH FHUWLILHV WKDW WKH IROORZLQJVWDWHPHQWVDUHWUXH
7KH\DUHDXWKRUL]HGWRELQG%LGGHU¶VRUJDQL]DWLRQ
1R DWWHPSW KDV EHHQ PDGH RU ZLOO EH PDGH E\ %LGGHU WR LQGXFH DQ\ RWKHU SHUVRQ RU RUJDQL]DWLRQWRVXEPLWRUQRWVXEPLWD3URSRVDO
%LGGHU GRHV QRW GLVFULPLQDWH LQ LWV HPSOR\PHQW SUDFWLFHV ZLWK UHJDUG WR UDFH FUHHG DJH UHOLJLRXVDIILOLDWLRQVH[GLVDELOLW\VH[XDORULHQWDWLRQRUQDWLRQDORULJLQ
%LGGHU KDV QRW GLVFULPLQDWHG DQG ZLOO QRW GLVFULPLQDWH DJDLQVW DQ\ PLQRULW\ ZRPHQ RU HPHUJLQJVPDOOEXVLQHVVHQWHUSULVHLQREWDLQLQJDQ\VXEFRQWUDFWVLIUHTXLUHG
%LGGHU ZLOO HQWHU LQWR D FRQWUDFW ZLWK $YLVWD DQG XQGHUVWDQGV WKDW WKH ILQDO $JUHHPHQW DQG *HQHUDO &RQGLWLRQV DSSOLFDEOH WR WKH 6FRSH RI :RUN XQGHU WKLV 5)3 ZLOO EH VHQW IRU VLJQDWXUHXQGHUVHSDUDWHFRYHU
7KH VWDWHPHQWV FRQWDLQHG LQ WKLV 3URSRVDO DUH WUXH DQG FRPSOHWH WR WKH EHVW RI WKH $XWKRUL]HG 5HSUHVHQWDWLYH¶VNQRZOHGJH
,IDZDUGHGDFRQWUDFWXQGHUWKLV5)3%LGGHUL $FFHSWV WKH REOLJDWLRQ WR FRPSO\ ZLWK DOO DSSOLFDEOH VWDWH DQG IHGHUDO UHTXLUHPHQWV SROLFLHV VWDQGDUGV DQG UHJXODWLRQV LQFOXGLQJ DSSURSULDWH LQYRLFLQJ RI VWDWH DQG ORFDO VDOHVXVHWD[HVLIDQ\DVVHSDUDWHOLQHLWHPV
LL $FNQRZOHGJHV LWV UHVSRQVLELOLW\ IRU WUDQVPLWWDO RI VXFK VDOHV WD[ SD\PHQWV WR WKH WD[LQJ DXWKRULW\
LLL $JUHHV WR SURYLGH DW OHDVW WKH PLQLPXP OLDELOLW\ LQVXUDQFH FRYHUDJH VSHFLILHG LQ $YLVWD¶VDWWDFKHGVDPSOH$JUHHPHQWLIDZDUGHGDFRQWUDFWXQGHUWKLV5)3
,I WKHUH DUH DQ\ H[FHSWLRQV WR $YLVWD¶V 5)3 UHTXLUHPHQWV RU WKH FRQGLWLRQV VHW IRUWK LQ DQ\ RI WKH5)3GRFXPHQWVVXFKH[FHSWLRQVKDYHEHHQGHVFULEHGLQGHWDLOLQ%LGGHU¶V3URSRVDO
%LGGHU KDV UHDG WKH ³&RQILGHQWLDOLW\ 1RWLFH´ VHW IRUWK RQ WKH VHFRQG SDJH RI WKHVH ³,16758&7,216$1'5(48,5(0(176´DQGDJUHHVWREHERXQGE\WKHWHUPVRIVDPH
6LJQDWXUH 'DWH
7+,63$*(0867%(7+(7233$*(2)%,''(5¶6352326$/
5/18/2020
DocuSign Envelope ID: 7CC689CE-B496-41AE-A9B1-5AEA49BCC614

AER R-43127 Proposal: Automating Predictive Maintenance for Energy Efficiency via Machine
Learning and IoT Sensors
1. Institution: Idaho State University (ISU)2. Principal Investigator: Paul Bodily
3. Project Objective and Total amount requested: $82,112
Our goal is to develop an energy management decision support tool, with the purpose of leveraging
sensors, to automate prediction and optimization of energy efficiency and reduce operational costs from
the point of view of management in the context of small to medium size businesses. Our central
hypothesis is that a significant portion of energy losses and inefficiencies among small- to medium-sized
business, consumers arise due to a common set of maintenance-related issues that can be assessed and
mitigated through the application of predictive modeling using data collected both manually and
automatically via sensors. We have based our central hypothesis on the fact that the keys to saving energy
include the implementation of energy management techniques, specifically equipment maintenance and
monitoring techniques [12]. In addition, predictive maintenance uses equipment sensors (manually or
automatically operated) that indicate and predict when maintenance will be required [12]. Both sensors
and a commodity Internet of Things (IoT) platform that can serve as the basis for these sensors are readily
available. Additionally, machine learning has been shown to be highly effective at predictive modeling
[7]. Combined, these are capable of automatically collecting, propagating, and assessing underlying
maintenance data, all of which are necessary to develop the tools required by managers to effectively plan
and manage energy efficient maintenance [13]. Our rationale for this project is that its successful
completion will lead to cost-effective, automated solutions for overcoming maintenance-related energy
losses in small- to medium-sized businesses and to the education and training of a skilled workforce in
smart energy decision support ready to apply this new knowledge to develop a platform that serves to
strengthen small- to medium-sized businesses. Our objective in this application is to perform assessments
of the existing operational infrastructure and constraints at ISU that represent many of the systems found
in small to medium sized manufacturing businesses, such as material/product handling, fluid flow, electric
motor drive systems, and other systems. Components making up these systems can be the cause of
maintenance issues that lead to energy losses, such as vibration causing wear in bearings, which can be
identified by a change of sound, movement, or temperature, indicating possible changes within the
component that are outside the required operational range. The data collected will be used to design,
develop, and test an IoT sensor platform and cloud-based smart decision-support tool incorporating
Attachment A
DocuSign Envelope ID: 7CC689CE-B496-41AE-A9B1-5AEA49BCC614

predictive machine learning to improve and automate decisions for energy efficiency and curtailment. We
plan to attain the overall objective by pursuing the following three specific aims:
Specific aim #1: Development of a cost effective, general IoT-based sensor platform for
automated collection of operational data for predictive maintenance.
Specific aim #2: Development of an online and mobile, data-driven, decision-support tool for
improved energy efficiency in maintenance practices at small-to-medium businesses.
Specific aim #3: Training of students (2 ME and 1 CS) in the development of smart energy
efficiency tools, providing hands-on industrial experience and reinforcing classroom learning.
4. Resource Commitments: We are well-positioned to lead this project based on our years of experience
in working with sensor data and machine learning and decision support development experience, a team
member with experience in energy assessment through a CEERI-IAC project and experience in process
auditing, evaluation and assessment, our connections to several key businesses in our target demographic,
and the facilities of the Measurement & Control Engineering Research Center (MCERC) at Idaho State
University which will support this project. MCERC is a state-approved research facility devoted to
fostering and facilitating controls engineering research.
Our research team consists of an interdisciplinary group of seven researchers that regularly collaborate
under MCERC. Marco P. Schoen, Professor of Mechanical Engineering (ME) and director of MCERC,
focuses on control systems, estimation, vibration analysis, and optimization. His work includes controls
for renewable energy systems such as wind power and wave energy converters. Dr. Anish Sebastian,
Assistant Professor of ME, has expertise in sensor design and development with multi-array sensor data
fusion and probabilistic data optimization. He has also been the PI for Plant Virus Detection using
Multi-Agent Robotic Sensing and Learning supported by Idaho State University ($19,982 from 2018
-2019) and PI for Materials Testing for the Washie Project supported by Idaho Global Entrepreneurial
Mission (IGEM)($94,097, 2019-2021). Dr. Omid Heidari, Visiting Assistant Professor, specializes in
robotics focused on kinematics and motion planning with applications in exoskeletons and rehabilitation.
Professor Mary Hofle (ME), has expertise in energy and process auditing, evaluation, and assessment,
equipment design and process development and improvement, research focus in thermal/fluid systems,
and is a licensed professional engineer. Professor Kellie Wilson (ME) specializes in control systems
focusing on adaptive control and thermodynamic systems. Dr. Paul Bodily, Assistant Professor of
DocuSign Envelope ID: 7CC689CE-B496-41AE-A9B1-5AEA49BCC614
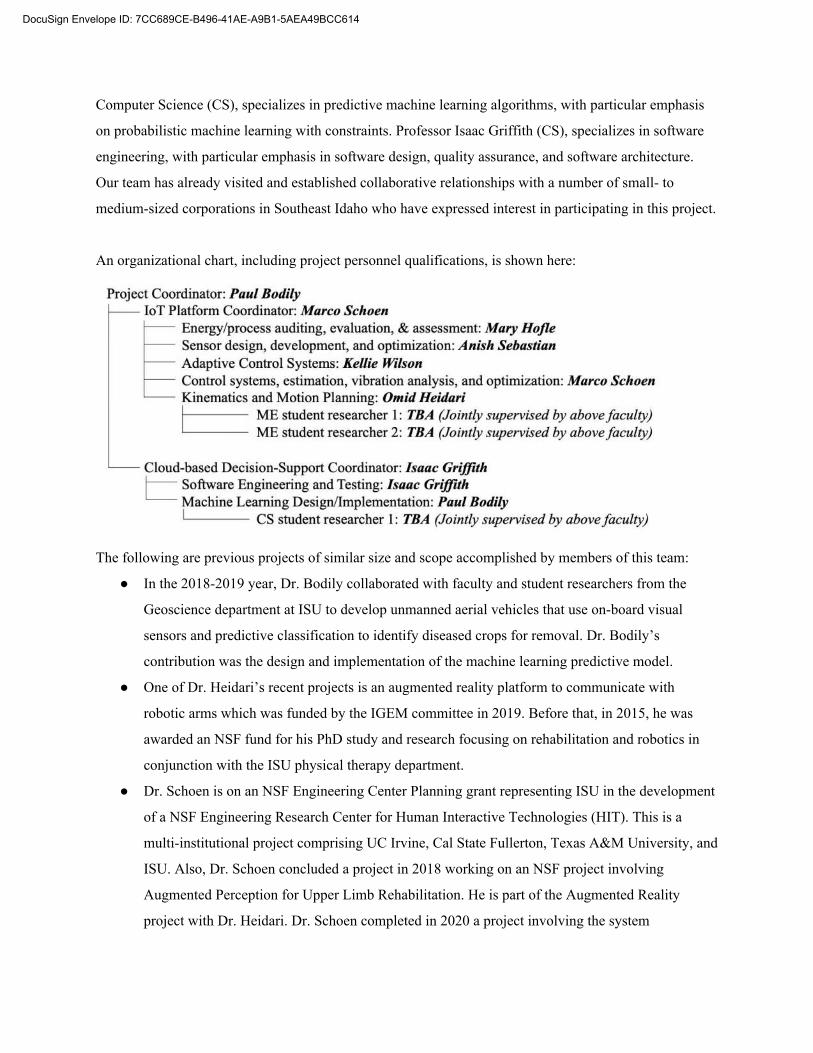
Computer Science (CS), specializes in predictive machine learning algorithms, with particular emphasis
on probabilistic machine learning with constraints. Professor Isaac Griffith (CS), specializes in software
engineering, with particular emphasis in software design, quality assurance, and software architecture.
Our team has already visited and established collaborative relationships with a number of small- to
medium-sized corporations in Southeast Idaho who have expressed interest in participating in this project.
An organizational chart, including project personnel qualifications, is shown here:
The following are previous projects of similar size and scope accomplished by members of this team:
In the 2018-2019 year, Dr. Bodily collaborated with faculty and student researchers from the
Geoscience department at ISU to develop unmanned aerial vehicles that use on-board visual
sensors and predictive classification to identify diseased crops for removal. Dr. Bodily’s
contribution was the design and implementation of the machine learning predictive model.
One of Dr. Heidari’s recent projects is an augmented reality platform to communicate with
robotic arms which was funded by the IGEM committee in 2019. Before that, in 2015, he was
awarded an NSF fund for his PhD study and research focusing on rehabilitation and robotics in
conjunction with the ISU physical therapy department.
Dr. Schoen is on an NSF Engineering Center Planning grant representing ISU in the development
of a NSF Engineering Research Center for Human Interactive Technologies (HIT). This is a
multi-institutional project comprising UC Irvine, Cal State Fullerton, Texas A&M University, and
ISU. Also, Dr. Schoen concluded a project in 2018 working on an NSF project involving
Augmented Perception for Upper Limb Rehabilitation. He is part of the Augmented Reality
project with Dr. Heidari. Dr. Schoen completed in 2020 a project involving the system
DocuSign Envelope ID: 7CC689CE-B496-41AE-A9B1-5AEA49BCC614

identification of additive manufacturing processes, funded by Idaho National Laboratory. He is
starting on a project entitled “Materials and Efficient Processing Approach for Materials for
Harsh Environments,” funded by the DOE addressing the controls portion of the project.
Professor Griffith’s is currently working with a team of students to develop an event scheduling
web app for the College of Science and Engineering at ISU. This project started in 2019 and
consists of a team of 2 - 5 students. Professor Griffith’s roles on this team is system architect and
software development lead. Previously from 2015 to 2018, Professor Griffith worked with the
TechLink Center to develop a software quality analysis system for the Army Corps of Engineers,
while also working with a team of student software engineers.
5. Specific Project Plan: To accomplish the specific aims of the project, the project milestones with clear
stage and gates are described below. An overview of the proposed project is provided in Fig. 1.
Aim #1: August 17, 2020 – October 31, 2020
Systems have been identified at ISU that represent those found in small to medium sized manufacturing
facilities. Examples of these systems include belt drive transmission systems including motors and
bearings, piping systems including pumps, and heat exchangers. Areas of energy loss within the system
will be identified and instrumented with appropriate sensors, such as temperature and humidity, vibration,
accelerometers, and pressure sensors. A combination of these sensors applied to each component offer
information on the relationship between the parameters being measured and data being collected. The aim
is to collect data automatically, evaluate the data for changes in performance of the component, and use
the data to develop a prototype of a general IoT platform for predictive maintenance. Testing and
assessment of the prototype IoT platform will be performed on systems with sensors at the MCERC lab
and other facilities at ISU by Drs. Sebastian, Heidari, Hofle, Wilson, and Schoen and students.
Aim #2: November 1, 2020 – May 1, 2021
Drs. Bodily and Griffith well design and develop a prototype of a cloud-based smart tool for a data-driven
decision support. The tool will provide a machine-to-machine interface for data collection. The tool will
have a guided user interface to facilitate the data-driven decision support to the end user (deadline:
December 31, 2021). In between these two layers will be a machine learning infrastructure that collects
data for individual components and aggregates data across components for ongoing training of machine
learning models. The machine learning approach proposed in this work will use predictive classification
models to detect precursors of system component degradation and/or failure to then be communicated via
DocuSign Envelope ID: 7CC689CE-B496-41AE-A9B1-5AEA49BCC614
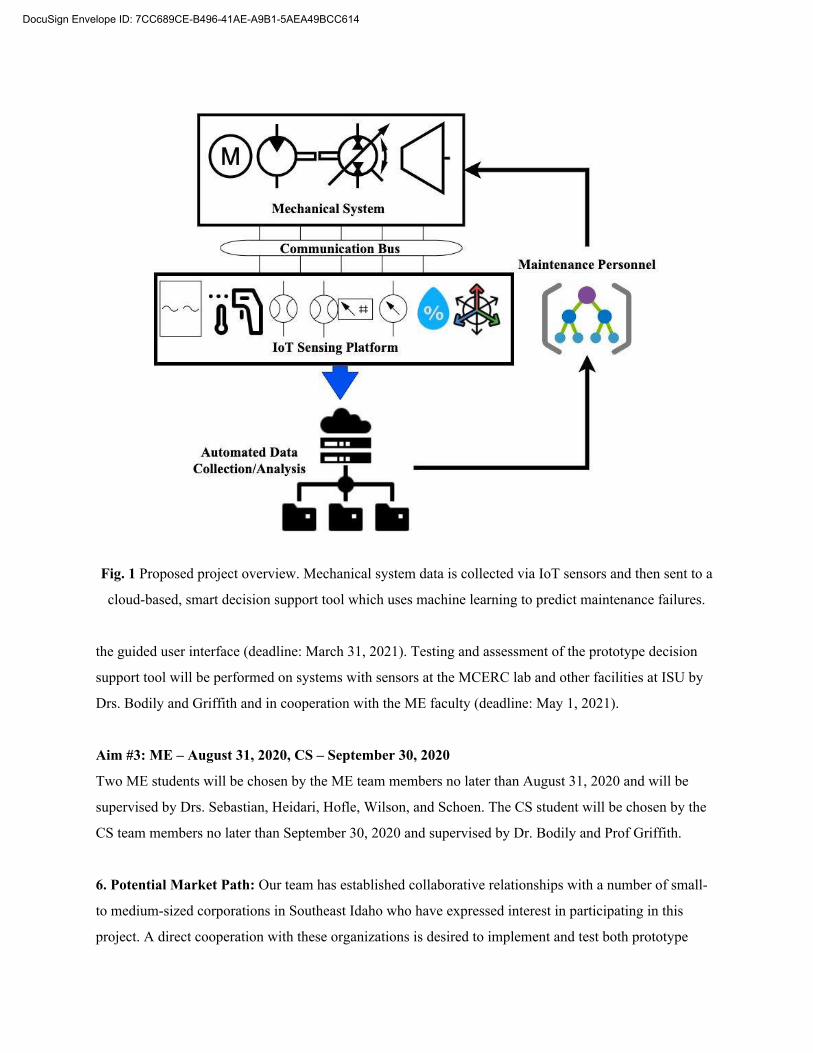
Fig. 1 Proposed project overview. Mechanical system data is collected via IoT sensors and then sent to a
cloud-based, smart decision support tool which uses machine learning to predict maintenance failures.
the guided user interface (deadline: March 31, 2021). Testing and assessment of the prototype decision
support tool will be performed on systems with sensors at the MCERC lab and other facilities at ISU by
Drs. Bodily and Griffith and in cooperation with the ME faculty (deadline: May 1, 2021).
Aim #3: ME – August 31, 2020, CS – September 30, 2020
Two ME students will be chosen by the ME team members no later than August 31, 2020 and will be
supervised by Drs. Sebastian, Heidari, Hofle, Wilson, and Schoen. The CS student will be chosen by the
CS team members no later than September 30, 2020 and supervised by Dr. Bodily and Prof Griffith.
6. Potential Market Path: Our team has established collaborative relationships with a number of small-
to medium-sized corporations in Southeast Idaho who have expressed interest in participating in this
project. A direct cooperation with these organizations is desired to implement and test both prototype
DocuSign Envelope ID: 7CC689CE-B496-41AE-A9B1-5AEA49BCC614

platforms (IoT and cloud-based platforms) being developed in an actual manufacturing environment. The
requested funds allow for developing all the necessary algorithms as well as the corresponding IoT sensor
platform and cloud-based decision-support tool as a prototype.
7. Criteria for Measuring Success: Results of the testing of the general IoT platform will be evaluated
and assessed for being able to monitor and identify small changes in the performance of the areas of
energy loss based on the data collected. Successful evaluation will lead to the development of the
prototype for the cloud-based system. Results of the testing of the cloud-based prototype will be evaluated
and assessed for being able to monitor and identify changes in the performance of the energy loss areas
based on the data collected and the ability of the system to work for both web and mobile interfaces.
8. Budget: Requested funding is for one year and will support three students on an hourly base for 46
weeks, 19 hrs/wk, $15 per hour, amounting to $13,110 per student per year. The students are from the
ME, CS, and Measurement and Control Engineering programs at ISU. The fringe benefit is computed as
8.9% of the hourly support, resulting in $1,167 per student and per year. Total personnel costs are
$42,830. One computer handling the communication with all the remote sensing systems and hosting the
machine learning components, will be acquired at $3,500 along with 10 Raspberry Pi 4’s, one for each
remote location at $100 for each Raspberry Pi. Two additional computers for student work are acquired
for $2,500 each. A set of sensors that are compatible with the Raspberry Pi 4’s including temperature,
flow, position, acceleration (contact and non-contact) current, electrostatics, and sound will be purchased
in order to instrument the various systems to be monitored. The total cost for all the different sensors is
$4,895. In addition, mechanical fasteners, tools and as well as electrical component supplies will be
needed to interface the various sensors to the different systems as well as to the Raspberry Pi units. The
costs for these mechanical and electrical supplies is $600. The budget is as follows:
Category Total Cost
Fringe Benefits $3,500
Supplies/Services $14,995
Equipment $0
Subcontracts $0
Category Total Cost
Other Direct Costs $0
Indirect Costs $24,287
Student and Wages $39,330
Total Costs: $82,112
DocuSign Envelope ID: 7CC689CE-B496-41AE-A9B1-5AEA49BCC614

ƉƉĞŶĚŝdž
/ĚĂŚŽ^ƚĂƚĞhŶŝǀĞƌƐŝƚLJĂĂƌŶĞŐŝĞͲĐůĂƐƐŝĨŝĞĚĚŽĐƚŽƌĂůƌĞƐĞĂƌĐŚĂŶĚƚĞĂĐŚŝŶŐŝŶƐƚŝƚƵƚŝŽŶĨŽƵŶĚĞĚŝŶϭϵϬϭĂƚƚƌĂĐƚƐƐƚƵĚĞŶƚƐĨƌŽŵĂƌŽƵŶĚƚŚĞǁŽƌůĚƚŽŝƚƐ/ĚĂŚŽĐĂŵƉƵƐĞƐƚƚŚĞŵĂŝŶĐĂŵƉƵƐŝŶWŽĐĂƚĞůůŽĂŶĚĂƚůŽĐĂƚŝŽŶƐŝŶDĞƌŝĚŝĂŶ/ĚĂŚŽ&ĂůůƐĂŶĚdǁŝŶ&ĂůůƐ/^hŽĨĨĞƌƐĂĐĐĞƐƐƚŽŚŝŐŚͲƋƵĂůŝƚLJĞĚƵĐĂƚŝŽŶŝŶŵŽƌĞƚŚĂŶϮϱϬƉƌŽŐƌĂŵƐKǀĞƌϭϮϬϬϬƐƚƵĚĞŶƚƐĂƚƚĞŶĚ/^hƌĞĐĞŝǀŝŶŐĞĚƵĐĂƚŝŽŶĂŶĚƚƌĂŝŶŝŶŐŝŶƚŚŽƐĞƉƌŽŐƌĂŵƐ/ĚĂŚŽ^ƚĂƚĞhŶŝǀĞƌƐŝƚLJŝƐƚŚĞƐƚĂƚĞΖƐĚĞƐŝŐŶĂƚĞĚůĞĂĚŝŶƐƚŝƚƵƚŝŽŶŝŶŚĞĂůƚŚƉƌŽĨĞƐƐŝŽŶƐ/ĚĂŚŽ^ƚĂƚĞhŶŝǀĞƌƐŝƚLJĨĂĐƵůƚLJĂŶĚƐƚƵĚĞŶƚƐĂƌĞůĞĂĚŝŶŐƚŚĞǁĂLJŝŶĐƵƚƚŝŶŐͲĞĚŐĞƌĞƐĞĂƌĐŚĂŶĚŝŶŶŽǀĂƚŝǀĞƐŽůƵƚŝŽŶƐŝŶƚŚĞĂƌĞĂƐŽĨĞŶĞƌŐLJŚĞĂůƚŚƉƌŽĨĞƐƐŝŽŶƐŶƵĐůĞĂƌƌĞƐĞĂƌĐŚƚĞĂĐŚŝŶŐŚƵŵĂŶŝƚŝĞƐĞŶŐŝŶĞĞƌŝŶŐƉĞƌĨŽƌŵŝŶŐĂŶĚǀŝƐƵĂůĂƌƚƐƚĞĐŚŶŽůŽŐLJďŝŽůŽŐŝĐĂůƐĐŝĞŶĐĞƐƉŚĂƌŵĂĐLJĂŶĚďƵƐŝŶĞƐƐ
DĞĂƐƵƌĞŵĞŶƚĂŶĚŽŶƚƌŽůŶŐŝŶĞĞƌŝŶŐZĞƐĞĂƌĐŚĞŶƚĞƌ;DZͿdŚĞDZŝƐĂƐƚĂƚĞĂƉƉƌŽǀĞĚƌĞƐĞĂƌĐŚĐĞŶƚĞƌŚŽƵƐŝŶŐĂŶƵŵďĞƌŽĨƌĞƐĞĂƌĐŚůĂďŽƌĂƚŽƌŝĞƐĂƚƚŚĞŶŐŝŶĞĞƌŝŶŐZĞƐĞĂƌĐŚŽŵƉůĞdž;ZͿďƵŝůĚŝŶŐŝŶWŽĐĂƚĞůůŽ/
Z^ƚƌƵĐƚƵƌĂůLJŶĂŵŝĐƐ>ĂďŽƌĂƚŽƌLJdŚŝƐůĂďŽƌĂƚŽƌLJŝƐůŽĐĂƚĞĚĂƚ/^hΖƐŶŐŝŶĞĞƌŝŶŐZĞƐĞĂƌĐŚĞŶƚĞƌ;ZͿĂƚƚŚĞZŚŽĚĞƐƵŝůĚŝŶŐŝŶĂŶĂƌĞĂŽĨĂƉƉƌŽdžŝŵĂƚĞůLJϳϮϬƐƋĨƚ;ϳϬƐƋŵͿdŚĞůĂďŝƐĞƋƵŝƉƉĞĚǁŝƚŚƚǁŽƐŚĂŬĞƚĂďůĞƐĂϭϬͲĐŚĂŶŶĞů^ƉĞĐƚƌĂůLJŶĂŵŝĐƐǀŝďƌĂƚŝŽŶĐŽŶƚƌŽůƐLJƐƚĞŵŵĞĂƐƵƌŝŶŐĚĞǀŝĐĞƐĂŶĚŽƚŚĞƌĂĐĐĞƐƐŽƌŝĞƐ
DZ^ƚƌƵĐƚƵƌĞƐ>ĂďŽƌĂƚŽƌLJdŚŝƐůĂďŽƌĂƚŽƌLJŝƐůŽĐĂƚĞĚĂƚZŝŶĂŶĂƌĞĂŽĨĂƉƉƌŽdžŝŵĂƚĞůLJϳϬϬƐƋĨƚ;ϲϱƐƋŵͿdŚĞůĂďŝƐĞƋƵŝƉƉĞĚǁŝƚŚĂŶŐŝůĞŶƚdĞĐŚŶŽůŽŐŝĞƐϯϱϲϳϬϰͲĐŚĂŶŶĞůĚLJŶĂŵŝĐƐŝŐŶĂůĂŶĂůLJnjĞƌ<ŝŶĞƚŝĐĞƌĂŵŝĐƐ/ŶĐǀŽůƚĂŐĞĂŵƉůŝĨŝĞƌ;ĨŽƌƉŝĞnjŽĞůĞĐƚƌŝĐĚĞǀŝĐĞƐ
DZŝŽŵĞĚZĞƐĞĂƌĐŚ>ĂďŽƌĂƚŽƌLJdŚŝƐůĂďŽƌĂƚŽƌLJŝƐĞƋƵŝƉƉĞĚǁŝƚŚĂĂŶŐŽůŝϭϲĐŚĂŶŶĞůƐD'ƐLJƐƚĞŵĂǀŝƌƚƵĂůŐůŽǀĞŶƵŵĞƌŽƵƐĚĂƚĂĂĐƋƵŝƐŝƚŝŽŶƐLJƐƚĞŵƐĂĨƵŶĐƚŝŽŶĂůƐƚŝŵƵůĂƚŽƌĂŶĚƐŽĨƚǁĂƌĞĨŽƌĚĂƚĂĂĐƋƵŝƐŝƚŝŽŶ
DZĞƌŽƐƉĂĐĞZĞƐĞĂƌĐŚ>ĂďŽƌĂƚŽƌLJdŚŝƐůĂďŽƌĂƚŽƌLJĐŽŶƚĂŝŶƐƐŵĂůůƐŚĂŬĞƌƚĂďůĞƐ;ϰϬͲůďͿĂĚ^WĐŽŶƚƌŽůůĞƌĂWŽůLJdĞĐ/ŶĐŵŽĚĞůW^sͲϯϬϬͲ&^ĐĂŶŶŝŶŐ>ĂƐĞƌŽƉƉůĞƌsŝďƌŽŵĞƚĞƌĂŶĚĚĂƚĂƉƌŽĐĞƐƐŝŶŐƐŽĨƚǁĂƌĞƐĞǀĞƌĂůƉŽǁĞƌĂŵƉůŝĨŝĞƌƐ;YƵĂŶƐĂƌͿĞŵďĞĚĚĞĚƐLJƐƚĞŵƐƉůĂƚĨŽƌŵƐ;ǀĂƌŝŽƵƐŵĂŶƵĨĂĐƚƵƌĞƌƐͿǀŝďƌĂƚŝŽŶŝƐŽůĂƚŝŽŶƚĂďůĞĨƵŶĐƚŝŽŶŐĞŶĞƌĂƚŽƌƐĂŶĚŽƐĐŝůůŽƐĐŽƉĞƐ
DZZŽďŽƚŝĐƐZĞƐĞĂƌĐŚ>ĂďŽƌĂƚŽƌLJdŚŝƐůĂďŽƌĂƚŽƌLJĐŽŶƚĂŝŶƐĂŶ/ZϭϮϬŝŶĚƵƐƚƌŝĂůƌŽďŽƚĂŶĚƚǁŽƌŽďŽƚŵĂŶŝƉƵůĂƚŽƌƐ;Z^ͲWůƵƐƌŽďŽƚĂŶĚĚĞƉƚKŶĞ^ZͿƚŚƌĞĞƌŽďŽƚŝĐŚĂŶĚƐĂƌƌĞƚƚŚĂŶĚZŽďŽƚŝƋϮͲĨŝŶŐĞƌŐƌŝƉƉĞƌĂŶĚůĂďͲŵĂĚĞ^ĐŽƚƚŚĂŶĚĂƌĞƉƌŽŐƌĂŵŵĂďůĞE/ĐŽŶƚƌŽůůĞƌŽŶĞDĂŬĞƌŽƚZĞƉůŝĐĂƚŽƌϯƉƌŝŶƚĞƌŽŶĞƚĂďůĞƚŽƉĚƌŝůůĂŵƵůƚŝͲĐĂŵĞƌĂŵŽƚŝŽŶĐĂƉƚƵƌĞƐƚƵĚŝŽǁŝƚŚĨŝǀĞǀŝĚĞŽĐĂŵĞƌĂƐĂŶĚƚǁŽZ'ͲĐĂŵĞƌĂƐEĂƚŝŽŶĂů/ŶƐƚƌƵŵĞŶƚƐĚĂƚĂĂĐƋƵŝƐŝƚŝŽŶĞƋƵŝƉŵĞŶƚƌŽďŽƚĐŽŶƚƌŽůůĞƌƐĂŶĚŽƚŚĞƌĞdžƉĞƌŝŵĞŶƚƐǀŝƌƚƵĂůͲƌĞĂůŝƚLJƵŶŝƚĐŽŶƐŝƐƚŝŶŐŽĨKĐƵůƵƐŐŽŐŐůĞƐ>WŵŽƚŝŽŶƐĞŶƐŽƌĂŶĚĂĐŽŵƉƵƚĞƌǁŝƚŚƚŚĞsZƐŽĨƚǁĂƌĞŝƐƚĞŵƉŽƌĂƌŝůLJƉůĂĐĞĚĂƚĂĚŝĨĨĞƌĞŶƚůĂďŽƌĂƚŽƌLJĨŽƌƉĞƌĨŽƌŵŝŶŐĞdžƉĞƌŝŵĞŶƚƐ/ŶĂĚĚŝƚŝŽŶϳĚĞƐŬƚŽƉĐŽŵƉƵƚĞƌƐǁŝƚŚƐŽĨƚǁĂƌĞĨŽƌĚĞƐŝŐŶƐĞŶƐŝŶŐĂŶĚĐŽŶƚƌŽů^ŽůŝĚtŽƌŬƐΞDĂƚůĂďΞ>Ăďs/tΞĂŶĚDĂƚŚĞŵĂƚŝĐĂΞĂŵŽŶŐŽƚŚĞƌƐ
Facilities and Equipment
DocuSign Envelope ID: 7CC689CE-B496-41AE-A9B1-5AEA49BCC614

ƉƉĞŶĚŝdž
:ĞƚWƌŽƉƵůƐŝŽŶĂŶĚtŝŶĚdƵŶŶĞů>ĂďŽƌĂƚŽƌLJdŚŝƐůĂďŽƌĂƚŽƌLJĐŽŶƚĂŝŶƐĂϮͲĨƚŽƉĞŶǁŝŶĚƚƵŶŶĞůĂtĞƐƚŝŶŐŚŽƵƐĞ:ͲϯϰũĞƚĞŶŐŝŶĞĂŶĚĂ>LJĐŽŵŝŶŐdͲϱϯũĞƚĞŶŐŝŶĞdŚĞůĂďŽƌĂƚŽƌLJŝƐĞƋƵŝƉƉĞĚǁŝƚŚĂǀĂƌŝĂďůĞĞůĞĐƚƌŝĐĂůƐƉĞĞĚĚƌŝǀĞĨŽƌƚŚĞǁŝŶĚƚƵŶŶĞůĂŶĚƚŚĞƚǁŽũĞƚĞŶŐŝŶĞƐĂƐǁĞůůĂƐǀĂƌŝŽƵƐƐĞŶƐŽƌƐĂŶĚYƐLJƐƚĞŵƐ
ŽŶƚƌŽůƐ>ĂďŽƌĂƚŽƌLJdŚŝƐůĂďŽƌĂƚŽƌLJĐŽŶƚĂŝŶƐŽŶĞWŝŬƐŝDƵůƚŝǀĂůƵĂƚŝŽŶŬŝƚǁŚŝĐŚŝƐĂŵƵůƚŝͲďĂŶĚŵƵůƚŝͲĐŽŶƐƚĞůůĂƚŝŽŶZd<'E^^ƌĞĐĞŝǀĞƌƚŚĂƚƉƌŽǀŝĚĞƐĐĞŶƚŝŵĞƚĞƌͲůĞǀĞůĂĐĐƵƌĂĐLJdǁŽWŝŬƐŝDƵůƚŝ>ϭ>Ϯ'ϭ'ϮϭϮϭϱďĂŶĚ^^'E^^DŽĚƵůĞƐƚǁŽǀĂůƵĂƚŝŽŶŽĂƌĚƐƚǁŽŚŝŐŚͲƋƵĂůŝƚLJƐƵƌǀĞLJͲŐƌĂĚĞ'E^^ĂŶƚĞŶŶĂƐƚǁŽŚŝŐŚͲƉĞƌĨŽƌŵĂŶĐĞŝŶĚƵƐƚƌŝĂůϮϰ',nj&ƌĞĞtĂǀĞΠƌĂĚŝŽƐǁŝƚŚĞĨĨĞĐƚŝǀĞƌĂŶŐĞƐƵƉƚŽϭϱŬŝůŽŵĞƚĞƌƐ;ΕϭϬŵŝůĞƐͿĐĐĞƐƐƚŽŵƵůƚŝƉůĞƐĂƚĞůůŝƚĞĐŽŶƐƚĞůůĂƚŝŽŶƐŝŵƉƌŽǀĞƐĂǀĂŝůĂďŝůŝƚLJƌĞůŝĂďŝůŝƚLJĂŶĚƌĂŶŐĞďĞƚǁĞĞŶďĂƐĞĂŶĚƌŽǀĞƌďĂƌĞͲďŽŶĞƐƌŽǀĞƌŵŽďŝůĞƉůĂƚĨŽƌŵKŶĞƚĂďůĞƚŽƉĚƌŝůůϮƌĞƐĞĂƌĐŚůĂƉƚŽƉƐĂŶĚϭĚĞƐŬƚŽƉĐŽŵƉƵƚĞƌǁŝƚŚƐŽĨƚǁĂƌĞĨŽƌĚĞƐŝŐŶƐĞŶƐŝŶŐĂŶĚĐŽŶƚƌŽů^ŽůŝĚtŽƌŬƐΞDĂƚůĂďΞĂŶĚ>Ăďs/tΞtĞĂƌĞŝŶƚŚĞƉƌŽĐĞƐƐŽĨƉƌŽĐƵƌŝŶŐĂZW>/ZϯDϭϯϲϬΣ>ĂƐĞƌZĂŶŐĞ^ĐĂŶŶĞƌ>ŝZĨŽƌƚŚĞŵŽďŝůĞƉůĂƚĨŽƌŵϭƉƌŽŐƌĂŵŵĂďůĞĐƵƐƚŽŵǁĂǀĞĨŽƌŵƉŽǁĞƌƐƵƉƉůLJϰdĞŬƚƌŽŶŝdžŽƐĐŝůůŽƐĐŽƉĞƐ
ĞƉĂƌƚŵĞŶƚŽĨŽŵƉƵƚĞƌ^ĐŝĞŶĐĞdŚĞĞƉĂƌƚŵĞŶƚŽĨŽŵƉƵƚĞƌ^ĐŝĞŶĐĞŽůůĞŐĞŽĨ^ĐŝĞŶĐĞĂŶĚŶŐŝŶĞĞƌŝŶŐŝƐůŽĐĂƚĞĚŝŶƚŚĞƵƐŝŶĞƐƐĚŵŝŶŝƐƚƌĂƚŝŽŶƵŝůĚŝŶŐŽŶ/ĚĂŚŽ^ƚĂƚĞhŶŝǀĞƌƐŝƚLJƐŵĂŝŶĐĂŵƉƵƐŝŶWŽĐĂƚĞůůŽ/
ƌƐŽĚŝůLJĂŶĚ'ƌŝĨĨŝƚŚďŽƚŚŚĂǀĞƌĞƐĞĂƌĐŚůĂďƐǁŝƚŚĂǀĂŝůĂďŝůŝƚLJĨŽƌŚŽƵƐŝŶŐƚŚĞ^ƐƚƵĚĞŶƚƌĞĐƌƵŝƚĞĚƚŽǁŽƌŬŽŶƚŚĞĚĞǀĞůŽƉŵĞŶƚŽĨƚŚĞĐůŽƵĚͲďĂƐĞĚƚŽŽůĂŶĚŵĂĐŚŝŶĞůĞĂƌŶŝŶŐĂůŐŽƌŝƚŚŵƐŝŶƚŚĞƉƌŽƉŽƐĞĚƌĞƐĞĂƌĐŚdŚĞĐŽŵƉƵƚĞƌŝŶĐůƵĚĞĚŝŶƚŚĞƉƌŽƉŽƐĞĚďƵĚŐĞƚĨŽƌ^ǁŝůůďĞƵƐĞĚďŽƚŚĂƐĂǁŽƌŬƐƚĂƚŝŽŶĨŽƌƚŚĞƐƚƵĚĞŶƚŚŝƌĞĚĂŶĚĂƐĂŶŝŶŝƚŝĂůƚĞƐƚŝŶŐƐĞƌǀĞƌǁŝƚŚƉŽǁĞƌƚŽĞĨĨŝĐŝĞŶƚůLJĞdžĞĐƵƚĞƚŚĞŶĞĞĚĞĚƉƌĞĚŝĐƚŝǀĞŵĂĐŚŝŶĞůĞĂƌŶŝŶŐĂůŐŽƌŝƚŚŵƐ
dŚĞĚĞƉĂƌƚŵĞŶƚŚĂƐĂĐĐĞƐƐƚŽĂůůƐŽĨƚǁĂƌĞŶĞĞĚĞĚĨŽƌĚĞǀĞůŽƉŵĞŶƚĂŶĚƚĞƐƚŝŶŐƌĞƋƵŝƌĞĚďLJƚŚŝƐƉƌŽũĞĐƚ
DocuSign Envelope ID: 7CC689CE-B496-41AE-A9B1-5AEA49BCC614

!! "#
$%&%'() (*%
+ !,-
)%
))))
.").# # /010
.").# # ! /010
.").# # !! /012
.").# # !! 3( /014
/0145 !! "# ! (
! "! !#!$!%!
16 33 " *" 6378.9.:;%6.. !". .!</0/0< 6
/6 7(6 ##35#! .6! #</01=< * 6#," &&9996!".6& ,!&21=>=1/?@A A#A#A35#A! A.
26 7(6;7B,.6! #</01=< * 6#," &&! !#6&!!!/01=&A1=A!! A,&51=A A>C6
@6 7(63'9D(,. (# . %.'!!#6BD" !!</01=< * 6#," &&!!6.&/01=& !.&6
>6 * .. 6,,!*E!6.. !". .!</0/0< 6
#!&'(&)&(*+#!#!! !#!$!%!
16 ': $!,$ F 6.*,!9"( ..6!."1="
DocuSign Envelope ID: 7CC689CE-B496-41AE-A9B1-5AEA49BCC614

!9"( ..6!."1="!!..+-6/01=<#," &&6.&106110C&6/01=6005?2(106110C&6/01=6005?2
/6 .. *6G".H,,!.!(#!*6!.""! #6/01C<#," &&! !#6&!!!/01C&&!!!A !.A/01C6
26 " " 5!" *) F $"653(!6(,!. BD" "('</01/<"." "6#," &&9996!".6& ,!&/?12/0@4@AA 53AA!
@6 7(6 #I!!!6BD" !!</014<! 6#," &&!!6.&/014& !.&6
>6 7(6(!!.%"9""!'E!.6!9"!.!</01C< % 6#," &&; 66.&,!&!&4CC>2=2
, -
16 .! !!#" !! . !.!!!. !!".&. #.140.!"..6
/6 &! 59#!5. .9"!" 5#5#!".! !. 3!# 5!" . . !."!BJ!6
26 %!"./.! !!#.. , !!". #!9D..""6
@6 (!9D.!9"#!."."!"!# !!! !!!! !!!"."!"!6
>6 !! !"!!.!.! !! #.! !# !" .""D51/!"6
DocuSign Envelope ID: 7CC689CE-B496-41AE-A9B1-5AEA49BCC614

!" # $%&% '%&#$(&)
# ! *+, #-
.//010&2
-
----
%$$&#$(&) 3%4&5$ 0%%/) 3
%$$&#$(&) 3%4&5$ %5/6&&$& 3
%$$&#$(&) 3%4&5$ %5/6&&$& 7
%$$&#$(&) 3%4&5$ //0&' 8 7
$%&% '%&#$(&) %&00%
! "! !#!$!%!
9 46& %%0& )$ : 8&0%$ 3&$' 36;$9&(&0%/5&$$'//0%$%560%$$(%$5&$.2%$&;$;5/0$'%5/6%$0$(&;%$%)&5!&(&0%5/0&:)9$&$%$0%$&&$&%$$%5%$&$&$'//0%$9$&$%$0%$&&$&%$$%5%$&$&$'//0%$.2<<6=%$ >%&.%629<9
9 8 46& 06'%9560%$6')%/05&%'%&$0'&15$;&5&$$;0&%=&'&(&0%/5&$9%&&'$;%&?$&560%$%$&&$&797?$&560%$%$&&$&.?72<<($ #9<79
@9 ?0 46&9(%06%$%0&;))&5%5/&&$10)%6;6%5&'&%$;9%&&'$;%&$&$%$0?%A%/%$$&!&$$; &$%0%;&$%=&$;$&&$;! B9&$&$%$0?%A%/<<!=&$& >$9&=-%A &=-%A #&<9
79 46& 86(&&9$$'6)&/&(&%%5/$;&C!$'C65%%%=&C60)%'&09+$&$%$0)5/%65%$5/0%=&$;$&&$;$'&6&5&$.29+$&$%$0)5/%65%$5/0%=&$;$&&$;$'&6&5&$.2<< %%$% 9<9
D9 46&9 9 &5$9 $4 99660$'1&(%0:%$%5&%'&;$/&$;5&9#?%A%/%&&'$;9<9
#!&'(&)&(*+#!#!! !#!$!%!
9 46& 86(&&9$$'6)&/&(&%%5/$;&C!$'C65%%%=&C60)%'&09+$&$%$0)5/%65%$5/0%=&$;$&&$;$'&6&5&$.29+$&$%$0)5/%65%$
DocuSign Envelope ID: 7CC689CE-B496-41AE-A9B1-5AEA49BCC614

%=&$;$&&$;$'&6&5&$.29+$&$%$0)5/%65%$5/0%=&$;$&&$;$'&6&5&$.2<< %%$% 9<9
9 &5$ 46& %'16:E &% ?00539 &%&/%$'&$&3&=&&$%=&C60)%'&0$' &$0&15%$//%&97:$&$%$0?%A%/%$$;$; &$0&197$&$%$0?%A%/%$$;$; &$0&1. 2<<F% 3 $'9<79
@9 46&9&;$/&$'&)9%&&'$;%&+$&$%$0)5/%65%$5/0%=&$;$&&$;$'&6&5&$B79&+$&$%$0)5/%65<< %$% 0)9&=-%A &=-%A #&<79
79 46& %G 9&&5/(&$;&5&$%%'&0(&$ &$0&1%5/%($;%=&C60)9%&&'$;%&$&$%$0, %$&&$&%$C60)%%=&&6&C%BD9&$&$%$0, %$&&$&<<%$"H@@<0 C $'9&=-%A &=-%A #&<D9
D9 %G9 46&9 99 %='&$0'&1=&%=&5%'&0$;91II1&%5&$%$&&$&%$%=&$;$&&$;9<9
, -
9 '...&!! $&%$0)5/%65%$5/0%=&$;$&&$;$'&6&5&$/&&$9$&$%$0?%A%/%$$;$; &$0&1D9$&$%$0%$&&$&%$ &$0&19
9 !#&('&(&0%/5&$$''&0(&)%6$'&;'6&%6&%$$%'6%)/%;55$; '66&$'0;%5 %=&&$;$&&$; /%;55$;0$;6;& %5/6&;/ )&5$0)$''&;$ &5/05&%' $'%=&&$;9/&&$9
@9 ".!(,60)5&$%%&%%$%%5/6$;$&)6'&$/&'%&#$(&)9/&&$9
79 !!#!(%76$'&;'6&6'&$'&(&0%/$;%%0%&0/0&&&$%%=&&$;$&&$;&$;$&&$;/&$%5&$9
DocuSign Envelope ID: 7CC689CE-B496-41AE-A9B1-5AEA49BCC614

BIOGRAPHICAL SKETCH
MARCO P. SCHOEN
Department of Mechanical Engineering, Idaho State University, Pocatello, Idaho 83209,
Phone: (208) 282 4377, E-mail: [email protected], Web: www.isu.edu/~schomarc A Professional Preparation:
Amt für Berufsbildung (Liestal) Design Engineer Eidg. Dipl. 1986 Swiss College of Eng. (Muttenz) Mechanical Engineering B.S. 1989 Widener University Mechanical Engineering M.E. 1993 Old Dominion University Engineering Mechanics Ph.D. 1997
B Appointments:
• 2015- pres. Director, Measurement and Controls Engineering Research Center (MCERC) at Idaho State University, Pocatello, ID
• 2011-2012, Visiting Research Professor, Chinese Academy of Science, Institute for Engineering Thermophysics, Beijing, China
• 2010 – 2013, Chair, Department of Mechanical Engineering, Idaho State U., Pocatello, ID • 2008 – pres., Professor of Mechanical Engineering, Idaho State University, Pocatello, ID • 2007 – 2013, Graduate Program Director, Measurement and Control Engineering, ISU,
Pocatello, ID • 2003 – 2015, Associate Director, MCERC at Idaho State University, Pocatello, ID • 2001 – 2008, Associate Professor of Mechanical Engineering, Idaho State University, Pocatello,
ID • 1999- 2001, Director, Applied Research Center (ARC), Indiana Institute of Technology, Fort
Wayne, IN • 1998 – 2001, Associate Professor of Mechanical Engineering, Indiana Institute of
Technology, Fort Wayne, IN • 1997 – 1998, Assistant Professor, Lake Superior State University, Sault Ste. Marie, MI • 1996 – 1997, Consultant, Innovative Aerospace Technologies, Poquoson, VA • 1990 – 1991, Mechanical Engineer/Group Leader, Habasit Inc., Reinach, Switzerland • April - July 1986, Design Engineer, Buss Inc., Pratteln, Switzerland • 1982 – 1986 Apprenticeship Design Engineer, Buss Inc., Pratteln, Switzerland
C Products:
Five most relevant to this project (out of over 150 publications): 1. Feng Lin, Marco P. Schoen, U. A. Korde, "Numerical Investigation with Rub-related
Vibrations in Rotating Machinery," Journal of Vibration and Control, Vol. 7, pp.: 833-848, 2001.
2. Shat C. Pratoomratana, Marco P. Schoen, “Allowing Type-3 Wind Turbines to Participate in Frequency regulation using Genetic Algorithm For Parameter Tuning,” Submitted for peer review to the Dynamic Systems and Control Conference, DSC 2019
3. M. P. Schoen, J. Hals, T. Moan, “Wave Prediction and Robust Control of Heaving Wave Energy Devices for Irregular Waves,” IEEE Transaction of Energy Conversion, Vol. 26(2), pp. 627-638, June 2011.
DocuSign Envelope ID: 7CC689CE-B496-41AE-A9B1-5AEA49BCC614

4. Marco P. Schoen, “Application of Genetic Algorithms to Observer Kalman Filter Identification,” Journal of Vibration and Control, Vol.14 (7), 2008, pp.971 - 997.
5. Umesh A. Korde and Marco P. Schoen, "Time Domain Control of a Single-Mode Wave Energy Device," ISOPE 2001, Stavanger, Norway, June 17-22, 2001.
Five other significant products: 1. Asif A. Ahmed, Marco P. Schoen, and Ken W. Bosworth, “System Identification using Nuclear
Norm and Tabu Search Optimization,” Special issue of IOP Conference Series: Materials Science and Engineering, vol. 297, doi:10.1088/1757, 2018.
2. Marco P. Schoen, Ji-Chao Lee, "Application of System Identification for Modeling the Dynamic Behavior of Axial Flow Compressor Dynamics,” International Journal of Rotating Machinery Volume 2017, Article ID 7529716, 14 pages, 2017.
3. M. P. Schoen, R. C. Hoover, S. Chinvorarat, G. M. Schoen, “System Identification and Robust Controller Design using Genetic Algorithms for Flexible Space Structures,” Journal of Dynamic Systems, Measurement, and Control, ASME, Vol. 131(3), May 2009.
4. M. P. Schoen, “Dynamic Compensation of Smart Sensors” IEEE Transaction of Instrumentation and Measurement, Vol. 56 (5), pp. 1991-2001, October 2007.
5. Marco P. Schoen, Ji-Chao Lee, Feng Lin, "Identification of Coupling Dynamics due to Tip Air injection in an Axial Flow Compressor," Proceedings of the International Symposium on Experimental and Computational Aerothermodynamics of Internal Flows, Genoa, Italy, July 2015.
D Synergistic Activities:
1. Former Chair of the Model Identification and Intelligent Systems Technical Committee of the Dynamic Systems and Controls Division / American Society of Mechanical Engineers (ASME) (2005-2008).
2. Developed and directed the Applied Research Center (ARC) at Indiana Institute of Technology, focusing in all areas of engineering, particular in Controls, Energy systems, Autonomous systems, and Biomedical Systems.
3. Associate Editor, Journal of Dynamic Systems, Measurement and Control, ASME, July 2009 – 2012.
4. Faculty advisor to various student groups, such as the SME sumo robot student competition (IIT), American Society of Mechanical Engineers (ASME) at IIT, Society of Manufacturing Engineers, SAE Mini Baja competition at IIT, Rocketry Club at ISU and SAE clean snow mobile competition at ISU.
5. Registered Professional Engineer, State of Idaho, No. 11382, Member of ASME, IEEE, Sigma Xi, IFAC, and AIAA.
DocuSign Envelope ID: 7CC689CE-B496-41AE-A9B1-5AEA49BCC614

Biographical Sketch
Mary M. Hofle Professional Preparation University of Akron Mechanical Engineering BS, 1982 Rensselaer Polytechnic Institute Mechanical Engineering MS, 1984 Rensselaer Polytechnic Institute Industrial and Mgmt. Engineering MS, 1984 Idaho State University (ISU) Mechanical Engineering PhD, ABD Professional Appointments 2015 – present Senior Lecturer, Dept. of Mechanical Engineering, ISU 2016 – 2017 Chair, Dept. of Mechanical Engineering, ISU 2012 – 2015 Chair, Dept. of Mechanical Engineering, ISU 2005 – 2009 Chair, Dept. of Mechanical Engineering, ISU 1996 – 2011 Associate Lecturer, Mechanical Engineering, ISU 1992 – 1996 Adjunct Instructor, Colleges of Engineering and Business, ISU 1990 – 1992 Quality Assurance Engineer & Certified Lead Auditor, Calvert Cliffs Nuclear
Power Plant, Lusby, MD 1987 – 1990 Manager, Manufacturing Engineering, Bourns Networks, Logan, UT 1987 – 1987 Senior Manufacturing Engineer, Bourns Networks 1985 – 1987 Manufacturing Engineer, Bourns Networks 1985 – 1985 Associate Manufacturing Engineer, Bourns Networks Products D.M. Sterbentz, S. Prasai, M. Hofle, T. Walters, J.c. Li, F. Lin, K. Bosworth, M. Schoen, "System Identification and Modeling of the Dynamics within an Axial compressor's Blade Passage, Proceedings of the International Symposium on Experimental and Computational Aerothermodynamics of Internal Flows, Genoa, Italy, July, 2015. Sterbentz D., Prasai S., Hofle M., Walters T., Lin F., Li J., Bosworth K., and Schoen M. P., “System Identification within the Tip Region of an Axial Compressor Blade Passage,” accepted for publication in Journal of Thermal Science, March 2016. Synergistic Activities Developed a Process Engineering course in response to requests from Portneuf Medical Center, Pocatello, ID, Spring 2013. Evaluated five different areas for efficiency, energy, and cost savings. CEERI Industrial Assessment Center conducted on behalf of the US Department of Energy, April 2012. ISU Department of Mechanical Engineering was a participant in the assessment center. Conducted energy conservation/efficiency studies for local industries.
DocuSign Envelope ID: 7CC689CE-B496-41AE-A9B1-5AEA49BCC614

Industrial experience in equipment design, process development and improvement to minimize waste, implementation, training, and use of statistical process control, and quality audits. Faculty advisor for the student chapter of ASME, Advisor for the BAJA Capstone Project, Advisor for clean snowmobile and ethanol challenge. Registered Profession Engineer, State of Idaho, Number 7400, Member of ASME
DocuSign Envelope ID: 7CC689CE-B496-41AE-A9B1-5AEA49BCC614

Appendix D
1
BIOGRAPHICAL SKETCH
OMID HEIDARI Department of Mechanical Engineering, Idaho State University, Pocatello, Idaho 83209,
Phone: (208)-282-2902, E-mail: [email protected], Web: robotics.engr.isu.edu A Professional Preparation:
Azad University of Sari Fluid Mechanics and Heat Transfer B.Sc. 2010 Babol University of Technology Mechanical Engineering M.Sc. 2012 Idaho State University Applied Science Ph.D. 2019
B Appointments:
x 2020 - present. Visiting Assistant Professor at Idaho State University, Pocatello, ID x 2020 Summer, Mentor for Google Summer of Code 2020 for project: Cartesian motion
planning with constraints in MoveIt x 2019 Sept - Dec, Applied Robotics Scientist, PickNik Robotics, Boulder, Colorado x 2019 Summer, Robotics Intern, PickNik Robotics, Boulder, Colorado x 2018 Summer, Robotics & AR/VR Intern, The House of Design, Nampa, Idaho x 2015 – 2019, Research/Teaching Assistant, Mechanical Engineering and Robotics
C Products:
Five most relevant to this project (out of over 150 publications): 1. Omid Heidari, Hamid Daniali, Alireza Fathi, “Searching for special cases of the 6R serial
manipulators using mutable smart bee optimization algorithm,” International Journal of Robotics and Automation 29 (4).
2. Omid Heidari, Vahid Pourgharibshahi, Alex Urfer, Alba Perez-Gracia, “A New Algorithm to Estimate Glenohumeral Joint Location Based on Scapula Rhythm,” 2018 40th Annual International Conference of the IEEE Engineering in Medicine and Biology Society (EMBC).
3. Omid Heidari, John O Roylance, Alba Perez-Gracia, Eydie Kendall, “Quantification of upper-body synergies: a case comparison for stroke and non-stroke victims,” ASME 2016 International Design Engineering Technical Conferences and Computers and Information in Engineering Conference.
4. Omid Heidari, Alba Perez-Gracia, “Virtual Reality Synthesis of Robotic Systems for Human Upper-Limb and Hand Tasks,” 2019 IEEE Conference on Virtual Reality and 3D User Interfaces (VR).
5. Omid Heidari, Eric T Wolbrecht, Alba Perez-Gracia, Yimesker S Yihun, “A task-based design methodology for robotic exoskeletons,” Journal of rehabilitation and assistive technologies engineering.
Five other significant products: 1. TrajOpt planner plugin for MoveIt (Current). C++, MoveIt. Link to Project
Added TrajOpt, an optimization algorithm for motion planning, as planner plugin to MoveIt. 2. TrackPose. C++, MATLAB, CodeGen. Link to Project
Developed a real-time smoothing algorithm in Cartesian space called TrackPose. 3. Augmented Reality Platform for Robot Interaction(Current). C#, Unity3d, HoloLens.
DocuSign Envelope ID: 7CC689CE-B496-41AE-A9B1-5AEA49BCC614

Appendix D
2
Link to Project Augmented Reality Platform for Robot Interaction (ARPRI) is an AR HoloLens application to interact with ABB IRC5 controllers.
4. VR Robot Synthesis. C#, Unity3d, ArtTreeKS, Leap Motion. Link to Project A VR windows application for robot kinematics synthesis.
5. Superquadric approach for fitting different shapes to point cloud data. Link to Project Superquadric is a generalized form of quadrics where plenty of quadrics surfaces can be represented by single formula with different arbitrarily values for exponents.
D Synergistic Activities:
1. Coordinator of Robotics Lab at Idaho State University (2020 January - present) 2. Core contributor for MoveIt software (2019 June - present) 3. Reviewer for ARK, Advances in Robot Kinematics (2020) 4. Reviewer for ASME – IDETEC conference (2016) 5. Reviewer for IEEE Access (2020) 6. Reviewer for IFToMM Symposium on Mechanism Design for Robotics (2018) 7. Reviewer for 2014 Second RSI/ISM international conference on robotics and mechatronics
(ICRoM) 8. ASME Student Member 2016
DocuSign Envelope ID: 7CC689CE-B496-41AE-A9B1-5AEA49BCC614

Appendix D
1
BIOGRAPHICAL SKETCH
KELLIE N. WILSON Department of Mechanical Engineering, Idaho State University, Pocatello, Idaho 83209,
E-mail: [email protected] A Professional Preparation:
Idaho State University Mechanical Engineering B.S. 2009 Idaho State University Mechanical Engineering M.S. 2011
B Appointments:
x 2017- pres. Teaching LabTech & Coordinator at Idaho State University, Pocatello, ID x 2011-2017, Adjunct Professor in Mechanical Engineering at Idaho State University, Pocatello,
ID x 2010 – 2011, Graduate Teachers Assistant of Mechanical Engineering, Idaho State University,
Pocatello, ID x 2010 – 2009, Graduate Student in K-12 Fellowship, Idaho State University, Pocatello, ID
C Products:
1. Kellie N. Wilson, Marco P. Schoen, "Jet Engine Modeling and Control Using T-MATS," 2020 Intermountain Engineering, Technology and Computing (IETC), Accepted for publication.
D Synergistic Activities: 1. Reviewer for Inter Journal of Computing and Digital Systems'20 2020 2. Senior design advisor for multiple teams 3. Rocketry club 4. Shop development with new infrastructure
DocuSign Envelope ID: 7CC689CE-B496-41AE-A9B1-5AEA49BCC614
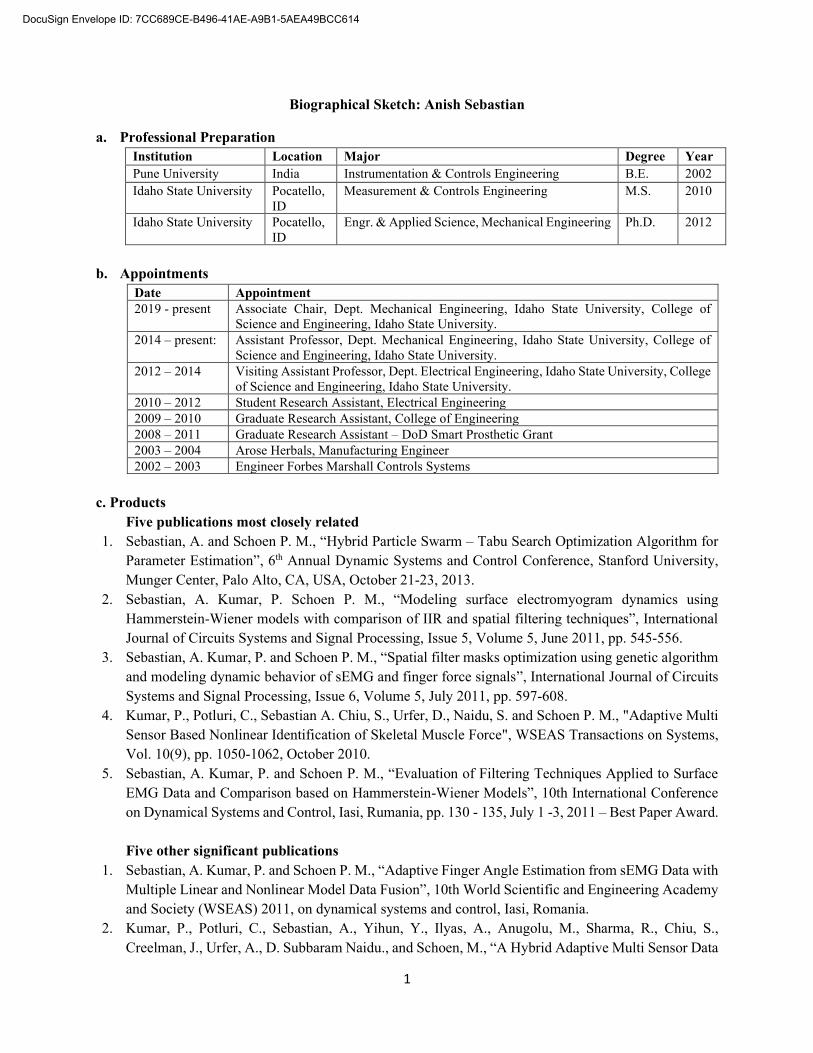
1
Biographical Sketch: Anish Sebastian
a. Professional Preparation Institution Location Major Degree Year Pune University India Instrumentation & Controls Engineering B.E. 2002 Idaho State University Pocatello,
ID Measurement & Controls Engineering M.S. 2010
Idaho State University Pocatello, ID
Engr. & Applied Science, Mechanical Engineering Ph.D. 2012
b. Appointments
Date Appointment 2019 - present Associate Chair, Dept. Mechanical Engineering, Idaho State University, College of
Science and Engineering, Idaho State University. 2014 – present: Assistant Professor, Dept. Mechanical Engineering, Idaho State University, College of
Science and Engineering, Idaho State University. 2012 – 2014 Visiting Assistant Professor, Dept. Electrical Engineering, Idaho State University, College
of Science and Engineering, Idaho State University. 2010 – 2012 Student Research Assistant, Electrical Engineering 2009 – 2010 Graduate Research Assistant, College of Engineering 2008 – 2011 Graduate Research Assistant – DoD Smart Prosthetic Grant 2003 – 2004 Arose Herbals, Manufacturing Engineer 2002 – 2003 Engineer Forbes Marshall Controls Systems
c. Products
Five publications most closely related 1. Sebastian, A. and Schoen P. M., “Hybrid Particle Swarm – Tabu Search Optimization Algorithm for
Parameter Estimation”, 6th Annual Dynamic Systems and Control Conference, Stanford University, Munger Center, Palo Alto, CA, USA, October 21-23, 2013.
2. Sebastian, A. Kumar, P. Schoen P. M., “Modeling surface electromyogram dynamics using Hammerstein-Wiener models with comparison of IIR and spatial filtering techniques”, International Journal of Circuits Systems and Signal Processing, Issue 5, Volume 5, June 2011, pp. 545-556.
3. Sebastian, A. Kumar, P. and Schoen P. M., “Spatial filter masks optimization using genetic algorithm and modeling dynamic behavior of sEMG and finger force signals”, International Journal of Circuits Systems and Signal Processing, Issue 6, Volume 5, July 2011, pp. 597-608.
4. Kumar, P., Potluri, C., Sebastian A. Chiu, S., Urfer, D., Naidu, S. and Schoen P. M., "Adaptive Multi Sensor Based Nonlinear Identification of Skeletal Muscle Force", WSEAS Transactions on Systems, Vol. 10(9), pp. 1050-1062, October 2010.
5. Sebastian, A. Kumar, P. and Schoen P. M., “Evaluation of Filtering Techniques Applied to Surface EMG Data and Comparison based on Hammerstein-Wiener Models”, 10th International Conference on Dynamical Systems and Control, Iasi, Rumania, pp. 130 - 135, July 1 -3, 2011 – Best Paper Award. Five other significant publications
1. Sebastian, A. Kumar, P. and Schoen P. M., “Adaptive Finger Angle Estimation from sEMG Data with Multiple Linear and Nonlinear Model Data Fusion”, 10th World Scientific and Engineering Academy and Society (WSEAS) 2011, on dynamical systems and control, Iasi, Romania.
2. Kumar, P., Potluri, C., Sebastian, A., Yihun, Y., Ilyas, A., Anugolu, M., Sharma, R., Chiu, S., Creelman, J., Urfer, A., D. Subbaram Naidu., and Schoen, M., “A Hybrid Adaptive Multi Sensor Data
DocuSign Envelope ID: 7CC689CE-B496-41AE-A9B1-5AEA49BCC614
2
Fusion for Estimation of Skeletal Muscle Force for Prosthetic Hand Control”, 2011 International Conference on Artificial Intelligence, WorldComp Congress 2011,
3. Kumar, P., Chen, C., Sebastian, A., Potluri, C., Yihun, Y., Ilyas, A., Anugolu, M., Potluri, C., Fassih, A., Yihun, Y., Jensen, A., Tang, Y., Chiu, S., Bosworth, K., Creelman, J., Urfer, A., D. Subbaram Naidu., and Schoen, M., “An Adaptive Hybrid Data Fusion Based Identification of Skeletal Muscle Force with ANFIS and Smoothing Spline Curve Fitting”, 2011 IEEE International Conference on Fuzzy Systems (FUZZ-IEEE 2011.
4. Kumar, C. Potluri, A. Sebastian, S. Chiu, A. Urfer, D. S. Naidu, and Marco P. Schoen, “Adaptive Multi Sensor Based Nonlinear Identification of Skeletal Muscle Force,” WSEAS Transactions on Systems, Issue 10, Volume 9, October 2010, pp. 1051-1062, 2010.
5. Sebastian, A. Kumar, P. and Schoen P. M., Creelman, J., Urfer, A., D. Subbaram Naidu., “Analysis of EMG-Force relation using system identification and Hammerstein-Wiener models”. Dynamic Systems and Controls Conference (DSCC), Cambridge, Massachusetts 2010.
d. Synergistic Activities x PI award – IGEM Washie, Accelerated Materials Testing (IGEM 2019-2020) x PI award – Plant Virus Detection using Multi-Agent Robotic Sensing and Learning (ISU 2018 -2019) x Reviewer for DSCC – Dynamic Systems and Control Conference 2017, 2016, 2015, 2011, and 2012. x Reviewer for ICRA – IEEE Conferences in Robotics and Automation. x Reviewer for Elsevier – Computers in Biology and Medicine 2017, Mechatronics 2016.
DocuSign Envelope ID: 7CC689CE-B496-41AE-A9B1-5AEA49BCC614

R-41387
Attachment B
Billing / Invoicing
1.1 The invoices shall reference the appropriate contract number as referenced on the
Agreement. Invoices must include any project name and / or job number. The University
shall submit electronic invoices and all invoicing material, which includes all back up
documentation for the expenditures invoiced.
1.2 Invoices shall be submitted on a Quarterly basis unless other arrangements are agreed
upon between the University and the Sponsor Representative. The University shall
provide invoices in a timely manner.
1.3 The University may set up a direct deposit with Sponsor and fill-out an authorization for
direct deposit per Sponsor’s normal terms (30 days). The alternative payment method
is by mail.
1.4 If discrepancies are found regarding the invoicing and/or omissions on the invoices, these
issues will be mutually resolved between the University and Sponsor’s Representative.
1.5 All invoices shall be submitted, to: Natasha Jostad Phone: _509-319-2580
Address: 121 W. Pacific Ave. Suite 200 E-mail: [email protected]
City/State/Zip: Spokane, WA 99201. Bill processing and payment may be declined
and the invoice returned to the University if the data supporting the invoice is missing,
inaccurate, or incomplete.
1.6 The University’s invoices are on a time and material basis and must set forth: a complete
description of the research work provided, the number of labor-hours spent performing
such work, the dates on which such work was performed and any approved expenses.
Further, invoices must be supported by such receipts, documents, compensation
segregation, information, and other items as Sponsor may request.
1.7 The University shall keep accurate and complete accounting records in support of all
costs billed to Avista in accordance with generally recognized accounting principles and
practices. Avista or its audit representative will have the right at any reasonable time or
times to examine, audit, and/or reproduce the records, vouchers, and their source
documents, which serve as the basis for compensation. Such documents will be made
available for examination, audit, and/or reproduction by Avista for three (3) years after
completion of the work.
1.8 Upon request by Avista, Contractor shall provide Avista and any federal or state agency
access to (and the right to examine, audit and copy) such information and records
providing verification of Contractor’s compliance with federal and state regulations
applicable to Contractor’s performance under the Agreement.
DocuSign Envelope ID: 62831623-6318-4801-83A9-A44C2B5FD65F

R-41387
Example
Attachment B Invoicing
UNIVERSITY_____
# __________
Group Previous Current Cumulative
________________Invoice____________ Invoice Invoice
Salaries $ $____ $____________
Student Wages $ $____ $____________
Fringe Benefits $ $____ $____________
Travel $ $____ $____________
Supplies/Services $ $____ $____________
Equipment $ $____ $____________
Subcontracts $ $____ $____________
Other Direct Costs $ $____ $____________
Total Costs $
DocuSign Envelope ID: 62831623-6318-4801-83A9-A44C2B5FD65F
APPENDIX EFinal Report: Gamification of Energy Use
Feedback Phase II

Gamification of Energy Use Feedback - Phase 2
A Final Report Submitted to Avista Corporationfor the Energy Research Initiative (AER) Program
For the University of Idaho:
Richard Reardon, Co-PI (Psychology and Organizational Sciences)
Julie Beeston, Co-PI (Computer Science)
Kellen Probert (Psychology, Human Factors)
Jode Keehr (Psychology, Human Factors)
Mary McInnis (Human Factors Consultant)
Hailey Warren (Psychology)
Sharalee Howard (Organizational Sciences, Business)
Stephani Steelman (Psychology), and
Holly Knoblauch-Goodman (Organizational Sciences)
October 29, 2021

Gamification Phase 2
1
Major Sections
Introduction . . . . . . 2
What We Learned in Phase 1 . . . . 5
Objectives and Plan for Phase 2. . . . 6
Dashboard and Game Development . . . 8
System Description and Operation . . . 9
Game and Concept Testing . . . . 15
Testing Outcomes . . . . . 19
Conclusions and Potential Benefits . . . 26
Budget Report . . . . . 28
References . . . . . . 30
Executive Summary/Project Description . . 31
APPENDIX A (Relevant Literature, Phase 2). . 32
APPENDIX B (Focus Group Comments). . . 52
APPENDIX C (Survey Questions and Data) . . 57

Gamification Phase 2
2
Introduction
Major utility companies have an interest in reducing energy consumption. Only by reducing consumption can companies stretch their resources to serve more customers within the pricing boundaries set by state regulatory bodies. Of course, customers benefit as well through energy cost savings. Much progress has been made in development of energy hardware and software that make energy delivery more efficient and cost effective. However, nudging customers to change their consumptive behavior, an under-explored strategy, could reduce consumption by as much as a third (Hallinan, 2014).
This report covers the second and final phase of a two-year project to look into the feasibility of one type of behavior intervention, gamification. Gamification is the use of entertaining aspects of gameplaying to motivate behavior toward a desired outcome or outcomes. The primary outcome in this case is a reduction in energy use but, as we detail in this report, there can be a number of secondary outcomes (e.g., customer education, prosocial actions, marketing, savings on purchases, etc.).
We framed the problem as a human performance problem (Boehm-Davis, Durso, & Lee, 2015) in which the goal was to lower one’s score, i.e., to be more efficient. In our Phase 1 report, we went into detail on how gamification can work. We will not repeat those details here but will summarize the main points.
In human systems, feedback is essential to understanding the relationship between effort, error, and optimal (or at least successful) performance. The evidence is quite clear that if human users can be made explicitly aware of the essential elements of their performance, they can modify that performance in the service of improvement. However, this is only the case if they actually see the feedback, attend to it, understand it, and have a readily available response action (or actions).
Gamification: The Big Game and Little Games
We have approached the conservation project with the view that there are really two games, or game levels. The “Big Game” involves reduction in overall energy usage; or, in some cases, making more strategic choices about usage that impact the utility and fellow customers in beneficial ways (e.g., choosing the best time of day to use a particular appliance). Then there are the “little games” that we believe can serve as attractants to a portion of the customer base. Our work in Phase 1 confirmed that online game playing is a much broader pastime than it used to be in terms of segments of the population who play. Thus, for some, the games can motivate attention, and attention is critical.
Presently, modern utility usage is not so much a moment-to-moment experience. It plays out over days and months. Feedback about usage over previous months has been available on monthly bills for many years. Monthly paper bills are almost a thing of the past; billing and usage information are available through online accounts. It is possible to pay one’s bill, or have it automatically paid, without ever seeing usage information; in the case of automatic payment, a customer need never access the utility site again after setup. Modern smart meters can produce more timely and more frequent glimpses of usage data, but that information is not salient—it has to be sought. The little games can push customers to attend to (and thus play) the Big Game.

Gamification Phase 2
3
In Phase 1, we proposed a possible reward structure for little game play to enhance effectiveness as attractants. Customers could be rewarded within the little games with points that apply to discounts, or that could be donated. Or, the earnings might be used within the games themselves to affect future play. At the moment, it seems Avista is not ready to develop such a program, but we want to keep the idea alive. We have designed the little games to provide points for successful play. A future point system might also permit social comparison as customers play against others. Play against others is also a capability that will have to remain undeveloped for the moment. We have included placeholders for points earnings and comparative play in our system.
We have to acknowledge that not everyone responds to the same motivational sticks and carrots (Drachen, Sifa, Bauckhage, & Thurau, 2012; Heckhausen, & Heckhausen, 2005; Hilgard, Engelhardt, & Bartholow, 2013; Yee, 2006). This should be especially important to the utility as the best outcome would be to have as many users as possible reducing their usage, not just a dedicated subset that is attracted to a particular motivational system. The feedback provided can be fairly uniform, but the motivations to attend to and follow that feedback could vary (Carver & Scheir, 2001), and that must be a constant consideration.
As we noted, feedback systems work best if there is a readily available set of actions to the person monitoring the feedback. For the Big Game, the actions available (e.g., thermostat settings, efficient appliances, weatherizing) have to be handy. A task we set for Phase 2 was finding an elegant way to make this so. We decided that the game interface could be the tool that accomplishes this. We referred to that interface as a Dashboard in Phase 1 and continue that in Phase 2. There is a growing literature on Dashboard practices that we could tap, and we speculated that the Dashboard might end up the centerpiece of a system that involves comparison play, usage information, little game play, and conservation actions. The little games themselves should also have available actions (banking/spending points, game settings, routing to other locations in the website, “leveling up” and playing again, etc.).
Some Interesting numbers. Some descriptive residential customer data was provided to the University of Idaho (UI) team that helps establish the major issue of lack of attention to usage. We do not view this data as indicating a problem; rather, it highlights the opportunity.
Avista has approximately 347,000 residential customer accounts. Approximately 190,000 of those customers (55%) have registered online. The remaining customers, presumably, are interacting with Avista through mail, telephone, or perhaps in-person at service centers. Of the 190,000 online customers, 139,000 had logged in to their accounts in last 90 days (that is, 73% of registered customers, or 40% of total customers). They logged in an average of 29 times, once every 36 days (again, on average). The latter figures are a bit misleading because the variability is large. Some long-term online customers logged in only a handful of times over hundreds of days and others did so regularly. Importantly, of the 40% who logged in in the past 90 days, we have no idea how many may have checked their usage. We suspect few. Likely, customers are logging in to pay their bills, and not much else.
A couple of interesting side issues emerged from the data. Avista has a fine rebate program. Of the online customers, only about 3.5% had taken advantage of the program. Rebates offer immediate real savings, yet many seem unaware that they exist. Two prosocial programs,

Gamification Phase 2
4
Project Share and Buck a Block, attract less than 1% of online customers. Our data from Phase 1 suggest that typical customers are very interested in personal savings, but they also are interested in conservation and helping the less fortunate. These motives are not being well-tapped.

Gamification Phase 2
5
What We Learned in Phase 1
In Phase 1, we conducted a literature review to evaluate the current state of gamification in household conservation efforts. That review confirmed that there was interest in the concept, but that implementation efforts resulted in spotty, unsustained outcomes. (We continued the literature review throughout Phase 2 and have provided an updated list in APPENDIX A.)
A survey was conducted with over 800 respondents in the Avista service area. The survey was designed to assess game type preferences, incentive values, smart device and computer usage, and some broad demographic variables (gender, income, age, etc.). The survey results suggested that two types of short, little games would be the best choices for gamification: puzzle/word games and action games. The results also showed that the major demographic variables did not differentially predict game type preference. This permitted us to focus on a narrow range of game types, obviating the need to target game types to particular demographic groups.
The survey also revealed that personal savings was the most important incentive for customers and potential customers and, importantly, that desire for personal savings did not detract from other incentives, e.g., supporting prosocial causes, purchasing educational or recreational materials. Thus, the games selected for the gamification tool, though limited to just two types, could have wide impact. Play of those games could be incentivized by a wide range of incentive types led by personal savings.
Several little games were developed, and rapid prototyping undertaken. Our prototypes were evaluated for their potential to entertain and inform, and two games were selected for further development. A game-playing software platform had to be settled on, and a Chrome web browser running JavaScript code was chosen. The use of JavaScript guaranteed that the games could be played on a wide array of devices and could be resident on the Avista website (therefore they could interact securely with usage data). The two games developed were a Driving Game and a Sudoquote game. Simple user testing was performed to refine the aesthetics of the games and to confirm playability and entertainment value. In creating and testing the prototypes, we found that the differences in the two games permitted them to provide different experiences with the data and information at the Avista website. We decided that this was a positive development that should be further explored.
Gamification Phase 2
6
Objectives and Plan for Phase 2
We had particular objectives when we started the project year. However, the more we learned, the more other opportunities became evident. This led us to organize our objectives into Primary and Emergent categories.
Primary Objectives
We began the year wanting to continue to develop, test, and refine our little games. Our first two games, the Driving Game and Sudoquotes, were fairly far along, but needed polishing. Moreover, we needed to explore in more detail how they related to customer usage data streams and other information available at the utility’s site.
Our user testing in Phase 1 was useful, but less sophisticated than we wanted. An objective of Phase 2 was to explore more capable testing protocols and applications, i.e., the process of asking and the technology needed to ask during a time of pandemic sheltering. Sheltering became much less restrictive as time passed, but we decided it was best to assume the most socially restrictive circumstances.
As noted earlier, we continued our literature gathering and have appended the additions. Our review broadened, reflecting some of the emergent paths discussed below.
For any feedback system to work, there must be readily available actions. An objective of Phase 2 had to be to identify actions that could be connected to the little games and the Big Game. Starting points were content already offered at the Avista site, but we also wanted to consider new actions.
With little games, the Big Game, usage data, and actions, we had a system. Once we assembled a working simulation of that system, we had to test for proof of the overall concept.
Emergent Objectives
Rather than just offering Avista a game or two, for us the system itself became an emergent objective. The system included elements that made usage data salient and accessible, elements that linked to the little games, and elements that offered pathways to actions. The last of these, how to link to actions was ill-defined at the beginning of Phase 2.
We had to choose a control point or interface and work out how the elements related to each other. We became less satisfied with our original concept of a “game page” interface and shifted toward the more comprehensive Dashboard described later. Dashboard construction is an art and a science, and we knew we would have to learn more about it.
As we noted in our review of Phase 1, development of our first little games (including early prototypes that were not chosen for elaboration) led us to the realization that the little games could serve different purposes and could interact differently with the usage data. Game types were chosen in Phase 1; they were limited to types that could be played briefly, and that had broad appeal. However, we recognized that some tailoring was possible, and that tailoring

Gamification Phase 2
7
could be in the form of how the little games were informative and what form usage could take within a game. We also decided to look at what else the little games might be able to do.
Phase 2 Plan
Although our objectives expanded, our plans for the year remained straightforward. Because we were using human participants, we had to begin the process of working with our own resources, and Avista’s, to secure approvals to recruit and make use of those participants, and to share data with Avista. Those approvals were obtained.
Our original plan, and hope, in fall/winter of 2019 was to conduct our testing sessions in-person at our facilities in Coeur d’Alene. Also, Avista suggested that their Spokane facilities might be available to us. In late winter/early spring of 2020, all organizations had to deal with the unusual circumstances presented by the Covid-19 pandemic. Sheltering in place orders were given and public areas were closed. We had to pivot completely in our thinking about testing. This started in late spring of 2020 and into summer and fall (bridging Phase 1 and Phase 2 of the project). We knew we would have to shift to online testing. We knew we would have to evaluate online testing platforms. We knew that this would require user testing of the user testing platforms, settling on one or two by mid-year. (In anticipation of this, our Phase 2 budget included funds for licensing of such software).
At the end of Phase 1, we presented a very primitive Dashboard. It was basically a page with two links, i.e., a simple “landing place”. However, we knew that the Dashboard would be critical and, even then, suggested that it could be more elaborate and functional. Thus part of our plan was to investigate Dashboard practices and create a Dashboard that interfaced with the little games we were developing, and with usage data pages. We also wanted to explore other opportunities that the Dashboard could offer. The Dashboard was key to connecting participants to actions. We needed to identify feasible actions.
We had to create a connection to actions. Initially, we thought of a simple list. However, stimulated by the helpful lists at the Avista site, we considered the potential for a Self Audit tool, and added research and development of such a tool to our plan.
Of course, we had to test. We planned to continue user testing of the little games and game play, as well as more wholistic testing of the system. We expected to do the latter following the same procedures as game user testing, but eventually shifted to a Focus Group approach.
Gamification Phase 2
8
Dashboard and Game Development
Game Refinement and a New Game
The Driving Game and the Sudoquotes games continued to be tested and refined. In an attempt to develop a game that had a closer connection to usage data, we added the Helicopter Game. We had explored a primitive helicopter game in Phase 1 but found that the version we prototyped was too simple and too disconnected to utility usage and knowledge. In Phase 2, we created another game built around a helicopter. This Helicopter Game takes advantage of a scene that is all too familiar in the Avista service area. A helicopter has a bucket slung underneath. It must dip the bucket into bodies of water below and then rise and empty the bucket over bars of flame. Two minutes are allowed to put out all of the flames. The bars of flame are produced by data from yesterday’s usage. The less efficient was yesterday’s usage, the harder the game is to play. We began user testing this game in spring, 2021 and continued through summer.
Dashboard
There are many organizations that offer advice about best practices for Dashboard creation and development, and we explored many of those. Typically, the advice is about color schemes, the best places to put elements (depending on their importance), how to make the board dynamic, and so on. We presented some early ideas midway through Phase 2.
It was recommended that we use a simplified version in user testing, and we did so. However, as the system started to come together and turn into a simulation, we went back to a version that was close to what we had presented mid-phase. The color scheme is very close to Avista’s, the important elements are there, and it was a “working” Dashboard, i.e., clicking on buttons and links led to navigation to other screens and sites. The Self Audit became an important element of the Dashboard. There are many sources of advice regarding what should be in a home Self Audit. Those and the current Avista site have very useful lists that helped us come up with a starting set of actions that could be included in the audit. We assigned points and times to the audit tasks. Those were informed by our casual research but could easily be modified to reflect formal research findings.
Moreover, our list was minimalist for simulation purposes. If adopted, such a list could easily be made customizable. A customer could, for example, choose a more frequent timing scheme for filter replacement. Other tasks could be added that tap into different motivations or identities, e.g., helping the less fortunate through bill assistance or donation programs. Current persona models developed by Avista might help with a list of setup options for the task list. Also, the list can be altered to inactivate tasks that are irrelevant to customers’ living circumstances. For example, renters are usually not responsible for insulation.
The Dashboard itself became a subject of testing until we were confident in its operation, then became the starting point for system testing.

Gamification Phase 2
9
System Description and Operation
We organized our system around a smart phone platform. Our own research in Phase 1 as well as independent research suggested that smartphones would be the platform most likely used to check usage. However, we understand that some would prefer to interact with our system, or any other system, using their home PCs or laptops, or tablets. The graphics we will present here are necessarily static, but the demonstration system was scalable.
We have talked about the need to have customers attend to their usage. The overall purpose is to have customers go to a location where usage information is immediately evident, and where details on that usage can be sought easily and quickly with a single click. The little games are primary attractants (they need not be the only ones). If a customer came to the Dashboard to play a game, the game choices are clearly visible, and the usage data would require only a glance and a click. We believe that as customers discover how easy it is to view and parse their usage data, some portion will be entertained by this and will return for this alone.
Importantly, an opportunity to take an action must also be immediately available. We suggest that an energy Self Audit can perform this function. Simply going to the Self Audit page is an action, but then there are a number of sub-actions that both confirm the validity of the first action (going to the Self Audit), and that then offer specific tasks with their own feedback loops. Completion, or near completion, of the Self Audit can be self-rewarding, or could be linked to other rewards as the utility desires. Sub-task information includes why the task is important, how to perform the task, and what is necessary in terms of time and expense. Depending on the sub-task, there is an opportunity to link to other areas of the Avista website that provide relevant details and opportunities.
The Dashboard we propose, with its functional elements, is shown in Figure 1 (“Dashboard 1”). It incorporates, to a degree, all of the elements we have discussed. The Big Game is clearly represented with usage information made very prominent. The data bars can be drawn from actual customer usage, and the view of the data can be changed with a button. We have simulated “Yesterday” and “This Month”. The data bars in either case are also a clickable icon. When clicked, a customer’s account usage page is opened, as in Figure 3 (“Dashboard 2”). This page already exists in every customer’s account and offers the opportunity for the customer to examine his or her usage in a number of ways. Avista is exploring the possibility that customers can run projections showing future usage outcomes under various circumstances of use. Presumably, this capability would be available on the usage page, or linkable from it.
The clickable icons for the little games are in a band just below the usage element. Figure
2 (“Dashboard 1a”) shows that clicking on the icon takes you to the game; in our simulation, there was an intervening instruction page before you arrived at any game page. We discussed the possibility that Avista could make the gaming icon(s) an entry point to the Dashboard. That is, a customer could have a little game icon on their computer, smartphone, or device screen. Clicking that can take them to the Dashboard or to an Avista login page, then the Dashboard.

Gamification Phase 2
10
Figure 1. The proposed Dashboard and functions.
Figure 2. Game icons take you to the games. A game icon elsewhere would take you to the Dashboard.
Placeholder for ”best time to do laundry”. Couldbe a link or an indicator.
Placeholder for a possible point system. Pointsbased on game play, maintenance of a highcompletion score on the audit, and/or overallreduction I usage.
Yesterday’s (or most recent day’s) usage in iconicform. Buttons allow choice of yesterday orcurrent month. Click on icon takes customers totheir actual usage page.
Game choices; clickable icons. Can be scrollableleft or right if new games added.
Self audit. Ring at 0% indicates that nothing hasbeen done. Ring is clickable to get to componentsof the audit.
Dashboard1
Dashboard1a

Gamification Phase 2
11
Figure 3. Usage data icon is salient and functional. Buttons change allow user to select icon view, from “Yesterday” to “this Month”. Clicking Icon takes you to page with detailed
usage information.
Yest
erda
y’s(
orm
ostr
ecen
tda
y’s)
Usa
gese
lect
ed.
Dashboard 2
This
Mon
th’s
Usa
gese
lect
ed.
Clic
king
onei
ther
will
take
you
toon
e’su
sage
page
inon
e’sa
ccou
nt.

Gamification Phase 2
12
Figure 4. The Self Audit function.
In Figure 4 (“Dashboard 3”), we take note of the Self Audit element. Clicking on the completion circle takes the customer to actions in the form of a task list. This list is customizable, as described earlier, but these are the tasks that were used in our simulation. When a customer takes an action, he or she checks off the task and the completion ring updates in the background; the 0% will change to a percentage associated with the completed task.
The task list is made of clickable links. If a customer clicks on the task, it will take him or her to a page that shows why that task matters, how to accomplish it, how much time it will take, and how much it should cost. There can also be a link to another page within the Avista site associated with that task. In the example in Figure 5 (“Dashboard 4”), filter replacement is the task, and the link at the bottom of the page on filter replacements goes to Avista’s filter management program.
Figure 6 (“Dashboard 5”) shows what happens when a customer checks off a number of tasks as complete. When he or she “goes back”, the completion ring shows a completion percentage of 76%.
Not shown here, but a capability we put into our simulation, was the automatic expiration of a completion at the end of its time frame. For example, the filter completion check box would automatically uncheck itself (changing the completion ring) after six weeks. A reversion like this could be tied to an automatic notification that the Dashboard, or just the task, needs attention.
Self Audit. Ring at 0% indicates that nothing hasbeen done. Ring is clickable to get to componentsof the audit. The 0% now makes sense becausenothing is checked. Dashboard
3

Gamification Phase 2
13
Figure 5. The Self audit and possible sub-actions.
Self
Audi
tund
erta
ken.
Task
sare
clic
kabl
ean
dle
adto
info
rmat
ion
onw
hyea
chm
atte
rs,h
owto
doit,
how
muc
htim
eit
take
s,an
dho
wm
uch
itco
sts.
Exam
ple
isHV
ACFi
lter.
(Not
eth
atlin
kto
Avist
aFi
lterP
rogr
amis
atbo
ttom
.)
Dashboard 4
Cust
omer
can
indi
cate
com
plet
ion
ofta
skhe
reof
back
onpr
evio
uspa
ge.

Gamification Phase 2
14
Figure 6. The Self Audit is nearly complete.
Customizability of the Dashboard was addressed earlier, but deserves elaboration. Our simulation shows the simple customization needed to accommodate differences in dwelling type or home ownership status. We mentioned that renters do not have to worry about insulation. It is also the case that some homeowners own newly constructed houses that will not have significant air leaks for some years. Checking the N/A column next to these tasks takes them out of completion calculations for these customers. They are measuring themselves only with respect to what is possible for them.
Customers may want to change the timing of the task intervals. A person with allergies might want to change his or her air filter monthly rather than every six weeks. The system could be set to default to an Avista recommended level and could be reset to a shorter interval (but not a longer one).
Other tasks could be added. For example, a customer with solar capability may want to perform tasks associated with that add-on. A person who supplements their heat with a pellet stove, or propane heater, may want to have their supplies of pellets or gas monitored at intervals. A person who wants to donate to less fortunate customers may want reminders set for winter and summer months.
Several tasks are completed. Ring now shows 76%completion. Note that “N/A” column is providedfor those for whom a particular task is one forwhich they are not responsible (e.g., becausethey are renters). Choosing N/A removes this taskfrom calculations. Dashboard
5

Gamification Phase 2
15
Game and Concept Testing
Two approaches. We decided to approach our testing along two different pathways. We had been doing user testing of individual games as early as Phase 1 in 2020. The kind of testing we were doing involved single participants interacting with a test moderator (and often an observer). This kind of testing is ideal for identifying unclear or misleading instructions, problems with play (speed and timing, “winning”, action of keys or swipes, etc.), identification of game elements, recommendations about aesthetics, and so on). The key is to let users’ experience with the games inform us about whether our goals for the games are being realized.
For the system as a whole, we used a Focus Group approach. The goals of Focus Groups are similar to user testing, but they can be a bit more formal and wholistic. Focus Group members can also use information and opinions offered by their fellow members to help them form their judgments and recommendations.
Participants. All testing methods, procedures, and question classes were submitted to the
University’s Institutional Review Board, which ruled the project “Exempt” (i.e., not risky, not in need of a comprehensive legal evaluation), and thus approved.
Testing of game playability and aesthetics did not require a special participant pool. This testing was done using samples of convenience: Students, co-workers, friends, local available volunteers, stay-at-homers, retirees, etc. To go to the next level, testing of the system, our hope was to have access to actual Avista customers; a Data Sharing Agreement was approved by Avista and the University with this in mind. That proved impracticable, so we returned to available participants. Some of our participants were Avista customers, by happenstance, but were not recruited on that basis. Participants were recruited from our local community. That community is an academic one, so efforts were made to ensure that participants included people who were older than traditional college student age. A requirement was that the participants have a utility account (or have had one in the past) or shared an account with a roommate or family member (or had done so in the past). For their participation, participants were offered $20 e-gift cards.
Test setting and applications. Our original intent at the beginning of Phase 1 was to conduct in-person testing and group sessions at Avista locations in Spokane or at University facilities in Coeur d’Alene. In late winter, 2020, pandemic precautions were instituted that made in-person testing unlikely in the immediate future. As time went on, ambiguity about future in-person testing led us to accept the fact that such testing would not be possible, or wise, during the life of the project. We shifted efforts toward online testing methodology.
Initially, in late Phase 1 and into Phase 2, we used a tool that was readily available, Zoom. The University has a license, and we were already using it extensively. We also conducted a search for a more capable online system that was designed for user testing. After a number of trials and demonstrations with various vendors, we settled on the Lookback system. This system allows the moderator (and observer) to view the participant and the participant’s device screen, and it records both along with all of the audio discussion. The session can be annotated in progress as specific issues are identified. We used the Lookback system starting in spring, 2021, through early summer.

Gamification Phase 2
16
User Testing
The user testing process is iterative and interactive. The moderator and observer follow a protocol that is flexible enough to allow them to pursue issues that are identified by participants, and that may be different for each participant. When the issues are identified, they are noted and weighed against the goals of the process or system. A report can be created, or a change can be made immediately if the issue is simple. The system or process is then tested again to confirm that the problem was resolved. This ensures that a change designed to fix one problem does not create a new problem. Testing tends to focus on a particular aspect of the process or system.
In the case of our game testing, an example of a report that was prepared is shown in Figure 7. The figure is a screen capture as the original report is a video that include the moderator and observer notes as well as the spoken remarks of the participant. In Figure 7, the aspects of the game being tested were its entertainment value (“Fun”) and whether the participant processed the tips embedded in the game. In this case, the participant did enjoy the game and did notice and process the tip, but misunderstood the tip. In this case, our response was to clarify the pre-game instructions.
Typical prompts and questions early in our user testing revolved around whether the game was fun, what kinds of changes would make it better, and would the participant play it again. Later, we explored how well participants “got it” with respect to utility usage data and other useful energy and conservation information. Thus, we also included prompts such as “did you notice anything” to see if participants could discover usage and purpose without a stimulus that was too informative.
Figure 7. Example of an issue identified in a user testing session.

Gamification Phase 2
17
Focus Group Testing
Focus group testing is a proven qualitative methodology that is commonly used in marketing research as well as attitude and opinion research; it is frequently conducted by social psychologists, consumer behavior researchers, and political scientists. It is a different approach than user testing in that the search for information and reaction is less granular. In our user testing sessions, the work was done with a single participant per session, and focus was on particular elements of game play and game experience. In Focus Groups in general, and ours in particular, interest was in the overall experience. What do participants know already, what do they think of a proposed system, would they employ that system? Lookback is not the best platform for group sessions, so Focus Groups were conducted using Zoom.
As in user testing, there are targeted questions and prompts and participants are encouraged to speak out. Unlike our user testing sessions, the session moderator in our Focus Groups took a more active role in presenting the system. There were 3-7 participants in each session, not including the session leader and an observer. Sessions were recorded and transcribed. Figure 8 shows what a typical Focus Group session looked like.
Figure 8. A typical online Zoom Focus Group. The group moderator is at the top center; the observer is middle row left. (The participant at the lower right went off camera briefly.)
Three questionnaires were also prepared. Qualitative data is valuable, but the questionnaires would give us meaningful quantitative data. The first questionnaire, the Pre-Session Questionnaire, was administered at the beginning of the session; the second, the Post-Session Questionnaire, was administered at the end of the session; the third instrument, the Lagged Questionnaire, was administered 7-10 days after the session.
The University mandates that Informed Consent be obtained from all research participants. The Consent process requires that each participant be given an overview explaining what the upcoming session is about, what will happen (including that the session was being recorded), and what we will ask them to do. They are then asked to agree to participate. In our case, the Consent agreement was presented to participants as the beginning of the Pre-Session Questionnaire.

Gamification Phase 2
18
Each session was led by a moderator who was a project PI. One of the project’s research assistants joined as an observer. The session protocol was intentionally flexible to allow the moderator and participants to pursue interesting threads, but generally followed this pattern: The moderator warmed-up the participants with questions about their utility provider, their bill-pay habits, and so on. The participants were given a link to the Pre-Session Questionnaire (with its Consent form). When all participants indicated completion of the questionnaire, the moderator began to “walk” them, with screen-sharing, through a typical Avista account that included a review of the many elements of the Avista site (e.g., the data usage page, the Marketplace link and page, the pages with tips and suggestions, etc.). The themes in this walk, especially with respect to the data usage page, were “did you know this was here?” and “did you know you could do this?”
After the Avista account review, the participants were presented via screen-share with our Dashboard. They were told that we were recommending to Avista that a similar Dashboard be implemented by the company, and that our Dashboard was a simulation of what was possible in the Avista context. Before any actions were attempted on the Dashboard, participants were asked what they thought, based on their first viewing, were the Dashboard’s capabilities and key elements. They were prompted to start their speculations at the top of the Dashboard, and to work down through the major sections. The moderator then walked the participants through each section illustrating the capabilities, and briefly engaging in the little games. In the latter case, they were asked about the unique properties of each game (e.g., with respect to the Helicopter game, “What is the first thing you noticed when the game opened? What do the columns of fire tell you?”).
Participants were then provided a link to the dashboard and were given several minutes to explore the Dashboard and its elements on their own. An occasional prompt was provided so that they did not spend all of those minutes on a single element. When time for this exploration was over (about 5-6 minutes), participants were asked to discuss their feelings about the Dashboard. The prompts here were simple: Did they like it? Would the games be attractants to the Dashboard? Would they check their usage more often? Would they engage in the Self Audit? Would they recommend any changes or additions? And so on.
At the end of the discussion, participants were given a link to the Post-Session Questionnaire and reminded that a link would be sent to them in about a week for the Lagged Questionnaire. They were thanked for their participation and dismissed to the questionnaire.

Gamification Phase 2
19
Testing Outcomes
User Testing Outcomes
The outcomes for user testing of the games appear in the games themselves. As we identified specific problem areas (i.e., areas of confusion in game play and instructions, flaws in game control, programming bugs, etc.), they were passed on to our programmer (Prof. Beeston). The information was synthesized from reports such as the one shown below in Figure 9. Supplementing these lists were specialized meetings in which our team gathered on Zoom to talk our programmer through the issues as she made modifications. As we said, user testing is an iterative process. Repair of some problems can create other problems. Eventually, with enough iterations, the games are deemed stable and playable, though perhaps not yet as aesthetically polished as those professionally prepared.
Figure 9. An example of a handoff prepared for our programmer after a user testing with one or more participants.

Gamification Phase 2
20
Outcomes of Focus Groups-Qualitative Reponses
The recorded Focus Group sessions produced over 100 pages of transcribed conversation. We continue to examine that data but having both the moderator and observer present at every session meant that we were able to identify, and make note of particularly relevant participant vocalizations and expressions. It is difficult to set numbers to those vocalizations, but we were able to come to some general conclusions from the sessions.
First, it is clear that the little games can be attractants. Equally true is that some people are not interested in the games and would never play them. A small but real portion of our respondents viewed usage as one of life’s routine burdens, not particularly worthy of attention. About 10% of participants were aware of how rich the usage data was and had done casual analysis of their usage. In one case, this was in preparation to sell their house (so that household efficiency could be touted to potential buyers. In another case, the data was discovered and the participant simply enjoyed playing with the many ways to look at the data.
Almost all of the participants noticed the connections of the game to usage data and were entertained by that. They offered suggestions for game improvement, but these were mostly aesthetic. One participant suggested adding a child’s game. The child would not care about usage data, but the parent would face that data when presenting the game to the child.
The placeholder for points and possible comparisons with others was intriguing, but because that feature was not yet enabled, participants expressed slightly less fondness for little game playing (i.e., they thought the games would be more fun if points with real value were attached to play).
As expected, most of our participants said that they only visit their utility company’s site to pay their bill, or perhaps to check on outages.
Three participants mentioned the rebate program and the marketplace program and discussed opportunities they missed for immediate savings because they were unaware of those programs.
Finally, the big winner in our groups was the energy Self Audit. Participants liked the structure, they liked the fact that they felt in control of the audit, they liked having actions all in one place, and they liked that it was customizable to take into account type of dwelling.
We have assembled the most informative comments and included them in APPENDIX B.
Outcomes of Focus Groups-Survey (Quantitative) Reponses
APPENDIX C shows the questions that appeared on each survey; the response data is summarized below, but available in detail in APPENDIX C. The small sample size, which is not unusual for Focus Group approaches, limited our reporting to descriptive data, but that data was informative.

Gamification Phase 2
21
Conservation as a value. Most of our items were repeated from questionnaire to questionnaire, with slight differences in wording to account for timing. However, in the Pre-Session Questionnaire, we place one item that only appeared in that questionnaire:
“In a very general sense, conservation is _________.”
Participants could respond on a 5-point scale, where the higher the number, the more they thought conservation was valuable. The mean response was 4.57 on the 5-point scale. In our Phase 1 survey, we detected this value, but could infer it only obliquely given the question set. The spontaneous responses from our Focus Group members also suggested the value was important, but such settings can inhibit expression on an issue like this. It was good that the quantitative data showed that the value was widely held. Not only was the mean decisively in favor of conservation, but the variability among responses was not large (Std Dev = .65).
Questions about usage and awareness. Several questions focused on participants’ understanding of their own usage and awareness of what could be learned. Below, we present those questions in groups of three, corresponding to the Pre-Session, Post-Session, and Lagged surveys, with mean and mode of responses.
(Pre) How aware are you regarding your own individual or household energy (electric and/or gas) consumption? (Scale 1-5, where 5 is very aware)
Mean = 4.54Mode = 4
(Post) How aware do you think you could be regarding your own individual or household energy (electric and/or gas) consumption?
Mean = 5.56Mode = 5
(Lag) How aware do you think you could be regarding your own individual or household energy (electric and/or gas) consumption?
Mean = 5.31Mode = 5
(Pre) Compared to other individuals or households like yours, how would you rate your typical energy consumption? (Scale 1-5, where 5 is much higher)
Mean = 2.74Mode = 3
(Post) Compared to other individuals or households like yours, how would you rate your typical energy consumption? (Yes, this is a repeat question--we are curious about slight changes in opinions over time.)
Mean = 2.94Mode = 2
(Lag) Compared to other individuals or households like yours, how would you rate your typical energy consumption? (Yes, this is a repeat question--we are curious about slight changes in opinions over time.)
Mean = 2.56Mode = 3
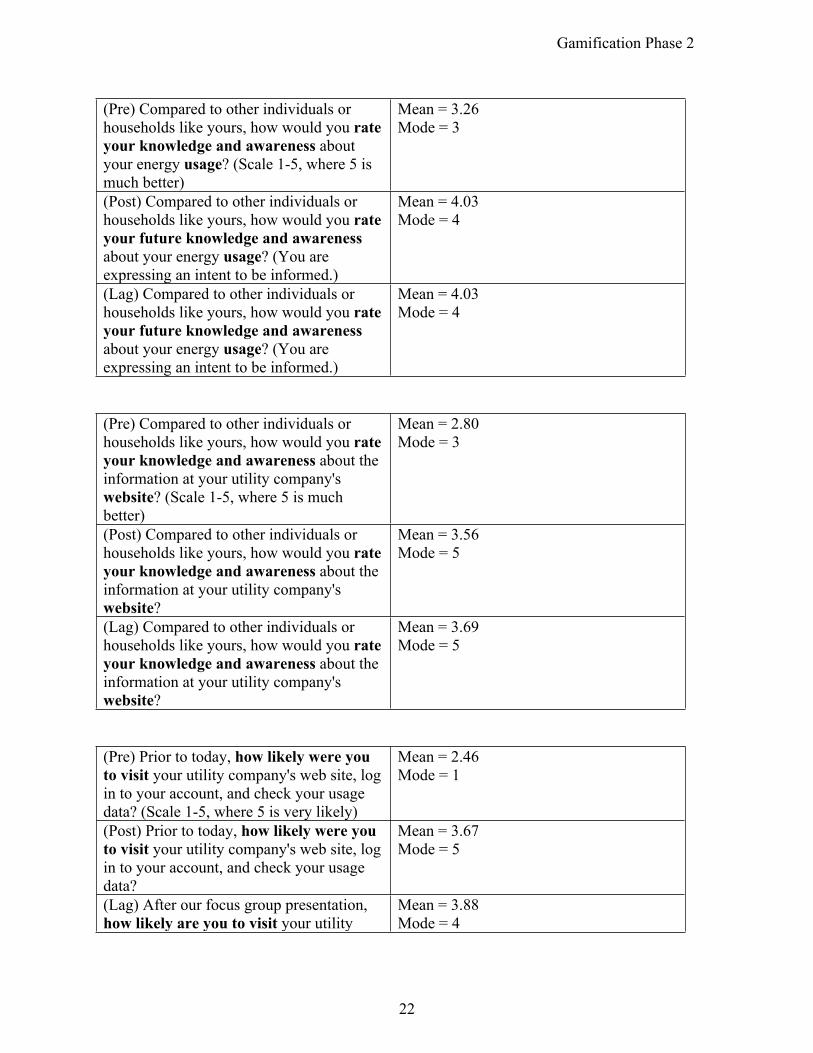
Gamification Phase 2
22
(Pre) Compared to other individuals or households like yours, how would you rate your knowledge and awareness about your energy usage? (Scale 1-5, where 5 is much better)
Mean = 3.26Mode = 3
(Post) Compared to other individuals or households like yours, how would you rate your future knowledge and awareness about your energy usage? (You are expressing an intent to be informed.)
Mean = 4.03Mode = 4
(Lag) Compared to other individuals or households like yours, how would you rate your future knowledge and awareness about your energy usage? (You are expressing an intent to be informed.)
Mean = 4.03Mode = 4
(Pre) Compared to other individuals or households like yours, how would you rate your knowledge and awareness about the information at your utility company's website? (Scale 1-5, where 5 is much better)
Mean = 2.80Mode = 3
(Post) Compared to other individuals or households like yours, how would you rate your knowledge and awareness about the information at your utility company's website?
Mean = 3.56Mode = 5
(Lag) Compared to other individuals or households like yours, how would you rate your knowledge and awareness about the information at your utility company's website?
Mean = 3.69Mode = 5
(Pre) Prior to today, how likely were you to visit your utility company's web site, log in to your account, and check your usage data? (Scale 1-5, where 5 is very likely)
Mean = 2.46Mode = 1
(Post) Prior to today, how likely were you to visit your utility company's web site, log in to your account, and check your usage data?
Mean = 3.67Mode = 5
(Lag) After our focus group presentation, how likely are you to visit your utility
Mean = 3.88Mode = 4
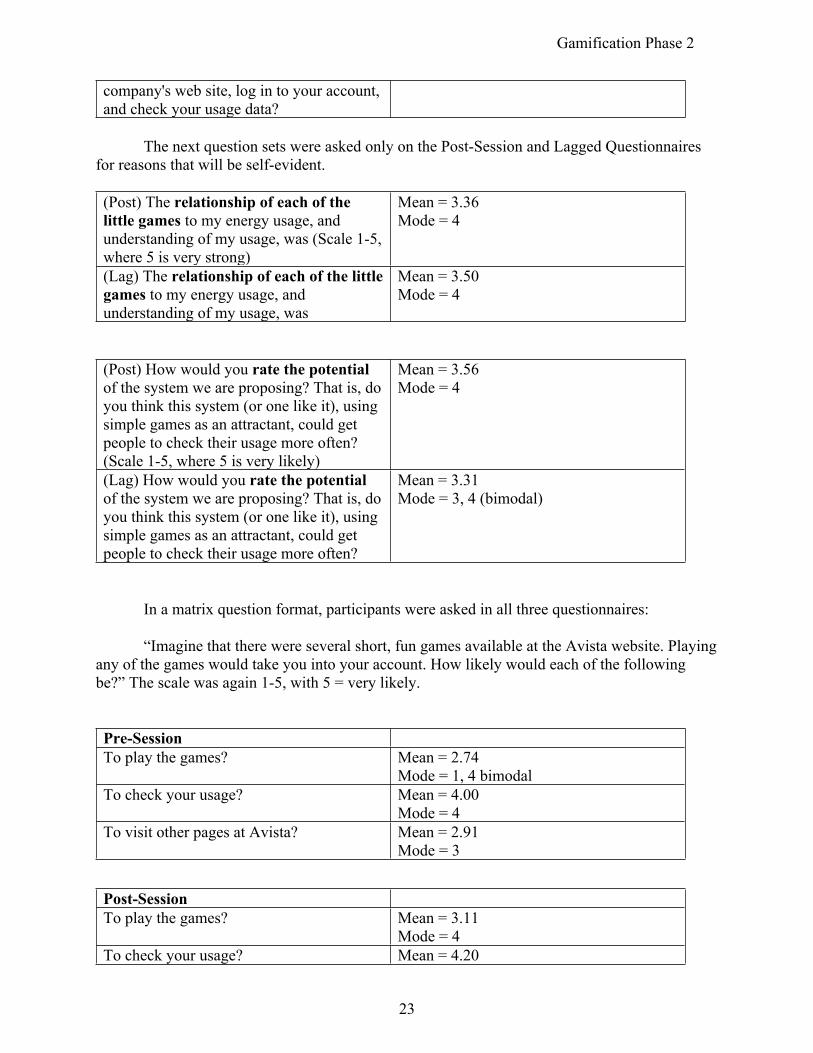
Gamification Phase 2
23
company's web site, log in to your account, and check your usage data?
The next question sets were asked only on the Post-Session and Lagged Questionnaires for reasons that will be self-evident.
(Post) The relationship of each of the little games to my energy usage, and understanding of my usage, was (Scale 1-5, where 5 is very strong)
Mean = 3.36Mode = 4
(Lag) The relationship of each of the little games to my energy usage, and understanding of my usage, was
Mean = 3.50Mode = 4
(Post) How would you rate the potential of the system we are proposing? That is, do you think this system (or one like it), using simple games as an attractant, could get people to check their usage more often? (Scale 1-5, where 5 is very likely)
Mean = 3.56Mode = 4
(Lag) How would you rate the potential of the system we are proposing? That is, do you think this system (or one like it), using simple games as an attractant, could get people to check their usage more often?
Mean = 3.31Mode = 3, 4 (bimodal)
In a matrix question format, participants were asked in all three questionnaires:
“Imagine that there were several short, fun games available at the Avista website. Playing any of the games would take you into your account. How likely would each of the following be?” The scale was again 1-5, with 5 = very likely.
Pre-SessionTo play the games? Mean = 2.74
Mode = 1, 4 bimodalTo check your usage? Mean = 4.00
Mode = 4To visit other pages at Avista? Mean = 2.91
Mode = 3
Post-SessionTo play the games? Mean = 3.11
Mode = 4To check your usage? Mean = 4.20

Gamification Phase 2
24
Mode = 5To visit other pages at Avista? Mean = 3.50
Mode = 3, 4 bimodal
LaggedTo play the games? Mean = 2.81
Mode = 4To check your usage? Mean = 4.03
Mode = 4To visit other pages at Avista? Mean = 3.13
Mode = 4
Two questions were included in the Lagged Questionnaire only, again for reasons that will make sense when they are read.
First, participants were asked to indicate if they, in fact, had visited their utility website since the time of their Focus Group. Fifty per cent reported that they had visited their utility site once, and another 18% said they had visited 2 or more times.
We also asked participants if they would like to have the link to the Dashboard to play the games and explore the other aspects of the Dashboard further on their own time. Responding “yes” took participants to the link; “no” resulted in an expression of thanks and the end of the survey. Over 40% of respondents responded “yes”. While this is hopeful, our simulation system did not permit us to get an actual measure of contact that would confirm this expressed interest.
Here is what the data suggest to us:
Most of our participants feel they are fairly aware of their energy usage. They realized after our sessions that could be more aware and expressed that intention.
Most thought that compared to others, they use less energy. This did not change in any meaningful way after our sessions and a week later.
Participants thought they were a little better than most in terms of how informed they were about their usage. However, after their sessions, they clearly intended to become better informed. The same pattern was seen when they were asked about their awareness of the information on their utility’s website. They thought they were average, but clearly intended to become better informed. In both cases, this would seem to be, at least partly, an admission that they knew less than they thought and had much to learn.
Participants indicated that they were, on average, less likely to visit their utility’s web site before their sessions. After their sessions, that attitude changed by a whole scale point in favor of visiting the site, and this was maintained over the next week or so.

Gamification Phase 2
25
In Post-Session and Lagged Responses, participants indicated that, on average, the relationship between the little games and their energy usage was discoverable.
In Post-Session and Lagged Responses, participants indicated that, on average, they thought the system we proposed did have the potential to be effective in getting customers to check their usage more often.
Responses to the matrix question indicated that if customers could be drawn to their online accounts with the games (or, presumably, any other attractants), checking usage would be their highest priority. Visiting other pages at the Avista site would be next in line. Game playing itself was in third place. We were pleased that checking usage was most important but puzzled about why game playing was least important. In retrospect, we believe the wording of the question is responsible. The wording implies that participants were drawn by the games, so participants may have thought to themselves that they were already playing or had just finished. Also, to a point made earlier in discussion of the qualitative responses, some of our respondents simply do not play games and are not interested in playing. There are hints about that in the high and low bimodal distribution of responses in the Pre-Session responses.
Lastly, our participants were typical in saying that they did not visit their utility’s web site often. However, over 68% reported that they did visit the site in the week between the Focus Group and the Lagged survey. We did seem to pique interest and nudge behavior. Moreover, a good portion of participants expressed an interest in taking their own time to examine the Dashboard and play the little games.

Gamification Phase 2
26
Conclusions
People are typically not attending to their usage (except, perhaps, to pay bills). However, when exposed to our system, participants said they were willing to pay more attention and to take action. Based on our sample, people will play the big game. Not all will be attracted by the little games, but even if it is just the game players who are, there is value. Game players are a significant portion of the population. Moreover, we believe, and our findings suggest, that nonplayers will find the Big Game itself entertaining if we can somehow get them to begin play.
The comparative possibilities need to be explored. We did not expect this, but Focus Group participants were intrigued with the placeholder we put in place on the Dashboard for “points”, and were mildly disappointed when we informed them that this was a potential part of the system, not yet incorporated. Developing a meaningful points system, with points earned for little game play, Big Game play, and perhaps time spent with a high completion rate on the Self Audit, is something worthy of future consideration. We considered that in discussions in Phase 1 and Phase 2, but there appeared to be no way to build such a system without considerable planning and testing.
The Self Audit and Dashboard make the Big Game more entertaining and more playable.
The Self Audit nicely serves its intended purpose of consolidating potential actions. Moreover, because it is also self-customizable, its value to a customer can grow. From Avista’s point of view, the ability to customize opens the door to tapping into customers’ self-understandings to take advantage of their values and preferences. It enables some tailoring of the experience. In Phase 1, we were discouraged about developing specific little games to serve audience sub-groups. It turns out that the way to stimulate subgroups to play the Big Game may be as much in the Self Audit as the little games.
The little game set sits at three. However, this is easily expanded. We have discussed the addition of games or puzzles that encourage specific behaviors or learning, but did not do full prototypes. One suggestion was a simple crossword puzzle that uses energy-related terms. Another was a scavenger hunt in which customers earned points by finding chips or chunks of information in other areas of the Avista site. We think Tom Lienhard’s Plant Manger game could be adapted. It would attract a narrow segment, but that segment might be fanatical about that game. Games could be specialized to focus on customer education, marketing and advertising, data projections, and so on.
Potential Benefits
Gamification is the use of the entertaining aspects of games to motivate desired behaviors. With this project, we proposed gamification as a means to motivate customers to pay closer attention to their energy usage. Data on such usage is now commonly available through their online accounts. If customers pay closer attention, and have readily available actions, then they can engage in conservation behavior, thus completing a feedback loop: Attention to usage followed by a conservation action, then re-attention to usage data. We suggest that there are two game levels. Brief, fun “little games” attract customers to their accounts where, we suggest, usage data is made salient. Thus aware, customers can choose actions that reduce usage, then they can check on the outcome of those efforts. They are now playing the “Big Game” of “keep your usage score as low as possible”. The benefits of such a system are many. It takes advantage

Gamification Phase 2
27
of information that is already available. It offers actions that can be taken in response to that information, actions that are often already detailed in the company’s web site. It is low cost, i.e., basically programming. No hardware add-ons or specialized devices are needed. The actions offered to customers when they check their usage data can also be linked to other desirable activities within the utility website (e.g., shopping for energy-saving appliances, viewing educational text and videos, getting guidance on how to hire a contractor for major efforts, and so on). Finally, the game interface, or Dashboard, can consolidate potential actions in the form of an energy Self Audit. The Self Audit is dynamic in that completions are tied to tasks, and it can be customized to cover not only basic concerns like filter replacement and insulation, but to concerns unique to customers’ values (e.g., donations, green energy programs, etc.).

Gamification Phase 2
28
Budget Report
Expense Proposed Spent Returned
PI/Faculty Salaries (Richard Reardon, PhD) $ 9,337.92 $ 9,403.14 $ (65.22)
PI/Faculty Fringe (Richard Reardon, PhD) $ 2,885.42 $ 2,942.24 $ (56.82)
Co-PI/Staff Salaries (Julie Beeston, Ph.D.) $ 16,134.00 $ 16,010.76 $ 123.24
Co-PI/Staff Fringe (Julie Beeston, Ph.D.) $ 4,986.00 $ 5,009.77 $ (23.77)
Graduate/Undergrad Intern/Asst. $ 5,700.00 $ 2,755.00 $ 2,945.00
Intern/Asst. Fringe $ 194.00 $ 237.50 $ (43.50)
Software Licensing/Subscription $ 3,000.00 $ 891.00 $ 2,109.00
F&A/Overhead $ 21,245.38 $ 18,736.46 $ 2,508.92
Project TOTAL $ 63,482.72 $ 55,985.87 $ 7,496.85
$ 7,497.13
Budget Wrap-up Phase 2 was completed under budget and we will return $7497.13 to Avista. That number is from the University Sponsored Programs Office, and is shown in the last cell of the third column above. The number just above that, $7496.85, is the calculation we came up with internally. The $0.28 difference is, we presume, a rounding difference. The categories underspent were the Graduate/Undergraduate Intern, Software licenses/subscriptions, and F&A. Intern/Assistant. Our hope and intent with the Intern category was to hire a graduate student, or accomplished undergraduate, in Human Factors or Computer Science to assist with programming and user testing. In Winter, we found an ideal candidate, Mary McInnis. Mary was a recent graduate of our Human Factors M.S. program, and was also a Bachelors-level

Gamification Phase 2
29
Mechanical Engineer. Because she was no longer a student, we were concerned that we would have to reserve more of the funds from the $5700 salary category to cover a higher Fringe rate (the student fringe rate is less than 5%; the “irregular help” rate is over 35%). This reduced the total number of hours we could employ Mary to 195. The larger concern was that Mary’s time with us could be limited. In spring, as the job market picked up, she sought full-time employment. We lost Mary to a great opportunity in May after 145-150 hours. Her skill set was such that we certainly benefitted as much from her 145-150 hours as we would have from a graduate student’s 195 hours. Software. Prior to preparing the budget for Phase 2, we had already decided to do all user testing online for reasons mentioned in the body of this report. We expected that we would need to acquire, or subscribe to, planning and testing software. We had Zoom as a base system through a University license. We were able to save funds when we found that the University also had an ongoing contract with Miro to help us plan. The final piece was testing software. By streamlining our testing, and negotiating a University rate, we were able to subscribe to the Lookback system for far less than anticipated. We anticipated that the remainder in this category might, with Avista’s approval, be put toward incentives for test participants. However, Avista offered an internal incentive (which, in the end, was not used **).
F&A. F&A/Overhead is nothing more than a percentage of funds spent directly on the project. When we saved in the Intern/Assistant and Software categories, it automatically reduced F&A costs.
**Participant incentives (the e-gift cards) were provided from resources outside of the project.)

Gamification Phase 2
30
References(Note see APPENDIX A for extensive annotated list of relevant references.)
Boehm-Davis, D., Durso, F., & Lee, J. (2015). APA Handbook of Human Systems Integration. Washington, DC, American Psychological Association. (Multiple chapters in this edited volume)
Drachen, A., Sifa, R., Bauckhage, C., & Thurau, C. (2012). Guns, Swords and Data: Clustering of Player Behavior in & Games in the Wild. Proceedings of the Annual Meeting of the IEEE Conference on Computational Intelligence and Games. Grenada, Spain.
Geelen, D., Keyson, D., Boess, S., & Brezet, H. (2012). Exploring the use of a game to stimulate energy saving in households. Journal of Design Research, 10, 103-120.
Hallinan,K. (2014). http://adigaskell.org/2014/01/06/the-gamification-of-energy-conservation/
Heckhausen, J. & Heckhausen, H. (2005). Motivation and Action. Cambridge, UK: Cambridge University Press.
Hilgard, J., Engelhardt, C., & Bartholow, B. (2013). Individual differences in motives, preferences, and pathology in video games: the gaming attitudes, motives, and experiences scales. Frontiers in Psycholology, 9.

Gamification Phase 2
31
Executive Summary/Project Description
This project was Phase 2 in the development of a program designed to motivate residential energy customers to reduce, or become more efficient, in their energy usage. Customer data from Avista indicate that customers are typically not paying attention to usage data, and this was confirmed by our own test subjects.
Awareness of performance, i.e., performance feedback, is essential to understanding the relationship between actions and outcomes. Gamification, the use of the entertaining aspects of games to produce behavior change, was proposed as a tool to encourage attention to usage information. We proposed two levels of gameplay. First, brief “little games” to attract customers to view their usage data. Second, and obviously more important, the “Big Game”, in which our goal was to have customers, once aware of their usage, take action to lower their energy “score”. In Phase 1, we explored ways of trying to enhance the attraction potential of the Little Games by tying usage to them as game components, and began user testing the games and that capability. In Phase 2, we continued game development and added a third game. We highlighted the notion that the games themselves can serve different purposes and have different relationships with usage data.
In Phase 1, we saw potential in developing a game interface, or Dashboard, that would link the little and Big Games together, but could serve several other purposes as well. In particular, it could serve as a home base for accessing actions to complete the feedback loop in the Big Game. In Phase 2, we explored the potential of the Dashboard, investigated Dashboard best practices, and created a working mockup. We linked both game levels to the mockup, and we made usage data a very salient feature, a feature that made access to the detailed usage page in customer’s accounts simple and quick. Then, rather than creating a list of Big Game actions on the Dashboard, we consolidated those actions into an energy Self Audit. The Dashboard display for the audit showed how much of the audit was complete and, with a click, revealed tasks that needed attention. Deeper exploration with the Self Audit could take customers to useful and informative places within the Avista site. The audit itself could be tailored to customers’ housing circumstances and values to further encourage attention.
We user-tested the little games with individual participants and we tested the overall system with Focus Groups. The results of that testing indicated that (1) the little games were attractants to a segment of the customer base (i.e., not to all), (2) the information about usage integrated into the games was discoverable and useful, (3) participants in our groups were motivated to pay closer attention to their usage and were drawn to the Big Game. Finally, the Self Audit, though not originally a subject of our investigation, emerged as a very popular potential tool.

Gamification Phase 2
32
APPENDIX A
Relevant Literature Collected During Phase 2. (To save space, the
literature collected during Phase 1 is not in this report but can be
found in the final report for that Phase.)
The studies are listed alphabetically.

Gamification Phase 2
33
Abrahamse, W., Steg, L., Vlek, C. & Rothengatter, T. (2007). The effect of tailored information, goal setting, and tailored feedback on household energy use, energy-related behaviors, and behavioral antecedents. Journal of Environmental Psychology, 27: 265–276. doi:10.1016/j.jenvp.2007.08.002.
In this multidisciplinary study, an Internet-based tool was used to encourage households (N . 189) to reduce their direct (gas, electricity and fuel) and indirect energy use (embedded in the production, transportation and disposal of consumer goods). A combination of tailored information, goal setting (5%), and tailored feedback was used. The purpose of this study was to examine whether this combination of interventions would result in (i) changes in direct and indirect energy use, (ii) changes in energy-related behaviors, and (iii) changes in behavioral antecedents (i.e. knowledge). After 5 months, households exposed to the combination of interventions saved 5.1%, while households in the control group used 0.7% more energy. Households exposed to the interventions saved significantly more direct energy than households in the control group did. No difference in indirect energy savings emerged. Households exposed to the interventions adopted a number of energy-saving behaviors during the course of the study, whereas households in the control group did so to a lesser extent. Households exposed to the interventions had significantly higher knowledge levels of energy conservation than the control group had. It is argued that if the aim is to effectively encourage household energy conservation, it is necessary to examine changes in energy use, energy-related behaviors and behavioral antecedents.
Andor, M. & Fels, K. (2018). Behavioral economics and energy conservation – A systematic review ofnon-price interventions and their causal effects. Ecological Economics, 148:178-210. doi: 10.1016/j.ecolecon.2018.01.018.
Research from economics and psychology suggests that behavioral interventions can be a powerful climate policy instrument. This paper provides a systematic review of the existing empirical evidence on non-price interventions targeting energy conservation behavior of private households. Specifically, we analyze the four nudge-like interventions referred to as social comparison, pre-commitment, goal setting and labeling in 38 international studies comprising 91 treatments. This paper differs from previous systematic reviews by solely focusing on studies that permit the identification of causal effects. We find that all four interventions have the potential to significantly reduce energy consumption of private households, yet effect sizes vary immensely. We conclude by emphasizing the importance of impact evaluations before rolling out behavioral policy interventions at scale.
Asensioa, O., & Magali, A. D. (2015). Nonprice incentives and energy conservation. Proceeding of the National Academy of Science of the US. E510–E515PNAS. Published online, www.pnas.org/cgi/doi/10.1073/pnas.1401880112.
In the electricity sector, energy conservation through technological and behavioral change is estimated to have a savings potential of 123 million metric tons of carbon per year, which represents 20% of US household direct emissions in the United States. In this article, we investigate the effectiveness of nonprice information strategies to motivate conservation behavior. We introduce environment and health-based messaging as a behavioral strategy to reduce energy use in the home and promote energy conservation. In a randomized controlled trial with real-time appliance level energy metering, we find that environment and health- based information strategies, which communicate the environmental and public health externalities of electricity production, such as pounds of pollutants, childhood asthma, and cancer, outperform monetary savings information to drive behavioral change in the home. Environment and health-based information treatments motivated 8% energy savings versus control and were particularly effective on families with children, who achieved up to 19% energy savings. Our results are based on a panel of 3.4 million hourly appliance-level kilowatt–hour observations for 118 residences over 8 mo. We discuss the relative impacts of both cost-savings information and environmental health messaging strategies with residential consumers.
Benders, M.J., Kok, R., Moll, H.C., Wiersma, G., & Noorman, K.J. (2006). New approaches for household energy conservation—In search of personal household energy budgets and energy reduction options. Energy Policy, 34: 3612–3622.
Large-scale energy reduction campaigns focusing on households generally have two shortcomings. First, an energy reduction campaign is either personalized but time intensive or time extensive but generalized. Second, because only
Gamification Phase 2
34
the direct energy requirements are addressed, only 50% of the total household energy requirement is subject to reduction. The other 50%, the indirect energy requirement, is much more difficult to calculate and address and therefore not subject to reduction. In this paper, we describe a web-based tool that has the potential to overcome both of these shortcomings. The tool addresses direct as well as indirect energy requirements. By means of a simple expert system participants obtain personalized reduction options and feedback on the energy reduced. The tool was tested in Groningen (the Netherlands) with a sample of 300 households, resulting in a direct energy reduction of about 8.5% compared to a control group. The reduction in indirect energy was not statistically significant.
Bolderdijk JW, Gorsira M, Keizer K, Steg L (2013) Values determine the (in)effectiveness of informational interventions in promoting pro- environmental behavior. PLoS ONE, 8(12): e83911. doi:10.1371/journal.pone.0083911.
Informational interventions (e.g., awareness campaigns, carbon footprint calculators) are built on the assumption that informing the public about the environmental consequences of their actions should result in increased pro- environmental intentions and behavior. However, empirical support for this reasoning is mixed. In this paper, we argue that informational interventions may succeed in improving people’s knowledge about the negative environmental consequences of one’s actions, but this knowledge will not gain motivational force if people do not consider protecting the environment an important personal value. In an experiment, we measured individual differences in value priorities, and either presented participants a movie clip that portrayed the negative environmental consequences of using bottled water, or a control movie. As predicted, we found that the environmental movie improved recipients’ knowledge of the negative environmental impact of bottled water, but this knowledge only resulted in concomitant changes in intentions and acceptability of related policies among participants who strongly endorsed biospheric (i.e. environmental) values, while having no effect on those who care less about the environment. Interestingly, the results suggest that although informational interventions are perhaps not always successful in directly affecting less environmentally-conscious recipients, they could still have beneficial effects, because they make those who strongly care about the environment more inclined to act on their values.
Brown, C.J. and N. Markusson (2019). The responses of older adults to smart energy monitors, Energy Policy, 130: 218-226. doi.org/10.1016/j.enpol.2019.03.063
By 2020, every UK household has the option to have a Smart Energy Monitor (SEM) installed, displaying electricity consumption monetarily. The success of the £11 billion scheme in enabling people to reduce energy consumption is questioned amongst researchers and relatively little is known about older adults’ (60+ years) responses to SEMs. This paper explores older adult responses to SEM feedback and compares them to those of younger-middle aged adults (25-59 years). A qualitative, interpretative methodology was used with participants from 20 households recording their SEM experiences during one month through a diary, and post-study semi-structured interview allowing methodological triangulation. Data analysis indicated that older adults were generally more aware of their energy use pre-SEM and practiced energy saving behaviours learnt from upbringing. This appeared to result in negligible positive benefits and low engagement with the device. Other limiting factors included lack of technical skills and confidence, and the risk of losing the comfort and convenience of using electrical appliances. The device also triggered negative emotions and depression amongst some older adults surrounding electricity usage, potentially leading to dangerously cold homes. Consequently, the scheme’s appropriateness is questioned, especially for older adults, and improvements are suggested for SEMs and the scheme.
Buchanan, K. Russo, R., & Anderson, B. (2015). The question of energy reduction: The problem(s) with feedback. Energy Policy, 77: 89–96. http://dx.doi.org/10.1016/j.enpol.2014.12.008.
With smart metering initiatives gaining increasing global popularity, the present paper seeks to challenge the increasingly entrenched view that providing householders with feedback about their energy usage, via an in- home-display, will lead them to substantially reduce their energy consumption. Specifically, we draw on ex- isting quantitative and qualitative evidence to outline three key problems with feedback, namely: (a) the limited evidence of efficacy, (b) the need for user engagement, and (c) the potential for unintended con- sequences. We conclude by noting that, in their current form, existing in-home-displays may not induce the desired energy-reduction response anticipated by smart metering initiatives. Instead, if smart metering is to effectively reduce energy consumption there is a clear need to develop and test innovative new feedback devices that have been designed with user engagement in mind.

Gamification Phase 2
35
Byerly, H., Balmford, A., Ferraro, P. Wagner, C., Palchak, E., Polasky, S. Ricketts, T., Schwartz, A., & Fisher, B. (2018). Nudging pro-environmental behavior: evidence and opportunities. Frontiers of Ecology and Environment, 16(3): 159–168. http://doi: 10.1002/fee.1777
Human behavior is responsible for many of our greatest environmental challenges. The accumulated effects of many individual and household decisions have major negative impacts on biodiversity and ecosystem health. Human behavioral science blends psychology and economics to understand how people respond to the context in which they make decisions (eg who presents the information and how it is framed). Behavioral insights have informed new strategies to improve personal health and financial choices. However, less is known about whether and how these insights can encourage choices that are better for the environment. We review 160 experimental interventions that attempt to alter behavior in six domains in which decisions have major environmental impacts: family planning, land management, meat consumption, transportation choices, waste production, and water use. The evidence suggests that social influence and simple adjustments to decision settings can influence pro-environmental decisions. We identify four important gaps in the evidence that provide opportunities for future research. To address these gaps, we encourage collaborations between researchers and practitioners that look at the effects of embedding tests of behavior-change interventions within environmental programs.
Castelli, N., Ogonowski, C., Jakobil, T., Stein, M. Stevens, G., & Wulf, V. (2017). What happened in my home? An end-user development approach for smart home data visualization. CHI 2017, May 06 - 11, Denver, CO, USA. doi: http://dx.doi.org/10.1145/3025453.3025485
Smart home systems change the way we experience the home. While there are established research fields within HCI for visualizing specific use cases of a smart home, studies targeting user demands on visualizations spanning across multiple use cases are rare. Especially, individual data-related demands pose a challenge for usable visualizations. To investigate potentials of an end-user development (EUD) approach for flexibly supporting such demands, we developed a smart home system featuring both pre-defined visualizations and a visualization creation tool. To evaluate our concept, we installed our prototype in 12 households as part of a Living Lab study. Results are based on three interview studies, a design workshop and system log data. We identified eight overarching interests in home data and show how participants used pre-defined visualizations to get an overview and the creation tool to not only address specific use cases but also to answer questions by creating temporary visualizations.
Daamen, D., Staats, H., Wilke, H., & Engelen, M. (2001). Improving environmental behavior in companies—The effectiveness of tailored versus nontailored interventions. Environment and Behavior, 33(2): 229-248.
Workshop managers in garages (N = 153) received a message by mail with recommendations on how their subordinates should behave to reduce oil pollution of wastewater. The recommendations were either tailored or not tailored to the current behavior routines in each specific workshop. Tailored messages resulted in more accu- rate knowledge (assessed 1 week postintervention) and in more pro-environmental behavior (assessed 3 months postintervention and compared to pretest data). Tailored messages were as effective with or without additional information on behavior rou- tines in other garages. Compared to no message (control group, n = 60), the tailored messages resulted in more pro-environmental behavior. The nontailored messages were hardly more effective than no message. The nontailored messages remained as ineffective when readers were helped (via a routing procedure) to select those parts of the message relevant to their workshop. It is concluded that tailoring is a promising new approach when campaigning for pro-environmental behavior in organizations.
De Young, R, (2000). Expanding and evaluating motives for environmentally responsible behavior. Journal of Social Issues, 56(3), 509–526.
This article contends that while striving to promote environmentally responsible behavior, we have focused attention too narrowly on just two classes of motives. There is a need to expand the range of motives available to practitioners and to provide a framework within which motives can be evaluated for both their immediate and long-term effectiveness. The article then examines a strategy for promoting environmentally responsible behavior that has significant potential. This strategy is based on a particular form of motivation called intrinsic satisfaction. Nine

Gamification Phase 2
36
studies are reviewed that have outlined the structure of intrinsic satisfaction. A key theme discussed is the human inclination for competence. This fundamental human concern is shown to have both a general form and a resource-specific version.
Delmas, M., Fischlein, O., & Asensio, O. (2013). Information strategies and energy conservation behavior: A meta-analysis of experimental studies from 1975 to 2012. Energy Policy, 61: 729–739
Strategies that provide information about the environmental impact of activities are increasingly seen as effective to encourage conservation behavior. This article offers the most comprehensive meta-analysis of information based energy conservation experiments conducted to date. Based on evidence from 156 published field trials and 525,479 study subjects from 1975 to 2012, we quantify the energy savings from information based strategies. On average, individuals in the experiments reduced their electricity consumption by 7.4%. Our results also show that strategies providing individualized audits and consulting are comparatively more effective for conservation behavior than strategies that provide historical, peer comparison energy feedback. Interestingly, we find that pecuniary feedback and incentives lead to a relative increase in energy usage rather than induce conservation. We also find that the conservation effect diminishes with the rigor of the study, indicating potential methodological issues in the current literature.
Ezzine-de-Blasa, D., Corberac, E., & Lapeyre, R. (2019). Payments for environmental services and motivation crowding: Towards a conceptual framework. Ecological Economics, 156: 434-443. https://doi.org/10.1016/j.ecolecon.2018.07.026.
Research on Payments for Environmental Services has only recently started to pay attention to motivation "crowding", i.e. the effect that such rewards might have on either strengthening (crowding-in) or weakening (crowding-out) participants' intrinsic motivations to protect and sustainably manage natural ecosystems. In this Introduction to the special issue Crowding-out or crowding-in? Behavioral and motivational responses to economic incentives for conservation, we propose a conceptual framework that maps out how PES implementation, or incentive-based conservation more broadly, might lead to motivation and behavioural change, drawing on theoretical insights and empirical evidence from behavioural economics and social psychology. We also explain how PES design and implementation factors, such as payment type, communication and verbal rewards, inclusive and participatory decision-making, and monitoring and sanctioning procedures, might harm or enhance intrinsic motivations. We suggest that motivation crowding depends on how these policy features are perceived by and affect an individual's need for satisfaction, modulated in turn by the stimulation or inhibition of competence, autonomy, social and environmental relatedness. We highlight the importance of measuring these variables and their motivation and behavioural outcomes in future PES research, in order to relate psychological processes with other contextual determinants of PES social-ecological performance.
Fischer, C. (2008). Feedback on household electricity consumption: A tool for saving energy? Energy Efficiency, 1:79-104. http:// doi 10.1007/s12053-008-9009-7.
Improved feedback on electricity consumption may provide a tool for customers to better control their consumption and ultimately save energy. This paper asks which kind of feedback is most successful. For this purpose, a psychological model is presented that illustrates how and why feedback works. Relevant features of feedback are identified that may determine its effectiveness: frequency, duration, content, breakdown, medium and way of presentation, comparisons, and combination with other instruments. The paper continues with an analysis of international experience in order to find empirical evidence for which kinds of feedback work best. In spite of considerable data restraints and research gaps, there is some indication that the most successful feedback combines the following features: it is given frequently and over a long time, provides an appliance-specific breakdown, is presented in a clear and appealing way, and uses computerized and interactive tools.
Freed, A., & Wong, D. (2019). The relationship between university students’ environmental identity, decision-making process, and behavior. Journal of Sustainability Education, 20.
Environmental education scholars have argued for the need to focus on identity as a more predictive factor than attitude of individuals’ environmental behavior. We examine individuals’ decision-making as a mediating process
Gamification Phase 2
37
between identity and behavior. University undergraduates (n=299) were surveyed, with a select sub-sample interviewed. As expected, environmental identity was correlated with pro-environment behavior (recycling). However, students with lower pro-environmental identity also recycled regularly. Similarly, analysis of decision-making revealed most students, regardless of their environmental identity, do not think much when recycling. Environmental structures such as presence of recycling bins surfaced as a powerful influence on pro-environment behavior.
Fuerst, F. & Singh, R. (2018). How present bias forestalls energy efficiency upgrades: A study of household appliance purchases in India. Journal of Cleaner Production, 186(10): 558-569.
This paper investigates household decision-making behaviour in the market for energy-efficient lighting and appliances in Delhi, India to study the energy efficiency gap using the inter-disciplinary framework of behavioural economics. A primary dataset of survey responses and choice experiments is analysed to test whether under-investment in energy-efficient technologies is explained by present-biased preferences. A ‘Multiple Price List’ set is employed to compute the standard discount factor, and the present bias and long-run component of a quasi-hyperbolic specification. Individuals who are more patient and less present-biased are found to be more likely to invest in certain energy-efficient appliances. As expected, time preferences are relevant for larger purchases such as refrigerators but lose some or all of their explanatory power for inexpensive purchases such as light bulbs. Our quantitative study contributes to the existing literature, which is limited to qualitatively identifying the (market failure) barriers for energy efficiency; inter alia, it tests for behavioural failures in individuals' decision-making towards the environment.
Gaterslebena, B., Murtagha, N., & Wokje, A. (2014). Values, identity and pro-environmental behaviour. Contemporary Social Science, 9(4): 374–392. http://dx.doi.org/10.1080/21582041.2012.682086.
The importance of understanding and promoting pro-environmental behaviour among individual consumers in modern Western Societies is generally accepted. Attitudes and attitude change are often examined to help reach this goal. But although attitudes are relatively good predictors of behaviour and are relatively easy to change they only help explain specific behaviours. More stable individual factors such as values and identities may affect a wider range of behaviours. In particular factors which are important to the self are likely to influence behaviour across contexts and situations. This paper examines the role of values and identities in explaining individual pro- environmental behaviours. Secondary analyses were conducted on data from three studies on UK residents, with a total of 2694 participants. Values and identities were good predictors of pro- environmental behaviour in each study and identities explain pro-environmental behaviours over and above specific attitudes. The link between values and behaviours was fully mediated by identities in two studies and partially mediated in one study supporting the idea that identities may be broader concepts which incorporate values. The findings lend support for the concept of identity campaigning to promote sustainable behaviour. Moreover, it suggests fruitful future research directions which should explore the development and maintenance of identities.
Gifford, R. (2011). The dragons of inaction: Psychological barriers that limit climate change mitigation and adaptation. American Psychologist, 66(4):290-302. doi: 10.1037/a0023566.
Most people think climate change and sustainability are important problems, but too few global citizens engaged in high-greenhouse-gas-emitting behavior are engaged in enough mitigating behavior to stem the increasing flow of greenhouse gases and other environmental problems. Why is that? Structural barriers such as a climate-averse infra- structure are part of the answer, but psychological barriers also impede behavioral choices that would facilitate mitigation, adaptation, and environmental sustainability. Al- though many individuals are engaged in some ameliorative action, most could do more, but they are hindered by seven categories of psychological barriers, or “dragons of inaction”: limited cognition about the problem, ideological worldviews that tend to preclude pro-environmental attitudes and behavior, comparisons with key other people, sunk costs and behavioral momentum, discredence toward experts and authorities, perceived risks of change, and positive but inadequate behavior change. Structural barriers must be removed wherever possible, but this is unlikely to be sufficient. Psychologists must work with other scientists, technical experts, and policymakers to help citizens overcome these psychological barriers.

Gamification Phase 2
38
Gifford, R. & Nilsson, A. (2014). Personal and social factors that influence pro-environmental concern and behaviour: A review. International Journal of Psychology, 49(3): 141–157. doi: 10.1002/ijop.12034
We review the personal and social influences on pro-environmental concern and behaviour, with an emphasis on recent research. The number of these influences suggests that understanding pro-environmental concern and behaviour is far more complex than previously thought. The influences are grouped into 18 personal and social factors. The personal factors include childhood experience, knowledge and education, personality and self-construal, sense of control, values, political and world views, goals, felt responsibility, cognitive biases, place attachment, age, gender and chosen activities. The social factors include religion, urban–rural differences, norms, social class, proximity to problematic environmental sites and cultural and ethnic variations We also recognize that pro-environmental behaviour often is undertaken based on none of the above influences, but because individuals have non-environmental goals such as to save money or to improve their health. Finally, environmental outcomes that are a result of these influences undoubtedly are determined by combinations of the 18 categories. Therefore, a primary goal of researchers now should be to learn more about how these many influences moderate and mediate one another to determine pro-environmental behaviour.
Gillingham, K. & Tsvetanov, T. (2018). Nudging energy efficiency audits: Evidence from a field experiment. Journal of Environmental Economics and Management, 90: 303-316. doi: 10.1016/j.jeem.2018.06.009. xxxxx This paper uses a randomized field experiment to test how information provision leveraging social norms, salience, and a personal touch can serve as a nudge to influence the uptake of residential energy audits. Our results show that a low-cost carefully-crafted notecard can increase the probability of a household to follow through with an already scheduled audit by 1.1 percentage points on a given day. The effect is very similar across individuals with different political views, but households in rural areas display a substantially greater effect than those in urban areas. Our findings have important managerial and policy implications, as they suggest a cost-effective nudge for increasing energy audit uptake and voluntary energy efficiency adoption.
Gregory, G., & Leo, M. (2003). Repeated behavior and environmental psychology: The role of personal involvement and habit formation in explaining water consumption. Journal of Applied Social Psychology, 33(6): 1261-1296.
Extending existing theory in social and environmental psychology, we develop a model to study important predictors of water consumption behavior. Overall results provide support for the predictive ability of stimuli (e.g., environmental awareness), reasoned processes (e.g., personal involvement), unreasoned processes (e.g., habits), and situational factors (e.g., income) on water consumption behavior. Findings indicate that households with lower water usage display greater awareness of water conservation issues, are more highly involved in the decision to use water, and tend to form habits associated with lower usage levels. Furthermore, the results are consistent with past research that attitudes toward water usage appear to be poor predictors of water consumption behavior. After controlling for situational factors (e.g., household size), the findings substantiate the role of personal involvement and habit formation in explaining water consumption, lending further support to the adaptation and development of repeated behavior models in environmental psychology.
Grilli, G. & Curtis, J. (2019). Encouraging pro-environmental behaviours: a review of methods andApproaches. ESRI Working Paper No. 645.
Many urgent environmental problems can be mitigated with more sustainable use of resource. An acknowledgement of which is a growing interest among policy practitioners in encouraging pro-environmental behaviour change initiatives. The effect of anthropic pressure on the environment is long known and the first pro-environmental behaviour studies date back to the middle 1970s. Despite this, the behavioural changes? What are the barriers to project implementation? What are the long run effects of behavioural change projects? With this in mind, this contribution offers a review of the existing literature on behavioural change case studies and provides a categorisation of treatments and guidelines for successful project implementation. Five different approaches have been considered: education and awareness, social influence, relationship building, incentives and nudges, which have been used in experimental studies. On balance the case studies suggest that all approaches are suitable but their selection should be based on specific objectives and target population. Interestingly, the choice of the behaviour to

Gamification Phase 2
39
change is rarely discussed before project implementation. This analysis also highlights that little is known on whether behaviour change projects achieve sustained pro-environmental behavioural change over time.
Haines, V. & Mitchell, V. (2014). A persona-based approach to domestic energy retrofit. Building Research & Information, 42(4): 462-476. http://dx.doi.org/10.1080/09613218.2014.893161.
In order to improve the efficiency of the housing stock successfully, the offered technical solutions also need to meet occupants’ needs and match their aspirations. Owner-occupiers present particular challenges: conflicting demands on their use of time and financial resources and their role as decision-makers for their own domestic renovation. A persona-driven study (based on user-centred design) was undertaken to explore the varying behaviours, attitudes and motivations towards home improvement for owner-occupiers who live in ‘hard to treat’ solid-walled dwellings. Five evidence-based personas are constructed that reflect archetypes, based on the outcomes of a qualitative study involving 33 owner-occupier householders in the East Midlands region of the UK. The adoption of a persona-based approach in response to the socio-technical challenges of energy renovation is important for understanding the specific drivers and appropriate range of policy responses for each persona. The persona development process is described and the success of the approach is evaluated in relation to the needs of policy developers, energy providers and product developers. Tailoring strategies to suit different personas will considerably enhance the diffusion of policy goals for low-energy retrofit and also allow business and technology developers to target an appropriate user.
Hamari, J. & Koivisto, J. (2014). Measuring flow in gamification: Dispositional Flow Scale-2. Computers in Human Behavior, 40: 133-143. http://dx.doi.org/10.1016/j.chb.2014.07.048.
This paper measures flow in the context of gamification and investigates the psychometric properties of the Dispositional Flow Scale-2 (DFS-2). We employ data gathered from users of an exercise gamification service (N = 200). The results show that the original DFS-2 factorial structure does result in a similar model fit as the original work. However, we also present a factorial respecification that satisfies more recent model fit thresholds. Beyond validating the original DFS-2 instrument in the context of gamifica- tion, the psychometric analysis and the respecifications suggest that the components of flow divide into highly correlated conditions of flow (which were also found to be more salient in the context of gamification: autotelic experience, balance of skill and challenge, control, clear goals, and feedback) and into possible outcomes (merging action-awareness, concentration, loss of sense of time, and loss of self- consciousness) from achieving flow.
Hartmann, P., Eisend, M. Vanessa Apaolaza, V., & D'Souza, C. (2017). Warm glow vs. altruistic values: How important is intrinsic emotional reward in proenvironmental behavior? Journal of Environmental Psychology 52: 43-55. http://dx.doi.org/10.1016/j.jenvp.2017.05.006.
This research addresses the role of warm glow as an antecedent of proenvironmental behavior in a comparative study of the behavioral effects of warm glow and altruistic personality traits and values. So far the influences of altruism and warm glow have not been analyzed simultaneously. Two online surveys with representative population samples show that warm glow has a stronger influence on pro- environmental intentions than altruism. However, the study also provides a process explanation for the decreased influence of altruism when warm glow is introduced into the model. Results show that warm glow mediates the effects of altruism, but that introducing warm glow together with altruism also ex- plains additional variance of proenvironmental behavior, apart from the indirect effect of altruism. Further findings support a reinforcing mechanism by which warm glow strengthens the effect of prior proenvironmental behavior on future intention. Implications for the promotion of proenvironmental behavior are discussed.
Henkel, C., Seidler, A., Kranz, J., & Fiedler, M. (2019). How to nudge pro-environmental behavior: An experimental study. Twenty-Seventh European Conference on Information Systems (ECIS2019), Stockholm-Uppsala, Sweden.
Last year, human mankind exhausted the planet’s resources for the year as early as never before by consuming food, water, or clean air beyond the nature’s sustainable means. To prevent further environmental damages, understanding and promoting individual pro-environmental behaviour (PEB) is crucial. However, motivating individual PEB is
Gamification Phase 2
40
considered difficult as it is often costlier and more burdensome than non-eco-friendly behaviour. One promising recent approach is the concept of ‘digital nudging’, which examines the effectiveness of user-interface elements to guide people’s behaviour in digital choice environments. Prior research has focused on nudging PEB through anchoring and adjustment, overlooking the import nudging mechanisms of priming and status quo bias. To test nudges’ direct and interaction effects on motivating individual PEB, we conducted a randomized, laboratory experiment with 120 participants. We find that groups nudged with a status quo bias acted more pro-environmentally. Surprisingly, we find no differences in PEB between groups nudged with priming and the control group, indicating priming’s ineffectiveness in motivating PEB. Our study contributes to research on Green IS and digital nudging and offers directions for future research.
Hewitt, E. & Wang, Y. (2020). Understanding the Drivers of National-Level Energy Audit Behavior: Demographics and Socioeconomic Characteristics. Sustainability, 12: 2059-ff.; doi:10.3390/su12052059.
The energy audit—an assessment of a home’s energy systems performed by a trained auditor in order to provide the resident with strategies for saving energy and money—is provided by many utility companies throughout the United States for free or at a reduced cost. The uptake of such programs is generally low, and little is known about audit participants. Importantly, as more evidence points to the need to look beyond physical building characteristics to increase energy efficiency, this work explores if specific characteristics of the individual are correlated with increased participation in audit programs. This research analyzes the most recent (2015) national level Residential Energy Consumption Survey (RECS) data through a binary logit regression to determine what socioeconomic and demographic factors, if any, are statistically significant in linking to the decision to undertake an audit, while controlling for physical building characteristics. The findings indicate that age has a significant and positive relationship with the decision to undertake an audit, as does being non-white, while renting has a significant and negative relationship. Knowledge about national-level participation in audit programs can help policy makers craft more strategic incentives to increase participation and, ultimately, help connect the audit decision to the more important next step of retrofits and upgrades to save energy.
Ho, E., Hagman, D. Loewensteind (2020). Measuring Information Preferences. Management Science, Articles in Advance, 1-20. http://pubsonline.informs.org/journal/mnsc ISSN 0025-1909 (print), ISSN 1526-5501 (online). https://doi.org/10.1287/mnsc.2019.3543.
Advances in medical testing and widespread access to the internet have made it easier than ever to obtain information. Yet, when it comes to some of the most important decisions in life, people often choose to remain ignorant for a variety of psychological and economic reasons. We design and validate an information preferences scale to measure an individual’s desire to obtain or avoid information that may be unpleasant but could improve future decisions. The scale measures information preferences in three domains that are psychologically and materially consequential: consumer finance, personal characteristics, and health. In three studies incorporating responses from over 2,300 individuals, we present tests of the scale’s reliability and validity. We show that the scale predicts a real decision to obtain (or avoid) information in each of the domains as well as decisions from out-of-sample, unrelated domains. Across settings, many respondents prefer to remain in a state of active ignorance even when information is freely available. Moreover, we find that information preferences are a stable trait but that an individual’s preference for information can differ across domains.
Iria, J., Fonseca, N., Cassola, F., Barbosa, A., Soares, F., Coelho, A., & Ozdemir, A. (2020). A gamification platform to foster energy efficiency in office buildings. Energy and Buildings, 222. http://doi:10.1016/j.enbuild.2020.110101.
Office buildings consume a significant amount of energy that can be reduced through behavioral change. Gamification offers the means to influence the energy consumption related to the activities of the office users. This paper presents a new mobile gamification platform to foster the adoption of energy efficient behaviors in office buildings. The gamification platform is a mobile application with multiple types of dashboards, such as (1) an information dashboard to increase the awareness of the users about their energy consumption and footprint, (2) a gaming dashboard to engage users in real-time energy efficiency competitions, (3) a leaderboard to promote peer competition and comparison, and (4) a message dashboard to send tailor-made messages about energy efficiency opportunities. The engagement and gamification strategies embedded in these dashboards exploit economic, environmental, and social motivations to stimulate office users to adopt energy efficient behaviors without

Gamification Phase 2
41
compromising their comfort and autonomy levels. The gamification platform was demonstrated in an office building environment. The results suggest electricity savings of 20%.
Karlin, B., Zinger, J.F., & Ford, R. (2015). The effects of feedback on energy conservation: A meta-analysis. Psychological Bulletin, 141(6): 1205–1227. http://dx.doi.org/10.1037/a0039650.
Feedback has been studied as a strategy for promoting energy conservation for more than 30 years, with studies reporting widely varying results. Literature reviews have suggested that the effectiveness of feedback depends on both how and to whom it is provided; yet variations in both the type of feedback provided and the study methodology have made it difficult for conclusions to be drawn. The current article analyzes past theoretical and empirical research on both feedback and proenvironmental behavior to identify unresolved issues, and utilizes a meta-analysis of 42 feedback studies published between 1976 and 2010 to test a set of hypotheses about when and how feedback about energy usage is most effective. Results indicate that feedback is effective overall, r =.071, p < .001, but with significant variation in effects (r varied from .080 to .480). Several treatment variables were found to moderate this relationship, including frequency, medium, comparison message, duration, and combination with other interventions (e.g., goal, incentive). Overall, results provide further evidence of feedback as a promising strategy to promote energy conservation and suggest areas in which future research should focus to explore how and for whom feedback is most effective.
Khoshkangini, R., Valetto, G., Marconi, A., & Pistore, M. (2020). Automatic generation and recommendation of personalized challenges for gamification. User Modeling and User-Adapted Interaction. Published online. https://doi.org/10.1007/s11257-019-09255-2.
Gamification, that is, the usage of game content in non-game contexts, has been successfully employed in several application domains to foster end users’ engagement and to induce a change in their behavior. Despite its impact potential, well-known limitations concern retaining players and sustaining over time the newly adopted behavior. This problem can be sourced from two common errors: basic game elements that are considered at design time and a one-size-fits-all strategy in generating game content. The former issue refers to the fact that most gamified applications focus only on the superficial layer of game design elements, such as points, badges and leaderboards, and do not exploit the full potential of games in terms of engagement and motivation; the latter relates to a lack of personalization, since the game content proposed to players does not take into consideration their specific abilities, skills and preferences. Taken together, these issues often lead to players’ boredom or frustration. The game element of challenges, which propose a demanding but achievable goal and rewarding completion, has empirically proved effective to keep players’ interest alive and to sustain their engagement over time. However, they require a significant effort from game designers, who must periodically conceive new challenges, align goals with the objectives of the gamification campaign, balance those goals with rewards and define assignment criteria to the player population. Our hypothesis is that we can overcome these limitations by automatically generating challenges, which are personalized to each individual player throughout the game. To this end, we have designed and implemented a fully automated system for the dynamic generation and recommendation of challenges, which are personalized and contextualized based on the preferences, history, game status and performances of each player. The proposed approach is generic and can be applied in different gamification application contexts. In this paper, we present its implementation within a large-scale and long-running open-field experiment promoting sustainable urban mobility that lasted 12 weeks and involved more than 400 active players. A comparative evaluation is performed, considering challenges that are generated and assigned fully automatically through our system versus analogous challenges developed and assigned by human game designers. The evaluation covers the acceptance of challenges by players, the impact induced on players’ behavior, as well as the efficiency in terms of rewarding cost. The evaluation results are very encouraging and suggest that procedural content generation applied to the customization of challenges has a great potential to enhance the performance of gamification applications and augment their engagement and persuasive power.
Kirgiosa, W., Changa, E., Levine, E., Milkmana, K., & Kesslerc, J. (2020). Forgoing earned incentives to signal pure motives. PNAS, 117(29): 16891–16897. http://www.pnas.org/cgi/doi/10.1073/pnas.
Policy makers, employers, and insurers often provide financial incentives to encourage citizens, employees, and customers to take actions that are good for them or for society (e.g., energy conservation, healthy living, safe

Gamification Phase 2
42
driving). Although financial incentives are often effective at inducing good behavior, they’ve been shown to have self-image costs: Those who receive incentives view their actions less positively due to the perceived incompatibility between financial incentives and intrinsic motives. We test an intervention that allows organizations and individuals to resolve this tension: We use financial rewards to kick-start good behavior and then offer individuals the opportunity to give up some or all of their earned financial rewards in order to boost their self-image. Two preregistered studies—an incentivized online experiment (n = 763) on prosocial behavior and a large field experiment (n = 17,968) on exercise—provide evidence that emphasizing the intrinsic rewards of a past action leads individuals to forgo or donate earned financial rewards. Our intervention allows individuals to retroactively signal that they acted for the right reason, which we call “motivation laundering.” We discuss the implications of motivation laundering for the design of incentive systems and behavioral change.
Kristen Berman (2020). The Biggest Missing Element in Most Product Experiences, According to Behavioural Science (Does Yours Have It?). https://www.mindtheproduct.com/the-biggest-missing-element-in-most-product-experiences-according-to-behavioural-science-does-yours-have-it/. Accessed 2021.
The worst culprits, however, are fintech personal financial management apps. These companies spend most of their engineering budgets improving categorization and data visualizations. This results in beautiful pie charts and trend graphs of your spending last month vs prior months. But what does it leave out? What a user should do to change their spending.
And the research is clear — simply tracking your behavior is not enough to change it. This is especially true in complex environments where the “best action” may not be obvious to the beginner. For example, researchers paid diabetics to monitor their glucose levels, and people did succeed in tracking their levels. But despite heavy monitoring, there was no actual change in glucose levels.
As product managers and designers, you are the experts in your domains. It’s likely very few people in the world think more deeply about your problem space than you do. And so while it’s challenging to make recommendations, it’s your job. You’re in the best position to bridge the gap between beautifully-presented data and helping people improve their lives.
These are meaningful and worthwhile questions to ask and answer. Because once you go beyond just furnishing users with data, you move into behavioral design, which is where things get really exciting. xxxxx We also used behavioral design in collaboration with a bank, helping them to decrease their rate of auto loan defaults by 69% year-over-year. Behavioral science revealed that the opportunity to intervene with repayments wasn’t after someone missed a payment — but at the point of loan origination. We, therefore, designed the bank’s welcome call to include setting up auto-pay and bill pay reminders. Imagine the human cost saved — the stress reduction for people who got to keep their cars and feel like they had things under control financially.
Lewis, N. A., Jr., & Oyserman, D. (2016). Using identity-based motivation to improve the nation’s health without breaking the bank. Behavioral Science & Policy, 2(2): pp. 25–38.
For the first time in two decades, overall life expectancy in the United States is in decline. This unsettling increase in mortality is largely due to lifestyle-associated causes. It is in the national interest to address this decline. This article outlines identity-based motivation theory (IBM), an evidence- based behavioral science theory that provides insight and a behavioral toolset which together may help lower lifestyle- associated mortality and morbidity rates. A key place to start is the health aspiration-attainment gap: Most people aspire to live healthy lives yet often fail to sufficiently engage in behaviors necessary to achieve or maintain good health. This aspiration-attainment gap is particularly prevalent amongst people of lower socioeconomic status. We offer evidentiary insight into how IBM may be deployed by health- care providers, insurers and policymakers to help ameliorate the health aspiration-attainment gap and improve the health status of various demographic groups.
Identity-based motivation theory is a social psychological theory of motivation and goal pursuit that explains when and in which situa- tions people’s identities motivate them to take action toward their goals.25,26 Throughout this article, we use the term identity to refer to the traits and characteristics, social relationships, roles, and group memberships that define who a person is or might become, the combi- nation of which defines his/her sense of self.27 Identity-based motivation theory starts with the assumption that people prefer to act and make sense of situations in identity-congruent ways— ways consistent with what people “like me” do. Yet, at the same time, which

Gamification Phase 2
43
particular identity comes to mind and what that identity implies for action and meaning is not fixed but is instead malleable. That is, the influence a salient iden- tity has on which actions feel right depends on features of the immediate situation. The thing of interest here is not that people can change how they regard themselves after putting in sustained and conscious effort but rather that small shifts in context can have surprisingly large effects by changing how people regard themselves.
Maki, A., Burns, R. J., Ha, L., & Rothman, A. J. (2016). Paying people to protect the environment: A meta-analysis of financial incentive interventions to promote proenvironmental behaviors. Journal of Environmental Psychology, 47: 242-255. https://doi.org/10.1016/j.jenvp.2016.07.006.
What effect do financial incentive interventions have on initial and sustained proenvironmental behavior, how do different types of incentives (e.g., cash, transit tickets) affect proenvironmental behavior, and how does the effect of incentive interventions vary across different types of behaviors (e.g., recycling, travel behavior)? A meta-analysis of 22 studies (k = 30) addressed these questions. Incentive interventions had a small-to-medium effect on behavior while incentives were in place (d+ = 0.36) and after they were discontinued (d+ = 0.41). Moreover, certain financial incentives features tended to be more effective at changing behavior, such as incentives distributed on variable schedules as compared to fixed schedules. Finally, financial incentive types were more effective at changing specific proenvironmental behaviors; cash incentives had a stronger effect on recycling and non-cash incentives had a stronger effect on travel behavior. These findings suggest that financial incentives can change proenvironmental behavior, can contribute to sustained behavior, and are particularly effective in certain contexts.
Moore, H., & Boldero, J. (2017). Designing Interventions that Last: A Classification of Environmental Behaviors in Relation to the Activities, Costs, and Effort Involved for Adoption and Maintenance Front. Psychol. 8:1874. doi: 10.3389/fpsyg.2017.01874.
Policy makers draw on behavioral research to design interventions that promote the voluntary adoption of environmental behavior in societies. Many environmental behaviors will only be effective if they are maintained over the long-term. In the context of climate change and concerns about future water security, behaviors that involve reducing energy consumption and improving water quality must be continued indefinitely to mitigate global warming and preserve scarce resources. Previous reviews of environmental behavior have focused exclusively on factors related to adoption. This review investigates the factors that influence both adoption and maintenance, and presents a classification of environmental behaviors in terms of the activities, costs, and effort required for both adoption and maintenance. Three categories of behavior are suggested. One-off behaviors involve performing an activity once, such as purchasing an energy efficient washing machine, or signing a petition. Continuous behaviors involve the performance of the same set of behaviors for adoption and for maintenance, such as curbside recycling. Dynamic behaviors involve the performance of different behaviors for adoption and maintenance, such as revegetation. Behaviors can also be classified into four categories related to cost and effort: those that involve little cost and effort for adoption and maintenance, those that involve moderate cost and effort for adoption and maintenance, those that involve a high cost or effort for adoption and less for maintenance, and those that involve less cost or effort for adoption and a higher amount for maintenance. In order to design interventions that last, policy makers should consider the factors that influence the maintenance as well as the adoption of environmental behaviors.
Mumm, J. & Mutlu, B. (2011). Designing motivational agents: The role of praise, social comparison, and embodiment in computer feedback. Computers in Human Behavior, 27(5):1643-1650. doi: 10.1016/j.chb.2011.02.002.
The present study draws on theories of attribution, social comparison, and social facilitation to investigate how computers might use principles of motivation and persuasion to provide user feedback. In an online experiment, 192 participants performed a speed-reading task. The independent variables included whether or not the verbal feedback from the computer involved praise, whether the objective feedback showed that the participants were performing better or worse from their peers, and whether or not the feedback was presented by an on-screen agent. The main dependent variables included a subjective measure of participants’ intrinsic motivation and an objective measure of their task persistence. Results showed that providing participants with praise or comparative information on others’ performance improved intrinsic motivation. When praised, participants whose performances were comparatively

Gamification Phase 2
44
low persisted in the task longer than those whose performances were comparatively high did. Additionally, the mere presence of an embodied agent on the screen increased participants’ motivation. Together, these results indicate that praise and social comparison can serve as effective forms of motivational feedback and that humanlike embodiment further improves user motivation.
Nacke, L. E., & Deterding, S. (2017). Editorial: The maturing of gamification research. Computers in Human Behavior. Published online. http://dx.doi.org/10.1016/j.chb.2016.11.062.
Throughout history, many have championed the use of play, games, and game-inspired design to improve the human condition. In the mid-2000s, the confluence of web technologies, digital business models, and online and location-based gaming gave rise to the most recent manifestation of this basic idea. Mobile applications like foursquare and websites like StackOverflow borrowed design elements like point scores, badges, or leaderboards from social network games and meta-gaming systems like Xbox Live to motivate user activity. This industry practice quickly became known as gamification, which can be defined as the use of game design elements in non-game contexts (Deterding et al., 2011). Many startups and design agencies emerged to offer gamification design or software-as-aservice (SaaS) packages, and organisations across the globe began exploring gamification as a way to motivate people and improve the user experience. Applications reach from education and training to health, self-management, innovation, employee engagement, heritage, crowdsourcing, civic engagement, and marketing (Seaborn & Fels, 2015). Today, gamification is an established practice and industry segment, by some estimates poised to grow to over US$ 11 bn by 2020 (Markets and Markets, 2016).
A key enabler of this groundswell has been now-ubiquitous sensor and computing technology: smart cities, smartphones, and wearables are increasingly tracking and processing our every step, effectively turning our life-world into a digital game in waiting. In parallel, we see a shift to postmaterial values of self-expression and experience, catered to by a dematerialized ‘experience economy’ and a new profession and practice of experience designers, as well as the growth of digital games into a dominant cultural form, complete with a whole ‘gamer generation’ socialised into them. Economically, we can observe the transformation of business models and market differentiators towards innovation, user experience, customer relations, and the tight integration of customers into value chains with user-led innovation, crowdsourcing, and word-of-mouth-marketing, all of which make employee customer engagement a crucial capacity for organisations. Meanwhile, policy-makers around the globe awake to motivation, engagement, and user experience as vital levers for public policy goals in health, education, or civic engagement. Taken together, these technical, cultural, economic, and political forces afforded and demanded a design practice that harnessed the potential of computing technology for improving user experience and engagement across domains and industries – and gamification filled this niche (Deterding, 2015).
As a research field, gamification has similarly risen to significance in the past six years and shows no sign of slowing growth. The first wave of gamification research has predominantly consisted of (1) definitions, frameworks and taxonomies for gamification and game design elements; (2) technical papers describing systems, designs, and architectures; and (3) effect and user studies of gamified systems (Hamari, Koivisto, & Sarsa, 2014; Seaborn & Fels, 2015). While work was initially published across venues in computer science, informatics, human-computer interaction, game studies, psychology, and many other disciplines, we are today seeing early signs of gamification research institutionalising as a cross-disciplinary field in the form of dedicated professorships,1 educational programs,2 collected volumes (Fuchs, Ruffino, & Schrape, 2014; Walz & Deterding, 2015; Reiners & Wood, 2015; Stieglitz et al., 2016), and academic conferences like Gamification 2013, where many authors submitted first versions of the present papers (Nacke, Harrigan, & Randall, 2013) and where the idea for this special issue was born.
Over the past six years, gamification has grown from a novel research topic into a thriving multidisciplinary field. Where first studies often lacked in theoretical grounding, methodological rigour, and differentiation, the articles in this volume speak of a more mature mode of scholarship. Yet many challenges and open questions remain for gamification research going forward. In terms of understanding how gamification works, we are now seeing studies isolating individual design elements, building on theories to derive and test hypotheses. This is an important first step. Still, the scope of elements being explored is limited (points, badges or levels, leaderboards), as is the canon of theories (SDT and increasingly, goal-setting) – fertile unexplored ground for future work. Yet we are still dearly lacking studies with rigorous designs that assess both psychological mediators and behavioural outcomes – and do so long-term and in the wild, not just short-term and in the lab. Finally, many studies are still to some extent comparing apples with oranges, testing different implementations of design elements with different effect measures.

Gamification Phase 2
45
Moving forward, a harmonizing and standardising of interventions and measures would do much to enable true comparison and metaanalyses of effect studies. This would be the methodological precondition for the next step in instituting gamification research as a field: systematically developing germane new theories.
Moving on to designing gamification, we are seeing a welcome broadening from points/badges/leaderboards to other features and aspects of game design, and a merging of design concerns like participation or inclusion with motivation as the core concern of gamification. But again, there is a dearth of rigorous evaluation studies comparing different proposed methods, principles, tools both in terms of process quality (such as time efficiency or self-efficacy of designers) and outcome quality (such as quantity and effectiveness of produced designs). Maybe even more importantly, gamification design research faces the research/practice hurdle of much human-computer interaction research – most research outcomes are not adopted by practitioners because they are unknown or impractical (Rogers, 2004). Developing new formats of research outcomes and research practice collaboration that improve the utility and adoption of gamification design research thus remains a desideratum.
Finally looking at application contexts, the articles in this special issue underline that one size does not fit all. Much has been made about the individual differences of ‘player types’ in existing literature (Deterding, 2015a; Tondello et al., 2016). But as Fitz-Walter and colleagues demonstrate, the very kind of activity might lend itself more or less to being gamified. Barata et al. show that there can also be important context-specific individual differences such as learning performance. And Caro and Malinverni with their colleagues expose how current gamification applications and methods are mostly limited to adults without disabilities, urging us to better understand and design for all audiences. We are just at the beginning of understanding what gamification design elements and methods best map onto what application domains (see e.g. Arnab et al., 2015, for education; Morschheuser, Hamari, & Koivisto, 2016, for crowdsourcing; or Johnson et al., 2016, for health and wellbeing). We know extremely little about the actual effect of ‘player types’, and the effectiveness of designing with player types in mind, let alone individual differences beyond them. And all of that says nothing yet about the relative impact of person versus situation on the effects of gamification, let alone potential interaction effects of the two. In a sense, current gamification research in its almost singular focus on player types seems blissfully unaware of 40 years of person-situation debate in psychology (Donellan, Lucas, & Fleeson, 2009). Future work in gamification research would do well to look at recent attempts of integrating these two factors (Fleeson & Noftle, 2008). Gamification research promises no less than a science of how individual design elements, dimensions, and qualities affect user experience and engagement, with near-limitless applications. But to make good on that promise, we need validated theories how design elements function and interact with individual dispositions, situational circumstances, and the characteristics of particular target activities. We need validated formats that translate research findings into a shape useful for designers. And we need rigorous empirical studies informing both, theories and formats. However, at the heart of the gamification design process is the development of gameful systems, which are complex combinations and interactions between elements. To explain these systems, we will also need more complex explanations than the mere understanding of how each element functions individually. To explain these systems, we need to study the interaction of game design elements and the dynamics that emerge during gameplay. In short, while gamification research is maturing, it is most certainly still in the early years of a long life.
Organ, S., Proverbs, D., & Squires, G. (2013). Motivations for energy efficiency refurbishment in owner-occupied housing. Structural Survey, 31(2): 101-120. http://dx.doi.org/10.1108/02630801311317527.
Purpose – The existing housing stock needs substantial adaptation to meet national and international carbon reduction targets. The largest proportion of housing is owner-occupied, and will require improvement works which go beyond those measures provided through the Green Deal and similar programmes. Therefore, the motivation of owner-occupiers to perform more substantial energy efficiency refurbishments is essential to facilitate greater action. This paper aims to address these issues.
Design/methodology/approach – A synthesis of the extant literature from a range of disciplines reveals the role of motivation and the factors influencing motivation and pro-environmental action in the context of the home. Based on this synthesis of the literature, a new motivation model for energy efficiency refurbishment in the owner-occupied housing stock is then described.
Findings – The study has found that multiple factors affect motivation to refurbish in the owner- occupied housing stock. Key motivations for energy efficient refurbishment can be categorized into the broad themes of economic, social, and environmental motivations. These motivations will be affected by a wide number of interrelated internal
Gamification Phase 2
46
and external factors and mediated by the emotions of the individual. The model presented demonstrates the relationship between the multiple factors that affect energy efficiency refurbishment in relation to specific contexts.
Originality/value – The study represents a potential addition to motivational theory and concepts for use within the field of energy efficient refurbishment of the owner-occupied housing stock. Implications for future government policy and towards raising the motivation of owner-occupiers are identified: it can be used to shape national and local policy and information campaigns to motivate energy efficiency refurbishment in the owner-occupied housing stock. To be successful, this should take differing internal factors and contexts into consideration and the dynamic nature of owner- occupier motivation. The model can also be used by industry professionals to better understand the owner-occupier customer motivations for energy efficiency refurbishment and therein provide a better service.
Palmer, K., Walls, M., Gordon, H. & Gerarden, T. (2013). Assessing the energy-efficiency information gap: results from a survey of home energy auditors. Energy Efficiency, 6:271–292. doi 10.1007/s12053-012-9178-2.
Commercial and residential buildings are responsible for 42 % of all U.S. energy consumption and 41 % of U.S. CO2 emissions. Engineering studies identify several investments in new energy-efficiency equipment or building retrofits that would more than pay for themselves in terms of lower future energy costs, but homeowners and businesses generally do not have good information about how to take advantage of these opportunities. Energy auditors make up a growing industry of professionals who evaluate building energy use and provide this information to building owners. This paper reports the results of a survey of nearly 500 home energy auditors and contractors that Resources for the Future conducted in summer 2011. The survey asked about the characteristics of these businesses and the services they provide, the degree to which homeowners follow up on their recommendations, and the respondents’ opinions on barriers to home energy retrofits and the role for government. Findings from the survey suggest that the audit industry only partially is filling the information gap. Not enough homeowners know about or understand audits, and the follow-through on recommendations once they do have audits is incomplete. But the survey findings suggest that low energy prices and the high cost of retrofits may be more responsible for these outcomes than failures of information.
Petkov, Petromil, Köbler, Felix, Foth, Marcus, & Krcmar, Helmut (2011) Motivating domestic energy conservation through comparative, community‐based feedback in mobile and social media. In: 5th International Conference on Communities & Technologies (C&T 2011), 29 June ‐ 2 July 2011, Brisbane.
The progress of technology has led to the increased adoption of energy monitors among household energy consumers. While the monitors available on the market deliver real-time energy usage feedback to the consumer, the format of this data is usually unengaging and mundane. Moreover, it fails to address consumers with different motivations and needs to save and compare energy. This paper presents a study that seeks to provide initial indications for motivation-specific design of energy-related feedback. We focus on comparative feedback supported by a community of energy consumers. In particular, we examine eco-visualisations, temporal self-comparison, norm comparison, one-on-one comparison and ranking, whereby the last three allow us to explore the potential of socialising energy-related feedback. These feedback types were integrated in EnergyWiz – a mobile application that enables users to compare with their past performance, neighbours, contacts from social networking sites and other EnergyWiz users. The application was evaluated in personal, semi-structured interviews, which provided first insights on how to design motivation-related comparative feedback.
Reid, G. (2012). Motivation in video games: a literature review. The Computer Games Journal, 1(2).
Video gaming is a firmly established leisure pursuit, which continues to grow in popularity. This paper is an examination of what motivates people to play computer games, and the relevance of such factors to the positive and negative aspects of computer gaming. When all of an individual’s motivations to play video games are for the pursuit of ‘fun’, it is said that an intrinsic motivation is the most prevalent motivation. However, the primary motivation for playing video games among periodic gamers is different from the primary motivation of regular gamers: periodic gamers are driven by extrinsic motivation, whereas regular gamers are driven by intrinsic motivation. The pursuit of a challenge is the prevalent motivation reported by regular gamers of both genders.

Gamification Phase 2
47
The Theory of Flow Experience, and the Attribution Theory have contributed to the understanding of why games may provide a safe medium, in which to learn about the consequences of actions through experience. Computer games may facilitate the development of self-monitoring and coping mechanisms. If the avoidance or escape from other activities is the primary motivation for playing video games, there tends to be an increased risk of engaging in addiction-related behaviours.
This paper reports on the findings of previous research (into the motivations for playing computer games), and on industry reports containing data relating to gamer motivations. The aim is to build a picture of what motivates people to play computer games, and how motivation is associated with the main positive and negative aspects of computer gaming.
Ryan, R, Rigby, C., & Przybylski, A. (2006). The motivational pull of video games: A Self-Determination Theory approach. Motivation and Emotion, 30:347-363. DOI 10.1007/s11031-006-9051-8.
Four studies apply self-determination theory (SDT; Ryan & Deci, 2000) in investigating motivation for computer game play, and the effects of game play on well- being. Studies 1–3 examine individuals playing 1, 2 and 4 games, respectively and show that perceived in-game autonomy and competence are associated with game enjoyment, preferences, and changes in well-being pre- to post-play. Competence and autonomy perceptions are also related to the intuitive nature of game controls, and the sense of presence or immersion in participants’ game play experiences. Study 4 surveys an on-line community with experience in multi- player games. Results show that SDT’s theorized needs for autonomy, competence, and relatedness independently predict enjoyment and future game play. The SDT model is also compared with Yee’s (2005) motivation taxonomy of game play motivations. Results are discussed in terms of the relatively unexplored landscape of human motivation within virtual worlds.
Sanguinetti, A. (2018). Onboard feedback to promote eco-driving: Average impact and important features. A National Center for Sustainable Transportation White Paper. Univ. of California Davis, and California Digital Library.
This white paper presents a statistical meta-analysis of eco-driving feedback studies in order to determine a pooled estimate of the impact on fuel economy and explore how characteristics of feedback interventions influence their impact. This review is for policy-makers and fleet operators who have a stake in reducing vehicle fuel consumption and emissions. It provides the most accurate estimate to-date of the average impact of in-vehicle feedback on fuel economy and summarizes the current state of knowledge regarding characteristics of eco-driving feedback interventions that determine effectiveness.
Given that eco-driving feedback outcomes are generally better in the short-term, it is crucial to understand how feedback design can maximize and prolong effects. Likely due to small sample sizes, feedback design variables did not emerge as statistically significant moderators of effectiveness. However, trends in these variables aligned with study hypotheses, suggesting feedback should: (a) be provided in multiple modalities (e.g., visual and haptic or auditory rather than visual only); (b) include both fine- and course-grained information; (c) provide feedback standards against which to compare performance; (d) integrate gameful design elements (e.g., points, levels, badges); and (e) be combined with other interventions, such as education and rewards contingent on performance. More experiments that compare the impact of different feedback designs are needed in order to identify the most promising designs, which can then be promoted to manufacturers and inform potential future standardization of fuel economy and related displays.
Schultz, P. W., Nolan, J., Cialdini, R., Goldstein, N., Griskevicius, V. (2007). The constructive, destructive, and reconstructive power of social norms. Psychological Science, 18: 429–434.
Despite a long tradition of effectiveness in laboratory tests, normative messages have had mixed success i n changing behavior in field contexts, with some studies showing boomerang effects. To test a theoretical account of this inconsistency, we conducted a field experiment in which normative messages were used to promote household energy conservation. As predicted, a descriptive normative message detailing average neighborhood usage produced either desirable energy savings or the undesirable boomerang effect, depending on whether households were already consuming at a low or high rate. Also as predicted, adding an injunctive message (conveying social approval or

Gamification Phase 2
48
disapproval) eliminated the boomerang effect. The results offer an explanation for the mixed success of persuasive appeals based on social norms and suggest how such appeals should be properly crafted.
Schultz, P. W., Nolan, J., Cialdini, R., Goldstein, N., Griskevicius, V. (2018). The Constructive, Destructive, and Reconstructive Power of Social Norms: Reprise. Perspectives on Psychological Science, 13(2): 249-254. https://doi.org/10.1177/1745691617693325.
The influence of social norms on behavior has been a longstanding storyline within social psychology. Our 2007 Psychological Science publication presented a new rendition of this classic telling. The reported field experiment showed that social norms could be leveraged to promote residential energy conservation, but importantly, the descriptive norm was shown to increase consumption for low-consuming households. This potential destructive effect of social norms was eliminated with the addition of an injunctive message of social approval for using less energy. The article is among the 30 most-cited articles across all APS publications, which we attribute to our methodology, which measured real behavior in a large-scale field experiment and to several circumstances associated with the timing of the work. The article coincided with the explosion of social media, the emergence of behavioral economics, and a heightened level of concern about climate change. These contemporaneous activities set the stage for our work and for its high degree of citation.
Steg, L. (2008). Promoting household energy conservation. Energy Policy, 36: 4449–4453.
It is commonly assumed that households must change their behaviour to reduce the problems caused by increasing levels of fossil energy use. Strategies for behaviour change will be more effective if they target the most important causes of the behaviour in question. Therefore, this paper first discusses the factors influencing household energy use. Three barriers to fossil fuel energy conservation are discussed: insufficient knowledge of effective ways to reduce household energy use, the low priority and high costs of energy savings, and the lack of feasible alternatives. Next, the paper elaborates on the effectiveness and acceptability of strategies aimed to promote household energy savings. Informational strategies aimed at changing individuals’ knowledge, perceptions, cognitions, motivations and norms, as well as structural strategies aimed at changing the context in which decisions are made, are discussed. This paper focuses on the psychological literature on household energy conservation, which mostly examined the effects of informational strategies. Finally, this paper lists important topics for future research.
Steg, L. (2016). Values, Norms, and Intrinsic Motivation to Act Proenvironmentally. Annual Review of Environment and Resources, 41: 277-292. https://doi.org/10.1146/annurev-environ-110615-085947.
Environmental problems can be reduced if people more consistently engage in proenvironmental actions. In this article, I discuss factors that motivate or inhibit individuals to act proenvironmentally. Many people are intrinsically motivated to engage in proenvironmental actions, because protecting the environment makes them feel good about themselves. People are more likely to be intrinsically motivated to act proenvironmentally over and again when they strongly endorse biospheric values. However, people may be less likely to act on their biospheric values when these values are not supported by the context, or when competing values are activated by factors in a choice context. Next, I discuss strategies to encourage proenvironmental actions by strengthening biospheric values, or by empowering and motivating people to act on their biospheric values. Moreover, I discuss factors influencing the acceptability of environmental policies that aim to encourage proenvironmental behavior.
Steg, L. & Vlek, C. (2009). Encouraging pro-environmental behaviour: An integrative review and research agenda. Journal of Environmental Psychology, 29: 309–317.
Environmental quality strongly depends on human behaviour patterns. We review the contribution and the potential of environmental psychology for understanding and promoting pro-environmental behaviour. A general framework is proposed, comprising: (1) identification of the behaviour to be changed, (2) examination of the main factors underlying this behaviour, (3) design and application of interventions to change behaviour to reduce environmental impact, and (4) evaluation of the effects of interventions. We discuss how environmental psychologists empirically studied these four topics, identify apparent shortcomings so far, and indicate major issues for future research.

Gamification Phase 2
49
Sweeny, K., Melnyk, D., Miller, W., & Shepperd, J. (2010). Information avoidance: Who, what, when, and why. Review of General Psychology, 14(4), 340–353.
Although acquiring information can provide numerous benefits, people often opt to remain ignorant. We define information avoidance as any behavior designed to prevent or delay the acquisition of available but potentially unwanted information. We review the various literatures that examine information avoidance and provide a unique framework to integrate the contributions of these disparate areas of research. We first define information avoidance and distinguish it from related phenomena. We then discuss the motivations that prompt information avoidance and the factors that moderate the likelihood of avoidance. Finally, we discuss individual differences that predict preferences for information avoidance. We conclude by evaluating the current state of research on information avoidance and discussing directions for future research.
Tondello, G., Wehbel, R., Diamond, L., Busch, M., Marczewski, A., & Nacke, L. (2016). The gamification User Types Hexad Scale. CHI PLAY, October 16-19, Austin, TX, USA. doi: http://dx.doi.org/10.1145/2967934.2968082.
Several studies have indicated the need for personalizing gamified systems to users’ personalities. However, mapping user personality onto design elements is difficult. Hexad is a gamification user types model that attempts this mapping but lacks a standard procedure to assess user preferences. Therefore, we created a 24-items survey response scale to score users’ preferences towards the six different motivations in the Hexad framework. We used internal and test- retest reliability analysis, as well as factor analysis, to vali- date this new scale. Further analysis revealed significant associations of the Hexad user types with the Big Five personality traits. In addition, a correlation analysis confirmed the framework’s validity as a measure of user preference towards different game design elements. This scale instrument contributes to games user research because it enables accurate measures of user preference in gamification.
Vasseur, V.; Marique, A.-F.; Udalov, V. A (2019). Conceptual framework to understand households’ energy consumption. Energies, 12: 4250-ff. https://doi.org/10.3390/en12224250.
Households’ energy consumption has received a lot of attention in debates on urban sustainability and housing policy due to its possible consequences for climate change. In Europe, the residential sector accounts for roughly one third of the energy consumption and is responsible for 16% of total CO2 emissions. Households have been progressively highlighted as the main actor that can play a substantial in the reduction of this energy use. Their behavior is a complex and hard to change process that combines numerous determinants. These determinants have already been extensively studied in the literature from a variety of thematic domains (psychology, sociology, economics, and engineering), however, each approach is limited by its own assumptions and often omit important energy behavioral components. Therefore, energy behavior studies require an integration of disciplines through interdisciplinary approaches. Based on that knowledge, this paper introduces a conceptual framework to capture and understand households’ energy consumption. The paper aims at connecting objective (physical and technical) with subjective (human) aspects related to energy use of households. This combination provide the answers to the ‘what’, the ‘how’ and most importantly the ‘why’ questions about people’s behavior regarding energy use. It allows clarifying the numerous internal and external factors that act as key determinants, as well as the need to take into account their interactions. By doing so, we conclude the paper by discussing the value of the conceptual framework along with valuable insights for researchers, practitioners and policymakers.

Gamification Phase 2
50
In summary, the conceptual model shows that energy consumption of households is based ona complex interaction between contextual, economic and social influence. This interaction has beenstructured into three categories implying a multilevel division of factors to shape the process ofhouseholds' behavior and its transition to assume and adopt new insights affecting their day-to-dayactions. The conceptual framework suggests a range of determinants for energy-saving behavior atdifferent levels. However, it should be noted that an important point of attention is which specific labelto be used in the conceptual framework and where the specific labels should be placed. This could berelated to the disciplinary angle from which one approaches the framework. This is especially the casealong the boundary of the social context. Although all the determinants are presented separately, froma practical approach are working synergistically and interrelated influencing the behavior and theircurrent performance in households.
Wee, S. & Choong, W. (2018). Gamification: Predicting the effectiveness of variety game design elements to intrinsically motivate users' energy conservation behaviour. Journal of Environmental Management, 233: 97–106. https://doi.org/10.1016/j.jenvman.2018.11.127.
This research predicted the effectiveness of variety game design elements in enhancing the intrinsic motivation of users on energy conservation behaviour prior to its actual implementation to ensure cost-effective. Face-to- face questionnaire surveys were conducted at the five recognized Malaysian research universities and obtained a total of 1500 valid survey data. The collected data was run with Structural Equation Modeling (SEM) analysis using SmartPLS 3 software. The results predicted the positive effect of gamification on intrinsically motivate the users based on Self-Determination Theory (SDT). The identified nine core game design elements were found to be useful in satisfying users' autonomy, competence and relatedness need satisfactions specified by SDT. This research is useful to guide the campaign organizer in designing a gamified design energy-saving campaign and provide understanding on the causal relationships between game design elements and users' intrinsic motivation to engage on energy conservation. A game-like campaign environment is believed to be created to users by implementing the game design elements in energy-saving campaign, and subsequently users' intrinsic motivation to engage on energy conservation behaviour can be enhanced.

Gamification Phase 2
51
West, R. & Michiel, S. (2020). A brief introduction to the COM-B Model of behaviour and the PRIME Theory of motivation. Qeios, CC-BY 4.0. (document preprint service)
The COM-B model of behaviour is widely used to identify what needs to change in order for a behaviour change intervention to be effective. It identifies three factors that need to be present for any behaviour to occur: capability, opportunity and motivation. T hese factors interact over time so that behaviour can be seen as part of a dynamic system with positive and negative feedback loops. Motivation is a core part of the model and the PRIME T heory of motivation provides a framework for understanding how reflective thought processes (Planning and Evaluation processes) and emotional and habitual processes (Motive and Impulse/inhibition processes)
White, K., Habib, R., & Hardisty, D. (2019). How to SHIFT consumer behaviors to be more sustainable: A literature review and guiding framework. Journal of Marketing, 83(3): 22-49. doi: 10.1177/0022242919825649 journals.sagepub.com/home/jmx.
Highlighting the important role of marketing in encouraging sustainable consumption, the current research presents a review of the academic literature from marketing and behavioral science that examines the most effective ways to shift consumer behaviors to be more sustainable. In the process of the review, the authors develop a comprehensive framework for conceptualizing and encouraging sustainable consumer behavior change. The framework is represented by the acronym SHIFT, and it proposes that consumers are more inclined to engage in pro-environmental behaviors when the message or context leverages the following psychological factors: Social influence, Habit formation, Individual self, Feelings and cognition, and Tangibility. The authors also identify five broad challenges to encouraging sustainable behaviors and use these to develop novel theoretical propositions and directions for future research. Finally, the authors outline how practitioners aiming to encourage sustainable consumer behaviors can use this framework.

Gamification Phase 2
52
APPENDIX B
Sample Focus Group Responses
(Note: The responses have been edited slightly. Without this,
spontaneous statements would be awkward to read.)

Gamification Phase 2
53
Sample Focus Group Responses This is just a sample. There were over 90 pages of transcript, so our goal here is to illustrate the kinds of comments generated, the adjustments we had to make to understand afterward what was said and meant, the relevance, and so on. Our focus is on comments of substance. We are not including simple comments of affirmation, agreement, and the like (as when, for example, other Group members express agreement with one of the comments of substance). Generally, each entry was provided by a different Group member. Some editing of the entries was necessary to clarify the comments. This was in the form of punctuation, or correcting a word that the transcript generator miscalculated. Text that we contributed is in italicized and in parentheses. All comments are archived and available in their entirety (as are the video recordings). Mainly because, I mean, they just kind of I mean they need the electricity so they need.(I.e., why bother—they just need it and will pay whatever.) How's this. Yeah. Okay. Okay now, finally, um, so when I first opened an account with the AVISTA, I definitely looked at the website at that point, pay my bill; set up auto pay those types of things and then I moved on. I took advantage of some rebates they had for new windows. Yeah, I just, I check it a couple times a month but we, I think part of that is because we had a furnace die. And I was curious how our energy change with kind of how our energy usage would change using space heaters versus a furnace. I'm just kind of into that (checking usage data). So, well I'm going to actually go through the kinds of things that are there, and others … But, you know, as (name) said yeah you set up automatic bill pay and then like why ever go back. You know, it's, you know, there's no, you know, I think the primary reason people go back as perhaps just to pay the bill. Out of sight, out of mind; I don't have to think about it. (after seeing the sample usage data page) So would that be, if you could just log into a VISTA and see that. Yeah. Would that be something that draws you into to look further at your usage. I would say yes, especially if like someone like me that lives with three other roommates. I remember this past winter, it was this is was last year was my first time ever like paying bills ever having my own apartment right and so in the winter time the when the bill is getting higher and higher. And I knew that I was being a little bit more cautious about like when I would be the heater on and the amount of time, and I would see that the bill would go a little bit higher, I would have liked to see, like maybe what times, like maybe if I wasn't there but I certain roommates were there at this time, I would have, I would have been able to see like, who it was, oh yeah you can compare with the before and after compare what it's like

Gamification Phase 2
54
when you're on vacation and not on vacation so there's lots of information that can be gathered here, if this would just pop it would tell you maybe I should look at the data. And some of us are like I guess I'm like (name of another group member) I would, I'm just fascinated by having this kind of data. So I just I'm always happy to have it. (About the games) Well honestly I wouldn't want to play and just because about (the) looks. Yes, like the idea though where you're trying to like put out the fires of your high usage that's an interesting way to convey. Yeah, I see that the bars are like the fires that are going up are like your usage. It's an interesting concept, I can see this more for children with their curriculum and what they're learning. I mean I like it but you have to have a very dedicated person that is very curious about their energy use, I think, to use it. (Referring to the Self Audit) Actually, love to see is a VISTA include that reading, that minute reading, and the app so it's easy to access. So if you're curious, or just your furnace. You know, you can look at those things. (Also, the Self Audit) I'm not feel like it's being (too intrusive). We have too many notices in life. (I.e., the Self Audit need not send an active notification to be useful.) (What do you notice about the Dashboard?) Besides the helicopter? And the car? Earning points. Yeah, there, there could be winnings involved in these games. But what do you notice about the game. Anything jump out at you as you see the game. This in this. This graph appear shows you the full course. (And there's times down at the bottom so what do you suppose these fires might be?)Our usage. Yeah, so you're actually putting it (out) and if you had a good day yesterday in terms of your usage, there's less fire to put out. So you're actually again what, even though you're just playing a simple helicopter game you are again faced with usage. Maybe the games would to be more will be modified to look better. Visually, probably and, yeah, but I learned that I think, I think that's, I think that's pretty cool to be able to play with your usage. Not sure (if games would attract). I think that they (i.e., typical customer) might check your usage; because while thing I guess the helicopter game like just by showing how the fire is their usage level, I think it might make them like get interested like oh that's my usage for like maybe, like, was it five

Gamification Phase 2
55
minutes ago or, then the old maybe I've been, I guess it would make them wonder what is maybe their monthly usage. Yeah, it's all this is to steer people to that page that has the usage on it. (What are you pretty much trying to do most of the time?)Pay my bill. (Regarding the “Points” at the top of the Dashboard) My neighbor, maybe, does that mean like, it's like competition, like my neighbors doing maybe better because they have lower usage than me. Yeah, that's one thing. So starting at the top yeah there's kind of a status and earnings points perhaps from gameplay but, uh huh. There's two helicopters for some reason it's bothering me. I don't think there should be a helicopter under the usage section just the game section. (This was changed after similar comments, and was not an issue in remaining groups.) (Re: The Helicopter game) If you drop the water on the fire from to high up it'll just disperse and and be effective. So you have to get the most effective is by dropping close by, and you have to refill your bucket. You can't land on the fires, or you'll destroy yourself. I'll be I'll be honest, I don't think I would play the games based on time availability. However, if there was some sort of additional incentive to them like let's say there's a monthly drawing where you could win enough like maybe $1,000 or something where like, you know, it could be 10,000 people but try to play, but you know if I might win $1,000 I might play it just to kind of get my name in the hat but otherwise I'm busy parent go you know, working all that. I don't think I would you play. (“The games are designed to be played in about 5 minutes, or so.”) I mean some people don't even have that. Yeah, I don't and I wouldn't play unless there was an incentive to, like, an additional incentive that I know I understand that conservation is an incentive but for me there has to be some sort of again drawing or something. It could be that the bigger game itself is interesting enough if you could actually check your usage, and in a couple of short quick clicks. Um, I feel I’d mainly play the games just to look at the tips, maybe because I don't know as much as maybe other people. And so that's mainly the main reason I'd be playing them. But I wouldn't have choose to go and play them out; I can just look at the data instead. Yeah, if against your just quickly available, just on the, on your phone surface. Right, and they played phone like. Yeah, no, you're just, you know, pulling it out trying to kill like five minutes. So what might they be able to do to help you understand what (usage) changes meant to you personally Oh, sorry. So, just, I was thinking, comparing like, how is my household compared to similar household and maybe that was on there.

Gamification Phase 2
56
(What about travel?) Yeah, I, yeah, cuz if I'm still burning a lot of energy while I'm not even home that's going to be a concern for me. Yeah, that's one of the things is and again that just like, even though just quick view on the app itself might tell you that, you know, I forgot to turn something off and that I'm going to kick myself for that are you know you turned everything off and squatters in your house. I mean that's, that kind of stuff that a lot of people have home systems, but it can just turn the cameras on but in case but yeah that's part of what we're after he too is that kind of a target. (Not really a big user:) But, um, but I don't know that's sort of motivating in a way like, Am I like a super user of energy compared to other people and if I am, I might be more mindful and thinking about that. (I.e., more useful for big user customers.)I would think, I mean I don't know if I would if I would recommend that as the only way but it would make me; so I personally don't like the games I'm just not a game player; that games don't give me any sort of mental stimulation whatsoever, but I do like the self audit thing a lot because I self audit, my entire life and I love checklists and having just like all of that there in one place for me to check off and know what I'm doing. Just kind of echoing what everyone else has been saying; I really do like the check list to I feel like that's okay. It just helps me focus more on being more productive and scrolling down (the Audit list). (To slow response of data usage page.) If you have a few seconds to check your usage, you don't want to spend five minutes while it grinds away like this. The earn points areas kind of interesting. (Re: the Dashboard.). It's also, you know, something that could be a standalone application. And I actually went to the website to pay my bill instead of just calling it in or going to the store to do it; but, had I access to the game to kind of compare my day to (yesterday), or right now my, my energy usage throughout the day throughout the month and everything (I would like that.) I think it's something I would definitely give it a shot at least I mean, a good, like you said, in between appointments, (it is a ) good time killer like hey, let's go see how much energy I'm burning real quick and, you know, see if there's something I need to change. The dashboard so interactive is very beneficial. And having just the usage, that was my favorite part is seeing like the usage of the day before, like just seeing that, for me personally, I don't handle like electricity bills or anything like that for my household (the person I share the apartment with does). But if I did, I would pay attention to that the most. Okay.

Gamification Phase 2
57
APPENDIX C
Pre-Session, Post-Session, and Lagged Questionnaires and Responses

Gamification Phase 2
58
Pre-Session Questionnaire(A reminder that the Consent and any identification information have been removed)
# Field Minimum Maximum Mean Std Deviation Variance Count
1
How aware are you regarding your own
individual or household energy (electric and/or
gas) consumption?
2.00 6.00 4.54 0.87 0.76 35
# Answer % Count
2 very unaware 2.86% 1
3 somewhat unaware 11.43% 4
4 not particularly aware or unaware 20.00% 7
5 somewhat aware 60.00% 21
6 very aware 5.71% 2
Total 100% 35
# Field Minimum Maximum Mean Std Deviation Variance Count
1
Compared to other individuals or
households like yours, how would you rate your typical energy
consumption?
1.00 5.00 2.74 0.78 0.61 34
# Answer % Count
1 much less than others like me 2.94% 1
2 less than others like me 35.29% 12
3 about the same as others like me 50.00% 17
4 more than others like me 8.82% 3
5 much more than others like me 2.94% 1

Gamification Phase 2
59
Total 100% 34
# Field Minimum Maximum Mean Std Deviation Variance Count
1
Compared to other individuals or
households like yours, how would you rate
your knowledge and awareness about your
energy usage?
2.00 5.00 3.26 0.69 0.48 35
# Answer % Count
1 much worse than others like me 0.00% 0
2 worse than others like me 11.43% 4
3 about the same as others like me 54.29% 19
4 better than others like me 31.43% 11
5 much better than others like me 2.86% 1
Total 100% 35
# Field Minimum Maximum Mean Std Deviation Variance Count
1
Compared to other individuals or
households like yours, how would you rate your
knowledge and awareness about the information at your
utility company's website?
1.00 5.00 2.80 0.92 0.85 35
# Answer % Count
1 much worse than others like me 8.57% 3
2 worse than others like me 25.71% 9
3 about the same as others like me 45.71% 16

Gamification Phase 2
60
4 better than others like me 17.14% 6
5 much better than others like me 2.86% 1
Total 100% 35
# Field Minimum Maximum Mean Std Deviation Variance Count
1
Prior to today, how likely were you to visit
the your utility company's web site, log in to your account, and check your usage data?
1.00 5.00 2.46 1.38 1.91 35
# Answer % Count
1 very unlikely 34.29% 12
2 unlikely 25.71% 9
3 neither likely nor unlikely 8.57% 3
4 likely 22.86% 8
5 very likely 8.57% 3
Total 100% 35
# Field Minimum Maximum Mean Std Deviation Variance Count
1
Considering all of the times you have logged in to your account at your
utility site, about how many other pages and features there did you
visit beside the bill-pay page?
1.00 5.00 1.74 1.08 1.16 35
# Answer % Count
1 I have only visited the bill-pay page (or have never visited the site) 54.29% 19

Gamification Phase 2
61
2 1-2 additional pages/features 31.43% 11
3 2-3 additional pages/features 5.71% 2
4 3-4 additional pages/features 2.86% 1
5 more than 4 5.71% 2
Total 100% 35Imagine that there were several short, fun games available at the Avista website. Playing any of the games would take you into your account. How likely would each of the following be?
# Field Minimum Maximum Mean Std Deviation Variance Count
1 to play the games 1.00 5.00 2.74 1.38 1.91 35
2 to check your usage 1.00 5.00 4.00 1.07 1.14 35
3 to visit other pages at Avista.com 1.00 5.00 2.91 1.02 1.05 35
# Question very unlikely unlikely
neither likely
nor unlikely
likely very likely Total
1 to play the games 25.71% 9 22.86% 8 14.29% 5 25.71% 9 11.43% 4 35
2 to check your usage 5.71% 2 5.71% 2 5.71% 2 48.57% 17 34.29% 12 35
3
to visit other pages
at Avista.com
11.43% 4 20.00% 7 37.14% 13 28.57% 10 2.86% 1 35
# Field Minimum Maximum Mean Std Deviation Variance Count
1 In a very general sense, conservation is 2.00 5.00 4.57 0.65 0.42 35
# Answer % Count
1 quite unimportant 0.00% 0

Gamification Phase 2
62
2 unimportant 2.86% 1
3 neither unimportant nor important 0.00% 0
4 important 34.29% 12
5 quite important 62.86% 22
Total 100% 35
Post-Session Questionnaire(A reminder that the Consent and any identification information have been removed)
# Field Minimum Maximum Mean Std Deviation Variance Count
1
How aware do you think you could be regarding your own individual or
household energy (electric and/or gas)
consumption?
3.00 6.00 5.56 0.68 0.47 36
# Answer % Count
2 very unaware 0.00% 0
3 somewhat unaware 2.78% 1
4 not particulalry aware or unaware 2.78% 1
5 somewhat aware 30.56% 11
6 very aware 63.89% 23
Total 100% 36

Gamification Phase 2
63
# Field Minimum Maximum Mean Std Deviation Variance Count
1
Compared to other individuals or
households like yours, how would you rate your
typical energy consumption? (Yes, this is a repeat question--we are curious about slight
changes in opinions over time.)
2.00 5.00 2.94 0.94 0.89 36
# Answer % Count
1 much less than others like me 0.00% 0
2 less than others like me 41.67% 15
3 about the same as others like me 27.78% 10
4 more than others like me 25.00% 9
5 much more than others like me 5.56% 2
Total 100% 36

Gamification Phase 2
64
# Field Minimum Maximum Mean Std Deviation Variance Count
1
Compared to other individuals or
households like yours, how would you rate your
future knowledge and awareness about your
energy usage? (You are expressing an intent to
be informed.)
3.00 5.00 4.03 0.50 0.25 36
# Answer % Count
1 much worse than others like me 0.00% 0
2 worse than others like me 0.00% 0
3 about the same as others like me 11.11% 4
4 better than others like me 75.00% 27
5 much better than others like me 13.89% 5
Total 100% 36
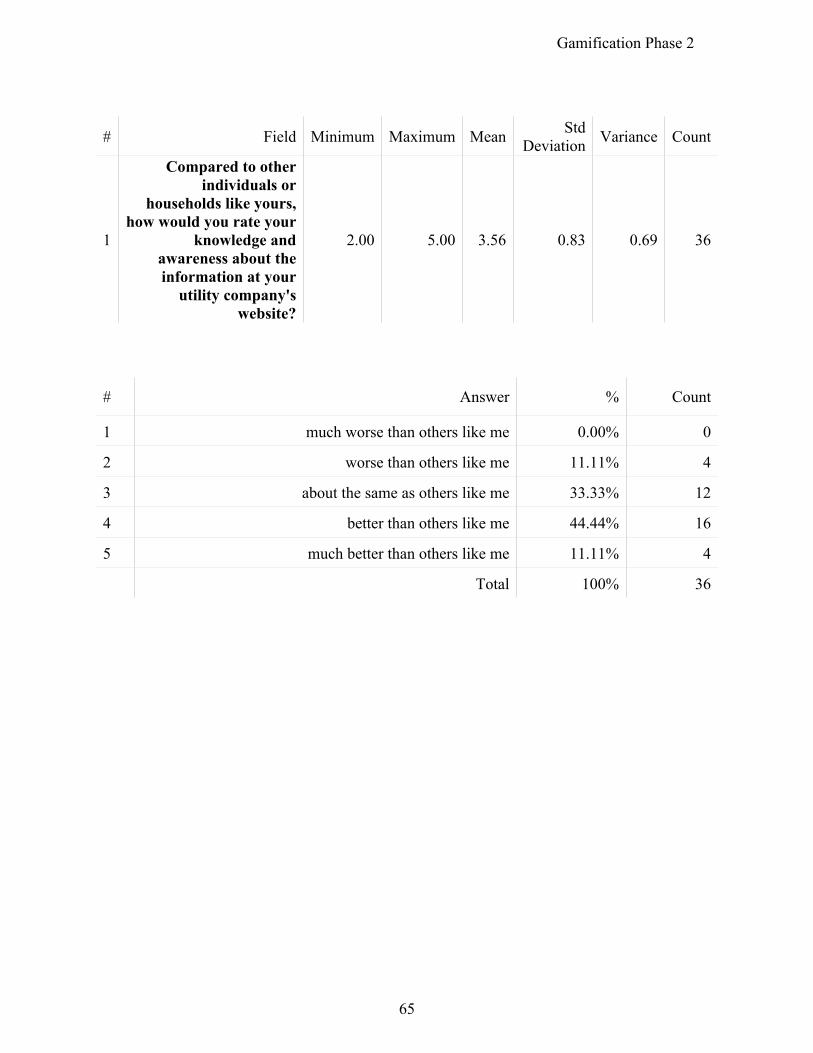
Gamification Phase 2
65
# Field Minimum Maximum Mean Std Deviation Variance Count
1
Compared to other individuals or
households like yours, how would you rate your
knowledge and awareness about the information at your
utility company's website?
2.00 5.00 3.56 0.83 0.69 36
# Answer % Count
1 much worse than others like me 0.00% 0
2 worse than others like me 11.11% 4
3 about the same as others like me 33.33% 12
4 better than others like me 44.44% 16
5 much better than others like me 11.11% 4
Total 100% 36

Gamification Phase 2
66
# Field Minimum Maximum Mean Std Deviation Variance Count
1
Prior to today, how likely were you to visit
the your utility company's web site, log in to your account, and check your usage data?
1.00 5.00 2.67 1.29 1.67 36
# Answer % Count
1 very unlikely 27.78% 10
2 unlikely 19.44% 7
3 neither likely nor unlikely 13.89% 5
4 likely 36.11% 13
5 very likely 2.78% 1
Total 100% 36

Gamification Phase 2
67
Imagine that there were several short, fun games available at the Avista website. Playing any of the games would take you into your account. How likely would each of the following be?
# Field Minimum Maximum Mean Std Deviation Variance Count
1 to play the games 1.00 5.00 3.11 1.24 1.54 36
2 to check your usage 1.00 5.00 4.20 1.06 1.13 35
3 to visit other pages at Avista.com 1.00 5.00 3.50 1.21 1.47 36
# Question very unlikely unlikely
neither likely
nor unlikely
likely very likely Total
1 to play the games 13.89% 5 19.44% 7 19.44% 7 36.11% 13 11.11% 4 36
2 to check your usage 5.71% 2 2.86% 1 5.71% 2 37.14% 13 48.57% 17 35
3
to visit other pages
at Avista.com
8.33% 3 11.11% 4 27.78% 10 27.78% 10 25.00% 9 36

Gamification Phase 2
68
# Field Minimum Maximum Mean Std Deviation Variance Count
1
The relationship of each of the little games to my
energy usage, and understanding of my
usage, was
1.00 5.00 3.36 0.98 0.95 36
# Answer % Count
1 very weak 5.56% 2
2 weak 13.89% 5
3 neutral 25.00% 9
4 strong 50.00% 18
5 very strong 5.56% 2
Total 100% 36
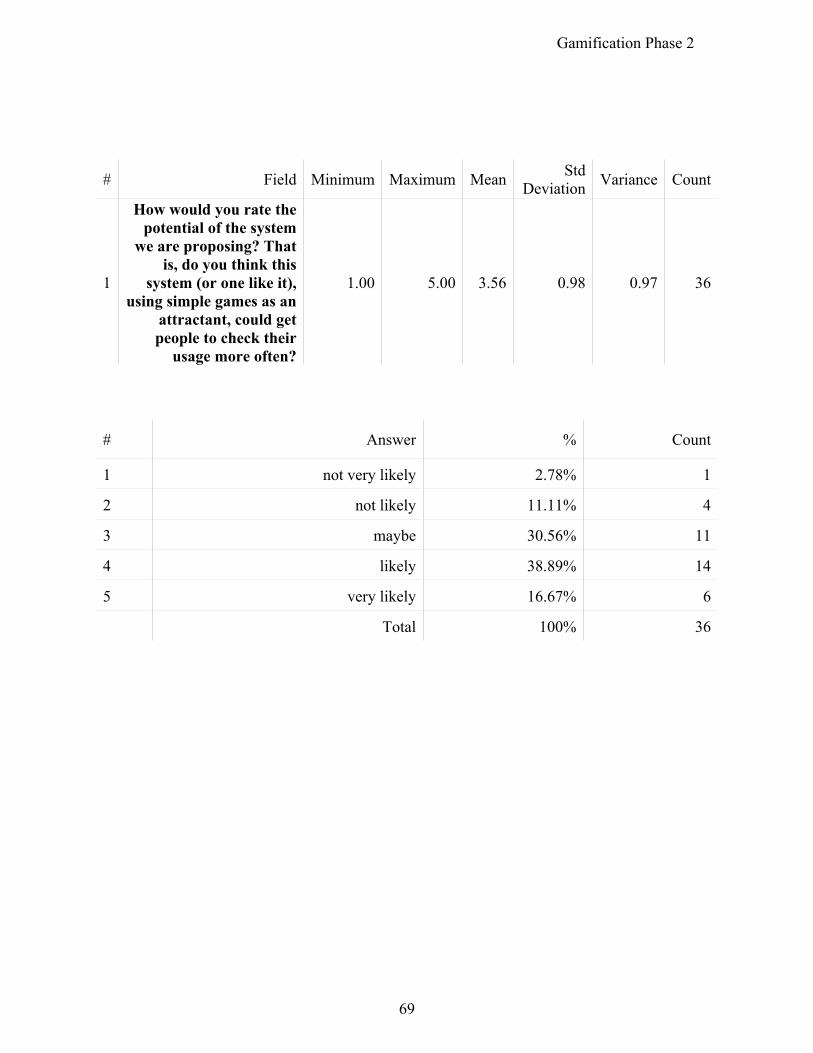
Gamification Phase 2
69
# Field Minimum Maximum Mean Std Deviation Variance Count
1
How would you rate the potential of the system
we are proposing? That is, do you think this
system (or one like it), using simple games as an
attractant, could get people to check their
usage more often?
1.00 5.00 3.56 0.98 0.97 36
# Answer % Count
1 not very likely 2.78% 1
2 not likely 11.11% 4
3 maybe 30.56% 11
4 likely 38.89% 14
5 very likely 16.67% 6
Total 100% 36

Gamification Phase 2
70
Lagged Questionnaire(A reminder that the Consent and any identification information have been removed)
# Answer % Count
2 very unaware 3.13% 1
3 somewhat unaware 6.25% 2
4 not particulalry aware or unaware 6.25% 2
5 somewhat aware 25.00% 8
6 very aware 59.38% 19
Total 100% 32
# Field Minimum Maximum Mean Std Deviation Variance Count
1
How aware do you think you could be regarding your own individual or
household energy (electric and/or gas)
consumption?
2.00 6.00 5.31 1.04 1.09 32

Gamification Phase 2
71
# Field Minimum Maximum Mean Std Deviation Variance Count
1
Compared to other individuals or
households like yours, how would you rate your
typical energy consumption? (Yes, this is a repeat question--we are curious about slight
changes in opinions over time.)
1.00 4.00 2.56 0.70 0.50 32
# Answer % Count
1 much less than others like me 6.25% 2
2 less than others like me 37.50% 12
3 about the same as others like me 50.00% 16
4 more than others like me 6.25% 2
5 much more than others like me 0.00% 0
Total 100% 32

Gamification Phase 2
72
# Field Minimum Maximum Mean Std Deviation Variance Count
1
Compared to other individuals or
households like yours, how would you rate your
future knowledge and awareness about your
energy usage? (You are expressing an intent to
be informed.)
3.00 5.00 4.03 0.47 0.22 32
# Answer % Count
1 much worse than others like me 0.00% 0
2 worse than others like me 0.00% 0
3 about the same as others like me 9.38% 3
4 better than others like me 78.13% 25
5 much better than others like me 12.50% 4
Total 100% 32

Gamification Phase 2
73
# Field Minimum Maximum Mean Std Deviation Variance Count
1
Compared to other individuals or
households like yours, how would you rate your
knowledge and awareness about the information at your
utility company's website?
1.00 5.00 3.69 0.95 0.90 32
# Answer % Count
1 much worse than others like me 3.13% 1
2 worse than others like me 6.25% 2
3 about the same as others like me 28.13% 9
4 better than others like me 43.75% 14
5 much better than others like me 18.75% 6
Total 100% 32

Gamification Phase 2
74
# Field Minimum Maximum Mean Std Deviation Variance Count
1
After our focus group presentation, how likely
are you to visit your utility company's web
site, log in to your account, and check your
usage data?
2.00 5.00 3.88 0.82 0.67 32
# Answer % Count
1 very unlikely 0.00% 0
2 unlikely 6.25% 2
3 neither likely nor unlikely 21.88% 7
4 likely 50.00% 16
5 very likely 21.88% 7
Total 100% 32

Gamification Phase 2
75
# Field Minimum Maximum Mean Std Deviation Variance Count
1
If, in fact, you visited your utility's website
since our groups, how many times did you do
so?
1.00 5.00 1.94 0.86 0.75 32
# Answer % Count
1 I did not visit the site 31.25% 10
2 just once 50.00% 16
3 2 times 15.63% 5
5 3 times 3.13% 1
6 4 or more times 0.00% 0
Total 100% 32

Gamification Phase 2
76
Imagine that there were several short, fun games available at the Avista website. Playing any of the games would take you into your account. How likely would each of the following be?
# Field Minimum Maximum Mean Std Deviation Variance Count
1 to play the games 1.00 5.00 2.81 1.31 1.71 32
2 to check your usage 1.00 5.00 4.03 1.06 1.13 31
3 to visit other pages at Avista.com 1.00 5.00 3.13 1.16 1.34 31
# Question very unlikely unlikely
neither likely
nor unlikely
likely very likely Total
1 to play the games 25.00% 8 15.63% 5 18.75% 6 34.38% 11 6.25% 2 32
2 to check your usage 6.45% 2 3.23% 1 6.45% 2 48.39% 15 35.48% 11 31
3
to visit other pages
at Avista.com
9.68% 3 22.58% 7 22.58% 7 35.48% 11 9.68% 3 31

Gamification Phase 2
77
# Field Minimum Maximum Mean Std Deviation Variance Count
1
The relationship of each of the little games to my
energy usage, and understanding of my
usage, was
1.00 5.00 3.50 1.00 1.00 32
# Answer % Count
1 very weak 3.13% 1
2 weak 12.50% 4
3 neutral 31.25% 10
4 strong 37.50% 12
5 very strong 15.63% 5
Total 100% 32

Gamification Phase 2
78
# Field Minimum Maximum Mean Std Deviation Variance Count
1
How would you rate the potential of the system
we are proposing? That is, do you think this
system (or one like it), using simple games as an
attractant, could get people to check their
usage more often?
1.00 5.00 3.31 1.36 1.84 32
# Answer % Count
1 not very likely 18.75% 6
2 not likely 3.13% 1
3 maybe 28.13% 9
4 likely 28.13% 9
5 very likely 21.88% 7
Total 100% 32

Gamification Phase 2
79
# Field Minimum Maximum Mean Std Deviation Variance Count
1
We had hoped to send you the link to the
dashboard and games after the groups, but needed some time to
make some changes. If you would like to visit
the dashboard now and take another look at our
system, select “yes” below.
1.00 2.00 1.59 0.49 0.24 32
# Answer % Count
1 yes 40.63% 13
2 no 59.38% 19
Total 100% 32

APPENDIX FFinal Report: Energy Trading Phase III

Avista Transactive Power: Final Project Report for Phase III
Center for Secure and Dependable Systems,University of Idaho
AbstractWe have developed a prototype software system with the objectives of supporting the creation and management of a market that enables prosumers and consumers to trade electric power between themselves or with the utility, with utility oversight. This prototype software system supports creating and managing electric power transaction agreements between prosumers, integrating power flow analysis, and calculating distribution locational marginal prices (DLMP) and demand response. The proposed prototype enables the study of approaches to create a transactive energy market while ensuring a feasible, secure, and economical distribution grid operation.
Phase I Developed Work At the end of phase I, we completed the analysis, design, and implementation of prototype software that integrates energy market management and a power flow analysis. This prototype supports the creation and management of prosumer-enabled transaction intents and determines whether such transactions could be supported by a distribution grid model based on voltage levels. Results of the voltage feasibility analysis were used to enable/disable transactions on the market application.
The Avista Transactive Power Application (ATPA) prototype system architecture developed consists of four modules. These are: 1) Distribution System Model and OpenDSS Simulation, 2) Web-based Management Interface; 3) Database; and 4) Communications Manager [1].
We used a distributed renewable generation-enhanced 13-bus system model with added realistic and hourly configurable load and generation profiles. This system fully supported voltage-based energy transaction feasibility analysis. The details of the power system model and the ATPA modules are available in our final report of phase I [1].
Phase II Obtained ResultsCustomer-initiated energy transaction prioritization and pricing
We have enhanced the prototype during phase II and integrated it with an algorithm for energy price calculation. This algorithm calculates the Distribution Locational Marginal Pricing (DLMP) for each bus in the system and determines dispatch schedules for a dispatchable distributed generation. The estimated power flow, dispatch schedules, and DLMPs are calculated after all information from the prosumer's usage, generation profiles, and all transaction intents have been considered within each hourly window and for any selected time window.
The system prototype has also been enhanced with a transaction intent prioritization algorithm that enables the selection of transactions based on priority and the DLMP price, in addition to voltage feasibility. Transactions are enabled/disabled depending on voltage, DLMP results, and the transaction given priority.

Phase III Obtained ResultsThe System model within the database was modified to incorporate demand response and smart buildings. The Additions of these buildings were on both main lines, where each smart building is different. These buildings were initially modeled after sample buildings in energy plus as medium office buildings and simulated with weather data in the Pacific Northwest. The projected power usages from buildings were adjusted to meet estimated power usages for a building located at the University of Idaho.
A richer analysis scenario, based on a 34-Bus model, was developed and implemented for additional analytics. The new case scenarios provided insight for cases where the feeder is susceptible to power flow issues, voltage instabilities, and regulators control. The line characteristics were modeled to more accurately represent a distribution system, and in turn to see how this impacted the price of the DLMP.
Demand ResponseAccording to energy.gov [1], "demand response provides an opportunity for consumers to play a significant role in the operation of the electric grid." The website states that this is accomplished by users responding to various incentives to change their electricity usage [1]. The AvistaATP project seeks to enable users to participate in 'demand response' using 'transaction intents.'
'Transaction intents' fall into two categories: production and consumption intents. These intents are created by individual smart-buildings and are stored in a local database, modeled in Sqlite. The primary values these two intent categories communicate are the estimated amount of photovoltaic (PV) power production possible for each building in each hour and the amount of power that the building will need to consume in the same hour. These values are both estimates based on projected outside temperature and sunlight data. Once the values in the 'transaction intents' are calculated from the weather data, they are transmitted from a smart-building client, through the Internet, to a utility market server. The 'transaction intents' are then processed by the market server to ascertain their feasibility.
In creating the AvistaATP prototype, we evaluated two different software libraries. The first library was OpenLEADR [2], a python implementation of the OpenADR standard [3]. The second library we evaluated was ZeroMQ [4]. While both libraries could conceivably have been made to work with the AvistaATP project, we determined that ZeroMQ was the more appropriate of the two after experimenting with each library.
OpenLEADR's online documentation reveals that this library is "fully compliant" with the "OpenADR 2.0b implementation for both servers (Virtual Top Node) and clients (Virtual End Node)." Further, it is "fully asyncio" – meaning that the user can "set up the co-routines that can handle certain events, and they get called when needed." Finally, the documentation claims that OpenLEADR is "fully Pythonic," which means that "all messages are represented as simple Python dictionaries. All XML parsing and generation are done for you" [2]. Following an online video tutorial [5] allowed us to get a small OpenLEADR code example up and executing quickly.
The code example created in the previously mentioned video tutorial involved creating both a "Virtual Top Node" (VTN) and a "Virtual End Node" (VEN) [5]. According to the OpenADR website, a VTN is described as "a 'server' that transmits OpenADR signals to end devices or other intermediate servers." In contrast, a VEN "is typically a 'client' and can be an 'Energy Management System' (EMS), a thermostat, or another end device that accepts the OpenADR signal from the server (VTN)" [6].

The initial code example we created with OpenLEADR involved a VEN connecting to a VTN and then sending a random number, generated by the VEN, over the network to the VTN every 15 seconds. If the random number fell below a certain threshold, the VTN would send a response value of zero to the VEN. If the random number were above the threshold, the VTN would send a response value of one. Upon receiving a value of zero from the VTN, the VEN would send an 'optOut' signal to the VTN. If the VEN received a value of one from the VTN, the VEN would send an 'optIn’ signal.
It is clear to see how the previously described code example could potentially be expanded to fit the needs of AvistaATP. Instead of sending a random number, the VEN could instead send relevant consumer/ producer intent information. Instead of sending this information every 15 seconds, this transaction intent information could perhaps be sent every 24 hours. Instead of the VTN returning a one or a zero, it could return the DLMP price values and the rest of the transaction feasibility information. The VEN could finally decide whether to ‘optIn’ or ‘optOut’ of the proposed transaction intents. This level of functionality would meet the needs of AvistaATP at this phase of the project. However, experimenting with the OpenLEADR code example revealed several shortcomings to using OpenLEADR for this project.
As per the video tutorial, reported values from the VEN to the VTN are given a ‘callback’ function that generates the value to be reported and a ‘measurement’ type that appears to be an arbitrary string [5]. Our experimentation suggested that reported values could be generated and given ‘measurement’ names such that the two items would form a value/ key pair. However, our experiments revealed that these value/ key pairs would be constrained to having a numerical value – meaning that we could not send a pair of strings as the value/ key. Further, each value/ key would have to be created and sent individually through the network to the VTN. This means that transaction intent data items, such as the DateTime they were created, consumption/ production-intent coefficients, the building ID that made the intent, etc., would all need to be packaged and sent individually by the VEN. This multitude of individual data points would then need to be ‘re-congealed’ by the VTN into a cohesive format so that it could be easily inserted into the utility market server’s MySQL database.
Another potential issue with using OpenLEADR comes from its use of a ‘sampling rate.’ The ‘sampling rate’ used by OpenLEADR is the time interval for every report from the VEN to the VTN [5]. This means that we would not be able to send transaction intent data manually. Instead, messages are sent from client to server at regular intervals like a metronome. This is potentially a problem as it would remove the ability for smart building clients to send multiple sets of transaction intents throughout an arbitrary period. It would also prevent the client from sending single sets of transaction intents at different times relative to previous sets being sent. Using OpenLEADR, the smart building clients would seemingly be limited to sending out one set of transaction intents every ‘sampling rate’ cycle, with the transmission time being the same every cycle. Finally, it appeared that sending the ‘optIn’ or ‘optOut’ signal, while useful for ‘opting in’ or ‘opting out’ of a processed transaction intent, would be the terminating event in the process. This means that further rounds of negotiations/ communication between the client and the server would not be possible. The client would need to wait until the next ‘sampling rate’ cycle before proposing different transaction intents.
One of our early goals with communicating transaction intents was to be able to have our VEN clients be able to send messages that other VTN servers could understand. However, according to the OpenADR Program guide, “there is enough optionality in OpenADR that the deployment of servers (VTNs) at the utility and clients (VENs) at downstream sites is not a plug-n-play experience.” The “OpenADR characteristics such as event signals, report formats, and targeting must be specified on a DR program-by-program basis” [7]. This language in the documentation indicates that all the smart buildings that wished to use our VEN clients would also have to connect to our VTN server. Clients and servers would need to be paired up with one another in their development and deployment. In conjunction with the other

previously mentioned issues, we have decided to explore other options for passing messages from the smart building clients to the utility market server.
Given the difficulties presented by the OpenLEADR library, we instead used ZeroMQ to handle the transmission of transaction intent data from the clients to the server. ZeroMQ allowed us to use simple TCP socket connections [8] to manually transmit our transaction intent data from the clients to the server and back again. Experimentation with the ZeroMQ library revealed that we could connect multiple clients to a single server, and the server would automatically return the proper responses to the right clients. This means that a client with a specific ID could send a message to the server, and the server could return messages particular to that client.
Using Python’s ‘simplejson’ library, we could pack all the information for a client’s transaction intent into a JSON structure and then translate that structure into a string format. This string could then be sent from the client to the server and easily reconverted back into JSON on the other end. Once the transaction intent was processed, the new data could be returned from the server to the client similarly.
Effectively, ZeroMQ solved the previously mentioned issue that OpenLEADR had with sending individual reports by allowing us to send all the necessary data for a transaction intent in a single message. Furthermore, as there is no concept of a ‘sampling rate’ as with OpenLEADR, we have complete control of what messages get sent between the client and the server and when they get processed and returned.
Currently, the message being passed between the clients and server are unencrypted. This means that the messages we are sending are being broadcast in plaintext. However, in the future, we will implement CurveZMQ. According to the online documentation, “CurveZMQ is an authentication and encryption protocol for ZeroMQ” [9]. Once CurveZMQ is implemented, smart building clients can be confident that their transaction intents will remain confidential between themselves and the utility.
Smart BuildingsThe ‘smart buildings’ used to calculate the values used in the production/ consumption transaction intents consist of simplified building abstractions. Instead of using a fully detailed building model, with its multiple different geometries, appliances, and heating/ cooling systems, the current version of AvistaATP uses a simple geometric solid to represent the building. This geometric solid has a length, a width, and a height to create a six-sided figure with surfaces representing a floor, a ceiling, and four walls. The geometric solid also has an ‘R-value’ associated with all the surfaces and models insulation. The simplified building model is also assigned an arbitrary value for its maximum power needs and its maximum power generation from its roof-mounted PV panels. Further, the building is assumed to have a constant internal temperature of 21.1111° C, which is maintained by a fictional heating/ cooling system that can maintain that temperature regardless of changes to the outside temperature. Maintaining a constant internal temperature over time simplifies the building model, which allows for relative ease in calculating the amount of power a building would need to consume in each hour.
The smart buildings used in the simulations calculate the final load value for their consumption intents by way of an equation that uses the building’s internal temperature, the external temperature, the R-value of the insulation, and the summed areas of the four walls, the floor, and the ceiling. This equation is derived from the statement of Fourier’s law, and the definitions of ‘resistance to heat transfer,’ and ‘unit thermal resistance’ found in [10]:

Fourier’s Law:
𝑄 = 𝑘𝐴 ∙(𝑇1 ― 𝑇2)
Δx #(1)
𝑄 =(𝑇1 ― 𝑇2)
(Δx𝑘𝐴)
#(2)
Resistance to Heat Transfer (Definition):
𝑅 = Δ𝑥𝑘𝐴 #(3)
Unit Thermal Resistance (R-value):
𝑅𝑡ℎ =Δ𝑥𝑘 = 𝐴𝑅#(4)
Combining Equations 2 and 4:
𝑄 =(𝑇1 ― 𝑇2)
(Δx𝑘𝐴)
=(𝑇1 ― 𝑇2)
(Δx𝑘 )(1
𝐴)=
(𝑇1 ― 𝑇2)
𝑅𝑡ℎ(1𝐴)
=(𝑇1 ― 𝑇2) ∙ 𝐴
𝑅𝑡ℎ#(5)
𝑄 = heat transfer rate/ heat conduction rate
𝑘 = thermal conductivity
𝐴 = surface area of the rectangular solid
𝑇1 = temperature outside
𝑇2 = temperature inside
Δx = the thickness of the material (wall)
𝑅 = resistance to heat transfer
𝑅𝑡ℎ = unit thermal resistance (R-value)
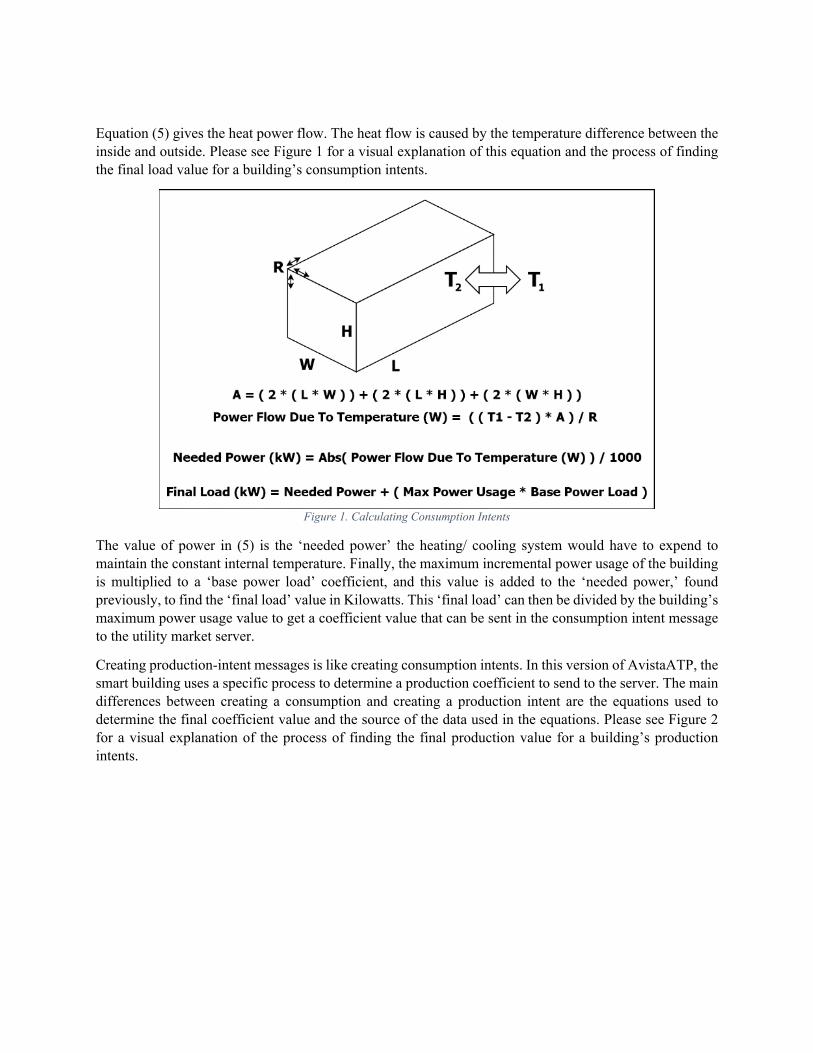
Equation (5) gives the heat power flow. The heat flow is caused by the temperature difference between the inside and outside. Please see Figure 1 for a visual explanation of this equation and the process of finding the final load value for a building’s consumption intents.
Figure 1. Calculating Consumption Intents
The value of power in (5) is the ‘needed power’ the heating/ cooling system would have to expend to maintain the constant internal temperature. Finally, the maximum incremental power usage of the building is multiplied to a ‘base power load’ coefficient, and this value is added to the ‘needed power,’ found previously, to find the ‘final load’ value in Kilowatts. This ‘final load’ can then be divided by the building’s maximum power usage value to get a coefficient value that can be sent in the consumption intent message to the utility market server.
Creating production-intent messages is like creating consumption intents. In this version of AvistaATP, the smart building uses a specific process to determine a production coefficient to send to the server. The main differences between creating a consumption and creating a production intent are the equations used to determine the final coefficient value and the source of the data used in the equations. Please see Figure 2 for a visual explanation of the process of finding the final production value for a building’s production intents.

Figure 2. Calculating Production Intents
While the consumption intent equations utilize both outside and inside temperature data, the production-intent equation uses a value that weather.gov calls ‘Sky Cover.’ This value “is the expected amount of opaque clouds (in percent) covering the sky valid for the indicated hour” [11]. As this value is a percentage, it can be converted to a coefficient value. Subtracting this value from a value of one will therefore yield a ‘clear sky’ coefficient value.
The production intents also use a simulated position of the sun. This value is calculated by mapping a sin function in a range of 0 to π radians over the total number of hours in the given day. This mapping starts relative to the starting hour of the day, with sin(0) occurring at the starting hour and sin(π) occurring at the final hour. This mapping ensures that the sin function returns values ranging between zero and one, with values of zero at the start and end of the day and a value of one in the middle of the day.
In the current version of AvistaATP, when calculating the values for the first and last hours of the day, which correspond to sin(0) and sin(π), the code returns a small random number instead of zero for these values of sin. This small number ranges between 0.05 and 0.11 to simulate sunrise and sunset effects on the PV panels. This enables a smoother curve in the output data of the sin function for those hours. The sun would still be present in the sky at those times even though there may be some effect on its luminescence due to its interaction with the horizon, lingering precipitation, etc. Returning values of zero during those hours would imply that the sky was completely dark.
The starting hour of the day is calculated as occurring at the ending hour of the previous day’s night cycle. The ending hour of the current day can be calculated as occurring at the starting hour of the present day’s night cycle. The night cycles for both the previous and current days are calculated using a Python package called ‘Astral,’ which contains a function called ‘night,’ that takes a given date and returns time data for when its nighttime period occurs [12].
Once the start and end times of the day cycle are calculated, the number of hours in the day can also be deduced by subtracting the day’s starting hour from the day’s ending hour. The hour in the daytime cycle can be found by subtracting the day’s starting hour from the current hour under consideration in the 24 hours. This will yield a value between zero and the total number of hours in the daytime cycle. A final transformed daylight hour value, ranging between zero and π, can be found by multiplying the current daytime cycle hour by π and then dividing this value by the total number of hours in the daytime cycle. The

‘sun position’ coefficient can be calculated by taking the value of the sin function for this transformed daylight hour value. Multiplying the ‘clear sky’ coefficient by the ‘sun position’ coefficient will yield the ‘sunshine coefficient.’
Finally, the expected PV production for the smart building can be calculated by multiplying the ‘sunshine coefficient’ by the building’s maximum PV generation. This will yield a value in Kilowatts for the given hour under consideration. However, for consistency with the creation of consumption intents, the production intents will return the ‘sunshine coefficient’ instead of the expected production in Kilowatts. Returning this value means that all the smart buildings in the simulation will return the same ‘sunshine coefficient’ as all the other smart buildings. This makes sense as all the smart buildings in the simulation are in the same place, under the same sun. But, because each building has a different maximum PV generation value, each building will be generating a different amount of power in the given hour.
Smart AgentsEach smart building used in the simulation has a small relational database at its core. This database, modeled in Sqlite, has tables that hold all the data used in the ‘transaction intent’ calculations. The agent database includes tables for the building model, a table of historical weather data, a table of predicted weather data, and the ‘outstanding transaction agreement’ table, which stores the data for the transaction intents. Please see Figure 3 for a visual representation of the smart building client’s Sqlite database.
Figure 3. Smart Building Agent Data Model
The building model table in the Sqlite database includes the length, width, height, R-value, power needs/ PV generation, price criteria information for buying and selling, etc., for all the possible buildings that could be represented. This means that there are currently multiple building models present in the database, and the user of the smart building client must specify which building model to use for the simulation. As per the previous section’s explanation of consumption/ production intent creation, different building models will result in different final values in the consumption intents. In a practical production release of the AvistaATP client, only one set of building values would be present in the client database – the values pertinent to the client’s building.

The temperature values found in the historical weather data table were populated via a Python API called ‘Meteostat’ [13]. The cloud cover coefficient data in the historical weather table currently duplicates values from the predicted weather table. This is because the Meteostat API did not provide this cloud cover data as the weather.gov API did. The historical weather table would only be used for post hoc simulation purposes. Instead of creating actual transaction values to be sent to the utility market server, this data duplication should not be an issue.
The values present in the predicted weather data are specific to an area over Moscow, Idaho, and are populated via a call to api.weather.gov [14]. This API call is made with Python’s ‘requests’ package [15]. The data used in this version of AvistaATP can be accessed manually via an ordinary web browser with the following link: ( https://api.weather.gov/gridpoints/OTX/147,44 ). The values 147 and 44 in the previous URL refer to the ‘gridpoint’ above Moscow, Idaho. According to the National Weather Service, “each National Weather Service forecast office issues numerical forecasts on a 2.5-kilometer grid across their entire forecast area. Each gridpoint is one of these 2.5km squares” [16].
The gridpoint at 147/ 44 was determined, as per the instructions from the National Weather Service [16], by taking the latitude and longitude of Moscow, Idaho. According to a Google search, those lie at 46.7324° N, 117.0002° W [17], and making the following call to api.weather.gov: ( https://api.weather.gov/points/46.7324,-117.0002 ) [16]. The longitudinal value of 117.0002° W is set to be negative in the previous API call, as, according to pacioos.hawaii.edu, this negative longitude refers to a location in the western hemisphere [18]. Experimentation reveals that replacing -117.0002 with a positive value results in api.weather.gov returning status 404 – indicating that the requested data is unavailable. However, using -117.0002 instead of a positive value correctly returns the requested data.
The data in the ‘outstanding transaction agreement’ table is created/ updated via an 11-step process outlined in Figure 4:
Figure 4. Process for Creating/ Retrieving Transaction Intents

Steps for creating/ retrieving consumption/ production intents:
1) Create consumption/ production intents and place them in the Sqlite database.a. The consumption/ production coefficients are calculated as per the description in the
previous section.2) Obtain the transactions from the Sqlite database and pack the data into a JSON structure.3) Convert the JSON data to a string and send it to the utility market server via ZeroMQ.4) Convert the string that was sent via ZeroMQ into JSON data, and then place the consumption/
production-intent data into the server’s MySQL database.5) Generate the power system model with OpenDSS and use it to calculate the overvoltages in the
consumption/ production intents. Then, use the DLMP calculator to calculate the prices for the non-overvoltage consumption/ production intents.
6) Update the consumption/ production-intent data in the MySQL database with the overvoltage/ price criteria/ transaction enabled status information and DLMP prices.
7) Display the DLMP prices and transactions in web application in a Google Maps interface and other visualizations.
8) Allow for the changing of data in the MySQL database via user input.9) Retrieve the updated consumption/ production transaction intents and convert this data to a JSON
structure.10) Convert the JSON data to a string and send the updated consumption/ production-intent data back
to the client via ZeroMQ.11) Convert the string that was sent via ZeroMQ into JSON data, and then update the client’s Sqlite
database with the overvoltage/ price criteria/ transaction enabled status information and the DLMP price data from the utility market server.
Web Application Data VisualizationThe AvistaATP web application has been updated to display data from the market server’s MySQL database. The purpose of this was to enable users to track trending patterns in the DLMP price signals visually and to be able to spot discrepancies in the price data. Users can easily access this information from several new entries in the web application’s ‘dashboard’ area.
There are four new ‘dashboards’ of particular note. These are labeled “Energy Price at Node Timeline,” “Price+Voltage Chart for Date+Hour for All Busses,” “Producer Transaction Agr. Power+Value Timeline,” and “Consumer Transaction Agr. Power+Value Timeline.”
To demonstrate the differences in the visualizations of different data sets, we conducted three experiments using the IEEE-13 bus model. All three experiments involved generating consumption/ production transaction intents from three ‘smart buildings.’ The three buildings differed in terms of their size, the R-value of their insulation, and the amount of PV power they can generate. These differences led to each building having different power needs/ behaviors over time. Each building generated consumption/ production transaction intents for every hour of a specified period. This means that each hour would have a total of six transaction intents – one consumption intent and one production intent for each of the three buildings. The values in these transaction intents were calculated as per the descriptions in the ‘Smart Buildings’ section of this report. These calculations used the ‘predicted weather table’ stored in each ‘smart building’ client’s Sqlite database as the source of relevant data for their output.
The first two experiments used data that ranged over a period of 11 days, from hour 0 of 4/5/2021 through hour 23 of 4/15/2021. This means that each building produced a total of 528 transaction intents, as

(11 𝑑𝑎𝑦𝑠 ∗ 24 ℎ𝑜𝑢𝑟𝑠
𝑑𝑎𝑦 ∗ 2𝑡𝑟𝑎𝑛𝑠𝑎𝑐𝑡𝑖𝑜𝑛 𝑖𝑛𝑡𝑒𝑛𝑡𝑠ℎ𝑜𝑢𝑟 = 528 𝑡𝑟𝑎𝑛𝑠𝑎𝑐𝑡𝑖𝑜𝑛 𝑖𝑛𝑡𝑒𝑛𝑡𝑠). As such, the first two experiments
involved processing a total of 1,584 transaction intents for the three buildings. The difference between the first two experiments lies in the configuration of the IEEE-13 bus model. The first experiment does not include any capacitors in the model setup, whereas the second one includes capacitors.
The third experiment used data focused on three specific hours, using the IEEE-13 bus model from the second experiment. These were hours 12 – 14 on 4/9/2021. These hours were chosen to focus more clearly on a ‘spike’ in the data present in the second experiment. This experiment also shows the contrast in how the AvistaATP web application’s data visualization dashboards display a large number of data points instead of a smaller number.
The following figures show the output of the three experiments as they are visualized in the four new dashboards. Please note that Figure 5, Figure 6, and Figure 7 display data from all the hours of each experiment, but only for bus 634. Figure 8, Figure 9, and Figure 10 only display data for a single hour, which is set to hour 13 of 4/9/2021, but these figures show the data for that hour for all the busses in the IEEE-13 bus model. Finally, Figure 11, Figure 12, Figure 13, Figure 14, Figure 15, and Figure 16 all display aggregated data over all the busses in the IEEE-13 bus model over all the hours in each experiment.
Figure 5. Energy Price at Node Timeline - No Capacitors
Figure 6. Energy Price at Node Timeline - Using Capacitors

Figure 7. Energy Price at Node Timeline - Using Capacitors, Three Hour Focus
Figure 8. Price+Voltage Chart for Data+Hour for All Busses - No Capacitors
Figure 9. Price+Voltage Chart for Data+Hour for All Busses – Capacitors

Figure 10. Price+Voltage Chart for Data+Hour for All Busses - Capacitors, Three Hour Focus
Figure 11. Producer Transaction Agr. Power+Value Timeline - No Capacitors
Figure 12. Producer Transaction Agr. Power+Value Timeline – Capacitors

Figure 13. Producer Transaction Agr. Power+Value Timeline - Capacitors, Three Hour Focus
Figure 14. Consumer Transaction Agr. Power+Value Timeline - No Capacitors
Figure 15. Consumer Transaction Agr. Power+Value Timeline – Capacitors
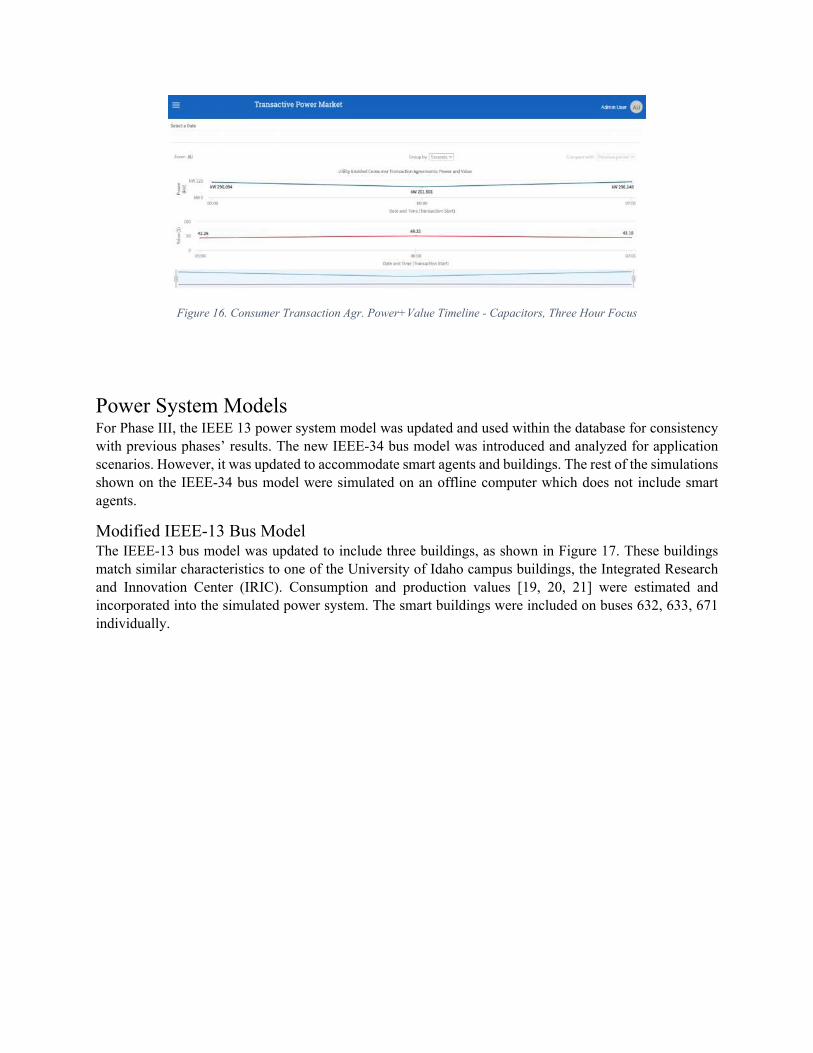
Figure 16. Consumer Transaction Agr. Power+Value Timeline - Capacitors, Three Hour Focus
Power System ModelsFor Phase III, the IEEE 13 power system model was updated and used within the database for consistency with previous phases’ results. The new IEEE-34 bus model was introduced and analyzed for application scenarios. However, it was updated to accommodate smart agents and buildings. The rest of the simulations shown on the IEEE-34 bus model were simulated on an offline computer which does not include smart agents.
Modified IEEE-13 Bus ModelThe IEEE-13 bus model was updated to include three buildings, as shown in Figure 17. These buildings match similar characteristics to one of the University of Idaho campus buildings, the Integrated Research and Innovation Center (IRIC). Consumption and production values [19, 20, 21] were estimated and incorporated into the simulated power system. The smart buildings were included on buses 632, 633, 671 individually.

Figure 17: Modified IEEE-13 bus Feeder
Modified IEEE-34 Bus ModelThe IEEE-34 bus model [22] shown in Figure 18 was selected for additional analysis for more realistic application. The IEEE-34 bus model has longer and smaller power lines and regulators to support the voltage down the feeder. The modified IEEE-34 bus model was kept as close to the original as possible. The primary modifications were the additions of dispatchable generators and smart buildings. These modifications are shown in Table 1.
Figure 18: Modified IEEE-34 bus Feeder
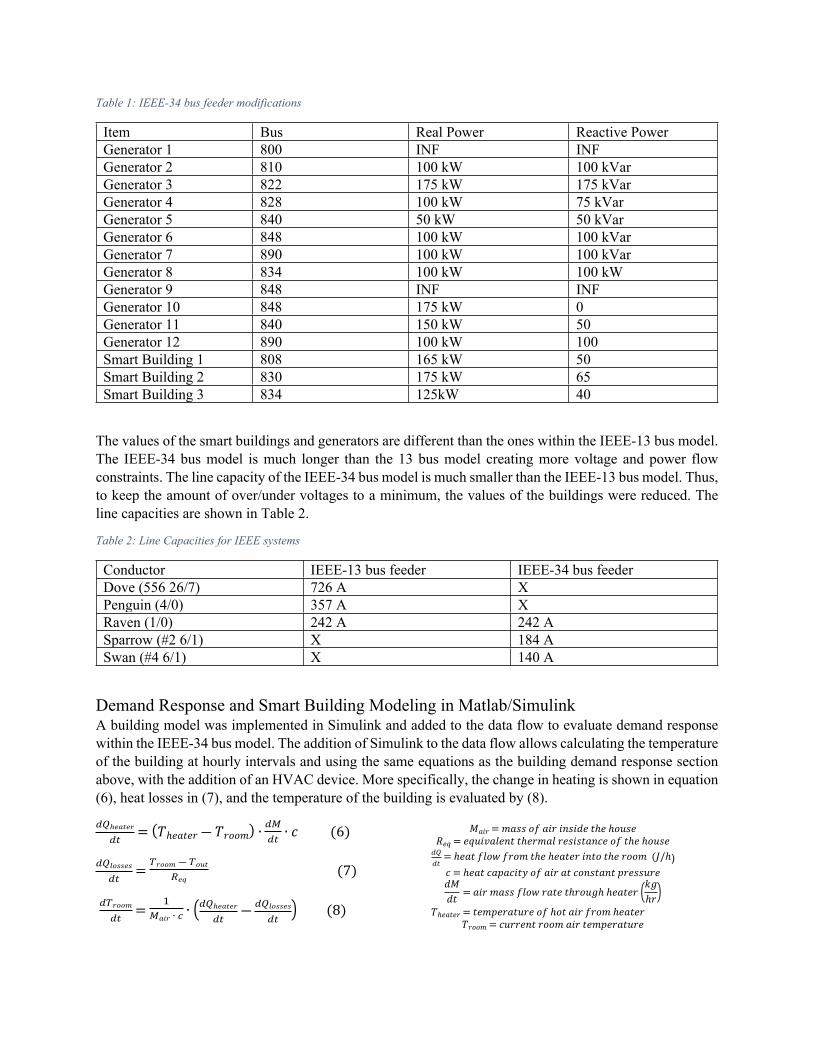
Table 1: IEEE-34 bus feeder modifications
Item Bus Real Power Reactive PowerGenerator 1 800 INF INFGenerator 2 810 100 kW 100 kVarGenerator 3 822 175 kW 175 kVarGenerator 4 828 100 kW 75 kVarGenerator 5 840 50 kW 50 kVarGenerator 6 848 100 kW 100 kVarGenerator 7 890 100 kW 100 kVarGenerator 8 834 100 kW 100 kWGenerator 9 848 INF INFGenerator 10 848 175 kW 0Generator 11 840 150 kW 50Generator 12 890 100 kW 100Smart Building 1 808 165 kW 50Smart Building 2 830 175 kW 65Smart Building 3 834 125kW 40
The values of the smart buildings and generators are different than the ones within the IEEE-13 bus model. The IEEE-34 bus model is much longer than the 13 bus model creating more voltage and power flow constraints. The line capacity of the IEEE-34 bus model is much smaller than the IEEE-13 bus model. Thus, to keep the amount of over/under voltages to a minimum, the values of the buildings were reduced. The line capacities are shown in Table 2.
Table 2: Line Capacities for IEEE systems
Conductor IEEE-13 bus feeder IEEE-34 bus feederDove (556 26/7) 726 A XPenguin (4/0) 357 A XRaven (1/0) 242 A 242 ASparrow (#2 6/1) X 184 ASwan (#4 6/1) X 140 A
Demand Response and Smart Building Modeling in Matlab/SimulinkA building model was implemented in Simulink and added to the data flow to evaluate demand response within the IEEE-34 bus model. The addition of Simulink to the data flow allows calculating the temperature of the building at hourly intervals and using the same equations as the building demand response section above, with the addition of an HVAC device. More specifically, the change in heating is shown in equation (6), heat losses in (7), and the temperature of the building is evaluated by (8).
𝑑𝑄ℎ𝑒𝑎𝑡𝑒𝑟
𝑑𝑡= (𝑇ℎ𝑒𝑎𝑡𝑒𝑟 ― 𝑇𝑟𝑜𝑜𝑚) ∙ 𝑑𝑀
𝑑𝑡 ∙ 𝑐 (6)
𝑑𝑄𝑙𝑜𝑠𝑠𝑒𝑠
𝑑𝑡=
𝑇𝑟𝑜𝑜𝑚 ― 𝑇𝑜𝑢𝑡
𝑅𝑒𝑞 (7)
𝑑𝑇𝑟𝑜𝑜𝑚
𝑑𝑡=
1𝑀𝑎𝑖𝑟 ∙ 𝑐 ∙ (𝑑𝑄ℎ𝑒𝑎𝑡𝑒𝑟
𝑑𝑡― 𝑑𝑄𝑙𝑜𝑠𝑠𝑒𝑠
𝑑𝑡) (8)
𝑀𝑎𝑖𝑟 = 𝑚𝑎𝑠𝑠 𝑜𝑓 𝑎𝑖𝑟 𝑖𝑛𝑠𝑖𝑑𝑒 𝑡ℎ𝑒 ℎ𝑜𝑢𝑠𝑒𝑅𝑒𝑞 = 𝑒𝑞𝑢𝑖𝑣𝑎𝑙𝑒𝑛𝑡 𝑡ℎ𝑒𝑟𝑚𝑎𝑙 𝑟𝑒𝑠𝑖𝑠𝑡𝑎𝑛𝑐𝑒 𝑜𝑓 𝑡ℎ𝑒 ℎ𝑜𝑢𝑠𝑒
𝑑𝑄𝑑𝑡
= ℎ𝑒𝑎𝑡 𝑓𝑙𝑜𝑤 𝑓𝑟𝑜𝑚 𝑡ℎ𝑒 ℎ𝑒𝑎𝑡𝑒𝑟 𝑖𝑛𝑡𝑜 𝑡ℎ𝑒 𝑟𝑜𝑜𝑚 (𝐽/ℎ) 𝑐 = ℎ𝑒𝑎𝑡 𝑐𝑎𝑝𝑎𝑐𝑖𝑡𝑦 𝑜𝑓 𝑎𝑖𝑟 𝑎𝑡 𝑐𝑜𝑛𝑠𝑡𝑎𝑛𝑡 𝑝𝑟𝑒𝑠𝑠𝑢𝑟𝑒𝑑𝑀𝑑𝑡 = 𝑎𝑖𝑟 𝑚𝑎𝑠𝑠 𝑓𝑙𝑜𝑤 𝑟𝑎𝑡𝑒 𝑡ℎ𝑟𝑜𝑢𝑔ℎ ℎ𝑒𝑎𝑡𝑒𝑟 (𝑘𝑔
ℎ𝑟)𝑇ℎ𝑒𝑎𝑡𝑒𝑟 = 𝑡𝑒𝑚𝑝𝑒𝑟𝑎𝑡𝑢𝑟𝑒 𝑜𝑓 ℎ𝑜𝑡 𝑎𝑖𝑟 𝑓𝑟𝑜𝑚 ℎ𝑒𝑎𝑡𝑒𝑟
𝑇𝑟𝑜𝑜𝑚 = 𝑐𝑢𝑟𝑟𝑒𝑛𝑡 𝑟𝑜𝑜𝑚 𝑎𝑖𝑟 𝑡𝑒𝑚𝑝𝑒𝑟𝑎𝑡𝑢𝑟𝑒

The final Simulink model is shown in Figure 19. The major control loop contains the heating control, cooling control, and building temperature calculation block.
Figure 19: Simulink Building HVAC Control Flow
Distribution Locational Marginal Pricing (DLMPs)
Added to the ATP transactive market throughout Phase II, the DLMPs are calculated by executing a constrained optimization of a cost function. The objective is to minimize the total cost while ensuring the system constraints and boundaries are satisfied. Equality constraints translate the need for real and reactive power consumption and supply balances within the distribution system. The inequality constraints represent the limits of the distributed generation, lines’ and transformers’ capacity limits, and voltage constraints at different nodes. These constraints are included in the cost function using Lagrangian multipliers. The cost function is then minimized using semi-definite programming that provides the total optimized cost and the DLMPs at different nodes. The obtained DLMPs can be classified into real power DLMPs and reactive power DLMPs. Each DLMP contains four price components that are added together to provide the nodal price [23]. The four elements of a DLMP are increment costs corresponding to injected energy, loss, congestion, and voltage levels. Indeed, the final nodal price (DLMP) represents the impact of loads and generation (injections) at that node on the distribution grid, considering the value of losses, voltages, energy cost, and congestion components.
These DLMP values provide a standpoint of the distribution grid conditions to the wholesale energy market or cleared price for the energy market. The LMP from the transmission system was included as well at the distribution feeder. DLMP prices were evaluated and calculated down the feeder, and the obtained fluctuations of the DLMP prices relate to the grid conditions and cleared prices from the transmission market. More details about the equations considered are available in [23].
Demand Response Simulation ScenarioWeather data was collected from April 5th, 2021, to April 11th, 2021, to study the impact of demand response on a distribution feeder. Gathered dry bulb temperature and cloud cover were considered. The cloud cover was used to calculate the amount of PV production at each hour. Residential consumption profiles were
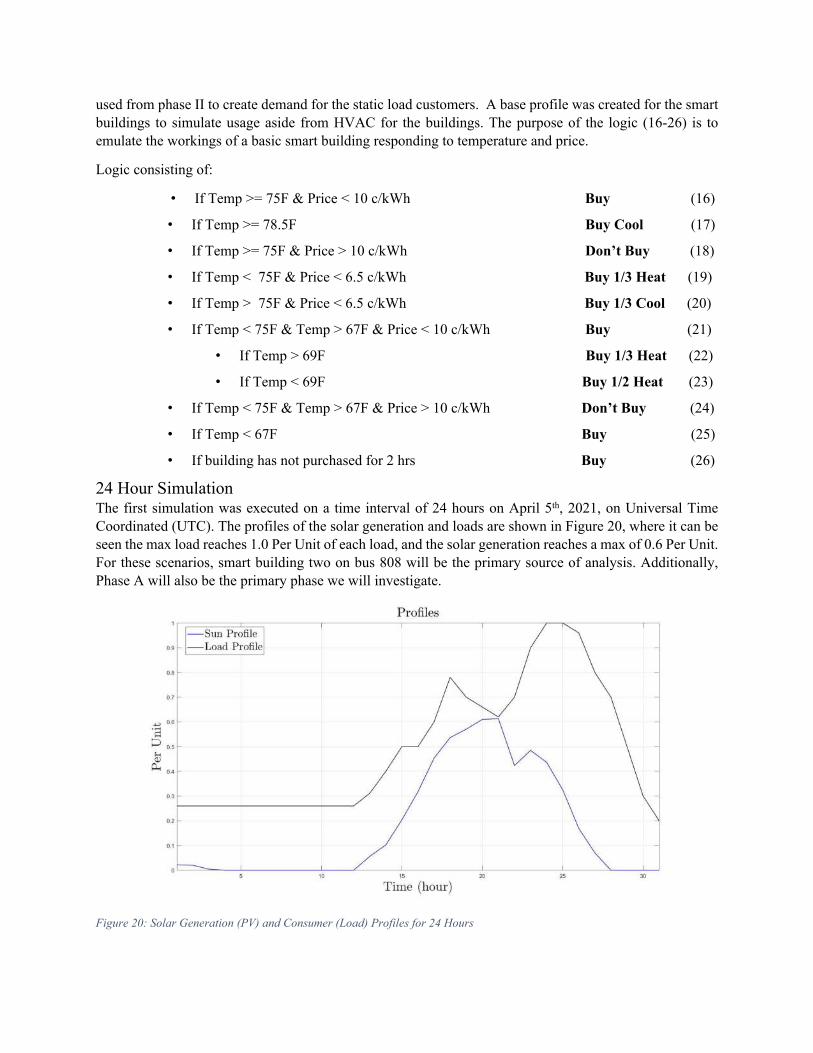
used from phase II to create demand for the static load customers. A base profile was created for the smart buildings to simulate usage aside from HVAC for the buildings. The purpose of the logic (16-26) is to emulate the workings of a basic smart building responding to temperature and price.
Logic consisting of:
• If Temp >= 75F & Price < 10 c/kWh Buy (16)
• If Temp >= 78.5F Buy Cool (17)
• If Temp >= 75F & Price > 10 c/kWh Don’t Buy (18)
• If Temp < 75F & Price < 6.5 c/kWh Buy 1/3 Heat (19)
• If Temp > 75F & Price < 6.5 c/kWh Buy 1/3 Cool (20)
• If Temp < 75F & Temp > 67F & Price < 10 c/kWh Buy (21)
• If Temp > 69F Buy 1/3 Heat (22)
• If Temp < 69F Buy 1/2 Heat (23)
• If Temp < 75F & Temp > 67F & Price > 10 c/kWh Don’t Buy (24)
• If Temp < 67F Buy (25)
• If building has not purchased for 2 hrs Buy (26)
24 Hour SimulationThe first simulation was executed on a time interval of 24 hours on April 5th, 2021, on Universal Time Coordinated (UTC). The profiles of the solar generation and loads are shown in Figure 20, where it can be seen the max load reaches 1.0 Per Unit of each load, and the solar generation reaches a max of 0.6 Per Unit. For these scenarios, smart building two on bus 808 will be the primary source of analysis. Additionally, Phase A will also be the primary phase we will investigate.
Figure 20: Solar Generation (PV) and Consumer (Load) Profiles for 24 Hours
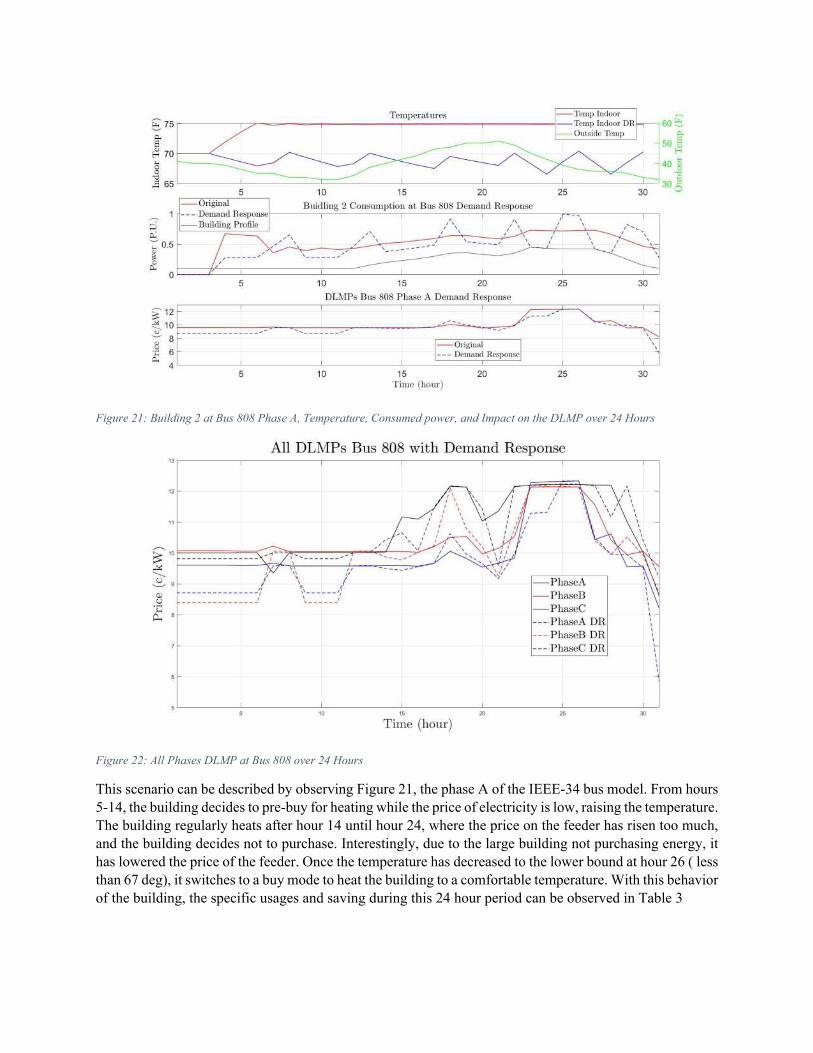
Figure 21: Building 2 at Bus 808 Phase A, Temperature, Consumed power, and Impact on the DLMP over 24 Hours
Figure 22: All Phases DLMP at Bus 808 over 24 Hours
This scenario can be described by observing Figure 21, the phase A of the IEEE-34 bus model. From hours 5-14, the building decides to pre-buy for heating while the price of electricity is low, raising the temperature. The building regularly heats after hour 14 until hour 24, where the price on the feeder has risen too much, and the building decides not to purchase. Interestingly, due to the large building not purchasing energy, it has lowered the price of the feeder. Once the temperature has decreased to the lower bound at hour 26 ( less than 67 deg), it switches to a buy mode to heat the building to a comfortable temperature. With this behavior of the building, the specific usages and saving during this 24 hour period can be observed in Table 3
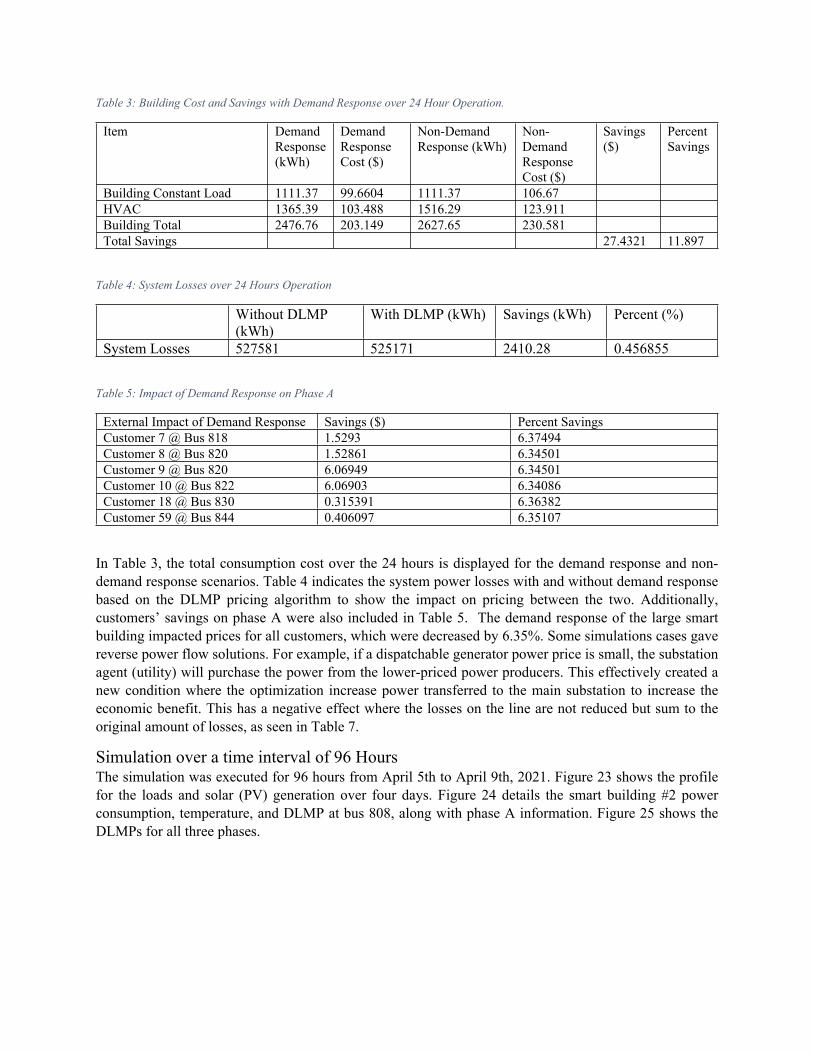
Table 3: Building Cost and Savings with Demand Response over 24 Hour Operation.
Item Demand Response (kWh)
Demand Response Cost ($)
Non-Demand Response (kWh)
Non-Demand Response Cost ($)
Savings ($)
Percent Savings
Building Constant Load 1111.37 99.6604 1111.37 106.67HVAC 1365.39 103.488 1516.29 123.911Building Total 2476.76 203.149 2627.65 230.581Total Savings 27.4321 11.897
Table 4: System Losses over 24 Hours Operation
Without DLMP (kWh)
With DLMP (kWh) Savings (kWh) Percent (%)
System Losses 527581 525171 2410.28 0.456855
Table 5: Impact of Demand Response on Phase A
External Impact of Demand Response Savings ($) Percent SavingsCustomer 7 @ Bus 818 1.5293 6.37494Customer 8 @ Bus 820 1.52861 6.34501Customer 9 @ Bus 820 6.06949 6.34501Customer 10 @ Bus 822 6.06903 6.34086Customer 18 @ Bus 830 0.315391 6.36382Customer 59 @ Bus 844 0.406097 6.35107
In Table 3, the total consumption cost over the 24 hours is displayed for the demand response and non-demand response scenarios. Table 4 indicates the system power losses with and without demand response based on the DLMP pricing algorithm to show the impact on pricing between the two. Additionally, customers’ savings on phase A were also included in Table 5. The demand response of the large smart building impacted prices for all customers, which were decreased by 6.35%. Some simulations cases gave reverse power flow solutions. For example, if a dispatchable generator power price is small, the substation agent (utility) will purchase the power from the lower-priced power producers. This effectively created a new condition where the optimization increase power transferred to the main substation to increase the economic benefit. This has a negative effect where the losses on the line are not reduced but sum to the original amount of losses, as seen in Table 7.
Simulation over a time interval of 96 HoursThe simulation was executed for 96 hours from April 5th to April 9th, 2021. Figure 23 shows the profile for the loads and solar (PV) generation over four days. Figure 24 details the smart building #2 power consumption, temperature, and DLMP at bus 808, along with phase A information. Figure 25 shows the DLMPs for all three phases.

Figure 23: Load and Solar (PV) Generation Profiles for 96 Hours
Figure 24: Building #2 Temperature, Power Consumption, and DLMP Prices on Bus 808 Phase A

Figure 25:DLMPs per phase Over 96 Hours
The operation and demand response of building #2 is shown in Figure 12 over the 96 hours. Like the 24 hour scenario, the building takes advantage of preheating before the higher demand times. The building allows its temperature to drop during peak demand hours, generating savings of 9.8% for the HVAC system. As the 24 hour run, the building demand response has lowered the DLMP on phase A, generating savings for all customers on the feeder.
Table 6: Demand response and non-demand response values for building #2 and customers
Item Demand Response (kWh)
Demand Response Cost ($)
Non-Demand Response (kWh)
Non-Demand Response Cost ($)
Savings ($)
PercentSavings
Building Constant Load 4122.07 371.978 4122.07 395.716HVAC 4659.37 363.16 4967.2 419.401Building Total 8781.44 735.138 9089.27 815.117Total Savings 79.979 9.81197
Table 7: System losses with and without DLMP
Without DLMP (MWh)
With DLMP (MWh)
Savings (kWh) Percent (%)
System Losses 1.90387 1.8919 11969.2 0.628676
Table 8: Impact of demand response on A phase
External Impact of Demand Response Savings ($) Percent SavingsCustomer 7 @ Bus 818 5.44919 6.0118Customer 8 @ Bus 820 5.46099 5.99912Customer 9 @ Bus 820 21.6833 5.99912Customer 10 @ Bus 822 21.6906 5.99762Customer 18 @ Bus 830 1.12573 6.01152

Customer 59 @ Bus 844 1.45193 6.00965
Table 6 shows the numerical savings of building #2 and customers located throughout Phase A. It can be noted that the saving percentage of building #2 has decreased compared to the 24-hour run. This can be attributed to the colder weather on the 4th day. While the building is still able to respond to the price signals and temperature variations, it becomes less efficient when it is required to buy more energy. Table 7 shows the losses on the system over the 4-day scenario, and Table 8 shows the impact of demand response on phase A.
Even though the buildings are able to shift their loads to off-peak hours, in some cases, it does not fully assist in lowering the price of the feeder. It can be noted in Figure 13 that phase C price still increases noticeably as the peak hours of the day appear. While the building has delayed its purchase of energy, when it purchases it later, it still increases the phase price to a higher level due to congestion and high voltage. However, the building still manages a 9.8% savings over the four days.
ConclusionBuilding upon the work completed, the ATP prototype was updated to incorporate smart agents and smart buildings. Through this integration, the agents can gather temperature and cloud cover data from an external API, use this data to create consumption/ production transaction intents based on simplified building/ sun position models. The transaction intents are then sent through a network to the utility marketplace server and have the updated transaction status/ DLMP values of those transaction intents returned to the proper smart building client. This behavior is a necessary step forward towards creating smart building agents capable of handling a broader array of more complex scenarios in the future.
Furthermore, the IEEE-34 bus model was incorporated as a more realistic system for analytics. Smart buildings and their respective demand response behaviors were added into the scenario to show the impacts of demand response on a sensitive distribution feeder. The simulation results show positive effects on the phases as the buildings decide to defer their load, causing the buildings to save on their cost of operation (9.81%). It is important to note that the savings were only due to the HVAC system, and additional savings could be tied to human factors, behavior, and the number of people within the building. The simulation showed that customers located on the feeder saw savings of 6% due to the consumption being moved off the peak of the day.
There are many avenues forward, integrating DLMPs, smart buildings, smart agents, and transactive contracts into real distribution systems. The team noticed that National Grid contracted Opus One to build a similar distribution platform for economic optimization with New York’s Reform the Energy Vision [24]. The platform was used within the Buffalo Niagara Medical Campus. Additional research work is being conducted on transactive markets with the assistance of blockchain technologies [25].
Bibliography
[1] Office of Electricity, "Demand Response," [Online]. Available: https://www.energy.gov/oe/activities/technology-development/grid-modernization-and-smart-grid/demand-response. [Accessed 27 5 2021].

[2] OpenLEADR, "OpenLEADR Documentation," 2020. [Online]. Available: https://openleadr.org/docs/. [Accessed 27 5 2021].
[3] OpenADR Alliance, "OpenADR Alliance," [Online]. Available: https://www.openadr.org/. [Accessed 27 5 2021].
[4] The ZeroMQ Authors, "ZeroMQ: An Open-Source Universal Messaging Library," 2021. [Online]. Available: https://zeromq.org/. [Accessed 27 5 2021].
[5] R. Bienert and S. Janssen, "Introduction to openLEADR & OpenADR - Rolf Bienert & Stan Janssen," [Online]. Available: https://youtu.be/zc60Klzah3Y. [Accessed 31 5 2021].
[6] OpenADR Alliance, "OpenADR: Frequently Asked Questions," [Online]. Available: https://www.openadr.org/faq. [Accessed 31 5 2021].
[7] OpenADR Alliance, "OpenADR 2.0 Demand Response Program Implementation Guide," 2019. [Online]. Available: https://openadr.memberclicks.net/index.php?option=com_content&view=article&id=142:dr-program-guide&catid=20:general-site-content&Itemid=168. [Accessed 24 5 2021].
[8] The ZeroMQ authors, "Documentation: Get Started," [Online]. Available: https://zeromq.org/get-started/?language=python#. [Accessed 31 5 2021].
[9] curvezmq.org, "CurveZMQ - Security for ZeroMQ," [Online]. Available: http://curvezmq.org/. [Accessed 31 5 2021].
[10] J. Kreider, P. Curtiss, and A. Rabl, "Heating and Cooling of Buildings: Design for Efficiency, Revixed Second Edition," 2009. [Online]. Available: https://books.google.com/books?id=9g3SBQAAQBAJ&pg=PA28#v=onepage&q&f=false. [Accessed 28 5 2021].
[11] National Weather Service, "NOAA Graphical Forecast for CONUS Area," [Online]. Available: https://graphical.weather.gov/sectors/conus.php?element=Sky. [Accessed 28 5 2021].
[12] S. Kennedy, "The astral Package (astral.sun.night)," 2020. [Online]. Available: https://astral.readthedocs.io/en/latest/package.html?highlight=night#astral.sun.night. [Accessed 28 5 2021].
[13] Meteostat, "Hourly Data," [Online]. Available: https://dev.meteostat.net/python/hourly.html#example. [Accessed 28 5 2021].
[14] National Weather Service, "API Web Service," [Online]. Available: https://www.weather.gov/documentation/services-web-api. [Accessed 30 5 2021].
[15] K. Reitz, "Requests: HTTP for Humans," [Online]. Available: https://docs.python-requests.org/en/master/. [Accessed 30 5 2021].
[16] National Weather Service, "api.weather.gov: Gridpoint Frequently Asked Questions," [Online]. Available: https://weather-gov.github.io/api/gridpoints. [Accessed 30 5 2021].

[17] Google, "moscow idaho latitude and longitude," [Online]. Available: https://www.google.com/search?client=firefox-b-1-d&q=moscow+idaho+latitude+and+longitude. [Accessed 30 5 2021].
[18] PacIOOS, "Latitude/Longitude Formats," 25 11 2014. [Online]. Available: https://www.pacioos.hawaii.edu/voyager-news/lat-long-formats/. [Accessed 30 5 2021].
[19] J. Matheison and M. Compton, "University of Idaho Solar Initiative," University of Idaho, October 06th 2020. [Online]. Available: https://uandigive.uidaho.edu/project/16664/updates/1. [Accessed 01 02 2021].
[20] U. o. Idaho, "Sustainability Center," University of Idaho, 2020. [Online]. Available: https://www.uidaho.edu/current-students/sustainability-center/solar-energy-initiative. [Accessed 01 02 2021].
[21] E. Dennis, "Harnessing the power of the sun," Argonaut, 14 11 2019. [Online]. Available: https://www.uiargonaut.com/2019/11/14/university-of-idaho-harnessing-the-power-of-the-sun/. [Accessed 01 02 2021].
[22] Power and Energy Society, "IEEE PES AMPS DSAS Test Feeder Working Group," IEEE, 17 09 2010. [Online]. Available: https://site.ieee.org/pes-testfeeders/resources/. [Accessed 31 08 2020].
[23] S. Hanif, M. Barati, A. Kargarian, H. B. Gooi, and T. Hamacher, "Multiphase Distribution Locational Marginal Prices: Approximation and Decomposition," IEEE Power & Energy Society General Meeting (PESGM), 2018.
[24] O. One, "Opus One Solutions," [Online]. Available: https://www.opusonesolutions.com/customers_projects/launching-the-worlds-first-transactive-energy-market-at-national-grid/. [Accessed 06 06 2021].
[25] N. R. U. C. F. Corporation, “National Rural Utilities Cooperative Finance Corporation,” [Online]. Available: https://www.nrucfc.coop/content/dam/nrucfc/public-tier/documents/industry-insights/CFC_Blockchain_report.pdf. [Accessed 06 06 2021].

APPENDIX GFinal Report: Automating Predictive Maintenance
for Energy Efficiency

This space is reserved for the EPiC Series header, do not use it
Automating Predictive Maintenance for Energy Eciencyvia Machine Learning and IoT Sensors
Paul M. Bodily1, Isaac D. Grith1, Mary Hofle2, Omid Heidari2, Safal Lama2,Avery Conlin2, Andrew Christiansen1, Delaney Moore1, Kellie Wilson2, Anish
Sebastian2, and Marco P. Schoen2
1 Department of Computer Science, Idaho State University, Pocatello, ID, 832092 Department of Mechanical Engineering, Idaho State University, Pocatello, ID, 83209
bodipaul,grifisaa,hoflmary,heidomid,lamasafa,conlaver,chriandr,moordela,wilskell,sebaanis,[email protected]
Abstract
The arise of maintenance issues in mechanical systems is cause for decreased energyeciency and higher operating costs for many small- to medium-sized businesses. Thesooner such issues can be identified and addressed, the greater the energy savings. Wehave designed and implemented an automated predictive maintenance system that usesmachine learning models to predict maintenance needs from data collected via data sensorsattached to mechanical systems. As a proof of concept, we demonstrate the e↵ectivenessof the system by predicting several operating states for a standard clothes dryer.
1 Introduction
A significant portion of energy losses and ineciencies among small- to medium-sized businessesand consumers arise due to a common set of maintenance-related issues that can be assessed andmitigated through the application of predictive modeling using data collected both manually andautomatically via sensors. Historically, the keys to saving energy include the implementation ofenergy management techniques, specifically equipment maintenance and monitoring techniques[1]. In addition, predictive maintenance uses equipment sensors (manually or automaticallyoperated) that indicate and predict when maintenance will be required [1].
Both sensors and a commodity Internet of Things (IoT) platform that can serve as thebasis for these sensors are readily available. Additionally, machine learning has been shown tobe highly e↵ective at predictive modeling [2]. Combined, these are capable of automaticallycollecting, propagating, and assessing underlying maintenance data, all of which are neces-sary to develop the tools required by managers to e↵ectively plan and manage energy ecientmaintenance [3]. In this paper we describe the design and implementation of cost-e↵ective, au-tomated solutions for overcoming maintenance-related energy losses in small- to medium-sizedbusinesses. Our objective in this application is to perform assessments of existing operationalinfrastructure and constraints that represent many of the systems found in small- to medium-sized manufacturing businesses, such as material/product handling, fluid flow, electric motor
Automating Predictive Maintenance Bodily et al.
drive systems, and other systems. Maintenance issues caused by the failure or degradation ofsystem subcomponents (e.g., vibration causing wear in bearings) can be identified by a changeof sound, movement, or temperature, indicating possible changes within a subcomponent thatare outside the required operational range.
Much recent attention has focused on automative prediction using machine learning as anintegral part of broadly emergent fields of Industrial IoT (IIOT) and Industry 4.0. Buildinginformation modeling (BIM) and IoT have been suggested as a means of facility maintenancemanagement (FMM) [4]. In particular the proposed system uses artificial neural networks(ANNs) and support vector machines (SVMs) to perform condition monitoring and fault alarm-ing, condition assessment, condition prediction, and maintenance planning. Their findings sug-gest that the future condition of mechanical, electrical, and plumbing (MEP) components formaintenance planning can be eciently predicted, particularly in the architecture, engineering,construction, and facility management (AEC/FM) industry.
Published in 2019, a systematic literature review of machine learning methods applied topredictive maintenance asserts that the performance of predictive maintenance applicationsdepends on the appropriate choice of the ML method [5]. A second systematic literature reviewpublished in 2020 provides a similar overview of machine learning algorithms used for predictivemaintenance (including ANNs, SVMs, Decision Trees, Random Forests, and Linear, Logistic,and Symbolic Regression) [6]. This review includes a review not only of the types of algorithms,but also of the equipment, data acquisition devices, and most common commercial ML platformsused in predictive maintenance architectures.
As predictive maintenance capabilities have broadened, other work has focused on the op-timal management of tasks that result from predictive maintenance systems. One comparisonof optimization algorithms used in tandem with predictive machine learning in this domainfound that a genetic algorithm-based resource management algorithm outperformed MinMin,MaxMin, FCFS, and RoundRobin algorithms in execution time, cost and energy usage [7].
Related work has specifically looked at the implementation of automated predictive mainte-nance systems in the so-called “brownfield” which refers to technologically-outdated industrialor commercial sites. As an example, this work looks at the process of retrofitting a heavy liftElectric Monorail System at the BMW Group sites with low-cost sensors, an IIoT architec-ture and cloud-based machine learning to avoid unplanned downtime, increase availability andeciency, and save costs through optimized maintenance strategies [8].
In the present study we collect data for use in the design, development, and testing of an IoTsensor platform and cloud-based smart decision-support tool incorporating predictive machinelearning to improve and automate decisions for energy eciency and curtailment.
2 Methods
Figure 1 shows a high-level overview of the system we have designed. Sensors are attached tomechanical systems. Data from the sensors is collected by an IoT device (i.e., a Raspberry Pi).The IoT device sends data to a cloud server which acts as both a data warehouse and as aplatform for data analysis using machine learning models. A user interface (UI) provides accessto data and system configuration information at both the IoT and server levels. The followingsubsections go into each of these components in detail.
2

Automating Predictive Maintenance Bodily et al.
Table 1: Catalog of sensorsSensor name Attribute measured Data communication protocolMPU6050 Vibration I2C1528-2526-ND IR Break Beam GPIOMLX90614ESF IR Temperature I2CDHT22 Temperature & Humidity ProprietaryMAX446 Sound SPI (via ADC)YHDC-SCT-013-000 Current SPI (via ADC)
2.1 Mechanical Systems
Much of the energy consumption of small- to medium-sized businesses comes from variousmechanical systems (e.g., pumps, motors, etc.). As with all mechanical systems, the energyeciency of these systems depends on maintenance needs being met in a timely and routinemanner. Breakdown and degradation in performance of motors, belts, and pumps can lead toenergy losses. In our study we included four mechanical systems that collectively included avariety of motors, pumps, and belts. This included two dryers, one blender, and a water pump.
2.2 Sensors
Automated assessment of maintenance needs is conducted by measuring attributes of the me-chanical systems. Such attributes may include temperature (both that of the ambient andparticular system elements), sound, vibration, rotation speed, and electric current. To measurethese attribute we attach several sensors to each mechanical system. A catalog of the sensorsattached to each of our four mechanical systems can be found in Table 1. For each sensor thedata communication protocol is also listed.
Each sensor is attached to the mechanical device in a position that optimizes the quality ofdata collection for the sensor. Figure 2 illustrates the placement of sensors on the clothes dryerwe used for the experiment we describe below.
To collect data from the sensors, we connected all of the sensors for a particular mechanical
Figure 1: System overview
3

Automating Predictive Maintenance Bodily et al.
Figure 2: Diagram of sensor placement on disassembled drying machine. We attached aMAX446 sound sensor near the motor to observe variance in sound produced by motor. We at-tached an IR temperature sensor on the wall of the casing to read the temperature of the motorwindings. We attached a MPU6050 vibration sensor on the rear wall for direct contact with themotor and the rotating drum. A current sensor was attached in the rear of the dryer to measureelectric current used by the dryer. We attached an IR break beam sensor on the side wall todetect the rotations per minute of the dryer drum. Not shown is a DHR temperature/humiditysensor for measuring aspects of the contextual environment.
system to a single Raspberry Pi by means of an attached hardware board called a Pi HAT(short for “Hardware Attached on Top”). A diagram of the configuration of sensor wires to thePi HAT is shown in Figure 3. Sensor wires are soldered onto the hardware board, being carefulnot to burn or damage the connection or the board itself.
2.3 Software overview
Software for the automated predictive maintenance system is divided primarily between A)software local to the IoT sensor platform and B) portal software on a cloud server. Softwareon the IoT sensor platform is designed to collect data from the sensors; temporarily store smallquantities of data; and send data in batches to the portal software. The portal software isdesigned to receive batches of data from one or more IoT devices; to act as a data warehousefor data from multiple devices across multiple locations; and to perform data analysis usingmachine learning for anomaly detection for the automation of predictive maintenance needs.Both the IoT and portal software are developed with an accompanying browser-based UI thatreports on the state of the system and allows for configuration of connected sensors/servers.
4
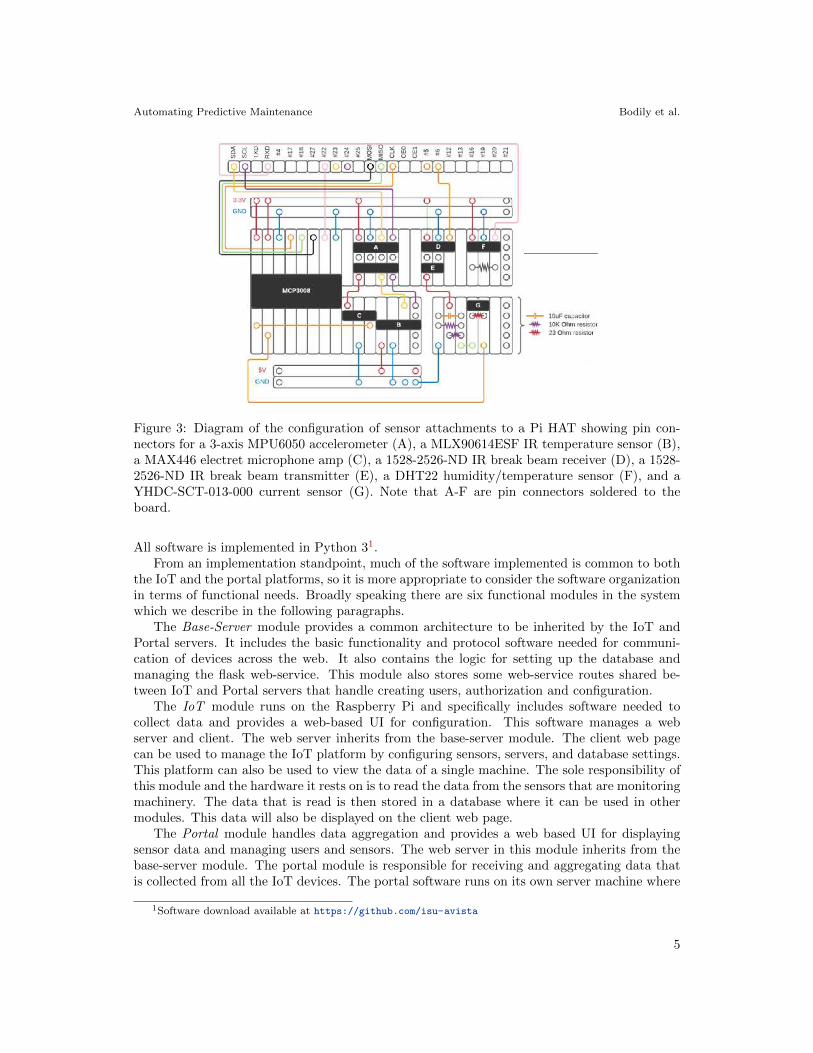
Automating Predictive Maintenance Bodily et al.
Figure 3: Diagram of the configuration of sensor attachments to a Pi HAT showing pin con-nectors for a 3-axis MPU6050 accelerometer (A), a MLX90614ESF IR temperature sensor (B),a MAX446 electret microphone amp (C), a 1528-2526-ND IR break beam receiver (D), a 1528-2526-ND IR break beam transmitter (E), a DHT22 humidity/temperature sensor (F), and aYHDC-SCT-013-000 current sensor (G). Note that A-F are pin connectors soldered to theboard.
All software is implemented in Python 31.From an implementation standpoint, much of the software implemented is common to both
the IoT and the portal platforms, so it is more appropriate to consider the software organizationin terms of functional needs. Broadly speaking there are six functional modules in the systemwhich we describe in the following paragraphs.
The Base-Server module provides a common architecture to be inherited by the IoT andPortal servers. It includes the basic functionality and protocol software needed for communi-cation of devices across the web. It also contains the logic for setting up the database andmanaging the flask web-service. This module also stores some web-service routes shared be-tween IoT and Portal servers that handle creating users, authorization and configuration.
The IoT module runs on the Raspberry Pi and specifically includes software needed tocollect data and provides a web-based UI for configuration. This software manages a webserver and client. The web server inherits from the base-server module. The client web pagecan be used to manage the IoT platform by configuring sensors, servers, and database settings.This platform can also be used to view the data of a single machine. The sole responsibility ofthis module and the hardware it rests on is to read the data from the sensors that are monitoringmachinery. The data that is read is then stored in a database where it can be used in othermodules. This data will also be displayed on the client web page.
The Portal module handles data aggregation and provides a web based UI for displayingsensor data and managing users and sensors. The web server in this module inherits from thebase-server module. The portal module is responsible for receiving and aggregating data thatis collected from all the IoT devices. The portal software runs on its own server machine where
1Software download available at https://github.com/isu-avista
5

Automating Predictive Maintenance Bodily et al.
Figure 4: Mock-up of the user interface for the portal web page, allowing users to view problemswith machinery, look at aggregated data, and record fixed issues.
data collected from all IoT devices can be stored. The portal web page will provide the enduser with a UI to view problems with machinery, look at aggregated data, and record fixedissues if needed (see Figure 4). Users, depending on their role permissions, may also edit theirprofile; edit, add, and delete sensors; and edit, add, and delete users.
The Data module houses an interface to our database schema through an object-relationalmapping for use in the other system modules. This allows both the IoT and portal devices tostore and transfer data. The data module also manages users. Users can have di↵erent roleswhich include devices, administrators, managers, and maintenance workers. The data modulecontrols what tasks certain roles have access to. For an example, a maintenance worker canedit their profile on the portal, but they may not add or delete other users like a manager isable to do. The data module also manages API keys.
The Sensors module contains implementations for each of the physical sensors used forhardware data collection. Each sensor-specific implementation is customized according to theprotocol defined for the sensor. The module periodically retrieves data from all the sensors andstores the data locally. When a specified period of time has been reached then the data is sentto and recorded on the main server where other modules can make use of it.
The Control module handles message queuing with RabbitMQ to send data and predic-tions respectively to and from the machine learning module. The Control module provides aninterface through which we can interact with RabbitMQ using a python library called Pika.Specifically, the Portal service employs a docker container with a Publisher that will continu-ally check the database for new data. If there is new data it will be sent to a Consumer. ThisConsumer will then use learners from the MLearn module that will make predictions on thedata based on some machine learning algorithm. The resulting prediction is then returned tothe Publisher and provided to the Portal if there is a predicted issue. The idea here is thatthe Portal web page will then display to the end user that something is wrong with a machinebeing monitored by an IoT device.
The machine learning or mlearn module is responsible for loading pre-trained machine learn-ing models and making automated predictions on data. For this phase of the project, there arefour di↵erent classifiers that have been used: Perceptron, Naive Bayes, Random Forest, andMultilayer Perceptron. These classifiers are built using Waikato Environment for Knowledge
6

Automating Predictive Maintenance Bodily et al.
Analysis (WEKA) [9].
3 Results
3.1 First Experiment
As a proof of concept and to test the design of the system so far, we conducted an initialexperiment in which we equipped a clothes dryer with all of the sensors listed in Table 1 minusthe current sensor (for reasons described below). The sensors gathered the rotations per minuteof the dryer belt, the internal temperature, the external temperature, sound made by the dryer,humidity inside the dryer, and the vibration of the dryer. The system was set to collect datafrom the sensors at 30-second intervals. We ran the dryer for approximately 10 minutes under 5di↵erent experimental conditions: o↵; on but with the belt removed; on with the belt attachedand the drum empty; on with the belt attached with a load of dry towels; and on with thebelt attached with a load of wet towels. Data for a total of 89 training instances was collected(18 o↵; 18 no belt; 17 empty; 18 dry towels; and 18 wet towels)2. We trained four di↵erentclassifiers—Perceptron, Naive Bayes, Random Forest, and Multilayer Perceptron—with the goalof determining how well each model could be used to predict whether or not the dryer was o↵,on with no belt, on with nothing inside, on with dry towels, or on with wet towels (see Fig. 7)3.
Figure 5: Scatterplot submatrix generated by WEKA showing correlation between pairs ofinput features. Instance labels are as follows: o↵ (blue); no belt (red); empty drum (cyan);dry towel load (grey); wet towel load (pink). As expected, volume readings are lower when thedryer is o↵. It is suspected that the variation in object (i.e., motor) and ambient temperaturereadings may be caused more by the time of day in which data was collected than by theexperimental condition of the dryer.
Of the four trained models, the Random Forest and Multilayer Perceptron models achieved
2The dataset is available in ARFF format at https://tinyurl.com/dryerarff.3A video demonstrating experimental design available at https://tinyurl.com/dryerexperiment.
7

Automating Predictive Maintenance Bodily et al.
Table 2: Classifier resultsClassifier Correctly Classified Predictive AccuracyPerceptron 70/89 78.65%Naıve Bayes 87/89 97.75%Random Forest 88/89 98.88%Multilayer Perceptron 88/89 98.88%
Table 3: Confusion matrix for the Perceptron classifierPredicted class
o↵ no belt empty dry towels wet towelso↵ 18 0 0 0 0
no belt 0 18 0 0 0Actual class empty 0 0 8 2 7
dry towels 0 0 1 17 0wet towels 0 0 9 0 9
the highest predictive accuracy (see Table 2). That these models showed improvement over thePerceptron and Naıve Bayes models suggests that predicting mechanical system conditions asa function of the configured sensors will require a classifier capable of modeling non-linearly-separable data classes. An examination of the confusion matrix for the Perceptron classifershows that the model struggled to discriminate between when the dryer was on and emptyversus when the dryer was on with a load of dry/wet towels (see Table 3). Misclassifications bythe other three models followed this same pattern.
A decision tree generated via the Random Forest method is shown in Fig. 6. The first splitattribute is ambient temperature, suggesting that the outside temperature (which correlateswith the time of day and/or the order in which data for the several experimental conditionswas collected) most e↵ectively discriminates which experimental condition is predictable. Whilethis results in high accuracy for this dataset, it will likely not generalize. In future experiments,we will collect data across a wide variety of environmental conditions.
Other intuitive insights come from examining nodes further down in the tree. For ambienttemperature above or equal to 24.63°C, the volume feature very e↵ectively discriminates betweenwhen the dryer is o↵ versus on with the belt removed. For ambient temperature below 24.63°C,the “object” (i.e., motor) temperature is used to broadly discriminate between wet towels anddry/no towels, possibly indicative of the fact that greater energy is required to turn the drumwith wet towels. These initial findings broadly suggest that predicting the operating conditionsof a mechanical system from sensor data is achievable.
Our initial findings provide critical insights into several issues that should be addressedmoving forward. First, as mentioned above, models must be trained on data collected under avariety of environmental conditions (i.e., ambient temperature, humidity, sound, etc.). Second,it is critical to ensure that sensors are accurately collecting and reporting data. We foundfrom visualizing the data that the break beam RPM sensor and the 3-axis vibration sensorare currently not providing any meaningful data to the classifier. This finding prompted thesubsequent addition of a full sensor sweep feature to the system combined with a batteryof tests designed to indicate when individual sensors are failing to report meaningful data.Third, whereas we had initially assumed that predictive classes would be linearly separablefrom the data, the relatively poor performance of the Perceptron classifier suggests that a more
8

Automating Predictive Maintenance Bodily et al.
Figure 6: Decision tree generated by WEKA for predicting dryer status. Intermediate nodesrepresent input features (i.e., sensor readings). The features “ambient” and “object” referto the temperature values in °C of the environment and motor respectively. The “volume”feature represents the sound volume in decibels. The “x”, “y”, and “z” features representvibration movement along 3 axes. Leaf nodes are labeled with predicted class labels togetherwith the number of training instances associated with the node that are accurately/inaccuratelyassociated with the node’s label.
sophisticated model will be necessary for optimal system diagnosis.
3.2 Second Experiment
After our initial experiment, we conducted another experiment to see how well models couldpredict malfunctions. In order to simulate something going wrong within the dryer, we ran thedryer normal with nothing in it, then we ran the dryer with one cut, and then made anothercut, and then a third cut. The goal was to see if the model could predict if the dryer was o↵,on with no cuts, on with one cut, on with two cuts, or on with three cuts. Due to an unevennumber of data between labels, some data was duplicated in order to have an evenly distributeddataset. Each model was trained on 600 instances (120 o↵, 120 no cuts, 120 one cut, 120 twocuts, and 120 three cuts).
For this second experiment, Perceptron was not used as a model. The three models usedare Naıve Bayes, Random Forest, and Multilayer Perceptron. Of the three trained models,Random Forest achieved the highest predictive accuracy, with Multilayer Perceptron not toofar behind (see Table 4). The confusion matrix for the Naıve Bayes model suggests that the
9

Automating Predictive Maintenance Bodily et al.
Figure 7: Scatterplot submatrix generated by WEKA showing correlation between pairs ofinput features. Instance labels are as follows: o↵ (red); no cuts (blue); one cut (cyan); twocuts (grey); three cuts (pink). As expected, volume readings and motor temperature readingsare lower when the dryer is o↵. This scatterplot submatrix also shows that the data is not aslinearly separable as the previous experiment.
Table 4: Belt Test Classifier resultsClassifier Correctly Classified Predictive AccuracyNaıve Bayes 423/600 70.5%Random Forest 597/600 99.5%Multilayer Perceptron 570/600 95%
model had the most dicult time di↵erentiating no cut, one cut, and two cuts (see Table 4). Themisclassifications of the model are along the diagonal of the confusion matrix, which indicatesthat the model is learning something of value.
After inspecting the Random Forest tree visualization seen in Fig. 8, it is clear that themodel is making almost all its classification decisions based on the external temperature andhumidity of the lab. We speculated that this might be because the external temperature actsalmost like a timestamp. Out of curiosity, we trained the same three models with the same dataset except we took out the external temperature and humidity readings. The Random Foresttree visualization for this model can be seen in Fig. ??. This model has a predictive accuracyof 93.8%. Although the model does not have as high of a predictive accuracy as the previousone, it still has an impressively high accuracy. However, this tree is much more complicatedthan the previous, which may indicate overfitting.
10

Automating Predictive Maintenance Bodily et al.
Predicted Classo↵ no cuts one cut two cuts three cuts
o↵ 120 0 0 0 0no cuts 0 61 53 1 5one cut 0 0 120 0 0two cuts 0 11 107 2 0
Actual Class three cuts 0 0 0 0 120
Figure 8: Decision tree generated by WEKA for predicting belt status.
4 Discussion and Conclusion
Our initial experiment serves to validate some of the critical aspects of our central hypothesis.It demonstrates that the state of a mechanical system—at a suciently nuanced level to be ableto detect the di↵erence between a dryer with load of wet towels versus a dryer with a load of drytowels—is well within the capability of the system we have designed. Furthermore it validatesthat our implementation thus far of the designed system is (with some minor reparable issues)working as anticipated from the sensor functions to the data collection to the data transmissionto the data analysis. This initial experiment serves to highlight areas of needed improvementin the system, most notably the need to verify proper functionality of the sensors.
As mentioned, the current sensor was not included in our initial experimental design. Thiswas for several reasons. First, the thought to add a current sensor came later in the projectas a result of discussions about the means by which we might begin to estimate or measureenergy savings in the system. Second, the YHDC-SCT-013-000 current sensor is not innatelydesigned to interface with a Raspberry Pi, and the software programming necessary to interpretthe data from the sensor proved more involved than that for the other sensors. Since our initialexperiment, this sensor has been fully implemented and future research will assess its usefulnessfor predicting maintenance needs.
11
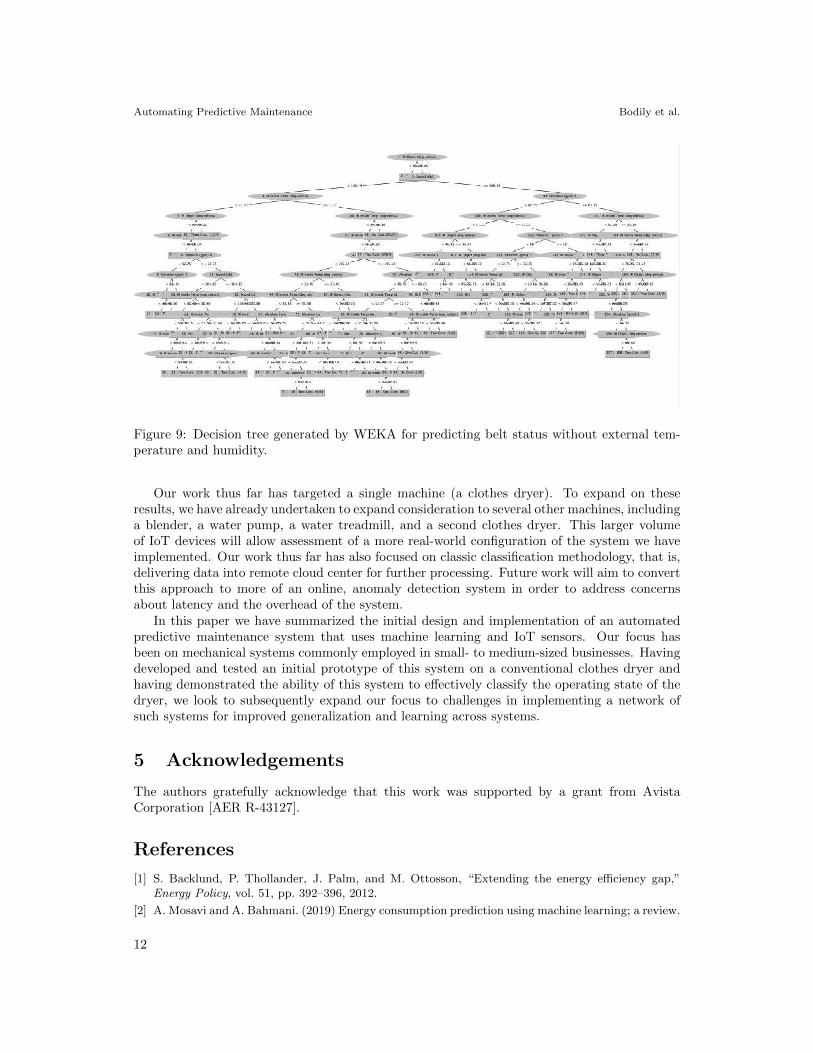
Automating Predictive Maintenance Bodily et al.
Figure 9: Decision tree generated by WEKA for predicting belt status without external tem-perature and humidity.
Our work thus far has targeted a single machine (a clothes dryer). To expand on theseresults, we have already undertaken to expand consideration to several other machines, includinga blender, a water pump, a water treadmill, and a second clothes dryer. This larger volumeof IoT devices will allow assessment of a more real-world configuration of the system we haveimplemented. Our work thus far has also focused on classic classification methodology, that is,delivering data into remote cloud center for further processing. Future work will aim to convertthis approach to more of an online, anomaly detection system in order to address concernsabout latency and the overhead of the system.
In this paper we have summarized the initial design and implementation of an automatedpredictive maintenance system that uses machine learning and IoT sensors. Our focus hasbeen on mechanical systems commonly employed in small- to medium-sized businesses. Havingdeveloped and tested an initial prototype of this system on a conventional clothes dryer andhaving demonstrated the ability of this system to e↵ectively classify the operating state of thedryer, we look to subsequently expand our focus to challenges in implementing a network ofsuch systems for improved generalization and learning across systems.
5 Acknowledgements
The authors gratefully acknowledge that this work was supported by a grant from AvistaCorporation [AER R-43127].
References
[1] S. Backlund, P. Thollander, J. Palm, and M. Ottosson, “Extending the energy eciency gap,”Energy Policy, vol. 51, pp. 392–396, 2012.
[2] A. Mosavi and A. Bahmani. (2019) Energy consumption prediction using machine learning; a review.
12

Automating Predictive Maintenance Bodily et al.
[3] A. Lewis, A. Elmualim, and D. Riley, “Linking energy and maintenance management for sustain-ability through three American case studies,” Facilities, 2011.
[4] J. C. Cheng, W. Chen, K. Chen, and Q. Wang, “Data-driven predictive maintenance planningframework for MEP components based on BIM and IoT using machine learning algorithms,” Au-tomation in Construction, vol. 112, p. 103087, 2020.
[5] T. P. Carvalho, F. A. Soares, R. Vita, R. d. P. Francisco, J. P. Basto, and S. G. Alcala, “A systematicliterature review of machine learning methods applied to predictive maintenance,” Computers &Industrial Engineering, vol. 137, p. 106024, 2019.
[6] Z. M. Cınar, A. Abdussalam Nuhu, Q. Zeeshan, O. Korhan, M. Asmael, and B. Safaei, “Machinelearning in predictive maintenance towards sustainable smart manufacturing in industry 4.0,” Sus-tainability, vol. 12, no. 19, p. 8211, 2020.
[7] Y. K. Teoh, S. S. Gill, and A. K. Parlikad, “IoT and Fog Computing based Predictive MaintenanceModel for E↵ective Asset Management in Industry 4.0 using Machine Learning,” IEEE Internet ofThings Journal, 2021.
[8] P. Strauß, M. Schmitz, R. Wostmann, and J. Deuse, “Enabling of predictive maintenance in thebrownfield through low-cost sensors, an iiot-architecture and machine learning,” in 2018 IEEEInternational Conference on Big Data. IEEE, 2018, pp. 1474–1483.
[9] M. Hall, E. Frank, G. Holmes, B. Pfahringer, P. Reutemann, and I. H. Witten, “The WEKA datamining software: an update,” ACM SIGKDD explorations newsletter, vol. 11, no. 1, pp. 10–18,2009.
13