Boise Interagency Dispatch Center - Idaho Fire Information
60
2015 Boise Interagency Dispatch Center
-
Upload
khangminh22 -
Category
Documents
-
view
0 -
download
0
Transcript of Boise Interagency Dispatch Center - Idaho Fire Information

2015
Boise Interagency Dispatch Center
1
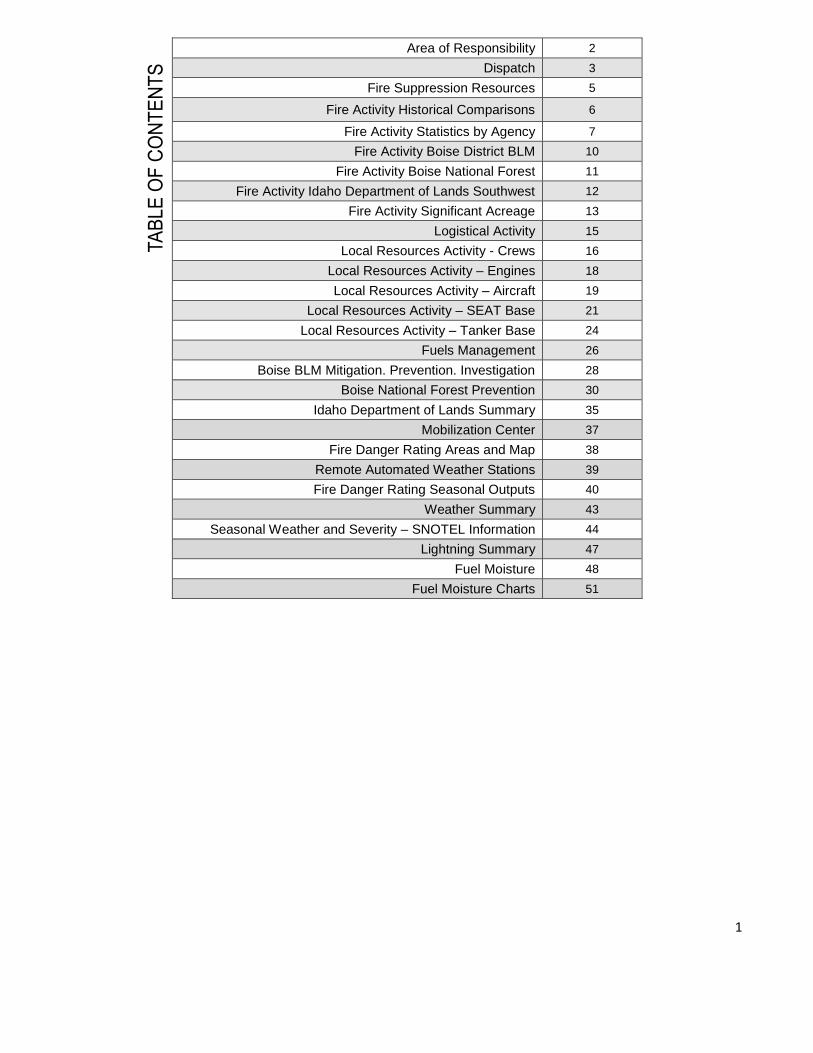
Area of Responsibility 2
Dispatch 3
Fire Suppression Resources 5
Fire Activity Historical Comparisons 6
Fire Activity Statistics by Agency 7
Fire Activity Boise District BLM 10
Fire Activity Boise National Forest 11
Fire Activity Idaho Department of Lands Southwest 12
Fire Activity Significant Acreage 13
Logistical Activity 15
Local Resources Activity - Crews 16
Local Resources Activity – Engines 18
Local Resources Activity – Aircraft 19
Local Resources Activity – SEAT Base 21
Local Resources Activity – Tanker Base 24
Fuels Management 26
Boise BLM Mitigation. Prevention. Investigation 28
Boise National Forest Prevention 30
Idaho Department of Lands Summary 35
Mobilization Center 37
Fire Danger Rating Areas and Map 38
Remote Automated Weather Stations 39
Fire Danger Rating Seasonal Outputs 40
Weather Summary 43
Seasonal Weather and Severity – SNOTEL Information 44
Lightning Summary 47
Fuel Moisture 48
Fuel Moisture Charts 51

2
AREA OF RESPONSIBILITY
The Boise Interagency Dispatch Center continued its interagency success in providing
safe, cost effective service for wildland fires within southwest Idaho for Boise District
Bureau of Land Management, Boise National Forest, and Southwest Idaho Department of
Lands. Listed below is the total acreage responsibility of Boise Interagency Dispatch
Center and each agency’s ownership and protection areas.
BOISE DISTRICT BLM BOISE NATIONAL FOREST SOUTHWEST IDAHO
DEPARTMENT OF LANDS
OWNERSHIP ACRES 3,826,577 2,085,836 501,394
PROTECTION ACRES 6,603,159 2,124,851 393,058
BOISE DISPATCH PROTECTION RESPONSIBILITY ACRES 9,121,068
OWNERSHIP ACRES BY PROTECTION AREA
BOISE DISTRICT BLM BOISE NATIONAL FOREST SW IDAHO DEPT OF LANDS
BLM 3,790,694 16,540 19,343
BOR 34,598 46,905 1,386
DOI 11 0 0
HISTORIC WATER 23,461 5,375 722
MILITARY 10,311 805 104
NATIONAL WILDLIFE REFUGE 1,392 0 0
PRIVATE 2,215,556 138,903 193,122
STATE 418,928 46,694 35,771
STATE FISH & GAME 18,802 5,596 432
STATE OTHER 4,094 0 0
STATE PARKS & REC 5,687 0 0
USFS 79,626 1,864,032 142,179
3
Jill Leguineche
Center Manager GS-11 PFT (FS)
Cathy Baird
Assistant Center Manager-Logistics GS-9 PFT (FS)
Nicole Oke
Lead Dispatcher GS-7 PFT(FS)
Alan Mebane
Lead Dispatcher GS-7 PFT (FS)
Casey Moore
Lead Dispatcher GS-7 PFT (FS)
Ed Harper
IA Dispatcher GS-5/6/7
1039 (BLM)
Mardi Hart
IA Dispatcher
GS-7 PSE (BLM)
Vacant
Assistant Center Manager-Intel GS-9 PFT (BLM)
Carol Field
Lead Dispatcher GS-7 PFT (FS)
Mark Rich
IA Dispatcher
GS-5/6/7
1039 (BLM)
Ashley Zimmerman
IA Dispatcher GS-5/6/7
1039 (FS)
Andra Peterson
IA Dispatcher GS-5/6/7
1039 (BLM)
Job Corp Student
Office Assistant
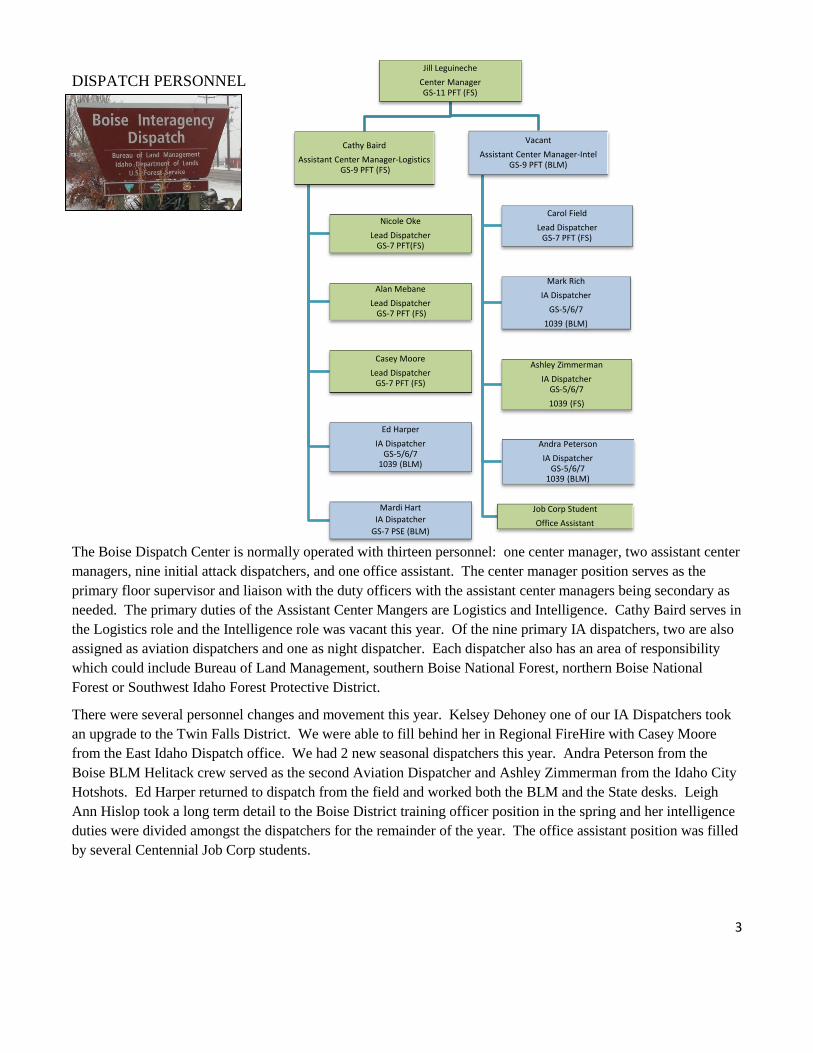
DISPATCH PERSONNEL
The Boise Dispatch Center is normally operated with thirteen personnel: one center manager, two assistant center
managers, nine initial attack dispatchers, and one office assistant. The center manager position serves as the
primary floor supervisor and liaison with the duty officers with the assistant center managers being secondary as
needed. The primary duties of the Assistant Center Mangers are Logistics and Intelligence. Cathy Baird serves in
the Logistics role and the Intelligence role was vacant this year. Of the nine primary IA dispatchers, two are also
assigned as aviation dispatchers and one as night dispatcher. Each dispatcher also has an area of responsibility
which could include Bureau of Land Management, southern Boise National Forest, northern Boise National
Forest or Southwest Idaho Forest Protective District.
There were several personnel changes and movement this year. Kelsey Dehoney one of our IA Dispatchers took
an upgrade to the Twin Falls District. We were able to fill behind her in Regional FireHire with Casey Moore
from the East Idaho Dispatch office. We had 2 new seasonal dispatchers this year. Andra Peterson from the
Boise BLM Helitack crew served as the second Aviation Dispatcher and Ashley Zimmerman from the Idaho City
Hotshots. Ed Harper returned to dispatch from the field and worked both the BLM and the State desks. Leigh
Ann Hislop took a long term detail to the Boise District training officer position in the spring and her intelligence
duties were divided amongst the dispatchers for the remainder of the year. The office assistant position was filled
by several Centennial Job Corp students.

4
Local fire activity as a whole was well below the ten year
average. Boise District BLM was well below the average
for starts and above average for acres burned. For Boise
National Forest, the number of fire starts and acres were
both well below the 10 year average. Southwest Idaho
Department of Lands was just above average for the
number of starts but acres burned was over five times the
normal (reference charts on page 8). Logistically, our
dispatch workload was busier than normal throughout the
year as Nationally we spend a fair amount of time in
Planning Level 5 and supported all of California, Oregon
and Washington (refer to the charts on page 17). For
operations, initial attack started with a busy May and June
but a very quiet July. Activity picked up the second week
of August with the Soda Fire and then it stayed fairly
steady but not overwhelming the entire season. Dispatch
went to the seven day coverage on May 17th and ended on
October 18th. The first 24-hour coverage was May 5th. The
regular night shift started on June 14th and ended on
September 27th. We opened expanded dispatch on August
11th and closed October 17
th. We hosted five Incident
Management Teams and two Buying Team this season.
Soda Fire 2015
INCIDENT IMT TYPE IMT NAME TEAM HOME UNIT
SODA COMPLEX TYPE 1 PECHOTA ROCKY MTN
SODA COMPLEX TYPE 2 MARTIN/WHALEN GREAT BASIN
COUGAR TYPE 2 ROSENTHAL GREAT BASIN
COUGAR TYPE 3 WYATT NEVADA
WALKER TYPE 2 DUNFORD GREAT BASIN
SODA COMPLEX BUYING TEAM SHUPLA GREAT BASIN
WALKER BUYING TEAM EARLY GREAT BASIN
Due to our dispatch location being in close proximity to the National Interagency Fire Center, we were honored to
have numerous tours from many different offices and countries that included: Office of Aircraft Services, ROSS
Phacil and Project Developers, Irwin and the Fire Reporting Group from DOI, Idaho Power Dispatchers, DOI
Secretary Jewel, Austin Texas Fire Department, USDA Under Secretary and CIO’s.

5
FIRE SUPPRESSION RESOURCES
Below is the list of resources that are dispatched through BDC.
AGENCY BLM USFS IDL
UNIT IDENTIFICATION ID-BOD ID-BOF ID-SWS
AIR ATTACK PLATFORM 1 1 0
TYPE 1 HELICOPTER 0 1 0
TYPE 2 HELICOPTER 0 1 0
TYPE 3 HELICOPTER 1 1 0
HELITACK PERSONNEL 11 22 0
TYPE 1 IHC 0 2 0
TYPE 2 REGULAR IA CREW 0 2 0
TYPE 2 CREW 0 1 1
SMOKE CHASE CREW (5-10 PEOPLE) 0 1 1
SUPER HEAVY ENGINE (TYPE 3) 2 0 0
TYPE 4 ENGINE 12 5 0
TYPE 5/6/7 ENGINE 0 0 4
TYPE 5/6/7 PATROL/PREVENTION 0 8 0
WATER TENDER 3 0 0
DOZER 3 0 0
FUEL TRUCK 1 0 0
MOBILE COMMUNICATIONS TRAILER 1 0 0
MOBILE CACHE/COMMAND TRAILER 1 1 0
CONTRACT RESOURCES
NATIONAL TYPE 2 IA CREW 2
REGIONAL ENGINES TYPE 4 17
REGIONAL ENGINES TYPE 6 21
AIRCRAFT CRASH RESCUE APPARTUS 1
NATIONAL BUSES – CREW CARRIER 54
REGIONAL WATER TENDERS - TACTICAL 5
REGIONAL WATER TENDERS - SUPPORT 26
CHIPPER 5
CLERICAL SUPPORT UNIT 1
DOZERS 26
EXCAVATORS 12
FALLER MODULE 8
ROAD GRADERS 5
SKIDDER 0
SKIDGINE 0
HELICOPTER OPERATIONS SUPPORT TRAILER 2
TRANSPORTS TRACTOR/TRAILER 50
MECHANICS/SERVICE TRUCK 6
REFRIGERATED TRUCK/TRAILER 11
WEED WASHING UNIT 9
FUEL TENDER 8
GRAY WATER TRUCK 12
POTABLE WATER TRUCK 4
HANDWASHING STATION – TRAILER MOUNTED 7

6
FIRE ACTIVITY
Boise Interagency Dispatch Center dispatched a total of 253 incidents which includes wildland fires, assists to
local cooperators, and UTL/false alarms. Within our response area we dispatched to 183 confirmed incidents for
316,963 acres. Our Southwest Idaho 10 year average (2006-2015) is 236 fires for 185,718 acres.
Below is a list of 2015 fires and acres that belong to each wildland protection agency with averages and percent
of averages.
BOISE DISTRICT BLM BOISE NATIONAL FOREST SW IDAHO DEPT OF LANDS BDC – SW IDAHO
FIRES 89 FIRES 66 FIRES 28 FIRES 183
5 YR AVG 108 5 YR AVG 98 5 YR AVG 29 5 YR AVG 234
% OF 5 YR AVG 82% % OF 5 YR AVG 67% % OF 5 YR AVG 96% % OF 5 YR AVG 78%
10 YR AVG 101 10 YR AVG 108 10 YR AVG 26 10 YR AVG 236
% OF 10 YR AVG 88% % OF 10 YR AVG 61% % OF 10 YR AVG 107% % OF 10 YR AVG 78%
25 YR AVG 102 25 YR AVG 142 25 YR AVG 26 25 YR AVG 270
% OF 25 YR AVG 87% % OF 25 YR AVG 46% % OF 25 YR AVG 107% % OF 25 YR AVG 67%
ACRES 309,046 ACRES 1,600 ACRES 6,317 ACRES 316,963
5 YR AVG 159,610 5 YR AVG 61,709 5 YR AVG 3,664 5 YR AVG 224,983
% OF 5 YR AVG 193% % OF 5 YR AVG 02% % OF 5 YR AVG 172% % OF 5 YR AVG 140%
10 YR AVG 107,674 10 YR AVG 75,182 10 YR AVG 2,862 10 YR AVG 185,718
% OF 10 YR AVG 287% % OF 10 YR AVG 02% % OF 10 YR AVG 221% % OF 10 YR AVG 170%
25 YR AVG 87,180 25 YR AVG 51,282 25 YR AVG 1,407 25 YR AVG 139,869
% OF 25 YR AVG 354% % OF 25 YR AVG 03% % OF 25 YR AVG 449% % OF 25 YR AVG 227%
The following table provides a 10 year comparison and average. Acres shown are total protection acres, not
solely agency acres.
YEAR BOD FIRES BOD ACRES BOF FIRES BOF ACRES IDL FIRES IDL ACRES
2006 128 115,926 202 87,493 30 4,748
2007 122 96,050 113 341,615 24 3,784
2008 65 4885 100 152 10 61
2009 63 3584 87 2197 32 29
2010 98 58,244 89 11,821 24 1,676
2011 118 153,070 105 4,954 21 179
2012 148 156,726 62 153,540 20 802
2013 119 172,027 134 139,282 48 3,201
2014 64 7,179 122 9,170 27 7,823
2015 89 309,046 66 1,600 28 6,317
10 YR AVG 2006-2015
101 107,674 108 75,182 26 2,862

7
Below are charts listing of the first and last fires and monthly breakdown of fires within each agency’s protection
areas for 2015.
FIRST FIRE ACRES LAST FIRE ACRES
BOISE DISTRICT BLM 5/11 0.10 10/17 5.0
BOISE NATIONAL FOREST 4/10 0.75 10/20 0.10
SOUTHWEST IDAHO DEPARTMENT OF LANDS 4/22 3.4 10/10 5,963
Fires & Acres Burned by Month - Boise District BLM Protection
TOTAL # FIRES HUMAN FIRES LIGHTNING FIRES BLM ACRES PRIVATE ACRES TOTAL ACRES
FEBRUARY 0 0 0 0 0 0
MARCH 0 0 0 0 0 0
APRIL 0 0 0 0 0 0
MAY 4 3 1 0.2 0 4.7
JUNE 21 17 4 1588.3 10073.5 22987.2
JULY 32 16 16 3084 103.4 3199.4
AUGUST 26 16 10 228,466.3 41,321 282,840.25
SEPTEMBER 4 4 0 5 4.1 9.2
OCTOBER 2 2 0 5.1 0 5.1
NOVEMBER 0 0 0 0 0 0
TOTAL 89 58 31 241,567.9 51,501.9 309, 045.8
Fires & Acres Burned by Month - Boise National Forest Protection
TOTAL # FIRES HUMAN FIRES LIGHTNING FIRES USFS ACRES PRIVATE ACRES TOTAL ACRES
FEBRUARY 0 0 0 0 0 0
MARCH 0 0 0 0 0 0
APRIL 1 1 0 0 0.75 0.75
MAY 5 2 3 0.3 0.6 0.9
JUNE 12 5 7 5.1 0.25 5.6
JULY 20 4 16 7.1 0.6 7.8
AUGUST 20 3 17 1565.2 12 1580.8
SEPTEMBER 4 3 1 1.6 0 1.7
OCTOBER 4 4 0 0.45 1.5 1.95
NOVEMBER 0 0 0 0 0 0
TOTAL 66 22 44 1579.95 16.6 1599.65

8
Fires & Acres Burned by Month – Southwest Idaho Department of Lands Protection
TOTAL # FIRES HUMAN FIRES LIGHTNING FIRES IDL ACRES PRIVATE ACRES TOTAL ACRES
FEBRUARY 0 0 0 0 0 0
MARCH 0 0 0 0 0 0
APRIL 1 1 0 0.4 3 3.4
MAY 1 1 0 0 2.5 15.6
JUNE 6 5 1 0 294.15 315.75
JULY 13 5 8 3.35 1.65 5.4
AUGUST 3 2 1 0 7.7 12.8
SEPTEMBER 2 1 1 0 0 .45
OCTOBER 2 2 0 465 216.25 5963.25
NOVEMBER 0 0 0 0 0 0
TOTAL 28 17 11 468.75 525.25 6316.65
Walker Fire 2015
AGENCY FIRE ACTIVITY STATISTICS
Below are statistics by fire size class for each agency’s protection area.
SIZE BOD BOF SWS
A (0 – 0.25) 28 45 15
B (0.26 – 9) 26 16 9
C (10 – 99) 15 3 2
D (100-299) 8 1 1
E (300 – 999) 4 0 0
F (1000 – 4999) 5 1 0
G (5000+) 3 0 1
Lightning during the Whiskey Complex

9
FIRE ACTIVITY – BOISE DISTRICT BLM
The total number of fires suppressed by BOD, and acres burned, regardless of land status or ownership.
INCIDENTS SUPPRESSED WITHIN BOD PROTECTION
HUMAN ACRES
LIGHTNING ACRES
FIRES BY OWNERSHIP @ ORIGIN TOTAL ACRES
BY OWNERSHIP TOTAL HUMAN LIGHTNING
BUREAU OF LAND MANAGEMENT 10545.7 231,022.2 50 29 21 241567.9
US FOREST SERVICE 0 0.1 1 0 1 0.1
IDAHO DEPARTMENT OF LANDS 1717.4 13180 4 3 1 14894.4
PRIVATELY OWNED 9802.8 41699.1 33 25 8 51501.9
MILITARY/ARMY CORP OF ENG 0 0 0 0 0 0
US FISH & WILDLIFE SERVICE 0 0 0 0 0 0
BUREAU OF RECLAMATION 924.4 157 1 1 0 1081.4
COMBINED TOTAL 5719.6 1459.2 58 31
RURAL FIRE DEPARTMENT ASSIST 50.7 10 --- --- 50.7
FEDERAL AND STATE ASSIST 364.5 9 --- --- 364.5
OTHER BOD-BLM OWNED ACRES SUPPRESSED WITHIN OTHER PROTECTION AREAS
9 --- --- 43.3
TOTAL BOD FALSE ALARMS 19
MILITARY ORCHARD TRAINING AREA FIRES WITHIN BLM OWNED GROUND
FIRE SERVICE ORGANIZATION RESPONSE
48 FULL SUPPRESSION STRATEGY 82
FIRES 26 WILDLAND URBAN INTERFACE 28 MULTIPLE STRATEGY 0
ACRES 42.1 SUCCESSFUL INITIAL ATTACK 76 MONITOR STRATEGY 7
CAUSE CODE 632 FIRES - SAGE GROUSE AREA 30 BORDER FIRES 6
FIELD OFFICE STATISTICS – BLM OWNED ACRES DETECTION METHOD
# FIRES (BY ORIGIN)
HUMAN ACRES
LIGHTNING ACRES
TOTAL ACRES DETECTION METHOD TOTAL %
FOUR RIVERS FO 54 4721.2 2267 6988.2 LOOKOUTS 19 21
OWYHEE FO 20 943 226,160 227,103 AIRCRAFT 2 2
BRUNEAU FO 6 5.25 2595 2600.25 PRIVATE CITIZEN 21 24
BIRDS OF PREY NCA 13 4895.1 3 4898.1 AGENCY PERSONNEL 7 8
OWYHEE MGT AREA 5 0 0.5 0.5 COUNTY DISPATCH 40 45
FIRES SUPPRESSED BY BOD TOTAL ACRES SUPPRESSED BY BOD (ALL OWNERS)
ASSISTS TO RURAL FIRE DEPT 10 ASSISTS TO RURAL FIRE DEPT 50.7
ASSISTS TO OTHER FEDERAL AND STATE AGENCIES
9 ASSISTS TO OTHER FEDERAL
AND STATE AGENCIES 364.5
HUMAN CAUSED FIRES 58 HUMAN CAUSED ACRES 22,987.4
LIGHTNING CAUSED ACRES 31 LIGHTNING CAUSED ACRES 286,058.4
BOD PROTECTION TOTAL FIRES 89 BOD PROTECTION TOTAL ACRES 309,045.8

10
FIRE ACTIVITY – BOISE NATIONAL FOREST
The total number of fires suppressed by BOF, and acres burned, regardless of land status or ownership.
INCIDENTS SUPPRESSED WITHIN BOISE NATIONAL FOREST PROTECTION
HUMAN ACRES
LIGHTNING ACRES
FIRES BY OWNERSHIP @ ORIGIN TOTAL ACRES BY OWNERSHIP TOTAL HUMAN LIGHTNING
US FOREST SERVICE 2.8 1577.15 51 14 37 1579.95
BUREAU OF LAND MANAGEMENT 0 2.5 2 0 2 2.5
IDAHO DEPARTMENT OF LANDS 0.2 0.2 4 2 2 0.4
PRIVATELY OWNED 4.45 12.15 7 5 2 16.6
MILITARY 0 0 0 0 0 0
BUREAU OF RECLAMATION 0.1 0.1 2 1 1 0.2
COMBINED TOTAL 7.55 1592.1 66 22 44 1599.65
RURAL FIRE DEPARTMENT ASSIST 0.3 1 --- --- 0.3
FEDERAL AND STATE ASSIST 14,245.35 16 --- --- 9451.35
Assist acres are those associated with assisting the local non-federal or state agencies all based on protection areas.
OTHER BOF OWNED ACRES SUPPRESSED WITHIN OTHER PROTECTION AREAS
11 --- --- 5303.45
FULL SUPPRESSION 65 FIRE SERVICE ORGANIZATION RESPONSE 5 FALSE ALARMS 17
MULTIPLE STRATEGY 0 WILDLAND URBAN INTERFACE 11 UNABLE TO LOCATE 17
MONITOR STRATEGY 1 SUCCESSFUL INITIAL ATTACK FIRES 59 # OF BORDER FIRES 2
FIRES SUPPRESSED BY BOF TOTAL ACRES SUPPRESSED BY BOF (ALL OWNERS)
ASSISTS TO RURAL FIRE DEPT 1 ASSISTS TO RURAL FIRE DEPT 0.3
ASSISTS TO OTHER FEDERAL AND STATE AGENCIES
17 ASSISTS TO OTHER FEDERAL AND
STATE AGENCIES 14,245.35
HUMAN CAUSED FIRES 22 HUMAN CAUSED ACRES 7.55
LIGHTNING CAUSED FIRES 44 LIGHTNING CAUSED ACRES 1592.1
BOF PROTECTION TOTAL FIRES 66 BOF PROTECTION TOTAL ACRES 1599.65
DETECTION METHOD
TOTAL %
LOOKOUT 14 21
AIRCRAFT 15 22
AGENCY PERSONNEL 23 35
PRIVATE CITIZEN 7 11
COUNTY DISPATCH 7 11
BOISE NATIONAL FOREST RANGER DISTRICT STATISTICS
FIRES
(BY ORIGIN)
HUMAN ACRES
LIGHTNING ACRES
TOTAL ACRES
MOUNTAIN HOME 13 18.3 235.15 253.45
IDAHO CITY 21 5284.15 68.55 5352.7
CASCADE 16 1.75 1240.7 1242.45
LOWMAN 12 0.5 25.55 26.05
EMMETT 20 0.3 585 585.3

11
FIRE ACTIVITY – SOUTHWEST IDAHO DEPARTMENT OF LANDS
The total number of fires suppressed by SWS, and acres burned, regardless of land status or ownership.
INCIDENTS SUPPRESSED WITHIN IDAHO DEPARTMENT OF LANDS PROTECTION
HUMAN ACRES
LIGHTNING ACRES
FIRES BY OWNERSHIP @ ORIGIN TOTAL ACRES
BY OWNERSHIP TOTAL HUMAN LIGHTNING
IDAHO DEPARTMENT OF LANDS 468.5 0.25 2 1 1 468.75
BUREAU OF LAND MANAGEMENT 19.1 0.1 2 1 1 19.2
US FOREST SERVICE 5302.9 0.45 8 5 3 5303.35
PRIVATELY OWNED 523.9 1.35 15 9 6 525.25
FISH & WILDLIFE SERVICE 0 0 0 0 0 0
MILITARY 0 0 0 0 0 0
BUREAU OF RECLAMATION 0.1 0 1 1 0 0.1
COMBINED TOTAL 6314.5 2.15 28 17 11 6,316.65
FEDERAL AND STATE ASSIST 10,959.75 8 --- --- 10,959.75
OTHER SWS OWNED ACRES SUPPRESSED WITHIN OTHER PROTECTION AREAS
13 --- --- 14,894.8
DETECTION METHOD TOTAL %
LOOKOUTS 5 18
AIRCRAFT 2 7
PRIVATE CITIZEN 8 28
AGENCY PERSONNEL 5 18
COUNTY DISPATCH 8 29
FIRES SUPPRESSED BY SWS TOTAL ACRES SUPPRESSED BY SWS (ALL OWNERS)
ASSISTS TO OTHER FEDERAL AND STATE AGENCIES
8 ASSISTS TO OTHER FEDERAL AND
STATE AGENCIES 10,959.75
HUMAN CAUSED FIRES 17 HUMAN CAUSED ACRES 6314.5
LIGHTNING CAUSED ACRES 11 LIGHTNING CAUSED ACRES 2.15
SWS PROTECTION TOTAL FIRES 28 SWS PROTECTION TOTAL ACRES 6316.65
FALSE ALARM 2
UNABLE TO LOCATE 3
SUCCESSFUL INITIAL ATTACK 25
FIRE SERVICE ORGANIZATION RESPONSE 12
# OF BORDER FIRES 0
WILDLAND URBAN INTERFACE 7
12
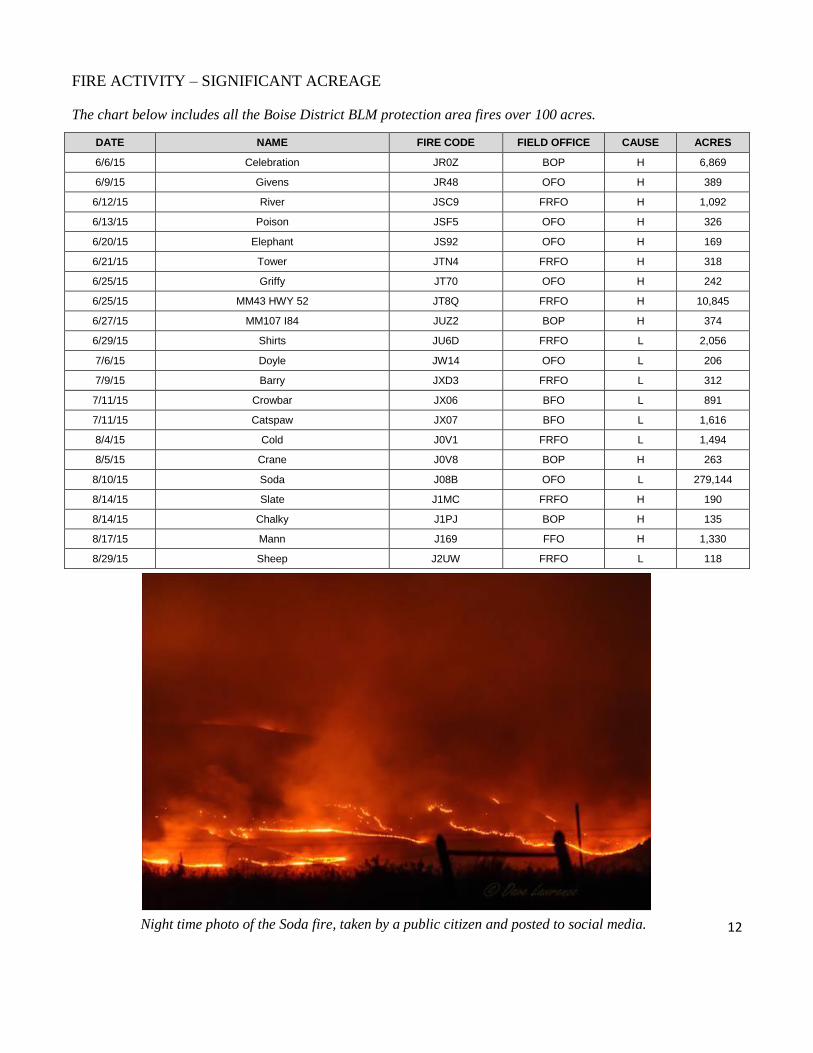
FIRE ACTIVITY – SIGNIFICANT ACREAGE
The chart below includes all the Boise District BLM protection area fires over 100 acres.
DATE NAME FIRE CODE FIELD OFFICE CAUSE ACRES
6/6/15 Celebration JR0Z BOP H 6,869
6/9/15 Givens JR48 OFO H 389
6/12/15 River JSC9 FRFO H 1,092
6/13/15 Poison JSF5 OFO H 326
6/20/15 Elephant JS92 OFO H 169
6/21/15 Tower JTN4 FRFO H 318
6/25/15 Griffy JT70 OFO H 242
6/25/15 MM43 HWY 52 JT8Q FRFO H 10,845
6/27/15 MM107 I84 JUZ2 BOP H 374
6/29/15 Shirts JU6D FRFO L 2,056
7/6/15 Doyle JW14 OFO L 206
7/9/15 Barry JXD3 FRFO L 312
7/11/15 Crowbar JX06 BFO L 891
7/11/15 Catspaw JX07 BFO L 1,616
8/4/15 Cold J0V1 FRFO L 1,494
8/5/15 Crane J0V8 BOP H 263
8/10/15 Soda J08B OFO L 279,144
8/14/15 Slate J1MC FRFO H 190
8/14/15 Chalky J1PJ BOP H 135
8/17/15 Mann J169 FFO H 1,330
8/29/15 Sheep J2UW FRFO L 118
Night time photo of the Soda fire, taken by a public citizen and posted to social media.
13
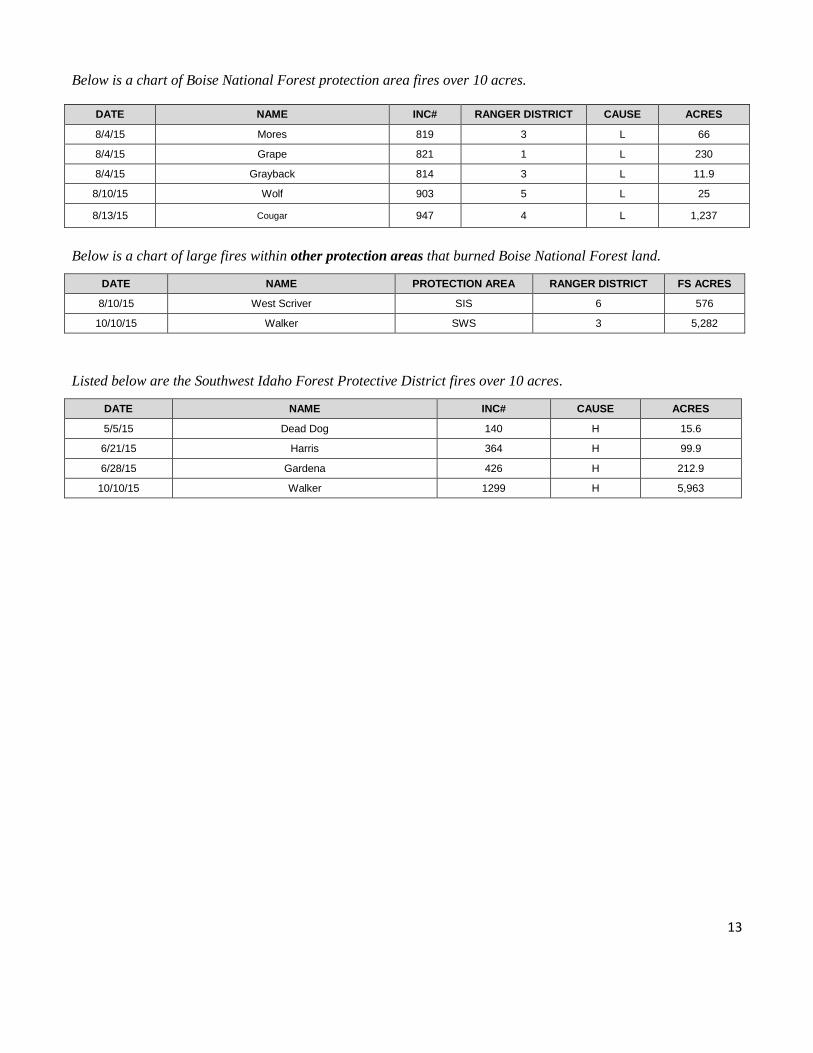
Below is a chart of Boise National Forest protection area fires over 10 acres.
DATE NAME INC# RANGER DISTRICT CAUSE ACRES
8/4/15 Mores 819 3 L 66
8/4/15 Grape 821 1 L 230
8/4/15 Grayback 814 3 L 11.9
8/10/15 Wolf 903 5 L 25
8/13/15 Cougar 947 4 L 1,237
Below is a chart of large fires within other protection areas that burned Boise National Forest land.
DATE NAME PROTECTION AREA RANGER DISTRICT FS ACRES
8/10/15 West Scriver SIS 6 576
10/10/15 Walker SWS 3 5,282
Listed below are the Southwest Idaho Forest Protective District fires over 10 acres.
DATE NAME INC# CAUSE ACRES
5/5/15 Dead Dog 140 H 15.6
6/21/15 Harris 364 H 99.9
6/28/15 Gardena 426 H 212.9
10/10/15 Walker 1299 H 5,963

14
LOGISTICAL ACTIVITY
Boise Dispatch Center mobilizes 1154 personnel representing the following agencies:
BOD – Boise District BLM, BOF – Boise National Forest, SWS – Idaho Department of Lands, Southwest, DFR – Deer Flat National Wildlife Refuge, SER – Southeast Idaho National Wildlife Refuge Complex, ISO – Idaho State Office, Bureau of Land Management, DCWOI – Office of Wildland Fire Coordination, FCD – National Interagency Fire Center, Bureau of Land Management, FCA – National Interagency Fire Center, Bureau of Indian Affairs, FCF – National Interagency Fire
Center, United States Forest Service, FCR – National Interagency Fire Center, Fish and Wildlife Service, FCP – National Interagency Fire Center, National Park Service, AMDH – Aviation Management, National Business Center, Headquarters, AMRO – Aviation Management, National Business Center, Regional Office
MOBILIZATION
Below shows a chart of how our resources supported each geographical area. (Please note – 2015 overhead requests do not
include the engine and crew subordinates).
ALA
SK
A
EA
ST
ER
N A
RE
A
EA
TE
RN
GR
EA
T B
AS
IN
NO
RT
HE
RN
C
ALIF
OR
NIA
NO
RT
HE
RN
R
OC
KIE
S
NO
RT
HW
ES
T
RO
CK
Y
MO
UN
TA
IN
SO
UT
HE
RN
A
RE
A
SO
UT
HE
RN
C
ALIF
OR
NIA
SO
UT
HW
ES
T
AU
ST
RA
ILIA
CA
NA
DA
NA
TIO
NA
L
INT
ER
AG
EN
CY
CO
OR
DIN
AT
ION
OVERHEAD 60 3 130 65 72 177 8 13 19 10 0 2 20
CREW 6 0 165 1 8 6 1 0 0 0 0 0 3
EQUIPMENT 1 0 1129 30 5 24 0 0 2 1 0 0 2
AIRCRAFT 0 0 53 6 24 83 8 3 1 2 0 0
Boise Interagency Dispatch Center processed 35,739 resource orders for 2015. Below is a chart showing the
breakdown of the type of work processed. In comparison, last year we processed 29,403, 49399 in 2013, 62,173
in 2012; 16,343 in 2011 and 31,229 in 2010. An additional workload is rental vehicles. This year we processed
278 rental vehicle orders
ENTER DELETE PLACE RETRIEVE FILL UNFILL REASSIGN RELEASE CANCEL CANCEL
UTF UTF
AIRCRAFT 792 1 354 14 706 15 224 466 54 63 40
CREW 253 7 133 15 198 13 70 128 26 37 7
EQUIPMENT 1262 30 205 15 1198 23 168 964 81 38 93
OVERHEAD 4571 32 2699 262 4170 176 1986 2473 137 220 593
SUPPLY 5161 453 2067 8 2572 6 0 311 111 38 0
TOTAL 12039 523 5458 314 8844 233 2448 4342 409 396 733
UTF orders greater than 5 included – IADP, ACDP, EDSD, HEQB, TFLD, HMGB, ENGB, SPUL, GISS,
ABRO, PIO2 and PIO1.
AGENCY BOD BOF SWS BOS DFR UT R04
ISO DC
WOI
NATIONAL INTERAGENCY FIRE CENTER
FCD FCA FCF FCR FCP AMDH AMRO
TOTAL # OF PERSONNEL
168 370 85 6 4 10 31 6 123 21 95 17 31 8 9
ADMINISTRATIVELY DETERMINED 69 108 2 0 0 0 0 0 0 0 0 0 0 0 0

15
CREWS
The 2015 fire season for the IHC crews started out slow with some local
IA. Boise IHC’s first off district assignment was to the Sockeye Fire in
Alaska in June. Idaho City IHC’s first off district assignment was to the
Washington Fire in Nevada. Idaho City went to Alaska in July. Other off
district assignments for the crews included fires in Idaho, Utah, Oregon,
Washington, and Wyoming.
Below is a list of their accomplishments and statistics.
DA
TE
OF
FIR
ST
FIR
E
DA
TE
OF
LA
ST
A
SS
IGN
ME
NT
DA
YS
CR
EW
A
SS
EM
BLE
D
DA
YS
IN
TR
AV
EL
ST
AT
US
PR
OJE
CT
WO
RK
DA
YS
–
CO
MM
ITT
ED
DA
YS
UN
PA
ID
14 D
AY
TO
UR
S
LA
RG
E F
IRE
AS
SIG
NM
EN
TS
IA F
IRE
A
SS
IGN
ME
NT
S
MIL
ES
TR
AV
ELE
D
TR
AIN
EE
AS
SIG
NM
EN
TS
BOISE IHC 3/31 10/11 140 10 15 90 19 4 10 4 15,200 26
IDAHO CITY IHC 5/5 9/24 160 9 18 84 20 4 11 9 30,948 53
Boise Interagency Hot Shot Crew
16
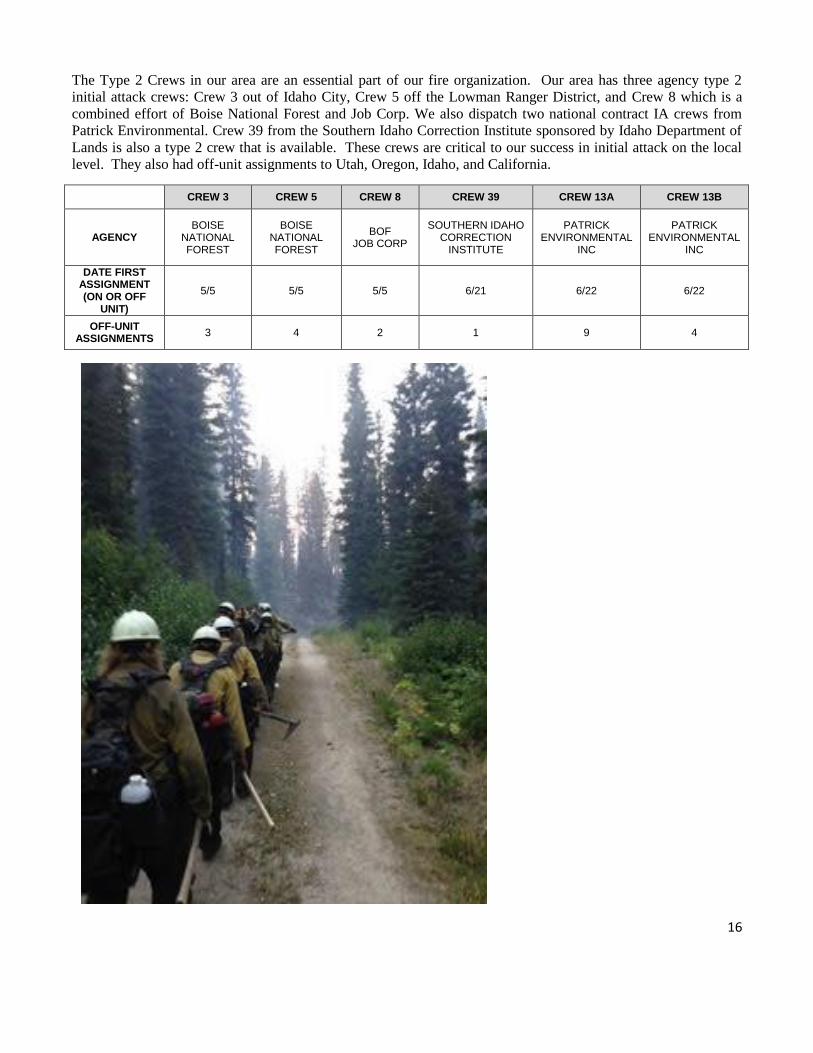
The Type 2 Crews in our area are an essential part of our fire organization. Our area has three agency type 2
initial attack crews: Crew 3 out of Idaho City, Crew 5 off the Lowman Ranger District, and Crew 8 which is a
combined effort of Boise National Forest and Job Corp. We also dispatch two national contract IA crews from
Patrick Environmental. Crew 39 from the Southern Idaho Correction Institute sponsored by Idaho Department of
Lands is also a type 2 crew that is available. These crews are critical to our success in initial attack on the local
level. They also had off-unit assignments to Utah, Oregon, Idaho, and California.
CREW 3 CREW 5 CREW 8 CREW 39 CREW 13A CREW 13B
AGENCY BOISE
NATIONAL FOREST
BOISE NATIONAL FOREST
BOF JOB CORP
SOUTHERN IDAHO CORRECTION
INSTITUTE
PATRICK ENVIRONMENTAL
INC
PATRICK ENVIRONMENTAL
INC
DATE FIRST ASSIGNMENT (ON OR OFF
UNIT)
5/5 5/5 5/5 6/21 6/22 6/22
OFF-UNIT ASSIGNMENTS
3 4 2 1 9 4

17
ENGINES
Below shows the activity the engine crews received off-unit which includes traveling to California, Oregon, and
Utah. These also include assisting neighbors such as Elko, Payette, Salmon-Challis, Sawtooth, Twin Falls, and
Vale.
BLM USFS IDL CONTRACT
STAFFED TYPE 3 ENGINES 3 0 0 0
STAFFED TYPE 4 ENGINES 18 6 0 17
STAFFED TYPE 6 ENGINES 0 0 4 18
TOTAL NUMBER OF ASSIGNMENTS 239 42 53 40
TOTAL NUMBER OF OFF-UNIT INCIDENT ASSIGNMENTS 24 19 9 32
DATE OF FIRST OFF-UNIT ASSIGNMENT 6/21 7/7 7/21 7/16
BLM Type 3 “Super Heavy” and a
beautiful Boise District sunset.

18
AIRCRAFT
Listed are the helicopters assigned to the Boise Dispatch area with their capabilities and accomplishments for the
2015 season.
AGENCY BLM USFS USFS USFS
IDENTIFICATION NUMBER N350MW N864H N205DY N526MW
TYPE OF AIRCRAFT AS 350 B3E BELL 407 BELL 205A1++ KAMAN 1200 K-MAX
CATEGORY TYPE 3 3 2 1
MANDATORY AVAILABILITY PERIOD 100 115 120 120
DAYS ON EXTENTION 13 12 13 6
BASE LOCATION BOISE GARDEN VALLEY LUCKY PEAK LUCKY PEAK
CREW SIZE 10 11 17 1
TOTAL FLIGHT HOURS 150.7 250.8 297.2 283.8
FIRE MANAGEMENT HOURS 141.2 246.1 285.1 283.8
OTHER HOURS 9.5 4.7 12.1 0
INITIAL ATTACK INCIDENTS 39 20 30 13
LARGE FIRE INCIDENTS 3 10 7 21
PERSON DAYS ON FIRES 792 638 2,016 206
% IA SUPPORTED WITH BUCKET 77% 65% 73% 100%
GALLONS OF WATER 174,540 114,692 340,832 1,428,320
GALLONS OF RETARDANT N/A 0 0 26,555
PERSONNEL TRANSPORTED 396 894 1,633 NA
OPERATIONAL RAPPELS N/A NA 42 NA
FIRES STAFFED BY RAPPELLERS N/A NA 1 NA
POUNDS OF INTERNAL CARGO 41,225 48,400 177,978 0
POUNDS OF EXTERNAL CARGO 9,570 65,430 68,044 10750
AERIAL IGNITION HOURS 11.2 7
0 0
HELITACK VEHICLE MILEAGE 7881 NR NR NR
DETAILER TOTAL DAYS 231 NR NR NR
TOTAL OPERATIONAL COST $243,591 $698,826.04 $1,402,299.49 $2,071,315.50
Left: H0MW Boise BLM exclusive-use ship
Right: Boise NF H64H based out of Garden Valley

19
The two air attacks we have in our area have been an essential part in firefighting operations and detection.
AGNECY BLM USFS
IDENTIFICATION NUMBER N5DT N531SA
TYPE OF AIRCRAFT AERO COMMANDER 690B AERO COMMANDER 500S
DAYS UNDER CONTRACT 100 93
BASE LOCATION BOISE AIRPORT BOISE AIRPORT
FLIGHT HOURS INITIAL ATTACK 121.7 NR
# OF INCIDENTS NR 15
DETECTION FLIGHTS NR 8
TOTAL # OF TRAINEES 5 2
TOTAL TRAINEE HOURS 19.2 NR
TOTAL TRAINEE MISSIONS 9 NR
DAYS USED 112 36
TOTAL FLIGHT TIME 149.9 149.95
TOTAL COST $217,700 $162,216.55
View from inside Air Attack

20
MOUNTAIN HOME SEAT BASE
SEATS (Single Engine Air Tankers) are such an asset to our fire fighting force. Mountain Home SEAT Base
serviced 12 different SEATS this season for a total cost of $540,836.02. For comparison in 2014, 9 SEATS were
used, and in 2013 17 different SEATS flew out of Mountain Home. The base pumped 99,716 gallons of retardant
this year, which was considerably more than the previous year. In 2014 the base pumped 21,760 gallons, in 2013
the base pumped 278,527 gallons of retardant and in 2012 pumped 143,527 gallons.
Below is information from all the SEATS used out of Mountain Home SEAT Base sorted by individuals SEATS.
SEAT WATER LOADS
WATER GALLONS
RETARDANT LOADS
RETARDANT GALLONS
RETARDANT COSTS
FLIGHT TIME
FLIGHT COSTS
ES & OTHER COSTS
TOTAL COST
833 0 0 18 13,545 24,922.80 14.73 41,244.00 3,996.00 $70,162.80
801 0 0 34 25,029 46,053.36 31.07 85,119.52 6,018.00 $137,190.88
819 2 1,480 30 21,830 40,167.20 29.26 76,105.26 5,510.00 $123,262.46
846 0 0 8 6,153 11,321.52 5.49 14,274.00 0.00 $25,595.52
848 0 0 10 7,355 13,533.20 10.84 28,184.00 436.00 $42,153.20
845 0 0 4 2,865 5,271.60 9.86 25,636.00 352.00 $31,259.60
878 0 0 11 7,787 14,328.08 8.34 23,318.64 0.00 $37,646.72
879 0 0 8 5,474 10,072.16 6.16 19,496.40 0.00 $29,568.56
809 0 0 7 5,313 9,775.92 4.85 12,610.00 0.00 $22,385.92
884 0 0 1 715 1,315.60 0.97 3,014.76 0.00 $4,330.36
850 0 0 3 2,150 3,956.00 2.61 6,264.00 0.00 $10,220.00
837 0 0 2 1,500 2,760.00 1.50 4,200.00 100.00 $7,060.00
TOTAL 2 1,480 136 99,716 183,477.44 125.68 $339,466.58 16,412.00 $540,836.02

21
Below is information from all the SEATS used out of Mountain Home SEAT Base sorted by incident.
INC NAME FIRE
CODE UNIT
WATER LOADS
WATER GALLONS
RETARDANT LOADS
RETARDANT GALLONS
FLIGHT TIME
TOTAL COSTS
3 POLE JZ5W BOD 0 0 0 0 0.00 $454.00
ABC. MISC EKW2 BOF 0 0 0 0 0.00 $781.00
BARRY JXD3 BOD 0 0 16 11,932 9.23 $48,087.41
BDC PREPO EKR6 BDC 0 0 0 0 4.57 $26,399.50
BERRY J1ST SLD 0 0 0 0 2.99 $8,075.42
BLM NAT. SEVERITY
D9ES BOD 2 1,480 0 0 0.41
$3,758.41
BULL FIRE EKW3 BTF 0 0 3 2,175 5.47 $18,737.40
CATSPAW JX07 BOD 0 0 0 0 0.00 $579.00
CNC PREPO EKR6 CNC 0 0 0 0 1.15 $2,991.15
COLD J0V1 BOD 0 0 16 11,690 8.62 $51,439.40
COUGAR EKW2 BOF 0 0 11 8,015 12.15 $49,172.30
DIETRICH BUTTE JVH6 TFD 0 0 1 765 1.07 $4,957.60
DOYLE JW14 BOD 0 0 15 10,965 12.02 $54,576.30
ELDORADO J14Y 972S 0 0 0 0 0.57 $1,596.00
FAREWELL BEND
J0SJ VAD 0 0 2 1,430 2.83
$10,717.03
GRAPE EKW2 BOF 0 0 10 7,392 7.54 $40,630.81
GRAYBACK EKW2 BOF 0 0 2 1,527 1.79 $8,333.40
HULL JZM5 BOD 0 0 2 1,475 0.96 $5,567.48
JAKES J2J0 BOD 0 0 3 2,225 2.29 $11,326.56
LIME HILL J0W7 VAD 0 0 5 3,425 5.50 $26,435.59
LUCKY JWU5 BOD 0 0 1 715 0.33 $2,559.93
MANN J169 BOD 0 0 3 2,210 3.53 $14,725.98
MAPROCK J0LV BOD 0 0 2 1,485 1.46 $6,579.86
MORES EKW2 BOF 0 0 2 1,450 1.82 $8,397.61
PARK JZH5 VAD 0 0 1 750 1.22 $4,796.00
PINE FIRE EKW2 BOF 0 0 3 2,175 2.56 $11,528.69
RADIO TOWER J2SQ VAD 0 0 1 700 1.88 $6,506.88
RAPID J1MA SIS 0 0 1 750 1.07 $4,163.07
ROCK CREEK JX0L TWX 0 0 2 1,500 1.55 $6,791.55
ROYAL EK1M STF 0 0 3 2,200 2.89 $12,714.02
SAGE GROUSE 259 BOD 0 0 0 0 0.00 $336.00

22
SEVERITY D0YJ FCD 0 0 0 0 0.00 $302.00
SHOE J1RU BOD 0 0 4 2,950 2.07 $11,133.50
SLATE J1MC BOD 0 0 3 2,220 1.50 $8,529.30
SODA J08B BOD 0 0 12 8,740 10.75 $47,657.85
TEPEE SPRINGS J1KS PAF 0 0 4 2,920 4.83 $18,687.51
TOLL J2G5 SWS 0 0 0 0 0.00 $411.00
TRAIL CREEK JW9N VAD 0 0 2 1,535 2.68 $10,267.73
WEBB JW3K BOD 0 0 2 1,500 1.83 $7,698.93
WINDY RIDGE J1BV VAD 0 0 2 1,450 2.79 $10,069.79
TOTAL --- --- 2 1,480 134 98,266 123.92 $568,472.96
Retardant drop on the Shirts fire.

23
BOISE TANKER BASE
The Boise Tanker Base was used by 36 different tankers including both large airtankers and SEATS (Single
Engine Airtanker). The Boise Airtanker Base supported 16 different large air tankers this season. The first
retardant activity in Boise occurred on June 6 and the last day of activity was on October 17. The Boise Tanker
Base supported 90 different incidents and pumped a total of 756 loads for 1,155,851 gallons for a total cost
of $6,146,000.40. In comparison last year the base supported 72 different incidents for 726,110 gallons of
retardant for a total cost of $3,564,281. The largest number of loads by the tanker base and the most retardant
pumped for an incident was for the Soda fire with 180 (202,900gallons) for $967,084.88.
Below is a chart that lists the top eight incidents by cost from the Boise Tanker Base.
NAME SODA TEPEE
SPRINGS ELEVEN
MILE MM43
HWY52 WALKER RAPID
WEST SCRIVER
COUGAR
UNIT BOD PAF SCF BOD SWS SIS SIS BOF
FIRE CODE J08B J1KS EKW8 JT8Q J4C0 J1MA J09U EKW2
LANDING COSTS 16423.91 9404.64 7047.26 7471.79 12309.48 5762.83 5280.78 3629.37
LOADS 180 40 47 75 61 24 22 19
RETARDANT GALLONS
202,900 108,459 87,937 93,505 100,784 62,271 60,246 39,337
RETARDANT COSTS 357,852.34 219,087.18 177,632.74 199,127.55 203,583.68 125,787.42 107,440.08 79,460.74
FLIGHT TIME 157.76 44.18 52.34 51.99 46.12 23.61 13.57 16.59
FLIGHT COSTS 583,244.63 372,863.31 274,575.25 207,243.26 185,306.22 200,428.60 122,983.46 111,647.93
OTHER COSTS 8,244 5,865 2,394 2,799 9,389 3,333 0 1,884
RETARDANT CREW COST
1,320 1,280 1,200 1,400 2,120 1,320 0 0
TOTAL COST 967,084.88 608,500.13 462,849.25 418,041.60 412,708.38 336,631.85 235,704.32 196,622.04
Boise Tanker Base hosting large and very large airtankers during the fire season
Rural Assist 9 Ada County

24
Below is a list of all the airtankers that Boise Airtanker Base supported.
In comparison for 2014: 27 Airtankers. 314 loads, 726,110 gallons and 308.23 flight time.
AIRTANKERS AIRCRAFT LOADS RETARDANT GALLONS FLIGHT TIME
TOTAL 37 TYPE 756 1,155,351 723.89
T01 Large 62 184,206 53.83
T02 Large 86 253,279 70.11
T05 Large 27 56,283 35.46
T07 Large 23 47,806 20.55
T101 Large 4 14,702 5.13
T105 Large 4 14,941 7.70
T131 Large 28 98,097 24.24
T160 Large 4 11,175 2.92
T161 Large 11 31,279 7.26
T162 Large 11 29,224 7.11
T163 Large 5 14,648 5.67
T40 Large 4 11,810 7.80
T41 Large 8 23,569 7.55
T43 Large 0 0 0.00
T44 Large 5 10,453 10.13
T45 Large 3 6,224 3.33
T801 SEAT 53 39,749 45.22
T802 SEAT 36 27,043 40.89
T809 SEAT 7 5,228 13.25
T811 SEAT 1 738 11.82
T819 SEAT 60 43,444 50.84
T824 SEAT 6 4,383 5.48
T833 SEAT 109 79,375 90.91
T837 SEAT 44 33,713 40.61
T845 SEAT 41 29,141 42.26
T846 SEAT 11 8,306 14.23
T848 SEAT 20 14,790 21.19
T850 SEAT 7 5,276 4.94
T866 SEAT 7 5,176 10.55
T873 SEAT 1 672 1.43
T878 SEAT 16 12,110 16.19
T879 SEAT 21 15,590 16.75
T881 SEAT 20 14,835 16.72
T884 SEAT 2 1,487 1.44
T891 SEAT 2 1,470 2.25
T896 SEAT 3 2,213 3.43
T899 SEAT 4 2,916 4.70

25
FUELS MANAGEMENT – Hazardous Fuels Acre Accomplishments
Boise District BLM
TYPE OF PROJECT ACRES
PRESCRIBED BURNING 7,890
MECHANICAL TREATMENT 11,660
OTHER FUEL REDUCTION CONTROL 900
TOTAL 20,450
In comparison to 201: 670 acres of prescribed burning, 11,562 mechanical treatment acres, 1,125 of other fuel
reduction acres.
Top: Pole Creek RX 2015
Bottom: South Mountain RX 2015
Bruneau Duck Ponds RX completed by Boise District BLM on March 6

26
Boise National Forest
RANGER DISTRICT
NON-WUI WUI TOTAL
PRESCRIBED BURN
MECHANICAL PRESCRIBED
BURN MECHANICAL
PRESCRIBED BURN
MECHANICAL INTEGRATED MECHANICAL
MOUNTAIN HOME
0 0 149 0 149 0 36
IDAHO CITY 0 0 955 542 955 542 0
CASCADE 59 0 144.3 66.9 203.3 66.9 634
LOWMAN 61 0 1586 20 1647 20 108
EMMETT 2552 0 0 0 2552 0 4386
TOTAL 2672 0 2834.3 625.9 5506.3 625.9 5164
These numbers reflect both core (main HZ fuels objectives) and integrated (other target along with HZ fuels objectives) targets.
In comparison to 2014: 3817 prescribed burn acres, 5450 mechanical treated acres, and 4904 Integrated
mechanical acres.
Southwest Idaho Department of Lands
TYPE OF PROJECT ACRES
MECHANICAL/PILE BURNING 5121
PRESCRIBED BURN – WILDLIFE 0
TOTAL 5121

27
FIRE PREVENTION & MITAGATION PROGRAM – Boise District BLM
Over the course of the 2015 season, Boise District fire prevention staff facilitated 32 fire prevention, mitigation
and education events. These events included: school presentations, community events, National Night Out, the
Table Rock Challenge, Smokey Bear’s Birthday, and the Caldwell Night Rodeo.
For the 6th year in a row, the Boise District partnered with KBOI radio to produce Public Service Announcements
(PSAs). 2015 PSAs included topics such as: preparedness, summer recreation, fireworks, prevention, restrictions
and sage grouse.
District personnel were able to make significant inroads with several local communities with substantial Wildland
Urban Interface (WUI) concerns regarding fuel breaks. Through participation in Home Owners Association
meetings in the Columbia Village, Warm Springs Mesa and Surprise Valley communities, we were able to
educate homeowners on the risks, challenges and mitigation options regarding WUI. We are working with these
communities at risk to develop fuel brakes that could also provide fire equipment access when necessary.
Prevention personnel were assisted by investigation staff and fire staff throughout the season.
The Boise District prevention and education program was able to reach 360 elementary students through our
education efforts, including 120 students with a focus on wildfire curriculum. The fourth grade wildfire
curriculum project is one of the most significant mitigation and education efforts we are currently focusing on and
will be refined and expanded in 2016, reaching an even greater number of Treasure Valley students. District
personnel will participate in a teacher training event in March, 2016 and will work with educators to ensure that
content is at an understandable, age-appropriate level, and will incorporate elements of core standards, such as
mathematics.
The 2015 fire season was average for fire starts, and above average for acres burned. Boise District protection
total fires: 89 starts that burned 309,261.55 acres, of which 241,589.6 acres were Boise District land. Of the 89
fires, 58 were human caused and 31 were ignited by lightning. The 10-year average is 99 total fires, of which 68
are typically human caused, with 31 lightning starts that burn an average of 82, 270 acres.
The most significant fire of 2015 was the Soda Fire, Northeast of Jordan Valley, OR. This fire constitutes the
majority of 2015 acres burned; otherwise 2015 would have been below average in terms of acres burned. The
Soda Fire started on August 10, in extreme conditions and rapidly out-paced initial attack efforts, ultimately
growing to 279,144 acres. The Soda fire was controlled on August 25.
The Boise District went into Stage 1 fire restrictions on August 21, 2015. Stage 1 restrictions were in effect until
they were rescinded on September 11, 2015, after some changes in the weather, including some precipitation.
Boise District prevention staff posted restriction notices in a number of popular recreation areas and fielded
frequent questions from the public regarding the restrictions.
Fire Mitigation Project Highlights - 2015
Fourth grade curriculum development project. The purpose of this effort is based on the fact that
many people envision the devastating effects of wildland fire and associate all wildfires as bad.
Wildfire plays an important role in our ecosystem if managed properly. Fire and fuels
management can be used to promote a healthier forest and rangeland environment, influence

28
sustainable wildlife habitat, and protect comminutes from the devastating effects of uncontrolled,
unwanted wildland fires. By introducing this integrated wildfire history unit to Idaho schools at
the fourth grade level, it is our hope to induce a “culture change” from “all fire is bad” to “fire
can be good”. This education effort will be expanded to 35 Treasure Valley schools in 2016.
We are excited about the potential of this project to reach a great number of students at an early
age to explain fire’s natural role in our landscapes.
Josh Renz helping with the final group activity for the 4th grade fire curriculum test group at
Whitney Elementary School.
Matchstick forest activity demonstrated at Shadow Hills Elementary School.
Surprise Valley Vegetative Fuel Break. This project focused on the southern and eastern sides of
Canyon Point, a Surprise Valley subdivision in Southeast Boise. A 50-foot wide fuel break was
established through mowing and hand removal of brush. The swath was then seeded with Forage
Kochia, a fire tolerant shrub that exhibits low fire behavior in terms of rates of spread, flame
length and intensity and once established, can out-compete Cheat Grass. The purpose of this
project was to reduce the threat of wildfire to the community, as well as reduce the risk of human-
caused starts in the area. The vegetative fuel break will also provide initial attack resources with
an anchor point, as well as access for equipment in the event of a wildfire.

29
FIRE INVESTIGATION AND TRESPASS – Boise District BLM
The Boise District had an average number of fires caused by human activities this year at 58:
Campfires = 4
Escaped burns = 6
Arson = 2 (1 stolen vehicle and 1 hot set – UTL suspect )
Equipment = 22(14 vehicle related fires (5 exhaust); 3 powerline equipment; 3 mowing; 2 welding)
Railroad = 1 (RR tie, no wildland involved)
Miscellaneous = 23 (5 birds in powerlines, 11 possibly shooting-related including 2 exploding targets, 5
unknown, 1 fireworks, and 1 toilet paper burning incident that made international news)
Eighteen fires were identified as potential fire trespass cases. Sixteen were recommended to go forward with
trespass proceedings. A suspect has not been identified for the stolen vehicle arson and negligence could not be
determined on a recreational vehicle fire. The five bird related powerline caused fires are still under investigation
and review for potential fire trespass. The remaining fires were not pursued due to lack of evidence to prove
negligence, the potential responsible party could not be located/identified, or the cause was undetermined.
There was an increase in escaped burns, mowing, and bird-related powerline caused fires. Vehicles and shooting
continue to be the District’s top causes, however, powerlines are a close third. There was a decrease in the
number of exploding targets and fireworks caused fires. Future fire prevention efforts will focus on general
shooting/target practice and vehicle maintenance.
Fire Investigators also assisted other jurisdictions including Boise National Forest, Idaho Department of Lands,
Ada County and Boise Fire Department with seven fire investigations; four may be pursued for cost recovery.

30
FIRE PREVENTION PROGRAM – Boise National Forest
2015 District Prevention Staff
D1 Mountain Home RD Terry Carrico , Chad Cline, Will Hunt
D3 Idaho City RD Joe Schindel
D4 Cascade RD Kim Drake, Matt Parish
D5 Lowman RD Penny Myers, Chris Knight
D6 Emmett RD Larry Bolen, Francis White, Kelsey Griffee
The 2015 Forest Prevention Numbers
District Abandoned Campfires Documented
D1 Mountain Home 96
D3 Idaho City 15
D4 Cascade 27
D5 Lowman 112
D6 Emmett 65
Forest Prevention Total 315
Incident Reports issued 300
Citations Issued 71
Days in Stage 1 Fire Restrictions 21
Days on Fire Suppression Activities 112
Number of off Forest Assignments 31
Days working on Fire Investigations 30
New Prevention Signs installed 19
The 2015 Forest Prevention Events
February
25th - Boise School District Bingo (70 attendees)
26th- Idaho Opportunity Conference, Boise (100)

31
March
28th - South Fork Boise River, Fire Recovery Tree Planting Day (45)
April
7th-Cascade After school co-op. Leave no trace/ woodsy owl (5)
9th- Donnelly Head. Be Bear Aware (15)
14th-Cascade Library preschool story time and puppet show (7)
14th- South Fork Boise River, Fire Recovery Tree Planting Day (35)
18th- Idaho Horse Expo, Nampa (1000)
21st - Arbor Day at Home Depoe with KTVB Larry Gilbert with
Smokey Bear
23-Cascade pre-kindergarten Smokey story and fire education (28)
24th -Arbor Day celebration at Idaho State House with Smokey Bear (100)
25th - Robie Creek Fire Department, Firewise (30)
30th-Cascade 1-3rd graders Fire Safety talk, and intro to Smokey/Woodsy Poster contest
May
1st -Cascade School Bicycle Rodeo K-6th grades. Smokey Bear (120)
2nd -Assessing Wildfire Hazards in the Home ignition Zone Training
4th -Horseshoe Bend Outdoor School- Fire education (28)
5th - Lowman Volunteer Fire Department meeting to facilitate information sharing
5th -Cascade after school co-op. Fire Education (9)
16th Centerville First Responder Exercise (250)
20th- 5th Graders at Sage Hen, Emmett Middle school (100)
22nd -Desert Sage Elementary School Visit with Smokey Bear (125)
23rd – Silver Creek Plunge campfire talk (100)
23rd Placerville VFD Event (100)
28th Snake River Elementary Event (100)
28th- Prospect Elementary School Visit with Smokey Bear (100)
28rd-1-3rd grade poster contest winners awarded at end of year awards banquet ~(240)

32
29th Pepper Ridge Elementary Event (100)
29t-h -1st grade Donnelly Elementary fire education (22)
29th-Eagle Elementary School Visit with Smokey Bear (60)
30-1 Enduro Idaho City(300)
June
2nd- Fire Investigation Procedures Training at Forest Ready Review (600)
3rd/4th- Project Learning Tree, After the Burn Training (30)
6th - Camp ground host meeting, Emmett6th Dagget Crk Prescribed Burn(Private Land owner/contractors)
(30)
6th Dagget Crk Prescribed Burn(Private Land owner/contractors) (30)
6th Clear Creek VFD Event (200)
8th- Veteran’s Free Fishing Day, Lowman
8th-11th- Fire Investigation Training for PT-22 and PT-12
9th- Camp Host Fire Prevention Program Lowman (smoke reports, campfire reports)
11th - Hewlett-Packard Sustainability Conference with Smokey Bear (500)
12th- Forest Lookout Refresher Training
12th - Lowman Community Mtg: Hazardous Fuel Reduction, Homeowners Grants
13th Atlanta Event (200)
13th - Horseshoe Bend free fishing day (50)
13th -Free Fishing Day at Fischer pond w/ Smokey~(120)
14th- Idaho Free Fishing Day with Smokey Bear
14th-Boise Zoo Celebration with Smokey Bear (500)
15th- Pioneer Elementary School Visit with Smokey Bear (120)
17th – Garden Valley Summer Reading Program (100)
17th-20th- Emmett Cherry Festival.
18th Regional Videographer event (available to all via FS Youtube channel)
20th-Boise World Refugee Day on the Grove with Smokey Bear (1000)
33
19-21st - Payette River Games at Kelly’s Whitewater Park. Smokey~(2000)
23rd-Treasure Valley Fire Prevention and Safety Cooperative Meeting
25th- Kids in the Woods Day, Lowman, Lowman School fire Ecology Program (7days)
26th- Idaho Frontier Days support
29th NPR Interview, Ch. 7 Interview OLS (played throughout South Idaho)
July
2nd Middleton PSA event
4th Marsing Event (500)
4th Idaho City Event (300)
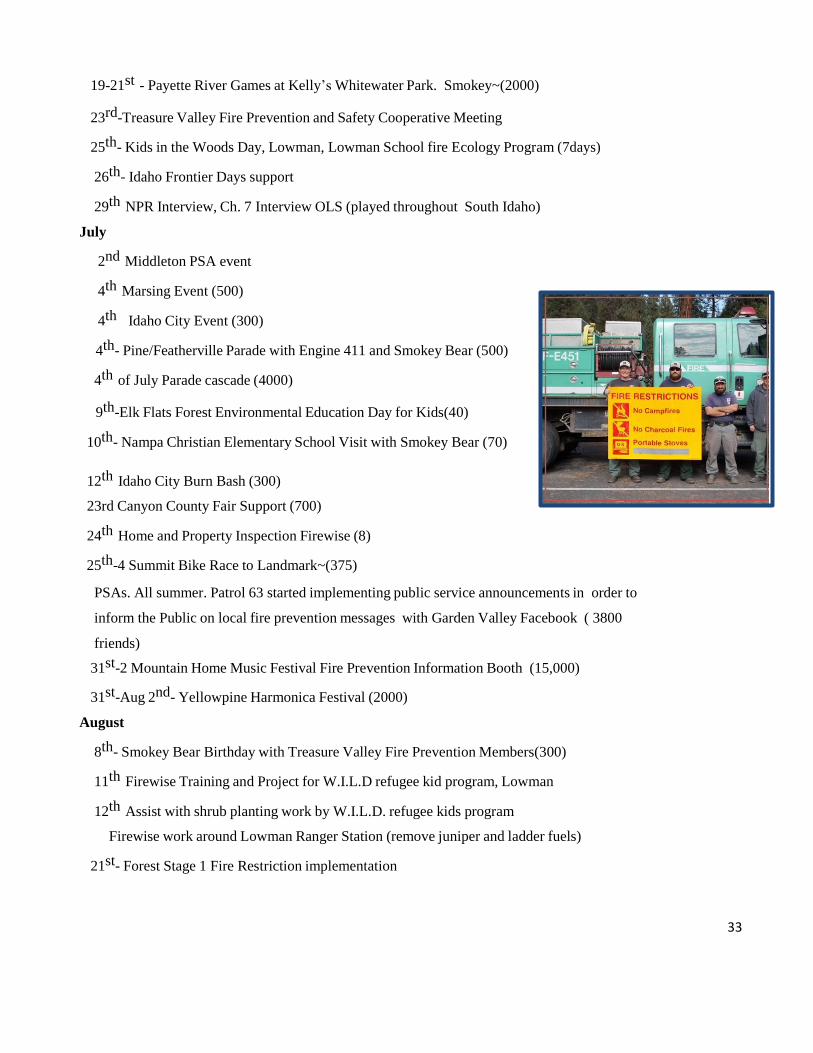
4th- Pine/Featherville Parade with Engine 411 and Smokey Bear (500)
4th of July Parade cascade (4000)
9th-Elk Flats Forest Environmental Education Day for Kids(40)
10th- Nampa Christian Elementary School Visit with Smokey Bear (70)
12th Idaho City Burn Bash (300)
23rd Canyon County Fair Support (700)
24th Home and Property Inspection Firewise (8)
25th-4 Summit Bike Race to Landmark~(375)
PSAs. All summer. Patrol 63 started implementing public service announcements in order to
inform the Public on local fire prevention messages with Garden Valley Facebook ( 3800
friends)
31st-2 Mountain Home Music Festival Fire Prevention Information Booth (15,000)
31st-Aug 2nd- Yellowpine Harmonica Festival (2000)
August
8th- Smokey Bear Birthday with Treasure Valley Fire Prevention Members(300)
11th Firewise Training and Project for W.I.L.D refugee kid program, Lowman
12th Assist with shrub planting work by W.I.L.D. refugee kids program
Firewise work around Lowman Ranger Station (remove juniper and ladder fuels)
21st- Forest Stage 1 Fire Restriction implementation

34
September
5th- Table Rock Challenge a Treasure Valley Fire Prevention Event (60)
8th- Started the Pine School Boundary Fuels Hazard Removal Project
9th- Sage School Fire Ecology Program, Lowman
12th-Mountain Home Air Force Appreciation Parade with Smokey Bear (10,000)
12th -Gravel Grind Mountain Bike race. Forest Service assist at an aid station
22nd Firewise work at Warm Spring Rental Cabin by E451
October
3rd- Eagle Home Depot Safety Day with Smokey Bear (200)
5th- Lowman School Firewise work day at Lowman One Room School.
6th-8th- Fire Prevention Week in Schools, Horseshoe Bend, Garden Valley, Shadow
Butte, Kenneth Carberry, and Emmett Valley Christian
8th- Mountain Home City Fire Station Open House with Smokey Bear (1,500)
The 2015 Forest Prevention District Summaries
D1 Mountain Home District
This season the Mountain Home program added new duties as the Lead Forest Prevention contact for the Boise,
Treasure Valley area. This work had been covered by Ellen Dunlap at the Forest S.O. until her retirement in 2014.
With some minor staffing adjustments and the assistance of many, we continued to invest in our commitment to
our Forest Fire Prevention objective of minimizing person-caused fires.
D3 Idaho City District
The intent for this season was to build upon the relationships that were cultivated last season within the
community; this was achieved by actively participating in local events as well as placing a higher emphasis on
educating the public and local homeowners.
D4 Cascade District
The Cascade Ranger District Fire Prevention organization consists of one permanent 18/8 prevention employee
and one 13/13 prevention employee. We also have support from the district Recreation staff with 2 seasonal
Recreation technicians. There are campground hosts at French Creek, Rainbow Point, Warm Lake and Shoreline
Campgrounds. This summer we had a Severity Patrol Unit from Las Vegas to assist with prevention coverage
during fire restrictions for a full 14 day assignment.
D5 Lowman District and D6 Emmett District
No written summary provided, all events and statistics are included in the 2015 Fire Prevention section.

35
IDAHO DEPARTMENT OF LANDS 2014 FIRE SEASON SUMMARY
The 2015 fire season was one of the biggest on record. Over 75,000 acres were burned across the state, which is
617 percent of the 20 year average. The total number of fires on lands protected by the State of Idaho was 321.
State wide, 63 structures and 79 out buildings were lost.
Southwest Idaho Forest Protective District Crew
Southwest Idaho Forest Protective District protects over 393,318 acres of private, state and federal lands. The fire
fighting force resources include a Fire Warden, two assistant Fire Wardens and fifteen seasonal firefighters. The
district operates four light wildland fire engines out of three guard stations. The guard stations are located in High
Valley, Centerville and the Southwest Area Office in Boise.
Southwest IDL firefighters responded to 28 fires on lands protected by the Idaho Department of Lands. These
fires burned 6,310 acres. Over 60 percent of these fires were human caused.
In addition to district fires, Southwest fire resources assisted IDL districts on several fires in north Idaho.
Southwest resources also assisted the Boise National Forest on fires. Several Southwest Area employees
participated on IMTs throughout Idaho, California and Alaska in support positions.
Walker Fire
The Walker Fire was the largest fire on the District in 2015. The human-caused 5,963 acre fire started October
10, approximately 8 miles south west of Idaho City. A Great Basin Type 2 Incident Management Team
(Dunford) along with resources from local, state and federal agencies (over 500 personnel) assisted in the
suppression effort. The Incident Command Post was located at the Idaho City airport. Many interagency fire
managers did outstanding work in supporting this incident.

36
Walker Fire - October 11, 2015 0300hrs.
Volunteer Fire Assistance (VFA) Grants
In 2015, thirteen volunteer fire departments and Two RFPA’s in southwest Idaho received VFA grants totaling
$35,538.00 through the Idaho Department of Lands. The grant money was used to purchase communication
equipment, training expenses, personal protective equipment (including new generation fire shelters, nomex
clothing, gloves and hard hats) for volunteer fire fighters as well as hand tools, hose and fittings for engines.
Federal Excess Personal Property (FEPP)
Seventeen fire service organizations in southwest Idaho take advantage of the FEPP and FFP program with over
forty assigned pieces of equipment including utility trailers, fire engines and water tenders.
Rangeland Fire Protection Associations
Three Rangeland Fire Protection Associations are active in the Southwest Area: Black Canyon, Mountain Home
and Owyhee RFPAs. These three RFPAs provided heavy equipment, engines, water tenders and personnel for
several fires on the Boise District. An equivalent total of 95 members assisted on 19 fires including the Mile
Marker 43, Slate and Soda fires.
Prescribed Fire
During October and November, Southwest IDL fire crews completed 5,121 acres of Hazard (pile) burning in the
Prairie and Thorn Cr. Timber Sale Blocks and phase 1 of the Warm Springs Timber sale in the Packer John Unit.
Reforestation
IDL foresters planted a record 1.1 million trees in the spring and fall of 2015, between the Elk Complex and
Springs fire timber sale units and Prairie and Packer John units.

37
MOBILIZATION CENTER
Below is a comparison list by year of the Mobilization Center activity
YEAR PERSONNEL REMARKS
2015 1188 Mobilized crews, IMT2 to support activity in Alaska. Supported
the Australians with meals and rooms for 4 days
2014 40 Mobilized once for FCF NICC Support to bring in two Alaska
crews
2013 1403 Geographic Area large fire support: Elk Complex, Beaver Creek,
Pony Complex, Tank and Patch Springs
2012 1875 Mainly Geographic Area Support: Mustang Complex, Trinity
Ridge, Bull Run Complex and Halstead
2011 377 Southwest Large Fire Preparedness, Hastings, TAD Little Creek,
TX Powerline, MN Pagami Creek
2010 1557 Alaska (2),The Boise Complex, Israel
2009 0 Did not open Mob Center in 2009
2008 203 Most in support of CA fires: Type 1& Type 2 Crews &
firefighters from Australia & New Zealand
2007 4637 No International or Military Personnel
2006 3915 Included Australian, New Zealand, and Military, Canadians
2005 500 Mainly Hurricane Support
2004 200 Minimal Fire Activity
2003 3457 Included shuttle recovery support personnel, Australian, New
Zealand, and Military
2002 3460 Included Australian, New Zealand, and Military, Canadians
2001 NR Minimal Fire Activity
2000 3145 Included Australian, New Zealand, and Military
One of the jets used for crew transport
38
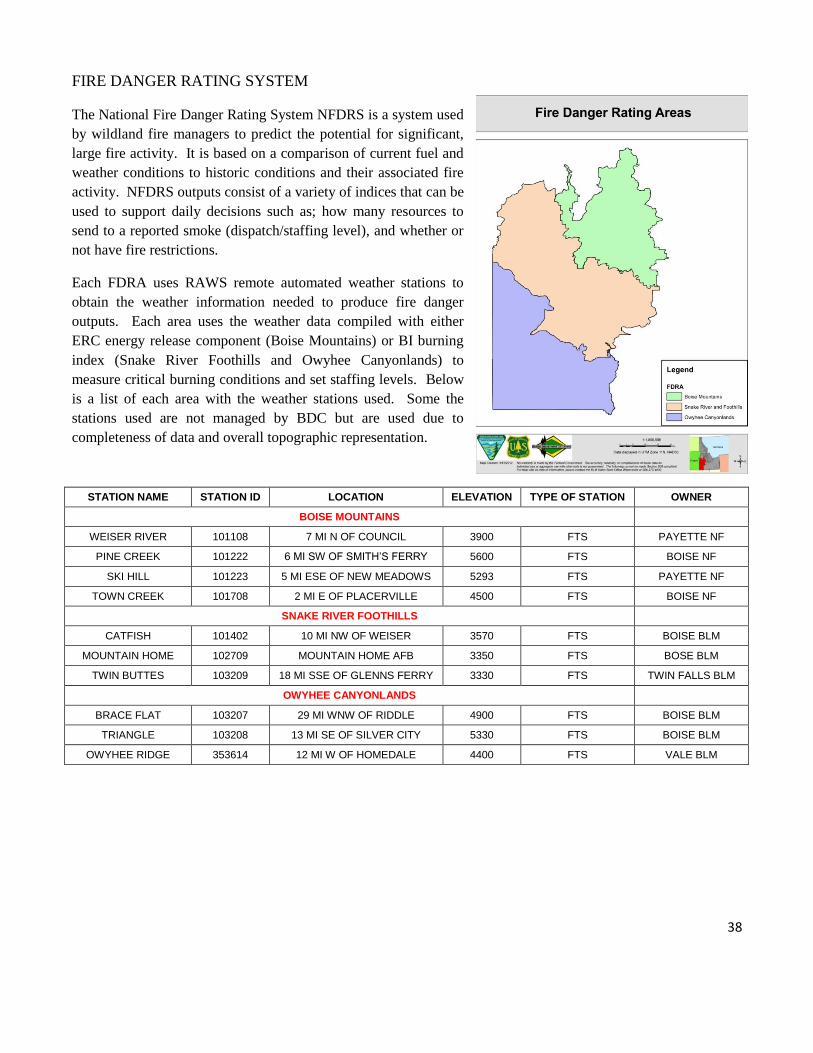
FIRE DANGER RATING SYSTEM
The National Fire Danger Rating System NFDRS is a system used
by wildland fire managers to predict the potential for significant,
large fire activity. It is based on a comparison of current fuel and
weather conditions to historic conditions and their associated fire
activity. NFDRS outputs consist of a variety of indices that can be
used to support daily decisions such as; how many resources to
send to a reported smoke (dispatch/staffing level), and whether or
not have fire restrictions.
Each FDRA uses RAWS remote automated weather stations to
obtain the weather information needed to produce fire danger
outputs. Each area uses the weather data compiled with either
ERC energy release component (Boise Mountains) or BI burning
index (Snake River Foothills and Owyhee Canyonlands) to
measure critical burning conditions and set staffing levels. Below
is a list of each area with the weather stations used. Some the
stations used are not managed by BDC but are used due to
completeness of data and overall topographic representation.
STATION NAME STATION ID LOCATION ELEVATION TYPE OF STATION OWNER
BOISE MOUNTAINS
WEISER RIVER 101108 7 MI N OF COUNCIL 3900 FTS PAYETTE NF
PINE CREEK 101222 6 MI SW OF SMITH’S FERRY 5600 FTS BOISE NF
SKI HILL 101223 5 MI ESE OF NEW MEADOWS 5293 FTS PAYETTE NF
TOWN CREEK 101708 2 MI E OF PLACERVILLE 4500 FTS BOISE NF
SNAKE RIVER FOOTHILLS
CATFISH 101402 10 MI NW OF WEISER 3570 FTS BOISE BLM
MOUNTAIN HOME 102709 MOUNTAIN HOME AFB 3350 FTS BOSE BLM
TWIN BUTTES 103209 18 MI SSE OF GLENNS FERRY 3330 FTS TWIN FALLS BLM
OWYHEE CANYONLANDS
BRACE FLAT 103207 29 MI WNW OF RIDDLE 4900 FTS BOISE BLM
TRIANGLE 103208 13 MI SE OF SILVER CITY 5330 FTS BOISE BLM
OWYHEE RIDGE 353614 12 MI W OF HOMEDALE 4400 FTS VALE BLM
Castro Fire on the Boise National Forest, on the day it decided to burn August 26, 2011
The dispatch fire map depicting the lightning bust on July 14

39
Below is a list of the weather stations managed by Boise Dispatch Center.
STATION NAME STATION ID LOCATION ELEVATION AGENCY
BOISE MANUAL 102601 NWS – BOISE 2838 BLM
DEAD INDIAN RIDGE 101402 10 MI NW OF WEISER 3570 BLM
MOUNTAIN HOME 102709 MOUNTAIN HOME AFB 3350 BLM
BRACE FLAT 103207 29 MI WNW OF RIDDLE 4900 BLM
TRIANGLE 103208 13 MI SE OF SILVER CITY 5330 BLM
POLE CREEK 103210 DUCKY VALLEY INDIAN RES 5660 BLM
BEARSKIN 101221 5 MI NE OF DEADWOOD RES 6700 USFS
PINE CREEK 101222 6 MI SW OF SMITH’S FERRY 5600 USFS
TOWN CREEK 101708 2 MI E OF PLACERVILLE 4500 USFS
LITTLE ANDERSON 101710 3 MI NE OF GARDEN VALLEY 4560 USFS
WAGONTOWN 102712 3 MI SSW OF FEATHERVILLE 6200 USFS
The Boise National Forest also has four portable weather stations available to use for wildfires or prescribed
burns. Of the four stations, two of them are Quick-Deploy F6 Forest Technology System portables. These
stations are much more user friendly and will be utilized on projects. At the end of 2015 the older Vaisala stations
will no longer be supported/serviceable.
40
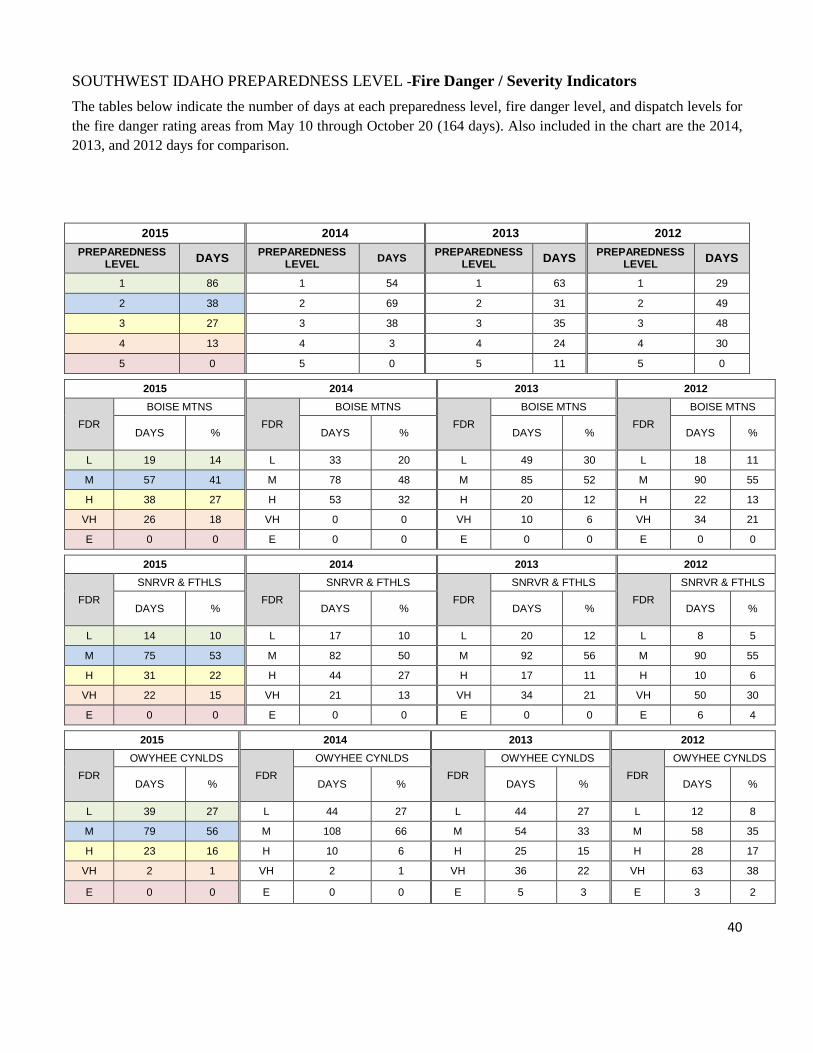
SOUTHWEST IDAHO PREPAREDNESS LEVEL -Fire Danger / Severity Indicators
The tables below indicate the number of days at each preparedness level, fire danger level, and dispatch levels for
the fire danger rating areas from May 10 through October 20 (164 days). Also included in the chart are the 2014,
2013, and 2012 days for comparison.
2015 2014 2013 2012
PREPAREDNESS LEVEL
DAYS PREPAREDNESS
LEVEL DAYS
PREPAREDNESS LEVEL DAYS
PREPAREDNESS LEVEL DAYS
1 86 1 54 1 63 1 29
2 38 2 69 2 31 2 49
3 27 3 38 3 35 3 48
4 13 4 3 4 24 4 30
5 0 5 0 5 11 5 0
2015 2014 2013 2012
FDR
BOISE MTNS
FDR
BOISE MTNS
FDR
BOISE MTNS
FDR
BOISE MTNS
DAYS % DAYS % DAYS % DAYS %
L 19 14 L 33 20 L 49 30 L 18 11
M 57 41 M 78 48 M 85 52 M 90 55
H 38 27 H 53 32 H 20 12 H 22 13
VH 26 18 VH 0 0 VH 10 6 VH 34 21
E 0 0 E 0 0 E 0 0 E 0 0
2015 2014 2013 2012
FDR
SNRVR & FTHLS
FDR
SNRVR & FTHLS
FDR
SNRVR & FTHLS
FDR
SNRVR & FTHLS
DAYS % DAYS % DAYS % DAYS %
L 14 10 L 17 10 L 20 12 L 8 5
M 75 53 M 82 50 M 92 56 M 90 55
H 31 22 H 44 27 H 17 11 H 10 6
VH 22 15 VH 21 13 VH 34 21 VH 50 30
E 0 0 E 0 0 E 0 0 E 6 4
2015 2014 2013 2012
FDR
OWYHEE CYNLDS
FDR
OWYHEE CYNLDS
FDR
OWYHEE CYNLDS
FDR
OWYHEE CYNLDS
DAYS % DAYS % DAYS % DAYS %
L 39 27 L 44 27 L 44 27 L 12 8
M 79 56 M 108 66 M 54 33 M 58 35
H 23 16 H 10 6 H 25 15 H 28 17
VH 2 1 VH 2 1 VH 36 22 VH 63 38
E 0 0 E 0 0 E 5 3 E 3 2

41
2015 2014 2013 2012 D
ISP
AT
CH
LE
VE
L
BOISE MTNS
DIS
PA
TC
H
LE
VE
L
BOISE MTNS
DIS
PA
TC
H
LE
VE
L
BOISE MTNS
DIS
PA
TC
H
LE
VE
L
BOISE MTNS
DAYS % DAYS % DAYS % DAYS %
L 21 13 L 14 8 L 72 44 L 44 27
M 47 29 M 73 45 M 47 29 M 33 20
H 95 58 H 77 47 H 45 27 H 87 53
2015 2014 2013 2012
DIS
PA
TC
H
LE
VE
L
SNRVR & FTHLS D
ISP
AT
CH
LE
VE
L
SNRVR & FTHLS
DIS
PA
TC
H
LE
VE
L
SNRVR & FTHLS
DIS
PA
TC
H
LE
VE
L
SNRVR & FTHLS
DAYS % DAYS % DAYS % DAYS %
L 46 28 L 29 18 L 43 26 L 16 10
M 75 46 M 79 48 M 77 47 M 84 51
H 43 26 H 56 34 H 44 27 H 64 39
2015 2014 2013 2012
DIS
PA
TC
H
LE
VE
L
OWYHEE CYNLDS
DIS
PA
TC
H
LE
VE
L
OWYHEE CYNLDS D
ISP
AT
CH
LE
VE
L
OWYHEE CYNLDS
DIS
PA
TC
H
LE
VE
L
OWYHEE CYNLDS
DAYS % DAYS % DAYS % DAYS %
L 73 45 L 50 31 L 55 33 L 27 16
M 72 44 M 99 60 M 68 42 M 83 51
H 19 11 H 15 9 H 41 25 H 54 33
DA
YS
AB
OV
E T
HE
CR
ITIC
AL P
ER
CE
NT
ILE
LE
VE
L
BOISE MTNS
DA
YS
AB
OV
E T
HE
CR
ITIC
AL P
ER
CE
NT
ILE
LE
VE
L
SNRVR & FTHLS
DA
YS
AB
OV
E T
HE
C
RIT
ICA
L P
ER
CE
NT
ILE
LE
VE
L
OWYHEE CYNLDS
YEAR DAYS % YEAR DAYS % YEAR 2014
DAYS %
2015 98 60 2015 44 27 2015 18 11
2014 87 53 2014 58 35 2014 15 9
2013 42 26 2013 42 26 2013 53 32
2012 81 49 2012 66 40 2012 75 57
**22-24 days of Fire Danger Ratings were not recorded for each zone in 2015

42
Below are outputs produced from each of the FDRA within our area from May 10th through October 20
th. These
charts include the historical data, the current previous year highlighted, a previous large fire year, and the critical
percentile that has been identified which varies for each area.

43
WEATHER SUMMARY
Information taken directly from the Boise Weather Service 2015 Fire Weather Annual Report.
Winter 2014-2015 can be best described by the well-known idiom, “In like a lion, out like a lamb.” November’s roar was most apparent in the Treasure Valley, where a mid-month storm dropped nearly eight
inches of snow over Boise proper. This snowfall was preceded by a record setting rain event early in the month,
and was quickly followed by an artic air mass and several cold, dry “inversion days.” Despite a dry ending,
November precipitation met or surpassed normal values in Boise, Twin Falls, and McCall; but fell short in Burns,
Baker City, and Jerome. Significant precipitation returned to much of eastern Oregon and southwest Idaho in December (excluding the
Magic Valley and areas just north of the Nevada border). Temperatures fluctuated in an active and changeable
weather pat- tern; keeping cold highs at bay by limiting the number of stagnant “inversion days.” By month’s
end, all sites had a mean temperature between 7 and 9 degrees above average and Boise had recorded its second
warmest December ever. (Only December of 1973 was warmer.)
A broad, nearly-stationary upper level ridge set up over the West Coast in January, forcing the primary storm
track well to our north. Snow levels were, on average, quite high during this time frame, and what little
precipitation did occur fell more as rain than snow. Rainfall helped increase mid-winter reservoir storage, but
this rain-on-snow was detrimental to the sea- son’s snowpack. This pattern continued into February as temperatures warmed even further. By month’s end, all local climate
sites (i.e. ASOS stations with a long- standing observational record) reported well above- normal mean
temperatures, with most coming in a whop- ping 9 to 11 degrees above normal. (Including: Baker City, Burns,
McCall, Boise, Ontario, Jerome, and Twin Falls.) Daily high temperature records were set at the Boise Airport,
with February 2015 being the warmest since 1940 (when observations started at the that location). By mid-
month, the persistent upper level ridge had gained significant amplitude— cutting off moisture supplies and
limiting any additional precipitation gains. So, winter came in like a lion, but quickly evolved into a late
December-February lamb; marked by very warm temperatures, high snow levels and a suffering winter
snowpack.
The regional warm spell continued in March. Cool conditions early in the month were quickly edged out by a
warmer air mass — a large, nearly stationary upper level ridge over the Pacific Northwest. The ridge remained
essentially stagnant through the end of the month, forcing incoming systems to both our north and south.
Precipitation totals lagged, with some portions of the forecast area receiving less than twenty percent of their
monthly average. April was similarly dry, with the bulk of eastern Oregon and southwest Idaho receiving less than seventy percent
of their monthly average. Boise reported half their typical April precipitation, while the Magic Valley received
less than one-quarter of their average. Across the whole forecast area, only the southern third of the Vale BLM
managed to approach normal. Mountain snowack, which typically peaks at the beginning of April, was near or
below 25% of normal. Many SNOTEL locations hit record low snow-water equivalent (SWE). Temperatures
averaged near to slightly above- normal in this time frame. The weather pattern be- came more active in May, as a deep upper level trough migrated southeast from the Gulf
of Alaska; deepening and setting up shop over the West for nearly three weeks. The moist, unstable air mass

44
caused more changeable temperatures and provided intermittent rounds of convective showers, helping boost
May’s precipitation back toward normal values. This resurgence in precipitation did little for drought recovery,
however, and the regional mountain snowpack melted off 4 to 6 weeks ahead of normal.
Record-breaking warmth continued in June. All climate sites averaged between 6° and 10.5° degrees above the
monthly normal. Boise had its warmest June ever, with records dating back to 1869. Dry westerly flow aloft
dominated the region from the 5th through the 25th, producing little-to-no precipitation. A pattern shift occurred
on the 26th, as a strong upper level ridge amplified over the Great Basin. The anomalously strong ridge spurred
record-breaking, triple-digit temperatures and supported the northward transport of the monsoon moisture. What
little precipitation occurred fell via convection this last week of the month. It wasn’t enough to cover the earlier
deficit, however, and all sites reported well below- normal precipitation yet again. July was more changeable overall. The upper level ridge from June held on through the 4th of July, but fell
victim to an incoming Pacific trough on the 5th. Intermittent troughs coupled with monsoon moisture; boosting
precipitation to above-normal values near and north of the Nevada border.
August was neither as stagnant as June, nor as changeable as July. High pressure dominated much of the month,
but proved weaker (and more susceptible to passing upper level troughs) than the upper level ridging seen
earlier in the summer. Southcentral Idaho faired the best precipitation-wise, but drought conditions worsened
across eastern Oregon. By month’s end, the bulk of the Pacific Northwest was listed as being in “extreme
drought”; including all of eastern Oregon, and Adams, Washington, and Owyhee counties of Idaho.
An active and unsettled weather pattern brought minor relief to local drought conditions, with most of eastern
Oregon and western Idaho receiving near or above normal precipitation in September. Temperature fluctuations
averaged to near- normal by month’s end. Passing fronts spurred thunderstorms, triggering additional fire starts. Despite ongoing smoke from local fires hindering afternoon sunshine, the return of high pressure aloft produced
yet another month of above-normal temperatures. For Boise, October was the eleventh (eleventh!) month in a row
that rang in above-normal. Three separate rounds of light precipitation brought rainfall amounts to above-normal
values across much of the area. Burns BLM and the Baker Valley were the exceptions, with precipitation amounts
at or below the monthly normal. November marked a welcomed transition to cooler, wetter weather. It was also the first month of the year with
across-the-board below normal temperatures. After three weeks of fall-like weather, an upper level trough moved
southeast from the British Columbia coastline, bringing the first significant round of snowfall for lower elevations.
Artic air then filtered in behind the storm (from British Columbia and western Montana), causing a shallow
temperature inversion. Higher elevations saw a slow increase in temperatures, but lower valleys were entrenched
in cold air.

45
SEASONAL WEATHER & SEVERITY
The graphs depict the snow water equivalent and precipitation for the 2015 Water Year.
Atlanta Summit Located: Mountain Home RD, Boise NF
Elevation: 7580 ft Latitude: 43 45’
Longitude: 115 14’
Deadwood Summit Located: Mountain Home RD, Boise NF
Elevation: 7580 ft Latitude: 43 45’
Longitude: 115 14’
Jackson Peak Located: Lowman RD, Boise NF
Elevation: 7070 ft Latitude: 43 03’
Longitude: 115 26’
Trinity Mountain Located: Mountain Home RD, Boise NF
Elevation: 7770 ft Latitude: 43 37’
Longitutde: 115 26’

46
Mores Creek Summit Located: Idaho City RD, Boise NF
Elevation: 6100 ft Latitude: 43 55’
Longitude: 115 39’
Mud Flat Located: Bruneau FO, Boise BLM
Elevation: 5730 ft Latitude: 42 36’
Longitude: 116 33’
South Mountain Located: Owyhee FO, Boise BLM
Elevation: 6500 ft Latitude: 42 45”
Longitude: 116 54’
Wilson Creek
Located: Jarbidge FO, Twin Falls BLM Elevation: 7120 ft
Latitude: 42 00’ Longitude: 115 00’

47
LIGHTNING SUMMARY
Boise District BLM
The first lightning fire for Boise District BLM protection occurred May 19th, significantly earlier than the first
lightning fire in 2014 which was July 22nd
. It was called Orchard and burned 0.1 acres of Boise National Forest
land. The first multiple lightning cause fire day was June 29th, with two starts for a total of 2,135 acres. This was
the theme for the season, as there was not a hugely impacted day by a multiple lightning fire bust. Throughout the
season the BLM had 31 lightning fires. The largest lightning ignited fire was the Soda fire on August 10th for
279,144 acres. The number of lightning starts was up compared to the 19 lighting fires in 2014.
Boise National Forest
The first lightning fire occurred on May 19th on the Emmett RD and burned 0.1 acres. The Boise National Forest
had the first lightning bust of the year on July 10th with 9 fires for just over an acre total. The largest lightning
caused fire started on August 13th which was the Cougar Fire that burned for 1,237 acres. The last lightning
caused fire occurred on September 9 for 0.40 acre. The forest had a total of 44 lightning starts for the season,
significantly less than the 101 lightning starts in 2014.
Idaho Department of Lands
The first lightning fire occurred within IDL protection on June 9th, and burned 0.1 acres. Southwest Idaho had a
total of 11 lightning caused fires that burned only 2.15 acres. The largest multi-lightning start day occurred July
10th for six fires for 1 acre. The 2015 season had fewer lightning caused fires than in 2014, which had 17 lightning
fires.

48
FUEL MOISTURE
Snake River & Foothills and Owyhee Canyonlands Areas
The Boise District BLM Fuels program collects the live fuel moisture data at five different locations throughout
the district. The following is a chart of their readings which are color coded by expected fire behavior. From the
Guidelines for Fire Behavior and Tactics Based on Live Fuel Moisture Values in the Great Basin Fuel Project as
described below: Fuel moistures from 101-125% will exhibit high fire behavior with frontal attack with engines
and/or dozers would be nearly impossible on large fires. This year the live fuel moistures in Kuna hit this level in
June. All other sites hit this level in July, except Triangle. This year most sites remained close to average until
September when fuel moistures dipped below average levels.
4/15 5/1 5/15 6/1 6/15 7/1 7/15 8/1 8/15 9/1 9/15 10/1 10/15 11/1
HAMMETT 195 205 191 151 129 106 96 89 87 92 62 100 85 N/A
HAMMETT AVG
240 210 177 162 139 107 101 89 83 80 80 80 86 82
KUNA 219 178 168 140 119 95 95 84 88 69 66 72 71 N/A
KUNA AVG
214 200 180 158 138 105 93 83 75 79 78 69 82 79
WILD WEST 207 186 174 156 131 108 97 80 73 77 60 67 110 N/A
WILD WEST AVG
217 209 187 146 129 107 90 80 74 73 72 75 84 91
TRIANGLE 183 206 220 255 185 129 119 99 88 80 66 87 84 N/A
TRIANGLE AVG
152 179 208 202 197 145 124 114 104 103 85 99 95 96
BLACKSTONE 188 175 161 183 132 83 76 79 72 64 48 92 87 N/A
BLACKSTONE AVG
195 163 161 127 95 72 61 55 78 102 76 98 94 86
GREEN: Very Low and Low Fire Behavior. BLUE: Moderate Fire Behavior. YELLOW: High Fire Behavior. ORANGE: Extreme Fire Behavior.
RED: Advanced Fire Behavior.
FIRE BEHAVIOR AND TACTICS Live Fuel Moisture
181% & Above - Fires will exhibit VERY LOW BEHAVIOR with difficulty burning. Residual fine fuels from the previous year may carry the fire. Foliage will remain on the stems following the burn. Fires can generally be attacked at the head or flanks by persons using hand tools. Hand line should hold fire without any problems. Fires will normally go out as soon as wind dies down.
151%-180% - Fires will exhibit LOW FIRE BEHAVIOR with fire beginning to be carried in the live fuels. Both foliage and stem material up to 1/4 inch in diameter will be consumed by the fire. Burns will be generally patchy with many unburned islands. Engines may be necessary to catch fires at the head and handling will be more difficult to construct, but should hold at the head and the flanks.
126%-150% - Fires will exhibit MODERATE FIRE BEHAVIOR with a fast continuous rate of spread that will consume stem material up to 2 inches in diameter. These fires may be attacked at the head with engines but may require support of dozers and retardant aircraft. Handline will become ineffective at the fire head, but should still hold at the flanks. Under high winds and low humidity, indirect line should be given considerations.
101%-125% - Fires will exhibit HIGH FIRE BEHAVIOR leaving no material unburned. Head attack with fire engines and dozers will be nearly impossible on large fires, but may still be possible on smaller, developing fires. Retardant aircraft will be necessary on all these fires. Flanking attack by engines and indirect attack ahead of the fire must be used. Spotting should be anticipated. Fires will begin to burn through the night, calming down several hours before sunrise.
75%-100% - Fires will exhibit EXTREME FIRE BEHAVIOR. Extreme rates of spread and moderate to long range spotting will occur. Engines and dozers may be best used to back up firing operations, and to protect structures. Indirect attack must be used to control these fires. Fires will burn actively through the night. Air turbulence caused by the fire will cause problems for air operations.
74% & Below - Fires will have ADVANCED FIRE BEHAVIOR with high potential to control their environment. Large acreage will be consumed in a very short time period. Backfiring from indirect line, roads, etc. must be considered. Aircraft will need to be cautious of hazardous turbulence around the fire.

49
Shown are graphs indicating the 10 hour and woody fuel moisture status for the Snake River & Foothills and
Owyhee Canyonlands Fire Danger Rating Areas from May 10 to October 20. They include the historical data, the
current previous year highlighted, a previous large fire year and the 5th and 20
th percentiles.
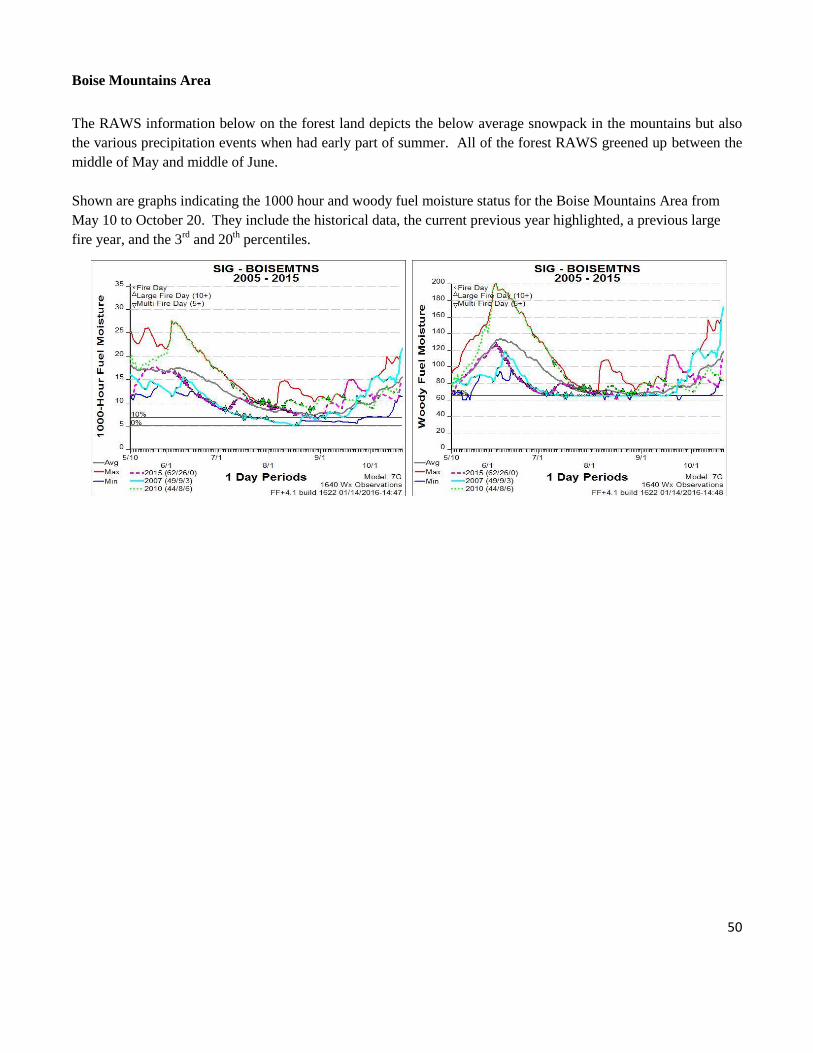
50
Boise Mountains Area
The RAWS information below on the forest land depicts the below average snowpack in the mountains but also
the various precipitation events when had early part of summer. All of the forest RAWS greened up between the
middle of May and middle of June.
Shown are graphs indicating the 1000 hour and woody fuel moisture status for the Boise Mountains Area from
May 10 to October 20. They include the historical data, the current previous year highlighted, a previous large
fire year, and the 3rd
and 20th percentiles.
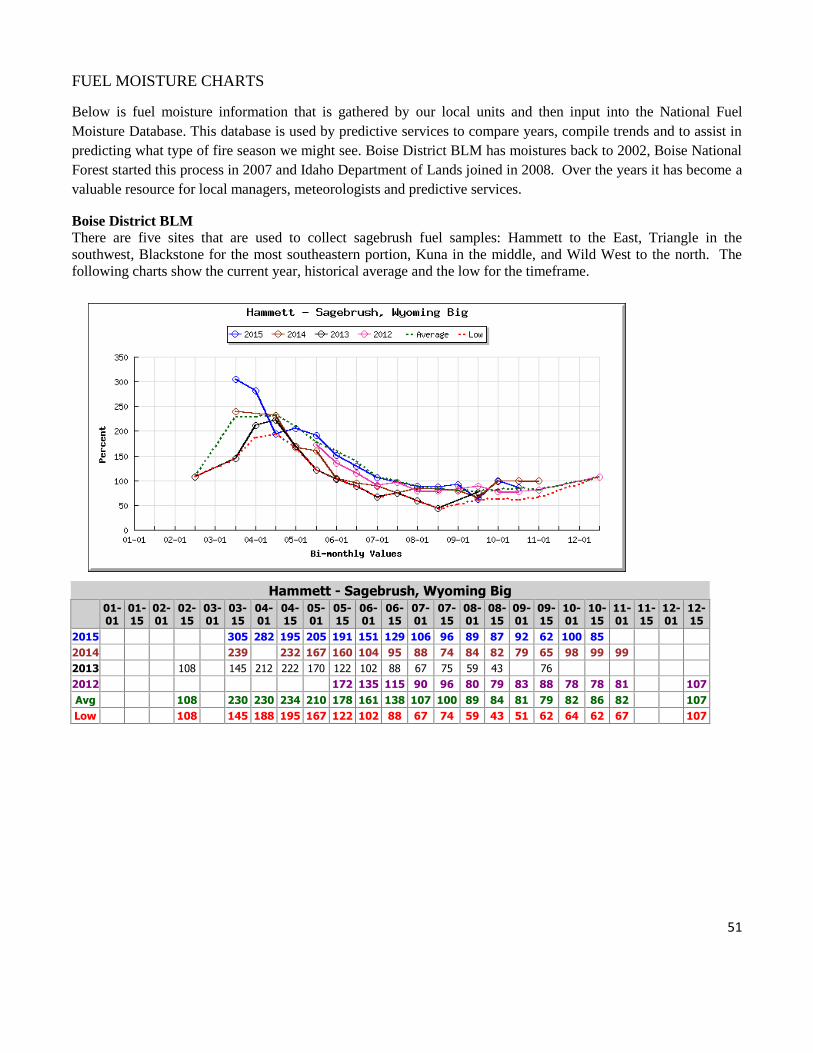
51
FUEL MOISTURE CHARTS
Below is fuel moisture information that is gathered by our local units and then input into the National Fuel
Moisture Database. This database is used by predictive services to compare years, compile trends and to assist in
predicting what type of fire season we might see. Boise District BLM has moistures back to 2002, Boise National
Forest started this process in 2007 and Idaho Department of Lands joined in 2008. Over the years it has become a
valuable resource for local managers, meteorologists and predictive services.
Boise District BLM
There are five sites that are used to collect sagebrush fuel samples: Hammett to the East, Triangle in the
southwest, Blackstone for the most southeastern portion, Kuna in the middle, and Wild West to the north. The
following charts show the current year, historical average and the low for the timeframe.
Hammett - Sagebrush, Wyoming Big
01-01
01-15
02-01
02-15
03-01
03-15
04-01
04-15
05-01
05-15
06-01
06-15
07-01
07-15
08-01
08-15
09-01
09-15
10-01
10-15
11-01
11-15
12-01
12-15
2015 305 282 195 205 191 151 129 106 96 89 87 92 62 100 85
2014 239 232 167 160 104 95 88 74 84 82 79 65 98 99 99
2013 108 145 212 222 170 122 102 88 67 75 59 43 76
2012 172 135 115 90 96 80 79 83 88 78 78 81 107
Avg 108 230 230 234 210 178 161 138 107 100 89 84 81 79 82 86 82 107
Low 108 145 188 195 167 122 102 88 67 74 59 43 51 62 64 62 67 107

52
Kuna - Sagebrush, Wyoming Big
01-01
01-15
02-01
02-15
03-01
03-15
04-01
04-15
05-01
05-15
06-01
06-15
07-01
07-15
08-01
08-15
09-01
09-15
10-01
10-15
11-01
11-15
12-01
12-15
2015 250 219 178 168 140 119 95 95 84 88 69 66 72 71
2014 193 233 185 166 123 104 90 80 76 65 69 65 84 98 101
2013 109 157 193 181 147 135 141 89 97 52 76 58 125
2012 209 206 160 140 116 115 84 82 76 74 67 80 89 99
Avg 109 175 215 214 198 179 157 136 104 93 83 76 78 77 69 81 79 99
Low 109 157 188 181 147 135 118 76 58 48 60 37 64 59 41 40 46 99
Wild West - Sagebrush, Wyoming Big
01-01
01-15
02-01
02-15
03-01
03-15
04-01
04-15
05-01
05-15
06-01
06-15
07-01
07-15
08-01
08-15
09-01
09-15
10-01
10-15
11-01
11-15
12-01
12-15
2015 234 207 186 174 156 131 108 97 80 73 77 60 67 110
2014 211 247 204 175 128 110 94 84 86 69 66 65 82 93 96
2013 112 138 175 178 168 144 105 75 93 77 64 55 93
2012 192 126 111 78 86 62 63 51 59 61 66 104 113
Avg 112 175 203 216 206 185 147 129 107 90 80 74 74 71 74 87 91 113
Low 112 138 175 178 168 144 85 75 67 70 62 44 51 59 52 51 67 113

53
Triangle - Sagebrush, Mountain Big
01-01
01-15
02-01
02-15
03-01
03-15
04-01
04-15
05-01
05-15
06-01
06-15
07-01
07-15
08-01
08-15
09-01
09-15
10-01
10-15
11-01
11-15
12-01
12-15
2015 183 206 220 255 185 129 119 99 88 80 66 87 84
2014 132 166 186 203 179 164 137 98 106 95 95 79 108 103 108
2013 110 133 152 211 240 218 202 142 118 79 80 84
2012 139 182 171 161 129 97 93 77 91 82 93 82 83 87
Avg 121 133 160 186 211 213 195 141 123 112 102 99 82 96 93 96 87
Low 110 133 139 141 182 171 161 129 97 79 77 80 66 87 82 83 87
Blackstone - Sagebrush, Wyoming Big
01-01
01-15
02-01
02-15
03-01
03-15
04-01
04-15
05-01
05-15
06-01
06-15
07-01
07-15
08-01
08-15
09-01
09-15
10-01
10-15
11-01
11-15
12-01
12-15
2015 181 185 175 177 183 132 83 76 79 72 64 48 92 87
2014 134 181 145 156 102 82 71 66 65 132 150 112 139 121 116
2013 90 103 156 209 180 166 151 107 77 70 60 48 61
2012 68 48 40 55 54 55 57 66 56 86
Avg 90 139 156 192 167 166 145 107 75 65 61 77 89 69 96 91 86 86
Low 90 103 156 181 145 156 102 82 68 48 40 48 54 48 57 66 56 86
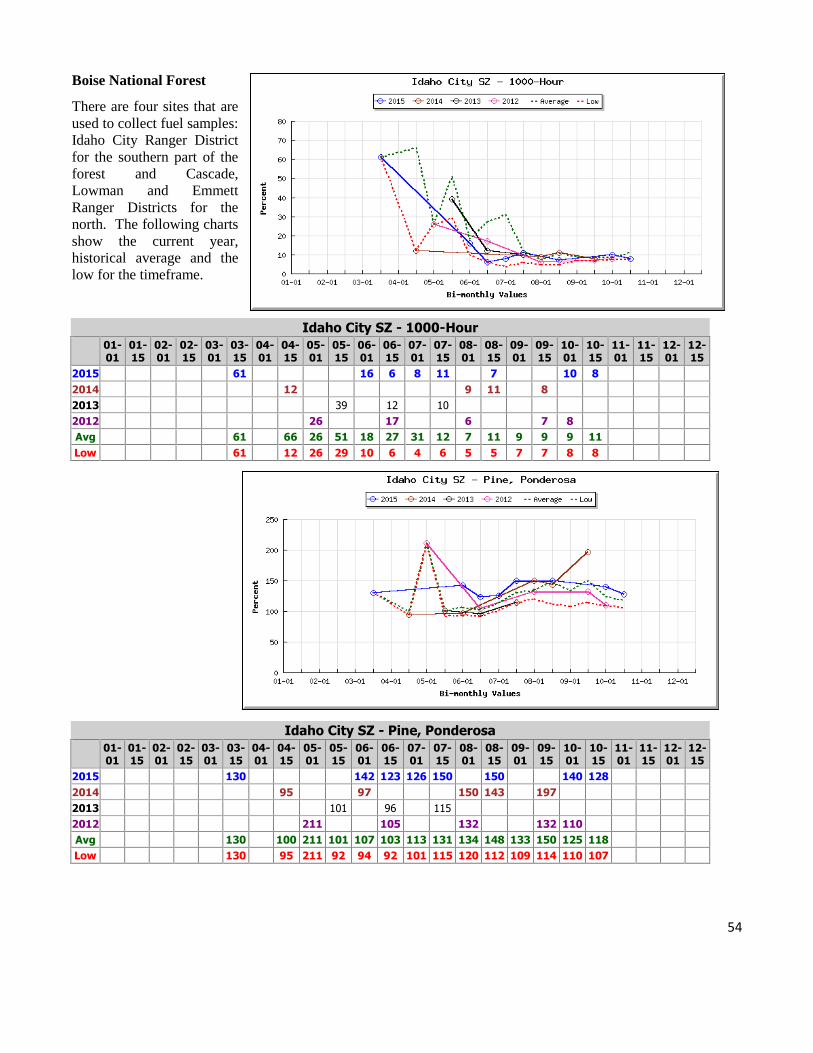
54
Boise National Forest
There are four sites that are
used to collect fuel samples:
Idaho City Ranger District
for the southern part of the
forest and Cascade,
Lowman and Emmett
Ranger Districts for the
north. The following charts
show the current year,
historical average and the
low for the timeframe.
Idaho City SZ - 1000-Hour
01-01
01-15
02-01
02-15
03-01
03-15
04-01
04-15
05-01
05-15
06-01
06-15
07-01
07-15
08-01
08-15
09-01
09-15
10-01
10-15
11-01
11-15
12-01
12-15
2015 61 16 6 8 11 7 10 8
2014 12 9 11 8
2013 39 12 10
2012 26 17 6 7 8
Avg 61 66 26 51 18 27 31 12 7 11 9 9 9 11
Low 61 12 26 29 10 6 4 6 5 5 7 7 8 8
Idaho City SZ - Pine, Ponderosa
01-01
01-15
02-01
02-15
03-01
03-15
04-01
04-15
05-01
05-15
06-01
06-15
07-01
07-15
08-01
08-15
09-01
09-15
10-01
10-15
11-01
11-15
12-01
12-15
2015 130 142 123 126 150 150 140 128
2014 95 97 150 143 197
2013 101 96 115
2012 211 105 132 132 110
Avg 130 100 211 101 107 103 113 131 134 148 133 150 125 118
Low 130 95 211 92 94 92 101 115 120 112 109 114 110 107

55
Cascade North Zone - 1000-Hour
01-01
01-15
02-01
02-15
03-01
03-15
04-01
04-15
05-01
05-15
06-01
06-15
07-01
07-15
08-01
08-15
09-01
09-15
10-01
10-15
11-01
11-15
12-01
12-15
2015 26 25 25 22 13 15 12 10 9 10 15
2014 16 14 15 11 10 10 13 10 12 12
2013 23 35 18 28 14 7 8 11
2012 29 13 10 9 7 9 8
Avg 26 33 28 26 19 13 11 10 10 10 11 12
Low 26 23 16 14 13 6 7 8 6 6 8 12
Cascade North Zone - Douglas-Fir
01-01
01-15
02-01
02-15
03-01
03-15
04-01
04-15
05-01
05-15
06-01
06-15
07-01
07-15
08-01
08-15
09-01
09-15
10-01
10-15
11-01
11-15
12-01
12-15
2015 98 96 96 220 124 112 135 122 118 117 125
2014 85 198 228 189 158 159 138 143 141 137
2013 82 79 201 144 155 155 134 139
2012 113 114 107 111 118 112 115
Avg 98 108 100 184 154 157 131 136 135 126 123 137
Low 98 82 79 113 98 112 107 111 112 112 112 137

56
Lowman North Zone - 1000-Hour
01-01
01-15
02-01
02-15
03-01
03-15
04-01
04-15
05-01
05-15
06-01
06-15
07-01
07-15
08-01
08-15
09-01
09-15
10-01
10-15
11-01
11-15
12-01
12-15
2015 20 14 16 12 11 10 10
2014 14 19 13 13 13 13
2013 13 10 13 17 13 12 12
2012 23 23 29 14 20 9 4 9 6 8
Avg 29 21 20 27 18 14 11 11 14 8 9
Low 25 13 10 13 14 8 9 4 9 6 8
Lowman North Zone - Douglas-Fir
01-01
01-15
02-01
02-15
03-01
03-15
04-01
04-15
05-01
05-15
06-01
06-15
07-01
07-15
08-01
08-15
09-01
09-15
10-01
10-15
11-01
11-15
12-01
12-15
2015 94 216 162 119 124 116 110
2014 79 93 112 112 112 116
2013 97 97 110 104 108 104 103
2012 95 91 93 251 139 140 121 107 117 113
Avg 87 94 93 174 126 118 112 113 91 112
Low 70 91 79 93 99 96 100 107 44 110

57
Emmett North Zone - 1000-Hour
01-01
01-15
02-01
02-15
03-01
03-15
04-01
04-15
05-01
05-15
06-01
06-15
07-01
07-15
08-01
08-15
09-01
09-15
10-01
10-15
11-01
11-15
12-01
12-15
2015 28 25 23 12 20 10 8 9 11
2014 50 39 24 20 19 19 17 9 10 14 9
2013 21 19 13 17 12 13
2012 24 18 7 7
Avg 28 50 29 25 20 22 21 16 14 14 10 11 10 10 12 16
Low 28 50 21 19 13 17 12 12 9 7 8 7 5 7 12 16
Emmett North Zone - Douglas-Fir
01-01
01-15
02-01
02-15
03-01
03-15
04-01
04-15
05-01
05-15
06-01
06-15
07-01
07-15
08-01
08-15
09-01
09-15
10-01
10-15
11-01
11-15
12-01
12-15
2015 80 83 79 100 103 95 109 106 108
2014 97 96 91 83 90 89 88 88 100 92 113
2013 109 114 160 197 137 107
2012 280 120 100
Avg 80 97 118 108 104 150 198 129 145 141 105 107 104 107 119 79
Low 80 97 96 91 83 79 89 88 88 95 100 92 79 100 119 79
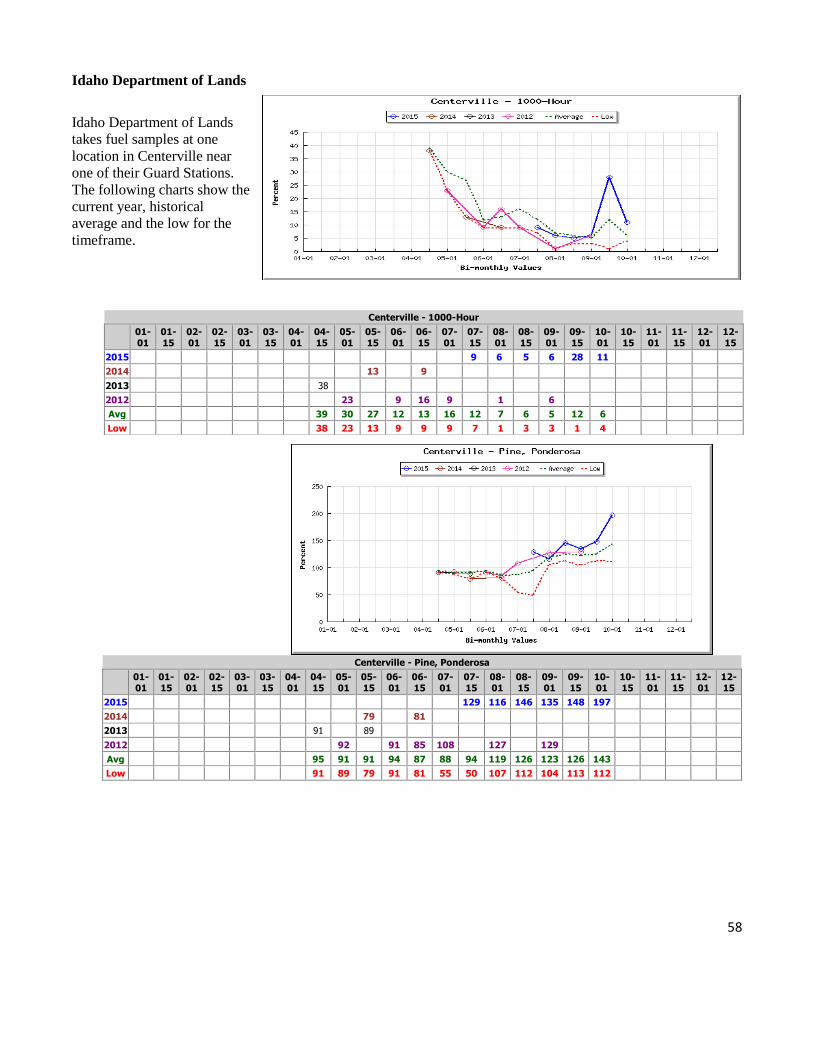
58
Idaho Department of Lands
Idaho Department of Lands
takes fuel samples at one
location in Centerville near
one of their Guard Stations.
The following charts show the
current year, historical
average and the low for the
timeframe.
Centerville - Pine, Ponderosa
01-01
01-15
02-01
02-15
03-01
03-15
04-01
04-15
05-01
05-15
06-01
06-15
07-01
07-15
08-01
08-15
09-01
09-15
10-01
10-15
11-01
11-15
12-01
12-15
2015
129 116 146 135 148 197
2014
79 81
2013 91
89
2012 92 91 85 108 127 129
Avg 95 91 91 94 87 88 94 119 126 123 126 143
Low 91 89 79 91 81 55 50 107 112 104 113 112
Centerville - 1000-Hour
01-01
01-15
02-01
02-15
03-01
03-15
04-01
04-15
05-01
05-15
06-01
06-15
07-01
07-15
08-01
08-15
09-01
09-15
10-01
10-15
11-01
11-15
12-01
12-15
2015
9 6 5 6 28 11
2014
13 9
2013 38
2012 23 9 16 9 1 6
Avg 39 30 27 12 13 16 12 7 6 5 12 6
Low 38 23 13 9 9 9 7 1 3 3 1 4

59
Centerville - Sagebrush, Threetip
01-01
01-15
02-01
02-15
03-01
03-15
04-01
04-15
05-01
05-15
06-01
06-15
07-01
07-15
08-01
08-15
09-01
09-15
10-01
10-15
11-01
11-15
12-01
12-15
2015
178 148 150 102 141 181
2014
156 167
2013 98
188
2012 127 169 168 138 111 101
Avg 102 124 188 200 208 125 123 133 140 102 118 111
Low 98 120 156 169 167 69 67 111 129 101 95 76