
ICCE 2016 Main Conference Proceedings.pdf - Educational ...
719
-
Upload
khangminh22 -
Category
Documents
-
view
1 -
download
0
Transcript of ICCE 2016 Main Conference Proceedings.pdf - Educational ...
Main ConferenceProceedings

Copyright 2016 Asia-Pacific Society for Computers in Education
All rights reserved. No part of this book may be reproduced, stored in a retrieval system,
transmitted, in any forms or any means, without the prior permission of the Asia-Pacific Society
for Computers in Education.
ISBN 9789868473577
Publisher
Asia-Pacific Society for Computers in Education
i-2
No.300, Jungda Road, Jhongli District, Taoyuan City 320, Taiwan

Editors
Weiqin CHEN
Jie-Chi YANG
Sahana MURTHY
Su Luan WONG
Sridhar IYER
Associate Editors
(in alphabetical order)
Nelson BALOIAN
Michelle P. BANAWAN
Alba Garcia BARRERA
Gautam BISWAS
Hui-Chun CHU
Muhammet DEMIRBILEK
Matthew GAYDOS
Xiaoqing GU
Agneta GULZ
Tore HOEL
Chris HOLDEN
Ulrich HOPPE
Ting-Chia HSU
Jun Song HUANG
Sridhar IYER
Ming-Fong JAN
Jiyou JIA
Greg KESSLER
Beaumie KIM
Agnes KUKULSKA-HULME
Chui-Pin LIN
Hiroyuki MITSUHARA
Xavier OCHOA
Ma. Mercedes T. RODRIGO
Pratim SENGUPTA
Jin Gon SHON
Daner SUN
Peppi TAALAS
Lung-Hsiang WONG
Chengjiu YIN
i-3

1 MESSAGES
Message from the Conference Chair
On behalf of the organizing committee, I would like to extend my warm welcome to all delegates of
the 24th International Conference on Computers in Education (ICCE) 2016, held for the very first time
in India. This year, the conference is held in Mumbai — a beautiful city, rich in heritage and culture.
Building on the continuous success of the conference series in recent years, the program aims to play
the paramount role of connecting researchers in the Asia-Pacific region and beyond with international
research communities to disseminate and share new ideas, taking into consideration the various local
contexts and global impacts. This crucial role is reflected well in the conference theme of ICCE 2016
— “Think Global Act Local: Contextualizing Technology-Enhanced Education”.
Three outstanding keynote speakers will share their insights across varying areas in the field of
computers in education. They are 1). Deepak B. Pathak from the Indian Institute of Technology
Bombay, India who will discuss about MOOCs and how a hybrid methodology where the benefits of
online learning and the conventional face-to-face educational systems are combined to enhance
learning; 2). Nikol Rummel from the Ruhr-University Bochum, Germany who will highlight the
importance of moving towards a Utopian future for CSCL by focusing on the need to carry out
rigorous empirical research and engage in related theory-building towards a comprehensive
instructional framework for CSCL; 3). Bruce McLaren from the Carnegie Mellon University, USA
who will talk about learning with educational games and provide some answers whether it is all hype
or supported by evidence. He will share some findings of a study conducted among middle school
students who learned about decimals by playing Decimal Point. In addition, there are four equally
exciting theme-based talks — 1). “Technology Enhanced Language Learning in China” by Jiyou Jia
from the Graduate School of Education, Peking University, China; 2). “Informal Learning with
Mobile Devices: Issues and Challenges” by Wenli Chen from the National Institute of Education,
Nanyang Technological University, Singapore; 3). “Conversation-Based Social Network Game
Design” by Ben Chang from the Graduate Institute of Learning and Instruction, National Central
University, Taiwan; 4). “Lessons Learned from Building a Reference System for Learning Analytics”
by Jaeho Lee from the University of Seoul, Korea. These presentations capture the essence of the
aforesaid conference theme and will surely act as catalysts to transform the learning environments and
inspire us to re-think the roles of technological tools, pedagogical strategies and innovative theories.
Indeed, organizing such a large-scale conference requires the concerted efforts and unwavering
support from the conference organizing committee members and conference paper reviewers. To
i-4

recognize these amazing efforts and support, their names are listed in the proceedings. I would also
like to take this opportunity to record my sincerest appreciation to all the kind individuals who have
rendered their help in every possible way to make this conference a reality. I am also grateful to all
the paper authors and registered participants for their exciting academic contributions to the fruitful
intellectual exchange in this conference. I hope all delegates will have further opportunities to forge
new friendships and professional collaborations, and to leave Mumbai—a thriving cosmopolitan,
multi-cultural city—with fond and everlasting memories.
Thank you!
Su Luan WONG (Conference Chair)
University Putra Malaysia
Malaysia
i-5
Message from Local Organizing Committee Chairs
It is a great pleasure to welcome you to the 24th International Conference on Computers in Education
(ICCE2016). ICCE2016 is being held in the Indian Institute of Technology (IIT) Bombay, Mumbai,
India. Established in 1958, IIT Bombay was the second IIT to be setup and has a rich tradition of
pursuing excellence and has continually re-invented itself in terms of academic programmes and
research infrastructure. IIT Bombay has about 650 faculty members currently, and about 50,000
students have graduated till date. IIT Bombay hosts several international conferences throughout each
year. We are honored to hold ICCE2016 at IIT Bombay. We hope that all participants enjoy not only
the conference but also the beautiful campus.
The conference series of ICCE is organized by APSCE. In ICCE2016, we worked particularly with
the executive committee of APSCE. We greatly benefited from their valuable advice. In addition, we
would like to warmly acknowledge the financial support of corporate sponsors: Next Education India
Pvt. Ltd., and Educational Initiatives Pvt. Ltd., and of government sponsor: Ministry of Human
Resources and Development, through the National Mission on Education through ICT projects being
carried out at IIT Bombay. This support was crucial to enable a large number of participants from
Indian Academia to attend the conference. Without the support from these sponsors, this conference
would not have been a success. We are also deeply thankful to the many student volunteers and staff
volunteers from IIT Bombay, who have unstintingly given their time to ensure the success of
ICCE2016.
Finally, we cordially welcome all of you to IIT Bombay, Mumbai, India. We believe your
participation and contribution to ICCE2016 is crucial make it productive and successful. We also
hope that you enjoy not just the conference and campus, but also other parts of Mumbai and India, to
gain a wonderful experience.
November 2016
LOC Co-chairs
Sridhar Iyer Sahana Murthy
i-6
Message from the International Program Coordination Chairs
The International Conference on Computers in Education (ICCE) is an annual conference series
encompassing a broad range of issues related to using Information and Communication Technology
(ICT) for education, organized by the Asia-Pacific Society for Computers in Education (APSCE).
ICCE 2016 is taking place in Mumbai, India from 28 November to 2 December 2016. It aims to bring
together researchers from all over the world to share and exchange research and to develop and
deploy new ideas that span the field of Computers in Education. Following the tradition of previous
conferences in this series, ICCE 2016 is organized as a meta-conference where there are seven sub-
conferences focusing on specialized themes. Each sub-conference is organized by a program
committee appointed by the respective Special Interest Group (SIG – see
http://www.apsce.net/sigs_list.php?id=1026). These sub-conferences are:
C1: ICCE Conference on Artificial Intelligence in Education/Intelligent Tutoring System (AIED/ITS)
and Adaptive Learning (AL)
C2: ICCE Conference on Computer-supported Collaborative Learning (CSCL) and Learning Sciences
(LS)
C3: ICCE Conference on Advanced Learning Technologies (ALT), Learning Analytics and Digital
Infrastructure
C4: ICCE Conference on Classroom, Ubiquitous, and Mobile Technologies Enhanced Learning
(CUMTEL)
C5: ICCE Conference on Digital Game and Digital Toy Enhanced Learning and Society (GTEL&S)
C6: ICCE Conference on Technology Enhanced Language Learning (TELL)
C7: ICCE Conference on Practice-driven Research, Teacher Professional Development and Policy of
ICT in Education (PTP)
The International Program Committee consists of a strong and dedicated team that includes the
Conference Chair, the Program Coordination Chair and Co-Chair, seven executive Sub-Conference
Chairs and 305 experts in the field of Computers in Education from 39 different countries or
economies. Former ICCE local organizing and program coordination chairs have played the role of
consultants in overseeing the conference organization process. The conference received a total of 154
papers (106 full, 32 short, and 16 posters) from 24 different countries or economies. Table 1 provides
the submissions by country of the first author in individual paper. All papers were subjected to a
rigorous review process by 3-4 reviewers from the respective Sub-Conference program committees.
After the reviews are completed a meta-review was provided for each paper. 623 reviews and meta-
reviews were received in total. After a discussion period within the individual program committees led
by the Sub-Conference Executive Co-Chairs and Co-Chairs, recommendations were made to the
Coordination Committee Chair and Co-Chair, who oversee the review process and quality for all sub-
conferences. This resulted in 32 full, 47 short, and 42 poster acceptances across all of the sub-
i-7
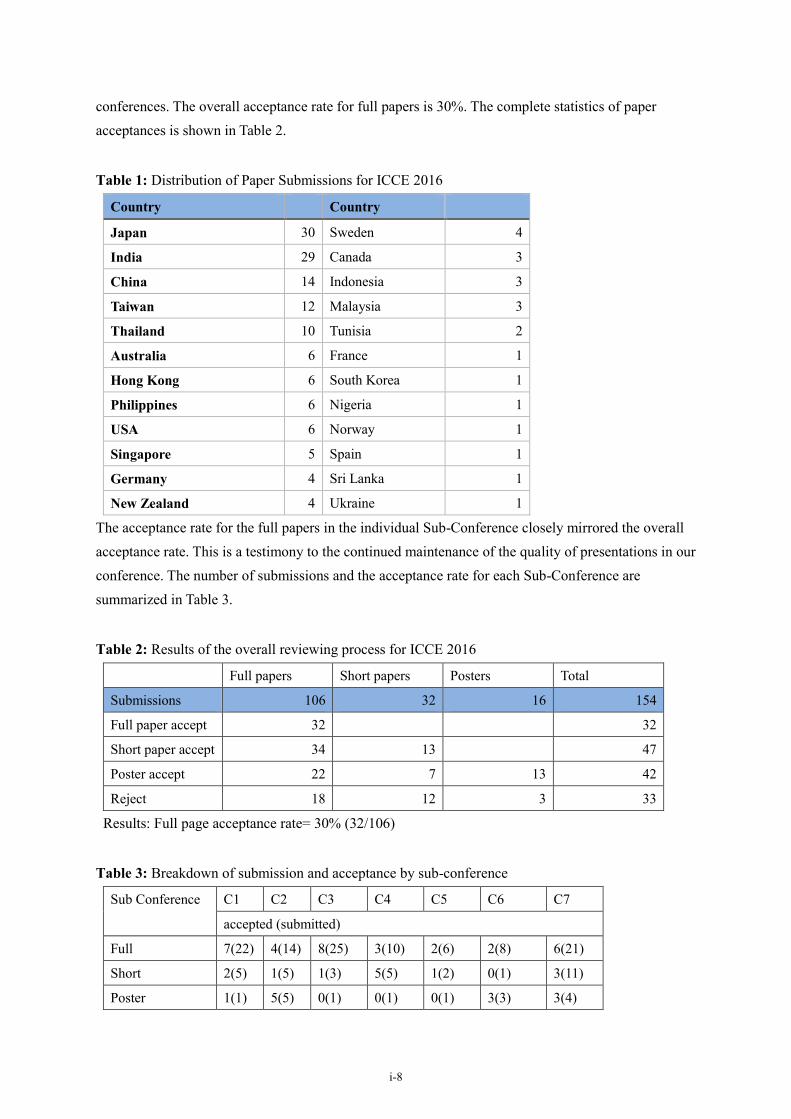
conferences. The overall acceptance rate for full papers is 30%. The complete statistics of paper
acceptances is shown in Table 2.
Table 1: Distribution of Paper Submissions for ICCE 2016
Country Country
Japan 30 Sweden 4
India 29 Canada 3
China 14 Indonesia 3
Taiwan 12 Malaysia 3
Thailand 10 Tunisia 2
Australia 6 France 1
Hong Kong 6 South Korea 1
Philippines 6 Nigeria 1
USA 6 Norway 1
Singapore 5 Spain 1
Germany 4 Sri Lanka 1
New Zealand 4 Ukraine 1
The acceptance rate for the full papers in the individual Sub-Conference closely mirrored the overall
acceptance rate. This is a testimony to the continued maintenance of the quality of presentations in our
conference. The number of submissions and the acceptance rate for each Sub-Conference are
summarized in Table 3.
Table 2: Results of the overall reviewing process for ICCE 2016
Full papers Short papers Posters Total
Submissions 106 32 16 154
Full paper accept 32 32
Short paper accept 34 13 47
Poster accept 22 7 13 42
Reject 18 12 3 33
Results: Full page acceptance rate= 30% (32/106)
Table 3: Breakdown of submission and acceptance by sub-conference
Sub Conference C1 C2 C3 C4 C5 C6 C7
accepted (submitted)
Full 7(22) 4(14) 8(25) 3(10) 2(6) 2(8) 6(21)
Short 2(5) 1(5) 1(3) 5(5) 1(2) 0(1) 3(11)
Poster 1(1) 5(5) 0(1) 0(1) 0(1) 3(3) 3(4)
i-8

In addition to existing program components including full papers, short papers, posters, Work-in-
Progress Posters (WIPP), panels, tutorials, interactive events, and Doctoral Student Consortia (DSC),
ICCE2016 adds two new program components: Early Career Workshop (ECW) that aims to offer an
opportunity for early career scholars in the learning technology field to discuss their research, early-
career challenges and career directions with peers and senior advisors, and Extended Summary (ES),
which aims to respond to raising concerns about overlapping conference and journal papers and
provide opportunities for authors to pitch main ideas and key results. ICCE2016 has also formalized
the call for panel and review process and the final versions of panels are included in the main
proceedings. In addition, the Workshop papers, ECW papers ES papers, and DSC papers are
published in separate proceedings with their own ISBN numbers.
Pre-conference events are held on the first two days of the conference, including 7 workshops, 4
tutorials, the Early Career Workshop that includes an academic and professional development panel
where the early career scholars receive advice and guidance from established researchers in the
learning technology field, and the Doctoral Student Consortia (DSC) that includes 7 doctoral student
presentations followed by mentoring activities by experts in the respective research areas.
We would like to thank all who have contributed to making ICCE2016 a successful conference. First
of all, we would like to thank all paper authors for your contributions and for choosing ICCE 2016 as
the outlet to present your research. We would also like to thank the IPC members and the Executive
Chairs who undertook the responsibility of reviewing and selecting papers representing research of
high quality. Specially thanks to our keynote and invited speakers for accepting our invitations and
bring inspiring research to ICCE2016 participants. The Local Organization Committee deserves a big
thank you for their hard work under the tremendous time pressure.
We hope that all participants will find the activities in ICCE2016 interesting and inspiring, and have
opportunities to meet old friends and establish new professional collaborations. Furthermore, we hope
that participants will enjoy not only the academic activities, but also the vibrant and exciting culture
experiences in Mumbai.
Program Coordination Chairs:
Weiqin CHEN (Chair)
Oslo and Akershus University College of Applied Sciences,
University of Bergen
Norway
i-9

Jie Chi YANG (Co-Chair)
National Central University
Taiwan
Sahana MURTHY (Co-Chair)
Indian Institute of Technology Bombay
India
i-10

2 ORGANIZATION
ORGANIZED BY:
Asia Pacific Society for Computers in Education
HOSTED BY:
Indian Institute of Technology Bombay, India
CONFERENCE CHAIR:
Su Luan WONG, University Putra Malaysia, Malaysia
INTERNATIONAL PROGRAM COMMITTEE (IPC)
IPC Coordination Chair:
Weiqin CHEN, Oslo and Akershus University College of Applied Sciences,
University of Bergen, Norway
Co-Chair: Jie Chi YANG, National Central University, Taiwan
Sahana MURTHY, Indian Institute of Technology Bombay, India
Workshop/Tutorial/Interactive Event Coordination Chair:
Thepchai SUPNITHI, National Electronics and Computer Technology Center, Thailand
Co-Chairs: Ahmad Fauzi bin Mohd AYUB, University Putra Malaysia, Malaysia
Madhuri MAVINKURVE, Thakur College of Engineering & Technology, India
Tomoko KOJIRI, Kansai University, Japan
Poster Coordination Chair:
Bo JIANG, Zhejiang University of Technology, China
Co-Chairs: Chengjiu YIN, Kyushu University, Japan
Jayakrishnan WARRIEM, IIT Bombay, India
Doctoral Student Consortia Co-Chairs:
Ben CHANG, National Central University, Taiwan
Yanjie Song, The Education University of Hong Kong, Hong Kong
M. Sasikumar, IIT Bombay, India
Gautam BISWAS, Vanderbilt University, USA
i-11

Wenli CHEN, Nanyang Technological University, Singapore
Early Career Workshop Co-Chairs:
Lung-Hsiang WONG, Nanyang Technological University, Singapore
Tanja MITROVIC, University of Canterbury, New Zealand
Hyo-Jeong SO, Ewha Womans University, South Korea
Panel Co-Chairs:
Chen-Chung LIU, National Central University, Taiwan
Morris JONG, Chinese University of Hong Kong, Hong Kong
Extended Summary Coordination Chair:
Jie Chi Yang, National Central University, Taiwan
Merit Scholarship Committee Co-Chairs:
Yanjie SONG, The Hong Kong Institute of Education, Hong Kong
Jon MASON, Charles Darwin University, Australia
Award Committee Members:
Tsukasa HIRASHIMA, Hiroshima University, Japan
Tore HOEL, Oslo and Akershus University College of Applied Sciences, Norway
Ulrich HOPPE, University Duisburg-Essen, Germany
Siu Cheung KONG, The Hong Kong Institute of Education, Hong Kong
Chee-Kit LOOI, Nanyang Technological University, Singapore
Hiroaki OGATA, Kyushu University, Japan
Ma. Mercedes T. RODRIGO, Ateneo De Manila University, Philippines
Chin-Chung TSAI, National Taiwan University of Science and Technology, Taiwan
Jayakrishnan WARRIEM, IIT Bombay, India
Theme-based Conference Program Co-Chairs:
C1: ICCE Conference on Artificial Intelligence in Education/Intelligent Tutoring System
(AIED/ITS) and Adaptive Learning (AL)
Ma. Mercedes T. RODRIGO, Ateneo De Manila University, Philippines (Executive chair)
Michelle P. BANAWAN, Ateneo de Davao University, Philippines
Gautam BISWAS, Vanderbilt University, USA
Agneta GULZ, Lund University, Sweden
C2: ICCE Conference on Computer-supported Collaborative Learning (CSCL) and Learning
Sciences (LS)
i-12

Beaumie KIM, University of Calgary, Canada (Executive chair)
Jun Song HUANG, Nanyang Technological University, Singapore
Chui-Pin LIN, National Hsinchu University of Education, Taiwan
Pratim SENGUPTA, University of Calgary, Canada
C3: ICCE Conference on Advanced Learning Technologies (ALT), Learning Analytics and Digital
Infrastructure
Tore HOEL, Oslo and Akershus University College of Applied Sciences, Norway (Executive chair)
Ulrich HOPPE, University of Duisburg-Essen, Germany
Xavier OCHOA, Escuela Superior Politécnica del Litoral, Ecuador
Jin Gon SHON, Korea National Open University, South Korea
C4: ICCE Conference on Classroom, Ubiquitous and Mobile Technologies Enhanced Learning
(CUMTEL)
Hui-Chun CHU, Soochow University, Taiwan (Executive chair)
Chengjiu YIN, Kyushu University, Japan (Executive chair)
Nelson BALOIAN, University of Chile, Chile
Xiaoqing GU, East China Normal University, China
C5: ICCE Conference on Digital Game and Digital Toy Enhanced Learning and Society (GTEL&S)
Ming-Fong JAN, National Central University, Taiwan (Executive chair)
Muhammet DEMIRBILEK, Suleyman Demirel University, Turkey
Hiroyuki MITSUHARA, University of Tokushima, Japan
Chris HOLDEN, University of New Mexico, United States
Matthew GAYDOS, The State University of New York, South Korea
C6: ICCE Conference on Technology Enhanced Language Learning (TELL)
Lung-Hsiang WONG, Nanyang Technological University, Singapore (Executive chair)
Ting-Chia HSU, National Taiwan Normal University, Taiwan
Jiyou JIA, Peking University, China
Greg KESSLER, Ohio University, USA
Agnes KUKULSKA-HULME, The Open University, UK
Peppi TAALAS, Jyväskylä University, Finland
C7: ICCE Conference on Practice-driven Research, Teacher Professional Development and Policy
of ICT in Education (PTP)
Xiaoqing GU, East China Normal University, China (Executive chair)
i-13
Alba Garcia BARRERA, Madrid Open University, Spain
Daner SUN, Hong Kong Institute of Education, Hong Kong
Sridhar IYER, Indian Institute of Technology Bombay, India
Consultants:
Bo JIANG, Zhejiang University of Technology, China
Akihiro KASHIHARA, The University of Electro-Communications, Japan
Hiroaki OGATA, Kyushu University, Japan
Lung-Hsiang WONG, Nanyang Technological University, Singapore
Special Interest Groups (SIG) Chairs:
AIED/ITS/LS: Yusuke HAYASHI, Hiroshima University, Japan
CSCL/LS: Seng Chee TAN, Nanyang Technological University, Singapore
ALT/OC/S: Tore HOEL, Oslo and Akershus University College of Applied Sciences, Norway
CUMTEL: Xiaoqing GU, Eastern China Normal University, China
GTEL&S: Maiga CHANG, Athabasca University, Canada
TELL: Masanori YAMADA, Kyushu University, Japan
PTP: Hiroaki OGATA, Kyushu University, Japan
DICTAP: Md Khambari MAS NIDA, University Putra Malaysia, Malaysia
Educational Use of Problems: Tsukasa HIRASHIMA, Hiroshima University, Japan
LA&EDM: Weiqin CHEN, Oslo and Akershus University College of Applied Sciences, University
of Bergen, Norway
LOCAL ORGANIZING COMMITTEE (LOC)
Chairs Sridhar Iyer
Sahana Murthy
Sponsorship Co-Chair Deepak B Phatak
Finance Co-Chair Sridhar Iyer
Exhibition Co-Chair M. Sasikumar
Publicity Co-Chair Kannan Moudgalya
Academic Liaison Co-Chair Madhuri Mavinkurve
Local Arrangement Co-
chairs
Jayakrishnan Warriem
Mahendra Parmar
Printing & Design Ashutosh Raina (In-Charge)
Sameer Sahasrabudhe
Rwitajit Majumdar
i-14

Transportation Sanjay Kharat
Accommodation Hitesh Gawade (In-Charge)
Ajoy Raj
Technical and
Administrative Support
Ajit Mhatre (In-Charge)
Soumya Narayana
Website Prajish Prasad (In-Charge)
Kavya Alse
Social Media Shitanshu Mishra (In-Charge)
Vikram Vincent
Publicity and Events Anurag Deep (In-Charge)
Gargi Banerjee
Abhinav Anand
Pratidnya Hegdepatil
Lakshmi Ganesh
Anura Kenkre
Industry Outreach Kapil Kadam
Ashutosh Raina
Academic Outreach Mrinal Patwardhan
Rekha Ramesh
Anita Diwakar
Deepti Reddy
Food Aditi Kothiyal (In-Charge)
Gargi Banerjee
Registration Priti Ghuikar (In-Charge)
Kishore Bhuingal
Sarika Shivsharan
Registration Liaison Comet Solutions
i-15

C1 PC members
Dietrich Albert, TU Graz (KTI), Austria
Ryan Baker, Teachers College, Columbia University, USA
Ben Du Boulay, Informatics Department, University of Sussex, UK
Kritya Bunchongchit, Mahidol University International College, Thailand
Jose Luis Perez De La Cruz, Universidad de Malaga, Spain
Claude Frasson, University of Montreal, Canada
Shinobu Hasegawa, Japan Advanced Institute of Science and Technology, Japan
Tsukasa Hirashima, Hiroshima University, Japan
Ulrich Hoppe, University Duisburg-Essen, Germany
Tomoya Horiguchi, Kobe University, Japan
Paul Inventado, Carnegie Mellon University, USA
Seiji Isotani, University of Sao Paulo, Brazil
Akihiro Kashihara, Univ. of Electro-Communications, Japan
Tatsuhiro Konishi, Shizuoka University, Japan
Chad Lane, University of Illinois, USA
Lydia Lau, University of Leeds, UK
Nguyen-Thinh Le, Humboldt Universität zu Berlin, Germany
Chi-Jen Lin, Fo Guang University, Taiwan
Tatsunori Matsui, Waseda University, Japan
Moffat Matthews, Computer Science & Software Engineering, University of Canterbury, Christchurch, New
Zealand
Tanya Mitrovic, Intelligent Computer Tutoring Group, University of Canterbury, Christchurch, New Zealand
Kazuhisa Miwa, Nagoya University, Japan
Riichiro Mizoguchi, Japan Advanced Institute of Science and Technology, Japan
Norwati Mustapha, University Putra Malaysia, Malaysia
Jaclyn Ocumpaugh, Teachers College, Columbia University, USA
Elvira Popescu, University of Craiova, Romania
Sagaya Sabestinal, UNITAR International University, Malaysia
M. Sasikumar, Research Director of CDAC, India
Sergey Sosnovsky, CeLTech, DFKI, Germany
Kazuhisa Seta, Osaka Prefecture University, Japan
Merlin Suarez, De La Salle University, Philippines
Amali Weerasinghe, The University of Adelaide, Australia
Diego Zapata, Educational Testing Service, USA
Maria San Pedro, Teachers College Columbia University, USA
Matthew Jadud, Berea College, USA
Kasia Muldner, Carleton University, Canada
Scotty Craig, Arizona State University, Polytechnic, USA
i-16

Olga Santos, aDeNu Research Group, UNED, Spain
C2 PC members
Jun OSHIMA, Shizuoka University, Japan
Peter REINMANN, University of Sydney, Australia
Chee Kit LOOI, Nanyang Technological University, Singapore
Chen-Chung LIU, National Central University, Taiwan
Ronghuai HUANG, Beijing Normal University, China
Xiaoqing GU, East China Normal University, China
Rose LIANG, National University of Singapore, Singapore
Joyce Hwee Ling KOH, Nanyang Technological University, Singapore
Seng Chee TAN, Nanyang Technological University, Singapore
Timothy Khe Foon HEW, The University of Hong Kong, Hong Kong
Huang-Yao HONG, National Chengchi University, Taiwan
Gwendoline Choon Lang QUEK, Nanyang Technological University, Singapore
Gale Parchoma, University of Calgary, Canada
Jianhua ZHAO, South China Normal University, China
Qiyun WANG, Nanyang Technological University, Singapore
Doris CHOY, Nanyang Technological University, Singapore
Yun WEN, The Swiss Federal Institute of Technology, Switzerland
Madhuri Mavinkurve, Indian Institute of Technology Bombay, India
Mrinal Patwardhan, Indian Institute of Technology Bombay, India
Sanjay Chandrasekharan, Tata Institute of Fundamental Research, India
Yotam Hod, University of Haifa, Israel
Shiang-Kwei Wang, New York Institute of Technology, USA
Johanna Pöysä-Tarhonen, Finnish Institute for Educational Research, Finland
Youngju Lee, Korea National University of Education, Korea
Dani Ben-Zvi, University of Haifa, Israel
Daniel Bodemer, University Duisburg-Essen, Germany
Rosemary Luckin, The London Knowledge Lab, UK
Jan-Willem Strijbos, Ludwig-Maximilians-Universität München, Germany
Moon-Heum Cho, Sungkyunkwan University, Korea
Sahana Murthy, Indian Institute of Technology Bombay, India
Suneeta Pathak, Communication Analytics Pte. Ltd., Singapore
C3 PC members
Irene CHEN, National Changhua University of Education, Taiwan
Jean-Noel COLIN, University of Namur, Belgium
Ingo DAHN, University of Koblenz, Germany
i-17

Dai GRIFFITS, University of Bolton, United Kingdom
Seungyeon HAN, Hanyang Cyber University, Korea
Yih-Ruey JUANG, Jinwen University of Science and Technology, Taiwan
Tatsuhiro KONISHI, Shizuoka University, Japan
Eugenijus KURILOVAS, Vilnius University, Lithuania
Lam-for KWOK, City University of Hong Kong, Hong Kong
Chien-Sing LEE, Universiti Tunku Abdul Rahman, Malaysia
Ching-Jung LIAO, Chung Yuan Christian University, Taiwan
Kin Chew LIM, SIM University, Singapore
Jon MASON, Charles Darwin University, Australia
Kenji MATSUURA, Tokushima University, Japan
Kuo-Liang OU, National Hsinchu University of Education, Taiwan
Jan Pawlowski, Hochschule Ruhr West University of Applied Sciences, Germany
Luis ANIDO RIFON, University of Vigo, Spain
Manuel Caeiro RODRIGUEZ, University of Vigo, Spain
Eunice SARI, University of Western Australia, Australia
Hitoshi SASAKI, Takushoku University, Japan
Marcus SPECHT, the Open University of the Netherlands, Netherlands
Riina VUORIKARI, Institute for Prospective Technological Studies, European Commission, Belgium
Maggie M. WANG, The University of Hong Kong, Hong Kong
C4 PC members
Morris JONG, The Chinese University of Hong Kong, Hong Kong
Yanjie SONG, Hong Kong Institute of Education, Hong Kong
Ray Yueh-Min HUANG, National Cheng Kung University, Taiwan
Tzung-Shi CHEN, National University of Tainan, Taiwan
Gwo-Jen HWANG, National University of Science and Technology, Taiwan
Yih-Ruey JUANG, Jinwen University of Science and Technology, Taiwan
Chen-Chung LIU, National Central University, Taiwan
Jun-Ming SU, National Taiwan Jiao Tung University, Taiwan
Hiroaki OGATA, University of Tokushima, Japan
Noriko UOSAKI, Osaka University, Japan
Su CAI, Beijing Normal University, China
Qun JIN, Waseda University, Japan
Yuichi ONO, University of Tsukuba, Japan
Ting-Chia (Ching-Kun) HSU, National Taiwan Normal University, Taiwan
Ping LI, The Hong Kong Institute of Education
TingTing WU, National Yunlin University of Science & Technology, Taiwan
JuLing SHIH, National University of Tainan, Taiwan
i-18

Gi-Zen LIU, National Cheng Kung University, Taiwan
Kai-Hsiang YANG, National Taipei University of Education, Taiwan
Bo JIANG, Zhejiang University of Technology, China
Gwo-Haur HWANG, Ling Tung University, Taiwan
Tosti CHIANG. National Taiwan Normal University, Taiwan
Po-Han WU, National Taipei University of Education, Taiwan
Ivica BOTICKI, University of Zagreb, Croatia
Oscar LIN, Athabasca University, Canada
Kinshuk, Athabasca University, Canada
Daniel Spikol, Malmo University, Sweden
Sachio Hirokawa, Kyushu University, Japan
Tomoo Inoue, University of Tsukuba, Japan
Serge Garlatti, Telecom Bretagne, France
Yoshiaki Hada, The Open University of Japan, Japan
Shengquan Yu, Beijing Normal University, China
C5 PC members
Fernández-Manjón BALTASAR, Universidad Complutense de Madrid, Spain
Tak-Wai CHAN, National Central University, Taiwan
Ben CHANG, National Chiayi University, Taiwan
Maiga CHANG, Athabasca University, Canada
Ming-Puu CHEN, National Taiwan Normal University, Taiwan
Nian-Shing CHEN, National Sun Yat-Sen University, Taiwan
Zhi-Hon CHEN, Yuan-Ze University, Taiwan
John I-Tsun CHIANG, National Changhua University of Education, Taiwan
Tsung-Yen CHUANG, National University of Tainan, Taiwan
Huei-Tse HOU, National Taiwan University of Science and Technology, Taiwan
Jun HU, Eindhoven University of Technology, Netherlands
Gwo-Jen HWANG, National Taiwan University of Science and Technology, Taiwan
Morris S. Y. JONG, The Chinese University of Hong Kong, Hong Kong
Fong-Lok LEE, The Chinese University of Hong Kong, Hong Kong
Hao-Chiang Koong LIN, National University of Tainan, Taiwan
Wolfgang MUELLER, University of Education Weingarten, Germany
Chuen-Tsai SUN, National Chiao Tung University, Taiwan
Hiroyuki TARUMI, Kagawa University, Japan
Christopher WALSH, Torrens University Australia and The Open University (UK), Australia & UK
Kuo-Liang Ou, National HsinChu University of Education, Taiwan
Chang-Yen Liao, National Central University, Taiwan
Chung-Yuan Hsu, National Pingtung University, Taiwan
i-19

Ek Ming Tan, The English Language Institute of Singapore
Susan Gwee, The English Language Institute of Singapore
Jungmin Kwon, Seoul National University, Korea
Chun-Yi Shen, Tamkang University, Taiwan
Ju-Ling Shih, National University of Tainan, Taiwan
Yu-Jen Hsu, National Chiayi University, Taiwan
C6 PC members
Rebecca BABCOCK, University of Texas of the Permian Basin, USA
Emerita BAÑADOS, Universidad de Concepción, Chile
Alex BOULTON, Nancy University, France
Ching Sing CHAI, Nanyang Technological University, Singapore
Mei Mei CHANG, National Pingtung University of Science and Technology, Taiwan
Thierry CHANIER, Université Blaise Pascal, France
Jozef COLPAERT, University of Antwerp, Belgium
Liliana CUESTA, Universidad de La Sabana, Columbia
Vera Lucia Menezes DE OLIVEIRA PAVIA, Universidade Federal de Minas Gerais, Brazil
Piet DESMET, KU Leuven and KU Leuven KULAK, Belgium
Lara DUCATE, University of South Carolina, USA
Gülcan ERÇETIN, Boğaziçi University, Turkey
Yoshiko GODA, Kumamoto University, Japan
Robert GODWIN-JONES, Virginia Commonwealth University, USA
Hock Huan GOH, Singapore Centre for Chinese Language, Singapore
Scott GRANT, Monash University, Australia
Regine HAMPEL, The Open University, UK
Mirjam HAUCK, The Open University, UK
Chia-Ling HSIEH, National Taiwan Normal University, Taiwan
Phil HUBBARD, Stanford University, USA
Hsiu-Ting HUNG, National Kaohsiung First University of Science and Technology, Taiwan
Nicole KENG, University of Vaasa, Finland
Claire KENNEDY, Griffith University, Australia
Yu-Min KU, National Central University, Taiwan
Ho Cheong LAM, Hong Kong Institute of Education, Hong Kong
Michael LEVY, University of Queensland, Australia
Jia (Joan) LI, University of Ontario Institute of Technology, Canada
Li LI, Singapore Centre for Chinese Language, Singapore
Meei-Ling LIAW, National Taichung University, Taiwan
Tsun-Ju LIN, Kainan University, Taiwan
Chao-Hong LIU, National Cheng Kung University, Taiwan
i-20

Yi-Chun LIU, Chia Nan University of Pharmacy and Science, Taiwan
Lara LOMICKA-ANDERSON, University of South Carolina, USA
Caesar LUN, City University of Hong Kong, Hong Kong
François MANGENOT, Université Grenoble Alpes, France
Carlos Rubín MONTORO SANJOSÉ, University of Guanajuato, Mexico
Teadira PÉREZ, University of Los Andes, Venezuela
Thomas ROBB, Kyoto Sangyo University, Japan
Chee Lay TAN, Singapore Centre for Chinese Language, Singapore
Siew Ming THANG, Universiti Kebangsaan Malaysia, Malaysia
Ka-Ho TSE, Hong Kong Institute of Education, Hong Kong
Meng-Ping TSUEI, National Taipei University of Education, Taiwan
Noriko UOSAKI, Osaka University, Japan
Takafumi UTASHIRO, Hokkai Gakuen University, Japan
Jane VINTHER, University of Southern Denmark, Denmark
Yuping WANG, Griffith University, Australia
Yun WEN, Singapore Centre for Chinese Language, Singapore
Juan WU, Beijing Normal University, China
Junhong XIAO, Shantou Radio & Television University, China
Tim XIE, California State University, USA
Masanori YAMADA, Kyushu University, Japan
Shelley YOUNG, National Tsinghua University, Taiwan
Liming ZHANG, University of Macau, Macau
Additional reviewers
Wenjin BO, University of Hong Kong, Hong Kong
Wan-Chen CHANG, National Central University, Taiwan
Kae NAKAYA, University of Tokyo, Japan
Yen-Ning SU, National Cheng Kung University, Taiwan
Yuh Huann TAN, Singapore Centre for Chinese Language, Singapore
C7 PC members
Sevil AKAYGUN, Bogazici University, Turkey
Yiwei CAO, Information Multimedia Communication AG, Germany
Yam San CHEE, Nanyang Technological University, Singapore
Pearl CHEN, California State University, USA
Kun-Hung CHENG, National Chiao Tung University, Taiwan
Yu-Hui Ching, Boise State University, USA
Yen-Lin CHIU, National Taiwan University of Science and Technology, Taiwan
Huang-Yao Hong, National Chengchi University, Taiwan
i-21

Joyce Hwee Ling KOH, Nanyang Technological University, Singapore
Shu-Sheng LIAW, China Medical University, Taiwan
Chia-Chin LIN, National Kaohsiung Normal University, Taiwan
Will MA, Hong Kong Shue Yan University, Hong Kong
Yongwu Miao, University Duisburg-Essen, China
Shu-chien PAN, Ohio University, USA
Patcharin PANJABUREE, Mahidol University, Thailand
Monamorn PRECHARATTANA, Mahidol University, Thailand
Rustam SHADIEV, National Cheng Kung University, Taiwan
Niwat Srisawasdi, Khon Kaen University, Thailand
Katsuaki SUZUKI, Kumamoto University, Japan
Pei-Shan TSAI, National Pingtung University, Taiwan
Hsiao-Shen WANG, National Taicung University of Education, Taiwan
Shu-Ming WANG, Chinese Culture University, Taiwan
Chun-Wang Wei, Far East University, Taiwan
Dechawut WANICHSAN, Rambhai Barni Rajabhat University, Thailand
Gary K.W. WONG, The Hong Kong Institute of Education, Hong Kong
Su Luan WONG, University Putra Malaysia, Malaysia
Longkai WU, Nanyang Technological University, Singapore
Yau-yeun YEUNG, The Hong Kong Institute of Education, Hong Kong
Yuen Tak YU, City University of Hong Kong, Hong Kong
Hsiu-Ping YUEH, National Taiwan University, Taiwan
Yun WEN, Singapore Centre for Chinese Language, Singapore
Yushun LI, Beijing Normal University, China
Hui Jin, Shanghai International studies University, China
Bian Wu, East China Normal University, China
Xianqing Bao, Shanghai Normal University, China
Mingzhuo Liu, East China Normal University, China
Chao Zhang, Shanghai Normal University, China
Junjie Shang, Peking University, China
Jing Leng, East China Normal University, China
Madhuri Mavinkurve, Thakur College of engineering and technology, India
Vijay Raisinghani, NMIMS University, India
Rong Miao, Peking University, China
Xiang Feng, East China Normal University, China
Carlos MONGE LÓPEZ, University of Alcalá, Spain
MARTÍNEZ DE LA MUELA, International University of La Rioja (UNIR), Spain
Rocío GARRIDO MARTOS, Madrid Open University, Spain
Patricia GÓMEZ HERNÁNDEZ, University of Alcalá, Spain
i-22

Yayoi ANZAI, Aoyama Gakuin University, Japan
Kannan Moudgalya, Indian Institute of Technology Bombay, India
Seng Chee TAN, Nanyang Technological University, Singapore
Hsin-Chih LAI, Chang Jung Christian University, Taiwan
Charuni SAMART, Khon Kaen University, Thailand
Ying-Tien Wu, National Central University, Taiwan
Jinbao Zhang, Beijing Normal University, China
i-23
3 KEYNOTE AND INVITED
SESSIONS
KEYNOTE SPEAKER 1
Learning With Educational Games: Is it Just Hype or Supported by Evidence?
Bruce McLaren
Carnegie Mellon University, USA
Abstract
Do computer-based educational games lead to learning? While many people take this for granted, given
the obvious motivational characteristics of educational games, there is relatively limited scientific
evidence for learning with games. In this talk, I will discuss the rise and appeal of educational games,
as well as meta-analyses of educational game research that reveal the lack of evidence. I will also
discuss my own research in this area, in which my lab has uncovered some evidence for the benefits of
games in learning mathematics. We have developed and empirically tested an educational game called
Decimal Point, a game to help middle school students learn about decimals. I will present the results of
a recent study we did with the game, as well as some of the game and instructional design characteristics
that appear to have led to our results. More generally, I will discuss how the investigation of design
characteristics is critical in educational games research. Finally, I will summarize some directions
forward in educational games research.
i-24
KEYNOTE SPEAKER 2
Computer-Supported Collaborative Learning: Working Towards a Utopian Future
Nikol Rummel
Ruhr-University Bochum, Germany
Abstract
Building on a recent position paper (Rummel, Walker & Aleven, 2016), I will first contrast different
Dystopian and Utopian visions of the future of computer-supported collaborative learning (CSCL).
Against this background, I will discuss research that I see as important in working towards a Utopian
future for CSCL. In particular, I will argue that we need to carry out rigorous empirical research and
engage in related theory-building towards a comprehensive instructional framework for CSCL. This
framework will allow us to provide nuanced and flexible support to collaborative learners in computer-
based settings. The proposed research can build on prior work, which has produced several taxonomies
of support for collaborating students. These taxonomies identify dimensions such as the timing of
support (whether support is provided immediately or with some delay during the collaboration, or
before or after the collaboration), the psychological realm of support (cognitive, social, metacognitive,
motivational, affective), the mode of support (explicit or implicit), the locus of support (direct or
indirect), the target of support (group formation, domain knowledge, peer interaction, social skill), and
the type of support (guiding, challenging reflection, mirroring). However, as yet they fall short of
providing an integrated instructional framework that allows orchestrating support across the multiple
dimensions. Working towards such a framework will be one of the major challenges of our field in the
coming years.
Rummel, N., Walker, E. & Aleven, V. (2016). Different futures of adaptive collaborative learning
support. Journal of Artificial Intelligence in Education, 26(2), 784-795.
i-25
KEYNOTE SPEAKER 3
Main-Streaming MOOCs in India - A Hybrid Approach
Deepak B. Phatak
Indian Institute of Technology Bombay
Abstract
The established educational system of universities and colleges, continues to offer standard courses
taught in a conventional manner. These lead to a degree recognized by the society, and by the
prospective employers. MOOCs provide an opportunity to learn from best teachers from well-known
universities of the world. The grades and certificates obtained by learners are not yet recognized by
employers. University system thus has a monopoly on certification, and therefore has no incentive to
adopt MOOCs as a part of pedagogy.
I believe that the technology and methodology underlying MOOCs, have positive implications for
enhancing learning. I also believe that we now have a great opportunity to combine the benefits of
online learning and the conventional face-to-face educational system, by adopting a hybrid
methodology. The flipped classroom, for example, permits significant increase in the engagement level
of learners. This has been effectively tried and used by many.
This keynote describes the efforts made in India for creating such hybrid model. One approach was
used to train teachers on a large scale. Another effort was to let students from multiple colleges learn a
subject through both online and face-to-face simultaneously, with their grade determined by a
composite score from both online and regular university assessments – a key factor ensuring actual
adoption of MOOCs. A third pilot offered a blended MOOC for a skill course, where large scale
audio/video interaction was arranged, with local hand-holding provided to groups.
The talk will conclude with suggestions for speeding up the main-streaming process, including
enhanced scope, and need for addressing important policy issues.
i-26

THEME-BASED INVITED SPEAKER: ALT(C3)
Lessons Learned from Building a Reference System for Learning Analytics
Jaeho Lee
University of Seoul, Korea
Abstract
Over the past three years, an effort has been focused on the designing and building a reference system
for learning analytics to fulfill the requirements identified in ISO/IEC JTC 1/SC 36 Information
technology for learning, education and training, an international standards development committee.
Building learning analytics systems faces the challenge of being an open and extensible framework for
effective integration of various information and processes such as data collection, data storing and
processing, analyzing, visualization, and feedback to the learning activities. In this talk, I present the
lessons learned from our approach of designing a reference model and testing with the experimental
implementation to build an open and extensible learning analytics system.
i-27
THEME-BASED INVITED SPEAKER: CUMTEL (C4)
Informal learning with mobile devices: Issues and Challenges
Wenli CHEN
Nanyang Technological University, Singapore
Abstract
With increasing access to mobile devices, informal learning has been enhanced or extended across
multiple contexts and time scales. The mobile technologies proffer rapid access to information as well
as new means of assembling and communicating knowledge. Existing literature shows that while
informal learning is enhanced with mobile devices, studies conducted on the informal learning with
mobile technologies are not as prolific as those examining formal learning on mobile. The reasons for
the dearth in such studies include the difficulty in capturing informal learning when it occurs and no
commonly agreed key performance indicators against which to measure the progress of learners. In this
talk Dr Chen will share her insights on understanding how children use mobile technology to traverse
different learning contexts and harness a constellation of resources to make sense of their learning in
daily lives. She will discuss the pros and cons on technology-centric lens, learner-centric lens and the
socio-cultural lens to make sense of the rich complexities coalescing around the learners’ in-situ use of
mobile devices. Issues and challenges on methodology in researching informal learning on mobile will
be discussed.
i-28

THEME-BASED INVITED SPEAKER: GTEL&S(C5)
Conversation-Based Social Network Game Design Principles
Ben Chang
National Central University, Taiwan
Abstract
Conversations promoting learning through ideas exchange are central to our learning and fundamental
to being human. Based on people’s conversation abilities, conversation-based learning focuses on the
concept of considering learning a direct function of processes of social interaction and dynamic
argumentative talk between peers. Conversations can benefit online learning, and one source of
inspiration is social network where conversations have been an important strand. With mobile
technology evolution, social network—a social structure made up of a set of social actors, media, and
other interactions on the media between actors—is mature for online learning.
This talk contributes to the proposition that combining conversation-based learning and online social
networks can positively influence the learning behavior. To underpin this statement, we propose a series
of design principles that combine features of conversation-based learning and social network.
To demonstrate the conversation-based learning social network idea, a CoCoing.info social network
platform is established to support the collaborative online conversation-based learning in which the
conversational process is guided, and the students’ knowledge goals are set to be achieved.
We found that enriching conversations with social networks can improve learning towards the common
goal and existing expertise. Based on the findings from the CoCoing.info platform, a series of
conversation-based social network learning design principles, including personal goal setting, user-
generated content, awarding system, conversation process, cross-platform design, cloud computing,
gamification, and emoticons, will be elaborated in this talk.
i-29

THEME-BASED INVITED SPEAKER: TELL (C6)
Tell (Technology Enhanced Language Learning) in China
Jiyou Jia
Peking University, China
Abstract
Chinese as mother language and English as a foreign language are always two required examination
subjects from primary school to graduate study in China. With the popularity of wired or wireless
Internet,smart phones and personal computers, emerging technologies such as artificial intelligence,
virtual reality, big data and intelligent tutoring system have been widely applied in language teaching
and learning including Chinese, English and other languages from K-12 through higher education and
life-long learning. Both the government and the business sector invest much on TELL. This speech at
first will present the latest technologies used in China in large scale to facilitate the basic language skills
including vocabulary, grammar, listening, speaking, reading and writing: speech recognition and
synthesis, writing analysis and assistance, computer-assisted examination, machine translation, video
lectures and other open educational resource, and computer mediated communication. In the second
part, this speech will introduce the technology enhanced pedagogical change in China: MOOC or SPOC,
micro lectures and flipped classroom equipped with smart phones, tablet computer or instant responder,
as well as electronic white board or interactive television. At last this speech will address the problems
existing in TELL in China: lack of theoretical innovation, exam-oriented education, regional imbalance,
teacher training and so on.
i-30
4 PANELS PANEL 1 Technology Enhanced Learning of Thinking Skills (TELoTS)
ABSTRACT
The development of thinking skills has now been heralded by educators
worldwide as an urgent educational need. Thinking skills broadly are abilities
and processes that human beings apply for sense-making, reasoning, learning
and problem-solving. Many thinking skills in engineering and science are pan-
domain in nature, that is, they share common characteristics and have
applicability across domains. Examples include systems thinking,
computational thinking, design thinking, and so on. This panel aims to bring
together researchers to discuss issues such as: How can TELs be designed for
teaching and learning of pan-domain thinking skills in K16 classrooms? How
can such learning environments restructure traditional domains of knowledge?
How have these thinking skills been assessed? How can teachers and
practitioners adopt and appropriate new and innovative TEL environments as
part of their classroom practices? How transferable are these thinking skills
and strategies across topics and domains? In addition, the panel seeks to
stimulate a discussion with audience members on both paradigmatic and
pragmatic issues pertaining to research and practice in this area.
FACILITATOR Sahana MURTHY, Indian Institute of Technology Bombay, India
PANELISTS
Gautam BISWAS, Vanderbilt University, USA
Tsukasa HIRASHIMA, Hiroshima University, Japan
Sridhar IYER, Indian Institute of Technology Bombay, India
Madhuri MAVINKURVE, Thakur College of Engineering, India
Pratim SENGUPTA, University of Calgary, Canada
Chee-Kit LOOI, Nanyang Technological University, Singapore
i-31
Technology Enhanced Learning of Thinking
Skills (TELoTS)
Sahana MURTHYa*, Gautam BISWASb, Tsukasa HIRASHIMAc, Sridhar IYERa,
Madhuri MAVINKURVEd, Pratim SENGUPTAe, Chee-Kit LOOIf aIndian Institute of Technology Bombay, India
bVanderbilt University, USA cHiroshima University, Japan
dThakur College of Engineering, India eUniversity of Calgary, Canada
fNanyang Technological University, Singapore
Abstract: The development of thinking skills has now been heralded by educators worldwide
as an urgent educational need. Thinking skills broadly are abilities and processes that human
beings apply for sense-making, reasoning, learning and problem-solving. Many thinking skills
in engineering and science are pan-domain in nature, that is, they share common characteristics
and have applicability across domains. Examples include systems thinking, computational
thinking, design thinking, and so on. This panel aims to bring together researchers to discuss
issues such as: How can TELs be designed for teaching and learning of pan-domain thinking
skills in K16 classrooms? How can such learning environments restructure traditional domains
of knowledge? How have these thinking skills been assessed? How can teachers and
practitioners adopt and appropriate new and innovative TEL environments as part of their
classroom practices? How transferable are these thinking skills and strategies across topics and
domains? In addition, the panel seeks to stimulate a discussion with audience members on both
paradigmatic and pragmatic issues pertaining to research and practice in this area.
Keywords: Thinking skills, TEL environments
1. Introduction
Background
An important goal of education is that students need to develop thinking skills, or cognitive process
skills, that are widely regarded as abilities and processes that human beings apply for sense-making,
reasoning and problem-solving (Lipman, 2003). Thinking skills in engineering and science include
system thinking, computational thinking, design thinking, estimation, problem-posing and so on. Many
of these thinking skills are pan-domain in nature, that is, they share common characteristics that have
applicability across domains. Researchers have identified and characterized pan-domain thinking skills
in a variety of ways such as, and trans-disciplinary habits of mind (Mishra, Koehler & Henrikson, 2011),
21st Century skills (Pellegrino & Hilton, 2012), science process skills (Padilla, 1990), computational
thinking skills (Sengupta, Kinnebrew, Biswas, Basu & Clark, 2013; ISTE, 2014), Practices (NGSS) and
so on. Regardless of the education discipline, development of thinking skills has been shown to be
crucial for students’ success in the 21st century workplace (NAS, 2014).
While the importance of thinking skills has been well-established, its teaching and learning is
complex. Learners do not automatically develop thinking skills while learning content; thus thinking
skills need to be explicitly addressed. Research shows that the development of complex abilities such
as design thinking and computational thinking and modeling necessitates careful technological and
pedagogical design (Sengupta et al., 2013; Grover & Pea, 2013). A particularly relevant finding in the
literature is the difficulties faced by learners and teachers in learning and teaching both disciplinary
knowledge and these complex skills (e.g., Sherin, diSessa & Hammer, 1993; Guzdial, 1994; Basu, et
al., 2016). Therefore, of central concern is the curricular integration of pan-domain thinking skills and
the more traditional disciplinary forms of knowledge and practices that are still the mainstay in K-16
classrooms. The proposed panel will present pedagogical frameworks, technological innovations,
curricular and assessment strategies to address this issue.
i-32
Aims of this panel
Many TEL researchers have focused their efforts on developing learners’ thinking skills at various
educational levels and in various domains. Given the diversity of thinking skills addressed by
researchers, this panel aims to bring together researchers to discuss various issues such as:
What thinking skills are relevant in and across STEM disciplines, and can be integrated in the
curricula?
How can TEL environments be designed and assessed for teaching and learning of such pan-
domain thinking skills?
How can such complex learning environments restructure traditional domains of knowledge for
K12 and university classrooms?
How can K12 and university teachers adopt and appropriate new and innovative TEL
environments as part of their everyday practices?
What strategies have been used for assessment of thinking skills?
How transferable are these thinking skills across topics and domains
2. Abstracts of Individual Panelists’ Presentation
2.1 Pedagogical framework for developing thinking skills in TEL (Sahana MURTHY)
Emerging technology enhanced learning environments have high potential in developing learners’
thinking skills. While there exist various teaching-learning strategies and TEL environments to promote
thinking skills, there is a need for a pedagogical framework that helps the design of effective TEL
environments targeting learners’ development of thinking skills. This presentation describes one such
framework, called the TELoTS framework, which was developed using a design-based research
methodology. The framework prescribes a set of actions to be followed to design a TEL environment
for thinking skills and offers guidelines on implementing the actions.
2.2 Computational Thinking (Gautam BISWAS)
Science education in K-12 classrooms has been a topic of growing importance. The National Research
Council framework for K-12 science education includes several core science and engineering practices:
asking questions and defining problems, developing and using models, planning and carrying out
investigations, analyzing and interpreting data, using mathematics and computational thinking, and
constructing explanations and designing solutions. Several of these epistemic and representational
practices central to the development of expertise in STEM disciplines are also primary components of
Computational Thinking (CT). CT involves formulating and solving problems, designing systems, and
understanding human behavior by drawing on the fundamental concepts of computer science.
Specifically, CT promotes abstraction, problem representation, decomposition, simulation, and
verification practices. In this presentation, we will discuss TEL environments that support synergistic
learning of science and CT concepts in middle and high school STEM classrooms. We will also discuss
some challenges students faced in their learning and model-building tasks, and an adaptive scaffolding
approach that has been effective in helping students learn effective skills and strategies to support their
model building and model verification tasks.
2.3 Developing and assessing engineering design thinking (Madhuri MAVINKURVE)
An important goal of engineering education is to develop students’ design thinking skills. A key
challenge lies in defining what to teach as engineering design thinking, how to develop learners’ design
thinking, and how to assess this skill. In this presentation, we apply the TELoTS framework to discuss
the characterization and assessment of engineering design thinking skill in terms of competencies such
as: Structure Open Problem, Multiple Representation, Information Gathering, Convergent Thinking and
Divergent Thinking. We then discuss the design of a TEL environment we developed for Structure
Open Problem competency, and the role played by Learning Dialogs – interactive learning activities
supported by formative assessment. We focus on how metacognitive scaffolds in the form of self-
assessment rubrics promote student learning of thinking skills.
i-33
2.4 Externalization of Thinking Task as a Scaffolding Method (Tsukasa HIRASHIMA)
In order to promote thinking, externalization of thinking task is a promising scaffolding method. In this
presentation, from viewpoint of technology-enhanced learning, a framework of externalization of
comprehension task as kit-building task is introduced. In the framework, domain-specific information
structure oriented approach is adopted as a task modeling technique.
2.5 Computing in Practice: The Role of Subjective and Interpretive Experiences in Fostering Long-
term Computational Thinking in K12 Science (Pratim SENGUPTA)
Studies of scientists building models show that the development of scientific models involves
a great deal of subjectivity. However, science as experienced in school settings typically emphasizes an
overly objective and rationalistic view. In this paper, we argue for focusing on the development of
disciplined interpretation as an epistemic and representational practice that progressively deepens
students’ computational modeling in of students’ disciplined interpretations in terms of their
development of computational modeling as a way of seeing and doing science, and will discuss
implications of emphasizing, rather than ignoring such subjectivities for the democratization of science
and computing.
3. Discussion and Conclusion
The goal of developing thinking skills among students has been established to be important, and there
are several efforts towards this goal in the ICCE community. However, this effort is sometimes scattered
across different focal points (such as various disciplinary boundaries, specific technologies and so on).
This panel contributes to ICCE by providing a common platform for researchers working on this
important learning goal to discuss common issues and exchange ideas. The panel will consist of a
discussant (Chee-Kit Looi), who will synthesize the presentation of panelists and raise questions,
towards reaching a common understanding of technology enhanced learning of thinking skills.
References
Basu, S., Biswas, G., Sengupta, P., Dickes, A., Kinnebrew, J. S., & Clark, D. (2016). Identifying middle school
students’ challenges in computational thinking-based science learning. Research and Practice in Technology
Enhanced Learning, 11(1), 1-35.
Guzdial, M. (1994). Software‐realized scaffolding to facilitate programming for science learning. Interactive
Learning Environments, 4(1), 001-044.
ISTE. (2014). International Society for Technology in Education. Computational thinking for all, retrieved from
http://www.iste.org/learn/computational-thinking
Lipman, M. (2003). Thinking in education. Cambridge University Press.
Mishra, P., Koehler, M.J., & Henriksen, D. (2011). The Seven Trans-Disciplinary Habits of Mind: Extending the
TPACK Framework Towards 21st Century learning. Educational Technology, 51(2), 22-28.
NAS (2014). Preparing for 21st Century, the Education Imperative. Retrieved from
http://www.nas.edu/21st/education , June 2016.
Padilla, M.J. (1990). The Science Process Skills. Research Matters - to the Science Teacher, No. 9004.
Pellegrino, J. and Hilton, M. L. (2012). Editors, National Research Council, Education for Life and Work:
Developing Transferable Knowledge and Skills in the 21st Century. Washington, DC: The National
Academies Press
Sherin, B., diSessa, A. A., & Hammer, D. (1993). Dynaturtle revisited: Learning physics through collaborative
design of a computer model. Interactive Learning Environments, 3(2), 91-118.
Sengupta, P., Kinnebrew, J. S., Basu, S., Biswas, G., & Clark, D. (2013). Integrating computational thinking with
K-12 science education using agent-based computation: A theoretical framework. Education and
Information Technologies, 18(2), 351-380.
i-34

PANEL 2 Multiple Pathways of Developing Computational Thinking in K-12
Schools in Different Countries/Regions: Approaches, Challenges and
Research-based Solutions (CT)
ABSTRACT
The development of Computational Thinking (CT) has received much attention
in K-12 schools around the world. Computational Thinking skills are associated
with problem solving, reasoning and logic skills that all students should develop
in 21st century. Countries around world have recognized the importance of CT
and embarked multiple pathways in piloting CT curriculum in regional or
national education systems. In this panel, a group of researchers representing
different countries and regions will be invited to share their insights on the work,
research and implementation of CT in schools or outside of schools, and share
their research efforts that address common research questions of teaching CT.
We hope this panel will help inform researchers, policy makers, and school
practitioners in proposing approaches and addressing challenges in the adoption
and implementation of CT in schools.
FACILITATOR Chee-Kit LOOI, Nanyang Technological University, Singapore
PANELISTS
Gautam BISWAS, Vanderbilt University, USA
Shuchi GROVER, SRI International, USA
Ronghuai HUANG, Beijing Normal University, China
Sridhar IYER, IIT, Bombay, India
Siu-Cheung KONG, Education University of HK, China
Longkai WU, Nanyang Technological University, Singapore
i-35

Multiple Pathways of Developing
Computational Thinking in K-12 Schools in
Different Countries/Regions: Approaches,
Challenges and Research-based Solutions
Chee-Kit LOOIa*, Gautam BISWASb, Shuchi GROVERc, Ronghuai HUANGd, Sridhar IYERe,
Siu-Cheung KONGf & Longkai WUa aNanyang Technological University, Singapore
bVanderbilt University, USA cSRI International, USA
dBeijing Normal University, China eIIT, Bombay, India
fEducation University of Hong Kong, Hong Kong SAR, China
Abstract: The development of Computational Thinking (CT) has received much attention in
K-12 schools around the world. Computational Thinking skills are associated with problem
solving, reasoning and logic skills that all students should develop in 21st century. Countries
around world have recognized the importance of CT and embarked multiple pathways in
piloting CT curriculum in regional or national education systems. In this panel, a group of
researchers representing different countries and regions will be invited to share their insights
on the work, research and implementation of CT in schools or outside of schools, and share
their research efforts that address common research questions of teaching CT. We hope this
panel will help inform researchers, policy makers, and school practitioners in proposing
approaches and addressing challenges in the adoption and implementation of CT in schools.
Keywords: Computational Thinking, STEM, Computer fluency, Programming, Assessment
1. Introduction
The development of Computational Thinking (CT) (Wing, 2006) has received much attention
in K-12 schools around the world. CT skills are associated with problem solving, reasoning and logic
skills that all students should develop in 21st century. With CT, students are able to think how to
breakdown a problem in small segments, design sequential and logical steps, and recognize patterns to
generalize and abstract reusable parts to solve problems. These skills will not only serve students well
in developing competencies in using programming to solve problems but also develop creative
cognitive capabilities for problem solving for all aspects of modern society.
Countries and regions around world, such as United States, Singapore, United Kingdom,
South Korea, Finland, and Hong Kong, have recognized the importance of CT and have embarked on
multiple pathways in piloting CT curriculum in regional or national education systems. Different
pedagogical and practical challenges and issues have emerged in the teaching of CT in classrooms,
which call for further and deeper discussions and investigations of relevant and effective strategies,
approaches or solutions. In this panel, a group of representative yet diverse researchers will be invited
to share their insights on the work, research and implementation of CT in schools, and discuss their
research efforts that address common research questions of teaching CT.
2. Abstracts of Individual Panelists’ Presentation
2.1 Building environments for CT in US schools (Gautam Biswas)
Computing knowledge and skills provide the foundation for modern competency in a multitude of
STEM-related fields, prompting research on how to best prepare students for the 21st century
workforce and for lifelong learning. Realization of the learning benefits of CT provides us with a
i-36
unique and timely opportunity to develop computer-based learning environments (CBLEs) that
leverage the synergies between STEM and computing education, by adopting learning by modeling
and problem solving approaches to make learning active, engaging, and relevant to the real world.
Leveraging the synergy between CT and K-12 science, our group has been developing
CBLEs, where students learn their science by constructing computational models of real world
systems (e.g., roller coasters, fish tanks, and traffic flow models) using domain-specific visual
languages. Modeling, the collective action of developing, testing and refining models involves
carefully selecting aspects of the phenomenon to be modeled, identifying relevant variables,
developing formal representations, and verifying and validating these representations with the
supporting science principles. In our work, we have demonstrated that the model building, analysis,
and verification tasks help students gain a deep understanding of STEM concepts; in addition, they
are successful in developing computing skills and applying computational thinking practices. In my
presentation, I will discuss design principles that support the synergistic learning of science and CT
concepts, demonstrate the effectiveness of our approach to introducing CT in US K-12 classrooms,
and hypothesize that CT is most useful, when it is studied as a practice that permeates all STEM
domains, and perhaps, all of 21st century learning.
2.2 CT in China (Ronghuai Huang) Wing (2006)’s idea of CT was introduced to China in 2007. From 2007 to 2010, the research of CT in
China mainly reflected in the concept of CT and the basic principles of CT. Since 2010, researchers
started to see the importance of teaching CT skills for college students through the course of computer
basics that offered by every university in China as the compulsory course. From 2013, more and more
researchers started to discuss the necessity of integrating the CT into the course of informational
technology in K-12 schools. The course of information technology in K-12 schools faced lots of
challenges, one of which was the technology-oriented teaching methods. Researchers in China
discussed the necessities of bringing computational thinking to K-12 schools and how to integrate this
kind of ability into the course of information technology. The methods of integrating CT into the
course was the main research focus, such as how to define the performance standards of CT in the
course of information technology, how to develop the instructional content according to the
performance standards, and how to organize inquiry learning activities for practice. Government
started to recognize the importance of training CT skills to cultivate future ready citizens, and began
to initiate the curriculum reform in K-12 schools.
2.3 CT in HK (Siu-Cheung Kong)
A four-year international project about the development of computational thinking of senior primary
schools students through coding education has been launched in Hong Kong since April 2016. It is a
collaborative project of the Education University of Hong Kong, Massachusetts Institute of
Technology and the City University of Hong Kong. The aim of the project is to nurture and enhance
students’ capabilities of CT. The major objectives of the project are to: (1) equip senior primary
school students with fundamental programming knowledge; (2) develop CT skills including logical
thinking and problem solving skills through coding; (3) develop CT perspectives of students including
understandings of themselves and their relationships to others with the digital technological world;
and (4) raise public awareness of the importance of developing CT of the young generation.
2.4 CT in India (Sridhar Iyer) Our group started work on defining a CS curriculum appropriate from Indian schools in 2007. The
third edition of this curriculum, called CMC, was released in 2013 (Iyer, et.al, 2013). The philosophy
of CMC can be summarized as: (i) Develop computer fluency, not just computer literacy, (ii) Develop
thinking process skills, not just content mastery, and (iii) Highlight the interconnectedness of
knowledge, not just address a topic in isolation. CMC includes CT through explicit emphasis on
thinking process skills, and thematic integration. Based on CMC, our group wrote textbooks for
grades 1-8, called Computer Masti series. Chapters in Computer Masti books build the cognitive
abilities of algorithmic thinking, reasoning, problem solving, information gathering, brain storming
and synthesizing, using multiple representations, and divergent thinking. CT is inculcated by activities
such as students planning and executing complex projects by breaking any given task into a sequence
i-37

of steps, and then doing the detailed steps required to complete the task. The use of these books in
schools has been growing, through governmental and industry efforts, from about 10 schools in 2010
to more than 300 schools in 2016, reaching about half-million students.
2.5 CT in Singapore (Chee-Kit Looi & Longkai Wu)
In 2017, Singapore’s Ministry of Education will be implementing a new GCE ‘O’ Level Computing
curriculum. The new curriculum is a distinct shift teaching students from the use of software
technology to the development of CT skills and programming competencies. At the National level, the
government is encouraging Computing with the Prime Minister making an impression by sharing his
experiences in programming a Sudoko game. The Ministry of Education has introduced Computing to
Primary and Lower Secondary students through the “Code for Fun” enrichment classes where
students learn to program in Scratch. These efforts has been made to expose students to Computing as
early possible and possibly serve as a pipeline for more students to take up Computing as a GCE O
Level subject in the Upper Secondary, as well as to interest them early in STEM or computing
careers. As Singapore moves to implement a new curriculum with a greater emphasis on the
development of CT and programming, we will discuss some of the challenges that must be addressed:
teachers’ competency and knowledge on CT, and pedagogy for teaching CT and programming.
2.6 Assessing CT (Shuchi Grover)
As educators move to introduce computing in K-12 classrooms, the issue of assessing student learning
of computational concepts still remains a challenge. Assessments remain under-developed and under-
researched. They are central, however, if the goal is to help students develop deeper, transferable CT
skills that prepare them for future computing experiences. This presentation will present the current
landscape of assessments for CT and describe several different ongoing efforts and approaches to
assess CT. These include, among others, the use of the Evidence-Centered Design framework to
develop assessments of CT practices for the Exploring CS high school curriculum, specially designed
programming tasks for assessment of middle and high school students programming in Alice, the use
of debugging games, artifact-based interviews, emerging learning analytics approaches as well as the
idea of a comprehensive “system of assessments” that includes multiple measures that are
complementary, attend to cognitive and non-cognitive aspects of CT, and contribute to a
comprehensive picture of student learning. This presentation will also briefly touch upon pedagogical
strategies informed by the learning sciences that will help prepare students for deeper learning of
computational thinking and how to align curriculum, pedagogy, and assessment.
3. Discussion and Conclusion
There are multiple approaches to support students’ learning of CT in K-12 schools: as enrichment
activities, as curricula, as a skill in its own right, as programming (e.g. Scratch), as programming
robotic or electronic devices, as integrating components into STEM learning, as unplugged computing
activities, etc. Different countries and regions posit different contextual conditions and educational
priorities and policies, as well as constraints for the introduction of CT as a basic skill to be taught.
This panel provides a platform and represents a new starting point for the expositions and discussion
of diverse perspectives, and hopefully stimulates a concerted research agenda for us as a diverse
community of researchers to advance the teaching, learning and assessment of CT.
References
Iyer, S., Khan, F., Murthy, S., Chitta, V., Baru, M., & Vishwanathan, U. (2013) CMC: A Model Computer
Science Curriculum for K-12 Schools. Technical Report (TR-CSE-2013-52), Dept of Computer
Science and Engg,, IIT Bombay, June 2013.
Wing, J. M. (2006). Computational thinking. Communications of the ACM, 49(3), 33-35.
i-38
PANEL 3 A Critical Dialogue on Technology-Enhanced Interest-Driven Creation
(IDC)
ABSTRACT
To prepare the young generation for the era of industry 4.0, a group of Asian
researchers embark on the Interest‐Driven Creator (IDC) Initiative to co-
construct a learning design theory that offers crucial design principles, with the
support of technology, for 21st century educational reform. The IDC theory
views learning as a process of creation driven by interest. As a design theory,
IDC suggests how to nurture our young generation as lifelong creators by
engaging them to create with interest habitually. In this panel, a group of non-
IDC Initiative members will share their insights and critiques on the IDC theory
with respect to their research experiences, thus eliciting a dialogue among the
ICCE participants on how to nurture lifelong IDC. We hope this panel will help
inform the community on how to transform the teacher‐centered knowledge
acquisition approaches into an interest‐driven creation practice.
FACILITATOR Tak-Wai CHAN, National Central University, Taiwan
PANELISTS
Gautam BISWAS, Vanderbilt University, USA
Maiga CHANG, Athabasca University, Canada
H. Ulrich HOPPE, University of Duisburg-Essen, Germany
Chen-Chung LIU, National Central University, Taiwan
Jon MASON, Charles Darwin University, Australia
i-39
A Critical Dialogue on Technology-Enhanced
Interest-Driven Creation (IDC)
Tak-Wai CHANa*, Lung-Hsiang WONGb, Gautam BISWASc, Maiga CHANGd, H. Ulrich
HOPPEe, Chen-Chung LIUa, Jon MASONf, Chee-Kit LOOIb, Wenli CHENb & Longkai WUb aNational Central University, Taiwan
bNational Institute of Education, Nanyang Technological University, Singapore cVanderbilt University, USA
dAthabasca University, Canada eUniversity of Duisburg-Essen, Germany
fCharles Darwin University, Australia
Abstract: To prepare the young generation for the era of industry 4.0, a group of Asian
researchers embark on the Interest‐Driven Creator (IDC) Initiative to co-construct a learning
design theory that offers crucial design principles, with the support of technology, for 21st
century educational reform. The IDC theory views learning as a process of creation driven by
interest. As a design theory, IDC suggests how to nurture our young generation as lifelong
creators by engaging them to create with interest habitually. In this panel, a group of non-IDC
Initiative members will share their insights and critiques on the IDC theory with respect to
their research experiences, thus eliciting a dialogue among the ICCE participants on how to
nurture lifelong IDC. We hope this panel will help inform the community on how to transform
the teacher ‐ centered knowledge acquisition approaches into an interest ‐ driven creation
practice.
Keywords: Interest-Driven Creator (IDC) Theory, interest, creation, habits, theory building
1. Introduction
Asian researchers who desire to bring about a significant impact on education will face a great barrier:
a considerable part of formal education in Asia remains exam-driven (Gu et al., 2016) and most
educators’ instructions are still largely behaviorist. The 21st century, however, requires learners with
creative and critical thinking and new values to thrust social and economic development. Thus, a
group of Asian researchers embark on the Interest‐Driven Creator (IDC) Initiative to co-construct a
learning design theory that offers crucial dispositions and design principles for 21st century
educational reform.
The IDC theory (Looi, Chan, Wu, & Chang, 2015) views learning as a process of creation
driven by interest. The theory talks about mechanisms for designing learning environments based on
three concepts: interest, creation, and habit. Interest is critical because learning is enjoyable and
effective when it is relevant to leraners’ interests. Creation makes learning productive and achieving.
Habit substantiates the effect of learning and decides whether learners take up the identity of creators
which is demonstrated by their repeated behavior. Driven by interest, learners are being engaged in
creation, and we nurture their learning habits by repeating this process in their daily learning
activities.
2. Abstracts of Individual Panelists’ Presentation
2.1 Does Learning by Modeling and Problem Solving generate Interest and Creativity?
(Gautam BISWAS)
The concept of IDC in education shares ideas with constructivist, anchored, problem- and project-
based, exploratory, self-guided and self-motivated learning, all of which have been studied in detail
by education researchers, but adopted to a lesser extent by practitioners and policy makers in K-12
i-40
settings. This discussion will leverage my group’s research in computational thinking (CT), an
analytic approach to problem solving, designing systems, and understanding human behaviors. CT
combines concepts fundamental to computing and computer science with general practices, such as
problem representation, abstraction, decomposition, simulation, verification, and prediction. These
practices are also central to modeling, reasoning and problem solving in STEM disciplines (Sengupta,
Kinnebrew, Basu, Biswas, & Clark, 2013). I will show using results of our experimental studies how
CT promotes synergistic learning of science, computing principles, design, modeling, and problem
solving - all are fundamental skills for the 21st century workforce. Such environments also promote
self-regulation, and support collaboration, which are also key ingredients for interest-driven learning
and creation.
2.2 Start using mobile app due to interests and end with getting used to practice everyday
(Maiga CHANG)
In this panel I would like to share our experience of helping our industry partner to create an interest-
driven solution based on its existing educational mobile app. The purpose is to have students using the
app regularly to practice math and science knowledge and skills. In the beginning, we design
hundreds of game based achievements based on the app usage to get students motivated in using the
app more often (Chen, Chang, Amistad, & Garn, 2015). At the second stage, we develop an algorithm
that identifies difficulties faced by the students by analyzing results of their time-stamped sequential
actions while doing practices. Thus, the app could know students’ mastery level of knowledge and
skills and give them better rewards when they keep trying and overcome the difficulties. The students
would also be engaged in trying to do difficult practices again instead of always attempting easier
ones. At the last stage, we combine the concept of game based achievements, the theory of self-
regulated learning, and the learning analytics to get students used to do certain amount of practices
with the app every day and make a complete interest-driven solution.
2.3 “Learning through Making” as a new educational paradigm? (H. Ulrich HOPPE)
“Maker” scenarios have been identified as a new approach to education. Beyond concrete products,
the maker culture is about the process of creating an artifact in a social arena. During this process,
makers learn how to search for and choose appropriate information, how to put it in use, how to
communicate and collaborate in the community, how to evaluate one’s own practice, how to solve
problems. Specific experience with maker scenarios has been gathered in a series of dev camps with
IT students in The Netherlands and Germany. The purpose of these dev camps was to challenge
learners at a high level, triggering creativity and innovation in teams. The analysis of the activities
showed that the participants were able to plan their resources and actions efficiently and to generate
and present innovative solutions. We see a challenge for future research in “creativity management”
in such productive educational scenarios by providing analytics and reflection tools in addition to the
production tools. Here, we want to further exploit existing approaches to providing creativity metrics
for programming tasks (Manske & Hoppe, 2014) using machine learning to derive models and criteria
based on expert judgments.
2.4 From Model-based Learning to Creativity-based Learning (Chen-Chung LIU)
Creativity is one of the core competences in contemporary education. However, many studies have
pointed out the significant contrast between the creativity-based approach to learning and the model-
based learning that takes place in schools. To leverage creativity in education, the learning task design
needs to assist students to build up sufficient domain knowledge, while also allow freedom to exercise
creativity in order to be intrinsically engaging in the long term learning process. Yet, producing
creative work is not an easy task for students; it takes the individual’s motivation for the task, both
domain knowledge and creativity, and a socially supportive environment. It is thus worthwhile to
investigate how motivation, scaffoldings and creativity could be integrated in social media to support
a long term learning goal (Liu, Wang, & Tai, 2016).
2.5 Connecting with Questions – Pathways to Smarter Education (Jon MASON)
i-41
The digital revolution continues to enable and disrupt. It has spawned numerous agendas that focus on
developing the requisite 21st century skills and competencies. Placing emphasis on student
questioning represents a testbed and viable option (Rothstein & Santana, 2011). Indeed, theory and
practice are mutually informing and tested in the real world of experience. This is illustrated in the
progression from the desktop computer (an extended cognitive and connected domain) to handheld
devices (an intimate and social domain) to virtual and augmented reality (an immersive, experiential
domain). IDC Theory suggests that when the interests of the learner and learning opportunities align
then learning can be optimized. It will be argued that making strong connections with cultural
tradition while also embracing innovations in digital technology provides a robust strategy. A focus
upon cultivating student questioning skills can achieve this. By connecting questioning with the
frontier of digital innovation it is argued that question technologies could be an effective way forward
to smarter educational futures.
3. Discussion and Conclusion
In this panel, five learning technologists will share their takes on IDC, four of whom are conceptually
associating it with their studies pertaining to computational thinking (Biswas), makerspace (Hoppe),
student questioning (Mason) and mobile game-based learning (Chang) respectively. The first three
approaches are related to creation, which is further unpacked conceptually by Liu. This emphasis on
creation is a reflection of the prominent trend in the field where a shift of the design philosophy from
the “acquisition” metaphor to the “knowledge creation” metaphor (Paavola, 2012) of learning ensues.
What is not neglected is interest. The panel does not see interest and creation as two distinct
elements in learning designs; rather, as Liu argues, “allowing freedom in exercising creativity would
be intrinsically motivating and engaging in long-term learning process.” Biswas and Hoppe will also
explore how computational thinking or maker activities would promote self-regulated learning and/or
collaborative learning. Mason sees the progression from the desktop computer to handhelds to
augmented reality as an opportunity for aligning interests of the learner and learning opportunities.
Habit is perhaps the least exposed one in the learning technology field. Nevertheless, the
digital game-based learning approach which Chang’s study is based on is not only being regarded by
learning technologists as an efficient measure to promote learning interest, the incorporation of
various game elements such as the challenges of increasing difficulty levels or game-based
achievements would further motivate learners to return to the game habitually as an “everyday
practice”.
We hope this panel will help inform the ICCE community on how to transform the current
teacher‐centered knowledge acquisition classroom practices into an interest‐driven creation system.
References Chen, C.-L., Chang, M., Amistad, I., & Garn, K. (2015). Educational Game Achievement Design based on the
Analysis of Achievements in Commercial Games. Proceedings of the Global Chinese Conference on
Computers in Education 2015 (pp. 324-331), Taipei, Taiwan.
Gu, X., Wong, L.-H., Chan, T.-W., Shirozu, H., Jeong, H., Crook, C., & Kong, S. C. (2016). How students learn
in East Asian Cultures and How That Learning May Evolve in the Future. Proceedings of the
International Conference of the Learning Sciences 2016 (pp. 1350-1352), Singapore.
Liu, C.-C., Wang, P.-C., & Tai, S. J.-D. (2016). An analysis of student engagement patterns in language learning
facilitated by Web 2.0 technologies. ReCALL, 28(2), 104-122.
Looi, C.-K., Chan, T.-W., Wu, L., & Chang, B. (2015). The IDC Theory: Research Agenda and Challenges.
Proceedings of the International Conference on Computers in Education 2015 (pp. 796-803), Hangzhou,
China.
Manske, S., & Hoppe, H. U. (2014). Automated indicators to assess the creativity of solutions to programming
exercises. Proceedings of the IEEE International Conference on Advanced Learning Technoogies 2014
(pp. 497-501), Athens, Greece.
Paavola, S. (2012). The Knowledge Creation Metaphor. In N. Seel, M. (Ed.), Encyclopedia of the Sciences of
Learning (pp. 1682-1684): Springer.
Rothstein, D., & Santana, L. (2011). Make Just One Change: Teach Students to Ask Their Own Questions.
Cambridge, MA: Harvard Education Press.
Sengupta, P., Kinnebrew, J., Basu, S., Biswas, G., & Clark, D. (2013). Integrating computational thinking with
K-12 science education using agent-based computation: A theoretical framework. Education and
Information Technologies, 18(2), 351-380.
i-42

5 TABLE OF CONTENT
Paper Title Authors Page
C1: Artificial Intelligence in Education/Intelligent Tutoring System (AIED/ITS) and Adaptive Learning
Full paper
Investigating the Incubation Effect among Students playing Physics Playground
Joshua Martinez, Jun Rangie Obispo, May Marie Talandron and Ma. Mercedes T. Rodrigo
1
Detecting Affective States Based on Facial Expressions Among Students using an Educational Game for Physics
Emily Tabanao and Ma. Mercedes T. Rodrigo
9
An Embedded Constraint-based Tutor for On-the-Job Training
Jill De Jong, Antonija Mitrovic and Moffat Mathews
19
Practical Use of Visualizing Lesson Structures in Teacher Training Education and Its Effectiveness
Toshinobu Kasai, Kazuo Nagano and Riichiro Mizoguchi
27
Practical Use of Triangle Block Model for Bridging between Problem and Solution in Arithmetic Word Problems
Tsukasa Hirashima, Kazutoshi Furukubo, Sho Yamamoto, Yusuke Hayashi and Kazushige Maeda
36
Do Novices and Advanced Students Benefit Differently from Erroneous Examples?
Xingliang Chen, Antonija Mitrovic and Moffat Mathews
46
LOD Based Semantically Enhanced Open Learning Space Raises Engagement for Historical Deep Consideration
Corentin Jouault, Kazuhisa Seta and Yuki Hayashi
54
Short paper
Ontology of Culture: A Procedural Approach for Cultural Adaptation in ITSs
Isabelle Savard and Riichiro Mizoguchi
64
Ontology-based Systemization Approach to Capture Meta-level Thinking Processes from Gaze Behaviors
Yuki Hayashi, Kazuhisa Seta and Mitsuru Ikeda
70
Poster
An Improved Genetic Algorithm Approach for Optimal Learner Group Formation in Collaborative Learning Contexts
Yaqian Zheng, Jiazhi Du, Haibo Yu, Weigang Lu and Chunrong Li
76
Ongoing Formative Assessment with Concept Map in Proposition Level Exact Matching
Jaruwat Pailai, Warunya Wunnasri, Yusuke Hayashi and Tsukasa Hirashima
79
Towards a Social Student Model in a Software Engineering Group Project Course
Edward Armstrong, Moffat Mathews and Neville Churcher
82
A Modular Approach for Multi-Dimensional Learning Support in Educational Games
Alexander Nussbaumer, Christina M. Steiner, Matthias Maurer, Rob Nadolski and Dietrich Albert
85
i-43
A Teachable Agent for the Japanese Dictogloss Learning Support Environment
Satoru Kogure, Kenta Miyagishima, Yasuhiro Noguchi, Makoto Kondo, Tatsuhiro Konishi and Yukihiro Itoh
88
Learning Task Generation from a Series of Propositions of a Learning Topic: Kit-Building Task of Concept Map and Multiple Choice Task of Fill-in-the-blank Questions
Takuya Kitamura, Akira Yamanaka, Keisuke Maeda, Yusuke Hayashi and Tsukasa Hirashima
91
Proposal for Primitives Representing Brain Function of Facial Expression Recognition
Yoshimasa Tawatsuji and Tatsunori Matsui
94
Hybrid ITS for DFA Construction Problems Darshan K. M. and Viraj Kumar 96
C2: Computer-supported Collaborative Learning (CSCL) and Learning Sciences
Full paper
Students Learning Paths in Developing Micro-Macro Thinking: Productive Actions for Exploration in MIC-O-MAP Learning Environment
Anura Kenkre and Sahana Murthy
99
Identity Play in Gameful Learning: Avatars as Multiplayers in a Graduate Course
Beaumie Kim and Diali Gupta 109
Gamifying a CSCL and its effect on collaboration and self-organization
Astrid Veroy, Ganga Kasi, Daniel Hannon and Ethan Danahy
119
Integrating Agent-based Programming with Elementary Science: The Role of Sociomathematical Norms
Amanda Dickes, Amy Farris and Pratim Sengupta
129
Short paper
Designing a web tool to support teamwork awareness and reflection: Evaluation of two trial cycles
Elizabeth Koh, Yi-Huan Tee, Antonette Shibani, Kian Leng Tay, Jennifer Pei-Ling Tan, Helen Hong, Munir Hussin and Hwee Leng Chan
139
Socio-culturally Adaptive and Personalized Collaborative learning environments
Fadoua Ouamani, Narjes Bellamine and Henda Hajjami Ben Ghezala
145
Detecting Metacognitive Strategies through Performance Analyses in Open-Ended Learning Environments
Michael Tscholl, Gautam Biswas, Benjamin S. Goldberg and Robert A. Sottilare
151
Poster
Supporting the Creation and Sharing of Domain Taxonomies in STEM Learning
Nils Malzahn, Christina Schneegaß and Ulrich Hoppe
157
Development of Immersive Teaching Material using HMD and 3D Gesture Operation for Astronomy Education
Keisuke Tajiri and Norio Setozaki 160
Teacher Support and Personalised Student Learning as Means to Obtain Visible and Measurable Improvement in Learning Levels
Nishchal Shukla 163
Students’ Perceptions on Problem Solving with Collaborative Computer Simulation
Chia-Jung Chang, Chen-Chung Liu, Ying-Tien Wu, Ming-Hua Chang, Shih-Hsun Fan Chiang, Bing-Cheng Chiu, Cai-Ting Wen, Fu-Kwun Hwang, Po-Yao Chao, Chia-Hsi Lai, Su-Wen Wu and Chih-Kang Chang
166
Provision of Latitude for Target Selection during Online Peer-Assessment
Fu-Yun Yu 169
i-44
C3: Advanced Learning Technologies (ALT), Learning Analytics and Digital Infrastructure
Full paper
“VC/DC” - Video versus Domain Concepts in Comments to Learner-generated Science Videos
Ulrich Hoppe, Maximilian Müller, Aris Alissandrakis, Marcelo Milrad, Christina Schneegaß and Nils Malzahn
172
Data Sharing for Learning Analytics – designing conceptual artefacts and processes to foster interoperability
Tore Hoel and Weiqin Chen 182
Reflective Experiential Learning: Using Active Video Watching for Soft Skills Training
Antonija Mitrovic, Vania Dimitrova, Amali Weerasinghe and Lydia Lau
192
Augmenting Online Video Lectures with Topically Relevant Assessment Items
Subhayan Roy and Plaban Kumar Bhowmick
202
Student Behavior in Computer Simulation Practices by Pair Programming and Flip Teaching
Satoshi V. Suzuki, Sachio Hirokawa, Shinji Mukoyama, Ryo Uehara and Hiroyuki Ogata
212
Graph-Alignment Approach towards Identifying Gaps in Student Answer
Archana Sahu and Plaban Kumar Bhowmick
222
Empirical Study on the Effect of Digital Badges in a General Physics Homework System
James O. Uanhoro, Shelley Shwu-Ching Young and Yi-Hsuan Lin
232
Analysis of Steps in Posing Arithmetic Word Problem as Sentence-Integration on Interactive Learning Environment
Ahmad Afif Supianto, Yusuke Hayashi and Tsukasa Hirashima
242
Short paper
Networked Tutoring Support System for a Programming Class based on Reusable Tutoring Content and Semi-automatic Program Assessment
Yasuhiro Noguchi, Ryota Osawa, Koichi Yamashita, Satoru Kogure, Tatsuhiro Konishi and Yukihiro Itoh
252
Semi-automated Tool for Providing Effective Feedback on Programming Assignments
Min Yan Beh, Swapna Gottipati, David Lo and Venky Shankararaman
258
Behaviors and Features Selection of Online Learning Data
Bo Jiang and Ming Gao 264
Towards a Trace-Based Adaptation Model in e-Learning Systems
Soraya Chachoua, Nouredine Tamani, Jamal Malki and Pascal Estraillier
270
Design of a Learning Support System and Lecture to Teach Systematic Debugging to Novice Programmers
Raiya Yamamoto, Yasuhiro Noguchi, Satoru Kogure, Koichi Yamashita, Tatsuhiro Konishi and Yukihiro Itoh
276
A Case Study of Interactive Environment for Learning by Problem-posing in Special Classroom at Junior High School
Sho Yamamoto and Tsukasa Hirashima 282
A context modeling approach and a tool for reusing learning scenarios
Mariem Chaabouni, Mona Laroussi, Claudine Piau-Toffolon, Christophe Choquet and Henda Hajjami Ben Ghezala
288
Poster
A Competency Similarity Detection for Generating Career Path
Wasan Na Chai, Taneth Ruangrajitpakorn, Marut Buranarach and Thepchai Supnithi
294
A Relational Design Oriented Seamless Framework to Support Idea Sharing and Social Network
Yen-An Shih and Ben Chang 297
i-45
What do star rates for MOOCs tell you? An analysis of pedagogy and review rates to identify effective pedagogical model
Dilrukshi Gamage, Indika Perera and Shantha Fernando
300
GUI-Based Environment to Support Writing and Debugging Rules for a Program Visualization Tool
Daiki Tezuka, Satoru Kogure, Yasuhiro Noguchi, Koichi Yamashita, Tatsuhiro Konishi and Yukihiro Itoh
303
C4: Classroom, Ubiquitous, and Mobile Technologies Enhanced Learning (CUMTEL)
Full paper
Learning Analytics in Ubiquitous Learning Environments: Self-Regulated Learning Perspective
Masanori Yamada, Fumiya Okubo, Misato Oi, Atsushi Shimada, Kentaro Kojima and Hiroaki Ogata
306
Visualization for Analyzing Learning Logs in the seamless learning environment
Kousuke Mouri, Hiroaki Ogata, Noriko Uosaki and Mahiro Kiyota
315
Enhancing Course Timetable Management in Science Classrooms with User-oriented Mobile Application: Analysis and Prototype Development on KMUTT-ESC Case Study
Jintana Wongta, Charoenchai Wongwatkit, Jarukit Boonkerd, Ratchapon Chaikajornwat, Vittunyuta Maeprasart and Chonlada Khrutthaka
325
Short paper
The Interest-Driven Creator Theory and Computational Thinking
Bowen Liu, Ping Li, Siu Cheung Kong and Sing Kai Lo
335
A case study of teaching probability using augmented reality in secondary school
Shuhui Li, Yihua Shen, Peiwen Wang, Enrui Liu and Su Cai
340
Effectiveness of Low Cost FOSSEE Laptops in a CS101 Course
Kannan Moudgalya, Kiran L.N. Eranki, Sohinee Ganguly and Varsha Apte
345
Examining Students’ Perception of Using Crowd sourcing based Mobile Apps for Environmental Education and Research Experiences.
Divya C.Senan and Udaysankar S.Nair 351
The Impact of E-schoolbag on Students’ Information Literacy Proficiency- A Case Study of M District in Shanghai, China
Lingliang Shen, Dongming Qian, Jueqi Guan and Yanyan Sun
357
Practice Class Using Spherical Panorama VR Learning Material for Peace Education
Norio Setozaki and Kazunori Sato 363
Towards an Architecture for Supporting Educational Virtual Reality Applications
Dan Kohen-Vacs, Marc Jansen and Marcelo Milrad
368
Measuring & Evaluating Textbook Through Quizzes Chengjiu Yin, Jane Yin-Kim Yan, Noriko Uosaki, Sachio Hirokawa and Etsuko Kumamoto
374
AETEL : Supporting Seamless Learning and Learning Log Recording with e-Book System
Mahiro Kiyota, Kousuke Mouri, Noriko Uosaki and Hiroaki Ogata
380
Fieldfriend: A Smartphone App for Mobile Learning in the Field
Alexis Pang and Anthony Weatherley 386
The (still) unused potential of mobile HTML5 in educational settings
Janosch Zbick, Nelson Baloian, Marcelo Milrad, Marc Jansen and Gustavo Zurita
392
Photocasting: A Low-Cost Technique to Create and Disseminate Digital Lecture Notes
Manasa H. G., Kavitha Puranik, Lakshmi Antin and Viraj Kumar
398
Poster
i-46

Developing an Online Video Presentation Evaluation System to Promote Mutual Evaluation and Survey of Operability
Shin Kurata, Takashi Fujiki and Masao Murota 404
C5: Digital Game and Digital Toy Enhanced Learning and Society (GTEL&S)
Full paper
Game Design as Problem Solving Diali Gupta and Beaumie Kim 407 Investigating the Effect of Game-based Writing Environment on Students’ Writing Participation, Performance, and Interest
Chang-Yen Liao, Wan-Chen Chang and Tak-Wai CHAN
417
Short paper
Wearable Learning Technologies for Math on SmartWatches: a feasibility study
Jonathan Casano, Ivon Arroyo, Jenilyn Agapito and Ma. Mercedes T. Rodrigo
425
Transference of Learning from Play with iPads in Early Childhood
Gretchen Geng, Leigh Disney and Jon Mason
431
Augmented Reality Systems for Immediate-Action Commander Training During Disasters
Hiroyuki Mitsuhara, Keisuke Iguchi, Junya Kawai and Masami Shishibori
437
Usability Study of an Augmented Reality Game for Philippine History
Ma. Mercedes T. Rodrigo, Eric Cesar E. Jr. Vidal, Nicko Caluya, Jenilyn Agapito and Walfrido David Diy
442
Poster
Using a Text Adventure Game for an Extended Series of Assignments in CS2
Clifton Kussmaul 448
Exploring Difference of Educational Game Design between the United States and China through the Lens of Hofstede's Culture Dimensions
Lijie Wu and Xiaoqing Gu 451
C6: Technology Enhanced Language Learning (TELL)
Full paper
How Learners of Different Learning Styles Collaborate in a Mobile-Assisted Chinese Character Game Based on Flexible Grouping
Lung-Hsiang Wong, Ting-Chia Hsu and Ivica Boticki
454
Effects of Embodied Interaction on Reading Comprehension in a Multimodal Environment
Ya-Wen Cheng, Wei-Chieh Fang, Wei Chang, Li-Chun Lin and Nian-Shing Chen
464
Short paper
Exploring the Effect of Writing Mini-lessons on Peer Response in Elementary Classroom
Wan-Chen Chang, Chang-Yen Liao, Chi-Yang HSU and Tak-Wai CHAN
472
An Application for Speech and Language Therapy Using Customized Interaction Between Physical Objects and Mobile Devices
Romain Christian Herault and Aris Alissandrakis
477
A Development of Augmented Reality-supported Mobile Game Application based on Jolly Phonics Approach to Enhancing English Phonics Learning Performance of ESL Learners
Sirimon Limsukhawat, Suchada Kaewyoun, Charoenchai Wongwatkit and Jintana Wongta
483
Poster
i-47
Exploring the Relationship between Language Learning Strategy Usage and Anxiety among Chinese University Students
Olha Dalte, Jing Leng and Xiaoqing Gu 489
Learning Behavior Analysis on VoiceTube for Recommender System Construction
Chih-Kai Chang and Hsin-Yu Yeh 492
Automatic Scoring of English Speaking Test Using Automatic Speech Recognition
Keiji Yasuda, Hiroyuki Kawashima and Hiroaki Kimura
495
Enhancing EFL learners’ intercultural sensitivity through a cross-border writing instruction
Jun Scott Chen Hsieh, Wen-Chi Vivian Wu and Jie Chi Yang
498
C7: Practice-driven Research, Teacher Professional Development and Policy of ICT in Education (PTP)
Full paper
Affecting children’s ability to understand other’s feelings through an online cyber-wellness programme
Chee-Kit Looi, Yuhyun Park, Jesmine Goh and Longkai Wu
501
Using ICT in Early Childhood: What Teachers, Principals, and Parents Say
Anika Saxena and Khe Foon Hew 511
Learning Support System for Visualizing Memory Image and Target Domain World, and Classroom Practice for Understanding Pointers
Koichi Yamashita, Ryota Fujioka, Satoru Kogure, Yasuhiro Noguchi, Tatsuhiro Konishi and Yukihiro Itoh
521
Shifting the focus from Learner Completion to Learner Perseverance: Evidences from a Teacher Professional Development MOOC
Jayakrishnan Warriem, Sahana Murthy and Sridhar Iyer
531
Experimental Studies to Clarify the Knowledge-to-action Gap in Information Ethics
Koji Tanaka, Miku Sonoda, Mitsuru Ikeda and Masahiro Hori
541
Training Teachers to Develop Work-process-oriented Curricula
Yongwu Miao, Li Xiang, Lisa Ying, Kai Qiu and Disi Wang
551
Short paper
Teacher educators’pedagogical beliefs and practices towards ICT in teaching and learning
Mei Lick Cheok, Su Luan Wong, Ahmad Fauzi Mohd Ayub and Rosnaini Mahmud
561
Examination of Factors that Influence Science Teachers’ Attitudes toward Using Information and Communication Technologies For Teaching and Learning
Ahmad Fauzi Mohd Ayub, Dauda Isiyaku Dansarki, Su Luan Wong and Md. Khambari Mas Nida
567
Best Practices in ICT Integration: Teacher Education through Teachers’ Views
Arit Uyouko, Su Wong and Imaikop Akpan
573
A Case Study Illustrating Coding for Computational Thinking Development
Siu Cheung Kong and Ping Li 579
Mathematics Visualization for Developing the Concept of Average
Siu Cheung Kong 585
Content Creation and Pedagogic Strategies for Skill Development MOOC
Sameer Sahasrabudhe and Rwitajit Majumdar
591
Exploring effects of immersivity across three dimensions in Training Design: Technology Integration Training Workshop for Engineering Teachers in India
Madhuri Mavinkurve, Soumya Narayana and Mahesh Patil
597
A Study of an Online Community for Promoting Chinese Reading among Primary Schools in Hong Kong
Siu Cheung Kong 603
Literate, Numerate, and Discriminate – Realigning 21st Century Skills
Jon Mason, Khalid Khan and Sue Smith 609
i-48
Coordinated Faculty Professional Development Activity: Key for High Retention in MOOCs
Shashikant Halkude, Dipali Awasekar, Manisha Nirgude and Roohshad Mistry
615
The effectiveness and suitability of MOOCs hybrid learning: A case study of public schools in Thai rural area
Titie Panyajamorn, Youji Kohda, Pornpimol Chongphaisal and Thepchai Supnithi
621
Open Educational Resources to Improve Students’ Learning & Performance: A Case Study with Practitioner’s Approach
Parkavi A and Satheesh A 627
Challenges in Flipping Hong Kong’s Classroom Kelvin Cheung, Morris Jong and Eric Luk
633
Poster
Synthesis of Theoretical Framework for Augmented Reality Learning Environment to Promote Creative Thinking on Topic Implementation of Graphic Design for Grade 9 Students
Sathaporn Wongchiranuwat and Charuni Samat
639
A Pilot Study on Effects of Tangible Learning System for Pre-Service Teacher Training
Yusuke Morita, Toru Nagahama, Norio Setozaki, Keisuke Tajiri and Takeshi Kitazawa
642
Design of Cognitive Tools to Enhance Problem-Solving in Computer Language Programming for High School Students
Priew Pholasa and Charuni Samat 645
Influence of Learning On Mathematics Realistic ICT-Assisted Critical Thinking Skills Students
Sigid Edy Purwanto, Desah Arofah and Ayu Tsurayya
648
Characterizing Students’ Behavioral Patterns in an Online Reading Test
Hercy Cheng, Jian-Wen Sun, Zhi Liu and San-Ya Liu
651
Research in Web3D Virtual Technology based Online Education Platform for Historical Battle
Liu Chang, Jinyuan Jia and Ning Xie 654
ICT Based School Mapping Application for Elementary Education in India
Nidhi Rawat 657
Development of Constructivist Flipped Classroom to Enhance Students’ Creative Thinking for Designing Logo
Charuni Samat and Kridsana Kampira 660
i-49
Investigating the Incubation Effect among
Students playing Physics Playground
Joshua MARTINEZa,b*, Jun Rangie OBISPOa,c*, May Marie TALANDRONa,d*, & Ma.
Mercedes RODRIGOa*
aAteneo de Manila University, Quezon City, Philippines bAteneo de Naga University, Naga City, Philippines
cXavier University – Ateneo de Cagayan, Cagayan de Oro City, Philippines dCentral Mindanao University, Bukidnon, Philippines
*[email protected], *[email protected],
*[email protected], *[email protected]
Abstract: We investigate the Incubation Effect (IE), a phenomenon by which a momentary
break facilitates the generation of a solution to a problem, and its relationship with both
achievement and affect of middle school students playing Physics Playground. Statistical data
reports no significant improvement in the overall performance when breaks are done. Also,
the success rate of solving problems after taking a break has no significant difference with the
success rate of attempts without breaks. This could be attributed to the fact that the activity
done during breaks is very similar to the problem-solving task, but further investigation needs
to be done for validation. The results may say IE has not improved the in-game achievement
of students, however, majority of IE occurrences resulted to success. This is evidence to
support the positive effect of incubation. Also, a significant positive correlation was found
between IE incidence and frustration.
Keywords: Incubation Effect, Physics Playground
1. Introduction
When a student, or learner, engages in a problem solving activity, he or she sometimes gets stuck with
the problem. A learner who is stuck feels to be out of control, loses focus. “Stuck” often leads to
mental fatigue and distress (Burleson & Picard, 2004).
One of the solutions to being stuck is to take a momentary break. Students engage in a
different task, after which they return to the original problem, and are suddenly able to find a solution.
This short, beneficial break and its positive result is known as the Incubation Effect (IE). The
phenomenon is divided into three phases (Gilhooly, Georgiou, & Devery, 2013): (a) pre-incubation
phase, (b) incubation phase, and (c) post-incubation phase. In the pre-incubation phase, learners start
to solve a particular problem. The learner takes a break from the problem-solving task and engages in
a different task during the incubation phase. Lastly, the learner goes back to the task and eventually
solves the problem during the post-incubation period.
Many studies (Fulgosi & Guilford, 1968; Gilhooly et al., 2013; Penaloza & Calvillo, 2012;
Sio & Ormerod, 2009) have claimed that taking a break in the middle of the performance of an
engaging task helps results in more effective and creative solutions than continuously working on a
problem. Many of these studies recommend engaging in a significantly different activity during the
incubation from the task at hand for a better effect. However, another study claims that the task during
incubation has no effect (Segal, 2004). Attention withdrawal would be enough to facilitate a shift
from a misleading solution to a more useful solution of the problem. It is also suggested that engaging
in a task with similar nature would promote priming, where a solution would be unconsciously
formed during incubation, and would then eventually emerge during the post-incubation phase
(Penney, Godsell, Scott, & Balsom, 2004).
IE’s positive effects are not limited to cognitive outcomes. It is presumed that the underlying
processes are emotional in nature (Beeftink, van Eerde, & Rutte, 2008). Those that utilize a flawed
strategy often build up negative feelings such as frustration and confusion, and then reach a certain
1

peak that would result in an impasse. Breaks generally minimize the possibility of reaching this
impasse.
The presence and effects of IEs and similar phenomena may differ depending on context. For
example, studies comparing achievement between private and public schools (Bernardo, Ganotice Jr.,
& King, 2015; Carbonaro & Covay, 2010; Chua, 2000; Coulson, 2009; Jimenez, Lockheed, &
Paqueo, 1991; Jimenez, Paqueo, & de Vera, 1988) showed that students in private schools tend to
outperform their public schools counterparts. According to Bernardo et.al (2015), the availability of
funding and infrastructure, among others, contribute to this gap. In this study, we consider the
possible impact of the school classification on the incidence of IEs.
This study investigates the occurrence of the incubation effect among users who play Physics
Playground, a physics-based problem solving game, and its relation to both in-game achievement and
observed affective states.
This study asks the following questions:
1. What is the incidence of IEs among users playing Physics Playground?
2. What is the relationship between the incidence of IEs and in-game achievement of the
players?
3. What is the relationship between IEs and affect?
4. How does school classification (private or public) affect the incidence of IE?
2. Physics Playground (PP)
Physics Playground (PP), formerly Newton’s Playground, is a two-dimensional computer game that is
designed for high school students to better understand qualitative physics. These are concepts of how
the physical world operates in relation to Newton’s laws of motion: balance, mass, conservation and
transfer of momentum, gravity, and potential and kinetic energy (Shute & Ventura, 2013). Players are
presented with a series of challenges in which players draw using the mouse, and their drawings
become part of the physics environment. The core mechanic of the game is to guide a green ball to a
red balloon by drawing physical objects and simple mechanical devices (i.e., ramp, lever, pendulum,
springboard) on the screen that come to life once drawn. The example level of PP shown in Figure 1,
for example, requires a pendulum as its solution. Everything obeys the basic rules of physics relating
to gravity and Newton’s three laws of motion (Shute & Ventura, 2013).
Figure 1. Example level of Physics Playground.
The 74 levels in PP encourage the player to solve levels in different and creative ways that
adhere to the laws of physics via drawing different simple machines, representing agents of force and
motion: inclined plane/ramps, levers, pendulums, and springboards. A ramp is any line drawn that
helps to guide a ball in motion. A ramp is useful when a ball must travel over a hole. A lever rotates
2
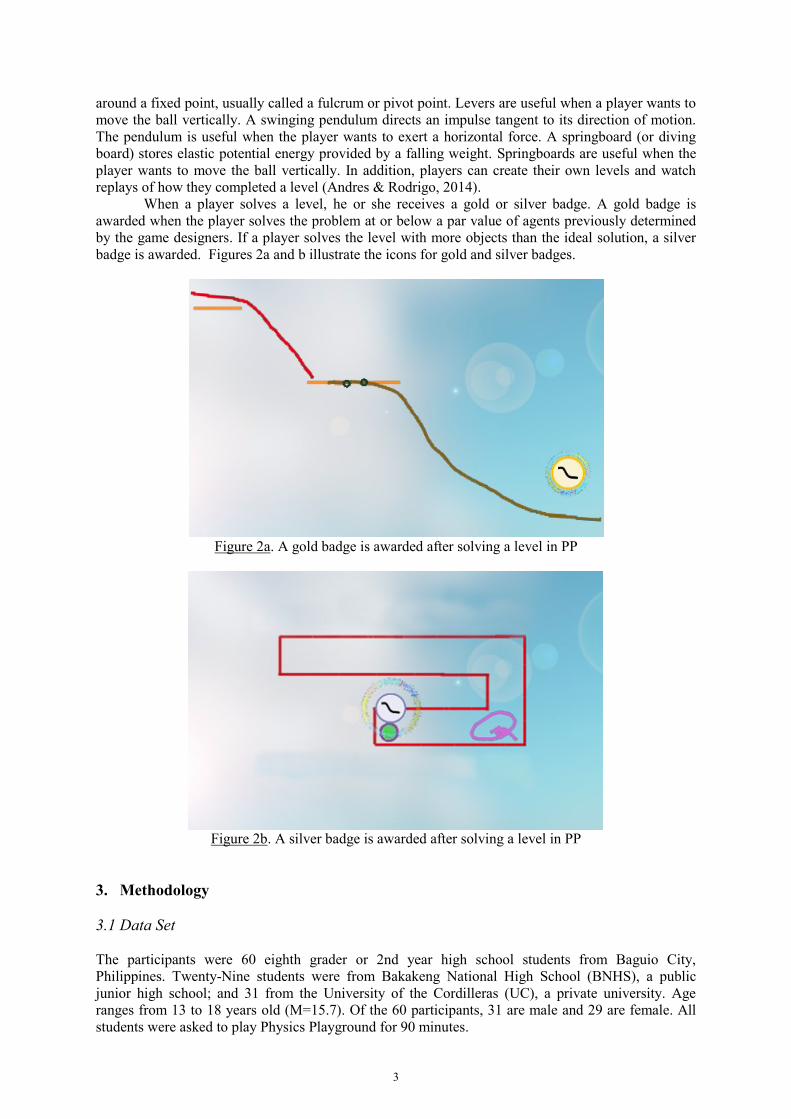
around a fixed point, usually called a fulcrum or pivot point. Levers are useful when a player wants to
move the ball vertically. A swinging pendulum directs an impulse tangent to its direction of motion.
The pendulum is useful when the player wants to exert a horizontal force. A springboard (or diving
board) stores elastic potential energy provided by a falling weight. Springboards are useful when the
player wants to move the ball vertically. In addition, players can create their own levels and watch
replays of how they completed a level (Andres & Rodrigo, 2014).
When a player solves a level, he or she receives a gold or silver badge. A gold badge is
awarded when the player solves the problem at or below a par value of agents previously determined
by the game designers. If a player solves the level with more objects than the ideal solution, a silver
badge is awarded. Figures 2a and b illustrate the icons for gold and silver badges.
Figure 2a. A gold badge is awarded after solving a level in PP
Figure 2b. A silver badge is awarded after solving a level in PP
3. Methodology
3.1 Data Set
The participants were 60 eighth grader or 2nd year high school students from Baguio City,
Philippines. Twenty-Nine students were from Bakakeng National High School (BNHS), a public
junior high school; and 31 from the University of the Cordilleras (UC), a private university. Age
ranges from 13 to 18 years old (M=15.7). Of the 60 participants, 31 are male and 29 are female. All
students were asked to play Physics Playground for 90 minutes.
3
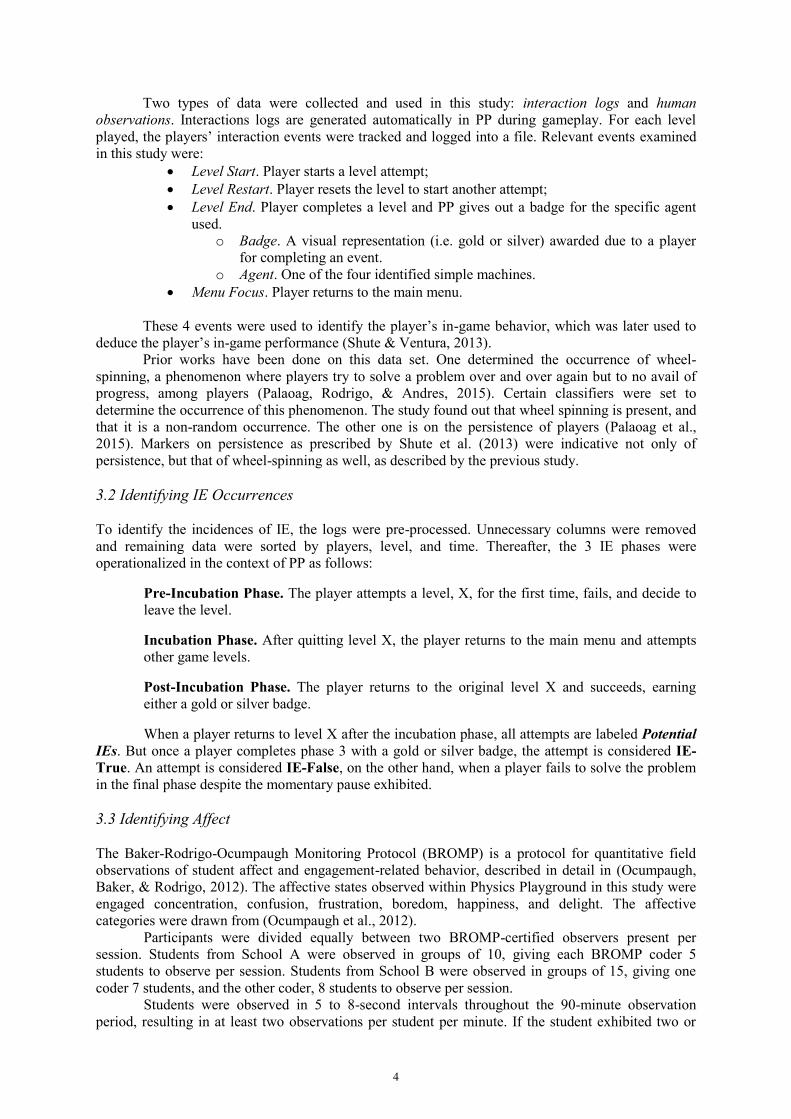
Two types of data were collected and used in this study: interaction logs and human
observations. Interactions logs are generated automatically in PP during gameplay. For each level
played, the players’ interaction events were tracked and logged into a file. Relevant events examined
in this study were:
Level Start. Player starts a level attempt;
Level Restart. Player resets the level to start another attempt;
Level End. Player completes a level and PP gives out a badge for the specific agent
used.
o Badge. A visual representation (i.e. gold or silver) awarded due to a player
for completing an event.
o Agent. One of the four identified simple machines.
Menu Focus. Player returns to the main menu.
These 4 events were used to identify the player’s in-game behavior, which was later used to
deduce the player’s in-game performance (Shute & Ventura, 2013).
Prior works have been done on this data set. One determined the occurrence of wheel-
spinning, a phenomenon where players try to solve a problem over and over again but to no avail of
progress, among players (Palaoag, Rodrigo, & Andres, 2015). Certain classifiers were set to
determine the occurrence of this phenomenon. The study found out that wheel spinning is present, and
that it is a non-random occurrence. The other one is on the persistence of players (Palaoag et al.,
2015). Markers on persistence as prescribed by Shute et al. (2013) were indicative not only of
persistence, but that of wheel-spinning as well, as described by the previous study.
3.2 Identifying IE Occurrences
To identify the incidences of IE, the logs were pre-processed. Unnecessary columns were removed
and remaining data were sorted by players, level, and time. Thereafter, the 3 IE phases were
operationalized in the context of PP as follows:
Pre-Incubation Phase. The player attempts a level, X, for the first time, fails, and decide to
leave the level.
Incubation Phase. After quitting level X, the player returns to the main menu and attempts
other game levels.
Post-Incubation Phase. The player returns to the original level X and succeeds, earning
either a gold or silver badge.
When a player returns to level X after the incubation phase, all attempts are labeled Potential
IEs. But once a player completes phase 3 with a gold or silver badge, the attempt is considered IE-
True. An attempt is considered IE-False, on the other hand, when a player fails to solve the problem
in the final phase despite the momentary pause exhibited.
3.3 Identifying Affect
The Baker-Rodrigo-Ocumpaugh Monitoring Protocol (BROMP) is a protocol for quantitative field
observations of student affect and engagement-related behavior, described in detail in (Ocumpaugh,
Baker, & Rodrigo, 2012). The affective states observed within Physics Playground in this study were
engaged concentration, confusion, frustration, boredom, happiness, and delight. The affective
categories were drawn from (Ocumpaugh et al., 2012).
Participants were divided equally between two BROMP-certified observers present per
session. Students from School A were observed in groups of 10, giving each BROMP coder 5
students to observe per session. Students from School B were observed in groups of 15, giving one
coder 7 students, and the other coder, 8 students to observe per session.
Students were observed in 5 to 8-second intervals throughout the 90-minute observation
period, resulting in at least two observations per student per minute. If the student exhibited two or
4
more distinct states during his or her respective observation period, the observers only coded the first
state.
The observers recorded their observations using the Human Affect Recording Tool, or HART.
HART is an Android application developed specifically to guide researchers in conducting
quantitative field observations according to BROMP, and facilitate synchronization of BROMP data
with educational software log data.
We synchronized the affective states with the PP interaction logs using a small utility
program we wrote in Java. The result of the program were used to identify the affective states in the
time frame of the 3 IE phases.
4. Results
4.1 Incidence of IE in PP
A total of 106 (5%) incidences of potential IEs were observed in the PP logs. Sixty-nine (65%) of
these resulted to either a silver or gold badge and were considered as IE-true. The remaining 35%
were classified as IE-false for not successfully solving the problem during the post-incubation phase.
All other attempts without a break were considered as Non-IE.
Out of the 60 players, 37 (62%) exhibited potential IEs with an average of 3 potential IEs per
player. These identified players took a momentary break, came back to the level, and tried again. Of
the 37, there were 34 (92%) who had at least one incidence of IE-true.
4.2 IE and Player In-game Achievement
The IE success rate per student was calculated as the count the student’s IE-true occurrences divided
by that student’s total potential IE occurrences. The average of all the students’ IE success rates was
75% (SD=34%). The Non-IE success rate per student was calculated as the count of the student’s
badges earned without taking a break divided by that student’s non-IE attempts. The average of all the
students’ Non-IE success rate was 66% (SD=18%). A paired two-sample for means t-test was
conducted to compare the IE success rate and Non-IE success rate of the 37 students who exhibited
IE. There was no significant difference in the IE success rate (M=75%, SD=34%) and Non-IE success
rate (M=66%, SD=18%), t(36)=1.44, p=0.16. The result suggests that there is no statistical difference
on the likelihood of solving a problem whether the learner took a break or not. At first glance, this
may imply that taking a break does not make a difference. However, recall that the students who took
the break and then returned to the problem were stuck on the problem during the prior attempt. The
IE success rate implies that leaving the problem and then coming back to it gives the student a good
chance of getting unstuck. One factor that might have affected the IE success rate is the incubation
duration. However, when correlated, the result was not significant, r(37)=-0.24, p=0.15.
We also analyzed the relationship of IE incidence per student and the overall in-game success
rate per student. The student’s IE incidence was the student’s number of Potential IE over all of the
student’s attempts during game play. Overall in-game success rate per student was the number of
badges the student earned over all of the student’s attempts. The result showed a strong negative
correlation between the two factors, r(60)=-0.62, p<0.01. With this, one might say that higher IE
incidence led to a lower overall in-game success rate. But it was observed that students with high
incidence of IE had low non-IE success rate. It should be noted that non-IEs compose 95% of all
attempts. This very high incidence of non-IEs has dominated the learner’s overall success rate. Thus,
even if the learner had a high incidence of IE, it is possible that the learner’s overall success rate
turned out low because of the low non-IE success rate. This aspect makes the negative correlation
non-conclusive.
4.3 Affective States surrounding Potential IE and IE-True in PP
5
The incidence of the affective states surrounding all potential IEs were computed as the total count of
observation per affective state over the total number of observations during the 3 phases of all
potential IE incidences per student. The average of the computed percentages is presented in Table 1.
From the results, engaged concentration was the most commonly observed cognitive-affective state,
followed by frustration and confusion. Students also exhibited occasional boredom and happiness. On
the other hand, surprise, excitement, delight, and pride were rarely observed.
Table 1: Cognitive-affective states of students over all potential IE incidences
Affective State Percentage
Engaged Concentration 76.22
Frustration 8.47
Confusion 5.87
Give Boredom 4.34
Happiness 3.50
Others (Surprise, Excitement, Delight, Pride) 1.61
We then attempted to determine the relationship between potential IEs with the 5 most
common cognitive-affective states observed: engaged concentration, frustration, confusion, boredom,
and happiness.
First, we determined the correlation between the cognitive-affective states and the incidence
rate of potential IEs per player. With a confidence level of 95% and using the False Discovery Rate
(FDR) correction for multiple comparisons, only the positive correlation between IE incidence and
frustration (r(37)=0.42, p=0.01, α=0.01) was found significant.
Second, we looked at the relationship of the cognitive-affective states with the players’ IE
success rate but no significant result was found.
4.4 Relationship of School Classification with the Incidence of IE
To determine the relationship of the school classification in relation to IE, the Chi-Square test of
independence was used. There is no significant dependency, c2(1,N=37)=1.62, p=0.20, between the
number of students who exhibited potential-IE and the school classification, whether private or public.
In terms of success rate, the number of IE-true over the number of potential-IE from each school
showed no dependency on the school classification c2(1,N=37)=0.04, p=0.84. Even in the
performance of the students, there is no significant dependency between the number of students who
exhibited IE-true over the number of students with potential-IE, c2(1,N=37)= 0.06, p=0.80, and the
school where they are from.
5. Discussion, Conclusion, and Contributions
Prior work hypothesizes that taking a short break from a problem-solving activity, most especially
when stuck, can help students arrive at solutions. In this study, we investigated this phenomenon, the
incubation effect, within the context of Physics Playground. We also examined its relationship with
in-game achievement and user affect.
Based on results, the higher their IE incidence, the lower their overall in-game success rate is.
But due to the very low incidence of IE (5%) from all attempts made, the success rate of IE is very
much under-represented in the overall success rate. And with the high incidence of Non-IEs (95%),
it’s success rate had a high representation in the overall in-game achievement result. The students
during the experiment were not told to have an actual break. This scenario might explain the low
incidence of IE.
6
Moreover, it was observed among the 37 players that attempts with break in between have an
average success rate of 75% while those attempts that have no incubation have an average success rate
of 66%. This difference, though not statistically significant gives evidence that the break enabled
students to solve the problem. Thus, it may be inferred that taking a break can help learners to get
unstuck from a problem they were previously stuck with. This validates some earlier studies (Fulgosi
& Guilford, 1968; Gilhooly et al., 2013; Penaloza & Calvillo, 2012; Sio & Ormerod, 2009) claiming
that taking a break in the middle of the performance of an engaging task helps improve success rates.
In addition, results show that incubation duration is insignificantly correlated with IE success
rate. Hence, the duration of the incubation did not contribute immensely to the success rate of the
players on levels where they took a break.
The positive correlation of the number of potential IE incidences with frustration validates
that when students are confronted with an initial failure in an attempt to solve a problem, they tend to
repeat their ineffective problem-solving approach again and again in vain. In this situation, a student
may feel frustrated (Yoo, Zellner, & Kim, 2005) for not being able to solve the problem. Hence, they
turn their attention to something else like going back to the menu, taking a break, or trying out a
different level.
In terms of in-game achievement of students in private and public schools, results show that
the students’ school classification proves to have no bearing to the incidence of both potential-IE and
IE-true in PP. This contradicts the previous studies (Bernardo et al., 2015; Carbonaro & Covay, 2010;
Chua, 2000; Coulson, 2009; Jimenez et al., 1991, 1988) indicating that students in private schools
outperform students in public schools in all levels of achievement, at least, in the context of IE in
Physics Playground. Meaning, the IE success rate of students in solving the PP problem has no direct
relationship with their school classification.
Aside from contributing to what is known about IEs, the study contributes in the following
ways:
First, relatively little has been written in the investigation of IE in computer-based learning
environments with fine-grained interaction logs like Physics Playground. Most researches in IE used
standard tests to measure fluency and creativity (Baird et al., 2012; Fulgosi & Guilford, 1968;
Gilhooly et al., 2013; Sio & Ormerod, 2015), mathematical adeptness (Fulgosi & Guilford, 1968;
Segal, 2004; Tan, Zou, Chen, & Luo, 2015), and even memory (Ellwood, Pallier, Snyder, & Gallate,
2009). Most of these researches manually observe, record, and assess test subjects based on task-
performance and are scored based on the results produced in the pre- and post-incubation phases. This
study, on the other hand, opens the idea of using computer-based learning environments in studying
phenomenon of a similar construct with IE since interaction logs of test subjects can be recorded
automatically and hence more accurately.
Second, the average success rate of attempts that have incubation is higher than those
attempts that do not have and majority of attempts with a break in between resulted to a solved
problem. This is an additional evidence to show that incubation can be an effective technique in
solving problems (Fulgosi & Guilford, 1968; Gilhooly et al., 2013; Penaloza & Calvillo, 2012; Sio &
Ormerod, 2009, 2015) where activities performed during the break are similar or related tasks. It helps
students form new, and even creative, ideas that could possibly help generate potential solutions on
the succeeding attempts (Penney et al., 2004). This finding can greatly be considered as a pedagogical
practice where teachers instruct students who are stuck at a problem to take a break and engage on
different tasks with a similar context.
Third, in this study, 84% of the players did relatively similar tasks during incubation. But the
study of Gilhooly et al. (2013) claims that an entirely irrelevant activity during the break yields better
results at the last IE phase. It is highly recommended that this claim be further investigated.
Lastly, further study is also recommended to determine the factors that might predict whether
the incubation would result to a success or not.
Acknowledgement
7
The authors would like to thank Ms. Thelma Palaoag of the University of the Cordilleras, Baguio City
for her substantial help in the analysis of the data set. We also would like to thank the Ateneo
Laboratory for the Learning Sciences and the Ateneo de Manila University Department of
Information Systems and Computer Science. This study was made possible through a grant from the
Philippines’ Department of Science and Technology Philippine Council for Industry, Energy and
Emerging Technology Research and Development entitled “Stealth assessment of student
conscientiousness, cognitive-affective states, and learning using an educational game for Physics.”
References
Andres, J. M., & Rodrigo, M. M. T. (2014). Learning and Affect Trajectories Within Newton’s Playground. In
22nd International Conference on Computers in Education. Japan.
Baird, B., Smallwood, J., Mrazek, M., Kam, J., Franklin, M., & Schooler, J. (2012). Inspired by Distraction:
Mind Wandering Facilitates Creative Incubation. Psychological Science, 23(10), 1117–1122.
Beeftink, F., van Eerde, W., & Rutte, C. (2008). The Effect of Interruptions and Breaks on Insight and Impasses:
Do You Need a Break Right Now? Creativity Research Journal, 20(4), 358–364.
Bernardo, A. B., Ganotice Jr., F. A., & King, R. B. (2015). Motivation Gap and Achievement Gap between
Public and Private High Schools in the Philippines. The Asia-Pacific Education Researcher, 24(4), 657–
667.
Burleson, W., & Picard, R. (2004). Affective Agents: Sustaining Motivation to Learn Through Failure and a
State of Stuck. In The 7th Conference on Intelligent Tutoring Systems (ITS): Workshop on Social and
Emotional Intelligence in Learning Environments. Brasil.
Carbonaro, W., & Covay, E. (2010). School Sector and Student Achievement in the Era of Standards Based
Reforms. Sociology of Education, 83, 160–182.
Chua, Y. T. (2000). Overextended and Underfunded, Public Schools are at the Bottom of the Academic Ladder.
Philippine Center for Investigative Journalism, 6.
Coulson, A. J. (2009). Comparing Public, Private, and Market Schools: The International Evidence. Journal of
School Choice, 3, 31–54.
Ellwood, S., Pallier, G., Snyder, A., & Gallate, J. (2009). The Incubation Effect: Hatching a Solution? Creativity
Research Journal, 29(1), 6–14. http://doi.org/10.1080/10400410802633368
Fulgosi, A., & Guilford, J. P. (1968). Short-term Incubation in Divergent Production. American Journal of
Psychology, 81(2), 241–246.
Gilhooly, K., Georgiou, G., & Devery, U. (2013). Incubation and Creativity: Do Something Different. Thinking
and Reasoning, 19(2), 137–149. http://doi.org/10.1080/13546783.2012.749812
Jimenez, E., Lockheed, M. E., & Paqueo, V. (1991). The Relative Efficiency of Private and Public Schools in
Developing Countries. The World Bank Research Observer, 6, 205–218.
Jimenez, E., Paqueo, V., & de Vera, M. L. (1988). Student Performance and Schools Costs in the Philippines’
High Schools. The World Bank.
Ocumpaugh, J., Baker, R. S., & Rodrigo, M. M. T. (2012). Baker-Rodrigo-Ocumpaugh Monitoring Protocol
(BROMP).
Palaoag, T., Rodrigo, M. M. T., & Andres, J. M. (2015). An Exploratory Study of Persistence Markers within a
Game-based Learning Environment. In 23rd International Conference for Computers in Education. China.
Penaloza, A., & Calvillo, D. (2012). Incubation Provides Relief from Artificial Fixation in Problem Solving.
Creativity Research Journal, 24(4), 338–344. http://doi.org/10.1080/10400419.2012.730329
Penney, C., Godsell, A., Scott, A., & Balsom, R. (2004). Problem Variables that Promote Incubation Effects.
Journal of Creative Behavior, 38(1), 35–55.
Segal, E. (2004). Incubation in Insight Problem Solving. Creativity Research Journal, 16(1), 141–148.
Shute, V., & Ventura, M. (2013). Stealth Assessment: Measuring and Supporting Learning in Video Games.
USA: Massachusetts Institute of Technology.
Sio, U. N., & Ormerod, T. (2009). Does Incubation Enhance Problem Solving? A Meta-Analytic Review.
Psychological Bulletin, 135(1), 94–120.
Sio, U. N., & Ormerod, T. (2015). Incubation and Cueing Effects in Problem-Solving: Set Aside the Difficult
Problems but Focus on the Easy Ones. Thinking and Reasoning, 21(1), 113–129.
Tan, T., Zou, H., Chen, C., & Luo, J. (2015). Mind Wandering and the Incubation Effect in Insight Problem
Solving. Creativity Research Journal, 27(4), 375–382.
Yoo, S., Zellner, R., & Kim, H. J. (2005). Exploring Incubation Effects on Insight Problem-Solving with
Computer-based Tasks. Journal of Psychological and Educational Research, 23(2), 17–40.
8
Chen, W. et al. (Eds.) (2016). Proceedings of the 24th International Conference on Computers in
Education. India: Asia-Pacific Society for Computers in Education
Detecting Affective States Based on Facial
Expressions Among Students using an
Educational Game for Physics
Emily TABANAOa,b*
, Ma. Mercedes RODRIGOb
aMSU-Iligan Institute of Technology, Philippines
bAteneo de Manila University, Philippines
Abstract. We built logistic regression models to identify facial action units that are
associated with affective states of Filipino students using Physics Playground, an
educational game for Physics. We found that facial action units AU1 (Inner Brow
Raiser), AU5 (Upper Lid Raiser) and AU6 (Cheek Raiser) are significantly associated
with engaged concentration, AU20 (Lip Stretcher) with Frustration, AU12 (Lip Corner
Puller) with Delight and AU6 with Happiness. We discuss features in the models and
future work.
Keywords: Affect detection, facial expression recognition, Physics Playground
1. Introduction
Affective computing refers to computing that “relates to, arises from, or deliberately influences
emotions” (Picard, 1997). One branch of affective computing is affect detection, the automatic
recognition of feelings, emotions, moods, attitudes, affective styles or temperament of users while
interacting with a computer (Calvo & D’Mello, 2010). When applied to an educational context,
affect detection refers to the recognition of student feelings and emotions as they engage in an
education-related activity. Within the learning context, emotions relate to student behaviour and
achievement, and the overall educational experience (Hascher, 2010; Meyer&Turner, 2006).
Emotion is expressed in several channels: voice, body language, physiology and facial
expressions. One of the most referenced tools for the analysis of facially-expressed emotions is
Ekman and Friesen’s Facial Action Coding System (FACS), a system that provides a means for
measuring facial expressions by detecting a set of muscular actions called action units or AUs.
FACS 2002 specifies 9 action units in the upper face and 18 in the lower face. In addition, there
are 14 head positions and movements, 9 eye positions and movements, 5 miscellaneous action
units, 9 action descriptors, 9 gross behaviors, and 5 visibility codes (Cohn, Ambadar & Ekman,
2007). FACS does not impose the emotion associated with the measurements hence it can be
objectively used to find which action units or combination of facial actions that are activated while
an affect is displayed. Table 1 shows the action units that are recognized by FACET, the software
that we use for this study.
Ekman also believed that ones’ action can be anticipated from the facial expression (Duffy
2002). However, there has been very few studies conducted on affect detection using facial
expressions in in-situ learning environments as opposed to laboratory settings that support
Ekman’s belief. But, studies using other modalities such as data logs from interaction in an
educational software combined with observer judgments on affect and behaviour have shown the
effects of emotion in learning. In particular (Baker, D’Mello, Rodrigo & Graesser 2010) and (Lee,
et.al, 2011) find boredom to be negatively correlated with learning and may lead to problematic
behaviour such as gaming the system. Confusion may be beneficial for learning (D’Mello, et.al,
2014) but prolonged state of confusion may lead to frustration and may eventually lead to
disengagement and boredom which may further result to the learner giving up (Craig, et.al., 2004;
D’Mello et.al., 2011; Liu, et.al, 2013). However, frustration may not always be detrimental to
9

learning but may lead to better understanding of the material and good achievement scores
(Pardos, et.al., 2013).
Table 1 Action Units Recognized by FACET
Action Unit Description Action Unit Description
AU1 Inner Brow Raiser AU15 Lip Corner Depressor
AU2 Outer Brow Raiser AU17 Chin Raiser
AU4 Brow Lowerer AU18 Lip Puckerer
AU5 Upper Lid Raiser AU20 Lip Stretcher
AU6 Cheek Raiser AU23 Lip Tightener
AU7 Lid Tightener AU24 Lip Pressor
AU9 Nose Wrinkler AU25 Lips Parted
AU10 Upper Lip Raiser AU26 Jaw Drop
AU12 Lip Corner Puller AU28 Lip Suck
AU14 Dimpler
Our research goal for this study is to examine the relationship between student learning
affective states and facial expressions among Filipino learners. In particular, we want to determine
which facial action units are directly associated with the different learning affective states that are
observed in the classroom.
Affect-aware systems are recently gaining popularity (D’Mello & Graesser, 2014; Calvo
& D’Mello, 2010). A learning system that is able to detect the affective state of its users can
effectively provide the proper intervention for the learner to maximize learning. However, research
in basic emotions suggests that there are cultural differences in the way emotions are expressed
(Marsh, et.al., 2003; Elfenbein & Ambady, 2003) As such, there is a need to determine whether
facial expressions of learning affective states among students of different cultures are expressed
differently. An even better affect-aware learning system will be a system that is able to detect
emotions of students of different cultures for it to respond accordingly.
2. Related Work
Past studies among American learners have found associations between AUs and emotions. Listed
in Table 2 are the action units that are found to be associated with the learning affective states
indicated.
Table 2. List of AUs associated with Learning-Affective State
AU/Combination of AUs Associated Affective State Findings of
AU4, AU7
AU1, AU1 & AU4, AU45
Confusion McDaniel, et.al. (2007)
Bosch, Chen & D’Mello, (2014)
AU7, AU12, AU25, AU26 Delight McDaniel, et.al. (2007)
AU12
AU45, yaw (head orientation)
AU4
Frustration McDaniel, et.al. (2007)
Bosch, Chen & D’Mello, (2014)
Grafsgaard,et.al. (2013)
AU1, AU2, AU4, AU14 Engagement Grafsgaard,et.al. (2013)
Ekman believed that the basic emotions happy, sad, anger, fear and disgust are universal
(Ekman, 1992). A happy face in one country will be manifested with the same facial muscles in
people in other countries. Taduran (2012) tested Ekman’s universality hypothesis on facial
expression judgment by applying cross-cultural agreement tests on Filipinos. His findings showed
strong cultural agreement on the recognition of happiness, sadness, anger, disgust and surprise.
However, for the case of affective learning states, the literature on Filipino learners have only
10
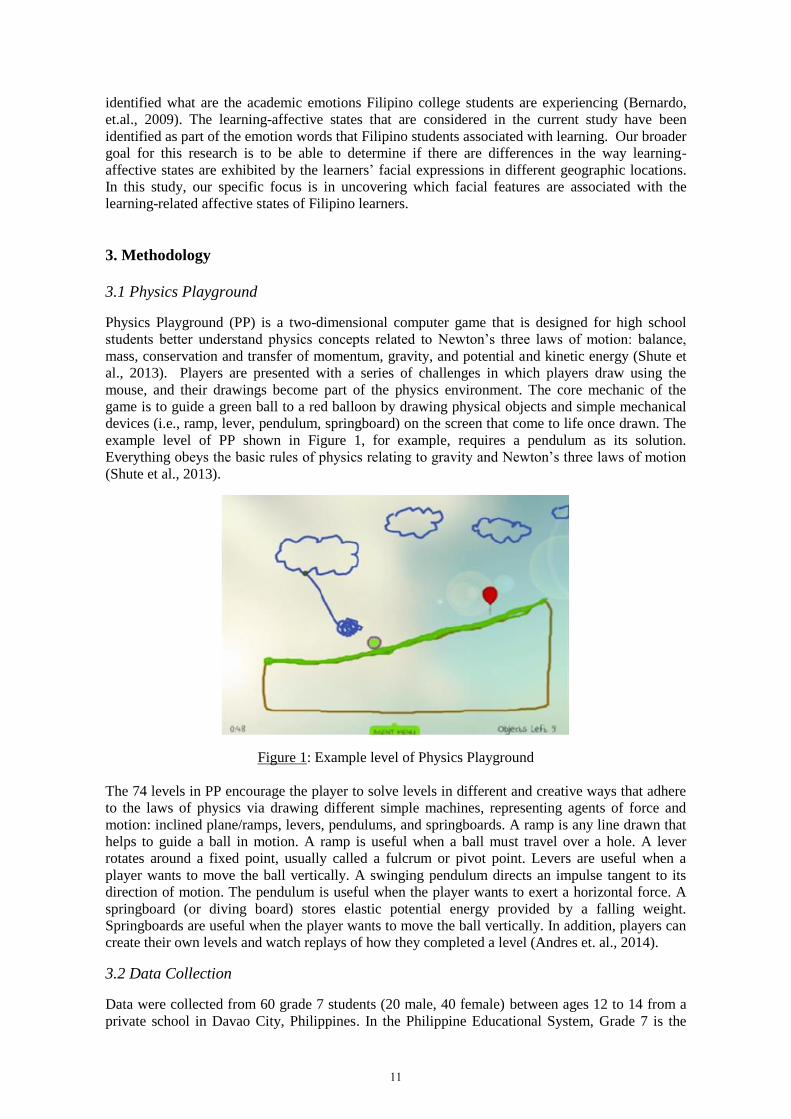
identified what are the academic emotions Filipino college students are experiencing (Bernardo,
et.al., 2009). The learning-affective states that are considered in the current study have been
identified as part of the emotion words that Filipino students associated with learning. Our broader
goal for this research is to be able to determine if there are differences in the way learning-
affective states are exhibited by the learners’ facial expressions in different geographic locations.
In this study, our specific focus is in uncovering which facial features are associated with the
learning-related affective states of Filipino learners.
3. Methodology
3.1 Physics Playground
Physics Playground (PP) is a two-dimensional computer game that is designed for high school
students better understand physics concepts related to Newton’s three laws of motion: balance,
mass, conservation and transfer of momentum, gravity, and potential and kinetic energy (Shute et
al., 2013). Players are presented with a series of challenges in which players draw using the
mouse, and their drawings become part of the physics environment. The core mechanic of the
game is to guide a green ball to a red balloon by drawing physical objects and simple mechanical
devices (i.e., ramp, lever, pendulum, springboard) on the screen that come to life once drawn. The
example level of PP shown in Figure 1, for example, requires a pendulum as its solution.
Everything obeys the basic rules of physics relating to gravity and Newton’s three laws of motion
(Shute et al., 2013).
Figure 1: Example level of Physics Playground
The 74 levels in PP encourage the player to solve levels in different and creative ways that adhere
to the laws of physics via drawing different simple machines, representing agents of force and
motion: inclined plane/ramps, levers, pendulums, and springboards. A ramp is any line drawn that
helps to guide a ball in motion. A ramp is useful when a ball must travel over a hole. A lever
rotates around a fixed point, usually called a fulcrum or pivot point. Levers are useful when a
player wants to move the ball vertically. A swinging pendulum directs an impulse tangent to its
direction of motion. The pendulum is useful when the player wants to exert a horizontal force. A
springboard (or diving board) stores elastic potential energy provided by a falling weight.
Springboards are useful when the player wants to move the ball vertically. In addition, players can
create their own levels and watch replays of how they completed a level (Andres et. al., 2014).
3.2 Data Collection
Data were collected from 60 grade 7 students (20 male, 40 female) between ages 12 to 14 from a
private school in Davao City, Philippines. In the Philippine Educational System, Grade 7 is the
11
first year of Junior High School. Inexpensive webcams were mounted at the top of each computer
monitor. At the start of each session, the webcam and its software were configured so that the
students can adjust themselves in a position where their face is at the center of the camera’s view.
All instructions were given by the experimenters who also served as field observation coders.
3.2.1 Affect Observation
Student affect and behavior was collected using the Baker-Rodrigo-Ocumpaugh Monitoring
Protocol (BROMP), a method for recording quantitative field observations, described in detail in
(Ocumpaugh, Baker, and Rodrigo, 2015).
The affective states observed within Physics Playground in this study were engaged
concentration, confusion, frustration, boredom, happiness, delight, curious, excited, hope and
anxious. The affective categories were drawn from (Ocumpaugh, Baker, and Rodrigo, 2015).
Participants were divided equally between three BROMP-certified observers present per
session. Students were observed in groups of 15, giving each BROMP coder 5 students to observe
per session. Students were observed in 5 to 8 second intervals throughout the 90-minute
observation period, resulting in at least two observations per student per minute. If the student
exhibited two or more distinct states during his or her respective observation period, the observers
only coded the first state.
The observers recorded their observations using the Human Affect Recording Tool, or
HART. HART is an Android application developed specifically to guide researchers in conducting
quantitative field observations according to BROMP, and facilitates synchronization of BROMP
data with educational software log data. The BROMP Manual gives a thorough discussion on how
the behaviour and affective states are judged.
3.3 Model Building
Emotient FACET provides five categories of information from raw video data input
(https://imotions.com/emotient/). Data exported includes the head orientation, facial landmark
location (nose, eyes, lips), basic and complex emotions, the likelihood estimates of the presence of
the 19 actions units of the face, and the respondents’ gender and whether or not the respondent
wears glasses (Facet Manual from emotient.com). In this study we only used two categories of
data from FACET logs, the head orientation which tells whether a face is detected or not and the
estimates of the 19 facial action units. Our FACET data was exported at a frame rate of 12.5
frames per second. This resulted to an average of twelve rows of information per second.
Around twenty percent (19.9%) of the synchronized data was discarded either because
there was not enough valid data (at least one second of face must be detected) or there was no face
detected for the entire window. Since we captured data in a naturalistic environment, several
factors can cause face registration errors: a lack of good lighting, face was out-of-frame,
obstructions such as hands, fast head movements, etc.. Furthermore, six cameras failed to record at
all. Hence we only had 54 FACET data logs and thus the participants without the FACET logs are
not included in the analysis.
We synchronized the FACET and affect logs using the timestamps for alignment. Similar
to the studies of Kai, et.al, we created datasets for five different window sizes (3, 6, 9, 12, and 20
seconds). The window ends at the time the affect log was observed and the window starts at the
affect log time minus the window size minus 1. For example in a 3-second window, if the affect
log was taken at time 08:00:30 (hour:minute:second), we computed for the maximum, mean,
median and standard deviation by aggregating the data at the rows 08:00:28 to 08:00:30. For each
window size, we obtained the maximum, median, mean and standard deviation for each of the
action units. A total of 78 features were created.
To create the datasets for our logistic regression models, we collapsed the computed
values for each of the affective states by taking the mean in each of the computed features for each
of the participants. For example for the affective state Engage Concentration, we computed the
mean of all the concentrating rows in each feature. Then for the NOT Engage Concentration
values, we computed the mean for all the rest of the affective states’ rows (meaning all other
affective states observed was combined). In this study, we only built models for five out of ten
12
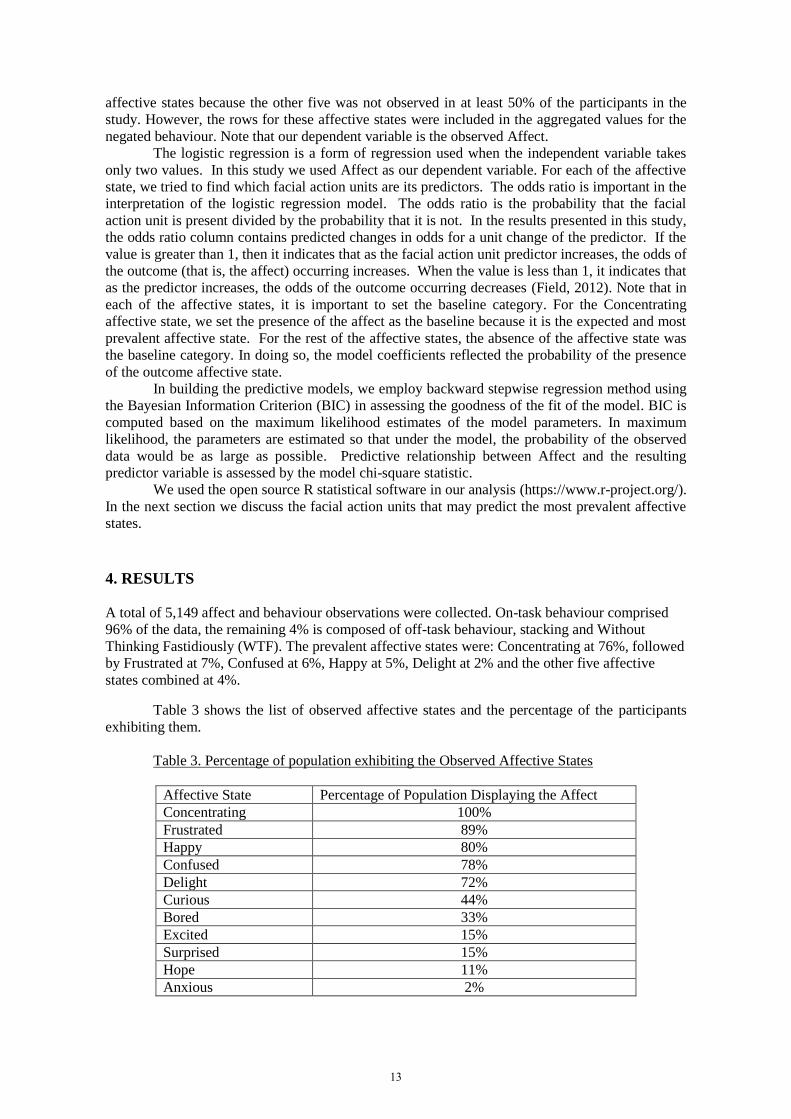
affective states because the other five was not observed in at least 50% of the participants in the
study. However, the rows for these affective states were included in the aggregated values for the
negated behaviour. Note that our dependent variable is the observed Affect. The logistic regression is a form of regression used when the independent variable takes
only two values. In this study we used Affect as our dependent variable. For each of the affective
state, we tried to find which facial action units are its predictors. The odds ratio is important in the
interpretation of the logistic regression model. The odds ratio is the probability that the facial
action unit is present divided by the probability that it is not. In the results presented in this study,
the odds ratio column contains predicted changes in odds for a unit change of the predictor. If the
value is greater than 1, then it indicates that as the facial action unit predictor increases, the odds of
the outcome (that is, the affect) occurring increases. When the value is less than 1, it indicates that
as the predictor increases, the odds of the outcome occurring decreases (Field, 2012). Note that in
each of the affective states, it is important to set the baseline category. For the Concentrating
affective state, we set the presence of the affect as the baseline because it is the expected and most
prevalent affective state. For the rest of the affective states, the absence of the affective state was
the baseline category. In doing so, the model coefficients reflected the probability of the presence
of the outcome affective state.
In building the predictive models, we employ backward stepwise regression method using
the Bayesian Information Criterion (BIC) in assessing the goodness of the fit of the model. BIC is
computed based on the maximum likelihood estimates of the model parameters. In maximum
likelihood, the parameters are estimated so that under the model, the probability of the observed
data would be as large as possible. Predictive relationship between Affect and the resulting
predictor variable is assessed by the model chi-square statistic.
We used the open source R statistical software in our analysis (https://www.r-project.org/).
In the next section we discuss the facial action units that may predict the most prevalent affective
states.
4. RESULTS
A total of 5,149 affect and behaviour observations were collected. On-task behaviour comprised
96% of the data, the remaining 4% is composed of off-task behaviour, stacking and Without
Thinking Fastidiously (WTF). The prevalent affective states were: Concentrating at 76%, followed
by Frustrated at 7%, Confused at 6%, Happy at 5%, Delight at 2% and the other five affective
states combined at 4%.
Table 3 shows the list of observed affective states and the percentage of the participants
exhibiting them.
Table 3. Percentage of population exhibiting the Observed Affective States
Affective State Percentage of Population Displaying the Affect
Concentrating 100%
Frustrated 89%
Happy 80%
Confused 78%
Delight 72%
Curious 44%
Bored 33%
Excited 15%
Surprised 15%
Hope 11%
Anxious 2%
13
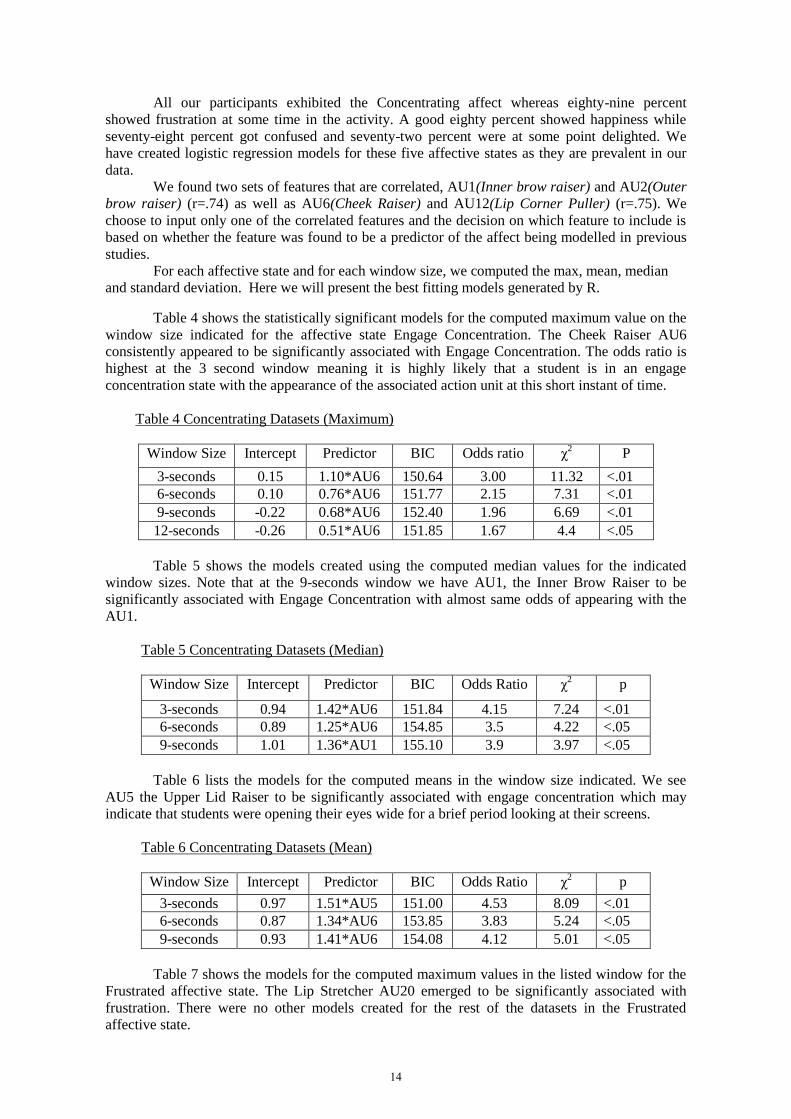
All our participants exhibited the Concentrating affect whereas eighty-nine percent
showed frustration at some time in the activity. A good eighty percent showed happiness while
seventy-eight percent got confused and seventy-two percent were at some point delighted. We
have created logistic regression models for these five affective states as they are prevalent in our
data.
We found two sets of features that are correlated, AU1(Inner brow raiser) and AU2(Outer
brow raiser) (r=.74) as well as AU6(Cheek Raiser) and AU12(Lip Corner Puller) (r=.75). We
choose to input only one of the correlated features and the decision on which feature to include is
based on whether the feature was found to be a predictor of the affect being modelled in previous
studies.
For each affective state and for each window size, we computed the max, mean, median
and standard deviation. Here we will present the best fitting models generated by R.
Table 4 shows the statistically significant models for the computed maximum value on the
window size indicated for the affective state Engage Concentration. The Cheek Raiser AU6
consistently appeared to be significantly associated with Engage Concentration. The odds ratio is
highest at the 3 second window meaning it is highly likely that a student is in an engage
concentration state with the appearance of the associated action unit at this short instant of time.
Table 4 Concentrating Datasets (Maximum)
Window Size Intercept Predictor BIC Odds ratio χ2 P
3-seconds 0.15 1.10*AU6 150.64 3.00 11.32 <.01
6-seconds 0.10 0.76*AU6 151.77 2.15 7.31 <.01
9-seconds -0.22 0.68*AU6 152.40 1.96 6.69 <.01
12-seconds -0.26 0.51*AU6 151.85 1.67 4.4 <.05
Table 5 shows the models created using the computed median values for the indicated
window sizes. Note that at the 9-seconds window we have AU1, the Inner Brow Raiser to be
significantly associated with Engage Concentration with almost same odds of appearing with the
AU1.
Table 5 Concentrating Datasets (Median)
Window Size Intercept Predictor BIC Odds Ratio χ2 p
3-seconds 0.94 1.42*AU6 151.84 4.15 7.24 <.01
6-seconds 0.89 1.25*AU6 154.85 3.5 4.22 <.05
9-seconds 1.01 1.36*AU1 155.10 3.9 3.97 <.05
Table 6 lists the models for the computed means in the window size indicated. We see
AU5 the Upper Lid Raiser to be significantly associated with engage concentration which may
indicate that students were opening their eyes wide for a brief period looking at their screens.
Table 6 Concentrating Datasets (Mean)
Window Size Intercept Predictor BIC Odds Ratio χ2 p
3-seconds 0.97 1.51*AU5 151.00 4.53 8.09 <.01
6-seconds 0.87 1.34*AU6 153.85 3.83 5.24 <.05
9-seconds 0.93 1.41*AU6 154.08 4.12 5.01 <.05
Table 7 shows the models for the computed maximum values in the listed window for the
Frustrated affective state. The Lip Stretcher AU20 emerged to be significantly associated with
frustration. There were no other models created for the rest of the datasets in the Frustrated
affective state.
14
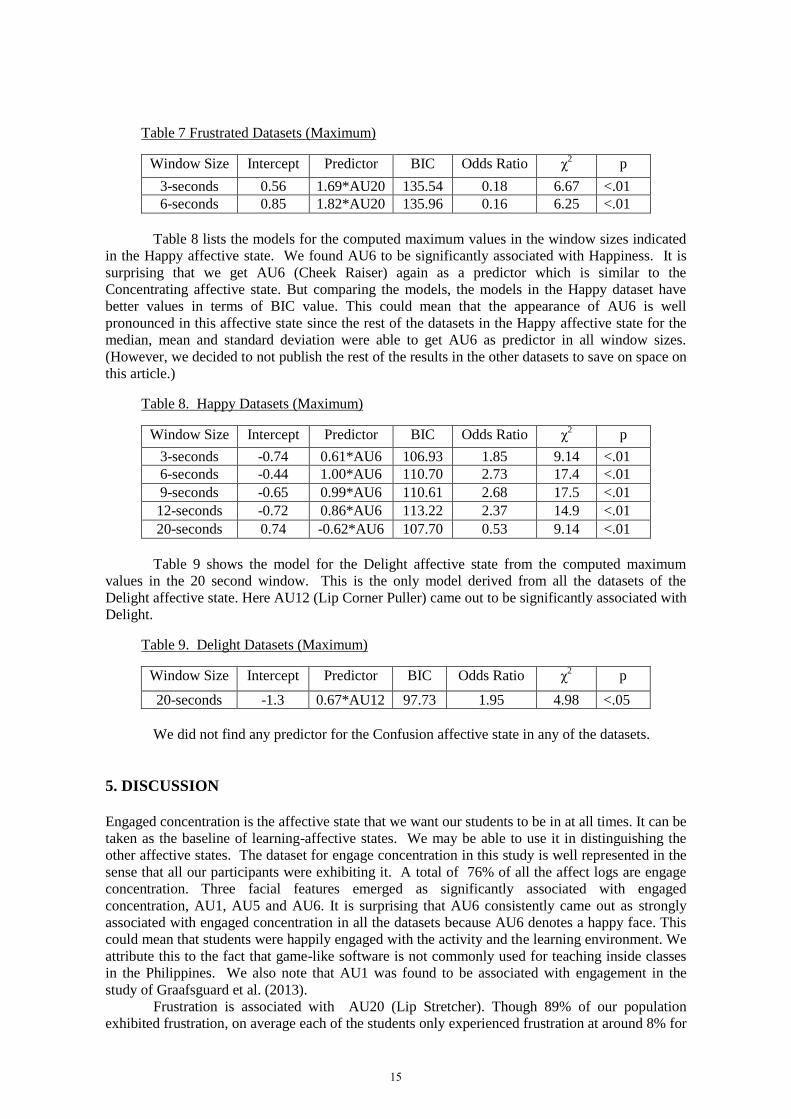
Table 7 Frustrated Datasets (Maximum)
Window Size Intercept Predictor BIC Odds Ratio χ2 p
3-seconds 0.56 1.69*AU20 135.54 0.18 6.67 <.01
6-seconds 0.85 1.82*AU20 135.96 0.16 6.25 <.01
Table 8 lists the models for the computed maximum values in the window sizes indicated
in the Happy affective state. We found AU6 to be significantly associated with Happiness. It is
surprising that we get AU6 (Cheek Raiser) again as a predictor which is similar to the
Concentrating affective state. But comparing the models, the models in the Happy dataset have
better values in terms of BIC value. This could mean that the appearance of AU6 is well
pronounced in this affective state since the rest of the datasets in the Happy affective state for the
median, mean and standard deviation were able to get AU6 as predictor in all window sizes.
(However, we decided to not publish the rest of the results in the other datasets to save on space on
this article.)
Table 8. Happy Datasets (Maximum)
Window Size Intercept Predictor BIC Odds Ratio χ2 p
3-seconds -0.74 0.61*AU6 106.93 1.85 9.14 <.01
6-seconds -0.44 1.00*AU6 110.70 2.73 17.4 <.01
9-seconds -0.65 0.99*AU6 110.61 2.68 17.5 <.01
12-seconds -0.72 0.86*AU6 113.22 2.37 14.9 <.01
20-seconds 0.74 -0.62*AU6 107.70 0.53 9.14 <.01
Table 9 shows the model for the Delight affective state from the computed maximum
values in the 20 second window. This is the only model derived from all the datasets of the
Delight affective state. Here AU12 (Lip Corner Puller) came out to be significantly associated with
Delight.
Table 9. Delight Datasets (Maximum)
Window Size Intercept Predictor BIC Odds Ratio χ2 p
20-seconds -1.3 0.67*AU12 97.73 1.95 4.98 <.05
We did not find any predictor for the Confusion affective state in any of the datasets.
5. DISCUSSION
Engaged concentration is the affective state that we want our students to be in at all times. It can be
taken as the baseline of learning-affective states. We may be able to use it in distinguishing the
other affective states. The dataset for engage concentration in this study is well represented in the
sense that all our participants were exhibiting it. A total of 76% of all the affect logs are engage
concentration. Three facial features emerged as significantly associated with engaged
concentration, AU1, AU5 and AU6. It is surprising that AU6 consistently came out as strongly
associated with engaged concentration in all the datasets because AU6 denotes a happy face. This
could mean that students were happily engaged with the activity and the learning environment. We
attribute this to the fact that game-like software is not commonly used for teaching inside classes
in the Philippines. We also note that AU1 was found to be associated with engagement in the
study of Graafsguard et al. (2013).
Frustration is associated with AU20 (Lip Stretcher). Though 89% of our population
exhibited frustration, on average each of the students only experienced frustration at around 8% for
15
the entire duration that they were observed. In the study of Hoque, McDuff & Picard (2012) they
observed smiles in frustration but not the same smile as a delighted smile. The Lip Stretcher,
AU20, most likely fit this description of a frustrated smile. We note however, that AU20 was not
found to be associated with frustration in previous studies. As such Filipino learners seems to
exhibit a different facial expression when frustrated compared to American learners.
Happiness was consistently associated with AU6 (Cheek Raiser) in all time windows and
in all datasets even though the students were observed to be in the happiness state at only 7% for
the whole duration. We suspect these are the times when students successfully solved the problems
in the game and they were truly happy at that instant such that AU6 was well pronounced in the
participants’ faces. According to Ekman, the prototypical facial expression of happy is evident by
the activation of AU12 with or without AU6 (Ekman, et.al, 2002). Happiness being a basic
emotion is believed to be universal and our result somehow confirms this as our participants
showed the presence of AU6. The absence of AU12 could be due to the fact that the students are
in a class performing an activity and at the same time they are being observed, hence we believe
the students are controlling their emotions and thus the intensity of the facial expressions may not
be perfectly the same as the universally known prototypical face which are mostly exaggerated
expressions of the basic emotions.
The affect observers have agreed on how they will differentiate happiness from delight.
They decided that delight will be some sort of exaggerated happiness without the surprise
indicators. We found one feature associated with delight at the 20-second window, the AU12 (Lip
Corner Puller). It is surprising that the model for delight was at the 20-second window as we don’t
expect delight to last that long. The prototypical facial expression of surprise is comprised of three
components: eyebrow raising (AU1/AU2), eye widening (AU5), and mouth opening/jaw drop
(AU25/26) (Ekman, et.al, 2002). We note that our result agrees to the observers’ definition of
delight. We only have AU12 without the AUs of the surprise facial expression. It appears that the
American learners’ facial expression of delight is more intense compared to the Filipino learners
due to the presence of AU25/26 among American learners. This could partly be due to the
presence of the observers and the Filipino’s culture of timidity in the presence of visitors and their
being more respectful to their teachers (Bulatao, 1964; Church, et.al, 1992).
Though confusion was exhibited by 78% of our population and was observed at 7.5% the
whole time in each of the participants, we did not arrive at a model. We attribute this to the fact
that game-like educational software is a new experience to the students and they were enjoying the
activity as evident by the presence of AU6 in the engage concentration state. This resulted to facial
features that are not strong enough to come up with a model for confusion.
6. CONCLUSION
We have identified facial features that are significantly associated with some of the learning
affective states (engaged concentration, frustration, delight and happiness) that are prevalent in a
natural learning environment. Though our models are modest in terms of fit, this is understandable
due to the many challenges in doing this study. Some data were removed due to the challenges in
taking data in in-situ learning environments where students behaved normally during data
collection. They were free to view their classmates monitor, or talk to their classmates or to go
take comfort room breaks. Another reason could be the number of participants and the duration of
the data collection. This resulted to a limited number of instances for some of the affective-states.
However, this serves as a good start as this is the first study in this part of the world to look at the
facial features to detect learning affective states. In future work we will look into the data in other
parts of the country and compare it to the findings in other parts of the world to know what are the
differences and similarities in the facial expressions inside learning environments.
Acknowledgements
We thank Miggy Andres, Jessica Sugay, Michelle Banawan, Yancy Paredes, the officials at
Ateneo de Davao University High School, Nigel Bosch of University of Notre Dame, Drs. Jaclyn
16
Ocumpaugh and Luc Paquette of Teachers College, Columbia University, and Drs. Valerie Shute,
Matthew Ventura, and Matthew Small of Florida State University. This study was made possible
through a grant from the Philippines’ Department of Science and Technology Philippine Council
for Industry, Energy and Emerging Technology Research and Development entitled “Stealth
assessment of student conscientiousness, cognitive-affective states, and learning using an
educational game for Physics.”
References
Andres, J. M. L., Rodrigo, M. M. T., Sugay, J. O., Baker, R. S., Paquette, L., Shute, V. J., ... &
SMALL, M. (2014, November). An Exploratory Analysis of Confusion Among Students
Using Newton’s Playground. In 22nd International Conference on Computers in Education.
Baker, R. S., D'Mello, S. K., Rodrigo, M. M. T., & Graesser, A. C. (2010). Better to be frustrated
than bored: The incidence, persistence, and impact of learners’ cognitive–affective states
during interactions with three different computer-based learning environments. International
Journal of Human-Computer Studies, 68(4), 223-241.
Bernardo, A. B., Ouano, J. A., & Salanga, M. G. C. (2009). What is an academic emotion? Insights
from Filipino bilingual students’ emotion words associated with learning. Psychological
Studies, 54(1), 28-37.
Bosch, N., Chen, Y., & D’Mello, S. (2014, June). It’s written on your face: detecting affective
states from facial expressions while learning computer programming. In Intelligent Tutoring
Systems (pp. 39-44). Springer International Publishing.
Bulatao, J. C. (1964). Hiya. Philippine Studies, 12(3), 424-438.
Calvo, R. A., & D'Mello, S. (2010). Affect detection: An interdisciplinary review of models,
methods, and their applications. Affective Computing, IEEE Transactions on, 1(1), 18-37.
Church, A. T., & Katigbak, M. S. (1992). The Cultural Context of Academic Motives A
Comparison of Filipino and American College Students. Journal of Cross-Cultural
Psychology, 23(1), 40-58.
Cohn, J. F., Ambadar, Z., & Ekman, P. (2007). Observer-based measurement of facial expression
with the Facial Action Coding System. The handbook of emotion elicitation and assessment,
203-221.
Craig, S., Graesser, A., Sullins, J., & Gholson, B. (2004). Affect and learning: an exploratory look
into the role of affect in learning with AutoTutor. Journal of Educational Media, 29(3), 241-
250.
D’Mello, S. K., & Graesser, A. C. (2014). Feeling, thinking, and computing with affect-aware
learning. The Oxford handbook of affective computing, 419-434.
Duffy, K.G. 2002. Psychology 02/03. McGraw-Hill/Dushkin
Ekman, P. (1992). Facial expressions of emotion: New findings, new questions. Psychological
Science, 3(1), 34-38.
Ekman P, Friesen WV, Hager JC. Facial action coding system (FACS). Salt Lake City: A Human
Face; 2002
Emotient Module: Facial Expression Emotion Analysis. (n.d.). Retrieved August 23, 2016, from
https://imotions.com/emotient/
Elfenbein, H. A., & Ambady, N. (2003). Universals and cultural differences in recognizing
emotions. Current directions in psychological science, 12(5), 159-164.
Field, A. (2012). Discovering Statistics using R. Sage.
Grafsgaard, J. F., Wiggins, J. B., Boyer, K. E., Wiebe, E. N., & Lester, J. C. (2013, July).
Automatically Recognizing Facial Expression: Predicting Engagement and Frustration.
In EDM (pp. 43-50).
Hascher, T. (2010). Learning and Emotion: perspectives for theory and research. European
Educational Research Journal, 9(1), 13-28.
Hoque, M. E., McDuff, D. J., & Picard, R. W. (2012). Exploring temporal patterns in classifying
frustrated and delighted smiles. Affective Computing, IEEE Transactions on, 3(3), 323-334.
17

Kai, S., Paquette, L., Baker, R. S., Bosch, N., D'Mello, S., Ocumpaugh, J., ... & Ventura, M.
(2015). A Comparison of Video-Based and Interaction-Based Affect Detectors in Physics
Playground. International Educational Data Mining Society.
Kort, B., Reilly, R., & Picard, R. (2004). An affective model of interplay between emotions and
learning. In Proceedings of IEEE International Conference on Advanced Learning
Technologies (pp. 43-46).
Lee, D. M. C., Rodrigo, M. M. T., d Baker, R. S., Sugay, J. O., & Coronel, A. (2011). Exploring
the relationship between novice programmer confusion and achievement. In Affective
computing and intelligent interaction (pp. 175-184). Springer Berlin Heidelberg.
Marsh, A. A., Elfenbein, H. A., & Ambady, N. (2003). Nonverbal “accents” cultural differences in
facial expressions of emotion. Psychological Science,14(4), 373-376.
McDaniel, B. T., D’Mello, S., King, B. G., Chipman, P., Tapp, K., & Graesser, A. C. (2007).
Facial features for affective state detection in learning environments. In Proceedings of the
29th Annual Cognitive Science Society (pp. 467-472). Austin, TX: Cognitive Science
Society.
Meyer, D. K., & Turner, J. C. (2006). Re-conceptualizing emotion and motivation to learn in
classroom contexts. Educational Psychology Review,18(4), 377-390.
Pardos, Z. A., Baker, R. S., San Pedro, M. O., Gowda, S. M., & Gowda, S. M. (2013, April).
Affective states and state tests: Investigating how affect throughout the school year predicts
end of year learning outcomes. In Proceedings of the Third International Conference on
Learning Analytics and Knowledge (pp. 117-124). ACM.
Shute, V. J., Ventura, M., & Kim, Y. J. (2013). Assessment and learning of qualitative physics in
newton's playground. The Journal of Educational Research, 106(6), 423-430.
Taduran, R. J. O. (2012). Mukha mo: a preliminary study on Filipino facial expressions. Social
Science Diliman, 8(2).
18
Chen, W. et al. (Eds.) (2016). Proceedings of the 24th
International Conference on Computers in Education.
India: Asia-Pacific Society for Computers in Education
An Embedded Constraint-based Tutor for
On-the-Job Training
Jill DE JONGa, Antonija MITROVIC
a* & Moffat MATHEWS
a
aIntelligent Computer Tutoring Group, University of Canterbury, New Zealand
Abstract: We present Chreos Tutor, a constraint-based tutor embedded into Chreos, an existing
business software system. The goal of Chreos Tutor is to teach users new to Chreos how to
complete realistic tasks. In Chreos Tutor, the student interface is the combination of a new
tutoring screen and existing Chreos data input screens. We conducted a study investigating the
effect of feedback Chreos Tutor provides, which shows that the feedback resulted in a
significantly higher learning gain. An experienced Chreos user found the tutor to be a preferred
training option for new users.
Keywords: embedded intelligent tutoring system, on-the-job training, evaluation study
1. Introduction
Traditional on-the-job training for software typically involves human tutoring, training videos, manuals
and open-ended exploration of the software. All of these tools have their limitations. Human tutoring
can be tailored to each individual user, but is expensive and can be inflexible in terms of timing.
Training videos and documentation are normally less expensive options that can be used when
convenient, but are less effective because of lack of guidance and feedback. The risk with open-ended
exploration is that some essential skills may be missed. A field study investigating the learning
behaviour and attitudes of computer users in everyday working situations (Rieman, 1996) indicated that
the main focus of software users in a job situation is on successful completion of their tasks within the
minimum time frame. Time pressure tends to favour a ‘just in time’ task-driven approach to acquiring
software skills.
Intelligent Tutoring Systems (ITSs) provide an alternative to conventional on-the-job training
tools for software users. Embedding the ITS in the software allows users to practice on realistic tasks in
the actual environment, at their convenience. ITSs tailor tasks for incremental learning of software
features or task types, and provide adaptive feedback.
A number of ITSs have been embedded in a range of existing software, such as MACSYMA
Advisor (Genesereth, 1979), Geometer Sketchpad and Microsoft Excel (Ritter and Koedinger, 1996), a
military information system (Cheikes et al., 1998) and Microsoft Access (Risco and Reye, 2012).
DM-Tutor (Amalathas, Mitrovic and Ravan, 2012) is a constraint-based tutor developed using the
ASPIRE authoring system (Mitrovic et al., 2009). This tutor was embedded within an existing
Management Information System (MIS) for oil palm plantation management, with the aim of
improving decision making skills by providing scenario-based training using actual data and plantation
conditions.
We present Chreos Tutor, a constraint-based tutor embedded into an existing business software
system to assist users to successfully complete realistic tasks. Similar to DM-Tutor, Chreos Tutor is also
developed in ASPIRE. Its student interface is the combination of a new tutoring screen and an existing
data input screen inside the Chreos Business Software application (referred to as Chreos). Chreos Tutor
operates in a similar manner to Motherboard Assembly Tutor (MAT) Westerfield, Mitrovic and
Billinghurst, 2013), with Chreos obtaining problems and feedback from the tutor and providing
information on user actions to the tutor via remote procedure calls. However, the MAT teaches how to
assemble components on a computer motherboard via an Augmented Reality interface rather than an
existing workplace system.
19
This paper is organized as follows. In the next section we introduce Chreos Business Software,
which provides the context for workplace learning. Section 3 discusses the development of Chreos
Tutor in ASPIRE. We have recently performed a study, in which we focused on the effect of feedback
provided by the tutor. The study is presented in Section 5, followed by the results and conclusions.
2. Chreos Business Software
Chreos
1 is a modular, integrated business system. Its modules include Point of Sale, Debtors or Clients,
Creditors, Inventory and General Ledger. These modules are integrated where relevant in order to
minimize duplication of data input and maintain data consistency. The most commonly used modules
are Inventory and Debtors. The Inventory module provides a business with the functionality to manage
the products and services it is buying and selling. The Debtors module enables keeping track of client
data. The processes for entering transactions and viewing data are reasonably consistent throughout
Chreos, so that knowledge acquired in one module is applicable in other modules.
Chreos implements double entry bookkeeping principles for all financial transactions. This can
be implemented explicitly, where the user enters both sides of the transaction in a screen. However,
with most screens users enter the minimal amount of data. Chreos then carries out any necessary
calculations and generates all the appropriate bookkeeping entries. New Chreos Service Packs are
released on a regular basis, usually at a rate of 1 to 2 per year. The software is written in Delphi and runs
on a MS Windows operating system. It uses Client-Server architecture and the Firebird relational
database for data storage.
Wild Software Ltd, the developers of Chreos, provide training and support to all users, which
often incorporates training sessions run by one or more support personnel. Remote training is also
available, where support staff can see the user’s desktop and talk them through the process via
telephone. Each client of Chreos can also set up a Practice Company to use for training, which is either
a copy of their current database or of an earlier backup. This enables users to try out various tasks,
without impacting live data. Beyond that there are some training videos and a range of web-based help
documentation.
The background and attitudes of new users of software can affect the learning experience. The
size of the Chreos user base limits the chances of a new user having previous Chreos experience. A new
user can be an existing employee of a business that decides to install Chreos, or a new employee of a
business already using Chreos. In the first case, there are usually multiple people having to learn about
Chreos, with at least some of them perceiving that it has advantages over the previous system. In the
second case, there is a single new user who may have preconceived ideas of how Chreos should behave
from previous systems. An ITS that allows users to practice real world tasks in the actual Chreos
environment at their convenience would be a valuable training tool in both situations.
3. Modelling Chreos Tasks in ASPIRE
ASPIRE is a system for authoring and deploying constraint-based tutors. ASPIRE-Author provides a
web-based interface that supports authors in developing new tutors, by specifying domain ontologies,
problem/solution structure and student interfaces as well as entering problems and their solutions.
ASPIRE automatically generates constraints which the author can modify, if necessary. ASPIRE-Tutor
is a web-based server that deploys tutors to students.
Chreos already breaks business processes down into tasks, so for ease of learning Chreos Tutor
adopts the same definition of tasks. A task only involves a single Chreos screen. We selected two tasks
from the Clients module. The first task involves making financial adjustments to debtor balances, which
is done via the Debtor journal screen. The second task is to enter client orders. When users enter data
into Chreos, the order in which fields are entered is not critical. The critical thing is that when the user
clicks the Save button, everything they have entered into the screen is correct. Consequently each of
these tasks is modeled as a separate non-procedural domain in ASPIRE.
1 http://www.chreos.com
20
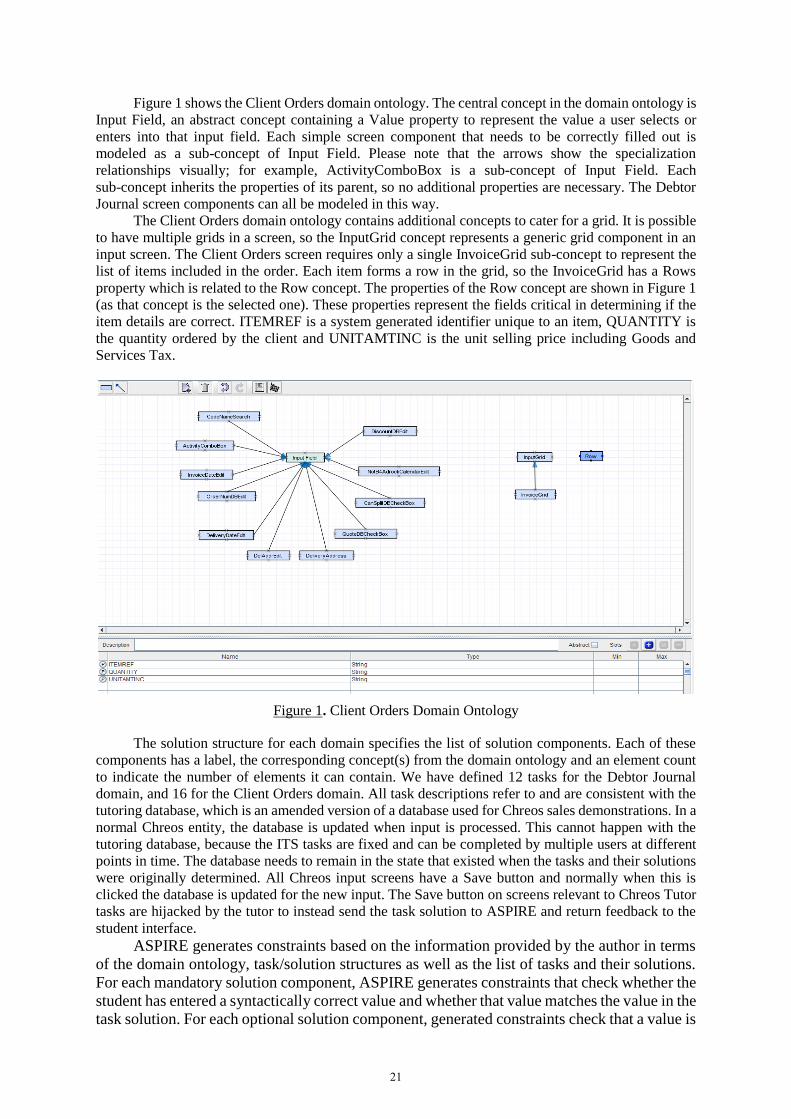
Figure 1 shows the Client Orders domain ontology. The central concept in the domain ontology is
Input Field, an abstract concept containing a Value property to represent the value a user selects or
enters into that input field. Each simple screen component that needs to be correctly filled out is
modeled as a sub-concept of Input Field. Please note that the arrows show the specialization
relationships visually; for example, ActivityComboBox is a sub-concept of Input Field. Each
sub-concept inherits the properties of its parent, so no additional properties are necessary. The Debtor
Journal screen components can all be modeled in this way.
The Client Orders domain ontology contains additional concepts to cater for a grid. It is possible
to have multiple grids in a screen, so the InputGrid concept represents a generic grid component in an
input screen. The Client Orders screen requires only a single InvoiceGrid sub-concept to represent the
list of items included in the order. Each item forms a row in the grid, so the InvoiceGrid has a Rows
property which is related to the Row concept. The properties of the Row concept are shown in Figure 1
(as that concept is the selected one). These properties represent the fields critical in determining if the
item details are correct. ITEMREF is a system generated identifier unique to an item, QUANTITY is
the quantity ordered by the client and UNITAMTINC is the unit selling price including Goods and
Services Tax.
Figure 1. Client Orders Domain Ontology
The solution structure for each domain specifies the list of solution components. Each of these
components has a label, the corresponding concept(s) from the domain ontology and an element count
to indicate the number of elements it can contain. We have defined 12 tasks for the Debtor Journal
domain, and 16 for the Client Orders domain. All task descriptions refer to and are consistent with the
tutoring database, which is an amended version of a database used for Chreos sales demonstrations. In a
normal Chreos entity, the database is updated when input is processed. This cannot happen with the
tutoring database, because the ITS tasks are fixed and can be completed by multiple users at different
points in time. The database needs to remain in the state that existed when the tasks and their solutions
were originally determined. All Chreos input screens have a Save button and normally when this is
clicked the database is updated for the new input. The Save button on screens relevant to Chreos Tutor
tasks are hijacked by the tutor to instead send the task solution to ASPIRE and return feedback to the
student interface.
ASPIRE generates constraints based on the information provided by the author in terms
of the domain ontology, task/solution structures as well as the list of tasks and their solutions.
For each mandatory solution component, ASPIRE generates constraints that check whether the
student has entered a syntactically correct value and whether that value matches the value in the
task solution. For each optional solution component, generated constraints check that a value is
21
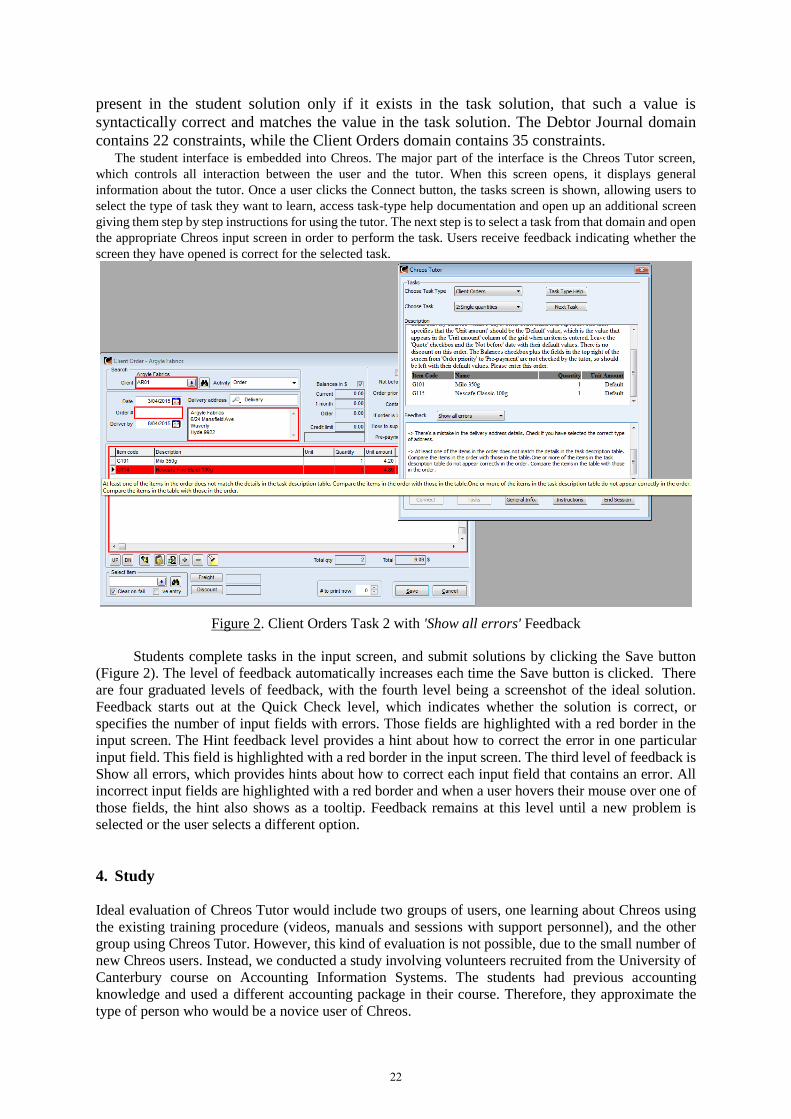
present in the student solution only if it exists in the task solution, that such a value is
syntactically correct and matches the value in the task solution. The Debtor Journal domain
contains 22 constraints, while the Client Orders domain contains 35 constraints. The student interface is embedded into Chreos. The major part of the interface is the Chreos Tutor screen,
which controls all interaction between the user and the tutor. When this screen opens, it displays general
information about the tutor. Once a user clicks the Connect button, the tasks screen is shown, allowing users to
select the type of task they want to learn, access task-type help documentation and open up an additional screen
giving them step by step instructions for using the tutor. The next step is to select a task from that domain and open
the appropriate Chreos input screen in order to perform the task. Users receive feedback indicating whether the
screen they have opened is correct for the selected task.
Figure 2. Client Orders Task 2 with 'Show all errors' Feedback
Students complete tasks in the input screen, and submit solutions by clicking the Save button
(Figure 2). The level of feedback automatically increases each time the Save button is clicked. There
are four graduated levels of feedback, with the fourth level being a screenshot of the ideal solution.
Feedback starts out at the Quick Check level, which indicates whether the solution is correct, or
specifies the number of input fields with errors. Those fields are highlighted with a red border in the
input screen. The Hint feedback level provides a hint about how to correct the error in one particular
input field. This field is highlighted with a red border in the input screen. The third level of feedback is
Show all errors, which provides hints about how to correct each input field that contains an error. All
incorrect input fields are highlighted with a red border and when a user hovers their mouse over one of
those fields, the hint also shows as a tooltip. Feedback remains at this level until a new problem is
selected or the user selects a different option.
4. Study
Ideal evaluation of Chreos Tutor would include two groups of users, one learning about Chreos using
the existing training procedure (videos, manuals and sessions with support personnel), and the other
group using Chreos Tutor. However, this kind of evaluation is not possible, due to the small number of
new Chreos users. Instead, we conducted a study involving volunteers recruited from the University of
Canterbury course on Accounting Information Systems. The students had previous accounting
knowledge and used a different accounting package in their course. Therefore, they approximate the
type of person who would be a novice user of Chreos.
22
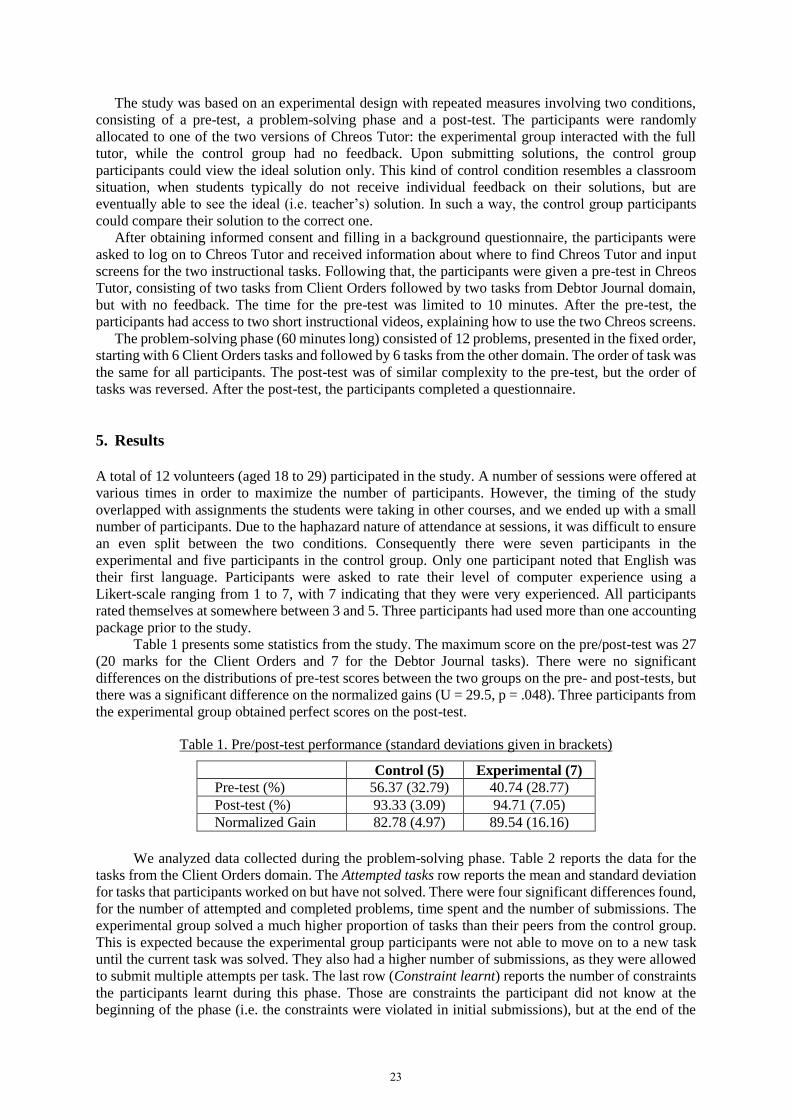
The study was based on an experimental design with repeated measures involving two conditions,
consisting of a pre-test, a problem-solving phase and a post-test. The participants were randomly
allocated to one of the two versions of Chreos Tutor: the experimental group interacted with the full
tutor, while the control group had no feedback. Upon submitting solutions, the control group
participants could view the ideal solution only. This kind of control condition resembles a classroom
situation, when students typically do not receive individual feedback on their solutions, but are
eventually able to see the ideal (i.e. teacher’s) solution. In such a way, the control group participants
could compare their solution to the correct one.
After obtaining informed consent and filling in a background questionnaire, the participants were
asked to log on to Chreos Tutor and received information about where to find Chreos Tutor and input
screens for the two instructional tasks. Following that, the participants were given a pre-test in Chreos
Tutor, consisting of two tasks from Client Orders followed by two tasks from Debtor Journal domain,
but with no feedback. The time for the pre-test was limited to 10 minutes. After the pre-test, the
participants had access to two short instructional videos, explaining how to use the two Chreos screens.
The problem-solving phase (60 minutes long) consisted of 12 problems, presented in the fixed order,
starting with 6 Client Orders tasks and followed by 6 tasks from the other domain. The order of task was
the same for all participants. The post-test was of similar complexity to the pre-test, but the order of
tasks was reversed. After the post-test, the participants completed a questionnaire.
5. Results
A total of 12 volunteers (aged 18 to 29) participated in the study. A number of sessions were offered at
various times in order to maximize the number of participants. However, the timing of the study
overlapped with assignments the students were taking in other courses, and we ended up with a small
number of participants. Due to the haphazard nature of attendance at sessions, it was difficult to ensure
an even split between the two conditions. Consequently there were seven participants in the
experimental and five participants in the control group. Only one participant noted that English was
their first language. Participants were asked to rate their level of computer experience using a
Likert-scale ranging from 1 to 7, with 7 indicating that they were very experienced. All participants
rated themselves at somewhere between 3 and 5. Three participants had used more than one accounting
package prior to the study. Table 1 presents some statistics from the study. The maximum score on the pre/post-test was 27
(20 marks for the Client Orders and 7 for the Debtor Journal tasks). There were no significant
differences on the distributions of pre-test scores between the two groups on the pre- and post-tests, but
there was a significant difference on the normalized gains (U = 29.5, p = .048). Three participants from
the experimental group obtained perfect scores on the post-test.
Table 1. Pre/post-test performance (standard deviations given in brackets)
Control (5) Experimental (7)
Pre-test (%) 56.37 (32.79) 40.74 (28.77)
Post-test (%) 93.33 (3.09) 94.71 (7.05)
Normalized Gain 82.78 (4.97) 89.54 (16.16)
We analyzed data collected during the problem-solving phase. Table 2 reports the data for the
tasks from the Client Orders domain. The Attempted tasks row reports the mean and standard deviation
for tasks that participants worked on but have not solved. There were four significant differences found,
for the number of attempted and completed problems, time spent and the number of submissions. The
experimental group solved a much higher proportion of tasks than their peers from the control group.
This is expected because the experimental group participants were not able to move on to a new task
until the current task was solved. They also had a higher number of submissions, as they were allowed
to submit multiple attempts per task. The last row (Constraint learnt) reports the number of constraints
the participants learnt during this phase. Those are constraints the participant did not know at the
beginning of the phase (i.e. the constraints were violated in initial submissions), but at the end of the
23
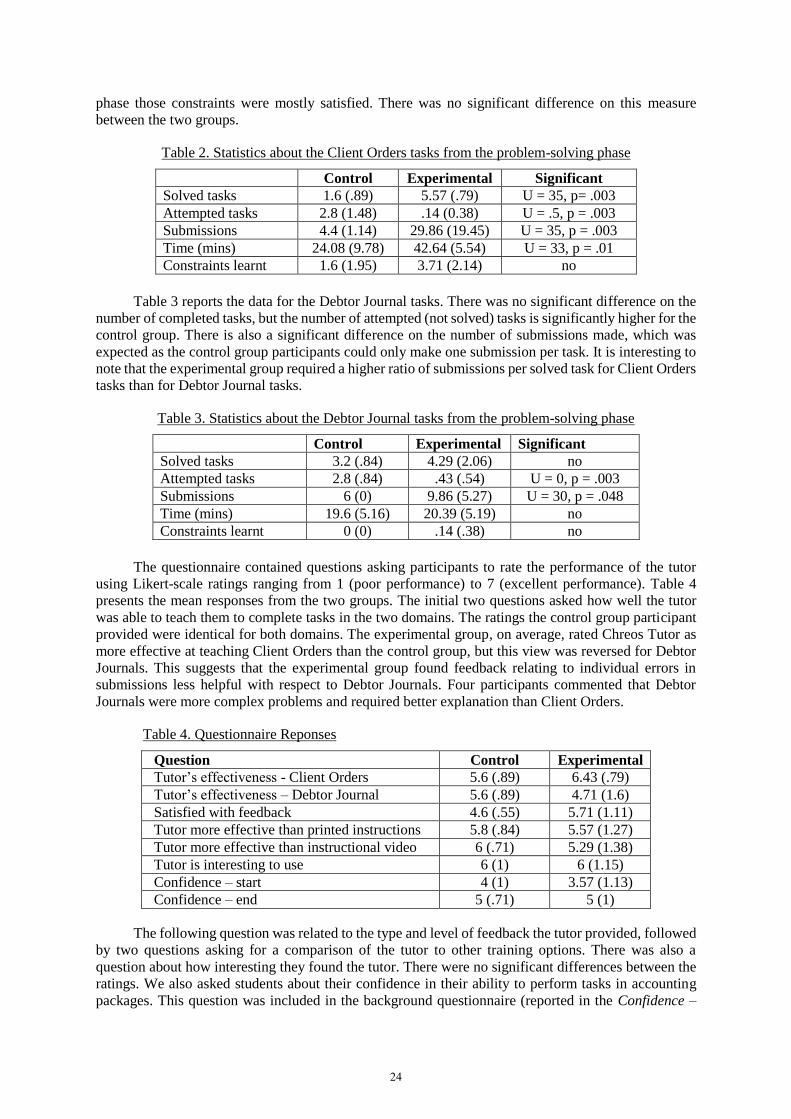
phase those constraints were mostly satisfied. There was no significant difference on this measure
between the two groups.
Table 2. Statistics about the Client Orders tasks from the problem-solving phase
Control Experimental Significant
Solved tasks 1.6 (.89) 5.57 (.79) U = 35, p= .003
Attempted tasks 2.8 (1.48) .14 (0.38) U = .5, p = .003
Submissions 4.4 (1.14) 29.86 (19.45) U = 35, p = .003
Time (mins) 24.08 (9.78) 42.64 (5.54) U = 33, p = .01
Constraints learnt 1.6 (1.95) 3.71 (2.14) no
Table 3 reports the data for the Debtor Journal tasks. There was no significant difference on the
number of completed tasks, but the number of attempted (not solved) tasks is significantly higher for the
control group. There is also a significant difference on the number of submissions made, which was
expected as the control group participants could only make one submission per task. It is interesting to
note that the experimental group required a higher ratio of submissions per solved task for Client Orders
tasks than for Debtor Journal tasks.
Table 3. Statistics about the Debtor Journal tasks from the problem-solving phase
Control Experimental Significant
Solved tasks 3.2 (.84) 4.29 (2.06) no
Attempted tasks 2.8 (.84) .43 (.54) U = 0, p = .003
Submissions 6 (0) 9.86 (5.27) U = 30, p = .048
Time (mins) 19.6 (5.16) 20.39 (5.19) no
Constraints learnt 0 (0) .14 (.38) no
The questionnaire contained questions asking participants to rate the performance of the tutor
using Likert-scale ratings ranging from 1 (poor performance) to 7 (excellent performance). Table 4
presents the mean responses from the two groups. The initial two questions asked how well the tutor
was able to teach them to complete tasks in the two domains. The ratings the control group participant
provided were identical for both domains. The experimental group, on average, rated Chreos Tutor as
more effective at teaching Client Orders than the control group, but this view was reversed for Debtor
Journals. This suggests that the experimental group found feedback relating to individual errors in
submissions less helpful with respect to Debtor Journals. Four participants commented that Debtor
Journals were more complex problems and required better explanation than Client Orders.
Table 4. Questionnaire Reponses
Question Control Experimental
Tutor’s effectiveness - Client Orders 5.6 (.89) 6.43 (.79)
Tutor’s effectiveness – Debtor Journal 5.6 (.89) 4.71 (1.6)
Satisfied with feedback 4.6 (.55) 5.71 (1.11)
Tutor more effective than printed instructions 5.8 (.84) 5.57 (1.27)
Tutor more effective than instructional video 6 (.71) 5.29 (1.38)
Tutor is interesting to use 6 (1) 6 (1.15)
Confidence – start 4 (1) 3.57 (1.13)
Confidence – end 5 (.71) 5 (1)
The following question was related to the type and level of feedback the tutor provided, followed
by two questions asking for a comparison of the tutor to other training options. There was also a
question about how interesting they found the tutor. There were no significant differences between the
ratings. We also asked students about their confidence in their ability to perform tasks in accounting
packages. This question was included in the background questionnaire (reported in the Confidence –
24
start row), and also in the final questionnaire (Confidence – end). The participants rated their
confidence higher after the session, but there was no significant difference between the groups.
The questionnaire also included some open questions that involved qualitative responses. This
feedback was generally positive for both groups. A recurring theme was that the help and feedback
provided for the Debtor Journal tasks was not as helpful as that provided for Client Orders. The
participants felt that they did not come to understand this type of task as well as they would have liked.
The participants also indicated that the process of viewing the tutorial videos needed to be more flexible,
by giving them options to pause, rewind or fast forward. Lack of these features made it time consuming
to look at parts of the video more than once. Two of the Control Group participants suggested that it
would be better if the tutor provided feedback on their particular errors, instead of just showing them the
full solution.
In addition to the reported study, we performed an informal case study with a single Chreos user,
who used Chreos Tutor in their own time. The user had previous experience with Chreos. The user
found Chreos Tutor a more suitable training tool for new users than the existing help documentation,
which is more suited to experienced users looking for specific information. Furthermore, instructional
videos were insufficient on their own for new users, but the user thought that the videos included in
Chreos Tutor were well-paced and acted as a type of introduction to how Chreos input fields work. The
user liked the graduated task descriptions, which provided more detail in earlier tasks and just basic
information in later tasks. The user commented that the style of feedback was excellent, with graduated
levels encouraged people to figure things out for themselves, but the full solution was available for
those who were really struggling. When asked to indicate which type of task they felt that the tutor was
better at teaching, the response was Debtor Journals. Client Orders are more complicated than Debtor
Journals as there is more to learn. On the negative side, the user found that the content of feedback
messages with respect to errors in the Client Orders item grid was not as helpful as they could be.
6. Discussion and Conclusions
Embedding ITSs in existing software facilitates on-the-job training in the actual software environment
at a time convenient to users. One requirement for embedding a tutor into existing software is that the
tutor must use the same type of interface, rather than an interface designed specifically for instruction
purposes. We presented Chreos Tutor, a constraint-based tutor embedded into the Chreos business
software system.
A study with accounting students showed the beneficial effect of feedback provided by the tutor. The
experimental group completed significantly more problems from both domains, and their learning gain
measured by the pre- and post-test was significantly higher in comparison to the control group. The
experimental group participants were less satisfied with feedback received for the Debtor Journal tasks.
However, the experimental group achieved higher scores in the post-test on the Debtor Journal tasks
(mean = 91.84, sd = 21.6) in comparison to the Client Order tasks (mean = 87.74, sd = 13.32), with all
but one student achieving a perfect score on the Debtor journal tasks in the post-test. The small number
of actions necessary to complete a Debtor Journal task makes it reasonably easy to determine what
information from the task description corresponds to which input field. Therefore users may learn how
to complete task without necessarily understanding the accounting concepts behind the task. The other
possible explanation is that the participants were more familiar with the type of tasks included in the
Client Orders as these tasks resemble online shopping, while the Debtor Journal domain requires
accounting knowledge.
The limitations of our study include the small sample size, due to the timing of the study.
Additionally, it would have been preferred to conduct the study with real Chreos users, rather than
University students. The experienced Chreos user found Chreos Tutor to be more effective with Debtor
Journal tasks, when the majority of the experimental group participants reported the need to improve the
way Debtor Journal was taught. Possibly the experienced Chreos user had a deeper understanding of the
purpose of Debtor Journals than most of the participants in the study. The feedback messages were
composed by someone with an excellent understanding of Debtor Journals. This may have resulted in
them being more appropriate for those with a strong accounting background rather than novice users.
25
Acknowledgements
We thank Wild Software Ltd for their assistance in implementing Chreos Tutor.
References
Amalathas, S., Mitrovic, A., Ravan, S. (2012). Decision-Making Tutor: Providing On-the-Job Training For Oil
Palm Plantation Managers. Research and Practice in Technology-Enhanced Learning, 7(3), 131-152.
Cheikes, B. A., Geier, M., Hyland, R., Linton, F., Rodi, L., Schaefer, H. P. (1989). Embedded Training for
Complex Information Systems. Proc. Intelligent Tutoring Systems, pp. 36-45.
Genesereth, M. R. (1979). The Role of Plans in Automated Consultation. Proc. 6th Int. Joint Conf. on Artificial
Intelligence, pp. 311-319.
Mitrovic, A., Martin, B. Suraweera, P., Zakharov, K., Milik, N., Holland, J., McGuigan, N. (2009). ASPIRE: an
authoring system and deployment environment for constraint-based tutor. Artificial Intelligence in
Education, 19(2), 155-188.
Rieman, J. (1996). A Field Study of Exploratory Learning Strategies. ACM Transactions on Computer-Human
Interaction, 3(3), 189-218.
Risco, S., Reye, J. (2012). Evaluation of an intelligent tutoring system used for teaching RAD in a database
environment. ACE 2012: Proc. 14th
Australasian Computing Education Conference, pp. 131-140.
Ritter, S., Koedinger, K. (1996). An architecture for plug-in tutor agents. Artificial Intelligence in Education,
7(3-4), 315-347.
Westerfield, G., Mitrovic, A., Billinghurst, M. (2015). Intelligent Augmented Reality Training for Assembly
Tasks. Artificial Intelligence in Education, 25(1), 157-172.
26
Practical Use of Visualizing Lesson Structures in
Teacher Training Education and Its Effectiveness
Toshinobu KASAIa*, Kazuo NAGANOb & Riichiro MIZOGUCHIc aOkayama University Graduate School of Education Master’s Program, Japan
bFaculty of Liberal Arts, University of the Sacred Heart, Japan cResearch Center for Service Science, Japan Advanced Institute of Science and Technology, Japan
Abstract: We have built an instructional design support system called “FIMA-Light” which
uncovers teacher’s intentions from his/her lesson plan and automatically visualizes them as goal
decomposition trees. A decomposition tree expresses the ways of achieving a learner’s state
change that should be realized in a whole lesson in the form of a tree structure. We have made
use of FIMA-Light so that incumbent teachers themselves can improve their lessons. In this
paper, we report on a practical use of goal-decomposition trees produced by FIMA-Light to
improve trainee teachers’ skills in designing instructions before teaching practices in the teacher
education program, and we discuss its effectiveness.
Keywords: Instructional Design, Ontology, Teacher Training, Teachers’ Professional Ability
1. Introduction
Alignment between teaching practices in schools and teacher training education provided at university
is an important aspect in improving teacher education programs (The Central Education Council, 2015).
However, almost all universities provide only abstract descriptions in their policies, such as “Bridging
Theory and Practice” (Department of Teaching & School Leadership, Okayama University, 2013;
Fujimura & Sakanashi, 2010; Graduate School of Teacher Education, Waseda University, 2013) about
the alignment between teaching practices and university education. The importance of and difficulty
involved in achieving alignment between university education and teaching practice have also been
reported in countries other than Japan (Smith, 2004; Curriculum Center for Teachers, 2012). In this
study, we examined the ability of teachers to instruct learners (the ability to properly design and practice
instruction). We also clarified the respective roles of teaching practice and university education in
teacher education programs, as well as the relationship between them (Kasai, Nagano & Mizoguchi,
2013). The principal difference between them is whether real students are present in front of the
university students (trainee teachers). Thus, it is difficult for them to design a detailed lesson in
university education, because they cannot imagine concrete learners (Kouno et al., 1998, See 3.2 in this
paper: we found two types of problems included in the lesson plans which university students
designed.). We identified the following two problems when university students design lessons in
university education.
Since it is difficult for university students to predict learners’ diverse actions, it is difficult to plan
the concrete reactions that teachers should follow in a lesson.
Since it is difficult for them to imagine the learning processes of general learners concretely, it is
difficult to envisage the detailed flow of learners’ state changes, which are the sub-goals in a lesson
and to plan concrete strategies to attain the sub-goals.
To solve the former problem, some methods that aim to allow university students imagine
concrete diverse learners have been proposed (i.e. Microteaching (Allen and Ryan, 1969, Clifford,
Jorstad and Lange, 1977), and Simulation of Instruction (Kubota, Suzuki and Mochizuki, 2014). On the
other hand, to the best of our knowledge, there is no approach that aims to solve the latter problem, and
therefore, we aim to solve the latter problem. To solve this problem, it is necessary for university
students to design instructional strategies concretely for attaining the educational goals in all learners.
Therefore, it is important to allow them to imagine general learners and their learning processes
27
concretely. However, since it is difficult for university students to imagine general learners concretely,
it is difficult for them to envisage the detailed flow of learners’ state changes that are sub-goals in a
lesson. As a result, in university education, students often design insufficient lessons that contain no
concrete strategy for attaining sub-goals (for example, "Learners are interested in an object"). It is
necessary for university students to learn the skill required to design detailed concrete flows of
instructional and learning activities in university education. Here, to attain an overall goal in the whole
lesson, every concrete strategy for attaining sub-goals has to be related to the global strategy for
attaining the overall goal. Therefore, it is necessary for teachers to have skills in designing lessons that
integrate a global strategy and local strategies. From this consideration, in university education, in
which there are no real learners, we identified the following two main goals that university students
should aim to achieve.
To understand that there are various strategies (flows of instruction and learning) for students to
attain the educational goals.
To understand learning/instructional theories and expert teachers’ knowledge gained from
practice.
To improve their skills in designing lessons that integrate a global strategy for attaining an overall
goal in the whole lesson and local strategies for attaining sub-goals.
To improve their skills in designing lessons that contain detailed concrete strategies for
attaining sub-goals.
To improve their skills in assessing every learning/instructional activity in terms of attainment
of an overall goal and sub-goals.
To allow university students learn these skills efficiently, it is necessary to express all
learning/instructional theories and practical knowledge with a common format. A representation format
that will help university students to think about strategies in their lessons from global to local
viewpoints is required. We considered that the I_L event decomposition tree (described in 2.1), which
defined based on the OMNIBUS ontology (Hayashi, Bourdeau, & Mizoguchi, 2009), might be suitable
for such university education. We think that the goal of their university education should be to let
university students learn the skills needed to produce not only lesson plans but also I_L event decomposition
trees. Since university students cannot think in the structure of lessons, it is difficult for them to produce I_L
event decomposition trees. We have proposed the use of a system called “FIMA-Light” (Kasai, Nagano and
Mizoguchi, 2011) which automatically produces I_L event decomposition trees. In that study, we showed
that the I_L event decomposition trees that FIMA-Light produces had effective information for university
education in a teacher training course. In this paper, we report the results of practical use of FIMA-Light in a
university lecture in a teacher training education course.
The remainder of this paper is structured as follows: In Section 2, we describe the features of our
study that can overcome the above difficulties in teacher training education. In Section 3, we report the
results of the practical use of FIMA-Light in the lecture in university education. This is followed by a
discussion of some related work and concluding remarks in Section 4.
2. Features of our Approach
In this section, we explain the I_L event decomposition tree and FIMA-Light which we propose for
practical use in university education in order to solve the problems described above.
2.1 The I_L event decomposition tree and its features
In the format of a “lesson plan”, teachers describe the learning activity, instructional activity, evaluation
method, and points to consider while teaching in every scene of their lessons. This format is generally
used also in teaching practices. Therefore, it is important for trainee teachers to learn how to describe
their plans for their lessons in the format of a lesson plan before their teaching practices. However, since
a lesson plan describes mainly superficial concrete activities, it is difficult for university students to
consider strategies to be applied in the lesson from global to local viewpoints. Therefore, we think that
effective instruction in university education cannot be realized using only the lesson plan as a format to
represent lessons. Another representation format that will help university students to think from a more
global viewpoint is required.
28
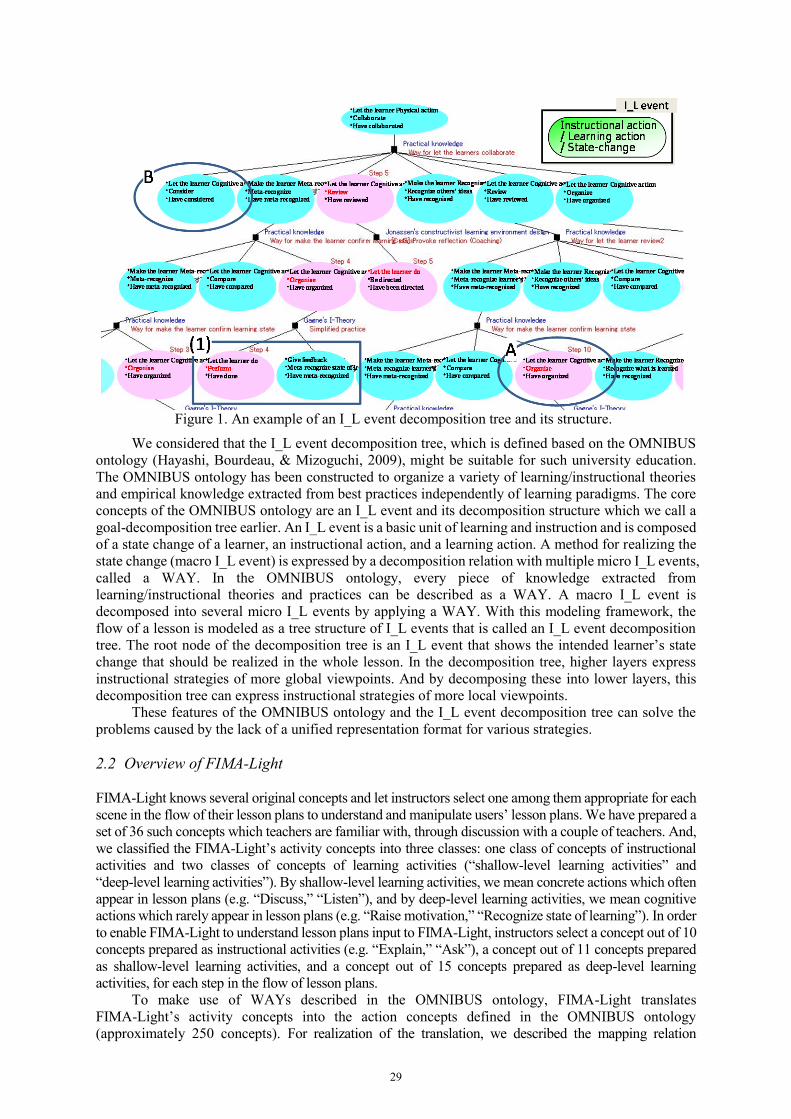
We considered that the I_L event decomposition tree, which is defined based on the OMNIBUS
ontology (Hayashi, Bourdeau, & Mizoguchi, 2009), might be suitable for such university education.
The OMNIBUS ontology has been constructed to organize a variety of learning/instructional theories
and empirical knowledge extracted from best practices independently of learning paradigms. The core
concepts of the OMNIBUS ontology are an I_L event and its decomposition structure which we call a
goal-decomposition tree earlier. An I_L event is a basic unit of learning and instruction and is composed
of a state change of a learner, an instructional action, and a learning action. A method for realizing the
state change (macro I_L event) is expressed by a decomposition relation with multiple micro I_L events,
called a WAY. In the OMNIBUS ontology, every piece of knowledge extracted from
learning/instructional theories and practices can be described as a WAY. A macro I_L event is
decomposed into several micro I_L events by applying a WAY. With this modeling framework, the
flow of a lesson is modeled as a tree structure of I_L events that is called an I_L event decomposition
tree. The root node of the decomposition tree is an I_L event that shows the intended learner’s state
change that should be realized in the whole lesson. In the decomposition tree, higher layers express
instructional strategies of more global viewpoints. And by decomposing these into lower layers, this
decomposition tree can express instructional strategies of more local viewpoints.
These features of the OMNIBUS ontology and the I_L event decomposition tree can solve the
problems caused by the lack of a unified representation format for various strategies.
2.2 Overview of FIMA-Light
FIMA-Light knows several original concepts and let instructors select one among them appropriate for each
scene in the flow of their lesson plans to understand and manipulate users’ lesson plans. We have prepared a
set of 36 such concepts which teachers are familiar with, through discussion with a couple of teachers. And,
we classified the FIMA-Light’s activity concepts into three classes: one class of concepts of instructional
activities and two classes of concepts of learning activities (“shallow-level learning activities” and
“deep-level learning activities”). By shallow-level learning activities, we mean concrete actions which often
appear in lesson plans (e.g. “Discuss,” “Listen”), and by deep-level learning activities, we mean cognitive
actions which rarely appear in lesson plans (e.g. “Raise motivation,” “Recognize state of learning”). In order
to enable FIMA-Light to understand lesson plans input to FIMA-Light, instructors select a concept out of 10
concepts prepared as instructional activities (e.g. “Explain,” “Ask”), a concept out of 11 concepts prepared
as shallow-level learning activities, and a concept out of 15 concepts prepared as deep-level learning
activities, for each step in the flow of lesson plans.
To make use of WAYs described in the OMNIBUS ontology, FIMA-Light translates
FIMA-Light’s activity concepts into the action concepts defined in the OMNIBUS ontology
(approximately 250 concepts). For realization of the translation, we described the mapping relation
Figure 1. An example of an I_L event decomposition tree and its structure.
29

between FIMA-Light’s concepts and OMNIBUS action concepts. For example, the mapping relation
between the concept “Raise motivation” in FIMA and 11 concepts (“Raise aspirations,” “Recognize the
relevance,” “Feel familiarity,” and so on) which are defined in the OMNIBUS ontology was described.
Based on the description of the mapping relation, FIMA-Light can translate FIMA-Light’s activity concepts
selected by instructors into OMNIBUS action concepts.
In OMNIBUS, I_L event decomposition trees are made by teachers by decomposing how to
achieve learners’ state change in the whole lesson in a top-down manner. In contrast, FIMA-Light
produces I_L event decomposition trees in a bottom-up manner by interpreting the sequence of
concrete-level instructional and learning activities described in lesson plans. Analogically, we can say that
FIMA-Light builds a syntax (parse) tree of an action sequence in the lesson plan as a sentence by parsing
it. So, when FIMA-Light produces I_L event decomposition trees, it is automatically adds hypothetical
I_L events at higher levels of abstraction to show underlying intention (intermediate goals) than is
described in usual lesson plans. FIMA-Light produces I_L event decomposition trees following the
procedure described below after translating FIMA vocabulary selected by instructors into several related
concepts defined in the OMNIBUS ontology. FIMA-Light
1. extracts WAYs relevant to each step in the flow of the lesson plan, and develops decomposition
sub-trees that have hypothetical root nodes by applying the WAYs,
2. produces all I_L event decomposition trees appropriate for the given lesson by configuring appropriate
sub-trees developed above, and
3. determines an I_L event decomposition tree that fit well with the lesson plan by calculating degrees of
similarity of every decomposition tree to the lesson plan.
The current version of FIMA-Light produces I_L event decomposition trees based on 100 Ways
that were extracted from learning/instructional theories and 20 Ways that were extracted from actual
lessons. An example I_L event decomposition tree that FIMA-Light produced by interpreting an actual
lesson plan is shown in Figure 1. An I_L event decomposition tree includes two kinds of nodes. One
type includes pink nodes that show I_L events which FIMA-Light judged corresponding to the lesson
plan (e.g. “A” in Figure 1). The other type includes blue nodes that show I_L events that FIMA-Light
judged not to correspond to any scenes explicitly described in the lesson plan (e.g. “B” in Figure 1). The
aim of FIMA-Light is to help teachers to deeply reflect on their lesson plans by providing them with the
I_L event decomposition trees. In practical use for teacher education, thanks to the I_L event
decomposition trees provided by FIMA-Light, teachers could find, on average, 2.5 points that could be
improved in each lesson plan.
In practical use of FIMA-Light in the past, we had provided teachers with I_L event
decomposition trees to help them to deeply reflect on their lesson plans. However, helping university
students to deeply reflect on their lesson plans did not provide a useful effect in their learning, because
university students could not think appropriately in designing lessons. Therefore, we used FIMA-Light
in the university lectures of teacher training education with the following two aims.
To improve university students' awareness that a lesson has not only an overall goal but also
various sub-goals.
To improve their awareness that every learning/instructional activity has a role in attaining an
overall goal and sub-goals in the lesson.
3. Use of FIMA-Light in the University Lecture
3.1 Purpose and Outline of the University Lecture in which We Used FIMA-Light
The lecture in which we used FIMA-Light was “Studies on Information Study Method A”, given at the
Faculty of Education that one of the authors of this paper belongs to. This lecture was open to university
students studying in the Faculty of Science, the Faculty of Engineering, and the Faculty of Environmental
Science and Technology and who would like to become teachers. Eleven students attended this lecture in
2015. All students had learned how to write lesson plans in other lectures but had no experience of
teaching practice. The educational goal of this lecture was to let them learn the skills required to design
instruction on the subject "Information" in high school. Figure 2 shows the flow of the lecture (five
classes) in which we used FIMA-Light.
30
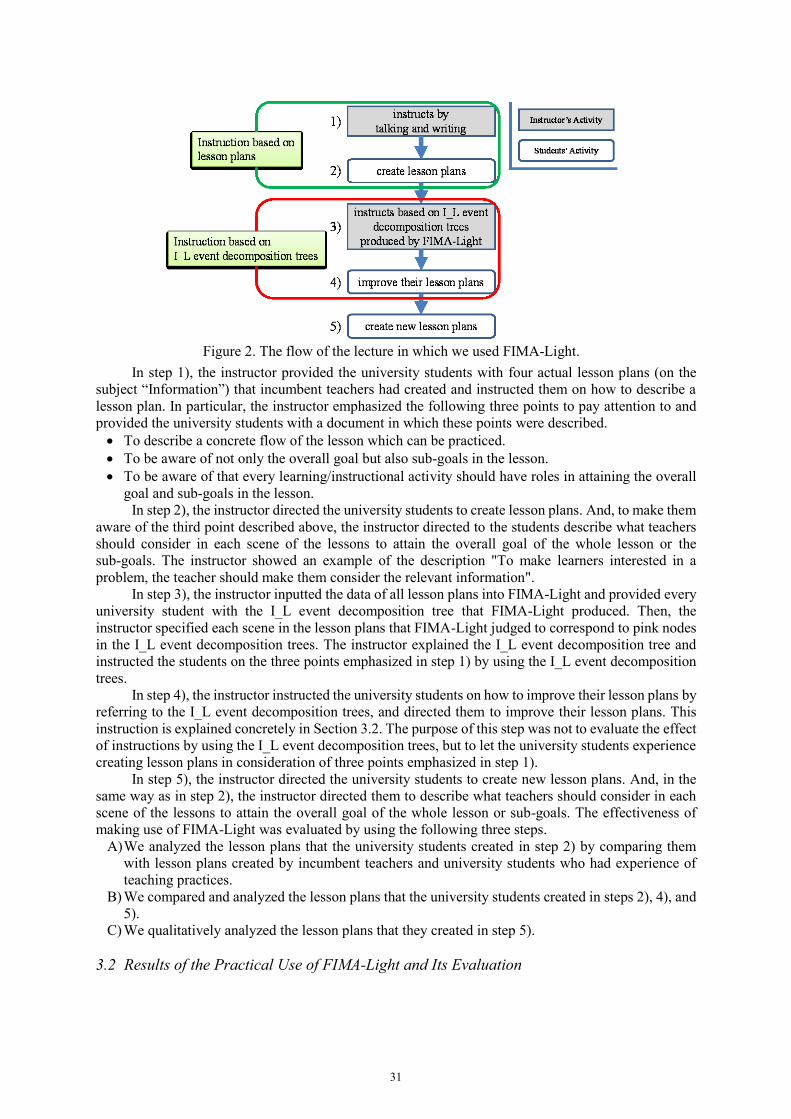
In step 1), the instructor provided the university students with four actual lesson plans (on the
subject “Information”) that incumbent teachers had created and instructed them on how to describe a
lesson plan. In particular, the instructor emphasized the following three points to pay attention to and
provided the university students with a document in which these points were described.
To describe a concrete flow of the lesson which can be practiced.
To be aware of not only the overall goal but also sub-goals in the lesson.
To be aware of that every learning/instructional activity should have roles in attaining the overall
goal and sub-goals in the lesson.
In step 2), the instructor directed the university students to create lesson plans. And, to make them
aware of the third point described above, the instructor directed to the students describe what teachers
should consider in each scene of the lessons to attain the overall goal of the whole lesson or the
sub-goals. The instructor showed an example of the description "To make learners interested in a
problem, the teacher should make them consider the relevant information".
In step 3), the instructor inputted the data of all lesson plans into FIMA-Light and provided every
university student with the I_L event decomposition tree that FIMA-Light produced. Then, the
instructor specified each scene in the lesson plans that FIMA-Light judged to correspond to pink nodes
in the I_L event decomposition trees. The instructor explained the I_L event decomposition tree and
instructed the students on the three points emphasized in step 1) by using the I_L event decomposition
trees.
In step 4), the instructor instructed the university students on how to improve their lesson plans by
referring to the I_L event decomposition trees, and directed them to improve their lesson plans. This
instruction is explained concretely in Section 3.2. The purpose of this step was not to evaluate the effect
of instructions by using the I_L event decomposition trees, but to let the university students experience
creating lesson plans in consideration of three points emphasized in step 1).
In step 5), the instructor directed the university students to create new lesson plans. And, in the
same way as in step 2), the instructor directed them to describe what teachers should consider in each
scene of the lessons to attain the overall goal of the whole lesson or sub-goals. The effectiveness of
making use of FIMA-Light was evaluated by using the following three steps.
A) We analyzed the lesson plans that the university students created in step 2) by comparing them
with lesson plans created by incumbent teachers and university students who had experience of
teaching practices.
B) We compared and analyzed the lesson plans that the university students created in steps 2), 4), and
5).
C) We qualitatively analyzed the lesson plans that they created in step 5).
3.2 Results of the Practical Use of FIMA-Light and Its Evaluation
Figure 2. The flow of the lecture in which we used FIMA-Light.
31
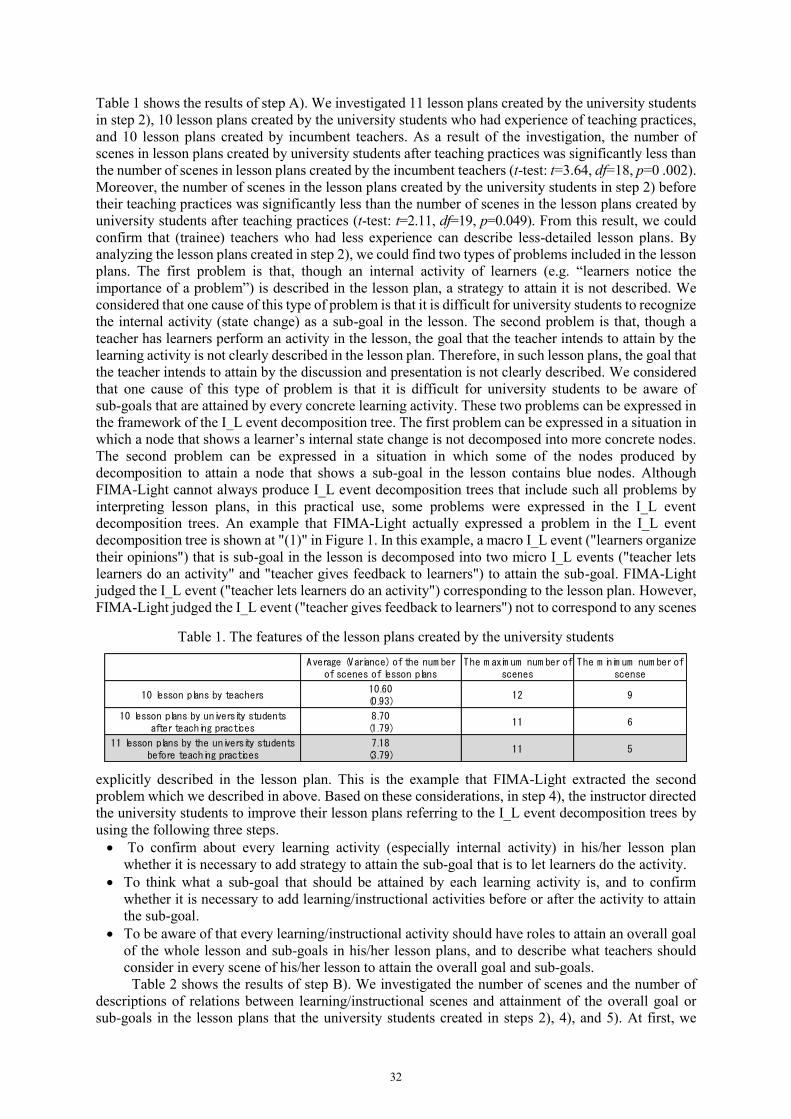
Table 1. The features of the lesson plans created by the university students
Average (Variance) of the num berof scenes of lesson plans
The m axim um num ber ofscenes
The m inim um num ber ofscense
10 lesson plans by teachers10.60(0.93)
12 9
10 lesson plans by university studentsafter teaching practices
8.70(1.79)
11 6
11 lesson plans by the university studentsbefore teaching practices
7.18(3.79)
11 5
Table 1 shows the results of step A). We investigated 11 lesson plans created by the university students
in step 2), 10 lesson plans created by the university students who had experience of teaching practices,
and 10 lesson plans created by incumbent teachers. As a result of the investigation, the number of
scenes in lesson plans created by university students after teaching practices was significantly less than
the number of scenes in lesson plans created by the incumbent teachers (t-test: t=3.64, df=18, p=0 .002).
Moreover, the number of scenes in the lesson plans created by the university students in step 2) before
their teaching practices was significantly less than the number of scenes in the lesson plans created by
university students after teaching practices (t-test: t=2.11, df=19, p=0.049). From this result, we could
confirm that (trainee) teachers who had less experience can describe less-detailed lesson plans. By
analyzing the lesson plans created in step 2), we could find two types of problems included in the lesson
plans. The first problem is that, though an internal activity of learners (e.g. “learners notice the
importance of a problem”) is described in the lesson plan, a strategy to attain it is not described. We
considered that one cause of this type of problem is that it is difficult for university students to recognize
the internal activity (state change) as a sub-goal in the lesson. The second problem is that, though a
teacher has learners perform an activity in the lesson, the goal that the teacher intends to attain by the
learning activity is not clearly described in the lesson plan. Therefore, in such lesson plans, the goal that
the teacher intends to attain by the discussion and presentation is not clearly described. We considered
that one cause of this type of problem is that it is difficult for university students to be aware of
sub-goals that are attained by every concrete learning activity. These two problems can be expressed in
the framework of the I_L event decomposition tree. The first problem can be expressed in a situation in
which a node that shows a learner’s internal state change is not decomposed into more concrete nodes.
The second problem can be expressed in a situation in which some of the nodes produced by
decomposition to attain a node that shows a sub-goal in the lesson contains blue nodes. Although
FIMA-Light cannot always produce I_L event decomposition trees that include such all problems by
interpreting lesson plans, in this practical use, some problems were expressed in the I_L event
decomposition trees. An example that FIMA-Light actually expressed a problem in the I_L event
decomposition tree is shown at "(1)" in Figure 1. In this example, a macro I_L event ("learners organize
their opinions") that is sub-goal in the lesson is decomposed into two micro I_L events ("teacher lets
learners do an activity" and "teacher gives feedback to learners") to attain the sub-goal. FIMA-Light
judged the I_L event ("teacher lets learners do an activity") corresponding to the lesson plan. However,
FIMA-Light judged the I_L event ("teacher gives feedback to learners") not to correspond to any scenes
explicitly described in the lesson plan. This is the example that FIMA-Light extracted the second
problem which we described in above. Based on these considerations, in step 4), the instructor directed
the university students to improve their lesson plans referring to the I_L event decomposition trees by
using the following three steps.
To confirm about every learning activity (especially internal activity) in his/her lesson plan
whether it is necessary to add strategy to attain the sub-goal that is to let learners do the activity.
To think what a sub-goal that should be attained by each learning activity is, and to confirm
whether it is necessary to add learning/instructional activities before or after the activity to attain
the sub-goal.
To be aware of that every learning/instructional activity should have roles to attain an overall goal
of the whole lesson and sub-goals in his/her lesson plans, and to describe what teachers should
consider in every scene of his/her lesson to attain the overall goal and sub-goals.
Table 2 shows the results of step B). We investigated the number of scenes and the number of
descriptions of relations between learning/instructional scenes and attainment of the overall goal or
sub-goals in the lesson plans that the university students created in steps 2), 4), and 5). At first, we
32

Table 2. The result of the investigation of the lesson plans created by the university students
Average of 11 lessonplans
The num ber ofscenes
The num ber of descriptions relatedto the overall goal
(Rate of the num ber of scenes)
The num ber of descriptions relatedto sub-goals
(Rate of the num ber of scenes)
1.91 (26.6%) 0.45 (6.0%)
3.82 (39.3%) 3.27 (33.6%)
3.09 (33.3%) 2.09 (22.5%)Lesson plans createdin the step 5)
9.275.18 (55.9%)
Lesson plans createdin the step 2)
7.182.36 (33.0%)
Lesson plans im provedin the step 4)
9.737.09 (72.9%)
consider the number of descriptions related to goals in the lesson plans that were created in step 2).
Although the instructor emphasized that every learning/instructional activity should have roles to attain
goals in the lesson plans, the university students described what teachers should consider in only 33.0%
of scenes to attain goals in the lessons. In particular, they could hardly describe what teachers should
consider to attain sub-goals. This result shows that it is difficult for the university students to recognize
sub-goals of the lessons explicitly by traditional instruction in university education. This is an important
problem in the teacher training education in university education.
The number of scenes and the number of description of relations between learning/instructional
scenes and attainment of goals of the lesson plans that were improved in step 4) were improved by
instructing how to improve their lesson plans concretely. However, the rate of the number of scenes that
the university students described relations with attainment of goals was not improved enough (72.9%),
even though the instructor directed them to describe in every scene of the lessons in step 4). Here, in the
lesson plans created by the university students, some descriptions that include plural
learning/instructional scenes in a sentence existed. Since they could not separate such sentence into
plural scenes, the number of descriptions of relations with attainment of goals was less than the number
of scenes. By analyzing the lesson plans improved in step 4) in consideration of this point, we could
confirm that the university students described relations between almost all scenes and attainment of
goals in the lessons. Therefore, they could create lesson plans that attain three points of attention that the
instructor emphasized by instruction in steps 3), 4) based on the I_L event decomposition trees that
FIMA-Light produced. We can predict that a similar result will be given to them by instructing each
lesson plan carefully like instruction in teaching practice. However, it is difficult to realize the
instruction in a lecture of university education, because it is necessary for an instructor to spend much
time for each university student. In the lecture of university education in which we made use of
FIMA-Light, the instructor could instruct all university students in abstract level at the same time by
using one I_L event decomposition tree that FIMA-Light automatically produced. Therefore, we think
that our approach is significantly meaningful.
The number of learning/instructional scenes of the lesson plans that the university students
created newly in step 5) was 9.27 on average. After the instruction, in step 5), the university students
learned to create detailed lesson plans at the same level as the lesson plans that university students
created after their teaching practices (t-test t=0.95, df=19, p=0.35, n.s.). Although we cannot claim the
effectiveness with statistical significance, the results obtained are encouraging, and hence we would
like to explore this topic further in the future. And, the number of descriptions of relations between
learning/instructional scenes and attainment of goals in the lessons was 5.15 on average (55.9% of
scenes). By analyzing the lesson plans created in step 5) in consideration of above point, we confirmed
that 20% of scenes were not described relations with attainment of goals. In particular, the number of
description of relations with sub-goals of the lesson plans created in step 5) greatly decreases in
comparison with the lesson plans improved in the 4). Therefore, we think that the university lecture
could not let the university students improve their skills enough that they should learn in university
education. However, for the university students that had no experience of teaching practices, we think
that the instruction based on the I_L event decomposition tree produced by FIMA-Light could give
effectiveness to them more than traditional ways.
Finally, we discuss the results of step C). Here, we show concrete description of an actual lesson
plan created by the university students in step 5), and consider the effectiveness of instructions of the
33
university lecture. The overall goal of a lesson plan created in step 5) was to become able to practice
appropriate collection of information in the information society. In this lesson plan, there were the
following two descriptions of relations between learning/instructional scenes and sub-goals of the
lesson.
To make learners consider the features of the Internet to collect information appropriately
To make learners aware of merits and demerits of the Internet to collect information appropriately
The teacher intend to attain the same sub-goal ("to collect information appropriately") by two
learning/instructional activities (scenes). These descriptions show that the university student who
created this lesson plan was explicitly aware of the sub-goal of this lesson and a strategy to attain the
sub-goal. We could confirm some such descriptions in the lesson plans created by the university
students in step 5). These descriptions shows the effectiveness of the university lecture by using
FIMA-Light.
4. Related Work and Concluding Remarks
We have built an instructional design support system called FIMA-Light based on the OMNIBUS
ontology. FIMA-Light can automatically produce I_L event decomposition trees from teachers’ lesson
plans. We have previously evaluated FIMA-Light in practical use by incumbent teachers. In the present
study, we reported the results of practical use of FIMA-Light in a university lecture in teacher training
education. In university education, since it is difficult for university students to imagine learning
process of general learners concretely, it is difficult to envisage detailed flow of learning/instructional
scenes. To solve this problem, we used the I_L event decomposition trees which FIMA-Light produced
from their lesson plans to make them be aware of not only an overall goal but also various sub-goals in
the lesson. By using FIMA-Light in the university lecture, the university students learned to create
detailed lesson plans at the same level as the lesson plans that university students created after their
teaching practices.
Here, we would like to discuss some related work on a system known as SMARTIES (Hayashi,
Bourdeau, & Mizoguchi, 2009) to contrast it with FIMA-Light. SMARTIES is an authoring system that
aims to support teachers in designing learning/instructional scenarios based on the OMNIBUS ontology
and that is compliant with the standard technology of IMS Learning Design. By using SMARTIES,
teachers can make I_L event decomposition trees that are compliant with learning/instructional theories
through deeply reflecting on the design intentions of their lessons. In addition, SMARTIES can suggest
WAYs, described in the OMNIBUS ontology as strategies for achieving state changes in learners. In
this approach, in which teachers employ a so-called top-down method, when they design scenarios, they
have to think about deep intentions that they may not usually be explicitly aware of. For such
instructional design, it is necessary for teachers to think deeply about the lessons from global to local
viewpoints. Therefore, though this approach is effective for expert teachers, it is very difficult for
novice teachers and university students (trainee teachers) to employ.
On the other hand, our approach employs a bottom-up method and can automatically produce I_L
event decomposition trees through reasoning about teachers’ design intentions from given lesson plans
that they usually design. With our approach, therefore, even novice (trainee) teachers can participate in
this process. This is one of the features of our approach. To support incumbent teachers, FIMA-Light
does not directly improve, or tell them how to improve, their lesson plans by itself, because such
support would prevent teachers from improving their professional skills. Therefore, by providing
teachers with the I_L event decomposition trees that is produces, FIMA-Light aims at letting them
themselves think about how to improve their lessons and in what respects. However, to support
university students (trainee teachers), even though FIMA-Light provides them with I_L event
decomposition trees, we cannot expect that they will recognize their underlying intentions. So, in
university education, FIMA-Light aims at letting them be aware of sub-goals and strategies to attain the
sub-goals. To the best of our knowledge, there is no system that can automatically reason sub-goals of
the lesson as teachers’ deep-level intentions from their designed lesson plans.
The purpose of university education that we proposed in this study is to provide university
students with the ability to make I_L event decomposition trees themselves through thinking deeply
about their lessons. Therefore, we think that, in the final stages of their university education,
SMARTIES rather than FIMA-Light can support them more effectively. In future work, we intend to
34
clarify how FIMA-Light should be utilized in university education in order to let university students
efficiently attain the educational goals for teacher training education. In particular, in order to realize an
alignment between university education and teaching practice based on the I_L event decomposition,
we intend to examine the following two topics: 1) the generation of suitable feedback based on I_L
event decomposition trees produced by FIMA-Light, and 2) the spread of the I_L event decomposition
tree among teachers who will instruct university students in their teaching practices.
Acknowledgements
This work is supported in part by Grant-in-Aid for Young Scientists (B) No. 16H03077 from the
Ministry of Education, Culture, Sports, Science and Technology, Japan.
References Central Education Council (2015). How the teacher training education should be conducted in the future. Home
Page of Ministry of Education, Culture, Sports, Science and Technology, Japan, http://www.mext.go.jp/
b_menu/shingi/chukyo/chukyo0/toushin/1365665.htm.
Department of Teaching & School Leadership, Okayama University (2013). The purpose of Department of
Teaching & School Leadership, Home Page of Department of Teaching & School Leadership, Okayama
University, http://ed-www.ed.okayama-u.ac.jp/~kyoujissen/gaiyo_mokuteki.html
Fujimura N., & Sakanashi M. (2010). Teaching profession special training for the improvement of practical
teaching skills required of the teachers, Journal of educational research / Center for Educational Research
and Training, Kyoto University of Education, Vol.10, 221-230.
Graduate School of Teacher Education, Waseda University (2013). Three Policies of Graduate School of Teacher
Education. Home Page of Graduate School of Teacher Education, Waseda University,
http://www.waseda.jp/ted/eng/about/outline/policy.html
Smith, S. J. (2004). The Bearing of Inquiry in Teacher Education. The S.F.U. Experience, Vancouver: Faculty of
Education, Simon Fraser University.
Curriculum Center for Teachers (2012). Project Report on Comparative Study on the Role of Schoolteachers in
the Initial Teacher Education, http://www.u-gakugei.ac.jp/~currict/data/reports/s2_international/schoolteacher.pdf
Kasai T., Nagano K., & Mizoguchi R. (2013). Effective Alignment between University Education and Teaching
Practice through Automatic Interpretation of Lesson Plans, Proceedings of ICCE2013, 158-160.
Kouno S., Souma T., Ueno M., Gotoh T., Nakamura N., Miyadera Y., and Yokoyama S. (1998). Design of a
Computer Supported System to draw up Teaching Plans. IEICE technical report, ET98-81, 67-74
Allen, D. W. & Ryan K. (1969). Microteaching. Addison-Wesley, Reading, Massachusetts.
Clifford, R.T., Jorstad H.L., and Lange D.L. (1977). Student Evaluation of Peer-Group Microteaching as Preparation
for Student Teaching, Modern Language Journal, 61(5-6), 229-236.
Kubota Y., Suzuki H., & Mochizuki T. (2014). Improvements of Lesson Plans by Cartoon-Based Teaching Simulation
in Pre-service Teacher Training, Japan Journal of Educational Technology, 37(4), 469-478.
Hayashi Y., Bourdeau J., & Mizoguchi, R. (2009). Using Ontological Engineering to Organize
Learning/Instructional Theories and Build a Theory-Aware Authoring System, International Journal of
Artificial Intelligence in Education, Vol.19, No.2, 211-252.
Kasai T., Nagano K., & Mizoguchi R. (2011). Instructional Design Support System Based on Both Theory and
Practice and Its Evaluation, Proceedings of ICCE2011, 1-8.
35
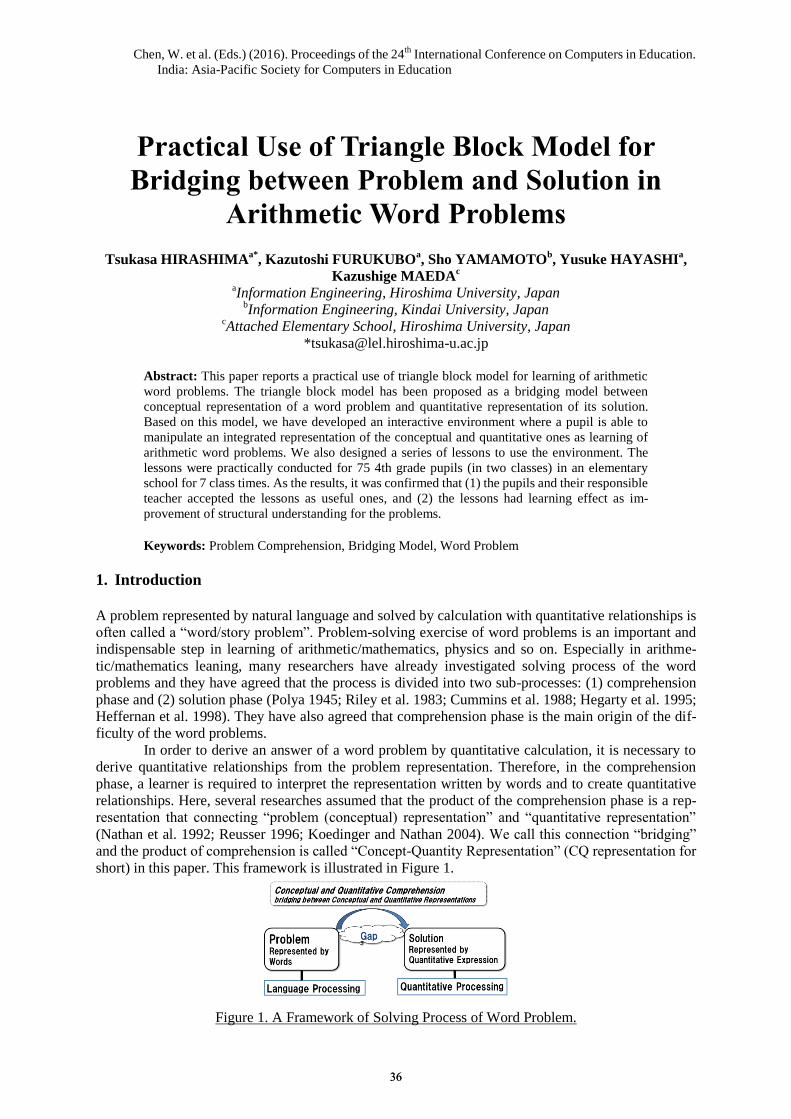
Chen, W. et al. (Eds.) (2016). Proceedings of the 24th
International Conference on Computers in Education.
India: Asia-Pacific Society for Computers in Education
Practical Use of Triangle Block Model for
Bridging between Problem and Solution in
Arithmetic Word Problems
Tsukasa HIRASHIMAa*
, Kazutoshi FURUKUBOa, Sho YAMAMOTO
b, Yusuke HAYASHI
a,
Kazushige MAEDAc
aInformation Engineering, Hiroshima University, Japan
bInformation Engineering, Kindai University, Japan
cAttached Elementary School, Hiroshima University, Japan
Abstract: This paper reports a practical use of triangle block model for learning of arithmetic
word problems. The triangle block model has been proposed as a bridging model between
conceptual representation of a word problem and quantitative representation of its solution.
Based on this model, we have developed an interactive environment where a pupil is able to
manipulate an integrated representation of the conceptual and quantitative ones as learning of
arithmetic word problems. We also designed a series of lessons to use the environment. The
lessons were practically conducted for 75 4th grade pupils (in two classes) in an elementary
school for 7 class times. As the results, it was confirmed that (1) the pupils and their responsible
teacher accepted the lessons as useful ones, and (2) the lessons had learning effect as im-
provement of structural understanding for the problems.
Keywords: Problem Comprehension, Bridging Model, Word Problem
1. Introduction
A problem represented by natural language and solved by calculation with quantitative relationships is
often called a “word/story problem”. Problem-solving exercise of word problems is an important and
indispensable step in learning of arithmetic/mathematics, physics and so on. Especially in arithme-
tic/mathematics leaning, many researchers have already investigated solving process of the word
problems and they have agreed that the process is divided into two sub-processes: (1) comprehension
phase and (2) solution phase (Polya 1945; Riley et al. 1983; Cummins et al. 1988; Hegarty et al. 1995;
Heffernan et al. 1998). They have also agreed that comprehension phase is the main origin of the dif-
ficulty of the word problems.
In order to derive an answer of a word problem by quantitative calculation, it is necessary to
derive quantitative relationships from the problem representation. Therefore, in the comprehension
phase, a learner is required to interpret the representation written by words and to create quantitative
relationships. Here, several researches assumed that the product of the comprehension phase is a rep-
resentation that connecting “problem (conceptual) representation” and “quantitative representation”
(Nathan et al. 1992; Reusser 1996; Koedinger and Nathan 2004). We call this connection “bridging”
and the product of comprehension is called “Concept-Quantity Representation” (CQ representation for
short) in this paper. This framework is illustrated in Figure 1.
Figure 1. A Framework of Solving Process of Word Problem.
3636
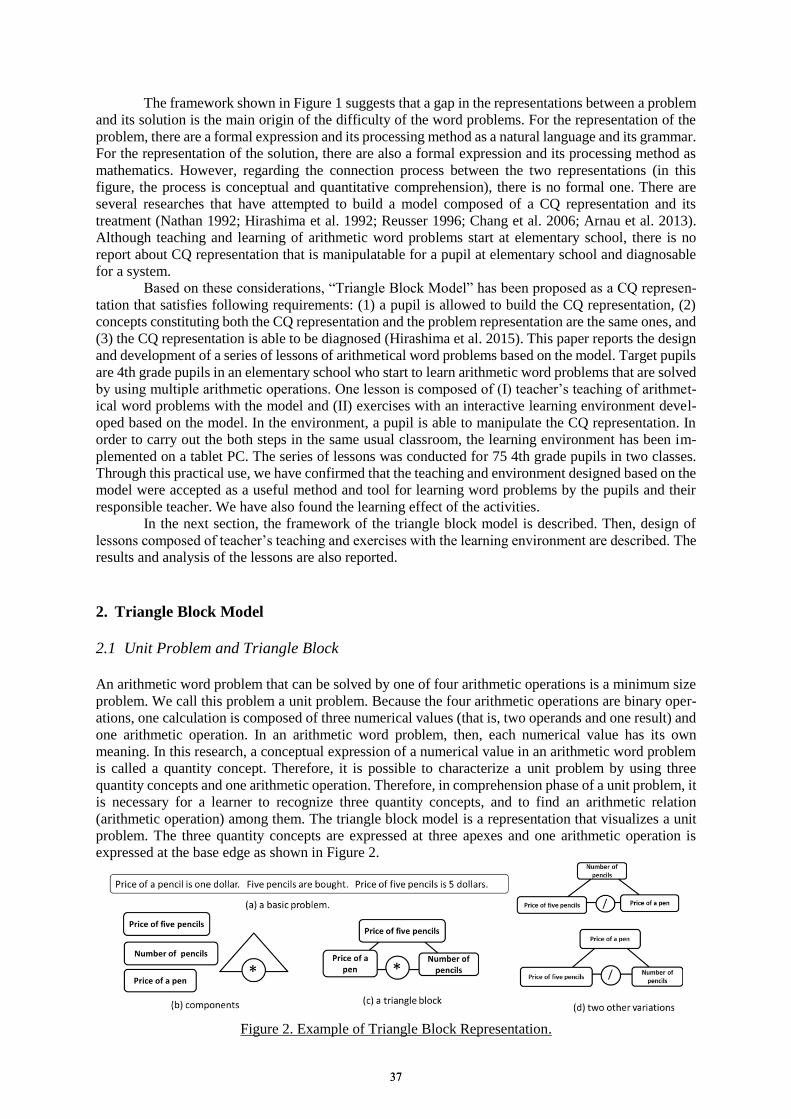
The framework shown in Figure 1 suggests that a gap in the representations between a problem
and its solution is the main origin of the difficulty of the word problems. For the representation of the
problem, there are a formal expression and its processing method as a natural language and its grammar.
For the representation of the solution, there are also a formal expression and its processing method as
mathematics. However, regarding the connection process between the two representations (in this
figure, the process is conceptual and quantitative comprehension), there is no formal one. There are
several researches that have attempted to build a model composed of a CQ representation and its
treatment (Nathan 1992; Hirashima et al. 1992; Reusser 1996; Chang et al. 2006; Arnau et al. 2013).
Although teaching and learning of arithmetic word problems start at elementary school, there is no
report about CQ representation that is manipulatable for a pupil at elementary school and diagnosable
for a system.
Based on these considerations, “Triangle Block Model” has been proposed as a CQ represen-
tation that satisfies following requirements: (1) a pupil is allowed to build the CQ representation, (2)
concepts constituting both the CQ representation and the problem representation are the same ones, and
(3) the CQ representation is able to be diagnosed (Hirashima et al. 2015). This paper reports the design
and development of a series of lessons of arithmetical word problems based on the model. Target pupils
are 4th grade pupils in an elementary school who start to learn arithmetic word problems that are solved
by using multiple arithmetic operations. One lesson is composed of (I) teacher’s teaching of arithmet-
ical word problems with the model and (II) exercises with an interactive learning environment devel-
oped based on the model. In the environment, a pupil is able to manipulate the CQ representation. In
order to carry out the both steps in the same usual classroom, the learning environment has been im-
plemented on a tablet PC. The series of lessons was conducted for 75 4th grade pupils in two classes.
Through this practical use, we have confirmed that the teaching and environment designed based on the
model were accepted as a useful method and tool for learning word problems by the pupils and their
responsible teacher. We have also found the learning effect of the activities.
In the next section, the framework of the triangle block model is described. Then, design of
lessons composed of teacher’s teaching and exercises with the learning environment are described. The
results and analysis of the lessons are also reported.
2. Triangle Block Model
2.1 Unit Problem and Triangle Block
An arithmetic word problem that can be solved by one of four arithmetic operations is a minimum size
problem. We call this problem a unit problem. Because the four arithmetic operations are binary oper-
ations, one calculation is composed of three numerical values (that is, two operands and one result) and
one arithmetic operation. In an arithmetic word problem, then, each numerical value has its own
meaning. In this research, a conceptual expression of a numerical value in an arithmetic word problem
is called a quantity concept. Therefore, it is possible to characterize a unit problem by using three
quantity concepts and one arithmetic operation. Therefore, in comprehension phase of a unit problem, it
is necessary for a learner to recognize three quantity concepts, and to find an arithmetic relation
(arithmetic operation) among them. The triangle block model is a representation that visualizes a unit
problem. The three quantity concepts are expressed at three apexes and one arithmetic operation is
expressed at the base edge as shown in Figure 2.
Figure 2. Example of Triangle Block Representation.
3737
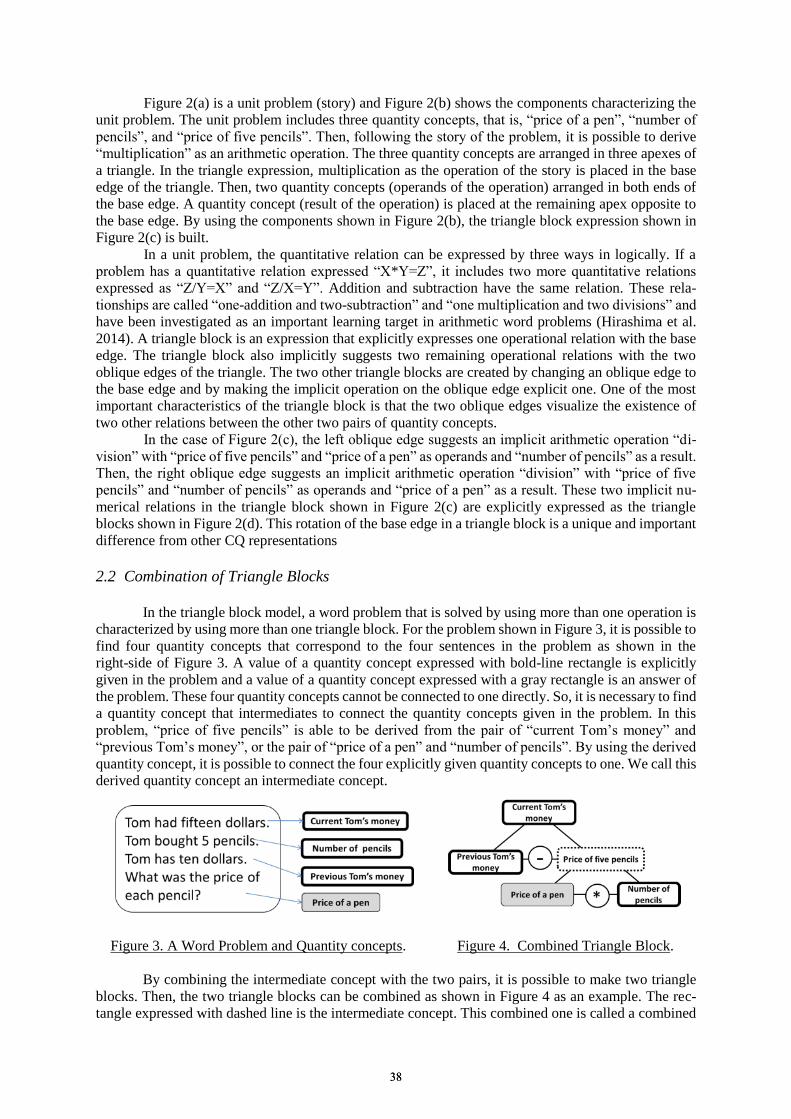
Figure 2(a) is a unit problem (story) and Figure 2(b) shows the components characterizing the
unit problem. The unit problem includes three quantity concepts, that is, “price of a pen”, “number of
pencils”, and “price of five pencils”. Then, following the story of the problem, it is possible to derive
“multiplication” as an arithmetic operation. The three quantity concepts are arranged in three apexes of
a triangle. In the triangle expression, multiplication as the operation of the story is placed in the base
edge of the triangle. Then, two quantity concepts (operands of the operation) arranged in both ends of
the base edge. A quantity concept (result of the operation) is placed at the remaining apex opposite to
the base edge. By using the components shown in Figure 2(b), the triangle block expression shown in
Figure 2(c) is built.
In a unit problem, the quantitative relation can be expressed by three ways in logically. If a
problem has a quantitative relation expressed “X*Y=Z”, it includes two more quantitative relations
expressed as “Z/Y=X” and “Z/X=Y”. Addition and subtraction have the same relation. These rela-
tionships are called “one-addition and two-subtraction” and “one multiplication and two divisions” and
have been investigated as an important learning target in arithmetic word problems (Hirashima et al.
2014). A triangle block is an expression that explicitly expresses one operational relation with the base
edge. The triangle block also implicitly suggests two remaining operational relations with the two
oblique edges of the triangle. The two other triangle blocks are created by changing an oblique edge to
the base edge and by making the implicit operation on the oblique edge explicit one. One of the most
important characteristics of the triangle block is that the two oblique edges visualize the existence of
two other relations between the other two pairs of quantity concepts.
In the case of Figure 2(c), the left oblique edge suggests an implicit arithmetic operation “di-
vision” with “price of five pencils” and “price of a pen” as operands and “number of pencils” as a result.
Then, the right oblique edge suggests an implicit arithmetic operation “division” with “price of five
pencils” and “number of pencils” as operands and “price of a pen” as a result. These two implicit nu-
merical relations in the triangle block shown in Figure 2(c) are explicitly expressed as the triangle
blocks shown in Figure 2(d). This rotation of the base edge in a triangle block is a unique and important
difference from other CQ representations
2.2 Combination of Triangle Blocks
In the triangle block model, a word problem that is solved by using more than one operation is
characterized by using more than one triangle block. For the problem shown in Figure 3, it is possible to
find four quantity concepts that correspond to the four sentences in the problem as shown in the
right-side of Figure 3. A value of a quantity concept expressed with bold-line rectangle is explicitly
given in the problem and a value of a quantity concept expressed with a gray rectangle is an answer of
the problem. These four quantity concepts cannot be connected to one directly. So, it is necessary to find
a quantity concept that intermediates to connect the quantity concepts given in the problem. In this
problem, “price of five pencils” is able to be derived from the pair of “current Tom’s money” and
“previous Tom’s money”, or the pair of “price of a pen” and “number of pencils”. By using the derived
quantity concept, it is possible to connect the four explicitly given quantity concepts to one. We call this
derived quantity concept an intermediate concept.
Figure 3. A Word Problem and Quantity concepts. Figure 4. Combined Triangle Block.
By combining the intermediate concept with the two pairs, it is possible to make two triangle
blocks. Then, the two triangle blocks can be combined as shown in Figure 4 as an example. The rec-
tangle expressed with dashed line is the intermediate concept. This combined one is called a combined
3838
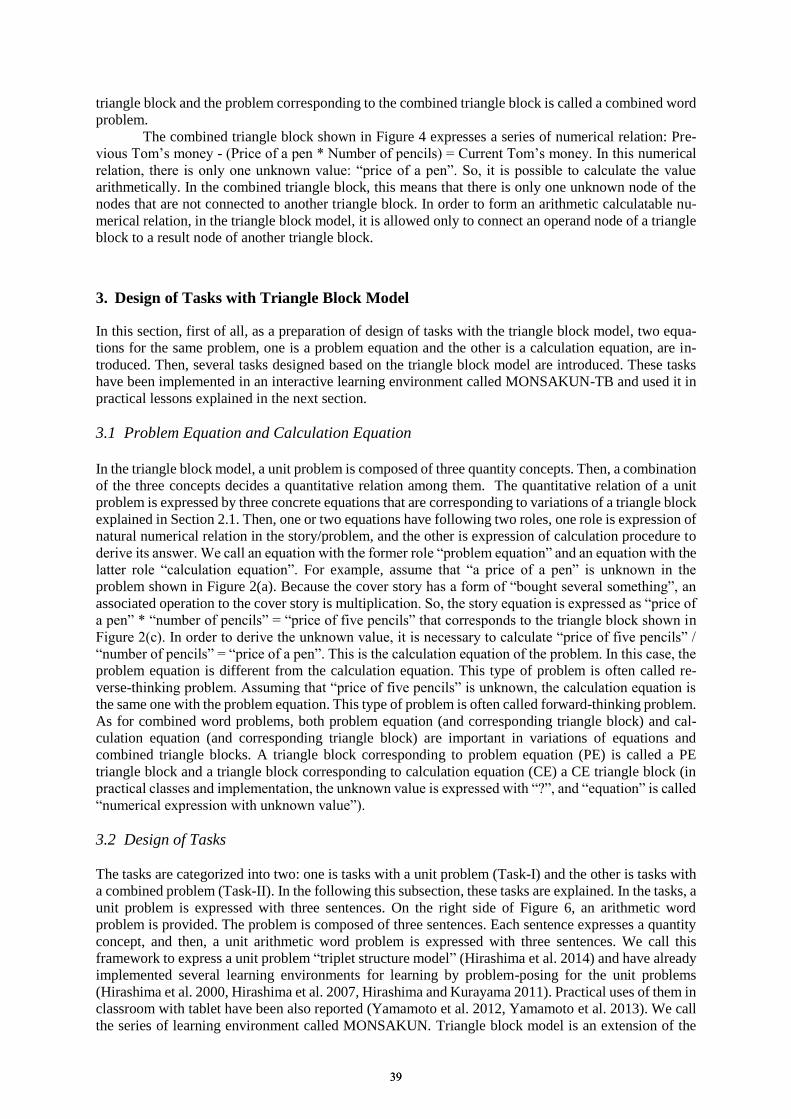
triangle block and the problem corresponding to the combined triangle block is called a combined word
problem.
The combined triangle block shown in Figure 4 expresses a series of numerical relation: Pre-
vious Tom’s money - (Price of a pen * Number of pencils) = Current Tom’s money. In this numerical
relation, there is only one unknown value: “price of a pen”. So, it is possible to calculate the value
arithmetically. In the combined triangle block, this means that there is only one unknown node of the
nodes that are not connected to another triangle block. In order to form an arithmetic calculatable nu-
merical relation, in the triangle block model, it is allowed only to connect an operand node of a triangle
block to a result node of another triangle block.
3. Design of Tasks with Triangle Block Model
In this section, first of all, as a preparation of design of tasks with the triangle block model, two equa-
tions for the same problem, one is a problem equation and the other is a calculation equation, are in-
troduced. Then, several tasks designed based on the triangle block model are introduced. These tasks
have been implemented in an interactive learning environment called MONSAKUN-TB and used it in
practical lessons explained in the next section.
3.1 Problem Equation and Calculation Equation
In the triangle block model, a unit problem is composed of three quantity concepts. Then, a combination
of the three concepts decides a quantitative relation among them. The quantitative relation of a unit
problem is expressed by three concrete equations that are corresponding to variations of a triangle block
explained in Section 2.1. Then, one or two equations have following two roles, one role is expression of
natural numerical relation in the story/problem, and the other is expression of calculation procedure to
derive its answer. We call an equation with the former role “problem equation” and an equation with the
latter role “calculation equation”. For example, assume that “a price of a pen” is unknown in the
problem shown in Figure 2(a). Because the cover story has a form of “bought several something”, an
associated operation to the cover story is multiplication. So, the story equation is expressed as “price of
a pen” * “number of pencils” = “price of five pencils” that corresponds to the triangle block shown in
Figure 2(c). In order to derive the unknown value, it is necessary to calculate “price of five pencils” /
“number of pencils” = “price of a pen”. This is the calculation equation of the problem. In this case, the
problem equation is different from the calculation equation. This type of problem is often called re-
verse-thinking problem. Assuming that “price of five pencils” is unknown, the calculation equation is
the same one with the problem equation. This type of problem is often called forward-thinking problem.
As for combined word problems, both problem equation (and corresponding triangle block) and cal-
culation equation (and corresponding triangle block) are important in variations of equations and
combined triangle blocks. A triangle block corresponding to problem equation (PE) is called a PE
triangle block and a triangle block corresponding to calculation equation (CE) a CE triangle block (in
practical classes and implementation, the unknown value is expressed with “?”, and “equation” is called
“numerical expression with unknown value”).
3.2 Design of Tasks
The tasks are categorized into two: one is tasks with a unit problem (Task-I) and the other is tasks with
a combined problem (Task-II). In the following this subsection, these tasks are explained. In the tasks, a
unit problem is expressed with three sentences. On the right side of Figure 6, an arithmetic word
problem is provided. The problem is composed of three sentences. Each sentence expresses a quantity
concept, and then, a unit arithmetic word problem is expressed with three sentences. We call this
framework to express a unit problem “triplet structure model” (Hirashima et al. 2014) and have already
implemented several learning environments for learning by problem-posing for the unit problems
(Hirashima et al. 2000, Hirashima et al. 2007, Hirashima and Kurayama 2011). Practical uses of them in
classroom with tablet have been also reported (Yamamoto et al. 2012, Yamamoto et al. 2013). We call
the series of learning environment called MONSAKUN. Triangle block model is an extension of the
3939

triple structure model and a learning environment extended based on the triangle block model is
MONSAKUN-TB (MONSAKUN Triangle Block). Assuming pupils have already experienced to deal
with unit arithmetic problems expressed with three sentences, the tasks of MONSAKUN-TB are de-
signed.
3.2.1 Task-I: Tasks with a unit problem
Tasks in Task-I request a pupil to deal with a unit problem, its equations (PE and CE) and corresponding
triangle blocks. Four tasks are designed as follows: (Task-I-1) make a PE triangle block from a unit
problem, (Task-I-2) select a correct pair of problem equation and calculation equation for a problem,
and then make triangle blocks corresponding to the equations, (Task-I-3) select a correct problem
equation for a problem, make a PE triangle block corresponding to the problem equation, and then,
select a correct CE triangle block for the PE triangle block, (Task-I-4) pose a problem by combining
three sentences and complete a triangle block to the posed problem.
Figure 5 shows interface of Task-I-1 (words in figures of system interface are translated into
English from Japanese). On the left side of the interface, a unit problem compose of three sentences is
provided. A pupil is requested to complete a triangle block corresponding to the problem on a field of
the right side. The field is called “triangle block field”. In the triangle block field, three concept nodes
corresponding to sentences and a triangle block with one operation (operation in PE) are provided. With
drag and drop manipulation, the three nodes are put on the three apexes in the triangle block. When the
pupil pushes “answer” button, the system diagnoses the triangle block and gives the pupil feedback
based on the diagnosis.
Figure 5. Task-I-1.
Figure 6 shows the interface of Task-I-2. In this task, a unit problem and four pairs of PE and
CE are provided, and then, a pupil is requested to select an adequate pair to the unit problem from the
four choices. After selecting a pair by clicking an area of a pair, the pupil is requested to push “answer”
button. Then, the system diagnoses the selection and gives feedback. Here, when the pupil thinks that
there is no adequate choice, the pupil is allowed to push “no correct choice” button. There are a few
assignments where “no correct choice” is a right answer. After selecting correct PE and CE, the pupil is
requested to complete two triangle blocks corresponding to PE and CE respectively as shown in Figure
7.
The main task of Task-I-3 is to select a triangle block with the same meaning. In triangle block
model, a triangle block can be changed to two other triangle blocks keeping their numerical relation as
mentioned in 2.1. Here, it is regarded that these three triangle blocks has the same meaning. Figure 8 is
the snapshot of this task. In Task-I-4, at first, a pupil is requested to pose a problem as shown in Figure
9. The pupil selects three cards from a set of cards on the right side and puts them in the three blanks on
the left side. A request sentence shown in the upper side in the figure is conditions that the posed
problem should satisfy. After the pupil correctly posed a problem, he/she is requested to complete a
triangle block as shown in Figure 10. In this task, a student is requested to select the arithmetic opera-
4040

tion of a triangle by him/herself. When the student clicks an arithmetic operation at the right bottom, a
triangle block with the operation appears.
Figure 6. Task-I-2(a). Figure 7. Task-I-2(b).
Figure 8. Task-I-3.
Figure 9. Task-I-4(a).
Figure 10. Task-I-4(b).
4141
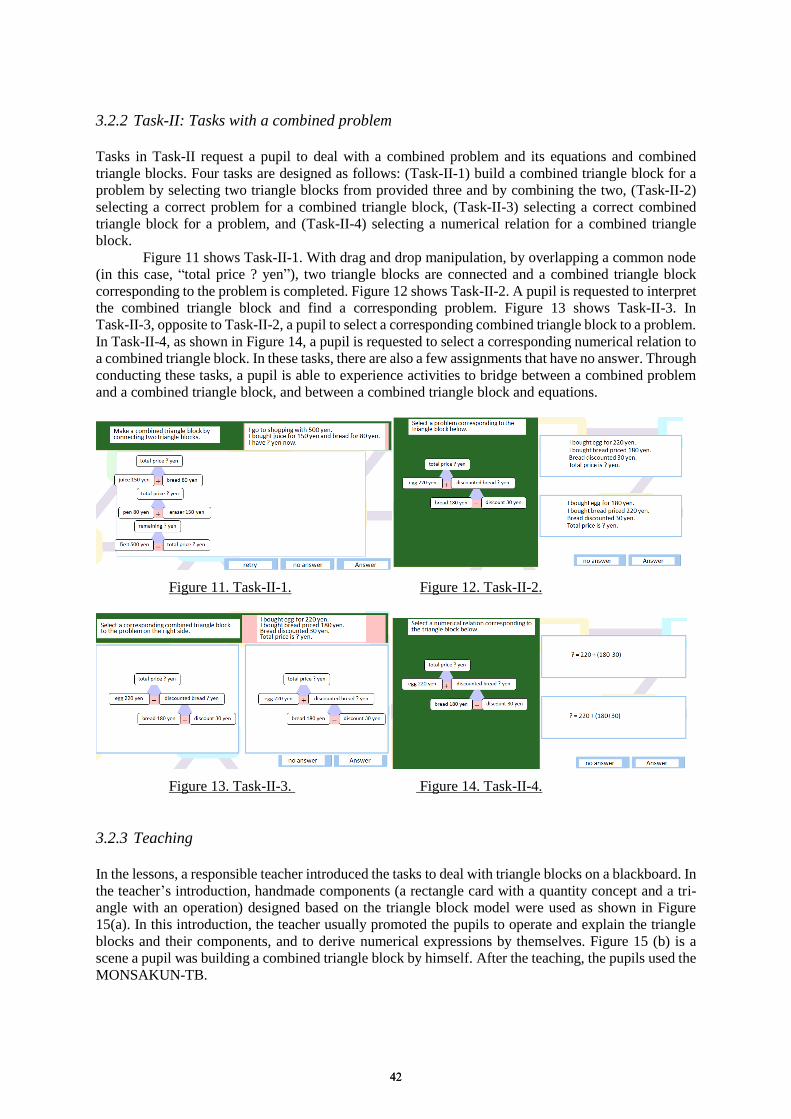
3.2.2 Task-II: Tasks with a combined problem
Tasks in Task-II request a pupil to deal with a combined problem and its equations and combined
triangle blocks. Four tasks are designed as follows: (Task-II-1) build a combined triangle block for a
problem by selecting two triangle blocks from provided three and by combining the two, (Task-II-2)
selecting a correct problem for a combined triangle block, (Task-II-3) selecting a correct combined
triangle block for a problem, and (Task-II-4) selecting a numerical relation for a combined triangle
block.
Figure 11 shows Task-II-1. With drag and drop manipulation, by overlapping a common node
(in this case, “total price ? yen”), two triangle blocks are connected and a combined triangle block
corresponding to the problem is completed. Figure 12 shows Task-II-2. A pupil is requested to interpret
the combined triangle block and find a corresponding problem. Figure 13 shows Task-II-3. In
Task-II-3, opposite to Task-II-2, a pupil to select a corresponding combined triangle block to a problem.
In Task-II-4, as shown in Figure 14, a pupil is requested to select a corresponding numerical relation to
a combined triangle block. In these tasks, there are also a few assignments that have no answer. Through
conducting these tasks, a pupil is able to experience activities to bridge between a combined problem
and a combined triangle block, and between a combined triangle block and equations.
Figure 11. Task-II-1. Figure 12. Task-II-2.
Figure 13. Task-II-3. Figure 14. Task-II-4.
3.2.3 Teaching
In the lessons, a responsible teacher introduced the tasks to deal with triangle blocks on a blackboard. In
the teacher’s introduction, handmade components (a rectangle card with a quantity concept and a tri-
angle with an operation) designed based on the triangle block model were used as shown in Figure
15(a). In this introduction, the teacher usually promoted the pupils to operate and explain the triangle
blocks and their components, and to derive numerical expressions by themselves. Figure 15 (b) is a
scene a pupil was building a combined triangle block by himself. After the teaching, the pupils used the
MONSAKUN-TB.
4242
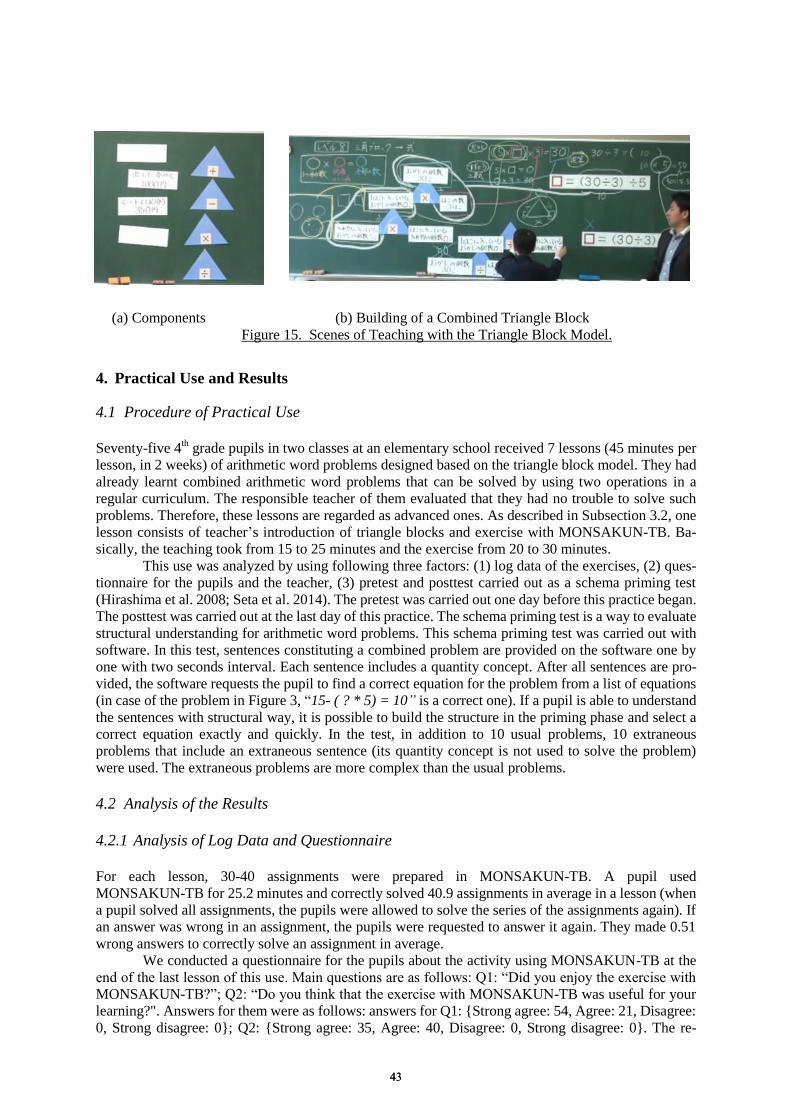
(a) Components (b) Building of a Combined Triangle Block
Figure 15. Scenes of Teaching with the Triangle Block Model.
4. Practical Use and Results
4.1 Procedure of Practical Use
Seventy-five 4
th grade pupils in two classes at an elementary school received 7 lessons (45 minutes per
lesson, in 2 weeks) of arithmetic word problems designed based on the triangle block model. They had
already learnt combined arithmetic word problems that can be solved by using two operations in a
regular curriculum. The responsible teacher of them evaluated that they had no trouble to solve such
problems. Therefore, these lessons are regarded as advanced ones. As described in Subsection 3.2, one
lesson consists of teacher’s introduction of triangle blocks and exercise with MONSAKUN-TB. Ba-
sically, the teaching took from 15 to 25 minutes and the exercise from 20 to 30 minutes.
This use was analyzed by using following three factors: (1) log data of the exercises, (2) ques-
tionnaire for the pupils and the teacher, (3) pretest and posttest carried out as a schema priming test
(Hirashima et al. 2008; Seta et al. 2014). The pretest was carried out one day before this practice began.
The posttest was carried out at the last day of this practice. The schema priming test is a way to evaluate
structural understanding for arithmetic word problems. This schema priming test was carried out with
software. In this test, sentences constituting a combined problem are provided on the software one by
one with two seconds interval. Each sentence includes a quantity concept. After all sentences are pro-
vided, the software requests the pupil to find a correct equation for the problem from a list of equations
(in case of the problem in Figure 3, “15- ( ? * 5) = 10” is a correct one). If a pupil is able to understand
the sentences with structural way, it is possible to build the structure in the priming phase and select a
correct equation exactly and quickly. In the test, in addition to 10 usual problems, 10 extraneous
problems that include an extraneous sentence (its quantity concept is not used to solve the problem)
were used. The extraneous problems are more complex than the usual problems.
4.2 Analysis of the Results
4.2.1 Analysis of Log Data and Questionnaire
For each lesson, 30-40 assignments were prepared in MONSAKUN-TB. A pupil used
MONSAKUN-TB for 25.2 minutes and correctly solved 40.9 assignments in average in a lesson (when
a pupil solved all assignments, the pupils were allowed to solve the series of the assignments again). If
an answer was wrong in an assignment, the pupils were requested to answer it again. They made 0.51
wrong answers to correctly solve an assignment in average.
We conducted a questionnaire for the pupils about the activity using MONSAKUN-TB at the
end of the last lesson of this use. Main questions are as follows: Q1: “Did you enjoy the exercise with
MONSAKUN-TB?”; Q2: “Do you think that the exercise with MONSAKUN-TB was useful for your
learning?". Answers for them were as follows: answers for Q1: {Strong agree: 54, Agree: 21, Disagree:
0, Strong disagree: 0}; Q2: {Strong agree: 35, Agree: 40, Disagree: 0, Strong disagree: 0}. The re-
4343

sponsible teacher commented that the pupils were very activated in the lessons than usual. He also
commented that the lessons were very useful to let the pupils think arithmetic word problems more
deeply. Then, he confirmed that the exercise with MONSAKUN-TB was an indispensable step in the
lessons and the pupils engaged in the exercise very eagerly. These results of log data and questionnaire
suggest that the lessons were accepted by most of the pupils as meaningful ones. This is important
evidence that the triangle block model is a suitable representation for the CQ representation.
4.2.2 Analysis of Results of Pretest and Posttest
In this analysis, accuracy rate (AR (%)) and response time (RT (second)) for the usual problems (P-1)
and the extraneous problems (P-2) are used. The posttest was carried out two weeks later of the pretest.
In the posttest, the same problems with the posttest were used by permuting the sequence of problems.
Two-sided Wilcoxon rank sum test is used for all statistical analyses. As shown in Table 1, in the ac-
curacy rate, there were significant differences between pretest and posttest for both the usual problems
and the extraneous problems. In the response time, there were also significant differences between
pretest and posttest for the both problems as shown in Table 1. Medium effect sizes were obtained for
AR of P-1, AR of P-2 and RT of P-1, and large effect size for RT of P-2. These results suggest that the
lessons improve pupil’s structural understanding for arithmetic word problems.
As for additional analysis, the pupils were categorized into two groups by using an average of
accuracy rate in the pretest of P-1: one is higher group (27 pupils) and the other lower group (48 pupils).
In the higher group, although there were no significant differences for the both problems in the accuracy
rate, the response time reduced significantly for both problems, as shown in Table 2. In the lower group,
the accuracy rate and response time were significantly improved for the both problems, as shown in
Table 3. These results suggest that these lessons were more effective for the pupils in the lower group.
Table 1: Results of All Pupils.
All Pupils (75) Pretest Posttest p-value Effect Size (r) AR (%) P-1 0.70(SD=0.14) 0.81(0.12) 2.9e-07 0.42(Medium Size)
P-2 0.63(0.21) 0.78(0.16) 3.3e-05 0.34(Medium) RT (second)
P-1 6.1(2.3) 4.1 (1.7) 4.2e-09 0.48(Medium) P-2 9.5 (2.7) 7.1(2.5) 7.8e-08 0.55(Large)
Table 2: Results of Higher Group. Higher Group (27 ) Pretest Posttest p-value Effect Size (r) AR (%) P-1 0.84(0.06) 0.84(0.09) 0.856 -
P-2 0.71(0.23) 0.83(0.16) 0.067 - RT (second)
P-1 6.0(2.2) 4.2(1.8) 0.0009 0.45(Medium) P-2 9.2(2.1) 7.0 (2.6) 0.0013 0.55(Large)
Table 3: Results of Lower Group. Lower Group (48) Pretest Posttest p-value Effect Size (r) AR (%) P-1 0.62(0.10) 0.80(0.13) 1.924e-10 0.65(Large)
P-2 0.59(0.19) 0.75(0.16) 6.843e-05 0.41(Medium) RT (second)
P-1 6.2(2.3) 4.1(1.6) 2.424e-07 0.53(Large) P-2 9.72(2.9) 7.2(2.5) 1.789e-05 0.55(Large)
5. Considerations and Remarks
The results of these lessons suggest that the pupils could use the triangle blocks in the teaching with
blackboard and exercise with the learning environment actively, and they thought that the activities
were enjoyable and useful for their learning. The responsible teacher also agreed these considerations.
Moreover, learning effect was also observed. The teacher commented that the pupils' manipulation and
explanation for the components of triangle blocks were really improved through the lessons and the
improvement suggested their deep understanding for arithmetic word problems. Based on these results,
we have concluded that the triangle block model is a promising as a CQ representation for pupils in
elementary school.
4444
This paper is a report of the first trail of practical use of the triangle block model in a specific
situation. Based on the results, we will extend this research from the viewpoints of teaching and in-
teractive learning environment, and then will evaluate them through the long-term use by more and
various pupils, as our future work.
Acknowledgements
This work was partially supported by JSPS KAKENHI Grant Number 15H02931 and 15K12413.
References
Arnau, D., Arevalillo-Herráez, M., Antonio González-Calero, J. (2013). Fundamentals of the design and the
operation of an intelligent tutoring system for the learning of the arithmetical and algebraic way of solving
word problems. Computers & Education, 63, 119-130.
Chang, K., Sung, Y., Lin, S. (2006). Computer-assisted learning for mathematical problem solving Solution Path
with Semantics. Computers & Education, 46,140–151.
Cummins, D., Kintsch, W., Reusser, K., Weimer, R. (1988). The role of understanding in solving word problems.
Cognitive Psychology, 20, 439-462.
Heffernan, N., Koedinger, K. (1998). A developmental model for algebra symbolization: The results of a diffi-
culty factors assessment. Proceedings of the twentieth annual conference of the cognitive science society,
484-489.
Hegarty,M.,Mayer,R.E., Monk,C.A. (1995). Comprehension of arithmetic word problems: a comparison of
successful and unsuccessful problem solvers. Journal of Educational Psychology, Vol.87, No.1, 18-32.
Hirashima, T., Nakano, A., Takeuchi, A. (2000). A diagnosis function of arithmetical word problems for learning
by problem posing. PRICACI2000, 745-755.
Hirashima, T., Kashihara, A., Toyoda, T. (1992). Providing Problem Explanation for ITS. Proc. of ITS1992,
76-83.
Hirashima, T., Yokoyama, T., Okamoto, M., Takeuchi, A. (2007). Learning by problem-posing as sen-
tence-integration and experimental use. AIED 2007, 254-261.
Hirashima, T., Yokoyama, T., Okamoto, M., Takeuchi, A. (2008). Long-term Use of Learning Environment for
Problem-Posing in Arithmetical Word Problems. ICCE2008, pp.817-824.
Hirashima, T., Kurayama, M. (2011). Learning by problem-posing for reverse-thinking problems. AIED2011,
pp.123-130.
Hirashima, T., Yamamoto, S., Hayashi, Y., (2014). Triplet structure model of arithmetical word problems for
learning by problem-posing. Human Interface and the Management of Information. Information and
Knowledge in Applications and Services, Volume 8522 of the series Lecture Notes in Computer Science,
42-50.
Hirashima, T., Hayashi, Y., Yamamoto, S., Maeda, K. (2015). Bridging Model between Problem and Solution
Representations in Arithmetic/Mathematics Word Problem. ICCE2015, pp. 9-18.
Koedinger, K. R., & Nathan, M. J. (2004). The real story behind story problems: Effects of representations on
quantitative reasoning. Journal of the Learning Sciences, 13(2), 129–164.
Nathan, M., Kintsch, W., Young, E. (1992). A theory of Algebra-Word-Problem Comprehension and Its Impli-
cations for the Design of Learning Environments. Cognition and Instruction, Vol. 9, No.4, 329-389.
Pólya, G. (1945). How to Solve It. Princeton University Press.
Reusser, K. (1996). From Cognitive Modeling to the Design of Pedagogical Tools. In S. Vosniadou et al.(Eds.):
International Perspective on the Design of Technology-Supported Learning Environments, . LEA, 81-103.
Riley,M.S, Greeno,J.G, Heller,J.I. (1983). Development of children’s problem solving ability in arithmetic,
H.P.Ginsburg(Ed.). The development of mathematical thinking. New York: Academic Press, 153-196.
Seta, K., Shimazoe, A., Mori, K., Okamoto, M. (2014): Schema Formulation with Schema Priming Test in Ele-
mentary Arithmetic class in Japan. ICCE2014, 451-460.
Yamamoto, S., Kanbe, T., Yoshida, Y., Maeda, K., Hayashi, Y., Hirashima, T. (2012). A Case Study of Learning
by Problem-Posing in Introductory Phase of Arithmetic Word Problems, ICCE2012, Main Conference
E-Book, 25-32.
Yamamoto, S., Kanbe, T., Yoshida, Y., Maeda, K., Hayashi, Y., Hirashima, T. (2013). Interactive Environment
for Learning by Problem-Posing of Arithmetic Word Problems Solved by One-step Multiplication,
ICCE2013, 51-60.
4545
Chen, W. et al. (Eds.) (2016). Proceedings of the 24th
International Conference on Computers in Education.
India: Asia-Pacific Society for Computers in Education
Do Novices and Advanced Students benefit from
Erroneous Examples differently?
Xingliang CHENa*
, Tanja MITROVICb & Moffat MATHEWS
c
a,b,c University of Canterbury, New Zealand
Abstract: Learning from problem solving, worked examples, and Erroneous Examples (ErrEx)
have all proven to be effective learning strategies. However, what kind of learning material
should be provided to students with different level of prior knowledge within Intelligent
Tutoring Systems (ITSs) is still an open question. Recently, alternating worked examples and
problem solving (AEP) has been shown to benefit students compared to problems only or
worked examples only in SQL-Tutor (Najar & Mitrovic, 2013). However, how students with
different prior knowledge learn from ErrEx in SQL-Tutor is unknown. In this paper, we
compared AEP to a new instructional strategy (WPEP) which provides ErrEx in addition to
worked examples and problem solving to students. The results show that that both novices and
advanced students improved their post-test scores significantly in either condition. Our findings
also show that novices acquired significantly more debugging knowledge when erroneous
examples were presented (WPEP) in comparison to the AEP condition. Moreover, both novices
and advanced students benefitted from ErrEx. In particular, advanced students who studied with
erroneous examples showed better performance on problem solving as measured by the number
of attempts per problem.
Keywords: Problem solving, Worked examples, Erroneous examples, Novices, Advanced
students, Intelligent Tutoring System, SQL-Tutor
1. Introduction
Previous studies have compared studying from Worked Examples (WE) to unsupported problem
solving (Atkinson, Derry, Renkl, & Wortham, 2000; Kalyuga, Chandler, Tuovinen, & Sweller, 2001;
Van Gog & Rummel, 2010). A worked example consists of a problem statement, its solution and
additional explanations, and therefore provides a high level of assistance to students. WEs reduce
cognitive load on the students’ working memory, thus allowing students to learn faster and deal with
more complex problems (Sweller, Van Merrienboer, & Paas, 1998). The effectiveness of WEs has been
investigated in various studies (Atkinson et al., 2000; Kirschner, Sweller, & Clark, 2006; Van Gog &
Rummel, 2010). It has been shown that WEs are beneficial for novices (Kirschner et al., 2006), but
problem solving was proven to be superior to WEs for students with high prior knowledge (Kalyuga et
al., 2001). The effects of problem solving only (PS), worked-examples only (WE),
worked-examples/problem-solving pairs (WE-PS) and problem-solving/worked-examples pairs
(PS-WE) have been studied on novices by using electrical circuits troubleshooting tasks (Van Gog,
Kester, & Paas, 2011). The results suggest that the performance of the WE and WE-PS conditions were
significantly higher than that of the PS and PS-WE conditions. However, van Gog later claimed that the
result of WE-PS and PS-WE conditions might be not sufficient because the examples and problems
should be identical within and across pairs (van Gog, 2011). As a consequence, she employed an
example-problem sequence (EP condition) and a problem-example sequence (PE) condition for
learning. The result demonstrated that students showed better performance on EP condition than PE
condition. For advanced students, they have sufficient knowledge to learn from practice without much
feedback or support, therefore, worked examples are not as effective for them (Kalyuga et al., 2001),
since worked examples provide redundant assistance for high prior knowledge students.
Many studies have also demonstrated the benefits of learning from WEs compared to learning
from tutored problem solving (TPS) in ITSs (McLaren & Isotani, 2011; Schwonke et al., 2009). In
comparison to unsupported problem solving, ITSs provide adaptive feedback, hints or other types of
4646
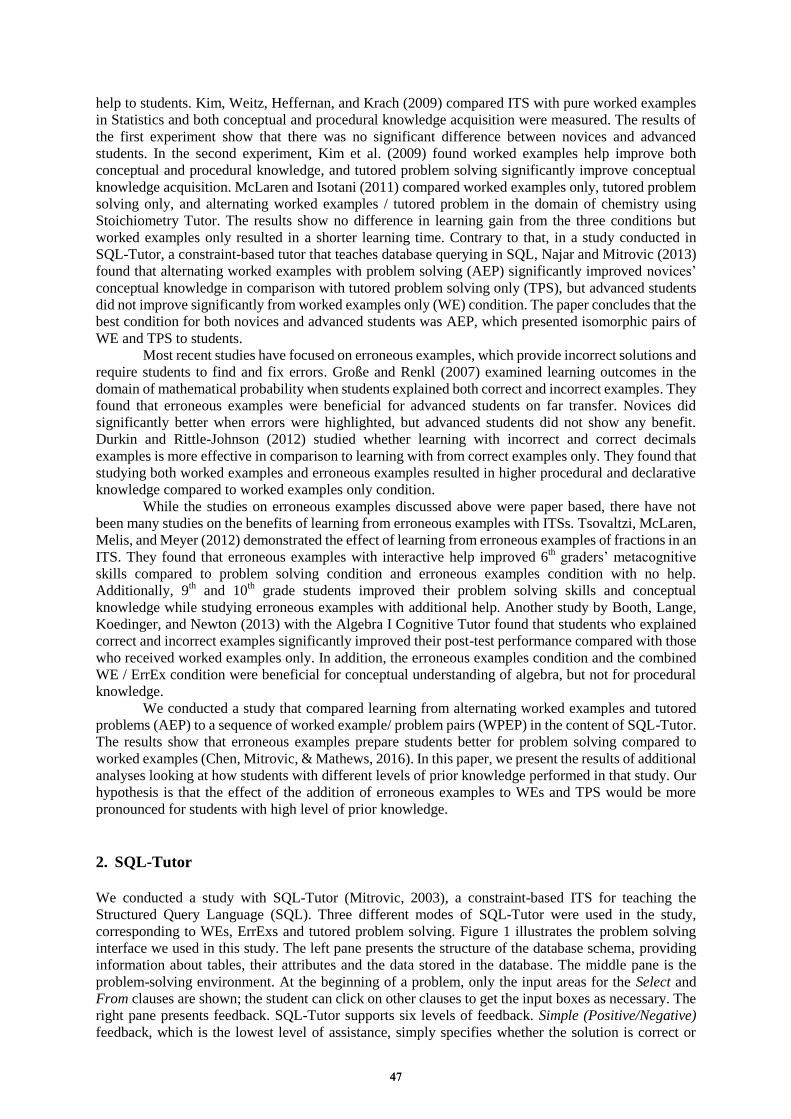
help to students. Kim, Weitz, Heffernan, and Krach (2009) compared ITS with pure worked examples
in Statistics and both conceptual and procedural knowledge acquisition were measured. The results of
the first experiment show that there was no significant difference between novices and advanced
students. In the second experiment, Kim et al. (2009) found worked examples help improve both
conceptual and procedural knowledge, and tutored problem solving significantly improve conceptual
knowledge acquisition. McLaren and Isotani (2011) compared worked examples only, tutored problem
solving only, and alternating worked examples / tutored problem in the domain of chemistry using
Stoichiometry Tutor. The results show no difference in learning gain from the three conditions but
worked examples only resulted in a shorter learning time. Contrary to that, in a study conducted in
SQL-Tutor, a constraint-based tutor that teaches database querying in SQL, Najar and Mitrovic (2013)
found that alternating worked examples with problem solving (AEP) significantly improved novices’
conceptual knowledge in comparison with tutored problem solving only (TPS), but advanced students
did not improve significantly from worked examples only (WE) condition. The paper concludes that the
best condition for both novices and advanced students was AEP, which presented isomorphic pairs of
WE and TPS to students.
Most recent studies have focused on erroneous examples, which provide incorrect solutions and
require students to find and fix errors. Große and Renkl (2007) examined learning outcomes in the
domain of mathematical probability when students explained both correct and incorrect examples. They
found that erroneous examples were beneficial for advanced students on far transfer. Novices did
significantly better when errors were highlighted, but advanced students did not show any benefit.
Durkin and Rittle-Johnson (2012) studied whether learning with incorrect and correct decimals
examples is more effective in comparison to learning with from correct examples only. They found that
studying both worked examples and erroneous examples resulted in higher procedural and declarative
knowledge compared to worked examples only condition.
While the studies on erroneous examples discussed above were paper based, there have not
been many studies on the benefits of learning from erroneous examples with ITSs. Tsovaltzi, McLaren,
Melis, and Meyer (2012) demonstrated the effect of learning from erroneous examples of fractions in an
ITS. They found that erroneous examples with interactive help improved 6th graders’ metacognitive
skills compared to problem solving condition and erroneous examples condition with no help.
Additionally, 9th and 10
th grade students improved their problem solving skills and conceptual
knowledge while studying erroneous examples with additional help. Another study by Booth, Lange,
Koedinger, and Newton (2013) with the Algebra I Cognitive Tutor found that students who explained
correct and incorrect examples significantly improved their post-test performance compared with those
who received worked examples only. In addition, the erroneous examples condition and the combined
WE / ErrEx condition were beneficial for conceptual understanding of algebra, but not for procedural
knowledge.
We conducted a study that compared learning from alternating worked examples and tutored
problems (AEP) to a sequence of worked example/ problem pairs (WPEP) in the content of SQL-Tutor.
The results show that erroneous examples prepare students better for problem solving compared to
worked examples (Chen, Mitrovic, & Mathews, 2016). In this paper, we present the results of additional
analyses looking at how students with different levels of prior knowledge performed in that study. Our
hypothesis is that the effect of the addition of erroneous examples to WEs and TPS would be more
pronounced for students with high level of prior knowledge.
2. SQL-Tutor
We conducted a study with SQL-Tutor (Mitrovic, 2003), a constraint-based ITS for teaching the
Structured Query Language (SQL). Three different modes of SQL-Tutor were used in the study,
corresponding to WEs, ErrExs and tutored problem solving. Figure 1 illustrates the problem solving
interface we used in this study. The left pane presents the structure of the database schema, providing
information about tables, their attributes and the data stored in the database. The middle pane is the
problem-solving environment. At the beginning of a problem, only the input areas for the Select and
From clauses are shown; the student can click on other clauses to get the input boxes as necessary. The
right pane presents feedback. SQL-Tutor supports six levels of feedback. Simple (Positive/Negative)
feedback, which is the lowest level of assistance, simply specifies whether the solution is correct or
4747
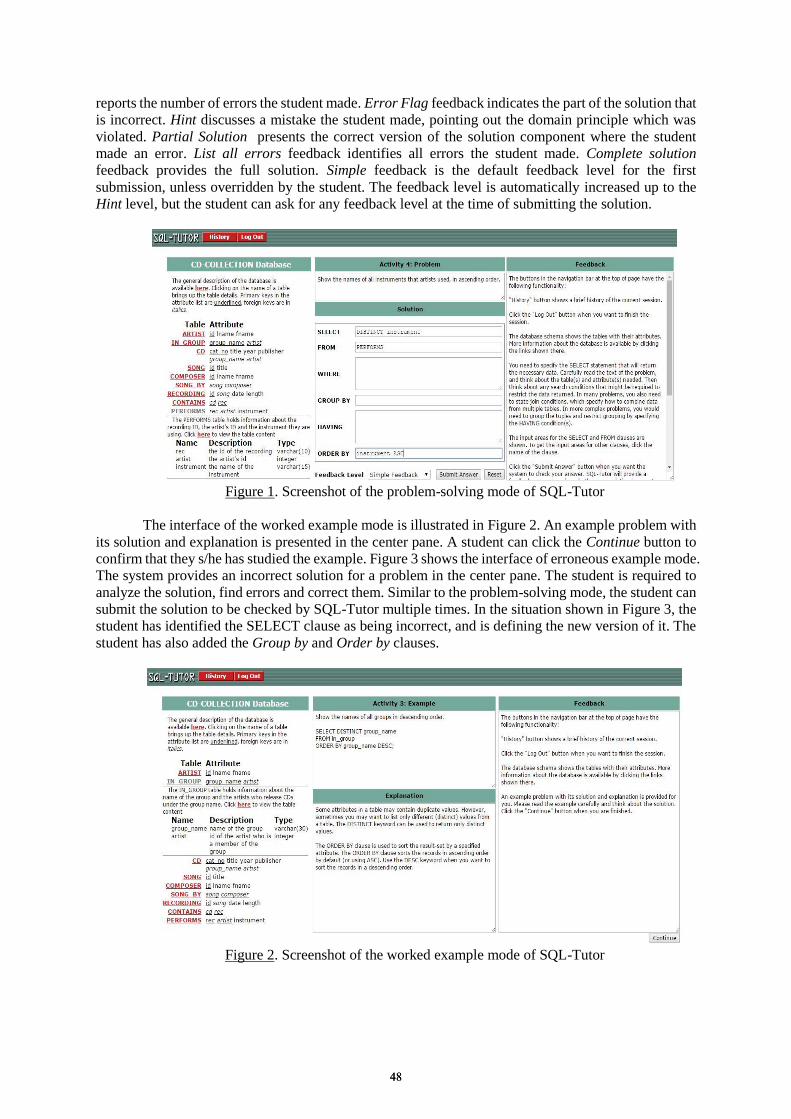
reports the number of errors the student made. Error Flag feedback indicates the part of the solution that
is incorrect. Hint discusses a mistake the student made, pointing out the domain principle which was
violated. Partial Solution presents the correct version of the solution component where the student
made an error. List all errors feedback identifies all errors the student made. Complete solution
feedback provides the full solution. Simple feedback is the default feedback level for the first
submission, unless overridden by the student. The feedback level is automatically increased up to the
Hint level, but the student can ask for any feedback level at the time of submitting the solution.
Figure 1. Screenshot of the problem-solving mode of SQL-Tutor
The interface of the worked example mode is illustrated in Figure 2. An example problem with
its solution and explanation is presented in the center pane. A student can click the Continue button to
confirm that they s/he has studied the example. Figure 3 shows the interface of erroneous example mode.
The system provides an incorrect solution for a problem in the center pane. The student is required to
analyze the solution, find errors and correct them. Similar to the problem-solving mode, the student can
submit the solution to be checked by SQL-Tutor multiple times. In the situation shown in Figure 3, the
student has identified the SELECT clause as being incorrect, and is defining the new version of it. The
student has also added the Group by and Order by clauses.
Figure 2. Screenshot of the worked example mode of SQL-Tutor
4848

Figure 3. Screenshot of the erroneous example mode of SQL-Tutor
Previous studies have demonstrated that students learn more while they self-explain, but that
many students do not self-explain spontaneously (Chi, Leeuw, Chiu, & LaVancher, 1994; Kim et al.,
2009; Weerasinghe & Mitrovic, 2006). A common method to encourage students to self-explain is to
provide Self-Explanation (SE) prompts. Previous work has found that problem solving help improve
procedural knowledge more than conceptual knowledge, while WEs result in higher level of conceptual
knowledge (Kim et al., 2009; Schwonke et al., 2009). Consequently, Najar and Mitrovic (2013)
developed Conceptual-focused Self-Explanation (C-SE) prompts that support students to self-explain
relevant domain concepts after problem solving, and Procedural-focused Self-Explanation (P-SE)
prompts that aid students to self-explain solution steps after WEs. A C-SE prompt is provided after a
problem is solved, in order to assist students to acquire conceptual knowledge corresponded to the
problem they just completed (e.g. What does DISTINCT in general do?). On the other hand, a P-SE
prompt is presented after WEs to aid learners to focus on problem-solving approaches (e.g. How can
you specify a string constant?). In this study, we provided C-SE and P-SE prompts alternatively after
ErrExs, since ErrExs contain both properties of problems and WEs.
3. Experiment Design
The study was conducted with volunteers enrolled in an introductory database course at the University
of Canterbury, in regular labs scheduled for the course (100 minutes long). Prior to the study, the
students have learnt about SQL in lectures, and had one lab session. There were two conditions:
Alternating Examples and Problems (AEP), the most effective learning condition from (Najar &
Mitrovic, 2013), and the experimental condition consisting of a fixed sequence of Worked example /
Problem pairs and Erroneous example / Problem Pairs (WPEP). In both conditions, there were 20 tasks
to be completed in a fixed order (of increasing difficulty), with the only difference being whether the
tasks were presented as problems to be solved, WEs or ErrExs.
The students were randomly assigned to either AEP or WPEP condition after they logged on to
SQL-Tutor, and then the pre-test was provided. The pre-test and post-test were administered online.
After completing all 20 tasks, the participants received the post-test of similar complexity and length to
the pre-test. Figure 4 shows the study design. The pre/post-tests consisted of 11 questions each.
Questions 1-6 were multi-choice or true-false questions, which measured conceptual knowledge (with
the maximum of 6 marks). Questions 7-9 focused on procedural knowledge; question 7 was a
multi-choice question (one mark), followed by a true-false question (one mark), while question 9
required the student to write a query for a given problem (four marks). The last two questions presented
incorrect solutions to two problems, and required the student to correct them, thus measuring debugging
knowledge (six marks). Therefore, the maximum mark on the tests was 18.
4949

AEP WPEP
Pre-Test
20 Problems / WEs
(10 isomorphic pairs)
10 problems / WEs
(5 isomorphic pairs), and
10 problems / ErrExs
(5 isomorphic pairs),
presented in alternation
Each problem followed by a C-SE prompt and
each example followed by a P-SE prompt
Post-Test
Figure 4. Study design
4. Results
There were 64 participants in the study. Since the participation was voluntary, not all students
completed all phases of the study, and we removed data about 38 students who have not finished the
post-test. We present the results obtained by analyzing the data collected from the remaining 26
students (15 in the AEP and 11 in the WPEP condition). We classified students post-hoc based on their
pre-test scores; the students whose pre-test scores are lower than 66% (the median of the pre-test scores
for the whole group) were classified as novices, and the rest as advanced students (12 novices, 14
advanced students). Table 1 shows the overall scores, as well as scores for novices and advanced
students.
Table 1: The pre-test scores (%)
All students (26) Novices (12) Advanced students (14)
All questions 65.81 (13.14) 54.63 (6.3) 75.4 (9.17)
Conceptual questions 53.85 (17.2) 41.67 (13.3) 64.29 (12.84)
Procedural questions 85.26 (16.72) 81.91 (18.41) 88.1 (15.23)
Debugging questions 58.33 (24.15) 40.28 (16.6) 73.81 (18.16)
Table 2 shows the basic statistics for novices. The Mann-Whitney U-test revealed that there
were no significant differences between the two conditions on the pre-test scores, post-test scores and
the normalized learning gain. The Wilcoxon signed-test shows that novices in both conditions improved
significantly between the pre- and post-test (the Improvement row of Table 2). The effect sizes (Cohen’s
d) are high for both conditions, with the WPEP condition having a higher effect size. On average, the
students spent 63 minutes interacting with the learning tasks. There was no significant difference on the
total interaction time between the two conditions. The students in both conditions solved the same
number of problems (10). The AEP condition had 10 worked examples, while the WPEP condition had
5 worked examples and 5 erroneous examples. We expected erroneous examples to take more time
compared to worked examples, but the difference was not significant.
Table 2: The basic statistics for Novices
AEP (6) WPEP (6) p
Pre-test (%) 52.31 (7.94) 56.94 (3.4) .28
Post-test (%) 80.09 (13.77) 91.2 (7.54) .13
Improvement W = 21, p < .05, d = 1.54 W = 21, p < .05, d = 1.83
Normalized learning gain 0.57 (0.28) 0.8 (0.17) .12
Interaction time (min) 67.71 (15.9) 58.78 (14.73) .2
The basic statistics for advanced students are given in Table 3. The Mann-Whitney U-Test
revealed no significant differences between the two groups on pre- and post-test scores, as well as on the
normalized learning gain. The Wilcoxon signed-rank test identified significant improvements (p < .05)
5050
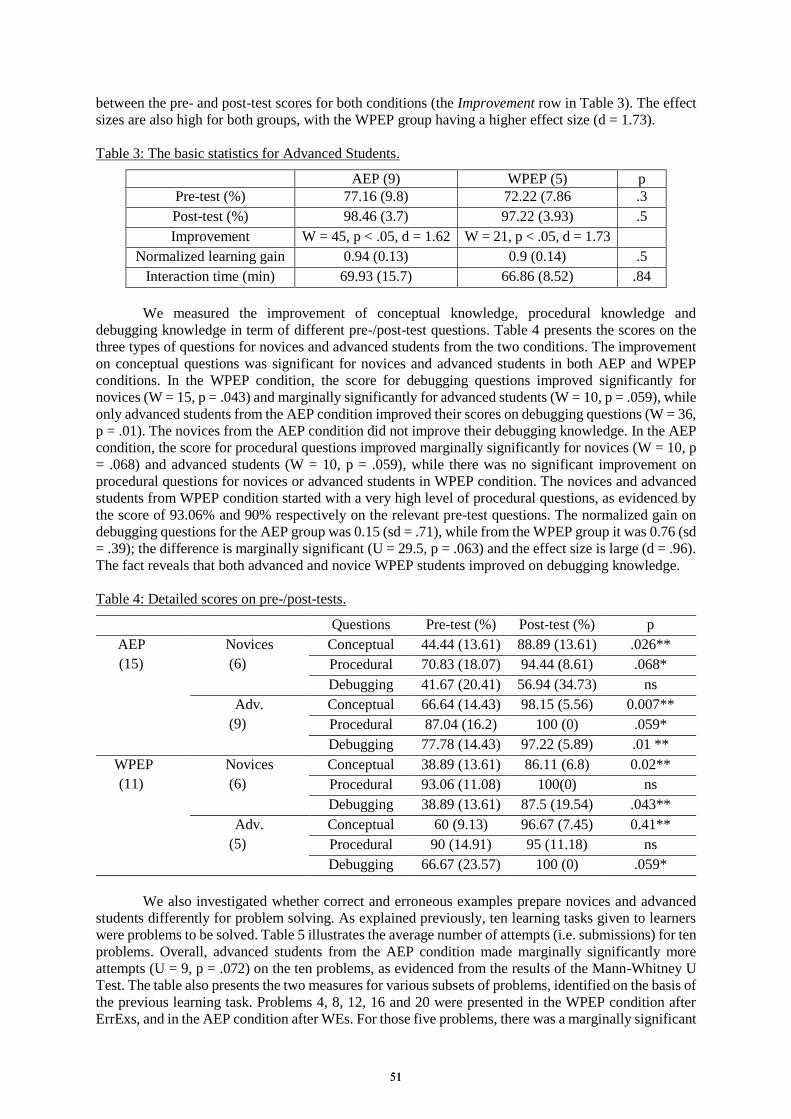
between the pre- and post-test scores for both conditions (the Improvement row in Table 3). The effect
sizes are also high for both groups, with the WPEP group having a higher effect size (d = 1.73).
Table 3: The basic statistics for Advanced Students.
AEP (9) WPEP (5) p
Pre-test (%) 77.16 (9.8) 72.22 (7.86 .3
Post-test (%) 98.46 (3.7) 97.22 (3.93) .5
Improvement W = 45, p < .05, d = 1.62 W = 21, p < .05, d = 1.73
Normalized learning gain 0.94 (0.13) 0.9 (0.14) .5
Interaction time (min) 69.93 (15.7) 66.86 (8.52) .84
We measured the improvement of conceptual knowledge, procedural knowledge and
debugging knowledge in term of different pre-/post-test questions. Table 4 presents the scores on the
three types of questions for novices and advanced students from the two conditions. The improvement
on conceptual questions was significant for novices and advanced students in both AEP and WPEP
conditions. In the WPEP condition, the score for debugging questions improved significantly for
novices (W = 15, p = .043) and marginally significantly for advanced students (W = 10, p = .059), while
only advanced students from the AEP condition improved their scores on debugging questions (W = 36,
p = .01). The novices from the AEP condition did not improve their debugging knowledge. In the AEP
condition, the score for procedural questions improved marginally significantly for novices (W = 10, p
= .068) and advanced students (W = 10, p = .059), while there was no significant improvement on
procedural questions for novices or advanced students in WPEP condition. The novices and advanced
students from WPEP condition started with a very high level of procedural questions, as evidenced by
the score of 93.06% and 90% respectively on the relevant pre-test questions. The normalized gain on
debugging questions for the AEP group was 0.15 (sd = .71), while from the WPEP group it was 0.76 (sd
= .39); the difference is marginally significant (U = 29.5, p = .063) and the effect size is large (d = .96).
The fact reveals that both advanced and novice WPEP students improved on debugging knowledge.
Table 4: Detailed scores on pre-/post-tests.
Questions Pre-test (%) Post-test (%) p
AEP
(15)
Novices
(6)
Conceptual 44.44 (13.61) 88.89 (13.61) .026**
Procedural 70.83 (18.07) 94.44 (8.61) .068*
Debugging 41.67 (20.41) 56.94 (34.73) ns
Adv.
(9)
Conceptual 66.64 (14.43) 98.15 (5.56) 0.007**
Procedural 87.04 (16.2) 100 (0) .059*
Debugging 77.78 (14.43) 97.22 (5.89) .01 **
WPEP
(11)
Novices
(6)
Conceptual 38.89 (13.61) 86.11 (6.8) 0.02**
Procedural 93.06 (11.08) 100(0) ns
Debugging 38.89 (13.61) 87.5 (19.54) .043**
Adv.
(5)
Conceptual 60 (9.13) 96.67 (7.45) 0.41**
Procedural 90 (14.91) 95 (11.18) ns
Debugging 66.67 (23.57) 100 (0) .059*
We also investigated whether correct and erroneous examples prepare novices and advanced
students differently for problem solving. As explained previously, ten learning tasks given to learners
were problems to be solved. Table 5 illustrates the average number of attempts (i.e. submissions) for ten
problems. Overall, advanced students from the AEP condition made marginally significantly more
attempts (U = 9, p = .072) on the ten problems, as evidenced from the results of the Mann-Whitney U
Test. The table also presents the two measures for various subsets of problems, identified on the basis of
the previous learning task. Problems 4, 8, 12, 16 and 20 were presented in the WPEP condition after
ErrExs, and in the AEP condition after WEs. For those five problems, there was a marginally significant
5151
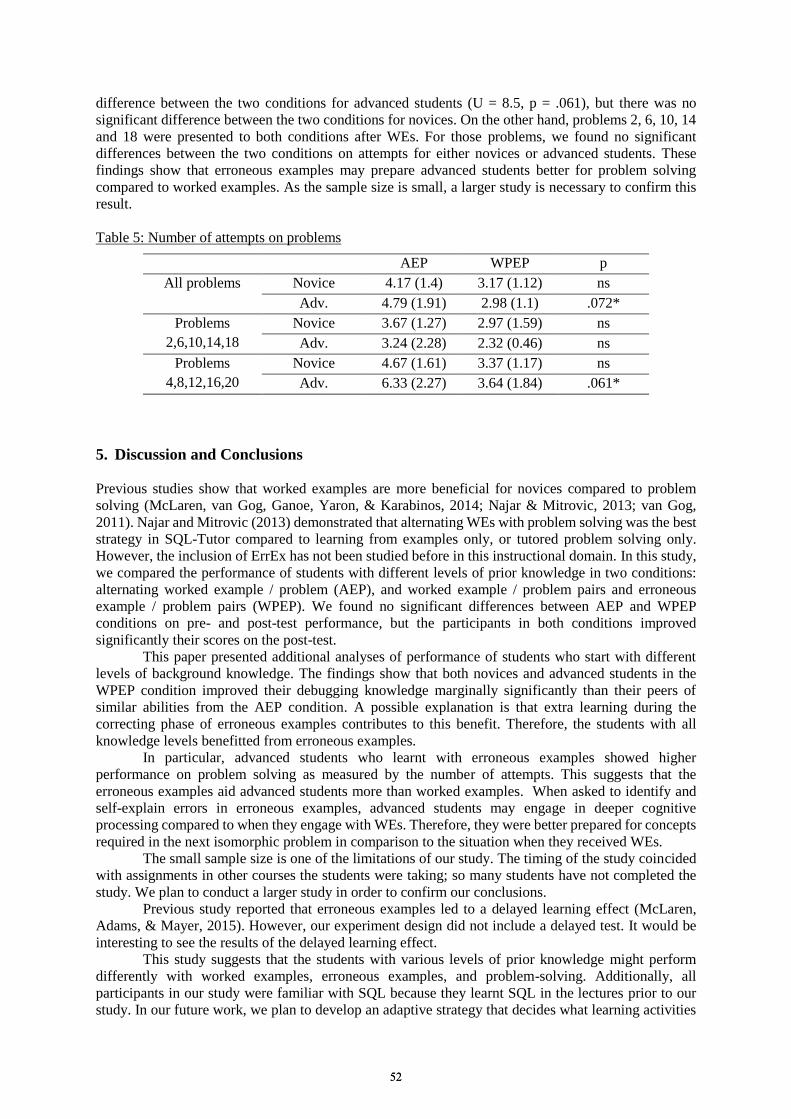
difference between the two conditions for advanced students (U = 8.5, p = .061), but there was no
significant difference between the two conditions for novices. On the other hand, problems 2, 6, 10, 14
and 18 were presented to both conditions after WEs. For those problems, we found no significant
differences between the two conditions on attempts for either novices or advanced students. These
findings show that erroneous examples may prepare advanced students better for problem solving
compared to worked examples. As the sample size is small, a larger study is necessary to confirm this
result.
Table 5: Number of attempts on problems
AEP WPEP p
All problems Novice 4.17 (1.4) 3.17 (1.12) ns
Adv. 4.79 (1.91) 2.98 (1.1) .072*
Problems
2,6,10,14,18
Novice 3.67 (1.27) 2.97 (1.59) ns
Adv. 3.24 (2.28) 2.32 (0.46) ns
Problems
4,8,12,16,20
Novice 4.67 (1.61) 3.37 (1.17) ns
Adv. 6.33 (2.27) 3.64 (1.84) .061*
5. Discussion and Conclusions
Previous studies show that worked examples are more beneficial for novices compared to problem
solving (McLaren, van Gog, Ganoe, Yaron, & Karabinos, 2014; Najar & Mitrovic, 2013; van Gog,
2011). Najar and Mitrovic (2013) demonstrated that alternating WEs with problem solving was the best
strategy in SQL-Tutor compared to learning from examples only, or tutored problem solving only.
However, the inclusion of ErrEx has not been studied before in this instructional domain. In this study,
we compared the performance of students with different levels of prior knowledge in two conditions:
alternating worked example / problem (AEP), and worked example / problem pairs and erroneous
example / problem pairs (WPEP). We found no significant differences between AEP and WPEP
conditions on pre- and post-test performance, but the participants in both conditions improved
significantly their scores on the post-test.
This paper presented additional analyses of performance of students who start with different
levels of background knowledge. The findings show that both novices and advanced students in the
WPEP condition improved their debugging knowledge marginally significantly than their peers of
similar abilities from the AEP condition. A possible explanation is that extra learning during the
correcting phase of erroneous examples contributes to this benefit. Therefore, the students with all
knowledge levels benefitted from erroneous examples.
In particular, advanced students who learnt with erroneous examples showed higher
performance on problem solving as measured by the number of attempts. This suggests that the
erroneous examples aid advanced students more than worked examples. When asked to identify and
self-explain errors in erroneous examples, advanced students may engage in deeper cognitive
processing compared to when they engage with WEs. Therefore, they were better prepared for concepts
required in the next isomorphic problem in comparison to the situation when they received WEs.
The small sample size is one of the limitations of our study. The timing of the study coincided
with assignments in other courses the students were taking; so many students have not completed the
study. We plan to conduct a larger study in order to confirm our conclusions.
Previous study reported that erroneous examples led to a delayed learning effect (McLaren,
Adams, & Mayer, 2015). However, our experiment design did not include a delayed test. It would be
interesting to see the results of the delayed learning effect.
This study suggests that the students with various levels of prior knowledge might perform
differently with worked examples, erroneous examples, and problem-solving. Additionally, all
participants in our study were familiar with SQL because they learnt SQL in the lectures prior to our
study. In our future work, we plan to develop an adaptive strategy that decides what learning activities
5252
(TPS, WE or ErrEx) to provide to the student based on his/her performance and prior level of
knowledge would be an important issue.
References
Atkinson, R. K., Derry, S. J., Renkl, A., & Wortham, D. (2000). Learning from examples: Instructional principles
from the worked examples research. Review of educational research, 70(2), 181-214.
Booth, J. L., Lange, K. E., Koedinger, K. R., & Newton, K. J. (2013). Using example problems to improve student
learning in algebra: Differentiating between correct and incorrect examples. Learning and Instruction, 25,
24-34.
Chen, X., Mitrovic, A., & Mathews, M. (2016). Do Erroneous Examples Improve Learning in Addition to
Problem Solving and Worked Examples? In Int. Conf. Intelligent Tutoring Systems (pp. 13-22). Springer
International Publishing.
Chi, M. T., Leeuw, N., Chiu, M. H., & LaVancher, C. (1994). Eliciting self‐explanations improves understanding.
Cognitive science, 18(3), 439-477.
Durkin, K., & Rittle-Johnson, B. (2012). The effectiveness of using incorrect examples to support learning about
decimal magnitude. Learning and Instruction, 22(3), 206-214.
Große, C. S., & Renkl, A. (2007). Finding and fixing errors in worked examples: Can this foster learning
outcomes? Learning and Instruction, 17(6), 612-634.
Kalyuga, S., Chandler, P., Tuovinen, J., & Sweller, J. (2001). When problem solving is superior to studying
worked examples. Journal of educational psychology, 93(3), 579.
Kim, R. S., Weitz, R., Heffernan, N. T., & Krach, N. (2009). Tutored problem solving vs.“pure” worked
examples. Proc. 31st Annual Conf. of the Cognitive Science Society. Austin, TX: Cognitive Science Society.
Kirschner, P. A., Sweller, J., & Clark, R. E. (2006). Why minimal guidance during instruction does not work: An
analysis of the failure of constructivist, discovery, problem-based, experiential, and inquiry-based teaching.
Educational psychologist, 41(2), 75-86.
McLaren, B. M., & Isotani, S. (2011). When is it best to learn with all worked examples? In Int. Conf. Artificial
Intelligence in Education (pp. 222-229). Springer Berlin Heidelberg.
McLaren, B. M., van Gog, T., Ganoe, C., Yaron, D., & Karabinos, M. (2014). Exploring the assistance dilemma:
comparing instructional support in examples and problems. In Int. Conf. Intelligent Tutoring Systems (pp.
354-361). Springer International Publishing.
McLaren, B. M., Adams, D. M., & Mayer, R. E. (2015). Delayed Learning Effects with Erroneous Examples: a
Study of Learning Decimals with a Web-Based Tutor. Artificial Intelligence in Education, 25(4), 520-542.
Mitrovic, A. (2003). An intelligent SQL tutor on the web. Artificial Intelligence in Education, 13, 173-197.
Najar, A. S., & Mitrovic, A. (2013). Examples and tutored problems: How can self-explanation make a difference
to learning?. In Int. Conf. Artificial Intelligence in Education (pp. 339-348). Springer Berlin Heidelberg.
Najar, A. S., & Mitrovic, A. (2013). Do novices and advanced students benefit differently from worked examples
and ITS. In Proc. Int. Conf. Computers in Education (pp. 20-29).
Schwonke, R., Renkl, A., Krieg, C., Wittwer, J., Aleven, V., & Salden, R. (2009). The worked-example effect:
Not an artefact of lousy control conditions. Computers in Human Behavior, 25(2), 258-266.
Sweller, J., Van Merrienboer, J. J., & Paas, F. G. (1998). Cognitive architecture and instructional design.
Educational psychology review, 10(3), 251-296.
Tsovaltzi, D., McLaren, B. M., Melis, E., & Meyer, A.-K. (2012). Erroneous examples: effects on learning
fractions in a web-based setting. International Journal of Technology Enhanced Learning, 4(3-4), 191-230.
van Gog, T. (2011). Effects of identical example–problem and problem–example pairs on learning. Computers &
Education, 57(2), 1775-1779.
van Gog, T., Kester, L., & Paas, F. (2011). Effects of worked examples, example-problem, and problem-example
pairs on novices’ learning. Contemporary Educational Psychology, 36(3), 212-218.
van Gog, T., & Rummel, N. (2010). Example-based learning: Integrating cognitive and social-cognitive research
perspectives. Educational Psychology Review, 22(2), 155-174.
Weerasinghe, A., & Mitrovic, A. (2006). Studying human tutors to facilitate self-explanation. Paper presented at
the Intelligent Tutoring Systems.
Weerasinghe, A., & Mitrovic, A. (2006). Studying human tutors to facilitate self-explanation. In Int. Conf.
Intelligent Tutoring Systems (pp. 713-715). Springer Berlin Heidelberg.
5353
Chen, W. et al. (Eds.) (2016). Proceedings of the 24th International Conference on Computers in Education. India: Asia-Pacific Society for Computers in Education
LOD Based Semantically Enhanced Open Learning Space Raises Engagement for
Historical Deep Consideration
Corentin JOUAULTa, Kazuhisa SETAa* & Yuki HAYASHIa a Graduate School of Humanities and Sustainable System Sciences, OPU, Japan
Abstract: The purpose of this research is to support learners in self-directed learning on the Internet using automatically generated support using the current state of the semantic web. The main issue of creating meaningful content-dependent questions automatically is that it requires the machine to understand the concepts in the learning domain. The originality of this work is that it uses Linked Open Data (LOD) to enable meaningful content-dependent support in open learning space. Learners are supported by a learning environment, the Semantically Enhanced Open Learning Space (SOLS). Learners use the system to build a concept map representing their knowledge. SOLS support learners following the principle of inquiry-based learning. Learners that request help are provided with automatically generated questions that give them learning objectives. To verify whether the current system can support learners with fully automatically generated support, we evaluated the system. The results showed that LOD based support was feasible. Learners felt that the support provided was useful and helped them learn. The question support succeeded in improving the development of learners’ historical considerations and deep historical thinking skills. In addition, the engagement and interest in history of learners was improved by the questions. The results are meaningful because they show that LOD based support can be a viable tool to support learners in open learning space and that the question support has potential to support learners during a long time study.
Keywords: Linked Open Data, Question Generation, Semantic Open Learning Space, History Learning
1. Introduction When conducting self-directed learning in an open learning space, one of the difficulties is that it requires learners to plan their learning in an unfamiliar domain. It requires learners to find and set their learning objectives while they are learning. It is difficult for learners to plan their learning effectively because they are unfamiliar with the domain and cannot decide easily which topic they should study next. This problem is increased in an open learning space because the quantity of information is much larger and the information is not organized with clear learning objectives. Thus, learners can easily become overwhelmed and discouraged during learning. One way to eliminate the difficulty is prompting question generation and answering activities (inquiry-based learning) (De Jong, 06, Roth, 96). This helps to lighten the difficulties of self-directing learning by lessening the planning activities that the learners need to perform. However, creating good inquiry questions requires an understanding of the domain, and thus learners cannot always create good questions by themselves.
Another problem of self-directed learning is that learners must stay engaged in the learning task to have fruitful learning outcomes. To raise the engagement of learners while keeping them motivated, the support given them should be adapted to their interests and orient them to information that can help them develop their knowledge without forcing them to do so.
In closed learning spaces, it is possible for experts to set clear learning objectives and to prepare meaningful content-dependent questions for learners beforehand because the quantity of information is limited. However, in an open learning space, the quantity of information is too large to be processed manually. Thus it becomes necessary to implement dynamic question generation.
5454
For this reason, we previously proposed a question generation function to create and adapt questions to learners in open learning spaces. In a previous paper (Jouault et al., 16), we demonstrated that it is possible to generate good quality history questions automatically in open learning spaces using Linked Open Data (LOD). The method integrates data from two LOD sources, Freebase and DBpedia, to create a large source of information (around 80GB of semantic data) that satisfies the requirements to support history learning. The integrated data is combined with a history domain ontology and a history dependent question ontology to create natural language questions that can support learners. An evaluation of the automatically generated questions by a history professor showed that they could cover 84% of the human questions requiring basic knowledge to be answered. Furthermore, the evaluator judged that the quality of the automatically generated questions requiring deep historical thinking was on the same level as the ones generated by human experts. This suggests that the automatically generated questions have the potential to reinforce deep historical understanding.
The quality of the questions was assuredly high enough to support learners, but they could only be provided to learners in an adequate way to support their learning. Thus, we created a learning environment we call the “Semantically enhanced Open Learning Space” (SOLS) and installed the aforementioned question generation function into it to support learners in self-directed learning of history. In other words, we realize inquiry-based learning to support learners in open learning spaces by providing automatically generated content-dependent questions based on LOD.
The research question to be answered in this paper is whether automatic question generation support is feasible and can help learners in self-directed learning of history in an open learning space. The details of the question generation method and the quality of questions can be found in the aforementioned previous paper (Jouault et al., 16). 2. Related Work In history learning, unskilled learners tend to only memorize basic information and do not try to integrate it to create an opinion. In learning history, an understanding of chronology is necessary (Stow, 00). Chronology is defined by Smart (Smart, 96) as “the sequencing of events/people in relation to other and existing knowledge of other, already known, events/people.” Learning history is not only remembering a series of facts; learners need to construct an image of the past in their mind. Learners need, of course, to know the events but they also need to understand their context. Thus, classroom teachers ask them questions to trigger their thinking about historical considerations, which helps the learners to integrate and assess their knowledge.
In self-directed learning, learners have to decide the direction of their learning by themselves. However, unskilled learners cannot perform good quality learning in that situation without support. Thus, to support learners in self-directed learning in an open learning space, previous research lead to the creation of systems such as the Navigation Planning Assistant (Kashihara et al., 09), which provides an environment used to describe learners’ learning plans and state of understanding to prompt their self-regulation in an open learning space. The limitation of this system is that its support is content-independent due to the difficulty of working with natural language information on the Web.
On the other hand, to provide content-dependent advice, learning materials can be prepared in advance in a specific closed domain. This is the case of Betty’s Brain (Biswas et al., 09), which uses a concept map in an environment for learning by teaching, or the Kit-Build method (Hirashima et al., 11), which provides a knowledge externalization environment for building a concept map using pre-defined kits and supporting the learner during the concept map construction. However, for both systems, the preparation requires a considerable amount of time even for constructing a closed learning space. It is not possible to use the same method in open learning spaces because there are too many learning materials.
One of the promising methods to provide support in open learning spaces is to ask meaningful questions about a specific domain. Inquiry-based learning in an open space is recognized as a useful strategy to prevent learners from losing their way and to avoid disturbing their learning processes (Hmelo-Silver et al., 07). A notable piece of research is the Web-based Inquiry Science Environment (WISE) (Slotta, 04), which provides support in self-directed learning. Learners using WISE gather information to answer an inquiry. Learners are trained in designing solutions, debating subjects, and
5555
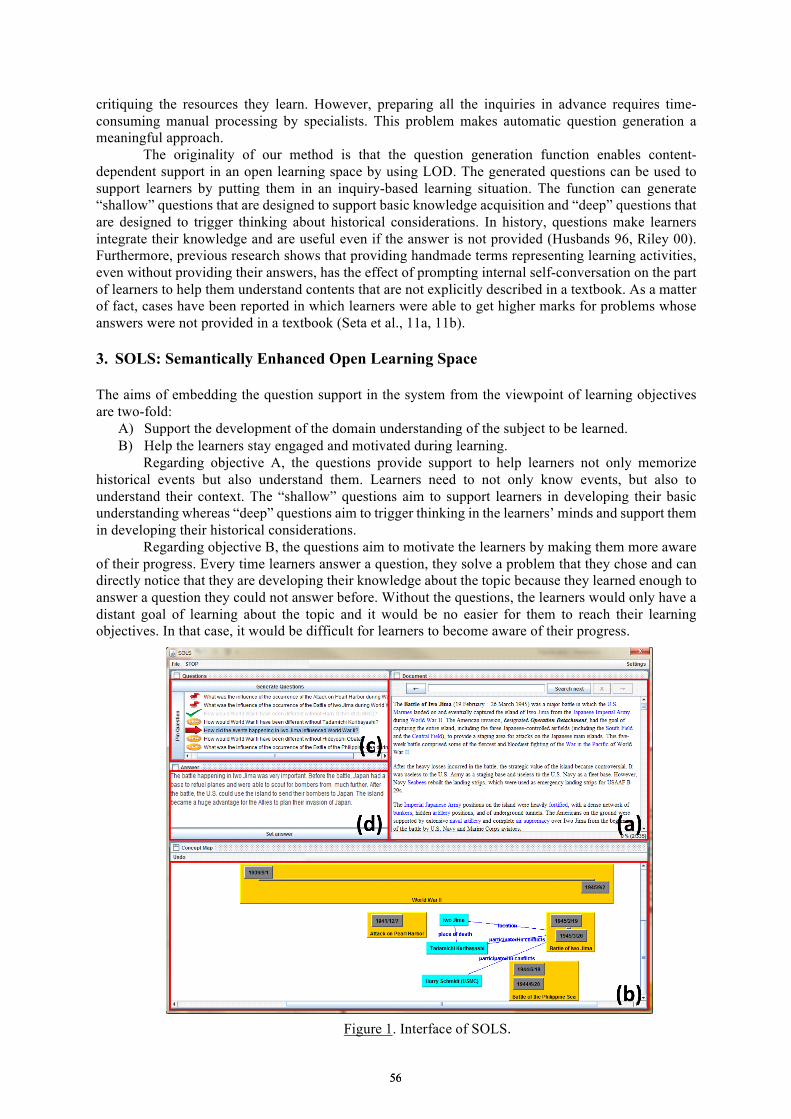
critiquing the resources they learn. However, preparing all the inquiries in advance requires time-consuming manual processing by specialists. This problem makes automatic question generation a meaningful approach.
The originality of our method is that the question generation function enables content-dependent support in an open learning space by using LOD. The generated questions can be used to support learners by putting them in an inquiry-based learning situation. The function can generate “shallow” questions that are designed to support basic knowledge acquisition and “deep” questions that are designed to trigger thinking about historical considerations. In history, questions make learners integrate their knowledge and are useful even if the answer is not provided (Husbands 96, Riley 00). Furthermore, previous research shows that providing handmade terms representing learning activities, even without providing their answers, has the effect of prompting internal self-conversation on the part of learners to help them understand contents that are not explicitly described in a textbook. As a matter of fact, cases have been reported in which learners were able to get higher marks for problems whose answers were not provided in a textbook (Seta et al., 11a, 11b). 3. SOLS: Semantically Enhanced Open Learning Space The aims of embedding the question support in the system from the viewpoint of learning objectives are two-fold:
A) Support the development of the domain understanding of the subject to be learned. B) Help the learners stay engaged and motivated during learning.
Regarding objective A, the questions provide support to help learners not only memorize historical events but also understand them. Learners need to not only know events, but also to understand their context. The “shallow” questions aim to support learners in developing their basic understanding whereas “deep” questions aim to trigger thinking in the learners’ minds and support them in developing their historical considerations.
Regarding objective B, the questions aim to motivate the learners by making them more aware of their progress. Every time learners answer a question, they solve a problem that they chose and can directly notice that they are developing their knowledge about the topic because they learned enough to answer a question they could not answer before. Without the questions, the learners would only have a distant goal of learning about the topic and it would be no easier for them to reach their learning objectives. In that case, it would be difficult for learners to become aware of their progress.
Figure 1. Interface of SOLS.
5656
Raising engagement and motivation is an important part of self-directing learning. Since the learners do not have as much external incentive to learn as they do in classroom learning, the quality of their learning becomes dependent on their engagement and motivation as well as their previous knowledge. Learners also usually set their learning time by themselves and will stop learning if they are not motivated.
The SOLS system interface shown in Fig. 1 is designed to support learners in self-directed learning of history. It provides learning materials in natural language and a space that learners can use to build their concept map, shown in Fig. 1(b), representing their knowledge. Learners are instructed to get information from the document and build their concept map. Questions are available but only appear if the learner requests them. By letting learners request the questions as needed, we aim to let learners keep their own pace and encourage them to use their own skills when possible. Learners can request two types of questions, i.e., “shallow” and “deep” questions, which appear respectively in the concept map in Fig. 1(b) and the question window in Fig. 1(c). Shallow question has a unique answer that the system can detect, while deep does not. The function of each window is described in detail as follows.
(a) Document window: It displays the learning material (Wikipedia document) the learner selected and provides usual Internet browser functions. All the links to a document about another concept appear in blue text. The learners can also use the links to add concepts to their maps.
(b) Concept map window: Learners use this window to manage the concept map. The concepts in the middle are events. Events are represented on an automatically generated timeline built using data from the LOD. Other concepts are colored in blue and can be moved freely by the learner. They appear around the timeline of events, thus forming a chronology. The lines between two concepts are relations with the type of relation written at the center of the line. The concept map window also displays “shallow” questions that are designed to support basic knowledge acquisition.
(c) Question window: It displays a list of “deep” questions generated by the system designed to trigger deep historical considerations.
(d) Answer window: Learners use this window to answer the questions they selected in (c). Learners can write their answers to the questions in natural language. When using SOLS, learners can request a question to support their learning whenever they want.
The questions appear either in the concept map (b) or in the question window (c) depending on the learner’s request. If a learner is interested in a question, it becomes a learning objective to be reached.
The concept map represents the learners’ understanding states and reflects their interests (Nesbit et al., 06). Research has shown that building a concept map deepens the understanding of learners (Nesbit et al., 06). Building a chronology also reinforces learners’ historical understanding (Stow et al., 00). One of the advantages of our concept map is that it is machine understandable even if built in an open learning space. Each concept added to the concept map has an ID that can be used to gather information on the LOD giving additional information about the concept to the system. Thus, it plays a key role in realizing adaptive question generation that aims to deepen learners’ historical considerations and help learners set learning objectives. The machine understandable concept map makes it possible for the system to assess the learners’ knowledge and interests and adapt the generated questions accordingly.
Then, on the learner’s request, the system generates shallow questions appearing in the concept map to help the learners extend their basic knowledge. In one example, the learner requested questions about “Battle of Iwo Jima” and the system generated questions to help the learner acquire basic information about the countries involved (“Which countries were involved in the Battle of Iwo Jima?”) or its commanders (“Which commanders were in charge of the Battle of Iwo Jima?”). The learner then answered the second question about the commanders by dragging and dropping one of the valid answers: “Raymond A. Spruance.” Once the question is answered, the learner may request more questions about the concept that are more interesting for him/her, e.g. Germany, and keep studying more details about it, e.g., learn about battles involving Germany such as the “Invasion of Poland”, which is an important event of WWII. Basic knowledge is required to answer all these questions. The questions generated by this action are all relevant to the concept selected by the learner. To answer the questions, the learners need to drag and drop the concept that answers it to the empty node and the system can verify the validity of the answer by using the data from the LOD.
The question window (c) from Fig. 1 is designed to provide learners with adaptive deep questions generated on the basis of the machine understandable concept map. Learners are provided
5757

with a list of deep questions from which they can select any that they consider interesting and try to answer them. In this situation, learners decide their learning objectives by choosing and ordering questions. The questions are generated depending on the learners’ interests to respect and reinforce these interests. More detail about the algorithm to generate questions can be seen in (Jouault et al., 16).
The deep questions generated by the system were previously evaluated (Jouault et al., 16) to be of a quality high enough to trigger historical thinking. The learners have access to good quality questions to direct their learning and thus their learning should be improved.
Learners then use the Fig. 1(a) window to browse documents to find the answers to questions. Finally, they answer the chosen question in the Fig. 1(d) answer space or the Fig. 1(b) concept map. Although the system cannot grade the answer written in Fig. 1(d), for learners to answer prompts historical consideration. By repeating this process, the learners build their understanding by performing inquiry-based learning in the open learning space. 4. Experimental Setting 4.1 Objectives In the evaluation experiment we conducted we aims to verify three points:
1. The feasibility and usefulness of LOD based support in a real learning scenario. 2. Whether the question support helps learners develop their historical considerations. 3. Whether the system can raise learners’ engagement in learning history in an open learning space.
Concerning objective (1), we aim to verify whether the functions implemented in the system work smoothly so as not to disturb learning and whether the generated questions in a real learning context seem useful from the viewpoint of learners. Of particular note is that the system stores around 100 GB of LOD to enable history learning support in an open learning space. Thus, we need to confirm that the system can work smoothly without frustrating the learners. This experiment was the first evaluation involving the system and many of the functions implemented in it that use the LOD had not been proven to be effective in previous studies. For this reason, we felt we should verify the system’s feasibility in a real learning scenario to prove whether the system can successfully support learners using automatically generated support created using the LOD.
Furthermore, we need to verify whether it performs meaningfully from the viewpoint of learning support.
Concerning objective (2), the hypothesis to verify is that learners using the question support should perform better in a task that requires integrated understanding to perform, such as essay writing. We expect that the deep questions prompt learners to develop their historical considerations during learning.
Concerning objective (3), the hypothesis to verify is that the question support improves the learners’ engagement and interest in learning history. We expect the engagement of learners to be raised because the questions give objectives to learners to facilitate their learning, which should minimize the difficulties of self-directed learning. 4.2 Procedure Table 1 shows the experiment procedure timetable. This evaluation involved 24 Japanese university students. They were given instructions to study about World War I (WWI) using a standard browser before the experiment (Table 1 (b1)). Why they study about WW1 is to make them consider what they should learn in addition to memorizing facts before main experiment; we instructed them to “Imagine you were able to successfully enter the history department in a university where you hope to broaden your knowledge about history. You are now going to learn about WWI again using only Wikipedia as a learning resource. We will not test your knowledge about WWI after your study.”
To form the control and experimental groups, the learners were then separated into two groups of 12 on the basis of the results they produced in a basic knowledge test about WWII (Table 1 (b2)).
We set a structure where both control and experimental groups can build a machine understandable concept map to support their knowledge externalization because this experiment focuses
5858
on the validity of the question support for step-by-step clarification of the effects. Thus, even the control group (CtrlG) is supported by the concept map building situation. The only difference between the groups is the availability of the question support. The learners in the experimental group (ExpG) can request questions at any time to support their learning, while learners in the control group do not have access to questions even if they can build their own concept maps.
Learners are then introduced to inquiry-based learning and given examples of good historical considerations concerning the topic they had studied by themselves, WWI (Table 1 (e1)). We aim to prompt learners to reflect on their self-learning activities when learning about WWI and raise their readiness for performing inquiry-based learning when learning about WWII in the following experimental setting.
Learners are taught how to use the different functions of the system with a demonstration (Table 1 (e2)) and practice on the system for the WWI topic (Table 1 (e3)).
Before moving onto the main experiment (Table 1 (e4)), learners are instructed that they will have to write a report about their historical considerations on WWII after learning. Both groups are informed about the report and are instructed to study with that objective in mind.
In the main experiment (Table 1 (e4)), we set the inquiry-based learning task to learn about WWII in 90 min including learning about one topic among two in detail. The candidate topics to learn in detail are two important events from WWII: “Attack on Pearl Harbor” and “Battle of Iwo Jima.” We set a self-directed learning situation where learners can choose their learning topic according to their interests. By providing two possible topics to the learners, we can maintain this aspect in the constraints of the evaluation even if they cannot choose freely.
Furthermore, we do not set the hypothesis that we will observe large differences among the learners’ knowledge by using the effects of this experiment: we set a relatively short-term time setting to get positive feelings on the feasibility and validity of the system. We need to verify this matter by conducting a long-term study. We therefore did not set the hypothesis that we can observe large differences between the two groups regarding knowledge acquisition during this experiment, although we intend to conduct a basic knowledge test to make sure that the learning environment does not have a negative effect on learning.
At the end of the learning phase (Table 1 (e5)-(e7)), we ask learners to: 1. Fill in a questionnaire about the system to evaluate their feelings about the different
functions of the system using the 5-grade Likert scale (Table 1 (e5)). 2. Answer a high-school level test about their chosen topic and WWII to evaluate their basic
knowledge (Table 1 (e6)). 3. Write a report about their historical considerations to evaluate whether they performed
deep historical thinking activities (Table 1 (e7)). The knowledge tests (Table 1 (e6)) aim to test the learners’ basic knowledge and context
understanding of what they had studied. Evaluating the basic knowledge of learners in self-directed learning is not easy because learners are free to learn about any concept following their interests. Effectively measuring the knowledge of each learner would require adapting the test to each learner and comparing the results for each test would be impossible. To compare the results of the learners, we have to provide all learners with the same tests even if the test questions may be about a topic the learners did not study.
The topic specific test includes 10 multiple choice questions with answers explicitly provided in the Wikipedia documents. The test about WWII takes the form of a “fill in the blank” test about general knowledge of WWII with 20 blanks to fill in. The learners do not have access to the system or to other learning materials when answering the test.
Table 1: Experiment Procedure
5959
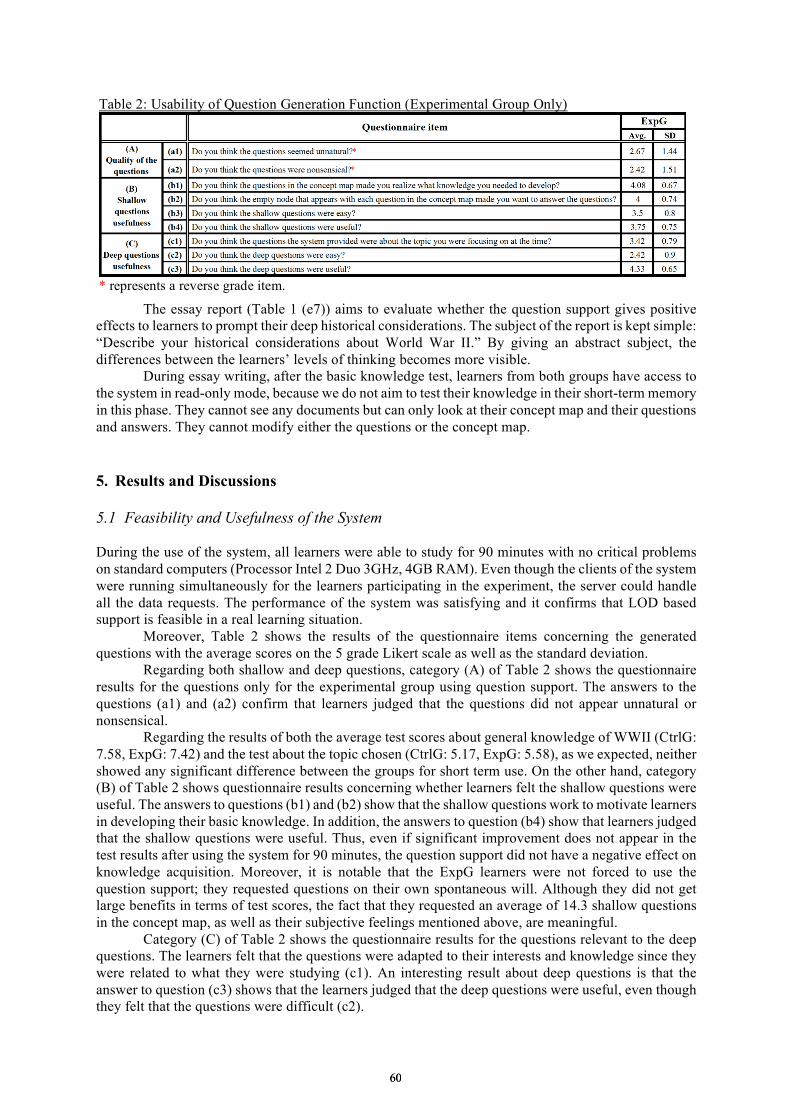
The essay report (Table 1 (e7)) aims to evaluate whether the question support gives positive effects to learners to prompt their deep historical considerations. The subject of the report is kept simple: “Describe your historical considerations about World War II.” By giving an abstract subject, the differences between the learners’ levels of thinking becomes more visible.
During essay writing, after the basic knowledge test, learners from both groups have access to the system in read-only mode, because we do not aim to test their knowledge in their short-term memory in this phase. They cannot see any documents but can only look at their concept map and their questions and answers. They cannot modify either the questions or the concept map. 5. Results and Discussions 5.1 Feasibility and Usefulness of the System During the use of the system, all learners were able to study for 90 minutes with no critical problems on standard computers (Processor Intel 2 Duo 3GHz, 4GB RAM). Even though the clients of the system were running simultaneously for the learners participating in the experiment, the server could handle all the data requests. The performance of the system was satisfying and it confirms that LOD based support is feasible in a real learning situation.
Moreover, Table 2 shows the results of the questionnaire items concerning the generated questions with the average scores on the 5 grade Likert scale as well as the standard deviation.
Regarding both shallow and deep questions, category (A) of Table 2 shows the questionnaire results for the questions only for the experimental group using question support. The answers to the questions (a1) and (a2) confirm that learners judged that the questions did not appear unnatural or nonsensical.
Regarding the results of both the average test scores about general knowledge of WWII (CtrlG: 7.58, ExpG: 7.42) and the test about the topic chosen (CtrlG: 5.17, ExpG: 5.58), as we expected, neither showed any significant difference between the groups for short term use. On the other hand, category (B) of Table 2 shows questionnaire results concerning whether learners felt the shallow questions were useful. The answers to questions (b1) and (b2) show that the shallow questions work to motivate learners in developing their basic knowledge. In addition, the answers to question (b4) show that learners judged that the shallow questions were useful. Thus, even if significant improvement does not appear in the test results after using the system for 90 minutes, the question support did not have a negative effect on knowledge acquisition. Moreover, it is notable that the ExpG learners were not forced to use the question support; they requested questions on their own spontaneous will. Although they did not get large benefits in terms of test scores, the fact that they requested an average of 14.3 shallow questions in the concept map, as well as their subjective feelings mentioned above, are meaningful.
Category (C) of Table 2 shows the questionnaire results for the questions relevant to the deep questions. The learners felt that the questions were adapted to their interests and knowledge since they were related to what they were studying (c1). An interesting result about deep questions is that the answer to question (c3) shows that the learners judged that the deep questions were useful, even though they felt that the questions were difficult (c2).
Table 2: Usability of Question Generation Function (Experimental Group Only)
* represents a reverse grade item.
6060
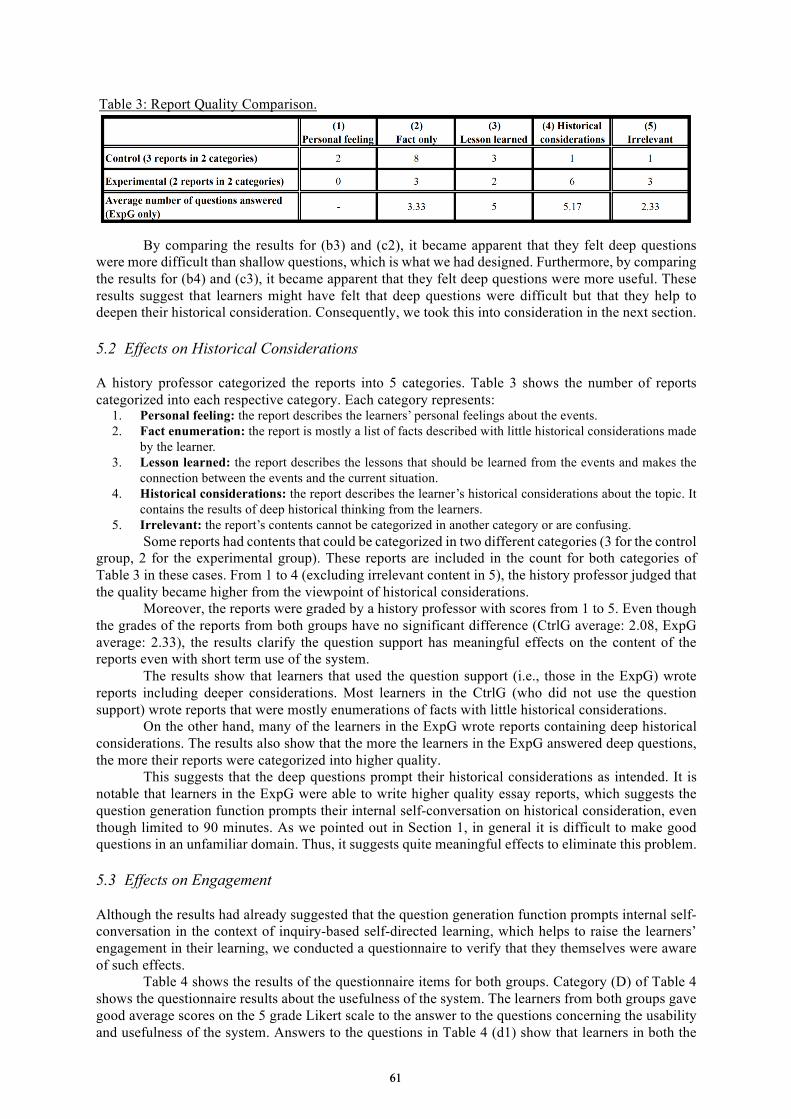
By comparing the results for (b3) and (c2), it became apparent that they felt deep questions were more difficult than shallow questions, which is what we had designed. Furthermore, by comparing the results for (b4) and (c3), it became apparent that they felt deep questions were more useful. These results suggest that learners might have felt that deep questions were difficult but that they help to deepen their historical consideration. Consequently, we took this into consideration in the next section. 5.2 Effects on Historical Considerations A history professor categorized the reports into 5 categories. Table 3 shows the number of reports categorized into each respective category. Each category represents:
1. Personal feeling: the report describes the learners’ personal feelings about the events. 2. Fact enumeration: the report is mostly a list of facts described with little historical considerations made
by the learner. 3. Lesson learned: the report describes the lessons that should be learned from the events and makes the
connection between the events and the current situation. 4. Historical considerations: the report describes the learner’s historical considerations about the topic. It
contains the results of deep historical thinking from the learners. 5. Irrelevant: the report’s contents cannot be categorized in another category or are confusing.
Some reports had contents that could be categorized in two different categories (3 for the control group, 2 for the experimental group). These reports are included in the count for both categories of Table 3 in these cases. From 1 to 4 (excluding irrelevant content in 5), the history professor judged that the quality became higher from the viewpoint of historical considerations.
Moreover, the reports were graded by a history professor with scores from 1 to 5. Even though the grades of the reports from both groups have no significant difference (CtrlG average: 2.08, ExpG average: 2.33), the results clarify the question support has meaningful effects on the content of the reports even with short term use of the system.
The results show that learners that used the question support (i.e., those in the ExpG) wrote reports including deeper considerations. Most learners in the CtrlG (who did not use the question support) wrote reports that were mostly enumerations of facts with little historical considerations.
On the other hand, many of the learners in the ExpG wrote reports containing deep historical considerations. The results also show that the more the learners in the ExpG answered deep questions, the more their reports were categorized into higher quality.
This suggests that the deep questions prompt their historical considerations as intended. It is notable that learners in the ExpG were able to write higher quality essay reports, which suggests the question generation function prompts their internal self-conversation on historical consideration, even though limited to 90 minutes. As we pointed out in Section 1, in general it is difficult to make good questions in an unfamiliar domain. Thus, it suggests quite meaningful effects to eliminate this problem. 5.3 Effects on Engagement Although the results had already suggested that the question generation function prompts internal self-conversation in the context of inquiry-based self-directed learning, which helps to raise the learners’ engagement in their learning, we conducted a questionnaire to verify that they themselves were aware of such effects.
Table 4 shows the results of the questionnaire items for both groups. Category (D) of Table 4 shows the questionnaire results about the usefulness of the system. The learners from both groups gave good average scores on the 5 grade Likert scale to the answer to the questions concerning the usability and usefulness of the system. Answers to the questions in Table 4 (d1) show that learners in both the
Table 3: Report Quality Comparison.
6161
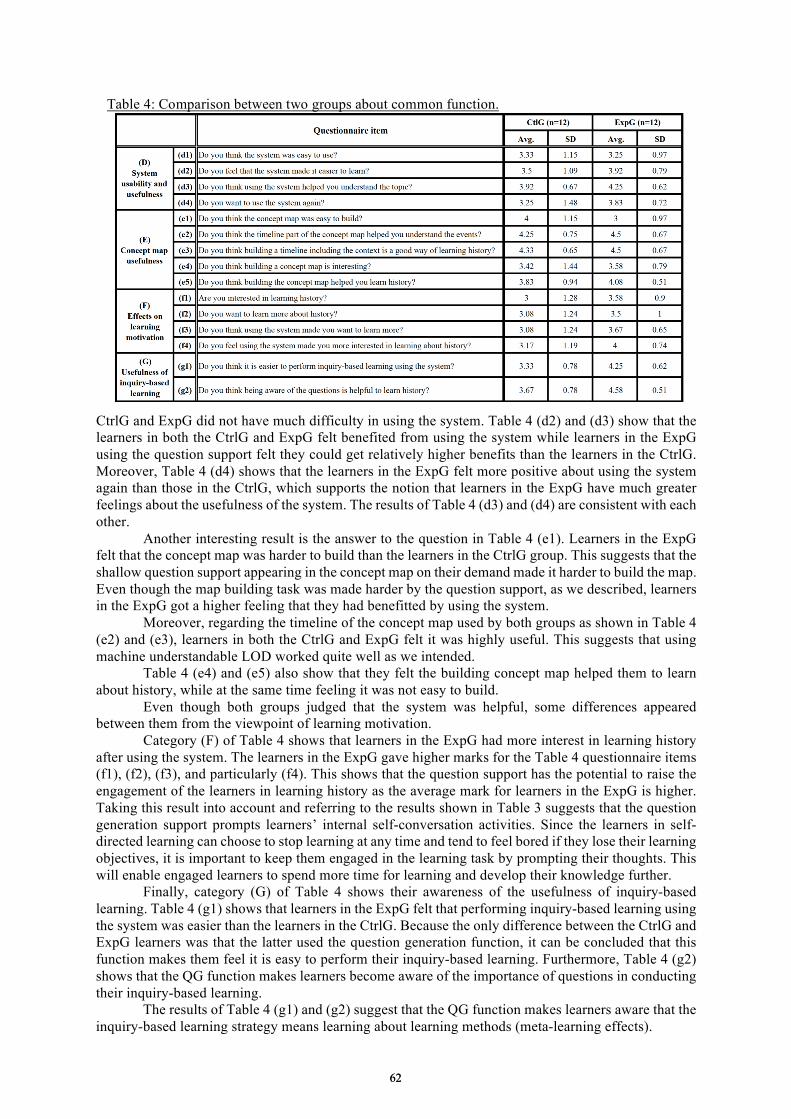
CtrlG and ExpG did not have much difficulty in using the system. Table 4 (d2) and (d3) show that the learners in both the CtrlG and ExpG felt benefited from using the system while learners in the ExpG using the question support felt they could get relatively higher benefits than the learners in the CtrlG. Moreover, Table 4 (d4) shows that the learners in the ExpG felt more positive about using the system again than those in the CtrlG, which supports the notion that learners in the ExpG have much greater feelings about the usefulness of the system. The results of Table 4 (d3) and (d4) are consistent with each other.
Another interesting result is the answer to the question in Table 4 (e1). Learners in the ExpG felt that the concept map was harder to build than the learners in the CtrlG group. This suggests that the shallow question support appearing in the concept map on their demand made it harder to build the map. Even though the map building task was made harder by the question support, as we described, learners in the ExpG got a higher feeling that they had benefitted by using the system.
Moreover, regarding the timeline of the concept map used by both groups as shown in Table 4 (e2) and (e3), learners in both the CtrlG and ExpG felt it was highly useful. This suggests that using machine understandable LOD worked quite well as we intended.
Table 4 (e4) and (e5) also show that they felt the building concept map helped them to learn about history, while at the same time feeling it was not easy to build.
Even though both groups judged that the system was helpful, some differences appeared between them from the viewpoint of learning motivation.
Category (F) of Table 4 shows that learners in the ExpG had more interest in learning history after using the system. The learners in the ExpG gave higher marks for the Table 4 questionnaire items (f1), (f2), (f3), and particularly (f4). This shows that the question support has the potential to raise the engagement of the learners in learning history as the average mark for learners in the ExpG is higher. Taking this result into account and referring to the results shown in Table 3 suggests that the question generation support prompts learners’ internal self-conversation activities. Since the learners in self-directed learning can choose to stop learning at any time and tend to feel bored if they lose their learning objectives, it is important to keep them engaged in the learning task by prompting their thoughts. This will enable engaged learners to spend more time for learning and develop their knowledge further.
Finally, category (G) of Table 4 shows their awareness of the usefulness of inquiry-based learning. Table 4 (g1) shows that learners in the ExpG felt that performing inquiry-based learning using the system was easier than the learners in the CtrlG. Because the only difference between the CtrlG and ExpG learners was that the latter used the question generation function, it can be concluded that this function makes them feel it is easy to perform their inquiry-based learning. Furthermore, Table 4 (g2) shows that the QG function makes learners become aware of the importance of questions in conducting their inquiry-based learning.
The results of Table 4 (g1) and (g2) suggest that the QG function makes learners aware that the inquiry-based learning strategy means learning about learning methods (meta-learning effects).
Table 4: Comparison between two groups about common function.
6262
6. Conclusion The evaluation results showed that supporting learners in an open learning space using support automatically generated using the LOD is feasible and can be useful for learners. Most learners judged that using the system was useful and that it helped them learn about history.
Even though the use time was short (90 min), the question support still had an effect on the development of historical considerations of learners and motivated them to perform deep historical thinking to develop their opinions.
The question support also had an effect on the engagement of learners. Engagement has strong effects in self-directed learning because being engaged and interested in the topic leads learners to study for a longer time and learn about more topics. Acknowledgements This work is supported by JSPS KAKENHI Grant Number 24300288 and 15H02934. References Biswas, G., Roscoe, R., Jeong, H. and Sulcer, B. (2009). Promoting self-regulated learning skills in agent-based
learning environments. In Proceedings of the 17th International Conference on Computers in Education, pp. 67-74.
De Jong, T. (2006). Technological advances in inquiry learning. In Science, Vol.312, No.5773, pp. 532-533. Hirashima, T., Yamasaki, K., Fukuda, H. and Funaoi, H. (2011). Kit-build concept map for automatic diagnosis.
In Artificial Intelligence in Education, pp. 466-468. Springer Berlin Heidelberg. Hmelo-Silver, C. E., Duncan, R. G. and Chinn, C. A. (2007). Scaffolding and achievement in problem-based and
inquiry learning: A response to Kirschner, Sweller, and Clark (2006). In Educational Psychologist, Vol.42, No.2, pp. 99-107.
Husbands, C. (1996). What is History Teaching?: Language, Ideas and Meaning in Learning about the Past. Berkshire: Open University Press.
Husbands, C., Kitson, A. and Pendry, A. (2003). Understanding History Teaching: Teaching and Learning about the Past in Secondary Schools. McGraw-Hill International.
Jouault, C., Seta, K., & Hayashi, Y. (2016, to appear). Content-Dependent Question Generation using LOD for History Learning in Open Learning Space, New Generation Computing, Springer.
Kashihara, A. and Taira, K. (2009). Developing navigation planning skill with learner-adaptable scaffolding. In Proceedings of the 2009 Conference on Artificial Intelligence in Education: Building Learning Systems that Care: From Knowledge Representation to Affective Modelling, pp. 433-440. IOS Press.
Knowles, M. S. (1975). Self-directed learning. Association Press New York. McClure, J. R., Sonak, B., & Suen, H. K. (1999). Concept map assessment of classroom learning: Reliability,
validity, and logistical practicality. In Journal of research in science teaching, Vol.36, No.4, pp. 475-492. Nesbit, J.C. and Adesope, O. O. (2006) Learning with concept and knowledge maps: A meta-analysis. In Review
of Educational Research, Vol. 76, No.3, pp. 413-448. Riley, M. (2000). Into the Key Stage 3 history garden: choosing and planting your enquiry questions. In Teaching
History. London: Historical Association. Roth, W. M. (1996). Teacher questioning in an open-inquiry learning environment: Interactions of context,
content, and student responses. Journal of Research in Science Teaching, Vol.33, No.7, pp. 709-736. Seta, K., Noguchi, D. and Ikeda, M. (2011). Presentation-based collaborative learning support system to facilitate
meta-cognitively aware learning communication. In The Journal of Information and Systems in Education, Vol.9, No.1, pp.3-14.
Seta, K. and Ikeda, M. (2011). Presentation based meta-learning environment by facilitating thinking between lines: A model based approach. In Toyohide Watanabe and Lakhmi C. Jain (Eds.): Innovations in Intelligent Machines-2-Intelligent Paradigms and Applications, Studies in Computational Intelligence, Vol. 376, pp. 143-166. Springer.
Slotta, J. D. (2004). The web-based inquiry science environment (WISE): Scaffolding knowledge integration in the science classroom. In Internet Environments for Science Education, pp. 203-232.
Smart, L. (1996). Using I.T. in Primary School History. London: Cassell. Stow, W. and Haydn, T. (2000). Seven Issues in the teaching of chronology. In Issues in History Teaching, pp.
83. Routledge.
6363
Chen, W. et al. (Eds.) (2016). Proceedings of the 24th
International Conference on Computers in Education.
India: Asia-Pacific Society for Computers in Education
Ontology of Culture: A Procedural Approach
for Cultural Adaptation in ITSs
Isabelle SAVARDa*
& Riichiro MIZOGUCHIb
aInstructional Designer, Laval University, Canada
bResearch Professor, Japan Advanced Institute of Science and Technology (JAIST), Japan
Abstract: We believe that Culture can affect teaching and learning, primarily due to the
existence of cultural variables in educational practices. The multiplication of opportunities to
learn and teach abroad and the growing desire on the part of universities to attract an
international clientele increase the need for cultural adaptation. However, as pointed out by
Rogers, Graham and Mayes (2007), teachers are not always aware of these cultural variables. If
these cultural variables were made explicit, it would be easier for instructional designers,
teachers and learners to adapt to the different cultures. In this article, we present our
understanding of the notion of Culture and an upper ontology of Culture modeled according to a
procedural approach. We believe that such an approach allows us to make explicit the
functionalities of Culture so that we are able to understand how it can influence not only our
daily lives, but more particularly teaching and learning. It opens the door to concrete and
practical solutions for cultural adaptation in ITSs.
Keywords: Ontology, Culture, Cultural Variables, Instructional Design, Cultural Adaptation
1. Introduction
We face new challenges with the internationalization of education. The multiplication of opportunities
to learn and teach abroad and the growing desire on the part of universities to attract an international
clientele increase the need for cultural adaptation. In fact, we have noticed the growing popularity of
distance learning and the appearance (and utilization) of Massive Open Online Courses (MOOCs).
Many professors are now required to teach learners from a different culture than their own, and learners
do not hesitate to study abroad, often by staying in their homes. Clearly, these realities give rise to new
concerns in curriculum planning. The need for flexibility seems obvious. Instructional designers,
teachers and learners need to adapt to these new cultural meetings.
We believe that Culture can affect teaching and learning, primarily due to the existence of
cultural variables in educational practices. For example, expectations of the learner or of the teacher
might be quite different from one Culture to another. An unexpected behavior could lead one to
estimate the other unfairly as incompetent, with all the consequences that this entails. Vigorous
competition among learners in one Culture can make it difficult to use collaborative learning activities
that are considered normal in another.
However, as pointed out by Rogers, Graham and Mayes (2007), teachers are not always aware
of cultural variables in educational practices and instructional designers are not immune to the influence
of their own cultural blinders. We believe that if these cultural variables are made explicit (since they
are often implicit), it will be easier for instructional designers, teachers and learners to adapt to the
different cultures.
In this article, we present our understanding of the notion of Culture and an upper ontology of
Culture modeled according to a procedural approach. We believe that such an approach allows us to
make explicit the functionalities of Culture so that we are able to understand how it can influence not
only our daily lives, but more particularly teaching and learning. It opens the door to concrete and
practical solutions for cultural adaptation in ITSs.
6464
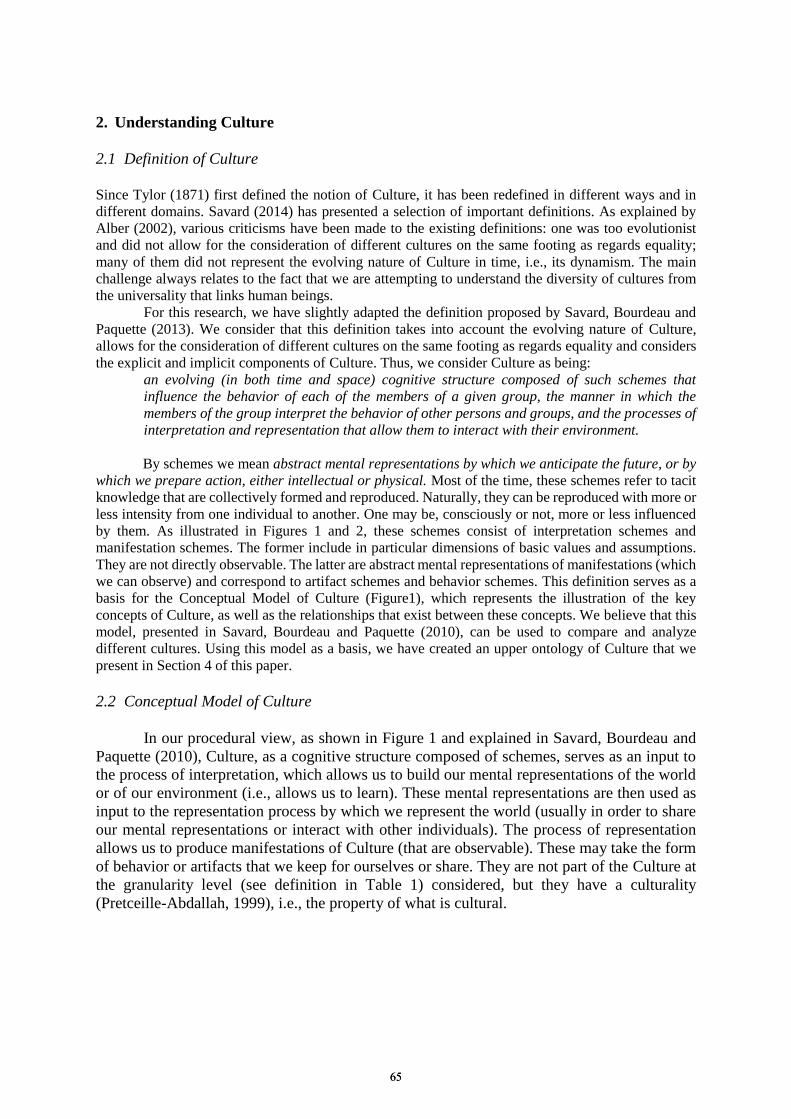
2. Understanding Culture
2.1 Definition of Culture
Since Tylor (1871) first defined the notion of Culture, it has been redefined in different ways and in
different domains. Savard (2014) has presented a selection of important definitions. As explained by
Alber (2002), various criticisms have been made to the existing definitions: one was too evolutionist
and did not allow for the consideration of different cultures on the same footing as regards equality;
many of them did not represent the evolving nature of Culture in time, i.e., its dynamism. The main
challenge always relates to the fact that we are attempting to understand the diversity of cultures from
the universality that links human beings.
For this research, we have slightly adapted the definition proposed by Savard, Bourdeau and
Paquette (2013). We consider that this definition takes into account the evolving nature of Culture,
allows for the consideration of different cultures on the same footing as regards equality and considers
the explicit and implicit components of Culture. Thus, we consider Culture as being:
an evolving (in both time and space) cognitive structure composed of such schemes that
influence the behavior of each of the members of a given group, the manner in which the
members of the group interpret the behavior of other persons and groups, and the processes of
interpretation and representation that allow them to interact with their environment.
By schemes we mean abstract mental representations by which we anticipate the future, or by
which we prepare action, either intellectual or physical. Most of the time, these schemes refer to tacit
knowledge that are collectively formed and reproduced. Naturally, they can be reproduced with more or
less intensity from one individual to another. One may be, consciously or not, more or less influenced
by them. As illustrated in Figures 1 and 2, these schemes consist of interpretation schemes and
manifestation schemes. The former include in particular dimensions of basic values and assumptions.
They are not directly observable. The latter are abstract mental representations of manifestations (which
we can observe) and correspond to artifact schemes and behavior schemes. This definition serves as a
basis for the Conceptual Model of Culture (Figure1), which represents the illustration of the key
concepts of Culture, as well as the relationships that exist between these concepts. We believe that this
model, presented in Savard, Bourdeau and Paquette (2010), can be used to compare and analyze
different cultures. Using this model as a basis, we have created an upper ontology of Culture that we
present in Section 4 of this paper.
2.2 Conceptual Model of Culture
In our procedural view, as shown in Figure 1 and explained in Savard, Bourdeau and
Paquette (2010), Culture, as a cognitive structure composed of schemes, serves as an input to
the process of interpretation, which allows us to build our mental representations of the world
or of our environment (i.e., allows us to learn). These mental representations are then used as
input to the representation process by which we represent the world (usually in order to share
our mental representations or interact with other individuals). The process of representation
allows us to produce manifestations of Culture (that are observable). These may take the form
of behavior or artifacts that we keep for ourselves or share. They are not part of the Culture at
the granularity level (see definition in Table 1) considered, but they have a culturality
(Pretceille-Abdallah, 1999), i.e., the property of what is cultural.
6565
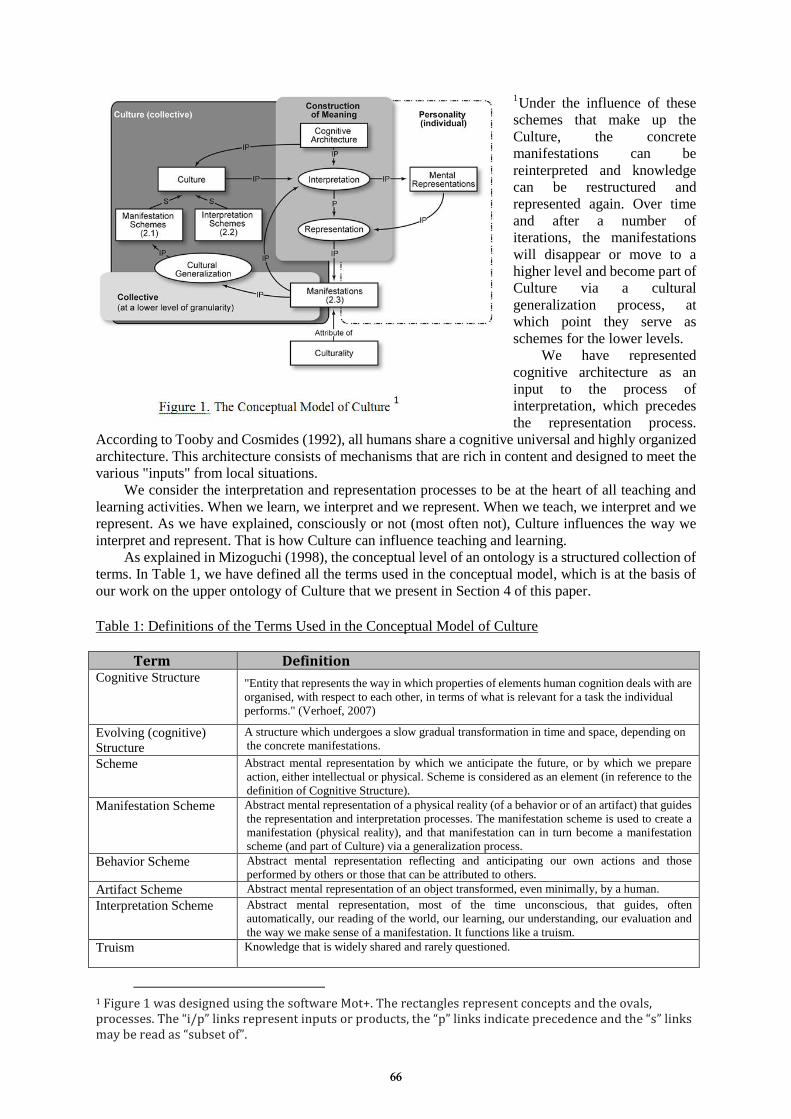
1Under the influence of these
schemes that make up the
Culture, the concrete
manifestations can be
reinterpreted and knowledge
can be restructured and
represented again. Over time
and after a number of
iterations, the manifestations
will disappear or move to a
higher level and become part of
Culture via a cultural
generalization process, at
which point they serve as
schemes for the lower levels.
We have represented
cognitive architecture as an
input to the process of
interpretation, which precedes
the representation process.
According to Tooby and Cosmides (1992), all humans share a cognitive universal and highly organized
architecture. This architecture consists of mechanisms that are rich in content and designed to meet the
various "inputs" from local situations.
We consider the interpretation and representation processes to be at the heart of all teaching and
learning activities. When we learn, we interpret and we represent. When we teach, we interpret and we
represent. As we have explained, consciously or not (most often not), Culture influences the way we
interpret and represent. That is how Culture can influence teaching and learning.
As explained in Mizoguchi (1998), the conceptual level of an ontology is a structured collection of
terms. In Table 1, we have defined all the terms used in the conceptual model, which is at the basis of
our work on the upper ontology of Culture that we present in Section 4 of this paper.
Table 1: Definitions of the Terms Used in the Conceptual Model of Culture
Term Definition Cognitive Structure "Entity that represents the way in which properties of elements human cognition deals with are
organised, with respect to each other, in terms of what is relevant for a task the individual
performs." (Verhoef, 2007)
Evolving (cognitive)
Structure
A structure which undergoes a slow gradual transformation in time and space, depending on
the concrete manifestations.
Scheme Abstract mental representation by which we anticipate the future, or by which we prepare
action, either intellectual or physical. Scheme is considered as an element (in reference to the
definition of Cognitive Structure).
Manifestation Scheme Abstract mental representation of a physical reality (of a behavior or of an artifact) that guides
the representation and interpretation processes. The manifestation scheme is used to create a
manifestation (physical reality), and that manifestation can in turn become a manifestation
scheme (and part of Culture) via a generalization process.
Behavior Scheme Abstract mental representation reflecting and anticipating our own actions and those
performed by others or those that can be attributed to others.
Artifact Scheme Abstract mental representation of an object transformed, even minimally, by a human.
Interpretation Scheme Abstract mental representation, most of the time unconscious, that guides, often
automatically, our reading of the world, our learning, our understanding, our evaluation and
the way we make sense of a manifestation. It functions like a truism.
Truism Knowledge that is widely shared and rarely questioned.
1 Figure 1 was designed using the software Mot+. The rectangles represent concepts and the ovals, processes. The “i/p” links represent inputs or products, the “p” links indicate precedence and the “s” links may be read as “subset of”.
1
6666

Values Values are central constructs that function like truisms and that are supported by emotional
information (inspired by Maio and Olson, 1998). They are relatively stable and durable. As
pointed out by Schwartz (2012), when they are activated, they become infused with feeling,
they refer to desirable goals that motivate action, they transcend specific actions and situations
and they serve as standards or criteria. They are considered here as an interpretation scheme
that orient our interpretations and representations of the world.
Interpretation (process) Process that allows us to learn, to understand, to make our a physical representation, a
manifestation.
Representation (process) Process that allows us to make concrete the content of our thoughts, to share our mental
representations, our knowledge.
Mental Representation
(product)
Representations whose main characteristic is to exist or operate in the absence of a stimulus or
an external situation.
Cognitive Architecture Universal architecture composed of highly organized mechanisms that are rich in content and
designed to meet the "inputs" of local situations.
Manifestation (concrete) Physical reality, which may take the form of behavior or artifacts. These events are the product
of the representation process and they have a culturality.
Cultural That which is related to Culture.
Culturality Property of that which is cultural.
Generalization Operation by which a manifestation is adopted as a manifestation scheme through multiple
uses of the manifestation as a reference by a majority of the members of a cultural group.
Granularity Level The scale concerned by the Culture or used for an analysis or comparison, for example,
universal, continental, national, provincial, local, etc.
3. Declarative and Procedural Approach to Culture
We have been introducing the procedural approach, but, in fact, two different approaches can be used to
model Culture. Blanchard and Mizoguchi (2014) have adopted a declarative approach to represent the
cultural domain. We have adopted a procedural approach to model Culture because it is
process-oriented, it takes into account the evolving nature of Culture and we consider that it provides an
essential basis for concrete and procedural solutions for cultural adaptation in ITSs. Table 2 presents a
comparison between these two approaches.
Table 2: Two Different Approaches to Model Culture
Approach Declarative Procedural Characterization The objectives:
1) To concentrate and structure in one
place the many scientific-grade notions
needed to get a coherent view of the
cultural domain.
2) Translate these scientific-grade notions
into a common ground.
The objectives:
1) To represent how Culture can affect daily
life, but more particularly teaching and
learning.
2) Model the functionalities of Culture (process
oriented).
What It Can
Offer to the ITS
Community
Guidelines to situate the cultural
adaptation efforts into theory.
Theoretical guidance to develop
"theory-grounded Culturally Adapted
Tutoring Systems (CATS)."
A framework for the analysis and comparison
of cultures in order to facilitate cultural
adaptation.
A solid structure on which we can build
different knowledge bases about cultural
variables in different identified cultures.
4. Towards an Upper Ontology of Culture
On the basis of the Conceptual Model of Culture (Savard, Bourdeau and Paquette, 2010) and of the
work at the conceptual level, we have developed an upper ontology of Culture, shown partly in Figure 2,
where we clearly see that Culture is presented as being a cognitive structure composed of interpretation
and manifestation schemes.
6767

Figure 2. An Upper Ontology of Culture
We have defined a common world, inspired by the one we find in Omnibus, the ontology of
education presented by Hayashi, Bourdeau and Mizoguchi (2009). In this world we have represented
the interpretation and manifestation schemes according to the conceptual model and definitions
introduced in Section 2 of this article. We have identified two different levels of behavior schemes: the
mental and the concrete level schemes. In the latter, we distinguished between generic and situated
schemes. We identified different kinds of situated schemes: ritual scheme, event-specific scheme,
actor-specific scheme and environment-specific scheme. Using this structure, we can represent
different specialized worlds, for example the educational world, and their associated subcultures. In
each subculture we can identify cultural variables in the interpretation and manifestation schemes.
Savard, Bourdeau and Paquette (2013) have identified cultural variables in the professional Culture of
instructional design. Their work has inspired our work on the upper ontology, which we want to render
capable of accommodating the identified variables.
5. Identified Cultural Variables in the Professional Culture of Instructional Design Savard, Bourdeau and Paquette (2013) have grouped the identified variables into three main categories:
values (interpretation scheme), human interactions and common practices (both manifestation
schemes). The (dimensions of) Values category consists of the following variables: relationship with
authority, tolerance for uncertainty, individualism/collectivism, approach towards time (represented in
Figure 2). The Common Practices category consists of the following variables: learning aims, lesson
plan, rhythm of learning activities, learning situations, pedagogical communication, instructional
methods, cooperation-collaboration, detailed feedback, summative evaluation methods, results
interpretation. The Human Interactions category consists of the following: teacher’s role, learner’s role,
responsibility for reaching learning goals, responsibility for making available learning resources (all in
6868
“actor-specific scheme” in the ontology presented in Figure 2). They have built an ontology of cultural
variables (in instructional design).
In fact, we are currently working on a new version of the cultural variables (in the professional
Culture of instructional design) ontology. This work is being completed in alternation with our work on
the upper ontology of Culture presented in this article. Our goal is to build a strong basis for the
development of tools that will support cultural adaptation in practice. We believe that these tools (upper
ontology of Culture and revised ontology of cultural variables in instructional design) would help
instructional designers, learners and teachers in their cultural adaptation. We believe that this may
improve the effectiveness of international learning and teaching activities in both physical and virtual
environments.
6. Future Work
We believe we have elaborated the basis for the development of a computerized system that we have the
intention to develop. It could advise the instructional designer, the teacher and also the learner by using
the knowledge modeled about theories of Culture (MAUOC, Blanchard and Mizoguchi, 2014), theories
of education (OMNIBUS, Hayachi, Bourdeau and Mizoguchi, 2009) and the cultural variables
identified in pedagogical practices (Savard, 2014). This system could take the form of a web module
that would provide a framework for planning the learner’s pedagogical path, for example in accordance
with the philosophy of personal pedagogies (Maina and Garcia, 2016). The user (Instructional
Designer, Teacher or Learner) could find information and/or advice both on cultural adaptation and
variables and on strategic pedagogical practices based on theories of education. The prototype of this
system will be tested and will allow us to stabilize our ontologies.
References
Alber, J. L. (2002). Le concept anthropologique de culture. Terra Cognita, 1, 34-38.
Blanchard, E., & Mizoguchi, R. (2014). Designing culturally-aware tutoring systems with MAUOC, the more
advanced upper ontology of culture. Research and Practice in Technology Enhanced Learning, 9(1),41-69.
Hayashi, Y., Bourdeau, J., & Mizoguchi, R. (2009). Using ontological engineering to organize
learning/instructional theories and build a theory-aware authoring system. International Journal of Artificial
Intelligence in Education, 19(2), 211-252.
Maina, M. F., & González, I. G. (2016). Articulating personal pedagogies through learning ecologies. In The
Future of Ubiquitous Learning (pp. 73-94). Springer Berlin Heidelberg.
Maio, G. R., & Olson, J. M. (1998). Values as truisms: Evidence and implications. Journal of Personality and
Social Psychology, 74(2), 294.
Mizoguchi, R. (1998, June). A step towards ontological engineering. In 12th National Conference on AI of
JSAI (pp. 24-31).
Pretceille-Abdallah, M. (1999). L'éducation interculturelle. Paris, Presses Universitaires de France, 127 pages.
Rogers, P. C., Graham, C. R., & Mayes, C. T. (2007). Cultural competence and instructional design: Exploration
research into the delivery of online instruction cross-culturally. Educational Technology Research and
Development, 55(2), 197-217.
Schwartz, S. H. (2012). An overview of the Schwartz theory of basic values. Online Readings in Psychology and
Culture, 2(1), 11.
Savard, I., Bourdeau, J., et Paquette, G. (2010). Modélisation des connaissances pour un environnement de conception
pédagogique conscient des variables culturelles. In Les cahiers de l’ISC, 1, 49-58. Retrieved from: https://isc.uqam.ca/upload/files/CahiersISC/ACTES_Final-pourMiseEnLigne.pdf#page=49 (May 24th, 2016)
Savard, I., Bourdeau, J., & Paquette, G. (2013). An Ontology and a Method to Support Instructional Design Integrating
Cultural Variables. Proceedings of the Workshop on Culturally-aware Technology Enhanced Learning (CULTEL),
hold in EC-TEL (Eighth European Conference on Technology Enhanced Learning). Paphos, Cyprus. Retrieved from http://www.macs.hw.ac.uk/CulTEL/submissions/cultel2013_submission_3.pdf. (May 24th, 2016)
Savard, I. (2014). Modélisation des connaissances pour un design pédagogique intégrant les variables culturelles.
(Doctoral Thesis), TÉLUQ-UQAM, Montréal, Canada. Retrieved from: http://r-libre.teluq.ca/362/.
Tooby, J., & Cosmides, L. (1995). The psychological foundations of culture. The adapted mind: Evolutionary
psychology and the generation of culture, 19-136.
Tylor, E. B. (1871). Primitive culture: Researches into the development of mythology, philosophy, religion, art,
and custom (Vol. 2). Murray.
Verhoef, L. (2007). Why designers can't understand their users. Human Efficiency, L. Verhoef.
6969
Chen, W. et al. (Eds.) (2016). Proceedings of the 24th International Conference on Computers in Education. India: Asia-Pacific Society for Computers in Education
Ontology-based Systemization Approach to Capture Meta-level Thinking Processes from
Gaze Behaviors
Yuki HAYASHIa*, Kazuhisa SETAa & Mitsuru IKEDAb a Graduate School of Humanities and Sustainable System Sciences, Osaka Prefecture University,
Japan b School of Knowledge Science, Japan Advanced Institute of Science and Technology, Japan
Abstract: It is difficult to capture a person’s thinking processes because of the invisible, shapeless, complex structure of thought. In order to approach implicit thinking processes, we propose a framework for capturing a portion of meta-level thinking processes from gaze behaviors. Here, we focus on the meta-level thinking processes in the dissolution of belief conflicts, and introduce the concept of semi-metacognitive-level thinking, which allows us to make assumptions about the monitoring/control cycle based on gaze behaviors toward externalization objects of base-level thinking. In this paper, we discuss a framework for capturing metacognitive thinking processes from gaze behaviors and propose an ontology to embody the concept of the framework.
Keywords: Metacognitive skill, meta-level thinking, critical thinking, thinking-gaze ontology, gaze behaviors.
1. Introduction In daily life, we face many difficult social issues that may have various viewpoints, making it difficult to find a proper solution in such situations. In this case, an aspect of metacognitive skill, or “thinking about thinking,” should be exerted as an internal self-conversation that serves to explain our thoughts in a logical manner. While thinking activity is the essence of human existence, it is difficult to train thinking skills because this is essentially a cognitive activity and implicit behavior unobservable by others (Rana and Upton, 2013).
In order to grasp the implicit thinking processes of internal self-conversation, the thinking aloud method, which requires subjects to talk while solving a problem or performing a task, is often used (Jaspers et al., 2004). However, this method has some limitations; for example, unconscious processing is inaccessible and high cognitive load can hinder verbalization by utilizing all available cognitive resources (Jääskeläinen, 2010). To tackle this problem, there are several studies that use an eye-tracker to analyze thinking; for example, verbalization processes (Guan et al., 2006) and the difference between normal and mindless reading (Reichle et al., 2010). Bondareva et al. analyzed relations between students’ learning performance and eye-tracking data in self-regulated learning (Bondareva et al., 2013). However, there is little research that focuses on revealing the metacognitive processes in the context of internal self-conversation.
The objective of this research is to make the implicit and chaotic metacognitive processes clear using eye-movement information. In internal self-conversation, metacognitive monitoring and control refer to higher order thinking that targets base-level thinking. In this study, we hypothesize that some meta-level thinking processes can be captured from gaze behaviors on the assumption that an application allows a user to externalize his or her base-level thinking into a designed interface component. As the term “metacognition” is used in many different ways in different situations (Kayashima et al., 2005), as a first step in validating our hypothesis, it is essential to clarify the conceptual connection between meta-level thinking and gaze activities in order to determine the meta-level thinking processes that may be captured through eye movements. To approach this objective, we introduce an ontology that systematizes the concept of meta- and base-level thinking activity,
7070

representation component for externalization of cognitive thinking, and gaze behaviors. In this paper, we discuss the concept and applicable scope of gaze-thinking ontology. We then introduce an example of thinking recognition application (Hayashi et al., 2016) that can capture the sequence of user’s gaze information during his or her meta-level thinking processes. 2. Approach for Developing an Ontology 2.1 Target Thinking Processes We focus on the critical thinking processes in internal self-conversation. More specifically, we focus on meta-level thinking processes in the dissolution of belief conflicts. These thinking processes require the creation of new knowledge by identifying meaningful conflicts between one’s own thinking and that of others.
In order for learners to train themselves in the critical thinking processes involved in internal self-conversation, Chen et al. proposed a thinking training environment called Sizhi (Chen et al., 2011). This tool is designed to encourage meta-level thinking processes by clearly verbalizing one’s own thinking and that of others’ processes in a logical manner, and reflecting on the thinking processes to find meaningful conflicts for fruitful knowledge creation. While Sizhi allows learners to externalize their base-level thinking, the thinking processes in meta-level monitoring and control (e.g., proving or comparing the validity of externalized statements and finding conflict) are still implicit. The idea behind this research is to approach the implicit and chaotic meta-level thinking processes using clues from gaze behaviors to externalize base-level thinking processes. 2.2 Capturing Meta-level Thinking Processes Figure 1 represents a framework for capturing meta-level thinking processes from gaze behaviors. The thinking processes include base-level and meta-level thinking, where meta-level thinking monitors (metacognitive monitoring) and controls (metacognitive control) the base-level thinking processes. In the case of internal self-conversation about the dissolution of belief conflicts, to think about fact, conflict, hypothesis, decision, results, etc. corresponds to base-level thinking activities; for example, “Eri was bullied because she changed her attitude when she interacted with boys” (fact), and “I was bullied because I got along well with Eri” (results). Meta-level thinking targets the base-level thinking; for instance, “comparing certain fact with the reason” and “proving a hypothesis,” are components of metacognitive monitoring while, “modifying the conflict” is an aspect of metacognitive control. As we know, thinking processes cannot be observed from the external world (as shown in the lower left of Fig. 1).
Figure 1. Framework for Capturing Meta-level Thinking Processes from Gaze Behaviors.
7171
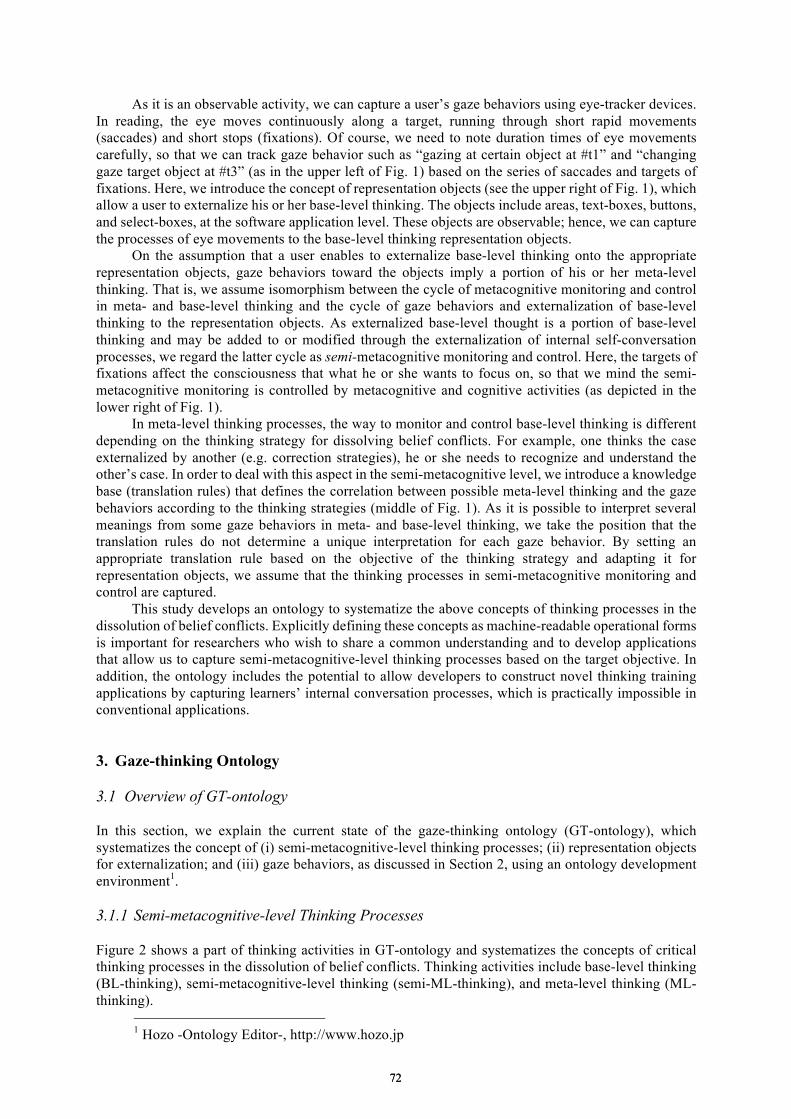
As it is an observable activity, we can capture a user’s gaze behaviors using eye-tracker devices. In reading, the eye moves continuously along a target, running through short rapid movements (saccades) and short stops (fixations). Of course, we need to note duration times of eye movements carefully, so that we can track gaze behavior such as “gazing at certain object at #t1” and “changing gaze target object at #t3” (as in the upper left of Fig. 1) based on the series of saccades and targets of fixations. Here, we introduce the concept of representation objects (see the upper right of Fig. 1), which allow a user to externalize his or her base-level thinking. The objects include areas, text-boxes, buttons, and select-boxes, at the software application level. These objects are observable; hence, we can capture the processes of eye movements to the base-level thinking representation objects.
On the assumption that a user enables to externalize base-level thinking onto the appropriate representation objects, gaze behaviors toward the objects imply a portion of his or her meta-level thinking. That is, we assume isomorphism between the cycle of metacognitive monitoring and control in meta- and base-level thinking and the cycle of gaze behaviors and externalization of base-level thinking to the representation objects. As externalized base-level thought is a portion of base-level thinking and may be added to or modified through the externalization of internal self-conversation processes, we regard the latter cycle as semi-metacognitive monitoring and control. Here, the targets of fixations affect the consciousness that what he or she wants to focus on, so that we mind the semi-metacognitive monitoring is controlled by metacognitive and cognitive activities (as depicted in the lower right of Fig. 1).
In meta-level thinking processes, the way to monitor and control base-level thinking is different depending on the thinking strategy for dissolving belief conflicts. For example, one thinks the case externalized by another (e.g. correction strategies), he or she needs to recognize and understand the other’s case. In order to deal with this aspect in the semi-metacognitive level, we introduce a knowledge base (translation rules) that defines the correlation between possible meta-level thinking and the gaze behaviors according to the thinking strategies (middle of Fig. 1). As it is possible to interpret several meanings from some gaze behaviors in meta- and base-level thinking, we take the position that the translation rules do not determine a unique interpretation for each gaze behavior. By setting an appropriate translation rule based on the objective of the thinking strategy and adapting it for representation objects, we assume that the thinking processes in semi-metacognitive monitoring and control are captured.
This study develops an ontology to systematize the above concepts of thinking processes in the dissolution of belief conflicts. Explicitly defining these concepts as machine-readable operational forms is important for researchers who wish to share a common understanding and to develop applications that allow us to capture semi-metacognitive-level thinking processes based on the target objective. In addition, the ontology includes the potential to allow developers to construct novel thinking training applications by capturing learners’ internal conversation processes, which is practically impossible in conventional applications. 3. Gaze-thinking Ontology 3.1 Overview of GT-ontology In this section, we explain the current state of the gaze-thinking ontology (GT-ontology), which systematizes the concept of (i) semi-metacognitive-level thinking processes; (ii) representation objects for externalization; and (iii) gaze behaviors, as discussed in Section 2, using an ontology development environment1. 3.1.1 Semi-metacognitive-level Thinking Processes Figure 2 shows a part of thinking activities in GT-ontology and systematizes the concepts of critical thinking processes in the dissolution of belief conflicts. Thinking activities include base-level thinking (BL-thinking), semi-metacognitive-level thinking (semi-ML-thinking), and meta-level thinking (ML-thinking).
1 Hozo -Ontology Editor-, http://www.hozo.jp
7272
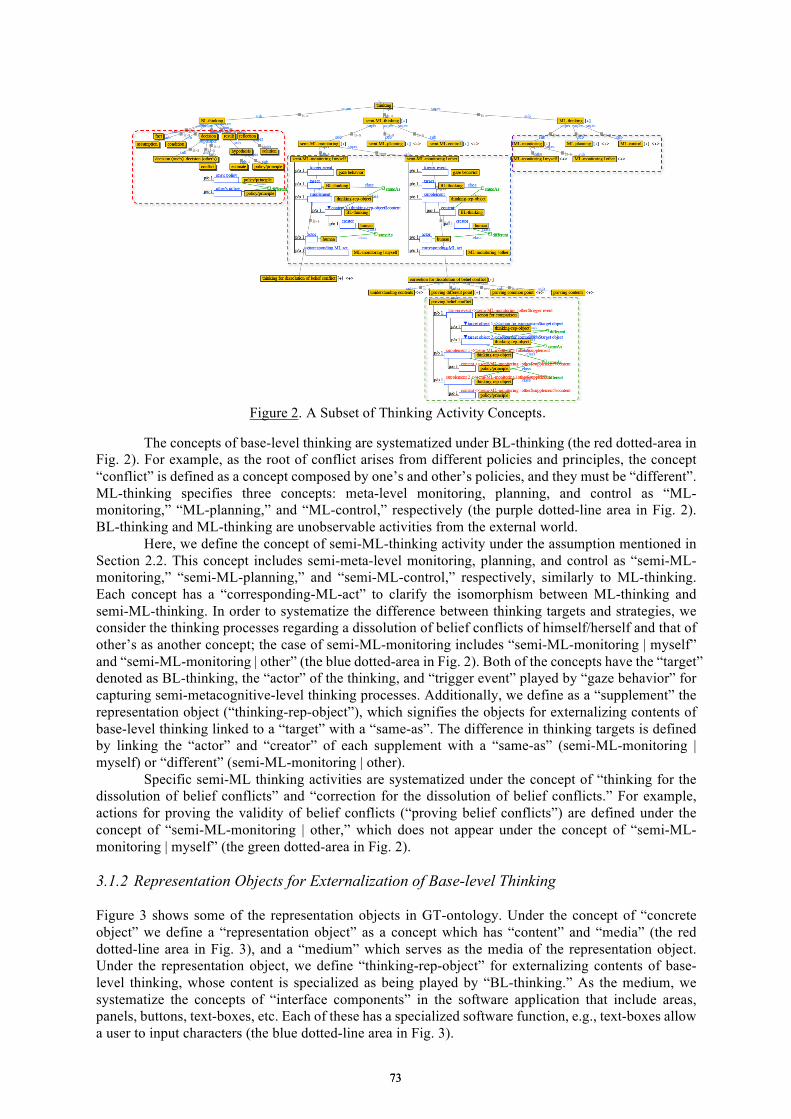
The concepts of base-level thinking are systematized under BL-thinking (the red dotted-area in Fig. 2). For example, as the root of conflict arises from different policies and principles, the concept “conflict” is defined as a concept composed by one’s and other’s policies, and they must be “different”. ML-thinking specifies three concepts: meta-level monitoring, planning, and control as “ML-monitoring,” “ML-planning,” and “ML-control,” respectively (the purple dotted-line area in Fig. 2). BL-thinking and ML-thinking are unobservable activities from the external world.
Here, we define the concept of semi-ML-thinking activity under the assumption mentioned in Section 2.2. This concept includes semi-meta-level monitoring, planning, and control as “semi-ML-monitoring,” “semi-ML-planning,” and “semi-ML-control,” respectively, similarly to ML-thinking. Each concept has a “corresponding-ML-act” to clarify the isomorphism between ML-thinking and semi-ML-thinking. In order to systematize the difference between thinking targets and strategies, we consider the thinking processes regarding a dissolution of belief conflicts of himself/herself and that of other’s as another concept; the case of semi-ML-monitoring includes “semi-ML-monitoring | myself” and “semi-ML-monitoring | other” (the blue dotted-area in Fig. 2). Both of the concepts have the “target” denoted as BL-thinking, the “actor” of the thinking, and “trigger event” played by “gaze behavior” for capturing semi-metacognitive-level thinking processes. Additionally, we define as a “supplement” the representation object (“thinking-rep-object”), which signifies the objects for externalizing contents of base-level thinking linked to a “target” with a “same-as”. The difference in thinking targets is defined by linking the “actor” and “creator” of each supplement with a “same-as” (semi-ML-monitoring | myself) or “different” (semi-ML-monitoring | other).
Specific semi-ML thinking activities are systematized under the concept of “thinking for the dissolution of belief conflicts” and “correction for the dissolution of belief conflicts.” For example, actions for proving the validity of belief conflicts (“proving belief conflicts”) are defined under the concept of “semi-ML-monitoring | other,” which does not appear under the concept of “semi-ML-monitoring | myself” (the green dotted-area in Fig. 2).
3.1.2 Representation Objects for Externalization of Base-level Thinking Figure 3 shows some of the representation objects in GT-ontology. Under the concept of “concrete object” we define a “representation object” as a concept which has “content” and “media” (the red dotted-line area in Fig. 3), and a “medium” which serves as the media of the representation object. Under the representation object, we define “thinking-rep-object” for externalizing contents of base-level thinking, whose content is specialized as being played by “BL-thinking.” As the medium, we systematize the concepts of “interface components” in the software application that include areas, panels, buttons, text-boxes, etc. Each of these has a specialized software function, e.g., text-boxes allow a user to input characters (the blue dotted-line area in Fig. 3).
Figure 2. A Subset of Thinking Activity Concepts.
7373
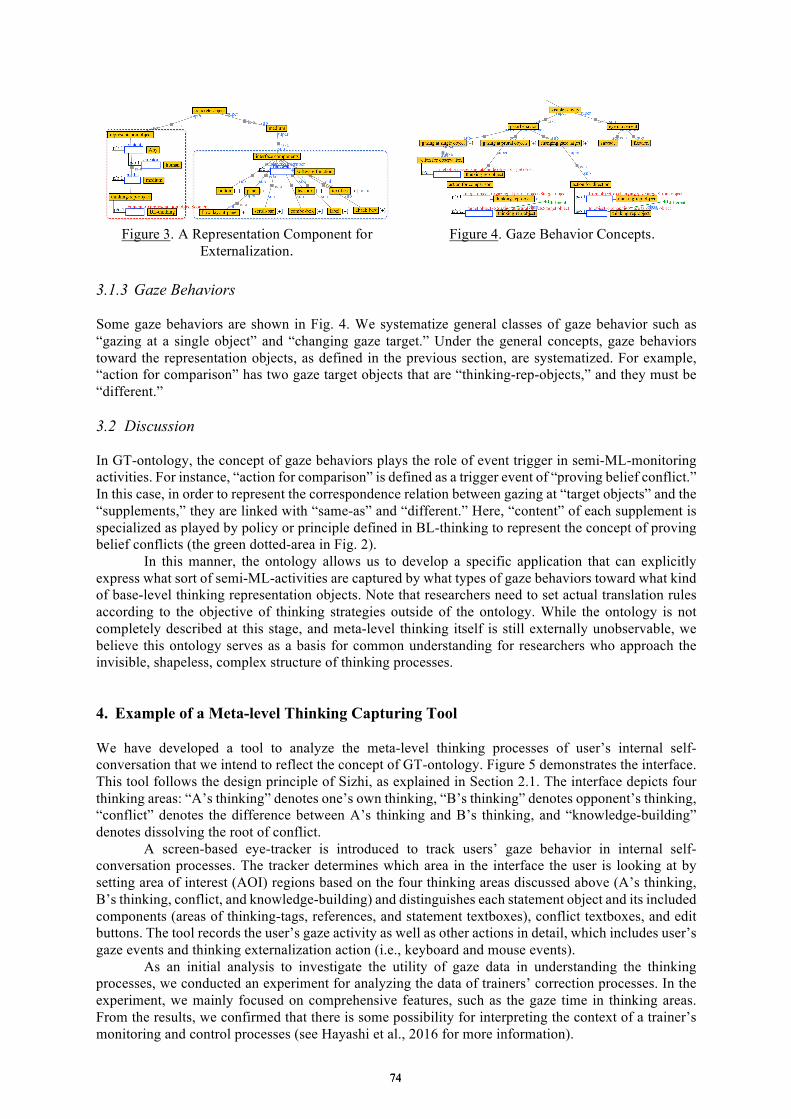
3.1.3 Gaze Behaviors Some gaze behaviors are shown in Fig. 4. We systematize general classes of gaze behavior such as “gazing at a single object” and “changing gaze target.” Under the general concepts, gaze behaviors toward the representation objects, as defined in the previous section, are systematized. For example, “action for comparison” has two gaze target objects that are “thinking-rep-objects,” and they must be “different.”
3.2 Discussion In GT-ontology, the concept of gaze behaviors plays the role of event trigger in semi-ML-monitoring activities. For instance, “action for comparison” is defined as a trigger event of “proving belief conflict.” In this case, in order to represent the correspondence relation between gazing at “target objects” and the “supplements,” they are linked with “same-as” and “different.” Here, “content” of each supplement is specialized as played by policy or principle defined in BL-thinking to represent the concept of proving belief conflicts (the green dotted-area in Fig. 2).
In this manner, the ontology allows us to develop a specific application that can explicitly express what sort of semi-ML-activities are captured by what types of gaze behaviors toward what kind of base-level thinking representation objects. Note that researchers need to set actual translation rules according to the objective of thinking strategies outside of the ontology. While the ontology is not completely described at this stage, and meta-level thinking itself is still externally unobservable, we believe this ontology serves as a basis for common understanding for researchers who approach the invisible, shapeless, complex structure of thinking processes.
4. Example of a Meta-level Thinking Capturing Tool We have developed a tool to analyze the meta-level thinking processes of user’s internal self-conversation that we intend to reflect the concept of GT-ontology. Figure 5 demonstrates the interface. This tool follows the design principle of Sizhi, as explained in Section 2.1. The interface depicts four thinking areas: “A’s thinking” denotes one’s own thinking, “B’s thinking” denotes opponent’s thinking, “conflict” denotes the difference between A’s thinking and B’s thinking, and “knowledge-building” denotes dissolving the root of conflict.
A screen-based eye-tracker is introduced to track users’ gaze behavior in internal self-conversation processes. The tracker determines which area in the interface the user is looking at by setting area of interest (AOI) regions based on the four thinking areas discussed above (A’s thinking, B’s thinking, conflict, and knowledge-building) and distinguishes each statement object and its included components (areas of thinking-tags, references, and statement textboxes), conflict textboxes, and edit buttons. The tool records the user’s gaze activity as well as other actions in detail, which includes user’s gaze events and thinking externalization action (i.e., keyboard and mouse events).
As an initial analysis to investigate the utility of gaze data in understanding the thinking processes, we conducted an experiment for analyzing the data of trainers’ correction processes. In the experiment, we mainly focused on comprehensive features, such as the gaze time in thinking areas. From the results, we confirmed that there is some possibility for interpreting the context of a trainer’s monitoring and control processes (see Hayashi et al., 2016 for more information).
Figure 3. A Representation Component for
Externalization. Figure 4. Gaze Behavior Concepts.
7474
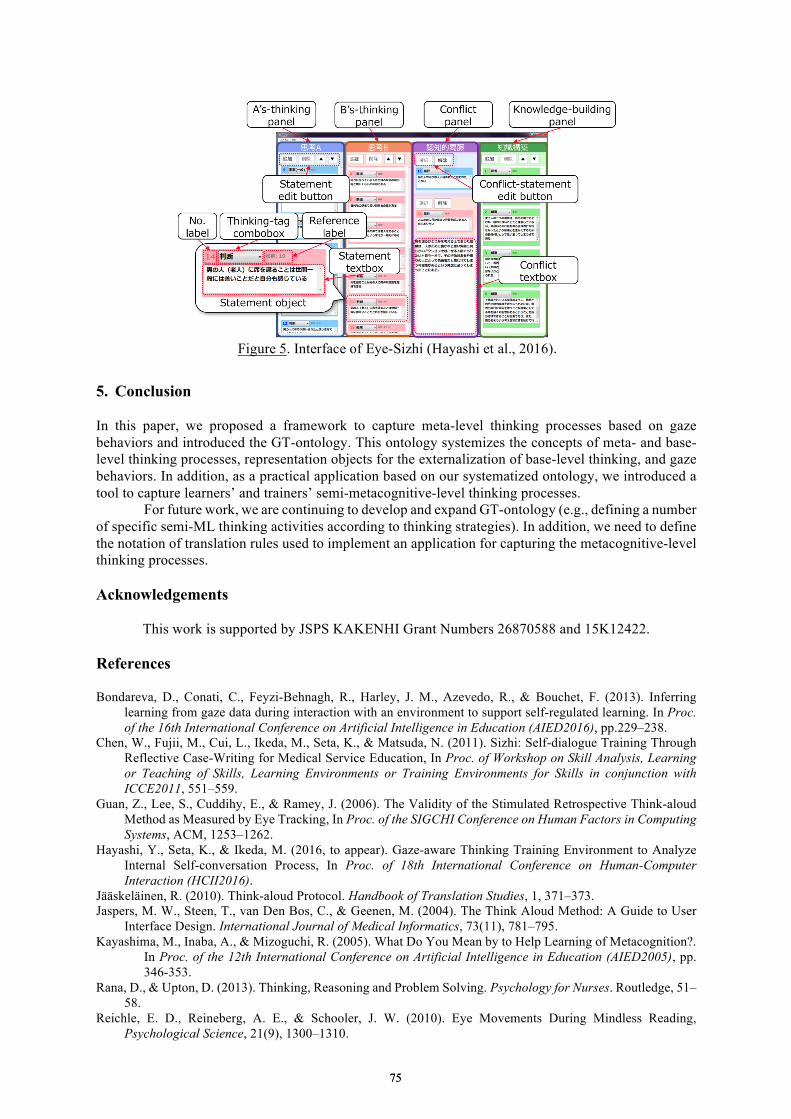
5. Conclusion In this paper, we proposed a framework to capture meta-level thinking processes based on gaze behaviors and introduced the GT-ontology. This ontology systemizes the concepts of meta- and base-level thinking processes, representation objects for the externalization of base-level thinking, and gaze behaviors. In addition, as a practical application based on our systematized ontology, we introduced a tool to capture learners’ and trainers’ semi-metacognitive-level thinking processes.
For future work, we are continuing to develop and expand GT-ontology (e.g., defining a number of specific semi-ML thinking activities according to thinking strategies). In addition, we need to define the notation of translation rules used to implement an application for capturing the metacognitive-level thinking processes. Acknowledgements
This work is supported by JSPS KAKENHI Grant Numbers 26870588 and 15K12422. References Bondareva, D., Conati, C., Feyzi-Behnagh, R., Harley, J. M., Azevedo, R., & Bouchet, F. (2013). Inferring
learning from gaze data during interaction with an environment to support self-regulated learning. In Proc. of the 16th International Conference on Artificial Intelligence in Education (AIED2016), pp.229–238.
Chen, W., Fujii, M., Cui, L., Ikeda, M., Seta, K., & Matsuda, N. (2011). Sizhi: Self-dialogue Training Through Reflective Case-Writing for Medical Service Education, In Proc. of Workshop on Skill Analysis, Learning or Teaching of Skills, Learning Environments or Training Environments for Skills in conjunction with ICCE2011, 551–559.
Guan, Z., Lee, S., Cuddihy, E., & Ramey, J. (2006). The Validity of the Stimulated Retrospective Think-aloud Method as Measured by Eye Tracking, In Proc. of the SIGCHI Conference on Human Factors in Computing Systems, ACM, 1253–1262.
Hayashi, Y., Seta, K., & Ikeda, M. (2016, to appear). Gaze-aware Thinking Training Environment to Analyze Internal Self-conversation Process, In Proc. of 18th International Conference on Human-Computer Interaction (HCII2016).
Jääskeläinen, R. (2010). Think-aloud Protocol. Handbook of Translation Studies, 1, 371–373. Jaspers, M. W., Steen, T., van Den Bos, C., & Geenen, M. (2004). The Think Aloud Method: A Guide to User
Interface Design. International Journal of Medical Informatics, 73(11), 781–795. Kayashima, M., Inaba, A., & Mizoguchi, R. (2005). What Do You Mean by to Help Learning of Metacognition?.
In Proc. of the 12th International Conference on Artificial Intelligence in Education (AIED2005), pp. 346-353.
Rana, D., & Upton, D. (2013). Thinking, Reasoning and Problem Solving. Psychology for Nurses. Routledge, 51–58.
Reichle, E. D., Reineberg, A. E., & Schooler, J. W. (2010). Eye Movements During Mindless Reading, Psychological Science, 21(9), 1300–1310.
Figure 5. Interface of Eye-Sizhi (Hayashi et al., 2016).
7575

Chen, W. et al. (Eds.) (2016). Proceedings of the 24th
International Conference on Computers in Education.
India: Asia-Pacific Society for Computers in Education
An Improved Genetic Algorithm Approach for
Optimal Learner Group Formation in
Collaborative Learning Contexts
Ya-Qian ZHENG, Jia-Zhi DU, Hai-Bo YU, Wei-Gang LU & Chun-Rong LI
*
Department of Educational Technology, Ocean University of China, China
Abstract: Collaborative learning has been widely used in educational contexts. Considering
that group formation is one of the key processes in collaborative learning, the aim of this paper
is to propose a method to obtain inter-homogeneous and intra-heterogeneous groups. In this
method, the group formation problem is translated into a combinatorial optimization problem,
and an improved genetic algorithm approach is also proposed to cope with this problem. To
evaluate the proposed method, we carry out computational experiments based on eight datasets
with different levels of complexity. The results show that the proposed approach is effective and
stable for composing inter-homogeneous and intra-heterogeneous groups.
Keywords: Collaborative learning, group formation, combinatorial optimization problem,
genetic algorithm
1. Introduction
Collaborative learning (CL) is an instructional strategy which allows students to work together in small
groups toward a common learning goal (Dillenbourg, 1999). To apply this strategy, the initial task is
assigning students into groups, which is a crucial process. Previous research has indicated that
well-structured CL groups allow for a good interaction among members, which is fundamental to obtain
appropriate learning results (Sadeghi and Kardan, 2015). Building inter-homogeneous and
intra-heterogeneous groups based on student characteristics has been considered as an effective
approach for the formation of well-structured groups (Dascalu et al., 2014; Moreno, Ovalle and Vicari,
2012). However, when the number of students and characteristics under consideration is very large, it is
almost impossible for an instructor to organize optimal learning groups that meet multiple criteria.
Therefore, we translate the group formation problem into a combinatorial optimization problem. In
order to cope with this problem, an improved genetic algorithm is presented.
2. Problem Description and Mathematical Formulation
In this section, the group formation problem is formally described and mathematically formulated.
Assume that there is a set of n students in a class S, S={s1,…,si,...,sn}, which are required to be divided
into g groups G, G={G1,...,Gk,...,Gg}. Each group Gk is made up of a zk number of students. Let
C={c1,…,cu,...,cp+q} be the set of all required attributes for the grouping of students, where p and q are
the number of student characteristics for achieving inter-homogeneous and intra-heterogeneous groups.
Let viu denote the value of attribute cu associated with student si, normalized between 0 and 1. Letvu
denote the mean value of attribute cu associated with all the participated students, and letvk,u represent
the mean value of attribute cu associated with students in group Gk.
For inter-homogenous groups (all the groups have similar compositions), the sum of the
squared differences (Fhomo) to measure such homogeneity with regard to the p characteristics between
each group and the whole sample is calculated as: 2
,1hom
11
( )p
gu u k uu
o pk uu
w v vF
w
(1)
7676
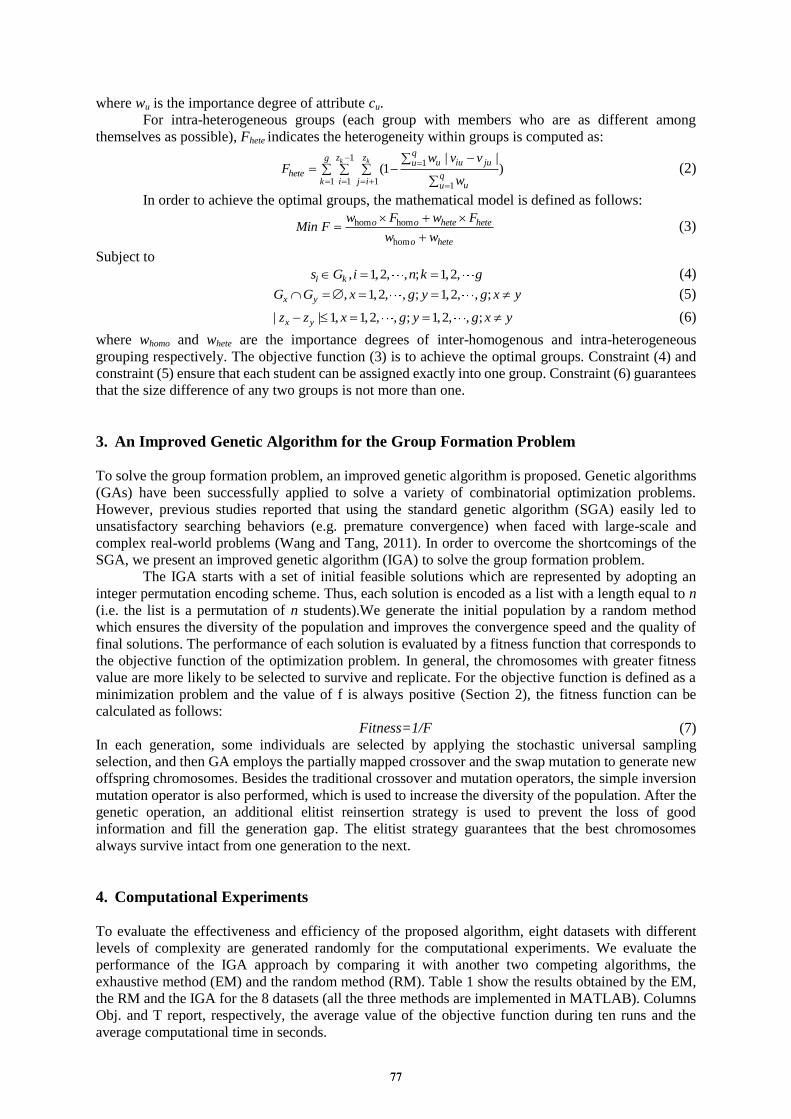
where wu is the importance degree of attribute cu.
For intra-heterogeneous groups (each group with members who are as different among
themselves as possible), Fhete indicates the heterogeneity within groups is computed as:
11
1 1 11
| |(1 )
k kq
z zgu iu juu
hete qk i j i uu
w v vF
w
(2)
In order to achieve the optimal groups, the mathematical model is defined as follows:
hom hom
hom
o o hete hete
o hete
w F w FMin F
w w
(3)
Subject to
, 1,2, , ; 1,2,i ks G i n k g (4)
, 1,2, , ; 1,2, , ;x yG G x g y g x y (5)
| | 1, 1,2, , ; 1,2, , ;x yz z x g y g x y (6)
where whomo and whete are the importance degrees of inter-homogenous and intra-heterogeneous
grouping respectively. The objective function (3) is to achieve the optimal groups. Constraint (4) and
constraint (5) ensure that each student can be assigned exactly into one group. Constraint (6) guarantees
that the size difference of any two groups is not more than one.
3. An Improved Genetic Algorithm for the Group Formation Problem
To solve the group formation problem, an improved genetic algorithm is proposed. Genetic algorithms
(GAs) have been successfully applied to solve a variety of combinatorial optimization problems. However, previous studies reported that using the standard genetic algorithm (SGA) easily led to
unsatisfactory searching behaviors (e.g. premature convergence) when faced with large-scale and
complex real-world problems (Wang and Tang, 2011). In order to overcome the shortcomings of the
SGA, we present an improved genetic algorithm (IGA) to solve the group formation problem.
The IGA starts with a set of initial feasible solutions which are represented by adopting an
integer permutation encoding scheme. Thus, each solution is encoded as a list with a length equal to n
(i.e. the list is a permutation of n students).We generate the initial population by a random method
which ensures the diversity of the population and improves the convergence speed and the quality of
final solutions. The performance of each solution is evaluated by a fitness function that corresponds to
the objective function of the optimization problem. In general, the chromosomes with greater fitness
value are more likely to be selected to survive and replicate. For the objective function is defined as a
minimization problem and the value of f is always positive (Section 2), the fitness function can be
calculated as follows:
Fitness=1/F (7)
In each generation, some individuals are selected by applying the stochastic universal sampling
selection, and then GA employs the partially mapped crossover and the swap mutation to generate new
offspring chromosomes. Besides the traditional crossover and mutation operators, the simple inversion
mutation operator is also performed, which is used to increase the diversity of the population. After the
genetic operation, an additional elitist reinsertion strategy is used to prevent the loss of good
information and fill the generation gap. The elitist strategy guarantees that the best chromosomes
always survive intact from one generation to the next.
4. Computational Experiments
To evaluate the effectiveness and efficiency of the proposed algorithm, eight datasets with different
levels of complexity are generated randomly for the computational experiments. We evaluate the
performance of the IGA approach by comparing it with another two competing algorithms, the
exhaustive method (EM) and the random method (RM). Table 1 show the results obtained by the EM,
the RM and the IGA for the 8 datasets (all the three methods are implemented in MATLAB). Columns
Obj. and T report, respectively, the average value of the objective function during ten runs and the
average computational time in seconds.
7777
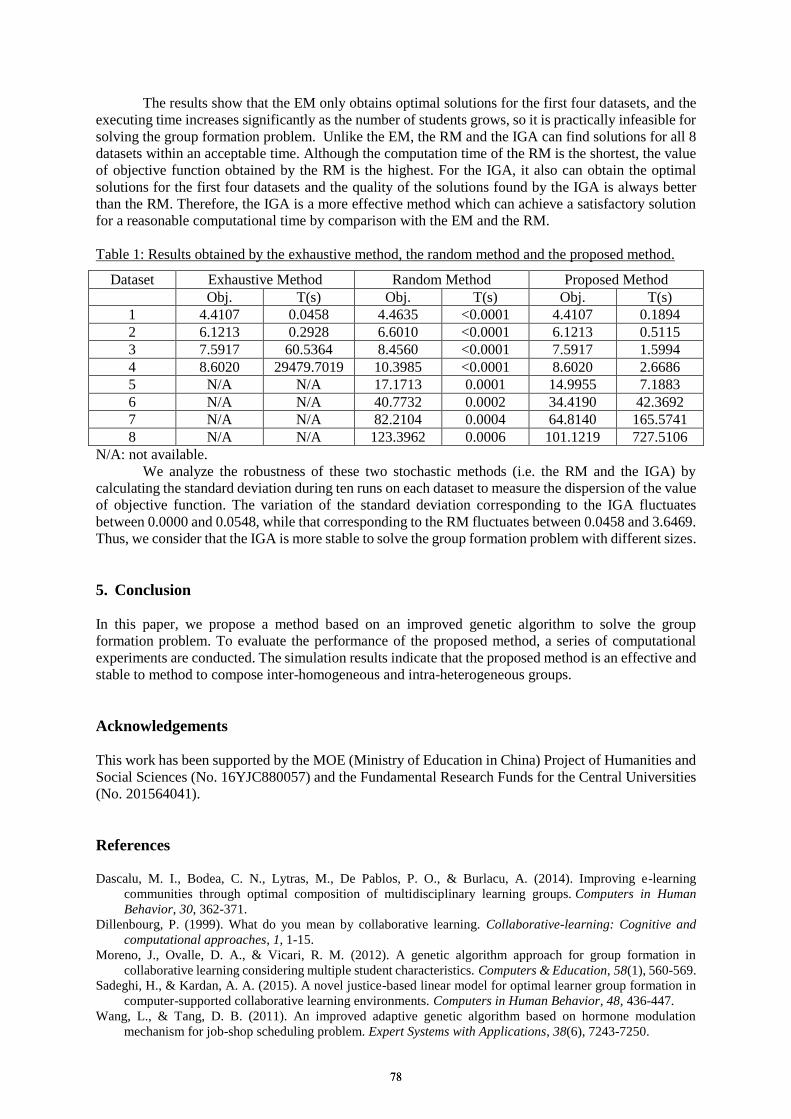
The results show that the EM only obtains optimal solutions for the first four datasets, and the
executing time increases significantly as the number of students grows, so it is practically infeasible for
solving the group formation problem. Unlike the EM, the RM and the IGA can find solutions for all 8
datasets within an acceptable time. Although the computation time of the RM is the shortest, the value
of objective function obtained by the RM is the highest. For the IGA, it also can obtain the optimal
solutions for the first four datasets and the quality of the solutions found by the IGA is always better
than the RM. Therefore, the IGA is a more effective method which can achieve a satisfactory solution
for a reasonable computational time by comparison with the EM and the RM.
Table 1: Results obtained by the exhaustive method, the random method and the proposed method.
Dataset Exhaustive Method Random Method Proposed Method
Obj. T(s) Obj. T(s) Obj. T(s)
1 4.4107 0.0458 4.4635 <0.0001 4.4107 0.1894
2 6.1213 0.2928 6.6010 <0.0001 6.1213 0.5115
3 7.5917 60.5364 8.4560 <0.0001 7.5917 1.5994
4 8.6020 29479.7019 10.3985 <0.0001 8.6020 2.6686
5 N/A N/A 17.1713 0.0001 14.9955 7.1883
6 N/A N/A 40.7732 0.0002 34.4190 42.3692
7 N/A N/A 82.2104 0.0004 64.8140 165.5741
8 N/A N/A 123.3962 0.0006 101.1219 727.5106
N/A: not available.
We analyze the robustness of these two stochastic methods (i.e. the RM and the IGA) by
calculating the standard deviation during ten runs on each dataset to measure the dispersion of the value
of objective function. The variation of the standard deviation corresponding to the IGA fluctuates
between 0.0000 and 0.0548, while that corresponding to the RM fluctuates between 0.0458 and 3.6469.
Thus, we consider that the IGA is more stable to solve the group formation problem with different sizes.
5. Conclusion
In this paper, we propose a method based on an improved genetic algorithm to solve the group
formation problem. To evaluate the performance of the proposed method, a series of computational
experiments are conducted. The simulation results indicate that the proposed method is an effective and
stable to method to compose inter-homogeneous and intra-heterogeneous groups.
Acknowledgements
This work has been supported by the MOE (Ministry of Education in China) Project of Humanities and
Social Sciences (No. 16YJC880057) and the Fundamental Research Funds for the Central Universities
(No. 201564041).
References Dascalu, M. I., Bodea, C. N., Lytras, M., De Pablos, P. O., & Burlacu, A. (2014). Improving e-learning
communities through optimal composition of multidisciplinary learning groups. Computers in Human
Behavior, 30, 362-371.
Dillenbourg, P. (1999). What do you mean by collaborative learning. Collaborative-learning: Cognitive and
computational approaches, 1, 1-15.
Moreno, J., Ovalle, D. A., & Vicari, R. M. (2012). A genetic algorithm approach for group formation in
collaborative learning considering multiple student characteristics. Computers & Education, 58(1), 560-569.
Sadeghi, H., & Kardan, A. A. (2015). A novel justice-based linear model for optimal learner group formation in
computer-supported collaborative learning environments. Computers in Human Behavior, 48, 436-447.
Wang, L., & Tang, D. B. (2011). An improved adaptive genetic algorithm based on hormone modulation
mechanism for job-shop scheduling problem. Expert Systems with Applications, 38(6), 7243-7250.
7878

Chen, W. et al. (Eds.) (2016). Proceedings of the 24th International Conference on Computers in Education.
India: Asia-Pacific Society for Computers in Education
Ongoing Formative Assessment
with Concept Map
in Proposition Level Exact Matching
Jaruwat PAILAIa*, Warunya WUNNASRIa, Yusuke HAYASHIa, Tsukasa HIRASHIMAa aGraduate School of Information Engineering, Hiroshima University, Japan
Abstract: Formative assessment is widely used in education area for improve learning
achievements. And we propose a framework of Kit-Build concept map for utilizing in ongoing
formative assessment. Concept map strategy is already proven to represent learner’s
understanding and becomes to a suitable strategy for formative assessment. We investigate the
proposition of concept map that is constructed by connecting two concepts via linking words.
The framework can gather and assess concept maps as learners’ evidence for identifying
learners’ state in classroom situation that is a task of formative assessment. It provides
assessment result and diagnosis result to instructor. These results are generated by using the
proposition level exact matching method of an automatic concept map assessment. The
assessment result is the similarity score between instructor’s concept map (Goal map) and
learner’s concept map (Learner map). And the diagnosis result is represented in form of concept
map with three error types. The errors show the different proposition between goal map and
learners map, which is called individual-goal difference map. Both assessment result and
diagnosis result provide information about understanding of each learner on lecture content to
instructor that is called individual diagnosis. It can contribute instructor’s feedback that is a key
of formative assessment. As more as possible to gather and assess learner’s evidence provides
more opportunities to instructor for improving learner’s achievements. Providing overview of
learners can reduce analysis time of instructor to recognize learners’ understanding. It means
instructor can design and provide instructor’s feedback in less time based on group diagnosis of
Kit-Build concept map. The group diagnosis includes group map and group-goal difference
map. The group map is generated from overlaying all of learners map. It shows common
understanding of learners that is used to generate group-goal difference map, this group-goal
difference map shows most common misunderstanding. In this paper, we would like to propose
the scenario that is suitable for supporting through of learning process since setting goal,
gathering evidence of learners and providing effective information to designing instructor’s
feedback for improving teaching and learning in classroom situation.
Keywords: Ongoing Formative Assessments, Concept map, Kit-Build concept map,
Proposition level exact matching
1. Introduction
Concept map that is used as a formative assessment strategy is a useful method for responding to
formative assessment requirement. It is used for goal setting, gathering learner’s evidence and
identifying learner’s state. Automatic concept map assessment is required for ongoing formative
assessment in classroom situation. The assessment can provide information of learners immediately,
which is used to design instructor’s feedback for improving learner’s understanding. The most suitable
solution to identify the disagreement is exact matching between learner map and instructor map. The
analyzer generates diagnosis results that can provide formative information for designing instructor’s
feedback together with instructor’s actions. In other words, this information will contribute instructor to
reflective practitioner in part of “Reflection-in-action” and “Reflection-on-action” for intra-class
feedback and inter-class feedback. They can be used to improve learning achievements.
7979
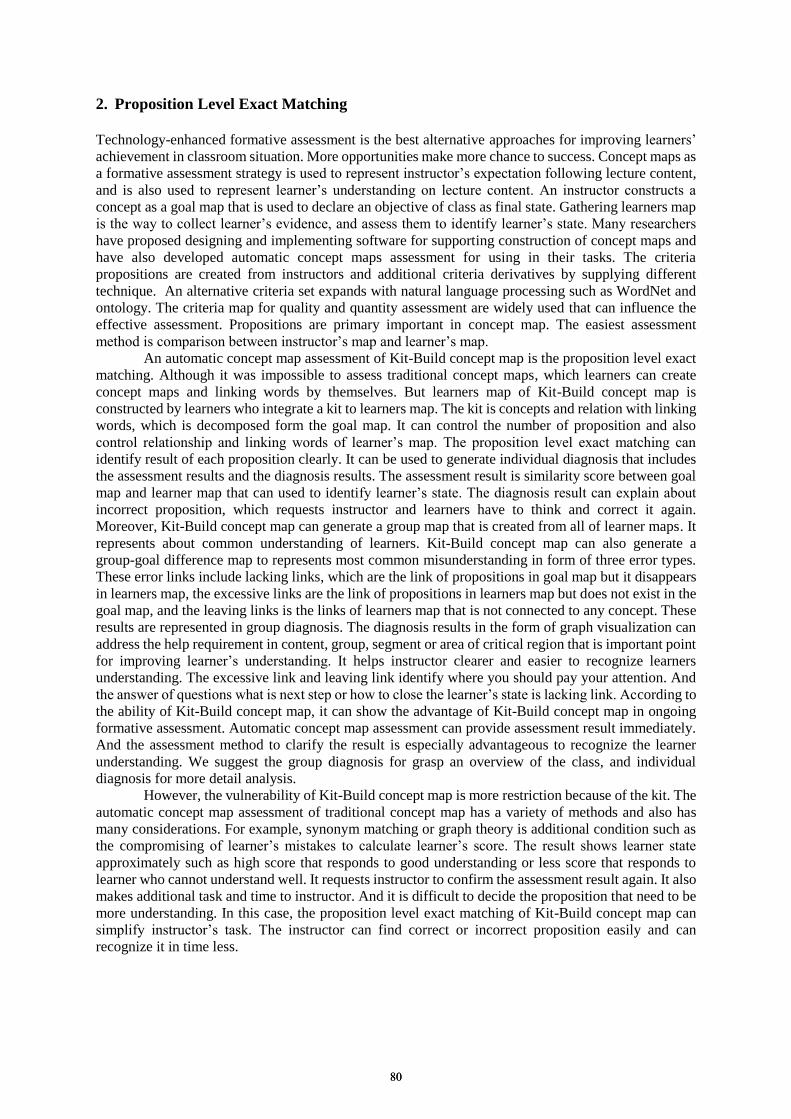
2. Proposition Level Exact Matching
Technology-enhanced formative assessment is the best alternative approaches for improving learners’
achievement in classroom situation. More opportunities make more chance to success. Concept maps as
a formative assessment strategy is used to represent instructor’s expectation following lecture content,
and is also used to represent learner’s understanding on lecture content. An instructor constructs a
concept as a goal map that is used to declare an objective of class as final state. Gathering learners map
is the way to collect learner’s evidence, and assess them to identify learner’s state. Many researchers
have proposed designing and implementing software for supporting construction of concept maps and
have also developed automatic concept maps assessment for using in their tasks. The criteria
propositions are created from instructors and additional criteria derivatives by supplying different
technique. An alternative criteria set expands with natural language processing such as WordNet and
ontology. The criteria map for quality and quantity assessment are widely used that can influence the
effective assessment. Propositions are primary important in concept map. The easiest assessment
method is comparison between instructor’s map and learner’s map. An automatic concept map assessment of Kit-Build concept map is the proposition level exact
matching. Although it was impossible to assess traditional concept maps, which learners can create
concept maps and linking words by themselves. But learners map of Kit-Build concept map is
constructed by learners who integrate a kit to learners map. The kit is concepts and relation with linking
words, which is decomposed form the goal map. It can control the number of proposition and also
control relationship and linking words of learner’s map. The proposition level exact matching can
identify result of each proposition clearly. It can be used to generate individual diagnosis that includes
the assessment results and the diagnosis results. The assessment result is similarity score between goal
map and learner map that can used to identify learner’s state. The diagnosis result can explain about
incorrect proposition, which requests instructor and learners have to think and correct it again.
Moreover, Kit-Build concept map can generate a group map that is created from all of learner maps. It
represents about common understanding of learners. Kit-Build concept map can also generate a
group-goal difference map to represents most common misunderstanding in form of three error types.
These error links include lacking links, which are the link of propositions in goal map but it disappears
in learners map, the excessive links are the link of propositions in learners map but does not exist in the
goal map, and the leaving links is the links of learners map that is not connected to any concept. These
results are represented in group diagnosis. The diagnosis results in the form of graph visualization can
address the help requirement in content, group, segment or area of critical region that is important point
for improving learner’s understanding. It helps instructor clearer and easier to recognize learners
understanding. The excessive link and leaving link identify where you should pay your attention. And
the answer of questions what is next step or how to close the learner’s state is lacking link. According to
the ability of Kit-Build concept map, it can show the advantage of Kit-Build concept map in ongoing
formative assessment. Automatic concept map assessment can provide assessment result immediately.
And the assessment method to clarify the result is especially advantageous to recognize the learner
understanding. We suggest the group diagnosis for grasp an overview of the class, and individual
diagnosis for more detail analysis.
However, the vulnerability of Kit-Build concept map is more restriction because of the kit. The
automatic concept map assessment of traditional concept map has a variety of methods and also has
many considerations. For example, synonym matching or graph theory is additional condition such as
the compromising of learner’s mistakes to calculate learner’s score. The result shows learner state
approximately such as high score that responds to good understanding or less score that responds to
learner who cannot understand well. It requests instructor to confirm the assessment result again. It also
makes additional task and time to instructor. And it is difficult to decide the proposition that need to be
more understanding. In this case, the proposition level exact matching of Kit-Build concept map can
simplify instructor’s task. The instructor can find correct or incorrect proposition easily and can
recognize it in time less.
8080
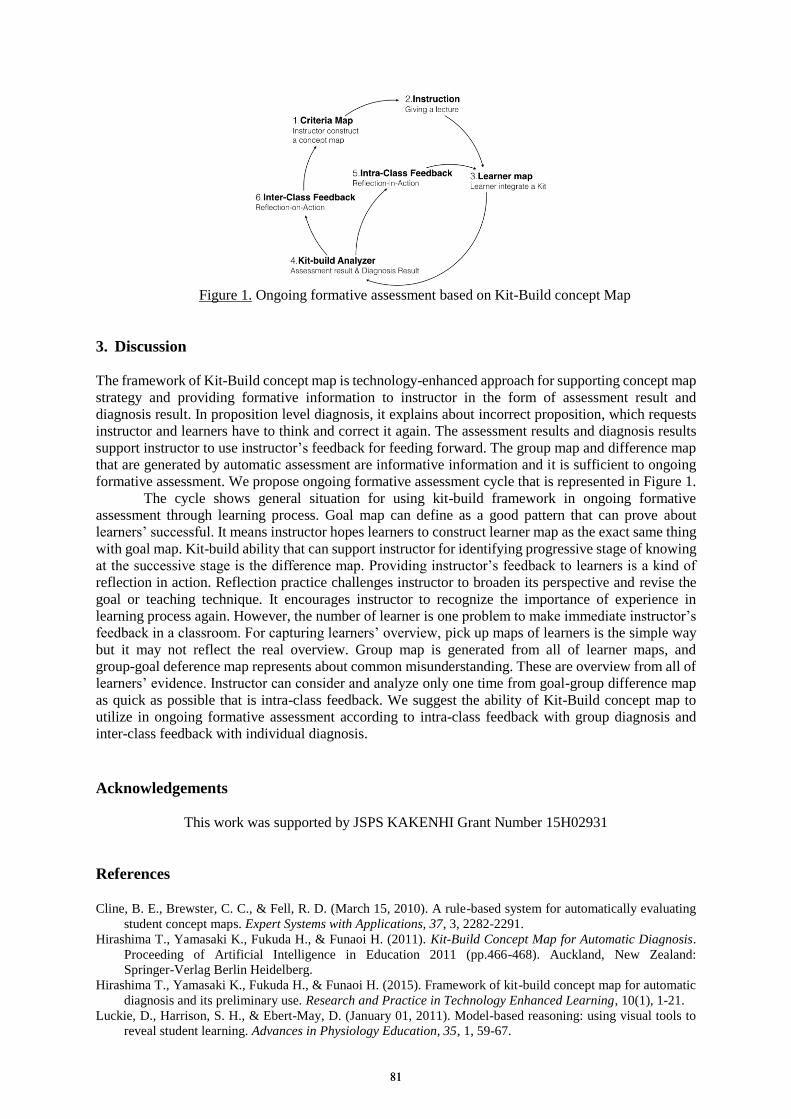
Figure 1. Ongoing formative assessment based on Kit-Build concept Map
3. Discussion
The framework of Kit-Build concept map is technology-enhanced approach for supporting concept map
strategy and providing formative information to instructor in the form of assessment result and
diagnosis result. In proposition level diagnosis, it explains about incorrect proposition, which requests
instructor and learners have to think and correct it again. The assessment results and diagnosis results
support instructor to use instructor’s feedback for feeding forward. The group map and difference map
that are generated by automatic assessment are informative information and it is sufficient to ongoing
formative assessment. We propose ongoing formative assessment cycle that is represented in Figure 1.
The cycle shows general situation for using kit-build framework in ongoing formative
assessment through learning process. Goal map can define as a good pattern that can prove about
learners’ successful. It means instructor hopes learners to construct learner map as the exact same thing
with goal map. Kit-build ability that can support instructor for identifying progressive stage of knowing
at the successive stage is the difference map. Providing instructor’s feedback to learners is a kind of
reflection in action. Reflection practice challenges instructor to broaden its perspective and revise the
goal or teaching technique. It encourages instructor to recognize the importance of experience in
learning process again. However, the number of learner is one problem to make immediate instructor’s
feedback in a classroom. For capturing learners’ overview, pick up maps of learners is the simple way
but it may not reflect the real overview. Group map is generated from all of learner maps, and
group-goal deference map represents about common misunderstanding. These are overview from all of
learners’ evidence. Instructor can consider and analyze only one time from goal-group difference map
as quick as possible that is intra-class feedback. We suggest the ability of Kit-Build concept map to
utilize in ongoing formative assessment according to intra-class feedback with group diagnosis and
inter-class feedback with individual diagnosis.
Acknowledgements
This work was supported by JSPS KAKENHI Grant Number 15H02931
References
Cline, B. E., Brewster, C. C., & Fell, R. D. (March 15, 2010). A rule-based system for automatically evaluating
student concept maps. Expert Systems with Applications, 37, 3, 2282-2291.
Hirashima T., Yamasaki K., Fukuda H., & Funaoi H. (2011). Kit-Build Concept Map for Automatic Diagnosis.
Proceeding of Artificial Intelligence in Education 2011 (pp.466-468). Auckland, New Zealand:
Springer-Verlag Berlin Heidelberg.
Hirashima T., Yamasaki K., Fukuda H., & Funaoi H. (2015). Framework of kit-build concept map for automatic
diagnosis and its preliminary use. Research and Practice in Technology Enhanced Learning, 10(1), 1-21.
Luckie, D., Harrison, S. H., & Ebert-May, D. (January 01, 2011). Model-based reasoning: using visual tools to
reveal student learning. Advances in Physiology Education, 35, 1, 59-67.
8181

Chen, W. et al. (Eds.) (2016). Proceedings of the 24th International Conference on Computers in Education. India:
Asia-Pacific Society for Computers in Education
Towards a Social Student Model in a Software
Engineering Group Project Course
Edward ARMSTRONG, Moffat MATHEWS* & Neville CHURCHER
Computer Science & Software Engineering, University of Canterbury
Abstract: We describe an observational investigation that explores whether creating open social
student models using software metrics promotes reflection. Metric visualisations were shown
to six groups in an undergraduate software engineering project course. Seeing their own
visualisations prompted reflection on their codebase at a conceptual level as expected; this is as
predicted by previous research. When viewing other’s visualisations, the focus changed to
comparative statements with reasoning to explain differences showing that this increased
performance orientation. Delayed queries showed that engagement was varied but increased in
all groups.
Keywords: Open Student Model, Open Learner Model, Open Social Student Modelling, User
Modelling, Software Engineering Education
1. Introduction
This is the first step towards creating an adaptive system to guide students in a software engineering
project course while they are designing and implementing their project. Teaching software engineering
group projects is challenging, as there are several ill-defined elements and heuristics with high
dependence on context. In our yearlong project course, groups build software against a similar backlog.
Each group can view their burndowns/burnups however, due to the ill-natured aspect of the domain, the
concept of student/team models does not exist. As there are no set rules for creating “good” software
but instead fuzzy heuristics, the modelling of such a domain is very difficult. Furthermore, a software
engineering “problem” is often vague and ill-defined. To start this project, we created open social
student models for each group using common software metrics and conducted an initial observational
investigation.
The purpose of open student models is to give the student the system’s view of the student’s
knowledge or progress within the domain (Mathews, Mitrovic, Lin, Holland, & Churcher, 2012). The
hope is that the student builds a high-level view of the domain and increases their meta-cognitive skills
helping them become independent learners as they continually reflect on their learning. Recently, work
has been done in opening up other’s anonymised models to a student to increase motivation and self-
assessment skills. Other models (Open Social Student Models – OSSM) might be shown so that the
student can compare their knowledge and progress against their peers (Brusilovsky et al., 2016).
In cases like this, it is often recommended that ITS developers build on smaller investigations
(even Wizard of Oz studies) as they iterate towards the final ITS; the layered evaluation (Brusilovsky,
Karagiannidis, & Sampson, 2004) is an example of this. We started this process from a high-level by
creating a visualisation of graphs of one artefact (codebase) using well-known software metrics so that
teams could see aspects of their domain without any feedback. After a short period, they were shown
metric graphs of other groups. Being an observational investigation, we wrote notes on any interactions,
particularly when groups viewed other groups’ graphs.
2. Investigation Method
The participants of this investigation were students in a full year project course at the University of
Canterbury. Following a method similar to the OSSM, does providing visualisations of other teams’
codebase to compare against your own help in reflecting on your codebase?
8282
As metrics are used by professionals to understand their codebase better (Fenton & Bieman,
2014; Mordal et al., 2013) and improve efficiency (Basili et al., 2010), we selected that as our “model”
from which to build the representations. We are confident that metrics can provide valuable information
for teaching and learning in the software engineering filed as they can provide information about the
state of a software project (Jalote, 2012; Jureczko & Spinellis, 2010). We chose the Chidamber &
Kemerer metric suite (Chidamber & Kemerer, 1994) as they are common and all our participants are
familiar with them as they are taught in a sister theory course. Each of the groups’ master branch was
downloaded from their git repositories at the same time and frequency histograms were created for each
metric. By this stage of the course, each codebase on the master branch only is over 20,000 lines of
code. The visualisations do not need to be novel as we can use various proven techniques (Spence, 2000;
Steele & Iliinsky, 2010; Ware, 2000). However, seeing if making comparisons using the OSSM
technique within a project course is.
Forty-three participants in six groups (7-8 students in each) attended a voluntary session each.
The discussion between team members was the focus of the sessions. For the most part, the
experimenter simply observed, noted the interactions, and answered any questions.
Each session was split into two parts, the second part was initially unknown to the students.
During the first part, each group was presented with their C&K metrics graphs (e.g. frequency
histograms) on a large ten-touch screen; this allowed participants to zoom in/out and move
visualisations to enable better comparisons. More detail was available for each metric at the granularity
of the class or method. In the second part, each group was presented with the graphs for all the other
groups. Seeing the other groups’ histograms did not give any information about their design or method
of implementation.
3. Observational Results and Discussion
All groups asked for a detailed explanation of each metric. This is understandable as metrics are not the
students’ focus. Metric thresholds were also a point of interest to the student; if these are calculated
incorrectly, they could result in spurious results. Understanding the overall picture in terms of their
codebase means finding the links between the different metrics. As expected, all groups concentrated a
lot more on the shape of the graphs and the outliers. Groups discussed specific classes and what could
be affecting the metrics values. In almost all cases, the details confirmed what the team knew about
their codebase already. It was interesting to note that spurred on conversations between team members
about their code and solutions to a few of the potential problems.
All groups were very keen to see other groups’ graphs. They spent a lot more time interacting
with the other graphs, including comparing theirs to others’. As there were only six teams, the graphs
and data were not anonymised.
All groups had several reasons for any differences between their histograms and other groups’.
In this part, it was encouraging to see that the comparisons were made at a much deeper level than just
the metric values showing a lot more thought and reflection about their design and implementation. As
each group only had access to their own codebase, all references to the possible interpretations of other
groups’ histograms were at a high level of abstraction in the design. Five of the six groups wanted more
details about other groups’ code while four also wanted details about their design, showing signs of
competitiveness.
Surprisingly, towards the end of the sessions, five of the six teams explained away the
differences, settling on the opinion that they were either better than the other teams or at least no
different. This could have been because they did not have access to the codebases/designs or because
the initial histograms were at a very high-level while the accompanying details were overwhelming, as
a few students commented. As such, only two teams had action items to check and correct certain areas
of their code.
At the end of the session, all groups asked if, during the year, they could continue to see all
visualisations; it was very clear that this was solely related to competitive performance. All students
enjoyed using the system and even made requests for change, including timeline charts, a greater
number of visualisations, and the ability to change granularity.
Two weeks after the initial session, we conducted a short session with each of the six groups.
They were asked if they had taken any actions because of the discussions and to describe what they did.
8383
Three groups inspected areas of their code that they identified as problematic; two of those three groups
also made changes. Four of the groups attempted to get the other groups’ designs while two of the
groups were motivated to attend the other groups’ formal sessions to get a better idea of their design
and implementations. We could possibly attribute the low number of actions on the codebases due to
the nature of the course and the information these particular metrics show. This course emphasises the
need of giving the customer value by having concrete results and large refactoring becomes hard to
justify within short sprints. The C&K metrics that the teams were shown at this time may not have been
suitable as they only look at classes, which in a ~20KLOC project would be a rather small number that
is relatively well known by all team members.
4. Conclusions
Open student models have been shown to help students understand the domain better, assess their skills,
and plan their own learning. Recent work on open social student models have shown that they can
motivate students particularly in terms of performance. Our exploratory observations showed that
visualisations instigated group discussion. Students reflected by making connections between the
graphs and their work (codebase) and then deciding what, if anything, needed to be done to address it.
During this time, they primarily focused on content (such as architecture, code smells, etc.). These
observations are in line with previous research into open models. However, when students saw others’
models, the focus immediately changed to performance-oriented competitiveness. As predicted by
OSSM research, students were very keen to make comparisons. OSSM techniques using metric
visualisations seem to be useful to increase reflection, engagement, and competitiveness in the software
engineering project course. There are several limitations to this investigation. It was an observational
exploratory investigation rather than a controlled study. There were no follow up sessions with new
visualisations. The observations were manually recorded. In spite of these limitations, our results show
that further investigations in this domain are worthwhile.
References
Basili, V. R., Heidrich, J., Lindvall, M., Münch, J., Regardie, M., Rombach, D., et al. (2010). Linking
software development and business strategy through measurement. IEEE Computer, 43(4), 57-
65.
Brusilovsky, P., Karagiannidis, C., & Sampson, D. (2004). Layered evaluation of adaptive learning
systems. Int. J. Cont. Engineering Education and Lifelong Learning, 14(4/5).
Brusilovsky, P., Somyurek, S., Guerra, J., Hosseini, R., Zadorozhny, V., & Durlach, P. (2016). Open
Social Student Modeling for Personalized Learning. IEEE Transactions on Emerging Topics in
Computing, 4(3), 450-461.
Chidamber, S. R., & Kemerer, C. F. (1994). A Metrics Suite for Object Oriented Design. [Article].
IEEE Transactions on Software Engineering, 20(6), 476-493.
Fenton, N., & Bieman, J. (2014). Software metrics: a rigorous and practical approach: CRC Press.
Jalote, P. (2012). An Integrated Approach to Software Engineering (3 ed.): Springer.
Jureczko, M., & Spinellis, D. (2010). Using object-oriented design metrics to predict software defects.
Models and Methods of System Dependability. Oficyna Wydawnicza Politechniki Wrocławskiej,
69-81.
Mathews, M., Mitrovic, A., Lin, B., Holland, J., & Churcher, N. (2012). Do Your Eyes Give it Away?
Using Eye Tracking Data to Understand Students' Attitudes towards Open Student Model
Representations. Paper presented at the 11th International Conference of Intelligent Tutoring
Systems.
Mordal, K., Anquetil, N., Laval, J., Serebrenik, A., Vasilescu, B., & Ducasse, S. (2013). Software
quality metrics aggregation in industry. Journal of Software: Evolution and Process, 25(10),
1117-1135.
Spence, R. (2000). Information visualization. Harlow: Addison-Wesley.
Steele, J., & Iliinsky, N. P. N. (2010). Beautiful visualization (Vol. 1st). Beijing;Sebastopol, CA;:
O'Reilly.
Ware, C. (2000). Information visualization: perception for design. San Francisco: Morgan Kaufman.
8484
Chen, W. et al. (Eds.) (2016). Proceedings of the 24th
International Conference on Computers in Education.
India: Asia-Pacific Society for Computers in Education
A Modular Approach for Multi-Dimensional
Learning Support in Educational Games
Alexander NUSSBAUMERa*
, Christina M. STEINERa,
Matthias MAURERa, Rob NADOLSKI
b, & Dietrich ALBERT
a,c
aKnowlege Technologies Institute, Graz University of Technology, Austria
b Faculty of Psychology and Educational Sciences, Open University of the Netherlands
cDepartment of Psychology, University of Graz, Austria
Abstract: In this paper we present a modular approach for learning support in game
environments. In applied or educational games both aspects are important – the fun to play and
a topic to learn. While traditional games or leisure games only focus on the enjoyment and
entertainment of the player, educational games also aim to convey knowledge and competences.
However, in order to fulfill this goal, an applied game should take care that the player actually
learns. The various components of our approach specifically support the learning aspects in a
game in different and balanced ways. This includes adaptation of the game for smooth
competence development, maintaining motivation, support in problem solving tasks, support
for meta-cognition and reflection, and adaptation to the players' personality.
Keywords: Educational games, adaptation, competences, motivation, reflection support
1. Introduction
Digital learning games represent an e-learning technology that is increasingly recognized by
educational practitioners (Johnson, 2014). With their highly engaging and motivating character games
constitute effective educational tools for creating authentic learning tasks and meaningful, situated
learning (De Freitas, 2013).
Psychological research has targeted many aspects of leisure and educational games, such as
engagement, challenge, motivation, and achievement. Starks (2014) proposes a cognitive-behavioral
game design model that incorporates a wide range of psychological constructs and relates them with
game design elements. In this three-tier model cognitive elements (e.g. knowledge, goals,
encouragements) are connected with game design elements derived from the Social Cognitive Theory
(Bandura, 2006) and the Theory of Multiple Intelligences (Gardner, 1983). According to the model of
Starks, this leads to the factors that make games both enjoyable and educational, which are engagement,
challenge, flow, persistence, and mastery. All of these factors have been extensively researched from a
psychological perspective. For example, the flow concept (Csikszentmihalyi & LeFevre, 1989)
describes a situation when people are highly engaged and lose track of time, which often happens, when
competence development and game challenges are balanced (e.g. the game should not demand to much
or too little from the player).
While all these concepts are important and helpful for increasing the performance in serious
games, there is a distinction between performance and learning (VandeWalle et al, 1999; Fisher & Ford,
1998). For example, there is a difference, if the goal of a game is to learn about topic and acquire
knowledge or just to complete tasks and challenges not related to learning topics. Supporting and
assessing learning requires a clear model of learning activities and the processes involved towards the
achievement of learning goals.
This paper presents a modular approach for learning support that takes into account these
psychological aspects and relates them with a technical design that can be included in educational
games. Hence, these components consist of an integration of pedagogical and technical concepts.
8585
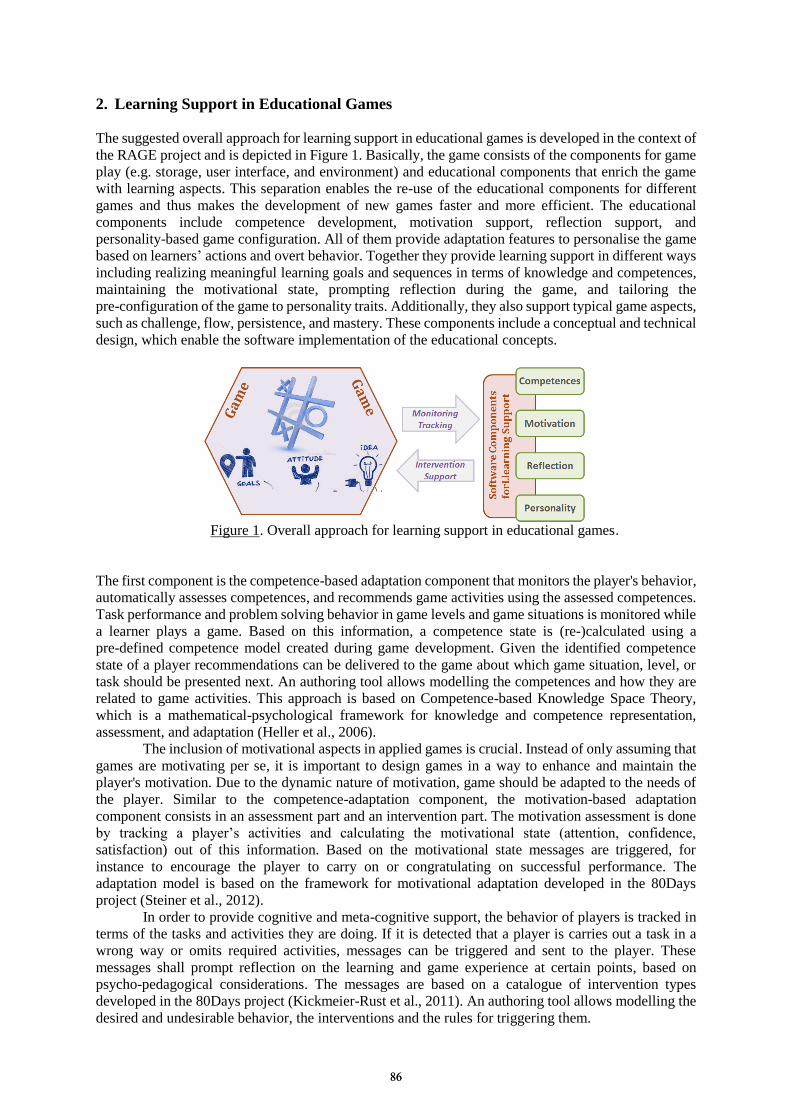
2. Learning Support in Educational Games
The suggested overall approach for learning support in educational games is developed in the context of
the RAGE project and is depicted in Figure 1. Basically, the game consists of the components for game
play (e.g. storage, user interface, and environment) and educational components that enrich the game
with learning aspects. This separation enables the re-use of the educational components for different
games and thus makes the development of new games faster and more efficient. The educational
components include competence development, motivation support, reflection support, and
personality-based game configuration. All of them provide adaptation features to personalise the game
based on learners’ actions and overt behavior. Together they provide learning support in different ways
including realizing meaningful learning goals and sequences in terms of knowledge and competences,
maintaining the motivational state, prompting reflection during the game, and tailoring the
pre-configuration of the game to personality traits. Additionally, they also support typical game aspects,
such as challenge, flow, persistence, and mastery. These components include a conceptual and technical
design, which enable the software implementation of the educational concepts.
Figure 1. Overall approach for learning support in educational games.
The first component is the competence-based adaptation component that monitors the player's behavior,
automatically assesses competences, and recommends game activities using the assessed competences.
Task performance and problem solving behavior in game levels and game situations is monitored while
a learner plays a game. Based on this information, a competence state is (re-)calculated using a
pre-defined competence model created during game development. Given the identified competence
state of a player recommendations can be delivered to the game about which game situation, level, or
task should be presented next. An authoring tool allows modelling the competences and how they are
related to game activities. This approach is based on Competence-based Knowledge Space Theory,
which is a mathematical-psychological framework for knowledge and competence representation,
assessment, and adaptation (Heller et al., 2006).
The inclusion of motivational aspects in applied games is crucial. Instead of only assuming that
games are motivating per se, it is important to design games in a way to enhance and maintain the
player's motivation. Due to the dynamic nature of motivation, game should be adapted to the needs of
the player. Similar to the competence-adaptation component, the motivation-based adaptation
component consists in an assessment part and an intervention part. The motivation assessment is done
by tracking a player’s activities and calculating the motivational state (attention, confidence,
satisfaction) out of this information. Based on the motivational state messages are triggered, for
instance to encourage the player to carry on or congratulating on successful performance. The
adaptation model is based on the framework for motivational adaptation developed in the 80Days
project (Steiner et al., 2012).
In order to provide cognitive and meta-cognitive support, the behavior of players is tracked in
terms of the tasks and activities they are doing. If it is detected that a player is carries out a task in a
wrong way or omits required activities, messages can be triggered and sent to the player. These
messages shall prompt reflection on the learning and game experience at certain points, based on
psycho-pedagogical considerations. The messages are based on a catalogue of intervention types
developed in the 80Days project (Kickmeier-Rust et al., 2011). An authoring tool allows modelling the
desired and undesirable behavior, the interventions and the rules for triggering them.
8686
The last component is the player profiling component, which allows adapting the game before
the player starts. Pre-game adaptation is enabled by presenting a short personality questionnaire when
first entering the game. Based on the analysis of the players’ responses, personality traits are identified
and the game features and versions may be tailored to a player’s characteristics. An authoring tool
allows the creation of such questionnaires, the calculation of personality scores and their interpretation
in terms of game adaptation.
3. Conclusion and Outlook
This poster paper presented an approach for providing learning support on multiple dimensions in
educational games. This approach is realized by a set of software components that support different
learning aspects. The modular design enables the use of these components by game developers and
game designers, which makes the development process more efficient, professional, and cheaper.
The next step is the integration of these software components with an educational game, in order
to test and evaluate our approach. This integration enables testing technically whether the components
function correctly and pedagogically whether the components support learning as it would be expected.
Moreover, a user-centric evaluation will be conducted to validate the practical usefulness and learning
effect.
Acknowledgements
This work has been partially funded by the EC H2020 project RAGE (Realising and Applied Gaming
Eco-System); http://www.rageproject.eu/; Grant agreement No 644187. This document reflects only
the views of the authors and the European Commission is not responsible for any use that may be made
of the information it contains.
References
Bandura, A. (2006). Toward a psychology of human agency. Perspect. Psychol. Sci. 1, 164–180. doi:
10.1111/j.1745-6916.2006.00011.x
Csikszentmihalyi, M., and LeFevre, J. (1989). Optimal experience in work and leisure. J. Pers. Soc. Psychol. 56,
815–822. doi: 10.1037/0022-3514.56.5.815
De Freitas, S. (2013). Learning in immersive worlds. A review of game-based learning. JISC E-learning
programme. Retrieved March 1, 2013 from
http://www.jisc.ac.uk/media/documents/programmes/elearninginnovation/gamingreport_v3.pdf
Fisher, S.L., Ford, J.K., “Differential effects of learner effort and goal orientation on two learning outcomes”,
Personnel Psychology (Wiley) vol. 51, pp.397–420, 1998.
Gardner, H. (1983). Frames of Mind: The Theory of Multiple Intelligences. New York: Basic Books.
Heller, J., Steiner, C., Hockemeyer, C., & Albert, D. (2006). Competence-Based Knowledge Structures for
Personalised Learning. International Journal on E-Learning, 5(1), 75-88.
Johnson, L., Adams Becker, S., Estrada, V., & Freeman, A. (2014). NMC Horizon Report: 2014, Higher
Education Edition. Austin: The New Media Consortium.
Kickmeier-Rust, M.D., Steiner, C.M., & Albert, D. (2011). Apt to adapt: Micro- and macro-level adaptation in
educational games. In T. Daradoumis, S. Caballé, A.A. Juan & F. Xhafa (Eds.), Technology-enhanced
systems and tools for collaborative learning scaffolding. Studies in Computational Intelligence Vol. 350 (pp.
221-238). Berlin: Springer.
Starks, K. (2014). Cognitive behavioral game design: a unified model for designing serious games. Frontiers in
Psychology, 5(28). doi: 10.3389/fpsyg.2014.00028
Steiner, C.M., Kickmeier-Rust, M.D., Mattheiss, E., Göbel, S., & Albert, D. (2012). Balancing on a high wire:
Adaptivity, a key factor of future learning games. In M.D. Kickmeier-Rust & D. Albert (Eds.), An alien’s
guide to multi-adaptive educational computer games (pp. 43-88). Santa Rosa: Informing Science Press.
VandeWalle, D., Brown, S.P., Cron, W.L., Slocum, L.W., “The influence of goal orientation and self-regulation
tactics on sales performance: A longitudinal field test”. Journal of Applied Psychology (APA), vol. 84,
pp.249–259, 1999.
8787
Chen, W. et al. (Eds.) (2016). Proceedings of the 24th International Conference on Computers in Education.
India: Asia-Pacific Society for Computers in Education
A Teachable Agent for the Japanese Dictogloss
Learning Support Environment
Satoru KOGURE a*, Kenta MIYAGISHIMA a, Yasuhiro NOGUCHI a,
Makoto KONDO a, Tatsuhiro KONISHI a & Yukihiro ITOH b aFaculty of Informatics, Shizuoka University, Japan
bShizuoka University, Japan
Abstract: Dictogloss is one of the methods of learning a second language. In dictogloss
activity, learners listen to a short text spoken by the teacher, after which they first reconstructs
what they have heard individually and then complete the text in discussion with one another.
Having already implemented a Japanese dictogloss learning environment without learning
partners and a teacher for the beginner level. We focus in this paper on the learning environment
for the intermediate learner. We anticipate that the learning by teaching method will help
intermediate learners to improve their target knowledge. We have thus implemented teachable
agent in our previous environment.
Keywords: Dictogloss, second language learning, learning by teaching, teachable agent
1. Introduction
Dictogloss is a multiple skills collaborative activity proposed by Wajnyrb (1990). In a dictogloss
activity, a teacher reads a short text to learners who try to reconstruct the content of the text
individually, after which they discuss the original text together based on their own reconstructed texts.
This activity requires learners to exercise the four skills of listening, reading, writing, and speaking.
Learners cannot engage in this activity by themselves because this activity is a collaborative learning
method, which requires real learning partners and a teacher. We developed a dictogloss system that
supported learners' self-study using two intelligent agents as a learning partner (learner agent) and a
teacher (teacher agent) (Kondo et al., 2012; Tashiro et al., 2013; Kogure et al., 2015). The system
supports the learning of three skills: listening, reading, and writing (without speaking). In the system, a
user can use the GUI interface to write the reconstructed text and discuss the own reconstructed text
with the collaborative learning agent (CLA).
The reconstruction stage is a phase in which learners discuss the original text based on their
own reconstructed texts. In this stage, the learner agent generates its own reconstructed text, which
leads the learner to identify his/her errors. The agent engages in discussion with the learner about the
reconstructed texts. The learner agent analyzes the learner's reconstructed text to recognize his/her
errors based on the architecture of error detection proposed by Kondo et al. (2010). The learner agent
generates its own reconstructed text applying a focus on form (FonF) approach. FonF is a pedagogical
approach in which a few specific grammatical forms are focused on in a lesson. In addition, it has been
pointed out that keywords in a dictogloss text should be given to learners before they listen to the text
(Wajnryb 1990). See Kondo et al. (2012) for further discussion.
Figure 1 shows a screenshot of a previous environment (Kogure et al., 2015) when a learner
inputs some reconstructed texts into the first sentence (S1 is “It is raining today.” in English) and the
second sentence (S2 is “And is it usually like this in Japan?” in English). In the left/top area, the system
illustrates the situation of the target problem. In the middle/top area, the system shows the chat history
with the CLA. In the chat area, the learner’s utterance is on the left and the agent’s utterance on the
right. The agent character “Tsugumi” is in the right/top area. There is a learner’s reconstructed text in
the left/bottom area and there is an agent’s reconstructed text in the right/bottom area. The agent
generates a corresponding reconstructed text when a learner inputs each text. In the second sentence S2,
the learner compares her/his reconstructed text with that of the CLA and notices that the word
8888
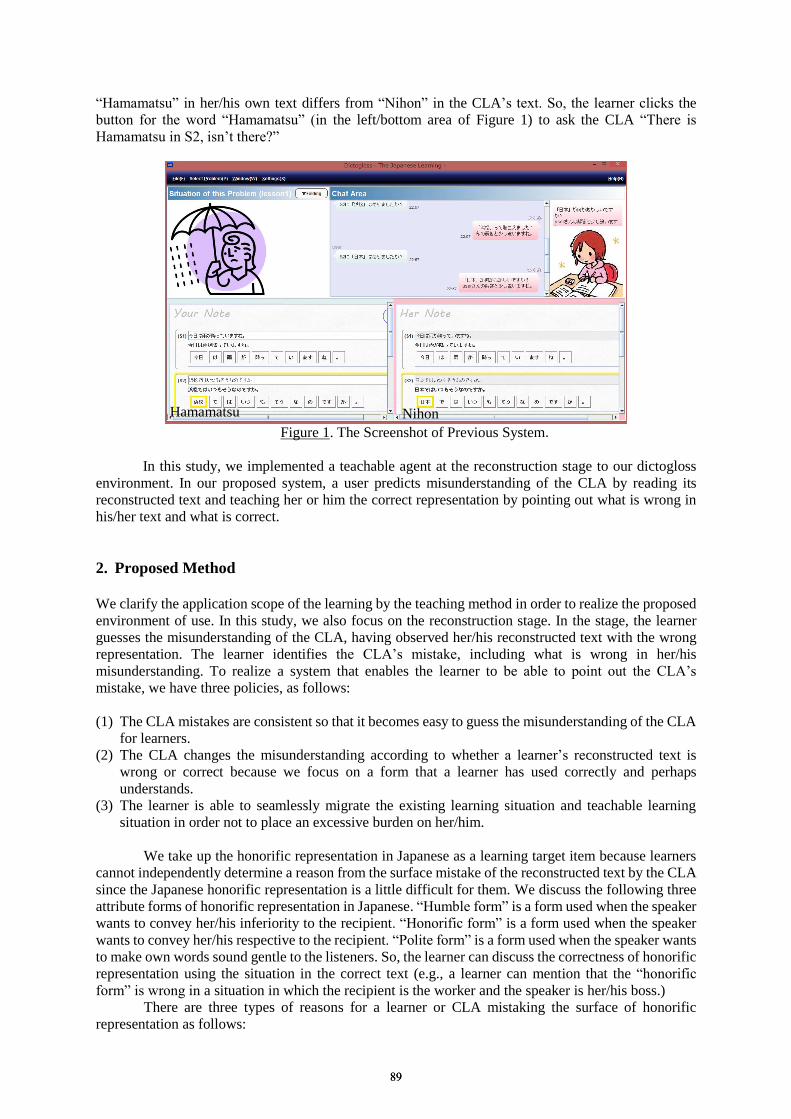
“Hamamatsu” in her/his own text differs from “Nihon” in the CLA’s text. So, the learner clicks the
button for the word “Hamamatsu” (in the left/bottom area of Figure 1) to ask the CLA “There is
Hamamatsu in S2, isn’t there?”
Figure 1. The Screenshot of Previous System.
In this study, we implemented a teachable agent at the reconstruction stage to our dictogloss
environment. In our proposed system, a user predicts misunderstanding of the CLA by reading its
reconstructed text and teaching her or him the correct representation by pointing out what is wrong in
his/her text and what is correct.
2. Proposed Method
We clarify the application scope of the learning by the teaching method in order to realize the proposed
environment of use. In this study, we also focus on the reconstruction stage. In the stage, the learner
guesses the misunderstanding of the CLA, having observed her/his reconstructed text with the wrong
representation. The learner identifies the CLA’s mistake, including what is wrong in her/his
misunderstanding. To realize a system that enables the learner to be able to point out the CLA’s
mistake, we have three policies, as follows:
(1) The CLA mistakes are consistent so that it becomes easy to guess the misunderstanding of the CLA
for learners.
(2) The CLA changes the misunderstanding according to whether a learner’s reconstructed text is
wrong or correct because we focus on a form that a learner has used correctly and perhaps
understands.
(3) The learner is able to seamlessly migrate the existing learning situation and teachable learning
situation in order not to place an excessive burden on her/him.
We take up the honorific representation in Japanese as a learning target item because learners
cannot independently determine a reason from the surface mistake of the reconstructed text by the CLA
since the Japanese honorific representation is a little difficult for them. We discuss the following three
attribute forms of honorific representation in Japanese. “Humble form” is a form used when the speaker
wants to convey her/his inferiority to the recipient. “Honorific form” is a form used when the speaker
wants to convey her/his respective to the recipient. “Polite form” is a form used when the speaker wants
to make own words sound gentle to the listeners. So, the learner can discuss the correctness of honorific
representation using the situation in the correct text (e.g., a learner can mention that the “honorific
form” is wrong in a situation in which the recipient is the worker and the speaker is her/his boss.)
There are three types of reasons for a learner or CLA mistaking the surface of honorific
representation as follows:
Hamamatsu Nihon
8989
(A) A learner or CLA misunderstands the situation of a short text spoken by the teacher. Especially,
s/he misunderstands the social relationships of each character that appears in the short text.
(B) S/he misunderstands an honorific rule corresponding to a situation. For example, s/he
misunderstands that the humble form is a form used when the speaker wants to convey her/his
respect to the recipient. (Correctly, this form is the honorific form.)
(C) S/he misunderstands a suitable surface representation for an honorific attribute form. For example,
s/he misunderstands that “ossaru” is an honorific form of the verb “iu” (meaning “say” in English).
Correctly, “ossaru” is a humble form.
We focus on reason types of (B) and (C) because our system presents a situation with a simple
image and simple description written in the learner’s native language in advance. Due to limitation of
space, we emit to explain the reason types in detail. In our proposed environment, the learner learns the
honorific representation using our learning environment with the function of previous works. The
system migrates the new mode for learning by teaching if s/he can properly use the honorific
representation. The system determines that the correct rate for using honorific representations exceeds
70% (a value that we decided on heuristically). When the system migrates the learning by teaching
mode, it decides the mistake type of the CLA from 18 patterns. The system generates the mistake
representation of honorifics according to the decided mistake type. We developed a proposed
environment in order to extend our previous environment. We implemented seven new modules and
five new GUI interfaces to the environment. In the environment, the learner can only use the GUI
interface by inputting her/his own question or description to the CLA in the same way as the previous
one. We prepared three lesson packages, and confirm that the environment correctly performs in
prepared three packages.
3. Conclusion
We designed a Japanese dictogloss environment for intermediate learners, in which we focus on the
learning by teaching method, implementing a dictogloss environment to be able to support the method.
We set the target learning form as Japanese honorific representation. In the environment, the CLA
misuses honorific representation and the learner attempts to persuade her/him to make corrections.
In the future, we must perform an experimental evaluation with foreign students, focusing on
the speaking skills. Especially, we will extend the environment to be able to use speech in the
reconstruction stage.
Acknowledgements
This work was supported by JSPS KAKENHI Grant Numbers 25730204 and 26350273.
References
Kogure, S., Tashiro, A., Noguchi, Y., Kondo, M., Konishi, T. & Itoh, Y. (2015). An answer support environment
based on grammar, context and situation for a dialogue to learner agent on Japanese dictogloss system.,
Proceedings of ICCE 2015, 94-96.
Kondo, M., Kure, U., Daicho, Y., Kogure, S., Konishi, T. & Itoh, Y. (2010). Form-wise error detection in a
FonF-based language education system. Proceedings of ICCE 2010, 9-16.
Kondo, M., Sano, R., Tashiro, A., Noguchi, Y., Kogure, S., Konishi, T. & Itoh, Y. (2012). Development of a
dictogloss system oriented for focus on form. Proceedings of ICCE 2012, 1-8.
Tashiro, A., Noguchi, Y., Kogure, S., Kondo, M., Konishi, T. & Itoh, Y. (2013). Evaluation of an improved
dictogloss system oriented for focus on form. Proceedings of ICCE2013, 110-114.
Wajnryb, R. (1990). Grammar dictation. Oxford: Oxford University Press.
9090
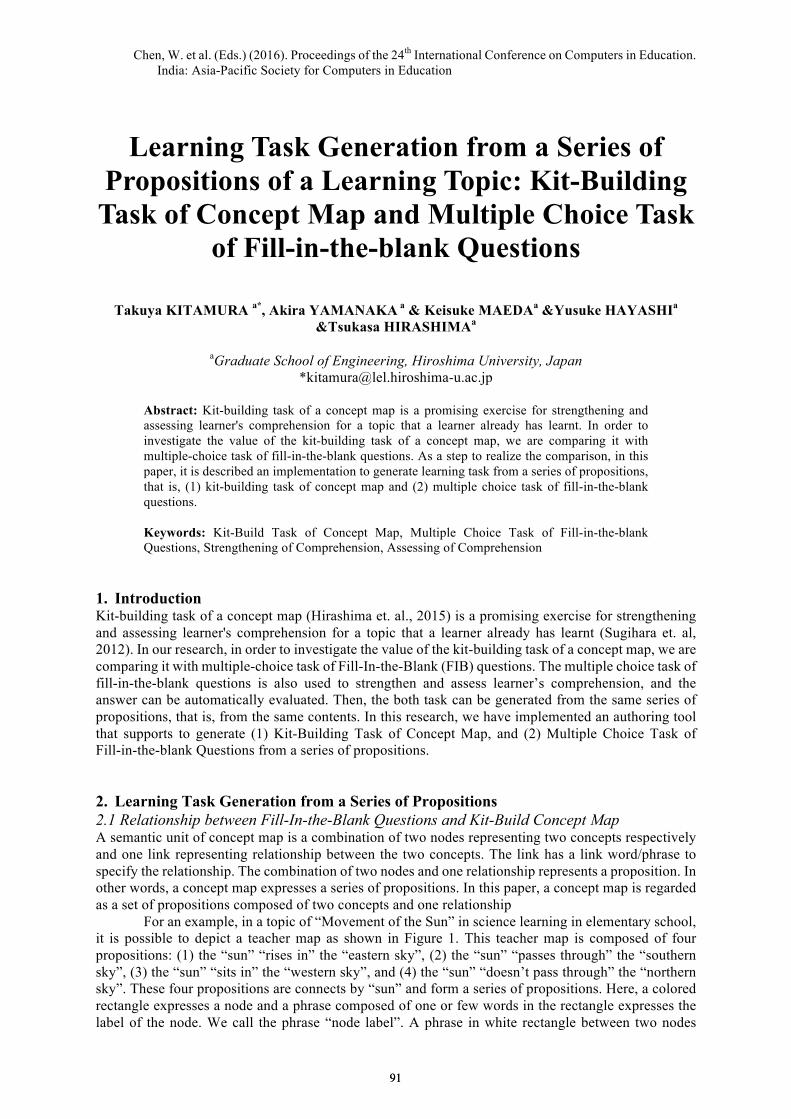
Chen, W. et al. (Eds.) (2016). Proceedings of the 24th International Conference on Computers in Education. India: Asia-Pacific Society for Computers in Education
Learning Task Generation from a Series of Propositions of a Learning Topic: Kit-Building Task of Concept Map and Multiple Choice Task
of Fill-in-the-blank Questions
Takuya KITAMURA a*, Akira YAMANAKA a & Keisuke MAEDAa &Yusuke HAYASHIa &Tsukasa HIRASHIMAa
aGraduate School of Engineering, Hiroshima University, Japan
Abstract: Kit-building task of a concept map is a promising exercise for strengthening and assessing learner's comprehension for a topic that a learner already has learnt. In order to investigate the value of the kit-building task of a concept map, we are comparing it with multiple-choice task of fill-in-the-blank questions. As a step to realize the comparison, in this paper, it is described an implementation to generate learning task from a series of propositions, that is, (1) kit-building task of concept map and (2) multiple choice task of fill-in-the-blank questions. Keywords: Kit-Build Task of Concept Map, Multiple Choice Task of Fill-in-the-blank Questions, Strengthening of Comprehension, Assessing of Comprehension
1. Introduction Kit-building task of a concept map (Hirashima et. al., 2015) is a promising exercise for strengthening and assessing learner's comprehension for a topic that a learner already has learnt (Sugihara et. al, 2012). In our research, in order to investigate the value of the kit-building task of a concept map, we are comparing it with multiple-choice task of Fill-In-the-Blank (FIB) questions. The multiple choice task of fill-in-the-blank questions is also used to strengthen and assess learner’s comprehension, and the answer can be automatically evaluated. Then, the both task can be generated from the same series of propositions, that is, from the same contents. In this research, we have implemented an authoring tool that supports to generate (1) Kit-Building Task of Concept Map, and (2) Multiple Choice Task of Fill-in-the-blank Questions from a series of propositions. 2. Learning Task Generation from a Series of Propositions 2.1 Relationship between Fill-In-the-Blank Questions and Kit-Build Concept Map A semantic unit of concept map is a combination of two nodes representing two concepts respectively and one link representing relationship between the two concepts. The link has a link word/phrase to specify the relationship. The combination of two nodes and one relationship represents a proposition. In other words, a concept map expresses a series of propositions. In this paper, a concept map is regarded as a set of propositions composed of two concepts and one relationship
For an example, in a topic of “Movement of the Sun” in science learning in elementary school, it is possible to depict a teacher map as shown in Figure 1. This teacher map is composed of four propositions: (1) the “sun” “rises in” the “eastern sky”, (2) the “sun” “passes through” the “southern sky”, (3) the “sun” “sits in” the “western sky”, and (4) the “sun” “doesn’t pass through” the “northern sky”. These four propositions are connects by “sun” and form a series of propositions. Here, a colored rectangle expresses a node and a phrase composed of one or few words in the rectangle expresses the label of the node. We call the phrase “node label”. A phrase in white rectangle between two nodes
9191
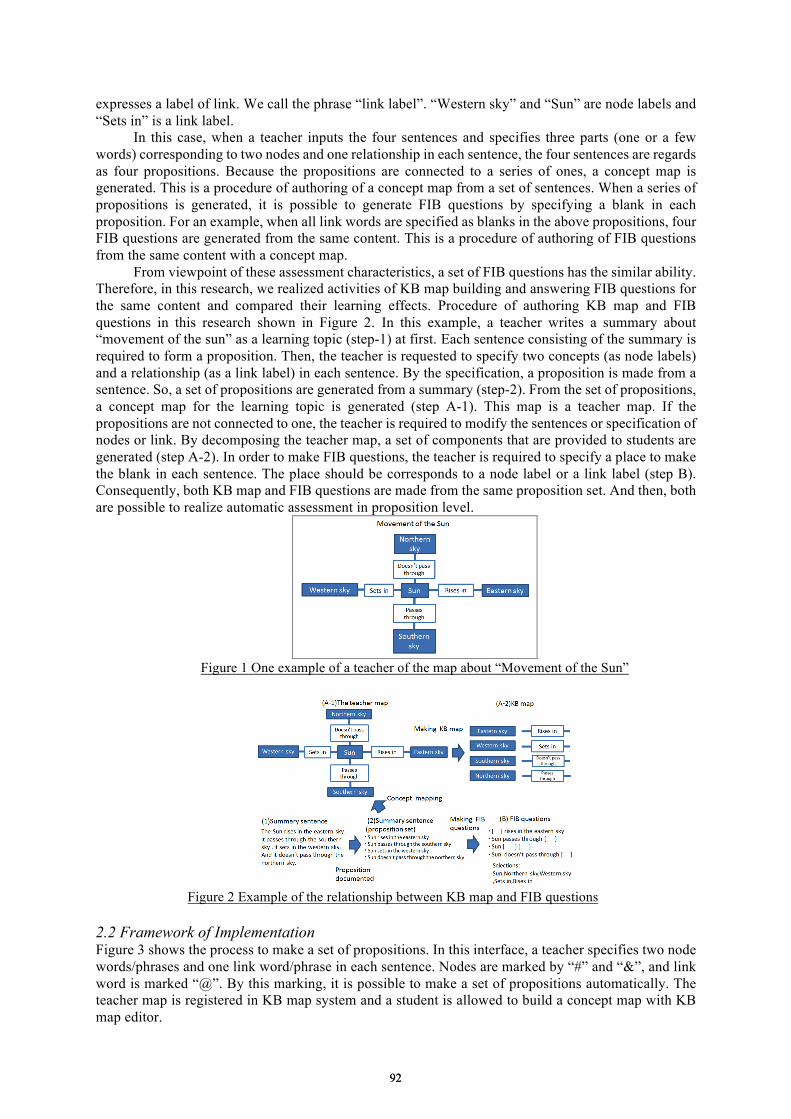
expresses a label of link. We call the phrase “link label”. “Western sky” and “Sun” are node labels and “Sets in” is a link label.
In this case, when a teacher inputs the four sentences and specifies three parts (one or a few words) corresponding to two nodes and one relationship in each sentence, the four sentences are regards as four propositions. Because the propositions are connected to a series of ones, a concept map is generated. This is a procedure of authoring of a concept map from a set of sentences. When a series of propositions is generated, it is possible to generate FIB questions by specifying a blank in each proposition. For an example, when all link words are specified as blanks in the above propositions, four FIB questions are generated from the same content. This is a procedure of authoring of FIB questions from the same content with a concept map.
From viewpoint of these assessment characteristics, a set of FIB questions has the similar ability. Therefore, in this research, we realized activities of KB map building and answering FIB questions for the same content and compared their learning effects. Procedure of authoring KB map and FIB questions in this research shown in Figure 2. In this example, a teacher writes a summary about “movement of the sun” as a learning topic (step-1) at first. Each sentence consisting of the summary is required to form a proposition. Then, the teacher is requested to specify two concepts (as node labels) and a relationship (as a link label) in each sentence. By the specification, a proposition is made from a sentence. So, a set of propositions are generated from a summary (step-2). From the set of propositions, a concept map for the learning topic is generated (step A-1). This map is a teacher map. If the propositions are not connected to one, the teacher is required to modify the sentences or specification of nodes or link. By decomposing the teacher map, a set of components that are provided to students are generated (step A-2). In order to make FIB questions, the teacher is required to specify a place to make the blank in each sentence. The place should be corresponds to a node label or a link label (step B). Consequently, both KB map and FIB questions are made from the same proposition set. And then, both are possible to realize automatic assessment in proposition level.
Figure 1 One example of a teacher of the map about “Movement of the Sun”
Figure 2 Example of the relationship between KB map and FIB questions
2.2 Framework of Implementation Figure 3 shows the process to make a set of propositions. In this interface, a teacher specifies two node words/phrases and one link word/phrase in each sentence. Nodes are marked by “#” and “&”, and link word is marked “@”. By this marking, it is possible to make a set of propositions automatically. The teacher map is registered in KB map system and a student is allowed to build a concept map with KB map editor.
9292
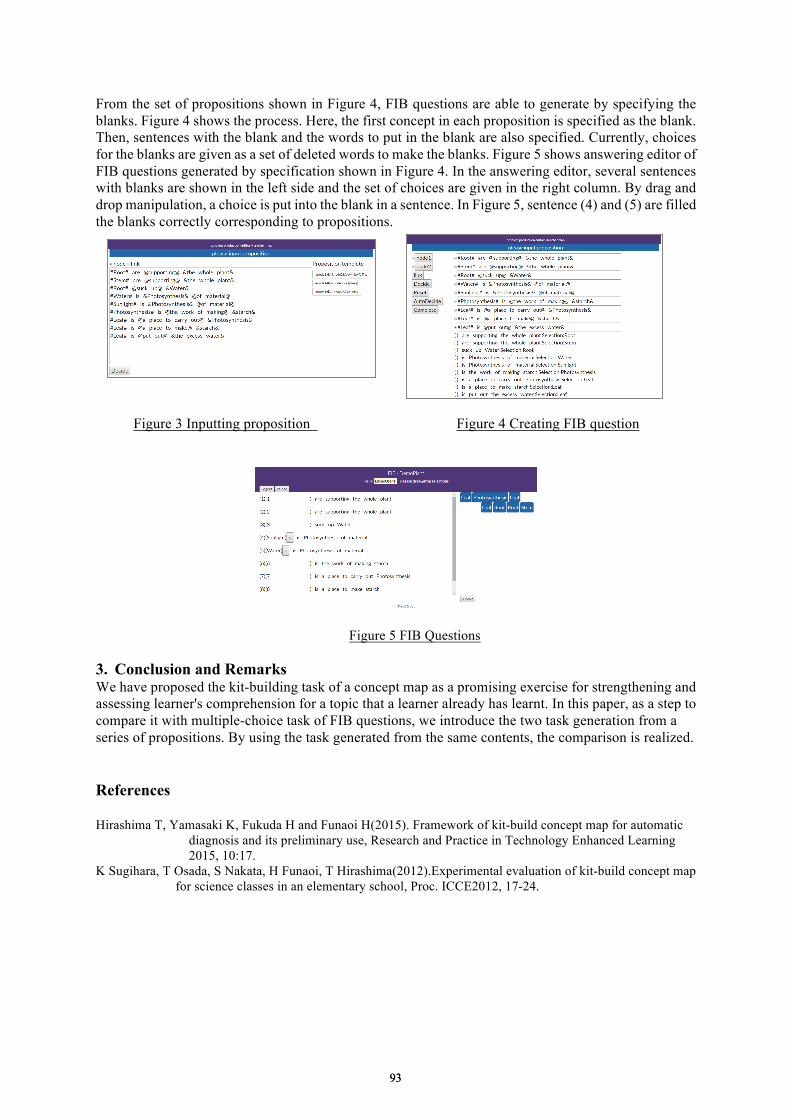
From the set of propositions shown in Figure 4, FIB questions are able to generate by specifying the blanks. Figure 4 shows the process. Here, the first concept in each proposition is specified as the blank. Then, sentences with the blank and the words to put in the blank are also specified. Currently, choices for the blanks are given as a set of deleted words to make the blanks. Figure 5 shows answering editor of FIB questions generated by specification shown in Figure 4. In the answering editor, several sentences with blanks are shown in the left side and the set of choices are given in the right column. By drag and drop manipulation, a choice is put into the blank in a sentence. In Figure 5, sentence (4) and (5) are filled the blanks correctly corresponding to propositions.
Figure 3 Inputting proposition Figure 4 Creating FIB question
Figure 5 FIB Questions 3. Conclusion and Remarks We have proposed the kit-building task of a concept map as a promising exercise for strengthening and assessing learner's comprehension for a topic that a learner already has learnt. In this paper, as a step to compare it with multiple-choice task of FIB questions, we introduce the two task generation from a series of propositions. By using the task generated from the same contents, the comparison is realized. References Hirashima T, Yamasaki K, Fukuda H and Funaoi H(2015). Framework of kit-build concept map for automatic
diagnosis and its preliminary use, Research and Practice in Technology Enhanced Learning 2015, 10:17.
K Sugihara, T Osada, S Nakata, H Funaoi, T Hirashima(2012).Experimental evaluation of kit-build concept map for science classes in an elementary school, Proc. ICCE2012, 17-24.
9393

Chen, W. et al. (Eds.) (2016). Proceedings of the 24th International Conference on Computers in Education.
India: Asia-Pacific Society for Computers in Education
Proposal for Primitives Representing Brain
Function of Facial Expression Recognition
Yoshimasa TAWATSUJIa* & Tatsunori MATSUIb a Graduate School of Human Sciences, Waseda University, Japan
b Faculty of Human Sciences, Waseda University, Japan
Abstract: Facial expression of humanlike pedagogical agent plays important role to affect the
learners’ motivation to interact with it. Uncanny Valley (UV) effect is notorious in the agent
design in that extraordinary humanlike agents affect observers negatively to feel eerie. In this
study, to uniformly describe the conceptual brain function model which provides the
explanation for the mechanism of UV effect, we propose the qualitative description with “basic
function” and “representation primitives.” Basic functions are hypothesized to be intrinsic
functions of brain functions with a consequence of which can represent arbitrary brain
functions. Representation primitive is a semantic description that is defined in correspondence
with a basic function.
Keywords: Uncanny Valley, Pedagogical Agent, Brain Function, Qualitative Description
1. Introduction
The emotional states of a learner is greatly affected by nonverbal information, such as facial expression
of a human teacher (Mashiko et al. 2012) or an embodied pedagogical agent (Hayashi et al. 2013). On
the other hand, “the uncanny valley” effect (Mori 1970) is issued in such attempt of humanlike design.
Its facial movement is getting more humanlike and more, which increased the probability that the agent
is perceived negative. In previous studies, eye width (Seyama and Negayama, 2007), skin texture and
balance of facial components (eyes, nose and mouth) (MacDorman et al. 2009) are investigated to effect
on eerie feeling in psychological experiments, while few model-based method are adopted to clarify
primitive mechanism generating the negative feeling. In order to provide the criteria for avoiding
implementation for eerie facial expression, we must understand a mechanism that generates such
feeling. Therefore, we provides the conceptual framework to explain the neuro-functional mechanism
underlying the relationship between the stimuli (e.g. smiling humanlike agent) and the feeling.
2. What should be modeled to understand the neural basis of emotion?
Previous studies of uncanny valley are common in hypothesizing that eerie feeling are related to the
mismatch between expectation to be a human and perception not to be a human (Shimada et al. 2007).
The explicit explanation should be given as the framework: “Prediction error” (Saygin et al. 2012). The
framework can be applied to the facial expression of humanlike agent. Therefore, we hypothesized that
facial expression of humanlike agent can be perceived eerie because agent’s facial muscle does not
move as like as human does. In other words, agent’s facial movement is not match to human expectation
of facial movement, which generates error signal.
Our proposed neuro-functional model represents the qualitative process in human recognition
of facial movements (Tawatsuji et al. 2016). When human perceives facial movements, initial
movement information is transmitted to the cerebellum, where in the meantime generates a prediction
of how the facial components will move, based on the internal model. Herein, perception and this
prediction can be processed in parallel. In the cases of seeing real humanlike agents, the prediction and
perception differ enough to generate alert signals. This processing must play a key role in error
detection to facial expressions of humanlike agents. In this paper, we propose a comprehensive
description for qualitative representation for brain function.
9494
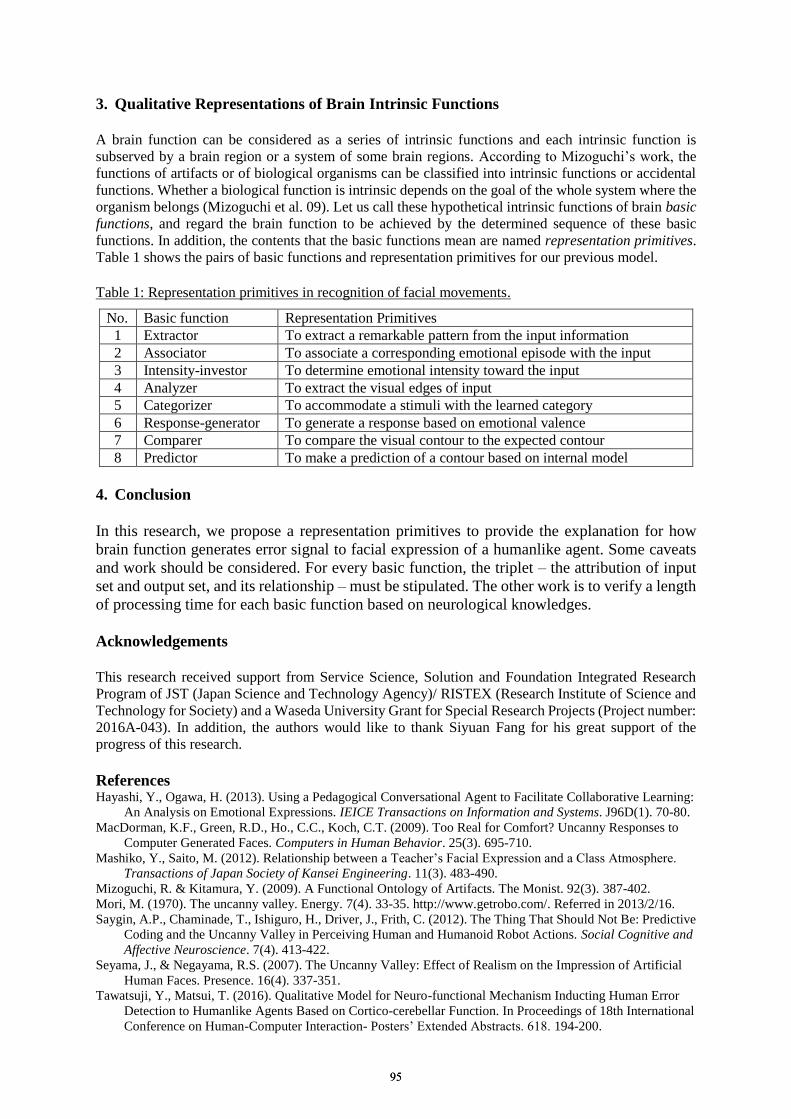
3. Qualitative Representations of Brain Intrinsic Functions
A brain function can be considered as a series of intrinsic functions and each intrinsic function is
subserved by a brain region or a system of some brain regions. According to Mizoguchi’s work, the
functions of artifacts or of biological organisms can be classified into intrinsic functions or accidental
functions. Whether a biological function is intrinsic depends on the goal of the whole system where the
organism belongs (Mizoguchi et al. 09). Let us call these hypothetical intrinsic functions of brain basic
functions, and regard the brain function to be achieved by the determined sequence of these basic
functions. In addition, the contents that the basic functions mean are named representation primitives.
Table 1 shows the pairs of basic functions and representation primitives for our previous model.
Table 1: Representation primitives in recognition of facial movements.
No. Basic function Representation Primitives
1 Extractor To extract a remarkable pattern from the input information
2 Associator To associate a corresponding emotional episode with the input
3 Intensity-investor To determine emotional intensity toward the input
4 Analyzer To extract the visual edges of input
5 Categorizer To accommodate a stimuli with the learned category
6 Response-generator To generate a response based on emotional valence
7 Comparer To compare the visual contour to the expected contour
8 Predictor To make a prediction of a contour based on internal model
4. Conclusion
In this research, we propose a representation primitives to provide the explanation for how
brain function generates error signal to facial expression of a humanlike agent. Some caveats
and work should be considered. For every basic function, the triplet – the attribution of input
set and output set, and its relationship – must be stipulated. The other work is to verify a length
of processing time for each basic function based on neurological knowledges.
Acknowledgements
This research received support from Service Science, Solution and Foundation Integrated Research
Program of JST (Japan Science and Technology Agency)/ RISTEX (Research Institute of Science and
Technology for Society) and a Waseda University Grant for Special Research Projects (Project number:
2016A-043). In addition, the authors would like to thank Siyuan Fang for his great support of the
progress of this research.
References Hayashi, Y., Ogawa, H. (2013). Using a Pedagogical Conversational Agent to Facilitate Collaborative Learning:
An Analysis on Emotional Expressions. IEICE Transactions on Information and Systems. J96D(1). 70-80.
MacDorman, K.F., Green, R.D., Ho., C.C., Koch, C.T. (2009). Too Real for Comfort? Uncanny Responses to
Computer Generated Faces. Computers in Human Behavior. 25(3). 695-710.
Mashiko, Y., Saito, M. (2012). Relationship between a Teacher’s Facial Expression and a Class Atmosphere.
Transactions of Japan Society of Kansei Engineering. 11(3). 483-490.
Mizoguchi, R. & Kitamura, Y. (2009). A Functional Ontology of Artifacts. The Monist. 92(3). 387-402.
Mori, M. (1970). The uncanny valley. Energy. 7(4). 33-35. http://www.getrobo.com/. Referred in 2013/2/16.
Saygin, A.P., Chaminade, T., Ishiguro, H., Driver, J., Frith, C. (2012). The Thing That Should Not Be: Predictive
Coding and the Uncanny Valley in Perceiving Human and Humanoid Robot Actions. Social Cognitive and
Affective Neuroscience. 7(4). 413-422.
Seyama, J., & Negayama, R.S. (2007). The Uncanny Valley: Effect of Realism on the Impression of Artificial
Human Faces. Presence. 16(4). 337-351.
Tawatsuji, Y., Matsui, T. (2016). Qualitative Model for Neuro-functional Mechanism Inducting Human Error
Detection to Humanlike Agents Based on Cortico-cerebellar Function. In Proceedings of 18th International
Conference on Human-Computer Interaction- Posters’ Extended Abstracts. 618. 194-200.
9595
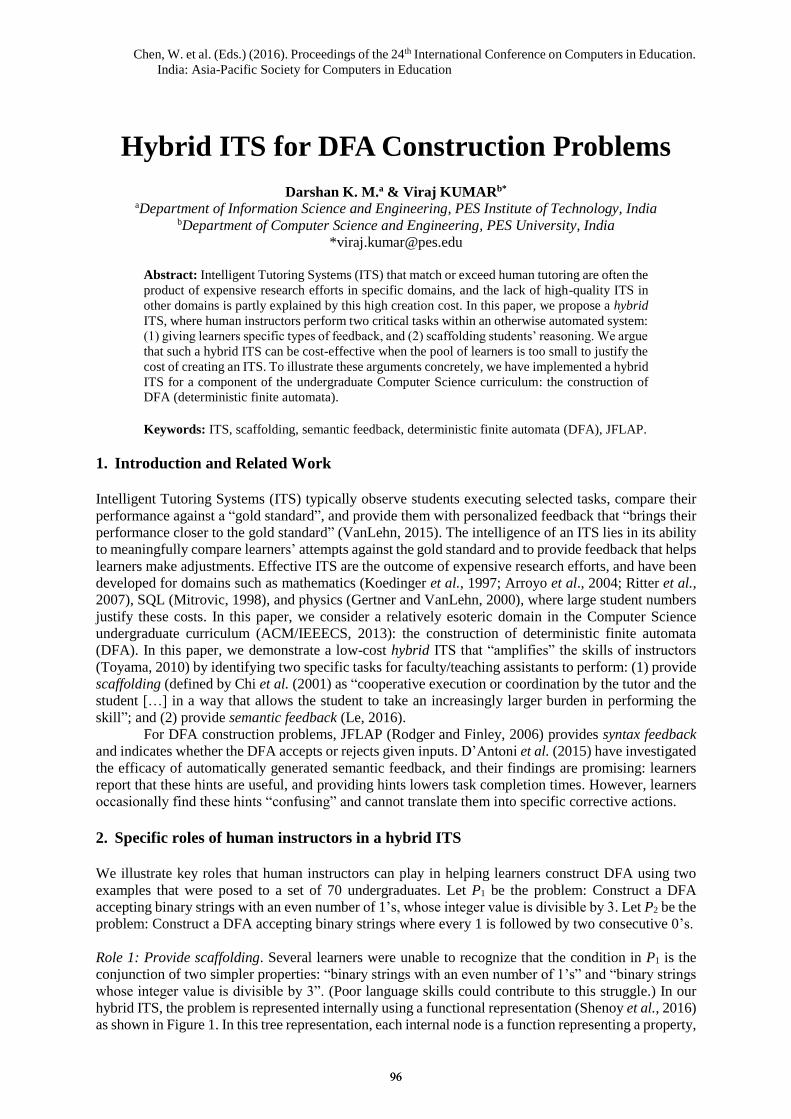
Chen, W. et al. (Eds.) (2016). Proceedings of the 24th International Conference on Computers in Education.
India: Asia-Pacific Society for Computers in Education
Hybrid ITS for DFA Construction Problems
Darshan K. M.a & Viraj KUMARb* aDepartment of Information Science and Engineering, PES Institute of Technology, India
bDepartment of Computer Science and Engineering, PES University, India
Abstract: Intelligent Tutoring Systems (ITS) that match or exceed human tutoring are often the
product of expensive research efforts in specific domains, and the lack of high-quality ITS in
other domains is partly explained by this high creation cost. In this paper, we propose a hybrid
ITS, where human instructors perform two critical tasks within an otherwise automated system:
(1) giving learners specific types of feedback, and (2) scaffolding students’ reasoning. We argue
that such a hybrid ITS can be cost-effective when the pool of learners is too small to justify the
cost of creating an ITS. To illustrate these arguments concretely, we have implemented a hybrid
ITS for a component of the undergraduate Computer Science curriculum: the construction of
DFA (deterministic finite automata).
Keywords: ITS, scaffolding, semantic feedback, deterministic finite automata (DFA), JFLAP.
1. Introduction and Related Work
Intelligent Tutoring Systems (ITS) typically observe students executing selected tasks, compare their
performance against a “gold standard”, and provide them with personalized feedback that “brings their
performance closer to the gold standard” (VanLehn, 2015). The intelligence of an ITS lies in its ability
to meaningfully compare learners’ attempts against the gold standard and to provide feedback that helps
learners make adjustments. Effective ITS are the outcome of expensive research efforts, and have been
developed for domains such as mathematics (Koedinger et al., 1997; Arroyo et al., 2004; Ritter et al.,
2007), SQL (Mitrovic, 1998), and physics (Gertner and VanLehn, 2000), where large student numbers
justify these costs. In this paper, we consider a relatively esoteric domain in the Computer Science
undergraduate curriculum (ACM/IEEECS, 2013): the construction of deterministic finite automata
(DFA). In this paper, we demonstrate a low-cost hybrid ITS that “amplifies” the skills of instructors
(Toyama, 2010) by identifying two specific tasks for faculty/teaching assistants to perform: (1) provide
scaffolding (defined by Chi et al. (2001) as “cooperative execution or coordination by the tutor and the
student […] in a way that allows the student to take an increasingly larger burden in performing the
skill”; and (2) provide semantic feedback (Le, 2016).
For DFA construction problems, JFLAP (Rodger and Finley, 2006) provides syntax feedback
and indicates whether the DFA accepts or rejects given inputs. D’Antoni et al. (2015) have investigated
the efficacy of automatically generated semantic feedback, and their findings are promising: learners
report that these hints are useful, and providing hints lowers task completion times. However, learners
occasionally find these hints “confusing” and cannot translate them into specific corrective actions.
2. Specific roles of human instructors in a hybrid ITS
We illustrate key roles that human instructors can play in helping learners construct DFA using two
examples that were posed to a set of 70 undergraduates. Let P1 be the problem: Construct a DFA
accepting binary strings with an even number of 1’s, whose integer value is divisible by 3. Let P2 be the
problem: Construct a DFA accepting binary strings where every 1 is followed by two consecutive 0’s.
Role 1: Provide scaffolding. Several learners were unable to recognize that the condition in P1 is the
conjunction of two simpler properties: “binary strings with an even number of 1’s” and “binary strings
whose integer value is divisible by 3”. (Poor language skills could contribute to this struggle.) In our
hybrid ITS, the problem is represented internally using a functional representation (Shenoy et al., 2016)
as shown in Figure 1. In this tree representation, each internal node is a function representing a property,
9696
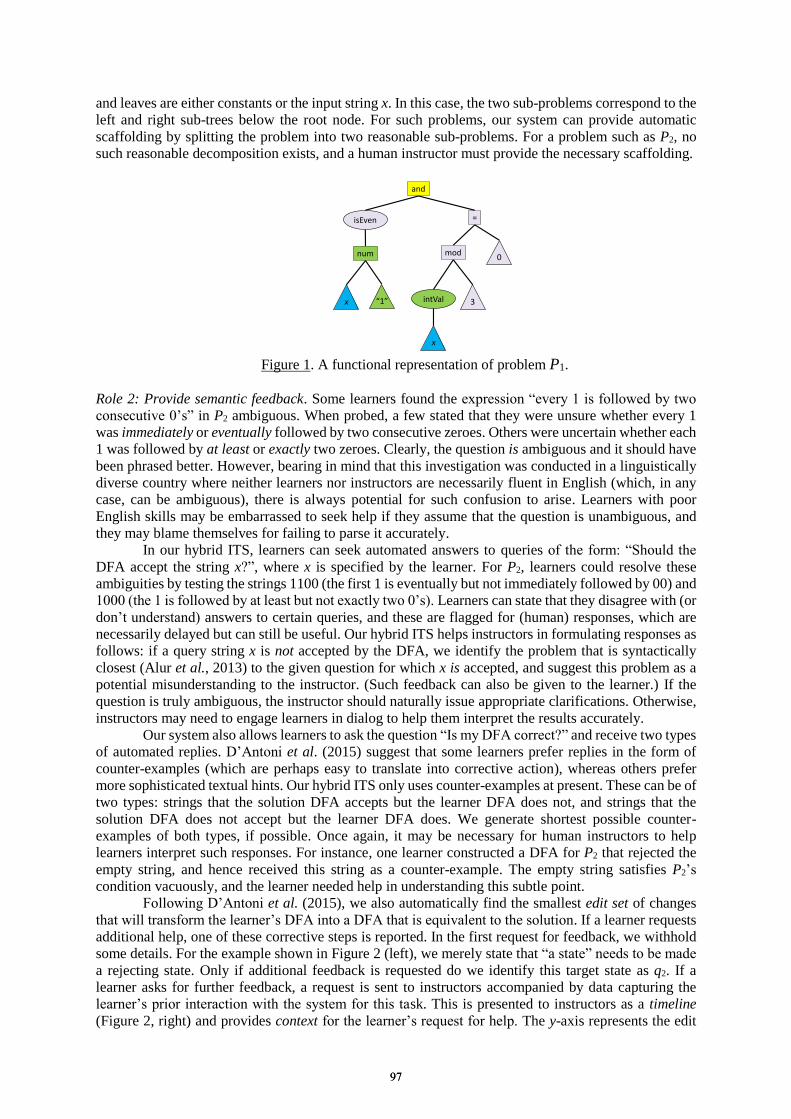
and leaves are either constants or the input string x. In this case, the two sub-problems correspond to the
left and right sub-trees below the root node. For such problems, our system can provide automatic
scaffolding by splitting the problem into two reasonable sub-problems. For a problem such as P2, no
such reasonable decomposition exists, and a human instructor must provide the necessary scaffolding.
and
num
isEven
x
=
mod
intVal
x
“1” 3
0
Figure 1. A functional representation of problem P1.
Role 2: Provide semantic feedback. Some learners found the expression “every 1 is followed by two
consecutive 0’s” in P2 ambiguous. When probed, a few stated that they were unsure whether every 1
was immediately or eventually followed by two consecutive zeroes. Others were uncertain whether each
1 was followed by at least or exactly two zeroes. Clearly, the question is ambiguous and it should have
been phrased better. However, bearing in mind that this investigation was conducted in a linguistically
diverse country where neither learners nor instructors are necessarily fluent in English (which, in any
case, can be ambiguous), there is always potential for such confusion to arise. Learners with poor
English skills may be embarrassed to seek help if they assume that the question is unambiguous, and
they may blame themselves for failing to parse it accurately.
In our hybrid ITS, learners can seek automated answers to queries of the form: “Should the
DFA accept the string x?”, where x is specified by the learner. For P2, learners could resolve these
ambiguities by testing the strings 1100 (the first 1 is eventually but not immediately followed by 00) and
1000 (the 1 is followed by at least but not exactly two 0’s). Learners can state that they disagree with (or
don’t understand) answers to certain queries, and these are flagged for (human) responses, which are
necessarily delayed but can still be useful. Our hybrid ITS helps instructors in formulating responses as
follows: if a query string x is not accepted by the DFA, we identify the problem that is syntactically
closest (Alur et al., 2013) to the given question for which x is accepted, and suggest this problem as a
potential misunderstanding to the instructor. (Such feedback can also be given to the learner.) If the
question is truly ambiguous, the instructor should naturally issue appropriate clarifications. Otherwise,
instructors may need to engage learners in dialog to help them interpret the results accurately.
Our system also allows learners to ask the question “Is my DFA correct?” and receive two types
of automated replies. D’Antoni et al. (2015) suggest that some learners prefer replies in the form of
counter-examples (which are perhaps easy to translate into corrective action), whereas others prefer
more sophisticated textual hints. Our hybrid ITS only uses counter-examples at present. These can be of
two types: strings that the solution DFA accepts but the learner DFA does not, and strings that the
solution DFA does not accept but the learner DFA does. We generate shortest possible counter-
examples of both types, if possible. Once again, it may be necessary for human instructors to help
learners interpret such responses. For instance, one learner constructed a DFA for P2 that rejected the
empty string, and hence received this string as a counter-example. The empty string satisfies P2’s
condition vacuously, and the learner needed help in understanding this subtle point.
Following D’Antoni et al. (2015), we also automatically find the smallest edit set of changes
that will transform the learner’s DFA into a DFA that is equivalent to the solution. If a learner requests
additional help, one of these corrective steps is reported. In the first request for feedback, we withhold
some details. For the example shown in Figure 2 (left), we merely state that “a state” needs to be made
a rejecting state. Only if additional feedback is requested do we identify this target state as q2. If a
learner asks for further feedback, a request is sent to instructors accompanied by data capturing the
learner’s prior interaction with the system for this task. This is presented to instructors as a timeline
(Figure 2, right) and provides context for the learner’s request for help. The y-axis represents the edit
9797
distance to the solution (if known). Each feedback request by the learner is represented as a clickable
dot on this graph (a red dot indicates a request for manual feedback). Instructors can click on individual
dots and trace the evolution of the learner’s solution, which may suggest specific feedback that will be
useful to the learner. Our system logs all such feedback and can provide it automatically if a different
learner confronts the same problem. (We can detect this occurrence because the two learner DFAs will
be equivalent to each other.) Thus, our hybrid ITS amplifies human effort by recycling it.
4
3
2
1
0
0 1 2 3 4 5 6 7 8
Dis
tan
ce t
o s
olu
tio
n
Time (minutes)
Figure 2. (Left) A screenshot of our hybrid ITS, implemented as a JFLAP extension. Auto-
generated and instructor assistance appears in the scrollable pane to the right of the drawing
area. (Right) A learner’s timeline for the problem P1.
3. Conclusions
Our hybrid ITS uses existing techniques to provide learners with automated assistance as a “first line of
defense”, and also gives instructors automated suggestions and visualizations that can help identify why
the learner is struggling. Our system can recycle manual feedback in limited instances, and we are
exploring ways to enhance its capabilities. This hybrid ITS will be evaluated in the upcoming semester.
References
ACM/IEEECS (2013). Computer Science Curricula 2013: Curriculum Guidelines for Undergraduate Degree
Programs in Computer Science, Joint Task Force on Computing Curricula, Association for Computing
Machinery (ACM) and IEEE Computer Society, ACM, New York, NY, 2013.
Alur, R., D'Antoni, L., Gulwani, S., Kini, D. and Viswanathan, M. (2013). Automated Grading of DFA
Constructions, Proceedings of the 23rd International Joint Conference on Artificial Intelligence, 1976-1982.
Arroyo, I., Beal, C., Murray, T., Walles, R., and Woolf, B. P. (2004). Web-based intelligent multimedia tutoring
for high stakes achievement tests. In International Conference on Intelligent Tutoring Systems, 468–477.
Chi, M. T. H., Siler, S., Jeong, H., Yamauchi, T., and Hausmann, R. G. (2001). Learning from human tutoring.
Cognitive Science, 25, 471–533.
D'Antoni, L., Kini, D., Alur, R., Gulwani, S., Viswanathan, M. and Hartmann, B. (2015). How Can Automatic
Feedback Help Students Construct Automata? ACM Transactions on Computer-Human Interaction, 22(2).
Gertner, A. S., and VanLehn, K. (2000). Andes: A coached problem solving environment for physics. In
International conference on intelligent tutoring systems, 133–142.
Koedinger, K. R., Anderson, J. R., Hadley, W. H., and Mark, M. A. (1997). Intelligent tutoring goes to school in
the big city. International Journal of Artificial Intelligence in Education, 8(1), 30–43.
Le, Nguyen-Thinh (2016). A Classification of Adaptive Feedback in Educational Systems for Programming.
Systems, 4(2), 22.
Mitrovic, A. (1998). A knowledge-based teaching system for SQL. In Proc. of ED-MEDIA, vol. 98, 1027–1032.
Ritter, S., Anderson, J. R., Koedinger, K. R., and Corbett, A. (2007). Cognitive Tutor: Applied research in
mathematics education. Psychonomic bulletin & review, 14(2), 249-255.
Rodger, S. H. and Finley, T. W. (2006). JFLAP – An Interactive Formal Languages and Automata Package, Jones
and Bartlett, Sudbury, MA, 2006.
Shenoy, V., Aparanji, U., K., Sripradha and Kumar, V. (2016). Generating DFA Construction Problems
Automatically, Proc. of the 4th Intl. Conf. on Learning and Teaching in Computing and Engineering, 32-37.
Toyama, K. (2010). Can technology end poverty? Boston Review, 36(5), 12-18, 28-29, www.bostonreview.net/
forum/can-technology-end-poverty.
VanLehn, K. (2015). Regulative Loops, Step Loops and Task Loops. International Journal of Artificial
Intelligence in Education, 26, 107–112.
9898
Chen, W. et al. (Eds.) (2016). Proceedings of the 24th International Conference on Computers in Education.
India: Asia-Pacific Society for Computers in Education
Students Learning Paths in Developing
Micro-Macro Thinking:
Productive Actions for Exploration in
MIC-O-MAP Learning Environment
Anura KENKRE* & Sahana MURTHY
Inter-Disciplinary Program in Educational Technology, Indian Institute of Technology Bombay, India
Abstract: MIC-O-MAP is a technology enhanced learning environment designed for
developing micro-macro thinking skills in science and engineering topics at the tertiary level.
Micro-macro thinking involves the analysis of dynamic microscopic and establishing
co-relations to the outcomes that are measurable in the real or macroscopic world. Different
students undertake multiple paths while interacting with MIC-O-MAP learning environment in
an attempt to undertake the tasks of making predictions in the macro world, justifying them by
establishing a micro to macro link. The focus of this study is to investigate how different
students’ interactions in MIC-O-MAP leads to productive actions, i.e actions that are effective
in their learning of micro-macro thinking. A grounded theory approach has been adopted for
analyzing the screen capture recordings of students as they explore MIC-O-MAP, along with
semi structured interviews in order to infer these actions.
Keywords: micro-macro thinking, MIC-O-MAP, productive actions
1. Introduction
Science and engineering graduates are expected to not only learn domain knowledge but also develop
scientific skills such as formulating questions, designing and conducting experiments, collecting,
representing and analyzing data, modeling, creating and testing hypotheses (Crowley, et.al., 2001).
Learning how to relate microscopic models to macroscopic phenomena, here referred to as
micro-macro thinking, is an important skill to be developed as it will help to bridge the gap between
theory and experiment. Making such connections has been found to be problematic for students (for
example, Eilam, 2004; Gilbert & Treagust, 2009). Substantial effort has been put in by researchers in
developing technology enhanced learning (TEL) environments to address student learning of scientific
thinking skills, some examples being: WISE, WiMVT, Model-It, Sim Quest, Modeling Space, nQuire,
Inquiry Island, virtual environments such as Co-Labs, Go-Labs etc (Slotta, 2004; Sun, & Looi, 2013;
Fretz, et.al., 2002; Van Joolingen & De Jong, 2003; Avouris, et.al., 2003; Mulholland, et.al., 2012;
White, et.al., 2002; van Joolingen, et.al., 2005; Govaerts, et.al., 2013). Several of these efforts have
reported successful outcomes.
We define ‘micro-macro thinking’ as the ability to establish a link between theoretical variables
in a micro-world and its corresponding manipulable variables in a macro-world in order to predict the
functionality of the system. The invisible processes/interactions on going at a microscopic level are
referred to as a micro world and a real world tangible device/component is referred to as a macro world.
In order to develop this skill of micro-macro thinking, it is important to develop the skills of making
observations, predictions, testing predictions against experimental outcomes and revising predictions.
Many of the TEL environments above have included the presence of a facilitator such as a teacher who
guides the learning path of students to various extents. Using a design-based research approach, we
have designed and developed a TEL environment MIC-O-MAP
(MICroscopic-Observations-Macroscopic Predictions) to be used in self-learning mode with its focus
on developing micro-macro thinking in science and engineering topics at the tertiary level.
Student-centered learning environments emphasize constructing personal meaning by relating
new knowledge to existing conceptions and technology promotes access to these resources and tools
that facilitate construction (Hannafin, & Land, 1997). A complex interaction then prevails among prior
9999
knowledge, perception of events, intents, actions, observations, and reflections attendant to on-going
thoughts and actions (Land & Hannafin, 1996). Technology-enhanced student-centered systems thus
rely on the learner to generate and implement individual learning plans. Prior studies with MIC-O-MAP
have shown that even though students develop micro-macro thinking skills there exist differences in the
learning paths of high and low scoring students. (Kenkre & Murthy, 2014). However, what is still
unknown is how students develop micro-macro thinking skills as navigate through MIC-O-MAP. Thus
the focus of this current study is to identify productive actions of students as they explore the learning
environment and interact with various features and activities in it. By ‘productive action’, we mean
those learner behaviors and interactions with MIC-O-MAP that can be correlated to the learning of
micro-macro thinking.
The current study is takes a grounded theory approach and analyzes screen recordings of learners’
interaction with MIC-O-MAP as well as the responses from follow-up semi-structured interviews.
Findings from this study provide possible reasons for how a particular navigation path and learner
interactions may lead to development of micro-macro thinking skill. Thus our study may provide
guidelines for prospective designers of TEL environments on how to promote productive actions to
maximize learning benefit of such TEL environments.
2. Background and Related Work
The practice of science and engineering requires students to establish a link between two levels. The
macroscopic level comprises the tangible and visible and the microscopic level often comprises an
invisible particulate level, such as the electrons, molecules, or atoms (Johnstone, 1982). Research
shows that students have difficulty transferring from a macroscopic level of representation to the
microscopic level (Gabel, 1998). It is important to have in-depth knowledge of the problematic features
of micro–macro thinking and to understand what it is that is to be communicated to students and how
this is best communicated to them (van Berkel, Pilot & Bulte, 2009).
Instructional interventions which target students’ scientific thinking skills include WISE
(Web-based Science Environment) which provides an Internet-based platform for middle and high
school science activities (Slotta, 2004). Web-based inquirer with modeling and visualization
technology (WiMVT) is based on the POE (Predict-Observe-Explain) principle (Sun & Looi, 2013).
Model-It argues that students go through an inquiry cycle in the phases of Planning, searching,
synthesis, analysis, explaining and evaluation (Fretz, et.al., 2002). Undergoing a similar inquiry cycle is
proposed by nQuire and Inquiry Island (Mulholland, et.al., 2012; White, et.al., 2002). Learning
Environments such as Co-Lab and Go-Lab also suggest similar phases of learning wherein students
create hypotheses, evaluate them through experiments and then reflect on them, possibly repeating the
cycle (van Joolingen, et.al., 2005; Govaerts, et.al., 2013). SimQuest promotes discovery learning and
suggest following the WHAT-IF format (Van Joolingen & De Jong, 2003).
In these existing interventions, the teacher plays an important role by facilitating the process,
giving prompts or grading the student‘s efforts at a later stage, such as in MARS (Raghavan & Glaser,
1995). Most of these solutions are focused on middle and high school science curriculum, while ISLE
curriculum (Etkina & Van Heuvelen, 2007), which is mainly classroom-based has addressed
high-school and introductory college courses.
In addition to large-N studies evaluating the effectiveness of TEL environments, researchers have
conducted interaction analysis to identify how and why learners’ interactions with the TEL
environments and with peers have led to effective learning (for example, several chapters Puntambekar,
Erkens, Hmelo-Silver, 2009 analyze interactions in CSCL environments).
3. MIC-O-MAP Technology Enhanced Learning Environment.
3.1 Development Methodology-Design Based Research (DBR)
We have used a design-based research methodology for the design and development of the
MICroscopic Observations MAcrosocpic Prediction (MIC-O-MAP) learning environment. Design
Based Research (DBR) is defined as a systematic but flexible methodology aimed to improve
educational practices through iterative analysis, design, development, and implementation, based on
100100
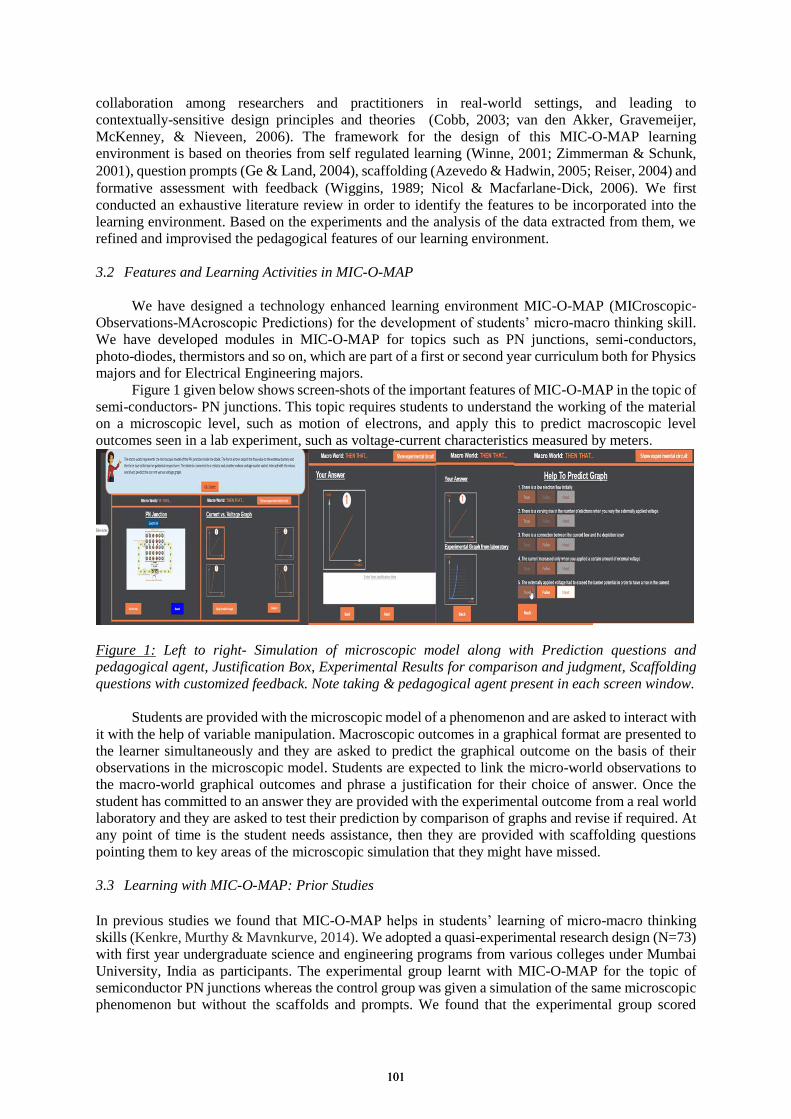
collaboration among researchers and practitioners in real-world settings, and leading to
contextually-sensitive design principles and theories (Cobb, 2003; van den Akker, Gravemeijer,
McKenney, & Nieveen, 2006). The framework for the design of this MIC-O-MAP learning
environment is based on theories from self regulated learning (Winne, 2001; Zimmerman & Schunk,
2001), question prompts (Ge & Land, 2004), scaffolding (Azevedo & Hadwin, 2005; Reiser, 2004) and
formative assessment with feedback (Wiggins, 1989; Nicol & Macfarlane‐Dick, 2006). We first
conducted an exhaustive literature review in order to identify the features to be incorporated into the
learning environment. Based on the experiments and the analysis of the data extracted from them, we
refined and improvised the pedagogical features of our learning environment.
3.2 Features and Learning Activities in MIC-O-MAP
We have designed a technology enhanced learning environment MIC-O-MAP (MICroscopic-
Observations-MAcroscopic Predictions) for the development of students’ micro-macro thinking skill.
We have developed modules in MIC-O-MAP for topics such as PN junctions, semi-conductors,
photo-diodes, thermistors and so on, which are part of a first or second year curriculum both for Physics
majors and for Electrical Engineering majors.
Figure 1 given below shows screen-shots of the important features of MIC-O-MAP in the topic of
semi-conductors- PN junctions. This topic requires students to understand the working of the material
on a microscopic level, such as motion of electrons, and apply this to predict macroscopic level
outcomes seen in a lab experiment, such as voltage-current characteristics measured by meters.
Figure 1: Left to right- Simulation of microscopic model along with Prediction questions and
pedagogical agent, Justification Box, Experimental Results for comparison and judgment, Scaffolding
questions with customized feedback. Note taking & pedagogical agent present in each screen window.
Students are provided with the microscopic model of a phenomenon and are asked to interact with
it with the help of variable manipulation. Macroscopic outcomes in a graphical format are presented to
the learner simultaneously and they are asked to predict the graphical outcome on the basis of their
observations in the microscopic model. Students are expected to link the micro-world observations to
the macro-world graphical outcomes and phrase a justification for their choice of answer. Once the
student has committed to an answer they are provided with the experimental outcome from a real world
laboratory and they are asked to test their prediction by comparison of graphs and revise if required. At
any point of time is the student needs assistance, then they are provided with scaffolding questions
pointing them to key areas of the microscopic simulation that they might have missed.
3.3 Learning with MIC-O-MAP: Prior Studies
In previous studies we found that MIC-O-MAP helps in students’ learning of micro-macro thinking
skills (Kenkre, Murthy & Mavnkurve, 2014). We adopted a quasi-experimental research design (N=73)
with first year undergraduate science and engineering programs from various colleges under Mumbai
University, India as participants. The experimental group learnt with MIC-O-MAP for the topic of
semiconductor PN junctions whereas the control group was given a simulation of the same microscopic
phenomenon but without the scaffolds and prompts. We found that the experimental group scored
101101
significantly better on the post-test on micro-macro thinking, leading to the conclusion that
MIC-O-MAP was effective in developing students’ micro-macro thinking skills.
While students from experimental group studied the material, their screen activities were
captured by My Screen Recorder software, screen-recording software. Post the study, all these screen
capturers were analyzed and later coded in accordance with the interaction pattern observed. To
understand possible reasons for the different time spent by students, we had compared the interaction
behavior of students from the low and high scoring groups respectively. It was found that high scorers
on an average try to establish a strong micro to macro link and then on the basis of this make an
informed decision about the macroscopic graphical outcome (Kenkre & Murthy, 2014).
4. Research Method
The research questions being addressed in this paper is:
1) What are productive actions of learners as they explore the features and learning activities in
rich, open-ended TEL environments?
2) How do these productive actions help learners acquire macro-micro thinking skills?
We addressed this research question using in-depth qualitative analysis of learners’ interaction
with MIC-O-MAP learning environment, combined with semi-structured interviews. Overall, the
analysis followed a grounded approach (Strauss & Corbin, 1998) wherein interleaved transcripts of
students’ interactions and interviews were coded such that the codes and categories emerged from data,
while guided by the above research question. Such a methodology is well suited to answer our research
questions, since our goal is to gain insight into the processes by which student learning happens, and
how interaction with the features of the TEL environment support these learning processes.
4.1 Participants and Procedure
Participants were students from the first year undergraduate science and engineering programs from
various colleges under Mumbai University, India. In order to understand various student behaviors for
this study, purposive sampling was conducted in the experimental group to obtain 10 participants who
scored high on post-test after interacting with MIC-O-MAP.
A total time period of one hour was allotted to the students for learning the topic. The topic being
learnt using the learning environment was P-N Junctions (forward biased) from the subject of physics.
Students were asked to explore the learning environment, MIC-O-MAP, and attempt every learning
activity in it (as described in Section 3.2). While they were learning the topic with MIC-O-MAP, their
interactions were recorded using a screen capture software. At the end of the learning session, the
recording was replayed to the students and semi-structured interviews were conducted. Questions were
asked to elicit the connection of students’ interactions in MIC-O-MAP to the learning objectives, i.e.
their ability to establish and articulate the connections between micro- and macro-worlds).
4.2 Data Sources and Instruments
Students’ on-screen activities were captured by My Screen Recorder software. Post the study, all these
screen capturers were analyzed and later coded in accordance with the interaction pattern observed.
This is known as Clickstream Analysis i.e. analyzing the record of screens or pages that user clicks on
and sees, as they use a site or software product.
Semi-structured interviews were conducted right after students’ interactions with the learning
environment in order to gather an understanding into the thought process behind the choice of a
particular learning path. Semi structured interviews contained questions such as, “Can you elaborate
why you have opted to go back to this feature?”, “In what manner is this feature helpful for finishing
this task?”, “Can you explain how are you phrasing this justification your prediction? Can you detail out
how you managed to establish the micro-macro link?”. Post recording the interview, the process of data
analysis was undertaken, wherein the interview was transcribed, coded and categories were extracted
out from the data. This helped in getting an insight into the experience of the user while interacting with
the learning environment.
102102
SIM PQ SIM PQ SIM PQ SIM PQ SIM PQ JUS PQ JUS RWA SQ PQ SIM PQ SIM PQ JUS RWA SUM ASM
4.3 Data Analysis
The recordings of the screen captures and interviews were transcribed leading to a complete interleaved
transcript of interviews and screen captures of each of the 10 students, amounting to 5-6 pages worth
data per student. Focusing on the screen capture recording, we took note of which feature was viewed in
order, one after another. Analysis of this provided us with the navigation path taken by students as they
interact with MIC-O-MAP. The unit of analysis was one question by the interviewer and a
corresponding answer by the student. Codes were allotted to each unit of analysis depending upon what
was being reported- usability, purpose of visit and time spent. Initially new codes were allotted till
saturation of these codes was reached, after 4-5 students transcript. Two raters coded the transcripts.
Inter-rater reliability for the raters was calculated and the value of Cohen’s Kappa was found to be 0.839
(p<0.001).
Students reported the usage of a particular feature of MIC-O-MAP for various learning goals. The
interviewer at the same time took notes of the actual actions of the students while interacting with the
learning environment in the recordings. Analysis of a mapping between the codes allocated and the
navigation path taken by students gave rise to the productive actions when students learn with rich
technology enhanced environments such as MIC-O-MAP.
5. Findings: Learner Actions and Learning Paths in MIC-O-MAP
We first present three illustrative cases of learner actions and behaviors as they interact with
MIC-O-MAP. The first two cases reported here are those students who developed the micro-macro
thinking skill whereas the last case is of a student who did not develop this skill inspite working with the
same environment of MIC-O-MAP. An indication of the development of micro-macro thinking skill is
their scores on the post tests. Also the interview transcript analysis for these chosen students were
representative of productive action to be undertaken by learner while using MIC-O-MAP. The specific
learning paths of the first two learners are different, yet each of these learners was seen to display
productive underlying actions to develop micro-macro thinking. One case representative of a typical
path undertaken by low scorers is also presented in end. The key point to be noted is that the last student
who is a low scoring student, does not perform the productive actions undertaken by the high scoring
students. This stands out as a crucial evidence for establishing a correlation between the productive
actions performed by the learner and development of micro-macro thinking skill.
5.1 Case 1-High Scoring Student
Student-1 begins by interacting with the simulation of the micro-world and almost immediately goes to
the prediction task. In the prediction task, in which he has to choose one correct graph out of four shown
graphs, his cursor moves over and pauses on the graph in each option, however he does not commit to
the prediction. He then goes back to the simulation of the micro-world and makes more minute and
careful observations. After this, he commits to one graph. He then tries to phrase a justification, comes
back to take a look at other options in prediction task, does not change initial answer and continues
phrasing the justification. Then he comes to the testing phase, notices that the prediction is incorrect and
goes to scaffolding questions. He reads all the options and feedback, deliberately moving and pausing
between the words, indicating careful reading. He once again goes back and watches each and every
part of the previous screen (as indicated by the cursor movement and corroborated in the interview). He
repeats the action of going back and forth between the simulation of the micro-world, the prediction
question and the scaffolding questions. This brings him to the summary phase where he writes a correct
description of how the different representations are linked to each other. He also reads assumptions
listed before stopping.
Given below is his corresponding navigation path:
Here, SIM- Simulation of the micro world, PQ- Prediction Questions, JUS- Justification of Prediction,
RWA- Real World Answer, SQ- Scaffolding Questions, SUM- Summarization, ASM- Assumptions.
Summarized below is an excerpt from the interview transcript for Student-1:
103103

SIM PQ SIM PQ SIM PQ SQ PQ GLO SIM PQ JUS SIM PQ SIM PQ JUS RWA SUM ASM RWA SUM
Question by Researcher: Please share your entire experience while interacting with this module.
Answer by Student-1: Understanding improved using MIC-O-MAP as opposed to what is taught in
class.
Q: Can you elaborate how you have made a choice of the graph?
A: I have followed whatever was suggested on top [by the mentor agent in the system]. It was told that
we should observe what happens when the voltage is varied. That is why I clicked on the button
indicating + and -. I interacted this for quite some time and saw how the electrons moved. Then I saw
that four graph options are given and submit is written, it means that I should choose one of these. So I
went ahead and chose one.
Q: On what basis did you chose a graph? You have selected option2, so what was your thought process
behind this?
A: When I was playing with this, for starting few values of voltages not many electrons flow. Later they
start increasing and move faster with each voltage value.
Q: You have clicked on the help button in after the task of testing your prediction.
A: Yes I was answering each question, combining the feedback with what I observed in the animation
and then chose another graph and wrote my answer.
5.2 Case 2-High Scoring Student
Student-2 similarly begins by interacting with the simulation of micro-world, varies different voltages
and observes the output electron motion for each value. She then comes to the prediction question task.
When she realizes that a graph is to be predicted, she goes back and interacts with the simulation of
micro-world for a longer time repeating the voltage values and observing onscreen action. After this she
goes the scaffolding questions. Her cursor moves along each option of the scaffolding questions, and
then she answers each question. She then goes back to the simulation of micro-world as per the
suggestions in the feedback obtained in the scaffolding questions. Later she tries to attempt the
prediction question once again and chooses one graph. In the justification task, she writes a detailed
justification: “… as the voltage is increased step by step, the current increases but after the knee voltage
is crossed, the current increased rapidly”. Then she goes back to the simulation of micro-world and
rapidly varies the voltage and checks what is happening. She returns to the justification task, and she
writes an even more detailed justification. She tests her answer with the real world answer, when found
correct proceeds to summary and assumptions.
Given below is her corresponding navigation path:
Summarized below is an excerpt from the interview transcript for case 2:
Question by Researcher: Can you share what you were thinking while the cursor is moving around?
Answer by Student-2: Yes I am trying to decide what I should be clicking on first. I have clicked on PN
junction animation.
Q: Please explain why.
A: Because everything is dependent on this, including graphs.
Q: Now before choosing a graph you have clicked on help to predict graph.
A: Yes the graphs were voltage versus current and I am trying to see which one depicts the fact that
current increases after a certain value.
Q: Can you elaborate that based on your choice of option how did you decide your answer of the graph?
A: Because I realized after reading the third point that when we increase the voltage of the external
battery, that at certain voltage current increases. That’s how I decided my choice of a graph.
5.3 Case 3- Low Scoring Student
Student 3 begins by interacting with the simulation presented in the micro-world. He proceeds to the
prediction question but is unable to make a choice and returns to make more observations in the
micro-world. He repeats the action of choosing one graph and going back to the simulation of the
micro-word. He tries to proceed without making a prediction. When not allowed to proceed he commits
to one choice of graph but is unable to phrase a justification. He goes back and forth between the
scaffolding questions and the simulation in an attempt to copy the on screen text. Finally, post reaching
104104
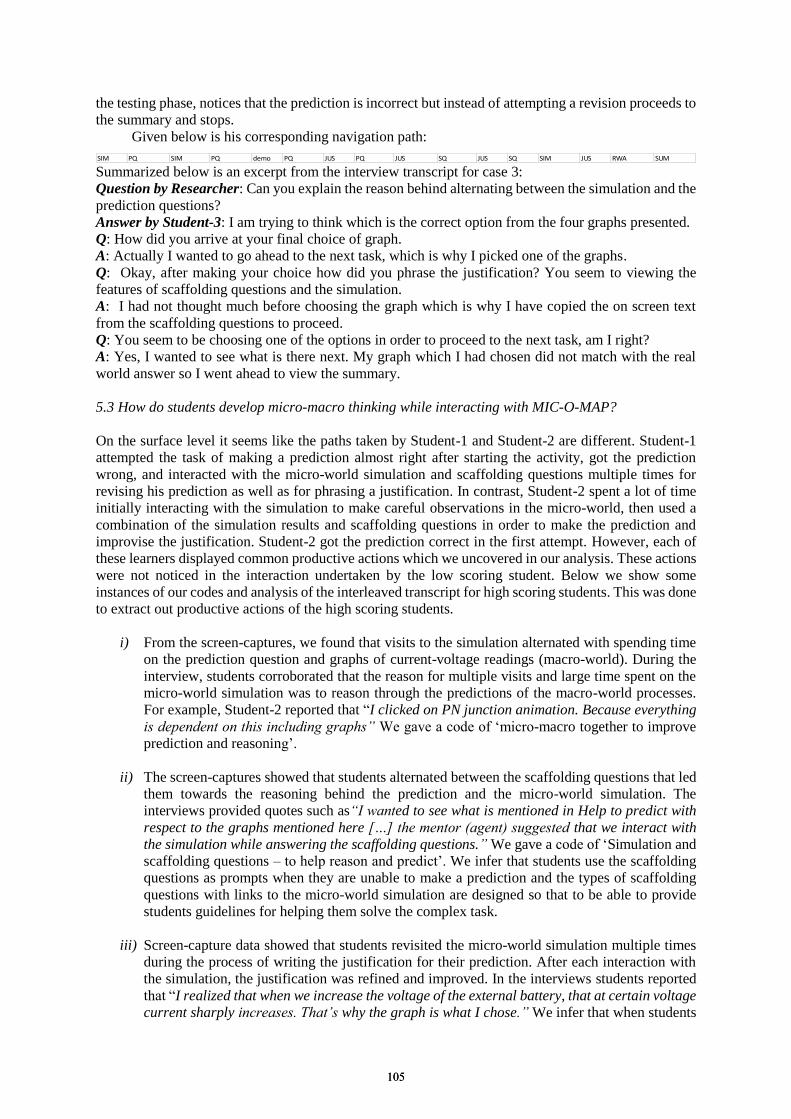
the testing phase, notices that the prediction is incorrect but instead of attempting a revision proceeds to
the summary and stops.
Given below is his corresponding navigation path:
SIM PQ SIM PQ demo PQ JUS PQ JUS SQ JUS SQ SIM JUS RWA SUM
Summarized below is an excerpt from the interview transcript for case 3:
Question by Researcher: Can you explain the reason behind alternating between the simulation and the
prediction questions?
Answer by Student-3: I am trying to think which is the correct option from the four graphs presented.
Q: How did you arrive at your final choice of graph.
A: Actually I wanted to go ahead to the next task, which is why I picked one of the graphs.
Q: Okay, after making your choice how did you phrase the justification? You seem to viewing the
features of scaffolding questions and the simulation.
A: I had not thought much before choosing the graph which is why I have copied the on screen text
from the scaffolding questions to proceed.
Q: You seem to be choosing one of the options in order to proceed to the next task, am I right?
A: Yes, I wanted to see what is there next. My graph which I had chosen did not match with the real
world answer so I went ahead to view the summary.
5.3 How do students develop micro-macro thinking while interacting with MIC-O-MAP?
On the surface level it seems like the paths taken by Student-1 and Student-2 are different. Student-1
attempted the task of making a prediction almost right after starting the activity, got the prediction
wrong, and interacted with the micro-world simulation and scaffolding questions multiple times for
revising his prediction as well as for phrasing a justification. In contrast, Student-2 spent a lot of time
initially interacting with the simulation to make careful observations in the micro-world, then used a
combination of the simulation results and scaffolding questions in order to make the prediction and
improvise the justification. Student-2 got the prediction correct in the first attempt. However, each of
these learners displayed common productive actions which we uncovered in our analysis. These actions
were not noticed in the interaction undertaken by the low scoring student. Below we show some
instances of our codes and analysis of the interleaved transcript for high scoring students. This was done
to extract out productive actions of the high scoring students.
i) From the screen-captures, we found that visits to the simulation alternated with spending time
on the prediction question and graphs of current-voltage readings (macro-world). During the
interview, students corroborated that the reason for multiple visits and large time spent on the
micro-world simulation was to reason through the predictions of the macro-world processes.
For example, Student-2 reported that “I clicked on PN junction animation. Because everything
is dependent on this including graphs” We gave a code of ‘micro-macro together to improve
prediction and reasoning’.
ii) The screen-captures showed that students alternated between the scaffolding questions that led
them towards the reasoning behind the prediction and the micro-world simulation. The
interviews provided quotes such as“I wanted to see what is mentioned in Help to predict with
respect to the graphs mentioned here […] the mentor (agent) suggested that we interact with
the simulation while answering the scaffolding questions.” We gave a code of ‘Simulation and
scaffolding questions – to help reason and predict’. We infer that students use the scaffolding
questions as prompts when they are unable to make a prediction and the types of scaffolding
questions with links to the micro-world simulation are designed so that to be able to provide
students guidelines for helping them solve the complex task.
iii) Screen-capture data showed that students revisited the micro-world simulation multiple times
during the process of writing the justification for their prediction. After each interaction with
the simulation, the justification was refined and improved. In the interviews students reported
that “I realized that when we increase the voltage of the external battery, that at certain voltage
current sharply increases. That’s why the graph is what I chose.” We infer that when students
105105
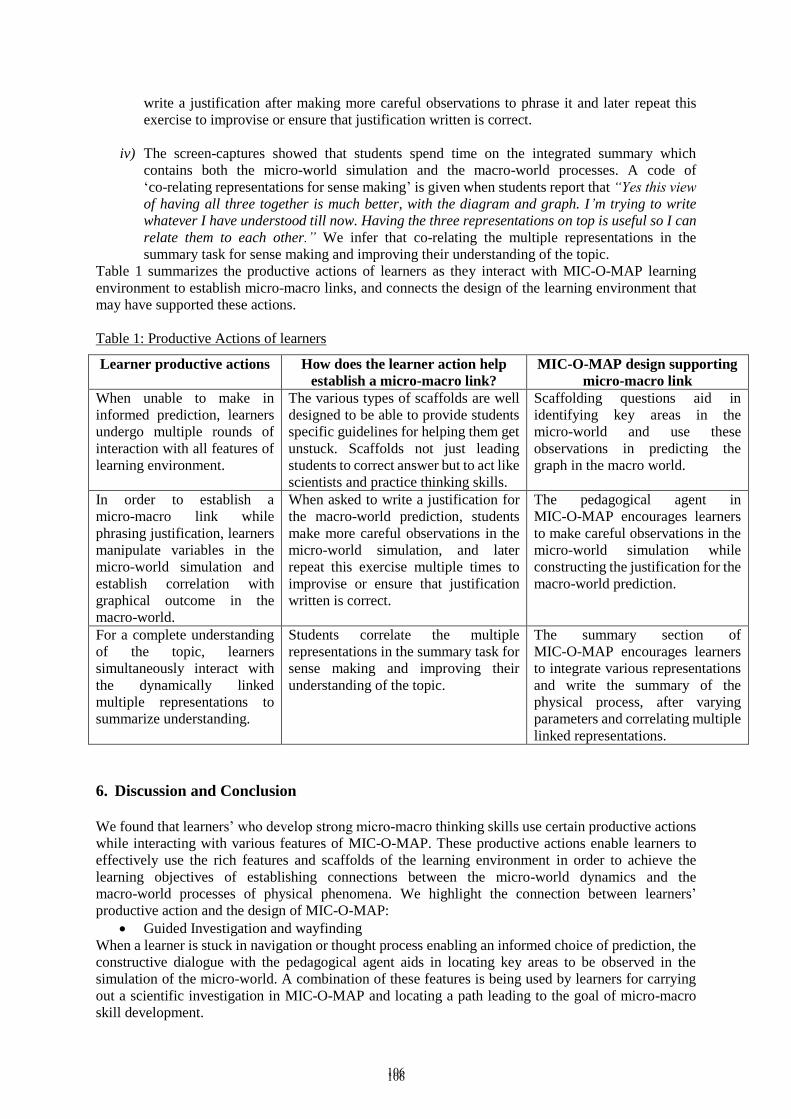
write a justification after making more careful observations to phrase it and later repeat this
exercise to improvise or ensure that justification written is correct.
iv) The screen-captures showed that students spend time on the integrated summary which
contains both the micro-world simulation and the macro-world processes. A code of
‘co-relating representations for sense making’ is given when students report that “Yes this view
of having all three together is much better, with the diagram and graph. I’m trying to write
whatever I have understood till now. Having the three representations on top is useful so I can
relate them to each other.” We infer that co-relating the multiple representations in the
summary task for sense making and improving their understanding of the topic.
Table 1 summarizes the productive actions of learners as they interact with MIC-O-MAP learning
environment to establish micro-macro links, and connects the design of the learning environment that
may have supported these actions.
Table 1: Productive Actions of learners
Learner productive actions How does the learner action help
establish a micro-macro link?
MIC-O-MAP design supporting
micro-macro link
When unable to make in
informed prediction, learners
undergo multiple rounds of
interaction with all features of
learning environment.
The various types of scaffolds are well
designed to be able to provide students
specific guidelines for helping them get
unstuck. Scaffolds not just leading
students to correct answer but to act like
scientists and practice thinking skills.
Scaffolding questions aid in
identifying key areas in the
micro-world and use these
observations in predicting the
graph in the macro world.
In order to establish a
micro-macro link while
phrasing justification, learners
manipulate variables in the
micro-world simulation and
establish correlation with
graphical outcome in the
macro-world.
When asked to write a justification for
the macro-world prediction, students
make more careful observations in the
micro-world simulation, and later
repeat this exercise multiple times to
improvise or ensure that justification
written is correct.
The pedagogical agent in
MIC-O-MAP encourages learners
to make careful observations in the
micro-world simulation while
constructing the justification for the
macro-world prediction.
For a complete understanding
of the topic, learners
simultaneously interact with
the dynamically linked
multiple representations to
summarize understanding.
Students correlate the multiple
representations in the summary task for
sense making and improving their
understanding of the topic.
The summary section of
MIC-O-MAP encourages learners
to integrate various representations
and write the summary of the
physical process, after varying
parameters and correlating multiple
linked representations.
6. Discussion and Conclusion
We found that learners’ who develop strong micro-macro thinking skills use certain productive actions
while interacting with various features of MIC-O-MAP. These productive actions enable learners to
effectively use the rich features and scaffolds of the learning environment in order to achieve the
learning objectives of establishing connections between the micro-world dynamics and the
macro-world processes of physical phenomena. We highlight the connection between learners’
productive action and the design of MIC-O-MAP:
Guided Investigation and wayfinding
When a learner is stuck in navigation or thought process enabling an informed choice of prediction, the
constructive dialogue with the pedagogical agent aids in locating key areas to be observed in the
simulation of the micro-world. A combination of these features is being used by learners for carrying
out a scientific investigation in MIC-O-MAP and locating a path leading to the goal of micro-macro
skill development.
106106
Accurate articulation and establishment of micro-macro link
Learners use the conceptual scaffolds for establishing or strengthening the micro-macro link after
committing to a graphical prediction in the macro-world. This is done via a dialogue with the
pedagogical agent who provides scaffolds. Learners use these scaffolds in order to analyze the graphical
curves and observations in the micro-world and later link the two. This is done when they justify their
commitment to a certain graphical outcome.
Activities based on dynamic linked representation for holistic sense making
After interacting with various activities in the learning environment, a complete summary is written by
learner post interacting with all representations present on the screen. While they do this they are able to
understand the on-going process in the micro world and the tangible outcomes in the macro world.
Establishment of this correlation is essential for their conceptual understanding as well as transfer of
this knowledge in future learning.
One limitation of this study is that the analysis described in this paper only focuses on students
who did develop micro-macro thinking skills, i.e. those who scored high on the post-test that included
questions on relating micro- and macro- worlds in a new topic. Our rationale was to attempt to identify
if there were any common behaviours and actions of such students which may have led to increased
learning. We found such a common set, i.e. the productive actions. However, we have not checked if
absence of these productive actions leads to a lack of development of micro-macro thinking skills. This
is relegated to future work, in which we have begun to analyze screen-captures and interviews of
students who scored low in the post test. Preliminary results indicate that such productive actions are
missing among low-scoring students. Another limitation is that we performed the analysis in this study
only on ten students, and for one topic in MIC-O-MAP. Increasing and diversifying the population as
well as testing the inferences in multiple topics in MIC-O-MAP is required.
The contribution of this study is firstly the identification of the productive actions of learners as
the attempt to make sense of complex learning in a rich, open-ended learning environment. Since
learners are guided only by the pedagogical agent in the learning environment (and not by a facilitator
or mentor), the task of the researcher designing such learning environments is challenging: it is not
sufficient to include effective features in technology-enhanced learning environments, but it is
important to ensure that learners in fact use these rich features in an effective manner. This study
attempts to address this challenge by indicating how such self-learning environments and scaffolds
within can be designed to promote productive actions by learners.
References
Avouris, N., Margaritis, M., Komis, V., Saez, A., & Meléndez, R. (2003). Modelling Space: Interaction Design
and Architecture of a collaborative modelling environment. Proc. of 6th CBLIS, 993-1004.
Azevedo, R., & Hadwin, A. F. (2005). Scaffolding self-regulated learning and metacognition–Implications for the
design of computer-based scaffolds. Instructional Science, 33(5), 367-379.
Cobb, P., Confrey, J., Lehrer, R., & Schauble, L. (2003). Design experiments in educational research. Educational
researcher, 32(1), 9-13.
Crowley, K., Schunn, C. D., & Okada, T. (Eds.). (2001). Designing for science: Implications from everyday,
classroom, and professional settings. Psychology Press.
Eilam, B. (2004). Drops of water and of soap solution: Students' constraining mental models of the nature of
matter. Journal of Research in Science Teaching, 41(10), 970-993.
Etkina, E., & Van Heuvelen, A. (2007). Investigative science learning environment–A science process approach
to learning physics. Research-based reform of university physics, 1.
Fretz, E. B., Wu, H. K., Zhang, B., Davis, E. A., Krajcik, J. S., & Soloway, E. (2002). An investigation of software
scaffolds supporting modeling practices. Research in Science Education, 32(4), 567-589.
Ge, X. & Land, S. M. (2004). A conceptual framework for scaffolding III-structured problem-solving processes
using question prompts and peer interactions. Educational Technology R&D, 52(2), 5-22.
Gilbert, J. K., & Treagust, D. F. (2009). Introduction: Macro, submicro and symbolic representations and the
relationship between them: Key models in chemical education. In Multiple representations in chemical
education (pp. 1-8). Springer Netherlands.
Govaerts, S., Cao, Y., Vozniuk, A., Holzer, A., Zutin, D. G., Ruiz, E. S. C., ... & Gillet, D. (2013). Towards an
online lab portal for inquiry-based stem learning at school. In Advances in Web-Based Learning–ICWL 2013
(pp. 244-253). Springer Berlin Heidelberg.
Hannafin, M. J., & Land, S. M. (1997). The foundations and assumptions of technology-enhanced
student-centered learning environments. Instructional science, 25(3), 167-202.
107107
Kenkre, A., Murthy S. & Mavinkurve, M. (2014). Development of Predict-Test-Revise Modeling Abilities via a
self-study Learning Environment. 22nd International Conference on Computers in Education, (ICCE 2014),
Nara, Japan. November 30- December 4, 2014.
Kenkre, A. & Murthy, S. (2014). A Self Study Learning Environment for Modeling Abilities: Do All Learners
Take the Same Learning Path?. In Technology for Education (T4E), 2014 IEEE Sixth International
Conference on (pp. 10-17). IEEE, Amritapuri, December 2014.
Land, S.M. & Hannafin, M.J. (1996). A conceptual framework for the development of theoriesin-action with
open-learning environments. Educational Technology Research and Development 44(3): 37–53.
Mulholland, P., Anastopoulou, S., Collins, T., Feisst, M., Gaved, M., Kerawalla, L., ... & Wright, M. (2012).
nQuire: technological support for personal inquiry learning. Learning Technologies, IEEE Transactions on,
5(2), 157-169.
‘My Screen Recorder’: http://www.deskshare.com/screen-recorder.aspx
Puntambekar, S., Erkens, G., & Hmelo-Silver, C. (Eds.). (2011). Analyzing interactions in CSCL: Methods,
approaches and issues (Vol. 12). Springer Science & Business Media.
Raghavan, K., & Glaser, R. (1995). Model–based analysis and reasoning in science: the MARS curriculum.
Science Education, 79(1), 37-61.
Reiser, B. J. (2002, January). Why scaffolding should sometimes make tasks more difficult for learners. In
Proceedings of the Conference on Computer Support for Collaborative Learning: Foundations for a CSCL
Community (pp. 255-264). International Society of the Learning Sciences.
Slotta, J. D. (2004). The web-based inquiry science environment (WISE): Scaffolding knowledge integration in
the science classroom. Internet environments for science education, 203-232.
Strauss, A., & Corbin, J. (1998). Basics of qualitative research: Techniques and procedures for developing
grounded theory (2nd ed.). Thousand Oaks, CA: Sage Publications.
Sun, D., & Looi, C. K. (2013). Designing a web-based science learning environment for model-based
collaborative inquiry. Journal of Science Education and Technology, 22(1), 73-89.
van Berkel, B., Pilot, A., & Bulte, A. M. (2009). Micro–macro thinking in chemical education: Why and how to
escape. In Multiple representations in chemical education (pp. 31-54). Springer Netherlands.
van den Akker, J., Gravemeijer, K., McKenney, S., & Nieveen, N. (2006). Introducing Educational Design
Research. In J. Van den Akker, K. Gravemeijer, S. McKenney & N. Nieveen (Eds.), Educational Design
Research (pp. 3-7). London: Routledge
van Joolingen, W. R., & De Jong, T. (2003). Simquest. In Authoring tools for advanced technology learning
environments (pp. 1-31). Springer Netherlands.
van Joolingen, W. R., de Jong, T., Lazonder, A. W., Savelsbergh, E. R., & Manlove, S. (2005). Co-Lab: research
and development of an online learning environment for collaborative scientific discovery learning.
Computers in human behavior, 21(4), 671-688.
White, B., Frederiksen, J., Frederiksen, T., Eslinger, E., Loper, S., & Collins, A. (2002, October). Inquiry Island:
Affordances of a multi-agent environment for scientific inquiry and reflective learning. In Proceedings of the
Fifth International Conference of the Learning Sciences (ICLS), Mahwah, NJ.
Winne, P. H. (2001). Self-regulated learning viewed from models of information processing. Self-regulated
learning and academic achievement: Theoretical perspectives, 2, 153-189.
Zimmerman, B. J., & Schunk, D. H. (Eds.). (2001). Self-regulated learning and academic achievement:
Theoretical perspectives. Routledge.
108108
Chen, W. et al. (Eds.) (2016). Proceedings of the 24th International Conference on Computers in Education. India: Asia-Pacific Society for Computers in Education
Identity Play in Gameful Learning: Avatars as Multiplayers in a Graduate Course
Beaumie KIMa* & Diali GUPTAa aWerklund School of Education, University of Calgary, Canada
Abstract: Considering how games engage players in goal-driven pursuits, educators and researchers are paying attention to the learning and design principles of games for their efforts to support meaningful learning experiences in classrooms. We argue that educators’ experience in gameful learning is important in order for them to understand the gaming context of young people. We propose that as educators engage in identity play through gameful learning, they are able to discover their own potentials and work towards a constructionist ethos of creating both artifacts and selves. In this paper, we discuss how we designed a graduate course on digital game-based learning to engage participants who are educators in its concepts and practices. The design of the course was a progressive development for three years, which included gaining experience points (XP) mediated by a social media technology, Google+. The design was modified with subsequent iterations to implement the use of avatars and self-assessment of XP. The social media worked as a possibility space for the participants to explore, embody and implement new identities especially from the second iteration, which introduced the avatars. In this paper, we discuss the identity play across three iterations from three different perspectives: as a course facilitator, a student and researchers. Our findings, which are primarily based on learner-generated content on Google+, demonstrate the participants’ emergent play with identities in their effort towards being gameful.
Keywords: Identity, avatar, gameful learning, social media, game-based learning
1. Introduction
Monster Den is an avatar with no indication of real name, age or gender. It provides anonymityin an online environment where gaming is undertaken with complete strangers. It is an exemplar name that I use with students to bring home the idea that when you log off your game, your gaming identity stays online, and your real life identity resumes. The two do not cross over one into the other; and your safety and integrity in real life is always preserved.
Monster Den, Day 1, Your Alter Ego
In recent years, using game-like elements in classrooms has gained attention to support meaningful learning experience in varying levels of education (e.g., Johnson, Adams-Becker, Estrada, & Freeman, 2014; Salen, 2011; Sheldon, 2011). Researchers and instructors found their game-like course assessments motivational for students in higher education (Fishman & Aguilar, 2012; Sheldon, 2011). In this paper, we discuss our effort to support meaningful learning experience in a graduate course using a game-like approach. We use the term ‘gameful’ that better captures the seriousness of gameplay than ‘playful’ for its goals-driven efforts (McGonigal, 2011). The term was adopted by McGonigal (2011) and further explored by other scholars (e.g., Holden et al., 2014; Walz & Deterding, 2015). Monster Den (avatar name of an educator in the graduate course discussed in this study) in the above quote also spoke of undisturbed effort of online gameplay, in which only the players’ dexterity, decisions, and progress (i.e., seriousness) matter in developing the online gaming identity regardless of their gender and age. At the same time, Monster Den emphasized the separation between gaming and real life identities as a teacher and a parent who is concerned about safety of young people. In this paper, we discuss the educators’ efforts to take on the challenge of being and becoming gameful and their intricately interwoven identity play in the graduate course. Being gameful requires a player (or learner)
109109
to have an attitude of pursuing success by understanding and utilizing rules and constraints, an unceasing effort to be and become players of identities, and a constant endeavor to learn from the failure or success experience and from other players (Holden et al. 2014; Kim, Gupta & Clyde, 2015). We propose that educators, as graduate students described in this paper, should engage in identity play through the opportunities for gameful learning. Their experience to work toward a constructionist aspiration of creating something and becoming someone is invaluable in realizing the same ethos in their own classrooms. In the following, we conceptualize identity play in gameful learning, discuss the design of the graduate course on digital game-based learning to provide an opportunity for students to be gameful, and present the emergent identity play through gameful learning in three course iterations. 2. Identity Play in Gameful Learning In conceptualizing gameful learning, we build on Holden and colleagues’ (2014) proposed notion of gameful learning experience, which emphasizes learners’ agency in response to social necessities for contributions in social games or game-like learning environments. Learners’ responses are considered the dynamic influences of attitude, identity and ignorance, which Holden et al. (2014) call the elements of gamefulness. We pay special attention to the identity element in gaming, as players often take on virtual identities in addition to multiple identities they explore and express in their daily lives. As they weave through these multiple social “sites” “lifeworlds” or “layers” of existence or complexity, they are able to take on risks and discover their current and potential capabilities (Holden et al., 2014). Discovering and developing their own capabilities involve learning, becoming, and negotiating of identities as learners define who they are through experience (Kim, Tan, & Bielaczyc, 2015; Wenger, 2008). Drawing from Lee & Hammer’s (2011) notion of identity play in the social context of games, we can re-emphasize how learners negotiate and experiment with various identities as they gain recognition or reward. Expanding the notion of persons in transition that focuses on identity development of adolescents who are supposedly in the period of uncertainty (Buckingham, 2008), we suggest that engaged learners are in identity play, negotiating and seeking social recognitions on who they are and are becoming. Such identity play in turn could motivate risk-taking and create opportunities for re-evaluating one’s self, potential and social relations. In game-like virtual learning environments, learners are seen to employ cooperative or competitive social mechanisms (Domínguez et al., 2013). Such social interactions help them realize new identities, as identity play becomes relevant to the game both inside and outside of the learning environment, within workplaces, homes and other environments (Holden et al., 2014). In general, virtual environments or platforms enable students to experience learning opportunities such as role playing or creating simulations of physical or procedural processes (Antonacci, DiBartolo, Edwards, Fritch, MacMullen & Murch-Shafer, 2008), and to be at the centre of the design process of their learning (de Freitas & Oliver, 2006). Thus virtual learning environments become the possibility spaces for learners to explore, create, and embody new identities (Holden et al, 2014) through the cognitive and social engagement of imagining oneself as a different person and acting in social context as one (Dominguez et al, 2013; Lee & Hammer, 2011).
Avatars are often used as representations of real life communication in virtual worlds. Avatars, as the communicator’s representation of self, capture the interaction between the communicator and others (Schultz & Leahy, 2009). Avatars, if used by learners, would indicate their social presence through their collaborative, competitive and other social transactions that would define their play with existing and projected identity. Research has also shown how anonymity of interactions through avatars in a virtual world enabled individuals to communicate or express themselves in ways they might have been incapable of doing otherwise, thereby enhancing their level of unbiased social connection and feeling of confidence (e.g., Martino, 2007; van den Brekel, 2007). Connecting this to Holden et al. (2014)’s notion on identity in gameful learning, we suggest that students might be able to take risks and explore their identities, as there are low consequences.
3. The Study and Its Context The graduate course in this study was titled Digital Game-Based Learning, which incorporated game elements to engage the participants in the concepts and practices of game-based learning. The first author initially designed and taught this course while the second author enrolled in it during the two-
110110
week residential period for an online Master of Education program in the summer of 2013. In the two subsequent years, we modified the various course elements, in which the second author was a researcher. For all three years, the course used the game concepts, such as experience points (XP) and multiple battles for students’ learning tasks (Johnson et al., 2014; Sheldon, 2011). This paper reports on the identity play from three iterations, which we believe were influenced by the design changes as well as the dynamics that was brought by the students themselves. The questions addressed in this study are:
(1) How do learners engage in identity play with game-like course activities?(2) How do learners’ identity play influence the gameful engagement in their learning?
For our data analysis, we took qualitatively different approaches to three iterations for a practical reason. For the first iteration, the two authors took a reflective account on the second author’s work during the course, as we did not have a study approved and were unable to collect data. For the second and third iterations, observation notes were taken every day during the course. We collected the assignments and the electronic artifacts posted online from the 15 participants from 2014 and 7 from 2015. We looked for indicators of learners’ expressions and explorations of their multiple identities as they engaged in various course activities. For the second and third iterations, we particularly focused on their online posts, as they were relevant to an important design change (i.e., using avatars).
3.1 Course Design Elements
Overall, the course took game-based and design-based approaches to learning. In addition to positioning the course as a game, the team assignment for designing an educational game was positioned as three battles (e.g., forming, introducing, and working as a design team). The participants were challenged to be gamers and game designers throughout the course. The course design changes that are important for this paper include social gaming, avatars in multiplayer game, experience points (XP) and leaderboard. Table 1 summarizes the design and contextual changes for these design elements that affected their gameful engagement and identity play.
Table 1: Change in design elements of three iterations.
2013 2014 2015 Social Gaming SuperGamer ranking In-class gaming In-class gaming Multiplayer 15 (4 teams) 17 (4 teams) 7 (2 teams) Avatars Online profile Online avatar Online avatar XP Instructor-assessed Self-assessed Self-assessed Leaderboard Initially shared, Private Details shared Summary shared
Social Gaming. Assuming that gaming experience is essential for understanding the potentials and challenges of digital game-based learning, students were asked to play games every day, submit a short review and report on their engagement (i.e., level advancement and minutes of play) for the first iteration. “SuperGamer” was a short online survey for them to submit this report, with which the instructor provided a ranking of the level advancement and play time, with no consequence. From the second iteration, in-class gaming sessions were incorporated in collaboration with the university library, which had a diverse digital game collection. We made this change with the expectation that the shared experience of playing the topical games (e.g., educational games, violent games, games with gendered character portraits) would deepen their discussion. At the same time, social gaming would create interactions of coaching and observing each other’s game play (Reed, Satwicz, & McCarthy, 2008). In the third iteration, we limited the number of games in each session, so that the educators with less gaming experience could learn to play complex games and experience some success.
Avatars in Multiplayer Game. For all iterations, we used social media, Google+, through which students could share, accumulate, and trace evolving ideas and digital resources. For the first iteration, students used their own names and created online profiles, usually with their own photos. From the second iteration, students used online avatars for anonymity. By using avatars, we wanted to create some level of privacy for students to more freely participate in an online community for exchanging ideas (Domínguez et al., 2013). We called the online posts microblogs with which the participants would start the initial reflection on the readings and continue their discussion in class. The dynamics
111111
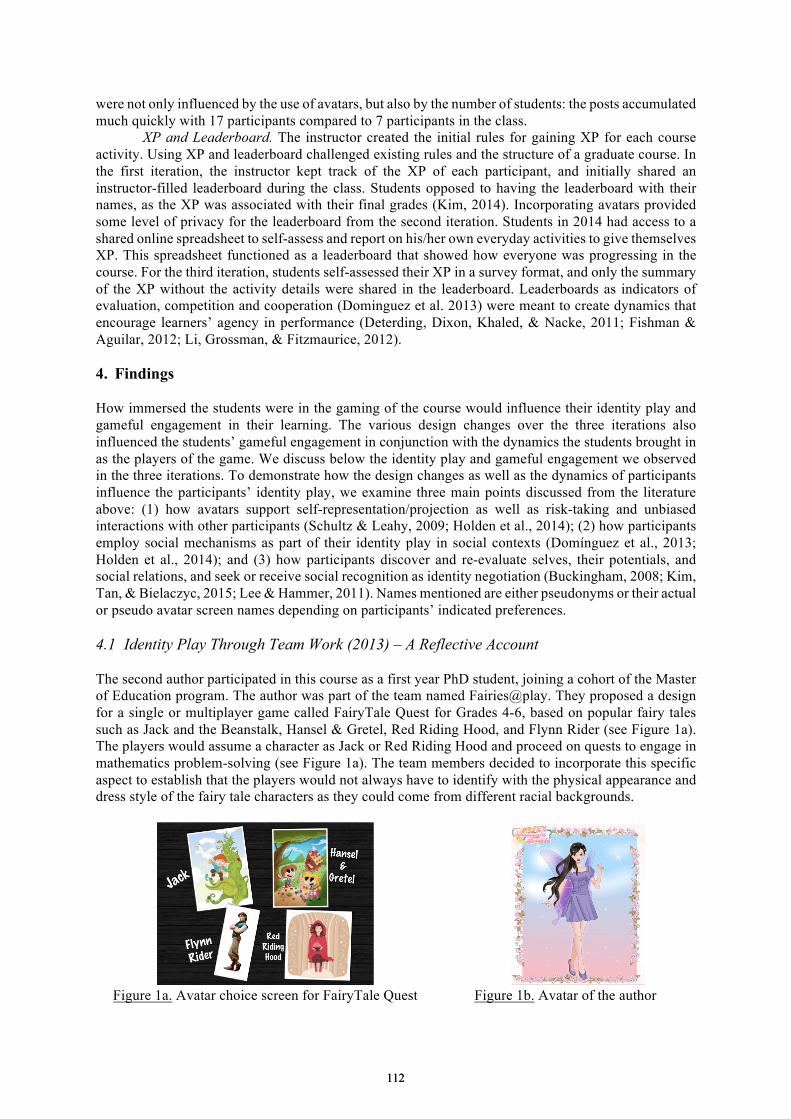
were not only influenced by the use of avatars, but also by the number of students: the posts accumulated much quickly with 17 participants compared to 7 participants in the class. XP and Leaderboard. The instructor created the initial rules for gaining XP for each course activity. Using XP and leaderboard challenged existing rules and the structure of a graduate course. In the first iteration, the instructor kept track of the XP of each participant, and initially shared an instructor-filled leaderboard during the class. Students opposed to having the leaderboard with their names, as the XP was associated with their final grades (Kim, 2014). Incorporating avatars provided some level of privacy for the leaderboard from the second iteration. Students in 2014 had access to a shared online spreadsheet to self-assess and report on his/her own everyday activities to give themselves XP. This spreadsheet functioned as a leaderboard that showed how everyone was progressing in the course. For the third iteration, students self-assessed their XP in a survey format, and only the summary of the XP without the activity details were shared in the leaderboard. Leaderboards as indicators of evaluation, competition and cooperation (Dominguez et al. 2013) were meant to create dynamics that encourage learners’ agency in performance (Deterding, Dixon, Khaled, & Nacke, 2011; Fishman & Aguilar, 2012; Li, Grossman, & Fitzmaurice, 2012). 4. Findings How immersed the students were in the gaming of the course would influence their identity play and gameful engagement in their learning. The various design changes over the three iterations also influenced the students’ gameful engagement in conjunction with the dynamics the students brought in as the players of the game. We discuss below the identity play and gameful engagement we observed in the three iterations. To demonstrate how the design changes as well as the dynamics of participants influence the participants’ identity play, we examine three main points discussed from the literature above: (1) how avatars support self-representation/projection as well as risk-taking and unbiased interactions with other participants (Schultz & Leahy, 2009; Holden et al., 2014); (2) how participants employ social mechanisms as part of their identity play in social contexts (Domínguez et al., 2013; Holden et al., 2014); and (3) how participants discover and re-evaluate selves, their potentials, and social relations, and seek or receive social recognition as identity negotiation (Buckingham, 2008; Kim, Tan, & Bielaczyc, 2015; Lee & Hammer, 2011). Names mentioned are either pseudonyms or their actual or pseudo avatar screen names depending on participants’ indicated preferences. 4.1 Identity Play Through Team Work (2013) – A Reflective Account The second author participated in this course as a first year PhD student, joining a cohort of the Master of Education program. The author was part of the team named Fairies@play. They proposed a design for a single or multiplayer game called FairyTale Quest for Grades 4-6, based on popular fairy tales such as Jack and the Beanstalk, Hansel & Gretel, Red Riding Hood, and Flynn Rider (see Figure 1a). The players would assume a character as Jack or Red Riding Hood and proceed on quests to engage in mathematics problem-solving (see Figure 1a). The team members decided to incorporate this specific aspect to establish that the players would not always have to identify with the physical appearance and dress style of the fairy tale characters as they could come from different racial backgrounds.
Figure 1a. Avatar choice screen for FairyTale Quest Figure 1b. Avatar of the author
112112

As discussed earlier, the first iteration in 2013 did not employ avatars for online microblogging. This also meant that there were no opportunities to take risks in communicating their opinions with unbiased opinions and projecting themselves differently online through Google+. On the other hand, Fairies@Play team members decided to assume different identities of fairies through their avatars in introducing their team members (see Figure 1b). The rationale behind the avatars was that as they were designing a game with avatars, they would also engage in the design task as a role playing game. The use of avatars as characters playing out a narrative helped articulate a relative coherent identity (Schultz & Leahy, 2009). They identified the diverse expertise of each members and defined roles within the team. As the second author reflected on this experience, her multiple real world identities were morphed and merged within her avatar persona from a variety of perspectives to highlight a way of being, which Holden and colleagues (2014) define as gameful learning. It allowed the designers/teachers to assume new roles through their avatars, where identity play became a social activity to be embraced both within and beyond the virtual world of the game and the classroom walls (Holden et al. 2014). The members of Fairies@play projected themselves as non-player characters in the game, such as the Vocabulary Fairy, Math Fairy and Reward Fairy. As teachers and designers, Fairies@play cared about a structure where players receive feedback and assistance during gameplay, which they carefully considered in their game design and learning principles as well as their experience on what kind of feedback would help learners progress.
Employing social mechanisms as identity play during the first iteration was rather contained within each team, as the classroom discourse was focused solely on academic readings and individual gaming experience. There was no social gaming, the shared experience of playing and learning new games together. Fairies@Play, who identified as the most racially diverse team in this course, focused on the team collaboration that harnessed their strengths. The author had two-year experience of teaching elementary grades one, four and six at a charter school whereas two of the other group members were teachers with the local school board with experience teaching elementary curriculum in French immersion and regular schools in Canada. The fourth member was an ESL specialist and therefore careful considerations towards problems faced by new language learners or newly arrived immigrants were incorporated in the game. The identity play of the team members, especially of the three teachers including the author, is reflected in the planning and implementation of the curriculum aspects in the game. As a teacher, the author had experienced how grade 4 or 6 learners often faced problems decoding the story problems in mathematics. This was accentuated by the fact that schools in Canada often have new students who as new immigrants lack English language proficiency. Hence building in help or feedback elements in the game in the form of a vocabulary fairy was considered to assist the students to proceed with the problem solving involving current or new math concepts.
The avatars of Fairies@play were assumed as an object of reflection and as an object of play (Schultz & Leahy, 2009). As fairies, there was also an element of wishful identification (Hoffner & Buchanan, 2005), which allowed Fairies@play to learn about themselves and explore new approaches in teaching and game design. Their efforts created new participatory trajectories from the game world towards non-game life spaces like the classroom (Holden et al. 2014). The reflexive relationship between teacher and designer selves helped the team members realize their own potential or expertise (Schultz & Leahy, 2009), which encouraged experimentation with their own capabilities and identities that led to generating questions and cultivating curiosity (Holden et al. 2014). The identities of Fairies@play as gamers are also reflected through commonalities they incorporated from various games they had played or used in the classroom as teachers. At the same time their experience with other educational software added value to their design. For example, the game had a teacher login along with student login so that teachers could understand the game play if required. This feature is similar to many education versions of software where the teacher monitors the activities of the students. Besides two of the team members had backgrounds in graphic design and fine arts, whose expertise were recognized as important assets to create visuals for depicting screens, interface tools, and navigation in creating the blueprint of the game.
In concluding the discussion on the first iteration, the gamers and those more familiar with digital game designs stood out as people who shared useful resources for the classwork. For example, an avid gamer in the cohort found his own way to keep track of his XP with a spreadsheet and shared the file with the rest of the class on Google+. Others who were in administrative positions were instrumental in sharing their perspectives on how game-based learning approaches could be feasible or adopted within their school settings. At the same time, their report on the everyday gameplay showed
113113

their current gaming levels and preferences (e.g., pastime gamers using their smartphones vs. avid gamers of complex games). In other words, students’ identity play in the first course iteration focused more on expressing their existing gamer, educator and graduate student identity. 4.2 Avatars and Identities in a Multiplayer Game (2014) In the second iteration, the participants used avatars for all communication and learning purposes using the social media of Google+. As a class their gamefulness was reflected through their interplay of multiple identities ranging from professional to personal or family identities in the realm of gaming (novices or experts) or assumed identities through avatars on the social network. Their identity play turned into a social activity that they embraced within and beyond the virtual walls or even the classroom (Holden et al., 2014; Kim, 2015). The names or visual representation of the avatars did not always reflect their own or projected identities but some made a connection with their hopes and preferences. We asked them to introduce their avatars, and some students used the chance to project their identities as protagonists embarking on a quest as gamers or designers of games (see Figure 2, Kin Hammer).
Figure 2. Google+ group page for microblogging as avatars during the second iteration
Using avatars, we observed that some participants took this opportunity to take risks in communicating their unbiased opinions and projecting themselves differently online. Birdee Bee, for example, introduced herself through her avatar in relation to games when she posted on the first day after the class:
Birdie Bee likes to flutter around and look at everything that goes on. Although I can’t really call myself a “gamer” the idea of playing games is both fun but at times frustrating. Today’s games from the good old games still provided some element of challenge. Bring it on!
From this short post, the influence that the design changes in social gaming and online avatars had on identity play is quite apparent. We can see that Birdie Bee was also taking on the challenge of developing or exploring her gamer identity as students were engaged in social gaming every day. Others like Troy Floor expressed excitement, trepidation and curiosity towards what the course could offer while introducing himself as a gamer and an educator who had used many educational games in the classroom. Gin & Tonic, who was rather quiet in class possibly used his avatar as a tool for social expression (Schultz & Leahy, 2009). In his reflection, he expressed his appreciation of using avatars in this respect:
I think that the use of avatars was an innovated teaching strategy that encouraged me to construct understanding through a more candid and open communication and (reducing potential for bias).’
Using avatars created diverse new social interactions as identity play. In the open-ended
question to comment on using avatars, many students (10 out of 17) mentioned that they enjoyed figuring out who the person was. Doc Claw, for example, mentioned, ‘I thought the avatar thing was a great idea! It is fun trying to figure out who everybody is just by their comments online.’ Interestingly,
114114
using avatars as a protective measure for the XP leaderboard was not much of a concern once they became familiar with the routine practice. At the same time, students made different types of moves in their use of avatars. For example, some students mentioned that they tried not to say something similar in class so that they would not accidently reveal their identities to others. Other students found themselves focusing more on ideas rather than associating the opinions with particular classmates. Another example includes how each of the teams reported on their progress with their game-based learning design project, which Bumble Bee, the avatar of the instructor, posted on behalf of the teams in order to keep their identities private. The needs and value of sharing and receiving feedback were established as the days went by, embracing their own ignorance as one of the important element of gamefulness (Holden et al., 2014). The teams identified the aspects of their designs to seek feedback from their peers, and started posting their group work using their own avatars. This generated clues for others regarding their avatar identities while receiving feedback on their design projects. At this juncture, however, it became clear that it was more important to be game designers and students of the course as opposed to protecting avatar identities.
Student identities also played out during the microblogging activities, which revealed their gaming or non-gaming backgrounds or experience. Turbo Snail and Doc Claw rediscovered their own gaming expertise valuable in this course, clearly showed their identities as gamers throughout the course, and created new social relationships as they became recognized as gaming experts. Doc Claw stated in his reflection paper:
I have been a gamer for all of my life, so incorporating all these different types of games into the course was a welcome surprise. Even with my experience, at first, I still wasn’t sure of the reasons for selecting the games that were chosen for the course. After a few classes I started to understand that by examining such a broad range of games, you get to figure out and develop a clear understanding of what would work in a classroom, which seems to me the most important thing to take away from this class.
The avid gaming backgrounds of Doc Claw and Turbo Snail also came across through their postings on Google + which they used to critically reflect upon their daily readings and game play. Turbo Snail for example, reflected on his own identity as a gamer in relation to a day’s reading assignment about violent games and in-class game play. Speaking to the general concern about violent video games affecting violent behaviour in individuals, he played out his multiple real identities – that of an educator and an avid/experienced video game player. He expressed that he would take risks of using first person shooter games in his classroom, which reinforced his gameful engagement in his learning about and experimenting with game-based learning. Doc Claw similarly provided gamer perspectives in response to Google+ posts. For instance, he explained the distinction between present generation and retro-games through the gaming process that encapsulates multiple pathways as opposed to a win through a definite pathway. Sometimes he responded to his own posts in order to critically analyze a game. After reviewing Grand Theft Auto 5, he voiced his concern that its sexual content often took away the gaming experience. Thus sharing findings in relation to both Doc Claw and Turbo Snail’s gaming experience and teaching backgrounds were good examples of the interplay between identities. This interplay reinforced their gamefulness in supporting a positive way of being and becoming an innovative teacher. 4.3 Avatars and Identities with Smaller Number of Players (2015) Similar to the second iteration, the third iteration of the course had the participants use avatars for communicating in Google+. However, in this iteration, we had only 7 students compared to 15 and 17 students in previous years. The gamefulness of this class was similarly reflected through the expressions and shifts in identities ranging from professional to personal or family identities in the realm of gaming.
Participants’ multiple identities were often expressed in their assumed identities on Google+ through avatars (see Figure 3). While some actively made a connection with how they act in relation to games and gaming, others chose avatars that did not affect their real or projected identities. For example, one participant chose to have her avatar named as “Hiriti” and claimed:
Hiriti is Tibetan in origin meaning "Protector of Children". As a teacher, I feel a strong sense of responsibility to protect and nurture the students I have been trusted with. I am excited to
115115
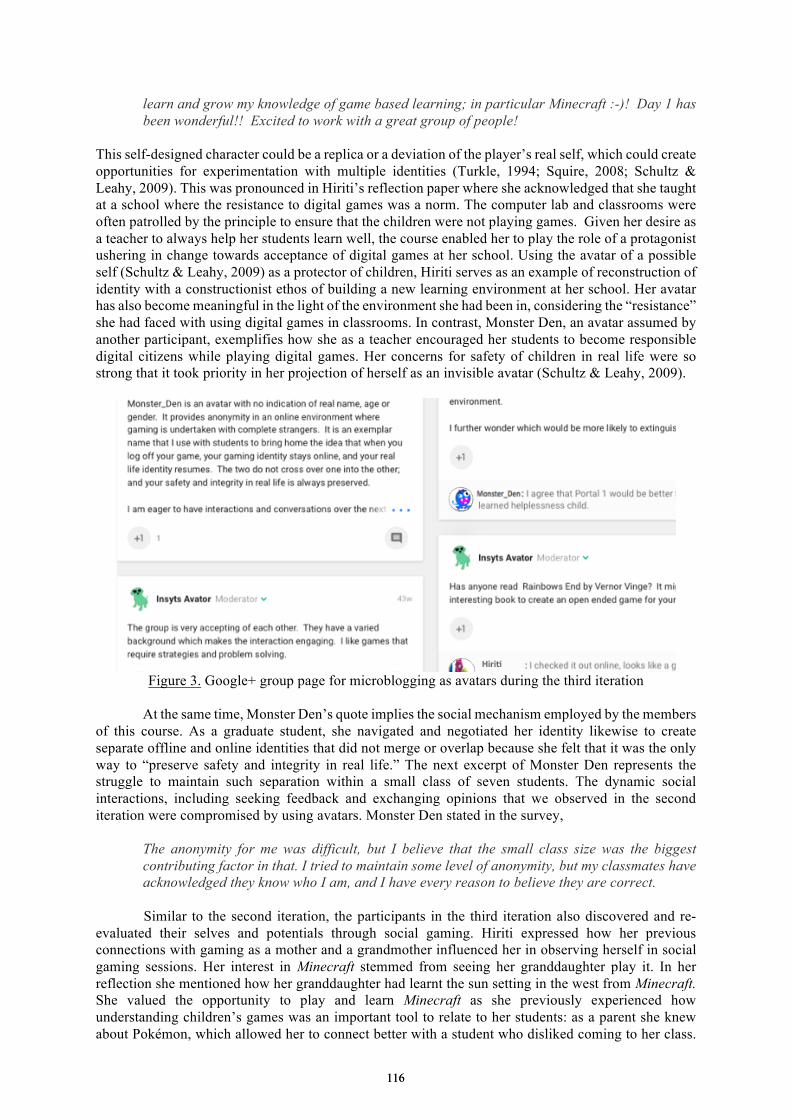
learn and grow my knowledge of game based learning; in particular Minecraft :-)! Day 1 has been wonderful!! Excited to work with a great group of people!
This self-designed character could be a replica or a deviation of the player’s real self, which could create opportunities for experimentation with multiple identities (Turkle, 1994; Squire, 2008; Schultz & Leahy, 2009). This was pronounced in Hiriti’s reflection paper where she acknowledged that she taught at a school where the resistance to digital games was a norm. The computer lab and classrooms were often patrolled by the principle to ensure that the children were not playing games. Given her desire as a teacher to always help her students learn well, the course enabled her to play the role of a protagonist ushering in change towards acceptance of digital games at her school. Using the avatar of a possible self (Schultz & Leahy, 2009) as a protector of children, Hiriti serves as an example of reconstruction of identity with a constructionist ethos of building a new learning environment at her school. Her avatar has also become meaningful in the light of the environment she had been in, considering the “resistance” she had faced with using digital games in classrooms. In contrast, Monster Den, an avatar assumed by another participant, exemplifies how she as a teacher encouraged her students to become responsible digital citizens while playing digital games. Her concerns for safety of children in real life were so strong that it took priority in her projection of herself as an invisible avatar (Schultz & Leahy, 2009).
Figure 3. Google+ group page for microblogging as avatars during the third iteration
At the same time, Monster Den’s quote implies the social mechanism employed by the members of this course. As a graduate student, she navigated and negotiated her identity likewise to create separate offline and online identities that did not merge or overlap because she felt that it was the only way to “preserve safety and integrity in real life.” The next excerpt of Monster Den represents the struggle to maintain such separation within a small class of seven students. The dynamic social interactions, including seeking feedback and exchanging opinions that we observed in the second iteration were compromised by using avatars. Monster Den stated in the survey,
The anonymity for me was difficult, but I believe that the small class size was the biggest contributing factor in that. I tried to maintain some level of anonymity, but my classmates have acknowledged they know who I am, and I have every reason to believe they are correct.
Similar to the second iteration, the participants in the third iteration also discovered and re-evaluated their selves and potentials through social gaming. Hiriti expressed how her previous connections with gaming as a mother and a grandmother influenced her in observing herself in social gaming sessions. Her interest in Minecraft stemmed from seeing her granddaughter play it. In her reflection she mentioned how her granddaughter had learnt the sun setting in the west from Minecraft. She valued the opportunity to play and learn Minecraft as she previously experienced how understanding children’s games was an important tool to relate to her students: as a parent she knew about Pokémon, which allowed her to connect better with a student who disliked coming to her class.
116116
Monster Den, on the other hand, found her role as a Minecraft gamer and technology expert gaining visibility as she worked with other members of her team for their game design project. She chose to work on game aesthetics and contributed to the design conception of monsters and zombies attacking the players while learning language, as seen in Minecraft adventure or survival mode. In her reflection she has stated how she enjoyed the experience.
Beyond my experience playing games on all types of platforms, I also brought the computer skill to the guild. The task of creating our image prototypes fell to me as I am fairly proficient in Photoshop and other imaging software. The creation of the maze in Adobe Illustrator, a program I am much less familiar with, also was my task……. I just felt very fortunate to bring the experience with technology and gaming into this course that I did.
Even for those participants who did not identify as gamers, they were able to connect with their childhood gaming experience or their observations of others who play games in their homes. By engaging in identity play relevant to games, inside and outside of school, at the university and at home, the participants contributed to the gamefulness of the class.
5. Discussion and Conclusion
The findings in this paper illustrate the potentials for our suggestion that experience in gameful activities is a valuable tool for teachers to connect to the gaming context of young people through their own exploration of identities. The participants were engaged in identity play and were able to discover their own potentials as they constructed both game design artifacts and selves. The design changes as well as the dynamics brought by the students themselves in three iterations influenced the ways in which the participants engaged in their identity play. Especially when there were novel opportunities to engage in game-like or gaming activities (e.g., social gaming, the use of avatars), learners were put to the test of exploring and developing new identities as particular kinds of gamers or designers. When there were fewer opportunities in the first iteration, the team, Fairies@Play, represented by the second author, chose to bring in the avatars themselves in conjunction with the game design they worked together.
In this research, social media (Google+) worked as a possibility space for both the students and the researchers, where identity play could be explored and witnessed, as new topics and new games were introduced and discussed. We paid special attention to identity as one of the dynamic elements of gameful learning (Holden et al., 2014), as we believe that being and becoming someone is the strong indicator of in-depth learning. Our findings also indicate that the learners gained recognitions for their expertise as artists, designers, and gamers, through which they found opportunities for re-evaluating their potentials and social contributions within their teams and the class. The practice and changes discussed as the three iterations in this paper provided an effort to create a stronger connection among the course pedagogy, its content, and the gaming practice of the youth. The exploration and development of identities are the results of experienced discourse and examined practices of gaming and game-based learning. For all three iterations, initial (or sustained for some students) tensions existed when faced with novel structures and rules of graduate course as a gaming experience (Kim, 2014; Kim, Gupta, & Clyde, 2015). However, gameful learning practices and creative engagement with avatars also emerged in all three iterations as students gradually accepted or co-modified the new rules of the course, and navigated their identities as gamers, teachers, designers, and students.
Acknowledgements
The research described was supported by the Teaching Innovation Grant from the Werklund School of Education at the University of Calgary. We thank the graduate students participated in this research, and Taylor Family Digital Library for their support, including various conceptual, technical, facility and teaching assistance by Jerremie Clyde, Jeremiah Baker, and Dylan Tetrault.
References
Antonacci, D., DiBartolo, S., Edwards, N., Fritch, K., McMullen, B. & Murch-Shafer, R. (2008). The power of virtual worlds in education: a second life primer and resource for exploring the potential of virtual
117117

worlds to impact teaching and learning. Report from the Angel Learning Isle Steering Committee. Indianapolis, IN: Angel Learning.
Buckingham, D. (2008). Introducing identity. In D. Buckingham (Ed.). Youth, identity, and digital Media (pp. 1–24). The John D. and Catherine T. MacArthur Foundation Series on Digital Media and Learning. Cambridge, MA: The MIT Press. doi: 10.1162/dmal.9780262524834.001
de Freitas, S., & Oliver, M. (2006). How can exploratory learning with games and simulations within the curriculum be most effectively evaluated? Computers & Education, 46(3), 249–264. http://doi.org/10.1016/j.compedu.2005.11.007
Deterding, S., Dixon, D., Khaled, R., & Nacke, L. (2011). From Game Design Elements to Gamefulness: Defining “Gamification.” In Proceedings of the 15th International Academic MindTrek Conference: Envisioning Future Media Environments (pp. 9–15). New York, NY, USA: ACM. http://doi.org/10.1145/2181037.2181040
Domínguez, A., Saenz-de-Navarrete, J., de-Marcos, L., Fernández-Sanz, L., Pagés, C., & Martínez-Herráiz, J.-J. (2013). Gamifying learning experiences: Practical implications and outcomes. Computers & Education, 63, 380–392. http://doi.org/10.1016/j.compedu.2012.12.020
Fishman, B., & Aguilar, S. (2012). Gaming the class: Using a game-based grading system to get students to work harder... and like It. Poster presented at the Games+Learing+Society Conference 9.0, University of Wisconsin- Madison. Madison, WI.
Holden, J. I., Kupperman, J., Dorfman, A., Saunders, T., Pratt, A., & MacKay, P. (2014). Gameful learning as a way of being. International Journal of Learning Technology, 9(2), 181–201. http://doi.org/10.1504/IJLT.2014.064492
Johnson, L., Adams Becker, S., Estrada, V., & Freeman, A. (2014). NMC Horizon Report: 2014 Higher Education Edition. Austin, TX, USA: The New Media Consortium.
Kim, B. (2014). A graduate course as a game to learn about digital game-based learning. In A. P. Preciado (Ed.), Proceedings of the IDEAS 2014: Rising to Challenge Conference (pp. 103–112). Calgary, AB, Canada: University of Calgary.
Kim, B. (2015). Playing with Gameful Activities and Assessments: Avatars and Experience Points in a Graduate Course. In O. Lindwall, P. Häkkinen, T. Koschmann, P. Tchounikine, & S. Ludvigsen (Eds.), The Computer Supported Collaborative Learning (CSCL) Conference 2015 (pp. 485–489). Gothenburg, Sweden: International Society of the Learning Sciences.
Kim, B., Gupta, D., & Clyde, J. V. (2015). Gameful Space, Activities, and Assessment for Game-Based Learning. In P. Preciado Babb, M. Takeuchi, & J. Lock (Eds.), IDEAS 2015: Designing Responsive Pedagogy Conference (pp. 90–100). Calgary, AB, Canada: University of Calgary.
Kim, B., Tan, L., & Bielaczyc, K. (2015). Learner-generated designs in participatory culture: what they are and how they are shaping learning. Interactive Learning Environments, 23(5), 545–555. doi:10.1080/10494820.2015.106797
Lee, J. J., & Hammer, J. (2011). Gamification in education: What, how, why bother? Academic Exchange Quarterly, 15(2), 1–5.
Li, W., Grossman, T., & Fitzmaurice, G. (2012). Gamicad: a gamified tutorial system for first time autocad users. In Proceedings of the 25th annual ACM symposium on User interface software and technology (pp. 103–112). ACM. Retrieved from http://dl.acm.org/citation.cfm?id=2380131
Martino, J. (2007). The avatar project: Connected but not engaged –the paradox of cyberspace. Final Report for VicHealth. Victoria, Australia: Victorian Health Commission.
McGonigal, J. (2011). Reality is broken: Why games make us better and how they can change the world. New York, NY: Penguin Press.
Reed, S., Satwicz, T., & McCarthy, L. (2008). In-Game, In-Room, In-World: Reconnecting Video Game Play to the Rest of Kids’ Lives. In K. Salen (Ed.), The Ecology of Games (pp. 41–66). Cambridge, MA: The MIT Press. Retrieved from http://mitpress.mit.edu/books/ecology-games
Salen, K. (2011). Quest to learn: Developing the school for digital kids. Cambridge, MA: MIT Press. Retrieved from http://mitpress.mit.edu/books/quest-learn
Sheldon, L. (2011). The multiplayer classroom: Designing coursework as a game. Boston, MA: Cengage Learning.
Shultze, U., & Leahy, M. M. (2009). The avatar self relationship: Presence in second life. In Proceedings of the 30th International Conference on Information Systems. Phoenix, AZ, USA.: Association for Information System
Walz, S. P., & Deterding, S. (2015). The gameful world: approaches, issues, applications. Cambridge, MA, USA: MIT Press.
Wenger, E. (2008). Identity in practice. In K. Hall, P. Murphy, & J. Soler (Eds.), Pedagogy and Practice: Culture and identities (pp. 105–114). Los Angeles, CA: Sage.
118118
Chen, W. et al. (Eds.) (2016). Proceedings of the 24th International Conference on Computers in Education.
India: Asia-Pacific Society for Computers in Education
Gamifying a CSCL and its effect on
collaboration and self-organization
Astrid VEROY*, Ganga KASI , Daniel HANNON & Ethan DANAHY
Center for Engineering Education and Outreach, Tufts University, USA
Abstract: InterLACE (Interactive Learning and Collaboration Environment), is a
Computer-Supported Collaborative Learning (CSCL) tool that was developed at Tufts
University to support active learning in high school Physics education. Usability testing yielded
positive results, but usability did not translate to usage in a learning environment. In classroom
testing, peer-to-peer interactions among student users did not live up to expectations.
Gamification, or the use of design elements characteristic for games in non-game contexts, was
identified as a possible means to encourage more interaction among users. A study was
conducted to examine the influence of gamification on the number of interactions and
self-organization that occurs in InterLACE users during a high school Physics learning activity.
University students in the Boston area (N = 48) between the ages of 18 and 31 were recruited
and randomly assigned in groups of 4-6 to two conditions: gamified and control. Gamifying
elements were introduced in the experimental condition, such as rules for earning points, a
leaderboard, badges and time constraints. The leaderboard provided immediate feedback on
individual scores and rank in relation to other players. Results indicate an increase in
inter-participant collaboration indicated by a greater number of interactions (15.37 vs. 4.81
average per person). Participation also increased, as indicated by the count of words posted
(303.14 vs 205.99 average per person). The number of self-organized groups formed were also
higher (4 vs 1.6), but the difference between the two conditions was not statistically significant.
Keywords: Collaboration, CSCL, gamification, human factors
1. Introduction
Traditional education has given much emphasis to the interaction between students and teachers. Class
discussions have been teacher-centric, with the teacher being perceived as the main source of
information. Many hours have likewise been devoted to the interaction between students and materials,
such as textbooks and curriculum. The interaction among students is seemingly not as well thought out
(Johnson & Johnson, 1988).
According to Johnson and Johnson (1988), there are three ways in which students interact with
each other in the learning process: they can compete with each other; they can work individualistically,
being measured against a set of criteria; or they can work cooperatively. Having students work alone,
whether individualistically or competitively, is the dominant interaction pattern in most classrooms.
This goes against the majority of research on this topic, which reveals that students learn more
effectively when they work cooperatively. Students achieve more and they are more positive about
school, subject areas, teachers and each other. Moreover, they have more effective interpersonal skills.
Working collaboratively is a natural consequence of the innate sociability of humans (Mendoza
& Galvis, 1998 as cited in Zea et al., 2009). Social interaction lets us access opinions and attitudes that
are different from our own. During the learning process, interacting with others in a group modulates
students’ tendency to oversimplify complex concepts (Zea et al., 2009). This occurs as a result of
exposure to different opinions from other students about the concept being studied.
Collaboration in learning can be supported through the use of technology. Computer-Supported
Collaborative Learning (CSCL) emerged in the 1990s as a reaction to software that forced students to
learn as individuals. In recent years, more and more technology for CSCL has been introduced in the
classroom (Stahl, Koschmann & Suthers, 2006).
InterLACE (Interactive Learning and Collaboration Environment), is a CSCL tool that was
developed at Tufts University to support high school Physics instruction (“Visual Classrooms,” n.d.). It
119119
aids students in the process of creating, interacting and refining their ideas within a common workspace.
The software allows an instructor to post a question (a “prompt”), to which users can then respond. It
enables the users to capture their ideas in text, graphical or video form, then just as easily share these
ideas with other users on a common display. Collaboration and idea refinement is encouraged by
providing tools for commenting on and tagging posts, and comparing images. The user interface for
InterLACE was designed using Human Factors principles, specifically to build user collaboration.
Usability has been defined as “the degree to which something is easy to use and a good fit for
the people who use it”. (“What is Usability?,” n.d.). Usability testing was performed on the InterLACE
interface and it yielded positive results. However, this usability did not translate to usage. In subsequent
studies done in various classrooms, peer-to-peer interactions were examined qualitatively and were
found to be less collaborative than expected (E. Danahy, personal communication, January 11, 2016).
Despite being given the necessary tools for collaboration, students still needed the motivation to use
them.
Motivation can be described as the general desire of someone to do something. For students, the
motivation to learn is important because they need to be receptive to the topic being taught. There are a
number of ways that teachers may help to motivate students to interact and collaborate with their peers
(Tharp, 1987). They can provide ways for students to demonstrate mastery of the topic. Moreover,
instructors must provide early and continual feedback regarding student performance. Lastly, providing
multiple paths for students to excel can make more of them believe that they can do well in the course.
Gamification is defined as the use (rather than the extension) of design (rather than game-based
technology or other game-related practices) elements (rather than full-fledged games) characteristic for
games (rather than play or playfulness) in non-game contexts (regardless of specific usage intentions,
contexts, or media of implementation) (Deterding, et al., 2011). It can be used to motivate students by
addressing several of the means for motivation mentioned above. It employs tasks for students to be
able to solve problems and demonstrate their mastery of a particular topic (Lee & Hammer, 2011).
Gamification affords students the chance to interact with game elements and other students - something
they cannot obtain from a textbook. These interactions give students the chance to earn points and
advance in the game. Scores provide timely and continual feedback (Lee & Hammer, 2011). Finally,
games can provide multiple opportunities to obtain scores, thereby providing multiple paths for students
to excel (Nicholson, 2015).
Gamification has been a trending topic for the past few years as a means to increase user
activity, social interaction and quality and productivity of actions (Hamari, Koivisto, & Sarsa, 2014). In
a recent review of twenty-four peer-reviewed, empirical studies on gamification, nine were in the field
of education or learning. All nine reported positive outcomes when gamification was used, such as
increased motivation, engagement and enjoyment in the learning tasks (Hamari, et al., 2014). This
supports our intention to use gamification as a means to increase motivation in a learning context.
This study examines the gamification of the InterLACE environment and its influence on the
level of collaboration and self-organization that occurs in a group of student users. It attempts to answer
the following research questions:
1. Does gamification of InterLACE influence the level of collaboration among users?
2. Does gamification of InterLACE lead to increased participation among users?
3. Does gamification of InterLACE influence self-organization among users?
The level of collaboration among users of InterLACE may be measured by the number of
comments and tags that a user made on another user's posts, as well as the number of ideas that a user
obtains from another user and incorporates into their revised answer, referred to as “uptake”. Only
comments that show engagement with the subject matter should be counted. Others that merely express
an emotion or reaction should be excluded from the count. A user's level of participation may be
measured by the number of words they posted during the session. Lastly, self-organization into groups
may be measured as the number of two or more users mutually commenting on each other's posts.
The level of collaboration is measured because we aim to increase user interaction on
InterLACE. User participation is measured because it indicates the extent of user motivation to engage
in the activity. We are also interested in measuring self-organization because it indicates that users are
engaging in a discussion. This back-and-forth of ideas provides opportunities for deeper understanding
of the topic being discussed.
120120
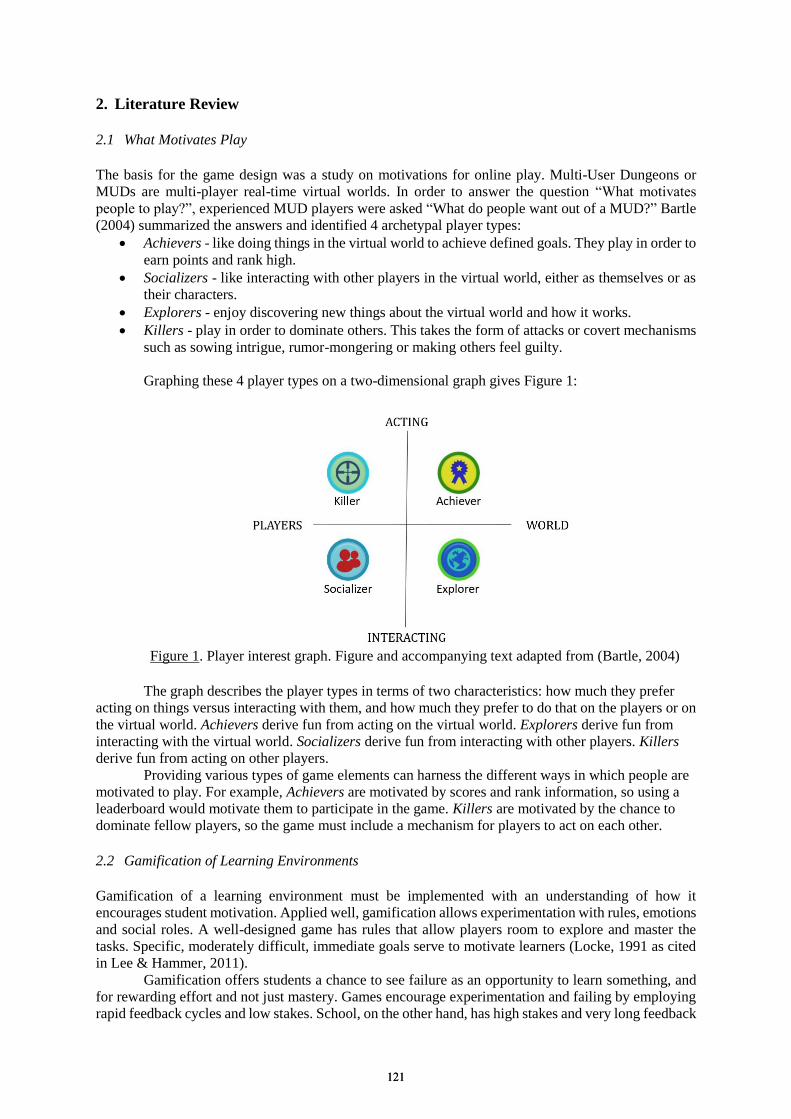
2. Literature Review
2.1 What Motivates Play
The basis for the game design was a study on motivations for online play. Multi-User Dungeons or
MUDs are multi-player real-time virtual worlds. In order to answer the question “What motivates
people to play?”, experienced MUD players were asked “What do people want out of a MUD?” Bartle
(2004) summarized the answers and identified 4 archetypal player types:
Achievers - like doing things in the virtual world to achieve defined goals. They play in order to
earn points and rank high.
Socializers - like interacting with other players in the virtual world, either as themselves or as
their characters.
Explorers - enjoy discovering new things about the virtual world and how it works.
Killers - play in order to dominate others. This takes the form of attacks or covert mechanisms
such as sowing intrigue, rumor-mongering or making others feel guilty.
Graphing these 4 player types on a two-dimensional graph gives Figure 1:
Figure 1. Player interest graph. Figure and accompanying text adapted from (Bartle, 2004)
The graph describes the player types in terms of two characteristics: how much they prefer
acting on things versus interacting with them, and how much they prefer to do that on the players or on
the virtual world. Achievers derive fun from acting on the virtual world. Explorers derive fun from
interacting with the virtual world. Socializers derive fun from interacting with other players. Killers
derive fun from acting on other players.
Providing various types of game elements can harness the different ways in which people are
motivated to play. For example, Achievers are motivated by scores and rank information, so using a
leaderboard would motivate them to participate in the game. Killers are motivated by the chance to
dominate fellow players, so the game must include a mechanism for players to act on each other.
2.2 Gamification of Learning Environments
Gamification of a learning environment must be implemented with an understanding of how it
encourages student motivation. Applied well, gamification allows experimentation with rules, emotions
and social roles. A well-designed game has rules that allow players room to explore and master the
tasks. Specific, moderately difficult, immediate goals serve to motivate learners (Locke, 1991 as cited
in Lee & Hammer, 2011).
Gamification offers students a chance to see failure as an opportunity to learn something, and
for rewarding effort and not just mastery. Games encourage experimentation and failing by employing
rapid feedback cycles and low stakes. School, on the other hand, has high stakes and very long feedback
121121
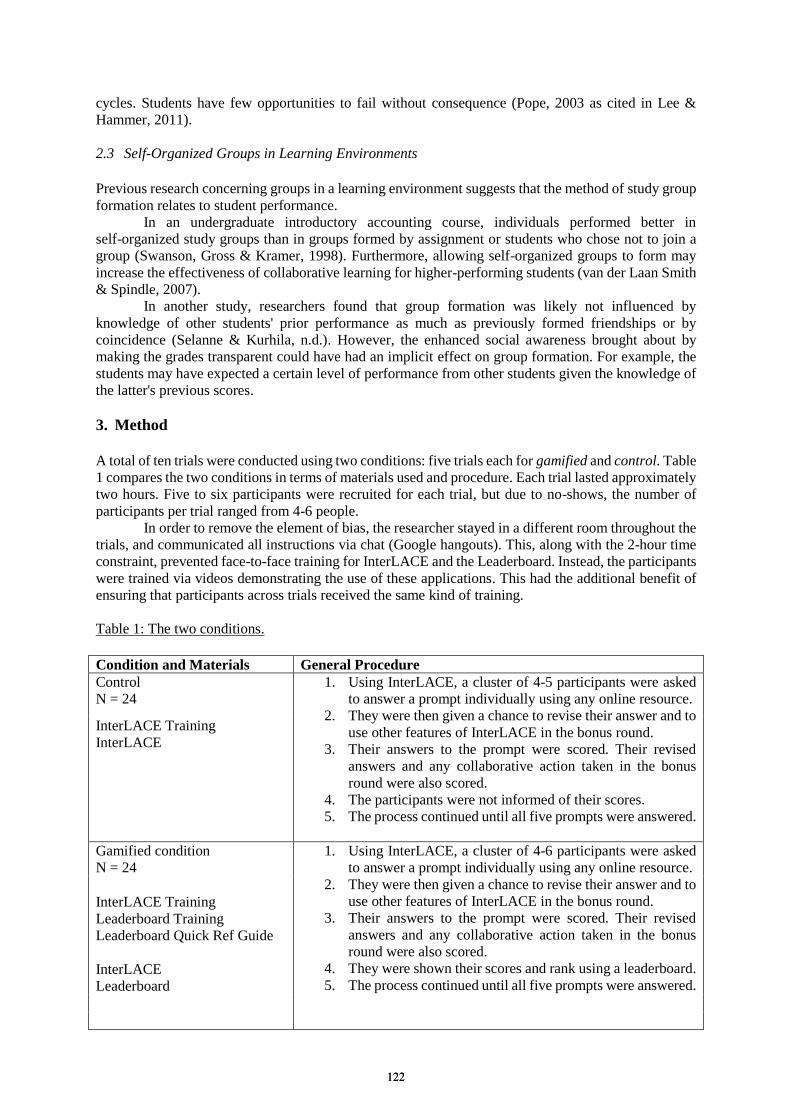
cycles. Students have few opportunities to fail without consequence (Pope, 2003 as cited in Lee &
Hammer, 2011).
2.3 Self-Organized Groups in Learning Environments
Previous research concerning groups in a learning environment suggests that the method of study group
formation relates to student performance.
In an undergraduate introductory accounting course, individuals performed better in
self-organized study groups than in groups formed by assignment or students who chose not to join a
group (Swanson, Gross & Kramer, 1998). Furthermore, allowing self-organized groups to form may
increase the effectiveness of collaborative learning for higher-performing students (van der Laan Smith
& Spindle, 2007).
In another study, researchers found that group formation was likely not influenced by
knowledge of other students' prior performance as much as previously formed friendships or by
coincidence (Selanne & Kurhila, n.d.). However, the enhanced social awareness brought about by
making the grades transparent could have had an implicit effect on group formation. For example, the
students may have expected a certain level of performance from other students given the knowledge of
the latter's previous scores.
3. Method
A total of ten trials were conducted using two conditions: five trials each for gamified and control. Table 1 compares the two conditions in terms of materials used and procedure. Each trial lasted approximately
two hours. Five to six participants were recruited for each trial, but due to no-shows, the number of
participants per trial ranged from 4-6 people.
In order to remove the element of bias, the researcher stayed in a different room throughout the
trials, and communicated all instructions via chat (Google hangouts). This, along with the 2-hour time
constraint, prevented face-to-face training for InterLACE and the Leaderboard. Instead, the participants
were trained via videos demonstrating the use of these applications. This had the additional benefit of
ensuring that participants across trials received the same kind of training.
Table 1: The two conditions.
Condition and Materials General Procedure
Control
N = 24
1. Using InterLACE, a cluster of 4-5 participants were asked
to answer a prompt individually using any online resource.
2. They were then given a chance to revise their answer and to
use other features of InterLACE in the bonus round.
3. Their answers to the prompt were scored. Their revised
answers and any collaborative action taken in the bonus
round were also scored.
4. The participants were not informed of their scores.
5. The process continued until all five prompts were answered.
InterLACE Training
InterLACE
Gamified condition
N = 24
1. Using InterLACE, a cluster of 4-6 participants were asked
to answer a prompt individually using any online resource.
2. They were then given a chance to revise their answer and to
use other features of InterLACE in the bonus round.
3. Their answers to the prompt were scored. Their revised
answers and any collaborative action taken in the bonus
round were also scored.
4. They were shown their scores and rank using a leaderboard.
5. The process continued until all five prompts were answered.
InterLACE Training
Leaderboard Training
Leaderboard Quick Ref Guide
InterLACE
Leaderboard
122122
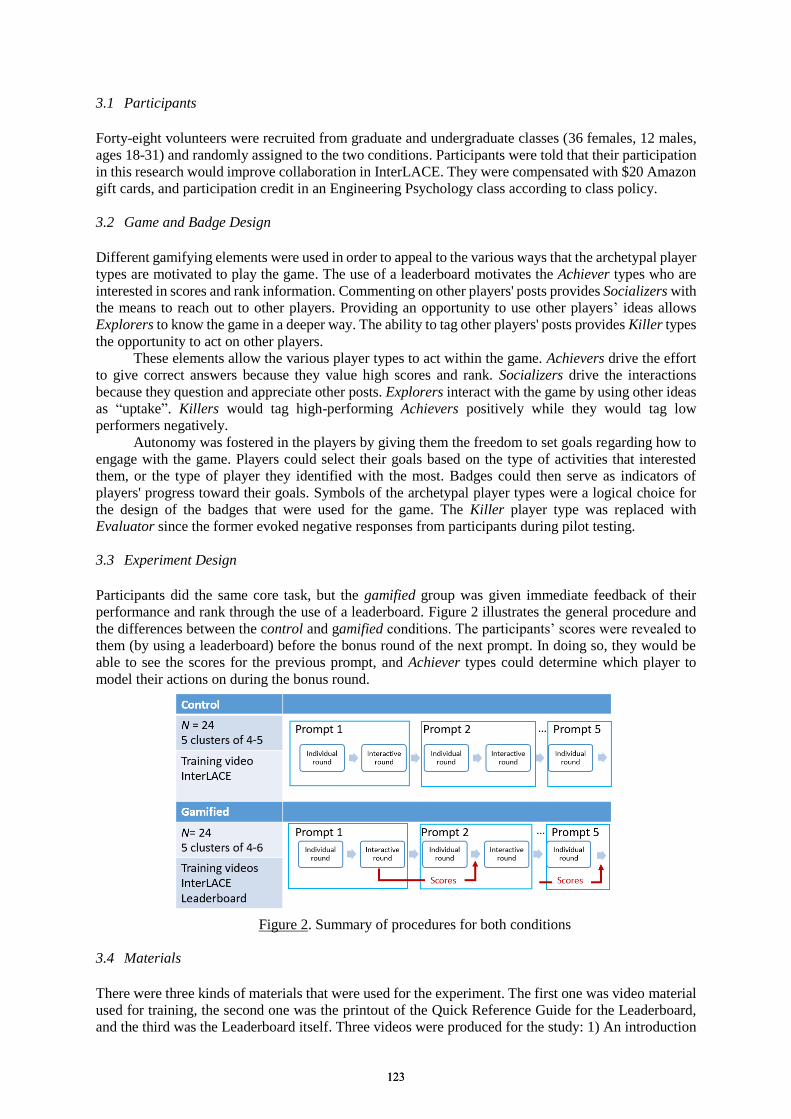
3.1 Participants
Forty-eight volunteers were recruited from graduate and undergraduate classes (36 females, 12 males,
ages 18-31) and randomly assigned to the two conditions. Participants were told that their participation
in this research would improve collaboration in InterLACE. They were compensated with $20 Amazon
gift cards, and participation credit in an Engineering Psychology class according to class policy.
3.2 Game and Badge Design
Different gamifying elements were used in order to appeal to the various ways that the archetypal player
types are motivated to play the game. The use of a leaderboard motivates the Achiever types who are
interested in scores and rank information. Commenting on other players' posts provides Socializers with
the means to reach out to other players. Providing an opportunity to use other players’ ideas allows
Explorers to know the game in a deeper way. The ability to tag other players' posts provides Killer types
the opportunity to act on other players.
These elements allow the various player types to act within the game. Achievers drive the effort
to give correct answers because they value high scores and rank. Socializers drive the interactions
because they question and appreciate other posts. Explorers interact with the game by using other ideas
as “uptake”. Killers would tag high-performing Achievers positively while they would tag low
performers negatively.
Autonomy was fostered in the players by giving them the freedom to set goals regarding how to
engage with the game. Players could select their goals based on the type of activities that interested
them, or the type of player they identified with the most. Badges could then serve as indicators of
players' progress toward their goals. Symbols of the archetypal player types were a logical choice for
the design of the badges that were used for the game. The Killer player type was replaced with
Evaluator since the former evoked negative responses from participants during pilot testing.
3.3 Experiment Design
Participants did the same core task, but the gamified group was given immediate feedback of their
performance and rank through the use of a leaderboard. Figure 2 illustrates the general procedure and
the differences between the control and gamified conditions. The participants’ scores were revealed to
them (by using a leaderboard) before the bonus round of the next prompt. In doing so, they would be
able to see the scores for the previous prompt, and Achiever types could determine which player to
model their actions on during the bonus round.
Figure 2. Summary of procedures for both conditions
3.4 Materials
There were three kinds of materials that were used for the experiment. The first one was video material
used for training, the second one was the printout of the Quick Reference Guide for the Leaderboard,
and the third was the Leaderboard itself. Three videos were produced for the study: 1) An introduction
123123

to the study and an explanation of the consent form, 2) A training video demonstrating the use and
features of InterLACE, and 3) A training video for interpreting the Leaderboard. The training videos
included a short quiz at the end, in order to assess the participant’s understanding.
Participants in the gamified condition were provided with a printout of the quick reference guide
for the Leaderboard. It was intended to be used during the session as a reminder of how to interpret each
part of the Leaderboard.
The design for the user interface of the leaderboard is shown in Fig. 3 below. The leaderboard
shows player scores on the left side, and player rankings on the right. On the top left of the page are a
name selector, the player name, their total points and overall rank. It also shows the badges they have
earned. The center of the page shows the name of the session, and the upper right portion shows the date
that the session occurred.
Figure 3. Leaderboard interface
3.5 Procedure
One condition (either control or gamified) was tested for a particular session. Participants were seated in
individual cubicles, given a Chromebook, and assigned anonymous Participant IDs. Participants in the
gamified condition were provided a printout of the Leaderboard Quick Reference Guide.
1. The participants watched an introductory video to explain the study and the consent form.
2. The participants then watched a training video that explained the actions available on
InterLACE that they would be using for the study. They joined a live session on InterLACE and
tried out the individual actions on the test session.
3. The participants in the gamified condition watched the Leaderboard training video and were
referred to the Quick Reference Guide that was provided to them earlier.
4. Participants performed the following tasks during the experiment:
a. Answered the first prompt using any online resource. They could only see other
players’ answers once they posted an idea. (8 minutes)
b. Revised their answer based on other players’ posts and used InterLACE features. This
was the Bonus round. (4 minutes)
c. Answered some survey questions on an online questionnaire. While they were doing
this task, the researcher evaluated their scores. In the gamified condition, the researcher
updated the Leaderboard before the Bonus round of the next prompt. (5 minutes)
d. Moved to the next prompt and repeated the process until all prompts were answered.
124124
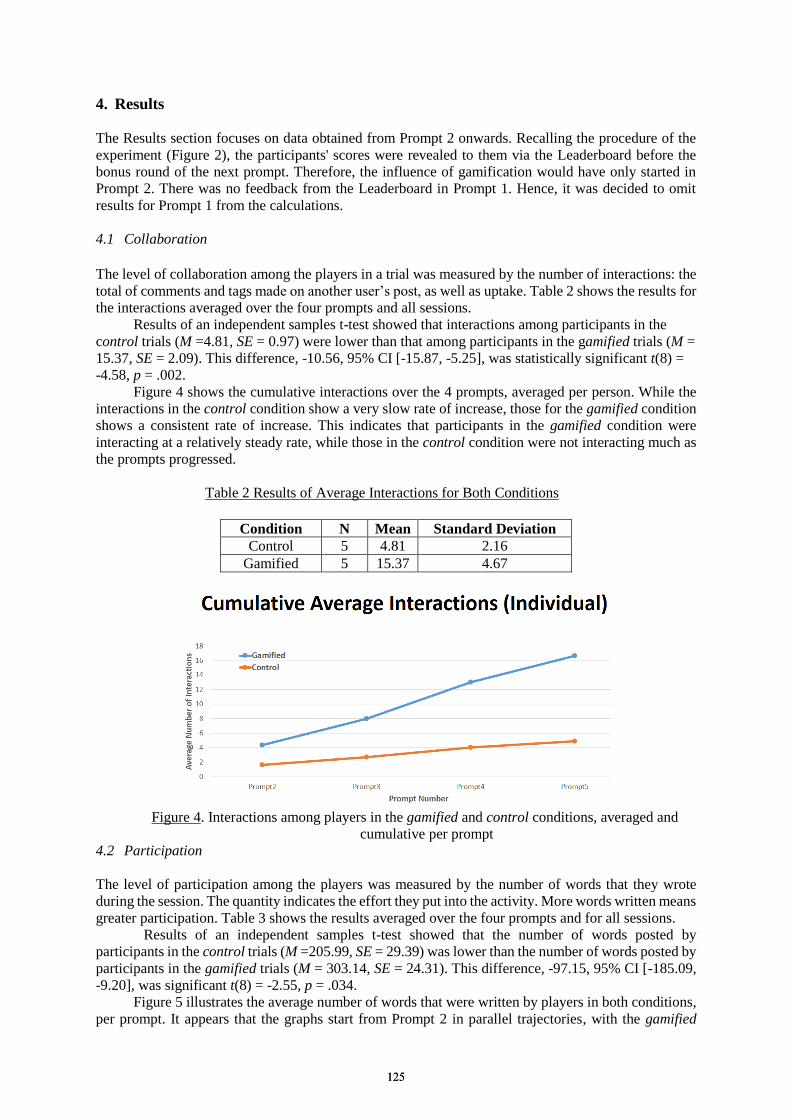
4. Results
The Results section focuses on data obtained from Prompt 2 onwards. Recalling the procedure of the
experiment (Figure 2), the participants' scores were revealed to them via the Leaderboard before the
bonus round of the next prompt. Therefore, the influence of gamification would have only started in
Prompt 2. There was no feedback from the Leaderboard in Prompt 1. Hence, it was decided to omit
results for Prompt 1 from the calculations.
4.1 Collaboration
The level of collaboration among the players in a trial was measured by the number of interactions: the
total of comments and tags made on another user’s post, as well as uptake. Table 2 shows the results for
the interactions averaged over the four prompts and all sessions.
Results of an independent samples t-test showed that interactions among participants in the
control trials (M =4.81, SE = 0.97) were lower than that among participants in the gamified trials (M =
15.37, SE = 2.09). This difference, -10.56, 95% CI [-15.87, -5.25], was statistically significant t(8) =
-4.58, p = .002.
Figure 4 shows the cumulative interactions over the 4 prompts, averaged per person. While the
interactions in the control condition show a very slow rate of increase, those for the gamified condition
shows a consistent rate of increase. This indicates that participants in the gamified condition were
interacting at a relatively steady rate, while those in the control condition were not interacting much as
the prompts progressed.
Table 2 Results of Average Interactions for Both Conditions
Condition N Mean Standard Deviation
Control 5 4.81 2.16
Gamified 5 15.37 4.67
Figure 4. Interactions among players in the gamified and control conditions, averaged and
cumulative per prompt
4.2 Participation
The level of participation among the players was measured by the number of words that they wrote
during the session. The quantity indicates the effort they put into the activity. More words written means
greater participation. Table 3 shows the results averaged over the four prompts and for all sessions.
Results of an independent samples t-test showed that the number of words posted by
participants in the control trials (M =205.99, SE = 29.39) was lower than the number of words posted by
participants in the gamified trials (M = 303.14, SE = 24.31). This difference, -97.15, 95% CI [-185.09,
-9.20], was significant t(8) = -2.55, p = .034.
Figure 5 illustrates the average number of words that were written by players in both conditions,
per prompt. It appears that the graphs start from Prompt 2 in parallel trajectories, with the gamified
125125
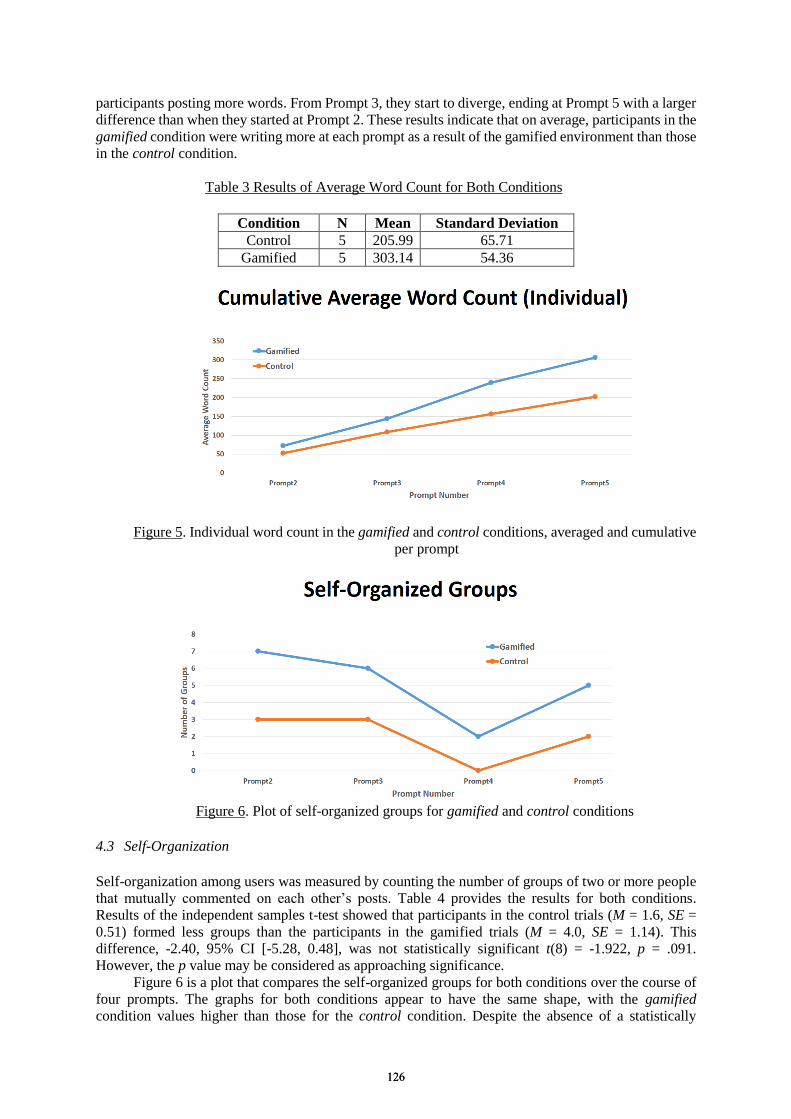
participants posting more words. From Prompt 3, they start to diverge, ending at Prompt 5 with a larger
difference than when they started at Prompt 2. These results indicate that on average, participants in the
gamified condition were writing more at each prompt as a result of the gamified environment than those
in the control condition.
Table 3 Results of Average Word Count for Both Conditions
Condition N Mean Standard Deviation
Control 5 205.99 65.71
Gamified 5 303.14 54.36
Figure 5. Individual word count in the gamified and control conditions, averaged and cumulative
per prompt
Figure 6. Plot of self-organized groups for gamified and control conditions
4.3 Self-Organization
Self-organization among users was measured by counting the number of groups of two or more people
that mutually commented on each other’s posts. Table 4 provides the results for both conditions. Results of the independent samples t-test showed that participants in the control trials (M = 1.6, SE =
0.51) formed less groups than the participants in the gamified trials (M = 4.0, SE = 1.14). This
difference, -2.40, 95% CI [-5.28, 0.48], was not statistically significant t(8) = -1.922, p = .091.
However, the p value may be considered as approaching significance.
Figure 6 is a plot that compares the self-organized groups for both conditions over the course of
four prompts. The graphs for both conditions appear to have the same shape, with the gamified
condition values higher than those for the control condition. Despite the absence of a statistically
126126
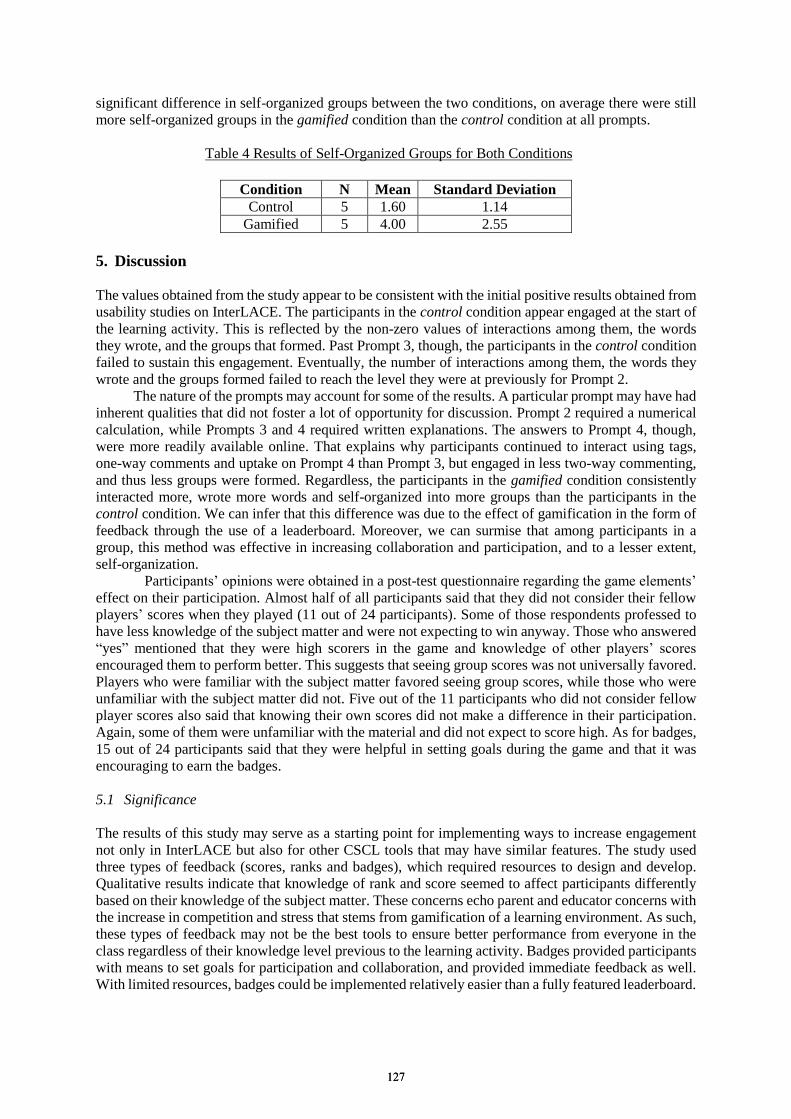
significant difference in self-organized groups between the two conditions, on average there were still
more self-organized groups in the gamified condition than the control condition at all prompts.
Table 4 Results of Self-Organized Groups for Both Conditions
Condition N Mean Standard Deviation
Control 5 1.60 1.14
Gamified 5 4.00 2.55
5. Discussion
The values obtained from the study appear to be consistent with the initial positive results obtained from
usability studies on InterLACE. The participants in the control condition appear engaged at the start of
the learning activity. This is reflected by the non-zero values of interactions among them, the words
they wrote, and the groups that formed. Past Prompt 3, though, the participants in the control condition
failed to sustain this engagement. Eventually, the number of interactions among them, the words they
wrote and the groups formed failed to reach the level they were at previously for Prompt 2.
The nature of the prompts may account for some of the results. A particular prompt may have had
inherent qualities that did not foster a lot of opportunity for discussion. Prompt 2 required a numerical
calculation, while Prompts 3 and 4 required written explanations. The answers to Prompt 4, though,
were more readily available online. That explains why participants continued to interact using tags,
one-way comments and uptake on Prompt 4 than Prompt 3, but engaged in less two-way commenting,
and thus less groups were formed. Regardless, the participants in the gamified condition consistently
interacted more, wrote more words and self-organized into more groups than the participants in the
control condition. We can infer that this difference was due to the effect of gamification in the form of
feedback through the use of a leaderboard. Moreover, we can surmise that among participants in a
group, this method was effective in increasing collaboration and participation, and to a lesser extent,
self-organization.
Participants’ opinions were obtained in a post-test questionnaire regarding the game elements’
effect on their participation. Almost half of all participants said that they did not consider their fellow
players’ scores when they played (11 out of 24 participants). Some of those respondents professed to
have less knowledge of the subject matter and were not expecting to win anyway. Those who answered
“yes” mentioned that they were high scorers in the game and knowledge of other players’ scores
encouraged them to perform better. This suggests that seeing group scores was not universally favored.
Players who were familiar with the subject matter favored seeing group scores, while those who were
unfamiliar with the subject matter did not. Five out of the 11 participants who did not consider fellow
player scores also said that knowing their own scores did not make a difference in their participation.
Again, some of them were unfamiliar with the material and did not expect to score high. As for badges,
15 out of 24 participants said that they were helpful in setting goals during the game and that it was
encouraging to earn the badges.
5.1 Significance
The results of this study may serve as a starting point for implementing ways to increase engagement
not only in InterLACE but also for other CSCL tools that may have similar features. The study used
three types of feedback (scores, ranks and badges), which required resources to design and develop.
Qualitative results indicate that knowledge of rank and score seemed to affect participants differently
based on their knowledge of the subject matter. These concerns echo parent and educator concerns with
the increase in competition and stress that stems from gamification of a learning environment. As such,
these types of feedback may not be the best tools to ensure better performance from everyone in the
class regardless of their knowledge level previous to the learning activity. Badges provided participants
with means to set goals for participation and collaboration, and provided immediate feedback as well.
With limited resources, badges could be implemented relatively easier than a fully featured leaderboard.
127127
5.2 Limitations
The study was conducted over a two-hour period and with a limited number of participants. It would be
helpful to compare the results with a study done in an actual classroom learning Physics over a
prolonged period of time. The participants in the study were also likely to be less invested than actual
students, since there was no direct consequence on their grades however they participated in the game.
6. Conclusion
Participants in the gamified trials received three types of immediate feedback using the Leaderboard:
scores, rank and badges. They exhibited greater collaboration, participation, and to a lesser extent,
self-organization compared to the participants in the control trials, who did not receive any feedback.
This increase in interactions may then be explained as the participants’ responses to the feedback. They
responded individualistically to score feedback, competitively to rank feedback and collaboratively to
badges. Based on participants’ qualitative responses, the use of badges had no negative effect on the
participants. With limited resources, badges may be used in pilot testing the gamification of a CSCL
tool.
By using gamification, the usefulness of InterLACE’s features was effectively demonstrated to
participants, resulting in increased engagement with each other and with the tool. Effective product
design should therefore consider not only usability; it should include an assessment of the product’s
usefulness in achieving user goals. That is, the motivation behind its use.
Acknowledgements
We would like to thank the Tufts Center for Engineering and Outreach (CEEO) for sponsoring this
study. This material is based upon work supported by the NSF under Grant No. 1119321. Any opinions,
findings and conclusions or recommendations expressed in this material are those of the author(s) and
do not necessarily reflect the views of the National Science Foundation.
References
Bartle, R. A. (2004). Designing virtual worlds. New Riders.
Deterding, S., Dixon, D., Khaled, R., & Nacke, L. (2011, September). From game design elements to
gamefulness: defining gamification. In Proceedings of the 15th international academic MindTrek
conference: Envisioning future media environments (pp. 9-15). ACM.
Hamari, J., Koivisto, J., & Sarsa, H. (2014, January). Does gamification work?--a literature review of empirical
studies on gamification. In System Sciences (HICSS), 2014 47th Hawaii International Conference on (pp.
3025-3034). IEEE.
Johnson, Roger, T., & Johnson, D. W. (1988). Cooperative Learning: two heads learn better than one. Context, 18.
Lee, J. J., & Hammer, J. (2011). Gamification in education: What, how, why bother?. Academic exchange
quarterly, 15(2), 146.
Nicholson, S. (2015). A recipe for meaningful gamification. In Gamification in education and business (pp. 1-20).
Springer International Publishing.
Selänne, L., & Kurhila, J. Group Dynamics in Socially Aware E-Learning.
Stahl, G., Koschmann, T., & Suthers, D. (2006). Computer-supported collaborative learning: An historical
perspective. Cambridge handbook of the learning sciences, 2006, 409-426.
Swanson, Z. L., Gross, N. J., & Kramer, T. (1998). Alternative modes of study group formation and student
examination performance. The Accounting Educators' Journal, 10(2).
Tharp, A. L. (1987, February). Let's motivate. In ACM SIGCSE Bulletin (Vol. 19, No. 1, pp. 415-422). ACM.
van der Laan Smith, J., & Spindle, R. M. (2007). The impact of group formation in a cooperative learning
environment. Journal of Accounting Education, 25(4), 153-167.
Visual Classrooms (n.d.). Retrieved from https://visualclassrooms.com/about/story
What is Usability?. (n.d.). In Usability Body of Knowledge. Retrieved from
http://www.usabilitybok.org/what-is-usability
Zea, N. P., Sánchez, J. L. G., Gutiérrez, F. L., Cabrera, M. J., & Paderewski, P. (2009). Design of educational
multiplayer videogames: A vision from collaborative learning. Advances in Engineering Software, 40(12),
1251-1260.
128128
Chen, W. et al. (Eds.) (2016). Proceedings of the 24th International Conference on Computers in Education. India: Asia-Pacific Society for Computers in Education
Integrating Agent-based Programming with Elementary Science: The Role of
Sociomathematical Norms Amanda DICKESa,c, Amy FARRISa,c & Pratim SENGUPTAb,c*
aLearning Sciences Program, Vanderbilt University – Peabody College, USA bEducational Studies in Learning Sciences, University of Calgary, Canada
cMind, Matter & Media Lab, University of Calgary, Canada *[email protected]
Abstract: How can elementary grade teachers integrate programming and computational thinking with the science curriculum? To answer this question, we present results from a long-term, design-based, microgenetic study where 1) agent-based programming using ViMAP was integrated with existing elementary science curricula and 2) lessons were taught by the classroom teacher. We present an investigation of the co-development of children’s computational thinking and scientific modeling and show that the integration of programming with scientific modeling can be supported by the development of sociomathematical norms for designing “mathematically good” computational models.
Keywords: Programming, Modeling, Elementary Science, Computational Thinking, Teacher professional learning, Sociomathematical norms
1. Introduction
Modeling is the language of science (Lehrer, 2009; NGSS, 2013). The integration of modeling, and other epistemic practices has been recognized as a central objective for K-12 science education (NGSS, 2013). Over the past few years, the integration of computational modeling in K-12 classrooms has become an important focus of research (Sengupta, Kinnebrew, Basu, Biswas & Clark, 2013; Wilensky, Brady & Horn, 2014; Dickes, Sengupta, Farris & Basu, 2016).
The particular form (genre) of computational programming and modeling we focus on in this paper is agent-based modeling and programming (ABM). The term “agent” in ABM indicates an individual computational object or actor (e.g., a Logo Turtle), which carries out actions based on simple rules that are body-syntonic and therefore intuitive for learners (e.g., moving forward, changing directions, speeding up, etc.). Consequently, it is no surprise that researchers have been arguing for teaching and learning motion in elementary classrooms using agent-based programming since the 1980s (Papert, 1980). Many contemporary ABM platforms employ visual programming interfaces, which makes it even easier for learners to assigned or control these rules (Sengupta et al., 2015). In the context of learning kinematics, previous research shows that given appropriate teacher-led scaffolding, middle and high school students can effectively use Logo-based platforms to develop deep understandings and mathematical representations of motion (diSessa, Hammer, Sherin, & Kolpakowski, 1991; Sherin, diSessa, & Hammer, 1993; Sengupta & Farris, 2014). However, the same literature also highlights challenges in the classroom adoption of such pedagogical approaches. The high overhead associated with teaching Logo programming and teaching physics can lead the demands on the teacher to be potentially "prohibitive” (Sherin, diSessa, & Hammer, 1993, p. 116). A central challenge stems from the sequestered nature of teaching and learning programming on one hand, and teaching and learning physics using programming on the other, typically requiring a different teacher for each part (Sherin, diSessa, & Hammer, 1993). Our goal is to address this challenge by integrating, and not sequestering these two forms of instruction.
In this paper, we advance an argument that emphasizing mathematizing and measurement as key forms of learning activities, through the development of sociomathematical norms (McClain & Cobb, 2001; Yackel & Cobb, 1996; Cobb, Wood, Yackel, & McNeal, 1992) can help teachers meaningfully integrate programming as the “language” of science. We report a study in which a third
129129
grade teacher, in partnership with researchers, integrated agent-based programming with her regular science curriculum by iteratively developing sociomathematical norms for modeling motion using agent-based computational models.
2. Theoretical Framework: Socimathematical Norms for Integrating Programming with K-12Science
Our previous work has demonstrated that bringing about the integration of programming and K-12 science education requires careful attention to the design of programming languages, as well as activity systems. Along the first dimension, we have argued that programming languages should employ both domain-specific and domain-general programming commands (Sengupta, & Farris, 2012; Sengupta et al., 2013; Farris & Sengupta, 2014). Along the second dimension, we have argued that the design of learning activities should seek to tightly couple programming and science. For example, Sengupta & Farris (2012) and Sengupta et al. (2013) proposed an activity sequence in which initial activities can foster necessary competencies such as thinking like an agent through embodied modeling, which can also help children become proficient with programming syntax, commands and control flow, and practices such as debugging, through activities such as “drawing” simple geometric shapes with their bodies and then modeling the shapes using programming. In later activities, children can use these shapes as models of motion. These studies have shown that as students progress through these activities, they begin to become more fluent in modeling motion as a process of continuous change, which has been shown to be a key conceptual challenge for K16 students (Dykstra & Sweet, 2009).
However, research on integrating programing with the K-12 science curriculum has been largely interventionist in nature (diSessa et al., 1991; Sengupta et al., 2013; Wilkerson-Jerde, Wagh & Wilensky, 2015). In contrast, our work here takes an integrative stance, where our role as researchers were largely limited to designing activities in partnership with the teacher, based on what the teacher wanted to accomplish on a day to day basis, as mandated by the state and national science and math standards. We believe that such forms of partnership are methodologically crucial for addressing the issue of effectively managing the tradeoff between teaching programming and teaching science.
In this paper, we propose that emphasizing mathematizing and measurement as key forms of learning activities can help teachers meaningfully integrate programming as a “language” of science, and further, that teachers can accomplish this by supporting the development of sociomathematical norms. The iterative design of mathematical measures can result in deep conceptual growth of students in elementary science, especially when these activities are integrated throughout the curriculum over several months (Lehrer, 2009). Furthermore, the development of children’s scientific and mathematical modeling in the classroom in an authentic manner should also involve and can be greatly benefitted by the iterative development and refinement of collective, (i.e., classroom-level), normative modeling practices (McClain & Cobb, 2001; Lehrer, Schauble & Lucas, 2008). Sociomathematical norms (McClain & Cobb, 2001; Yackel & Cobb, 1996; Cobb, Wood, Yackel, & McNeal, 1992) differ from general social norms that constitute the classroom participation structure in that they concern the normative aspects of classroom actions and interactions that are specifically mathematical. These norms regulate classroom discourse and influence the learning opportunities that arise for both the students and the teacher.
An important, and rather fundamental sociomathemtical norm is what counts as an acceptable mathematical solution, and further, this norm typically originates as a socially defined norm, and shifts over time to a more sociomathematically defined norm (Yackel & Cobb, 1996). Similarly, science educators have also shown that the question of what counts as a “good” model also needs to be normatively established in classroom instruction in order to deepen students’ engagement with scientific modeling in elementary grades, and that these norms also follow similar shifts toward deeper disciplinary warrants over time (Lehrer, Lucas & Schauble, 2008). Our goal is to demonstrate how the emphasis on developing and refining sociomathematical norms pertaining to the design of mathematical measures of motion can help teachers seamlessly integrate programming with science education in a 3rd grade classroom.
3. Research QuestionsSpecifically, we investigate the following research questions:
130130
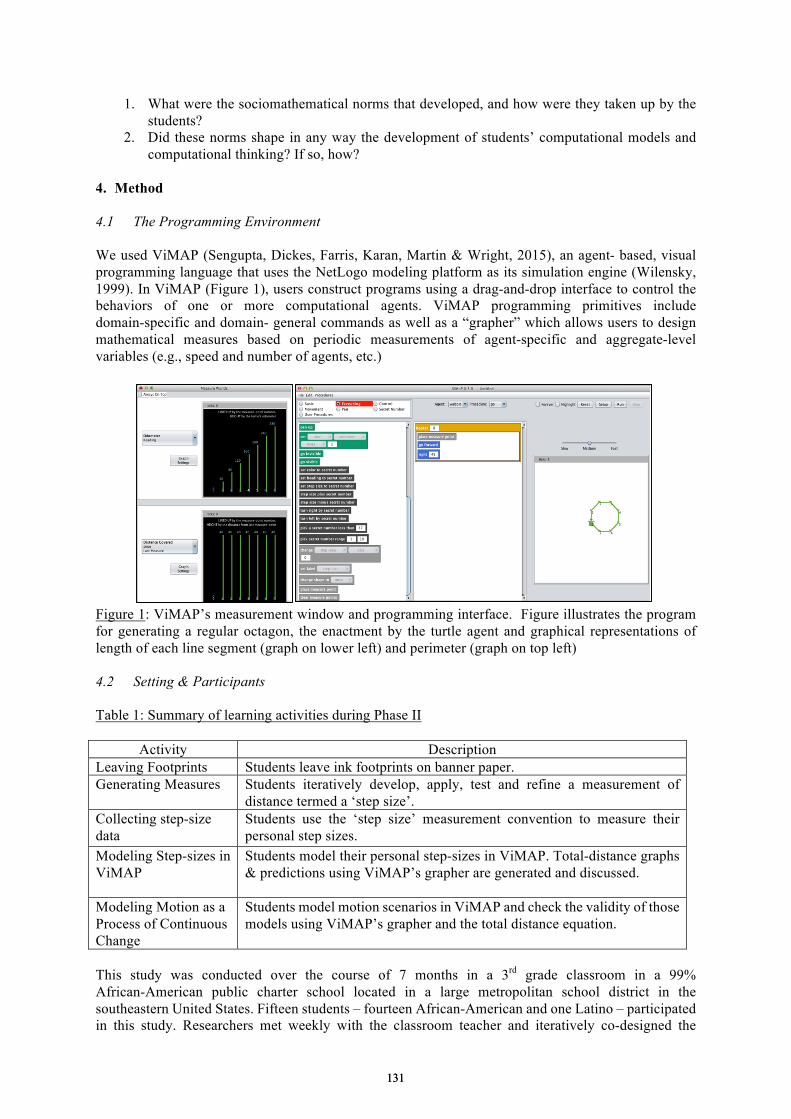
1. What were the sociomathematical norms that developed, and how were they taken up by thestudents?
2. Did these norms shape in any way the development of students’ computational models andcomputational thinking? If so, how?
4. Method
4.1 The Programming Environment
We used ViMAP (Sengupta, Dickes, Farris, Karan, Martin & Wright, 2015), an agent- based, visual programming language that uses the NetLogo modeling platform as its simulation engine (Wilensky, 1999). In ViMAP (Figure 1), users construct programs using a drag-and-drop interface to control the behaviors of one or more computational agents. ViMAP programming primitives include domain-specific and domain- general commands as well as a “grapher” which allows users to design mathematical measures based on periodic measurements of agent-specific and aggregate-level variables (e.g., speed and number of agents, etc.)
Figure 1: ViMAP’s measurement window and programming interface. Figure illustrates the program for generating a regular octagon, the enactment by the turtle agent and graphical representations of length of each line segment (graph on lower left) and perimeter (graph on top left)
4.2 Setting & Participants
Table 1: Summary of learning activities during Phase II
Activity Description Leaving Footprints Students leave ink footprints on banner paper. Generating Measures Students iteratively develop, apply, test and refine a measurement of
distance termed a ‘step size’. Collecting step-size data
Students use the ‘step size’ measurement convention to measure their personal step sizes.
Modeling Step-sizes in ViMAP
Students model their personal step-sizes in ViMAP. Total-distance graphs & predictions using ViMAP’s grapher are generated and discussed.
Modeling Motion as a Process of Continuous Change
Students model motion scenarios in ViMAP and check the validity of those models using ViMAP’s grapher and the total distance equation.
This study was conducted over the course of 7 months in a 3rd grade classroom in a 99% African-American public charter school located in a large metropolitan school district in the southeastern United States. Fifteen students – fourteen African-American and one Latino – participated in this study. Researchers met weekly with the classroom teacher and iteratively co-designed the
131131
classroom activities. The teacher taught all lessons, and changes to the activities were made based on the her formal and informal assessments of student understanding of the material or in-the-moment responses to student ideas. These adjustments often took the form of extending instructional time on a topic, and modifying the designed classroom materials to better meet the mandated instructional goals. Throughout the year, the teacher emphasized connecting modeling in ViMAP to other out-of-computer modeling experiences, such as embodied and physical modeling activities, as well as re-framed the computational representations in ViMAP as analogous to meaningful lived experiences for both herself and the students. The emphasis on developing classroom-wide conventions was a practice that the teacher employed in her regular math instruction. Our study focuses on how the teacher adapted and employed this approach as a way to integrate modeling motion using ViMAP with her science curriculum.
The learning activities were divided into three phases: Phase I (Geometry), Phase II (Kinematics) and Phase III (Ecology). The present paper reports on Phase II, Kinematics, and traces the development of three normative, mathematical criteria for “what counts” as good ViMAP models of motion. Instruction during Phase II focused on the invention and interpretation of mathematical measures and using ViMAP as a way to explain a real-life phenomenon involving motion (e.g., walking at a constant rate or two cars traveling at different rates for different periods of time). Table 1 summarizes the learning activities during Phase II. 4.3 Data & Analysis Data for this work comes from informal interviews with the participants, video recordings of class activities and discussion, student artifacts (e.g. student representations, activity sheets, ViMAP models and pre-, mid, and post-assessments) and daily field notes. The lead researcher and the classroom teacher conducted informal interviews during opportune moments while the students were engaged in single, pair or small group work around modeling and representational activities. Classes were video recorded, and student-created artifacts (ViMAP models, written work) were also collected.
We present the analysis of in the form of explanatory case studies (Yin, 1994), which are well suited as a methodology to answer how and why questions. We find this to be good fit because our goal here is to illustrate the process through which the classroom developed sociomathematical norms, which includes answering how the development of these norms shaped the students’ interactions with ViMAP and other modeling experiences, and why these norms were deemed useful by the teacher. Following previous studies (Dickes et al., 2015), our selection and analysis of cases were guided by the following two criteria: representativeness and typicality.
Representativeness implies that the selected cases should aptly represent key aspects of learning experienced by the students. These key aspects or themes, in turn, are defined based on the research questions. For our purposes, representativeness implies that each case should highlight an important aspect of the process through which the relevant sociomathematical norm emerged. Typicality implies that the selected case(s) should potentially offer insights that are likely to have wider relevance for the remainder of the participants in the study. In other words, the cases selected should represent aspects of the process of learning experienced by a majority of the student population. Each of the cases we presented here was typical of majority of the students in the classroom (>80%), as evident in comparisons of student work across all students. In addition, to answer RQ2, we also present a classroom-level analysis of students’ ViMAP code and models in terms of the quality of their code. We explain the coding scheme later, along with the Findings, and also explain why we believe these changes in students’ computational work were shaped by their take-up of the sociomathematical norms. 5. Findings The analysis presented below illustrates the development of sociomathematical norms for measuring (Inventing Measures), describing (Approximations) and extending data (Predictions). We explain these norms, describe how they were taken up in student work and how the development of each norm paralleled the new computational practices. 5.1 Inventing Measures: Movement from Social to Sociomathematical
132132
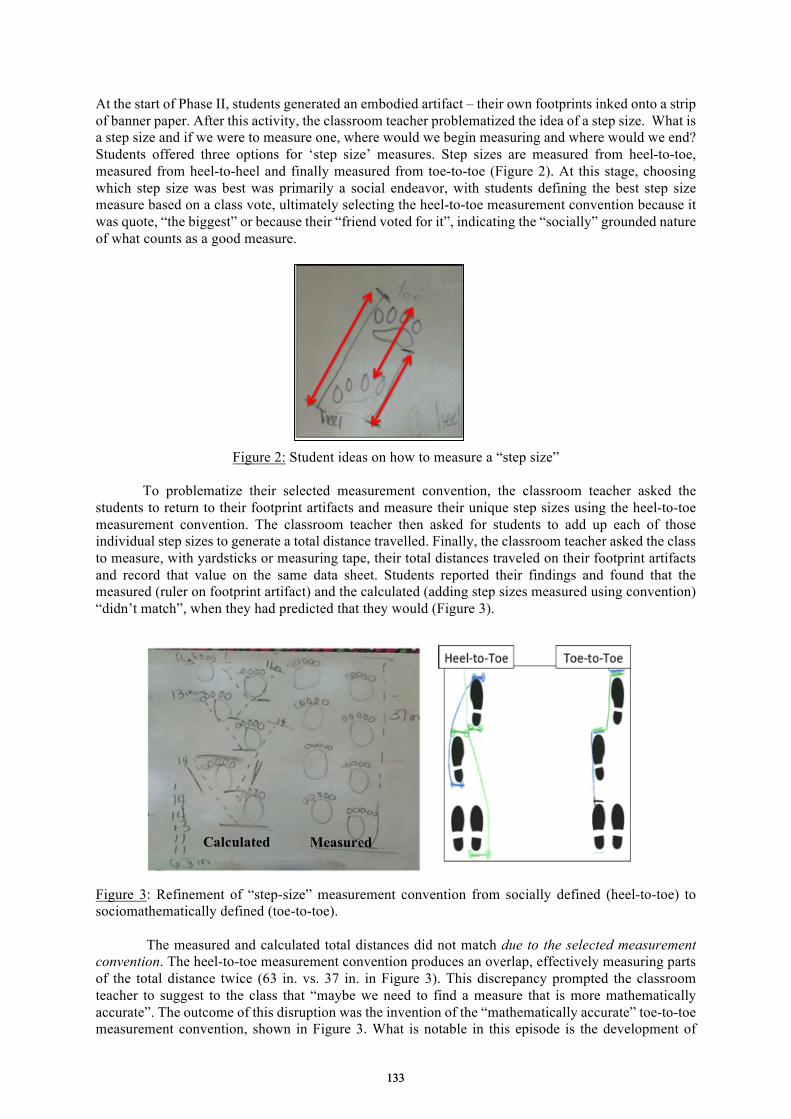
At the start of Phase II, students generated an embodied artifact – their own footprints inked onto a strip of banner paper. After this activity, the classroom teacher problematized the idea of a step size. What is a step size and if we were to measure one, where would we begin measuring and where would we end? Students offered three options for ‘step size’ measures. Step sizes are measured from heel-to-toe, measured from heel-to-heel and finally measured from toe-to-toe (Figure 2). At this stage, choosing which step size was best was primarily a social endeavor, with students defining the best step size measure based on a class vote, ultimately selecting the heel-to-toe measurement convention because it was quote, “the biggest” or because their “friend voted for it”, indicating the “socially” grounded nature of what counts as a good measure.
Figure 2: Student ideas on how to measure a “step size”
To problematize their selected measurement convention, the classroom teacher asked the students to return to their footprint artifacts and measure their unique step sizes using the heel-to-toe measurement convention. The classroom teacher then asked for students to add up each of those individual step sizes to generate a total distance travelled. Finally, the classroom teacher asked the class to measure, with yardsticks or measuring tape, their total distances traveled on their footprint artifacts and record that value on the same data sheet. Students reported their findings and found that the measured (ruler on footprint artifact) and the calculated (adding step sizes measured using convention) “didn’t match”, when they had predicted that they would (Figure 3).
Figure 3: Refinement of “step-size” measurement convention from socially defined (heel-to-toe) to sociomathematically defined (toe-to-toe).
The measured and calculated total distances did not match due to the selected measurement convention. The heel-to-toe measurement convention produces an overlap, effectively measuring parts of the total distance twice (63 in. vs. 37 in. in Figure 3). This discrepancy prompted the classroom teacher to suggest to the class that “maybe we need to find a measure that is more mathematically accurate”. The outcome of this disruption was the invention of the “mathematically accurate” toe-to-toe measurement convention, shown in Figure 3. What is notable in this episode is the development of
Calculated Measured
133133
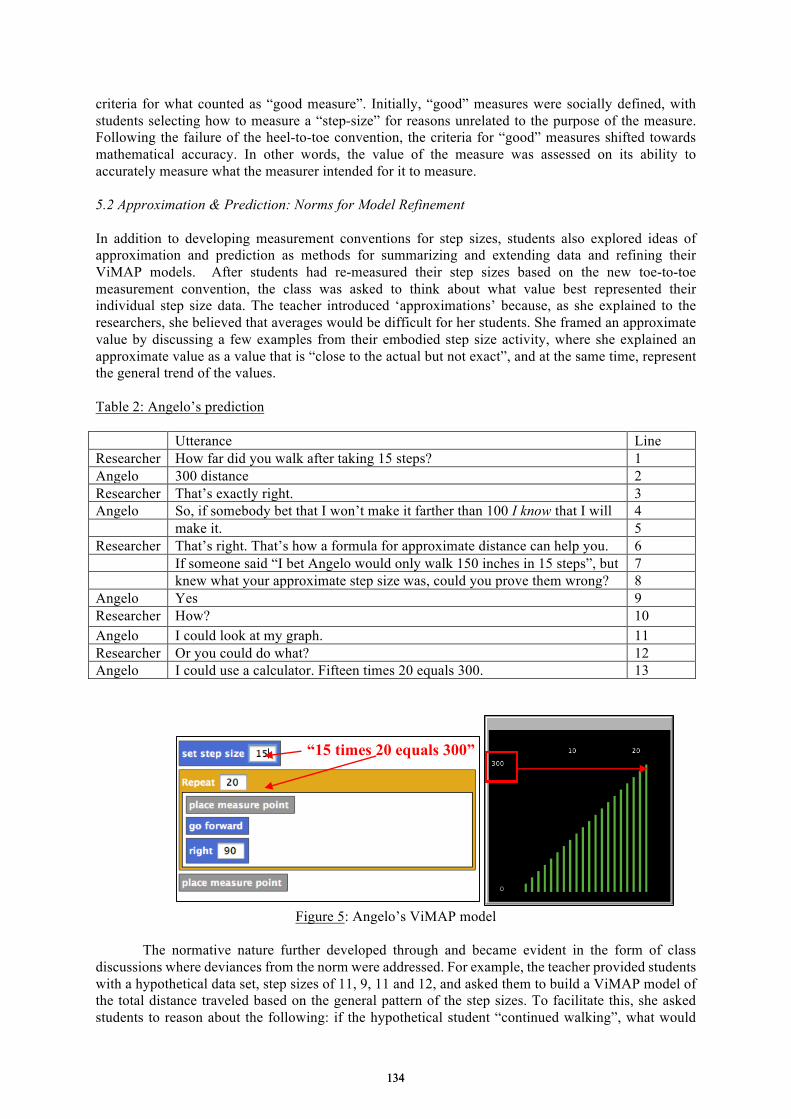
criteria for what counted as “good measure”. Initially, “good” measures were socially defined, with students selecting how to measure a “step-size” for reasons unrelated to the purpose of the measure. Following the failure of the heel-to-toe convention, the criteria for “good” measures shifted towards mathematical accuracy. In other words, the value of the measure was assessed on its ability to accurately measure what the measurer intended for it to measure.
5.2 Approximation & Prediction: Norms for Model Refinement
In addition to developing measurement conventions for step sizes, students also explored ideas of approximation and prediction as methods for summarizing and extending data and refining their ViMAP models. After students had re-measured their step sizes based on the new toe-to-toe measurement convention, the class was asked to think about what value best represented their individual step size data. The teacher introduced ‘approximations’ because, as she explained to the researchers, she believed that averages would be difficult for her students. She framed an approximate value by discussing a few examples from their embodied step size activity, where she explained an approximate value as a value that is “close to the actual but not exact”, and at the same time, represent the general trend of the values.
Table 2: Angelo’s prediction
Utterance Line Researcher How far did you walk after taking 15 steps? 1 Angelo 300 distance 2 Researcher That’s exactly right. 3 Angelo So, if somebody bet that I won’t make it farther than 100 I know that I will 4
make it. 5 Researcher That’s right. That’s how a formula for approximate distance can help you. 6
If someone said “I bet Angelo would only walk 150 inches in 15 steps”, but 7 knew what your approximate step size was, could you prove them wrong? 8
Angelo Yes 9 Researcher How? 10 Angelo I could look at my graph. 11 Researcher Or you could do what? 12 Angelo I could use a calculator. Fifteen times 20 equals 300. 13
Figure 5: Angelo’s ViMAP model
The normative nature further developed through and became evident in the form of class discussions where deviances from the norm were addressed. For example, the teacher provided students with a hypothetical data set, step sizes of 11, 9, 11 and 12, and asked them to build a ViMAP model of the total distance traveled based on the general pattern of the step sizes. To facilitate this, she asked students to reason about the following: if the hypothetical student “continued walking”, what would
“15 times 20 equals 300”
134134
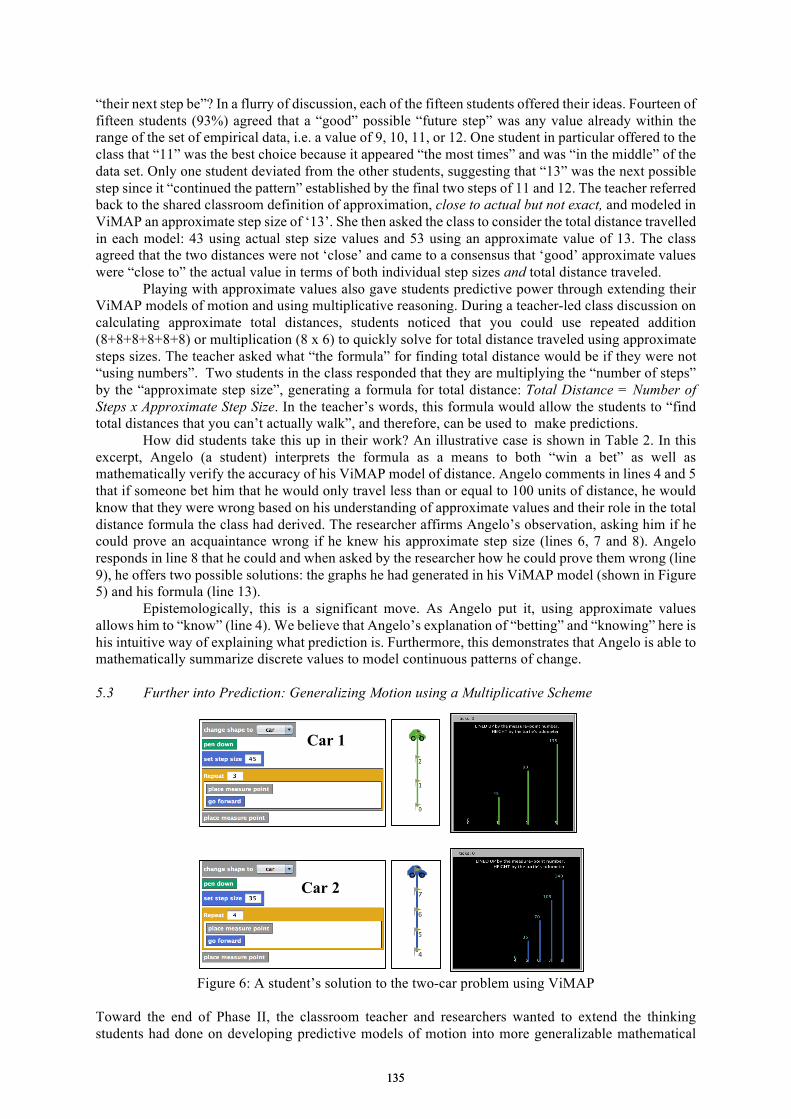
“their next step be”? In a flurry of discussion, each of the fifteen students offered their ideas. Fourteen of fifteen students (93%) agreed that a “good” possible “future step” was any value already within the range of the set of empirical data, i.e. a value of 9, 10, 11, or 12. One student in particular offered to the class that “11” was the best choice because it appeared “the most times” and was “in the middle” of the data set. Only one student deviated from the other students, suggesting that “13” was the next possible step since it “continued the pattern” established by the final two steps of 11 and 12. The teacher referred back to the shared classroom definition of approximation, close to actual but not exact, and modeled in ViMAP an approximate step size of ‘13’. She then asked the class to consider the total distance travelled in each model: 43 using actual step size values and 53 using an approximate value of 13. The class agreed that the two distances were not ‘close’ and came to a consensus that ‘good’ approximate values were “close to” the actual value in terms of both individual step sizes and total distance traveled.
Playing with approximate values also gave students predictive power through extending their ViMAP models of motion and using multiplicative reasoning. During a teacher-led class discussion on calculating approximate total distances, students noticed that you could use repeated addition (8+8+8+8+8+8) or multiplication (8 x 6) to quickly solve for total distance traveled using approximate steps sizes. The teacher asked what “the formula” for finding total distance would be if they were not “using numbers”. Two students in the class responded that they are multiplying the “number of steps” by the “approximate step size”, generating a formula for total distance: Total Distance = Number of Steps x Approximate Step Size. In the teacher’s words, this formula would allow the students to “find total distances that you can’t actually walk”, and therefore, can be used to make predictions.
How did students take this up in their work? An illustrative case is shown in Table 2. In this excerpt, Angelo (a student) interprets the formula as a means to both “win a bet” as well as mathematically verify the accuracy of his ViMAP model of distance. Angelo comments in lines 4 and 5 that if someone bet him that he would only travel less than or equal to 100 units of distance, he would know that they were wrong based on his understanding of approximate values and their role in the total distance formula the class had derived. The researcher affirms Angelo’s observation, asking him if he could prove an acquaintance wrong if he knew his approximate step size (lines 6, 7 and 8). Angelo responds in line 8 that he could and when asked by the researcher how he could prove them wrong (line 9), he offers two possible solutions: the graphs he had generated in his ViMAP model (shown in Figure 5) and his formula (line 13).
Epistemologically, this is a significant move. As Angelo put it, using approximate values allows him to “know” (line 4). We believe that Angelo’s explanation of “betting” and “knowing” here is his intuitive way of explaining what prediction is. Furthermore, this demonstrates that Angelo is able to mathematically summarize discrete values to model continuous patterns of change.
5.3 Further into Prediction: Generalizing Motion using a Multiplicative Scheme
Figure 6: A student’s solution to the two-car problem using ViMAP
Toward the end of Phase II, the classroom teacher and researchers wanted to extend the thinking students had done on developing predictive models of motion into more generalizable mathematical
Car 1
Car 2
135135
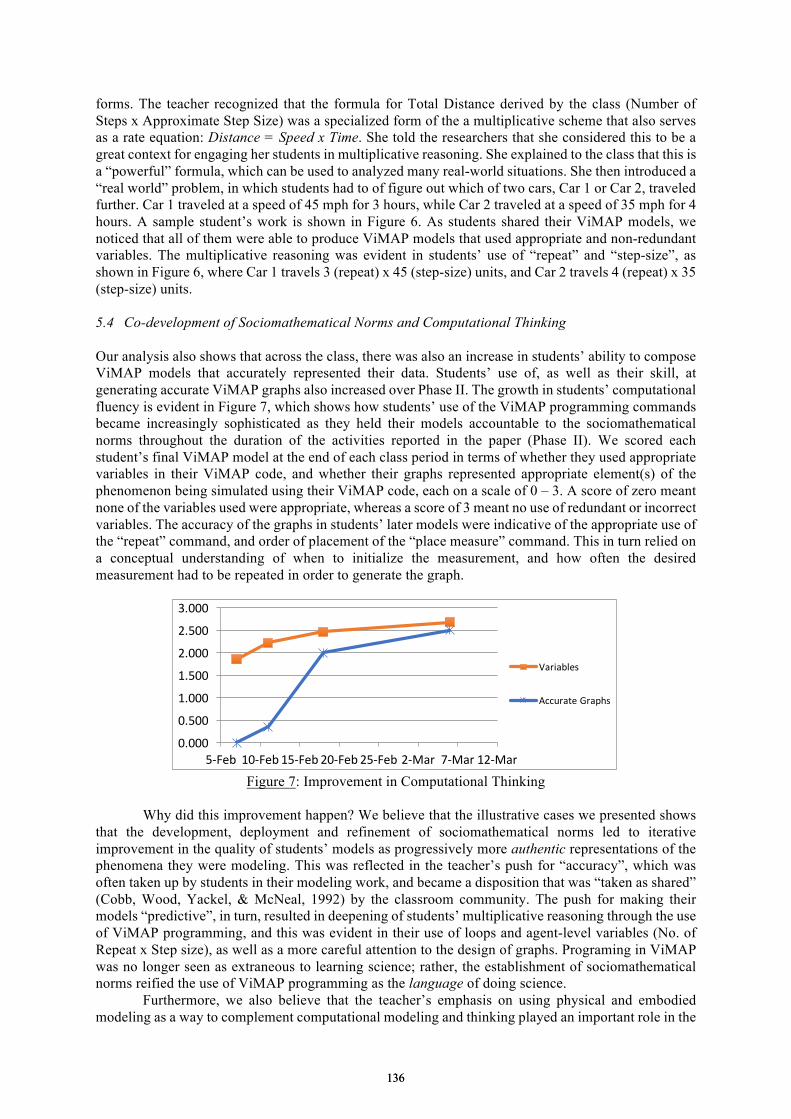
forms. The teacher recognized that the formula for Total Distance derived by the class (Number of Steps x Approximate Step Size) was a specialized form of the a multiplicative scheme that also serves as a rate equation: Distance = Speed x Time. She told the researchers that she considered this to be a great context for engaging her students in multiplicative reasoning. She explained to the class that this is a “powerful” formula, which can be used to analyzed many real-world situations. She then introduced a “real world” problem, in which students had to of figure out which of two cars, Car 1 or Car 2, traveled further. Car 1 traveled at a speed of 45 mph for 3 hours, while Car 2 traveled at a speed of 35 mph for 4 hours. A sample student’s work is shown in Figure 6. As students shared their ViMAP models, we noticed that all of them were able to produce ViMAP models that used appropriate and non-redundant variables. The multiplicative reasoning was evident in students’ use of “repeat” and “step-size”, as shown in Figure 6, where Car 1 travels 3 (repeat) x 45 (step-size) units, and Car 2 travels 4 (repeat) x 35 (step-size) units.
5.4 Co-development of Sociomathematical Norms and Computational Thinking
Our analysis also shows that across the class, there was also an increase in students’ ability to compose ViMAP models that accurately represented their data. Students’ use of, as well as their skill, at generating accurate ViMAP graphs also increased over Phase II. The growth in students’ computational fluency is evident in Figure 7, which shows how students’ use of the ViMAP programming commands became increasingly sophisticated as they held their models accountable to the sociomathematical norms throughout the duration of the activities reported in the paper (Phase II). We scored each student’s final ViMAP model at the end of each class period in terms of whether they used appropriate variables in their ViMAP code, and whether their graphs represented appropriate element(s) of the phenomenon being simulated using their ViMAP code, each on a scale of 0 – 3. A score of zero meant none of the variables used were appropriate, whereas a score of 3 meant no use of redundant or incorrect variables. The accuracy of the graphs in students’ later models were indicative of the appropriate use of the “repeat” command, and order of placement of the “place measure” command. This in turn relied on a conceptual understanding of when to initialize the measurement, and how often the desired measurement had to be repeated in order to generate the graph.
Figure 7: Improvement in Computational Thinking
Why did this improvement happen? We believe that the illustrative cases we presented shows that the development, deployment and refinement of sociomathematical norms led to iterative improvement in the quality of students’ models as progressively more authentic representations of the phenomena they were modeling. This was reflected in the teacher’s push for “accuracy”, which was often taken up by students in their modeling work, and became a disposition that was “taken as shared” (Cobb, Wood, Yackel, & McNeal, 1992) by the classroom community. The push for making their models “predictive”, in turn, resulted in deepening of students’ multiplicative reasoning through the use of ViMAP programming, and this was evident in their use of loops and agent-level variables (No. of Repeat x Step size), as well as a more careful attention to the design of graphs. Programing in ViMAP was no longer seen as extraneous to learning science; rather, the establishment of sociomathematical norms reified the use of ViMAP programming as the language of doing science.
Furthermore, we also believe that the teacher’s emphasis on using physical and embodied modeling as a way to complement computational modeling and thinking played an important role in the
0.000
0.500
1.000
1.500
2.000
2.500
3.000
5-Feb 10-Feb 15-Feb 20-Feb 25-Feb 2-Mar 7-Mar 12-Mar
Variables
AccurateGraphs
136136
students’ take-up of the norms. Cobb and colleagues have argued that sociomathematical normspertaining to what counts as an acceptable mathematical explanation and justification typically have to be interpretable in terms of actions on mathematical objects that are experientially real to the listening students, rather than in terms of procedural instructions (Cobb, Wood, Yackel, & McNeal, 1992). In our study, by emphasizing embodied modeling as a way to mathematize motion, the teacher facilitated the students’ take-up of norms pertaining to “what counts as a good model” of motion, by making ViMAP commands such as “step-size” experientially real to the students.
6. Discussion
6.1 Sociomathematical Norms Integrate Computational Thinking and Science
Our study highlights the reflexive relationship between computational thinking, scientific modeling and mathematical thinking when agent-based programming is the computational medium. While this has been noted previously in researcher-led studies (Kafai & Harel, 1991; Papert, 1980; Sengupta et al., 2013), our work here shows that teachers with no background in programming can integrate programming with their existing science curricula by reframing programming as mathematization – in particular, designing measures of change. Furthermore, our study also shows that using agent-based programming as the means to develop these models of change can be supported by the teacher by developing sociomathematical norms around the mathematical quality of these models.
6.2 Methodological Concerns: Teacher Voice and Conceptual Dissonance in Researcher-Teacher Partnerships
Design-based researchers have recently begun advocating for greater teacher voice and agency in research studies, which in turn reframes studies as researcher-teacher partnerships (Severance, Penuel, Sumner & Leary, 2016). Our study is certainly an example where teacher voice often led the direction of research; but it also raises an important methodological and epistemological question: how should we address conceptual dissonances between the researchers and the teachers? For example, in our study, the teacher’s framing of “accuracy” - i.e., students’ models must be “mathematically accurate” - was largely based on her intuitive conceptualization of the term. Let us now imagine answering this question as educational researchers and epistemologists. “Accuracy” will take on a very different meaning, and perhaps even have a negative connotation - because an essential characteristic of models, according to the epistemologists of science, is that they are incomplete. In fact, a few months later, the teacher did introduce the notion of incompleteness (albeit in her own language, and in a different context) – in Phase III, while modeling ecological interdependence. The notion of accuracy, though, lingers throughout the academic year.
We will take up this issue in more detail in a different paper. But we do want to raise the following question here: what should we do in such situations? Should we have intervened and coached the teachers about the professional vision of scientists and epistemologists about accuracy and incompleteness of models? This study is an example where we did not intervene to bridge conceptual dissonance on this issue. Our decision stems from the fact that researchers must fundamentally position teachers as the director of the partnership – rather than at an equal footing with the researcher. An equitable partnership may not be one in which everyone has equal say. Instead, an equitable partnership in educational computing research must seek to support teachers in voicing (and re-voicing) computation from their own perspectives, with curricular mandates and classroom constraints in mind.
As Heidegger famously remarked, the essence of technology is nothing technological (Heidegger, 1954). Rather, it is the “frame” in which technology lives – its lifeworld of human experience – that defines it. Unfortunately, researchers in educational computing – in particular, programing languages for children – have traditionally not engaged with the issue of curricular integration from the perspective of K-12 teachers. Research studies in this field (including some of our earlier work), therefore, largely carry out a strong interventionist agenda where teacher voice is often overshadowed by the researchers. In contrast, we have come to see the K-12 public school classroom as a complex, interdependent system, where teachers, students, curricula and curricular mandates – must all be considered alongside one another, especially if we set out to integrate any new literacy and/or technology with the classroom. So, if our goal is to make programming and computational modeling
137137
ubiquitous in the K-12 science classroom, we posit that researchers and designers of programming languages for the K-12 classrooms must learn to see the world through the eyes of the teachers, especially when it involves conceptual dissonance between researchers and teachers. It is through carefully studying the unfolding of such dissonances over longer periods of time (i.e., not a short intervention study), especially when teachers are working with new technologies and literacies (such as programming and computational modeling), that we (as researchers) will learn to design technological and activity systems that will be aligned with the perspectives of the teachers, and therefore, have a greater chance of becoming a mainstay in their classrooms.
Acknowledgements
Funding from the US National Science Foundation (NSF CAREER Award #1150320) and the Imperial Oil Foundation (Canada) is greatly acknowledged.
References
Cobb, P., Wood, T., Yackel, E., & McNeal, B. (1992). Characteristics of classroom mathematics traditions: An interactional analysis. American Educational Research Journal, 29(3), 573-604.
diSessa, A., Hammer, D., Sherin, B., & Kolpakowski, T. (1991). Inventing graphing: Children's meta-representational expertise. Journal of Mathematical Behavior, 10(2), 117-160.
Dickes, A., Sengupta, P., Farris, A.V., & Basu, S. (2016). Development of Mechanistic Reasoning and Multi-level Explanations in 3rd Grade Biology Using Multi-Agent Based Models. Science Education, 100(4), 734–776.
Dykstra Jr, D. I., & Sweet, D. R. (2009). Conceptual development about motion and force in elementary and middle school students. American Journal of Physics, 77(5), 468-476.
Farris, A.V., & Sengupta, P. (2014). Perspectival Computational Thinking for Learning Physics: A Case Study of Collaborative Agent-based Modeling. In: Proceedings of the 12th International Conference of the Learning Sciences. (ICLS 2014), pp 1102 - 1107.
Giere, R. N. (1988). Explaining science: A cognitive approach. Chicago: University of Chicago Press. Heidegger, M. (1954). The question concerning technology. Technology and values: Essential readings, 99-113. Kafai, Y., & Harel, I. (1991). Learning through design and teaching: Exploring social and collaborative aspects of
constructionism. Lehrer, R. (2009). Designing to develop disciplinary dispositions: modeling natural systems. American
Psychologist, 64(8), 759. Lehrer, R., Schauble, L., & Lucas, D. (2008). Supporting development of the epistemology of inquiry. Cognitive
Development, 23(4), 512-529. McClain, K., & Cobb, P. (2001). An analysis of development of sociomathematical norms in one first-grade
classroom. Journal for Research in Mathematics Education, 32(3), 236-266. Next Generation Science Standards (2013). www.nextgenscience.org/next-generation-science-standards. Papert, S. (1980). Mindstorms: Children, computers, and powerful ideas. Basic Books, Inc. Pickering, A. (1995). The mangle of practice: Time, agency, and science. Chicago: University of Chicago Press. Sengupta, P., Dickes, A., Farris, A. V., Karan, A., Martin, D., & Wright, M. (2015). Programming in K-12 science
classrooms. Communications of the ACM, 58(11), 33-35. Sengupta, P., & Farris, A. V. (2012). Learning kinematics in elementary grades using agent-based computational
modeling: a visual programming-based approach. In: Proceedings of the 11th International Conference on Interaction Design and Children (pp. 78-87). ACM.
Sengupta, P., Kinnebrew, J. S., Basu, S., Biswas, G., & Clark, D. (2013). Integrating computational thinking with K-12 science education using agent-based computation: A theoretical framework. Education andInformation Technologies, 18(2), 351-380.
Sherin, B., diSessa, A. A., & Hammer, D. (1993). Dynaturtle revisited: Learning physics through collaborative design of a computer model. Interactive Learning Environments, 3(2), 91-118.
Severance, S., Penuel, W. R., Sumner, T., & Leary, H. (2016). Organizing for Teacher Agency in Curricular Co-Design. Journal of the Learning Sciences, (just-accepted).
Wilensky, U. (1999). {NetLogo}. Wilkerson-Jerde, M., Wagh, A., & Wilensky, U. (2015). Balancing curricular and pedagogical needs in
computational construction kits: Lessons from the deltatick project. Science Education,99(3), 465-499. Wing, J. M. (2006). Computational thinking. Communications of the ACM, 49(3), 33-35. Yackel, E. and Cobb, P. (1996) Sociomathematical norms, argumentation, and autonomy in mathematics. Journal
for Research in Mathematics Education, 22(4), 390-408.
138138
Designing a web tool to support teamwork awareness and reflection: Evaluation of two
trial cycles Elizabeth KOH*a, Yi-Huan TEEa, Antonette SHIBANIa, Kian Leng TAYb, Jennifer Pei-Ling TANa,
Helen HONGa, Munir HUSSINa and Hwee Leng CHAN baNational Institute of Education, Nanyang Technological University, Singapore
bAnglican High School, Singapore *[email protected]
Abstract: Teamwork is an important 21st century competency to be nurtured in students. In this study, we describe the first two trial cycles of a web tool “My Groupwork Buddy” that is designed to support teamwork awareness and reflection in collaborative inquiry tasks. The tool is developed using a design-based approach and was based on the Team and Self Diagnostic Learning pedagogical framework. The system was trialled with 35 Secondary School students in a blended learning environment. Qualitative feedback from student focus group discussions and questionnaires were analysed from each trial. Design changes that focused students on specific reflection questions and goals helped to improve the quality of student responses of their teamwork. Further refinement of the tool and activity designs is in progress to better support teamwork awareness and reflection to build the teamwork competency of 21st century learners.
Keywords: Teamwork, collaboration, design-based research, web tool
1. Introduction
Teamwork and collaboration are important skills needed for the 21st century learner (Pellegrino & Hilton, 2013; Voogt et al., 2013). Moreover, ICT tools can be harnessed to help nurture students’ teamwork in collaborative inquiry tasks (Soller et al., 2005). Using design-based research, a web application “My Groupwork Buddy” (MGB) was co-designed by researchers and teachers to support Secondary school students’ teamwork awareness and reflection in collaborative inquiry tasks. This paper reports on the first two trial cycles of the project. ICT was harnessed as a metacognitive and reflective tool (Soller et al., 2005). It was a reflective mirror of teamwork processes as it provided data on certain teamwork processes. As it provided normative data through self and peer ratings, it was also a metacognitive tool, which allow for a more triangulated and fairer measurement (Freeman & McKenzie, 2002), for students to reflect and grow their teamwork competency.
The paper is structured as follows: First, we share the methodology and the pedagogical model of the study. Next, the research context followed by the technical details of implementation is explained. The two trial cycles will be subsequently described in terms of the design and implementation; these will then be evaluated before ending with a brief discussion and future work.
2. Methodology
Design-based research was the overarching methodology in this project as it allows rapid prototyping and refinement of systems, learning designs and principles in authentic learning settings (Barab, 2004; Brown, 1992). It also emphasizes co-designing with stakeholders (Barab, 2004). The tool, MGB was co-designed with a team of researchers and educators, with support from a web developer. MGB was developed to facilitate the growth of students’ teamwork competency based on the Team and Self Diagnostic Learning (TSDL) Pedagogical Framework (Koh et al., 2016).
TSDL is rooted in experiential learning, socio-constructivism and the learning analytics process model (Kolb, 1984; Duffy & Jonassen, 1992; Verbert et al., 2013). The framework comprises four stages: (1) concrete experience through involving students in the experience of collaborative activities, (2) building students’ awareness of their teamwork competencies, (3) engaging students in
139139
reflection and goal-setting, which helps to (4) engender growth and change in students’ teamwork competency. In this study, we focused on four teamwork competency dimensions (See Koh et al., 2016 for further details on TSDL as well as the teamwork competency dimensions).
Multiple forms of data were collected and for this paper, we mainly draw on qualitative data collected for the evaluation e.g., student feedback questionnaires and focus group discussions.
3. Research Context
This project is an intervention for 14-year-old students to nurture their teamwork competency and for teachers to develop their pedagogical practice in collaborative inquiry tasks. It is planned for 2 years and this paper reports on the first two trial cycles of the project in the first 6 months (2 school terms). A mixed-gender school participated in the project with the course, Design and Technology. In this course, students collaborate in teams to create a physical prototype of a useful device for a welfare organization (e.g., a home for the elderly or destitute). Two classes taught by the same teacher (a total of 35 students, 10 teams) participated in the project. Students were grouped by the teacher into teams of 3 or 4. Most of the tasks and assignments for the course involved group activities in a blended learning environment. Students had 70 minutes for the course each week during the 2 school terms.
4. Techno-pedagogical Design
The development of the MGB web tool is underpinned by the TSDL framework. It is designed as a Single-Page Application (SPA) website which allows dynamic updating and contains several features. The base MGB system allows login and lesson content management for students and teachers to access necessary information. To support students’ concrete teamwork experiences, MGB provides a collaborative platform via a real-time team chat. Students are able to chat with other members of the same team. The teacher can also broadcast messages to all teams in a class through the chat.
Being a SPA, students are able to navigate through the different pages while using the chat, without being interrupted by a page reload. Remote Procedure Calls (RPC) are used to call functions on the server asynchronously to load new content from the server. MGB is written in Haxe programming language (http://haxe.org/), making it easy to implement RPC for communications between client and server. The Haxe compiler is a source-to-source transpiler that will compile codes to JavaScript on the client side, and to PHP on the server side. It requires a function to be written only once in Haxe for use in both client and server side. The chat is implemented using a JavaScript library called Firebase (https://www.firebase.com/) that can synchronize objects between multiple clients.
To enable students’ teamwork awareness building, a self and peer rating feature is embedded in the system and the results are visualised on a radar chart to students on the MGB dashboard, on a page we term the Teamwork Competency Micro-profile. This makes visible the students’ teamwork competency strengths and weaknesses based on the four teamwork competency dimensions mentioned earlier. Visualisations are developed using a JavaScript library called Chart.js (http://www.chartjs.org/). A MySQL database is used to store system and student data. Several other features are developed in the second iteration which we will elaborate on in the subsequent sections.
5. First Iteration
5.1 Design and Implementation
In the first trial cycle, My Groupwork Buddy was used for 3 weeks. MGB was a web-based system containing features required for login, lesson content management, team chat, teamwork competency self and peer ratings and the dashboard for the teamwork competency micro-profile (Figure 1).
For stage 1 of TSDL where students participate in concrete team experiences, students collaboratively researched on a welfare organization to obtain information (e.g., needs, profile of residents) and produce a collaborative research report. The MGB user interface was designed to facilitate students’ collaborative research activities. With reference to the right-hand side of Figure 1, students were introduced to the team chat system on MGB by the teacher through a series of questions relating to their collaborative research task e.g. probing questions about evaluating the credibility of online sources. Other than face-to-face communication, the MGB team chat allowed students to
140140

converse and share web links with their team members for discussion. Course materials uploaded by the teacher were located in the lesson content pages on MGB accessible from the left navigation panel (Figure 1), containing lesson information and useful online resources such as web links and videos. As seen in Figure 1, the lesson pages and team chat are positioned right next to each other to help guide students’ discussion on the team chat. Students were allowed to use other communication media to complete their collaborative research report e.g. Google Docs, WhatsApp. In all, these were the concrete team experiences that formed the first part of the TSDL framework.
Figure 1. Screenshot of MGB lesson content pages and team chat
Figure 2. Screenshot of MGB personal teamwork
competency micro-profile in trial 1
In TSDL stage 2, students rated themselves and their team members on their teamwork behaviours on an online self and peer rating survey on MGB. After all students in a team finished the self and peer ratings, teamwork competency scores were computed based on the ratings. Students clicked on My Dashboard during the lesson in the following week to view their personal teamwork competency micro-profile. The micro- profile included a graph and a table of their own teamwork competency scores based on self, peer and overall ratings in the form of a radar chart (Figure 2). Peer scores were the average of team members’ ratings and the overall similarity score indicates the average difference in ratings between self and peer. Definitions for the teamwork dimensions were also displayed. This rating and micro-profile
visualisation activity helped the students to build self and team awareness, which is the second stage of TSDL.
The subsequent TSDL stage 3 is the self and team reflection and sense making. In this stage, students viewed their teamwork competency micro-profile and reflected individually and as a team. The different teamwork dimensions were explained to students with examples provided. Students then reflected on their personal micro-profile using the following reflection questions adapted from Phielix et al. (2011): (1) What differences do you see between the rating that you received from your peers and your self rating? (2) Why do or do you not you agree with your peers concerning your rating? This time
141141
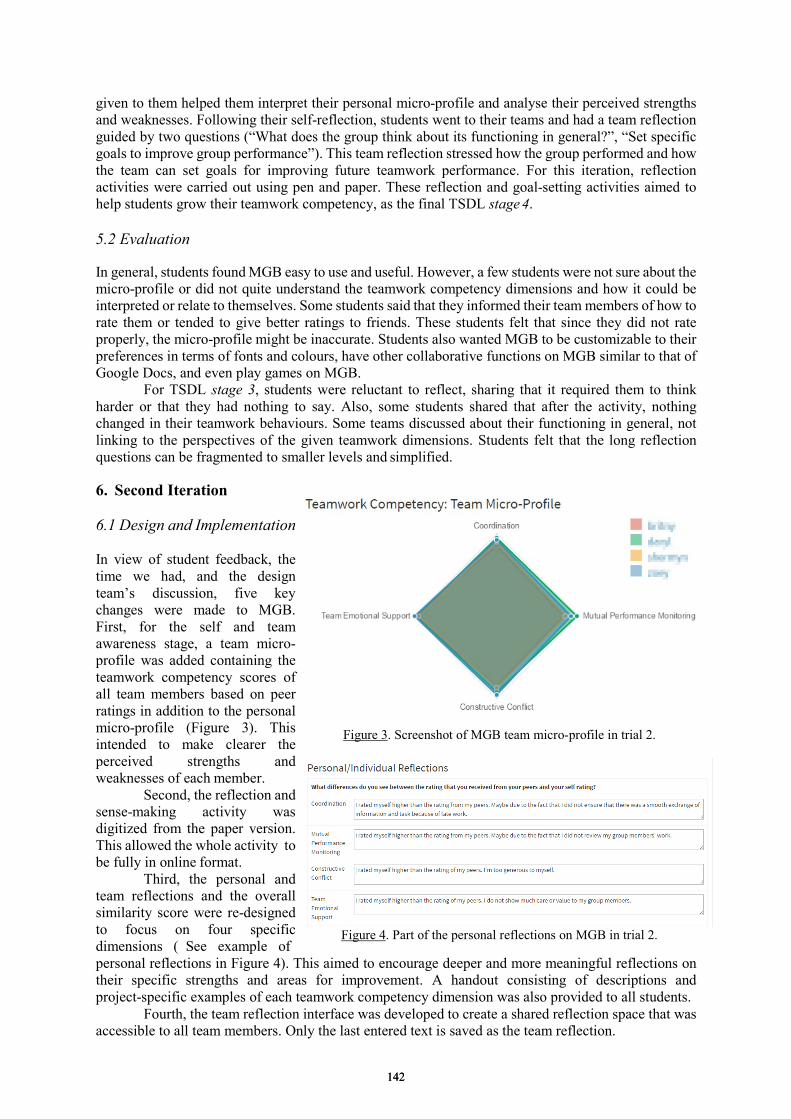
given to them helped them interpret their personal micro-profile and analyse their perceived strengths and weaknesses. Following their self-reflection, students went to their teams and had a team reflection guided by two questions (“What does the group think about its functioning in general?”, “Set specific goals to improve group performance”). This team reflection stressed how the group performed and how the team can set goals for improving future teamwork performance. For this iteration, reflection activities were carried out using pen and paper. These reflection and goal-setting activities aimed to help students grow their teamwork competency, as the final TSDL stage 4. 5.2 Evaluation In general, students found MGB easy to use and useful. However, a few students were not sure about the micro-profile or did not quite understand the teamwork competency dimensions and how it could be interpreted or relate to themselves. Some students said that they informed their team members of how to rate them or tended to give better ratings to friends. These students felt that since they did not rate properly, the micro-profile might be inaccurate. Students also wanted MGB to be customizable to their preferences in terms of fonts and colours, have other collaborative functions on MGB similar to that of Google Docs, and even play games on MGB.
For TSDL stage 3, students were reluctant to reflect, sharing that it required them to think harder or that they had nothing to say. Also, some students shared that after the activity, nothing changed in their teamwork behaviours. Some teams discussed about their functioning in general, not linking to the perspectives of the given teamwork dimensions. Students felt that the long reflection questions can be fragmented to smaller levels and simplified. 6. Second Iteration 6.1 Design and Implementation
In view of student feedback, the time we had, and the design team’s discussion, five key changes were made to MGB. First, for the self and team awareness stage, a team micro- profile was added containing the teamwork competency scores of all team members based on peer ratings in addition to the personal micro-profile (Figure 3). This intended to make clearer the perceived strengths and weaknesses of each member.
Second, the reflection and sense-making activity was digitized from the paper version. This allowed the whole activity to be fully in online format.
Third, the personal and team reflections and the overall similarity score were re-designed to focus on four specific dimensions ( See example of
Figure 3. Screenshot of MGB team micro-profile in trial 2.
Figure 4. Part of the personal reflections on MGB in trial 2.
personal reflections in Figure 4). This aimed to encourage deeper and more meaningful reflections on their specific strengths and areas for improvement. A handout consisting of descriptions and project-specific examples of each teamwork competency dimension was also provided to all students.
Fourth, the team reflection interface was developed to create a shared reflection space that was accessible to all team members. Only the last entered text is saved as the team reflection.
142142
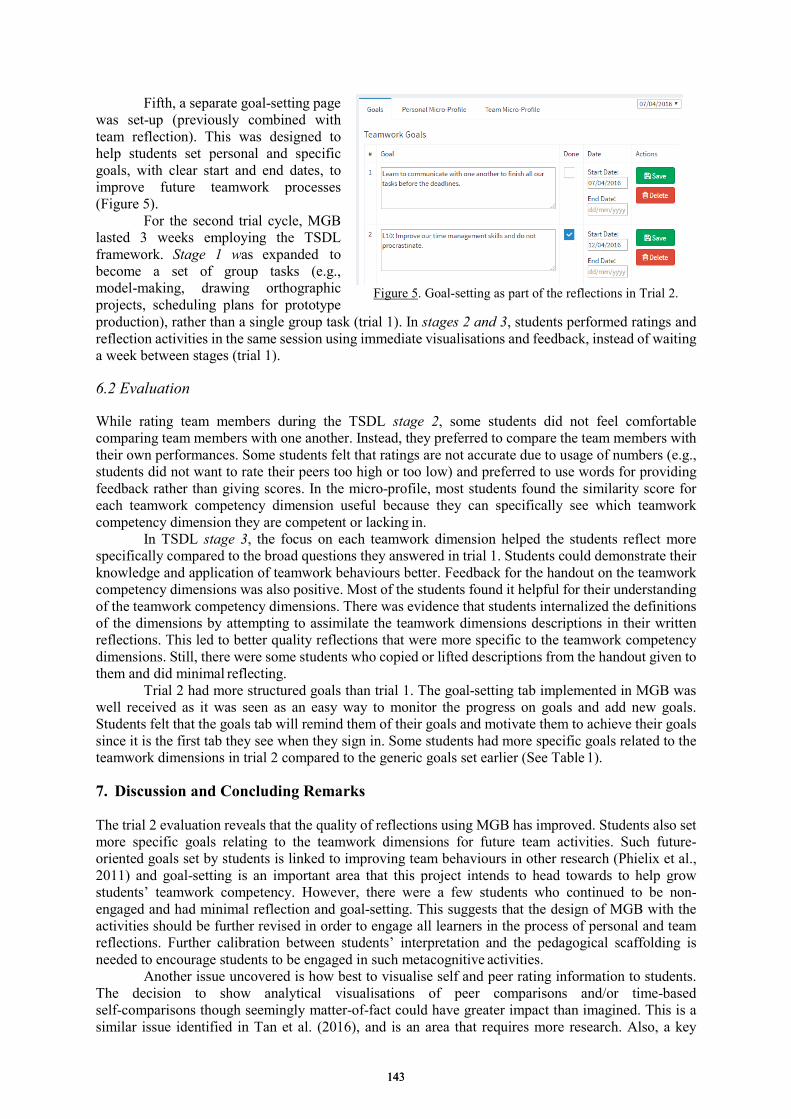
Fifth, a separate goal-setting page was set-up (previously combined with team reflection). This was designed to help students set personal and specific goals, with clear start and end dates, to improve future teamwork processes (Figure 5).
For the second trial cycle, MGB lasted 3 weeks employing the TSDL framework. Stage 1 was expanded to become a set of group tasks (e.g., model-making, drawing orthographic projects, scheduling plans for prototype
Figure 5. Goal-setting as part of the reflections in Trial 2.
production), rather than a single group task (trial 1). In stages 2 and 3, students performed ratings and reflection activities in the same session using immediate visualisations and feedback, instead of waiting a week between stages (trial 1). 6.2 Evaluation While rating team members during the TSDL stage 2, some students did not feel comfortable comparing team members with one another. Instead, they preferred to compare the team members with their own performances. Some students felt that ratings are not accurate due to usage of numbers (e.g., students did not want to rate their peers too high or too low) and preferred to use words for providing feedback rather than giving scores. In the micro-profile, most students found the similarity score for each teamwork competency dimension useful because they can specifically see which teamwork competency dimension they are competent or lacking in.
In TSDL stage 3, the focus on each teamwork dimension helped the students reflect more specifically compared to the broad questions they answered in trial 1. Students could demonstrate their knowledge and application of teamwork behaviours better. Feedback for the handout on the teamwork competency dimensions was also positive. Most of the students found it helpful for their understanding of the teamwork competency dimensions. There was evidence that students internalized the definitions of the dimensions by attempting to assimilate the teamwork dimensions descriptions in their written reflections. This led to better quality reflections that were more specific to the teamwork competency dimensions. Still, there were some students who copied or lifted descriptions from the handout given to them and did minimal reflecting.
Trial 2 had more structured goals than trial 1. The goal-setting tab implemented in MGB was well received as it was seen as an easy way to monitor the progress on goals and add new goals. Students felt that the goals tab will remind them of their goals and motivate them to achieve their goals since it is the first tab they see when they sign in. Some students had more specific goals related to the teamwork dimensions in trial 2 compared to the generic goals set earlier (See Table 1). 7. Discussion and Concluding Remarks The trial 2 evaluation reveals that the quality of reflections using MGB has improved. Students also set more specific goals relating to the teamwork dimensions for future team activities. Such future- oriented goals set by students is linked to improving team behaviours in other research (Phielix et al., 2011) and goal-setting is an important area that this project intends to head towards to help grow students’ teamwork competency. However, there were a few students who continued to be non- engaged and had minimal reflection and goal-setting. This suggests that the design of MGB with the activities should be further revised in order to engage all learners in the process of personal and team reflections. Further calibration between students’ interpretation and the pedagogical scaffolding is needed to encourage students to be engaged in such metacognitive activities.
Another issue uncovered is how best to visualise self and peer rating information to students. The decision to show analytical visualisations of peer comparisons and/or time-based self-comparisons though seemingly matter-of-fact could have greater impact than imagined. This is a similar issue identified in Tan et al. (2016), and is an area that requires more research. Also, a key
143143
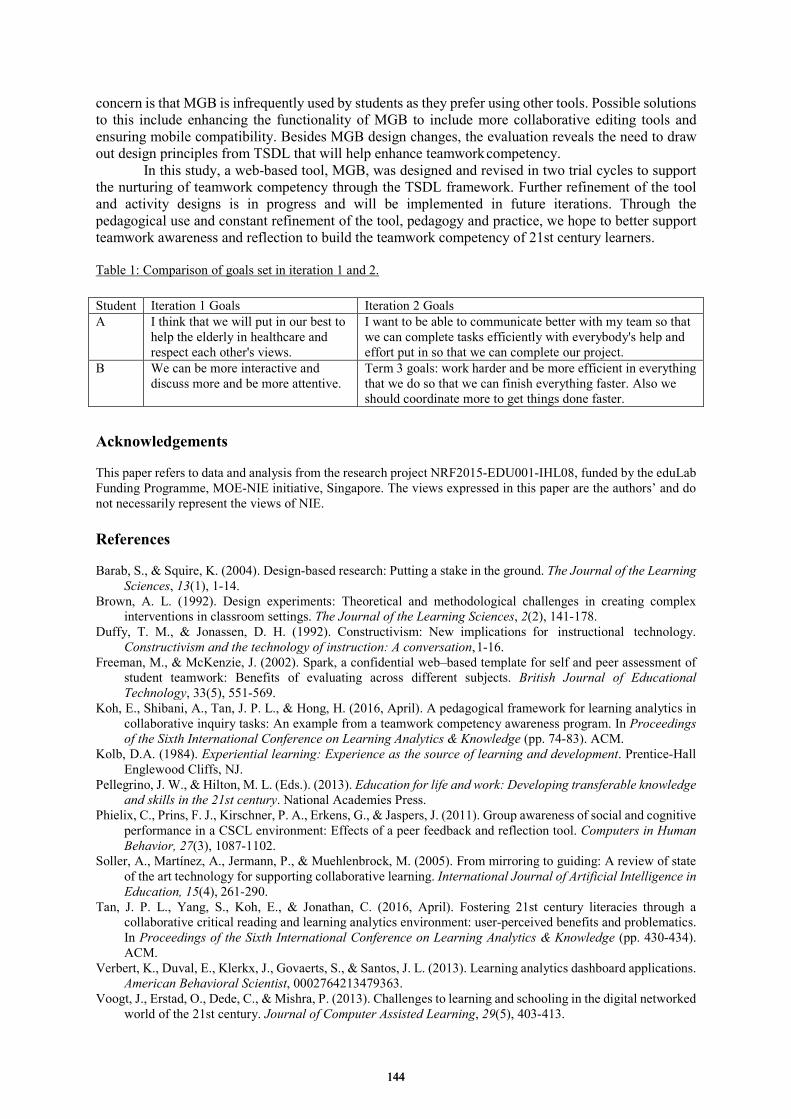
concern is that MGB is infrequently used by students as they prefer using other tools. Possible solutions to this include enhancing the functionality of MGB to include more collaborative editing tools and ensuring mobile compatibility. Besides MGB design changes, the evaluation reveals the need to draw out design principles from TSDL that will help enhance teamwork competency.
In this study, a web-based tool, MGB, was designed and revised in two trial cycles to support the nurturing of teamwork competency through the TSDL framework. Further refinement of the tool and activity designs is in progress and will be implemented in future iterations. Through the pedagogical use and constant refinement of the tool, pedagogy and practice, we hope to better support teamwork awareness and reflection to build the teamwork competency of 21st century learners. Table 1: Comparison of goals set in iteration 1 and 2.
Student Iteration 1 Goals Iteration 2 Goals A I think that we will put in our best to
help the elderly in healthcare and respect each other's views.
I want to be able to communicate better with my team so that we can complete tasks efficiently with everybody's help and effort put in so that we can complete our project.
B We can be more interactive and discuss more and be more attentive.
Term 3 goals: work harder and be more efficient in everything that we do so that we can finish everything faster. Also we should coordinate more to get things done faster.
Acknowledgements This paper refers to data and analysis from the research project NRF2015-EDU001-IHL08, funded by the eduLab Funding Programme, MOE-NIE initiative, Singapore. The views expressed in this paper are the authors’ and do not necessarily represent the views of NIE. References Barab, S., & Squire, K. (2004). Design-based research: Putting a stake in the ground. The Journal of the Learning
Sciences, 13(1), 1-14. Brown, A. L. (1992). Design experiments: Theoretical and methodological challenges in creating complex
interventions in classroom settings. The Journal of the Learning Sciences, 2(2), 141-178. Duffy, T. M., & Jonassen, D. H. (1992). Constructivism: New implications for instructional technology.
Constructivism and the technology of instruction: A conversation, 1-16. Freeman, M., & McKenzie, J. (2002). Spark, a confidential web–based template for self and peer assessment of
student teamwork: Benefits of evaluating across different subjects. British Journal of Educational Technology, 33(5), 551-569.
Koh, E., Shibani, A., Tan, J. P. L., & Hong, H. (2016, April). A pedagogical framework for learning analytics in collaborative inquiry tasks: An example from a teamwork competency awareness program. In Proceedings of the Sixth International Conference on Learning Analytics & Knowledge (pp. 74-83). ACM.
Kolb, D.A. (1984). Experiential learning: Experience as the source of learning and development. Prentice-Hall Englewood Cliffs, NJ.
Pellegrino, J. W., & Hilton, M. L. (Eds.). (2013). Education for life and work: Developing transferable knowledge and skills in the 21st century. National Academies Press.
Phielix, C., Prins, F. J., Kirschner, P. A., Erkens, G., & Jaspers, J. (2011). Group awareness of social and cognitive performance in a CSCL environment: Effects of a peer feedback and reflection tool. Computers in Human Behavior, 27(3), 1087-1102.
Soller, A., Martínez, A., Jermann, P., & Muehlenbrock, M. (2005). From mirroring to guiding: A review of state of the art technology for supporting collaborative learning. International Journal of Artificial Intelligence in Education, 15(4), 261-290.
Tan, J. P. L., Yang, S., Koh, E., & Jonathan, C. (2016, April). Fostering 21st century literacies through a collaborative critical reading and learning analytics environment: user-perceived benefits and problematics. In Proceedings of the Sixth International Conference on Learning Analytics & Knowledge (pp. 430-434). ACM.
Verbert, K., Duval, E., Klerkx, J., Govaerts, S., & Santos, J. L. (2013). Learning analytics dashboard applications. American Behavioral Scientist, 0002764213479363.
Voogt, J., Erstad, O., Dede, C., & Mishra, P. (2013). Challenges to learning and schooling in the digital networked world of the 21st century. Journal of Computer Assisted Learning, 29(5), 403-413.
144144

Chen, W. et al. (Eds.) (2016). Proceedings of the 24th International Conference on Computers in Education. India: Asia-Pacific Society for Computers in Education
Socio-culturally Adaptive and Personalized Collaborative learning environments
Fadoua OUAMANI a*, Narjès BELLAMINE BEN SAOUD a & Henda HAJJAMI BEN GHEZALA a
aEcole Nationale des Sciences de l’Informatique, Université de la Manouba, Tunisia *[email protected]
Abstract: There was a growing interest in the development of CSCL (Computer Supported Collaborative Learning) environments over the last decade. Despite the plethora of tools available, they ignore the cultural differences between learners. In fact, especially, in the case of distant learning, these environments may bring together learners from different socio-cultural backgrounds that have acquired different socio-cultural values and behaviors and developed different needs, points of view and learning styles. Thus, CSCL environments need to be socio-culturally adapted to each learner’s culture. The main goal of this paper is to emphasize the need of socio-cultural aware collaborative learning, to present our proposed ontology-driven adaptation approach to meet this need, its operationalization and its experimental validation. Results and limits are discussed at the end of the paper.
Keywords: CSCL, user profile, adaptation and personalization, ontology, design patterns.
1. In troduction There was a growing interest in the development of CSCL environments over the last decade. Despite the plethora of tools available, they ignore the cultural differences between learners as they are dedicated to learners from dominant cultures (Economides, 2008). These environments may bring together learners from different cultures that have acquired different socio-cultural values and behaviors and developed different needs, points of view and learning styles (Economides, 2008). Thus, CSCL environments need to be socio-culturally adaptive to each learner’s culture (Economides, 2008; Blanchard, 2007). Socio-cultural Adaptation may ensure learner satisfaction, consequently enhance their motivation to learn in an intercultural group by resolving potential socio-cultural conflicts emerging during intercultural communication, and thereby improve interaction and learning.
The main goal of this paper is to emphasizes the need of socio-cultural aware CL (section 2) and presents the proposed ontology-driven adaptation approach to meet this need (section 3). The use of ontologies allows us to build a socio-cultural user profile which will be used to adapt dynamically the functionalities of CSCL environments to the socio-cultural specificities of each learner. At the group level, the use of design patterns for cross-cultural collaboration allows us to handle and resolve intercultural communication and collaboration conflicts. The operationalization, where the design and implementation challenges are discussed, followed by the experimental validation is given and discussed in section 4. 2. Is Socio-cultural awareness a necessity for collaborative learning?
Since the early design phase of a CL system, instructors and designers should be aware of the socio-cultural diversity of learners (Economides, 2008). In fact, according to (Henri and Lundgren-Cayrol, 1998; Blanchard, 2007), in classroom CL context, teachers have noted that the learning goal of the collective activity is not always equally achieved by all the learners. Looking for the reasons of such observations, we have found that this is due to the difference in affordance appropriation. This difference is explained by differences in personalities, social contexts, behavior patterns, learning styles and motivation degree which are all culturally sensitive. Therefore, it is important that such tools ensure equal opportunities to learning for all learners by taking into account their cultural differences (Henri and Lundgren-Cayrol, 1998; Blanchard, 2007; Economides, 2008)
145145
2.1 Culture definition
Culture has many definitions. After the review of a collection of fifteen most influential definitions of culture (e.g. Tylor, 1871; Hofstede, 1980), we were able to identify the following specifications of culture (Ouamani et al., 2012): Culture is a set of characteristics that affect ways of acting (explicit behavior patterns, language, customs, laws, etc.), thinking (standards,beliefs, ideology) and feeling (values, character traits, cognitive styles) of individuals in a group that distinguish them. Socio-cultural differences are measured through the use of national culture models which are composed of a set of socio-cultural dimensions that translate standard behavior patterns. A comparative study (Ouamani et al., 2012) of the six most influential models (e.g Hofstede, 1997; Hall, 1990) allowed us to define five common socio-cultural factors (Ouamani et al., 2012) that have been used in the course of our thesis work: power distance (values: hierarchic/Linear), belonging (values: collectivism/individualism), relation with environment (values mastery/harmony), attitude toward time (values: polychromic/monochromic) and Risk and uncertainty avoidance (values: Universalism/Particularism).
2.2 Socio-cultural impacts on individuals
The impacts of socio-cultural factors were demonstrated on individuals: 1) on behaviors (Linton, 1977), 2) on communication (Hall, 1976), 3) on cognition (Nisbett and Norenzayan, 2002), 4) on motivation(Gurleyik, 2012), 5) on emotion expression, perception, understanding, management and using and(Miyamoto, 2011), 6) on learning (Valiente, 2008).
2.3 Socio-cultural impacts on collaborative learning
We have carried a deep study (Ouamani, 2015) of research works (e.g. Economides, 2008; Valiente, 2008) within Educational Sciences and CSCL research domains that focused on and demonstrated socio-cultural impacts on collaborative learning domain. This study allowed us to extract and define the following domain variables classes which are socio-culturally sensitive. These variables (describing the communication process, the collective activity control, the system support, the group composition and homogeneity) take two values depending on the type of culture as shown in Table 1.
Table 1: An excerpt of socio-culturally sensitive CL domain variable values (Ouamani et al., 2013).
Variables Values Hierarchic and collectivist cultures Egalitarian and individualistic cultures
Activity structure Formal Informal Activity focus Specific General
3. Ontology-driven adaptation approach
In order to consider the socio-cultural differences between learners when designing CSCL environments, we need first to model the socio-cultural knowledge about the learner and the CSCL domain and then use these models to adapt such environments at different levels: GUI (Graphic User Interface), Functionalities and content in addition to handling the intercultural communication problems.
3.1 Socio-cultural user profile
As we aim to propose a generic, shared and consensual model, understandable and usable by both humans and machines which allows not only the representation of socio-cultural knowledge but also inferential reasoning about it, we have chosen to use ontologies. An ontology framework composed of two ontologies is built: � The first one, SocioCUltural Domain Ontology (called SOCUDO) is a generic core ontology that
models the user related socio-cultural knowledge:
146146

� The second one, Socio-Cultural Aware Collaborative Learning Ontology (called SCACLO) is a domain ontology that models socio-cultural knowledge of CSCL domain.
These two ontologies communicate together and share socio-cultural knowledge about “users” involved in collaborative learning sessions. In fact, the instantiation of SOCUDO triggers the instantiation of SCACLO for each user based on association rules (see Table 1) that associate SOCUDO concepts values to SCACLO concept values. The merging of the two instances results in the generation of the socio-cultural user profile. The detailed definition of the ontologies (hierarchy of concepts, relationships, etc.), the construction processes, and their validation are out of the scope of this paper (Ouaman, Bellamine Ben Saoud and Ben ghézala, 2014a). The ontologies are available at the following link1 and their ORSD (Ontology requirement specification document) can be found at the following link2.
3.2 Socio-cultural adaptation process
The socio-cultural user profile is managed and used by an adaptation process (Ouamani et al., 2016) which was implemented to operationalize the proposed ontology-driven socio-cultural adaptation approach. This process consists in two main modules: socio-cultural user profile management module and functionality adaptation module. 3.2.1 Socio-cultural user profile management module It performs what follows: 1) socio-cultural data acquisition from the user by filling out a form, 2) The acquired data is processed to infer socio-cultural knowledge which is a SOCUDO instance for this user. 3) By applying association rules, connecting both ontologies, we get a SCACLO instance.4) the two instances are then merged to get the socio-cultural user profile which is stored in the profile data-base to insure adequate personalization. 3.2.2 Functionality adaptation module It is based on the application of suitable adaptation rules on the user profile socio-cultural knowledge. These rules match SCACLO concept values to adaptation tasks that need to be carried out by the system to provide socio-culturally adapted recommendations to participants of a collaborative session.
We have proposed and implemented two types of adaptation rules: “If condition then do action“ and “On event do action”. Each one matches one or more SCACLO concept values to one or more adaptations tasks (Table 2).
The definition of the second type of rules was based on the use of existing design patterns proposed by (Schadewitz, 2009) to handle intercultural collaboration (Table 3) These rules were validated by an empirical study (Ouamani, Bellamine Ben Saoud and Hajjami, 2016) we have conducted based on an online trilingual survey to verify two assumptions related to the accuracy and precision of these findings. Table 2: An excerpt of the proposed adaptation rules for learners from hierarchic and collectivist cultures
SCACLO concept values Adaptation rules
Activity structure= formal The activity statement provided to such learners are structured in different parts: problem desciption, questions, pedagogical resources.
Activity focus= specific The activity statement provided gave accurate information and details about the problem, how to resolve it and the future solution
1 http://ontohub.org/repositories/socudo-scaclo/ontologies 2 https://www.academia.edu/23295514/SOCUDO-SCACLO_ontology_ORSD
147147
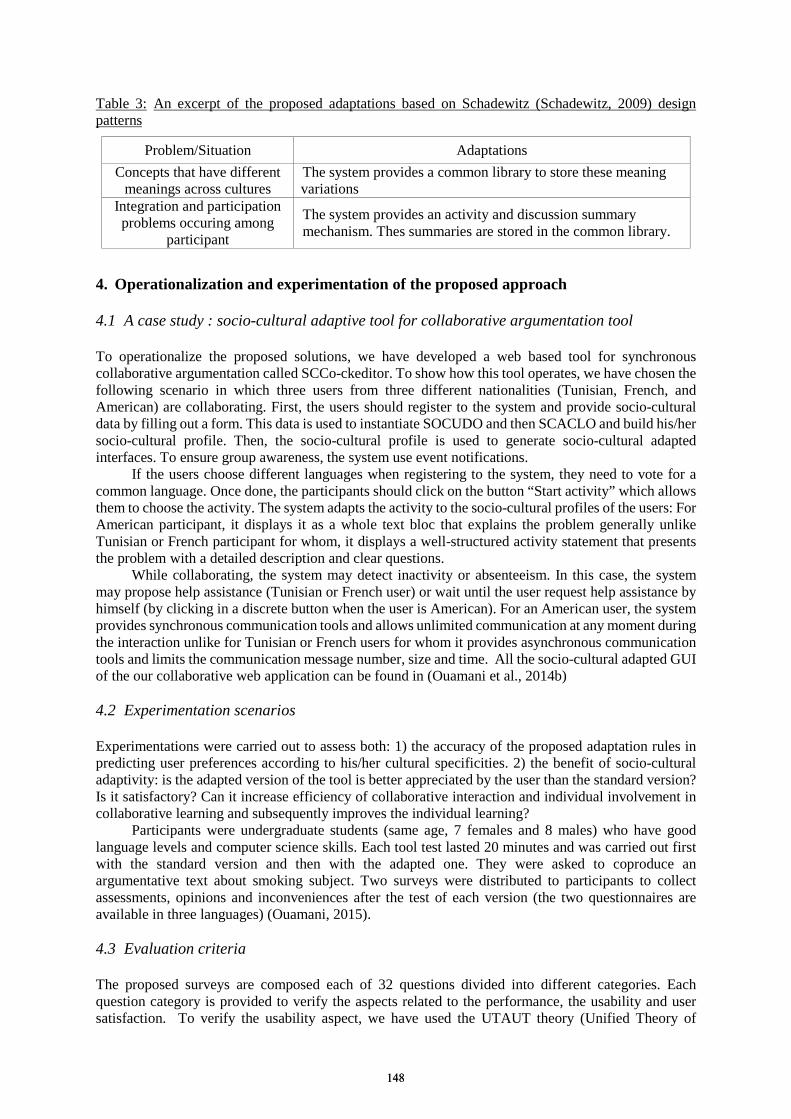
Table 3: An excerpt of the proposed adaptations based on Schadewitz (Schadewitz, 2009) design patterns
Problem/Situation Adaptations
Concepts that have different meanings across cultures
The system provides a common library to store these meaning variations
Integration and participation problems occuring among
participant
The system provides an activity and discussion summary mechanism. Thes summaries are stored in the common library.
4. Operationalization and experimentation of the proposed approach 4.1 A case study : socio-cultural adaptive tool for collaborative argumentation tool To operationalize the proposed solutions, we have developed a web based tool for synchronous collaborative argumentation called SCCo-ckeditor. To show how this tool operates, we have chosen the following scenario in which three users from three different nationalities (Tunisian, French, and American) are collaborating. First, the users should register to the system and provide socio-cultural data by filling out a form. This data is used to instantiate SOCUDO and then SCACLO and build his/her socio-cultural profile. Then, the socio-cultural profile is used to generate socio-cultural adapted interfaces. To ensure group awareness, the system use event notifications.
If the users choose different languages when registering to the system, they need to vote for a common language. Once done, the participants should click on the button “Start activity” which allows them to choose the activity. The system adapts the activity to the socio-cultural profiles of the users: For American participant, it displays it as a whole text bloc that explains the problem generally unlike Tunisian or French participant for whom, it displays a well-structured activity statement that presents the problem with a detailed description and clear questions.
While collaborating, the system may detect inactivity or absenteeism. In this case, the system may propose help assistance (Tunisian or French user) or wait until the user request help assistance by himself (by clicking in a discrete button when the user is American). For an American user, the system provides synchronous communication tools and allows unlimited communication at any moment during the interaction unlike for Tunisian or French users for whom it provides asynchronous communication tools and limits the communication message number, size and time. All the socio-cultural adapted GUI of the our collaborative web application can be found in (Ouamani et al., 2014b)
4.2 Experimentation scenarios
Experimentations were carried out to assess both: 1) the accuracy of the proposed adaptation rules in predicting user preferences according to his/her cultural specificities. 2) the benefit of socio-cultural adaptivity: is the adapted version of the tool is better appreciated by the user than the standard version? Is it satisfactory? Can it increase efficiency of collaborative interaction and individual involvement in collaborative learning and subsequently improves the individual learning?
Participants were undergraduate students (same age, 7 females and 8 males) who have good language levels and computer science skills. Each tool test lasted 20 minutes and was carried out first with the standard version and then with the adapted one. They were asked to coproduce an argumentative text about smoking subject. Two surveys were distributed to participants to collect assessments, opinions and inconveniences after the test of each version (the two questionnaires are available in three languages) (Ouamani, 2015).
4.3 Evaluation criteria The proposed surveys are composed each of 32 questions divided into different categories. Each question category is provided to verify the aspects related to the performance, the usability and user satisfaction. To verify the usability aspect, we have used the UTAUT theory (Unified Theory of
148148

Acceptance and Use of Technology) (Venkatesh et al., 2003) (validated by (Oshlyanski, Caims and Thimbleby, 2007) across cultures). To verify the performance aspect, we have proposed 4 questions inspired from the work of (Reinecke, 2010). To verify the user satisfaction aspect, we have used the measurement scale proposed by (Hassenzahl and Tractinsky, 2006) and (Hassenzahl, 2010) that confronts the pragmatic perceived quality and the perceived attractiveness.
For all questions that ask for answers with a Likert scale, we have used Cronbach’s alpha (Nunnally and Bernstein, 1994) to test internal consistency, to check the overall reliability and to detect incoherent answers (the test is considered consistent when the alpha value is close to 1). We have also used: 1) The kolmogorov-Smirnov test to verify the distribution of the sample, 2) The t-test to compare data. This test allowed us to assess the average answer for both versions to verify assumptions related to user satisfaction aspect and the benefits of socio-cultural adaptivity, 3) The correction (Benjamini and Hochberg, 1995) of the p values calculated by kolmogorov-Smirnov tests for each evaluation criteria, 4) Pearson correlation to test correlation between answers related to the usability and user satisfactions and general preference information in which each participant have to choose between the two versions and 5) The chi-square goodness of fit who had as input the variable “preferred version” with three levels of answers “PreferredAdapted”, “PreferredStandard” and “Neutral” to categorize participant preferences 4.4 Experimentation results An excerpt of results was as follows: � The Cronbash’s alpha (above 0.5) showed that for usability and satisfaction criteria, we have
obtained values near to 1 (more than 0.5) for the two versions. This proves the validity of our test and the homogeneity of participants answers. However for the performance criteria, the values were close to 0 (0.2 for the two versions). This translates the divergences of participant answers.
� The Kolmogorov-Smirnov tests showed in most cases and for most of the evaluation criteria that we have normal data distributions for the two versions.
� The correction of p values for the different evaluation criteria had shown that the usability, the performance of the adapted version was better according to the participant answers. When comparing the participant answers for both the two versions; 56% of participants think they can work more efficiently with the adapted version, 66% of the participants find the adapted version more suitable, attractive, easy to use, understandable and user-friendly. 100% of participants choose the adapted versions as the best one. Participants had always accepted the system recommendations.
5. Discussion and limits This paper tries to address a set of challenging questions. The first question is about the socio-cultural knowledge we can adapt to. To address this question and based on literature review of research studies on socio-cultural influence on individual, we have proposed an ontology that models this knowledge. The second question is about the CSCL components that can be socio-culturally adapted and based on literature review related to socio-cultural influences on collaborative learning, we have built an ontology that models these socio-culturally sensitive CSCL variables. To collect socio-culturally data needed to instantiate the two ontologies, the developed tool inquires the users and then uses the collected data to infer socio-cultural knowledge. Inferences are based on association rules modeling expertise and knowledge extracted from the same literature reviews. The remaining questions are about the impact of the socio-cultural adaptation, how socio-culturally adaptive and personalized CSCL environments may promote learning in real contexts and how learners of different profiles perceive socio-cultural adaptation, the results of our experiments validate the benefits of socio-cultural adaptivity. The adaptive collaborative environments developed had improved the efficiency and the satisfaction of participants belonging to the studied cultures. However, this performed set of experiments is limited: more time and collaborative efforts are required to test the tool within several cultures and with large samples to validate our assumptions across cultures. References
149149

Blanchard, E. G. (2007). Motivation and culture, Thèse présentée à la Faculté des études supérieures en vue de l’obtention du grade de Philosophiae Doctor (Ph.D.) en Informatique, université de Montréal, Canada.
Benjamini, Y. & Hochberg, Y. (1995). Controlling the False Discovery Rate: a practical and powerful Approach to Multiple Testing, Journal of the Royal Statistical Society. Series B (Methodological). Published by Wiley. 57(1), 289-300.
Economides, A. A. (2008). Culture-aware collaborative learning. Multicultural Education & Technology Journal, 2, 243– 267.
Gurleyik, D. (2012). The Effects of Cultural Differences on Motivation Goal Theory in Physical Activity Settings. thesis Directed by Dr. Jennifer L. Etnier.
Hall, E. (1990). The silent language. New York: Anchor Books. Hassenzahl, M. & Tractinsky, N. (2006). User Experience –a Research Agenda. Behaviour & Information
Technology, 25, 91-97. Hassenzahl, M. (2010). Experience Design: Technology for all the right reasons. San Francisco: Morgan
Claypool. Henri, F. & Lundgren-Cayrol, K. (1998). Apprentissage collaboratif et nouvelles technologies, centre de
recherche LICEF, Bureau des technologies d’apprentissage. Hofstede, G. (1980). Culture's Consequences: International Differences in Work-Related Values. 475 pages.
Beverly Hills CA: Sage Publications. Hardcover. ISBN 0-8039-1444-X. Hofstede, G. (1997). Cultures and organizations: Software of the mind. Intercultural Cooperation and its
Importance for survival: Mcgraw-Hill. Linton, R. (1977). le fondement culturel de la personnalité. translated by A. Léotard, Paris :Bordas, 138 pages. Miyamoto, Y. & Ryff; C. (2011). Cultural differences in the dialectical and non-dialectical emotional styles and
their implications for health. Cognition and Emotion, 2, 22–30. Nisbett, R. E. & Norenzayan, A. (2002). Culture and cognition. In Medin, D. L. and Stevens’ Handbook of
experimental Psychology, 561-597. Nunnally, C. & Bernstein, I. H. (1994). Psychometric theory (3rd ed.).New York: McGraw-Hill. Oshlyanski, L., Caims, P. & Thimbleby, H. (2007). Validating the Unified Theory of Acceptance and Use of
Technology (UTAUT) tool cross-culturally. Proceedings of the 21st British HCI Group Annual Conference on People and Computers (pp.83-86), British Computer Society.
Ouamani, F., Bellamine Ben Saoud, N., Hadj M’tir, R. & Hajjami Ben Ghézala, H. (2012). Proposal of a generic and multidimensional socio-cultural user profile for collaborative environments. Proceeding of the 5th International Conference on Information Systems and Economic Intelligence (pp. 75-83), Djerba, Tunisia.
Ouamani, F., Bellamine Ben Saoud, N., Hadj M’tir, R. & Hajjami Ben Ghézala, H. (2013). Conceptual Ontology Framework for Socio-Cultural Aware Computer Supported Collaborative Learning Environments. Proceeding of CSCL’2013 (pp 329-331) , Madison, Wisconsin.
Ouamani, F., Bellamine Ben Saoud, N. & Hajjami Ben ghézala, H. (2014a). Sociocultural Knowledge Management toward the Adaptation of a CSCL Environment. in Information Systems for Knowledge Management, London: Wiley-ISTE, pp. 61-92, ISBN 978-1-84821-664-8.
Ouamani, F., Bellamine Ben Saoud, N. & Hajjami Ben ghézala, H. (2014b) Operatonalization of an ontology based sociocultural adaptation approach and its application to CSCL. Proceeding of The 11th ACS/IEEE AICCSA’2014 (pp 457-465),Doha, Qatar.
Ouamani, F. (2015) Adaptation socioculturelle d’environnements d’apprentissage collaborative, available at : https://www.academia.edu/23295215/Adaptation_socioculturelle_denvironnements_dapprentissage_colla boratif
Ouamani, F., Bellamine Ben Saoud, N. & Hajjami Ben ghézala, H. (2016). Socio-cultural adaptation approach to enhance intercultural collaboration and learning. Proceeding of the 30th International Conference on Advanced Information Networking and Applications Workshops (pp.171-176), 23-25 March 2016 Crans-Montana, Switzerland.
Reinecke, K. (2010). Culturally Adaptive User Interfaces. University of Zurich, Germany. Schadewitz, N. (2009). Design Patterns for cross-cultural collaboration.International Journal of Design, 3(3). Tylor, E. B. (1871). Primitive culture: Researches into the development of mythology, philosophy, religion, art,
and custom. NewYork:Gordon Press. Valiente, C. (2008). Are students using the ‘wrong’ style of learning?. Active Learning in Higher Education, 9 (1),
73-91. Venkatesh, V., Morris, M. G., & Davis, F. D. (2003). User acceptance of information technology: toward a unified
view. MIS Quarterly, 27(3), 425-478.
150150
Chen, W. et al. (Eds.) (2016). Proceedings of the 24th International Conference on Computers in Education. India: Asia-Pacific Society for Computers in Education
Detecting Metacognitive Strategies through Performance Analyses in
Open-‐Ended Learning Environments
Michael TSCHOLLa, Gautam BISWASa*, Benjamin S. GOLDBERGb, & Robert A. SOTTILAREb
aInstitute for Software Integrated Systems, Department of Electrical
Engineering and Computer Science, Vanderbilt University, USA bU.S. Army Research Laboratory – Human Research and Engineering
Directorate, Simulation and Training Technology Center, USA *[email protected]
Abstract. The detection and analysis of students’ domain-specific and metacognitive strategy use in Open-Ended Learning Environments (OELE) is a necessary step to support their learning and problem solving through contextualized scaffolding. We present an analysis of students’ performance from information captured in log files in UrbanSim, a turn-based simulation environment for counterinsurgency training. We illustrate the benefits of this approach within a task-model framework. Our overall goals are to implement a generalizable detection and adaptive scaffolding framework in an extended version of the GIFT tutoring system developed at ARL. Keywords: Open-Ended Learning Environments, Learning Analytics, Performance Analysis, Metacognitive Processes and Strategies
1. Introduction Promoting students’ learning of metacognitive and self-regulatory strategies is increasingly seen as an important component of Intelligent Tutoring Systems, especially those that support open-ended complex problem solving and decision-making. Such open-ended learning environments (OELEs) allow the learner to make choices in their approach to developing, monitoring, and managing their evolving solution paths (Land, 2000; Segedy, Kinnebrew, & Biswas, 2015). To be successful, learners have to become adept at employing metacognition and self-regulation processes and strategies (Butler & Winne, 1995; Kinnebrew, Segedy, & Biswas, 2016). Such processes and strategies encompass information acquisition, situation awareness, plan development and refinement taking into account resource limitations and trade-offs presented by the solution space, solution monitoring, evaluation, and, finally, reflection, to see how they may do better.
In a project supported by the Army Research Labs, we have been designing a metacognitive tutoring framework to the Generalized Intelligent Framework for Tutoring (GIFT), “a computer-based tutoring framework to evaluate adaptive tutoring concepts, models, authoring capabilities, and instructional strategies across various populations, training tasks and conditions.” (Goldberg & Cannon-Bowers 2013; Sottilare, et al. 2012; Sottilare & Holden 2013). Among other services, GIFT provides tools that support authoring of tutoring system content, which includes domain concepts and remedial instruction modules (Sottilare, et al. 2012). Our goal is to extend the learner modeling in GIFT to capture a more continual and fine-grained assessments of learners’ capabilities, and then use these assessments to provide adaptive scaffolding and feedback to learners as they work on their tasks. Our particular focus is on understanding the cognitive and metacognitive strategies students employ in their understanding and decision-making tasks, and provide adaptive scaffolding on these strategies to help students become better learners and decision makers.
In this paper, we present our work on leveraging and extending the capabilities of GIFT to provide contextualized conversational scaffolding to students’ learning about counterinsurgency operations (COIN) with UrbanSim (McAlinden, et al., 2009), a turn-based game environment, where
151151
users take on the role of a battalion commander to deal with fictional counterinsurgency scenarios. UrbanSim simulates a complex social and political environment, where COIN operations can have multiple short-and long-term effects. This requires trainees to maintain awareness of the evolving simulation scenarios, and apply metacognitive processes, such as seeking and analyzing relevant information, using that information to select appropriate actions, and predicting, evaluating, and reflecting on the effects of operations. The turn-by-turn analysis of student performance is a first step toward inferring students’ metacognitive and problem solving processes. We discuss our analyses methods, and how the results of our analyses will help us define learner models that capture students cognitive and metacognitive processes. 2. Background In its general formulation, metacognition is the ability to reason about and manage one’s own cognition (Flavell, 1976). When applied to learning, metacognition implies awareness of a learning or problem solving situation, and describes how learners are able to set goals, create plans for achieving those goals, monitor their progress, reflect on outcomes, and revise plans to improve progress (Zimmerman & Schunk, 2011). Typically, at the most general level, many models of learning and problem solving include processes for information acquisition and interpretation, goal setting, planning, and operation execution, and assessment. The Army’s Common Operational Procedure (COP), for example, expresses complex problem solving as stages of Visualization, Description, Direction and Assessment, stages that map onto the more general processes above. Almost all current Army operations are mission-oriented, which gives sub-ordinates some flexibility in assigning operations in the field.
Our focus on metacognition is centered on students’ understanding and use of strategies, defined as consciously controllable processes for completing tasks (Kinnebrew, Segedy, & Biswas, 2016). It is commonly assumed that learners possessing metacognitive skills are more able to learn in unfamiliar domains because common metacognitive strategies combining information acquisition, solution generation, and solution monitoring and evaluation, apply to many learning situations. Thus, our goal in UrbanSim is to support students’ learning of metacognitive strategies and help them to apply them in complex tasks. 3. Counterinsurgency and UrbanSim Understanding of the COIN doctrine and COIN strategies supported in UrbanSim is key to analyzing trainees’ problem solving abilities and performance in UrbanSim. Counterinsurgency is the comprehensive civilian and military effort designed to simultaneously defeat and contain insurgencies and address their root causes. Legitimacy – fostering effective governance by a legitimate government – is its main objective. Counterinsurgency operations, therefore, aim to defeat insurgents while also working with local political and religious leaders to increase population support, separate (to protect) the population from insurgents, and ultimately install a Host Nation government that promotes self-sufficiency and economic growth.
As Host Nation security forces often have insufficient capabilities to defeat the insurgents, Coalition Forces may initially shoulder the burden of being the primary counterinsurgents. The overall goal is to apply a stated army doctrine called Clear-Hold-Build (CHB). Operations are conducted to engage and flush out insurgents in the Clear phase, to clamp down and prevent insurgent activity in the Hold phase, and to address the root causes of the insurgency and promote self-governance and economic viability in the Build phase. UrbanSim (McAlinden et al., 2009) is a turn-based simulation environment in which users assume command of a COIN (Counter Insurgency) operation in a fictional Middle-Eastern country. Users can view information on the main interface or in pages that includes:
I. Information about economic, military, and political ties between local groups; the Army’s current level of population support; and PMESII (Political, Military, Economic, Social, Information, Infrastructure) values to assess an operational environment;
152152
II. Progress in achieving six primary lines of effort (LOEs): (1) Civil security; (2) Governance; (3) Economics; (4) Host Nation security forces; (5) Essential services; and (6) Information operations; and
III. Intelligence reports on events provided as Situation Reports (SITREPs) and Significant Activities (SIGACTs).
Mission goals are typically expressed in percentage values assigned to the LOEs. Students assign operations to 11 available units (e.g., E CO b). Once committed, the simulation executes the orders and models their effects on the regions of operation in the scenario. During this phase, additional events caused by other agents (e.g., the insurgents) can occur (e.g., an attack on a gas station) that are displayed at the beginning of a new turn. The combination of all activities may result in net changes to population support, PMESII values and LOE scores that provide the user aggregated feedback on how well they are performing. 4. Understanding student activities Our approach to infer metacognitive processes that students may invoke as they perform their activities on the system is motivated by the rationale that, as their actions produce the context within which new actions are carried out, performance measures reflect how they engaged metacognitively with the context. We leverage context values (the Game state) to compute measures on whether the students: 1) execute the CHB (Clear-Hold-Build) strategy, 2) select operations in line with the LOEs, 3) conduct operations to increase population support and 4) monitor the situation for unexpected events and react appropriately CHB Strategy execution. PMESII values, and especially the M value (representing the degree of military control over a region), play a particularly important role in executing the CHB strategy. Regions over which the Army has little military control (low M values) require Clear operations; regions where some control has been established (average M values) require Hold operations; and in regions with sufficient military control (high M values), Build operations can be conducted. We trace whether students’ follow the CHB strategy through 3 measures: CMatch, HMatch and BMatch, calculated by counting the number of regions in the Clear, Hold and Build phase at the each turn, using a region’s Political (P), Military (M) and Information (I) values. Executing CHB consistently and appropriate to a region phase will result in CMatch to decrease, and HMatch and BMatch to increase. Lines of Effort. In UrbanSim, LOEs are represented as percentage values. A low percentage value of a high-priority Line of Effort indicates to the Battalion Commander that operations improving the conditions represented by a Line of Effort (e.g. Civil Security) are required. Tracing the trend of LOE scores allows inferences on whether students are able to translate the Battalion Commander’s intent into effective operations. Population Support. In line with the broad goal of COIN operations, student performance is measured in terms of the percentage values representing population support: support for, against, and neutral. The values add up to 100%. The causal model of UrbanSim reproduces to a large degree the COIN directive to avoid lethal force and instead undermine insurgents’ popular support. Aggressive operations may have immediate security benefits, but are resented by the population, thus potentially increasing the tendency of local to join insurgents. Situational awareness. The process consists in developing understanding of the situation as it undergoes change as a result of operations and unexpected events (which may result from operations). Primary sources of information are indicators of key operational values (e.g. population support), and SITREPs and SIGACTs. Students’ situational awareness is measured by tracking their responses to events and changes in key values. We compute a measure of responsiveness – the number of events or changes a student responds to. 5. Task model To represent student proficiency in domain-specific strategies and their more general metacognitive counterparts, we developed a task model consisting of a set of cognitive actions corresponding to
153153
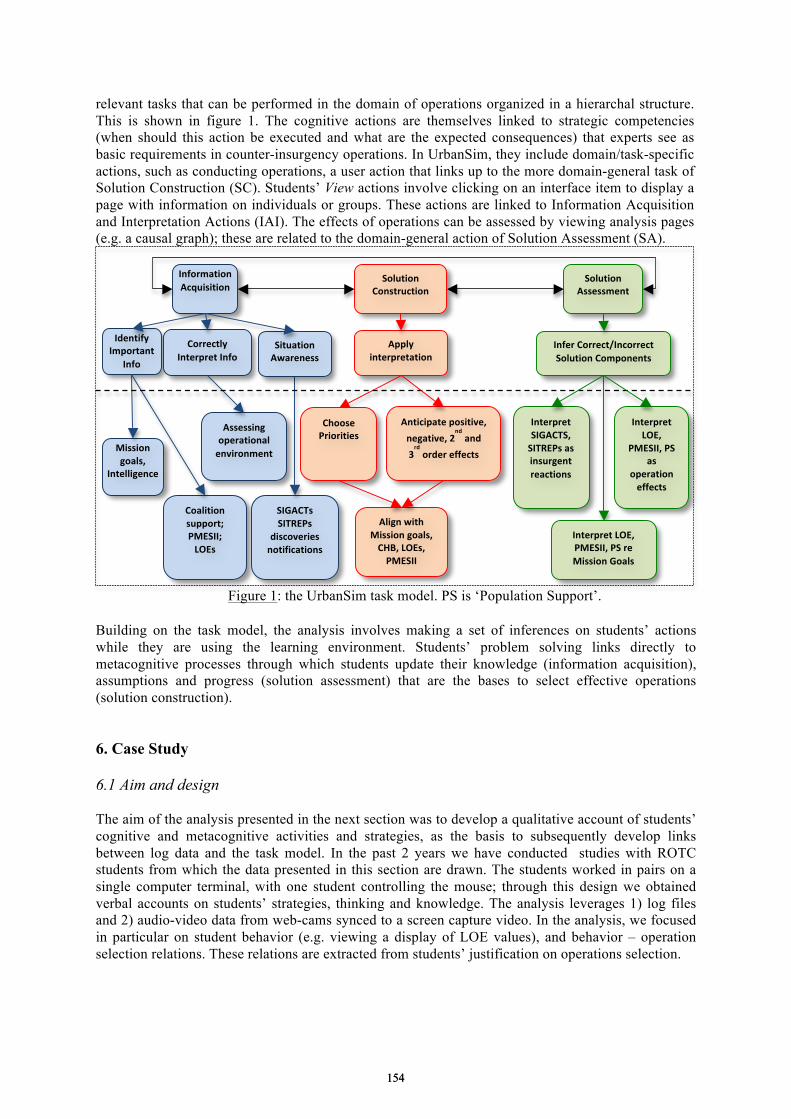
relevant tasks that can be performed in the domain of operations organized in a hierarchal structure. This is shown in figure 1. The cognitive actions are themselves linked to strategic competencies (when should this action be executed and what are the expected consequences) that experts see as basic requirements in counter-insurgency operations. In UrbanSim, they include domain/task-specific actions, such as conducting operations, a user action that links up to the more domain-general task of Solution Construction (SC). Students’ View actions involve clicking on an interface item to display a page with information on individuals or groups. These actions are linked to Information Acquisition and Interpretation Actions (IAI). The effects of operations can be assessed by viewing analysis pages (e.g. a causal graph); these are related to the domain-general action of Solution Assessment (SA).
Figure 1: the UrbanSim task model. PS is ‘Population Support’.
Building on the task model, the analysis involves making a set of inferences on students’ actions while they are using the learning environment. Students’ problem solving links directly to metacognitive processes through which students update their knowledge (information acquisition), assumptions and progress (solution assessment) that are the bases to select effective operations (solution construction).
6. Case Study
6.1 Aim and design
The aim of the analysis presented in the next section was to develop a qualitative account of students’ cognitive and metacognitive activities and strategies, as the basis to subsequently develop links between log data and the task model. In the past 2 years we have conducted studies with ROTC students from which the data presented in this section are drawn. The students worked in pairs on a single computer terminal, with one student controlling the mouse; through this design we obtained verbal accounts on students’ strategies, thinking and knowledge. The analysis leverages 1) log files and 2) audio-video data from web-cams synced to a screen capture video. In the analysis, we focused in particular on student behavior (e.g. viewing a display of LOE values), and behavior – operation selection relations. These relations are extracted from students’ justification on operations selection.
Information Acquisition
Identify Important
Info Correctly
Interpret Info
Mission goals,
Intelligence
Coalition support; PMESII; LOEs
Assessing operational environment
SIGACTs SITREPs
discoveries notifications
Solution Construction
Apply interpretation
Solution Assessment
Infer Correct/Incorrect Solution Components
Interpret SIGACTS, SITREPs as insurgent reactions
Interpret LOE,
PMESII, PS as
operation effects
Situation Awareness
Align with Mission goals, CHB, LOEs, PMESII
Choose Priorities
Anticipate positive, negative, 2
nd and
3rd order effects
Interpret LOE, PMESII, PS re Mission Goals
154154
6.2 Data analysis and interpretation
We begin with a turn-by-turn description of a dyad’s (Group A) attention to and analysis of information, and which sources of information are the basis for selecting operations. We then offer a broad interpretation of the students’ strategies and metacognitive processes. Turn 1. The students activate the ‘religious affiliation’ overlay; notice that Shiite regions are more supportive than others; they decide to maintain control over Shiite regions while moving into hostile areas. Operations and regions are selected on the basis of location. Turn 2. Students discontinue the strategy devised in turn 1 because they notice drops in LOE values; in effect, students stop clearing regions. They don’t read PMESII values, and instead focus on LOE trend indicators. They decide to increase the LOE HN Security Forces by Recruiting Police in 3 regions; they read notifications, and follow Staff recommendations. Turn 3. Students are concerned about drops in HN Security Forces, Governance and Civil Security; they attempt to identify the cause in HN Security Forces by consulting the Political Network page, and to counter it with further Recruitments; decide to increase Governance by hosting 3 meetings; and to increase Civil Security by attacking an insurgent group. No other efforts are made to clear regions. Turn 4. Students read LOE trend indicators and are satisfied with the increase in HN Security Forces value; they focus their efforts on Civil Security and Government values. They consult the Political Network page and Intelligence entries on local political figures to find out how to increase Governance. They decide to host meetings with tribal leaders and to pay tribes. Turn 5. Students are satisfied with LOE trends; they also notice that Population Support has increased. They discuss that following recommendations didn’t prove to be useful, and decide to base operation selection more on their own analysis and understanding. They also decide to focus more in gathering intelligence and interaction with the population. Turn 6. Continue with approach of previous turn. Turn 7. All LOEs decrease as a result of a major insurgent attack. Students seem at loss on how to react; continue with approach of previous two turns. Operations are conducted with little analysis, and there is no clear focus. Turn 8. Students notice increases of LOE trends, and continue with approach. As in the previous turn, there is no clear focus of the operations, but operations are selected because LOE trends are positive. Students discussions are infrequent now. Turn 9. The approach of the previous turns is continued. There are no discussions in this turn.
A clearly evident aspect of the dyad’s metacognitive behavior is the focus on a single source of information: the LOE trend indicators, and developing strategies based on the trend in these values. These indicators are displayed at the sides of the LOE value representations. The group uses the indicators as the primary source of information to assess progress. This single source is clearly insufficient to achieve high performance values and the mission goals. Students’ very rarely read PMESII or Coalition Support values, indicating that they had no idea about differences in regions under the total area of operations.
In terms of strategic competence, students fail to execute Clear-Hold-Build. Starting at about turn 5 and 6, the students have, however, developed an approach: after noticing scant progress and some dissatisfaction with Staff recommendations, students decide to conduct operation in line with a Soft approach – to increase LOE values by interacting with the population.
A key problem we identified through this analysis is that students notice changes in some of the values and are aware of events, but may conduct ineffective operations for two or more turns before becoming aware that the operations don’t advance a set goal. For example, to counter the drop in Governance, the students decide to meet with tribal leaders and give payments to tribes, both operations that have little effect on Governance. LOE trend indicators aggregate the effects of all operations and also NPC moves, making it difficult to pinpoint cause-effect relations. The students in this group never consult regional PMESII values to identify specific problems, or study the Causal Graphs to determine the longer term effects of actions, and thus continue with ineffective operations for several turns.
Overall we find that the students in this group frequently engage in limited amounts of information acquisition and analysis activities, but exhibit sub-optimal strategies in identifying all of the relevant information that would best serve their analytical and information-gathering aims.
155155
Students’ overall performance is would be classified as weak. By turn 7, only 5 out of 15 regions have been cleared, and population support is low throughout all turns. Failing to view PMESII values and execute Clear-Hold-Build operations in their proper sequence as required in the different regions, is the main reason of the low performance; also, the exclusive focus on LOE trend indicators prevents students from developing a more informative picture of progress, one which could have instigated them to adapt operations better to the changing environment.
7. Discussion and conclusions
This paper reports our work on the automated detection of students’ strategies in complex OELE, the necessary step to provide contextualized feedback and scaffolding for students. We have advanced the work to a degree where students’ problem solving is tracked as a function of how their choice of operations matches with the CHB strategy, advance the mission goals, align with the LOEs, and take into account regional PMESII values. The details are discussed in Tscholl, et al. (2016, in review), where we show how quantitative calculations are performed to establish students’ cognitive and metacognitive proficiencies.
Our future work will consist in conducting further data analyses. We predict that by developing characterizations of a larger number of groups, we will be able to uncover patterns of behavior and relationships between behavior and problem solving. This will enable us to develop inferences from performance values to metacognitive processes and strategies, which will then allow us to evaluate further data or probe students.
By tracking in detail problem solving we are gradually identifying components of a learner model. It represents the learner at several levels: the learners’ domain competence and assumptions about operations effects, the competence to chose appropriate and effective operations, a tendency to thoughtful planning or more spontaneous actions, and a tendency for reflective assessment on prior actions.
References
Basu, S. & Biswas, G. (2016). Providing adaptive scaffolds and measuring their effectiveness in open ended learning environments, in Proc. of ICLS 2016, Singapore, June 2016.
Butler, D. L. & Winne, P.H. (1995) Feedback and self-regulated learning: a theoretical synthesis, Review of Educational Research, 65, pp. 245-281
Flavell, J. (1976). Metacognitive aspects of problem solving. In L. Resnick (Ed.), The Nature of Intelligence (pp. 231-236). Hillsdale, NJ: Erlbaum.
Goldberg, B., & Cannon-Bowers, J. (2013). Experimentation with the generalized intelligent framework for tutoring (GIFT): a testbed use case. In AIED2013 Workshops Proceedings v. 7.
Land, S. M. (2000). Cognitive requirements for learning with open-ended learning environments, Educational Technology Research and Development, 48(3), 61-78.
Kinnebrew, J., Segedy, J.R. & Biswas, G. (2016). Integrating Model-Driven and Data-Driven Techniques for Analyzing Learning Behavior in Open-Ended Learning Environments. IEEE Transactions on Learning Technologies.
McAlinden, R., Durlach, P., Lane, H., Gordon, A., & Hart, J. (2008). UrbanSim: A game-based instructional package for conducting counterinsurgency operations. In: Proceedings of the 26th Army Science Conference, Orlando, FL.
Segedy, J. R., Kinnebrew, J. S., & Biswas, G. (2015). Using coherence analysis to characterize self-regulated learning behaviours in open-ended learning environments, The Journal of Learning Analytics, 2(1), 13-48.
Sottilare, R. A., Goldberg, B. S., Brawner, K. W., & Holden, H. K. (2012). A modular framework to support the authoring and assessment of adaptive computer-based tutoring systems (CBTS). In Proceedings of the Interservice/Industry Training, Simulation, and Education Conference.
Sottilare, R. A., & Holden, H. K. (2013). Motivations for a generalized intelligent framework for tutoring (GIFT) for authoring, instruction and analysis. In AIED2013 Workshops Proc., v. 7, pp. 1-9.
Tscholl, M., Ramkumar, R., Biswas, G, Goldberg, B. S. & Sottilare, R. A. (in review). Integrating UrbanSim and GIFT to Support Complex Problem Solving with Metacognitive Tutoring. International Journal of Artificial Intelligence in Education (Special Edition: GIFT).
156156
Supporting the Creation and Sharing of Domain Taxonomies in STEM Learning
Nils MALZAHN*, Christina SCHNEEGASS & H. Ulrich HOPPE Rhine-Ruhr Institute for Applied System Innovation, Germany
Abstract: Aiming at facilitating STEM learning through video-making, the JuxtaLearn project supports teachers in defining their own domain taxonomies as semantic building blocks for various learning activities. This paper reports on an evaluation with 17 teachers using a se-mantic recommender system for taxonomy building and lesson planning. Our results indicate that the system is perceived as supportive, but it also reveals problems caused by teachers’ in-dividual preferences.
Keywords: collaborative knowledge building, recommender systems, lesson planning
1. Introduction
The EU project JuxtaLearn aims at supporting students’ learning of STEM subjects through the crea-tion, exchange and discussion of learner-created videos. The JuxtaLearn approach can be seen as a kind of “second order inquiry learning” in which the creative process follows an initial phase in which the learners appropriate the basic concepts of the domain. No specific assumptions are made about the prior knowledge building process. The ensuing JuxtaLearn-specific process (cf. Figure 1) comprises eight steps: (1) Identification of Tricky Topics, (2) demonstration of subject matter, (3) interpretation of the subject matter by the students, (4) video enactment, (5) composition of a video, (6) sharing the video with others, (7) discussion of the video and (8) review of the results. Tricky Topics and their particular Stumbling Blocks feed through the whole process.
From an educational design perspective, the JuxtaLearn approach is based on the notion of “threshold concepts” (Meyer & Land, 2003) to characterize knowledge elements that enable important shifts of understanding. In the JuxtaLearn approach these are represented as so-called “Tricky Topics” with subordinate “Stumbling Blocks”. Initially, the selection of Tricky Topics and Stumbling Blocks depends on the teachers’ choices and are not prescribed through a normative reference list e.g. repre-sented in an ontology. Whilst applying a top down ontological construction of threshold concepts would quickly support the system development it would not provide the level of school based validity and engagement required for the levels of impact envisioned in the project.
To support the Tricky Topic definition teachers are provided with a tool to create, manage and explore Tricky Topics easily. The possibility to reuse and share them with other teachers is particularly useful for novice teachers as they profit from previously identified student problems by other teachers.
Teachers begin by identifying the main Tricky Topic and the related Stumbling Blocks. When teachers have problems doing this, they are guided to reflecting on the student problems by proposing Stumbling Blocks that are considered matching to the current set of Stumbling Blocks.
Technically, Tricky Topics and Stumbling Blocks serve as “semantic glue” in the learning environment, as they are attached to all types of learning objects: student problems, quizzes, teaching materials and all subsequent work that students perform.
2. Recommendation of Stumbling Blocks
The recommendation algorithm relies on given pre-knowledge about relations between science topics. The initial knowledge base contains an excerpt from Wikipedia’s pages and their underlying taxonomic structure. Thus, a mapping is required between the entered labels and the concepts in the knowledge
157157
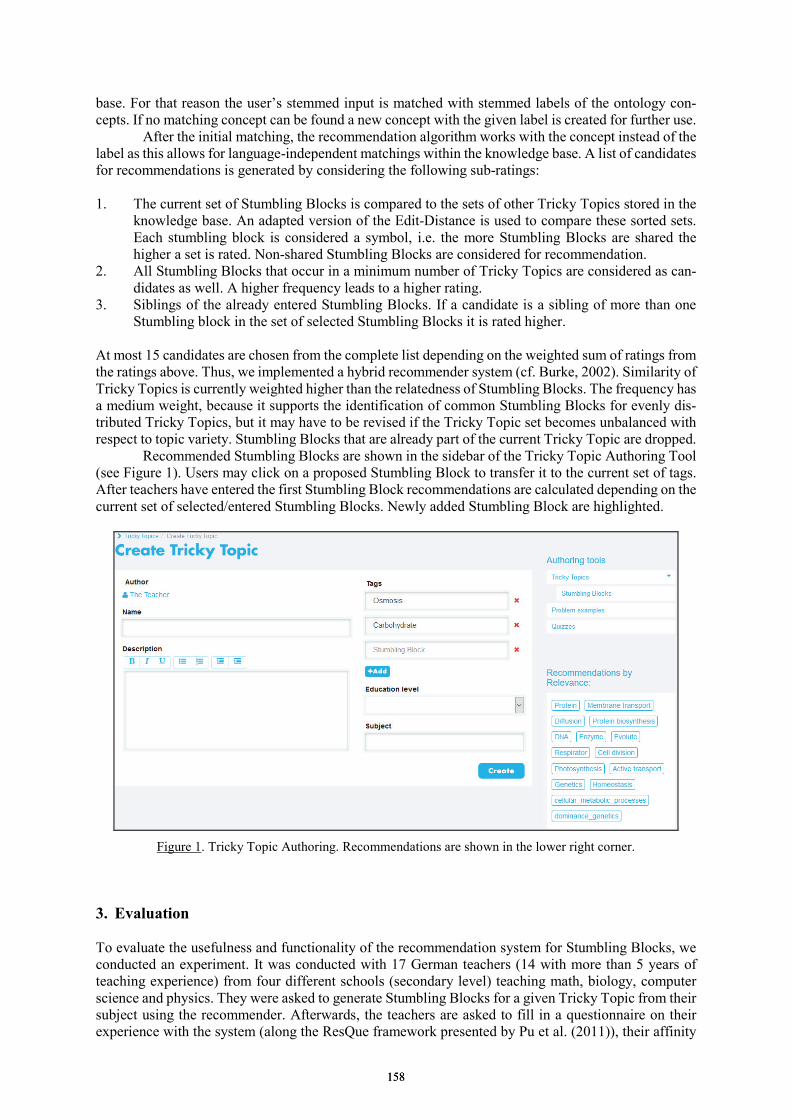
base. For that reason the user’s stemmed input is matched with stemmed labels of the ontology con-cepts. If no matching concept can be found a new concept with the given label is created for further use.
After the initial matching, the recommendation algorithm works with the concept instead of the label as this allows for language-independent matchings within the knowledge base. A list of candidates for recommendations is generated by considering the following sub-ratings:
1. The current set of Stumbling Blocks is compared to the sets of other Tricky Topics stored in theknowledge base. An adapted version of the Edit-Distance is used to compare these sorted sets.Each stumbling block is considered a symbol, i.e. the more Stumbling Blocks are shared thehigher a set is rated. Non-shared Stumbling Blocks are considered for recommendation.
2. All Stumbling Blocks that occur in a minimum number of Tricky Topics are considered as can-didates as well. A higher frequency leads to a higher rating.
3. Siblings of the already entered Stumbling Blocks. If a candidate is a sibling of more than oneStumbling block in the set of selected Stumbling Blocks it is rated higher.
At most 15 candidates are chosen from the complete list depending on the weighted sum of ratings from the ratings above. Thus, we implemented a hybrid recommender system (cf. Burke, 2002). Similarity of Tricky Topics is currently weighted higher than the relatedness of Stumbling Blocks. The frequency has a medium weight, because it supports the identification of common Stumbling Blocks for evenly dis-tributed Tricky Topics, but it may have to be revised if the Tricky Topic set becomes unbalanced with respect to topic variety. Stumbling Blocks that are already part of the current Tricky Topic are dropped.
Recommended Stumbling Blocks are shown in the sidebar of the Tricky Topic Authoring Tool (see Figure 1). Users may click on a proposed Stumbling Block to transfer it to the current set of tags. After teachers have entered the first Stumbling Block recommendations are calculated depending on the current set of selected/entered Stumbling Blocks. Newly added Stumbling Block are highlighted.
Figure 1. Tricky Topic Authoring. Recommendations are shown in the lower right corner.
3. Evaluation
To evaluate the usefulness and functionality of the recommendation system for Stumbling Blocks, we conducted an experiment. It was conducted with 17 German teachers (14 with more than 5 years of teaching experience) from four different schools (secondary level) teaching math, biology, computer science and physics. They were asked to generate Stumbling Blocks for a given Tricky Topic from their subject using the recommender. Afterwards, the teachers are asked to fill in a questionnaire on their experience with the system (along the ResQue framework presented by Pu et al. (2011)), their affinity
158158

for computers and e-Learning (using the 3TUM questionnaire by (Liaw, Huang, & Chen, 2007), and basic demographic data including age and gender. In addition, the Stumbling Blocks taken from the system-generated recommendations were counted and set in relation to the Stumbling Blocks teachers entered individually. The teachers created 16 Math, 16 Biology, 8 Physics and 8 Computer Science topics. The following observations have been derived: 1. Teachers make use of the recommendations and add them to the given Tricky Topic: 29 were
created using at least 1 recommended item as a stumbling block. On average 26,69% of theStumbling Blocks added to a Tricky Topic were added using the Recommendations. ´
2. Teachers perceive the recommendations as a support to build a Tricky Topic: The recommendersystem was perceived as helpful to discover new items (M = 2.33, SD = .900).
3. The embedding of the Recommendation Tool proves to be smooth and well integrated into theprocess of creating a Tricky Topic. Most of the users found the embedment of the recommen-dations results adequate (M = 3.29, SD = .985) and be-came quickly familiar with the system (M= 3.71, SD = .588). Thus, the recommendations are sufficiently embedded.
4. Recommendations contain both novel and diverse items (variety). The Stumbling Blocks wereperceived as mostly up-to-date and relevant (M = 2.50, SD = .730). Regarding the variability ofthe recommended Stumbling Blocks, teachers assessed this desirable feature as moderately ex-pressed (M = 2.29, SD = 1.160).
4. Conclusion
Using the Wikipedia concept hierarchy as a starting point for the underlying system taxonomy provides a rich and solid basis, but it does not always match the teachers’ needs in a given curricular context. This is especially true for lower grades in which the systematic scientific structure of the domain may be too detailed for the curricular needs. Accordingly, the system highly benefits from an increasing number of teacher generated Tricky Topics.
We have also observed that the idea of Tricky Topics and Stumbling Blocks was not understood by all teachers (although they said otherwise), as they used whole sentences and very broad concepts (like “problem solving” or “using a calculator”) as Stumbling Blocks. While this cannot be solved solely by a recommender system, it once again shows that Tricky Topic editing is a worthwhile exercise that stimulates teachers in anticipating essential problems of understanding on the part of their students.
To enhance the variety of labels that are mapped to the same concept it is planned to include dbpedia’s redirection information for similar/equivalent terms. Additionally, a distinction with respect to the educational level may be helpful. It is clear from our findings that teachers want “autonomy of choice” (of vocabulary to describe their curricular concepts) and do not accept to be forced to use only a pre-defined, standardized terminology. On the other hand, they are willing to make use of recom-mendations as long as these are well contextualized and remain under their control.
Acknowledgements
The research leading to these results has received funding from the European Community's (FP7/2007-2013) under grant agreement n° 317964 JUXTALEARN.
References Burke, R. (2002). Hybrid recommender systems: Survey and experiments. User Modeling and User-Adapted
Interaction, 12(4), 331–370. Liaw, S.-S., Huang, H.-M., & Chen, G.-D. (2007). Surveying instructor and learner attitudes toward e-learning.
Computers & Education, 49(4), 1066–1080. Meyer, J. H. ., & Land, R. (2003). Threshold concepts and troublesome knowledge: linkages to ways of thinking
and practising. In C. Rust (Ed.), Improving Student Learning - Theory and Practice Ten Years On (pp. 412–424). Oxford, UK: Oxford Centre for Staff and Learning Development (OCSLD).
Pu, P., Chen, L., & Hu, R. (2011). A user-centric evaluation framework for recommender systems. In Proceedings of the fifth ACM conference on Recommender systems (pp. 157–164). ACM.
159159

Chen, W. et al. (Eds.) (2016). Proceedings of the 24th International Conference on Computers in Education.
India: Asia-Pacific Society for Computers in Education
Development of Immersive Teaching Material
using HMD and 3D Gesture Operation for
Astronomy Education
Keisuke TAJIRI a* & Norio SETOZAKI b
a School of Human Sciences, Waseda University, Japan b Faculty of Education, Nagasaki University, Japan
Abstract: The purpose of this study was to discuss usability of the immersive astronomical
teaching material that enabled teachers to intervene in the virtual space. The pictures of starry
sky and instructor's hand were presented in two conditions; the head mount display (HMD)
condition and the PC monitor condition. 20 college students completed the questionnaire about
asking to assess the ease of the 3D gesture-operations and switching of the view in tandem with
user's bodily motions. The t-test reported that the HMD condition was significantly above the
PC monitor condition. The results showed that there was the possibility that the switching the
view corresponding to user's body motions allowed the students to more easily recognize
orientation and direction, which was consistent with the findings of Kawasaki et al. (2010).
Meanwhile, the results also indicated the possibility that the teacher's interventions in the virtual
space promoted the understanding of the students.
Keywords: Virtual Reality, Astronomy Education, HMD, 3D gesture operation
1. IntroductionIt is difficult for children and students to understand contents that require spatial awareness, and it isconsidered that it is one of factors that learner's ability of viewpoint movement is being growth stage(Tsuchida et al.1986). Learning based on observations of movement of stars and moon in elementaryand junior high schools, it is effective outdoor observation that can provide accompanied by experiencefeelings. However, weather problems or time constraints, and considering geographical situations,practices in school education are practically difficult.
On the other hand, Virtual reality (VR) by using technology enable the simulated experiences
in the virtual space to provide a celestial learning as an alternative field observation. Setozaki et al
(2009), developed a VR teaching material for learning the mechanics of the phases of the moon, it
showed that it is useful for improving the interest and level of understanding.
In astronomical field, there's a lot of individual variation to understand learning contents
because it is related to spatial cognition. So it is considered that Head-mounted display (HMD) is
useful as one of the ways to use VR materials for individual lesson for leaners who cannot understand
spatial cognition easily. HMD can provide a higher immersion and prompt an observer to switch the
view corresponding to user's body motions. Kawasaki et al (2010) developed a VR astronomical
observation system using the HMD, reported that it is easy to recognize learner orientation and
direction. Therefore, it can be expected as an interface that can solve the problem that Kusumoto et al
(2010) described it is difficult to recognize orientation and direction by using a screen. However,
while learners are building a VR environment by HMD, it is assumed that he is immersed in the VR
environment alone, so it is difficult to be supported by teacher's intervention. If it is assumed the case
of individual lessons for learners who are poor in an ability to understand the contents of the
astronomical field, it is considered that the teacher's spatial interventions in the VR environment are
effective.
Therefore, the purpose of this study was development of immersive astronomical teaching
material that enabled teachers to intervene in the virtual space assuming the individual learning in
160160
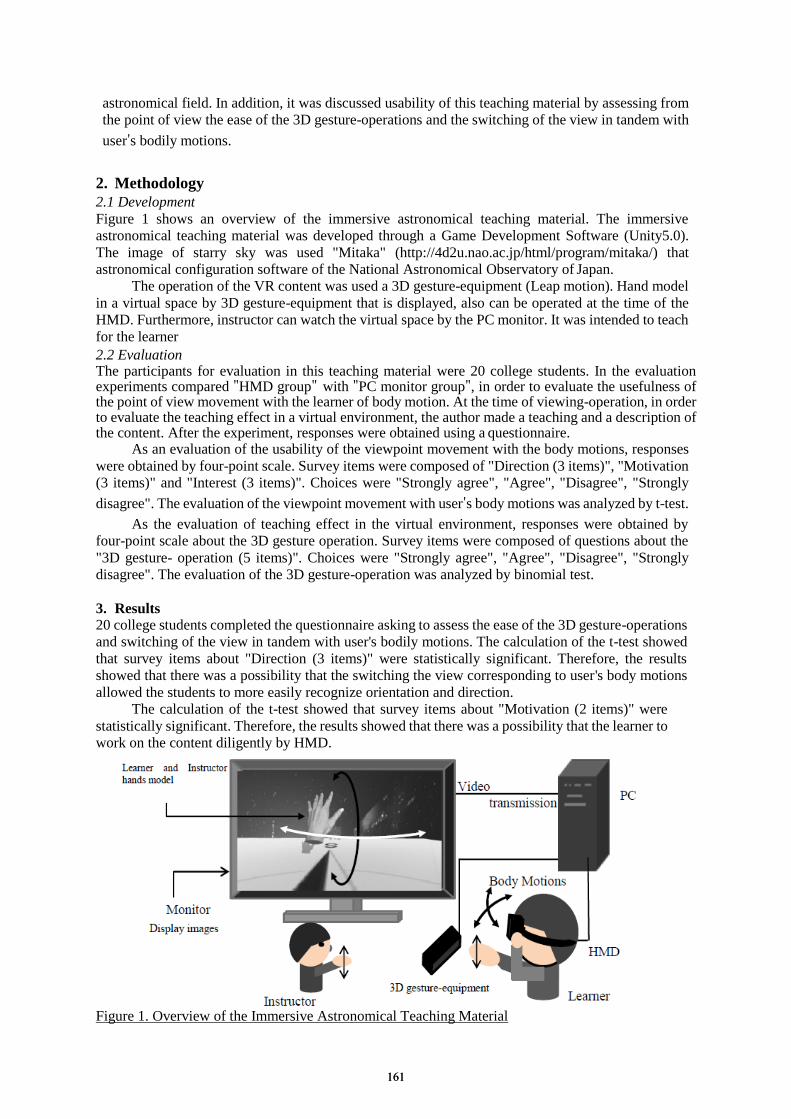
astronomical field. In addition, it was discussed usability of this teaching material by assessing from
the point of view the ease of the 3D gesture-operations and the switching of the view in tandem with
user's bodily motions.
2. Methodology
2.1 Development
Figure 1 shows an overview of the immersive astronomical teaching material. The immersive
astronomical teaching material was developed through a Game Development Software (Unity5.0).
The image of starry sky was used "Mitaka" (http://4d2u.nao.ac.jp/html/program/mitaka/) that
astronomical configuration software of the National Astronomical Observatory of Japan.
The operation of the VR content was used a 3D gesture-equipment (Leap motion). Hand model
in a virtual space by 3D gesture-equipment that is displayed, also can be operated at the time of the
HMD. Furthermore, instructor can watch the virtual space by the PC monitor. It was intended to teach
for the learner
2.2 Evaluation The participants for evaluation in this teaching material were 20 college students. In the evaluation experiments compared "HMD group" with "PC monitor group", in order to evaluate the usefulness of the point of view movement with the learner of body motion. At the time of viewing-operation, in order to evaluate the teaching effect in a virtual environment, the author made a teaching and a description of the content. After the experiment, responses were obtained using a questionnaire.
As an evaluation of the usability of the viewpoint movement with the body motions, responses
were obtained by four-point scale. Survey items were composed of "Direction (3 items)", "Motivation
(3 items)" and "Interest (3 items)". Choices were "Strongly agree", "Agree", "Disagree", "Strongly
disagree". The evaluation of the viewpoint movement with user's body motions was analyzed by t-test.
As the evaluation of teaching effect in the virtual environment, responses were obtained by
four-point scale about the 3D gesture operation. Survey items were composed of questions about the
"3D gesture- operation (5 items)". Choices were "Strongly agree", "Agree", "Disagree", "Strongly
disagree". The evaluation of the 3D gesture-operation was analyzed by binomial test.
3. Results
20 college students completed the questionnaire asking to assess the ease of the 3D gesture-operations
and switching of the view in tandem with user's bodily motions. The calculation of the t-test showed
that survey items about "Direction (3 items)" were statistically significant. Therefore, the results
showed that there was a possibility that the switching the view corresponding to user's body motions
allowed the students to more easily recognize orientation and direction.
The calculation of the t-test showed that survey items about "Motivation (2 items)" were
statistically significant. Therefore, the results showed that there was a possibility that the learner to
work on the content diligently by HMD.
Figure 1. Overview of the Immersive Astronomical Teaching Material
161161
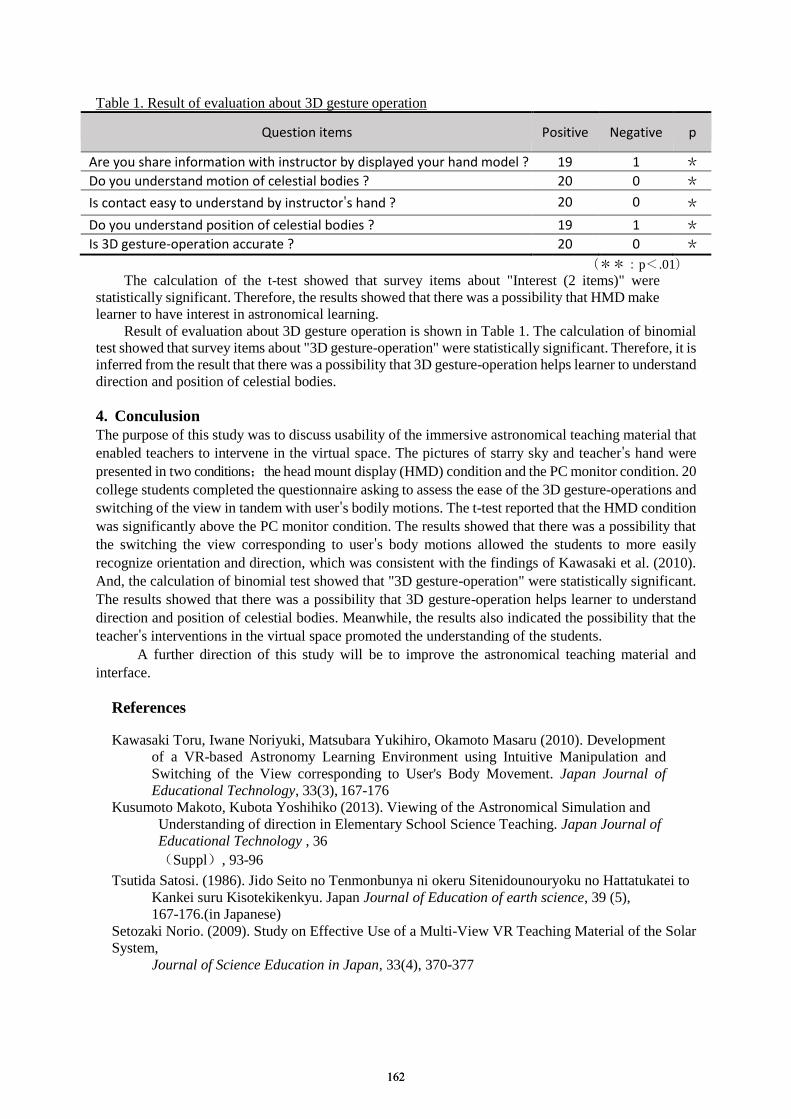
Table 1. Result of evaluation about 3D gesture operation
Question items Positive Negative p
Are you share information with instructor by displayed your hand model ? 19 1 *
*Do you understand motion of celestial bodies ? 20 0 *
*Is contact easy to understand by instructor's hand ? 20 0 *
*Do you understand position of celestial bodies ? 19 1 *
*Is 3D gesture-operation accurate ? 20 0 *
*(**:p<.01) The calculation of the t-test showed that survey items about "Interest (2 items)" were
statistically significant. Therefore, the results showed that there was a possibility that HMD make
learner to have interest in astronomical learning.
Result of evaluation about 3D gesture operation is shown in Table 1. The calculation of binomial
test showed that survey items about "3D gesture-operation" were statistically significant. Therefore, it is
inferred from the result that there was a possibility that 3D gesture-operation helps learner to understand
direction and position of celestial bodies.
4. Conculusion
The purpose of this study was to discuss usability of the immersive astronomical teaching material that
enabled teachers to intervene in the virtual space. The pictures of starry sky and teacher's hand were
presented in two conditions;the head mount display (HMD) condition and the PC monitor condition. 20
college students completed the questionnaire asking to assess the ease of the 3D gesture-operations and
switching of the view in tandem with user's bodily motions. The t-test reported that the HMD condition
was significantly above the PC monitor condition. The results showed that there was a possibility that
the switching the view corresponding to user's body motions allowed the students to more easily
recognize orientation and direction, which was consistent with the findings of Kawasaki et al. (2010).
And, the calculation of binomial test showed that "3D gesture-operation" were statistically significant.
The results showed that there was a possibility that 3D gesture-operation helps learner to understand
direction and position of celestial bodies. Meanwhile, the results also indicated the possibility that the
teacher's interventions in the virtual space promoted the understanding of the students.
A further direction of this study will be to improve the astronomical teaching material and
interface.
References
Kawasaki Toru, Iwane Noriyuki, Matsubara Yukihiro, Okamoto Masaru (2010). Development
of a VR-based Astronomy Learning Environment using Intuitive Manipulation and
Switching of the View corresponding to User's Body Movement. Japan Journal of
Educational Technology, 33(3), 167-176
Kusumoto Makoto, Kubota Yoshihiko (2013). Viewing of the Astronomical Simulation and
Understanding of direction in Elementary School Science Teaching. Japan Journal of
Educational Technology , 36
(Suppl), 93-96
Tsutida Satosi. (1986). Jido Seito no Tenmonbunya ni okeru Sitenidounouryoku no Hattatukatei to
Kankei suru Kisotekikenkyu. Japan Journal of Education of earth science, 39 (5),
167-176.(in Japanese)
Setozaki Norio. (2009). Study on Effective Use of a Multi-View VR Teaching Material of the Solar
System,
Journal of Science Education in Japan, 33(4), 370-377
162162
Chen, W. et al. (Eds.) (2016). Proceedings of the 24th International Conference on Computers in Education. India: Asia-Pacific Society for Computers in Education
Teacher Support and Personalised Student Learning as Means to Obtain Visible and Measurable
Improvement in Learning Levels Nishchal SHUKLAa*, Pranav KOTHARIa*
aEducational Initiatives Pvt. Ltd., India*[email protected]
Abstract: Learning levels of students in government schools of India have been found to be low. Need to provide relevant ICT-based personalised learning material to them as well as the need to support the teachers and build their capacity was identified as the major focus area for an intervention in Gujarat. This poster presents the intervention and the improvement shown by the intervention schools in the past 4 years. Overall net improvement shown by the intervention group seems positive. Item-wise analysis indicates that the intervention group is doing relatively better than the control group on the conceptual/application-based items.
Keywords: Student assessment, Personalised learning, Adaptive learning, Teacher support
1. Introduction
Large-scale assessment studies conducted in India have pointed out the low learning levels of students in the government schools across India (Student Learning Study, 2009). Most of the grade 8 students typically don’t understand the outcomes expected by grade 4 (ASER, 2015). Factors related to teacher capacity, needs and attention to individual student learning levels play a crucial role in the overall status of learning among students.
The “Learning Assessment & Learning Improvement Programme” aimed to obtain visible and measurable improvement in the learning levels of students of classes 3-8, over a 5-year period starting from 2011.
2. Methodology
2.1 Intervention group
This group consisted of 18 schools from 5 different locations in a state of Gujarat in India. The first year of the intervention, 2011, focused on grades 3, 4 and 5 and in each subsequent year, a grade was added. In the fourth year of the intervention, 2014, all the intended grades, 3 to 8, were incorporated. Year 1 covered 2676 students across grades 3 to 5 whereas Year 4 covered 4893 students across grades 3 to 8.
For the purpose of this analysis, we will be considering only students who have gone through the intervention for all the past 4 years.
2.2 Intervention
The intervention included –
i. Continuous Teacher Support (CTS): This component aimed at providing continuous support to teacherskeeping in mind their specific needs and student gaps. Every year subject experts carried out 9 visits for3-5 days in each location for ensuring adequate support to teachers, including observation of the teacher’s
163163
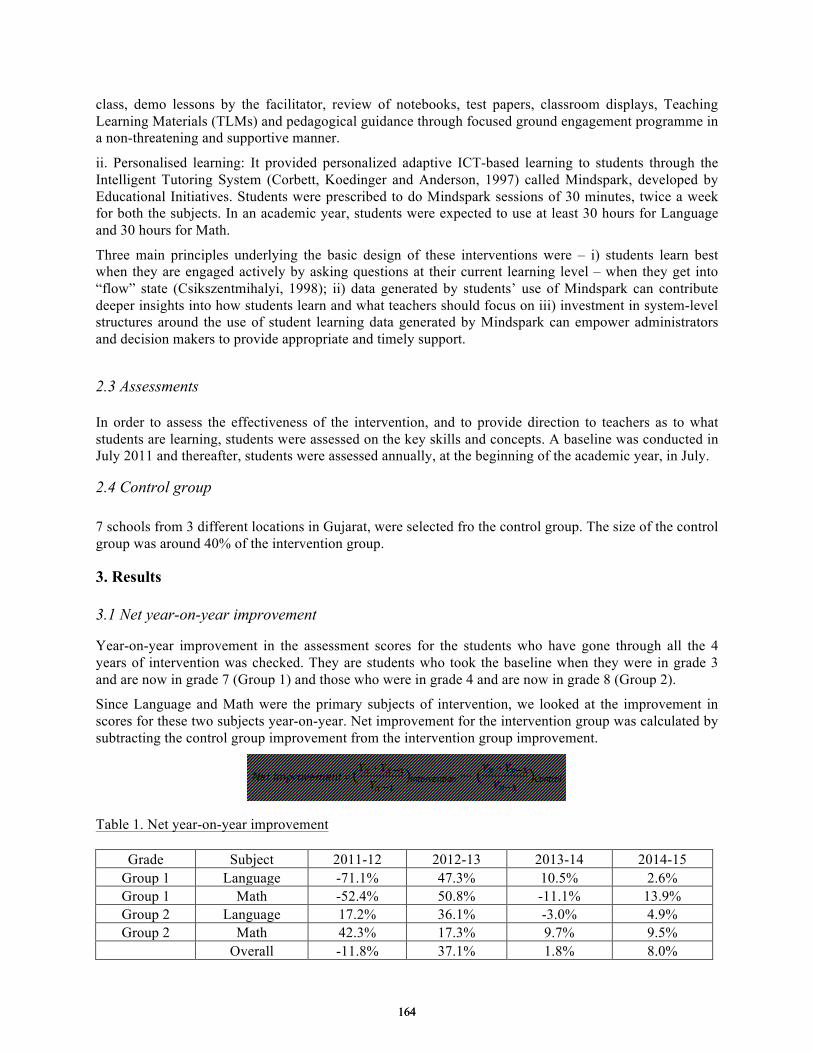
class, demo lessons by the facilitator, review of notebooks, test papers, classroom displays, Teaching Learning Materials (TLMs) and pedagogical guidance through focused ground engagement programme in a non-threatening and supportive manner.
ii. Personalised learning: It provided personalized adaptive ICT-based learning to students through theIntelligent Tutoring System (Corbett, Koedinger and Anderson, 1997) called Mindspark, developed byEducational Initiatives. Students were prescribed to do Mindspark sessions of 30 minutes, twice a weekfor both the subjects. In an academic year, students were expected to use at least 30 hours for Languageand 30 hours for Math.
Three main principles underlying the basic design of these interventions were – i) students learn best when they are engaged actively by asking questions at their current learning level – when they get into “flow” state (Csikszentmihalyi, 1998); ii) data generated by students’ use of Mindspark can contribute deeper insights into how students learn and what teachers should focus on iii) investment in system-level structures around the use of student learning data generated by Mindspark can empower administrators and decision makers to provide appropriate and timely support.
2.3 Assessments
In order to assess the effectiveness of the intervention, and to provide direction to teachers as to what students are learning, students were assessed on the key skills and concepts. A baseline was conducted in July 2011 and thereafter, students were assessed annually, at the beginning of the academic year, in July.
2.4 Control group
7 schools from 3 different locations in Gujarat, were selected fro the control group. The size of the control group was around 40% of the intervention group.
3. Results
3.1 Net year-on-year improvement
Year-on-year improvement in the assessment scores for the students who have gone through all the 4 years of intervention was checked. They are students who took the baseline when they were in grade 3 and are now in grade 7 (Group 1) and those who were in grade 4 and are now in grade 8 (Group 2).
Since Language and Math were the primary subjects of intervention, we looked at the improvement in scores for these two subjects year-on-year. Net improvement for the intervention group was calculated by subtracting the control group improvement from the intervention group improvement.
Table 1. Net year-on-year improvement
Grade Subject 2011-12 2012-13 2013-14 2014-15 Group 1 Language -71.1% 47.3% 10.5% 2.6% Group 1 Math -52.4% 50.8% -11.1% 13.9% Group 2 Language 17.2% 36.1% -3.0% 4.9% Group 2 Math 42.3% 17.3% 9.7% 9.5%
Overall -11.8% 37.1% 1.8% 8.0%
164164
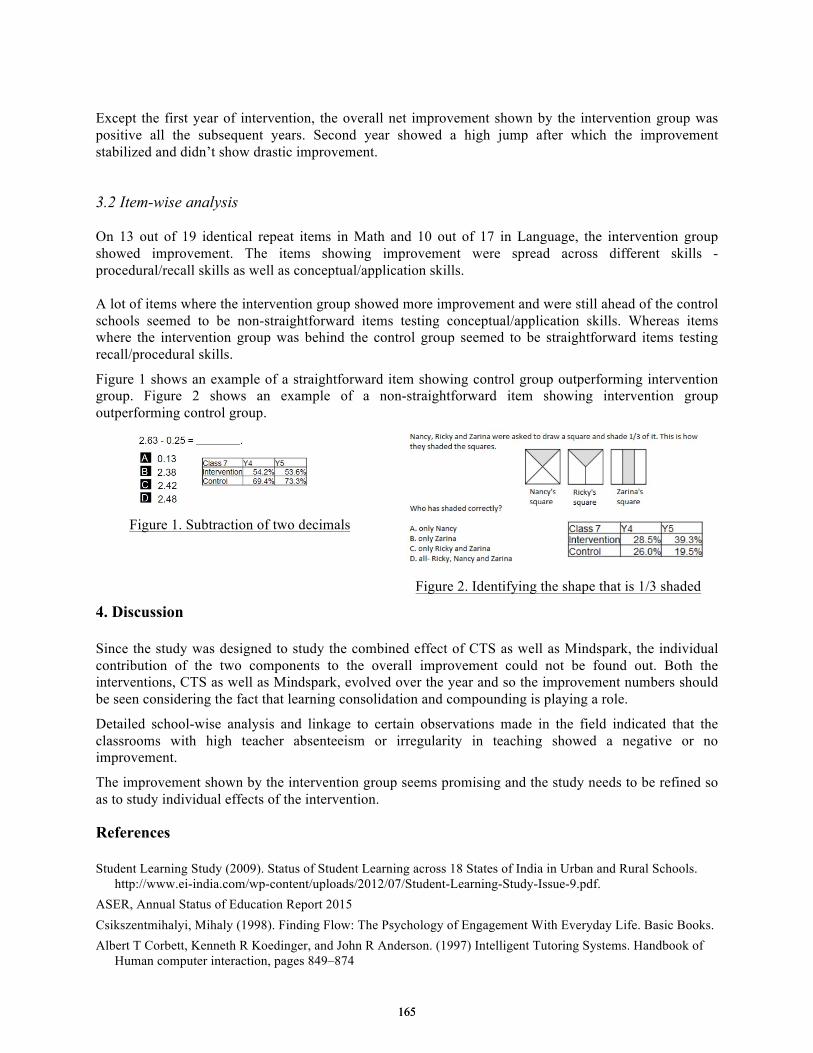
Except the first year of intervention, the overall net improvement shown by the intervention group was positive all the subsequent years. Second year showed a high jump after which the improvement stabilized and didn’t show drastic improvement.
3.2 Item-wise analysis
On 13 out of 19 identical repeat items in Math and 10 out of 17 in Language, the intervention group showed improvement. The items showing improvement were spread across different skills - procedural/recall skills as well as conceptual/application skills.
A lot of items where the intervention group showed more improvement and were still ahead of the control schools seemed to be non-straightforward items testing conceptual/application skills. Whereas items where the intervention group was behind the control group seemed to be straightforward items testing recall/procedural skills.
Figure 1 shows an example of a straightforward item showing control group outperforming intervention group. Figure 2 shows an example of a non-straightforward item showing intervention group outperforming control group.
Figure 1. Subtraction of two decimals
Figure 2. Identifying the shape that is 1/3 shaded
4. Discussion
Since the study was designed to study the combined effect of CTS as well as Mindspark, the individual contribution of the two components to the overall improvement could not be found out. Both the interventions, CTS as well as Mindspark, evolved over the year and so the improvement numbers should be seen considering the fact that learning consolidation and compounding is playing a role.
Detailed school-wise analysis and linkage to certain observations made in the field indicated that the classrooms with high teacher absenteeism or irregularity in teaching showed a negative or no improvement.
The improvement shown by the intervention group seems promising and the study needs to be refined so as to study individual effects of the intervention.
References
Student Learning Study (2009). Status of Student Learning across 18 States of India in Urban and Rural Schools. http://www.ei-india.com/wp-content/uploads/2012/07/Student-Learning-Study-Issue-9.pdf.
ASER, Annual Status of Education Report 2015 Csikszentmihalyi, Mihaly (1998). Finding Flow: The Psychology of Engagement With Everyday Life. Basic Books. Albert T Corbett, Kenneth R Koedinger, and John R Anderson. (1997) Intelligent Tutoring Systems. Handbook of
Human computer interaction, pages 849–874
165165
Chen, W. et al. (Eds.) (2016). Proceedings of the 24th International Conference on Computers in Education.
India: Asia-Pacific Society for Computers in Education
Students’ Perceptions on Problem Solving with
Collaborative Computer Simulation
Chia-Jung CHANGa*, Chen-Chung LIUa, Ying-Tien WUa, Ming-Hua CHANGa,
Shih-Hsun FAN CHIANGa, Bing-Cheng CHIUa, Cai-Ting WENa, Fu-Kwun HWANGb,
Po-Yao CHAOc, Chia-Hsi LAId, Su-Wen WUd, Chih-Kang CHANGe aGraduate Institute of Network Learning Technology, National Central University, Taiwan
bDepartment of Physics, National Taiwan Normal University, Taiwan cDepartment of Information Communication, Yuan Ze University, Taiwan
dJhongli Senior High School, Taiwan eHsinchuang Senior High School, Taiwan
Abstract: With the development of Web technology, a number of collaborative computer
simulations are designed to support collaborative problem solving activities. However, studies
show that some students often failed to collaboratively solve a problem with collaborative
computer simulation. Little research has so far been done to explore the factors why students
failed to solve problems with collaboratively computer simulation. The study designed a
problem solving activity with collaborative computer simulation and attempted to identify the
key factors to a successful learning task by analyzing students’ perceptions on collaborative
problem solving. The implication indicated that, with collaborative computer simulation,
communication, coordination, mutual support, and effort may be the key factors to solve the
problem.
Keywords: collaborative computer simulation, collaborative problem solving, quality of
collaboration
1. Introduction
Collaborative problem solving has long been extensively applied in science education where students
explore and understand the problem context (Care et al., 2015). With the development of Web
technology, computer simulations may be a potential approach to supporting science learning since it
can visualize abstract scientific concepts and support interaction learning (Rutten et al., 2012).
Therefore, a number of computer simulations were designed to support group collaborative problem
solving activities where two or more students interact with a computer simulation to collaboratively
explore scientific phenomena or solve scientific problems. However, the mouse dominance behavior
often naturally emerges in these situations. The lack of controls in a shared computer results in
superficial and incoherent group discussion (Chang, Liu, & Shen, 2012).
To solve the problems mentioned above, some studies designed collaborative computer
simulations where each member can control and interact with a shared simulation simultaneously (Jara
et al., 2009; van Joolingen et al., 2005). The problems above seemed to be solved, however,
collaborative problem solving is a complicated learning activity (Johnson & Johnson, 1991) and most
students often failed to collaboratively solve a problem since they were unable to effectively analyze the
problem (Lin et al., 2014) and conduct coherent discussion (Barron, 2003). Unfortunately, little
research has so far been done to explore the factors why students failed to solve problems together with
a collaborative computer simulation.
Therefore, this study aims to design a collaborative computer simulation to support students to
collaboratively solve a physics problem. Moreover, the study further analyzes the students’ perceptions
on process of collaborative problem solving in order to explore the key factors that may lead to a
successful problem solving with collaborative computer simulation.
166166
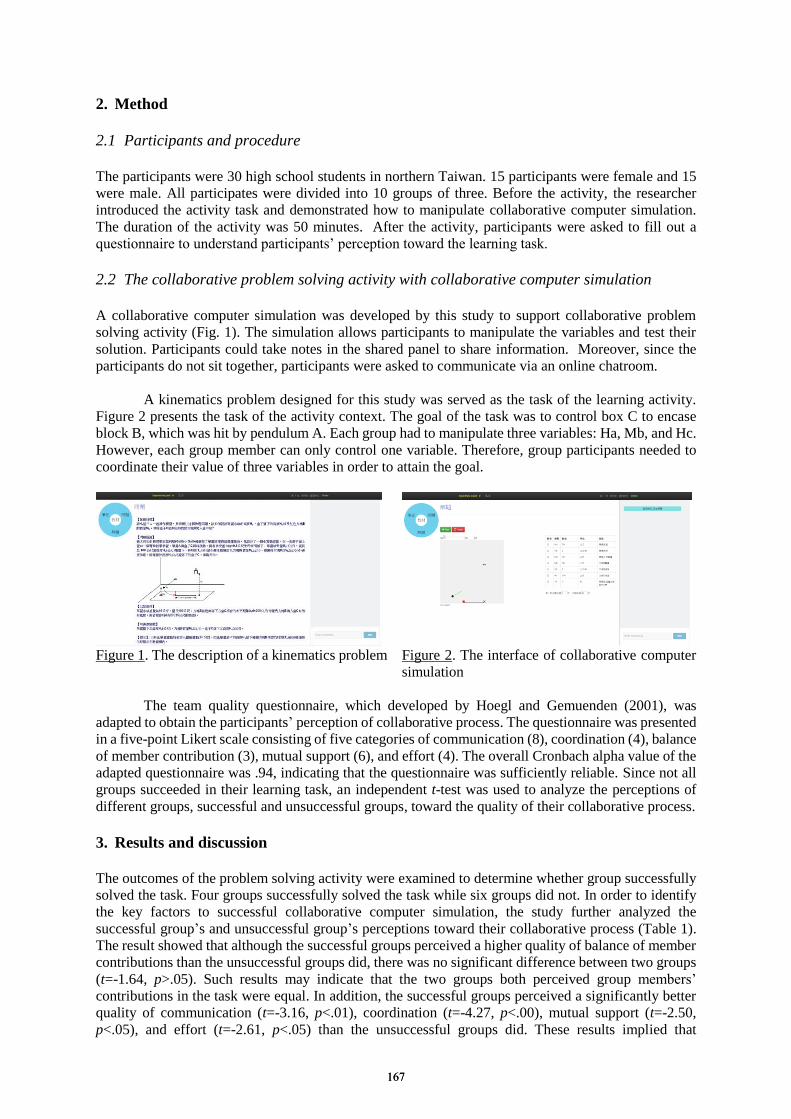
2. Method
2.1 Participants and procedure
The participants were 30 high school students in northern Taiwan. 15 participants were female and 15
were male. All participates were divided into 10 groups of three. Before the activity, the researcher
introduced the activity task and demonstrated how to manipulate collaborative computer simulation.
The duration of the activity was 50 minutes. After the activity, participants were asked to fill out a
questionnaire to understand participants’ perception toward the learning task.
2.2 The collaborative problem solving activity with collaborative computer simulation
A collaborative computer simulation was developed by this study to support collaborative problem
solving activity (Fig. 1). The simulation allows participants to manipulate the variables and test their
solution. Participants could take notes in the shared panel to share information. Moreover, since the
participants do not sit together, participants were asked to communicate via an online chatroom.
A kinematics problem designed for this study was served as the task of the learning activity.
Figure 2 presents the task of the activity context. The goal of the task was to control box C to encase
block B, which was hit by pendulum A. Each group had to manipulate three variables: Ha, Mb, and Hc.
However, each group member can only control one variable. Therefore, group participants needed to
coordinate their value of three variables in order to attain the goal.
Figure 1. The description of a kinematics problem Figure 2. The interface of collaborative computer
simulation
The team quality questionnaire, which developed by Hoegl and Gemuenden (2001), was
adapted to obtain the participants’ perception of collaborative process. The questionnaire was presented
in a five-point Likert scale consisting of five categories of communication (8), coordination (4), balance
of member contribution (3), mutual support (6), and effort (4). The overall Cronbach alpha value of the
adapted questionnaire was .94, indicating that the questionnaire was sufficiently reliable. Since not all
groups succeeded in their learning task, an independent t-test was used to analyze the perceptions of
different groups, successful and unsuccessful groups, toward the quality of their collaborative process.
3. Results and discussion
The outcomes of the problem solving activity were examined to determine whether group successfully
solved the task. Four groups successfully solved the task while six groups did not. In order to identify
the key factors to successful collaborative computer simulation, the study further analyzed the
successful group’s and unsuccessful group’s perceptions toward their collaborative process (Table 1).
The result showed that although the successful groups perceived a higher quality of balance of member
contributions than the unsuccessful groups did, there was no significant difference between two groups
(t=-1.64, p>.05). Such results may indicate that the two groups both perceived group members’
contributions in the task were equal. In addition, the successful groups perceived a significantly better
quality of communication (t=-3.16, p<.01), coordination (t=-4.27, p<.00), mutual support (t=-2.50,
p<.05), and effort (t=-2.61, p<.05) than the unsuccessful groups did. These results implied that
167167
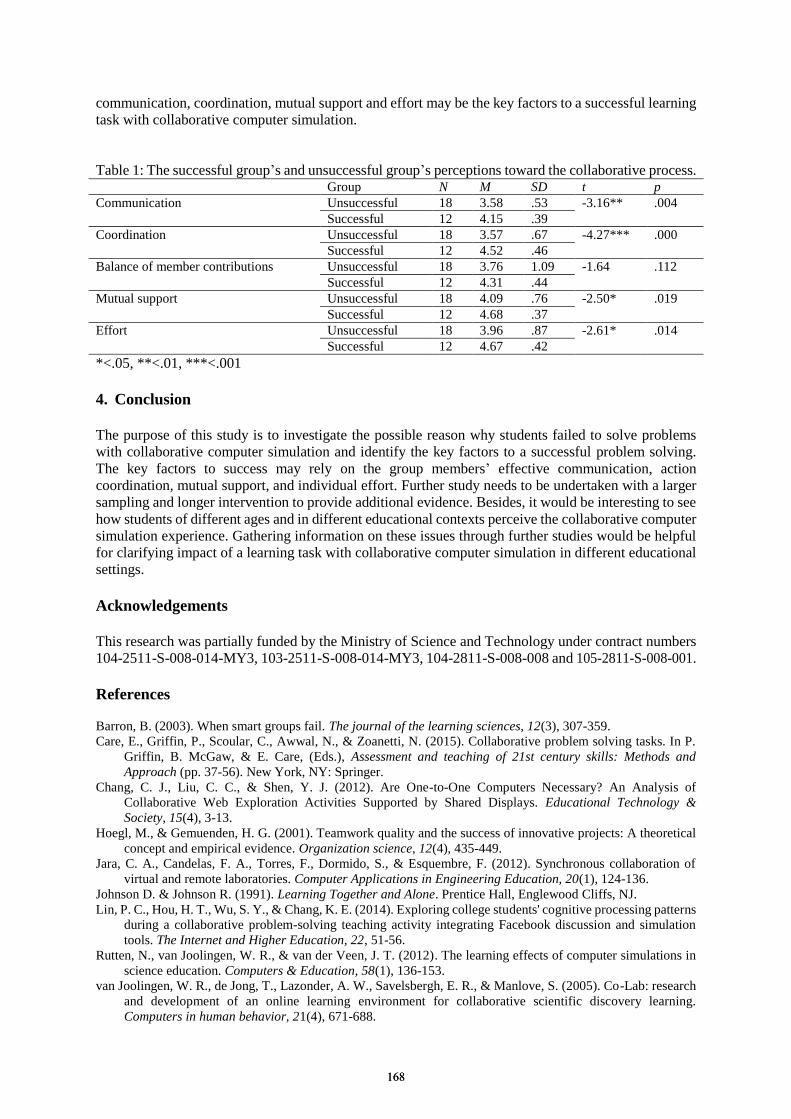
communication, coordination, mutual support and effort may be the key factors to a successful learning
task with collaborative computer simulation.
Table 1: The successful group’s and unsuccessful group’s perceptions toward the collaborative process. Group N M SD t p
Communication Unsuccessful 18 3.58 .53 -3.16** .004
Successful 12 4.15 .39
Coordination Unsuccessful 18 3.57 .67 -4.27*** .000
Successful 12 4.52 .46
Balance of member contributions Unsuccessful 18 3.76 1.09 -1.64 .112
Successful 12 4.31 .44
Mutual support Unsuccessful 18 4.09 .76 -2.50* .019
Successful 12 4.68 .37
Effort Unsuccessful 18 3.96 .87 -2.61* .014
Successful 12 4.67 .42
*<.05, **<.01, ***<.001
4. Conclusion
The purpose of this study is to investigate the possible reason why students failed to solve problems
with collaborative computer simulation and identify the key factors to a successful problem solving.
The key factors to success may rely on the group members’ effective communication, action
coordination, mutual support, and individual effort. Further study needs to be undertaken with a larger
sampling and longer intervention to provide additional evidence. Besides, it would be interesting to see
how students of different ages and in different educational contexts perceive the collaborative computer
simulation experience. Gathering information on these issues through further studies would be helpful
for clarifying impact of a learning task with collaborative computer simulation in different educational
settings.
Acknowledgements
This research was partially funded by the Ministry of Science and Technology under contract numbers
104-2511-S-008-014-MY3, 103-2511-S-008-014-MY3, 104-2811-S-008-008 and 105-2811-S-008-001.
References
Barron, B. (2003). When smart groups fail. The journal of the learning sciences, 12(3), 307-359.
Care, E., Griffin, P., Scoular, C., Awwal, N., & Zoanetti, N. (2015). Collaborative problem solving tasks. In P.
Griffin, B. McGaw, & E. Care, (Eds.), Assessment and teaching of 21st century skills: Methods and
Approach (pp. 37-56). New York, NY: Springer.
Chang, C. J., Liu, C. C., & Shen, Y. J. (2012). Are One-to-One Computers Necessary? An Analysis of
Collaborative Web Exploration Activities Supported by Shared Displays. Educational Technology &
Society, 15(4), 3-13.
Hoegl, M., & Gemuenden, H. G. (2001). Teamwork quality and the success of innovative projects: A theoretical
concept and empirical evidence. Organization science, 12(4), 435-449.
Jara, C. A., Candelas, F. A., Torres, F., Dormido, S., & Esquembre, F. (2012). Synchronous collaboration of
virtual and remote laboratories. Computer Applications in Engineering Education, 20(1), 124-136.
Johnson D. & Johnson R. (1991). Learning Together and Alone. Prentice Hall, Englewood Cliffs, NJ.
Lin, P. C., Hou, H. T., Wu, S. Y., & Chang, K. E. (2014). Exploring college students' cognitive processing patterns
during a collaborative problem-solving teaching activity integrating Facebook discussion and simulation
tools. The Internet and Higher Education, 22, 51-56.
Rutten, N., van Joolingen, W. R., & van der Veen, J. T. (2012). The learning effects of computer simulations in
science education. Computers & Education, 58(1), 136-153.
van Joolingen, W. R., de Jong, T., Lazonder, A. W., Savelsbergh, E. R., & Manlove, S. (2005). Co-Lab: research
and development of an online learning environment for collaborative scientific discovery learning.
Computers in human behavior, 21(4), 671-688.
168168

Chen, W. et al. (Eds.) (2016). Proceedings of the 24th International Conference on Computers in Education. India: Asia-Pacific Society for Computers in Education
Provision of Latitude for Target Selection during Online Peer-Assessment
Fu-Yun YU Institute of Education, National Cheng Kung University, Taiwan
Abstract: The aim of this study was to investigate the potential of the provision of latitude for target selection during online peer-assessment. One online system was expanded to support the associated learning activities. Fifty-four undergraduates participated and experienced different ranges of items available for online peer-assessment: full range (i.e., all items listed), partial range (half or one-fourth items listed), and the exact items to be assessed. Two major findings were obtained. First, Pearson's chi-squared test of goodness of fit found that the observed frequency distribution among the three arrangements was statistically significant. Second, while the majority of the participants preferred the system automatically assigning the exact number of items to be assessed, still nearly half of all participants appreciated having some latitude in choosing their targets during online peer-assessment, with explicit and legitimate reasons supporting their revealed preference. Suggestions for instructors and system developers are provided.
Keywords: Choice of targets, online learning activity, peer-assessment, revealed preference
1. Introduction
Peer-assessment (PA) has attracted increasing attention among researchers and practitioners since the 1990s, along with the greater acceptance of the notion of interconnectedness of teaching, learning and assessment. PA is the practice of students giving evaluative feedback to their peers about the work they have produced and their overall performance (Topping, 2009). Through the resulting processes of mutual support and assistance, it is suggested that peers with similar learning status are able to assist each other to achieve their respective learning goals, expand their knowledge bases and enhance their skill levels (Topping and Ehly, 2001).
With empirical evidence generally confirming the use of PA to support various cognitive, affective and social growth (e.g., self-regulated learning, critical thinking, performance, learner motivation, sense of responsibility, and attitudes) (Topping, 2009; van Gennip, Segers and Tillema, 2009; Yu and Wu, 2013), issues regarding how such activities can be further made varied and versatile have been the focus of several recent research endeavors. For instance, the potential of embedding the features of anonymity and created identities for assessors (Yu and Wu, 2011), allowing multiple PA modes (Yu, 2011), and incorporating different types of feedback (Gielen, Peeters, Dochy, Onghena and Struyven, 2010; Nelson and Schunn, 2009; Yang, Badger and Yu, 2006) have all been explored. Along this same line of thought and in consideration that students being asked to assess a specific item or a fixed set of items seems to be the main form of online PA, the aim of this study was to investigate whether the provision of latitude for target selection would be a viable approach for online PA. Specifically, the two research questions examined in this work are as follows:
(1) Would students exhibit preferences for different ranges of latitude for target selection?(2) What were the students’ underlying reasons supporting their revealed preferences for
a specific PA arrangement?
2. Methods
To serve the research purposes of this study, an online system supporting students to generate different types of questions using different media formats, and engage in followed-up PA was extended. The expanded version of the system allows the instructor to determine different ranges of latitude for online
169169
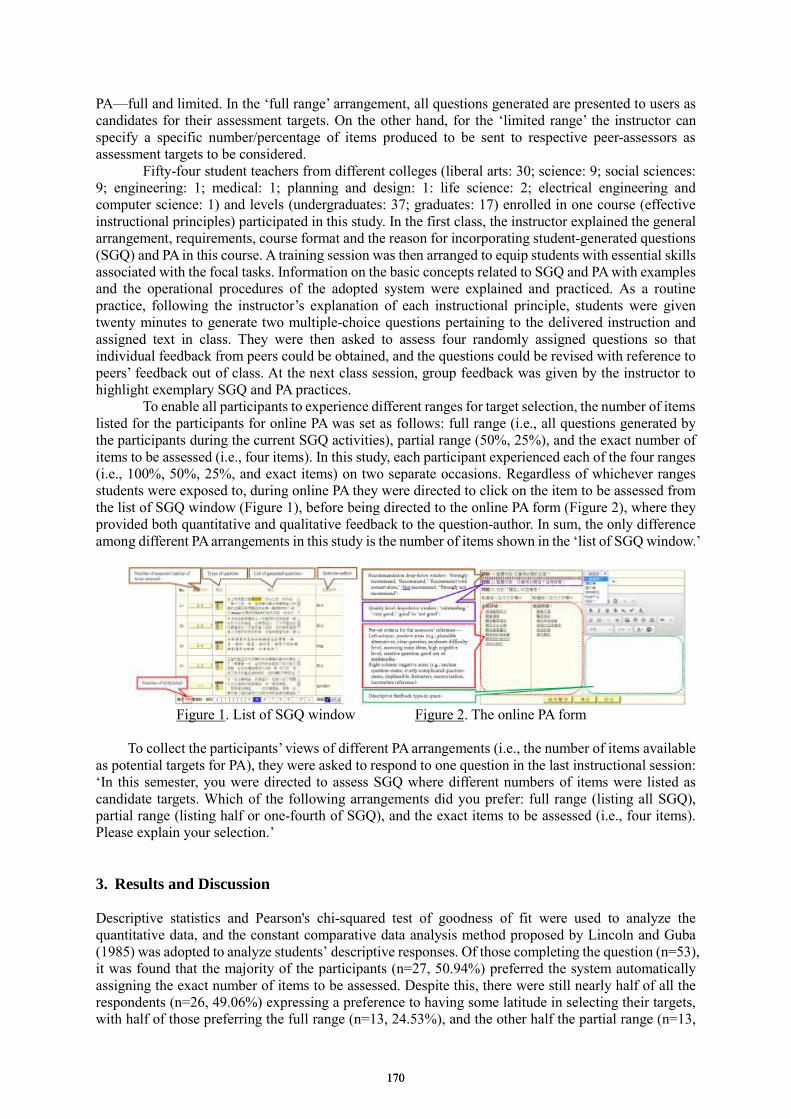
PA—full and limited. In the ‘full range’ arrangement, all questions generated are presented to users as candidates for their assessment targets. On the other hand, for the ‘limited range’ the instructor can specify a specific number/percentage of items produced to be sent to respective peer-assessors as assessment targets to be considered.
Fifty-four student teachers from different colleges (liberal arts: 30; science: 9; social sciences: 9; engineering: 1; medical: 1; planning and design: 1: life science: 2; electrical engineering and computer science: 1) and levels (undergraduates: 37; graduates: 17) enrolled in one course (effective instructional principles) participated in this study. In the first class, the instructor explained the general arrangement, requirements, course format and the reason for incorporating student-generated questions (SGQ) and PA in this course. A training session was then arranged to equip students with essential skills associated with the focal tasks. Information on the basic concepts related to SGQ and PA with examples and the operational procedures of the adopted system were explained and practiced. As a routine practice, following the instructor’s explanation of each instructional principle, students were given twenty minutes to generate two multiple-choice questions pertaining to the delivered instruction and assigned text in class. They were then asked to assess four randomly assigned questions so that individual feedback from peers could be obtained, and the questions could be revised with reference to peers’ feedback out of class. At the next class session, group feedback was given by the instructor to highlight exemplary SGQ and PA practices.
To enable all participants to experience different ranges for target selection, the number of items listed for the participants for online PA was set as follows: full range (i.e., all questions generated by the participants during the current SGQ activities), partial range (50%, 25%), and the exact number of items to be assessed (i.e., four items). In this study, each participant experienced each of the four ranges (i.e., 100%, 50%, 25%, and exact items) on two separate occasions. Regardless of whichever ranges students were exposed to, during online PA they were directed to click on the item to be assessed from the list of SGQ window (Figure 1), before being directed to the online PA form (Figure 2), where they provided both quantitative and qualitative feedback to the question-author. In sum, the only difference among different PA arrangements in this study is the number of items shown in the ‘list of SGQ window.’
Figure 1. List of SGQ window Figure 2. The online PA form
To collect the participants’ views of different PA arrangements (i.e., the number of items available as potential targets for PA), they were asked to respond to one question in the last instructional session: ‘In this semester, you were directed to assess SGQ where different numbers of items were listed as candidate targets. Which of the following arrangements did you prefer: full range (listing all SGQ), partial range (listing half or one-fourth of SGQ), and the exact items to be assessed (i.e., four items). Please explain your selection.’
3. Results and Discussion
Descriptive statistics and Pearson's chi-squared test of goodness of fit were used to analyze the quantitative data, and the constant comparative data analysis method proposed by Lincoln and Guba (1985) was adopted to analyze students’ descriptive responses. Of those completing the question (n=53), it was found that the majority of the participants (n=27, 50.94%) preferred the system automatically assigning the exact number of items to be assessed. Despite this, there were still nearly half of all the respondents (n=26, 49.06%) expressing a preference to having some latitude in selecting their targets, with half of those preferring the full range (n=13, 24.53%), and the other half the partial range (n=13,
170170

24.53%). A X2 test further indicated that the observed frequency distribution among the three arrangements was statistically significant, X2 =7.40, p < .05.
Two salient themes emerged from students’ written responses explaining their preference for the full range arrangement. Of the thirteen respondents, almost all (n=12, 92.31%) highlighted the feature of ‘being able to observe questions with various styles and focus,’ which helped to enhance their abilities. In addition, more than two-thirds (n=9, 69.23%) stressed the feature of ‘being given choices regarding which item to assess.’
For those preferring the partial range, all thirteen respondents acknowledged the strengths associated with the other two arrangements while appreciating what this eclectic approach could do by mitigating problems frequently associated with each of the other two arrangements. More explicitly, users were given a choice in selecting their assessment targets and could learn from observing peers’ work with various styles (which was not possible with the exact item approach), while not feeling overwhelmed (as would be the case in the full range arrangement).
Finally, the reason of ‘ensuring each question generated receives some feedback from peers for further improvement’ was highlighted most frequently by those preferring the exact item arrangement (n=17, 62.96%), followed up by ‘the opportunity to be challenged since students could no longer target items of their liking’ (n=11, 40.74%). Also, quite a few (n=8, 29.63%) pointed out the reason of ‘time being saved and better spent on giving feedback rather than on reviewing and deciding which item to assess.’
Existing studies have found that students based their choice of items to assess on a number of reasons, including the characteristics of the assessed item (e.g., the interestingness, quality, and difficulty level), its relation to the key ideas of the study material, the number of times the item was assessed, item submission time, and the length of the question item (Yu and Sung, in press). Also, as recognized by humanists, each learner has different motivations, interests, needs, and preferences (Ediger, 2006). In light of these, as well as the findings of this study, instructors are advised to consider giving their students some freedom in selecting targets to create more versatile PA activities. In addition, developers of online learning systems supporting PA may consider incorporating such a feature to allow the provision of some latitude in target selection.
References
Ediger, M. (2006). Present day philosophies of education. Journal of Instructional Psychology. 33(3), 179-182. Gielen, S., Peeters, E., Dochy, F., Onghena, P., & Struyven, K. (2010). Improving the effectiveness of peer
feedback for learning. Learning and Instruction, 20(4), 304-315. Lincoln, Y. S. & Guba, E. G. (1985). Naturalistic inquiry. Beverly Hills, CA: Sage Publications. Nelson, M. M., & Schunn, C. D. (2009). The nature of feedback: How different types of peer feedback affect
writing performance. Instructional Science, 37(4), 375-401. Topping, K. J. (2009). Peer assessment. Theory into Practice, 48(1), 20-27. Topping, K. J., & Ehly, S. E. (2001). Peer-assisted learning. Journal of Educational and Psychological
Consultation, 12(2), 113-132. van Gennip, N. A. E., Segers, M. & Tillema, H. H. (2009). Peer assessment for learning from a social perspective:
The influence of interpersonal and structural features. Learning and Instruction, 4(1), 41–54. Yang, M., Badger, R., & Yu, Z. (2006). A comparative study of peer and teacher feedback in a Chinese EFL
writing class. Journal of Second Language Writing, 15, 179-200. Yu, F. Y. (2011). Multiple peer assessment modes to augment online student question-generation processes.
Computers & Education, 56(2), 484-494. Yu, F. Y. & Sung, S. (in press). A mixed methods approach to the assessor’s targeting behavior during online
peer-assessment: Effects of anonymity and underlying reasons. Interactive Learning Environments. Yu, F. Y. & Wu, C. P. (2013). Predictive effects of online peer feedback types on performance quality.
Educational Technology and Society, 16(1), 332-341. Yu, F. Y. & Wu, C. P. (2011). Different identity revelation modes in an online peer-assessment learning
environment: Effects on perceptions toward assessors, classroom climate and learning activities. Computers & Education, 57(3), 2167-2177.
171171
Chen, W. et al. (Eds.) (2016). Proceedings of the 24th International Conference on Computers in Education. India: Asia-Pacific Society for Computers in Education
“VC/DC” - Video versus Domain Concepts in Comments to Learner-generated
Science Videos H. Ulrich HOPPEa*, Maximilian MÜLLERb, Aris ALISSANDRAKISb, Marcelo MILRADb,
Christina SCHNEEGASSa & Nils MALZAHNa aRhine-Ruhr Institute for Applied System Innovation (RIAS), Germany
bLinnaeus University, Sweden *[email protected]
Abstract: The recently finished EU project JuxtaLearn aimed at supporting students’ learning of STEM subjects through the creation, exchange and discussion of learner-made videos. The approach is based on an eight-stage activity cycle in the beginning of which teachers identify specific “stumbling blocks” for a given theme (or “tricky topic”). In JuxtaLearn, video comments were analyzed to extract information on the learners’ acquisition and understanding of domain concepts, especially to detect problems and misconceptions. These analyses were based on mapping texts to networks of concepts (“network-text analysis”) as a basis for further processing. In this article we use data collected from recent field trials to shed light on what is actually discussed when students share their own videos in science domains. Would the aspect of video-making dominate over activities related to a deepening of domain understanding? Our findings indicate that there are different ways of balancing both aspects and interventions will be needed to bring forth the desired blend.
Keywords: learning analytics, learner-generated content, video making, network-text analysis
1. Introduction
The recently finished European project JuxtaLearn explored the potential of fostering learning in different fields of science (or STEM) by stimulating curiosity and understanding through creative performance on the part of the students. Concretely, the students’ performance is substantiated in the form of creative video making (including idea generation, authoring of a storyboard, video taking and editing) together with the sharing and commenting of videos in a learning community. The videos are conceived in such a way as to combine or “juxtapose” a dramatized story or narrative with the representation of domain concepts. In their collaboration around videos, learners may take on different roles in their teams such as actors, editors or production directors. Video production is followed by sharing the videos on a learning platform with annotation and discussion facilities.
The JuxtaLearn approach can be seen as a kind of “second order inquiry learning” in that the creative process follows an initial phase in which the learners appropriate the basic concepts of the domain. The approach is neutral with respect to the initial pedagogical framing of the prior knowledge building processes. From an educational design perspective, the JuxtaLearn approach is based on the notion of “threshold concepts” (Meyer & Land, 2003) to characterize knowledge elements that are central and critical for important shifts of understanding. In the JuxtaLearn approach, threshold concepts are represented as so-called “tricky topics” with subordinate “stumbling blocks”. Initially, the selection of tricky topics and stumbling blocks depends on the teachers’ choices. In the system’s knowledge-based backend, these concepts are integrated into an evolving general domain ontology.
The basic JuxtaLearn process (see Figure 3 for an example) comprises eight steps: (1) identification of tricky topics, (2) demonstration of subject matter, (3) interpretation of the subject matter by the students, (4) video enactment, (5) composition of a video, (6) sharing the video with others, (7) discussion of the video, and (8) review of the results.
172172
There is clear practical evidence of the positive motivational effects of video making and sharing in terms of high involvement and engagement that is not limited to only a few students. However, we cannot be sure if this actually leads to better learning in the domain. In the study reported here, we want to shed light on this question by characterizing the focus of student activities especially in the phase of sharing and commenting between video-related and domain-related communications. In our analysis, we particularly rely on advanced network analysis techniques.
2. Background
2.1 Pedagogical ideas and challenges
The JuxtaLearn approach is based on pre-structuring the domain in the form of a micro-curriculum. Here, the definition of the curricular ingredients of specific learning scenarios relies centrally on threshold concepts as defined by Meyer & Land (2003). Practically, the selection of threshold concepts depends on the teachers’ choices in the form of tricky topics and subordinate stumbling blocks; it is not derived from a pre-existing domain ontology used as a normative reference. We see the acquisition and appropriation of these concepts by the learners as a process of knowledge revision and conceptual change (cf. Chi, 2008, for a synoptic view of this perspective). The acquisition of threshold concepts does not correspond to normal extensions of the learner’s pre-knowledge (called enrichment by Chi, 2008) but to knowledge revisions that arise from cognitive conflicts between pre-knowledge and new phenomena or dependencies to be explained (Vosniadou, 2007).
JuxtaLearn’s choice of video making and sharing as central activities is based on the assumption that there would be positive motivational effects of video usage (both active video production as well as video sharing/viewing) on STEM learning. This assumption is supported by the success of video-based learning platforms such as Khan Academy (www.khanacademy.org). Video production is considered beneficial for the motivation and learning by several authors (Jonassen, 2000; Zahn et al., 2005). Regarding the underlying learning principles, this approach can also be considered as “reflection-in-action” (Schön, 1987) as the students construct their own videos.
However, there is a potential threat to the intended learning effects in possibility that students concentrate their efforts on producing “nice” videos rather than improving and deepening their understanding of the domain. In the JuxtaLearn practice, this has been counter-balanced by focusing on the threshold concepts (tricky topics) and related stumbling blocks identified and targeted by teachers. Especially in the initial stages of the learning process, emphasis has been placed on the accuracy of the students’ representations of the concepts by comparing their interpretations with reference examples provided by the teachers. Also, the task specifications given to the students include collections of stumbling blocks as targets.
2.2 Network-Text Analysis of video comments
In order to intelligently analyze and support the sharing and commenting of videos, we have adapted and used specific techniques for the analysis of learner created textual artifacts to characterize the learners’ understanding of science concepts in terms of semantic networks. In an initial phase of the project, the textual artifacts were video comments from existing web-based learning platforms such as Khan Academy1 or YouTube2. These sources provide a vast amount of videos on different STEM topics and offer the option to enter into a learning dialogue with other users (learners). Although these videos are mostly in “lecture style” (voice + screen capture from a whiteboard using hand-written notations) and not “dramatized”, the process of sharing and discussing is comparable to the type of “domain talk” that we expect. With this material, content-related learning analytics techniques have been successfully used to identify the students’ models of understanding and misconceptions (Daems et al., 2014). These results form a basis for supporting teacher in supervising their students’ supervision as well as for the direct scaffolding of learners.
1 https://www.khanacademy.org 2 https://www.youtube.com
173173
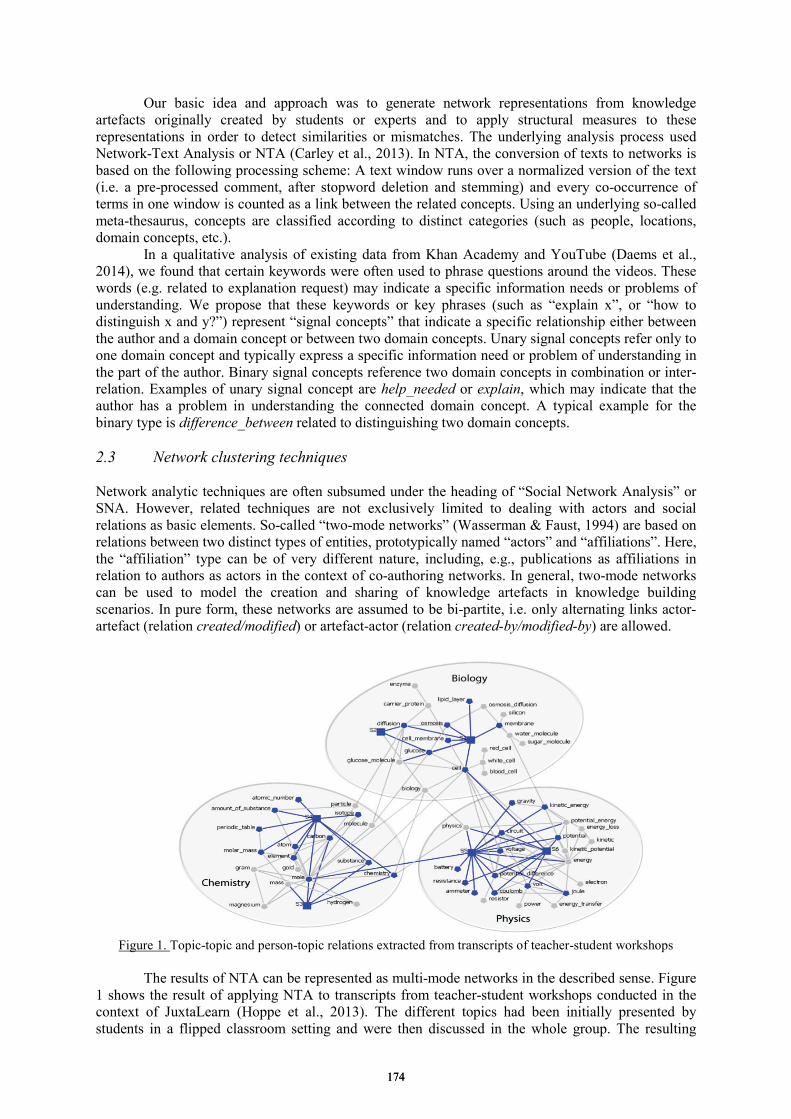
Our basic idea and approach was to generate network representations from knowledge artefacts originally created by students or experts and to apply structural measures to these representations in order to detect similarities or mismatches. The underlying analysis process used Network-Text Analysis or NTA (Carley et al., 2013). In NTA, the conversion of texts to networks is based on the following processing scheme: A text window runs over a normalized version of the text (i.e. a pre-processed comment, after stopword deletion and stemming) and every co-occurrence of terms in one window is counted as a link between the related concepts. Using an underlying so-called meta-thesaurus, concepts are classified according to distinct categories (such as people, locations, domain concepts, etc.).
In a qualitative analysis of existing data from Khan Academy and YouTube (Daems et al., 2014), we found that certain keywords were often used to phrase questions around the videos. These words (e.g. related to explanation request) may indicate a specific information needs or problems of understanding. We propose that these keywords or key phrases (such as “explain x”, or “how to distinguish x and y?”) represent “signal concepts” that indicate a specific relationship either between the author and a domain concept or between two domain concepts. Unary signal concepts refer only to one domain concept and typically express a specific information need or problem of understanding in the part of the author. Binary signal concepts reference two domain concepts in combination or inter-relation. Examples of unary signal concept are help_needed or explain, which may indicate that the author has a problem in understanding the connected domain concept. A typical example for the binary type is difference_between related to distinguishing two domain concepts.
2.3 Network clustering techniques
Network analytic techniques are often subsumed under the heading of “Social Network Analysis” or SNA. However, related techniques are not exclusively limited to dealing with actors and social relations as basic elements. So-called “two-mode networks” (Wasserman & Faust, 1994) are based on relations between two distinct types of entities, prototypically named “actors” and “affiliations”. Here, the “affiliation” type can be of very different nature, including, e.g., publications as affiliations in relation to authors as actors in the context of co-authoring networks. In general, two-mode networks can be used to model the creation and sharing of knowledge artefacts in knowledge building scenarios. In pure form, these networks are assumed to be bi-partite, i.e. only alternating links actor-artefact (relation created/modified) or artefact-actor (relation created-by/modified-by) are allowed.
Figure 1. Topic-topic and person-topic relations extracted from transcripts of teacher-student workshops
The results of NTA can be represented as multi-mode networks in the described sense. Figure 1 shows the result of applying NTA to transcripts from teacher-student workshops conducted in the context of JuxtaLearn (Hoppe et al., 2013). The different topics had been initially presented by students in a flipped classroom setting and were then discussed in the whole group. The resulting
174174

networks reflect nicely the different topics from the areas of biology, chemistry, and physics as more densely connected sub-networks. Here topics (pentagon-shaped nodes) and topic-topic relations are depicted in grey, whereas persons (square nodes) and person-topic relations are colored blue. The number of connections between one actor and surrounding topics (also called “degree”) indicates the thematic richness of this actor’s contributions. In this sense, the students S4, S5 and S6 score clearly better than S2. In addition, S5 and S6 share many common topics and both have made contributions to different fields (physics/chemistry and physics/biology). This shows that network measures capture interesting characteristics of group interactions and discussions.
This two-mode network (see Figure 1) could be easily “folded” into a pure social network of actors (i.e. students) by inter-linking any pair of actors who share a common topic. This, however, goes along with loss of information and structure (in the ensuing one-mode network, S3, S4 and S5 would form a triangle with a linear tail through S5-S6-S1-S3), and the substructure in terms of network clusters would no longer be explicit. Although network clustering techniques such as modularity clustering (Newman & Girvan, 2004) or clique percolation (Derenyi, Palla & Vicsek, 2005) were originally defined for the one-mode case, recent developments have extrapolated these methods to two-mode networks (Sawardecker et al., 2009; Hecking et al., 2014). This provides us with algorithmic solutions for detecting cohesive substructures in the original two-mode networks. Even in the absence of rich data sources, bipartite connectivity analysis allows for identifying quite fine-structured relational patterns. Such techniques have recently been employed to characterize user roles and emerging themes in a MOOC discussion forum (Hecking, Chounta & Hoppe, 2015).
3. The JuxtaLearn Video-Making Process
The basic idea of the video performance part of the Juxtalearn process is very similar to that of project-based learning (Krajcik et al., 1997): 1. Engage students in investigating an authentic question or real world problem that drives activities
and organizes concepts and principles [driving questions]2. Result in students developing a series of artefacts, or products that address the question/problem.3. Allow students to engage in investigations4. Involve students, teachers and members of the society in a community of inquiry as they
collaborate about the problem5. Promote students’ learning using cognitive tools
While the students are planning for and working on their specific video performance, the teachershave to help all groups to work productively, i.e. they have coordinate the students where necessary, help the students with their topic related questions and keep them motivated and engaged.
To support the students’ learning we provide two palettes: a creative performance palette and a practical performance palette. Students must use the creative performance palette to start crafting their performance and to discuss what they are doing. This approach favours distributed creativity. The practical performance palette supports the students in juxtaposing their creative performance with their teacher’s standard teaching activity (STA), e.g. a classroom experiment or a talk about the subject matter, by providing reminders, lists and checkpoints.
A video performance has five steps: development, pre-production, production, post-production and upload and screening. The students’ creativity is encouraged by a creative performance palette at the development and post-production steps. At post-production, students may need to draw again on the creative performance palette. Of course, the creative process runs throughout the discussion of their video performance enabling differing perspectives on similar STEM topics offering opportunities for understanding. The creative performance palette is made available either as a pack of cards from which to peruse and choose or as an interactive palette on a tabletop (if available). Each card will identify itself as genre, format or story and have the name of the suggestion, along with a description and at least one example. A storyboard acts as a road map to help students create a shared language and providing a solid foundation on which to place the components of the video. It is a structure for the working out of ideas and the overall visual design of a video.
The learning process takes place in ClipIt (Llinás et al., 2014; see Figure 2), a web-based learning environment specifically tailored to supporting the JuxtaLearn process. It acts as central point
175175
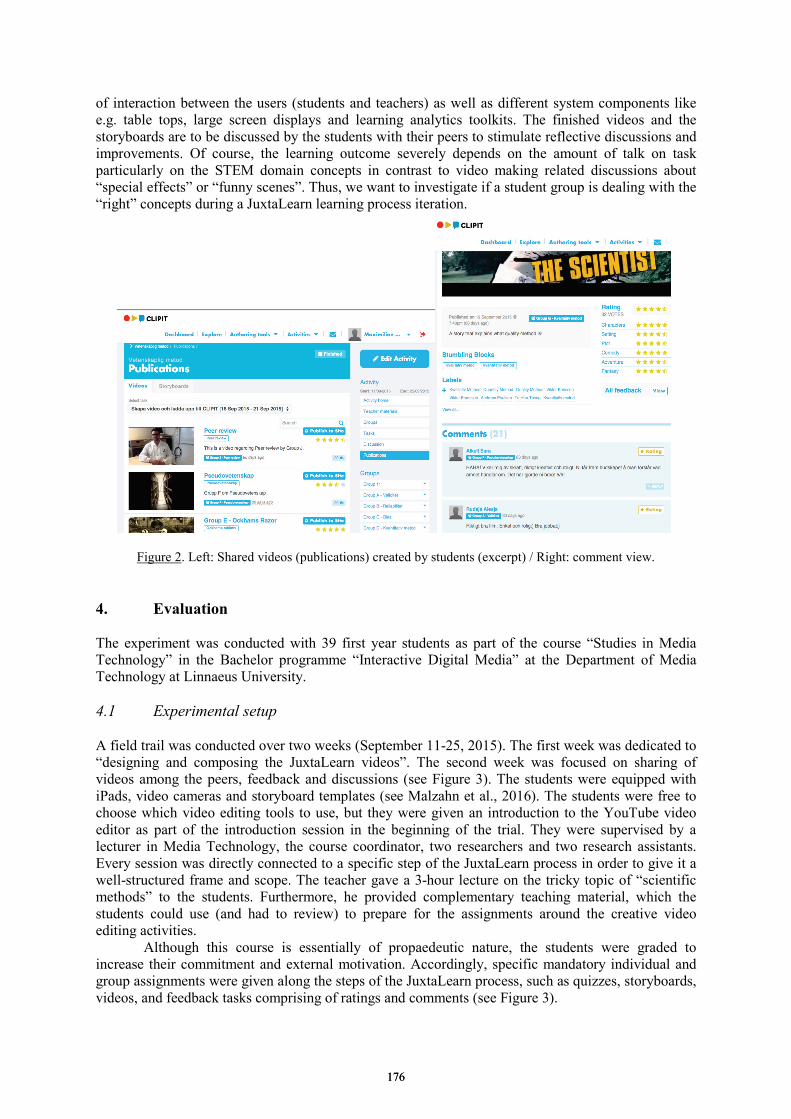
of interaction between the users (students and teachers) as well as different system components like e.g. table tops, large screen displays and learning analytics toolkits. The finished videos and the storyboards are to be discussed by the students with their peers to stimulate reflective discussions and improvements. Of course, the learning outcome severely depends on the amount of talk on task particularly on the STEM domain concepts in contrast to video making related discussions about “special effects” or “funny scenes”. Thus, we want to investigate if a student group is dealing with the “right” concepts during a JuxtaLearn learning process iteration.
Figure 2. Left: Shared videos (publications) created by students (excerpt) / Right: comment view.
4. Evaluation The experiment was conducted with 39 first year students as part of the course “Studies in Media Technology” in the Bachelor programme “Interactive Digital Media” at the Department of Media Technology at Linnaeus University. 4.1 Experimental setup A field trail was conducted over two weeks (September 11-25, 2015). The first week was dedicated to “designing and composing the JuxtaLearn videos”. The second week was focused on sharing of videos among the peers, feedback and discussions (see Figure 3). The students were equipped with iPads, video cameras and storyboard templates (see Malzahn et al., 2016). The students were free to choose which video editing tools to use, but they were given an introduction to the YouTube video editor as part of the introduction session in the beginning of the trial. They were supervised by a lecturer in Media Technology, the course coordinator, two researchers and two research assistants. Every session was directly connected to a specific step of the JuxtaLearn process in order to give it a well-structured frame and scope. The teacher gave a 3-hour lecture on the tricky topic of “scientific methods” to the students. Furthermore, he provided complementary teaching material, which the students could use (and had to review) to prepare for the assignments around the creative video editing activities.
Although this course is essentially of propaedeutic nature, the students were graded to increase their commitment and external motivation. Accordingly, specific mandatory individual and group assignments were given along the steps of the JuxtaLearn process, such as quizzes, storyboards, videos, and feedback tasks comprising of ratings and comments (see Figure 3).
176176
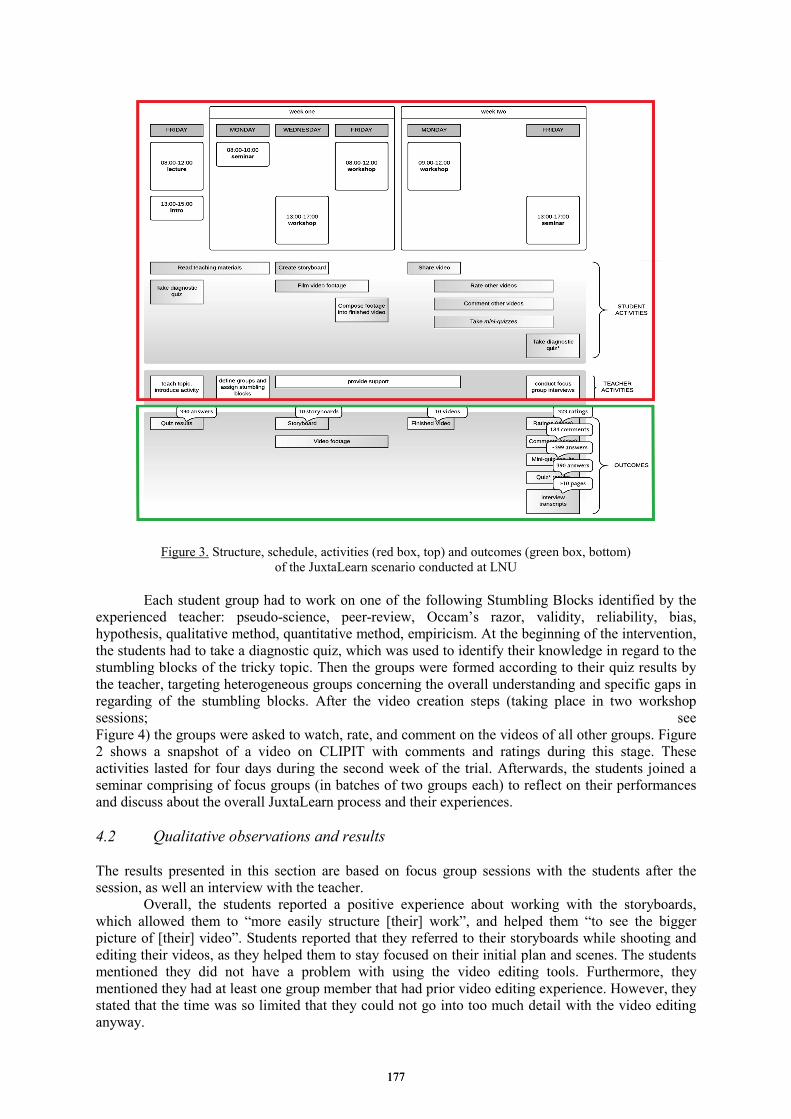
Figure 3. Structure, schedule, activities (red box, top) and outcomes (green box, bottom) of the JuxtaLearn scenario conducted at LNU
Each student group had to work on one of the following Stumbling Blocks identified by the experienced teacher: pseudo-science, peer-review, Occam’s razor, validity, reliability, bias, hypothesis, qualitative method, quantitative method, empiricism. At the beginning of the intervention, the students had to take a diagnostic quiz, which was used to identify their knowledge in regard to the stumbling blocks of the tricky topic. Then the groups were formed according to their quiz results by the teacher, targeting heterogeneous groups concerning the overall understanding and specific gaps in regarding of the stumbling blocks. After the video creation steps (taking place in two workshop sessions; seeFigure 4) the groups were asked to watch, rate, and comment on the videos of all other groups. Figure 2 shows a snapshot of a video on CLIPIT with comments and ratings during this stage. These activities lasted for four days during the second week of the trial. Afterwards, the students joined a seminar comprising of focus groups (in batches of two groups each) to reflect on their performances and discuss about the overall JuxtaLearn process and their experiences.
4.2 Qualitative observations and results
The results presented in this section are based on focus group sessions with the students after the session, as well an interview with the teacher.
Overall, the students reported a positive experience about working with the storyboards, which allowed them to “more easily structure [their] work”, and helped them “to see the bigger picture of [their] video”. Students reported that they referred to their storyboards while shooting and editing their videos, as they helped them to stay focused on their initial plan and scenes. The students mentioned they did not have a problem with using the video editing tools. Furthermore, they mentioned they had at least one group member that had prior video editing experience. However, they stated that the time was so limited that they could not go into too much detail with the video editing anyway.
177177
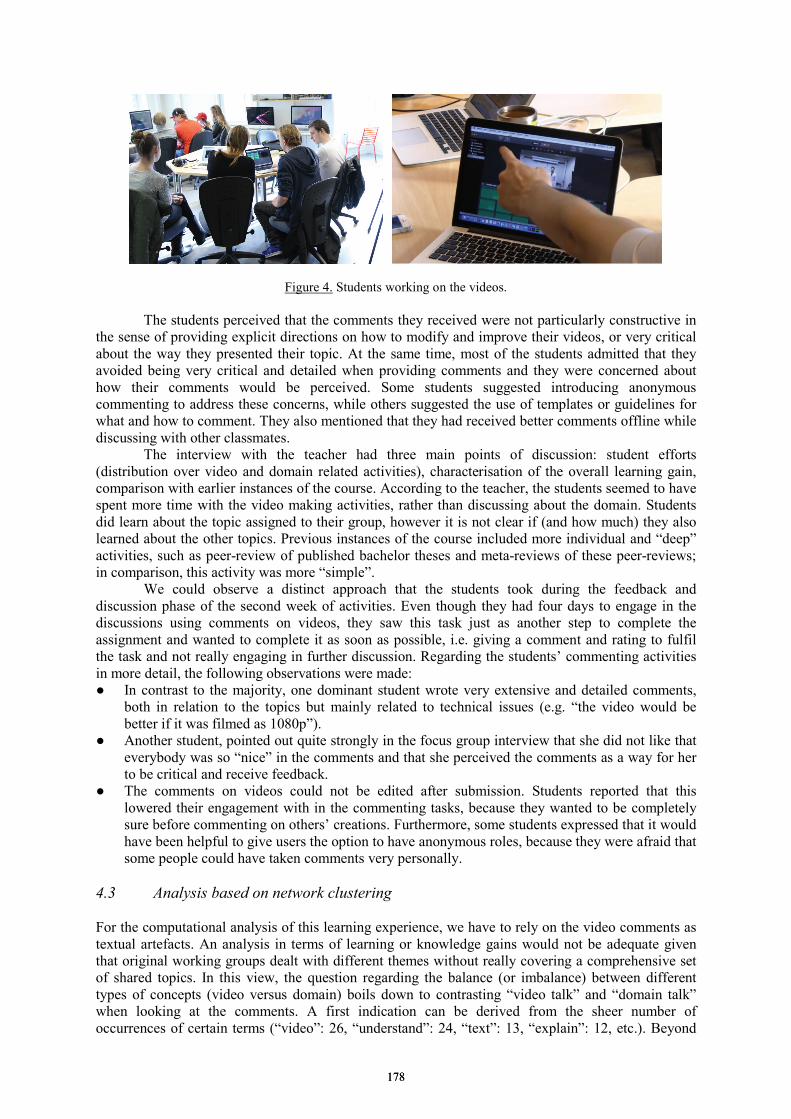
Figure 4. Students working on the videos.
The students perceived that the comments they received were not particularly constructive in the sense of providing explicit directions on how to modify and improve their videos, or very critical about the way they presented their topic. At the same time, most of the students admitted that they avoided being very critical and detailed when providing comments and they were concerned about how their comments would be perceived. Some students suggested introducing anonymous commenting to address these concerns, while others suggested the use of templates or guidelines for what and how to comment. They also mentioned that they had received better comments offline while discussing with other classmates.
The interview with the teacher had three main points of discussion: student efforts (distribution over video and domain related activities), characterisation of the overall learning gain, comparison with earlier instances of the course. According to the teacher, the students seemed to have spent more time with the video making activities, rather than discussing about the domain. Students did learn about the topic assigned to their group, however it is not clear if (and how much) they also learned about the other topics. Previous instances of the course included more individual and “deep” activities, such as peer-review of published bachelor theses and meta-reviews of these peer-reviews; in comparison, this activity was more “simple”.
We could observe a distinct approach that the students took during the feedback and discussion phase of the second week of activities. Even though they had four days to engage in the discussions using comments on videos, they saw this task just as another step to complete the assignment and wanted to complete it as soon as possible, i.e. giving a comment and rating to fulfil the task and not really engaging in further discussion. Regarding the students’ commenting activities in more detail, the following observations were made: ● In contrast to the majority, one dominant student wrote very extensive and detailed comments,
both in relation to the topics but mainly related to technical issues (e.g. “the video would bebetter if it was filmed as 1080p”).
● Another student, pointed out quite strongly in the focus group interview that she did not like thateverybody was so “nice” in the comments and that she perceived the comments as a way for herto be critical and receive feedback.
● The comments on videos could not be edited after submission. Students reported that thislowered their engagement with in the commenting tasks, because they wanted to be completelysure before commenting on others’ creations. Furthermore, some students expressed that it wouldhave been helpful to give users the option to have anonymous roles, because they were afraid thatsome people could have taken comments very personally.
4.3 Analysis based on network clustering
For the computational analysis of this learning experience, we have to rely on the video comments as textual artefacts. An analysis in terms of learning or knowledge gains would not be adequate given that original working groups dealt with different themes without really covering a comprehensive set of shared topics. In this view, the question regarding the balance (or imbalance) between different types of concepts (video versus domain) boils down to contrasting “video talk” and “domain talk” when looking at the comments. A first indication can be derived from the sheer number of occurrences of certain terms (“video”: 26, “understand”: 24, “text”: 13, “explain”: 12, etc.). Beyond
178178
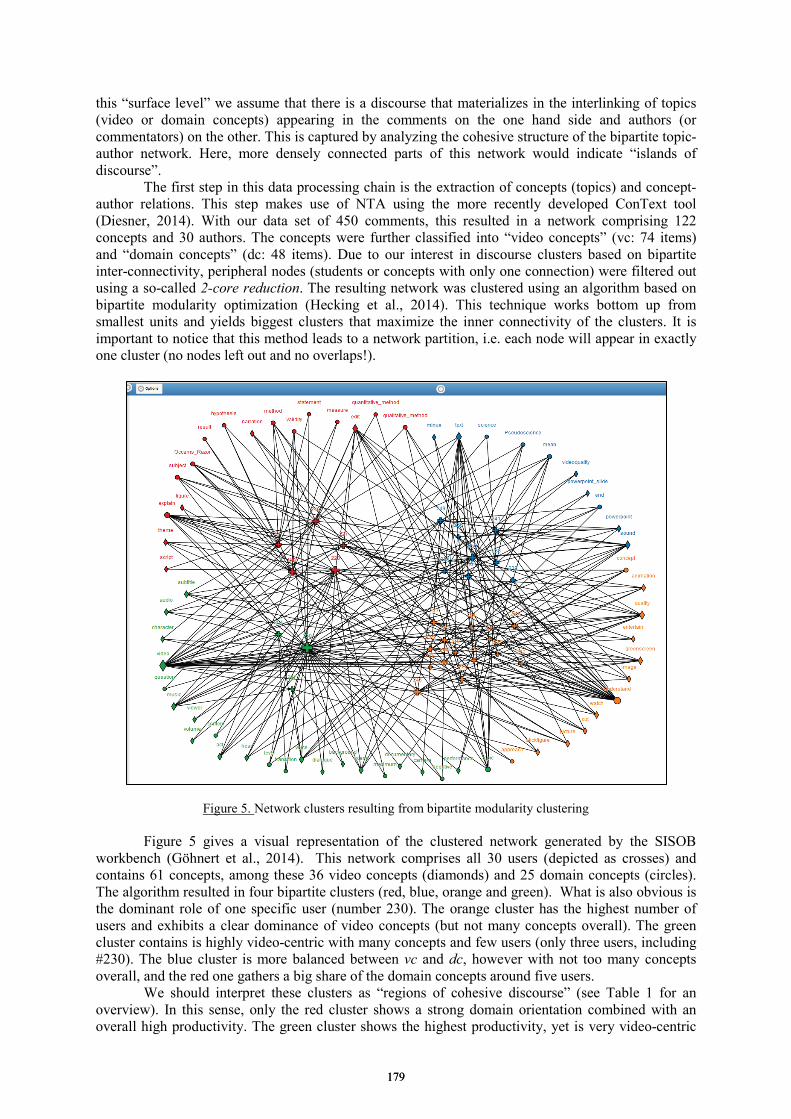
this “surface level” we assume that there is a discourse that materializes in the interlinking of topics (video or domain concepts) appearing in the comments on the one hand side and authors (or commentators) on the other. This is captured by analyzing the cohesive structure of the bipartite topic-author network. Here, more densely connected parts of this network would indicate “islands of discourse”.
The first step in this data processing chain is the extraction of concepts (topics) and concept-author relations. This step makes use of NTA using the more recently developed ConText tool (Diesner, 2014). With our data set of 450 comments, this resulted in a network comprising 122 concepts and 30 authors. The concepts were further classified into “video concepts” (vc: 74 items) and “domain concepts” (dc: 48 items). Due to our interest in discourse clusters based on bipartite inter-connectivity, peripheral nodes (students or concepts with only one connection) were filtered out using a so-called 2-core reduction. The resulting network was clustered using an algorithm based on bipartite modularity optimization (Hecking et al., 2014). This technique works bottom up from smallest units and yields biggest clusters that maximize the inner connectivity of the clusters. It is important to notice that this method leads to a network partition, i.e. each node will appear in exactly one cluster (no nodes left out and no overlaps!).
Figure 5. Network clusters resulting from bipartite modularity clustering
Figure 5 gives a visual representation of the clustered network generated by the SISOB workbench (Göhnert et al., 2014). This network comprises all 30 users (depicted as crosses) and contains 61 concepts, among these 36 video concepts (diamonds) and 25 domain concepts (circles). The algorithm resulted in four bipartite clusters (red, blue, orange and green). What is also obvious is the dominant role of one specific user (number 230). The orange cluster has the highest number of users and exhibits a clear dominance of video concepts (but not many concepts overall). The green cluster contains is highly video-centric with many concepts and few users (only three users, including #230). The blue cluster is more balanced between vc and dc, however with not too many concepts overall, and the red one gathers a big share of the domain concepts around five users.
We should interpret these clusters as “regions of cohesive discourse” (see Table 1 for an overview). In this sense, only the red cluster shows a strong domain orientation combined with an overall high productivity. The green cluster shows the highest productivity, yet is very video-centric
179179
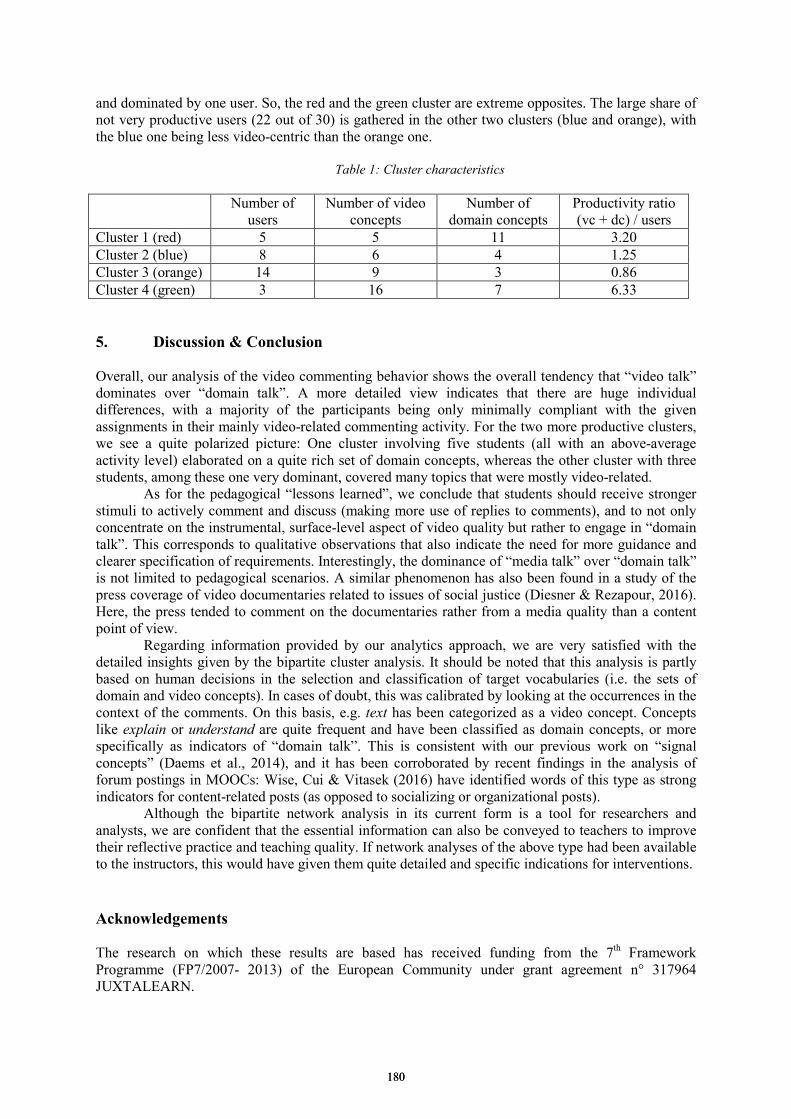
and dominated by one user. So, the red and the green cluster are extreme opposites. The large share of not very productive users (22 out of 30) is gathered in the other two clusters (blue and orange), with the blue one being less video-centric than the orange one.
Table 1: Cluster characteristics
Number of users
Number of video concepts
Number of domain concepts
Productivity ratio (vc + dc) / users
Cluster 1 (red) 5 5 11 3.20 Cluster 2 (blue) 8 6 4 1.25 Cluster 3 (orange) 14 9 3 0.86 Cluster 4 (green) 3 16 7 6.33
5. Discussion & Conclusion
Overall, our analysis of the video commenting behavior shows the overall tendency that “video talk” dominates over “domain talk”. A more detailed view indicates that there are huge individual differences, with a majority of the participants being only minimally compliant with the given assignments in their mainly video-related commenting activity. For the two more productive clusters, we see a quite polarized picture: One cluster involving five students (all with an above-average activity level) elaborated on a quite rich set of domain concepts, whereas the other cluster with three students, among these one very dominant, covered many topics that were mostly video-related.
As for the pedagogical “lessons learned”, we conclude that students should receive stronger stimuli to actively comment and discuss (making more use of replies to comments), and to not only concentrate on the instrumental, surface-level aspect of video quality but rather to engage in “domain talk”. This corresponds to qualitative observations that also indicate the need for more guidance and clearer specification of requirements. Interestingly, the dominance of “media talk” over “domain talk” is not limited to pedagogical scenarios. A similar phenomenon has also been found in a study of the press coverage of video documentaries related to issues of social justice (Diesner & Rezapour, 2016). Here, the press tended to comment on the documentaries rather from a media quality than a content point of view.
Regarding information provided by our analytics approach, we are very satisfied with the detailed insights given by the bipartite cluster analysis. It should be noted that this analysis is partly based on human decisions in the selection and classification of target vocabularies (i.e. the sets of domain and video concepts). In cases of doubt, this was calibrated by looking at the occurrences in the context of the comments. On this basis, e.g. text has been categorized as a video concept. Concepts like explain or understand are quite frequent and have been classified as domain concepts, or more specifically as indicators of “domain talk”. This is consistent with our previous work on “signal concepts” (Daems et al., 2014), and it has been corroborated by recent findings in the analysis of forum postings in MOOCs: Wise, Cui & Vitasek (2016) have identified words of this type as strong indicators for content-related posts (as opposed to socializing or organizational posts).
Although the bipartite network analysis in its current form is a tool for researchers and analysts, we are confident that the essential information can also be conveyed to teachers to improve their reflective practice and teaching quality. If network analyses of the above type had been available to the instructors, this would have given them quite detailed and specific indications for interventions.
Acknowledgements
The research on which these results are based has received funding from the 7th Framework Programme (FP7/2007- 2013) of the European Community under grant agreement n° 317964 JUXTALEARN.
180180
References
Carley, K. M., Columbus, D., & Landwehr, P. (2013). AutoMap User’s Guide 2013 (Technical Report No. CMU-ISR-13-105) (pp. 1–219). Pittsburgh: Carnegie Mellon University, Institute for Software Research. Retrieved from: www.casos.cs.cmu.edu/publications/papers/CMU-ISR-13-105.pdf
Chi, M. (2008). Three types of conceptual change: Belief revision, mental model transformation, and categorical shift. In S. Vosniadou (Ed.), International Handbook of Research on Conceptual Change (pp. 61–82). New York, Oxon: Routledge.
Daems, O., Erkens, M., Malzahn, N., & Hoppe, H. U. (2014). Using content analysis and domain ontologies to check learners’ understanding of science concepts. Journal of Computers in Education, 1(2-3), 113-131.
Derényi, I., Palla, G., & Vicsek, T. (2005). Clique percolation in random networks. Physical Review Letters, 94(16), 160202.
Diesner, J. (2014). ConText: Software for the integrated analysis of text data and network data. Paper presented at the Social and Semantic Networks in Communication Research. Preconference at Conference of International Communication Association (ICA), Seattle, WA.
Diesner, J., & Rezapour, R. (2015). Social computing for impact assessment of social change projects. In Social Computing, Behavioral-Cultural Modeling, and Prediction (pp. 34-43). Springer International Publishing.
Göhnert, T., Harrer A., Hecking T., & Hoppe H. U. (2014). A workbench for visual design of executable and re-usable network analysis workflows. In Kawash, Jalal, (Ed.): Online Social Media Analysis and Visualization (pp. 181-199). Springer International.
Hecking, T., Ziebarth, S., & Hoppe, H. U. (2014, March). Analysis of dynamic resource access patterns in a blended learning course. In Proceedings of the Fourth International Conference on Learning Analytics and Knowledge (pp. 173-182). ACM.
Hecking, T., Chounta, I. A., & Hoppe, H. U. (2015). Analysis of user roles and the emergence of themes in discussion forums. In Proceedings of the Second European Network Intelligence Conference (ENIC) (pp. 114-121). IEEE Press.
Jonassen, D.H. (2000). Computers as Mindtools for Schools. Engaging Critical Thinking. Upper Saddle River, NJ: Prentice-Hall.
Hoppe, H. U., Erkens, M., Clough, G., Daems, O., & Adams, A. (2013). Using Network Text Analysis to characterise teachers’ and students’ conceptualisations in science domains. Proc. of the 2nd International Workshop on Teaching Analytics (IWTA 2013) at LAK 2016, Leuven (Belgium), April 2013.
Krajcik, J. S., Blumenfeld, P. C., Marx, R. W., & Soloway, E. (1994). A collaborative model for helping middle grade science teachers learn project-based instruction. The Elementary School Journal 1994, 483-497.
Llinás, P., Haya, P., Gutierrez, M. A., Martín, E., Castellanos, J., Hernán, I., & Urquiza, J. (2014). ClipIt: Supporting social reflective learning through student-made educational videos. In Open Learning and Teaching in Educational Communities (Proc. of EC-TEL 2014) (pp. 502-505). Springer International.
Malzahn, N., Hartnett, E., Llinás, P., & Hoppe, H. U. (2016). A smart environment supporting the creation of juxtaposed videos for learning. In State-of-the-Art and Future Directions of Smart Learning (pp. 461-470). Springer Singapore.
Meyer, J. H. F. & Land, R. (2003) Threshold concepts and troublesome knowledge: Linkages to ways of thinking and practising within the disciplines. In Rust, C. (Ed.) Improving Student Learning - Theory and Practice Ten Years on. Oxford (UK), Oxford Centre for Staff and Learning Development (OCSLD).
Newman, M. E., & Girvan, M. (2004). Finding and evaluating community structure in networks. Physical Review E, 69(2), 026113.
Sawardecker, E. N., Amundsen, C. A., Sales-Pardo, M., & Amaral, L. A. N. (2009). Comparison of methods for the detection of node group membership in bipartite networks. The European Physical Journal B, 72(4), 671-677.
Schön, D. A (1987) Educating the Reflective Practitioner. San Francisco, CA: Jossey-Bass Publishers. Vosniadou, S. (2007). Conceptual Change and Education. Human Development, 50(1), 47–54. Wasserman, S., & and Faust, K. (1994). Social Network Analysis: Methods and Applications. New York
(USA): Cambridge University Press. Wise, A. F., Cui, Y., & Vytasek, J. (2016). Bringing order to chaos in MOOC discussion forums with content-
related thread identification. In Proceedings of the Sixth International Conference on Learning Analytics & Knowledge (pp. 188-197). ACM.
Zahn, C., Hesse, F., Finke, M., Pea, R., Mills, M., & Rosen, J. (2005). Advanced digital video technologies to support collaborative learning in school education and beyond. In Proc. of the International Conference on Computer Support for Collaborative Learning (CSCL 2005) (pp. 737-742). International Society of the Learning Sciences.
181181

Chen, W. et al. (Eds.) (2016). Proceedings of the 24th International Conference on Computers in Education. India: Asia-Pacific Society for Computers in Education
Data Sharing for Learning Analytics – designing conceptual artefacts and processes to
foster interoperability Tore HOEL* & Weiqin CHEN
Oslo and Akershus University College of Applied Sciences, Norway *[email protected]
Abstract: Learning Analytics is based on data from the digital traces left by learning activities. In the controlled environment of a research lab combining data from different sources does not pose many problems. However, when scaling up learning analytics for general use in schools and universities data sharing and interoperability become major challenges. These issues are now being addressed in standardisation settings, both internationally and nationally. A case study of a Norwegian standards project shows that there are considerable conceptual issues emerging when stakeholders representing different interests start working towards consensus on these issues. Based on the case study this paper contributes with a number of conceptual constructs and a process that will make it easier to reach consensus about different aspects related to access to and exchange of data from different sources relevant for analysis of learning and the contexts in which learning occurs.
Keywords: Data Sharing, Interoperability, Learning Analytics, Educational Data Mining, Standardisation
1. Introduction
A common definition of Learning Analytics (LA) is given by the Society for Learning Analytics Research (SOLAR): "Learning analytics is the measurement, collection, analysis and reporting of data about learners and their contexts, for purposes of understanding and optimising learning and the environments in which it occurs" (LAK11, 2011). The definition presupposes that we have a clear idea of what kinds of data are needed to optimise learning and its environments. When moving out of the research lab into the complex field of real life actors representing the vastly diverse interests we find in education we see that it is not only the access to data that represents a challenge; we also lack good concepts to describe the data we want to collect. According to the LA definition it is our understanding of what contributes to learning and optimal learning contexts that should frame our search for data. In the real world we have to do with what we have got, implying that we often start with the data coming out of our learning management systems and our learning assessment systems (Macfadyen & Dawson, 2010; Rienties, Toetenel, & Bryan, 2015; Kitto, Cross, Waters, & Lupton, 2015).
Data sharing can be defined as the release of data for use by others (Cooper & Hoel, 2015). In beginning of 2016, Standards Norway, the main standards organisation of Norway, gathered 'the others' around a table and started work on a technical report on "data sources and conditions for data sharing for learning analytics". The work is to be based on the interest of vendors, school authorities, universities, publishers, and others in the Norwegian market who want to advance the use of LA based on a richer set of data. A provisional scope has been agreed to clarify what are the most important data sources in the Norwegian market; what conditions regulate access and sharing; and to come up with ideas of methods for sharing that will give access to data across actor groups.
In the opening meeting of this project, in which both authors took part, it soon became clear that a data centric approach to data sharing was fraught with subtleties that soon could render the discussion impenetrable. As an example, the concept of a data source proved difficult to use. A data source does not tell much about what information is embedded in the data, which in turn is important to know in order to see if for example entailed personally identifiable information (PII) would make it difficult to share the data. In this meeting it was felt that there was a need for developing a new conceptual toolbox to make the exploration of different data sharing scenarios fruitful.
182182182
This paper will explore the discourse space one enters when addressing the data sharing needs for the LA community. Based on this case study we will develop a set of conceptual artefacts that can be used in further work in this particular group and hopefully beyond. The paper is organised as follows: After reviewing related work, we will present a small case study of the Norwegian standards project on data sharing. Based on the requirements identified in the case study, we will construct conceptual artefacts and a process that could be used in this context. The proposals will be discussed and the conclusions will present ideas how this work could be developed further.
2. Related Work Interoperability and data sharing become issues first when we go beyond LA research and start to explore how LA will influence the agendas for schools, universities and national policy makers. LA being an emergent field of research, it is as expected that till now 'interoperability' and 'data sharing' in the context of LA have been rather absent in the research literature. The European Union LA support and coordination action, LACE, on the other hand had a work package on interoperability and data sharing. In a deliverable on 'Data Sharing Requirements and Roadmap' Cooper and Hoel (2015) reported they were struck by the extent to which the characterisation and ramifications of data sharing had not been worked on.
The interpretation of data sharing is at present somewhat confused by common conceptions of ownership and related factors, under-developed thinking about the topic, and sometimes a failure to consider it. The increasing use of software hosted in “the cloud” - i.e. Software as a Service (SaaS) - has amplified this situation, but we have also inherited a confusion from the days when most software used in education was running on-site. This confusion relates to ownership and control, and the extent to which the educational establishment has absolute authority or acts as a custodian on behalf of the learner. While it is clear that there is some data which the educational establishment is required to keep, and some of which the learner has no right to change, there has generally been little attention to the details of ownership, control, and custodianship. (Cooper & Hoel, 2015, p. 11)
Within a research context there is a long tradition for data handling with ethical committees and a systematic approach for deposit, sharing, reuse, curation and preservation of data (van den Eynden & Bishop, 2014). Even if some of the processes and technologies are relevant for large scale LA delivery, going beyond a controlled research setting will bring into play a more complex set of actors and systems. Till now it is mainly technical factors that are driving the need for data sharing. "Increasing use of Cloud Computing models of service and IT provision, where expertise or technology is provided by a separate organisation to the education provider, has increased the extent to which data is not only distributed between different IT systems, but is also distributed among legal entities" (Cooper & Hoel, 2015, p. 9). However, as pointed out in the report from the LACE project, the situation for educational institutions is more characterised by Small Data than Big Data, – "you can easily fit your data in a spreadsheet on your laptop computer!" (Cooper & Hoel, 2015, p. 9). While a spreadsheet may be inadequate for captured activity data, it remains true that for most of the potential applications of learning analytics in education and training practice, the useful data will be of a scale well below that of Big Data.
For the practical work the Norwegian standards group sets out to do on data sharing and interoperability Cooper and Hoel (2015) give limited help. They observe that the variety of data that is relevant to learning analytics is indeed potentially very great; however, the LACE report limited the interest primarily to concern data about people and their activity in a learning-related situation. Other data sources, e.g., national and international classification schemas for subject matter of courses or learning resources lack many of the complications of person-related data, and they are undertaken as Open Data initiatives and other projects (Cooper & Hoel, 2015, p. 7). However, as the initial meeting in the standards group showed, these other data sources are often the point of interest, from where the stakeholders start to explore LA data sharing and interoperability. Therefore, it seems to be a gap – not addressed by the current LA research literature – how to bridge between person-related activity data and the other data sources well established in the education community.
One way of proceeding is to actually see what kinds of data are used for LA. In 2012, Chatti, Dyckhoff, Schroeder, and Thüs did a review of recent literature related to LA and related fields and
183183183
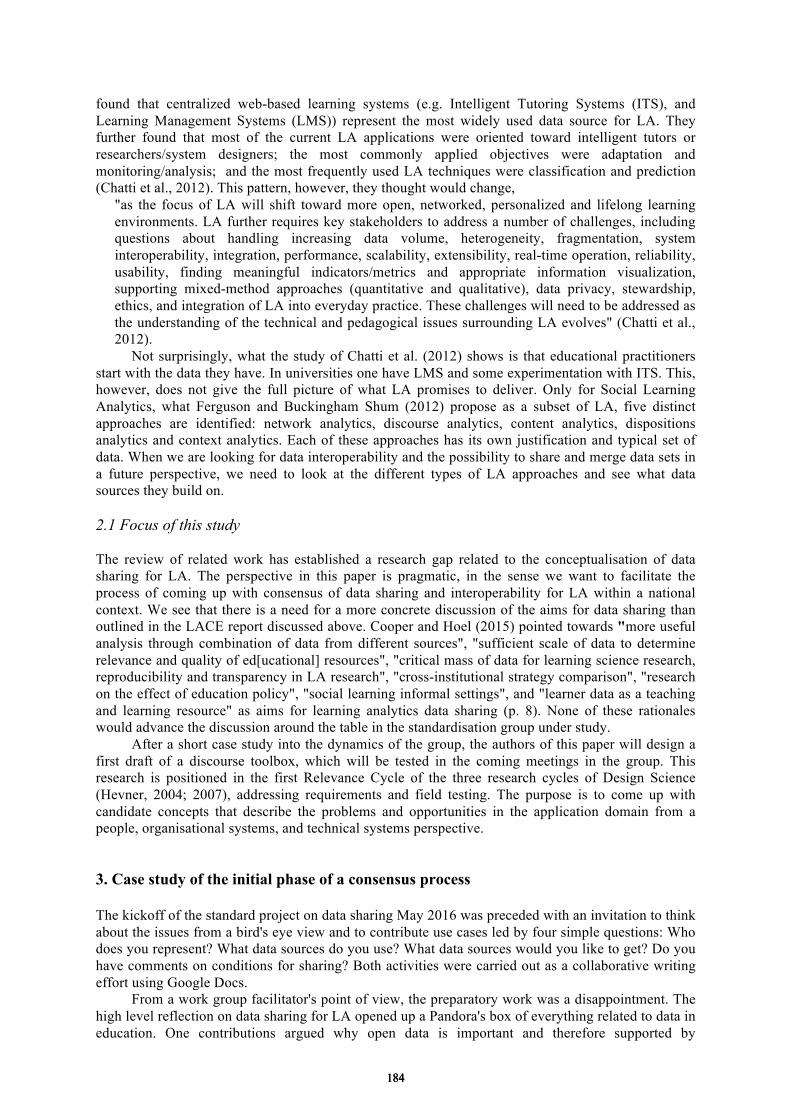
found that centralized web-based learning systems (e.g. Intelligent Tutoring Systems (ITS), and Learning Management Systems (LMS)) represent the most widely used data source for LA. They further found that most of the current LA applications were oriented toward intelligent tutors or researchers/system designers; the most commonly applied objectives were adaptation and monitoring/analysis; and the most frequently used LA techniques were classification and prediction (Chatti et al., 2012). This pattern, however, they thought would change,
"as the focus of LA will shift toward more open, networked, personalized and lifelong learning environments. LA further requires key stakeholders to address a number of challenges, including questions about handling increasing data volume, heterogeneity, fragmentation, system interoperability, integration, performance, scalability, extensibility, real-time operation, reliability, usability, finding meaningful indicators/metrics and appropriate information visualization, supporting mixed-method approaches (quantitative and qualitative), data privacy, stewardship, ethics, and integration of LA into everyday practice. These challenges will need to be addressed as the understanding of the technical and pedagogical issues surrounding LA evolves" (Chatti et al., 2012).
Not surprisingly, what the study of Chatti et al. (2012) shows is that educational practitioners start with the data they have. In universities one have LMS and some experimentation with ITS. This, however, does not give the full picture of what LA promises to deliver. Only for Social Learning Analytics, what Ferguson and Buckingham Shum (2012) propose as a subset of LA, five distinct approaches are identified: network analytics, discourse analytics, content analytics, dispositions analytics and context analytics. Each of these approaches has its own justification and typical set of data. When we are looking for data interoperability and the possibility to share and merge data sets in a future perspective, we need to look at the different types of LA approaches and see what data sources they build on.
2.1 Focus of this study The review of related work has established a research gap related to the conceptualisation of data sharing for LA. The perspective in this paper is pragmatic, in the sense we want to facilitate the process of coming up with consensus of data sharing and interoperability for LA within a national context. We see that there is a need for a more concrete discussion of the aims for data sharing than outlined in the LACE report discussed above. Cooper and Hoel (2015) pointed towards "more useful analysis through combination of data from different sources", "sufficient scale of data to determine relevance and quality of ed[ucational] resources", "critical mass of data for learning science research, reproducibility and transparency in LA research", "cross-institutional strategy comparison", "research on the effect of education policy", "social learning informal settings", and "learner data as a teaching and learning resource" as aims for learning analytics data sharing (p. 8). None of these rationales would advance the discussion around the table in the standardisation group under study.
After a short case study into the dynamics of the group, the authors of this paper will design a first draft of a discourse toolbox, which will be tested in the coming meetings in the group. This research is positioned in the first Relevance Cycle of the three research cycles of Design Science (Hevner, 2004; 2007), addressing requirements and field testing. The purpose is to come up with candidate concepts that describe the problems and opportunities in the application domain from a people, organisational systems, and technical systems perspective.
3. Case study of the initial phase of a consensus process The kickoff of the standard project on data sharing May 2016 was preceded with an invitation to think about the issues from a bird's eye view and to contribute use cases led by four simple questions: Who does you represent? What data sources do you use? What data sources would you like to get? Do you have comments on conditions for sharing? Both activities were carried out as a collaborative writing effort using Google Docs.
From a work group facilitator's point of view, the preparatory work was a disappointment. The high level reflection on data sharing for LA opened up a Pandora's box of everything related to data in education. One contributions argued why open data is important and therefore supported by
184184184

government policies. Another reported ongoing work to create a data architecture for higher education in Norway mapping the activities of all service providers in the sector. Just a quick look at the draft document would prove that this attempt to get a high level grasp of challenges would lead nowhere.
Four stakeholders contributed to the first round of use cases: a big vendor, a local school authority, a school agency, and a publisher. Even with the same set of questions and access to each others' contributions the answers vary a lot in scope. We have a list of services and data providers, with a number of concerns and issues related to technical architecture, ownership, sharing culture, what type of data are collected, etc.
The school authority gave an overview of their central databases on curricula and learning goals and official statistics from national authorities. They were also pointing out that they had access to student information data on users, LMS data and user-generated data from a number of applications for digital learning resources. What they wanted to get hold of were roster data, competency information related to learning activities, and local learning goals related to the curriculum.
The school agency was concerned with the availability of the vast datasets managed by The Norwegian Directorate for Education and Training and the Norwegian Centre for Research Data. The data are essential for assessing the quality of education in Norway; however, the datasets are not easily accessible, and provided examples of exchange with these data authorities prove that substantial negotiations are necessary to make these datasets an active open source for learning analytics.
The publisher presented their solution for ebooks, explaining that they stored detailed information on usage patterns of each learning resource (e.g., right and wrong answers to quizzes, did the user check for right answer, how does the learning resource relate to curriculum, etc.).
The kickoff meeting, gathering 22 experts representing all the relevant stakeholders for this work in Norway discussed rationale, scope, output of work and agreed on working procedures before embarking upon technical work. As expected, the initial discussion was dominated by framing activities, positioning the actors (Hoel & Pawlowski, 2012), making sense of the scope of work (Hoel & Mason, 2012), and exploring the stakeholder interests (Hoel & Hollins, 2011). The appointed technical lead tried to drive discussion towards getting a grasp of what data the stakeholders were interested in exchanging, but struggled to get beyond principled views of open access and sweeping reference to categories of data and the data sources mentioned in the shared document.
Much as the facilitator repeatedly referred to use cases as a useful instrument to map concrete and relevant stakeholder interests the discussion never came to the point where for example a publisher would declare: We have these data, which makes this application work today; however, if we get those data form that source we could make a much better learning resource. Participant observation of the discussion made it visible that the group lacked a common conceptual understanding of data sharing and LA. To discuss use cases did not make any sense for the group. Along the LA spectrum from person-related, activity-focussed analytics to more traditional academic analytics (Baepler & Murdoch, 2010) different concepts of data come into play. The group lacked the necessary conceptual common base to engage in a solution oriented discourse.
To create a common ground one needs to reach out – to find a new position. However, the discourse in this start-up meeting also highlighted another prerequisite for moving towards consensus: willingness to be explicit about one's own position and interests. Conceptual tools are not enough; one also need motivation.
Two comments were noticed as pointing towards a common ground on which to build consensus about ways forward. The representative for the data protection authorities said the legal boundaries were not that difficult to map providing one was able to identify what information to be exchanged. It was not enough to just to focus on sources of data without knowing what information was represented. The other comment was from a publisher who said: We have only been discussing what data we would want to have. As a publisher we have data to give, or sell, but we don't know how this could be done.
3.1 Requirements for design This short case study of the setting up of a standards project highlights the need for conceptual clarification and the design of a process that will deliver consensus on principles that will level the
185185185

playing field for the Norwegian LA actors. Also the case study demonstrates the need to bridge the gap identified in the review of related work (Section 2) between person-related activity data and other types of education data.
In the initial phase of the project a survey of available data sources is foreseen. The challenge, however, is to ensure that this survey identifies the relevant data sources that will be part of actual negotiations between actors in the market who want to extend their existing data sets or make more data available for analysis. In doing so, we need a description of the data attributes that are stumbling blocks for exchange.
It is also clear from this case study that the objective of LA needs to be made explicit in order to focus the search for fitting data. LA is still an ill-defined field of interest. The different stakeholders focus on different data types, e.g., along the range from person-related data to aggregated high-level data on different groups' learning results. If a stakeholder's aim with the LA is not stated, it may be easy to define a data source out of scope because it does not fit a dominant stakeholder interest.
4. Design of conceptual artefacts and process The aim of this design is to better facilitate a standards development process. The process is set up to arrive at a common and negotiated understanding of what data should be shared in the Norwegian market, giving the different stakeholders increased opportunities to develop LA services for all sectors of education by also pointing towards how it could be achieved.
Therefore, the developed artefacts are designed to make the stakeholders sitting around the table willing and able to share enough information so that they can work out what data in the Norwegian educational market could be made available for exchange between actors, on what conditions. Standardisation is a consensus process, and the intended output, a technical report (ISO 5966:1982), should pave the road for practical progress within the community in question. The test of success is whether new data sources are released for use by others as a result of the consensus documented in the technical report.
4.1 Concepts The conceptual artefacts we propose are designed to answer specific questions. I) How to declare specific stakeholder's interest in data sharing? Stakeholder's position is often given by business interests. Many actors are reluctant to discuss their business models, and therefore, in standardisation settings we often see specific business interests hidden behind more general high-level market concerns. One way of making it easier to discuss business drivers for data sharing is to ask stakeholders to position themselves in the LA landscape. The following instruments are proposed: 1. How do you characterise your interest in LA (referring to the definition of LA given by SOLAR) – are you mainly working to improve learning or the contexts, in which learning occurs?
If you do not want to choose one or the other, think of one or more typical scenario(s) where you are 1) working directly on providing feedback to the learner, or 2) working on different learning contexts (learning resources, learning design, learning tools provision, physical infrastructure, etc) where the learner is more indirectly influenced. 2. In case of alternative 1 learning, Figure 1 gives a simple model of the LA cycle, focussing on data and metrics informing learner interventions.
186186186
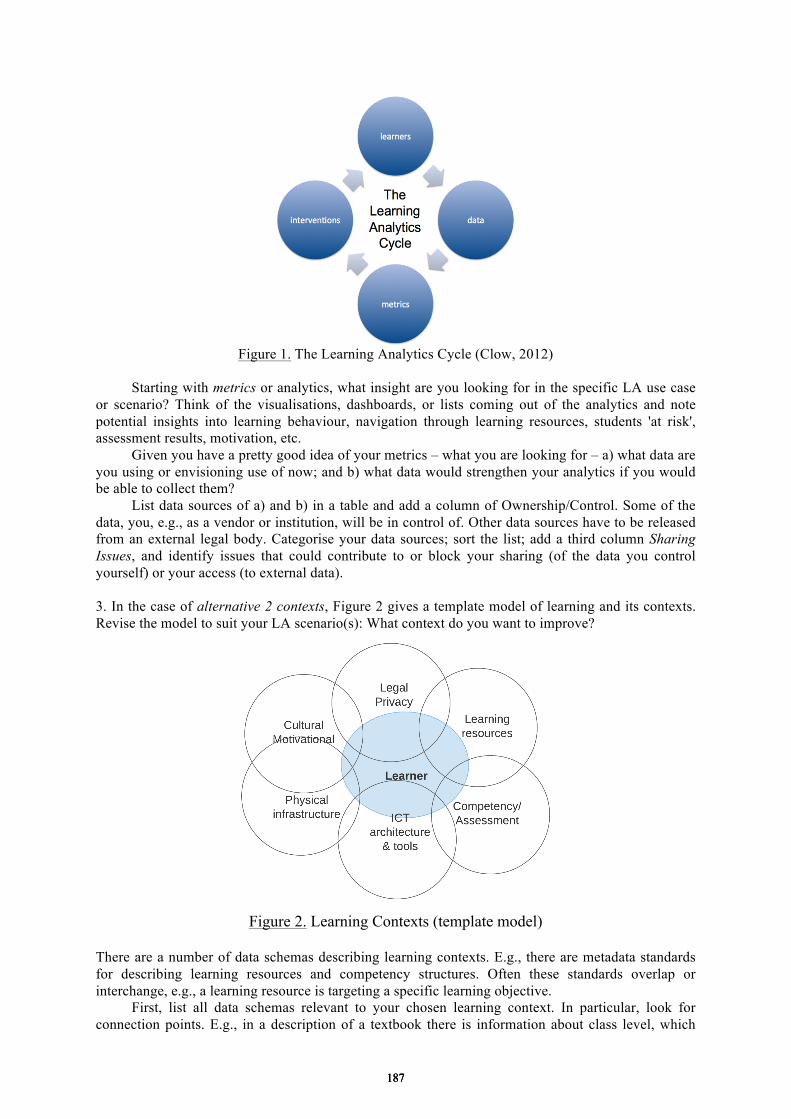
Figure 1. The Learning Analytics Cycle (Clow, 2012)
Starting with metrics or analytics, what insight are you looking for in the specific LA use case
or scenario? Think of the visualisations, dashboards, or lists coming out of the analytics and note potential insights into learning behaviour, navigation through learning resources, students 'at risk', assessment results, motivation, etc.
Given you have a pretty good idea of your metrics – what you are looking for – a) what data are you using or envisioning use of now; and b) what data would strengthen your analytics if you would be able to collect them?
List data sources of a) and b) in a table and add a column of Ownership/Control. Some of the data, you, e.g., as a vendor or institution, will be in control of. Other data sources have to be released from an external legal body. Categorise your data sources; sort the list; add a third column Sharing Issues, and identify issues that could contribute to or block your sharing (of the data you control yourself) or your access (to external data). 3. In the case of alternative 2 contexts, Figure 2 gives a template model of learning and its contexts. Revise the model to suit your LA scenario(s): What context do you want to improve?
Figure 2. Learning Contexts (template model)
There are a number of data schemas describing learning contexts. E.g., there are metadata standards for describing learning resources and competency structures. Often these standards overlap or interchange, e.g., a learning resource is targeting a specific learning objective.
First, list all data schemas relevant to your chosen learning context. In particular, look for connection points. E.g., in a description of a textbook there is information about class level, which
187187187
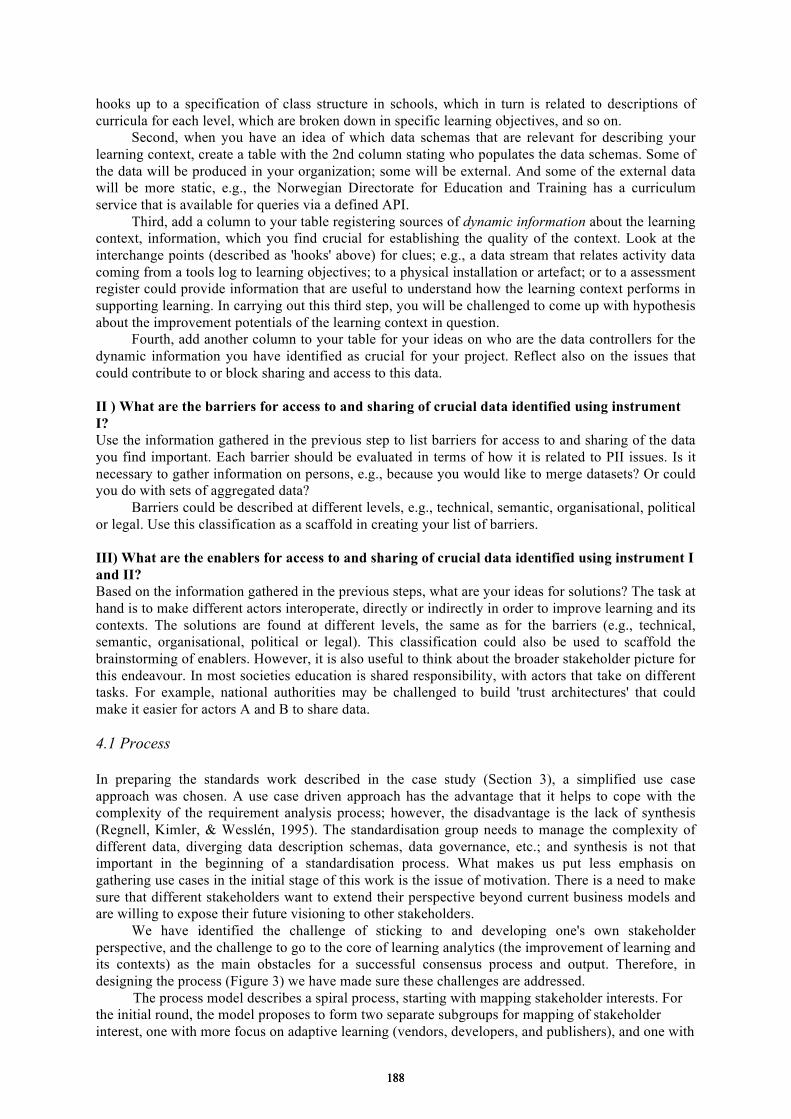
hooks up to a specification of class structure in schools, which in turn is related to descriptions of curricula for each level, which are broken down in specific learning objectives, and so on.
Second, when you have an idea of which data schemas that are relevant for describing your learning context, create a table with the 2nd column stating who populates the data schemas. Some of the data will be produced in your organization; some will be external. And some of the external data will be more static, e.g., the Norwegian Directorate for Education and Training has a curriculum service that is available for queries via a defined API.
Third, add a column to your table registering sources of dynamic information about the learning context, information, which you find crucial for establishing the quality of the context. Look at the interchange points (described as 'hooks' above) for clues; e.g., a data stream that relates activity data coming from a tools log to learning objectives; to a physical installation or artefact; or to a assessment register could provide information that are useful to understand how the learning context performs in supporting learning. In carrying out this third step, you will be challenged to come up with hypothesis about the improvement potentials of the learning context in question.
Fourth, add another column to your table for your ideas on who are the data controllers for the dynamic information you have identified as crucial for your project. Reflect also on the issues that could contribute to or block sharing and access to this data. II ) What are the barriers for access to and sharing of crucial data identified using instrument I? Use the information gathered in the previous step to list barriers for access to and sharing of the data you find important. Each barrier should be evaluated in terms of how it is related to PII issues. Is it necessary to gather information on persons, e.g., because you would like to merge datasets? Or could you do with sets of aggregated data?
Barriers could be described at different levels, e.g., technical, semantic, organisational, political or legal. Use this classification as a scaffold in creating your list of barriers. III) What are the enablers for access to and sharing of crucial data identified using instrument I and II? Based on the information gathered in the previous steps, what are your ideas for solutions? The task at hand is to make different actors interoperate, directly or indirectly in order to improve learning and its contexts. The solutions are found at different levels, the same as for the barriers (e.g., technical, semantic, organisational, political or legal). This classification could also be used to scaffold the brainstorming of enablers. However, it is also useful to think about the broader stakeholder picture for this endeavour. In most societies education is shared responsibility, with actors that take on different tasks. For example, national authorities may be challenged to build 'trust architectures' that could make it easier for actors A and B to share data. 4.1 Process In preparing the standards work described in the case study (Section 3), a simplified use case approach was chosen. A use case driven approach has the advantage that it helps to cope with the complexity of the requirement analysis process; however, the disadvantage is the lack of synthesis (Regnell, Kimler, & Wesslén, 1995). The standardisation group needs to manage the complexity of different data, diverging data description schemas, data governance, etc.; and synthesis is not that important in the beginning of a standardisation process. What makes us put less emphasis on gathering use cases in the initial stage of this work is the issue of motivation. There is a need to make sure that different stakeholders want to extend their perspective beyond current business models and are willing to expose their future visioning to other stakeholders.
We have identified the challenge of sticking to and developing one's own stakeholder perspective, and the challenge to go to the core of learning analytics (the improvement of learning and its contexts) as the main obstacles for a successful consensus process and output. Therefore, in designing the process (Figure 3) we have made sure these challenges are addressed. The process model describes a spiral process, starting with mapping stakeholder interests. For the initial round, the model proposes to form two separate subgroups for mapping of stakeholder interest, one with more focus on adaptive learning (vendors, developers, and publishers), and one with
188188188
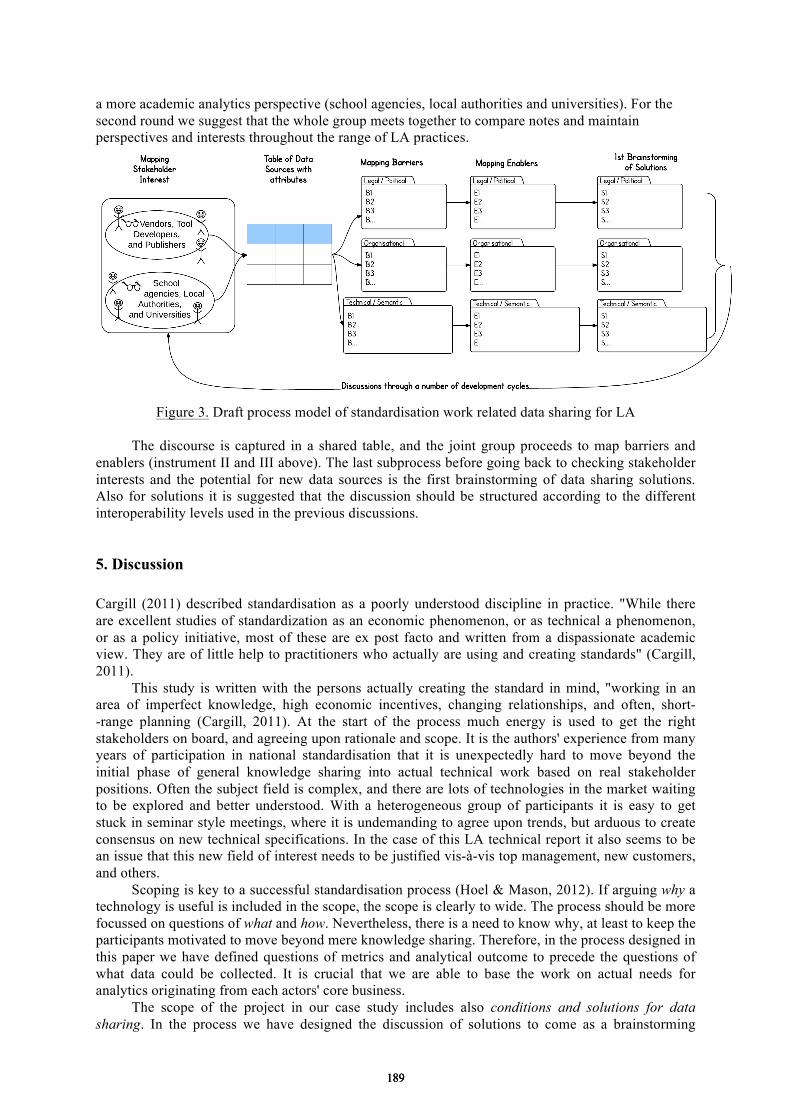
a more academic analytics perspective (school agencies, local authorities and universities). For the second round we suggest that the whole group meets together to compare notes and maintain perspectives and interests throughout the range of LA practices.
Figure 3. Draft process model of standardisation work related data sharing for LA
The discourse is captured in a shared table, and the joint group proceeds to map barriers and
enablers (instrument II and III above). The last subprocess before going back to checking stakeholder interests and the potential for new data sources is the first brainstorming of data sharing solutions. Also for solutions it is suggested that the discussion should be structured according to the different interoperability levels used in the previous discussions. 5. Discussion
Cargill (2011) described standardisation as a poorly understood discipline in practice. "While there are excellent studies of standardization as an economic phenomenon, or as technical a phenomenon, or as a policy initiative, most of these are ex post facto and written from a dispassionate academic view. They are of little help to practitioners who actually are using and creating standards" (Cargill, 2011).
This study is written with the persons actually creating the standard in mind, "working in an area of imperfect knowledge, high economic incentives, changing relationships, and often, short--range planning (Cargill, 2011). At the start of the process much energy is used to get the right stakeholders on board, and agreeing upon rationale and scope. It is the authors' experience from many years of participation in national standardisation that it is unexpectedly hard to move beyond the initial phase of general knowledge sharing into actual technical work based on real stakeholder positions. Often the subject field is complex, and there are lots of technologies in the market waiting to be explored and better understood. With a heterogeneous group of participants it is easy to get stuck in seminar style meetings, where it is undemanding to agree upon trends, but arduous to create consensus on new technical specifications. In the case of this LA technical report it also seems to be an issue that this new field of interest needs to be justified vis-à-vis top management, new customers, and others.
Scoping is key to a successful standardisation process (Hoel & Mason, 2012). If arguing why a technology is useful is included in the scope, the scope is clearly to wide. The process should be more focussed on questions of what and how. Nevertheless, there is a need to know why, at least to keep the participants motivated to move beyond mere knowledge sharing. Therefore, in the process designed in this paper we have defined questions of metrics and analytical outcome to precede the questions of what data could be collected. It is crucial that we are able to base the work on actual needs for analytics originating from each actors' core business.
The scope of the project in our case study includes also conditions and solutions for data sharing. In the process we have designed the discussion of solutions to come as a brainstorming
189189189

exercise at the end of the process cycle. At the initial stage of this specification work we would like to downplay the role of sharing solutions and conditions till we have a good grasp of what data sources are available. We see in the discussion that some data sources are described as not available simply because there are no solutions developed that would make sharing possible. In such cases it is useful to have a short brainstorming about solutions in order to put the source on a roadmap for data sharing. We also see that some data sources are taken for granted, while it would be easy to come up with scenarios that would scatter that impression (e.g., related to re-identification of anonymised data). A brainstorming of solutions would also help in this discussion. The main purpose of the process described in Figure 3 is to identify data sources and start the next phase of mapping sharing conditions and requirements for sharing solutions.
For barriers, enablers and solutions we propose to use the interoperability levels from the European interoperability framework (IDABC, 2004) as a scaffold for the discussion. The framework reminds us that interoperability is not only a technical question; it is also about agreeing upon using the same concepts, harmonising business cultures, agreeing upon common policies, and developing rules of law in order to level the playing ground for a well functioning market.
6. Conclusions and further work This study has designed conceptual artefacts and a process to support the initial discourse of a standardisation group organised to draft a technical report on data sharing and interoperability for learning analytics. The case study informing the design is set in a Norwegian context; however, both the challenges addressed and the contributions of this research are international in scope. It is one of the paradoxes when big data comes to school that without work on data models and interoperability there are only small data available for learning analytics, "the data [will] remain isolated in self-referencing islands" (Cope & Kalantzis, 2016).
As the field of LA is maturing we will move from big data to meaningful data, where the LA community becomes "more focused on broad research from many data sources and targeting many nuanced questions about what it can deliver" (Merceron, Blikstein, & Siemens, 2015). The challenge for a local market with a mixed stakeholder group, ranging from advanced tool developers looking for an international market for their cutting edge technologies to school authorities wanting to evidence-base their assessment policies, is to agree on what questions to ask. Knowing that it is the questions that lead to fruitful data sources, we need to design a consensus process that pick the low-hanging fruits without losing sight of the big promises of learning analytics.
The developed conceptual artefacts and the process will be tested in the Norwegian standardisation project. Already now we see the need for further development, and we will point to two obvious cases: one related to our understanding of data that are difficult to share, and one related to the use of existing technical infrastructure in Norway.
A data source (or we might use the more precise term data catalogue) contains a number of datasets. Not all of these datasets are problematic in terms of data sharing. But some are, and how do we pinpoint these aspects so that we can start to design solutions for easier access? It is clear to us that a group of these problematic aspects relates to personally identifiable information (PII). However, we would suggest there is a need for a LA specific conceptual model of this phenomenon. We cannot see that this model exists, and we think such a model would have helped the current work on data sharing and interoperability for LA.
Looking ahead to solutions that could support data sharing, we see that Norway have a good technical infrastructure for education that could be used. We have a identity management system now being expanded to include a API gateway1 connecting data sources and end-user applications. This infrastructure could be used to solve privacy and data protection issues allowing market actors to exchange data without compromising PII (Hoel & Chen, In press; 2016; 2015). References
1 www.uninett.no/en/service-platform-dataporten
190190190
Baepler, P., & Murdoch, C. J. (2010). Academic Analytics and Data Mining in Higher Education. International Journal for the Scholarship of Teaching and Learning,
Cargill, C. F. (2011). Why Standardization Efforts Fail. The Journal of Electronic Publishing, 14(1). http://doi.org/10.3998/3336451.0014.103
Chatti, M. A., Dyckhoff, A. L., & Schroeder, U. (2012). A reference model for learning analytics. International Journal of Technology Enhanced Learning (IJTEL), Vol. 4, No. 5/6 http://doi.org/10.1504/IJTEL.2012.051815
Clow, Doug. (2012). The Learning Analytics Cycle: Closing the Loop Effectively. In Proceedings of the 2nd International Conference on Learning Analytics and Knowledge (LAK12), Vancouver,
BC, Canada, April 29 May 02, 2012, edited by Simon Buckingham Cooper, A. & Hoel, T. (2015) Data Sharing Requirements and Roadmap. Deliverable 7.2 from LACE project,
online at http://www.laceproject.eu/deliverables/d7-2-data-sharing-roadmap.pdf Cope, B., & Kalantzis, M. (2016). Big Data Comes to School: Implications for Learning, Assessment, and
Research. AERA Open, 2(2), 1–20. http://doi.org/10.1177/2332858416641907 Ferguson, R., & Shum, S. B. (2012). Social learning analytics: five approaches. the 2nd International
Conference (pp. 23–33). New York, New York, USA: ACM. http://doi.org/10.1145/2330601.2330616 Hevner, A. (2007). A Three Cycle View of Design Science Research. Scandinavian Journal of Information
Systems, 2007, 19(2):87-92, 1–6. Hevner, A., March, S. T., Park, J., & Ram, S. (2004). Design science in information systems research. Mis
Quarterly, 28(1), 75–105. Hoel, T., & Chen, W. (In press) Privacy and Data Protection in Learning Analytics – Suggestions for Systems
Design Hoel, T., & Chen, W. (2016). Privacy-driven design of learning analytics applications: Exploring the design
space of solutions for data sharing and interoperability. Journal of Learning Analytics, 3(1), 139–158. http://dx.doi.org/10.18608/jla.2016.31.9
Hoel, T. & Chen, W. (2015). Privacy in Learning Analytics – Implications for System Architecture — In Watanabe, T. and Seta, K. (Eds.) (2015). Proceedings of the 11th International Conference on Knowledge Management. ISBN 978-4-9908620-0-8
Hoel, T., & Mason, J. (2012). Deficiencies of scope statements in ITLET standardization. In G. Biswas et al. (Eds.) (2012). Proceedings of the 20th International Conference on Computers in Education. Singapore: Asia-Pacific Society for Computers in Education
Hoel, T. & Pawlowski, J.M. (2012). Managing standards development in emergent fields of technology innovation – a proposed model of key processes in ICT standardisation, in Enterprise Interoperability - Proceedings of the Workshops of the Sixth International Conference I-ESA '12, ISTE Ltd, London.
Hoel, T., & Hollins, P. A. (2011). Standards for Learning, Education and Training – a proposal for an improved process (pp. 1–3). Presented at the ICALT 2011. http://doi.org/10.1109/ICALT.2011.146
IDABC. (2004). European interoperability framework for pan-European eGovernment services. Version 1.0. Luxembourg: Office for Official Publications of the European Communities. Retrieved from http://ec.europa.eu/idabc/servlets/Docd552.pdf?id=19529
ISO 5966:1982 Documentation -- Presentation of scientific and technical reports. http://www.iso.org/iso/catalogue_detail.htm?csnumber=12160
Kitto, K., Cross, S., Waters, Z., & Lupton, M. (2015). Learning analytics beyond the LMS (pp. 11–15). Presented at the the Fifth International Conference, New York, New York, USA: ACM Press. http://doi.org/10.1145/2723576.2723627
LAK11 (2011). Call for Papers. 1st International Conference on Learning Analytics and Knowledge. Online at https://tekri.athabascau.ca/analytics/call-papers
Macfadyen, L. P., & Dawson, S. (2010). Mining LMS data to develop an “early warning system” for educators: A proof of concept. Computers and Education, 54(2), 588–599. http://doi.org/10.1016/j.compedu.2009.09.008
Merceron, A., Blikstein, P., & Siemens, G. (2015). Learning analytics: From big data to meaningful data. Journal of Learning Analytics, 2(3), 4–8. http://doi.org/10.18608/jla.2015.23.2
Regnell, B., Kimbler, K., & Wesslen, A. (1995). Improving the use case driven approach to requirements engineering. Presented at the RE '95: Proceedings of the Second IEEE International Symposium on Requirements Engineering, IEEE Computer Society.
Rienties, B., Toetenel, L., & Bryan, A. (2015). “Scaling up” learning design: impact of learning design activities on LMS behavior and performance (pp. 315–319). Presented at the LAK '15: Proceedings of the Fifth International Conference on Learning Analytics And Knowledge, ACM. http://doi.org/10.1145/2723576.2723600
Van den Eynden, V., and Bishop, L. (2014). Incentives and motivations for sharing research data. A Knowledge Exchange Report. Retrieved from: knowledge-exchange.info/Default. aspx?ID=733
191191191
Chen, W. et al. (Eds.) (2016). Proceedings of the 24th
International Conference on Computers in Education.
India: Asia-Pacific Society for Computers in Education
Reflective Experiential Learning: Using Active
Video Watching for Soft Skills Training
Antonija MITROVICa*
, Vania DIMITROVAb, Amali WEERASINGHE
c & Lydia LAU
b
aIntelligent Computer Tutoring Group, University of Canterbury, New Zealand
bSchool of Computing, University of Leeds, UK
cSchool of Computer Science, University of Adelaide, Australia
Abstract: Learning by watching videos has become the dominant way of learning for
millennials. However, watching videos is a passive form of learning which usually results in a
low level of engagement. As the result, video-based learning often results in poor learning
outcomes. One of the proven strategies to increase engagement is to integrate interactive
activities such as quizzes and assessment problems into videos. Although this strategy increases
engagement, it requires changing existing videos and therefore substantial effort from the
teacher. We have developed the Active Video Watching (AVW) system that enables the teacher
to use existing videos from YouTube without modifications. The teacher is required to define a
set of aspects for videos, which serve as reflective scaffolds in order to increase engagement and
focus learners’ thinking. AVW provides a Personal Space for individual learners to link their
personal experiences while watching videos. The comments collected can be used by the
individuals to reflect on their own thoughts or to be shared with other learners in the Social
Space. We conducted a study with postgraduate students on presentation skills. The results
show that the level of engagement with AVW was high, and that the aspects were effective as
reflection prompts. We plan to conduct further studies related to other types of soft skills, and
also to further extend AVW to provide individualized feedback to students.
Keywords: soft skills, video-based learning, engagement, scaffolding reflection
1. Introduction
Video-based learning is one of the main strategies to provide learning environments for millennials,
together with mobile learning and gamification (Arelando, 2013). Learning by watching videos is used
in a wide spectrum of instructional settings, ranging from flipped classrooms (Kurtz et al., 2014), online
learning and MOOCs (Guo, Kim and Rubin, 2014; Koedinger et al., 2015), to informal learning using
YouTube. Videos are especially useful for soft-skills training, as such skills are difficult to teach in
classrooms due to their resource-intensive nature. Soft skills (such as communicating, negotiating,
collaborating, critical thinking, reasoning about societal/ethical responsibilities and intercultural
awareness) are widely seen as crucial for employability in the knowledge economy (National Research
Council, 2012; EU Policy communication, 2012; World Economic Forum Report, 2016). These skills
are gaining growing attention in the technology-enhanced learning community, with a focus on ill-
defined domains (Mitrovic and Weerasinghe, 2009). Example systems to support learning in ill-
defined domains include collaborative spaces building on social interactions or situational simulations
where the learners can ‘experience’ complex situations in, e.g. simulated internships (Chesler et al.,
2015).
Watching videos is inherently a passive form of learning (Chi, 2009), which usually results in a
low level of engagement. In order to learn effectively, students need to engage with video content and
self-regulate their learning. Research shows that several factors influence how students engage with
videos. Guo and colleagues (2014) found that shorter videos are more engaging than longer ones, and
that video production is also important: students engage more with informal, talking-head style or
Khan-style drawing videos in comparison to pre-recorded lectures.
One of the proven strategies to increase engagement is to integrate interactive activities such as
quizzes into videos (Kovacs, 2016). Although this strategy increases engagement, it requires changing
192192
existing videos, resulting in substantial effort from the teacher. Additionally, such activities exist
outside the video watching space and they do not provide mechanisms to engage with video content
while watching. There is evidence in MOOCs that students who engage primarily with videos skip
assessment problems and other interactive activities (Guo, Kim and Rubin, 2014).
Therefore, it would be beneficial to provide explicit support for engagement during video
watching. Such support can also aim to foster metacognitive skills essential for effective learning,
which students often lack (Bannert and Mengelkapm, 2008; Chi, 2000). Explicit prompts have been
used to support metacognitive activities such as self-explanation (Conati and VanLehn, 2000;
Weerasinghe and Mitrovic, 2004) or reflection (Lin and Lehman, 1999; Bannert and Mengelkamp,
2013) in computer-based learning environments.
We have developed the Active Video Watching (AVW) system that provides such support via
aspects. Aspects are prompts that focus the learner’s attention on important elements presented in
videos, and encourage learners to link the presented material to their previous experience. Therefore,
aspects support reflection, by offering students opportunities to think about their own experience in
relation to presented material (Verpoorten, Westera and Specht, 2010). While aspects in AVW provide
explicit support for reflection, their usage is at the learners’ discretion.
In this paper, we focus on the ill-defined task of delivering pitch presentations. Increasingly,
researchers are asked to present their work in a short, sharp and engaging manner. This is also crucial in
businesses where a new product or a proposal has to be presented to customers or funders. Pitch
presentations are being used as a form of public engagement vehicle, which aim to excite, persuade, and
open up opportunities. This can be at odds with the usual presentations for research dissemination,
which would examine the rigour of approach, grounded in the past for credibility, and the details of the
approach/techniques employed. Training students to deliver presentations is mostly based on practical
role-based experiences, which is resource intense (Hetzner et al., 2011). AVW provides a scalable way
of assisting learners to improve their knowledge about delivering pitch presentations.
The focus of our study is to understand the effect of aspects on engagement and reflection during
video-based learning. The work is part of an ongoing collaboration between the University of Leeds,
the University of Canterbury and the University of Adelaide, which aims at scaling up the deployment
of AVW for soft skills training, and its potential in the development of interactive personalized nudges
for self-regulated learning.
The goal of the learning resources used in AVW is to help postgraduate students acquire new
skills for a pitch presentation, and use this opportunity to reflect on their own presentation skills. There
are two assumptions in our approach. Firstly, we assume that past experience may be recalled while
watching a video that is useful for personal reflection. Furthermore, sharing these experiences may be
useful for opening up the learner’s mind when there is dissimilarity amongst the experiences, or
improving the learner’s confidence when similar experiences were voiced by others.
We start by presenting the AVW system, and the activities students perform in its Private and
Social Spaces. Section 3 presents the design of our experiment, while Section 4 presents the findings.
We then discuss the outcomes of the study and the plans for future research.
2. The Active Video Watching (AVW) System
AVW is a controlled video watching environment that facilitates reflective experiential learning. In
AVW, the teacher creates a class, and specifies a set of videos to be used. For each video, the teacher
provides a short description, and defines a set of aspects. Aspects serve as scaffolds for reflection: their
goal is to focus the student’s attention to specific points related to the videos. The choice of aspects is
important, as they should guide student’s thinking, scaffold and foster reflection. The student can use
aspects to tag his/her comments.
The AVW system provides a learning environment consisting of two components: the Private
Space and the Social Space. Initially students watch and comment on videos individually in the Private
Space (Figure 1). In order to enter a comment, the learner needs to stop the video, type in their thoughts
and select an aspect. The system records information about the specific place in the video (i.e. the time
elapsed from the start) related to the comment together with other relevant information. The student can
193193

watch the video multiple times, including rewinding and skipping parts of the video. Previously made
comments are visible at the bottom of the page.
Once the teacher approves comments for sharing, anonymized comments are available to the
whole class in the Social Space (Figure 2). In this space, the learner can browse the comments made by
the class, and rate them. The learner can sort the comments by the elapsed time in the video, so that
comments on the same part of the video are close to each other. That way, the student can check how
similar or different those comments are from their own comments. It is also possible to sort the
comments by aspects used, which allows the learner to see the reactions of other students about the
same concepts presented in the videos. The options for rating are predefined by the teacher. In addition
to reading/rating the comments, the learner can click on ‘view video snippet’ and watch the part of the
video that the comment refers to.
Figure 1. Personal Space
The teacher can observe comments and ratings, and also download the interaction data from the
AVW as an XML file that includes comments tagged with aspects, timing in the video when a comment
was made and ratings made on comments. The file can be processed for further analysis to get deeper
insights into the learners’ experience with AVW. In the previous trials of AVW, the researchers within
194194
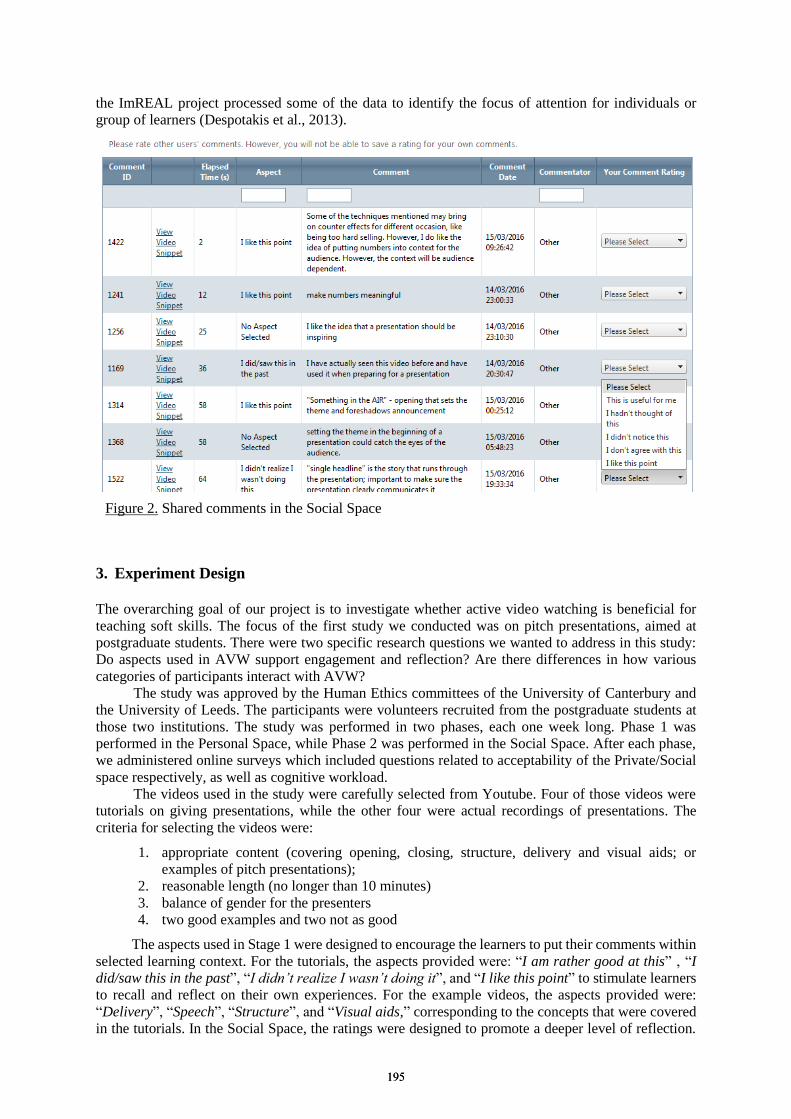
the ImREAL project processed some of the data to identify the focus of attention for individuals or
group of learners (Despotakis et al., 2013).
Figure 2. Shared comments in the Social Space
3. Experiment Design
The overarching goal of our project is to investigate whether active video watching is beneficial for
teaching soft skills. The focus of the first study we conducted was on pitch presentations, aimed at
postgraduate students. There were two specific research questions we wanted to address in this study:
Do aspects used in AVW support engagement and reflection? Are there differences in how various
categories of participants interact with AVW?
The study was approved by the Human Ethics committees of the University of Canterbury and
the University of Leeds. The participants were volunteers recruited from the postgraduate students at
those two institutions. The study was performed in two phases, each one week long. Phase 1 was
performed in the Personal Space, while Phase 2 was performed in the Social Space. After each phase,
we administered online surveys which included questions related to acceptability of the Private/Social
space respectively, as well as cognitive workload.
The videos used in the study were carefully selected from Youtube. Four of those videos were
tutorials on giving presentations, while the other four were actual recordings of presentations. The
criteria for selecting the videos were:
1. appropriate content (covering opening, closing, structure, delivery and visual aids; or
examples of pitch presentations);
2. reasonable length (no longer than 10 minutes)
3. balance of gender for the presenters
4. two good examples and two not as good
The aspects used in Stage 1 were designed to encourage the learners to put their comments within
selected learning context. For the tutorials, the aspects provided were: “I am rather good at this” ‚ “I
did/saw this in the past”, “I didn’t realize I wasn’t doing it”, and “I like this point” to stimulate learners
to recall and reflect on their own experiences. For the example videos, the aspects provided were:
“Delivery”, “Speech”, “Structure”, and “Visual aids,” corresponding to the concepts that were covered
in the tutorials. In the Social Space, the ratings were designed to promote a deeper level of reflection.
195195
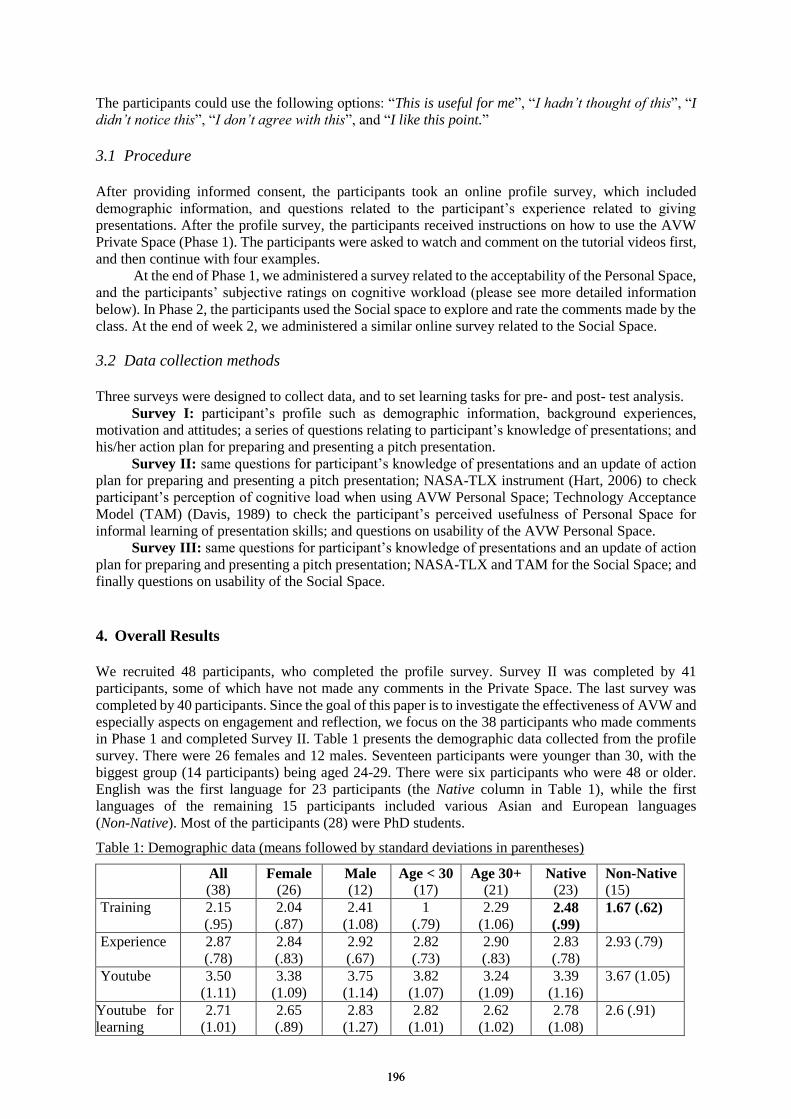
The participants could use the following options: “This is useful for me”, “I hadn’t thought of this”, “I
didn’t notice this”, “I don’t agree with this”, and “I like this point.”
3.1 Procedure
After providing informed consent, the participants took an online profile survey, which included
demographic information, and questions related to the participant’s experience related to giving
presentations. After the profile survey, the participants received instructions on how to use the AVW
Private Space (Phase 1). The participants were asked to watch and comment on the tutorial videos first,
and then continue with four examples.
At the end of Phase 1, we administered a survey related to the acceptability of the Personal Space,
and the participants’ subjective ratings on cognitive workload (please see more detailed information
below). In Phase 2, the participants used the Social space to explore and rate the comments made by the
class. At the end of week 2, we administered a similar online survey related to the Social Space.
3.2 Data collection methods
Three surveys were designed to collect data, and to set learning tasks for pre- and post- test analysis.
Survey I: participant’s profile such as demographic information, background experiences,
motivation and attitudes; a series of questions relating to participant’s knowledge of presentations; and
his/her action plan for preparing and presenting a pitch presentation.
Survey II: same questions for participant’s knowledge of presentations and an update of action
plan for preparing and presenting a pitch presentation; NASA-TLX instrument (Hart, 2006) to check
participant’s perception of cognitive load when using AVW Personal Space; Technology Acceptance
Model (TAM) (Davis, 1989) to check the participant’s perceived usefulness of Personal Space for
informal learning of presentation skills; and questions on usability of the AVW Personal Space.
Survey III: same questions for participant’s knowledge of presentations and an update of action
plan for preparing and presenting a pitch presentation; NASA-TLX and TAM for the Social Space; and
finally questions on usability of the Social Space.
4. Overall Results
We recruited 48 participants, who completed the profile survey. Survey II was completed by 41
participants, some of which have not made any comments in the Private Space. The last survey was
completed by 40 participants. Since the goal of this paper is to investigate the effectiveness of AVW and
especially aspects on engagement and reflection, we focus on the 38 participants who made comments
in Phase 1 and completed Survey II. Table 1 presents the demographic data collected from the profile
survey. There were 26 females and 12 males. Seventeen participants were younger than 30, with the
biggest group (14 participants) being aged 24-29. There were six participants who were 48 or older.
English was the first language for 23 participants (the Native column in Table 1), while the first
languages of the remaining 15 participants included various Asian and European languages
(Non-Native). Most of the participants (28) were PhD students.
Table 1: Demographic data (means followed by standard deviations in parentheses)
All
(38) Female
(26) Male
(12) Age < 30
(17) Age 30+
(21) Native
(23) Non-Native
(15)
Training 2.15
(.95)
2.04
(.87)
2.41
(1.08)
1
(.79)
2.29
(1.06) 2.48
(.99)
1.67 (.62)
Experience 2.87
(.78)
2.84
(.83)
2.92
(.67)
2.82
(.73)
2.90
(.83)
2.83
(.78)
2.93 (.79)
Youtube 3.50
(1.11)
3.38
(1.09)
3.75
(1.14)
3.82
(1.07)
3.24
(1.09)
3.39
(1.16)
3.67 (1.05)
Youtube for
learning
2.71
(1.01)
2.65
(.89)
2.83
(1.27)
2.82
(1.01)
2.62
(1.02)
2.78
(1.08)
2.6 (.91)
196196

Because one of our research questions is to investigate the effect of individual differences on
engagement in AVW, we divided the participants based on their gender, age and the first language, and
report the demographic data for those subgroups. One of the questions in the profile student required the
participants to report the amount of training they had on giving presentations prior to the study (the
Training row in Table 1), using the Likert scale ranging from 1 (No training) to 5 (Extensive training).
There was no difference on this measure between males and females, or between younger and more
mature students, but there was a significant difference between native and non-native English speakers
(Mann-Whitney U = 210.5, p = .014). We also asked the participants about their experience in giving
presentations (1 – Not experienced, 5 – Highly experienced). There was no significant difference on
experience for any of the classifications, but there was a significant correlation between the overall
scores for Training and Experience (r = .507, p = .001).
We asked participants how often they watched Youtube videos, and how often they used
Youtube for learning (1 - never, 2 - occasionally, 3 - once a month, 4 - every week, 5 - every day). There
were no significant differences on the scores for these questions between various categories of
participants, but the scores on these questions are significantly correlated overall (r = .615, p < .001).
4.1 Do aspects support engagement and reflection?
In order to investigate whether AVW is effective in supporting engagement, we analyzed the collected
data from AVW. For each video available in the Private Space, Table 2 presents its duration and the
total number of comments made by the participants. It is encouraging to see that the participants were
very active, and made many comments on tutorials and examples. The paired t-test reported a
marginally significant difference on the total number of comments the participants made on tutorials
compared to the comments made on examples (two-tailed t = 1.72, p = .093). Table 2 also reports the
number of ratings made in the Social Space. The number of comments that were not rated in the Social
Space is very small (2.42%). The total number of ratings in the Social Space is 2,706. There were more
ratings on comments related to tutorials in comparison to the ratings on examples, but the difference is
not significant.
Table 2. Information about videos and comments/ratings
Video Length
Comments
[Personal
Space]
Comments
without
ratings
Ratings
[Social Space]
Tutorial 1 2.54' 89 2 603
Tutorial 2 7.37' 110 1 382
Tutorial 3 6.55' 120 3 402
Tutorial 4 6.22' 90 3 261
Example 1 3.23' 79 0 272
Example 2 8.28' 93 2 281
Example 3 6.48' 100 3 283
Example 4 3.25' 63 4 222
Total 744 18 2,706
We also analyzed the comments based on different aspects, reported in Table 3. In the Private
Space, the participants could make a comment without selecting an aspect, and that happened more
often for tutorials than for examples. The most frequently used aspect for tutorials was ‘I like this point’
(41.8%), but the participants also used aspects that require reflection on their past experiences and
presentation skills: ‘I am rather good at this’ (8%), ‘I did/saw this in the past’ (12.7%) and ‘I didn’t
realize I wasn’t doing this’ (12.22%). The use of those aspects shows evidence of reflective thinking.
For the four examples, the comments are almost equally distributed over various aspects,
showing that the participants were watching the videos with those aspects in mind. This is evidence that
aspects do scaffold participants’ thinking.
197197
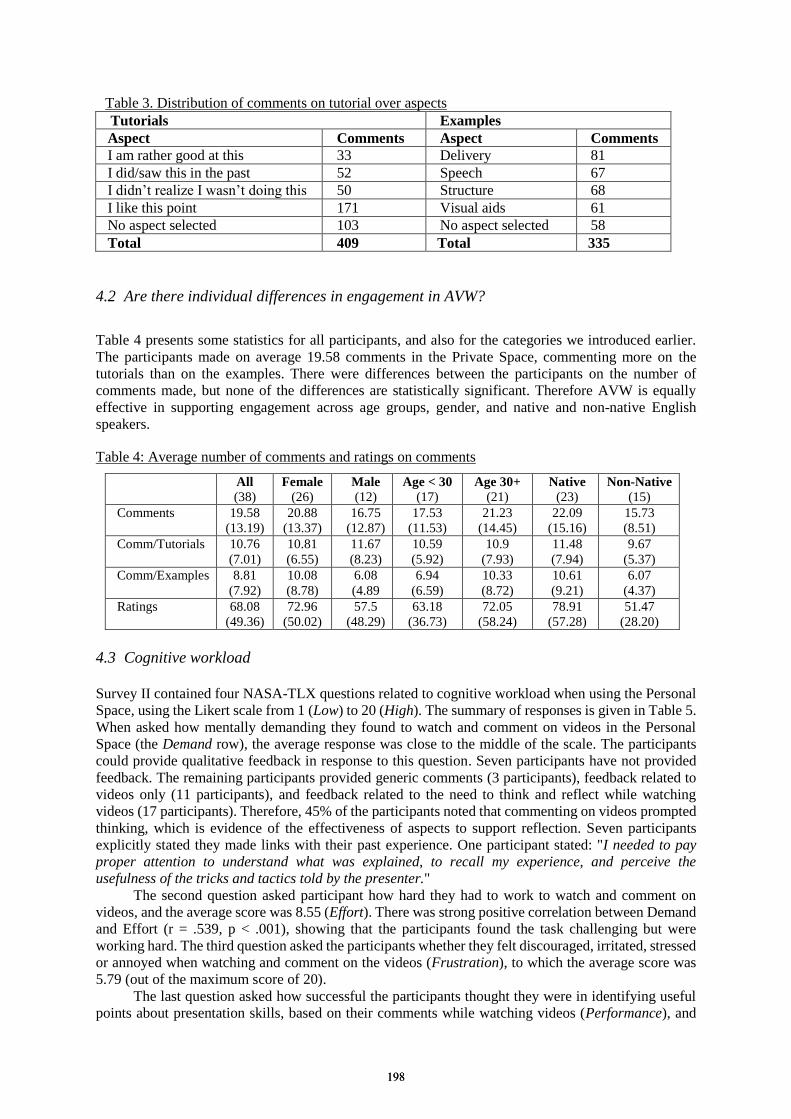
Table 3. Distribution of comments on tutorial over aspects
Tutorials Examples
Aspect Comments Aspect Comments
I am rather good at this 33 Delivery 81
I did/saw this in the past 52 Speech 67
I didn’t realize I wasn’t doing this 50 Structure 68
I like this point 171 Visual aids 61
No aspect selected 103 No aspect selected 58
Total 409 Total 335
4.2 Are there individual differences in engagement in AVW?
Table 4 presents some statistics for all participants, and also for the categories we introduced earlier.
The participants made on average 19.58 comments in the Private Space, commenting more on the
tutorials than on the examples. There were differences between the participants on the number of
comments made, but none of the differences are statistically significant. Therefore AVW is equally
effective in supporting engagement across age groups, gender, and native and non-native English
speakers.
Table 4: Average number of comments and ratings on comments
All
(38) Female
(26) Male
(12) Age < 30
(17) Age 30+
(21) Native
(23) Non-Native
(15)
Comments 19.58
(13.19)
20.88
(13.37)
16.75
(12.87)
17.53
(11.53)
21.23
(14.45)
22.09
(15.16)
15.73
(8.51)
Comm/Tutorials 10.76
(7.01)
10.81
(6.55)
11.67
(8.23)
10.59
(5.92)
10.9
(7.93)
11.48
(7.94)
9.67
(5.37)
Comm/Examples 8.81
(7.92)
10.08
(8.78)
6.08
(4.89
6.94
(6.59)
10.33
(8.72)
10.61
(9.21)
6.07
(4.37)
Ratings 68.08
(49.36)
72.96
(50.02)
57.5
(48.29)
63.18
(36.73)
72.05
(58.24)
78.91
(57.28)
51.47
(28.20)
4.3 Cognitive workload
Survey II contained four NASA-TLX questions related to cognitive workload when using the Personal
Space, using the Likert scale from 1 (Low) to 20 (High). The summary of responses is given in Table 5.
When asked how mentally demanding they found to watch and comment on videos in the Personal
Space (the Demand row), the average response was close to the middle of the scale. The participants
could provide qualitative feedback in response to this question. Seven participants have not provided
feedback. The remaining participants provided generic comments (3 participants), feedback related to
videos only (11 participants), and feedback related to the need to think and reflect while watching
videos (17 participants). Therefore, 45% of the participants noted that commenting on videos prompted
thinking, which is evidence of the effectiveness of aspects to support reflection. Seven participants
explicitly stated they made links with their past experience. One participant stated: "I needed to pay
proper attention to understand what was explained, to recall my experience, and perceive the
usefulness of the tricks and tactics told by the presenter."
The second question asked participant how hard they had to work to watch and comment on
videos, and the average score was 8.55 (Effort). There was strong positive correlation between Demand
and Effort (r = .539, p < .001), showing that the participants found the task challenging but were
working hard. The third question asked the participants whether they felt discouraged, irritated, stressed
or annoyed when watching and comment on the videos (Frustration), to which the average score was
5.79 (out of the maximum score of 20).
The last question asked how successful the participants thought they were in identifying useful
points about presentation skills, based on their comments while watching videos (Performance), and
198198
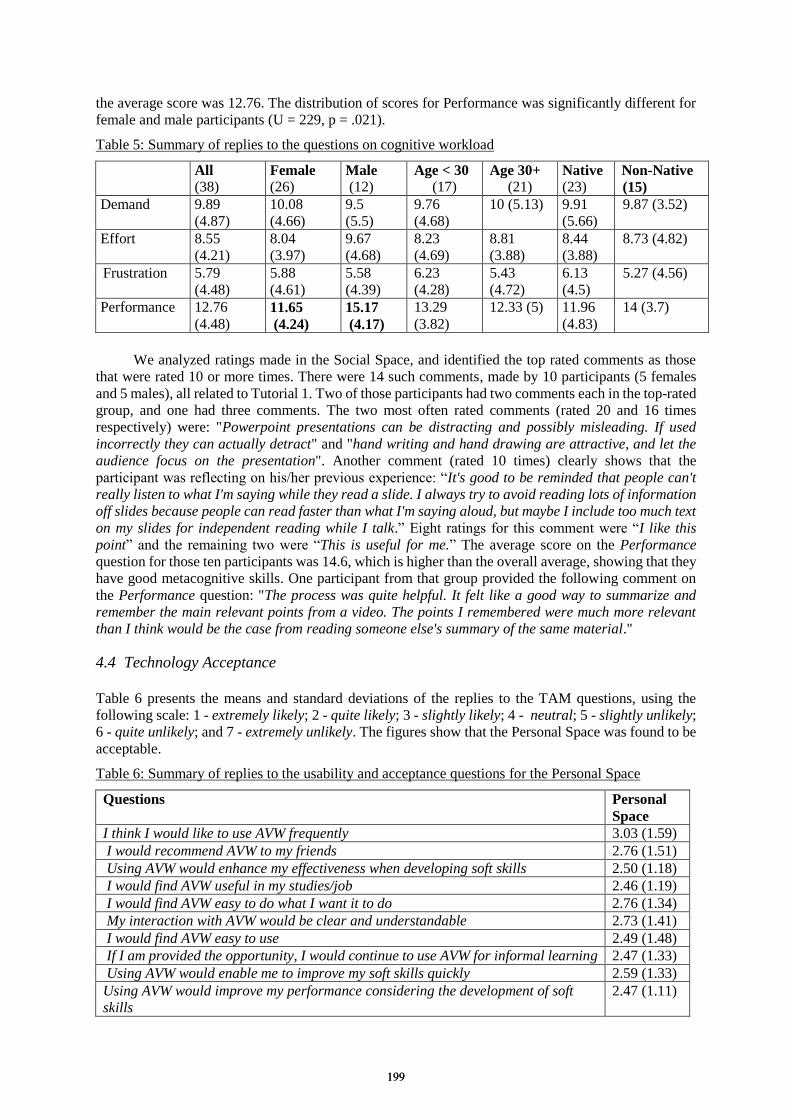
the average score was 12.76. The distribution of scores for Performance was significantly different for
female and male participants (U = 229, p = .021).
Table 5: Summary of replies to the questions on cognitive workload
All
(38) Female
(26) Male
(12) Age < 30
(17) Age 30+
(21) Native
(23) Non-Native
(15)
Demand 9.89
(4.87)
10.08
(4.66)
9.5
(5.5)
9.76
(4.68)
10 (5.13) 9.91
(5.66)
9.87 (3.52)
Effort 8.55
(4.21)
8.04
(3.97)
9.67
(4.68)
8.23
(4.69)
8.81
(3.88)
8.44
(3.88)
8.73 (4.82)
Frustration 5.79
(4.48)
5.88
(4.61)
5.58
(4.39)
6.23
(4.28)
5.43
(4.72)
6.13
(4.5)
5.27 (4.56)
Performance 12.76
(4.48) 11.65
(4.24)
15.17
(4.17)
13.29
(3.82)
12.33 (5) 11.96
(4.83)
14 (3.7)
We analyzed ratings made in the Social Space, and identified the top rated comments as those
that were rated 10 or more times. There were 14 such comments, made by 10 participants (5 females
and 5 males), all related to Tutorial 1. Two of those participants had two comments each in the top-rated
group, and one had three comments. The two most often rated comments (rated 20 and 16 times
respectively) were: "Powerpoint presentations can be distracting and possibly misleading. If used
incorrectly they can actually detract" and "hand writing and hand drawing are attractive, and let the
audience focus on the presentation". Another comment (rated 10 times) clearly shows that the
participant was reflecting on his/her previous experience: “It's good to be reminded that people can't
really listen to what I'm saying while they read a slide. I always try to avoid reading lots of information
off slides because people can read faster than what I'm saying aloud, but maybe I include too much text
on my slides for independent reading while I talk.” Eight ratings for this comment were “I like this
point” and the remaining two were “This is useful for me.” The average score on the Performance
question for those ten participants was 14.6, which is higher than the overall average, showing that they
have good metacognitive skills. One participant from that group provided the following comment on
the Performance question: "The process was quite helpful. It felt like a good way to summarize and
remember the main relevant points from a video. The points I remembered were much more relevant
than I think would be the case from reading someone else's summary of the same material."
4.4 Technology Acceptance
Table 6 presents the means and standard deviations of the replies to the TAM questions, using the
following scale: 1 - extremely likely; 2 - quite likely; 3 - slightly likely; 4 - neutral; 5 - slightly unlikely;
6 - quite unlikely; and 7 - extremely unlikely. The figures show that the Personal Space was found to be
acceptable.
Table 6: Summary of replies to the usability and acceptance questions for the Personal Space
Questions Personal
Space
I think I would like to use AVW frequently 3.03 (1.59)
I would recommend AVW to my friends 2.76 (1.51)
Using AVW would enhance my effectiveness when developing soft skills 2.50 (1.18)
I would find AVW useful in my studies/job 2.46 (1.19)
I would find AVW easy to do what I want it to do 2.76 (1.34)
My interaction with AVW would be clear and understandable 2.73 (1.41)
I would find AVW easy to use 2.49 (1.48)
If I am provided the opportunity, I would continue to use AVW for informal learning 2.47 (1.33)
Using AVW would enable me to improve my soft skills quickly 2.59 (1.33)
Using AVW would improve my performance considering the development of soft
skills
2.47 (1.11)
199199

5. Discussion and Conclusions
AVW was effective in supporting engagement overall, and also for various categories of participants.
Although the participants differed in how much they watched videos in Youtube and used them for
learning, it is encouraging that there was no strong correlation between the use of Youtube and the
amount of engagement in AVW (in terms of the number of comments the participants made in AVW).
In fact, ten participants who stated that they never or only occasionally watched Youtube videos made
on average 20 comments in the Private Space (which is higher than the overall average number of
comments). Although there was a significant difference in self-reported scores for the amount of
previous training for native and non-native English speakers, there was neither significant difference on
any measures collected from AVW nor on the self-reported scores for mental workload.
The participants made a lot of comments in the Private Space, and submitted many ratings of the
comments in the Social Space. There were more comments on tutorials than on example videos, which
shows that the participants paid more attention to the tutorials. This fact is consistent with the relatively
low scores the participants selected for the amount of prior training and experience in giving
presentations in the profile survey. Since the participants felt they needed to improve their presentation
skills, they paid more attention to the tutorials.
Most of the comments made on the tutorials were about liking certain points in the tutorials,
showing that the participants were learning from those videos. The participants also used the aspects
which show reflection, such ‘‘I am rather good at this,’ ‘I did/saw this in the past’ and ‘I didn’t realize
I wasn’t doing this’ (33% of the comments). Therefore, the aspects did scaffold reflection.
When watching the example videos, the participants commented on them in relation to the
important aspects of presentations they learnt about in the tutorial videos (delivery, speech, structure
and visual aids). Therefore, the aspects were effective in focusing the participants’ thinking in relation
to the examples.
The findings from our study show that AVW supported engagement and reflective thinking. The
level of acceptance was relatively good. The participants reported that the task was demanding (10 out
of the maximum score of 20). The qualitative feedback on the four TLX questions showed strong
evidence of the participants engaging in reflection, thus showing that the aspects are effective in
supporting such metacognitive activities.
Overall, we found evidence that aspects are effective as scaffolds for engagement and reflection.
We plan to perform semantic analyses of the open-ended comments provided by the participants, to get
a better understanding of how much the participants reflected on their experiences. We also plan to
conduct more studies on supporting presentations skills with different populations of students, as our
population was small and relatively homogeneous (i.e. all participants were postgraduate students).
Additional future plans include conducting studies on using AVW to support other soft skills.
The presented results on using AVW and especially aspects to scaffold reflective learning are
encouraging, primarily because of the relatively low level of effort required to provide such a learning
environment to students. Soft skills are very demanding to teach in classroom situations, as feedback
and support needs to be provided at an individual level. AVW is cost-effective, as it only requires the
teacher to select videos and specify a set of thought-provoking aspects for them.
Our future research plans include providing adaptive feedback to students while they watch
videos, as well as developing tools to provide feedback to the teachers about the individual student's
activities in the Personal Space and the activities of the class in the Social Space.
Acknowledgements
We would like to thank the participants who took part in our study. This research was supported by the
EU-FP7-ICT-257184 ImREAL grant, and by a teaching development grant from the University of
Canterbury.
References
Arelando, E. (2013). The Millennials Are Coming! Proven Engagement Strategies. Learning Solutions Magazine.
200200

www.learningsolutionsmag.com/articles/1188/the-millennials-are-coming-proven-engagement-strategies
Bannert, M., Mengelkamp, C. (2008). Assessment of metacognitive skills by means of instruction to think aloud
and reflect when prompted. Does the verbalisation method affect learning?. Metacognition and Learning,
3(1), 39-58.
Bannert, M., Mengelkamp, C. (2013). Scaffolding hypermedia learning through metacognitive prompts. In
International handbook of metacognition and learning technologies (pp. 171-186). Springer New York.
Chesler, N. C., Ruis, A. R., Collier, W., Swiecki, Z., Arastoopour, G., Shaffer, D. W. (2015). A novel paradigm
for engineering education: Virtual internships with individualized mentoring and assessment of engineering
thinking. Journal of biomechanical engineering, 137(2).
Chi, M. T. (2000). Self-explaining expository texts: The dual processes of generating inferences and repairing
mental models. Advances in instructional psychology, 5, 161-238.
Chi, M. T. (2009). Active constructive interactive: A conceptual framework for differentiating learning activities.
Topics in Cognitive Science, 1(1), 73-105.
Conati, C., VanLehn, K. (2000). Toward computer-based support of meta-cognitive skills: A computational
framework to coach self-explanation. International Journal of Artificial Intelligence in Education, 11,
389-415.
Davis, F. D. (1989). Perceived usefulness, perceived ease of use, and user acceptance of information technology.
MIS quarterly, 319-340.
Despotakis, D., Dimitrova V., Lau, L. Thakker, D., Ascolose, A., Pannese, L. (2013). ViewS in User Generated
Content for Enriching Learning Environments: A Semantic Sensing Approach. Proc. Artificial Intelligence
in Education, Memphis, USA, pp. 121-130.
EU Policy Communication (2012). Rethinking Education: Investing in skills for better socio-economic outcomes.
Guo, P., J., Kim, J., Rubin, R. (2009). How Video Production Affects Student Engagement: An Empirical Study
of MOOC Videos. Proc. 1st ACM Conf. Learning at Scale, pp. 41-50.
Hart, S. G. (2006). NASA-task load index (NASA-TLX); 20 years later. In Proc. the Human Factors and
Ergonomics Society annual meeting, 50(9), pp. 904-908, Sage Publications.
Hetzner, S., Steiner, C.M., Dimitrova, V., Brna, P., Conlan, O., Adult Self-regulated Learning through Linking
Experience in Simulated and Real World: A Holistic Approach(2011), Sixth European Conference on
Technology Enhanced Learning, 166-180
Koedinger, K.R., Kim, J., Jia Z., McLaughlin E., Bier, N. (2015). Learning is Not a Spectator Sport: Doing is
Better than Watching for Learning from a MOOC Learning at Scale, Proc. 2nd
ACM Conf. Learning @
Scale, 111-120.
Koedinger, K. R., McLaughlin, E. A., Jia, J. Z., Bier, N. L. (2016). Is the doer effect a causal relationship?: how
can we tell and why it's important. Proc. 6th
Int. Conf. Learning Analytics & Knowledge, pp. 388-397.
Kovacs, G. (2016). Effects of in-video quizzes on MOOC lecture viewing, Proc. 3rd
Learning @ Scale conf., pp.
31-40.
Kurtz, G., Tsimerman, A., Steiner-Lavi, O. (2014) The Flipped-Classroom Approach: The Answer to Future
Learning? European Journal of Open, Distance and E-learning, 17(2), 172-182.
Lin, X., Lehman, J. D. (1999). Supporting learning of variable control in a computer-based biology environment:
Effects of prompting college students to reflect on their own thinking. Journal of research in science
teaching, 36(7), 837-858.
Mitrovic, A., Weerasinghe, A. (2009). Revisiting ill-definedness and the consequences for ITSs. Proc. Artificial
intelligence in education: Building learning systems that care from knowledge representation to affective
modelling, pp. 375-382.
National Research Council (2012) Education for Life and Work: Developing Transferable Knowledge and Skills
in the 21st Century. Washington, DC: The National Academies Press.
Tan J. P., Yang S., Koh, E. Jonathan, C., (2016). Fostering 21st century literacies through a collaborative critical
reading and learning analytics environment: User-perceived benefits and problematics. Proc. 6th
Int. Conf.
Learning Analytics, pp. 430-434
Verpoorten, D., Westera, W., Specht, M. (2010). Reflection amplifiers in online courses: a classification
framework. Journal of Interactive Learning Research, 21(4).
Weerasinghe, A., & Mitrovic, A. (2004, September). Supporting self-explanation in an open-ended domain. In
Knowledge-based intelligent information and engineering systems (pp. 306-313). Springer Berlin
Heidelberg.
World Economic Forum Report (2016) What are the 21st-century skills every student needs?
https://www.weforum.org/agenda/2016/03/21st-century-skills-future-jobs-students
201201
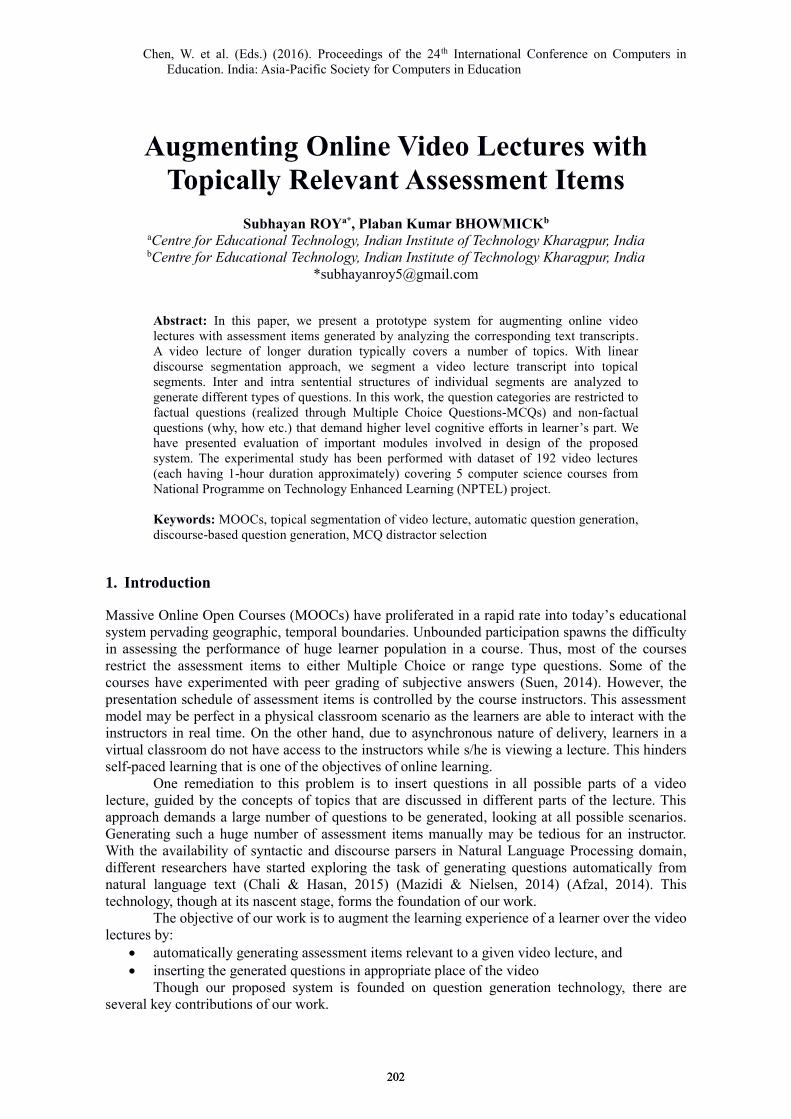
Chen, W. et al. (Eds.) (2016). Proceedings of the 24th International Conference on Computers in
Education. India: Asia-Pacific Society for Computers in Education
Augmenting Online Video Lectures with
Topically Relevant Assessment Items
Subhayan ROYa*, Plaban Kumar BHOWMICKb
aCentre for Educational Technology, Indian Institute of Technology Kharagpur, India
bCentre for Educational Technology, Indian Institute of Technology Kharagpur, India
Abstract: In this paper, we present a prototype system for augmenting online video
lectures with assessment items generated by analyzing the corresponding text transcripts.
A video lecture of longer duration typically covers a number of topics. With linear
discourse segmentation approach, we segment a video lecture transcript into topical
segments. Inter and intra sentential structures of individual segments are analyzed to
generate different types of questions. In this work, the question categories are restricted to
factual questions (realized through Multiple Choice Questions-MCQs) and non-factual
questions (why, how etc.) that demand higher level cognitive efforts in learner’s part. We
have presented evaluation of important modules involved in design of the proposed
system. The experimental study has been performed with dataset of 192 video lectures
(each having 1-hour duration approximately) covering 5 computer science courses from
National Programme on Technology Enhanced Learning (NPTEL) project.
Keywords: MOOCs, topical segmentation of video lecture, automatic question generation,
discourse-based question generation, MCQ distractor selection
1. Introduction
Massive Online Open Courses (MOOCs) have proliferated in a rapid rate into today’s educational
system pervading geographic, temporal boundaries. Unbounded participation spawns the difficulty
in assessing the performance of huge learner population in a course. Thus, most of the courses
restrict the assessment items to either Multiple Choice or range type questions. Some of the
courses have experimented with peer grading of subjective answers (Suen, 2014). However, the
presentation schedule of assessment items is controlled by the course instructors. This assessment
model may be perfect in a physical classroom scenario as the learners are able to interact with the
instructors in real time. On the other hand, due to asynchronous nature of delivery, learners in a
virtual classroom do not have access to the instructors while s/he is viewing a lecture. This hinders
self-paced learning that is one of the objectives of online learning.
One remediation to this problem is to insert questions in all possible parts of a video
lecture, guided by the concepts of topics that are discussed in different parts of the lecture. This
approach demands a large number of questions to be generated, looking at all possible scenarios.
Generating such a huge number of assessment items manually may be tedious for an instructor.
With the availability of syntactic and discourse parsers in Natural Language Processing domain,
different researchers have started exploring the task of generating questions automatically from
natural language text (Chali & Hasan, 2015) (Mazidi & Nielsen, 2014) (Afzal, 2014). This
technology, though at its nascent stage, forms the foundation of our work.
The objective of our work is to augment the learning experience of a learner over the video
lectures by:
automatically generating assessment items relevant to a given video lecture, and
inserting the generated questions in appropriate place of the video
Though our proposed system is founded on question generation technology, there are
several key contributions of our work.
202202

Deciding assessment timings: Typically, questions are asked after completion of the text
module, for example, completion of a topic. A topical segmentation-based approach has
been adopted in our work to identify appropriate places for inserting the questions.
Handling the noisy transcript: Most of the question generation systems in literature have
considered well-formed text (e.g., book paragraph, web article etc.) as source. However,
manually generated video transcripts are conversational in nature and in another extreme,
the transcript is not available at all. Automatic Speech Recognizers (ARSs) may be
employed to generate transcriptions. As a result, the transcripts either are conversational or
are noisy. This poses a significant challenge to generate question from noisy text.
Generation of the questions: Some previous work covers factual question generation with
information available at intra-sentence level. In this work, we intend to generate questions
that demand higher level cognitive skills on the learners’ part. Generation of such
questions may use inter-sentence relations guided by discourse theories.
Distractor selection for MCQs: In this work, external resources like Wikipedia have been
used to extract distractors for generated MCQs.
Choosing appropriate questions: A question ranking scheme has been devised to present
good quality questions to the learners.
With the above-mentioned contributions, the proposed work integrates different resources
to develop an end-to-end question generation system to augment learners’ experience in online
video lectures.
2. System Overview
In this section, we present an overview of the modules involved in implementation of the proposed
system (see Figure 1).
Figure 1. Overview of the proposed system
A video lecture can be seen as a sequence of segments, in each of which an instructor
covers a specific topic. End of each topic is a potential place for inserting assessment items, as a
self-motivated learner may want to test his/her understanding on the topic that s/he has covered
recently. Thus, the first module in the architecture takes a transcript of a video lecture as input and
203203

passes it to the topic boundary detection module. The architectural overview of the system is
shown in Figure 1. Different modules and processing flow of the system are as follows:
Topical n: Even if a typical video lecture covers a particular topic, it can be divided into
several sub-topics. This module looks at the topical distribution of input video lecture
transcript and marks potential topical boundaries.
Retrieving Well-formed Similar Text: To deal with the noisy nature of the transcripts, the
system finds well-formed text, that is semantically similar to the input transcript segment.
Wikipedia has been used as the source for well-formed text. However, it may be replaced
by any other resources. This module outputs a text slice from Wikipedia that is
semantically similar to the transcript segment.
Non-factual question generation: At this juncture, the processing flow forks into two
paths, namely, generation of factual MCQs and generation of non-factual questions. The
generation of non-factual questions involves inter sentence relations. A rule-based
approach has been adopted towards generating this kind of questions.
Choosing candidates for MCQs: CMU question generation tool1 has been used to generate
factual questions from the text. Among those questions, we choose some of the questions
as MCQ, for which the distractor can be generated.
Generating distractors for MCQs: The distractor or wrong alternatives for each of the
MCQs are generated using external knowledge base or ontology.
Question ranking: Due to different uncertain measures or heuristics taken by the preceding
sub-systems, there may be a possibility of having syntactically or semantically erroneous
questions as output. The question-ranking model helps to filter out the malformed or
irrelevant questions.
3. Topical Boundary Detection
Identification of topical boundaries is crucial for posing questions at appropriate temporal co-
ordinates of the video lecture. In the present study, such boundaries are detected using TopicTiling
algorithm (Riedl & Biemann, 2012) which uses topic models to determine topical shift. For
effective topical distinction, topic models are trained on Wikipedia articles sampled from subject
domains of the targeted lecture. According to the algorithm, the transcript is split into minimum
text units, i.e. sentences. A coherence score (𝑐𝑝) at each sentence boundary (𝑝) is computed by
comparing the distribution of topics in two adjacent blocks separated by 𝑝. These coherence scores
are computed by defining a window around each of the sentence boundaries. A window consists of
a left block, sentence boundary and a right block. Each block is represented as a T-dimensional
vector (assuming LDA model consists of 𝑇 topics) where the 𝑡-th dimension represents the
frequency of topic 𝑡 in the block. Coherence score (𝑐𝑝) is measured using cosine similarity of topic
vectors of two adjacent blocks. High similarity score indicates stronger coherence between two
adjacent blocks. The similarity scores are plotted and depth scores (𝑑𝑝) are computed at minima
points of the plot (refer to TextTiling algorithm (Hearst, 1997)). The points having depth score
beyond a threshold are considered to be segment boundaries. The output of this module will be a
set of transcript segments: TS={T1, T2, T3,. . . , Tm}.
4. Retrieving Well-formed Similar Text
As discussed earlier, video lectures may contain noise in terms of grammatical error and/or
homonyms (in case of ASR generated transcript). Directly generating questions from this text may
produce erroneous and irrelevant questions. Hence, a preliminary step is required to deal with
noisy transcript. This can be achieved using one of the following approaches:
Remove the noise from the transcript: The conversational texts can be removed from the
transcript by developing a classifier that classifies each sentence either into conversational
and non-conversational sentence.
1 CMU Question Generation Tool. http://www.cs.cmu.edu/~ark/mheilman/questions/
204204
Replace the transcript with a semantically similar document: Irrespective of the type of
the noise, replace the text with a semantically similar document taken from source where
the text is well-formed.
There are several issues with the first approach.
Removing the conversational sentences from transcript segment may break the coherence
of the text. This may interfere with discourse-based question generation module as abrupt
or rough transition of discourse relations will be observed.
An informative sentence may contain some conversational cues. This may confuse the
classifier and consequently informative text may be filtered out.
Apprehending the above-mentioned issues with the first approach, we have adopted the
second strategy that aims at finding similar and well-formed text slices from other sources.
We replaced each of the segments in 𝑇𝑆, with a semantically similar Wikipedia section. In
order to find the proper replacement for the targeted transcript segment 𝑇𝑆𝑡 ∈ 𝑇𝑆 , the concepts are
first identified using DBpedia’s Spotlight service (Mendes, Jakob, García-Silva, & Bizer, 2011).
Let 𝐶 = {𝐶1, 𝐶2, 𝐶3, . . . , 𝐶𝑛} is the list of concepts in 𝑇𝑆𝑡. For each 𝐶𝑏 ∈ 𝐶, Wikipedia article that is
linked to 𝐶𝑏 is fetched and divided into slices according to the Wikipedia article’s section and sub-
section headings. Some of the sections are not taken as candidates for replacement, like,
External_links, Further_reading, References, See_also, Notes, Footnotes, History etc. Let the
candidate slices of Wikipedia article 𝐶𝑏 are: 𝑊𝑏 = {𝑊𝑏1,𝑊𝑏2,𝑊𝑏3, . . . ,𝑊𝑏𝑘}. For the targeted
transcript segment 𝑇𝑆𝑡, a set of Wikipedia slices as 𝑊𝑆 = ⋃ 𝑊𝑘𝑛𝑘=1 are collected. In order to select
the most semantically similar slice from 𝑊𝑆, we have taken distributional semantics based
approach. Latent Semantic Analysis (LSA) model is used to collect distributional information and
to get semantic similarity in terms of vector/cosine similarity of the given text. Similarity scores
between 𝑇𝑆 and 𝑊𝑆𝑟 ∈ 𝑊𝑆 are calculated using the Cosine similarity as follows:
𝑠𝑖𝑚𝑖𝑙𝑎𝑟𝑖𝑡𝑦(𝑇𝑆⃗⃗ ⃗⃗ ,𝑊𝑆𝑟⃗⃗ ⃗⃗ ⃗⃗ ⃗⃗ ) = 𝑐𝑜𝑠(𝜃) =
𝑇𝑆⃗⃗⃗⃗ ⃗ . 𝑊𝑆𝑟⃗⃗ ⃗⃗ ⃗⃗ ⃗⃗ ⃗
‖𝑇𝑆⃗⃗⃗⃗ ⃗‖ ‖𝑊𝑆𝑟⃗⃗ ⃗⃗ ⃗⃗ ⃗⃗ ⃗‖ ………… (1)
𝑊𝑆𝑠 = 𝑎𝑟𝑔𝑚𝑎𝑥𝑊𝑆𝑟
𝑠𝑖𝑚𝑖𝑙𝑎𝑟𝑖𝑡𝑦(𝑇𝑆⃗⃗ ⃗⃗ ,𝑊𝑆𝑟⃗⃗ ⃗⃗ ⃗⃗ ⃗⃗ ) ………………….… (2)
The Wikipedia slice with the maximum similarity score (𝑊𝑆𝑠) is selected as the
replacement of the targeted transcript segment 𝑇𝑆.
5. Question Generation and Ranking
This module takes a Wikipedia slice (found similar to a transcript segment) and generates MCQ-
based factual questions and non-factual questions.
5.1 Text Preprocessing
It has been observed that anaphoric expressions present in the retrieved Wikipedia slice pose
difficulty in generating meaningful questions. For example:
Original text This has the advantage that incorrect candidate system designs can be revised
before a major investment has been made in actually implementing the design.
Generated question What are the advantages of this?
Where, the word “this” referred to “formal verification technique”, after anaphora resolution the
question will become:
Revised Question What are the advantages of formal verification technique?
In order to deal with this issue, a pre-processing step that performs pronoun resolution (Reconcile2
has been used) is applied over the text slice.
5.2 Generation of Non-Factual Questions
While factoid questions are good at testing learners’ knowledge level skills (lower order cognitive
skill), non-factual questions demand higher order cognitive skills such as inference, synthesis,
2 Reconcile – Coreference Resolution Engine. https://www.cs.utah.edu/nlp/reconcile/
205205
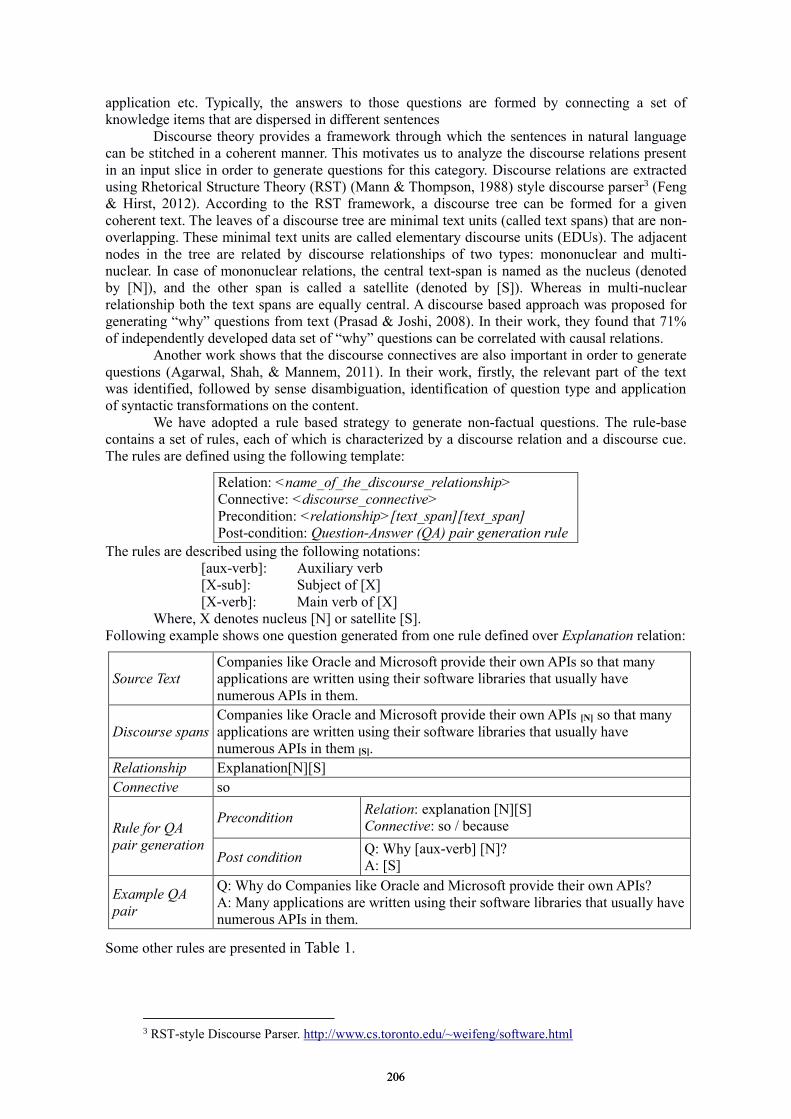
application etc. Typically, the answers to those questions are formed by connecting a set of
knowledge items that are dispersed in different sentences
Discourse theory provides a framework through which the sentences in natural language
can be stitched in a coherent manner. This motivates us to analyze the discourse relations present
in an input slice in order to generate questions for this category. Discourse relations are extracted
using Rhetorical Structure Theory (RST) (Mann & Thompson, 1988) style discourse parser3 (Feng
& Hirst, 2012). According to the RST framework, a discourse tree can be formed for a given
coherent text. The leaves of a discourse tree are minimal text units (called text spans) that are non-
overlapping. These minimal text units are called elementary discourse units (EDUs). The adjacent
nodes in the tree are related by discourse relationships of two types: mononuclear and multi-
nuclear. In case of mononuclear relations, the central text-span is named as the nucleus (denoted
by [N]), and the other span is called a satellite (denoted by [S]). Whereas in multi-nuclear
relationship both the text spans are equally central. A discourse based approach was proposed for
generating “why” questions from text (Prasad & Joshi, 2008). In their work, they found that 71%
of independently developed data set of “why” questions can be correlated with causal relations.
Another work shows that the discourse connectives are also important in order to generate
questions (Agarwal, Shah, & Mannem, 2011). In their work, firstly, the relevant part of the text
was identified, followed by sense disambiguation, identification of question type and application
of syntactic transformations on the content.
We have adopted a rule based strategy to generate non-factual questions. The rule-base
contains a set of rules, each of which is characterized by a discourse relation and a discourse cue.
The rules are defined using the following template:
Relation: <name_of_the_discourse_relationship>
Connective: <discourse_connective>
Precondition: <relationship>[text_span][text_span]
Post-condition: Question-Answer (QA) pair generation rule
The rules are described using the following notations:
[aux-verb]: Auxiliary verb
[X-sub]: Subject of [X]
[X-verb]: Main verb of [X]
Where, X denotes nucleus [N] or satellite [S].
Following example shows one question generated from one rule defined over Explanation relation:
Source Text
Companies like Oracle and Microsoft provide their own APIs so that many
applications are written using their software libraries that usually have
numerous APIs in them.
Discourse spans
Companies like Oracle and Microsoft provide their own APIs [N] so that many
applications are written using their software libraries that usually have
numerous APIs in them [S].
Relationship Explanation[N][S]
Connective so
Rule for QA
pair generation
Precondition Relation: explanation [N][S]
Connective: so / because
Post condition Q: Why [aux-verb] [N]?
A: [S]
Example QA
pair
Q: Why do Companies like Oracle and Microsoft provide their own APIs?
A: Many applications are written using their software libraries that usually have
numerous APIs in them.
Some other rules are presented in Table 1.
3 RST-style Discourse Parser. http://www.cs.toronto.edu/~weifeng/software.html
206206

Table 1: Rules for generating question answer pair.
Sl. Relationship Discourse connectives Rules for generating QA pairs
1 Explanation
[N][S] in order to, so, because
Q: Why [aux-verb] [N]?
A: [S]
2 Elaboration
[N][S] which, that
Q: What is [N-sub]?
A: [S]
Q: What [aux-verb] [N-sub] [N-verb]?
A: [S]
3 Joint
[N1][N2] and
Q: What [aux-verb] [N1-sub] [N2-verb]?
A: [N2]
4 Attribution
[S][N] on, that
Q: What [aux-verb] [S] about [N-sub]?
A: [N]
5 Condition
[N][S] if, there
Q: What happens if [S]?
A: [N]
Q: Where [N]?
A: [S]
6 Same-unit
[N1][N2] in
Q: What [aux-verb] [N1-verb] in [N1]?
A: [N2]
Examples of some more QA pairs generated using the above rules are shown in Table 2.
Table 2: Example questions generated by the rules.
Relationship Connective Question-Answer pair
Explanation
[N][S] because
Q: Why Security breaches on application service provider applications
are a major concern?
A: because application service provider can involve both enterprise
information and private customer data.
Elaboration
[N][S] that
Q: What are the advantages of formal verification technique?
A: that incorrect candidate system designs can be revised before a
major investment has been made in actually implementing the design.
Condition
[S][N] there
Q: Where there may be no need for a pretty graphical user interface,
leaving the application leaner, faster and easier to maintain?
A: If an application is only going to be run by the original programmer
and/or a few colleagues
Same-unit
[N][N] in
Q: What will happen in the absence of an experienced architect?
A: there is an unfortunate tendency to confuse the two architectures,
the engineer thinks in terms of hardware and software and the
technical solution space, whereas the user may be thinking in terms of
solving a problem in a reasonable amount of time and money.
Attribution
[S][N] that
Q: What does many people believe about software engineering?
A: software engineering implies a certain level of academic training,
professional discipline, adherence to formal processes, and especially
legal liability.
5.3 MCQ generation and distractor selection
The factual questions are presented as MCQs in the present system. The methodology presented by
Michael Heilman generates factual questions from syntactically complex sentences (Heilman,
2011). In his work, firstly the simplified factual statements are extracted from different syntactic
transformations. Then the factual question-answer pairs (QA pair) are generated. A subset of the
207207
questions generated by CMU question generator tool is selected as all are not observed to be
appropriate MCQ candidates. The selection strategy uses answer associated to a question
generated by CMU tool. The question is a candidate for MCQ if an associated Wikipedia page for
the corresponding answer phrase can be found; otherwise, it is discarded.
To generate the distractors or the wrong alternatives of the MCQ questions, domain
specific ontology based approach is already proposed (Alsubait, Parsia, & Sattler, 2015). In present
implementation, we rely on the Wikipedia article-category hierarchy for this task. The categories
of the correct answer (say 𝐴𝐶) have been extracted first, let, the categories for 𝐴𝐶 are: 𝐶𝑤 ={𝐶1, 𝐶2, … , 𝐶ℎ}. Titles of the articles belonging to these categories can be possible candidates for
distractors. These candidates are ranked and top ones are selected as distractors. We have used the
distribution of the candidates over the answer categories as ranking function. All the article titles
belonging to the categories in 𝐶𝑤 are collected and frequencies of the titles are extracted. The top
three article titles are chosen as the final distractors. For example, the factual question with the
correct answer is as follows:
Question Who introduced the key concept of modularity and information hiding in 1972 to help
programmers deal with the ever increasing complexity of software systems?
Answer David Parnas
The Wikipedia categories for the article “David Parnas” are: Canadian computer
scientists, Formal methods people, Software engineering researchers etc. Articles under those
categories are as follows: { 𝐷𝑎𝑣𝑖𝑑 𝐻𝑎𝑟𝑒𝑙, 𝐸𝑟𝑖𝑐 𝐻𝑒ℎ𝑛𝑒𝑟, 𝐷𝑎𝑣𝑖𝑑 𝑃𝑎𝑟𝑛𝑎𝑠, 𝐽𝑜𝑒 𝑆𝑡𝑜𝑦 . . . 𝑒𝑡𝑐. } ∈ 𝐹𝑜𝑟𝑚𝑎𝑙 𝑚𝑒𝑡ℎ𝑜𝑑𝑠 𝑝𝑒𝑜𝑝𝑙𝑒
{ 𝐷𝑎𝑣𝑖𝑑 𝐻𝑎𝑟𝑒𝑙, 𝐷𝑎𝑣𝑖𝑑 𝑃𝑎𝑟𝑛𝑎𝑠, 𝐻𝑎𝑘𝑎𝑛 𝐸𝑟𝑑𝑜𝑔𝑚𝑢𝑠,… 𝑒𝑡𝑐. } ∈ 𝑆𝑜𝑓𝑡𝑤𝑎𝑟𝑒 𝑒𝑛𝑔𝑖𝑛𝑒𝑒𝑟𝑖𝑛𝑔 𝑟𝑒𝑠𝑒𝑎𝑟𝑐ℎ𝑒𝑟𝑠
{ 𝐽𝑖𝑡 𝐵𝑜𝑠𝑒,𝐻𝑎𝑘𝑎𝑛 𝐸𝑟𝑑𝑜𝑔𝑚𝑢𝑠, 𝐸𝑟𝑖𝑐 𝐻𝑒ℎ𝑛𝑒𝑟, 𝐷𝑎𝑣𝑖𝑑 𝑃𝑎𝑟𝑛𝑎𝑠, . . . 𝑒𝑡𝑐. } ∈ 𝐶𝑎𝑛𝑎𝑑𝑖𝑎𝑛 𝑐𝑜𝑚𝑝𝑢𝑡𝑒𝑟 𝑠𝑐𝑖𝑒𝑛𝑡𝑖𝑠𝑡𝑠 The sorted list of candidates based on frequency count is: David Harel(2), Eric Hehner(2),
Hakan Erdogmus(2), Joe Stoy(1), Jit Bose(1). So, the final distractors are (top 3): David Harel,
Eric Hehner, Hakan Erdogmus.
5.4 Question Ranking
The questions generated may have issues with respect to their acceptability level. These issues
range from syntactic to semantic level, as follows:
Syntactic validity: The rules for generating questions have been devised by inspecting a
bounded set of text segments. Thus, there may be cases that are not handled or handled
erroneously by the system due to lack of coverage of the rule base. Because of this
imperfection in the rule base, some of the generated questions may be grammatically
incorrect.
Ambiguous questions: Due to several text properties (e.g., overuse of nouns), some of the
generated questions are observed to be semantically ambiguous. For example:
Original
text
As of 2004, in the U.S., about 50 universities offer software engineering
degrees, [N] which teach both computer science and engineering principles and
practices [S].
Question What is software engineering degrees?
Irrelevant to the transcript: Some questions are syntactically correct, but irrelevant to the
video lecture.
To handle the above scenarios, we have assigned scores against each of the questions,
based on some weighted features.
Grammatical correctness (𝑓1): The feature measures syntactic validity of the generated
questions and is quantified with the number of grammatical errors. LanguageTool4 is used
to compute this feature.
4LanguageTool. https://www.languagetool.org/
208208
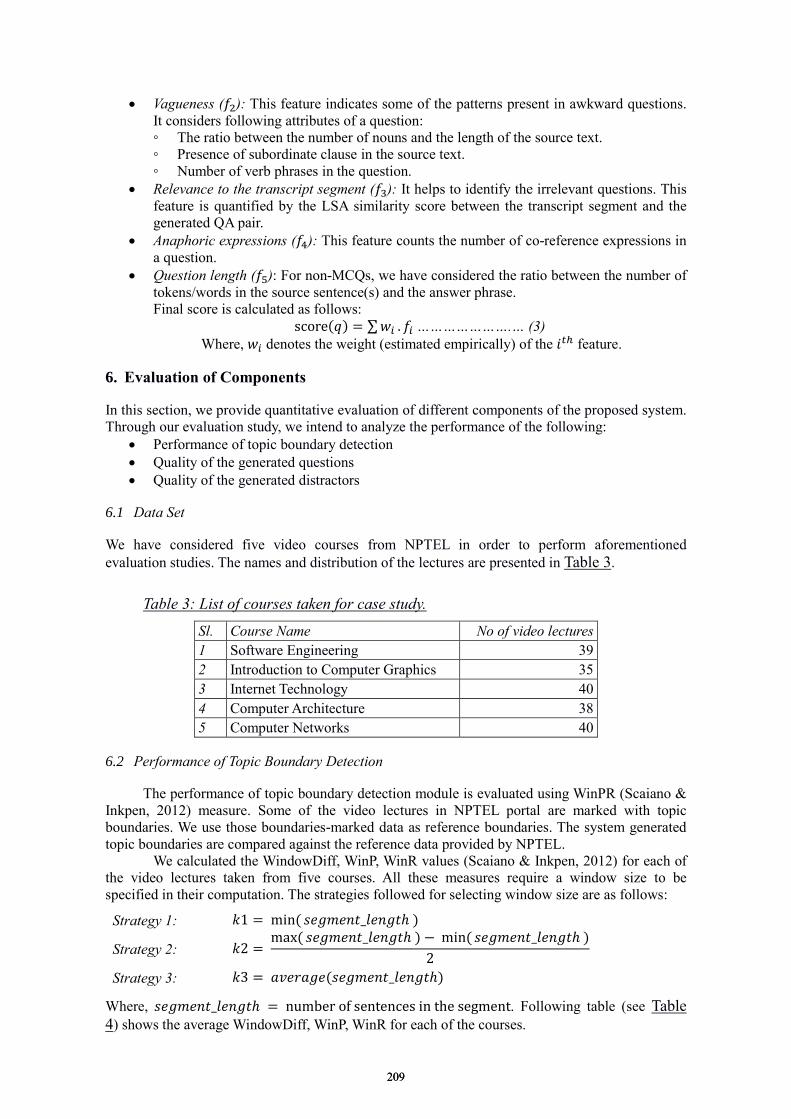
Vagueness (𝑓2): This feature indicates some of the patterns present in awkward questions.
It considers following attributes of a question:
◦ The ratio between the number of nouns and the length of the source text.
◦ Presence of subordinate clause in the source text.
◦ Number of verb phrases in the question.
Relevance to the transcript segment (𝑓3): It helps to identify the irrelevant questions. This
feature is quantified by the LSA similarity score between the transcript segment and the
generated QA pair.
Anaphoric expressions (𝑓4): This feature counts the number of co-reference expressions in
a question.
Question length (𝑓5): For non-MCQs, we have considered the ratio between the number of
tokens/words in the source sentence(s) and the answer phrase.
Final score is calculated as follows:
score(𝑞) = ∑𝑤𝑖 . 𝑓𝑖 ………………….… (3)
Where, 𝑤𝑖 denotes the weight (estimated empirically) of the 𝑖𝑡ℎ feature.
6. Evaluation of Components
In this section, we provide quantitative evaluation of different components of the proposed system.
Through our evaluation study, we intend to analyze the performance of the following:
Performance of topic boundary detection
Quality of the generated questions
Quality of the generated distractors
6.1 Data Set
We have considered five video courses from NPTEL in order to perform aforementioned
evaluation studies. The names and distribution of the lectures are presented in Table 3.
Table 3: List of courses taken for case study.
Sl. Course Name No of video lectures
1 Software Engineering 39
2 Introduction to Computer Graphics 35
3 Internet Technology 40
4 Computer Architecture 38
5 Computer Networks 40
6.2 Performance of Topic Boundary Detection
The performance of topic boundary detection module is evaluated using WinPR (Scaiano &
Inkpen, 2012) measure. Some of the video lectures in NPTEL portal are marked with topic
boundaries. We use those boundaries-marked data as reference boundaries. The system generated
topic boundaries are compared against the reference data provided by NPTEL.
We calculated the WindowDiff, WinP, WinR values (Scaiano & Inkpen, 2012) for each of
the video lectures taken from five courses. All these measures require a window size to be
specified in their computation. The strategies followed for selecting window size are as follows:
Strategy 1: 𝑘1 = min( 𝑠𝑒𝑔𝑚𝑒𝑛𝑡_𝑙𝑒𝑛𝑔𝑡ℎ )
Strategy 2: 𝑘2 = max( 𝑠𝑒𝑔𝑚𝑒𝑛𝑡_𝑙𝑒𝑛𝑔𝑡ℎ ) − min( 𝑠𝑒𝑔𝑚𝑒𝑛𝑡_𝑙𝑒𝑛𝑔𝑡ℎ )
2
Strategy 3: 𝑘3 = 𝑎𝑣𝑒𝑟𝑎𝑔𝑒(𝑠𝑒𝑔𝑚𝑒𝑛𝑡_𝑙𝑒𝑛𝑔𝑡ℎ)
Where, 𝑠𝑒𝑔𝑚𝑒𝑛𝑡_𝑙𝑒𝑛𝑔𝑡ℎ = number of sentences in the segment. Following table (see Table
4) shows the average WindowDiff, WinP, WinR for each of the courses.
209209
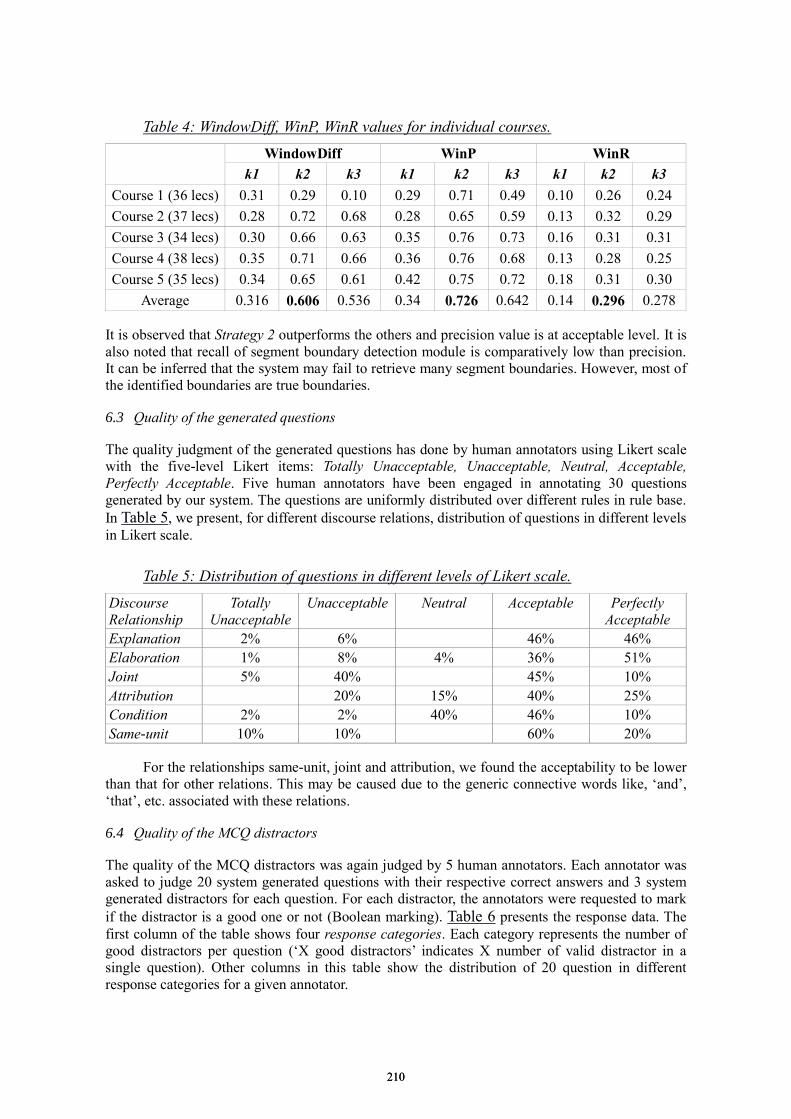
Table 4: WindowDiff, WinP, WinR values for individual courses.
WindowDiff WinP WinR
k1 k2 k3 k1 k2 k3 k1 k2 k3
Course 1 (36 lecs) 0.31 0.29 0.10 0.29 0.71 0.49 0.10 0.26 0.24
Course 2 (37 lecs) 0.28 0.72 0.68 0.28 0.65 0.59 0.13 0.32 0.29
Course 3 (34 lecs) 0.30 0.66 0.63 0.35 0.76 0.73 0.16 0.31 0.31
Course 4 (38 lecs) 0.35 0.71 0.66 0.36 0.76 0.68 0.13 0.28 0.25
Course 5 (35 lecs) 0.34 0.65 0.61 0.42 0.75 0.72 0.18 0.31 0.30
Average 0.316 0.606 0.536 0.34 0.726 0.642 0.14 0.296 0.278
It is observed that Strategy 2 outperforms the others and precision value is at acceptable level. It is
also noted that recall of segment boundary detection module is comparatively low than precision.
It can be inferred that the system may fail to retrieve many segment boundaries. However, most of
the identified boundaries are true boundaries.
6.3 Quality of the generated questions
The quality judgment of the generated questions has done by human annotators using Likert scale
with the five-level Likert items: Totally Unacceptable, Unacceptable, Neutral, Acceptable,
Perfectly Acceptable. Five human annotators have been engaged in annotating 30 questions
generated by our system. The questions are uniformly distributed over different rules in rule base.
In Table 5, we present, for different discourse relations, distribution of questions in different levels
in Likert scale.
Table 5: Distribution of questions in different levels of Likert scale.
Discourse
Relationship
Totally
Unacceptable
Unacceptable Neutral Acceptable Perfectly
Acceptable
Explanation 2% 6% 46% 46%
Elaboration 1% 8% 4% 36% 51%
Joint 5% 40% 45% 10%
Attribution 20% 15% 40% 25%
Condition 2% 2% 40% 46% 10%
Same-unit 10% 10% 60% 20%
For the relationships same-unit, joint and attribution, we found the acceptability to be lower
than that for other relations. This may be caused due to the generic connective words like, ‘and’,
‘that’, etc. associated with these relations.
6.4 Quality of the MCQ distractors
The quality of the MCQ distractors was again judged by 5 human annotators. Each annotator was
asked to judge 20 system generated questions with their respective correct answers and 3 system
generated distractors for each question. For each distractor, the annotators were requested to mark
if the distractor is a good one or not (Boolean marking). Table 6 presents the response data. The
first column of the table shows four response categories. Each category represents the number of
good distractors per question (‘X good distractors’ indicates X number of valid distractor in a
single question). Other columns in this table show the distribution of 20 question in different
response categories for a given annotator.
210210
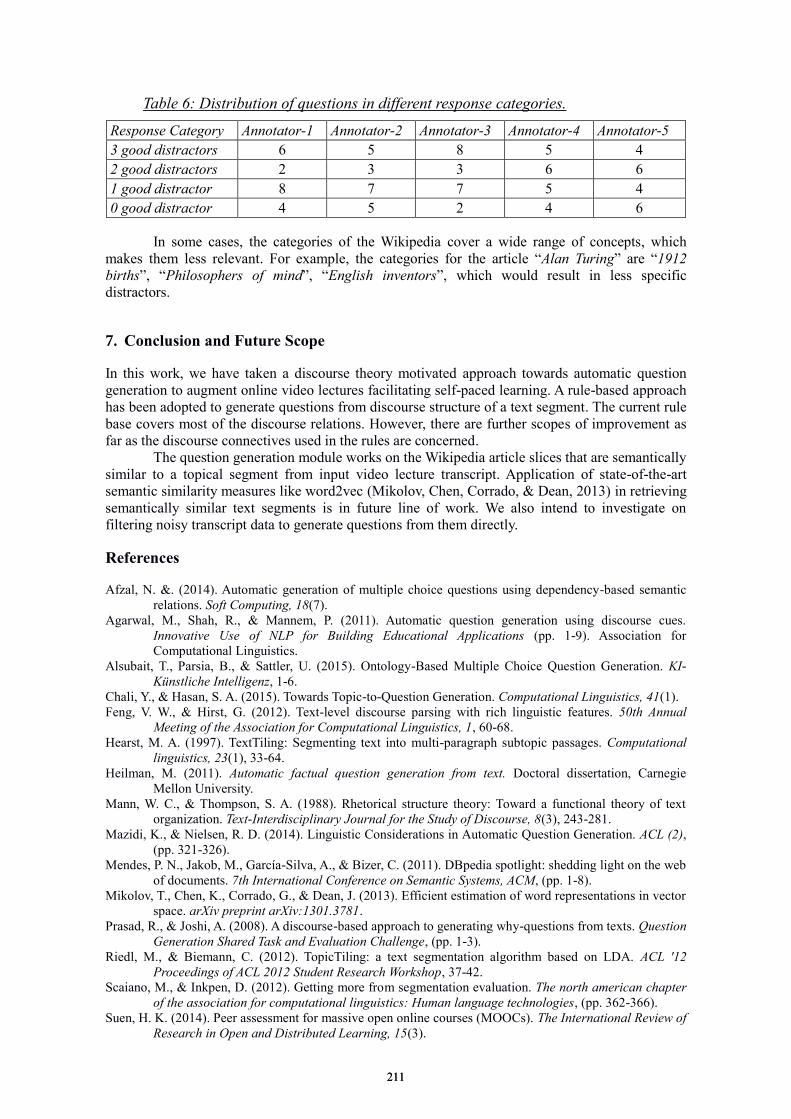
Table 6: Distribution of questions in different response categories.
Response Category Annotator-1 Annotator-2 Annotator-3 Annotator-4 Annotator-5
3 good distractors 6 5 8 5 4
2 good distractors 2 3 3 6 6
1 good distractor 8 7 7 5 4
0 good distractor 4 5 2 4 6
In some cases, the categories of the Wikipedia cover a wide range of concepts, which
makes them less relevant. For example, the categories for the article “Alan Turing” are “1912
births”, “Philosophers of mind”, “English inventors”, which would result in less specific
distractors.
7. Conclusion and Future Scope
In this work, we have taken a discourse theory motivated approach towards automatic question
generation to augment online video lectures facilitating self-paced learning. A rule-based approach
has been adopted to generate questions from discourse structure of a text segment. The current rule
base covers most of the discourse relations. However, there are further scopes of improvement as
far as the discourse connectives used in the rules are concerned.
The question generation module works on the Wikipedia article slices that are semantically
similar to a topical segment from input video lecture transcript. Application of state-of-the-art
semantic similarity measures like word2vec (Mikolov, Chen, Corrado, & Dean, 2013) in retrieving
semantically similar text segments is in future line of work. We also intend to investigate on
filtering noisy transcript data to generate questions from them directly.
References
Afzal, N. &. (2014). Automatic generation of multiple choice questions using dependency-based semantic
relations. Soft Computing, 18(7).
Agarwal, M., Shah, R., & Mannem, P. (2011). Automatic question generation using discourse cues.
Innovative Use of NLP for Building Educational Applications (pp. 1-9). Association for
Computational Linguistics.
Alsubait, T., Parsia, B., & Sattler, U. (2015). Ontology-Based Multiple Choice Question Generation. KI-
Künstliche Intelligenz, 1-6.
Chali, Y., & Hasan, S. A. (2015). Towards Topic-to-Question Generation. Computational Linguistics, 41(1).
Feng, V. W., & Hirst, G. (2012). Text-level discourse parsing with rich linguistic features. 50th Annual
Meeting of the Association for Computational Linguistics, 1, 60-68.
Hearst, M. A. (1997). TextTiling: Segmenting text into multi-paragraph subtopic passages. Computational
linguistics, 23(1), 33-64.
Heilman, M. (2011). Automatic factual question generation from text. Doctoral dissertation, Carnegie
Mellon University.
Mann, W. C., & Thompson, S. A. (1988). Rhetorical structure theory: Toward a functional theory of text
organization. Text-Interdisciplinary Journal for the Study of Discourse, 8(3), 243-281.
Mazidi, K., & Nielsen, R. D. (2014). Linguistic Considerations in Automatic Question Generation. ACL (2),
(pp. 321-326).
Mendes, P. N., Jakob, M., García-Silva, A., & Bizer, C. (2011). DBpedia spotlight: shedding light on the web
of documents. 7th International Conference on Semantic Systems, ACM, (pp. 1-8).
Mikolov, T., Chen, K., Corrado, G., & Dean, J. (2013). Efficient estimation of word representations in vector
space. arXiv preprint arXiv:1301.3781.
Prasad, R., & Joshi, A. (2008). A discourse-based approach to generating why-questions from texts. Question
Generation Shared Task and Evaluation Challenge, (pp. 1-3).
Riedl, M., & Biemann, C. (2012). TopicTiling: a text segmentation algorithm based on LDA. ACL '12
Proceedings of ACL 2012 Student Research Workshop, 37-42.
Scaiano, M., & Inkpen, D. (2012). Getting more from segmentation evaluation. The north american chapter
of the association for computational linguistics: Human language technologies, (pp. 362-366).
Suen, H. K. (2014). Peer assessment for massive open online courses (MOOCs). The International Review of
Research in Open and Distributed Learning, 15(3).
211211
Chen, W. et al. (Eds.) (2016). Proceedings of the 24th International Conference on Computers in Education.
India: Asia-Pacific Society for Computers in Education
Student Behavior in Computer Simulation
Practices by Pair Programming
and Flip Teaching
Satoshi V. SUZUKIa*, Sachio HIROKAWAb, Shinji MUKOYAMAc, Ryo UEHARAd & Hiroyuki
OGATAd aFaculty of Liberal Arts, Osaka University of Economics and Law, Japan
bResearch Institute for Information Technology, Kyushu University, Japan cGraduate School of Science and Technology, Seikei University, Japan
dFaculty of Science and Technology, Seikei University, Japan
Abstract: Recent education roles encourage willingness to learn individually, solve unfamiliar
problems using knowledge acquired through information and communication technologies
(ICTs), and collaborate with others. Various learning methods to cultivate this ability have been
invented and researchers discussed learning effect on such methods with qualitative and
quantitative analyses. One of the authors introduced pair programming as a method of peer
learning and flip teaching, which consists of preliminary learning of basic programming and
advanced learning practices based on peer activity in classroom lessons, into computer
simulation practices for undergraduate students. With introducing class schedule design for flip
teaching and development of peer learning preparation support system for determining the
appropriate pair formation and seat allocation in the classroom utilizing a probabilistic
combinatorial optimization algorithm, this study focuses on learning behavior of
well-performing students, analyzing learning records and access logs on a learning management
system and answers to a questionnaire administered after the practices. In this analysis, we
attempted to discriminate behavior of well-performing students observed from the learning
records, access logs, and questionnaire to discover best practices for improving the performance
of medium to bottom-line students. Well-performing students tended to prepare for classroom
lessons in good time, but their performance depended on the lesson content difficulty. A
correlation was observed between the frequency of interaction among students and skill
acquisition. We discuss how to improve learning environments using ICTs and collaborative
learning methods based on the analysis.
Keywords: CSCL, peer learning, pair programming, flip teaching, learning analytics
1. Introduction
Various recent education opportunities, including higher education, must encourage willingness in
students to learn individually, solve unfamiliar problems using knowledge acquired through
information and communication technologies (ICTs), and collaborate with others. One of the suggested
frameworks required skill sets in contemporary society is known as “21st-century skills” (Griffin,
McGaw, & Care, 2012) and includes the skills of metacognition, communication and collaboration,
ICT literacy, and understanding of social structures. Moreover, when applying acquired knowledge to
solve problems in society, the skills to solve unfamiliar and ill-formed problems are required more than
those for well-known and well-formed problems. In fact, learning environments that enable learners to
acquire skills to solve “complex, unfamiliar, and non-routine” problems focusing on metacognitive
processes, utilization of ICTs, and collaborative learning among diverse learners are developing in
mathematical education (Mevarech & Kramarski, 2014). For this reason, providing learning
environments that enable learners to learn individually and attempt to solve problems with acquired
knowledge is an emergent problem in a dynamically changing contemporary society.
212212
One of the authors introduced pair programming (PP) as a method of peer learning and flip
teaching (FT) to enable students to acquire the basis of such skills into computer simulation practices
for undergraduate students. PP is a method of collaborative software development in which one pair
member assumes the role of driver, inputting the source code, and the other assumes the role of
navigator, asking questions and suggesting programming ideas; these roles are then swapped (Beck &
Andres, 2005; Williams & Kessler, 2002). FT is a method of blended learning that requires students to
learn basic knowledge via video lessons to prepare for classroom lessons requiring students to solve
advanced problems, providing opportunity to solve advanced problems with help (Bergmann & Sams,
2012; DeLozier & Rhodes, 2016). There are two purposes of FT dependent on a learning goal: mastery
of knowledge and skills aiming the same goal, among students and acquisition of higher-order
knowledge skills in classroom based on video lessons. Lucke (2014) claimed that there was no
significant correlation between the time to spend to learn learning content via video lesson and learning
performance of students, although the students tended to prefer the flip teaching class to traditional
teaching. However, the analysis by Lucke (2014) only focused on comprehensive variables of student
performance such as grade point average (GPA), total time spent on learning via video lesson through
the course, total score of quizzes in the lessons and the score of final examination. Learning
performance of students through flip teaching should be dependent on various aspects of learning
behavior inside and outside the classroom. We attempted to discover student learning behavior in the
computer simulation practices, analyzing students’ behavior as observed on a learning management
system (LMS) and through a questionnaire after the lessons. We aim to suggest ideas to improve
learning environments considering middle and bottom-line students based on discovered best practices
of well-performing learners.
In this paper, firstly, we review the studies of collaborative learning mainly focusing on peer
learning and development of ICT-enhanced learning environment mainly for science and technology.
Secondly, we explain the purpose, schedule and routine of computer simulation practices. Thirdly, we
describe how to collect and analyze the data regarding to learning behavior of the students. Finally, we
discuss best practices of well-performed learners based on the result of the analysis.
2. Related Work
2.1 Peer Learning
Peer learning is a popular form of collaborative learning in which two students interact to work on a
learning activity. Many studies in psychology, cognitive science, and learning science suggest the
advantage of peer learning. Miyake (1986) claims that the role of a task-doer and an observer in peer
learning and changing these roles between learners promote detailed understanding of learning content
in each learner. In addition, requiring explanation of learning content for each other also induce deep
understanding of learning content of explainer (Okada & Simon, 1997). Moreover, externalization of
thought of one of the pair induces awareness of overlooked problems in the learner who externalized
her/his thought by being pointed out the problems by the other (Shirouzu, Miyake, & Masukawa, 2002).
In fact, various education practices introduce its use. For example, some studies on development of
learning support systems for academic writing introduce peer learning function (e.g. peer review of
draft among learners) suggest that interaction between learners improves learners’ writing quality (Cho
& Schunn, 2007; Suzuki & Suzuki, 2013). As introduced in Section 2.2, PP is often regarded to
productive method of team software development. However, PP in learning environment has potential
to promote deep understanding for programming of students considering the discussion above.
2.2 Pair Programming as Peer Learning
The main advantage of PP, as explained in Section 1, is found in software engineering productivity, but
it can be a method of peer learning. Fundamentally, PP is an important activity in extreme
programming, an agile software development framework (Beck & Andres, 2005). One of its purposes is
to promote communication among development team members (Williams & Kessler, 2002). One
experiment implied that a novice–novice pair could improve productivity by PP over an expert–expert
pair (Lui & Chan, 2006). Another experiment suggested that the improvement of productivity in PP
213213
depends on programming knowledge and skills of a programmer and complexity of PP tasks (Arisholm,
Gallis, Dybå, & Sjøberg, 2007). A conversational analysis of novice–novice PP suggests that the pairs
who can properly explain programming and frequently provide mutual explanations between them can
improve the quality of their programs (Inoue, 2013). These studies suggest that novice–novice PP can
promote understanding of programming, arranging the learning environment to promote mutual
interaction between learner pairs.
2.3 Learning Environment Utilizing ICTs
Arranging learning environments to motivate learners to voluntarily acquire knowledge and skills and
to promote interaction among learners using ICTs is an important problem. Recent studies of learning
analytics aim to improve learning environments based on analysis of learning activities (Ferguson,
2012). Many educational practices have been introducing FT, as explained in Section 1, to promote
voluntary learning activity. From the perspective of successful collaborative learning, group formation
plays an important role. In fact, some studies have attempted to decide automatically on proper group
formation using probabilistic optimization algorithms, clustering algorithms, and multi-agent
simulation (Cruz & Isotani, 2014). This study also attempted to automatically decide on pair formation
and seat allocation based on student learning performance using probabilistic optimization; we explain
this procedure briefly to describe the analysis of learning behavior and to discuss the approach to
improving learning environments including pair formation and seat allocation.
3. Class Design
One of the authors introduced PP and FT into computer simulation practices dealing with MATLAB
programming and basic thoughts on computer simulation. The practices were part of a course called
“Basis of the Simulation” for science and technology undergraduate students. Eighty-five students took
the course, and two teachers, including one of the authors (with no teaching assistant), taught in the
practices. The students had already studied the basis of C programming, but this was their first time
learning MATLAB. We introduced Moodle1 as an LMS in the practices. Considering the purpose of FT
introduced in Section 1, FT in the practices was aimed at student mastery of MATLAB programming
skills and application of the programming skills to computer simulation.
3.1 Probabilistic Optimization of Pair Combination and Seat Allocation in Classroom
Proper pair formation and seat allocation of students promote the learning performance of students.
Some methods to manually determine pair formation have been already suggested (Johnson, Johnson,
& Holubec, 2009). The role of groups in collaborative learning mainly depends on tasks which the
groups should work on (Barkley, Cross, & Major, 2005; Johnson et al., 2009), however, we focused on
formation of the informal groups (Johnson et al., 2009) which work on the tasks which the groups can
finish within each lesson. Additionally, changing pairs in PP can improve programming efficiency
given several opportunities for PP (Williams & Kessler, 2002). Moreover, we pointed out in Section 2.2
that novice–novice PP can facilitate acquiring programming knowledge and skills. Besides programmer
personality and temperaments (Sfetsos, Stamelos, Angelis, & Deligiannis, 2009), extreme
programming knowledge and skill differences within a pair can increase troubles in programming
activities, and those with inadequate programming knowledge and skills will have difficulty interacting
to solving problems (Arisholm et al., 2007; Williams & Kessler, 2002). Taking the discussion above
into account, pair formation was decided to minimize variance of differences within pairs in
programming knowledge and skills using a genetic algorithm (GA) (Goldberg, 1989) shown in the left
side of Figure 1, one of the popular methods of probabilistic combinatorial optimization, based on the
results of prior C programming tests and quizzes before each lesson. We adopted pair formation itself as
a genotype and developed crossover operation among the population of the parent generation based on
1 http://moodle.org/
214214

edge recombination crossover used to solve a travelling salesman problem (Whitley, Starkweather, &
Fuquay, 1989).
Furtherclassroom seating behavioror influences learning performance. A correlation exists
between classroom position and learning willingness and performance (Becker, Sommer, Bee, & Oxley,
1973). Seat arrangement with well-performing students allocated to the seats promotes teaching of
students close to them (Cox, Cody, Fleming, & Miller, 2012). Taking these studies and Section 2.2 into
account, we decided on the seat allocation to enable students to be seated in different positions in the
classroom and to enable students who frequently taught reciprocally in the classroom to be seated close
to each other. Seat allocation was also decided to use a GA shown in the right side of Figure 1, adopting
seat allocation itself as a genotype and adopting crossover and mutation operation on matrices
suggested by Shin-ike and Iima (2012) on population of parent generation.
Figure 1. Applying GA to find approximate solution of optimal pair formation (left) and seat allocation
(right).
3.2 Lesson Schedule Lesson 1 Orientation and basic usage of MATLAB (in-class tasks)
Take-home C programming test to diagnose programming knowledge and skills
Lesson 2 Basis of operation of vectors and matrices, drawing graphs (video lesson) / Solution of a quadratic equation, graphing
a trigonometric function (in-class tasks)
Lesson 3 Matrix definition and modification (video lesson) / Dealing with matrix as table data, solution of Monty Hall problem
with Monte Carlo technique (in-class tasks)
Lesson 4 Operation of matrices (video lesson) / Various expressions of Fibonacci sequence, linear transformation of figures
(in-class tasks)
Lesson 5 Loop control, conditional branching, and computation time (video lesson) / Summation of sequence, solution of
equation by bisection method, rectangle method of numerical integration (in-class tasks)
No homework
Lesson 6 Comprehension test and questionnaire
Figure 2. Lesson schedule in the class.
Figure 2 shows the lesson schedule. Students were required to watch video lessons on basic MATLAB
programming knowledge and to take a quiz about the lesson before each classroom lesson. The
classroom consisted of a traditional row-and-column arrangement with a PC on each seat. We decided
on pair formation and seat allocation as explained in Section 3.1 except for in Lessons 1 and 6. We
assigned the pairs four in-class tasks, and pair members changed driver and navigator roles after each
task. Students submitted worksheets on program execution results and discussed the results for each
task via Moodle. One of the authors rated these worksheets. Students were allowed to talk with other
215215
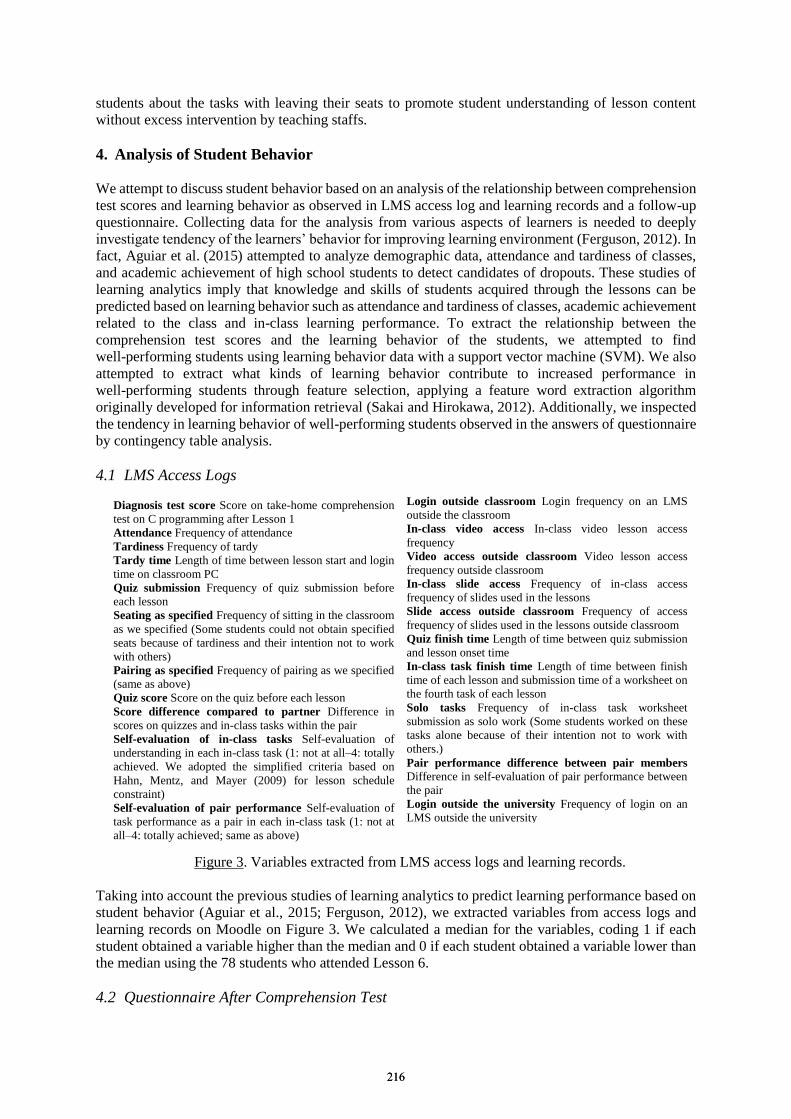
students about the tasks with leaving their seats to promote student understanding of lesson content
without excess intervention by teaching staffs.
4. Analysis of Student Behavior
We attempt to discuss student behavior based on an analysis of the relationship between comprehension
test scores and learning behavior as observed in LMS access log and learning records and a follow-up
questionnaire. Collecting data for the analysis from various aspects of learners is needed to deeply
investigate tendency of the learners’ behavior for improving learning environment (Ferguson, 2012). In
fact, Aguiar et al. (2015) attempted to analyze demographic data, attendance and tardiness of classes,
and academic achievement of high school students to detect candidates of dropouts. These studies of
learning analytics imply that knowledge and skills of students acquired through the lessons can be
predicted based on learning behavior such as attendance and tardiness of classes, academic achievement
related to the class and in-class learning performance. To extract the relationship between the
comprehension test scores and the learning behavior of the students, we attempted to find
well-performing students using learning behavior data with a support vector machine (SVM). We also
attempted to extract what kinds of learning behavior contribute to increased performance in
well-performing students through feature selection, applying a feature word extraction algorithm
originally developed for information retrieval (Sakai and Hirokawa, 2012). Additionally, we inspected
the tendency in learning behavior of well-performing students observed in the answers of questionnaire
by contingency table analysis.
4.1 LMS Access Logs
Figure 3. Variables extracted from LMS access logs and learning records.
Taking into account the previous studies of learning analytics to predict learning performance based on
student behavior (Aguiar et al., 2015; Ferguson, 2012), we extracted variables from access logs and
learning records on Moodle on Figure 3. We calculated a median for the variables, coding 1 if each
student obtained a variable higher than the median and 0 if each student obtained a variable lower than
the median using the 78 students who attended Lesson 6.
4.2 Questionnaire After Comprehension Test
Diagnosis test score Score on take-home comprehension
test on C programming after Lesson 1
Attendance Frequency of attendance
Tardiness Frequency of tardy
Tardy time Length of time between lesson start and login
time on classroom PC
Quiz submission Frequency of quiz submission before
each lesson
Seating as specified Frequency of sitting in the classroom
as we specified (Some students could not obtain specified
seats because of tardiness and their intention not to work
with others)
Pairing as specified Frequency of pairing as we specified
(same as above)
Quiz score Score on the quiz before each lesson
Score difference compared to partner Difference in
scores on quizzes and in-class tasks within the pair
Self-evaluation of in-class tasks Self-evaluation of
understanding in each in-class task (1: not at all–4: totally
achieved. We adopted the simplified criteria based on
Hahn, Mentz, and Mayer (2009) for lesson schedule
constraint)
Self-evaluation of pair performance Self-evaluation of
task performance as a pair in each in-class task (1: not at
all–4: totally achieved; same as above)
Login outside classroom Login frequency on an LMS
outside the classroom
In-class video access In-class video lesson access
frequency
Video access outside classroom Video lesson access
frequency outside classroom
In-class slide access Frequency of in-class access
frequency of slides used in the lessons
Slide access outside classroom Frequency of access
frequency of slides used in the lessons outside classroom
Quiz finish time Length of time between quiz submission
and lesson onset time
In-class task finish time Length of time between finish
time of each lesson and submission time of a worksheet on
the fourth task of each lesson
Solo tasks Frequency of in-class task worksheet
submission as solo work (Some students worked on these
tasks alone because of their intention not to work with
others.)
Pair performance difference between pair members
Difference in self-evaluation of pair performance between
the pair
Login outside the university Frequency of login on an
LMS outside the university
216216
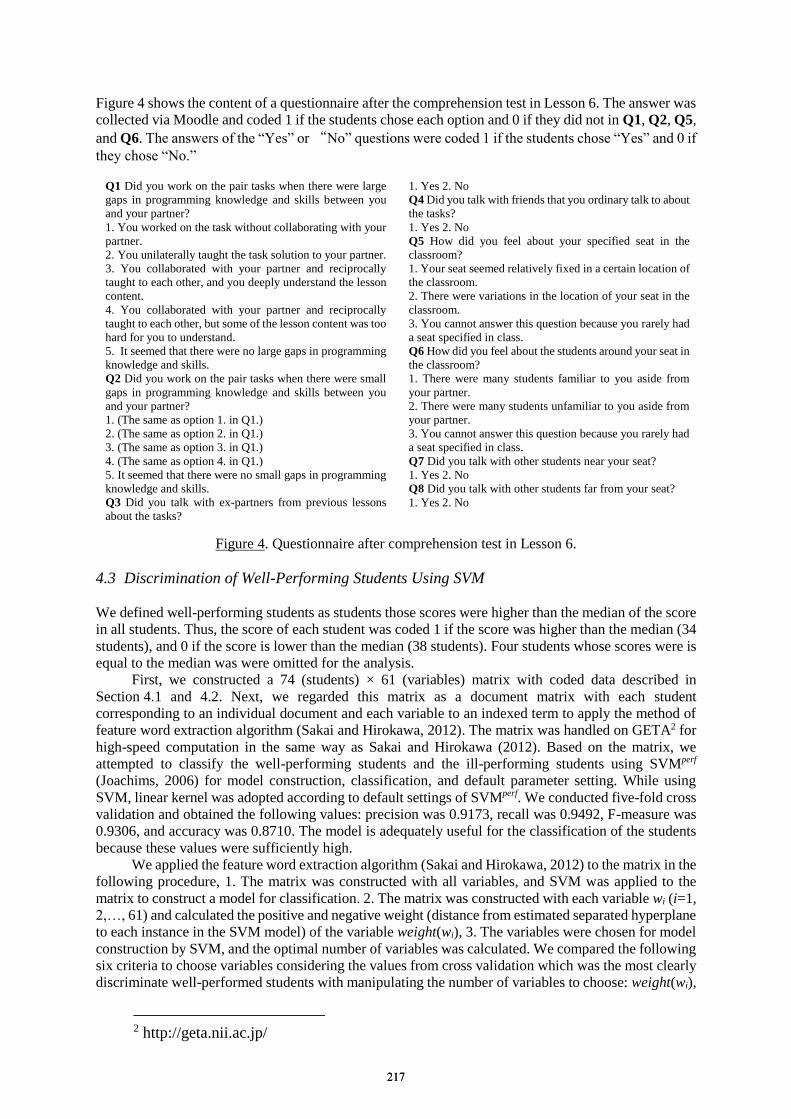
Figure 4 shows the content of a questionnaire after the comprehension test in Lesson 6. The answer was
collected via Moodle and coded 1 if the students chose each option and 0 if they did not in Q1, Q2, Q5,
and Q6. The answers of the “Yes” or “No” questions were coded 1 if the students chose “Yes” and 0 if
they chose “No.”
Figure 4. Questionnaire after comprehension test in Lesson 6.
4.3 Discrimination of Well-Performing Students Using SVM
We defined well-performing students as students those scores were higher than the median of the score
in all students. Thus, the score of each student was coded 1 if the score was higher than the median (34
students), and 0 if the score is lower than the median (38 students). Four students whose scores were is
equal to the median was were omitted for the analysis.
First, we constructed a 74 (students) × 61 (variables) matrix with coded data described in
Section 4.1 and 4.2. Next, we regarded this matrix as a document matrix with each student
corresponding to an individual document and each variable to an indexed term to apply the method of
feature word extraction algorithm (Sakai and Hirokawa, 2012). The matrix was handled on GETA2 for
high-speed computation in the same way as Sakai and Hirokawa (2012). Based on the matrix, we
attempted to classify the well-performing students and the ill-performing students using SVMperf
(Joachims, 2006) for model construction, classification, and default parameter setting. While using
SVM, linear kernel was adopted according to default settings of SVMperf. We conducted five-fold cross
validation and obtained the following values: precision was 0.9173, recall was 0.9492, F-measure was
0.9306, and accuracy was 0.8710. The model is adequately useful for the classification of the students
because these values were sufficiently high.
We applied the feature word extraction algorithm (Sakai and Hirokawa, 2012) to the matrix in the
following procedure, 1. The matrix was constructed with all variables, and SVM was applied to the
matrix to construct a model for classification. 2. The matrix was constructed with each variable wi (i=1,
2,…, 61) and calculated the positive and negative weight (distance from estimated separated hyperplane
to each instance in the SVM model) of the variable weight(wi), 3. The variables were chosen for model
construction by SVM, and the optimal number of variables was calculated. We compared the following
six criteria to choose variables considering the values from cross validation which was the most clearly
discriminate well-performed students with manipulating the number of variables to choose: weight(wi),
2 http://geta.nii.ac.jp/
Q1 Did you work on the pair tasks when there were large
gaps in programming knowledge and skills between you
and your partner?
1. You worked on the task without collaborating with your
partner.
2. You unilaterally taught the task solution to your partner.
3. You collaborated with your partner and reciprocally
taught to each other, and you deeply understand the lesson
content.
4. You collaborated with your partner and reciprocally
taught to each other, but some of the lesson content was too
hard for you to understand.
5. It seemed that there were no large gaps in programming
knowledge and skills.
Q2 Did you work on the pair tasks when there were small
gaps in programming knowledge and skills between you
and your partner?
1. (The same as option 1. in Q1.)
2. (The same as option 2. in Q1.)
3. (The same as option 3. in Q1.)
4. (The same as option 4. in Q1.)
5. It seemed that there were no small gaps in programming
knowledge and skills.
Q3 Did you talk with ex-partners from previous lessons
about the tasks?
1. Yes 2. No
Q4 Did you talk with friends that you ordinary talk to about
the tasks?
1. Yes 2. No
Q5 How did you feel about your specified seat in the
classroom?
1. Your seat seemed relatively fixed in a certain location of
the classroom.
2. There were variations in the location of your seat in the
classroom.
3. You cannot answer this question because you rarely had
a seat specified in class.
Q6 How did you feel about the students around your seat in
the classroom?
1. There were many students familiar to you aside from
your partner.
2. There were many students unfamiliar to you aside from
your partner.
3. You cannot answer this question because you rarely had
a seat specified in class.
Q7 Did you talk with other students near your seat?
1. Yes 2. No
Q8 Did you talk with other students far from your seat?
1. Yes 2. No
217217
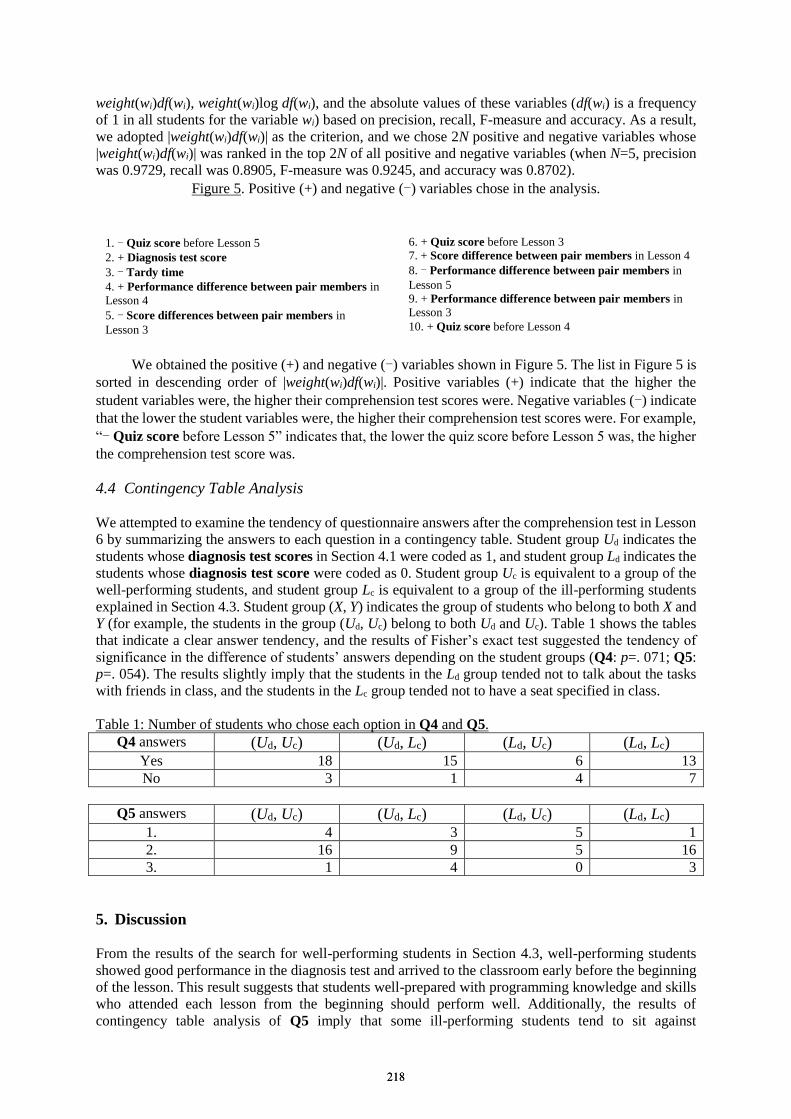
weight(wi)df(wi), weight(wi)log df(wi), and the absolute values of these variables (df(wi) is a frequency
of 1 in all students for the variable wi) based on precision, recall, F-measure and accuracy. As a result,
we adopted |weight(wi)df(wi)| as the criterion, and we chose 2N positive and negative variables whose
|weight(wi)df(wi)| was ranked in the top 2N of all positive and negative variables (when N=5, precision
was 0.9729, recall was 0.8905, F-measure was 0.9245, and accuracy was 0.8702).
Figure 5. Positive (+) and negative (-) variables chose in the analysis.
We obtained the positive (+) and negative (-) variables shown in Figure 5. The list in Figure 5 is
sorted in descending order of |weight(wi)df(wi)|. Positive variables (+) indicate that the higher the
student variables were, the higher their comprehension test scores were. Negative variables (-) indicate
that the lower the student variables were, the higher their comprehension test scores were. For example,
“- Quiz score before Lesson 5” indicates that, the lower the quiz score before Lesson 5 was, the higher
the comprehension test score was.
4.4 Contingency Table Analysis
We attempted to examine the tendency of questionnaire answers after the comprehension test in Lesson
6 by summarizing the answers to each question in a contingency table. Student group Ud indicates the
students whose diagnosis test scores in Section 4.1 were coded as 1, and student group Ld indicates the
students whose diagnosis test score were coded as 0. Student group Uc is equivalent to a group of the
well-performing students, and student group Lc is equivalent to a group of the ill-performing students
explained in Section 4.3. Student group (X, Y) indicates the group of students who belong to both X and
Y (for example, the students in the group (Ud, Uc) belong to both Ud and Uc). Table 1 shows the tables
that indicate a clear answer tendency, and the results of Fisher’s exact test suggested the tendency of
significance in the difference of students’ answers depending on the student groups (Q4: p=. 071; Q5:
p=. 054). The results slightly imply that the students in the Ld group tended not to talk about the tasks
with friends in class, and the students in the Lc group tended not to have a seat specified in class.
Table 1: Number of students who chose each option in Q4 and Q5.
Q4 answers (Ud, Uc) (Ud, Lc) (Ld, Uc) (Ld, Lc) Yes 18 15 6 13
No 3 1 4 7
Q5 answers (Ud, Uc) (Ud, Lc) (Ld, Uc) (Ld, Lc) 1. 4 3 5 1
2. 16 9 5 16
3. 1 4 0 3
5. Discussion
From the results of the search for well-performing students in Section 4.3, well-performing students
showed good performance in the diagnosis test and arrived to the classroom early before the beginning
of the lesson. This result suggests that students well-prepared with programming knowledge and skills
who attended each lesson from the beginning should perform well. Additionally, the results of
contingency table analysis of Q5 imply that some ill-performing students tend to sit against
1. - Quiz score before Lesson 5
2. + Diagnosis test score
3. - Tardy time
4. + Performance difference between pair members in
Lesson 4
5. - Score differences between pair members in
Lesson 3
6. + Quiz score before Lesson 3
7. + Score difference between pair members in Lesson 4
8. - Performance difference between pair members in
Lesson 5
9. + Performance difference between pair members in
Lesson 3
10. + Quiz score before Lesson 4
218218
specifications because of tardiness and unwillingness to working on peer learning tasks. The results of
contingency table analysis of Q4 suggest that students who performed poorly on the diagnosis test
tended to avoid interaction with others. This can be because such students were reluctant to interact with
others because of lack of programming knowledge and skills and verbalization of the programming
question. These results imply that the environment in which students acquire sufficient programming
knowledge and skills to attend this course is crucial. Moreover, successful classes including FT should
be designed to enable students to avoid tardiness and finish preparation for class learning with video
lessons (Bergmann & Sams, 2012). One of the important class design features for FT is to separate
in-class content for students who finished class preparation and for students who arrived late and/or did
not prepare. Motivating students to sufficiently prepare for class by improving class design should be
important for successful FT practices.
Analysis results also implied that learning behavior of well-performing students should depend
on learning content in each lesson. In preparation for in-class tasks, well-performing students showed
better performance in Lessons 3 and 4 and worse performance in Lesson 5 than did ill-performing
students. Compared to their partners, well-performing students showed better in-class task performance
in Lesson 4 and worse performance in Lesson 3 than did ill-performing students. In self-evaluation of
pair performance compared to the partner, well-performing students showed better performance in
Lesson 3 and worse performance in Lesson 5. We examined differences in In-class task finish time
among lessons using one-way ANOVA (within-participant), and found a significant main effect (F (3,
231) =19.93, p<.001, η2=0.206); the finish time in Lessons 2 (M=10.62, SD=6.76) and 5 (M=8.73,
SD=11.79) were longer than in Lessons 3 (M=2.83, SD=3.31) and 4 (M=4.56, SD=4.66) according to
multiple comparisons using Holm’s method. This means that the in-class tasks in Lessons 2 and 5 are
harder for students than those in Lessons 3 and 4 and suggests that the difficulty of in-class tasks
affected the difference in learning behavior of well-performing students. Well-performing students
tended to show better performance in preparation for in-class tasks and self-evaluation of pair
performance. Nevertheless, a different tendency of in-class task performance in Lessons 3 and 4 was
observed in well-performing students. While inductive reasoning of execution results was mainly
required for students in Lesson 3, utilizing knowledge of linear algebra was mainly required in Lesson 4.
The difference of tendency in the in-class task performance represents a similar type of required skills.
The results also suggest that consistency in learning content design is needed because different lesson
content policies can confuse understanding and self-evaluation of learners.
As explained in Section 3.1, we attempted to determine pair formation focusing on the knowledge
and skill differences in programming between each student pair and seat allocation focusing on the
history of seat positions in previous lessons and friendship among the students using GA. The analysis
suggested that the knowledge and skill differences in programming between each student pair can
influence learning performance in computer simulation. On the other hand, little influence of seat
position was observed from the analysis of the questionnaire. It is difficult to find policies to modify the
method to determine the pair formation and the seat allocation through the result of the analysis in this
study. As well as calculation performance evaluation of the algorithms suggested in this paper by
comparing other probabilistic optimization algorithms suggested by Cruz and Isotani (2014), improving
the algorithms with considering what kinds of data and evaluation function for optimization are
effective for pair formation and seat allocation should be investigated through learning analysis.
The discussion above contains some speculations, because we could not record the detailed
process of interaction among students. Collecting data to comprehend student behavior in detail is
needed, such as questions with free descriptive answers and student interviews. In addition, Inoue (2013)
analyzed within-pair conversation in PP as peer learning in detail. Similarly, analysis of interaction not
only with the PP partner but also other students is required for further discussion. Furthermore, various
classroom settings should be taken into account in class design. We used traditional row-and-column
seat arrangement in this study; however, various class designs are considered for facilitating peer
learning, including the use of ICTs and seat arrangements (Prensky, 2010). Possibilities to improve
classroom environment and the lesson content design should be discussed further based on student
behavior analysis.
Furthermore, the results of the analysis and the appropriate method to determine pair/group
formation and seat allocation should be depend on the number of teaching staff, the number of students,
the number of lessons conducting flip teaching, learning content, and students’ readiness and
motivation for the learning content as well as the classroom environment. Despite the increasing
219219

number of practices of flip teaching (Bergmann & Sams, 2012; DeLozier & Rhodes, 2016), there were
few attempts to measure learning effect in such practices with a learning analytics approach (for
example, Lucke, 2014). Evidence-based improvement of the learning environment is needed with the
discussion on various aspects of data observable in the learning environment utilizing ICTs.
To improve the learning environment, especially for ill-performed students based on best
practices of well-performed learners, we attempted to discover general tendency of learning behavior of
well-performing students from discrimination of their data using SVM. However, there can be various
learning processes among well-performing students as well as ill-performing students. Recent studies
suggest a skeptical view on the existence of learning styles and the effect of adaptive learning
environment, according to the learning styles (for example, Cuevas, 2015). Nevertheless, investigating
several possibilities to succeed and fail in learning via flip teaching and peer learning based on student
learning behavior should be valuable for finding hypotheses of relationship between learning behavior
and learning performance of the students in flip teaching.
6. Conclusion
This study reported computer simulation practices adopting PP and LT, analyzed the students’ learning
behavior based on LMS records and learning performance, and discovered the learning behavior of
well-performing students. Allowing for learning environment design to encourage a willingness to learn
voluntarily especially for ill-performed students, to learn utilizing ICTs, and to collaborate with others
in learning activities, learning environments should be explored further based on the analysis of
learning behavior of students.
Acknowledgements
We would like to express our gratitude to Kohei Yuge (Seikei University) and Kiiko
Katsuno-Matsumoto (Seikei University) for the arrangement of the class, and Japan Society for
Educational Technology SIG-03 (Development and Practice of Education and Learning Management
Systems) for providing the opportunity to collaborate among the authors and deeply discuss this study.
The research is partially supported by “Research and Development on Fundamental and Utilization
Technologies for Social Big Data” (178A03), the Commissioned Research of the National Institute of
Information and Communications Technology (NICT), Japan; Grant-in-Aid for Scientific Research (S),
16H06304; the Education Enhancement Program (EEP) of Kyushu University; and Grant-in-Aid for
Scientific Research (C), 24501147.
References Aguiar, E., Lakkaraju, H., Bhanpuri, N., Miller, D., Yuhas, B., & Addison, K. L. (2015). Who, when, and why: A
machine learning approach to prioritizing students at risk of not graduating high school on time. In
Proceedings of the Fifth International Conference on Learning Analytics and Knowledge (LAK '15) (pp.
93–102). Poughkeepsie, NY, USA. doi: 10.1145/2723576.2723619
Arisholm, E., Gallis, H., Dybå, T., & Sjøberg, D. I. K. (2007). Evaluating pair programming with respect to
system complexity and programmer expertise. IEEE Transactions on Software Engineering, 33(2), 65–86.
doi: 10.1109/TSE.2007.17
Barkley, E. F., Cross, K. P., & Major, C. H. (2005). Collaborative learning techniques: A handbook for college
faculty. San Francisco, CA, USA: Jossey-Bass.
Beck, K., & Andres, C. (2005). Extreme programming explained: Embrace change (2nd ed.). Boston, MA, USA:
Addison-Wesley.
Becker, F. D., Sommer, R., Bee, J., & Oxley, B. (1973). College classroom ecology. Sociometry, 36(4), 514–525.
Bergmann, J., & Sams, A. (2012). Flip your classroom: Reach every student in every class every day. Alexandria,
VA, USA: International Society for Technology in Education.
Cho, K., & Schunn, C. D. (2007). Scaffolded writing and rewriting in the discipline: A web-based reciprocal peer
review system. Computers and Education, 48(3), 409–426.
220220
Cox, J., Cody, J., Fleming, J., & Miller, M. (2012). Seat assignment contribution to student performance in an
information technology classroom. In 2012 ASEE Northeast Section Conference. Lowell, MA, USA.
Cruz, W. M., & Isotani, S. (2014). Group formation algorithms in collaborative learning contexts: A systematic
mapping of the literature. In Proceedings of the 20th International Conference on Collaboration and
Technology (CRIWG 2014) (pp. 199–214). Santiago, Chile: Springer International Publishing. doi:
10.1007/978-3-319-10166-8_18
Cuevas, J. (2015). Is learning styles-based instruction effective? A comprehensive analysis of recent research on
learning styles. Theory and Research in Education, 13(3), 308–333. doi: 10.1177/1477878515606621
DeLozier, S. J., & Rhodes, M. G. (2016). Flipped classrooms: A review of key ideas and recommendations for
practice. Educational Psychology Review, online, 1–11. doi: 10.1007/s10648-015-9356-9
Ferguson, R. (2012). Learning analytics: Drivers, developments and challenges. International Journal of
Technology Enhanced Learning, 4(5/6), 304–317. doi: 10.1504/IJTEL.2012.051816
Goldberg, D. E. (1989). Genetic algorithms in search, optimization, and machine learning. Reading, MA, USA:
Addison-Wesley.
Griffin, P. E., McGaw, B., & Care, E. (2012). Assessment and teaching of 21st century skills. Dordrecht, the
Netherlands: Springer.
Hahn, J. H., Mentz, E., & Meyer, L. (2009). Assessment strategies for pair programming. Journal of Information
Technology Education, 8, 278–289.
Inoue, T. (2013). Investigating the relation between behavior and result in pair programming: Talk and work leads
to success. The Journal of Information and Systems in Education, 12(1), 39–49. doi: 10.12937/ejsise.12.39
Joachims, T. (2006). Training linear SVMs in linear time. In Proceedings of the 12th ACM SIGKDD International
Conference on Knowledge Discovery and Data Mining (KDD '06) (pp. 217–226). Philadelphia, PA, USA.
doi: 10.1145/1150402.1150429
Johnson, D. W., Johnson, R. T., & Holubec, E. J. (2009). Circles of learning: Cooperation in the classroom (6th
ed.). Edina, MN, USA: Interaction Book Co.
Lucke, T. (2014). Using learning analytics to evaluate the effectiveness of the flipped classroom approach. In
Proceedings of the 2014 Australasian Association for Engineering Education Conference (pp. 1–9).
Wellington, New Zealand.
Lui, K. M., & Chan, K. C. C. (2006). Pair programming productivity: Novice-novice vs. expert-expert.
International Journal of Human-Computer Studies, 64(9), 915–925.
Mevarech, Z., & Kramarski, B. (2014). Critical maths for innovative societies: the role of metacognitive
pedagogies. Paris, France: OECD.
Miyake, N. (1986). Constructive interaction and the iterative process of understanding. Cognitive Science, 10(2),
151–177.
Okada, T., & Simon, H. A. (1997). Collaborative discovery in a scientific domain. Cognitive Science, 21(2),
109–146.
Prensky, M. (2010). Teaching digital natives: Partnering for real learning. Thousand Oaks, CA, USA: Corwin.
Sakai, T., & Hirokawa, S. (2012). Feature words that classify problem sentence in scientific article. In
Proceedings of the 14th International Conference on Information Integration and Web-based Applications
and Services (IIWAS '12) (pp. 360–367). Bali, Indonesia. doi: 10.1145/2428736.2428803
Sfetsos, P., Stamelos, I., Angelis, L., & Deligiannis, I. (2009). An experimental investigation of personality types
impact on pair effectiveness in pair programming. Empirical Software Engineering, 14(2), 187–226.
Shin-ike, K., & Iima, H. (2012). A method for determining classroom seating arrangements by using a genetic
algorithm. In Proceedings of the 20th International Conference on Computers in Education (ICCE 2012).
Singapore, Singapore.
Shirouzu, H., Miyake, N., & Masukawa, H. (2002). Cognitively-active externalization for situated reflection.
Cognitive Science, 26(4), 469–501.
Suzuki, S. V., & Suzuki, H. (2013). Improving academic essays by writing and reading peer annotations on source
documents. In Proceedings of the 10th International Conference on Computer-supported Collaborative
Learning (CSCL 2013) (Vol. 2, pp. 363–364). Madison, WI, USA.
Topping, K., & Ehly, S. (Eds.). (1998). Peer-assisted learning. Mahwah, NJ, USA: Lawrence Erlbaum
Associates.
Whitley, L. D., Starkweather, T., & Fuquay, D. (1989). Scheduling problems and travelling salesman: The genetic
edge recombination operator. In Proceedings of the 3rd International Conference on Genetic Algorithms
(pp. 133–140). Fairfax, VA, USA.
Williams, L., & Kessler, R. (2002). Pair programming illuminated. Boston, MA, USA: Addison-Wesley.
221221

Chen, W. et al. (Eds.) (2016). Proceedings of the 24thInternational Conference on Computers in
Education. India: Asia-Pacific Society for Computers in Education
Graph-Alignment Approach towards
Identifying Gaps in Student Answer
Archana SAHUa*, Plaban Kumar BHOWMICKb aCentre for Educational Technology, Indian Institute of Technology Kharagpur, West Bengal, India bCentre for Educational Technology, Indian Institute of Technology Kharagpur, West Bengal, India
Abstract: Formative assessment aims to provide hints regarding quality of student answers.
The hints are in the form of gaps or irrelevant entities in the student answers on comparison
with the corresponding model answers. The main objective of the present work is to extract
gaps in short answers provided by students. In this work, each of the student and model
answers for a given question are transformed into graphs by extracting different relations
present in the answers. The nodes of the resultant answer graphs are aligned by considering
the similarity of neighborhood topologies of a pair of nodes in addition to the node-node
similarity. This leads to the effective extraction of gaps in the form of meaningful phrases in
student answers, rather than mere words. Evaluation metrics for reporting performance of
the proposed task have been formally defined in this paper. We have compared our proposed
methodology with a word-word alignment based baseline system. The proposed
methodology outperforms the baseline system in a significant margin.
Keywords: Short answer grading, Formative Feedback, word-to-word alignment, Relation
Extraction, Graph Alignment.
1. Introduction
Automatic evaluation of student generated discourses such as essays, short answers has attracted
considerable attention of natural language processing and educational technology research
communities. These systems work with the aim to ease the burden of human graders, who are
generally entrusted with responsibilities to grade innumerable writings in a short time. Evaluation of
student responses can be classified into holistic evaluation and formative evaluation.
In the present work, our aim is to focus on providing formative feedback to the student answers
driven by the following requirements pertaining to the educational scenario:
Apart from the grade, students also desire to know the areas where they are lagging so that they
could work upon them to improve their learning.
At the same time, instructors wish to recognize where students are struggling so that they could
adapt their instructional strategy.
This is where the concept of formative assessment comes into focus where the objective is to
provide feedback to the students regarding gaps that are there in the student provided answers as
well as irrelevant entities in them. The task of generating formative assessment can be divided into
three sub-tasks: a) Identifying gaps, b) Corrections to remediate the identified gaps and c) Entities
irrelevant to the question. The task of formative assessment can be defined as follows:
Definition 1: Formative Assessment
The problem of formative assessment can be described as follows:
Input: A pair of short answers (S, M) to the same question Q where:
S: Student answer
M: Model answer
Output: Gaps and redundant entities in student answer
222222
Generation of formative feedback may vary with the type of answers that are being evaluated.
For example, feedback that a student receives in concept completion type answer should contain
concepts that are missing in the student answer; whereas, formative assessment of argumentative
answers should point out the unsupported claims. Various cases involving following kinds of
answers present the central challenges to the system of formative assessment (FA):
Concept-completion: A question from these kind of answers has a prompt and each prompt is
like a slot which has to be filled up with appropriate concept(s). Both M and S would have such
slots that are filled with some concepts. The FA system is put to test in such circumstances
when it should be capable of detecting synonymy and paraphrasing to match the concepts in the
pair of answers. This would also lead to extraction of correct gaps as well as the redundant
entities in S, too.
Definition-type of answers: This kind of answer seeks the definition involving a concept. The
challenge for FA here lies in effective extraction of salient points that defines the ‘concept’
matching of the same so that the crucial terms missing in S can be highlighted in addition to the
redundant entities in it.
With reference to the challenges faced by the formative assessment system, following are our
contributions for the same.
Identification of gaps in student answer: Meaningful gaps in the form of phrases are extracted
in student answer
Evaluation metric: New evaluation measures have been formally defined to evaluate the task
of formative assessment.
Relation extraction and Graph alignment approach: Extraction of relations in the sentences
of answers uncover the key elements. This is then followed by alignment of answer graphs and
appropriate thresholding of similarity between the aligned nodes, which helps in pinpointing the
gaps in student answers.
In this paper, we focus on the extraction of gaps in short answers. The central idea in the
proposed methodology is to compare a student answer and the corresponding model answer by
transforming the answers into their corresponding abstract representations. The abstract
representation is realized through answer graphs generated by extracting the relations present in the
respective answers.
The next section gives an overview of the approaches discussed so far in the research area of
formative assessment. This is followed by the description of baseline system and the proposed
system based on Graph-alignment. The evaluation metrics for FA have been defined in Section 4,
followed by the experimental results and analysis.
2. Related Work
The approaches proposed for formative assessment of student answers have been discussed in this
section.
C-rater (Sukkarieh & Bolge, 2008; Sukkarieh & Blackmore, 2009) has adopted concept-based
scoring to enable individualized formative feedback for each student answer (concept-completion
answers have been tested). At first, a sample of students’ answers (manually annotated with
evidence for each of the concepts in the test question, such that concept C entails evidence E) and the
corresponding test question are available. Then a set of model sentences are manually written by
referring to the manually annotated students’ answers. The pairs of students’ answers and
corresponding model answers are linguistically processed using a deeper parser followed by
extraction of Linguistic features based on hand-written rules. The result is a flat structure
representation consisting of phrases, predicates and relations between them. Then, pronoun
resolution and morphological analysis of the entities extracted as part of the linguistic features is
done. The above process is repeated for all the pairs of answers selected as training data and then the
features extracted are used to train a Goldmap matching model. The answer pairs are manually
labeled as 0 or 1 for no-match, match respectively.
Unseen student answers and the corresponding model answers are processed as follows:
223223
Spelling correction
Part-of-speech tagging and deeper parsing (OpenNLP parser outputs a deep constituent
parse tree)
Feature extraction from parse tree (same as done for training data)
Pronoun resolution and morphological analysis
The features extracted for a pair of unseen student answer and model answer, is applied to the
trained Goldmap matching model (based on maximum entropy modeling). A probability on the
match between the unseen student answer and model answer is obtained. A specific threshold is
decided to determine a match. C-rater gives quality feedback to students with details such as, which
concepts they get right in their answers and which concepts they get wrong.
No comprehensive evaluation for concept-based scoring and linguistically-driven feedback
has been carried out for C-rater. There are no such notable works till date, regarding formative
assessment of Definition answers and Explanation answers.
Some recent works such as Auto-marking (Sukkarieh, Pulman, & Raikes, 2003) aim to
provide formative feedback for each student answer in the following manner:
A panel of experienced teachers may be employed to look at samples of student answers and
sort each of the answers into a feedback category depending on its semantic content.
The teachers write formative feedback for each category, leading to a sample of student answers
matched to appropriate formative feedback. When an unseen student answer was submitted, it
is initially compared with all the sample answers. The formative feedback of the category of the
sample student answers to which the unseen student answer is close enough, is assigned to the
student answer.
Systems such as OpenMark (Butcher, 2008) are being used for formative assessment.
OpenMark has been designed by Open University such that feedback at multiple levels of learning
could be included.
WriteToLearn (Landauer, Lochbaum, & Dooley, 2009) is an iterative writing tool in which
students write essays and receive feedback about their writing. Feedback regarding various aspects
of writing such as ideas, organization, word choice, sentence fluency is given to the students.
Review of the existing works in the current problem area resulted in the following research
gaps:
Limitation of approaches: Although some efforts have been put forward in identifying
gaps in student answers, no formal approach has been adopted till date.
No evaluation of formative assessment (FA) systems: There is a clear absence of
appropriate literature regarding a systematic study for evaluation of FA systems. The
evaluation measures based on which a particular automated FA system could be declared as
close to human assessment have not been discussed anywhere.
3. Research Design
The main objective of the present work is to generate formative feedback for the student answers. As
existing literature does not contain a comprehensive study in the current problem domain, we intend
to compare our proposed method with a baseline system.
3.1 Baseline System
The baseline system adopts a naive approach in the form of simple word-to-word alignment between
a pair of answers (Sultan, Bethard, & Sumner, 2014). The related words in the two answers are
aligned by exploiting semantic and contextual similarities of the words. The words in model answer
not participating in the resulting word-to-word alignment are designated as gaps in the student
answer. This is shown with an example shown in Figure 1.
It is observed that the gaps in student answer are extracted as words rather than complete
phrases, for example, ‘function’ and ‘members’ indicate independent entities or different gaps but
224224
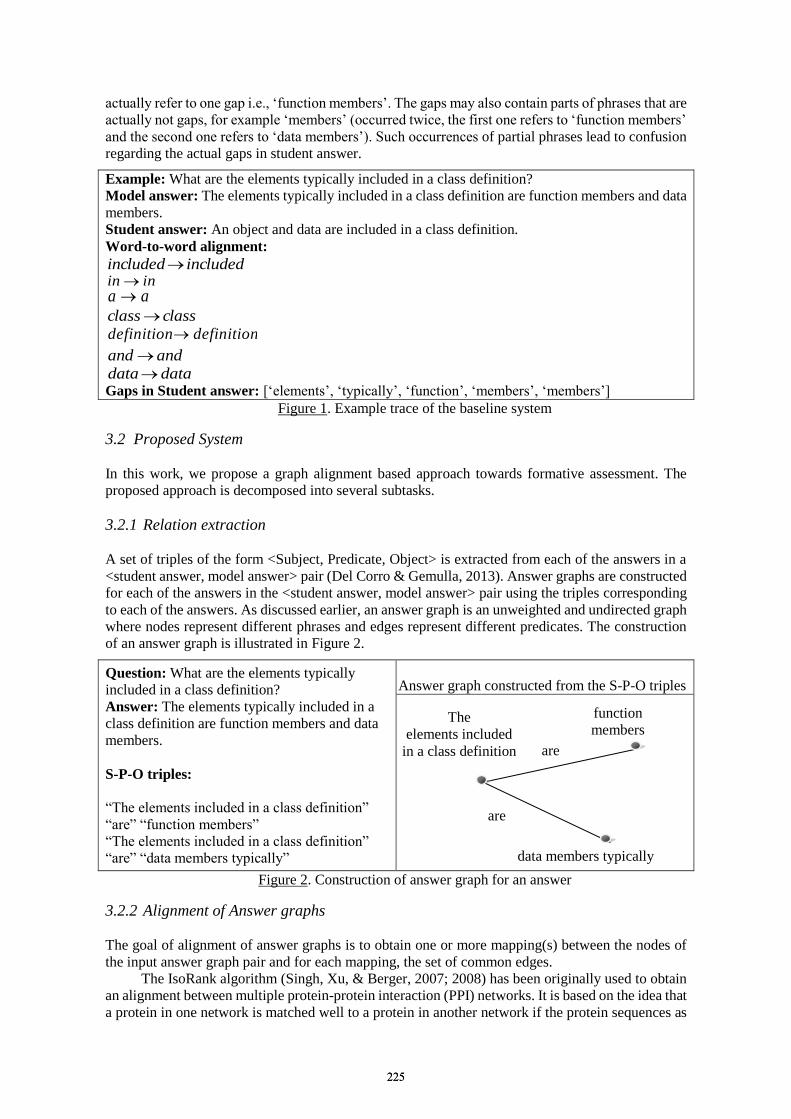
actually refer to one gap i.e., ‘function members’. The gaps may also contain parts of phrases that are
actually not gaps, for example ‘members’ (occurred twice, the first one refers to ‘function members’
and the second one refers to ‘data members’). Such occurrences of partial phrases lead to confusion
regarding the actual gaps in student answer.
Example: What are the elements typically included in a class definition?
Model answer: The elements typically included in a class definition are function members and data
members.
Student answer: An object and data are included in a class definition.
Word-to-word alignment:
includedincluded
inin aa
classclass
definitiondefinition
andand
datadata
Gaps in Student answer: [‘elements’, ‘typically’, ‘function’, ‘members’, ‘members’]
Figure 1. Example trace of the baseline system
3.2 Proposed System
In this work, we propose a graph alignment based approach towards formative assessment. The
proposed approach is decomposed into several subtasks.
3.2.1 Relation extraction
A set of triples of the form <Subject, Predicate, Object> is extracted from each of the answers in a
<student answer, model answer> pair (Del Corro & Gemulla, 2013). Answer graphs are constructed
for each of the answers in the <student answer, model answer> pair using the triples corresponding
to each of the answers. As discussed earlier, an answer graph is an unweighted and undirected graph
where nodes represent different phrases and edges represent different predicates. The construction
of an answer graph is illustrated in Figure 2.
Question: What are the elements typically
included in a class definition?
Answer: The elements typically included in a
class definition are function members and data
members.
S-P-O triples:
“The elements included in a class definition”
“are” “function members”
“The elements included in a class definition”
“are” “data members typically”
Answer graph constructed from the S-P-O triples
Figure 2. Construction of answer graph for an answer
3.2.2 Alignment of Answer graphs
The goal of alignment of answer graphs is to obtain one or more mapping(s) between the nodes of
the input answer graph pair and for each mapping, the set of common edges.
The IsoRank algorithm (Singh, Xu, & Berger, 2007; 2008) has been originally used to obtain
an alignment between multiple protein-protein interaction (PPI) networks. It is based on the idea that
a protein in one network is matched well to a protein in another network if the protein sequences as
The
elements included
in a class definition
function
members
data members typically
are
are
225225
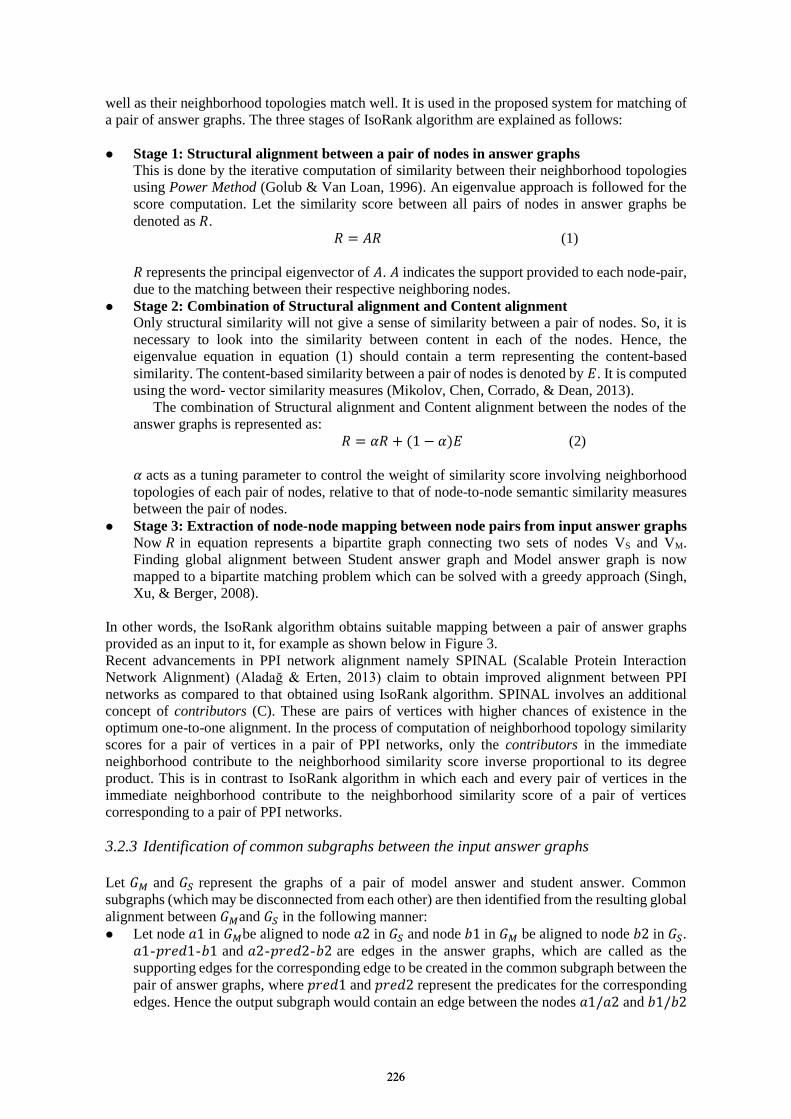
well as their neighborhood topologies match well. It is used in the proposed system for matching of
a pair of answer graphs. The three stages of IsoRank algorithm are explained as follows:
Stage 1: Structural alignment between a pair of nodes in answer graphs
This is done by the iterative computation of similarity between their neighborhood topologies
using Power Method (Golub & Van Loan, 1996). An eigenvalue approach is followed for the
score computation. Let the similarity score between all pairs of nodes in answer graphs be
denoted as 𝑅.
𝑅 = 𝐴𝑅 (1)
𝑅 represents the principal eigenvector of 𝐴. 𝐴 indicates the support provided to each node-pair,
due to the matching between their respective neighboring nodes.
Stage 2: Combination of Structural alignment and Content alignment
Only structural similarity will not give a sense of similarity between a pair of nodes. So, it is
necessary to look into the similarity between content in each of the nodes. Hence, the
eigenvalue equation in equation (1) should contain a term representing the content-based
similarity. The content-based similarity between a pair of nodes is denoted by 𝐸. It is computed
using the word- vector similarity measures (Mikolov, Chen, Corrado, & Dean, 2013).
The combination of Structural alignment and Content alignment between the nodes of the
answer graphs is represented as:
𝑅 = 𝛼𝑅 + (1 − 𝛼)𝐸 (2)
𝛼 acts as a tuning parameter to control the weight of similarity score involving neighborhood
topologies of each pair of nodes, relative to that of node-to-node semantic similarity measures
between the pair of nodes.
Stage 3: Extraction of node-node mapping between node pairs from input answer graphs
Now 𝑅 in equation represents a bipartite graph connecting two sets of nodes VS and VM.
Finding global alignment between Student answer graph and Model answer graph is now
mapped to a bipartite matching problem which can be solved with a greedy approach (Singh,
Xu, & Berger, 2008).
In other words, the IsoRank algorithm obtains suitable mapping between a pair of answer graphs
provided as an input to it, for example as shown below in Figure 3.
Recent advancements in PPI network alignment namely SPINAL (Scalable Protein Interaction
Network Alignment) (Aladağ & Erten, 2013) claim to obtain improved alignment between PPI
networks as compared to that obtained using IsoRank algorithm. SPINAL involves an additional
concept of contributors (C). These are pairs of vertices with higher chances of existence in the
optimum one-to-one alignment. In the process of computation of neighborhood topology similarity
scores for a pair of vertices in a pair of PPI networks, only the contributors in the immediate
neighborhood contribute to the neighborhood similarity score inverse proportional to its degree
product. This is in contrast to IsoRank algorithm in which each and every pair of vertices in the
immediate neighborhood contribute to the neighborhood similarity score of a pair of vertices
corresponding to a pair of PPI networks.
3.2.3 Identification of common subgraphs between the input answer graphs
Let 𝐺𝑀 and 𝐺𝑆 represent the graphs of a pair of model answer and student answer. Common
subgraphs (which may be disconnected from each other) are then identified from the resulting global
alignment between 𝐺𝑀and 𝐺𝑆 in the following manner:
Let node 𝑎1 in 𝐺𝑀be aligned to node 𝑎2 in 𝐺𝑆 and node 𝑏1 in 𝐺𝑀 be aligned to node 𝑏2 in 𝐺𝑆.
𝑎1-𝑝𝑟𝑒𝑑1-𝑏1 and 𝑎2-𝑝𝑟𝑒𝑑2-𝑏2 are edges in the answer graphs, which are called as the
supporting edges for the corresponding edge to be created in the common subgraph between the
pair of answer graphs, where 𝑝𝑟𝑒𝑑1 and 𝑝𝑟𝑒𝑑2 represent the predicates for the corresponding
edges. Hence the output subgraph would contain an edge between the nodes 𝑎1/𝑎2 and 𝑏1/𝑏2
226226
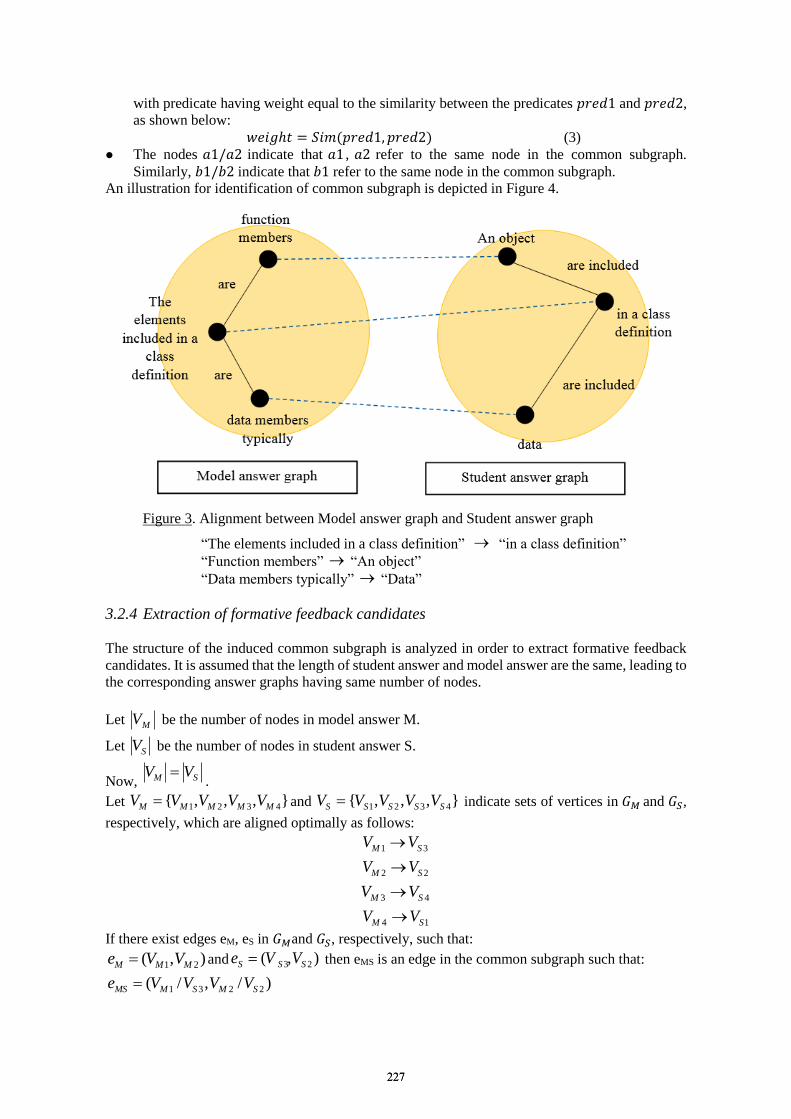
with predicate having weight equal to the similarity between the predicates 𝑝𝑟𝑒𝑑1 and 𝑝𝑟𝑒𝑑2,
as shown below:
𝑤𝑒𝑖𝑔ℎ𝑡 = 𝑆𝑖𝑚(𝑝𝑟𝑒𝑑1, 𝑝𝑟𝑒𝑑2) (3)
The nodes 𝑎1/𝑎2 indicate that 𝑎1 , 𝑎2 refer to the same node in the common subgraph.
Similarly, 𝑏1/𝑏2 indicate that 𝑏1 refer to the same node in the common subgraph.
An illustration for identification of common subgraph is depicted in Figure 4.
Figure 3. Alignment between Model answer graph and Student answer graph
“The elements included in a class definition” “in a class definition”
“Function members” “An object”
“Data members typically” “Data”
3.2.4 Extraction of formative feedback candidates
The structure of the induced common subgraph is analyzed in order to extract formative feedback
candidates. It is assumed that the length of student answer and model answer are the same, leading to
the corresponding answer graphs having same number of nodes.
Let MV be the number of nodes in model answer M.
Let SV be the number of nodes in student answer S.
Now, SM VV .
Let },,,{ 4321 MMMMM VVVVV and },,,{ 4321 SSSSS VVVVV indicate sets of vertices in 𝐺𝑀 and 𝐺𝑆,
respectively, which are aligned optimally as follows:
31 SM VV
22 SM VV
43 SM VV
14 SM VV
If there exist edges eM, eS in 𝐺𝑀and 𝐺𝑆, respectively, such that:
),( 21 MMM VVe and ),( 23 SSS VVe then eMS is an edge in the common subgraph such that:
)/,/( 2231 SMSMMS VVVVe
a
r
e d
a
t
a
p
r
d
a
t
a
p
r
227227
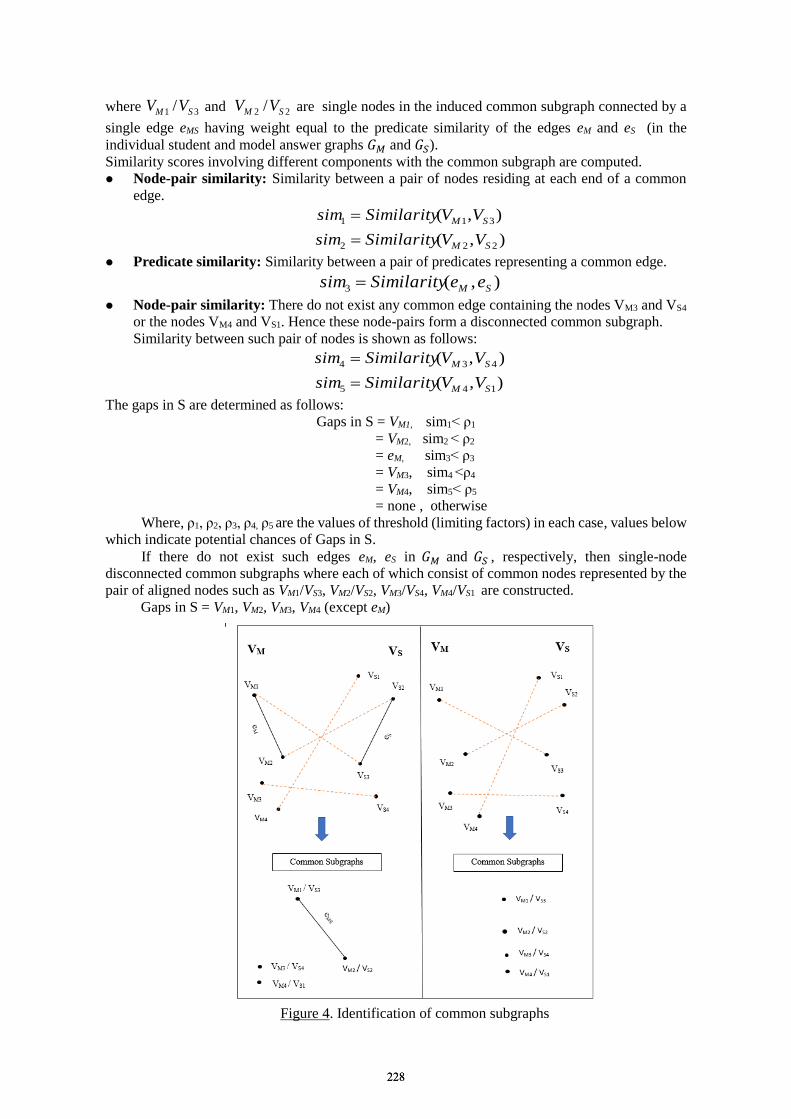
where 31 / SM VV and 22 / SM VV are single nodes in the induced common subgraph connected by a
single edge eMS having weight equal to the predicate similarity of the edges eM and eS (in the
individual student and model answer graphs 𝐺𝑀 and 𝐺𝑆).
Similarity scores involving different components with the common subgraph are computed.
Node-pair similarity: Similarity between a pair of nodes residing at each end of a common
edge.
),( 311 SM VVSimilaritysim
),( 222 SM VVSimilaritysim
Predicate similarity: Similarity between a pair of predicates representing a common edge.
),(3 SM eeSimilaritysim
Node-pair similarity: There do not exist any common edge containing the nodes VM3 and VS4
or the nodes VM4 and VS1. Hence these node-pairs form a disconnected common subgraph.
Similarity between such pair of nodes is shown as follows:
),( 434 SM VVSimilaritysim
),( 145 SM VVSimilaritysim
The gaps in S are determined as follows:
Gaps in S = VM1, sim1< ρ1
= VM2, sim2 < ρ2
= eM, sim3< ρ3
= VM3, sim4 <ρ4
= VM4, sim5< ρ5
= none , otherwise
Where, ρ1, ρ2, ρ3, ρ4, ρ5 are the values of threshold (limiting factors) in each case, values below
which indicate potential chances of Gaps in S.
If there do not exist such edges eM, eS in 𝐺𝑀 and 𝐺𝑆 , respectively, then single-node
disconnected common subgraphs where each of which consist of common nodes represented by the
pair of aligned nodes such as VM1/VS3, VM2/VS2, VM3/VS4, VM4/VS1 are constructed.
Gaps in S = VM1, VM2, VM3, VM4 (except eM)
Figure 4. Identification of common subgraphs
228228
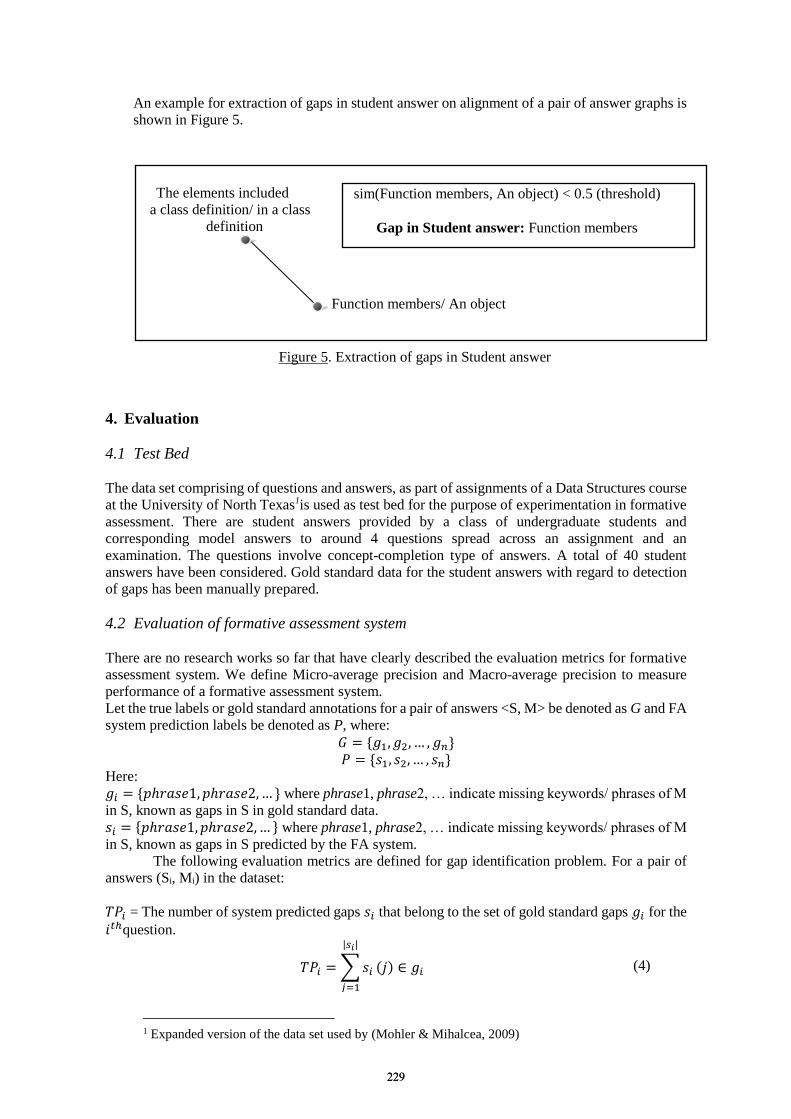
An example for extraction of gaps in student answer on alignment of a pair of answer graphs is
shown in Figure 5.
Figure 5. Extraction of gaps in Student answer
4. Evaluation
4.1 Test Bed
The data set comprising of questions and answers, as part of assignments of a Data Structures course
at the University of North Texas1is used as test bed for the purpose of experimentation in formative
assessment. There are student answers provided by a class of undergraduate students and
corresponding model answers to around 4 questions spread across an assignment and an
examination. The questions involve concept-completion type of answers. A total of 40 student
answers have been considered. Gold standard data for the student answers with regard to detection
of gaps has been manually prepared.
4.2 Evaluation of formative assessment system
There are no research works so far that have clearly described the evaluation metrics for formative
assessment system. We define Micro-average precision and Macro-average precision to measure
performance of a formative assessment system.
Let the true labels or gold standard annotations for a pair of answers <S, M> be denoted as G and FA
system prediction labels be denoted as P, where:
𝐺 = {𝑔1, 𝑔2, … , 𝑔𝑛}
𝑃 = {𝑠1, 𝑠2, … , 𝑠𝑛}
Here:
𝑔𝑖 = {𝑝ℎ𝑟𝑎𝑠𝑒1, 𝑝ℎ𝑟𝑎𝑠𝑒2, … } where phrase1, phrase2, … indicate missing keywords/ phrases of M
in S, known as gaps in S in gold standard data.
𝑠𝑖 = {𝑝ℎ𝑟𝑎𝑠𝑒1, 𝑝ℎ𝑟𝑎𝑠𝑒2, … } where phrase1, phrase2, … indicate missing keywords/ phrases of M
in S, known as gaps in S predicted by the FA system.
The following evaluation metrics are defined for gap identification problem. For a pair of
answers (Si, Mi) in the dataset:
𝑇𝑃𝑖 = The number of system predicted gaps 𝑠𝑖 that belong to the set of gold standard gaps 𝑔𝑖 for the
𝑖𝑡ℎquestion.
𝑇𝑃𝑖 = ∑ 𝑠𝑖
|𝑠𝑖|
𝑗=1
(𝑗) ∈ 𝑔𝑖 (4)
1 Expanded version of the data set used by (Mohler & Mihalcea, 2009)
The elements included
in a class definition/ in a class
definition
Function members/ An object
sim(Function members, An object) < 0.5 (threshold)
Gap in Student answer: Function members
229229
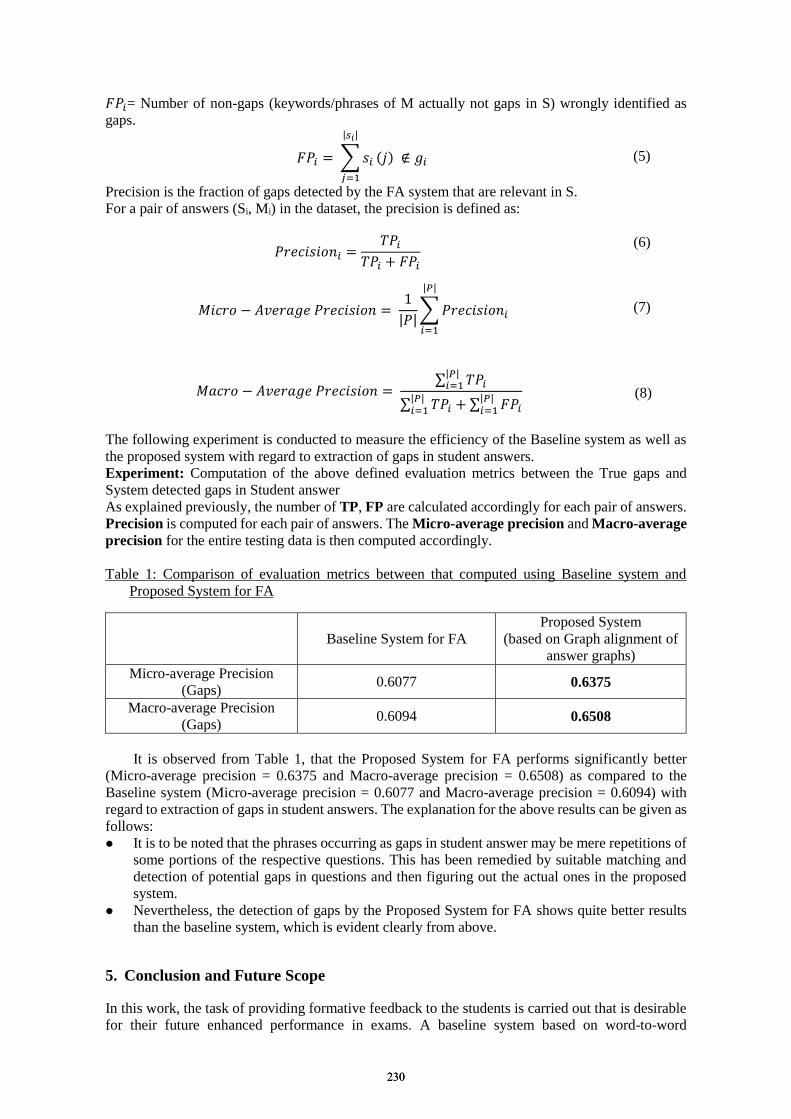
𝐹𝑃𝑖= Number of non-gaps (keywords/phrases of M actually not gaps in S) wrongly identified as
gaps.
𝐹𝑃𝑖 = ∑ 𝑠𝑖
|𝑠𝑖|
𝑗=1
(𝑗) ∉ 𝑔𝑖 (5)
Precision is the fraction of gaps detected by the FA system that are relevant in S.
For a pair of answers (Si, Mi) in the dataset, the precision is defined as:
𝑃𝑟𝑒𝑐𝑖𝑠𝑖𝑜𝑛𝑖 =𝑇𝑃𝑖
𝑇𝑃𝑖 + 𝐹𝑃𝑖
(6)
𝑀𝑖𝑐𝑟𝑜 − 𝐴𝑣𝑒𝑟𝑎𝑔𝑒 𝑃𝑟𝑒𝑐𝑖𝑠𝑖𝑜𝑛 = 1
|𝑃|∑ 𝑃𝑟𝑒𝑐𝑖𝑠𝑖𝑜𝑛𝑖
|𝑃|
𝑖=1
(7)
𝑀𝑎𝑐𝑟𝑜 − 𝐴𝑣𝑒𝑟𝑎𝑔𝑒 𝑃𝑟𝑒𝑐𝑖𝑠𝑖𝑜𝑛 = ∑ 𝑇𝑃𝑖
|𝑃|𝑖=1
∑ 𝑇𝑃𝑖 + ∑ 𝐹𝑃𝑖|𝑃|𝑖=1
|𝑃|𝑖=1
(8)
The following experiment is conducted to measure the efficiency of the Baseline system as well as
the proposed system with regard to extraction of gaps in student answers.
Experiment: Computation of the above defined evaluation metrics between the True gaps and
System detected gaps in Student answer
As explained previously, the number of TP, FP are calculated accordingly for each pair of answers.
Precision is computed for each pair of answers. The Micro-average precision and Macro-average
precision for the entire testing data is then computed accordingly.
Table 1: Comparison of evaluation metrics between that computed using Baseline system and
Proposed System for FA
Baseline System for FA
Proposed System
(based on Graph alignment of
answer graphs)
Micro-average Precision
(Gaps) 0.6077 0.6375
Macro-average Precision
(Gaps) 0.6094 0.6508
It is observed from Table 1, that the Proposed System for FA performs significantly better
(Micro-average precision = 0.6375 and Macro-average precision = 0.6508) as compared to the
Baseline system (Micro-average precision = 0.6077 and Macro-average precision = 0.6094) with
regard to extraction of gaps in student answers. The explanation for the above results can be given as
follows:
It is to be noted that the phrases occurring as gaps in student answer may be mere repetitions of
some portions of the respective questions. This has been remedied by suitable matching and
detection of potential gaps in questions and then figuring out the actual ones in the proposed
system.
Nevertheless, the detection of gaps by the Proposed System for FA shows quite better results
than the baseline system, which is evident clearly from above.
5. Conclusion and Future Scope
In this work, the task of providing formative feedback to the students is carried out that is desirable
for their future enhanced performance in exams. A baseline system based on word-to-word
230230
alignment is prepared as well a system based on Graph-alignment is proposed for FA. Gaps
extracted using the baseline system are words rather than phrases. Due to this, there is a false notion
of more gaps rather than few of them. The proposed system based on Graph-alignment approach
manages to extract more meaningful gaps in the form of phrases in student answers. This is clearly
observed from the significantly high values of evaluation metrics computed using proposed system
as that compared to Baseline system. The concept of using neighborhood similarity of pairs of nodes
in addition to the traditional node-node similarity scores in Graph alignment have resulted in a huge
improvement in the precision measures.
This system has been successful in providing formative feedback. In addition, to the best of our
knowledge, this is the first time that supporting evaluation has been provided for evidence.
Evaluation measures have been newly defined in the field of formative assessment.
We plan to perform the experiment for a larger span of answers, with a wide variety at the same
time. Presently, we have worked upon a limited set of concept-completion type of answers. It is our
aim to extend the experimental work and analysis towards the definition and explanation-type of
answers too. It is perceived that the experimental results could be improved by considering better
extraction of relations from the answers as well as better graph alignment approaches in alignment of
answer graphs. We plan to work on the same in future.
References
Aladağ, A. E., & Erten, C. (2013). SPINAL: scalable protein interaction network alignment. Bioinformatics,
917-924.
Butcher, P. (2008). Online assessment at the Open University using open source software: Moodle, OpenMark
and more.
Del Corro, L., & Gemulla, R. (2013). Clausie: clause-based open information extraction. 22nd international
conference on World Wide Web (pp. 355-366). International World Wide Web Conferences Steering
Committee.
Golub, G. H., & Van Loan, C. F. (1996). Matrix computations. 3.
Landauer, T. K., Lochbaum, K. E., & Dooley, S. (2009). A new formative assessment technology for reading
and writing. Theory into Practic. 48(1), 44-52.
Mikolov, T., Chen, K., Corrado, G., & Dean, J. (2013). Efficient estimation of word representations in vector
spac. arXiv preprint arXiv, 1301-3781.
Mohler, M., & Mihalcea, R. (2009). Text-to-text semantic similarity for automatic short answer grading. 12th
Conference of the European Chapter of the Association for Computational Linguistics (pp. 567-575).
Association for Computational Linguistics.
Singh, R., Xu, J., & Berger, B. (2007). Pairwise global alignment of protein interaction networks by matching
neighborhood topology. Annual International Conference on Research in Computational Molecular
Biology (pp. 16-31). Springer Berlin Heidelberg.
Singh, R., Xu, J., & Berger, B. (2008). Global alignment of multiple protein interaction networks with
application to functional orthologydetection. National Academy of Sciences, 105(35), 12763-12768.
Sukkarieh, J. Z., & Blackmore, J. (2009). c-rater: Automatic Content Scoring for Short Constructed Responses.
FLAIRS Conference.
Sukkarieh, J. Z., Pulman, S. G., & Raikes, N. (2003). Auto-marking: using computational linguistics to score
short, free text responses. International Association for Educational Assessment (IAEA), Manchester,
UK.
Sukkarieh, J., & Bolge, E. (2008). Leveraging C-rater’s automated scoring capability for providing
instructional feedback for short constructed responses. Intelligent Tutoring Systems, Springer Berlin
Heidelberg, (pp. 779-783).
Sultan, M. A., Bethard, S., & Sumner, T. (2014). Back to basics for monolingual alignment: Exploiting word
similarity and contextual evidence. Transactions of the Association for Computational Linguistics,
219-230.
231231
Chen, W. et al. (Eds.) (2016). Proceedings of the 24th International Conference on Computers in Education.
India: Asia-Pacific Society for Computers in Education
Empirical Study on the Effect of Digital Badges
in a General Physics Homework System
James UANHOROa, Shelley Shwu-Ching YOUNGb*, Yi-Hsuan LINb aInstitute of Information Systems and Applications, National Tsing Hua University, Taiwan
bInstitute of Learning Sciences, National Tsing Hua University, Taiwan
Abstract: In this paper, we study the effect of digital badges within an online homework system
for an undergraduate general physics course at a large university in Taiwan. Students (N=162)
self-selected themselves into two course sections; students in one course section (N = 68) were
able to earn one badge per assignment for turning their assignments in earlier than the
assignment deadline – treatment group, while students in the other section (N = 94) could not –
control group. In addition to submission before a special badge deadline, students in the
treatment group were also required to obtain maximum scores to get these badges. However,
assignments were designed to be easy enough for students to earn the maximum grade (which
students generally did). Additionally, students in the treatment group were able to earn higher
level badges by combining the assignment badges. Students in the treatment group were fully
aware of badge requirements and the badge design was visible. Our results show that students
in the treatment group actively attempted to earn badges, and there was a statistically significant
increase in the timeliness of their assignment submissions. These findings show that badges can
be used to motivate specific behaviors in students whilst requiring minimal changes to the
course structure.
Keywords: digital badges, timeliness, graduate attributes, homework system
1. Introduction
A digital badge is an online representation of a skill earned (Mozilla Foundation, 2014). However, it is
easiest to understand badges in terms of their affordances. Joseph (2012) undertook a review of the
digital badge ecosystem, with the intention of identifying the way different actors approach the concept
of digital badges, or the different frames of use. His review identified six frames of use: Badges as
Alternative Assessment; Gamifying Education with Badges; Badges as Learning Scaffolding; Badges
to Develop Lifelong Learning Skills; Badges as a Digital Media and Learning Driver; and Badges to
Democratise Learning.
Of particular interest to this study is the fourth frame identified by Joseph – Badges to Develop
Lifelong Skills. These skills are sometimes referred to as (key) competencies, and within higher
education, they are referred to as graduate attributes (Hager & Holland, 2006). Timeliness, a major
focus of this study, is a translational graduate attribute skill (Barrie, 2004) i.e. a graduate attribute that
learners can apply in an unfamiliar environment; as an example, students newly employed in the
workplace. The ability of badges to motivate learners to adopt particular attitudes is empirically
verifiable. Thus, raising the question: how effective are digital badges at motivating graduate attributes
in learners? Having an answer to this question can help educational practitioners know whether creating
badging systems is worth the effort expended on it.
This study has one primary research question:
• What is the effect of digital badges on the timeliness of assignment submissions within an
undergraduate physics course?
In addition to this question, there was one secondary research question:
• Do students actively attempt to earn digital badges when given the opportunity?
1.1 Context of the Study
232232
The study took place at National Tsing Hua University, a relatively large university in North-East
Taiwan. Study participants were enrollees in an undergraduate physics course typically taken by first-
year undergraduate students who are non-physics majors. Enrolment in the course was subject to
university-wide regulation; hence, enrollees in the course were able to choose one from eight course-
sections taught by different professors to enroll in. Thus, this was a quasi-experimental study rather
than an experimental one, as the samples were self-selected. Only enrollees in two of the eight sections
of the course were participants in the study. One section was randomly picked as the treatment group –
students in this section were able to earn badges; while students in the other section were not – the
control group. Students were not aware of this difference during the period of course selection.
Students enrolled in the course were required to complete assignments via an online platform.
These assignments were accessible to students after students had been taught the related content in class;
but were due for submission in three batches. After each batch of assignments, students took an exam;
thus, there were three exams.
2. Literature Review
2.1 A Framework for Graduate Attributes
Barrie (2004) employed a phenomenological approach to research academic understandings of graduate
attributes, focusing on university teachers who had the task of integrating generic attributes into the
undergraduate experience. Barrie (2004) discovered four qualitatively distinct and hierarchical
conceptions of graduate attributes. Interestingly, these conceptions of graduate attributes did not pertain
to specific groupings of academic disciplines, and there was wide variation within certain disciplines.
In increasing order of complexity, the conceptions of graduate attributes are:
1) Precursor conceptions of attributes: This understanding of graduate attributes views graduate
attributes as foundational skills such as basic numeracy and literacy. They can be taught by non-
discipline specific educators, are prerequisites for discipline specific study, and are truly generic.
Within higher education institutions, these skills are usually imparted via remedial education.
2) Complementary conceptions of attributes: This viewpoint sees graduate attributes as those
complementary to discipline knowledge. While precursor attributes are a prerequisite to discipline
specific study, complementary attributes are typically learned concurrently with discipline specific
study. Nevertheless, they are similar to precursor attributes in the sense that they are truly generic.
Teachers may attempt to impart these attributes via extra seminars or workshops.
3) Translation conceptions of attributes: This understanding of graduate attributes views graduate
attributes as attributes that help students apply university learning into an unfamiliar environment.
These attributes may include personal and intellectual autonomy, and research and inquiry.
Furthermore, these attributes can be imparted to students via engagement with the course.
4) Enabling conceptions of attributes: This viewpoint sees graduate attributes as the attitudinal stances
and abilities at the heart of all scholarly learning and knowledge, with potential to create new
knowledge, and transform the individual. Such attitudinal stances and abilities include global
citizenship and scholarship. These attributes may be learned within the broader context of a
student’s academic and non-academic experience.
2.2 The Origins of Digital Badges within Education
Based on the writings of Davidson (as cited in Abramovich, Schunn, & Higashi, 2013), badge advocates
claim badges as a form of alternative assessment will increase learner motivation whilst maintaining
high-quality feedback. Abramovich, Schunn, and Higashi (2013) state the origin for these claims and
beliefs in the efficacy of badges can be found by investigating the antecedents to digital badges in
education: merit badges and video-game achievements.
The Boy and Girl Scout organizations in the United States offer children the chance to learn
different skills. Merit badges are then used to certify that the skills chosen by children have been learned.
The underlying theory is the goal of earning a badge will increase motivation for children who want
formal recognition. Many video games have elements (including badges) which afford players the
233233
opportunity to translate in-game accomplishment to real world recognition. Players can choose which
badges to earn or can achieve them through normal game-play.
Abramovich, Schunn, and Higashi (2013) then proceed to highlight the similarities between
digital badges in education and merit badges and video-game badges. Digital badges in education may
be used to show learning outside the classroom as used with merit badges. Learners can show off their
badges on personal profiles like video-game badges. Similarly to video-game achievements, learners
may also earn badges on intention or simply as a by-product of learning.
Hakulinen, Auvinen, and Korhonen (2013) also draw the link between digital badges in education,
merit badges and video- game achievements by focusing on the concept of gamification. Gamification
is a broad concept that uses methods such as leaderboards, achievement badges and point systems to
make systems more motivating and engaging (Hakulinen, Auvinen, & Korhonen, 2013).
This link between gamification and badges in education is similar to one of the frames identified
by Joseph (2012); but as Joseph (2012) notes, it is important to be skeptical when the claim is made that
gamification can replicate the level of engagement found with gaming. Linderoth (2012) provides one
reason why this is so: games are built such that progress is not necessarily a result of learning. Thus,
relative to education, this undemanding nature of games is what makes them motivating and pleasurable.
2.3 Quantitative Studies on Badges in Education
Given the relative recency of the concept of badges in education. Experimental and quasi-experimental
studies of badges are relatively few as of the moment of writing.
Hakulinen, Auvinen, and Korhonen (2013) found that badges could elicit positive behavioral
responses from students. These responses though were heavily influenced by learner motivations.
Homework contributed 30% to the final grade of computer science minors, while it contributed 20% to
the final grade of computer science majors. Thus, computer science minors tended to earn badges that
rewarded correctness as they were already predisposed to paying more attention to their assignment
grade. Computer science majors tended to earn badges that rewarded timeliness, sometimes at the
expense of accuracy.
Abramovich, Schunn, and Higashi (2013) found both positive and negative effects of badges on
the motivation of students, depending on the prior knowledge of learners. A major flaw in this study
though is the absence of comparison groups. There is no way to ascertain whether the changes in student
motivation were due to exposure to badges or exposure to the intelligent tutor system and/or badges as
all 51 study participants were exposed to the same treatment.
Hanus and Fox (2015) used questionnaires to test the effect of gamification (using badges and a
leaderboard) on intrinsic motivation at four points during the semester. They found that gamification
led to a statistically significant drop in intrinsic motivation, but they failed to find any direct relationship
between gamification and final exam scores. As badges were used in concert with leaderboards, and
there were only two comparison groups – badges combined with leaderboards; and no badges, no
leaderboard – it is particularly difficult to identify the exact effect of badges on the intrinsic motivation
of students.
Denny (2013) conducted a study to test the ability of badges to motivate students to perform
specific learning tasks. Denny (2013) did not find a significant difference between the two groups in
the number of questions authored by the students, but found a significant difference in the number of
answers provided by both groups. The students in the badge group answered more questions than
students in the non-badge group; there was no drop in quality of answers – this contributes to the notion
that badges are indeed useful motivators. However, it should be noted that authoring questions requires
significantly greater effort than answering questions, and given there was no significant difference in
authorship between both groups, it is indeed possible that badges will only serve as useful motivators
when the task is relatively easy. This is particularly noteworthy as a survey of the class showed that
students felt authoring questions was a more effective way of learning than answering questions.
Of the four quantitative studies reviewed, three provided control groups (Denny, 2013; Hakulinen,
Auvinen, & Korhonen, 2013; Hanus & Fox, 2015). Of these three studies, only two directly focused on
the effect of badges. The study by Hanus and Fox (2015) combined badges with leaderboards, without
a comparison group where only one item was used – the only other comparison group had none of these
gamification elements – thereby making it impossible to identify the specific effect of badges.
234234
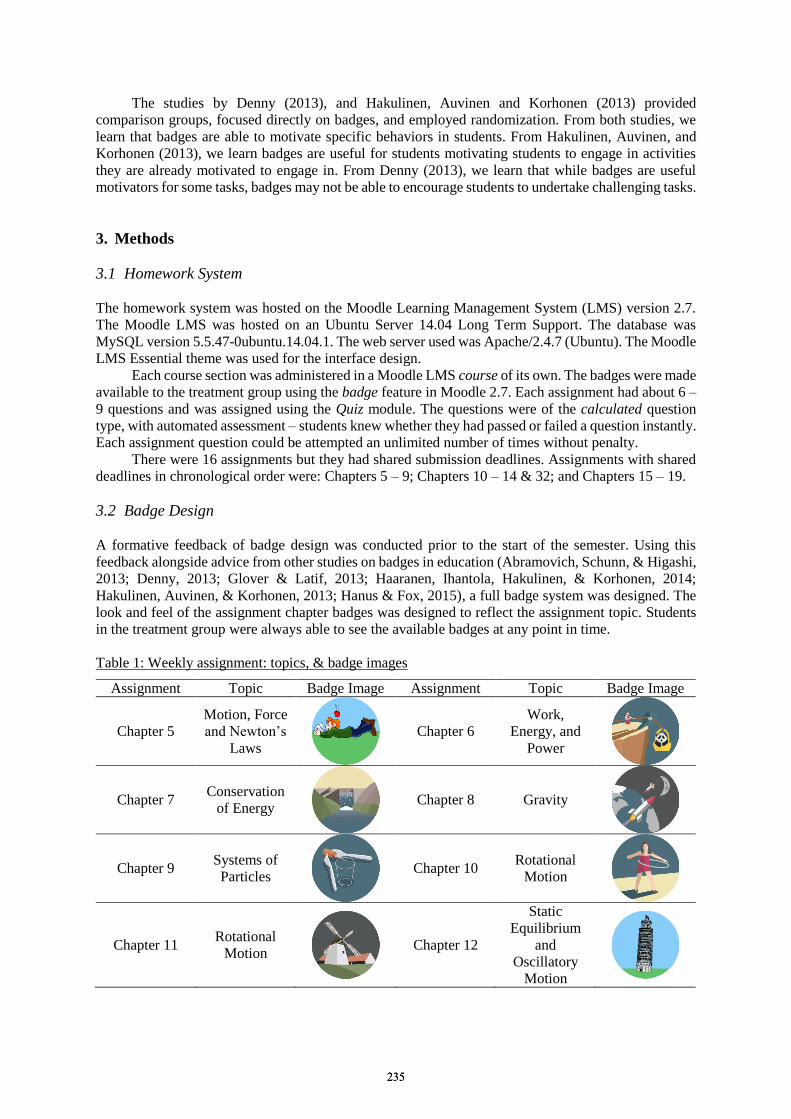
The studies by Denny (2013), and Hakulinen, Auvinen and Korhonen (2013) provided
comparison groups, focused directly on badges, and employed randomization. From both studies, we
learn that badges are able to motivate specific behaviors in students. From Hakulinen, Auvinen, and
Korhonen (2013), we learn badges are useful for students motivating students to engage in activities
they are already motivated to engage in. From Denny (2013), we learn that while badges are useful
motivators for some tasks, badges may not be able to encourage students to undertake challenging tasks.
3. Methods
3.1 Homework System
The homework system was hosted on the Moodle Learning Management System (LMS) version 2.7.
The Moodle LMS was hosted on an Ubuntu Server 14.04 Long Term Support. The database was
MySQL version 5.5.47-0ubuntu.14.04.1. The web server used was Apache/2.4.7 (Ubuntu). The Moodle
LMS Essential theme was used for the interface design.
Each course section was administered in a Moodle LMS course of its own. The badges were made
available to the treatment group using the badge feature in Moodle 2.7. Each assignment had about 6 –
9 questions and was assigned using the Quiz module. The questions were of the calculated question
type, with automated assessment – students knew whether they had passed or failed a question instantly.
Each assignment question could be attempted an unlimited number of times without penalty.
There were 16 assignments but they had shared submission deadlines. Assignments with shared
deadlines in chronological order were: Chapters 5 – 9; Chapters 10 – 14 & 32; and Chapters 15 – 19.
3.2 Badge Design
A formative feedback of badge design was conducted prior to the start of the semester. Using this
feedback alongside advice from other studies on badges in education (Abramovich, Schunn, & Higashi,
2013; Denny, 2013; Glover & Latif, 2013; Haaranen, Ihantola, Hakulinen, & Korhonen, 2014;
Hakulinen, Auvinen, & Korhonen, 2013; Hanus & Fox, 2015), a full badge system was designed. The
look and feel of the assignment chapter badges was designed to reflect the assignment topic. Students
in the treatment group were always able to see the available badges at any point in time.
Table 1: Weekly assignment: topics, & badge images
Assignment Topic Badge Image Assignment Topic Badge Image
Chapter 5
Motion, Force
and Newton’s
Laws
Chapter 6
Work,
Energy, and
Power
Chapter 7 Conservation
of Energy
Chapter 8 Gravity
Chapter 9 Systems of
Particles
Chapter 10 Rotational
Motion
Chapter 11 Rotational
Motion
Chapter 12
Static
Equilibrium
and
Oscillatory
Motion
235235
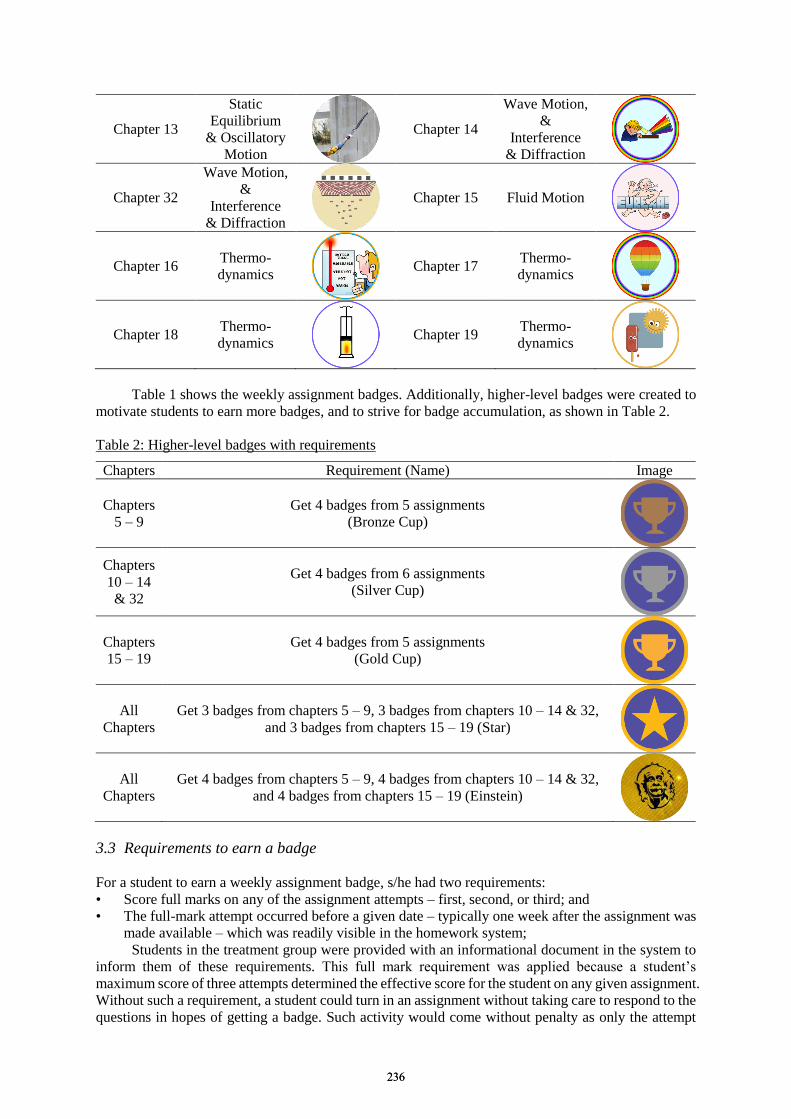
Chapter 13
Static
Equilibrium
& Oscillatory
Motion
Chapter 14
Wave Motion,
&
Interference
& Diffraction
Chapter 32
Wave Motion,
&
Interference
& Diffraction
Chapter 15 Fluid Motion
Chapter 16 Thermo-
dynamics
Chapter 17 Thermo-
dynamics
Chapter 18 Thermo-
dynamics
Chapter 19 Thermo-
dynamics
Table 1 shows the weekly assignment badges. Additionally, higher-level badges were created to
motivate students to earn more badges, and to strive for badge accumulation, as shown in Table 2.
Table 2: Higher-level badges with requirements
Chapters Requirement (Name) Image
Chapters
5 – 9
Get 4 badges from 5 assignments
(Bronze Cup)
Chapters
10 – 14
& 32
Get 4 badges from 6 assignments
(Silver Cup)
Chapters
15 – 19
Get 4 badges from 5 assignments
(Gold Cup)
All
Chapters
Get 3 badges from chapters 5 – 9, 3 badges from chapters 10 – 14 & 32,
and 3 badges from chapters 15 – 19 (Star)
All
Chapters
Get 4 badges from chapters 5 – 9, 4 badges from chapters 10 – 14 & 32,
and 4 badges from chapters 15 – 19 (Einstein)
3.3 Requirements to earn a badge
For a student to earn a weekly assignment badge, s/he had two requirements:
• Score full marks on any of the assignment attempts – first, second, or third; and
• The full-mark attempt occurred before a given date – typically one week after the assignment was
made available – which was readily visible in the homework system;
Students in the treatment group were provided with an informational document in the system to
inform them of these requirements. This full mark requirement was applied because a student’s
maximum score of three attempts determined the effective score for the student on any given assignment.
Without such a requirement, a student could turn in an assignment without taking care to respond to the
questions in hopes of getting a badge. Such activity would come without penalty as only the attempt
236236
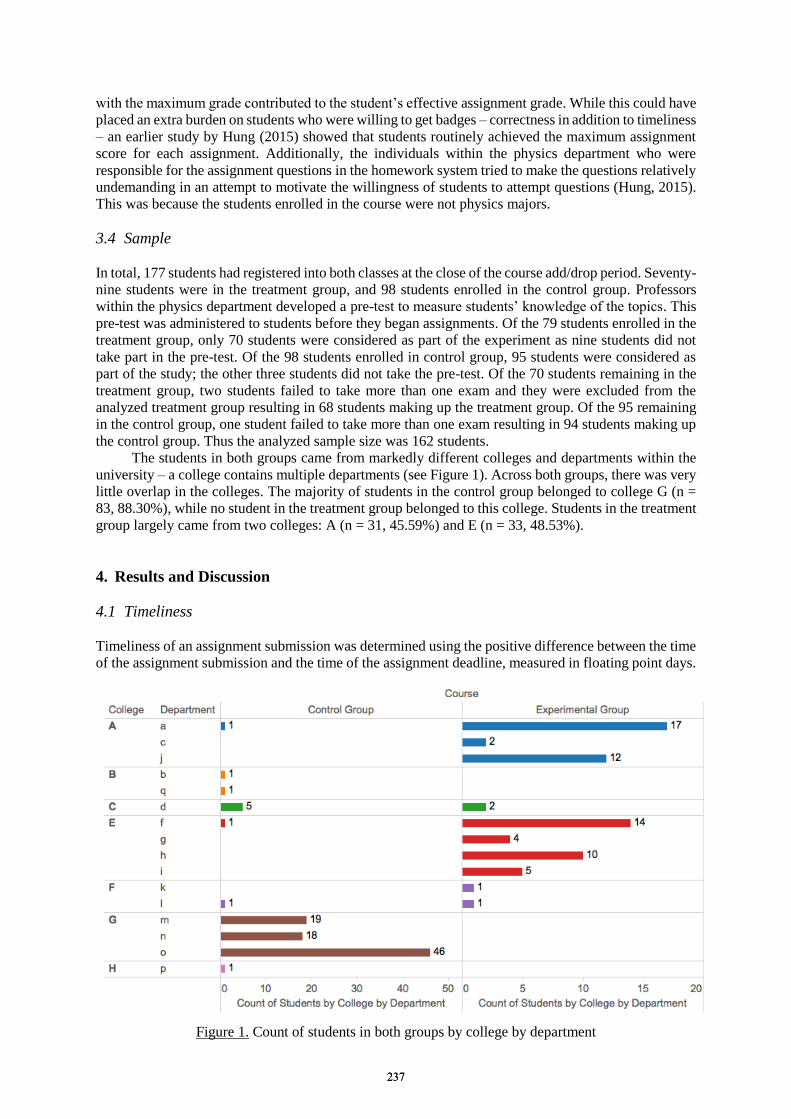
with the maximum grade contributed to the student’s effective assignment grade. While this could have
placed an extra burden on students who were willing to get badges – correctness in addition to timeliness
– an earlier study by Hung (2015) showed that students routinely achieved the maximum assignment
score for each assignment. Additionally, the individuals within the physics department who were
responsible for the assignment questions in the homework system tried to make the questions relatively
undemanding in an attempt to motivate the willingness of students to attempt questions (Hung, 2015).
This was because the students enrolled in the course were not physics majors.
3.4 Sample
In total, 177 students had registered into both classes at the close of the course add/drop period. Seventy-
nine students were in the treatment group, and 98 students enrolled in the control group. Professors
within the physics department developed a pre-test to measure students’ knowledge of the topics. This
pre-test was administered to students before they began assignments. Of the 79 students enrolled in the
treatment group, only 70 students were considered as part of the experiment as nine students did not
take part in the pre-test. Of the 98 students enrolled in control group, 95 students were considered as
part of the study; the other three students did not take the pre-test. Of the 70 students remaining in the
treatment group, two students failed to take more than one exam and they were excluded from the
analyzed treatment group resulting in 68 students making up the treatment group. Of the 95 remaining
in the control group, one student failed to take more than one exam resulting in 94 students making up
the control group. Thus the analyzed sample size was 162 students.
The students in both groups came from markedly different colleges and departments within the
university – a college contains multiple departments (see Figure 1). Across both groups, there was very
little overlap in the colleges. The majority of students in the control group belonged to college G (n =
83, 88.30%), while no student in the treatment group belonged to this college. Students in the treatment
group largely came from two colleges: A (n = 31, 45.59%) and E (n = 33, 48.53%).
4. Results and Discussion
4.1 Timeliness
Timeliness of an assignment submission was determined using the positive difference between the time
of the assignment submission and the time of the assignment deadline, measured in floating point days.
Figure 1. Count of students in both groups by college by department
237237
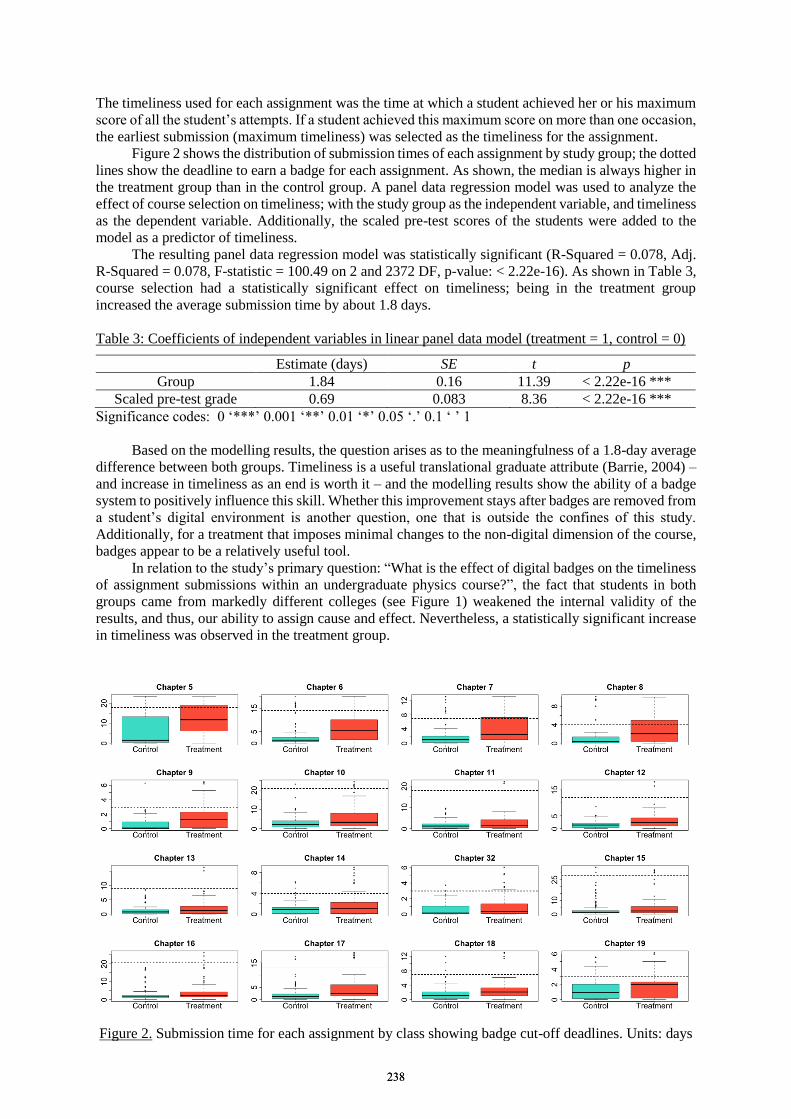
The timeliness used for each assignment was the time at which a student achieved her or his maximum
score of all the student’s attempts. If a student achieved this maximum score on more than one occasion,
the earliest submission (maximum timeliness) was selected as the timeliness for the assignment.
Figure 2 shows the distribution of submission times of each assignment by study group; the dotted
lines show the deadline to earn a badge for each assignment. As shown, the median is always higher in
the treatment group than in the control group. A panel data regression model was used to analyze the
effect of course selection on timeliness; with the study group as the independent variable, and timeliness
as the dependent variable. Additionally, the scaled pre-test scores of the students were added to the
model as a predictor of timeliness.
The resulting panel data regression model was statistically significant (R-Squared = 0.078, Adj.
R-Squared = 0.078, F-statistic = 100.49 on 2 and 2372 DF, p-value: < 2.22e-16). As shown in Table 3,
course selection had a statistically significant effect on timeliness; being in the treatment group
increased the average submission time by about 1.8 days.
Table 3: Coefficients of independent variables in linear panel data model (treatment = 1, control = 0)
Estimate (days) SE t p
Group 1.84 0.16 11.39 < 2.22e-16 ***
Scaled pre-test grade 0.69 0.083 8.36 < 2.22e-16 ***
Significance codes: 0 ‘***’ 0.001 ‘**’ 0.01 ‘*’ 0.05 ‘.’ 0.1 ‘ ’ 1
Based on the modelling results, the question arises as to the meaningfulness of a 1.8-day average
difference between both groups. Timeliness is a useful translational graduate attribute (Barrie, 2004) –
and increase in timeliness as an end is worth it – and the modelling results show the ability of a badge
system to positively influence this skill. Whether this improvement stays after badges are removed from
a student’s digital environment is another question, one that is outside the confines of this study.
Additionally, for a treatment that imposes minimal changes to the non-digital dimension of the course,
badges appear to be a relatively useful tool.
In relation to the study’s primary question: “What is the effect of digital badges on the timeliness
of assignment submissions within an undergraduate physics course?”, the fact that students in both
groups came from markedly different colleges (see Figure 1) weakened the internal validity of the
results, and thus, our ability to assign cause and effect. Nevertheless, a statistically significant increase
in timeliness was observed in the treatment group.
Figure 2. Submission time for each assignment by class showing badge cut-off deadlines. Units: days
238238

Reversing the treatment and control groups and repeating the experiment could resolve this issue.
This would be dependent on the expectation that students in a set of colleges are typically attracted to
the exact professors involved in both classes. If the results stay the same in terms of treatment and
control group, then it is resolved that, the outcomes found at the end of this study are not related to the
colleges the students come from but are an effect of badges.
4.2 Badges
In order to find out whether students in the treatment group actively attempted to earn badges, the
criteria used to award badges to students in the treatment group was retrospectively applied to the
control group to see how both groups fared in terms of acquiring badges.
Table 4: Descriptive statistics and results of Wilcoxon rank sum tests on badge data
Type of Badge Group Badge count (Unique earners) M SD W p
Sum: chapters
5-9 badges
Control 22 (12) 0.23 0.71 2375
0.00015
*** Treatment 67 (25) 0.99 1.54
Sum: chapters
10-14,32 badges
Control 6 (6) 0.064 0.25 2759
0.0080
** Treatment 29 (13) 0.43 1.00
Sum: chapters
15-19 badges
Control 14 (10) 0.15 0.53 2806 0.035 *
Treatment 31 (15) 0.46 1.01
Sum: all chapter
badges
Control 42 (19) 0.45 1.09 2276
0.00013
*** Treatment 127 (31) 1.87 2.92
Bronze Cup Control 1 (1) 0.011 0.10
2854 0.0035
** Treatment 8 (8) 0.12 0.33
Silver Cup Control 0 (0) 0 0
3149 0.24 Treatment 1 (1) 0.015 0.12
Gold Cup Control 1 (1) 0.011 0.10
3136 0.38 Treatment 2 (2) 0.029 0.17
Star Control 0 (0) 0 0
3102 0.097 . Treatment 2 (2) 0.029 0.17
Significance codes: 0 ‘***’ 0.001 ‘**’ 0.01 ‘*’ 0.05 ‘.’ 0.1 ‘ ’ 1
No student earned the Einstein badge
Across all the periods in the semester, students in the treatment group never got fewer badges
than students got in the control group. To test whether this difference was statistically significant, a
two-tailed Wilcoxon Rank Sum test with continuity correction was employed; the badge data was
heavily skewed towards zero, as a majority students never earned a single badge.
As shown in Table 4, the mean of badges earned by students in the treatment group across the
semester is significantly higher than the mean of badges gained by students in the control group. Thus,
it appears that students actively attempt to earn badges when given the opportunity. However, there is
no significant difference between both groups in terms of earning the higher level badges except for the
Bronze Cup.
4.3 Performance on Assignment and Exams.
The performance of both groups on the assignments and exams is reported; however, there is nothing
in the literature that suggests improved or reduced performance. The average assignment score was
94% in the control group, and 96% in the treatment group. To test whether the difference in means of
exam scores of both groups was statistically significant, a linear regression model with study group as
the independent variable was used to predict each exam score. Only for the second exam is there a
statistically significant increase in the average grade of a student in the treatment group (see Table 6).
239239
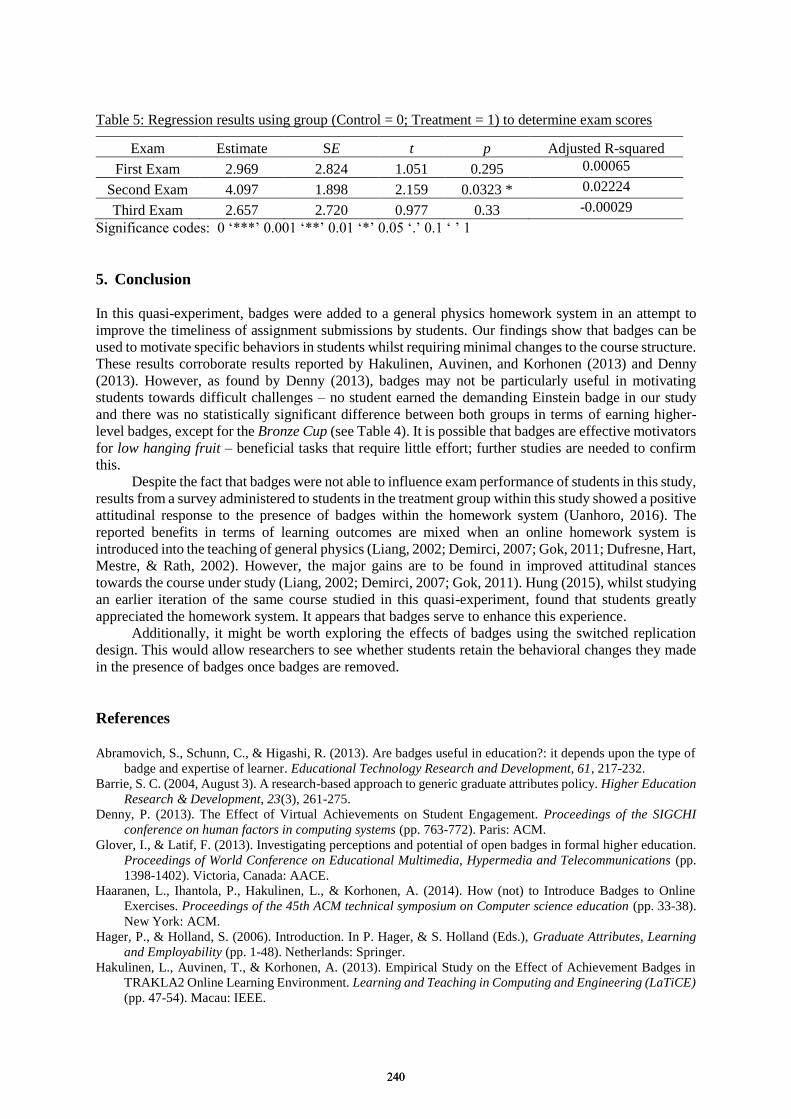
Table 5: Regression results using group (Control = 0; Treatment = 1) to determine exam scores
Exam Estimate SE t p Adjusted R-squared
First Exam 2.969 2.824 1.051 0.295 0.00065
Second Exam 4.097 1.898 2.159 0.0323 * 0.02224
Third Exam 2.657 2.720 0.977 0.33 -0.00029
Significance codes: 0 ‘***’ 0.001 ‘**’ 0.01 ‘*’ 0.05 ‘.’ 0.1 ‘ ’ 1
5. Conclusion
In this quasi-experiment, badges were added to a general physics homework system in an attempt to
improve the timeliness of assignment submissions by students. Our findings show that badges can be
used to motivate specific behaviors in students whilst requiring minimal changes to the course structure.
These results corroborate results reported by Hakulinen, Auvinen, and Korhonen (2013) and Denny
(2013). However, as found by Denny (2013), badges may not be particularly useful in motivating
students towards difficult challenges – no student earned the demanding Einstein badge in our study
and there was no statistically significant difference between both groups in terms of earning higher-
level badges, except for the Bronze Cup (see Table 4). It is possible that badges are effective motivators
for low hanging fruit – beneficial tasks that require little effort; further studies are needed to confirm
this.
Despite the fact that badges were not able to influence exam performance of students in this study,
results from a survey administered to students in the treatment group within this study showed a positive
attitudinal response to the presence of badges within the homework system (Uanhoro, 2016). The
reported benefits in terms of learning outcomes are mixed when an online homework system is
introduced into the teaching of general physics (Liang, 2002; Demirci, 2007; Gok, 2011; Dufresne, Hart,
Mestre, & Rath, 2002). However, the major gains are to be found in improved attitudinal stances
towards the course under study (Liang, 2002; Demirci, 2007; Gok, 2011). Hung (2015), whilst studying
an earlier iteration of the same course studied in this quasi-experiment, found that students greatly
appreciated the homework system. It appears that badges serve to enhance this experience.
Additionally, it might be worth exploring the effects of badges using the switched replication
design. This would allow researchers to see whether students retain the behavioral changes they made
in the presence of badges once badges are removed.
References
Abramovich, S., Schunn, C., & Higashi, R. (2013). Are badges useful in education?: it depends upon the type of
badge and expertise of learner. Educational Technology Research and Development, 61, 217-232.
Barrie, S. C. (2004, August 3). A research-based approach to generic graduate attributes policy. Higher Education
Research & Development, 23(3), 261-275.
Denny, P. (2013). The Effect of Virtual Achievements on Student Engagement. Proceedings of the SIGCHI
conference on human factors in computing systems (pp. 763-772). Paris: ACM.
Glover, I., & Latif, F. (2013). Investigating perceptions and potential of open badges in formal higher education.
Proceedings of World Conference on Educational Multimedia, Hypermedia and Telecommunications (pp.
1398-1402). Victoria, Canada: AACE.
Haaranen, L., Ihantola, P., Hakulinen, L., & Korhonen, A. (2014). How (not) to Introduce Badges to Online
Exercises. Proceedings of the 45th ACM technical symposium on Computer science education (pp. 33-38).
New York: ACM.
Hager, P., & Holland, S. (2006). Introduction. In P. Hager, & S. Holland (Eds.), Graduate Attributes, Learning
and Employability (pp. 1-48). Netherlands: Springer.
Hakulinen, L., Auvinen, T., & Korhonen, A. (2013). Empirical Study on the Effect of Achievement Badges in
TRAKLA2 Online Learning Environment. Learning and Teaching in Computing and Engineering (LaTiCE)
(pp. 47-54). Macau: IEEE.
240240

Hanus, M. D., & Fox, J. (2015). Assessing the effects of gamification in the classroom: A longitudinal study on
intrinsic motivation, social comparison, satisfaction, effort, and academic performance. Computers &
Education, 80, 152-161.
Hung, K. C. (2015). A Study of Integrating Homework System into University General Physics (Unpublished
master's thesis). National Tsing Hua University, Hsinchu, Taiwan.
Joseph, B. (2012, June 25). Six Ways to Look at Badging Systems Designed for Learning. Retrieved February 3,
2015, from Online Leadership Program: http://www.olpglobalkids.org/content/six-ways-look-badging-
systems-designed-learning/
Linderoth, J. (2012, March 27). Why gamers don't learn more. An ecological approach to games as learning
environments. Journal of Gaming & Virtual Worlds, 4(1), 45-62.
Maidis. (2006, December 26). Horizontal Striped Hot Air Balloons [hot air balloon]. Retrieved May 29, 2015,
from https://openclipart.org/detail/18938/
Chapter 17 Badge
Martin, P. (n.d.). Archimedes [Archimedes running]. Retrieved May 29, 2015, from
http://greece.phillipmartin.info/greece_archimedes.htm
Chapter 15 Badge
Martin, P. (n.d.). Color Spectrum[Apple falling on Newton's head]. Retrieved May 29, 2015, from
http://science.phillipmartin.info/science_color_spectrum.htm
Chapter 14 Badge
Martin, P. (n.d.). Physics [Apple falling on Newton's head]. Retrieved May 29, 2015, from
http://science.phillipmartin.info/science_physics.htm
Chapter 5 Badge
Martin, P. (n.d.). Thermometer [Person looking at thermometer]. Retrieved May 29, 2015, from
http://science.phillipmartin.info/science_thermo.htm
Chapter 16 Badge
MesserWoland. (2006, July 14). Enema syringe [Enema syringe]. Retrieved May 29, 2015, from
https://commons.wikimedia.org/wiki/File:Enema_syringe.svg
Chapter 18 Badge
MoodleBadges.com. (n.d.). Retrieved May 29, 2015, from http://moodlebadges.com/?page_id=17
Bronze, Silver, Gold and Star Badges
Mozilla Foundation. (2014). About | Open Badges. Retrieved February 3, 2015, from Open Badges:
http://openbadges.org/about/
PrinterKiller. (2011, July 31). Popsicle and the sun [Popsicle and the sun]. Retrieved May 29, 2015, from
https://openclipart.org/detail/152863/
Chapter 19 Badge
Rhodeson. (2011, June 12). La Belle France [Man bungee jumping]. Retrieved May 29, 2015, from
https://www.flickr.com/photos/rhodeson/5832029034/
Chapter 13 Badge
Saddler, D. (2007, May 16). [Einstein Image Painted on Hazard Marker]. Retrieved May 29, 2015, from
https://www.flickr.com/photos/80502454@N00/501890523/
Einstein Badge
Uanhoro, J. O. (2016). A Quasi-Experimental Study on the Effect of Badges on Timeliness within an
Undergraduate Physics Cours (Unpublished master's thesis). National Tsing Hua University, Hsinchu,
Taiwan.
241241
Chen, W. et al. (Eds.) (2016). Proceedings of the 24th International Conference on Computers in Education.
India: Asia-Pacific Society for Computers in Education
Analysis of Steps in Posing Arithmetic Word
Problem as Sentence-Integration on Interactive
Learning Environment
Ahmad Afif SUPIANTOa,b*, Yusuke HAYASHIa & Tsukasa HIRASHIMAa a Graduate School of Engineering, Hiroshima University, Japan
b Department of Informatics, Brawijaya University, Indonesia
Abstract: Learning by problem-posing is promising activity in learning mathematics and con-
sidered to contribute the understanding of the problem’s structure. If we can clarify how
learners are thinking in steps of problem-posing, we will support learning by problem-posing
more. This study investigate what learners think during problem-posing as sentence-integration
in terms of intermediate products as well as the posed problems as the resultant product.
Problem-posing as sentence-integration defines that arithmetic word problems have a structure
and problem-posing is a task to satisfy all the constraints and the requirements to build a valid
structure. A previous study shows, in problem-posing of arithmetic word problems as sen-
tence-integration, learners try to satisfy relatively large number of the constraints in the posed
problems. This study focuses on the violation of constraints in the intermediate products during
problem-posing as sentence-integration. If learners have concern with the structure, they will
try to avoid relatively larger number of the violated constraints on the way to the resultant posed
problems. We conducted Pearson’s correlation test between the occurrence frequency of in-
termediate products and the number of violated constraints of them. The result shows the neg-
ative correlation between them. We consider that learners had an inclination to avoid as many
violated constraints as possible throughout problem-posing activity.
Keywords: problem-posing activity, intermediate products, arithmetic word problems, learning
analytics
1. Introduction
The development of problem-posing skills for learners is one of the main aims of mathematics learning
and it should occupy a central role in mathematics activities (Crespo, 2003). Several investigations have
confirmed that learning by problem-posing in conventional classrooms is promising activity in learning
mathematics (Silver and Cai, 1996; English, 1998). In problem-posing, assessment of each posed
problem and assistance based on it are necessary (Hirashima et al., 2007). Teacher assessment of posed
problems encompasses learners’ development of diverse mathematical thinking (English, 1997). Since
learners are usually allowed to pose several kinds of problems, including a large range of them, it can be
challenging for teachers to complete assessment and feedback for the posed problems in classrooms.
To address this issue, technology-enhanced approaches have been used and peer-assessment
posed has been conducted to realize learning by problem-posing in a practical way, especially in regard
to assessment and feedback. Self- and peer-assessed posed problems were conducted. A novel way for
merging assessment and knowledge sharing using an on-line Question-Posing Assignment (QPA) has
been examined (Barak & Rafaeli, 2004). A networked question-posing and peer assessment learning
system enabling students to pose questions was developed (Yu and Pan, 2014). In contrast, diagnosis
functions that can assess and give feedback to each posed problem automatically have been proposed
(Nakano, Hirashima and Takeuchi, 1999; Hirashima, Nakano and Takeuchi, 2000). This automatic way
of diagnosis-facility assessment is called agent-assessment. Furthermore, a learning environment sys-
tem, named Monsakun, which practically use agent-assessment for one operation of addition and sub-
traction has been developed (Hirashima et al., 2007). The system has many assignments of prob-
lem-posing and requests learners to pose the required problem by combining three simple sentences
242242
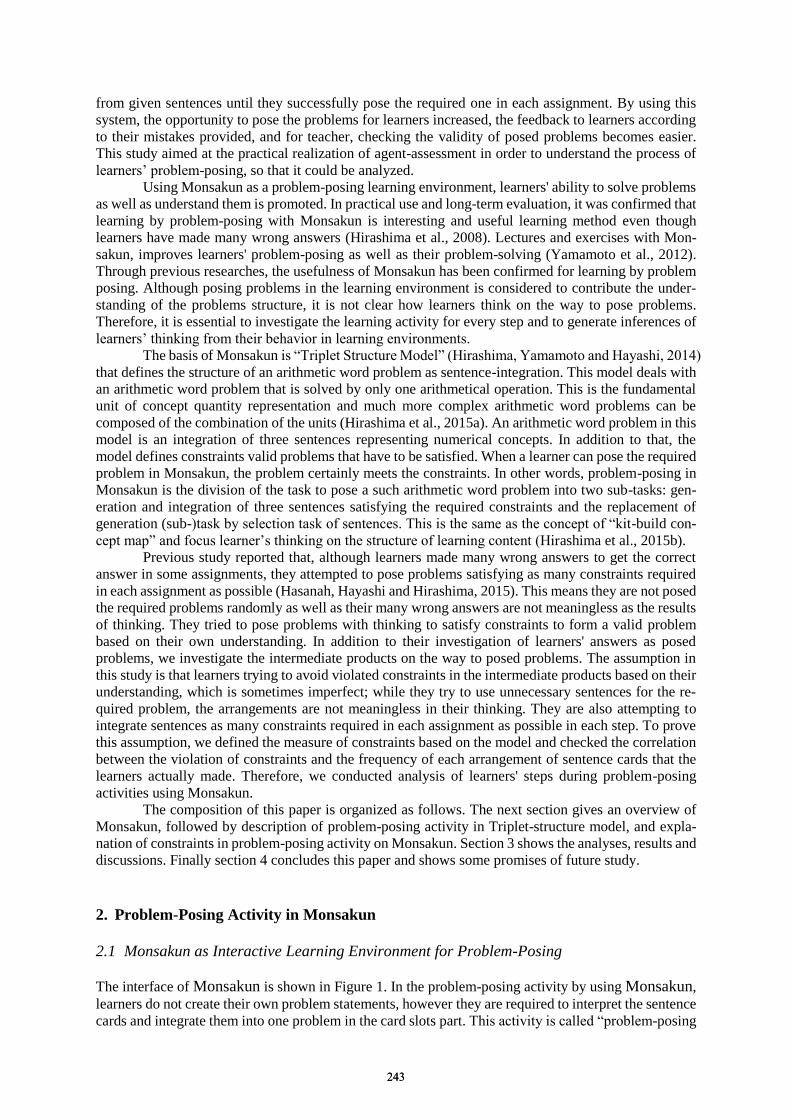
from given sentences until they successfully pose the required one in each assignment. By using this
system, the opportunity to pose the problems for learners increased, the feedback to learners according
to their mistakes provided, and for teacher, checking the validity of posed problems becomes easier.
This study aimed at the practical realization of agent-assessment in order to understand the process of
learners’ problem-posing, so that it could be analyzed.
Using Monsakun as a problem-posing learning environment, learners' ability to solve problems
as well as understand them is promoted. In practical use and long-term evaluation, it was confirmed that
learning by problem-posing with Monsakun is interesting and useful learning method even though
learners have made many wrong answers (Hirashima et al., 2008). Lectures and exercises with Mon-
sakun, improves learners' problem-posing as well as their problem-solving (Yamamoto et al., 2012).
Through previous researches, the usefulness of Monsakun has been confirmed for learning by problem
posing. Although posing problems in the learning environment is considered to contribute the under-
standing of the problems structure, it is not clear how learners think on the way to pose problems.
Therefore, it is essential to investigate the learning activity for every step and to generate inferences of
learners’ thinking from their behavior in learning environments.
The basis of Monsakun is “Triplet Structure Model” (Hirashima, Yamamoto and Hayashi, 2014)
that defines the structure of an arithmetic word problem as sentence-integration. This model deals with
an arithmetic word problem that is solved by only one arithmetical operation. This is the fundamental
unit of concept quantity representation and much more complex arithmetic word problems can be
composed of the combination of the units (Hirashima et al., 2015a). An arithmetic word problem in this
model is an integration of three sentences representing numerical concepts. In addition to that, the
model defines constraints valid problems that have to be satisfied. When a learner can pose the required
problem in Monsakun, the problem certainly meets the constraints. In other words, problem-posing in
Monsakun is the division of the task to pose a such arithmetic word problem into two sub-tasks: gen-
eration and integration of three sentences satisfying the required constraints and the replacement of
generation (sub-)task by selection task of sentences. This is the same as the concept of “kit-build con-
cept map” and focus learner’s thinking on the structure of learning content (Hirashima et al., 2015b).
Previous study reported that, although learners made many wrong answers to get the correct
answer in some assignments, they attempted to pose problems satisfying as many constraints required
in each assignment as possible (Hasanah, Hayashi and Hirashima, 2015). This means they are not posed
the required problems randomly as well as their many wrong answers are not meaningless as the results
of thinking. They tried to pose problems with thinking to satisfy constraints to form a valid problem
based on their own understanding. In addition to their investigation of learners' answers as posed
problems, we investigate the intermediate products on the way to posed problems. The assumption in
this study is that learners trying to avoid violated constraints in the intermediate products based on their
understanding, which is sometimes imperfect; while they try to use unnecessary sentences for the re-
quired problem, the arrangements are not meaningless in their thinking. They are also attempting to
integrate sentences as many constraints required in each assignment as possible in each step. To prove
this assumption, we defined the measure of constraints based on the model and checked the correlation
between the violation of constraints and the frequency of each arrangement of sentence cards that the
learners actually made. Therefore, we conducted analysis of learners' steps during problem-posing
activities using Monsakun.
The composition of this paper is organized as follows. The next section gives an overview of
Monsakun, followed by description of problem-posing activity in Triplet-structure model, and expla-
nation of constraints in problem-posing activity on Monsakun. Section 3 shows the analyses, results and
discussions. Finally section 4 concludes this paper and shows some promises of future study.
2. Problem-Posing Activity in Monsakun
2.1 Monsakun as Interactive Learning Environment for Problem-Posing
The interface of Monsakun is shown in Figure 1. In the problem-posing activity by using Monsakun,
learners do not create their own problem statements, however they are required to interpret the sentence
cards and integrate them into one problem in the card slots part. This activity is called “problem-posing
243243

as sentence-integration” (Hirashima and Kurayama, 2011). The system provides a set of sentence cards
and a numerical expression in the requirement part, and then learners pose an arithmetical word prob-
lem based on triplet structure model using the numerical expression by selecting and arranging appro-
priate sentence cards.
Triplet-structure model defines an arithmetic word problem solved by addition or subtraction as
a composition of three simple sentences with two “existence sentences” and one “relational sentence”.
An existence sentence represents a number of single objects that has an independent quantity. A rela-
tional sentence has a relative quantity and contains keyword that represents a story type. Although an
existence sentence can be used in any story, a relational sentence is used only in one specific story.
There are four story types: combination story, increase story, decrease story, and comparison story.
Figure 1. Interface of Monsakun.
2.2 Problem-Posing Activity in Triplet-Structure Model
Monsakun records learners' problem-posing activity as a combination of sentence cards in the card
slots. The product of a problem-posing activity is a resultant of selecting and arranging a sentence card
in the card slot or removing a sentence card from the card slot, which is called "state". When the product
is composed of three sentence cards (the card slots is completely arranged), then it is called the "posed
problem". An example of the posed problem condition is shown in Figure 2(c). Whereas when the
product is not composed by three sentence cards, then it is called the "intermediate product" on the way
to pose the problem. The examples of the intermediate product are shown in Figure 2(a) and Figure
2(b).
The sentence cards are encoded with indexing number shown in Figure 2(d). When the slot is
still empty, index = 0 is implemented. For instance, when learners pose the problem by selecting sen-
tence card #4 and arrange it into the second slot, state 040 has obtained, it is shown in Figure 2(a).
Another example of state is shown in Figure 2(b), state 310 happens when learners pose the problem by
selecting sentence card #3 then arranging into the first slot and selecting sentence card #1 then arranging
into the second slot.
Figure 2. Example of states and the index of available sentence cards.
244244
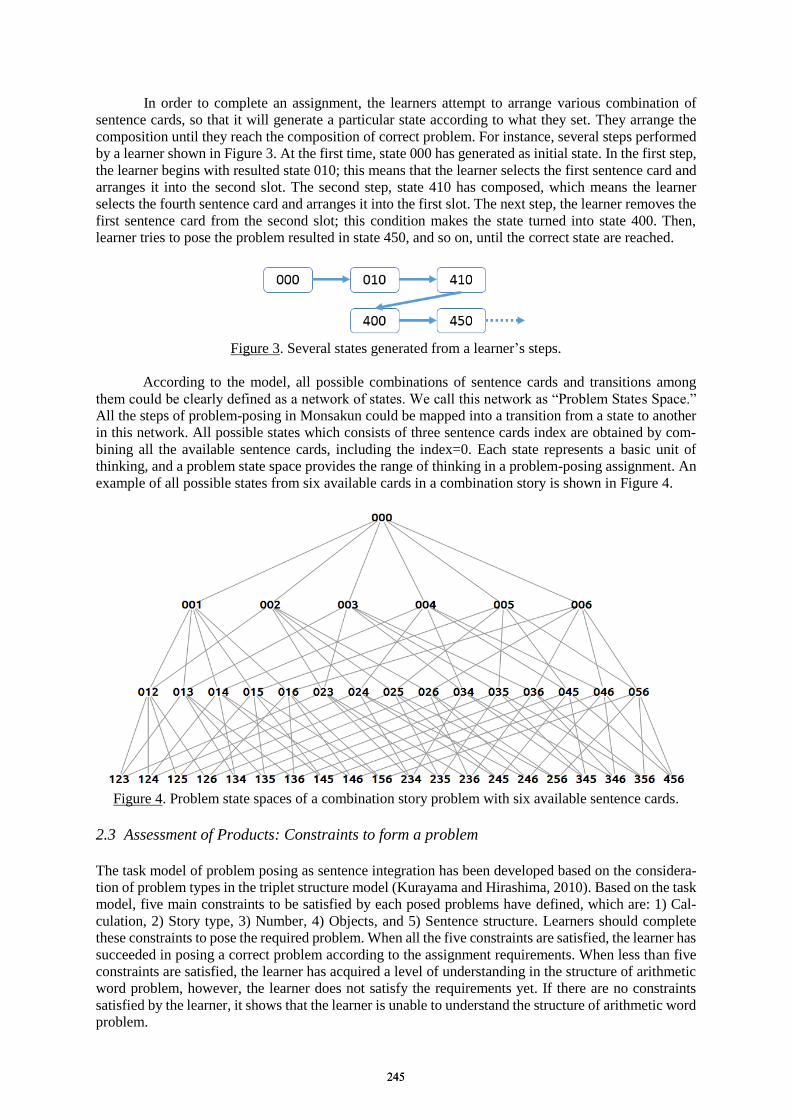
In order to complete an assignment, the learners attempt to arrange various combination of
sentence cards, so that it will generate a particular state according to what they set. They arrange the
composition until they reach the composition of correct problem. For instance, several steps performed
by a learner shown in Figure 3. At the first time, state 000 has generated as initial state. In the first step,
the learner begins with resulted state 010; this means that the learner selects the first sentence card and
arranges it into the second slot. The second step, state 410 has composed, which means the learner
selects the fourth sentence card and arranges it into the first slot. The next step, the learner removes the
first sentence card from the second slot; this condition makes the state turned into state 400. Then,
learner tries to pose the problem resulted in state 450, and so on, until the correct state are reached.
Figure 3. Several states generated from a learner’s steps.
According to the model, all possible combinations of sentence cards and transitions among
them could be clearly defined as a network of states. We call this network as “Problem States Space.”
All the steps of problem-posing in Monsakun could be mapped into a transition from a state to another
in this network. All possible states which consists of three sentence cards index are obtained by com-
bining all the available sentence cards, including the index=0. Each state represents a basic unit of
thinking, and a problem state space provides the range of thinking in a problem-posing assignment. An
example of all possible states from six available cards in a combination story is shown in Figure 4.
Figure 4. Problem state spaces of a combination story problem with six available sentence cards.
2.3 Assessment of Products: Constraints to form a problem
The task model of problem posing as sentence integration has been developed based on the considera-
tion of problem types in the triplet structure model (Kurayama and Hirashima, 2010). Based on the task
model, five main constraints to be satisfied by each posed problems have defined, which are: 1) Cal-
culation, 2) Story type, 3) Number, 4) Objects, and 5) Sentence structure. Learners should complete
these constraints to pose the required problem. When all the five constraints are satisfied, the learner has
succeeded in posing a correct problem according to the assignment requirements. When less than five
constraints are satisfied, the learner has acquired a level of understanding in the structure of arithmetic
word problem, however, the learner does not satisfy the requirements yet. If there are no constraints
satisfied by the learner, it shows that the learner is unable to understand the structure of arithmetic word
problem.
245245

According to the triplet structure model, actually we only can measure the validity of the posed
problem products, which is based on the number of satisfied constraints. Therefore, in order to cover the
measurement of the intermediate products, we define three values for each constraint: -1, 0, and 1. The
value of -1 means the constraint is violated, the value of 0 means the constraint is not violated, and the
value of 1 means the constraint is satisfied. The validity of product is calculated by summing all con-
strains value, and the number of violated constraints is obtained by counting how many constraints are
violated. The example of several states from assignment 1 at level 5 and their satisfaction of constraints
are presented in Table 1.
The requirement of the Assignment 1 at level 5 is: Make a word problem about "How many are
there overall" that can be solved by "8 - 3", which is an arithmetic word problem in combination story.
There are six available sentence cards that could be used by learners. The sentences for each card are
composed of: (1) There are 3 white rabbits, (2) There are _ black rabbits, (3) There are 8 white and black
rabbits altogether, (4) There are 8 white rabbits, (5) There are 3 more white rabbits than black rabbits,
and (6) There are 3 brown rabbits. There is no satisfied constraint, nor violated constraint at the first
example state because it is possible to make calculation using sentence card in the state and it is not
violated. The story type, number, object, and sentence structure also not violated. Therefore, all con-
straints in this state are assigned to 0. The second example is state 014, which violate the calculation
constraint. Based on the numerical expression in the requirement, the number “8” should be on the
relational sentence. However, sentence card #4 is an existence sentence card and it contains the number
“8”. Therefore, this state violate the calculation constraint and this constraint is assigned to -1. The story
type, number, object, and sentence structure are not violated, nor satisfied, because we still can’t decide
it. Thus, the four constraints are assigned to 0. The last example satisfies one constraint, number. There
is no story can be built from this composition, nor the calculation and sentence structure. It can be
calculated and well-structured when it consists of two existence sentences and one relational sentence,
instead of all sentence cards are existence cards. In addition, there is no relation between objects in the
composition of sentence cards. They are independent objects consist of white, black, and brown rabbits.
This condition causes the number of violated constraint is assigned to 4, because there are four con-
straints are violated. We calculate the validity values for all states and present the visualization that is
shown in Figure 5. The graph in Figure 5 visualize the validity of states presented by the size of nodes.
The nodes with the larger size have the higher validity than the nodes with the smaller size.
3. Analysis of Steps in Terms of Constraints
This section show the results of analyses of the intermediate products as well as the posed problem of
problem-posing from Monsakun log data of a practical use in a classroom of 39 first grade students. The
goal of this analysis is to answer the research question in this study whether learners are attempting to
integrate sentences in avoiding the violated constrains on each step of posing the problem. To answer
this question, we analyze the following two things: (1) the correlation between the number of violated
Table 1: The example of several states and their satisfaction of constraints.
No States Composition of
sentence cards
Constraint
Validity
Number of
Violated
Constraints C1 C2 C3 C4 C5
1 001
0 0 0 0 0 0 0
There are 3 white rabbits
2 014
-1 0 0 0 0 -1 1 There are 3 white rabbits
There are 8 white rabbits
3 246
There are _ black rabbits
-1 -1 1 -1 -1 -3 4 There are 8 white rabbits
There are 3 brown rabbits
C1: Calculation constraint, C2: Story type constraint, C3: Number constraint,
C4: Object constraint, C5: Sentence structure constraint
246246
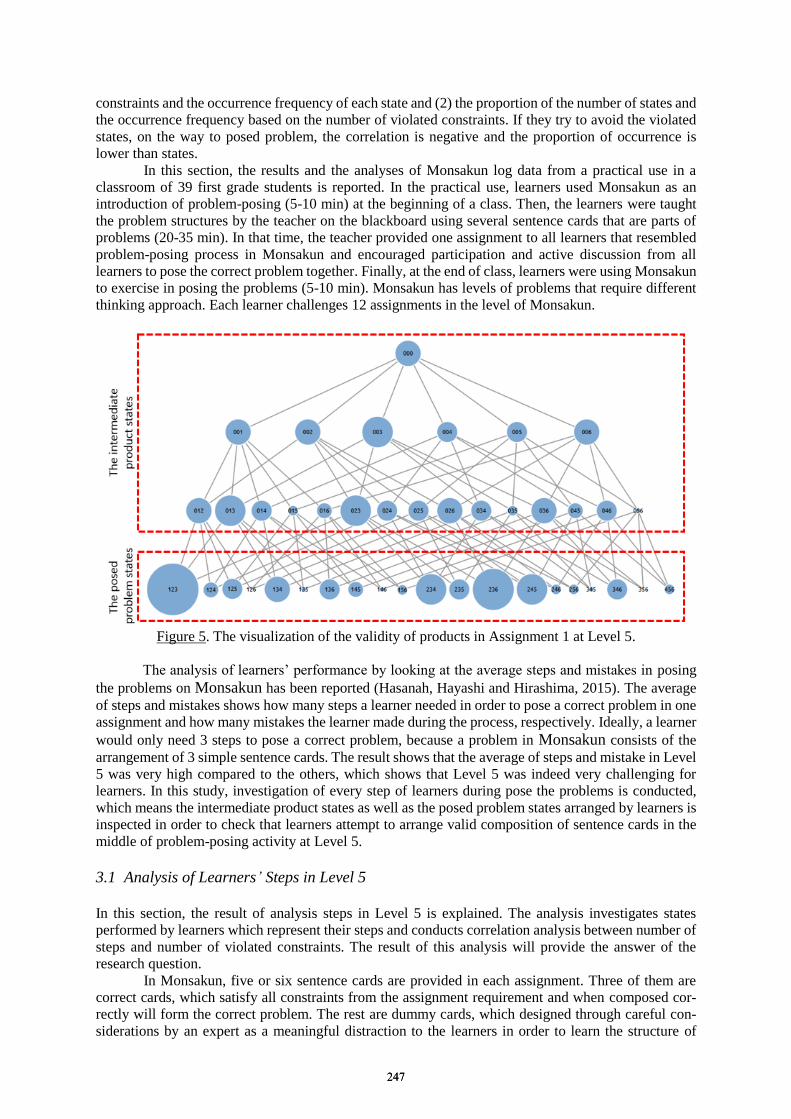
constraints and the occurrence frequency of each state and (2) the proportion of the number of states and
the occurrence frequency based on the number of violated constraints. If they try to avoid the violated
states, on the way to posed problem, the correlation is negative and the proportion of occurrence is
lower than states.
In this section, the results and the analyses of Monsakun log data from a practical use in a
classroom of 39 first grade students is reported. In the practical use, learners used Monsakun as an
introduction of problem-posing (5-10 min) at the beginning of a class. Then, the learners were taught
the problem structures by the teacher on the blackboard using several sentence cards that are parts of
problems (20-35 min). In that time, the teacher provided one assignment to all learners that resembled
problem-posing process in Monsakun and encouraged participation and active discussion from all
learners to pose the correct problem together. Finally, at the end of class, learners were using Monsakun
to exercise in posing the problems (5-10 min). Monsakun has levels of problems that require different
thinking approach. Each learner challenges 12 assignments in the level of Monsakun.
Figure 5. The visualization of the validity of products in Assignment 1 at Level 5.
The analysis of learners’ performance by looking at the average steps and mistakes in posing
the problems on Monsakun has been reported (Hasanah, Hayashi and Hirashima, 2015). The average
of steps and mistakes shows how many steps a learner needed in order to pose a correct problem in one
assignment and how many mistakes the learner made during the process, respectively. Ideally, a learner
would only need 3 steps to pose a correct problem, because a problem in Monsakun consists of the
arrangement of 3 simple sentence cards. The result shows that the average of steps and mistake in Level
5 was very high compared to the others, which shows that Level 5 was indeed very challenging for
learners. In this study, investigation of every step of learners during pose the problems is conducted,
which means the intermediate product states as well as the posed problem states arranged by learners is
inspected in order to check that learners attempt to arrange valid composition of sentence cards in the
middle of problem-posing activity at Level 5.
3.1 Analysis of Learners’ Steps in Level 5
In this section, the result of analysis steps in Level 5 is explained. The analysis investigates states
performed by learners which represent their steps and conducts correlation analysis between number of
steps and number of violated constraints. The result of this analysis will provide the answer of the
research question.
In Monsakun, five or six sentence cards are provided in each assignment. Three of them are
correct cards, which satisfy all constraints from the assignment requirement and when composed cor-
rectly will form the correct problem. The rest are dummy cards, which designed through careful con-
siderations by an expert as a meaningful distraction to the learners in order to learn the structure of
247247
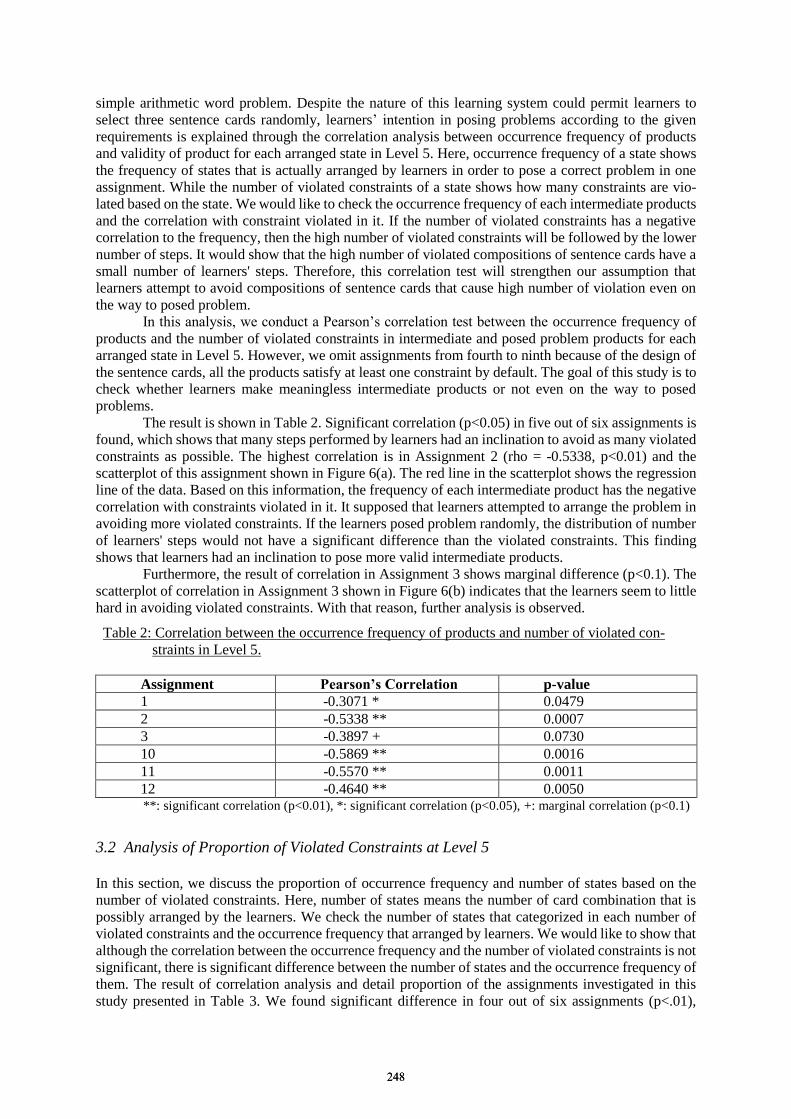
simple arithmetic word problem. Despite the nature of this learning system could permit learners to
select three sentence cards randomly, learners’ intention in posing problems according to the given
requirements is explained through the correlation analysis between occurrence frequency of products
and validity of product for each arranged state in Level 5. Here, occurrence frequency of a state shows
the frequency of states that is actually arranged by learners in order to pose a correct problem in one
assignment. While the number of violated constraints of a state shows how many constraints are vio-
lated based on the state. We would like to check the occurrence frequency of each intermediate products
and the correlation with constraint violated in it. If the number of violated constraints has a negative
correlation to the frequency, then the high number of violated constraints will be followed by the lower
number of steps. It would show that the high number of violated compositions of sentence cards have a
small number of learners' steps. Therefore, this correlation test will strengthen our assumption that
learners attempt to avoid compositions of sentence cards that cause high number of violation even on
the way to posed problem.
In this analysis, we conduct a Pearson’s correlation test between the occurrence frequency of
products and the number of violated constraints in intermediate and posed problem products for each
arranged state in Level 5. However, we omit assignments from fourth to ninth because of the design of
the sentence cards, all the products satisfy at least one constraint by default. The goal of this study is to
check whether learners make meaningless intermediate products or not even on the way to posed
problems.
The result is shown in Table 2. Significant correlation (p<0.05) in five out of six assignments is
found, which shows that many steps performed by learners had an inclination to avoid as many violated
constraints as possible. The highest correlation is in Assignment 2 (rho = -0.5338, p<0.01) and the
scatterplot of this assignment shown in Figure 6(a). The red line in the scatterplot shows the regression
line of the data. Based on this information, the frequency of each intermediate product has the negative
correlation with constraints violated in it. It supposed that learners attempted to arrange the problem in
avoiding more violated constraints. If the learners posed problem randomly, the distribution of number
of learners' steps would not have a significant difference than the violated constraints. This finding
shows that learners had an inclination to pose more valid intermediate products.
Furthermore, the result of correlation in Assignment 3 shows marginal difference (p<0.1). The
scatterplot of correlation in Assignment 3 shown in Figure 6(b) indicates that the learners seem to little
hard in avoiding violated constraints. With that reason, further analysis is observed.
3.2 Analysis of Proportion of Violated Constraints at Level 5
In this section, we discuss the proportion of occurrence frequency and number of states based on the
number of violated constraints. Here, number of states means the number of card combination that is
possibly arranged by the learners. We check the number of states that categorized in each number of
violated constraints and the occurrence frequency that arranged by learners. We would like to show that
although the correlation between the occurrence frequency and the number of violated constraints is not
significant, there is significant difference between the number of states and the occurrence frequency of
them. The result of correlation analysis and detail proportion of the assignments investigated in this
study presented in Table 3. We found significant difference in four out of six assignments (p<.01),
Table 2: Correlation between the occurrence frequency of products and number of violated con-
straints in Level 5.
Assignment Pearson’s Correlation p-value
1 -0.3071 * 0.0479
2 -0.5338 ** 0.0007
3 -0.3897 + 0.0730
10 -0.5869 ** 0.0016
11 -0.5570 ** 0.0011
12 -0.4640 ** 0.0050 **: significant correlation (p<0.01), *: significant correlation (p<0.05), +: marginal correlation (p<0.1)
248248
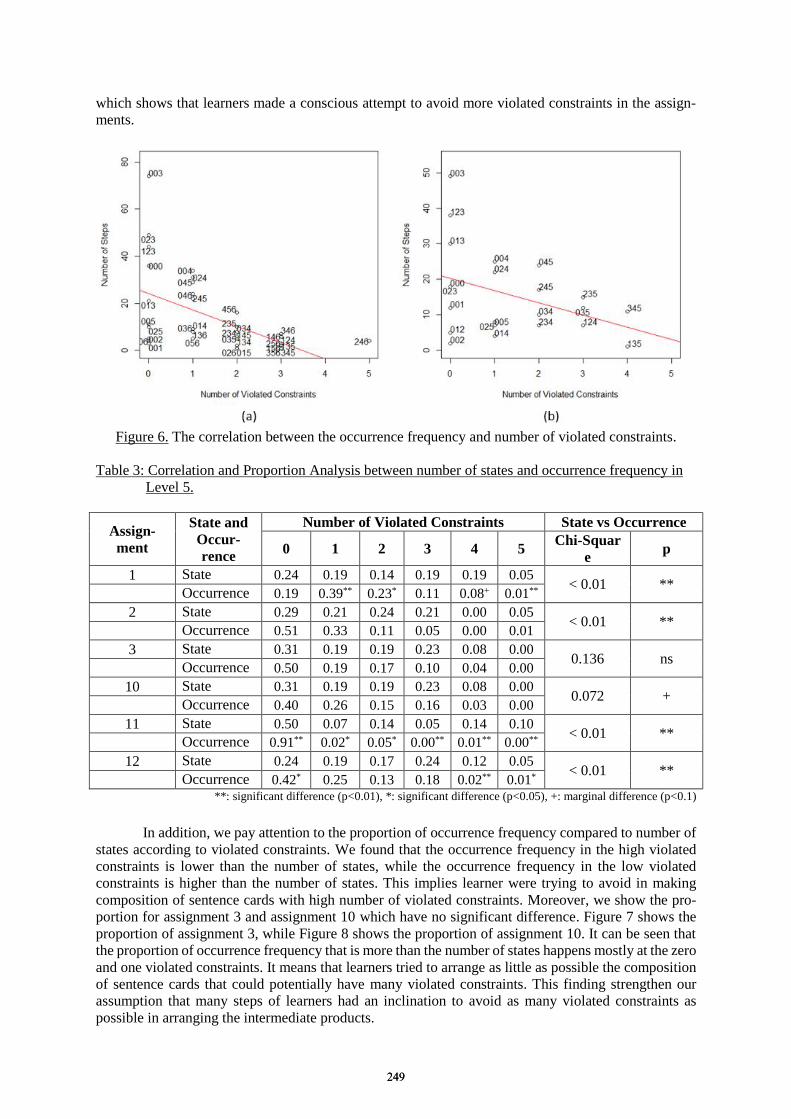
which shows that learners made a conscious attempt to avoid more violated constraints in the assign-
ments.
Figure 6. The correlation between the occurrence frequency and number of violated constraints.
Table 3: Correlation and Proportion Analysis between number of states and occurrence frequency in
Level 5.
Assign-
ment
State and
Occur-
rence
Number of Violated Constraints State vs Occurrence
0 1 2 3 4 5 Chi-Squar
e p
1 State 0.24 0.19 0.14 0.19 0.19 0.05 < 0.01 **
Occurrence 0.19 0.39** 0.23* 0.11 0.08+ 0.01**
2 State 0.29 0.21 0.24 0.21 0.00 0.05 < 0.01 **
Occurrence 0.51 0.33 0.11 0.05 0.00 0.01
3 State 0.31 0.19 0.19 0.23 0.08 0.00 0.136 ns
Occurrence 0.50 0.19 0.17 0.10 0.04 0.00
10 State 0.31 0.19 0.19 0.23 0.08 0.00 0.072 +
Occurrence 0.40 0.26 0.15 0.16 0.03 0.00
11 State 0.50 0.07 0.14 0.05 0.14 0.10 < 0.01 **
Occurrence 0.91** 0.02* 0.05* 0.00** 0.01** 0.00**
12 State 0.24 0.19 0.17 0.24 0.12 0.05 < 0.01 **
Occurrence 0.42* 0.25 0.13 0.18 0.02** 0.01* **: significant difference (p<0.01), *: significant difference (p<0.05), +: marginal difference (p<0.1)
In addition, we pay attention to the proportion of occurrence frequency compared to number of
states according to violated constraints. We found that the occurrence frequency in the high violated
constraints is lower than the number of states, while the occurrence frequency in the low violated
constraints is higher than the number of states. This implies learner were trying to avoid in making
composition of sentence cards with high number of violated constraints. Moreover, we show the pro-
portion for assignment 3 and assignment 10 which have no significant difference. Figure 7 shows the
proportion of assignment 3, while Figure 8 shows the proportion of assignment 10. It can be seen that
the proportion of occurrence frequency that is more than the number of states happens mostly at the zero
and one violated constraints. It means that learners tried to arrange as little as possible the composition
of sentence cards that could potentially have many violated constraints. This finding strengthen our
assumption that many steps of learners had an inclination to avoid as many violated constraints as
possible in arranging the intermediate products.
249249
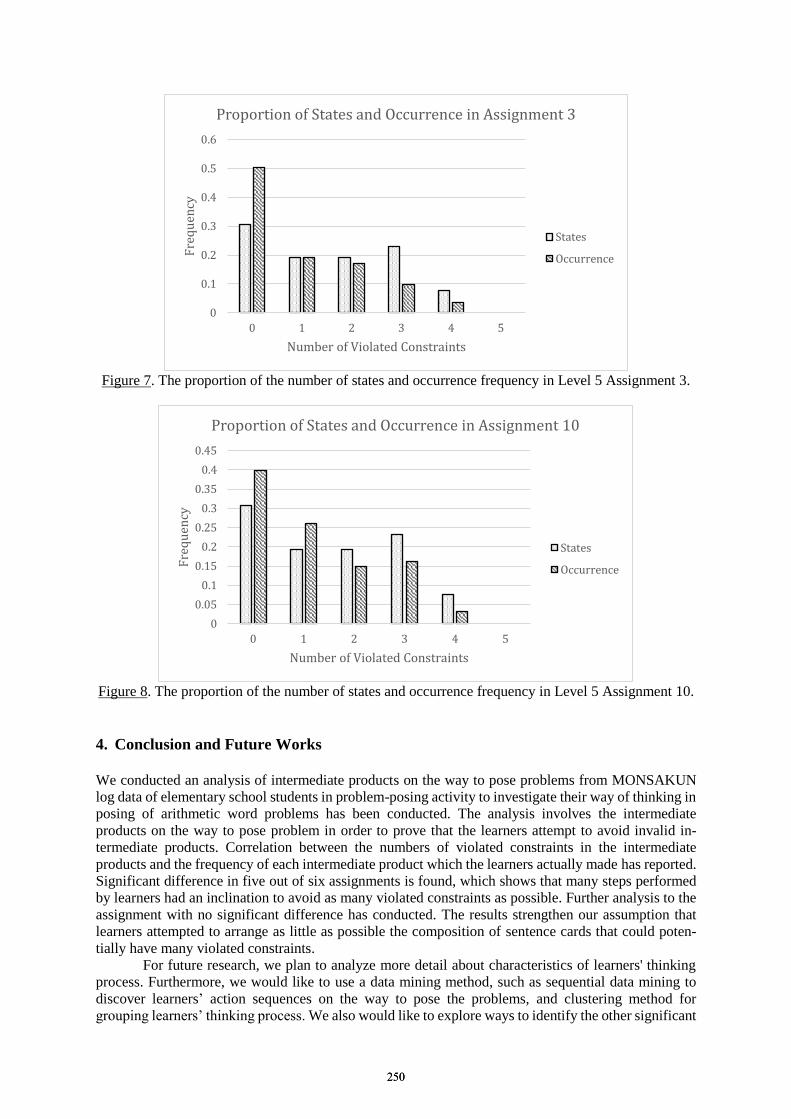
Figure 7. The proportion of the number of states and occurrence frequency in Level 5 Assignment 3.
Figure 8. The proportion of the number of states and occurrence frequency in Level 5 Assignment 10.
4. Conclusion and Future Works
We conducted an analysis of intermediate products on the way to pose problems from MONSAKUN
log data of elementary school students in problem-posing activity to investigate their way of thinking in
posing of arithmetic word problems has been conducted. The analysis involves the intermediate
products on the way to pose problem in order to prove that the learners attempt to avoid invalid in-
termediate products. Correlation between the numbers of violated constraints in the intermediate
products and the frequency of each intermediate product which the learners actually made has reported.
Significant difference in five out of six assignments is found, which shows that many steps performed
by learners had an inclination to avoid as many violated constraints as possible. Further analysis to the
assignment with no significant difference has conducted. The results strengthen our assumption that
learners attempted to arrange as little as possible the composition of sentence cards that could poten-
tially have many violated constraints.
For future research, we plan to analyze more detail about characteristics of learners' thinking
process. Furthermore, we would like to use a data mining method, such as sequential data mining to
discover learners’ action sequences on the way to pose the problems, and clustering method for
grouping learners’ thinking process. We also would like to explore ways to identify the other significant
0
0.1
0.2
0.3
0.4
0.5
0.6
0 1 2 3 4 5
Fre
qu
ency
Number of Violated Constraints
Proportion of States and Occurrence in Assignment 3
States
Occurrence
0
0.05
0.1
0.15
0.2
0.25
0.3
0.35
0.4
0.45
0 1 2 3 4 5
Fre
qu
ency
Number of Violated Constraints
Proportion of States and Occurrence in Assignment 10
States
Occurrence
250250
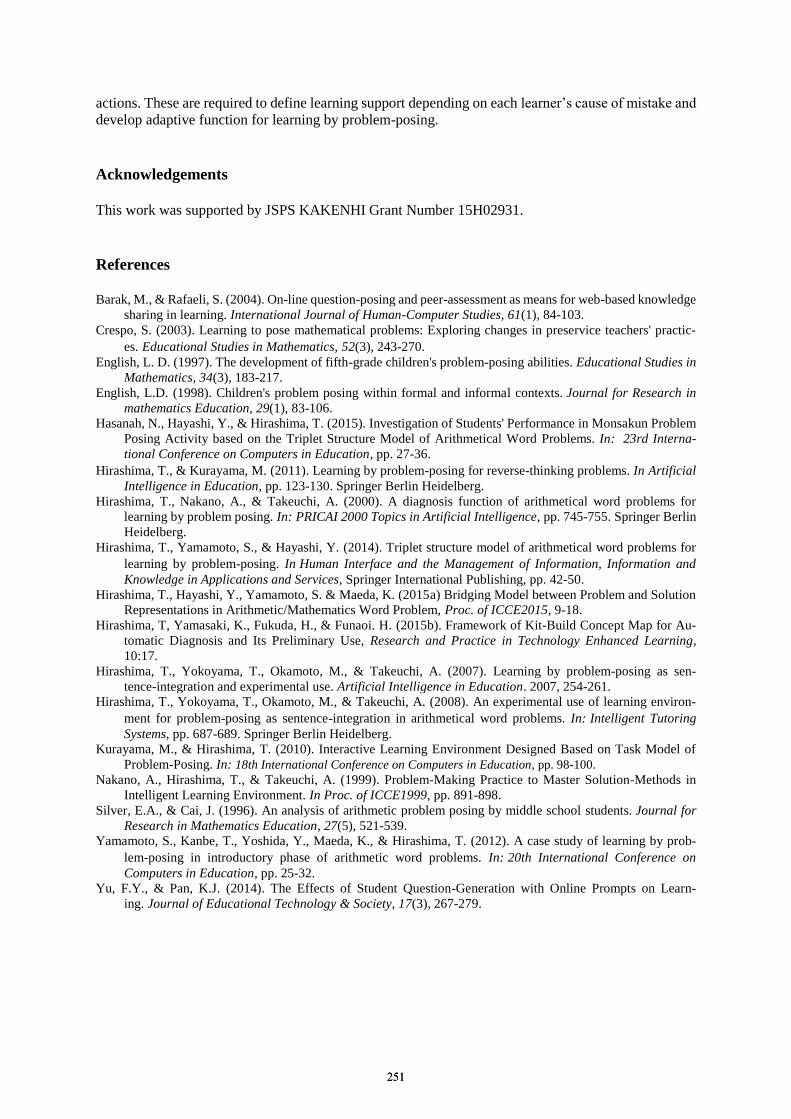
actions. These are required to define learning support depending on each learner’s cause of mistake and
develop adaptive function for learning by problem-posing.
Acknowledgements
This work was supported by JSPS KAKENHI Grant Number 15H02931.
References
Barak, M., & Rafaeli, S. (2004). On-line question-posing and peer-assessment as means for web-based knowledge
sharing in learning. International Journal of Human-Computer Studies, 61(1), 84-103.
Crespo, S. (2003). Learning to pose mathematical problems: Exploring changes in preservice teachers' practic-
es. Educational Studies in Mathematics, 52(3), 243-270.
English, L. D. (1997). The development of fifth-grade children's problem-posing abilities. Educational Studies in
Mathematics, 34(3), 183-217.
English, L.D. (1998). Children's problem posing within formal and informal contexts. Journal for Research in
mathematics Education, 29(1), 83-106.
Hasanah, N., Hayashi, Y., & Hirashima, T. (2015). Investigation of Students' Performance in Monsakun Problem
Posing Activity based on the Triplet Structure Model of Arithmetical Word Problems. In: 23rd Interna-
tional Conference on Computers in Education, pp. 27-36.
Hirashima, T., & Kurayama, M. (2011). Learning by problem-posing for reverse-thinking problems. In Artificial
Intelligence in Education, pp. 123-130. Springer Berlin Heidelberg.
Hirashima, T., Nakano, A., & Takeuchi, A. (2000). A diagnosis function of arithmetical word problems for
learning by problem posing. In: PRICAI 2000 Topics in Artificial Intelligence, pp. 745-755. Springer Berlin
Heidelberg.
Hirashima, T., Yamamoto, S., & Hayashi, Y. (2014). Triplet structure model of arithmetical word problems for
learning by problem-posing. In Human Interface and the Management of Information, Information and
Knowledge in Applications and Services, Springer International Publishing, pp. 42-50.
Hirashima, T., Hayashi, Y., Yamamoto, S. & Maeda, K. (2015a) Bridging Model between Problem and Solution
Representations in Arithmetic/Mathematics Word Problem, Proc. of ICCE2015, 9-18.
Hirashima, T, Yamasaki, K., Fukuda, H., & Funaoi. H. (2015b). Framework of Kit-Build Concept Map for Au-
tomatic Diagnosis and Its Preliminary Use, Research and Practice in Technology Enhanced Learning,
10:17.
Hirashima, T., Yokoyama, T., Okamoto, M., & Takeuchi, A. (2007). Learning by problem-posing as sen-
tence-integration and experimental use. Artificial Intelligence in Education. 2007, 254-261.
Hirashima, T., Yokoyama, T., Okamoto, M., & Takeuchi, A. (2008). An experimental use of learning environ-
ment for problem-posing as sentence-integration in arithmetical word problems. In: Intelligent Tutoring
Systems, pp. 687-689. Springer Berlin Heidelberg.
Kurayama, M., & Hirashima, T. (2010). Interactive Learning Environment Designed Based on Task Model of
Problem-Posing. In: 18th International Conference on Computers in Education, pp. 98-100.
Nakano, A., Hirashima, T., & Takeuchi, A. (1999). Problem-Making Practice to Master Solution-Methods in
Intelligent Learning Environment. In Proc. of ICCE1999, pp. 891-898.
Silver, E.A., & Cai, J. (1996). An analysis of arithmetic problem posing by middle school students. Journal for
Research in Mathematics Education, 27(5), 521-539.
Yamamoto, S., Kanbe, T., Yoshida, Y., Maeda, K., & Hirashima, T. (2012). A case study of learning by prob-
lem-posing in introductory phase of arithmetic word problems. In: 20th International Conference on
Computers in Education, pp. 25-32.
Yu, F.Y., & Pan, K.J. (2014). The Effects of Student Question-Generation with Online Prompts on Learn-
ing. Journal of Educational Technology & Society, 17(3), 267-279.
251251
Chen, W. et al. (Eds.) (2016). Proceedings of the 24th International Conference on Computers in Education. India: Asia-Pacific Society for Computers in Education
Networked Tutoring Support System for a Programming Class based on Reusable
Tutoring Content and Semi-automatic Program Assessment
Yasuhiro NOGUCHI a*, Ryota OSAWA b, Koichi YAMASHITA c, Satoru KOGURE a,
Tatsuhiro KONISHI a & Yukihiro ITOH d
aFaculty of Informatics, Shizuoka University, Japan
bGraduate School of Informatics, Shizuoka University, Japan
dFaculty of Business Administration, Tokoha University, Japan
dShizuoka University, Japan *[email protected]
Abstract: In programming classes, teachers and teaching assistants (TAs) cooperate to support students’ programming exercises. A teacher is required to support many students and sometimes hand them over to another teacher or assistant. However, it is difficult to check students’ source code without interrupting the students, to share tutoring information among teachers and TAs, and to reuse tutoring documents created for one student. In this paper, we propose a tutoring support system based on reusable tutoring content and semi-automatic assessment of students’ code and report on a trial conducted in university programming classes that found the system could spontaneously promote tutoring content sharing and reuse. Keywords: Class support system, novice programming education, information sharing, decision support
1. Introduction Recent novice programming classes are typically one-to-many teaching situations. First, a teacher teaches programming theories to many students in the teaching section. Next, in the exercise section, the teacher and teaching assistants (TAs) cooperate to support the students’ programming development (tutoring). In general, each student writes his own program code at his own computer display. Thus, the major role of the teacher and TAs (hereinafter, “teachers”) is to circulate among the students to answer their questions, check the work of students having trouble, and to give them learning support. However, there are some problems in tutoring efficiently in exercise sections. A) When teachers check a student’s work, they can see only the section of code shown on the
display, and if they need, they must interrupt the student and ask to see the rest of the code. B) When a student asks the teacher about code she has just written, the question must be answered
after rapidly reading the code and finding bugs. However, it is difficult for not only TAs but also experienced teachers to answer quickly.
C) Teachers cannot remember every detail of their discussions with students. Thus, later directions and discussions lack the earlier context.
D) It is hard for teachers to find the opportunity to share information during class, and scheduling regular meetings to share information reduces the time for tutoring. Therefore, when teachers handed students over, directions and discussions lack the earlier content or lose time to ask them to the students. In general, they cannot answer them correctly because they required help by their misunderstanding.
252252
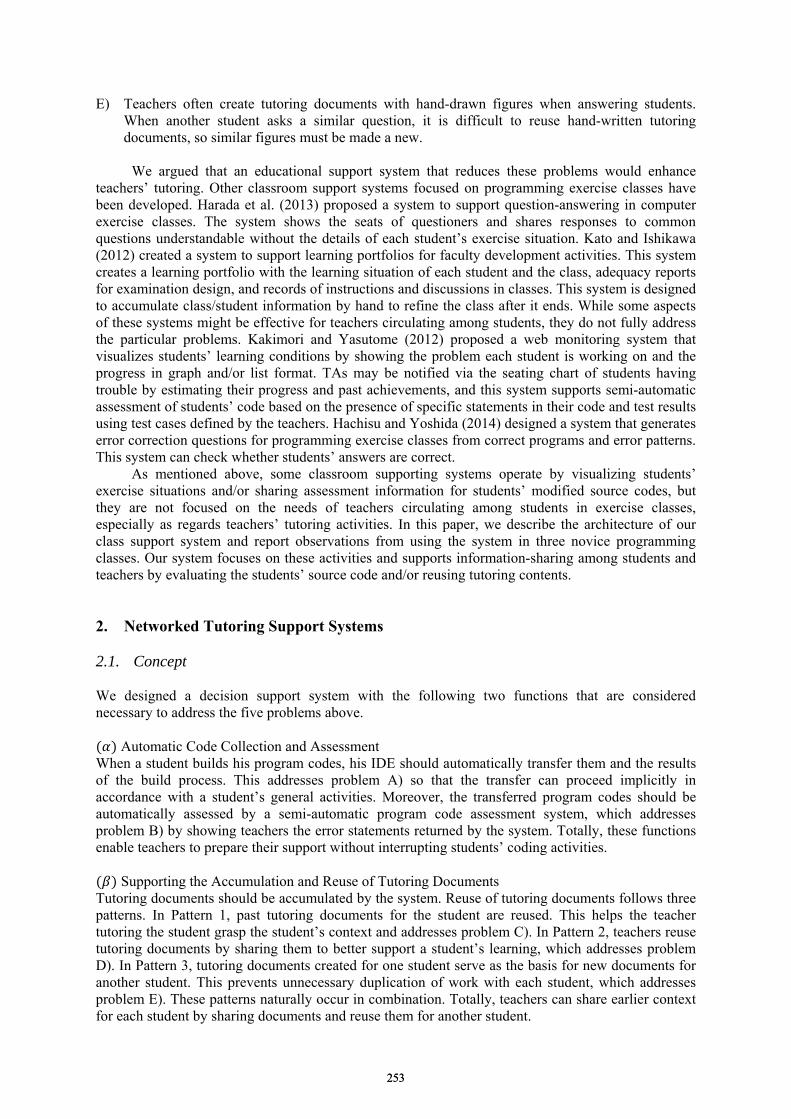
E) Teachers often create tutoring documents with hand-drawn figures when answering students. When another student asks a similar question, it is difficult to reuse hand-written tutoring documents, so similar figures must be made a new.
We argued that an educational support system that reduces these problems would enhance
teachers’ tutoring. Other classroom support systems focused on programming exercise classes have been developed. Harada et al. (2013) proposed a system to support question-answering in computer exercise classes. The system shows the seats of questioners and shares responses to common questions understandable without the details of each student’s exercise situation. Kato and Ishikawa (2012) created a system to support learning portfolios for faculty development activities. This system creates a learning portfolio with the learning situation of each student and the class, adequacy reports for examination design, and records of instructions and discussions in classes. This system is designed to accumulate class/student information by hand to refine the class after it ends. While some aspects of these systems might be effective for teachers circulating among students, they do not fully address the particular problems. Kakimori and Yasutome (2012) proposed a web monitoring system that visualizes students’ learning conditions by showing the problem each student is working on and the progress in graph and/or list format. TAs may be notified via the seating chart of students having trouble by estimating their progress and past achievements, and this system supports semi-automatic assessment of students’ code based on the presence of specific statements in their code and test results using test cases defined by the teachers. Hachisu and Yoshida (2014) designed a system that generates error correction questions for programming exercise classes from correct programs and error patterns. This system can check whether students’ answers are correct.
As mentioned above, some classroom supporting systems operate by visualizing students’ exercise situations and/or sharing assessment information for students’ modified source codes, but they are not focused on the needs of teachers circulating among students in exercise classes, especially as regards teachers’ tutoring activities. In this paper, we describe the architecture of our class support system and report observations from using the system in three novice programming classes. Our system focuses on these activities and supports information-sharing among students and teachers by evaluating the students’ source code and/or reusing tutoring contents. 2. Networked Tutoring Support Systems 2.1. Concept We designed a decision support system with the following two functions that are considered necessary to address the five problems above.
Automatic Code Collection and Assessment When a student builds his program codes, his IDE should automatically transfer them and the results of the build process. This addresses problem A) so that the transfer can proceed implicitly in accordance with a student’s general activities. Moreover, the transferred program codes should be automatically assessed by a semi-automatic program code assessment system, which addresses problem B) by showing teachers the error statements returned by the system. Totally, these functions enable teachers to prepare their support without interrupting students’ coding activities.
Supporting the Accumulation and Reuse of Tutoring Documents Tutoring documents should be accumulated by the system. Reuse of tutoring documents follows three patterns. In Pattern 1, past tutoring documents for the student are reused. This helps the teacher tutoring the student grasp the student’s context and addresses problem C). In Pattern 2, teachers reuse tutoring documents by sharing them to better support a student’s learning, which addresses problem D). In Pattern 3, tutoring documents created for one student serve as the basis for new documents for another student. This prevents unnecessary duplication of work with each student, which addresses problem E). These patterns naturally occur in combination. Totally, teachers can share earlier context for each student by sharing documents and reuse them for another student.
253253
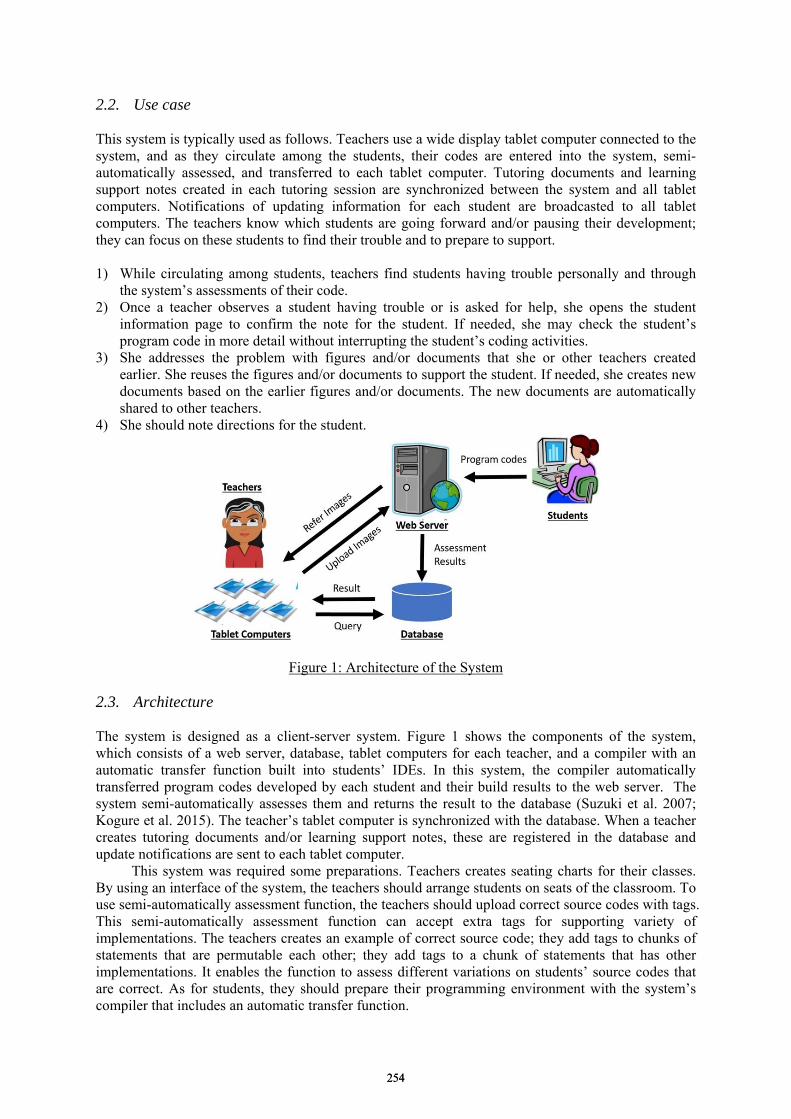
2.2. Use case This system is typically used as follows. Teachers use a wide display tablet computer connected to the system, and as they circulate among the students, their codes are entered into the system, semi-automatically assessed, and transferred to each tablet computer. Tutoring documents and learning support notes created in each tutoring session are synchronized between the system and all tablet computers. Notifications of updating information for each student are broadcasted to all tablet computers. The teachers know which students are going forward and/or pausing their development; they can focus on these students to find their trouble and to prepare to support. 1) While circulating among students, teachers find students having trouble personally and through
the system’s assessments of their code. 2) Once a teacher observes a student having trouble or is asked for help, she opens the student
information page to confirm the note for the student. If needed, she may check the student’s program code in more detail without interrupting the student’s coding activities.
3) She addresses the problem with figures and/or documents that she or other teachers created earlier. She reuses the figures and/or documents to support the student. If needed, she creates new documents based on the earlier figures and/or documents. The new documents are automatically shared to other teachers.
4) She should note directions for the student.
Figure 1: Architecture of the System 2.3. Architecture The system is designed as a client-server system. Figure 1 shows the components of the system, which consists of a web server, database, tablet computers for each teacher, and a compiler with an automatic transfer function built into students’ IDEs. In this system, the compiler automatically transferred program codes developed by each student and their build results to the web server. The system semi-automatically assesses them and returns the result to the database (Suzuki et al. 2007; Kogure et al. 2015). The teacher’s tablet computer is synchronized with the database. When a teacher creates tutoring documents and/or learning support notes, these are registered in the database and update notifications are sent to each tablet computer.
This system was required some preparations. Teachers creates seating charts for their classes. By using an interface of the system, the teachers should arrange students on seats of the classroom. To use semi-automatically assessment function, the teachers should upload correct source codes with tags. This semi-automatically assessment function can accept extra tags for supporting variety of implementations. The teachers creates an example of correct source code; they add tags to chunks of statements that are permutable each other; they add tags to a chunk of statements that has other implementations. It enables the function to assess different variations on students’ source codes that are correct. As for students, they should prepare their programming environment with the system’s compiler that includes an automatic transfer function.
254254
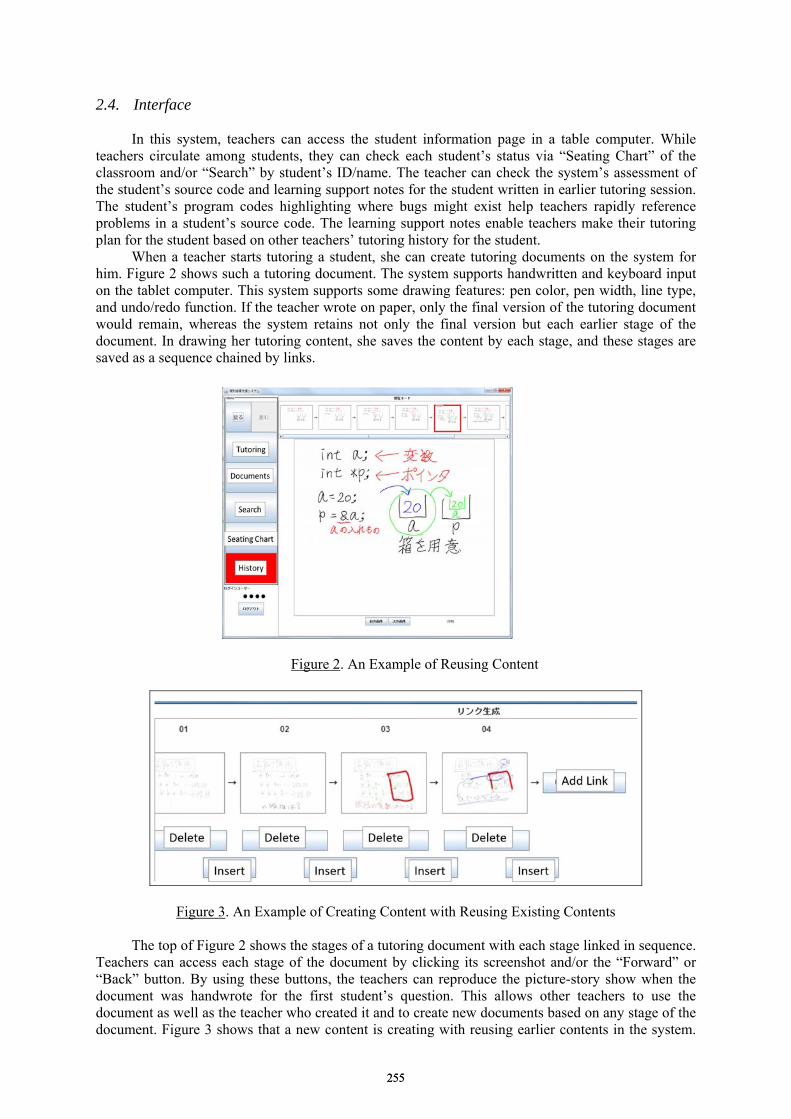
2.4. Interface
In this system, teachers can access the student information page in a table computer. While teachers circulate among students, they can check each student’s status via “Seating Chart” of the classroom and/or “Search” by student’s ID/name. The teacher can check the system’s assessment of the student’s source code and learning support notes for the student written in earlier tutoring session. The student’s program codes highlighting where bugs might exist help teachers rapidly reference problems in a student’s source code. The learning support notes enable teachers make their tutoring plan for the student based on other teachers’ tutoring history for the student.
When a teacher starts tutoring a student, she can create tutoring documents on the system for him. Figure 2 shows such a tutoring document. The system supports handwritten and keyboard input on the tablet computer. This system supports some drawing features: pen color, pen width, line type, and undo/redo function. If the teacher wrote on paper, only the final version of the tutoring document would remain, whereas the system retains not only the final version but each earlier stage of the document. In drawing her tutoring content, she saves the content by each stage, and these stages are saved as a sequence chained by links.
Figure 2. An Example of Reusing Content
Figure 3. An Example of Creating Content with Reusing Existing Contents
The top of Figure 2 shows the stages of a tutoring document with each stage linked in sequence. Teachers can access each stage of the document by clicking its screenshot and/or the “Forward” or “Back” button. By using these buttons, the teachers can reproduce the picture-story show when the document was handwrote for the first student’s question. This allows other teachers to use the document as well as the teacher who created it and to create new documents based on any stage of the document. Figure 3 shows that a new content is creating with reusing earlier contents in the system.
255255

The teachers can pick up each stage or part of stages of documents to new content. They creates new contents by creating new stages and linking between earlier contents’ stages and new stages. Even when a tutoring document was used to customize a new tutoring document, the system keeps the original, which allows the first teacher to recall the context of the document later. 3. Results and Discussion 3.1. Conditions of Use in Programming Class Our system was used in several novice-programming classes in a university. These classes were open to 2nd-year university students studying business administration and used the C programming language. Table 1 shows the details of three classes that used our system. All three were managed by the same teacher, who managed Class 1 alone and Classes 2 and 3 each with a different TA. In these classes, students were strongly encouraged to ask the teachers anything. Our system was refined based on the feedback from Classes 1-3. We sought to determine following five points.
(1) The system does not obstruct the smooth operation of the class. (2) The frequency that tutoring documents and/or direction notes are accumulated. (3) The efficiency of the system in tutoring a student with the help of previous documents and
directions. (4) The efficiency of the system in information-sharing among teachers. (5) The efficiency of the system when teachers reuse documents created for other students. As Class 1 had only one teacher, it was excluded from (4). From practical use in the three
classes, the following were obtained: (a) observations that these classes were operated with the system, (b) the records of all user operations in the interface of the system, (c) accumulated tutoring documents and direction notes, and (d) the opinions of the teachers in interviews. Table 1: Programming Classes Using the System.
Name Teacher and TAs
Class Length
No. Students
Topics
1 Programming I 1 Teacher 180 min 5 Arrays and double loop
2 Exercises for Professional Basis
1 Teacher and 1 TA
90 min 5 Arrays and double loop
3 Exercises for Professional Basis
1 Teacher and 1 TA
90 min 5 Arrays and double loop
3.2. Results and Discussions On point (1), the teacher stated in the interview that the classes were not delayed by using the system compared with previous classes not using the system. The records of the users’ operations showed that the users performed some operations indirectly until they became familiar with the system. On point (2), 62 tutoring documents and 6 learning support notes were accumulated in the three classes. The system could accumulate a certain number of tutoring documents. The number of learning support notes accumulated were none in Class 1, four in Class 2, and two in Class 3. On point (3), records of the users’ operations show that a user used the same tutoring documents for the same student four times. In this case, documents from an earlier tutoring were used because the learning support note did not have a link to the documents. There is also an instance of tutoring documents being shared between a teacher and a TA, so that a different teacher could follow the student from the last topic. On point (4), accumulated information was shared among the teachers. In the interviews, the teachers confirmed that the learning support notes could be shared to show the level and/or current situation of the student. The records of the users’ operations showed that shared learning support notes and/or tutoring documents were especially used when handing on a student to the other teacher during times of busy questioning. In the interviews, they stated that the tutoring documents worked for guessing what the student needed even if the learning support notes could not be found. Above all, students’ information could be shared without interrupting the other teacher. On point (5), the records
256256
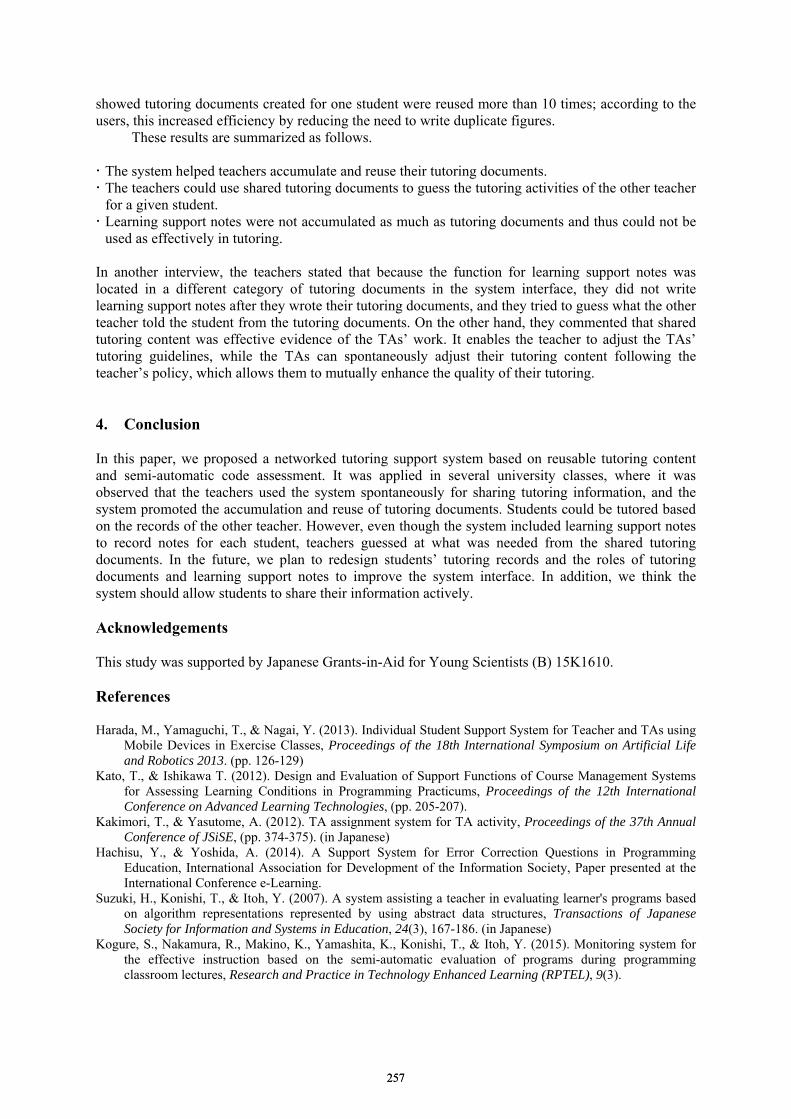
showed tutoring documents created for one student were reused more than 10 times; according to the users, this increased efficiency by reducing the need to write duplicate figures.
These results are summarized as follows.
The system helped teachers accumulate and reuse their tutoring documents. The teachers could use shared tutoring documents to guess the tutoring activities of the other teacher
for a given student. Learning support notes were not accumulated as much as tutoring documents and thus could not be
used as effectively in tutoring. In another interview, the teachers stated that because the function for learning support notes was located in a different category of tutoring documents in the system interface, they did not write learning support notes after they wrote their tutoring documents, and they tried to guess what the other teacher told the student from the tutoring documents. On the other hand, they commented that shared tutoring content was effective evidence of the TAs’ work. It enables the teacher to adjust the TAs’ tutoring guidelines, while the TAs can spontaneously adjust their tutoring content following the teacher’s policy, which allows them to mutually enhance the quality of their tutoring. 4. Conclusion In this paper, we proposed a networked tutoring support system based on reusable tutoring content and semi-automatic code assessment. It was applied in several university classes, where it was observed that the teachers used the system spontaneously for sharing tutoring information, and the system promoted the accumulation and reuse of tutoring documents. Students could be tutored based on the records of the other teacher. However, even though the system included learning support notes to record notes for each student, teachers guessed at what was needed from the shared tutoring documents. In the future, we plan to redesign students’ tutoring records and the roles of tutoring documents and learning support notes to improve the system interface. In addition, we think the system should allow students to share their information actively. Acknowledgements This study was supported by Japanese Grants-in-Aid for Young Scientists (B) 15K1610. References Harada, M., Yamaguchi, T., & Nagai, Y. (2013). Individual Student Support System for Teacher and TAs using
Mobile Devices in Exercise Classes, Proceedings of the 18th International Symposium on Artificial Life and Robotics 2013. (pp. 126-129)
Kato, T., & Ishikawa T. (2012). Design and Evaluation of Support Functions of Course Management Systems for Assessing Learning Conditions in Programming Practicums, Proceedings of the 12th International Conference on Advanced Learning Technologies, (pp. 205-207).
Kakimori, T., & Yasutome, A. (2012). TA assignment system for TA activity, Proceedings of the 37th Annual Conference of JSiSE, (pp. 374-375). (in Japanese)
Hachisu, Y., & Yoshida, A. (2014). A Support System for Error Correction Questions in Programming Education, International Association for Development of the Information Society, Paper presented at the International Conference e-Learning.
Suzuki, H., Konishi, T., & Itoh, Y. (2007). A system assisting a teacher in evaluating learner's programs based on algorithm representations represented by using abstract data structures, Transactions of Japanese Society for Information and Systems in Education, 24(3), 167-186. (in Japanese)
Kogure, S., Nakamura, R., Makino, K., Yamashita, K., Konishi, T., & Itoh, Y. (2015). Monitoring system for the effective instruction based on the semi-automatic evaluation of programs during programming classroom lectures, Research and Practice in Technology Enhanced Learning (RPTEL), 9(3).
257257
Chen, W. et al. (Eds.) (2016). Proceedings of the 24th
International Conference on Computers in Education.
India: Asia-Pacific Society for Computers in Education
Semi-automated Tool for Providing Effective
Feedback on Programming Assignments
Min Yan BEH, Swapna GOTTIPATI*, David LO, Venky SHANKARARAMAN
School of Information Systems, Singapore Management University
minyan.beh.2014,*swapnag,davidlo,[email protected]
Abstract: Human grading of introductory programming assignments is tedious and
error-prone, hence researchers have attempted to develop tools that support automatic
assessment of programming code. However, most such efforts often focus only on scoring
solutions, rather than assessing whether students correctly understand the problems. To aid the
students improve programming skills, effective feedback on programming assignments plays an
important role. Individual feedback generation is tedious and painstaking process. We present a
tool that not only automatically generates the static and dynamic program analysis outcomes,
but also clusters similar code submissions to provide scalable and effective feedback to the
students. We studied our tool on data from introductory Java programming assignments of year
1 course in School of Information Systems. In this paper, we share the details of our tool and
findings of our experiments on 261 code submissions.
Keywords: Automated grading, effective feedback, programming assignments, clustering
1. Introduction
Human grading of introductory programming assignments is a tedious and error-prone task, a problem
compounded by the large student cohorts of programming courses. It is a challenge for instructors to
review individual code submissions and provide specific feedback for each student. Therefore, the
instructors tend to provide a general feedback on correctness of code and common errors. As a result,
we observe that most of the students in introductory programming classes struggle to improve in their
mastery of programming techniques.
One of the most common solutions to this problem is to automate the grading process such that
students can electronically submit their programming assignments and receive instant feedback.
Several tools are developed for assisting teachers in assessing student programs through assessing the
program output and program code (Ala-Mutka, 2005). Most systems evaluate the function correctness
of student programs by compiling and executing the programs with test inputs and comparing the
output of student programs with that of the model program (Higgins, et al. 2003, Cheang, et al. 2003,
Joy, et al. 2005). Auto-assessment often focuses only on scoring solutions, rather than assessing
whether students correctly understand the problem and then providing individual feedback.
Many universities take on a test-case-based approach to evaluate submissions for student
assignments and timed assessments that put the students’ practical programming skills to test (Cheang,
et al. 2003). As such, there is a lack of personalised and comprehensive feedback for most introductory
programming classes, since the overwhelming number of student submissions precludes the option of
manual evaluation (Irene, et al. 2015). Specific feedback on areas of improvement for code submissions
is critical for novice programmers, who lack the experience to decipher their own mistakes for further
improvement. Therefore, code feedback should not only focus on programming errors, but also on the
logical approach and correctness improvements (Melina, et al. 2012).
In this paper, we propose a semi-automated tool based on static and dynamic program analysis,
and clustering model (Maimon et al. 2009) that can facilitate the process of feedback generation. The
tool takes programming assignments as input and generates clusters of similar codes together with the
compilation errors and code structures. Through summarized visual outputs, instructor will be able to
provide relevant feedback text to be propagated to all submissions within that cluster.
We studied the tool on 261 student code submissions to a “String Manipulation” programming
assignment during a timed programming assessment for an introductory Java programming course, IS
Software Foundations, at School of Information Systems, Singapore Management University. The tool
generated eight clusters and visual outputs of code details for each cluster. Instead of evaluating 261
258258
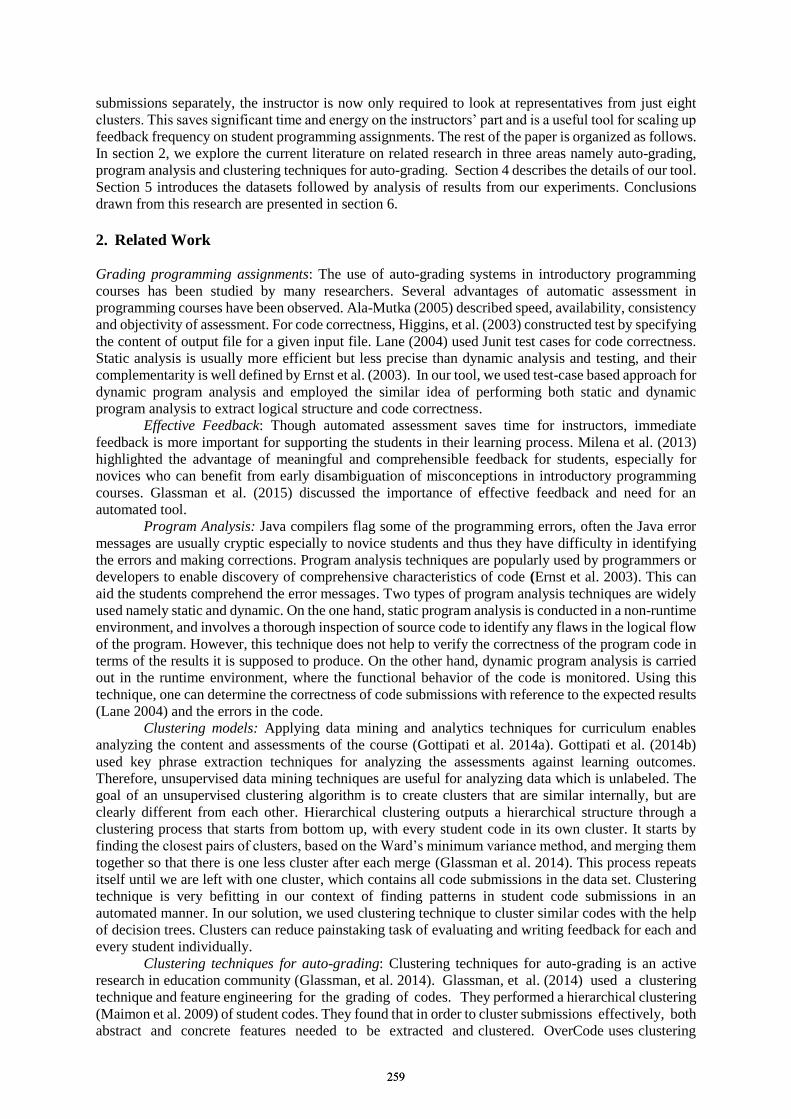
submissions separately, the instructor is now only required to look at representatives from just eight
clusters. This saves significant time and energy on the instructors’ part and is a useful tool for scaling up
feedback frequency on student programming assignments. The rest of the paper is organized as follows.
In section 2, we explore the current literature on related research in three areas namely auto-grading,
program analysis and clustering techniques for auto-grading. Section 4 describes the details of our tool.
Section 5 introduces the datasets followed by analysis of results from our experiments. Conclusions
drawn from this research are presented in section 6.
2. Related Work
Grading programming assignments: The use of auto-grading systems in introductory programming
courses has been studied by many researchers. Several advantages of automatic assessment in
programming courses have been observed. Ala-Mutka (2005) described speed, availability, consistency
and objectivity of assessment. For code correctness, Higgins, et al. (2003) constructed test by specifying
the content of output file for a given input file. Lane (2004) used Junit test cases for code correctness.
Static analysis is usually more efficient but less precise than dynamic analysis and testing, and their
complementarity is well defined by Ernst et al. (2003). In our tool, we used test-case based approach for
dynamic program analysis and employed the similar idea of performing both static and dynamic
program analysis to extract logical structure and code correctness.
Effective Feedback: Though automated assessment saves time for instructors, immediate
feedback is more important for supporting the students in their learning process. Milena et al. (2013)
highlighted the advantage of meaningful and comprehensible feedback for students, especially for
novices who can benefit from early disambiguation of misconceptions in introductory programming
courses. Glassman et al. (2015) discussed the importance of effective feedback and need for an
automated tool.
Program Analysis: Java compilers flag some of the programming errors, often the Java error
messages are usually cryptic especially to novice students and thus they have difficulty in identifying
the errors and making corrections. Program analysis techniques are popularly used by programmers or
developers to enable discovery of comprehensive characteristics of code (Ernst et al. 2003). This can
aid the students comprehend the error messages. Two types of program analysis techniques are widely
used namely static and dynamic. On the one hand, static program analysis is conducted in a non-runtime
environment, and involves a thorough inspection of source code to identify any flaws in the logical flow
of the program. However, this technique does not help to verify the correctness of the program code in
terms of the results it is supposed to produce. On the other hand, dynamic program analysis is carried
out in the runtime environment, where the functional behavior of the code is monitored. Using this
technique, one can determine the correctness of code submissions with reference to the expected results
(Lane 2004) and the errors in the code.
Clustering models: Applying data mining and analytics techniques for curriculum enables
analyzing the content and assessments of the course (Gottipati et al. 2014a). Gottipati et al. (2014b)
used key phrase extraction techniques for analyzing the assessments against learning outcomes.
Therefore, unsupervised data mining techniques are useful for analyzing data which is unlabeled. The
goal of an unsupervised clustering algorithm is to create clusters that are similar internally, but are
clearly different from each other. Hierarchical clustering outputs a hierarchical structure through a
clustering process that starts from bottom up, with every student code in its own cluster. It starts by
finding the closest pairs of clusters, based on the Ward’s minimum variance method, and merging them
together so that there is one less cluster after each merge (Glassman et al. 2014). This process repeats
itself until we are left with one cluster, which contains all code submissions in the data set. Clustering
technique is very befitting in our context of finding patterns in student code submissions in an
automated manner. In our solution, we used clustering technique to cluster similar codes with the help
of decision trees. Clusters can reduce painstaking task of evaluating and writing feedback for each and
every student individually.
Clustering techniques for auto-grading: Clustering techniques for auto-grading is an active
research in education community (Glassman, et al. 2014). Glassman, et al. (2014) used a clustering
technique and feature engineering for the grading of codes. They performed a hierarchical clustering
(Maimon et al. 2009) of student codes. They found that in order to cluster submissions effectively, both
abstract and concrete features needed to be extracted and clustered. OverCode uses clustering
259259

techniques to aid teachers write general feedback for the entire class (Glassman et al. 2015). In our tool,
we adopt a similar approach where we use clustering algorithm to cluster similar codes. However, our
tool also aids in generating more specific feedback for each cluster instead of the entire class. Our
solution approach combines both static and dynamic program analysis to aid the instructors
provide effective feedback along three dimensions namely analysis of the logical approach
adopted by the student in structuring the code, evaluation of the code for correctness in terms of
the results it is supposed to produce, and an analysis of the errors in the code.
3. Solution
Our solution approach takes programming assignments, test cases and student submissions as inputs
and generates visual outputs of clusters of codes, static analysis results and dynamic analysis results.
Figure 1 depicts the overall solution framework of our programming assignment feedback tool.
Figure 1: Framework of semi-automated tool for feedback on programming assignments
Program Analysis Stage: Static program analysis is performed by extrating the structures of the
code using lexical parsers written in Java. A snippet of parser is shown below.
static void extractMethods(String student, String content){
Pattern pMtd = Pattern.compile("([0-9_a-zA-Z]*[.][0-9_a-zA-Z, -<>(]+[)])");
Pattern pNew = Pattern.compile("(new[ ][0-9_a-zA-Z(,]+[)])");
Scanner sc = null;
try{
writer.write(student + "," + extractConstructs(content) + "," );
Dynamic program analysis is performed using test-case based approach. The tool embeds a
script that extracts the output from java compiler, summarizes the compile time and runtime outcomes.
A snippet of the script is shown below.
javac -classpath ${i%%}/Q2 ${i}/Q2/Q${QN}Tester.java 2> ${i}/Q2/op-CPerror${QN}.txt
if [[ -s ${i}/Q2/op-CPerror${QN}.txt ]] ; then
# error=`tr '\n' ' ' < ${i}/Q2/op-CPerror${QN}.txt`
errtype=`./error-extractor.sh 1 /${root}/${i}/Q2/op-CPerror${QN}.txt`
errline=`./error-extractor.sh 2 /${root}/${i}/Q2/op-CPerror${QN}.txt`
summary=${summary},0,${errtype},${errline},-,-,-
Feature Selection Stage: Features for each student data point includes; methods such as length,
charAt etc. and controls such as if, for, while etc. All the features are then represented as a matrix which
is suitable for classification models. Decision trees generates a list of releavant features for
programming assignment and their corresponding importance. The features with low importance are
removed from the data points to improve the performance of the Clustering algorithm.
Clustering Stage: We use Jaccard Coefficient (Maimon et al. 2009) to measure the similarity
between two codes, a popular technique for text mining tasks. Finally, hierarchical clustering algorithm
identifies common features on the codes and clusters the codes into clusters.
Visual Outputs: The outputs of all the three stages are shown in a comprehensive view using
html pages. Students’ information, clusters, code structures and errors are represented in a table. The
instructors will be able to use the comprehensive information and provide more meaningful feedback on
the codes to the students.
4. Experiments
4.1 Data Sets
The tool is tested on foundation course, IS Software Foundations, from School of Information Systems
in Singapore Management University. Seven sections, G1 to G7 are run concurrently for year 1 students.
260260
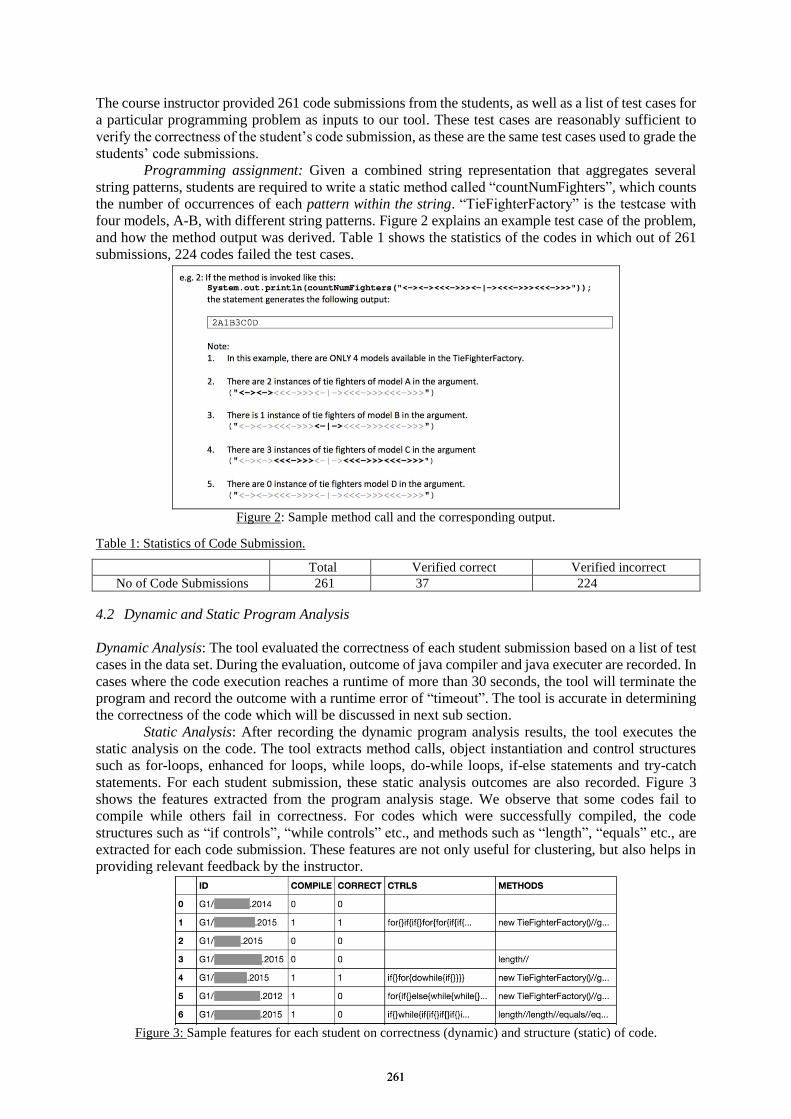
The course instructor provided 261 code submissions from the students, as well as a list of test cases for
a particular programming problem as inputs to our tool. These test cases are reasonably sufficient to
verify the correctness of the student’s code submission, as these are the same test cases used to grade the
students’ code submissions.
Programming assignment: Given a combined string representation that aggregates several
string patterns, students are required to write a static method called “countNumFighters”, which counts
the number of occurrences of each pattern within the string. “TieFighterFactory” is the testcase with
four models, A-B, with different string patterns. Figure 2 explains an example test case of the problem,
and how the method output was derived. Table 1 shows the statistics of the codes in which out of 261
submissions, 224 codes failed the test cases.
Figure 2: Sample method call and the corresponding output.
Table 1: Statistics of Code Submission.
Total Verified correct Verified incorrect
No of Code Submissions 261 37 224
4.2 Dynamic and Static Program Analysis
Dynamic Analysis: The tool evaluated the correctness of each student submission based on a list of test
cases in the data set. During the evaluation, outcome of java compiler and java executer are recorded. In
cases where the code execution reaches a runtime of more than 30 seconds, the tool will terminate the
program and record the outcome with a runtime error of “timeout”. The tool is accurate in determining
the correctness of the code which will be discussed in next sub section.
Static Analysis: After recording the dynamic program analysis results, the tool executes the
static analysis on the code. The tool extracts method calls, object instantiation and control structures
such as for-loops, enhanced for loops, while loops, do-while loops, if-else statements and try-catch
statements. For each student submission, these static analysis outcomes are also recorded. Figure 3
shows the features extracted from the program analysis stage. We observe that some codes fail to
compile while others fail in correctness. For codes which were successfully compiled, the code
structures such as “if controls”, “while controls” etc., and methods such as “length”, “equals” etc., are
extracted for each code submission. These features are not only useful for clustering, but also helps in
providing relevant feedback by the instructor.
Figure 3: Sample features for each student on correctness (dynamic) and structure (static) of code.
261261
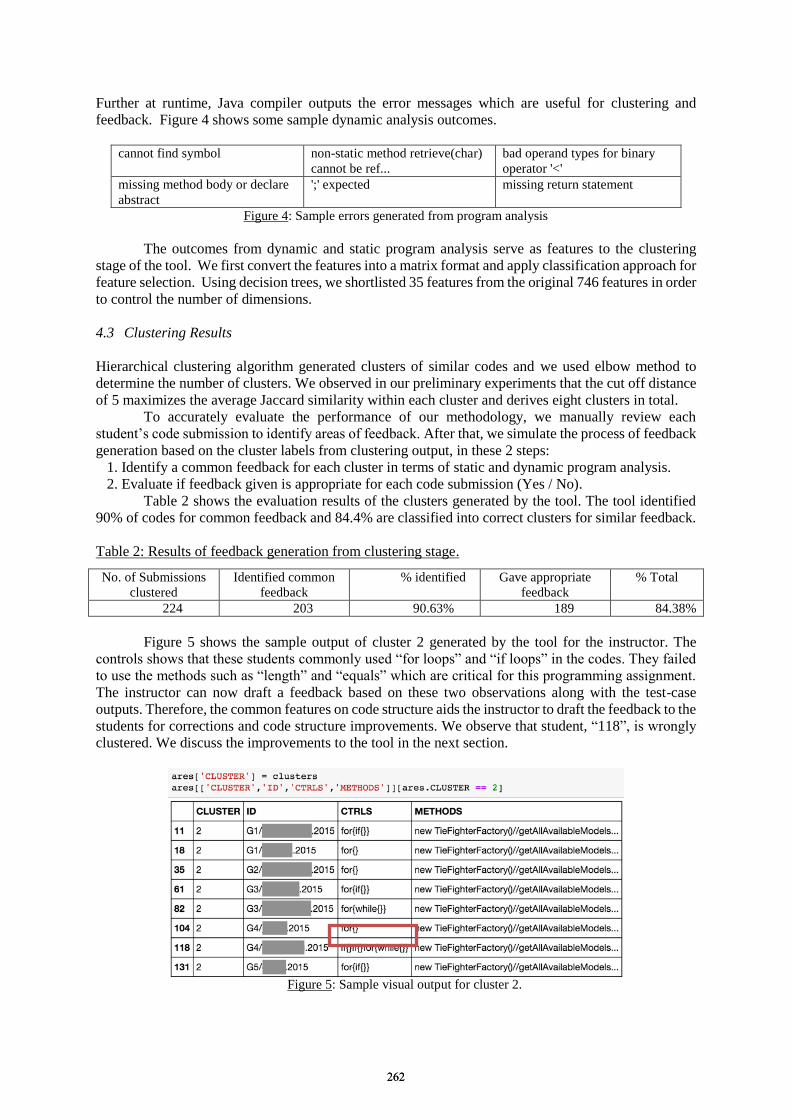
Further at runtime, Java compiler outputs the error messages which are useful for clustering and
feedback. Figure 4 shows some sample dynamic analysis outcomes.
cannot find symbol non-static method retrieve(char)
cannot be ref...
bad operand types for binary
operator '<'
missing method body or declare
abstract
';' expected missing return statement
Figure 4: Sample errors generated from program analysis
The outcomes from dynamic and static program analysis serve as features to the clustering
stage of the tool. We first convert the features into a matrix format and apply classification approach for
feature selection. Using decision trees, we shortlisted 35 features from the original 746 features in order
to control the number of dimensions.
4.3 Clustering Results
Hierarchical clustering algorithm generated clusters of similar codes and we used elbow method to
determine the number of clusters. We observed in our preliminary experiments that the cut off distance
of 5 maximizes the average Jaccard similarity within each cluster and derives eight clusters in total.
To accurately evaluate the performance of our methodology, we manually review each
student’s code submission to identify areas of feedback. After that, we simulate the process of feedback
generation based on the cluster labels from clustering output, in these 2 steps:
1. Identify a common feedback for each cluster in terms of static and dynamic program analysis.
2. Evaluate if feedback given is appropriate for each code submission (Yes / No).
Table 2 shows the evaluation results of the clusters generated by the tool. The tool identified
90% of codes for common feedback and 84.4% are classified into correct clusters for similar feedback.
Table 2: Results of feedback generation from clustering stage.
No. of Submissions
clustered
Identified common
feedback
% identified Gave appropriate
feedback
% Total
224 203 90.63% 189 84.38%
Figure 5 shows the sample output of cluster 2 generated by the tool for the instructor. The
controls shows that these students commonly used “for loops” and “if loops” in the codes. They failed
to use the methods such as “length” and “equals” which are critical for this programming assignment.
The instructor can now draft a feedback based on these two observations along with the test-case
outputs. Therefore, the common features on code structure aids the instructor to draft the feedback to the
students for corrections and code structure improvements. We observe that student, “118”, is wrongly
clustered. We discuss the improvements to the tool in the next section.
Figure 5: Sample visual output for cluster 2.
262262
4.4 Discussions
We observe that there is an area for improvement for the clustering algorithm to better assist the
instructor in feedback generation. We also observed that some codes are incorrectly clustered and one
of eight clusters cannot be labelled coherently due to lack of common features. A proposed method
would be to generate more clusters to improve homogeneity in each cluster. Another approach is to
study other clustering techniques such as agglomerative and k-means and feature selection techniques.
One limitation of our clustering methodology is that it produces hard clustering outputs, as
opposed to soft clustering. In hard clustering, we see that each code submission is a member of exactly
one cluster. In contrast, in soft clustering technique, a submission may have fractional membership in
several clusters, which could be more helpful in generating more than one feedback point for the same
code submission. It is suggested that the hidden Markov model and fuzzy c-means algorithms would be
useful areas to explore should we venture into this scope in the future. We also study on extending our
solution to a fully automated feedback tool where the model is trained on instructors’ feedback. Further,
applying analytics on student codes can aid the instructors in discovering common challenges in
programming learning process.
5. Conclusion
In this paper, we presented a feedback tool for introductory programming course code assignments. The
tool aids instructors provide specific feedback in an effective manner by discovering the similar codes
and clustering them into groups. It can be seen from this study that the use of automated program
analysis, feature selection techniques and clustering algorithms can facilitate the process of effective
feedback generation. The instructor uses visual outputs for each generated cluster to provide relevant
feedback text to be propagated to all submissions within that cluster.
References
Ala-Mutka, K. M. (2005). A survey of automated assessment approaches for programming assignments,
Computer Science Education, 15 (2), pp. 83-102.
Cheang, B., Kurnia, A., Lim, A., & Oon, W.-C. (2003). On automated grading of Programming Assignments
in an academic institution. Computers & Education, 41, 121-131.
Glassman, E. L., Scott, J., Singh, R., and Miller, R. C. (2015) Overcode: visualizing variation in student solutions
to programming problems at scale. In Proceedings of the adjunct publication of the 27th annual ACM
symposium on User interface software and technology, 129–130, 2015
Glassman, E. L., Singh, R., and Miller, R. C. (2014). Feature engineering for clustering student solutions. In
Proceedings of the First ACM Conference on Learning @ Scale Conference, ACM (New York, NY, USA).
Gottipati, Swapna and Shankararaman, Venky. Learning Analytics Applied to Curriculum Analysis. (2014). In
proceedings of the International Conference on Informatics Education and Research. (SIGED IAIM). 2014.
Higgins, C., Hergazy, T., Symeonidis, P., & Tsinsifas, A. (2003). The CourseMarker CBA system:
Improvements over Ceilidh. Education and Information Technologies, 8, 287 – 304.
Irena Koprinska, Joshua Stretton, and Kalina Yacef. (2015). Students at risk: Detection and remediation. The 8th
International Conference on Educational Data Mining, 2015.
Joy, M., Griffiths, N., & Boyatt, R. (2005). The BOSS Online Submission and Assessment System, ACM Journal
on Educational Resources in Computing, Vol. 5, No. 3, Article No. 2
Lane D. (2004). Junit: The Definitive Guide. O’Reilly, Sebastopol , CA.
M. D. Ernst. (2003). Static and dynamic analysis: synergy and duality. In Proceedings of WODA’2003 (ICSE
Workshop on Dynamic Analysis), Portland, May 2003
Maimon, Oded, and Lior Rokach. (2009). Introduction to knowledge discovery and data mining. Data mining and
knowledge discovery handbook. Springer US, 2009. 1-15.
Milena Vujošević-Janicić and Viktor Kuncak. (2012). Development and evaluation of LAV: an SMT-based error
finding platform. In Verified Software: Theories, Tools and Experiments (VSTTE), LNCS, 2012
Milena Vujošević-Janičić, Mladen Nikolić, Dušan Tošić, and Viktor Kuncak. (2013). Software verification and
graph similarity for automated evaluation of students' assignments. Inf. Softw. Technol. 55, 6 (June 2013).
Shankararaman, Venky and Gottipati, Swapna. Aligning Assessments with Competencies using Keyphrase
Extraction. (2014). In proceedings of Teaching, Assessment, and Learning for Engineering (TALE). 2014.
263263
Chen, W. et al. (Eds.) (2016). Proceedings of the 24th International Conference on Computers in Education. India: Asia-Pacific Society for Computers in Education
Behaviors and Features Selection of Online Learning Data
Bo JIANG*, Ming GAO
Center for Educational Big Data, College of Education Science and Technology, Zhejiang University of Technology, China
Abstract: To identify any patterns in learning behaviors, learners’ learning behavior data are captured and stored in many online learning platforms. It is crucial to determine which behaviors and which features of a behavior are most related to the specific analytics task. To do this, feature selection method has often been applied to determine a global reduced feature space. However, little attention has been paid to select the behaviors and features within behavior simultaneously. In this work, we propose a two-level feature selection method which can determine the importance of behaviors and features simultaneously. The proposed method is embedded into the classical k-means to cluster a famous e-learning dataset. Our experimental results show that the proposed method is an effective way to improve the clustering performance significantly.
Keywords: learning analytics; feature selection; behavior selection; multi-view clustering
1. Introduction In the past decade, more and more students’ learning behavior data were generated and collected from several kinds of tutoring systems and online learning courses(Baker, 2014; Romero & Ventura, 2013). With these learning behavior data, we may find how students learn, what kind of learning materials are more attractive, and even, why some students achieve high academic performance but others fail. The amount of behavior feature captured by log systems, such as keyboard and mouse actions within a behavior, behavior sequence, behavior duration and behavior frequency, make the learning behavior data highly dimensional, which bring challenge for pattern discovery(Jong, Y., & Wu, 2007) (Perera, Kay, Koprinska, Yacef, & Zaiane, 2009).
Most learning behavior data have several behaviors and each of them contains a number of features, which means there are multiple feature groups in the feature space. Figure 1 shows an example of two-level feature group structure of learning behavior data. On one hand, we often want to know which learning behavior(s) dedicate more than others to learning outputs(Ramesh, Goldwasser, Huang, Daumé III, & Getoor, 2013, December). On the other hand, within each learning behavior, it is also crucial to recognize which features are more important than others for a specific analytics task, which provides valuable feedback for us to optimize the learning system(Riley, Miller, Soh, Samal, & Nugent, 2009,July). To the best of our knowledge, there existed several works dedicated to solve the two issues independently, but few works were involved in how to solve them simultaneously. For instance, (Minaei-Bidgoli & Punch, 2003, July) and (Romero, Espejo, Zafra, Romero, & Ventura, 2013) used the behavior’s total number to predict student performance; (Perera et al., 2009) investigated students’ three behaviors in an online learning environment and used them to group students.
In this work, a simple yet efficient feature selection method was developed to select feature within each learning behavior. We conducted our feature selection method in students clustering task, which cluster students using their learning behavior data recorded by system. In the proposed method, each behavior and each feature belonging to it are assigned a positive weight to express their importance to the clustering result. A weight adaptation strategy was developed to update the behavior and feature weights automatically. The proposed method was tested on a famous learning behavior dataset Digital Electronics Education and Design Suite (Deeds), which was developed by University of Genoa(Vahdat, Oneto, Anguita, Funk, & Rauterberg, 2015). “Deeds” is a learning environment for digital electronics courses, which records several kinds of behaviors and features of each behavior.
264264
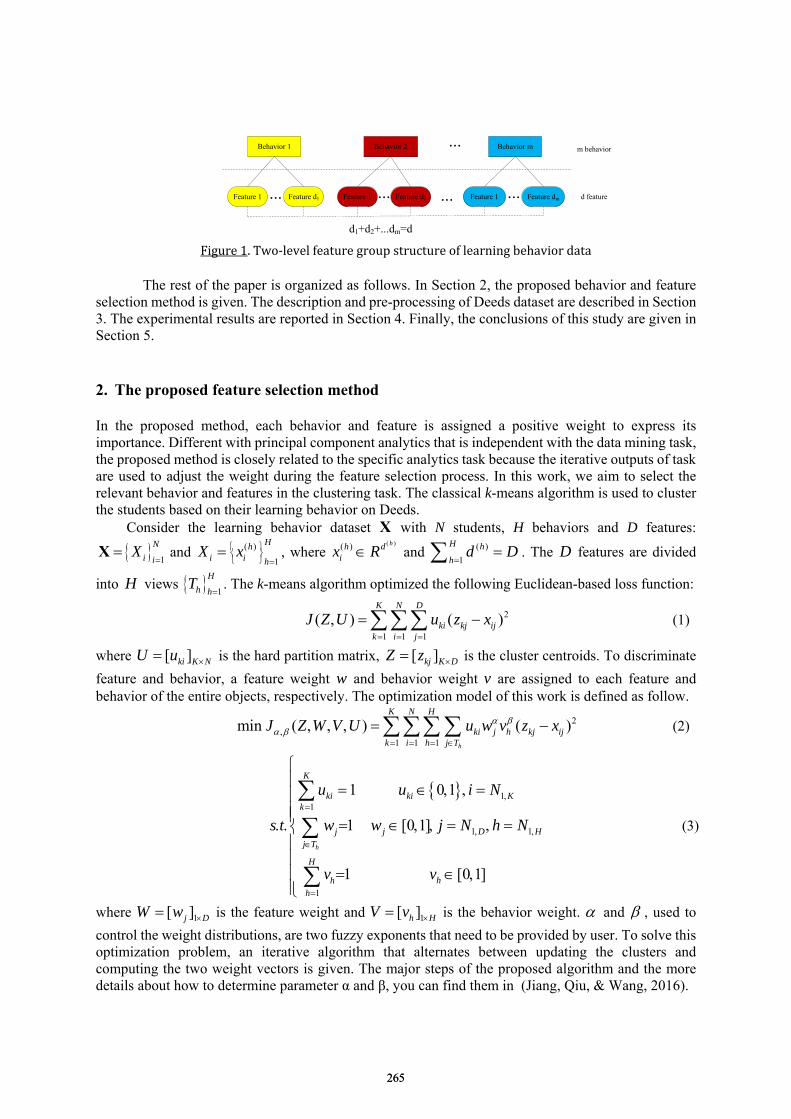
Behavior 1 Behavior 2 Behavior m
Feature 1 Feature d1 Feature 1 Feature d2 Feature 1 Feature dm... ... ...
d1+d2+...dm=d
...
...
m behavior
d feature
Figure1.Two‐levelfeaturegroupstructureoflearningbehaviordata
The rest of the paper is organized as follows. In Section 2, the proposed behavior and feature
selection method is given. The description and pre-processing of Deeds dataset are described in Section 3. The experimental results are reported in Section 4. Finally, the conclusions of this study are given in Section 5. 2. The proposed feature selection method In the proposed method, each behavior and feature is assigned a positive weight to express its importance. Different with principal component analytics that is independent with the data mining task, the proposed method is closely related to the specific analytics task because the iterative outputs of task are used to adjust the weight during the feature selection process. In this work, we aim to select the relevant behavior and features in the clustering task. The classical k-means algorithm is used to cluster the students based on their learning behavior on Deeds.
Consider the learning behavior dataset X with N students, H behaviors and D features:
1
N
i iX
X and ( )
1
Hhi i h
X x
, where ( )( ) hh d
ix R and ( )1
H h
hd D
. The D features are divided
into H views 1
H
h hT
. The k-means algorithm optimized the following Euclidean-based loss function:
2
1 1 1( ) ( )
K N D
ki kj ijk i j
J Z U u z x
(1)
where [ ]ki K NU u is the hard partition matrix, [ ]kj K DZ z is the cluster centroids. To discriminate feature and behavior, a feature weight w and behavior weight v are assigned to each feature and behavior of the entire objects, respectively. The optimization model of this work is defined as follow.
2
1 1 1min ( ) ( )
h
K N H
ki j h kj ijk i h j T
J Z W V U u w v z x
(2)
11
1 1
1
1 0 1
1 [0 1]
1 [0 1]
h
K
ki ki Kk
j D Hjj T
H
hhh
u u i N
s t w w j N h N
v v
(3)
where 1[ ]j DW w is the feature weight and 1[ ]h HV v is the behavior weight. and , used to control the weight distributions, are two fuzzy exponents that need to be provided by user. To solve this optimization problem, an iterative algorithm that alternates between updating the clusters and computing the two weight vectors is given. The major steps of the proposed algorithm and the more details about how to determine parameter α and β, you can find them in (Jiang, Qiu, & Wang, 2016).
265265
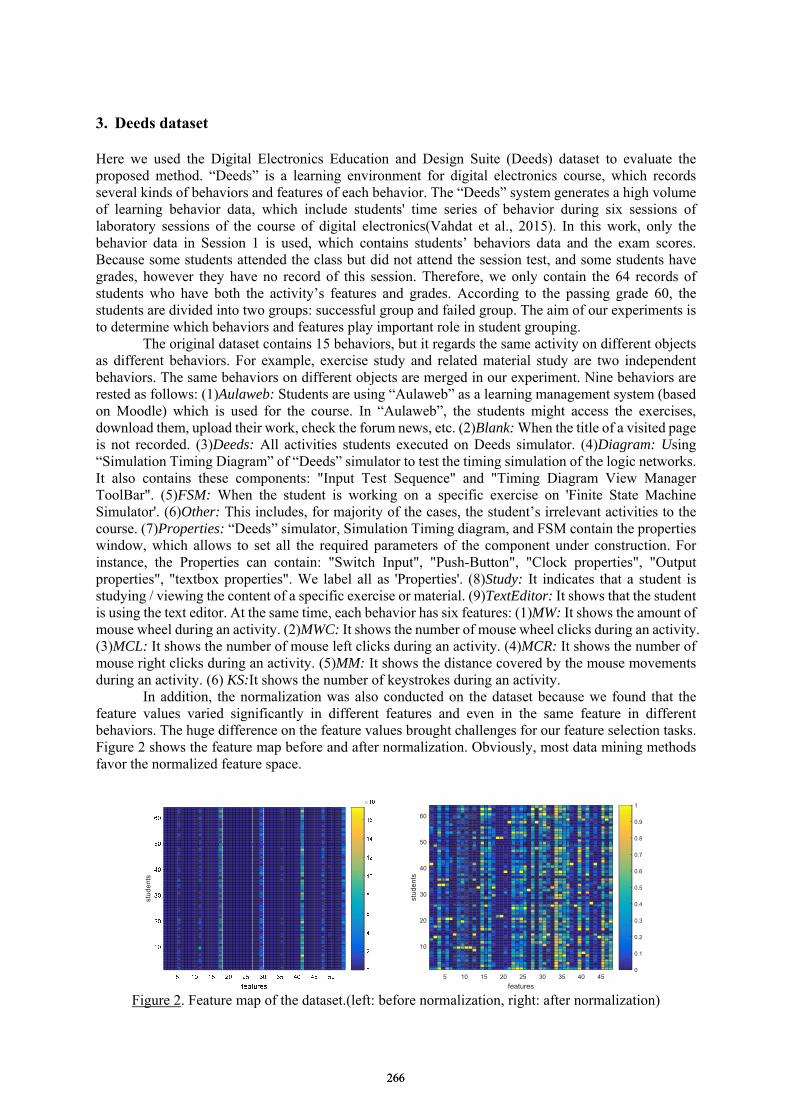
3. Deeds dataset Here we used the Digital Electronics Education and Design Suite (Deeds) dataset to evaluate the proposed method. “Deeds” is a learning environment for digital electronics course, which records several kinds of behaviors and features of each behavior. The “Deeds” system generates a high volume of learning behavior data, which include students' time series of behavior during six sessions of laboratory sessions of the course of digital electronics(Vahdat et al., 2015). In this work, only the behavior data in Session 1 is used, which contains students’ behaviors data and the exam scores. Because some students attended the class but did not attend the session test, and some students have grades, however they have no record of this session. Therefore, we only contain the 64 records of students who have both the activity’s features and grades. According to the passing grade 60, the students are divided into two groups: successful group and failed group. The aim of our experiments is to determine which behaviors and features play important role in student grouping.
The original dataset contains 15 behaviors, but it regards the same activity on different objects as different behaviors. For example, exercise study and related material study are two independent behaviors. The same behaviors on different objects are merged in our experiment. Nine behaviors are rested as follows: (1)Aulaweb: Students are using “Aulaweb” as a learning management system (based on Moodle) which is used for the course. In “Aulaweb”, the students might access the exercises, download them, upload their work, check the forum news, etc. (2)Blank: When the title of a visited page is not recorded. (3)Deeds: All activities students executed on Deeds simulator. (4)Diagram: Using “Simulation Timing Diagram” of “Deeds” simulator to test the timing simulation of the logic networks. It also contains these components: "Input Test Sequence" and "Timing Diagram View Manager ToolBar". (5)FSM: When the student is working on a specific exercise on 'Finite State Machine Simulator'. (6)Other: This includes, for majority of the cases, the student’s irrelevant activities to the course. (7)Properties: “Deeds” simulator, Simulation Timing diagram, and FSM contain the properties window, which allows to set all the required parameters of the component under construction. For instance, the Properties can contain: "Switch Input", "Push-Button", "Clock properties", "Output properties", "textbox properties". We label all as 'Properties'. (8)Study: It indicates that a student is studying / viewing the content of a specific exercise or material. (9)TextEditor: It shows that the student is using the text editor. At the same time, each behavior has six features: (1)MW: It shows the amount of mouse wheel during an activity. (2)MWC: It shows the number of mouse wheel clicks during an activity. (3)MCL: It shows the number of mouse left clicks during an activity. (4)MCR: It shows the number of mouse right clicks during an activity. (5)MM: It shows the distance covered by the mouse movements during an activity. (6) KS:It shows the number of keystrokes during an activity.
In addition, the normalization was also conducted on the dataset because we found that the feature values varied significantly in different features and even in the same feature in different behaviors. The huge difference on the feature values brought challenges for our feature selection tasks. Figure 2 shows the feature map before and after normalization. Obviously, most data mining methods favor the normalized feature space.
stu
den
ts
5 10 15 20 25 30 35 40 45
features
10
20
30
40
50
60
stud
ents
0
0.1
0.2
0.3
0.4
0.5
0.6
0.7
0.8
0.9
1
Figure 2. Feature map of the dataset.(left: before normalization, right: after normalization)
266266
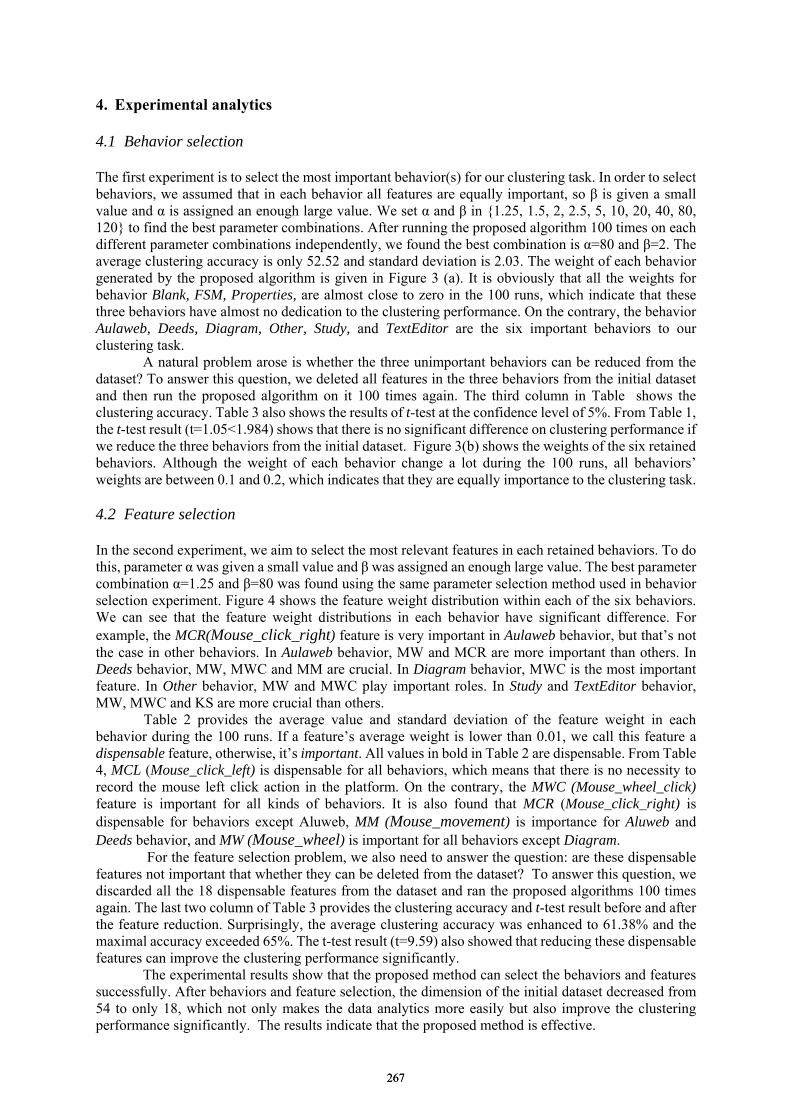
4. Experimental analytics 4.1 Behavior selection The first experiment is to select the most important behavior(s) for our clustering task. In order to select behaviors, we assumed that in each behavior all features are equally important, so β is given a small value and α is assigned an enough large value. We set α and β in {1.25, 1.5, 2, 2.5, 5, 10, 20, 40, 80, 120} to find the best parameter combinations. After running the proposed algorithm 100 times on each different parameter combinations independently, we found the best combination is α=80 and β=2. The average clustering accuracy is only 52.52 and standard deviation is 2.03. The weight of each behavior generated by the proposed algorithm is given in Figure 3 (a). It is obviously that all the weights for behavior Blank, FSM, Properties, are almost close to zero in the 100 runs, which indicate that these three behaviors have almost no dedication to the clustering performance. On the contrary, the behavior Aulaweb, Deeds, Diagram, Other, Study, and TextEditor are the six important behaviors to our clustering task.
A natural problem arose is whether the three unimportant behaviors can be reduced from the dataset? To answer this question, we deleted all features in the three behaviors from the initial dataset and then run the proposed algorithm on it 100 times again. The third column in Table shows the clustering accuracy. Table 3 also shows the results of t-test at the confidence level of 5%. From Table 1, the t-test result (t=1.05<1.984) shows that there is no significant difference on clustering performance if we reduce the three behaviors from the initial dataset. Figure 3(b) shows the weights of the six retained behaviors. Although the weight of each behavior change a lot during the 100 runs, all behaviors’ weights are between 0.1 and 0.2, which indicates that they are equally importance to the clustering task.
4.2 Feature selection In the second experiment, we aim to select the most relevant features in each retained behaviors. To do this, parameter α was given a small value and β was assigned an enough large value. The best parameter combination α=1.25 and β=80 was found using the same parameter selection method used in behavior selection experiment. Figure 4 shows the feature weight distribution within each of the six behaviors. We can see that the feature weight distributions in each behavior have significant difference. For example, the MCR(Mouse_click_right) feature is very important in Aulaweb behavior, but that’s not the case in other behaviors. In Aulaweb behavior, MW and MCR are more important than others. In Deeds behavior, MW, MWC and MM are crucial. In Diagram behavior, MWC is the most important feature. In Other behavior, MW and MWC play important roles. In Study and TextEditor behavior, MW, MWC and KS are more crucial than others.
Table 2 provides the average value and standard deviation of the feature weight in each behavior during the 100 runs. If a feature’s average weight is lower than 0.01, we call this feature a dispensable feature, otherwise, it’s important. All values in bold in Table 2 are dispensable. From Table 4, MCL (Mouse_click_left) is dispensable for all behaviors, which means that there is no necessity to record the mouse left click action in the platform. On the contrary, the MWC (Mouse_wheel_click) feature is important for all kinds of behaviors. It is also found that MCR (Mouse_click_right) is dispensable for behaviors except Aluweb, MM (Mouse_movement) is importance for Aluweb and Deeds behavior, and MW (Mouse_wheel) is important for all behaviors except Diagram.
For the feature selection problem, we also need to answer the question: are these dispensable features not important that whether they can be deleted from the dataset? To answer this question, we discarded all the 18 dispensable features from the dataset and ran the proposed algorithms 100 times again. The last two column of Table 3 provides the clustering accuracy and t-test result before and after the feature reduction. Surprisingly, the average clustering accuracy was enhanced to 61.38% and the maximal accuracy exceeded 65%. The t-test result (t=9.59) also showed that reducing these dispensable features can improve the clustering performance significantly.
The experimental results show that the proposed method can select the behaviors and features successfully. After behaviors and feature selection, the dimension of the initial dataset decreased from 54 to only 18, which not only makes the data analytics more easily but also improve the clustering performance significantly. The results indicate that the proposed method is effective.
267267
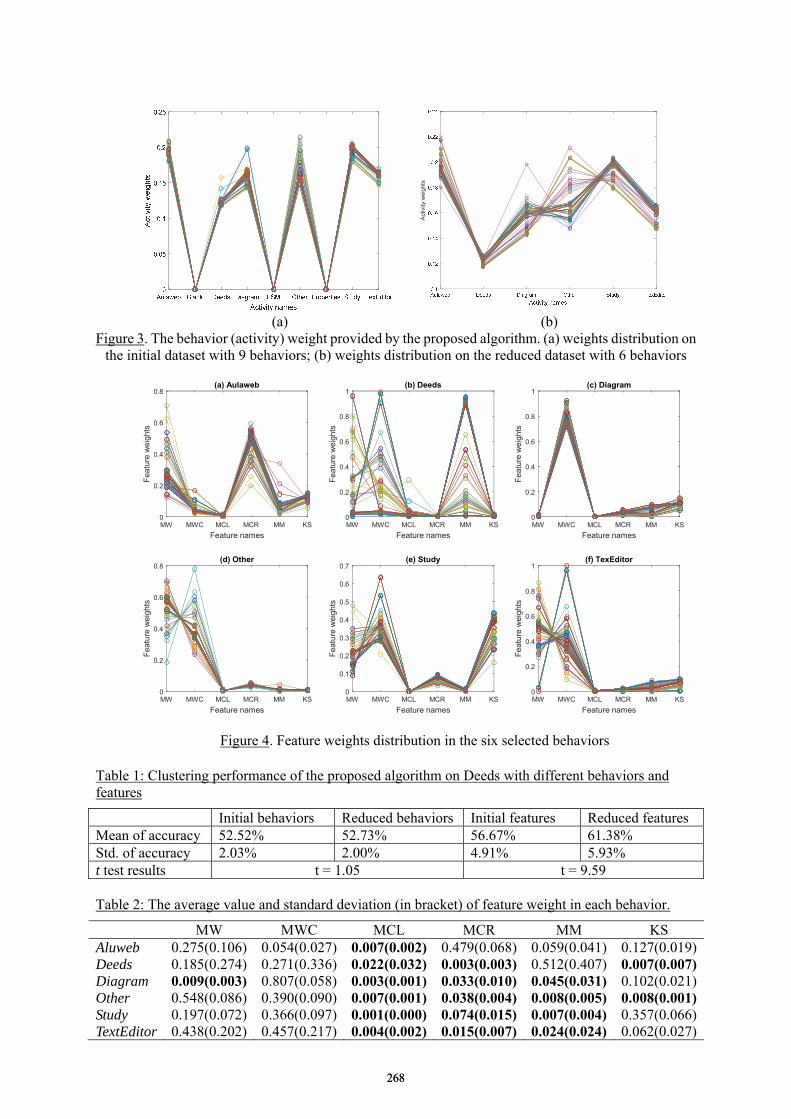
Act
ivity
wei
ghts
(a) (b)
Figure 3. The behavior (activity) weight provided by the proposed algorithm. (a) weights distribution on the initial dataset with 9 behaviors; (b) weights distribution on the reduced dataset with 6 behaviors
MW MWC MCL MCR MM KS
Feature names
0
0.2
0.4
0.6
0.8
Fea
ture
wei
ghts
(a) Aulaweb
MW MWC MCL MCR MM KS
Feature names
0
0.2
0.4
0.6
0.8
1
Fea
ture
wei
ghts
(b) Deeds
MW MWC MCL MCR MM KS
Feature names
0
0.2
0.4
0.6
0.8
1
Fea
ture
wei
ghts
(c) Diagram
MW MWC MCL MCR MM KS
Feature names
0
0.2
0.4
0.6
0.8
Fea
ture
wei
ghts
(d) Other
MW MWC MCL MCR MM KS
Feature names
0
0.1
0.2
0.3
0.4
0.5
0.6
0.7
Fea
ture
wei
ghts
(e) Study
MW MWC MCL MCR MM KS
Feature names
0
0.2
0.4
0.6
0.8
1
Fea
ture
wei
ghts
(f) TexEditor
Figure 4. Feature weights distribution in the six selected behaviors
Table 1: Clustering performance of the proposed algorithm on Deeds with different behaviors and features
Initial behaviors Reduced behaviors Initial features Reduced features Mean of accuracy 52.52% 52.73% 56.67% 61.38% Std. of accuracy 2.03% 2.00% 4.91% 5.93% t test results t = 1.05 t = 9.59 Table 2: The average value and standard deviation (in bracket) of feature weight in each behavior.
MW MWC MCL MCR MM KS Aluweb 0.275(0.106) 0.054(0.027) 0.007(0.002) 0.479(0.068) 0.059(0.041) 0.127(0.019) Deeds 0.185(0.274) 0.271(0.336) 0.022(0.032) 0.003(0.003) 0.512(0.407) 0.007(0.007) Diagram 0.009(0.003) 0.807(0.058) 0.003(0.001) 0.033(0.010) 0.045(0.031) 0.102(0.021) Other 0.548(0.086) 0.390(0.090) 0.007(0.001) 0.038(0.004) 0.008(0.005) 0.008(0.001) Study 0.197(0.072) 0.366(0.097) 0.001(0.000) 0.074(0.015) 0.007(0.004) 0.357(0.066) TextEditor 0.438(0.202) 0.457(0.217) 0.004(0.002) 0.015(0.007) 0.024(0.024) 0.062(0.027)
268268
5. Discussion Despite significant progress of educational data mining achieved in recent years, the topic of learning behavior analytics is still very challenging, due to the complicated structure of learning behavior. One of the challenges for learning behavior analytics is how to select the most relevant behaviors and features for the specific analytics task. This paper proposes two-level feature selection framework to the construction of effective feature space for online learning data. Experimental results show that the proposed method can discriminate the behaviors and features simultaneously. More importantly, the results also show that the reduction on behaviors and features wouldn’t degrade performance, instead it improves clustering accuracy significantly.
We note some limitations of the current study that highlight opportunities for future method improvement. Firstly, the feature selection results and clustering results are sensitive to the two parameters α and β which need to run the algorithm several times to determine the best parameter combination. Secondly, the proposed k-means based algorithm failed to preform very well on the Deeds dataset. This may be caused by the sparsity in the feature space, because we found that there are large amounts of zero values in the feature space. And there is no evidence supporting that there must have a direct relationship between these learning behaviors and the test performance. Lastly, although we found that some behaviors and features are not important for our analytics, we fail to discover the reason behind it.
In future work we plan to continue to investigate the application of the proposed method to other sessions of the Deeds dataset. We also plan to combine the proposed method with the classification task to predict the learning performance. Further, we aim to develop a sparse feature selection method using regularization terms and evaluate the methodology on other learning datasets. Acknowledgements This work is partly supported by the National Natural Science Foundation of China under Grant No. 61503340 and Zhejiang Provincial Natural Science Foundation of under Grant No. LQ16F030008. References Baker, R. S. (2014). Educational Data Mining: An Advance for Intelligent Systems in Education. IEEE Intelligent Systems, 29(3), 78-82. Jiang, B., Qiu, F., & Wang, L. (2016). Multi-view clustering via simultaneous weighting on views and features.
Applied Soft Computing, 47, 304-315. Jong, B. S., Y., T., & Wu, Y. L. (2007). Learning log explorer in e-learning diagnosis. IEEE Transactions on
education, 50(3), 216-228. Minaei-Bidgoli, B., & Punch, W. F. (2003, July). Using genetic algorithms for data mining optimization in an
educational web-based system. In Genetic and evolutionary computation conference (pp. 2252-2263). Springer Berlin Heidelberg.
Perera, D., Kay, J., Koprinska, I., Yacef, K., & Zaiane, O. R. (2009). Clustering and sequential pattern mining of online collaborative learning data. IEEE Transactions on Knowledge and Data Engineering, 21(6), 759-772.
Ramesh, A., Goldwasser, D., Huang, B., Daumé III, H., & Getoor, L. (2013, December). Modeling learner engagement in MOOCs using probabilistic soft logic. In NIPS Workshop on Data Driven Education
(Vol. 21, p. 62). Riley, S. A., Miller, L. D., Soh, L. K., Samal, A., & Nugent, G. (2009,July). Intelligent Learning Object Guide
(iLOG): A Framework for Automatic Empirically-Based Metadata Generation. Artificial Intelligence in Education, 200, 515-522.
Romero, C., Espejo, P. G., Zafra, A., Romero, J. R., & Ventura, S. (2013). Web usage mining for predicting final marks of students that use Moodle courses. Computer Applications in Engineering Education, 21(1), 135-146.
Romero, C., & Ventura, S. (2013). Data mining in education. Wiley Interdisciplinary Reviews: Data Mining and Knowledge Discovery, 3(1), 12-27.
Vahdat, M., Oneto, L., Anguita, D., Funk, M., & Rauterberg, M. (2015). A Learning Analytics Approach to Correlate the Academic Achievements of Students with Interaction Data from an Educational Simulator. In Design for Teaching and Learning in a Networked World (pp. 352-366). Springer International Publishing.
269269
Chen, W. et al. (Eds.) (2016). Proceedings of the 24th International Conference on Computers in Education.
India: Asia-Pacific Society for Computers in Education
Towards a Trace-Based Adaptation Model in
e-Learning Systems
Soraya CHACHOUA, Nouredine TAMANI, Jamal MALKI, and Pascal ESTRAILLIER L3i laboratory, University of La Rochelle, France
{soraya.chachoua, nouredine.tamani, jamal.malki, pascal.estraillier}@univ-lr.fr
Abstract: Adaptive learning systems aim to personalize and adapt resources and learning
strategies according to learners' knowledge acquisition and behavior. In this paper, knowledge
acquisition is estimated by using traces learners left during their learning activities. Learner's
traces considered are activity duration and number of attempts to solve a given problem, upon
which we developed a trace-based evaluation model. The latter is integrated into a trace-based
adaptation model made of ontological rules and reasoning mechanism to deliver adapted
resources and personalized learning strategy, represented as learning paths, which are
sequences of situations containing resources. The reasoning mechanism is implemented as a
state-transition process governed by an adaptation algorithm we proposed.
Keywords: Evaluation, adaptation, ontology, situation, resource, trace.
1. Introduction
Personalized adaptation of learning materials and navigation paths through learning resources has been
considered as an important aspect for the development of efficient e-learning systems (Van Seters,
Ossevoort, Tramper, & Goedhart, 2012; Brusilovsky, 2001). The adaptation process takes into
consideration different parameters such as learners' characteristics or preferences, and/or attributes of
learning contents (Wang & Wu, 2011), often considered as resources. The inconvenient of such
approaches lies in the fact that learners' characteristics or preferences are inputs that the adaptive system
must acquire before any adaptation process. These items of information are often static and need to be
continuously updated in order to obtain valid and good content and learning strategy adaptations.
Therefore, we introduce in this paper a trace-based adaptive e-learning system in which traces are
meta-data about learner's behavior during a training session (Djouad, Settouti, Prié, Reffay, & Mille,
2010). Indeed, given the possibility to attach the duration and number of attempts to an interactive
training activity, we can make use of these information as traces to evaluate both learner level and
progress (Lebis, Lefevre, Guin, & Luengo, 2015). To estimate learner's knowledge acquisition, we have
considered our trace-based evaluation model, previously introduced in (Chachoua, Tamani, Malki, &
Estraillier, 2016). Based on both traces and students assessment model, our e-learning adaptive system
builds a state-transition model in which states represent situations (made of learning resources such as
lecture, quiz, exercise, etc.) and transitions express adaptation steps from one state to another, according
to traces collected about learner activities.
The adaptation process generates a dynamic learning path from a situation to another forming a
teaching strategy adapted to learner knowledge status. In addition, the transitions in our trace-based
adaptive model are governed by logical rules and reasoning mechanism to maintain the consistency of
the system. The logical rules and reasoning mechanism are implemented within a domain ontology we
designed for trace-based situation to describe the main concepts in our system, namely, scenario,
situation, learner, resource and trace.
The remainder of the paper is organized as follows. Section 2 summarizes some definitions
about traces, and recalls our modeled trace-based assessment process. Section 3 details our trace-based
adaptation model. Section 4 discusses some related works in the domain of adaptive e-learning systems.
Section 5 concludes the paper and gives some perspectives.
270270
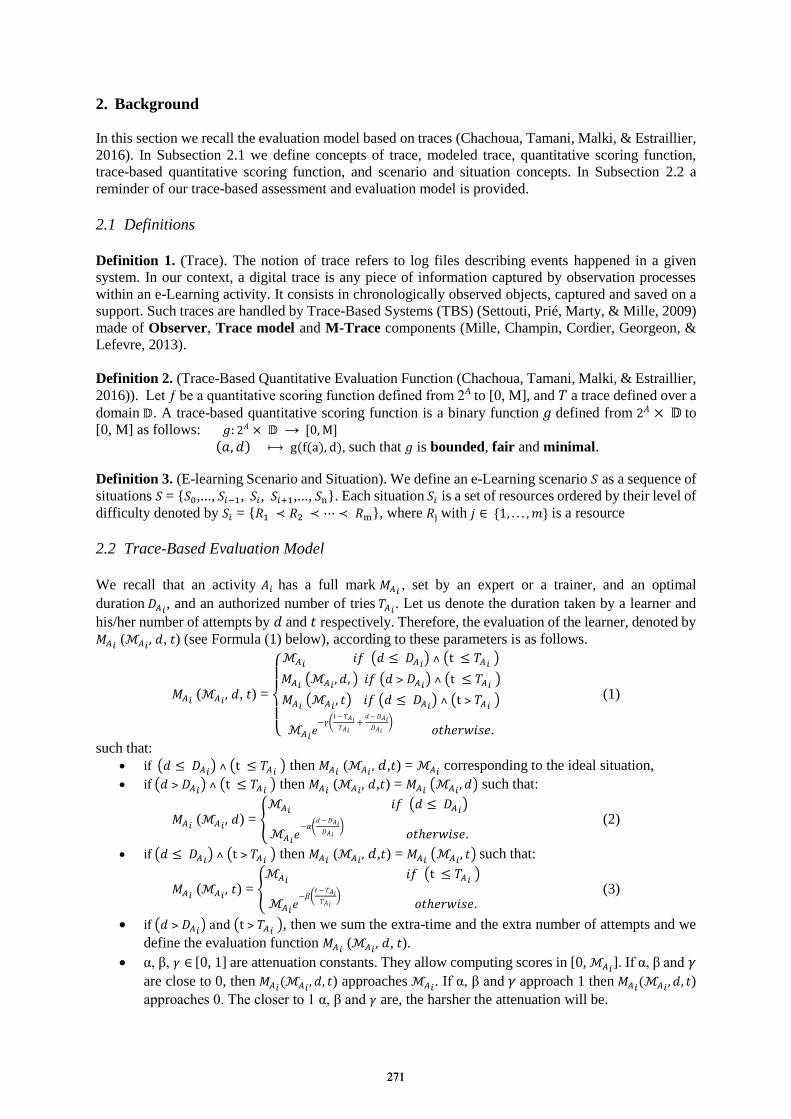
2. Background
In this section we recall the evaluation model based on traces (Chachoua, Tamani, Malki, & Estraillier,
2016). In Subsection 2.1 we define concepts of trace, modeled trace, quantitative scoring function,
trace-based quantitative scoring function, and scenario and situation concepts. In Subsection 2.2 a
reminder of our trace-based assessment and evaluation model is provided.
2.1 Definitions
Definition 1. (Trace). The notion of trace refers to log files describing events happened in a given
system. In our context, a digital trace is any piece of information captured by observation processes
within an e-Learning activity. It consists in chronologically observed objects, captured and saved on a
support. Such traces are handled by Trace-Based Systems (TBS) (Settouti, Prié, Marty, & Mille, 2009)
made of Observer, Trace model and M-Trace components (Mille, Champin, Cordier, Georgeon, &
Lefevre, 2013).
Definition 2. (Trace-Based Quantitative Evaluation Function (Chachoua, Tamani, Malki, & Estraillier,
2016)). Let ƒ be a quantitative scoring function defined from 2A to [0, M], and 𝑇 a trace defined over a
domain 𝔻. A trace-based quantitative scoring function is a binary function 𝑔 defined from 2𝐴 × 𝔻 to
[0, M] as follows: 𝑔: 2𝐴 × 𝔻 → [0,M]
(𝑎, 𝑑) ⟼ g(f(a), d), such that 𝑔 is bounded, fair and minimal.
Definition 3. (E-learning Scenario and Situation). We define an e-Learning scenario 𝑆 as a sequence of
situations 𝑆 = {𝑆0,..., 𝑆𝑖−1, 𝑆𝑖, 𝑆𝑖+1,..., 𝑆n}. Each situation 𝑆𝑖 is a set of resources ordered by their level of
difficulty denoted by 𝑆𝑖 = {𝑅1 ≺ 𝑅2 ≺ ⋯ ≺ 𝑅m}, where 𝑅j with 𝑗 ∈ {1, . . . , 𝑚} is a resource
2.2 Trace-Based Evaluation Model
We recall that an activity 𝐴𝑖 has a full mark 𝑀𝐴𝑖 , set by an expert or a trainer, and an optimal
duration 𝐷𝐴𝑖, and an authorized number of tries 𝑇𝐴𝑖. Let us denote the duration taken by a learner and
his/her number of attempts by 𝑑 and 𝑡 respectively. Therefore, the evaluation of the learner, denoted by
𝑀𝐴𝑖 (ℳ𝐴𝑖, 𝑑, 𝑡) (see Formula (1) below), according to these parameters is as follows.
𝑀𝐴𝑖 (ℳ𝐴𝑖, 𝑑, 𝑡) =
{
ℳ𝐴𝑖
𝑖𝑓 (𝑑 ≤ 𝐷𝐴𝑖) ˄ (t ≤ 𝑇𝐴𝑖 )
𝑀𝐴𝑖 (ℳ𝐴𝑖, 𝑑, ) 𝑖𝑓 (𝑑 ˃ 𝐷𝐴𝑖) ˄ (t ≤ 𝑇𝐴𝑖 )
𝑀𝐴𝑖 (ℳ𝐴𝑖, 𝑡) 𝑖𝑓 (𝑑 ≤ 𝐷𝐴𝑖) ˄ (t ˃ 𝑇𝐴𝑖 )
ℳ𝐴𝑖𝑒−𝛾(
𝑡 − 𝑇𝐴𝑖
𝑇𝐴𝑖 +
𝑑 − 𝐷𝐴𝑖
𝐷𝐴𝑖) 𝑜𝑡ℎ𝑒𝑟𝑤𝑖𝑠𝑒.
(1)
such that:
if (𝑑 ≤ 𝐷𝐴𝑖) ˄ (t ≤ 𝑇𝐴𝑖 ) then 𝑀𝐴𝑖 (ℳ𝐴𝑖, 𝑑,𝑡) = ℳ𝐴𝑖
corresponding to the ideal situation,
if (𝑑 ˃ 𝐷𝐴𝑖) ˄ (t ≤ 𝑇𝐴𝑖 ) then 𝑀𝐴𝑖 (ℳ𝐴𝑖, 𝑑,𝑡) = 𝑀𝐴𝑖 (ℳ𝐴𝑖
, 𝑑) such that:
𝑀𝐴𝑖 (ℳ𝐴𝑖, 𝑑) = {
ℳ𝐴𝑖 𝑖𝑓 (𝑑 ≤ 𝐷𝐴𝑖)
ℳ𝐴𝑖𝑒−𝛼(
𝑑 − 𝐷𝐴𝑖𝐷𝐴𝑖
) 𝑜𝑡ℎ𝑒𝑟𝑤𝑖𝑠𝑒.
(2)
if (𝑑 ≤ 𝐷𝐴𝑖) ˄ (t ˃ 𝑇𝐴𝑖 ) then 𝑀𝐴𝑖 (ℳ𝐴𝑖, 𝑑,𝑡) = 𝑀𝐴𝑖 (ℳ𝐴𝑖
, 𝑡) such that:
𝑀𝐴𝑖 (ℳ𝐴𝑖, 𝑡) = {
ℳ𝐴𝑖 𝑖𝑓 (t ≤ 𝑇𝐴𝑖 )
ℳ𝐴𝑖𝑒−𝛽(
𝑡 − 𝑇𝐴𝑖𝑇𝐴𝑖
) 𝑜𝑡ℎ𝑒𝑟𝑤𝑖𝑠𝑒.
(3)
if (𝑑 ˃ 𝐷𝐴𝑖) and (t ˃ 𝑇𝐴𝑖 ), then we sum the extra-time and the extra number of attempts and we
define the evaluation function 𝑀𝐴𝑖 (ℳ𝐴𝑖, 𝑑, 𝑡).
α, β, 𝛾 ∈ [0, 1] are attenuation constants. They allow computing scores in [0, ℳ𝐴𝑖]. If α, β and 𝛾
are close to 0, then 𝑀𝐴𝑖(ℳ𝐴𝑖, 𝑑, 𝑡) approaches ℳ𝐴𝑖
. If α, β and 𝛾 approach 1 then 𝑀𝐴𝑖(ℳ𝐴𝑖, 𝑑, 𝑡)
approaches 0. The closer to 1 α, β and 𝛾 are, the harsher the attenuation will be.
271271
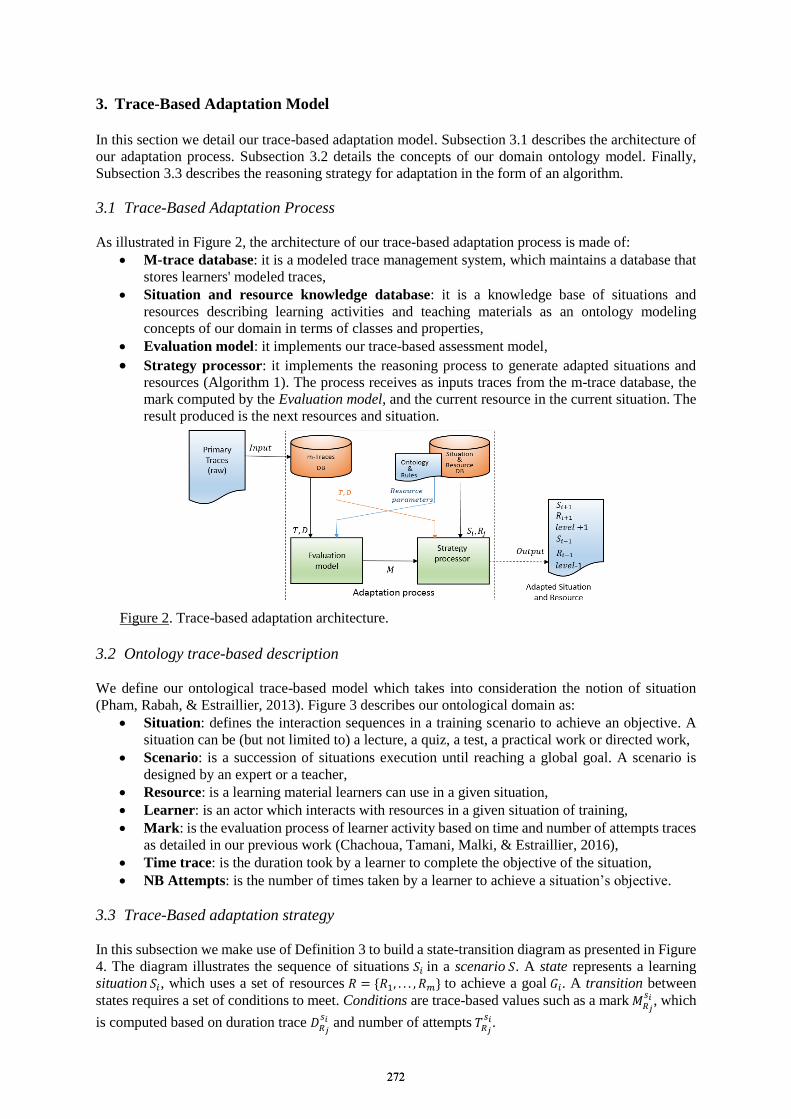
3. Trace-Based Adaptation Model
In this section we detail our trace-based adaptation model. Subsection 3.1 describes the architecture of
our adaptation process. Subsection 3.2 details the concepts of our domain ontology model. Finally,
Subsection 3.3 describes the reasoning strategy for adaptation in the form of an algorithm.
3.1 Trace-Based Adaptation Process
As illustrated in Figure 2, the architecture of our trace-based adaptation process is made of:
M-trace database: it is a modeled trace management system, which maintains a database that
stores learners' modeled traces,
Situation and resource knowledge database: it is a knowledge base of situations and
resources describing learning activities and teaching materials as an ontology modeling
concepts of our domain in terms of classes and properties,
Evaluation model: it implements our trace-based assessment model,
Strategy processor: it implements the reasoning process to generate adapted situations and
resources (Algorithm 1). The process receives as inputs traces from the m-trace database, the
mark computed by the Evaluation model, and the current resource in the current situation. The
result produced is the next resources and situation.
Figure 2. Trace-based adaptation architecture.
3.2 Ontology trace-based description
We define our ontological trace-based model which takes into consideration the notion of situation
(Pham, Rabah, & Estraillier, 2013). Figure 3 describes our ontological domain as:
Situation: defines the interaction sequences in a training scenario to achieve an objective. A
situation can be (but not limited to) a lecture, a quiz, a test, a practical work or directed work,
Scenario: is a succession of situations execution until reaching a global goal. A scenario is
designed by an expert or a teacher,
Resource: is a learning material learners can use in a given situation,
Learner: is an actor which interacts with resources in a given situation of training,
Mark: is the evaluation process of learner activity based on time and number of attempts traces
as detailed in our previous work (Chachoua, Tamani, Malki, & Estraillier, 2016),
Time trace: is the duration took by a learner to complete the objective of the situation,
NB Attempts: is the number of times taken by a learner to achieve a situation’s objective.
3.3 Trace-Based adaptation strategy
In this subsection we make use of Definition 3 to build a state-transition diagram as presented in Figure
4. The diagram illustrates the sequence of situations 𝑆𝑖 in a scenario 𝑆. A state represents a learning
situation 𝑆𝑖, which uses a set of resources 𝑅 = {𝑅1, . . . , 𝑅𝑚} to achieve a goal 𝐺𝑖. A transition between
states requires a set of conditions to meet. Conditions are trace-based values such as a mark 𝑀𝑅𝑗
𝑠𝑖 , which
is computed based on duration trace 𝐷𝑅𝑗𝑠𝑖 and number of attempts 𝑇𝑅𝑗
𝑠𝑖.
272272

The user starts from a situation 𝑆𝑖, 𝑖 ∈ {0, . . . , 𝑛} and a resource 𝑅𝑗 of 𝑆𝑖 where 𝑗 ∈ {1, . . . , 𝑚𝑖} and
𝑚𝑖 is the number of resources in situation 𝑆𝑖. The starting point can be defined by the system according
to learner’s skill level. Algorithm 1 computes a trace-based mark to assess a learning knowledge
acquisition and determines the next resource and situation.
Figure 3. Fragment of trace-based situation ontology.
Figure 4. State-Transition diagram for situation and resource adaptation.
4. Related Work
Several adaptation processes have been proposed in different contexts to implement learning adaptive
systems such as in (Hwang, Kuo, Yin, & Chuang, 2010; Mustafa & Sharif, 2011; Sosnovsky &
Brusilovsky, 2015), in addition to adaptive e-learning hypermedia systems, which exploit navigational
and presentation adaptations to implement learning styles and their dimensions (Felder & Spurlin,
2005). But, few of them make use of traces as a basis of the adaptation process. We can cite (Zouhair,
Amami, Boukachour, Person, & others, 2013) in Computer Environment for Human Learning domain,
in which a learner monitoring system has been designed to detect learner difficulties and drop out
causes, and acts accordingly relying on a dynamic trace-based reasoning. However, the trace model, the
analyzing process and the domain ontology have not been detailed.
In a web-based e-learning environment, an adaptive platform, called Lecomps, has been
developed (Sterbini & Temperini, 2009) that builds adaptive personalized learning paths, by using
learning goals, learner's knowledge and individual learning styles. It relies on a constraint logic-based
engine to build learning objects LOs (Felder & Spurlin, 2005) and compliant with Bloom's and ACM's
Taxonomies (Gorgone, Davis, Valacich, Topi, & others, 2002). A similar approach has been used to
build personalized learning paths based on student’s learning status (Hwang, Kuo, Yin, & Chuang,
2010). However, this approach does not provide adaptive adjustment in case of failure.
In the field of educational game (EG), (Göbel, Mehm, Radke, & Steinmetz, 2009), developed
(i) a macro-adaptation, which is about scene sequences, and (ii) a micro-adaptation, which is about
elements of scenes. Both adaptations are used in (Gros & Maina, 2015) to develop an extended
adaptation that allows altering a predefined sequence and varying the level of difficulty by
activate/deactivate game rules. Our approach does not need to predefine any sequence of situations.
They are defined dynamically according to the level of the learner and his/her knowledge acquisition.
It is noteworthy that SCORM norm (Costagliola, Ferrucci, & Fuccella, 2006) considers both
duration and attempts in test activities as parameters to set for tests but no traces have been used.
273273
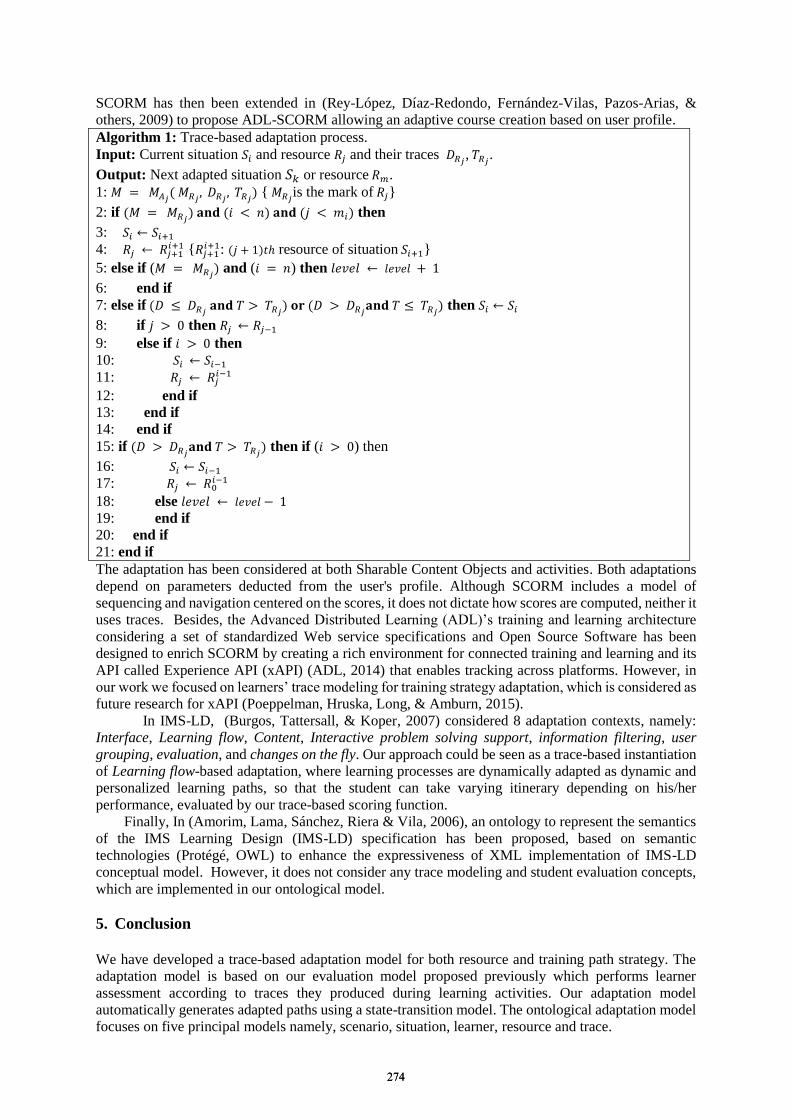
SCORM has then been extended in (Rey-López, Díaz-Redondo, Fernández-Vilas, Pazos-Arias, &
others, 2009) to propose ADL-SCORM allowing an adaptive course creation based on user profile.
Algorithm 1: Trace-based adaptation process.
Input: Current situation 𝑆𝑖 and resource 𝑅𝑗 and their traces 𝐷𝑅𝑗, 𝑇𝑅𝑗.
Output: Next adapted situation 𝑆𝑘 or resource 𝑅𝑚.
1: 𝑀 = 𝑀𝐴𝑗( 𝑀𝑅𝑗, 𝐷𝑅𝑗 , 𝑇𝑅𝑗) { 𝑀𝑅𝑗
is the mark of 𝑅𝑗}
2: if (𝑀 = 𝑀𝑅𝑗) 𝐚𝐧𝐝 (𝑖 < 𝑛) 𝐚𝐧𝐝 (𝑗 < 𝑚𝑖) then
3: 𝑆𝑖 ← 𝑆𝑖+1
4: 𝑅𝑗 ← 𝑅𝑗+1𝑖+1 {𝑅𝑗+1
𝑖+1: (𝑗 + 1)𝑡ℎ resource of situation 𝑆𝑖+1}
5: else if (𝑀 = 𝑀𝑅𝑗) and (𝑖 = 𝑛) then 𝑙𝑒𝑣𝑒𝑙 ← 𝑙𝑒𝑣𝑒𝑙 + 1
6: end if
7: else if (𝐷 ≤ 𝐷𝑅𝑗 𝐚𝐧𝐝 𝑇 > 𝑇𝑅𝑗) 𝐨𝐫 (𝐷 > 𝐷𝑅𝑗𝐚𝐧𝐝 𝑇 ≤ 𝑇𝑅𝑗) then 𝑆𝑖 ← 𝑆𝑖
8: if 𝑗 > 0 then 𝑅𝑗 ← 𝑅𝑗−1
9: else if 𝑖 > 0 then
10: 𝑆𝑖 ← 𝑆𝑖−1
11: 𝑅𝑗 ← 𝑅𝑗𝑖−1
12: end if
13: end if
14: end if
15: if (𝐷 > 𝐷𝑅𝑗𝐚𝐧𝐝 𝑇 > 𝑇𝑅𝑗) then if (𝑖 > 0) then
16: 𝑆𝑖 ← 𝑆𝑖−1
17: 𝑅𝑗 ← 𝑅0𝑖−1
18: else 𝑙𝑒𝑣𝑒𝑙 ← 𝑙𝑒𝑣𝑒𝑙− 1
19: end if
20: end if
21: end if
The adaptation has been considered at both Sharable Content Objects and activities. Both adaptations
depend on parameters deducted from the user's profile. Although SCORM includes a model of
sequencing and navigation centered on the scores, it does not dictate how scores are computed, neither it
uses traces. Besides, the Advanced Distributed Learning (ADL)’s training and learning architecture
considering a set of standardized Web service specifications and Open Source Software has been
designed to enrich SCORM by creating a rich environment for connected training and learning and its
API called Experience API (xAPI) (ADL, 2014) that enables tracking across platforms. However, in
our work we focused on learners’ trace modeling for training strategy adaptation, which is considered as
future research for xAPI (Poeppelman, Hruska, Long, & Amburn, 2015).
In IMS-LD, (Burgos, Tattersall, & Koper, 2007) considered 8 adaptation contexts, namely:
Interface, Learning flow, Content, Interactive problem solving support, information filtering, user
grouping, evaluation, and changes on the fly. Our approach could be seen as a trace-based instantiation
of Learning flow-based adaptation, where learning processes are dynamically adapted as dynamic and
personalized learning paths, so that the student can take varying itinerary depending on his/her
performance, evaluated by our trace-based scoring function.
Finally, In (Amorim, Lama, Sánchez, Riera & Vila, 2006), an ontology to represent the semantics
of the IMS Learning Design (IMS-LD) specification has been proposed, based on semantic
technologies (Protégé, OWL) to enhance the expressiveness of XML implementation of IMS-LD
conceptual model. However, it does not consider any trace modeling and student evaluation concepts,
which are implemented in our ontological model.
5. Conclusion
We have developed a trace-based adaptation model for both resource and training path strategy. The
adaptation model is based on our evaluation model proposed previously which performs learner
assessment according to traces they produced during learning activities. Our adaptation model
automatically generates adapted paths using a state-transition model. The ontological adaptation model
focuses on five principal models namely, scenario, situation, learner, resource and trace.
274274
The next step in our work is the implementation and validation of our trace-based adaptation
model. To do so, it is important to have on hand an e-learning application and a collection of modeled
traces. The former is an online laboratory for SQL training which has been already developed
(Chachoua, Malki, & Estraillier, 2016), and its extension to our adaptation model is in progress.
References ADL: Advanced Distributed Learning. (2014). Training and Learning Architecture and Experience API (TLA:
http://www.adlnet.gov/capabilities/tla; xAPI: http://www.adlnet.gov/tla/experience-api)
Amorim, R. R., Lama, M., Sánchez, E., Riera, A., & Vila, X. A. (2006). A learning design ontology based on the
IMS specification. Educational Technology & Society, 9(1), 38-57.
Brusilovky, P. (2001). Adaptive Hypermedia. Modeling and User-Adapted Interaction, 11, 87–110.
Burgos, D., Tattersall, C., & Koper, R. (2007). How to represent adaptation in e-learning with IMS learning
design. Interactive Learning Environments, 15(2), 161-170.
Chachoua, S., Tamani, N., Malki, J., & Estraillier, P. (2006). Towards a Trace-Based Evaluation Model for
Knowledge Acquisition and Training Resource Adaption. In Proceeding of the 8th International
Conference on Computer Supported Education, CSEDU (1), 114-122. SCITEPRESS. 2016.
Chachoua, S., Malki, J., & Estraillier, P. (2006). POLARISQL: An Online Tutoring System for Learning SQL
Language (short paper). In Proc. of the 13th Inter. Conference On Intelligent Tutoring Systems, ITS, 2016.
Costagliola, G., Ferrucci, F., & Fuccella, V. (2006). Scorm run-time environment as a service. In Proceedings of
the 6th international conference on Web engineering (pp. 103-110). ACM.
Djouad, T., Settouti, L. S., Prié, Y., Reffay, C., & Mille, A. (2010). Un Système à Base de Traces pour la
modélisation et l’élaboration d'indicateurs d'activités éducatives individuelles et collectives. Mise à
l'épreuve sur Moodle. Technique et Science Informatiques.
Felder, R. M., & Spurlin, J. (2005). Applications, reliability and validity of the index of learning styles.
International Journal of Engineering Education, 21(1), 103–112.
Göbel, S., Mehm, F., Radke, S., & Steinmetz, R. (2009). 80 days: Adaptive digital storytelling for digital
educational games. In Proc. of 2nd International Workshop on Story-Telling and Educational Games
(STEG’09) (Vol. 498).
Gorgone, J. T., Davis, G. B., Valacich, J. S., Topi, H., Feinstein, D. L., & Longenecker Jr, H. E. (2002). Model
curriculum and guidelines for undergraduate degree programs in information systems. ACM, AIS and AITP
Associations.
Gros, B., & Maina, M. (2015). The Future of Ubiquitous Learning.
Hwang, G.-J., Kuo, F.-R., Yin, P.-Y., & Chuang, K.-H. (2010). A heuristic algorithm for planning personalized
learning paths for context-aware ubiquitous learning. Computers & Education, 54(2), 404–415.
Lebis, A., Lefevre, M., Guin, N., & Luengo, V. (2015). Capitaliser les processus d’analyses de traces
d'apprentissage indépendamment des plates-formes d'analyses de traces. http://hubblelearn.imag.fr/
wp-content/uploads/2015/04/A.-Lebis-Memoire-M2R-Capitaliser-les-processus.pdf
Mille, A., Champin, P.-A., Cordier, A., Georgeon, O., & Lefevre, M. (2013). Trace-based reasoning-modeling
interaction traces for reasoning on experiences. In The 26th International FLAIRS Conference (pp. 1–15).
Mustafa, Y. E. A., & Sharif, S. M. (2011). An approach to adaptive e-learning hypermedia system based on
learning styles: Implementation and evaluation. Jouranl of Library and Information Science, 3(1), 15–28.
Pham, P. T., Rabah, M., & Estraillier, P. (2013). Agent-based architecture and situation-based scenario for
consistency management. In Computer Science and Information Systems (FedCSIS), (pp. 1041–1046).
Poeppelman, T., Hruska, M., Long, R., & Amburn, C. (2015). Interoperable Performance Assessment for
Individuals and Teams Using Experience API. In Second Annual GIFT Users Symposium, Orlando, FL.
Rey-López, M., Díaz-Redondo, R. P., Fernández-Vilas, A., Pazos-Arias, J. J., García-Duque, J., Gil-Solla, A., &
Ramos-Cabrer, M. (2009). An extension to the ADL SCORM standard to support adaptivity: The t-learning
case-study. Computer Standards & Interfaces, 31(2), 309-318.
Settouti, L. S., Prié, Y., Marty, J.-C., Mille, A. (2009). A Trace-Based System for Technology-Enhanced Learning
Systems Personalisation. In 9th IEEE Conf. on Advanced Learning Technologies. (pp. 93–97).
Sosnovsky, S., & Brusilovsky, P. (2015). Evaluation of topic-based adaptation and student modeling in
QuizGuide. User Modeling and User-Adapted Interaction, 25(4), 371–424.
Sterbini, A., & Temperini, M. (2009). Adaptive construction and delivery of web-based learning paths. In
Frontiers in Education Conference, 2009. FIE’09. 39th IEEE (pp. 1–6).
Van Seters, J. R., Ossevoort, M. A., Tramper, J., & Goedhart, M. J. (2012). The influence of student
characteristics on the use of adaptive e-learning material. Computers & Education, 58(3), 942–952.
Wang, S.-L., Wu, C.-Y. (2011). Application of context-aware and personalized recommendation to implement an
adaptive ubiquitous learning system. Expert Systems with Applications, 38(9), 10831–10838.
Zouhair, A., Amami, B., Boukachour, H., Person, P., Bertelle, C., & others. (2013). Dynamic Case-Based
Reasoning Based on the Multi-Agent Systems: Individualized Follow-Up of Learners in Distance Learning.
In Intelligent Distributed Computing VI (pp. 51–57). Springer.
275275
Chen, W. et al. (Eds.) (2016). Proceedings of the 24th International Conference on Computers in Education. India: Asia-Pacific Society for Computers in Education
Design of a Learning Support System and Lecture to Teach Systematic Debugging to
Novice Programmers
Raiya YAMAMOTOa*, Yasuhiro NOGUCHIb, Satoru KOGUREb, Koichi YAMASHITAc, Tatsuhiro KONISHIb & Yukihiro ITOHd
aGraduate School of Science and Technology, Shizuoka University, Japan bFaculty of Informatics, Shizuoka University, Japan
cFaculty of Business Administration, Tokoha University, Japan dShizuoka University, Japan
Abstract: In our previous research, we developed a learning support system for teaching a systematic debugging process. However, it was observed that all the subjects were unable to learn the entire process but some managed to learn it partially at experimental evaluation. We considered following two reasons: (1) the level of debugging skills we expected for subjects was higher than their actual level and (2) subjects were not offered lectures about the debugging process and required skills but were provided with only some exercises. For (1), we consider that they need to gain more basic debugging skills. For example, we decided to teach a skill to observe variables’ values. For (2), we designed a lecture that learners could attend to learn the process and debugging skills. The lecture has instruction and exercise parts. Next, we extended our learning support system to be adapted to the lecture and assist learners who face difficulties in the exercises. In this paper, we report a design of the learning support system and the lecture.
Keywords: Programming education, debugging learning, interactive learning support system
1. Introduction In previous research, we developed a learning support system for learners who do hit-or-miss debugging to assist learning a systematic debugging process (Yamamoto et al., 2015). However, from a result of an evaluation, all subjects were unable to learn the entire debugging process but managed to learn it partially. We considered following two main reasons; The level of debugging skills we expected from the subjects was higher than their actual level (Reason 1). Subjects were not offered lectures on the debugging process and skills required but were provided with only three exercises (Reason 2). First, as for Reason 1, we designed the learning support system by considering that the subjects have adequate skills to achieve the process; however, they did not. Judging from the experimental evaluation, we considered they required training in obtaining basic debugging skills. Therefore, in the proposed process, they learned not only the debugging process but also basic debugging skills required in the process. They need to gain skills for arranging function relations and for checking data flow for selecting a function that can contain bugs. In addition, they needed skills to evaluate values of variables and to focus on a statement that requires to be checked.
Second, as for Reason 2, the learning situation in the experimental evaluation corresponded to learning discovery. It is obvious that learning with the help of only three exercises is difficult for subjects. Therefore, we explicitly designed a lecture for teaching the debugging process and the skills required. Miljanovic (2015) devised a game-based learning support system called RoboBUG to learn debugging. In his teaching method, he conducted a lecture to teach the concept of debugging before learners started learning debugging by using the system. However, his method imparts partial debugging skills and does not focus on the entire debugging process. Thus, we devised a lecture that
276276276

teaches learners the entire debugging process and skills. The goal is to learn the debugging process and skills required to debug programs that contain several or various functions. However, it can be difficult for some learners to start learning through debugging programs containing some functions. Therefore, we divided the process and the skills into two parts and designed two lectures: A lecture for teaching the debugging process and skills required to debug programs that contain only the main function (Lecture 1) and a lecture for teaching the debugging process and skills required to debug programs that contain several or various functions (Lecture 2).
In addition, we designed exercises to help learners practice using the processes and debugging skills they learned in the lecture. Next, we analyzed when learners experienced difficulty in the exercises and developed a learning support system to assist those learners. We extended the learning support system we developed in the previous research because the previous system was unable to support the learning of some skills in the lecture. The system should work as a scaffold, that is, it should adjust its assistance according to the student’s skill level.
In this paper, we report the design of a learning support system and lecture for learners in the desired level. 2. Designing Lectures 2.1 Basic Ideas In this section, we describe the design of the lectures as discussed in chapter 1. We need to design two lectures for novice learners to be able to learn the entire debugging process and acquire skills. First, we designed the process as the goal of the lecture, as shown in Figure 1, by combining our experiences and knowledge from the references (Myers et al., 2012, Zeller, 2009). The debugging process and skills taught in the lectures correspond to the figure. Further, we must start teaching the debugging process and skills for debugging programs containing only a main function, so we must divide the process in Figure 1 to fit each lecture. Section 2.2.1 describes the process that is scaled down for the lecture to teach debugging program that contains only a main program.
Figure 1. Process established as the goal of the lecture
In addition, learners must have sufficient practice to learn the process and skills. We decided
that each lecture must be of 90 min. The instruction part is of approximately 30 min and the exercise part is of 60 min. We considered approximately 5–10 min for each exercise so that the learners may practice with at least five or six exercises at every lecture. This number of exercises is approximately twice more than the number of exercises in the previous experimental evaluation, so we think this
277277277
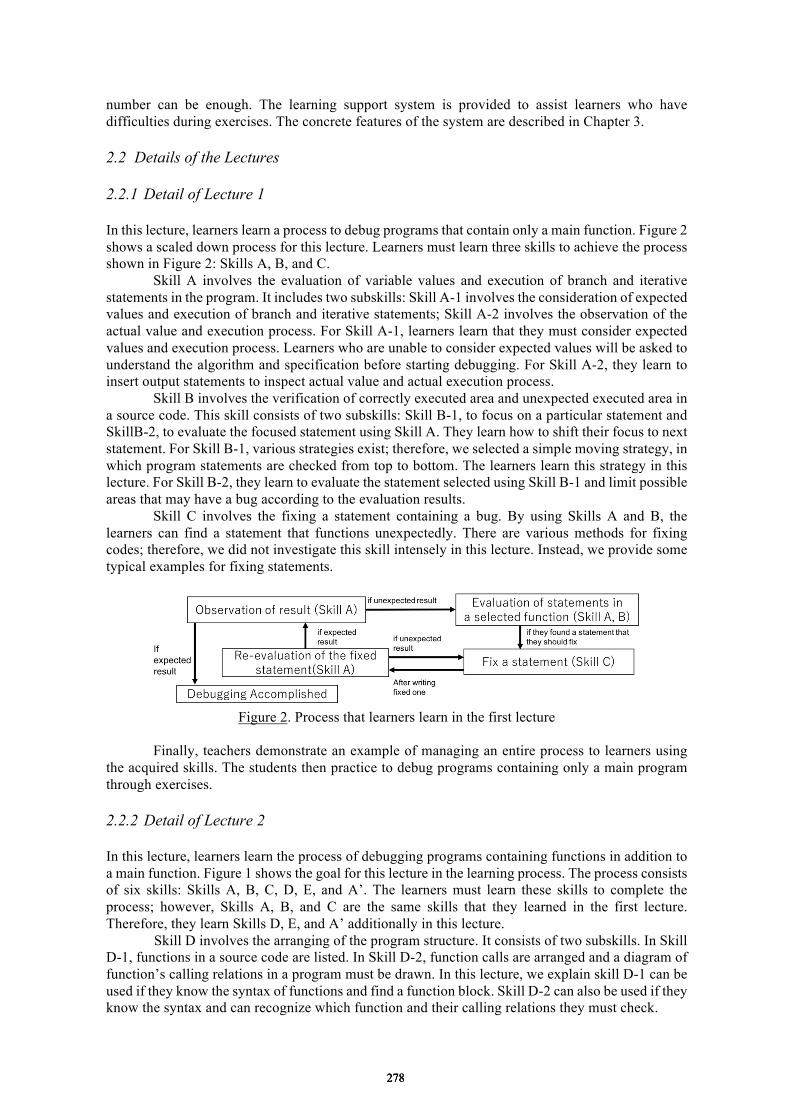
number can be enough. The learning support system is provided to assist learners who have difficulties during exercises. The concrete features of the system are described in Chapter 3. 2.2 Details of the Lectures 2.2.1 Detail of Lecture 1 In this lecture, learners learn a process to debug programs that contain only a main function. Figure 2 shows a scaled down process for this lecture. Learners must learn three skills to achieve the process shown in Figure 2: Skills A, B, and C.
Skill A involves the evaluation of variable values and execution of branch and iterative statements in the program. It includes two subskills: Skill A-1 involves the consideration of expected values and execution of branch and iterative statements; Skill A-2 involves the observation of the actual value and execution process. For Skill A-1, learners learn that they must consider expected values and execution process. Learners who are unable to consider expected values will be asked to understand the algorithm and specification before starting debugging. For Skill A-2, they learn to insert output statements to inspect actual value and actual execution process.
Skill B involves the verification of correctly executed area and unexpected executed area in a source code. This skill consists of two subskills: Skill B-1, to focus on a particular statement and SkillB-2, to evaluate the focused statement using Skill A. They learn how to shift their focus to next statement. For Skill B-1, various strategies exist; therefore, we selected a simple moving strategy, in which program statements are checked from top to bottom. The learners learn this strategy in this lecture. For Skill B-2, they learn to evaluate the statement selected using Skill B-1 and limit possible areas that may have a bug according to the evaluation results.
Skill C involves the fixing a statement containing a bug. By using Skills A and B, the learners can find a statement that functions unexpectedly. There are various methods for fixing codes; therefore, we did not investigate this skill intensely in this lecture. Instead, we provide some typical examples for fixing statements.
Figure 2. Process that learners learn in the first lecture
Finally, teachers demonstrate an example of managing an entire process to learners using
the acquired skills. The students then practice to debug programs containing only a main program through exercises. 2.2.2 Detail of Lecture 2 In this lecture, learners learn the process of debugging programs containing functions in addition to a main function. Figure 1 shows the goal for this lecture in the learning process. The process consists of six skills: Skills A, B, C, D, E, and A’. The learners must learn these skills to complete the process; however, Skills A, B, and C are the same skills that they learned in the first lecture. Therefore, they learn Skills D, E, and A’ additionally in this lecture.
Skill D involves the arranging of the program structure. It consists of two subskills. In Skill D-1, functions in a source code are listed. In Skill D-2, function calls are arranged and a diagram of function’s calling relations in a program must be drawn. In this lecture, we explain skill D-1 can be used if they know the syntax of functions and find a function block. Skill D-2 can also be used if they know the syntax and can recognize which function and their calling relations they must check.
278278278

In Skill E, the data flow among functions is checked. Skill E has two subskills: Skill E-1 involves the determining of functions being called in the current execution. Skill E-2 involves the tracing of functions called through a diagram. Skill E can be learned if learners know function syntax and can follow the flow in the diagram of function’s calling relations.
After selecting a function, the learners have to check the function. Next, a skill is required for evaluating the working of the function: Skill A’. We explained that the use of Skill A’ is similar to Skill A except that a statement-calling function must be determined. Next, an argument(s) and return value must be evaluated to confirm the called function works correctly. The learners acquire knowledge of inserting an output statement to check the values of arguments and return value.
In the last part of the lecture, teachers demonstrate an example of managing an entire process to learners like the first lecture. They have exercises in the second lecture, too. 3. Design of a Learning Support System We designed a learning support system to support learners in practicing debugging through exercises. The three WorkSheets (WS) are provided. WS has structures that correspond to the process. Learners can learn the process by working on WS repeatedly. In addition, all WS can work as scaffolds, that is, they reduce their support functions according to learners’ skill level. The basic strategy of reduction is to cut a part of the structures of support functions that corresponds to a skill that the learners have already acquired. Then, functions that WS can provide to the learners will become almost same with the ones that ordinary programming environments have. We expect that they move to the environment when they notice it. 3.1 WS for Learning Debugging Process and Skills to Debug a Selected Function (WS0) This WS (Figure 3) assists in learning the debugging of a selected function. The system corresponds to the process and skills learned in the first lecture. Furthermore, this WS encompasses Skill A’. In exercises for these skills, learners may face the following difficulties; They cannot shift their focus to next statement (Difficulty 1-1). They cannot consider expected values and execution process of branch and iterative statements correctly (Difficulty 1-2). They cannot observe the actual values and execution process of branch and iterative statements correctly(Difficulty 1-3). They are unable to identify the process they must perform (Difficulty 1-4).
Figure 3. WS0 user interface
The WS shows system message on area (i) at each step. Reading the message, they know
what to do next. For Difficulty 1-1, the WS provides the function that learners can color backgrounds of source codes on area (ii). They can learn how to classify statements in their source
279279279
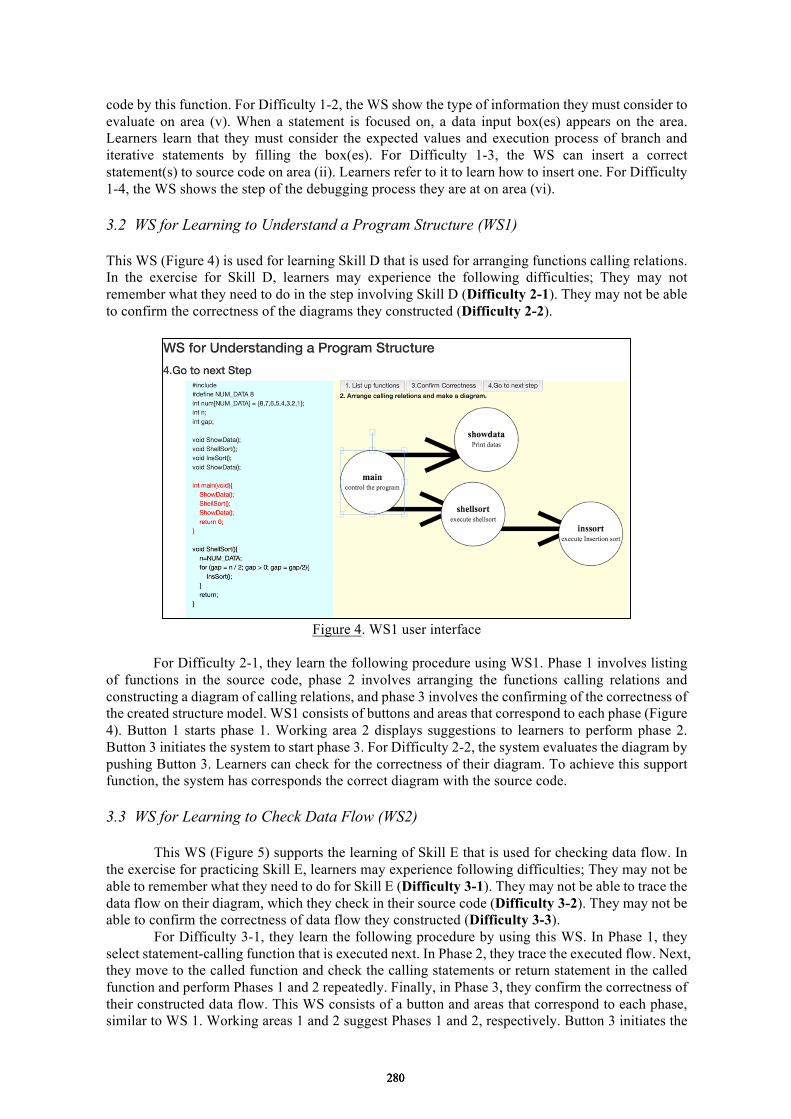
code by this function. For Difficulty 1-2, the WS show the type of information they must consider to evaluate on area (v). When a statement is focused on, a data input box(es) appears on the area. Learners learn that they must consider the expected values and execution process of branch and iterative statements by filling the box(es). For Difficulty 1-3, the WS can insert a correct statement(s) to source code on area (ii). Learners refer to it to learn how to insert one. For Difficulty 1-4, the WS shows the step of the debugging process they are at on area (vi). 3.2 WS for Learning to Understand a Program Structure (WS1) This WS (Figure 4) is used for learning Skill D that is used for arranging functions calling relations. In the exercise for Skill D, learners may experience the following difficulties; They may not remember what they need to do in the step involving Skill D (Difficulty 2-1). They may not be able to confirm the correctness of the diagrams they constructed (Difficulty 2-2).
Figure 4. WS1 user interface
For Difficulty 2-1, they learn the following procedure using WS1. Phase 1 involves listing
of functions in the source code, phase 2 involves arranging the functions calling relations and constructing a diagram of calling relations, and phase 3 involves the confirming of the correctness of the created structure model. WS1 consists of buttons and areas that correspond to each phase (Figure 4). Button 1 starts phase 1. Working area 2 displays suggestions to learners to perform phase 2. Button 3 initiates the system to start phase 3. For Difficulty 2-2, the system evaluates the diagram by pushing Button 3. Learners can check for the correctness of their diagram. To achieve this support function, the system has corresponds the correct diagram with the source code. 3.3 WS for Learning to Check Data Flow (WS2)
This WS (Figure 5) supports the learning of Skill E that is used for checking data flow. In the exercise for practicing Skill E, learners may experience following difficulties; They may not be able to remember what they need to do for Skill E (Difficulty 3-1). They may not be able to trace the data flow on their diagram, which they check in their source code (Difficulty 3-2). They may not be able to confirm the correctness of data flow they constructed (Difficulty 3-3).
For Difficulty 3-1, they learn the following procedure by using this WS. In Phase 1, they select statement-calling function that is executed next. In Phase 2, they trace the executed flow. Next, they move to the called function and check the calling statements or return statement in the called function and perform Phases 1 and 2 repeatedly. Finally, in Phase 3, they confirm the correctness of their constructed data flow. This WS consists of a button and areas that correspond to each phase, similar to WS 1. Working areas 1 and 2 suggest Phases 1 and 2, respectively. Button 3 initiates the
280280280
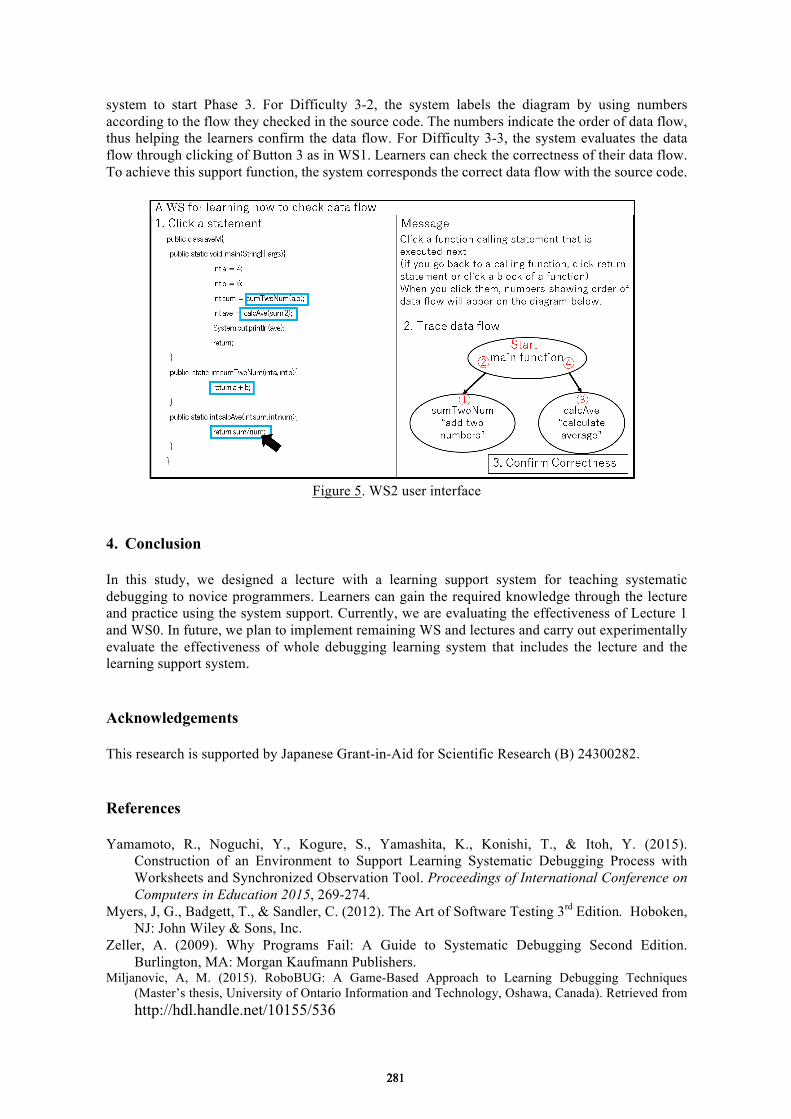
system to start Phase 3. For Difficulty 3-2, the system labels the diagram by using numbers according to the flow they checked in the source code. The numbers indicate the order of data flow, thus helping the learners confirm the data flow. For Difficulty 3-3, the system evaluates the data flow through clicking of Button 3 as in WS1. Learners can check the correctness of their data flow. To achieve this support function, the system corresponds the correct data flow with the source code.
Figure 5. WS2 user interface
4. Conclusion In this study, we designed a lecture with a learning support system for teaching systematic debugging to novice programmers. Learners can gain the required knowledge through the lecture and practice using the system support. Currently, we are evaluating the effectiveness of Lecture 1 and WS0. In future, we plan to implement remaining WS and lectures and carry out experimentally evaluate the effectiveness of whole debugging learning system that includes the lecture and the learning support system. Acknowledgements This research is supported by Japanese Grant-in-Aid for Scientific Research (B) 24300282. References Yamamoto, R., Noguchi, Y., Kogure, S., Yamashita, K., Konishi, T., & Itoh, Y. (2015).
Construction of an Environment to Support Learning Systematic Debugging Process with Worksheets and Synchronized Observation Tool. Proceedings of International Conference on Computers in Education 2015, 269-274.
Myers, J, G., Badgett, T., & Sandler, C. (2012). The Art of Software Testing 3rd Edition. Hoboken, NJ: John Wiley & Sons, Inc.
Zeller, A. (2009). Why Programs Fail: A Guide to Systematic Debugging Second Edition. Burlington, MA: Morgan Kaufmann Publishers.
Miljanovic, A, M. (2015). RoboBUG: A Game-Based Approach to Learning Debugging Techniques (Master’s thesis, University of Ontario Information and Technology, Oshawa, Canada). Retrieved from http://hdl.handle.net/10155/536
281281281

Chen, W. et al. (Eds.) (2016). Proceedings of the 24th
International Conference on Computers in Education.
India: Asia-Pacific Society for Computers in Education
A Case Study of Interactive Environment for
Learning by Problem-posing in Special
Classroom at Junior High School
Sho YAMAMOTOa*
& Tsukasa HIRASHIMAb
aFaculty of Engineering, Kindai University, Japan
bGraduate school of Engineering, Hiroshima University, Japan
Abstract: We have developed a learning environment for problem-posing as sentence
integration. In this exercise, a learner is required to select and arrange given simple sentence
cards for posing problems. On the other hands, learners write problems from scratch in usual
problem-posing. Because it is very difficult for learners with reading disability to write a
sentence, they cannot exercise by usual problem-posing virtually even though a teacher would
like to teach the arithmetic word problems to them through problem-posing exercise. However,
several learners with reading disability are able to read a simple sentence. So, we assumed that
these learners realize to exercise problem-posing by problem-posing as sentence integration.
Moreover, its practical use targeted as sixteen junior high school students in special classroom is
reported.
Keywords: Problem-posing as sentence integration, arithmetic word problem, special
classroom, reading disability
1. Introduction
Special classroom is small-group class that consists of a student with special needs. The special needs
include learning disabilities, communication disorders, emotional and behavioral disorders, physical
disabilities, and developmental disabilities. Teacher provides them an education that addresses their
individual differences and needs. There are many learners who have reading disability in learning
disabilities. It is very difficult for them to read and write a sentence. A teacher teaches them the
arithmetic word problem as easily as possible (William, 2007; Xin et al, 2005). In school, if the learner
difficult to read the simple sentence, the teacher often explains the arithmetic word problem by using
some picture. It is hard for a teacher to teach the arithmetic word problems in special classroom.
Problem-posing is suggested as an effective way for improving learner’s understanding of
mathematical concepts and the development of mathematical thinking (Silver, 1997; Singer and
Moscovici, 2008). In this exercise, a learner is given an assignment, and then, he/she is required to pose
a problem by writing it from scratch. The teacher of special classroom would like to teach the arithmetic
word problem by problem-posing but learner with reading disability is not able to pose an arithmetic
word problem because of their disability. We have designed and developed a learning environment for
posing an arithmetic word problem (Hirashima, 2007; Yamamoto et al, 2012, 2013, 2014). In this
problem-posing, the learner is required to select and arrange a few sentences in order to pose the
problem. We call this exercise problem-posing as sentence integration. By using this learning
environment, the learner can understand a problem structure to pose the problem. Actually, we have
confirmed that the learner improved their understanding of problem structure after they have learned the
arithmetic word problem by using our environment in regular class.
We assumed that the learner with reading disability can pose an arithmetic word problem and
understands a structure of arithmetic word problem by using our learning environment if he/she is able
to understand a simple sentence. The purpose of this research is to realize the learning of
problem-posing in special classroom by using our learning environment. Previously, a teacher in
special classroom requested us to use our learning environment in his class because he has same
282282
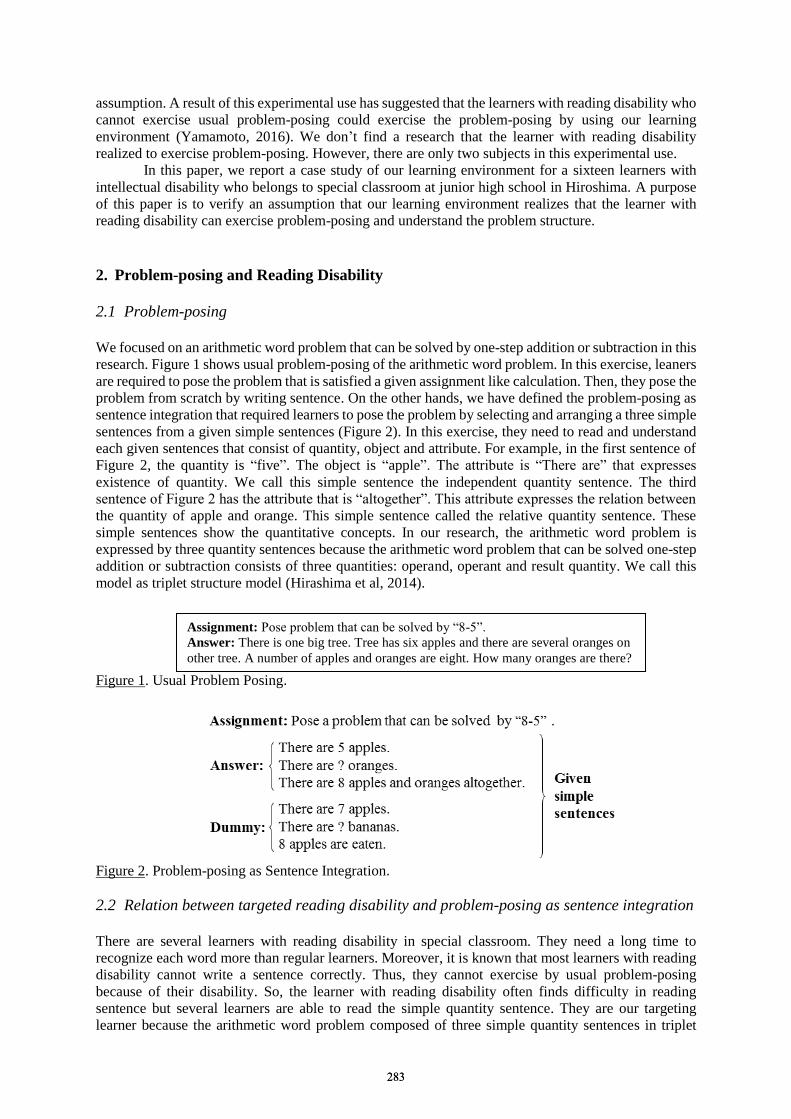
Assignment: Pose problem that can be solved by “8-5”.
Answer: There is one big tree. Tree has six apples and there are several oranges on
other tree. A number of apples and oranges are eight. How many oranges are there?
assumption. A result of this experimental use has suggested that the learners with reading disability who
cannot exercise usual problem-posing could exercise the problem-posing by using our learning
environment (Yamamoto, 2016). We don’t find a research that the learner with reading disability
realized to exercise problem-posing. However, there are only two subjects in this experimental use.
In this paper, we report a case study of our learning environment for a sixteen learners with
intellectual disability who belongs to special classroom at junior high school in Hiroshima. A purpose
of this paper is to verify an assumption that our learning environment realizes that the learner with
reading disability can exercise problem-posing and understand the problem structure.
2. Problem-posing and Reading Disability
2.1 Problem-posing
We focused on an arithmetic word problem that can be solved by one-step addition or subtraction in this
research. Figure 1 shows usual problem-posing of the arithmetic word problem. In this exercise, leaners
are required to pose the problem that is satisfied a given assignment like calculation. Then, they pose the
problem from scratch by writing sentence. On the other hands, we have defined the problem-posing as
sentence integration that required learners to pose the problem by selecting and arranging a three simple
sentences from a given simple sentences (Figure 2). In this exercise, they need to read and understand
each given sentences that consist of quantity, object and attribute. For example, in the first sentence of
Figure 2, the quantity is “five”. The object is “apple”. The attribute is “There are” that expresses
existence of quantity. We call this simple sentence the independent quantity sentence. The third
sentence of Figure 2 has the attribute that is “altogether”. This attribute expresses the relation between
the quantity of apple and orange. This simple sentence called the relative quantity sentence. These
simple sentences show the quantitative concepts. In our research, the arithmetic word problem is
expressed by three quantity sentences because the arithmetic word problem that can be solved one-step
addition or subtraction consists of three quantities: operand, operant and result quantity. We call this
model as triplet structure model (Hirashima et al, 2014).
Figure 1. Usual Problem Posing.
Figure 2. Problem-posing as Sentence Integration.
2.2 Relation between targeted reading disability and problem-posing as sentence integration
There are several learners with reading disability in special classroom. They need a long time to
recognize each word more than regular learners. Moreover, it is known that most learners with reading
disability cannot write a sentence correctly. Thus, they cannot exercise by usual problem-posing
because of their disability. So, the learner with reading disability often finds difficulty in reading
sentence but several learners are able to read the simple quantity sentence. They are our targeting
learner because the arithmetic word problem composed of three simple quantity sentences in triplet
283283
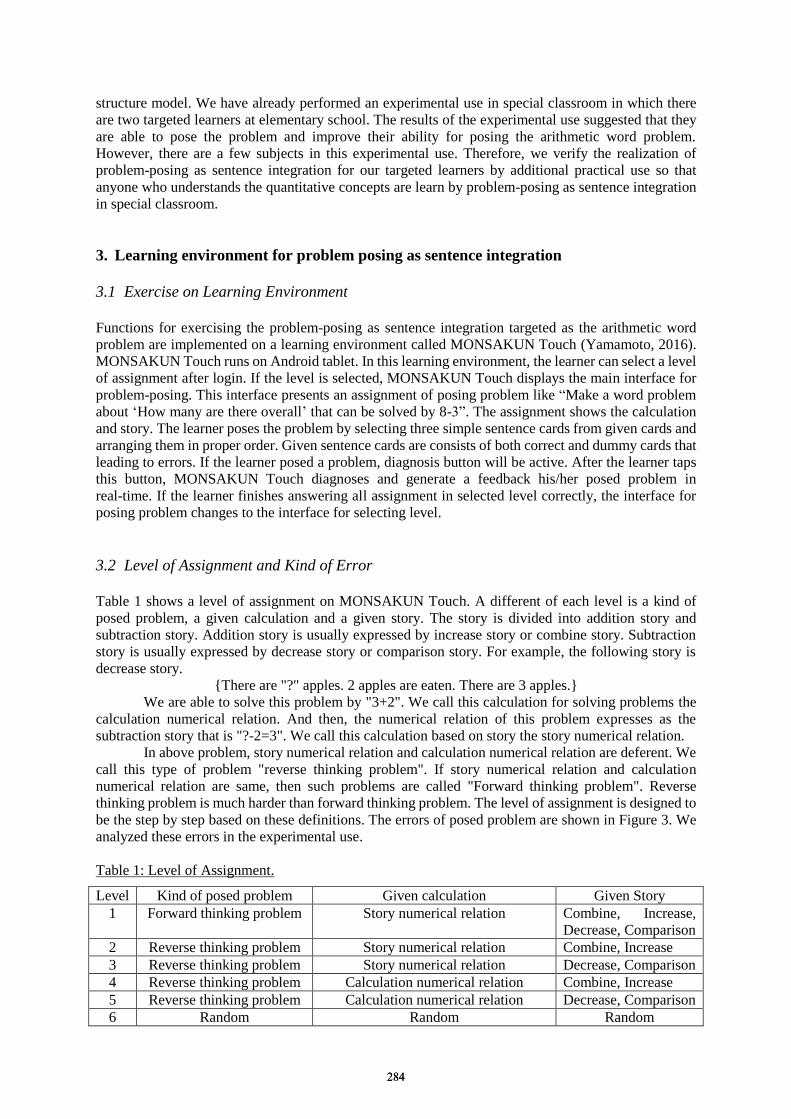
structure model. We have already performed an experimental use in special classroom in which there
are two targeted learners at elementary school. The results of the experimental use suggested that they
are able to pose the problem and improve their ability for posing the arithmetic word problem.
However, there are a few subjects in this experimental use. Therefore, we verify the realization of
problem-posing as sentence integration for our targeted learners by additional practical use so that
anyone who understands the quantitative concepts are learn by problem-posing as sentence integration
in special classroom.
3. Learning environment for problem posing as sentence integration
3.1 Exercise on Learning Environment
Functions for exercising the problem-posing as sentence integration targeted as the arithmetic word
problem are implemented on a learning environment called MONSAKUN Touch (Yamamoto, 2016).
MONSAKUN Touch runs on Android tablet. In this learning environment, the learner can select a level
of assignment after login. If the level is selected, MONSAKUN Touch displays the main interface for
problem-posing. This interface presents an assignment of posing problem like “Make a word problem
about ‘How many are there overall’ that can be solved by 8-3”. The assignment shows the calculation
and story. The learner poses the problem by selecting three simple sentence cards from given cards and
arranging them in proper order. Given sentence cards are consists of both correct and dummy cards that
leading to errors. If the learner posed a problem, diagnosis button will be active. After the learner taps
this button, MONSAKUN Touch diagnoses and generate a feedback his/her posed problem in
real-time. If the learner finishes answering all assignment in selected level correctly, the interface for
posing problem changes to the interface for selecting level.
3.2 Level of Assignment and Kind of Error
Table 1 shows a level of assignment on MONSAKUN Touch. A different of each level is a kind of
posed problem, a given calculation and a given story. The story is divided into addition story and
subtraction story. Addition story is usually expressed by increase story or combine story. Subtraction
story is usually expressed by decrease story or comparison story. For example, the following story is
decrease story.
{There are "?" apples. 2 apples are eaten. There are 3 apples.}
We are able to solve this problem by "3+2". We call this calculation for solving problems the
calculation numerical relation. And then, the numerical relation of this problem expresses as the
subtraction story that is "?-2=3". We call this calculation based on story the story numerical relation.
In above problem, story numerical relation and calculation numerical relation are deferent. We
call this type of problem "reverse thinking problem". If story numerical relation and calculation
numerical relation are same, then such problems are called "Forward thinking problem". Reverse
thinking problem is much harder than forward thinking problem. The level of assignment is designed to
be the step by step based on these definitions. The errors of posed problem are shown in Figure 3. We
analyzed these errors in the experimental use.
Table 1: Level of Assignment.
Level Kind of posed problem Given calculation Given Story
1 Forward thinking problem Story numerical relation Combine, Increase,
Decrease, Comparison
2 Reverse thinking problem Story numerical relation Combine, Increase
3 Reverse thinking problem Story numerical relation Decrease, Comparison
4 Reverse thinking problem Calculation numerical relation Combine, Increase
5 Reverse thinking problem Calculation numerical relation Decrease, Comparison
6 Random Random Random
284284
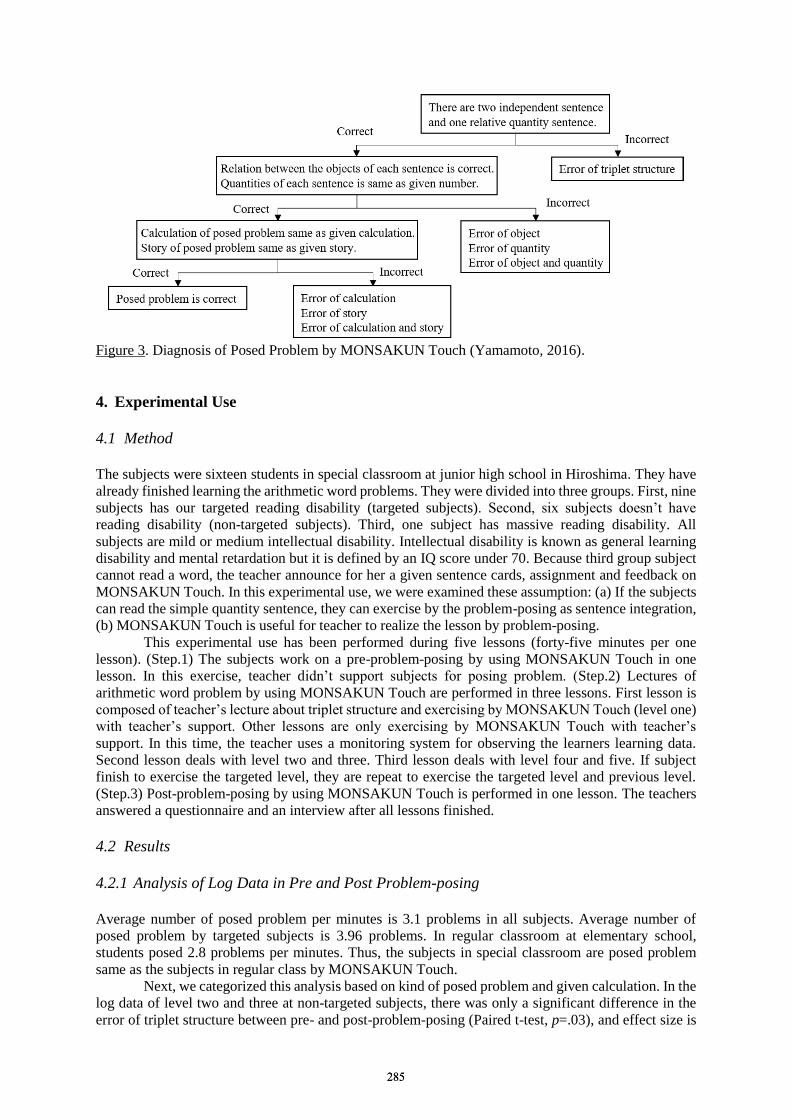
Figure 3. Diagnosis of Posed Problem by MONSAKUN Touch (Yamamoto, 2016).
4. Experimental Use
4.1 Method
The subjects were sixteen students in special classroom at junior high school in Hiroshima. They have
already finished learning the arithmetic word problems. They were divided into three groups. First, nine
subjects has our targeted reading disability (targeted subjects). Second, six subjects doesn’t have
reading disability (non-targeted subjects). Third, one subject has massive reading disability. All
subjects are mild or medium intellectual disability. Intellectual disability is known as general learning
disability and mental retardation but it is defined by an IQ score under 70. Because third group subject
cannot read a word, the teacher announce for her a given sentence cards, assignment and feedback on
MONSAKUN Touch. In this experimental use, we were examined these assumption: (a) If the subjects
can read the simple quantity sentence, they can exercise by the problem-posing as sentence integration,
(b) MONSAKUN Touch is useful for teacher to realize the lesson by problem-posing.
This experimental use has been performed during five lessons (forty-five minutes per one
lesson). (Step.1) The subjects work on a pre-problem-posing by using MONSAKUN Touch in one
lesson. In this exercise, teacher didn’t support subjects for posing problem. (Step.2) Lectures of
arithmetic word problem by using MONSAKUN Touch are performed in three lessons. First lesson is
composed of teacher’s lecture about triplet structure and exercising by MONSAKUN Touch (level one)
with teacher’s support. Other lessons are only exercising by MONSAKUN Touch with teacher’s
support. In this time, the teacher uses a monitoring system for observing the learners learning data.
Second lesson deals with level two and three. Third lesson deals with level four and five. If subject
finish to exercise the targeted level, they are repeat to exercise the targeted level and previous level.
(Step.3) Post-problem-posing by using MONSAKUN Touch is performed in one lesson. The teachers
answered a questionnaire and an interview after all lessons finished.
4.2 Results
4.2.1 Analysis of Log Data in Pre and Post Problem-posing
Average number of posed problem per minutes is 3.1 problems in all subjects. Average number of
posed problem by targeted subjects is 3.96 problems. In regular classroom at elementary school,
students posed 2.8 problems per minutes. Thus, the subjects in special classroom are posed problem
same as the subjects in regular class by MONSAKUN Touch.
Next, we categorized this analysis based on kind of posed problem and given calculation. In the
log data of level two and three at non-targeted subjects, there was only a significant difference in the
error of triplet structure between pre- and post-problem-posing (Paired t-test, p=.03), and effect size is
285285

large (|d|=1.72). Next, the analysis of log data of targeted subjects is described. In the analysis of level
one, there was a significant difference in the error of triplet structure between pre- and
post-problem-posing (Paired t-test, p=.04), and effect size is large (|d|=1.7). Also, there was a
significant difference in the error of quantity and object between pre- and post-problem-posing (Paired
t-test, p=.02), and effect size is large (|d|=1.5). In the analysis of level two and three, there was a
significant difference in the error of triplet structure between pre- and post-problem-posing (Paired
t-test, p=.002), and effect size is large (|d|=2.3). There was no significant difference in each error of
level four and five between pre-problem-posing and post-problem posing because the assignments of
level four and five are very difficult for a learner in regular class. The details of log data are omitted
because of page limits.
In addition to these results, one subject with massive reading disability has caused the one error
of triplet structure in post-problem-posing exercise, first. However, she didn’t cause the error of triplet
structure from twice to fourteen times diagnosis. This result suggested that the problem-posing as
sentence integration is effective method for massive reading disability student.
Table 2 shows the number of subjects who finished each level. From the results of Table 2, all
subjects learned the method of posing problem because their reached levels are improved. From
mentioned above, we demonstrate the assumption (a). However, they couldn’t improve their ability of
problem-posing in level four and five. For improving these results, we need to sophisticate the level of
assignment more gradually.
Table 2: Number of Subjects who finished Each Level.
Lv.1 Lv.2 Lv.3 Lv.4 Lv.5
Non-targeted Subjects
(N=5)
Pre-problem-posing 5 5 5 1 0
Post-problem-posing 5 5 5 2 1
Targeted Subjects
(N=7)
Pre-problem-posing 7 4 4 0 0
Post-problem-posing 7 7 7 2 2
4.2.2 Analysis of Questionnaire and Interview
The result of questionnaire for teacher is shown in Table 3. From the question (1), they find it is very
hard for them to teach problem-posing without MONSAKUN Touch in special classroom. They also
said that teachers need to have enough experience in order to teach problem-posing. One teacher
answered neutral because she has never taught problem-posing. These teachers consider that
MONSAKUN Touch is useful software to teach the arithmetic word problem in special classroom but a
learner with reading disability can read and understand the simple sentence. Therefore, three teachers
answered question (2) “neutral” but they would like to use MONSAKUN Touch continually.
In the results of interview, these teachers suspected that subjects are able to pose problem by
using MONSAKUN Touch but most subjects have difficulty in exercising by problem-posing and they
cannot concentrate on a problem-posing for a long time. These teachers also suspected that some
subjects can learn the arithmetic word problem by using MONSAKUN Touch before experimental use
but many subjects cannot learn because of their disability. However, all subjects concentrated on a
Table 3: Result of Questionnaire for Teacher (N=4).
Question Strongly
Agree
Agree Neutral Disagree Strongly
Disagree
(1) Is it easy to teach problem-posing without
MONSAKUN Touch?
0 0 1 0 3
(2) Is it effective to use problem-posing as
sentence integration for reading disability leaner?
0 0 3 0 1
(3) Is it easy for you to use MONSAKUN Touch
in your class?
1 2 1 0 0
(4) Would you like to use MONSAKUN Touch in
your class continually?
3 1 0 0 0
286286
problem-posing during lesson and the number of error was decreased. Besides, most subjects answered
that the problem-posing as sentence integration is difficult exercise but they enjoy learning by
problem-posing and want to learn again. These results are better than the results that the teachers
suspected. These results also demonstrate the assumption (b).
5. Conclusions
We designed and developed the learning environment for problem-posing as sentence integration. On
this learning environment, learners pose the arithmetic word problem as selecting and arranging given
simple sentence cards. In usual problem-posing, learners need to write an arithmetic word problem with
some sentences. So, learners with reading disability cannot exercise problem-posing because they feel
difficulty in writing sentence and reading long sentence. However, we assumed that these learners
exercise the problem-posing by using our learning environment if they can read the simple sentence.
Through the experimental use of the system, it was confirmed that the learners could pose the problem.
Moreover, the teachers accepted that our learning environment is effective for targeted learner. It is
believed that the leaner with reading disability who can read the simple sentence could learn by
problem-posing for our learning environment.
As our future works, we have to sophisticate the level of assignment and analyze the results of
this experimental use in more detail. Furthermore, we are going to perform the experimental use
continually for confirming the effect of our learning environment.
Acknowledgements
I am deeply grateful to the teachers and the students in junior high school for performing the
experimental use and giving insightful comments by the teachers. This work was supported by JSPS
KAKENHI Grant Number 15K16259.
References
Hirashima, T., Yamamoto, S., & Hayashi, Y. (2014, June). Triplet structure model of arithmetical word problems
for learning by problem-posing. In International Conference on Human Interface and the Management of
Information (pp. 42-50). Springer International Publishing.
Hirashima, T., Yokoyama, T., Okamoto, M., & Takeuchi, A. (2007, June). Learning by problem-posing as
sentence-integration and experimental use. In AIED (Vol. 2007, pp. 254-261).
Silver, E. A. (1997). Fostering creativity through instruction rich in mathematical problem solving and problem
posing. Zdm, 29(3), 75-80.
Singer, F. M., & Moscovici, H. (2008). Teaching and learning cycles in a constructivist approach to instruction.
Teaching and Teacher Education, 24(6), 1613-1634.
William N. Bender. (2007). Learning disabilities : characteristics, identification, and teaching strategies (6th ed),
Boston Pearson, Allyn and Bacon.
Xin, Y. P., Jitendra, A. K., & Deatline-Buchman, A. (2005). Effects of mathematical word Problem—Solving
instruction on middle school students with learning problems. The Journal of Special Education, 39(3),
181-192.
Yamamoto, S., Akao, Y., Murotsu, M., Kanbe, T., Yoshida, Y., Maeda, K., ... & Hirashima, T. (2014). Interactive
Environment for Learning by Problem-Posing of Arithmetic Word Problems Solved by One-step
Multiplication and Division. In Proc. of ICCE2014, 89-94.
Yamamoto, S., Hirashima, T., & Ogihara, A. (2016). Experimental Use of Learning Environment by Posing
Problem for Learning Disability. In Applied Computing & Information Technology (pp. 101-112). Springer
International Publishing.
Yamamoto, S., Kanbe, T., Yoshida, Y., Maeda, K., & Hirashima, T. (2012). A case study of learning by
problem-posing in introductory phase of arithmetic word problems. In Proc. of ICCE2012, 25-32.
Yamamoto, S., Takuya H., Kanbe, T., Yoshida, Y., Maeda, K., Hirashima, T. (2013). Interactive Environment for
Learning by Problem-Posing of Arithmetic Word Problems Solved by One-step Multiplication, In Proc. of
ICCE2013, 51-60.
287287
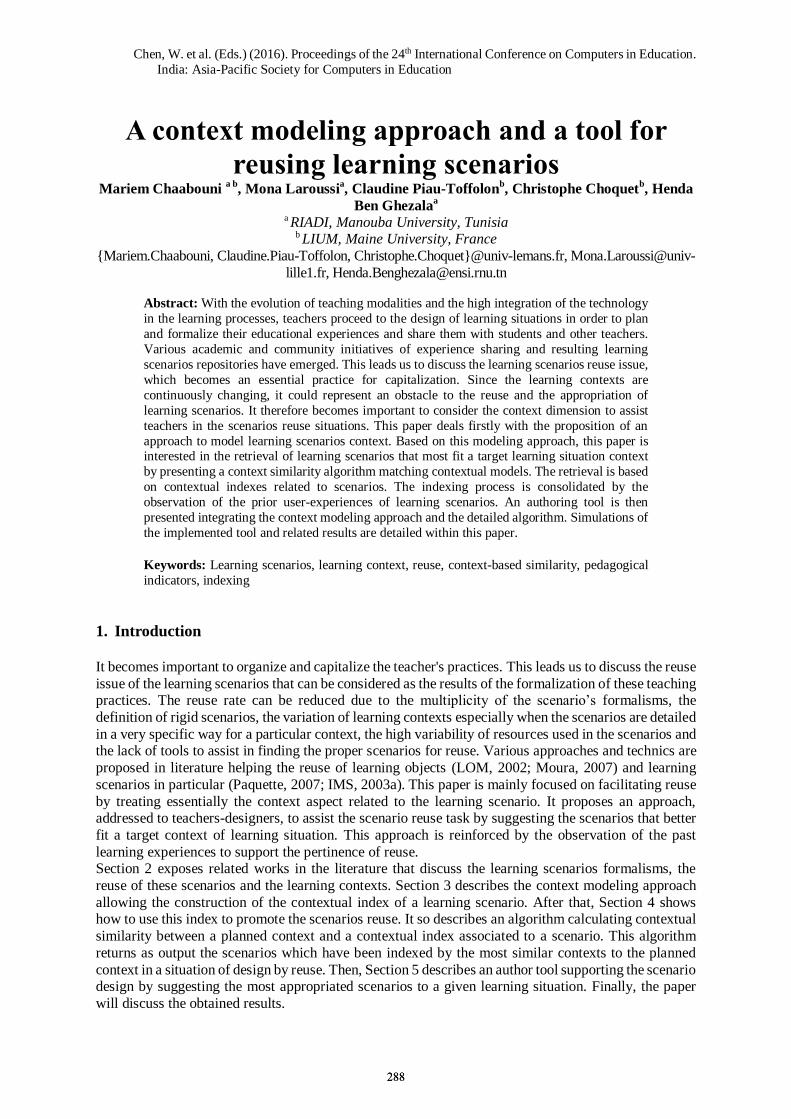
Chen, W. et al. (Eds.) (2016). Proceedings of the 24th International Conference on Computers in Education.
India: Asia-Pacific Society for Computers in Education
A context modeling approach and a tool for
reusing learning scenarios Mariem Chaabouni
a b, Mona Laroussi
a, Claudine Piau-Toffolon
b, Christophe Choquet
b, Henda
Ben Ghezalaa
a RIADI, Manouba University, Tunisia b LIUM, Maine University, France
{Mariem.Chaabouni, Claudine.Piau-Toffolon, Christophe.Choquet}@univ-lemans.fr, Mona.Laroussi@univ-
lille1.fr, [email protected]
Abstract: With the evolution of teaching modalities and the high integration of the technology
in the learning processes, teachers proceed to the design of learning situations in order to plan
and formalize their educational experiences and share them with students and other teachers.
Various academic and community initiatives of experience sharing and resulting learning
scenarios repositories have emerged. This leads us to discuss the learning scenarios reuse issue,
which becomes an essential practice for capitalization. Since the learning contexts are
continuously changing, it could represent an obstacle to the reuse and the appropriation of
learning scenarios. It therefore becomes important to consider the context dimension to assist
teachers in the scenarios reuse situations. This paper deals firstly with the proposition of an
approach to model learning scenarios context. Based on this modeling approach, this paper is interested in the retrieval of learning scenarios that most fit a target learning situation context
by presenting a context similarity algorithm matching contextual models. The retrieval is based
on contextual indexes related to scenarios. The indexing process is consolidated by the
observation of the prior user-experiences of learning scenarios. An authoring tool is then
presented integrating the context modeling approach and the detailed algorithm. Simulations of
the implemented tool and related results are detailed within this paper.
Keywords: Learning scenarios, learning context, reuse, context-based similarity, pedagogical
indicators, indexing
1. Introduction
It becomes important to organize and capitalize the teacher's practices. This leads us to discuss the reuse
issue of the learning scenarios that can be considered as the results of the formalization of these teaching practices. The reuse rate can be reduced due to the multiplicity of the scenario’s formalisms, the
definition of rigid scenarios, the variation of learning contexts especially when the scenarios are detailed
in a very specific way for a particular context, the high variability of resources used in the scenarios and the lack of tools to assist in finding the proper scenarios for reuse. Various approaches and technics are
proposed in literature helping the reuse of learning objects (LOM, 2002; Moura, 2007) and learning
scenarios in particular (Paquette, 2007; IMS, 2003a). This paper is mainly focused on facilitating reuse
by treating essentially the context aspect related to the learning scenario. It proposes an approach, addressed to teachers-designers, to assist the scenario reuse task by suggesting the scenarios that better
fit a target context of learning situation. This approach is reinforced by the observation of the past
learning experiences to support the pertinence of reuse. Section 2 exposes related works in the literature that discuss the learning scenarios formalisms, the
reuse of these scenarios and the learning contexts. Section 3 describes the context modeling approach
allowing the construction of the contextual index of a learning scenario. After that, Section 4 shows how to use this index to promote the scenarios reuse. It so describes an algorithm calculating contextual
similarity between a planned context and a contextual index associated to a scenario. This algorithm
returns as output the scenarios which have been indexed by the most similar contexts to the planned
context in a situation of design by reuse. Then, Section 5 describes an author tool supporting the scenario design by suggesting the most appropriated scenarios to a given learning situation. Finally, the paper
will discuss the obtained results.
288288

2. Related works
The designations and the representations of the teacher practices have been widely treated with different
views in prior works. IMS-LD (IMS, 2003a), a proposed Educational Modeling Language (EML), defines the concept of a learning process as "a time ordered series of activities to be performed by
learners and teachers (role), within the context of an environment consisting of learning objects or
services". We cite also the PoEML language (Perspective-oriented Educational Modeling Language)
(Caeiro-Rodrıguez, et al. 2007) sharing a similar approach by referring to the term "educational
scenario" that is "intended to support the modeling of any kind of educational unit at different
aggregation levels, from simple lessons, to complete courses or curriculums". With the increase of these modeling approaches, learning scenarios repositories (E-LEN, 2005;
BASAR project, 2012) appeared implementing these approaches and containing a large number of
scenarios. These bases are supplied to share the experience of the scenarios designers. This leads us to
discuss the scenario reuse problematic that becomes an essential practice. An exploratory study of the BASAR base (Bank of hybrid, reusable an interoperable learning scenarios) (BASAR project, 2012)
has revealed an important need of reuse of scenarios or activities sequences of scenarios. The study also
shown a wide variation and a diversification of contexts associated with these learning scenarios. In fact, these scenarios implement different modalities like temporal, spatial, and collaborative. The
designed scenarios are also targeting learners with different educational levels, technical skills or social
characteristics. This variability might reduce the potential reuse of the scenarios by another designer or leads him to reuse non-adapted scenarios to its usage context.
It thus becomes important to consider the contextual dimension to assist teachers in the
scenarios reuse situations. For that, we opt for a multidimensional modeling approach of the context of
a learning scenario including any environmental factor that can influence the scenario progress whether educational, technical, social or others. The context of a learning situation is seen from a large
perspective varying from educational and social profile of the learner or the teacher, pedagogical and
affective objectives of the learning situation, used software/hardware resources, to the physical environment surrounding the execution of the scenario. Therefore, trying to use the same scenario in a
different context from the original one may be not adapted to this targeted context.
The principal aim of the study presented in this paper is to define an approach to model and to analyze the context in which the scenario was implemented and to use it to build a contextual index.
This will help a designer to reuse scenarios that have been indexed by closest contexts to his target
context. A scenario performed in a specific context can succeed or fail with this particular case. So, the
past learning experience can be useful for enhancing the indexing scenarios. In that situation, we propose to integrate this dimension of user experience in order to reflect the degree of success of a
scenario in a particular context, and so benefiting from previous experiences already implemented in a
given context. In order to consider the past learning experiences, it is proposed to use the observation of the learning sessions by calculating pedagogical indicators. Thus, the observation allows the teacher-
designer to assess the progress of the scenario and to determine whether it was successful in a such
specific context and if it has been effectively adapted to this context.
3. A context modeling approach of learning scenarios
Firstly, we present the approach of modeling of the learning scenario context. This modeling approach
is useful to express the contextual information of a learning scenario. The main characteristics of this
proposed approach, that will be more detailed thereafter, are: "multi-leveled", "scenario language-independent", and "multi-faceted" modeling of a scenario context enhanced by observation.
The forms of the scenario context vary during the phases of the engineering process of a
learning scenario. This process is detailed in prior works (Chaabouni, et al. 2015). So, we distinguish 3 levels of context related to a scenario as shown in Figure 1: the real usage context of the scenario during
its implementation phase (ECM-LS: Effective Context Model of Learning Scenario), the contextual
index of the scenario at its indexing phase (ICM-LS: Indexed Context Model of Learning Scenario) and
the context of the scenario that is planned during the design phase (PCM-LS: Planned Context Model of Learning scenario). The context is formalized independently from the scenario language. So the
context modeling approach is not restricted to a specific scenario’s language or formalism.
289289
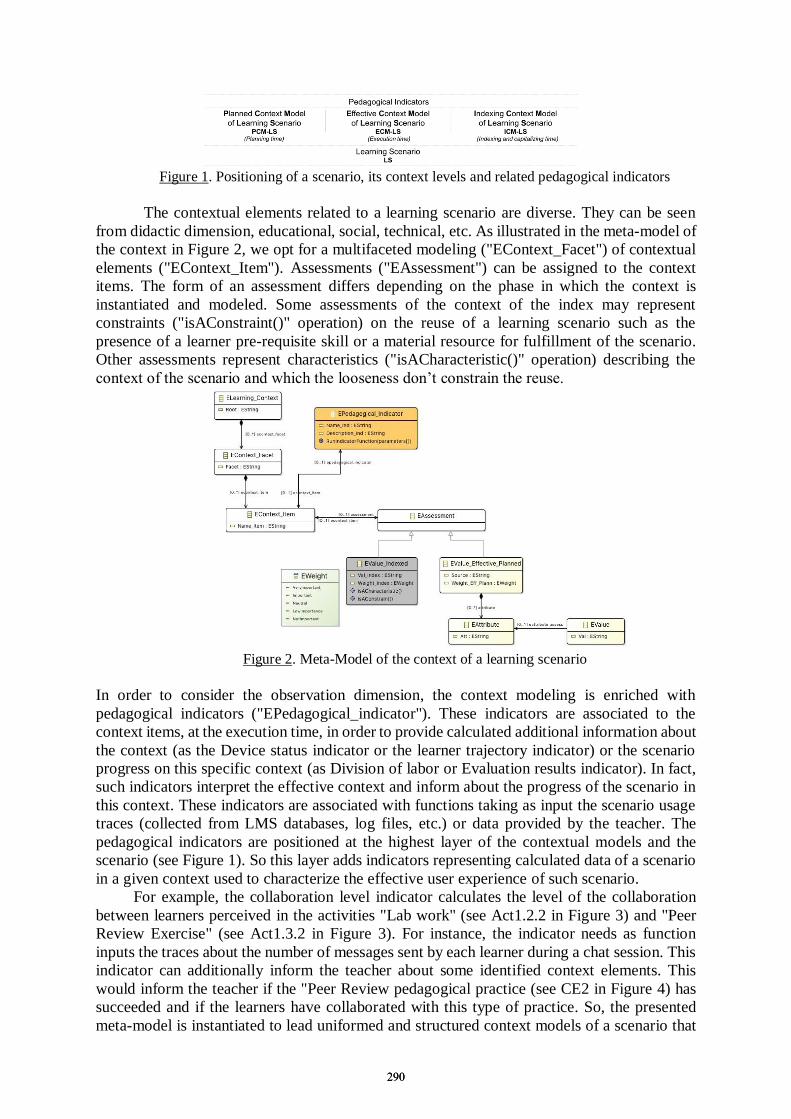
Figure 1. Positioning of a scenario, its context levels and related pedagogical indicators
The contextual elements related to a learning scenario are diverse. They can be seen
from didactic dimension, educational, social, technical, etc. As illustrated in the meta-model of
the context in Figure 2, we opt for a multifaceted modeling ("EContext_Facet") of contextual
elements ("EContext_Item"). Assessments ("EAssessment") can be assigned to the context
items. The form of an assessment differs depending on the phase in which the context is
instantiated and modeled. Some assessments of the context of the index may represent
constraints ("isAConstraint()" operation) on the reuse of a learning scenario such as the
presence of a learner pre-requisite skill or a material resource for fulfillment of the scenario.
Other assessments represent characteristics ("isACharacteristic()" operation) describing the
context of the scenario and which the looseness don’t constrain the reuse.
Figure 2. Meta-Model of the context of a learning scenario
In order to consider the observation dimension, the context modeling is enriched with
pedagogical indicators ("EPedagogical_indicator"). These indicators are associated to the
context items, at the execution time, in order to provide calculated additional information about
the context (as the Device status indicator or the learner trajectory indicator) or the scenario
progress on this specific context (as Division of labor or Evaluation results indicator). In fact,
such indicators interpret the effective context and inform about the progress of the scenario in
this context. These indicators are associated with functions taking as input the scenario usage
traces (collected from LMS databases, log files, etc.) or data provided by the teacher. The
pedagogical indicators are positioned at the highest layer of the contextual models and the
scenario (see Figure 1). So this layer adds indicators representing calculated data of a scenario
in a given context used to characterize the effective user experience of such scenario.
For example, the collaboration level indicator calculates the level of the collaboration
between learners perceived in the activities "Lab work" (see Act1.2.2 in Figure 3) and "Peer
Review Exercise" (see Act1.3.2 in Figure 3). For instance, the indicator needs as function
inputs the traces about the number of messages sent by each learner during a chat session. This
indicator can additionally inform the teacher about some identified context elements. This
would inform the teacher if the "Peer Review pedagogical practice (see CE2 in Figure 4) has
succeeded and if the learners have collaborated with this type of practice. So, the presented
meta-model is instantiated to lead uniformed and structured context models of a scenario that
290290
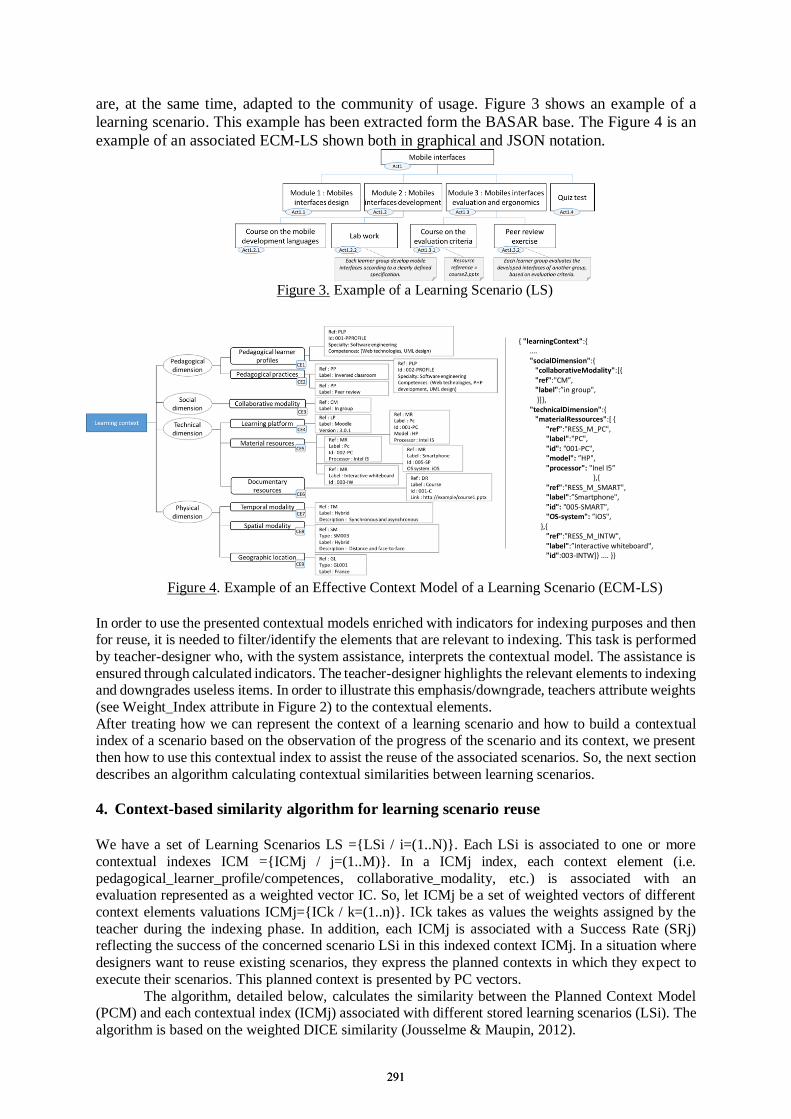
are, at the same time, adapted to the community of usage. Figure 3 shows an example of a
learning scenario. This example has been extracted form the BASAR base. The Figure 4 is an
example of an associated ECM-LS shown both in graphical and JSON notation.
Figure 3. Example of a Learning Scenario (LS)
{ "learningContext":{ …. "socialDimension":{ "collaborativeModality":[{ "ref":"CM”, "label":”in group", }]}, "technicalDimension":{ "materialRessources":[ { "ref":"RESS_M_PC", "label":"PC", "id": "001-PC", "model": ”HP", "processor": "Inel I5”
},{ "ref":"RESS_M_SMART", "label":”Smartphone", "id": "005-SMART", "OS-system": ”iOS", },{ "ref":"RESS_M_INTW", "label":”Interactive whiteboard", "id":003-INTW]} .... }}
Figure 4. Example of an Effective Context Model of a Learning Scenario (ECM-LS)
In order to use the presented contextual models enriched with indicators for indexing purposes and then for reuse, it is needed to filter/identify the elements that are relevant to indexing. This task is performed
by teacher-designer who, with the system assistance, interprets the contextual model. The assistance is
ensured through calculated indicators. The teacher-designer highlights the relevant elements to indexing and downgrades useless items. In order to illustrate this emphasis/downgrade, teachers attribute weights
(see Weight_Index attribute in Figure 2) to the contextual elements.
After treating how we can represent the context of a learning scenario and how to build a contextual index of a scenario based on the observation of the progress of the scenario and its context, we present
then how to use this contextual index to assist the reuse of the associated scenarios. So, the next section
describes an algorithm calculating contextual similarities between learning scenarios.
4. Context-based similarity algorithm for learning scenario reuse
We have a set of Learning Scenarios LS ={LSi / i=(1..N)}. Each LSi is associated to one or more
contextual indexes ICM ={ICMj / j=(1..M)}. In a ICMj index, each context element (i.e.
pedagogical_learner_profile/competences, collaborative_modality, etc.) is associated with an evaluation represented as a weighted vector IC. So, let ICMj be a set of weighted vectors of different
context elements valuations ICMj={ICk / k=(1..n)}. ICk takes as values the weights assigned by the
teacher during the indexing phase. In addition, each ICMj is associated with a Success Rate (SRj) reflecting the success of the concerned scenario LSi in this indexed context ICMj. In a situation where
designers want to reuse existing scenarios, they express the planned contexts in which they expect to
execute their scenarios. This planned context is presented by PC vectors.
The algorithm, detailed below, calculates the similarity between the Planned Context Model (PCM) and each contextual index (ICMj) associated with different stored learning scenarios (LSi). The
algorithm is based on the weighted DICE similarity (Jousselme & Maupin, 2012).
291291
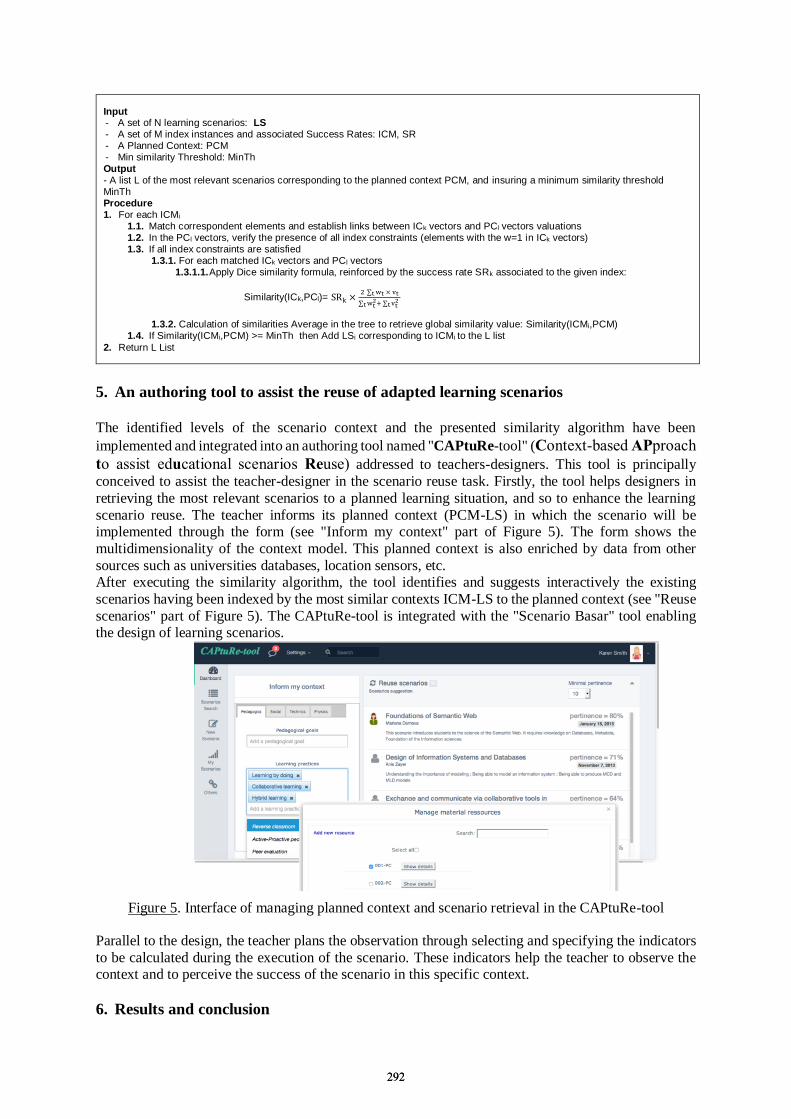
Input - A set of N learning scenarios: LS - A set of M index instances and associated Success Rates: ICM, SR - A Planned Context: PCM - Min similarity Threshold: MinTh Output - A list L of the most relevant scenarios corresponding to the planned context PCM, and insuring a minimum similarity threshold MinTh Procedure 1. For each ICMi
1.1. Match correspondent elements and establish links between ICk vectors and PCl vectors valuations 1.2. In the PCl vectors, verify the presence of all index constraints (elements with the w=1 in ICk vectors) 1.3. If all index constraints are satisfied
1.3.1. For each matched ICk vectors and PCl vectors 1.3.1.1. Apply Dice similarity formula, reinforced by the success rate SRk associated to the given index:
Similarity(ICk,PCl)= SRk ×2 ∑ wtt × vt
∑ wt2
t + ∑ vt2
t
1.3.2. Calculation of similarities Average in the tree to retrieve global similarity value: Similarity(ICMi,PCM) 1.4. If Similarity(ICMi,PCM) >= MinTh then Add LSi corresponding to ICMi to the L list
2. Return L List
5. An authoring tool to assist the reuse of adapted learning scenarios
The identified levels of the scenario context and the presented similarity algorithm have been
implemented and integrated into an authoring tool named "CAPtuRe-tool" (Context-based APproach
to assist educational scenarios Reuse) addressed to teachers-designers. This tool is principally
conceived to assist the teacher-designer in the scenario reuse task. Firstly, the tool helps designers in
retrieving the most relevant scenarios to a planned learning situation, and so to enhance the learning
scenario reuse. The teacher informs its planned context (PCM-LS) in which the scenario will be implemented through the form (see "Inform my context" part of Figure 5). The form shows the
multidimensionality of the context model. This planned context is also enriched by data from other
sources such as universities databases, location sensors, etc. After executing the similarity algorithm, the tool identifies and suggests interactively the existing
scenarios having been indexed by the most similar contexts ICM-LS to the planned context (see "Reuse
scenarios" part of Figure 5). The CAPtuRe-tool is integrated with the "Scenario Basar" tool enabling the design of learning scenarios.
Figure 5. Interface of managing planned context and scenario retrieval in the CAPtuRe-tool
Parallel to the design, the teacher plans the observation through selecting and specifying the indicators
to be calculated during the execution of the scenario. These indicators help the teacher to observe the context and to perceive the success of the scenario in this specific context.
6. Results and conclusion
292292

During the setting up of the exposed approach, and in order to highlight the need of reuse, a
first phase of controlled experiments has been performed with teachers placed in design situations without having a tool assisting the scenarios reuse task. Results have been collected through an online
survey diffused for BASAR designers. In this usage case, the survey demonstrates that, during the
design phase, 80% of teachers did not reuse existing scenarios from any scenario’s repository and 92.3%
did not reuse scenarios from the BASAR base especially. The main reason of the non-reuse is "after research, I didn’t find the appropriate scenario" with a percentage of 51.1%. In addition, 57.1% of
participants confirm a need of reuse, with, on the other hand, 42.9% expressing that they did not feel
the necessity of reusing scenarios. This analysis reveals the importance of reuse and confirms the need of assisting teachers-designers in the scenarios reuse task.
Then, in order to validate contextual model data and the presented similarity algorithm, we
firstly start by the analysis of the existing BASAR scenarios (currently 106 scenarios) and the extraction of the associated context of each one. We complement these contextual data through the establishment
of a survey addressed to BASAR designers. This survey allowed us to collect complementary context
information in which the scenarios were effectively executed. Therefore, we construct, from the
collected data, the associated contextual indexes (ICM-LS) to enrich existing BASAR scenarios. We proceed then to different simulations of planned contexts (PCM-LS).
To conclude, we have firstly proposed in this paper a representation formalism of a learning
scenario context in different phases (Planned time - execution time - indexing and capitalizing time) and the main characteristics of the adopted approach. Based on this representation, we have then defined
an approach of indexing a learning scenario with its contextual dimension. The idea is to consider the
user experience to index the scenario with contexts having been the most adapted to this scenario. This is performed by observing the scenario progress through pedagogical indicators calculating and
analyzing the success of the scenario in a given context. An algorithm of context-based similarity is
then illustrated calculating the similarities between a planned context in a learning situation and
contextual indexes associated with learning scenarios. In order to concretize the proposed approach and the context-based similarity algorithm, the tool "CAPtuRe-tool" has been presented. In a situation of
pedagogical design by reuse, this tool suggests the scenario that can be the most adapted to the context
of the learning situation. Finally, results are discussed through the simulations of usages of the implemented tool in controlled experiments performed by a group of teachers-designers.
References
ADL Technical Team. (2004b). SCORM: Sharable Content Object Reference Model. Documentation 1st Edition,
Advanced Distributed Learning (ADL). BASAR project. (2012). A Database of French blended-learning scenarios.
http://www.projetbasar.net/index.php/fr/ (Consulted on January, 2016).
Caeiro-Rodrıguez, M., Marcelino, M. J., Llamas-Nistal, M., Anido-Rifón, L., & Mendes, A. J. (2007). Supporting
the Modeling of Flexible Educational Units, PoEML: A Separation of Concerns Approach Journal of
Universal Computer Science, 13(7), 980-990.
Chaabouni, M., Piau-Toffolon, C., Laroussi, M., Choquet, C., & Ben Ghezala, H. (2015, July). Indexing Learning
Scenarios by the Most Adapted Contexts: An approach Based on the Observation of Scenario Progress in
Session. 15th International Conference on Advanced Learning Technologies (pp. 39-43) IEEE.
E-LEN: A network of e-learning centres. (2005). http://www2.tisip.no/E-LEN/patterns_info.php. Consulted on
January, 2016
IMS Global Learning Consortium. (2003a). IMS-LD: IMS Learning Design specification. 2008206225. http://www.imsglobal.org/learningdesign/index.html.
Jousselme, A. L., & Maupin, P. (2012). Distances in evidence theory: Comprehensive survey and generalizations.
International Journal of Approximate Reasoning, 53(2), 118-145.
LOM: Learning Object Metadata. (2002). http://ltsc.ieee.org/wg12/index.html, accessed January 12, 2015.
Moura, C. (2007). Conceiving and Implementing a language-oriented approach for the design of automated
learning scenarios, Doctoral dissertation, Science and technology university of Lille-Lille I.
Paquette, G. (2007). An ontology and a software framework for competency modeling and management.
Educational Technology & Society, 10(3), 1-21.
293293

Chen, W. et al. (Eds.) (2016). Proceedings of the 24th International Conference on Computers in Education.
India: Asia-Pacific Society for Computers in Education
A Competency Similarity Detection for
Generating Career Path
Wasan Na Chai a*, Taneth Ruangrajitpakorn a b Marut Buranarach a, Thepchai Supnithi a
aLanguage and Semantic Technology Laboratory,
National Electronics and Computer Technology Center, Pathum Thani, Thailand bDepartment of Computer Science, Faculty of Science and Technology,
Thammasat University, Pathumthanee, Thailand
Abstract: In this paper, we propose a method to detect a similarity of competency to generate a career
path. Career path is important for students and workers for their planning in career. In this work, data
of competencies from Thailand Professional Qualification Institute are used for generating a relation
among units of competency (UoC) as a crossable path for career transfer. Similarity Score using n-
gram precision is exploited to find the commonness in UoC context to indicate the possibility in
career relation. From an experiment, the proposed method gained 80% accuracy. As a result, career
path is generated as a map for a person in career planning for both promotional path and crossable
path.
Keywords: Career Path, Competency, Word Matching, Natural Language Processing, Text
Similarity
1. Introduction
Previously, a research of career pathing [1] was conducted with the data from TPQI. The work applied
string similarity matching to create a career path of similar wording competencies, and it was reported
to perform fine in the task. However, we found that there are cases that some competencies are linked
as transferrable since strings in those are commonly agree, but they are not semantically related. In
details, some look-alike competencies are not technically related in skills or knowledge since they
contain many same functional words due to the rich of function words used in Thai. Hence, in this work,
we aim to improve an automatic career pathing using TPQI data by using word level similarity for more
precision in concern of excessive grammatical word usage.
2. Methodology
This work aims to detect a similarity among competencies to create a career path in different career
roles. Unlike the previous work, the detection focuses on word level to find similar words in
competencies across career roles. To prevent inclusion of grammatical words in similarity calculation,
function words are pruned out. An overview of the proposed method is drawn in Figure 1.
Figure 1. An overview of the proposed method
294294

List of certifications and its competency data are collected from TPQI website [2] and stored in
our designed database. Structure of data is that professions are provided as a list while each profession
(PROF) contains a list of certifications (CERT) numbered for certification level. Certification levels are
level 1 - 7, which indicates an ordinal rank of certification. The higher-level number signifies superior
certification. In each certification, a list of unit of competencies (UoC) is assigned. It refers to all
competencies must be acquired for certification.
Since this work focuses on word level, Thai word boundary segmentation [3] is exploited to
handle Thai text in UoC. Function words in UoC are removed because Thai language is rich with
function word usage, and they tentatively cause a misleading high similarity score due to their
appearance in textual usage. The removed function words [4] are the words with grammatical based
part-of-speech including preposition, conjunction, unit classifier, and pronoun.
In this work, we aim to detect commonness of UoCs in CERT to link a relation between CERTs
for transferability. In word level, each word in UoC in a CERT is compared to UoCs in another CERT.
We apply a BLEU formula [5,6] to calculate word-base similarity. A targeted UoC is referred as
candidate, and a compared UoC of another CERT is treated as reference. Applying BLEU measurement
metric helps to measures the n-gram (n=1 to 4) precisions of the candidate comparing to the reference.
The BLEU score is a product of the geometric mean of the cumulative n-gram precisions and the brevity
penalty. BLEU has advantage as:
• focusing on words in the candidate in sequence that only exist in the reference
• balancing for the candidate containing low number of words from obtaining extremely high
precision score
• smoothing precisions to prevent a zero score
As similarity measure metric, n-gram of words in UoC is calculated and compared with the
reference UoC using (1) to gain n-gram precision (Pn) score.
𝑃𝑛 = ∑ 𝐶𝑜𝑢𝑛𝑡𝐶𝑙𝑖𝑝(𝑛−𝑔𝑟𝑎𝑚)𝑛−𝑔𝑟𝑎𝑚 ∈ 𝐶
∑ 𝐶𝑜𝑢𝑛𝑡(𝑛−𝑔𝑟𝑎𝑚′)𝑛−𝑔𝑟𝑎𝑚′ ∈ 𝐶
(1)
With (1), we can obtain a geometric mean of n-gram precision scores comparing between UoCs.
In this work, N is set as 1-4 gram, and a ratio to indicate similar UoC is set as 0.80.
3. Experiment
3.1 Experiment Setting
To test the proposed method, collected TPQI data of 126 certifications (CERT) from six professions
(PROF) are used as testing data. The chosen professions are weaving industry, printing industry, vehicle
service, transportation service, Thai spa service, and hair salon service. The data contain 291 units of
competency (UoC).
For approving the proposed method, we test it against two other methods. The first one is string
similarity method [1][7] using in previous work. This method uses (2) to calculate similarity among
UoCs.
𝑁𝑀𝐿𝐶𝑆1(𝑋𝑖,𝑌𝑗) =𝑙𝑒𝑛𝑔𝑡ℎ(𝑁𝑀𝐿𝐶𝑆1(𝑋𝑖,𝑌𝑗))
2
𝑙𝑒𝑛𝑔𝑡ℎ(𝑋𝑖)×𝑙𝑒𝑛𝑔𝑡ℎ(𝑌𝑗) (2)
For both methods in this experiment, a ratio to indicate similar UoC is equally set as 0.80. In
the proposed method, we set N = 4. The similarity results are approved with a gold standard career path
generated by experts and are calculated into accuracy score.
3.2 Experiment Result and Discussion
By comparing the methods, we gained accuracy results shown in Table 1. From Table 1, we found that
the proposed n-gram precision in word level with function word removed performed better on pathing
between UoCs. We observe into detail of pathing results from the proposed method. The pathing result
295295
can be separated into three types: UoC with no matched path to other, UoC matched to another by one-
to-one, and UoC matched to many other as many-to-many. From analysis, we obtain insight statistics
shown in Table 2. We found that incorrect results are the case of pathing UoCs that are not related and
the case of missing path to the related pair, respectively. To summarise types of incorrectness in the
proposed system, there are two major issues. The first issue is words that represent specific skill,
knowledge and technique are not focused. This issue is the major cause of the incorrect result. Since
these technical words are merely a word among many words in UoC, they are equally counted regardless
how important they are in the context. Rationally, a detection of these words will highly improve overall
accuracy. The second issue is a synonym word using in UoC. Though this issue rarely occurs in this
dataset, solving it can correct the missing result in the work.
Table 1: Comparison result of four methods by accuracy matrix
Method Accuracy String similarity 54.98%
n-gram precision in word level with function word removed 80.07%
Table 2: Results in details from the proposed method
Type Amount Correct Incorrect
no matched one-to-
one
many-to-
many
Sum
no matched 182 148 (81.32%) X 32 2 34
one-to-one 71 55 (77.46%) 16 X 0 16
many-to-many 38 30 (78.95%) 6 2 X 8
Sum 291 233 (80.07%) 22 34 2
4. Conclusion and Future Work
This paper presents a method to detect a crossable competency in career for generating paths among
job positions. This work is the improved version of the previous work that used string base similarity.
In the proposed method, word based similarity with n-gram precision is used to find a commonness in
terms using in competency description and the score is used to signify a relation of competencies. From
the experiment results, the proposed method obtained the higher accuracy score as around 80% and
gained 25% higher accuracy than the previous method.
References Ruangrajitpakorn T., Na Chai W., Buranarach M., Supnithi T., Kongkachandra R. (2015). An automatic Thai
career path generation using similarity of roles and their competencies. In Proceeding of International
Symposium on Multimedia and Communication Technology.Thailand.
Thailand Professional Qualification Institute Homepage. Retrieved April 20, 2016, from http://www.tpqi.go.th/en
SegIt : Thai Word Segmentation Tool. Retrieved May 22, 2016, from http://thaimt.org/lstnlp/wordseg.php
Ruangrajitpakorn T., Trakultaweekoon K., Supnithi T. (2009). A Syntactic Resource for Thai: CG Treebank.
Proceedings of the 7th Workshop on Asian Language Resources, ACL-IJCNLP (pp. 69–102). Singapore.
Papineni, K.; Roukos, S.; Ward, T.; Zhu, W. J.(July 2002). BLEU: a Method for Automatic Evaluation of Machine
Translation. Proceedings of the 40th Annual Meeting of the Association for Computational Linguistics
(ACL) (pp. 311-318). Philadelphia, USA.
Madnani N. (2011). iBLEU: Interactively Debugging & Scoring Statistical Machine Translation Systems.
Proceedings of the Fifth IEEE International Conference on Semantic Computing. Palo Alto, CA, USA.
A. Islam and D. Inkpen. (2008). Semantic Text Similarity Using Corpus-Based Word Similarity and String
Similarity. ACM Transactions on Knowledge Discovery from Data, Vol.2, No.2.
296296
Chen, W. et al. (Eds.) (2016). Proceedings of the 24th International Conference on Computers in Education.
India: Asia-Pacific Society for Computers in Education
A Relational Design Oriented Seamless
Framework to Support Idea Sharing and Social
Network
Yen-An SHIH & Ben CHANG*
Graduate Institute of Learning and Instruction, National Central University, Taiwan
Abstract: Mobile technique and device development have become mature. Online community
and application of social networking facilitate our connection and communication with other
people. However, the design of social networking supporting learning activity still remains
many gaps. The aim of this study is to demonstrate the relational design oriented seamless
framework and the seamless learning environment architecture. Currently, a platform named
cocoing.info is under construction based on the proposed frameworks. In the future, the users’
behavior on the platform will be collected and analyzed.
Keywords: Social learning network, seamless framework design, concept map
1. Introduction
With the mobile technology evolution, online social networking is affecting students with its effective
communication and convenient usage. However, using social networking on facilitating students’
learning still have many problems. For examples, social networking is a casual interactive platform
where the students’ interactions mostly are occasional. Meanwhile, social networking learning
environment structure is weak to support a compact learning activity. Therefore, a systematic
framework is needed to help teachers as well as students to integrate the social networking into the
learning activity. This study aims to design an online relationship-based social networking cloud
platform, in which learners can create and share their personal knowledge with concept map. The
framework describes the relationship between knowledge and social communities, and how they work
on courses. Furthermore, to evaluate the possibility of the framework, an online learning platform
named CoCoing.info is designed and implemented according to the guidelines of the framework.
2. Related Work
2.1 Concept Map Assisting Learning Activity
Many studies indicated adopting concept map in learning strategy has many advantages comparing with
traditional learning (Chu, Hwang, & Liang, 2014; Hwang, Yang, & Wang, 2013; Liu, Chen, & Chang,
2010). More specifically, as assistance of online computer software, computerized concept map
facilitates learners to (1) create and edit the concepts anytime and anywhere; (2) extend the scope of
learning topic by the relationships of concept maps; (3) integrate online learning resource into concept
map, such as webpage and multimedia; (4) share their concept maps with others; (5) construct content
of concept map with peers. For example, Liu et al. (2010) implemented a computerized concept
mapping learning strategy on English reading comprehension. Concept map was used as a tool for
students to easily understand the English article structure when they were reading. Key point words of
article were displayed and connected as a graph that helped students to recognize text. The results of this
study indicated computerized concept map is helpful on reading for low-level students and enhance the
using motivation.
297297
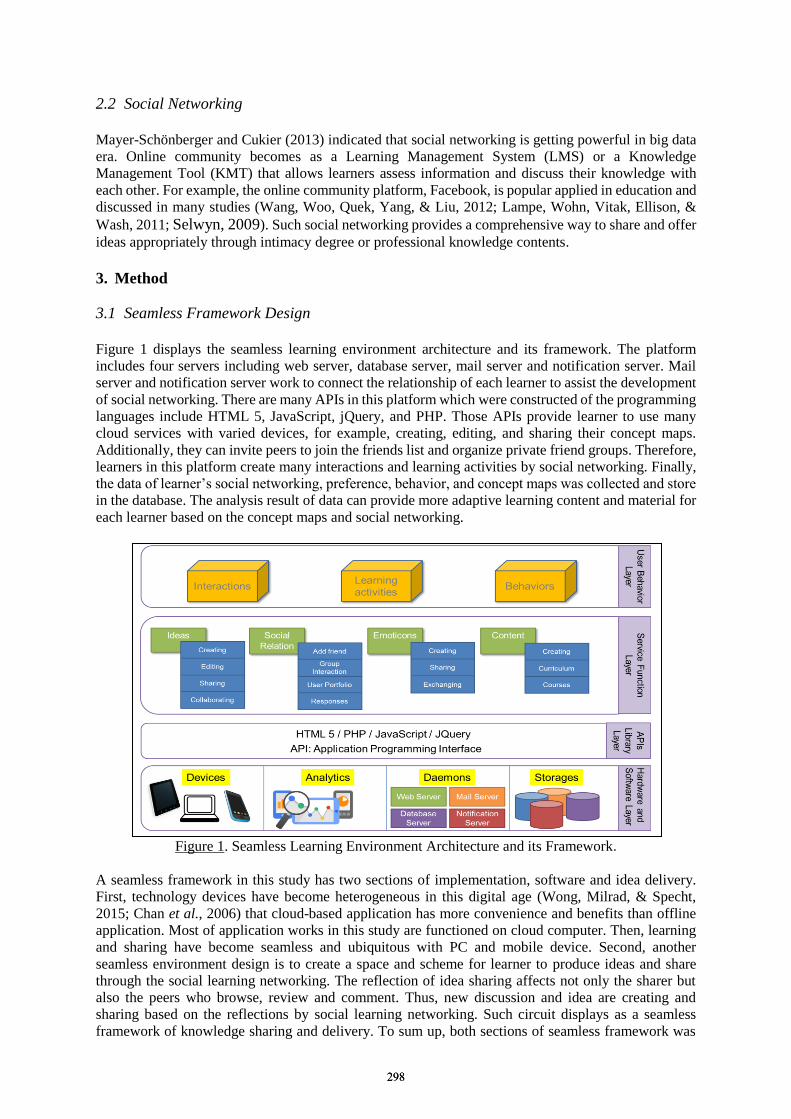
2.2 Social Networking
Mayer-Schönberger and Cukier (2013) indicated that social networking is getting powerful in big data
era. Online community becomes as a Learning Management System (LMS) or a Knowledge
Management Tool (KMT) that allows learners assess information and discuss their knowledge with
each other. For example, the online community platform, Facebook, is popular applied in education and
discussed in many studies (Wang, Woo, Quek, Yang, & Liu, 2012; Lampe, Wohn, Vitak, Ellison, &
Wash, 2011; Selwyn, 2009). Such social networking provides a comprehensive way to share and offer
ideas appropriately through intimacy degree or professional knowledge contents.
3. Method
3.1 Seamless Framework Design
Figure 1 displays the seamless learning environment architecture and its framework. The platform
includes four servers including web server, database server, mail server and notification server. Mail
server and notification server work to connect the relationship of each learner to assist the development
of social networking. There are many APIs in this platform which were constructed of the programming
languages include HTML 5, JavaScript, jQuery, and PHP. Those APIs provide learner to use many
cloud services with varied devices, for example, creating, editing, and sharing their concept maps.
Additionally, they can invite peers to join the friends list and organize private friend groups. Therefore,
learners in this platform create many interactions and learning activities by social networking. Finally,
the data of learner’s social networking, preference, behavior, and concept maps was collected and store
in the database. The analysis result of data can provide more adaptive learning content and material for
each learner based on the concept maps and social networking.
Figure 1. Seamless Learning Environment Architecture and its Framework.
A seamless framework in this study has two sections of implementation, software and idea delivery.
First, technology devices have become heterogeneous in this digital age (Wong, Milrad, & Specht,
2015; Chan et al., 2006) that cloud-based application has more convenience and benefits than offline
application. Most of application works in this study are functioned on cloud computer. Then, learning
and sharing have become seamless and ubiquitous with PC and mobile device. Second, another
seamless environment design is to create a space and scheme for learner to produce ideas and share
through the social learning networking. The reflection of idea sharing affects not only the sharer but
also the peers who browse, review and comment. Thus, new discussion and idea are creating and
sharing based on the reflections by social learning networking. Such circuit displays as a seamless
framework of knowledge sharing and delivery. To sum up, both sections of seamless framework was
298298
developed in this study in order to provide an online relationship-based social networking cloud
platform.
3.2 Benefits of Concept Oriented Design and Social Networking
Based on the concept oriented design and social networking, knowledge creating and sharing becomes
more easily and convenient. The features of concept map such as knowledge deconstruction and
relational connection are an important role in this progress. Additionally, through social networking,
each learner can be a concept map provider and mentor which interacts with peers. The concept oriented
design with social networking can bring many advantages, learners can do such works including (1)
saving their ideas; they can create concept maps for extracting personal knowledge and store on cloud
platform; (2) sharing their ideas; they can deliver and share concept maps with peers and friends; (3)
building their own community; through social networking design, they can add friends, and manage
their friend list; (4) using authoring tools to create their curricula; the platform provides functions for
creating curricula which construct of their own concept maps and online learning resources, such as
web pages, images and videos.
4. Conclusions
Social networking is getting mature to implement into learning activity to assist student’s learning.
However, how to build a social networking with seamless learning platform still remain some problems.
To this end, this study designs a framework of how to design a relational oriented seamless learning
environment. The framework provides a structure which may be a reference for implementing a scheme
of integrating social networking and concept map for supporting knowledge sharing and exchanging.
To evaluate the possibility of the framework, a relationship-based social networking cloud platform is
under construction based on the proposed frameworks. Currently, it is an idea proposal. The website
based on the idea is still under construction. In the future, the users’ behavior on the platform will be
collected and analyzed.
References
Chan, T.-W., Roschelle, J., Hsi, S., Kinshuk, Sharples, M., Brown, T., et al. (2006). One-to-one
technology-enhanced learning: An opportunity for global research collaboration. Research and Practice in
Technology Enhanced Learning, 1(1), 3-29.
Chu, H. C., Hwang, G. J., & Liang, Y. R. (2014). A cooperative computerized concept-mapping approach to
improving students’ learning performance in web-based information-seeking activities. Journal of
Computers in Education,1(1), 19-33.
Hwang, G. J., Yang, L. H., & Wang, S. Y. (2013). A concept map-embedded educational computer game for
improving students' learning performance in natural science courses. Computers & Education, 69, 121-130.
Lampe, C., Wohn, D. Y., Vitak, J., Ellison, N. B., & Wash, R. (2011). Student use of Facebook for organizing
collaborative classroom activities. International Journal of Computer-Supported Collaborative
Learning, 6(3), 329-347.
Liu, P. L., Chen, C. J., & Chang, Y. J. (2010). Effects of a computer-assisted concept mapping learning strategy on
EFL college students’ English reading comprehension. Computers & Education, 54(2), 436-445.
Mayer-Schönberger, V., & Cukier, K. (2013). Big data: A revolution that will transform how we live, work, and
think. MA: Houghton Mifflin Harcourt.
Selwyn, N. (2009). Faceworking: Exploring students' education‐related use of Facebook. Learning, Media and
Technology, 34(2), 157-174.
Wang, Q., Woo, H. L., Quek, C. L., Yang, Y., & Liu, M. (2012). Using the Facebook group as a learning
management system: An exploratory study. British Journal of Educational Technology, 43(3), 428-438.
Wong, L. H., Milrad, M., & Specht, M. (2015). Seamless learning in the age of mobile connectivity. Springer.
299299
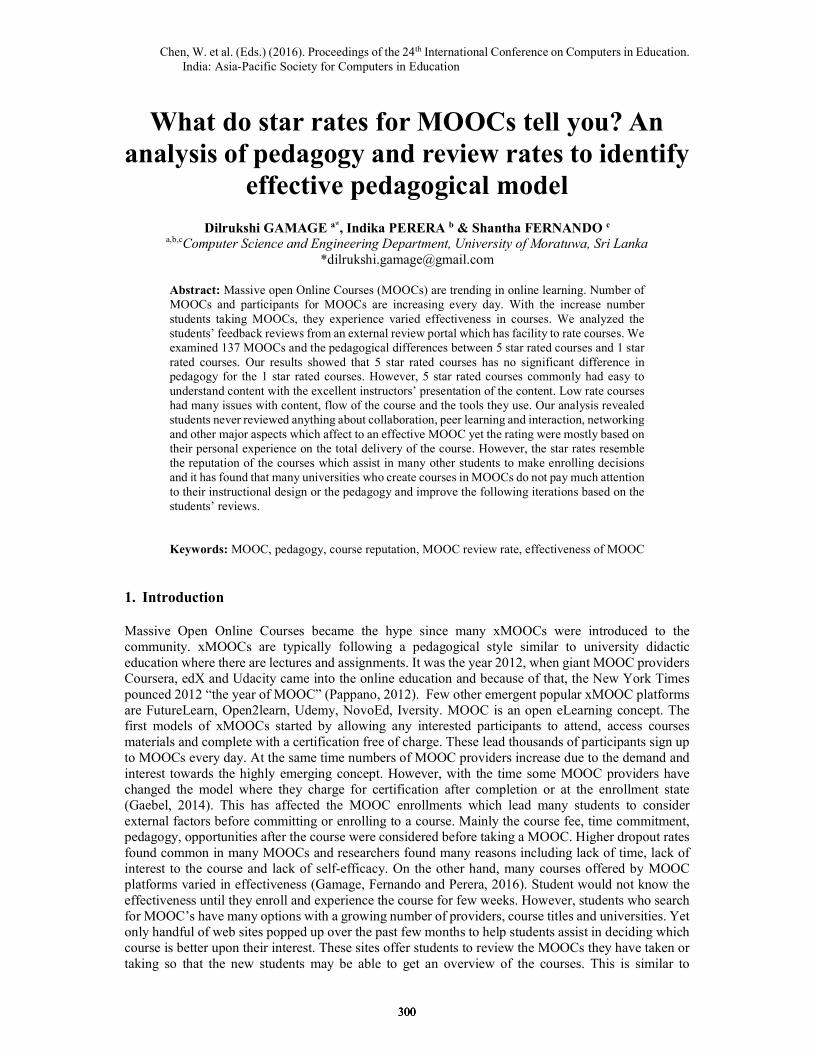
Chen, W. et al. (Eds.) (2016). Proceedings of the 24th International Conference on Computers in Education. India: Asia-Pacific Society for Computers in Education
What do star rates for MOOCs tell you? An analysis of pedagogy and review rates to identify
effective pedagogical model
Dilrukshi GAMAGE a*, Indika PERERA b & Shantha FERNANDO c a,b,cComputer Science and Engineering Department, University of Moratuwa, Sri Lanka
Abstract: Massive open Online Courses (MOOCs) are trending in online learning. Number of MOOCs and participants for MOOCs are increasing every day. With the increase number students taking MOOCs, they experience varied effectiveness in courses. We analyzed the students’ feedback reviews from an external review portal which has facility to rate courses. We examined 137 MOOCs and the pedagogical differences between 5 star rated courses and 1 star rated courses. Our results showed that 5 star rated courses has no significant difference in pedagogy for the 1 star rated courses. However, 5 star rated courses commonly had easy to understand content with the excellent instructors’ presentation of the content. Low rate courses had many issues with content, flow of the course and the tools they use. Our analysis revealed students never reviewed anything about collaboration, peer learning and interaction, networking and other major aspects which affect to an effective MOOC yet the rating were mostly based on their personal experience on the total delivery of the course. However, the star rates resemble the reputation of the courses which assist in many other students to make enrolling decisions and it has found that many universities who create courses in MOOCs do not pay much attention to their instructional design or the pedagogy and improve the following iterations based on the students’ reviews. Keywords: MOOC, pedagogy, course reputation, MOOC review rate, effectiveness of MOOC
1. Introduction Massive Open Online Courses became the hype since many xMOOCs were introduced to the community. xMOOCs are typically following a pedagogical style similar to university didactic education where there are lectures and assignments. It was the year 2012, when giant MOOC providers Coursera, edX and Udacity came into the online education and because of that, the New York Times pounced 2012 “the year of MOOC” (Pappano, 2012). Few other emergent popular xMOOC platforms are FutureLearn, Open2learn, Udemy, NovoEd, Iversity. MOOC is an open eLearning concept. The first models of xMOOCs started by allowing any interested participants to attend, access courses materials and complete with a certification free of charge. These lead thousands of participants sign up to MOOCs every day. At the same time numbers of MOOC providers increase due to the demand and interest towards the highly emerging concept. However, with the time some MOOC providers have changed the model where they charge for certification after completion or at the enrollment state (Gaebel, 2014). This has affected the MOOC enrollments which lead many students to consider external factors before committing or enrolling to a course. Mainly the course fee, time commitment, pedagogy, opportunities after the course were considered before taking a MOOC. Higher dropout rates found common in many MOOCs and researchers found many reasons including lack of time, lack of interest to the course and lack of self-efficacy. On the other hand, many courses offered by MOOC platforms varied in effectiveness (Gamage, Fernando and Perera, 2016). Student would not know the effectiveness until they enroll and experience the course for few weeks. However, students who search for MOOC’s have many options with a growing number of providers, course titles and universities. Yet only handful of web sites popped up over the past few months to help students assist in deciding which course is better upon their interest. These sites offer students to review the MOOCs they have taken or taking so that the new students may be able to get an overview of the courses. This is similar to
300300300

consumers make their purchase decisions based on online reviews and rates provided by web sites (Hu, Liu, & Zhang, 2008). Some of the sites let students review the MOOC’s they’ve taken, incorporating their views into the sites’ as an overall guidance. Typically, students who completed any course or experienced for few weeks leave their experience in reviews on an external MOOC review platforms or the same MOOC platform who facilitate reviews or even in their personal blogs. This created a reputation for MOOC courses and it affected any new students’ decision to participate the course and at the same time it act as a recommender system. This reputation is positive or negative depending on the previous students’ reviews. Students who never experience any MOOC or if they are interested in specific course offered in MOOC platform subject, it is likely that they read reviews before they enroll. Many students and universities invest considerable amounts of time and monetary values for MOOCs, yet in the end there is a possibility that the university or course design crew losing the credibility due to bad reviews. Some universities already promote the fact of having highest rated courses in their MOOC list. Hence it is important for MOOC designers to pay attention to what students felt in previous course offering and improve the courses when they offer next time. Nevertheless, attention given to reviews are very less by the course designers. In this research we analyzed 137 computer science MOOC reviews rates. We sought to identify pedagogical designs which lead to positive reputation rates. Our contribution support to MOOC designers to design a best case instructional design. 2. Review of Literature Previous research which focused on reviewing factors, recommender systems in online learning were considered. The factors mostly considered in rating an online course are pedagogy, interactions, completion rates, satisfaction, collaboration and many more. Many researchers’ review MOOCs and many of them follow a systematic approach in providing reviews (Kennedy, 2014). A review of MOOC effectiveness from learner’s perspective using grounded theory methodology was found by (Gamage, Perera and Fernando, 2015) and a review of pedagogical models explained by experiencing 12 MOOCs explained by (Bali, 2014). It is evidence that many MOOC experience reviews in participants’ perspective has been shared by many researchers (Cross, 2013), (Guàrdia, Maina, & Sangrà, 2013), (Zutshi, O'Hare, & Rodafinos, 2013). Pedagogy of the MOOCs are concern by some researchers (Bali, 2014) (Bates, 2014) (Daniel, 2012) (Downes, 2013), but according to (Glance, Forsey, & Riley, 2013), MOOC has a sound pedagogy. Daniel (2012) specially argues that MOOC is following the traditional didactic pedagogy which faces many problems itself. However, there were no evidence of research which consider review rates of MOOCs to consider the effective pedagogical approaches. 3. Methodology In order to explore the best practiced pedagogical models of the MOOCs, we analyzed MOOC reviews and rates. The reviews were extracted data from an external platform Class Central. For many years it has assist students to find courses they desire to take from reputable MOOC providers (Class Central FAQs, 2016). Since it is independednt of the MOOC providers, the reviews in Class Central has equal space for possive and negetive reviews. We used the content analysis method to analyze the categories and criteria for the pedagogy. Then we compared the pedagogical design in courses which has 5-star rating to 1-star rating. Our total data represent more than 4000 MOOC courses in Class Central and sample derived from Computer Science MOOCs further filtered number of MOOC platforms and courses depending on whether there is a review on that particular course in Class Central portal because there were courses without students being reviewed or rated. This filtering resulted 137 courses from Cousera, edX, FutureLearn, Udacity, Iversity, Canvas and few Independent MOOCs platforms from Universities. In order to analysis the content of the reviews, we used content analysis tool which is a widely used qualitative research technique and in this research. We performed content analysis to the descriptions in the reviews by students in order to identify effective pedagogical patterns.
4. Results and Conclusion First, the Class Central rates were analyzed. The 136 courses in total distributed in start rates 1 to 5. Figure 3 depicts the frequency chart of the star rate.
301301301
Figure 3. The Class Central star rate distribution in the MOOCs Computer Science courses
In the content analysis, we found that the students did not review about learner empowerment, collaborative learning, social networking, peer assistance, quality knowledge creation, interest groups, assessment and peer feedback or any codes which we benchmarked to provide effective pedagogy. However, we found that students are highly reviewing about the course content, the instructor and assessments. The courses which had review star rates between 1-3 mostly had confusing course materials, Technical problems, less interactions while star rates of 4-5 had content which is easy to navigate & digest, it was fun and interactive, flexible scheduling, apply real world examples and connection. 5. Conclusion and Future work In this research, we analyzed the star rates given by student to the MOOCs which explains their experience in taking the MOOC, so it will help the rest students to take decisions in selecting MOOCs. It is critical that institutions that create courses in MOOC platforms need to pay attention to what students really experience from MOOCs than just creating a MOOC for the sake of publicity. The research found MOOC pedagogical model followed by 5 star rated courses to 1 star rated courses has less variances which means, the pedagogy is very similar to each other in courses. This also resulted the typical MOOC pedagogical structure which has been following by many universities has not much impact on the effectiveness of MOOCs. However, we found that students pay attention to “Content” and “Institution/ Instructor” flow of the instructional design and those themes been highly reviewed. References Bali, M. (2014). MOOC Pedagogy: Gleaning Good Practice from Existing MOOCs. Journal of Online Teaching
and Learning (JOLT), 10(1), 44-57. Bates, T. (2014). MOOCs: getting to know you better. Distance Education, 35(2), 145-148. Class Central FAQs. (2016). Retrieved 5 10, 2016, from Class Central: https://www.class-central.com/faq Cross, S. (2013). Evaluation of the OLDS MOOC curriculum design course: participant perspectives,
expectations and experiences. eLearning Papers. Daniel, J. (2012). Making sense of MOOCs: Musings in a maze of myth, paradox and possibility. Journal of
Interactive Media in Education. Downes, S. (2013). Retrieved from The Quality of Massive Open Online:
http://mooc.efquel.org/week-2-the-quality-of-massiveopen-online-courses-by-stephen-downes Gaebel, M. (2014). MOOCs: Massive open online courses. . EUA. Gamage, D.,Perera, I., Fernando, S. (2016). Evaluating effectiveness of MOOCs using empirical tools: learners perspective. In preceedings 10th annual International Technology Education and Development Conference, Valencia, Spain. Glance, D. G., Forsey, M., & Riley, M. (2013). The pedagogical foundations of massive open online courses. First
Monday, 18(5). Guàrdia, L., Maina, M., & Sangrà, A. (2013). MOOC design principles: A pedagogical approach from the
learner’s perspective. eLearning Papers, 33. Hu, N., Liu, L., & Zhang, J. J. (2008). Do online reviews affect product sales? The role of reviewer characteristics
and temporal effects. Information Technology and Management,, 9(3), 201-214. Kennedy, J. (2014). Characteristics of Massive Open Online Courses (MOOCs): A Research Review, 2009-2012.
Journal of Interactive Online Learning, 13(1). Pappano, L. (2012). The Year of the MOOC. New York: New York Times. Zutshi, S., O'Hare, S., & Rodafinos, A. (2013). Experiences in MOOCs: The perspective of students. . American
Journal of Distance Education, 218-227.
302302302
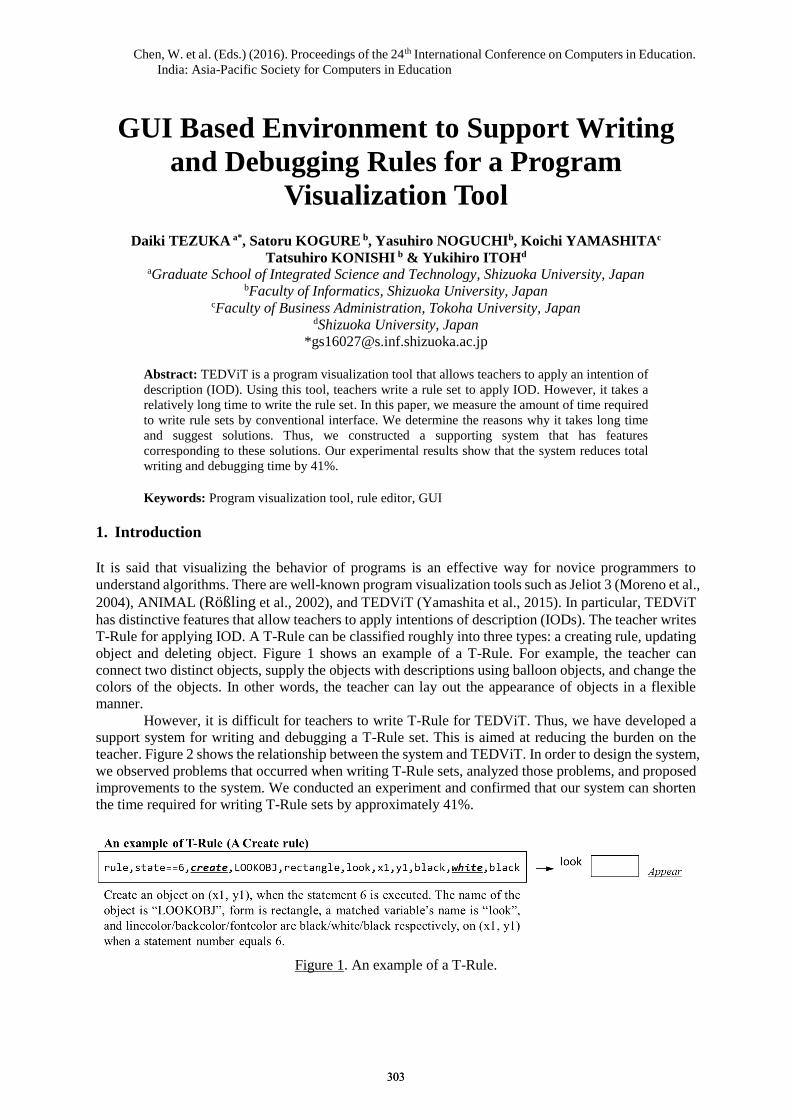
Chen, W. et al. (Eds.) (2016). Proceedings of the 24th International Conference on Computers in Education.
India: Asia-Pacific Society for Computers in Education
GUI Based Environment to Support Writing
and Debugging Rules for a Program
Visualization Tool
Daiki TEZUKA a*, Satoru KOGURE b, Yasuhiro NOGUCHIb, Koichi YAMASHITAc
Tatsuhiro KONISHI b & Yukihiro ITOHd aGraduate School of Integrated Science and Technology, Shizuoka University, Japan
bFaculty of Informatics, Shizuoka University, Japan cFaculty of Business Administration, Tokoha University, Japan
dShizuoka University, Japan
Abstract: TEDViT is a program visualization tool that allows teachers to apply an intention of
description (IOD). Using this tool, teachers write a rule set to apply IOD. However, it takes a
relatively long time to write the rule set. In this paper, we measure the amount of time required
to write rule sets by conventional interface. We determine the reasons why it takes long time
and suggest solutions. Thus, we constructed a supporting system that has features
corresponding to these solutions. Our experimental results show that the system reduces total
writing and debugging time by 41%.
Keywords: Program visualization tool, rule editor, GUI
1. Introduction
It is said that visualizing the behavior of programs is an effective way for novice programmers to
understand algorithms. There are well-known program visualization tools such as Jeliot 3 (Moreno et al.,
2004), ANIMAL (Rößling et al., 2002), and TEDViT (Yamashita et al., 2015). In particular, TEDViT
has distinctive features that allow teachers to apply intentions of description (IODs). The teacher writes
T-Rule for applying IOD. A T-Rule can be classified roughly into three types: a creating rule, updating
object and deleting object. Figure 1 shows an example of a T-Rule. For example, the teacher can
connect two distinct objects, supply the objects with descriptions using balloon objects, and change the
colors of the objects. In other words, the teacher can lay out the appearance of objects in a flexible
manner.
However, it is difficult for teachers to write T-Rule for TEDViT. Thus, we have developed a
support system for writing and debugging a T-Rule set. This is aimed at reducing the burden on the
teacher. Figure 2 shows the relationship between the system and TEDViT. In order to design the system,
we observed problems that occurred when writing T-Rule sets, analyzed those problems, and proposed
improvements to the system. We conducted an experiment and confirmed that our system can shorten
the time required for writing T-Rule sets by approximately 41%.
Figure 1. An example of a T-Rule.
303303
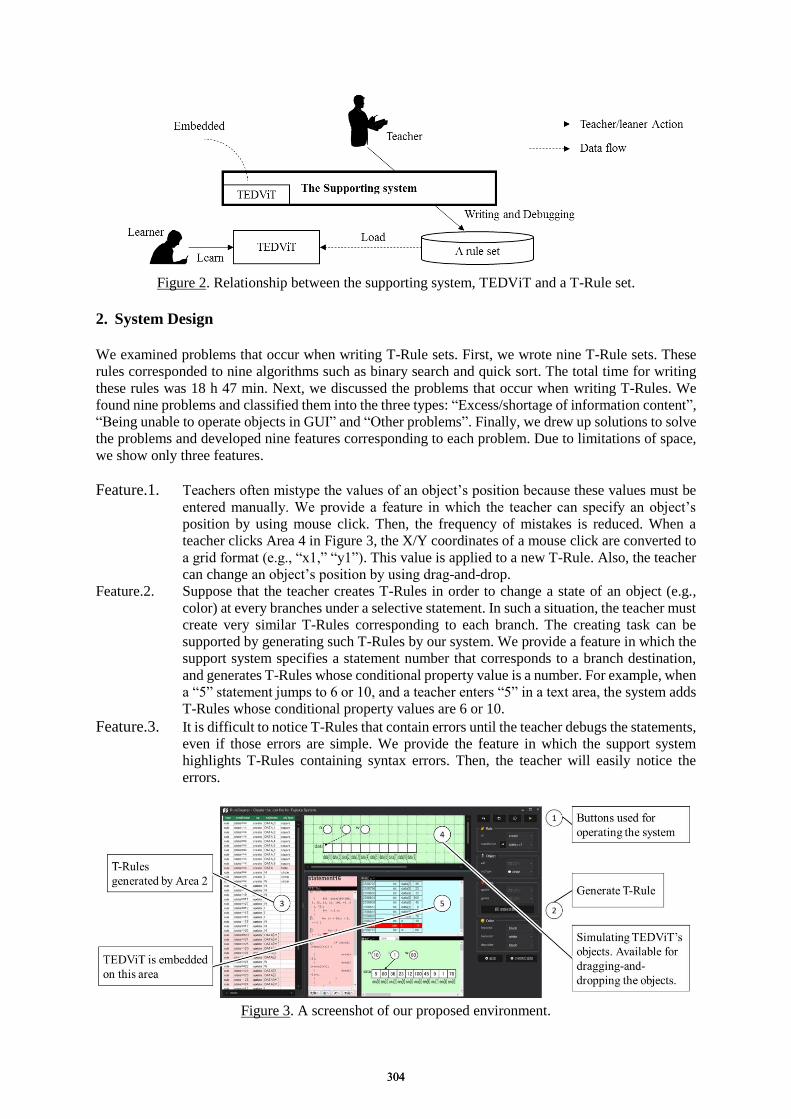
Figure 2. Relationship between the supporting system, TEDViT and a T-Rule set.
2. System Design
We examined problems that occur when writing T-Rule sets. First, we wrote nine T-Rule sets. These
rules corresponded to nine algorithms such as binary search and quick sort. The total time for writing
these rules was 18 h 47 min. Next, we discussed the problems that occur when writing T-Rules. We
found nine problems and classified them into the three types: “Excess/shortage of information content”,
“Being unable to operate objects in GUI” and “Other problems”. Finally, we drew up solutions to solve
the problems and developed nine features corresponding to each problem. Due to limitations of space,
we show only three features.
Feature.1. Teachers often mistype the values of an object’s position because these values must be
entered manually. We provide a feature in which the teacher can specify an object’s
position by using mouse click. Then, the frequency of mistakes is reduced. When a
teacher clicks Area 4 in Figure 3, the X/Y coordinates of a mouse click are converted to
a grid format (e.g., “x1,” “y1”). This value is applied to a new T-Rule. Also, the teacher
can change an object’s position by using drag-and-drop. Feature.2. Suppose that the teacher creates T-Rules in order to change a state of an object (e.g.,
color) at every branches under a selective statement. In such a situation, the teacher must
create very similar T-Rules corresponding to each branch. The creating task can be
supported by generating such T-Rules by our system. We provide a feature in which the
support system specifies a statement number that corresponds to a branch destination,
and generates T-Rules whose conditional property value is a number. For example, when
a “5” statement jumps to 6 or 10, and a teacher enters “5” in a text area, the system adds
T-Rules whose conditional property values are 6 or 10.
Feature.3. It is difficult to notice T-Rules that contain errors until the teacher debugs the statements,
even if those errors are simple. We provide the feature in which the support system
highlights T-Rules containing syntax errors. Then, the teacher will easily notice the
errors.
Figure 3. A screenshot of our proposed environment.
304304
We developed the support system using C# language and .NET Framework, which is a software
platform developed by Microsoft. A teacher can complete writing and debugging T-Rule sets with only
this system. Figure 3 shows a screenshot of the system.
3. Experimental Evaluation
We gathered 8 subjects who have been experienced a teaching assistant of programming class. First, we
instructed the subject to write a T-Rule set that behaves like a model T-Rule that we prepared. The
model T-Rule is written such that it contains all types of objects that the teacher can use. We explained
how to use the support system to each subject. These instructions took approximately 1 h. Then, the
subjects start writing and debugging T-Rule sets. Themes for writing and debugging the T-Rule set are
“Determining a maximum value” (Theme A) and “Linear search” (Theme B). Each subject wrote and
debugged T-Rule sets for the different themes. 4 subjects wrote and debugged T-Rule sets for theme A
with our system and for theme B without the system. The other 4 subjects are vice versa.
Table 1 shows all subjects’ total time of writing and debugging T-Rule sets. The value in
“Ratio” column shows that our supporting system reduces by 41% of total time. However, the number
of subjects was limited.
Table 1: Total time of writing and debugging a T-Rule set.
Theme A Theme B Total Ratio
With system 1 h 55 min 2 h 54 min 4 h 49 min 0.59 : 1
Without System 4 h 07 min 4 h 02 min 8 h 09 min
4. Conclusion
In this paper, we developed a system to reduce the time spent on writing and debugging a T-Rule set.
The results of our experiments suggest that the system can reduce that time. Also, we used a
questionnaire to ask for the subjects’ impressions after using the system. According to subjects’
opinions in the questionnaire, the features of the system is effective. Going forward, we will improve
the system based on the results of a questionnaire and teachers’ opinions.
Acknowledgements
This study was supported by Japanese Grant-in-Aid for Scientific Research (B) 24300282.
References
Moreno, N., Sutinen, M. E.. (2004). Visualizing programs with Jeliot 3. AVI 04: Proceedings of the Working
Conference on Advanced Visual Interfaces, 373–376.
Rößling, G., Freisleben, B. (2002). ANIMAL: A system for supporting multiple roles in algorithm animation.
Journal of Visual Languages & Computing, 341–354.
K. Yamashita, R. Fujioka, S. Kogure, Y. Noguchi, T. Konishi, Y. Itoh. (2015). Educational Practice of Algorithm
using Learning Support System with Visualization of Program Behavior. Proceedings of the 23rd
International Conference on Computers in Education, 632-640.
305305
Chen, W. et al. (Eds.) (2016). Proceedings of the 24th International Conference on Computers in Education. India: Asia-Pacific Society for Computers in Education
Learning Analytics in Ubiquitous Learning Environments: Self-Regulated Learning
Perspective Masanori YAMADAa*, Fumiya OKUBOa, Misato OIa, Atsushi SHIMADAa,
Kentaro KOJIMAa & Hiroaki OGATAa aFaculty of Arts and Science, Kyushu University, Japan
Abstract: This research aims to investigate the relationship between self-regulated learning awareness, learning behaviors, and learning performance in ubiquitous learning environments. In order to do so, psychometric data about self-regulated learning and log data such as marker, annotation, accessing device types that stored the learning management system were collected and analyzed using multiple regression analysis with stepwise method. The results indicated that self-efficacy, internal value, and the number of read slides had a significant influence on the final score, and the awareness of cognitive learning strategy use has slightly significant power to predict the final score.
Keywords: Learning Analytics, Self-Regulated Learning, Ubiquitous Learning
1. Introduction
As information and communication technology (ICT) advances, data collection is taking place through various methods, in particular, ubiquitous technologies (Yin et al., 2015). From the learner’s perspective, ubiquitous technologies allow for learning to happen anytime and anywhere, and allow the collection of learning log data out of class hours. However, psychometric data such as learning style and motivation as well as learning logs should be collected, in order to analyze learners’ behaviors for providing effective learning support. Awareness of Self-regulated learning (SRL), which is one of the most important perspectives in educational research, is found to be helpful. This paper aims to investigate the learning behavior and SRL factor(s) that influence learning performance, examining the relationship between learning behaviors, SRL factors, and learning performance.
2. Review of previous research
2.1 Self-regulated learning
In using ICT, learners can control when, what, and how they learn, without the restrictions of time, learning space, and printed materials (Cunningham and Billingsley, 2003). One of the most popular platforms worldwide, the Learning Management System (LMS) offers the opportunity to learn outside class using the Internet. To exercise control in online learning, learners have to develop self-regulated learning (SRL) skills (Yukselturk and Bulut, 2007). SRL is the active learning process used to regulate and monitor learning cognition, motivation, and behavior, and to set personal learning goals, including social aspects (Wolters, Pintrich and Karabenick, 2003; Schunk and Zimmerman, 2008). Goda et al. (2013) conducted research about the relationship between SRL and learning performance. Goda et al. (2013) suggested that one of the SRL skills is adaptive help seeking, which leads to better academic performance. They concluded that a sense of seeking help can be useful in predicting learners’ academic performance.
SRL is also related to motivation, cognition, and self-control, as it is directed toward the accomplishment of learning purposes (Pintrich, 1999; Zimmerman, 1995). SR learners are those who can prepare a learning plan, adjust it, and apply self-control and self-evaluation (Deci, Ryan, and
306306

Williams, 1996). Goda, Yamada, Kato, Matsuda, Saito, and Miyagawa (2015) suggested that high-level SR learners can control and manage their learning plan in the context of their everyday lives. SRL is closely linked to the concept of autonomy, particularly in the aspects of metacognition, motivation, and learning behavior (Schunk and Zimmerman, 1998; Zimmerman, 1986), which enables learners themselves to take responsibility for learning. SRL skills are essential for effective and continuous learning.
Wolters et al. (2003) organized SRL into four phases: forethought (planning and activation), monitoring, control, as well as reaction and self-reflection (see Table 1). Several studies have suggested that the second and third phases can happen simultaneously (Pintrich, Wolters, and Baxter, 2000). Schunk and Zimmerman (1998) developed a similar model for SRL, which comprises three phases: forethought, performance/volitional, and self-reflection (see Figure. 1).
Table 1: Differences between naïve and skillful SRLs (Schunk and Zimmerman, 1998)
Classes of self-regulated learners Self-regulatory phases Naïve self-regulators Skillful self-regulators Forethought Nonspecific, distal goals Specific, hierarchical goals
Performance goal orientation
Learning goal orientation
Low self-efficacy High self-efficacy Disinterested Intrinsically interested
Performance/volitional control
Unfocused plan Focused on performance Self-handicapping strategies Self-instruction/imagery Outcome self-monitoring Process self-monitoring
Self-reflection Avoid self-evaluation Seeking self-evaluation Ability attributions Strategy/practice attributions Negative self-reactions Positive self-reactions Nonadaptive Adaptive
Figure 1. SRL cycle (Zimmerman, 1988)
Schunk and Zimmerman (1998) further compared the learning behaviors of novice and expert SRL learners in each SRL phase (see Table 1). In the forethought phase, skillful learners could articulate their final goals, as well as the necessary steps toward accomplishing the same. The features of both the goal and the steps toward it were constructive and clear. Skillful learners also tended to have internal motivation and high self-efficacy. In the performance/volitional phase, skillful learners enhanced their learning by monitoring the learning process. In the self-reflection phase, they sought to evaluate their learning performance independently and tended to attribute its quality to learning strategies and
307307
practice. The SRL features of the skillful learners in each phase support learning processes by helping teachers predict learning styles and learning performance.
2.2 SRL in a computer-based learning environment
Previous SRL research has focused mainly on the face-to-face classroom setting, but several scholars have also conducted studies on the computer-assisted learning environment (e.g., Azevedo, 2005). Recent research is focusing on SRL in an ICT-based learning environment, as ICTs are now used in education and learning settings. Attitudes towards the use of ICT affect SRL. Usta (2011) indicated that a negative attitude toward ICT use has a positive relationship with goal setting, time management, help-seeking, and self-regulation. Greene and Azevedo (2010) indicated that learners who do well in an ICT-based environment can manage their learning using cognitive and metacognitive processes, such as ensuring the effectiveness of learning strategies, setting learning objectives, and self-monitoring. Greene, Muis and Pieschl (2010) reviewed learning support in four types of ICT-based learning environments. One is behaviorism, such as drill and practice, in which the same questions are asked and answered repeatedly, followed by the reception of the same feedback. The second is an adaptive or intelligent tutoring system, which supports the activation of metacognition and information retrieval. The third is hypertext and hypermedia, which allow the organization of digital learning materials using linked information. Hypertext and hypermedia work as open-learning material databases. The last one is simulation, which supports cognitive and metacognitive learning, such as information organization, hypothesizing, observation, and learning output. As such, an ICT-based learning environment supports SRL skill acquisition by indirectly promoting the use of cognitive and metacognitive learning strategies.
2.3 Learning Analytics
Learning analytics have been the subject of attention in educational research over the world, as the findings of learning analytics studies can be applied to improve education, create learning supports, establish learning models, and so on (Yin et al., 2015). One of the key issues in learning analytics is to collect learning logs using ICT. As ICT advances, the methods of data collection have been various, and in particular, the focus here is on ubiquitous technologies. Ubiquitous technology can enhance the awareness and behaviors about SRL, because ubiquitous technology allows learner to access learning materials anywhere and anytime. Yamada et al. (2011) developed mobile-based language learning environment for business people, in order to the business people to learning English listening skills in their commuting time. Sha et al. (2012) developed the mobile based learning program for elementary science classes from the perspective of SRL.
Oi et al. (2015) investigated the relationship between the learning performance and the frequency of link among pages in learning materials using logs. The results revealed that good-achievement learners tended to link the pages and knowledge with learning materials. Goda et al. (2015) identified seven distinct learning behavior types using learning logs, 1: procrastination, 2: learning habit, 3: random, 4: diminished drive, 5: early bird, 6: chevron, and 7: catch-up. They revealed that the students who had the learning habit type and chevron type gained better scores than the procrastination type.
One of the common issues under discussion is how psychological variables affect learning performance in a learning environment using ICT (Greene and Azevedo, 2010). Psychometric data as well as learning logs should be collected, in order to analyze learners’ behaviors for effective learning support, and in particular, learning styles such as self-regulated learning (SRL) should be helpful (Roll and Winne, 2015). Yamada et al. (2015) indicated that self-efficacy, which is one of the factors of SRL, had significant correlation with learning behaviors such as highlighting and annotation. However, their limited research did not investigate the causal relationships between SRL and learning behaviors. If a relationship between self-regulated learning and learning behaviors is found, the results may be used to support learners effectively.
308308
2.4 Research purpose Reviewing the previous research, analysis about the relationship between SRL and learning behaviors needs to be conducted, in order to support teaching and learning. However, log types were limited, and the relationship between SRL awareness and learning behaviors was unclear. From the viewpoint of learning analytics, various log types for the analysis need to be considered for the support of teaching and learning. This research aims to investigate the relationship between SRL factors, learning behaviors, and learning performance, in particular, learning behaviors about cognitive learning strategies such as marker and annotation, accessing days, and accessing device type. 3. Method 3.1 Participants and Class This research was conducted in an information technology course (15-week course). The participants were 93 freshman university students. The teacher distributed digital learning materials to the students with the use of digital learning material reader (DLMR) in ubiquitous learning environments, and encouraged the students to read the materials in advance, before the commencement of every class. DLMR allowed the students to access the learning materials on devices such as laptops, tablets, and smartphones, and to use marking and annotation functions, whenever and wherever Internet was available. In class, learners were engaged in programming practice, after the comprehension test in every class. Figure 2 shows the several interface capture of DLMR. The students were required to answer questionnaires before the first class (pre questionnaire) and at the end of the last class (post questionnaire). 3.2 Data Collection and Analysis Two methods were used for the data collection: a questionnaire and log. The Motivated Strategies and Learning Questionnaire (MSLQ) (Pintrich and DeGroot, 1990), which consists of five factors (Self-Efficacy: SE, Internal Value: IV, Cognitive Strategies: CS, Self-Regulation: SR, Test Anxiety: TA; 44 items in sum, rated on a seven-point Likert scale from 1(negative) to 7(positive)), was used for the subjective evaluation of learners’ SRL skills. Items in MSLQ were displayed in Appendix. A.
The students were asked to complete the MSLQ both before and after the classes. The differences between their responses on the pre and post questionnaires were analyzed. The second method of data collection was a log that recorded the number of slide pages that learners read, and their marking and annotation behaviors. The number of transactions from both laptops and portable devices, and the accessed days were also recorded. The final score is the learning performance. 4. Results 4.1 Descriptive data The collected data indicates the number 90, as those who answered pre- and post MSLQ. Tables 2 and 3 show the descriptive data and the results of t-test of MSLQ (mean of sum-up score in each factor), learning behaviors (frequency in 15-week), and the final score. The results of paired t-test show the significant difference between pre- and post scores of MSLQ in SE.
In order to investigate the relationship between each SRL factor, learning behaviors, and final score, stepwise multiple regression analysis was conducted, setting the final score as dependent valuable, and the difference between pre- and post-scores of each MSLQ factor and learning behaviors as independent valuables. This point will be explained in the next section.
4.2 Multiple Regression Analysis In order to investigate the effects of SRL factors and learning behaviors on learning performance, we conducted multiple regression analysis with stepwise methods. We set the final test score as dependent variable, and other factors and learning behaviors as independent variables. This analysis
309309
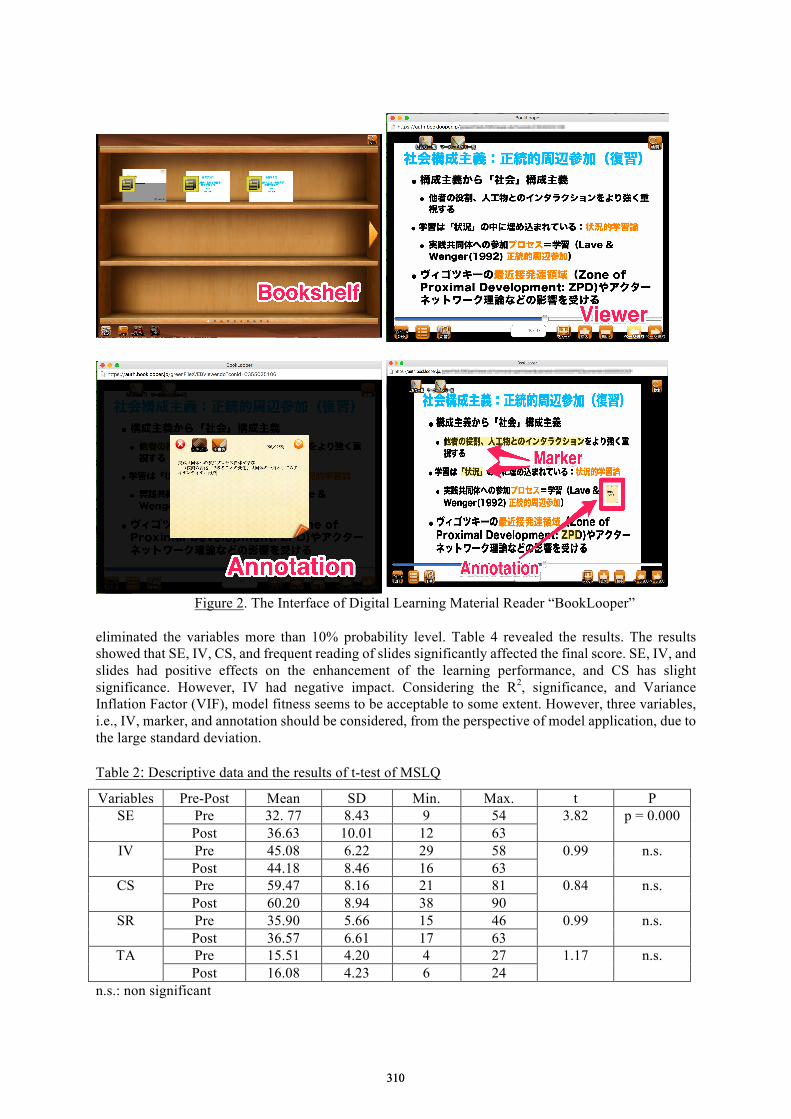
Figure 2. The Interface of Digital Learning Material Reader “BookLooper”
eliminated the variables more than 10% probability level. Table 4 revealed the results. The results showed that SE, IV, CS, and frequent reading of slides significantly affected the final score. SE, IV, and slides had positive effects on the enhancement of the learning performance, and CS has slight significance. However, IV had negative impact. Considering the R2, significance, and Variance Inflation Factor (VIF), model fitness seems to be acceptable to some extent. However, three variables, i.e., IV, marker, and annotation should be considered, from the perspective of model application, due to the large standard deviation. Table 2: Descriptive data and the results of t-test of MSLQ
Variables Pre-Post Mean SD Min. Max. t P SE Pre 32. 77 8.43 9 54 3.82 p = 0.000
Post 36.63 10.01 12 63 IV Pre 45.08 6.22 29 58 0.99 n.s.
Post 44.18 8.46 16 63 CS Pre 59.47 8.16 21 81 0.84 n.s.
Post 60.20 8.94 38 90 SR Pre 35.90 5.66 15 46 0.99 n.s.
Post 36.57 6.61 17 63 TA Pre 15.51 4.20 4 27 1.17 n.s.
Post 16.08 4.23 6 24 n.s.: non significant
310310
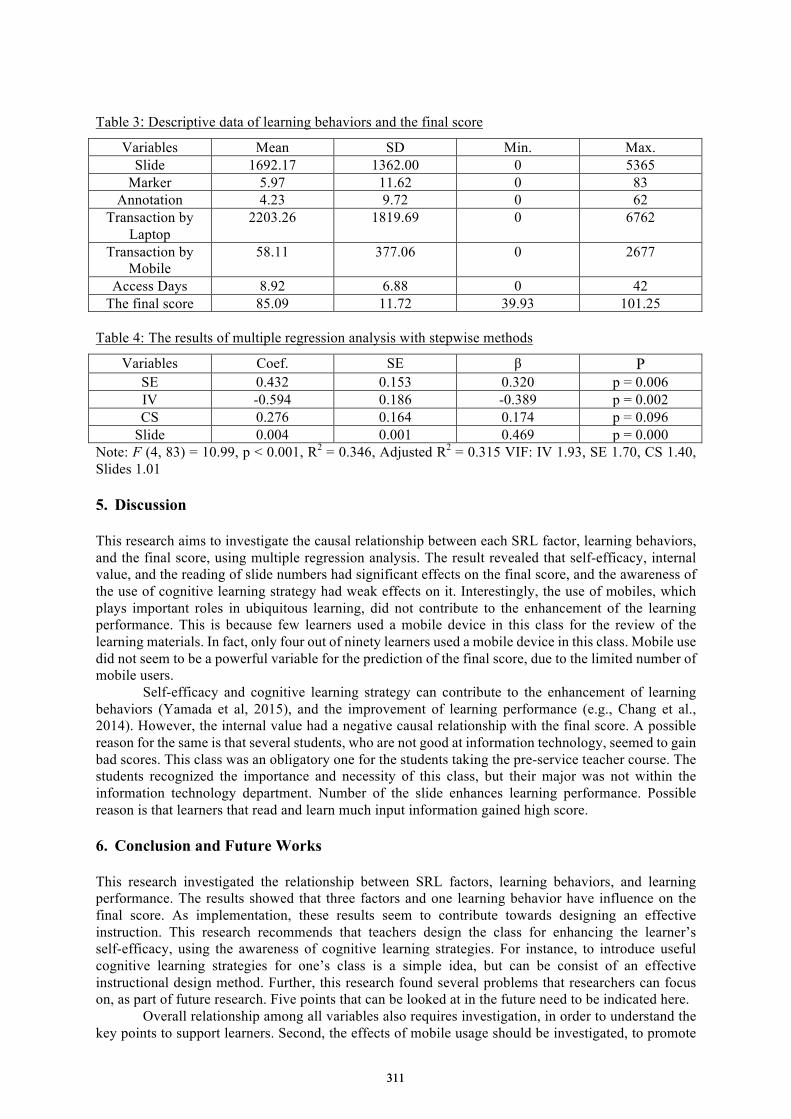
Table 3: Descriptive data of learning behaviors and the final score
Variables Mean SD Min. Max. Slide 1692.17 1362.00 0 5365
Marker 5.97 11.62 0 83 Annotation 4.23 9.72 0 62
Transaction by Laptop
2203.26 1819.69 0 6762
Transaction by Mobile
58.11 377.06 0 2677
Access Days 8.92 6.88 0 42 The final score 85.09 11.72 39.93 101.25
Table 4: The results of multiple regression analysis with stepwise methods
Variables Coef. SE β P SE 0.432 0.153 0.320 p = 0.006 IV -0.594 0.186 -0.389 p = 0.002 CS 0.276 0.164 0.174 p = 0.096
Slide 0.004 0.001 0.469 p = 0.000 Note: F (4, 83) = 10.99, p < 0.001, R2 = 0.346, Adjusted R2 = 0.315 VIF: IV 1.93, SE 1.70, CS 1.40, Slides 1.01
5. Discussion
This research aims to investigate the causal relationship between each SRL factor, learning behaviors, and the final score, using multiple regression analysis. The result revealed that self-efficacy, internal value, and the reading of slide numbers had significant effects on the final score, and the awareness of the use of cognitive learning strategy had weak effects on it. Interestingly, the use of mobiles, which plays important roles in ubiquitous learning, did not contribute to the enhancement of the learning performance. This is because few learners used a mobile device in this class for the review of the learning materials. In fact, only four out of ninety learners used a mobile device in this class. Mobile use did not seem to be a powerful variable for the prediction of the final score, due to the limited number of mobile users.
Self-efficacy and cognitive learning strategy can contribute to the enhancement of learning behaviors (Yamada et al, 2015), and the improvement of learning performance (e.g., Chang et al., 2014). However, the internal value had a negative causal relationship with the final score. A possible reason for the same is that several students, who are not good at information technology, seemed to gain bad scores. This class was an obligatory one for the students taking the pre-service teacher course. The students recognized the importance and necessity of this class, but their major was not within the information technology department. Number of the slide enhances learning performance. Possible reason is that learners that read and learn much input information gained high score.
6. Conclusion and Future Works
This research investigated the relationship between SRL factors, learning behaviors, and learning performance. The results showed that three factors and one learning behavior have influence on the final score. As implementation, these results seem to contribute towards designing an effective instruction. This research recommends that teachers design the class for enhancing the learner’s self-efficacy, using the awareness of cognitive learning strategies. For instance, to introduce useful cognitive learning strategies for one’s class is a simple idea, but can be consist of an effective instructional design method. Further, this research found several problems that researchers can focus on, as part of future research. Five points that can be looked at in the future need to be indicated here.
Overall relationship among all variables also requires investigation, in order to understand the key points to support learners. Second, the effects of mobile usage should be investigated, to promote
311311
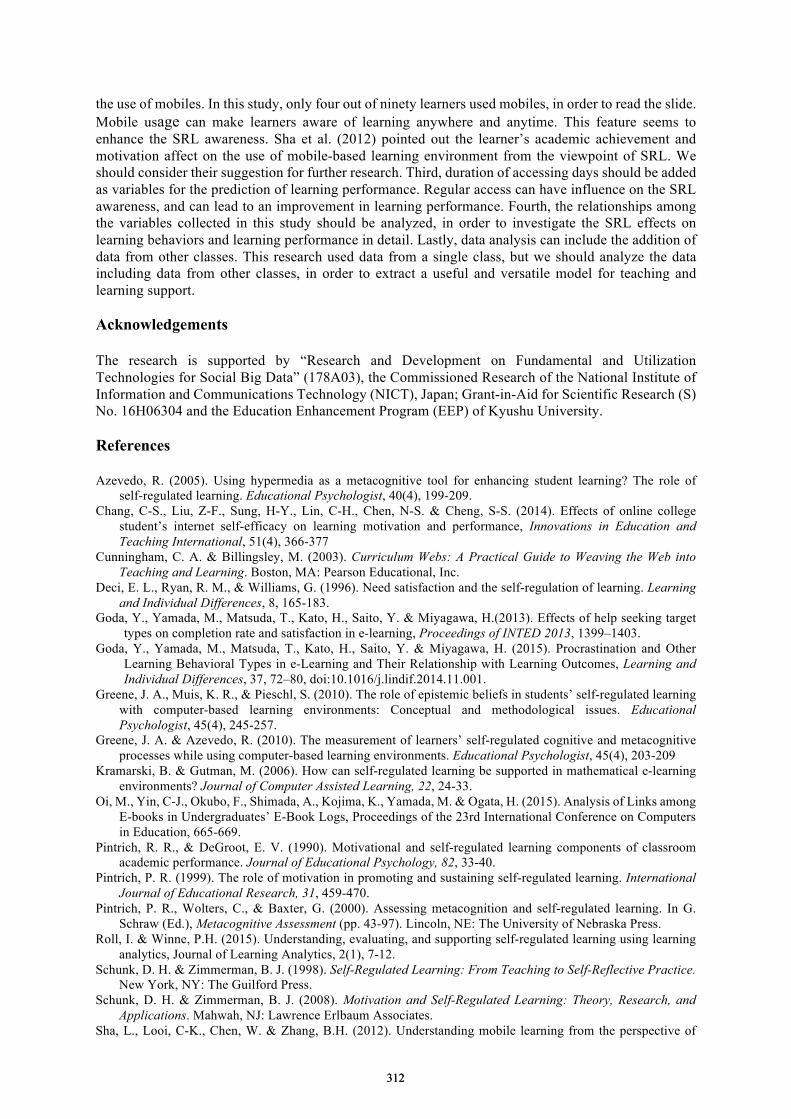
the use of mobiles. In this study, only four out of ninety learners used mobiles, in order to read the slide. Mobile usage can make learners aware of learning anywhere and anytime. This feature seems to enhance the SRL awareness. Sha et al. (2012) pointed out the learner’s academic achievement and motivation affect on the use of mobile-based learning environment from the viewpoint of SRL. We should consider their suggestion for further research. Third, duration of accessing days should be added as variables for the prediction of learning performance. Regular access can have influence on the SRL awareness, and can lead to an improvement in learning performance. Fourth, the relationships among the variables collected in this study should be analyzed, in order to investigate the SRL effects on learning behaviors and learning performance in detail. Lastly, data analysis can include the addition of data from other classes. This research used data from a single class, but we should analyze the data including data from other classes, in order to extract a useful and versatile model for teaching and learning support.
Acknowledgements
The research is supported by “Research and Development on Fundamental and Utilization Technologies for Social Big Data” (178A03), the Commissioned Research of the National Institute of Information and Communications Technology (NICT), Japan; Grant-in-Aid for Scientific Research (S) No. 16H06304 and the Education Enhancement Program (EEP) of Kyushu University.
References
Azevedo, R. (2005). Using hypermedia as a metacognitive tool for enhancing student learning? The role of self-regulated learning. Educational Psychologist, 40(4), 199-209.
Chang, C-S., Liu, Z-F., Sung, H-Y., Lin, C-H., Chen, N-S. & Cheng, S-S. (2014). Effects of online college student’s internet self-efficacy on learning motivation and performance, Innovations in Education and Teaching International, 51(4), 366-377
Cunningham, C. A. & Billingsley, M. (2003). Curriculum Webs: A Practical Guide to Weaving the Web into Teaching and Learning. Boston, MA: Pearson Educational, Inc.
Deci, E. L., Ryan, R. M., & Williams, G. (1996). Need satisfaction and the self-regulation of learning. Learning and Individual Differences, 8, 165-183.
Goda, Y., Yamada, M., Matsuda, T., Kato, H., Saito, Y. & Miyagawa, H.(2013). Effects of help seeking target types on completion rate and satisfaction in e-learning, Proceedings of INTED 2013, 1399–1403.
Goda, Y., Yamada, M., Matsuda, T., Kato, H., Saito, Y. & Miyagawa, H. (2015). Procrastination and Other Learning Behavioral Types in e-Learning and Their Relationship with Learning Outcomes, Learning and Individual Differences, 37, 72–80, doi:10.1016/j.lindif.2014.11.001.
Greene, J. A., Muis, K. R., & Pieschl, S. (2010). The role of epistemic beliefs in students’ self-regulated learning with computer-based learning environments: Conceptual and methodological issues. Educational Psychologist, 45(4), 245-257.
Greene, J. A. & Azevedo, R. (2010). The measurement of learners’ self-regulated cognitive and metacognitive processes while using computer-based learning environments. Educational Psychologist, 45(4), 203-209
Kramarski, B. & Gutman, M. (2006). How can self-regulated learning be supported in mathematical e-learning environments? Journal of Computer Assisted Learning, 22, 24-33.
Oi, M., Yin, C-J., Okubo, F., Shimada, A., Kojima, K., Yamada, M. & Ogata, H. (2015). Analysis of Links among E-books in Undergraduates’ E-Book Logs, Proceedings of the 23rd International Conference on Computersin Education, 665-669.
Pintrich, R. R., & DeGroot, E. V. (1990). Motivational and self-regulated learning components of classroom academic performance. Journal of Educational Psychology, 82, 33-40.
Pintrich, P. R. (1999). The role of motivation in promoting and sustaining self-regulated learning. International Journal of Educational Research, 31, 459-470.
Pintrich, P. R., Wolters, C., & Baxter, G. (2000). Assessing metacognition and self-regulated learning. In G. Schraw (Ed.), Metacognitive Assessment (pp. 43-97). Lincoln, NE: The University of Nebraska Press.
Roll, I. & Winne, P.H. (2015). Understanding, evaluating, and supporting self-regulated learning using learning analytics, Journal of Learning Analytics, 2(1), 7-12.
Schunk, D. H. & Zimmerman, B. J. (1998). Self-Regulated Learning: From Teaching to Self-Reflective Practice. New York, NY: The Guilford Press.
Schunk, D. H. & Zimmerman, B. J. (2008). Motivation and Self-Regulated Learning: Theory, Research, and Applications. Mahwah, NJ: Lawrence Erlbaum Associates.
Sha, L., Looi, C-K., Chen, W. & Zhang, B.H. (2012). Understanding mobile learning from the perspective of
312312

self-regulated learning, Journal of Computer Assisted Learning, 28, 366-378. Usta, E. (2011). The examination of online self-regulated learning skills in web-based learning environments in
terms of different variables. The Turkish Online Journal of Educational Technology, 10(3), 276-286. Wolters, C. A., Pintrich, P. R., & Karabenick, S. A. (2003). Assessing academic self-regulated learning. Paper
prepared for the Conference on Indicators of Positive Development: Definitions, Measures, and Prospective Validity. Sponsored by ChildTrends: National Institutes of Health.
Yamada, M., Yin, C-J., Shimada, A., Kojima, K., Okubo, F. & Ogata, H. (2015). Preliminary Research on Self-Regulated Learning and Learning Logs in a Ubiquitous Learning Environment, Proceedings of the 15th IEEE International Conference on Advanced Learning Technologies(ICALT 2015), 93-95
Yamada, M., Kitamura, S., Shimada, N., Utashiro, T., Shigeta, K., Yamaguchi, E.,Harrison, R, Yamauchi, Y. & Nakahara, J. (2011). Development and evaluation of English listening study materials for business people who use mobile devices: A case study, CALICO Journal, 29(1), 44-66.
Yin, C-J., Okubo, F., Shimada, A., Kojima, K., Yamada, M., Fujimura, N. & Ogata, H. (2014). Smart phone based data collecting system for analyzing learning behaviors, Proceedings of International Conference of Computers on Education 2014, 575–577.
Yukselturk, E. & Bulut, S. (2007). Predictors for student success in an online course. Educational Technology and Society, 10(2), 71-83.
Zimmerman, B. J. (2008). Goal Settings: A key proactive source of academic self-regulation. In D. H. Schunk & B. J. Zimmerman (Eds.), Motivation and Self-Regulated Learning: Theory, Research, and Applications (pp.267-295). New York, NY: Lawrence Erlbaum Associates.
Zimmerman, B. J. (2008). Investigating Self-Regulation and Motivation: Historical Background, Methodological Developments, and Future Prospects, American Educational Research Journal, 45(1), 166-183.
313313

Appendix. A. Motivated Strategies and Learning Questionnaire (Pintrich and DeGroot, 1990)
Factor Item Self-Efficacy Compared with other students in this class, I expect to do well.
I’m certain I can understand the ideas taught in this course. I expect to do very well in this class. Compared with others in this class, I think I’m a good student. I am sure I can do an excellent job on the problems and tasks assigned for this class. I think I will receive a good grade in this class. My study skills are excellent compared with those of other students in this class. Compared with other students in this class, I think I know a great deal about the subject. I know that I will be able to learn the material for this class.
Intrinsic Value I prefer class work that is challenging so that I can learn new things. It is important for me to learn what is being taught in this class. I like what I am learning in this class. I think I will be able to use what I learn in this class in other classes. I often choose paper topics I will learn something from even if they require more work. Even when I do poorly on a test, I try to learn from my mistakes. I think that what I am learning in this class is useful for me to know. I think that what we are learning in this class is interesting. Understanding this subject is important to me.
Test Anxiety I am so nervous during a test that I cannot remember facts I have learned. I have an uneasy, upset feeling when I take a test. I worry a great deal about tests. When I take a test, I think about how poorly I am doing.
Cognitive Strategy Use
When I study for a test, I try to put together the information from class and from the book. When I do homework, I try to remember what the teacher said in class so I can answer the questions correctly. It is hard for me to decide what the main ideas are in what I read. (R) When I study, I put important ideas into my own words. I always try to understand what the teacher is saying even if it doesn’t make sense. When I study for a test, I try to remember as many facts as I can. When studying, I copy my notes to help me remember material. When I study for a test, I practice saying the important facts over and over to myself. I use what I have learned from old homework assignments and the textbook to do new assignments. When I am studying a topic, I try to make everything fit together. When I read material for this class, I say the words over and over to myself to help me remember. I outline the chapters in my book to help me study. When reading, I try to connect the things I am reading about with what I already know.
Self-Regulation I ask myself questions to make sure I know the material I have been studying. When work is hard, I either give up or study only the easy parts. (R) I work on practice exercises and answer end of chapter questions even when I don’t have to. Even when the study materials are dull and uninteresting, I keep working until I finish. Before I begin studying, I think about the things I will need to do to learn. I often find that I have been reading for class but don’t know what it is all about. (R) I find that when the teacher is talking, I think of other things and don’t really listen to what is being said. (R) When I’m reading, I stop once in a while and go over what I have read. I work hard to get a good grade even when I don’t like a class.
Note: R means reversed items
314314
Chen, W. et al. (Eds.) (2016). Proceedings of the 24th
International Conference on Computers in Education.
India: Asia-Pacific Society for Computers in Education
Visualization for Analyzing Learning Logs in
the Seamless Learning Environment
Kousuke Mouria*
, Hiroaki Ogatab , Mahiro Kiyota
c & Noriko Uosaki
d
a,b,cFaculty of Arts and Science and the Graduate School of Information Science and Electrical
Engineering, University of Kyushu, Japan dCenter for International Education and Exchange, Osaka University, Japan
*{mourikousuke, hiroaki.ogata, n.uosaki, mkiyota}@gmail.com
Abstract: This paper describes an innovative visualization method called Seamless Learning
Visualization (SLV). As far, several researchers have introduced in the seamless learning
environments in order to bridge formal learning over informal learning. However, their focus
was the implementation of the seamless learning environment. Our proposed SLV is to
visualize and analyze learning logs collected in the seamless learning environment. This paper
describes how our visualization method could contribute to bridging the gap between formal
and informal learning. An experiment was conducted to evaluate (1) whether SLV would be
beneficial in terms of usability in finding words in the seamless learning environment and (2)
Which visualization layout (Random layout, Force-directed layout, Yifan-multilevel layout and
SLV) is effective in supporting learning in the seamless learning environment. Fifteen
international students participated in the evaluation experiment in order to evaluate (1) and (2).
In the experiment, it was found that SLV was very beneficial in terms of usability and
effectiveness for learning than previous visualization methods.
Keywords: Seamless learning, ubiquitous learning, e-book, information visualization, learning
analytics, ubiquitous learning analytics
1. Introduction
Seamless learning is a learning notion that emphasizes the bridging of different learning efforts across a
variety of learning settings (such as formal and informal learning, individual and social learning, and
learning in physical and digital realms), by leveraging mobile and ubiquitous technologies to assist
individual students. Several researchers in the seamless learning field have pointed out that mobile and
ubiquitous technologies have enabled students to learn continuously across different contexts.
According to (Wong et al., 2015; Looi et al., 2015; Milrad et al., 2013), the main characteristics of
seamless learning are shown as follows: (1) Encompassing formal and informal learning, (2)
Encompassing personalized and social learning, (3) Across time, (4) Across locations, (5) Ubiquitous
knowledge access, (6) Encompassing physical and digital worlds, (7) Combined use of multiple device
types, (8) Seamless switching between multiple learning tasks, (9) Knowledge synthesis, (10)
Encompassing multiple pedagogical or learning activity models. One of its most important issues is how to connect formal learning with informal one, because
this is inevitable in designing both in-school and out-of-school activities in order to link what they have
learned in school with their daily life experiences and vice versa, that is to say, to connect what they
have learned in their daily lives to their experiences in class. To tackle the issues, some researchers in
the educational engineering have constructed in the seamless learning environment. For example,
Wong et al. (2014) reported a seamless learning system called MyCLOUD (My Chinese UbiquitOUs
learning Days), which allows students to learn Chinese language in both in-school and out-of-school
learning spaces. Uosaki et al. (2010) reported a seamless learning system called SMALL System
(Seamless Mobile-Assisted Language Learning support system) in order to support Japanese students
who aim to learn English language in a formal and an informal setting.
Most of these studies focused on realizing a seamless learning environment at school or
university. Once realized, the students’ learning logs have been accumulated into their server. Therefore,
315315

we contend that learning efficacy can be enhanced by visualizing their accumulated learning logs. So
far, little attention has been paid to this aspect. The issues of learning analytics based on seamless
learning are as follows:
(1) How to visualize learning logs in the seamless learning environments.
(2) How the visualization can bridge the gap between formal learning and informal learning.
To tackle these issues, this paper proposes an innovative visualization method called Seamless
Learning Visualization (SLV), which supports learners to apply their own learning experiences in a
formal setting to their own daily lives in an informal setting. This paper describes the design, the
implementation and the initial evaluation of SLV.
2. Related works
2.1 E-book-based learning analytics
As a genetic term, an electronic book (variously: e-book, eBook, e-Book, ebook, digital book or
e-edition) or a digital book is a book-publication in digital form, consisting of text, images, or both,
readable on computers or other electronic devices. Some researchers at Kyushu University in Japan
reported several analytics using a document viewer system called BookLooper. The objectives of their
studies are as follows: (1) improving of learning materials, (2) analyzing learning patterns, (3) detecting
the students’ comprehensive level, (4) predicting final grades, and (5) recommending e-books in
accordance with personalization (Yin et al, 2015; Ogata et al., 2015; Mouri et al., 2016). Also, Kiyota et
al. (2015) proposed seamless learning system with EPUB (Electronic PUBlication: one of the e-book
formats), which support international students to read contents in the e-book in a formal and in an
informal setting.
The most common idea of those projects is to visualize and analyze either collected in a formal
setting or an informal setting. However, our proposed SLV aims to visualize learning logs accumulated
in both learning environments (formal and informal setting).
2.2 Ubiquitous Learning Analytics
Ubiquitous learning has been the focus of attention in educational researches across the world. One of the characteristics of u-learning allows learners to learn anytime and anywhere by using ubiquitous technologies such as RFID tags, QR-codes, wireless communications, mobile phones and wearable computers. These types of learning include not only in-class learning (formal learning), but also a variety of out-of-class learning (informal learning) in spaces such as homes, libraries, and museums. In such learning approaches, the majority of researchers have been constructing a context-aware u-learning system, which integrated learning materials and contextual information by using ubiquitous technologies.
For example, Hwang et al. (2011) developed a context-aware ubiquitous learning system with the attached RFID tag on the plants. The application domain of their studies is nature science. When a learner arrives in front of a plant with an RFID tag, the system asks him or her questions about the plant’s features, such as its trunk, shape, and color after they received it using an RFID reader. This enables learners to understand deeply by connecting knowledge about the plant with the real life experience.
On the other hand, Ogata et al. (2014) developed their u-learning system called SCROLL (System for Capturing and Reminding of Learning Log), which allows users to share with others by recording what learners have learned in their daily lives using a web browser and mobile device anytime and anywhere. The application domain of their studies is mainly language learning. Using SCROLL, international students can learn new knowledge through their experiences in their daily life with photos, audios, and context such as location and place.
Aljohani et al. (2012) described learning analytics called Ubiquitous Learning Analytics (ULA)
in order to analyze enormous learning data, including contextual information accumulated by using
these u-learning systems. The value of the ULA is discussed by considering two possible kinds of
interactions. The first is the interaction between learners and their contexts, referred to as
learners-to-context interaction. The second is the interaction between learners and context-based
knowledge, referred to as learner-to-context-based learning materials interaction. They suggested that
316316

the use of learner contextual data can enhance the interaction between learners and their mobile devices,
and between learners and objects in their learning environments. In addition, analyzing or visualizing
contextual data has a potential to increase their learning opportunities by recommending the
relationships between knowledge and contexts. One of the issues of the ULA is how to visualize and
analyze two interactions: learners-to-context and learner-to-context-based words. With this in minds,
Mouri et al. (2014, 2015a) tackled the issues and reported visualization and analysis system called
VASCORLL. However, the focus of their studies was to visualize and analyze learning logs
accumulated in ubiquitous learning environment (informal setting). Our SLV enables learners to bridge
the gap between formal and informal learning by visualizing what they have learned in the classroom
using e-book system and what they have learned outside the classroom using SCROLL.
3. System design
We have constructed the seamless learning environment to support international students aimed at
language learning as shown in Figure 1. There are two ways of supporting learning activities in our
framework:
(1) Supporting formal learning using SCROLL with e-book system: The teachers or instructors create
e-book contents using PowerPoint and Keynote before class, and use them in their course in the
university (Step 1 in Figure 1). International students can create an account and join the course
(Step 2). After international students choose a target e-book in their course in accordance with their
language level, they can read those learning materials on their web browser using e-book system as
shown in Figure 2 (left). They can also use the e-book system before, during and after class. Their
action logs such as opening a book, bookmark, zooming, and page turning are collected into
databases. If international students do not know a word in the e-book, they can save the word using
SCROLL, and their logs are accumulated into databases.
(2) Supporting informal learning using SCROLL with e-book system: In out-of-class activity,
international students proactively observe things, grasp the meanings, review on their daily
encounters, and apply what they have learned in an informal learning to other learning situations.
For example, when international students learned how to read, write and pronounce “natto (a
traditional Japanese food made from fermented soybeans)” in the e-book system, then they can save
their experiences as learning logs using SCROLL. The learning log includes the author name,
language, time of creation, location (latitude and longitude), learning place and tags. They actually
apply it to their real-life experience at the places such as supermarkets and restaurants using
SCROLL with SLV (Step 3). In addition, when they learn a word in an informal setting, they can
find other learning materials where it is used (Step 4). It is expected to let learners have an interest
to other learning materials. The teachers and instructors watch learners’ activities such as how often
they log in, view contents, save learning logs and etc. and they can send message to encourage
inactive learners to use the system by recommending some useful learning logs (Step 5).
Figure 1. Design of the seamless learning system
317317
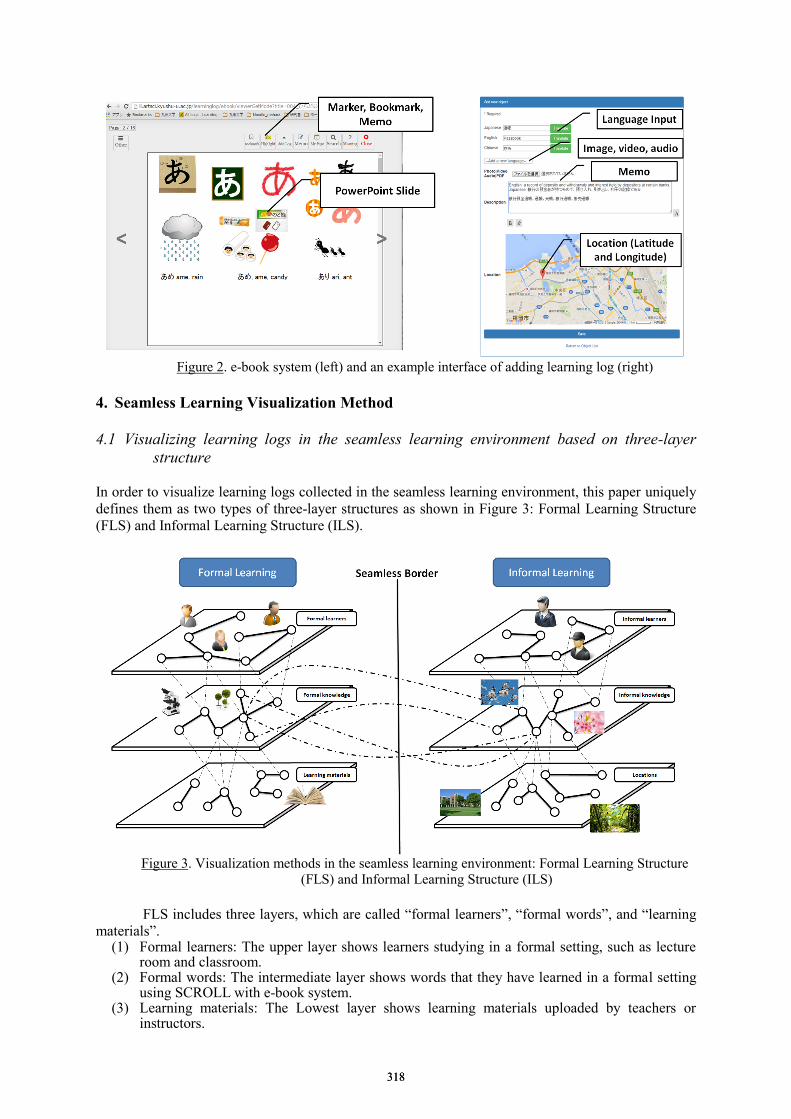
Figure 2. e-book system (left) and an example interface of adding learning log (right)
4. Seamless Learning Visualization Method
4.1 Visualizing learning logs in the seamless learning environment based on three-layer
structure
In order to visualize learning logs collected in the seamless learning environment, this paper uniquely
defines them as two types of three-layer structures as shown in Figure 3: Formal Learning Structure
(FLS) and Informal Learning Structure (ILS).
Figure 3. Visualization methods in the seamless learning environment: Formal Learning Structure
(FLS) and Informal Learning Structure (ILS)
FLS includes three layers, which are called “formal learners”, “formal words”, and “learning
materials”. (1) Formal learners: The upper layer shows learners studying in a formal setting, such as lecture
room and classroom.(2) Formal words: The intermediate layer shows words that they have learned in a formal setting
using SCROLL with e-book system.(3) Learning materials: The Lowest layer shows learning materials uploaded by teachers or
instructors.
318318

In order to visualize the relationships among formal learner, formal words and learning
materials, this paper visualizes the relationships using network directed graph. How our visualization
method connects relationships of each node? For example, if a learner learns and saves a newly learned
word using SCROLL with e-book system during class, our visualization method will connect the
learner’ node in the upper layer in the FLS to the word’ node in the intermediate layer in FLS. Besides,
the word’ node will connect to the learning material nodes in the lowest layer in FLS. By visualizing
these links, teachers and students can grasp which e-book and which page that word appears. ILS includes three layers, which is called “Informal learners”, “Informal words”, and “Locations” (1) Informal Learners: The upper layer shows learners studying in an informal setting such as
museums, restaurants and city halls.(2) Informal words: The intermediate layer shows words that they have learned in an informal
setting using SCROLL.(3) Locations: The lowest layer shows contextual data such as location and place where they have
learned in an informal setting.
According to Mouri et al. (2015b, 2015c), how to connect the relationships in ILS are as
follows: If a learner learns and saves a new word in an informal setting using SCROLL, it will connect
the learner’ node in the upper layer in ILS to the word’ node in the intermediate layer in ILS. Then, the
word’ node will connect to the node of the location where they have learned it. For example, if the
learner learned “natto” at the “supermarket”, it will connect “natto” in the intermediate layer to
“supermarket” in the lowest layer. In order to bridge the relationships between FLS and ILS, the visualization will connect same
words which appear in the intermediate layers both in the FLS and ILS (e.g. “natto” in the intermediate layer in FLS and “natto” in the intermediate layer in ILS). The analytics using two types of three-layers have the following advantages:
(1) On the FLS side, the formal words with a large number of links to related learning materialsmean students learned it in many classes. For example, if a student learns the word “passbook”using a learning material during class, the visualization informs them of other learning materialcontext where it is used. In addition, the formal words with a large number of links to the formallearners mean words which were learned by many students during class.
(2) On the ILS side, the informal words that are related to many places are the words can be learnedin various places. When a learner experiences tea ceremony of a traditional Japanese culture, forinstance at the university, they are likely to learn such tea ceremony related words as maccha(special tea for tea ceremony), seiza (to sit in the correct manner on a Japanese tatami mat). Theycan also be learned in other places. Maccha can be learned at the supermarket, and the seiza canbe learned at the martial arts gym.
4.2 Color coding of the visualized nodes
To avoid having learners get confused when they see each node since there are many visualized nodes, it is definitely necessary to establish some criteria for the distinction of each node. To effectively distinguish each node, we created a color coding scheme for the nodes as shown in Table 3.
Table 1 Color coding to distinguish the kinds of nodes
Node Layer Node Color
Formal learners Upper in FLS Red
Formal words Intermediate in FLS Yellow
Learning materials Lowest in FLS Blue
Informal learners Upper in ILS Pink
Informal words Intermediate in ILS Green
Locations Lowest in ILS Light blue
5. Implementation
319319
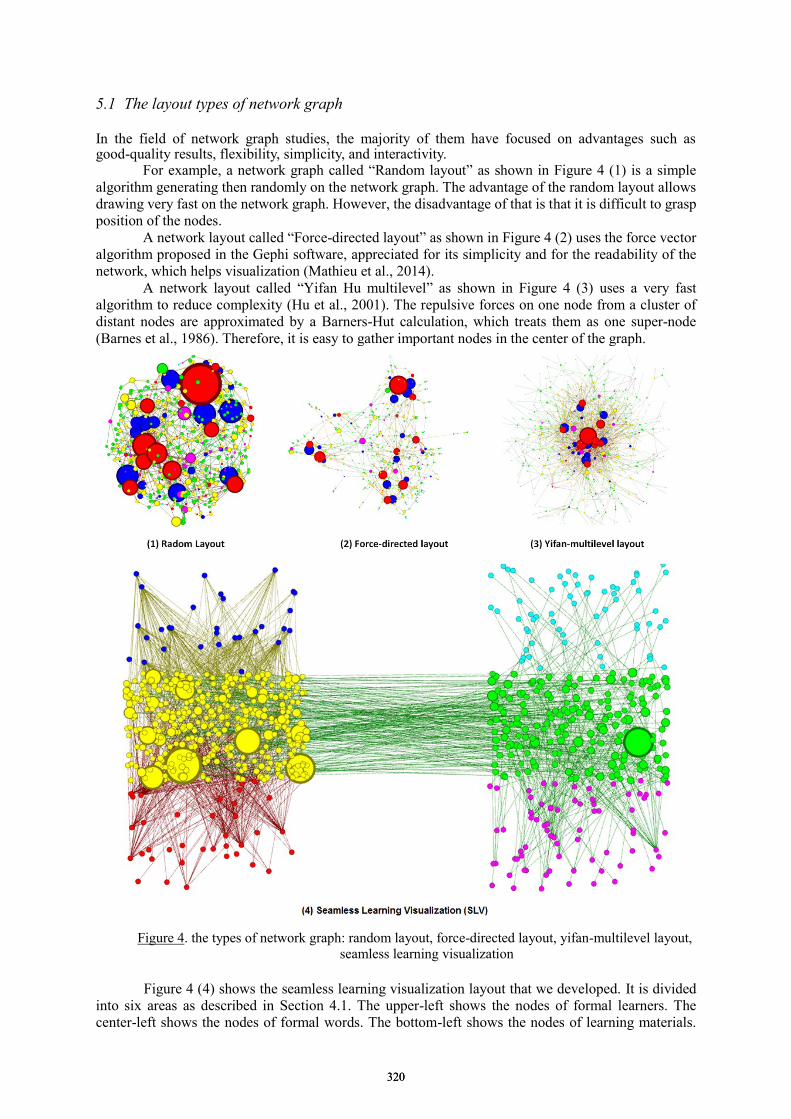
5.1 The layout types of network graph
In the field of network graph studies, the majority of them have focused on advantages such as good-quality results, flexibility, simplicity, and interactivity.
For example, a network graph called “Random layout” as shown in Figure 4 (1) is a simple
algorithm generating then randomly on the network graph. The advantage of the random layout allows
drawing very fast on the network graph. However, the disadvantage of that is that it is difficult to grasp
position of the nodes.
A network layout called “Force-directed layout” as shown in Figure 4 (2) uses the force vector
algorithm proposed in the Gephi software, appreciated for its simplicity and for the readability of the
network, which helps visualization (Mathieu et al., 2014).
A network layout called “Yifan Hu multilevel” as shown in Figure 4 (3) uses a very fast
algorithm to reduce complexity (Hu et al., 2001). The repulsive forces on one node from a cluster of
distant nodes are approximated by a Barners-Hut calculation, which treats them as one super-node
(Barnes et al., 1986). Therefore, it is easy to gather important nodes in the center of the graph.
Figure 4. the types of network graph: random layout, force-directed layout, yifan-multilevel layout,
seamless learning visualization
Figure 4 (4) shows the seamless learning visualization layout that we developed. It is divided
into six areas as described in Section 4.1. The upper-left shows the nodes of formal learners. The
center-left shows the nodes of formal words. The bottom-left shows the nodes of learning materials.
320320
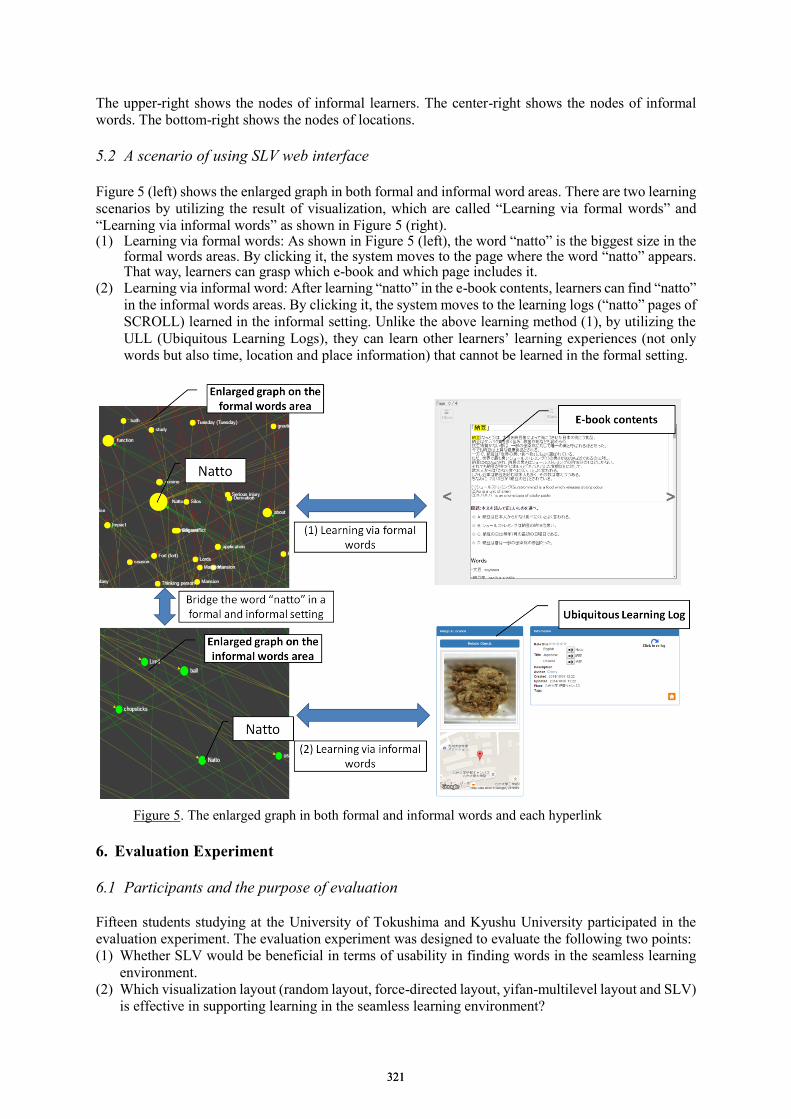
The upper-right shows the nodes of informal learners. The center-right shows the nodes of informal
words. The bottom-right shows the nodes of locations.
5.2 A scenario of using SLV web interface
Figure 5 (left) shows the enlarged graph in both formal and informal word areas. There are two learning
scenarios by utilizing the result of visualization, which are called “Learning via formal words” and
“Learning via informal words” as shown in Figure 5 (right). (1) Learning via formal words: As shown in Figure 5 (left), the word “natto” is the biggest size in the
formal words areas. By clicking it, the system moves to the page where the word “natto” appears.That way, learners can grasp which e-book and which page includes it.
(2) Learning via informal word: After learning “natto” in the e-book contents, learners can find “natto”
in the informal words areas. By clicking it, the system moves to the learning logs (“natto” pages of
SCROLL) learned in the informal setting. Unlike the above learning method (1), by utilizing the
ULL (Ubiquitous Learning Logs), they can learn other learners’ learning experiences (not only
words but also time, location and place information) that cannot be learned in the formal setting.
Figure 5. The enlarged graph in both formal and informal words and each hyperlink
6. Evaluation Experiment
6.1 Participants and the purpose of evaluation
Fifteen students studying at the University of Tokushima and Kyushu University participated in the
evaluation experiment. The evaluation experiment was designed to evaluate the following two points:
(1) Whether SLV would be beneficial in terms of usability in finding words in the seamless learning
environment.
(2) Which visualization layout (random layout, force-directed layout, yifan-multilevel layout and SLV)
is effective in supporting learning in the seamless learning environment?
321321

6.2 Method
Before the evaluation experiment began, a Japanese instructor uploaded e-book contents to SCROLL
server. The uploaded e-book contents were created based on the JLPT (Japanese Language Proficiency
Test). Since they had never used SCROLL with e-book system before, they practiced using it for one day
before using SLV and other visualization layouts. After that, they practiced using SCROLL with all
visualization layouts for one day. Participants used their own note-PC and smartphones (iPhone 5s or
android device) to upload their learning logs in a formal and an informal setting anytime and anywhere. The
mobile devices used in the evaluation experiment were ten iPhone 4s or 5s and four Samsung Galaxy Note
3s. When the participants used SLV during evaluation, they used their Note-PC because the screen size of
smartphone is too small. The participants learned words using four visualization layouts: random layout,
force-directed layout, yifan-multilevel layout and SLV. They were required to use the prearranged one
layout (e.g. participants firstly had to use random layout).
After the evaluation, the participants were asked to complete a questionnaire that used a
five-point-scale to evaluate the system’s performance and usability, as well as the ease of understanding the
content and finding other learning logs using SLV. In addition, we also evaluated the network layouts used
in the previous layout and SLV. For the comparison, the participants were asked to complete the
questionnaire.
6.3 Result and Discussion
The questionnaire results are presented in Table 2 (Best: 5; Wrong: 1). Q1 asks about whether the
participants were able to find that the words that learners learned during class using e-book system were
connected to the words that learners learned outside class. Similarly, Q2 asks about whether the
participants were able to find that the words that learners have learned outside class were connected to
the words that learners have learned in class. The results of Q1 and Q2 revealed that the participants
found the relationships of words between formal and informal learning. For example, some students
learned Japanese word, “ 納豆(natto)” in e-book contents in class. By uploading “natto” to the system,
the system could show them that other students had learned it at the shopping mall and supermarkets.
That way SLV was able to connect the words between formal and informal learning. Q3 asks about whether the system was easy to use. They were asked to evaluate the usability in
terms of the operability and readability of the visualized graph. The response shows that many participants felt that the visualization functions were easy to use.
Table 2 Result of the five-point-scale questionnaire for evaluating usability of system
Question Mean SD
Q1. Were you able to connect words inside-class to out-side-class
learning by using the system? 4.13 0.63
Q2. Were you able to connect words out-side-class to inside-class
learning by using the system? 3.93 0.88
Q3. Was the system ease of use? 3.86 0.99
We also evaluated the network layouts used in the previous works and the SLV we developed.
For the comparison, the participants used the conventional layouts and SLV during the evaluation and
completed the questionnaire shown in Table 3.
Table 3 The questionnaire about layouts
Question
Q1. Which layout is the easiest to use?
Q2. Which layout is the most effective for learning?
322322
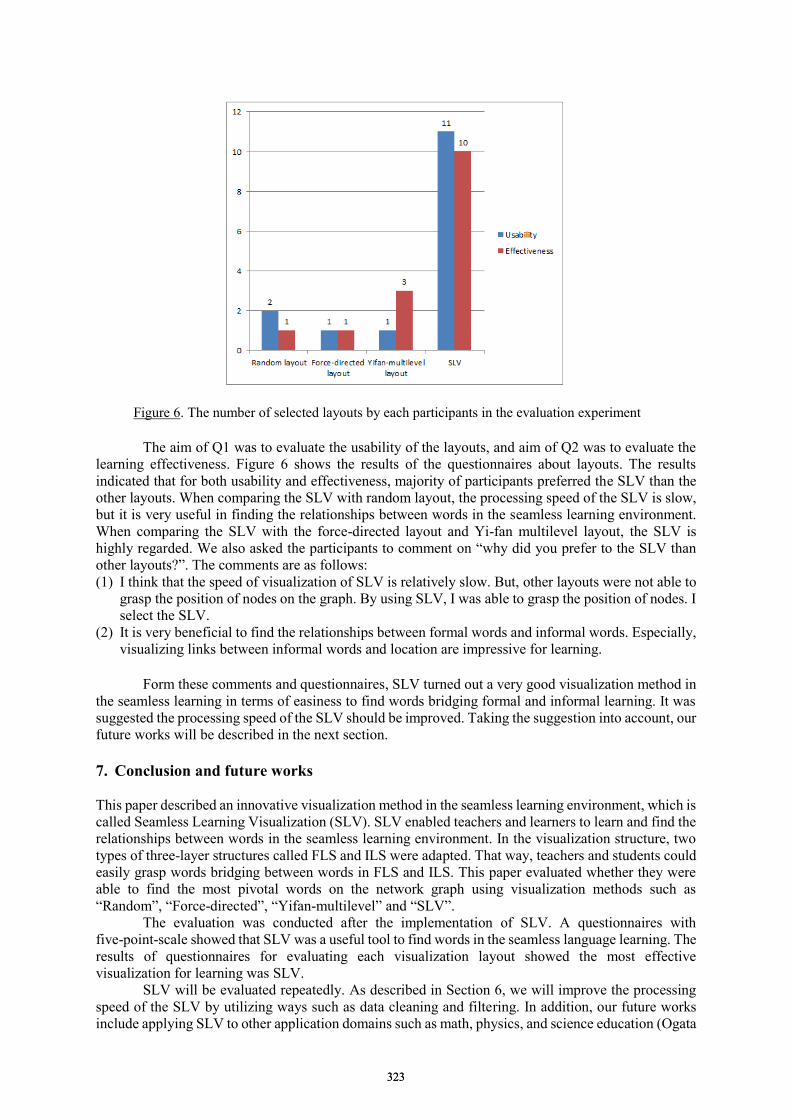
Figure 6. The number of selected layouts by each participants in the evaluation experiment
The aim of Q1 was to evaluate the usability of the layouts, and aim of Q2 was to evaluate the
learning effectiveness. Figure 6 shows the results of the questionnaires about layouts. The results
indicated that for both usability and effectiveness, majority of participants preferred the SLV than the
other layouts. When comparing the SLV with random layout, the processing speed of the SLV is slow,
but it is very useful in finding the relationships between words in the seamless learning environment.
When comparing the SLV with the force-directed layout and Yi-fan multilevel layout, the SLV is
highly regarded. We also asked the participants to comment on “why did you prefer to the SLV than
other layouts?”. The comments are as follows:
(1) I think that the speed of visualization of SLV is relatively slow. But, other layouts were not able to
grasp the position of nodes on the graph. By using SLV, I was able to grasp the position of nodes. I
select the SLV.
(2) It is very beneficial to find the relationships between formal words and informal words. Especially,
visualizing links between informal words and location are impressive for learning.
Form these comments and questionnaires, SLV turned out a very good visualization method in
the seamless learning in terms of easiness to find words bridging formal and informal learning. It was
suggested the processing speed of the SLV should be improved. Taking the suggestion into account, our
future works will be described in the next section.
7. Conclusion and future works
This paper described an innovative visualization method in the seamless learning environment, which is
called Seamless Learning Visualization (SLV). SLV enabled teachers and learners to learn and find the
relationships between words in the seamless learning environment. In the visualization structure, two
types of three-layer structures called FLS and ILS were adapted. That way, teachers and students could
easily grasp words bridging between words in FLS and ILS. This paper evaluated whether they were
able to find the most pivotal words on the network graph using visualization methods such as
“Random”, “Force-directed”, “Yifan-multilevel” and “SLV”.
The evaluation was conducted after the implementation of SLV. A questionnaires with
five-point-scale showed that SLV was a useful tool to find words in the seamless language learning. The
results of questionnaires for evaluating each visualization layout showed the most effective
visualization for learning was SLV.
SLV will be evaluated repeatedly. As described in Section 6, we will improve the processing
speed of the SLV by utilizing ways such as data cleaning and filtering. In addition, our future works
include applying SLV to other application domains such as math, physics, and science education (Ogata
323323

et al., 2014b), and long-term evaluations with an enough number of participants. Also, we will consider
that applying Onomatopoeia learning and career support for international students (Uosaki et al., 2015).
Acknowledgements
This part of this research work was supported by the Grant-in-Aid for Scientific Research
No.16H06304, No.25282059, No.26560122, No.25540091 and No.26350319 from the Ministry of
Education, Culture, Sports, Science and Technology (MEXT) in Japan. The research results have been
partly achieved by “Research and Development on Fundamental and Utilization Technologies for
Social Big Data” (178A03), the Commissioned Research of National Institute of Information and
Communications Technology (NICT), Japan. This work was supported by JSPS KAKENHI Grant
Number 16J05548.
References
Barnes, J. and Hut, P. (1986). A Hierarchical O (n log n) Force-Calculation Algorithm, Nature 324(4), 446–449.
Hu, Y. F. and Scolt, J. A. (2001). A Multilevel Algorithm for Wavefront Reduction”, SIAM J. Sci. Comput. 23(4),
1352–1375.
Hwang, G. J., Chu, H. C., Liu, Y. S. and Tsai, C. C. (2011). A knowledge acquisition approach to developing
Mindtools for organizing and sharing differentiating knowledge in a ubiquitous learning environment,
Computer & Education, Vol.57, No.1, 1368-1377.
Kiyota, M., Mouri, K. and Ogata, H. (2015). Seamless Learning System Based on e-Book, International
Conference on Computer in Education (ICCE 2015),448-452.
Looi, C. K., Sun, D. and Xie, W. (2015). Exploring Students’ Progression in an Inquiry Science Curriculum
Enabled by Mobile Learning, IEEE Transactions on Learning Technologies, Vol.8, No.1, 43-54.
Mathieu, J., Tommaso, V., Sebastien, H. and Mathieu, B. (2014). Forece Atlas2, a Continuous Graph Layout
Algorithm for Handy Network Visualization Designed for the Gephi Software, PLOS One 9(6), e98679
Milrad, M., Wong, L. H., Sharples, M., Hwang, G. J., Looi, C. K. and Ogata, H. (2013). Seamless learning: An
international perspective on next generation technology enhanced learning, In Z. L. Berge and L. Y.
Muilenburg, Handbook of mobile learning (Chapter 9), 95-108.
Mouri K., Ogata H., Uosaki N. and Liu S. (2014). Visualizaiton for analyzing Ubiquitous Learning Logs,
Proceedings of the 22nd
ICCE 2014, 461-470.
Mouri K., Ogata H. and Uosaki N. (2015a). Ubiquitous Learning Analytics in the Context of Real-world
Language Learning, International conference on Learning Analytics and Knowledge, 378-382.
Mouri, K., Uosaki, N. and Ogata, H. (2015b). Analysis of Ubiquitous Learning Logs Using Social Network
Analysis, International Journal of Mobile Learning and Organisation (IJMLO), vol.9, No.2, 101-123.
Mouri, K. and Ogata, H. (2015c). Ubiquitous Learning Analytics in the Real-world Language Learning, Smart
Learning Environments, 2:15, 1-18.
Mouri, K., Okubo, F., Shimada, A. and Ogata, H. (2016). Profiling High-achieving Students for E-book-based
Learning Analytics, Cross-LAK 2016, 1-6.
Ogata, H., Hou, B., Li, M., Uosaki, N., Mouri, K. and Liu, S. (2014). Ubiquitous Learning Project Using
Life-logging Technology in Japan, Educational Technology and Society Journal, Vol.17, No.2, 85-100.
Ogata, H., Mouri, K., Bono, M., Joh, A., Takanashi, K., Osaki, A. and Ochiai, H. (2014b) Supporting Science
Communication in aMuseum using Ubiquitous Learning Logs, Prof of Workshop on Computational
Approaches to Connecting Levels of Analysis in Networked Learning Communities, Lak 2014, USA
Ogata, H., Yin, C., Okubo, F., Shimada, A., Kojima, K. and Yamada, Y. (2015). E-Book-based Learning
Analytics in University Education, ICCE 2015, 401-406.
Uosaki, N., Li, M., Hou, B., Ogata, H. and Yano, Y. (2010). Supporting an English Course Using Handhelds in a
Seamless Learning Environment, Workshop of the 18nd ICCE 2010, 185-192.
Uosaki, N., Ogata, H., Mouri, K. and Lkhagvasuren, E. (2015) Career Support for International Students in Japan
Using Ubiquitous Learning Logs System, Proceedings of the 15th IEEE ICALT 2015, Taiwan,78-82
Wong, L. H., Chai, C. C., Zhang, X. and King, R. B. (2014). Employing the TPACK Framework for
Research-Teacher Co-Design of a Mobile-Assisted Seamless Language Learning Environment, IEEE
Transaction on Learning Technologies, Vol.8, No.1, 31-42.
Wong, L. H., Milrad, M. and Specht, M. (2015). Seamless learning in the age of mobile connectivity, Singapore:
Springer.
Yin, C., Okubo, F., Shimada, A., Oi, M., Hirokawa, S., Yamada, M. and Kojima, K. (2015). Analyzing the Feature
of Learning behaviors of Students using e-Books, ICCE 2015, 617- 626.
324324
Chen, W. et al. (Eds.) (2016). Proceedings of the 24th International Conference on Computers in Education. India: Asia-Pacific Society for Computers in Education
Enhancing Course Timetable Management in Science Classrooms with User-oriented Mobile
Application: Analysis and Prototype Development on KMUTT-ESC Case Study
Jintana WONGTAa, Charoenchai WONGWATKITb*, Jarukit BOONKERDc, Ratchapon CHAIKAJORNWATd, Vittunyuta MAEPRASARTe & Chonlada KHRUTTHAKAf
a,c,d,eEngineering Science Classroom, King Mongkut’s University of Technology Thonburi, Thailand bDepartment of Computer and Information Technology, Faculty of Industrial Education and
Technology, King Mongkut’s University of Technology Thonburi, Thailand fInstitute for Innovative Learning, Mahidol University, Thailand
Abstract: In Science schools, one of the challenging issues in learning management is course timetable for both learners and teachers. Unlike regular schools, most Science courses are provided in topic/module-based; that is the topics among courses are associated to each other, managed by several teachers simultaneously, learned by different groups of students, and altered frequently without notice. This causes a crisis for teachers who teach on the same topics being not aware of that changes leading to miss teaching management, while students could not prepare themselves for learning materials, reviews, assignments, etc. accordingly. As technology advances, mobile application has widely been accepted as an effective means to cope various management problems in the real time. Therefore, in this study, we proposed a design of mobile application prototype with user-oriented design to tackle such common problems in Science schools. A case of an Engineering Science School in central Bangkok, Thailand was studied for the actual problems and for the requirement analysis. The application was designed based on users’ UX/UI concepts and mobile platforms; whereas a prototype was developed with xCode based on MVC strategy. This application could help students and teachers to access the real-time changes of the timetable information, including notifications and history revisions; meanwhile, it helps them get ready for the class and finally would enhance more effective learning and teaching in science classrooms. In addition to that, an experiment has been conducted with users to examine the effectiveness of the application, while the feedback has been collected and analyzed for further development. The findings of this study not only showed that the proposed application was more effective than the conventional approach, but also provides any Science schools with similar contexts a practical guideline to cope with such complexity in timetable management of science classrooms.
Keywords: Science classroom, mobile application, course timetable management, user-oriented design
1. Introduction
In Science learning nowadays, many schools employ a variety of effective teaching approaches to enhance the quality and the performance of their classrooms and students, respectively. To reach the effective science learning, all science schools have set their goals for students. After learning, students should be able to construct their knowledge from the experiences within the context of narratives or stories, to merge their knowledge of Social Studies with Science and Mathematics, and to apply the solving skills to address scientific problems, social problems, including problems in their real lives. These approaches function differently in different environment of science classrooms. For example, Problem-based learning and Project-based learning (PBL) functions based on the problem and project set upon the learning topic; while Story-based learning (SBL) requires students to construct their knowledge by integrating related disciplines. To say, these approaches have their own outstanding
325325
features to help students to learn science more effectively and meaningfully under authentic problems (Du, Su & Liu, 2013; McQuiggan, Rowe, Lee & Lester, 2008; Story-Based Learning, 2016).
Although these features most of the time operate outside of the classrooms, Almeida and team reported that it is necessary to spend classroom time efficiently since both teachers and learners are located in the same physical learning environment as face-to-face learning (Almeida, Medeiros & Oliveira, 2015). During the classroom time, they are engaged to learn, share, and discuss newly-introduced or misunderstood topics; moreover, hands-on activities take place during this time with teacher facilitation.
Considering classroom management on these mentioned approaches, different schools are confronting different complex situations. These include handling limited resources of learning and teaching materials, classrooms, facilitation under time, program requirement constraints. For example, Du, Su and Liu (2013) reported that PBL can successfully facilitate participative learning, critical reflection, systemic thinking, creativity, and cultural awareness, which are the core values of sustainability in teaching and learning; therefore, these methods provided materials and activities for students. Furthermore, SBL focuses on training students to link their knowledge to real life; while requires students to prepare themselves for experiences in the classrooms (Ruiz-Gallardo, González-Geraldo & Castaño, 2016).
In past decades, technology has become more significant in terms of supporting management problems in various areas, including business (Chen & Popovich, 2003) medicine (Clifford & Clifton, 2012) and education (DiGiano & Patton, 2002; Treepuech, 2011). Meanwhile, mobile applications have been widely developed for its handy access and usage anytime anywhere in various context and applications (Holzer & Ondrus, 2011; Rana, Dwivedi & Al-Khowaiter, 2016; Zydney & Warner, 2016). In addition to that, mobile applications have been employed to support management for automation (Das, Chita, Peterson, Shirazi & Bhadkamkar, 2011; Kirubakaran & Karthikeyani, 2013) and for collaboration (Connolly, Cosgrave, & Krkoska, 2010; Hakkila & Mantyjarvi, 2005). Consequently, users found more convenient and productive in their working processes.
Based on the significance of classroom management in science school and benefits of mobile applications, the objectives of this study includes:
1) Problems and requirement analysis for classroom timetable management;2) Design and development of mobile application prototype, hereinafter called MASCAA;3) Experimental study and results for the effectiveness of the proposed application.In particular, a case of an Engineering Science Classroom, King Mongkut’s University of
Technology Thonburi (KMUTT-ESC) was later introduced and employed in this study. The originality of this study not only enhances the understanding of mobile development for management in practice, but also provides school administrators a possible solution to handle with the complexity in timetable management for science classrooms.
2. Related Studies
2.1 Effective Classroom Timetable Management
Classroom timetable is used to provide the information for students and teachers by presenting course name, classroom, course corresponding teachers, students group, and time. Teachers and students can prepare themselves for the class and manage their learning and teaching appropriately. Managing classroom timetable has been improved for decades, most of the time happen on a basic spreadsheet done by manual effort which is considered time-consuming (Padmini & Athre, 2010).
Later, technology has been adopted to better manage classroom timetable in offline mode, resulting in less time and less effort consumed. However, it still could not change any information after publishing to a hard copy timetable (Burke, Elliman, Ford, & Weare, 1995; Dorneles, de Araújo & Buriol, 2014; van den Broek, Hurkens, & Woeginger, 2006). In addition, the administrative staff in regular schools arranged the timetable only once a semester before the school begins, then students and teachers just used that fixed timetable along the semester (Babaei, Karimpour, & Hadidi, 2015). In science schools, the administrative staffs have to always follow-up and adjust the timetable to be corresponding with students’ learning progress which is more complex than the timetable of regular school as it always changes to reflect the students or teachers’ requirements.
326326
Therefore, the effective classroom timetable management need to be responded to teachers and students, which requires user-friendly interaction in real-time, convenience to use anywhere and notification. It should make possible for students or teachers to update their schedule to help them eliminate the problems and get more effective learning (Amaral & Pais, 2016; Cavus & Alhih, 2014; Vermuyten, Lemmens, Marques & Beliën, 2016).
Consequently, the science school timetable should be developed in consideration of above mentioned points to enhance better learning and to reduce possible mistakes that usually occur and affect to learning duration, material preparation, appointment management, homework and assignment management, class absence etc. (Burke & Petrovic, 2002; Kwok, Kong & Kam, 1997). 2.2 Design and Development of Mobile Application Recently, mobile application has become popular and important in various applications (Böhmer, Hecht, Schöning, Krüger & Bauer, 2011). For example, instructors use iTunes U to assign homework and share the materials with students, online banking is used to transfer and deposit money, and Scribd is a digital online library that users can read books. However, to make such mobile applications more human-oriented; in other words, to make it easier to use. Such that, it is important to concern many factors during design and develop the mobile applications.
In designing mobile applications, there are 2 key factors that should be considered, particularly User Interface (UI) and User Experience (UX). UI is any objects that is visible to users on mobile screen in which users can interact with, e.g. button, hypertext, text box. UI can make users interest and impress the application, while UX is what make feel when they use the application. UX will make them want to use the application again. That is, if they feel the application used is not user-friendly, they are not likely to continue using it anymore. In order to do that, a prototype is needed to be initially developed to collect users’ initial feedback, hence the developer can then improve it accordingly.
Although mobile application has been carefully designed, development phase is also considered to be more essential. The platform of mobile application is what the developer should keep in mind as a heart of the application. For example, Android Studio should be employed when developing applications for Android devices, while xCode should be implemented when developing applications for iOS devices (Hussin et al., 2014). To make the application more stabilized, right platform is required in development. Moreover, Model View Controller (MVC) is a development strategy that the developer should implement on as it views application into 3 separate components: Model (M) contains all of the data in the application, View (V) interacts with users, and Controller (C) makes control of everything in the application. This strategy has been widely accepted in developing mobile applications nowadays (Lossius et al., 2014). Finally, as a Service (aaS) is necessary when developing the application since it provide cloud-based services to manage incoming and outgoing data of the application in the cloud, which could save developer much time and effort (Sviridova, Sviridova & Tymoshenko, 2011). 3. Problems and Requirement Analysis 3.1 Case Study of KMUTT-ESC In this study, Engineering Science Classroom, King Mongkut’s University of Technology Thonburi in Thailand (KMUTT-ESC) was used as a case study. At KMUTT-ESC, each year there are about 80 students qualified to study in this higher secondary program (grade 10-12) under its science classroom-based curriculum design, called Story-based learning (SBL). Being expected to be young scientists, students are closely facilitated by 10 to 20 science teachers approximately. There is only 1 class for each grade.
SBL has been employed to make their science learning more meaningful by integrating multiple subjects together in order to learn the content based on the world history timeline as a story. This learning approach could help students better understand how everything in the world has happened in a meaningful, scientific way; besides, the students can see any phenomena happened in the world in different aspects.
327327
Regarding the classroom timetable management at KMUTT-ESC, teachers presently post the learning topics relevant to any learning story on Google Sheets and Facebook Group. The post information includes topic name, time and date, materials to bring, other advanced preparation for the class. However, students are facing a serious situation in which they miss prepare for the class, which are mainly caused by the changes of classroom timetable happening anytime. This makes a negative impact on students’ learning during the class; in addition, students tend to avoid following changes in the timetable since it is difficult to use and not user-friendly.
3.2 Problems and Requirement Analysis
In order to understand all the problems occurred at KMUTT-ESC, we conducted an interview with 22 students and 6 teachers. They were asked to feedback their feeling on using the current classroom timetable management in Google Sheets, particularly the difficulty and problems. Moreover, they were required to provide opinion on the preferred classroom timetable management.
Based on the interview analysis, we found that 2 key issues to be addressed including: 1. Google Sheets is not convenient for our SBL program since the timetable information can be changed anytime. Google Sheets makes students confused and misunderstood the information. Consequently, they don’t want to use it, and 2. Frequent changes without notification and multiple modes of communication lead to failed usage. It makes students wouldn’t know which information is the latest, resulting in miss preparation for the class that decreases efficient learning.
Nevertheless, interviewees are looking for a more effective classroom timetable management approach with following requirements: 1. User-friendly interface on the timetable, 2. Information presentation relevant to the selection of the topic, classroom, activities, etc., 3. Shorten time to get the latest information for right preparation in advance of the class time, and 4. Reduction in miss communication caused by the changes of the class/topic information.
4. Design and Prototype Development
In addition to the problems and requirement analysis results, the context of KMUTT-ESC was considered. This school program loans iPads for all students and teachers to use on- and off- school time. Therefore, mobile application is considered to be developed to cope with the mentioned issues.
The mobile application, hereinafter called MASCAA, has been developed by the authors who have background in Science-engineering pedagogy, Computer Science and information technology for years. The idea of UI and UX was carefully adopted to make the application more user-friendly. For example, clear color contrast for each day, each class of timetable, bigger button for easier access, real-time display of any class information changes, etc. During the prototype development, MVC strategy was employed for more effective development for mobile application, xCode was used to program this native mobile application for iOS, while Parse (https://parse.com) is used as a service (aaS) to provide two-way synchronization with the app whenever Internet is connected. As shown in Figure 1, the system structure of this mobile application prototype is depicted, while the examples of application screenshots are shown in Figure 2.
There are 2 databases in the system, one for class data and another one for revision history data. In the meantime, updated data from Parse is retrieved when any changes made and downloaded to the local data stores to save loading time and is available in offline mode. Regarding the timetable features, the system is responsible by 3 main modules. First, ‘Class information presentation’ module, the application displays class information, e.g. date, time, subjects, etc. retrieved from the local data store. As presented in Figure 2(a), students can view timetable in any particular week; moreover, they can click on any teacher name or topic to see more related information, as shown in Figure 2(b). Class changes, addition and cancellation features are enabled for teachers. The first module works in corresponding with ‘Showing classes’ module, as users have options to view timetable by selection of teacher name or subject code. With the subject code selected, students can have a long-term preparation before coming to the class of that subject, as it usually involves multiple topics and is taught by several teachers, as displayed in Figure 2(c). By selecting the teacher name, as shown in Figure 2(d), students can see all subjects taught by that particular teacher. This would also be a great benefit for teachers to set their lesson plans and make their teaching preparation on SBL program. In the last module,
328328
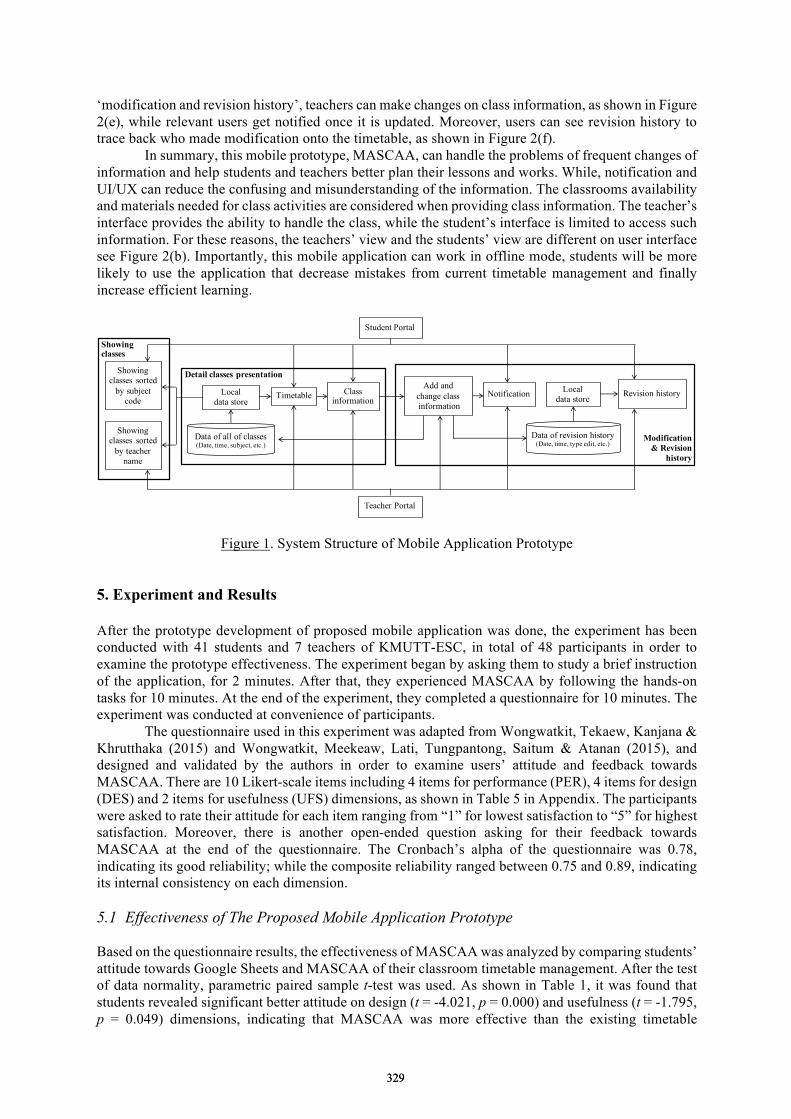
‘modification and revision history’, teachers can make changes on class information, as shown in Figure 2(e), while relevant users get notified once it is updated. Moreover, users can see revision history to trace back who made modification onto the timetable, as shown in Figure 2(f).
In summary, this mobile prototype, MASCAA, can handle the problems of frequent changes of information and help students and teachers better plan their lessons and works. While, notification and UI/UX can reduce the confusing and misunderstanding of the information. The classrooms availability and materials needed for class activities are considered when providing class information. The teacher’s interface provides the ability to handle the class, while the student’s interface is limited to access such information. For these reasons, the teachers’ view and the students’ view are different on user interface see Figure 2(b). Importantly, this mobile application can work in offline mode, students will be more likely to use the application that decrease mistakes from current timetable management and finally increase efficient learning.
Figure 1. System Structure of Mobile Application Prototype
5. Experiment and Results
After the prototype development of proposed mobile application was done, the experiment has been conducted with 41 students and 7 teachers of KMUTT-ESC, in total of 48 participants in order to examine the prototype effectiveness. The experiment began by asking them to study a brief instruction of the application, for 2 minutes. After that, they experienced MASCAA by following the hands-on tasks for 10 minutes. At the end of the experiment, they completed a questionnaire for 10 minutes. The experiment was conducted at convenience of participants.
The questionnaire used in this experiment was adapted from Wongwatkit, Tekaew, Kanjana & Khrutthaka (2015) and Wongwatkit, Meekeaw, Lati, Tungpantong, Saitum & Atanan (2015), and designed and validated by the authors in order to examine users’ attitude and feedback towards MASCAA. There are 10 Likert-scale items including 4 items for performance (PER), 4 items for design (DES) and 2 items for usefulness (UFS) dimensions, as shown in Table 5 in Appendix. The participants were asked to rate their attitude for each item ranging from “1” for lowest satisfaction to “5” for highest satisfaction. Moreover, there is another open-ended question asking for their feedback towards MASCAA at the end of the questionnaire. The Cronbach’s alpha of the questionnaire was 0.78, indicating its good reliability; while the composite reliability ranged between 0.75 and 0.89, indicating its internal consistency on each dimension.
5.1 Effectiveness of The Proposed Mobile Application Prototype
Based on the questionnaire results, the effectiveness of MASCAA was analyzed by comparing students’ attitude towards Google Sheets and MASCAA of their classroom timetable management. After the test of data normality, parametric paired sample t-test was used. As shown in Table 1, it was found that students revealed significant better attitude on design (t = -4.021, p = 0.000) and usefulness (t = -1.795, p = 0.049) dimensions, indicating that MASCAA was more effective than the existing timetable
Detail classes presentation
Student Portal
Teacher Portal
Timetable Class information
Showing classes sorted
by teacher name
Showing classes sorted
by subject code
Add and change classinformation
Revision history
Data of all of classes(Date, time, subject, etc.)
Data of revision history(Date, time, type edit, etc.)
Local data store
Local data store
Modification & Revision
history
Showing classes
Notification
329329
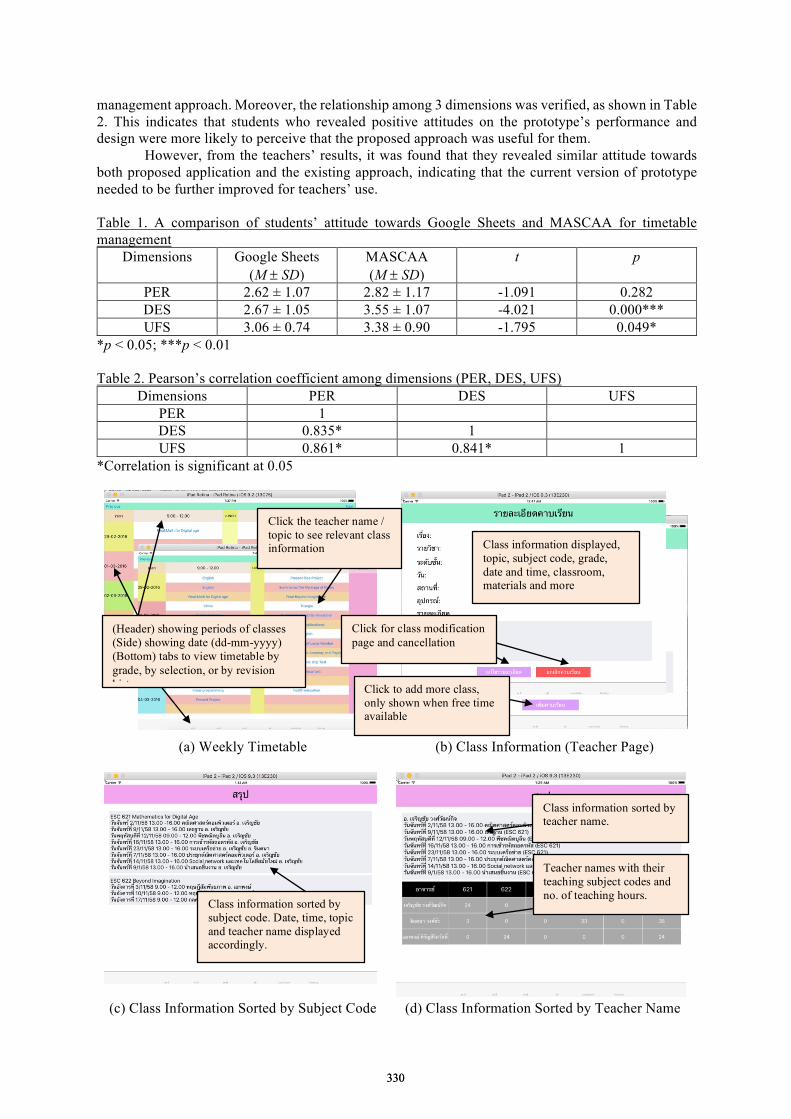
management approach. Moreover, the relationship among 3 dimensions was verified, as shown in Table 2. This indicates that students who revealed positive attitudes on the prototype’s performance and design were more likely to perceive that the proposed approach was useful for them.
However, from the teachers’ results, it was found that they revealed similar attitude towards both proposed application and the existing approach, indicating that the current version of prototype needed to be further improved for teachers’ use. Table 1. A comparison of students’ attitude towards Google Sheets and MASCAA for timetable management
Dimensions Google Sheets (M ± SD)
MASCAA (M ± SD)
t p
PER 2.62 ± 1.07 2.82 ± 1.17 -1.091 0.282 DES 2.67 ± 1.05 3.55 ± 1.07 -4.021 0.000*** UFS 3.06 ± 0.74 3.38 ± 0.90 -1.795 0.049*
*p < 0.05; ***p < 0.01 Table 2. Pearson’s correlation coefficient among dimensions (PER, DES, UFS)
Dimensions PER DES UFS PER 1 DES 0.835* 1 UFS 0.861* 0.841* 1
*Correlation is significant at 0.05
(a) Weekly Timetable
(b) Class Information (Teacher Page)
(c) Class Information Sorted by Subject Code
(d) Class Information Sorted by Teacher Name
(Header) showing periods of classes (Side) showing date (dd-mm-yyyy) (Bottom) tabs to view timetable by grade, by selection, or by revision history
Click the teacher name / topic to see relevant class information Class information displayed,
topic, subject code, grade, date and time, classroom, materials and more
Click to add more class, only shown when free time available
Class information sorted by subject code. Date, time, topic and teacher name displayed accordingly.
Click for class modification page and cancellation
Class information sorted by teacher name.
Teacher names with their teaching subject codes and no. of teaching hours.
330330
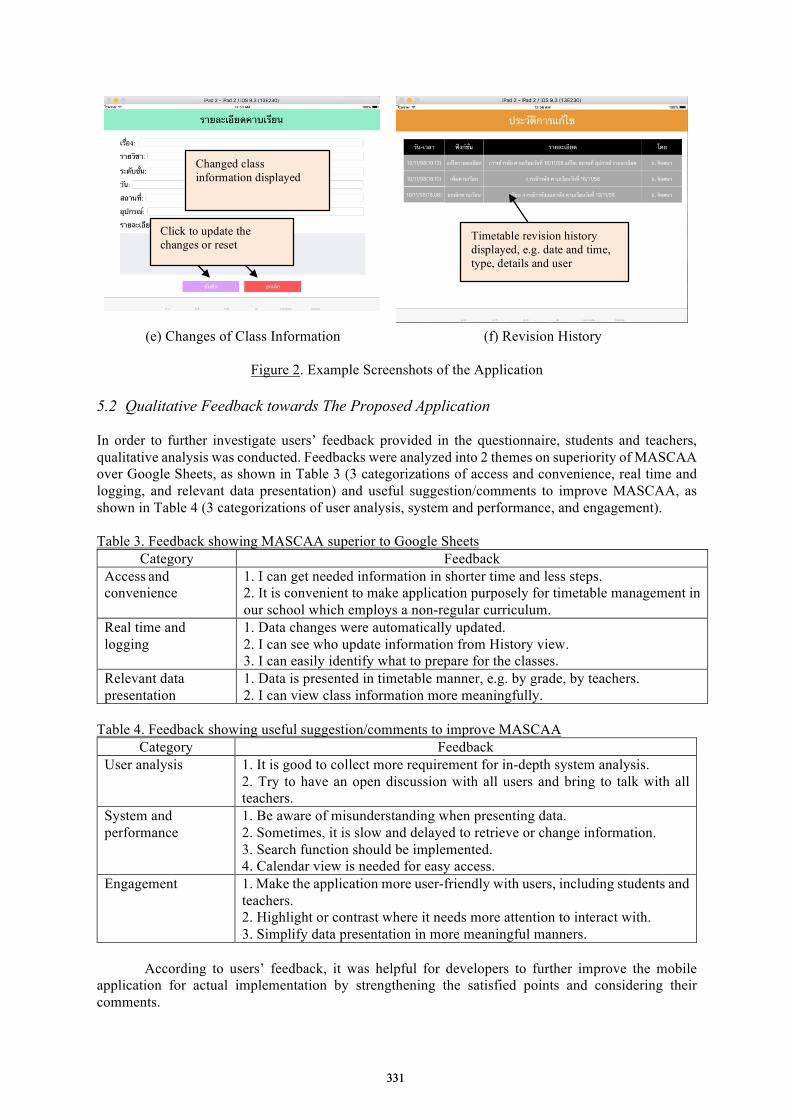
(e) Changes of Class Information (f) Revision History
Figure 2. Example Screenshots of the Application
5.2 Qualitative Feedback towards The Proposed Application
In order to further investigate users’ feedback provided in the questionnaire, students and teachers, qualitative analysis was conducted. Feedbacks were analyzed into 2 themes on superiority of MASCAA over Google Sheets, as shown in Table 3 (3 categorizations of access and convenience, real time and logging, and relevant data presentation) and useful suggestion/comments to improve MASCAA, as shown in Table 4 (3 categorizations of user analysis, system and performance, and engagement).
Table 3. Feedback showing MASCAA superior to Google Sheets Category Feedback
Access and convenience
1. I can get needed information in shorter time and less steps.2. It is convenient to make application purposely for timetable management inour school which employs a non-regular curriculum.
Real time and logging
1. Data changes were automatically updated.2. I can see who update information from History view.3. I can easily identify what to prepare for the classes.
Relevant data presentation
1. Data is presented in timetable manner, e.g. by grade, by teachers.2. I can view class information more meaningfully.
Table 4. Feedback showing useful suggestion/comments to improve MASCAA Category Feedback
User analysis 1. It is good to collect more requirement for in-depth system analysis.2. Try to have an open discussion with all users and bring to talk with allteachers.
System and performance
1. Be aware of misunderstanding when presenting data.2. Sometimes, it is slow and delayed to retrieve or change information.3. Search function should be implemented.4. Calendar view is needed for easy access.
Engagement 1. Make the application more user-friendly with users, including students andteachers.2. Highlight or contrast where it needs more attention to interact with.3. Simplify data presentation in more meaningful manners.
According to users’ feedback, it was helpful for developers to further improve the mobile application for actual implementation by strengthening the satisfied points and considering their comments.
Changed class information displayed
Click to update the changes or reset
Timetable revision history displayed, e.g. date and time, type, details and user
331331
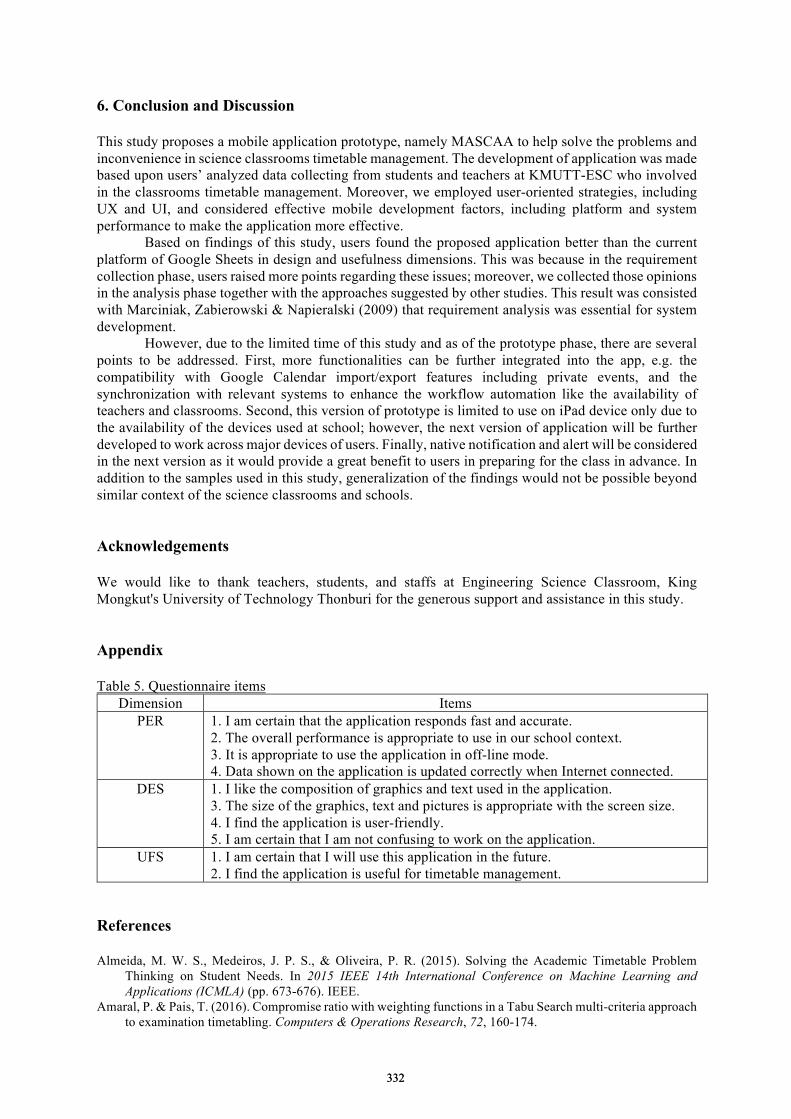
6. Conclusion and Discussion
This study proposes a mobile application prototype, namely MASCAA to help solve the problems and inconvenience in science classrooms timetable management. The development of application was made based upon users’ analyzed data collecting from students and teachers at KMUTT-ESC who involved in the classrooms timetable management. Moreover, we employed user-oriented strategies, including UX and UI, and considered effective mobile development factors, including platform and system performance to make the application more effective.
Based on findings of this study, users found the proposed application better than the current platform of Google Sheets in design and usefulness dimensions. This was because in the requirement collection phase, users raised more points regarding these issues; moreover, we collected those opinions in the analysis phase together with the approaches suggested by other studies. This result was consisted with Marciniak, Zabierowski & Napieralski (2009) that requirement analysis was essential for system development.
However, due to the limited time of this study and as of the prototype phase, there are several points to be addressed. First, more functionalities can be further integrated into the app, e.g. the compatibility with Google Calendar import/export features including private events, and the synchronization with relevant systems to enhance the workflow automation like the availability of teachers and classrooms. Second, this version of prototype is limited to use on iPad device only due to the availability of the devices used at school; however, the next version of application will be further developed to work across major devices of users. Finally, native notification and alert will be considered in the next version as it would provide a great benefit to users in preparing for the class in advance. In addition to the samples used in this study, generalization of the findings would not be possible beyond similar context of the science classrooms and schools.
Acknowledgements
We would like to thank teachers, students, and staffs at Engineering Science Classroom, King Mongkut's University of Technology Thonburi for the generous support and assistance in this study.
Appendix
Table 5. Questionnaire items Dimension Items
PER 1. I am certain that the application responds fast and accurate.2. The overall performance is appropriate to use in our school context.3. It is appropriate to use the application in off-line mode.4. Data shown on the application is updated correctly when Internet connected.
DES 1. I like the composition of graphics and text used in the application.3. The size of the graphics, text and pictures is appropriate with the screen size.4. I find the application is user-friendly.5. I am certain that I am not confusing to work on the application.
UFS 1. I am certain that I will use this application in the future.2. I find the application is useful for timetable management.
References
Almeida, M. W. S., Medeiros, J. P. S., & Oliveira, P. R. (2015). Solving the Academic Timetable Problem Thinking on Student Needs. In 2015 IEEE 14th International Conference on Machine Learning and Applications (ICMLA) (pp. 673-676). IEEE.
Amaral, P. & Pais, T. (2016). Compromise ratio with weighting functions in a Tabu Search multi-criteria approach to examination timetabling. Computers & Operations Research, 72, 160-174.
332332
Babaei, H., Karimpour, J., & Hadidi, A. (2015). A survey of approaches for university course timetabling problem. Computers & Industrial Engineering, 86, 43-59.
Böhmer, M., Hecht, B., Schöning, J., Krüger, A., & Bauer, G. (2011). Falling asleep with Angry Birds, Facebook and Kindle: a large scale study on mobile application usage. In 13th International Conference on Human Computer Interaction with Mobile Devices and Services (pp. 47-56). New York: ACM.
Burke, E., Elliman, D., Ford, P., & Weare, R. (1995). Examination timetabling in British Universities: A survey. In E. Burke & P. Ross (Eds.), Practice and Theory of Automated Timetabling (pp. 76–90). Edinburgh, U.K.: Springer Berlin Heidelberg.
Burke, E. K., & Petrovic, S. (2002). Recent Research Directions in Automated Timetabling. European Journal of Operational Research, 140(2), 266-280.
Cavus, N., & Alhih, M. (2014). Learning Management Systems Use in Science Education. Procedia - Social and Behavioral Sciences, 143, 517-520.
Chen, I., & Popovich, K. (2003). Understanding customer relationship management (CRM). Business Process Mgmt Journal, 9(5), 672-688.
Clifford, G., & Clifton, D. (2012). Wireless Technology in Disease Management and Medicine. Annual Review of Medicine, 63(1), 479-492.
Connolly, M., Cosgrave, T., & Krkoska, B. (2010). Mobilizing the Library's Web Presence and Services: A Student-Library Collaboration to Create the Library's Mobile Site and iPhone Application. The Reference Librarian, 52(1-2), 27-35.
Das, S. R., Chita, S., Peterson, N., Shirazi, B. A., & Bhadkamkar, M. (2011). Home Automation and Security for Mobile Devices. In Pervasive Computing and Communications Workshops (PERCOM Workshops), 2011 IEEE International (pp. 141-146). IEEE.
DiGiano, C., & Patton, C. (2002). Orchestrating Handhelds in the Classroom with SRI's ClassSync™. In Proceedings of the Conference on Computer Support for Collaborative Learning: Foundations for a CSCL Community (pp. 706-707). International Society of the Learning Sciences.
Dorneles, Á. P., de Araújo, O. C. B., & Buriol, L. S. (2014). A Fix-and-Optimize Heuristic for the High School Timetabling Problem. Computers & Operations Research, 52, 29–38.
Du, X., Su, L., & Liu, J. (2013). Developing Sustainability Curricula Using the PBL Method in a Chinese Context. Journal of Cleaner Production, 61, 80–88.
Hakkila, J., & Mantyjarvi, J. (2005). Collaboration in Context-Aware Mobile Phone Applications. In Proceedings of the 38th Annual Hawaii International Conference on System Sciences (p. 33a). IEEE.
Holzer, A., & Ondrus, J. (2011). Mobile Application Market: A Developer’s Perspective. Telematics and Informatics, 28(1), 22–31.
Hussin, M., Jusoh, M., Sulaiman, A., Aziz, M., Othman, F., & Ismail, M. (2014). Accident Reporting System Using an iOS Application. In Systems, Process and Control (ICSPC), 2014 IEEE Conference (pp. 13-18). Kuala Lumpur: IEEE.
Kirubakaran, B., & Karthikeyani, V. (2013). Mobile Application Testing — Challenges and Solution Approach through Automation. In Pattern Recognition, Informatics and Mobile Engineering (PRIME), 2013 International Conference (pp. 79-84). Salem: IEEE.
Kwok, L.-F., Kong, S.-C., & Kam, Y.-Y. (1997). Timetabling in Hong Kong Secondary Schools. Computers & Education, 28(3), 173–183.
Lossius, T., de la Hogue, T., Baltazar, P., Place, T., Wolek, N., & Rabin, J. (2014). Model-View-Controller Separation in Max Using Jamoma. In The joint 40th International Computer Music Conference & 11th Sound and Music Computing Conference (pp. 1573-1578). Athens, Greece.
Marciniak, P., Zabierowski, W., & Napieralski, A. (2009). Application for Managing School Timetables. In Proceedings of the 10th International Conference CADSM 2009 - The Experience of Designing and Application of CAD Systems in Microelectronics (pp. 328-321). IEEE.
McQuiggan, S., Rowe, J., Lee, S., & Lester, J. (2008). Story-Based Learning: The Impact of Narrative on Learning Experiences and Outcomes. In Intelligent Tutoring Systems, 9th International Conference, ITS 2008 (pp. 530-539). Montreal, Canada.
Padmini, M., & Athre, K. (2010). Efficient Design of University Timetable. In Electro/Information Technology (EIT), 2010 IEEE International Conference (pp. 1-5). Normal, IL: IEEE.
Rana, N., Dwivedi, Y., & Al-Khowaiter, W. (2016). A Review of Literature on the Use of Clickers in the Business and Management Discipline. The International Journal of Management Education, 14(2), 74-91.
Ruiz-Gallardo, J., González-Geraldo, J., & Castaño, S. (2016). What Are Our Students Doing? Workload, Time Allocation and Time Management in PBL Instruction. A case study in Science Education. Teaching and Teacher Education, 53, 51-62.
Story-Based Learning. (2016). Kmutt.ac.thIn ESC: ENGINEERING–SCIENCE CLASSROOM. Retrieved 24 May, 2016, from http://www.kmutt.ac.th/GiftEd
333333

Sviridova, T., Sviridova, L., & Tymoshenko, B. (2011). Google Apps as Solution of Communication Issues in Educational Process. In Perspective Technologies and Methods in MEMS Design (MEMSTECH), 2011 Proceedings of VIIth International Conference (pp. 183-184). Polyana: IEEE.
Treepuech, W. (2011). The application of Using Social Networking Sites with Available Online Tools for Teaching and Learning Management. In IT in Medicine and Education (ITME), 2011 International Symposium (pp. 326-330). Cuangzhou: IEEE.
Van Den Broek, J., Hurkens, C., & Woeginger, G. (2006). Timetabling Problems at the TU Eindhoven. In E. K. Burke & H. Rudová (Eds.), Practice and Theory of Automated Timetabling VI (pp. 210-227). Brno, Czech Republic: Springer Berlin Heidelberg.
Vermuyten, H., Lemmens, S., Marques, I., & Beliën, J. (2016). Developing Compact Course Timetables with Optimized Student Flows. European Journal of Operational Research, 251(2), 651–661.
Wongwatkit, C., Meekaew, N., Lati, W., Tungpantong, C., Saitum, W., & Atanan, Y. (2015). Inquiry-based Learning with Augmented Reality Mobile Application to Enhance Scientific Conceptual Understanding : TheFruitAR. In Workshop Proceedings of the 23rd International Conference on Computers in Education (pp. 230–235). Hangzhou, China.
Wongwatkit, C., Tekaew, S.-A., Kanjana, S., & Khrutthaka, C. (2015). A Systematic Vocabulary Learning-based Mobile Game Application to Improving English Vocabulary Learning Achievement for University Admission Examination in Thailand. In Proceedings of the 23rd International Conference on Computers in Education (pp. 549–558). Hangzhou, China.
Zydney, J. M., & Warner, Z. (2016). Mobile Apps for Science Learning: Review of Research. Computers & Education, 94, 1–17.
334334
Chen, W. et al. (Eds.) (2016). Proceedings of the 24th International Conference on Computers in Education.
India: Asia-Pacific Society for Computers in Education
The Interest-Driven Creator Theory and
Computational Thinking
Bowen LIU, Ping LI*, Siu Cheung KONG*& Sing Kai LO
The Education University of Hong Kong, Hong Kong
*{ pli, sckong }@ied.edu.hk
Abstract: There is a growing interest for Computational Thinking (CT) for the last decade.
Most studies focus on teaching CT skills in K-12 level. In higher education, applying CT
methods over all disciplines still needs cross institute movement, proper teaching tools and
assessment procedure. In this paper we discuss the potential of applying CT methods in the
mathematics courses at university level. With the inspiration of the Interest-Driven Creator
(IDC) theory, we suggest that applying CT methods in mathematics benefits students’
understanding of concepts and overcomes the drawbacks of traditional pedagogy. We study the
case of introducing the limit of a sequence, which is a fundamental concept in calculus. An
algorithm, inspired by the ε-N definition, is designed to find suitable N given a specific ε with
exhaustion methods. Based on the algorithm designed, a game that help to introduce the ε-N
definition of the limit of a sequence is presented as an example. The game would be developed
on mobile devices for easy accessibility and for catering the trend of mobile device.
Keywords: Computational Thinking, Higher Education, Interest-Driven Creator (IDC)
1. Introduction
Computational Thinking (CT) is considered as one of the fundamental skills in today’s society.
Computational Thinking is not specified to computer scientists, but a universal skill set including logic,
algorithmic thinking, recursive thinking, multi-level abstraction, parallel thinking, pattern matching and
related processes. Besides writing, reading, speaking and arithmetic, Computational Thinking should be
taught to students in all disciplines to prepare for future challenges. Increasing interests are emerging in
teaching Computational Thinking in K-12 level. Research of CT in K-12 level mainly focuses on
developing environments and tools that foster CT and relevant assessment. Most programming
platforms and tools are on desktop computers. However with the prevalence of smartphones and tablet
computers worldwide, mobile apps provide a good juncture of CT and other disciplines. In higher
education, research interests concentrate on teaching CT skills to early stage computer science
undergraduates. But since CT is universally applicable to every students, teaching CT methods in
various disciplines at college level is necessary and beneficial. In this paper, we will discuss the
application of CT in mathematics courses and the potential benefit for comprehension of mathematical
concepts with CT methods.
2. Background of Study
The concept of Computational Thinking dates back to 1960s. Alan Perlis, the first recipient of ACM
Turing Award, suggested that “information theory” should be included as a part of the education for
students in all disciplines (Guzdial, 2008). In the 1980s, Papert put forward the idea of fostering
children’s procedural thinking with LOGO programming language (Papert, 1980; Papert & Idit, 1991).
The term “Computational Thinking” is first used to refer to expressing powerful ideas with
computational representation (Papert, 1996). A more recent definition on computational thinking came
from Wing’s articles (2006). Wing proposed that computational thinking represents “a universally
applicable attitude and skill set everyone, not just computer scientists would be eager to learn and use”
335335
(Wing, 2006). Computational Thinking exploits recursive thinking, abstraction and decomposition,
debugging and prevention, and heuristic reasoning. Wing’s definition of CT is widely acknowledged
and applied across multiple fields by researchers and organizations. The National Research Council
(2010) conducted a workshop focusing on the scope and nature of computational thinking. More than
20 high-level skills and practices related to CT are included in the workshop report. In 2012, Royal
Society also offered a tangible and concise definition that reveal the essence of CT-“Computational
Thinking is the process of recognizing aspects of computation in the world that surrounds us, and
applying tools and techniques from Computer sciences to understand and reason about both natural and
artificial systems and processes” (Furber 2012).
A useful three dimensional (3D) framework on CT was proposed by Brennan and Resinick in
2012. The framework is mainly developed for design-based learning activities. Students who
participate in these activities are regarded as a designer. The framework includes three components:
concepts, practices and perspectives. Computational concepts refer to the concepts that designers are
exposed to when they are programming. Computational practices are the experiences when designers
engaged with the concepts. Computational perspectives are about how designers transfer their thinking
pattern formed in the computational activities to the world around them. This framework is valuable in
exploring the CT issues under computer-aid or game-based circumstances.
3. The Computational Thinking in Higher Education and Its Application in
Mathematics Classrooms
3.1 Computational Thinking in Higher Education
The idea of Computational Thinking have received much attention since the publication of Wing’s
essay (2006). Research studies are devoted to incorporating computational thinking skills into
K-12-level curricula (Barr & Stephenson, 2011). Grover and Pea (2013) review the state of CT in K-12
level and point out that much work mainly focuses on definitional issues, and tools for CT development
while empirical study is scarce. In higher education, studies focus on teaching CT skills to computer
science undergraduate in initial phrase of study. Practical research on teaching CT skills largely takes
place within the fields of computer science and the science, technology, engineering and math (STEM).
Miller and Settle (2011) make a comparative study of the learning process of tree traversal methods
between computer science and non-computer science students. Kilpeläinen (2010) proposed analogies
based on the metaphor of traveling to illustrate the concepts of reduction in computer science. A trend of
teaching Computational Thinking in game-based scenarios is emerging. An advantage of applying
game-based teaching method is the connection between abstraction, interactive computation and
constructivist pedagogy (Berland, 2011).
However, outside the computer science and STEM fields, there exists a lack of cross-institute
cooperation to add CT into fundamental skill-set. There are various potential reasons for this
phenomenon. One may be the potential obstacle around the conceptualization of CT. Different from the
situation in the K-12 level, higher education is research-oriented and a more precise definition on CT is
needed in different disciplines. Moreover, the distinction between applying CT method and simple
application of computers to problems is not apparent and required well-understanding for most
educators and students. Last but not least, even within the computer science, not all the problems are
computable. As Aho (2012) mentioned, there are emergent models of computing that beyond the
traditional Turing machine computation, but extending the scope of CT to these models requires great
efforts. Lacking a computable structure makes it difficult to apply CT methods.
3.2 Computational Thinking in Mathematics Classrooms and IDC Theory
In traditional mathematics courses, students acquire mathematical concepts largely through lecturers’
explanation and consolidate their comprehension through exercises. In class, lecturers have to face the
trade-off between conciseness and rigorousness in their teaching. Lecturers’ expertise play an important
role in the pedagogic process. Lectures who are also experienced researchers, which is common in
colleges and universities, tend to skip fundamental details which are important for students’
336336
understanding. After class, students usually spend lots of time in assessments. However, doing
mathematics exercises is time-consuming and the process could be painful. Students may lose interest
in math due to the failure in assessments and mistakenly equal the mathematical ability to correctly
doing mathematics exercises only. Mathematics courses in higher education try to equip learners with
profound logical thinking abilities and adequate understanding of mathematical concepts and
approaches but not simply an ability of doing exercises. In fact, mathematical thinking, such as
abstraction, algorithmic thinking, shares the same base with CT. This make it possible for students to
grasp mathematical idea while developing CT. We suggest that with proper computational tools and
pedagogy, students can study mathematics in a concrete scenario and can accomplish the transition
from figurative to abstract.
Game-based learning strategies is considered an effective method to teach complex
computational thinking skills. They enable students to accomplish certain tasks in games and acquired
knowledge in playing. The process of playing stimulates students’ interest and can cultivate learning
habits with adequate repetitions. The Interest-Driven Creator (IDC) theory provides a more precise
description of the nature behind this process (Chan, Looi and Chang, 2015). Designed by a group of
researchers in Asia, the Interest-Driven Creator (IDC) is a novel theory for technology enhanced
learning in the future. The IDC theory hypothesizes that with the development of technology, driven by
interest, students can participate in the creation activities and by repeating this process to cultivate
learning habits, our future generation will become lifelong interest-driven creator. One of the anchor
concepts of IDC theory is the creation loop which consist of imitating, combining and staging. Imitating
is the first creation component which refer to emulation through observation. Combining, the second
component, is to synthesizing the thoughts or things of others and individual views to form something
new. Staging, the third creation component, is about presenting new thoughts or achieved outcome to
others. Inspired by this theory, we suggest that if we could provide students a platform that can help to
apprehend mathematical concepts through creating (such as a numerical simulation program, algorithm
design or 3D models), combining mathematics study with the CT skills acquisition is possible.
4. Introducing Mathematics Concepts with CT Methods: An Example
The idea of limit is one of the fundamental concepts in mathematics. Students who participate calculus
courses (or real analysis courses) are commonly exposed to this concept at the beginning. Lecturers or
textbooks usually start the introduction with “limit of a sequence” then expand the definition to other
situations. Here we present an example of how to introduce the “Limit of a sequence” with CT methods.
Before applying CT methods, reviewing the definition of “limit of a sequence” can help to understand
why it is applicable to CT methods. The modern calculus is developed by Issac Newton and Gottfried
Wilhelm Leibniz in 17th century Europe. But the modern definition of a limit was given by Bernhard
Bolzano and by Karl Weierstrass in the 1870s (Grabiner, 1983). In the real numbers, a number L is
defined as the limit of the sequence Xi if the numbers in the sequence are getting closer and closer to L
than any other number. In formal definition, the limit of a sequence are described with ε-N: L is
defined as the limit of a sequence Xi if for each real number ε >0, there exists a natural number
N such that for every natural number i>N, we have | Xi - L |< ε. In the situation of a monotonous bounded sequence, with the inspiration of the ε-N definition,
we design an algorithm applying exhaustion method to find a suitable N. The pseudo code of the
algorithm is shown below. In the circumstance of a decreasing sequence, the limit exists if for each ε
the user input, the N could be found with finite iteration. The limit of a sequence is expressed in an
algorithmic way. This algorithm provides a recursive view on the ε-N definition.
337337

The ε-N definition can also be compared to a game: given a sequence and a limit L, one player
A provides an ε, and the other player B have to find out an N that meets the requirement to win the game.
If player B has a sure-win strategy, then the sequence has the limit L. This analogy make it possible for
educators to design a game for the concept introduction. With the algorithm designed, we develop a
computer program for this game that can used for computational experiment and pedagogy. The
flowchart of the program is shown in Figure 1. A player tries to win the game by entering an ε that
makes the computer cannot find an N that satisfies the condition. Considering the situation that the
algorithm maybe trapped in an endless loop or the ε entered beyond the accuracy and ability of a
computer, we introduce a timer for prevention. It is worth to point out that the failure of the algorithm
could also prevent with proper selection of the sequence by teachers. Teachers can decide students’ win
or lose by setting different sequences, limits or timer and conduct students to think about the
determinants of the game.
Figure 1. The program of a game to find out a suitable N of a sequence.
Initialize:
Given an monotonous bounded sequence Xi A possible limit L
i=1 Step 1. Input an ε
Step 2. Calculate | Xi - L |
Step 3. Compare | Xi - L |with ε
Step 4. If | Xi - L |< ε:
Then let N = i, Print N
Stop; Else let i = i + 1
Go back to Step 2.
Begin
Enter an ε
Apply the algorithm
Find the N
or not?
End
Set and start
a timer
Select a sequence and a limit
from the preset database
Computer win
Time
override?
Player win
Yes
Yes
No
No
338338
If a player always lose and get the suitable N with the algorithm, then the L may be the limit of
the sequence. If one enter an ε that can make the algorithm loop infinitely, he/she may reject L as the
limit. This algorithm provides opportunities for students to execute the ε-N definition with computers.
Students can have an intuitive impression of limit and infinite with the repetitive enter of ε or the long
waiting for a non-exist N in an infinite loop. Students can also have opportunities to use proper loop
statement to take place of repetitive enter of ε and hence are exposed to recursive thinking.
5. Summary and Future Work
In this paper, we discuss the Computational Thinking in mathematics education at university level.
With the inspiration of the IDC theory and the inherent connection between mathematics and
computational thinking, we suggest that applying CT methods in mathematics study at university level
benefits the comprehension of mathematical concepts and the cultivation of CT skills. We provide an
example illustrating how to introduce limit of a sequence with an algorithmic program. However, there
are still limitations. Firstly, a better user interface is needed. Most programming platforms for CT have
graphical interface and pre-design code modules. Students can easily write programs with drag and
drop. We would develop our game on mobile platform so that students can easily have access to the
game with their mobile devices. The game will become a reliable learning system simultaneously.
Secondly most definitions in mathematics are rigorous, it may not be possible to express all of them in
computable forms. Finally, whether the method is effective needs empirical study. We are going to
conduct experiments in universities and attempt to figure out whether the designed tools and pedagogy
is helpful for students’ understanding in calculus. A comparative experiment between students in
mathematics and other major would be valuable to measure the effectiveness of our pedagogy.
References .
Aho, A. V. (2012). Computation and computational thinking. Computer Journal, 55(7), 832-835.
Barr, V., & Stephenson, C. (2011). Bringing computational thinking to K-12: what is involved and what is the role
of the computer science education community?. ACM Inroads, 2(1), 48-54.
Berland, M., & Lee, V. R. (2011). Collaborative strategic board games as a site for distributed computational
thinking. International Journal of Game-Based Learning, 1(2), 65-81.
Brennan, K., & Resnick, M. (2012). New frameworks for studying and assessing the development of
computational thinking. Proceedings of the 2012 Annual Meeting of the American Educational Research
Association, Vancouver, Canada. Retrieved from http://scratched.gse.harvard.edu/ct/files/AERA2012.pdf
Chan, T., Looi, C., Kit, & Chang, B. (2015). The IDC theory: creation and creation loop. Workshop Proceedings
of the 23rd International Conference on Computers in Education, 814-820.
Furber, S. (2012). Shut down or restart? The way forward for computing in UK schools. London, UK: The Royal
Society. Retrieved from http://royalsociety.org/education/policy/computing-in-schools/report/
Grabiner, J. V. (1983). Who gave you the epsilon? Cauchy and the origins of rigorous calculus. American
Mathematical Monthly, 90(3), 185-194.
Grover, S., & Pea, R. (2013). Computational thinking in K-12: a review of the state of the field. Educational
Researcher, 42(1), 38-43.
Guzdial, M. (2008). Education: paving the way for computational thinking. Communications of the ACM, 51(8),
25-27.
Kilpeläinen, P. (2010). Do all roads lead to Rome? (“or” reductions for dummy travelers). Computer Science
Education, 20(3), 181-199.
Miller, C. S., & Settle, A. (2011). When practice doesn’t make perfect: effects of task goals on learning computing
concepts. ACM Transactions on Computing Education, 11(4)
National Research Council (2010). Report of a workshop on the scope and nature of computational thinking.
Washington, D.C.: The National Academics Press.
Papert, S. (1980). Mindstorms: children, computers, and powerful ideas. Sussex, U.K.: Basic Books.
Papert, S. (1996). An exploration in the space of mathematics educations. International Journal of Computers for
Mathematical Learning, 1(1), 95-123.
Papert, S., & Idit, H. (1991). Situating constructionism. In S. Papert, & I, Harel (Eds.). Constructionism (pp. 1-11).
Norwood, NJ: Ablex.
Wing, J. (2006). Computational thinking. Communications of the ACM, 49(3), 33-35.
339339
Chen, W. et al. (Eds.) (2016). Proceedings of the 24th International Conference on Computers in Education.
India: Asia-Pacific Society for Computers in Education
A case study of teaching probability using
augmented reality in secondary school
Shuhui LIa, Yihua SHEN
a, Peiwen WANG
b,c, Enrui LIU
b,c & Su CAI
b,c*
aTeachers College, Columbia University, USA bAdvanced Technology Innovation Center for Future Education, Beijing Normal University, China
bSchool of Educational Technology, Faculty of Education, Beijing Normal University, China
Abstract: In this study, we attempt to present a new way for high school students to explore the
relations between empirical probability and theoretical probability and build conceptual
understandings of probability by the means of Augmented Reality. Two classes of seventh
grade students were selected as an experimental class and a control class. Students were
assessed by the pretests and posttests handed to students at the beginning and the end of the
class respectively. The quantitative analysis showed an improvement of the mean score between
the two groups. Also, the qualitative analysis of the open-ended questions and interviews of
students and the teacher showed their strong inclinations toward the Augmented Reality
technology-equipped instruction.
Keywords: Augmented reality, post-secondary, probability learning
1. Introduction
Augmented Reality (AR), as a branch of Virtual Reality (VR), brings about richer immersive
experience than ordinary virtual reality technologies, successfully combining the virtual world and real
world. Virtual Reality generally constructs a complete virtual world, in which users are not conscious of
the real world around them. Augmented Reality blends the scene of virtual objects with the real world
and presents them to users at the same time. AR environments provide users with a seamless interface to
connect the real world and the virtual world. An ideal AR-based learning environment helps to vividly
demonstrate both the real world which is not accessible to learners and the micro worlds which only
exist in learners’ imagination by using 3D animation. It provides new possibilities for simulating
teaching environments, experiencing teaching processes and promoting teaching interaction through
certain teaching approaches, including virtual-real blended, real-time interactive or three-dimensional
immersive.
2. Related Works
According to recent studies on teaching and learning statistics, a line of inquiry has focused on how to
develop good statistical reasoning and understanding in elementary and secondary mathematics classes.
Garfield first investigated difficulties in learning basic concepts in Probability and Statistics in 1988,
and then he found that the experience of psychologists, educators, and statisticians alike is that a large
proportion of students, even in college, do not understand many of the basic statistical concepts they
have studied (Garfield & Ahlgren, 1988). However, most of the research involving technological tools
integration in statistics and probability courses has been conducted in college settings rather than at the
secondary school level. Among the few studies done at the secondary level, Christensen used Microsoft
Excel as a supplement in a high school statistics course. According to Christensen’s study conducted at
Arlington High School in a Probability and Statistics course for junior and senior level students, the
experimental group (the one using EXCEL) outperformed the control group on five of the six
teacher-created unit tests and on both of the criterion referenced assessments used by the district
(Christensen & Stephens, 2003).
340340
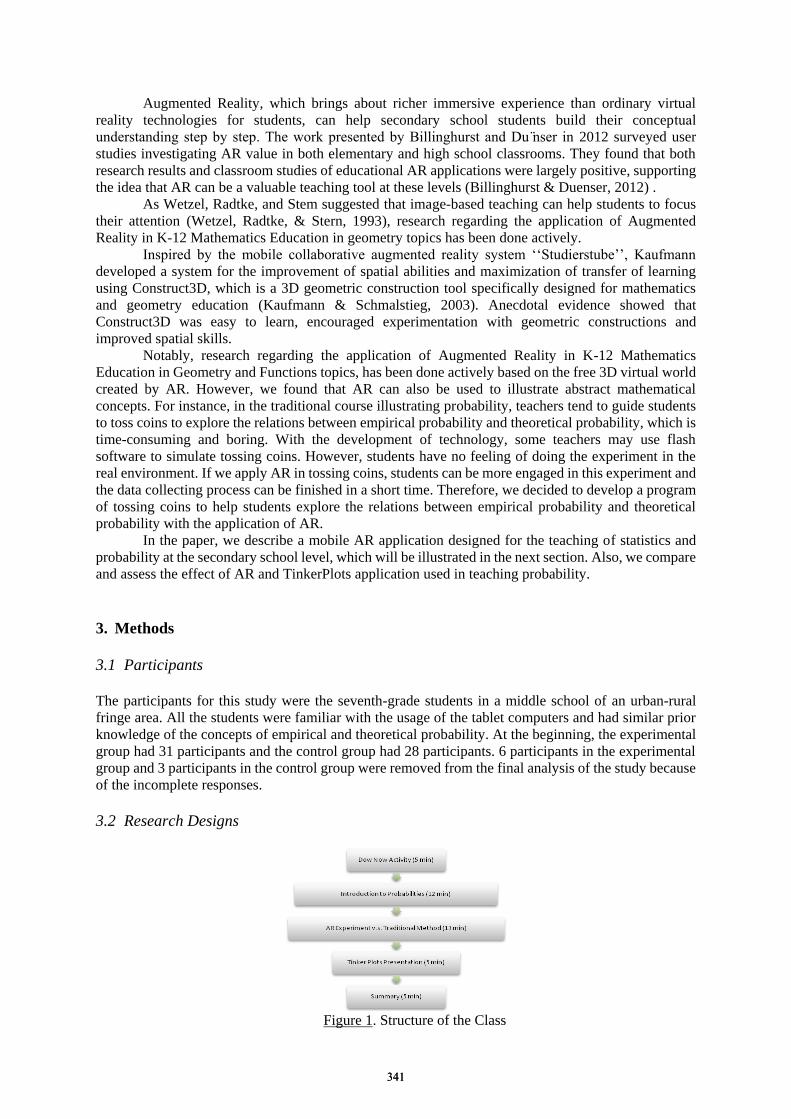
Augmented Reality, which brings about richer immersive experience than ordinary virtual
reality technologies for students, can help secondary school students build their conceptual
understanding step by step. he wor presented by illinghurst and Du nser in 2012 surveyed user
studies investigating AR value in both elementary and high school classrooms. They found that both
research results and classroom studies of educational AR applications were largely positive, supporting
the idea that AR can be a valuable teaching tool at these levels (Billinghurst & Duenser, 2012) .
As Wetzel, Radtke, and Stem suggested that image-based teaching can help students to focus
their attention (Wetzel, Radtke, & Stern, 1993), research regarding the application of Augmented
Reality in K-12 Mathematics Education in geometry topics has been done actively.
Inspired by the mobile collaborative augmented reality system ‘‘Studierstube’’, Kaufmann
developed a system for the improvement of spatial abilities and maximization of transfer of learning
using Construct3D, which is a 3D geometric construction tool specifically designed for mathematics
and geometry education (Kaufmann & Schmalstieg, 2003). Anecdotal evidence showed that
Construct3D was easy to learn, encouraged experimentation with geometric constructions and
improved spatial skills.
Notably, research regarding the application of Augmented Reality in K-12 Mathematics
Education in Geometry and Functions topics, has been done actively based on the free 3D virtual world
created by AR. However, we found that AR can also be used to illustrate abstract mathematical
concepts. For instance, in the traditional course illustrating probability, teachers tend to guide students
to toss coins to explore the relations between empirical probability and theoretical probability, which is
time-consuming and boring. With the development of technology, some teachers may use flash
software to simulate tossing coins. However, students have no feeling of doing the experiment in the
real environment. If we apply AR in tossing coins, students can be more engaged in this experiment and
the data collecting process can be finished in a short time. Therefore, we decided to develop a program
of tossing coins to help students explore the relations between empirical probability and theoretical
probability with the application of AR.
In the paper, we describe a mobile AR application designed for the teaching of statistics and
probability at the secondary school level, which will be illustrated in the next section. Also, we compare
and assess the effect of AR and TinkerPlots application used in teaching probability.
3. Methods
3.1 Participants
The participants for this study were the seventh-grade students in a middle school of an urban-rural
fringe area. All the students were familiar with the usage of the tablet computers and had similar prior
knowledge of the concepts of empirical and theoretical probability. At the beginning, the experimental
group had 31 participants and the control group had 28 participants. 6 participants in the experimental
group and 3 participants in the control group were removed from the final analysis of the study because
of the incomplete responses.
3.2 Research Designs
Figure 1. Structure of the Class
341341
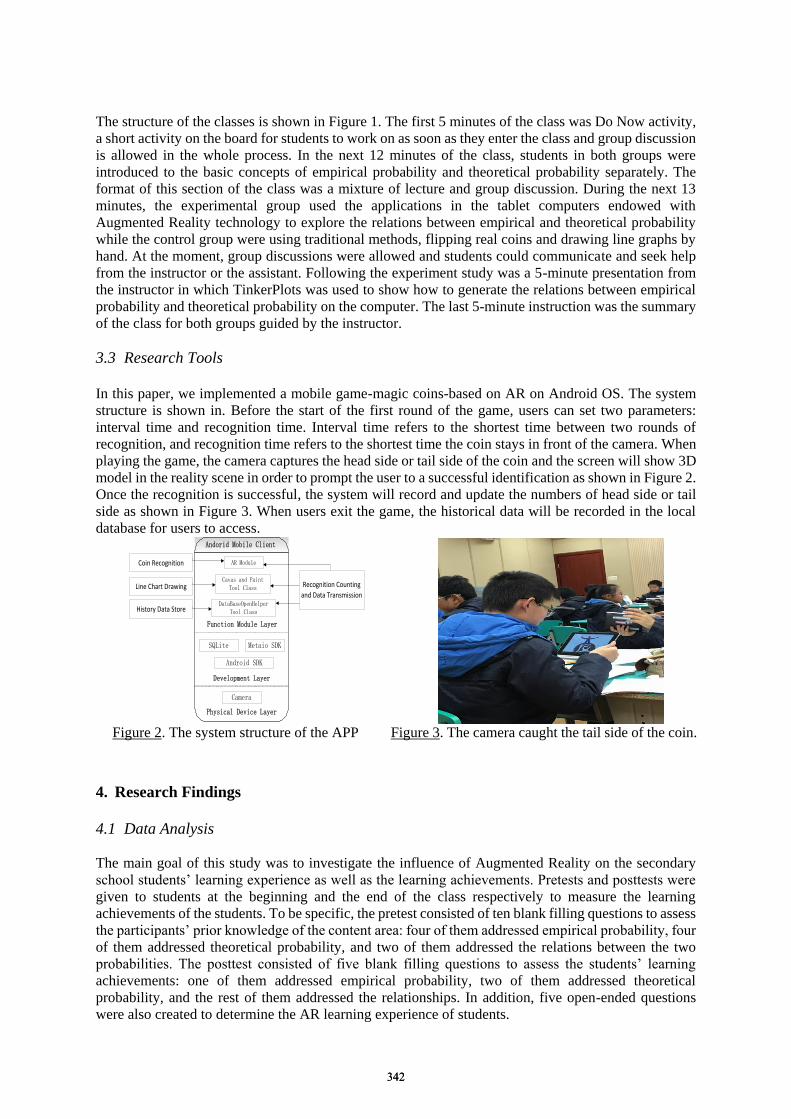
The structure of the classes is shown in Figure 1. The first 5 minutes of the class was Do Now activity,
a short activity on the board for students to work on as soon as they enter the class and group discussion
is allowed in the whole process. In the next 12 minutes of the class, students in both groups were
introduced to the basic concepts of empirical probability and theoretical probability separately. The
format of this section of the class was a mixture of lecture and group discussion. During the next 13
minutes, the experimental group used the applications in the tablet computers endowed with
Augmented Reality technology to explore the relations between empirical and theoretical probability
while the control group were using traditional methods, flipping real coins and drawing line graphs by
hand. At the moment, group discussions were allowed and students could communicate and seek help
from the instructor or the assistant. Following the experiment study was a 5-minute presentation from
the instructor in which TinkerPlots was used to show how to generate the relations between empirical
probability and theoretical probability on the computer. The last 5-minute instruction was the summary
of the class for both groups guided by the instructor.
3.3 Research Tools
In this paper, we implemented a mobile game-magic coins-based on AR on Android OS. The system
structure is shown in. Before the start of the first round of the game, users can set two parameters:
interval time and recognition time. Interval time refers to the shortest time between two rounds of
recognition, and recognition time refers to the shortest time the coin stays in front of the camera. When
playing the game, the camera captures the head side or tail side of the coin and the screen will show 3D
model in the reality scene in order to prompt the user to a successful identification as shown in Figure 2.
Once the recognition is successful, the system will record and update the numbers of head side or tail
side as shown in Figure 3. When users exit the game, the historical data will be recorded in the local
database for users to access. Andorid Mobile Client
SQLite Metaio SDK
Android SDK
Recognition Counting
and Data Transmission
AR Module
Cavas and Paint Tool Class
Camera
DataBaseOpenHelper Tool Class
Physical Device Layer
Development Layer
Function Module Layer
Coin Recognition
Line Chart Drawing
History Data Store
Figure 2. The system structure of the APP Figure 3. The camera caught the tail side of the coin.
4. Research Findings
4.1 Data Analysis
The main goal of this study was to investigate the influence of Augmented Reality on the secondary
school students’ learning experience as well as the learning achievements. Pretests and posttests were
given to students at the beginning and the end of the class respectively to measure the learning
achievements of the students. To be specific, the pretest consisted of ten blank filling questions to assess
the participants’ prior nowledge of the content area: four of them addressed empirical probability, four
of them addressed theoretical probability, and two of them addressed the relations between the two
probabilities. he posttest consisted of five blan filling questions to assess the students’ learning
achievements: one of them addressed empirical probability, two of them addressed theoretical
probability, and the rest of them addressed the relationships. In addition, five open-ended questions
were also created to determine the AR learning experience of students.
342342
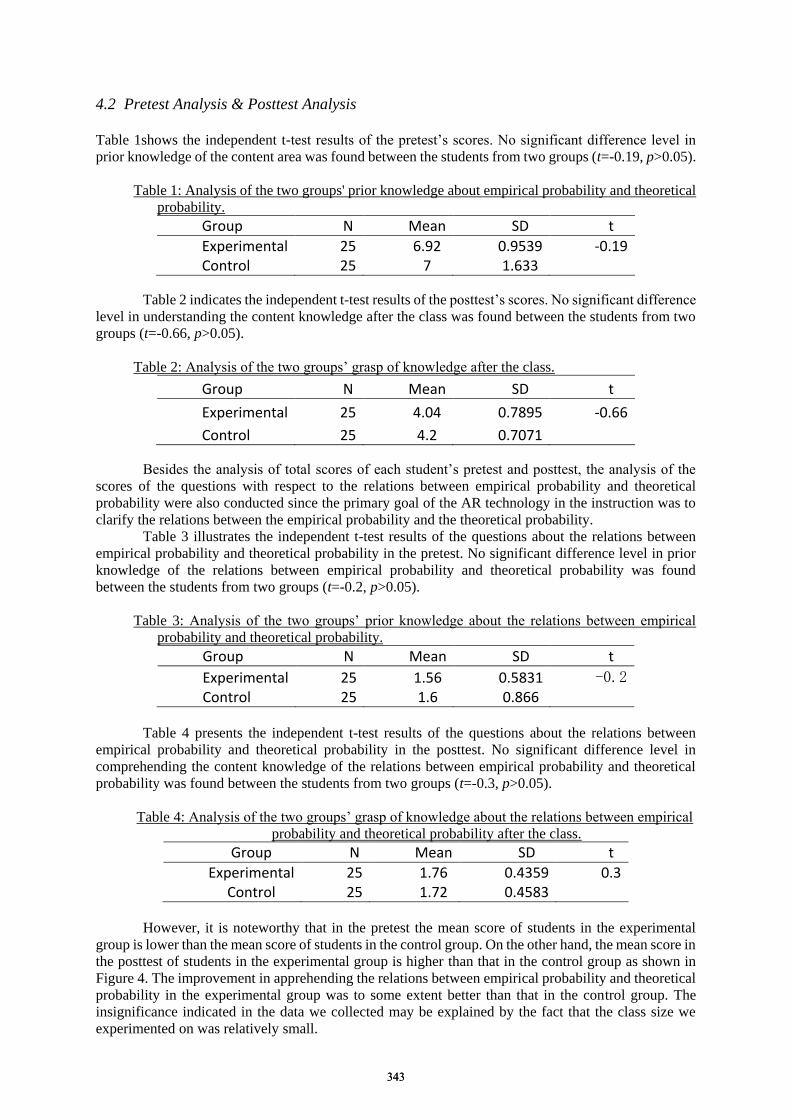
4.2 Pretest Analysis & Posttest Analysis
Table 1shows the independent t-test results of the pretest’s scores. No significant difference level in
prior knowledge of the content area was found between the students from two groups (t=-0.19, p>0.05).
Table 1: Analysis of the two groups' prior knowledge about empirical probability and theoretical
probability.
Group N Mean SD t
Experimental 25 6.92 0.9539 -0.19Control 25 7 1.633
Table 2 indicates the independent t-test results of the posttest’s scores. No significant difference
level in understanding the content knowledge after the class was found between the students from two
groups (t=-0.66, p>0.05).
Table 2: Analysis of the two groups’ grasp of nowledge after the class.
Group N Mean SD t
Experimental 25 4.04 0.7895 -0.66
Control 25 4.2 0.7071
esides the analysis of total scores of each student’s pretest and posttest, the analysis of the
scores of the questions with respect to the relations between empirical probability and theoretical
probability were also conducted since the primary goal of the AR technology in the instruction was to
clarify the relations between the empirical probability and the theoretical probability.
Table 3 illustrates the independent t-test results of the questions about the relations between
empirical probability and theoretical probability in the pretest. No significant difference level in prior
knowledge of the relations between empirical probability and theoretical probability was found
between the students from two groups (t=-0.2, p>0.05).
Table 3: Analysis of the two groups’ prior nowledge about the relations between empirical
probability and theoretical probability.
Group N Mean SD t
Experimental 25 1.56 0.5831 -0.2Control 25 1.6 0.866
Table 4 presents the independent t-test results of the questions about the relations between
empirical probability and theoretical probability in the posttest. No significant difference level in
comprehending the content knowledge of the relations between empirical probability and theoretical
probability was found between the students from two groups (t=-0.3, p>0.05).
Table 4: Analysis of the two groups’ grasp of nowledge about the relations between empirical
probability and theoretical probability after the class.
Group N Mean SD t
Experimental 25 1.76 0.4359 0.3 Control 25 1.72 0.4583
However, it is noteworthy that in the pretest the mean score of students in the experimental
group is lower than the mean score of students in the control group. On the other hand, the mean score in
the posttest of students in the experimental group is higher than that in the control group as shown in
Figure 4. The improvement in apprehending the relations between empirical probability and theoretical
probability in the experimental group was to some extent better than that in the control group. The
insignificance indicated in the data we collected may be explained by the fact that the class size we
experimented on was relatively small.
343343

1.54
1.59
1.64
1.69
1.74
Pretest Posttest
Experimental
Control
Figure 4. Mean scores of pretest and posttest from two groups.
5. Conclusion
his study was underta en to investigate the effects of the Augmented Reality techniques on students’
learning of mathematics, specifically, secondary school mathematics concentrating on statistics and
probability. From the experimental results, it was found that the learning achievements of students by
using AR instruction were not statistically different from the outcomes without AR instruction.
However, from the qualitative analysis of the AR instruction, both students and the teacher
acknowledged the positive influence AR had on students’ understanding of the materials. Due to the
fact that the sample size is comparatively small, the quantitative result does not show any statistical
significance. In future studies, more samples need to be collected in order to further analyze the effects
of AR application on students’ math learning. Additionally, a real time web server will be created in
order to collect all students’ data instantly such that students will be able to see a larger sample of data
and achieve a better understanding of the material.
Acknowledgements
Our work is supported by the National Natural Science Foundation of China (Grant No. 61602043) and
2015 Comprehensive Discipline Construction Fund of Faculty of Education and Fundamental Research
Funds for National Engineering Research Center for Educational Technology. We would like to express
our gratitude for the explorative, communicative and critical efforts made by our partner: Daixi Wu.
References
Billinghurst, M., & Duenser, A. (2012). Augmented reality in the classroom. Computer, 45(7), 56-63.
Christensen, A. R., & Stephens, L. J. (2003). Microsoft Excel as a supplement in a high school statistics course.
International Journal of Mathematical Education in Science and Technology, 34(6), 881-885.
Garfield, J., & Ahlgren, A. (1988). Difficulties in learning basic concepts in probability and statistics:
Implications for research. Journal for research in Mathematics Education, 44-63.
Kaufmann, H., & Schmalstieg, D. (2003). Mathematics and geometry education with collaborative augmented
reality. Computers & Graphics-Uk, 27(3), 339-345.
Wetzel, C., Radtke, P., & Stern, H. (1993). Review of the effectiveness of video media in instruction
(NPRDC-TR-93-4). Office of Naval Research, Navy Personnel Research and Development Center.
344344344

Chen, W. et al. (Eds.) (2016). Proceedings of the 24th International Conference on Computers in Education. India: Asia-Pacific Society for Computers in Education.
Effectiveness of Low Cost FOSSEE Laptops in a CS101 Course
Kannan M. MOUDGALYAa,b*, Kiran L.N. ERANKIa, Sohinee GANGULYb, Varsha APTEc IDP in Educational Technologya, Chemical Engineeringb, Computer Science and Engineeringc
Indian Institute of Technology Bombay [email protected], [email protected], [email protected], [email protected]
Abstract. This paper presents a case study of 278 first year students enrolled in a CS101 course of the department of Computer Science at the Indian Institute of Technology Bombay. The sufficiency of a low cost (Rs.7,500 or $110) laptop for this course is assessed. From the feedback questionnaires, the students' perception on the likability of this device is assessed. It is found that the students like this device. Users of this device used it as much others who had access to more expensive computers, and also performed as well as others in the course. This device is useful for several other applications also, and hence is a candidate for mass deployment in developing countries, such as India. Keywords: Low cost laptop, FOSSEE laptop, Student Perceptions, Usability, Spoken Tutorial
1 Introduction For developing countries like India to become developed, excellence in education is the first requirement. The brick and mortar approach to improve the education level is too expensive and time consuming. ICT based educational methods offer an attractive alternative.
Fortunately, a large number of educational resources are available on the Internet, for example OCW and Khan Academy, to mention a few. The Indian Government has also created high quality educational content, such as NPTEL, Virtual Labs, and courses created through recording of live classes in IIT Bombay (Moudgalya et al., 2009). Such initiatives have resulted in massive training (Moudgalya, 2014), while simultaneously being effective (Eranki and Moudgalya, 2016).
Although a large amount of extremely useful content is available on the web, they are not accessible to most students in developing countries, as they do not have an access device, such as a tablet or a laptop. To address this issue, our group piloted the low cost access device at a price of about $35, with funding from the Indian Government (Moudgalya et al., 2013; Patil and Patnaik, 2013; Phalkey and Chattapadhyay, 2015).
A tablet is only a consumption device and generally cannot be used to create content. As a matter of fact, 97% of the businesses use either a laptop or a desktop, but not a tablet (Sriram, 2015). To address these issues, our group came up with a laptop, referred to as the FOSSEE laptop, at an affordable price of about $110. It has the following specifications: Dual core 1 GHz ARM v7 processor, 1GB RAM, 8GB NAND flash, 10" screen, Complete Keyboard, 2 USB, 1 mini HDMI, a 32GB SD card slot, an ethernet port and audio I/O ports. It runs on a stripped down version of Ubuntu. A review of this work, along with a list of about 150 open source software packages ported on to this laptop, the process we adopted to procure this device, and also the media articles on this effort are summarised by Moudgalya (2015).
In a preliminary study we conducted at IIT Bombay, wherein 50 students of a computer science course (CS101) used them, we found these low end laptops to be adequate for the course. Emboldened by this
345345345
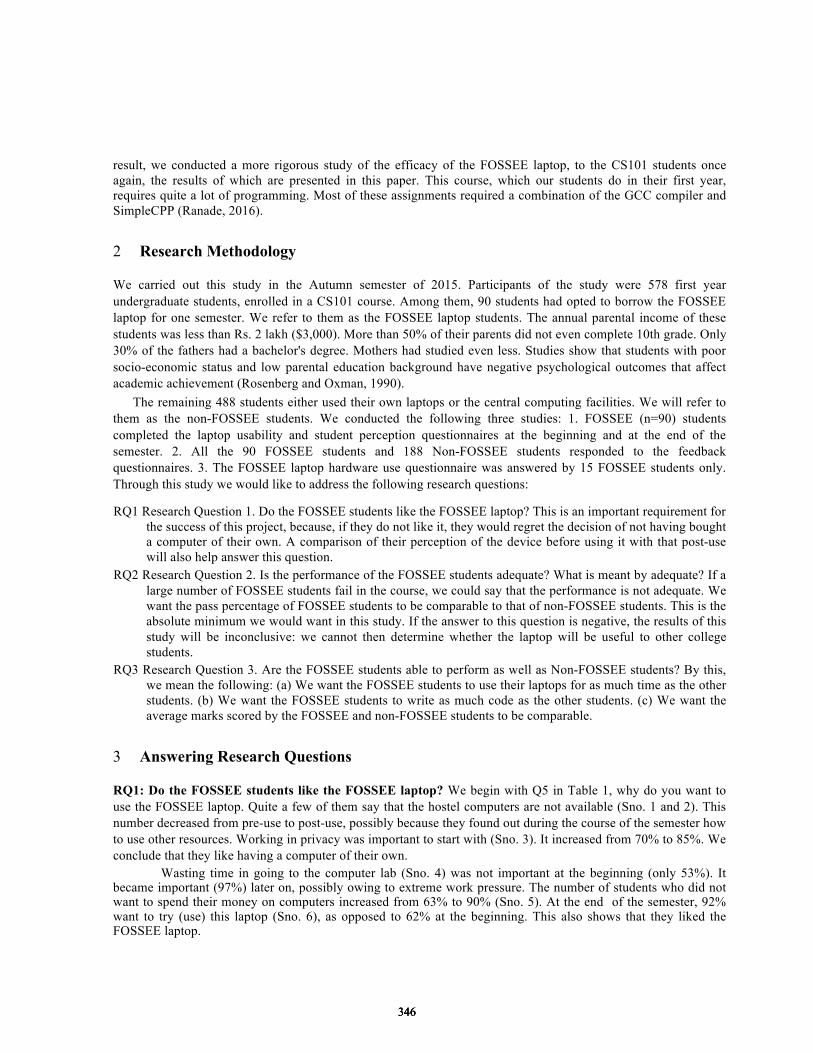
result, we conducted a more rigorous study of the efficacy of the FOSSEE laptop, to the CS101 students once again, the results of which are presented in this paper. This course, which our students do in their first year, requires quite a lot of programming. Most of these assignments required a combination of the GCC compiler and SimpleCPP (Ranade, 2016).
2 Research Methodology We carried out this study in the Autumn semester of 2015. Participants of the study were 578 first year undergraduate students, enrolled in a CS101 course. Among them, 90 students had opted to borrow the FOSSEE laptop for one semester. We refer to them as the FOSSEE laptop students. The annual parental income of these students was less than Rs. 2 lakh ($3,000). More than 50% of their parents did not even complete 10th grade. Only 30% of the fathers had a bachelor's degree. Mothers had studied even less. Studies show that students with poor socio-economic status and low parental education background have negative psychological outcomes that affect academic achievement (Rosenberg and Oxman, 1990).
The remaining 488 students either used their own laptops or the central computing facilities. We will refer to them as the non-FOSSEE students. We conducted the following three studies: 1. FOSSEE (n=90) students completed the laptop usability and student perception questionnaires at the beginning and at the end of the semester. 2. All the 90 FOSSEE students and 188 Non-FOSSEE students responded to the feedback questionnaires. 3. The FOSSEE laptop hardware use questionnaire was answered by 15 FOSSEE students only. Through this study we would like to address the following research questions: RQ1 Research Question 1. Do the FOSSEE students like the FOSSEE laptop? This is an important requirement for
the success of this project, because, if they do not like it, they would regret the decision of not having bought a computer of their own. A comparison of their perception of the device before using it with that post-use will also help answer this question.
RQ2 Research Question 2. Is the performance of the FOSSEE students adequate? What is meant by adequate? If a large number of FOSSEE students fail in the course, we could say that the performance is not adequate. We want the pass percentage of FOSSEE students to be comparable to that of non-FOSSEE students. This is the absolute minimum we would want in this study. If the answer to this question is negative, the results of this study will be inconclusive: we cannot then determine whether the laptop will be useful to other college students.
RQ3 Research Question 3. Are the FOSSEE students able to perform as well as Non-FOSSEE students? By this, we mean the following: (a) We want the FOSSEE students to use their laptops for as much time as the other students. (b) We want the FOSSEE students to write as much code as the other students. (c) We want the average marks scored by the FOSSEE and non-FOSSEE students to be comparable.
3 Answering Research Questions RQ1: Do the FOSSEE students like the FOSSEE laptop? We begin with Q5 in Table 1, why do you want to use the FOSSEE laptop. Quite a few of them say that the hostel computers are not available (Sno. 1 and 2). This number decreased from pre-use to post-use, possibly because they found out during the course of the semester how to use other resources. Working in privacy was important to start with (Sno. 3). It increased from 70% to 85%. We conclude that they like having a computer of their own.
Wasting time in going to the computer lab (Sno. 4) was not important at the beginning (only 53%). It became important (97%) later on, possibly owing to extreme work pressure. The number of students who did not want to spend their money on computers increased from 63% to 90% (Sno. 5). At the end of the semester, 92% want to try (use) this laptop (Sno. 6), as opposed to 62% at the beginning. This also shows that they liked the FOSSEE laptop.
346346346
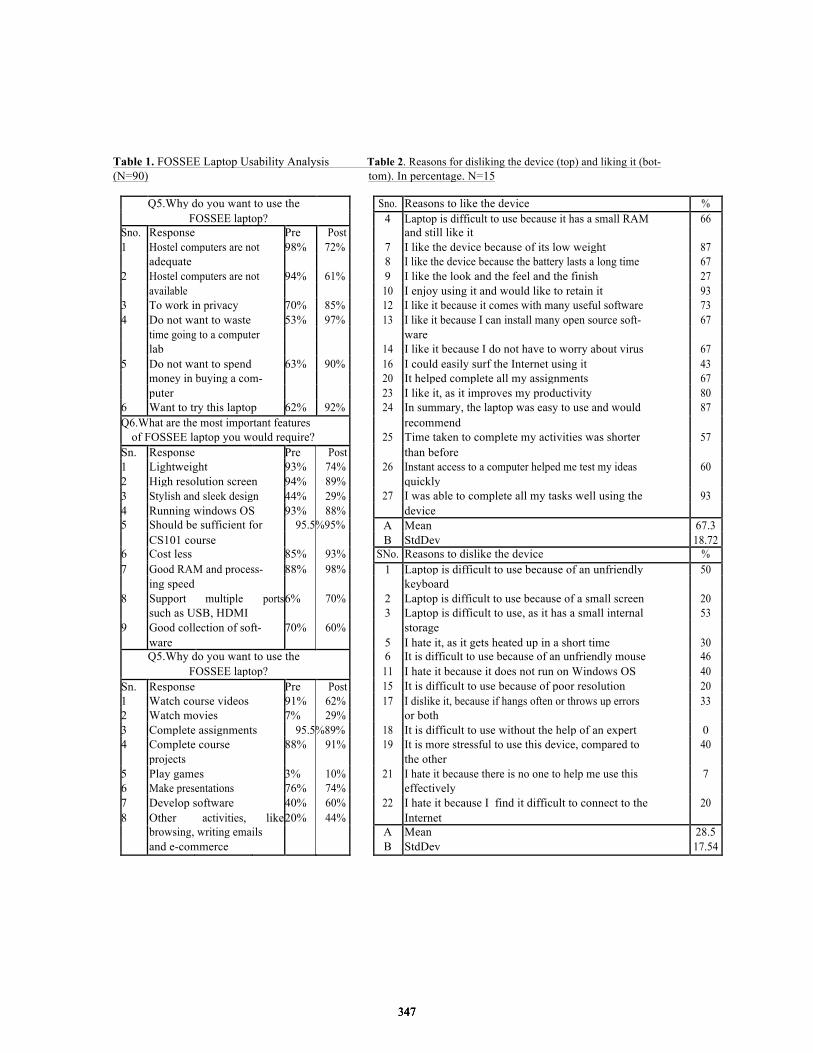
Table 1. FOSSEE Laptop Usability Analysis Table 2. Reasons for disliking the device (top) and liking it (bot- (N=90) tom). In percentage. N=15
Q5.Why do you want to use the Sno. Reasons to like the device %
FOSSEE laptop?
4 Laptop is difficult to use because it has a small RAM 66
Sno. Response Pre Post and still like it
1 Hostel computers are not 98% 72% 7 I like the device because of its low weight 87
adequate 8 I like the device because the battery lasts a long time 67
2 Hostel computers are not 94% 61% 9 I like the look and the feel and the finish 27
available 10 I enjoy using it and would like to retain it 93
3 To work in privacy 70% 85% 12 I like it because it comes with many useful software 73
4 Do not want to waste 53% 97% 13 I like it because I can install many open source soft- 67
time going to a computer ware
lab 14 I like it because I do not have to worry about virus 67
5 Do not want to spend 63% 90% 16 I could easily surf the Internet using it 43
money in buying a com- 20 It helped complete all my assignments 67
puter 23 I like it, as it improves my productivity 80
6 Want to try this laptop 62% 92% 24 In summary, the laptop was easy to use and would 87
recommend
Q6.What are the most important features
of FOSSEE laptop you would require? 25 Time taken to complete my activities was shorter 57
than before
Sn. Response Pre Post
1 Lightweight 93% 74% 26 Instant access to a computer helped me test my ideas 60
2 High resolution screen 94% 89% quickly
3 Stylish and sleek design 44% 29% 27 I was able to complete all my tasks well using the 93
4 Running windows OS 93% 88% device
5 Should be sufficient for 95.5%95% A Mean 67.3
CS101 course B StdDev 18.72
6 Cost less 85% 93% SNo. Reasons to dislike the device %
7 Good RAM and process- 88% 98%
1 Laptop is difficult to use because of an unfriendly 50
ing speed keyboard
8 Support multiple ports 6% 70% 2 Laptop is difficult to use because of a small screen 20
such as USB, HDMI 3 Laptop is difficult to use, as it has a small internal 53
9 Good collection of soft- 70% 60% storage
ware 5 I hate it, as it gets heated up in a short time 30
Q5.Why do you want to use the 6 It is difficult to use because of an unfriendly mouse 46
FOSSEE laptop? 11 I hate it because it does not run on Windows OS 40
15 It is difficult to use because of poor resolution 20
Sn. Response Pre Post
1 Watch course videos 91% 62% 17 I dislike it, because if hangs often or throws up errors 33
2 Watch movies 7% 29% or both
3 Complete assignments 95.5%89% 18 It is difficult to use without the help of an expert 0
4 Complete course 88% 91% 19 It is more stressful to use this device, compared to 40
projects the other
5 Play games 3% 10% 21 I hate it because there is no one to help me use this 7
6 Make presentations 76% 74% effectively
7 Develop software 40% 60% 22 I hate it because I find it difficult to connect to the 20
8 Other activities, like 20% 44% Internet
browsing, writing emails A Mean 28.5
and e-commerce B StdDev 17.54
347347347

Next, we take up Q6 of Table 1, what are the most important features of the laptop you would require. It is
interesting that they did not consider stylish and sleek design to be important (Sno. 3). Possibly, they did not understand the importance of external ports (Sno. 8) when they joined IIT. This number increased from 6% to 70%. As the FOSSEE laptops have many external ports, we can conclude that they liked the FOSSEE laptop on this count also.
Most people want Windows OS (Sno. 4). At the same time only 40% hate this laptop because of this reason (see Sno. 11 in Table 2). In any case, most students want to use this laptop for their coursework, for which, it is good enough. This shows that the students do not consider it as the greatest shortcoming.
They do not consider the collection of software important (Sno. 9), possibly because (a) they could install new software, being a Linux system or (b) they did not need more software - for them, use for CS101 is a lot more important (Sno. 5).
Next, we take up Q7 of Table 1, why do you want to use the FOSSEE laptop. For the FOSSEE students, completing course projects (Sno. 3) and assignments (Sno. 4) are the most important, both being 90%. Because of this reason, they want to use the FOSSEE laptop. The number of people who want to use this device for developing new software (Sno. 7) and for other activities, such as browsing, etc. (Sno. 8) increased after using the device. This shows that this device turned out to be better than what they expected at the beginning.
We now discuss the answers given in the likes and dislikes Table (Table 2). We have divided the answers in this fashion for easy analysis. We would like to point out that these questions were mixed in the actual questionnaire. The original serial number of every question is included in this Table. We begin with the likes. From Table 2, we notice that the FOSSEE students liked the laptop in general, with the average being 67.3%. It is interesting that I enjoy using the device and would like to retain it (Sno. 10) and I was able to complete all my tasks well using the device (Sno. 27) got the highest score of 93%. In summary, the laptop was easy to use and would recommend (Sno. 24) was the next highest at 87%. I like the device, as it improves my productivity (Sno. 23), was the next highest, at 80%. The FOSSEE students did not like the look and feel of the device (Sno. 9).
Next, we discuss the answers given in the dislikes Table 2. We notice that the FOSSEE students do not hate this device, as the mean is 28.5%. They have the least reason to dislike this device, as they have low scores: difficult to use without the help of an expert (Sno. 18 and 21), heating (Sno. 5), small screen (Sno. 2), poor resolution (Sno. 15), connecting to the Internet (Sno. 22). In the students opinion, these factors do not create any problems. They disliked the device most, because of the following reasons: unfriendly keyboard (Sno. 1), small internal storage (Sno. 3), unfriendly mouse (Sno. 6), and Windows OS (Sno. 11). These are pointers for improvement in the next version of this device.
Overall, most FOSSEE students have good things to say about the device: 1. This device is worth its price (60%). 2. I recommend it to school students (63%) and to college students (80%). 3. I recommend it to anyone who need a computer, but cannot afford high prices, such as Rs. 15,000 or more (63%). 4. This may be useful also to those who have a computer - for use during travel, as a second computer, etc. (67%). 5. This laptop is better than many other expensive computers i have seen or used before (71%). Only 29% feel that this is an expensive device and only 20% feel that this device cannot be used for serious work. We conclude that the FOSSEE students liked the laptop overwhelmingly.
RQ2: Is the performance of the FOSSEE students adequate? As mentioned earlier, here we look at the number of FOSSEE students who failed in this CS101 course and compare it with the non-FOSSEE student data. The answer to this question lies in Table 5, wherein, the overall marks scored by the FOSSEE and the non-FOSSEE students are listed. The pass percentage for this course is fixed at 30%: only those who scored less than 30% failed in this course. One has to remember that in a course such as CS101, where a lot of programming needs to be done, and projects have to be carried out, the pass percentage is arrived at after considering several factors. From Table 5, one can see that 14% of the FOSSEE students scored below 30%, while 13% of the non-FOSSEE students scored below the same level. Thus, the number of FOSSEE students who failed in this course is comparable to that of the non-FOSSEE students. Interestingly, most of the FOSSEE students who failed in the course (12 out of 14) are close to passing. This is reflected in the average mark of the failing students: it is 17.31 for non-FOSSEE and 22.86 for FOSSEE. Thus, with a little bit of effort, a majority of the FOSSEE students can be helped to go past the pass mark. We can
348348348
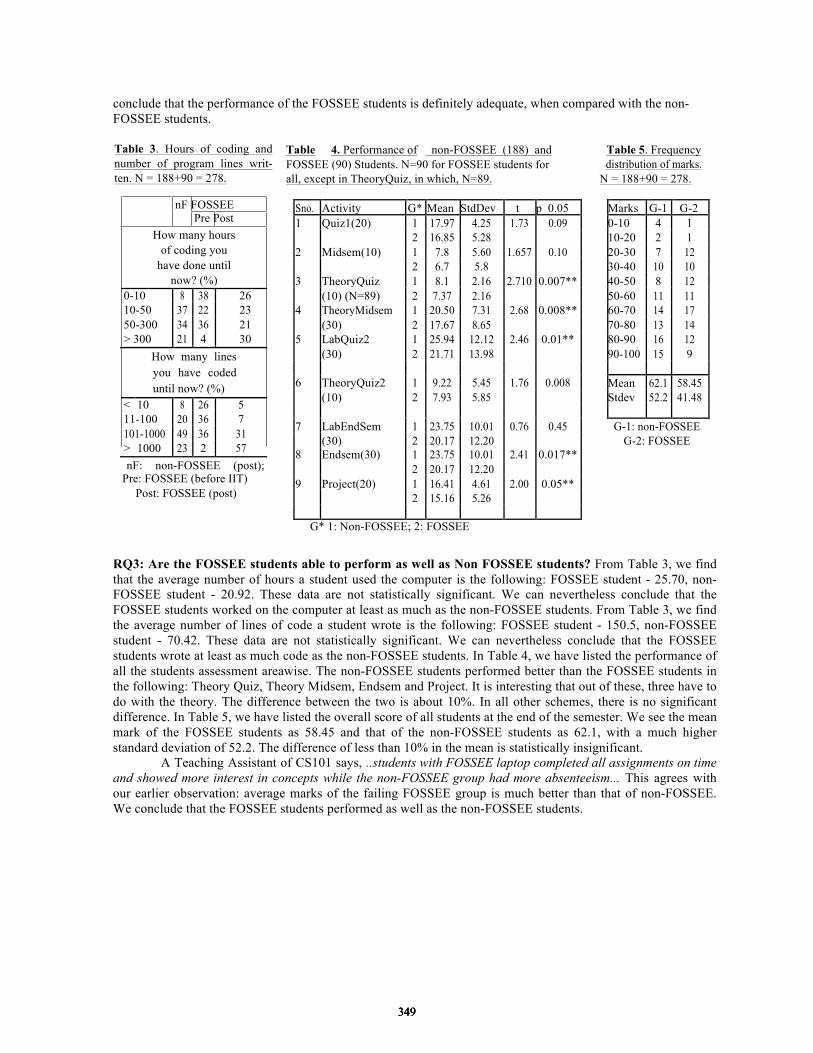
conclude that the performance of the FOSSEE students is definitely adequate, when compared with the non-FOSSEE students. Table 3. Hours of coding and number of program lines writ-ten. N = 188+90 = 278.
nF FOSSEE Pre Post
How many hours of coding you
have done until now? (%)
0-10 8 38 26 10-50 37 22 23 50-300 34 36 21 > 300 21 4 30
How many lines you have coded until now? (%)
< 10 8 26 5 11-100 20 36 7 101-1000 49 36 31 > 1000 23 2 57 nF: non-FOSSEE (post);
Pre: FOSSEE (before IIT) Post: FOSSEE (post)
Table 4. Performance of non-FOSSEE (188) and Table 5. Frequency FOSSEE (90) Students. N=90 for FOSSEE students for distribution of marks. all, except in TheoryQuiz, in which, N=89. N = 188+90 = 278. Sno. Activity G* Mean StdDev t p 0.05 Marks G-1 G-2 1 Quiz1(20) 1 17.97 4.25 1.73 0.09 0-10 4 1 2 16.85 5.28 10-20 2 1 2 Midsem(10) 1 7.8 5.60 1.657 0.10 20-30 7 12 2 6.7 5.8 30-40 10 10 3 TheoryQuiz 1 8.1 2.16 2.710 0.007** 40-50 8 12 (10) (N=89) 2 7.37 2.16 50-60 11 11 4 TheoryMidsem 1 20.50 7.31 2.68 0.008** 60-70 14 17 (30) 2 17.67 8.65 70-80 13 14 5 LabQuiz2 1 25.94 12.12 2.46 0.01** 80-90 16 12 (30) 2 21.71 13.98 90-100 15 9
6 TheoryQuiz2 1 9.22 5.45 1.76 0.008
Mean 62.1 58.45 (10) 2 7.93 5.85 Stdev 52.2 41.48
7 LabEndSem 1 23.75 10.01 0.76 0.45
G-1: non-FOSSEE (30) 2 20.17 12.20 G-2: FOSSEE 8 Endsem(30) 1 23.75 10.01 2.41 0.017** 2 20.17 12.20 9 Project(20) 1 16.41 4.61 2.00 0.05** 2 15.16 5.26
G* 1: Non-FOSSEE; 2: FOSSEE
RQ3: Are the FOSSEE students able to perform as well as Non FOSSEE students? From Table 3, we find that the average number of hours a student used the computer is the following: FOSSEE student - 25.70, non-FOSSEE student - 20.92. These data are not statistically significant. We can nevertheless conclude that the FOSSEE students worked on the computer at least as much as the non-FOSSEE students. From Table 3, we find the average number of lines of code a student wrote is the following: FOSSEE student - 150.5, non-FOSSEE student - 70.42. These data are not statistically significant. We can nevertheless conclude that the FOSSEE students wrote at least as much code as the non-FOSSEE students. In Table 4, we have listed the performance of all the students assessment areawise. The non-FOSSEE students performed better than the FOSSEE students in the following: Theory Quiz, Theory Midsem, Endsem and Project. It is interesting that out of these, three have to do with the theory. The difference between the two is about 10%. In all other schemes, there is no significant difference. In Table 5, we have listed the overall score of all students at the end of the semester. We see the mean mark of the FOSSEE students as 58.45 and that of the non-FOSSEE students as 62.1, with a much higher standard deviation of 52.2. The difference of less than 10% in the mean is statistically insignificant.
A Teaching Assistant of CS101 says, ..students with FOSSEE laptop completed all assignments on time and showed more interest in concepts while the non-FOSSEE group had more absenteeism... This agrees with our earlier observation: average marks of the failing FOSSEE group is much better than that of non-FOSSEE. We conclude that the FOSSEE students performed as well as the non-FOSSEE students.
349349349
4 Conclusions and future work The FOSSEE laptop has been proved effective for student performance in a rigorous IIT Bombay course-work. Students liked the laptops and wanted to continue to use it. We also validated the usefulness of this device in a non-IIT environment: Sasi (2015) has reported the effective use of this device by data entering health volunteers, most of whom have not studied beyond 10th grade.
Educational institutions and governments should consider making available such laptops in their curriculum and eGovernance applications for those who do not own such devices. If good enough for IIT Bombay and health volunteers, then such a device will surely be useful in many other fields as well.
This study has pointed out some improvements that will enhance the value of the FOSSEE laptop. We have now overcome these shortcomings (Patnaik, 2016), in a much better laptop, at a slightly higher cost of Rs. 10,000 ($ 150): Quad core intel atom (1.33GHz x 4) processor with a hardware graphic accelerator, 11.6" screen, 2GB RAM, 32GB NAND flash, a micro SD card slot, a professional keyboard, and a 10,000 mAH battery. The preliminary results with this new low cost, and a complete Linux, device are promising. Acknowledgement The authors like to acknowledge Srikant Patnaik for his help in conducting this study. The authors thank Sukanya Moudgalya for the help and critical comments given by her in writing this article. References Eranki, K., Moudgalya, K.M. (2016).: Comparing the effectiveness of self-learning java workshops with
traditional classrooms. J. of Ed. Tech. & Society 19(4), 62-78 (2016) Moudgalya, K. M. (2014). Pedagogical and Organisational Issues in the Campaign for IT Literacy Through
Spoken Tutorials. In The New Development of Technology Enhanced Learning (pp. 223-244). Springer Moudgalya, K. M. (2015). Low Cost FOSSEE Laptop of NMEICT. IIT Bombay, 26 Sept 2015. Available at http://laptop.fossee.in/data/Low-Cost-Laptop-of-NMEICT.pdf. Last seen on 31 Aug 2016. Moudgalya, K.M., Deshmukh, R., Patil, A. (2009).: Synchronous distance education at IIT Bombay. In:
International Workshop on Technology for Education. pp. 54-61. Bangalore (4-6 August 2009) Moudgalya, K.M., Phatak, D.B., Sinha, N.K., and Verma, P. (2013). Genesis of Aakash 2. CSI communications (pp.21-23 and 29), Jan. 2013. Retrieved from: http://aakashlabs.org/media/pubs/genesis-reprint.pdf Last seen on 31 Aug 2016 Patil. S., and Patnaik, S. (2013). GNU/Linux on Aakash. In CSI communications. July 2013 (pp.28-31).
Retrieved from: http://aakashlabs.org/media/pubs/GNU_Linux_on_Aakash.pdf. Last seen on 31 Aug 2016. Patnaik, S.: Laptop comparison (2016), Retrieved from http://laptop.fossee.in/data/laptop-compare.pdf Last
seen on 31 August 2016 Phalkey, J., and Chattapadhyay, S. (2015). The Aakash tablet and technological imaginaries of mass education in
contemporary India. History and Technology, 31(4), 452-481 Ranade, A. (2016). SimpleCPP. CSE, IIT Bombay. Retrieved from:
https://www.cse.iitb.ac.in/~ranade/simplecpp/ Last seen on 31 August 2016 Rosenberg, S. D., Schnurr, P. P. and Oxman, T. E. (1990). Content analysis: A comparison of manual and
computerized systems. Journal of Personality Assessment, 54(1-2):298–310, 1990. Sasi, A. (2015, Nov 8). Healthcare project in rural Gujarat charts path for broader template, gets IIT-B netbook
Retrieved from: http://indianexpress.com/article/india/india-news-india/healthcare-project-in-rural-gujarat- charts-path-for-broader-template-gets-iit-b-netbook-booster/#sthash.jJ6WtA3N.dpuf, Last seen on 31 Aug 2016.
Sriram, S. (2015, June 12). “10 Key Insights on PC Usage in India”, The Huffington Post. Retrieved from: http://www.huffingtonpost.in/2015/06/12/what-indian-pc-users-want_n_7551024.html, Last seen on 31 Aug 2016.
350350350
Chen, W. et al. (Eds.) (2016). Proceedings of the 24th International Conference on Computers in Education.
India: Asia-Pacific Society for Computers in Education
Examining Students’ Perception of Using
Crowdsourcing based Mobile Apps for
Environmental Education and Research
Experiences.
Divya C.SENANa*&Udaysankar S.NAIRb aSreeNarayana Training College, University of Kerala, India
bDepartment of Atmospheric Science, University of Alabama in Huntsville, USA
Abstract:In the context of complex environmental problems facing societies, it is desirable to
enhance public awareness of environmental issues. In response to this challenge,
environmental education is an integral part of curriculum utilized at all levels of education,
including universityeducation. Environmental education (EE) is now considered to be the
most prominent instrument to influence human behaviour towards more environmentally
sustainable patterns. However, it is often criticized for being reductionist and empirical and
thus not optimal for training next generation of students who are expected to formulate
solutions to complex, interdisciplinary environmental issues. We propose that new
technologies (crowdsourcing apps) that are being used in research settings to solve
interdisciplinary problems may also be used for experiential learning of environmental
science. New technologies and growth of digital media are profoundly affecting today’s
university students. So, in view of the pervasiveness of new mobile technologies in today’s
life and learning, it is essential to lead the instructional process with integrating mobile
technology in developing students’ educational and research experiences. In so doing
successfully, it is imperative to know the perception of students who are the real and prime
users and beneficiary of such approach. Henceforth, the centre of attention of this paper is to
investigate university students’ perception and effectiveness of a crowdsourcing based mobile
App for environmental education and research. The specific topic considered is land use and
land cover change due to human activity. The students were provided with hands on
‘experience of the Land Use Land Cover mobile application.Survey method was used to
collect the data.The study reports that the students have a positive perception regarding the use
of mobile application, based on the Open Data Kit (ODK), along with the Google Earth
Engine (GEE) in implementing experiential learning approach for environmental education
and research.
Keywords: Crowd sourcing, Mobile Application, Environmental Education and Research App,
Experiential Learning
1. Introduction
Integration of Mobile learning technologies into educational setting settings is still in its infancy, and
the development of new models, methods, systems and applications are needed to be put in place for
successful integration. Teachers need to re-blend the present learning environment in higher education
to ensure an efficient and effective mobile learning environment. The rapidly advancing mobile
computing technologies along with abundant mobile software applications make ubiquitous mobile
learning possible (Johnson, Adams, & Cummins, 2012). The innovation in mobile apps has raised
interests among educators because it facilitates teaching and learning (Johnson et al., 2012). Apps are
being developed at a rapid speed and are intensively used by students. Apps can be easily downloaded
and used on a mobile phone device. Today’s learners as digitally literate, ‘always on’ always
connected and reachable. They want to stay connected and be reachable, they also want to experiment
and have community oriented personalities and characteristics (Oblinger et al.,2005) They are
351351351
collaborative and multitasking learners who like to study in a group-based environment (McMahon,
M. et al 2005). Why can’t we take this opportunity to use the technology to improve student’s
collaboration, and interaction thus making the learning environment effective, fun and challenging?
Mobile Apps for teaching and learning are breakthrough technologies in recent years, and
teachers should use them and apply their methods to this effective learning environment. They should
acknowledge that mobile phones along with educational and communicational Apps can be an
efficient learning tool if integrated properly within the currently used settings at universities, as this
could enhance teaching and feedback, thus simplifying the learning process for students, by providing
experiential learning. Universities should implement this type of mobile learning environments and
technologies and encourage students to use it and integrate it into the curriculum. It may create a
learning environment that matches and fits today’s digital learner’s life style and improves their
access to learning content, and makes the learning process, creative, collaborative and challenging. It
is high time for universities and educators to re-design and revamp the forms of education according
to the changing dynamics of today’s learners, thus providing strategic solutions to various existing
problems. The application of mobile learning technologies will potentially place universities at the
forefront of pedagogical practice and addresses learners needs for flexibility and portability, as mobile
learning and its Apps are considered the real authentic, ultimate anywhere, anytime, on demand and
with any device, learning experience.
Behind this ‘practical axioms’ of learning prospect, this study aims at:
1. exploring Teacher Educators’ ‘perception’ about crowd sourcing based mobile application in
environmental education and research experiences
2. examining students’ expectations of mobile application use in experiential learning;
3. developing an up-to-date crowd sourcing based mobile apps mediated environmental
curricula; and
4. Preparing & equipping learners as workers and citizens in an information centric society.
2. Background
Environmental education should encourage children to become good stewards and to think globally
but act locally regarding the environment and environmental issues. Environmental education is an
invaluable tool for teaching critical thinking skills and applying these skills to the students’ everyday
world. The ultimate goal for environmental education is to create environmentally literate global
citizens (Disinger& Roth, 1992). In order to accomplish this, educators must help students acquire a
better understanding of their environment and natural resources as well as environmental issues
affecting them. Educators can enhance children’s explorations by providing them with interesting and
enriching experiences that help them to explore outside of their direct environment and make
connections and inferences within and between different phenomena in the environment. We create
meaningful learning experiences when we help children to move beyond simple observations to more
complex activities that require higher-level thinking and collaboration with peers (Jana Willis
&Brenda Weiser, 2014).The power of Environmental Education and experiential education acting
together is recognized by workers in the field. Thus using an experience-based approach to an
environmental topic invites students to examine their own effects on the environment, whether
positive or negative. We propose that new technologies (crowdsourcing apps) that are being used in
research settings to solve interdisciplinary problems may also be used for experiential learning of
environmental science. New technologies and growth of digital media are profoundly affecting
today’s university students. So, in view of the pervasiveness of new mobile technologies in today’s
life and learning, it is essential to lead the instructional process with integrating mobile technology in
developing students’ educational and research experiences. In so doing successfully, it is imperative
to know the perception of students who are the real and prime users and beneficiary of such approach.
Henceforth, the centre of attention of this paper is to investigate university students’ perception and
effectiveness of a crowdsourcing based mobile App for environmental education and research.
3. Crowdsourcing based Mobile Applications
352352352

It was with the development of web 2.0 4 that several technological trends and movements appeared:
open data, big data and crowdsourcing. The proliferation of smart phones has paved the way for Apps
that use crowdsourcing to gather their data. The wide availability of smart phones now makes it easier
than ever to devote them to data gathering, with or without actual human intervention. The rapidly
growing capabilities (sensors, hardware, software, social networking) of smart phones and tablets,
coupled with their portability and accessibility, make them one of the most impactful ICTs in the
world today. One of the most exciting developments made possible by the rapid spread of mobile
technology is crowdsourcing. By engaging citizen scientists in spatially and temporally distributed
measurements of processes, a significant yet inexpensive stream of useful information can be
generated. There is clear and accelerated progress in the application of mobile technologies in support
of crowd sourcing. Crowdsourcing apps are changing everything from the way we travel, to the way
we work, to the way we gather information.
This study reports on the perception of university students regarding the efficacy of a mobile
application - Public Environmental Education and Research App (PEERA), based on the Open Data
Kit (ODK), along with the Google Earth Engine (GEE) to implement experiential learning approach
for environmental education and research. The app functioning relies on open data and crowd
sourcing.
4. PEERA: Public Environmental Education and Research App
A mobile application (Android platform), based on the Open Data Kit (ODK), for populating a
Google Earth Engine based Land Use Land Cover ground truth database is developed. The ODK
(Open Data Kit) is a set of tools that allows data collection using mobile devices and data submission
to an online server, even without an internet connection or mobile carrier service at the time of data
collection. The Open Data Kit (ODK) based application is intended for crowd sourcing of ground
truth information regarding the nature of Land Use and Land Cover (LULC). The LULC ground truth
data, in conjunction with algorithms and Land sat satellite imagery available through Google Earth
Engine (GEE), will provide community based organizations the capability to generate LULC maps
with relative ease.
Figure 1: Screenshot showing the home page of PEERA user module
In an experiential learning approach the App is used to collect first-hand information regarding land
use and land cover upon which the students can reflect and form concepts to solve environmental
issues. When the class starts, the teacher can purposefully pose a problem or issue in front of the
students for them to solve. She/he should decide what the students should learn or gain from the
learning experience. Effective educational interventions should provide pupils with the kind of
education that appeals to and has a personal meaning for them. It is most probable that we do not
learn anything unless we have a clear personal motive for doing so (Rogers, 1957), i.e. unless it is
connected to our personal experiences. A question of the kind “How is your neighbourhood
changing”? can be posed to the students. Once begun, the facilitator should refrain from providing
students with all of the content and information and complete answers to their questions. Instead,
guide students through the process of finding and determining solutions for themselves.
353353353
Now the students can go out of their classrooms and use the mobile application to collect a sample of
geo-locations for different land cover types. Here the learner will be undergoing the concrete
experience which emphasizes personal involvement in everyday situations. In this stage, the learner
would tend to rely more on feelings than on a systematic approach to problems and situations.
Students perform a hands-on minds-on experience with little or no help from the instructor. They
collect three or four ground truth data and upload it to the server. Now the students can visualize the
collected data in a fusion table and will discuss their experiences as a group. Discussions will focus
on their thoughts and will provide differing views on the topic. In the classroom, reflection can take
the form of an individual activity, within small groups, or with the entire class. Children construct an
understanding of the world around them, and then experience discrepancies between what they
already know and what they discover in their environment. Students analyze the generated satellite
imagery and construct conceptual understanding that integrates one's observations into logically
sound theories. They classify satellite imagery and understand how their neighbourhood has changed
over the years. They can visually see how urban regions grow, crop lands shrink and forests
disappear. In the last phase students generate solutions to make decisions or to solve real life
problems.
4. Methodology
4.1. Research Context and Participants
The study was conducted in university of Kerala .The participants of this study were M.Ed
studentsM.Phil students and Research Scholars of Department of Education. They were chosen on
random basis. A total of 52 students took part in this study
4.2. Data Collection Procedure & Questionnaire
Survey methodology was facilitated through the use of a one page written research questionnaire for
this study. The questionnaire was given to the sample after conducting a workshop based on the above
mentioned mobile application. In the workshop the author presented a detailed overview of the
developed mobile App based on crowd sourcing followed by hands on experience session. Both the
sessions were highly interactive. There were multiple choice questions (MCQ) as well as question
asking for short suggestions, offering the respondents a free reign. Most of them responded to the
questionnaire willingly, and had made some admirable suggestions. The questionnaire for this survey
was designed to determine students’ self-reported perception and efficacy of mobile technology
supported experiential learning for capturing the ground reality. Out of 52, a total of 38 questionnaires
were returned representing a response rate of 73%.
5. Results
5.1. Data Analysis
This study administers mixed methodology. From the collected data of questionnaire, the percentage
of respondents offering the same answer was computed using MS Excel to produce research findings.
The questionnaires were tabulated to record the responses from each participant for each option of the
questions. Results were reported both quantitatively and qualitatively. Figures are drawn below to
sum up the frequency of responses.
The 1st question was designed to determine the students’ perceptions about using mobile App as an
experiential learning tool. The student respondents overwhelmingly answered (57+40) % underlining
the strong support with reference to their ties and attitude to digital technology integration in the
teaching/learning. 12% of the students responded negatively due to their belief that mobile technology
adversely affects their learning characteristics
354354354
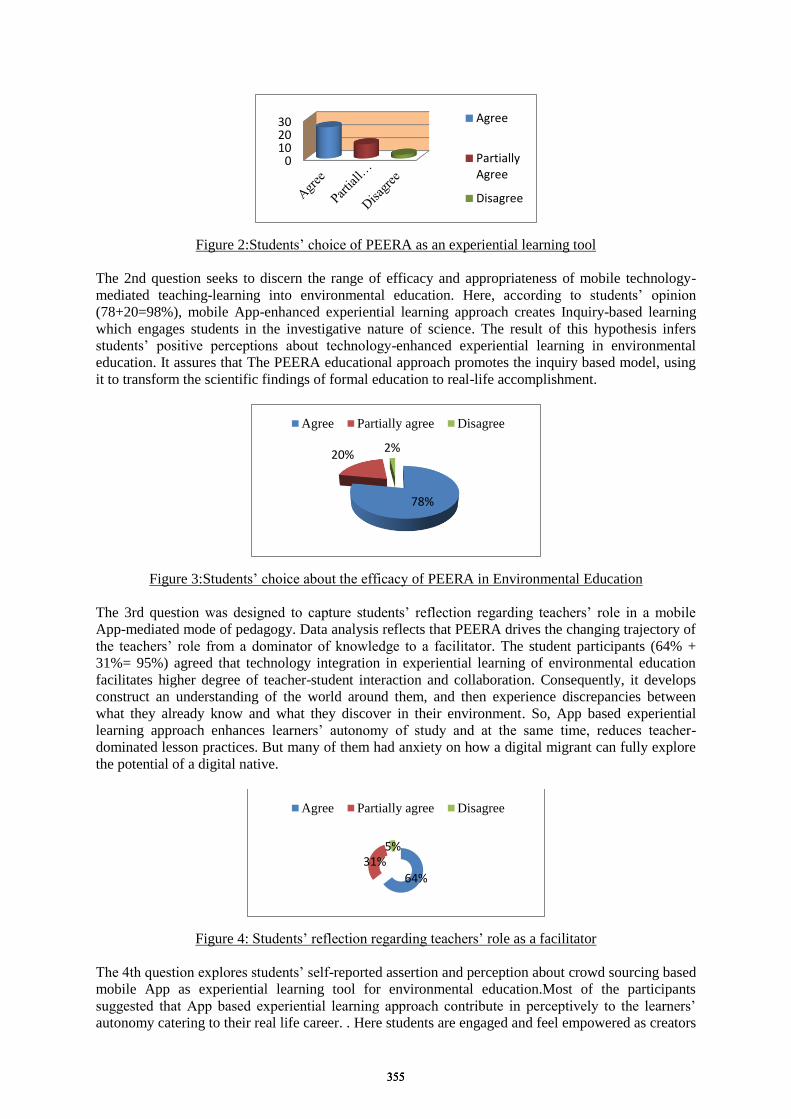
Figure 2:Students’ choice of PEERA as an experiential learning tool
The 2nd question seeks to discern the range of efficacy and appropriateness of mobile technology-
mediated teaching-learning into environmental education. Here, according to students’ opinion
(78+20=98%), mobile App-enhanced experiential learning approach creates Inquiry-based learning
which engages students in the investigative nature of science. The result of this hypothesis infers
students’ positive perceptions about technology-enhanced experiential learning in environmental
education. It assures that The PEERA educational approach promotes the inquiry based model, using
it to transform the scientific findings of formal education to real-life accomplishment.
Figure 3:Students’ choice about the efficacy of PEERA in Environmental Education
The 3rd question was designed to capture students’ reflection regarding teachers’ role in a mobile
App-mediated mode of pedagogy. Data analysis reflects that PEERA drives the changing trajectory of
the teachers’ role from a dominator of knowledge to a facilitator. The student participants (64% +
31%= 95%) agreed that technology integration in experiential learning of environmental education
facilitates higher degree of teacher-student interaction and collaboration. Consequently, it develops
construct an understanding of the world around them, and then experience discrepancies between
what they already know and what they discover in their environment. So, App based experiential
learning approach enhances learners’ autonomy of study and at the same time, reduces teacher-
dominated lesson practices. But many of them had anxiety on how a digital migrant can fully explore
the potential of a digital native.
Figure 4: Students’ reflection regarding teachers’ role as a facilitator
The 4th question explores students’ self-reported assertion and perception about crowd sourcing based
mobile App as experiential learning tool for environmental education.Most of the participants
suggested that App based experiential learning approach contribute in perceptively to the learners’
autonomy catering to their real life career. . Here students are engaged and feel empowered as creators
0102030 Agree
PartiallyAgree
Disagree
78%
20%2%
Agree Partially agree Disagree
64%
31%5%
Agree Partially agree Disagree
355355355
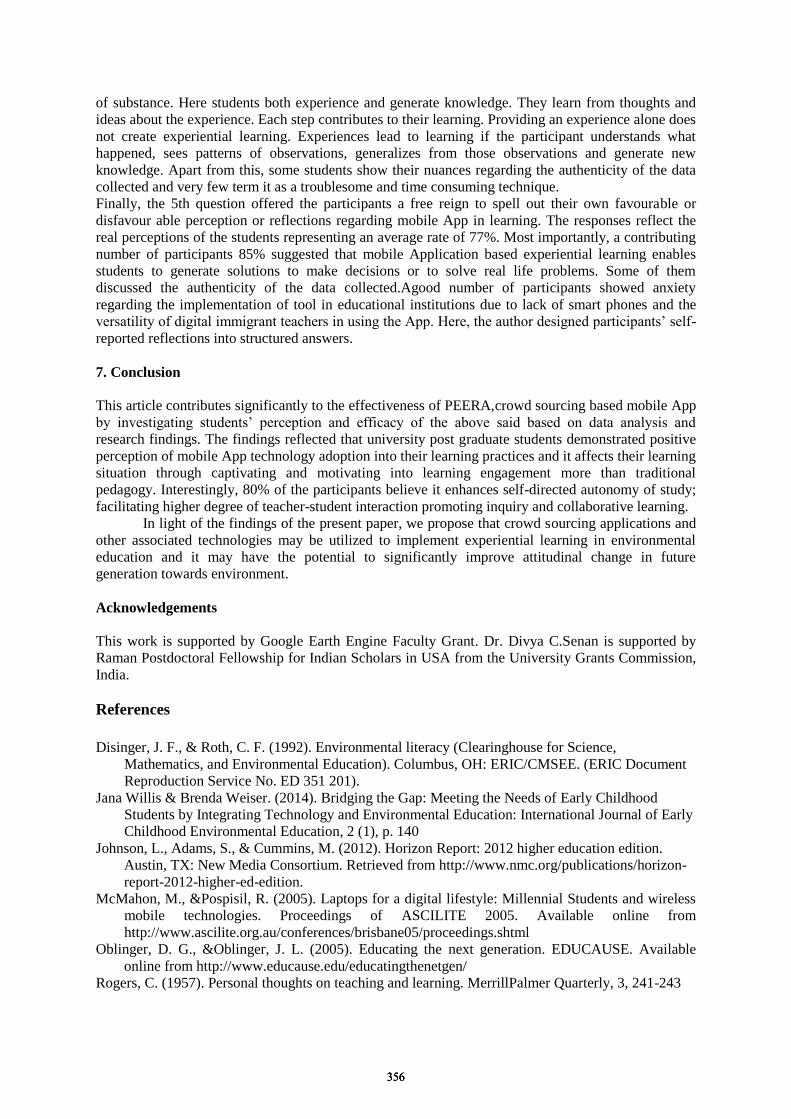
of substance. Here students both experience and generate knowledge. They learn from thoughts and
ideas about the experience. Each step contributes to their learning. Providing an experience alone does
not create experiential learning. Experiences lead to learning if the participant understands what
happened, sees patterns of observations, generalizes from those observations and generate new
knowledge. Apart from this, some students show their nuances regarding the authenticity of the data
collected and very few term it as a troublesome and time consuming technique.
Finally, the 5th question offered the participants a free reign to spell out their own favourable or
disfavour able perception or reflections regarding mobile App in learning. The responses reflect the
real perceptions of the students representing an average rate of 77%. Most importantly, a contributing
number of participants 85% suggested that mobile Application based experiential learning enables
students to generate solutions to make decisions or to solve real life problems. Some of them
discussed the authenticity of the data collected.Agood number of participants showed anxiety
regarding the implementation of tool in educational institutions due to lack of smart phones and the
versatility of digital immigrant teachers in using the App. Here, the author designed participants’ self-
reported reflections into structured answers.
7. Conclusion
This article contributes significantly to the effectiveness of PEERA,crowd sourcing based mobile App
by investigating students’ perception and efficacy of the above said based on data analysis and
research findings. The findings reflected that university post graduate students demonstrated positive
perception of mobile App technology adoption into their learning practices and it affects their learning
situation through captivating and motivating into learning engagement more than traditional
pedagogy. Interestingly, 80% of the participants believe it enhances self-directed autonomy of study;
facilitating higher degree of teacher-student interaction promoting inquiry and collaborative learning.
In light of the findings of the present paper, we propose that crowd sourcing applications and
other associated technologies may be utilized to implement experiential learning in environmental
education and it may have the potential to significantly improve attitudinal change in future
generation towards environment.
Acknowledgements
This work is supported by Google Earth Engine Faculty Grant. Dr. Divya C.Senan is supported by
Raman Postdoctoral Fellowship for Indian Scholars in USA from the University Grants Commission,
India.
References
Disinger, J. F., & Roth, C. F. (1992). Environmental literacy (Clearinghouse for Science,
Mathematics, and Environmental Education). Columbus, OH: ERIC/CMSEE. (ERIC Document
Reproduction Service No. ED 351 201).
Jana Willis & Brenda Weiser. (2014). Bridging the Gap: Meeting the Needs of Early Childhood
Students by Integrating Technology and Environmental Education: International Journal of Early
Childhood Environmental Education, 2 (1), p. 140
Johnson, L., Adams, S., & Cummins, M. (2012). Horizon Report: 2012 higher education edition.
Austin, TX: New Media Consortium. Retrieved from http://www.nmc.org/publications/horizon-
report-2012-higher-ed-edition.
McMahon, M., &Pospisil, R. (2005). Laptops for a digital lifestyle: Millennial Students and wireless
mobile technologies. Proceedings of ASCILITE 2005. Available online from
http://www.ascilite.org.au/conferences/brisbane05/proceedings.shtml
Oblinger, D. G., &Oblinger, J. L. (2005). Educating the next generation. EDUCAUSE. Available
online from http://www.educause.edu/educatingthenetgen/
Rogers, C. (1957). Personal thoughts on teaching and learning. MerrillPalmer Quarterly, 3, 241-243
356356356
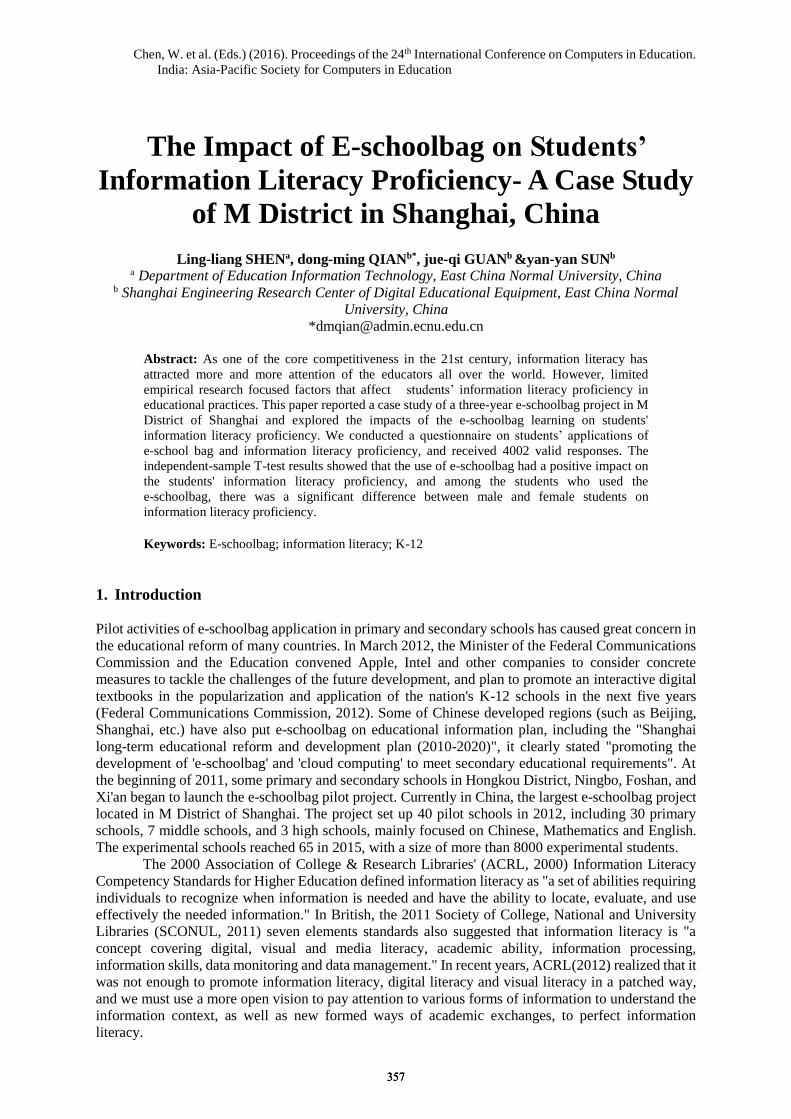
Chen, W. et al. (Eds.) (2016). Proceedings of the 24th International Conference on Computers in Education.
India: Asia-Pacific Society for Computers in Education
The Impact of E-schoolbag on Students’
Information Literacy Proficiency- A Case Study
of M District in Shanghai, China
Ling-liang SHENa, dong-ming QIANb*, jue-qi GUANb &yan-yan SUNb
a Department of Education Information Technology, East China Normal University, China b Shanghai Engineering Research Center of Digital Educational Equipment, East China Normal
University, China
Abstract: As one of the core competitiveness in the 21st century, information literacy has
attracted more and more attention of the educators all over the world. However, limited
empirical research focused factors that affect students’ information literacy proficiency in
educational practices. This paper reported a case study of a three-year e-schoolbag project in M
District of Shanghai and explored the impacts of the e-schoolbag learning on students'
information literacy proficiency. We conducted a questionnaire on students’ applications of
e-school bag and information literacy proficiency, and received 4002 valid responses. The
independent-sample T-test results showed that the use of e-schoolbag had a positive impact on
the students' information literacy proficiency, and among the students who used the
e-schoolbag, there was a significant difference between male and female students on
information literacy proficiency.
Keywords: E-schoolbag; information literacy; K-12
1. Introduction
Pilot activities of e-schoolbag application in primary and secondary schools has caused great concern in
the educational reform of many countries. In March 2012, the Minister of the Federal Communications
Commission and the Education convened Apple, Intel and other companies to consider concrete
measures to tackle the challenges of the future development, and plan to promote an interactive digital
textbooks in the popularization and application of the nation's K-12 schools in the next five years
(Federal Communications Commission, 2012). Some of Chinese developed regions (such as Beijing,
Shanghai, etc.) have also put e-schoolbag on educational information plan, including the "Shanghai
long-term educational reform and development plan (2010-2020)", it clearly stated "promoting the
development of 'e-schoolbag' and 'cloud computing' to meet secondary educational requirements". At
the beginning of 2011, some primary and secondary schools in Hongkou District, Ningbo, Foshan, and
Xi'an began to launch the e-schoolbag pilot project. Currently in China, the largest e-schoolbag project
located in M District of Shanghai. The project set up 40 pilot schools in 2012, including 30 primary
schools, 7 middle schools, and 3 high schools, mainly focused on Chinese, Mathematics and English.
The experimental schools reached 65 in 2015, with a size of more than 8000 experimental students.
The 2000 Association of College & Research Libraries' (ACRL, 2000) Information Literacy
Competency Standards for Higher Education defined information literacy as "a set of abilities requiring
individuals to recognize when information is needed and have the ability to locate, evaluate, and use
effectively the needed information." In British, the 2011 Society of College, National and University
Libraries (SCONUL, 2011) seven elements standards also suggested that information literacy is "a
concept covering digital, visual and media literacy, academic ability, information processing,
information skills, data monitoring and data management." In recent years, ACRL(2012) realized that it
was not enough to promote information literacy, digital literacy and visual literacy in a patched way,
and we must use a more open vision to pay attention to various forms of information to understand the
information context, as well as new formed ways of academic exchanges, to perfect information
literacy.
357357357
Students are the most direct beneficiaries of the e-schoolbag project. We study the impact of
e-schoolbag application on students' information literacy proficiency, the results will provide empirical
data to support the following study and policy decision. Penuel (Penuel, W. R., 2006) did a
comprehensive analysis of 30 "one to one" digital learning trials, and found that "one on one" digital
learning had a positive impact on students’ technology use, information literacy and writing skills.
Missouri State University researchers conducted a meta-analysis of 160 studies and found that "one on
one" digital learning can improve students’ technological literacy, had a significant influence on
students' writing skills, furthermore, it may have a positive impact on cooperation, self-orientation and
other 21st century skills(Sell, G., Cornelius-White, J., & Chang, C., 2012). The eight-year-study on
digital learning, which conducted by Maine Learning Technology Innovation Project (MLTI), showed
the project had a significant impact on the school curriculum, teaching and learning; the data from
students showed the experiment improved their academic achievement of writing, mathematics and
science, and enhanced the 21st century skills, including the students' access to information and
information evaluation (Silvernail, D. L., Pinkham, C., & Wintle, S. E., 2011). Researchers of Israel's
Bar-Ilan University did the analysis about the impact of digital learning on students’ 21st century skill
development, the study found that the students in experimental classes had a better access to
information, information evaluation, information processing and expression than traditional classes
(Spektor-Levy, O., & Granot-Gilat, Y., 2012). In summary, the applications of e-schoolbag have a wide
range of impact on students’ learning process and outcomes. Based upon a three-year e-schoolbag
project in M District of Shanghai, this paper focused on the impact of e-schoolbag the impact of the
e-schoolbag use on students' information literacy, to discover the value of e-schoolbag teaching from
the student perspective.
2. Research Design
2.1 Research Questions
Question 1: Is there any significant difference between the students who have used e-schoolbag to learn
and those not when it comes to information literacy proficiency?
Hypothesis 1a (H1a): After using the e-schoolbag, students show a better attitude towards
technology applications;
Hypothesis 1b (H1b): After using the e-schoolbag, students have a more skilled technical
operation skills;
Hypothesis 1c (H1c): After using the e-schoolbag, students have a better grasp of knowledge
and skills of technical application;
Hypothesis 1d (H1d): After using the e-book package, students have a stronger moral security.
Question 2: Among the students who have used e-schoolbag to learn, is there any significant
difference between male and female students when it comes to information literacy proficiency?
Hypothesis 2a (H2a): Male students show a better attitude towards technology applications;
Hypothesis 2b (H2b): Male students have a more skilled technical operation skills;
Hypothesis 2c (H2c): Male students have a better grasp of knowledge and skills of technical
application;
Hypothesis 2d (H2d): Male students have a stronger moral security.
2.2 Methods
The study focused on students involved in e-schoolbag pilot projects and students hadn’t used
e-schoolbag before. We designed "Student Information Technology Application Questionnaire." It
contained 35 questions, which were set according to the Likert scale, focusing on four modules, namely
technology attitude (A1-A6), technical operation skills (B1-B10), knowledge and skills of technical
application (C1-C16), safety moral (D1-D3). As for participants, we chose experimental students in 40
pilot schools of e-schoolbag project in M District as the research object, and non-experimental students
in the same grades of the pilot schools as a control group. All the students were chosen from the 40 pilot
schools.
358358358
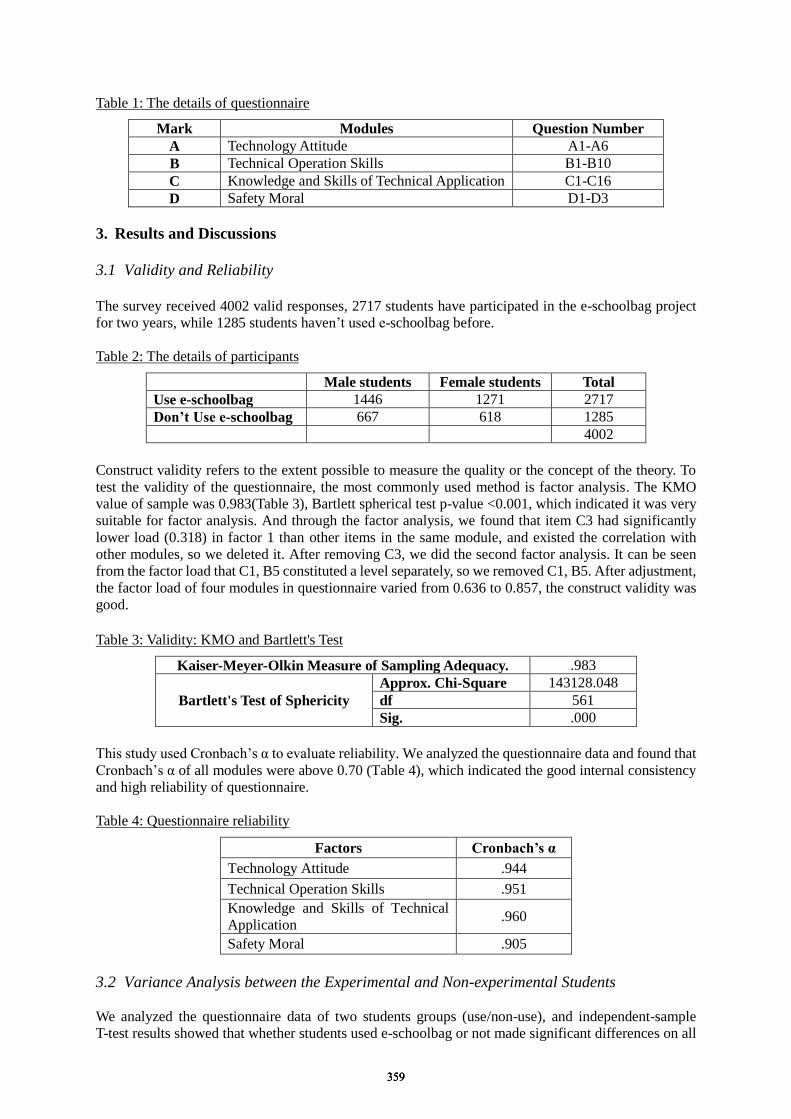
Table 1: The details of questionnaire
Mark Modules Question Number
A Technology Attitude A1-A6
B Technical Operation Skills B1-B10
C Knowledge and Skills of Technical Application C1-C16
D Safety Moral D1-D3
3. Results and Discussions
3.1 Validity and Reliability
The survey received 4002 valid responses, 2717 students have participated in the e-schoolbag project
for two years, while 1285 students haven’t used e-schoolbag before.
Table 2: The details of participants
Male students Female students Total
Use e-schoolbag 1446 1271 2717
Don’t Use e-schoolbag 667 618 1285
4002
Construct validity refers to the extent possible to measure the quality or the concept of the theory. To
test the validity of the questionnaire, the most commonly used method is factor analysis. The KMO
value of sample was 0.983(Table 3), Bartlett spherical test p-value <0.001, which indicated it was very
suitable for factor analysis. And through the factor analysis, we found that item C3 had significantly
lower load (0.318) in factor 1 than other items in the same module, and existed the correlation with
other modules, so we deleted it. After removing C3, we did the second factor analysis. It can be seen
from the factor load that C1, B5 constituted a level separately, so we removed C1, B5. After adjustment,
the factor load of four modules in questionnaire varied from 0.636 to 0.857, the construct validity was
good.
Table 3: Validity: KMO and Bartlett's Test
Kaiser-Meyer-Olkin Measure of Sampling Adequacy. .983
Bartlett's Test of Sphericity
Approx. Chi-Square 143128.048
df 561
Sig. .000
This study used Cronbach’s α to evaluate reliability. We analyzed the questionnaire data and found that
Cronbach’s α of all modules were above 0.70 (Table 4), which indicated the good internal consistency
and high reliability of questionnaire.
Table 4: Questionnaire reliability
Factors Cronbach’s α
Technology Attitude .944
Technical Operation Skills .951
Knowledge and Skills of Technical
Application .960
Safety Moral .905
3.2 Variance Analysis between the Experimental and Non-experimental Students
We analyzed the questionnaire data of two students groups (use/non-use), and independent-sample
T-test results showed that whether students used e-schoolbag or not made significant differences on all
359359359
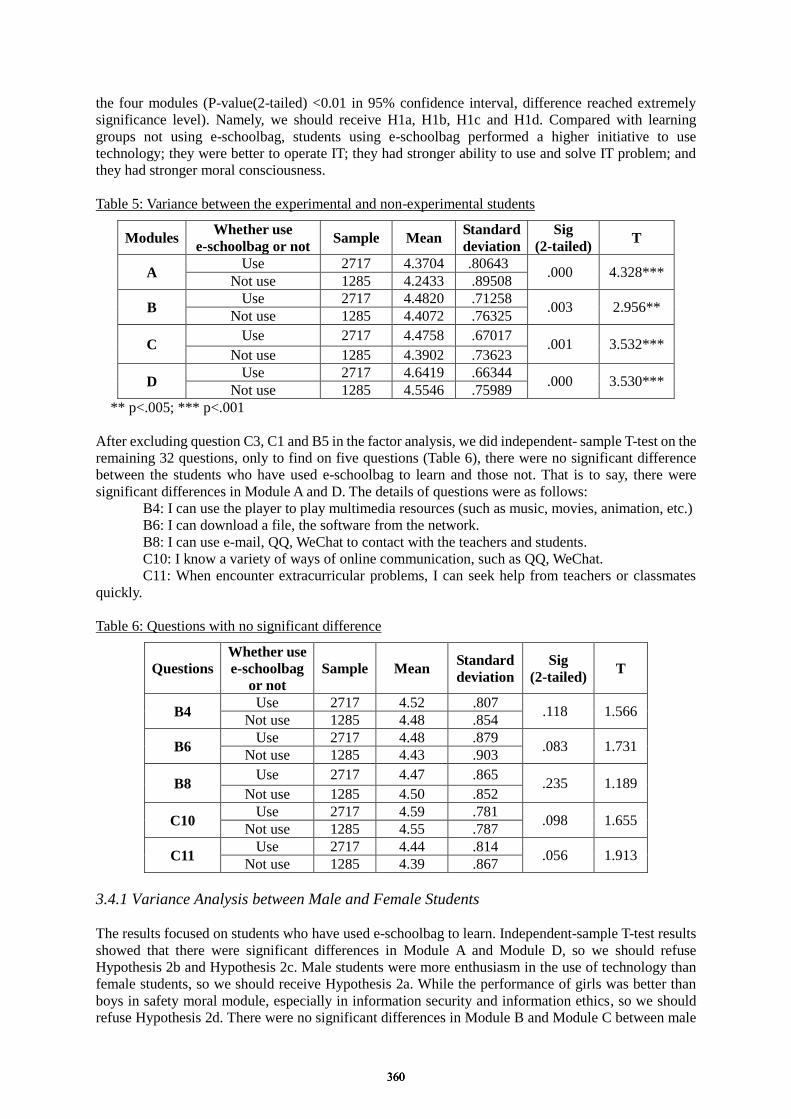
the four modules (P-value(2-tailed) <0.01 in 95% confidence interval, difference reached extremely
significance level). Namely, we should receive H1a, H1b, H1c and H1d. Compared with learning
groups not using e-schoolbag, students using e-schoolbag performed a higher initiative to use
technology; they were better to operate IT; they had stronger ability to use and solve IT problem; and
they had stronger moral consciousness.
Table 5: Variance between the experimental and non-experimental students
Modules Whether use
e-schoolbag or not Sample Mean
Standard
deviation
Sig
(2-tailed) T
A Use 2717 4.3704 .80643
.000 4.328*** Not use 1285 4.2433 .89508
B Use 2717 4.4820 .71258
.003 2.956** Not use 1285 4.4072 .76325
C Use 2717 4.4758 .67017
.001 3.532*** Not use 1285 4.3902 .73623
D Use 2717 4.6419 .66344
.000 3.530*** Not use 1285 4.5546 .75989
** p<.005; *** p<.001
After excluding question C3, C1 and B5 in the factor analysis, we did independent- sample T-test on the
remaining 32 questions, only to find on five questions (Table 6), there were no significant difference
between the students who have used e-schoolbag to learn and those not. That is to say, there were
significant differences in Module A and D. The details of questions were as follows:
B4: I can use the player to play multimedia resources (such as music, movies, animation, etc.)
B6: I can download a file, the software from the network.
B8: I can use e-mail, QQ, WeChat to contact with the teachers and students.
C10: I know a variety of ways of online communication, such as QQ, WeChat.
C11: When encounter extracurricular problems, I can seek help from teachers or classmates
quickly.
Table 6: Questions with no significant difference
Questions
Whether use
e-schoolbag
or not
Sample Mean Standard
deviation
Sig
(2-tailed) T
B4 Use 2717 4.52 .807
.118 1.566 Not use 1285 4.48 .854
B6 Use 2717 4.48 .879
.083 1.731 Not use 1285 4.43 .903
B8 Use 2717 4.47 .865
.235 1.189 Not use 1285 4.50 .852
C10 Use 2717 4.59 .781
.098 1.655 Not use 1285 4.55 .787
C11 Use 2717 4.44 .814
.056 1.913 Not use 1285 4.39 .867
3.4.1 Variance Analysis between Male and Female Students
The results focused on students who have used e-schoolbag to learn. Independent-sample T-test results
showed that there were significant differences in Module A and Module D, so we should refuse
Hypothesis 2b and Hypothesis 2c. Male students were more enthusiasm in the use of technology than
female students, so we should receive Hypothesis 2a. While the performance of girls was better than
boys in safety moral module, especially in information security and information ethics, so we should
refuse Hypothesis 2d. There were no significant differences in Module B and Module C between male
360360360
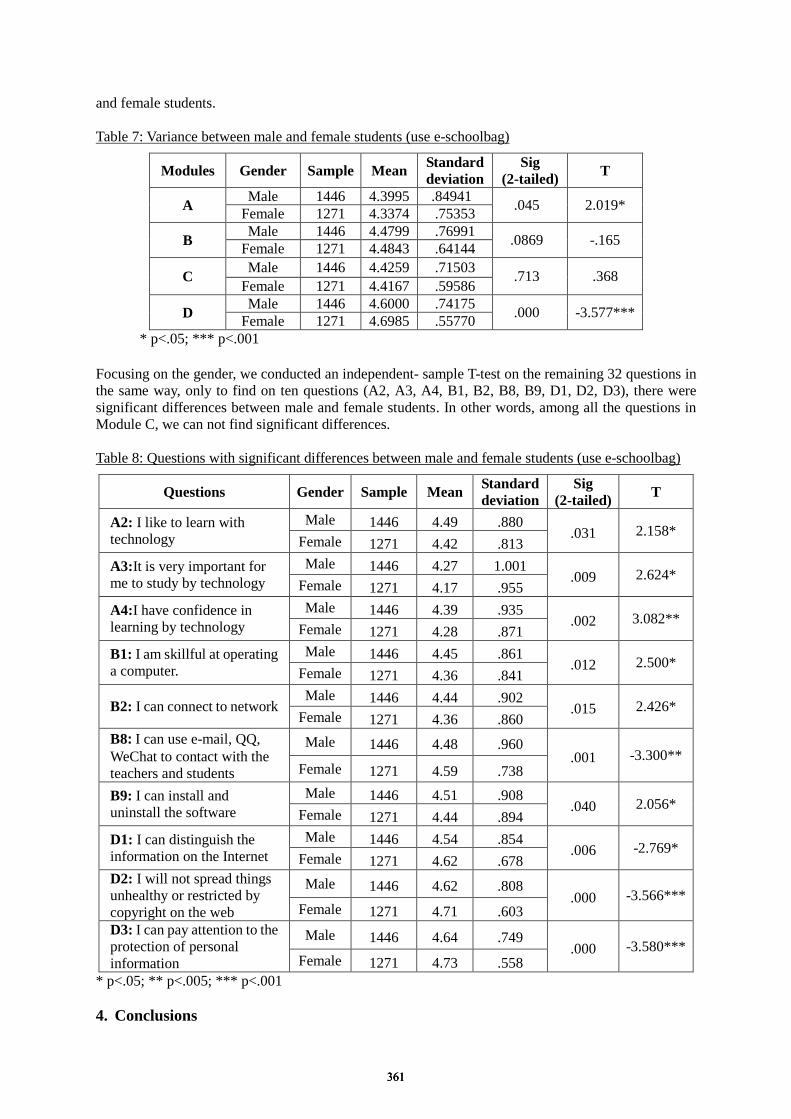
and female students.
Table 7: Variance between male and female students (use e-schoolbag)
Modules Gender Sample Mean Standard
deviation
Sig
(2-tailed) T
A Male 1446 4.3995 .84941
.045 2.019* Female 1271 4.3374 .75353
B Male 1446 4.4799 .76991
.0869 -.165 Female 1271 4.4843 .64144
C Male 1446 4.4259 .71503
.713 .368 Female 1271 4.4167 .59586
D Male 1446 4.6000 .74175
.000 -3.577*** Female 1271 4.6985 .55770
* p<.05; *** p<.001
Focusing on the gender, we conducted an independent- sample T-test on the remaining 32 questions in
the same way, only to find on ten questions (A2, A3, A4, B1, B2, B8, B9, D1, D2, D3), there were
significant differences between male and female students. In other words, among all the questions in
Module C, we can not find significant differences.
Table 8: Questions with significant differences between male and female students (use e-schoolbag)
Questions Gender Sample Mean Standard
deviation
Sig
(2-tailed) T
A2: I like to learn with
technology
Male 1446 4.49 .880 .031 2.158*
Female 1271 4.42 .813
A3:It is very important for
me to study by technology
Male 1446 4.27 1.001 .009 2.624*
Female 1271 4.17 .955
A4:I have confidence in learning by technology
Male 1446 4.39 .935 .002 3.082**
Female 1271 4.28 .871
B1: I am skillful at operating
a computer.
Male 1446 4.45 .861 .012 2.500*
Female 1271 4.36 .841
B2: I can connect to network Male 1446 4.44 .902
.015 2.426* Female 1271 4.36 .860
B8: I can use e-mail, QQ,
WeChat to contact with the
teachers and students
Male 1446 4.48 .960 .001 -3.300**
Female 1271 4.59 .738
B9: I can install and
uninstall the software
Male 1446 4.51 .908 .040 2.056*
Female 1271 4.44 .894
D1: I can distinguish the
information on the Internet
Male 1446 4.54 .854 .006 -2.769*
Female 1271 4.62 .678
D2: I will not spread things
unhealthy or restricted by
copyright on the web
Male 1446 4.62 .808 .000 -3.566***
Female 1271 4.71 .603
D3: I can pay attention to the
protection of personal
information
Male 1446 4.64 .749 .000 -3.580***
Female 1271 4.73 .558
* p<.05; ** p<.005; *** p<.001
4. Conclusions
361361361
According to our survey results, the study found that:
Experimental and non-experimental students performed extremely significant differences in all
the four modules. The data showed that after using the e-schoolbag, experimental students had
improved in all aspects of information literacy, indicating that students have had good basic technical
reserves already, which will create good environment to promote further regional e-schoolbag teaching
application.
Focusing on students who have used e-schoolbag to learn, the differences were obvious
between male and female students in some respects. Male students were more enthusiasm in the use of
technology than female students, while the performance of girls was better than boys in safety moral
module. If the school can provide targeted teaching for male and female students at the points of
difference, the effect may be more pronounced.
In this study, students in the experimental classes and non-experimental classes performed
significant differences in several aspects, such as information consciousness, information requirements,
information acquisition, information evaluation, task completion, information management and
organization, information innovation, and information ethics. As for experimental students, although
the survey results showed that students have improved in all aspects of information literacy, this is still
only the findings at this stage. So in order to verify the use of e-schoolbag can really enhance the
capacity of information technology and ability of using technology to learn, we need to get continuous
data. Moreover, we should observe the impact of e-schoolbag use on students’ learning from other
aspects, such as psychological outcomes, behavioral outcomes and other learning benefit outcomes.
Acknowledgements
This work was granted by Project supported by the National Key Technology Research and Developm
ent Program of the Ministry of Science and Technology of China (Digital Learning Resources Publicat
ion, Standards & Evaluation Tools on E-schoolbag, Grant Number 2015BAH33F03).
This work was also granted by Graduate Students’ Abroad Short-term Research and Developm
ent Fund of East China Normal University.
References
Association of College and Research Libraries. (2000). Information Literacy Competency Standards for Higher
Education. Retrieved May 9,2016, from http://www/ala/org/arcl/Standards/informationliteracycompetency
Association of College and Research Libraries. (2000). The Charge of the ACRL Information Literacy Competen
-cy Standards Review Task Force. Retrieved May 9,2016, from http://www.ala.org/acrl/sites/ala.org.acrl/fil
es/content/standards/ils_recomm.pdf
FCC Chairman and Ed Sec Discuss Digital Textbooks With EdTech Leaders. (2012, March 29). Retrieved May
9, 2016, from https://www.fcc.gov/document/fcc-chairman-and-ed-sec-discuss-digital-textbooks-edtech-lea
ders
Outline of the Shanghai Medium and Long Term Educational Reform and Development Plan (2010-2020). (201
0, March 30). Retrieved May 9, 2016, from http://www.scio.gov.cn/ztk/xwfb/jjfyr/28/wqfbh/Document/649
640/649640.htm
Penuel, W. R. (2006). Implementation and effects of one-to-one computing initiatives: A research synthesis. Jou
rnal of research on technology in education, 38(3), 329-348.
Sell, G., Cornelius-White, J., Chang, C., McLean, A., & Roworth, W. (2012). A meta-synthesis of research on 1:
1 technology initiatives in k-12 education. Unpublished master's thesis). Springfield/Missouri State Univer
sity. Retrieved May 9, 2016.
Silvernail, D. L., Pinkham, C., Wintle, S. E., Walker, L. C., & Bartlett, C. L. (2011). A middle school one-to-one
laptop program: The Maine experience. Gorham, ME: Maine Educational Policy Research Institute, Unive
rsity of Southern Maine.
Society of College, National, and University Libraries. (2011). SCONUL Seven Pillars ofInformation Literacy C
ore Model for Higher Education. Retrieved May 9,2016, from http://www.sconul.ac.uk/groups/information
_literacy/seven_pillars.html
Spektor-Levy, O., & Granot-Gilat, Y. (2012). The impact of learning with laptops in 1: 1 classes on the develop
ment of learning skills and information literacy among middle school students. Interdisciplinary Journal of
E-Learning and Learning Objects, 8(1), 83-96.
362362362
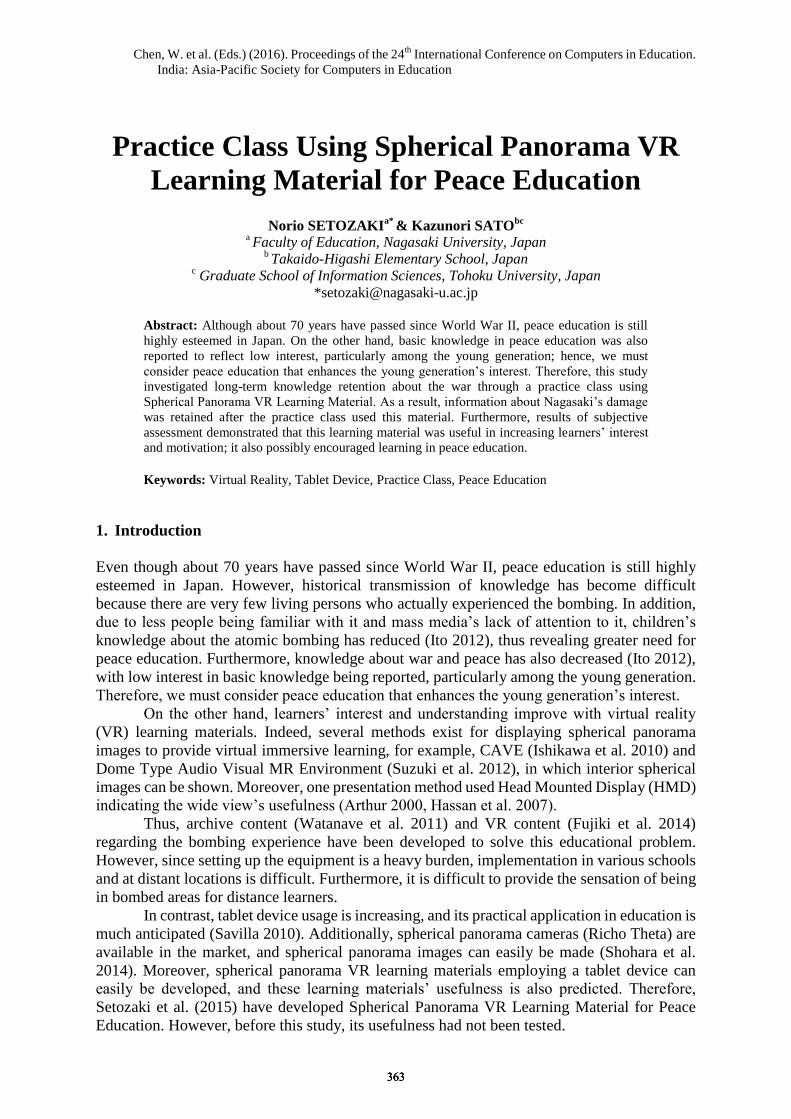
Chen, W. et al. (Eds.) (2016). Proceedings of the 24th
International Conference on Computers in Education.
India: Asia-Pacific Society for Computers in Education
Practice Class Using Spherical Panorama VR
Learning Material for Peace Education
Norio SETOZAKIa*
& Kazunori SATObc
a Faculty of Education, Nagasaki University, Japan
b Takaido-Higashi Elementary School, Japan
c Graduate School of Information Sciences, Tohoku University, Japan
Abstract: Although about 70 years have passed since World War II, peace education is still
highly esteemed in Japan. On the other hand, basic knowledge in peace education was also
reported to reflect low interest, particularly among the young generation; hence, we must
consider peace education that enhances the young generation’s interest. Therefore, this study
investigated long-term knowledge retention about the war through a practice class using
Spherical Panorama VR Learning Material. As a result, information about Nagasaki’s damage
was retained after the practice class used this material. Furthermore, results of subjective
assessment demonstrated that this learning material was useful in increasing learners’ interest
and motivation; it also possibly encouraged learning in peace education.
Keywords: Virtual Reality, Tablet Device, Practice Class, Peace Education
1. Introduction
Even though about 70 years have passed since World War II, peace education is still highly
esteemed in Japan. However, historical transmission of knowledge has become difficult
because there are very few living persons who actually experienced the bombing. In addition,
due to less people being familiar with it and mass media’s lack of attention to it, children’s
knowledge about the atomic bombing has reduced (Ito 2012), thus revealing greater need for
peace education. Furthermore, knowledge about war and peace has also decreased (Ito 2012),
with low interest in basic knowledge being reported, particularly among the young generation.
Therefore, we must consider peace education that enhances the young generation’s interest.
On the other hand, learners’ interest and understanding improve with virtual reality
(VR) learning materials. Indeed, several methods exist for displaying spherical panorama
images to provide virtual immersive learning, for example, CAVE (Ishikawa et al. 2010) and
Dome Type Audio Visual MR Environment (Suzuki et al. 2012), in which interior spherical
images can be shown. Moreover, one presentation method used Head Mounted Display (HMD)
indicating the wide view’s usefulness (Arthur 2000, Hassan et al. 2007).
Thus, archive content (Watanave et al. 2011) and VR content (Fujiki et al. 2014)
regarding the bombing experience have been developed to solve this educational problem.
However, since setting up the equipment is a heavy burden, implementation in various schools
and at distant locations is difficult. Furthermore, it is difficult to provide the sensation of being
in bombed areas for distance learners.
In contrast, tablet device usage is increasing, and its practical application in education is
much anticipated (Savilla 2010). Additionally, spherical panorama cameras (Richo Theta) are
available in the market, and spherical panorama images can easily be made (Shohara et al.
2014). Moreover, spherical panorama VR learning materials employing a tablet device can
easily be developed, and these learning materials’ usefulness is also predicted. Therefore,
Setozaki et al. (2015) have developed Spherical Panorama VR Learning Material for Peace
Education. However, before this study, its usefulness had not been tested.
363363363
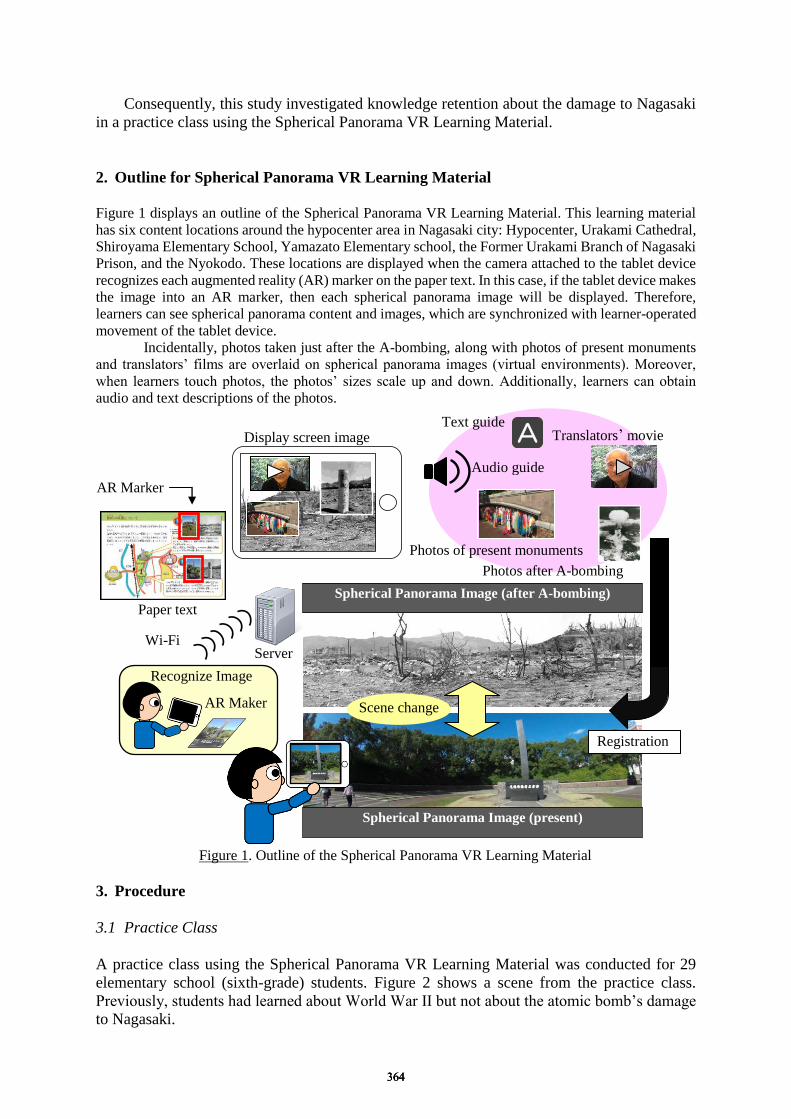
Consequently, this study investigated knowledge retention about the damage to Nagasaki
in a practice class using the Spherical Panorama VR Learning Material.
2. Outline for Spherical Panorama VR Learning Material
Figure 1 displays an outline of the Spherical Panorama VR Learning Material. This learning material
has six content locations around the hypocenter area in Nagasaki city: Hypocenter, Urakami Cathedral,
Shiroyama Elementary School, Yamazato Elementary school, the Former Urakami Branch of Nagasaki
Prison, and the Nyokodo. These locations are displayed when the camera attached to the tablet device
recognizes each augmented reality (AR) marker on the paper text. In this case, if the tablet device makes
the image into an AR marker, then each spherical panorama image will be displayed. Therefore,
learners can see spherical panorama content and images, which are synchronized with learner-operated
movement of the tablet device.
Incidentally, photos taken just after the A-bombing, along with photos of present monuments
and translators’ films are overlaid on spherical panorama images (virtual environments). Moreover,
when learners touch photos, the photos’ sizes scale up and down. Additionally, learners can obtain
audio and text descriptions of the photos.
3. Procedure
3.1 Practice Class
A practice class using the Spherical Panorama VR Learning Material was conducted for 29
elementary school (sixth-grade) students. Figure 2 shows a scene from the practice class.
Previously, students had learned about World War II but not about the atomic bomb’s damage
to Nagasaki.
AR Marker
Paper text
Server
Wi-Fi
AR Maker
Recognize Image
Spherical Panorama Image (present)
Spherical Panorama Image (after A-bombing)
Figure 1. Outline of the Spherical Panorama VR Learning Material
Display screen image Translators’ movie
Photos after A-bombing
Photos of present monuments
Scene change
Text guide
A
Registration
Audio guide
364364364
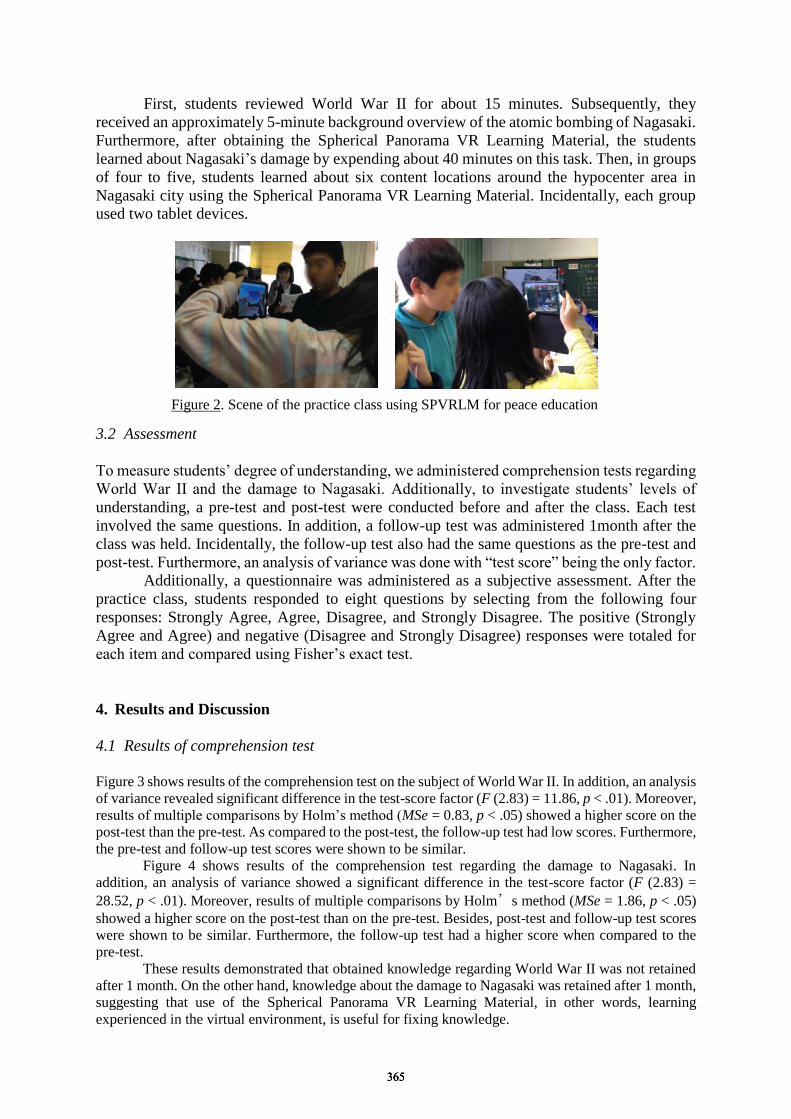
First, students reviewed World War II for about 15 minutes. Subsequently, they
received an approximately 5-minute background overview of the atomic bombing of Nagasaki.
Furthermore, after obtaining the Spherical Panorama VR Learning Material, the students
learned about Nagasaki’s damage by expending about 40 minutes on this task. Then, in groups
of four to five, students learned about six content locations around the hypocenter area in
Nagasaki city using the Spherical Panorama VR Learning Material. Incidentally, each group
used two tablet devices.
3.2 Assessment
To measure students’ degree of understanding, we administered comprehension tests regarding
World War II and the damage to Nagasaki. Additionally, to investigate students’ levels of
understanding, a pre-test and post-test were conducted before and after the class. Each test
involved the same questions. In addition, a follow-up test was administered 1month after the
class was held. Incidentally, the follow-up test also had the same questions as the pre-test and
post-test. Furthermore, an analysis of variance was done with “test score” being the only factor.
Additionally, a questionnaire was administered as a subjective assessment. After the
practice class, students responded to eight questions by selecting from the following four
responses: Strongly Agree, Agree, Disagree, and Strongly Disagree. The positive (Strongly
Agree and Agree) and negative (Disagree and Strongly Disagree) responses were totaled for
each item and compared using Fisher’s exact test.
4. Results and Discussion
4.1 Results of comprehension test
Figure 3 shows results of the comprehension test on the subject of World War II. In addition, an analysis
of variance revealed significant difference in the test-score factor (F (2.83) = 11.86, p < .01). Moreover,
results of multiple comparisons by Holm’s method (MSe = 0.83, p < .05) showed a higher score on the
post-test than the pre-test. As compared to the post-test, the follow-up test had low scores. Furthermore,
the pre-test and follow-up test scores were shown to be similar.
Figure 4 shows results of the comprehension test regarding the damage to Nagasaki. In
addition, an analysis of variance showed a significant difference in the test-score factor (F (2.83) =
28.52, p < .01). Moreover, results of multiple comparisons by Holm’s method (MSe = 1.86, p < .05)
showed a higher score on the post-test than on the pre-test. Besides, post-test and follow-up test scores
were shown to be similar. Furthermore, the follow-up test had a higher score when compared to the
pre-test.
These results demonstrated that obtained knowledge regarding World War II was not retained
after 1 month. On the other hand, knowledge about the damage to Nagasaki was retained after 1 month,
suggesting that use of the Spherical Panorama VR Learning Material, in other words, learning
experienced in the virtual environment, is useful for fixing knowledge.
Figure 2. Scene of the practice class using SPVRLM for peace education
365365365
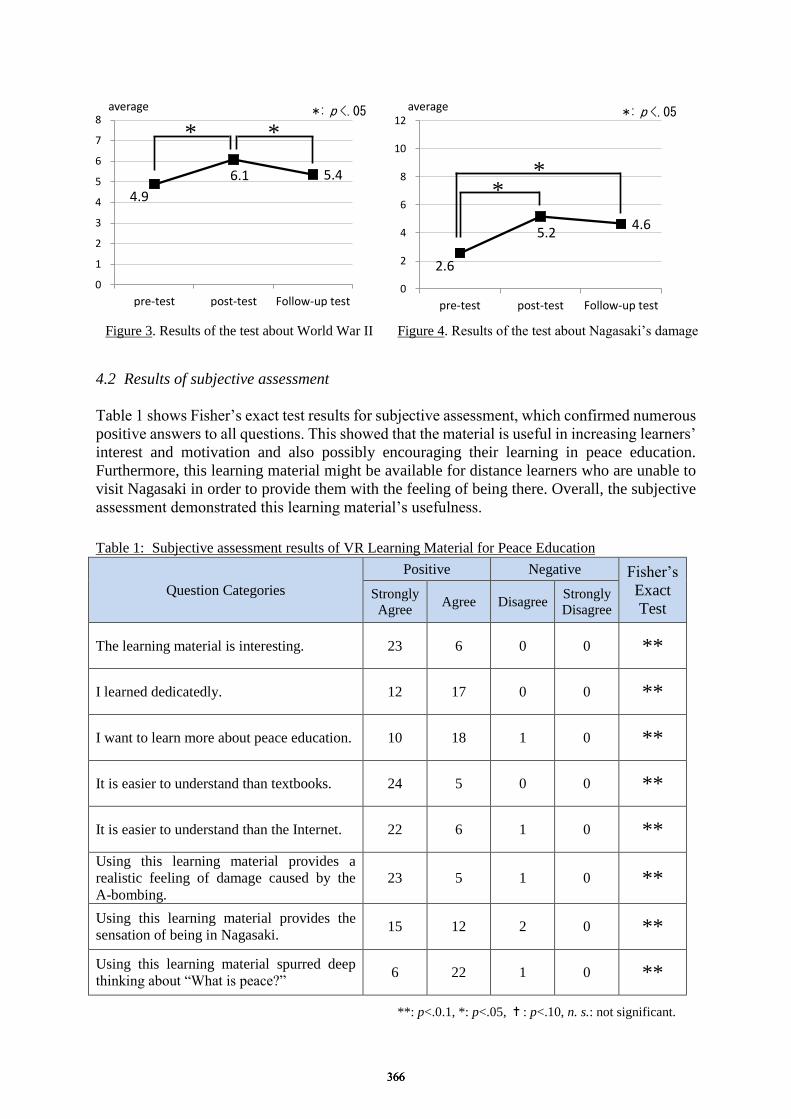
4.2 Results of subjective assessment
Table 1 shows Fisher’s exact test results for subjective assessment, which confirmed numerous
positive answers to all questions. This showed that the material is useful in increasing learners’
interest and motivation and also possibly encouraging their learning in peace education.
Furthermore, this learning material might be available for distance learners who are unable to
visit Nagasaki in order to provide them with the feeling of being there. Overall, the subjective
assessment demonstrated this learning material’s usefulness.
Table 1: Subjective assessment results of VR Learning Material for Peace Education
Question Categories
Positive Negative Fisher’s
Exact
Test Strongly
Agree Agree Disagree
Strongly
Disagree
The learning material is interesting. 23 6 0 0 **
I learned dedicatedly. 12 17 0 0 **
I want to learn more about peace education. 10 18 1 0 **
It is easier to understand than textbooks. 24 5 0 0 **
It is easier to understand than the Internet. 22 6 1 0 **
Using this learning material provides a
realistic feeling of damage caused by the
A-bombing.
23 5 1 0 **
Using this learning material provides the
sensation of being in Nagasaki. 15 12 2 0 **
Using this learning material spurred deep
thinking about “What is peace?” 6 22 1 0 **
**: p<.0.1, *: p<.05, ✝: p<.10, n. s.: not significant.
2.6
5.24.6
0
2
4
6
8
10
12
pre-test post-test Follow-up test
average
4.9
6.1 5.4
0
1
2
3
4
5
6
7
8
pre-test post-test Follow-up test
average
* *
*
Figure 3. Results of the test about World War II Figure 4. Results of the test about Nagasaki’s damage
*: p <.05 *: p <.05
*
366366366
5. Conclusion
This study investigated knowledge retention about the damage to Nagasaki through a practice
class using the Spherical Panorama VR Learning Material.
As a result, knowledge about the damage to Nagasaki was retained after 1 month.
Therefore, use of the Spherical Panorama VR Learning Material suggests that learning
experienced through the virtual environment is useful for knowledge retention. Furthermore,
results of subjective assessment proved that the material was useful in increasing learners’
interest and motivation and also possibly encouraging their learning in peace education.
Therefore, the study demonstrated the usefulness of this learning material.
A future study could be to design a class using this learning material and clarify its
learning effect. Furthermore, research should not only reflect knowledge retention but also
changes in learners’ feelings.
Acknowledgements
This research was supported by JSPS KAKENHI Grant-in-Aid for Young Scientists (B)
Number 16K16322.
References
Arthur, K. W. (2000) Effects of Field of View on Performance with Head-Mounted Displays, The University of
North Carolina at Chapel Hill, Doctoral Dissertation.
Fujiki, T., Kawakami, H., Terashima, K. (2013) Development and Evaluation of VR Environment Assisted with
Acquirement of Point of View Connecting Present and Backward by Learning of Atomic Bomb Ruins for
Elementary and Middle School Children, Japan Society for Educational Technology, 37(Suppl.), 121–124.
Hassan, S. E., Hicks, H. Lei, H., Turano, K, A. (2007) What is the Minimum Field of View Required for Efficient
Navigation?, Vision Research, 47(16), 2115–2123.
Ishikawa, T., Inoue, T. (2010) Head Tracking interface for CAVE−1ike VR Displays using the WiiRemote, IEICE
Technical Report, 109(447), 119–124.
Ito, T. (2012) Learner's Experience of : Peace, Knowledge of the Atomic Bomb, World War II, and Peace
Consciousness -An Analysis of Data Collected from Elementary & Junior High School Students in
Hiroshima, Departmental Bulletin Paper(Hiroshima Kokusai Gakuin University), 13, 23-48.
Savilla, B. (2010) Integrating the iPod Touch in K-12 Education: Visions and Vices. Computers in the Schools,
27(2), 121–131.
Setozak, N., Yoshitomi, R., Iwasaki, T. (2015) User Interface Evaluation in Spherical Panorama VR Learning
Material for Peace Education, Proceedings of 23th International Conference on Computers in Education
(ICCE), 486-488.
Shohara, M., Takeuchi, M. (2014) Development of “RICOH THETA”: Spherical Image Camera, Journal of the
Society of Photographic Science and Imaging of Japan, 77(3), 234–237.
Suzuki, S., Sugiyama, T., Miyai, T., Kimura, A., Shibata, F., Tamura, H. (2012) Dome Type Audio Visual MR
Environment and Its Core Software Library, IEICE Technical Report, 111(499), 135–140.
Watanave, H., Sakata, K., Kitahara, K., Torisu, T., Osera, R., Akutsu, Y., Nakamaru, Y., Kusano, F. (2011)
“Nagasaki Archive”: Plural Digital Archives That Urges Multipronged, Overall Understanding about
Archived Event, Transactions of the Virtual Reality Society of Japan, 16(3), 497–505.
367367367
Chen, W. et al. (Eds.) (2016). Proceedings of the 24th International Conference on Computers in Education.
India: Asia-Pacific Society for Computers in Education
Towards an Architecture for Educational
Virtual Reality Spaces
Dan KOHEN-VACSa*, Marc JANSENa & Marcelo MILRADa aCeLeKT, Linnaeus University (LNU), Sweden
Abstract: In recent years, hardware for the production and consumption of virtual reality
content has reached level of prices that make it affordable to everyone. Accordingly, schools
and universities are showing increased interest in implementations of virtual reality
technologies for supporting their innovative educational activities. Hence, this paper presents a
flexible architecture for supporting the development of virtual reality learning scenarios
conveniently deployed for educational purposes. We also suggest an example of such
educational scenario for medical purposes deployable with the suggested architecture. In
addition, we developed and used a questionnaire answered by 17 medical students in order to
derive additional requirements for refining such scenarios. Then, we present these efforts while
aiming at deployments usable also for additional domains. Finally, we summarize and mention
aspects we will address in our coming efforts while deploying such activities.
Keywords: TEL, Virtual Reality, Educational scenarios, Medicine
1. Introduction
Over the past decade, pioneering teachers started to seek for new technological implementations that
could potentially make educational activities to become more meaningful and appealing. In recent
years, teachers used Information and Communication Technologies (ICT) to enrich educational
experiences with interactive media experiences beyond the boundaries of the traditional classroom
(Cohen, 2015; Giemza et al., 2011). Occasionally, such educational implementations require
coordinated efforts exercised along a process that includes design, development, and deployment
practiced by various stakeholders including teachers, students and developers (Kohen-Vacs et al.,
2016(. In such cases, stakeholders focus their efforts on ICT systems and tools used to support
educational interactions elected while considering its availability and adaptability across different
settings and conditions (Zbick et al., 2014). Recently, teachers and developers began to examine technologies that could support
educational approaches combining innovative forms of rich media. They started to consider the
advantages of implementations including 360-degrees pictures and videos combined in their
educational strategies (Ramachandrappa, 2015). Accordingly, developers are required to cooperate and
adapt architectures and environments for these new forms of educational implementations. In other
cases, researchers and teachers began to seek new ways to combine advanced forms of rich media in
forms of Virtual reality (VR) implemented for educational activities (Merchant et al., 2014). They
exercise these efforts while developers could offer them a facilitated deployment process for innovative
VR applications through new and available Software Development Kits (SDK) as well as development
libraries (Weise et al., 2015). Consequently, various sectors including education rediscover and deploy
activities based on VR technologies. Wickens (1992) mentions this rediscovery while emphasizing that
VR implementations for education are not new and already exist for more than two decades. However,
and despite of several decades of evolvements in the field of VR for education, there exists no
architectural strategy yet for the incorporation of VR resources supporting pedagogical practices
(Stouffs et al., 2013). In this paper, we describe the initiation of our efforts towards an architectural
approach incorporating VR technologies that offers support for a variety of educational experiences.
In the next section, we present various cases dealing with VR deployments while focusing on
implementations for educational purposes. Thereafter, we present our future efforts towards the
368368368
establishment of an architectural approach adapted to support a pedagogical process practiced for
educational medicine. In addition, we propose this approach for supporting additional domains and
levels. Then, we present an educational scenario offering a meaningful and appealing experience for
students attending an anatomy course. We continue and offer an analysis practiced and used in order to
refine an educational scenario practiced for an anatomy course and supported by the mentioned
architecture. Finally, we summarize the mentioned aspects of architectural requirements followed by
our future research and deployment efforts.
2. Survey of VR Implementations Aimed for Training and Education
As already mentioned, the ideas behind the foundations for VR technologies have existed for
more than half a century. Back in the early 60’s Sutherland postulated the use of head-mounted and
stereoscopic hardware equipment (Sutherland, 1968). Two decades after these concepts were
introduced they developed into mature technologies that still were limited and available for a few elite
research labs (Cruz-Beira et al., 2015). Nowadays, there is a new renaissance in terms of hardware and
software used for VR purposes available for researchers, developers and end-users. Consequently, new
sectors with less economical resources can afford to own and explore these innovations and offer them
to their users. As mentioned, the educational field represents one of the sectors that rediscovered the
potentials of VR technologies. This sector including universities and training departments in corporate
companies have nowadays the opportunity to adopt and adapt VR technologies offered to its mass
amount of researchers, employees, educators and students (Ong & Nee, 2013). In this section, we
presented an overview of recent research efforts addressing various cases dealing with educational
deployments supported by VR technologies practiced in the recent years.
VR technologies used for educational implementations could vary in terms of their objective,
stakeholders and the nature of the used technologies. Furthermore, these implementations could vary in
terms of the used hardware and software enabling different types of ways to experience VR scenes as
well as to interact with them. For example, Cheng & Huang (2015) addressed in their efforts, VR
technologies used to improve children’s’ joint attention associated with pervasive developmental
disorder. For this aim, they developed a VR and educational scenario designed in the 3D MAX
environment and programmed with Virtools. In this implementation, teachers used regular computers to
support interactions performed from keyboards and data-gloves. The deployment of this scenario
included 12 specific interactions designed to support the mentioned aim.
The field of medical education represents another sector that could benefit from the use of VR
technologies. For example, Antoniou et al., (2014) presented a VR scenario offering to support training
for undergraduate dental education. In this case, designers and developers deployed their efforts based
on the Second-Life environment programmed with the LSL language. This deployment aimed to
provide a more open architecture offering additional options for integrating and using information
about virtual patients that is available on the web. Students interacted in a more natural manner while
using a set of available actions including chat and voice. However, the advancements along this
scenario were also possible through predefined and multiple-choice interactions.
Gao et al., (2015) carried another research effort involved VR for education that aimed to
provide college students with an appealing opportunity to understand the complex atmospheric
nucleation processes. In this implementation, developers utilized the Three.js library enabling to
experience 3D representations for VR across browsers and platforms. In addition, they used widely
available and affordable hardware including a PC, Anaglyph glasses, 3D monitor 3D graphic cards,
Oculus Rift and a Leap-Motion Controller. In other research effort, Casu et al., (2015) designed an
educational scenario supported by Three.js library. In their efforts, they offered students to experience
an educational scenario supported by VR containing models rendered with WebGL. This scenario
focuses on the mentioned subject domain and therefore the adoption of such scenario for other purposed
may be challenging.
In the next section, we present the design, development and deployment of architectures for
future VR-based educational environments. We base these efforts on previous research and deployment
experiences as described in this section. Furthermore, we consider previous efforts while focusing on
their use-cases as well as software and hardware implementation utilized to support them (Cheng &
Huang, 2012; Antoniou et al., 2014). Specifically, the aspects described in these cases cover
educational and technological interrelated consideration while aiming to provide VR experiences used
369369369
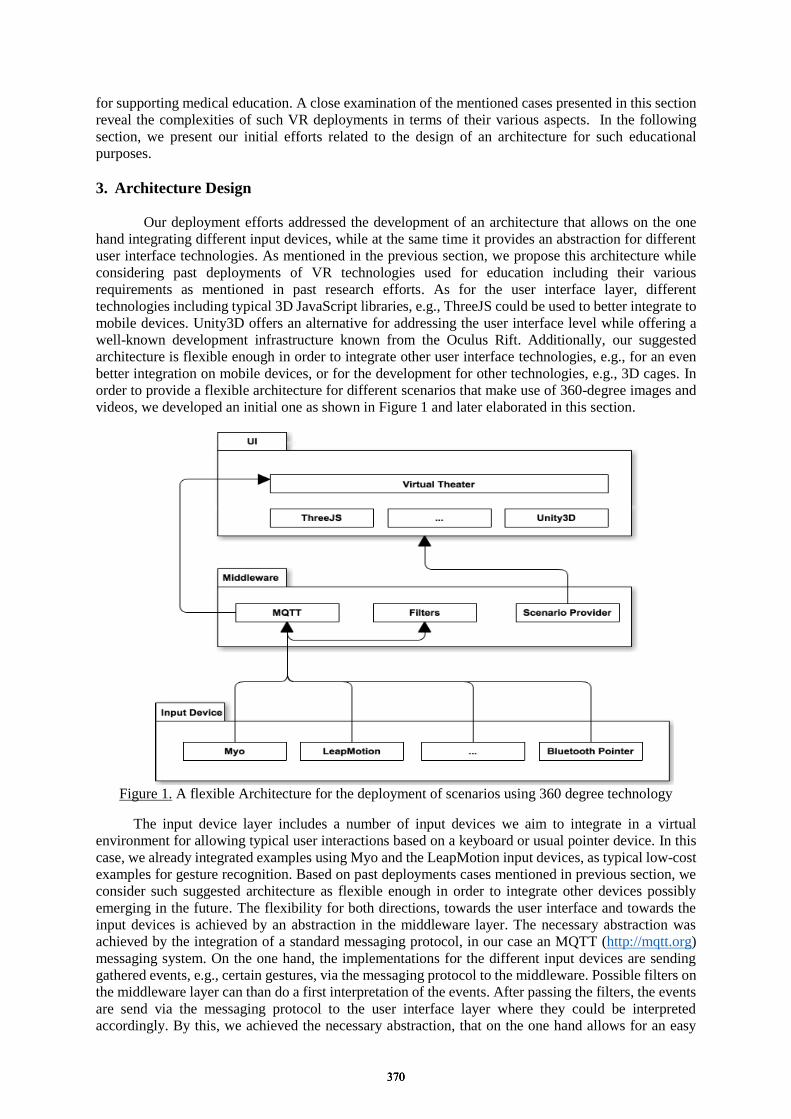
for supporting medical education. A close examination of the mentioned cases presented in this section
reveal the complexities of such VR deployments in terms of their various aspects. In the following
section, we present our initial efforts related to the design of an architecture for such educational
purposes.
3. Architecture Design
Our deployment efforts addressed the development of an architecture that allows on the one
hand integrating different input devices, while at the same time it provides an abstraction for different
user interface technologies. As mentioned in the previous section, we propose this architecture while
considering past deployments of VR technologies used for education including their various
requirements as mentioned in past research efforts. As for the user interface layer, different
technologies including typical 3D JavaScript libraries, e.g., ThreeJS could be used to better integrate to
mobile devices. Unity3D offers an alternative for addressing the user interface level while offering a
well-known development infrastructure known from the Oculus Rift. Additionally, our suggested
architecture is flexible enough in order to integrate other user interface technologies, e.g., for an even
better integration on mobile devices, or for the development for other technologies, e.g., 3D cages. In
order to provide a flexible architecture for different scenarios that make use of 360-degree images and
videos, we developed an initial one as shown in Figure 1 and later elaborated in this section.
Figure 1. A flexible Architecture for the deployment of scenarios using 360 degree technology
The input device layer includes a number of input devices we aim to integrate in a virtual
environment for allowing typical user interactions based on a keyboard or usual pointer device. In this
case, we already integrated examples using Myo and the LeapMotion input devices, as typical low-cost
examples for gesture recognition. Based on past deployments cases mentioned in previous section, we
consider such suggested architecture as flexible enough in order to integrate other devices possibly
emerging in the future. The flexibility for both directions, towards the user interface and towards the
input devices is achieved by an abstraction in the middleware layer. The necessary abstraction was
achieved by the integration of a standard messaging protocol, in our case an MQTT (http://mqtt.org)
messaging system. On the one hand, the implementations for the different input devices are sending
gathered events, e.g., certain gestures, via the messaging protocol to the middleware. Possible filters on
the middleware layer can than do a first interpretation of the events. After passing the filters, the events
are send via the messaging protocol to the user interface layer where they could be interpreted
accordingly. By this, we achieved the necessary abstraction, that on the one hand allows for an easy
370370370
integration of different input devices while at the same time is flexible enough to exchange the user
interface technology according to the needs of the scenario in question. In the following section, we
describe a scenario relying on the architecture presented here.
4. Scenario Description
In the previous section, we presented an architecture capable to support various educational
activities supported by VR environments including those described in the literature review presented in
presented section. Accordingly, we introduce an architecture including various software and hardware
technological solutions to support various aspects the current scenario. We use these technologies to
provide capabilities for authoring and using VR scenes deployed as educational scenario that are
represented in 3D models. In addition, these technologies include UI means enabling the users to
interact with the scenario. In this section, we demonstrate the potentials of this architecture to support
an educational activity focusing on the study of the human anatomy. We present a scenario supported
by the mentioned technology offering an educational process enriched with media presented in a VR
space. Furthermore, it aligns to previous research efforts conducted by our group and by the community
that deal with cases that include 3D visualizations and VR used to support educational processes for
medical purposes (Merchant et al., 2014). Here, we propose an education Scenarios Augmented by
Virtual Objects (SAViO) consisting of 4 phases:
The SaViO starts with a first phase conducted by the lecturer in a regular meeting in the
classroom. In this meeting, the lecturer introduces and presents rich media content related to human
anatomy. In the next phase, the lecturer requests from his/her students to access the presentation from
the previous phase and further inquire the topics there. In addition, he assigns to each of the student with
a specific sub-topic in anatomy including a 3D model followed by a description of the object of the
studied body. The lecturer requires each of the students to author an educational label describing the
anatomical object as well as single or multiple-choice types of interactions that relates to the addressed
object. In the following phase, students are required to visit a VR environment enabling them to
experience various virtual objects representing a structure of a human part as addressed in the previous
phase. The 3D objects located in the virtual space enabling students to freely browse, and experience
them. When arriving to such object, the student may examine it as well as to experience the interactions
previously assigned to it. Consequently, labels or interactions assigned to virtual objects enable
students with interactive opportunities to familiarize themselves with these virtual objects. The fourth
and final phase of this activity takes place during a debriefing session conducted at classroom in which
the lecturer illustrates and reviews key aspects of the learned material. In this debriefing, the teacher
addresses the type and temporal sequence of the interactions practiced by his students along previous
phases of the scenario.
5. Towards a Requirements Analysis
In order to initiate the design of the previously described scenario we commenced a process that
included the identification of requirements with 17 participants attending an anatomy course at a
medical school. In this case, we looked for specific aspects related to the learning practices supported by
technology as reported by students at medical schools in anatomy courses. In order to proceed with this
examination, we presented the students with a questionnaire including eight questions addressing
several aspects of their learning practices as experienced during their anatomy lessons (α =0.65). The
first group of questions addressed students’ habits related to the learning materials and used the same
Likert scale varying from 1 (does not apply at all) to 5 (does apply totally):
(Q1) Do you want to take compact learning materials to wherever you want?
(Q2) Do you think that questions or quizzes related to the learning materials helps you learn the topics?
(Q3) Do you feel that you understand the learning materials better if they are explained to you?
(Q4) Do you learn new materials on your own?
(Q5) Do you ask questions if you have not understood major parts of the learning content?
We collected the answers from these questions and considered their topics and their relation to the
Mobile Seamless Learning dimensions (MSLs) as suggested by Wong and Looi (2011). We consider
these questions in the light of MSLs as part of our continuous efforts to examine requirements for rich
371371371
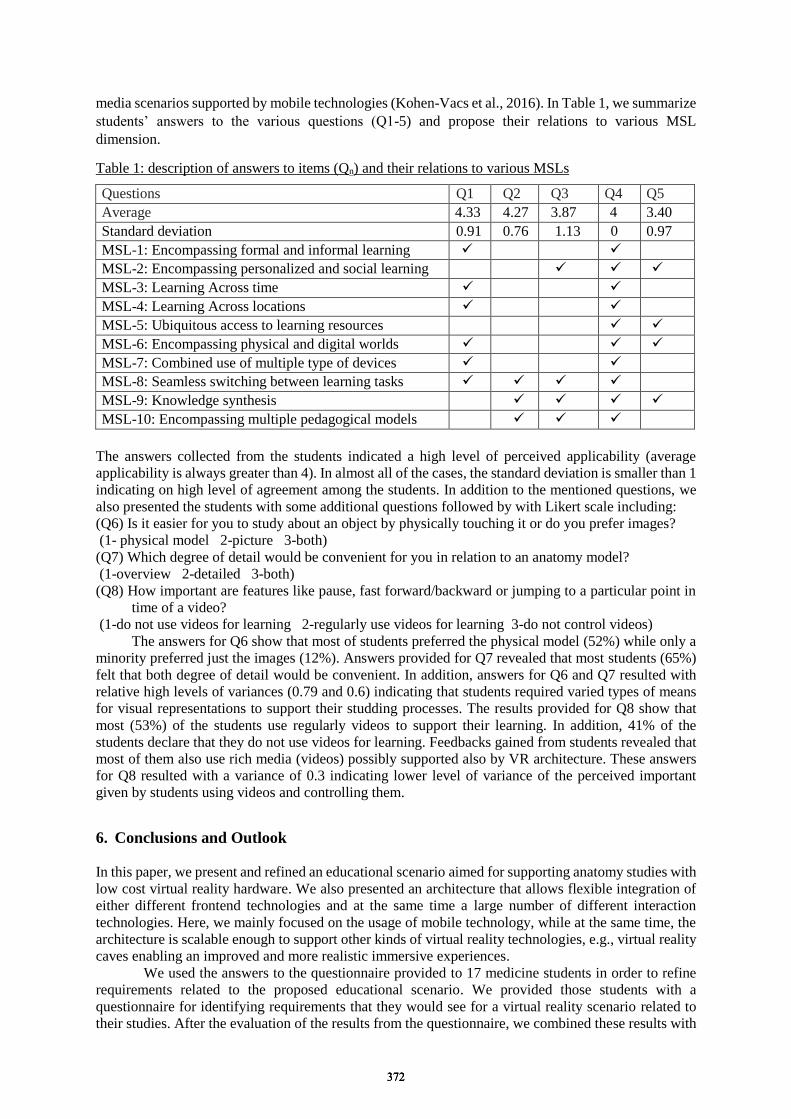
media scenarios supported by mobile technologies (Kohen-Vacs et al., 2016). In Table 1, we summarize
students’ answers to the various questions (Q1-5) and propose their relations to various MSL
dimension.
Table 1: description of answers to items (Qn) and their relations to various MSLs
Questions Q1 Q2 Q3 Q4 Q5
Average 4.33 4.27 3.87 4 3.40
Standard deviation 0.91 0.76 1.13 0 0.97
MSL-1: Encompassing formal and informal learning
MSL-2: Encompassing personalized and social learning
MSL-3: Learning Across time
MSL-4: Learning Across locations
MSL-5: Ubiquitous access to learning resources
MSL-6: Encompassing physical and digital worlds
MSL-7: Combined use of multiple type of devices
MSL-8: Seamless switching between learning tasks
MSL-9: Knowledge synthesis
MSL-10: Encompassing multiple pedagogical models
The answers collected from the students indicated a high level of perceived applicability (average
applicability is always greater than 4). In almost all of the cases, the standard deviation is smaller than 1
indicating on high level of agreement among the students. In addition to the mentioned questions, we
also presented the students with some additional questions followed by with Likert scale including:
(Q6) Is it easier for you to study about an object by physically touching it or do you prefer images?
(1- physical model 2-picture 3-both)
(Q7) Which degree of detail would be convenient for you in relation to an anatomy model?
(1-overview 2-detailed 3-both)
(Q8) How important are features like pause, fast forward/backward or jumping to a particular point in
time of a video?
(1-do not use videos for learning 2-regularly use videos for learning 3-do not control videos)
The answers for Q6 show that most of students preferred the physical model (52%) while only a
minority preferred just the images (12%). Answers provided for Q7 revealed that most students (65%)
felt that both degree of detail would be convenient. In addition, answers for Q6 and Q7 resulted with
relative high levels of variances (0.79 and 0.6) indicating that students required varied types of means
for visual representations to support their studding processes. The results provided for Q8 show that
most (53%) of the students use regularly videos to support their learning. In addition, 41% of the
students declare that they do not use videos for learning. Feedbacks gained from students revealed that
most of them also use rich media (videos) possibly supported also by VR architecture. These answers
for Q8 resulted with a variance of 0.3 indicating lower level of variance of the perceived important
given by students using videos and controlling them.
6. Conclusions and Outlook
In this paper, we present and refined an educational scenario aimed for supporting anatomy studies with
low cost virtual reality hardware. We also presented an architecture that allows flexible integration of
either different frontend technologies and at the same time a large number of different interaction
technologies. Here, we mainly focused on the usage of mobile technology, while at the same time, the
architecture is scalable enough to support other kinds of virtual reality technologies, e.g., virtual reality
caves enabling an improved and more realistic immersive experiences.
We used the answers to the questionnaire provided to 17 medicine students in order to refine
requirements related to the proposed educational scenario. We provided those students with a
questionnaire for identifying requirements that they would see for a virtual reality scenario related to
their studies. After the evaluation of the results from the questionnaire, we combined these results with
372372372
the former research conducted by Wong and Looi (2011) and applyied their different MSL dimensions
to our scenario. We performed this as part of our evolving research efforts aiming refine educational
scenarios enriched with new forms of media and supported by innovative technologies. Specifically, we
exercise this as part of our efforts to support educational scenarios with VR technologies. The results
from the questionnaire provided indications associating the questions to various aspects addressed in
various types of MSL also applicable for different types of SaViOs. Accordingly, our future efforts will
address several aspects of SaViOs including evaluation of usability addressing implementation of
different types of scenarios. In addition, we also aim on developing scenarios for new educational
topics.
In our coming efforts, we plan to integrate new VR hardware and devices that have the potential
can to provide more realistic and better educational experiences. In these future efforts, we aim on
providing deployments better adapted to scenarios refined according to feedbacks pointing over users’
preferences. The ultimate goal will be to, design and develop new Interactive and efficient Learning
Environments (ILE) that could be used by teachers for enhancing students’ learning experiences as well
as to support debriefing sessions to reflect on the content and subject matter that have been explored in
these new kind of ILEs.
References Antoniou, P. E., Athanasopoulou, C. A., Dafli, E., & Bamidis, P. D. (2014). Exploring design requirements for
repurposing dental virtual patients from the web to second life: a focus group study. Journal of medical
Internet research, 16(6), e151.
Cheng, Y., & Huang, R. (2012). Using virtual reality environment to improve joint attention associated with
pervasive developmental disorder. Research in developmental disabilities, 33(6), 2141-2152.
Cohen, S. (2015). Creating Innovative Pedagogical Opportunities via “Treasure-HIT”: Mobile Treasure Hunt
Games Generator. Master thesis published at Linnéuniversitetet, Sweden.
Cruz-Neira, C., Dolinsky, M., Lanier, J., Azuma, R., Baron, E., & Cruz-Neira, C. (2015, August). The renaissance
of VR: are we going to do it right this time?. In ACM SIGGRAPH 2015 Panels (p. 1). ACM.
Giemza, A., Bollen, L., & Hoppe, H. U. (2011). LEMONADE: field-trip authoring and classroom reporting for
integrated mobile learning scenarios with intelligent agent support. International Journal of Mobile
Learning and Organisation, 5(1), 96-114.
Helsel, S. (1992). Virtual Reality and Education. Educational Technology, 32(5), 38-42.
Kohen-Vacs, D., Milrad, M., Ronen, M., & Jansen, M. (2016). Evaluation of enhanced educational experiences
using interactive videos and web technologies: pedagogical and architectural considerations. Smart
Learning Environments, 3(1), 1-19.
Merchant, Z., Goetz, E. T., Cifuentes, L., Keeney-Kennicutt, W., & Davis, T. J. (2014). Effectiveness of virtual
reality-based instruction on students' learning outcomes in K-12 and higher education: A
meta-analysis.Computers & Education, 70, 29-40.
Ong, S. K., & Nee, A. Y. C. (2013). Virtual and augmented reality applications in manufacturing. Springer
Science & Business Media.
Ramachandrappa, A. (2015). Panoramic 360◦ videos in virtual reality using two lenses and a mobile phone.
Stouffs, R., Janssen, P., Roudavski, S., & Tunçer, B. (2013). What is happening to virtual and augemented L
reality applied to architecture? In Conference on Computer-Aided Architectural Design Research in Asia
(CAADRIA 2013) (Vol. 1, p. 10).
Sutherland, I. E. (1968, December). A head-mounted three dimensional display. In Proceedings of the December
9-11, 1968, fall joint computer conference, part I (pp. 757-764). ACM.
Weise, M., Zender, R., & Lucke, U. (2015, July). Systematic Fusion of Gesture Sensors for Practical Learning in
Virtual Environments. In Advanced Learning Technologies (ICALT), 2015 IEEE 15th International
Conference on(pp. 83-87). IEEE.
Wong, L. H., & Looi, C. K. (2011). What seams do we remove in mobile-assisted seamless learning? A critical
review of the literature. Computers & Education, 57(4), 2364-2381.
Wickens, C. D. (1992, October). Virtual reality and education. In Systems, Man and Cybernetics, 1992., IEEE
International Conference on systems (pp. 842-847). IEEE.
Zbick, Janosch, Maarten Jansen, and Marcelo Milrad. "Towards a web-based framework to support end-user
programming of mobile learning activities." Advanced Learning Technologies (ICALT), 2014 IEEE 14th
International Conference on. IEEE, 2014.
373373373

Chen, W. et al. (Eds.) (2016). Proceedings of the 24th International Conference on Computers in Education. India: Asia-Pacific Society for Computers in Education
Measuring & Evaluating Digital Textbooks through Quizzes
Chengjiu YIN a*, Jane Yin-Kim YAU b, Noriko Uosaki c, Sachio HIROKAWA d, Etsuko KUMAMOTO a
a Information Science Technology Center, Kobe University, Japan b German Institute for International Educational Research, Germany
c Center for International Education and Exchange, Osaka University, Japan d Research Institute for Information Technology, Kyushu University, Japan
Abstract: We currently utilize the Moodle learning management system for teachers and students who participate in the course ‘College of Liberal Arts and Sciences’ at Kobe University in Japan. Digital textbooks, reports, quizzes and questionnaires in this course were administered using Moodle. In this paper, we proposed to use quizzes to measure and evaluate those digital textbooks recorded on Moodle. At the beginning of our study, we examined the questions that students got lower scores, and then we found the related teaching materials of digital textbooks and feedback to the teachers in order to improve the content of these digital textbooks.
Keywords: digital textbooks, quizzes, educational data mining
1. Introduction
With the emergence of new generation smartphones such as the iPhone and Android-operated ones, it is no longer problematic to implement ubiquitous learning environments onto these high-powered devices. These smartphones utilize many advanced functions such as the multi-touch interface and the virtual keyboard (which allows users to type easier anywhere and anytime). Nowadays, smartphones can be held with just one hand for people to perform many functions on because the usability of these devices have been much improved as well as the physical size and weight of these have been designed better for our use.
During the past decades, many researchers focused on supporting students learning everywhere every time, which is called Computer Supported Ubiquitous Learning (abbreviated as CSUL) or context-aware ubiquitous learning (Yin et al., 2010; Hwang et al. 2009). Our current research is also focused on using digital textbook and quizzes to collect students’ learning data everywhere every time and analyzing these data to support teaching. Teachers and students can use our system and read the digital textbook by using mobile devices such as iPad, iPhone, and Android.
In the digital age, digital textbooks, such as “living books”, “talking books”, and “CD-ROM books”, can be conveniently accessed through Internet anywhere and anytime. Rainie, et al. (2012) indicated that the percentage of digital textbooks being read by learners has increased significantly from 17% in 2011 to 21% in 2012 in America. By 2020, the Ministry of Education, Culture, Sports, Science and Technology (MEXT) is scheduled to change all the traditional textbooks for elementary, middle, and high schools into digital textbooks in Japan1 (Yin et al., 2014).
By using mobile devices such as iPad, tablet PC or smartphones, anyone can easily create digital textbooks anywhere and anytime. However, many of these digital textbooks were created based
1 http://www.mext.go.jp/
374374374
on the authors’ experience in a subjective manner. Therefore, a number of problems have arisen in terms of the adoption of digital textbooks, for example:
1) How the quality of digital textbooks can be measured, 2) How the content of digital textbooks can be evaluated, and 3) How the content of digital textbooks can be improved.
In this paper, we examine the components of the digital textbooks, which should be revised by using students’ quizzes test scores. If the average score of a question is very low, it can be considered that the related content is not explained well, and then the data mining technology is used to find the related content in the digital textbooks, and then, the related content will be feedback to the teachers to improve the digital textbooks. In this paper, we proposed to use quizzes to measure and evaluate the component of the digital textbooks recorded on Moodle. At the beginning of our study, we attempted to find which questions that students got lower scores. If the average score of a question is very low, it can be considered that the related content is not explained well. And then through the data mining technology, we attempted to find the related learning contents of digital textbooks and feedback to the teachers in order to improve the content of these digital textbooks. 2. Literature Review 2.1 Previous Studies of Data Collection Research on Digital textbook Research has been conducted which examined the efficacy of digital textbooks compared with traditional paper-based textbooks in terms of the improvement of their reading skills, reading comprehensions, and reading strategies (Daniel et al, 2013; Anton et al., 2013; Nelson & O’Neil, 2001) as well as some research on technological literacy concerning reading and writing skills (Ihmeideh et al, 2014, Korat et al., 2008). There have also been some studies on distribution systems of digital learning materials where questionnaire surveys were conducted on their usability (Siegenthaler et al., 2010) and the learners’ learning styles (Rockinson-Szapkiw Rockinson et al., 2013). There are a few researches were conducted to improve digital textbook by using learning data. For example, Bakia and Güvelib (2008) proposed to improve a web based mathematics teaching material by collecting data such as attitude scale, interviews, field observations. These qualitative and quantitative data were collected from the sample, consisting of eighteen teachers and eighty students. However, the sample data is very smaller. However there have been very few research conducted so far In current research, using massive learning data (about 2600 students’ learning data) is used to improve digital textbook. 2.2 Previous Studies of Data Collection Collecting data is the first step in learning analysis. In May 2015, we thus performed a review of previous research to survey the categories that can be classified in terms of data collection, (Yin et al., 2013a; 2013b). Based based on the way of data collection source, previous studies on data collection could be classified into three categories (Yin et al., 2013a; 2013b):
A) Questionnaire/Quiz-based data collection. In this category, data are collected using a pre-designed questionnaire. Ho et al. (2013) used a questionnaire to investigate the teacher behavior of adopting mobile phone messages as a parent–teacher communication medium. Tan and Seah (2011) explored questioning behaviors among elementary students engaged in science inquiries via a computer-supported collaborative learning tool. Using a web-based portfolio assessment questionnaire, Chang et al. (2012) attempted to categorize global behaviors in a web-based portfolio assessment using the Chinese Word Segmenting System.
B) Manual data collection. In this category, a manual data collection system is opened to users, who can employ the system and consciously provide data about their learning behaviors. For example, Chiang et al. (2014) provided an augmented reality (AR) system to guide students in knowledge sharing in inquiry learning activities. In this approach, students capture images from an authentic environment and share these with others. Ogata et al. (2011) presented a system called System for Capturing and Reusing of Learning Logs, in which students can share their data learning logs
375375375
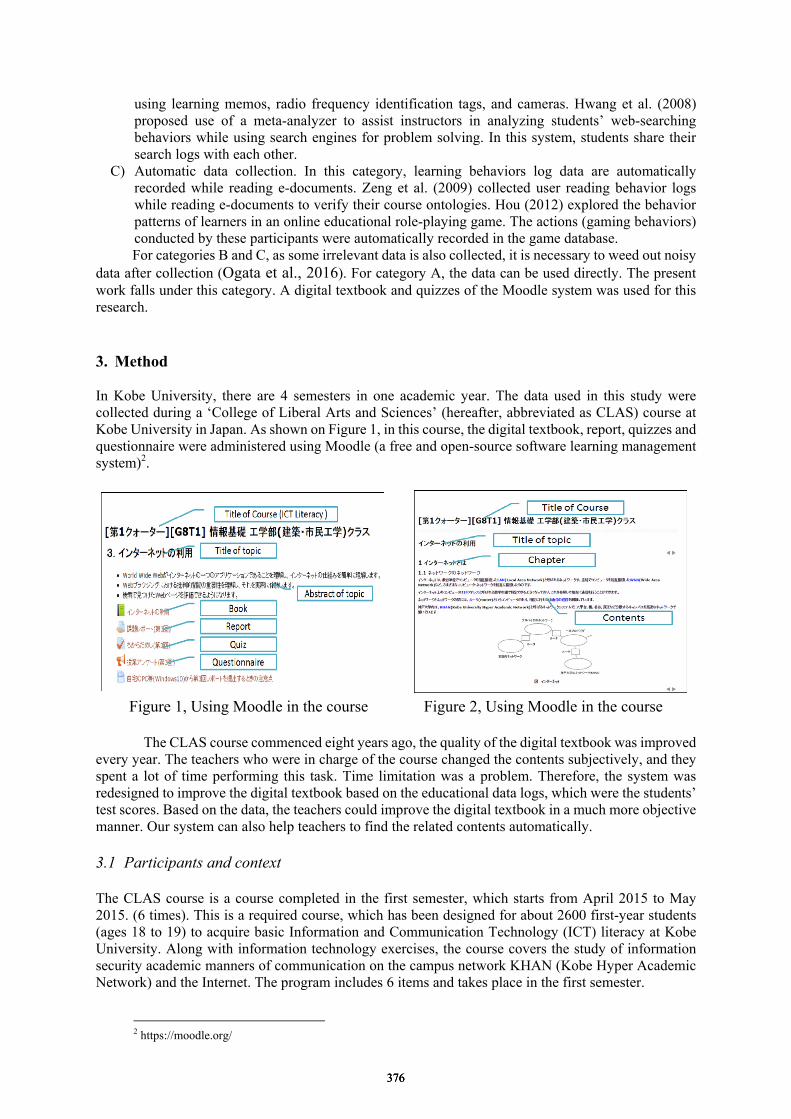
using learning memos, radio frequency identification tags, and cameras. Hwang et al. (2008) proposed use of a meta-analyzer to assist instructors in analyzing students’ web-searching behaviors while using search engines for problem solving. In this system, students share their search logs with each other.
C) Automatic data collection. In this category, learning behaviors log data are automatically recorded while reading e-documents. Zeng et al. (2009) collected user reading behavior logs while reading e-documents to verify their course ontologies. Hou (2012) explored the behavior patterns of learners in an online educational role-playing game. The actions (gaming behaviors) conducted by these participants were automatically recorded in the game database. For categories B and C, as some irrelevant data is also collected, it is necessary to weed out noisy
data after collection (Ogata et al., 2016). For category A, the data can be used directly. The present work falls under this category. A digital textbook and quizzes of the Moodle system was used for this research. 3. Method In Kobe University, there are 4 semesters in one academic year. The data used in this study were collected during a ‘College of Liberal Arts and Sciences’ (hereafter, abbreviated as CLAS) course at Kobe University in Japan. As shown on Figure 1, in this course, the digital textbook, report, quizzes and questionnaire were administered using Moodle (a free and open-source software learning management system)2.
Figure 1, Using Moodle in the course Figure 2, Using Moodle in the course
The CLAS course commenced eight years ago, the quality of the digital textbook was improved
every year. The teachers who were in charge of the course changed the contents subjectively, and they spent a lot of time performing this task. Time limitation was a problem. Therefore, the system was redesigned to improve the digital textbook based on the educational data logs, which were the students’ test scores. Based on the data, the teachers could improve the digital textbook in a much more objective manner. Our system can also help teachers to find the related contents automatically. 3.1 Participants and context The CLAS course is a course completed in the first semester, which starts from April 2015 to May 2015. (6 times). This is a required course, which has been designed for about 2600 first-year students (ages 18 to 19) to acquire basic Information and Communication Technology (ICT) literacy at Kobe University. Along with information technology exercises, the course covers the study of information security academic manners of communication on the campus network KHAN (Kobe Hyper Academic Network) and the Internet. The program includes 6 items and takes place in the first semester.
2 https://moodle.org/
376376376
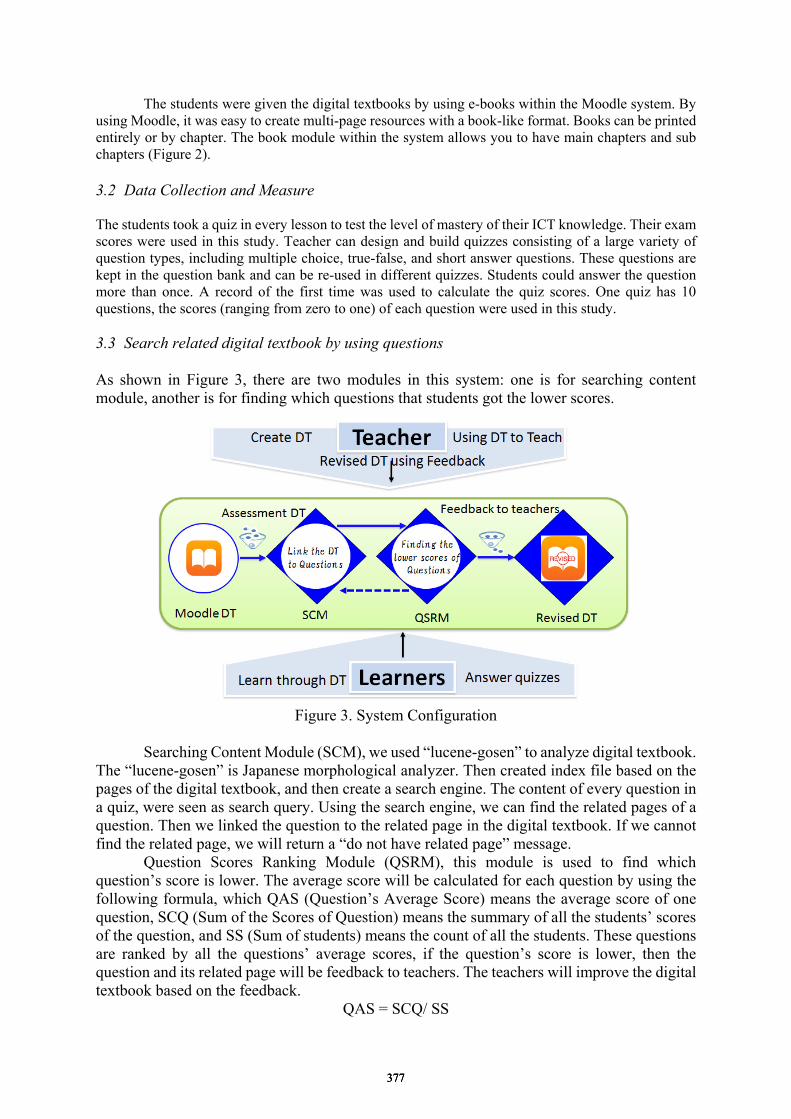
The students were given the digital textbooks by using e-books within the Moodle system. By using Moodle, it was easy to create multi-page resources with a book-like format. Books can be printed entirely or by chapter. The book module within the system allows you to have main chapters and sub chapters (Figure 2). 3.2 Data Collection and Measure The students took a quiz in every lesson to test the level of mastery of their ICT knowledge. Their exam scores were used in this study. Teacher can design and build quizzes consisting of a large variety of question types, including multiple choice, true-false, and short answer questions. These questions are kept in the question bank and can be re-used in different quizzes. Students could answer the question more than once. A record of the first time was used to calculate the quiz scores. One quiz has 10 questions, the scores (ranging from zero to one) of each question were used in this study. 3.3 Search related digital textbook by using questions As shown in Figure 3, there are two modules in this system: one is for searching content module, another is for finding which questions that students got the lower scores.
Figure 3. System Configuration
Searching Content Module (SCM), we used “lucene-gosen” to analyze digital textbook.
The “lucene-gosen” is Japanese morphological analyzer. Then created index file based on the pages of the digital textbook, and then create a search engine. The content of every question in a quiz, were seen as search query. Using the search engine, we can find the related pages of a question. Then we linked the question to the related page in the digital textbook. If we cannot find the related page, we will return a “do not have related page” message.
Question Scores Ranking Module (QSRM), this module is used to find which question’s score is lower. The average score will be calculated for each question by using the following formula, which QAS (Question’s Average Score) means the average score of one question, SCQ (Sum of the Scores of Question) means the summary of all the students’ scores of the question, and SS (Sum of students) means the count of all the students. These questions are ranked by all the questions’ average scores, if the question’s score is lower, then the question and its related page will be feedback to teachers. The teachers will improve the digital textbook based on the feedback.
QAS = SCQ/ SS
377377377
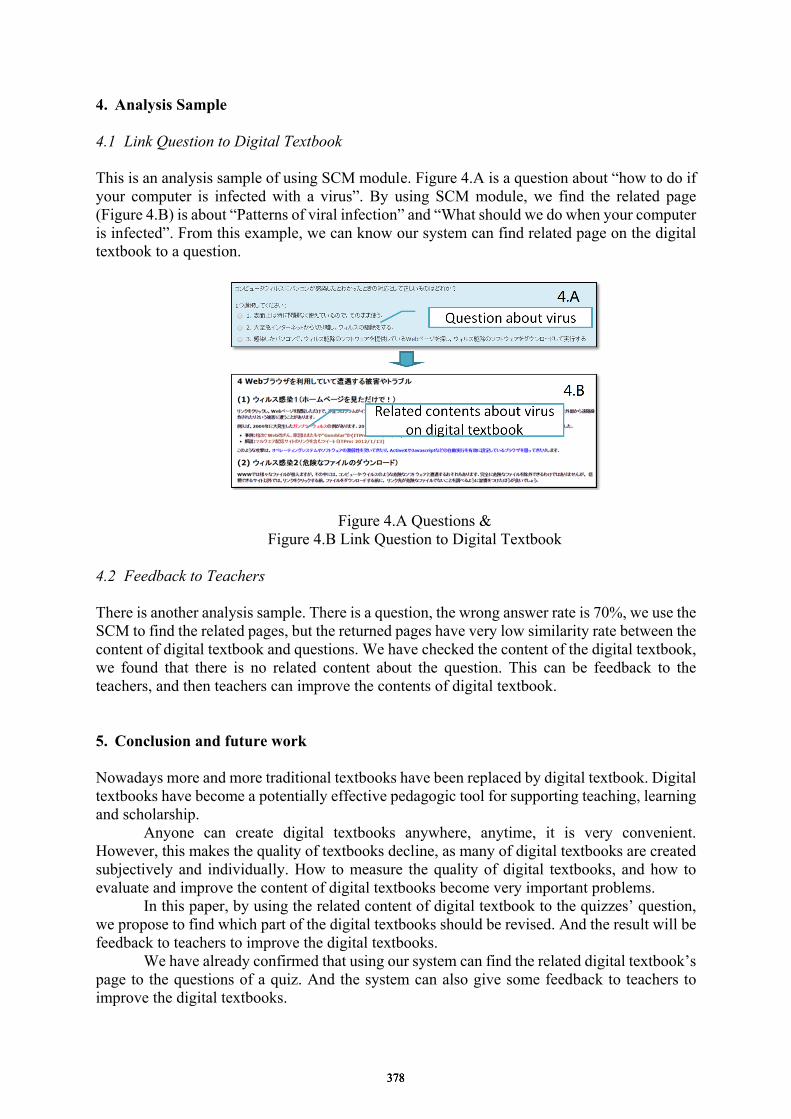
4. Analysis Sample 4.1 Link Question to Digital Textbook
This is an analysis sample of using SCM module. Figure 4.A is a question about “how to do if your computer is infected with a virus”. By using SCM module, we find the related page (Figure 4.B) is about “Patterns of viral infection” and “What should we do when your computer is infected”. From this example, we can know our system can find related page on the digital textbook to a question.
Figure 4.A Questions & Figure 4.B Link Question to Digital Textbook
4.2 Feedback to Teachers There is another analysis sample. There is a question, the wrong answer rate is 70%, we use the SCM to find the related pages, but the returned pages have very low similarity rate between the content of digital textbook and questions. We have checked the content of the digital textbook, we found that there is no related content about the question. This can be feedback to the teachers, and then teachers can improve the contents of digital textbook. 5. Conclusion and future work Nowadays more and more traditional textbooks have been replaced by digital textbook. Digital textbooks have become a potentially effective pedagogic tool for supporting teaching, learning and scholarship.
Anyone can create digital textbooks anywhere, anytime, it is very convenient. However, this makes the quality of textbooks decline, as many of digital textbooks are created subjectively and individually. How to measure the quality of digital textbooks, and how to evaluate and improve the content of digital textbooks become very important problems.
In this paper, by using the related content of digital textbook to the quizzes’ question, we propose to find which part of the digital textbooks should be revised. And the result will be feedback to teachers to improve the digital textbooks.
We have already confirmed that using our system can find the related digital textbook’s page to the questions of a quiz. And the system can also give some feedback to teachers to improve the digital textbooks.
378378378

In the future, we will use the system in the classroom and evaluate the system effectiveness.
Acknowledgements Part of this research work was supported by the Grant-in-Aid for Scientific Research No.16H03078 and No.26350319 from the Ministry of Education, Culture, Sports, Science and Technology (MEXT) in Japan. References Anton, C., Camarero, C., and Rodriguez, J. (2013). Usefulness, Enjoyment, and Self-Image Congruence: The
Adoption of e-Book Readers, Psychology and Marketing, vol. 30, no. 4, pp.372–384. Bakia,A., Güvelib, E.(2008). Evaluation of a web based mathematics teaching material on the subject of
functions, Computers & Education, vol.51, no.2,pp.854–863 Chang, C.C., Chen, C.C., & Chen, Y.H. (2012). Reflective behaviors under a web-based portfolio assessment
environment for high school students in a computer course, Computers & Education, vol. 58, pp.459–469. Chiang, T.H.C., Yang, S.J.H., & Hwang, G.J. (2014). Students’ online interactive patterns in augmented
reality-based inquiry activities, Computers & Education, vol. 78, pp. 97-108. Daniel, D. B., et al. (2013). E-textbooks at what cost? Performance and use of electronic v. print texts, Computers
& Education, 62, pp. 18–23. Ho, L.H., Hung, C.L., & Chen, H.C. (2013). Using theoretical models to examine the acceptance behavior of
mobile phone messaging to enhance parent–teacher interactions, Computers & Education, vol. 61, pp.105–114.
Hou, H.T. (2012). Exploring the behavioral patterns of learners in an educational massively multiple online role-playing game (MMORPG), Computers & Education, vol. 58, pp. 1225–1233.
Hwang, G.J., Tsai, P.S., Tsai, C.C., & Tseng, J.C.R. (2008), A novel approach for assisting teachers in analyzing student web-searching behaviors, Computers & Education, vol. 51, pp. 926–938.
Hwang, G.J., Yang, T.C., Tsai, C.C., Yang, S. J.H.(2009).A context-aware ubiquitous learning environment for conducting complex science experiments, Computers & Education, 53, pp.402– 413
Ihmeideh, F. M. (2014). The effect of electronic books on enhancing emergent literacy skills of pre-school children. Computers & Education, 79, pp. 40–48.
Nelson, L., & O’Neil, F. (2001). Electronic monographs in the academic library: an implementation story. LASIE, 32, pp.13–20.
Ogata, H. et al.(2016).Learning Analytics towards the Usage of Educational Big Data, The Journal of Information and Systems in Education, vol.33, no.2, pp.58-66. (in Japanese)
Rainie, Lee, Kathryn Zickuhr, Kristen Purcell, Mary Madden, and Johanna Brenner (2012). The rise of e-reading. Washington D.C: Pew Research Center’s Internet & American Life Project. http://libraries.pewinternet.org/2012/04/04/the-rise-of-e-reading/
Siegenthaler, E., et al., Improving the usability of e-book readers. Journal of Usability Studies,6(1),25–38,2010 Tan, S.-C., & Seah, L.-H. (2011). Exploring relationship between students’ questioning behaviors and inquiry
tasks in an online forum through analysis of ideational function of questions, Computers & Education, vol. 57, pp. 1675–1685.
Yin C-J., et al. (2014). Smart phone based data collecting system for analyzing learning behaviors, Proc. International Conference of Computers on Education 2014, pp. 575–577
Yin, C.J., Sung, H.Y., Hwang, G.J., Hirokawa, S., Chu, H.C., Flanagan, B., & Tabata, Y. (2013a). Learning by searching: a learning approach that provides searching and analysis facilities to support research trend surveys, Journal of Educational Technology & Society, vol. 16, no. 3, pp. 286–300.
Yin, C.J., Hirokawa, S., Yau, J., Nakatoh, T., Hashimoto, K. & Tabata, Y. (2013b). Analyzing research trends with cross tabulation search engine. Int. Journal of Distance Education Technologies, vol. 11. no.1, pp. 31-44.
Yin, C.J., Ogata, H., Tabata, Y. and Yano, Y. (2010). Supporting the acquisition of Japanese polite expressions in context-aware ubiquitous learning, Int. J. Mobile Learning and Organisation, Vol. 4, No. 2, pp.214–234.
Zeng, Q., Zhao, Z., & Liang, Y. (2009). Course ontology-based user’s knowledge requirement acquisition from behaviors within e-learning systems, Computers & Education, vol. 53, pp. 809–818.
379379379
Chen, W. et al. (Eds.) (2016). Proceedings of the 24th
International Conference on Computers in Education.
India: Asia-Pacific Society for Computers in Education
AETEL: Supporting Seamless Learning and
Learning Log Recording with e-Book System
Mahiro KIYOTAa*
, Kousuke MOURIa, Noriko UOSAKI
b , & Hiroaki OGATA
a*
a Faculty of Arts and Science and the Graduate School of Information Science and Electrical
Engineering, University of Kyushu, Japan b Center for International Education and Exchange, Osaka University, Japan
*{mkiyota.kyushuuniv, hiroaki.ogata}@gmail.com
Abstract: Seamless learning is an approach in which learners can build a relationship between
their formal learning and informal learning. One of the issues of seamless learning is the way to
connect formal learning with informal learning. To tackle this issue, we propose an e-Book
based system in this paper. Our proposal learning system has two functions. One is an e-Book
viewing function which can log what learners learned from e-Books as learning logs. The other
is a seamless learning function which enables users to connect formal learning with informal
learning. In this paper, we introduce our system and its evaluation.
Keywords: mobile learning, ubiquitous learning, seamless learning, e-Book
1. Introduction
With the advances of the mobile and wireless technologies, a learning approach called “seamless
learning” has been gaining many researchers’ attention. Seamless learning is defined as a learning
environment where learners can learn whenever they want to in a variety of scenarios and that they can
switch from one scenario to another easily and quickly using one device or more per student
(“one-to-one”) as a mediator (Chan et al. 2006). Meanwhile, Wong et al. (2011) identified ten salient
features of seamless learning; (1) Encompassing formal and informal learning, (2) Encompassing
personalized and social learning, (3) Across time, (4) Across locations, (5) Ubiquitous knowledge
access, (6) Encompassing physical and digital worlds, (7) Combined use of multiple device types, (8)
Seamless switching between multiple learning tasks, (9) Knowledge synthesis, and (10) Encompassing
multiple pedagogical or learning activity models.
Since seamless learning proposed, many researchers approached their seamless learning based
projects. For example, Milrad et al. (2013) introduced five different seamless learning projects
researched in Taiwan, United Kingdom, Sweden, Singapore, and Japan.
When we consider connecting formal learning with informal learning as one of the seamless
learning styles, one of the issues is the way to connect formal learning with informal learning. To tackle
the issue, some seamless learning systems have been explored by researchers. For example, Uosaki et
al. (2010) proposed a seamless learning system called SMALL System (Seamless Mobile-Assisted
Language Learning Support System). Meanwhile, Wong et al. (2014) proposed a system called
MyCloud (My Chinese Language ubiquitOUs learning Days).
Thus, some seamless learning systems have been approached. However, they do not consider
connecting learning from learning materials with the other learning. Generally, textbooks provided by
schools are used during class. Especially, when we consider providing learning materials as e-Books
(electronic-books), by connecting inside-class e-Book based learning with outside-of-class
self-learning, it is expected that learners can connect formal learning with informal learning.
Meanwhile, e-Books have been introduced to schools in many countries; especially, in Japan, Japanese
Ministry of Education, Culture, Sports, Science and Technology (MEXT, 2011) planned to introduce
e-Books in schools by 2020. Therefore, it is highly expected that there will be a growing demand of
e-Book based learning in the near future.
In our research, we tried to connect formal learning with informal learning by using e-Books to
tackle the issue mentioned above. This paper describes an e-Book based seamless learning system
called AETEL (Actions and learning on E-TExtbook Logging) System and its evaluation.
380380380
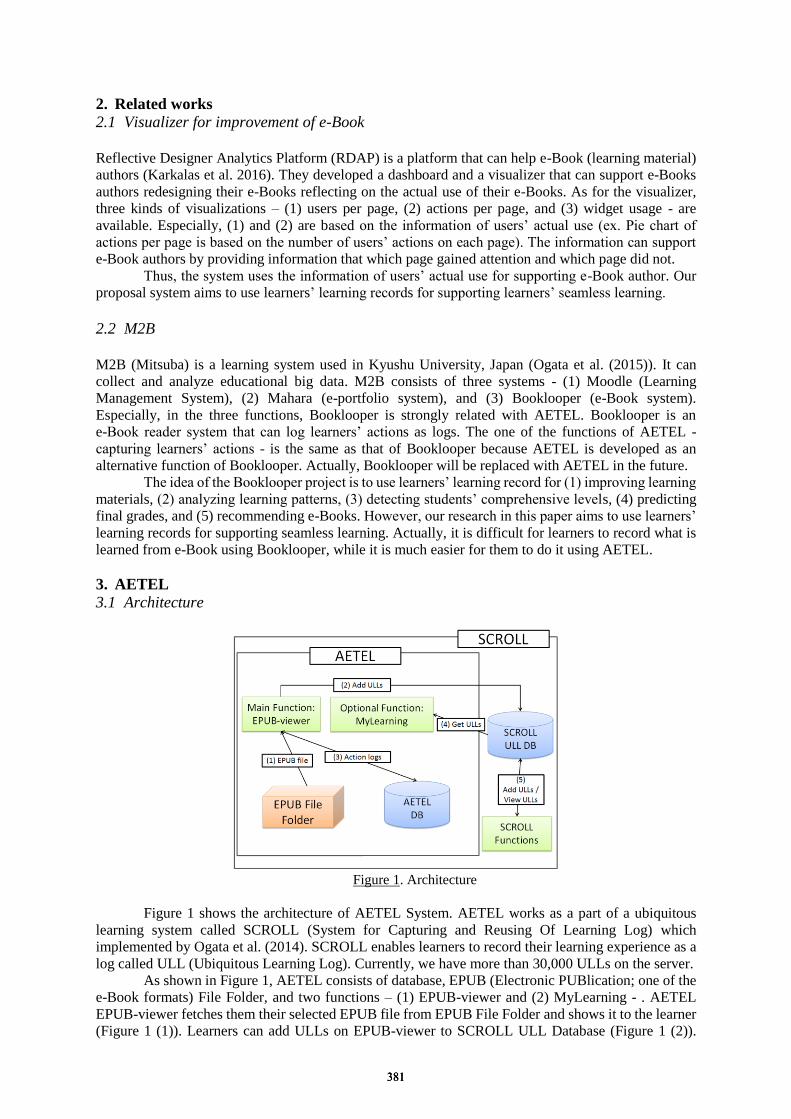
2. Related works
2.1 Visualizer for improvement of e-Book
Reflective Designer Analytics Platform (RDAP) is a platform that can help e-Book (learning material)
authors (Karkalas et al. 2016). They developed a dashboard and a visualizer that can support e-Books
authors redesigning their e-Books reflecting on the actual use of their e-Books. As for the visualizer,
three kinds of visualizations – (1) users per page, (2) actions per page, and (3) widget usage - are
available. Especially, (1) and (2) are based on the information of users’ actual use (ex. Pie chart of
actions per page is based on the number of users’ actions on each page). The information can support
e-Book authors by providing information that which page gained attention and which page did not.
Thus, the system uses the information of users’ actual use for supporting e-Book author. Our
proposal system aims to use learners’ learning records for supporting learners’ seamless learning.
2.2 M2B
M2B (Mitsuba) is a learning system used in Kyushu University, Japan (Ogata et al. (2015)). It can
collect and analyze educational big data. M2B consists of three systems - (1) Moodle (Learning
Management System), (2) Mahara (e-portfolio system), and (3) Booklooper (e-Book system).
Especially, in the three functions, Booklooper is strongly related with AETEL. Booklooper is an
e-Book reader system that can log learners’ actions as logs. The one of the functions of AETEL -
capturing learners’ actions - is the same as that of Booklooper because AETEL is developed as an
alternative function of Booklooper. Actually, Booklooper will be replaced with AETEL in the future.
The idea of the Booklooper project is to use learners’ learning record for (1) improving learning
materials, (2) analyzing learning patterns, (3) detecting students’ comprehensive levels, (4) predicting
final grades, and (5) recommending e-Books. However, our research in this paper aims to use learners’
learning records for supporting seamless learning. Actually, it is difficult for learners to record what is
learned from e-Book using Booklooper, while it is much easier for them to do it using AETEL.
3. AETEL
3.1 Architecture
Figure 1. Architecture
Figure 1 shows the architecture of AETEL System. AETEL works as a part of a ubiquitous
learning system called SCROLL (System for Capturing and Reusing Of Learning Log) which
implemented by Ogata et al. (2014). SCROLL enables learners to record their learning experience as a
log called ULL (Ubiquitous Learning Log). Currently, we have more than 30,000 ULLs on the server.
As shown in Figure 1, AETEL consists of database, EPUB (Electronic PUBlication; one of the
e-Book formats) File Folder, and two functions – (1) EPUB-viewer and (2) MyLearning - . AETEL
EPUB-viewer fetches them their selected EPUB file from EPUB File Folder and shows it to the learner
(Figure 1 (1)). Learners can add ULLs on EPUB-viewer to SCROLL ULL Database (Figure 1 (2)).
381381381
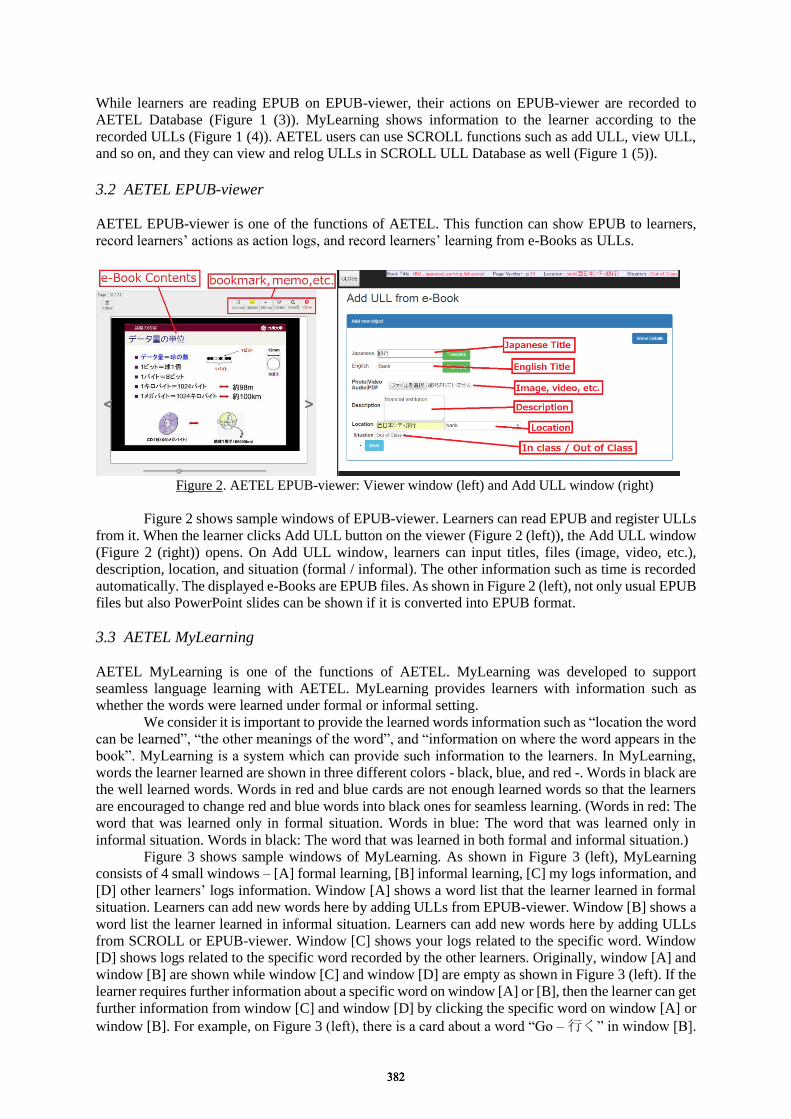
While learners are reading EPUB on EPUB-viewer, their actions on EPUB-viewer are recorded to
AETEL Database (Figure 1 (3)). MyLearning shows information to the learner according to the
recorded ULLs (Figure 1 (4)). AETEL users can use SCROLL functions such as add ULL, view ULL,
and so on, and they can view and relog ULLs in SCROLL ULL Database as well (Figure 1 (5)).
3.2 AETEL EPUB-viewer
AETEL EPUB-viewer is one of the functions of AETEL. This function can show EPUB to learners,
record learners’ actions as action logs, and record learners’ learning from e-Books as ULLs.
Figure 2. AETEL EPUB-viewer: Viewer window (left) and Add ULL window (right)
Figure 2 shows sample windows of EPUB-viewer. Learners can read EPUB and register ULLs
from it. When the learner clicks Add ULL button on the viewer (Figure 2 (left)), the Add ULL window
(Figure 2 (right)) opens. On Add ULL window, learners can input titles, files (image, video, etc.),
description, location, and situation (formal / informal). The other information such as time is recorded
automatically. The displayed e-Books are EPUB files. As shown in Figure 2 (left), not only usual EPUB
files but also PowerPoint slides can be shown if it is converted into EPUB format.
3.3 AETEL MyLearning
AETEL MyLearning is one of the functions of AETEL. MyLearning was developed to support
seamless language learning with AETEL. MyLearning provides learners with information such as
whether the words were learned under formal or informal setting.
We consider it is important to provide the learned words information such as “location the word
can be learned”, “the other meanings of the word”, and “information on where the word appears in the
book”. MyLearning is a system which can provide such information to the learners. In MyLearning,
words the learner learned are shown in three different colors - black, blue, and red -. Words in black are
the well learned words. Words in red and blue cards are not enough learned words so that the learners
are encouraged to change red and blue words into black ones for seamless learning. (Words in red: The
word that was learned only in formal situation. Words in blue: The word that was learned only in
informal situation. Words in black: The word that was learned in both formal and informal situation.)
Figure 3 shows sample windows of MyLearning. As shown in Figure 3 (left), MyLearning
consists of 4 small windows – [A] formal learning, [B] informal learning, [C] my logs information, and
[D] other learners’ logs information. Window [A] shows a word list that the learner learned in formal
situation. Learners can add new words here by adding ULLs from EPUB-viewer. Window [B] shows a
word list the learner learned in informal situation. Learners can add new words here by adding ULLs
from SCROLL or EPUB-viewer. Window [C] shows your logs related to the specific word. Window
[D] shows logs related to the specific word recorded by the other learners. Originally, window [A] and
window [B] are shown while window [C] and window [D] are empty as shown in Figure 3 (left). If the
learner requires further information about a specific word on window [A] or [B], then the learner can get
further information from window [C] and window [D] by clicking the specific word on window [A] or
window [B]. For example, on Figure 3 (left), there is a card about a word “Go – 行く” in window [B].
382382382
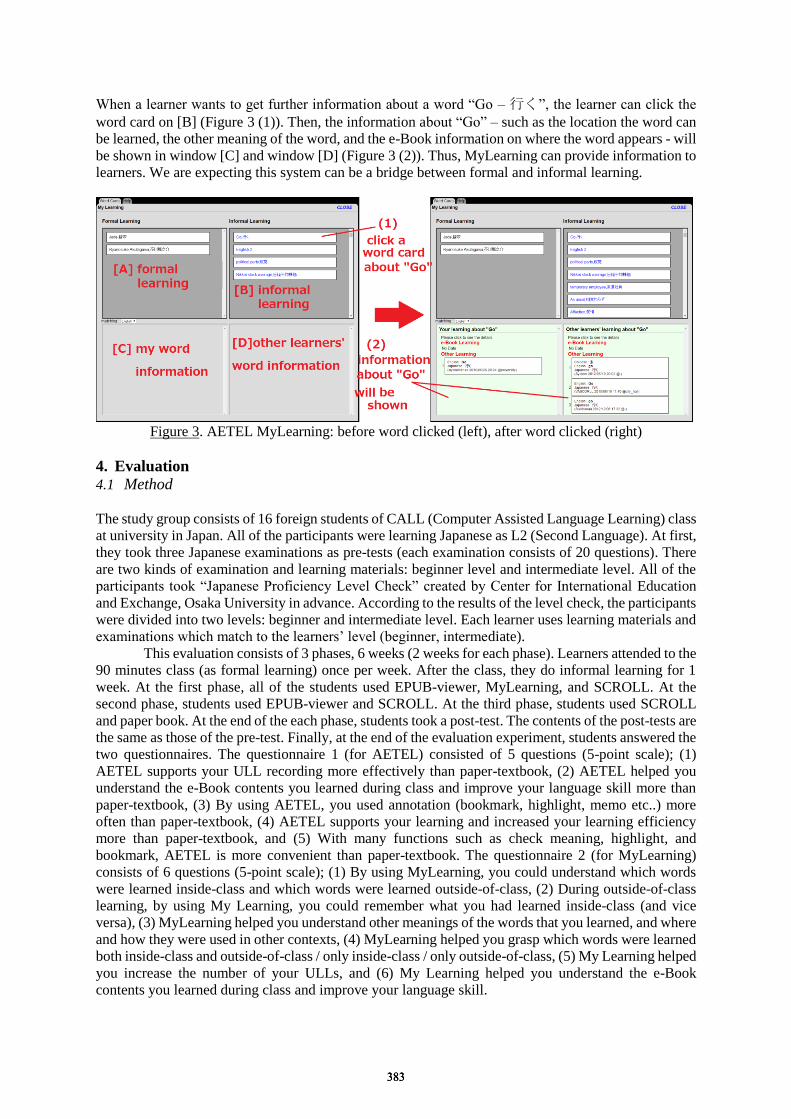
When a learner wants to get further information about a word “Go – 行く”, the learner can click the
word card on [B] (Figure 3 (1)). Then, the information about “Go” – such as the location the word can
be learned, the other meaning of the word, and the e-Book information on where the word appears - will
be shown in window [C] and window [D] (Figure 3 (2)). Thus, MyLearning can provide information to
learners. We are expecting this system can be a bridge between formal and informal learning.
Figure 3. AETEL MyLearning: before word clicked (left), after word clicked (right)
4. Evaluation
4.1 Method
The study group consists of 16 foreign students of CALL (Computer Assisted Language Learning) class
at university in Japan. All of the participants were learning Japanese as L2 (Second Language). At first,
they took three Japanese examinations as pre-tests (each examination consists of 20 questions). There
are two kinds of examination and learning materials: beginner level and intermediate level. All of the
participants took “Japanese Proficiency Level Check” created by Center for International Education
and Exchange, Osaka University in advance. According to the results of the level check, the participants
were divided into two levels: beginner and intermediate level. Each learner uses learning materials and
examinations which match to the learners’ level (beginner, intermediate).
This evaluation consists of 3 phases, 6 weeks (2 weeks for each phase). Learners attended to the
90 minutes class (as formal learning) once per week. After the class, they do informal learning for 1
week. At the first phase, all of the students used EPUB-viewer, MyLearning, and SCROLL. At the
second phase, students used EPUB-viewer and SCROLL. At the third phase, students used SCROLL
and paper book. At the end of the each phase, students took a post-test. The contents of the post-tests are
the same as those of the pre-test. Finally, at the end of the evaluation experiment, students answered the
two questionnaires. The questionnaire 1 (for AETEL) consisted of 5 questions (5-point scale); (1)
AETEL supports your ULL recording more effectively than paper-textbook, (2) AETEL helped you
understand the e-Book contents you learned during class and improve your language skill more than
paper-textbook, (3) By using AETEL, you used annotation (bookmark, highlight, memo etc..) more
often than paper-textbook, (4) AETEL supports your learning and increased your learning efficiency
more than paper-textbook, and (5) With many functions such as check meaning, highlight, and
bookmark, AETEL is more convenient than paper-textbook. The questionnaire 2 (for MyLearning)
consists of 6 questions (5-point scale); (1) By using MyLearning, you could understand which words
were learned inside-class and which words were learned outside-of-class, (2) During outside-of-class
learning, by using My Learning, you could remember what you had learned inside-class (and vice
versa), (3) MyLearning helped you understand other meanings of the words that you learned, and where
and how they were used in other contexts, (4) MyLearning helped you grasp which words were learned
both inside-class and outside-of-class / only inside-class / only outside-of-class, (5) My Learning helped
you increase the number of your ULLs, and (6) My Learning helped you understand the e-Book
contents you learned during class and improve your language skill.
383383383
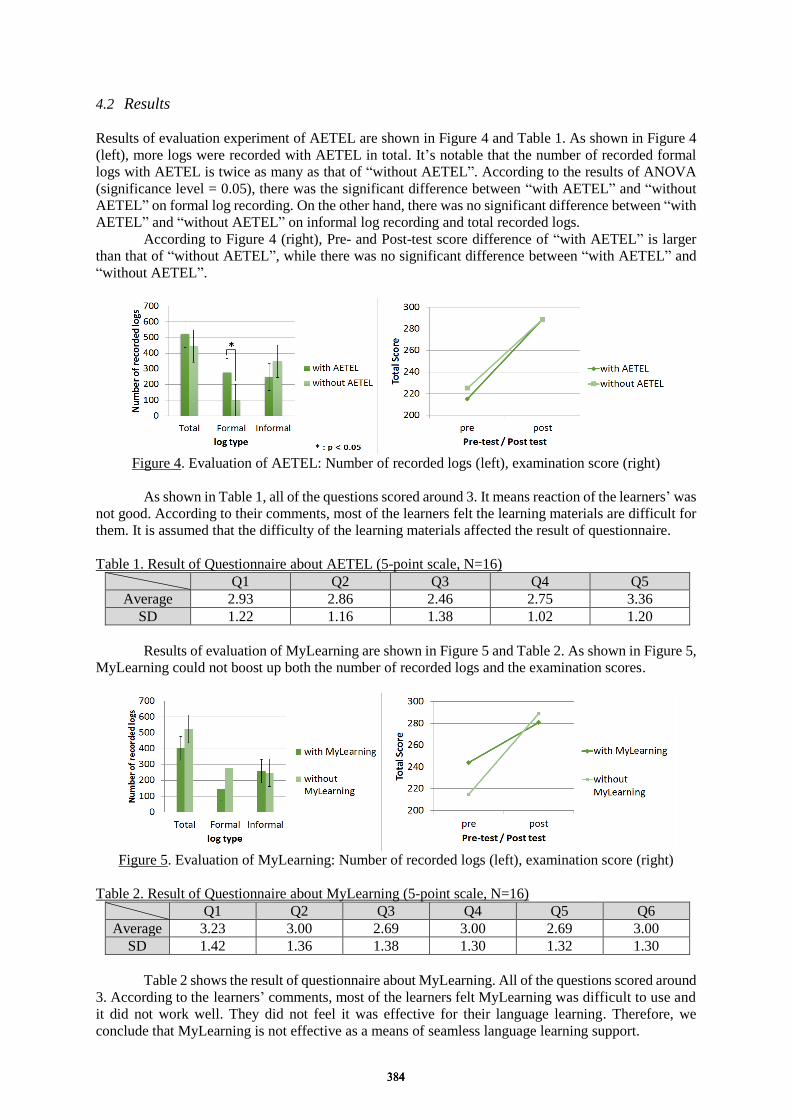
4.2 Results
Results of evaluation experiment of AETEL are shown in Figure 4 and Table 1. As shown in Figure 4
(left), more logs were recorded with AETEL in total. It’s notable that the number of recorded formal
logs with AETEL is twice as many as that of “without AETEL”. According to the results of ANOVA
(significance level = 0.05), there was the significant difference between “with AETEL” and “without
AETEL” on formal log recording. On the other hand, there was no significant difference between “with
AETEL” and “without AETEL” on informal log recording and total recorded logs.
According to Figure 4 (right), Pre- and Post-test score difference of “with AETEL” is larger
than that of “without AETEL”, while there was no significant difference between “with AETEL” and
“without AETEL”.
Figure 4. Evaluation of AETEL: Number of recorded logs (left), examination score (right)
As shown in Table 1, all of the questions scored around 3. It means reaction of the learners’ was
not good. According to their comments, most of the learners felt the learning materials are difficult for
them. It is assumed that the difficulty of the learning materials affected the result of questionnaire.
Table 1. Result of Questionnaire about AETEL (5-point scale, N=16)
Q1 Q2 Q3 Q4 Q5
Average 2.93 2.86 2.46 2.75 3.36
SD 1.22 1.16 1.38 1.02 1.20
Results of evaluation of MyLearning are shown in Figure 5 and Table 2. As shown in Figure 5,
MyLearning could not boost up both the number of recorded logs and the examination scores.
Figure 5. Evaluation of MyLearning: Number of recorded logs (left), examination score (right)
Table 2. Result of Questionnaire about MyLearning (5-point scale, N=16)
Q1 Q2 Q3 Q4 Q5 Q6
Average 3.23 3.00 2.69 3.00 2.69 3.00
SD 1.42 1.36 1.38 1.30 1.32 1.30
Table 2 shows the result of questionnaire about MyLearning. All of the questions scored around
3. According to the learners’ comments, most of the learners felt MyLearning was difficult to use and
it did not work well. They did not feel it was effective for their language learning. Therefore, we
conclude that MyLearning is not effective as a means of seamless language learning support.
384384384
5. Conclusions and future work
This paper proposes an e-Book system called AETEL. This system currently has two functions -
EPUB-viewer and MyLearning. EPUB-viewer can show EPUB and log learners’ actions and learning
on EPUB. Furthermore, it supports learners’ ULL recording as well. According to the results of the
evaluations, it has a positive educational impact on the learners.
MyLearning is an additional function of AETEL which was expected to support seamless
language learning. This system can show words information and we expected it could support learners’
seamless language learning. However, according to the results of the evaluation experiment, we could
not recognize the effectiveness of the MyLearning.
In this paper, the effectiveness of AETEL was successfully demonstrated, while MyLearning
did not work effectively as expected. Therefore, as our future work, we will remove MyLearning from
AETEL and add a new function - adaptation function which uses ULLs and action logs – to AETEL
instead of MyLearning. Also, we will consider analyzing various methods such as social network
analysis and visualization of graph theory (Mouri et al., 2014, 2015).
Acknowledgements
This part of the research was supported by Grants-in-Aid for Scientific Research (No.25282059,
No.26560122, No.25540091, and No.26350319) from the Ministry of Education, Culture, Sports,
Science and Technology (MEXT), Japan. The research results were partly achieved by “Research and
Development on Fundamental and Utilization Technologies for Social Big Data” (178A03),
Commissioned Research by the National Institute of Information and Communications Technology
(NICT), Japan.
References MEXT, Japanese Ministry of Education, Culture, Sports, Science and Technology (2011).
“The Vision for ICT in Education”,
http://www.mext.go.jp/b_menu/houdou/23/04/__icsFiles/afieldfile/2012/08/03/1305484_14_1.pdf
Milrad, M., Wong, L. H., Sharples, M., Hwang, G. J., Looi, C. K. and Ogata, H. (2013). Seamless learning: An
international perspective on next generation technology enhanced learning, In Z. L. Berge and L. Y.
Muilenburg, Handbook of mobile learning (Chapter 9), 95-108
Mouri K., Ogata H., Uosaki N. and Liu S. (2014). Visualization for analyzing Ubiquitous Learning Logs,
Proceedings of the 22nd ICCE 2014, 461-470.
Mouri K., Ogata H. and Uosaki N. (2015). Ubiquitous Learning Analytics in the Context of Real-world Language
Learning, International conference on Learning Analytics and Knowledge, 378-382.
Ogata, H., Hou, B., Li, M., Uosaki, N., Mouri, K. and Liu, S. (2014). Ubiquitous Learning Project Using
Life-logging Technology in Japan, Educational Technology and Society Journal, Vol. 17, No.2, 85-100
Ogata, H., Yin, C., Oi, M., Okubo, F., Shimada, A., Kojima, K., Yamada, M., e-Book-based Learning Analytics in
University Education, Proceedings of the 23rd
ICCE2015, 401-406
S. Karkalas, M. Mavrikis, O. Labs, (2016). Towards Analytics for Educational Interactive e-Books, LAK ’16,
143-147
T.-W. Chan, J. Roschelle, S. Hsi, Kinshuk, M. Sharples, T. Brown, C. Patton, J. Cherniavsky, R. Pea, C. Norris, E.
Soloway, and N. Balacheff, (2006). One-to-one technology enhanced learning: an opportunity for global
research collaboration, Research and Practice of Technology Enhanced Learning, Vol. 1, 3-29
Uosaki, N., Li, M. Hou, B., Ogata, H., & Yano, Y. (2010). Supporting an English Course Using Handhelds in a
Seamless Learning Environment. Workshop Proc. Of the 18th
ICCE2010, 185-192
Wong, L.-H, Chai, CS, King, R., Zhang, X., & Aw, GP (2014). Unpacking the Researcher-Teacher Co-Design
Process of a Seamless Language Learning Environment with the TPACK Framework. 22nd
ICCE2014,
886-895
Wong, L.-H, Looi, C.-K., (2011). What seams do we remove in mobile-assisted seamless learning? A critical
review of the literature. Comput. Educ. 57, 2364-2381
385385385
Chen, W. et al. (Eds.) (2016). Proceedings of the 24th International Conference on Computers in Education. India: Asia-Pacific Society for Computers in Education
Fieldfriend: A Smartphone App for Mobile Learning in the Field
Alexis PANGa* & Anthony WEATHERLEY
aFaculty of Veterinary and Agricultural Sciences, University of Melbourne, Australia *[email protected]
Abstract: In this paper, we describe the context, design and implementation of the Fieldfriend smartphone app for iterative and experiential field-based learning for first-year undergraduate Environments students at the University of Melbourne. Developed for Apple iOS mobile devices, Fieldfriend leverages upon current smartphone technology and ubiquitous mobile networks to afford, scaffolded and situated, field-based learning for novice learners that enables location-based self-guided learning, user-generated multimodal learning artifact generation and flexible re-use of digital content for learning. The Fieldfriend website and database enable flexible design of learning trails, assessment of students’ progress, data security and sharing of user-generated content. We demonstrate how Fieldfriend was used to support learning about the earth’s natural systems and processes in the Natural Environments subject. Because of the Google Maps spatial interface and smartphone GPS-enabled location services, and web-based design environment, Fieldfriend can be flexibly contextualized and designed for a wide range of mobile learning scenarios and requirements in different localities around the globe.
Keywords: Fieldfriend, mobile learning, field-based learning, smartphone, app
1. Introduction The ubiquity of mobile technology and networks in the present time has led to a plethora of opportunities for the transformative implementation of one-to-one technology-enhanced learning (TEL) predicted by Chan, et al. (2006). Networked smartphones with ample functionalities, processing power and storage, and the ability to design, customize and bundle smartphone functionalities in the form of applications - “apps”, mean that traditional fieldwork, an indubitably effective mode of learning (Delamont, 2002), can be transformed through the enrichment of learners’ experiences using digital technology.
In this paper, we describe the context, design and implementation of the Fieldfriend smartphone app and web environment for iterative and experiential field-based learning for first-year undergraduate ‘Environments’ students at the University of Melbourne. Developed for Apple iOS mobile devices, Fieldfriend leveraged upon current smartphone technology and ubiquitous mobile networks to afford scaffolded and situated field-based learning for novice learners for location-based self-guided learning, user-generated multimodal learning artifact generation and flexible re-use of digital content. 2. Curricula and learning needs of Environments undergraduate students Fieldwork has taken a central role in the curricula of the three core subjects of the Bachelor of Environments course – Natural, Re-shaping and Urban Environments, at the University of Melbourne. Current fieldwork across the three subjects require students to observe, record and reflect upon various aspects and elements of their allocated field sites, in small groups ranging from 2 to 5. This small group learning was in part a response to the size of the class which precluded the traditional ‘expert guided’ field excursion. Based on several discussions between academics teaching the three core subjects, it was found that students, as novices in each discipline and in fieldwork, needed expert guidance and additional learning resources to draw upon to achieve an acceptable degree of quality of observation, recording and reflection on which to build their own knowledge. This scaffolding (Wilson and Devereux, 2014) in fieldwork could be enabled by leveraging upon mobile learning approaches through the development of a smartphone app amenable for use across the three subjects totaling approximately 1000 students per semester.
386386386

Natural Environments (ENVS10001) the curricular focus of this paper, aims to provide students with a broad understanding of the Earth’s natural systems structured around the four great realms, namely the lithosphere, atmosphere, hydrosphere and biosphere, and develop skills for interpreting natural landscapes, processes and phenomena applicable to a wide range of professions in the natural and built environment. Through lectures, students learn about key theories, concepts and examples associated with each of these ‘spheres’. In the tutorials, students develop relevant skills and knowledge to examine the natural world through designed classroom activities. For example, in one of the tutorials, students learn how to interpret a geological map and topographic map, and discuss the formation and development of the landforms of the granite-dominated Glenrowan region in Victoria, Australia.
The fieldwork component of Natural Environments is embedded in the main ‘semester task’ assessment component which accounts for 75% of the total awarded mark. Students work together in groups of 3 to 5 and select one of eleven field sites to investigate in detail. They first compile a desktop-based background research report on the site’s natural features such as geology, landforms, soils, climate, hydrology, ecology, and likely human influences. They also plan and conduct their own self guided site visits to investigate key natural features identified in the background research. Additionally, groups report their observations at an assessed ‘site-visit presentation’, and individuals develop a ‘Landscape Function Analysis’ report detailing the natural processes and features at their particular site, as the final summative assessment for the subject.
On the self-guided site visit, students would traditionally bring along references such as maps, geographic coordinates of points of interest, navigation and observation instructions in static digital and/or printed format. They would also have disparate pieces of equipment such as a magnetic compass, handheld GPS unit and inclinometer. This meant that students had to divide their energies between disparate modes and sources of information and record their observations on their individual devices or notepads. Through the development of the Fieldfriend app, we sought to build upon the multitude of options for ubiquitous learning afforded by the proliferation of mobile phones and network connectivity in present times (Sharples et al. 2010). Mobile learning would be used to enable effective learning by engendering social interactions enriched and mediated by digitally-enhanced field exploration, learning artifacts and discussions between learners (Vavoula, Pachler and Kukulska-Hulme, 2012; Pea, 2004). 3. Design considerations for Fieldfriend The design of Fieldfriend was aligned with Herrington et al. (2009) eleven design principles for incorporating mobile learning into the higher-education learning environment to meet the range of curricular and pedagogical requirements from a range of subjects with a broad spectrum of envisioned technology-enabled authentic learning experiences (Table 1): Table 1. Design features of Fieldfriend following mobile design principles by Herrington et al. (2009).
Design Principle
Fieldfriend technological and pedagogical design
Real world relevance
Learners situate their learning in authentic, in-the-field contexts for direct observation and interaction.
Mobile contexts Learners traverse distances in the environment between locations and observe actively along the way – spatially dynamic.
Explore Learners are given time to explore the app and its uses prior to and during field activity.
Blended Learners use the app itself, related apps (e.g. clinometer) and non-technological tools (e.g. tape measure; soil pH tests).
Whenever Learners use Fieldfriend spontaneously to capture digital records of their observations and/or reflections that may occur en-route or serendipitously – temporally dynamic.
Wherever Learners use the app in non-traditional learning spaces; this may be reflecting on use of fossil fuels to power the transport network while on the bus or train, or water use while in the shower (personal time-space).
Whomsoever Learners use Fieldfriend individually and collaboratively while in the field and use the learning artifacts in the database or in their smartphones.
387387387
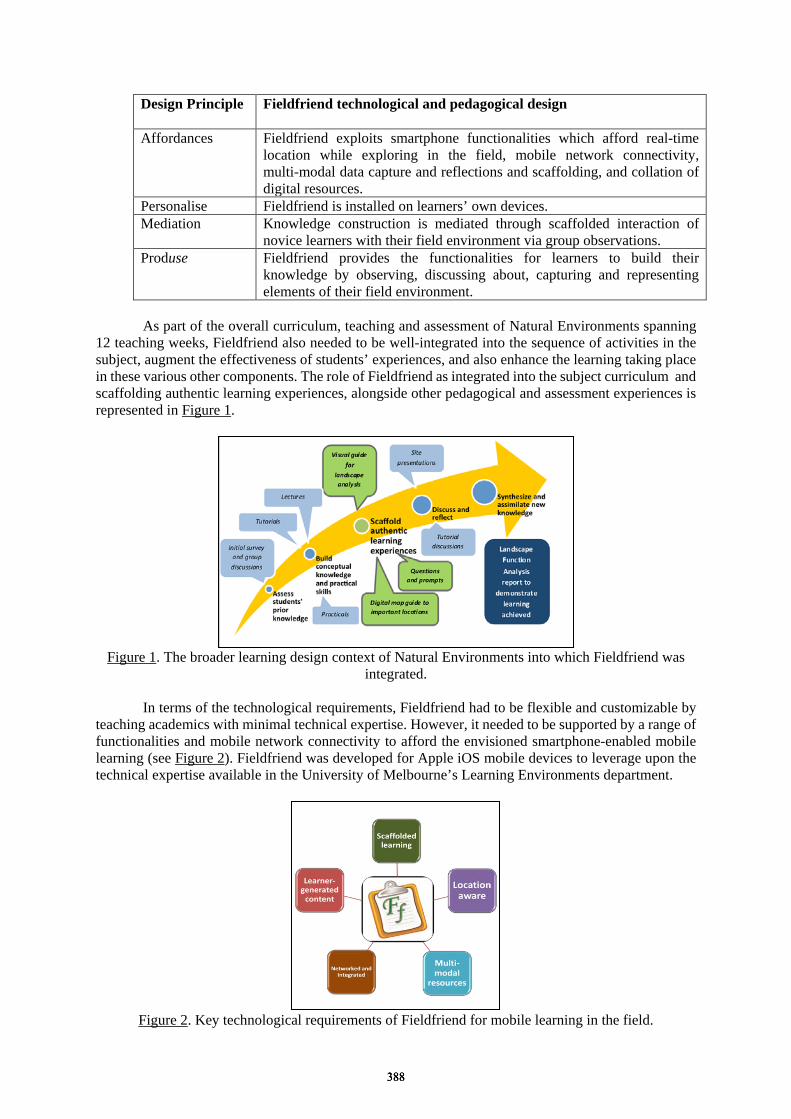
Design Principle
Fieldfriend technological and pedagogical design
Affordances Fieldfriend exploits smartphone functionalities which afford real-time location while exploring in the field, mobile network connectivity, multi-modal data capture and reflections and scaffolding, and collation of digital resources.
Personalise Fieldfriend is installed on learners’ own devices. Mediation Knowledge construction is mediated through scaffolded interaction of
novice learners with their field environment via group observations. Produse Fieldfriend provides the functionalities for learners to build their
knowledge by observing, discussing about, capturing and representing elements of their field environment.
As part of the overall curriculum, teaching and assessment of Natural Environments spanning
12 teaching weeks, Fieldfriend also needed to be well-integrated into the sequence of activities in the subject, augment the effectiveness of students’ experiences, and also enhance the learning taking place in these various other components. The role of Fieldfriend as integrated into the subject curriculum and scaffolding authentic learning experiences, alongside other pedagogical and assessment experiences is represented in Figure 1.
Figure 1. The broader learning design context of Natural Environments into which Fieldfriend was
integrated.
In terms of the technological requirements, Fieldfriend had to be flexible and customizable by teaching academics with minimal technical expertise. However, it needed to be supported by a range of functionalities and mobile network connectivity to afford the envisioned smartphone-enabled mobile learning (see Figure 2). Fieldfriend was developed for Apple iOS mobile devices to leverage upon the technical expertise available in the University of Melbourne’s Learning Environments department.
Figure 2. Key technological requirements of Fieldfriend for mobile learning in the field.
388388388
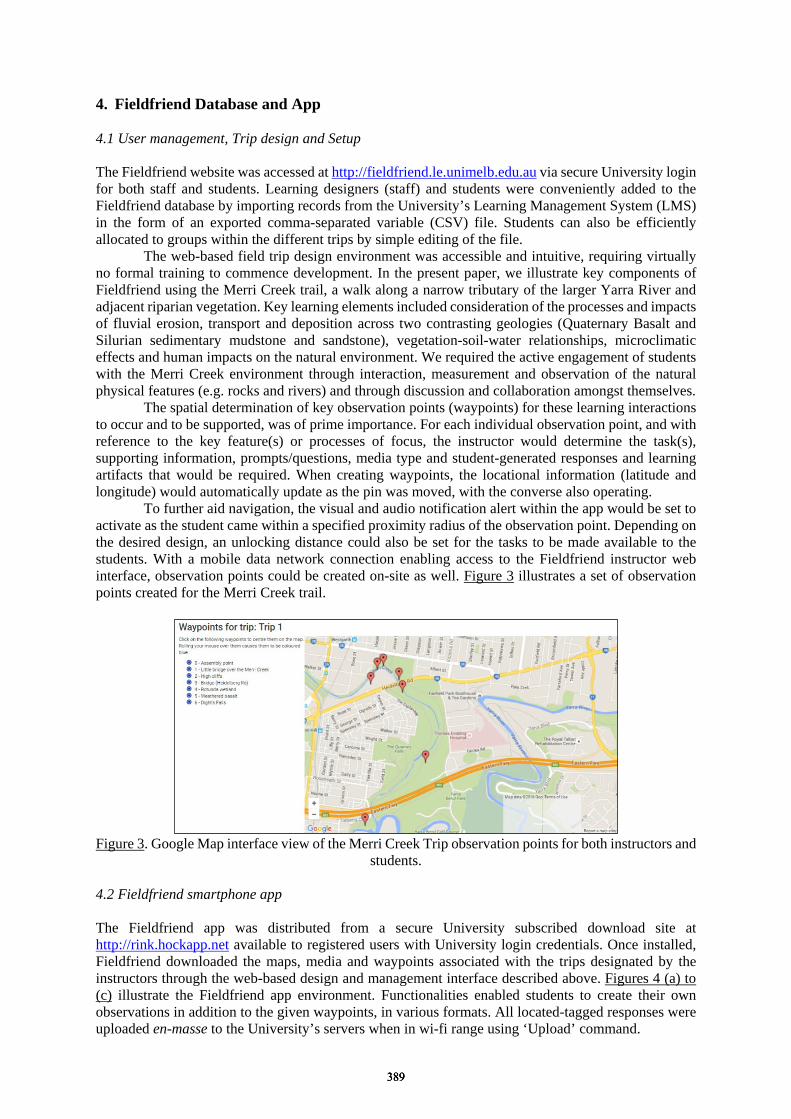
4. Fieldfriend Database and App 4.1 User management, Trip design and Setup The Fieldfriend website was accessed at http://fieldfriend.le.unimelb.edu.au via secure University login for both staff and students. Learning designers (staff) and students were conveniently added to the Fieldfriend database by importing records from the University’s Learning Management System (LMS) in the form of an exported comma-separated variable (CSV) file. Students can also be efficiently allocated to groups within the different trips by simple editing of the file.
The web-based field trip design environment was accessible and intuitive, requiring virtually no formal training to commence development. In the present paper, we illustrate key components of Fieldfriend using the Merri Creek trail, a walk along a narrow tributary of the larger Yarra River and adjacent riparian vegetation. Key learning elements included consideration of the processes and impacts of fluvial erosion, transport and deposition across two contrasting geologies (Quaternary Basalt and Silurian sedimentary mudstone and sandstone), vegetation-soil-water relationships, microclimatic effects and human impacts on the natural environment. We required the active engagement of students with the Merri Creek environment through interaction, measurement and observation of the natural physical features (e.g. rocks and rivers) and through discussion and collaboration amongst themselves.
The spatial determination of key observation points (waypoints) for these learning interactions to occur and to be supported, was of prime importance. For each individual observation point, and with reference to the key feature(s) or processes of focus, the instructor would determine the task(s), supporting information, prompts/questions, media type and student-generated responses and learning artifacts that would be required. When creating waypoints, the locational information (latitude and longitude) would automatically update as the pin was moved, with the converse also operating.
To further aid navigation, the visual and audio notification alert within the app would be set to activate as the student came within a specified proximity radius of the observation point. Depending on the desired design, an unlocking distance could also be set for the tasks to be made available to the students. With a mobile data network connection enabling access to the Fieldfriend instructor web interface, observation points could be created on-site as well. Figure 3 illustrates a set of observation points created for the Merri Creek trail.
Figure 3. Google Map interface view of the Merri Creek Trip observation points for both instructors and
students. 4.2 Fieldfriend smartphone app The Fieldfriend app was distributed from a secure University subscribed download site at http://rink.hockapp.net available to registered users with University login credentials. Once installed, Fieldfriend downloaded the maps, media and waypoints associated with the trips designated by the instructors through the web-based design and management interface described above. Figures 4 (a) to (c) illustrate the Fieldfriend app environment. Functionalities enabled students to create their own observations in addition to the given waypoints, in various formats. All located-tagged responses were uploaded en-masse to the University’s servers when in wi-fi range using ‘Upload’ command.
389389389

(a) (b) (c) Figure 4 (a) Fieldfriend navigation environment; (b) Multi-modal observation options; (c) example of location-tagged observation point photo taken by student along Merri Creek. 4.3 Automated upload and collation of student learning responses and artifacts As various student groups completed their trails, the responses and learning artifacts were uploaded to the university servers for secure storage and access by students and instructors for a range of subsequent uses such as formative assessment, tutorial discussions and presentations (see Figure 5).
Figure 5. Web access to students’ responses at designated observation points.
5. Conclusion At the time of writing, Fieldfriend had undergone its first large-scale implementation for the first semester of 2016 for Natural Environments. As part of the overall unit evaluation survey, feedback from students was sought on the usefulness of Fieldfriend for their group site visits; the rating given by students was 5.8 out of 10 (n = 50); total cohort size was 350. This positive qualitative feedback mostly related to accuracy in directing the learner groups to the correct locations to conduct their observations. This would have increased the groups’ efficiencies in traversing the landscape and enabled them to focus their energies on landscape observation and on-site discussions. Areas for improvements suggested by the respondents included even more information, structure and guidance for “things to
Student details obscured for data security and privacy
390390390
observe”, pointing to the central importance of ‘inscriptions’ in field-based learning (Mogk and Goodwin, 2012). Some students utilized the media acquired using the Fieldfriend app from the web database for their site-visit presentations.
Fieldfriend will continue to be used in subsequent teaching semesters for Natural Environments. Based on enquiries from other Faculty, Fieldfriend could be easily adapted for use in a range of different learning contexts, including language learning (e.g. of Japanese), agriculture – soil and crop evaluation, urban studies and architecture. Fieldfriend enabled mobile learning could thus be scaled-up and utilised by different institutions.
In this initial iteration of Fieldfriend implementation, the total number of students using the app for their site visits was limited by its availability only on AppleTM iOS devices. An Android OS version is currently being developed to enable more widespread use by students and faculty. Further development will include improvements to the Fieldfriend database to have design and functionalities that engender greater collaborative and reflective learning through richer use of the acquired digital learning artifacts. A more comprehensive evaluation of Fieldfriend’s usability, aligned to Herrington et al. (2009), will also be implemented. Acknowledgements Fieldfriend was developed with the technical expertise of David Vasjuta (app) and Gordon Yau (web) of the Learning Environments team at the University of Melbourne. This project was supported by the Learning and Teaching Innovation (LTI) Grant scheme (Large-scale) of the University of Melbourne and in-kind contribution from Learning Environments. References Chan, T.-W., Roschelle, J., Hsi, S., Kinshuk, Sharples, M., Brown, T., et al. (2006). One-to-one
technology-enhanced learning: An opportunity for global research collaboration. Research and Practice in Technology-Enhanced Learning, 1(1), pp. 3-29.
Delamont, S. (2002). Fieldwork in Educational Settings – Methods, pitfalls and perspectives (2nd Ed.). Routledge, London.
Herrington, A., Herrington, J. and Mantei, J. (2009) Design principles for mobile learning. In: Herrington, J., Herrington, A., Mantei, J., Olney, I. and Ferry, B., (eds.) New technologies, new pedagogies: Mobile learning in higher education. University of Wollongong, Wollongong, pp. 129-138.
Mogk, D. W. and Goodwin, C. (2012). Learning in the field: Synthesis of research on thinking and learning in the geosciences. In Kastens, K. A. and Manduca, C. A. (eds.), Earth and Mind II: A Synthesis of Research on Thinking and Learning in the Geosciences: Geological Society of America Special Paper 486, pp. 131-163.
Pea, R. D. (2004). The Social and Technological Dimensions of Scaffolding and Related Theoretical Concepts for Learning, Education, and Human Activity. The Journal of the Learning Sciences, 13(3), 423–451. Retrieved from http://www.jstor.org/stable/1466943.
Sharples, M., Taylor, J. and Vavoula, G. (2010). A Theory of Learning for the Mobile Age. In Bachmair, B. (Ed.) (2010). Medienbildung in neuen Kulturräumen, pp. 87-99.
Vavoula, G., Pachler, N. & Kukulska-Hulme (2012). Research Methods in Mobile and Informal Learning: Some Issues. Chapter 1 in Researching Mobile Learning: Frameworks, Tools and Research Designs by Giasemi Vavoula, Norbert Pachler, Agnes Kukulska-Hulme (2012).
Wilson, K., and Devereux, L. (2014). Scaffolding theory: High challenge, high support in Academic Language and Learning (ALL) contexts. Journal of Academic Language and Learning, 8(3), A91-A100.
391391391
Chen, W. et al. (Eds.) (2016). Proceedings of the 24th International Conference on Computers in Education. India: Asia-Pacific Society for Computers in Education
The (still) unused potential of mobile HTML5 in educational settings
Janosch ZBICKa*, Nelson BALOIANb, Marcelo MILRADa,
Marc JANSENa & Gustavo ZURITAb aLinnaeus University, Department of Media Technology, Växjö, Sweden
bUniversidad de Chile, Santiago de Chile, Chile *[email protected]
Abstract: The wide availability of mobile devices like smartphones and tablets among students as well as the included positioning technologies, high definition cameras and other sensors, together with continuous Internet access bring many new opportunities for developing mobile applications supporting learning activities. However, there is an immense fragmentation of operating systems for mobile devices. HTML5 is a promising approach to tackle this challenge. Mobile web applications run within browsers and nowadays, most mobile devices possess a browser that interprets HTML5. Nevertheless, the educational domain seems to ignore this potential and relies on the development of native applications. In this paper, we analyze the opportunities, advantages and drawbacks of developing mobile applications supporting learning activities with HTML5 compared with developing them natively. To illustrate our ideas, we present a couple of showcases that already rely on HTML5, which allow us to further review the development opportunities for mobile HTML5 applications in general, as well as specifically in educational settings.
Keywords: Mobile HTML5, mobile learning, mobile web development
1. Introduction The importance of integrating information and communication technologies (ICT) in the field of education is increasing. In schools, a trend of digital supported education can be identified and studies show that introducing the latest developments of ICT in classroom environments can improve teaching methods (Milrad et al., 2013). Taking the mobility of learners into account and when they advantage of mobile technologies, we can refer to those activities as mobile learning activities (O’Malley et al., 2005). Furthermore, mobile technologies can facilitate learning outside traditional environments, such as classrooms, to enhance the learning experience (Farmer, Knapp, & Benton, 2007).
Especially modern mobile devices like smartphones and tablets can be utilized to support mobile learning tasks. High definition cameras, positioning technologies and other sensors, as well as ubiquitous Internet access became standard features. In spite of the multiple benefits that this setup offers, a major challenge for developers and researchers of mobile applications arises due to the huge fragmentation of mobile devices and their operating systems. Nowadays, the availability of mobile devices like smartphones or tablets is vast among students. Schools begin to recognize the potential that ICT can have in educational settings and even governments are starting to create policies to support ICT in teaching methods (The Swedish National Agency for Education (Skolverket), 2011). The often applied concept of using available devices in different settings is referred to as “bring your own device” and is especially interesting for the field of mobile learning (Ng, 2015). Therefore, it is important to offer cross-platform solutions.
Emerging web technologies, e.g. HTML5 and new JavaScript technologies, provide some of the solutions that can be used to address some of the challenges mentioned above (Xanthopoulos & Xinogalos, 2015). In recent versions of mobile operating systems, it is possible to access internal sensors of the device via a web browser. Our efforts are driven by the mentioned challenges and in this paper we discuss several approaches that serve as showcases for mobile HTML5. However, empirical results will not be discussed in this paper, since the mentioned approaches are serving as
392392392
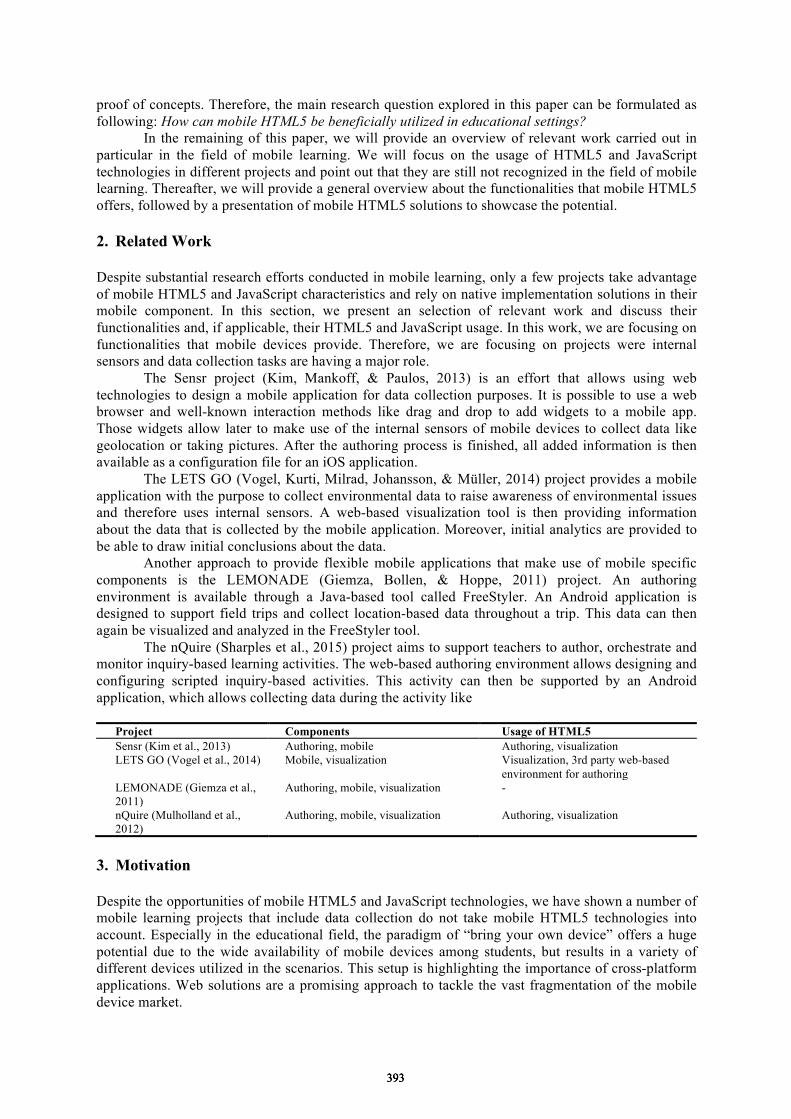
proof of concepts. Therefore, the main research question explored in this paper can be formulated as following: How can mobile HTML5 be beneficially utilized in educational settings?
In the remaining of this paper, we will provide an overview of relevant work carried out in particular in the field of mobile learning. We will focus on the usage of HTML5 and JavaScript technologies in different projects and point out that they are still not recognized in the field of mobile learning. Thereafter, we will provide a general overview about the functionalities that mobile HTML5 offers, followed by a presentation of mobile HTML5 solutions to showcase the potential. 2. Related Work Despite substantial research efforts conducted in mobile learning, only a few projects take advantage of mobile HTML5 and JavaScript characteristics and rely on native implementation solutions in their mobile component. In this section, we present an selection of relevant work and discuss their functionalities and, if applicable, their HTML5 and JavaScript usage. In this work, we are focusing on functionalities that mobile devices provide. Therefore, we are focusing on projects were internal sensors and data collection tasks are having a major role.
The Sensr project (Kim, Mankoff, & Paulos, 2013) is an effort that allows using web technologies to design a mobile application for data collection purposes. It is possible to use a web browser and well-known interaction methods like drag and drop to add widgets to a mobile app. Those widgets allow later to make use of the internal sensors of mobile devices to collect data like geolocation or taking pictures. After the authoring process is finished, all added information is then available as a configuration file for an iOS application.
The LETS GO (Vogel, Kurti, Milrad, Johansson, & Müller, 2014) project provides a mobile application with the purpose to collect environmental data to raise awareness of environmental issues and therefore uses internal sensors. A web-based visualization tool is then providing information about the data that is collected by the mobile application. Moreover, initial analytics are provided to be able to draw initial conclusions about the data.
Another approach to provide flexible mobile applications that make use of mobile specific components is the LEMONADE (Giemza, Bollen, & Hoppe, 2011) project. An authoring environment is available through a Java-based tool called FreeStyler. An Android application is designed to support field trips and collect location-based data throughout a trip. This data can then again be visualized and analyzed in the FreeStyler tool.
The nQuire (Sharples et al., 2015) project aims to support teachers to author, orchestrate and monitor inquiry-based learning activities. The web-based authoring environment allows designing and configuring scripted inquiry-based activities. This activity can then be supported by an Android application, which allows collecting data during the activity like
Project Components Usage of HTML5 Sensr (Kim et al., 2013) Authoring, mobile Authoring, visualization LETS GO (Vogel et al., 2014) Mobile, visualization Visualization, 3rd party web-based
environment for authoring LEMONADE (Giemza et al., 2011)
Authoring, mobile, visualization -
nQuire (Mulholland et al., 2012)
Authoring, mobile, visualization Authoring, visualization
3. Motivation Despite the opportunities of mobile HTML5 and JavaScript technologies, we have shown a number of mobile learning projects that include data collection do not take mobile HTML5 technologies into account. Especially in the educational field, the paradigm of “bring your own device” offers a huge potential due to the wide availability of mobile devices among students, but results in a variety of different devices utilized in the scenarios. This setup is highlighting the importance of cross-platform applications. Web solutions are a promising approach to tackle the vast fragmentation of the mobile device market.
393393393
Although Baloian et al. (2011) presented a work already in 2011 that discussed the potential that HTML5 has within the area of Technology Enhanced Learning (TEL) (Baloian, Frez, Diego, Jansen, & Zurita, 2011), we showed that the field still does not yet recognize this potential (sufficiently) regarding mobile HTML5.
By developing mobile web applications, it is possible to ensure continuous support for mobile devices. In previous updates of mobile operating systems, it occurred that vendors changed parts in their API and therefore certain functionalities needed to be re-implemented, which is not an issue while using web technologies. When it comes to updating an application, in web-based applications where we apply the Software as a Service (SaaS) pattern, it is only necessary to update the deployed application on the server and all users are using the latest version. Furthermore, if a new brand or operating system has a big impact and the current market pattern changes, it is safe to assume that HTML5 and JavaScript technologies will be supported. Additionally, due to the architectural characteristics of web applications, it is possible to easily integrate external web-based services or migrate to cloud-based environments. Moreover, existing tools allow to easily deploying web applications in terms of Continuous Integration.
We strongly believe that the mentioned features make the design of mobile applications with HTML5 and JavaScript a very fitting approach in the field of mobile learning. It offers a cross-platform solution while accessing internal sensors, which is a crucial requirement and can scope with fast evolving requirements. Therefore, this work discusses and highlights the potential of mobile HTML5 and JavaScript technologies in order to increase the awareness of the potential and discuss alternatives to native mobile application development. 4. HTML5 mobile support As mentioned before, Baloian et al., (2011) discussed already the potential of HTML5 and their work serves as a foundation for this paper. However, the rapid development of HTML5 since 2011 increased the potential even more. The following aspects were discussed in the early work by Baloian et al.: Canvas, Web Database, Local Storage, File System, offline capabilities, Web Worker, semantic, WebGL, and Geolocation (the only mentioned sensor)
It is important to notice that the only relevant specifics for mobile devices are the geolocation and offline capability aspects. In the previous section about relevant related work (section 2), we identified that a general usage of HTML5 and JavaScript technologies among desktop components is already common. However, regarding mobile applications it is still not considered, therefore we are focusing on the aspects of mobile HTML5 and JavaScript support.
Since the discussed aspects by Baloian et al., (2011), HTML5 evolved immensely. Additional sensors are accessible via HTML5 and JavaScript, as well as other important aspects for mobile applications, like system-wide notifications, are now supported by HTML5 and JavaScript. Below, we present a list of the most important features already supported and also discuss existing drafts expected to be supported by mobile web browsers soon.
Sensors: Camera (Real-time QR-code scanning (only Firefox); Microphone; Accelerometer; Light Sensor; Magnetometer; Gyroscope; Proximity Sensor (only Firefox); Vibration; Battery Status
Additional features: Notifications (only supported by Chrome and Firefox); WebRTC; Web Speech API (only Safari and Chrome); Touch Events (Gestures)
It is important to notice that despite the development in HMTL5 and JavaScript technologies there are still challenges related to the usage of those technologies. Various functionalities mentioned in the list above are not supported yet by all modern mobile web-browsers or have a slightly different behavior within different browsers. Thus, a shift from the fragmentation of mobile devices to mobile browsers can be identified and is a challenge for web-developers that needs to be addressed. Nonetheless, we believe that HTML5 and JavaScript approaches are a valid option for cross-platform solutions. Furthermore, new standards for HTML5 are constantly developed by the World Wide Web Consortium (W3C) and multiple drafts of new functionalities are available. For instance, a draft for the support of NFC by HTML5 exists and is waiting to get supported by mobile browsers.
394394394
5. Software Engineering Aspects The development of complex software systems based on platform independent technologies, demands for a high quality during the complete software development process. Especially with technologies like JavaScript that are not per se prominent for well-structured code. In order to achieve this, different technologies are available that provide different aspects of code quality assurance.
First of all, the code itself should be organized using frameworks that target towards a high code quality, e.g., by modularization of the code. A well-known framework in the area of platform independent JavaScript development is the AngularJS framework developed by Google. The resulting code should be organized in a central code repository, especially if more than one developer works on the code, but also for single developer projects in order to provide a base point for the Continuous Integration/Continuous Delivery framework. The major task here is to regularly check out the code from the central code repository, build it and run tests in order to ensure that only high quality versions of the software will finally be deployed. Usually, before deployment also quality checks directly on the code level are performed. Here, tools like linting or Sonar Cube are well accepted in the community and stand for high quality code checks. After all checks and quality gates are passed, the Continuous Integration/Continuous Delivery system directly deploys the code automatically to potentially Cloud Computing based systems, e.g., in a traditional IaaS/PaaS (Infrastructure/Platform as a Service) or a more modern container based way.
Next to general advantages of deploying IaaS/PaaS, like reduced costs, it is also a good solution to scope with fast evolving requirements like present in the field of mobile learning. In contrast to the multi-user, multi-installation deployment method, the multi-user, single installation deployment as in IaaS/PaaS can be adjusted easily. When new requirements occur and updates are necessary to match new requirements, only the one installation needs to be updated in order for all users to use the newest version. These methods also allow to easily deploy systems in cloud-based environment and therefore offers an easy solution regarding the scalability of a system. IaaS/PaaS solutions are usually proving methods to easily integrate external services or to easily integrate parts of the system into other solutions. A common element in those solutions is the availability of an API that eases the integration process.
To summarize, the mentioned software engineering aspects (Continuous Integration, Deployment as IaaS/PaaS and integration characteristics) are a fitting approach to design applications in the field of mobile learning to scope with the fast evolving and changing requirements. 6. Implementation Details To provide evidence that mobile applications implemented with HTML5 and JavaScript technologies are sufficient to perform the desired activities, in particular data collection activities that involve using internal sensors of mobile devices, we present a variety of implementations that are build with HTML5 and JavaScript. 6.1 Proof of Concept We designed an application that can access various internal features of mobile devices from within a mobile web browser. This application serves as a proof of concept to showcase the potential of HTML5 and JavaScript technologies and can be accessed at the following link: http://celtest1.lnu.se/janosch/mobilehtml5/. It includes the following features: Taking pictures and videos; recording audio; getting the device orientation; detecting the device motion; detecting ambient light; using the microphone to perform speech-to-text processing; using the camera to scan QR codes; activating the vibration; getting the battery status; and measuring the proximity of obstacles in front of the mobile device. This highlights the potential of these technologies and at the same time serves as a test-platform to check for the support of mobile browsers. This showcase gives an imposing impression of the potential of mobile HTML5 and JavaScript technologies and proves that they are a viable alternative to native applications when it comes to access of internal sensors of mobile devices.
395395395
6.2 mLearn4web mLearn4web is a framework implemented within the field of mobile learning that allows teachers to design and deploy mobile applications (Zbick, Nake, Jansen, & Milrad, 2014). Teachers do usually not posses the technical knowledge to take advantage of the technologies existing among students. Therefore, we developed a framework consisting of three components to support teachers to design their own mobile learning activities. The three components of this framework are: (1) an authoring tool; (2) a mobile application; and (3) a visualization tool. All components are realized with pure web technologies. This framework is designed to support learning activities in “bring your own devices” scenarios. The authoring tool allows teachers with simple and known interaction methods like drag and drop to design the content of a mobile application. With the help of this tool it is possible to design a big amount of learning activities supported by modern mobile devices.
The mobile applications designed by the authoring tool mentioned above are automatically deployed and available as mobile web application. As discussed before, by using web technologies it is also possible to use certain internal sensors of mobile devices in our case: the camera, the microphone, and the geolocation. The third component of mLearn4web is a visualization tool. All data collected by the students using the mobile application and relevant (meta) data are displayed in this tool. This tool is supposed to offer an initial analysis of the performed learning activities. Studies regarding the usability, technological acceptance, and learnability of the presented framework have been conducted (Zbick et al., 2014; Zbick, Nake, Jansen, & Milrad, 2015) and the results were positive. Especially the good result regarding the technological acceptance leads to the conclusion that using HTML5 and JavaScript technologies to provide mobile applications is a fitting approach also for the users. 6.3 Designing geo-collaborative application for “learning with patterns” We have developed a prototype of a system (including a web-based authoring/visualization tool, as well as a mobile application based on HTML5 and JavaScript) to support geo-collaborative learning activities that include using sensors to collect data in order to find evidence of previously known patterns or identify new patterns. According to the specific scenario, the following functionalities for this system have been identified:
Creating Patterns: Creating a pattern consists on defining its name, goal, description, forces, etc. Students may also create patterns in order to document. Teachers can create patterns and tasks during classroom sessions, as they are presented to the students before the students start their tasks.
Creating Tasks: Teachers can create tasks consisting of instructions to be given to the students. Task creation involves defining a referencing geographic point or an area over the map. Students have to follow the path and find evidence of certain patterns in the designated points.
Assigning tasks to students: In the classroom and before leaving for the field activity, students turn on their mobile devices running the application.
Instantiating patterns: According to the proposed task, students may follow a certain path or explore an area of the city gathering data to collaboratively create instantiations of the pattern when they find a certain element that they think it corresponds to the pattern giving by the teacher. Instantiations consist of photographs or sketches of objects found which complies with the pattern definition.
Monitoring students’ work: teachers can monitor the students’ work in areas where Internet is available and a client-server communication is possible.
The system has been implemented and pre-tested by early users in an experiment with four subjects aged 22 to 24 aimed at evaluate the user interface. The task they were given was to find out which were the most common tree types in a certain park. For this experiment tablets were used. The activity lasted for 1.5 hours with a positive outcome. 7. Conclusions
396396396
In this paper, we discussed the potential for HTML5 and JavaScript technologies in the field of mobile learning. For mobile learning activities that often include data collection tasks, internal sensors and features of modern mobile devices like smartphones or tablets are a promising setup. We showed that web-technologies did get recognized when it comes to desktop applications like authoring environments and visualization tools. However, the mobile characteristics of HTML5 and JavaScript technologies are still not recognized when it comes to supporting mobile learning activities with mobile devices, and researchers and developers rely on native Android or iOS applications. We acknowledge the challenge that various features of mobile HTML5 are not yet supported by all mobile browsers. However, it is important to note that core functionalities to fulfill the requirements to perform mobile learning tasks, like accessing camera, audio, and geolocation, are supported by all modern mobile browsers. Therefore, we argue that it is a valid approach to replace native applications, especially since we showed how important it is to provide a platform independent solution. Moreover, HTML5 is a constantly evolving standard and it is safe to assume that more features will be supported by more mobile browsers in the soon. Therefore, we believe that mobile HTML5 and JavaScript technologies have a huge potential, especially in the field of mobile learning. Our presented projects and the proof of concepts are examples of taking advantages of the mentioned technologies and still satisfying the user’s needs. References Baloian, N., Frez, J., Diego, E.-U., Jansen, M., & Zurita, G. (2011). The Future Role of HTML5 in Mobile
Situated Learning Scenarios. In S. Yu (Ed.), 10th World Conference on Mobile and Contextual Learning (mLearn) (pp. 249–257). Beijing, China: Normal University of Beijing.
Farmer, J., Knapp, D., & Benton, G. M. (2007). An elementary school environmental education field trip: Long-term effects on ecological and environmental knowledge and attitude development. The Journal of Environmental Education, 38(3), 33–42.
Giemza, A., Bollen, L., & Hoppe, H. U. (2011). LEMONADE: field-trip authoring and classroom reporting for integrated mobile learning scenarios with intelligent agent support. International Journal of Mobile Learning and Organisation, 5(1), 96–114.
Kim, S., Mankoff, J., & Paulos, E. (2013). Sensr: evaluating a flexible framework for authoring mobile data-collection tools for citizen science. In Proceedings of the 2013 conference on Computer Supported Cooperative Work (CSCW’13) (pp. 1453–1462).
Milrad, M., Wong, L.-H., Sharples, M., Hwang, G.-J., Looi, C.-K., & Ogata, H. (2013). Seamless learning: An international perspective on next-generation technology-enhanced learning. In Z. L. Berge & L. Y. Muilenburg (Eds.), Handbook of Mobile Learning (pp. 95–108). New York: Routledge.
Mulholland, P., Anastopoulou, S., Collins, T., Feisst, M., Gaved, M., Kerawalla, L., … Wright, M. (2012). nQuire: technological support for personal inquiry learning. IEEE Transactions on Learning Technologies, 5(2), 157–169.
Ng, W. (2015). Mobile Learning: BYOD and Personalised Learning. In New Digital Technology in Education (pp. 171–189). Springer.
O’Malley, C., Vavoula, G., Glew, J. P., Taylor, J., Sharples, M., Lefrere, P., … Waycott, J. (2005). Guidelines for learning/teaching/tutoring in a mobile environment.
Sharples, M., Scanlon, E., Ainsworth, S., Anastopoulou, S., Collins, T., Crook, C., … others. (2015). Personal inquiry: Orchestrating science investigations within and beyond the classroom. Journal of the Learning Sciences, 24(2), 308–341.
The Swedish National Agency for Education (Skolverket). (2011). Curriculum for the compulsory school, preschool class and the leisure-time centre 2011. Stockholm: Skolverket.
Vogel, B., Kurti, A., Milrad, M., Johansson, E., & Müller, M. (2014). Mobile Inquiry Learning in Sweden : Development Insights on Interoperability , Extensibility and Sustainability of the LETS GO Software System. Educational Technology & Society, 4522(17 (2)), 43–57.
Xanthopoulos, S., & Xinogalos, S. (2015). Mobile app development in HTML5. In Proceedings of the international conference on numerical analysis and applies mathematics (ICNAAM) (Vol. 1648, p. 310009).
Zbick, J., Nake, I., Jansen, M., & Milrad, M. (2014). mLearn4web: a web-based framework to design and deploy cross-platform mobile applications. In Proceedings of the 13th International Conference on Mobile and Ubiquitous Multimedia MUM ’14 (pp. 252–255). Melbourne, Australia: ACM.
Zbick, J., Nake, I., Jansen, M., & Milrad, M. (2015). A web-based framework to design and deploy mobile learning activities : Evaluating its usability , learnability and acceptance. In 2015 IEEE 15th International Conference on Advanced Learning Technologies (ICALT) (pp. 88–92). Hualien, Taiwan: IEEE.
397397397

Chen, W. et al. (Eds.) (2016). Proceedings of the 24th International Conference on Computers in Education.
India: Asia-Pacific Society for Computers in Education
Photocasting: A Low-Cost Technique to Create
and Disseminate Digital Lecture Notes
Manasa H. G.a, Kavitha G. PURANIKa, Lakshmi V. ANTINa & Viraj KUMARb* aDepartment of Information Science and Engineering, PES Institute of Technology, India
bDepartment of Computer Science and Engineering, PES University, India
Abstract: Instructors who wish to disseminate digital content to learners in an economical
manner must consider the costs of (1) content creation (software and hardware), (2) content
dissemination (data transfer costs), and (3) content access (hardware and software needed to
view content). In this paper, we present a novel technique – photocasting – to greatly reduce
these three costs in a one-to-one learning environment. Our technique has minimal
requirements: a low-end smartphone for instructors and learners, and a modest additional effort
by instructors after recording their digital notes. The delivery cost is primarily determined by
the size of the audio, and is approximately 100 times smaller than the size of a traditional video
of comparable quality. We have implemented our technique as a prototype for the Android
platform, and we report initial results of a small-scale user study with three participants: a
school teacher, a private tutor, and a high-school student.
Keywords: One-to-one learning, content creation, content delivery, chalk talk, photocasting.
1. Introduction
An extremely popular format for digital instruction consists of handwritten notes accompanied by audio
commentary, with Khan Academy and Udacity being two large-scale exponents of this model. We
propose a novel, technique – photocasting – to help instructors create such content in a one-to-one
learning environment using low-end smartphones. Our goal is to minimize costs for (1) creating content
(the additional hardware and software that the instructor must purchase), (2) disseminating content
(which largely depends on the volume of data to transfer), and (3) accessing content (the additional
hardware and software that the learner must purchase). A comparison of our technique with existing
techniques along these cost dimensions is summarized in Table 1.
The pedagogical value of such content has been well studied, and in the context of mathematics
education it has a name: chalk talk (Artemeva and Fox, 2010). This multimodal style of instruction is
defined as “writing out a mathematical narrative on the board while talking aloud”. Fox and Artemeva
(2011) argue that such instruction can be “pedagogically interactive, meaningful, and engaging”.
Unlike the “chalk and talk” teaching style that is rightly criticized for being overly teacher-centric,
chalk talk plays an important pedagogical function in making the process of reasoning visible
(Greiffenhagen, 2014), and is more engaging than PowerPoint slides in MOOC videos (Guo, Kim and
Rubin, 2014). The blend of oral and written modes appears to be more important than the precise
technology used to create digital chalk talk lecture notes (Schleppegrell, 2007; Artemeva and Fox,
2011).
Table 1: A comparison of the cost components of techniques for creating chalk talk lecture notes.
Technique Cost components
Creation Dissemination Access
Interactive whiteboards High (hardware, software) High/Low Low/High
Screencasting High (hardware, software) High/Low Low/High
Pencasting Moderate (hardware, software) Low Low
Touchcasting Moderate (hardware) Low Low
Photocasting Low Low Low
398398398
2. Related work
In this section, we summarize existing techniques for creating chalk talk lecture videos, and specify the
reasons why each of these techniques can be prohibitively expensive in some contexts.
Pedersen et al. (1993) introduced interactive whiteboard (IWB) technology well over two
decades ago, and there is some evidence of its benefits in pedagogy (Schmid, 2008). Unfortunately, the
cost of IWB technology is substantial. Hardware requirements include a touch-sensitive whiteboard, an
electronic pen, a microphone and a computer to capture data. The software is also specialized, which
increases the cost. Further, it can be expensive to maintain IWBs in the presence of dust, fluctuations in
heat and humidity, and unreliable power. Chalk talk content created using IWBs can typically be
transmitted to learners in one of two formats: an open format (usually video) or a closed format. The
cost of content dissemination in a video format can be high (running to tens or even hundreds of
megabytes for short lectures), but learners can access the content using standard video players. On the
other hand, closed formats can be significantly more compact (which lowers dissemination costs), but
learners often need to purchase special software for accessing such content. We therefore indicate the
cost of dissemination and access as High/Low and Low/High respectively in Table 1.
Instructors in a one-to-one learning environment may have access to tablets, which can create
chalk talk lecture content for substantially lower hardware costs than IWBs by screencasting (i.e.,
capturing the instructor’s voice and touch-based interaction). In some contexts, however, it may be
infeasible to provide access to tablets for all instructors, even on a shared basis. Furthermore, software
costs remain high with tablet-based content creation. Khan Academy’s popular videos, for example,
were created on a system with a computer, an $80 writing tablet, and over $200 of software for screen
capture and video editing. The tradeoff in dissemination and access costs with tablets is similar to the
tradeoff with IWBs, and for the same reason.
Pencasting allows instructors to create content more naturally using smart ballpoint pens.
These pens are augmented with embedded cameras and can read patterns of tiny dots on special
note-paper. The dots encode the position of the pen as the instructor writes, and a built-in microphone
records audio. The location and audio are synchronized to recreate a video-like experience called a
pencast (Stasko and Caron, 2010). The costs (specialized hardware, software and note-paper) are lower
than for screencasts, but cannot be ignored. Interestingly, dissemination costs are very low because the
dominant component of data transfer is audio. Open formats for pencasts ensure low access costs.
Touchcasting (Palmer, 2011) attempts to retain the benefits of pencasting without incurring the
additional cost of procuring specialized hardware (smart pens). Instead, instructors use iPads or tablets
together with touch capacitive styluses or fingers to write. The audio is synchronized with the captured
handwriting, and can be disseminated in an open format similar to pencasts.
None of these techniques are feasible for instructors in cost-constrained environments where
the only affordable computing devices are low-end smartphones. For such contexts, our technique relies
on photographs instead of touch-based inputs, since even the cheapest smartphones have built-in digital
cameras with sufficient resolution for our purpose. We therefore call this technique photocasting. The
rest of this paper is organized as follows. Section 3 describes the process by which instructors and
learners use photocasting. The technology underlying photocasting is described in Section 4, and the
results of our small-scale user study are presented in Section 5. Finally, we conclude with a discussion
of the limitations of our current implementation and directions for future work in Section 6.
3. Photocasting
A photocast is a sequence of one or more pages of handwritten notes, together with audio commentary.
In this section, we describe our prototype Android apps: one to help instructors create photocasts, and
one for learners to view photocasts. The creation process consists of four steps:
1. The instructor turns off all telephonic and data services that are likely to interrupt the recording
process, and places the smartphone in a convenient location close enough to capture audio.
2. Next, the instructor launches our app, taps the Record button, and begins to speak and write (as
shown in Figure 1). If the instructor chooses, the app will permit the screen to turn off after a
399399399

few seconds to conserve battery power. However, the instructor can tap on the screen to pause
the recording as needed, and can resume by tapping Record again.
3. When the page of notes is complete, the instructor taps on the Photo button to capture a single
photograph of the whole page. Internally, our app uses image processing techniques (described
in Section 4) to identify the pixels corresponding to the written text.
4. Finally, the instructor uses our app’s interface (shown in Figure 2) to synchronize the audio
with a dynamic display of pixels in a manner that simulates handwriting.
Figure 1. Creating a photocast. The smartphone captures audio while notes are written, and the
built-in camera is later used to take a single photograph of the completed page.
It is important to note that the final step (4) is unnecessary for all the techniques described earlier (in
Section 2), where audio is automatically synchronized with handwriting. In a photocast, the app will
gradually reveal pixels corresponding to handwriting, but this process has to be synchronized manually
with the instructor’s audio. This step therefore represents a moderate additional cost (instructor effort)
for our method. In order to keep this cost manageable, we have attempted to make our app’s
synchronization interface as easy to use as possible (see Figure 2). However, we acknowledge that
significant improvements in usability can be achieved. We address this point further in Section 6.
Synchronization tools
Figure 2. The photograph captured by the smartphone (left) is binarized (white handwriting on
black background), and these pixels are displayed in synchrony with the audio. The instructor
must perform the synchronization, using the tools provided by our app (right).
400400400
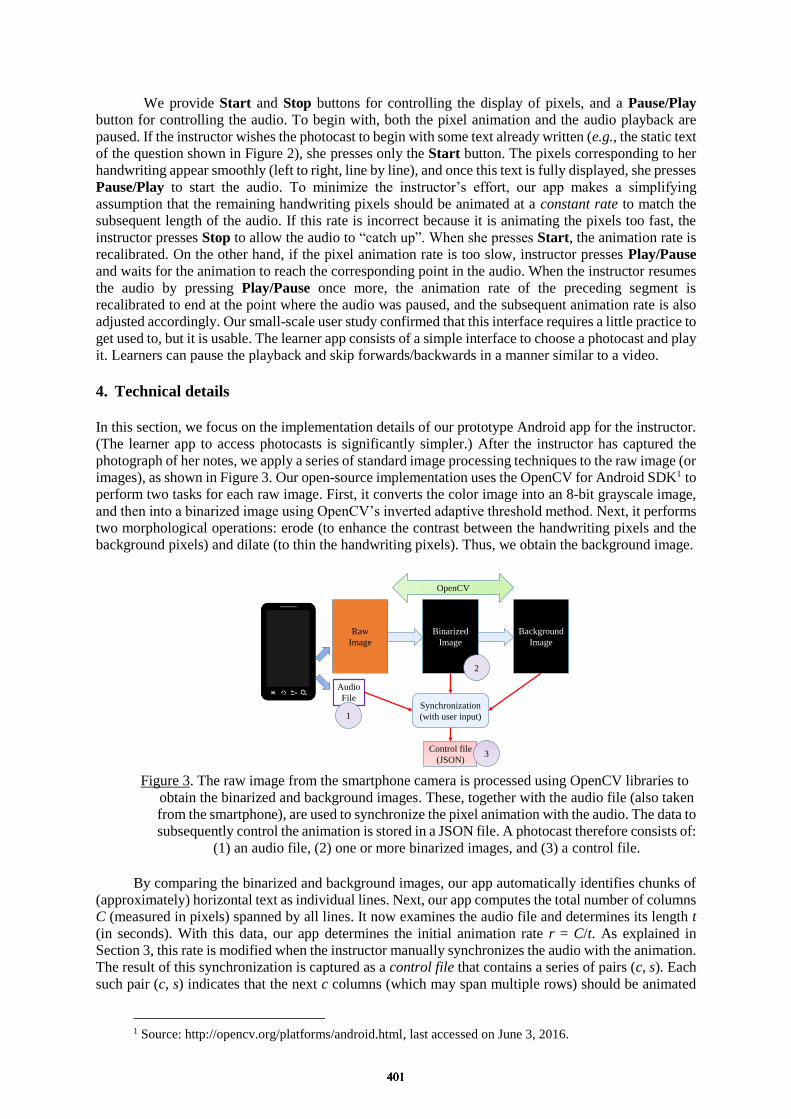
We provide Start and Stop buttons for controlling the display of pixels, and a Pause/Play
button for controlling the audio. To begin with, both the pixel animation and the audio playback are
paused. If the instructor wishes the photocast to begin with some text already written (e.g., the static text
of the question shown in Figure 2), she presses only the Start button. The pixels corresponding to her
handwriting appear smoothly (left to right, line by line), and once this text is fully displayed, she presses
Pause/Play to start the audio. To minimize the instructor’s effort, our app makes a simplifying
assumption that the remaining handwriting pixels should be animated at a constant rate to match the
subsequent length of the audio. If this rate is incorrect because it is animating the pixels too fast, the
instructor presses Stop to allow the audio to “catch up”. When she presses Start, the animation rate is
recalibrated. On the other hand, if the pixel animation rate is too slow, instructor presses Play/Pause
and waits for the animation to reach the corresponding point in the audio. When the instructor resumes
the audio by pressing Play/Pause once more, the animation rate of the preceding segment is
recalibrated to end at the point where the audio was paused, and the subsequent animation rate is also
adjusted accordingly. Our small-scale user study confirmed that this interface requires a little practice to
get used to, but it is usable. The learner app consists of a simple interface to choose a photocast and play
it. Learners can pause the playback and skip forwards/backwards in a manner similar to a video.
4. Technical details
In this section, we focus on the implementation details of our prototype Android app for the instructor.
(The learner app to access photocasts is significantly simpler.) After the instructor has captured the
photograph of her notes, we apply a series of standard image processing techniques to the raw image (or
images), as shown in Figure 3. Our open-source implementation uses the OpenCV for Android SDK1 to
perform two tasks for each raw image. First, it converts the color image into an 8-bit grayscale image,
and then into a binarized image using OpenCV’s inverted adaptive threshold method. Next, it performs
two morphological operations: erode (to enhance the contrast between the handwriting pixels and the
background pixels) and dilate (to thin the handwriting pixels). Thus, we obtain the background image.
Raw
Image
Binarized
Image
Audio
FileSynchronization
(with user input)
Background
Image
OpenCV
Control file
(JSON)
1
3
2
Figure 3. The raw image from the smartphone camera is processed using OpenCV libraries to
obtain the binarized and background images. These, together with the audio file (also taken
from the smartphone), are used to synchronize the pixel animation with the audio. The data to
subsequently control the animation is stored in a JSON file. A photocast therefore consists of:
(1) an audio file, (2) one or more binarized images, and (3) a control file.
By comparing the binarized and background images, our app automatically identifies chunks of
(approximately) horizontal text as individual lines. Next, our app computes the total number of columns
C (measured in pixels) spanned by all lines. It now examines the audio file and determines its length t
(in seconds). With this data, our app determines the initial animation rate r = C/t. As explained in
Section 3, this rate is modified when the instructor manually synchronizes the audio with the animation.
The result of this synchronization is captured as a control file that contains a series of pairs (c, s). Each
such pair (c, s) indicates that the next c columns (which may span multiple rows) should be animated
1 Source: http://opencv.org/platforms/android.html, last accessed on June 3, 2016.
401401401
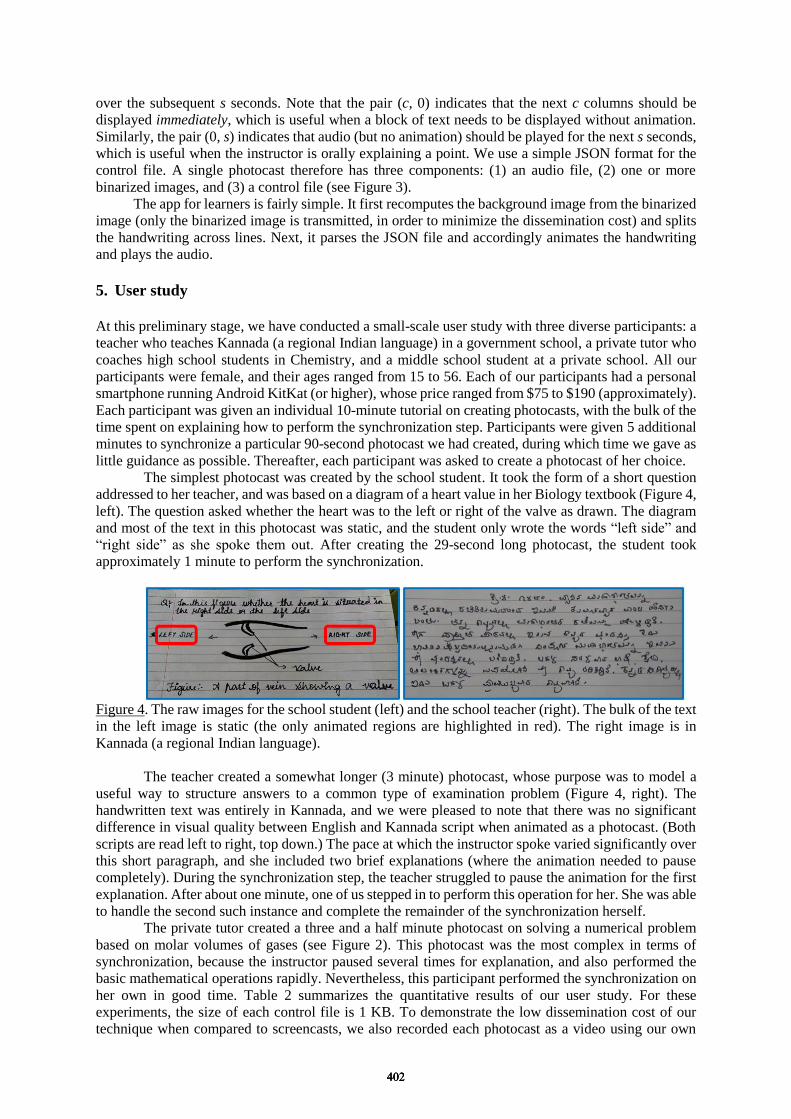
over the subsequent s seconds. Note that the pair (c, 0) indicates that the next c columns should be
displayed immediately, which is useful when a block of text needs to be displayed without animation.
Similarly, the pair (0, s) indicates that audio (but no animation) should be played for the next s seconds,
which is useful when the instructor is orally explaining a point. We use a simple JSON format for the
control file. A single photocast therefore has three components: (1) an audio file, (2) one or more
binarized images, and (3) a control file (see Figure 3).
The app for learners is fairly simple. It first recomputes the background image from the binarized
image (only the binarized image is transmitted, in order to minimize the dissemination cost) and splits
the handwriting across lines. Next, it parses the JSON file and accordingly animates the handwriting
and plays the audio.
5. User study
At this preliminary stage, we have conducted a small-scale user study with three diverse participants: a
teacher who teaches Kannada (a regional Indian language) in a government school, a private tutor who
coaches high school students in Chemistry, and a middle school student at a private school. All our
participants were female, and their ages ranged from 15 to 56. Each of our participants had a personal
smartphone running Android KitKat (or higher), whose price ranged from $75 to $190 (approximately).
Each participant was given an individual 10-minute tutorial on creating photocasts, with the bulk of the
time spent on explaining how to perform the synchronization step. Participants were given 5 additional
minutes to synchronize a particular 90-second photocast we had created, during which time we gave as
little guidance as possible. Thereafter, each participant was asked to create a photocast of her choice.
The simplest photocast was created by the school student. It took the form of a short question
addressed to her teacher, and was based on a diagram of a heart value in her Biology textbook (Figure 4,
left). The question asked whether the heart was to the left or right of the valve as drawn. The diagram
and most of the text in this photocast was static, and the student only wrote the words “left side” and
“right side” as she spoke them out. After creating the 29-second long photocast, the student took
approximately 1 minute to perform the synchronization.
Figure 4. The raw images for the school student (left) and the school teacher (right). The bulk of the text
in the left image is static (the only animated regions are highlighted in red). The right image is in
Kannada (a regional Indian language).
The teacher created a somewhat longer (3 minute) photocast, whose purpose was to model a
useful way to structure answers to a common type of examination problem (Figure 4, right). The
handwritten text was entirely in Kannada, and we were pleased to note that there was no significant
difference in visual quality between English and Kannada script when animated as a photocast. (Both
scripts are read left to right, top down.) The pace at which the instructor spoke varied significantly over
this short paragraph, and she included two brief explanations (where the animation needed to pause
completely). During the synchronization step, the teacher struggled to pause the animation for the first
explanation. After about one minute, one of us stepped in to perform this operation for her. She was able
to handle the second such instance and complete the remainder of the synchronization herself.
The private tutor created a three and a half minute photocast on solving a numerical problem
based on molar volumes of gases (see Figure 2). This photocast was the most complex in terms of
synchronization, because the instructor paused several times for explanation, and also performed the
basic mathematical operations rapidly. Nevertheless, this participant performed the synchronization on
her own in good time. Table 2 summarizes the quantitative results of our user study. For these
experiments, the size of each control file is 1 KB. To demonstrate the low dissemination cost of our
technique when compared to screencasts, we also recorded each photocast as a video using our own
402402402
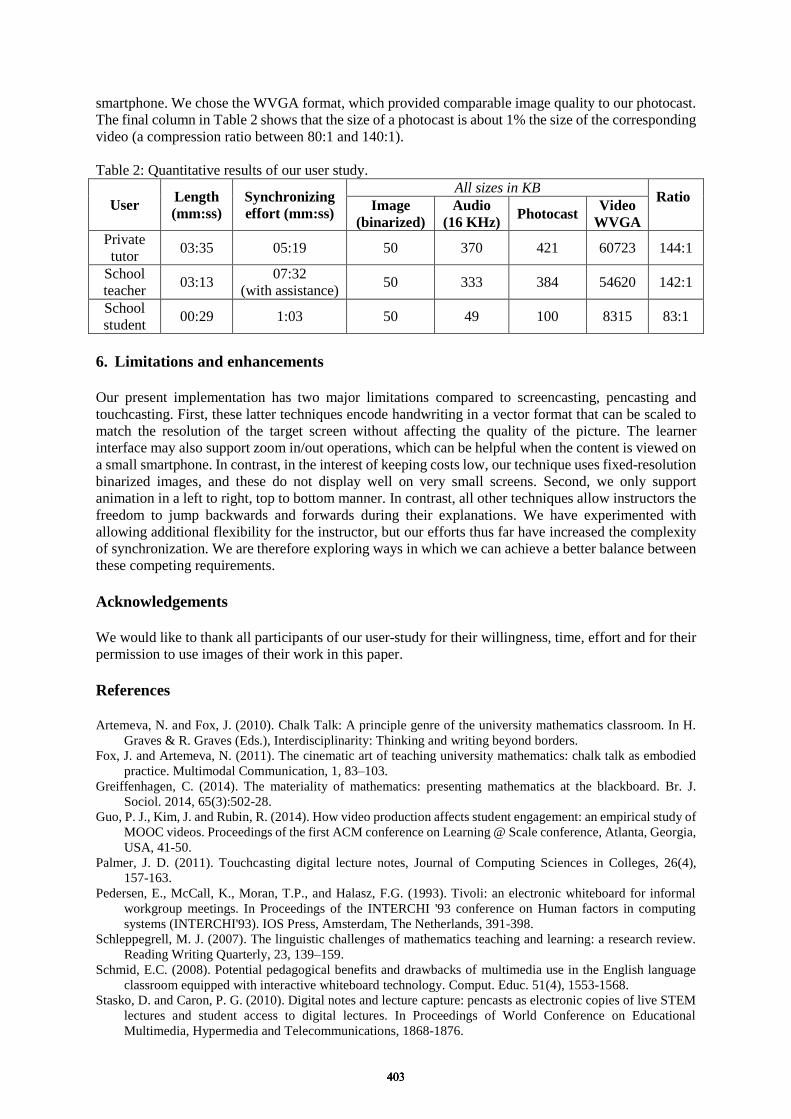
smartphone. We chose the WVGA format, which provided comparable image quality to our photocast.
The final column in Table 2 shows that the size of a photocast is about 1% the size of the corresponding
video (a compression ratio between 80:1 and 140:1).
Table 2: Quantitative results of our user study.
User Length
(mm:ss)
Synchronizing
effort (mm:ss)
All sizes in KB Ratio
Image
(binarized)
Audio
(16 KHz) Photocast
Video
WVGA
Private
tutor 03:35 05:19 50 370 421 60723 144:1
School
teacher 03:13
07:32
(with assistance) 50 333 384 54620 142:1
School
student 00:29 1:03 50 49 100 8315 83:1
6. Limitations and enhancements
Our present implementation has two major limitations compared to screencasting, pencasting and
touchcasting. First, these latter techniques encode handwriting in a vector format that can be scaled to
match the resolution of the target screen without affecting the quality of the picture. The learner
interface may also support zoom in/out operations, which can be helpful when the content is viewed on
a small smartphone. In contrast, in the interest of keeping costs low, our technique uses fixed-resolution
binarized images, and these do not display well on very small screens. Second, we only support
animation in a left to right, top to bottom manner. In contrast, all other techniques allow instructors the
freedom to jump backwards and forwards during their explanations. We have experimented with
allowing additional flexibility for the instructor, but our efforts thus far have increased the complexity
of synchronization. We are therefore exploring ways in which we can achieve a better balance between
these competing requirements.
Acknowledgements
We would like to thank all participants of our user-study for their willingness, time, effort and for their
permission to use images of their work in this paper.
References
Artemeva, N. and Fox, J. (2010). Chalk Talk: A principle genre of the university mathematics classroom. In H.
Graves & R. Graves (Eds.), Interdisciplinarity: Thinking and writing beyond borders.
Fox, J. and Artemeva, N. (2011). The cinematic art of teaching university mathematics: chalk talk as embodied
practice. Multimodal Communication, 1, 83–103.
Greiffenhagen, C. (2014). The materiality of mathematics: presenting mathematics at the blackboard. Br. J.
Sociol. 2014, 65(3):502-28.
Guo, P. J., Kim, J. and Rubin, R. (2014). How video production affects student engagement: an empirical study of
MOOC videos. Proceedings of the first ACM conference on Learning @ Scale conference, Atlanta, Georgia,
USA, 41-50.
Palmer, J. D. (2011). Touchcasting digital lecture notes, Journal of Computing Sciences in Colleges, 26(4),
157-163.
Pedersen, E., McCall, K., Moran, T.P., and Halasz, F.G. (1993). Tivoli: an electronic whiteboard for informal
workgroup meetings. In Proceedings of the INTERCHI '93 conference on Human factors in computing
systems (INTERCHI'93). IOS Press, Amsterdam, The Netherlands, 391-398.
Schleppegrell, M. J. (2007). The linguistic challenges of mathematics teaching and learning: a research review.
Reading Writing Quarterly, 23, 139–159.
Schmid, E.C. (2008). Potential pedagogical benefits and drawbacks of multimedia use in the English language
classroom equipped with interactive whiteboard technology. Comput. Educ. 51(4), 1553-1568.
Stasko, D. and Caron, P. G. (2010). Digital notes and lecture capture: pencasts as electronic copies of live STEM
lectures and student access to digital lectures. In Proceedings of World Conference on Educational
Multimedia, Hypermedia and Telecommunications, 1868-1876.
403403403

Chen, W. et al. (Eds.) (2016). Proceedings of the 24th International Conference on Computers in Education. India: Asia-Pacific Society for Computers in Education
Developing an Online Video Presentation Evaluation System to Promote Mutual Evaluation and Survey of Operability
Shin KURATAa,b*, Takashi FUJIKIa & Masao MUROTAb aFaculty of Education, Nagasaki University, Japan
bGraduate School of Decision Science and Technology, Tokyo Institute of Technology, Japan *[email protected]
Abstract: Today, e-learning through video-on-demand, such as MOOCs, has become popular. However, there is a problem in the evaluation of learning outcomes of the large-scale e-learning environment. This study’s aim is to solve the problems related to the load on learners that affect the mutual evaluation of the e-learning environment. Therefore, we developed an Online Video Presentation Evaluation System to reduce the load on learners. In addition, we conducted a questionnaire survey about its operability for learners. Consequently, it is revealed that OVPES is a tool that can reduce the burden of conscious on learners.
Keywords: presentation, mutual evaluation, mobile learning, mobile application
1. IntroductionToday, e-learning by video-on-demand has become popular the world over. Among the most popularvideo-on-demand methods are MOOCs (Massive Open Online Courses). There are many MOOC users.Therefore, it is difficult to evaluate the large number of artifacts produced by learners. In the future,through the improvement of technology, there will be a variety of digital contents and not only artifactsof character input. One solution is a mutual evaluation by peer review; advantages of this methodinclude the deepening of knowledge, gaining a new perspective, and improving learning motivation(Sluijsmans et al. 2001, Akahori and Kim 2003). In addition, mutual evaluation of artifacts is valid forthe achievement of learning goals (Namatame 2004). However, it is difficult to perform learning andevaluation in parallel (Hirai et al.). It is necessary to support mutual evaluation according to the artifactsso as to reduce the load on the learners.Though some previous research has investigated the development of an online presentation evaluationsystem (Pals and Shawback 2006), the research has focused on the presentation in real-time rather thanon video-on-demand. Further, another previous research study has developed a system for supportingmutual evaluation (Sibasaki 2008); however, this mutual evaluation was conducted by character inputon the computer. Furthermore, some previous research has developed a system operated simply formutual evaluation (Yaegashi et al. 2006). However, it did not aim to improve the artifacts of learners.Therefore, to fill in the gaps that all the above previous studies did not address, this study aims todevelop an Online Video Presentation Evaluation System (OVPES) to reduce the load on learners.Therefore, we conducted and analyzed the results of a questionnaire survey regarding learners’subjective evaluation after a trial experiment.
2. OVPES : Online Video Presentation Evaluation SystemFigure 1 demonstrates the main screen of the OVPES, Figure 2 demonstrates the main screen afterevaluation by the marker of evaluation on the OVPES, Figure 3 demonstrates the confirmation screen ofthe OVPES. OVPES is an application running on iOS, which conducts learning by online videopresentation. Concurrently, it is possible to evaluate an online video presentation by using OVPES. Themajor features of OVPES for learners are as follows:
・marker of evaluation・voice input・confirmation screen
404404404
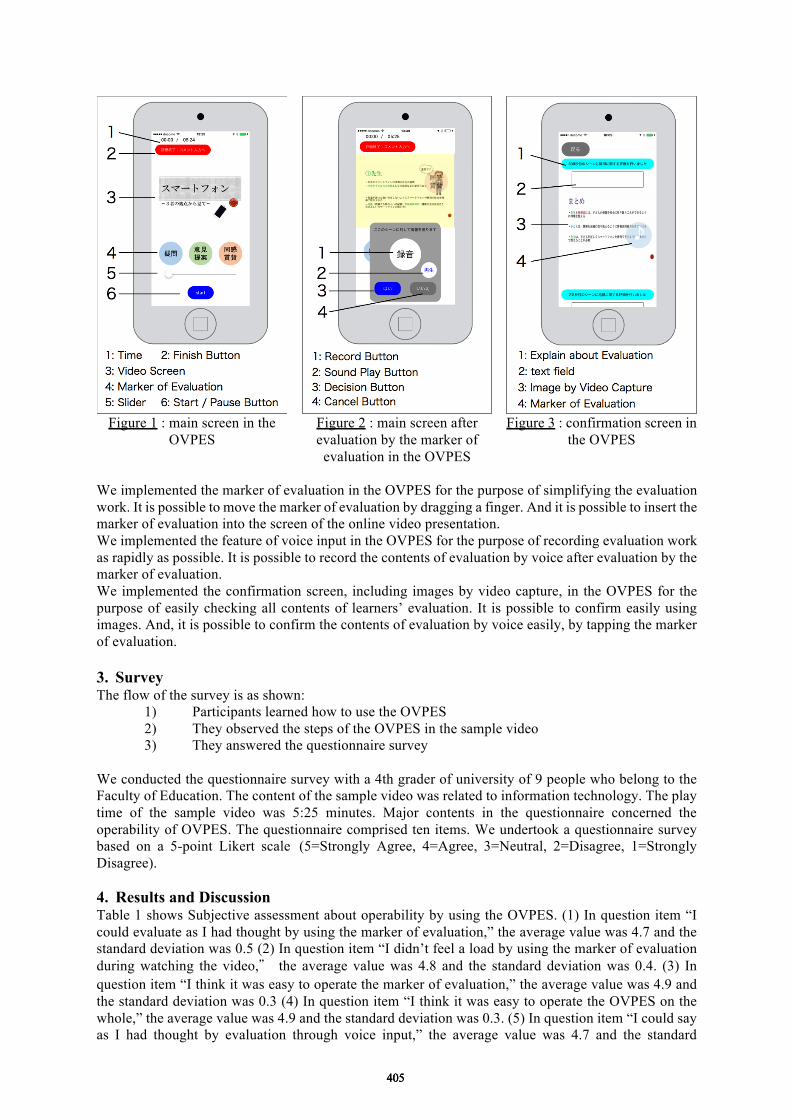
Figure 1 : main screen in the OVPES
Figure 2 : main screen after evaluation by the marker of evaluation in the OVPES
Figure 3 : confirmation screen in the OVPES
We implemented the marker of evaluation in the OVPES for the purpose of simplifying the evaluation work. It is possible to move the marker of evaluation by dragging a finger. And it is possible to insert the marker of evaluation into the screen of the online video presentation. We implemented the feature of voice input in the OVPES for the purpose of recording evaluation work as rapidly as possible. It is possible to record the contents of evaluation by voice after evaluation by the marker of evaluation. We implemented the confirmation screen, including images by video capture, in the OVPES for the purpose of easily checking all contents of learners’ evaluation. It is possible to confirm easily using images. And, it is possible to confirm the contents of evaluation by voice easily, by tapping the marker of evaluation.
3. SurveyThe flow of the survey is as shown:
1) Participants learned how to use the OVPES2) They observed the steps of the OVPES in the sample video3) They answered the questionnaire survey
We conducted the questionnaire survey with a 4th grader of university of 9 people who belong to the Faculty of Education. The content of the sample video was related to information technology. The play time of the sample video was 5:25 minutes. Major contents in the questionnaire concerned the operability of OVPES. The questionnaire comprised ten items. We undertook a questionnaire survey based on a 5-point Likert scale (5=Strongly Agree, 4=Agree, 3=Neutral, 2=Disagree, 1=Strongly Disagree).
4. Results and DiscussionTable 1 shows Subjective assessment about operability by using the OVPES. (1) In question item “Icould evaluate as I had thought by using the marker of evaluation,” the average value was 4.7 and thestandard deviation was 0.5 (2) In question item “I didn’t feel a load by using the marker of evaluationduring watching the video,” the average value was 4.8 and the standard deviation was 0.4. (3) Inquestion item “I think it was easy to operate the marker of evaluation,” the average value was 4.9 andthe standard deviation was 0.3 (4) In question item “I think it was easy to operate the OVPES on thewhole,” the average value was 4.9 and the standard deviation was 0.3. (5) In question item “I could sayas I had thought by evaluation through voice input,” the average value was 4.7 and the standard
405405405
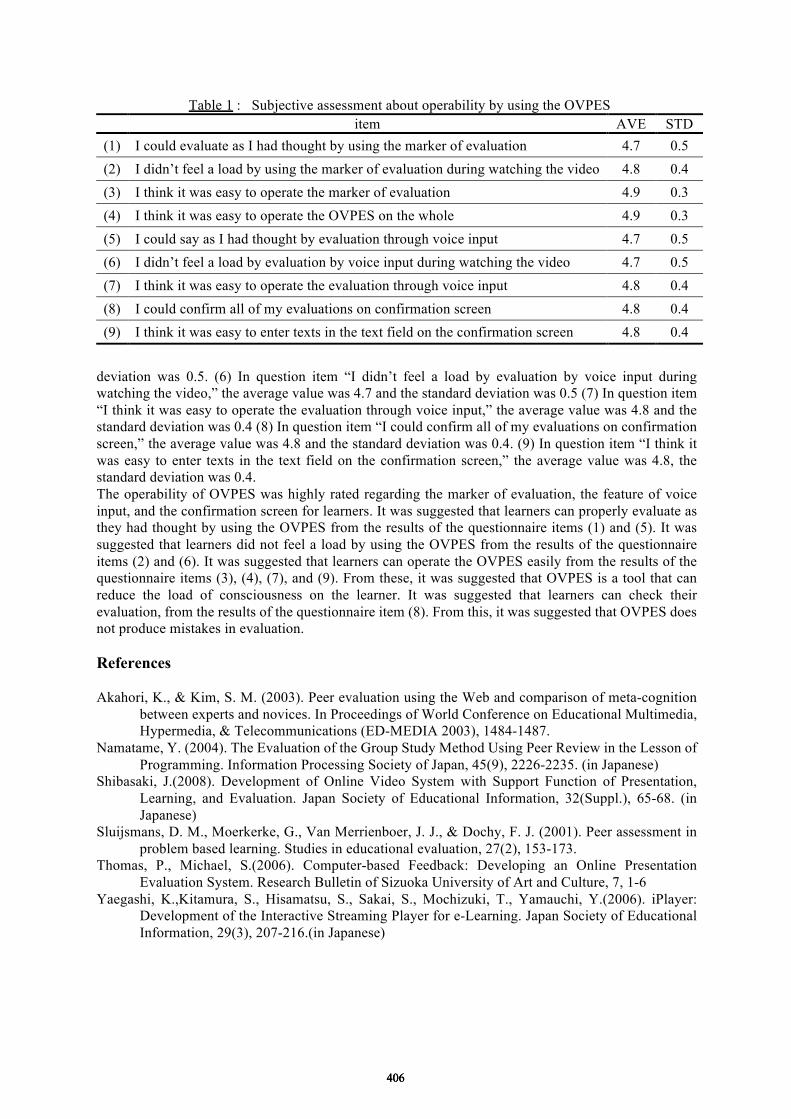
deviation was 0.5. (6) In question item “I didn’t feel a load by evaluation by voice input during watching the video,” the average value was 4.7 and the standard deviation was 0.5 (7) In question item “I think it was easy to operate the evaluation through voice input,” the average value was 4.8 and the standard deviation was 0.4 (8) In question item “I could confirm all of my evaluations on confirmation screen,” the average value was 4.8 and the standard deviation was 0.4. (9) In question item “I think it was easy to enter texts in the text field on the confirmation screen,” the average value was 4.8, the standard deviation was 0.4. The operability of OVPES was highly rated regarding the marker of evaluation, the feature of voice input, and the confirmation screen for learners. It was suggested that learners can properly evaluate as they had thought by using the OVPES from the results of the questionnaire items (1) and (5). It was suggested that learners did not feel a load by using the OVPES from the results of the questionnaire items (2) and (6). It was suggested that learners can operate the OVPES easily from the results of the questionnaire items (3), (4), (7), and (9). From these, it was suggested that OVPES is a tool that can reduce the load of consciousness on the learner. It was suggested that learners can check their evaluation, from the results of the questionnaire item (8). From this, it was suggested that OVPES does not produce mistakes in evaluation.
References
Akahori, K., & Kim, S. M. (2003). Peer evaluation using the Web and comparison of meta-cognition between experts and novices. In Proceedings of World Conference on Educational Multimedia, Hypermedia, & Telecommunications (ED-MEDIA 2003), 1484-1487.
Namatame, Y. (2004). The Evaluation of the Group Study Method Using Peer Review in the Lesson of Programming. Information Processing Society of Japan, 45(9), 2226-2235. (in Japanese)
Shibasaki, J.(2008). Development of Online Video System with Support Function of Presentation, Learning, and Evaluation. Japan Society of Educational Information, 32(Suppl.), 65-68. (in Japanese)
Sluijsmans, D. M., Moerkerke, G., Van Merrienboer, J. J., & Dochy, F. J. (2001). Peer assessment in problem based learning. Studies in educational evaluation, 27(2), 153-173.
Thomas, P., Michael, S.(2006). Computer-based Feedback: Developing an Online Presentation Evaluation System. Research Bulletin of Sizuoka University of Art and Culture, 7, 1-6
Yaegashi, K.,Kitamura, S., Hisamatsu, S., Sakai, S., Mochizuki, T., Yamauchi, Y.(2006). iPlayer: Development of the Interactive Streaming Player for e-Learning. Japan Society of Educational Information, 29(3), 207-216.(in Japanese)
Table 1 : Subjective assessment about operability by using the OVPES item AVE STD
(1) I could evaluate as I had thought by using the marker of evaluation 4.7 0.5 (2) I didn’t feel a load by using the marker of evaluation during watching the video 4.8 0.4 (3) I think it was easy to operate the marker of evaluation 4.9 0.3 (4) I think it was easy to operate the OVPES on the whole 4.9 0.3 (5) I could say as I had thought by evaluation through voice input 4.7 0.5 (6) I didn’t feel a load by evaluation by voice input during watching the video 4.7 0.5 (7) I think it was easy to operate the evaluation through voice input 4.8 0.4 (8) I could confirm all of my evaluations on confirmation screen 4.8 0.4 (9) I think it was easy to enter texts in the text field on the confirmation screen 4.8 0.4
406406406
Game Design as Problem Solving
Diali GUPTA & Beaumie KIM Werklund School of Education, University of Calgary, Canada
Abstract: In this paper we present how students at an arts immersion school in Canada, designed
games using Minecraft as a design tool to represent Grade 8 curriculum content learnt in Social
Studies. Our research was based on our theoretical framework on how game design could be an
aesthetic process, which elaborates how a design commences with a problem and progresses as an
iterative creative cycle towards finding a solution. Using this framework, we examined two groups
of Grade 8 students’ game design process. The groups represent unique approaches towards problem
solving that incorporated content from the Aztec and Spanish Civilization in their game design. We
have interpreted the representation of the content as the posed problem and analyzed how each group
proceeded with their game making based on their ideas, experience at playing the game and feedback
received from fellow classmates. Our findings highlight how the design process through Minecraft
was a creative endeavour on their part. Through our findings, we re-emphasize how involving
students in game creation efforts help them to experience an aesthetic learning process, allowing
them to become protagonists of their learning. We argue for game design as learners’ problem
solving experience, through which they struggled to construct knowledge in social systems while
developing fluencies both in gaming and technology.
Keywords: Aesthetic game design, Minecraft, Problem solving, Creativity
1. Introduction
A significant body of research in the field of learning sciences and technology have revealed how digital
games advocate problem solving skills by creating opportunities to pursue new roles in virtual worlds that
mimic real life scenarios (Gee, 2008; Gee & Levine, 2009; McGonigal, 2008, 2011). In fact, contemporary
games have established a functional or pragmatic way of knowing through meaning making that occurs on
account of direct interactions or responses of the player with the gaming world (Squire, 2011). In this paper
we explore these interactions further by examining how learners or students in a mid-high school in Canada
interact with digital games such as Minecraft to create and design their own games. Minecraft has no
prescribed goals and players are free to explore a seemingly infinite virtual space for constructing or
deconstructing the surrounding with blocks of materials (Johnson, Adams- Becker, Estrada & Freeman,
2014). Its compelling sandbox structure makes it a game with short term designer/player imposed goals
(Duncan, 2011). Hence it offers opportunities for learning design skills and as players are often required to
use programming skills to overcome challenges within the virtual world the game has been highlighted as
a potential gateway to learning computer science (Johnson et al. 2014).
Learning to design games helps develop gaming fluencies for players/learners because it allows
learners to become fluent not only in game design but also in the creative, critical and technical aspects of
working with new media (Kafai, 2006). What is often overlooked in this area are youth explorations and
participation in game production that expands beyond technical and critical considerations towards creative
or artistic ends (Kafai & Peppler, 2012). Hence we have analyzed the games using the aesthetic game design
cycle, which illustrates the creative process of game design (Gupta & Kim, 2014). The creative process
suggests how games can be aesthetically designed by learners with creative responses to the theme, content
or problem. Our analysis reveals how the learners were deeply engaged in seeking a solution to the problem.
The research was based in an arts immersion school in Canada where Grade 8 students participated
in designing games towards incorporating content from their Social Studies curriculum as in the Aztec and
Spanish Civilization. The entire process was viewed as a problem and the game design emerged as a
solution. The data was collected using a connective ethnography research design that utilized direct
407407
observations, audiovisual recordings, screen recordings of the game design process and semi-structured
interviews with the designers.
2. Literature Review
Gee (2003) has argued that learning to play games could engage players in valuable practices relevant to
and supportive of school learning and literacies. Extending the notion, Kafai & Peppler (2012) have
suggested how learning to design games could engage youth in a variety of valuable practices. These
practices evolve as complexly intertwined ecologies or types of meaning making systems that incorporate
developing fluencies both in terms of gaming practices as well as technology (Kafai, 2006). From a
constructionist perspective Kafai (2006) has also argued that when making games learners construct
knowledge and their relationship to it.
Research in the field of gaming fluencies have situated game design in the field of new media
literacies (Gee, 2010) emphasizing system-based or technical thinking (Salen, 2007) and critical
engagement with media (Buckingham & Burn, 2007; Pelletier, 2008). The artistic and creative ends towards
designing a game have also been taken into account expanding the palette of previously conceptualized
literacies to include a broader spectrum of design activities that reflect youth culture (Kafai & Peppler,
2012). In particular Kafai & Peppler (2012) have argued how creative practices in youth game design are
reflected through their artistic representation using any particular modality (visual, audio or kinesthetic) or
through multimodal sign systems that combine two or more modalities to express an artistic idea. Hence
from this perspective game design could demonstrate the ability of the youth to depict objects and ideas as
a combination of stimuli that becomes an important aspect of meaning making and learning. It is also
pertinent to note that computer games, in comparison to other multimodal texts, offer added complexity
both in terms of player and designer including the challenge that the player, anticipated by the designer
could move around inside the world of the text and experience it from more than one visual, spatial and
textual perspective (Robertson, 2011). Hence game making becomes a complex design task which requires
a range of creative skills including problem finding, problem solving, evaluation and communication
(Robertson & Nicholson, 2007; Robertson, 2011). Elaborating upon the evaluation and communication,
Robertson (2011) emphasized how both are inherent parts of the creative process as these involve the ability
to constructively evaluate elements of the game such as storytelling, visual design, level of challenge or
defining clear goals.
Egenfeldt-Nielsen, Smith and Tosca (2013) while elaborating on game design have defined the
elements that constitute a game as the rules, geography and representation, time and number of players
which they call as aesthetics. Kafai & Peppler (2012) have similarly stated that youth perceptions of a game
include gaming artifacts such as a set of rules, core mechanics, components, considerations of space and
goals, are deeply rooted in the aesthetics of the medium in which they are produced. Hence to illustrate this
creative component of game design we have examined how learners design games using the aesthetic game
design cycle (Gupta & Kim, 2014) (See Figure 1).
The development process of designing a game usually consists of a conceptual phase, a design
phase, a production phase and a testing phase (Egenfeldt-Nielsen, Smith & Tosca, 2013). However, we
have visualized this design process as a creative and iterative problem solving process, which in itself is an
aesthetic experience (Gupta & Kim, 2014). Our discussion of analysis, therefore, focuses on how the
learners’ design work is a problem solving process, showcasing the aesthetic nature of game design. Games
are representations of problems providing multimodal environments for embodied experiences in which
players take on new roles and identities to solve problems while managing complex semiotic domains
(Dickey, 2006; Gee, 2003, 2008). In our effort to use this cycle to explain the process of game design, we
have shown how game design commences with the problem of incorporating curricular content in the game
and ends with game creation as an aesthetic learning experience (Gupta & Kim, 2014; Parrish, 2009).
Problem-solving can be aesthetic learning experiences emerging like plots in a narrative (Parrish,
2009). Problem-solving as a cognitive activity generally emerges as learning experiences for
designers/learners to engage in (Jonassen, 2000). The design as problem-solving, however, becomes an
408408

aesthetic learning experience when the learners are immersed in the learning activity as protagonists of their
own learning (Parrish, 2009).
Figure 1. The Aesthetic Game Design Cycle
As stated in our recent work (Gupta & Kim, 2016) learners could become designers of their own
learning using digital sandbox games such as Minecraft. Research on Minecraft has revealed how the game
draws in players who become entrenched in the worlds, developing a skill set that leads to a sense of
ownership which in turn fuels the challenge of free and creative play (Robertson, 2010). Creativity also
springs from joyful explorations of the worlds that are procedurally created in the game allowing the players
to concentrate on their unique creations (Duncan, 2011). The emergent gameplay of Minecraft thus is
viewed less like a game but more like a creative platform for producing user-generated content (Duncan,
2011). Since user generated content is of primary importance in Minecraft it has afforded opportunities for
development of games that does not require altering the code of the game (Duncan, 2011). This could be
referred to as soft modding or socio-technical modding (Gee & Hayes, 2010) but with later versions
Minecraft emerged as a valuable platform for learning programming skills within the virtual worlds
(Johnson et al. 2014). Hence Minecraft as a design tool allowed the learners to engage in creative production
by offering the technical and critical aspects of new media.
3. Aesthetic Game Design Process
Using the aesthetic game design cycle we have analyzed the game design process of two groups of grade 8
students from an arts immersion school in Canada whose goal was to design or create games using
Minecraft as a game creation tool or platform that would help learn more about the Aztec and the Spanish
Civilization. One group consisted of three girls who designed a maze that also functioned as a trivia game
on the content they had to cover while the other group consisted of two boys who incorporated the content
within the game design by creating a game that was based on a game played by the Aztecs. We have focused
on the design of both games as problem solving efforts to elaborate how the game design process in itself
was aesthetic in nature contributing towards an aesthetic design for learning. For the purpose of this paper,
we call the all girls’ group as Team Tree and the all boys’ group as Team Ball Game.
The problem or the goal for the class in general was to represent the content learnt in Social Studies
through a game so that others can learn about the Aztec and the Spanish Civilization through a wide variety
or genre of games. Team Tree approached the problem by deciding on creating a trivia game within a maze
that would generate a rollercoaster experience using content from both the Aztec and Spanish Civilization
whereas Team Ball Game decided to incorporate the basic elements of a ball game that was played by the
Aztecs as in the Meso-American Ball Game, to create a game that would help learners experience the culture
of the Aztecs. We have described the process emphasizing how learners interacted with each aesthetic
element of the game to visualize the theme or the narrative, sustain the engagement and anticipation of
Problem/ Vision/
Inspiration
Developing & Organizing/ Preparing & Arranging
Reflection/
Evaluation
Artistic endeavours/
Decisive moments/Illum
ination
Elaboration/
Assimilation
409409
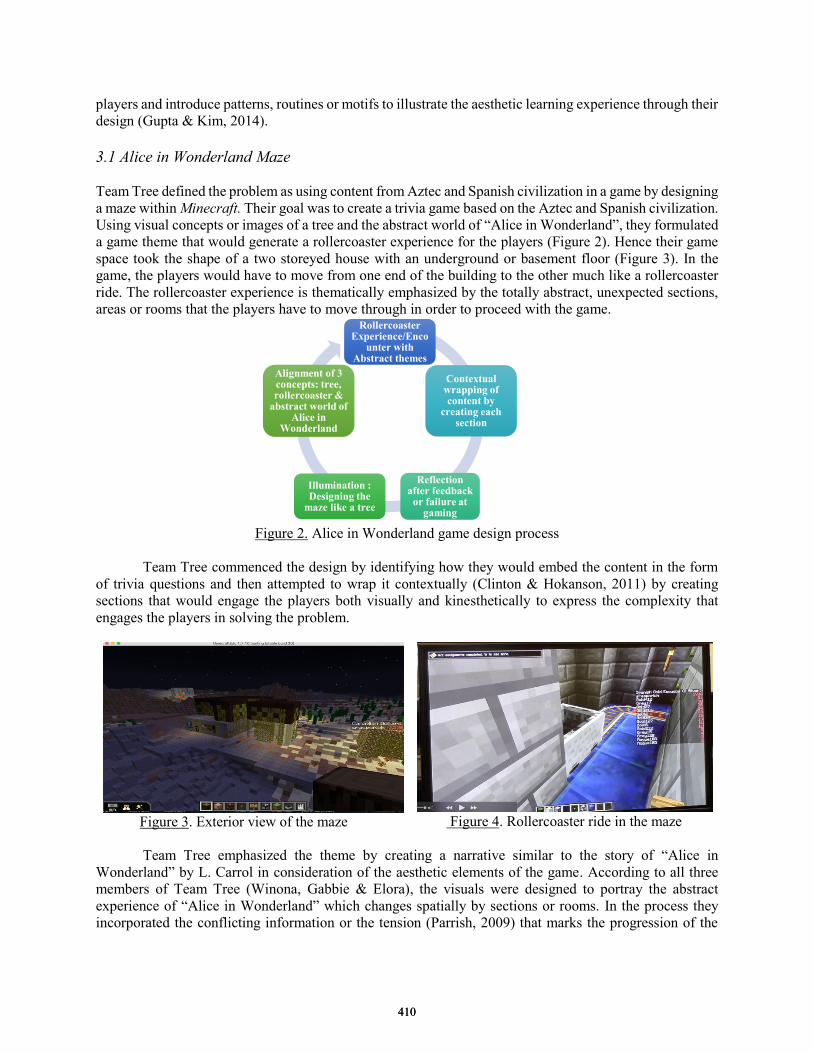
players and introduce patterns, routines or motifs to illustrate the aesthetic learning experience through their
design (Gupta & Kim, 2014).
3.1 Alice in Wonderland Maze
Team Tree defined the problem as using content from Aztec and Spanish civilization in a game by designing
a maze within Minecraft. Their goal was to create a trivia game based on the Aztec and Spanish civilization.
Using visual concepts or images of a tree and the abstract world of “Alice in Wonderland”, they formulated
a game theme that would generate a rollercoaster experience for the players (Figure 2). Hence their game
space took the shape of a two storeyed house with an underground or basement floor (Figure 3). In the
game, the players would have to move from one end of the building to the other much like a rollercoaster
ride. The rollercoaster experience is thematically emphasized by the totally abstract, unexpected sections,
areas or rooms that the players have to move through in order to proceed with the game.
Figure 2. Alice in Wonderland game design process
Team Tree commenced the design by identifying how they would embed the content in the form
of trivia questions and then attempted to wrap it contextually (Clinton & Hokanson, 2011) by creating
sections that would engage the players both visually and kinesthetically to express the complexity that
engages the players in solving the problem.
Figure 3. Exterior view of the maze
Figure 4. Rollercoaster ride in the maze
Team Tree emphasized the theme by creating a narrative similar to the story of “Alice in
Wonderland” by L. Carrol in consideration of the aesthetic elements of the game. According to all three
members of Team Tree (Winona, Gabbie & Elora), the visuals were designed to portray the abstract
experience of “Alice in Wonderland” which changes spatially by sections or rooms. In the process they
incorporated the conflicting information or the tension (Parrish, 2009) that marks the progression of the
Rollercoaster Experience/Enco
unter with Abstract themes
Contextual wrapping of content by
creating each section
Reflection after feedback
or failure at gaming
Illumination : Designing the
maze like a tree
Alignment of 3 concepts: tree, rollercoaster &
abstract world of Alice in
Wonderland
410410
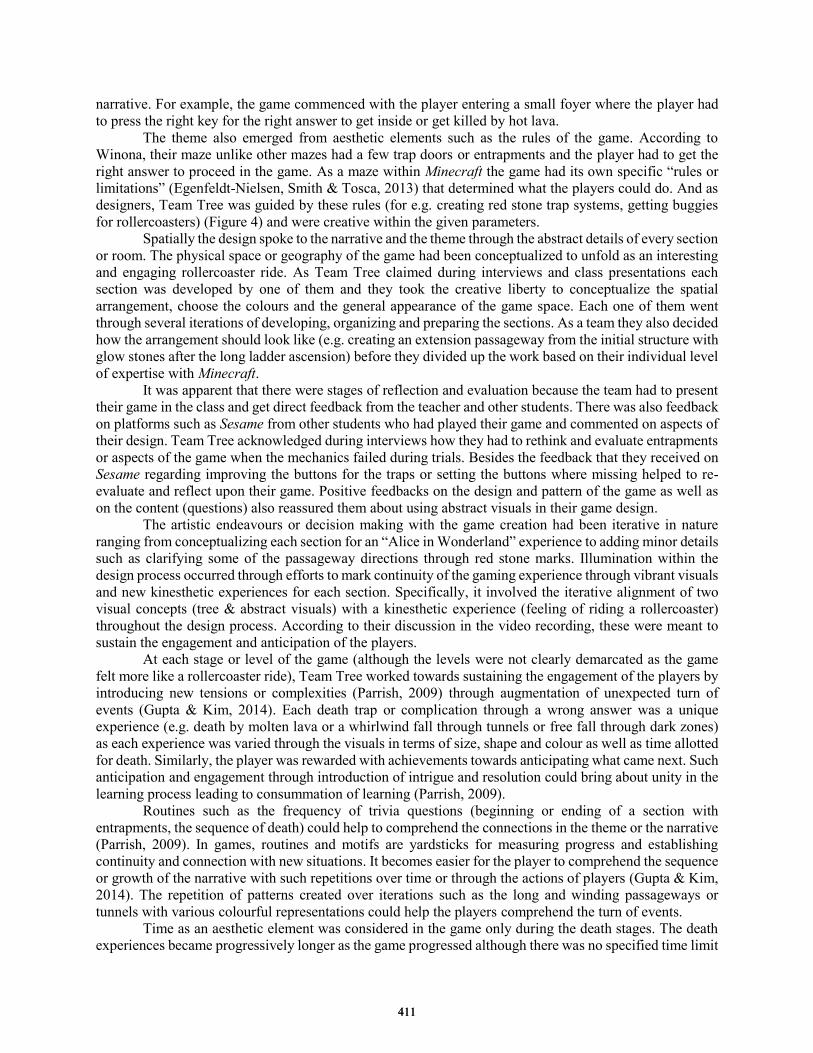
narrative. For example, the game commenced with the player entering a small foyer where the player had
to press the right key for the right answer to get inside or get killed by hot lava.
The theme also emerged from aesthetic elements such as the rules of the game. According to
Winona, their maze unlike other mazes had a few trap doors or entrapments and the player had to get the
right answer to proceed in the game. As a maze within Minecraft the game had its own specific “rules or
limitations” (Egenfeldt-Nielsen, Smith & Tosca, 2013) that determined what the players could do. And as
designers, Team Tree was guided by these rules (for e.g. creating red stone trap systems, getting buggies
for rollercoasters) (Figure 4) and were creative within the given parameters.
Spatially the design spoke to the narrative and the theme through the abstract details of every section
or room. The physical space or geography of the game had been conceptualized to unfold as an interesting
and engaging rollercoaster ride. As Team Tree claimed during interviews and class presentations each
section was developed by one of them and they took the creative liberty to conceptualize the spatial
arrangement, choose the colours and the general appearance of the game space. Each one of them went
through several iterations of developing, organizing and preparing the sections. As a team they also decided
how the arrangement should look like (e.g. creating an extension passageway from the initial structure with
glow stones after the long ladder ascension) before they divided up the work based on their individual level
of expertise with Minecraft.
It was apparent that there were stages of reflection and evaluation because the team had to present
their game in the class and get direct feedback from the teacher and other students. There was also feedback
on platforms such as Sesame from other students who had played their game and commented on aspects of
their design. Team Tree acknowledged during interviews how they had to rethink and evaluate entrapments
or aspects of the game when the mechanics failed during trials. Besides the feedback that they received on
Sesame regarding improving the buttons for the traps or setting the buttons where missing helped to re-
evaluate and reflect upon their game. Positive feedbacks on the design and pattern of the game as well as
on the content (questions) also reassured them about using abstract visuals in their game design.
The artistic endeavours or decision making with the game creation had been iterative in nature
ranging from conceptualizing each section for an “Alice in Wonderland” experience to adding minor details
such as clarifying some of the passageway directions through red stone marks. Illumination within the
design process occurred through efforts to mark continuity of the gaming experience through vibrant visuals
and new kinesthetic experiences for each section. Specifically, it involved the iterative alignment of two
visual concepts (tree & abstract visuals) with a kinesthetic experience (feeling of riding a rollercoaster)
throughout the design process. According to their discussion in the video recording, these were meant to
sustain the engagement and anticipation of the players.
At each stage or level of the game (although the levels were not clearly demarcated as the game
felt more like a rollercoaster ride), Team Tree worked towards sustaining the engagement of the players by
introducing new tensions or complexities (Parrish, 2009) through augmentation of unexpected turn of
events (Gupta & Kim, 2014). Each death trap or complication through a wrong answer was a unique
experience (e.g. death by molten lava or a whirlwind fall through tunnels or free fall through dark zones)
as each experience was varied through the visuals in terms of size, shape and colour as well as time allotted
for death. Similarly, the player was rewarded with achievements towards anticipating what came next. Such
anticipation and engagement through introduction of intrigue and resolution could bring about unity in the
learning process leading to consummation of learning (Parrish, 2009).
Routines such as the frequency of trivia questions (beginning or ending of a section with
entrapments, the sequence of death) could help to comprehend the connections in the theme or the narrative
(Parrish, 2009). In games, routines and motifs are yardsticks for measuring progress and establishing
continuity and connection with new situations. It becomes easier for the player to comprehend the sequence
or growth of the narrative with such repetitions over time or through the actions of players (Gupta & Kim,
2014). The repetition of patterns created over iterations such as the long and winding passageways or
tunnels with various colourful representations could help the players comprehend the turn of events.
Time as an aesthetic element was considered in the game only during the death stages. The death
experiences became progressively longer as the game progressed although there was no specified time limit
411411
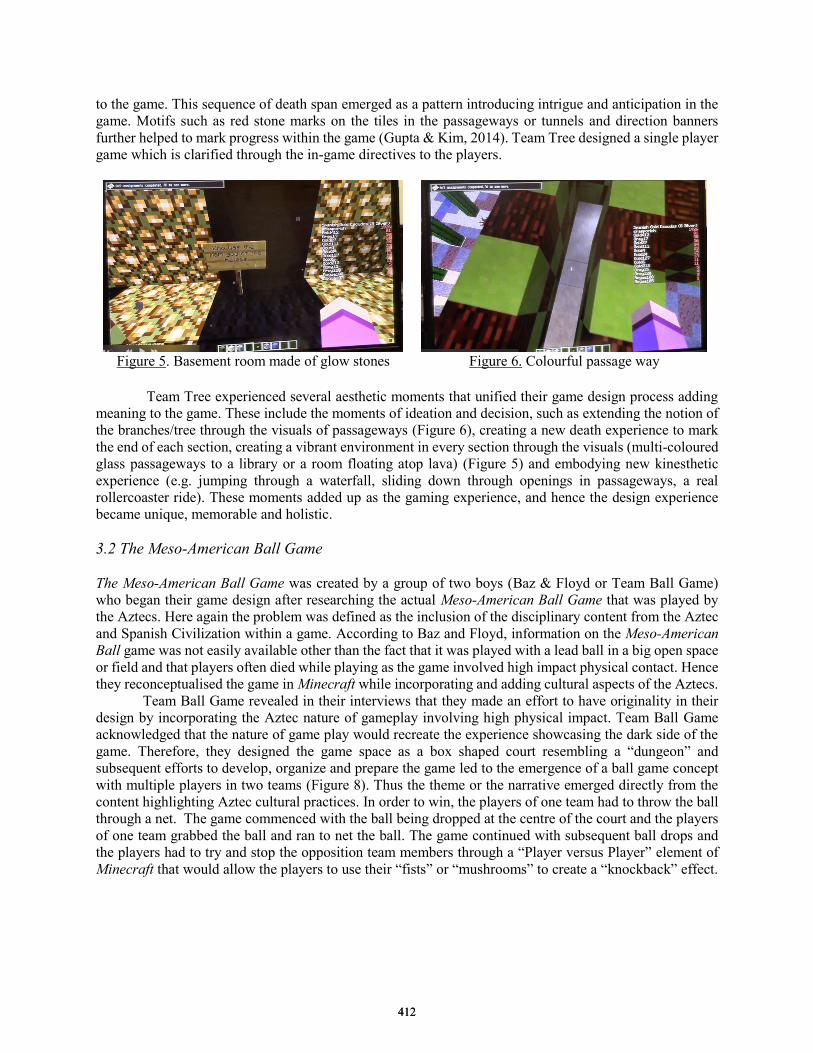
to the game. This sequence of death span emerged as a pattern introducing intrigue and anticipation in the
game. Motifs such as red stone marks on the tiles in the passageways or tunnels and direction banners
further helped to mark progress within the game (Gupta & Kim, 2014). Team Tree designed a single player
game which is clarified through the in-game directives to the players.
Figure 5. Basement room made of glow stones
Figure 6. Colourful passage way
Team Tree experienced several aesthetic moments that unified their game design process adding
meaning to the game. These include the moments of ideation and decision, such as extending the notion of
the branches/tree through the visuals of passageways (Figure 6), creating a new death experience to mark
the end of each section, creating a vibrant environment in every section through the visuals (multi-coloured
glass passageways to a library or a room floating atop lava) (Figure 5) and embodying new kinesthetic
experience (e.g. jumping through a waterfall, sliding down through openings in passageways, a real
rollercoaster ride). These moments added up as the gaming experience, and hence the design experience
became unique, memorable and holistic.
3.2 The Meso-American Ball Game
The Meso-American Ball Game was created by a group of two boys (Baz & Floyd or Team Ball Game)
who began their game design after researching the actual Meso-American Ball Game that was played by
the Aztecs. Here again the problem was defined as the inclusion of the disciplinary content from the Aztec
and Spanish Civilization within a game. According to Baz and Floyd, information on the Meso-American
Ball game was not easily available other than the fact that it was played with a lead ball in a big open space
or field and that players often died while playing as the game involved high impact physical contact. Hence
they reconceptualised the game in Minecraft while incorporating and adding cultural aspects of the Aztecs.
Team Ball Game revealed in their interviews that they made an effort to have originality in their
design by incorporating the Aztec nature of gameplay involving high physical impact. Team Ball Game
acknowledged that the nature of game play would recreate the experience showcasing the dark side of the
game. Therefore, they designed the game space as a box shaped court resembling a “dungeon” and
subsequent efforts to develop, organize and prepare the game led to the emergence of a ball game concept
with multiple players in two teams (Figure 8). Thus the theme or the narrative emerged directly from the
content highlighting Aztec cultural practices. In order to win, the players of one team had to throw the ball
through a net. The game commenced with the ball being dropped at the centre of the court and the players
of one team grabbed the ball and ran to net the ball. The game continued with subsequent ball drops and
the players had to try and stop the opposition team members through a “Player versus Player” element of
Minecraft that would allow the players to use their “fists” or “mushrooms” to create a “knockback” effect.
412412
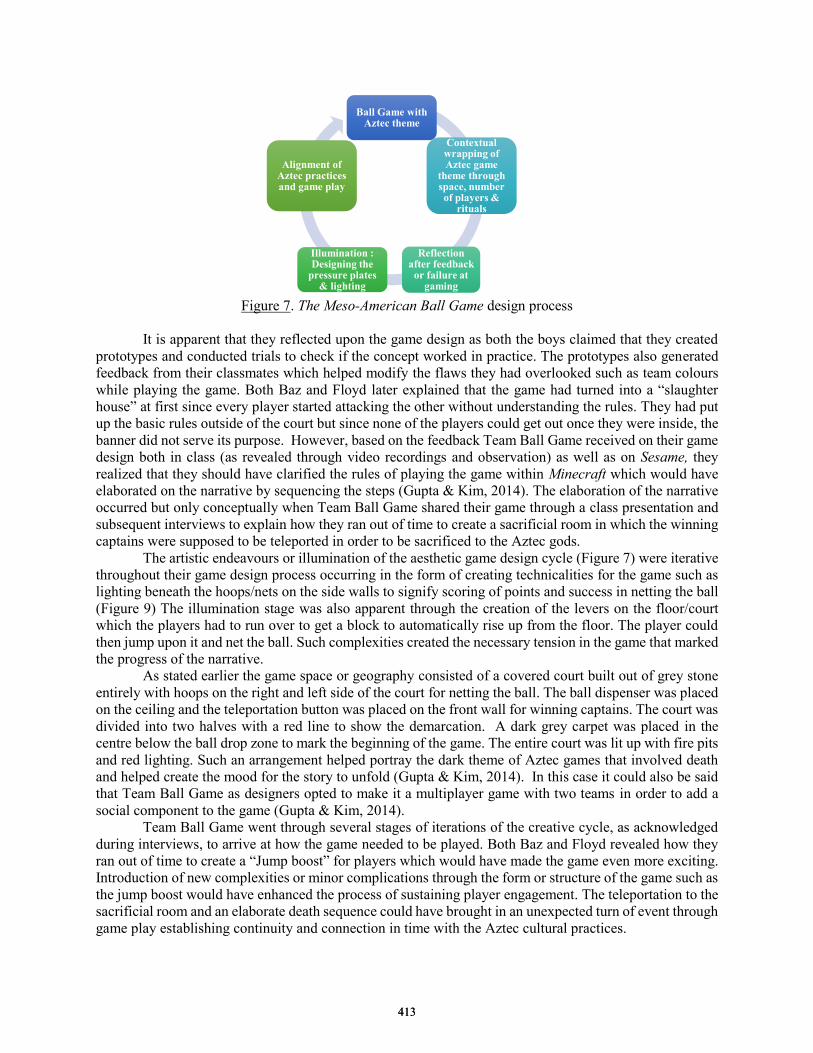
Figure 7. The Meso-American Ball Game design process
It is apparent that they reflected upon the game design as both the boys claimed that they created
prototypes and conducted trials to check if the concept worked in practice. The prototypes also generated
feedback from their classmates which helped modify the flaws they had overlooked such as team colours
while playing the game. Both Baz and Floyd later explained that the game had turned into a “slaughter
house” at first since every player started attacking the other without understanding the rules. They had put
up the basic rules outside of the court but since none of the players could get out once they were inside, the
banner did not serve its purpose. However, based on the feedback Team Ball Game received on their game
design both in class (as revealed through video recordings and observation) as well as on Sesame, they
realized that they should have clarified the rules of playing the game within Minecraft which would have
elaborated on the narrative by sequencing the steps (Gupta & Kim, 2014). The elaboration of the narrative
occurred but only conceptually when Team Ball Game shared their game through a class presentation and
subsequent interviews to explain how they ran out of time to create a sacrificial room in which the winning
captains were supposed to be teleported in order to be sacrificed to the Aztec gods.
The artistic endeavours or illumination of the aesthetic game design cycle (Figure 7) were iterative
throughout their game design process occurring in the form of creating technicalities for the game such as
lighting beneath the hoops/nets on the side walls to signify scoring of points and success in netting the ball
(Figure 9) The illumination stage was also apparent through the creation of the levers on the floor/court
which the players had to run over to get a block to automatically rise up from the floor. The player could
then jump upon it and net the ball. Such complexities created the necessary tension in the game that marked
the progress of the narrative.
As stated earlier the game space or geography consisted of a covered court built out of grey stone
entirely with hoops on the right and left side of the court for netting the ball. The ball dispenser was placed
on the ceiling and the teleportation button was placed on the front wall for winning captains. The court was
divided into two halves with a red line to show the demarcation. A dark grey carpet was placed in the
centre below the ball drop zone to mark the beginning of the game. The entire court was lit up with fire pits
and red lighting. Such an arrangement helped portray the dark theme of Aztec games that involved death
and helped create the mood for the story to unfold (Gupta & Kim, 2014). In this case it could also be said
that Team Ball Game as designers opted to make it a multiplayer game with two teams in order to add a
social component to the game (Gupta & Kim, 2014).
Team Ball Game went through several stages of iterations of the creative cycle, as acknowledged
during interviews, to arrive at how the game needed to be played. Both Baz and Floyd revealed how they
ran out of time to create a “Jump boost” for players which would have made the game even more exciting.
Introduction of new complexities or minor complications through the form or structure of the game such as
the jump boost would have enhanced the process of sustaining player engagement. The teleportation to the
sacrificial room and an elaborate death sequence could have brought in an unexpected turn of event through
game play establishing continuity and connection in time with the Aztec cultural practices.
Ball Game with Aztec theme
Contextual wrapping of Aztec game
theme throughspace, number of players &
rituals
Reflection after feedback
or failure at gaming
Illumination : Designing the
pressure plates & lighting
Alignment of Aztec practices and game play
413413

Figure 8. The court for playing the game Figure 9. The hoop or net with in-built lighting
Further patterns and routines in the game such as “fist” fighting with “player versus player” access
or stopping opposition team members in order to net the ball could have special significance towards
comprehending the brutality of the Aztec sport where people could die while playing the game. The routine
of netting the ball could be a yardstick for measuring progress in the game as it signified scoring points.
The pattern was reemphasized through visual lighting that further added to a sense of achievement
sustaining the engagement of the players.
The aesthetic moments in this game design process were several highlighting their moments of
coming up with ideas on how each design could result in a memorable experience for the gamers while
embedding the Aztec notion of gameplay. These aesthetic moments surfaced through the design of the
technicalities (pressure plates) to net the ball, the conceptual use of a dungeon as the physical space for the
game, the incorporation of the post-game rituals as well as thinking through and modifying the rules of the
actual Aztec game to make it playable. These moments lent continuity and meaning to the game, making
the design process a holistic experience for Team Ball Game.
4. Discussion
The design process of both games (Alice in Wonderland Maze and The Meso-American Ball Game)
emphasize how the process of game design engaged the students in valuable practices of coordinating the
creative, critical and technical dimensions of gaming (Kafai & Peppler, 2012). Learners can become
designers of their own learning through participation, collaboration and communication through Minecraft
which as a digital game-based learning environment became the design tool for their activities (Gupta,
Rasporich & Kim, 2016). Their creativity in envisioning the problem, preparing and organizing multiple
smaller design ideas that add up to the larger design conception, reflecting and evaluating through artistic
modifications or decisive changes in order to elaborate upon and develop the gaming experience reflects
how their work resembled an aesthetic design cycle (Gupta & Kim, 2014). This process was also very
similar to the technical game design process involving conceptual, design, production and testing phases as
defined by Egenfeldt-Nielsen, Smith & Tosca (2013).
We have also seen how the learners navigated the added complexity of analyzing the game from a
dual perspective of a designer and a player while creating and experiencing the game from a visual, spatial
and textual point of view (Robertson, 2011). The process of game design therefore became a complex
design task that incorporated finding the problem from the content as in aspects of the Aztec and Spanish
Civilization that was represented in the game, ways to solve the problem through the game, and evaluating
and communicating with fellow classmates in the process (Robertson & Nicholson, 2007, Robertson, 2011).
Evaluating elements of the game such as the theme or the unfolding of the narrative (rollercoaster theme
compounded by the “Alice in Wonderland” experience for Team Tree or the dark and latent theme of
violence and death in the Meso-American Ball Game accentuated by the dungeon feel and the teleportation
to the sacrificial room) and subsequently deciding upon the visual design (colourful vibrant and abstract
look of the maze as opposed to the grey and dark dungeon) or clarifying the goals through the selection or
414414
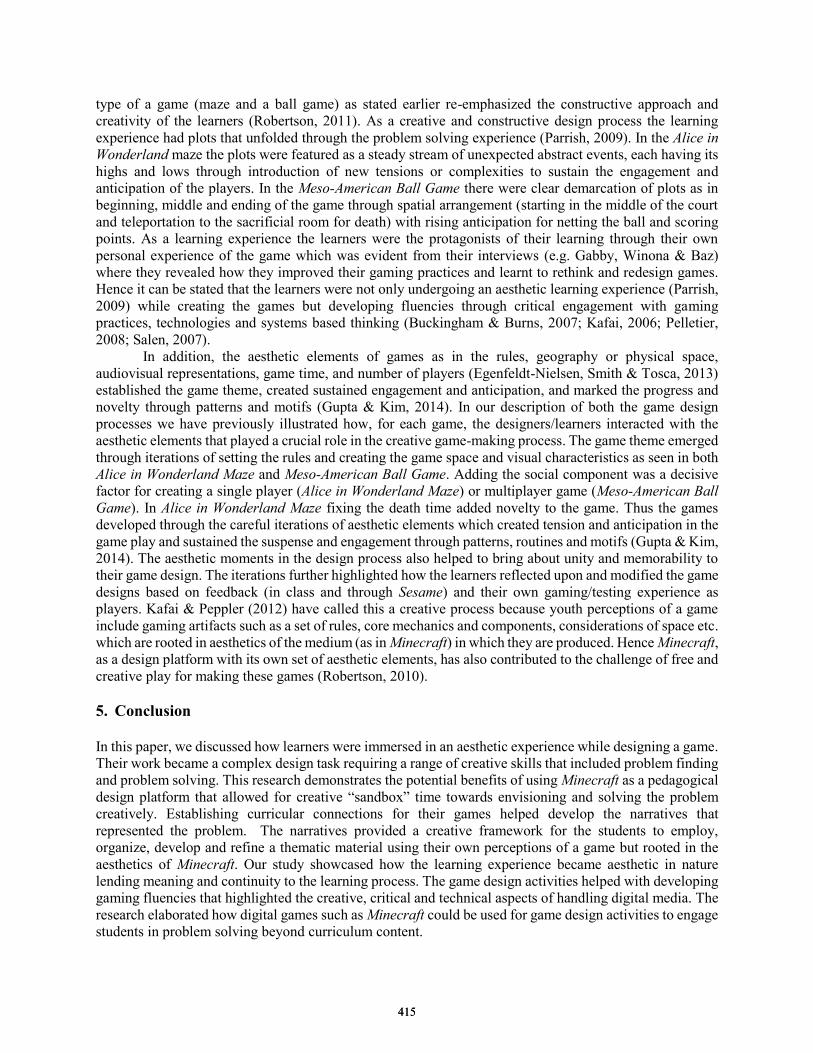
type of a game (maze and a ball game) as stated earlier re-emphasized the constructive approach and
creativity of the learners (Robertson, 2011). As a creative and constructive design process the learning
experience had plots that unfolded through the problem solving experience (Parrish, 2009). In the Alice in
Wonderland maze the plots were featured as a steady stream of unexpected abstract events, each having its
highs and lows through introduction of new tensions or complexities to sustain the engagement and
anticipation of the players. In the Meso-American Ball Game there were clear demarcation of plots as in
beginning, middle and ending of the game through spatial arrangement (starting in the middle of the court
and teleportation to the sacrificial room for death) with rising anticipation for netting the ball and scoring
points. As a learning experience the learners were the protagonists of their learning through their own
personal experience of the game which was evident from their interviews (e.g. Gabby, Winona & Baz)
where they revealed how they improved their gaming practices and learnt to rethink and redesign games.
Hence it can be stated that the learners were not only undergoing an aesthetic learning experience (Parrish,
2009) while creating the games but developing fluencies through critical engagement with gaming
practices, technologies and systems based thinking (Buckingham & Burns, 2007; Kafai, 2006; Pelletier,
2008; Salen, 2007).
In addition, the aesthetic elements of games as in the rules, geography or physical space,
audiovisual representations, game time, and number of players (Egenfeldt-Nielsen, Smith & Tosca, 2013)
established the game theme, created sustained engagement and anticipation, and marked the progress and
novelty through patterns and motifs (Gupta & Kim, 2014). In our description of both the game design
processes we have previously illustrated how, for each game, the designers/learners interacted with the
aesthetic elements that played a crucial role in the creative game-making process. The game theme emerged
through iterations of setting the rules and creating the game space and visual characteristics as seen in both
Alice in Wonderland Maze and Meso-American Ball Game. Adding the social component was a decisive
factor for creating a single player (Alice in Wonderland Maze) or multiplayer game (Meso-American Ball
Game). In Alice in Wonderland Maze fixing the death time added novelty to the game. Thus the games
developed through the careful iterations of aesthetic elements which created tension and anticipation in the
game play and sustained the suspense and engagement through patterns, routines and motifs (Gupta & Kim,
2014). The aesthetic moments in the design process also helped to bring about unity and memorability to
their game design. The iterations further highlighted how the learners reflected upon and modified the game
designs based on feedback (in class and through Sesame) and their own gaming/testing experience as
players. Kafai & Peppler (2012) have called this a creative process because youth perceptions of a game
include gaming artifacts such as a set of rules, core mechanics and components, considerations of space etc.
which are rooted in aesthetics of the medium (as in Minecraft) in which they are produced. Hence Minecraft,
as a design platform with its own set of aesthetic elements, has also contributed to the challenge of free and
creative play for making these games (Robertson, 2010).
5. Conclusion
In this paper, we discussed how learners were immersed in an aesthetic experience while designing a game.
Their work became a complex design task requiring a range of creative skills that included problem finding
and problem solving. This research demonstrates the potential benefits of using Minecraft as a pedagogical
design platform that allowed for creative “sandbox” time towards envisioning and solving the problem
creatively. Establishing curricular connections for their games helped develop the narratives that
represented the problem. The narratives provided a creative framework for the students to employ,
organize, develop and refine a thematic material using their own perceptions of a game but rooted in the
aesthetics of Minecraft. Our study showcased how the learning experience became aesthetic in nature
lending meaning and continuity to the learning process. The game design activities helped with developing
gaming fluencies that highlighted the creative, critical and technical aspects of handling digital media. The
research elaborated how digital games such as Minecraft could be used for game design activities to engage
students in problem solving beyond curriculum content.
415415
References Buckingham, D., & Burn, A. (2007). Game literacy in theory and practice. Journal of Educational Multimedia and
Hypermedia. 16(3). 323-349.
Clinton, G., & Hokanson, B. (2011). Creativity in the training and practice of instructional designers: The
Design/Creativity Loops Model. Educational Technology Research & Development. 60. 111-130.
Dickey, M. (2006). Game design narrative for learning: Appropriating adventure game design narrative devices and
techniques for the design of interactive learning environments. Educational Technology Research &
Design.54(3). 245-263.
Duncan, S. (2011). Minecraft beyond construction and survival. Well Played. 1(1). 1-22.
Egenfeldt-Nielsen, S., Smith, J.H., & Tosca, S.P. (2013). Understanding video games: The essential introduction.
New York, N.Y.: Routledge.
Gee, J.P. (2003). What can video games have to teach us about learning and literacy? New York, N.Y.: Palgrave
MacMillan.
Gee, J.P. (2008). Learning and games. In K. Salen (Ed.), The Ecology of Games: Connecting Youth, Game and
Learning. (pp.21-37). Cambridge, MA: The MIT Press.
Gee, J.P. & Levine, M.H. (2009). Welcome to our virtual worlds. Educational Leadership.66(6). 49-52.
Gee, J.P. & Hayes, E. (2010). No quitting without saving after bad events: Gaming paradigms and learning. Sims
International Journal of Learning and Media.1(3). 49-65.
Retrieved from http://dx.doi.org/10.1162/ijlm_a_00024.
Gupta, D., & Kim, B. (2014). Aesthetic design for learning with games. In Liu, C.C. et al. (Eds). Proceedings of the
22nd International Conference on Computers in Education. Nara, Japan : Asia Pacific Society for Computers in
Education.
Gupta, D., Rasporich, S., & Kim, B. (2016). An Emergent Design for Minecraft. In M. Takeuchi, A.P. Babb, & J.
Lock (Eds.), Proceedings of the IDEAS: Designing for Innovation Conference 2016, Calgary, Canada: University
of Calgary.
Jonassen, D. H., (2000). Toward a design theory of problem solving. Educational Technology Research &
Development.48(4). 63-85.
Kafai, Y. (2006). Playing and making games for learning: Instructionist and constructionist perspectives for game
studies. Games & Culture.1(1). 34-40.
Kafai, Y.B. & Peppler, K.A. (2012). Developing gaming fluencies with Scratch: Realizing game design as an artistic
process. In C Steinkuehler, K. Squire, & S. Barab (Eds.), Games Learning and Society: Learning and Meaning
in the Digital Age (pp.355-380). New York, N.Y.: Cambridge University Press.
McGonigal, J. (2011). Reality is broken: Why games make us better and how they can change the world. U.S.A:
Penguin Books. U.S.A : Penguin Books.
McGonigal, J. (2008). Why I love bees: A case study in collective intelligence gaming. In K. Salen (Ed). The Ecology
of Games: Connecting Youth, Game and Learning. pp.199-227. Cambridge, MA: The MIT Press.
Parrish, P.E. (2009). Aesthetic principles for instructional design. Educational Technology Research &
Development.57(4). 511-528.
Pelletier, C. (2008). Producing difference in studying and making computer games: How students construct games as
gendered in order to construct themselves as gendered. In Y.B. Kafai, C. Heeter, J. Denner & J. Sun (Eds.),
Beyond Barbie and Mortal Kombat : New Perpectives on Gender and Games. (pp.145-161). Cambridge, MA:
MIT Press.
Salen, K. (2007). Gaming literacies: A game design study in action.Journal of Educational Multimedia and
Hypermedia. 16(3). 301-322.
Robertson, M. (2010). Five minutes of ….Minecraft. Gamasutra.
Retrieved from http://www.gamasutra.com/view/feature/6179/five_minutes_of_minecraft_php Robertson, J. (2011). Making games in the classroom: Benefits and gender concerns. Computers and Education. 59.
385-398.
Robertson, J. & Nicholson, K. (2007). Adventure author: A Learning environment to support creative design.
Interaction Design & Children. Aalborg, Denmark: ACM Publishing.
Squire, K. (2011). Video games and learning. New York: Teachers College Press.
416416
Chen, W. et al. (Eds.) (2016). Proceedings of the 24th International Conference on Computers in Education. India: Asia-Pacific Society for Computers in Education
Investigating the Effect of Game-based Writing Environment on Students’ Writing
Participation, Performance, and Interest Calvin C. Y. LIAOd*, & Wan-Chen CHANGac, Tak-Wai CHANab
a Graduate Institute of Network Learning Technology, National Central University, Taiwan b Research Center for Science and Technology for Learning, National Central University, Taiwan
c Graduate Institute of Learning and Instruction, National Central University, Taiwan d National Engineering Research Center for E-Learning, Central China Normal University, Wuhan, China
Abstract: In this study, we investigated the effect of game-based writing environment for improving students’ participation, performance and interest of writing. An experiment was conducted to evaluate the effectiveness of two conditions in language art courses at an elementary school. Total of 245 third graders students participated in the experiment during a year. 139 students were assigned to the experimental group and learned with a game-based writing environment (GWE), and 106 students were in the control group and learned with an online writing environment (OWE). From the empirical results, it was found that GWE could effectively promote students’ writing participation, writing performance, interest on writing, as well as their perceptions of the use of educational self-management games. Moreover, some implications about the experimental results were also discussed.
Keywords: game-based learning, online writing environment, writing performance, interest on writing
1. Introduction
Digital game-based learning has shown some benefits in learning mathematics, science, and so on (Barab, Thomas, Dodge, Carteaux, & Tuzun, 2005). One potential advantage is to foster student engagement in game-based learning environment. Unfortunately, few researches were adopted into the use of game-based learning elements as a support for learning to write, or allowing students to practice their writing skills. This study carefully reviewed some related studies.
On one hand, some researchers utilized some narrative cues or attractive phenomena in 3D game-based learning environment and some studies considered that game narrative design provides rich and elaborate spaces for fostering imagination and play (Thomas & Brown, 2007). For examples, Dickey (2011) investigated that an immersive 3D game-based learning environment, entitled Murder on Grimm Isle, used to foster argumentation and persuasion writing, because game narrative experiences were transferred into prewriting activities. Moreover, Squire, & Jan (2007) developed a location-based augmented reality game for engaging students in meaningful scientific argumentation, called Mad City Mystery. This game provides a series of narrative accounts of scientific phenomena, and requires students to develop and argue scientific writing or explanations. In short, the game environment could provide a series of storylines and cues, and inspire students’ writing ideas.
On the other hand, some research groups attempted to support writing skill practice in game-based learning environment. McNamara and her colleagues (Roscoe, & McNamara, 2013; Proske, Roscoe, & McNamara, 2014; Allen, Crossley, Snow, & McNamara, 2014) developed an intelligent tutoring system, called Writing Pal, and provided students with explicit writing strategy instruction and practice. They adopted that game-based practice strategy to improve students’ writing skills (e. g. freewriting, paraphrasing, revising, and so on), and revealed that students perceived more interesting and engaging than other forms of practice (Proske, Roscoe, & McNamara, 2014). Allen et al. (2014) also found that mine-games of Writing Pal could increase writing engagement and provide students
417417
opportunities to practice writing strategies. In short, the game elements could facilitate the willing of students into practice writing skills.
Following the above studies, the game-based learning approach has been potential for facilitating the engagement of students in writing activities. However, it could be a challenge that to achieve and sustain students’ engagement with practice in a game-based writing environment. In brief, engagement likes as an important key which possible brings some benefits for students; yet there is currently few researches comparing the effectiveness of game-based writing environment with conventional forms of online writing environment and then exploring the game influence for students’ writing.
Hence, this study expected that game-based writing environment may be an effective approach which not only facilitates students’ participation or helping students learn how to write, but also sustains students’ the willing to write. The research goals in particularly were: 1) to understand the degree of students perceive more voluntary participation in game-based writing environment. 2) To examine the effects on writing performance, such as word level, sentence and paragraph level, and text level. 3) To investigate the extent to which students perceive game-based writing environment as more interesting.
2. Methods
2.1. Participants and Research Design
This study employed a between subject design with two groups. The participants were 245 nine-year-old third-grade students from nine classes of elementary school and 9 teachers in rural area in Taiwan. All students and teachers participated in this study during two semesters in order to understand the influence of students’ writing participation, writing performance about linguistic differences and their writing interesting.
In the first semester, all students participated in an online writing environment (OWE). In the second semester, these students were assigned to two conditions: online writing platform with game-based writing environment (GWE) and pure online writing environment (OWE). GWE means experimental group (EG) and there are 139 students participated in. In contrast, OWE means control group and there are 106 students participated in. Both of these two group students should write the same writing topics: There are two themes in the first semester, Theme #1: the imagination of nature and Theme #2: my father. There are three themes in the second semester, Theme #3: cherish time, Theme #4: the surprise of growing up, and Theme #5: a field trip.
2.2 Two Writing Environment Treatments
2.2.1. Online Writing Environment (OWE)
Online writing environment (OWE) developed by the research group (Liao, Chang, & Chan, 2014) for helping students to writing and rewriting, see figure 1. First, the writing process includes 3 steps: theme-based reading, association-stimulation freewriting, and organizing into a draft. Specifically, students could gain domain knowledge about writing topics through theme-based reading in step 1. The theme-based essay had to be convincing and based on authentic information sources. Students could generate ideas with guidance extensively through association-stimulation freewriting in step 2. Finally, students could compose an essay based on written ideas through composition in step 3.
Second, the rewriting process includes 3 steps: examining peer articles, peer talking, and self-revising. Specifically, students could access and aware other students’ content of articles through examining other articles in step 1. Students could read classmates’ articles and give suggestions for helpfulness and specificity. Moreover, students in the step of peer talking also could provide textual and oral responses with scaffolding prompts in step 2, such as, supporting classmates by cueing them about their articles or about aspects of revision; students could revise an essay based on other students’ suggestions through self-revising in step 3. The OWE enables students’ meaningful revision activity, not just editorial actions.
418418
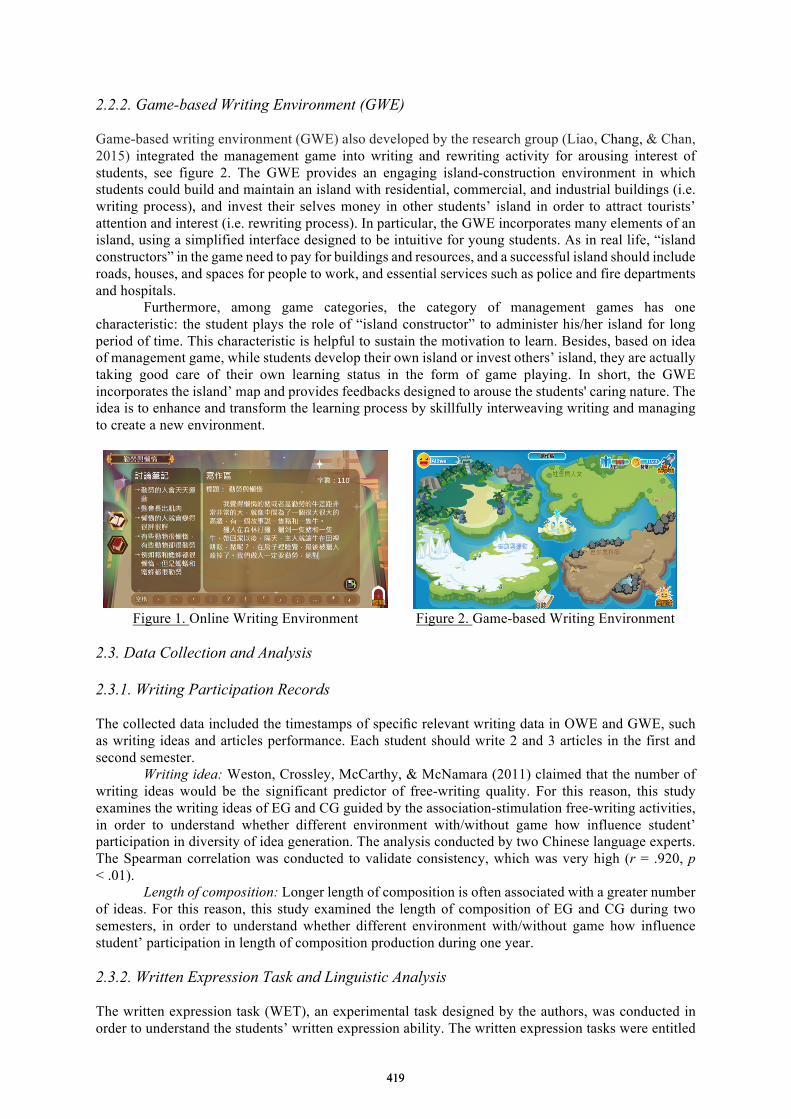
2.2.2. Game-based Writing Environment (GWE) Game-based writing environment (GWE) also developed by the research group (Liao, Chang, & Chan, 2015) integrated the management game into writing and rewriting activity for arousing interest of students, see figure 2. The GWE provides an engaging island-construction environment in which students could build and maintain an island with residential, commercial, and industrial buildings (i.e. writing process), and invest their selves money in other students’ island in order to attract tourists’ attention and interest (i.e. rewriting process). In particular, the GWE incorporates many elements of an island, using a simplified interface designed to be intuitive for young students. As in real life, “island constructors” in the game need to pay for buildings and resources, and a successful island should include roads, houses, and spaces for people to work, and essential services such as police and fire departments and hospitals.
Furthermore, among game categories, the category of management games has one characteristic: the student plays the role of “island constructor” to administer his/her island for long period of time. This characteristic is helpful to sustain the motivation to learn. Besides, based on idea of management game, while students develop their own island or invest others’ island, they are actually taking good care of their own learning status in the form of game playing. In short, the GWE incorporates the island’ map and provides feedbacks designed to arouse the students' caring nature. The idea is to enhance and transform the learning process by skillfully interweaving writing and managing to create a new environment.
Figure 1. Online Writing Environment
Figure 2. Game-based Writing Environment
2.3. Data Collection and Analysis 2.3.1. Writing Participation Records The collected data included the timestamps of specific relevant writing data in OWE and GWE, such as writing ideas and articles performance. Each student should write 2 and 3 articles in the first and second semester.
Writing idea: Weston, Crossley, McCarthy, & McNamara (2011) claimed that the number of writing ideas would be the significant predictor of free-writing quality. For this reason, this study examines the writing ideas of EG and CG guided by the association-stimulation free-writing activities, in order to understand whether different environment with/without game how influence student’ participation in diversity of idea generation. The analysis conducted by two Chinese language experts. The Spearman correlation was conducted to validate consistency, which was very high (r = .920, p < .01).
Length of composition: Longer length of composition is often associated with a greater number of ideas. For this reason, this study examined the length of composition of EG and CG during two semesters, in order to understand whether different environment with/without game how influence student’ participation in length of composition production during one year. 2.3.2. Written Expression Task and Linguistic Analysis The written expression task (WET), an experimental task designed by the authors, was conducted in order to understand the students’ written expression ability. The written expression tasks were entitled
419419
“My favorite food” in first semester and “After school” in second semester. Besides, the Chinese Readability Index Explorer (CRIE) has been developed by Sung and their colleagues (Sung, Chen, Lee, Cha, Tseng, Lin, Chang, & Chang, 2013) to understand Chinese text readability which includes several indicators based on the textual factors. CRIE generally relies on machine learning techniques that compute essay scores using a set of text variables. This study also adopted CRIE website to parse out the students’ articles on pre/post written expression task, such as word level (number of total words, number of different words, and number of difficult words), sentence and paragraph level (number of total sentences, average sentence length, and number of total paragraphs), and text level (the length of composition). 2.3.3. Writing Interest Questionnaire The interest on writing was measured by the Writing Interest Questionnaire (WIQ), designed and developed by the authors. The content of the questionnaire was developed based on the four-phase model of interest development (Hidi, & Renninger, 2006; Schraw, & Lehman, 2001) and RCTR model (Liao, Chang, &Chan, 2014). The WIQ had 12 items, each six items for two components of writing interest: individual interest (II), and situational interest (SI). Individual interest has been defined as an individual’s tendency towards a topic, activity, or knowledge domain, and situational interest has been defined as a series of stimuli and conditions that determine an immediate affective response. Past research also proposed that the both of the two kinds of interest certainly improve students’ learning (Hidi, & Renninger, 2006). Students were asked to rate their writing interest on a Likert-type item with five anchors (1 = strongly disagree, 2 = disagree, 3 = not sure, 4 = agree, 5 = strongly agree). Take sample items as an example for each interest concept: ‘I think that writing is interesting.’ (II), and ‘I like to share my article with others in online writing environment.’ (SI). 2.4. Procedure The experiments were divided into two phases: the first and second semester. During the first semester, to familiarize all students with the use of the online writing environment. All students should learn how to write and write two articles. In the end of the first semester, a pretest of written expression task and writing interest questionnaire were conducted in order to establish a baseline of writing performance and writing interest. After that, the main experiment was conducted in the second semester. In the beginning the GWE was introduced for the EG. The CG continued to participate in the OWE. When the students finished the experimental activity, which was followed by the posttest of written expression task and writing interest questionnaire. 3. Findings 3.1. Writing Participation 3.1.1 The Number of Writing Ideas Writing ideas could be the indicator of students’ participation, because the high participation of students possibly produces lot of different ideas about the theme more than low participation. The independent samples t-test was used to examine differences between the EG and CG, in terms of students’ writing ideas. The two group students were received the same experimental treatment in the first semester and different treatment condition in the second semester. Hence, students’ performance in the first semester showed the baseline and that in the second semester showed to compare the effect of the game-based environment.
First semester: Because the character and genre of writing themes were different, each theme was compared separately by two groups. Regarding the average number of ideas about Theme #1, no significant difference (t(238) = 0.34, p = .731 > .05) existed between the EG (M = 2.29, SD = 3.10) and the CG (M = 2.17, SD = 2.59). Regarding the average number of ideas about Theme #2, no significant difference (t(238) = 0.04, p = .966 > .05) existed between the EG (M = 1.65, SD = 2.50) and the CG (M = 1.67, SD = 2.21). This implied that both groups had a similar performance on Theme #1 and #2.
420420
Second semester: Regarding the average number of ideas about Theme #3, the EG (M =3.44,
SD = 3.18) significantly (t(238) = 4.90, p = .000 < .05) outperformed than the CG (M =1.83, SD = 1.37). Regarding the average number of ideas about Theme #4, the EG (M =4.02, SD = 5.80) significantly (t(238) = 2.94, p = .004 < .05) outperformed than the CG (M =2.16, SD = 2.79). Regarding the average number of ideas about Theme #5, the EG (M =3.72, SD = 2.46) significantly (t(238) = 2.11, p = .042 < .05) also outperformed than the CG (M =2.25, SD = 2.03). The t-test procedure revealed that students in EG showed a greater number of writing ideas than those in CG on Theme #3, #4 and #5. Consequently, these findings implied students with the GWE seemed more capable in generate their writing ideas than those pure OWE. 3.1.2 The Length of Composition The length of composition could be the indicator of students’ participation because the high participation of students possibly writes a lot of texts more than low participation. The results showed that length of composition increased gradually from theme-based article #1 to article #5. In order to understand the progress of increasing length of composition of students between EG and CG, it needed further to examined with paired t-test to uncover the development about students’ length of composition.
First semester: Regarding the average length of composition on Theme #1, the CG (M =186.27, SD = 139.60) significantly (t(238) = 2.89, p = .004 < .05) outperformed the EG (M =138.91, SD = 91.60). Regarding the average length of composition on Theme #2, no significant difference (t(238) = 1.72, p = 0.086 > .05) existed between the EG (M = 209.68, SD = 96.64) and the CG (M = 231.09, SD = 134.88). This implied that OWE reduce in extent of length of composition gradually between the two groups from Theme #1 to Theme #2.
Second semester: Regarding the average length of composition on Theme #3, no significant difference ( t(238) = 0.64, p = .64 > .05) existed between the EG (M =229.39, SD = 113.97) and the CG (M =215.07, SD = 97.67). Regarding the average length of composition on Theme #4, the EG (M =260.30, SD = 157.88) significantly outperformed (t(238) = 4.06, p = .000 < .05) than the CG (M =207.96, SD = 112.86). Regarding the average length of composition on Theme #5, no significant difference (t(238) = 1.02, p = .309 > .05) existed between the EG (M =284.06, SD = 189.33) and the CG (M =261.13, SD = 196.30). A series of paired t-test procedure revealed that students in EG showed a greater length of composition than those in CG gradually at Theme #4 and post-test. This means that students participating in GWE had improved the length of their written article more than OWE. 3.2. Writing Performance Students’ writing performance were evaluated according to three level: word level, sentence and paragraph level and text level.
Word Level: The indictor of writing performance in word level contains the number of total words, the number of difference word and the number of difficult words. First, to compare the number of total words of the two groups, one-way ANCOVA was conducted and the total words of pre-WET as covariate. The results revealed the main effect on treatments, F(1, 229) = 20.74, MSE = 103612.85, p = .000 < .05, partial η2= 0.080. The pairwise comparison revealed that students in EG (M = 189.89, SD = 89.74) with a significant greater number of total words than those in CG (M = 152.24, SD = 66.53). Second, to compare the number of different words of the two groups, one-way ANCOVA was conducted and the different words of pre-WET as covariate. The results revealed the main effect on treatments, F(1, 229) = 23.79, MSE = 20986.93, p = .000 < .05, partial η2= 0.094. The pairwise comparison revealed that students in EG (M = 101.01, SD = 39.44) with a significant greater number of different words than those in CG (M = 86.35, SD = 33.26). Next, to compare the number of difficult words of the two group, one-way ANCOVA was conducted and the difficult words of pre-WET as covariate. The results revealed the main effect on treatments, F(1, 229) = 16.19, MSE = 9323.96, p = .000 < .05, partial η2= 0.066. The pairwise comparison revealed that students in EG (M = 60.29, SD = 29.06) with a significant greater number of difficult words than those in CG (M = 49.38, SD = 23.55).
Sentence and Paragraph Level: The indictor of writing performance in sentence and paragraph level contains the number of total sentences, and the number of total paragraphs. First, to compare the
421421
number of total sentences of the two groups, a one-way ANCOVA was conducted and the total sentences of pre-WET as covariate. The results revealed a main effect on treatments, F(1, 229) = 17.16, MSE = 998.37, p = .000 < .05, partial η2= 0.070. The pairwise comparison revealed that students in EG (M = 18.54, SD = 10.10) with a significant greater number of total sentences than those in CG (M = 14.75, SD = 7.60). Second, to compare the number of total paragraphs of the two groups, a one-way ANCOVA was conducted and the total paragraphs of pre-WET as covariate. The results revealed no significant difference between the two groups, F(1, 229) = 0.06, MSE = 0.09, p = .807 > .05, partial η2= 0.000.
Text Level: The indictor of writing performance in text level is the length of composition. In order to understand the statistical significance of the increasing in the length of composition, we further compared EG with CG. The correlation coefficient of the length of composition between the pre-WET and post-WET was significantly high. A one-way ANCOVA was conducted and the composition’ length of pre-WET was the covariate. The results revealed a significant man effect on the treatments, F(1, 229) = 21.43, MSE = 315828.79, p = .000 < .05, partial η2= 0.086. The pairwise comparison procedure revealed that students in EG (M = 345.39, SD = 156.07) with a significant greater length of composition than those in CG (M = 282.88, SD = 121.32).
Above the results, it means that the EG students produced more sophisticated words and more complex sentence than the CG students. Consequently, these findings implied students with the GWE seemed to be more capable in producing their words and originating sentences into articles than that pure OWE. 3.3. Interest for Writing In order to understand how the effect of improving students’ interest of writing, we further examined the pre- and post-WIQ to uncover the students’ interest on writing between EG and CG. Further, writing interest consisted the concepts of individual interest and situational interest, so the two kinds of writing interest were compared isolated. Regarding as individual interest, the one-way ANCOVA was conducted and the pre-WIQ as covariate. The results showed no significant difference between the treatments, F(1, 229) = 0.72, MSE = 221.169, p = .396 > .05, partial η2= 0.003. In contrast, regarding as situational interest, a one-way ANCOVA was conducted and the pre-WIQ as covariate. The results revealed a significant main effect on the treatments, F(1, 229) = 13.56, MSE = 221.169, p = .000 < .05, partial η2= 0.056. The pairwise comparison revealed that students in EG (M = 24.01, SD = 3.84) with a significant greater situational interest than CG (M = 22.08, SD = 4.70).
Students participating in GWE increased the situational interest more than in OWE; on the contrary, the two groups presented similar on the concept of individual interest. According to above findings, this study confirmed that online writing environment with game-based learning approach possible supported the development of situational interest. 4. Conclusions and Discussions The aim of the present study was to examine the effect of writing performance in a game-based learning approach and take into consideration not only in the aspect of cognitive, but also in the aspects of affective and motivational experience. This study compered two writing environment with GWE and OWE that might lead students to have a different experience.
The results showed that a specific GWE practicing produced positive outcomes in three aspects: students’ participation in the number of ideas and the length of composition changed incrementally; students’ writing performance of improved significantly; and game-based learning approach increased students’ situational interest in the writing process. 4.1. Facilitating Students’ Voluntary Participation from Compulsory to Spontaneous Writing Generally speaking, it is meaningless for students to write in the classroom, because in the general situation, it is usually only one teacher to be the reader or evaluator. For students, they lack the opportunity to share their products with others and lack the motivation to write. In addition, the writing topic for students is usually unfamiliar or purely academic, because writing is for the requirements of
422422
school course rather than for the learning need of students. Moreover, students’ writing is usually an individual activity where the student has to produce a text, but do not share with each other. Thus, it is often a compulsory for students to write articles, which leads to students lack of motivation and voluntary participation.
This study explored that the influence of game-based learning approach for students’ participation on writing activity. The findings indicated that the number of writing ideas and the length of composition in GWE increasing significantly more than in OWE. This finding is consistent with previous research. For examples, Allen et al. (2014) found that utilized game with learning activity could increase writing engagement and provide opportunities to practice writing strategies. Our results proved that voluntary participation is a motivational factor, which is more complex than we expected. The findings have emphasized we should consider different tendency and interest of students and provide various writing topic and genre. It is a challenge for teachers to collect and edit approach writing materials. Thus, it is still a huge challenge for researchers to think about how to design and facilitate students’ voluntary participation from compulsory to spontaneous. 4.2. Improving Students’ Writing Performance from Reading to Creating, from Talking to
Revising The study compared two kinds of writing environment, GWE and OWE, in order to understand the influence of game-based approach on writing performance. Students in GWE could build their own island while at the same time practicing K-12 writing skills and concepts. The RCTR (Reading, Creating, Talking, and Revising) model contributed students’ writing performance form reading to creating by implementing the creativity and productive activities about primary students’ reading, creating, talking, and revising experiences. We looked specifically at three level improvements of students during two semesters via linguistic analysis. When students were allowed to explore and create a digital product on their own versus peer interaction. A joyful writing environment of reading, creating, talking, and revising may enable students to compile these skills into practice form learn-to-write to write-to-learn phase. In particularly, students could learn to apply practical knowledge representation and to construct a unique text; students also more sophisticated utilize literacy knowledge, such as naming a title, arranging the ideas, and presenting the statements into their products gradually. This phenomenon proved that GWE may promote these students’ reading, creating, talking, and revising experiences form emergent to conventional phase. 4.3. Increasing Students’ Situational Interest of Writing by Game-based Learning Approach The interest is often a prerequisite for success (Hidi, & Renninger, 2006). There is a high probability that learning will not be successful if it lacks sustainable motivation, or called interest. Moreover, in the present, the results showed GWE could increase students’ situation interest, but it is hard to change students’ individual interest. We speculated that to develop one’s individual interest should take more time rather than provide a different environment. Therefore, we suggested that researchers need to consider diverse strategies which increasing the students’ interest of writing by game-based learning approach. First, the design of self-management learning game should help to keep the students long-term engaging and interacting. For examples, more and more game-like multi-user virtual environment (MUVE) have been developed for educational purpose, such as Quest Atlantis (Barab, Thomas, Dodge, Carteaux, & Tuzun, 2005). Second, the writing topics of interactive games should be consideration. For examples, researchers and teachers could involve in the co-design of new courses and applications of educational games. Final, what kind of situations the sustainable games and stimulative games should be considered. Interesting games could motivate sustainable long-term writing activity and sustain the deep levels of motivation, such as adopted writing course in a semester; stimulative games could motivate short-term learning activity, such as applied a unit of writing course. Acknowledgements The authors would like to thank the Ministry of Science and Technology of the Republic of China, Taiwan, for financial support (MOST 101-2511-S-008 -016 -MY3, MOST 103-2811-S-008 -006 -, and
423423
MOST 102-2811-S-008 -009 -), and Research Center for Science and Technology for Learning, National Central University, Taiwan.
References
Allen, L. K., Crossley, S. A., Snow, E. L., & McNamara, D. S., (2014). L2 writing practice: Game enjoyment as a key to engagement. Language Learning & Technology, 18(2), 124–150.
Barab, S. A., Thomas, M., Dodge, T., Carteaux, R., & Tuzun, H. (2005). Making learning fun: Quest Atlantis, a game without guns. Educational Technology Research and Development, 53(1), 86–107.
Dickey, M. D. (2011). Murder on Grimm Isle: The impact of game narrative design in an educational game-based learning environment. British Journal of Educational Technology, 42(3), 456-469.
Hidi, S., & Renninger, K. A. (2006). The four-phase model of interest development. Educational psychologist, 41(2), 111-127.
Liao, C. C. Y., Chang, W. C., & Chan, T. W. (2014). The Model of “Reading for Creating” and “Talking for Revising” to Improve Students' Writing Quality in Scaffolded Writing and Rewriting Environment, Proceedings of the 22th International Conference on Computers in Education. Nara, Japan: Asia-Pacific Society for Computers in Education.
Liao, C. C. Y., Chang, W. C., & Chan, T. W. (2015). Creation-Island: A Game-Based Writing Environment to Support Students’ Writing Development. In T. Kojiri, T. Supnithi, Y. Wang, Y.-T. Wu, H. Ogata, W. Chen, S. C. Kong, & F. Qiu (Eds.), Proceedings of the 23rd International Conference on Computers in Education.Hangzhou, China: Asia-Pacific Society for Computers in Education.
McNamara, D. S., Crossley, S. A., & McCarthy, P. M. (2010). Linguistic features of writing quality. Written Communication, 27, 57-86.
Proske, A., Roscoe, R. D., & McNamara, D. S. (2014). Game-based practice versus traditional practice in computer-based writing strategy training: effects on motivation and achievement. Educational Technology Research and Development, 62(5), 481-505.
Roscoe, R. D., & McNamara, D. S. (2013). Writing pal: Feasibility of an intelligent writing strategy tutor in the high school classroom. Journal of Educational Psychology, 105(4), 1010.
Schraw, G., & Lehman, S. (2001). Situational interest: A review of the literature and directions for future research. Educational Psychology Review, 13(1), 23-52.
Squire, K. D., & Jan, M. (2007). Mad City Mystery: Developing scientific argumentation skills with a place-based augmented reality game on handheld computers. Journal of Science Education and Technology, 16(1), 5-29.
Sung, Y. T., Chen, J. L., Lee, Y. S., Cha, J. H., Tseng, H. C., Lin, W. C., Chang, T. H., & Chang, K. E. (2013). Investigating Chinese Text Readability: Linguistic Features, Modeling, and Validation. Chinese Journal of Psychology, 55(1), 75-106.
Thomas, D. & Brown, J. S. (2007). The play of imagination: extending the literary mind. Games and Culture, 2, 2, 149–177.
Weston, J. L., Crossley, S.A., McCarthy, P.M., & McNamara, D.S. (2011). Number of words versus number of ideas: Finding a better predictor of writing quality. In R. C. Murray & P. M. McCarthy (Eds.), Proceedings of the 24th International Florida Artificial Intelligence Research Society (FLAIRS) Conference (pp. 335-340). Menlo Park, CA: AAAI Press.
424424
Chen, W. et al. (Eds.) (2016). Proceedings of the 24th International Conference on Computers in Education.India: Asia-Pacific Society for Computers in Education
Wearable Learning Technologies for Math onSmartWatches: a feasibility study
Jonathan DL. CASANOa*, Ivon ARROYOb, Jenilyn L. AGAPITOa, Ma. Mercedes T. RODRIGOa
aAteneo de Manila UniversitybWorcester Polytechnic Institute
Abstract: A theory of cognition called embodied cognition believes that the development ofthinking skills is distributed among mind, senses and the environment. Research into this fieldhas resulted into the development of applications in different areas including Mathematics. Thispaper reports one part of a larger series of studies on the design and implementation ofembodied cognition of Mathematics educational systems. We describe the migration andevaluation of a game called "Estimate It", a wearables-based game for teaching measurementestimation and geometry. Experts were invited to evaluate the game, for which a generallypositive rating was acquired. The game's collaborative nature, its hands-on way of teachingestimation, and the incorporation of technology were seen as promising points. Infrastructurereadiness, classroom control and adjustment to the new technology were areas of concern.
Keywords: Embodied Cognition, Wearable Learning, Ubiquitous Learning, Mobile Devices
1. Introduction
Cognition has traditionally been viewed from a narrow perspective where the body has mostly a sensoryand motor function, subordinate to central cognitive processing. In recent years, though, cognition hastaken on a broader perspective in which it is believed to be distributed among mind, senses, motorcapabilities, and social interactions (Wilson and Foglia, 2011). This theory of cognition, calledembodied cognition, assumes that sensory perceptions, motor functions, and sociocultural contextsshape the structure and development of thinking skills including mathematical abilities andhigher-ordered abstract reasoning, as well as sense-making in general (Hornecker & Buur, 2006; Redish& Kuo, 2015).
In this paper, we report part of a larger study about the design and implementation of embodiedcognition of mathematics educational systems. We describe Estimate it!, a wearables-based game forteaching size estimation. We then summarize the results of an expert review of the application. Weattempt to answer the following questions:
1. In what ways is this method of teaching estimation superior (or inferior) to traditional ones?2. What student characteristics (intellectual, social, cultural) might make the application
suitable (or not suitable) for teaching estimation?
2. Prior Work
The work described in this paper is the continuation of work described in Arroyo (Cyberlearning watch)(Arroyo, 2016). The Cyberlearning Watch is a device that students wear on their wrist to receive cluesthat help them search for geometric pieces that may be hidden. As they complete the tasks, they receivecorrectness feedback via the watch’s display, buzzers, or lights, making the student’s experienceimmersive and interesting.
We migrated the Arduino-based framework to an Android-based and Tizen-based system. Todemonstrate the system’s functionality, we specifically migrated the game Estimate It! (Rountree,2015) and asked a group of grade school mathematics teachers to evaluate it. In Estimate It!, studentsreceive clues such as “Find a rectangle 2’ wide by 14’ long and have to traverse a physical spacesearching for objects, being provided with specific measurement tools such as a 12” dowel withoutmarkings which encourages rounding, and either partitioning or subsequent placing of the stick to
425425
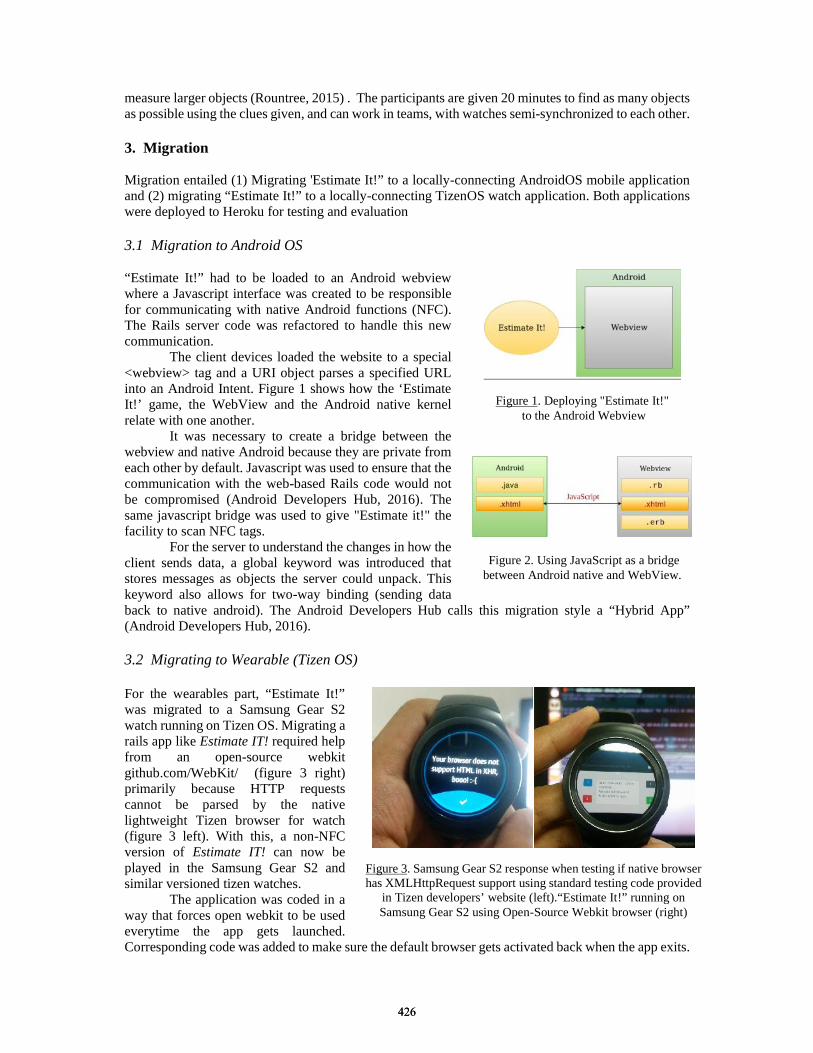
measure larger objects (Rountree, 2015) . The participants are given 20 minutes to find as many objectsas possible using the clues given, and can work in teams, with watches semi-synchronized to each other.
3. Migration
Migration entailed (1) Migrating 'Estimate It!” to a locally-connecting AndroidOS mobile applicationand (2) migrating “Estimate It!” to a locally-connecting TizenOS watch application. Both applicationswere deployed to Heroku for testing and evaluation
3.1 Migration to Android OS
“Estimate It!” had to be loaded to an Android webviewwhere a Javascript interface was created to be responsiblefor communicating with native Android functions (NFC).The Rails server code was refactored to handle this newcommunication.
The client devices loaded the website to a special<webview> tag and a URI object parses a specified URLinto an Android Intent. Figure 1 shows how the ‘EstimateIt!’ game, the WebView and the Android native kernelrelate with one another.
It was necessary to create a bridge between thewebview and native Android because they are private fromeach other by default. Javascript was used to ensure that thecommunication with the web-based Rails code would notbe compromised (Android Developers Hub, 2016). Thesame javascript bridge was used to give "Estimate it!" thefacility to scan NFC tags.
For the server to understand the changes in how theclient sends data, a global keyword was introduced thatstores messages as objects the server could unpack. Thiskeyword also allows for two-way binding (sending databack to native android). The Android Developers Hub calls this migration style a “Hybrid App”(Android Developers Hub, 2016).
3.2 Migrating to Wearable (Tizen OS)
For the wearables part, “Estimate It!”was migrated to a Samsung Gear S2watch running on Tizen OS. Migrating arails app like Estimate IT! required helpfrom an open-source webkitgithub.com/WebKit/ (figure 3 right)primarily because HTTP requestscannot be parsed by the nativelightweight Tizen browser for watch(figure 3 left). With this, a non-NFCversion of Estimate IT! can now beplayed in the Samsung Gear S2 andsimilar versioned tizen watches.
The application was coded in away that forces open webkit to be usedeverytime the app gets launched.Corresponding code was added to make sure the default browser gets activated back when the app exits.
Figure 1. Deploying "Estimate It!"to the Android Webview
Figure 2. Using JavaScript as a bridgebetween Android native and WebView.
Figure 3. Samsung Gear S2 response when testing if native browserhas XMLHttpRequest support using standard testing code provided
in Tizen developers’ website (left).“Estimate It!” running onSamsung Gear S2 using Open-Source Webkit browser (right)
426426
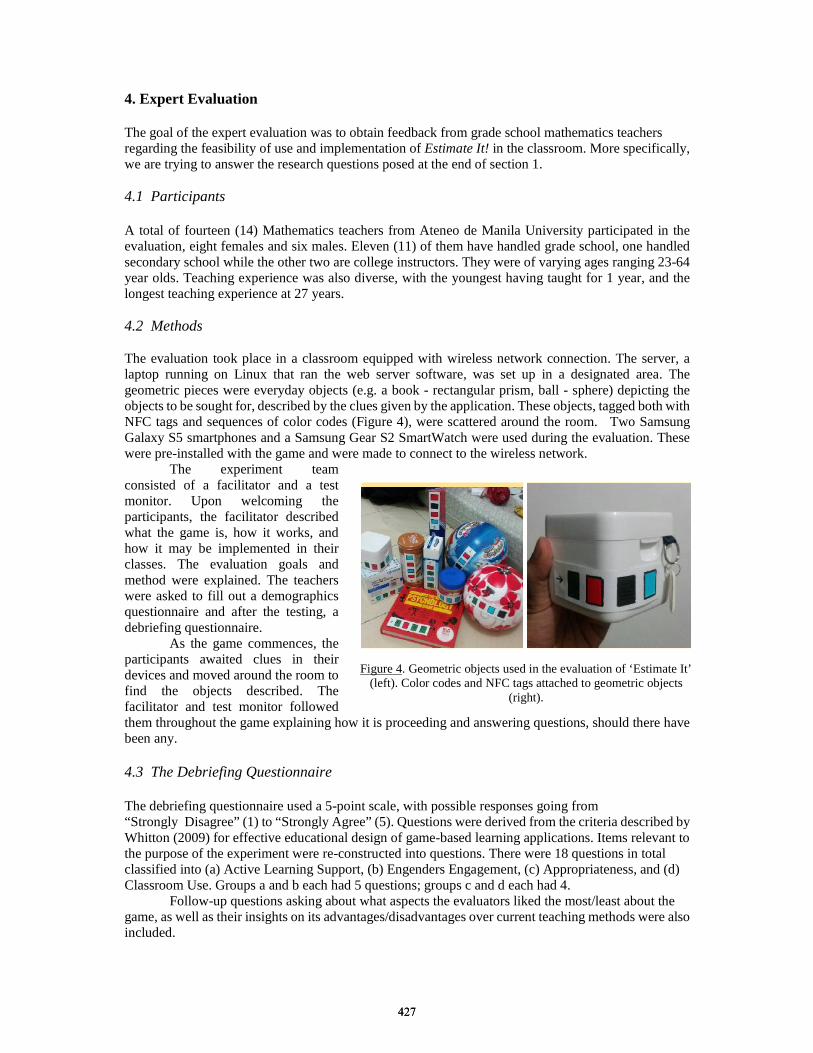
4. Expert Evaluation
The goal of the expert evaluation was to obtain feedback from grade school mathematics teachersregarding the feasibility of use and implementation of Estimate It! in the classroom. More specifically,we are trying to answer the research questions posed at the end of section 1.
4.1 Participants
A total of fourteen (14) Mathematics teachers from Ateneo de Manila University participated in theevaluation, eight females and six males. Eleven (11) of them have handled grade school, one handledsecondary school while the other two are college instructors. They were of varying ages ranging 23-64year olds. Teaching experience was also diverse, with the youngest having taught for 1 year, and thelongest teaching experience at 27 years.
4.2 Methods
The evaluation took place in a classroom equipped with wireless network connection. The server, alaptop running on Linux that ran the web server software, was set up in a designated area. Thegeometric pieces were everyday objects (e.g. a book - rectangular prism, ball - sphere) depicting theobjects to be sought for, described by the clues given by the application. These objects, tagged both withNFC tags and sequences of color codes (Figure 4), were scattered around the room. Two SamsungGalaxy S5 smartphones and a Samsung Gear S2 SmartWatch were used during the evaluation. Thesewere pre-installed with the game and were made to connect to the wireless network.
The experiment teamconsisted of a facilitator and a testmonitor. Upon welcoming theparticipants, the facilitator describedwhat the game is, how it works, andhow it may be implemented in theirclasses. The evaluation goals andmethod were explained. The teacherswere asked to fill out a demographicsquestionnaire and after the testing, adebriefing questionnaire.
As the game commences, theparticipants awaited clues in theirdevices and moved around the room tofind the objects described. Thefacilitator and test monitor followedthem throughout the game explaining how it is proceeding and answering questions, should there havebeen any.
4.3 The Debriefing Questionnaire
The debriefing questionnaire used a 5-point scale, with possible responses going from“Strongly Disagree” (1) to “Strongly Agree” (5). Questions were derived from the criteria described byWhitton (2009) for effective educational design of game-based learning applications. Items relevant tothe purpose of the experiment were re-constructed into questions. There were 18 questions in totalclassified into (a) Active Learning Support, (b) Engenders Engagement, (c) Appropriateness, and (d)Classroom Use. Groups a and b each had 5 questions; groups c and d each had 4.
Follow-up questions asking about what aspects the evaluators liked the most/least about thegame, as well as their insights on its advantages/disadvantages over current teaching methods were alsoincluded.
Figure 4. Geometric objects used in the evaluation of ‘Estimate It’
(left). Color codes and NFC tags attached to geometric objects(right).
427427
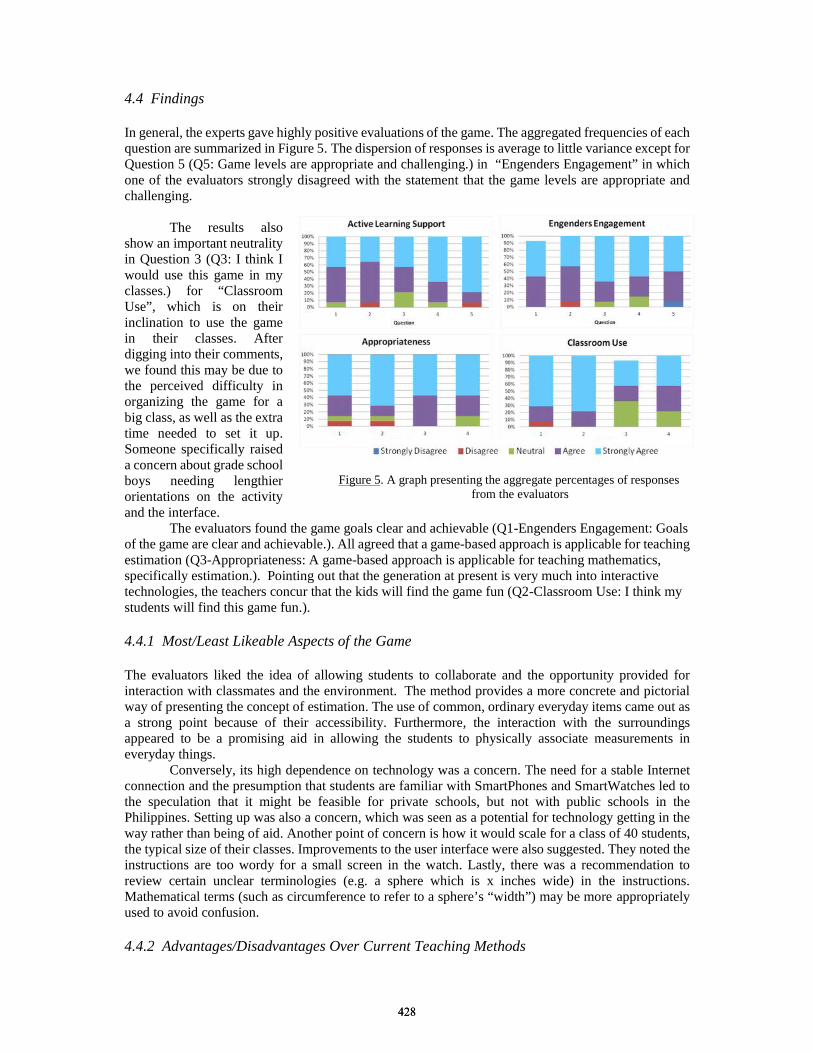
4.4 Findings
In general, the experts gave highly positive evaluations of the game. The aggregated frequencies of eachquestion are summarized in Figure 5. The dispersion of responses is average to little variance except forQuestion 5 (Q5: Game levels are appropriate and challenging.) in “Engenders Engagement” in whichone of the evaluators strongly disagreed with the statement that the game levels are appropriate andchallenging.
The results alsoshow an important neutralityin Question 3 (Q3: I think Iwould use this game in myclasses.) for “ClassroomUse”, which is on theirinclination to use the gamein their classes. Afterdigging into their comments,we found this may be due tothe perceived difficulty inorganizing the game for abig class, as well as the extratime needed to set it up.Someone specifically raiseda concern about grade schoolboys needing lengthierorientations on the activityand the interface.
The evaluators found the game goals clear and achievable (Q1-Engenders Engagement: Goalsof the game are clear and achievable.). All agreed that a game-based approach is applicable for teachingestimation (Q3-Appropriateness: A game-based approach is applicable for teaching mathematics,specifically estimation.). Pointing out that the generation at present is very much into interactivetechnologies, the teachers concur that the kids will find the game fun (Q2-Classroom Use: I think mystudents will find this game fun.).
4.4.1 Most/Least Likeable Aspects of the Game
The evaluators liked the idea of allowing students to collaborate and the opportunity provided forinteraction with classmates and the environment. The method provides a more concrete and pictorialway of presenting the concept of estimation. The use of common, ordinary everyday items came out asa strong point because of their accessibility. Furthermore, the interaction with the surroundingsappeared to be a promising aid in allowing the students to physically associate measurements ineveryday things.
Conversely, its high dependence on technology was a concern. The need for a stable Internetconnection and the presumption that students are familiar with SmartPhones and SmartWatches led tothe speculation that it might be feasible for private schools, but not with public schools in thePhilippines. Setting up was also a concern, which was seen as a potential for technology getting in theway rather than being of aid. Another point of concern is how it would scale for a class of 40 students,the typical size of their classes. Improvements to the user interface were also suggested. They noted theinstructions are too wordy for a small screen in the watch. Lastly, there was a recommendation toreview certain unclear terminologies (e.g. a sphere which is x inches wide) in the instructions.Mathematical terms (such as circumference to refer to a sphere’s “width”) may be more appropriatelyused to avoid confusion.
4.4.2 Advantages/Disadvantages Over Current Teaching Methods
Figure 5. A graph presenting the aggregate percentages of responsesfrom the evaluators
428428
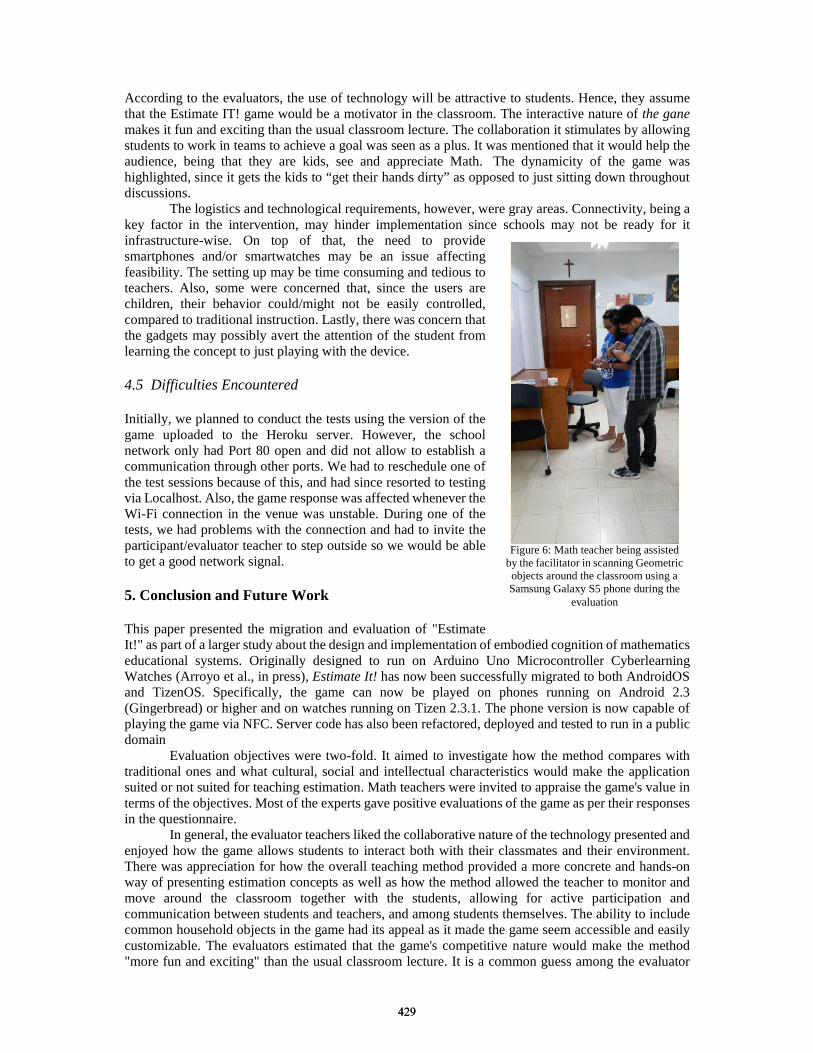
According to the evaluators, the use of technology will be attractive to students. Hence, they assumethat the Estimate IT! game would be a motivator in the classroom. The interactive nature of the ganemakes it fun and exciting than the usual classroom lecture. The collaboration it stimulates by allowingstudents to work in teams to achieve a goal was seen as a plus. It was mentioned that it would help theaudience, being that they are kids, see and appreciate Math. The dynamicity of the game washighlighted, since it gets the kids to “get their hands dirty” as opposed to just sitting down throughoutdiscussions.
The logistics and technological requirements, however, were gray areas. Connectivity, being akey factor in the intervention, may hinder implementation since schools may not be ready for itinfrastructure-wise. On top of that, the need to providesmartphones and/or smartwatches may be an issue affectingfeasibility. The setting up may be time consuming and tedious toteachers. Also, some were concerned that, since the users arechildren, their behavior could/might not be easily controlled,compared to traditional instruction. Lastly, there was concern thatthe gadgets may possibly avert the attention of the student fromlearning the concept to just playing with the device.
4.5 Difficulties Encountered
Initially, we planned to conduct the tests using the version of thegame uploaded to the Heroku server. However, the schoolnetwork only had Port 80 open and did not allow to establish acommunication through other ports. We had to reschedule one ofthe test sessions because of this, and had since resorted to testingvia Localhost. Also, the game response was affected whenever theWi-Fi connection in the venue was unstable. During one of thetests, we had problems with the connection and had to invite theparticipant/evaluator teacher to step outside so we would be ableto get a good network signal.
5. Conclusion and Future Work
This paper presented the migration and evaluation of "EstimateIt!" as part of a larger study about the design and implementation of embodied cognition of mathematicseducational systems. Originally designed to run on Arduino Uno Microcontroller CyberlearningWatches (Arroyo et al., in press), Estimate It! has now been successfully migrated to both AndroidOSand TizenOS. Specifically, the game can now be played on phones running on Android 2.3(Gingerbread) or higher and on watches running on Tizen 2.3.1. The phone version is now capable ofplaying the game via NFC. Server code has also been refactored, deployed and tested to run in a publicdomain
Evaluation objectives were two-fold. It aimed to investigate how the method compares withtraditional ones and what cultural, social and intellectual characteristics would make the applicationsuited or not suited for teaching estimation. Math teachers were invited to appraise the game's value interms of the objectives. Most of the experts gave positive evaluations of the game as per their responsesin the questionnaire.
In general, the evaluator teachers liked the collaborative nature of the technology presented andenjoyed how the game allows students to interact both with their classmates and their environment.There was appreciation for how the overall teaching method provided a more concrete and hands-onway of presenting estimation concepts as well as how the method allowed the teacher to monitor andmove around the classroom together with the students, allowing for active participation andcommunication between students and teachers, and among students themselves. The ability to includecommon household objects in the game had its appeal as it made the game seem accessible and easilycustomizable. The evaluators estimated that the game's competitive nature would make the method"more fun and exciting" than the usual classroom lecture. It is a common guess among the evaluator
Figure 6: Math teacher being assistedby the facilitator in scanning Geometricobjects around the classroom using aSamsung Galaxy S5 phone during the
evaluation
429429
teachers that the injection of technology would be seen by students as attractive and motivating to them.These strong points made Estimate It! seem like a promising aid to teach and cover estimation conceptsas part of the curriculum.
At the same time, there were areas of concern among the evaluators, that we may consider“cultural” concerns. There was a common worry that implementation of the game in schools may behindered because schools may not be ready for the technology infrastructure-wise. In particular, a stableInternet connection was one that was repeatedly mentioned. Acquiring devices (SmartWatches orSmartPhones) for students to use might already be difficult. Others worried that setting up the gamemight be too tedious for some teachers, and one particularly disliked how playing the game rids thestudents of the process of writing down their math. One evaluator urged the researchers to reflect onhow the game can accommodate a class of 40 students as most classes in their school are approximatelyof this size. Evaluators also dwelled on the propensity of students to misbehave while playing and onthe possibility of going off-task because of other interesting applications in the device.
In light of the feedback, we can summarize that the evaluators seemed open to the idea ofadopting a game-based reinforcement in their math classes. As one respondent has put it, "Whenexecuted well, the advantages of Estimate It! will outweigh the disadvantages".
Moving forward, an iteration of the game that accommodates the findings in this paper may becreated and afterwards tested with students to assess how they would respond to this new way ofteaching estimation. Given that previous evaluations had respondents that came from the United States,perhaps an evaluation of how this new method may affect the performance and understanding ofestimation of Filipino students can be conducted. Results can then be compared to discover similaritiesand differences.
Acknowledgments
We would like to thank the teacher experts for responding to the invitation to evaluate the game. Wethank the Ateneo Laboratory for the Learning Sciences (ALLS) for the acquisition of items needed forthe migration and the experiments (Samsung Gear S2, respondent tokens, toys and NFC tags etc.). Wethank the Department of Information Systems and Computer Science (DISCS) for allowing us to usecomputer laboratories in order to conduct the evaluation.
References
Arroyo, Ivon. Touch, Play Learn and... Watch: Toward Embodied Cognition based Intelligent Tutoring Systems.ITS2016
Android NFC and Mobile Development Stacks for Web. Accessed 20 May 2016 fromhttps://developer.android.com/reference/android/nfc/package-summary.html
Esteves, A. (2012, February). Designing tangible interaction for embodied facilitation. In Proceedings of the SixthInternational Conference on Tangible, Embedded and Embodied Interaction (pp. 395-396). ACM.
Esteves, A., van den Hoven, E., & Oakley, I. (2013, February). Physical games or digital games?: comparingsupport for mental projection in tangible and virtual representations of a problem-solving task.In Proceedings of the 7th International Conference on Tangible, Embedded and Embodied Interaction (pp.167-174). ACM.
Redish, E. F., & Kuo, E. (2015). Language of physics, language of math: Disciplinary culture and dynamicepistemology. Science & Education, 24(5-6), 561-590.
Rountree, W. L. (2015) Redesigning Traditional Children’s Games to Teach Number Sense and ReinforceMeasurement Estimation Skills Using Wearable Technology (Master’s Thesis).
Schaper, M. M., Malinverni, L., & Pares, N. (2014, November). Participatory design methods to defineeducational goals for full-body interaction. InProceedings of the 11th Conference on Advances in ComputerEntertainment Technology (p. 50). ACM.
Tizen native application development tutorials and developers forum. Accessed Feb 1, 2016 fromhttps://developer.tizen.org/forums/native-application-development/active
Whitton, N. (2009). Learning and teaching with computer games in higher education. Game-based LearningAdvancements for Multi-Sensory Human Computer Interfaces: Techniques and Effective Practices. ThomasConnally, Mark Stansfield and Liz Boyle editors. Information Science Reference, Hershey-New York.
Wilson, R. A., & Foglia, L. (2011). Embodied cognition. Accessed 26 April 2016 fromhttp://stanford.library.usyd.edu.au/entries/embodied-cognition/http://stanford.library.usyd.edu.au/entries/embodied-cognition/
430430
Chen, W. et al. (Eds.) (2016). Proceedings of the 24th
International Conference on Computers in Education.
India: Asia-Pacific Society for Computers in Education
Transference of Learning from Play with iPads
in Early Childhood
Gretchen GENG, Leigh DISNEY & Jon MASON*
International Graduate Centre of Education, Charles Darwin University, Australia
Abstract: Whether it is the alphabet, a song, or knowledge of touchscreen navigation, young
children now routinely learn many things while playing with iPads and similar devices. Despite
this child-friendly technology clearly stimulating engagement there also exist significant
debates about this topic among early childhood education professionals. This paper reports on a
small research project that investigates: a) whether touch screen digital devices can provide
young children with practical and educational information; b) whether these children can
transfer their learning through individual play with such devices; c) what factors need to be
considered that could improve the learning outcomes of young children; and, d) how young
children manifest their learning outcomes. Through an observational case-study that involved
young (2-year old) children we observed the transfer of learning from 2D sources to 3D objects
and the ability of these children in drawing 2D images from understanding 3D objects.
Although a video deficit effect showed young children displaying poorer ability in transferring
learning from 2D sources to 3D objects relative to their ability to do likewise from a live
demonstration, these children were effective at transferring their learning from 2D sources to
3D objects. However, it was also found that to be effective requires multiple presentations,
experience and assistance of language cues to scaffold their understanding. These findings
suggest that parents and teachers could further examine the value of using 2D sources, such as
television, videos, computers and touch screens in this way.
Keywords: Touch screen technology, learning transfer, iPad, play, childhood
1. Introduction
Teaching and learning in early childhood education has a long history of development and debate (Berk,
2013; Whitebread & Coltman, 2015). Today, with the stimulus of innovations in digital technology and
increased exposure of developmental issues in the media, there is increasing attention from parents,
early childhood educators and higher education institutions that teach early childhood educators. But
while technology can be seen to have stimulated engagement it has also been a topic for debate with the
efficacy of touch screen technologies such as iPads commonly discussed and explored.
There exists an increasing variety of tablets available for personal and technical use worldwide.
In marketing the benefits of iPads for developing fine motor skills, Apple (2011) explains that their
product “features a large, high-precision, touch-sensitive display that requires no physical force, just
simple contact with its surface”. More and more young children in the developed world have access to
these devices and special apps have been designed specifically for early childhood education. As a
consequence there exists a need to investigate the use of iPads in children’s learning, particularly in
terms of their transference of knowledge and skills. This paper investigates this issue from a small
case-study with immediate connection with this theorised field.
In previous studies, children’s knowledge transfer when using educational media has been
emphasised. For example, Linebarger and Walker (2004) observed that language development of
infants and toddlers can be transferred from viewing television although they also highlighted the
importance of content and program type when describing media effects. In another study Vandewater et
al (2007) provide important results regarding the extent of media use among young children; however,
they emphasised the role of a media-saturated environment in which media and technology are playing
an increasing and crucial role in young children’s daily life. Hayne (2004) stated that there are
significant developmental changes which can occur in young children’s learning particularly when they
431431
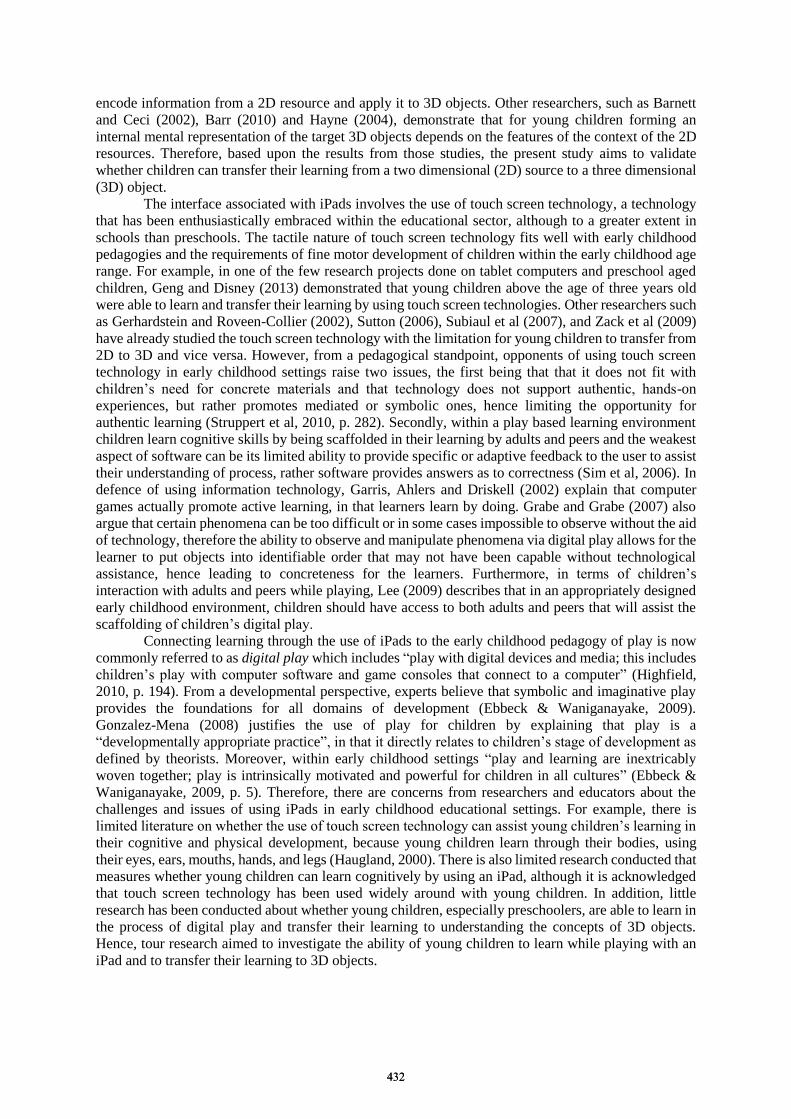
encode information from a 2D resource and apply it to 3D objects. Other researchers, such as Barnett
and Ceci (2002), Barr (2010) and Hayne (2004), demonstrate that for young children forming an
internal mental representation of the target 3D objects depends on the features of the context of the 2D
resources. Therefore, based upon the results from those studies, the present study aims to validate
whether children can transfer their learning from a two dimensional (2D) source to a three dimensional
(3D) object.
The interface associated with iPads involves the use of touch screen technology, a technology
that has been enthusiastically embraced within the educational sector, although to a greater extent in
schools than preschools. The tactile nature of touch screen technology fits well with early childhood
pedagogies and the requirements of fine motor development of children within the early childhood age
range. For example, in one of the few research projects done on tablet computers and preschool aged
children, Geng and Disney (2013) demonstrated that young children above the age of three years old
were able to learn and transfer their learning by using touch screen technologies. Other researchers such
as Gerhardstein and Roveen-Collier (2002), Sutton (2006), Subiaul et al (2007), and Zack et al (2009)
have already studied the touch screen technology with the limitation for young children to transfer from
2D to 3D and vice versa. However, from a pedagogical standpoint, opponents of using touch screen
technology in early childhood settings raise two issues, the first being that that it does not fit with
children’s need for concrete materials and that technology does not support authentic, hands-on
experiences, but rather promotes mediated or symbolic ones, hence limiting the opportunity for
authentic learning (Struppert et al, 2010, p. 282). Secondly, within a play based learning environment
children learn cognitive skills by being scaffolded in their learning by adults and peers and the weakest
aspect of software can be its limited ability to provide specific or adaptive feedback to the user to assist
their understanding of process, rather software provides answers as to correctness (Sim et al, 2006). In
defence of using information technology, Garris, Ahlers and Driskell (2002) explain that computer
games actually promote active learning, in that learners learn by doing. Grabe and Grabe (2007) also
argue that certain phenomena can be too difficult or in some cases impossible to observe without the aid
of technology, therefore the ability to observe and manipulate phenomena via digital play allows for the
learner to put objects into identifiable order that may not have been capable without technological
assistance, hence leading to concreteness for the learners. Furthermore, in terms of children’s
interaction with adults and peers while playing, Lee (2009) describes that in an appropriately designed
early childhood environment, children should have access to both adults and peers that will assist the
scaffolding of children’s digital play.
Connecting learning through the use of iPads to the early childhood pedagogy of play is now
commonly referred to as digital play which includes “play with digital devices and media; this includes
children’s play with computer software and game consoles that connect to a computer” (Highfield,
2010, p. 194). From a developmental perspective, experts believe that symbolic and imaginative play
provides the foundations for all domains of development (Ebbeck & Waniganayake, 2009).
Gonzalez-Mena (2008) justifies the use of play for children by explaining that play is a
“developmentally appropriate practice”, in that it directly relates to children’s stage of development as
defined by theorists. Moreover, within early childhood settings “play and learning are inextricably
woven together; play is intrinsically motivated and powerful for children in all cultures” (Ebbeck &
Waniganayake, 2009, p. 5). Therefore, there are concerns from researchers and educators about the
challenges and issues of using iPads in early childhood educational settings. For example, there is
limited literature on whether the use of touch screen technology can assist young children’s learning in
their cognitive and physical development, because young children learn through their bodies, using
their eyes, ears, mouths, hands, and legs (Haugland, 2000). There is also limited research conducted that
measures whether young children can learn cognitively by using an iPad, although it is acknowledged
that touch screen technology has been used widely around with young children. In addition, little
research has been conducted about whether young children, especially preschoolers, are able to learn in
the process of digital play and transfer their learning to understanding the concepts of 3D objects.
Hence, tour research aimed to investigate the ability of young children to learn while playing with an
iPad and to transfer their learning to 3D objects.
432432

2. Methods
This research used qualitative research methodology in which an observational case study was
undertaken: “a case study of a current phenomenon for which observations could be used to supplement
documents and interviews is called an observational case study” (Wiersma & Jurs, 2009, p. 241).
Denzin and Lincoln (2005) stated that observation is a fundamental basis in the social and behavioral
sciences; and it is possible to conduct observations in settings that are natural loci of those activities that
may be the result of a controlled experiment.
“Young children draw what they know while older children draw what they see” (Willats,
2005, p. 23), and children learn to draw and draw to learn (Anning, 2002). In this study, children’s
drawings were used as an assessment method against their learning outcomes. Drawings are one of the
most primitive forms of children’s expression and communication (Mitchell & Ziegler, 2007; Young &
Noel, 2006). Drawings have been regarded as an effective means for children to explore their
understandings (Steel, 1999). Cox (2005) further states that drawing is a constructive way of
thinking-in-action; and, by paying attention to their narratives and interpretations as they draw, we can
learn about children’s experience and views (Veale, 2005). In Einarsdottira et al (2009) children’s
drawings were used to assist teachers in examining the beliefs and values underlying their pedagogical
practices. In addition, the longitudinal study of young children drawing by Anne and Ring (2004) has
extended our understanding of drawing as a tool for constructing and sharing meaning.
2.1 Participants
Five children (3 females and 2 males) participated in this research. They were all normally developed
children with no specific needs. They were labeled as Child A, B, C, D and E. Child E was 2 years 5
months old, and all the other four children were between 3 years 0 months to 3 years 7 months.
2.2 Procedure
The research was conducted in five quiet households in Australia and China during February to
December, 2011. Each child was invited to play an iPad game/program called Animals 360 (Figure 1).
The colourful game/app was designed to enable different ways of exploring, such as introducing
animals’ habits, eating, sounds and living status. Children can play the app by watching videos,
touching screens to listen to different sounds, and browsing different pictures. Some simple tasks, such
as a taking a tour and quizzes also facilitate engagement. Each child was allowed 30 minutes to play the
game. After the 30 minutes, they were asked to draw a picture of a cat with pen and paper. Observation
was undertaken with the minimum of disruption during the procedure. Children were allowed to talk
and interpret their drawings during the period. Notes of children’s answers were taken.
Figure 1. Animals 360 (https://itunes.apple.com/au/app/animals-360/id339158840?mt=8)
3. Results
Four children out of the five played the iPad game continuously for 30 minutes, while the youngest
child (Child E), who was 2 years and 5 months, only spent approximately15 minutes on playing the
game. However, all of the five participants demonstrated their understanding of the image of a cat in the
iPad game, by pronouncing clearly and correctly the word “cat” while playing the game and drawing
their cats.
433433
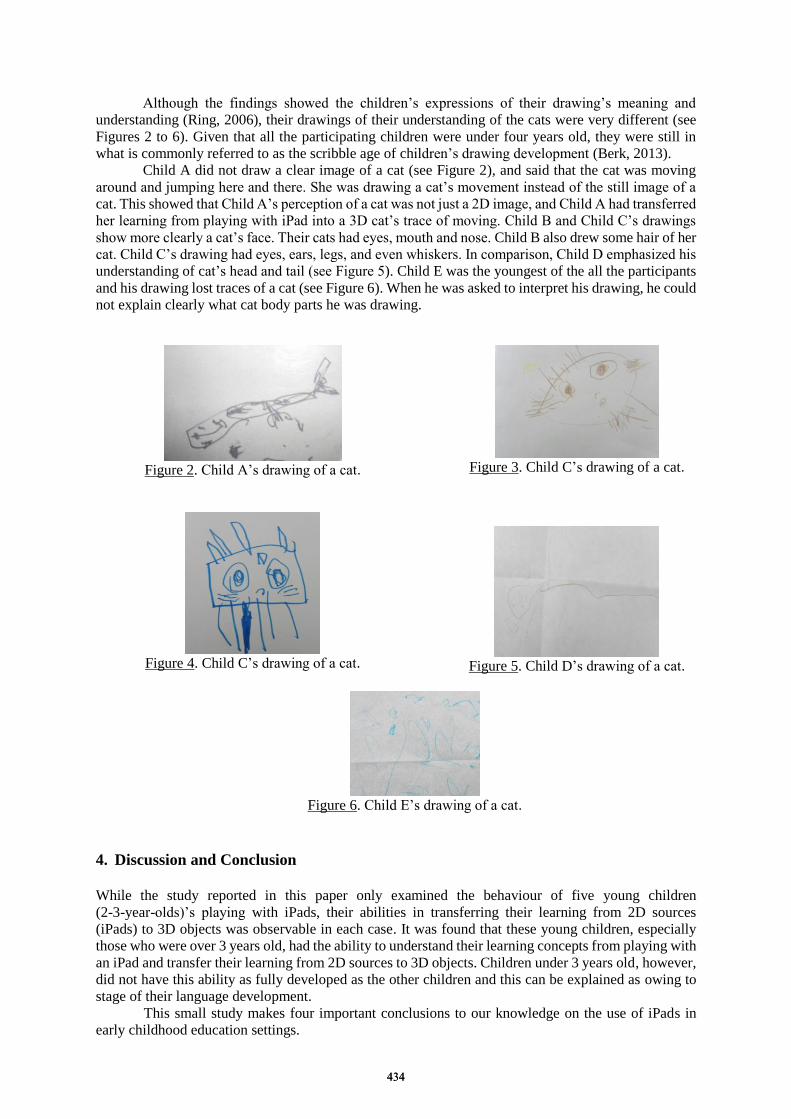
Although the findings showed the children’s expressions of their drawing’s meaning and
understanding (Ring, 2006), their drawings of their understanding of the cats were very different (see
Figures 2 to 6). Given that all the participating children were under four years old, they were still in
what is commonly referred to as the scribble age of children’s drawing development (Berk, 2013).
Child A did not draw a clear image of a cat (see Figure 2), and said that the cat was moving
around and jumping here and there. She was drawing a cat’s movement instead of the still image of a
cat. This showed that Child A’s perception of a cat was not just a 2D image, and Child A had transferred
her learning from playing with iPad into a 3D cat’s trace of moving. Child B and Child C’s drawings
show more clearly a cat’s face. Their cats had eyes, mouth and nose. Child B also drew some hair of her
cat. Child C’s drawing had eyes, ears, legs, and even whiskers. In comparison, Child D emphasized his
understanding of cat’s head and tail (see Figure 5). Child E was the youngest of the all the participants
and his drawing lost traces of a cat (see Figure 6). When he was asked to interpret his drawing, he could
not explain clearly what cat body parts he was drawing.
Figure 2. Child A’s drawing of a cat.
Figure 4. Child C’s drawing of a cat.
Figure 3. Child C’s drawing of a cat.
Figure 5. Child D’s drawing of a cat.
Figure 6. Child E’s drawing of a cat.
4. Discussion and Conclusion
While the study reported in this paper only examined the behaviour of five young children
(2-3-year-olds)’s playing with iPads, their abilities in transferring their learning from 2D sources
(iPads) to 3D objects was observable in each case. It was found that these young children, especially
those who were over 3 years old, had the ability to understand their learning concepts from playing with
an iPad and transfer their learning from 2D sources to 3D objects. Children under 3 years old, however,
did not have this ability as fully developed as the other children and this can be explained as owing to
stage of their language development.
This small study makes four important conclusions to our knowledge on the use of iPads in
early childhood education settings.
434434
1. Touch screen technology on tablets such as iPads can provide young children, in particular
children over 3 years old, with access to practical and educational information about learning
via an individual or personal media platform like books. Such technology is quite distinct from
other electronic media such as whiteboards, videos, or Television. A transfer of learning across
content and context (Barnett & Ceci, 2002; Hayne, 2004; Linebarger, D & Walker, D; 2005;
Vandewater et al., 2007) was observed for children over 3 years old while playing with such
touch screen devices.
2. Although four participating children demonstrated their understanding of a cat, none of them
could draw a whole cat image. For example, Child A only drew the movement of the cats and
Child B, C and D could only draw their memories of some important cat body parts. This may
be explained as (a) children’s understanding from playing the iPad game being linked with their
thinking, talking and reading from the images and (b) iPad games providing the children with
higher task complexity but disrupting their transfer of learning (Yang & Noel, 2006). However,
the findings are consistent with findings from Willats (2005) and Yang and Noel (2006) that
young children draw based upon their knowing, while older children draw based on their seeing
and their drawings were linked to their thinking, talking and reading.
3. Young children could learn and develop their cognitive skills while they were playing (Garries
et al, 2002); and only ‘playing’ with an iPad individually might not help young children learn or
grasp the knowledge completely or correctly. It was found that none of the participating
children received what might be regarded as adequate feedback from the game itself while they
were playing apart from responding to their touch-based input; therefore, their responses in
their drawings were very different. Playing an iPad individually may contribute to the
differences, although information technology should provide answers to learners as to
correctness. This finding supports Lee’s (2009) findings that assistance from teachers or peers’
interaction plays an important role in scaffolding children’s digital play.
4. When the children were exposed to a variety of different experiences of learning, such as touch
screens, their understanding is further developed when they experience multiple
representations, such as language cues. Together, these multiple cues can be seen to facilitate
their transference of learning, especially for children over 3 years old. However, for children
under 3 years old in this study, it was found that the use of drawing and language cues could not
scaffold their understanding of concepts. For example, Child E had not yet developed the
language communicative abilities, making it difficult to interpret his drawing. These findings
are consistent with Mitchell and Ziegler (2007) finding that drawings are one of the most
primitive forms of children’s expression and communication and also consistent with the
statement that drawing and accompanying narrative are integral parts of the meaning-making
process (Cox, 2005; Einarsdottira et al, 2009).
There are a number of limitations of this research. The data was solely based upon five children,
which clearly limits any generalisation among other children. Only one iPad app was used in this study.
All the five children were asked to play individually; therefore no collaborative play was studied. In
addition, adults’ assistance for these children was not studied either. As a consequence, a number of
future research directions can be identified. Further research needs to be conducted with more
participating children from different age groups, more iPad apps, involving a range of different
curricula – larger samples might enable in-depth exploration using quantitative content analysis or behavioural
analysis. Investigating young children’s interaction while playing iPads in pairs or groups as well as the
impact of how teachers or carers could be empowered also look like worthwhile topics for future
research.
References
Anning, A. (2002). Conversations around young children’s drawing: The impact of the beliefs of significant
others at home and school. Journal of Art and Design Education 21(3): 197–208.
Anning, A. & Ring, K. (2004). Making sense of children’s drawings. Maidenhead: Open University Press.
Apple (2011). Accessibility: physical and motor skills. Retrieved 18 February 2012 from:
http://www.apple.com/au/accessibility/ipad/physical.html
435435

Barnett, S.M. & Ceci, S.J. (2002). When and where do we apply what we learn? A taxonomy for far transfer.
Psychological Bulletin 128, 612–637.
Barr, R. (2010). Transfer of learning between 2D and 3D sources during infancy: Informing theory and practice.
Developmental Review 30, 128–154.
Berk, E. (2013).. Child Development (9th
Edn). Boston: Pearson.
Cox, S. (2005). Intention and meaning in young children’s drawing. International Journal of Art and Design
Education 24(2), 115–125.
Denzin, N. & Lincoln, Y. (2005). The Sage Handbook of Qualitative Research (third Edn). London: Sage
Publications.
Ebbeck, M. & Waniganayake, M. (2010). Perspectives on play in a changing world. In Ebbeck M and
Waniganayake M (eds.), Play in early childhood education: Learning in diverse contexts, South
Melbourne: Oxford University Press, pp. 5-25.
Einarsdottir, J., Dockett, S. & Perry, B. (2009). Making meaning: children's perspectives expressed through
drawings, Early Child Development and Care 179(2), 217 -232.
Garris, R., Ahlers, R. & Driskell, J.E. (2002). Games, motivation, and learning: a research and practice mode.
Simulation & Gaming 33(4), 441-467.
Geng, G. & Disney, L. (2013). ‘A Case Study: Exploring Video Deficit Effect in 2-Year-Old Children’s Playing
and Learning with an iPad’, Proceedings of 21st International Conference on Computers in Education
(ICCE2013), Bali, Indonesia, 18 to 22 November, 493-501.
Gerhardstein, P. & Rovee-Collier, C. (2002). The development of visual search in infants and very young
children. Journal of Experimental Child Psychology 81, 194-215.
Grabe, M. & Grabe, C. (2007). Integrating technology for meaningful learning (5th
ed.). Boston: Hougton
Mifflin.
Haugland, S.W. (2000). Computers and young children. Clearinghouse on Elementary and Early Childhood
Education.
Hayne, H. (2004). Infant memory development: Implications for childhood amnesia. Developmental Review 24,
33–73.
Highfield, K. (2010). Possibilities and pitfalls of techno-toys and digital play in mathematics learning. In Ebbeck
M and Waniganayake M (eds.), Play in early childhood education: Learning in diverse contexts. South
Melbourne: Oxford University Press.
Lee, Y. (2009). Pre-K children's interaction with educational software programs: an observation of capabilities
and levels of engagement. Journal of Educational Multimedia and Hypermedia 18(3), 289-309.
Linebarger, D. & Walker, D. (2005). Infants' and Toddlers' Television Viewing and Language Outcomes,
American Behavioral Scientist 48(5), 624-645.
Mitchell, P. & Ziegler, F. (2007). Fundamentals of development: The psychology of childhood. Hove, England:
Psychology Press.
Steele, B. (1999). Notes on the aesthetics of children’s drawings. The Education Network 15, 16–24.
Struppert, A., Guo, Q. & Waniganayake, M. (2010). Promoting intercultural competence through
technology-based play. In Ebbeck M and Waniganayake, M (eds), Play in early childhood education:
Learning in diverse contexts South Melbourne, Vic.: Oxford University Press, pp. 270-287.
Subiaul, F., Cantlon, J., Romansky, K., Klein, T. & Terrace, H.S. (2007). Cognitive imitation in 2-year old
human toddlers: A comparison with rhesus monkeys. Animal Cognition, 52.
Sutton, J. (2006). The development of landmark and beacon use in young children: Evidence from a touchscreen
search task. Developmental Science 9, 108–123.
Vanderwater, E., Rideout, V., Wartella, E., Huang, X., Lee, J. & Shim, M-S. (2007). Digital Childhood:
Electronic Media and Technology Use Among Infants Toddlers, and Preschoolers, Pediatrics 119(5),
e1006 -e1015.
Veale, A. (2005) Creative methodologies in participatory research with children. In Greene S and Hogan D (eds),
Researching children’s experience . Thousand Oaks, CA: Sage, pp. 270-287.
Whitebread, & Coltman, (2015). Teaching and Learning in the Early Years (4th
Edn). London: Routledge.
Wiersma, W. & Jurs, S.G. (2009). Research Methods in Education: An Introduction (9th
Edn). London: Pearson.
Willats, J. (2005), Making Sense of Children’s Drawings. Mahwah, NJ: Lawrence Erlbaum Associates.
Yang, H-C, & Noel, A,M (2006), The developmental characteristics of four- and five-year-old pre-schoolers’
drawing: An analysis of scribbles, placement patterns, emergent writing, and name writing in archived
spontaneous drawing samples, Journal of Early Childhood Literacy 6(2), 145-162.
Zack, E., Barr, R., Gerhardstein, P., Dickerson, K. & Meltzoff, A.N. (2009). Infant imitation from television
using novel touchscreen technology. British Journal of Developmental Psychology 27, 13–26.
436436
Augmented Reality Systems for
Immediate-Action Commander Training
During Disasters
Hiroyuki MITSUHARAa*, Keisuke IGUCHIb, Junya KAWAIb, & Masami SHISHIBORIa a Graduate School of Science and Technology, Tokushima University, Japan
b Graduate School of Advanced Technology and Science, Tokushima University, Japan
Abstract: Disaster education focusing on how we should take immediate actions after disasters
strike is essential to protect our lives. We proposed Immediate-Action Commanders (IACers)
training and prototyped three IACers training systems using augmented reality (AR) and
head-mounted displays (HMDs). The systems superimpose interactive virtual objects onto
HMDs’ real-time vision or a trainee’s actual view.
Keywords: Augmented reality, head-mounted display, digital game, disaster education
1. Introduction
Disaster education focusing on the execution of planned immediate actions against disasters, which has
been conducted in various ways and scenes, is essential to protect our lives. Nowadays, disasters are
diversified and we must acquire sufficient knowledge through disaster education. However, the
occurrence of a disaster is frequently regarded as someone else’s problem. We do not always apply
knowledge to immediate actions against a real disaster. Compared to adults, children find it difficult in
applying knowledge to a real disaster―children may panic and feel incapacitated by fear. Therefore,
adults should appropriately instruct children to take immediate actions in the event of a disaster. We
refer to such adults as Immediate-Action Commanders (IACers). However, few satisfactory training
programs are currently available, and majority of adults have not been trained yet. In this context, we
must develop multiple IACer training programs.
IACer training programs must represent disasters realistically because trainees (e.g., school
teachers) find it difficult to imagine disaster situations as they do not have a prior experience of such an
event. In other words, the programs need situational and audio-visual realities. An approach to the
realistic representation is to integrate digital games into the programs, i.e., game-based IACer training
programs. Digital games with high interactivity and audio-visual effects, which aim at improving
situational and audio-visual realities by scenarios and virtual worlds (computer sounds and graphics)
respectively, have gathered significant attention in disaster education (Tsai et al., 2014).
Game-based IACer training programs should involve the real world to further improve the
situational and audio-visual realities. In particular, we focus on visual reality because virtual worlds
may not encourage trainees to feel a sense of tension due to representational limitation in computer
graphics (CG). For high visual reality, we considered implementing augmented reality (AR) that
superimposes interactive virtual objects (e.g., 3DCG characters) on a real-time vision.
2. Prototype Systems
To save lives of numerous children, majority of the adults should be trained to become IACers. For the
ideal program as a game-based IACer training program, we adopted AR-based interactive virtual
children (i.e., 3DCG characters) who exhibit reactions and take immediate actions against disasters.
This means that an AR system is necessary to superimpose the virtual children on a real-time vision
437437
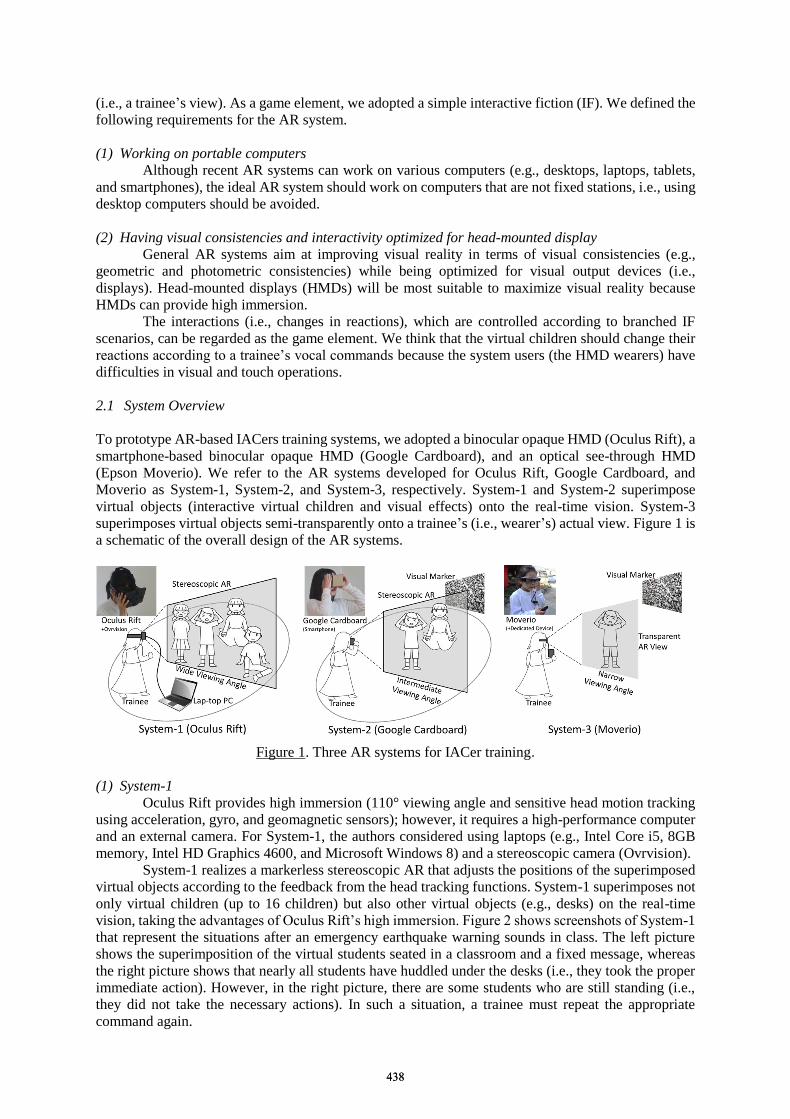
(i.e., a trainee’s view). As a game element, we adopted a simple interactive fiction (IF). We defined the
following requirements for the AR system.
(1) Working on portable computers
Although recent AR systems can work on various computers (e.g., desktops, laptops, tablets,
and smartphones), the ideal AR system should work on computers that are not fixed stations, i.e., using
desktop computers should be avoided.
(2) Having visual consistencies and interactivity optimized for head-mounted display
General AR systems aim at improving visual reality in terms of visual consistencies (e.g.,
geometric and photometric consistencies) while being optimized for visual output devices (i.e.,
displays). Head-mounted displays (HMDs) will be most suitable to maximize visual reality because
HMDs can provide high immersion.
The interactions (i.e., changes in reactions), which are controlled according to branched IF
scenarios, can be regarded as the game element. We think that the virtual children should change their
reactions according to a trainee’s vocal commands because the system users (the HMD wearers) have
difficulties in visual and touch operations.
2.1 System Overview
To prototype AR-based IACers training systems, we adopted a binocular opaque HMD (Oculus Rift), a
smartphone-based binocular opaque HMD (Google Cardboard), and an optical see-through HMD
(Epson Moverio). We refer to the AR systems developed for Oculus Rift, Google Cardboard, and
Moverio as System-1, System-2, and System-3, respectively. System-1 and System-2 superimpose
virtual objects (interactive virtual children and visual effects) onto the real-time vision. System-3
superimposes virtual objects semi-transparently onto a trainee’s (i.e., wearer’s) actual view. Figure 1 is
a schematic of the overall design of the AR systems.
Figure 1. Three AR systems for IACer training.
(1) System-1
Oculus Rift provides high immersion (110° viewing angle and sensitive head motion tracking
using acceleration, gyro, and geomagnetic sensors); however, it requires a high-performance computer
and an external camera. For System-1, the authors considered using laptops (e.g., Intel Core i5, 8GB
memory, Intel HD Graphics 4600, and Microsoft Windows 8) and a stereoscopic camera (Ovrvision).
System-1 realizes a markerless stereoscopic AR that adjusts the positions of the superimposed
virtual objects according to the feedback from the head tracking functions. System-1 superimposes not
only virtual children (up to 16 children) but also other virtual objects (e.g., desks) on the real-time
vision, taking the advantages of Oculus Rift’s high immersion. Figure 2 shows screenshots of System-1
that represent the situations after an emergency earthquake warning sounds in class. The left picture
shows the superimposition of the virtual students seated in a classroom and a fixed message, whereas
the right picture shows that nearly all students have huddled under the desks (i.e., they took the proper
immediate action). However, in the right picture, there are some students who are still standing (i.e.,
they did not take the necessary actions). In such a situation, a trainee must repeat the appropriate
command again.
438438
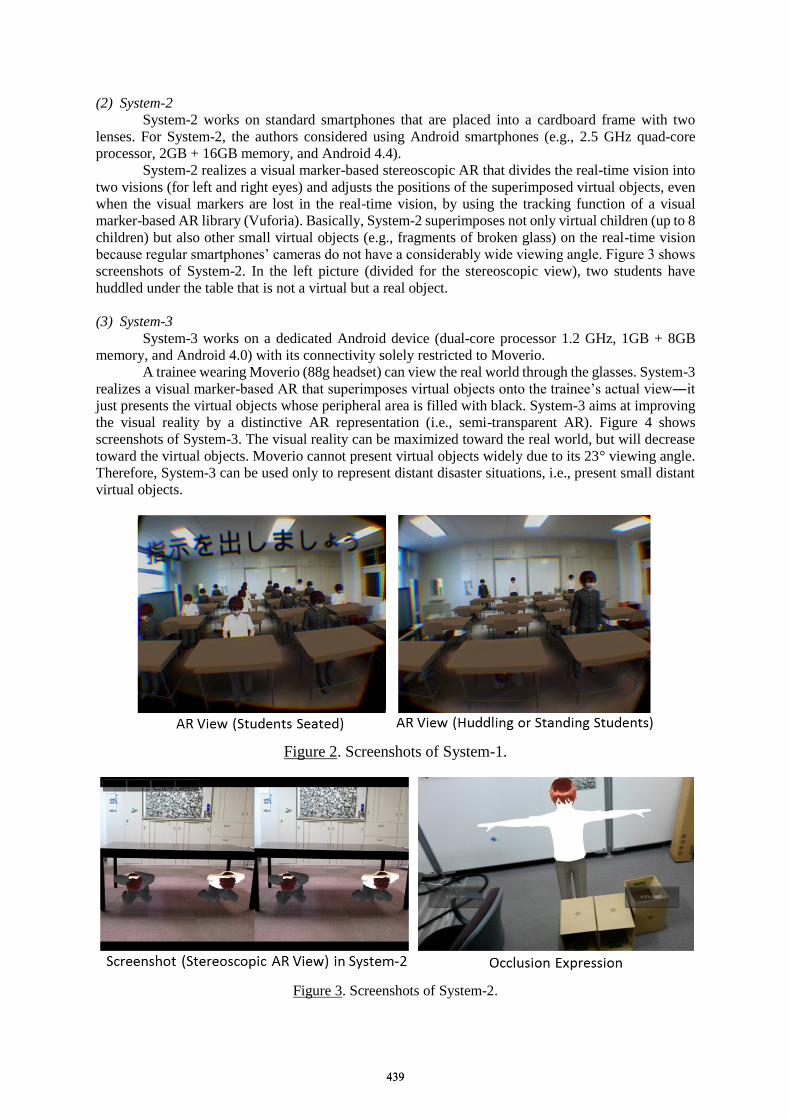
(2) System-2
System-2 works on standard smartphones that are placed into a cardboard frame with two
lenses. For System-2, the authors considered using Android smartphones (e.g., 2.5 GHz quad-core
processor, 2GB + 16GB memory, and Android 4.4).
System-2 realizes a visual marker-based stereoscopic AR that divides the real-time vision into
two visions (for left and right eyes) and adjusts the positions of the superimposed virtual objects, even
when the visual markers are lost in the real-time vision, by using the tracking function of a visual
marker-based AR library (Vuforia). Basically, System-2 superimposes not only virtual children (up to 8
children) but also other small virtual objects (e.g., fragments of broken glass) on the real-time vision
because regular smartphones’ cameras do not have a considerably wide viewing angle. Figure 3 shows
screenshots of System-2. In the left picture (divided for the stereoscopic view), two students have
huddled under the table that is not a virtual but a real object.
(3) System-3
System-3 works on a dedicated Android device (dual-core processor 1.2 GHz, 1GB + 8GB
memory, and Android 4.0) with its connectivity solely restricted to Moverio.
A trainee wearing Moverio (88g headset) can view the real world through the glasses. System-3
realizes a visual marker-based AR that superimposes virtual objects onto the trainee’s actual view―it
just presents the virtual objects whose peripheral area is filled with black. System-3 aims at improving
the visual reality by a distinctive AR representation (i.e., semi-transparent AR). Figure 4 shows
screenshots of System-3. The visual reality can be maximized toward the real world, but will decrease
toward the virtual objects. Moverio cannot present virtual objects widely due to its 23° viewing angle.
Therefore, System-3 can be used only to represent distant disaster situations, i.e., present small distant
virtual objects.
Figure 2. Screenshots of System-1.
Figure 3. Screenshots of System-2.
439439
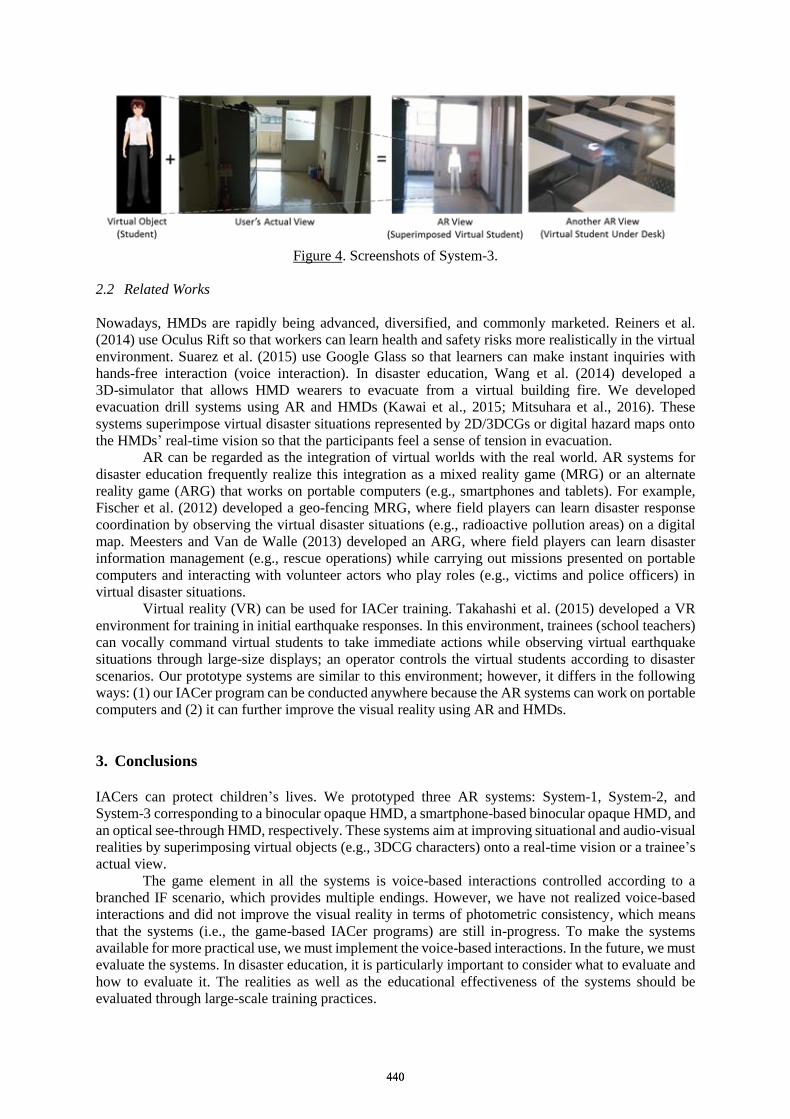
Figure 4. Screenshots of System-3.
2.2 Related Works
Nowadays, HMDs are rapidly being advanced, diversified, and commonly marketed. Reiners et al.
(2014) use Oculus Rift so that workers can learn health and safety risks more realistically in the virtual
environment. Suarez et al. (2015) use Google Glass so that learners can make instant inquiries with
hands-free interaction (voice interaction). In disaster education, Wang et al. (2014) developed a
3D-simulator that allows HMD wearers to evacuate from a virtual building fire. We developed
evacuation drill systems using AR and HMDs (Kawai et al., 2015; Mitsuhara et al., 2016). These
systems superimpose virtual disaster situations represented by 2D/3DCGs or digital hazard maps onto
the HMDs’ real-time vision so that the participants feel a sense of tension in evacuation.
AR can be regarded as the integration of virtual worlds with the real world. AR systems for
disaster education frequently realize this integration as a mixed reality game (MRG) or an alternate
reality game (ARG) that works on portable computers (e.g., smartphones and tablets). For example,
Fischer et al. (2012) developed a geo-fencing MRG, where field players can learn disaster response
coordination by observing the virtual disaster situations (e.g., radioactive pollution areas) on a digital
map. Meesters and Van de Walle (2013) developed an ARG, where field players can learn disaster
information management (e.g., rescue operations) while carrying out missions presented on portable
computers and interacting with volunteer actors who play roles (e.g., victims and police officers) in
virtual disaster situations.
Virtual reality (VR) can be used for IACer training. Takahashi et al. (2015) developed a VR
environment for training in initial earthquake responses. In this environment, trainees (school teachers)
can vocally command virtual students to take immediate actions while observing virtual earthquake
situations through large-size displays; an operator controls the virtual students according to disaster
scenarios. Our prototype systems are similar to this environment; however, it differs in the following
ways: (1) our IACer program can be conducted anywhere because the AR systems can work on portable
computers and (2) it can further improve the visual reality using AR and HMDs.
3. Conclusions
IACers can protect children’s lives. We prototyped three AR systems: System-1, System-2, and
System-3 corresponding to a binocular opaque HMD, a smartphone-based binocular opaque HMD, and
an optical see-through HMD, respectively. These systems aim at improving situational and audio-visual
realities by superimposing virtual objects (e.g., 3DCG characters) onto a real-time vision or a trainee’s
actual view.
The game element in all the systems is voice-based interactions controlled according to a
branched IF scenario, which provides multiple endings. However, we have not realized voice-based
interactions and did not improve the visual reality in terms of photometric consistency, which means
that the systems (i.e., the game-based IACer programs) are still in-progress. To make the systems
available for more practical use, we must implement the voice-based interactions. In the future, we must
evaluate the systems. In disaster education, it is particularly important to consider what to evaluate and
how to evaluate it. The realities as well as the educational effectiveness of the systems should be
evaluated through large-scale training practices.
440440
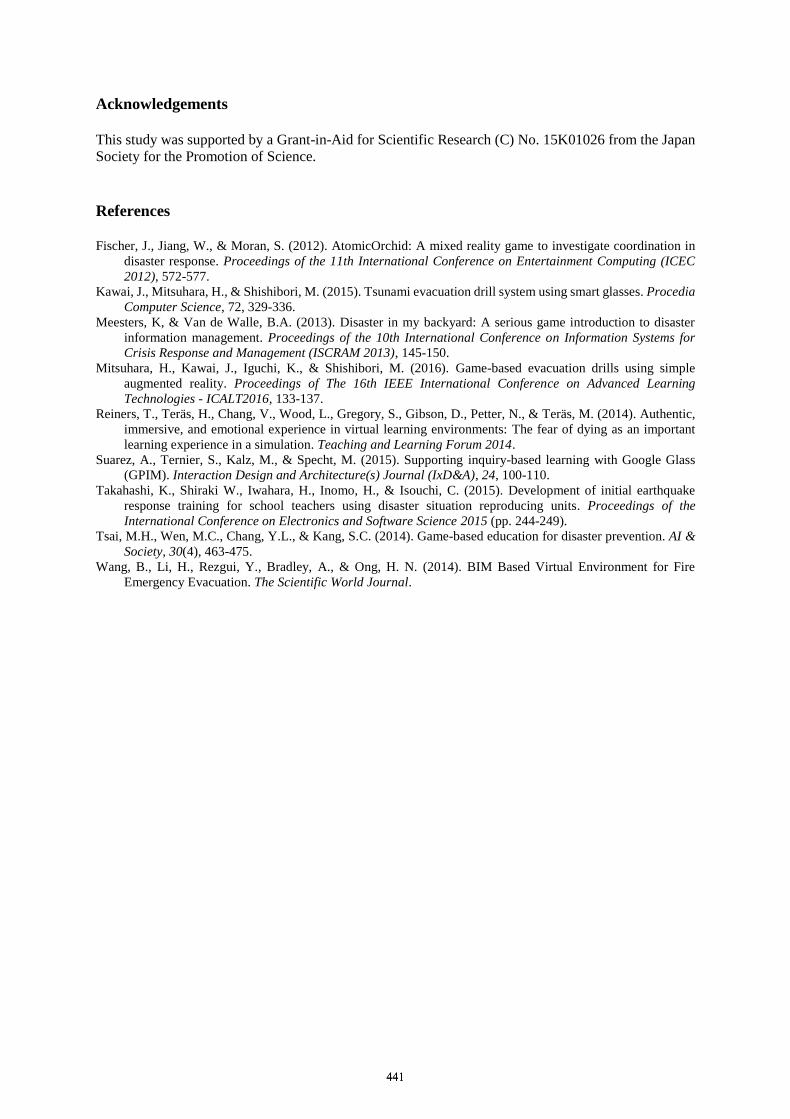
Acknowledgements
This study was supported by a Grant-in-Aid for Scientific Research (C) No. 15K01026 from the Japan
Society for the Promotion of Science.
References
Fischer, J., Jiang, W., & Moran, S. (2012). AtomicOrchid: A mixed reality game to investigate coordination in
disaster response. Proceedings of the 11th International Conference on Entertainment Computing (ICEC
2012), 572-577.
Kawai, J., Mitsuhara, H., & Shishibori, M. (2015). Tsunami evacuation drill system using smart glasses. Procedia
Computer Science, 72, 329-336.
Meesters, K, & Van de Walle, B.A. (2013). Disaster in my backyard: A serious game introduction to disaster
information management. Proceedings of the 10th International Conference on Information Systems for
Crisis Response and Management (ISCRAM 2013), 145-150.
Mitsuhara, H., Kawai, J., Iguchi, K., & Shishibori, M. (2016). Game-based evacuation drills using simple
augmented reality. Proceedings of The 16th IEEE International Conference on Advanced Learning
Technologies - ICALT2016, 133-137.
Reiners, T., Teräs, H., Chang, V., Wood, L., Gregory, S., Gibson, D., Petter, N., & Teräs, M. (2014). Authentic,
immersive, and emotional experience in virtual learning environments: The fear of dying as an important
learning experience in a simulation. Teaching and Learning Forum 2014.
Suarez, A., Ternier, S., Kalz, M., & Specht, M. (2015). Supporting inquiry-based learning with Google Glass
(GPIM). Interaction Design and Architecture(s) Journal (IxD&A), 24, 100-110.
Takahashi, K., Shiraki W., Iwahara, H., Inomo, H., & Isouchi, C. (2015). Development of initial earthquake
response training for school teachers using disaster situation reproducing units. Proceedings of the
International Conference on Electronics and Software Science 2015 (pp. 244-249).
Tsai, M.H., Wen, M.C., Chang, Y.L., & Kang, S.C. (2014). Game-based education for disaster prevention. AI &
Society, 30(4), 463-475.
Wang, B., Li, H., Rezgui, Y., Bradley, A., & Ong, H. N. (2014). BIM Based Virtual Environment for Fire
Emergency Evacuation. The Scientific World Journal.
441441

Chen, W. et al. (Eds.) (2016). Proceedings of the 24th International Conference on Computers in Education. India: Asia-Pacific Society for Computers in Education
Usability Study of an Augmented Reality Game for Philippine History
Ma. Mercedes RODRIGO*, Eric Cesar E. VIDAL Jr.†, Nicko CALUYA‡, Jenilyn AGAPITO° &
Walfrido David DIY¤ Ateneo Laboratory for the Learning Sciences, Ateneo de Manila University, Philippines
* [email protected], † [email protected], ‡ [email protected], ° [email protected], ¤ [email protected]
Abstract: We investigate the extent to which Augmented Reality can contribute to effectiveness and enjoyment in the context of history-game-based learning. This paper presents a series of usability tests of a mobile Augmented Reality game application for learning Philippine history, Igpaw: Intramuros, with representatives of the game’s target audience. These tests discovered issues that compromised player enjoyment, including fatigue during gameplay, hurdles in learning AR-specific game mechanics, game repetitiveness, and outdoor safety concerns, in addition to minor technical issues. Nevertheless, the tests show the game’s high effectivity in teaching Philippine history.
Keywords: Augmented Reality, Philippine History, Educational Game Design, Usability
1. Introduction Many students equate the learning of history with rote memorization of names, dates, and places to reach a common account of past events, but they fail to appreciate patterns of change, instead amassing disjoint, unrelated facts (Squire & Barab, 2004). Students therefore find history boring, and may pass a semester-long course without an appreciation of the historical narrative (e.g. Fitzhugh, 2004; McMichael, 2007). To mitigate this, educators have integrated computer games among their teaching materials, arguing that games can be excellent carriers of educational content that can deepen students’ understanding while keeping them engaged (Schell, 2014). The extents to which these theories and assumptions translate to outcomes, and the factors that contribute to or hinder games’ success as educational tools, are the subject of ongoing investigation (Schmitz, Klemke, and Specht, 2012; Arias, 2014; Backlund & Hendrix, 2013; Wouters et al 2013), but for history education, Mortara et al. (2014) believe games can raise cultural awareness by depicting folklore, rules of behavior, customs, traditions, and spiritual beliefs, and can create immersive experiences where students can examine artifacts or archeological locations as they were when they were originally constructed. History-related games tested in classrooms have been shown to have a positive effect on learning (Backlund & Hendrix, 2013). However, the effect of games on engagement and motivation is less definite. Squire & Barab (2004) found that user engagement is difficult to measure as it is influenced by the individual’s goals, the game’s affordances, and the general learning environment among others. Along a similar vein, Pujol et al. (2013) said that the affordances of a game played in a historical location such as a museum may impede player’s experiences, as they required players to stay in the same spot for a long time. It is necessary, therefore, for history games to undergo user experience testing (Keil, et al, 2013). As it is, much of the literature we reviewed regarding the use of games in history education were generous with technical details but seldom included user feedback (e.g. Sedano, et al., 2013; Ardito & Lanzilotti, 2008; Furió, et al., 2013; Keil, et al, 2011). Thus, the purpose of this paper is to describe one such effort to evaluate the user experience. We describe Igpaw: Intramuros, a mobile augmented reality game for Philippine history, and detail our play testing methods and results.
2. Introduction to Igpaw: Intramuros and Augmented Reality Augmented Reality (AR) refers to the superimposition of digital information (such as virtual characters) on top of real settings in 3D space, providing the user with situated knowledge (Azuma &
442442
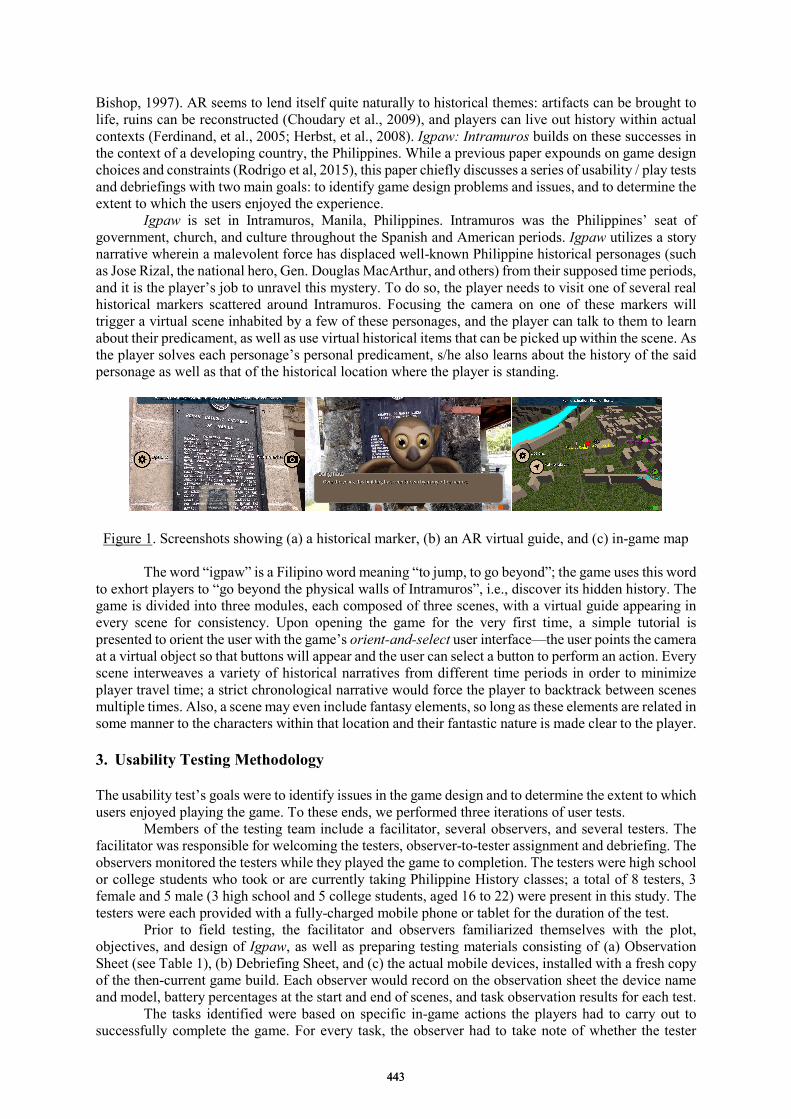
Bishop, 1997). AR seems to lend itself quite naturally to historical themes: artifacts can be brought to life, ruins can be reconstructed (Choudary et al., 2009), and players can live out history within actual contexts (Ferdinand, et al., 2005; Herbst, et al., 2008). Igpaw: Intramuros builds on these successes in the context of a developing country, the Philippines. While a previous paper expounds on game design choices and constraints (Rodrigo et al, 2015), this paper chiefly discusses a series of usability / play tests and debriefings with two main goals: to identify game design problems and issues, and to determine the extent to which the users enjoyed the experience. Igpaw is set in Intramuros, Manila, Philippines. Intramuros was the Philippines’ seat of government, church, and culture throughout the Spanish and American periods. Igpaw utilizes a story narrative wherein a malevolent force has displaced well-known Philippine historical personages (such as Jose Rizal, the national hero, Gen. Douglas MacArthur, and others) from their supposed time periods, and it is the player’s job to unravel this mystery. To do so, the player needs to visit one of several real historical markers scattered around Intramuros. Focusing the camera on one of these markers will trigger a virtual scene inhabited by a few of these personages, and the player can talk to them to learn about their predicament, as well as use virtual historical items that can be picked up within the scene. As the player solves each personage’s personal predicament, s/he also learns about the history of the said personage as well as that of the historical location where the player is standing.
Figure 1. Screenshots showing (a) a historical marker, (b) an AR virtual guide, and (c) in-game map
The word “igpaw” is a Filipino word meaning “to jump, to go beyond”; the game uses this word to exhort players to “go beyond the physical walls of Intramuros”, i.e., discover its hidden history. The game is divided into three modules, each composed of three scenes, with a virtual guide appearing in every scene for consistency. Upon opening the game for the very first time, a simple tutorial is presented to orient the user with the game’s orient-and-select user interface—the user points the camera at a virtual object so that buttons will appear and the user can select a button to perform an action. Every scene interweaves a variety of historical narratives from different time periods in order to minimize player travel time; a strict chronological narrative would force the player to backtrack between scenes multiple times. Also, a scene may even include fantasy elements, so long as these elements are related in some manner to the characters within that location and their fantastic nature is made clear to the player. 3. Usability Testing Methodology The usability test’s goals were to identify issues in the game design and to determine the extent to which users enjoyed playing the game. To these ends, we performed three iterations of user tests.
Members of the testing team include a facilitator, several observers, and several testers. The facilitator was responsible for welcoming the testers, observer-to-tester assignment and debriefing. The observers monitored the testers while they played the game to completion. The testers were high school or college students who took or are currently taking Philippine History classes; a total of 8 testers, 3 female and 5 male (3 high school and 5 college students, aged 16 to 22) were present in this study. The testers were each provided with a fully-charged mobile phone or tablet for the duration of the test.
Prior to field testing, the facilitator and observers familiarized themselves with the plot, objectives, and design of Igpaw, as well as preparing testing materials consisting of (a) Observation Sheet (see Table 1), (b) Debriefing Sheet, and (c) the actual mobile devices, installed with a fresh copy of the then-current game build. Each observer would record on the observation sheet the device name and model, battery percentages at the start and end of scenes, and task observation results for each test. The tasks identified were based on specific in-game actions the players had to carry out to successfully complete the game. For every task, the observer had to take note of whether the tester
443443

successfully accomplished the task (‘Task Success’) and the time it took in minutes/seconds (‘Task Time’). The ‘Comments’ column listed observations and verbal comments by the testers while playing the game. The observation sheet was updated to reflect any game changes between each testing session. Table 1: Sample of an Observation Sheet
Tutorial Battery Life at Start of Scene: ___% Tasks Task Success Task Time Comments
1) Calibrate Device 2) Talk to Daligmata (virtual guide) 3) Examine Daligmata 4) Locate & Pick Up Magic Wand 5) Give Magic Wand to Daligmata 6) Return to Map
Battery Life at End of Scene: ___%
The debriefing sheet, given after testers completed the game, was a two-part written
questionnaire that asked about their game experience. The first part consisted of the System Usability Scale (SUS), a standard tool for measuring users’ perceived system usability as well as learnability (Brooke, 1996). Various researchers have shown the tool to be reliable and valid even with a sample size of 8 – 12 participants (Tulis & Stetson, 2004) and that it can be used for a vast range of systems and technologies (Bangor, et al., 2008; Sauro, 2011). The SUS is composed of 10 questions with 5 response options, from Strongly Disagree to Strongly Agree, averaged to a single number representing overall system usability. Any number above a score of 68 is considered above average. The second part of the debriefing sheet consisted of questions taken from Desurvire & Wiberg (2009) that elicit feedback regarding game play, immersion, and usability and game mechanics, using a similar 5-point scale.
Observers also had to gather as much qualitative information as they could through tester observation and note-taking. The observers were directed to attentively watch the device’s battery life, whether the GPS tracking was working or not, and the accuracy of locations as depicted in the map (previously shown in Figure 1c). Furthermore, they had to monitor whether testers’ in-game actions correspond with the intended sequences of tasks. If this is not the case, observers ought to ascertain the cause. Apart from verbatim comments, facial expressions and bodily responses were also noted. During the first two sessions, participants played the game in the same order, i.e. Module 1, 2, then 3. For the last session, the game was played in three different sequences in order to test whether the in-game map screen is reliable enough to guide players to their destinations regardless of module order. 4. Testing and Debriefing Results We divide the major test findings into two sections: findings related to the game’s usability, and affective findings. Technical problems that emerged during the testing were mostly limited to minor bugs related to buggy animation and interface issues, although it is worthwhile to note that despite the average play time of 19 minutes per module and 98 minutes for the entire game (including travel time), the game consumed more battery life than the developers had anticipated due to AR consuming more power, guiding the decision to cut down the length of the game from the original four modules to three. 4.1 Usability Debriefing We summarize the responses from the debriefing questionnaire as a SUS score computation of the users’ responses across all usability sessions (see Table 2). The average SUS across all sessions was 71.56. These numbers are better interpreted as percentiles; thus, the 71.56 average falls roughly at the 69th percentile. Per SUS evaluation, Igpaw is 69% usable (grade B), implying that the game was generally usable and learnable, but can be improved. Additional questions taken from Desurvire & Wiberg (2009) revealed players’ thoughts about game play, immersion, and game mechanics (see Table 3). The first five items under game play measures the player’s enjoyment. While most of the items were average or above average (borderline enjoyable), players gave item 1 an average score of 2.83, that is, players found the game to be borderline repetitive or boring, which may be attributed to repetitive activities (e.g., talking to all characters, picking up all items). Also, the high standard deviation in item 5 (1.47) implies that some (though not all) players found the game physically tiring.
444444
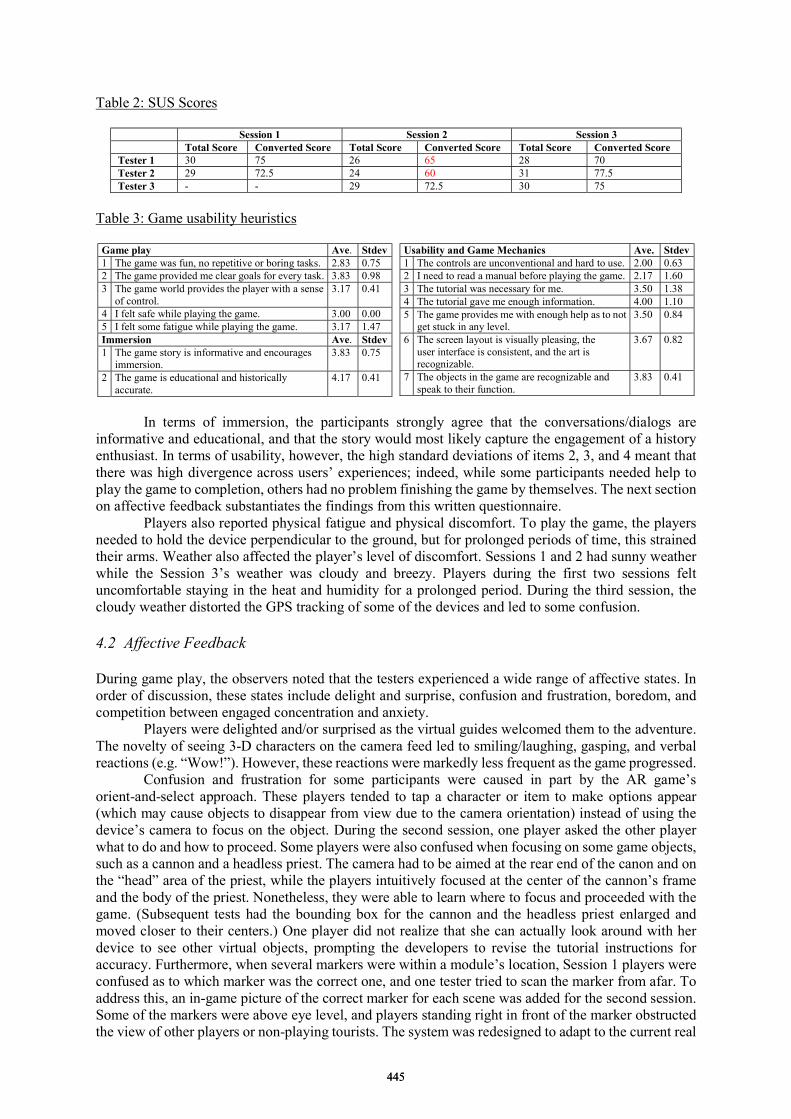
Table 2: SUS Scores
Session 1 Session 2 Session 3 Total Score Converted Score Total Score Converted Score Total Score Converted Score Tester 1 30 75 26 65 28 70 Tester 2 29 72.5 24 60 31 77.5 Tester 3 - - 29 72.5 30 75
Table 3: Game usability heuristics
Game play Ave. Stdev 1 The game was fun, no repetitive or boring tasks. 2.83 0.75 2 The game provided me clear goals for every task. 3.83 0.98 3 The game world provides the player with a sense
of control. 3.17 0.41
4 I felt safe while playing the game. 3.00 0.00 5 I felt some fatigue while playing the game. 3.17 1.47 Immersion Ave. Stdev 1 The game story is informative and encourages
immersion. 3.83 0.75
2 The game is educational and historically accurate.
4.17 0.41
Usability and Game Mechanics Ave. Stdev 1 The controls are unconventional and hard to use. 2.00 0.63 2 I need to read a manual before playing the game. 2.17 1.60 3 The tutorial was necessary for me. 3.50 1.38 4 The tutorial gave me enough information. 4.00 1.10 5 The game provides me with enough help as to not
get stuck in any level. 3.50 0.84
6 The screen layout is visually pleasing, the user interface is consistent, and the art is recognizable.
3.67 0.82
7 The objects in the game are recognizable and speak to their function.
3.83 0.41
In terms of immersion, the participants strongly agree that the conversations/dialogs are
informative and educational, and that the story would most likely capture the engagement of a history enthusiast. In terms of usability, however, the high standard deviations of items 2, 3, and 4 meant that there was high divergence across users’ experiences; indeed, while some participants needed help to play the game to completion, others had no problem finishing the game by themselves. The next section on affective feedback substantiates the findings from this written questionnaire.
Players also reported physical fatigue and physical discomfort. To play the game, the players needed to hold the device perpendicular to the ground, but for prolonged periods of time, this strained their arms. Weather also affected the player’s level of discomfort. Sessions 1 and 2 had sunny weather while the Session 3’s weather was cloudy and breezy. Players during the first two sessions felt uncomfortable staying in the heat and humidity for a prolonged period. During the third session, the cloudy weather distorted the GPS tracking of some of the devices and led to some confusion. 4.2 Affective Feedback During game play, the observers noted that the testers experienced a wide range of affective states. In order of discussion, these states include delight and surprise, confusion and frustration, boredom, and competition between engaged concentration and anxiety.
Players were delighted and/or surprised as the virtual guides welcomed them to the adventure. The novelty of seeing 3-D characters on the camera feed led to smiling/laughing, gasping, and verbal reactions (e.g. “Wow!”). However, these reactions were markedly less frequent as the game progressed.
Confusion and frustration for some participants were caused in part by the AR game’s orient-and-select approach. These players tended to tap a character or item to make options appear (which may cause objects to disappear from view due to the camera orientation) instead of using the device’s camera to focus on the object. During the second session, one player asked the other player what to do and how to proceed. Some players were also confused when focusing on some game objects, such as a cannon and a headless priest. The camera had to be aimed at the rear end of the canon and on the “head” area of the priest, while the players intuitively focused at the center of the cannon’s frame and the body of the priest. Nonetheless, they were able to learn where to focus and proceeded with the game. (Subsequent tests had the bounding box for the cannon and the headless priest enlarged and moved closer to their centers.) One player did not realize that she can actually look around with her device to see other virtual objects, prompting the developers to revise the tutorial instructions for accuracy. Furthermore, when several markers were within a module’s location, Session 1 players were confused as to which marker was the correct one, and one tester tried to scan the marker from afar. To address this, an in-game picture of the correct marker for each scene was added for the second session. Some of the markers were above eye level, and players standing right in front of the marker obstructed the view of other players or non-playing tourists. The system was redesigned to adapt to the current real
445445
position of the player, so that players can scan the marker from any angle and don’t have to give way to other people. Finally, during session 1, one of the selected markers turned out to be in a restricted site, with security personnel approaching the players. This was replaced with another marker for session 2.
As for boredom, the players found the in-game dialog to be too long, resulting in a tendency to skip most of the dialog, with some players missing important details for game completion. Subsequent tests used color-enhanced dialog to highlight these details, facilitating this kind of player behavior.
Most importantly, the players’ engaged concentration elicited safety concerns. Engrossed and focused players had a lack of regard for their surroundings. Holding a mobile device up for prolonged periods in a public place potentially exposed the players to crimes of opportunity (although no such incidents actually occurred). One of the sessions was conducted during a national holiday, when the foot traffic in Intramuros was heavy. Crowds of tourists were taking photos of the historical sites, vendors were selling their goods, and street children were begging for money. Furthermore, when walking from one location to another, the players tended to focus on the in-game map instead of their surroundings. The facilitators had to call the players’ attention before they fell off the sidewalk or stepped into oncoming traffic. Finally, players got anxious when other people stared at them, either curious about what the players were doing or suspecting that the players were photographing them. During the tests, the observers watched out for the players’ safety, but actual players might have no such backup. To address this, the tutorial of the game was redesigned to remind players regarding safety. The tutorial also encouraged players to go out in groups rather than solo.
5. Conclusions History education lends itself quite naturally to augmented reality games. By necessitating the exploration of actual historical locations, history-based games draw players into an immersive experience that is engaging and educational. The success of these types of games, though, rests largely on the quality of the overall user experience. Following Mortara et al.’s (2014) educational objectives, the design of Igpaw: Intramuros is meant to raise players’ cultural and historical awareness and immerse players in local folklore and literature while being at actual historical locations. Our usability testing with 8 players across three different sessions found that the game is highly effective in its goal of teaching Philippine history, confirming the strength of our game design.
However, this design is not without caveats. While there were technical problems that were trivial to correct, issues regarding how enjoyable the game was were more substantial. Players complained of fatigue from holding up the device. Environmental factors such as heat, humidity, traffic, and overall safety influenced players’ physical and emotional comfort levels. Game mechanics had to be learned, after which, game play tended to be repetitive. Developers and educators hoping to create more games of this genre should attempt to address these issues. Players may, for example, feel more comfortable and secure in enclosed, air-conditioned, contained environments rather than outdoors. Game storylines and dialogs need to be more compelling and varied. Opportunities for rest to mitigate fatigue should also be built in.
This paper contributes to the literature in that it highlights the need for user experience testing. We designed this game with several constraints in mind (Rodrigo et al., 2015), as other developers have. In this paper, we discussed the impact of our design decisions on our players—something not often found in similar work. No other paper discussed safety concern factors (resulting from the choice of outdoor game locations) affecting the user experience. These issues notwithstanding, the development of these types of games has the potential to contribute substantially to history education, AR game design, and development of related technologies. These games can make history come to life and draw learners in, helping them come to a deeper appreciation of the past and its connection with life today.
Igpaw: Intramuros is available as a free download on Google Play Store and Apple App Store. Acknowledgements We thank all the members and sponsors of our development team, as listed in Igpaw: Intramuros’s credits page. This work was made possible through a grant from the Philippines Commission on Higher Education entitled “Design, Development and Deployment of An Augmented Reality Game for Philippine History.”
446446
References Ardito, C., & Lanzilotti, R. (2008). Isn't this archaeological site exciting!: a mobile system enhancing school trips.
In Proceedings of the working conference on Advanced visual interfaces (pp. 488-489). ACM. Arias, M. (2014). Using Video Games in Education. Journal of Mason Graduate Research, 1(2), 49-69. Azuma, R., and Bishop, G. (1994). “Improving Static and Dynamic Registration in an Optical See-through
HMD.” In Proceedings of the 21st Annual Conference on Computer Graphics and Interactive Techniques, 197–204. ACM.
Backlund, P., & Hendrix, M. (2013). Educational games-are they worth the effort? A literature survey of the effectiveness of serious games. InGames and virtual worlds for serious applications (VS-GAMES), 2013 5th international conference on (pp. 1-8). IEEE.
Bangor, A., Kortum, P. T., & Miller, J. T. (2008). An empirical evaluation of the System Usability Scale. International Journal of Human-Computer Interaction, 24(6), 574-594.
Brooke, J. (1996). SUS - A Quick and Dirty Usability Scale. Usability Evaluation in Industry, 189(194), pp. 531-540.
Choudary, O., Charvillat, V., Grigoras, R., & Gurdjos, P. (2009). MARCH: mobile augmented reality for cultural heritage. In Proceedings of the 17th ACM international conference on Multimedia (pp. 1023-1024). ACM.
Desurvire, H. & Wiberg, C. (2009). Game Usability Heuristics (PLAY) for Evaluating and Designing Better Games: The Next Iteration. In Proceedings of the 3rd International Conference on Online Communities and Social Computing: Held as Part of HCI International 2009 (OCSC '09), A. Ant Ozok and Panayiotis Zaphiris (Eds.). Springer-Verlag, Berlin, Heidelberg, 557-566.
Ferdinand, P., Müller, S., Ritschel, T., & Wechselberger, U. (2005). The Eduventure-a new approach of digital game based learning combining virtual and mobile augmented reality games episodes. In Pre-Conference Workshop “Game based Learning” of DeLFI 2005 and GMW 2005 Conference, Rostock (Vol. 13).
Fitzhugh, W. (2004). History is Fun. In Concord Review Society Newsletter and Forum (Vol. 2, pp. 10-11). Furió, D., González-Gancedo, S., Juan, M. C., Seguí, I., & Costa, M. (2013). The effects of the size and weight of
a mobile device on an educational game.Computers & Education, 64, 24-41. Herbst, I., Braun, A. K., McCall, R., & Broll, W. (2008). TimeWarp: interactive time travel with a mobile mixed
reality game. In Proceedings of the 10th international conference on Human computer interaction with mobile devices and services (pp. 235-244). ACM.
Keil, J., Pujol, L., Roussou, M., Engelke, T., Schmitt, M., Bockholt, U., & Eleftheratou, S. (2013). A digital look at physical museum exhibits: Designing personalized stories with handheld Augmented Reality in museums. In Digital Heritage International Congress (DigitalHeritage), 2013(Vol. 2, pp. 685-688). IEEE.
Keil, J., Zollner, M., Becker, M., Wientapper, F., Engelke, T., & Wuest, H. (2011). The House of Olbrich—An augmented reality tour through architectural history. In Mixed and Augmented Reality-Arts, Media, and Humanities (ISMAR-AMH), 2011 IEEE International Symposium On (pp. 15-18). IEEE.
McMichael, A. (2007). PC Games and the Teaching of History. The History Teacher, 203-218. Mortara, M., Catalano, C. E., Bellotti, F., Fiucci, G., Houry-Panchetti, M., & Petridis, P. (2014). Learning cultural
heritage by serious games. Journal of Cultural Heritage, 15(3), 318-325. Normand, J.M., Servières, M. & Moreau, G. (2012). A new typology of augmented reality applications. In
Proceedings of the 3rd Augmented Human International Conference (AH '12). ACM, New York, NY, USA, Article 18, 8 pages. DOI=10.1145/2160125.2160143
Pujol, L., Katifori, A., Vayanou, M., Roussou, M., Karvounis, M., Kyriakidi, M., & Ioannidis, Y. E. (2013). From personalization to adaptivity-Creating immersive visits through interactive digital storytelling at the Acropolis Museum. In Intelligent Environments (Workshops) (pp. 541-554).
Rodrigo, M. M. T., Caluya, N. R., Diy, W. D. A. & Vidal, E. C. E. (2015). Igpaw: Intramuros: Design of an augmented reality game for Philippine history. In Proceedings of the 23rd International Conference for Computers in Education. Hangzhou, China.
Sauro, J. (2011). A practical guide to the System Usability Scale: Background, benchmarks, & best practices. Denver, CO: Measuring Usability LLC.
Sedano, C. I., Leendertz, V., Vinni, M., Sutinen, E., & Ellis, S. (2013). Hypercontextualized Learning Games Fantasy, Motivation, and Engagement in Reality. Simulation & Gaming, 44(6), 821-845.
Schmitz, B., Klemke, R., & Specht, M. (2012). Mobile gaming patterns and their impact on learning outcomes: A literature review. In 21st Century Learning for 21st Century Skills (pp. 419-424). Springer Berlin Heidelberg.
Schell, J. (2014). The Art of Game Design: A book of lenses. CRC Press. Squire, K., & Barab, S. (2004). Replaying history: engaging urban underserved students in learning world history
through computer simulation games. In Proceedings of the 6th International Conference on Learning Sciences (pp. 505-512).
Wouters, P., Van Nimwegen, C., Van Oostendorp, H., & Van Der Spek, E. D. (2013). A meta-analysis of the cognitive and motivational effects of serious games. Journal of Educational Psychology, 105(2), 249.
447447
Chen, W. et al. (Eds.) (2016). Proceedings of the 24th International Conference on Computers in
Education. India: Asia-Pacific Society for Computers in Education
Using a Text Adventure Game for
an Extended Series of Assignments in CS2
Clifton KUSSMAUL
Muhlenberg College, USA
Abstract: Students in computer science and related disciplines need experience with larger
software projects. This paper describes a sequence of assignments for CS2 that guide students
to develop a text-based adventure game. These assignments seek to increase motivation, provide
context for core topics, and explore some of the challenges associated with larger projects. This
paper also describes forms of support and scaffolding to make such projects more effective, and
describes lessons learned for faculty seeking to adapt or create their own extended assignments.
Keywords: CS2, iterative development, object-oriented design, refactoring, text game
1. Introduction
Students in computer science and related disciplines need experience with software projects that are
larger than a typical homework, even in introductory courses (e.g. Rebelsky and Flynt, 2000; Turner
and Zachary, 1999). A variety of approaches have been proposed, e.g. for graphics (Bruce, Danyluk,
and Murtagh, 2001; Kussmaul, 2008), object-oriented design (Alphonce and Ventura, 2002; Barry,
Ellsworth, Kurtz, and Wilkes, 2005), data structures and algorithms (Huggins, 2000; Newhall and
Meeden, 2002), and teamwork (Rebelsky and Flynt, 2000).
This paper describes a sequence of CS2 assignments to develop a text-based adventure game.
Text-based games have a long history, from the early Colossal Caves (Crowther, Woods, and Black,
1976), through the Choose Your Own Adventure books and commercial games (e.g. from InfoCom), to
scholarship on interactive fiction (Montfort, 2005), and popular press (Hudson, 2014).
Clearly, text games are less flashy and immersive, but require less programming experience,
depend less on an API, and can be adapted to a wide range of interests, whereas graphics games may
not appeal to all students. These assignments seek to: a) increase motivation through a more project that
students can adapt to their own interests and that it more complex than they could write on their own;
b) provide context and incentives for core topics in CS2; and c) explore some of the challenges
associated with larger projects, including testing, refactoring, and iterative design. This paper also
describes forms of support and scaffolding to increase the effectiveness of such projects, and describes
lessons learned for faculty seeking to adapt or create their own extended assignments.
These approaches offer a variety of benefits. Students are exposed to issues and techniques
which may not be apparent in smaller projects. For example, coding style and documentation matter
much more when code was written days or weeks before, or when trying to understand someone else’s
code. Students spend time refactoring code to make it more flexible or to add new requirements; in
addition to requiring deeper understanding of the code, it emphasizes the benefits of good design and
testing. This approach is also flexible; it can be split and rearranged into different assignments based on
the textbook and syllabus, teacher preference, and student aptitude and interest. Finally, using open-
ended projects support student-initiated extensions, as course projects or larger independent projects.
2. Text Games & Assignments
Specific assignments (boxed) are summarized below. Note that most prompt students to plan before
they start, and to reflect after they finish. The full assignments contain more details, sample code, etc.
448448
Twine Game: Twine is a platform to make it easy for non-programmers to create text games,
and should help you think about how such games work. Thus, you should:
1. Read Hudson (2014) Twine, video-game tech for all, New York Times Magazine.
2. Go to http://twinery.org, find 2 Twine games that look interesting, and play them.
3. Submit a text file with your name, the date, the game(s) you played,
and areas of strength and for improvement for the Twine software.
4. Use Twine to create your own game with at least 16 places and 32 actions.
5. Submit your game as a Twine source file or output HTML file.
Procedural Game: Design, implement, and test a simple text game program. The game should
minimize duplicate code and maximize flexibility, so that it is easy to expand the game, and so
that the code could be used without changes for a variety of different games. Thus, you should:
1. Before you edit any code, plan your work and your tests.
Email the instructor 100-200 words on how your code will be organized.
2. Design, implement, and test a game with places, and actions to move between places.
3. Create your own sample game with at least 8 places and 16 actions.
4. In README.TXT, describe areas of strength and for improvement in your code.
5. Submit a zip file with README.TXT and all of your Java source files (no other files).
Game, Place, & Action Classes: Object-oriented programming (OOP) is quite different
from procedural programming. Thus, you should:
1. Study the starting code classes: Game, Place, PlaceTest, ActionTest
2. Create Action to pass all of ActionTest, and GameTest to thoroughly test Game.
3. Create your own sample game with at least 10 places and 20 actions.
4. Edit README.TXT to describe areas of strength and for improvement in your code.
5. Submit a zip file with README.TXT and all of your Java source files (no other files).
Items to List, Take, & Drop: The game will be more interesting if it supports items,
such as prizes or tools (e.g. a key to open a lock). Thus, for this homework you should:
1. Before you edit any code, review the existing code and plan your work and tests.
Email the instructor a list of methods you plan to change, and how each will change.
2. Create class Item and class ItemTest to test Item as well as possible.
3. Modify Game and GameTest so that a game contains a list of all items and a dummy
place for the player’s items, with methods to add, get, and remove items from each list.
4. Modify your code to list items in each place, and to list items carried by the player.
5. Modify your code so that the player can carry, take, & drop items.
6. Create or extend your own sample game with at least 10 places, 20 actions, and 5 items.
7. In README.TXT, describe the hardest parts of this homework, and how to fix them.
8. Submit a zip file with README.TXT and all of your Java source files (no other files).
Inheritance: As programs get larger and more complex, duplicate (or similar) code will cause
extra work and problems, and should be refactored. In the game, Place, Item, Action, and
Game contain duplicate code, which can be improved. Thus, you should:
1. Before you edit any code, review the existing code and plan your work and tests.
Email the instructor a list of duplicate and near-duplicate code you plan to refactor.
2. Create class Parent with this duplicate code, and ParentTest to test it thoroughly.
3. Remove all duplicate code from Place, Item, Action, Game, and their test classes.
4. Create or extend your own sample game with at least 10 places, 20 actions, and 5 items.
5. In README.TXT, describe the hardest parts of this homework, and how to fix them.
6. Submit a zip file with README.TXT and all of your Java source files (no other files).
449449
The text game project can be continued and extended with a variety of other assignments.
Convert the entire game system to generate and handle exceptions.
Use inheritance to add support for multiple descriptions for a place, action, or item.
Add a system of points (e.g. health or money) that increase or decrease based on player actions.
Add the ability to read and write files with all of the data for a game.
Use other data structures (e.g. the Java ArrayList, hash maps, linked lists, stacks queues, trees).
3. Conclusions
We have learned a variety of lessons from such projects.
Have a mature design and staged implementation plan for the project, particularly in earlier
courses. This avoids wrong turns or dead ends that can lead to significant rework and student frustration,
although this is an integral part of software development.
Allow students to affect the direction and final form of the project. We often try to develop the
design through classroom activities and discussion. Some students feel more invested in a project if
they realize that the teacher has not completely determined what will happen.
Emphasize testing (e.g. Edwards, 2003; Edwards 2004; Wellington, Briggs, and Girard, 2007).
Unit test suites are particularly helpful for special cases that students might not consider or might have
trouble detecting. In the future, we would like to create more comprehensive test suites and use a system
like WebCAT (Edwards and Perez-Quinones, 2008).
Provide detailed requirements, particularly for the first few assignments. Gradually reduce the
level of detail as students gain experience (e.g. Buck and Stucki, 2000). This helps students learn to
analyze problems, elicit incomplete or hidden requirements, and design flexible solutions.
Interleave project assignments with unrelated assignments. This provides some variety for
students (and teachers). It increases the sense of returning to previous work, but also gives students
more time to catch up and respond to teacher feedback.
4. References
Alphonce, C. and Ventura, P. (2002). Object orientation in CS1-CS2 by design. Proceedings of the Annual
Conference on Innovation and Technology in Computer Science Education, 70-74.
Barry, E.F., Ellsworth, C.C., Kurtz, B.L. and Wilkes, J. T. (2005) Teaching OO methodology in a project-driven
CS2 course. ACM SIGPLAN Conference on Object-Oriented Programming, Systems, Languages, and
Applications, 338-343.
Bruce, K.B., Danyluk, A., and Murtagh, T. (2001). A library to support a graphics-based object-first approach to
CS 1. ACM SIGCSE Bulletin, 33, 6-10.
Buck, D. and Stucki, D.J. (2000). Design early considered harmful: Graduated exposure to complexity and
structure based on levels of cognitive development. SIGCSE Bulletin, 32, 75-79.
Crowther, W., Woods, D., & Black, K. (1976). Colossal cave adventure. Computer Game.
Edwards, S.H., & Perez-Quinones, M.A. (2008). Web-CAT: Automatically Grading Programming Assignments.
ACM Conference on Innovation and Technology in Computer Science Education (ITiCSE) (pp. 328–328).
Edwards, S.H. (2003). Rethinking computer science education from a test-first perspective. ACM SIGPLAN
Conference on Object-oriented Programming, Systems, Languages, and Applications, 148-155.
Edwards, S.H. (2004). Using software testing to move students from trial-and-error to reflection-in-action.
SIGCSE Bulletin, 36, 26-30.
Hudson, L. (2014, Nov 19) Twine, video-game technology for all. New York Times Magazine.
Huggins, J. (2000). Modular term-long CS2 projects. Frontiers in Education Conference.
Kussmaul, C. (2008). Scaffolding for multiple assignment projects in CS1 and CS2. ACM SIGPLAN Conference
on Object-oriented Programming, Systems, Languages, and Applications, 873-876.
Montfort, N. (2005). Twisty Little Passages: An Approach to Interactive Fiction. The MIT Press.
Newhall, T. and Meeden, L. (2002). A comprehensive project for CS2: combining key data structures and
algorithms into an integrated web browser and search engine. SIGCSE Bulletin 34, 386-390.
Rebelsky, S.A. and Flynt, C. (2000). Real-world program design in CS2: the roles of a large-scale, multi-group
class project. SIGCSE Bulletin, 32, 192-196.
Wellington, C.A., Briggs, T.H., and Girard, C.D. (2007). Experiences using automated tests and test driven
development in Computer Science I. AGILE 2007, 106-112.
450450

Exploring Difference of Educational Game
Design between the United States and
China through the Lens of Hofstede's
Culture Dimensions Lijie WUa*, Xiaoqing GUb
East China Normal University, China
East China Normal University, China
Abstract: Today, the fields of international education, economic and politics
exchanges closely, with the patterns of cultures exchanging closely. Settled into the
game, in the intercultural era, how are the difference behind the educational games
design under different culture context? On this issue, this research makes intercultural
value comparisons between the US and China, and have an inspection of design
mechanisms about cultural impact on educational game from the Hofstede Cultural
Dimensions. This research adopt a comparative study of currently educational game
design between China and the U S, aimed at identifying cultural differences between
the games with a view to provide a basis for design innovation for the educational
games in cultural diversity.
Keywords: Design of educational game; Cultural Dimensions, The United States and
China, Comparison
1. Method
This study compared the cultural differences of Sino-The United States educational games from
the perspective of Hofstede cultural dimension, This section will explain 1. Study Sample
2.Research design 3.Coding the game described as followings.
1.1Research Questions
Main research question of this study can be summarized as follows. (1) Which cultural values
are reflected in differences about the existing educational game design between the two
countries? (2) From the perspective of cultural differences, the author can explore how Chinese
educational game design needs "CHANGE" or "HOLD"?
1.2Samples
Did not choosing classic educational games for case study, this study selected 40 most popular
and representative Sino-US educational games cases for parents and students from the android
451451
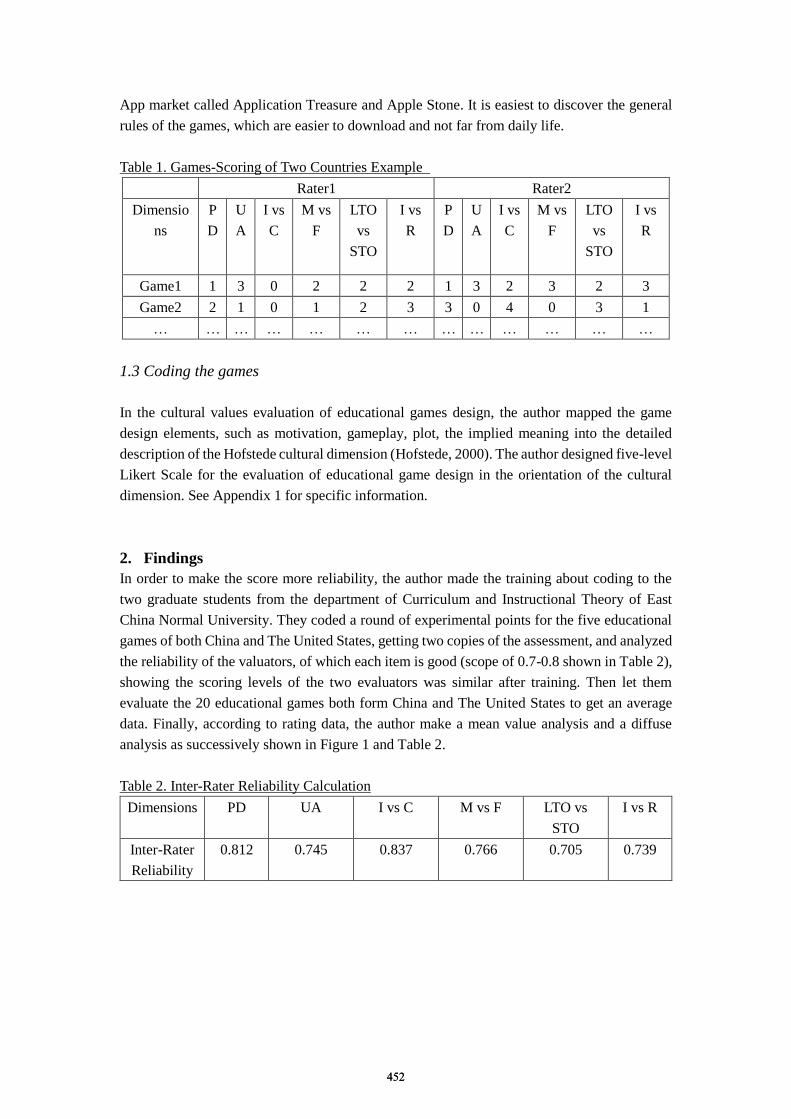
App market called Application Treasure and Apple Stone. It is easiest to discover the general
rules of the games, which are easier to download and not far from daily life.
Table 1. Games-Scoring of Two Countries Example
Rater1 Rater2
Dimensio
ns
P
D
U
A
I vs
C
M vs
F
LTO
vs
STO
I vs
R
P
D
U
A
I vs
C
M vs
F
LTO
vs
STO
I vs
R
Game1 1 3 0 2 2 2 1 3 2 3 2 3
Game2 2 1 0 1 2 3 3 0 4 0 3 1
… … … … … … … … … … … … …
1.3 Coding the games
In the cultural values evaluation of educational games design, the author mapped the game
design elements, such as motivation, gameplay, plot, the implied meaning into the detailed
description of the Hofstede cultural dimension (Hofstede, 2000). The author designed five-level
Likert Scale for the evaluation of educational game design in the orientation of the cultural
dimension. See Appendix 1 for specific information.
2. Findings
In order to make the score more reliability, the author made the training about coding to the
two graduate students from the department of Curriculum and Instructional Theory of East
China Normal University. They coded a round of experimental points for the five educational
games of both China and The United States, getting two copies of the assessment, and analyzed
the reliability of the valuators, of which each item is good (scope of 0.7-0.8 shown in Table 2),
showing the scoring levels of the two evaluators was similar after training. Then let them
evaluate the 20 educational games both form China and The United States to get an average
data. Finally, according to rating data, the author make a mean value analysis and a diffuse
analysis as successively shown in Figure 1 and Table 2.
Table 2. Inter-Rater Reliability Calculation
Dimensions PD UA I vs C M vs F LTO vs
STO
I vs R
Inter-Rater
Reliability
0.812 0.745 0.837 0.766 0.705 0.739
452452
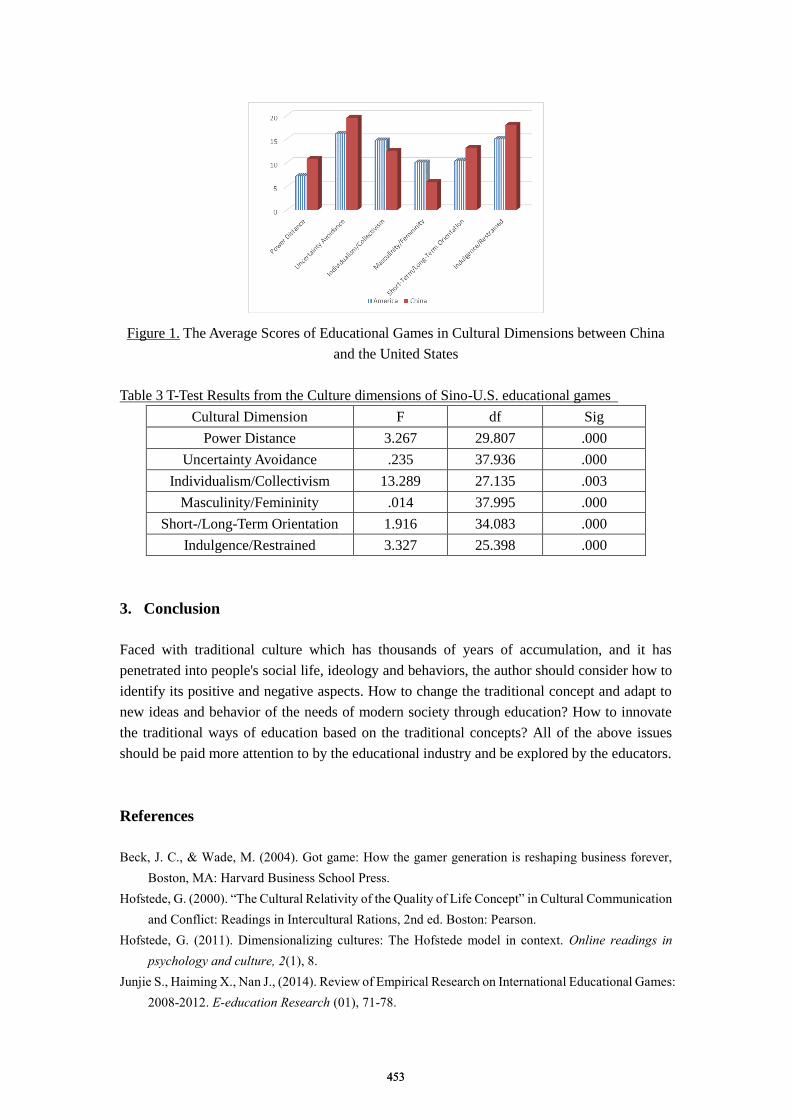
Figure 1. The Average Scores of Educational Games in Cultural Dimensions between China
and the United States
Table 3 T-Test Results from the Culture dimensions of Sino-U.S. educational games
Cultural Dimension F df Sig
Power Distance 3.267 29.807 .000
Uncertainty Avoidance .235 37.936 .000
Individualism/Collectivism 13.289 27.135 .003
Masculinity/Femininity .014 37.995 .000
Short-/Long-Term Orientation 1.916 34.083 .000
Indulgence/Restrained 3.327 25.398 .000
3. Conclusion
Faced with traditional culture which has thousands of years of accumulation, and it has
penetrated into people's social life, ideology and behaviors, the author should consider how to
identify its positive and negative aspects. How to change the traditional concept and adapt to
new ideas and behavior of the needs of modern society through education? How to innovate
the traditional ways of education based on the traditional concepts? All of the above issues
should be paid more attention to by the educational industry and be explored by the educators.
References
Beck, J. C., & Wade, M. (2004). Got game: How the gamer generation is reshaping business forever,
Boston, MA: Harvard Business School Press.
Hofstede, G. (2000). “The Cultural Relativity of the Quality of Life Concept” in Cultural Communication
and Conflict: Readings in Intercultural Rations, 2nd ed. Boston: Pearson.
Hofstede, G. (2011). Dimensionalizing cultures: The Hofstede model in context. Online readings in
psychology and culture, 2(1), 8.
Junjie S., Haiming X., Nan J., (2014). Review of Empirical Research on International Educational Games:
2008-2012. E-education Research (01), 71-78.
453453
Chen, W. et al. (Eds.) (2016). Proceedings of the 24th International Conference on Computers in Education. India: Asia-Pacific Society for Computers in Education
How Learners of Different Learning Styles Collaborate in a Mobile-Assisted Chinese
Character Game Based on Flexible Grouping Lung-Hsiang Wonga, Ting-Chia Hsub* & Ivica Botickic
aNational Institute of Education, Nanyang Technological University, Singapore bNational Taiwan Normal University, Taiwan
cUniversity of Zagreb, Croatia *[email protected]
Abstract: To assist young learners of Chinese Language in developing general orthographic awareness (i.e., the knowledge of Chinese character structures), a novel mobile game-based learning intervention was designed. In playing the “Chinese-PP” game in a 1:1 (one-device-per-pupil) setting, each of the 31 participating 9-year-old pupils was assigned a Chinese character component in her smartphone. A pupil may make use of her own and peers’ character components to form a legitimate Chinese character, and invite the peers with matching components to join her group, resulting in rapid social negotiation. In this paper, the students’ collaborative learning processes in three game sessions are analyzed. The relationships between pupils with varied learning styles and their game behaviors and learning gains are unveiled. Through the intervention that stimulates active peer coaching and social learning, we discover that all the pupils (regardless of their learning styles) became active learning participants and achieved high learning gains towards the last game session.
Keywords: mobile Computer-Supported Collaborative Learning (mCSCL); Learning of Chinese characters; learning styles; game-based learning
1. Introduction
A well-touted challenge in learning Chinese Language is the logographic (component-based) nature of Chinese characters (Wong, Chai, Chen, & Chin, 2013; Xing, 2006). There are 15 types of commonly used configurations. Most characters are formed by a combination of two or more components. One example is the “top-bottom” configuration where components are “stacked” together to form a character (e.g., 古 or 早). These components are the functional orthographic unit to recognize Chinese characters. As linguistic research on character components is getting mature, the component-based learning has been extensively applied in Chinese character teaching practice (Koda, 1996).
In this study, we designed an innovative techno-pedagogical environment to foster orthographic awareness which entails understanding of the ways which components can be combined to form characters, as well as the commonly used structures in these formations. When the pupils establish orthographic awareness of the Chinese characters, it is as if they have activated the meta-cognitive process to internalize Chinese character knowledge (Jiang, 2006). One example of the orthographic rules of Chinese characters is “phonogram”. More than 90% of the Chinese characters belong to this category. A phonogram character is typically comprised of a phonetic component and a semantic component to hint its pronunciation and meaning respectively. For example, the phonogram character “沐” is pronounced as “mù”, same as the pronunciation of its phonetic component “木”; and means “bath”, relevant to its semantic component “氵” (which means “water”).
We developed a mobile-assisted Chinese character forming game, namely, Chinese-PP. In playing the Chinese-PP game in a 1:1 (one-device-per-pupil) setting, each pupil is assigned a character component on her smartphone. She must attempt to use her own component and components of her peers to form legitimate Chinese characters, and invite those peers to form a small group. A pupil who invites others, known as ‘inviter’ hereafter, must negotiate with the ‘invitees’, and explain to the invitees on the proposed character in case it is unfamiliar to the latter, thereby convincing them to join
454454454
the group and score points. We refer to this novel game setting as “flexible grouping”, which means that pupils are not pre-assigned to groups. Instead, pupils form groups in a spontaneous, emergent manner, which is also of a transient nature. This leads to a higher degree of open-ended-ness and flexibility in the synergistic interactions of pupils and game process as pupils are not limited to pursuing standard answers determined by the teachers.
Thirty-one (31) Singapore Primary 3 (9-year-old) pupils in a public school participated in the pilot study of Chinese-PP. They were enrolled in the formal Chinese (as a second language) class in their school for two years and yet the amount of Chinese characters they had mastered were limited. This paper focuses on using quantitative analysis and case studies to compare the roles that the pupils play in the Chinese-PP game according to the various learning styles of the pupils. In particular, we investigated which learning styles have resulted in greater learning effectiveness, and whether pupils of these particular learning styles played the role of inviter or invitee most of the time. 2. Literature Review 2.1 Social Interdependence Despite the long-espoused benefits of peer-to-peer collaboration within academic contexts, there is still much to know about the nature and forms of effective collaborative learning from the perspective of the researcher (Alexander, 2013). Collaborative learning is generally learner-centered with an emphasis on proactive learning. Pupils are willing to commit to the learning goals of the team and encourage one another to pursue higher levels of performance (Slavin, 1995). In a collaborative activity, the interaction among individuals influence the way the group is organized which further determines the outcome of the activities, with “social interdependence theory” as the reason and foundation towards such sociological learning (Johnson & Johnson, 2011). Social interdependence exists when the outcomes of individuals are affected by their own and others' actions (Johnson & Johnson, 1989). There are three types of social interdependence: positive interdependence, no interdependence, and negative interdependence (Johnson & Johnson, 1989). First, positive interdependence (i.e., cooperation) exists when there is a positive correlation among individuals’ goal attainments. Positive interdependence results in promotive interaction (i.e., individuals encouraging and facilitating each other’s efforts to achieve the group’s goals). Second, no interdependence (i.e., individualistic efforts) exists when there is no correlation among individuals’ goal achievements. These individuals perceive that the achievement of their goals is unrelated to the goal achievement of others. Third, negative interdependence results in oppositional interaction (i.e., individuals obstructing each other’s efforts to achieve their goals). The pupils work against each other to achieve a goal that only one or a few can attain.
Positive interdependence tends to result in promotive interaction, while negative interdependence tends to result in contrient interaction, and no interdependence results in an absence of interaction. As such, it is important to design collaborative learning activities in the way that every learner is aware that the only way to achieve an individual goal is to work with their peers to achieve the group goal. Such positive interdependence drives group members to collaborate with one another and to encourage and help other group members learn (Janssen, Kirschner, Erkens, Kirschner, & Paas, 2010). 2.2 Learning Styles Learning style refers to the learners’ individual learning preference. Learners of varied learning styles affect each other in terms of accepting external stimuli, receiving, memorizing, thinking and problem solving. There have been studies for decades on the various types of learning styles (Coffield, Moseley, Hall, & Ecclestone, 2004) to facilitate the teachers’ design of curriculum activities, with the aim of catering to the needs of different pupils with varied learning styles. This has contributed to the potential development of technology-mediated and personalized learning.
The learning style is partly governed by a pupil’s native ability – the way that a pupil prefers to receive and process external information. Scholars systematically categorized the various learning methods subsequently determined the learning styles. The most commonly adopted instrument is Felder
455455455
& Silverman’s (1988) index of learning styles (ILS), consisting of 44 questions under “Active/Reflective”, “Sensing/Intuitive”, “Visual/Verbal”, and “Sequential/Global” respectively. This study adopts ILS (Soloman & Felder, 2001) which was developed based on Felder and Silverman’s index. The second dimension, Sensing/Intuitive, was adopted in this study as they are more relevant to the gaming behaviors and strategies of the players of Chinese-PP.
Learners with Sensing or Intuitive learning styles perform better by leveraging learning materials with more examples than theories. Sensing-style learners understand better, if the new information can be connected to their past concrete experience and daily life. It is hard for Sensing style learner to understand the abstract concepts. Instead, Intuitive style learners are capable of comprehending abstract materials; and they are more creative than sensing learners. They dislike learning materials that give away details. 3. Research Design 3.1 Research Context and Intervention Design Thirty-one (31) Singapore Primary 3 (9-year-old) pupils participated in the study. Prior to the intervention, we split them into three ability bands based on their pre-test (see below) results. Pupils whose scores were among the lowest 27% (9 pupils) were deemed as low achievement (LA) pupils, whereas pupils with scores that were among the top 27% (9 pupils) are classified as high achievement (HA) pupils, and the remaining were medium achievement pupils (MA) (13 pupils). Some HA and MA pupils scored the same marks and hence resulted in a higher number of pupils in those groups. All the pupils were then split into two “communities” heterogeneously with 15 in Community 1 and 16 in Community 2. The amounts of HA, MA and LA pupils in both communities were roughly the same.
The intervention was carried out in three 90-minute sessions. Each session comprised three segments – 20 minutes of pre-task activities, 60 minutes of main task activities and 10 minutes of post-task activities. First, pre-task (20 minutes) activities were conducted by the Chinese teacher where pupils built or strengthened their prior knowledge and revised themes learned previously before being introduced to new orthographic knowledge on character components (e.g., the phonogram structure) and how to make educated guesses on the meaning and pronunciation from the components. The pupils then used their smartphones to carry out the Chinese-PP game to form words using a flexible grouping approach during the main task (60 minutes) activities. Finally, the post-task activities (10 minutes) involving learning reflection were carried out. Guided by the teacher, the pupils recalled the characters that they formed during the game and related them to the knowledge acquired during the pre-task.
The technological infrastructure consists of: (1) a projector screen and a laptop that facilitate the projection of the teacher console management interface; (2) 1:1 smartphones (with the Chinese-PP app installed) and Internet access; (3) the server that runs the Chinese-PP system. In the beginning of each game round, the system assigns Chinese character components to individual pupils’ Chinese-PP app. The pupils may find out which components they and their peers are assigned through the app. As presented in Figure 1(a), “My Character” shows that Pupil A is assigned the component “女” and she drags the components “口” “月” which belong to Pupils B and C into the word formation frame to form the Chinese character “娟”, as demonstrated in Figure 1(b). Pupil A then sends invites to Pupils B and C by clicking on the “Submit” button. The composed character “娟” then appears in the “My Groups” interface (Figure 1(c)) on all three pupils’ smartphones. In addition to sending the invites through the app, the inviters would approach their invitees to negotiate with them verbally on group forming. Once the three pupils agree that the character formed is correct (Figure 1c), the invites will be accepted by Pupils B and C by clicking the confirmation button. The information will then be transmitted to the teacher console. The teacher then evaluates the answers through the teacher console and awards scores of 10 points to each pupil for each correct character formed by a pair of pupils (20 points each for a group of 3 pupils, 30 points each for a group of 4 pupils; i.e., the more complex the character is, the higher the points each pupil is earned). In addition, the teacher may opportunistically gather the pupils to discuss about the pupil-formed characters, stimulate their thinking and provide them appropriate hints for subsequent game time. At the end of a 15-minute game round, the groups are disbanded. The pupils then proceeds to the next round where the system assigns new character components to them.
456456456
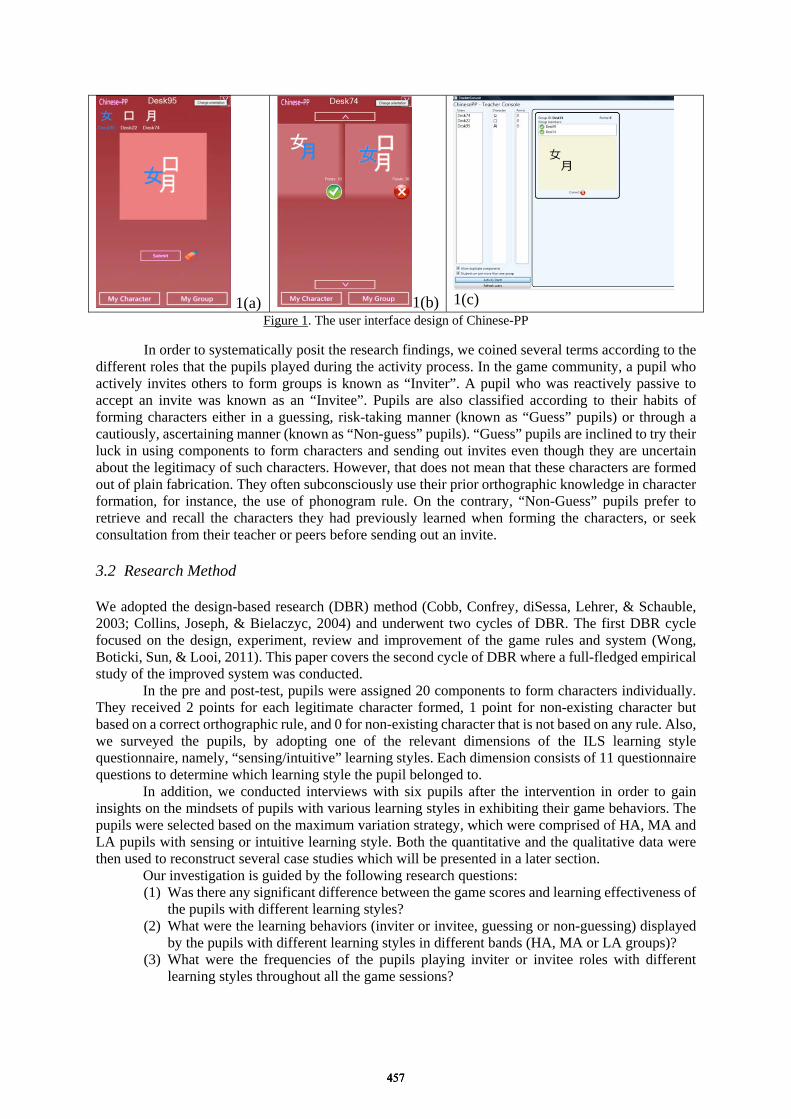
1(a) 1(b)
1(c) Figure 1. The user interface design of Chinese-PP
In order to systematically posit the research findings, we coined several terms according to the different roles that the pupils played during the activity process. In the game community, a pupil who actively invites others to form groups is known as “Inviter”. A pupil who was reactively passive to accept an invite was known as an “Invitee”. Pupils are also classified according to their habits of forming characters either in a guessing, risk-taking manner (known as “Guess” pupils) or through a cautiously, ascertaining manner (known as “Non-guess” pupils). “Guess” pupils are inclined to try their luck in using components to form characters and sending out invites even though they are uncertain about the legitimacy of such characters. However, that does not mean that these characters are formed out of plain fabrication. They often subconsciously use their prior orthographic knowledge in character formation, for instance, the use of phonogram rule. On the contrary, “Non-Guess” pupils prefer to retrieve and recall the characters they had previously learned when forming the characters, or seek consultation from their teacher or peers before sending out an invite. 3.2 Research Method We adopted the design-based research (DBR) method (Cobb, Confrey, diSessa, Lehrer, & Schauble, 2003; Collins, Joseph, & Bielaczyc, 2004) and underwent two cycles of DBR. The first DBR cycle focused on the design, experiment, review and improvement of the game rules and system (Wong, Boticki, Sun, & Looi, 2011). This paper covers the second cycle of DBR where a full-fledged empirical study of the improved system was conducted. In the pre and post-test, pupils were assigned 20 components to form characters individually. They received 2 points for each legitimate character formed, 1 point for non-existing character but based on a correct orthographic rule, and 0 for non-existing character that is not based on any rule. Also, we surveyed the pupils, by adopting one of the relevant dimensions of the ILS learning style questionnaire, namely, “sensing/intuitive” learning styles. Each dimension consists of 11 questionnaire questions to determine which learning style the pupil belonged to. In addition, we conducted interviews with six pupils after the intervention in order to gain insights on the mindsets of pupils with various learning styles in exhibiting their game behaviors. The pupils were selected based on the maximum variation strategy, which were comprised of HA, MA and LA pupils with sensing or intuitive learning style. Both the quantitative and the qualitative data were then used to reconstruct several case studies which will be presented in a later section. Our investigation is guided by the following research questions:
(1) Was there any significant difference between the game scores and learning effectiveness of the pupils with different learning styles?
(2) What were the learning behaviors (inviter or invitee, guessing or non-guessing) displayed by the pupils with different learning styles in different bands (HA, MA or LA groups)?
(3) What were the frequencies of the pupils playing inviter or invitee roles with different learning styles throughout all the game sessions?
457457457
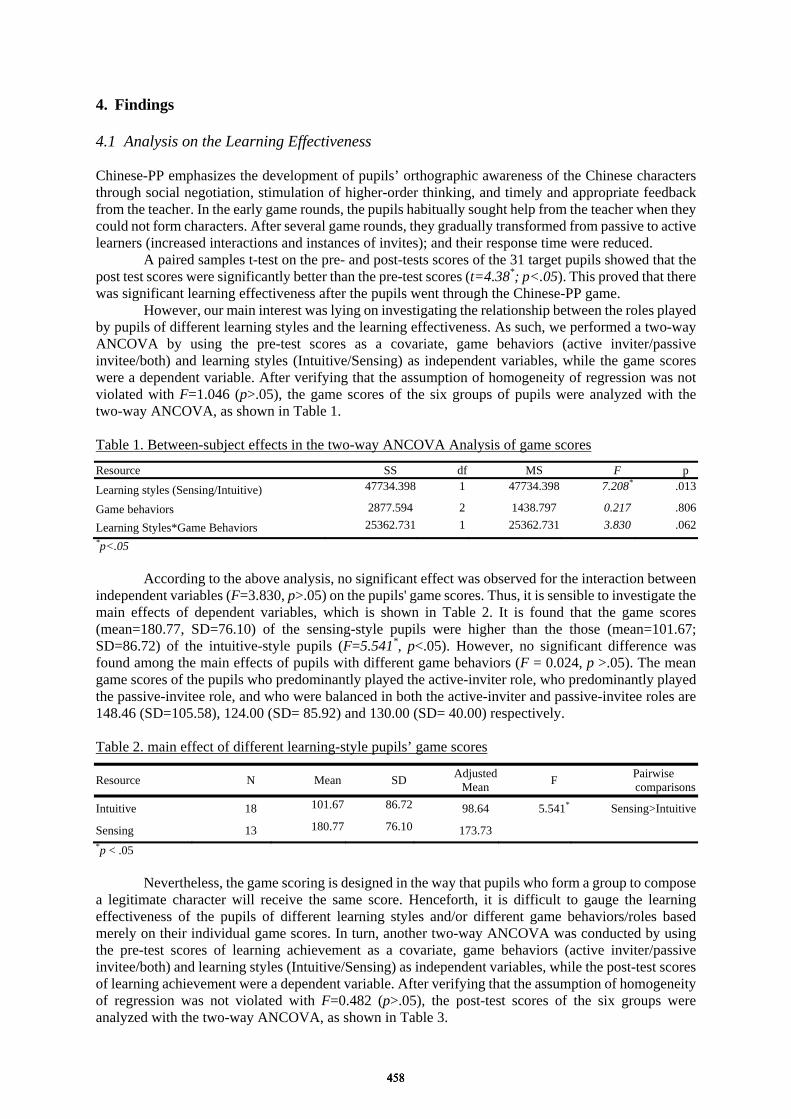
4. Findings 4.1 Analysis on the Learning Effectiveness Chinese-PP emphasizes the development of pupils’ orthographic awareness of the Chinese characters through social negotiation, stimulation of higher-order thinking, and timely and appropriate feedback from the teacher. In the early game rounds, the pupils habitually sought help from the teacher when they could not form characters. After several game rounds, they gradually transformed from passive to active learners (increased interactions and instances of invites); and their response time were reduced. A paired samples t-test on the pre- and post-tests scores of the 31 target pupils showed that the post test scores were significantly better than the pre-test scores (t=4.38*; p<.05). This proved that there was significant learning effectiveness after the pupils went through the Chinese-PP game. However, our main interest was lying on investigating the relationship between the roles played by pupils of different learning styles and the learning effectiveness. As such, we performed a two-way ANCOVA by using the pre-test scores as a covariate, game behaviors (active inviter/passive invitee/both) and learning styles (Intuitive/Sensing) as independent variables, while the game scores were a dependent variable. After verifying that the assumption of homogeneity of regression was not violated with F=1.046 (p>.05), the game scores of the six groups of pupils were analyzed with the two-way ANCOVA, as shown in Table 1. Table 1. Between-subject effects in the two-way ANCOVA Analysis of game scores
Resource SS df MS F pLearning styles (Sensing/Intuitive) 47734.398 1 47734.398 7.208* .013
Game behaviors 2877.594 2 1438.797 0.217 .806
Learning Styles*Game Behaviors 25362.731 1 25362.731 3.830 .062*p<.05 According to the above analysis, no significant effect was observed for the interaction between independent variables (F=3.830, p>.05) on the pupils' game scores. Thus, it is sensible to investigate the main effects of dependent variables, which is shown in Table 2. It is found that the game scores (mean=180.77, SD=76.10) of the sensing-style pupils were higher than the those (mean=101.67; SD=86.72) of the intuitive-style pupils (F=5.541*, p<.05). However, no significant difference was found among the main effects of pupils with different game behaviors (F = 0.024, p >.05). The mean game scores of the pupils who predominantly played the active-inviter role, who predominantly played the passive-invitee role, and who were balanced in both the active-inviter and passive-invitee roles are 148.46 (SD=105.58), 124.00 (SD= 85.92) and 130.00 (SD= 40.00) respectively. Table 2. main effect of different learning-style pupils’ game scores
Resource N Mean SD AdjustedMean F Pairwise
comparisons
Intuitive 18 101.67 86.72 98.64 5.541* Sensing>Intuitive
Sensing 13 180.77 76.10 173.73 *p < .05 Nevertheless, the game scoring is designed in the way that pupils who form a group to compose a legitimate character will receive the same score. Henceforth, it is difficult to gauge the learning effectiveness of the pupils of different learning styles and/or different game behaviors/roles based merely on their individual game scores. In turn, another two-way ANCOVA was conducted by using the pre-test scores of learning achievement as a covariate, game behaviors (active inviter/passive invitee/both) and learning styles (Intuitive/Sensing) as independent variables, while the post-test scores of learning achievement were a dependent variable. After verifying that the assumption of homogeneity of regression was not violated with F=0.482 (p>.05), the post-test scores of the six groups were analyzed with the two-way ANCOVA, as shown in Table 3.
458458458
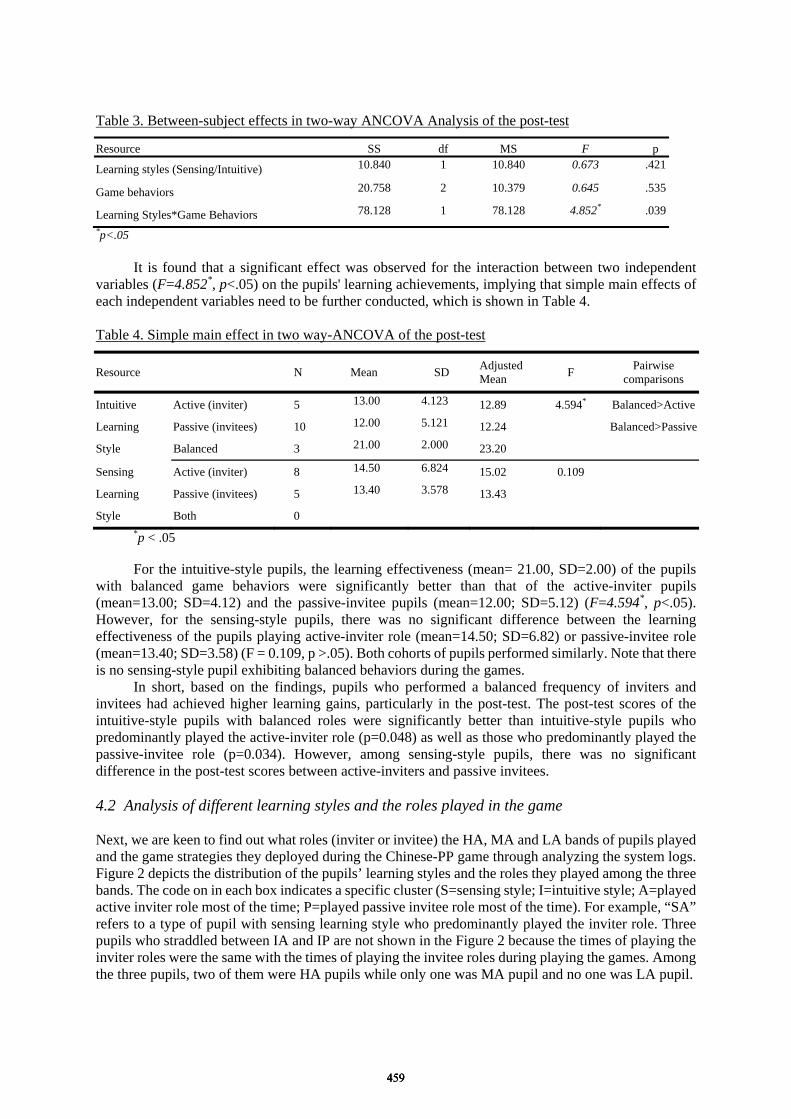
Table 3. Between-subject effects in two-way ANCOVA Analysis of the post-test
Resource SS df MS F p
Learning styles (Sensing/Intuitive) 10.840 1 10.840 0.673 .421
Game behaviors 20.758 2 10.379 0.645 .535
Learning Styles*Game Behaviors 78.128 1 78.128 4.852* .039*p<.05
It is found that a significant effect was observed for the interaction between two independent variables (F=4.852*, p<.05) on the pupils' learning achievements, implying that simple main effects of each independent variables need to be further conducted, which is shown in Table 4. Table 4. Simple main effect in two way-ANCOVA of the post-test
Resource N Mean SD AdjustedMean F Pairwise
comparisons
Intuitive Active (inviter) 5 13.00 4.123 12.89 4.594* Balanced>Active
Learning Passive (invitees) 10 12.00 5.121 12.24 Balanced>Passive
Style Balanced 3 21.00 2.000 23.20
Sensing Active (inviter) 8 14.50 6.824 15.02 0.109
Learning Passive (invitees) 5 13.40 3.578 13.43
Style Both 0 *p < .05 For the intuitive-style pupils, the learning effectiveness (mean= 21.00, SD=2.00) of the pupils
with balanced game behaviors were significantly better than that of the active-inviter pupils (mean=13.00; SD=4.12) and the passive-invitee pupils (mean=12.00; SD=5.12) (F=4.594*, p<.05). However, for the sensing-style pupils, there was no significant difference between the learning effectiveness of the pupils playing active-inviter role (mean=14.50; SD=6.82) or passive-invitee role (mean=13.40; SD=3.58) (F = 0.109, p >.05). Both cohorts of pupils performed similarly. Note that there is no sensing-style pupil exhibiting balanced behaviors during the games.
In short, based on the findings, pupils who performed a balanced frequency of inviters and invitees had achieved higher learning gains, particularly in the post-test. The post-test scores of the intuitive-style pupils with balanced roles were significantly better than intuitive-style pupils who predominantly played the active-inviter role (p=0.048) as well as those who predominantly played the passive-invitee role (p=0.034). However, among sensing-style pupils, there was no significant difference in the post-test scores between active-inviters and passive invitees. 4.2 Analysis of different learning styles and the roles played in the game Next, we are keen to find out what roles (inviter or invitee) the HA, MA and LA bands of pupils played and the game strategies they deployed during the Chinese-PP game through analyzing the system logs. Figure 2 depicts the distribution of the pupils’ learning styles and the roles they played among the three bands. The code on in each box indicates a specific cluster (S=sensing style; I=intuitive style; A=played active inviter role most of the time; P=played passive invitee role most of the time). For example, “SA” refers to a type of pupil with sensing learning style who predominantly played the inviter role. Three pupils who straddled between IA and IP are not shown in the Figure 2 because the times of playing the inviter roles were the same with the times of playing the invitee roles during playing the games. Among the three pupils, two of them were HA pupils while only one was MA pupil and no one was LA pupil.
459459459
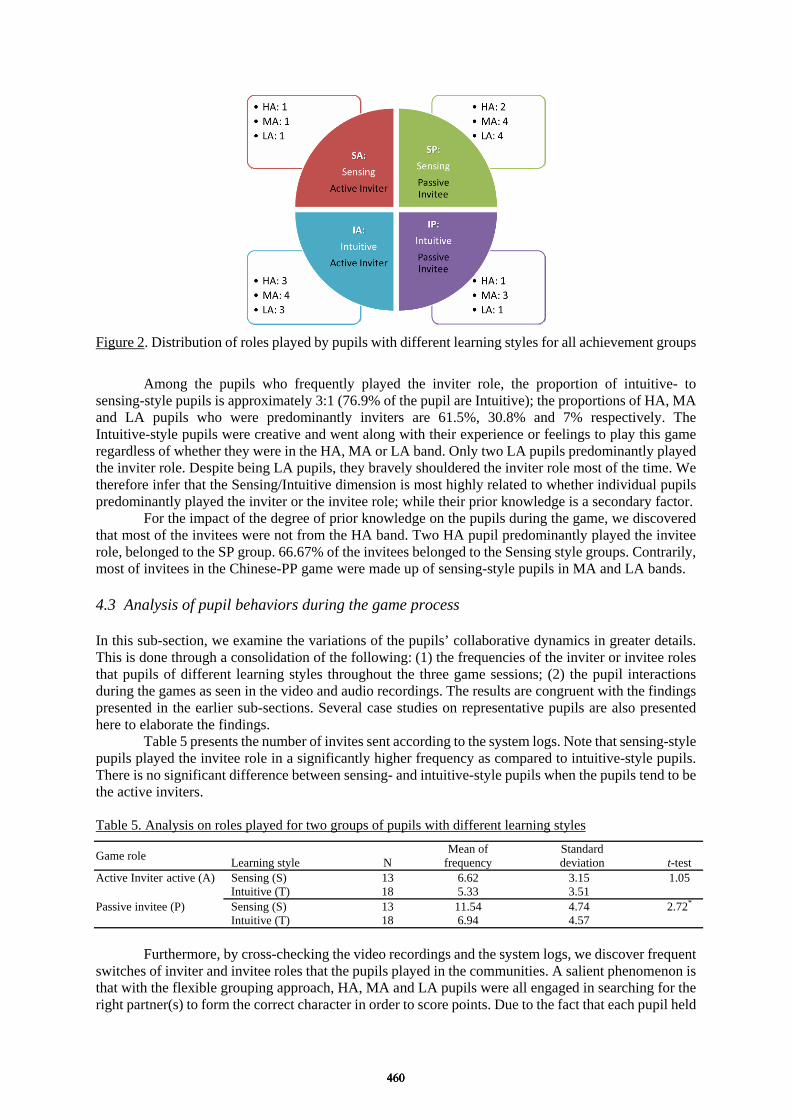
Figure 2. Distribution of roles played by pupils with different learning styles for all achievement groups
Among the pupils who frequently played the inviter role, the proportion of intuitive- to sensing-style pupils is approximately 3:1 (76.9% of the pupil are Intuitive); the proportions of HA, MA and LA pupils who were predominantly inviters are 61.5%, 30.8% and 7% respectively. The Intuitive-style pupils were creative and went along with their experience or feelings to play this game regardless of whether they were in the HA, MA or LA band. Only two LA pupils predominantly played the inviter role. Despite being LA pupils, they bravely shouldered the inviter role most of the time. We therefore infer that the Sensing/Intuitive dimension is most highly related to whether individual pupils predominantly played the inviter or the invitee role; while their prior knowledge is a secondary factor.
For the impact of the degree of prior knowledge on the pupils during the game, we discovered that most of the invitees were not from the HA band. Two HA pupil predominantly played the invitee role, belonged to the SP group. 66.67% of the invitees belonged to the Sensing style groups. Contrarily, most of invitees in the Chinese-PP game were made up of sensing-style pupils in MA and LA bands. 4.3 Analysis of pupil behaviors during the game process In this sub-section, we examine the variations of the pupils’ collaborative dynamics in greater details. This is done through a consolidation of the following: (1) the frequencies of the inviter or invitee roles that pupils of different learning styles throughout the three game sessions; (2) the pupil interactions during the games as seen in the video and audio recordings. The results are congruent with the findings presented in the earlier sub-sections. Several case studies on representative pupils are also presented here to elaborate the findings.
Table 5 presents the number of invites sent according to the system logs. Note that sensing-style pupils played the invitee role in a significantly higher frequency as compared to intuitive-style pupils. There is no significant difference between sensing- and intuitive-style pupils when the pupils tend to be the active inviters. Table 5. Analysis on roles played for two groups of pupils with different learning styles
Game role Learning style N Mean of
frequencyStandard deviation t-test
Active Inviter active (A) Sensing (S) 13 6.62 3.15 1.05 Intuitive (T) 18 5.33 3.51
Passive invitee (P) Sensing (S) 13 11.54 4.74 2.72*
Intuitive (T) 18 6.94 4.57
Furthermore, by cross-checking the video recordings and the system logs, we discover frequent switches of inviter and invitee roles that the pupils played in the communities. A salient phenomenon is that with the flexible grouping approach, HA, MA and LA pupils were all engaged in searching for the right partner(s) to form the correct character in order to score points. Due to the fact that each pupil held
460460460
a different component, even the LA pupils were needed in the games, resulting in a natural way of collaboration to work towards the common personal goal of scoring high.
Next, a few typical pupil cases are given to delineate the trajectory of the dynamic transition in social interactions over the three game sessions as a result of the varied pupil behaviors. In addition, we split the pupils into Guess and Non-guess categories in the following bases: (1) Whether the pupils preferred to guess during the Chinese-PP game, i.e., individual pupils’ responses to the teacher’s opportunistic questions during the game on whether they did recognize those Chinese characters or that they were formed; (2) pupils’ self-reporting on their guess or non-guess behaviors through an additional item in the questionnaire. Cases 1 & 2: A comparison of pupils ID 3 and ID 30 Case 1: Pupil ID 3 (HA / IA - intuitive; predominantly inviter type; non-guess) Case 2: Pupil ID 30 (MA / IP –intuitive; predominantly invitee type; non-guess) Pupil ID 3 who was “intuitive, inviter type and non-guessing” predominantly played the inviter role within Community 2 throughout the three game sessions. This is congruent with our general finding in the previous section that intuitive-style pupils were frequent inviters in the games. In addition, he exercised a non-guess behavior by always making sure that the character formed was indeed valid before sending it to the teacher’s console. In many other occasions, he was very sure about the characters that he composed and was able to make the connection with the orthographic knowledge that he learned during the pre-task phases. As he needed to obtain the other components, he often introduced to his potential team members (perhaps in MA or LA band) the form, pronunciation and meaning of the character that he intended to form. Whenever necessary, he explained the general orthographic knowledge related to the Chinese character. This is the emergent peer guidance commonly found in the games that had perhaps elevated the ability and self-efficacy of the MA and LA pupils as a result.
Two other pupils with the same learning style as Pupil 3 in the HA band, pupil ID 10 and pupil ID 20 (both in Community 1), exhibited similar behaviors throughout the three game sessions.
On the contrary, albeit also a pupil of active-intuitive type, pupil ID 30 in Community 2 was a passive invitee in the first game session. This is perhaps due to her lack of self-efficacy (for being a MA pupil) in the beginning. Nevertheless, we observed an increase of her level of proactive-ness in the second and third game sessions where she made two and five invites respectively. Eventually, the accumulative numbers of times that she played the inviter role and the invitee role were close (6 and 8 times respectively). In general, through the system logs, we discovered that there was an increasing trend in the level of peer interactions among the pupils regardless of the respective levels of their prior knowledge. Of which, 100% of the MA pupils made improvement in this aspect. Cases 3 & 4: A comparison of pupils ID 27 and ID 2 Case 3: ID27 (LA; SP –sensing; invitee-type; guess) Case 4: ID2 (LA; SP – sensing; invitee-type; [predominantly] non-guess) Pupil ID 27 in Community 1 was a pupil who liked to guess for potential characters. Albeit belonging to LA band, she participated in the game actively, patiently noting down and guessing all possible combinations of characters. Throughout the three game sessions, she seemed to comprehend the rules of the game well and enjoyed the game. Her inviter-to-invitee record stood at 8:13. That is, while being categorized under the invitee-type, she braved herself in assuming the inviter role frequently. She was not afraid to commit mistakes and consequently learned from the feedback the teacher and her peers. On the contrary, Pupil ID 2 of Community 1 exhibited a relatively inconsistent pattern. She was less active in the first game - only sent out one invite and was invited once. She played the invitee role throughout the second session. However, in the third session, she became very active by inviting different pupils and accepting invites from different peers. This was not only due to her faster actions, but more so of her courage to adopt the guessing approach. Initially, she perceived herself as one who had to heavily rely on her peers as she was from the LA band. However, in the final game, the number of times she invited others was the same as the occasions she played the invitee role (2 times each).
Another case with a similar pattern was seen in Pupil ID 22 (SA, MA) in Community 2. Both Cases 3 and 4 exemplify that during the games, MA and LA pupils were willing and dared to try.
461461461
5. Discussion The findings presented in the previous section indicates that there were indeed a complex variety of factors that shaped the pupils’ learning experiences during the Chinese-PP intervention. The flexible grouping approach stimulated the pupils of various learning styles and prior achievement levels to actively interact with peers after several rounds of games. Specifically, the sensing-style pupils played the invitee role more often than their intuitive-style peers. However, the learning outcomes of the sensing-style pupils were significantly better than intuitive-style pupils. As such, the pupils who played the invitee role did not necessarily achieve lower learning gains than pupils who played the inviter role. The Chinese-PP game promotes the premise of “learning from doing and learning from errors”. Even if the characters cannot be formed with 100% accuracy (perhaps due to the guessing approach), the pupils may still advance their orthographic awareness due to the in-situ or post-reflection. The teacher should encourage the pupils in reflective discussions during the game rather than adopting a repressive attitude towards characters formed via the guessing approach. Every pupil should be given the opportunity to receive constructive comments from the teacher and their peers, which may include feedback on analyzing if certain wrong characters formed do fit specific orthographic rules of Chinese characters. Thus, the pupils would be able to construct and reinforce such higher-level knowledge for their further attempts in forming characters in the right directions.
Indeed, the flexible, rapidly altered grouping model of the Chinese-PP game is a novel approach in mobile and game-based learning. Even within the general collaborative learning field, existing studies have been focusing on fixed, often pre-determined pupil groupings, perhaps for easier classroom/learning management by the facilitators or more robust execution of collaboration scripts. Instead, Chinese-PP leverages more on emergent peer negotiation as a form of positive interdependence to keep the learning activities going. Each pupil possesses a resource (a character component) and assumes full control on it. Nevertheless, in order to achieve the game goal of forming characters with the rest of the available resources (the other components possessed by her/his peers), she will not only need to draw upon her own knowledge of Chinese characters and problem solving skills, but also her social skills to negotiate with her peers to identify and form groups. Without convincing others to join her group (and perhaps sharing her knowledge to others in the process), her goal of winning the scores would not be attained. This can be attributed to ‘positive resource dependency’ as posited by Johnson and Johnson (1994). Such a game design is meant for balancing competition and collaboration – a major characteristic of Chinese-PP. In particular, the groupings are flexible; henceforth, there is ‘no permanent allies and no permanent competitors’ (unlike typical game-based learning designs). Mapping this game characteristic to the social interdependence theory, we see this as an innovative means to promote positive interdependence and minimize negative interdependence. 6. Conclusion This study concludes that the rapid and meaningful pupil interactions stimulated by the flexible grouping game design is the key factors of Chinese-PP to outstanding learning outcomes of pupils with respect to its learning goal of increasing orthographic awareness. The objective of the game is not to determine who have memorized more characters. It is meant for enhancing the general orthographic knowledge of Chinese characters through social learning and peer support. This is an inspiring form of intervention where learning is designed to bring about interactive support learning across peers, teachers and technology (Wong et al., 2011). In the future, we intend to collate the three sessions of game process information and conduct a more comprehensive and in-depth qualitative analysis. We will also incorporate the theories of second language acquisition into the analysis so as to investigate more thoroughly the unique nature of flexible grouping model. This will provide future reference to aid such application to the learning of other subject areas. Acknowledgements This project was funded by the Office of Education Research, National Institute of Education, Nanyang Technological University, Singapore (project ID: OER 16/10 WLH). We would like to thank Jizhen Sun, Yanqiu Li and Yancy Toh for their contribution to the project.
462462462

References Alexander, P. A. (2013). Foreword. In C. E. Hmelo-Silver, C. A. Chinn, C. K. K. Chan, & A. O'Donnell (Eds.),
The International Handbook of Collaborative Learning. New York: Routledge. Cobb, P., Confrey, J., diSessa, A., Lehrer, R., & Schauble, L. (2003). Design experiments in educational research.
Educational Researcher, 32(1), 9-13. Coffield, F., Moseley, D., Hall, E., & Ecclestone, K. (2004). Learning styles and pedagogy in post-16 learning: A
systematic and critical review. London: LSRC & Dept. for Education and Skills. Collins, A., Joseph, D., & Bielaczyc, K. (2004). Design research: Theoretical and methodological issues.
Learning Sciences, 13(1), 15-42. Felder, R. M., & Silverman, L. K. (1988). Learning and teaching Styles in engineering education. Journal of
Engineering Education, 78(7), 674-681. Janssen, J., Kirschner, F., Erkens, G., Kirschner, P. A., & Paas, F. (2010). Making the black box of collaborative
learning transparent: Combining process-oriented and cognitive load approaches. Educational Psychology Review, 22(2), 139-154.
Jiang, X. (2006). Study on the orthographic awareness of Chinese characters by American beginners. In D.-J. Sun (Ed.), Research on character learning as a second language (pp. 470-481). Beijing: Commercial Press.
Johnson, D., & Johnson, R. (2011). Social interdependence theory. In D. J. Christie (Ed.), The Encyclopedia of Peace Psychology (pp. 1028-1032): Blackwell Publishing.
Johnson, D., & Johnson, R. T. (1989). Cooperation and Competition: Theory and Research: Interaction Book Company.
Koda, K. (1996). L2 word recognition research: A critical review. The Modern Language Journal, 80(4), 450-460. Soloman, B. A., & Felder, R. M. (2001). Learning styles and strategies. Retrieved from
http://www4.ncsu.edu/unity/lockers/users/f/felder/public/ILSdir/styles.htm Wong, L.-H., Boticki, I., Sun, J., & Looi, C.-K. (2011). Improving the scaffolds of a mobile-assisted Chinese
character forming game via a design-based research cycle. Computers in Human Behavior, 27(5), 1783-1793.
Wong, L.-H., Chai, C. S., Chen, W., & Chin, C. K. (2013). Measuring Singaporean Students' Motivation and Strategies of Bilingual Learning. The Asia-Pacific Education Researcher, 22(3), 263-272.
Xing, J. Z. (2006). Teaching and learning Chinese as a foreign language: A pedagogical grammar (Vol. 1). Hong Kong: Hong Kong University Press.
463463463
Chen, W. et al. (Eds.) (2016). Proceedings of the 24th International Conference on Computers in Education.
India: Asia-Pacific Society for Computers in Education
Effects of Embodied Interaction on Reading
Comprehension in a Multimodal Environment
Ya-Wen CHENGa, Wei-Chieh FANG
b, Wei CHANG
a, Li-Chun LIN
a & Nian-Shing CHEN
a*
a Department of Information Management, National Sun Yat-sen University, Kaohsiung, Taiwan b Department of Education, Washington University in St Louis, MO, USA
Abstract: The study examined the effects of embodied interaction on reading comprehension in a multimodal environment. Specifically, this study compared how textual, visual or gestural
modes affect young children’s reading comprehension. 91 Chinese EFL learners were assigned
to one of the three modes to complete a reading task. During the reading task, they made several
predictions by selecting a text description, selecting a picture or doing gestures that best match
their predictions. Results showed that the three modes led to comparable level of reading
comprehension. However, when reading ability was taken into account, the high level readers’
comprehension was negatively affected by the gesture mode while the low level readers’
comprehension was not. The findings suggest that visuals and gestures can be integrated into a multimodal reading environment to make reading an active learning experience. However, in
designing an interactive digital storybook involving gestures, it is recommended that individual
differences in reading ability be addressed to maximize its effect. Suggestions for future studies
are discussed.
Keywords: Gesture-based interactions, multimodal texts, E-book, embodiment, reading
comprehension
1. Introduction
A multimodal learning environment is normally filled with visual, aural and textual input in a digital format. The rich affordances of such a digital learning environment are beneficial to young readers
(Dalton et al., 2011). Reading is not an automatic process as readers need to “visualize, infer, predict,
conceptualize and imagine” the ideologies conveyed in the text (Walsh, 2006). In multimodal texts, compared with print-based texts where meaning-making mainly relies on understanding the words
(Walsh, 2006), readers are able to use various senses to comprehend the texts. Studies looking into the
effects of technology-mediated reading comprehension found that digital tools and learning environments positively affect reading comprehension (Dalton et al., 2011). Multimodal texts have
been found to engage readers, activate various schemata (Yanguas, 2009), encourage imagination
(Maureen, 2006), facilitate understanding of information (Coiro, 2003). However, little research has looked into the how kinesthetic involvement such as gestures affects reading comprehension in a
multimodal learning environment.
2. Literature Review Typical multimodal studies in the field of reading have explored visual and audio modes. However, a
few researchers have argued that reading is not a passive learning activity. Rather it can be an embodied
activity, in which comprehension can arise from simulating the linguistic content by using body systems of perception, action and emotion (Glenberg, 2011). This notion has received support from
theories of embodied cognition, which proposed that cognitive processes are rooted in the body’s
interactions with the world (Wilson, 2002; Barsalou, 2008). One such theory is simulation theory of language comprehension, which posits that language comprehension can benefit from mapping abstract
symbols of language such as texts onto embodied experiences. These embodied experiences are
encoded in memory as perceptual symbols during previous interactions with objects in authentic situation. Thus, not only language symbols but also affordances deriving from interaction with an object
can reactivate the representation of embodied experiences in memory, which in turn can lead to better
text comprehension.
464464464
With the advancement of gesture-based technology, a multimodal environment has the
potential to involve integrated modes of senses such as visual, tactile, hearing and kinesthetic senses at the same time (Chen & Fang, 2014). In line with the embodied approach, a few studies in educational
technology have attempted to explore whether computer-guided physical involvement can lead to
enhanced learning during reading. Glenberg et al. (2009) found that physical manipulation of real objects and manipulation of digital image can facilitate young children’s comprehension on a short
narrative story describing a farm life (e.g., the farmer brings hay to the horse). First- and
second-graders, who were first asked to read a text and then to manipulate toys to correspond to what they read, comprehended the story better than those who merely read the text twice. It was also found
that manipulation of digital images on the computer could lead to the same effect on reading
comprehension. These insights suggest that manipulation of digital content can help to (1) map words to meaningful representation and (2) map the syntactic relations to actions during reading.
Another study by Homer et al. (2014) examined whether reading a Kinect-based storybook
would distract or enhance story comprehension and vocabulary learning during reading. In their study, kindergarten and first grade students received three interventions: reading a storybook, reading a digital
storybook or interacting with a digital storybook in a Kinect-based literacy game. Those in the
interactive digital condition used gestures or movement to interact with the story content including target vocabulary and plot points. It was found that the three types of storybook interventions led to
comparable levels of story comprehension, suggesting that interactive digital storybook did not enhance
nor distract readers. However, the interactive digital storybook did lead to better vocabulary learning. Based on the review here, it appears that the effects of physical engagements on reading comprehension
are mixed. More studies are needed to look into how technology can engage learners physically during
reading and how they affect reading comprehension. This study attempts to include the physical mode in a multimodal reading environment and to
compare the effects of physical mode with the effects of textual and visual modes on reading
comprehension. As young readers usually fail to understand the whole text while they are able to decode text (Oakhill et al., 2003), this study focuses on how to help young readers build cohesive
understanding of the text. To this end, a prediction making strategy, an instructional strategy commonly
used to activate top-down processing to facilitate general reading comprehension (Ajideh, 2003), was implemented in a multimodal reading environment.
The following questions guided the current study: 1. What are the effects of making prediction in the textual, visual or gestural mode on reading
comprehension?
2. Do the effects of making a prediction in different modes vary depending on the existing levels of reading ability?
3. Method
3.1 Participants
A total of 91 Chinese EFL learners, aged 9 to 10, were recruited from a science summer camp at the National Science and Technology Museum in Southern Taiwan. They were 3 to 6 graders who were
assigned to the textual, visual and gestural conditions using stratified sampling to ensure all graders
were balanced across all conditions. They had an average of 3.8 years of English learning experience.
3.2 Digital Storybook
A storybook titled I Entered a Wonderland was adapted from an English textbook for secondary school students in Taiwan. The story was a modified version with a plot different from the original story, which
was considered rather unfamiliar to our participants. The word choice and grammatical complexity
were tailored to the language level of the participants. The story was audio recorded by a native American speaker.
465465465

Three digital versions were created using Visual Studio in Windows. The interactive version of
the Kinect-based story can be run on Microsoft operating system with a Kinect unit. The application allows participants to use gestures to navigate the application and do gestures related to the story lines in
a natural user interface. The other two digital versions, textual and gestural ones, can be run on the
internet browsers. Readers can interact with the digital content in the graphic user interface.
2.3 Experimental and Application Design
An experiment with a between-subjects design was conducted to compare the effects of making
predictions in the interactive textual, visual and gestural modes. A multimodal application was developed to allow readers to select a text description, select a picture or act out a scenario that
corresponds to their prediction. The application begins with a reading section followed by a prediction
section for the three groups. An additional practice section was provided only for the gestural group. The following is the application design:
2.3.1 Practice Section
The purpose of the practice section is to familiarize participants with the nine gestures they might be using in the prediction section (see figure 1). This section is only available to the gestural group.
Figure 1. Practice section.
2.3.2 Reading Section
During the reading section, the screen shows story lines and pictures. When a story line is being read to
the participants, it is displayed in red. At the end of the reading section, the application pauses and
shows a blank to prompt readers to make prediction. The user interface is the same for the three conditions.
466466466

Figure 2. Reading section.
2.3.3 Predicting section
During the prediction section, the application prompts readers to make predictions about what would happen next. Participants make their selections after the questions are read and the light on the right side
turns green. For the gestural group, participants make their prediction by either moving the main
character to the option or making the same gestures (see figure 3) as they play a role as the story character in the story. Participants in the textual group (see figure 4(a)) and the visual group (see figure
4(b)) make prediction by clicking on one of the options.
Figure 3. Prediction section for the gestural group
Figure 4. (a) Prediction section for the textual group (b) Prediction section for the visual group
467467467
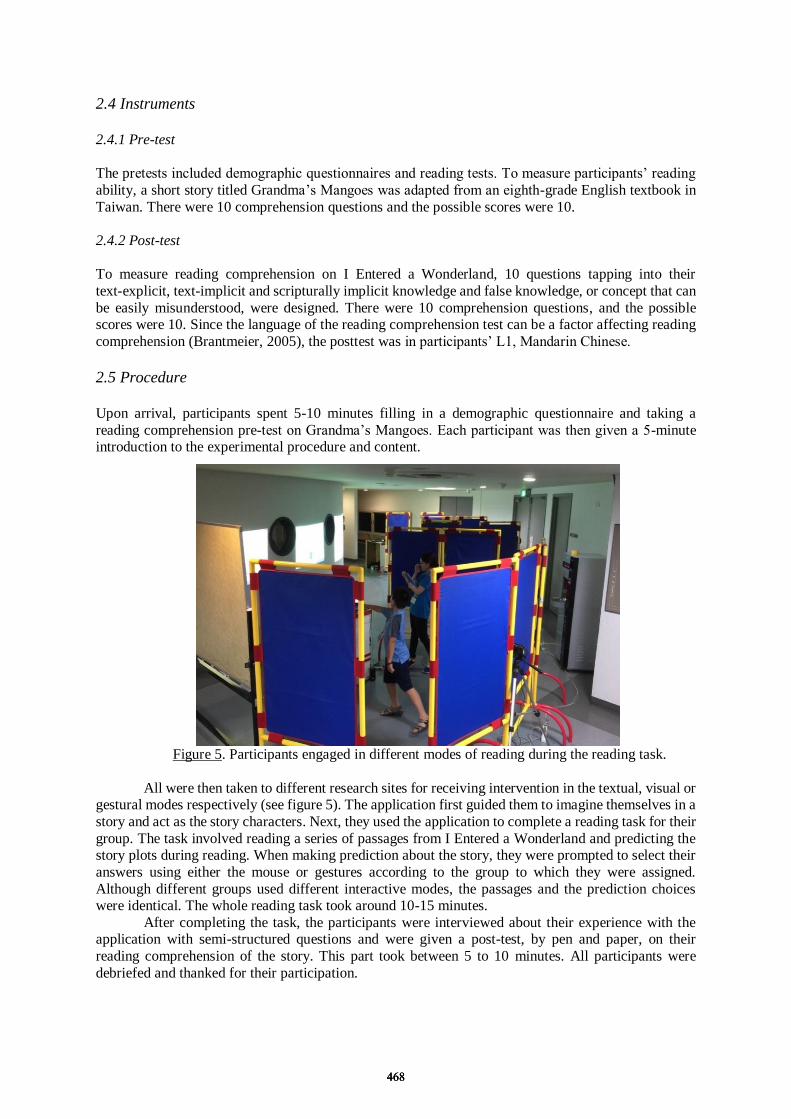
2.4 Instruments
2.4.1 Pre-test
The pretests included demographic questionnaires and reading tests. To measure participants’ reading
ability, a short story titled Grandma’s Mangoes was adapted from an eighth-grade English textbook in
Taiwan. There were 10 comprehension questions and the possible scores were 10.
2.4.2 Post-test
To measure reading comprehension on I Entered a Wonderland, 10 questions tapping into their
text-explicit, text-implicit and scripturally implicit knowledge and false knowledge, or concept that can
be easily misunderstood, were designed. There were 10 comprehension questions, and the possible scores were 10. Since the language of the reading comprehension test can be a factor affecting reading
comprehension (Brantmeier, 2005), the posttest was in participants’ L1, Mandarin Chinese.
2.5 Procedure
Upon arrival, participants spent 5-10 minutes filling in a demographic questionnaire and taking a
reading comprehension pre-test on Grandma’s Mangoes. Each participant was then given a 5-minute introduction to the experimental procedure and content.
Figure 5. Participants engaged in different modes of reading during the reading task.
All were then taken to different research sites for receiving intervention in the textual, visual or gestural modes respectively (see figure 5). The application first guided them to imagine themselves in a
story and act as the story characters. Next, they used the application to complete a reading task for their
group. The task involved reading a series of passages from I Entered a Wonderland and predicting the story plots during reading. When making prediction about the story, they were prompted to select their
answers using either the mouse or gestures according to the group to which they were assigned.
Although different groups used different interactive modes, the passages and the prediction choices were identical. The whole reading task took around 10-15 minutes.
After completing the task, the participants were interviewed about their experience with the application with semi-structured questions and were given a post-test, by pen and paper, on their
reading comprehension of the story. This part took between 5 to 10 minutes. All participants were
debriefed and thanked for their participation.
468468468
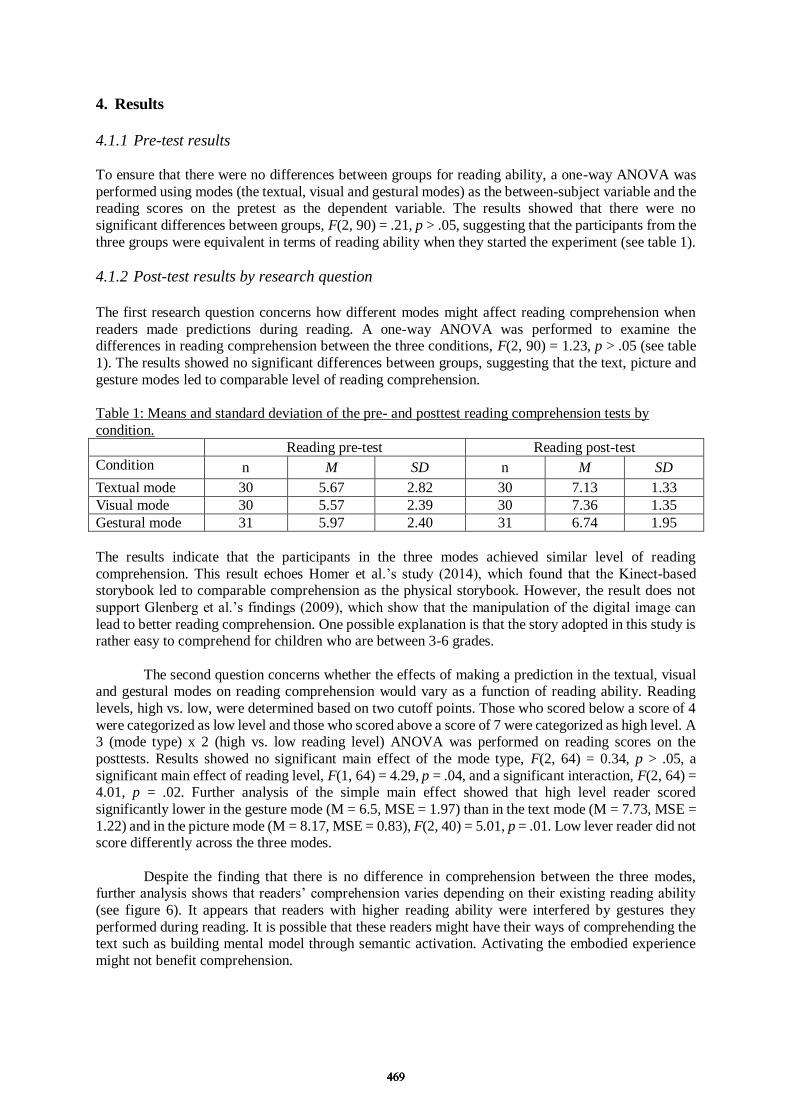
4. Results
4.1.1 Pre-test results
To ensure that there were no differences between groups for reading ability, a one-way ANOVA was
performed using modes (the textual, visual and gestural modes) as the between-subject variable and the reading scores on the pretest as the dependent variable. The results showed that there were no
significant differences between groups, F(2, 90) = .21, p > .05, suggesting that the participants from the
three groups were equivalent in terms of reading ability when they started the experiment (see table 1).
4.1.2 Post-test results by research question
The first research question concerns how different modes might affect reading comprehension when
readers made predictions during reading. A one-way ANOVA was performed to examine the differences in reading comprehension between the three conditions, F(2, 90) = 1.23, p > .05 (see table
1). The results showed no significant differences between groups, suggesting that the text, picture and
gesture modes led to comparable level of reading comprehension.
Table 1: Means and standard deviation of the pre- and posttest reading comprehension tests by
condition.
Reading pre-test Reading post-test
Condition n M SD n M SD
Textual mode 30 5.67 2.82 30 7.13 1.33
Visual mode 30 5.57 2.39 30 7.36 1.35
Gestural mode 31 5.97 2.40 31 6.74 1.95
The results indicate that the participants in the three modes achieved similar level of reading
comprehension. This result echoes Homer et al.’s study (2014), which found that the Kinect-based storybook led to comparable comprehension as the physical storybook. However, the result does not
support Glenberg et al.’s findings (2009), which show that the manipulation of the digital image can
lead to better reading comprehension. One possible explanation is that the story adopted in this study is rather easy to comprehend for children who are between 3-6 grades.
The second question concerns whether the effects of making a prediction in the textual, visual and gestural modes on reading comprehension would vary as a function of reading ability. Reading
levels, high vs. low, were determined based on two cutoff points. Those who scored below a score of 4
were categorized as low level and those who scored above a score of 7 were categorized as high level. A 3 (mode type) x 2 (high vs. low reading level) ANOVA was performed on reading scores on the
posttests. Results showed no significant main effect of the mode type, F(2, 64) = 0.34, p > .05, a
significant main effect of reading level, F(1, 64) = 4.29, p = .04, and a significant interaction, F(2, 64) = 4.01, p = .02. Further analysis of the simple main effect showed that high level reader scored
significantly lower in the gesture mode (M = 6.5, MSE = 1.97) than in the text mode (M = 7.73, MSE =
1.22) and in the picture mode (M = 8.17, MSE = 0.83), F(2, 40) = 5.01, p = .01. Low lever reader did not score differently across the three modes.
Despite the finding that there is no difference in comprehension between the three modes, further analysis shows that readers’ comprehension varies depending on their existing reading ability
(see figure 6). It appears that readers with higher reading ability were interfered by gestures they
performed during reading. It is possible that these readers might have their ways of comprehending the text such as building mental model through semantic activation. Activating the embodied experience
might not benefit comprehension.
469469469
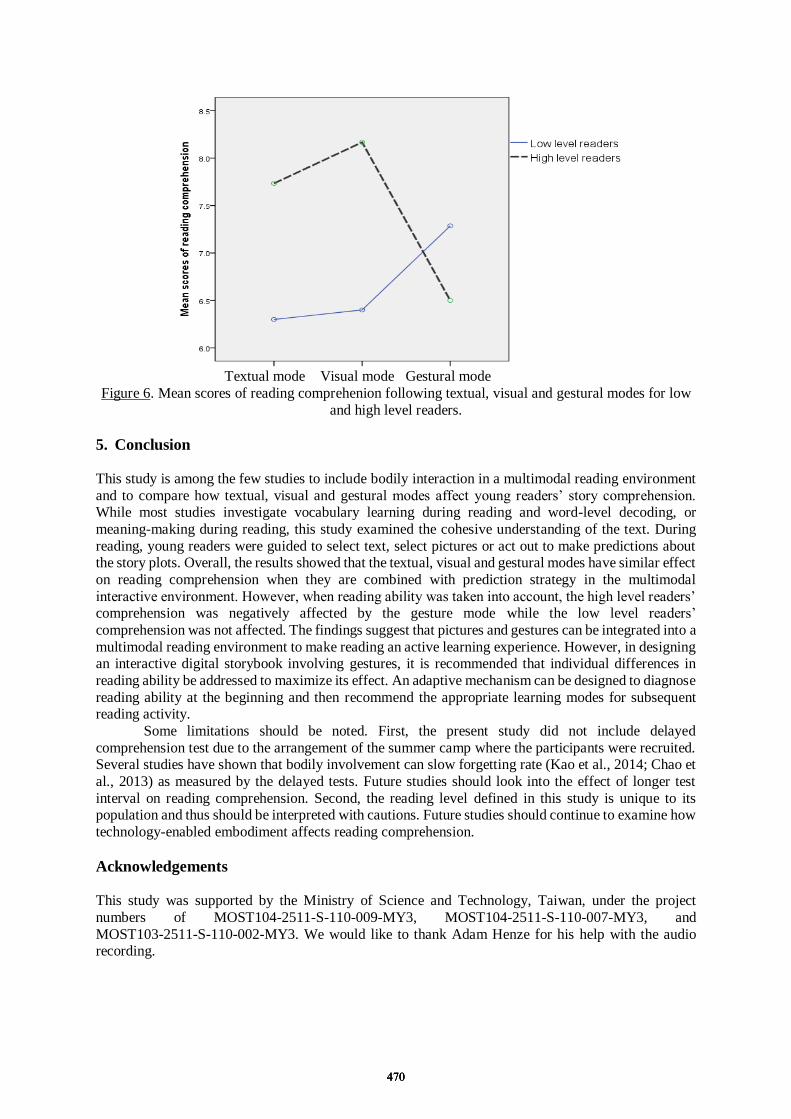
Textual mode Visual mode Gestural mode
Figure 6. Mean scores of reading comprehenion following textual, visual and gestural modes for low
and high level readers.
5. Conclusion
This study is among the few studies to include bodily interaction in a multimodal reading environment
and to compare how textual, visual and gestural modes affect young readers’ story comprehension. While most studies investigate vocabulary learning during reading and word-level decoding, or
meaning-making during reading, this study examined the cohesive understanding of the text. During
reading, young readers were guided to select text, select pictures or act out to make predictions about the story plots. Overall, the results showed that the textual, visual and gestural modes have similar effect
on reading comprehension when they are combined with prediction strategy in the multimodal
interactive environment. However, when reading ability was taken into account, the high level readers’ comprehension was negatively affected by the gesture mode while the low level readers’
comprehension was not affected. The findings suggest that pictures and gestures can be integrated into a
multimodal reading environment to make reading an active learning experience. However, in designing an interactive digital storybook involving gestures, it is recommended that individual differences in
reading ability be addressed to maximize its effect. An adaptive mechanism can be designed to diagnose
reading ability at the beginning and then recommend the appropriate learning modes for subsequent reading activity.
Some limitations should be noted. First, the present study did not include delayed
comprehension test due to the arrangement of the summer camp where the participants were recruited. Several studies have shown that bodily involvement can slow forgetting rate (Kao et al., 2014; Chao et
al., 2013) as measured by the delayed tests. Future studies should look into the effect of longer test
interval on reading comprehension. Second, the reading level defined in this study is unique to its population and thus should be interpreted with cautions. Future studies should continue to examine how
technology-enabled embodiment affects reading comprehension.
Acknowledgements This study was supported by the Ministry of Science and Technology, Taiwan, under the project
numbers of MOST104-2511-S-110-009-MY3, MOST104-2511-S-110-007-MY3, and
MOST103-2511-S-110-002-MY3. We would like to thank Adam Henze for his help with the audio recording.
470470470

References
Ajideh, P. (2003). Schema theory-based pre-reading tasks: A neglected essential in the ESL reading class. The
reading matrix, 3(1), 1-14.
Barsalou, L. W. (2008). Grounded cognition. Annual Review of Psychology, 59(1), 617-645. doi:
doi:10.1146/annurev.psych.59.103006.093639 Brantmeier, C. (2005). Effects of reader's knowledge, text type, and test type on L1 and L2 reading comprehension
in Spanish. The Modern Language Journal, 89(1), 37-53.
Coiro, J. (2003). Reading comprehension on the Internet: Expanding our understanding of reading comprehension
to encompass new literacies. The Reading Teacher, 56(5), 458-464.
Chao, K. J., Huang, H. W., Fang, W. C., & Chen, N. S. (2013). Embodied play to learn: Exploring Kinect‐facilitated memory performance. British Journal of Educational Technology, 44(5), E151-E155.
Chen, N. S., & Fang, W. C. (2014). Gesture-Based technologies for enhancing learning. In Huang et al. (Eds), The
New Development of Technology Enhanced Learning (pp. 95-112). doi: 10.1007/978-3-642-38291-8_6
Dalton, B., Proctor, C. P., Uccelli, P., Mo, E., & Snow, C. E. (2011). Designing for diversity the role of reading
strategies and interactive vocabulary in a digital reading environment for fifth-grade monolingual English and bilingual students. Journal of Literacy Research, 43(1), 68-100.
Glenberg, A. M., Brown, M., & Levin, J. R. (2007). Enhancing comprehension in small reading groups using a
manipulation strategy. Contemporary Educational Psychology, 32(3), 389-399.
Glenberg, A. M. (2011). How reading comprehension is embodied and why that matters. International Electronic
Journal of Elementary Education, 4(1), 5.
Homer, B. D., Kinzer, C. K., Plass, J. L., Letourneau, S. M., Hoffman, D., Bromley, M., ... & Kornak, Y. (2014).
Moved to learn: The effects of interactivity in a Kinect-based literacy game for beginning readers. Computers
& Education, 74, 37-49. Kuo, F. R., Hsu, C. C., Fang, W. C., & Chen, N. S. (2014). The effects of embodiment-based TPR approach on
student English vocabulary learning achievement, retention and acceptance. Journal of King Saud
University-Computer and Information Sciences, 26(1), 63-70.
Oakhill, J. V., Cain, K., & Bryant, P. E. (2003). The dissociation of word reading and text comprehension:
Evidence from component skills. Language and cognitive processes, 18(4), 443-468.
Walsh, M. (2006). The'textual shift': Examining the reading process with print, visual and multimodal texts.
Australian Journal of Language and Literacy, 29(1), 24.
Wilson, M. (2002). Six views of embodied cognition. Psychonomic Bulletin & Review, 9(4), 625-636. Yanguas, I. (2009). Multimedia glosses and their effect on L2 text comprehension and vocabulary learning.
Language Learning & Technology, 13(2), 48-67.
471471471
Chen, W. et al. (Eds.) (2016). Proceedings of the 24th International Conference on Computers in Education. India: Asia-Pacific Society for Computers in Education
Exploring the Effect of Writing Mini-lessons on Peer Response in Elementary Classroom
Wan-Chen CHANGab*, Calvin C. Y. LIAObcd, Chi-Yang HSUb, & Tak-Wai CHANbc
a Graduate Institute of Learning and Instruction, National Central University, Taiwan b Graduate Institute of Network Learning Technology, National Central University, Taiwan
c Research Center for Science and Technology for Learning, National Central University, Taiwan d National Engineering Research Center for E-Learning, Central China Normal University, Wuhan, China
Abstract: Previously, the research team designed a game-based writing environment to support students’ writing development. However, students are not good at peer response. It decreased the effect of talking for revising strategy. Therefore, the purpose of this study designed writing mini-lesson and enhanced students’ skill of giving peer response and revising their draft based on the received response. A quasi-experiment was conducted and 108 three-grade students from 4 classes participated in. The experimental group received the three writing mini-lessons during the semester and the control group received general instruction. Both of these two group students wrote three writing article on game-based writing environment. The writing mini-lesson was implemented in the beginning of every writing course and cost around 5-8 minutes. The results showed that there is no significant different on the number of peer response between control and experimental group. In contrast, the type of peer response was different between these two groups. It implied that writing mini-lesson could provide students how to give concrete response and proved the effect of writing mini-lesson for elementary school students.
Keywords: Game-based Writing Environment, Writing, Mini-Lesson, Peer Response
1. Introduction It is important for students to improve their knowledge and skills by learning and practicing. Students understand specific field of knowledge through learning and students reinforce specific field of knowledge through practicing. Writing is an important learning tool which students could write to learn and record their experience (Klein, 2000), because writing could let students to understand difficult content, to arrange and organize the content, and even construct new knowledge. Similarly, in the domain of writing, students also need to learn and practice the skills of writing. After several years of development and testing, our research team proposed an integrated writing activity and game-based learning approach into a game-based writing environment, entitled Creation-Island (Liao, Chang, & Chan, 2015). This game-based writing environment provides opportunities to encourage students to learn and practice the writing model which integrates reading, creating, talking, and revising activities. Our team also has implemented the game-based writing environment in serval elementary schools to enhance students for three years (e.g., Chang, Liao, & Chan, 2014) and gained the effect of improving students’ writing performance (Liao et al., 2015).
In previous studies, our team attempted to design some mechanisms to assist students to learn how to give peer responses through from a series of scaffolding which system provided (Chang, Liao, & Chan, 2014). Although we obtained some initial results, there are still many problems which needed to improve, such as the process of peer review, the level of peer discussions, and so on. In addition, from our observation in the practical classrooms, we also found that students still feel confused with peer response: how to give suitable peer response, or how to revise the draft based on receiving peer response, or how to give different aspects of peer response? In other words, students are not good at giving peer responses and revising their draft according to peer responses. Some of the teachers worried that students lack the skills of peer response and revising so the effect of talking for revising strategy could be limited.
472472472
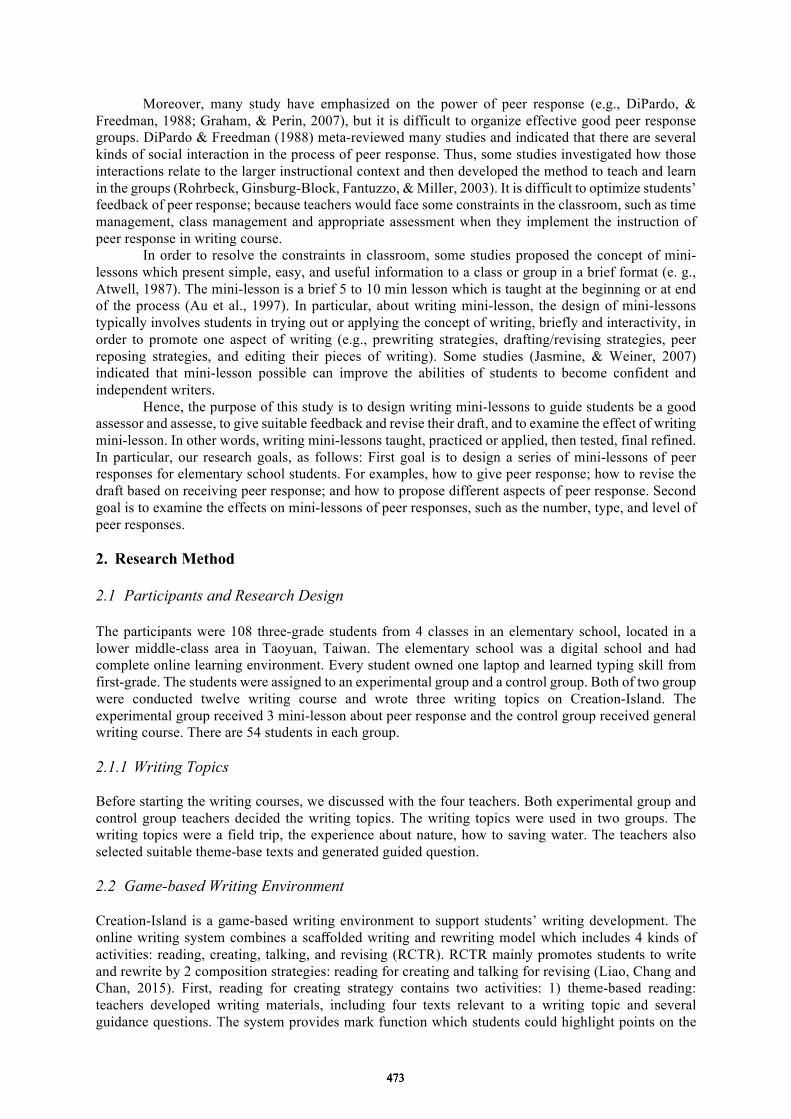
Moreover, many study have emphasized on the power of peer response (e.g., DiPardo, & Freedman, 1988; Graham, & Perin, 2007), but it is difficult to organize effective good peer response groups. DiPardo & Freedman (1988) meta-reviewed many studies and indicated that there are several kinds of social interaction in the process of peer response. Thus, some studies investigated how those interactions relate to the larger instructional context and then developed the method to teach and learn in the groups (Rohrbeck, Ginsburg-Block, Fantuzzo, & Miller, 2003). It is difficult to optimize students’ feedback of peer response; because teachers would face some constraints in the classroom, such as time management, class management and appropriate assessment when they implement the instruction of peer response in writing course.
In order to resolve the constraints in classroom, some studies proposed the concept of mini-lessons which present simple, easy, and useful information to a class or group in a brief format (e. g., Atwell, 1987). The mini-lesson is a brief 5 to 10 min lesson which is taught at the beginning or at end of the process (Au et al., 1997). In particular, about writing mini-lesson, the design of mini-lessons typically involves students in trying out or applying the concept of writing, briefly and interactivity, in order to promote one aspect of writing (e.g., prewriting strategies, drafting/revising strategies, peer reposing strategies, and editing their pieces of writing). Some studies (Jasmine, & Weiner, 2007) indicated that mini-lesson possible can improve the abilities of students to become confident and independent writers.
Hence, the purpose of this study is to design writing mini-lessons to guide students be a good assessor and assesse, to give suitable feedback and revise their draft, and to examine the effect of writing mini-lesson. In other words, writing mini-lessons taught, practiced or applied, then tested, final refined. In particular, our research goals, as follows: First goal is to design a series of mini-lessons of peer responses for elementary school students. For examples, how to give peer response; how to revise the draft based on receiving peer response; and how to propose different aspects of peer response. Second goal is to examine the effects on mini-lessons of peer responses, such as the number, type, and level of peer responses. 2. Research Method 2.1 Participants and Research Design The participants were 108 three-grade students from 4 classes in an elementary school, located in a lower middle-class area in Taoyuan, Taiwan. The elementary school was a digital school and had complete online learning environment. Every student owned one laptop and learned typing skill from first-grade. The students were assigned to an experimental group and a control group. Both of two group were conducted twelve writing course and wrote three writing topics on Creation-Island. The experimental group received 3 mini-lesson about peer response and the control group received general writing course. There are 54 students in each group.
2.1.1 Writing Topics Before starting the writing courses, we discussed with the four teachers. Both experimental group and control group teachers decided the writing topics. The writing topics were used in two groups. The writing topics were a field trip, the experience about nature, how to saving water. The teachers also selected suitable theme-base texts and generated guided question.
2.2 Game-based Writing Environment
Creation-Island is a game-based writing environment to support students’ writing development. The online writing system combines a scaffolded writing and rewriting model which includes 4 kinds of activities: reading, creating, talking, and revising (RCTR). RCTR mainly promotes students to write and rewrite by 2 composition strategies: reading for creating and talking for revising (Liao, Chang and Chan, 2015). First, reading for creating strategy contains two activities: 1) theme-based reading: teachers developed writing materials, including four texts relevant to a writing topic and several guidance questions. The system provides mark function which students could highlight points on the
473473473
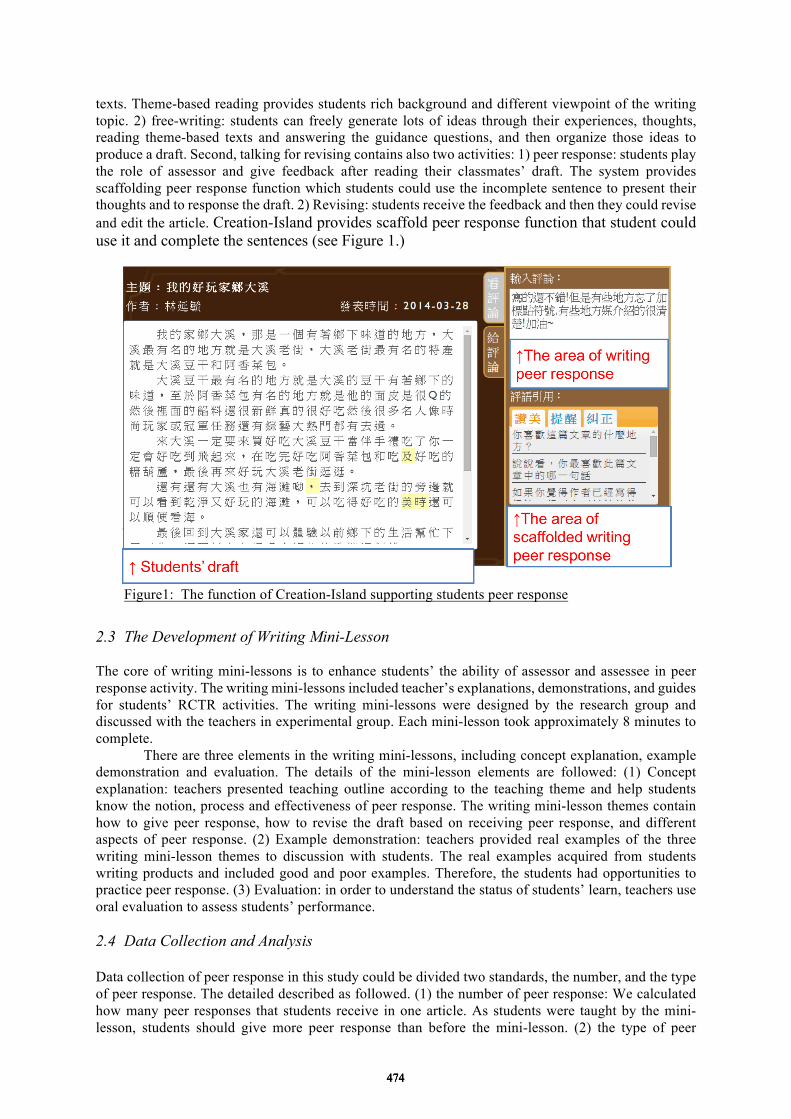
texts. Theme-based reading provides students rich background and different viewpoint of the writing topic. 2) free-writing: students can freely generate lots of ideas through their experiences, thoughts, reading theme-based texts and answering the guidance questions, and then organize those ideas to produce a draft. Second, talking for revising contains also two activities: 1) peer response: students play the role of assessor and give feedback after reading their classmates’ draft. The system provides scaffolding peer response function which students could use the incomplete sentence to present their thoughts and to response the draft. 2) Revising: students receive the feedback and then they could revise and edit the article. Creation-Island provides scaffold peer response function that student could use it and complete the sentences (see Figure 1.)
Figure1: The function of Creation-Island supporting students peer response
2.3 The Development of Writing Mini-Lesson The core of writing mini-lessons is to enhance students’ the ability of assessor and assessee in peer response activity. The writing mini-lessons included teacher’s explanations, demonstrations, and guides for students’ RCTR activities. The writing mini-lessons were designed by the research group and discussed with the teachers in experimental group. Each mini-lesson took approximately 8 minutes to complete.
There are three elements in the writing mini-lessons, including concept explanation, example demonstration and evaluation. The details of the mini-lesson elements are followed: (1) Concept explanation: teachers presented teaching outline according to the teaching theme and help students know the notion, process and effectiveness of peer response. The writing mini-lesson themes contain how to give peer response, how to revise the draft based on receiving peer response, and different aspects of peer response. (2) Example demonstration: teachers provided real examples of the three writing mini-lesson themes to discussion with students. The real examples acquired from students writing products and included good and poor examples. Therefore, the students had opportunities to practice peer response. (3) Evaluation: in order to understand the status of students’ learn, teachers use oral evaluation to assess students’ performance. 2.4 Data Collection and Analysis Data collection of peer response in this study could be divided two standards, the number, and the type of peer response. The detailed described as followed. (1) the number of peer response: We calculated how many peer responses that students receive in one article. As students were taught by the mini-lesson, students should give more peer response than before the mini-lesson. (2) the type of peer
474474474
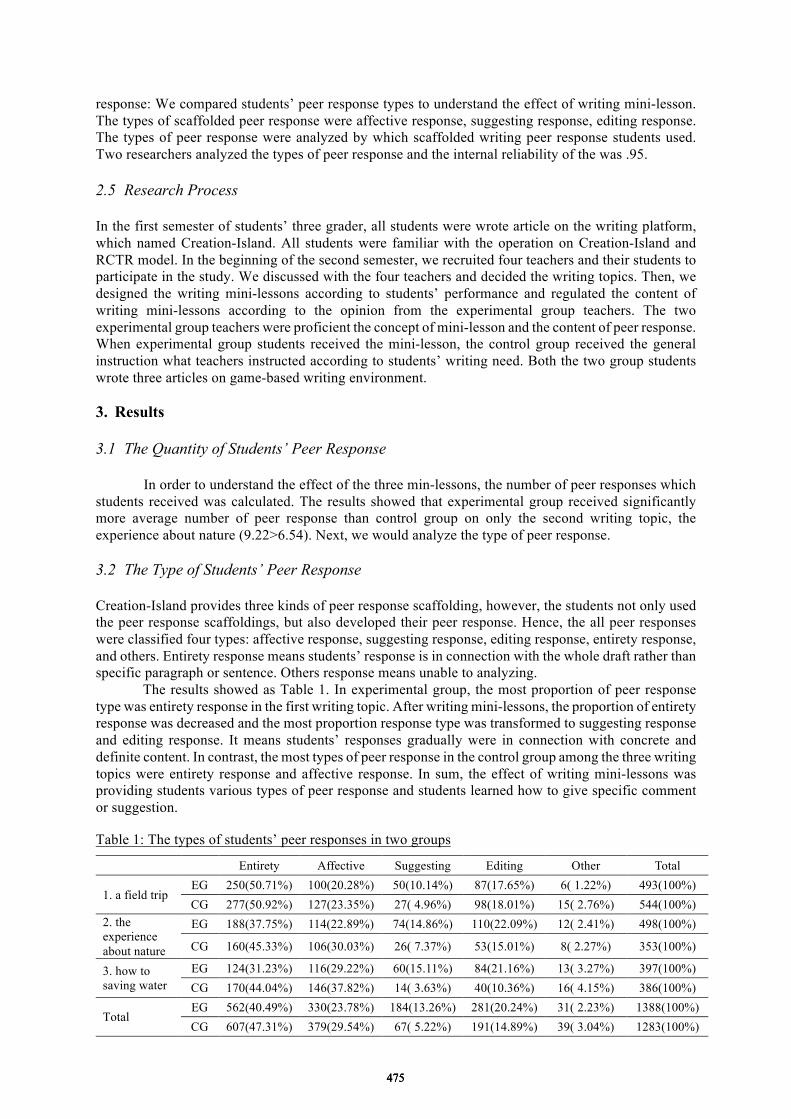
response: We compared students’ peer response types to understand the effect of writing mini-lesson. The types of scaffolded peer response were affective response, suggesting response, editing response. The types of peer response were analyzed by which scaffolded writing peer response students used. Two researchers analyzed the types of peer response and the internal reliability of the was .95. 2.5 Research Process In the first semester of students’ three grader, all students were wrote article on the writing platform, which named Creation-Island. All students were familiar with the operation on Creation-Island and RCTR model. In the beginning of the second semester, we recruited four teachers and their students to participate in the study. We discussed with the four teachers and decided the writing topics. Then, we designed the writing mini-lessons according to students’ performance and regulated the content of writing mini-lessons according to the opinion from the experimental group teachers. The two experimental group teachers were proficient the concept of mini-lesson and the content of peer response. When experimental group students received the mini-lesson, the control group received the general instruction what teachers instructed according to students’ writing need. Both the two group students wrote three articles on game-based writing environment. 3. Results 3.1 The Quantity of Students’ Peer Response
In order to understand the effect of the three min-lessons, the number of peer responses which students received was calculated. The results showed that experimental group received significantly more average number of peer response than control group on only the second writing topic, the experience about nature (9.22>6.54). Next, we would analyze the type of peer response.
3.2 The Type of Students’ Peer Response Creation-Island provides three kinds of peer response scaffolding, however, the students not only used the peer response scaffoldings, but also developed their peer response. Hence, the all peer responses were classified four types: affective response, suggesting response, editing response, entirety response, and others. Entirety response means students’ response is in connection with the whole draft rather than specific paragraph or sentence. Others response means unable to analyzing.
The results showed as Table 1. In experimental group, the most proportion of peer response type was entirety response in the first writing topic. After writing mini-lessons, the proportion of entirety response was decreased and the most proportion response type was transformed to suggesting response and editing response. It means students’ responses gradually were in connection with concrete and definite content. In contrast, the most types of peer response in the control group among the three writing topics were entirety response and affective response. In sum, the effect of writing mini-lessons was providing students various types of peer response and students learned how to give specific comment or suggestion. Table 1: The types of students’ peer responses in two groups
Entirety Affective Suggesting Editing Other Total
1. a field trip EG 250(50.71%) 100(20.28%) 50(10.14%) 87(17.65%) 6( 1.22%) 493(100%) CG 277(50.92%) 127(23.35%) 27( 4.96%) 98(18.01%) 15( 2.76%) 544(100%)
2. the experience about nature
EG 188(37.75%) 114(22.89%) 74(14.86%) 110(22.09%) 12( 2.41%) 498(100%)
CG 160(45.33%) 106(30.03%) 26( 7.37%) 53(15.01%) 8( 2.27%) 353(100%)
3. how to saving water
EG 124(31.23%) 116(29.22%) 60(15.11%) 84(21.16%) 13( 3.27%) 397(100%) CG 170(44.04%) 146(37.82%) 14( 3.63%) 40(10.36%) 16( 4.15%) 386(100%)
Total EG 562(40.49%) 330(23.78%) 184(13.26%) 281(20.24%) 31( 2.23%) 1388(100%) CG 607(47.31%) 379(29.54%) 67( 5.22%) 191(14.89%) 39( 3.04%) 1283(100%)
475475475
4. Conclusion and Discussion The purpose of this study is to improve students’ peer response through the intervention of writing mini-lessons. The content of peer response includes how to give peer response, and to consider difference viewpoint and to revise their draft according to the response. The elements of mini-lesson were the same, including concept explanation, example demonstration and evaluation. Comparing experimental group and control group students’ performance, the quantity was not difference between these two groups. We suspected the design of Creation-Island that students should give at least three students feedback and finish the activity in the game-based environment. In other words, almost every student completed the minimum requirements. However, it is worth noting that the type of peer response was significant improved by experimental group during the three writing topic.
Writing mini-lessons improve the quality of peer response and we speculated there are three reasons caused mini-lesson successful. First, we divided the concept of peer response into several mini-concept that is easy for students to learn. Students just mastered litter content and practice the skills. It could decrease students’ cognitive load. Second, although the content of writing mini-lessons was designed by researchers, the lessons provided appropriate examples which selected from students’ articles. The examples were familiar by students and suitable for students’ learning level. Third, every mini-lesson would provide the opportunity for students to practice the skills immediately. Besides, teachers could evaluate students’ learning performance at once. However, the effect of students’ revising according to the peer response didn’t be investigated. It is the next challenge for the further study. Acknowledgements The authors would like to thank the Ministry of Science and Technology of the Republic of China, Taiwan, for financial support (MOST 101-2511-S-008 -016 -MY3, MOST 103-2811-S-008 -006 -, and MOST 102-2811-S-008 -009 -), and Research Center for Science and Technology for Learning, National Central University, Taiwan.
References Atwell, N. (1987). In the middle writing, reading, and learning with adolescents. Portsmouth, NH: Heinemann. Au, K. H., Carroll, J. H., & Scheu, J. A. (1997). Balanced literacy instruction: A teacher’s resource book.
Norwood, MA: Christopher-Gordon. Chang, W. C., Liao, C. C. Y., & Chan, T. W. (2014). Computer Scaffolding Peer Response to Enhance Elementary
Students’ Writing Performance: A Case Study of a Summer School, Proceedings of the 22th International Conference on Computers in Education. Nara, Japan: Asia-Pacific Society for Computers in Education.
Chang, W. C., Liao, C. C. Y., & Chan, T. W. (2016). Explore the Effect of “Tomorrow’s Creating” Activity on Elementary School Students: The Experience from BYOD School to Practical School. International Journal on Digital Learning Technology,8(1), 25-49.
DiPardo, A., & Freedman, S. W. (1988). Peer response groups in the writing classroom: Theoretic foundations and new directions. Review of educational research, 58(2), 119-149.
Jasmine, J., & Weiner, W. (2007). The effects of writing workshop on abilities of first grade students to become confident and independent writers. Early Childhood Education Journal, 35(2), 131-139.
Klein, P. D. (2000). Elementary students' strategies for writing-to-learn in science. Cognition and Instruction, 18(3), 317-348.
Liao, C. C. Y., Chang, W. C., & Chan, T. W. (2014). The Model of “Reading for Creating” and “Talking for Revising” to Improve Students' Writing Quality in Scaffolded Writing and Rewriting Environment, Proceedings of the 22th International Conference on Computers in Education. Nara, Japan: Asia-Pacific Society for Computers in Education.
Liao, C. C. Y., Chang, W. C., & Chan, T. W. (2015). Creation-Island: A Game-Based Writing Environment to Support Students’ Writing Development, Proceedings of the 23th International Conference on Computers in Education. Hangzhou, China: Asia-Pacific Society for Computers in Education.
Rohrbeck, C. A., Ginsburg-Block, M. D., Fantuzzo, J. W., & Miller, T. R. (2003). Peer-assisted learning interventions with elementary school students: A meta-analytic review. Journal of Educational Psychology, 95(2), 240-257.
476476476
Chen, W. et al. (Eds.) (2016). Proceedings of the 24th International Conference on Computers in Education. India: Asia-Pacific Society for Computers in Education
An Application for Speech and Language Therapy Using Customized Interaction Between
Physical Objects and Mobile Devices
Romain Christian HERAULTa* & Aris ALISSANDRAKISa aLinnaeus University, Sweden
Abstract: This paper presents a prototype that facilitates the work of Speech and Language Therapists (SLTs) by providing an Android mobile device application that allows the therapist to focus on the patient rather than taking notes during exercises. Each physical object used by the therapist in those exercises can be given digital properties using Near Field Communication (NFC) tags. The registration does not require a high level of ICT skills from the therapists. SLTs often use such objects in non-technology driven exercises that deal with classification, seriation and inclusion. The application offers such exercises developed in close collaboration with two SLTs, and our aim was to provide therapists with a way to efficiently record activities while working with a patient using a mobile application. The tool was validated through several expert reviews, a usability study as well as a trial with a patient in Paris, France.
Keywords: NFC-based interactions; speech and language therapy; mobile application
1. Introduction Interacting with physical objects is a common everyday task. But object affordances are not necessarily limited to the physical world, but also to the digital one, e.g., a key card allows a door to be opened in a way that is not quite the same as a regular key does. Children from age 2 to 7 learn how to identify an object and give it meaning (Ginsburg and Opper, 1988). However, some children have trouble developing these skills and have problems associating words with objects or meanings. This problem can occur for adults as well in the case of, for example, victims of head trauma. Speech and language therapy helps people who are having such issues. Some examples of problems are classification (ability to group things according to common features), seriation (ability to sort objects or situations according to any feature, such as size, color, shape, or type), and inclusion (ability to assign groups of objects as a sub-set of a larger class, beyond simple classification). In the health and medical industry, the use of information and communication technologies (ICT) is increasing every year. The domain of speech and language therapy has been exploring the use of ICT to help aid children and adults (Drigas and Petrova, 2014). One of the few approaches that tackle the issue of classification, seriation and inclusion was created by Rodríguez et.al. (2008), exploring the use of desktop computer based tools. Our paper focuses instead on the exploration of the use of mobile devices, equipped with Near Field Communication (NFC) sensors, and is not bound to classic keyboard and mouse interactions. The application was developed using the Android platform on a tablet in close association with two French speech and language therapists (SLTs). This collaboration was done in order to gather specific requirements catered to the SLTs and what they need to conduct their exercises. The tool was validated by the SLTs in several iterations during its development, and a usability study was performed with five (non-patient) users. The study was concluded by a trial with a patient in order to prove the usefulness of the application for the SLTs. The next section will present the related work and well as the motivation behind this project. The implementation section describes the different functionalities offered by the prototype. The methodology section explains how the different steps of the study were conducted, including the collaboration with the SLT while developing the application, the usability study and the trial with a patient. Following these sections, the outcomes are presented, detailing the interviews with the SLT, the
477477477
feedback given by users testing the usability of the tool and finally related the first impression of the SLT and the patient during the trial. In the conclusion, the limitations encountered during this study as well as description of future work are presented. 2. Related Work and Motivation A lot of SLTs base their exercises on the work of Piaget and Inhelder (Piaget and Inhelder, 1959). Some researchers like Chalon-Blanc (2005) and Dolle (2005) refined this work later on, but they did not try to incorporate any new technology. The use of ICT in speech and language therapy brings positive reactions from therapists and patients according to Gowans et.al (2004). Moffat et.al. (2004) created a tool named ESI Planner that uses a PDA as a mobile platform to display images and sound stimulating the memory of patients. Boyd-Graber et.al. (2006) developed a hybrid approach that combine PC and mobile devices to help patient communicating using images and sound. These two tools were created to help outside the medical consultations and not under the supervision of the therapist. Many tools used by SLTs are either hand crafted or specialized board games as mentioned by Feugnet (2010). She relates the creation of a board game for SLTs and pointed out some major companies in France that design and sell material for SLTs. She noted that most of the games were re-editions of older games rather than new tools. One of the few projects exploring the issue of classification with ICT was developed by Rodríguez et.al. (2008). Their desktop computer software, named Cuéntame, deals with shapes and colors and was designed for children. It offers full customization of the exercises in order to adapt to each patient's needs. The team developed as well two other tools, Pre-Lingua and Vocaliza. Pre-Lingua is a tool that can “assist the work in speech therapy” (Rodriguez et.al., 2008). Vocaliza provides personalized profiles for patients; sound and images are associated to the profiles and are used to help patient with personalized content. These three tools show several concepts that are used also in our project such as the personalization of the content and the assistance rather than replacement of the therapists. Our application also makes use of mobile devices to facilitate the interactions between patient and therapist. Another addition is the use of NFC tags for personalizing already owned and used therapy objects, instead of having to invest in buying new pedagogic materials. The combination of new technology with familiar tools is also recommended in pedagogy as suggested by Kim and Smith (2015) for the implementation of new mobile learning tool.
A key card, a remote control or a smart phone are common physical objects that can produce digital responses. Each digital response is triggered by a physical manipulation of these devices. These objects serve a specific purpose and must be bought in consequence. Solutions have been explored to personalize already owned objects and use them to trigger digital responses. The Near Field Communication (NFC) technology (Want, 2011) is available in most of the modern smartphones and tablets. It allows wireless short-range data exchanges over 3 to 4 centimeters (theoretically up to 20 centimeters). NFC technology can be used to replace manual typing, menu selections, and other user interface actions with acts of touching. The technology will not replace other means of interaction, such as the keyboard, but it allows fast interactions between an application and tagged objects. Magic Touch is a tool built by Thomas Pederson (2001). This tool is used to detect the position of physical objects in a room using Radio Frequency identification (RFID) tags. Other technologies like magnets can be used to interact with physical objects. Bianchi and Oakley (2013) showed how one can interact with physical objects named appcessories and smartphones using magnetic fields. However, the use of magnetic field has issues such as external interferences and the need of calibration of the devices.
Different research groups have focused their efforts on the use of mobile devices and more particularly multimedia for learning. Nordmark and Milrad have developed a seamless learning approach supporting mobile digital storytelling for educational purposes (Nordmark and Milrad 2015). They believe that the mobile device is a perfect platform for learning that can support collaborative work. Ivanov (2013) used also mobile devices (with NFC) in order to help young children learn within a pervasive environment. His system is helping with the basis of classification, seriation and inclusion, and the personalization of physical objects is similar as the one proposed in our paper.
Based on the above, our application was created using mobile devices in order to facilitate the collaboration between therapists and patients. The NFC technology was chosen for its simplicity of use and its relatively cheap price, as well as its affinity to work with mobile devices.
478478478
3. Implementation The realized solution consists of a mobile device (a Nexus 10 tablet), an Android application (SDK 10 minimum, recommended 14 and above in order to handle NFC), and several NFC tags. It allows for the registration of physical objects into the application's database, the creation of exercises, and the visualization (for the SLT) of data gathered during the exercises. Interacting with physical objects was a requirement from the therapist who was initially consulted at the beginning of the project. Another request was the possibility of using their own objects, rather than buying new ones, which introduced the use of NFC tags. The use of NFC technology additionally allows for more intuitive interactions by simply touching the device to an object, compared to e.g., using buttons for selecting an object. The application is articulated around three main menus: Object Management, Patient Management, and Exercise.
In order to register a physical object in the system, the therapist must first attach a NFC tag to the object. Then, the tag must be scanned through the use of their mobile device in either the Object Management or Patient Management section. Each NFC tag has a unique identifier that will be registered into the database of the application and associated to a digital property. A usual digital property can be a label, like Animal or Color. An object is registered on a specific device's database and is later modifiable, both the property and the physical object associated to it. Being able to replace an associated object is important, e.g., in the case that a patient accidentally misplaces or damages it.
The SLT can personalize the object with a digital property (like Animal or Color). It is possible to register objects on two levels, as classes or elements. A class contains 0→∞ elements and an element is contained to 1→∞ classes. This system allows the therapist to also combine classes to form new ones, e.g., combing the class animal and flying into a new class flying animal.
The therapists requested a way to record every step and detail of the exercises. The log system allows a SLT to obtain data on almost every aspect of the session, as long as it is related to the use of the tool. Each patient is assigned a NFC tag, which is associated to the database for every exercise performed by this specific patient. The data can be accessed within the application in the form of a table displaying the time and the interaction with the device.
Once all necessary objects are tagged and registered in the system, the therapist and the patient are able to perform a classification, seriation, or inclusion exercise (or a combination of the three). The patient must be in the database to start an exercise.
In order to construct an exercise, the therapist must either scan the NFC tag of a class or an element. Then, to add more classes or elements, the SLT can scan another class or element NFC tag (or remove one by scanning the tag a second time). However, the first tag scanned will determine what type of exercise it will be: either find the elements contained in the classes selected, or find to which classes the elements selected belong to. For every class or element scanned, its associated name will be display on the mobile device. Scanning the other type of tag (i.e., an element or a class), will trigger the start of the exercise. Once the exercise starts, it is not possible to modify the conditions. The patient is able to scan as many items as possible once the SLT has constructed the exercise. Not a single interaction with the screen is needed until the therapist decides to end the exercise by pressing the finish exercise button. At the end of an exercise, the SLT can input a comment to add any additional notes about this particular session. This can help when reviewing an exercise several weeks or months later in order to understand a particular context associated to an exercise.
4. Methodology In order to develop this tool for speech and language therapist, several steps were planned. The first one was the conduction of a literature survey about the different technologies that could be used. An initial concept prototype with NFC functionality was built and tested by 20 non-patient participants, followed by further gathering of requirements from the SLT. Several semi-structured interviews were conducted along the development to ensure that the requirements were followed and to revise them if needed; three iterations of the prototype were made following this pattern. Once the last iteration was validated, a
479479479
usability study was conducted with five (non-patient) participants. The final step of the study was a trial with a patient.
The software application was developed following the Agile development approach. The SLT who was involved from the beginning of the project followed through until the end. Another SLT joined in the middle of the project in order to further help define and refine the requirements. Regular meetings were planned every two weeks in order to discuss the advancements of the project. In addition, three main meetings were planned to specifically define, refine and validate the requirements.
A series of unstructured interviews took place in order to develop the prototype. A first (online) interview was conducted with a SLT to present the concept prototype and discuss the specific needs of the SLT. A follow-up meeting took place two weeks later in Tours, France, to demonstrate the prototype. The therapist was asked to perform the same tasks as the one performed by the participants that tested the concept prototype. After having experience with the prototype, the therapist was asked to reflect on her domain and decide whether it could be useful during sessions with her patients. This meeting confirmed that the prototype would be very useful for SLT. The context of classification, seriation and inclusion was chosen as a trial. It could also be useful for other disorders; this list was later refined by the second SLT. The list includes meta phonology, mathematics logic, lexical organization & evocation, grammar, lexical orthography, memory work, and text comprehension.
Every two weeks, online meetings took place to check on the progress, to confirm that the development followed the requirements and most importantly, they were conducted to keep both parties involved in the entire development process. The last interview was conducted in Paris, France, in one of the SLTs office. This was an occasion to create an evaluation of the application with the SLTs own material. Both therapists were present and were asked to use the prototype as though conducting a real session. One of the two acted as the therapist, the other acted as the patient (and vice versa).
It is notable to mention that the two therapists do not share a similar work environment. One is a self-employed SLT, and the other is employed at a hospital. Their methods and budget are different and this affects the way therapists work with their patients. During this meeting, the SLTs were asked to evaluate the usability of the final version, the interface design and the flow of the application, the interactions with NFC within the application, the usefulness in real situation of the prototype, as well as to validate the final requirements.
Before delivering the prototype to the therapist to try out with a patient (in France), a usability study was conducted in Sweden (with non-patient participants), and several tests with the therapist to ensure that there would be no technical issues. Because of the medical confidentiality, an observer could not be present during the sessions. The therapist was provided with a tablet (Nexus 10), 100 NFC cards (0.60 euros a piece) and 24 NFC stickers (1.80 euros a piece). During a period of two months, the therapist and the patient used alternatively the SLT regular methods and the tool developed for this study. They met for a total of seven sessions and used the prototype four times. After each session, the therapist was asked questions about her experience when using the prototype and the log of the exercises was collected (anonymously).
This evaluation trial served the purpose of confirming if the prototype would be useful for SLTs in real situations by saving them time during a session, allowing them to focus more on the patient rather than on taking notes, allowing them to keep track of the learning process of the patient, and finally making sure that using the prototype was not a burden for the therapists. 5. Outcomes The initial interview gave some general feedback on the speech and language therapy profession: (1) SLTs in general do not use a lot of ICT during their sessions, (2) the newer generation of SLTs started to be interested in technologies, but the older generation of SLTs does not trust technology and are sometimes considered to be technophobes, (3) the particular therapist interviewed had no knowledge about any projects involving ICT in their field, and (4) the use of ICT, and especially interactions with physical objects that have been digitally enhanced, is appealing for many scenarios.
Allowing the SLT to have a hands-on experience with the concept prototype helped to illustrate how the NFC stickers could allow the personalization of physical objects, as well as: (1) confirmed the interest of the SLT for the project, (2) confirmed the usefulness of such a tool for the domain of speech and
480480480
language therapy, (3) defined requirements, and (4) defined the type of exercises that the prototype could help with (classification, seriation and inclusion were selected for the trial).
The presentation of the next version of the prototype was well received by the SLT and the possibilities were understood and approved. The second therapist was briefed by her peer on how the prototype works and what kind of interactions were possible. Having a second SLT in the conversation gave more insight on the field of speech and language therapy and helped refine the previous requirements. The last interview with the two SLTs that took place in France, was conducted to validate the final prototype. The therapists used the material they owned in association with the NFC stickers and cards to create the same type of exercises they would do in a regular session. It was agreed during this session that after the last minor modifications, the final prototype could be tested with a patient.
As the observer was not allowed during the session with the patient, unstructured interviews were conducted with the therapist after each of the seven sessions. No personal information was gathered on the patient, only data directly related to the use of the tool as well as the learning outcomes for the patient. On the first session, the patient was curious and exited to work with new technologies. The therapist was initially nervous about using the tool with a patient, however she became more comfortable in the following sessions. The SLT chose to create before the session some classes and elements and created two more classes with four elements in each with the patient in order to demonstrate the use of the application.
The next session was done without using the prototype. The patient mentioned that is was more fun to use the application and the NFC stickers. The therapist observed that the patient organized the objects the same way as they were organized in the previous session (with the use of the tablet). The next sessions, alternatively with and without the prototype, saw progress in the patient's ability to do the exercises -- according to the SLT. It was mentioned that while the application is not required to help the patient, it assists the therapist by allowing her to focus more on the patient and not having to take that many notes. In average, twenty-three NFC tags (attached or not to an object) were used during a session.
Both patient and therapist mentioned that the prototype was easy to use and the patient also mentioned a notion of fun.
6. Conclusion This paper presents the development of an Android application for mobile devices that uses NFC technology to aid the work of speech and language therapists (SLTs). The main focus of the application was to introduce an easy to use technical solution to conduct classification, seriation and inclusion exercises during speech therapy sessions. The tool gathers data automatically and facilitates exercises with patients using NFC stickers placed on physical objects, used by the SLTs during these sessions.
A literature survey was conducted to determine what is state of the art for technologies dealing with interactions between physical objects and mobile devices. A concept prototype was created and tested to determine which technology would be best for the realization of this tool. The development of the application included the involvement of two SLTs through the multiple iterations. Regular interviews were conducted with the SLTs in order to determine their needs and further define the requirements. To validate the prototype, a usability study and a trial with a patient were conducted. The usability study and the trial produced encouraging results regarding the usefulness of the prototype.
The application was perceived useful by the SLTs as it can allow them to gain time and does not disturb their regular workflow, nor the learning process of the patients. The patient seemed more enthusiastic while using the application according to the SLT. Gathering data automatically was declared useful according to the therapist who participated in the trial. The tool serves as support for an SLT rather than replacing them. In terms of patient data privacy, the collected data remain on the device used and are stored in the database of the application, instead of on an online server or some other kind of publicly accessible storage solution.
It is important to note some limitations. The application was developed in collaboration, initially, with one SLT and a second one joined later in the development. It is safe to assume that the application mainly follows the view of these two therapists and does not necessarily represent the majority of the profession, even if they represent two different branches of SLT practice (based on hospital, and self-employed). The main limitation of this initial work is the lack of a clinical trial. Only one patient and one therapist participated in the final trial. This can be partially explained by the fact that therapists
481481481
do not always have patients requiring help with classification, seriation and inclusion, and during the time allocated to this project, only one patient was available. A larger number of participants would be required to validate the data and make sure it is usable for the majority of therapists and patients, and this is part of the planned future work. The therapists and patient participating in this study were French, and the practices in some other countries may differ; if possible, in the future, more countries will be included.
As mentioned also above, the data privacy, especially medical data, is another critical concern. In some countries such as France, the medical confidentiality has to be taken very seriously while developing eHealth applications. The collected data remain on the device of the therapist. Encryption of data was not part of this project, but should be strongly considered. References Bianchi, A., & Oakley, I. (2013, February). Designing tangible magnetic appcessories. In Proceedings of the 7th
International Conference on Tangible, Embedded and Embodied Interaction (pp. 255-258). ACM. Boyd-Graber, J. L., Nikolova, S. S., Moffatt, K. A., Kin, K. C., Lee, J. Y., Mackey, L. W., Tremaine, M. M. &
Klawe, M. M. (2006, April). Participatory design with proxies: developing a desktop-PDA system to support people with aphasia. In Proceedings of the SIGCHI Conference on Human Factors in Computing Systems (pp. 151-160). ACM.
Chalon-Blanc, A. (2005). Inventer, compter et classer: De Piaget aux débats actuels. Armand Colin. Drigas, A., & Petrova, A. (2014). ICTs in Speech and Language Therapy. iJEP, 4(1), 49-54. Feugnet, C. (2010). Création et expérimentation du jeu “A l’abordage des notions de sériation, classification et
inclusion” (Master’s Thesis, University of Bordeaux II, Bordeaux, France). Retrieved from http://dumas.ccsd.cnrs.fr/dumas-01302499/document
Ginsburg, H. P., & Opper, S. (1988). Piaget's theory of intellectual development. Prentice-Hall, Inc. Gowans, G., Campbell, J., Alm, N., Dye, R., Astell, A., & Ellis, M. (2004, April). Designing a multimedia
conversation aid for reminiscence therapy in dementia care environments. In CHI'04 Extended Abstracts on Human Factors in Computing Systems (pp. 825-836). ACM.
Ivanov, R. (2013, June). NFC-based pervasive learning service for children. In Proceedings of the 14th International Conference on Computer Systems and Technologies (pp. 329-336). ACM.
Dolle, J. M. (1974). Pour comprendre Jean Piaget (Vol. 11). Privat. Kim, Y., & Smith, D. (2015). Pedagogical and technological augmentation of mobile learning for young children
interactive learning environments. Interactive Learning Environments, 1-13. Moffatt, K., McGrenere, J., Purves, B., & Klawe, M. (2004, April). The participatory design of a sound and image
enhanced daily planner for people with aphasia. In Proceedings of the SIGCHI conference on Human factors in computing systems (pp. 407-414). ACM.
Nordmark, S., & Milrad, M. (2015). Tell Your Story About History: A Mobile Seamless Learning Approach to Support Mobile Digital Storytelling (mDS). In Seamless Learning in the Age of Mobile Connectivity (pp. 353-376). Springer Singapore.
Pederson, T. (2001). Magic touch: A simple object location tracking system enabling the development of physical-virtual artefacts in office environments. Personal and Ubiquitous Computing, 5(1), 54-57.
Piaget, J., & Inhelder, B. (1959). Inhelder, B., & Piaget, J. (1959). La Genèse des Structures Logiques Élémentaires Classifications Et Sériations. In Revue Philosophique de Louvain, 57(55), 489-490.
Rodríguez, W. R., Saz, O., Lleida, E., Vaquero, C., & Escartín, A. (2008, October). COMUNICA-tools for speech and language therapy. In WOCCI (p. 12).
Want, R. (2011). Near field communication. IEEE Pervasive Computing, (3), 4-7.
482482482
Chen, W. et al. (Eds.) (2016). Proceedings of the 24th International Conference on Computers in Education. India: Asia-Pacific Society for Computers in Education
A Development of Augmented Reality-supported Mobile Game Application based on
Jolly Phonics Approach to Enhancing English Phonics Learning Performance of
ESL Learners
Sirimon LIMSUKHAWATa, Suchada KAEWYOUNb, Charoenchai WONGWATKITc* & Jintana WONGTAd
a,b,cDepartment of Computer and Information Technology, Faculty of Industrial Education and Technology, King Mongkut’s University of Technology Thonburi, Thailand
dEngineering Science Classroom, King Mongkut’s University of Technology Thonburi, Thailand *[email protected]
Abstract: Phonics is an essential foundation for English learning, particularly in reading and writing. However, most students who learned English as a second language have not learned phonics appropriately when they were young, resulting in failed pronunciation in reading and writing English words. With Jolly Phonics approach, students could develop their phonics learning performance effectively regardless of memorization. In addition, game has been considered to be an engaging platform, while augmented reality can provide students more interactive learning environment. Therefore, in this study, an augmented reality supported mobile game application was developed based on Jolly Phonics approach in order to improve students’ phonics learning performance. In addition, an experiment has been conducted with primary school students to examine the effectiveness of the proposed mobile game application. Consequently, it was found that students who learned with this application could improve their phonics learning performance, also revealed positive attitudes towards the application. The findings of this study could provide an effective learning approach to improve phonics efficiency for English as a second language learners.
Keywords: Phonics learning, Jolly Phonics, Augmented Reality, Mobile game application, English learning, L2, ESL
1. Introduction As a beginner in learning English as a Second Language (ESL), learning how to read might be too difficult. They have to use multiple perceptions, e.g. seeing, recognizing and understanding of the words to read well. In reading, learners need to have a number of vocabulary, know how they are pronounced (Fry, 2005), which requires understanding on Phonics learning (Ehri, Nunes, Stahl, & Willows, 2001). Phonics focuses on how to connect sounds with letters and decoding them; while its learning can be either Analytic phonics or Synthetic phonics.
Compared to the phonics learners, the non-phonics learners usually have much faster reading ability to get familiar with words but they scored less in phoneme segmentation and non-word reading tasks (Connelly, Johnston, & Thompson, 2001). Besides, Analytic phonics learners learn to analyze letter sounds after seeing the word in which this approach cannot sustain over time. Students will be memorizing and can’t spell the word. Both types of learners face problems in reading comprehension performance.
Conversely, there have been several studies showing that students who learned phonics; especially those who learned Synthetic phonics, namely Jolly Phonics approach outperformed in reading (Ekpo, Udosen, Afangideh, Ekukinam, & Ikorok, 2007). Jolly Phonics approach enables students to learn the letter sounds before seeing the word, regardless of memorization of words because
483483483
they learn each letter sounds and blend them to make a word before reading the whole passage (Johnston, & Watson, 2005).
In the past decade, there have been a number of applications that use augmented reality (AR) technology in various subjects in education (Barreira, Bessa, Pereira, Adão, Peres, & Magalhães, 2012; Liu, & Tsai, 2013). It was found that AR could increase language learning performance since it enables students to pay more attention, increase their enthusiasm, and engage students in manipulating virtual materials from a variety of students’ perspective Significantly, AR helps bridge the gap between learning in formal and informal settings and enhancing students’ understanding of abstract and invisible concepts or phenomena (Wu, Lee, Chang, & Liang, 2013).
Therefore, a mobile game application was developed based on Synthetic phonics (Jolly Phonics approach) in order to enhance students’ phonics learning performance, hereinafter called P-Whale. AR was integrated into the application to make their learning more engaging by enabling students to interact on the mobile, and bridging the virtual games and interactive medias with phonics learning. Moreover, the experiment has been conducted to examine the effectiveness of the proposed application with following research questions: • Do students have better phonics learning performance after experiencing P-Whale? • How are the students’ attitudes towards P-Whale? 2. Related Studies 2.1 Jolly Phonics Learning Jolly Phonics approach was proposed by Sue Lloyd in 1998 to help students understand how letter sounds can be blended together to pronounce unfamiliar words, which produce sustainable reading skill for learners (Johnston, & Watson, 2003). This approach contains 5 main steps of learning. First step is learning the letter sounds in which students learn 42 main letter sounds (divided into 7 groups); while letters are not in alphabetical order. Second, learning letter formation, students learn how to connect the sound with its letters. This step helps students to recognize the letter and know how to write it when they hear the sound. Third, blending, students listen to the sounds and blend it to a word. Forth, identifying sounds in words, this step helps student to spell better by listening to the sounds in word. Finally, spelling the tricky words, this step contains different words that not go along with all the above items.
Jolly Phonics approach can help students’ phonics learning without memorization. For example, Bednarz’s study found that students who learned with Jolly Phonics had better skill to decode words in which other approaches teach students to memorize words which does not develop skill to decode unknown words; while Ginsberg’s study (2000) showed that Jolly Phonics aims at teaching students to decode any words not like the look-and-say method that students learn through memorization.
By considering the benefits and successful applications of Jolly Phonics approach, it could not only help students to improve their phonics learning skills, but also help them to learn without memorization.
2.2 Language Learning with AR Augmented Reality (AR) can support language learning incredibly by offering new learning opportunities and also creates new challenges for students (Wu, Lee, Chang, & Liang, 2013). AR combines the real world with the virtual world by overlay each other.
Nowadays, technology has been used to support education in many fields since it can encourage students more effectively by using interaction with multimedia via mobile or tablet devices. It also helps enhance cognitive learning outcomes (Schmitz, Klemke, & Specht, 2012). Dunleavy and Dede (2013) reported that AR technology is effective in changing students’ perspective because this technology can be used with multimedia interaction. Besides, Hsieh and Lin (2010) found that AR technology encouraged students to pay more attention than learning in the regular class.
484484484

Therefore, it would be interesting to integrate the language learning, especially Jolly Phonics approach with AR technology in order to increase reading and spelling skills. AR technology could enhance the traditional learning to be more engaging by using multiple virtual interactions and multimedia which are suitable for students (Liarokapis & Anderson, 2010). 2.3 Mobile Game-assisted Language Learning Learning language in mobile game application can motivate students to have better language learning skill (Kukulska-Hulme & Shield, 2008). Recently, mobile-assisted language learning (MALL) is known as an innovation that motivate students’ language learning anywhere anytime on mobile devices. Nowadays game has become an effective tool to enhance learning, help students to learn certain contents, and increase skills when they play the game. Recent studies showed that mobile games can improve language learning (Wongwatkit, Tekeaw, Kanjana, & Khrutthaka, 2015); while games could motivate students to learn with happiness and enjoyment during the learning process (Cornillie, Clarebout, & Desmet, 2012).
Therefore, mobile game could be considered as an interesting platform to promote language learning performance. 3. The Development of P-Whale
3.1 Word Analysis Prior to develop P-Whale, we conducted an analysis to find the proper words to be used in the application in following steps: 1) Gathering all the words from 9 English text books used in first grade students’ English subject in Thai schools and the original Phonics handbook written by Sue Lloyd. There are more than 500 words in total, 2) Reordering the words by the frequency of appearance, 3) Selecting words based on 1) frequency and 2) number of letters used in each group, and 4) Dividing qualified words into 7 groups according to Jolly Phonics approach (Lloyd, 1998). After the analysis, we had 70 words in total to be used in the application. Each group contains 20 words (excepting the first group with only 10 words). These words were then divided for ‘Blending’ and ‘Identifying’ stages. 3.2 Mobile Game Application Development P-Whale, a mobile game application, was developed with Unity3D and Vuforia SDK. P-Whale comes in a package with 42 AR marker cards. There are four mini games in the mobile application running in sequence of Jolly Phonics approach for first four stages. While learning and applying their existing knowledge, the games are challenging and fun for students with limited score, and number of letters and words, and they require students multiple perceptions interacting with AR. Sound feedback is provided to help remind the students. Note that students are suggested to learn under teachers’ or parents’ facilitation in sequence of letters groups. The four mini games are run as follows: 1. Learning the letter sounds: students need to understand how each letter sound. This stage was designed to work with AR, as shown in Figure 1(a). At this point, students begin the phonics learning foundation by recognizing the difference between phonemes and letter sounds of letter. 2. Letter formation: students use the back of the marker card to begin the session. Once detected, students form a letter by tilting the device and reminds students how each letter sounds when forming a letter, as shown in Figure 1(b). At this point, students could better understand the relationship between sound and its letter character. 3. Blending: students learn to blend the listened sound into word by playing a 2D game, as shown in Figure 1(c). Students have 15 seconds for each word, 10 words a game. If they couldn’t finish each word on time, the question will change to another in a random order. At this point students can blend each letter into words as an essential bridge to the final stage of phonics learning. 4. Identifying the sounds in word: students will have to listen to the word and will be able to recognize its sounds by using a camera to detect a marker card of missing letter, as shown in
485485485

Figure 1 (d). This final stage allows student to apply existing knowledge of phonics sound to identify the correct word.
Figure 1. Illustrative Examples of P-Whale Screenshots
By using P-Whale, students can cultivate the phonics learning from the basic foundation of letter sound and letter formation through searching and matching with the right AR marker cards, to the more advanced steps of blending and identifying the sounds from words trough mini matching games facilitated with AR. This could motivate students to learn each step to enhance their phonics learning performance. 4. Experimental Design 4.1 Procedure and Participants In order to examine the effectiveness of the application, we conducted an experiment with 36 students in grade 1 of a primary school in Thailand. All students participating in the experiment had similar understanding of phonics and were taught by the same English teacher. The experiment was conducted in 1.5 periods of their regular English class in the following steps: 1) The students were asked to do the pretest to examine their prior knowledge on the phonics for 10 minutes, 2) Prior to the experiment, learning orientation and demonstration of the application were introduced to students for 10 minutes, 3) While being facilitated by 3 teacher assistants, the students learned phonics by following the guidance on the application for 30 minutes, 4) Students were then asked to take a parallel posttest for another 10 minutes to evaluate their learning performance, and 5) At the end, they took a questionnaire to evaluate their attitude towards the application for 10 minutes. 4.2 Research Tools Pretest and posttest were designed to evaluate the phonics understanding by 2 experienced English phonics teachers and 3 linguists. Each test consisted of 5 pairs of words for blending and identifying, worth 10 scores in total. The reliability of the test has been judged by the majority of 5 above-mentioned experts’ opinion. In addition, a questionnaire was developed to investigate students’ attitude towards the application, consisting of 9 items of 5-point Likert scale. The questionnaire was designed by 3 experts in computer, multimedia and gamification fields. The Cronbach’s alpha of the questionnaire was 0.83,
486486486
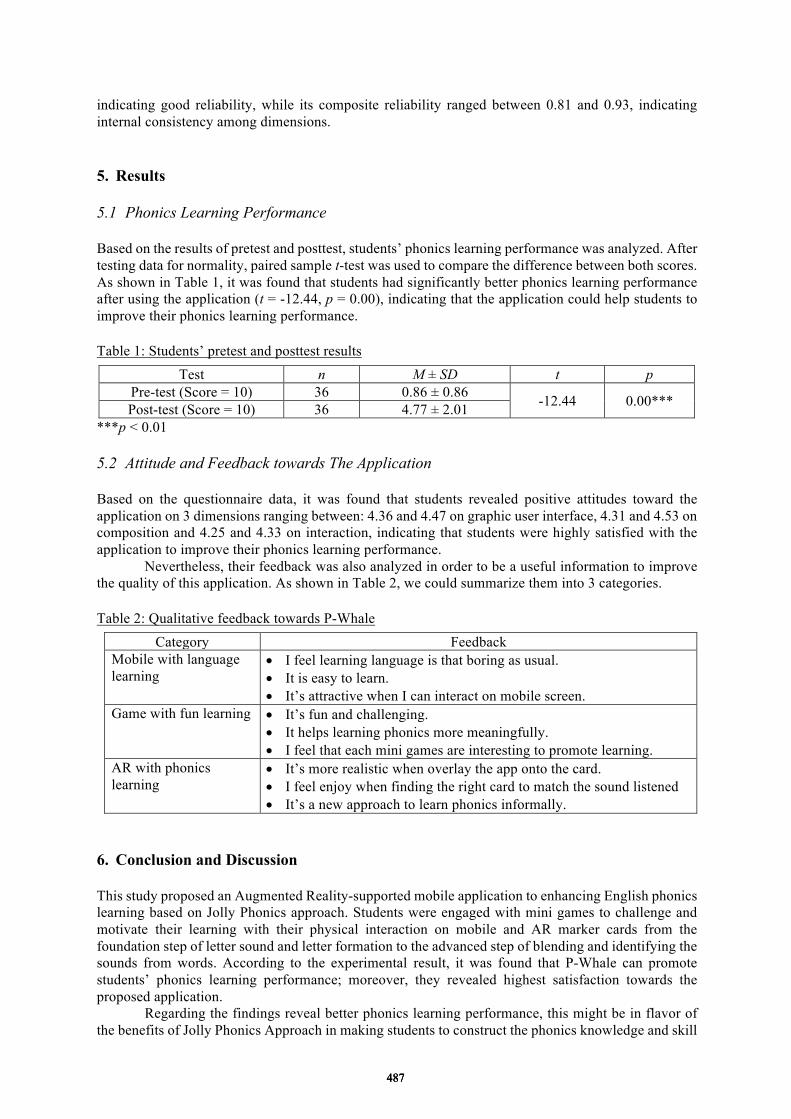
indicating good reliability, while its composite reliability ranged between 0.81 and 0.93, indicating internal consistency among dimensions. 5. Results 5.1 Phonics Learning Performance Based on the results of pretest and posttest, students’ phonics learning performance was analyzed. After testing data for normality, paired sample t-test was used to compare the difference between both scores. As shown in Table 1, it was found that students had significantly better phonics learning performance after using the application (t = -12.44, p = 0.00), indicating that the application could help students to improve their phonics learning performance. Table 1: Students’ pretest and posttest results
Test n M ± SD t p Pre-test (Score = 10) 36 0.86 ± 0.86 -12.44 0.00*** Post-test (Score = 10) 36 4.77 ± 2.01
***p < 0.01 5.2 Attitude and Feedback towards The Application Based on the questionnaire data, it was found that students revealed positive attitudes toward the application on 3 dimensions ranging between: 4.36 and 4.47 on graphic user interface, 4.31 and 4.53 on composition and 4.25 and 4.33 on interaction, indicating that students were highly satisfied with the application to improve their phonics learning performance. Nevertheless, their feedback was also analyzed in order to be a useful information to improve the quality of this application. As shown in Table 2, we could summarize them into 3 categories. Table 2: Qualitative feedback towards P-Whale
Category Feedback Mobile with language learning
• I feel learning language is that boring as usual. • It is easy to learn. • It’s attractive when I can interact on mobile screen.
Game with fun learning • It’s fun and challenging. • It helps learning phonics more meaningfully. • I feel that each mini games are interesting to promote learning.
AR with phonics learning
• It’s more realistic when overlay the app onto the card. • I feel enjoy when finding the right card to match the sound listened • It’s a new approach to learn phonics informally.
6. Conclusion and Discussion This study proposed an Augmented Reality-supported mobile application to enhancing English phonics learning based on Jolly Phonics approach. Students were engaged with mini games to challenge and motivate their learning with their physical interaction on mobile and AR marker cards from the foundation step of letter sound and letter formation to the advanced step of blending and identifying the sounds from words. According to the experimental result, it was found that P-Whale can promote students’ phonics learning performance; moreover, they revealed highest satisfaction towards the proposed application.
Regarding the findings reveal better phonics learning performance, this might be in flavor of the benefits of Jolly Phonics Approach in making students to construct the phonics knowledge and skill
487487487
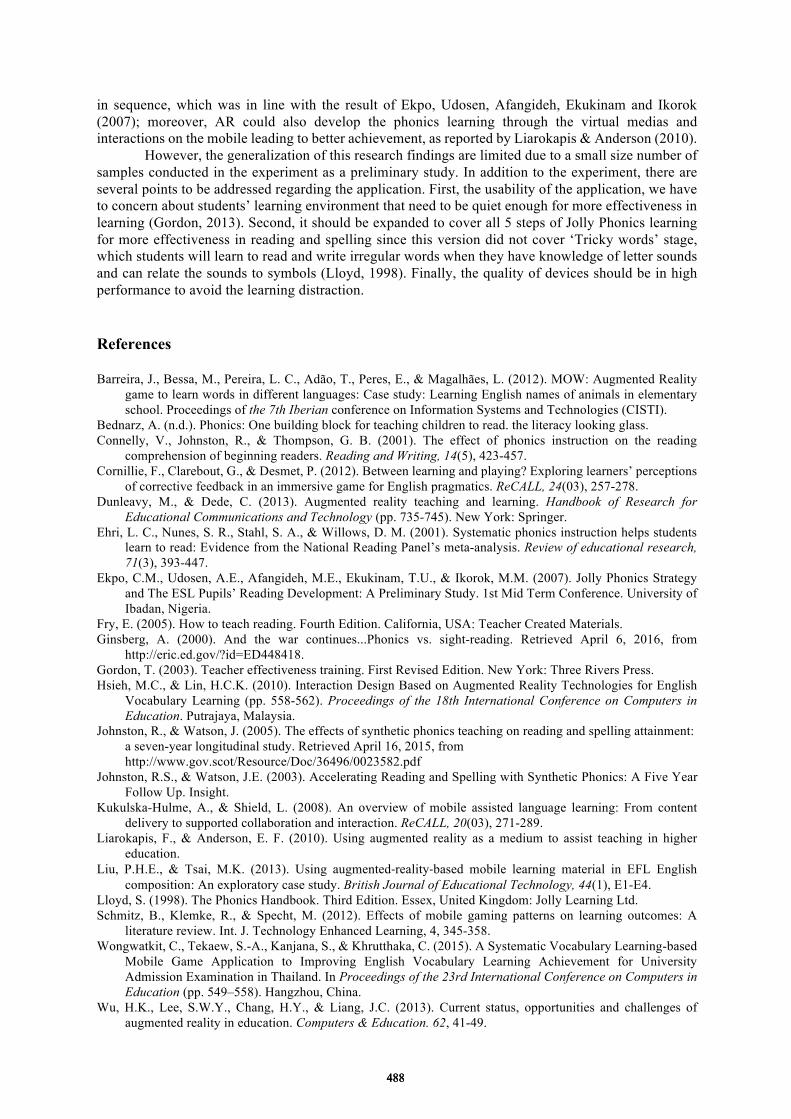
in sequence, which was in line with the result of Ekpo, Udosen, Afangideh, Ekukinam and Ikorok (2007); moreover, AR could also develop the phonics learning through the virtual medias and interactions on the mobile leading to better achievement, as reported by Liarokapis & Anderson (2010).
However, the generalization of this research findings are limited due to a small size number of samples conducted in the experiment as a preliminary study. In addition to the experiment, there are several points to be addressed regarding the application. First, the usability of the application, we have to concern about students’ learning environment that need to be quiet enough for more effectiveness in learning (Gordon, 2013). Second, it should be expanded to cover all 5 steps of Jolly Phonics learning for more effectiveness in reading and spelling since this version did not cover ‘Tricky words’ stage, which students will learn to read and write irregular words when they have knowledge of letter sounds and can relate the sounds to symbols (Lloyd, 1998). Finally, the quality of devices should be in high performance to avoid the learning distraction. References Barreira, J., Bessa, M., Pereira, L. C., Adão, T., Peres, E., & Magalhães, L. (2012). MOW: Augmented Reality
game to learn words in different languages: Case study: Learning English names of animals in elementary school. Proceedings of the 7th Iberian conference on Information Systems and Technologies (CISTI).
Bednarz, A. (n.d.). Phonics: One building block for teaching children to read. the literacy looking glass. Connelly, V., Johnston, R., & Thompson, G. B. (2001). The effect of phonics instruction on the reading
comprehension of beginning readers. Reading and Writing, 14(5), 423-457. Cornillie, F., Clarebout, G., & Desmet, P. (2012). Between learning and playing? Exploring learners’ perceptions
of corrective feedback in an immersive game for English pragmatics. ReCALL, 24(03), 257-278. Dunleavy, M., & Dede, C. (2013). Augmented reality teaching and learning. Handbook of Research for
Educational Communications and Technology (pp. 735-745). New York: Springer. Ehri, L. C., Nunes, S. R., Stahl, S. A., & Willows, D. M. (2001). Systematic phonics instruction helps students
learn to read: Evidence from the National Reading Panel’s meta-analysis. Review of educational research, 71(3), 393-447.
Ekpo, C.M., Udosen, A.E., Afangideh, M.E., Ekukinam, T.U., & Ikorok, M.M. (2007). Jolly Phonics Strategy and The ESL Pupils’ Reading Development: A Preliminary Study. 1st Mid Term Conference. University of Ibadan, Nigeria.
Fry, E. (2005). How to teach reading. Fourth Edition. California, USA: Teacher Created Materials. Ginsberg, A. (2000). And the war continues...Phonics vs. sight-reading. Retrieved April 6, 2016, from
http://eric.ed.gov/?id=ED448418. Gordon, T. (2003). Teacher effectiveness training. First Revised Edition. New York: Three Rivers Press. Hsieh, M.C., & Lin, H.C.K. (2010). Interaction Design Based on Augmented Reality Technologies for English
Vocabulary Learning (pp. 558-562). Proceedings of the 18th International Conference on Computers in Education. Putrajaya, Malaysia.
Johnston, R., & Watson, J. (2005). The effects of synthetic phonics teaching on reading and spelling attainment: a seven-year longitudinal study. Retrieved April 16, 2015, from http://www.gov.scot/Resource/Doc/36496/0023582.pdf
Johnston, R.S., & Watson, J.E. (2003). Accelerating Reading and Spelling with Synthetic Phonics: A Five Year Follow Up. Insight.
Kukulska-Hulme, A., & Shield, L. (2008). An overview of mobile assisted language learning: From content delivery to supported collaboration and interaction. ReCALL, 20(03), 271-289.
Liarokapis, F., & Anderson, E. F. (2010). Using augmented reality as a medium to assist teaching in higher education.
Liu, P.H.E., & Tsai, M.K. (2013). Using augmented-reality-based mobile learning material in EFL English composition: An exploratory case study. British Journal of Educational Technology, 44(1), E1-E4.
Lloyd, S. (1998). The Phonics Handbook. Third Edition. Essex, United Kingdom: Jolly Learning Ltd. Schmitz, B., Klemke, R., & Specht, M. (2012). Effects of mobile gaming patterns on learning outcomes: A
literature review. Int. J. Technology Enhanced Learning, 4, 345-358. Wongwatkit, C., Tekaew, S.-A., Kanjana, S., & Khrutthaka, C. (2015). A Systematic Vocabulary Learning-based
Mobile Game Application to Improving English Vocabulary Learning Achievement for University Admission Examination in Thailand. In Proceedings of the 23rd International Conference on Computers in Education (pp. 549–558). Hangzhou, China.
Wu, H.K., Lee, S.W.Y., Chang, H.Y., & Liang, J.C. (2013). Current status, opportunities and challenges of augmented reality in education. Computers & Education. 62, 41-49.
488488488

Chen, W. et al. (Eds.) (2016). Proceedings of the 24th International Conference on Computers in Education.
India: Asia-Pacific Society for Computers in Education
Exploring the Relationship between Language
Learning Strategy Usage and Anxiety among
Chinese University Students
Olha DALTE*, Jing LENG, Xiaoqing GU
East China Normal University,
Department of Educational Technology,
Shanghai, China
Abstract: Previous research in term of traditional classroom has indicated that the effectiveness
of English learning depends significantly on the strategy usage and different anxiety-provoking
situations during communication. Meanwhile, researches in terms of technology-enhanced
environment showed that the technology itself also can be a source of anxiety. This paper aims
to understand the correlation between LLS usage and two types of anxiety – communication and
technology. We adopted the FLASC and SILL questionnaires in order to collect the data from
187 Chinese University Students. The results showed that learners more often used direct LLS
than the indirect ones; the most popular are compensation strategies and the least - affective. In
addition, findings indicated that there was no significant difference between technology anxiety
and the LLS usage. However, the communication anxiety influenced significantly the choice of
LLS, especially social, cognitive, affective and memory strategies.
Keywords: language learning strategies, technology anxiety, communication anxiety.
1. Introduction
The concepts of technology-enhanced environment have opened a new resources to assist the learning
process. We aim to find out how different factors influences the language learning process of adults and
how to make it more resultative and engaging. Language Learning strategies (LLS) are procedures used
to facilitate learning and to enable learners to become more independent and autonomous lifelong
learners (Chamot, 2004). In other words, LLS are actions that learners take to accomplish their learning
goals.
As any learning activity, language learning has different anxiety provoking situations. Most researchers
agree that feeling of stress, anxiety or nervousness may impede language learning and performance
abilities (Zafaria, Biriab, 2014). It is also believed that anxiety is one of the main hurdle to be overcome
while learning English or any other foreign language.
The main purpose of language learning is communication, that is why it is regarded as one of the most
anxiety-provoking activities. In addition, as we have already mentioned, modern technologies penetrate
in every sphere of our life, so they also can be a new source of stress.
Even though, there are a lot of studies devoted to LLS usage and learning anxiety in traditional
classroom, a few researches are made in terms of technology-enhanced learning environment.
2. Literature Review
In the middle 1980s the researchers noticed that there is a correlation between LLS usage and anxiety.
Most of them assure: the higher the level of anxiety is, the less strategies are used (MacIntyre & Noels,
1996; Noormohamadi, 2009). From the other point of view, Benjamin (1981) found that improper
usage of LLS becomes a new source of anxiety. Later these ideas were confirmed by Warr and Downing
(2000) who stated that learners who appropriately use more different types of LLS are more motivated
and have lower levels of anxiety.
489489489
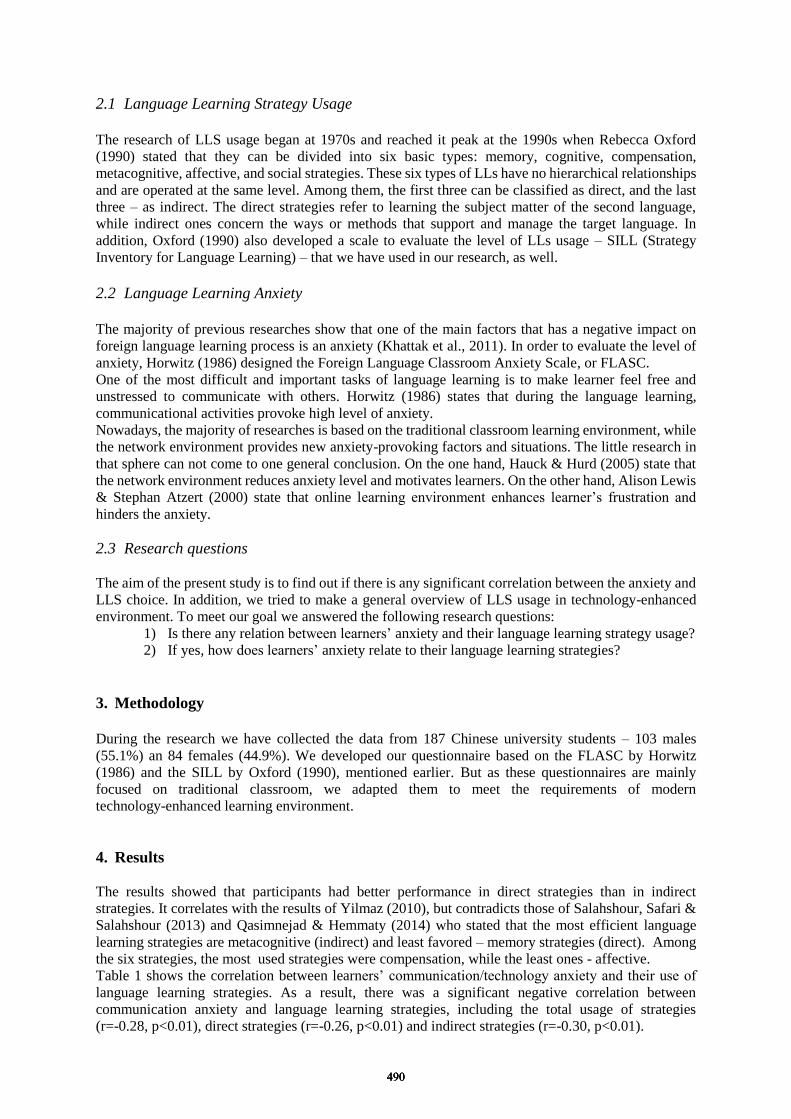
2.1 Language Learning Strategy Usage
The research of LLS usage began at 1970s and reached it peak at the 1990s when Rebecca Oxford
(1990) stated that they can be divided into six basic types: memory, cognitive, compensation,
metacognitive, affective, and social strategies. These six types of LLs have no hierarchical relationships
and are operated at the same level. Among them, the first three can be classified as direct, and the last
three – as indirect. The direct strategies refer to learning the subject matter of the second language,
while indirect ones concern the ways or methods that support and manage the target language. In
addition, Oxford (1990) also developed a scale to evaluate the level of LLs usage – SILL (Strategy
Inventory for Language Learning) – that we have used in our research, as well.
2.2 Language Learning Anxiety
The majority of previous researches show that one of the main factors that has a negative impact on
foreign language learning process is an anxiety (Khattak et al., 2011). In order to evaluate the level of
anxiety, Horwitz (1986) designed the Foreign Language Classroom Anxiety Scale, or FLASC.
One of the most difficult and important tasks of language learning is to make learner feel free and
unstressed to communicate with others. Horwitz (1986) states that during the language learning,
communicational activities provoke high level of anxiety.
Nowadays, the majority of researches is based on the traditional classroom learning environment, while
the network environment provides new anxiety-provoking factors and situations. The little research in
that sphere can not come to one general conclusion. On the one hand, Hauck & Hurd (2005) state that
the network environment reduces anxiety level and motivates learners. On the other hand, Alison Lewis
& Stephan Atzert (2000) state that online learning environment enhances learner’s frustration and
hinders the anxiety.
2.3 Research questions
The aim of the present study is to find out if there is any significant correlation between the anxiety and
LLS choice. In addition, we tried to make a general overview of LLS usage in technology-enhanced
environment. To meet our goal we answered the following research questions:
1) Is there any relation between learners’ anxiety and their language learning strategy usage?
2) If yes, how does learners’ anxiety relate to their language learning strategies?
3. Methodology
During the research we have collected the data from 187 Chinese university students – 103 males
(55.1%) an 84 females (44.9%). We developed our questionnaire based on the FLASC by Horwitz
(1986) and the SILL by Oxford (1990), mentioned earlier. But as these questionnaires are mainly
focused on traditional classroom, we adapted them to meet the requirements of modern
technology-enhanced learning environment.
4. Results
The results showed that participants had better performance in direct strategies than in indirect
strategies. It correlates with the results of Yilmaz (2010), but contradicts those of Salahshour, Safari &
Salahshour (2013) and Qasimnejad & Hemmaty (2014) who stated that the most efficient language
learning strategies are metacognitive (indirect) and least favored – memory strategies (direct). Among
the six strategies, the most used strategies were compensation, while the least ones - affective.
Table 1 shows the correlation between learners’ communication/technology anxiety and their use of
language learning strategies. As a result, there was a significant negative correlation between
communication anxiety and language learning strategies, including the total usage of strategies
(r=-0.28, p<0.01), direct strategies (r=-0.26, p<0.01) and indirect strategies (r=-0.30, p<0.01).
490490490
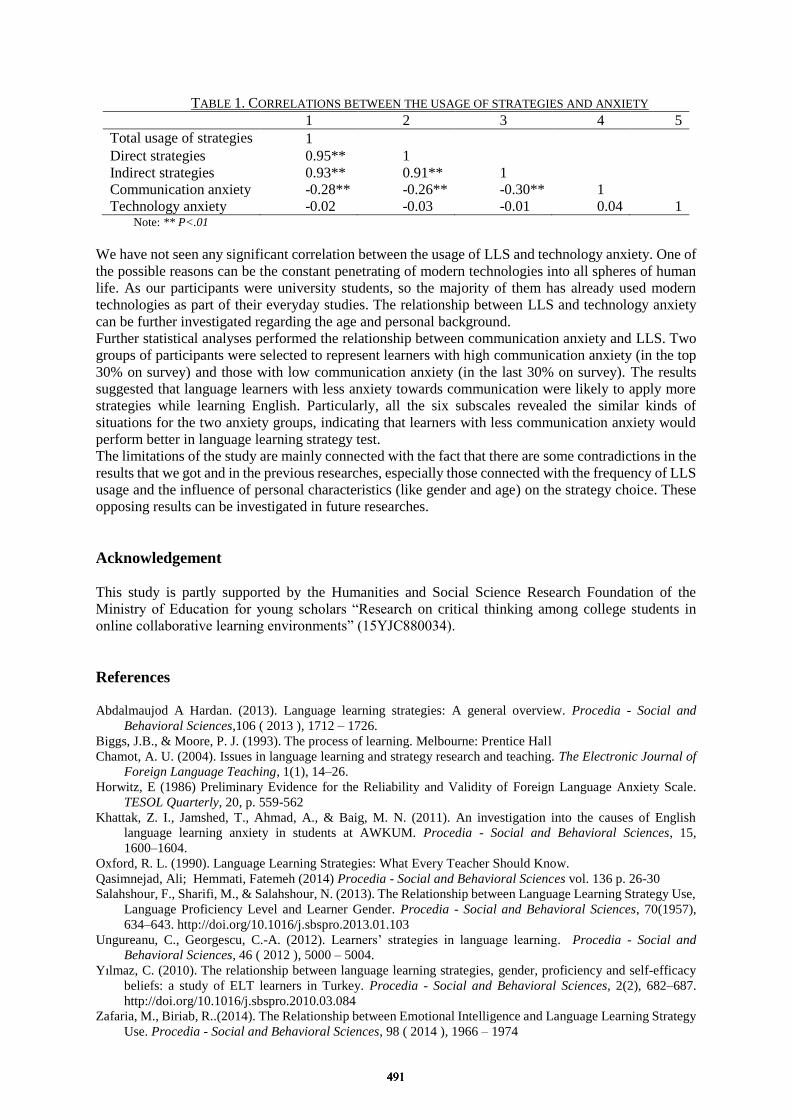
TABLE 1. CORRELATIONS BETWEEN THE USAGE OF STRATEGIES AND ANXIETY
1 2 3 4 5
Total usage of strategies 1
Direct strategies 0.95** 1
Indirect strategies 0.93** 0.91** 1
Communication anxiety -0.28** -0.26** -0.30** 1
Technology anxiety -0.02 -0.03 -0.01 0.04 1 Note: ** P<.01
We have not seen any significant correlation between the usage of LLS and technology anxiety. One of
the possible reasons can be the constant penetrating of modern technologies into all spheres of human
life. As our participants were university students, so the majority of them has already used modern
technologies as part of their everyday studies. The relationship between LLS and technology anxiety
can be further investigated regarding the age and personal background.
Further statistical analyses performed the relationship between communication anxiety and LLS. Two
groups of participants were selected to represent learners with high communication anxiety (in the top
30% on survey) and those with low communication anxiety (in the last 30% on survey). The results
suggested that language learners with less anxiety towards communication were likely to apply more
strategies while learning English. Particularly, all the six subscales revealed the similar kinds of
situations for the two anxiety groups, indicating that learners with less communication anxiety would
perform better in language learning strategy test.
The limitations of the study are mainly connected with the fact that there are some contradictions in the
results that we got and in the previous researches, especially those connected with the frequency of LLS
usage and the influence of personal characteristics (like gender and age) on the strategy choice. These
opposing results can be investigated in future researches.
Acknowledgement
This study is partly supported by the Humanities and Social Science Research Foundation of the
Ministry of Education for young scholars “Research on critical thinking among college students in
online collaborative learning environments” (15YJC880034).
References
Abdalmaujod A Hardan. (2013). Language learning strategies: A general overview. Procedia - Social and
Behavioral Sciences,106 ( 2013 ), 1712 – 1726.
Biggs, J.B., & Moore, P. J. (1993). The process of learning. Melbourne: Prentice Hall
Chamot, A. U. (2004). Issues in language learning and strategy research and teaching. The Electronic Journal of
Foreign Language Teaching, 1(1), 14–26.
Horwitz, E (1986) Preliminary Evidence for the Reliability and Validity of Foreign Language Anxiety Scale.
TESOL Quarterly, 20, p. 559-562
Khattak, Z. I., Jamshed, T., Ahmad, A., & Baig, M. N. (2011). An investigation into the causes of English
language learning anxiety in students at AWKUM. Procedia - Social and Behavioral Sciences, 15,
1600–1604.
Oxford, R. L. (1990). Language Learning Strategies: What Every Teacher Should Know.
Qasimnejad, Ali; Hemmati, Fatemeh (2014) Procedia - Social and Behavioral Sciences vol. 136 p. 26-30
Salahshour, F., Sharifi, M., & Salahshour, N. (2013). The Relationship between Language Learning Strategy Use,
Language Proficiency Level and Learner Gender. Procedia - Social and Behavioral Sciences, 70(1957),
634–643. http://doi.org/10.1016/j.sbspro.2013.01.103
Ungureanu, C., Georgescu, C.-A. (2012). Learners’ strategies in language learning. Procedia - Social and
Behavioral Sciences, 46 ( 2012 ), 5000 – 5004.
Yılmaz, C. (2010). The relationship between language learning strategies, gender, proficiency and self-efficacy
beliefs: a study of ELT learners in Turkey. Procedia - Social and Behavioral Sciences, 2(2), 682–687.
http://doi.org/10.1016/j.sbspro.2010.03.084
Zafaria, M., Biriab, R..(2014). The Relationship between Emotional Intelligence and Language Learning Strategy
Use. Procedia - Social and Behavioral Sciences, 98 ( 2014 ), 1966 – 1974
491491491
Chen, W. et al. (Eds.) (2016). Proceedings of the 24th International Conference on Computers in Education.
India: Asia-Pacific Society for Computers in Education
Learning Behavior Analysis on VoiceTube for
Recommender System Construction
Chih-Kai CHANG*, Hsin-Yu YEH
Department of Information and Learning Technology, National University of Tainan, Taiwan
Abstract: Learning English on Internet has become increasingly common, where Internet
movies for learning English are also booming. For instance, the VoiceTube, an Internet video
platform for learning English, has pluralistic free videos with both Chinese and English
captions. Meanwhile, VoiceTube can combine social media to create a learning network
community. However, a good recommendation system is necessary to select proper videos from
the English film resources according personal preferences. Hence, the present study used
collaborative filtering method to recommend videos, which were found in the learners’ lists
with similar preferences. First, we used a web crawler to crawl user information on VoiceTube.
Then, the Crab, which is recommender engine in Python, was used to analyze the collected data
for identifying similar learners. According to the preference scores, Crab can precisely
recommend proper English learning films to every learner. Finally, we created a query interface
for the data crawled from VoiceTube. Thus, learners can use the query function to search
friends, collecting similar favorite movies, through VoiceTube social networks. As a result,
learners can passively get recommended videos or actively select proper English movies that
can enhance their motivation of learning English through watching videos.
Keywords: VoiceTube, social media, recommendation system, collaborative filtering, learning
motivation.
1. Introduction With the popularity of the Internet, it is relative convenient to access rich and free online resources for
learning English. Learning English is no longer just to acquire knowledge from books. A large number
of English-language teaching-related Web sites, software, videos and other resources can be used for
various purposes. English-language film is a great learning tool while watching entertainment movies.
Learners can listen to conversations while watching, and can try to recognize the words on caption. In
addition, the situations in the film can help learners into the context of a foreign culture, which is
difficult to learn in books.
There are many video sharing platform and YouTube is a popular video sharing site for users to
upload, watch, and share videos freely. The VoiceTube (URL: www.voicetube.com) is an English
learning website based on watching YouTube videos at Taiwan. Learners can repeatedly play a single
sentence to enhance English listening comprehension and reading. In addition to the both English and
Chinese captions, learners can use the instant dictionary to check words. Furthermore, VoiceTube
combined with social media Facebook. Because VoiceTube is so successful, this study explored how to
integrate with recommendation system on this platform.
Furthermore, it is difficult to make a selection correctly among a large number of, various types
of film resources according to learners’ different preferences. Moreover, quality of online videos cannot
judge due to lack of appropriate assessment and management mechanism. How can learners quickly
find the right information on Internet becomes a very important issue. Therefore, using recommender
system to help users filter out useful information from large amounts of data is necessary. The
recommender system can actively provide information to users according to user preferences at the
right time. In summary, this study uses Crab, a flexible, fast recommender engine, to recommend video
clips on VoiceTube.
2. Related Studies O'Donovan & Smyth (2005) pointed out that collaborative filtering recommender system, sometimes
called social filtering, are built mainly on property or interest similar or user experience to provide
personalized information service. Based on preference data, users can be divided into a number of
492492492
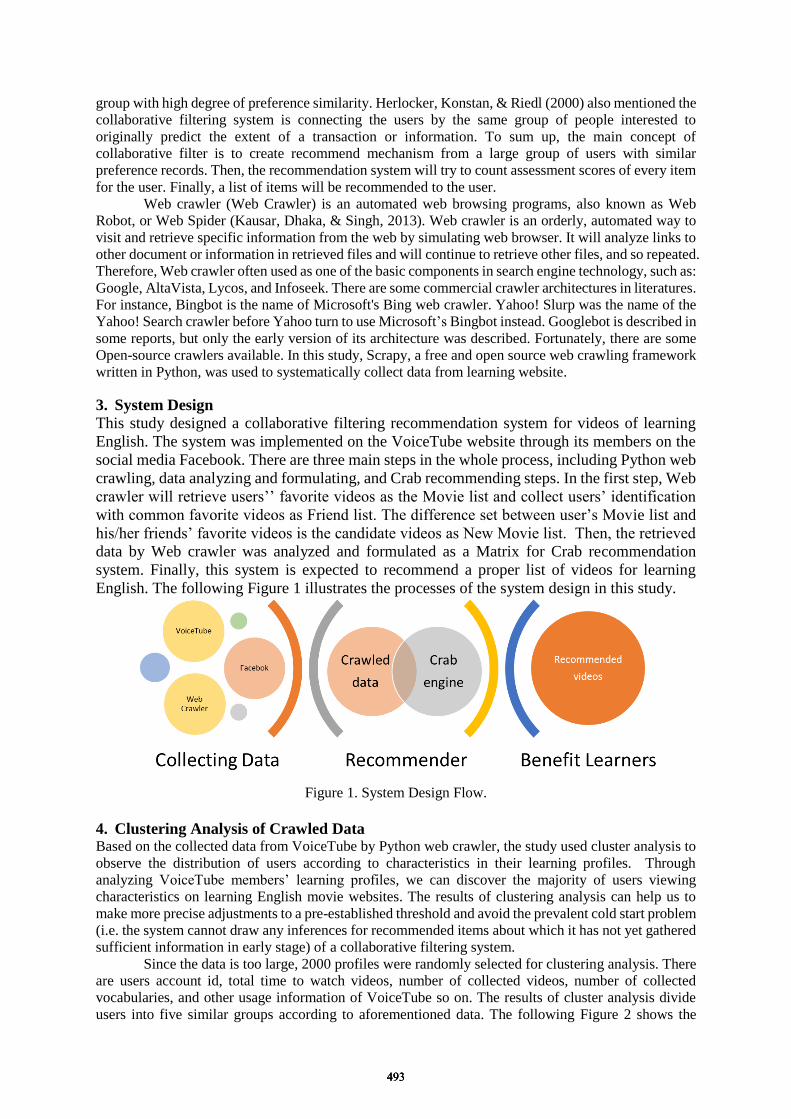
group with high degree of preference similarity. Herlocker, Konstan, & Riedl (2000) also mentioned the
collaborative filtering system is connecting the users by the same group of people interested to
originally predict the extent of a transaction or information. To sum up, the main concept of
collaborative filter is to create recommend mechanism from a large group of users with similar
preference records. Then, the recommendation system will try to count assessment scores of every item
for the user. Finally, a list of items will be recommended to the user. Web crawler (Web Crawler) is an automated web browsing programs, also known as Web
Robot, or Web Spider (Kausar, Dhaka, & Singh, 2013). Web crawler is an orderly, automated way to
visit and retrieve specific information from the web by simulating web browser. It will analyze links to
other document or information in retrieved files and will continue to retrieve other files, and so repeated.
Therefore, Web crawler often used as one of the basic components in search engine technology, such as:
Google, AltaVista, Lycos, and Infoseek. There are some commercial crawler architectures in literatures.
For instance, Bingbot is the name of Microsoft's Bing web crawler. Yahoo! Slurp was the name of the
Yahoo! Search crawler before Yahoo turn to use Microsoft’s Bingbot instead. Googlebot is described in
some reports, but only the early version of its architecture was described. Fortunately, there are some
Open-source crawlers available. In this study, Scrapy, a free and open source web crawling framework
written in Python, was used to systematically collect data from learning website.
3. System Design
This study designed a collaborative filtering recommendation system for videos of learning
English. The system was implemented on the VoiceTube website through its members on the
social media Facebook. There are three main steps in the whole process, including Python web
crawling, data analyzing and formulating, and Crab recommending steps. In the first step, Web
crawler will retrieve users’’ favorite videos as the Movie list and collect users’ identification
with common favorite videos as Friend list. The difference set between user’s Movie list and
his/her friends’ favorite videos is the candidate videos as New Movie list. Then, the retrieved
data by Web crawler was analyzed and formulated as a Matrix for Crab recommendation
system. Finally, this system is expected to recommend a proper list of videos for learning
English. The following Figure 1 illustrates the processes of the system design in this study.
Figure 1. System Design Flow.
4. Clustering Analysis of Crawled Data Based on the collected data from VoiceTube by Python web crawler, the study used cluster analysis to
observe the distribution of users according to characteristics in their learning profiles. Through
analyzing VoiceTube members’ learning profiles, we can discover the majority of users viewing
characteristics on learning English movie websites. The results of clustering analysis can help us to
make more precise adjustments to a pre-established threshold and avoid the prevalent cold start problem
(i.e. the system cannot draw any inferences for recommended items about which it has not yet gathered
sufficient information in early stage) of a collaborative filtering system.
Since the data is too large, 2000 profiles were randomly selected for clustering analysis. There
are users account id, total time to watch videos, number of collected videos, number of collected
vocabularies, and other usage information of VoiceTube so on. The results of cluster analysis divide
users into five similar groups according to aforementioned data. The following Figure 2 shows the
493493493

results of clustering analysis, where x-axis for number of watched videos for learning English and
y-axis for the total time of watching those videos.
Figure 2. Result of Clustering Analysis
Based on the results shown in Figure, yellow blocks can be found mostly in the figure.
The yellow blocks actually occupied 89%, so it can be used as a major group. Furthermore,
yellow blocks are widely distributed, mostly gathered in the lower left corner. However, there
are still some scattered at another end (i.e. upper right corner). Moreover, the number of yellow
blocks at the lower right part is more than the number of yellow blocks at the upper left part.
This phenomenon shows that users’ learning strategies can be divided into two groups in spite
of their similar features (such as collections of videos and vocabularies). The group at the lower
right part, may called Extensive Learning group, watched as many different kinds of videos as
they can, chiefly for pleasure, and only needing a general understanding of the videos. Another
group watched videos with concentration and great care in order to understand exactly the
meaning in the videos. It can be seen that most users on VoiceTube will learn English in a
Extensive Learning style. In the future, we will report details about characteristics for that
group and how we used those feature to achieve more accurate recommendations.
5. Conclusion and Future Work
This study uses collaborative filtering method through social media scoring mechanism and
Crab recommender engine to recommend English movies according to learners’ preferences.
Thus, the system can stimulate interest in watching videos to enhance English learning
motivation. Consequently, learning English through watching videos are not just interesting;
they are engaging and compelling. In addition, we found that members of VoiceTube mostly
prefer Extensive Learning style. In other words, learning website, such as VoiceTube, may not
suitable for learners who prefer looking up the words and grammatical structures and
translating every word. Through this analysis, we not only can understand VoiceTube user
features, but also can use the results to revise the computing equation of the recommender
system in the future.
Acknowledgements We would like to thank supports by the Ministry of Science and Technology, Taiwan, R. O. C., under
Grant no. MOST 104-2628-S-024-001-MY3 and MOST 103-2511-S-024-003.
References Herlocker, J. L., Konstan, J. A., & Riedl, J. (2000). Explaining collaborative filtering recommendations.
In Proceedings of the 2000 ACM conference on Computer supported cooperative work (pp. 241-250). ACM.
Kausar, M. A., Dhaka, V. S., & Singh, S. K. (2013). Web crawler: a review. International Journal of Computer
Applications, 63(2), 31-36.
O'Donovan, J., & Smyth, B. (2005). Trust in recommender systems. In Proceedings of the 10th international
conference on Intelligent user interfaces (pp. 167-174). ACM.
494494494
Chen, W. et al. (Eds.) (2016). Proceedings of the 24th
International Conference on Computers in Education.
India: Asia-Pacific Society for Computers in Education
Automatic Scoring of English Speaking Test
Using Automatic Speech Recognition
Keiji YASUDA*, Hiroyuki KAWASHIMA
*, & Hiroaki Kimura
*
*KDDI R&D Laboratories, Inc.
{ke-yasuda,hi-kawashima,ha-kimura}@kddilabs.jp
Abstract: In this paper, we propose an automatic scoring method for conversational English
test using automatic speech recognition and machine learning techniques. We administered a
mock English speaking test with 111 Japanese speakers. According to the experimental results
using the data, the correlation between human expert scoring results and automatic scoring
results was 0.825.
Keywords: English speaking test, automatic evaluation, machine learning, SVR
1. Introduction
English Communicative skills are becoming more important due to globalization of economic
activities, widespread use of the Internet, and other factors. There are four language skills: reading,
listening, speaking, and writing (CEFR, 2001). Measuring learners’ proficiencies in these skills is
necessary in the language learning phase. Computer Based Testing (CBT) offers a short turnaround
time with the potential to boost learning efficiency.
Here, we discuss the relationship between the four language skills and the testing method.
Listening and reading skills are suitable for conventional multiple choice testing. Hence, these skills are
easy to measure with CBT. On the other hand, writing and speaking skills take ingenuity to measure
with CBT because conventional multiple choice testing is inappropriate to measure proficiency in these
skills. For writing skill, an automatic essay scoring method based on text coherence has been proposed
by Crossley and McNamara (2011). For speaking skill, the Pearson Versant system was developed from
the original Phone Pass ASR-based test by Ordinate. It tests vocabulary and fluency in addition to
pronunciation and word ordering (Pearson, 2011).
In this paper, we propose an automatic method for a high spontaneity speaking test using
Automatic Speech Recognition (ASR) and machine learning techniques. Compared with the
conventional speaking test service, this method is more suitable for measuring a practical speaking skill
in a concrete topic or field as well as evaluation using can-do descriptors, such as Common European
Framework of Reference for Languages (CEFR, 2011). Although the experiments in this paper were
carried out using Japanese non-native English speakers, the proposed method is highly data driven
method and is portable to other mother tongues and other languages as far as the data are available.
Section 2 explains the English speaking test. Section 3 describes the proposed automatic scoring
system. Section 4 shows the evaluation experiments and results. Finally, section 5 concludes the paper.
2. English Speaking Test
Here, we explain the English speaking test material. In this experiment, we used an English speaking
test from one of the largest online English lesson providers, the Rare Job Company. The test consisted
of six sections. Each section was bounded by time up to two minutes. Total testing time for one
examinee was about 30 minutes. The test measured six English skills—Ability to Express (AE), Ability
to Make sentences (AM), Ability to Understand (AU), Pronunciation (P), Grammar (G), and Fluency
(F). The relationship between each section and measured English skills are shown in table 1.
3. Developed Automatic Scoring System
3.1 Non-native Automatic Speech Recognition
495495495
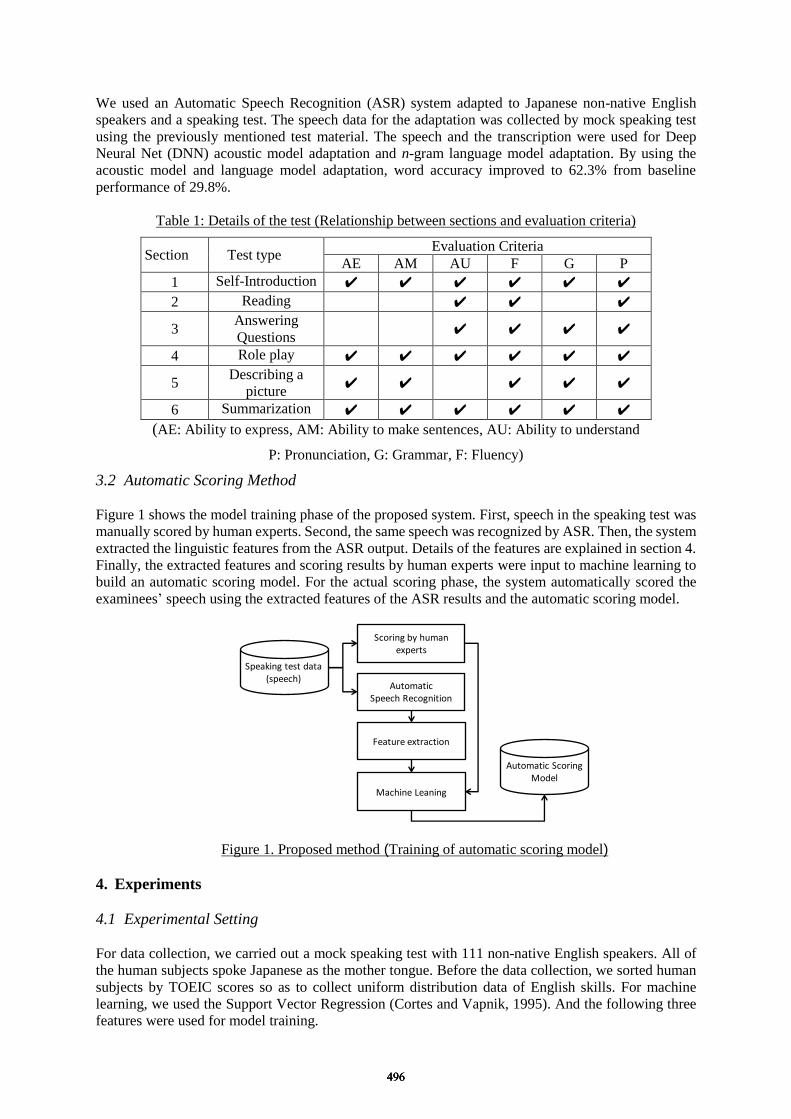
We used an Automatic Speech Recognition (ASR) system adapted to Japanese non-native English
speakers and a speaking test. The speech data for the adaptation was collected by mock speaking test
using the previously mentioned test material. The speech and the transcription were used for Deep
Neural Net (DNN) acoustic model adaptation and n-gram language model adaptation. By using the
acoustic model and language model adaptation, word accuracy improved to 62.3% from baseline
performance of 29.8%.
Table 1: Details of the test (Relationship between sections and evaluation criteria)
Section Test type Evaluation Criteria
AE AM AU F G P
1 Self-Introduction ✔ ✔ ✔ ✔ ✔ ✔
2 Reading ✔ ✔ ✔
3 Answering
Questions ✔ ✔ ✔ ✔
4 Role play ✔ ✔ ✔ ✔ ✔ ✔
5 Describing a
picture ✔ ✔ ✔ ✔ ✔
6 Summarization ✔ ✔ ✔ ✔ ✔ ✔
(AE: Ability to express, AM: Ability to make sentences, AU: Ability to understand
P: Pronunciation, G: Grammar, F: Fluency)
3.2 Automatic Scoring Method
Figure 1 shows the model training phase of the proposed system. First, speech in the speaking test was
manually scored by human experts. Second, the same speech was recognized by ASR. Then, the system
extracted the linguistic features from the ASR output. Details of the features are explained in section 4.
Finally, the extracted features and scoring results by human experts were input to machine learning to
build an automatic scoring model. For the actual scoring phase, the system automatically scored the
examinees’ speech using the extracted features of the ASR results and the automatic scoring model.
Automatic Speech Recognition
Feature extraction
Speaking test data (speech)
Machine Leaning
Scoring by human experts
Automatic Scoring Model
Figure 1. Proposed method (Training of automatic scoring model)
4. Experiments
4.1 Experimental Setting
For data collection, we carried out a mock speaking test with 111 non-native English speakers. All of
the human subjects spoke Japanese as the mother tongue. Before the data collection, we sorted human
subjects by TOEIC scores so as to collect uniform distribution data of English skills. For machine
learning, we used the Support Vector Regression (Cortes and Vapnik, 1995). And the following three
features were used for model training.
496496496
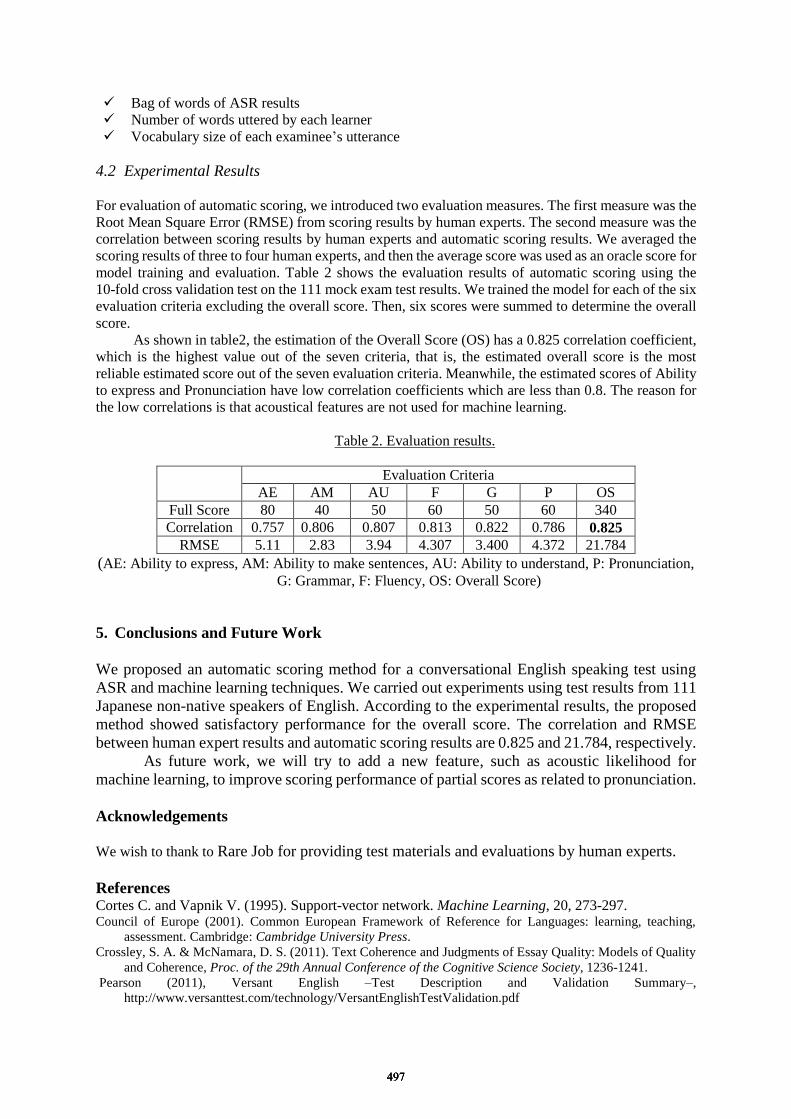
Bag of words of ASR results
Number of words uttered by each learner
Vocabulary size of each examinee’s utterance
4.2 Experimental Results
For evaluation of automatic scoring, we introduced two evaluation measures. The first measure was the
Root Mean Square Error (RMSE) from scoring results by human experts. The second measure was the
correlation between scoring results by human experts and automatic scoring results. We averaged the
scoring results of three to four human experts, and then the average score was used as an oracle score for
model training and evaluation. Table 2 shows the evaluation results of automatic scoring using the
10-fold cross validation test on the 111 mock exam test results. We trained the model for each of the six
evaluation criteria excluding the overall score. Then, six scores were summed to determine the overall
score.
As shown in table2, the estimation of the Overall Score (OS) has a 0.825 correlation coefficient,
which is the highest value out of the seven criteria, that is, the estimated overall score is the most
reliable estimated score out of the seven evaluation criteria. Meanwhile, the estimated scores of Ability
to express and Pronunciation have low correlation coefficients which are less than 0.8. The reason for
the low correlations is that acoustical features are not used for machine learning.
Table 2. Evaluation results.
Evaluation Criteria
AE AM AU F G P OS
Full Score 80 40 50 60 50 60 340
Correlation 0.757 0.806 0.807 0.813 0.822 0.786 0.825
RMSE 5.11 2.83 3.94 4.307 3.400 4.372 21.784
(AE: Ability to express, AM: Ability to make sentences, AU: Ability to understand, P: Pronunciation,
G: Grammar, F: Fluency, OS: Overall Score)
5. Conclusions and Future Work
We proposed an automatic scoring method for a conversational English speaking test using
ASR and machine learning techniques. We carried out experiments using test results from 111
Japanese non-native speakers of English. According to the experimental results, the proposed
method showed satisfactory performance for the overall score. The correlation and RMSE
between human expert results and automatic scoring results are 0.825 and 21.784, respectively.
As future work, we will try to add a new feature, such as acoustic likelihood for
machine learning, to improve scoring performance of partial scores as related to pronunciation.
Acknowledgements
We wish to thank to Rare Job for providing test materials and evaluations by human experts.
References Cortes C. and Vapnik V. (1995). Support-vector network. Machine Learning, 20, 273-297. Council of Europe (2001). Common European Framework of Reference for Languages: learning, teaching,
assessment. Cambridge: Cambridge University Press.
Crossley, S. A. & McNamara, D. S. (2011). Text Coherence and Judgments of Essay Quality: Models of Quality
and Coherence, Proc. of the 29th Annual Conference of the Cognitive Science Society, 1236-1241.
Pearson (2011), Versant English –Test Description and Validation Summary–,
http://www.versanttest.com/technology/VersantEnglishTestValidation.pdf
497497497
Chen, W. et al. (Eds.) (2016). Proceedings of the 24th
International Conference on Computers in Education.
India: Asia-Pacific Society for Computers in Education
Enhancing EFL learners’ intercultural
sensitivity through a cross-border writing
instruction
Jun CHEN HSIEHa*
, Wen-Chi Vivian WUb & Jie Chi YANG
c
acGraduate Institute of Network Learning Technology, National Central University, Taiwan
bDepartment of English Language, Literature, and Linguistics, Providence University, Taiwan
Abstract: Language and culture are inseparable since individuals express themselves out of
their cultural background, thus highlighting the importance of the cultural cultivation. Research
has shown the positive effects of embedding foreign cultures in the writing process. However,
intercultural competence is still not adequately reflected in current English as a foreign
language (EFL) education. In addition, students feel demotivated to write in conventional
writing courses, thus signifying an urgent call for innovation. As writing instructions that
incorporate intercultural competence are insufficiently implemented, the current study,
therefore, aimed to examine how EFL learners’ intercultural sensitivity could be enhanced via
the use of a cross-border writing instruction. A total of 44 sophomore English-majors in two
required English Composition classes were respectively paired up with their American peers
from a public liberal arts college. Data included students’ responses to “Intercultural Sensitivity
Scale” and focus-group interviews. The findings revealed positive affordances from the
cross-border writing instruction, that pre-class activities (reading relevant materials, answering
comprehension questions online, reviewing instructional videos) and online interaction with
foreign peers enhanced the students’ intercultural sensitivity. The participants held positive
perceptions about the intercultural experience with foreign partners and such learning
experience enhanced observation of the similarities as well as differences of diverse cultures.
Keywords: intercultural sensitivity, cross-border instruction, writing
1. Introduction
Traditional approaches to teaching writing widely used in most EFL writing classes (drill on grammar,
vocabulary, and finding and “red-penning” all inaccurate language usage) has not effectively motivated
students to love writing in a foreign language. Innovative instructors, therefore, constantly look for new
methods and strategies to make the best use of what students do well and to teach new skills effectively.
As the point of communicating is to allow students to reach beyond themselves into the larger world, or
even across the globe, developing students’ competence for effective intercultural communication with
people from different cultures is crucial, thus accentuating the understanding of the target culture as
language and culture are indivisible and interrelated (Heidari, Ketabi, & Zonoobi, 2014; Mitchell &
Myles, 2004). However, the interaction of culture and EFL pedagogies has been insufficiently
implemented and remained as an underexplored issue (Chan, 2006), evidenced by its “peripheral to the
real business of language instruction” (Kearney, 2010, p. 332) and its insignificance in the curriculum
(Byrd, Hlas, Watzke, & Valencia, 2011; Tsou, 2005; Warford & White, 2012).
As learning in intercultural contexts receives much more attention and online learning
platforms are widely integrated into language education, how to innovate conventional instructions has
been critical issues worth investigation. Therefore, this study was designed to enhance EFL learners’
sensitivity to the target culture via the interaction with American partners in a cross-border writing
instruction. According to the purposes of the study, the following research questions were formulated to
guide the exploring procedures:
1. Did EFL learner improve their intercultural sensitivity in the intercultural writing
instruction?
498498498
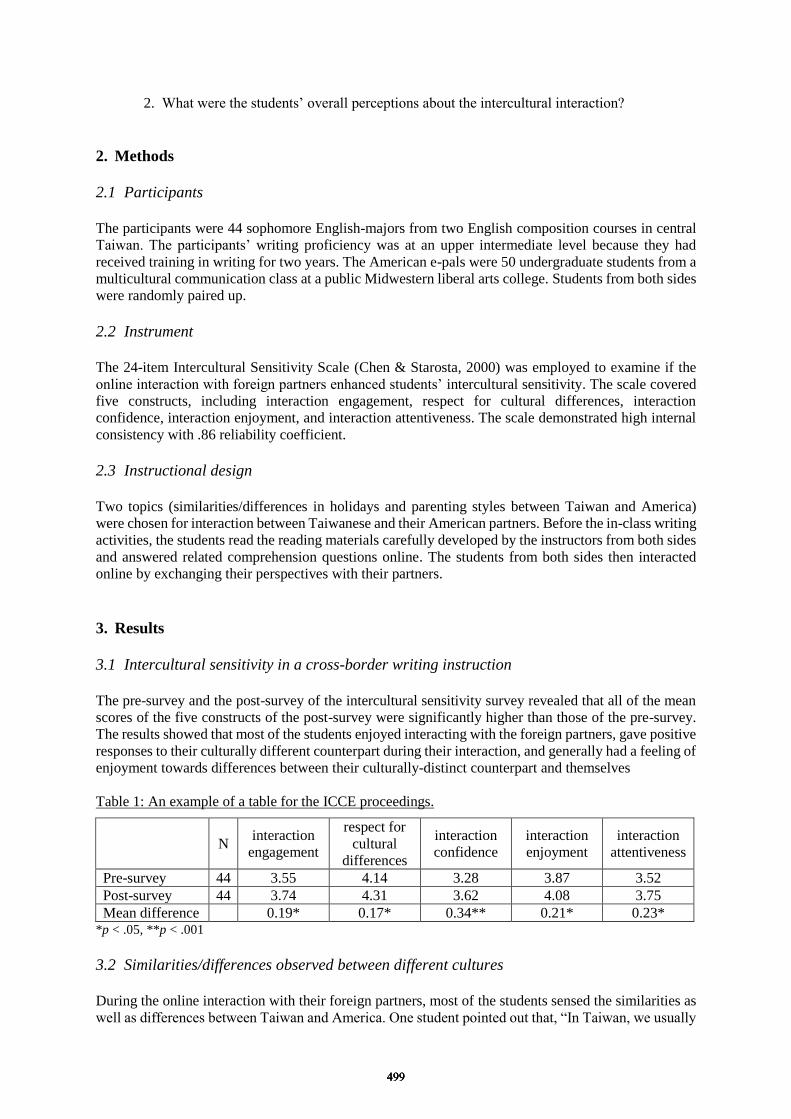
2. What were the students’ overall perceptions about the intercultural interaction?
2. Methods
2.1 Participants
The participants were 44 sophomore English-majors from two English composition courses in central
Taiwan. The participants’ writing proficiency was at an upper intermediate level because they had
received training in writing for two years. The American e-pals were 50 undergraduate students from a
multicultural communication class at a public Midwestern liberal arts college. Students from both sides
were randomly paired up.
2.2 Instrument
The 24-item Intercultural Sensitivity Scale (Chen & Starosta, 2000) was employed to examine if the
online interaction with foreign partners enhanced students’ intercultural sensitivity. The scale covered
five constructs, including interaction engagement, respect for cultural differences, interaction
confidence, interaction enjoyment, and interaction attentiveness. The scale demonstrated high internal
consistency with .86 reliability coefficient.
2.3 Instructional design
Two topics (similarities/differences in holidays and parenting styles between Taiwan and America)
were chosen for interaction between Taiwanese and their American partners. Before the in-class writing
activities, the students read the reading materials carefully developed by the instructors from both sides
and answered related comprehension questions online. The students from both sides then interacted
online by exchanging their perspectives with their partners.
3. Results
3.1 Intercultural sensitivity in a cross-border writing instruction
The pre-survey and the post-survey of the intercultural sensitivity survey revealed that all of the mean
scores of the five constructs of the post-survey were significantly higher than those of the pre-survey.
The results showed that most of the students enjoyed interacting with the foreign partners, gave positive
responses to their culturally different counterpart during their interaction, and generally had a feeling of
enjoyment towards differences between their culturally-distinct counterpart and themselves
Table 1: An example of a table for the ICCE proceedings.
N interaction
engagement
respect for
cultural
differences
interaction
confidence
interaction
enjoyment
interaction
attentiveness
Pre-survey 44 3.55 4.14 3.28 3.87 3.52
Post-survey 44 3.74 4.31 3.62 4.08 3.75
Mean difference 0.19* 0.17* 0.34** 0.21* 0.23* *p < .05, **p < .001
3.2 Similarities/differences observed between different cultures
During the online interaction with their foreign partners, most of the students sensed the similarities as
well as differences between Taiwan and America. One student pointed out that, “In Taiwan, we usually
499499499
evaluate an individual in terms of academic grades. However, my partners told me that they would also
be evaluated by engagement in extracurricular activities, term papers, or sports”. Some students even
pointed out the differences in giving feedback among students from both sides. “American partners
gave me feedback that is more straightforward and to the point, while my classmate tends to give me
indirect and general comments”, explained a few students.
4. Conclusion
The results of this study revealed that the cross-border writing instruction created an appropriate online
context for learners with diverse cultural backgrounds to communicate effectively and interact in
greater depth, leading to subsequent enhancement of intercultural sensitivity and mutual respect for as
well as acceptance of different cultures.
References
Byrd, D. R., Hlas, A. C., Watzke, J., & Valencia, M. F. M. (2011). An examination of culture knowledge: A study
of l2 teachers’ and teacher educators’ beliefs and practices. Foreign Language Annals, 44, 4-39.
Chan, E. (2006). Teacher experiences of culture in the curriculum. Journal of Curriculum Studies, 38, 161-176.
Heidari, A., Ketabi, S. & Zonoobi, R. (2014). The role of culture through the eyes of different approaches to and
methods of foreign language teaching. Journal of Intercultural Communication, 34. Retrieved from
http://immi.se/intercultural/
Kearney, E. (2010). Cultural immersion in the foreign language classroom: Some narrative possibilities. The
Modern Language Journal, 94, 332-336.
Mitchell, R., & Myles, F. (2004). Second language learning theories (2nd ed.). London: Arnold.
Tsou, W. (2005). The effects of cultural instruction on foreign language learning. RELC Journal, 36, 39-57.
Warford, M. K., & White, W. L. (2012). Reconnecting proficiency, literacy, and culture: From theory to practice.
Foreign Language Annals, 45, 400-414.
500500500
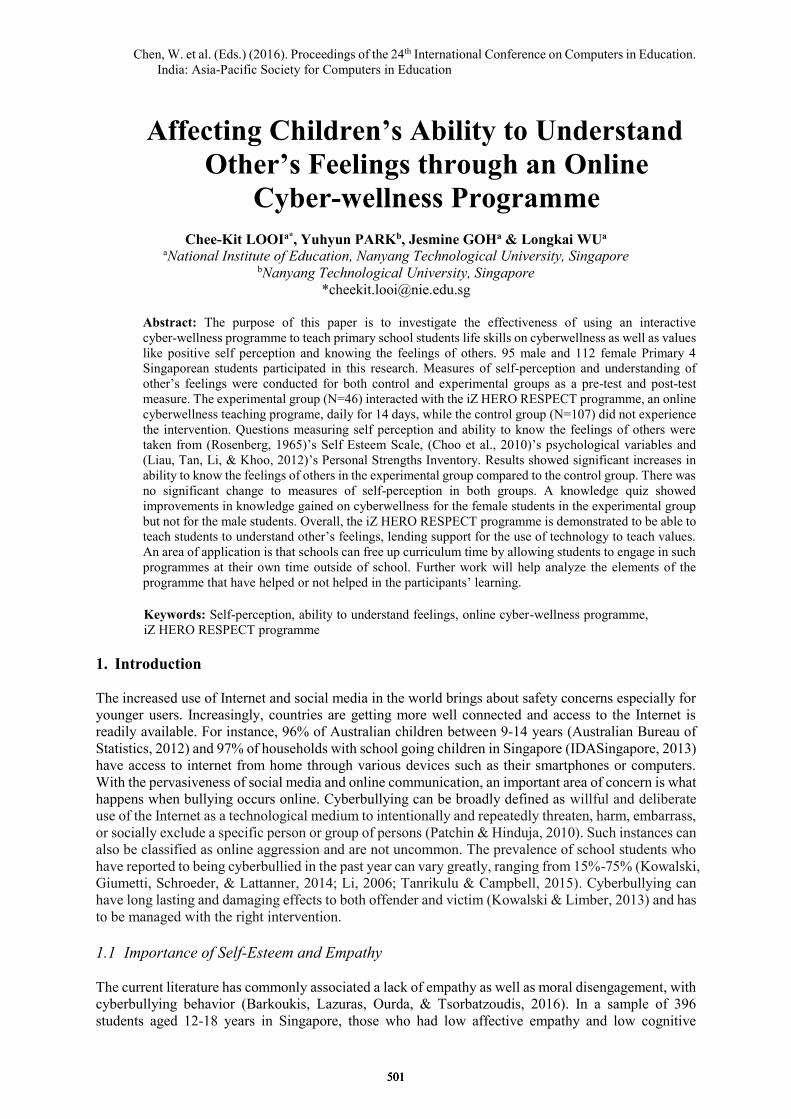
Chen, W. et al. (Eds.) (2016). Proceedings of the 24th International Conference on Computers in Education.
India: Asia-Pacific Society for Computers in Education
Affecting Children’s Ability to Understand
Other’s Feelings through an Online
Cyber-wellness Programme
Chee-Kit LOOIa*, Yuhyun PARKb, Jesmine GOHa & Longkai WUa aNational Institute of Education, Nanyang Technological University, Singapore
bNanyang Technological University, Singapore
Abstract: The purpose of this paper is to investigate the effectiveness of using an interactive
cyber-wellness programme to teach primary school students life skills on cyberwellness as well as values
like positive self perception and knowing the feelings of others. 95 male and 112 female Primary 4
Singaporean students participated in this research. Measures of self-perception and understanding of
other’s feelings were conducted for both control and experimental groups as a pre-test and post-test
measure. The experimental group (N=46) interacted with the iZ HERO RESPECT programme, an online
cyberwellness teaching programe, daily for 14 days, while the control group (N=107) did not experience
the intervention. Questions measuring self perception and ability to know the feelings of others were
taken from (Rosenberg, 1965)’s Self Esteem Scale, (Choo et al., 2010)’s psychological variables and
(Liau, Tan, Li, & Khoo, 2012)’s Personal Strengths Inventory. Results showed significant increases in
ability to know the feelings of others in the experimental group compared to the control group. There was
no significant change to measures of self-perception in both groups. A knowledge quiz showed
improvements in knowledge gained on cyberwellness for the female students in the experimental group
but not for the male students. Overall, the iZ HERO RESPECT programme is demonstrated to be able to
teach students to understand other’s feelings, lending support for the use of technology to teach values.
An area of application is that schools can free up curriculum time by allowing students to engage in such
programmes at their own time outside of school. Further work will help analyze the elements of the
programme that have helped or not helped in the participants’ learning.
Keywords: Self-perception, ability to understand feelings, online cyber-wellness programme,
iZ HERO RESPECT programme
1. Introduction
The increased use of Internet and social media in the world brings about safety concerns especially for
younger users. Increasingly, countries are getting more well connected and access to the Internet is
readily available. For instance, 96% of Australian children between 9-14 years (Australian Bureau of
Statistics, 2012) and 97% of households with school going children in Singapore (IDASingapore, 2013)
have access to internet from home through various devices such as their smartphones or computers.
With the pervasiveness of social media and online communication, an important area of concern is what
happens when bullying occurs online. Cyberbullying can be broadly defined as willful and deliberate
use of the Internet as a technological medium to intentionally and repeatedly threaten, harm, embarrass,
or socially exclude a specific person or group of persons (Patchin & Hinduja, 2010). Such instances can
also be classified as online aggression and are not uncommon. The prevalence of school students who
have reported to being cyberbullied in the past year can vary greatly, ranging from 15%-75% (Kowalski,
Giumetti, Schroeder, & Lattanner, 2014; Li, 2006; Tanrikulu & Campbell, 2015). Cyberbullying can
have long lasting and damaging effects to both offender and victim (Kowalski & Limber, 2013) and has
to be managed with the right intervention.
1.1 Importance of Self-Esteem and Empathy
The current literature has commonly associated a lack of empathy as well as moral disengagement, with
cyberbullying behavior (Barkoukis, Lazuras, Ourda, & Tsorbatzoudis, 2016). In a sample of 396
students aged 12-18 years in Singapore, those who had low affective empathy and low cognitive
501501501
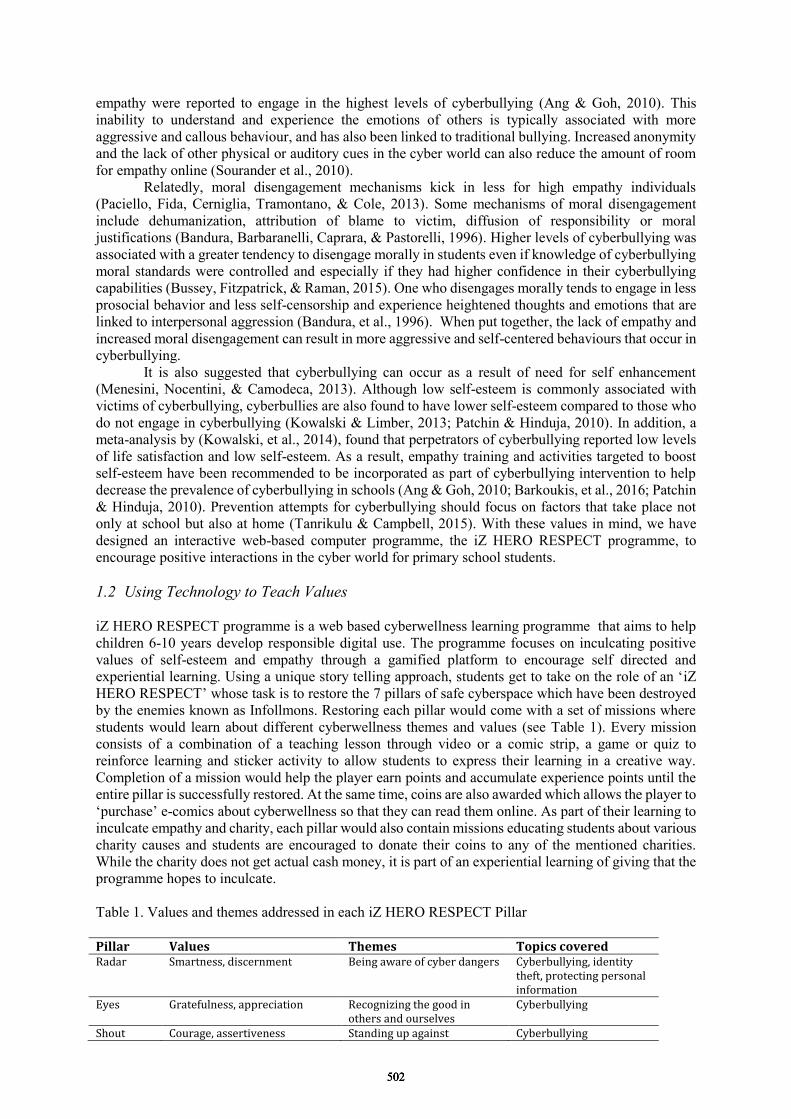
empathy were reported to engage in the highest levels of cyberbullying (Ang & Goh, 2010). This
inability to understand and experience the emotions of others is typically associated with more
aggressive and callous behaviour, and has also been linked to traditional bullying. Increased anonymity
and the lack of other physical or auditory cues in the cyber world can also reduce the amount of room
for empathy online (Sourander et al., 2010).
Relatedly, moral disengagement mechanisms kick in less for high empathy individuals
(Paciello, Fida, Cerniglia, Tramontano, & Cole, 2013). Some mechanisms of moral disengagement
include dehumanization, attribution of blame to victim, diffusion of responsibility or moral
justifications (Bandura, Barbaranelli, Caprara, & Pastorelli, 1996). Higher levels of cyberbullying was
associated with a greater tendency to disengage morally in students even if knowledge of cyberbullying
moral standards were controlled and especially if they had higher confidence in their cyberbullying
capabilities (Bussey, Fitzpatrick, & Raman, 2015). One who disengages morally tends to engage in less
prosocial behavior and less self-censorship and experience heightened thoughts and emotions that are
linked to interpersonal aggression (Bandura, et al., 1996). When put together, the lack of empathy and
increased moral disengagement can result in more aggressive and self-centered behaviours that occur in
cyberbullying.
It is also suggested that cyberbullying can occur as a result of need for self enhancement
(Menesini, Nocentini, & Camodeca, 2013). Although low self-esteem is commonly associated with
victims of cyberbullying, cyberbullies are also found to have lower self-esteem compared to those who
do not engage in cyberbullying (Kowalski & Limber, 2013; Patchin & Hinduja, 2010). In addition, a
meta-analysis by (Kowalski, et al., 2014), found that perpetrators of cyberbullying reported low levels
of life satisfaction and low self-esteem. As a result, empathy training and activities targeted to boost
self-esteem have been recommended to be incorporated as part of cyberbullying intervention to help
decrease the prevalence of cyberbullying in schools (Ang & Goh, 2010; Barkoukis, et al., 2016; Patchin
& Hinduja, 2010). Prevention attempts for cyberbullying should focus on factors that take place not
only at school but also at home (Tanrikulu & Campbell, 2015). With these values in mind, we have
designed an interactive web-based computer programme, the iZ HERO RESPECT programme, to
encourage positive interactions in the cyber world for primary school students.
1.2 Using Technology to Teach Values
iZ HERO RESPECT programme is a web based cyberwellness learning programme that aims to help
children 6-10 years develop responsible digital use. The programme focuses on inculcating positive
values of self-esteem and empathy through a gamified platform to encourage self directed and
experiential learning. Using a unique story telling approach, students get to take on the role of an ‘iZ
HERO RESPECT’ whose task is to restore the 7 pillars of safe cyberspace which have been destroyed
by the enemies known as Infollmons. Restoring each pillar would come with a set of missions where
students would learn about different cyberwellness themes and values (see Table 1). Every mission
consists of a combination of a teaching lesson through video or a comic strip, a game or quiz to
reinforce learning and sticker activity to allow students to express their learning in a creative way.
Completion of a mission would help the player earn points and accumulate experience points until the
entire pillar is successfully restored. At the same time, coins are also awarded which allows the player to
‘purchase’ e-comics about cyberwellness so that they can read them online. As part of their learning to
inculcate empathy and charity, each pillar would also contain missions educating students about various
charity causes and students are encouraged to donate their coins to any of the mentioned charities.
While the charity does not get actual cash money, it is part of an experiential learning of giving that the
programme hopes to inculcate.
Table 1. Values and themes addressed in each iZ HERO RESPECT Pillar
Pillar Values Themes Topics covered Radar Smartness, discernment Being aware of cyber dangers Cyberbullying, identity
theft, protecting personal information
Eyes Gratefulness, appreciation Recognizing the good in others and ourselves
Cyberbullying
Shout Courage, assertiveness Standing up against Cyberbullying
502502502
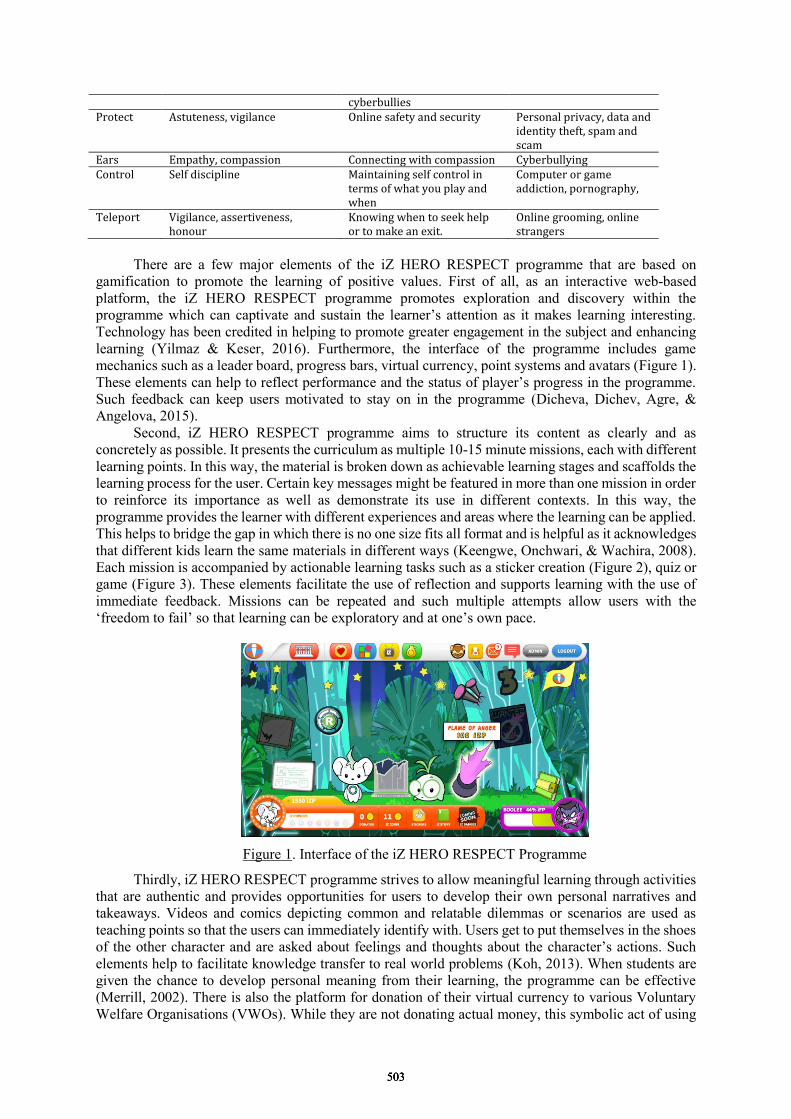
cyberbullies Protect Astuteness, vigilance Online safety and security Personal privacy, data and
identity theft, spam and scam
Ears Empathy, compassion Connecting with compassion Cyberbullying Control Self discipline Maintaining self control in
terms of what you play and when
Computer or game addiction, pornography,
Teleport Vigilance, assertiveness, honour
Knowing when to seek help or to make an exit.
Online grooming, online strangers
There are a few major elements of the iZ HERO RESPECT programme that are based on
gamification to promote the learning of positive values. First of all, as an interactive web-based
platform, the iZ HERO RESPECT programme promotes exploration and discovery within the
programme which can captivate and sustain the learner’s attention as it makes learning interesting.
Technology has been credited in helping to promote greater engagement in the subject and enhancing
learning (Yilmaz & Keser, 2016). Furthermore, the interface of the programme includes game
mechanics such as a leader board, progress bars, virtual currency, point systems and avatars (Figure 1).
These elements can help to reflect performance and the status of player’s progress in the programme.
Such feedback can keep users motivated to stay on in the programme (Dicheva, Dichev, Agre, &
Angelova, 2015).
Second, iZ HERO RESPECT programme aims to structure its content as clearly and as
concretely as possible. It presents the curriculum as multiple 10-15 minute missions, each with different
learning points. In this way, the material is broken down as achievable learning stages and scaffolds the
learning process for the user. Certain key messages might be featured in more than one mission in order
to reinforce its importance as well as demonstrate its use in different contexts. In this way, the
programme provides the learner with different experiences and areas where the learning can be applied.
This helps to bridge the gap in which there is no one size fits all format and is helpful as it acknowledges
that different kids learn the same materials in different ways (Keengwe, Onchwari, & Wachira, 2008).
Each mission is accompanied by actionable learning tasks such as a sticker creation (Figure 2), quiz or
game (Figure 3). These elements facilitate the use of reflection and supports learning with the use of
immediate feedback. Missions can be repeated and such multiple attempts allow users with the
‘freedom to fail’ so that learning can be exploratory and at one’s own pace.
Figure 1. Interface of the iZ HERO RESPECT Programme
Thirdly, iZ HERO RESPECT programme strives to allow meaningful learning through activities
that are authentic and provides opportunities for users to develop their own personal narratives and
takeaways. Videos and comics depicting common and relatable dilemmas or scenarios are used as
teaching points so that the users can immediately identify with. Users get to put themselves in the shoes
of the other character and are asked about feelings and thoughts about the character’s actions. Such
elements help to facilitate knowledge transfer to real world problems (Koh, 2013). When students are
given the chance to develop personal meaning from their learning, the programme can be effective
(Merrill, 2002). There is also the platform for donation of their virtual currency to various Voluntary
Welfare Organisations (VWOs). While they are not donating actual money, this symbolic act of using
503503503
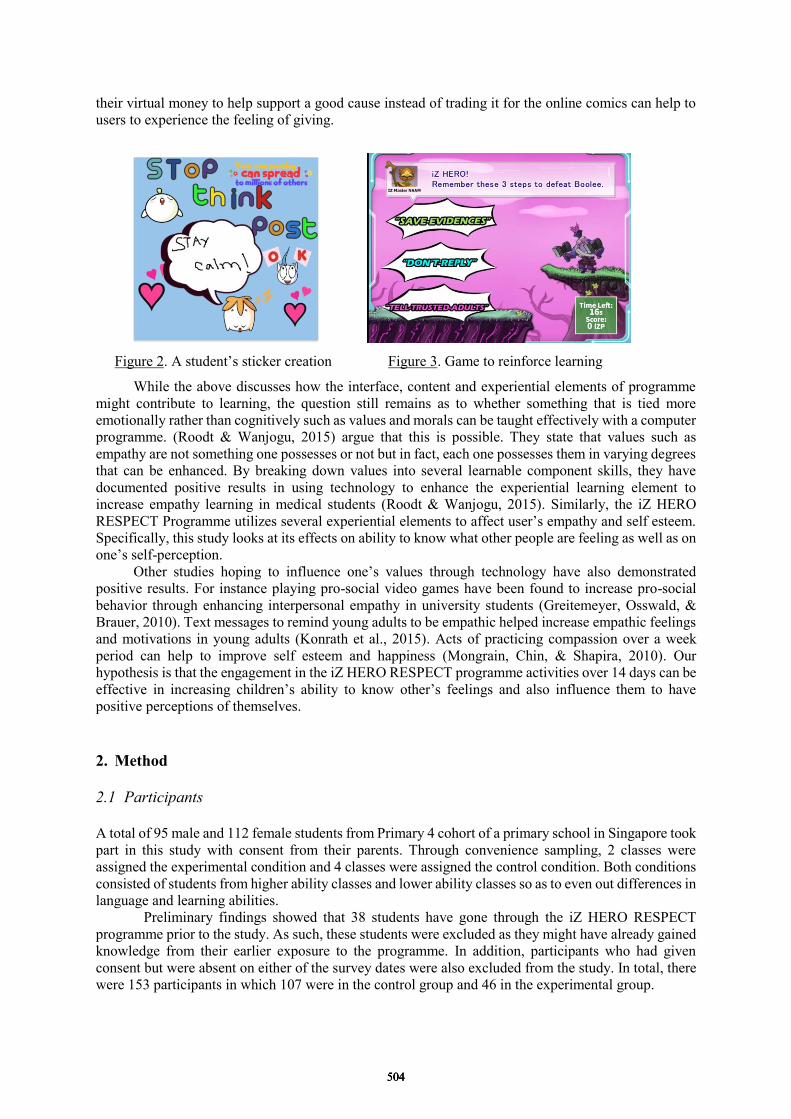
their virtual money to help support a good cause instead of trading it for the online comics can help to
users to experience the feeling of giving.
Figure 2. A student’s sticker creation Figure 3. Game to reinforce learning
While the above discusses how the interface, content and experiential elements of programme
might contribute to learning, the question still remains as to whether something that is tied more
emotionally rather than cognitively such as values and morals can be taught effectively with a computer
programme. (Roodt & Wanjogu, 2015) argue that this is possible. They state that values such as
empathy are not something one possesses or not but in fact, each one possesses them in varying degrees
that can be enhanced. By breaking down values into several learnable component skills, they have
documented positive results in using technology to enhance the experiential learning element to
increase empathy learning in medical students (Roodt & Wanjogu, 2015). Similarly, the iZ HERO
RESPECT Programme utilizes several experiential elements to affect user’s empathy and self esteem.
Specifically, this study looks at its effects on ability to know what other people are feeling as well as on
one’s self-perception.
Other studies hoping to influence one’s values through technology have also demonstrated
positive results. For instance playing pro-social video games have been found to increase pro-social
behavior through enhancing interpersonal empathy in university students (Greitemeyer, Osswald, &
Brauer, 2010). Text messages to remind young adults to be empathic helped increase empathic feelings
and motivations in young adults (Konrath et al., 2015). Acts of practicing compassion over a week
period can help to improve self esteem and happiness (Mongrain, Chin, & Shapira, 2010). Our
hypothesis is that the engagement in the iZ HERO RESPECT programme activities over 14 days can be
effective in increasing children’s ability to know other’s feelings and also influence them to have
positive perceptions of themselves.
2. Method
2.1 Participants
A total of 95 male and 112 female students from Primary 4 cohort of a primary school in Singapore took
part in this study with consent from their parents. Through convenience sampling, 2 classes were
assigned the experimental condition and 4 classes were assigned the control condition. Both conditions
consisted of students from higher ability classes and lower ability classes so as to even out differences in
language and learning abilities.
Preliminary findings showed that 38 students have gone through the iZ HERO RESPECT
programme prior to the study. As such, these students were excluded as they might have already gained
knowledge from their earlier exposure to the programme. In addition, participants who had given
consent but were absent on either of the survey dates were also excluded from the study. In total, there
were 153 participants in which 107 were in the control group and 46 in the experimental group.
504504504
2.2 Materials
2.2.1 Self Perception
Ten items were chosen after deliberation between the investigators of this project and a panel of experts
from the Self-esteem scale (Rosenberg, 1965) and certain psychological variables used by (Choo, et al.,
2010) in their study of pathological gaming in Singaporean youth. Participants had to rate each item on
a 5-point scale ranging from 1 which indicates “Strongly Disagree” to 5 which indicates “Strongly
Agree”.
2.2.2 Ability to Know What Others Feel
The ability to know what another is feeling is determined using 2 questions from the empathy subscale
of Liau et al.’s (2012) Personal Strengths Inventory. Each item was also scored on a 5-point scale that
ranged from 1 which indicates “Strongly Disagree” to 5 which indicates “Strongly Agree”.
2.2.3 Knowledge Quiz
A 13-question multiple choice quiz on the various topics of the content taught was also given to the
students to determine their understanding of what has been taught. The topics include educating
students about the Internet, cyber security measures, bullying and how to respond to various dangers
online. The participant is required to indicate their answer to each question from a choice of 4 different
responses.
2.3 Design
The study is set up as a quasi-experiment with an experimental group and a control group. It utilises a
mixed factors design as both between and within subjects are compared. Students in each condition are
required to complete a pre and post test approximately 2 months apart. The changes in the pre and post
scores are first noted within each condition and then compared between condition to determine the
impact the programme has on the gain in knowledge.
2.4 Procedure
Students in the experimental group took part in a pre test in a classroom setting. They were then
required to go through the iZ HERO RESPECT programme on their own at home with structured guides
to tell them which mission to go to each day for 14 days. The missions are sorted into different themes to
enhance each day’s learning objective. Thereafter, they had to sit for a post test in the classroom. The
duration between the administration of the pre test and post test is approximately one month. The
control group took the same pre-test and post-test in the same time frame. Changes in their ability to
know other’s feelings, self-perception and quiz scores were then examined.
3. Results
Prior to the main analysis, an independent-samples t-test was conducted to verify that there were no
significant differences between the 2 groups prior to intervention on all the items. Paired samples t-test
was then used to analyse the data. Visual examination of the histograms showed no violation in the
assumption of normal distribution in the difference scores. The results are presented in Table 1. Items
that are reverse coded to maintain the same directionality of change are also indicated in the table.
3.1 Quiz Score
We compared the pre- and post- quiz scores in experimental and control groups to determine knowledge
gains. As shown in Table 2, both experimental and control groups improved from pre- to post- quiz, but
the differences have not reached a significant level. The analysis was then repeated across gender to test
505505505
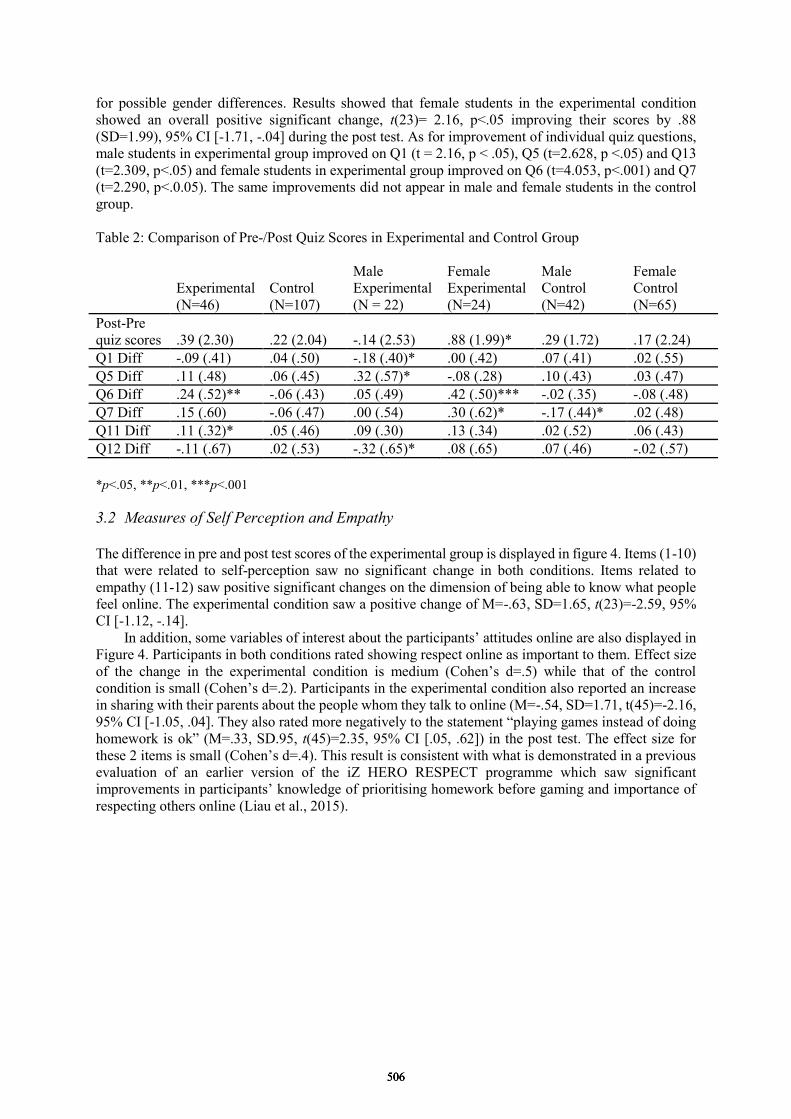
for possible gender differences. Results showed that female students in the experimental condition
showed an overall positive significant change, t(23)= 2.16, p<.05 improving their scores by .88
(SD=1.99), 95% CI [-1.71, -.04] during the post test. As for improvement of individual quiz questions,
male students in experimental group improved on Q1 (t = 2.16, p < .05), Q5 (t=2.628, p <.05) and Q13
(t=2.309, p<.05) and female students in experimental group improved on Q6 (t=4.053, p<.001) and Q7
(t=2.290, p<.0.05). The same improvements did not appear in male and female students in the control
group.
Table 2: Comparison of Pre-/Post Quiz Scores in Experimental and Control Group
Experimental
(N=46)
Control
(N=107)
Male
Experimental
(N = 22)
Female
Experimental
(N=24)
Male
Control
(N=42)
Female
Control
(N=65)
Post-Pre
quiz scores .39 (2.30) .22 (2.04) -.14 (2.53) .88 (1.99)* .29 (1.72) .17 (2.24)
Q1 Diff -.09 (.41) .04 (.50) -.18 (.40)* .00 (.42) .07 (.41) .02 (.55)
Q5 Diff .11 (.48) .06 (.45) .32 (.57)* -.08 (.28) .10 (.43) .03 (.47)
Q6 Diff .24 (.52)** -.06 (.43) .05 (.49) .42 (.50)*** -.02 (.35) -.08 (.48)
Q7 Diff .15 (.60) -.06 (.47) .00 (.54) .30 (.62)* -.17 (.44)* .02 (.48)
Q11 Diff .11 (.32)* .05 (.46) .09 (.30) .13 (.34) .02 (.52) .06 (.43)
Q12 Diff -.11 (.67) .02 (.53) -.32 (.65)* .08 (.65) .07 (.46) -.02 (.57)
*p<.05, **p<.01, ***p<.001
3.2 Measures of Self Perception and Empathy
The difference in pre and post test scores of the experimental group is displayed in figure 4. Items (1-10)
that were related to self-perception saw no significant change in both conditions. Items related to
empathy (11-12) saw positive significant changes on the dimension of being able to know what people
feel online. The experimental condition saw a positive change of M=-.63, SD=1.65, t(23)=-2.59, 95%
CI [-1.12, -.14].
In addition, some variables of interest about the participants’ attitudes online are also displayed in
Figure 4. Participants in both conditions rated showing respect online as important to them. Effect size
of the change in the experimental condition is medium (Cohen’s d=.5) while that of the control
condition is small (Cohen’s d=.2). Participants in the experimental condition also reported an increase
in sharing with their parents about the people whom they talk to online (M=-.54, SD=1.71, t(45)=-2.16,
95% CI [-1.05, .04]. They also rated more negatively to the statement “playing games instead of doing
homework is ok” (M=.33, SD.95, t(45)=2.35, 95% CI [.05, .62]) in the post test. The effect size for
these 2 items is small (Cohen’s d=.4). This result is consistent with what is demonstrated in a previous
evaluation of an earlier version of the iZ HERO RESPECT programme which saw significant
improvements in participants’ knowledge of prioritising homework before gaming and importance of
respecting others online (Liau et al., 2015).
506506506

Figure 4. Difference in pre and post test scores in the experimental group, *p<.05
4. Discussion
The aim of this paper is to explore the possibility of effecting change in participants’ self-perception and
ability to know other’s feelings through an online cyber-wellness programme. Empathy is commonly
understood as a form of interpersonal connection through the expression of one’s insight and
understanding of others (Sharp & Morris, 2014). In our study, we used a similar operationalization and
507507507
examined participant’s ability to understand other’s feelings in an online context. Results showed that
the experimental group improved in their ability to know the feelings of others when compared to the
control condition. In particular, participants in the experimental group demonstrated more agreement to
the statement “I know what other people are feeling online” compared to the control group. This result
is consistent with the current literature that indicates that traits like empathy are indeed teachable
through an online platform (Roodt & Wanjogu, 2015). The improvement in ability to understand the
feelings of others is seen as a first step to effecting positive change in cyberbullying behavior (Ang &
Goh, 2010). Being able to teach values such as this in students through an online programme can help
free up more school curriculum time for other activities. Schools teachers are generally overloaded with
their usual teaching subjects and extra-curricular activities and it is the hope that this programme will be
able to lighten their and to allow students to be able to learn lifeskills independently and outside of the
school context.
In addition, we also compared their knowledge gain about the cyber-world and its dangers from
participants’ quiz scores. The results show non-significant changes in both control and experimental
conditions. However, gender differences were noted where the females in the experimental group were
found to have improved significantly in terms of knowledge compared to the males in the experimental
group. This finding might suggest that females are more receptive to the programme that males.
However this could also be due to the difference in levels of engagement in the programme. While all
students participated in the programme, 67.4% reported to have completed all the missions in the
programme. When examining gender differences, 55% of the boys compared to 79% of the girls
completed all the activities. As such, the results of knowledge gain could be a reflection of the
participant’s completion of the programme rather than of the ability of the programme to impart
knowledge.
Contrary to our hypothesis, our study did not show any significant changes to participants’
self-perception after the use of the programme. This also runs contrary to some of the literature
reviewed. For instance, (Vatankhah, Daryabari, Ghadami, & KhanjanShoeibi, 2014) showed that
teaching life skills to students such as anger management, can positively impact their self esteem
especially for female students. The iZ HERO RESPECT programme comprises of various topics of life
skills such as managing one’s emotions, self discipline and assertiveness. As such, we had expected to
see positive influences on participants’ self perception as well. There could be a few reasons for this
lack of significance.
Firstly, as mentioned above, student’s level of participation might have an impact on
completion of the programme. Because participants were expected to complete the programme on their
own at home, the depth of their engagement with the programme also cannot be judged. It is possible for
children to complete the programme without understanding or digesting its content fully. As this was an
extra aspect of the school curriculum and the study was conducted close to their exams period, engaging
deeply in the programme might have been a lower priority for the students and could have resulted in
hasty completion.
Secondly, the lack of change might be due to a ceiling effect as the average baseline scores of
items of self esteem and empathy are relatively high to begin with so might not have a clear effect. In
our study we did not restrict our programme to only those identified with low empathy or self esteem
scores as our programme was targeted at the general level. However, it might also lead to a dilution of
the effects as seen from the high average baseline scores. This ceiling effect might also be the result of
participants wanting to present positive answers to appear more socially desirable.
Thirdly, the duration of engagement of the programme might be too short to produce much
change. Programmes that have documented success in this area had generally longer participation rates.
(Schultze-Krumbholz, Schultze, Zagorscak, Wölfer, & Scheithauer, 2016)’s study showed success in
improving affective empathy in participants through ten 90-minute sessions over 10 weeks. In contrast,
the iZ HERO RESPECT programme is implemented in fourteen 30-minute sessions. The total run-time
of the sessions are less than half of (Schultze-Krumbholz, et al., 2016)’s programme. However this was
done with the limitation of the amount of content and activities in the current iZ HERO RESPECT
programme. The iZ HERO RESPECT programme is currently undergoing some re-development and
increasing its content might be one improvement that can be explored.
508508508
4.1 Limitations
One major limitation of the study is the inability to track how the participants interacted with the
programme such as how much time they spent on each mission’s activities as well as their depth of
engagement and how they are able to apply it to their own experiences. While self reports of
engagement have been largely positive – more than 90% of the participants ‘agreed’ or ‘strongly
agreed’ that the programme was helpful and made learning interesting and 80.4% found engaging in the
programme worthwhile – they do not provide additional information on how the programme was used.
While the design of the programme encourages self-directed learning, the participant also has to expand
effort in meaning making and reflection of the content in order to maximize the benefit of the
programme. Hence it is useful to understand how much of the lack of significance in results might be
due to a lack of effort of students to engage in the programme. Knowing this could help identify
elements of the programme that have helped or not helped in enriching the participant’s learning.
Another limitation of the study is that it uses measurements that are individual questions rather
than a full scale. Hence, it is unable to make the conclusion with regards to self esteem and empathy.
Examining individual questions also provide limited sensitivity for change. The measures are also all
reliant on the self-report of the students where inherent biases of social desirability might be present.
The sample for this study is taken from one school and might be affected by the demographics,
learning abilities and socio-economic factors that might be particular to students of that school. While
care was taken care to ensure that they are matched according to ability and results also indicated no
difference in baseline scores, there might be limited generalizability to the entire population. More data
from other schools can also be used to supplement this study.
5. Conclusion and Future Directions
While not all without its limitations, this study suggests some success in the iZ HERO RESPECT
programme to teach students to understand other’s feelings. This contributes to the growing field of
using technology to influence learning. Importantly it also lends partial support to other studies which
have achieved similar successes. Future studies can improve on the study’s limitations and be replicated
in other schools to ensure generalisability. Future versions of the iZ HERO RESPECT programme
might need to take into account improvements in its addition of content and quality.
Acknowledgements
The work reported in this paper is funded by NTU ACRF grant RP 2/14 LCK. Equal contributions to the
work are put in by the first and second co-authors.
References
Ang, R. P., & Goh, D. H. (2010). Cyberbullying Among Adolescents: The Role of Affective and Cognitive
Empathy, and Gender. Child Psychiatry and Human Development, 41(4), 387-397. doi:
http://dx.doi.org/10.1007/s10578-010-0176-3
Bandura, A., Barbaranelli, C., Caprara, G. V., & Pastorelli, C. (1996). Mechanisms of Moral Disengagement in
the Exercise of Moral Agency. Journal of Personality and Social Psychology, 71(2), 364-374.
Barkoukis, V., Lazuras, L., Ourda, D., & Tsorbatzoudis, H. (2016). Tackling psychosocial risk factors for
adolescent cyberbullying: Evidence from a school-based intervention. Aggressive Behavior, 42(2),
114-122. doi: 10.1002/ab.21625
Bussey, K., Fitzpatrick, S., & Raman, A. (2015). The Role of Moral Disengagement and Self-Efficacy in
Cyberbullying. Journal of School Violence, 14(1), 30-46. doi: 10.1080/15388220.2014.954045
Choo, H., Gentile, D. A., Sim, T., Li, D., Khoo, A., & Liau, A. K. (2010). Pathological video-gaming among
Singaporean youth. Annals Academy of Medicine, 39(1), 822-829.
Dicheva, D., Dichev, C., Agre, G., & Angelova, G. (2015). Gamification in Education: A Systematic Mapping
Study. Journal of Educational Technology & Society, 18(3), 75-88. doi: 10.1.1.368.1256
509509509

Greitemeyer, T., Osswald, S., & Brauer, M. (2010). Playing Prosocial Video Games Increases Empathy and
Decreases Schadenfreude. Emotion, 10(6), 796-802.
IDASingapore. (2013). ANNUAL SURVEY ON INFOCOMM USAGE IN HOUSEHOLDS AND BY
INDIVIDUALS FOR 2012 Retrieved 21 December, 2015, from
https://www.ida.gov.sg/~/media/Files/Infocomm%20Landscape/Facts%20and%20Figures/SurveyRepo
rt/2012/2012HHmgt.pdf
Keengwe, J., Onchwari, G., & Wachira, P. (2008). The Use of Computer Tools to Support Meaningful Learning.
AACE Journal, 16(1), 77-92.
Koh, J. H. L. (2013). A rubric for assessing teacher' lesson activities with respect to TPACK for meaningful
learning with ICT. Australasian Journal of Educational Technology, 29(6), 887-900.
Konrath, S., Falk, E., Fuhrel-Forbis, A., Liu, M., Swain, J., Tolman, R., . . . Walton, M. (2015). Can Text
Messages Increase Empathy and Prosocial Behaviour? The Development and Initial Validation of Text
to Connect. PLoS ONE, 10(9), 1-27.
Kowalski, R. M., Giumetti, G. W., Schroeder, A. N., & Lattanner, M. R. (2014). Bullying in the digital age: A
critical review and meta-analysis of cyberbullying research among youth. Psychological Bulletin, 140(4),
1073-1137. doi: 10.1016/j.sbspro.2010.12.436
http://dx.doi.org/10.1037/a0035618
Kowalski, R. M., & Limber, S. P. (2013). Psychological, physical, and academic correlates of cyberbullying and
traditional bullying. Journal of adolescent health, 53(1 suppl), S13-S20. doi:
10.1016/j.jadohealth.2012.09.018
Li, Q. (2006). Cyberbullying in Schools: A Research of Gender Differences. School psychology international,
27(2), 157.
Liau, A. K., Park, Y., Gentile, D. A., Katna, D. P., Tan, C. H. A., & Khoo, A. (2015). iZ HERO Adventure:
Evaluating the Effectiveness of a Peer-Mentoring and Transmedia Cyberwellness Program for Children.
Psychology of Popular Media Culture. doi: 10.1037/ppm0000094
Liau, A. K., Tan, T. K., Li, D., & Khoo, A. (2012). Factorial invariance of the Personal Strengths Inventory-2 for
children and adolescents across school level and gender. European Journal of Psychology of Education,
27(4), 451-465. doi: 10.1007/s10212-011-0088-z
Menesini, E., Nocentini, A., & Camodeca, M. (2013). Morality, values, traditional bullying, and cyberbullying in
adolescence. British journal of developmental psychology, 31(1), 1-14. doi:
10.1111/j.2044-835X.2011.02066.x
Merrill, M. D. (2002). First principles of instruction. Educational Technology Research and Development, 50(3),
43-59.
Mongrain, M., Chin, J. M., & Shapira, L. B. (2010). Practicing Compassion Increases Happiness and Self-Esteem.
[journal article]. Journal of Happiness Studies, 12(6), 963-981. doi: 10.1007/s10902-010-9239-1
Paciello, M., Fida, R., Cerniglia, L., Tramontano, C., & Cole, E. (2013). High cost helping scenario: The role of
empathy, prosocial reasoning and moral disengagement on helping behavior. Personality and Individual
Differences, 55(1), 3-7. doi: http://dx.doi.org/10.1016/j.paid.2012.11.004
Patchin, J. W., & Hinduja, S. (2010). Cyberbullying and Self‐Esteem. The Journal of school health, 80(12),
614-621. doi: 10.1111/j.1746-1561.2010.00548.x
Roodt, S., & Wanjogu, E. (2015). A Practical Approach to Using Technology in Teaching Empathy to Medical
Students. International Journal of Arts & Sciences, 8(6), 307-314.
Rosenberg, M. (1965). Society and the adolescent of self-image. Pinceton, NJ: Princeton University Press.
Schultze-Krumbholz, A., Schultze, M., Zagorscak, P., Wölfer, R., & Scheithauer, H. (2016). Feeling
Cybervictims' Pain - The Effect of Empathy Training on Cyberbullying. Aggressive Behaviour, 42,
147-156.
Sharp, M. M., & Morris, M. A. (2014). Virtual Empathy? Anxieties and Connections Teaching and Learning
Pastoral Care Online. Teaching Tehology and Religion, 17(3), 247-263.
Sourander, A., Klomek, A. B., Ikomen, M., Lindroos, J., Luntamo, T., Koskelainen, M., . . . Helenius, H. (2010).
Psychosocial Risk Factors Associated with Cyberbullying Among Adolescents. Arch Gen Psychiatry,
67(7), 720-728.
Tanrikulu, I., & Campbell, M. (2015). Correlates of traditional bullying and cyberbullying perpetration among
Australian students. Children and youth services review, 55, 138-146. doi:
10.1016/j.childyouth.2015.06.001
Vatankhah, H., Daryabari, D., Ghadami, V., & KhanjanShoeibi, E. (2014). Teaching how Life Skills (anger
control) Affect the Happiness and Self-esteem of Tonekabon Female Students. Procedia - Social and
Behavioral Sciences, 116, 123-126. doi: http://dx.doi.org/10.1016/j.sbspro.2014.01.178
Yilmaz, F. G. K., & Keser, H. (2016). The impact of reflective thinking activities in e-learning: A critical review
of the empirical research. Computers & Education, 95, 163-173. doi:
http://dx.doi.org/10.1016/j.compedu.2016.01.006
510510510
Chen, W. et al. (Eds.) (2016). Proceedings of the 24th International Conference on Computers in
Education. India: Asia-Pacific Society for Computers in Education
Using ICT in Early Childhood: What
Teachers, Principals, and Parents Say
Anika SAXENAa*& Khe Foon HEWb aFaculty of Education, The University of Hong Kong, Hong Kong SAR bFaculty of Education, The University of Hong Kong, Hong Kong SAR
Abstract: Many countries around the world have recognized the importance of early
childhood education. As facilitators of learning, preschool teachers are expected to plan and
provide for their children’s learning by using a variety of resources, including information
communication technology (ICT). The term IT refers to digital media or tools, including
computers, tablets, multi-touch screens, Internet, digital cameras, audio recorders, and e-book
readers. The key purpose of this study is to identify the key ICT competencies that are
expected of pre-school teachers. In addition, this study examines the benefits of using ICT
with preschool children as perceived by teachers, principals, and parents. This study also
identifies the concerns or limitations of using ICT with preschool children.
Keywords: Early childhood education, information communication technology, preschool,
ICT
1. Introduction
Today’s children are surrounded by a wide variety of digital media and tools at their homes and
schools. This has led to a growing interest among researchers to develop baseline data on computer
habits and behaviors among young children. While there is research on the use of ICT by pre-school
children, far less is known about how ICT is used by pre-school teachers in early childhood programs
(Wartella, Schomburg, Lauricella, Robb, & Flynn, 2010). In many early childhood programs and
schools, IT will be a part of the learning landscape of the future (Wardle, 2008). We are aware that there are concerns about whether children should have access to ICT, due
to potential health or social risks such as eye strain, poor sitting postures, and poor ability to interact
with peers. However, many of these concerns seem to stem mainly from unsupervised use of ICT by
children. For example, Teng (2013), who reported a study led by Nirmala Karuppiah, wrote that few
parents monitored how their children used devices such as smartphones and tablets at home. Only 18
of 60 parents enforced rules on how much screen time their children were allowed, while the
remaining 70% gave their children the freedom to use devices of any kind (Teng, 2013). However,
85% of parents believed that their children had benefited from using the technology (Teng, 2013). What about the use of ICT in pre-school classrooms? Do we completely eliminate it in pre-
school settings? Do we, for example, want to shut the door on a teacher being able to read children a
new picture book that is available only online (Guernsey, 2010)? Some educators, researchers, and
parents stress that pre-school children already spend too much time in front of television and
computer screens (Plowman, McPake, & Stephen 2010), so why add more technology use during the
school day (Shifflet et al., 2012)? In the following section, we describe some of the rationale for using
ICT in early childhood. We also describe some of the ICT competencies, hardware, and software that
have been used in preschools of many countries during the recent decade (2005-2014).
511511511
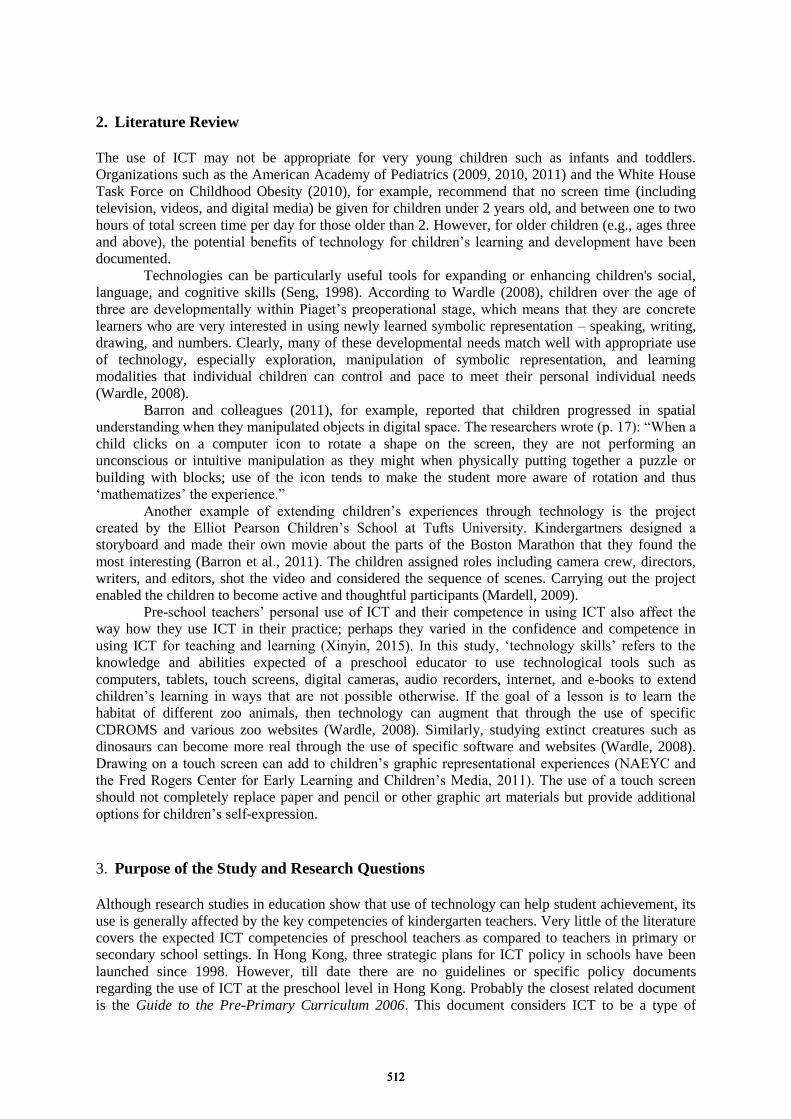
2. Literature Review
The use of ICT may not be appropriate for very young children such as infants and toddlers.
Organizations such as the American Academy of Pediatrics (2009, 2010, 2011) and the White House
Task Force on Childhood Obesity (2010), for example, recommend that no screen time (including
television, videos, and digital media) be given for children under 2 years old, and between one to two
hours of total screen time per day for those older than 2. However, for older children (e.g., ages three
and above), the potential benefits of technology for children’s learning and development have been
documented. Technologies can be particularly useful tools for expanding or enhancing children's social,
language, and cognitive skills (Seng, 1998). According to Wardle (2008), children over the age of
three are developmentally within Piaget’s preoperational stage, which means that they are concrete
learners who are very interested in using newly learned symbolic representation – speaking, writing,
drawing, and numbers. Clearly, many of these developmental needs match well with appropriate use
of technology, especially exploration, manipulation of symbolic representation, and learning
modalities that individual children can control and pace to meet their personal individual needs
(Wardle, 2008). Barron and colleagues (2011), for example, reported that children progressed in spatial
understanding when they manipulated objects in digital space. The researchers wrote (p. 17): “When a
child clicks on a computer icon to rotate a shape on the screen, they are not performing an
unconscious or intuitive manipulation as they might when physically putting together a puzzle or
building with blocks; use of the icon tends to make the student more aware of rotation and thus
‘mathematizes’ the experience.” Another example of extending children’s experiences through technology is the project
created by the Elliot Pearson Children’s School at Tufts University. Kindergartners designed a
storyboard and made their own movie about the parts of the Boston Marathon that they found the
most interesting (Barron et al., 2011). The children assigned roles including camera crew, directors,
writers, and editors, shot the video and considered the sequence of scenes. Carrying out the project
enabled the children to become active and thoughtful participants (Mardell, 2009). Pre-school teachers’ personal use of ICT and their competence in using ICT also affect the
way how they use ICT in their practice; perhaps they varied in the confidence and competence in
using ICT for teaching and learning (Xinyin, 2015). In this study, ‘technology skills’ refers to the
knowledge and abilities expected of a preschool educator to use technological tools such as
computers, tablets, touch screens, digital cameras, audio recorders, internet, and e-books to extend
children’s learning in ways that are not possible otherwise. If the goal of a lesson is to learn the
habitat of different zoo animals, then technology can augment that through the use of specific
CDROMS and various zoo websites (Wardle, 2008). Similarly, studying extinct creatures such as
dinosaurs can become more real through the use of specific software and websites (Wardle, 2008).
Drawing on a touch screen can add to children’s graphic representational experiences (NAEYC and
the Fred Rogers Center for Early Learning and Children’s Media, 2011). The use of a touch screen
should not completely replace paper and pencil or other graphic art materials but provide additional
options for children’s self-expression.
3. Purpose of the Study and Research Questions Although research studies in education show that use of technology can help student achievement, its
use is generally affected by the key competencies of kindergarten teachers. Very little of the literature
covers the expected ICT competencies of preschool teachers as compared to teachers in primary or
secondary school settings. In Hong Kong, three strategic plans for ICT policy in schools have been
launched since 1998. However, till date there are no guidelines or specific policy documents
regarding the use of ICT at the preschool level in Hong Kong. Probably the closest related document
is the Guide to the Pre-Primary Curriculum 2006. This document considers ICT to be a type of
512512512

product or resource that relates to children’s daily lives, but gives no specific guidance concerning the
desired or expected preschool teachers’ technology skills. The key purpose of this study is to fill this knowledge gap by identifying the key ICT
competencies that are expected of preschool teachers in Hong Kong. This study also examines some
of the key benefits and concerns of using ICT with preschool children as perceived by teachers,
principals, and parents. The identification of key ICT competencies, as well as concerns of using ICT
would be useful for policy makers to formulate a possible ICT education curriculum to teach
preschool teachers. This ensures that preschool teachers have the necessary ICT competencies, and
appropriate strategies to extend their children’s learning needs and address the concerns. Specifically,
this study was underpinned by four questions based on practitioners and parent perspectives: 1. What basic technology skills should a preschool teacher have? 2. What technologies regarding software and hardware are children using practically at school? 3. What are some benefits of using ICT with preschool children, as perceived by teachers, principals,
and parents? 4. What are some concerns or limitations of using ICT with preschool children, as perceived by
teachers, principals, and parents?
4. Method
The research design is based on case study approach. The case study approach has chosen because the
key purpose of the study is to gain a deeper understanding of a phenomenon or situation (Merriam,
1998). To address the research questions, the study has adopted both quantitative and qualitative
methods to collect data. Data collection approaches include questionnaire and semi-structured
interviews. 4.1 Participants and procedure
The study sample consisted of the kindergarten principals, teachers, and parents from two
international Kindergartens located in Hong Kong. Survey and interview participants were recruited
through face to face discussions and e-mail. E-mails and survey links were sent out to principals,
teachers, and parents to solicit their participation. The teachers’ questionnaire comprised a range of scenarios relating to the use of technology,
such as software tools including software for teachers to use, software for students to learn, hardware
devices that teachers will use in the classroom, important technological skills that a competent teacher
should possess, technological skills of particular teachers, frequency and duration of integrated
technology in teaching, school support to integrate technology in terms of hardware and software
acquisitions, and technical support from the schools involved in the research project. Recent
professional development opportunities and future improvement plans were also discussed. Copies of
the teachers’ questionnaires were emailed to all the educators from these two schools as well as pre-
school teachers from other international Kindergartens (n=56). 39 questionnaires were returned using
email, resulting in a return rate of 69%. The questionnaire issued to parents was designed to collect parents’ views on important
software tools that they believed kindergartens should have, what hardware devices should be used,
and what are the most important technology skills that a competent teacher should possess. The
questionnaire also asked what software tools and hardware devices children were using at home, their
frequency, and what the parents had done to improve their children’s IT knowledge recently. The list
of possible answers was provided in a fixed-response questionnaire. Copies of parental questionnaires
(n=80) were presented in hard copies after parent session, with a return rate of 38 copies or 47.5%. Fourteen face to face interviews with principals / executives, teachers, and parents were
conducted and their audio responses were recorded. The term, ‘executives’ includes supervisors, head
teachers, and Special education needs (SEN) coordinators. Each interview took approximately 20
minutes to complete. Most of the questions were open-ended and would lead to the practical
implementation of ICT. Supportive documents such as scaffolding notes, photos, pictures, diagrams,
513513513

and charts were collected. These taped interviews were transcribed and the salient points of content
were sent back to the users for validation. Interview questions included: examples of teacher use of
technology in class, along with software tools and hardware devices used for teaching purposes, how
teachers integrate technology in instructions, the benefits and limitations of technology use, examples
of successful and unsuccessful IT integrated lessons, ten important technology skills for preschool
teachers, and IT support and training needs. The majority of participant teachers were below 35 years old and the second largest age group
of respondent teachers was 35 - 49 years old. The findings from demographic questions interpret that
the majority of teachers may not be digital natives but digital immigrants. 92.3% of educators who
took part were female, and 7.7% were male.
4.2 Data Analysis
4.2.1. Quantitative Data Analysis
The survey results were studied based on educators and parental votes (selection) for different
categories. Data collected through the survey of educators and parents were analysed using Excel
statistical software. Clustered charts were used to make relative comparisons within the categories.
4.2.2 Qualitative Data Analysis
The interview results were studied based on the three categories; principals/executives, teachers, and
parents’ perspective. Data quantification was used to determine the relationship between various
factors. Average subscale scores were also generated from the total number of participants. Data
triangulation was used on the data, collected through open-ended questions from surveys and
interviews to analyse, reflect, and construct thematic categorization. To identify the key benefits and
limitations of ICT use in preschools, collected data from the interviews and open-ended questions in
the questionnaire were analysed. Statements were coded within each focus group transcript. All the
transcripts were read and coded to identify and summarize the main themes or domains that emerged
from the collected data to answer the specific research questions.
5. Results
5.1 Technology Skills that Pre-School Teachers should possess
To determine the eight most important technology skills for a pre-school teacher as revealed in the
collected data, the clustered bar graph, shown in Figure1 is used. The results are based on a statistical
comparison in this frequency cluster bar graph. The majority of respondents from both the surveys
(Educators- 92.3%, Parents- 63.2%) said that pre-school teachers should know how to operate a
computer and printer. The second skill reflected is the use of Internet browsers (E- 87.2%; P-50%). The findings regarding the third skill are the use of word processor (E- 61.5; P-
55.3%), and the fourth is the ability to operate an interactive whiteboard (E-79.5%; P- 36.8%). Use of
a computer management system is the fifth skill. The sixth and seventh clear findings are the use of
new digital devices such as the iPad, iPod, and Tablet (E-71.8%; P- 36.8%) and use of web based
application software for learning and teaching (E-61.5; P- 44.4%). Use of educational CDs and DVDs
with their respective players and projectors is the eighth skill that the respondents perceived
kindergarten teachers should possess. Based on findings from the parental survey the other two important skills
kindergarten teachers should possess are the ability to use simple statistical software programs to
process students’ data and to possess knowledge and skills on maintaining security and privacy. The
results of the survey of educators demonstrated that 33.3% of teachers considered it to be important to
use simple statistics. On the other hand, principal B. in her interview, stated, “Statistics is something
teachers should know how to analyse and understand; as far as statistics are concerned, I think I
514514514
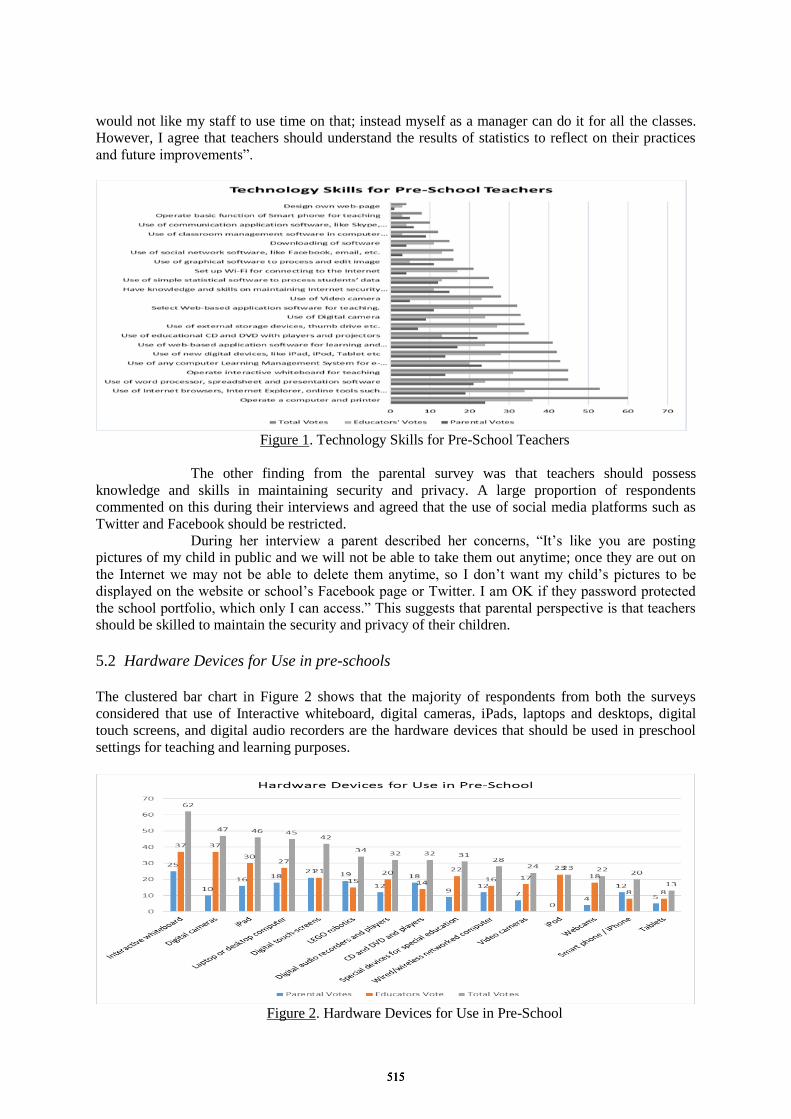
would not like my staff to use time on that; instead myself as a manager can do it for all the classes.
However, I agree that teachers should understand the results of statistics to reflect on their practices
and future improvements”.
Figure 1. Technology Skills for Pre-School Teachers
The other finding from the parental survey was that teachers should possess
knowledge and skills in maintaining security and privacy. A large proportion of respondents
commented on this during their interviews and agreed that the use of social media platforms such as
Twitter and Facebook should be restricted. During her interview a parent described her concerns, “It’s like you are posting
pictures of my child in public and we will not be able to take them out anytime; once they are out on
the Internet we may not be able to delete them anytime, so I don’t want my child’s pictures to be
displayed on the website or school’s Facebook page or Twitter. I am OK if they password protected
the school portfolio, which only I can access.” This suggests that parental perspective is that teachers
should be skilled to maintain the security and privacy of their children.
5.2 Hardware Devices for Use in pre-schools
The clustered bar chart in Figure 2 shows that the majority of respondents from both the surveys
considered that use of Interactive whiteboard, digital cameras, iPads, laptops and desktops, digital
touch screens, and digital audio recorders are the hardware devices that should be used in preschool
settings for teaching and learning purposes.
Figure 2. Hardware Devices for Use in Pre-School
515515515
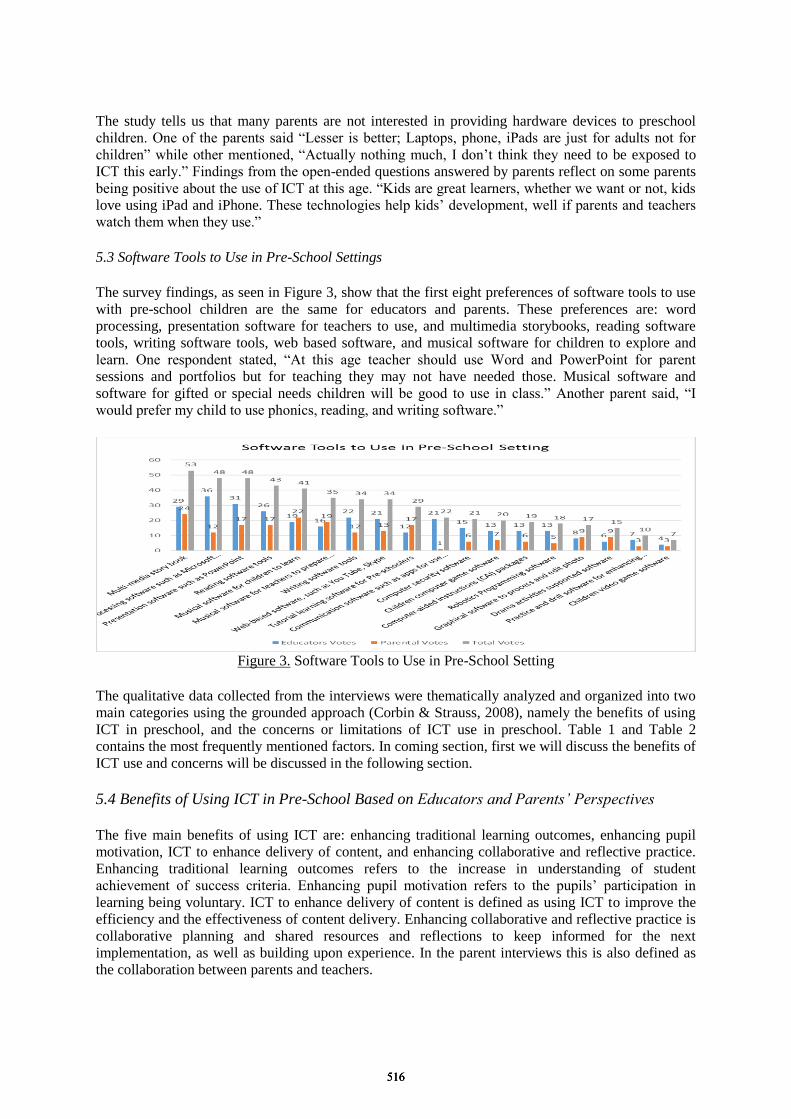
The study tells us that many parents are not interested in providing hardware devices to preschool
children. One of the parents said “Lesser is better; Laptops, phone, iPads are just for adults not for
children” while other mentioned, “Actually nothing much, I don’t think they need to be exposed to
ICT this early.” Findings from the open-ended questions answered by parents reflect on some parents
being positive about the use of ICT at this age. “Kids are great learners, whether we want or not, kids
love using iPad and iPhone. These technologies help kids’ development, well if parents and teachers
watch them when they use.” 5.3 Software Tools to Use in Pre-School Settings The survey findings, as seen in Figure 3, show that the first eight preferences of software tools to use
with pre-school children are the same for educators and parents. These preferences are: word
processing, presentation software for teachers to use, and multimedia storybooks, reading software
tools, writing software tools, web based software, and musical software for children to explore and
learn. One respondent stated, “At this age teacher should use Word and PowerPoint for parent
sessions and portfolios but for teaching they may not have needed those. Musical software and
software for gifted or special needs children will be good to use in class.” Another parent said, “I
would prefer my child to use phonics, reading, and writing software.”
Figure 3. Software Tools to Use in Pre-School Setting
The qualitative data collected from the interviews were thematically analyzed and organized into two
main categories using the grounded approach (Corbin & Strauss, 2008), namely the benefits of using
ICT in preschool, and the concerns or limitations of ICT use in preschool. Table 1 and Table 2
contains the most frequently mentioned factors. In coming section, first we will discuss the benefits of
ICT use and concerns will be discussed in the following section.
5.4 Benefits of Using ICT in Pre-School Based on Educators and Parents’ Perspectives
The five main benefits of using ICT are: enhancing traditional learning outcomes, enhancing pupil
motivation, ICT to enhance delivery of content, and enhancing collaborative and reflective practice.
Enhancing traditional learning outcomes refers to the increase in understanding of student
achievement of success criteria. Enhancing pupil motivation refers to the pupils’ participation in
learning being voluntary. ICT to enhance delivery of content is defined as using ICT to improve the
efficiency and the effectiveness of content delivery. Enhancing collaborative and reflective practice is
collaborative planning and shared resources and reflections to keep informed for the next
implementation, as well as building upon experience. In the parent interviews this is also defined as
the collaboration between parents and teachers.
516516516
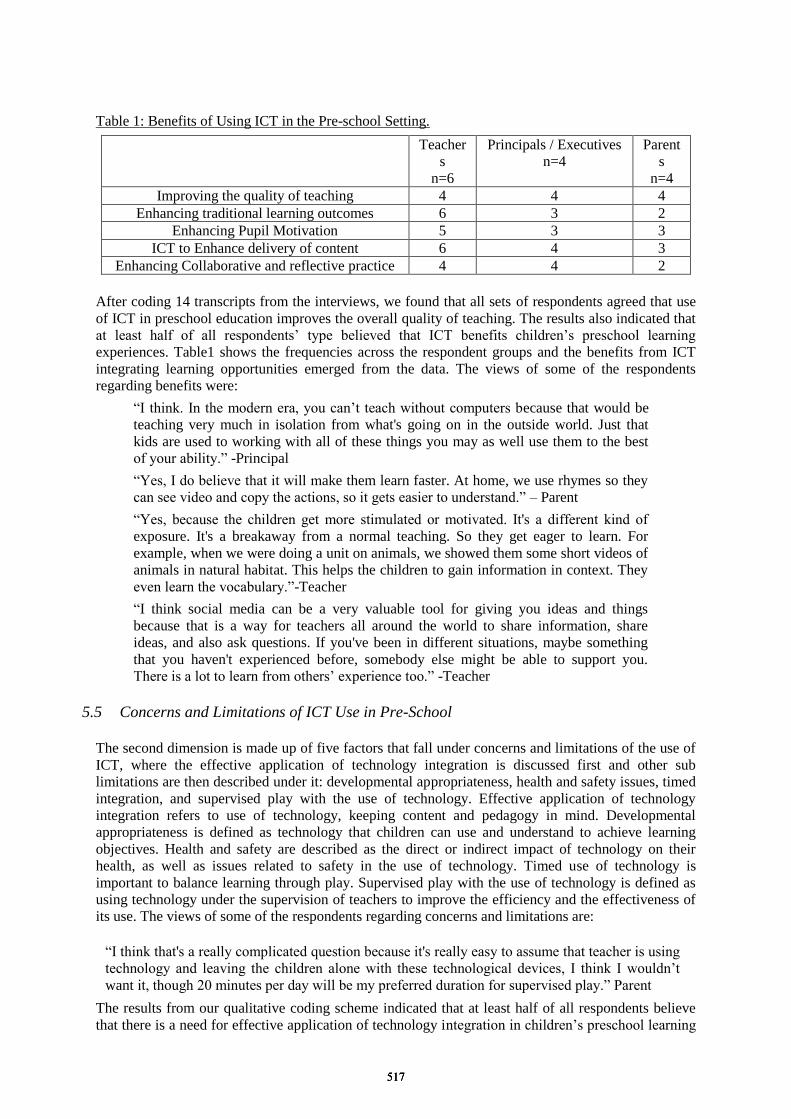
Table 1: Benefits of Using ICT in the Pre-school Setting.
Teacher
s n=6
Principals / Executives n=4
Parent
s n=4
Improving the quality of teaching 4 4 4 Enhancing traditional learning outcomes 6 3 2
Enhancing Pupil Motivation 5 3 3 ICT to Enhance delivery of content 6 4 3
Enhancing Collaborative and reflective practice 4 4 2
After coding 14 transcripts from the interviews, we found that all sets of respondents agreed that use
of ICT in preschool education improves the overall quality of teaching. The results also indicated that
at least half of all respondents’ type believed that ICT benefits children’s preschool learning
experiences. Table1 shows the frequencies across the respondent groups and the benefits from ICT
integrating learning opportunities emerged from the data. The views of some of the respondents
regarding benefits were:
“I think. In the modern era, you can’t teach without computers because that would be
teaching very much in isolation from what's going on in the outside world. Just that
kids are used to working with all of these things you may as well use them to the best
of your ability.” -Principal
“Yes, I do believe that it will make them learn faster. At home, we use rhymes so they
can see video and copy the actions, so it gets easier to understand.” – Parent
“Yes, because the children get more stimulated or motivated. It's a different kind of
exposure. It's a breakaway from a normal teaching. So they get eager to learn. For
example, when we were doing a unit on animals, we showed them some short videos of
animals in natural habitat. This helps the children to gain information in context. They
even learn the vocabulary.”-Teacher
“I think social media can be a very valuable tool for giving you ideas and things
because that is a way for teachers all around the world to share information, share
ideas, and also ask questions. If you've been in different situations, maybe something
that you haven't experienced before, somebody else might be able to support you.
There is a lot to learn from others’ experience too.” -Teacher
5.5 Concerns and Limitations of ICT Use in Pre-School
The second dimension is made up of five factors that fall under concerns and limitations of the use of
ICT, where the effective application of technology integration is discussed first and other sub
limitations are then described under it: developmental appropriateness, health and safety issues, timed
integration, and supervised play with the use of technology. Effective application of technology
integration refers to use of technology, keeping content and pedagogy in mind. Developmental
appropriateness is defined as technology that children can use and understand to achieve learning
objectives. Health and safety are described as the direct or indirect impact of technology on their
health, as well as issues related to safety in the use of technology. Timed use of technology is
important to balance learning through play. Supervised play with the use of technology is defined as
using technology under the supervision of teachers to improve the efficiency and the effectiveness of
its use. The views of some of the respondents regarding concerns and limitations are:
“I think that's a really complicated question because it's really easy to assume that teacher is using
technology and leaving the children alone with these technological devices, I think I wouldn’t
want it, though 20 minutes per day will be my preferred duration for supervised play.” Parent
The results from our qualitative coding scheme indicated that at least half of all respondents believe
that there is a need for effective application of technology integration in children’s preschool learning
517517517
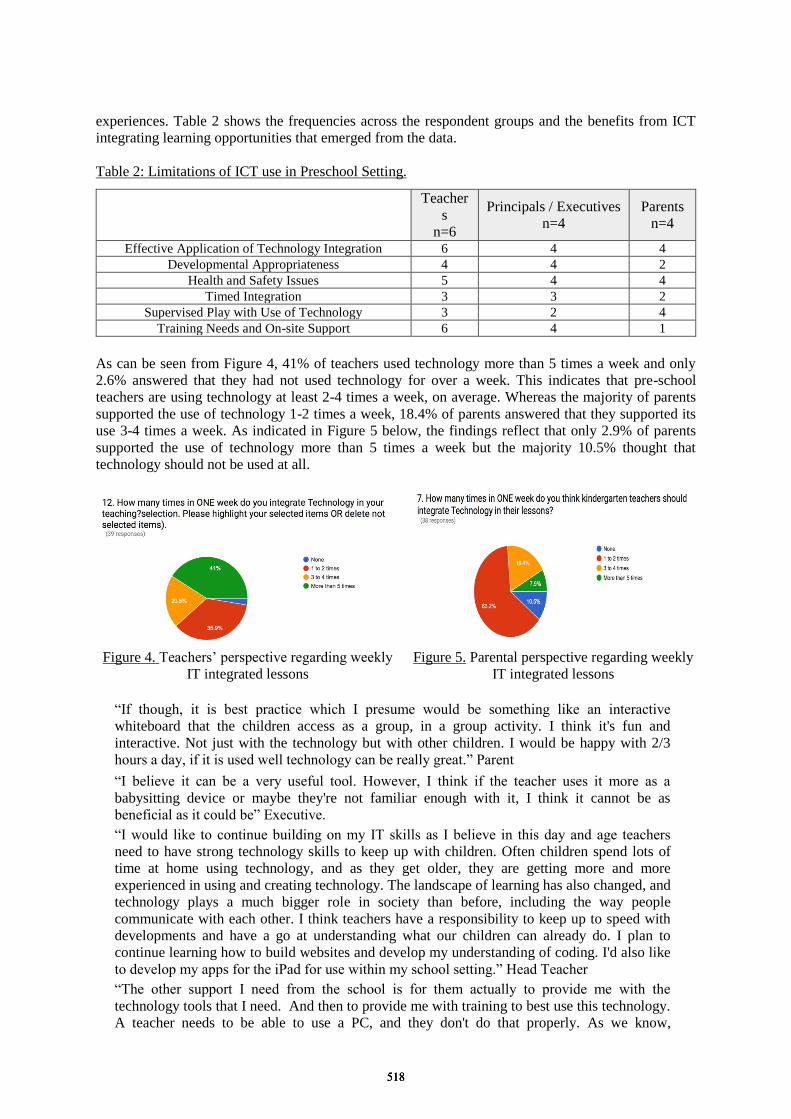
experiences. Table 2 shows the frequencies across the respondent groups and the benefits from ICT
integrating learning opportunities that emerged from the data.
Table 2: Limitations of ICT use in Preschool Setting.
Teacher
s n=6
Principals / Executives n=4
Parents n=4
Effective Application of Technology Integration 6 4 4 Developmental Appropriateness 4 4 2
Health and Safety Issues 5 4 4 Timed Integration 3 3 2
Supervised Play with Use of Technology 3 2 4 Training Needs and On-site Support 6 4 1
As can be seen from Figure 4, 41% of teachers used technology more than 5 times a week and only
2.6% answered that they had not used technology for over a week. This indicates that pre-school
teachers are using technology at least 2-4 times a week, on average. Whereas the majority of parents
supported the use of technology 1-2 times a week, 18.4% of parents answered that they supported its
use 3-4 times a week. As indicated in Figure 5 below, the findings reflect that only 2.9% of parents
supported the use of technology more than 5 times a week but the majority 10.5% thought that
technology should not be used at all.
Figure 4. Teachers’ perspective regarding weekly
IT integrated lessons Figure 5. Parental perspective regarding weekly
IT integrated lessons
“If though, it is best practice which I presume would be something like an interactive
whiteboard that the children access as a group, in a group activity. I think it's fun and
interactive. Not just with the technology but with other children. I would be happy with 2/3
hours a day, if it is used well technology can be really great.” Parent
“I believe it can be a very useful tool. However, I think if the teacher uses it more as a
babysitting device or maybe they're not familiar enough with it, I think it cannot be as
beneficial as it could be” Executive.
“I would like to continue building on my IT skills as I believe in this day and age teachers
need to have strong technology skills to keep up with children. Often children spend lots of
time at home using technology, and as they get older, they are getting more and more
experienced in using and creating technology. The landscape of learning has also changed, and
technology plays a much bigger role in society than before, including the way people
communicate with each other. I think teachers have a responsibility to keep up to speed with
developments and have a go at understanding what our children can already do. I plan to
continue learning how to build websites and develop my understanding of coding. I'd also like
to develop my apps for the iPad for use within my school setting.” Head Teacher
“The other support I need from the school is for them actually to provide me with the
technology tools that I need. And then to provide me with training to best use this technology.
A teacher needs to be able to use a PC, and they don't do that properly. As we know,
518518518
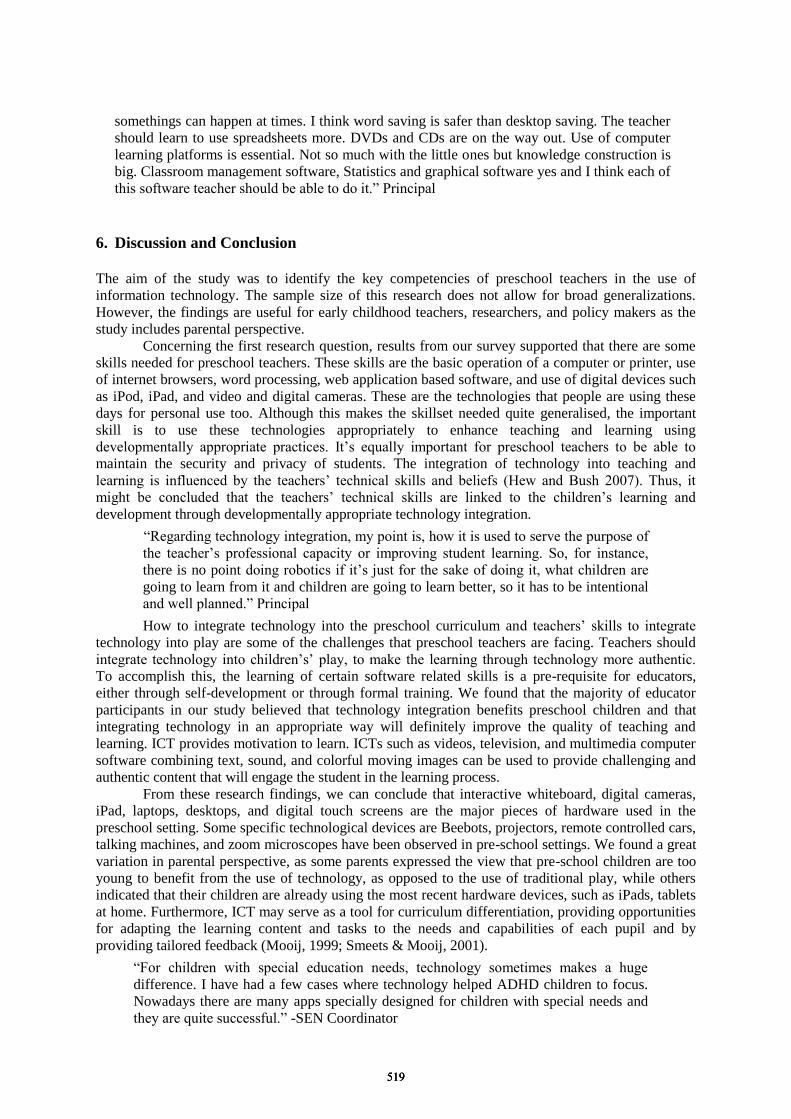
somethings can happen at times. I think word saving is safer than desktop saving. The teacher
should learn to use spreadsheets more. DVDs and CDs are on the way out. Use of computer
learning platforms is essential. Not so much with the little ones but knowledge construction is
big. Classroom management software, Statistics and graphical software yes and I think each of
this software teacher should be able to do it.” Principal
6. Discussion and Conclusion
The aim of the study was to identify the key competencies of preschool teachers in the use of
information technology. The sample size of this research does not allow for broad generalizations.
However, the findings are useful for early childhood teachers, researchers, and policy makers as the
study includes parental perspective. Concerning the first research question, results from our survey supported that there are some
skills needed for preschool teachers. These skills are the basic operation of a computer or printer, use
of internet browsers, word processing, web application based software, and use of digital devices such
as iPod, iPad, and video and digital cameras. These are the technologies that people are using these
days for personal use too. Although this makes the skillset needed quite generalised, the important
skill is to use these technologies appropriately to enhance teaching and learning using
developmentally appropriate practices. It’s equally important for preschool teachers to be able to
maintain the security and privacy of students. The integration of technology into teaching and
learning is influenced by the teachers’ technical skills and beliefs (Hew and Bush 2007). Thus, it
might be concluded that the teachers’ technical skills are linked to the children’s learning and
development through developmentally appropriate technology integration.
“Regarding technology integration, my point is, how it is used to serve the purpose of
the teacher’s professional capacity or improving student learning. So, for instance,
there is no point doing robotics if it’s just for the sake of doing it, what children are
going to learn from it and children are going to learn better, so it has to be intentional
and well planned.” Principal
How to integrate technology into the preschool curriculum and teachers’ skills to integrate
technology into play are some of the challenges that preschool teachers are facing. Teachers should
integrate technology into children’s’ play, to make the learning through technology more authentic.
To accomplish this, the learning of certain software related skills is a pre-requisite for educators,
either through self-development or through formal training. We found that the majority of educator
participants in our study believed that technology integration benefits preschool children and that
integrating technology in an appropriate way will definitely improve the quality of teaching and
learning. ICT provides motivation to learn. ICTs such as videos, television, and multimedia computer
software combining text, sound, and colorful moving images can be used to provide challenging and
authentic content that will engage the student in the learning process. From these research findings, we can conclude that interactive whiteboard, digital cameras,
iPad, laptops, desktops, and digital touch screens are the major pieces of hardware used in the
preschool setting. Some specific technological devices are Beebots, projectors, remote controlled cars,
talking machines, and zoom microscopes have been observed in pre-school settings. We found a great
variation in parental perspective, as some parents expressed the view that pre-school children are too
young to benefit from the use of technology, as opposed to the use of traditional play, while others
indicated that their children are already using the most recent hardware devices, such as iPads, tablets
at home. Furthermore, ICT may serve as a tool for curriculum differentiation, providing opportunities
for adapting the learning content and tasks to the needs and capabilities of each pupil and by
providing tailored feedback (Mooij, 1999; Smeets & Mooij, 2001).
“For children with special education needs, technology sometimes makes a huge
difference. I have had a few cases where technology helped ADHD children to focus.
Nowadays there are many apps specially designed for children with special needs and
they are quite successful.” -SEN Coordinator
519519519
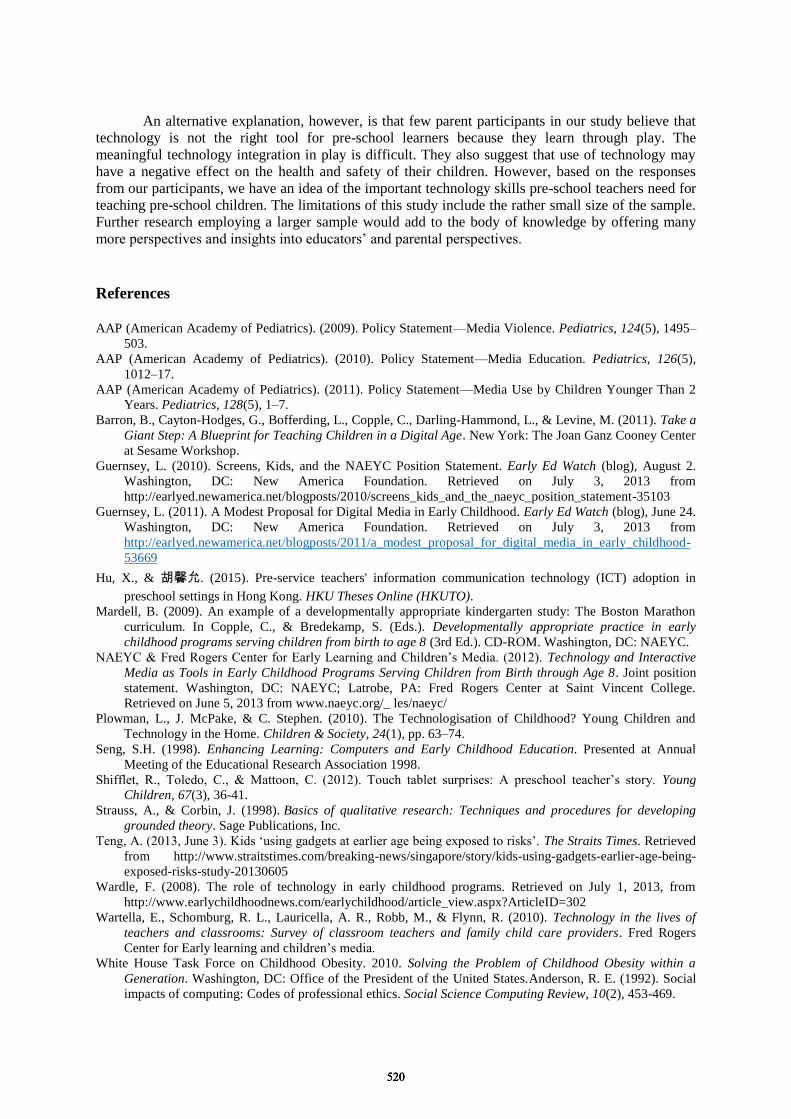
An alternative explanation, however, is that few parent participants in our study believe that
technology is not the right tool for pre-school learners because they learn through play. The
meaningful technology integration in play is difficult. They also suggest that use of technology may
have a negative effect on the health and safety of their children. However, based on the responses
from our participants, we have an idea of the important technology skills pre-school teachers need for
teaching pre-school children. The limitations of this study include the rather small size of the sample.
Further research employing a larger sample would add to the body of knowledge by offering many
more perspectives and insights into educators’ and parental perspectives.
References
AAP (American Academy of Pediatrics). (2009). Policy Statement—Media Violence. Pediatrics, 124(5), 1495–
503.
AAP (American Academy of Pediatrics). (2010). Policy Statement—Media Education. Pediatrics, 126(5),
1012–17.
AAP (American Academy of Pediatrics). (2011). Policy Statement—Media Use by Children Younger Than 2
Years. Pediatrics, 128(5), 1–7.
Barron, B., Cayton-Hodges, G., Bofferding, L., Copple, C., Darling-Hammond, L., & Levine, M. (2011). Take a
Giant Step: A Blueprint for Teaching Children in a Digital Age. New York: The Joan Ganz Cooney Center
at Sesame Workshop.
Guernsey, L. (2010). Screens, Kids, and the NAEYC Position Statement. Early Ed Watch (blog), August 2.
Washington, DC: New America Foundation. Retrieved on July 3, 2013 from
http://earlyed.newamerica.net/blogposts/2010/screens_kids_and_the_naeyc_position_statement-35103
Guernsey, L. (2011). A Modest Proposal for Digital Media in Early Childhood. Early Ed Watch (blog), June 24.
Washington, DC: New America Foundation. Retrieved on July 3, 2013 from
http://earlyed.newamerica.net/blogposts/2011/a_modest_proposal_for_digital_media_in_early_childhood-
53669
Hu, X., & 胡馨允. (2015). Pre-service teachers' information communication technology (ICT) adoption in
preschool settings in Hong Kong. HKU Theses Online (HKUTO).
Mardell, B. (2009). An example of a developmentally appropriate kindergarten study: The Boston Marathon
curriculum. In Copple, C., & Bredekamp, S. (Eds.). Developmentally appropriate practice in early
childhood programs serving children from birth to age 8 (3rd Ed.). CD-ROM. Washington, DC: NAEYC.
NAEYC & Fred Rogers Center for Early Learning and Children’s Media. (2012). Technology and Interactive
Media as Tools in Early Childhood Programs Serving Children from Birth through Age 8. Joint position
statement. Washington, DC: NAEYC; Latrobe, PA: Fred Rogers Center at Saint Vincent College.
Retrieved on June 5, 2013 from www.naeyc.org/_ les/naeyc/
Plowman, L., J. McPake, & C. Stephen. (2010). The Technologisation of Childhood? Young Children and
Technology in the Home. Children & Society, 24(1), pp. 63–74.
Seng, S.H. (1998). Enhancing Learning: Computers and Early Childhood Education. Presented at Annual
Meeting of the Educational Research Association 1998.
Shifflet, R., Toledo, C., & Mattoon, C. (2012). Touch tablet surprises: A preschool teacher’s story. Young
Children, 67(3), 36-41.
Strauss, A., & Corbin, J. (1998). Basics of qualitative research: Techniques and procedures for developing
grounded theory. Sage Publications, Inc.
Teng, A. (2013, June 3). Kids ‘using gadgets at earlier age being exposed to risks’. The Straits Times. Retrieved
from http://www.straitstimes.com/breaking-news/singapore/story/kids-using-gadgets-earlier-age-being-
exposed-risks-study-20130605
Wardle, F. (2008). The role of technology in early childhood programs. Retrieved on July 1, 2013, from
http://www.earlychildhoodnews.com/earlychildhood/article_view.aspx?ArticleID=302
Wartella, E., Schomburg, R. L., Lauricella, A. R., Robb, M., & Flynn, R. (2010). Technology in the lives of
teachers and classrooms: Survey of classroom teachers and family child care providers. Fred Rogers
Center for Early learning and children’s media.
White House Task Force on Childhood Obesity. 2010. Solving the Problem of Childhood Obesity within a
Generation. Washington, DC: Office of the President of the United States.Anderson, R. E. (1992). Social
impacts of computing: Codes of professional ethics. Social Science Computing Review, 10(2), 453-469.
520520520
Chen, W. et al. (Eds.) (2016). Proceedings of the 24th International Conference on Computers in Education.
India: Asia-Pacific Society for Computers in Education
Learning Support System for Visualizing
Memory Image and Target Domain World, and
Classroom Practice for Understanding Pointers
Koichi YAMASHITAa*, Ryota FUJIOKAb, Satoru KOGUREc,
Yasuhiro NOGUCHIc, Tatsuhiro KONISHIc & Yukihiro ITOHd aFaculty of Business Administration, Tokoha University, Japan
bGraduate School of Informatics, Shizuoka University, Japan cFaculty of Informatics, Shizuoka University, Japan
dShizuoka University, Japan
Abstract: In this paper, we describe a learning support system that can visualize program
behavior in memory image and status of the target domain world, and classroom practice that
introduces the system to a real class. Several learning support systems have been developed for
supporting novice learners in understanding program codes. However, visualization in existing
systems often conceals the concrete value of variables such as pointers; the way in which each
visualized object is located on the memory is not made explicit. In order to address this issue,
we developed a learning support system that visualizes simultaneously and synchronously the
memory image that is the field that presents the concrete value of variables, and the target
domain world that is the field that presents logically the data structures processed by the
program. Moreover, in order to allow teachers to set their instruction content based on the
growing variety of learner background knowledge, our system visualizes the status of the target
domain world according to the visualization policy defined by the teacher. We conducted
classroom practice for understanding pointers in connection with a memory model, thus
introducing our system to a real class. In this practice, we included a learning step for the
students to observe the memory image of variables and compare it with the status of the target
domain world, which had not been included in our preceding practice. Analysis of answered
scores in a questionnaire conducted after the practice suggests that our system contributed to
reducing irregularities in the participants’ understanding, and that appropriate learning support
reached every participant of our practice using our system.
Keywords: Education for programming, Learning support system, Domain world model,
Classroom practice.
1. Introduction
As information technology has pervaded our society in recent years, improving the productivity of
program codes has been expected increasingly. Many institutes of higher education have organized
programming classes for various students. Thus far, several learning support systems have been
developed to support novice learners in understanding program codes (Pears et al., 2007; Malmi et al.,
2004; Moreno, Myller, Sutinen, & Ben-Ari, 2004; Neve, Hunter, Livingstone, & Orwell, 2012;
Yamashita et al., 2016). These systems visualize the data structures processed by the target programs in
certain ways, and support learners in understanding the programs and algorithms by making their
behavior visible. When understanding algorithms and programs, having a clear image about their
behavior is important. However, novice learners often find it difficult to obtain such image correctly.
Hence, introducing these systems to classes is expected to allow learners to cultivate a better
understanding of program (Naps et al., 2002).
The visualization of data structures is also used in classroom lectures on algorithms. Teachers
often explain the behavior of an algorithm by drawing data structures with a concept that is specific to
the target algorithm, such as trees, lists, and stacks. However, such visualized structures often cannot be
521521521
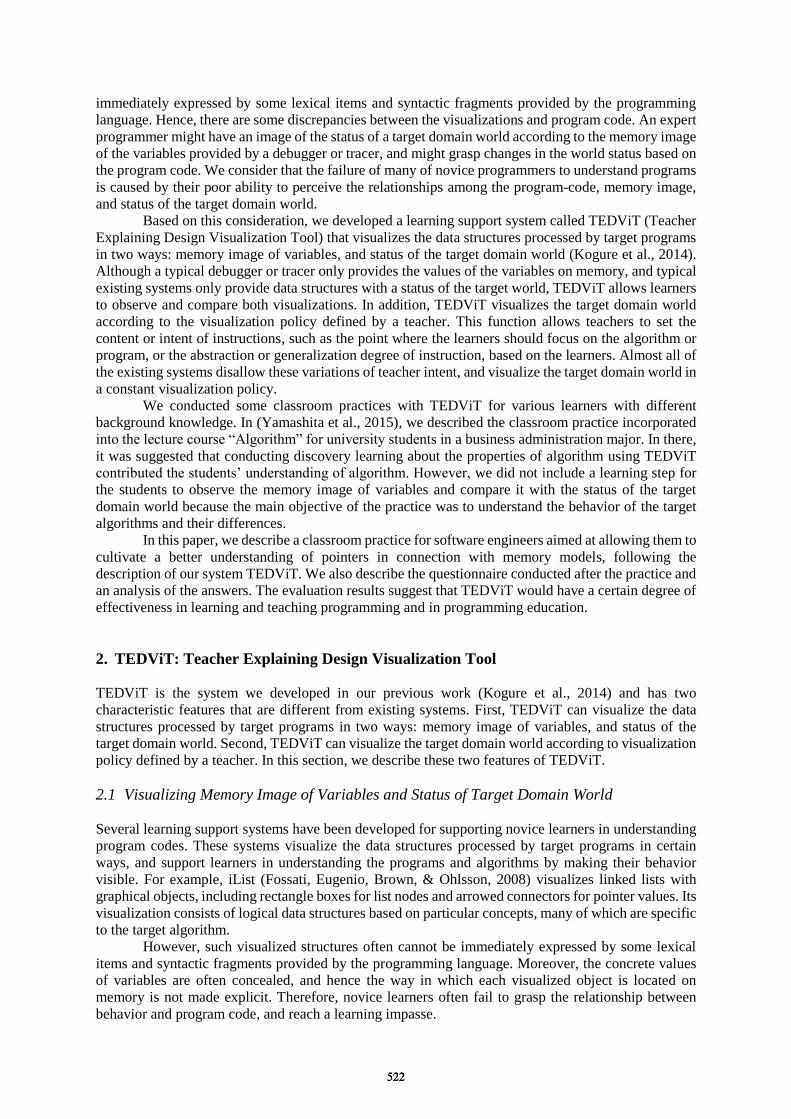
immediately expressed by some lexical items and syntactic fragments provided by the programming
language. Hence, there are some discrepancies between the visualizations and program code. An expert
programmer might have an image of the status of a target domain world according to the memory image
of the variables provided by a debugger or tracer, and might grasp changes in the world status based on
the program code. We consider that the failure of many of novice programmers to understand programs
is caused by their poor ability to perceive the relationships among the program-code, memory image,
and status of the target domain world.
Based on this consideration, we developed a learning support system called TEDViT (Teacher
Explaining Design Visualization Tool) that visualizes the data structures processed by target programs
in two ways: memory image of variables, and status of the target domain world (Kogure et al., 2014).
Although a typical debugger or tracer only provides the values of the variables on memory, and typical
existing systems only provide data structures with a status of the target world, TEDViT allows learners
to observe and compare both visualizations. In addition, TEDViT visualizes the target domain world
according to the visualization policy defined by a teacher. This function allows teachers to set the
content or intent of instructions, such as the point where the learners should focus on the algorithm or
program, or the abstraction or generalization degree of instruction, based on the learners. Almost all of
the existing systems disallow these variations of teacher intent, and visualize the target domain world in
a constant visualization policy.
We conducted some classroom practices with TEDViT for various learners with different
background knowledge. In (Yamashita et al., 2015), we described the classroom practice incorporated
into the lecture course “Algorithm” for university students in a business administration major. In there,
it was suggested that conducting discovery learning about the properties of algorithm using TEDViT
contributed the students’ understanding of algorithm. However, we did not include a learning step for
the students to observe the memory image of variables and compare it with the status of the target
domain world because the main objective of the practice was to understand the behavior of the target
algorithms and their differences.
In this paper, we describe a classroom practice for software engineers aimed at allowing them to
cultivate a better understanding of pointers in connection with memory models, following the
description of our system TEDViT. We also describe the questionnaire conducted after the practice and
an analysis of the answers. The evaluation results suggest that TEDViT would have a certain degree of
effectiveness in learning and teaching programming and in programming education.
2. TEDViT: Teacher Explaining Design Visualization Tool
TEDViT is the system we developed in our previous work (Kogure et al., 2014) and has two
characteristic features that are different from existing systems. First, TEDViT can visualize the data
structures processed by target programs in two ways: memory image of variables, and status of the
target domain world. Second, TEDViT can visualize the target domain world according to visualization
policy defined by a teacher. In this section, we describe these two features of TEDViT.
2.1 Visualizing Memory Image of Variables and Status of Target Domain World
Several learning support systems have been developed for supporting novice learners in understanding
program codes. These systems visualize the data structures processed by target programs in certain
ways, and support learners in understanding the programs and algorithms by making their behavior
visible. For example, iList (Fossati, Eugenio, Brown, & Ohlsson, 2008) visualizes linked lists with
graphical objects, including rectangle boxes for list nodes and arrowed connectors for pointer values. Its
visualization consists of logical data structures based on particular concepts, many of which are specific
to the target algorithm.
However, such visualized structures often cannot be immediately expressed by some lexical
items and syntactic fragments provided by the programming language. Moreover, the concrete values
of variables are often concealed, and hence the way in which each visualized object is located on
memory is not made explicit. Therefore, novice learners often fail to grasp the relationship between
behavior and program code, and reach a learning impasse.
522522522

To address this issue, TEDViT visualizes the data structures processed by a target program in
two ways, memory image of variables and status of target domain world, and provides a learning
environment where learners can observe and compare both visualizations. Figure 1 shows a learning
environment generated by TEDViT. The environment consists of three fields: the data structures
processed by the program in (A) are visualized in the two fields in (B) and (C). TEDViT reproduces a
series of memory images of variables in (B) for each step of the program’s execution, and a series of
statuses of the target domain world in (C) that visualizes logical data structures.
When a learner clicks the “Next” or “Prev” button, the highlight in (A) moves to the next or
previous statement in the program code; the memory image in (B) is updated according to the values of
the variables after executing the highlighted statement; and the corresponding status of the target
domain world is visualized in (C). TEDViT simulates statement execution step by step so that the
learner can understand the program’s behavior by observing the changes of the target domain world in
(C). Simultaneously, the learner can understand the concrete memory image in each execution step and
the concrete expression of the data structures by observing and comparing the world in (C) with the
memory image in (B).
Figure 1. Overview of learning environment generated by TEDViT.
2.2 Visualizing Status of Target Domain World Based on Teacher’s Intention
For example, a teacher might draw an object in a horizontal layout when the instruction target is to sort
an array, as shown in Figure 2, whereas the teacher might draw the array in a vertical layout for a stack.
Changes in visualization policy such as this are derived by fitting the instruction content to the learners’
background knowledge. For example, if the learners sufficiently understand a stack, drawing either
object in a horizontal or vertical layout would be acceptable to the learners. Similarly, the teacher would
not need to draw the temporary variable in a task that swaps the values of two variables for non-novice
learners.
523523523
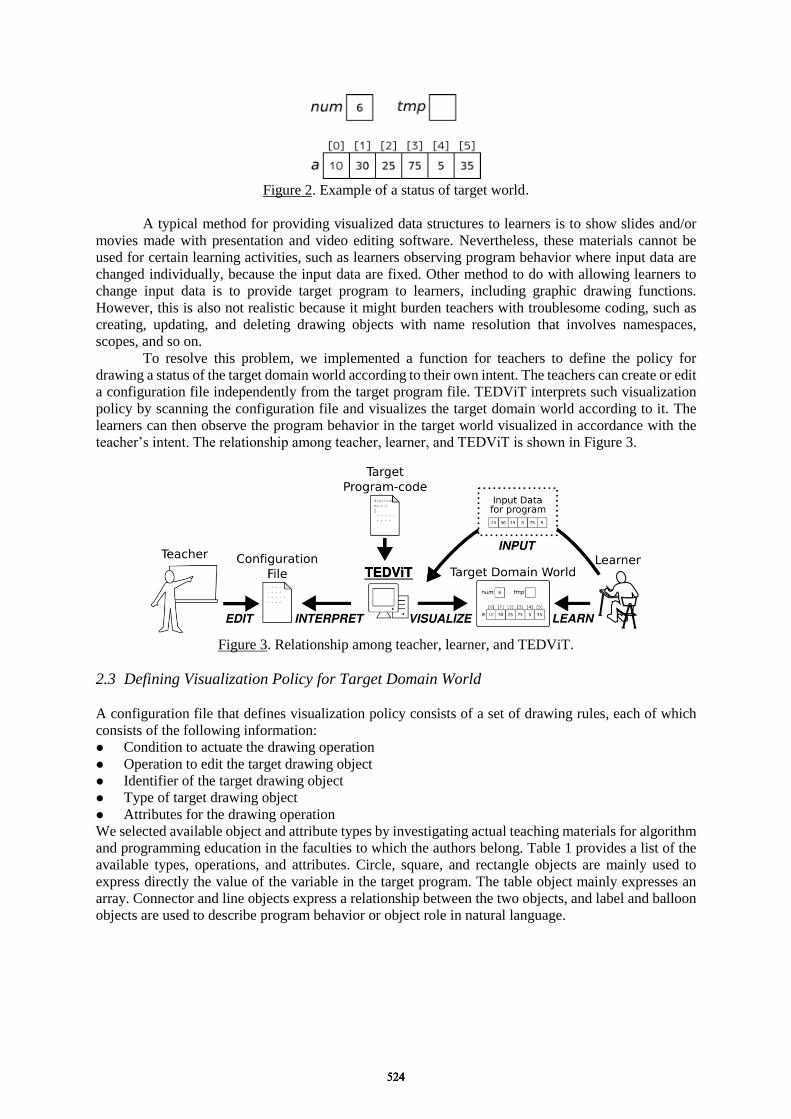
Figure 2. Example of a status of target world.
A typical method for providing visualized data structures to learners is to show slides and/or
movies made with presentation and video editing software. Nevertheless, these materials cannot be
used for certain learning activities, such as learners observing program behavior where input data are
changed individually, because the input data are fixed. Other method to do with allowing learners to
change input data is to provide target program to learners, including graphic drawing functions.
However, this is also not realistic because it might burden teachers with troublesome coding, such as
creating, updating, and deleting drawing objects with name resolution that involves namespaces,
scopes, and so on.
To resolve this problem, we implemented a function for teachers to define the policy for
drawing a status of the target domain world according to their own intent. The teachers can create or edit
a configuration file independently from the target program file. TEDViT interprets such visualization
policy by scanning the configuration file and visualizes the target domain world according to it. The
learners can then observe the program behavior in the target world visualized in accordance with the
teacher’s intent. The relationship among teacher, learner, and TEDViT is shown in Figure 3.
Figure 3. Relationship among teacher, learner, and TEDViT.
2.3 Defining Visualization Policy for Target Domain World
A configuration file that defines visualization policy consists of a set of drawing rules, each of which
consists of the following information:
Condition to actuate the drawing operation
Operation to edit the target drawing object
Identifier of the target drawing object
Type of target drawing object
Attributes for the drawing operation
We selected available object and attribute types by investigating actual teaching materials for algorithm
and programming education in the faculties to which the authors belong. Table 1 provides a list of the
available types, operations, and attributes. Circle, square, and rectangle objects are mainly used to
express directly the value of the variable in the target program. The table object mainly expresses an
array. Connector and line objects express a relationship between the two objects, and label and balloon
objects are used to describe program behavior or object role in natural language.
524524524
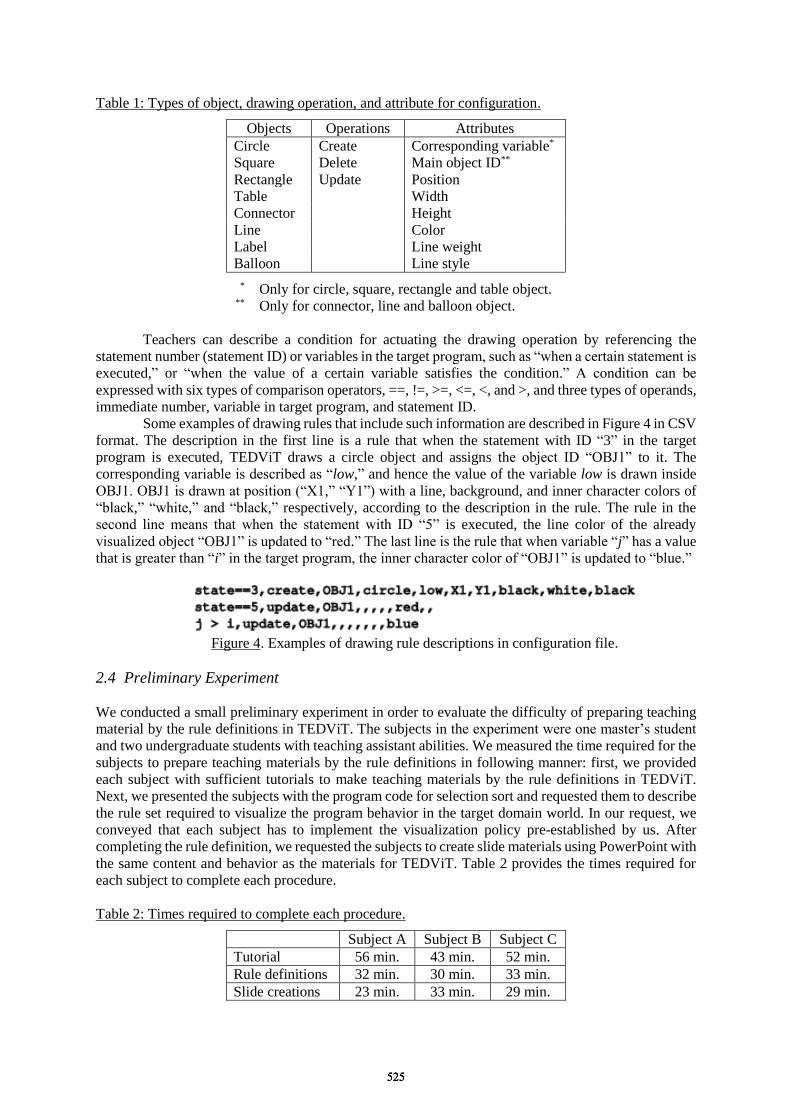
Table 1: Types of object, drawing operation, and attribute for configuration.
Objects Operations Attributes
Circle Create Corresponding variable*
Square Delete Main object ID**
Rectangle Update Position
Table Width
Connector Height
Line Color
Label Line weight
Balloon Line style
* Only for circle, square, rectangle and table object. ** Only for connector, line and balloon object.
Teachers can describe a condition for actuating the drawing operation by referencing the
statement number (statement ID) or variables in the target program, such as “when a certain statement is
executed,” or “when the value of a certain variable satisfies the condition.” A condition can be
expressed with six types of comparison operators, ==, !=, >=, <=, <, and >, and three types of operands,
immediate number, variable in target program, and statement ID.
Some examples of drawing rules that include such information are described in Figure 4 in CSV
format. The description in the first line is a rule that when the statement with ID “3” in the target
program is executed, TEDViT draws a circle object and assigns the object ID “OBJ1” to it. The
corresponding variable is described as “low,” and hence the value of the variable low is drawn inside
OBJ1. OBJ1 is drawn at position (“X1,” “Y1”) with a line, background, and inner character colors of
“black,” “white,” and “black,” respectively, according to the description in the rule. The rule in the
second line means that when the statement with ID “5” is executed, the line color of the already
visualized object “OBJ1” is updated to “red.” The last line is the rule that when variable “j” has a value
that is greater than “i” in the target program, the inner character color of “OBJ1” is updated to “blue.”
Figure 4. Examples of drawing rule descriptions in configuration file.
2.4 Preliminary Experiment
We conducted a small preliminary experiment in order to evaluate the difficulty of preparing teaching
material by the rule definitions in TEDViT. The subjects in the experiment were one master’s student
and two undergraduate students with teaching assistant abilities. We measured the time required for the
subjects to prepare teaching materials by the rule definitions in following manner: first, we provided
each subject with sufficient tutorials to make teaching materials by the rule definitions in TEDViT.
Next, we presented the subjects with the program code for selection sort and requested them to describe
the rule set required to visualize the program behavior in the target domain world. In our request, we
conveyed that each subject has to implement the visualization policy pre-established by us. After
completing the rule definition, we requested the subjects to create slide materials using PowerPoint with
the same content and behavior as the materials for TEDViT. Table 2 provides the times required for
each subject to complete each procedure.
Table 2: Times required to complete each procedure.
Subject A Subject B Subject C
Tutorial 56 min. 43 min. 52 min.
Rule definitions 32 min. 30 min. 33 min.
Slide creations 23 min. 33 min. 29 min.
525525525
Although the number of subjects was small, the result of this experiment suggests that teaching
materials for TEDViT could be prepared in practical time with some experience in rule definitions. The
times required to complete rule definitions are approximately the same as slide creations. However, the
teaching material for TEDViT would be more useful because TEDViT can reproduce the program
behavior without rule modifications, even if the target data processed by the program change.
3. Classroom Practice for Understanding Pointers
Thus far, we have conducted several educational practices with TEDViT incorporated in real classes. In
(Yamashita et al., 2015), we presented algorithm classroom practices for students in a business
administration major. The practices were based on discovery learning on the properties of algorithms,
such as the number of comparisons and swaps. TEDViT supported the students to construct their
discovery learning cycles by visualizing some suggestive objects in the target domain world in order to
provide learning guidance, and by allowing the students to input data in the target program based on
their hypotheses. The evaluation results based on the score improvements between pre and post-tests
suggest that the practices contributed, to a certain degree, to the students’ understanding of algorithms.
Nevertheless, the preceding practices did not include learning activities for observing memory
images in the learning scenario because the goal was to understand algorithm behaviors and the
differences among the target algorithms based on their properties. In this section, we describe the
classroom practice that used TEDViT for understanding pointers. The practice was conducted along
with a scenario that included activities for observing and comparing memory images and the target
domain world.
3.1 Classroom Practice Overview
Hamamatsu Embedded Programming Technology Consortium (HEPT) is a collaborative consortium
with industries and the university to which some of the authors belong; HEPT is also training system
engineers. HEPT offers a training course for software design and development engineering, including
lectures on programming in C. Our classroom practice was incorporated into a session of these lectures.
The practice participants were 15 software engineers responsible for software development, but without
much experience in C programming, as listed in Tables 3 and 4.
Table 3: Number of participants with different years of C programming experience.
Years of experience Less than 1 year 1-3 years 3-5 years 5-7 years
Number of participants 5 7 1 2
Table 4: Number of participants with experience in each language (multiple replies allowed).
Programming Language C C++ C# Visual Basic Java Perl
Number of participants 13 6 3 4 4 1
The goal of the session is to understand how to design and implement a function that can take
arbitrary data types using function and generic pointers. In order to achieve this goal, the learners need
to understand “relationships among types, variables, and pointers,” “pointers in function arguments,”
“pointers as return values,” “pointer operations,” and “relationships between pointers and arrays” in
connection with a memory model. However, it is difficult for novice learners to understand pointers
with a memory model. Hence, we introduced TEDViT into the session class to support learners in their
understanding.
In the practiced session, the teacher taught the following learning sections in order:
1. Variables and pointers
a. Pointer operators and memory model
2. Functions and pointers
a. Calls by value
b. Calls by pointer
526526526
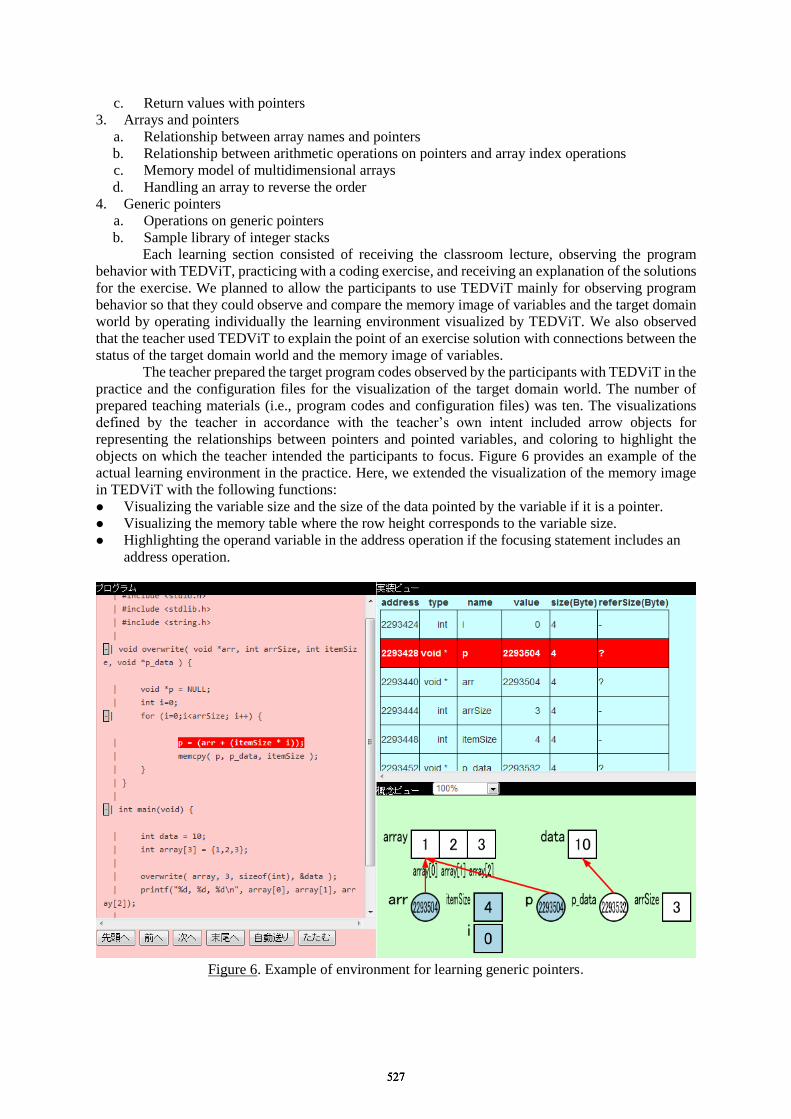
c. Return values with pointers
3. Arrays and pointers
a. Relationship between array names and pointers
b. Relationship between arithmetic operations on pointers and array index operations
c. Memory model of multidimensional arrays
d. Handling an array to reverse the order
4. Generic pointers
a. Operations on generic pointers
b. Sample library of integer stacks
Each learning section consisted of receiving the classroom lecture, observing the program
behavior with TEDViT, practicing with a coding exercise, and receiving an explanation of the solutions
for the exercise. We planned to allow the participants to use TEDViT mainly for observing program
behavior so that they could observe and compare the memory image of variables and the target domain
world by operating individually the learning environment visualized by TEDViT. We also observed
that the teacher used TEDViT to explain the point of an exercise solution with connections between the
status of the target domain world and the memory image of variables.
The teacher prepared the target program codes observed by the participants with TEDViT in the
practice and the configuration files for the visualization of the target domain world. The number of
prepared teaching materials (i.e., program codes and configuration files) was ten. The visualizations
defined by the teacher in accordance with the teacher’s own intent included arrow objects for
representing the relationships between pointers and pointed variables, and coloring to highlight the
objects on which the teacher intended the participants to focus. Figure 6 provides an example of the
actual learning environment in the practice. Here, we extended the visualization of the memory image
in TEDViT with the following functions:
Visualizing the variable size and the size of the data pointed by the variable if it is a pointer.
Visualizing the memory table where the row height corresponds to the variable size.
Highlighting the operand variable in the address operation if the focusing statement includes an
address operation.
Figure 6. Example of environment for learning generic pointers.
527527527

3.2 Classroom Practice Evaluation
It was difficult to conduct a certain test for the evaluation of the learning effect with TEDViT because
the participants in the practice were not students, but engineers already employed. Hence, our
evaluation of the classroom practice is based on an analysis of the answers of two questionnaires
conducted after the practice. One of them (Q1) was about learning with TEDViT, and the other (Q2)
was about the learning content in the session. The former contains six items.
Q1-1. Asks how much TEDViT contributed to understanding C programming using five-point scale.
Q1-2. Asks how much TEDViT contributed to ascertaining wanted matters using five-point scale.
Q1-3. Asks how much TEDViT was needed for learning using five-point scale.
Q1-4. Asks whether the teaching materials are regarded as useful from among the prepared ten
materials (allows multiple answers).
Q1-5. Asks for comments on the advantages and disadvantages of learning with TEDViT.
Q1-6. Asks for comments on the insufficient or inconvenient functions of TEDViT.
Table 5 provides an average of the answer scores for Q1-1, Q1-2, and Q1-3. These scores
suggest that the participants were basically satisfied with the learning support provided by TEDViT.
Table 6 lists the teaching materials found useful by a few participants (Q1-4). We consider that the
indicated materials are divided broadly into two categories: 1) learning items where a learner is required
to grasp the relationship between the target domain world and memory model, such as “pointer
operators and memory model,” “calls by pointer,” and “operations on generic pointers;” 2) items with
complicated behavior, such as “handling an array to reverse the order” and “sample library of integer
stacks.” These favorable evaluations for the two categories of our teaching materials suggest that our
aim of supporting learners in understanding pointers in connection with a memory model using
TEDViT was achieved successfully to a certain degree.
Table 5: Average and variance of answered scores in Q1-1, Q1-2, and Q1-3.
Average Variance SD
Q1-1 4.60 0.24 0.49
Q1-2 4.40 0.37 0.61
Q1-3 4.33 0.36 0.60
Table 6: Number of answers indicating useful teaching materials (multiple replies allowed).
Teaching material N
Pointer operators and memory model 7
Calls by value 3
Calls by pointer 7
Return values with pointers 4
Relationship between array names and pointers 3
Relationship between arithmetic operations on pointers and array index operations 3
Memory model of multidimensional arrays 4
Handling an array to reverse the order 5
Operations on generic pointers 9
Sample library of integer stacks 9
The latter questionnaire (Q2) has five items, all of which are similar to those conducted over several
years at the HEPT training course:
Q2-1. Asks how much the participant was interested in learning the session content using five-point
scale.
Q2-2. Asks how well the participant understood the session learning content using five-point scale.
Q2-3. Asks how fast the participant perceived was the teacher’s progress in the session using
five-point scale (1 = too slow, 5 = too fast).
Q2-4. Asks how difficult the session learning content was using five-point scale (1 = too easy, 5 = too
difficult).
Q2-5. Asks how difficult the exercises were in the session using five-point scale (similar to Q2-4).
528528528
Table 7 provides the average and variance of each answer score in Q2, including those in the
questionnaire conducted in 2013 and 2014. The corresponding learning sessions without TEDViT in
2013 and 2014 were conducted by the same teacher from our practice. We can observe that the variance
of answer scores on the understanding degree (Q2-2), session speed (Q2-3), and session difficulty
(Q2-4) with TEDViT are lower than those without TEDViT. There are no participants in our practice
who answered “not understandable at all” or “slightly not understandable” in Q2-2, in contrast to the
sessions in 2013 and 2014, where some participants did provide these answers. These reductions in
variance suggest that our practice with TEDViT contributed to reducing irregularities in the
participants’ understanding, regardless of the wide variety of background knowledge, as indicated in
Table 3. We consider that the reason for this is that learning support reached every participant using
TEDViT.
Table 7: Average and variance of answered scores in Q2.
2015 (using TEDViT) 2014 2013
Average Variance SD Average Variance SD Average Variance SD
Q2-1 4.67 0.36 0.60 4.31 0.34 0.58 4.33 0.82 0.91
Q2-2 4.07 0.60 0.77 4.38 0.86 0.93 3.17 1.21 1.10
Q2-3 3.07 0.20 0.44 3.06 0.43 0.66 3.37 0.30 0.55
Q2-4 3.27 0.33 0.57 3.13 0.73 0.86 3.53 0.58 0.76
Q2-5 3.47 0.52 0.72 3.25 0.69 0.83 3.60 0.44 0.66
4. Conclusion
In this paper, we described a learning support system called TEDViT, and the classroom practice for
understanding pointers where we introduced our system. There are many existing systems that visualize
the data structures processed by target programs in certain ways, and support learners in understanding
programs and algorithms by making their behavior visible. However, concrete values of pointer
variables are often concealed in such visualizations, and hence the way in which each visualized object
is located on the memory is not made explicit. Therefore, novice learners often fail to grasp the
relationship between program behavior and program code, and reach a learning impasse.
To address this issue, TEDViT visualizes simultaneously and synchronously the memory
image that is the field for presenting the concrete values of the variables, and the target domain world
that is the field for presenting logically the data structures processed by the target program. Moreover,
in order to allow teachers to set their instruction content based on the growing variety of learner
background knowledge, TEDViT visualizes the status of the target domain world according to the
visualization policy defined by the teacher. Using TEDViT, teachers can provide flexible visualizations
that are consistent with the teacher’s class instructions, and learners can be less confused with the
visualizations.
We conducted a classroom practice for understanding pointers in connection with a memory
model. The participants in this practice were not university students, but software engineers responsible
for software development. The participants learned program behavior by observing and comparing the
memory image and target domain world visualized in the learning environment of TEDViT. In the
questionnaire conducted after our practice, we obtained generally satisfactory answers for TEDViT.
The analysis of answered scores suggested that TEDViT contributed to reducing the irregularities of the
participants’ understanding, and that appropriate learning supports reached every participant using
TEDViT. In the questionnaire, some participants commented that the observations of the memory
image in learning pointers were especially valuable. The comments by the teacher of our practice were
also positive in that introducing TEDViT to the class would have a certain degree of effectiveness in
understanding pointers.
Based on the educational practices that we have conducted thus far, including the practice
described in this paper, we consider that visualizing synchronously the memory image and target
domain world has a certain effect in learning by observing program behavior, and that the usability of
TEDViT can be introduced to actual classrooms. We also consider that the definition method of the
529529529
visualization policy implemented in TEDViT has sufficient capability for visualizing a wide variety of
teacher instruction intents.
At the time of the practice described in this paper, the teacher had to edit directly the
configuration file with application software, such as Excel, in order to describe the drawing rules of the
status of the target domain world when defining the visualization policy. We are currently developing a
GUI tool for describing the drawing rules more intuitively. In future work, we plan to reduce the cost of
preparing teaching materials with it. Furthermore, we will conduct more educational practices and
evaluate the effectiveness of using TEDViT with higher reliability.
Acknowledgements
This study was supported by JSPS KAKENHI Grant Numbers JP24300282, JP16K01084.
References
Fossati, D., Eugenio, B. D., Brown, C., & Ohlsson, S. (2008). Learning linked lists: Experiments with the iList
system. Proceedings of the 9th International Conference on Intelligent Tutoring Systems, 80-89.
Kogure, S., Fujioka, R., Noguchi, Y., Yamashita, K., Konishi, T., & Itoh, Y. (2014). Code reading environment
according to visualizing both variable's memory image and target world's status. Proceeding of the 22nd
International Conference on Computers in Education, 343-348.
Malmi, L., Karavirta, V., Korhonen, A., Nikander, J., Seppälä, O., & Silvasti, P. (2004). Visual algorithm
simulation exercise system with automatic assessment: TRAKLA2. Informatics in Education, 3(2), 267-288.
Moreno, A., Myller, N., Sutinen, E., & Ben-Ari, M. (2004). Visualizing programs with Jeliot3. Proceedings of the
working conference on advanced visual interfaces, 373-376.
Naps, T. L., Rößling, G., Almstrum, V., Dann, W., Fleischer, R., Hundhausen, C., Korhonen, A., Malmi, L.,
McNally, M., Rodger, S., & Velázquez-Iturbide, J. (2002). Exploring the role of visualization and
engagement in computer science education. ACM SIGCSE Bulletin, 35(2), 131-152.
Neve, P., Hunter, G., Livingstone, D., & Orwell, J. (2012). NoobLab: An intelligent learning environment for
teaching programming. Proceedings of the 2012 IEEE/WIC/ACM Joint Conferences on Web Intelligence
and Intelligent Agent Technology, 3, 357-361.
Pears, A., Seidman, S., Malmi, L., Mannila, L., Adams, E., Bennedsen, J., Devlin, M., & Paterson, J. (2007). A
survey of literature on the teaching of introductory programming. ACM SIGCSE Bulletin, 39(4), 204-223.
Yamashita, K., Fujioka, R., Kogure, S., Noguchi, Y., Konishi, T., & Itoh, Y. (2015). Educational practice of
algorithm using learning support system with visualization of program behavior. The 23rd International
Conference on Computers in Education, 632-640.
Yamashita, K., Nagao, T., Kogure, S., Noguchi, Y., Konishi, T., & Itoh, Y. (2016). Code-reading support
environment visualizing three fields and educational practice to understand nested loops. Research and
Practice in Technology Enhanced Learning, 11(1), 1-22. doi:10.1186/s41039-016-0027-3
530530530
Chen, W. et al. (Eds.) (2016). Proceedings of the 24th International Conference on Computers in Education. India: Asia-Pacific Society for Computers in Education
Shifting the focus from Learner Completion to Learner Perseverance: Evidences from a
Teacher Professional Development MOOC
Jayakrishnan Madathil WARRIEMa*, Sahana MURTHYb & Sridhar IYER c aIDP in Educational Technology, IIT Bombay, India
Abstract: Most major Massive Open Online Course (MOOC) providers are focusing on design of xMOOCs. In these courses, a central course design team develops necessary learning content (in form of videos and/or documents), automated assessments and manages discussion forums to engage the participants in a structured manner. However the xMOOCs have been criticized for their cognitive-behaviourist pedagogic design, lower student engagement with discussion forums and lower completion rates that make it unsuitable for direct use in Teacher Professional Development (TPD). In this paper we introduce the idea of ‘Learner Perseverance’ that can be used as a better design goal for an xMOOC developed for TPD. The design principles of Immersivity and Pertinency were utilized in adapting the xMOOC components of videos, auto-graded assessment problems and discussion forums for a TPD MOOC (ET601Tx) to achieve learner perseverance. It was seen that there were 3447 active participants (67.5% of enrolled) in the course, i.e. people who have accessed courseware at least once. The data from the course logs show that 1201 (47.1%) active learners had participated in the discussion forum generating 5023 discussion threads generating 9861 comments (i.e. 4 threads and 8 comments per active learner who participated in the discussion forum). It was also seen that there is a completion rate of 36.58% (1261 learners) for ET601Tx, which is quite high compared to the average completion rates reported in xMOOCs (6-7%). The course completion survey indicated that these pedagogical designs were useful and relevant for the teachers in their own practice. Based on these findings we recommend use of a ‘Learner Perseverance’ based design for improving learner participation in xMOOCs that are used for TPD.
Keywords: Learner Persevrance, MOOC design, Teacher Professional Development, Immersivity, Pertinency
1. Introduction Over the past decade, Massive Open Online Courses (MOOCs) have had exponential proliferation within the online education space (Nkuyubwatsi, 2013). With many MOOC providers partnering with higher education institutions (for example Coursera, edX, FutureLearn etc), the MOOC landscape is now broadening and caters to a wide variety of learners. Teacher professional development (TPD) is one of the crucial areas that can largely be benefited through MOOCs (Jobe, Ostlund, & Svensson, 2014; Laurillard, 2016). Based on the official records available with department of higher education, Government of India, there are 38,056 higher education institutions that cater to 33.2 million students and 1.4 million teachers (MHRD, 2015). MOOC based TPD programmes can become a possible solution to address the professional development needs of these large group of teachers in India.
MOOCs can be broadly divided into two based on the format of content and activities available inside it. The extension or transmissive MOOCs (xMOOCs) are the most popular category as these offers a highly centralized and linear in structure (Margaryan, Bianco, & Littlejohn, 2015). These typically contain well-curated multimedia content, automated and peer assessment mechanisms and discussion forums to engage the learner. The connectivist MOOCs (cMOOCs) on the other hand relies on networked learning is developed based on the connectivist philosophy. These MOOCs provide opportunity for participants to build community and provide opportunities for social
531531531
construction of knowledge (Mackness et. al., 2013).
Existing research on TPD points out the effective programmes/courses should be able to promote higher participant engagement with content, facilitate active learning among participants, encourage reflection on practice and promote participant collaboration (Desmione, 2009; Wells, 2007; Korthagen, Loughran & Russell, 2006; Steinert et. al, 2006). Though there aren’t many, current research on MOOC based TPD points out that a hybrid approach that permits pedagogic modifications of xMOOC to incorporate the networked learning aspect of cMOOC as a possible way ahead to ensure that the above goals are met (Jobe, Ostlund, & Svensson, 2014; Laurillard, 2016). In this paper, we discuss one such attempt and propose a TPD MOOC design that we term as ‘MOOC design for Learner Perseverance’. The term ‘Learner Perseverance’ is adapted from the broader definition of ‘Academic Perseverance’ to denote the behaviour of being engaged, focused and persistent in pursuit of learning goals (Farrington et. al., 2012) within the MOOC setting. Perseverance can be increased directly by improving the academic mindset of the learner through mechanisms like increasing value of a task (McNight and Kashdan, 2009).
Our design for learner perseverance utilizes the design principles of Pertinency and Immersivity (Warriem, Murthy, & Iyer) for designing a TPD MOOC, ET601Tx (Educational Technology for Engineering Teachers). Within the existing xMOOC structure we incorporated slight pedagogic modifications on the videos, assessment activities and discussion forums to create Learning Dialogue (LeD) Videos linked with Learning by Doing activities (LbDs) and Practice focused Discussion Forums respectively. Each of these components was complemented with graded quizzes to provide an explicit connection to the long-term goal of course completion.
The course had an overall enrolment of 5267 students, of which 1261 students (23.9%) successfully completed the course. The course logs show that only 3447 (65.4%) were active in the course, which increases the effective completion rate to (36.6%). The course also saw 1201 participants post 14884 posts in the course discussion forum, thus providing an average of 12.39 posts per active participant. An end of course perception survey response indicated that the LeD videos, LbD activities and Discussion forums were the top 3 reasons for participants to persevere in the course.
Our experience of ET601Tx course shows that Learner Perseverance is a greater goal to target in TPD MOOCs. This has also shown that bringing in learner perseverance positively affects the existing MOOC metrics of completion rate. ET601Tx also provides an instance of validating the use of design principles of Pertinency and Immersivity in a MOOC setting. 2. Related Work Scaling up teacher professional development has always been a challenge within the academic community – both in terms of cost involved and also in terms of quality (Jobe, Ostlund, & Svensson, 2014). Some of the existing solutions that target the issue scaling are Communities of Practice (Triggs & John, 2004) and blended online TPDs (Murthy, Iyer, & Warriem, 2016). With the increased access to Internet among teaching community, the emergence of MOOCs provides a viable alternative to scale TPD efforts.
MOOCs are broadly divided into two main categories – transmissive/extension MOOCs (xMOOCs) and connectivist MOOCs (cMOOCs), based on their structure and format. The xMOOCs, have a more centralized, content-based and linear course structure (Margaryan, Bianco, & Littlejohn, 2015) and are more widely used. These use the cognitive-behaviourist pedagogy with a lot of focus around modularized video lectures, automated assessments and peer assessments (Jobe, Ostlund, & Svensson, 2014). cMOOCs on the other hand have a less formal structure and is developed based on the philosophy of connectivism and networking (Daniel, 2012). These use distributed platforms for learning and focus on social construction of knowledge, which might become difficult and disorienting for beginners (Mackness et. al., 2013). The current research points out that the MOOC designers need to focus on the pedagogy of MOOCs, especially xMOOCs, and also look at the problems of low completion rates (Bayne and Ross, 2014; Gasevic et. al, 2014; Margaryan, Bianco, & Littlejohn, 2015) to increase their effectiveness.
The available scant research on MOOC based TPD points to the need for pedagogic modification within both xMOOC and cMOOC settings (Jobe, Ostlund, & Svensson, 2014;
532532532
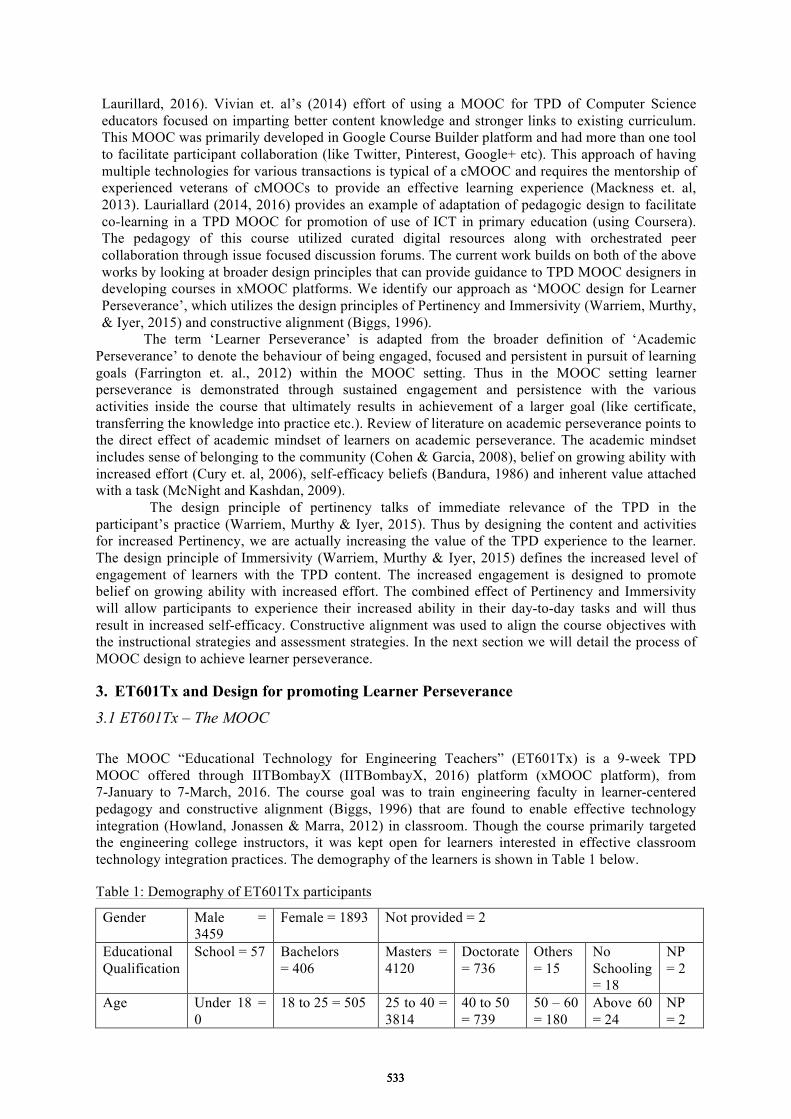
Laurillard, 2016). Vivian et. al’s (2014) effort of using a MOOC for TPD of Computer Science educators focused on imparting better content knowledge and stronger links to existing curriculum. This MOOC was primarily developed in Google Course Builder platform and had more than one tool to facilitate participant collaboration (like Twitter, Pinterest, Google+ etc). This approach of having multiple technologies for various transactions is typical of a cMOOC and requires the mentorship of experienced veterans of cMOOCs to provide an effective learning experience (Mackness et. al, 2013). Lauriallard (2014, 2016) provides an example of adaptation of pedagogic design to facilitate co-learning in a TPD MOOC for promotion of use of ICT in primary education (using Coursera). The pedagogy of this course utilized curated digital resources along with orchestrated peer collaboration through issue focused discussion forums. The current work builds on both of the above works by looking at broader design principles that can provide guidance to TPD MOOC designers in developing courses in xMOOC platforms. We identify our approach as ‘MOOC design for Learner Perseverance’, which utilizes the design principles of Pertinency and Immersivity (Warriem, Murthy, & Iyer, 2015) and constructive alignment (Biggs, 1996).
The term ‘Learner Perseverance’ is adapted from the broader definition of ‘Academic Perseverance’ to denote the behaviour of being engaged, focused and persistent in pursuit of learning goals (Farrington et. al., 2012) within the MOOC setting. Thus in the MOOC setting learner perseverance is demonstrated through sustained engagement and persistence with the various activities inside the course that ultimately results in achievement of a larger goal (like certificate, transferring the knowledge into practice etc.). Review of literature on academic perseverance points to the direct effect of academic mindset of learners on academic perseverance. The academic mindset includes sense of belonging to the community (Cohen & Garcia, 2008), belief on growing ability with increased effort (Cury et. al, 2006), self-efficacy beliefs (Bandura, 1986) and inherent value attached with a task (McNight and Kashdan, 2009).
The design principle of pertinency talks of immediate relevance of the TPD in the participant’s practice (Warriem, Murthy & Iyer, 2015). Thus by designing the content and activities for increased Pertinency, we are actually increasing the value of the TPD experience to the learner. The design principle of Immersivity (Warriem, Murthy & Iyer, 2015) defines the increased level of engagement of learners with the TPD content. The increased engagement is designed to promote belief on growing ability with increased effort. The combined effect of Pertinency and Immersivity will allow participants to experience their increased ability in their day-to-day tasks and will thus result in increased self-efficacy. Constructive alignment was used to align the course objectives with the instructional strategies and assessment strategies. In the next section we will detail the process of MOOC design to achieve learner perseverance. 3. ET601Tx and Design for promoting Learner Perseverance
3.1 ET601Tx – The MOOC The MOOC “Educational Technology for Engineering Teachers” (ET601Tx) is a 9-week TPD MOOC offered through IITBombayX (IITBombayX, 2016) platform (xMOOC platform), from 7-January to 7-March, 2016. The course goal was to train engineering faculty in learner-centered pedagogy and constructive alignment (Biggs, 1996) that are found to enable effective technology integration (Howland, Jonassen & Marra, 2012) in classroom. Though the course primarily targeted the engineering college instructors, it was kept open for learners interested in effective classroom technology integration practices. The demography of the learners is shown in Table 1 below. Table 1: Demography of ET601Tx participants
Gender Male = 3459
Female = 1893 Not provided = 2
Educational Qualification
School = 57 Bachelors = 406
Masters = 4120
Doctorate = 736
Others = 15
No Schooling = 18
NP = 2
Age Under 18 = 0
18 to 25 = 505 25 to 40 = 3814
40 to 50 = 739
50 – 60 = 180
Above 60 = 24
NP = 2
533533533
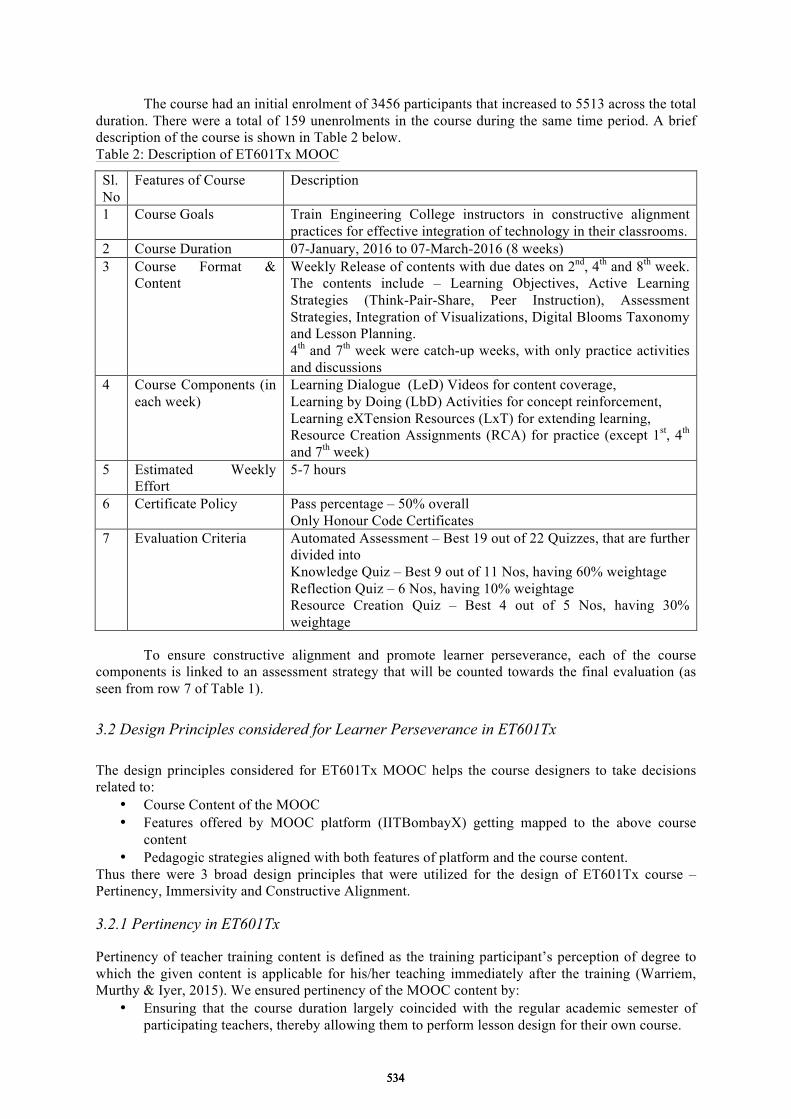
The course had an initial enrolment of 3456 participants that increased to 5513 across the total duration. There were a total of 159 unenrolments in the course during the same time period. A brief description of the course is shown in Table 2 below. Table 2: Description of ET601Tx MOOC
Sl. No
Features of Course Description
1 Course Goals Train Engineering College instructors in constructive alignment practices for effective integration of technology in their classrooms.
2 Course Duration 07-January, 2016 to 07-March-2016 (8 weeks) 3 Course Format &
Content Weekly Release of contents with due dates on 2nd, 4th and 8th week. The contents include – Learning Objectives, Active Learning Strategies (Think-Pair-Share, Peer Instruction), Assessment Strategies, Integration of Visualizations, Digital Blooms Taxonomy and Lesson Planning. 4th and 7th week were catch-up weeks, with only practice activities and discussions
4 Course Components (in each week)
Learning Dialogue (LeD) Videos for content coverage, Learning by Doing (LbD) Activities for concept reinforcement, Learning eXTension Resources (LxT) for extending learning, Resource Creation Assignments (RCA) for practice (except 1st, 4th and 7th week)
5 Estimated Weekly Effort
5-7 hours
6 Certificate Policy Pass percentage – 50% overall Only Honour Code Certificates
7 Evaluation Criteria Automated Assessment – Best 19 out of 22 Quizzes, that are further divided into Knowledge Quiz – Best 9 out of 11 Nos, having 60% weightage Reflection Quiz – 6 Nos, having 10% weightage Resource Creation Quiz – Best 4 out of 5 Nos, having 30% weightage
To ensure constructive alignment and promote learner perseverance, each of the course
components is linked to an assessment strategy that will be counted towards the final evaluation (as seen from row 7 of Table 1).
3.2 Design Principles considered for Learner Perseverance in ET601Tx The design principles considered for ET601Tx MOOC helps the course designers to take decisions related to:
• Course Content of the MOOC • Features offered by MOOC platform (IITBombayX) getting mapped to the above course
content • Pedagogic strategies aligned with both features of platform and the course content.
Thus there were 3 broad design principles that were utilized for the design of ET601Tx course – Pertinency, Immersivity and Constructive Alignment. 3.2.1 Pertinency in ET601Tx Pertinency of teacher training content is defined as the training participant’s perception of degree to which the given content is applicable for his/her teaching immediately after the training (Warriem, Murthy & Iyer, 2015). We ensured pertinency of the MOOC content by:
• Ensuring that the course duration largely coincided with the regular academic semester of participating teachers, thereby allowing them to perform lesson design for their own course.
534534534
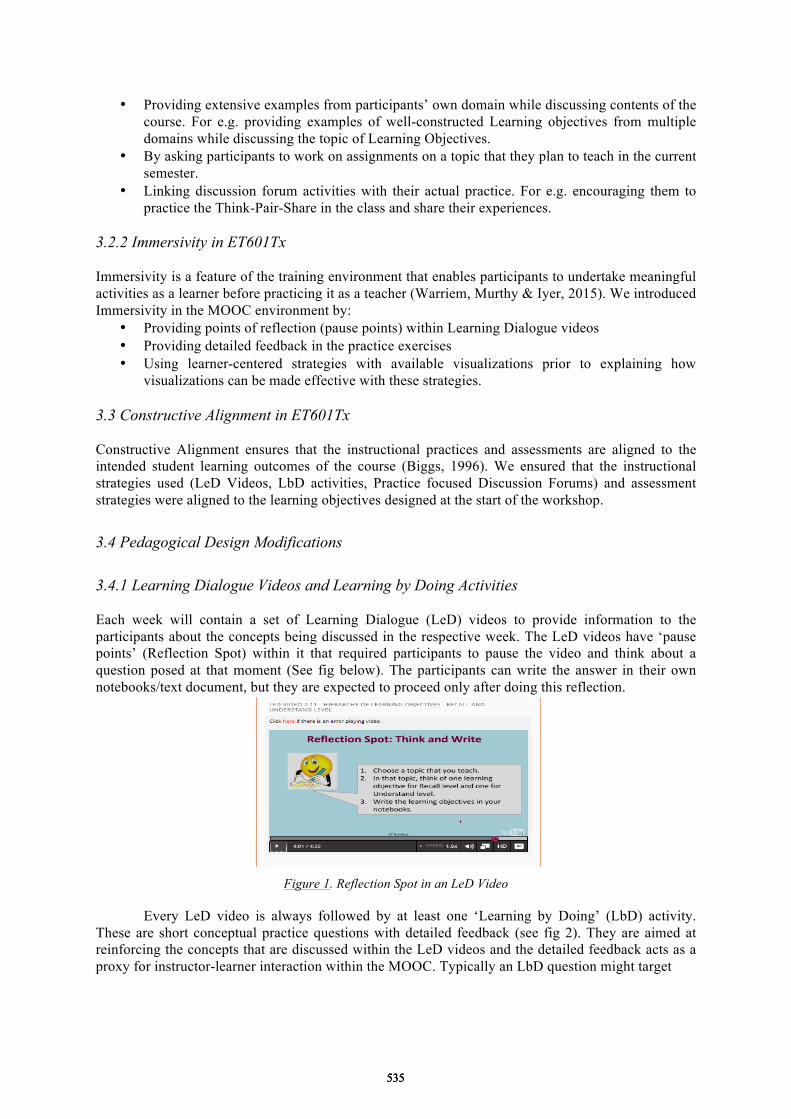
• Providing extensive examples from participants’ own domain while discussing contents of the course. For e.g. providing examples of well-constructed Learning objectives from multiple domains while discussing the topic of Learning Objectives.
• By asking participants to work on assignments on a topic that they plan to teach in the current semester.
• Linking discussion forum activities with their actual practice. For e.g. encouraging them to practice the Think-Pair-Share in the class and share their experiences.
3.2.2 Immersivity in ET601Tx Immersivity is a feature of the training environment that enables participants to undertake meaningful activities as a learner before practicing it as a teacher (Warriem, Murthy & Iyer, 2015). We introduced Immersivity in the MOOC environment by:
• Providing points of reflection (pause points) within Learning Dialogue videos • Providing detailed feedback in the practice exercises • Using learner-centered strategies with available visualizations prior to explaining how
visualizations can be made effective with these strategies. 3.3 Constructive Alignment in ET601Tx Constructive Alignment ensures that the instructional practices and assessments are aligned to the intended student learning outcomes of the course (Biggs, 1996). We ensured that the instructional strategies used (LeD Videos, LbD activities, Practice focused Discussion Forums) and assessment strategies were aligned to the learning objectives designed at the start of the workshop.
3.4 Pedagogical Design Modifications 3.4.1 Learning Dialogue Videos and Learning by Doing Activities Each week will contain a set of Learning Dialogue (LeD) videos to provide information to the participants about the concepts being discussed in the respective week. The LeD videos have ‘pause points’ (Reflection Spot) within it that required participants to pause the video and think about a question posed at that moment (See fig below). The participants can write the answer in their own notebooks/text document, but they are expected to proceed only after doing this reflection.
Figure 1. Reflection Spot in an LeD Video
Every LeD video is always followed by at least one ‘Learning by Doing’ (LbD) activity. These are short conceptual practice questions with detailed feedback (see fig 2). They are aimed at reinforcing the concepts that are discussed within the LeD videos and the detailed feedback acts as a proxy for instructor-learner interaction within the MOOC. Typically an LbD question might target
535535535
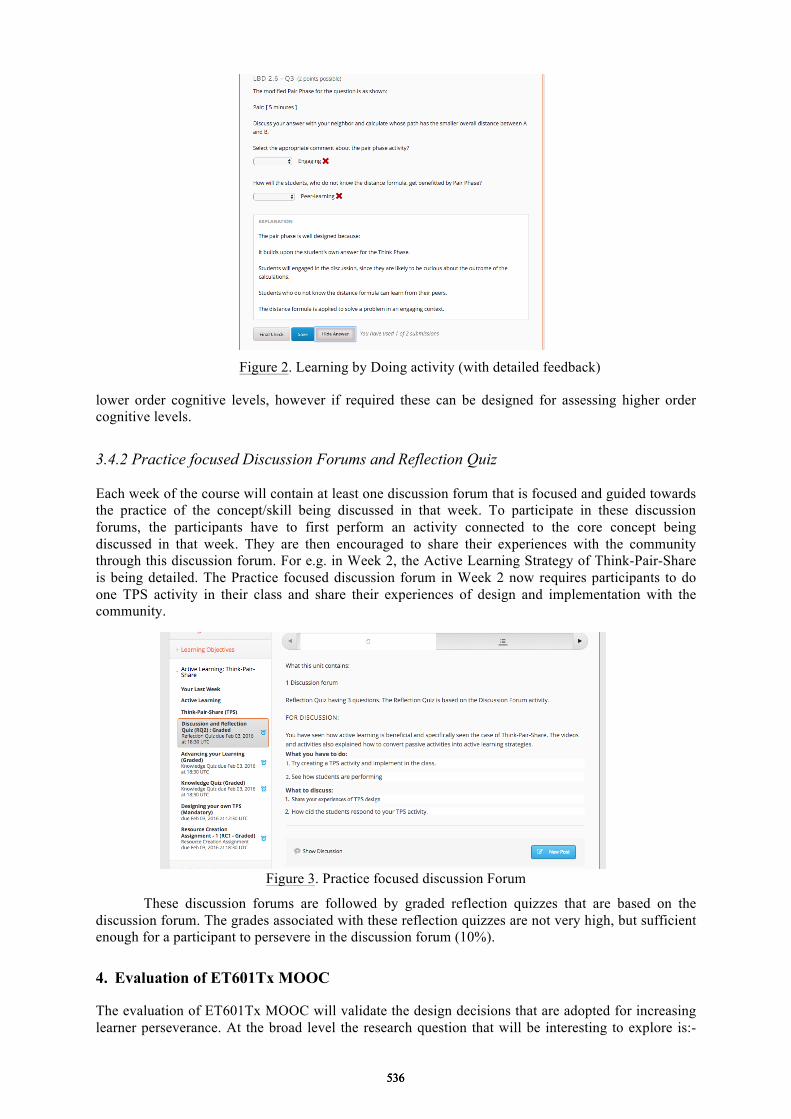
Figure 2. Learning by Doing activity (with detailed feedback)
lower order cognitive levels, however if required these can be designed for assessing higher order cognitive levels.
3.4.2 Practice focused Discussion Forums and Reflection Quiz Each week of the course will contain at least one discussion forum that is focused and guided towards the practice of the concept/skill being discussed in that week. To participate in these discussion forums, the participants have to first perform an activity connected to the core concept being discussed in that week. They are then encouraged to share their experiences with the community through this discussion forum. For e.g. in Week 2, the Active Learning Strategy of Think-Pair-Share is being detailed. The Practice focused discussion forum in Week 2 now requires participants to do one TPS activity in their class and share their experiences of design and implementation with the community.
Figure 3. Practice focused discussion Forum
These discussion forums are followed by graded reflection quizzes that are based on the discussion forum. The grades associated with these reflection quizzes are not very high, but sufficient enough for a participant to persevere in the discussion forum (10%).
4. Evaluation of ET601Tx MOOC The evaluation of ET601Tx MOOC will validate the design decisions that are adopted for increasing learner perseverance. At the broad level the research question that will be interesting to explore is:-
536536536
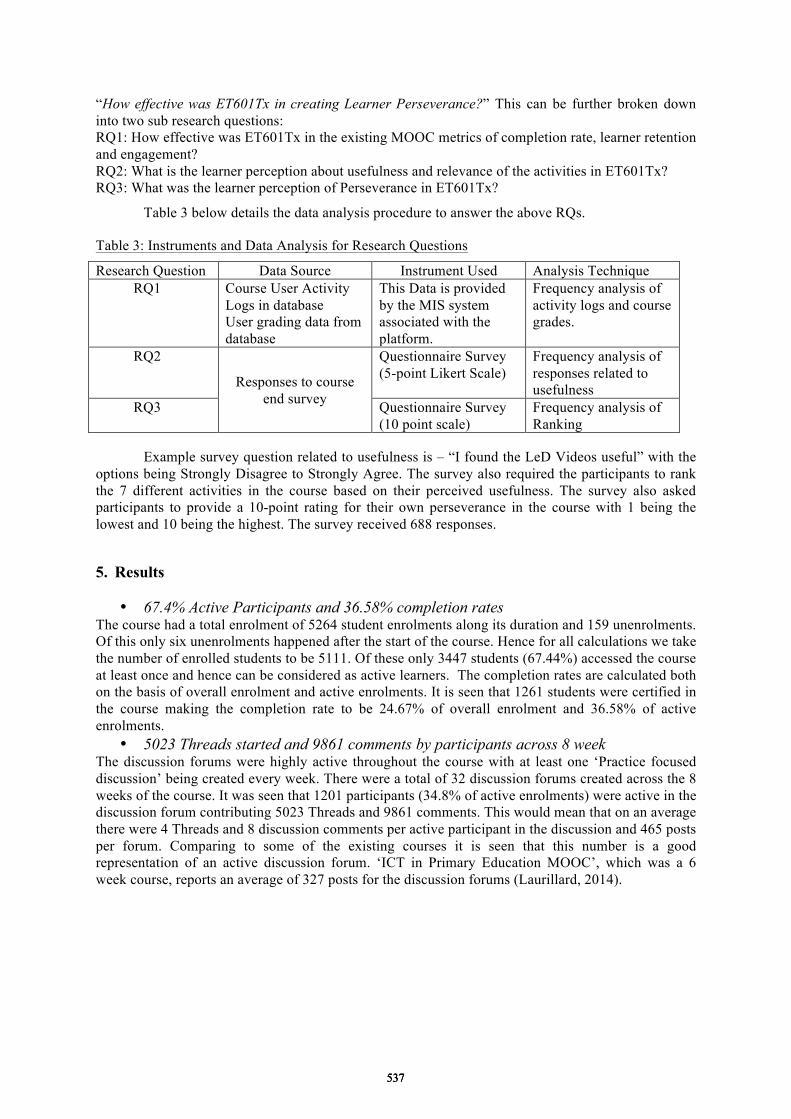
“How effective was ET601Tx in creating Learner Perseverance?” This can be further broken down into two sub research questions: RQ1: How effective was ET601Tx in the existing MOOC metrics of completion rate, learner retention and engagement? RQ2: What is the learner perception about usefulness and relevance of the activities in ET601Tx? RQ3: What was the learner perception of Perseverance in ET601Tx?
Table 3 below details the data analysis procedure to answer the above RQs.
Table 3: Instruments and Data Analysis for Research Questions Research Question Data Source Instrument Used Analysis Technique
RQ1 Course User Activity Logs in database User grading data from database
This Data is provided by the MIS system associated with the platform.
Frequency analysis of activity logs and course grades.
RQ2 Responses to course
end survey
Questionnaire Survey (5-point Likert Scale)
Frequency analysis of responses related to usefulness
RQ3 Questionnaire Survey (10 point scale)
Frequency analysis of Ranking
Example survey question related to usefulness is – “I found the LeD Videos useful” with the
options being Strongly Disagree to Strongly Agree. The survey also required the participants to rank the 7 different activities in the course based on their perceived usefulness. The survey also asked participants to provide a 10-point rating for their own perseverance in the course with 1 being the lowest and 10 being the highest. The survey received 688 responses. 5. Results
• 67.4% Active Participants and 36.58% completion rates The course had a total enrolment of 5264 student enrolments along its duration and 159 unenrolments. Of this only six unenrolments happened after the start of the course. Hence for all calculations we take the number of enrolled students to be 5111. Of these only 3447 students (67.44%) accessed the course at least once and hence can be considered as active learners. The completion rates are calculated both on the basis of overall enrolment and active enrolments. It is seen that 1261 students were certified in the course making the completion rate to be 24.67% of overall enrolment and 36.58% of active enrolments.
• 5023 Threads started and 9861 comments by participants across 8 week The discussion forums were highly active throughout the course with at least one ‘Practice focused discussion’ being created every week. There were a total of 32 discussion forums created across the 8 weeks of the course. It was seen that 1201 participants (34.8% of active enrolments) were active in the discussion forum contributing 5023 Threads and 9861 comments. This would mean that on an average there were 4 Threads and 8 discussion comments per active participant in the discussion and 465 posts per forum. Comparing to some of the existing courses it is seen that this number is a good representation of an active discussion forum. ‘ICT in Primary Education MOOC’, which was a 6 week course, reports an average of 327 posts for the discussion forums (Laurillard, 2014).
537537537
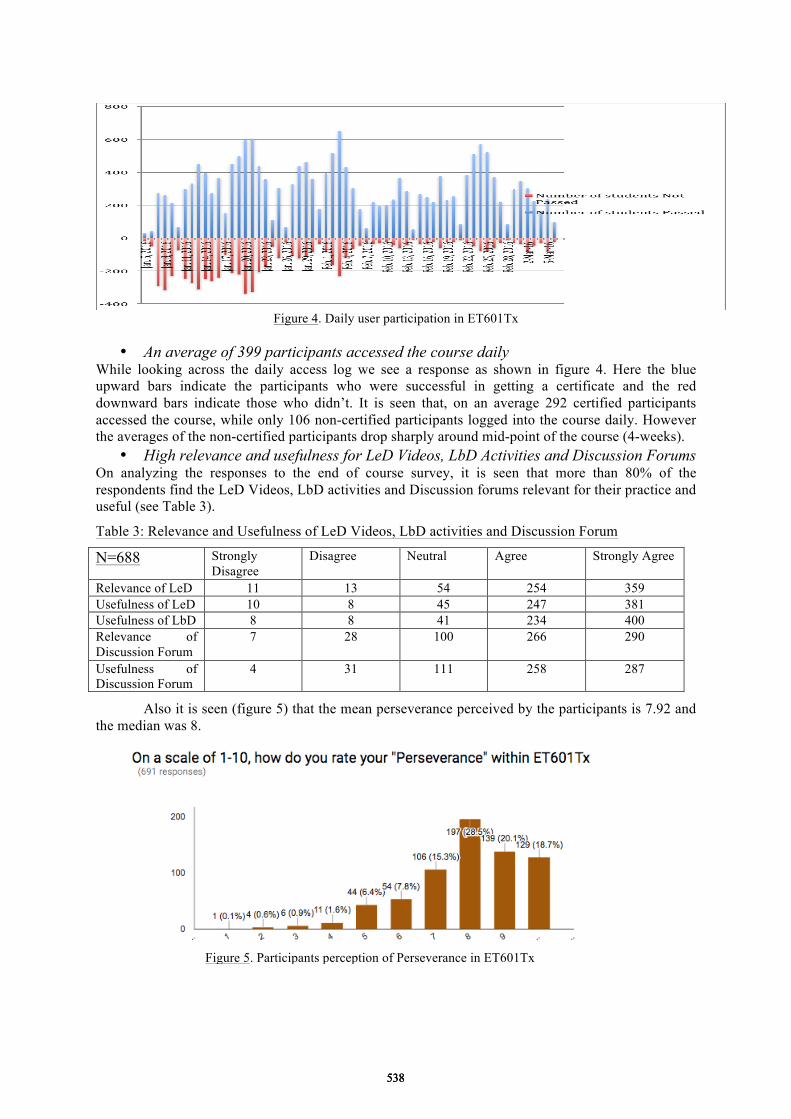
Figure 4. Daily user participation in ET601Tx
• An average of 399 participants accessed the course dailyWhile looking across the daily access log we see a response as shown in figure 4. Here the blue upward bars indicate the participants who were successful in getting a certificate and the red downward bars indicate those who didn’t. It is seen that, on an average 292 certified participants accessed the course, while only 106 non-certified participants logged into the course daily. However the averages of the non-certified participants drop sharply around mid-point of the course (4-weeks).
• High relevance and usefulness for LeD Videos, LbD Activities and Discussion ForumsOn analyzing the responses to the end of course survey, it is seen that more than 80% of the respondents find the LeD Videos, LbD activities and Discussion forums relevant for their practice and useful (see Table 3).
Table 3: Relevance and Usefulness of LeD Videos, LbD activities and Discussion Forum
N=688 Strongly Disagree
Disagree Neutral Agree Strongly Agree
Relevance of LeD 11 13 54 254 359 Usefulness of LeD 10 8 45 247 381 Usefulness of LbD 8 8 41 234 400 Relevance of Discussion Forum
7 28 100 266 290
Usefulness of Discussion Forum
4 31 111 258 287
Also it is seen (figure 5) that the mean perseverance perceived by the participants is 7.92 and the median was 8.
Figure 5. Participants perception of Perseverance in ET601Tx
538538538
6. Discussion and Conclusion
To answer RQ1, we need to look at first 3 results reported in the previous section. From the results it is seen that the completion rates (36.58%) reported in ET601Tx is high compared to the other TPD MOOCs. While ‘ICT in primary education MOOC’ reported 11% completion (Laurillard, 2016), ‘Australian F-10 PD MOOC’ reported 7% completion rates. The engagement rates of ET601Tx discussion forums (34.8% active and 465 posts per forum) are comparable with ‘ICT in Primary Education MOOCs’ rates of 39% and 327 posts/forum. The results also show that there is an average daily activity of 292 certified and 106 non-certified users in the course. Though the activity of non-certified users drastically reduces after 4 week, this is a good number. Based on all these we can conclude that ET601Tx was highly effective in terms of standard MOOC metrics of completion, engagement and retention.
More than 80% of the end of course survey respondents indicated high agreement to the usefulness and relevance of the LeD Videos, LbD activities and Discussion Forums. While 88.8% found the LeD Videos to be relevant, 80.5% found the discussion forums relevant for their practice. These figures are comparable with usefulness and relevance found in an earlier blended model of TPD (Warriem, Murthy, & Iyer, 2015) within the Indian context. Thus to answer RQ2, we can conclude that the activities in ET601Tx were highly useful and relevant for the participants. To answer RQ3, we look at the final result that indicates an average perseverance rating of 7.92 (out of 10). This helps us conclude that participants in ET601Tx had a high perception of perseverance.
The flexibility offered by the xMOOC platform coupled with our design features had allowed participants to blend both learning and practice throughout the duration of course. Results of high perception of relevance and usefulness of the designed activities (LeD Videos, LbD activities and Discussion Forum) are indicative of the Pertinency of the course content (Warriem, Murthy & Iyer, 2015). The higher engagement of participants (Average daily users = 398, Average posts per forum = 465) is a combined effect of Immersivity in the learning environment and Pertinency of coursecontent. Since the course was coinciding with the regular academic semester of many of theparticipants, they were able to implement their learning from TPD in their own classrooms and wereusing the discussion forums to share their experiences with their peers. Such high engagements indiscussion forums can be attributed to sense of belonging to the community (Cohen & Garcia, 2008)and belief of growing ability (Curry et. al., 2006) that the participants felt during ET601Tx. Boththese are essential to ensure perseverance (Farthington et. al., 2012) that further leads to coursecompletion.
A major limitation of this study is that we have not performed a detailed analysis of forum posts and response to understand the quality of posts and social networks that gets generated in such a discussion forum. This is crucial in developing reflection on practice and a collaborative community that are essential characteristics of a TPD (Desmione, 2009; Korthagen, Loughran & Russell, 2006).
Acknowledgements
The authors wish to acknowledge the contribution of Prof. D. B. Phatak and the entire IITBombayX support team, that includes the Development Team, System team, MIS Team eOutreach Team and eStudio Team for providing us with the IITBombayX platform and extending the the necessary support required for running this course. The authors also acknowledge the support provided by the Lakshmi Ganesh, Soumya Narayanan, Prajish Prasad and Gargi Banerjee (Research Scholars in IDP in Educational Technology, IIT Bombay) who helped us with TA work in the course and also with qualitative data analysis.
References
Bali, M. (2014). MOOC pedagogy: gleaning good practice from existing MOOCs. Journal of Online Learning and Teaching, 10(1), 44.
Bandura, A. (1986) Social foundations of thought and action: A social cognitive theory. Englewood Cliffs, NJ: Prentice Hall.
Bayne, S. & Ross, J. (2014) The Pedagogy of the Massive Open Online Course: The UK View, Higher Education Academy, York.
539539539
Biggs, J. (1996). Enhancing teaching through constructive alignment. Higher education, 32(3), 347-364. Cohen, G.L., and Garcia, J. (2008) Identity, belonging, and achievement: A model, interventions, implications.
Current Directions in Psychological Science, 17(6), 365-369. Cury, F., Elliot, A.J., Da Fonseca, D., and Moller, A.C. (2006) The social-cognitive model of achievement
motivation and the 2×2 achievement goal framework. Journal of Personality and Social Psychology, 90, 666-679
Daniel, J. (2012). Making sense of MOOCs: Musings in a maze of myth, paradox and possibility. JIME. Retrieved from http://jime.ubiquitypress.com/articles/10.5334/2012-18/ on Jun 4, 2016.
Desimone, L. M. (2009). Improving impact studies of teachers’ professional development: Toward better conceptualizations and measures. Educational researcher, 38(3), 181-199.
ET601Tx. (2016). Retrieved from https://www.iitbombayx.in/courses/IITBombayX/ET601Tx/2015-16/about on 4 June, 2016.
Farrington, C. A., Roderick, M., Allensworth, E., Nagaoka, J., Keyes, T. S., Johnson, D. W., & Beechum, N. O. (2012). Teaching Adolescents to Become Learners: The Role of Noncognitive Factors in Shaping School Performance--A Critical Literature Review. Consortium on Chicago School Research. Chicago.
Gasevic, D., Kovanovic, V., Joksimovic, S., & Siemens, G. (2014). Where is research on massive open online courses headed? A data analysis of the MOOC Research Initiative. The International Review Of Research In Open And Distributed Learning, 15(5).
Gillani, N., & Eynon, R. (2014). Communication patterns in massively open online courses. The Internet and Higher Education, 23, 18-26.
Howland, J. L., Jonassen, D. H., & Marra, R. M. (2012). Meaningful learning with technology. Upper Saddle River, NJ: Pearson
Jobe, W., Östlund, C., & Svensson, L. (2014). MOOCs for professional teacher development. In Society for Information Technology & Teacher Education International Conference, Mar 17, 2014 in Jacksonville, Florida, United States. 1580-1586. AACE.
Korthagen, F., Loughran, J., & Russell, T. (2006). Developing fundamental principles for teacher education programs and practices. Teaching and teacher education, 22(8), 1020-1041.
Laurillard, D. (2014). Anatomy of a MOOC for Teacher CPD. Technical report. UCL Institute of Education. Retrieved from http://www.lonklab.ac.uk/cms/files/jce/reports/anatomy_of_a_mooc_for_teacher_cpd_ucl-ioe.pdf on May 10, 2016.
Laurillard, D. (2016). The educational problem that MOOCs could solve: professional development for teachers of disadvantaged students. Research in Learning Technology, 24.
Margaryan, A., Bianco, M., & Littlejohn, A. (2015). Instructional quality of massive open online courses (MOOCs). Computers & Education, 80, 77-83.
McKnight, P.E., and Kashdan, T.B. (2009) Purpose in life as a system that creates and sustains health and well-being: An integrative, testable theory. Review of General Psychology, 13, 242-251
MHRD (2015). All India Survey on Higher Education Report, accessible at http://mhrd.gov.in/statist last retrieved on June 1, 2016.
Murthy, S., Iyer, S., & Warriem, J. (2015). ET4ET: a large-scale faculty professional development program on effective integration of educational technology. Journal of Educational Technology & Society, 18(3), 16-28.
Nkuyubwatsi, B. (2013). Evaluation of Massive Open Online Courses (MOOCs) from the learner's perspective. In European Conference on e-Learning (p. 340). Academic Conferences International Limited.
Skrypnyk, O., de Vries, P., & Hennis, T. (2015) Reconsidering Retention in MOOCs: the Relevance of Formal Assessment and Pedagogy. In Proceedings of European MOOC Stakeholder Summit, 18-20 May, 2015 in Mons, Belgium. 166-172.
Steinert, Y., Mann, K., Centeno, A., Dolmans, D., Spencer, J., Gelula, M., et al. (2006). A systematic review of faculty development initiatives designed to improve teaching effectiveness in medical education: BEME Guide No. Medical Teacher, 28(8), 497–526.
Triggs, P., & John, P. (2004). From transaction to transformation: information and communication technology, professional development and the formation of communities of practice. Journal of computer assisted learning, 20(6), 426-439.
Vivian, R., Falkner, K., & Falkner, N. (2014). Addressing the challenges of a new digital technologies curriculum: MOOCs as a scalable solution for teacher professional development. Research in Learning Technology, 22. pp 1-19. http://dx.doi.org/10.3402/rlt.v22.24691
Warriem, J. M., Murthy, S., & Iyer, S. (2015). Sustainability at Scale: Evidence based recommendations for Teacher Professional Development. In Proceedings of 23rd International Conference on Computers in Education (ICCE2016) in Hangzhou, China. 651-660.
540540540
Chen, W. et al. (Eds.) (2016). Proceedings of the 24th International Conference on Computers in Education. India: Asia-Pacific Society for Computers in Education
Experimental Studies to Clarify the Knowledge-to-action Gap in Information Ethics
Koji TANAKAa*, Miku SONODAb, Mitsuru IKEDAa & Masahiro HORIb aSchool of Knowledge Science, Japan Advanced Institute of Science and Technology, Japan
bGraduate School of Informatics, Kansai University, Japan *[email protected]
Abstract: If learners cannot form an intention to take an appropriate action with reference to the knowledge of information ethics, it cannot be said that the learners have working knowledge of ethical principles. In the present study, the two experiments are conducted with high school students to examine if the knowledge-to-action gap can be confirmed by means of paper-and-pencil tests consisting of knowledge and intention tasks of information ethics. The knowledge task is to inquire about appropriate behavior regarding the correct knowledge, while the intention task is an inquiry whether the respondents consciously select the action or not. The experiments 1 and 2 indicated that participants take unethical behaviors even though they know appropriate behavior. In addition, the experiment 2 demonstrated that the participants estimated the number of classmates with unethical behavior is higher than the actual number. These results indicate the importance of education and teaching methods, which need to be carefully designed to reduce the gap between knowledge and action to comply with information ethics.
Keywords: knowledge-to-action gap, information ethics, theory of planed behavior
1. Introduction Due to the rapid progress of information technology, there is a growing need of ethical maturity for individuals in information society. Ministry of Education, Japan (2009, p.37) defines information ethics as “thinking and attitudes that form the basis for appropriate conduct in information society” (Ministry of Education, Culture, Sports, Science and Technology, 2009, p.37). Thus, despite having knowledge of information ethics, if there is no intent to actualize that knowledge (behavioral intention) in practice, it cannot be said that working knowledge of ethical principles has been acquired. For examples, bad practices continue to abound in information moral behavior despite efforts for disseminating good practices by various organizations (Telecommunications Carriers Association, 2015b; The Japan Commercial Broadcasters Association, 2015; Information-technology Promotion Agency, Japan, 2015). A study of texting while walking reported 56.2% of respondents have experienced near run-ins with people smartphoning while walking. In another survey on password use, 93.1% of web service users answered yes to the question of password recycling. Such behavior is often called unsafe act (Haga, 2000, Reason, 1990), which is described as behavior that may harm the safety of the doer or others even when it is implemented unintentionally (Haga, 2000, p. 137). In this study, unsafe act against information ethics is referred to as unethical behavior.
The main objective of this study is to clarify the characteristics of unethical behavior, by quantifying inconsistencies between knowledge and behavioral intention, by using questionnaires created from descriptions in textbooks of information ethics for Japanese high schools. Students participated as respondents completed two types of questionnaires: one is to answer for ethical behavior to be regarded as correct knowledge (knowledge task), and another is to answer for actual behavior that will be taken by the respondents (intention task). Based on the results of the questionnaires, characteristics of unethical behavior are investigated considering how students estimated the behavior of their classmates. In the remainder of this paper, first we briefly review the studies of psychological processes underlying the relations between knowledge and behavior. Section 3 explains the results of surveys, where subject matters for information ethics are extracted and categorized from Japanese high school textbooks. Finally, in Sections 4 and 5, two psychological experiments are presented to make
541541541
sure there exist the knowledge-and-action gap, and then discuss findings from the experiments that reveal inconsistencies between knowledge and behavioral intention. 2. The psychological process from knowledge to behavior Appropriate information moral behavior, namely, ethical behavior, is observed when a person forms intention not only to avoid unethical behavior, but also to take ethical behavior. In the theory of planned behavior proposed by Ajzen (1991), the behavior stage is preceded by an intention stage, which in turn is influenced by attitudes toward the particular behavior, subjective norm, and perceived behavioral control. Gollwitzer (1993, 1996) further divides intention into two types: goal intentions and implementation intentions. Goal intentions take the form of a wish or desire “I intend to do X!” (Gollwitzer, 1996, p.292) while implementation intentions are concrete plans to achieve particular goals when there is an established relationship between a behavior and the situation on which it is premised “I intend to do X when situation Y is encountered!” (Gollwitzer, 1996, p.292). In case of information moral behavior, an example of implementation intentions will be as follows: a person intends to create a new password when password registration is required for use of a website.
Furthermore, Koike, et al. (2003) propose an extended psychological process model that begins with a stage of knowledge (i.e., knowing the subject) followed by the stages of interest, motivation, and behavioral intention, until an actual behavior is taken. Regardless of the progress of these qualitative models, there have not been any method for quantifying the knowledge-and-action gap. In contrast, focusing on the formation of the initial and final stages in the psychological process, Tanaka, et al. (2015b) proposed an experimental method to quantify inconsistencies between knowledge and behavioral intention, and demonstrated the validity of the method in disaster emergency situations. This experimental method is used in this study to investigate the relationship between knowledge and behavior in the case of information ethics. 3. Preliminary Study In order to apply the experimental method (Tanaka, et al. 2015b) to the field of information ethics, it is necessary to collect individual unethical behaviors and categorize them for use in questionnaires. Through factor analysis of existing studies on awareness of information ethics, Arimitsu (2015) has identified three major themes: copyright (copyright infringement and illegal copy), personal information (invasion of privacy), and information abuse. Arimitsu (2015) pointed out that the awareness should be measured with regard to risk aversion as well. In addition to these four themes, we consider public manners in this study, which are frequently cited as social problem with personal digital assistant such as mobile devices. We then reviewed textbooks and supplementary materials used in the subject of Information in Japanese high school curriculum, and surveyed unethical behaviors given in these materials. 3.1 Materials surveyed We surveyed 11 textbooks on the subject of Information. Six of them were textbooks officially approved in 2012, and five were supplementary booklets published in 2014 or later. 3.2 Survey Method Descriptions of unethical behaviors are extracted from the textbooks and supplementary booklets, taking account of the above-mentioned themes: copyright, personal information, information abuse, risk aversion, and manners.
542542542
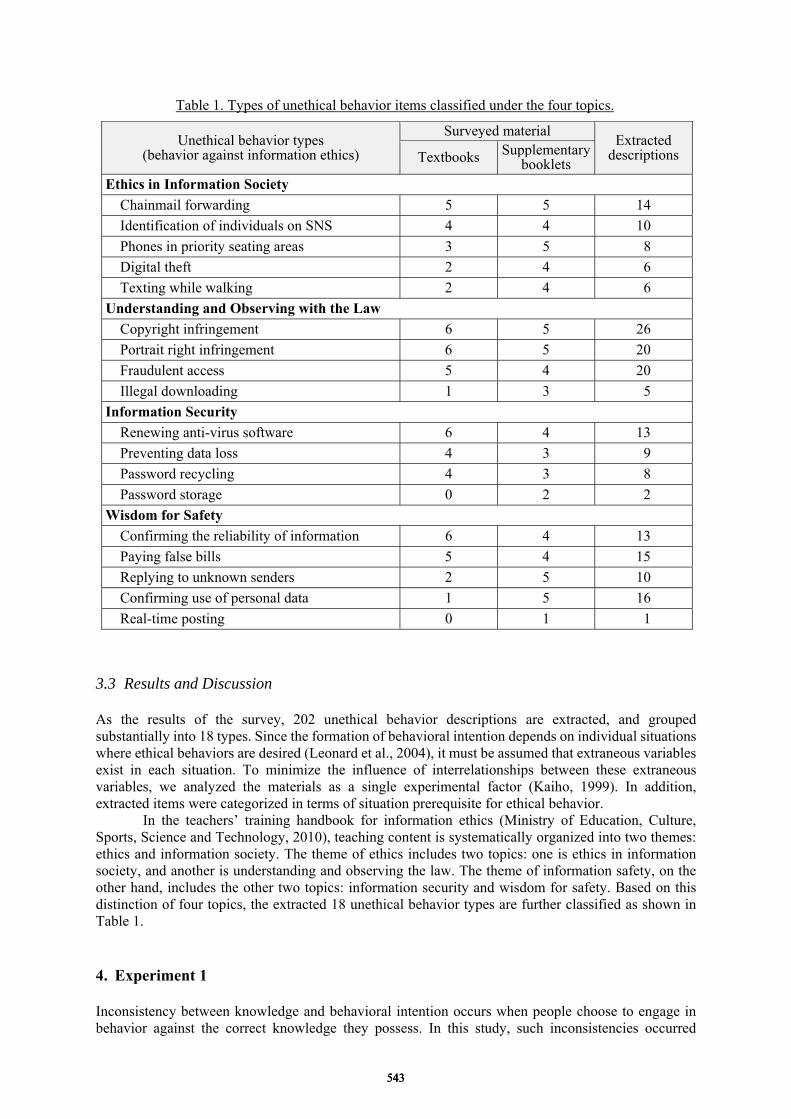
3.3 Results and Discussion As the results of the survey, 202 unethical behavior descriptions are extracted, and grouped substantially into 18 types. Since the formation of behavioral intention depends on individual situations where ethical behaviors are desired (Leonard et al., 2004), it must be assumed that extraneous variables exist in each situation. To minimize the influence of interrelationships between these extraneous variables, we analyzed the materials as a single experimental factor (Kaiho, 1999). In addition, extracted items were categorized in terms of situation prerequisite for ethical behavior.
In the teachers’ training handbook for information ethics (Ministry of Education, Culture, Sports, Science and Technology, 2010), teaching content is systematically organized into two themes: ethics and information society. The theme of ethics includes two topics: one is ethics in information society, and another is understanding and observing the law. The theme of information safety, on the other hand, includes the other two topics: information security and wisdom for safety. Based on this distinction of four topics, the extracted 18 unethical behavior types are further classified as shown in Table 1. 4. Experiment 1 Inconsistency between knowledge and behavioral intention occurs when people choose to engage in behavior against the correct knowledge they possess. In this study, such inconsistencies occurred
Table 1. Types of unethical behavior items classified under the four topics.
Unethical behavior types (behavior against information ethics)
Surveyed material Extracted descriptions Textbooks Supplementary
booklets Ethics in Information Society
Chainmail forwarding 5 5 14 Identification of individuals on SNS 4 4 10 Phones in priority seating areas 3 5 8 Digital theft 2 4 6 Texting while walking 2 4 6
Understanding and Observing with the Law
Copyright infringement 6 5 26 Portrait right infringement 6 5 20 Fraudulent access 5 4 20 Illegal downloading 1 3 5
Information Security
Renewing anti-virus software 6 4 13 Preventing data loss 4 3 9 Password recycling 4 3 8 Password storage 0 2 2
Wisdom for Safety
Confirming the reliability of information 6 4 13 Paying false bills 5 4 15 Replying to unknown senders 2 5 10 Confirming use of personal data 1 5 16 Real-time posting 0 1 1
543543543
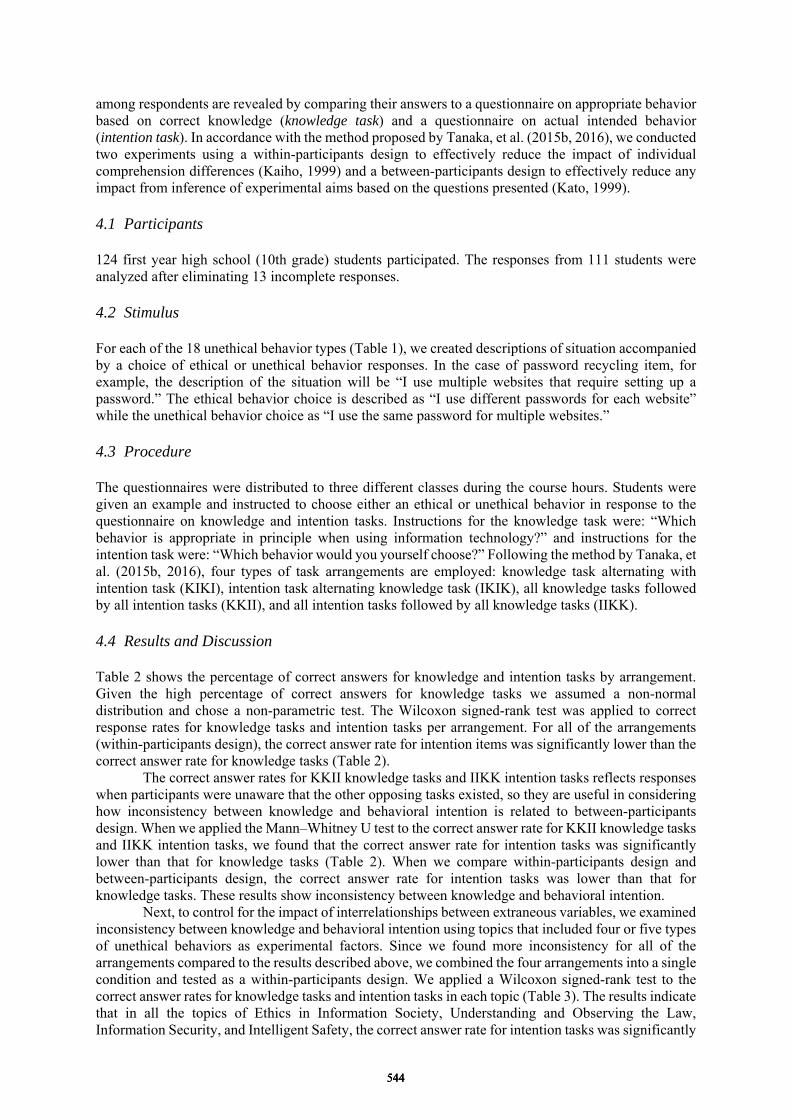
among respondents are revealed by comparing their answers to a questionnaire on appropriate behavior based on correct knowledge (knowledge task) and a questionnaire on actual intended behavior (intention task). In accordance with the method proposed by Tanaka, et al. (2015b, 2016), we conducted two experiments using a within-participants design to effectively reduce the impact of individual comprehension differences (Kaiho, 1999) and a between-participants design to effectively reduce any impact from inference of experimental aims based on the questions presented (Kato, 1999). 4.1 Participants 124 first year high school (10th grade) students participated. The responses from 111 students were analyzed after eliminating 13 incomplete responses. 4.2 Stimulus For each of the 18 unethical behavior types (Table 1), we created descriptions of situation accompanied by a choice of ethical or unethical behavior responses. In the case of password recycling item, for example, the description of the situation will be “I use multiple websites that require setting up a password.” The ethical behavior choice is described as “I use different passwords for each website” while the unethical behavior choice as “I use the same password for multiple websites.” 4.3 Procedure The questionnaires were distributed to three different classes during the course hours. Students were given an example and instructed to choose either an ethical or unethical behavior in response to the questionnaire on knowledge and intention tasks. Instructions for the knowledge task were: “Which behavior is appropriate in principle when using information technology?” and instructions for the intention task were: “Which behavior would you yourself choose?” Following the method by Tanaka, et al. (2015b, 2016), four types of task arrangements are employed: knowledge task alternating with intention task (KIKI), intention task alternating knowledge task (IKIK), all knowledge tasks followed by all intention tasks (KKII), and all intention tasks followed by all knowledge tasks (IIKK). 4.4 Results and Discussion Table 2 shows the percentage of correct answers for knowledge and intention tasks by arrangement. Given the high percentage of correct answers for knowledge tasks we assumed a non-normal distribution and chose a non-parametric test. The Wilcoxon signed-rank test was applied to correct response rates for knowledge tasks and intention tasks per arrangement. For all of the arrangements (within-participants design), the correct answer rate for intention items was significantly lower than the correct answer rate for knowledge tasks (Table 2).
The correct answer rates for KKII knowledge tasks and IIKK intention tasks reflects responses when participants were unaware that the other opposing tasks existed, so they are useful in considering how inconsistency between knowledge and behavioral intention is related to between-participants design. When we applied the Mann–Whitney U test to the correct answer rate for KKII knowledge tasks and IIKK intention tasks, we found that the correct answer rate for intention tasks was significantly lower than that for knowledge tasks (Table 2). When we compare within-participants design and between-participants design, the correct answer rate for intention tasks was lower than that for knowledge tasks. These results show inconsistency between knowledge and behavioral intention.
Next, to control for the impact of interrelationships between extraneous variables, we examined inconsistency between knowledge and behavioral intention using topics that included four or five types of unethical behaviors as experimental factors. Since we found more inconsistency for all of the arrangements compared to the results described above, we combined the four arrangements into a single condition and tested as a within-participants design. We applied a Wilcoxon signed-rank test to the correct answer rates for knowledge tasks and intention tasks in each topic (Table 3). The results indicate that in all the topics of Ethics in Information Society, Understanding and Observing the Law, Information Security, and Intelligent Safety, the correct answer rate for intention tasks was significantly
544544544
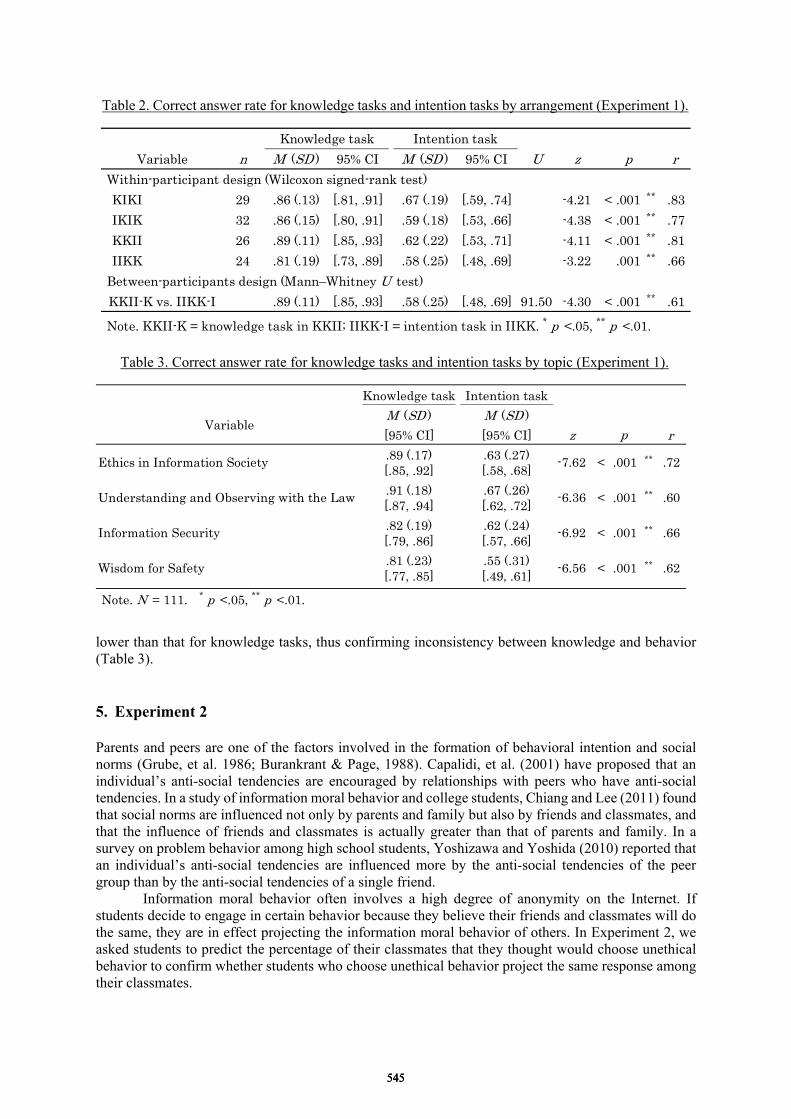
lower than that for knowledge tasks, thus confirming inconsistency between knowledge and behavior (Table 3). 5. Experiment 2 Parents and peers are one of the factors involved in the formation of behavioral intention and social norms (Grube, et al. 1986; Burankrant & Page, 1988). Capalidi, et al. (2001) have proposed that an individual’s anti-social tendencies are encouraged by relationships with peers who have anti-social tendencies. In a study of information moral behavior and college students, Chiang and Lee (2011) found that social norms are influenced not only by parents and family but also by friends and classmates, and that the influence of friends and classmates is actually greater than that of parents and family. In a survey on problem behavior among high school students, Yoshizawa and Yoshida (2010) reported that an individual’s anti-social tendencies are influenced more by the anti-social tendencies of the peer group than by the anti-social tendencies of a single friend.
Information moral behavior often involves a high degree of anonymity on the Internet. If students decide to engage in certain behavior because they believe their friends and classmates will do the same, they are in effect projecting the information moral behavior of others. In Experiment 2, we asked students to predict the percentage of their classmates that they thought would choose unethical behavior to confirm whether students who choose unethical behavior project the same response among their classmates.
Table 2. Correct answer rate for knowledge tasks and intention tasks by arrangement (Experiment 1).
Variable n M (SD ) 95% CI M (SD ) 95% CI U z r
Within-participant design (Wilcoxon signed-rank test)
KIKI 29 .86 (.13) [.81, .91] .67 (.19) [.59, .74] -4.21 < .001 ** .83
IKIK 32 .86 (.15) [.80, .91] .59 (.18) [.53, .66] -4.38 < .001 ** .77
KKII 26 .89 (.11) [.85, .93] .62 (.22) [.53, .71] -4.11 < .001 ** .81
IIKK 24 .81 (.19) [.73, .89] .58 (.25) [.48, .69] -3.22 .001 ** .66
Between-participants design (Mann–Whitney U test)
KKII-K vs. IIKK-I 50 .89 (.11) [.85, .93] .58 (.25) [.48, .69] 91.50 -4.30 < .001 ** .61
Knowledge task Intention task
p
Note. KKII-K = knowledge task in KKII; IIKK-I = intention task in IIKK. * p <.05, ** p <.01.
Table 3. Correct answer rate for knowledge tasks and intention tasks by topic (Experiment 1).
Knowledge task Intention task
M (SD ) M (SD )
[95% CI] [95% CI] z r
.89 (.17) .63 (.27)[.85, .92] [.58, .68]
.91 (.18) .67 (.26)[.87, .94] [.62, .72]
.82 (.19) .62 (.24)[.79, .86] [.57, .66]
.81 (.23) .55 (.31)[.77, .85] [.49, .61]
Variablep
Ethics in Information Society -7.62 < .001 **
.66
.72
Understanding and Observing with the Law -6.36 < .001 ** .60
Information Security -6.92 < .001 **
Note. N = 111. * p <.05, ** p <.01.
Wisdom for Safety -6.56 < .001 ** .62
545545545
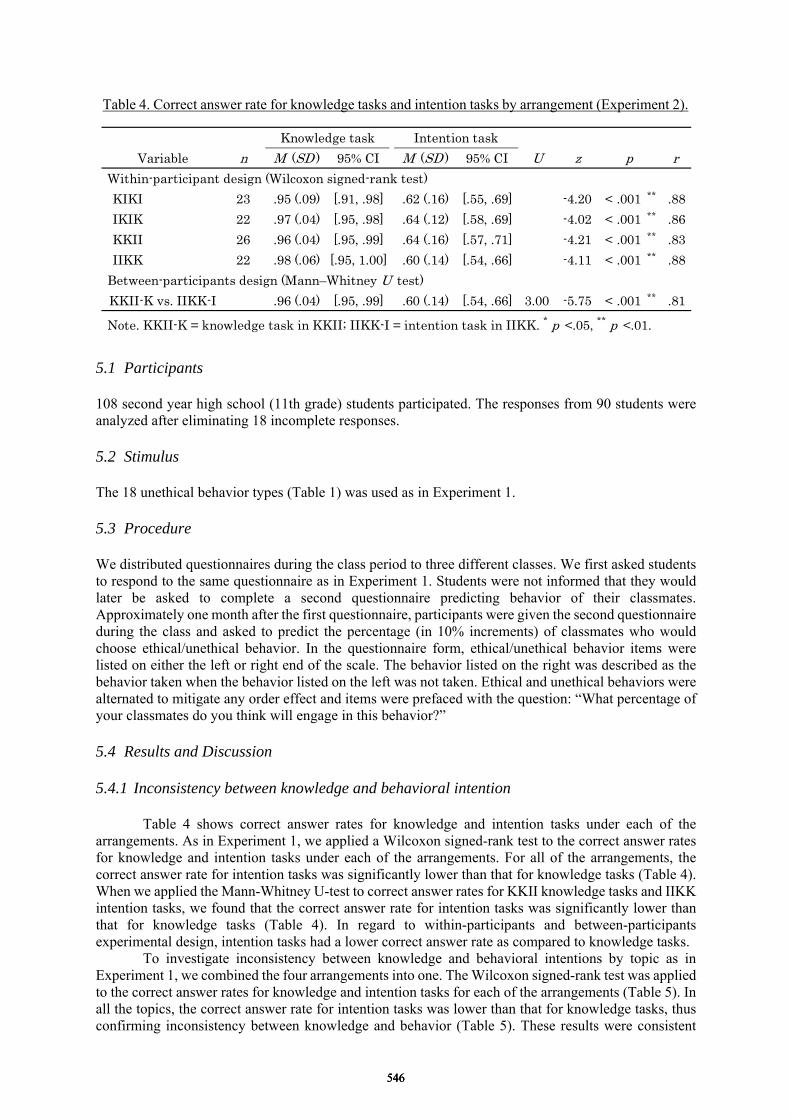
5.1 Participants 108 second year high school (11th grade) students participated. The responses from 90 students were analyzed after eliminating 18 incomplete responses. 5.2 Stimulus The 18 unethical behavior types (Table 1) was used as in Experiment 1. 5.3 Procedure We distributed questionnaires during the class period to three different classes. We first asked students to respond to the same questionnaire as in Experiment 1. Students were not informed that they would later be asked to complete a second questionnaire predicting behavior of their classmates. Approximately one month after the first questionnaire, participants were given the second questionnaire during the class and asked to predict the percentage (in 10% increments) of classmates who would choose ethical/unethical behavior. In the questionnaire form, ethical/unethical behavior items were listed on either the left or right end of the scale. The behavior listed on the right was described as the behavior taken when the behavior listed on the left was not taken. Ethical and unethical behaviors were alternated to mitigate any order effect and items were prefaced with the question: “What percentage of your classmates do you think will engage in this behavior?” 5.4 Results and Discussion 5.4.1 Inconsistency between knowledge and behavioral intention
Table 4 shows correct answer rates for knowledge and intention tasks under each of the arrangements. As in Experiment 1, we applied a Wilcoxon signed-rank test to the correct answer rates for knowledge and intention tasks under each of the arrangements. For all of the arrangements, the correct answer rate for intention tasks was significantly lower than that for knowledge tasks (Table 4). When we applied the Mann-Whitney U-test to correct answer rates for KKII knowledge tasks and IIKK intention tasks, we found that the correct answer rate for intention tasks was significantly lower than that for knowledge tasks (Table 4). In regard to within-participants and between-participants experimental design, intention tasks had a lower correct answer rate as compared to knowledge tasks.
To investigate inconsistency between knowledge and behavioral intentions by topic as in Experiment 1, we combined the four arrangements into one. The Wilcoxon signed-rank test was applied to the correct answer rates for knowledge and intention tasks for each of the arrangements (Table 5). In all the topics, the correct answer rate for intention tasks was lower than that for knowledge tasks, thus confirming inconsistency between knowledge and behavior (Table 5). These results were consistent
Table 4. Correct answer rate for knowledge tasks and intention tasks by arrangement (Experiment 2).
Variable n M (SD ) 95% CI M (SD ) 95% CI U z r
Within-participant design (Wilcoxon signed-rank test)
KIKI 23 .95 (.09) [.91, .98] .62 (.16) [.55, .69] -4.20 < .001 ** .88
IKIK 22 .97 (.04) [.95, .98] .64 (.12) [.58, .69] -4.02 < .001 ** .86
KKII 26 .96 (.04) [.95, .99] .64 (.16) [.57, .71] -4.21 < .001 ** .83
IIKK 22 .98 (.06) [.95, 1.00] .60 (.14) [.54, .66] -4.11 < .001 ** .88
Between-participants design (Mann–Whitney U test)
KKII-K vs. IIKK-I 45 .96 (.04) [.95, .99] .60 (.14) [.54, .66] 3.00 -5.75 < .001 ** .81
Knowledge task Intention task
p
Note. KKII-K = knowledge task in KKII; IIKK-I = intention task in IIKK. * p <.05, ** p <.01.
546546546
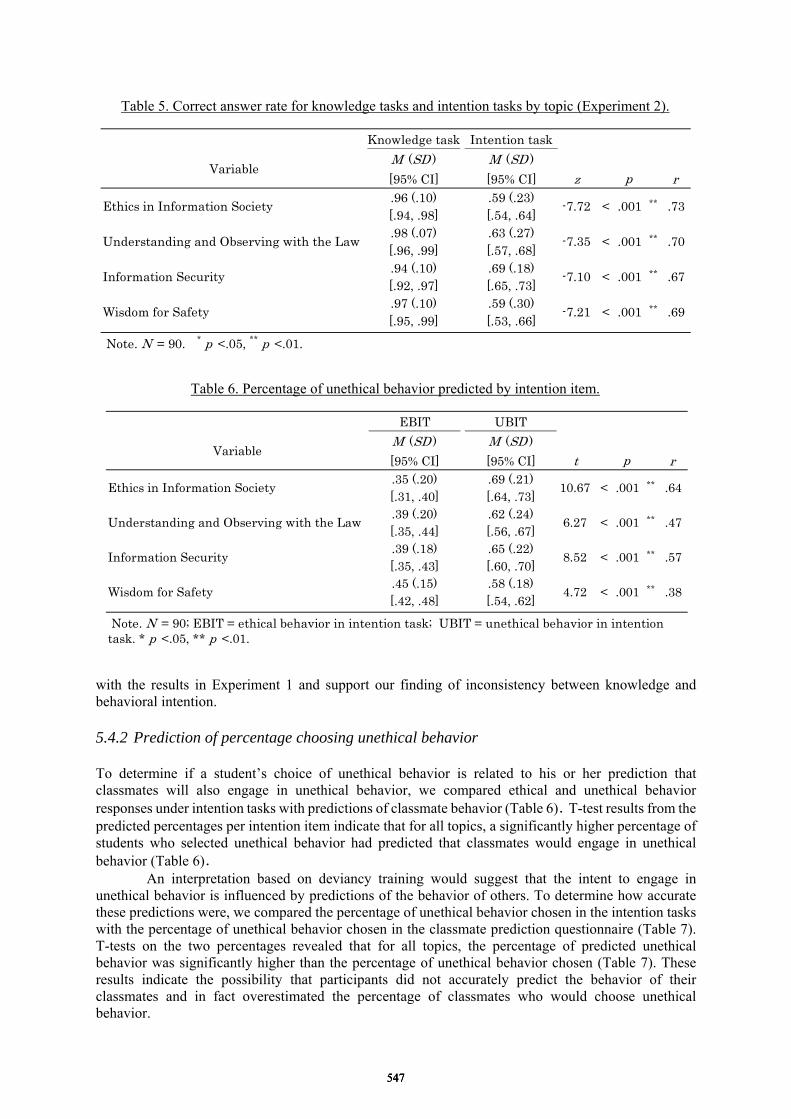
with the results in Experiment 1 and support our finding of inconsistency between knowledge and behavioral intention. 5.4.2 Prediction of percentage choosing unethical behavior To determine if a student’s choice of unethical behavior is related to his or her prediction that classmates will also engage in unethical behavior, we compared ethical and unethical behavior responses under intention tasks with predictions of classmate behavior (Table 6).T-test results from the predicted percentages per intention item indicate that for all topics, a significantly higher percentage of students who selected unethical behavior had predicted that classmates would engage in unethical behavior (Table 6).
An interpretation based on deviancy training would suggest that the intent to engage in unethical behavior is influenced by predictions of the behavior of others. To determine how accurate these predictions were, we compared the percentage of unethical behavior chosen in the intention tasks with the percentage of unethical behavior chosen in the classmate prediction questionnaire (Table 7). T-tests on the two percentages revealed that for all topics, the percentage of predicted unethical behavior was significantly higher than the percentage of unethical behavior chosen (Table 7). These results indicate the possibility that participants did not accurately predict the behavior of their classmates and in fact overestimated the percentage of classmates who would choose unethical behavior.
Table 5. Correct answer rate for knowledge tasks and intention tasks by topic (Experiment 2).
Knowledge task Intention task
M (SD ) M (SD )
[95% CI] [95% CI] z r.96 (.10) .59 (.23)[.94, .98] [.54, .64].98 (.07) .63 (.27)[.96, .99] [.57, .68].94 (.10) .69 (.18)[.92, .97] [.65, .73].97 (.10) .59 (.30)[.95, .99] [.53, .66]
Variablep
Ethics in Information Society -7.72 < .001 ** .73
Understanding and Observing with the Law -7.35 < .001 ** .70
.69
Information Security -7.10 < .001 ** .67
Wisdom for Safety -7.21 < .001 **
Note. N = 90. * p <.05, ** p <.01.
Table 6. Percentage of unethical behavior predicted by intention item.
EBIT UBIT
M (SD ) M (SD )
[95% CI] [95% CI] t r.35 (.20) .69 (.21)[.31, .40] [.64, .73].39 (.20) .62 (.24)[.35, .44] [.56, .67].39 (.18) .65 (.22)[.35, .43] [.60, .70].45 (.15) .58 (.18)[.42, .48] [.54, .62]
Note. N = 90; EBIT = ethical behavior in intention task; UBIT = unethical behavior in intentiontask. * p <.05, ** p <.01.
.38
Information Security 8.52 < .001 ** .57
Wisdom for Safety 4.72 < .001 **
.64
Understanding and Observing with the Law 6.27 < .001 ** .47
Variablep
Ethics in Information Society 10.67 < .001 **
547547547
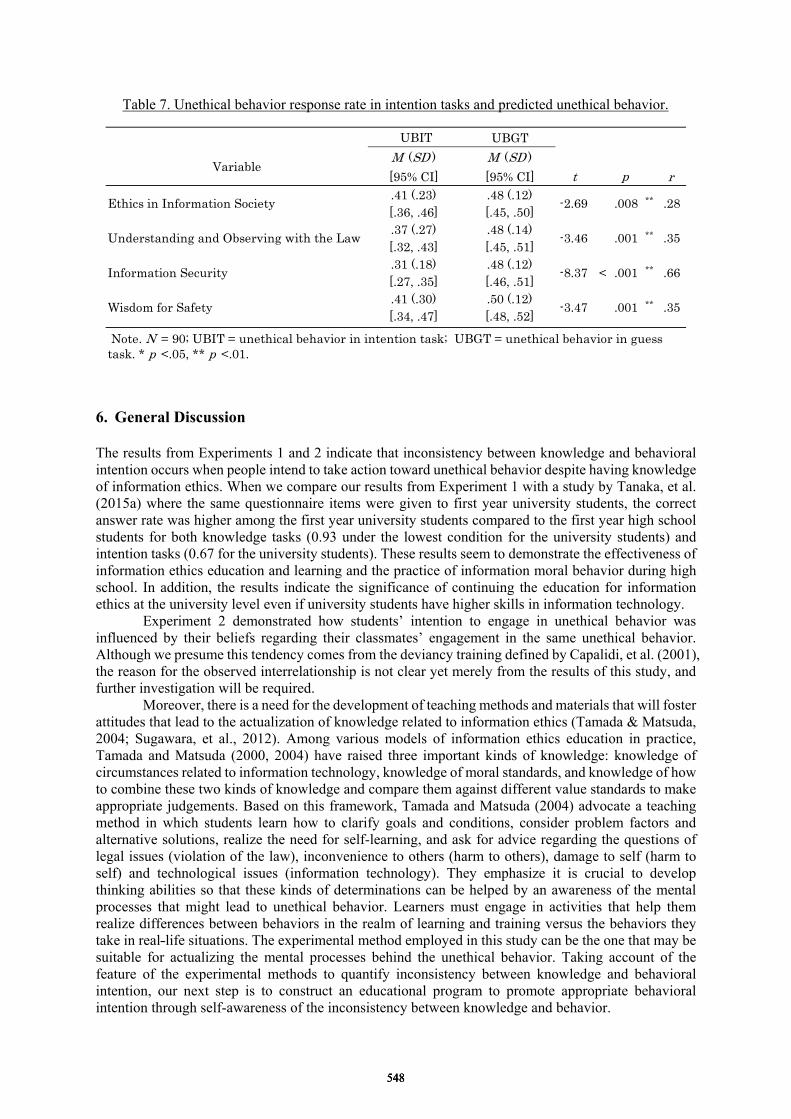
6. General Discussion The results from Experiments 1 and 2 indicate that inconsistency between knowledge and behavioral intention occurs when people intend to take action toward unethical behavior despite having knowledge of information ethics. When we compare our results from Experiment 1 with a study by Tanaka, et al. (2015a) where the same questionnaire items were given to first year university students, the correct answer rate was higher among the first year university students compared to the first year high school students for both knowledge tasks (0.93 under the lowest condition for the university students) and intention tasks (0.67 for the university students). These results seem to demonstrate the effectiveness of information ethics education and learning and the practice of information moral behavior during high school. In addition, the results indicate the significance of continuing the education for information ethics at the university level even if university students have higher skills in information technology.
Experiment 2 demonstrated how students’ intention to engage in unethical behavior was influenced by their beliefs regarding their classmates’ engagement in the same unethical behavior. Although we presume this tendency comes from the deviancy training defined by Capalidi, et al. (2001), the reason for the observed interrelationship is not clear yet merely from the results of this study, and further investigation will be required.
Moreover, there is a need for the development of teaching methods and materials that will foster attitudes that lead to the actualization of knowledge related to information ethics (Tamada & Matsuda, 2004; Sugawara, et al., 2012). Among various models of information ethics education in practice, Tamada and Matsuda (2000, 2004) have raised three important kinds of knowledge: knowledge of circumstances related to information technology, knowledge of moral standards, and knowledge of how to combine these two kinds of knowledge and compare them against different value standards to make appropriate judgements. Based on this framework, Tamada and Matsuda (2004) advocate a teaching method in which students learn how to clarify goals and conditions, consider problem factors and alternative solutions, realize the need for self-learning, and ask for advice regarding the questions of legal issues (violation of the law), inconvenience to others (harm to others), damage to self (harm to self) and technological issues (information technology). They emphasize it is crucial to develop thinking abilities so that these kinds of determinations can be helped by an awareness of the mental processes that might lead to unethical behavior. Learners must engage in activities that help them realize differences between behaviors in the realm of learning and training versus the behaviors they take in real-life situations. The experimental method employed in this study can be the one that may be suitable for actualizing the mental processes behind the unethical behavior. Taking account of the feature of the experimental methods to quantify inconsistency between knowledge and behavioral intention, our next step is to construct an educational program to promote appropriate behavioral intention through self-awareness of the inconsistency between knowledge and behavior.
Table 7. Unethical behavior response rate in intention tasks and predicted unethical behavior.
UBGT
M (SD ) M (SD )
[95% CI] [95% CI] t r.41 (.23) .48 (.12)[.36, .46] [.45, .50].37 (.27) .48 (.14)[.32, .43] [.45, .51].31 (.18) .48 (.12)[.27, .35] [.46, .51].41 (.30) .50 (.12)[.34, .47] [.48, .52]
Note. N = 90; UBIT = unethical behavior in intention task; UBGT = unethical behavior in guesstask. * p <.05, ** p <.01.
UBIT
Wisdom for Safety -3.47 .001
Variablep
** .35
Information Security -8.37 < .001 ** .66
.28
Understanding and Observing with the Law -3.46 .001 ** .35
Ethics in Information Society -2.69 .008 **
548548548
Acknowledgements We would like to express our gratitude to the K High School and T High School for supporting this study and kindly providing the class, as well as to Ms. Saki Nakata, who supported the experiments. This work was supported by JSPS KAKENHI Grant Number 26560133. References Ajzen, I. (1991). The theory of planned behavior. Organizational Behavior and Human Decision Processes,
50(2), 179-211. Arimitsu, K. (2015). Jyouhou moraru koudou. In Arimitsu, K. & Fujisawa, A. (Eds) Moraru no shinrigaku. Kyoto:
Kitaohji Syobou, 63-127. (in Japanese) Burnkrant, R. E. & Page, T. J. (1988). The structure and antecedents of the normative and attitudinal components
of Fishbein's theory of reasoned action. Journal of Experimental Social Psychology, 24(1), 66-87. Capaldi, D. M., Dishion, T. J., Stoolmiller, M., & Yoerger, K. (2001). Aggression toward female partners by
at-risk young men: the contribution of male adolescent friendships. Developmental Psychology, 37(1), 61-73.
Chiang, L. & Lee, B. (2011). Ethical attitude and behaviors regarding computer use. Ethics & Behavior, 21(6), 481-497.
Gollwitzer, P. M. (1993). Goal achievement: The role of intentions. European Review of Social Psychology, 4(1), 141-185.
Gollwitzer, P. M. (1996). The volitional benefits of planning. The Psychology of action: Linking Cognition and Motivation to Behavior, 13, 287-312.
Grube, J. W., Morgan, M., & Mcgree, S. T. (1986). Attitudes and normative beliefs as predictors of smoking intentions and behaviours: A test of three models. British Journal of Social Psychology, 25(2), 81-93.
Haga, S. (2000). Shippai no mekanizumu: Wasuremono kara kyodaijiko made. Tokyo: Japan Publication Service. Information-technology Promotion Agency, Japan (2015). Password: I want to protect you more strongly. (in
Japanese) Retrieved from https://www.ipa.go.jp/security/keihatsu/munekyun-pw/index.html (accessed 2015.9.5)
Japan Commercial Broadcasters Association (2015). Housoubangumi no ihouhaisin bokumetu kyanpe-nn. (in Japanese) Retrieved from http://www.j-ba.or.jp/ihoubokumetsu/ (accessed 2015.9.14)
Kaiho, H. (1999). Sozai no tishiki osen mondai. In Kaiho, H. & Kato, T. (Eds) Ninchi kenkyuu no gihou. Tokyo: Fukumura Shuppan Inc., 176-178. (in Japanese)
Kato, T. (1999). Jikkenito no satti mondai. In Kaiho, H. & Kato, T. (Eds) Ninchi kenkyuu no gihou. Tokyo: Fukumura Shuppan Inc., 170-172. (in Japanese)
Koike, T., Yoshitani, T., Shirakawa, N., Sawada, T., Miyashiro, N., Inoue, M., et al. (2003). Basic study on psychological processes and activities related to environmental problems. Proceedings of Hydraulic Engineering, 47, 361-366. (in Japanese with English abstract)
Leonard, L. K., Cronan, T. P. & Kreie, J. (1996). What influences IT ethical behavior intentions: Planned behavior, reasoned action, perceived importance, or individual characteristics? Information and Management, 42, 143-158.
Ministry of Education, Culture, Sports, Science and Technology (2009). Koutougakkou gakusyu shidou youryou kaisetu jyouhou hen. (in Japanese)
Ministry of Education, Culture, Sports, Science and Technology (2010). Information Ethics Teacher Training Handbook. Tokyo: Center for Educational Computing. (in Japanese)
Reason, J. T. (1990). Human error. New York: Cambridge University Press. Sugawara, S., Washibayashi, J., & Arai, N. (2012). Teaching methods for conveying abstract concepts in
information morals education. Japanese Journal of Educational Technology, 36(2), 135-146. (in Japanese with English abstract)
Tamada, K. & Matsuda, T. (2000). A method of teaching using three different types of knowledge for moral education in informatics. Japanese Journal of Educational Technology, 24, 147-152. (in Japanese)
Tamada, K. & Matsuda, T. (2004). Development of the instruction method of information morals by “the combination of three types of knowledge”. Japanese Journal of Educational Technology, 28(2), 79-88. (in Japanese with English abstract)
Tanaka, K., Ikeda, M., & Hori, M. (2016). A method to confirm knowledge-to-action gap by using a pair of knowledge and intention tasks. International Journal of Psychology, Special Issue: 31th International Congress of Psychology, 853 (abstract only)
549549549

Tanaka, K., Sonoda, M., Ikeda, M., & Hori, M. (2015a, September). Knowledge-to-intention gap to comply with information ethics. Proceedings of the 79th Annual Convention of the Japanese Psychological Association, 190. Nagoya, Japan. (in Japanese)
Tanaka, K., Umeno, K., Ikeda, M., & Hori, M. (2015b). Experimental studies on perceived danger of unsafe evacuation behavior seen in knowledge-to-action gap. Cognitive Studies, 22 (3), 356-367. (in Japanese with English abstract)
Telecommunications Carriers Association (2015a) “Aruki sumaho” no jittai oyobi ishiki ni kannsuru tyousa. (in Japanese) Retrieved from http://www.tca.or.jp/press_release/2015/0123_670.html (accessed 2015.05.07)
Telecommunications Carriers Association (2015b) “Yamemasyou aruki sumaho” kyanpe-nn no jisshi ni tsuite. (in Japanese) Retrieved from http://www.tca.or.jp/press_release/2015/1020_712.html (accessed 2015.11.07)
Trend micro Inc. (2014). Pasuwa-do no riyou jittai tyousa 2014. (in Japanese) Retrieved from http://www.trendmicro.co.jp/jp/about-us/press-releases/articles/20140609010140.html (accessed 2015.5.7)
Yoshizawa, H. & Yoshida, T. (2010). Interactional model of antisocial tendencies with best friend versus peer based on social information-processing. The Japanese Journal of Experimental Social Psychology, 50 (1), 103-116. (in Japanese with English abstract)
550550550
Chen, W. et al. (Eds.) (2016). Proceedings of the 24th
International Conference on Computers in Education.
India: Asia-Pacific Society for Computers in Education
Training Teachers to Develop
Work-process-oriented Curricula
Yongwu Miaoab*
, Li Xiangc, Lisa Ying
b, Kai Qiu
b and Disi Wang
ab
aDepartment of Computational and Cognitive Sciences, University of Duisburg-Essen, Germany
bWuhan E-competence Education LMT., China
cWuhan Polytechnic, China
Abstract: The work-process-oriented curriculum (WPOC) becomes increasingly popular in
vocational education and training (VET). It links the curricula and ultimately the learning
processes to the work activity and simultaneously to promote action-oriented learning at the
curricular level. In particular, information and communication technologies (ICTs) are more
and more applied in WPOC for effective and efficient working and learning. However, it is
difficult for a teacher in VET to develop a WPOC, because comprehensive technological
pedagogical content knowledge (TPACK) is needed for developing a sound WPOC. To help
teachers learn to acquire TPACK, we developed a web-based learning environment with three
training curricula that addresses the situated nature and complex interplay of technology,
pedagogy and content. In this paper, we present the development of our web-based WPOC
authoring and delivering environment and the development of the three training curricula. By
exploiting the tools and the curricula, the teacher can be trained to develop a
work-process-oriented curriculum in a way of Learning by Design (LbD). Through testing, the
technical feasibility and potential usability of this LbD environment are initially demonstrated.
Keywords: Work-process-oriented Curriculum (WPOC), Vocational Education and Training
(VET), Learning Arena, Technological Pedagogical Content Knowledge (TPACK), Learning
by Design (LbD), Learning Design
1. Introduction
In the past decades vocational education and training (VET) has experienced multiple changes, as a
consequence of the technological advances in different fields. In the context of the changes in VET
didactics concerning work and work processes, work-process-knowledge is regarded as a central
category of knowledge. In particular, the work process as a new didactical reference point has
increasingly moved to the center of interest in research (Spöttl 2008). Germany‟s tradition of
discipline-based vocational school curricula is to be replaced by a system which prioritizes the work
processes characteristic of an occupation as the focus for curricula structured around learning arenas
(KMK, 1996). Learning arenas are didactically reflected occupational fields which follow the
international trend of competence-based curricula (Fischer and Bauer, 2007). In such a learning arena
approach the gap between school-based learning and in-company training, between theory teaching and
practical work experience, between subjective knowledge and objective knowledge is considered
(Fischer and Bauer, 2007). Therefore, the learning process via learning arenas is related to a complete
process of work including information gathering, planning, execution, and evaluation while also being
aware of inter-disciplinary aspects (Rauner, 2007). Especially in today‟s digitalized world, digital
media are deeply integrated into the work processes due to an increased application of computers and
the Internet. Learning and work tasks can be supported by using the different potentials of digital media
in an educational context (Howe and Knutzen, 2013; Howe and Staden, 2015).
In Germany a paradigm shift from discipline-organized curricula in VET schools towards
work-process-related and competence-based curricula can be observed since 1990‟s (Rauner, 2007).
Since the start of the new millennium, the theories, strategies and methods regarding learning arenas are
introduced by Chinese scholars who studied in Germany. They advocated the concept of
action-orientation and promoted the ideas that curriculum design should take the work process as the
551551551
referential criterion (Zhao & Xu, 2008). Since then a curriculum reform in VET promoted by Chinese
government has taken place. However, the WPOC practice is still far from widespread. One of serious
impediments to WPOC‟s diffusion in VET is that teachers, with few exceptions, do not have the
expertise to transform a discipline-organized curriculum into a work-process-oriented curriculum,
because they are well-versed in teaching and lecturing discipline-based knowledge, but have less
work-process-oriented knowledge and, in particular, less theoretical knowledge and practical
experience about how to develop and deliver a work-process-oriented curriculum (Zhao & Xu, 2008).
It is crucial to train teachers in developing work-process-oriented curricula for promoting the
reform of the VET. Currently teacher training in developing work-process-oriented curricula is often in
a traditional way of face-to-face, lecture-based training. Viewing the development of
work-process-oriented curricula as a complex interplay process of technology, pedagogy and content,
we propose to train teachers to develop work-process-oriented curricula by taking
work-process-oriented curricula as well. In this paper the authors present the design and development of
a web-based learning environment with three curricula, which foster the acquiring technical
pedagogical content knowledge (TPACK) needed for developing work-process-oriented curricula
through adopting learning by design (LbD) approach. In the remainder of this paper, we first
characterize the work-process-oriented curriculum. Then we present our learning by design approach to
train teachers in developing a work-process-oriented curriculum. The following section demonstrates
the technical feasibility and potential usability of this approach by presenting the implementation of a
web-based learning environment for developing and delivering a work-process-oriented curriculum.
Finally, we summarize our work and indicate the future work.
2. Characterizing a Work-process-oriented Curriculum
The work-oriented change in the didactics of VET identifies „significant‟ vocational work situations
and the associated work-process-knowledge as the pivotal factor in the design of vocational curricula
and processes (Rauner, 2007). Learning takes place when the learner encounters a problem situation
during the work process and during the execution of work tasks.
The theoretical framework of work-process-oriented and competence-based curricula is based
on the socio-cultural understanding of learning rooted in activity theory (Vygotsky 1978; Engeström
1987), situated learning (Brown et. al. 1989), and community of practice (Lave and Wenger 1991;
Wenger 1998). This theoretical orientation considers the context of learning and the community of
practice as key elements influencing the process of learning. Situated conceptions of learning have
revealed the way in which learning in contextualized settings, such as the workplace and its simulation,
results from participation in socially valued activities within communities of practice. Situated theories
of knowledge acquisition argue that learning, as it normally occurs, is a function of the activity, context
and culture in which it takes place. A work-process-oriented and competence-based curriculum can be
generally characterized pedagogically as: 1) focus on authentic problems from professional practice; 2)
integration of the acquisition and application of knowledge and skills; 3)
self-directed/responsible/managed learning; 4) collaborative learning; 5) new forms of assessment; 6)
use of ICT. In this section, we especially emphasize two important characteristics (Klink, et. al. 2007).
2.1 Structuring the curricula based on work process
The term “work process” refers to the sequence of individual work steps and describes how professional
tasks are carried out. They are usually described for enterprises, and trainees can easily find out about
them for themselves from the relevant documents. VET acknowledges the work process as an important
“content” for learning and offering learning processes. In this respect, work processes are increasingly
becoming topics of vocational educational research with the aim to identify those elements beneficial
for learning within the processes (Spöttl, 2008). The term work-process-knowledge refers to the
knowledge needed for working in flexible and innovative business environments. This concept is based
on the premise that much of the knowledge that guides and supports work is created through the process
of work itself (Boreham, 2002). The orientation of vocational learning according to (occupational) work
and business processes - from a structurally oriented perspective - implies that work activity has a
rationality of its own beyond the one-dimensional scientific rationality typical of the discipline-based
curriculum (Rauner, 2007).
552552552
According to Reinhold et al (2003) it is assumed that every profession or occupation could be
empirically described by a defined number of professional tasks. A specific occupation is described
through a relationship between different aspects of the work (e.g. objectives, tools and requirements for
work) and tasks that are typical of the occupation and provide a complete picture of it. Professional
tasks as elements of the curriculum are not regarded as a single ability or action, but rather as a complete
process of work that encompasses all aspects of the occupation. Furthermore, it is need to analyze
professional tasks and their organizational structures as well as how the skilled workers are coping with
core professional tasks. A general description of how a professional task is carried out contains the
specific requirements of the task, its planning and execution and the assessment and evaluation of the
resulting work (Kleiner et al 2002).
In VET, an integrated learning environment would better be created with four components:
learning tasks, supporting information, just-in-time information and task segmentation. The most
important component is authentic learning tasks based on situations from professional practice. Each
learning task contains the entire professional task and is conducted in a realistic professional situation.
Learning tasks form the „backbone‟ of VET. The other components are developed in relation to the
learning tasks. Learning tasks are divided into classes arranged in order from simple to complex,
depending on the degree of support. There must be enough variation between the learning tasks in one
task class. A learning task from the highest task class, in which the task is carried out independently, can
be used as a test (Hoogveld et al, 2002; van Merriënboer, 1997).
2.2 Developing competence through action-oriented learning
After identifying typical professional tasks and the necessary appropriate core competences and
determining the curricular structure, it is required to didactically process the learning contents. The
didactical basics for the design of the identified learning contents represent a development-logical
didactical approach which concentrates on competence development by working on concrete work
tasks and on problem-solving in challenging real work situations.
In terms of learning theory, development logical didactics constitutes a further development
which - in contrast to behaviorism - applies some elements of the constructivist approach (Grantz, et. al.
2008.). The orientation to concrete professional tasks thus clearly differs from the stimulus-reaction
scheme of learning on the one hand but also from learning processes based on the mainly
experience-based construction of knowledge. Knowledge is not a static copy of real life phenomena but
includes dynamic structures that support the personal mastery of action demands. In a pragmatic sense
this means the primacy of action and experience over cognitive representation (Waibel, et. al. 1997).
The orientation on professional tasks makes greater demands on the ability of self-learning in the
context of work situations and contains active learning and self-reflection processes in the context of
work situations. In addition, the perspective of holistic learning processes is in the focus of development
logical didactics: knowledge and acting form a unit and allow the gaining of both implicit and explicit
learning experiences. This means that competence development is perceived as a behavioral change
oriented to consequences or as a context-specific generation of knowledge and skills.
In practice,a learning process was usually triggered by a problem resulting from a work
situation. Professional tasks or problems in VET are solved like in the real world of work in sequential
and logical steps (activities). The activities make up a complete, multi-dimensional work process that
copes with a corporate work order, corporate problem-solving or unknown tasks. The tasks must always
be seen with all their implications and must always aim at a work result (Spöttl, 2005). A complete and
multi-dimensional approach also reveals previous and successive processes, objects and tools, as well
as work methods as elements and takes into account that this complex process is important for the
individual.
In WPOC knowledge and skills are acquired and applied in an activity where knowledge
originates. While performing an activity, action-oriented learning takes place. This contains phases of
holistic acting (e.g., gathering information, planning, implementing and evaluating) and thus facilitates
the required holistic competence development process. Action-oriented learning in VET needs suitable
tasks for the learner to offer chances for self-responsible and self-organized learning with processes of
communication and cooperation between the learners and the teacher(s). The main difference compared
to traditional teaching is the change of learners‟ activity. The teacher is no more lecturing knowledge
and skills which the learner has to learn. In action-oriented learning the learner has to acquire the
553553553
knowledge and skills himself to find appropriate solutions to solve the task. Teaching is no more
“one-directional” from the teacher to the learner, who has to follow the teachers‟ instructions.
Action-oriented learning means that the learner has to gather the necessary information (e.g., from
teachers/experts and from internet) and to acquire the knowledge needed to fulfill the task. The learner
himself is responsible for his performance and his progress. The institute and the teacher provide a
learning environment with all necessary facilities including information resources and ICT tools.
3. Supporting the Development of TPACK through Adopting Learning by Design
Approach
Work-process-orientation as a new didactic concept in VET relates to organizational development as a
whole and thus confronts the teacher in occupational pedagogy with fundamentally new tasks (Koch &
Meerten, 2003). As analyzed above, it is obvious that teachers must have comprehensive knowledge in
technology, pedagogy and content for developing a work-process-oriented curriculum. In recent years,
technological pedagogical content knowledge (TPACK) has emerged as a strong framework (Mishra &
Koehler, 2006). It describes the kinds of knowledge that teachers need in order to teach with technology,
and the complex ways in which these bodies of knowledge interact with one another. To help teachers to
develop TPACK, a learning environment must address the situated nature and complex interplay of
technology, pedagogy, and content. Jonassen and his colleagues (Jonassen, 1995; Jonassen, Peck, & Wilson, 1999) pointed out that
integrating ICT into instructions requires a change in teaching and learning. Technology should be used
not only as tools to convey information or knowledge, but also as cognitive tools for learners to learn
with. However, teacher education programs have been criticized for not adequately preparing teachers
to use technology effectively for instruction. One major criticism of teacher technology preparation has
been that technology was taught as a set of context free and separate knowledge and skills in technology
classes and workshops (e.g. Ertmer, 1999; Mishra & Koehler 2006; Pope, Hare, & Howard, 2005;
Schrum, 1999). The argument behind this criticism is that technological knowledge and skills alone are
not sufficient for teachers to unleash the power of technology and catalyze educational changes.
Another criticism of teacher technology preparation is the lack of theoretical foundations. Mishra and
Koehler (2006) argued that technology use in education had lagged far behind advocates‟ vision. One
reason is that researchers and practitioners lack a theoretical base for understanding the process of
technology integration in education. In teacher technology preparation, practices should also be based
on a theoretically well-articulated grounding (Schrum, 1999).
In addition, new pedagogies such as project-based learning and case-based learning and
innovative use of technologies such as virtual collaborative environment and mobile devices seem to
offer much promise in terms of providing new educational experiences for learners. However in reality
practitioners are overwhelmed by the plethora of choices and may lack the necessary skills to make
informed design decisions about how to use these theories and technologies (Conole, Oliver, et. al.,
2007). Designing high quality, pedagogy-sound and technology-supported learning experiences is a
significant challenge for teachers (Lockyer, et al., 2008; Miao et. al., 2009).
Considering these challenges, what should teacher preparation programs do to prepare
technologically competent teachers? Discussions of this question highlight the reform of teacher
technology preparation programs. The TPACK framework identifies the essential knowledge for a
teacher to effectively integrate technology into instruction. In recent years, teacher educators and
researchers have developed an increasing interest in this framework and have been using it to guide the
design of technology preparation programs for teachers (Jaipal & Figg, 2010).
Based on the TPACK framework, the authors designed and developed a series of three curricula
that integrate pedagogy and technology. The goal of this initiative is to help teachers in developing
online or blended work-process-oriented curricula by gaining TPACK. According to Koehler and
Mishra's (2005) suggestion on how to teach TPACK, teachers should learn about teaching with
technology by designing technological artifacts to solve instructional problems. They proposed learning
by design (LbD) as a promising approach to help teachers develop TPACK (Koehler & Mishra, 2005).
Through the act of designing, teachers construct both online classes and an awareness of technology‟s
role in reaching instructional goals for specific content. This design-based process is an authentic
context for learning about educational technology that recognizes that design-based activities take on
meaning and occur iteratively over time. In light of LbD approach, we develop a web-based,
554554554
work-process-oriented curricula authoring and delivering environment with three courses. By taking
the curricula in our learning environment, pre-service teachers or in-service teachers who lack of
knowledge about the development of work-process-oriented curricula and about the development
multimedia courseware can be engaged in the design of an online or blended work-process-oriented
curriculum for a real-world context whereby they construct their understanding and meaning towards
the topics of both pedagogy and technology.
4. Development of a Work-process-oriented Authoring and Delivering Environment
In order to foster learning by doing, concretely speaking, learning by designing a work-process-oriented
curriculum, we provide a web-based platform for teachers to acquire the knowledge needed for
developing an online or hybrid work-process-oriented curriculum and meanwhile to apply the acquired
knowledge in the application context. This section briefly presents the development of our
work-process-oriented curriculum authoring and delivering environment
4.1 Development of a work-process-oriented curriculum authoring tool
To support learning by design, we attempt to provide a means for the teacher to represent design ideas
as a computational description (called a script) of the design results in the light of IMS Learning Design
(LD) (Koper and Tattersall, 2005), an international e-learning technical standard. Learning design has
emerged as a distinct field of research, which is concerned with the development of methods, tools, and
resources for helping learning designers in their design process (Conole, Oliver et al., 2007; Lockyer, et
al., 2008; Koper and Miao, 2008). By adopting an approach of a pedagogy-specific learning design
language (Miao, et. al. 2014), we develop a work-process-oriented curriculum scripting language.
Using this scripting language, a work-process-oriented curriculum, representing a learning arena, can
be specified by setting values of the attributes of the learning arena (e.g., title, typical professional task
description, time schedule, learning objectives, prerequisite, organization of the occupation, objects of
the occupation, tools, methods, requirements of the occupation, and assessment standard) and by
defining a sequence of learning situations, from simple situations to complex situations. A learning
situation represents a concrete work task that provides a learning task with learning context. A learning
situation is specified by setting values of attributes of the learning situation (e.g., title, learning situation
description, time schedule, prerequisite, learning objectives, work organization, work objects, tools,
methods, work requirements, and assessment standard) and by defining a sequence of learning activities
(or called sub-tasks). All learning activities within a learning situation make up a complete work
process to fulfill a work task or to solve a problem. As a work step, a learning activity is specified by
describing generic information (e.g., title, activity description, time schedule, prerequisite, learning
objectives, learning content, guiding questions, difficult and important points, and completion
condition), by providing information chuck to present associated theoretical knowledge and practical
knowledge needed for performing this learning activity, and by defining a series of actions categorized
as information-gathering, planning, decision-making, implementation, monitoring and controlling, and
evaluation. An action is an elemental unit that specifies which role(s) act to handle/produce which
artifact(s) with which tool(s) in which work mode towards which goal.
In order to facilitate teacher in representing a design of a learning arena, we develop a
work-process-oriented curriculum authoring tool. We design and implement this tool by making use of
the Business Process Model and Notation (BPMN) standard. Based on the BPMN, this tool provides a
diagram-based user interface. As illustrated in Figure 1, a teacher can to specify a learning arena in a
hierarchical structure by using the constructors of BPMN. Figure 1 presents two screenshots of the tool.
Besides the menu-bar and the BPMN component list in the left side of the window, the major part of the
user interface (UI) of the tool is an edit space, where the teacher can define a learning arena model. The
teacher can start to define a learning arena by opening a new page and dragging/dropping learning
situation nodes on it. She or he can define the sequence of the learning situation nodes by creating
arrows between them for specifying the learning path. To set the values of the attributes of a learning
situation, the teacher can fill the blanks in a dialog form opened when choosing a menu-item of the
associated learning situation node. Through double-clicking a learning situation node, the teacher can
open the learning situation page to define internal structure of the learning situation, a network of
learning activities, as a diagram. The simplest work-process structure is a linear structure. It is allowed
555555555
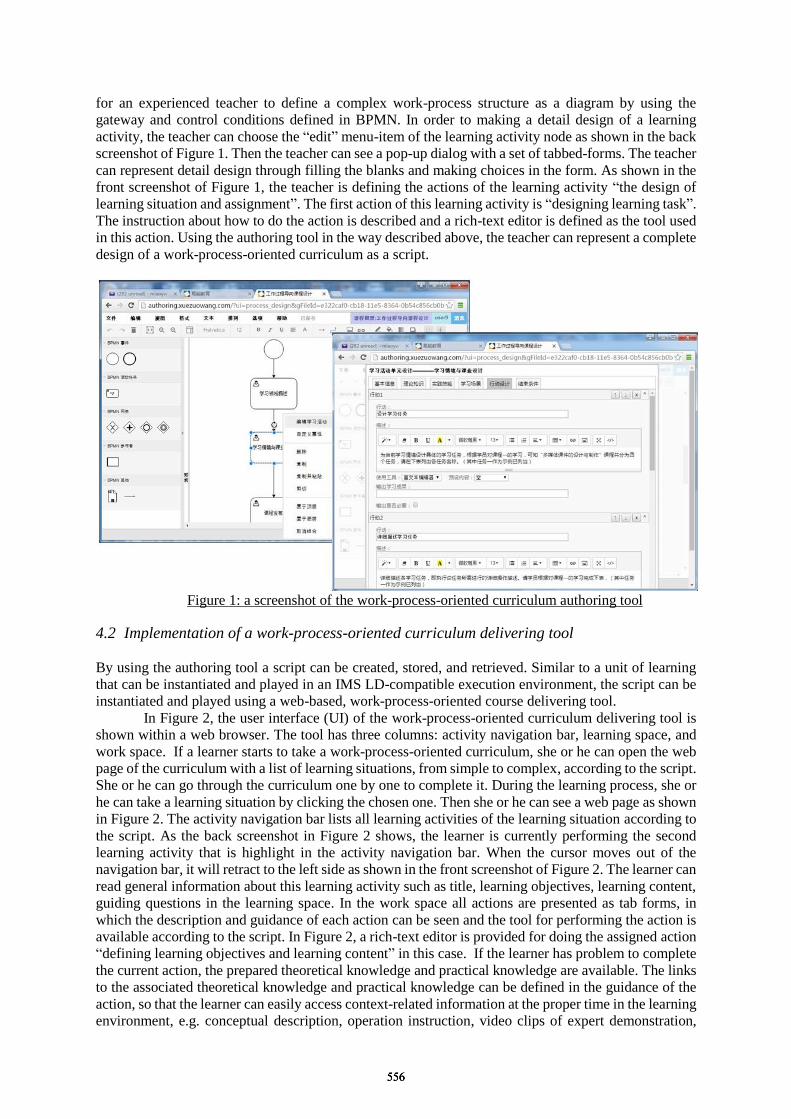
for an experienced teacher to define a complex work-process structure as a diagram by using the
gateway and control conditions defined in BPMN. In order to making a detail design of a learning
activity, the teacher can choose the “edit” menu-item of the learning activity node as shown in the back
screenshot of Figure 1. Then the teacher can see a pop-up dialog with a set of tabbed-forms. The teacher
can represent detail design through filling the blanks and making choices in the form. As shown in the
front screenshot of Figure 1, the teacher is defining the actions of the learning activity “the design of
learning situation and assignment”. The first action of this learning activity is “designing learning task”.
The instruction about how to do the action is described and a rich-text editor is defined as the tool used
in this action. Using the authoring tool in the way described above, the teacher can represent a complete
design of a work-process-oriented curriculum as a script.
Figure 1: a screenshot of the work-process-oriented curriculum authoring tool
4.2 Implementation of a work-process-oriented curriculum delivering tool
By using the authoring tool a script can be created, stored, and retrieved. Similar to a unit of learning
that can be instantiated and played in an IMS LD-compatible execution environment, the script can be
instantiated and played using a web-based, work-process-oriented course delivering tool.
In Figure 2, the user interface (UI) of the work-process-oriented curriculum delivering tool is
shown within a web browser. The tool has three columns: activity navigation bar, learning space, and
work space. If a learner starts to take a work-process-oriented curriculum, she or he can open the web
page of the curriculum with a list of learning situations, from simple to complex, according to the script.
She or he can go through the curriculum one by one to complete it. During the learning process, she or
he can take a learning situation by clicking the chosen one. Then she or he can see a web page as shown
in Figure 2. The activity navigation bar lists all learning activities of the learning situation according to
the script. As the back screenshot in Figure 2 shows, the learner is currently performing the second
learning activity that is highlight in the activity navigation bar. When the cursor moves out of the
navigation bar, it will retract to the left side as shown in the front screenshot of Figure 2. The learner can
read general information about this learning activity such as title, learning objectives, learning content,
guiding questions in the learning space. In the work space all actions are presented as tab forms, in
which the description and guidance of each action can be seen and the tool for performing the action is
available according to the script. In Figure 2, a rich-text editor is provided for doing the assigned action
“defining learning objectives and learning content” in this case. If the learner has problem to complete
the current action, the prepared theoretical knowledge and practical knowledge are available. The links
to the associated theoretical knowledge and practical knowledge can be defined in the guidance of the
action, so that the learner can easily access context-related information at the proper time in the learning
environment, e.g. conceptual description, operation instruction, video clips of expert demonstration,
556556556
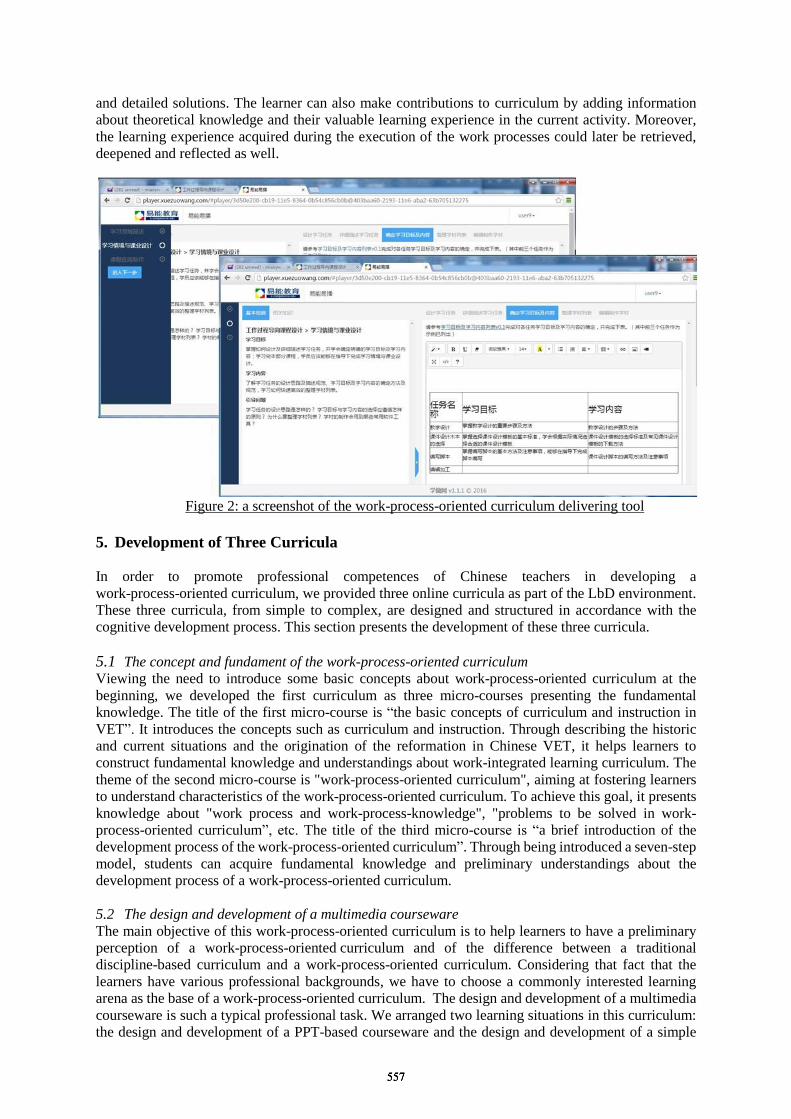
and detailed solutions. The learner can also make contributions to curriculum by adding information
about theoretical knowledge and their valuable learning experience in the current activity. Moreover,
the learning experience acquired during the execution of the work processes could later be retrieved,
deepened and reflected as well.
Figure 2: a screenshot of the work-process-oriented curriculum delivering tool
5. Development of Three Curricula
In order to promote professional competences of Chinese teachers in developing a
work-process-oriented curriculum, we provided three online curricula as part of the LbD environment.
These three curricula, from simple to complex, are designed and structured in accordance with the
cognitive development process. This section presents the development of these three curricula.
5.1 The concept and fundament of the work-process-oriented curriculum Viewing the need to introduce some basic concepts about work-process-oriented curriculum at the
beginning, we developed the first curriculum as three micro-courses presenting the fundamental
knowledge. The title of the first micro-course is “the basic concepts of curriculum and instruction in
VET”. It introduces the concepts such as curriculum and instruction. Through describing the historic
and current situations and the origination of the reformation in Chinese VET, it helps learners to
construct fundamental knowledge and understandings about work-integrated learning curriculum. The
theme of the second micro-course is "work-process-oriented curriculum", aiming at fostering learners
to understand characteristics of the work-process-oriented curriculum. To achieve this goal, it presents
knowledge about "work process and work-process-knowledge", "problems to be solved in work-
process-oriented curriculum”, etc. The title of the third micro-course is “a brief introduction of the
development process of the work-process-oriented curriculum”. Through being introduced a seven-step
model, students can acquire fundamental knowledge and preliminary understandings about the
development process of a work-process-oriented curriculum.
5.2 The design and development of a multimedia courseware
The main objective of this work-process-oriented curriculum is to help learners to have a preliminary
perception of a work-process-oriented curriculum and of the difference between a traditional
discipline-based curriculum and a work-process-oriented curriculum. Considering that fact that the
learners have various professional backgrounds, we have to choose a commonly interested learning
arena as the base of a work-process-oriented curriculum. The design and development of a multimedia
courseware is such a typical professional task. We arranged two learning situations in this curriculum:
the design and development of a PPT-based courseware and the design and development of a simple
557557557

micro-course. Taking the development of the first curriculum as an example and meanwhile an
assignment, this learning situation enables the learner to experience a learning arena with multiple
learning situations and a complete action-process including six phases: information-gathering, planning,
decision-making, implementation, monitoring, and evaluation. Furthermore, the learner can have
perception of the important concepts such as learning arena, learning situation, learning activity, action,
work object, tool, and work method when taking this work-process-oriented curriculum.
5.3 The design and development of a work-process-oriented curriculum
It is an online work-process-oriented curriculum. It is important to note that the objective of this
work-process-oriented curriculum is to guide the learners to design and develop an online
work-process-oriented curriculum through an LbD approach. It is expected that the learner can develop
competences in developing an online work-process-oriented curriculum in such an LbD environment
through acquiring TAPCK in a series of guided actions.
This curriculum is designed as only one learning situation with three learning activities: the
design of a learning arena, the design of a learning situation and assignment, and the design of a learning
activity. As shown in Figure 2, the learner can learn following the guidance from the first learning
activity to the last one step by step using our work-process-oriented curriculum delivering tool. The
learning situation of this curriculum is to develop the experienced curriculum “the design and
development of a multimedia courseware” described above. The learner can experience a complete
work process to design and develop a work-process-oriented curriculum by doing actually design work
using our work-process-oriented curriculum authoring tool. In each learning activity, the learner is
required to do assigned actions to complete parts of design work. When she or he has problems or lacks
of knowledge or skills to solve the problems in design, she or he can access the information chucks
categorized into theoretical knowledge and practical knowledge available in the learning space of this
learning activity. As shown in the back screenshot of Figure 1, a user can learn how to design the
structure through drawing a diagram with a sequence of learning activities. The front screenshot of
Figure 1 illustrates that the user can make a detail design of a learning activity through setting values of
attributes and elements of the learning activity on the aspects of generic information, theoretical
knowledge, practical knowledge, learning scene, action design, and completion condition, respectively.
At the moment of taking the screenshot, the user was defining a series of actions for making a detail
design of the learning activity “the design of a learning activity”.
6. Summery and Outlooks
In this paper, we characterized the work-process-oriented curriculum. The structure and content of the
work-process-oriented curriculum are based on work process and work-process knowledge. The
knowledge is acquired in an action-oriented learning in the context of application. Developing a
work-process-oriented curriculum is a result of a complex interplay of technology, pedagogy, and
content. In order to train teachers to develop a work-process-oriented curriculum, a learning
environment with traditional lecture-based approach with discipline-organized knowledge transference
is not appropriate, because comprehensive TAPCK is needed. It is wildly accepted to develop TAPCK
through an LbD approach. To promote such as action-oriented learning, we developed an LbD
environment for training teachers to develop a work-process-oriented curriculum. The LbD
environment is consisted of the work-process-oriented curriculum authoring tool and delivering tool
and three curricula. In fact, a work-process-oriented curriculum is developed for training teachers to
develop a work-process-oriented curriculum. In addition, a learning design language approach was used
in developing our work-process-oriented curriculum authoring tool and delivering tool. Through
internal test, it is initially demonstrated that it is technical feasible to develop such an LbD environment
by adopting the learning design language approach and that the work-process-oriented curricula are
potentially useful to train teachers to develop a work-process-oriented curriculum.
Our LbD environment can be characterized as 1) motivating and engaging the learner in
learning by assigning an design work, 2) facilitating design by guiding the learner to do actions, 3)
fostering contextualized learning by providing knowledge chucks in proper time and in the context of
application, and 4) assessing the learning by monitor and evaluating the design results.
558558558
This paper focuses on presenting our design ideas and technical development work. Recently we have finished the development work and intensively tested them on the aspects of the
functions. The test results demonstrated the usability of the tools and the feasibility of the technical
approach. We planned to conduct serious evaluations to investigate the usefulness of the LbD
environment in real-world setting. We will report the evaluation results in the near future. Furthermore,
we will improve the tools and the curricula according to the evaluation results.
Acknowledgement
Thanks to Fangzhou Tang, Jie Li, Longlong Zhang and Kui Tong for their contributions to the
implementation of the authoring tool and the delivering tool.
References
Boreham, N. (2002) Work process knowledge in technological and organizational development, in: N. Boreham,
R. SamurcËay & M. Fischer (Eds) Work process knowledge, 1-14, London: Routledge.
Boreham, N. (2004) Orienting the work‐based curriculum towards work process knowledge: a rationale and a
German case study, Studies in Continuing Education, 26(2), 209-227.
Brown, J.S.; Collins, A.; Duguid, P. (1989). Situated cognition and the culture of learning. Educational
Researcher, 18(1), 32–42.
Conole, G., Oliver, M., Falconer, I., Littlejohn, A. and Harvey, J. (2007). Designing for learning. In: G. Conole
and M. Oliver (ed), Contemporary perspectives in e-learning research: themes, methods and impact on
practice. Routledge Falmer.
Engeström, Y. (1987). Learning by expanding: An activity–theoretical approach to developmental research.
Helsinki: Orienta-Konsultit.
Ertmer, P. A. (1999). Addressing first- and second-order barriers to change: Strategies for technology integration.
Educational Technology Research and Development, 47(4), 47-61.
Fischer, M. and Bauer, W. (2007). Competing approaches towards work process orientation in German
curriculum development, European journal of vocational training, 40(1), 140-157.
Grantz, T., Schulte, S., Spöttl, G., (2008). Virtuelles Lernen auf der Baustelle, in: bwp@. Berufs- und
Wirtschaftspädagogik - Online, Ausgabe 15.
Hoogveld, A.W.M.; Paas, F.; Jochems, W.M.G; Van merriënboer, J.J.G. (2002). Exploring teachers‟ instructional
design practices: Implications for improving teacher training. Instructional Science, Vol. 30, 291-305.
Howe, F. and Staden C. (2015). Work Process Oriented and Multimedia-Based Learning in Vocational Education
and Training, In Gessler, M. & Freund, L. (Eds.), Crossing Boundaries in Vocational Education and
Training: Innovative Concepts for the 21st Century, Evaluate Europe Handbook Series Volume 6, 25-32.
Jaipal, K., & Figg, C. (2010). Unpacking the "Total PACKage": Emergent TPACK characteristics from a study of
preservice teachers teaching with technology. Journal of Technology and Teacher Education, 18(3),
415-441.
Jonassen, D. H. (1995). Supporting communities of learners with technology: A vision for integrating technology
with learning in schools. Educational technology, 35(4), 60-63.
Jonassen, D. H., Peck, K. L., & Wilson, B. G. (1999). Learning with technology: A constructivist perspective. NJ:
Prentice Hall, Inc.
Kleiner, Michael et al. (2002). Curriculum Design I. Identifizierung und Beschreibung von beruflichen
Arbeitsaufgaben. Konstanz: Christiani.
Klink, M., Boon, J., Schlusmans, K. (2007) Competences and vocational higher education: Now and in future,
European journal of vocational training, 40(1), pp.67-82.
KMK - KMK Secretariat (ed.). Handreichungen für die Erarbeitung von Rahmenlehrplänen der
Kultusministerkonferenz (KMK) für den berufsbezogenen Unterricht in der Berufsschule und ihre
Abstimmung mit Ausbildungsordnungen des Bundes für anerkannte Ausbildungsberufe. Bonn, 1996.
Koch, J.and Meerten, E. (2003). Prozessorientierte Qualifizierung – ein Paradigmenwechsel in der beruflichen
Bildung. In: BWP, 32 (5), pp. 42–46
Koehler, M. J., & Mishra, P. (2005). Teachers learning technology by design. Journal of computing in Teacher
Education, 21(3), 94-102.
Koper, R. & Tattersall, C. (Eds.) (2005). Learning design: A handbook on modelling and delivering networked
education and training. Berlin: Springer.
Koper, R., & Miao, Y. (2008). Using the IMS LD Standard to Describe Learning Designs. In L. Lockyer, S.
Bennet, S. Agostinho & B. Harper (Eds.), Handbook of Research on Learning Design and Learning Objects:
Issues, Applications and Technologies, 41-86. IDEA group.
559559559

Lave, J., and E. Wenger. (1991). Situated learning: Legitimate peripheral participation. Cambridge: Cambridge
University Press.
Lockyer, L., S. Bennett, S. Agostinho, and B. Harper, eds. (2009). Handbook of research on learning design and
learning objects: Issues, applications and technologies. Hershey, PA: Idea Group Publishing.
Merriënboer, J.J.G van. (1997). Training complex cognitive skills: a four-component instructional design model
for technical training. Englewood Cliffs, NJ: Educational Technology Publications.
Miao, Y., van der Klink, M., Boon, J., Sloep, P.B. and Koper, R. (2009). Enabling teachers to develop
pedagogically sound and technically executable learning designs. Distance Education 30(2), 259–276.
Miao, Y. and Hoppe, H.U. (2011). Applying learning design to work-based learning, Learning, Media and
Technology, 36(2), 189-205.
Miao, Y., Ally, M., Samaka, M., Tsinakos, A. (2014). Towards Pedagogy-Driven Learning Design: A Case Study
of Problem-Based Learning Design. In Proc. of the 13th International Conference on Web-based learning,
August 14-17, 2014, pp. 179-189, Tallinn, Estonia. Lecture Notes in Computer Science, 8613, Springer.
Mishra, P., & Koehler, M. J.(2006).Technological pedagogical content knowledge: A framework for teacher
knowledge. Teachers College Record, 108(6), 1017-54.
Pope, M., Hare, D. & Howard, E. (2005). Enhancing Technology Use in Student Teaching: A Case Study. Journal
of Technology and Teacher Education, 13(4), 573-618.
Rauner, F. (2007). Practical knowledge and occupational competence, European journal of vocational training
(40)1, 52-66.
Reinhold, M. et al. (2003). Curriculum Design II – Entwickeln von Lernfeldern. Von beruflichen Arbeitsaufgaben
zum Berufsbildungsplan. Konstanz: Christiani.
Schrum, L. (1999). Technology professional development for teachers. Educational Technology Research and
Development, 47(4), 83-90.
Spöttl, G. (2004). Promoting learning at the workplace: challenges in shaping the work environment. In: Fischer,
M.; Boreham, N.; Nyhan, B. (Ed.): European perspectives on learning at work: the acquisition of work
process knowledge, p. 186-195. Cedefop: Luxembourg.
Spöttl, G. (2008). Learning through the Work Process – Challenges and the Shaping of Skill Requirements., in: G.
Loose, G. Spöttl, Md. Sahir Yusoff, (eds.), ‘Re-Engineering’ Dual Training – The Malaysian Experience,
Frankfurt/M., Berlin u.a., pp. 31-44.
Vygotsky, L.S. 1978. Mind in society: The development of higher psychological processes. Cambridge, MA:
Harvard University Press.
Waibel-Fischer M., Michael, D., Theo, W. (2004). Local knowledge in activity systems: the socio-cultural
perspective of knowledge development. In: Fischer, M.; Boreham, N.; Nyhan, B. (Ed.): European
perspectives on learning at work: the acquisition of work process knowledge, p. 71-95. Cedefop:
Luxembourg.
Wenger, E. 1998. Communities of practice: Learning, meaning, and identity. Cambridge: Cambridge University
Press.
Zhao Z. and Xu H. (2008). Implementing Dual Vocational Education in China: A Case of Transnational
Innovation Transfer through a German-Chinese Research and Development Project. in F. Rauner and R.
Maclean (Eds), Handbook of Technical and Vocational Education and Training Research, 656-660,
Springer.
560560560
Chen, W. et al. (Eds.) (2016). Proceedings of the 24th
International Conference on Computers in Education.
India: Asia-Pacific Society for Computers in Education
Teacher Educators’Pedagogical Beliefs and
Practices towards ICT in Teaching and
Learning aMei Lick CHEOK,
bSu Luan WONG,
cAhmad Fauzi MOHD AYUB, &
dRosnaini MAHMUD
aTeacher Training Institute, Malaysia
bFaculty of Educational Studies , University Putra Malaysia, Malaysia
cFaculty of Educational Studies , University Putra Malaysia, Malaysia
dFaculty of Educational Studies , University Putra Malaysia, Malaysia
Abstract: This study investigates uses of ICT as reflected in teacher educators’ beliefs and
practices. The research is situated in Malaysia where ICT in education has still not reached the
desired expectation. Based on the argument that teacher educators’ limited use of technology in
teaching and learning can be explained by the lack of beliefs towards ICT, understanding their
rationales and behaviours is important for a successful implementation of an ICT initiative.
Interviews were used to solicit information from nine teacher educators from a teacher training
institute. Four foci emerged across the findings in terms of beliefs that guided their practices.
Analysis of the findings resulted in a development of a typology explaining the relationship
between beliefs and practices among the teacher educators.
Keywords: ICT, beliefs, practices, teacher educators
1. Introduction
It is interesting that Hooper and Rieber (1995) mentioned in their article that doctors or dentists
from 50 years ago will not be able to handle the equipment in today’s hospital but a teacher
from the same era would immediately feel at home in today’s classrooms. Despite the current
trend worldwide where there are more ready access to technology, increased opportunity for
more technology training, and more supportive policy, teachers use of technology is still
surprisingly low (Ertmer, 2005). There are a multitude of factors for this phenomenon but this
paper will focus on teachers’ pedagogical beliefs in their classroom instruction.
One’s beliefs can be inferred from what one’s speech, intention and action. When all
three aspects are examined then we can fairly say that we have an accurate representation of
one’s beliefs (Rokeach, 1968). Pedagogical beliefs is defined as whether or not we think
technology can help us achieve our instructional goals which we perceive to be most important
(Watson, 2006). Teachers make value judgments about whether the technology is relevant to
their goals in addressing their important teaching and learning needs. The more they value it to
be important, the more likely they are to use it. As learning and adopting any new tool will take
up a substantial amount of their time, energy and resources, they will only be willing to do that
for tools that would be instructionally worthwhile. Continuous professional development
trainings need to promote and sell the idea that the new tool alligns with their pedagogical
beliefs. If inconsistencies exist between their beliefs and practices, there may be contextual
factors that are preventing teachers from applying their beliefs at work. Issues like assessment,
facilities, management, availability of support and the community at workplace, to a large
extent influence beliefs from manifesting into practices. In a study by Fang (1996), the author
stresses that due to the complexities of a teachers’ job, inconsistency between what they believe
and what they actually do, happens. To a large extent, teachers’ beliefs are context specific.
This study sought to examine why and how teacher educators (TEs) use technology in
order to understand their pedagogical beliefs in relation to technology use. By understanding
this, relevant and effective professional development and training needs could be planned and
aligned accordingly. If these trainings are delivered based on their beliefs, they will be more
561561561
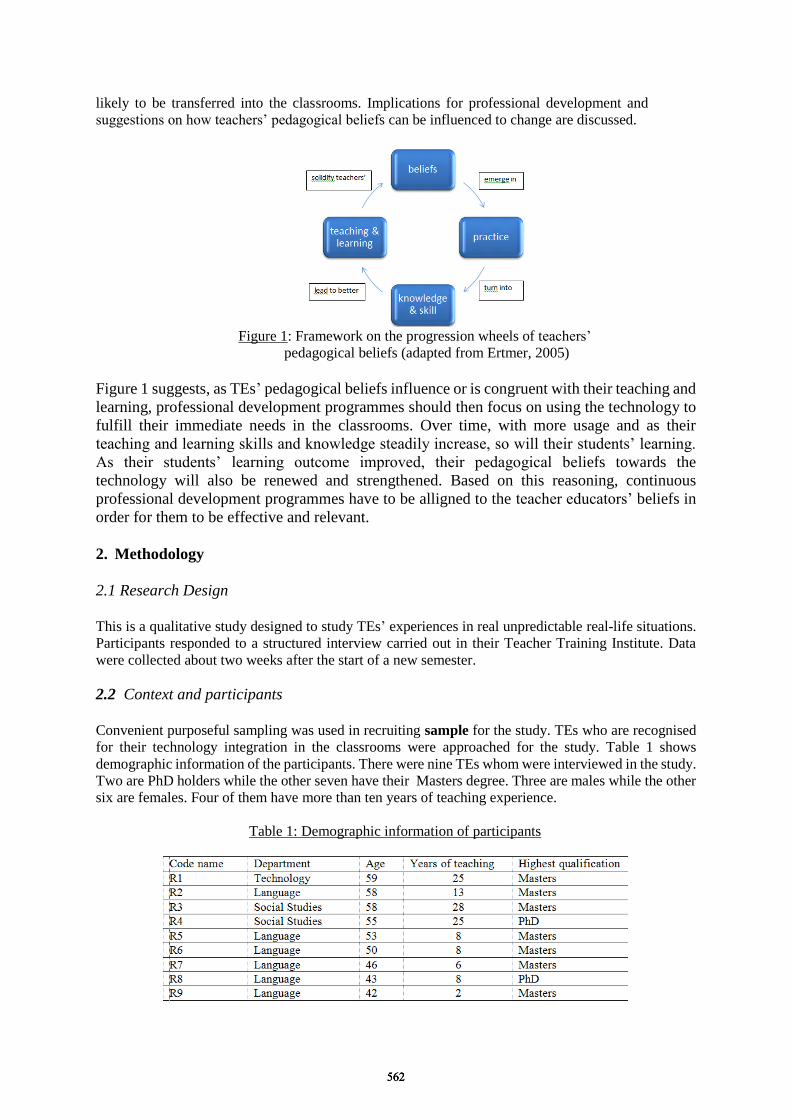
likely to be transferred into the classrooms. Implications for professional development and
suggestions on how teachers’ pedagogical beliefs can be influenced to change are discussed.
Figure 1: Framework on the progression wheels of teachers’
pedagogical beliefs (adapted from Ertmer, 2005)
Figure 1 suggests, as TEs’ pedagogical beliefs influence or is congruent with their teaching and
learning, professional development programmes should then focus on using the technology to
fulfill their immediate needs in the classrooms. Over time, with more usage and as their
teaching and learning skills and knowledge steadily increase, so will their students’ learning.
As their students’ learning outcome improved, their pedagogical beliefs towards the
technology will also be renewed and strengthened. Based on this reasoning, continuous
professional development programmes have to be alligned to the teacher educators’ beliefs in
order for them to be effective and relevant.
2. Methodology
2.1 Research Design
This is a qualitative study designed to study TEs’ experiences in real unpredictable real-life situations.
Participants responded to a structured interview carried out in their Teacher Training Institute. Data
were collected about two weeks after the start of a new semester.
2.2 Context and participants
Convenient purposeful sampling was used in recruiting sample for the study. TEs who are recognised
for their technology integration in the classrooms were approached for the study. Table 1 shows
demographic information of the participants. There were nine TEs whom were interviewed in the study.
Two are PhD holders while the other seven have their Masters degree. Three are males while the other
six are females. Four of them have more than ten years of teaching experience.
Table 1: Demographic information of participants
562562562
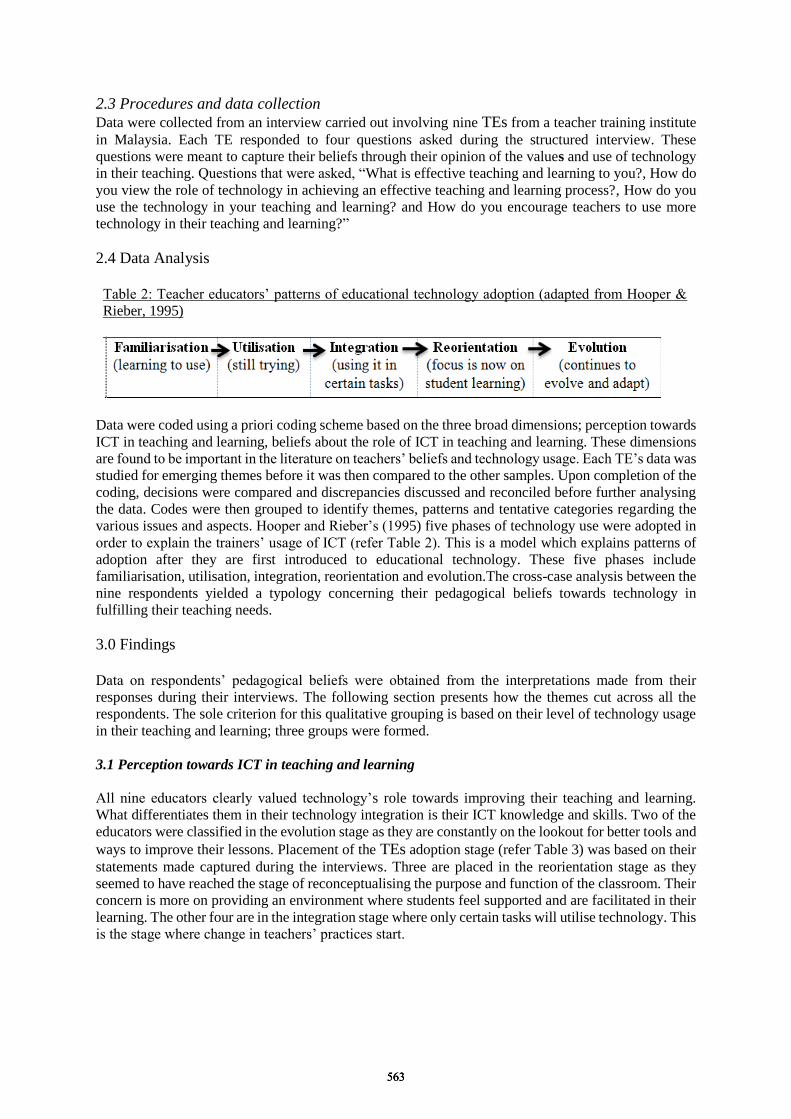
2.3 Procedures and data collection
Data were collected from an interview carried out involving nine TEs from a teacher training institute
in Malaysia. Each TE responded to four questions asked during the structured interview. These
questions were meant to capture their beliefs through their opinion of the values and use of technology
in their teaching. Questions that were asked, “What is effective teaching and learning to you?, How do
you view the role of technology in achieving an effective teaching and learning process?, How do you
use the technology in your teaching and learning? and How do you encourage teachers to use more
technology in their teaching and learning?”
2.4 Data Analysis
Table 2: Teacher educators’ patterns of educational technology adoption (adapted from Hooper &
Rieber, 1995)
Data were coded using a priori coding scheme based on the three broad dimensions; perception towards
ICT in teaching and learning, beliefs about the role of ICT in teaching and learning. These dimensions
are found to be important in the literature on teachers’ beliefs and technology usage. Each TE’s data was
studied for emerging themes before it was then compared to the other samples. Upon completion of the
coding, decisions were compared and discrepancies discussed and reconciled before further analysing
the data. Codes were then grouped to identify themes, patterns and tentative categories regarding the
various issues and aspects. Hooper and Rieber’s (1995) five phases of technology use were adopted in
order to explain the trainers’ usage of ICT (refer Table 2). This is a model which explains patterns of
adoption after they are first introduced to educational technology. These five phases include
familiarisation, utilisation, integration, reorientation and evolution.The cross-case analysis between the
nine respondents yielded a typology concerning their pedagogical beliefs towards technology in
fulfilling their teaching needs.
3.0 Findings
Data on respondents’ pedagogical beliefs were obtained from the interpretations made from their
responses during their interviews. The following section presents how the themes cut across all the
respondents. The sole criterion for this qualitative grouping is based on their level of technology usage
in their teaching and learning; three groups were formed.
3.1 Perception towards ICT in teaching and learning
All nine educators clearly valued technology’s role towards improving their teaching and learning.
What differentiates them in their technology integration is their ICT knowledge and skills. Two of the
educators were classified in the evolution stage as they are constantly on the lookout for better tools and
ways to improve their lessons. Placement of the TEs adoption stage (refer Table 3) was based on their
statements made captured during the interviews. Three are placed in the reorientation stage as they
seemed to have reached the stage of reconceptualising the purpose and function of the classroom. Their
concern is more on providing an environment where students feel supported and are facilitated in their
learning. The other four are in the integration stage where only certain tasks will utilise technology. This
is the stage where change in teachers’ practices start.
563563563

Table 3: Classification of teacher educators’ adoption stage
3.2 Beliefs about the role of ICT in teaching and learning
Teach and assess more effectively: All the TEs use technology to help them either to gain new
knowledge by reading up on new materials and resources or to disseminate information to their
students. Unlike in traditional setting, technology made it possible for the teachers and students to take
the lessons “…further than planned … (R2).” Besides, as the internet offers so much flexibility and
varieties, teaching and learning are more captivating and efficient. One of them, however, mentioned
that, “… technology is only another medium to enhance transmission of knowledge but be it effective or
not, it still depends on the teachers’ abilities in delivering and students to construct meaning upon
receiving those input … (R5)”. Help to create, search, share and provide better learning resources: Only two of the TEs are
using authoring tools to design their own learning packages, “… use any LMS to set up your teaching
and learning web site for your students. Example: Schoology, Edmodo. Currently, I am using the
institute’s platform, el@IPGKPM, created using Moodle(R2).”. Training for building own online
courses had started more than ten years ago in the teacher training institute. However, the uptake is
minimal as some felt the training were not sufficient for them to create their own courses online, “…
had some sort of technology-related professional development in the past years but the instruction … in
technology integration, whether online or face-to-face, is still too focused on learning how to use the
software versus integrating it into the teaching and learning process (R7).”
Transform and enhance teaching through wider range of resources: Information to be learned
need not only be transmitted by the teachers as they are no longer the fount of knowledge. Students
through well constructed technological pedagogical strategies will be able to construct knowledge and
problem solve either by looking up for new information or consulting experts and peers from any parts
of the world. By browsing for information, students learning becomes more meaningful as they will
need to generate webs of semantically and logically related information which makes sense to them
personally. Technology enables them to see the interrelatedness of content and subjects which in itself
leads to deep and meaningful processing of learning.
Increases comprehension and engagement: Human use of computing is vast and growing. The
potential for learning online has become greater, along with the complexity of identifying the most
viable and desirable ways. All echoed the sentiment that technology makes their teaching easier with
the ready accessibility to vast choices of resources. The exposure from varying perspectives and
modalities enable students to understand concepts at a deeper processing level and not superficially.
According to the TEs, when lessons using technology are designed with robust instructional principles,
students are more likely to stay engaged and committed, “… teachers who know their subject matter
thoroughly can be more effective and efficient at organizing the subject matter, connecting the subject
with the students' previous knowledge, finding useful analogies and examples, presenting current
thinking on the subject, and establishing appropriate emphases (R9).” Inert knowledge that are the the
result of traditional learning approach will be replaced with knowledge that are applicable in the real
world. This leads to the emergence of new learning scenario where, “... see the world from a different
perspective and gained more satisfaction utilizing their own material for teaching and learning. They are
able to relate content to the real-world… (R2).”
564564564

Table 4 presents the typology of pedagogical beliefs among the teacher educators which
summarised the essence of the findings.
Table 4: Typology of teacher educators’ pedagogical beliefs towards technology integration in
teaching and learning
4. Discussion
TEs in this study reflect varying pedagogical beliefs towards technology in their teaching and learning.
This is due to their self-efficacy level in handling technology. The more confident they feel, the more
risks they are willing to take. On the other hand, even if they have high pedagogical beliefs towards
technology, but their self-efficacy towards technology is low, chances are they will not have much
technology integration in their classrooms. On a more positive note, this latter group of teachers would
also be equally ready to embrace new technology provided they are given sufficient training. As
teachers are faced with a variety of implicit and explicit mandates that will define and limit their
instructional options, their pedagogical beliefs will only be relevant to a certain extent. Their practices
will be largely situational, as mentioned by a respondent “… most of the schools do have a computer lab
but it is hardly used or the computers are outdated and not functioning properly (R9).” She further adds,
“… limited computers mean grouping, making it harder for teachers to control the class … and unruly
students … (R9).”
Various strategies have been proposed in order for teachers to change their belief. These
include obeservation, practice, reflection and social cultural support (Ertmer, 2005). By observing
others, it may spark teachers to reflect on their ways of teaching and make necessary changes in the
ways they integrate technology in their lessons. It would also trigger them to think and re-evaluate their
roles and responsibilities in preparing students to survive in the 21st century workforce. Rather than
working alone behind the closed doors of their classrooms, in collaborative classrooms, teachers can
witness successful outcomes of innovative uses of technology. According to De Liddo (2014), for new
knowledge and new beliefs to be constructed, reflections and annotations need to be shared within
community in a social interactive environment, where together they examine their existing beliefs,
filtering prior beliefs, and alligning conflicting beliefs. However, a one-time off effort to change
teachers’ belief systems may not be effective. Fundamental changes need time to take place. This is
where on-going continuous experiences of change, growth and professional development, is the key for
a sustained change and growth. When new experiences and knowledge formed, their beliefs, will also
be reshaped.
Any Continuous Professional Development (CPD) programmes and trainings should only be
conducted after teachers’ assessment needs are conducted (refer Figure 1). Only then can the process of
designing, developing and implementing CPD trainings be carried out. The starting point of teachers’ in
any CPD trainings is important. Information like how proficient and comfortable they are with
technology and the subject they are teaching is of utmost important consideration. As mentioned by a
respondent, “…the instruction they receive is still too focused on learning how to use the software …
(R9)”. She adds, “… the focus should not be on the technology itself, but on how computers can
improve performance in these core areas of the teacher’s job (R9).” Trainings must be able to convey
the message that whatever new technology training introduced, the sole purpose is to make teachers’ job
easier and more effective within the context of their subject matter.
565565565
Leadership aspect must not be overlooked where school leaders are the connecting medium
between what their teachers need and the appropriate CPD trainings to be taken place. Schools where
technology integration thrives, they have leaders that provide strong support and advocacy for
technology integration. Leadership is one core area that will make an impact on teachers’ newer beliefs.
However, without the empowerment to act, school leaders will not be able to influence and induce much
change. Give them the voice and choice to act.
5.0 Implications of the study
Various stakeholders can reflect upon findings from this study and use them to design relevant CPD
courses for TEs specifically. These courses need to explicitly target teachers’ pedagogical beliefs as
asserted by Buehl and Fives (2011) the importance of teachers’ beliefs to practices in the classrooms.
Teachers need to see the potential impact of technology on their students and how these have also been
used and applied in other actual classrooms before they can be convinced to try it out themselves.
Whatever new novel ideas have to be based in teachers’ situated contexts and only then it will have
better chance of survival among the teaching community. As stressed by one respondent, “…
teachers … have the power to decide whether they want to introduce technology into their classrooms
(R9).”
6.0 Conclusion
Though data were merely based on respondents’ self-reports and perceptions, the interrelationships
between teachers’ beliefs and their technology integration practices cannot be denied. In order to
expedite teachers’ technological practices in class, we need to understand the pedagogical beliefs that
are guiding them. By influencing their beliefs, we can influence their behaviours. The existence of other
equally dominant factors in determining one’s technological practices besides pedagogical beliefs have
been shown to exist. Varying levels of psychological, social and environmental realities of teachers at
their respective schools will either constrain or allow their beliefs to manifest in their practices. If
teachers’ strong faith in the role of technology are not reflected in their practices, this requires
scrutinisation of other contextual factors which are beyond the scope of this paper. In order to capitalise
on the potential of technology in blended approach, it is hoped that findings from this study will lead to
improved understanding of the complex and interrelated processes of experiences, beliefs and practices.
References
De Liddo, A. (2014). Enhancing Discussion Forums with Combined Argument and Social Network
Analytics. In Knowledge Cartography (pp. 333-359). Springer London.
Ertmer, P. A. (2005). Teacher pedagogical beliefs: The final frontier in our quest for technology
integration?. Educational technology research and development,53(4), 25-39.
Fang, Z. (1996). A review of research on teacher beliefs and practices.Educational research, 38(1),
47-65.
Hooper, S., & Rieber, L. P. (1995). Teaching with technology. In A. C. Ornstein (Ed.), Teaching:
Theory into practice, (pp. 154-170). Needham Heights, MA: Allyn and Bacon.
Watson, D. (2006). Understanding the relationship between ICT and education means
exploring innovation and change. Education and Information Technologies, 11(3-4),
199-216.
Zheng, H. (2013). Teachers' beliefs and practices: a dynamic and complex
relationship. Asia-Pacific Journal of Teacher Education, 41(3), 331-343.
566566566
Chen, W. et al. (Eds.) (2016). Proceedings of the 24th International Conference on Computers in Education. India: Asia-Pacific Society for Computers in Education
Examination of Factors that Influence Science Teachers’ Attitudes toward Using Information and Communication
Technologies For Teaching and Learning *Ahmad Fauzi MOHD AYUBa,b, Dauda Isiyaku DANSARKIa,c. Su Luan, WONGb, Md.
Khambari, MAS NIDAb aFaculty of Educational Studies, University Putra Malaysia, Malaysia
bInstitute For Mathematical Research, University Putra Malaysia acSchool Of Business Education, Federal College of Education (Tech) Bichi, Kano Nigeria
*[email protected], [email protected], [email protected], [email protected]
Abstract : This purpose of this study is to examine factors that influence Science Teachers’ attitudes towards using ICT for teaching and learning Science. A total of 121 Science Teachers participate in this study. The findings of this study revealed that the respondents had positive attitudes towards using ICT for teaching and learning with an average mean score of 3.91 (SD = 0.540) on a Likert scale of 1-5. The respondents also competent enough at handling basic technology tasks (M= 3.86; SD = .718). The results have also indicated that s teachers were getting support from the school (M=3.57, SD= .629) and the schools were well equipped to the extent of facilitating teachers use of ICTs in the classroom (M=3.45, SD=.386). Correlation analyses showed that positive correlations between attitudes towards using ICTs for teaching and learning on one hand and ICT competency (r = .546), School support (r = .519), School culture (r = .370) and Access to Resources (r = .467). Nevertheless, a multiple regression analysis has revealed that only ICT competence, school support and school culture have significant influence on teachers’ attitudes toward using ICT for teaching and learning. Keywords: attitudes towards using ICT for teaching and learning, Information and Communication Technology, ICT competency, School support, School culture and Access to Resources
1. Introduction
Information and communication technology (ICT) has become fundamentally crucial for teaching and learning efficiency in the current dispensation. Many factors have been associated with the use of ICTs for teaching purposes, among which is the teacher. The teachers play major roles in the classroom and their predispositions towards their overall teaching function have significant impact on teaching and learning outcomes (Guskey, 1989; Saye, 1998). Hence, exploring and addressing teachers’ attitudes toward technology integration in the classroom is a necessary step for ensuring that ICTs are adequately used in the classroom (Capan, 2012). Empirical evidence has shown that teachers’ attitudes have significant influence on their use of computers in the classroom (Atkins &Vasu, 2000; Kim, 2002). In Bingimlas (2009), findings have shown that one of the major barriers to the success of ICT adoption in the classroom is that teachers are reluctant to use ICTs for the purpose of teaching. But using the computer is significantly dependant on the users’ attitude (Liaw, 2002). Hence, it is quite necessary to ensure that teachers are favourably disposed towards ICTs in order to actualize the purpose of ICT integration (Gilakjani & Leong, 2012). Congruently to succeed in the ICT mission, teachers’ unfavourable dispositions towards ICTs must be investigated and refined since the teachers’ attitude is a strong determinant of ICT integration in the classroom (Sang, Valcke, Van Braak, Tondeur & Zhu, 2010).
Although many educators, researchers and policymakers for teacher educational programs may not be aware of the factors that can encourage teachers to use ICTs in the classroom (Teck, Choo, Hanafi, & Osman, 2010), it is quite obvious that they seek for explanations to the issues that hinder teachers from using these ICT tools in the classroom (Teck, et. al, 2010). Empirical evidence has shown that among the factors investigated is teachers’ competence in using ICT or computer. Teachers who are capable of using ICTs efficiently are able to perform better by teaching more efficiently and improving learning outcomes (Meeplat, 2015). A study by Denis (2007) has indicated
567567567

that teachers’ computer competence plays a key role in developing positive attitudes among teachers toward computers. Another study by Ocak and Akdemir (2008) has revealed that Science teachers’ computer literacy level is related to their computer use it will increase their integration of computer applications in their teaching. Isleem (2003) confirmed that computer competence was the strongest predictor of attitudes towards computer use. Results of a study by Berner (2003) have also supported the theoretical and empirical arguments for the importance of computer competence in determining teachers’ attitudes towards ICTs. The results have confirmed that computer competence was the most significant predictor of teachers’ attitudes towards ICT in education.
Besides teachers’ ICT competence, several factors were found by many researchers to be correlated with teachers’ attitudes and their computer utilization in the classroom. Among them is lack of adequate ICT facilities such as computers, (Deniz, 2007), lack of supporting materials for using computers (Lam, 2000), lack of adequate training and technological infrastructures (Gulbahar, 2008). Hitherto, it was suggested in Capan (2012) that issues related to computer competence, positive cultural perceptions and computer accessibility at home and in school should be properly investigated and addressed because they have significant effects on teachers’ attitudes towards computer use. In a study conducted by Melor (2007) findings have shown that majority of the teachers were identified with positive attitudes towards using ICT in teaching ESL but had no adequate access to computers. Similarly, in Shin and Son (2007) findings have shown that limited class hours, inconvenience of using computer facilities and other technical problems and issues associated with facilitating classroom functions have constituted serious hindrances to successful ICT integration in the classroom.
Further studies on teachers’ teaching experience and age have also indicated that teachers’ ICT use, experience, and age are inversely associated. Implicit in this proposition is the fact that more experienced teachers and older teachers tend to use computers less frequently (Van Braak et al., 2004; Bebell et. al. 2004). Overall, teachers’ computer experience relates positively to their computer attitudes, such that the more experience teachers have with computers, the more likely they will be favourably disposed towards using computers (Rozell & Gardner, 1999; Yildrim, 2000). Congruently, culture is also considered as one of the factors that have influence on teachers’ attitudes towards the use of ICTs in the classroom. Findings in Afshari, Abu Bakar, Su Luan, Abu Samah and Say Fooi (2009), have revealed that teachers who have positive perceptions about the cultural relevance of computer technology will apply ICTs in education. Similarly, in a study on TESOL by Rezaee, Zainol Abidin, Issa and Mustafa (2012) findings have shown that the cultural perceptions of in-service teachers and their computer competence were predictors of teachers’ computer attitudes. The study has also revealed that the cultural perception of teachers was the strongest predictor of teachers’ attitude towards the use of ICTs.
In another study conducted by Marthipa and Mukhari (2014) among teachers in South Africa, findings have revealed that the impending factors against the integration of ICTs in teaching and learning are: insufficient number of computers and lack of application programs; teacher generation gap; inadequate teacher training; lack of ICT skills and lack of confidence; teachers’ beliefs; poor school leadership and lack of public support. Studies by Tedla (2012) and Makgato (2012) have also revealed that the successful integration of ICTs in teaching and learning depends largely on the availability of ICT infrastructure. Hitherto, findings in Termit Kaur and Samli Chan (2014) have shown that lack of technical support, lack of ICT tools and ICT knowledge were among the strongest barriers that teachers face in Malaysia against integrating ICTs in their classrooms.
2 Objective of the study The objective of this study was to investigate the factors that influence Science teachers’ attitudes toward using ICTs in teaching and learning. The factors explored in the study are: years of teaching, ICT school culture, school support, ICT competency and access to ICT resources
3 Methodology The design of this study was descriptive and correlational. Data was collected using a survey questionnaire. A proportionate stratified random sampling technique was used to select 121 science teachers from nine districts in Selangor. The instrument consisting of five sections that solicited for information on participants’ demographic background, their attitudes towards using ICT for teaching
568568568
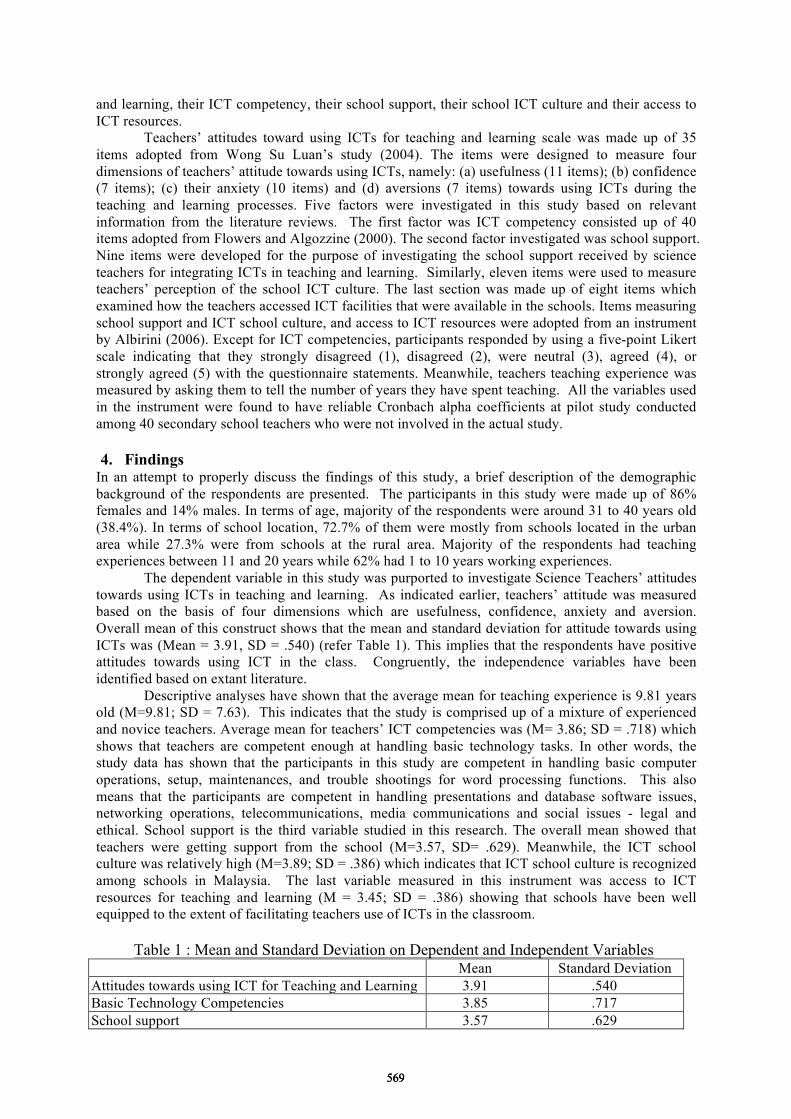
and learning, their ICT competency, their school support, their school ICT culture and their access to ICT resources. Teachers’ attitudes toward using ICTs for teaching and learning scale was made up of 35 items adopted from Wong Su Luan’s study (2004). The items were designed to measure four dimensions of teachers’ attitude towards using ICTs, namely: (a) usefulness (11 items); (b) confidence (7 items); (c) their anxiety (10 items) and (d) aversions (7 items) towards using ICTs during the teaching and learning processes. Five factors were investigated in this study based on relevant information from the literature reviews. The first factor was ICT competency consisted up of 40 items adopted from Flowers and Algozzine (2000). The second factor investigated was school support. Nine items were developed for the purpose of investigating the school support received by science teachers for integrating ICTs in teaching and learning. Similarly, eleven items were used to measure teachers’ perception of the school ICT culture. The last section was made up of eight items which examined how the teachers accessed ICT facilities that were available in the schools. Items measuring school support and ICT school culture, and access to ICT resources were adopted from an instrument by Albirini (2006). Except for ICT competencies, participants responded by using a five-point Likert scale indicating that they strongly disagreed (1), disagreed (2), were neutral (3), agreed (4), or strongly agreed (5) with the questionnaire statements. Meanwhile, teachers teaching experience was measured by asking them to tell the number of years they have spent teaching. All the variables used in the instrument were found to have reliable Cronbach alpha coefficients at pilot study conducted among 40 secondary school teachers who were not involved in the actual study.
4. Findings
In an attempt to properly discuss the findings of this study, a brief description of the demographic background of the respondents are presented. The participants in this study were made up of 86% females and 14% males. In terms of age, majority of the respondents were around 31 to 40 years old (38.4%). In terms of school location, 72.7% of them were mostly from schools located in the urban area while 27.3% were from schools at the rural area. Majority of the respondents had teaching experiences between 11 and 20 years while 62% had 1 to 10 years working experiences. The dependent variable in this study was purported to investigate Science Teachers’ attitudes
towards using ICTs in teaching and learning. As indicated earlier, teachers’ attitude was measured based on the basis of four dimensions which are usefulness, confidence, anxiety and aversion. Overall mean of this construct shows that the mean and standard deviation for attitude towards using ICTs was (Mean = 3.91, SD = .540) (refer Table 1). This implies that the respondents have positive attitudes towards using ICT in the class. Congruently, the independence variables have been identified based on extant literature. Descriptive analyses have shown that the average mean for teaching experience is 9.81 years
old (M=9.81; SD = 7.63). This indicates that the study is comprised up of a mixture of experienced and novice teachers. Average mean for teachers’ ICT competencies was (M= 3.86; SD = .718) which shows that teachers are competent enough at handling basic technology tasks. In other words, the study data has shown that the participants in this study are competent in handling basic computer operations, setup, maintenances, and trouble shootings for word processing functions. This also means that the participants are competent in handling presentations and database software issues, networking operations, telecommunications, media communications and social issues - legal and ethical. School support is the third variable studied in this research. The overall mean showed that teachers were getting support from the school (M=3.57, SD= .629). Meanwhile, the ICT school culture was relatively high (M=3.89; SD = .386) which indicates that ICT school culture is recognized among schools in Malaysia. The last variable measured in this instrument was access to ICT resources for teaching and learning (M = 3.45; SD = .386) showing that schools have been well equipped to the extent of facilitating teachers use of ICTs in the classroom.
Table 1 : Mean and Standard Deviation on Dependent and Independent Variables Mean Standard Deviation
Attitudes towards using ICT for Teaching and Learning 3.91 .540 Basic Technology Competencies 3.85 .717 School support 3.57 .629
569569569
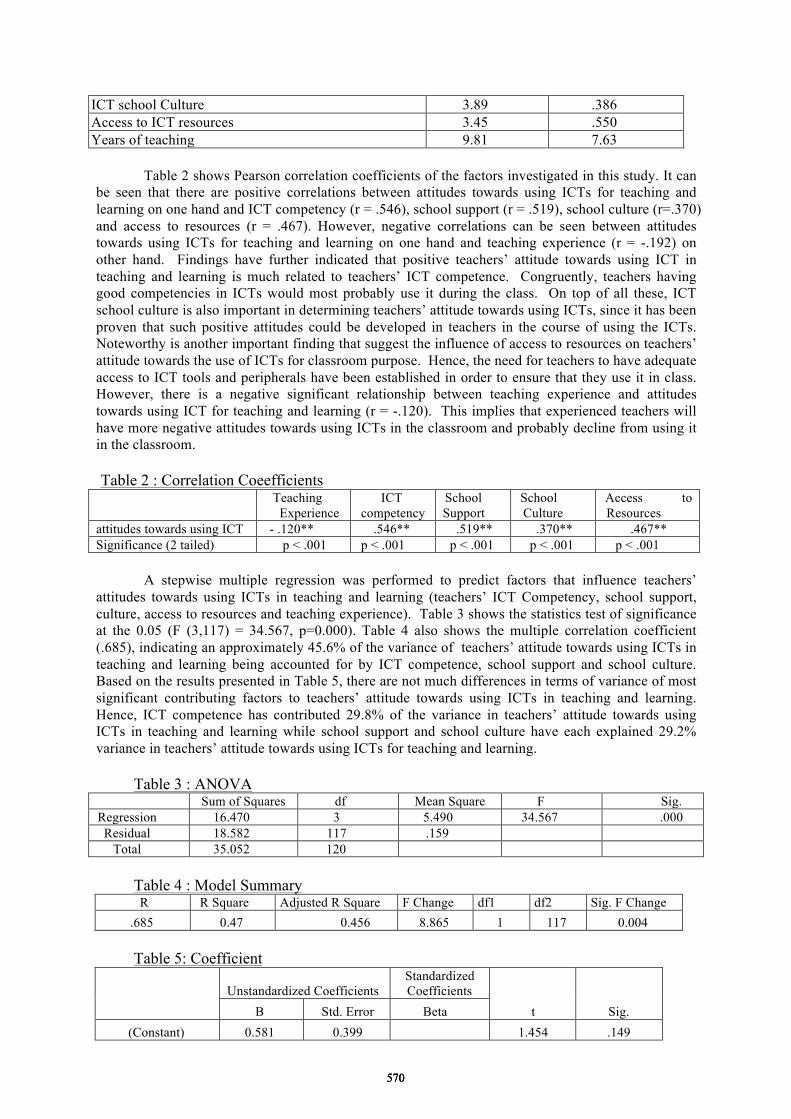
ICT school Culture 3.89 .386 Access to ICT resources 3.45 .550 Years of teaching 9.81 7.63
Table 2 shows Pearson correlation coefficients of the factors investigated in this study. It can
be seen that there are positive correlations between attitudes towards using ICTs for teaching and learning on one hand and ICT competency (r = .546), school support (r = .519), school culture (r=.370) and access to resources (r = .467). However, negative correlations can be seen between attitudes towards using ICTs for teaching and learning on one hand and teaching experience (r = -.192) on other hand. Findings have further indicated that positive teachers’ attitude towards using ICT in teaching and learning is much related to teachers’ ICT competence. Congruently, teachers having good competencies in ICTs would most probably use it during the class. On top of all these, ICT school culture is also important in determining teachers’ attitude towards using ICTs, since it has been proven that such positive attitudes could be developed in teachers in the course of using the ICTs. Noteworthy is another important finding that suggest the influence of access to resources on teachers’ attitude towards the use of ICTs for classroom purpose. Hence, the need for teachers to have adequate access to ICT tools and peripherals have been established in order to ensure that they use it in class. However, there is a negative significant relationship between teaching experience and attitudes towards using ICT for teaching and learning (r = -.120). This implies that experienced teachers will have more negative attitudes towards using ICTs in the classroom and probably decline from using it in the classroom.
Table 2 : Correlation Coeefficients
Teaching Experience
ICT competency
School Support
School Culture
Access to Resources
attitudes towards using ICT - .120** .546** .519** .370** .467** Significance (2 tailed) p < .001 p < .001 p < .001 p < .001 p < .001
A stepwise multiple regression was performed to predict factors that influence teachers’ attitudes towards using ICTs in teaching and learning (teachers’ ICT Competency, school support, culture, access to resources and teaching experience). Table 3 shows the statistics test of significance at the 0.05 (F (3,117) = 34.567, p=0.000). Table 4 also shows the multiple correlation coefficient (.685), indicating an approximately 45.6% of the variance of teachers’ attitude towards using ICTs in teaching and learning being accounted for by ICT competence, school support and school culture. Based on the results presented in Table 5, there are not much differences in terms of variance of most significant contributing factors to teachers’ attitude towards using ICTs in teaching and learning. Hence, ICT competence has contributed 29.8% of the variance in teachers’ attitude towards using ICTs in teaching and learning while school support and school culture have each explained 29.2% variance in teachers’ attitude towards using ICTs for teaching and learning.
Table 3 : ANOVA
Sum of Squares df Mean Square F Sig. Regression 16.470 3 5.490 34.567 .000 Residual 18.582 117 .159
Total 35.052 120 Table 4 : Model Summary R R Square Adjusted R Square F Change df1 df2 Sig. F Change
.685 0.47 0.456 8.865 1 117 0.004
Table 5: Coefficient
Unstandardized Coefficients Standardized Coefficients
t Sig. B Std. Error Beta (Constant) 0.581 0.399
1.454 .149
570570570
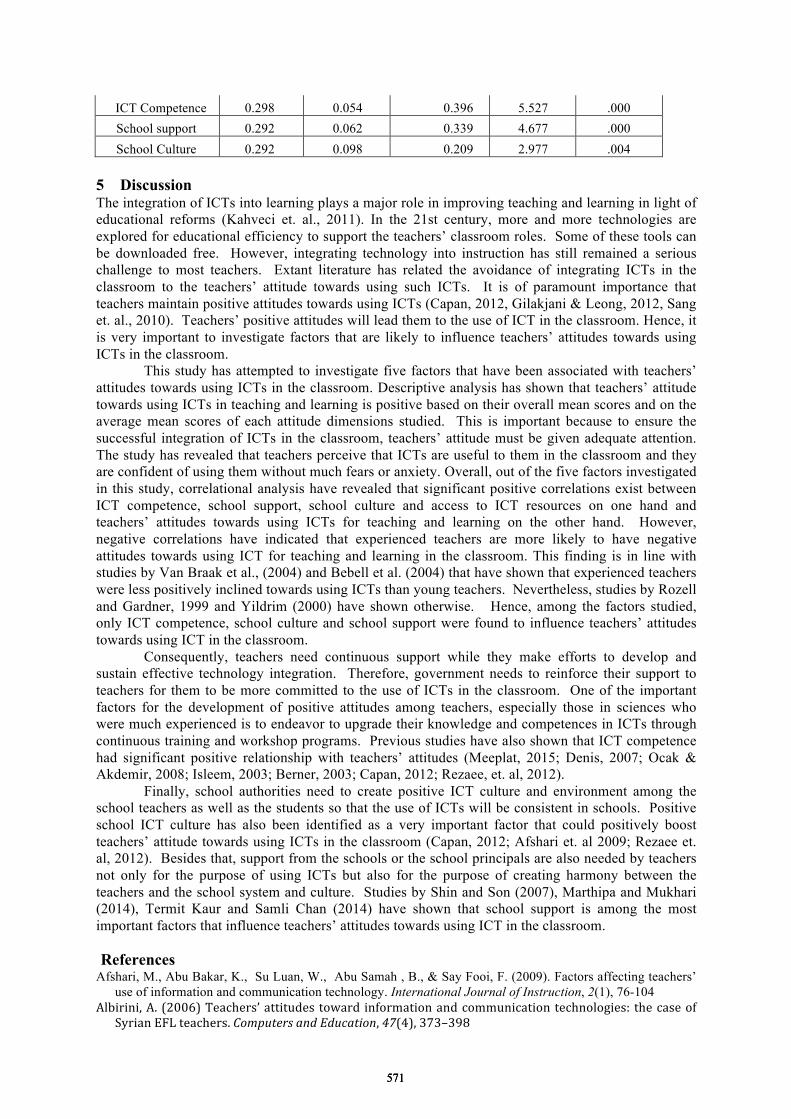
ICT Competence 0.298 0.054 0.396 5.527 .000 School support 0.292 0.062 0.339 4.677 .000 School Culture 0.292 0.098 0.209 2.977 .004
5 Discussion The integration of ICTs into learning plays a major role in improving teaching and learning in light of educational reforms (Kahveci et. al., 2011). In the 21st century, more and more technologies are explored for educational efficiency to support the teachers’ classroom roles. Some of these tools can be downloaded free. However, integrating technology into instruction has still remained a serious challenge to most teachers. Extant literature has related the avoidance of integrating ICTs in the classroom to the teachers’ attitude towards using such ICTs. It is of paramount importance that teachers maintain positive attitudes towards using ICTs (Capan, 2012, Gilakjani & Leong, 2012, Sang et. al., 2010). Teachers’ positive attitudes will lead them to the use of ICT in the classroom. Hence, it is very important to investigate factors that are likely to influence teachers’ attitudes towards using ICTs in the classroom.
This study has attempted to investigate five factors that have been associated with teachers’ attitudes towards using ICTs in the classroom. Descriptive analysis has shown that teachers’ attitude towards using ICTs in teaching and learning is positive based on their overall mean scores and on the average mean scores of each attitude dimensions studied. This is important because to ensure the successful integration of ICTs in the classroom, teachers’ attitude must be given adequate attention. The study has revealed that teachers perceive that ICTs are useful to them in the classroom and they are confident of using them without much fears or anxiety. Overall, out of the five factors investigated in this study, correlational analysis have revealed that significant positive correlations exist between ICT competence, school support, school culture and access to ICT resources on one hand and teachers’ attitudes towards using ICTs for teaching and learning on the other hand. However, negative correlations have indicated that experienced teachers are more likely to have negative attitudes towards using ICT for teaching and learning in the classroom. This finding is in line with studies by Van Braak et al., (2004) and Bebell et al. (2004) that have shown that experienced teachers were less positively inclined towards using ICTs than young teachers. Nevertheless, studies by Rozell and Gardner, 1999 and Yildrim (2000) have shown otherwise. Hence, among the factors studied, only ICT competence, school culture and school support were found to influence teachers’ attitudes towards using ICT in the classroom.
Consequently, teachers need continuous support while they make efforts to develop and sustain effective technology integration. Therefore, government needs to reinforce their support to teachers for them to be more committed to the use of ICTs in the classroom. One of the important factors for the development of positive attitudes among teachers, especially those in sciences who were much experienced is to endeavor to upgrade their knowledge and competences in ICTs through continuous training and workshop programs. Previous studies have also shown that ICT competence had significant positive relationship with teachers’ attitudes (Meeplat, 2015; Denis, 2007; Ocak & Akdemir, 2008; Isleem, 2003; Berner, 2003; Capan, 2012; Rezaee, et. al, 2012).
Finally, school authorities need to create positive ICT culture and environment among the school teachers as well as the students so that the use of ICTs will be consistent in schools. Positive school ICT culture has also been identified as a very important factor that could positively boost teachers’ attitude towards using ICTs in the classroom (Capan, 2012; Afshari et. al 2009; Rezaee et. al, 2012). Besides that, support from the schools or the school principals are also needed by teachers not only for the purpose of using ICTs but also for the purpose of creating harmony between the teachers and the school system and culture. Studies by Shin and Son (2007), Marthipa and Mukhari (2014), Termit Kaur and Samli Chan (2014) have shown that school support is among the most important factors that influence teachers’ attitudes towards using ICT in the classroom. References
Afshari, M., Abu Bakar, K., Su Luan, W., Abu Samah , B., & Say Fooi, F. (2009). Factors affecting teachers’ use of information and communication technology. International Journal of Instruction, 2(1), 76-104
Albirini, A. (2006) Teachers’ attitudes toward information and communication technologies: the case of Syrian EFL teachers. Computers and Education, 47(4), 373–398
571571571

Atkins, N., & Vasu, E. (2000). Measuring knowledge of technology usage and stages of concern about computing: A study of middle school teachers. Journal of Technology and Teacher Education, 8(4), 279–30
Bebell, D., Russell, M., & O'Dwyer, L. (2004). Measuring Teachers' Technology Uses: Why Multiple-Measures Are More Revealing. Journal of Research on Technology in Education, 37(1), 45-63.
Berner, J. E. (2003). A study of factors that may influence faculty in selected schools of education in the Commonwealth of Virginia to adopt computers in the classroom. Unpublished Doctoral Dissertation. George Mason University.
Capan, S.A. (2012). Teacher Attitudes towards Computer Use in EFL Classrooms. Frontiers of Language and Teaching, 3, 248-254
Deniz, L. (2007). Prospective class teachers’ computer experiences and computer attitudes. International Journal of Human and Social Sciences, 2(2), 116-122.
Flowers, C.P. & Algozzine, R.F. (2000). Development and Validation of Scores on the Basic Technology Competencies for Educators Inventory. Educational and Psychological Measurement, 60(3), 411-418.
Gilakjani, A. P. & Leong, L.-M. (2012). EFL teachers’ attitudes toward using computer technology in English language teaching. Theory and Practice in Language Studies, 2(3), 630-636.
Gulbahar, Y. (2008). ICT Usage in Higher Education: A Case Study on Pre-service Teachers and Instructors. The Turkish Online Journal of Educational Technology. 7(1), 32 – 37.
Guskey, T.R. (1989). Attitude and perceptual change in teachers. International Journal of Educational Research, 13(4), 439-453.
Isleem, M. (2003). Relationships of selected factors and the level of computer use for instructional purposes by technology education teachers in Ohio public schools: a statewide survey. The Ohio State University.
Kim, H. (2002). Teachers as a barrier to technology-integrated language teaching. English Teaching, 57(2), 35-64.
Lam, Y. (2000). Technophilia vs. technophobia: A preliminary look at why second –language teachers do or do not use technology in their classrooms. Canadian Modern Language Review, 15(3), 295-315.
Liaw, S.-S. (2002). An internet survey for perceptions of computers and the world wide web: relationship, prediction, and difference. Computer in Human Behavior, 18(1), 17-35.
Marthipa, E. R. & Mukhari, S. (2014) Teacher Factors Influencing the Use of Ict in Teaching and Learning in South African Urban Schools. Mediterranean Journal of Social Sciences. 5(23), 1213 – 1220
Makgato, M. (2012). Status of teachers’ use of educational technology: a case of some schools in South African semi-urban locations. International Proceedings of Economics Development and Research. 107-110
Melor Md Yunus. (2007). Malaysian ESL teachers’ use of ICT in their classrooms: expectations and realities. European Association for Computer Assisted Language Learning, 19(1), 79-95.
Meeplat, N. (2015). Assessing Teachers’ Attitude toward ICT Diffusion in Rural Primary School of Thailand. International Journal of Information and Education Technology, 5(6), 414-417
Ocak, M. A., & Akdemir, O. (2008). An Investigation of Primary School Science Teachers Use of Computer Applications. The Turkish Online Journal of Educational Technology, 7(4), 54 – 60.
Rezaee, A.A., Zainol Abidin, M.J., Issa, J.H., & Mustafa, P.O (2012). TESOL in-Service Teachers’ Attitudes towards Computer Use. English Language Teaching, 5(1), 61-68
Rozell, E.J., & Gardner, W.L. (1999). Computer-related success and failure: a longitudinal field study of the factors influencing computer-related performance. Computers in Human Behavior, 15(1), 1-10..
Shin, H.-J., & Son, J.-B. (2007). EFL teachers' perceptions and perspectives on Internet-assisted language teaching. Computer Assisted Language Leaning online Journal Online, 8(2).
Sang, G, Valcke, M. V. B, J. Tondeur, J. & Zhu, C. (2010). Factors associated with the integration of ICT into Chinese primary school classrooms: An interplay of teacher-related variable. Journal of Computer Assisted Learning, 27(2), 160-172
Saye, J. W. (1998). Technology in the classroom: The role of disposition in teacher gate keeping. Journal of Curriculum and Supervision, 13(3), 210-234.
Teck, W.K., Choo, G.S., Hanafi, H.F., & Osman, R. (2010). Computer Attitudes and Use Among Novice Teachers: The Moderating Effects of School Environment. Malaysian Journal Learning and Instruction. 7(2010), 93-112
Tedla, B A. (2012). Understanding the importance, Impacts and Barriers of ICT on Teaching and Learning in East African Countries. International Journal for e-learning Security, 2(3/4), 199 - 207
Termit Kaur & Samli Chan (2014). Teacher readiness on ICT integration in teaching-learning: a Malaysian case study. International Journal of Asian Social Science, 4(7), 874-885
van Braak, J., Tondeur, J., & Valcke, M. (2004). Explaining different types of computer use among primary school teachers. European Journal of Psychology of Education, 19, 407-422.
Wong, S. L. (2002). Development and validation of an Information Technology (IT) based instrument to measure teachers' IT preparedness. Unpublished doctoral thesis, University Putra Malaysia, Malaysia.
Yildirim, S. (2000). Effect of an educational computing course on pre-service and in-service teachers: A discussion and analysis of attitudes and use. Journal of Research on Computing in Education, 32(4), 479-495.
572572572

Chen, W. et al. (Eds.) (2016). Proceedings of the 24th
International Conference on Computers in
Education. India: Asia-Pacific Society for Computers in Education
Best Practices in ICT Integration: Teacher
Education through Teachers’ Views
Arit Uyouko UYOUKOa*
, Su Luan WONGb & Imaikop Okon AKPAN
c
aCollege of Education, Afaha Nsit, Nigeria
bFaculty of Educational Studies, Universiti Putra Malaysia, Malaysia
cCollege of Education, Afaha Nsit, Nigeria
Abstract: This study explored views held by teachers in Nigeria with regards to Information and
Communication Technologies (ICT) integration. This qualitative study used interview to collect data
from teachers at the college of education. Results of this study indicated that teacher education
programs failed to provide adequate instructional technologies and ICT facilities for class activities.
Further, three major issues which appeared to affect the integration of ICT were found to be: (a) the
redesigning of the curriculum and ICT policy, (b) incompetent teachers/lack of professional training in
ICT delivery, and (c) insufficient ICT structures.
Keywords: Best practices, teacher education, ICT integration, ICT facilities.
1. Introduction
The aim of any country’s education system is to provide quality education and training, the people
who act in this provision process are teachers. Teachers in Nigeria fall under three categories
depending on the level of professional training, (graduate teachers- university, NCE teachers –
college of education and grade II teachers – teacher training, gradually being phased out in the
county). The minimum qualification for a professional teacher is the National Certificate of
Education (NCE). The National Commission for Colleges of Education (NCCE) was established by
an Act in 1989 with a mandate to manage, regulate and enforce minimum standards for all teacher
education programmes including accreditation, academic awards and restructuring of pre-teachers
curriculum in a total of 82 Colleges of Education (federal, state and private owned) in the country.
The College of Education in this study is a highly qualified institution accredited by the NCCE of the
Federal Ministry of Education of Nigeria, with 25 years’ experience in teacher education. It
currently relies on five academic units that offer up to 21 remedial, pre NCE and NCE programmes.
Teacher education prepares teachers for the society, equips teachers with necessary skills and
competences required for the achievement of goals of the education system. Kafu and Simwelo,
(2015) view teacher education as a foundation of any established system, a launch pad for economic
progress and as custodian of culture of any given society.
The integration of ICT in teacher education programmes in Nigeria’s Colleges of Education
have not fully taken off and this have been attributed to several reasons, from lack of proper ICT
policy implementation, lack of ICT facilities and access to Internet to teachers resistance to change,
teachers non ICT compliant to the lack of skills in practical ICT training and integration as this is a
new wave in the Nigerian educational environment makes the list endless. According to Zhang,
Yang, Chang and Chang (2016), in realization of the potentials of ICT in education, many countries
in the developing world, including the least developed countries, are making huge investments on
developing their respective ICT in education plans and in turn bringing various ICT equipment and
resources into schools. They further state that other than the development of ICT in education, the
role and capacity of teachers have become more of a crisis situation, being one of the big challenges
for developing countries, on how to enable teachers’ use and integrate appropriate technology into
the teaching and learning process. Kozma and Vota (2014) points out that some countries in the face
of serious financial constraints are buying one laptop for every primary or secondary student. While
ICT can offer positive potential to the classroom and teachers may recognise these, the potential is
rarely realised (Gulbahar & Guven, 2008). The successful integration of ICT into the classroom
depends on the ability of teachers to structure their learning environments in non-traditional ways,
573573573
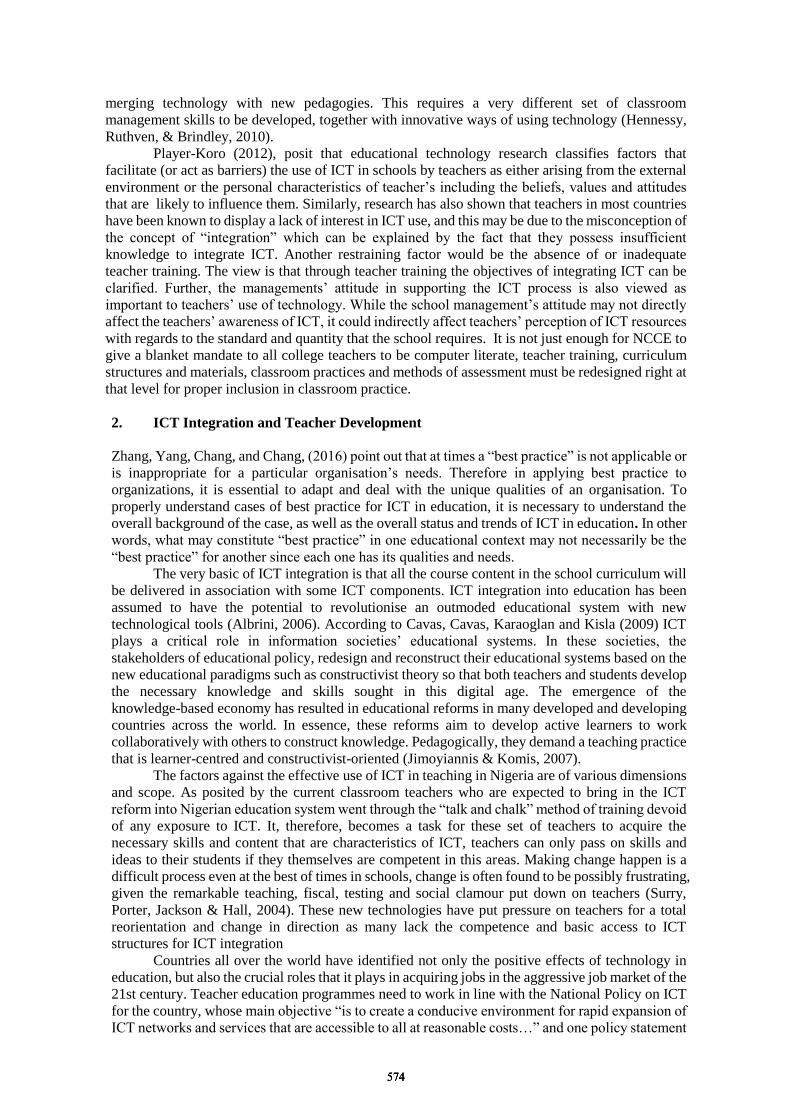
merging technology with new pedagogies. This requires a very different set of classroom
management skills to be developed, together with innovative ways of using technology (Hennessy,
Ruthven, & Brindley, 2010). Player-Koro (2012), posit that educational technology research classifies factors that
facilitate (or act as barriers) the use of ICT in schools by teachers as either arising from the external
environment or the personal characteristics of teacher’s including the beliefs, values and attitudes
that are likely to influence them. Similarly, research has also shown that teachers in most countries
have been known to display a lack of interest in ICT use, and this may be due to the misconception of
the concept of ―integration‖ which can be explained by the fact that they possess insufficient
knowledge to integrate ICT. Another restraining factor would be the absence of or inadequate
teacher training. The view is that through teacher training the objectives of integrating ICT can be
clarified. Further, the managements’ attitude in supporting the ICT process is also viewed as
important to teachers’ use of technology. While the school management’s attitude may not directly
affect the teachers’ awareness of ICT, it could indirectly affect teachers’ perception of ICT resources
with regards to the standard and quantity that the school requires. It is not just enough for NCCE to
give a blanket mandate to all college teachers to be computer literate, teacher training, curriculum
structures and materials, classroom practices and methods of assessment must be redesigned right at
that level for proper inclusion in classroom practice.
2. ICT Integration and Teacher Development
Zhang, Yang, Chang, and Chang, (2016) point out that at times a ―best practice‖ is not applicable or
is inappropriate for a particular organisation’s needs. Therefore in applying best practice to
organizations, it is essential to adapt and deal with the unique qualities of an organisation. To
properly understand cases of best practice for ICT in education, it is necessary to understand the
overall background of the case, as well as the overall status and trends of ICT in education. In other
words, what may constitute ―best practice‖ in one educational context may not necessarily be the
―best practice‖ for another since each one has its qualities and needs.
The very basic of ICT integration is that all the course content in the school curriculum will
be delivered in association with some ICT components. ICT integration into education has been
assumed to have the potential to revolutionise an outmoded educational system with new
technological tools (Albrini, 2006). According to Cavas, Cavas, Karaoglan and Kisla (2009) ICT
plays a critical role in information societies’ educational systems. In these societies, the
stakeholders of educational policy, redesign and reconstruct their educational systems based on the
new educational paradigms such as constructivist theory so that both teachers and students develop
the necessary knowledge and skills sought in this digital age. The emergence of the
knowledge-based economy has resulted in educational reforms in many developed and developing
countries across the world. In essence, these reforms aim to develop active learners to work
collaboratively with others to construct knowledge. Pedagogically, they demand a teaching practice
that is learner-centred and constructivist-oriented (Jimoyiannis & Komis, 2007).
The factors against the effective use of ICT in teaching in Nigeria are of various dimensions
and scope. As posited by the current classroom teachers who are expected to bring in the ICT
reform into Nigerian education system went through the ―talk and chalk‖ method of training devoid
of any exposure to ICT. It, therefore, becomes a task for these set of teachers to acquire the
necessary skills and content that are characteristics of ICT, teachers can only pass on skills and
ideas to their students if they themselves are competent in this areas. Making change happen is a
difficult process even at the best of times in schools, change is often found to be possibly frustrating,
given the remarkable teaching, fiscal, testing and social clamour put down on teachers (Surry,
Porter, Jackson & Hall, 2004). These new technologies have put pressure on teachers for a total
reorientation and change in direction as many lack the competence and basic access to ICT
structures for ICT integration
Countries all over the world have identified not only the positive effects of technology in
education, but also the crucial roles that it plays in acquiring jobs in the aggressive job market of the
21st century. Teacher education programmes need to work in line with the National Policy on ICT
for the country, whose main objective ―is to create a conducive environment for rapid expansion of
ICT networks and services that are accessible to all at reasonable costs…‖ and one policy statement
574574574
is ―to ensure the country’s effective participation in regional and international ICT market and to
promote ICT development in Nigeria, meet the country international obligation and derive
maximum benefit from inter co-operation in these areas‖ (NICTP, 2012; p. 13). The ICT Policy
facility for Nigeria was provided for research, evaluation and planning purposes. The policy is
aimed at tackling the entrepreneurship, innovation, digital divide strategies and development
problems in Nigeria.
At the same time, it has been noted that ICT has much to offer, but on that front it has failed
to deliver. So much time and effort has been invested in the development of effective ICT policy,
even so its implementation has also failed to yield results (Ololube, 2006a, 2006b). Therefore, there
is a need to theoretically ascertain if the factors mentioned by teachers in this study are responsible
for ICT integration in Nigeria teacher education environment. Little is known about the current
process of ICT integration in teacher education, the overall aim of the present study is to explore
ICT integration from the teachers’ views and in this context the current study adds some original
contributions to the theory and practice in the area of ICT integration in teacher education. This
study will help to reposition the teacher education programme in Nigeria in the preparation of
teachers at the Colleges of Education with emphasis placed on adequate knowledge and application
of ICT in teaching and learning process in their teacher education programmes.
3. Methodology
This is a qualitative study, using in-depth interview as the main research instrument to gather data
for the study. The use of in-depth interviews as a research tool for this study has the advantage of
providing in-depth investigation, allowing better understanding of teachers' beliefs, perceptions,
views, thoughts, feelings, experiences and understanding, in relation to ICT integration. According
to Cohen, Manion and Morrison (2007), ―the major justification of using interview in research is
that it is believed that in an interpersonal encounter with people, they are more likely to disclose
aspects of themselves, their thoughts, their feelings and values‖ (p.282). A College of Education
was selected for the study, expanding a purposive sampling method to cover six schools in the
college. The schools (faculties) selected included both science and arts. Three respondents were
selected from each of these schools; the criteria used being their position as senior academic
officers with more than five years as teaching experiences, their role in knowledge sharing as part
of their duties, as well as how it relates to teacher education. Some of the respondents had held such
posts as dean, head of departments, academic board member and director student affairs units.
Sixteen participants emerged at the end of the selection process. Two of the selected participants
were unable to participate in the study, due to other official duties.
The interviews were conducted over a three months period (January–March) with the
remaining 16 respondents, the interviews were scheduled during their break sessions, a few times
the sessions were cancelled because of other school work activity such as teaching practice
supervision, the respondents provided a rich insight into how ICT integration in the college can
translate into quality teaching and learning. Interpretative Qualitative Approach was used to discuss
the findings, teachers were given numbers for identification. The findings were first grouped into
themes as they occur in the study. Coding and selection of the themes depended on their importance
and relevance to the study as well as their significance to the informants' discussion.
4. Discussion and Findings - Teachers' Views
ICT integration in teacher education in Nigeria: Major findings from the interview data analysis are
presented in this section, in order to explore teachers’ views on ICT integration in teacher education.
Respondents were asked whether they think ICT integration was needed in teacher education and
why. In the analysis of the first question, two themes emerged — ICT facilities, no ICT competence
and one sub-theme — useful effective learning. All respondents were in support of ICT integration
given the rapid changes occurring in ICT and the relative lack of related transformation in current
teacher education, teacher quality is accepted as a critical factor in educational outcomes, there is so
little attention paid to improving the quality of teachers’ professional knowledge. Teacher 4,
Teacher 7 and Teacher 15 commented:
575575575
Teacher 7: Teacher competence whether in using ICT or in not using, is
already a problematic and challenging situation. You said something
about best practices that in itself are one of the challenges: How does
one come up with best practice for ICT integration in teaching and
learning? What should be looked at? When should measurements be
taken? I am the one now asking the questions because I know that all
these is with regards to international as well as local assessment…
aspects such as standardization. Government expects that ICT should be
used to enhance the quality of education there has been little movement
on their part towards using ICT to assist teachers with accessing the
knowledge and competence that might enhance their teaching.
Teacher 4: Whose best practice are we to follow? ICT integration should
start small if the stakeholders mean well or should I say are
serious…one day is one intervention process or the other all with
conflicting roles…one hasn’t taken off with visible results another is
taking off.
Teacher 15: Teachers have to be involved in this integration process
because they are the one right in the eyes of the storm if I can say
that…their input is necessary.
To further capture the participants’ views toward ICT integration, Teacher 1, Teacher 3,
Teacher 8 and Teacher 9 responded:
Teacher 3: ICT is very useful and effective for both teachers and
students…it will be good to have.
Teacher 9: ICT should be integrated into teacher
education…gradually… I think we are very late…however, it should be
put into requirements for accreditation by those concerned.
Teacher 1: I believe in the potentials of ICT to make learning more fun
and efficient as it enriches the learning environment.
Teacher 8: I believe with ICT our educational system will improve with
quality teachers if only there is the ICT implementation and integration.
Teacher 3, Teacher 2 and Teacher 16 affirmed to the lack of ICT
structures even when they are well aware that there should be ICT
integration in teacher education programmes.
Teacher 3: There is no such thing as ICT integration… how are we
going to do that when there is lack of access to ICT and support… by
providing computers in IT labs is not enough for ICT integration.
Teacher 16: There are no ICT infrastructures, so where will my
competence come from… is not sufficient especially in the IT labs.
Teacher 2: It is a very serious issue that there are no computers in the
classrooms…I know it is a lot of investment on the part of the
stakeholders.
The second question is a follow-up from the first where the participants were asked whether they
think ICT related teacher competence and their actual use of ICT are sufficient in the schools and
why. Two themes emerged from this question being ICT training and lack of opportunities. The
576576576
participants pointed out in their comments, that the existing ICT training they have had are not
sufficient for the implementation process if it were to be effective, so they desire to have more ICT
training for a successful ICT integration. Teachers 3, Teachers 11, Teachers 13 and Teacher 15
remarked:
Teacher 13: As a teacher do have minimum requirements in terms of
ICT competency, but I know I should, ICT is developing continually
and this means I do need more training in order to update myself
accordingly with the changing technology.
Teacher 11: I know I need more in terms of training to apply this
ICT…because it is difficult to give up old habits…when one is set in a
particular way.
Teacher 3: Teachers are already familiar with new technologies in their
daily lives…however; they do not have enough opportunities to use ICT
in their classes.
Teacher 15: I personally will want to use technology in class, it will take
a lot of training…every day is a new thing…in order to keep up with the
developments in new technologies… it is so fast.
On the second theme participants mentioned lack of opportunities to use ICT in the classroom and
they are also lack of enough ICT peripherals, software or hardware and ICT policy. The teachers
think that these conditions are some of the barriers to their integration of ICT in the teaching and
learning processes in teacher education programmes. Teacher 4, Teachers 7 and Teachers 10 noted:
Teacher 7: I know there are the school’s ICT policy….of course it is
there is somewhere.
Teacher 10: I have not read it but it there….maybe it will be
implemented…..we just make do with what we have been doing.
Teacher 4: The classrooms have to be purposely built for ICT
integration, so many things has to be on ground, security, electricity, the
equipment’s…a lot, and it is overwhelming…the stakeholders to me
have to take a bold step.
5. Conclusion and Recommendation
Teachers in this study hold common views on ICT integration and the major restraining factor would
be the absence of or inadequate teacher training in the use of ICT as a tool for teaching. The view is
that through teacher training the objectives of integrating ICT can be clarified. Further, the
stakeholders’ attitude in supporting the ICT process is also viewed as important to teachers’ use of
ICT. While the school management’s attitude and ICT policy may not directly affect the teachers’
awareness of ICT, it could indirectly affect teachers’ perception of ICT resources with regards to the
standard and quantity that the school requires.
Based on teachers’ views in this study, the following recommendations are hereby
suggested through which ICT integration in teacher education could be implemented to improve
teacher education. One major recommendation is the urgent need to review the educational policy
strategies and techniques by policy makers and education administrators as it concerns ICT in the
teaching methodologies of teachers. This implies that there is a need to introduce the teaching of ICT
in schools curricular for teacher education with emphasis on practical application. When ICT
integration at this level is made compulsory, the student teachers will graduate to teach the same way
they were taught. Also the findings of this study have clearly shown that the availability of ICT
facilities and teachers utilization of any such ICT facilities is quite low or not available. This creates
577577577
a serious limitation to quality instructional delivery in this ICT global age, support structures such as
electricity and the Internet should be improved and adequately provided for.
Training and re-training of teachers is a continuous process and cannot be over emphasised,
such could be achieved through exposure to what is available – conference, seminars and workshops
that are ICT based in content delivery, this way the teachers are forced in some ways to stay abreast
with the dynamic and modern development in ICT, while the government and stakeholders have a
duty towards qualitative education for its citizens, non-governmental organisations should be
encouraged to assist in areas of providing and funding of facilities for schools. ICT will not replace
the teacher, but ICT should be seen as a tool to enhance quality instructional delivery
References
Cakiroglu, O. (2015). Teachers’ views on the use of interactive whiteboards in secondary schools. Eurasia
Journal of Mathematics, Science & Technology Education, 11(2), 251–259. doi:
10.12973/eurasia.2015.1335a.
Cavas, B., Cavas, P., Karaoglan, B., & Kisla, T. (2009). A study on science teachers’ attitudes toward
information and communication technologies in education.
Cohen, L., Manion, L., & Morrison, K., 6th Edition (2007) Research Methods in Education. London:
RoutledgeFalmer.
Cox, M. J., Cox, K., & Preston, C. (2000). What factors support or prevent teachers from using ICT in their
classrooms? Paper presented at the Educational Research Association Annual Conference, University
of Sussex at Brighton, University of Sussex at Brighton.
Gulbahar, Y., & Guven, I. (2008). A survey on ICT usage and the perceptions of social studies teachers in
Turkey. Educational Technology & Society, 11(3), 37-51.
Hennessy, S., Ruthven, K., & Brindley, S. (2005). Teacher perspectives on integrating ICT into subject
teaching: commitment, constraints, caution, and change. Journal of Curriculum Studies, 37(2),
155-192.
Hooker, M., Mwiyeria, E., & Verma, A. (2011). ICT competency framework for teachers in Nigeria (pp. 1–93).
World Bank and GESCI.
Jimoyiannis, A., & Komis, V. (2007). Examining teachers’ beliefs about ICT in education: Implications of a
teacher preparation programme. Teacher Development, 11(2), 149-173.
Kafu, P.A., & Simwelo, G.N. (2015). Reforms and Innovations in teacher education.
http://www.eajournals.org/journals/british-journal-of-education..../.pdf.
Kozma, R., & Vota, W. (2014). ICT in developing countries: Policies, implementation, and impact. In J. M.
Spector, M. D. Merrill, J. Elen & M. J. Bishop (Eds.), Handbook of research on educational
communications and technology (pp. 885–894): New York: Springer.
NICTP (2012). Penetration of Information Technology in Nigeria. National Information Communication
Technology Policy.
Ololube, N. P. (2006a). Appraising the relationship between ICT usage and integration and the standard of
teacher education programs in a developing economy. International Journal of Education and
Development using ICT, 2(3).
Ololube, N. P. (2006b). The impact of professional and non-professional teachers’ ICT competencies in
secondary schools in Nigeria. Journal of Information Technology Impact, 6(2), 101-118.
Player-Koro, C. (2012). Factors influencing teachers' use of ICT in education. Education Inquiry, 3(1),
93–108.
Surry, D., Porter, B., Jackson, K., & Hall, D. (2004). Conditions for creating an innovation friendly
environment in K-12 schools. Paper presented at the Society for Information Technology & Teacher
Education International Conference, Chesapeake, VA.
UNESCO. (2015). Qingdao declaration—International conference on ICT and post-2015
education.http://www.unesco.org/new/en/education/resources/in-focus articles/qingdaodeclaration.
Zhang, J., Yang, J., Chang, M., & Chang, T. (Eds.). (2016). ICT in Education in Global Context: The Best
Practices in K-12 Schools. 1-17. Springer.
578578578

Chen, W. et al. (Eds.) (2016). Proceedings of the 24th
International Conference on Computers in Education.
India: Asia-Pacific Society for Computers in Education
A Case Study Illustrating Coding for
Computational Thinking Development
Siu Cheung KONGa*
& Ping LIb*
a Centre for Learning, Teaching and Technology, The Education University of Hong Kong
b Department of Mathematics and Information Technology, The Education University of Hong Kong
*[email protected]; *[email protected]
Abstract: Previous studies suggested that computational thinking is an important skill that
schools should start equipping children with from primary school education. This study
proposes way to develop a mobile app coding curriculum in primary 4 to 6 to nurture students’
computational thinking. It will guide students to undergo learning stages from developing their
own codes and combining with others’ work to create their own apps and staging their apps to
gain confidence and recognition of performance in coding. An example of mathematic game in
the curriculum is selected as a case study to illustrate in this study how it incorporates the
elements of computational thinking in the coding activities progressively. It is believed that the
proposed way of curriculum development paves a learning path which may drive students’
interest in coding and students could develop computational thinking skills progressively.
Keywords: computational thinking, coding education, coding curriculum, mobile app coding,
primary school education
1. Introduction
The term “computational thinking” had gained considerable global awareness in the past decade.
Societies are now in need of people with ability to think like a computer scientist. The importance of
computational thinking has been reinforced in primary and secondary schools in recent years. Many
countries implemented coding courses to develop students’ computational thinking ability. In Hong
Kong, computational thinking was also highlighted in the “Report on the Fourth Strategy on
Information Technology in Education” in 2015 (Education Bureau, 2015). This paper proposes a
computational thinking curriculum in senior primary school to teach students mobile apps coding. It
illustrates how coding education develops students’ computational thinking by various coding tasks.
2. Background of Study
Since the introduction by Jeannette Wing, computation thinking (Wing, 2006) had gained increasingly
heated discussion of its operational definition in multiple disciplines. According to Wing (2006, p. 33),
computational thinking is taking an approach to solve problems, design systems and understand human
behavior that draws on concepts fundamental to computing. Computational thinking is to think like a
computer scientist. It is a set of thinking skills, habits, and approaches integral to solve complex
problems (Wing, 2006; Lee, Martin, Denner, Coulter, et al., 2011). Abstraction in computational
thinking marks its differences from algorithmic and mathematical thinking (Wing, 2011). By definition,
abstraction is defining patterns, generalizing from specific instances, and also a key to attack
complexity. Apart from abstraction, computational thinking also requires automation and analysis
which instructed computers to carry out repetitive tasks efficiently and to validate whether the
abstractions made are correct. In recent years, computational thinking gains educators’ attention. It
sheds light on the potential practical applications among the youth. Lee et al. (2011) illustrated the
application of computational thinking among students and found that it has far-reaching influences on
upgrading students from consuming others’ creation to creating their own innovative products. Wing’s
call for computational thinking draws increased research investigations that attempt questions such as
579579579
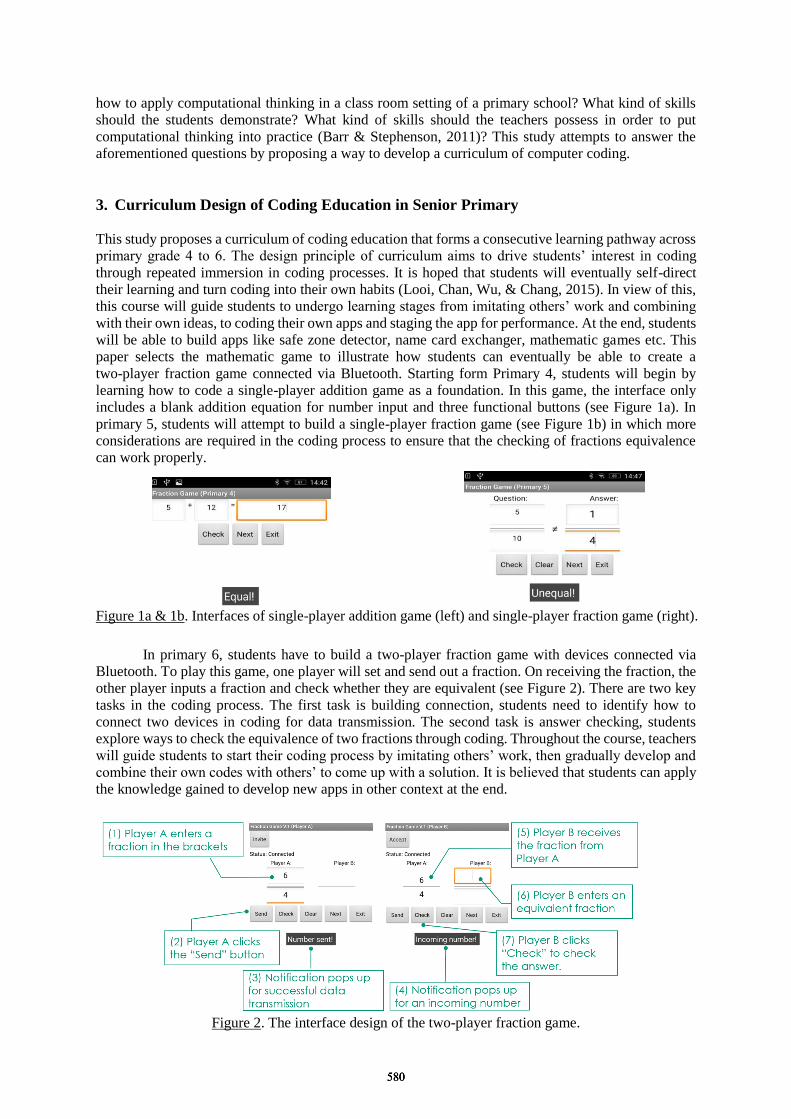
how to apply computational thinking in a class room setting of a primary school? What kind of skills
should the students demonstrate? What kind of skills should the teachers possess in order to put
computational thinking into practice (Barr & Stephenson, 2011)? This study attempts to answer the
aforementioned questions by proposing a way to develop a curriculum of computer coding.
3. Curriculum Design of Coding Education in Senior Primary
This study proposes a curriculum of coding education that forms a consecutive learning pathway across
primary grade 4 to 6. The design principle of curriculum aims to drive students’ interest in coding
through repeated immersion in coding processes. It is hoped that students will eventually self-direct
their learning and turn coding into their own habits (Looi, Chan, Wu, & Chang, 2015). In view of this,
this course will guide students to undergo learning stages from imitating others’ work and combining
with their own ideas, to coding their own apps and staging the app for performance. At the end, students
will be able to build apps like safe zone detector, name card exchanger, mathematic games etc. This
paper selects the mathematic game to illustrate how students can eventually be able to create a
two-player fraction game connected via Bluetooth. Starting form Primary 4, students will begin by
learning how to code a single-player addition game as a foundation. In this game, the interface only
includes a blank addition equation for number input and three functional buttons (see Figure 1a). In
primary 5, students will attempt to build a single-player fraction game (see Figure 1b) in which more
considerations are required in the coding process to ensure that the checking of fractions equivalence
can work properly.
Figure 1a & 1b. Interfaces of single-player addition game (left) and single-player fraction game (right).
In primary 6, students have to build a two-player fraction game with devices connected via
Bluetooth. To play this game, one player will set and send out a fraction. On receiving the fraction, the
other player inputs a fraction and check whether they are equivalent (see Figure 2). There are two key
tasks in the coding process. The first task is building connection, students need to identify how to
connect two devices in coding for data transmission. The second task is answer checking, students
explore ways to check the equivalence of two fractions through coding. Throughout the course, teachers
will guide students to start their coding process by imitating others’ work, then gradually develop and
combine their own codes with others’ to come up with a solution. It is believed that students can apply
the knowledge gained to develop new apps in other context at the end.
Figure 2. The interface design of the two-player fraction game.
580580580
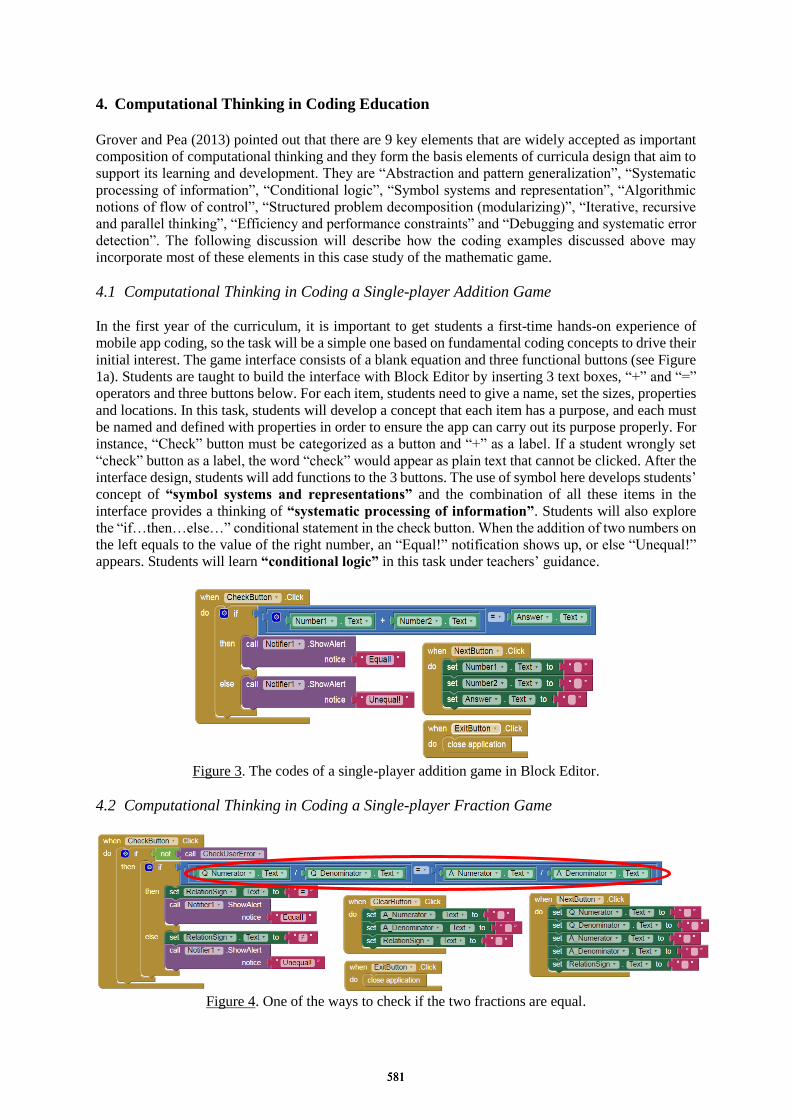
4. Computational Thinking in Coding Education
Grover and Pea (2013) pointed out that there are 9 key elements that are widely accepted as important
composition of computational thinking and they form the basis elements of curricula design that aim to
support its learning and development. They are “Abstraction and pattern generalization”, “Systematic
processing of information”, “Conditional logic”, “Symbol systems and representation”, “Algorithmic
notions of flow of control”, “Structured problem decomposition (modularizing)”, “Iterative, recursive
and parallel thinking”, “Efficiency and performance constraints” and “Debugging and systematic error
detection”. The following discussion will describe how the coding examples discussed above may
incorporate most of these elements in this case study of the mathematic game.
4.1 Computational Thinking in Coding a Single-player Addition Game
In the first year of the curriculum, it is important to get students a first-time hands-on experience of
mobile app coding, so the task will be a simple one based on fundamental coding concepts to drive their
initial interest. The game interface consists of a blank equation and three functional buttons (see Figure
1a). Students are taught to build the interface with Block Editor by inserting 3 text boxes, “+” and “=”
operators and three buttons below. For each item, students need to give a name, set the sizes, properties
and locations. In this task, students will develop a concept that each item has a purpose, and each must
be named and defined with properties in order to ensure the app can carry out its purpose properly. For
instance, “Check” button must be categorized as a button and “+” as a label. If a student wrongly set
“check” button as a label, the word “check” would appear as plain text that cannot be clicked. After the
interface design, students will add functions to the 3 buttons. The use of symbol here develops students’
concept of “symbol systems and representations” and the combination of all these items in the
interface provides a thinking of “systematic processing of information”. Students will also explore
the “if…then…else…” conditional statement in the check button. When the addition of two numbers on
the left equals to the value of the right number, an “Equal!” notification shows up, or else “Unequal!”
appears. Students will learn “conditional logic” in this task under teachers’ guidance.
Figure 3. The codes of a single-player addition game in Block Editor.
4.2 Computational Thinking in Coding a Single-player Fraction Game
Figure 4. One of the ways to check if the two fractions are equal.
581581581

When students reach primary 5, they are required to modify the addition game into a fraction game.
Most of the buttons in this coding task are similar, except that a “Clear” button will be added to clear the
input of answers and the change of addition equation to the checking of equivalence of two fractions.
This needs a more complicated interface design and allows more than one ways of answer checking. To
check whether the two fractions are equal, there are two solutions: (1) to check whether the values of
divisions on each side are equal; (2) to check if the multiplication of the left numerator and the right
denominator equals to that of the right numerator and the left numerator (see Figure 4). Teachers will
guide students to decide which would be a better solution. After discussion, students will come to two
conclusions. First, when the first solution is adopted, there is a potential error that computer might
wrongly judge two equal fractions as unequal due to their different values after rounding off. Second, if
users entered non-integral values in input boxes or zero in any denominators, errors appeared. Removal
of these bugs requires students’ “debugging and systematic error detection” skills. Considering that
the debugging codes are beyond students’ level, teachers will provide a solution of coding that disables
inputs of non-integral values and ask students to input non-zero value in denominators. Extended
learning materials will be provided to develop students’ debugging skills.
4.3 Computational Thinking in Coding Two-player Fraction Game Connected via Bluetooth
In primary 6, students will further develop the app into a two-player fraction game that enables data
transmission in two devices via Bluetooth. In order to support data transmission, two devices must
undergo Bluetooth connection and client server connection beforehand (see Figure 5). This requires
students’ understanding of the operation concept of the three-layer connection and that of the
client-server relation. To make a Bluetooth connection within the app, the two devices have to build a
client-server relation in which the server makes a connection invitation and the client accepts. As the
client and server are taking different actions in this task, “iterative and parallel thinking skills” are
needed here due to the two different versions of coding required for each of them respectively (see
Figure 6).
Figure 5. Three layers of device connection in support of data transmission in fraction game app.
Figure 6. Codes for Bluetooth connection within the app for server side (left) and client side (right).
In the coding for data transmission part, students need to think in a parallel way that the app
should contain both the sending fraction and receiving fraction components so that both devices can
detect when there is a new fraction sent from the partner device and thus act in response by showing
“Incoming number!” and the fraction received on screen (see Figure 7).
Apart from the above task of building Bluetooth connection and transmitting data between two
devices, students also need to add one more functional button “Send” to send the fractions to the partner.
From the whole coding task, we can see a much more advanced structure at primary 6 level. First, as
582582582
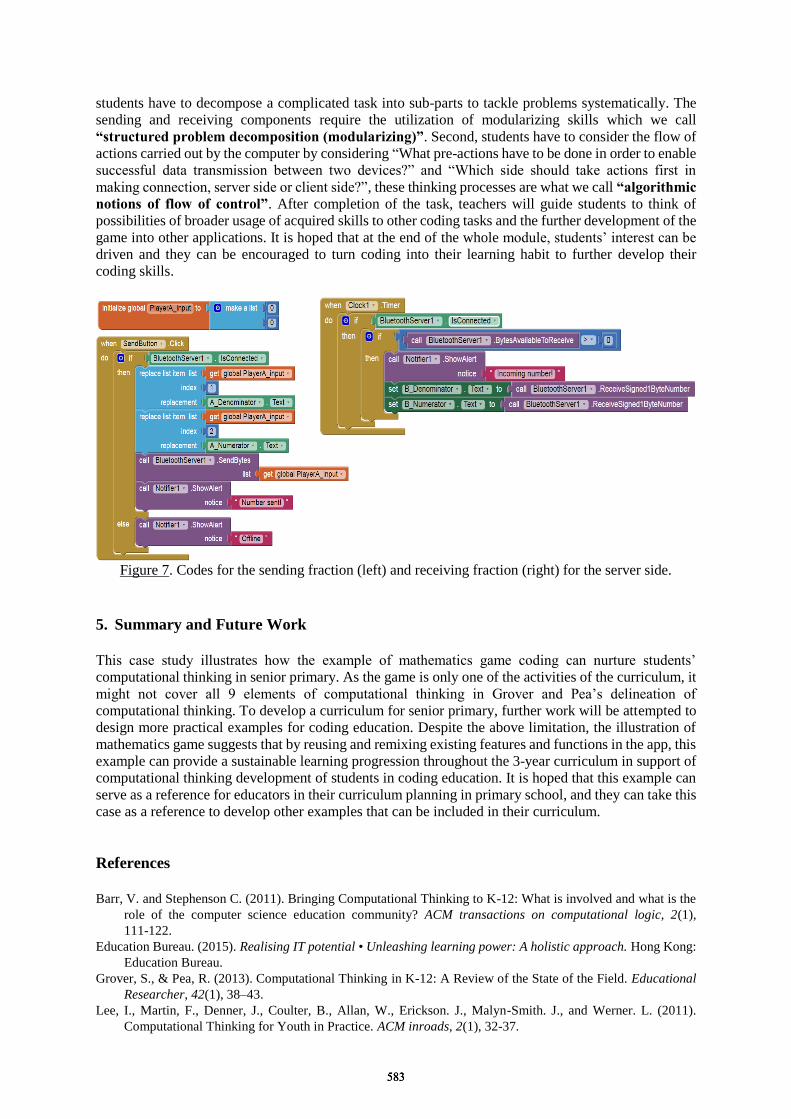
students have to decompose a complicated task into sub-parts to tackle problems systematically. The
sending and receiving components require the utilization of modularizing skills which we call
“structured problem decomposition (modularizing)”. Second, students have to consider the flow of
actions carried out by the computer by considering “What pre-actions have to be done in order to enable
successful data transmission between two devices?” and “Which side should take actions first in
making connection, server side or client side?”, these thinking processes are what we call “algorithmic
notions of flow of control”. After completion of the task, teachers will guide students to think of
possibilities of broader usage of acquired skills to other coding tasks and the further development of the
game into other applications. It is hoped that at the end of the whole module, students’ interest can be
driven and they can be encouraged to turn coding into their learning habit to further develop their
coding skills.
Figure 7. Codes for the sending fraction (left) and receiving fraction (right) for the server side.
5. Summary and Future Work
This case study illustrates how the example of mathematics game coding can nurture students’
computational thinking in senior primary. As the game is only one of the activities of the curriculum, it
might not cover all 9 elements of computational thinking in Grover and Pea’s delineation of
computational thinking. To develop a curriculum for senior primary, further work will be attempted to
design more practical examples for coding education. Despite the above limitation, the illustration of
mathematics game suggests that by reusing and remixing existing features and functions in the app, this
example can provide a sustainable learning progression throughout the 3-year curriculum in support of
computational thinking development of students in coding education. It is hoped that this example can
serve as a reference for educators in their curriculum planning in primary school, and they can take this
case as a reference to develop other examples that can be included in their curriculum.
References
Barr, V. and Stephenson C. (2011). Bringing Computational Thinking to K-12: What is involved and what is the
role of the computer science education community? ACM transactions on computational logic, 2(1),
111-122.
Education Bureau. (2015). Realising IT potential • Unleashing learning power: A holistic approach. Hong Kong:
Education Bureau.
Grover, S., & Pea, R. (2013). Computational Thinking in K-12: A Review of the State of the Field. Educational
Researcher, 42(1), 38–43.
Lee, I., Martin, F., Denner, J., Coulter, B., Allan, W., Erickson. J., Malyn-Smith. J., and Werner. L. (2011).
Computational Thinking for Youth in Practice. ACM inroads, 2(1), 32-37.
583583583

Looi, C. K., Chan, T.-W., Wu, L., and Chang, B. (2015). The IDC theory: research agenda and challenges.
Workshop Proceedings of the 23rd International Conference on Computers in Education, 796-803.
Wing, J. (2006). Computational Thinking. Communications of the ACM, 49(3), 33-36.
Wing, J. (2011). Research notebook: Computational thinking—What and why? The Link Magazine, Spring.
Carnegie Mellon University, Pittsburgh. Retrieved from
https://www.cs.cmu.edu/link/research-notebook-computational-thinking-what-and-why
584584584
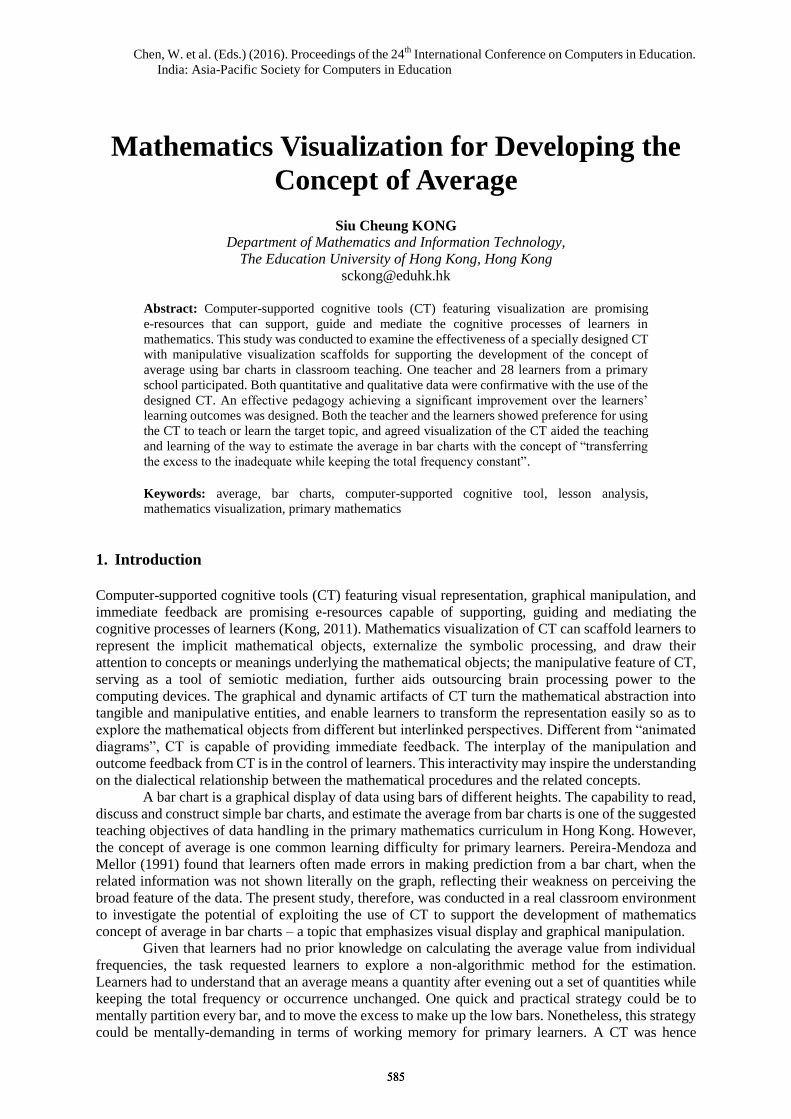
Chen, W. et al. (Eds.) (2016). Proceedings of the 24th
International Conference on Computers in Education.
India: Asia-Pacific Society for Computers in Education
Mathematics Visualization for Developing the
Concept of Average
Siu Cheung KONG
Department of Mathematics and Information Technology,
The Education University of Hong Kong, Hong Kong
Abstract: Computer-supported cognitive tools (CT) featuring visualization are promising
e-resources that can support, guide and mediate the cognitive processes of learners in
mathematics. This study was conducted to examine the effectiveness of a specially designed CT
with manipulative visualization scaffolds for supporting the development of the concept of
average using bar charts in classroom teaching. One teacher and 28 learners from a primary
school participated. Both quantitative and qualitative data were confirmative with the use of the
designed CT. An effective pedagogy achieving a significant improvement over the learners’
learning outcomes was designed. Both the teacher and the learners showed preference for using
the CT to teach or learn the target topic, and agreed visualization of the CT aided the teaching
and learning of the way to estimate the average in bar charts with the concept of “transferring
the excess to the inadequate while keeping the total frequency constant”.
Keywords: average, bar charts, computer-supported cognitive tool, lesson analysis,
mathematics visualization, primary mathematics
1. Introduction
Computer-supported cognitive tools (CT) featuring visual representation, graphical manipulation, and
immediate feedback are promising e-resources capable of supporting, guiding and mediating the
cognitive processes of learners (Kong, 2011). Mathematics visualization of CT can scaffold learners to
represent the implicit mathematical objects, externalize the symbolic processing, and draw their
attention to concepts or meanings underlying the mathematical objects; the manipulative feature of CT,
serving as a tool of semiotic mediation, further aids outsourcing brain processing power to the
computing devices. The graphical and dynamic artifacts of CT turn the mathematical abstraction into
tangible and manipulative entities, and enable learners to transform the representation easily so as to
explore the mathematical objects from different but interlinked perspectives. Different from “animated
diagrams”, CT is capable of providing immediate feedback. The interplay of the manipulation and
outcome feedback from CT is in the control of learners. This interactivity may inspire the understanding
on the dialectical relationship between the mathematical procedures and the related concepts.
A bar chart is a graphical display of data using bars of different heights. The capability to read,
discuss and construct simple bar charts, and estimate the average from bar charts is one of the suggested
teaching objectives of data handling in the primary mathematics curriculum in Hong Kong. However,
the concept of average is one common learning difficulty for primary learners. Pereira-Mendoza and
Mellor (1991) found that learners often made errors in making prediction from a bar chart, when the
related information was not shown literally on the graph, reflecting their weakness on perceiving the
broad feature of the data. The present study, therefore, was conducted in a real classroom environment
to investigate the potential of exploiting the use of CT to support the development of mathematics
concept of average in bar charts – a topic that emphasizes visual display and graphical manipulation.
Given that learners had no prior knowledge on calculating the average value from individual
frequencies, the task requested learners to explore a non-algorithmic method for the estimation.
Learners had to understand that an average means a quantity after evening out a set of quantities while
keeping the total frequency or occurrence unchanged. One quick and practical strategy could be to
mentally partition every bar, and to move the excess to make up the low bars. Nonetheless, this strategy
could be mentally-demanding in terms of working memory for primary learners. A CT was hence
585585585
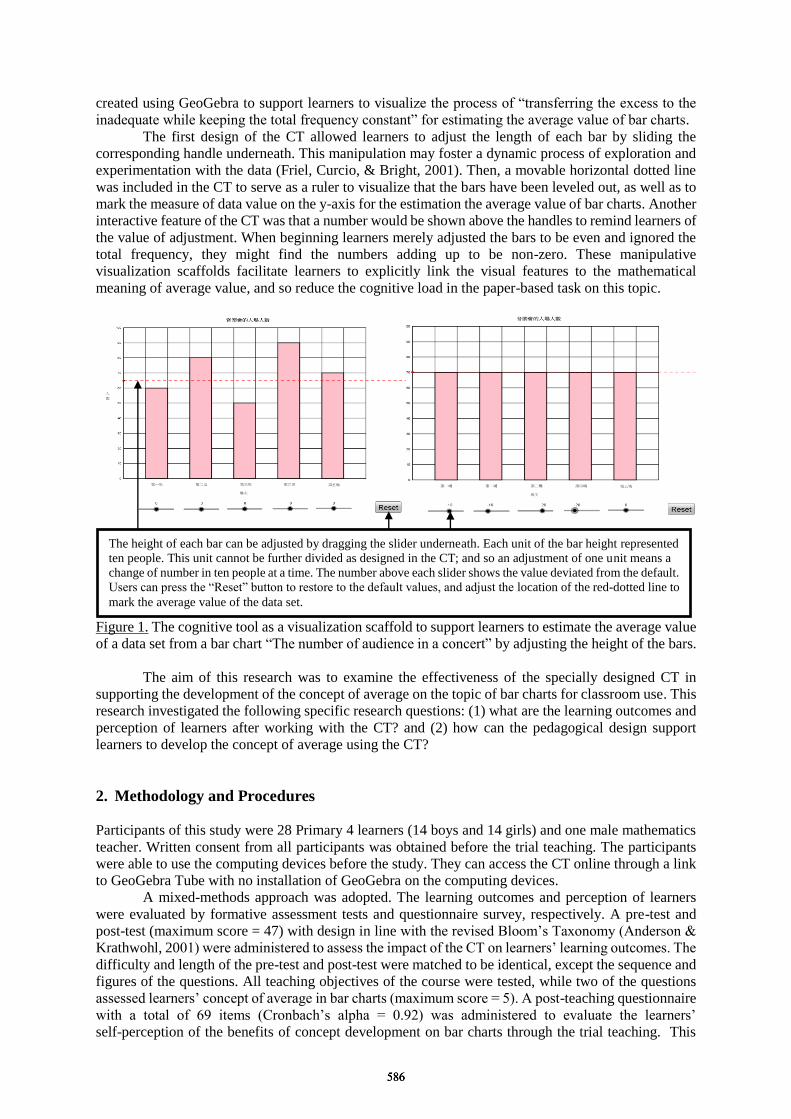
created using GeoGebra to support learners to visualize the process of “transferring the excess to the
inadequate while keeping the total frequency constant” for estimating the average value of bar charts.
The first design of the CT allowed learners to adjust the length of each bar by sliding the
corresponding handle underneath. This manipulation may foster a dynamic process of exploration and
experimentation with the data (Friel, Curcio, & Bright, 2001). Then, a movable horizontal dotted line
was included in the CT to serve as a ruler to visualize that the bars have been leveled out, as well as to
mark the measure of data value on the y-axis for the estimation the average value of bar charts. Another
interactive feature of the CT was that a number would be shown above the handles to remind learners of
the value of adjustment. When beginning learners merely adjusted the bars to be even and ignored the
total frequency, they might find the numbers adding up to be non-zero. These manipulative
visualization scaffolds facilitate learners to explicitly link the visual features to the mathematical
meaning of average value, and so reduce the cognitive load in the paper-based task on this topic.
Figure 1. The cognitive tool as a visualization scaffold to support learners to estimate the average value
of a data set from a bar chart “The number of audience in a concert” by adjusting the height of the bars.
The aim of this research was to examine the effectiveness of the specially designed CT in
supporting the development of the concept of average on the topic of bar charts for classroom use. This
research investigated the following specific research questions: (1) what are the learning outcomes and
perception of learners after working with the CT? and (2) how can the pedagogical design support
learners to develop the concept of average using the CT?
2. Methodology and Procedures
Participants of this study were 28 Primary 4 learners (14 boys and 14 girls) and one male mathematics
teacher. Written consent from all participants was obtained before the trial teaching. The participants
were able to use the computing devices before the study. They can access the CT online through a link
to GeoGebra Tube with no installation of GeoGebra on the computing devices.
A mixed-methods approach was adopted. The learning outcomes and perception of learners
were evaluated by formative assessment tests and questionnaire survey, respectively. A pre-test and
post-test (maximum score = 47) with design in line with the revised Bloom’s Taxonomy (Anderson &
Krathwohl, 2001) were administered to assess the impact of the CT on learners’ learning outcomes. The
difficulty and length of the pre-test and post-test were matched to be identical, except the sequence and
figures of the questions. All teaching objectives of the course were tested, while two of the questions
assessed learners’ concept of average in bar charts (maximum score = 5). A post-teaching questionnaire
with a total of 69 items (Cronbach’s alpha = 0.92) was administered to evaluate the learners’
self-perception of the benefits of concept development on bar charts through the trial teaching. This
The height of each bar can be adjusted by dragging the slider underneath. Each unit of the bar height represented
ten people. This unit cannot be further divided as designed in the CT; and so an adjustment of one unit means a
change of number in ten people at a time. The number above each slider shows the value deviated from the default.
Users can press the “Reset” button to restore to the default values, and adjust the location of the red-dotted line to
mark the average value of the data set.
586586586
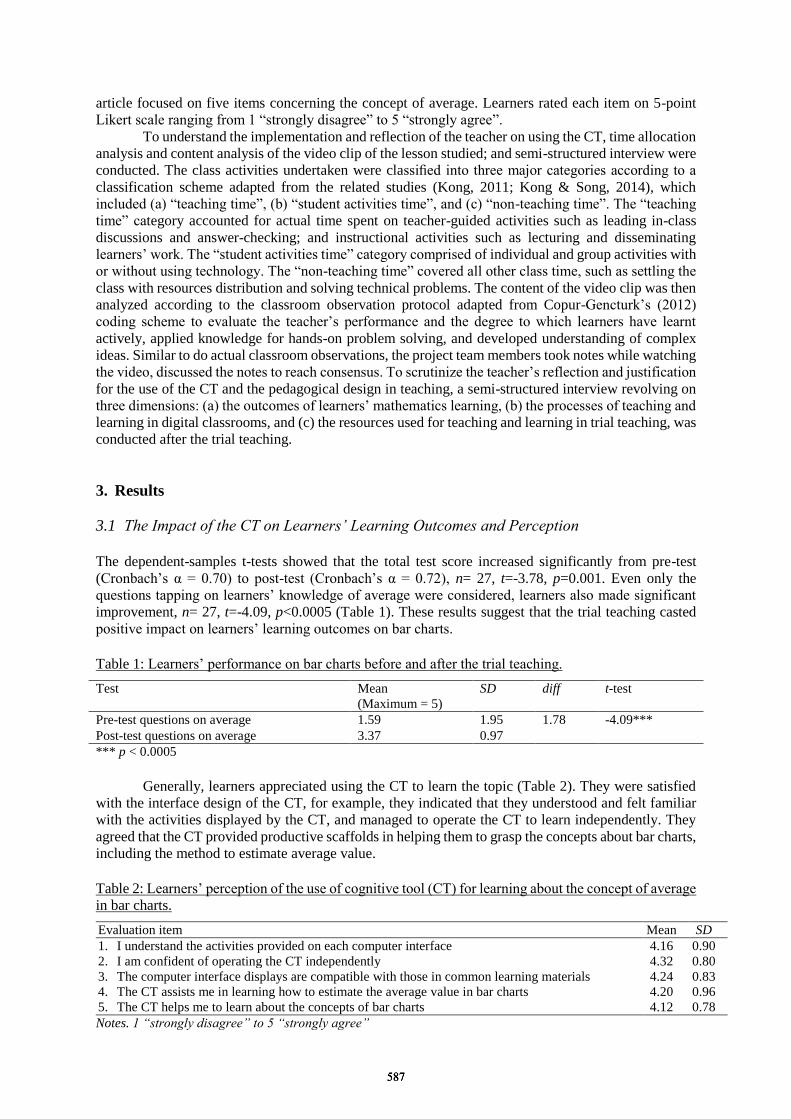
article focused on five items concerning the concept of average. Learners rated each item on 5-point
Likert scale ranging from 1 “strongly disagree” to 5 “strongly agree”.
To understand the implementation and reflection of the teacher on using the CT, time allocation
analysis and content analysis of the video clip of the lesson studied; and semi-structured interview were
conducted. The class activities undertaken were classified into three major categories according to a
classification scheme adapted from the related studies (Kong, 2011; Kong & Song, 2014), which
included (a) “teaching time”, (b) “student activities time”, and (c) “non-teaching time”. The “teaching
time” category accounted for actual time spent on teacher-guided activities such as leading in-class
discussions and answer-checking; and instructional activities such as lecturing and disseminating
learners’ work. The “student activities time” category comprised of individual and group activities with
or without using technology. The “non-teaching time” covered all other class time, such as settling the
class with resources distribution and solving technical problems. The content of the video clip was then
analyzed according to the classroom observation protocol adapted from Copur-Gencturk’s (2012)
coding scheme to evaluate the teacher’s performance and the degree to which learners have learnt
actively, applied knowledge for hands-on problem solving, and developed understanding of complex
ideas. Similar to do actual classroom observations, the project team members took notes while watching
the video, discussed the notes to reach consensus. To scrutinize the teacher’s reflection and justification
for the use of the CT and the pedagogical design in teaching, a semi-structured interview revolving on
three dimensions: (a) the outcomes of learners’ mathematics learning, (b) the processes of teaching and
learning in digital classrooms, and (c) the resources used for teaching and learning in trial teaching, was
conducted after the trial teaching.
3. Results
3.1 The Impact of the CT on Learners’ Learning Outcomes and Perception
The dependent-samples t-tests showed that the total test score increased significantly from pre-test
(Cronbach’s α = 0.70) to post-test (Cronbach’s α = 0.72), n= 27, t=-3.78, p=0.001. Even only the
questions tapping on learners’ knowledge of average were considered, learners also made significant
improvement, n= 27, t=-4.09, p<0.0005 (Table 1). These results suggest that the trial teaching casted
positive impact on learners’ learning outcomes on bar charts.
Table 1: Learners’ performance on bar charts before and after the trial teaching.
Test Mean
(Maximum = 5)
SD diff t-test
Pre-test questions on average 1.59 1.95 1.78 -4.09***
Post-test questions on average 3.37 0.97
*** p < 0.0005
Generally, learners appreciated using the CT to learn the topic (Table 2). They were satisfied
with the interface design of the CT, for example, they indicated that they understood and felt familiar
with the activities displayed by the CT, and managed to operate the CT to learn independently. They
agreed that the CT provided productive scaffolds in helping them to grasp the concepts about bar charts,
including the method to estimate average value.
Table 2: Learners’ perception of the use of cognitive tool (CT) for learning about the concept of average
in bar charts.
Evaluation item Mean SD
1. I understand the activities provided on each computer interface 4.16 0.90
2. I am confident of operating the CT independently 4.32 0.80
3. The computer interface displays are compatible with those in common learning materials 4.24 0.83
4. The CT assists me in learning how to estimate the average value in bar charts 4.20 0.96
5. The CT helps me to learn about the concepts of bar charts 4.12 0.78
Notes. 1 “strongly disagree” to 5 “strongly agree”
587587587
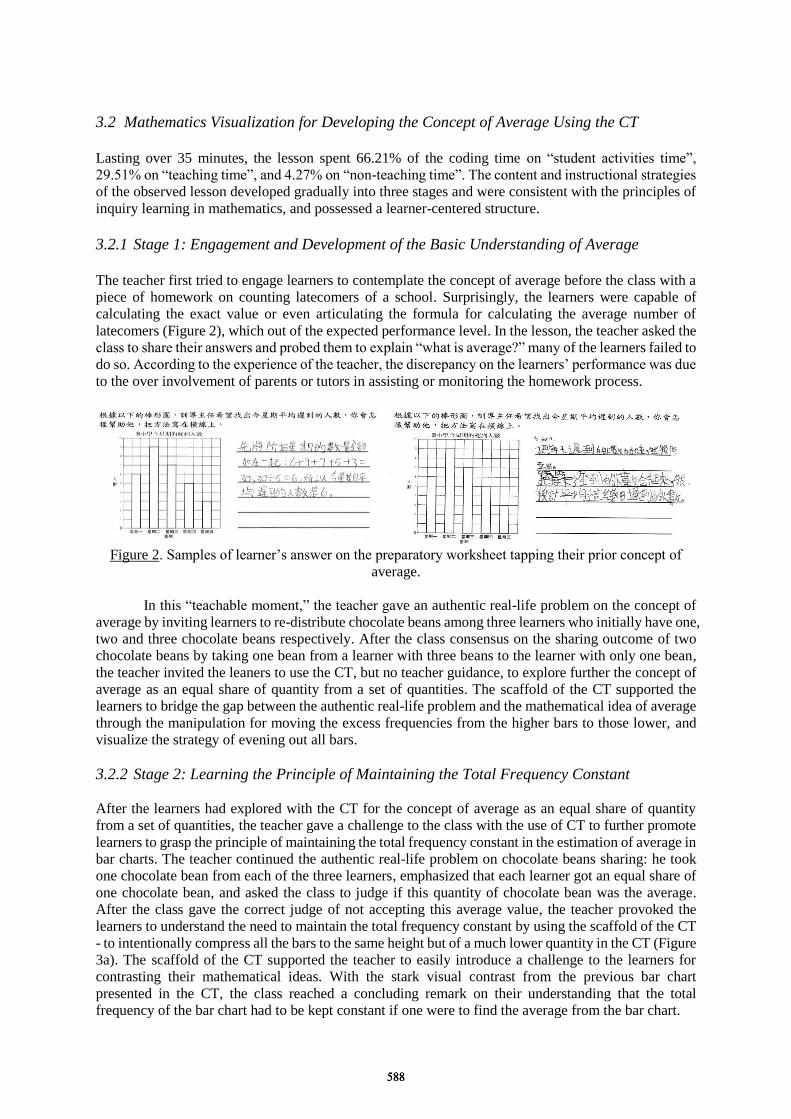
3.2 Mathematics Visualization for Developing the Concept of Average Using the CT
Lasting over 35 minutes, the lesson spent 66.21% of the coding time on “student activities time”,
29.51% on “teaching time”, and 4.27% on “non-teaching time”. The content and instructional strategies
of the observed lesson developed gradually into three stages and were consistent with the principles of
inquiry learning in mathematics, and possessed a learner-centered structure.
3.2.1 Stage 1: Engagement and Development of the Basic Understanding of Average
The teacher first tried to engage learners to contemplate the concept of average before the class with a
piece of homework on counting latecomers of a school. Surprisingly, the learners were capable of
calculating the exact value or even articulating the formula for calculating the average number of
latecomers (Figure 2), which out of the expected performance level. In the lesson, the teacher asked the
class to share their answers and probed them to explain “what is average?” many of the learners failed to
do so. According to the experience of the teacher, the discrepancy on the learners’ performance was due
to the over involvement of parents or tutors in assisting or monitoring the homework process.
Figure 2. Samples of learner’s answer on the preparatory worksheet tapping their prior concept of
average.
In this “teachable moment,” the teacher gave an authentic real-life problem on the concept of
average by inviting learners to re-distribute chocolate beans among three learners who initially have one,
two and three chocolate beans respectively. After the class consensus on the sharing outcome of two
chocolate beans by taking one bean from a learner with three beans to the learner with only one bean,
the teacher invited the leaners to use the CT, but no teacher guidance, to explore further the concept of
average as an equal share of quantity from a set of quantities. The scaffold of the CT supported the
learners to bridge the gap between the authentic real-life problem and the mathematical idea of average
through the manipulation for moving the excess frequencies from the higher bars to those lower, and
visualize the strategy of evening out all bars.
3.2.2 Stage 2: Learning the Principle of Maintaining the Total Frequency Constant
After the learners had explored with the CT for the concept of average as an equal share of quantity
from a set of quantities, the teacher gave a challenge to the class with the use of CT to further promote
learners to grasp the principle of maintaining the total frequency constant in the estimation of average in
bar charts. The teacher continued the authentic real-life problem on chocolate beans sharing: he took
one chocolate bean from each of the three learners, emphasized that each learner got an equal share of
one chocolate bean, and asked the class to judge if this quantity of chocolate bean was the average.
After the class gave the correct judge of not accepting this average value, the teacher provoked the
learners to understand the need to maintain the total frequency constant by using the scaffold of the CT
- to intentionally compress all the bars to the same height but of a much lower quantity in the CT (Figure
3a). The scaffold of the CT supported the teacher to easily introduce a challenge to the learners for
contrasting their mathematical ideas. With the stark visual contrast from the previous bar chart
presented in the CT, the class reached a concluding remark on their understanding that the total
frequency of the bar chart had to be kept constant if one were to find the average from the bar chart.
588588588
3.2.3 Stage 3: Building the Foundation of the Mathematical Procedures of Calculating
Average Value
After the class had understood the concept of “transferring the excess to the inadequate while keeping
the total frequency constant”, the teacher made use of CT to present another challenge about a topic
beyond the scope of the curriculum – the way to estimate the average from a bar chart by applying the
concept of fraction. The teacher manipulated the height of a bar to make it as the highest bar remaining
one unit, which represented ten people but could not be divided as designed in the CT (Figure 3b); and
then encouraged learners to adapt their “old” strategies flexibly to estimate the average of the new bar
chart. This challenge successfully created disequilibrium among learners, and prompted them to
connect the domain knowledge of bar charts to that of fraction. The learners eventually managed to
figure out a proper solution – allocating the remaining quantity of the excess bar in the concept of
fraction – to disintegrate the default unit representing ten people to ten smaller units and evenly allocate
two smaller units to each bar for the solution that the average of the new bar chart was 72. This task laid
a foundation for learning the mathematical procedures of calculating average values in higher grade.
3.2.4 The Teacher’s Reflection
The teacher was invited for an individual interview to share and reflect on his experience and
performance with the pedagogical design and instructional approach of the trial teaching. The results
showed that the teacher was affirmative towards the effectiveness of the CT in enhancing the teaching
of the concept of average in bar charts. Precisely, he mentioned that the manipulative and interactive
features of the CT allowed learners to grasp the tactic of estimating the average value. The visualization
of the CT helped illustrate the abstract concept of average, facilitated the class communication, and
helped learners articulate the related mathematical ideas. Nonetheless, the teacher also noticed his
inadequacy on class time management, and would like to utilize the electronic communication platform
more to increase the chance of idea exchange among learners in the future.
4. Discussion and Conclusion
In view of the popularity of digital technology in education, the CT was conjectured to be effective to
help learners develop the conceptual and procedural knowledge of mathematics. A CT tailored for
enhancing the development of the concept of average in bar charts was hence developed and examined.
The teacher adjusted all the bars to be even but at
a much lower value to stimulate the class to
consider the total frequency of the data set in
estimation of the average value.
The teacher deliberately asked the class to find the average
of a bar chart with non-integral value in order to create a
cognitive disequilibrium among learners. The learners had
to think flexibly to adapt their acquired strategy to tackle
the task.
589589589
The findings provided empirical evidence supporting the use of this CT in facilitating learners’
development of the concept of average using bar charts. Supplemented with the carefully designed
worksheets, the participating teacher managed to implement an inquiry-based and learner-centered
lesson with the tailor-made CT to help learners master the concept of average through three progressive
stages. In the first stage, learners learnt the basic concept of average as evening out a set of quantities; in
the second stage, learners discovered that the total frequency of the data set had to be remained constant;
and finally, learners were forced to accommodate their own acquired strategy of “transferring the
excess to the inadequacy” and assimilate it to the concept of fraction to estimate the average value of the
bar chart. The teacher’s personal reflection seconded the use of the designed CT for teaching the
concept of average, whilst the visualization and manipulative features of the CT were specifically
mentioned in supporting learners’ learning. Furthermore, learners have achieved significant
improvement in the post-test over the pre-test, and favored the use of the CT.
The perceptual, dynamic and interactive interface of CT provides visualization support to
conceptualize mathematical ideas (Noss et al., 2009; Rittle-Johnson & Koedinger, 2005) and
experience mathematical operations (Hoyles & Noss, 2009; Moreno-Armella, Hegedus, & Kaput,
2008). Findings of this study shed light on future directions that design-based research of CT might take
in other areas of mathematics. To give an instance, a CT may be designed as an interactive learning tool
about how to create a bar chart. The dynamic technological environment of the CT plays the ideal role
of a “hypothesis-testing” ground for learners to rescale the visual presentation of the graph. Future
research direction may also go for how visualization of CT is implicated in teaching and learning of
mathematics and what pedagogical support can be harnessed to capitalize on using CT for enhancing
learners’ mathematics concept development.
Acknowledgements
The author would like to acknowledge the Quality Education Fund of the Education Bureau of Hong
Kong SAR government in supporting the research.
References
Anderson, L. W., & Krathwohl, D. R. (Eds.). (2001). A taxonomy for learning, teaching and assessing: A revision
of Bloom's Taxonomy of educational objectives: Complete edition. New York: Longman.
Copur-Gencturk, Y. (2012). Teachers’ mathematical knowledge for teaching, instructional practices, and student
outcomes. Unpublished PhD dissertation, University of Illinois at Urbana-Champaign, Champaign, IL.
Friel, S. N., Curcio, F. R., & Bright, G. W. (2001). Making sense of graphs: Critical factors influencing
comprehension and instructional implications. Journal for Research in Mathematics Education, 32(2),
124-158.
Hoyles, C., & Noss, R. (2009). The technological mediation of mathematics and its learning. Human
Development, 52(2), 129-147.
Kong, S. C. (2011). An evaluation study of the use of a cognitive tool in a one-to-one classroom for promoting
classroom-based dialogic interaction. Computers & Education, 57(3), 1851-1864.
Kong, S. C., & Song, Y. (2014). The impact of a principle-based pedagogical design on inquiry-based learning in
a seamless learning environment in Hong Kong. Journal of Educational Technology & Society, 17(2),
127-141.
Moreno-Armella, L., Hegedus, S. J., & Kaput, J. J. (2008). From static to dynamic mathematics: Historical and
representational perspectives. Educational Studies in Mathematics, 68(2), 99-111.
Noss, R., Hoyles, C., Mavrikis, M., Geraniou, E., Gutierrez-Santos, S., & Pearce, D. (2009). Broadening the sense
of ‘dynamic’: A microworld to support students’ mathematical generalisation. ZDM Mathematics
Education, 41(4), 493-503.
Pereira-Mendoza, L., & Mellor, J. (1991). Students’ concepts of bar graphs: Some preliminary findings. Paper
presented at the Third International Conference on Teaching Statistics, Voorburg, The Netherlands.
Rittle-Johnson, B., & Koedinger, K. R. (2005). Designing knowledge scaffolds to support mathematical problem
solving. Cognition and Instruction, 23(3), 313-349.
590590590
Chen, W. et al. (Eds.) (2016). Proceedings of the 24th International Conference on Computers in Education. India: Asia-Pacific Society for Computers in Education
Content Creation and Pedagogic Strategies for Skill Development MOOC
Sameer S SAHASRABUDHEa & Rwitajit MAJUMDARb
aComputer Science and Engineering, Indian Institute of Technology Bombay, India bIDP in Educational Technology, Indian Institute of Technology Bombay, India
[email protected], [email protected]
Abstract: Skill development is being promoted throughout India, as a channel to create employable resource. Massive Online Open Courses (MOOCs) can provide a platform to enable such skill development programs at scale. The IITBombayX course, Basic 3D animation using Blender (SKANI101x), was the first of its kind offering of a Skill Development MOOC (sdMOOC) for the Indian learners. Over its two offerings, 6457 participants registered, 2465 (38%) were active and 1132 (19%) were certified. However while producing and conducting the course we realized the lack of content creation and pedagogic strategies for such sdMOOCs. Analysis of our pilot offering of SKANI101x, highlighted its effectiveness for both, first-time and experienced online learners. In the second offering we modified pedagogic strategies to foster student-instructor interactions that resulted in higher engagement and completion rate. This paper discusses the rationale of the decisions and reports an evaluation study of participants’ performance, engagement, and perceptions regarding the components of the course over two offerings. This provides an evidence for the effectiveness of the content creation and pedagogic strategies implemented.
Keywords: Skill development MOOCs, 3D animation skill development, content creation for MOOCs, pedagogic strategies for skill development MOOCs, IITBombayX, SKANI101x,
1.! Introduction
Skill development is being promoted as one of the national programs in India (www.nsdcindia.org). Traditional teaching methodologies for skill development aren’t enough to cater to this growing need. Therefore, online education initiatives are encouraged to reach out to the masses. Out of various popular domains, animation and visual effects are sought after, since they are considered creative and glamorous. These sectors show a growth of ~13% and expected to double in next five years as foreign studios eye Indian talent (Hirata, 2013; FICCI-KPMG report, 2015). However, lack of enough opportunities in formal education for animation limits the number of skilled personnel. Animation education in India has two clear sections. One section is of classical animation education available at reputed institutes (NIDs and IITs). These institutes focus on animation as a medium of communication, and the various presentation approaches. The intake of these institutes is severely low, in comparison with the growing demand. On the other hand, commercial animation training centers are mushrooming all over, who focus on the animation software tools. The students of these schools are aplenty; however they are typically categorized as software technicians, than creative animators (Sabnani, 2005). Animation students in India aspire for well-structured animation course, having appropriate balance of creativity and software skills, available at a low cost. Animation courses in Massive Online Open Courses (MOOC) format can address this gap. We offered a SKill development course on ANImation (SKANI 101) on IITBombayX (www.iitbombayx.in). It had two offerings where a total of 6457 participants have registered. Out of these, 2465 (38%) were active and 1132 (19%) got certificates. This paper presents the content creation and pedagogic strategies implemented in this course along with the evidences to show its effectiveness. 2.!SKANI101x: Our offering of skill development MOOC
IITBombayX was established in 2014, with an objective of creating and imparting high quality academic content, across the country using the MOOCs. It is built on the Open edX platform. We choose Blender as the free and open source 3D computer animation software to demonstrate the
591591591
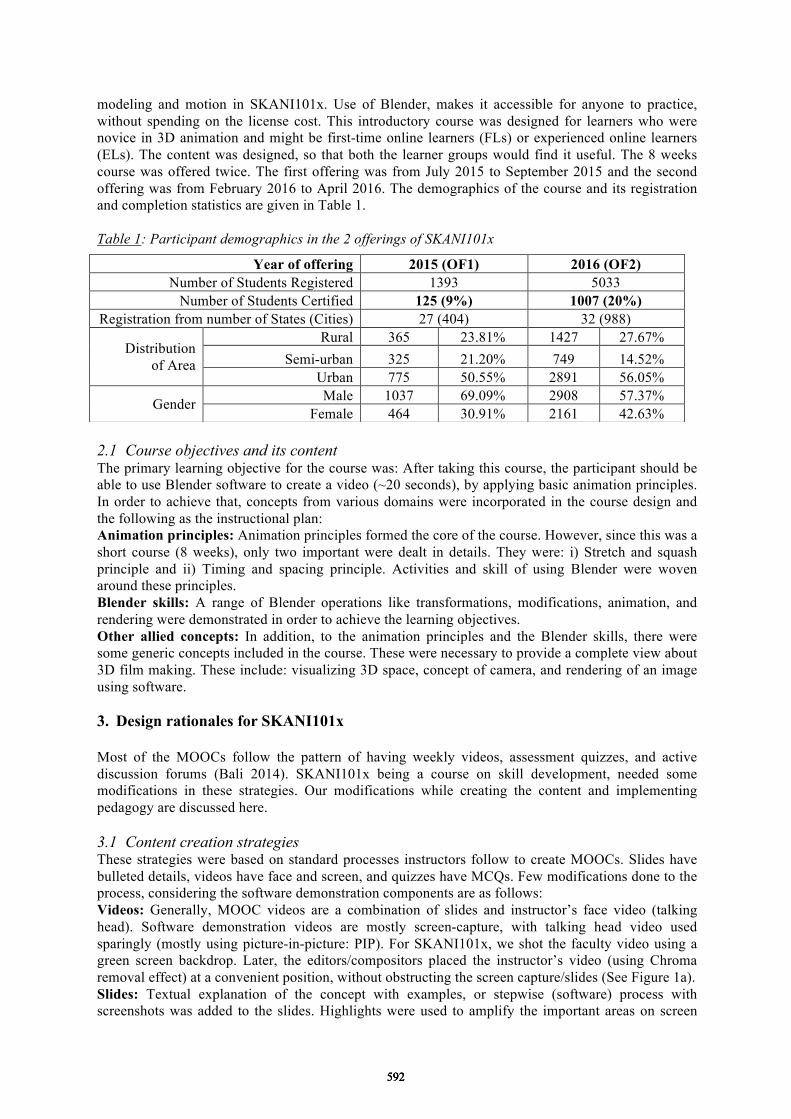
modeling and motion in SKANI101x. Use of Blender, makes it accessible for anyone to practice, without spending on the license cost. This introductory course was designed for learners who were novice in 3D animation and might be first-time online learners (FLs) or experienced online learners (ELs). The content was designed, so that both the learner groups would find it useful. The 8 weeks course was offered twice. The first offering was from July 2015 to September 2015 and the second offering was from February 2016 to April 2016. The demographics of the course and its registration and completion statistics are given in Table 1. Table 1: Participant demographics in the 2 offerings of SKANI101x
2.1! Course objectives and its content The primary learning objective for the course was: After taking this course, the participant should be able to use Blender software to create a video (~20 seconds), by applying basic animation principles. In order to achieve that, concepts from various domains were incorporated in the course design and the following as the instructional plan: Animation principles: Animation principles formed the core of the course. However, since this was a short course (8 weeks), only two important were dealt in details. They were: i) Stretch and squash principle and ii) Timing and spacing principle. Activities and skill of using Blender were woven around these principles. Blender skills: A range of Blender operations like transformations, modifications, animation, and rendering were demonstrated in order to achieve the learning objectives. Other allied concepts: In addition, to the animation principles and the Blender skills, there were some generic concepts included in the course. These were necessary to provide a complete view about 3D film making. These include: visualizing 3D space, concept of camera, and rendering of an image using software. 3.!Design rationales for SKANI101x
Most of the MOOCs follow the pattern of having weekly videos, assessment quizzes, and active discussion forums (Bali 2014). SKANI101x being a course on skill development, needed some modifications in these strategies. Our modifications while creating the content and implementing pedagogy are discussed here. 3.1! Content creation strategies These strategies were based on standard processes instructors follow to create MOOCs. Slides have bulleted details, videos have face and screen, and quizzes have MCQs. Few modifications done to the process, considering the software demonstration components are as follows: Videos: Generally, MOOC videos are a combination of slides and instructor’s face video (talking head). Software demonstration videos are mostly screen-capture, with talking head video used sparingly (mostly using picture-in-picture: PIP). For SKANI101x, we shot the faculty video using a green screen backdrop. Later, the editors/compositors placed the instructor’s video (using Chroma removal effect) at a convenient position, without obstructing the screen capture/slides (See Figure 1a). Slides: Textual explanation of the concept with examples, or stepwise (software) process with screenshots was added to the slides. Highlights were used to amplify the important areas on screen
Year of offering 2015 (OF1) 2016 (OF2) Number of Students Registered 1393 5033
Number of Students Certified 125 (9%) 1007 (20%) Registration from number of States (Cities) 27 (404) 32 (988)
Distribution of Area
Rural 365 23.81% 1427 27.67% Semi-urban 325 21.20% 749 14.52%
Urban 775 50.55% 2891 56.05%
Gender Male 1037 69.09% 2908 57.37% Female 464 30.91% 2161 42.63%
592592592
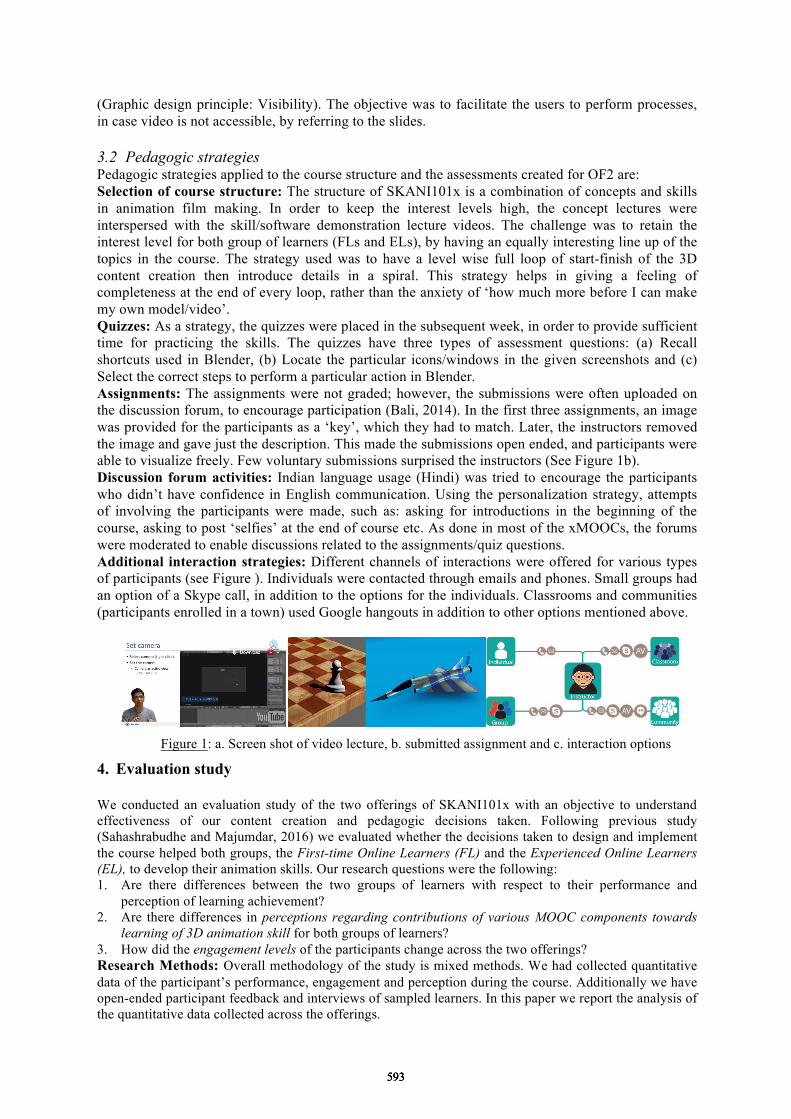
(Graphic design principle: Visibility). The objective was to facilitate the users to perform processes, in case video is not accessible, by referring to the slides.
3.2! Pedagogic strategies Pedagogic strategies applied to the course structure and the assessments created for OF2 are: Selection of course structure: The structure of SKANI101x is a combination of concepts and skills in animation film making. In order to keep the interest levels high, the concept lectures were interspersed with the skill/software demonstration lecture videos. The challenge was to retain the interest level for both group of learners (FLs and ELs), by having an equally interesting line up of the topics in the course. The strategy used was to have a level wise full loop of start-finish of the 3D content creation then introduce details in a spiral. This strategy helps in giving a feeling of completeness at the end of every loop, rather than the anxiety of ‘how much more before I can make my own model/video’. Quizzes: As a strategy, the quizzes were placed in the subsequent week, in order to provide sufficient time for practicing the skills. The quizzes have three types of assessment questions: (a) Recall shortcuts used in Blender, (b) Locate the particular icons/windows in the given screenshots and (c) Select the correct steps to perform a particular action in Blender. Assignments: The assignments were not graded; however, the submissions were often uploaded on the discussion forum, to encourage participation (Bali, 2014). In the first three assignments, an image was provided for the participants as a ‘key’, which they had to match. Later, the instructors removed the image and gave just the description. This made the submissions open ended, and participants were able to visualize freely. Few voluntary submissions surprised the instructors (See Figure 1b). Discussion forum activities: Indian language usage (Hindi) was tried to encourage the participants who didn’t have confidence in English communication. Using the personalization strategy, attempts of involving the participants were made, such as: asking for introductions in the beginning of the course, asking to post ‘selfies’ at the end of course etc. As done in most of the xMOOCs, the forums were moderated to enable discussions related to the assignments/quiz questions. Additional interaction strategies: Different channels of interactions were offered for various types of participants (see Figure ). Individuals were contacted through emails and phones. Small groups had an option of a Skype call, in addition to the options for the individuals. Classrooms and communities (participants enrolled in a town) used Google hangouts in addition to other options mentioned above.
Figure 1: a. Screen shot of video lecture, b. submitted assignment and c. interaction options
4.!Evaluation study We conducted an evaluation study of the two offerings of SKANI101x with an objective to understand effectiveness of our content creation and pedagogic decisions taken. Following previous study (Sahashrabudhe and Majumdar, 2016) we evaluated whether the decisions taken to design and implement the course helped both groups, the First-time Online Learners (FL) and the Experienced Online Learners (EL), to develop their animation skills. Our research questions were the following: 1.! Are there differences between the two groups of learners with respect to their performance and
perception of learning achievement? 2.! Are there differences in perceptions regarding contributions of various MOOC components towards
learning of 3D animation skill for both groups of learners? 3.! How did the engagement levels of the participants change across the two offerings? Research Methods: Overall methodology of the study is mixed methods. We had collected quantitative data of the participant’s performance, engagement and perception during the course. Additionally we have open-ended participant feedback and interviews of sampled learners. In this paper we report the analysis of the quantitative data collected across the offerings.
593593593
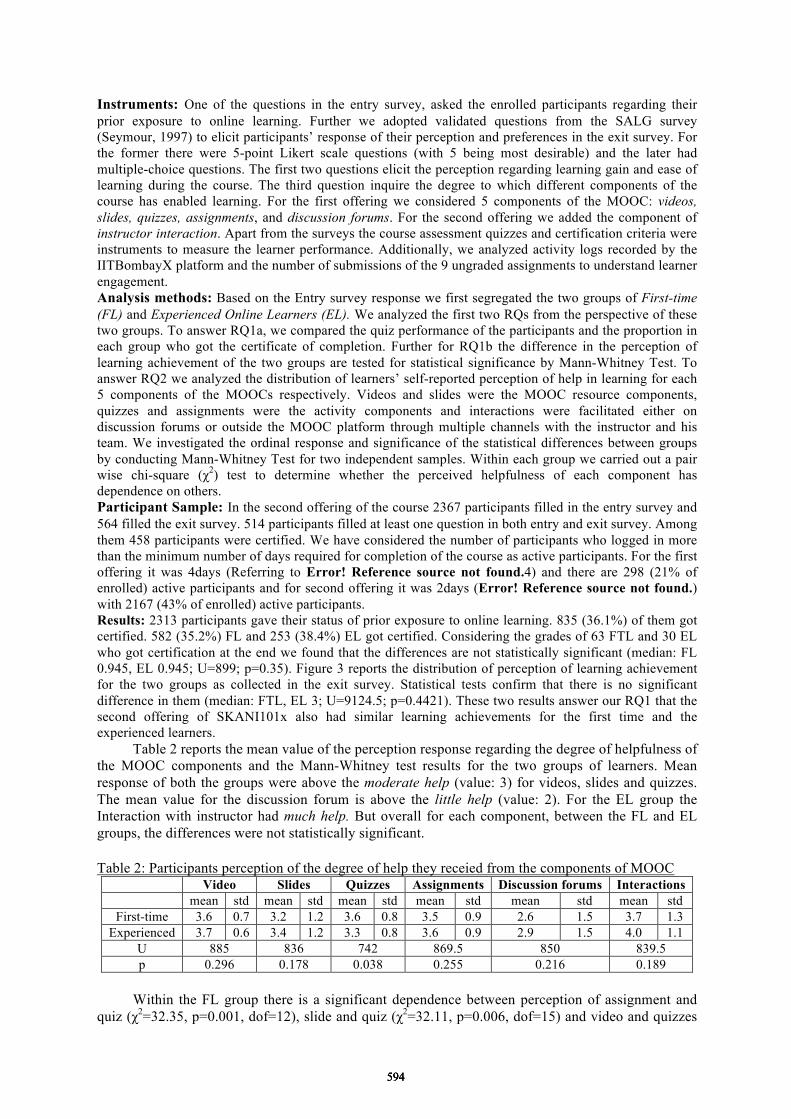
Instruments: One of the questions in the entry survey, asked the enrolled participants regarding their prior exposure to online learning. Further we adopted validated questions from the SALG survey (Seymour, 1997) to elicit participants’ response of their perception and preferences in the exit survey. For the former there were 5-point Likert scale questions (with 5 being most desirable) and the later had multiple-choice questions. The first two questions elicit the perception regarding learning gain and ease of learning during the course. The third question inquire the degree to which different components of the course has enabled learning. For the first offering we considered 5 components of the MOOC: videos, slides, quizzes, assignments, and discussion forums. For the second offering we added the component of instructor interaction. Apart from the surveys the course assessment quizzes and certification criteria were instruments to measure the learner performance. Additionally, we analyzed activity logs recorded by the IITBombayX platform and the number of submissions of the 9 ungraded assignments to understand learner engagement. Analysis methods: Based on the Entry survey response we first segregated the two groups of First-time (FL) and Experienced Online Learners (EL). We analyzed the first two RQs from the perspective of these two groups. To answer RQ1a, we compared the quiz performance of the participants and the proportion in each group who got the certificate of completion. Further for RQ1b the difference in the perception of learning achievement of the two groups are tested for statistical significance by Mann-Whitney Test. To answer RQ2 we analyzed the distribution of learners’ self-reported perception of help in learning for each 5 components of the MOOCs respectively. Videos and slides were the MOOC resource components, quizzes and assignments were the activity components and interactions were facilitated either on discussion forums or outside the MOOC platform through multiple channels with the instructor and his team. We investigated the ordinal response and significance of the statistical differences between groups by conducting Mann-Whitney Test for two independent samples. Within each group we carried out a pair wise chi-square (χ2) test to determine whether the perceived helpfulness of each component has dependence on others. Participant Sample: In the second offering of the course 2367 participants filled in the entry survey and 564 filled the exit survey. 514 participants filled at least one question in both entry and exit survey. Among them 458 participants were certified. We have considered the number of participants who logged in more than the minimum number of days required for completion of the course as active participants. For the first offering it was 4days (Referring to Error! Reference source not found.4) and there are 298 (21% of enrolled) active participants and for second offering it was 2days (Error! Reference source not found.) with 2167 (43% of enrolled) active participants. Results: 2313 participants gave their status of prior exposure to online learning. 835 (36.1%) of them got certified. 582 (35.2%) FL and 253 (38.4%) EL got certified. Considering the grades of 63 FTL and 30 EL who got certification at the end we found that the differences are not statistically significant (median: FL 0.945, EL 0.945; U=899; p=0.35). Figure 3 reports the distribution of perception of learning achievement for the two groups as collected in the exit survey. Statistical tests confirm that there is no significant difference in them (median: FTL, EL 3; U=9124.5; p=0.4421). These two results answer our RQ1 that the second offering of SKANI101x also had similar learning achievements for the first time and the experienced learners.
Table 2 reports the mean value of the perception response regarding the degree of helpfulness of the MOOC components and the Mann-Whitney test results for the two groups of learners. Mean response of both the groups were above the moderate help (value: 3) for videos, slides and quizzes. The mean value for the discussion forum is above the little help (value: 2). For the EL group the Interaction with instructor had much help. But overall for each component, between the FL and EL groups, the differences were not statistically significant.
Table 2: Participants perception of the degree of help they receied from the components of MOOC
Video Slides Quizzes Assignments Discussion forums Interactions mean std mean std mean std mean std mean std mean std
First-time 3.6 0.7 3.2 1.2 3.6 0.8 3.5 0.9 2.6 1.5 3.7 1.3 Experienced 3.7 0.6 3.4 1.2 3.3 0.8 3.6 0.9 2.9 1.5 4.0 1.1
U 885 836 742 869.5 850 839.5 p 0.296 0.178 0.038 0.255 0.216 0.189
Within the FL group there is a significant dependence between perception of assignment and
quiz (χ2=32.35, p=0.001, dof=12), slide and quiz (χ2=32.11, p=0.006, dof=15) and video and quizzes
594594594
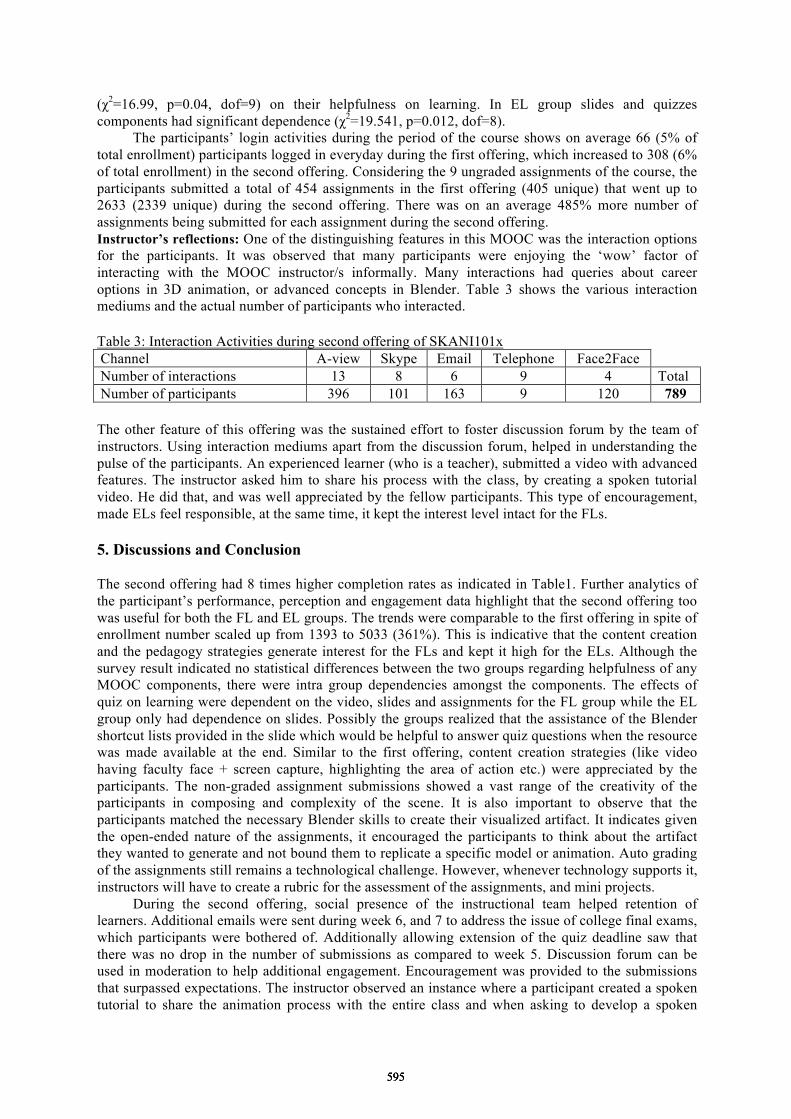
(χ2=16.99, p=0.04, dof=9) on their helpfulness on learning. In EL group slides and quizzes components had significant dependence (χ2=19.541, p=0.012, dof=8).
The participants’ login activities during the period of the course shows on average 66 (5% of total enrollment) participants logged in everyday during the first offering, which increased to 308 (6% of total enrollment) in the second offering. Considering the 9 ungraded assignments of the course, the participants submitted a total of 454 assignments in the first offering (405 unique) that went up to 2633 (2339 unique) during the second offering. There was on an average 485% more number of assignments being submitted for each assignment during the second offering. Instructor’s reflections: One of the distinguishing features in this MOOC was the interaction options for the participants. It was observed that many participants were enjoying the ‘wow’ factor of interacting with the MOOC instructor/s informally. Many interactions had queries about career options in 3D animation, or advanced concepts in Blender. Table 3 shows the various interaction mediums and the actual number of participants who interacted. Table 3: Interaction Activities during second offering of SKANI101x Channel A-view Skype Email Telephone Face2Face Number of interactions 13 8 6 9 4 Total Number of participants 396 101 163 9 120 789 The other feature of this offering was the sustained effort to foster discussion forum by the team of instructors. Using interaction mediums apart from the discussion forum, helped in understanding the pulse of the participants. An experienced learner (who is a teacher), submitted a video with advanced features. The instructor asked him to share his process with the class, by creating a spoken tutorial video. He did that, and was well appreciated by the fellow participants. This type of encouragement, made ELs feel responsible, at the same time, it kept the interest level intact for the FLs. 5. Discussions and Conclusion The second offering had 8 times higher completion rates as indicated in Table1. Further analytics of the participant’s performance, perception and engagement data highlight that the second offering too was useful for both the FL and EL groups. The trends were comparable to the first offering in spite of enrollment number scaled up from 1393 to 5033 (361%). This is indicative that the content creation and the pedagogy strategies generate interest for the FLs and kept it high for the ELs. Although the survey result indicated no statistical differences between the two groups regarding helpfulness of any MOOC components, there were intra group dependencies amongst the components. The effects of quiz on learning were dependent on the video, slides and assignments for the FL group while the EL group only had dependence on slides. Possibly the groups realized that the assistance of the Blender shortcut lists provided in the slide which would be helpful to answer quiz questions when the resource was made available at the end. Similar to the first offering, content creation strategies (like video having faculty face + screen capture, highlighting the area of action etc.) were appreciated by the participants. The non-graded assignment submissions showed a vast range of the creativity of the participants in composing and complexity of the scene. It is also important to observe that the participants matched the necessary Blender skills to create their visualized artifact. It indicates given the open-ended nature of the assignments, it encouraged the participants to think about the artifact they wanted to generate and not bound them to replicate a specific model or animation. Auto grading of the assignments still remains a technological challenge. However, whenever technology supports it, instructors will have to create a rubric for the assessment of the assignments, and mini projects.
During the second offering, social presence of the instructional team helped retention of learners. Additional emails were sent during week 6, and 7 to address the issue of college final exams, which participants were bothered of. Additionally allowing extension of the quiz deadline saw that there was no drop in the number of submissions as compared to week 5. Discussion forum can be used in moderation to help additional engagement. Encouragement was provided to the submissions that surpassed expectations. The instructor observed an instance where a participant created a spoken tutorial to share the animation process with the entire class and when asking to develop a spoken
595595595

tutorial of the modeling process he could motivate the participant to do it. Also while opening up interaction through multiple channels it was observed encouraging en-mass classroom enrolment facilitated (a) peer interaction and (b) have a Coordinator to support the logistics. In this regard another participating college instructor gave this view: “I'm an Asst. Professor and I and my 60+ students got registered for this (Basic 3D animation) course. Really I'm getting huge response from lot of them. They are learning lot... The video lecture is more informative and interactive, these are very helpful to understanding basic concept, and presentation of video lecture is very good and useful. The all resources which is proving by IITBombayX is really nice”.
SKANI101x is a first sdMOOC of its kind. Over the two offerings it could reach out to 6457 registered participants of which 2465 were active in the course and 1132 were certified. Over the two offerings though the course registration has grown 3.6 times, still there were 8.6 times more certifications during the second offering. In addition to following standard xMOOCs content presentation strategies, sdMOOCs needed some more modifications in content creation and pedagogic strategies. Second offering validates that skill development is a community-based activity. Even if xMOOC platform was used, fostering community building activities by social presence of the instructors have resulted in higher completion rate of the course. It has also resulted in sustaining the engagement of the participants. It can be seen that the course design has helped in the retention of the FLs and providing challenges to the ELs. Currently we are conducting a blended mode offering of SKANI101x. In future we would like to study the effectiveness of these three offerings. Acknowledgements We would like to thank entire team at IITBombayX, and the Ministry of HRD for their funding. References Bali, M. (2014). MOOC pedagogy: gleaning good practice from existing MOOCs. Journal of Online Learning
and Teaching, 10(1), 44. Conole, G. G. (2015). MOOCs as disruptive technologies: strategies for enhancing the learner experience and
quality of MOOCs. Revista de Educación a Distancia, (39). Gaebel, M. (2014). MOOCs: Massive open online courses. EUA. Glance, D. G., Forsey, M., & Riley, M. (2013). The pedagogical foundations of massive open online courses.
First Monday, 18(5). Hirata, Y. (2013). The Condition of Indian Animation Industries between Global Economy and Local Culture. Holotescu, C., Grosseck, G., Cretu, V., &Naaji, A. (2014, October). Integrating MOOCs in blended courses.In
The International Scientific Conference eLearning and Software for Education (Vol. 4, p. 243)." Carol I" National Defence University.
Kannan, K., & Narayanan, K. (2011, July). Model and learner feedback for a large scale technology enabled teacher training program. In IEEE Int. Conf. on Technology for Education (T4E), 2011 (pp. 250-253).
Rohe, B., & Literacy, E. M. MOOCs: Benefits, Costs, Ethics, Outcomes and Popular Opinion. Sabnani, N. (2005). The Challenges of a Sleeping Giant. Design Issues, 21 (4), 94–105. Sahasrabudhe, S. & Majumdar, R. (2016) MOOC for skill development in 3D animation: Comparing learning
perceptions of first time and experienced online learners. In The 16th IEEE Intn. Conf. on Adv. Learning Technologies (ICALT2016)
Seymour, E., Wiese, D., Hunter, A., &Daffinrud, S. (1997). Student assessment of learning gains (SALG) CAT. Yuan, L., Powell, S., & CETIS, J. (2013). MOOCs and open education: Implications for higher education. FICCI-KPMG report 2015: www.animationxpress.com/index.php/latest-news/2014-was-the-year-of-growth-of-indian-animation-content-ficci-kpmg-report-2015. Visited on May 23rd 2016
596596596
Chen, W. et al. (Eds.) (2016). Proceedings of the 24th International Conference on Computers in
Education. India: Asia-Pacific Society for Computers in Education
Exploring effects of immersivity across three
dimensions in Training Design: Technology
Integration Training Workshop for Engineering
Teachers in India
Madhuri MAVINKURVEa*, Soumya NARAYANAa* & Mahesh PATILb
aInter-disciplinary program in Educational Technology, IIT Bombay, India bDepartment of Electrical Engineering, IIT Bombay, India
*[email protected], [email protected]
Abstract: Short term training programs are relevant in Indian context as an effective teacher
professional development program as it addresses the ever present problem of paucity of time
among engineering faculty members and the need to keep abreast with latest technological
offerings. Most of the training programs studied so far, deal with techniques to incorporate
Technology, Content and Pedagogy in classroom teaching. However, they do not adequately
represent the techniques required when technology and content are inter-related as seen in
circuit simulations for instance. We propose training with immersivity in Technology, Content
and Pedagogy as an effective format for TDP when the technology aspect is closely connected
to the content. We specifically look into the integration of SEQUEL - a circuit simulation and
analysis tool, in the context of teaching analog electronic circuit design. In this paper, we
present findings from an implementation of short term training program, merging
recommendations from TPACK framework and immersivity in the three dimensions of
Technology, Content and Pedagogy, as the underlying design principle. Our study shows
promising results and indicates a clear shift towards adopting technology and pedagogy
principles to augment content in lesson plans by the participating faculty members.
Keywords: Immersivity, Technological knowledge, Content Knowledge, Pedagogical
Knowledge, SEQUEL, Short term training program, Teacher professional development
program
Introduction
In recent years, affordance of ICT has improved access to technology and its widespread application
in classrooms. Educationist and researchers believe that the technology enabled classrooms promote
constructivist learning to train students for 21st century skills. This demands need of effective
technology integration in classroom by teachers (Harris, Mishra & Koehler, 2009). In-Service
teachers generally utilize Teacher Professional Development programs (TPD) for improving their
technology integration skills. In such TPDs teachers are trained for technology as well as pedagogy
aspect along with the content (Lawless & Pellegrino, 2007; Mishra, Koehler & Kereluik, 2009).
Various frameworks and guidelines are available to design these workshops. TPACK is one
of the theoretical frameworks which integrates three main dimensions i.e. Technology, Pedagogy and
Content in training program (Koehler and Mishra, 2008). These guidelines are applicable to teacher
training program for long duration. In Indian engineering education system due to constraints of
academic load, time, and curriculum requirement, short term training programs (STTP) are preferred
for professional development of teachers.
ET4ET- a large-scale faculty professional development program (Murthy, Iyer & Warriem,
2015) uses the A2I model which describes the need of constructive alignment to design TPD’s. The
A2I model (Warriem, Murthy & Iyer, 2014) assumes content expertise of in-service teachers (CK)
that will enable them to readily start design of instructional activities with technology during the
training (TPACK).
597597597

However, when TPD workshops are designed for teaching specific technology tool this
assumption may not be valid and efforts are required to develop contextual knowledge as well. In a
larger implementation of ET4ET, the authors have identified use of immersivity as a design driver for
TPD to ensure sustainability of learning benefits. Immersivity is cognitively engaging learners in
content through meaningful activities (Warriem, Murthy & Iyer, 2015). In this paper, we report our
use of A2I model in a STTP by exploring the design driver of immersivity across the three dimensions
of technology, pedagogy and content, as informed by TPACK.
Our workshop is designed to train faculty from electronics engineering domain. The training
was conducted for the circuit simulator “SEQUEL”. SEQUEL is a versatile circuit simulation
program (Patil, 2002), developed at IIT Bombay. In order to assist teachers to integrate SEQUEL in
their classroom, we designed the workshop using immersivity in content, pedagogy and technology.
This paper provides guideline for workshop designers who wish to train faculty for specific
technology tool.
Design parameters for STTP (short term training program)
There are a number of teacher professional development programs with different goals and therefore
different design parameters. Goals of professional development training programs (TPD) vary from
skill development of teachers (Mishra, Koehler & Kereluik, 2009) to training them in pedagogical
practices for technology integration (Chai, Koh & Tsai, 2010).
Xanadu training program (Trentin, 2006) and the workshop by Joni de Almeida Amorim et al
(De Almeida Amorim, Rego, De Siqueira & Martínez-Sáez, 2011) are TPD's that focus on content
and technology knowledge improvement of teachers. They do not however address improving
pedagogy knowledge of teachers. Online teacher training program for Professional Development of
University Faculty (PDUF) on the other hand focuses on developing content expertise, pedagogical
practices and teacher’s belief about teaching learning process (Oliver and Herrington, 2003;
Kandlbinder, 2003). The format however does not support instantaneous feedback on participant
performance.
One of the theoretical frameworks to design TPDs for integration of technology is the
TPACK framework (Koehler and Mishra, 2008) which emphasizes need for integration of three forms
of knowledge i.e. Content, pedagogy and technology. In addition, TPACK framework also highlights
importance of interaction among technology, content and pedagogy for effective teacher training.
Most of the teacher professional development programs discussed in literature is long
duration courses conducted for school or university teachers. At higher education especially at
professional courses such as engineering, technology integration is left to instructor’s discretion. Very
few TPDs are available to train engineering faculty for technology integration. In addition, the course
duration of TPDs is necessarily short due to academic constraints of engineering faculty.
In Indian context, for short duration training, ET4ET program (Warriem, Murthy & Iyer,
2015) has been designed for engineering faculty in online mode. The ET4ET uses the A2I model for
its design and utilizes design drivers of immersivity and pertinency. A limitation of the existing
implementation is that, it has looked at more generic technology applications like – Wiki,
Visualizations etc. We believe that for such generic technology, the existing content knowledge would
be sufficient. However, when it comes to technologies that are much more rooted to content (like
Simulations) CK plays a greater role in enabling effective technology integration. The current work
explores the three dimensions of Immersivity – Technology, Pedagogy and Content, and tries to
identify the impact these have on learning and intention to transfer.
Implementation of SEQUEL training workshop
SEQUEL technology tool for simulating electronics circuits SEQUEL is a general-purpose circuit simulation application for electronic and power electronic
circuits. It allows learners to construct as well as simulate circuits rapidly and easily and has a very
short learning curve. In addition to having an extensive library, SEQUEL supports model creation as
well. An intuitive Graphical User Interface (GUI) facilitates easy schematic entry. SEQUEL provides
598598598
users with multiple simulation options such as DC, AC, transient and steady-state. The simulation
results can be viewed as plots or tables. A repository of a number of circuits are available with the
simulator. Learners can refer to these circuits and use the circuit files directly or with suitable
modifications. We selected the course of electronic circuit to train faculty for SEQUEL workshop.
The SEQUEL training program was based on three knowledge dimensions i.e. content, technology
and pedagogy. For each dimension, we designed sessions using immersivity.
SEQUEL training sessions
Simulation design training session We trained teachers to develop SEQUEL based simulations for their classrooms. We ensured
immersivity by engaging the participants in designing SEQUEL simulations for a simple RC circuit
such that, participants learnt about a new technology even as they updated their content knowledge.
Subsequently, they designed simulations for their classroom application. The steps during training
included preparing circuit schematic, defining output variables, specifying simulation type with
relevant parameters and finally running the simulation to view output. We evaluated their simulations
to find effect of adding technology immersivity in TPD sessions.
Conceptual development through content training In this session the instructor applied active learning strategies such as ‘Peer Instruction’ (PI), and
‘Flipped classroom’ to demonstrate technology and pedagogy integration in classroom for developing
conceptual understanding of students. We evaluated effect of immersivity in content by observing
learning gains through the tests conducted during the sessions.
Pedagogy training session Prior to the instruction on pedagogy, the participating teachers prepared a lesson plan detailing
SEQUEL based strategies for their selected content. At the end of the pedagogy training session, the
teachers re-designed the lesson plan for their classroom, integrating SEQUEL and active learning
strategies in the plan aligned to learning objectives. We evaluated these lesson plans to explore
immersivity in the three dimensions of TPD.
Evaluation of immersivity effect
Research Question The research question of this study is “How does immersivity in technology, pedagogy and content of
STTP design affect teacher’s technology integration practices?” In order to answer this research
question, a STTP was conducted for 11 participants who are faculty for polytechnic program, from
Mumbai, India. All participants have experience in teaching diploma engineering students for more
than 5 years. STTP was conducted for two days with multiple sessions per day. Each of the individual
sessions was of 2-hour duration followed by evaluation test. Data was collected from various sessions
of the STTP in different forms.
Data collection and analysis
We collected data at various points during the training sessions. In technology training session,
participants were given a circuit simulation and analysis problem. We assessed their simulations
based on circuit component assignment, selection of variable, type of analysis and final output. Fig 1
shows example of simulation designed by participants.
599599599
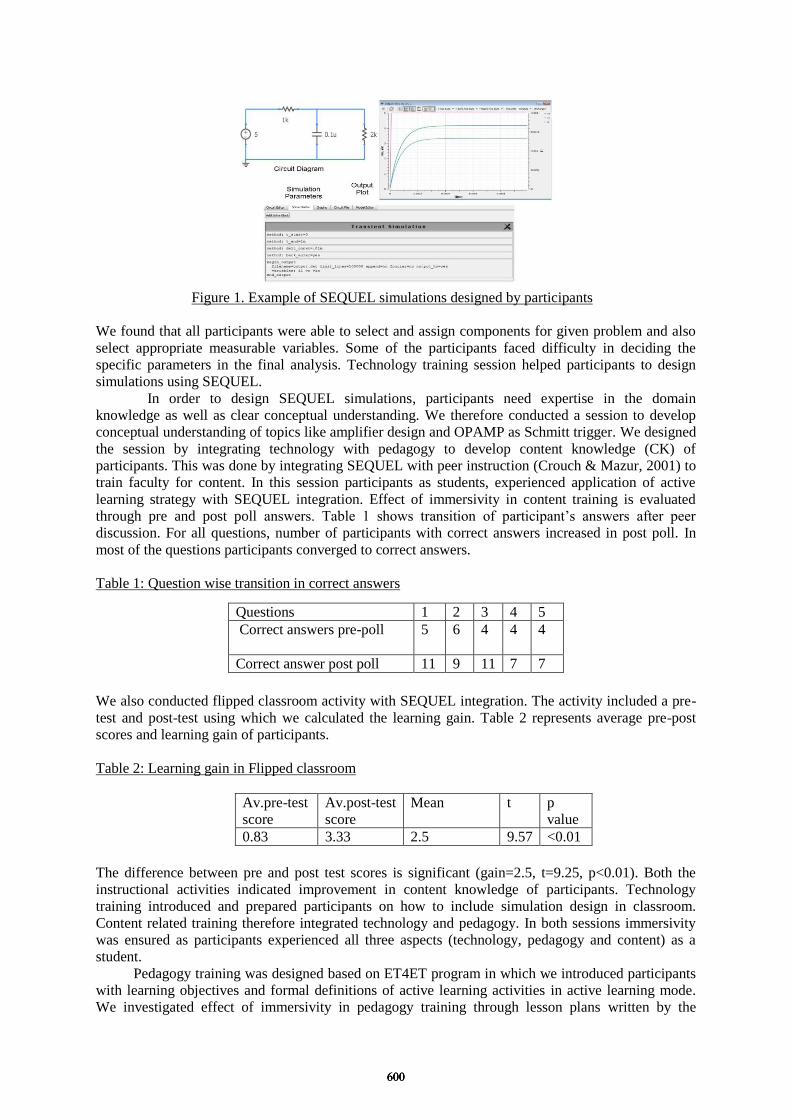
Figure 1. Example of SEQUEL simulations designed by participants
We found that all participants were able to select and assign components for given problem and also
select appropriate measurable variables. Some of the participants faced difficulty in deciding the
specific parameters in the final analysis. Technology training session helped participants to design
simulations using SEQUEL.
In order to design SEQUEL simulations, participants need expertise in the domain
knowledge as well as clear conceptual understanding. We therefore conducted a session to develop
conceptual understanding of topics like amplifier design and OPAMP as Schmitt trigger. We designed
the session by integrating technology with pedagogy to develop content knowledge (CK) of
participants. This was done by integrating SEQUEL with peer instruction (Crouch & Mazur, 2001) to
train faculty for content. In this session participants as students, experienced application of active
learning strategy with SEQUEL integration. Effect of immersivity in content training is evaluated
through pre and post poll answers. Table 1 shows transition of participant’s answers after peer
discussion. For all questions, number of participants with correct answers increased in post poll. In
most of the questions participants converged to correct answers.
Table 1: Question wise transition in correct answers
We also conducted flipped classroom activity with SEQUEL integration. The activity included a pre-
test and post-test using which we calculated the learning gain. Table 2 represents average pre-post
scores and learning gain of participants.
Table 2: Learning gain in Flipped classroom
Av.pre-test
score
Av.post-test
score
Mean t p
value
0.83 3.33 2.5 9.57 <0.01
The difference between pre and post test scores is significant (gain=2.5, t=9.25, p<0.01). Both the
instructional activities indicated improvement in content knowledge of participants. Technology
training introduced and prepared participants on how to include simulation design in classroom.
Content related training therefore integrated technology and pedagogy. In both sessions immersivity
was ensured as participants experienced all three aspects (technology, pedagogy and content) as a
student.
Pedagogy training was designed based on ET4ET program in which we introduced participants
with learning objectives and formal definitions of active learning activities in active learning mode.
We investigated effect of immersivity in pedagogy training through lesson plans written by the
Questions 1 2 3 4 5
Correct answers pre-poll 5 6 4 4 4
Correct answer post poll 11 9 11 7 7
600600600
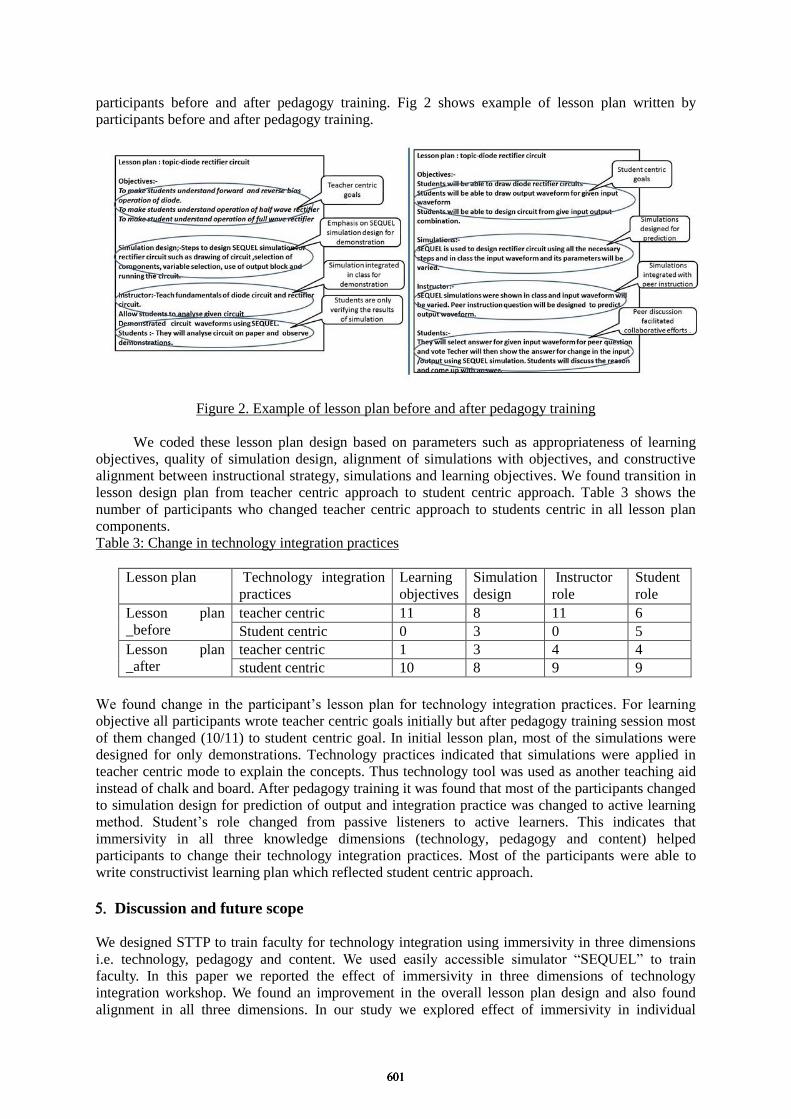
participants before and after pedagogy training. Fig 2 shows example of lesson plan written by
participants before and after pedagogy training.
Figure 2. Example of lesson plan before and after pedagogy training
We coded these lesson plan design based on parameters such as appropriateness of learning
objectives, quality of simulation design, alignment of simulations with objectives, and constructive
alignment between instructional strategy, simulations and learning objectives. We found transition in
lesson design plan from teacher centric approach to student centric approach. Table 3 shows the
number of participants who changed teacher centric approach to students centric in all lesson plan
components.
Table 3: Change in technology integration practices
Lesson plan Technology integration
practices
Learning
objectives
Simulation
design
Instructor
role
Student
role
Lesson plan
_before
teacher centric 11 8 11 6
Student centric 0 3 0 5
Lesson plan
_after
teacher centric 1 3 4 4
student centric 10 8 9 9
We found change in the participant’s lesson plan for technology integration practices. For learning
objective all participants wrote teacher centric goals initially but after pedagogy training session most
of them changed (10/11) to student centric goal. In initial lesson plan, most of the simulations were
designed for only demonstrations. Technology practices indicated that simulations were applied in
teacher centric mode to explain the concepts. Thus technology tool was used as another teaching aid
instead of chalk and board. After pedagogy training it was found that most of the participants changed
to simulation design for prediction of output and integration practice was changed to active learning
method. Student’s role changed from passive listeners to active learners. This indicates that
immersivity in all three knowledge dimensions (technology, pedagogy and content) helped
participants to change their technology integration practices. Most of the participants were able to
write constructivist learning plan which reflected student centric approach.
Discussion and future scope
We designed STTP to train faculty for technology integration using immersivity in three dimensions
i.e. technology, pedagogy and content. We used easily accessible simulator “SEQUEL” to train
faculty. In this paper we reported the effect of immersivity in three dimensions of technology
integration workshop. We found an improvement in the overall lesson plan design and also found
alignment in all three dimensions. In our study we explored effect of immersivity in individual
601601601
dimension also. We found that participants were able to design SEQUEL simulations for given topic.
In content training, we found improved conceptual understanding through high learning gain and we
also found that most of the time participants converged to right answers after PI. Finally, pedagogy
training helped them to change their technology integration practices from teacher centric approach to
student centric approach. We thus conclude that immersivity in all three dimensions of TPD helped
participants to design simulations as per their requirement and helped them to integrate these
simulations in active learning mode.
This study recommends that to develop STTP for technology integration, immersivity should
be design driver in each dimension. But in technology training especially with SEQUEL we need to
focus more on analysis training part. This study is limited due to small (N=11) sample. We have
assessed written lesson plans of the participants. However, to observe sustainability of these courses
we need to further observe the practice of SEQUEL based classroom activity.
References
Chai, C. S., Koh, J. H. L., & Tsai, C. C. (2010). Facilitating Preservice Teachers' Development of
Technological, Pedagogical, and Content Knowledge (TPACK). Educational Technology & Society, 13(4),
63-73.
Crouch, C. H., & Mazur, E. (2001). Peer instruction: Ten years of experience and results. American Journal of
Physics, 69(9), 970-977.
de Almeida Amorim, J., Rego, I. D. M. S., De Siqueira, J. M., & Martínez-Sáez, A. (2011). Defining the design
parameters of a teacher training course on the incorporation of ICT into teaching practices. Procedia-
Social and Behavioral Sciences, 15, 653-657.
Harris, J., Mishra, P., & Koehler, M. (2009). Teachers’ technological pedagogical content knowledge and
learning activity types: Curriculum-based technology integration reframed. Journal of Research on
Technology in Education, 41(4), 393-416.
Kandlbinder, P. (2003). Peeking under the covers: on‐ line academic staff development in Australia and the
United Kingdom. International Journal for Academic Development, 8(1-2), 135-143.
Koehler, M. J., & Mishra, P. (2008). Handbook of technological pedagogical content knowledge (TPCK) for
educators.
Lawless, K. A., & Pellegrino, J. W. (2007). Professional development in integrating technology into teaching
and learning: Knowns, unknowns, and ways to pursue better questions and answers. Review of educational
research, 77(4), 575-614.
Mishra, P., Koehler, M. J., & Kereluik, K. (2009). Looking back to the future of educational technology.
TechTrends, 53(5), 49.
Murthy, S., Iyer, S., & Warriem, J. (2015). ET4ET: a large-scale faculty professional development program on
effective integration of educational technology. Journal of Educational Technology & Society, 18(3), 16-
28.
Oliver, R., & Herrington, J. (2003). Exploring technology-mediated learning from a pedagogical perspective.
Interactive Learning Environments, 11(2), 111-126.
Patil, M. B. (2002). A new public-domain program for mixed-signal simulation. Education, IEEE Transactions
on, 45(2), 187-193.
Trentin, G. (2006). The Xanadu project: training faculty in the use of information and communication
technology for university teaching. Journal of computer assisted learning, 22(3), 182-196.
Warriem, J., Murthy, S. & Iyer, S. (2015). Sustainability at Scale: Evidence from a Large Scale Teacher
Professional Development Program. In Proceedings of 23rd International Conference on Computers in
Education (ICCE 2015), Hangzhou, China, 651-660.
Warriem, J., Murthy, S., & Iyer, S. (2014). A2I: A Model for Teacher Training in Constructive Alignment for
use of ICT in Engineering Education. In C. C. Liu, H. Ogata, S. C. Kong, & A. Kashihara (Eds.),
Proceedings of the 22nd International Conference on Computers in Education (pp. 896-902). Nara, Japan:
Asia-Pacific Society for Computers in Education.
602602602
Chen, W. et al. (Eds.) (2016). Proceedings of the 24th
International Conference on Computers in Education.
India: Asia-Pacific Society for Computers in Education
A Study of an Online Community for Promoting
Chinese Reading among Primary Schools in
Hong Kong
Siu Cheung KONG
Department of Mathematics and Information Technology,
The Education University of Hong Kong, Hong Kong
Abstract: An online community for promoting students to naturally develop true interest and
sustainable habit of Chinese reading has been set up among six primary schools in Hong Kong.
The approach of Reading of Tomorrow is adopted, which integrates the rationale of Modeled
Sustained Silent Reading (MSSR) and the use of a game-based learning platform “Bookstore of
Tomorrow”. This paper shares the first-phase experience of this online reading community, of
which a total of 534 students across Grade 4 to Grade 6 in the six collaborating schools
participated in the half-year Reading of Tomorrow activities for reading books according to
own interest, sharing personal reading records, making book recommendations to peers, and
reading peers’ book recommendations. In the student questionnaire survey, the participating
students positively perceived the impact of the Reading of Tomorrow approach on motivating
them to not only keep habit and increase interest in Chinese reading, but also to explore new
reading topics and develop new thinking ways through sharing book recommendations with
peers using the “Bookstore of Tomorrow” platform. In the focus group interviews, the
participating teachers acknowledged the potential of the Reading of Tomorrow approach to
influence students to increase reading frequency and widen reading topics; and suggested the
need to focus on promoting students to interact with peers more for sharing personal comments
and feelings after reading books. Implications are discussed for the online reading community
to sustain students’ motivation and interest in reading extensively for learning new knowledge
and developing creative thinking.
Keywords: Online reading community, primary schools, reading interest, reading habit,
game-based learning platform, Modeled Sustained Silent Reading (MSSR)
1. Introduction
The primary school sector in Hong Kong has put effort to enhance students’ competency and interest in
Chinese reading in the recent decade. Local primary schools have many related initiatives such as
arranging a “morning session” right after the morning assembly for students to read books in their own
classrooms. According to PIRLS 2011 International Results in Reading (Mullis, Martin, Foy, &
Drucker, 2012), Hong Kong primary school students rank top in the competency in Chinese reading
(ranking 1 out of 49), but rank low in the interest in Chinese reading (ranking 39 out of 49). This may be
due to the over-emphasis on the assessment of students’ Chinese reading competency by assigning
students to submit book reports once they finish reading books. This discourages students to take
initiative and so to develop interest and habit in reading extensively, as students easily link book reading
with formal learning coursework (Kirby, Ball, & Geier, 2011; Tse, Lam, Lam, Chan, & Loh, 2006).
An online community for promoting Chinese reading among Hong Kong primary schools is
therefore established. It aims to promote students to naturally develop true interest and sustainable habit
of reading. This paper shares the initial experience of this online community in adopting the approach of
Reading of Tomorrow, which integrates an established model on reading promotion with an emerging
trend of game-based learning, for enhancing students’ competency and interest in Chinese reading.
603603603
2. The Reading of Tomorrow Approach for Promoting Chinese Reading
The online reading community has adopted the approach of Reading of Tomorrow, which integrates the
rationale of Modeled Sustained Silent Reading (MSSR) and the use of a game-based learning platform
“Bookstore of Tomorrow”. This approach targets at fostering students to naturally develop interest and
habit of reading. A good reader has the capability to read actively; and the development of such
capability requires a strong interest-driven motivation (Duke & Pearson, 2002; Malloy, Marinak, &
Gambrell, 2010). Researchers find that once students develop such a strong interest-driven motivation,
they will develop a habit of regular reading and, in turn, advance proficiency in language use and skills
in independent thinking (Kirby et al., 2011; Krashen, 2004).
The rationale of Modeled Sustained Silent Reading (MSSR) addresses the importance of
fostering students to naturally develop interest and habit of reading. MSSR is originated from Sustained
Silent Reading (SSR), which has a principal assumption that the more the students read, the more they
enjoy reading, and then the better their reading ability. SSR consists of three core elements: Sustained,
Silent and Reading. SSR emphasizes the process that students read books in classrooms silently, at the
class-, grade-, or school-based level, in a fixed period every day. In this process, students are allowed to
freely select the books that they are interested in, change the books to be read at any time if they wish,
and extend reading process after class time (Gardiner, 2005; Pilgreen, 2000). It is found that students
and teachers consider SSR can positively influence the development of reading ability initiated in
school environment and extended to home environment (Garan & Devoogd, 2008; Gardiner, 2005).
The online reading community has proposed MSSR, which adds an element of “modeled” into
SSR framework, to promote students to enhance competency and interest in Chinese reading. The
process of MSSR emphasizes that teachers should act as a model reader when students are reading in
the designated reading session, that is, teachers also select a book that they are interested in, and sit
down in front of all students to read the selected book with their students in that designated reading
session. Teachers in the process of MSSR also need to lead the class to creating a silent reading
environment through the ways of, for example, asking the whole class to keep quiet, and allowing each
student to take two to three books at a time so that students need not to walk around the classroom for
selecting books. This is different from traditional reading sessions in which teachers monitor students to
read books and at the same time perform class duties or make class announcements.
The students will individually perform the post-reading activity by using the online game-based
learning platform – “Bookstore of Tomorrow”. This online platform is specially designed for peer
sharing under the approach of Reading of Tomorrow. It aims to support students to complete the
post-reading activities through the steps of answering simple questions related to the books read (for
engaging students in reading comprehension), recommending the books read via rating, drawing,
audio-recording and/or short writing (for engaging students in reflecting on the book contents),
publishing personal comments on recommended books (for engaging students in peer sharing), and
finally collecting virtual coins in the game-based learning environment (for motivating students to read
comments on books recommendations).
3. The Online Reading Community among Hong Kong Primary Schools
An online community named “The Hong Kong Reading Community of Tomorrow” has been built for
reading promotion under the Reading of Tomorrow approach in daily non-teaching sessions on campus
in Hong Kong primary school contexts. This online community targets at engaging students in a culture
of reading community that provides natural contexts of interactive sharing and supportive
recommendations on book reading. This community building is innovative among those young primary
school students, whom are often considered unable to demonstrate full autonomy in their learning
process and therefore are provided with limited opportunities for learner-initiated peer exchange tasks
on book reading within their learning process. The building of online reading community among
primary school students in this study enables these young learners to initiate peer sharing and discussion
about book reading habits and experiences; and in turn experience an approach of peer recognition that
is different from traditional classroom approach to promoting reading.
604604604
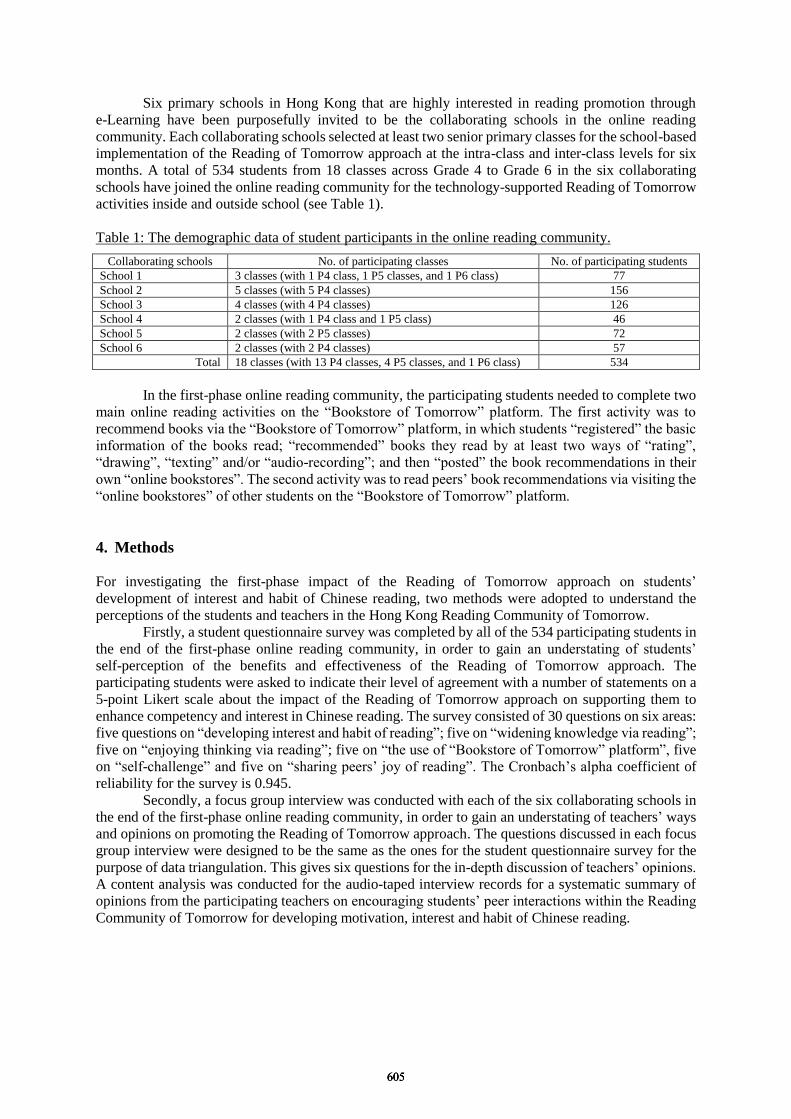
Six primary schools in Hong Kong that are highly interested in reading promotion through
e-Learning have been purposefully invited to be the collaborating schools in the online reading
community. Each collaborating schools selected at least two senior primary classes for the school-based
implementation of the Reading of Tomorrow approach at the intra-class and inter-class levels for six
months. A total of 534 students from 18 classes across Grade 4 to Grade 6 in the six collaborating
schools have joined the online reading community for the technology-supported Reading of Tomorrow
activities inside and outside school (see Table 1).
Table 1: The demographic data of student participants in the online reading community.
Collaborating schools No. of participating classes No. of participating students
School 1 3 classes (with 1 P4 class, 1 P5 classes, and 1 P6 class) 77
School 2 5 classes (with 5 P4 classes) 156
School 3 4 classes (with 4 P4 classes) 126
School 4 2 classes (with 1 P4 class and 1 P5 class) 46
School 5 2 classes (with 2 P5 classes) 72
School 6 2 classes (with 2 P4 classes) 57
Total 18 classes (with 13 P4 classes, 4 P5 classes, and 1 P6 class) 534
In the first-phase online reading community, the participating students needed to complete two
main online reading activities on the “Bookstore of Tomorrow” platform. The first activity was to
recommend books via the “Bookstore of Tomorrow” platform, in which students “registered” the basic
information of the books read; “recommended” books they read by at least two ways of “rating”,
“drawing”, “texting” and/or “audio-recording”; and then “posted” the book recommendations in their
own “online bookstores”. The second activity was to read peers’ book recommendations via visiting the
“online bookstores” of other students on the “Bookstore of Tomorrow” platform.
4. Methods
For investigating the first-phase impact of the Reading of Tomorrow approach on students’
development of interest and habit of Chinese reading, two methods were adopted to understand the
perceptions of the students and teachers in the Hong Kong Reading Community of Tomorrow.
Firstly, a student questionnaire survey was completed by all of the 534 participating students in
the end of the first-phase online reading community, in order to gain an understating of students’
self-perception of the benefits and effectiveness of the Reading of Tomorrow approach. The
participating students were asked to indicate their level of agreement with a number of statements on a
5-point Likert scale about the impact of the Reading of Tomorrow approach on supporting them to
enhance competency and interest in Chinese reading. The survey consisted of 30 questions on six areas:
five questions on “developing interest and habit of reading”; five on “widening knowledge via reading”;
five on “enjoying thinking via reading”; five on “the use of “Bookstore of Tomorrow” platform”, five
on “self-challenge” and five on “sharing peers’ joy of reading”. The Cronbach’s alpha coefficient of
reliability for the survey is 0.945.
Secondly, a focus group interview was conducted with each of the six collaborating schools in
the end of the first-phase online reading community, in order to gain an understating of teachers’ ways
and opinions on promoting the Reading of Tomorrow approach. The questions discussed in each focus
group interview were designed to be the same as the ones for the student questionnaire survey for the
purpose of data triangulation. This gives six questions for the in-depth discussion of teachers’ opinions.
A content analysis was conducted for the audio-taped interview records for a systematic summary of
opinions from the participating teachers on encouraging students’ peer interactions within the Reading
Community of Tomorrow for developing motivation, interest and habit of Chinese reading.
605605605
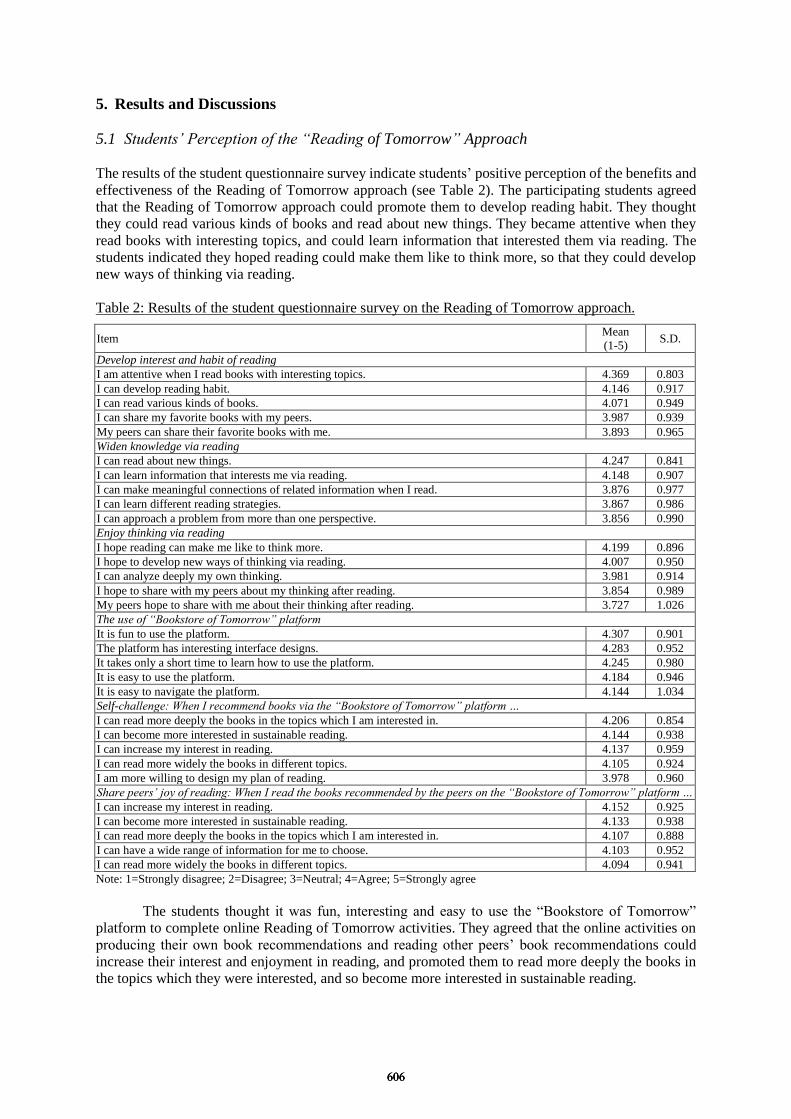
5. Results and Discussions
5.1 Students’ Perception of the “Reading of Tomorrow” Approach
The results of the student questionnaire survey indicate students’ positive perception of the benefits and
effectiveness of the Reading of Tomorrow approach (see Table 2). The participating students agreed
that the Reading of Tomorrow approach could promote them to develop reading habit. They thought
they could read various kinds of books and read about new things. They became attentive when they
read books with interesting topics, and could learn information that interested them via reading. The
students indicated they hoped reading could make them like to think more, so that they could develop
new ways of thinking via reading.
Table 2: Results of the student questionnaire survey on the Reading of Tomorrow approach.
Item Mean
(1-5) S.D.
Develop interest and habit of reading
I am attentive when I read books with interesting topics. 4.369 0.803
I can develop reading habit. 4.146 0.917
I can read various kinds of books. 4.071 0.949
I can share my favorite books with my peers. 3.987 0.939
My peers can share their favorite books with me. 3.893 0.965
Widen knowledge via reading
I can read about new things. 4.247 0.841
I can learn information that interests me via reading. 4.148 0.907
I can make meaningful connections of related information when I read. 3.876 0.977
I can learn different reading strategies. 3.867 0.986
I can approach a problem from more than one perspective. 3.856 0.990
Enjoy thinking via reading
I hope reading can make me like to think more. 4.199 0.896
I hope to develop new ways of thinking via reading. 4.007 0.950
I can analyze deeply my own thinking. 3.981 0.914
I hope to share with my peers about my thinking after reading. 3.854 0.989
My peers hope to share with me about their thinking after reading. 3.727 1.026
The use of “Bookstore of Tomorrow” platform
It is fun to use the platform. 4.307 0.901
The platform has interesting interface designs. 4.283 0.952
It takes only a short time to learn how to use the platform. 4.245 0.980
It is easy to use the platform. 4.184 0.946
It is easy to navigate the platform. 4.144 1.034
Self-challenge: When I recommend books via the “Bookstore of Tomorrow” platform …
I can read more deeply the books in the topics which I am interested in. 4.206 0.854
I can become more interested in sustainable reading. 4.144 0.938
I can increase my interest in reading. 4.137 0.959
I can read more widely the books in different topics. 4.105 0.924
I am more willing to design my plan of reading. 3.978 0.960
Share peers’ joy of reading: When I read the books recommended by the peers on the “Bookstore of Tomorrow” platform …
I can increase my interest in reading. 4.152 0.925
I can become more interested in sustainable reading. 4.133 0.938
I can read more deeply the books in the topics which I am interested in. 4.107 0.888
I can have a wide range of information for me to choose. 4.103 0.952
I can read more widely the books in different topics. 4.094 0.941
Note: 1=Strongly disagree; 2=Disagree; 3=Neutral; 4=Agree; 5=Strongly agree
The students thought it was fun, interesting and easy to use the “Bookstore of Tomorrow”
platform to complete online Reading of Tomorrow activities. They agreed that the online activities on
producing their own book recommendations and reading other peers’ book recommendations could
increase their interest and enjoyment in reading, and promoted them to read more deeply the books in
the topics which they were interested, and so become more interested in sustainable reading.
606606606
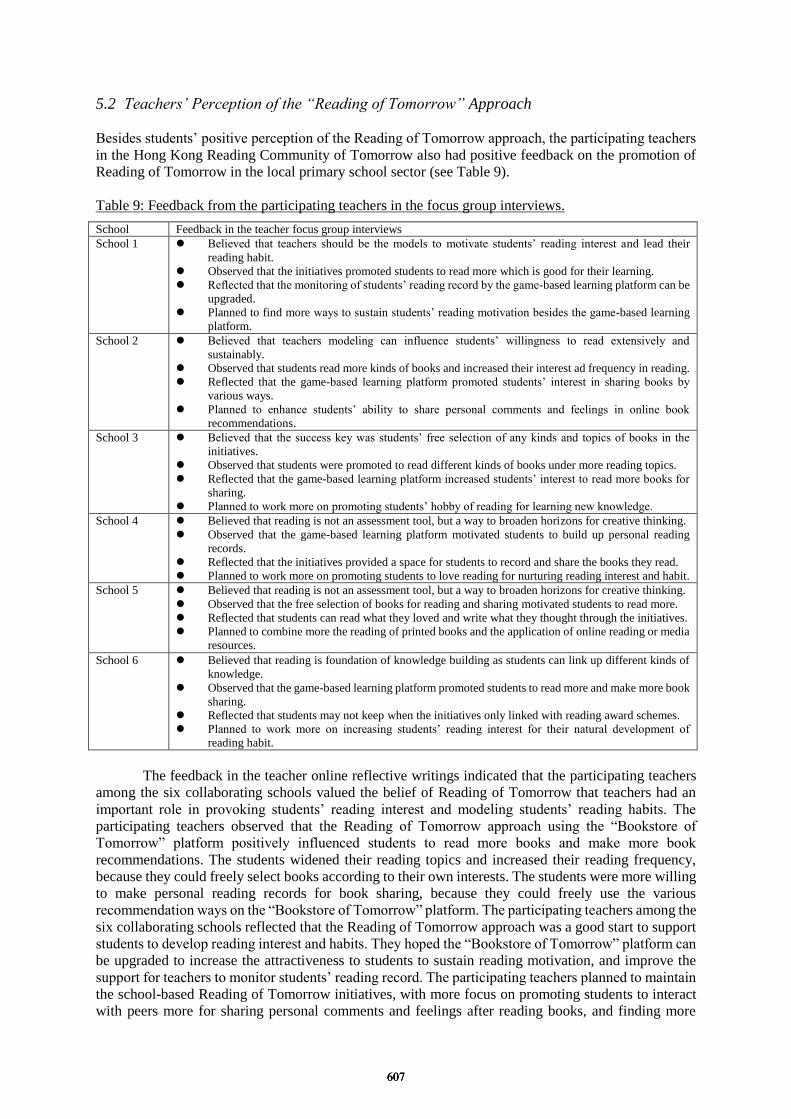
5.2 Teachers’ Perception of the “Reading of Tomorrow” Approach
Besides students’ positive perception of the Reading of Tomorrow approach, the participating teachers
in the Hong Kong Reading Community of Tomorrow also had positive feedback on the promotion of
Reading of Tomorrow in the local primary school sector (see Table 9).
Table 9: Feedback from the participating teachers in the focus group interviews.
School Feedback in the teacher focus group interviews
School 1 Believed that teachers should be the models to motivate students’ reading interest and lead their
reading habit.
Observed that the initiatives promoted students to read more which is good for their learning.
Reflected that the monitoring of students’ reading record by the game-based learning platform can be
upgraded.
Planned to find more ways to sustain students’ reading motivation besides the game-based learning
platform.
School 2 Believed that teachers modeling can influence students’ willingness to read extensively and
sustainably.
Observed that students read more kinds of books and increased their interest ad frequency in reading.
Reflected that the game-based learning platform promoted students’ interest in sharing books by
various ways.
Planned to enhance students’ ability to share personal comments and feelings in online book
recommendations.
School 3 Believed that the success key was students’ free selection of any kinds and topics of books in the
initiatives.
Observed that students were promoted to read different kinds of books under more reading topics.
Reflected that the game-based learning platform increased students’ interest to read more books for
sharing.
Planned to work more on promoting students’ hobby of reading for learning new knowledge.
School 4 Believed that reading is not an assessment tool, but a way to broaden horizons for creative thinking.
Observed that the game-based learning platform motivated students to build up personal reading
records.
Reflected that the initiatives provided a space for students to record and share the books they read.
Planned to work more on promoting students to love reading for nurturing reading interest and habit.
School 5 Believed that reading is not an assessment tool, but a way to broaden horizons for creative thinking.
Observed that the free selection of books for reading and sharing motivated students to read more.
Reflected that students can read what they loved and write what they thought through the initiatives.
Planned to combine more the reading of printed books and the application of online reading or media
resources.
School 6 Believed that reading is foundation of knowledge building as students can link up different kinds of
knowledge.
Observed that the game-based learning platform promoted students to read more and make more book
sharing.
Reflected that students may not keep when the initiatives only linked with reading award schemes.
Planned to work more on increasing students’ reading interest for their natural development of
reading habit.
The feedback in the teacher online reflective writings indicated that the participating teachers
among the six collaborating schools valued the belief of Reading of Tomorrow that teachers had an
important role in provoking students’ reading interest and modeling students’ reading habits. The
participating teachers observed that the Reading of Tomorrow approach using the “Bookstore of
Tomorrow” platform positively influenced students to read more books and make more book
recommendations. The students widened their reading topics and increased their reading frequency,
because they could freely select books according to their own interests. The students were more willing
to make personal reading records for book sharing, because they could freely use the various
recommendation ways on the “Bookstore of Tomorrow” platform. The participating teachers among the
six collaborating schools reflected that the Reading of Tomorrow approach was a good start to support
students to develop reading interest and habits. They hoped the “Bookstore of Tomorrow” platform can
be upgraded to increase the attractiveness to students to sustain reading motivation, and improve the
support for teachers to monitor students’ reading record. The participating teachers planned to maintain
the school-based Reading of Tomorrow initiatives, with more focus on promoting students to interact
with peers more for sharing personal comments and feelings after reading books, and finding more
607607607
ways to sustain students’ motivation and interest in reading extensively for learning new knowledge and
developing creative thinking.
6. Implications and Conclusion
This paper shares the initial experience in building an online community named the Hong Kong
Reading Community of Tomorrow among senior primary school students in Hong Kong for the goal of
developing the interest and habit of Chinese reading among young learners. This online reading
community adopts the approach of Reading of Tomorrow, which attempts to integrate the trend of
game-based learning into the existing guiding framework of Modeled Sustained Silent Reading
(MSSR). From the results of the student questionnaire survey and the teacher focus group interviews,
the Reading of Tomorrow could open alternative pedagogical opportunities for reading promotion
among students with a higher flexibility in terms of time, location and activity design.
The Reading of Tomorrow approach does not emphasize the submission of book-reading
reports or the number of books being read. It emphasizes teachers’ inputs as a role model to provoke
students’ interest in and mobilize their actions on reading. Teachers’ enthusiastic dedication is expected
to mobilize students’ reading behavior. The use of game-based learning platform is expected to sustain
a relaxed ambience of reading, which helps to provoke students’ reading interest and then their intrinsic
motivation in reading different types of books recommended by peers. The direction of the online
reading community in next phase will focus on further extending the Reading of Tomorrow initiatives
across different subjects for promoting students to sustain motivation and interest in reading extensively
for learning new knowledge and developing creative thinking, and building foundation for self-directed
learning and lifelong learning in the long run.
Acknowledgements
The author would like to acknowledge the Quality Education Fund of the Education Bureau of Hong
Kong SAR government in supporting the research.
References
Duke, N. K., & Pearson, D. (2002). Effective practices for developing reading comprehension. In A. E. Farstrup &
S. J. Samuels (Eds.), What research has to say about reading instruction (pp. 205-242). Newark, DE:
International Reading Association.
Garan, E. M., & Devoogd, G. (2008). The benefits of sustained silent reading: Scientific research and common
sense converge. Reading Teacher, 62(4), 336-344.
Gardiner, S. (2005). Building student literacy through sustained silent reading. Alexandria, VA: Association for
Supervision and Curriculum Development.
Kirby, J. R., Ball, A., & Geier, B. K. (2011). The development of reading interest and its relation to reading ability.
Journal of Research in Reading, 34(3), 263-280.
Krashen, S. D. (2004). The power of reading. Portsmouth, UK: Heinemann.
Malloy, J. A., Marinak, B., & Gambrell, L. (Eds.). (2010). Essential readings on motivation. Newark, DE:
International Reading Association.
Mullis, I. V. S., Martin, M. O., Foy, P., & Drucker, K. T. (2012). PIRLS 2011 International Results in Reading.
Chestnut Hill, MA: International Association for the Evaluation of Educational Achievement.
Pilgreen, J. L. (2000). The SSR handbook: How to organize and manage a sustained silent reading program.
Portsmouth, NH: Boynton/Cook Publishers.
Tse, S. K., Lam, Y. R., Lam, J. W. I., Chan, Y. M., & Loh, E. K. Y. (2006). Attitudes and attainment: A
comparison of Hong Kong, Singaporean and English students’ reading. Research in Education, 76, 74-87.
608608608

Chen, W. et al. (Eds.) (2016). Proceedings of the 24th
International Conference on Computers in
Education. India: Asia-Pacific Society for Computers in Education
Literate, Numerate, and Discriminate –
Realigning 21st Century Skills
Jon MASON*, Khalid KHAN, & Sue SMITH
School of Education, Charles Darwin University, Australia
Abstract: Discrimination can be said to take place during early childhood when the difference
between safety and danger are detected even though notions of real and imaginary may still be
blurred. Importantly, the versatility of this construct reaches further into lifelong learning and
is used in this paper as a means of distilling a range of competencies that are invoked by terms
such as information literacy, digital literacy, media literacy, e-literacy, ethical responsibility,
global citizenship, and the ‘getting of wisdom’. Following a meta-analysis of the various ways
in which 21st century skills are elucidated we propose a conceptual re-alignment of the
foundation skills of education to include being discriminate (discerning) alongside being
literate and numerate. Motivation for doing so arises from two sources: (1) a perceived
privileging of literacy and numeracy – particularly in the context of high-stakes testing; and,
(2) the converse of this situation in which literacy and numeracy appear to have a diminished
presence within the ‘21st century skills’ agenda. A gap between these agendas becomes more
prominent when considering that our interactions with the world are increasingly configured
by increasing production and consumption of data from an increasing diversity of sources.
Keywords: literacy, numeracy, discernment, data literacy, skills, competence, wisdom
1. Introduction
From an adult learning perspective “(t)he relationship between people’s lives and their learning is
complex” (Barton, et al., 2007, p.1). It is no less complex for infants and school-age children – and is
arguably more so in a turbulent world of economic uncertainty amidst the ever-present immediacy of
political, ideological, and religious conflict. Additionally, as emphasised by Castells and Himanen
(2014), the global era we now live in is profoundly different from earlier times: “a historical period
characterized by the technological revolution in information and communication, the rise of the
networking form of social organization, and the global interdependence of economies and societies”
(Castells & Himanen, 2014, p.1). Making sense of this world in ways that enable us to engage and
contribute to society requires developing appropriate skills and sensibilities. Are literacy and
numeracy adequate foundations in this changed context? For Misson and Mason (1997):
Literacy and education are so thoroughly bound up with each other that a change in literacy
practices such as the digital revolution has brought will inevitably have a profound impact on
education, just as the changes in education brought about by the new learning technologies
will inevitably have an impact on literacy both in its uses across the curriculum and in the
teaching of literacy itself (Misson & Mason, 1997, p. 129).
While literacy and numeracy are now globally regarded as prominent foundation skills, these
skills are insufficient in terms of developing the whole person, and in contexts that are increasingly
rich in inter-cultural and technological connections. For many children worldwide learning how to
read, write, and count are now increasingly enabled and mediated by technology. This technology also
connects and embeds us within networks of information and communication that are increasingly a
catalyst for the propagation of data – data that can then be manipulated for a huge variety of purposes,
from providing feedback to instructors and learners in the form of ‘learning analytics’, informing us
how many Facebook ‘likes’ we have to a post, enabling new forms of business intelligence, to serving
the purposes of surveillance. Thus:
609609609
“To thrive in a rapidly evolving, technology-mediated world, students must not only possess
strong skills in areas such as language arts, mathematics and science, but they must also be
adept at skills such as critical thinking, problem-solving, persistence, collaboration and
curiosity” (World Economic Forum, 2016, p. 1).
Such commentary is now commonplace within the literature focused on 21st Century Skills,
although the conceptions and points of emphasis associated with this discourse vary considerably
(Voogt, Erstad, Dede, & Mishra, 2013; Griffin, McGaw, & Care, 2012). A simple Google search for
images associated with these frameworks reveals an incredible variation, placing emphasis in varying
degrees upon competencies that include communication, collaboration, creativity, critical thinking,
digital literacy, and global citizenship – but rarely, literacy and numeracy. The recent findings from
the World Economic Forum (WEF) are summarized in the form of a compelling graphic in which 21st
Century Skills are presented as three interrelated groups of skills: ‘foundational literacies’,
‘competencies’, and ‘character qualities’ (p. 3). This framework attempts to connect, or re-establish,
literacy and numeracy as pivotal foundations of education within the evolving competency
requirements of the 21st century. As such, it represents a major step forward in this discourse.
For us, however, the WEF framework also reveals significant gaps. An example is that data
literacy is not listed, let alone addressed. Moreover, while the report acknowledges “the greater
variety, volume and velocity of data” it does not deal with how global citizens are interacting with it.
This anomaly seems stark when considering the discourse on learning analytics and big data in which
‘millions of datapoints’ are now identified as potential sources of evidence for learning (Cope &
Kalantzis, 2014, p. 221). Thus, an appropriate response to such developments would seem to be that
“increasing focus on education as an evidence-based practice requires that educators can effectively
use data to inform their practice” (Gummer & Mandinach, 2015, p. 1).
1.1 Literacy
Literacy has become a term with high utility in recent times, such as when used when referring to
information literacy, media literacy, or computer literacy. But as Barton and Hamilton (2000) point
out: “within a given culture, there are different literacies associated with different domains of life”
(p.11). In its most instrumental form literacy is reduced to reading and writing, as reflected in
Australia’s annual National Assessment Program - Literacy and Numeracy (NAPLAN). This is
despite UNESCO reflecting over a decade ago:
“Literacy is the ability to identify, understand, interpret, create, communicate and compute,
using printed and written materials associated with varying contexts. Literacy involves a
continuum of learning in enabling individuals to achieve their goals, to develop their
knowledge and potential, and to participate fully in their community and wider society.” This
proposed definition attempts to encompass several different dimensions of literacy. Yet
because even this plural notion of literacy remains centred on the life of the individual person,
more reflection should be given to incorporating into it the various circumstances in which
individual learners live their lives. An attendant challenge has to do with accurately
monitoring and assessing the multiple forms of literacy (UNESCO, 2004, p. 13).
1.1.1 The ‘new literacies’
The digital revolution can be seen as a powerful agent of change in terms of the ways in which
literacy has been appropriated as a qualifying term to indicate competence or knowledge of some
domain of practice. There are numerous examples but the most prominent have been information
literacy, computer literacy, media literacy, network literacy, and digital literacy. While there might be
implied differences in meaning between these terms it is clear that the semantics associated with
literacy prior to the digital revolution were more concerned with the basics of reading, writing, and
communicating. Thus, when we consider that digital technologies have also been commonly referred
to as information and communication technologies (ICT), it would seem there is a natural progression
for literacy to be qualified by terms such as information, computer, media, network, and digital.
In proposing a taxonomy of literacies Stordy (2015) provides a useful framework for
understanding the evolution of this term in which the notion of new literacies first emerges. As
seemingly comprehensive as it is, however, it does not contain any reference to data literacy, a term
610610610
we identify as a key concept because it has made us wonder where it fits best given that numerical
data is something that really belongs to an updated notion of numeracy (Athanases, Bennett, &
Wahleithner, 2013; Deahl, 2014; Gummer & Mandinach, 2015; Koltay, 2015).
1.2 Numeracy
One of the impacts of the rapid development of digital technologies is upon our micro habits. Thus,
the advent of wearables such as Apple and Samsung watches, virtual reality headgear etc., the
boundary between our natural human cognition and an increasingly extended domain that technology
enables has begun to blur. Exploring such innovations can be exciting but also bring new challenges
in terms of processing, authenticating, securing, and discriminating data.
What has this got to do with numeracy? In this rapidly evolving information age, numbers
mostly come in form of figures, graphs and statistics. We see them routinely in medical reports,
financial advice, government policies, and in the daily news media which are all filled with charts and
data. The presentation of data in this quantitative form has a consequence that the soundness of the
decisions we now make on daily basis is increasingly dependent on having an understanding of how
the data might have been gathered and analysed, not just presented. Developing such skills could be
understood in terms of both numeracy and data literacy.
While the semantics implicit in data literacy can be readily inferred or understood (Vahey,
Yarnall, Patton, Zalles, & Swan, 2006) and as common within STEM education (Qin, J., & D’Ignazio,
2010) we think the numeracy aspect is somehow masked or rendered subservient. Moreover, as we
discuss later, the capacity to discern the soundness of data demands a critical capacity to discriminate.
1.2.1 Numeracy and modern education
When the term numeracy was introduced into educational curriculums in Britain in the mid to late
twentieth century it was presented as equivalent to quantitative literacy, a term which was
simultaneously employed as its synonym. The expectation was that by having this core skill (on par
with literacy) the ordinary citizens would have sufficient skills with handling numbers to become
quantitatively literate (Steen, 1999).
For the past few decades much research has been done to explain and bridge the gap between
the data skills and numeracy of the public (Steen, 2001; Sullivan, 2011). However, there remains
confusion with regards to the right balance between numeracy for community life and its relation to
core mathematical processes. The Program for International Student Assessment (PISA) uses the term
mathematical literacy to describe:
[…] an individual’s capacity to formulate, employ, and interpret mathematics in a variety of
contexts. It includes reasoning mathematically and using mathematical concepts, procedures,
facts, and tools to describe, explain, and predict phenomena. (OECD, 2013, p. 25)
Mathematics is considered by educators as a system composed of multiple, interconnected
and interdependent concepts and structures which students must apply beyond the classrooms. There
is, however, no clear mandate on what essential elements in the basic education of mathematics this
constitutes. While all K-12 educational curriculums consider algebra, probability and geometry as a
core combination of skills, they will inevitably fall short of producing the numerically abled citizen
without concomitant foregrounding of discernment of the selections, uses and consequences
of these skills.
1.2.2 Data Literacy
Could one of the core functions of education in our global era be to raise student awareness of data,
statistics and related implications, particularly the data we encounter in everyday life? Such a
proposition may be implicit in many curriculums but it is not always explicit. Even within the 21st
Century Skills discourse such a notion seems to be inferred as an aspect of digital literacy or ICT
literacy when combined with skills such as critical thinking and problem solving (Griffin, McGaw, &
Care, 2012). An alternative is to define data literacy as a skill in itself. But while adopting such a term
within this discourse makes sense, such a term also needs to be adequately explained in context. It
611611611
could just describe the safe handling and manipulation of a variety of data and information on a daily
basis, and from a variety of digital devices. For us, more important is the discernment and
discrimination required to make sound decisions. This would not be possible unless we teach students
to understand how to identify questions, collect evidence (as data) and discover and apply tools to
interpret, communicate and exchange results (Rumsey, 2002).
Wells (2008; 2015) highlights the question ‘what’s the point, sir!’ It is precisely the point of
mathematics that students learn to actively think and ask this question when dealing with data in order
to separate the truth from vagueness that data, formulas, interpretation and context bring along, to
separate real from imaginary, argument from rhetoric, fact from fiction and plausible from certain.
The main aim of basic mathematics education is to develop mathematical thinking. Being
numerate, however, does not encapsulate the core of mathematical thinking. In contemporary global
settings the development of mathematical thinking also implies reasoning and processing skills that
involve precision while also enhancing intuition and problem solving abilities. Such skills underscore
the rationale for the advocacy of STEM education in our increasingly data-driven and evidence-based
requirements of social and economic advancement.
Innovation can also be seen as emerging from the ability to discriminate. Prime numbers
versus composite numbers, odd versus even numbers, normal distribution versus skewed distribution,
maximum versus minimum, certainty versus uncertainty, and so on. Discrimination is an ability to
find the odd one out – while looking for patterns, asymmetry stands out. Recognizing and
discriminating digital data when each individual action gives rise to another set of data is a skill that is
missing from our educational frameworks – where numerate and literate are the main focus.
In our view, data literacy can be subsumed within a core skill of being able to discriminate.
Such a conception is more encompassing than the operational aspects of being literate and numerate.
It is not necessarily separate from literacy and numeracy but another lens through which to read the
world. In other words, an essential ability needed to quantify, qualify, discern, and predict. Thus,
researchers have identified data literacy as a core competency within library science and STEM
education. To date, however, it is significant that a key concern is with the ethical use of data when
sharing and reusing it (Koltay, 2013; Zilinski, et al, 2014). A typical example is well summarized by
Calzada Prado & Marzal (2013) where data literacy is described as the ability that “enables
individuals to access, interpret, critically assess, manage, handle and ethically use data” (pp. 123-124).
Combining, discriminating and aggregating different sources of data also assists in posing new
questions and seeing new angles. Teaching data literacy, then, could therefore be classified into five
aspects:
Reading the data – understanding the need for data to be collected; recognizing more than one
way to collect and present data; literate with the basic concepts; numerate in understanding
formulas, graphs, charts and tables, etc.
Questioning the data – critically appraising the provenance of data; checking on who, how,
why, and when the data was collected; examining sample size, census, and survey integrity;
questioning the methodology; assessing data quality; and identifying potential issues.
Reading between the data – understanding of various factors that may have an impact on the
data, how a bias might have been or could have been introduced; questioning what is not
stated; sample selection, patterns, errors and outliers.
Reading beyond the data – understanding methodological issues such as sampling technique,
survey design, noise, context, significance, randomness, independence, and metadata;
distinguishing between correlation and causation, understanding how a third variable may
explain a relationship between the two others;
Using data – predicting and generalizing from available datasets; understanding trends,
drawing inferences; appreciating public and private use, ethical actions and consequences;
drawing inferences and understanding the difference between wise and irresponsible use.
We see the ability to make ethical decisions and employ analytical and questioning skills in
diverse contexts as paramount. Thus, the ability to ask the question ‘what’s the point?’ is not only a
fundamental act of sense-making but also being discriminate in order to understand better. For
example, in the context of both mathematics education and data literacy:
Regardless of where a person is involved in the chain of statistical information, there will be a
need for a basic understanding of the concepts and language, a level of reasoning (the abilities
612612612
to question, compare, and explain) and a level of statistical thinking (applying the ideas to
new problems and identifying questions of your own) (Rumsey, 2002).
Applications of mathematical skills are ubiquitous, be it geometry in art and architecture,
calculus and measurement in science, syllogism, logic and reasoning in language and communication,
ratios and patterns in music composition, matrices in data representation and ranking, or games and
networking. All these contexts require us to reason, process and distinguish useful versus useless, and
to collect evidence and interpret results. And all these skills require moving beyond mere ordinary
number operations and applying computational algorithms. Our reasoning skills require us to
discriminate and compare the data we might access, with the answers established by our internal
thinking mechanism before we process it. Under discriminate we distinguish and connect; through
this we understand the difference between the background data from the main data and be aware of
the relationships that may or may not exists.
2. Conclusion
Public policy associated with education is typically expressed at the jurisdictional and institutional
levels. As a consequence of recognising global trends, it is increasingly common for reports from non-
governmental organisations and private consortia to gain prominence in setting agendas – and
therefore, in influencing policies. The New Vision for Education from the World Economic Forum in
2016 and the Millennium Development Goals articulated by UNESCO in 2000 followed by the
Sustainable Development Goals in 2015 are all cases in point. The 21
st Century is already awash with data. Individuals, including children, are both
bombarded with data, and are themselves data, and amid the multiple literacies that are appropriated
and apportioned to various tasks and agendas it can be easy to lose sight of the roles that literacy and
numeracy continue to have. While such foundation as ‘literacies’ (WEF, 2016) might describe what
an individual needs to be equipped for lifelong learning and live a better life there is a third
foundation upon which most of the new ‘literacies’ depend. That requires discernment and
discrimination – even wisdom.
Within the 21st Century Skills framework developed by WEF (2016) the role of critical
thinking is potentially at the fulcrum. That is, insightful and discriminating thinking that cultivates
personal and social wisdom, as opposed to that which is cynical and dismissive (Wright, 2003). It is
also instructive to consider this framework in terms of its sub-heading: Fostering Social and
Emotional Learning through Technology. This kind of thinking is not new of course. It has its roots
deep in pedagogical thought: phronesis, Aristotle’s Practical Wisdom.
Such discriminate thinking is not a solely rational cognitive function. Discrimination also
functions in affective and kinesthetic ways. Arguably, discrimination also has a dark side when
manifest as racism or bigotry of any kind. But this is our point – to be discriminate requires the
identification of at least two distinctions: right versus wrong, safety versus danger, abstract versus
concrete, odd versus even, rational versus irrational, etc. In many ways it both requires and extends
beyond critical thinking. Creative competency is also required to imagine relationships between what
might be actual and what might be possible. To be discriminate requires pause to envision different
directions, have empathy, perceive connections, and to imagine real consequences. Choices are made
knowingly, emotion and imagination are also at play – and quite different from spontaneous reactions
to preferences. Importantly, this can be taught (Garrison, 2010). In drawing this discussion to a close we are acutely aware that our own investigation into this
topic represents initial findings as a work-in-progress. The two key findings to date are as follows:
(1) While there are numerous conceptualisations of what 21st century teaching and learning
entails, the alignment between the foundations of high stakes literacy and numeracy testing on
the one hand and the skills and competencies expressed in various formulations of 21st
century skills appears to be only beginning to take place; and,
(2) Missing from public policy associated with the foundations of an appropriate education for
the 21st century is any detailed discussion of the role of discrimination. We see such an ability
as an essential dimension for the development of an informed, wise, and just society and at
least as important as the other so-called 21st century skills. In short, discrimination needs to be
expressed in terms more robustly than as a ‘character quality’ (WEF, 2016).
613613613
References
Barton, D, & Hamilton, M. (2000). Literacy Practices, in D. Barton, M. Hamilton, & R. Ivanic (Eds.) Situated
Literacies: Reading and Writing in Context. pp. 7-15. New York, NY: Routledge.
Barton, D., Ivanic, R., Appleby, Y., Hodge, R., & Tusting, K. (2007). Literacy, Lives, and Learning. Abingdon,
Oxon, UK: Routledge.
Calzada Prado, J., & Marzal, M. Á. (2013). Incorporating data literacy into information literacy programs: Core
competencies and contents. Libri, 63(2), 123-134.
Castells, M., & Himanen, P. (Eds.). (2014). Reconceptualizing Development in the Global Information Age.
Oxford, United Kingdom: Oxford University Press.
Cope, B., & Kalantzis, M. (2015). Interpreting Evidence-of-Learning: Educational research in the era of big
data. Open Review of Educational Research, 2(1), 218–239.
Davies, T., & Edwards, D. (2012). Emerging Implications of Open and Linked Data for Knowledge Sharing in
Development. IDS Bulletin, 43(5), 117–127.
Dudley, U. (1997). Numerology: or, what Pythagoras wrought. Cambridge, MA: Cambridge University Press.
Garrison, J. (2010). Wisdom and desire in the art of teaching. Charlotte, NC: Information Age Publishing Inc.
Griffin, P., McGaw, B., & Care, E. (Eds.). (2012). Assessment and Teaching of 21st Century Skills. Springer.
Gummer, E. S., & Mandinach, E. B. (2015). Building a Conceptual Framework for Data Literacy. Teachers
College Record, 117(040305), 1–22.
Johnston, L., Lafferty, M., & Petsan, B. (2012). Training Researchers on Data Management: A Scalable, Cross-
Disciplinary Approach. Journal of eScience Librarianship, 1(2), 79–87. doi:10.7191/jeslib.2012.1012
Koltay, T. (2015). Data literacy: in search of a name and identity. Journal of Documentation, 71(2), 401–415.
Mandinach, E. B., & Gummer, E. S. (2013). A Systemic View of Implementing Data Literacy in Educator
Preparation. Educational Researcher, 42(1), 30–37. http://doi.org/10.3102/0013189X12459803
Martin, E. R. (2014). What is Data Literacy? Journal of eScience Librarianship, 3(1): Article 6, 1–2.
Misson, R. & Mason, J. (1997). Extending the Meaning of Literacy, in Mason, J., Nott, M., Fung, J., Hart, G., &
McTigue, P. (Eds), Proceedings, Doing IT at Melbourne, University of Melbourne, pp. 129-134
Organisation for Economic Co-operation and Development (OECD). (2013) PISA 2012 assessment and
analytical framework: Mathematics, reading, science, problem solving and financial literacy. Paris.
Qin, J., & D’Ignazio, J. (2010). Lessons learned from a two-year experience in science data literacy education.
International Association of Scientific and Technological University Libraries, 31st Annual Conference.
Roca, E. (2008). Introducing practical wisdom in business schools. Journal of Business Ethics, 82(3), 607-620.
Rumsey, D. J. (2002). Statistical literacy as a goal for introductory statistics courses. Journal of Statistics
Education, 10(3), 6-13.
Steen, L. A. (1999). Numeracy: The new literacy for a data-drenched society. Educational Leadership, 57, 8-13.
Steen, L. A. (2001). Mathematics and numeracy: Two literacies, one language. The mathematics educator, 6(1),
10-16.
Stordy, P. (2015). Taxonomy of literacies. Journal of Documentation, 71(3), 456–476.
Street, B. (1984). Literacy in Theory and Practice. Cambridge, UK: Cambridge University Press.
Sullivan, P. (2011). Teaching mathematics: Using research-informed strategies. Australian Council
For Educational Research Press.
Vahey, P., Yarnall, L., Patton, C., Zalles, D., & Swan, K. (2006, April). Mathematizing middle school: Results
from a cross-disciplinary study of data literacy. Paper presented at the annual conference of the American
Educational Research Association, San Francisco, CA.
UNESCO, (2004). The Plurality of Literacy and Implications for Policies and Programmes. UNESCO
Education Sector Position Paper. http://unesdoc.unesco.org/images/0013/001362/136246e.pdf
Voogt, J., Erstad, O., Dede, C., & Mishra, P. (2013). Challenges to learning and schooling in the digital
networked world of the 21st century. Journal of Computer Assisted Learning, 29, 403–413.
Wells, D. G. (2008). What's the Point?: Motivation and the Mathematics Crisis. Press. Rain
Wells, D.G. (2015). Motivating Mathematics: Engaging Teachers & Engaged Students. Imperial College Press
Williamson, B. (2015). Smarter learning software: Education and the big data imaginary. Presented at the Big
Data – Social Data, Warwick, UK: University of Warwick. Retrieved from http://rms.stir.ac.uk/converis-
stirling/publication/20253
World Economic Forum. (2016). New Vision for Education: Fostering Social and Emotional Learning through
Technology. Switzerland.
Wright, A. (2003). The contours of critical religious education: knowledge, wisdom, truth. British Journal of
Religious Education, 25(4), 279-291.
Zilinski, L., Sapp Nelson, M. R., & Van Epps, A. S. (2014). Developing professional skills in STEM students:
Data information literacy. Issues in Science and Technology Librarianship.
614614614
Chen, W. et al. (Eds.) (2016). Proceedings of the 24th International Conference on Computers in Education. India: Asia-Pacific Society for Computers in Education
Coordinated Faculty Professional Development Activity: Key for High Retention in MOOCs
Shashikant HALKUDE, Dipali AWASEKAR*, Manisha NIRGUDE, Roohshad MISTRY Walchand Institute of Technology, Solapur, India.
Abstract: Massive Open Online Courses (MOOCs) are a rapidly growing form of educational technology and have the potential to deliver world class education. The potential benefits are particularly of paramount importance in developing countries such as India due to paucity of good faculty with regards to scaling up of professional education. India has now officially jumped into the open online courses bandwagon with the government announcing many initiatives with an objective of providing affordable and quality education to all desirous. IITBombayX is one such online platform which offers interactive online classes and MOOCs for faculty professional development. This paper reports findings from MOOC on ET601Tx that were instrumental in 98.6% course completion rate conducted at our institute against a general 24% for this course at all over India. Out of the 146 registered, 144 went on to complete the entire course and received honor code certificates. The post MOOC survey of 133 participants revealed that ‘Institutional Leadership’ in the form of Coordinated Faculty Professional Development Activity (CFPDA) was a major contributing factor in making the faculty persists throughout the course and completing it successfully. The CFPDA at the institution, in the form of review meetings facilitation by education technology mentors, department coordinators has led to 98.6 % persistence and higher scores obtained by the faculty participants.
Keywords: MOOCs, ET601Tx, completion rate, persistence, coordinated professional development activity, institutional leadership, education technology.
1. Introduction
Massive Open Online Courses (MOOCs) is an emerging technology-enabled innovation in education which attempts to improve quality education and its extent of delivery using Internet and mobile technologies. MOOC will not replace in any way the existing education system but provides a supplementary platform to study quality courses from top class institutions. ‘Swayam’ programme is part of the initiatives undertaken by the ministry of human resource development (HRD) for enhancing education in India through MOOC. IITBombayX is one such online platform and offers interactive online classes and MOOCs. Courses from multiple disciplines are presently offered.
MOOCs have the potential to deliver quality education on a very large scale. This has been on account of the fantastic growth of technology over the last couple of decades. MOOC providers such as ‘iversity’, ‘Coursera’ & ‘edX’ have already conducted hundreds of classes based on content developed by top university professors and this list continues to expand (Colin Taylor et al, 2014). The fact that these courses are conducted by top universities, the quality and content of the courses is extremely good and this is a major advantage in developing countries where the quality of education is not at par with that of the west. However MOOCs programs all over world including India suffer from poor retention and course completion rates. It is important to analyze the completion and dropout rates for MOOC courses to become more successful in the future. If we understand the reasons behind the dropouts we will be able to take preemptive steps to ensure that participants persist with the course till the end. As per the available literature on MOOC attrition the major causes for high attrition in MOOC are; lack of time, lack of learner’s motivation and lack of interaction with peers, insufficient skills or prerequisites and hidden costs. For instance, in the ET601Tx MOOC course on education technology of the 5319 faculty participants who had enrolled for the course only 1281(24%) were awarded the honor certificate. In order to have minimum dropouts and successful completion there is a need for an institute to have a well-coordinated system in place. Our paper discusses the evidences from one such MOOC course ET601Tx executed under a CFPDA at our institute.
615615615
There are several types of MOOCs on offer today. The intended audience may be students from one particular university or a wider audience across the globe. In India MOOCs are likely to become a part of the university curriculum in the coming years. It is expected that one of the course per semester may be a MOOC. In such a scenario local institutions may find it difficult to manage and execute MOOCs given the issues associated with it. Our study focuses on one such type of MOOC in which the participants are from same location. Section 2 discusses the literature survey and in Section 3 provides the details MOOC for ET601Tx. Section 4 discusses the objective and methodology followed by implementation and execution details at our institute for sustaining the MOOC. We report the results of various analyses and its subsequent discussion in Section 5 followed conclusion and recommendation in section 6. Based on the findings of our study we present a model which may be adopted by other institutes for implementing such MOOCs.
2. Literature Review
Literature on MOOC reveals that even today MOOC retention rates are very low. Khalid Alraimi et al. (2015) have mentioned several studies which conclude that average retention rates in MOOCs are less than 10% (Kovanovi et al, 2015), (Adamopoulos, 2013). As mentioned before the most common research approach is to use a single MOOC course as a case study to study retention rates. In a case study of astronomy MOOC, de Fretas et al. (2015) speculate that challenging assignments and gamification positively impact completion (Kovanovi et al, 2015), (Adamopoulos, 2013). Greene et al. (2015) conducted a case study looking at learner retention within a single MOOC on ‘Metadata: Organization and Discovering Information’. They have tried to predicted retention using survival analysis based on the collected survey data. They found participants with prior experience of MOOCs were less likely to drop out, as were older and more educated participants.
There are some studies that have tried to look at retention factors over various MOOCs. Hew (2014) studied the three top rated MOOCs across three disciplines. On the basis of this work they propose five features that promote student engagement: problem-centric learning, instructor accessibility and passion, active learning, peer interaction and using helpful course resources. However, they did not look directly at retention and they did not include any lower ranked MOOCs as controls (Kovanovi et al, 2015). A detailed review about MOOC attrition has been done by Hanan Khail and Marin Ebner. They have listed five major causes for attrition in MOOCs; Lack of time, feeling of isolation and lack of interactivity, insufficient background knowledge and skills & hidden costs (Khalil, H & Ebner, M (2014). Belanger & Throntorn (2013) have reported that time is an important factor that determines MOOC completion rates. Most participants of MOOCs have reported in feedback surveys that watching online lectures, completing assignments & quizzes is very difficult to manage given their already busy schedule. Another issue with regards to course duration is that different people have different preferences when it comes to moving through the course. Bruff D (2013) mentions that while some students prefer to move through the course week by week others prefer to get all the content at the start.
According to Yuan and Brown (2013) there are many factors that influence student’s motivation. These are future economic benefit, development of personal and professional identity, challenge and achievement, enjoyment and fun. Feeling of isolation and lack of interaction in MOOCs was also a major factor which contributed to the poor retention rates. Pallof and Pratt (2003) have reported that the feeling of isolation is a direct result of poor course design. It is a consensus among various researchers that interaction and communication in MOOCs helps learners develop their own knowledge, their own ideas and develop long term relationships with peers. Insufficient background knowledge and skills are major reasons for poor completion rates among MOOCs. This is specifically the case for advanced topics and subjects that require specific skills such as programming, software simulations and intensive analytical treatment.
Apart from the above mentioned issues other literature reveals that the major reasons for poor persistence and completion are the lack of problem centric learning and instructor accessibility. The above literature reports the finding for MOOCs taken up by a wide range of learners form students to amateurs. There is no account of a MOOC specifically conducted for faculty on pedagogy. To train our faculty in modern pedagogic practices the institute motivated faculty for enrolling in MOOC ET601Tx.
616616616
3. MOOC course on ET601Tx
MOOC course on “Educational Technology for Engineering Teachers” (ET601Tx), aimed to provide an introduction to research-based and learner-centred pedagogy for effectively integrating ICT in engineering education helping them to become informed teachers and tackle teaching-learning problems competently. The MOOC was offered during the weeks of Jan. 7 to March 7, 2016 for a total of six weeks, on IITBombayX platform.
The MOOC on ET601Tx had a total of 5319 enrolled participants; out of the total 5319 only 3447 were active. Out of the total active 3447 participants 1281 participants have completed the course successfully and received honour code certificate.
The considerable quantitative growth in engineering education has posed the problem of maintaining quality of both faculty and students. Today Engineering colleges can try to maintain the quality of teaching and learning by upgrading their faculty and motivating them for bridging the industry academia gap. Therefore faculty development is an essential part of institutional effectiveness in delivering the professional education. Faculty development is therefore of paramount importance for teaching-learning process. Essentially faculty development takes place through various tasks assigned to them, such as revision of course curriculum, professional study groups, workshops, seminars, conferences, coaching, mentoring, in-service programs, professional portfolios, research activities, and professional learning communities (S. Halkude et al, 2016) (S. Pancucci, 2010). ET601Tx was the only course which offered pedagogy for faculty development. Moreover, many faculty members in engineering colleges are novice and have not had any formal training in education and pedagogy. In order to address this issue our institute encouraged faculty members to enroll for ET601Tx. Resultantly 146 faculty members enrolled for the same.
4. Coordinated Faculty Professional Development Activity (CFPDA) Model
The main focus of our study is on learner retention and institutional support for MOOC completion through a CFPDA. Learner retention has a lot to do with course quality. Shelton (2011) has mentioned 13 different paradigms for evaluation of quality of online resources. Of this Institutional Commitment, Support & Leadership are the most important paradigm for ensuring quality. The main reason for poor retention rates in MOOC as mentioned above are lack of time & lack of motivation & interaction.
Professional Learning community (PLC) at our institute was formed at the commencement of the academic year 2015-16 to improve teaching-learning process for various courses across engineering programs (S. Halkude et al, 2016). This served as the foundation for CFPDA model for executing MOOC ET601Tx as shown in Figure 1. The CFPDA aims at tackling the above mentioned issues that occur in a MOOC.
Within this model, three layers describe the relationship between faculty professional development activities and faculty persistence & successful completion in MOOC ET601Tx. At the first layer we have organizational structure: a cyclical process of conversation and conflict support the development of community, which in turn supports changes in knowledge, skills, and teaching practices. At the next layer, meeting details with the Principal, Institute MOOC Coordinator, all Heads of departments and Department Coordinators serve to mediate substance of faculty conversations. At the third layer, we have leadership practices that facilitate collaboration.
4.1 Participants
Out of the 5319 participants for MOOC on ET601Tx, 146 were from our Institute. The participating faculty members had varying teaching experience from 2 years to 30 years.
4.2 Organizational Structure
The organizational structure of CFPDA includes Principal, PLC coordinator as Institute MOOC Coordinator, Head of Departments, Department coordinators and all the enrolled faculty participants for MOOC on ET601Tx. The organizational structure tried to address the issue of Learner Motivation. The desire to participate is a personal matter and the institute can only suggest or recommend
617617617
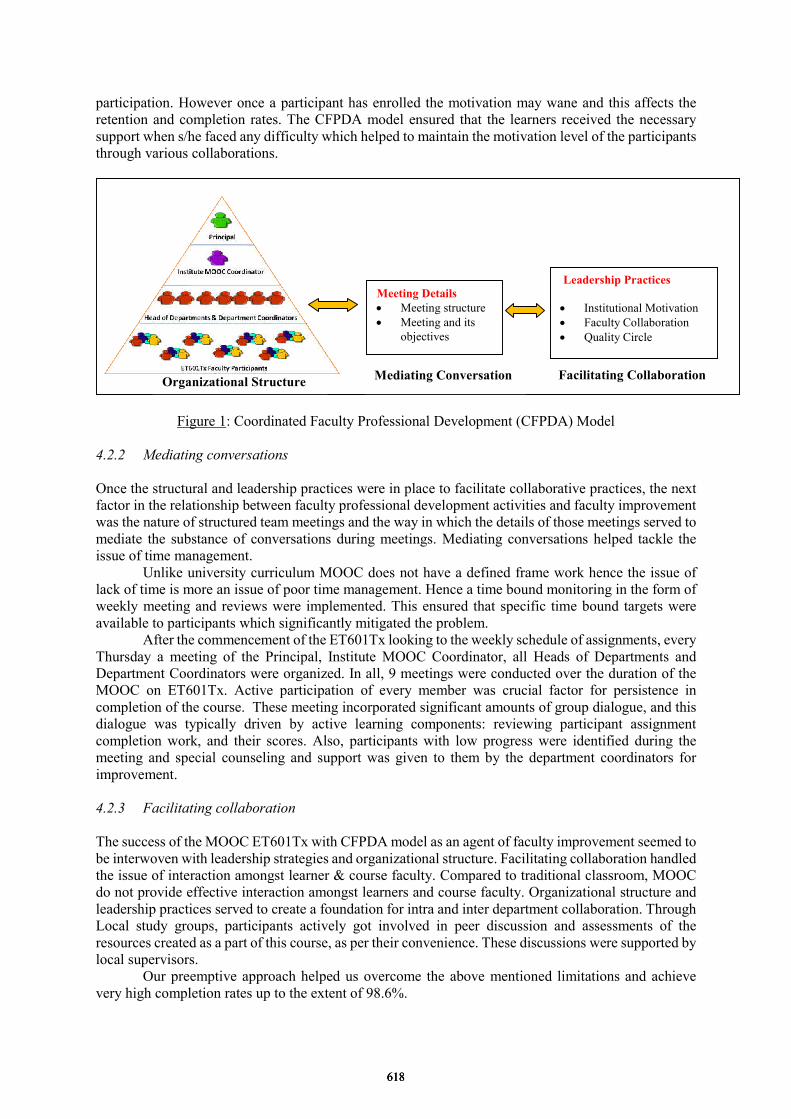
participation. However once a participant has enrolled the motivation may wane and this affects the retention and completion rates. The CFPDA model ensured that the learners received the necessary support when s/he faced any difficulty which helped to maintain the motivation level of the participants through various collaborations.
Figure 1: Coordinated Faculty Professional Development (CFPDA) Model
4.2.2 Mediating conversations
Once the structural and leadership practices were in place to facilitate collaborative practices, the next factor in the relationship between faculty professional development activities and faculty improvement was the nature of structured team meetings and the way in which the details of those meetings served to mediate the substance of conversations during meetings. Mediating conversations helped tackle the issue of time management.
Unlike university curriculum MOOC does not have a defined frame work hence the issue of lack of time is more an issue of poor time management. Hence a time bound monitoring in the form of weekly meeting and reviews were implemented. This ensured that specific time bound targets were available to participants which significantly mitigated the problem.
After the commencement of the ET601Tx looking to the weekly schedule of assignments, every Thursday a meeting of the Principal, Institute MOOC Coordinator, all Heads of Departments and Department Coordinators were organized. In all, 9 meetings were conducted over the duration of the MOOC on ET601Tx. Active participation of every member was crucial factor for persistence in completion of the course. These meeting incorporated significant amounts of group dialogue, and this dialogue was typically driven by active learning components: reviewing participant assignment completion work, and their scores. Also, participants with low progress were identified during the meeting and special counseling and support was given to them by the department coordinators for improvement.
4.2.3 Facilitating collaboration
The success of the MOOC ET601Tx with CFPDA model as an agent of faculty improvement seemed to be interwoven with leadership strategies and organizational structure. Facilitating collaboration handled the issue of interaction amongst learner & course faculty. Compared to traditional classroom, MOOC do not provide effective interaction amongst learners and course faculty. Organizational structure and leadership practices served to create a foundation for intra and inter department collaboration. Through Local study groups, participants actively got involved in peer discussion and assessments of the resources created as a part of this course, as per their convenience. These discussions were supported by local supervisors.
Our preemptive approach helped us overcome the above mentioned limitations and achieve very high completion rates up to the extent of 98.6%.
Facilitating Collaboration
Meeting Details Meeting structure Meeting and its
objectives
Organizational Structure
Leadership Practices
Institutional Motivation Faculty Collaboration Quality Circle
Mediating Conversation
618618618
5. Findings & Discussion
In order to evaluate the participants perceptions towards MOOC, contributing factors for the successful completion of ET601Tx course and their inclination towards taking up MOOC course in future, we developed a survey questionnaire of 28 questions regarding demographic information, participant perception, collaborative learning. The following are the some findings from the same:
More than 80% of the participants believed that the course will allow them to tackle teaching-learning issues better and that this would improve their teaching skills. This finding is in sync with findings from other studies about MOOC on account of the keenness of institutions and faculty who are interested to take up MOOC as a new technique in learning (Davidson 2012; Ruth 2012). Studies have shown that compared to attending face-to-face courses, participants need more discipline to succeed in an online course (Allen and Seaman 2014). Keeping the same in mind the institute created Faculty Professional Development Activity.
In this six-week ED601Tx MMOC, the all India completion rate was 24%. In comparison to this 98.6% (144/146) participants from our institute completed the course and went on receive their certificates. The reasons for this high success rates was on account of the proactive strategy adopted by the institute.
The survey results show that over 70% of the participants indicated that the department coordinator was the major motivation for them to complete the task. 29% respondents said that it was support from peers that motivated them to complete their assignments. Over 70% of the participants met with the department coordinator at least once a week, while 18% met the coordinator on a daily basis. This indicates very high interaction between the faculty participant and the coordinator. Nearly 75% of the participants found the interaction with the department ET coordinator to be very useful. As mentioned in the literature review one of the major reasons for poor dropout rates in MOOCs was the lack of interaction and poor motivation. The above mentioned strategy addresses specifically this issue. The positive atmosphere resulted in increased peer interaction with 90% participants interacting with each other on a regular basis.
Our survey also indicates that 32% participants were satisfied with the course content and 27% with the instruction quality. One of the major issues with MOOC was the issue of lack of time and motivation which depends on the design of the course. This finding indicates that the flexibility offered by the ET601Tx was also instrumental in high completion rates at our institute.
6. Conclusion & Recommendations
The objective of our study was on learner retention and institutional support for MOOC completion through a CFPDA. The main factors, which that are responsible for the high completion rates and scores at our institute are; interaction with Department ET Coordinator, weekly meeting and review and institutional support. This is because these measures directly addressed the three major causes of MOOC attrition as mentioned in the literature review. This study showed that the majority of this MOOC’s participants had a positive experience and learned new knowledge and skills about a topic they were interested in. A CFPDA is found to be effective in making a MOOC successful in which institutional motivation, collaboration & structured system for monitoring are the key driving factors. Using presented CFPDA approach with modifications as deemed fit for local situations, it is very much possible to make MOOC successful in Indian scenario where there is a paucity of good and qualified faculty due to scaling up of engineering education.
Acknowledgements
We would like to thank all faculty of Walchand Institute of Technology for their dedication and efforts during the MOOC on ET601Tx course. We would like to thank the management, principal and heads of various departments of Walchand institute of Technology, Solapur for participating and making this experiment successful. We extend our thanks to IIT Bombay for providing an opportunity to undergo MOOC through the IITBombayX platform.
619619619
References
Adamopoulos, P. (2013). What makes a great MOOC? An interdisciplinary analysis of student retention in online courses. In Thirty fourth international conference on information systems, Milan, 2013.
Allen, I. E. and J.Seaman. 2014. Grade change: Tracking online education in the United States. Wellesley, MA: Babson College/Sloan Foundation.
Alraimi, K. M., Zo, H., & Ciganek, A. P. (2015). Understanding the MOOCs continuance: the role of openness and reputation. Computers and Education, 80, 28e38.
Belanger, Y & Thronton J (2013), Bioelectricity: A Quantitative Approach, Duke University’s First MOOC, Duke Center for Instructional Technology.
Bruff D (2013), Lessons Learned from Vanderbilt’s First MOOCs – Centre for Teaching Retrieved 2nd August 2013, from http://irrodl.org/content/v5.1/lentell_orourke.html.
Colin Taylor, Kalyan Veeramachaneni, Una-May O’Reilly. Likely to Stop? Predicting Stopout in Massive Open Online Courses.
Davidson, C. (2012). What can MOOCs teaching us about learning? Retrieved from http://hastac.org/blogs/cathy-david son/2012/10/01/what-can-moocs-teach-us-about-learning
De Freitas, S. I., Morgan, J., & Gibson, D. (2015). Will MOOCs transform learning and teaching in higher education? British Journal of Educational Technology, 46, 455e471. http://dx.doi.org/10.1111/bjet.12268.
Hew, K. F. (2014). Promoting engagement in online courses: what strategies can we learn from three highly rated MOOCS. British Journal of Educational Technology (Online First).
Kate S. Hone , Ghada R. El Said. Exploring the factors affecting MOOC retention: A survey study.
K.M. Alraimi, Hangjung Zo, Andrew P. Cignanek. Understanding the MOOCs continuance: The role of Opennessand Reputation. Computers & Education 80 (2015) 28-38.
Khalil, H & Ebner, M (2014), MOOC Completion Rates & Possible Methods to Improve Retention – A literature review, Proceedings of World Conference on Education Multimedia, Hypermedia and Telecommunications.
Kovanovi c, V., Joksimovi c, S., Ga sevi c, D., Siemens, G., & Hatala, M. (2015). What public media reveals about MOOCs: a systematic analysis of news reports. British Journal of Educational Technology, 46(3), 510e527.
Palloff, R.M., & Pratt, K. (2001). Lessons from the cyberspace classroom: The realities of online teaching. San Francisco: Jossey-Bass.
Ruth, S. 2012. Can MOOCs and existing e-learning paradigms help reduce college costs? International Journal of Technology in Teaching and Learning8(1): 21–32.
S. Pancucci “Train the Trainer: The Bricks in the Learning Community Scaffold of Professional Development”World Academy of Science, Engineering and Technology International Journal of Social, Behavioral, Educational, Economic and Management Engineering Vol:1, No:11, 2007.
Shashikant Halkude, Dipali Awasekar, Manisha Nirgude, Satish Kashid, Vivek Sathe, Mahesh Mahant and Ganesh Agalave: Sustaining Faculty Professional Development: Evidences from a Localized Professional Learning Community, Fourth International Conference on Learning and Teaching in Computing and Engineering.
Shelton, K. (2011) A review of paradigms for evaluating the quality of online education programs. Online Journal of Distance Learning Administration, (4).
Yuan, L. & Bowel, S. (2013) MOOCs and Open Education: Implications for Higher Education, Retrieved 25th July 2013, available at: http://publications.cetis.ac.uk/2013/667.
620620620
Chen, W. et al. (Eds.) (2016). Proceedings of the 24th International Conference on Computers in Education. India: Asia-Pacific Society for Computers in Education
The Effectiveness and Suitability of MOOCs Flipped Learning: A Preliminary Study of
Public Schools in Thai Rural Area
Titie PANYAJAMORN a,b*,Youji KOHDAa ,Pornpimol CHONGPHAISALb and Thepchai SUPNITHIc
aSchool of Knowledge Science Japan Advanced Institute of Science and Technology (JAIST), Japan
bSchool of management technology Sirindhorn international institute of technology (SIIT), Thammasat University, Thailand
cLanguage and Semantic Laboratory, INIRU National Electronics and Computer Technology Center, Thailand
Abstract: In education sector, teaching style has been adapted to the online content platform. Moreover, MOOCs (Massive Online Open Courses) and flipped learning become high potential tools to support student learning process. These e-learning tools have been designed for education leading countries based on individual students’ learning style. It is quite difficult to apply for other countries. In Thailand, there are insufficient number of teachers in the rural schools and teachers have to teach a lot of subjects both experienced and inexperienced subjects. This paper proposes a new design of MOOCs hybrid learning model which is suitable and effective for rural areas students and analyse the important features to identify the factor which have influence on student ability.
Keywords: active learning, e-learning, flipped learning, Massive open online course (MOOCs)
1. Introduction In 2015, there are several new approaches in education sector. MOOCs (Massive Online Open Courses) is an online course aim to support a large number of participants and open for accessing via the web. (Bozkurt, 2015). A new model of blended learning called flipped learning, which allows to teach from an available materials outside classroom, and then use class time for assimilating that knowledge (Berrett, 2014). All of these new e-learning tools have been established and designed for leading education countries students to support their own cultures and individual learning styles. This is the massive problem when these e-learning tools have applied to other countries (Berrett, 2014). In Thailand, there are not sufficient number of teachers in the rural schools and they have to teach a lot of subjects both experienced and inexperienced subjects. A lot of countries face with similar problem in rural area and need a new solution to solve it (Mike, 2013).
This paper expects to propose and recommend the new design of MOOCs hybrid learning model which is suitable and effective for rural area students by analyzing important features which have influence on student’s ability. These answers will explore a new solution to solve the education problem not only Thailand but it can adapt to solve educational problem in rural area.
2. Literature review
2.1 Education and e-learning in Thailand
621621621
The government allocated 460 billion baht in education spending. This constitutes 4% of GDP (TDRI, 2012). The Thai government set up a plan to become a knowledge–based society under the National Information Technology (IT) policy framework 2001–2006, or IT2010. The vision of this plan was to provide opportunities for Thais to access the Internet, use IT for lifelong learning, and improve the quality of life and the environment throughout the country, equally and efficiently. (TDRI, 2012).
2.2 Model of Blended and flipped learning and MOOCs
Flipped learning approach allows students to gain first exposure to new material outside of class, usually via reading or lecture videos, and then use class time to do the harder work of assimilating that knowledge, perhaps through problem-solving, discussion, or debates (Berrett, 2012). In their free time, student go through the study materials in online content before class. In the class time, students are facilitated towards classroom discussion. Students’ understanding are checked through discussion in class, group problem solving and individual test. This model can improve efficiency and educational outcome through interactive lectures and data analytics (Amirtha Mary T and J. Florence Shalini, 2015). Massive open online course (MOOCs) is an online course aimed at unlimited participation and open access via the web. It provides interactive user forums to support community interactions between students, professors, and teaching assistants (Bozkurt, 2015) MOOCs are a recent and widely researched development in distance education which was first introduced in 2008 by Stephen Downes and George Siemens and based on ‘Connectivist’ distribued peer learning model and emerged as a popular mode of learning in 2012 (Meltem, 2014).
2.3 Student-centered learning (Active learning)
Active learning models make course concepts more meaningful, help students to explore diverse perspectives, evaluate student’s assumptions to improve student communication skills and develop a better understanding of student (Barkley. F., Cross, K. P., and Major, C.H., 2005). Moreover, Just in Time Teaching (JiTT) is one of important tool of active learning. Instructors use student-performance data to understand concepts that students are struggling with and pinpoint particular students who are more at-risk. It enables instructor to maximize student participation and ask the right question to each student. It also give timely feedback and allow sufficient time to calibrate lectures (Flipped learning Field guide, 2012).
3. Research Methodology
3.1 Problem definition and research hypotheses
The aim of this study is to propose and recommend the new design of MOOCs hybrid learning model and find the important factors which have influence on student abilities, considering chemistry learning in rural area. Flipped learning, Massive open online course (MOOCs), and Active learning are the main tools to investigate and identify the right patterns and design suitable criteria for developing countries students.
In this experiment, the results are divided to 2 sections. In the first section, the results of hypothesis H1 are provided for proving the effectiveness of learning improvement. Testing of different assumptions was conducted through pair t-test to determine the score difference between pre and post-test.
H1: There is a significant difference between pre and post-test scores
In the second section, the testing of assumptions H2-H13 are investigated to examine some relationships and influence on the learning improvement. In this section, the ANOVA test is conducted to analyze and find the influence and relationship between improvements of scores and internal factors.
H2: The GPAX will have a significant effect on score improvement
622622622
H3: Age will have a significant effect on score improvement
H4: Past e-learning experience will have a significant effect on score improvement
H5: Online quizzes will have a significant effect on score improvement
H6: In video quizzes will have a significant effect on score improvement
H7: Group quizzes will have a significant effect on score improvement
H8: Flash quizzes will have a significant effect on score improvement
H9: Discussion in forum will have a significant effect on score improvement
H10: Peer tutoring will have a significant effect on score improvement
H11: Group activity will have a significant effect on score improvement
H12: Pair activity will have a significant effect on score improvement
H13: Individual activity will have a significant effect on score improvement
3.2 Learning framework and instrument
The learning framework which is used in this research is combined from Flipped learning model, Massive open online course (MOOCs), and student-centered model (active learning). This framework combines three process of activities. Firstly, teacher-centered learning, before the class content, students were tested by pre-test and collected internal factor data. After that, they learned the chemistry content from the Coursera. Popped-up video quizzes are displayed during the explanation on content. After students have learned all contents, they will be tested twice, individually by ten online quizzes and forum discussion to confirm their deep understanding. Secondly, teacher activities had been conducted. In this step, teachers used student-performance data to understand which concepts students are struggling and identified the risk group. Moreover, ten flash quiz questions were tested again before class time to evaluate remaining knowledge. Finally, student-centered learning in class activities, teacher summarized all contents for warm up session. After that, teacher divided student to groups up to their knowledge and understanding which were analyzed by Just in Time Teacher method (JiTT). Teacher taught different contents in different groups to fulfill group lacking content. Moreover, student attended the 3 active learning activities.1) individual activities, students tackle problems in the class time and have an opportunity to ask questions the instructor. 2) pair activities, students work independently and flag out their thoughts and arguments then discuss their response with a partner, and 3) group activities (fishbowl discussion), starting from small group of students sit in a circle and engage in a peer-mediated discussion then remaining students sit in a larger circle and watch the discussion, taking notes and critiquing the content and for the outer circle can then discuss the interaction (Barkley. F., Cross, K. P., and Major, C.H., 2005). After that, students were tested by group quizzes to evaluate the peer tutoring tools and individual quizzes to test their individual understanding. These quizzes were counted as post-test scores.
623623623
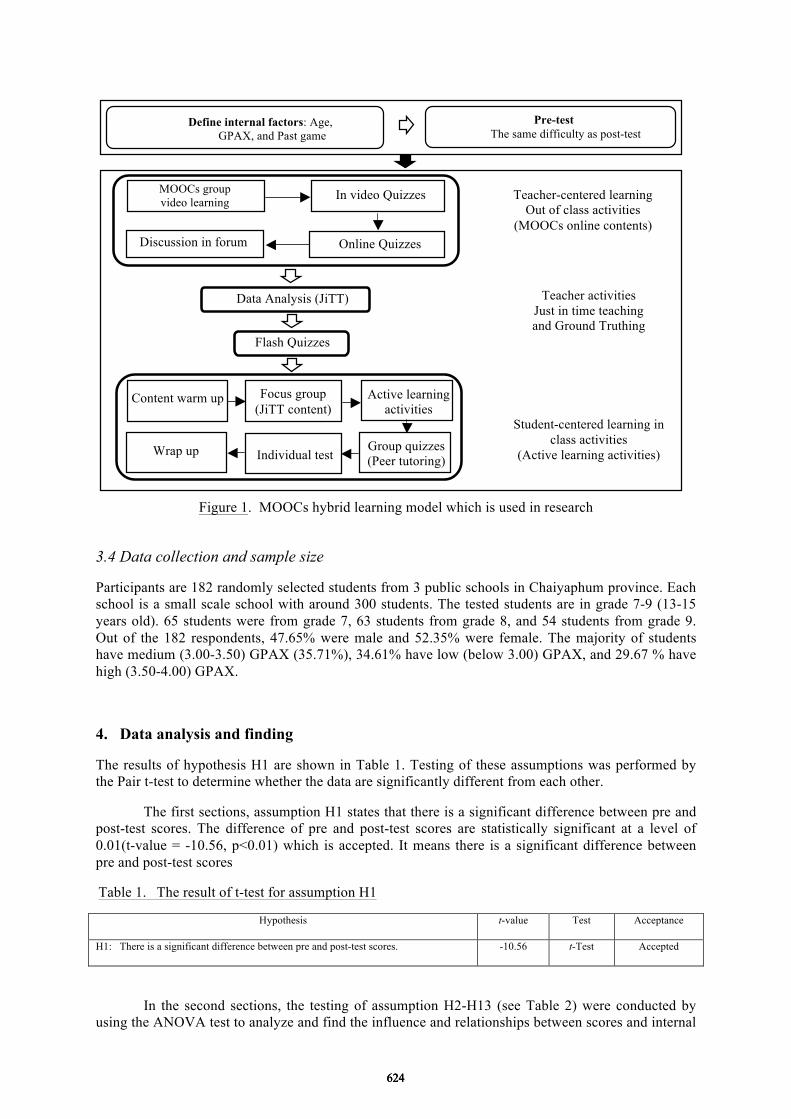
Figure 1. MOOCs hybrid learning model which is used in research
3.4 Data collection and sample size
Participants are 182 randomly selected students from 3 public schools in Chaiyaphum province. Each school is a small scale school with around 300 students. The tested students are in grade 7-9 (13-15 years old). 65 students were from grade 7, 63 students from grade 8, and 54 students from grade 9. Out of the 182 respondents, 47.65% were male and 52.35% were female. The majority of students have medium (3.00-3.50) GPAX (35.71%), 34.61% have low (below 3.00) GPAX, and 29.67 % have high (3.50-4.00) GPAX.
4. Data analysis and finding
The results of hypothesis H1 are shown in Table 1. Testing of these assumptions was performed by the Pair t-test to determine whether the data are significantly different from each other.
The first sections, assumption H1 states that there is a significant difference between pre and post-test scores. The difference of pre and post-test scores are statistically significant at a level of 0.01(t-value = -10.56, p<0.01) which is accepted. It means there is a significant difference between pre and post-test scores
Table 1. The result of t-test for assumption H1
Hypothesis t-value Test Acceptance
H1: There is a significant difference between pre and post-test scores. -10.56 t-Test Accepted
In the second sections, the testing of assumption H2-H13 (see Table 2) were conducted by using the ANOVA test to analyze and find the influence and relationships between scores and internal
Teacher-centered learning Out of class activities
(MOOCs online contents)
Teacher activities Just in time teaching and Ground Truthing
Student-centered learning in class activities
(Active learning activities)
Data Analysis (JiTT)
Flash Quizzes
MOOCs group video learning In video Quizzes
Online Quizzes Discussion in forum
Content warm up Focus group (JiTT content)
Active learning activities
Group quizzes (Peer tutoring) Individual test Wrap up
Define internal factors: Age, GPAX, and Past game
experience
Pre-testThe same difficulty as post-test
(Individual test)
624624624
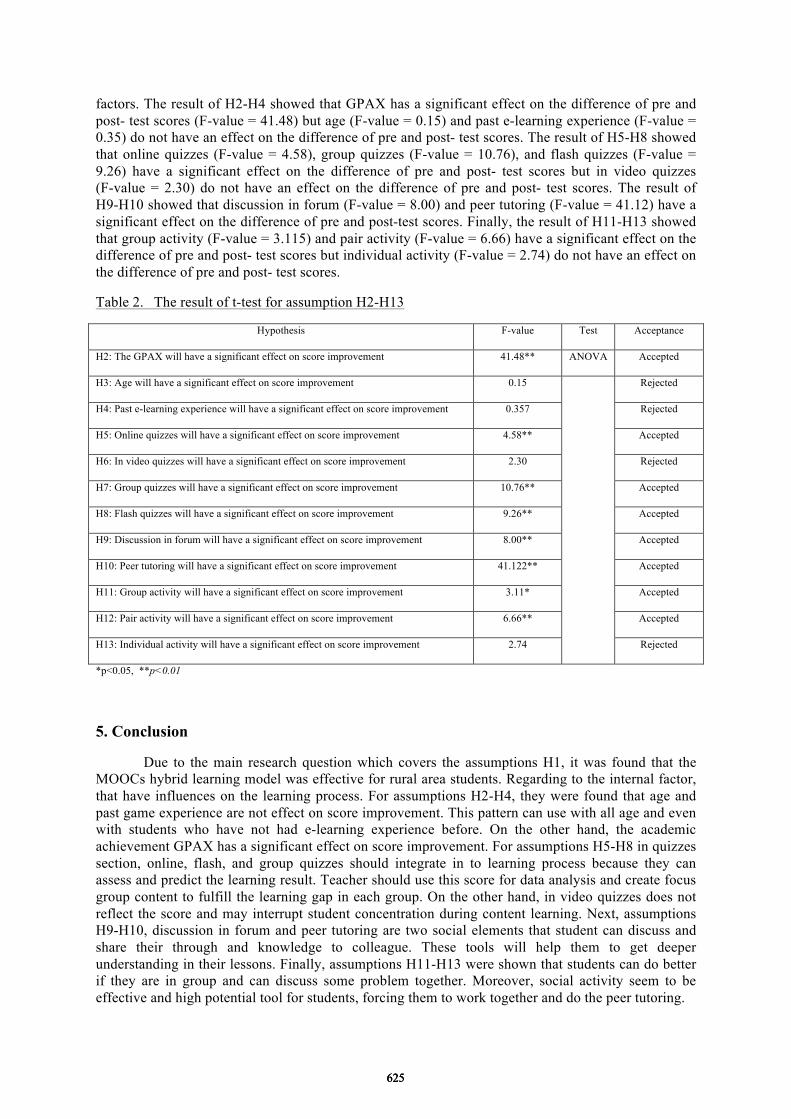
factors. The result of H2-H4 showed that GPAX has a significant effect on the difference of pre and post- test scores (F-value = 41.48) but age (F-value = 0.15) and past e-learning experience (F-value = 0.35) do not have an effect on the difference of pre and post- test scores. The result of H5-H8 showed that online quizzes (F-value = 4.58), group quizzes (F-value = 10.76), and flash quizzes (F-value = 9.26) have a significant effect on the difference of pre and post- test scores but in video quizzes (F-value = 2.30) do not have an effect on the difference of pre and post- test scores. The result of H9-H10 showed that discussion in forum (F-value = 8.00) and peer tutoring (F-value = 41.12) have a significant effect on the difference of pre and post-test scores. Finally, the result of H11-H13 showed that group activity (F-value = 3.115) and pair activity (F-value = 6.66) have a significant effect on the difference of pre and post- test scores but individual activity (F-value = 2.74) do not have an effect on the difference of pre and post- test scores.
Table 2. The result of t-test for assumption H2-H13
Hypothesis F-value Test Acceptance
H2: The GPAX will have a significant effect on score improvement 41.48** ANOVA Accepted
H3: Age will have a significant effect on score improvement 0.15 Rejected
H4: Past e-learning experience will have a significant effect on score improvement 0.357 Rejected
H5: Online quizzes will have a significant effect on score improvement 4.58** Accepted
H6: In video quizzes will have a significant effect on score improvement 2.30 Rejected
H7: Group quizzes will have a significant effect on score improvement 10.76** Accepted
H8: Flash quizzes will have a significant effect on score improvement 9.26** Accepted
H9: Discussion in forum will have a significant effect on score improvement 8.00** Accepted
H10: Peer tutoring will have a significant effect on score improvement 41.122** Accepted
H11: Group activity will have a significant effect on score improvement 3.11* Accepted
H12: Pair activity will have a significant effect on score improvement 6.66** Accepted
H13: Individual activity will have a significant effect on score improvement 2.74 Rejected
*p<0.05, **p<0.01
5. Conclusion
Due to the main research question which covers the assumptions H1, it was found that the MOOCs hybrid learning model was effective for rural area students. Regarding to the internal factor, that have influences on the learning process. For assumptions H2-H4, they were found that age and past game experience are not effect on score improvement. This pattern can use with all age and even with students who have not had e-learning experience before. On the other hand, the academic achievement GPAX has a significant effect on score improvement. For assumptions H5-H8 in quizzes section, online, flash, and group quizzes should integrate in to learning process because they can assess and predict the learning result. Teacher should use this score for data analysis and create focus group content to fulfill the learning gap in each group. On the other hand, in video quizzes does not reflect the score and may interrupt student concentration during content learning. Next, assumptions H9-H10, discussion in forum and peer tutoring are two social elements that student can discuss and share their through and knowledge to colleague. These tools will help them to get deeper understanding in their lessons. Finally, assumptions H11-H13 were shown that students can do better if they are in group and can discuss some problem together. Moreover, social activity seem to be effective and high potential tool for students, forcing them to work together and do the peer tutoring.
625625625

References Barkley. F., Cross, K. P., and Major, C.H. (2005). Collaborative learning Techniques. San Francisco, CA:
Jossey-Bass. Berrett, P. (2014), The Chronicle of higher education, Retrieved May 9, 2015, from http://cft.vanderbilt.edu
/guides-sub-pages/flipping-the-classroom/ Bozkurt, A., Akgun-Ozbek, E., Onrat-Yilmazer, S., Erdogdu, E., Ucar, H., Guler, E., Sezgin, S., Karadeniz, A.,
Sen, N., Goksel-Canbek, N., Dincer, G. D., Ari, S.,& Aydin, C. H. (2015). Trends in Distance Education Research: A Content Analysis of Journals 2009-2013. International Review of Research in Open and Distributed Learning, 16(1),330-363. Retrieved May 16, 2015, from https://www.academia.edu/11056576
Coursera (2015). Atoms and Electronic Structure. University of Kentucky, Retrieved December 22, 2015, from http://www.coursera.org/course/chemistry1?action=enroll&sessionId=974173
Flipped learning Field guide (2012). Retrieved June 15, 2015, from http://www0.sun.ac.za/ctl/wp-content/uploads/2015/10/Flipped-Classroom-Field-Guide.pdf
Kuder, G. F., & Richardson, M. W. (1937). The theory of the estimation of test reliability. Psychometrika, 2(3), 151–160.
Meltem Huri Baturay,(2015). An overview of the world of MOOCs, Procedia-Social and Behavioral Science. 174(2015) 427-433
PM Gordon Brown (2007), E-Learning: Strategies for Delivering Knowledge in the Digital Age (pp. 28). New York: McGraw-Hill.
Rovinelli, R., & Hambleton, R. (1977). On the use of content specialists in the assessment of criterion-referenced test item validity (PP. 49-60). Dutch Journal of Education Research, 2
TDRI (2012), The Thailand Development Research Institute’s: Education system ills setting up future failure Retrieved July 9, 2014, from http://tdri.or.th/en/tdri-insight/bp05/
Vicki, K. (2014). Education technology trend, Top 8 of e-learning and Edtech trends for 2015, Retrieved August 20, 2015, from http://elearningindustry.com/top-8-elearning-and-edtech-trends-201
626626626
Chen, W. et al. (Eds.) (2016). Proceedings of the 24th
International Conference on Computers in Education.
India: Asia-Pacific Society for Computers in Education
Open Educational Resources to
Improve Students’ Learning & Performance:
A Case Study with Practitioner’s Approach
Parkavi.Aa*
, Satheesh.Ab
a MS Ramaiah Institute of Technology, Bangalore,India
bSchool of Computer Science and Engineering (SCOPE),VIT University, Vellore, India,
Abstract Technology continues to play a pivotal role in every field. With each passing day,
technology has gained an exponential prominence in the field of education. This paper attempts
to survey the open educational resources along with their unique and major role across several
educational sectors. A study is conducted to launch open educational resources using freely
available resources, followed by active learning conduction. Then an analysis is carried out by
authors related to the usage of open educational resources (OER) with respect to the
performance of the students. Finally, a conclusion is derived regarding the impact of OER on
the learning and performance of students
Keywords: Open Educational Resources, course websites, video lessons, active learning
1. Introduction
Open educational resources (OER) refer to materials used for improving students’ learning. These are
open source material, freely available on the internet. Teachers provide additional material related to
their lessons, online using OER. OER eases out reusability of educational materials for learning
(Chung, Khor, 2015). There are several variations to OER. Open educational resources include
complete courses, course supportive materials, modules, text books, videos, test components, software,
tools and techniques which facilitate accessing knowledge (Chung, Khor, 2015)(Weili, Klotzkin,
Myers, Wagoner, White, 2015). By the end of a course, a particular students’ level of learning is
measured using surveys or questionnaires. (Phillip, Wan, 2014) (Zeng, Zhang, Huang, Dong, 2014). In
this paper, the authors have given their experimentation work with OERs and their usages. In Section 2,
OER related works are described. In section 3, the case study carried out is briefed. In section 4,
analysis of OER and in section 5 discussion and analysis are given. In section 6, conclusion is given.
2. Related works on OER to improve learning of students
E-chalk project helps in transforming lecturer input from large touchscreens to intelligent electronic
chalk board. The usage of these video lectures is analyzed to develop next generation educational tools.
Lecture recording system is used to record lectures and is later launched on the web. Educational Tools
like Lectern, Synote, Media rich repository of learning objects, Opencast Matterhorn are helpful in
recording lectures. Matterhorn provides the facility for teachers to upload their lecture materials using
powerpoint slides and videos. Students can refer to the material through Matterhorn and usages can be
analyzed. Analysis of students’ OER usage helps teachers in providing the appropriate feedback.
(Phillip, Wan, 2014)(Hugh, Gillian, 2013) (Edmundo, 2013) .Cloud based Virtual laboratory helps
students in testing their experiments online. This is highly helpful in subjects such as networking,
network security and cloud computing. These virtual labs improve the real time computer networks,
resource sharing, access control, knowledge sharing and learner centric resource management. Students
can conduct experiments and submit their work online as well. They can update the V-lab facility using
their code. The faculty in turn can login to the V-lab and grade the work, remotely. Thus, crowd
sourcing facility is made available with Cloud based V-lab (Le, Dijiang, Wei, 2014) (Qinran , Fangxing,
Chien, 2015). Moodle software is used for conducting assessments. This allows students to take up
exams from the luxury of their homes. OER resources facilitate multi hierarchy level and systematic
teaching. It is used at multi institutional level to create large repositories. Collaborative OER initiatives
627627627
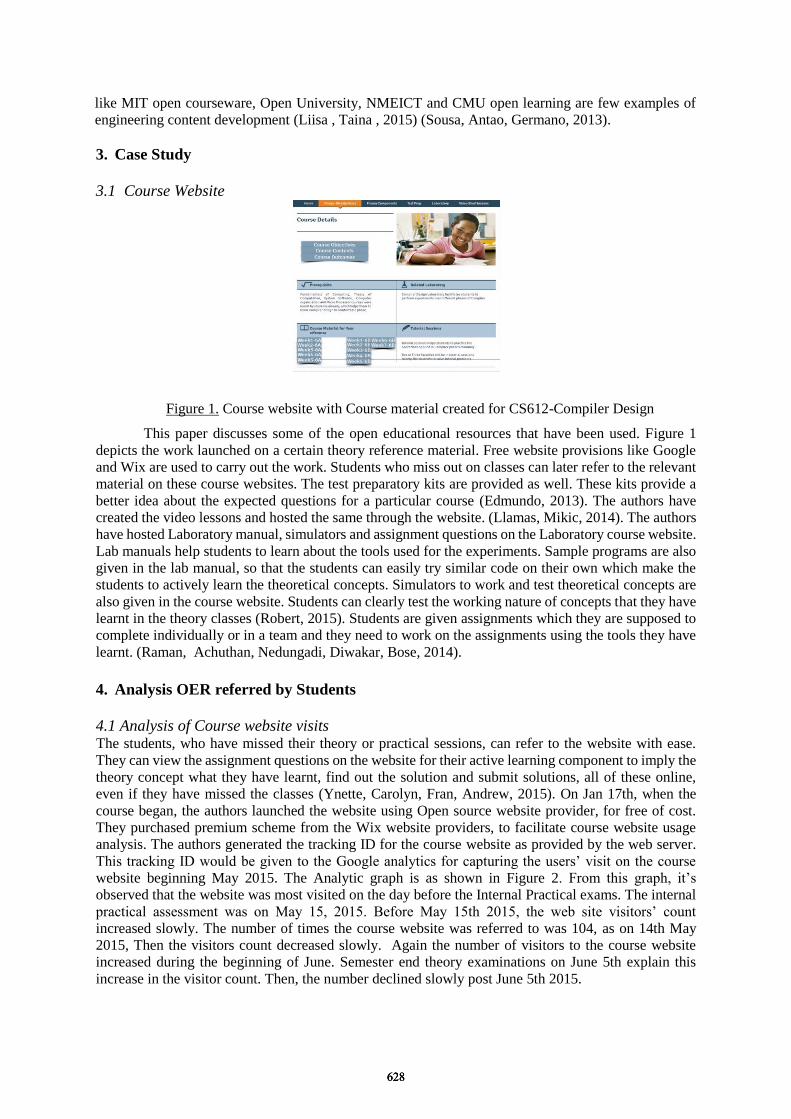
like MIT open courseware, Open University, NMEICT and CMU open learning are few examples of
engineering content development (Liisa , Taina , 2015) (Sousa, Antao, Germano, 2013).
3. Case Study
3.1 Course Website
Figure 1. Course website with Course material created for CS612-Compiler Design
This paper discusses some of the open educational resources that have been used. Figure 1
depicts the work launched on a certain theory reference material. Free website provisions like Google
and Wix are used to carry out the work. Students who miss out on classes can later refer to the relevant
material on these course websites. The test preparatory kits are provided as well. These kits provide a
better idea about the expected questions for a particular course (Edmundo, 2013). The authors have
created the video lessons and hosted the same through the website. (Llamas, Mikic, 2014). The authors
have hosted Laboratory manual, simulators and assignment questions on the Laboratory course website.
Lab manuals help students to learn about the tools used for the experiments. Sample programs are also
given in the lab manual, so that the students can easily try similar code on their own which make the
students to actively learn the theoretical concepts. Simulators to work and test theoretical concepts are
also given in the course website. Students can clearly test the working nature of concepts that they have
learnt in the theory classes (Robert, 2015). Students are given assignments which they are supposed to
complete individually or in a team and they need to work on the assignments using the tools they have
learnt. (Raman, Achuthan, Nedungadi, Diwakar, Bose, 2014).
4. Analysis OER referred by Students
4.1 Analysis of Course website visits The students, who have missed their theory or practical sessions, can refer to the website with ease.
They can view the assignment questions on the website for their active learning component to imply the
theory concept what they have learnt, find out the solution and submit solutions, all of these online,
even if they have missed the classes (Ynette, Carolyn, Fran, Andrew, 2015). On Jan 17th, when the
course began, the authors launched the website using Open source website provider, for free of cost.
They purchased premium scheme from the Wix website providers, to facilitate course website usage
analysis. The authors generated the tracking ID for the course website as provided by the web server.
This tracking ID would be given to the Google analytics for capturing the users’ visit on the course
website beginning May 2015. The Analytic graph is as shown in Figure 2. From this graph, it’s
observed that the website was most visited on the day before the Internal Practical exams. The internal
practical assessment was on May 15, 2015. Before May 15th 2015, the web site visitors’ count
increased slowly. The number of times the course website was referred to was 104, as on 14th May
2015, Then the visitors count decreased slowly. Again the number of visitors to the course website
increased during the beginning of June. Semester end theory examinations on June 5th explain this
increase in the visitor count. Then, the number declined slowly post June 5th 2015.
628628628
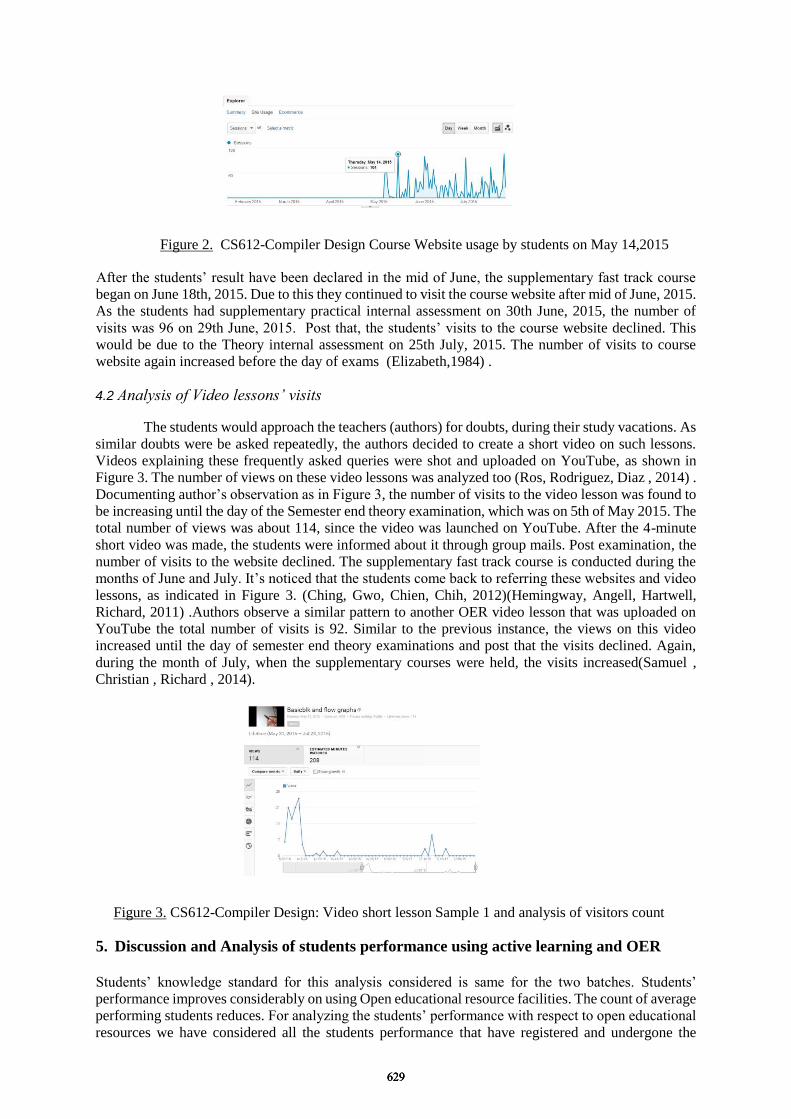
Figure 2. CS612-Compiler Design Course Website usage by students on May 14,2015
After the students’ result have been declared in the mid of June, the supplementary fast track course
began on June 18th, 2015. Due to this they continued to visit the course website after mid of June, 2015.
As the students had supplementary practical internal assessment on 30th June, 2015, the number of
visits was 96 on 29th June, 2015. Post that, the students’ visits to the course website declined. This
would be due to the Theory internal assessment on 25th July, 2015. The number of visits to course
website again increased before the day of exams (Elizabeth,1984) .
4.2 Analysis of Video lessons’ visits
The students would approach the teachers (authors) for doubts, during their study vacations. As
similar doubts were be asked repeatedly, the authors decided to create a short video on such lessons.
Videos explaining these frequently asked queries were shot and uploaded on YouTube, as shown in
Figure 3. The number of views on these video lessons was analyzed too (Ros, Rodriguez, Diaz , 2014) .
Documenting author’s observation as in Figure 3, the number of visits to the video lesson was found to
be increasing until the day of the Semester end theory examination, which was on 5th of May 2015. The
total number of views was about 114, since the video was launched on YouTube. After the 4-minute
short video was made, the students were informed about it through group mails. Post examination, the
number of visits to the website declined. The supplementary fast track course is conducted during the
months of June and July. It’s noticed that the students come back to referring these websites and video
lessons, as indicated in Figure 3. (Ching, Gwo, Chien, Chih, 2012)(Hemingway, Angell, Hartwell,
Richard, 2011) .Authors observe a similar pattern to another OER video lesson that was uploaded on
YouTube the total number of visits is 92. Similar to the previous instance, the views on this video
increased until the day of semester end theory examinations and post that the visits declined. Again,
during the month of July, when the supplementary courses were held, the visits increased(Samuel ,
Christian , Richard , 2014).
Figure 3. CS612-Compiler Design: Video short lesson Sample 1 and analysis of visitors count
5. Discussion and Analysis of students performance using active learning and OER
Students’ knowledge standard for this analysis considered is same for the two batches. Students’
performance improves considerably on using Open educational resource facilities. The count of average
performing students reduces. For analyzing the students’ performance with respect to open educational
resources we have considered all the students performance that have registered and undergone the
629629629
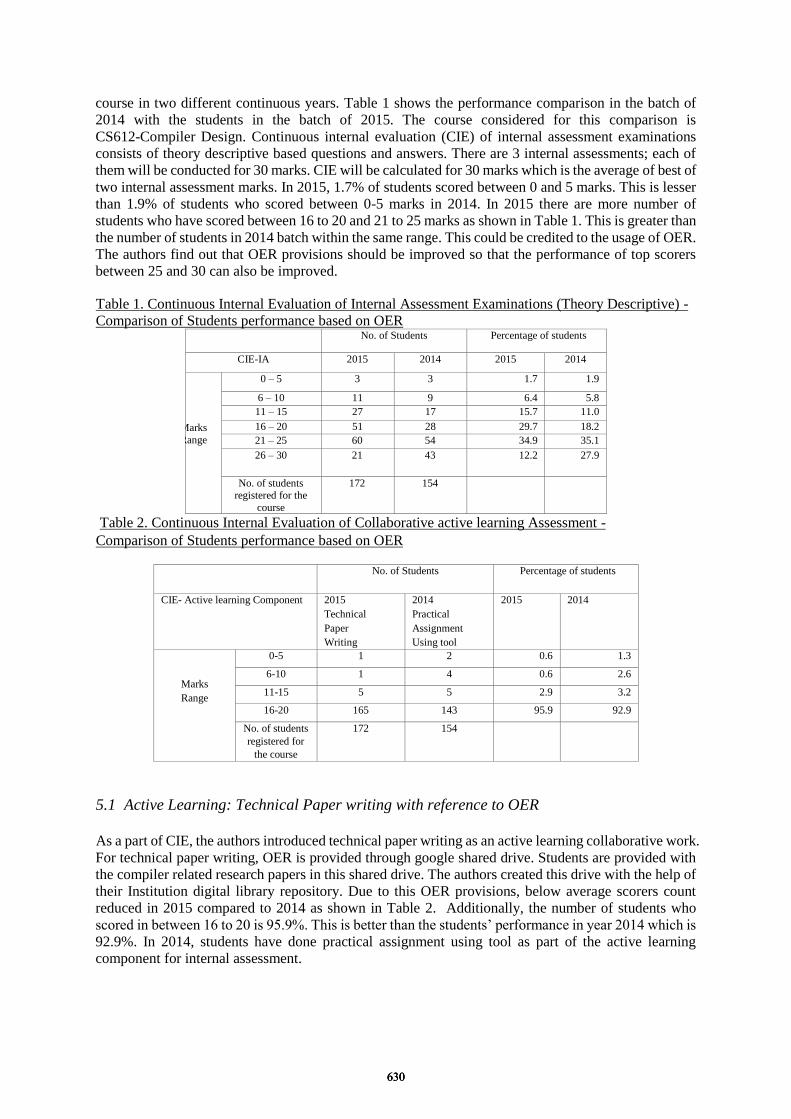
course in two different continuous years. Table 1 shows the performance comparison in the batch of
2014 with the students in the batch of 2015. The course considered for this comparison is
CS612-Compiler Design. Continuous internal evaluation (CIE) of internal assessment examinations
consists of theory descriptive based questions and answers. There are 3 internal assessments; each of
them will be conducted for 30 marks. CIE will be calculated for 30 marks which is the average of best of
two internal assessment marks. In 2015, 1.7% of students scored between 0 and 5 marks. This is lesser
than 1.9% of students who scored between 0-5 marks in 2014. In 2015 there are more number of
students who have scored between 16 to 20 and 21 to 25 marks as shown in Table 1. This is greater than
the number of students in 2014 batch within the same range. This could be credited to the usage of OER.
The authors find out that OER provisions should be improved so that the performance of top scorers
between 25 and 30 can also be improved.
Table 1. Continuous Internal Evaluation of Internal Assessment Examinations (Theory Descriptive) -
Comparison of Students performance based on OER No. of Students Percentage of students
CIE-IA 2015 2014 2015 2014
Marks
Range
0 – 5 3 3 1.7 1.9
6 – 10 11 9 6.4 5.8
11 – 15 27 17 15.7 11.0
16 – 20 51 28 29.7 18.2
21 – 25 60 54 34.9 35.1
26 – 30 21 43 12.2 27.9
No. of students registered for the
course
172 154
Table 2. Continuous Internal Evaluation of Collaborative active learning Assessment -
Comparison of Students performance based on OER
No. of Students Percentage of students
CIE- Active learning Component 2015
Technical
Paper
Writing
2014
Practical
Assignment
Using tool
2015 2014
Marks
Range
0-5 1 2 0.6 1.3
6-10 1 4 0.6 2.6
11-15 5 5 2.9 3.2
16-20 165 143 95.9 92.9
No. of students
registered for
the course
172 154
5.1 Active Learning: Technical Paper writing with reference to OER
As a part of CIE, the authors introduced technical paper writing as an active learning collaborative work.
For technical paper writing, OER is provided through google shared drive. Students are provided with
the compiler related research papers in this shared drive. The authors created this drive with the help of
their Institution digital library repository. Due to this OER provisions, below average scorers count
reduced in 2015 compared to 2014 as shown in Table 2. Additionally, the number of students who
scored in between 16 to 20 is 95.9%. This is better than the students’ performance in year 2014 which is
92.9%. In 2014, students have done practical assignment using tool as part of the active learning
component for internal assessment.
630630630
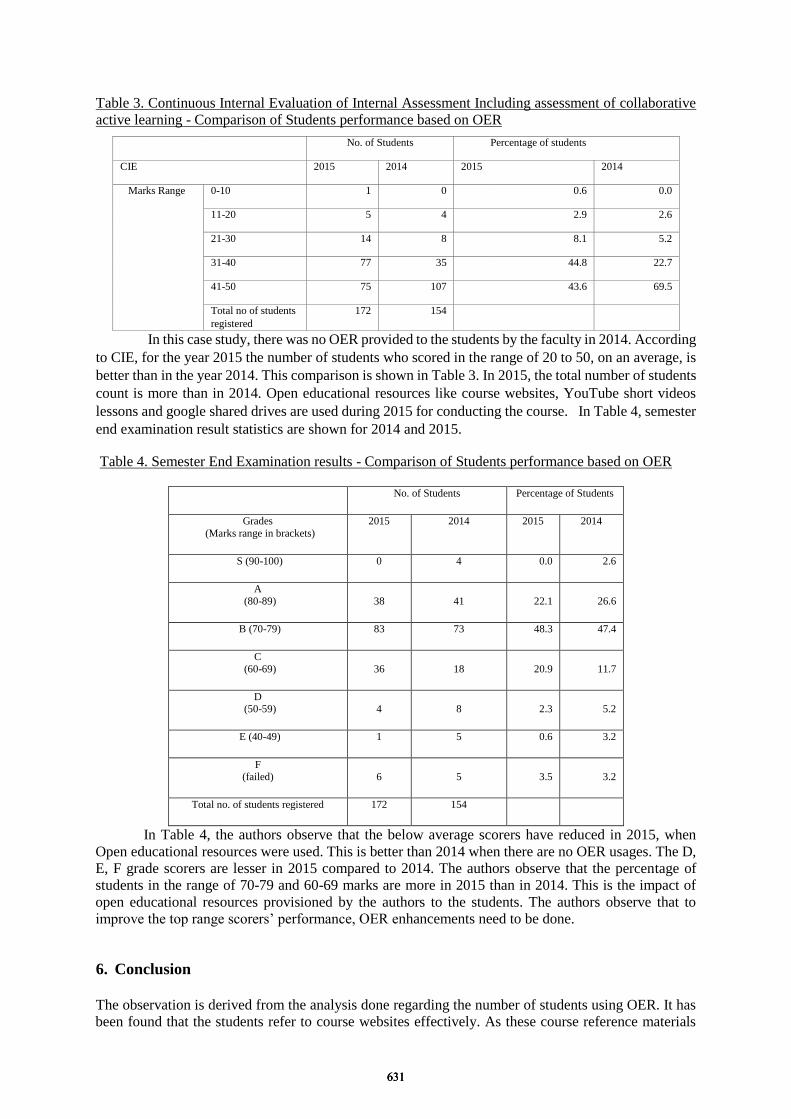
Table 3. Continuous Internal Evaluation of Internal Assessment Including assessment of collaborative
active learning - Comparison of Students performance based on OER
No. of Students Percentage of students
CIE 2015 2014 2015 2014
Marks Range 0-10 1 0 0.6 0.0
11-20 5 4 2.9 2.6
21-30 14 8 8.1 5.2
31-40 77 35 44.8 22.7
41-50 75 107 43.6 69.5
Total no of students
registered
172 154
In this case study, there was no OER provided to the students by the faculty in 2014. According
to CIE, for the year 2015 the number of students who scored in the range of 20 to 50, on an average, is
better than in the year 2014. This comparison is shown in Table 3. In 2015, the total number of students
count is more than in 2014. Open educational resources like course websites, YouTube short videos
lessons and google shared drives are used during 2015 for conducting the course. In Table 4, semester
end examination result statistics are shown for 2014 and 2015.
Table 4. Semester End Examination results - Comparison of Students performance based on OER
No. of Students Percentage of Students
Grades
(Marks range in brackets)
2015 2014 2015 2014
S (90-100) 0 4 0.0 2.6
A
(80-89) 38 41 22.1 26.6
B (70-79) 83 73 48.3 47.4
C
(60-69) 36 18 20.9 11.7
D (50-59) 4 8 2.3 5.2
E (40-49) 1 5 0.6 3.2
F (failed) 6 5 3.5 3.2
Total no. of students registered 172 154
In Table 4, the authors observe that the below average scorers have reduced in 2015, when
Open educational resources were used. This is better than 2014 when there are no OER usages. The D,
E, F grade scorers are lesser in 2015 compared to 2014. The authors observe that the percentage of
students in the range of 70-79 and 60-69 marks are more in 2015 than in 2014. This is the impact of
open educational resources provisioned by the authors to the students. The authors observe that to
improve the top range scorers’ performance, OER enhancements need to be done.
6. Conclusion
The observation is derived from the analysis done regarding the number of students using OER. It has
been found that the students refer to course websites effectively. As these course reference materials
631631631
cover theory and laboratory sessions, the students refer to them for both theory and practical exams.
This explains the increase in number of visitors just before the commencement of exams. Authors
recommend using free resources to create OER for students, so that students can refer to them in need of
any clarification during their active learning components for performing their assignments or technical
paper writing which are done individually or collaboratively. This will further help the students perform
better during their internal and semester end assessments.
References Weili, Klotzkin, Myers, Wagoner (2015). Realization of a Comprehensive Multidisciplinary Microfabrication
Education Program at Binghamton University,Education, IEEE Transactions on , vol.58, no.1, pp.25-31
Chung, Khor (2015).Strategies for Promoting OER in Course Development and Course Delivery in ODL
Environment, Proceedings of The International Symposium on Open Collaboration, ACM
Llamas, Mikic (2014).Generating OER by Recording Lectures: A Case Study, Education, IEEE Transactions on ,
vol.57, no.4, pp.220,228
Liisa, Taina (2015).Open-book, open-web online examinations: Developing examination practices to support
university students’ learning and self-efficacy, Active Learning in Higher Education, vol. 16, 2: pp. 119-132.
Sousa, Antao, Germano (2013).A Lab Project on the Design and Implementation of Programmable and
Configurable Embedded Systems, Education, IEEE Transactions on , vol.56, no.3, pp.322,328.
Edmundo, (2013) Impact of Open Educational Resources in Higher Education Institutions in Spain and Latin
Americas through Social Network Analysis, ASEE annual conference & Exposition
Qinran, Fangxing , Chien (2015). A Smart Home Test Bed for Undergraduate Education to Bridge the Curriculum
Gap From Traditional Power Systems to Modernized Smart Grids, Education, IEEE Transactions on , vol.58,
no.1, pp.32,38.
Hugh ,Gillian Wright (2013) Teaching close reading: A VLE-based approach, Arts and Humanities in Higher
Education, vol. 12, 4: pp. 391-407.
Le , Dijiang ,Wei(2014), Cloud-Based Virtual Laboratory for Network Security Education, Education, IEEE
Transactions on , vol.57, no.3, pp.145,150.
Phillip , Wan (2014). Growing in digital maturity: students and their computers in an academic laptop programme
in Singapore, Asia Pacific Journal of Education.
Zeng, Zhang , Huang , Dong (2014), Improving Aerospace Engineering Students' Achievements by an Open Aero
Control Experiment Apparatus, Education, IEEE Transactions on , vol.57, no.4, pp.229,234.
Robert , (2015).New ways of learning to fight fires? Learning processes and contradictions in distance and
on-campus firefighter training in Sweden, Australasian Journal of Educational Technology, 31(2) .
Raman, Achuthan, Nedungadi, Diwakar (2014). The VLAB OER Experience: Modeling Potential-Adopter
Student Acceptance, Education, IEEE Transactions on , vol.57, no.4, pp.235,241.
Ynette, Carolyn , Ciaran , Andrew (2015) ,Relationship between participants’ level of education and engagement
in their completion of the Understanding Dementia Massive Open Online Course, BMC Medical Education .
Ackovska, Ristov (2014).OER Approach for Specific Student Groups in HardwareBased Courses, Education,
IEEE Transactions on , vol.57, no.4, pp.242,247
Elizabeth (1984).Films and videotapes — a summary of what is available, Biochemical Education,Volume 12,
Issue 2, Pages: 69–76 .
Hernandez, Rodriguez , Diaz (2014). UNED OER Experience: From OCW to Open UNED,Education, IEEE
Transactions on , vol.57, no.4, pp.248,254.
Ching, Gwo, Chien, Chih (2012).Effects on learners' performance of using selected and open network resources in
a problem-based learning activity, British Journal of Educational Technology, Volume 43, Issue 4, Pages:
606–623 .
Hemingway, Angell, Hartwell, Richard (2011).An emerging model for publishing and using open educational
resources in public health”, Perspectives in Public Health, vol. 131, 1: pp. 38-43
Samuel ,Christian, Richard (2014). The role of evaluative metadata in an online teacher resource exchange”,
Education Tech Research and Development .
632632632
Chen, W. et al. (Eds.) (2016). Proceedings of the 24th International Conference on Computers in Education. India: Asia-Pacific Society for Computers in Education
Challenges in Flipping Hong Kong’s Classrooms
Kelvin CHEUNGa*, Eric T. H. LUKb Morris S. Y. JONGc , a b c Centre for Learning Sciences and Technologies
c Department of Curriculum and Instruction The Chinese University of Hong Kong, Hong Kong
Abstract: The new 5-year plan of implementing e-learning in Hong Kong has been laid out in the government’s “Report on the Fourth Strategy on Information Technology in Education” in which flipped classroom is one of the important pedagogic approaches being advocated. While many researches were conducted to explore the advantages of flipped classroom, some challenges should not be ignored. This paper discusses the challenges of flipping Hong Kong’s classrooms that include “learning by videos”, “technological and pedagogical concerns” as well as “students’ low learning motivation”. Through understanding these challenges, educators and researchers can develop articulated strategies and models to address the problems, and more importantly, inform the government to provide articulated professional development to schools and teachers in order to perfect the implementation of flipped classroom in Hong Kong.
Keywords: Flipped Classroom, Paradigm Shift, Education Strategies, Learning Challenges
1.! Introduction The advocacy of implementing flipped classroom in formal school curriculum has aroused discussions around the world. This paradigm shift further empowers the student-centered learning model. It gives us an idea that factual knowledge can be learnt at home while high-order learning activities such as discussions and debating can be conducted in class with teachers’ guidance (Cheung & Jong, 2016; Hwang et al., 2015; Baepler, 2014). However, towards these changes, limited research attention has been directed towards the challenges that students and teachers would encounter in flipped classrooms. We examine these difficulties using a qualitative approach by inviting students and teachers to share the challenges they faced in flipping the classroom. With this understanding, educators can find ways to address these problems, researchers can further investigate the potential drawbacks of flipping the classroom for constructing a more comprehensive model, administrators can provide professional developments to local schools and teachers based on the problems we explored. 2.!Conceptual Framework Existing studies documented characteristics and merits of practicing flipped classroom in formal curriculum (Hwang et al., 2015; Baepler, 2014; Johnson, 2013; Bergmann & Sams, 2012; Berrett, 2012; Stone, 2012; Strayer, 2008). They can be summarized as (a) enabling more in-class interactions among teachers and students, (b) providing more lesson time for high-order activities, (c) students can learn at anywhere at any time with mobile devices, (d) flipped classroom can benefit both elites and the less capable students, and (e) time outside of class can be assigned for gaining knowledge at the remembering and understanding level to free more lesson time. Although previous researches named a lot advantages, however, there is no prefect model in education. Critiques and doubts have made educators to reflect if flipping the classroom can effectively improve students’ learning outcomes (Cheung & Jong, 2016; Herreid & Schiller, 2013; Johnson, 2013; November & Mull, 2012).
Herreid and Schiller (2013) conducted case studies on flipped classroom which reported some pitfalls of this practice. They included (a) students’ resistance to new learning method, (b) finding good videos or relevant teaching materials for students’ pre-learning is difficult because they must be tailor made and (c) the quality of the videos made by teachers are usually marginal (Herreid & Schiller, 2013). With this understanding, there is another research conducted by Johnson (2013) which investigated
633633633
students’ perceptions of flipped classrooms. Although his findings also suggested some advantages, we should not ignore the challenges. He found that some of the students did not like watching videos. He also found students might have off-task behaviors when pre-learning on web. Some students also reported they could not ask questions immediately when they had frustrations while watching videos. It created a sense of learning helplessness which made them give up easily. Besides, students also expressed that they found traditional lectures more stimulating than videos. They could not stay motivated every day to watch the videos. They also found it is hard to read the words in videos. Against this backdrop, Cheung and Jong (2016) conducted an interview on teachers’ concerns over flipping classrooms in Hong Kong. The challenges hindering teachers not to flip their classrooms aligned with the previous findings. Teachers doubted if students have enough motivation to watch videos at home. They also concerned whether flipping classrooms can effectively enhance students’ learning outcomes. They also wondered if changing the teaching pedagogies would induce misunderstandings in parents. These are the authentic challenges that teachers worry about in flipping Hong Kong’s classrooms.
To sum up, previous researches showed us the challenges in flipping classrooms. These challenges can be studied by five dimensions: (a) Challenges about the way of learning through videos, (b) Challenges behind pre-learning, (c) Challenges from Learning Management Systems, (d)Challenges of student’s low learning motivation and (e) Challenges in choosing appropriate teachingpedagogies. We would employ these five dimensions to analyze the challenges that students andteachers face in flipping classrooms.
3.!Research Design
3.1! Research Background
Previous researches on flipped classroom mainly focused on the Science and Mathematics subjects (Song et al., 2016; Johnson, 2013; Bergmann & Sams, 2012). In this paper, we would focus on Liberal Studies (LS). Liberal Studies has been a compulsory subject in the Hong Kong’s New Secondary School Curriculum since 2009. It is a subject combining Social Sciences and Humanities. The reason of choosing Liberal Studies is that there are only limited researches on flipped classroom focused on Issue-quest learning. Issue-quest learning encourages students to discuss and raise questions related to specific issues (Hwang et al., 2015). Therefore, this paper aims to gain more understanding on a subject using issue-based inquiry to teach and learn so that we can investigate the challenges of flipping classrooms.
3.2! Definitions of Flipped Classroom
In order to facilitate the operation of this research, we define Flipped Classroom as a pedagogical model that traditional lecture and homework elements of a course are reversed to increase the opportunities of interaction between students and teachers. Teachers can have more time to design and guide high-order learning activities to enhance learning (Hwang et al., 2015; Bergmann & Sams, 2012; Educause, 2012).
3.3! Research Questions
The central question is implied in the title of the study “Challenges in flipping Hong Kong’s classrooms” and this paper is going to investigate two questions: (a) ‘What are the challenges students encounter in flipped classrooms?’ (b) and ‘What challenges do teachers encounter in flipping their classroom?’
3.4! Research Method
This research was conducted with interview data in Hong Kong. The participants are all from secondary schools. There were 16 form 4 students and 6 teachers flipping their LS classrooms. They came from 3 different secondary schools in Hong Kong. In this research, for understanding the first question ‘What are the challenges students encounter in flipped classrooms?’ We adopted the Focus-Group Interview approach, asking subjects open-ended questions. According to Creswell (2008), having 4-6 people in a
634634634
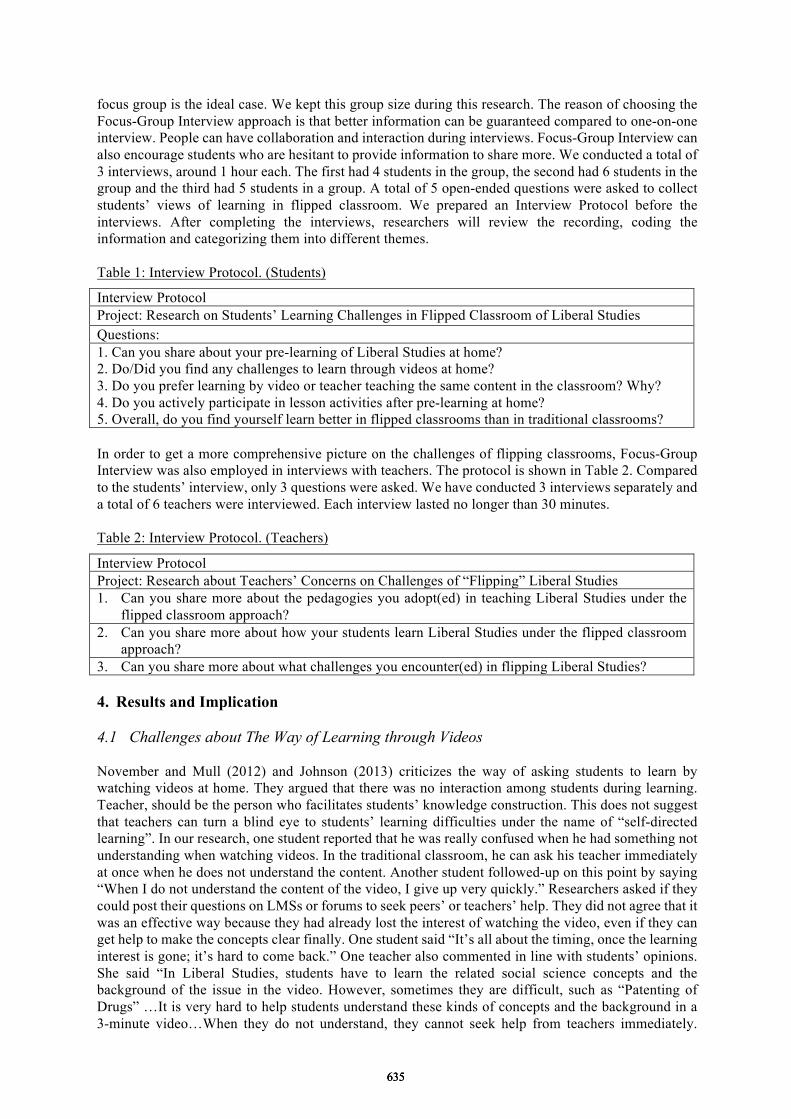
focus group is the ideal case. We kept this group size during this research. The reason of choosing the Focus-Group Interview approach is that better information can be guaranteed compared to one-on-one interview. People can have collaboration and interaction during interviews. Focus-Group Interview can also encourage students who are hesitant to provide information to share more. We conducted a total of 3 interviews, around 1 hour each. The first had 4 students in the group, the second had 6 students in the group and the third had 5 students in a group. A total of 5 open-ended questions were asked to collect students’ views of learning in flipped classroom. We prepared an Interview Protocol before the interviews. After completing the interviews, researchers will review the recording, coding the information and categorizing them into different themes. Table 1: Interview Protocol. (Students)
Interview Protocol Project: Research on Students’ Learning Challenges in Flipped Classroom of Liberal Studies Questions: 1. Can you share about your pre-learning of Liberal Studies at home? 2. Do/Did you find any challenges to learn through videos at home? 3. Do you prefer learning by video or teacher teaching the same content in the classroom? Why? 4. Do you actively participate in lesson activities after pre-learning at home? 5. Overall, do you find yourself learn better in flipped classrooms than in traditional classrooms? In order to get a more comprehensive picture on the challenges of flipping classrooms, Focus-Group Interview was also employed in interviews with teachers. The protocol is shown in Table 2. Compared to the students’ interview, only 3 questions were asked. We have conducted 3 interviews separately and a total of 6 teachers were interviewed. Each interview lasted no longer than 30 minutes. Table 2: Interview Protocol. (Teachers)
Interview Protocol Project: Research about Teachers’ Concerns on Challenges of “Flipping” Liberal Studies 1.! Can you share more about the pedagogies you adopt(ed) in teaching Liberal Studies under the
flipped classroom approach? 2.! Can you share more about how your students learn Liberal Studies under the flipped classroom
approach? 3.! Can you share more about what challenges you encounter(ed) in flipping Liberal Studies? 4.!Results and Implication 4.1! Challenges about The Way of Learning through Videos November and Mull (2012) and Johnson (2013) criticizes the way of asking students to learn by watching videos at home. They argued that there was no interaction among students during learning. Teacher, should be the person who facilitates students’ knowledge construction. This does not suggest that teachers can turn a blind eye to students’ learning difficulties under the name of “self-directed learning”. In our research, one student reported that he was really confused when he had something not understanding when watching videos. In the traditional classroom, he can ask his teacher immediately at once when he does not understand the content. Another student followed-up on this point by saying “When I do not understand the content of the video, I give up very quickly.” Researchers asked if they could post their questions on LMSs or forums to seek peers’ or teachers’ help. They did not agree that it was an effective way because they had already lost the interest of watching the video, even if they can get help to make the concepts clear finally. One student said “It’s all about the timing, once the learning interest is gone; it’s hard to come back.” One teacher also commented in line with students’ opinions. She said “In Liberal Studies, students have to learn the related social science concepts and the background of the issue in the video. However, sometimes they are difficult, such as “Patenting of Drugs” …It is very hard to help students understand these kinds of concepts and the background in a 3-minute video…When they do not understand, they cannot seek help from teachers immediately.
635635635
Despite that they can reach me by Whatsapp, there are still time lags that are enough for students to decide to give up.” This suggested that having no instant feedback to students during learning through videos is a challenge of implementing the flipped classroom. 4.2! Challenges behind pre-learning In addition to learning through videos, the technological limitations are also challenges we could not ignore. Herreid and Schiller (2013) reported that students’ resistance to new learning methods was one of the learning challenges in flipped classrooms. Our research subjects made some comments which align with these previous findings: one student said “We have to access Schoology to watch the videos at home and complete a set of questions that the teachers prepared. However, since the monitor of my mobile phone is too small, it is very hard to read the text.” The Researcher followed up on the comments and asked if the pre-learning could be done by using a desktop computer to resolve this problem. The students replied that he was not used to using computers to do the pre-learning as he usually didn’t watch the videos at home. Therefore, he only uses mobile devices to do the pre-learning. Another student agreed and further commented “Sometimes when I am doing the pre-learning on my mobile phone, there are messages popping up frequently at the top of the screen and I have to reply. Using mobile phone would distract my attention. After replying my friend, it is hard for me to recall which part I was pre-learning. Even if I could remember, my attention has been distracted already. That made me give up.”
Apart from the challenges regarding using mobile devices, students cannot stay focused on watching videos is also another challenge. As Liberal Studies has lots of concepts to be covered and complicated issues to be analyzed, students have to stay focused during learning. However, students reported that staying focused when watching videos was a challenge. One student made a comment and said “I cannot focus on watching videos, not even 2 minutes. That’s very boring, there are only sounds and slides illustrating the concepts and the background of some issues, I am just sitting in front of the screen to listen. In the traditional classroom, I can jot down the points that the teacher teaches, however, I cannot do it now in flipped classrooms. I cannot type Chinese well and it’s not possible for me to jot down the points on a paper when I am learning on a bus.” 4.3! Challenges from Learning Management System Flipped Classroom must have the element of a Learning Management System (LMS). However, there are challenges from the technological concerns of using LMSs to do pre-learning. They can be analyzed by 2 dimensions: (a) the problem of accessing LMSs and (b) the problems occurring during the use of LMS. Nowadays, LMSs can provide a portfolio of students’ pre-learning. Teachers can set a number of questions related to the video’s content and require students to complete them. Although LMS can provide good platforms for teachers and students to do pre-learning, there are some technological limitations behind that we cannot ignore.
The first limitation is about accessing to LMS. One teacher expressed “students do not remember their account and password of Schoology, which is a common problem, it becomes their excuse of not doing pre-learning.” The researcher followed-up by asking “Can they reset the password to get back the account through email?” The teacher answered “the point is that they do not even know which email they used in registration…I spent much time dealing with these kind of problems…It wasted my teaching time. If I had not flipped my classroom, maybe my teaching could have been more effective.” Another teacher expressed the same feeling and said “At the very beginning when I tried to flip my Liberal Studies lessons, I found it’s very complicated in setting up accounts for students. After setting up all the accounts, I still have to spend 2 to 3 lessons in getting everyone to know how to use the LMS… We have to teach them. Otherwise, they would have excuses of not doing pre-learning in the name of technological ignorance.” Hence, it is a challenge for teachers to get students accessing the LMS. Besides, they also mentioned the technological limitations behind using the platform. One student said “The layout of some LMSs is bad; I cannot answer the questions when I am watching the video because the video has already occupied the whole screen. After watching video, I may probably forget what I have learnt.” Another student followed-up and said “sometimes I cannot delete the words I typed in LMS… that’s a bug…As Liberal Studies requires me to express my own views on some issues, the bugs made me unable to modify the answers”.
636636636
4.4! Challenges from Students’ Learning Motivation Students’ learning motivation has been one of the key concerns in the implementation of Flipped Classroom (Hwang et al., 2015; Johnson, 2013; Bergmann & Sams, 2012). There are no agreed resolutions to students’ low learning motivation. If students’ learning motivation is low, flipped classroom is hard to exert positive influences on enhancing the learning outcomes. At the same time, it would bring heavy burden to teachers, both emotionally and in terms of workload. One teacher said “the failure of flipped classroom is not the problem of flipping classrooms but the inactive learning attitude of students. In the elite class of our school, students have more workload than before. They have to watch my videos, answer questions, search the relevant materials on web for the discussions on the next day. However, it’s impossible for them to keep hard working every day. Meanwhile, there are not many hardworking students in class”. The researcher followed-up by asking about the case of less-capable classes. Another teacher replied “Most of the students in those classes do not do pre-learning no matter how you try to force them. The reason is simple; they do not want to do it…I would ask them to complete the pre-learning during the lesson on desktop computers. However, there is only one computer in the classroom. I have to ask the lazy students to complete it one by one. That wasted a lot of lesson time.” Researcher followed-up and asked “could this problem be resolved by placing several tablets in the class?” The teacher replied “That would induce discipline problems when students are not using the tablet to pre-learn but to play games, unless I could lock all the functions except Schoology. Then students can only use the assigned tablet to complete the pre-learning instead of doing other things. Yet, I do not see how it can be possible so far.”
While teachers have expressed their views, students also explained the reasons why they do not have interest in learning by watching videos. One student said “sometimes the teacher would choose some foreign documentaries for us for the pre-learning. Despite the content is relevant to our study, the point is that I do not like watching English videos, it kills my interest to learn.” Another student expressed concerns about the quality of videos. She said “In some of the videos, my teacher speaks too fast and I cannot follow…Sometimes, there are many concepts introduced in the videos. They are very complicated. Even if I re-play the videos for several times, I still cannot understand. I cannot follow the pace of my teacher.” Another student further commented “we cannot get use to this learning style. We have been learning in the “traditional classroom” for many years. There is no reason for me to change. I think my teacher should discuss the teaching method with us instead of trying any “new” style he wants.” We can see students’ resistance to the new learning method is a big challenge for the implementation of flipped classroom. This also aligns with the findings of Herreid & Schiller (2013). 4.5! Challenges in Choosing Appropriate Teaching Pedagogies Flipped Classroom is shifting the education paradigm and it changes the way teachers teach. Therefore, the teaching pedagogies have to be refined (Bergmann & Sams, 2012). One teacher brought up the challenge he faced in setting questions on LMS when he decided to flip his classroom. He said “the challenges come from designing questions on LMS. You have to set multiple choices questions. However, it’s very difficult to set the questions as they are factual-based. Creating the false answers is really a challenge to me. I am not good at imagination. Besides, the questions should be simple but have to be in line with the learning objectives. I have to use a lot of time to do that” One teacher raised another challenge about the pedagogical use in lesson. She expressed “sometimes I do not know which videos I should choose for students’ pre-learning. There are so many videos on the web and it seems that just a few of them can fit my teaching objectives… When they have finished the pre-learning, I do not know how to transform my lesson to fit the standard of “Good Flipped Classroom” in the classroom. I am not very clear about my role in the classroom. Should I still have direct-teaching? Is direct-teaching not recommended? I am not very sure about what I should do in the classroom so it makes me frustrated sometimes.” Hence, we can see even teachers who are implementing flipped classroom may not fully understand the essence of flipped classroom. That would make them encounter many problems they do not know how to resolve. Another challenge raised by teachers is concerning the effectiveness of flipped classroom in enhancing students’ examination results. Cheung and Jong (2016) mentioned the education culture in Hong Kong is mainly driven by “performances”. We can also see teachers doubt if flipping classrooms can enhance students’ examination performance in Liberal Studies. One teacher explained “I doubt the
637637637
effectiveness of flipped classroom in helping our students to get high marks in public examination…Our examination does not test our students’ IT literacy. Flipping classroom also cannot enhance students’ abilities in answering formal essay questions…we can find the drawbacks of flipped classroom in uniform test obviously. Students cannot express their ideas comprehensively on paper. They only get used to answering multiple choices questions.” 5.!Conclusion This research aims to form a preliminary picture about the challenges in flipping classrooms and the findings align with previous studies. The challenges are manifold: (a) students cannot get instant response from teachers when they encounter difficulties at home, (b) the technological limitations behind pre-learning at home, in which we found mobile devices and LMS have them own shortcomings which constitute learning barriers to students, (c) teachers have to spend a lot of time teaching students to use the LMS and there are also discipline problems they have to deal with, (d) low learning motivation of students and unattractive content of videos that make both students and teachers frustrated and (e) teachers found the existing pedagogies cannot effectively enhance students’ examination results, with some teachers do not even know their role in the classroom. We should keep focusing on these challenges in finding ways to resolve the difficulties of flipping classrooms in Hong Kong. References Baepler, P., Walker, J. D., & Driessen, M. (2014). It’s not about seat time: Blanding, flipping, and efficiency in
active learning classrooms. Computers & Education 78, 227-36. Bishop, J. L., & Verleger, M. A. (2013). The flipped classroom: A survey of the research. Paper presented at the
American Society for Engineering Education, Atlanta, GA. Bergmann, J., & Sams, A. (2012). Flip your classroom: Reach every student in every class every day. Eugene,
Oregon: International Society for Technology in Education. Berrett, D. (2012). How 'flipping' the classroom can improve the traditional lecture. The Chronicle of Higher
Education, 31, 36-41. Cheung, K, & Jong, M. S. Y. (2016). Implementing flipped classroom in K-12 classroom in Hong Kong:
Teachers’ Concerns under the Shift of Educational Paradigm. Retrieved June 5, 2016 from http://gccce2016.ied.edu.hk/proceedings/MainConferenceIndividualPapers/C5-8.pdf.
Creswell, J. W. (2008). Educational research: Planning, conducting, and evaluating quantitative and qualitative research (3rd ed). Upper Saddle River, New Jersey: Merrill.
Education Bureau. (2015). Report on the fourth strategy on information technology in Education: Realising IT potential, unleashing learning power, a holistic approach. Retrieved December 26, 2015, from http://ite4.fwg.hk:8080/ite4/Eng/content/files/ITE4/report_ENG.pdf
Educause. (2012). Seven things you should know about flipped classrooms. Retrieved June 3, 2016, from https://library.educause.edu/resources/2012/2/7-things-you-should-know-about-flipped-classrooms
Hwang, G., Lai, C., & Wang, S. (2015). Seamless flipped learning: A mobile technology-enhanced flipped classroom with effective learning strategies. Journal of Computers in Education, 2(4), 449-473.
November, A. & Mull, B. (2012). Flipped Learning: A response to Five Common Criticisms. Retrieved June 2, 2016 from http://www.eschoolnews.com/2012/03/26/flipped-learning-a-response-to-five-common-criticisms/2/
Stone, B. B. (2012). Flip your classroom to increase active learning and student engagement. In: Proceedings from 28th annual conference on distance teaching and learning, Madison, WI.
Strayer, J. F. (2008). The effects of the classroom flip on the learning environment: A comparison of learning activity in a traditional classroom and a flip classroom that used an intelligent tutoring system (Doctoral dissertation, The Ohio State University). Retrieved May 27, 2016 from http://etd.ohiolink.edu/send-pdf.cgi/Strayer%20 Jeremy.pdf?osu1189523914.
C. H. Ku & Y. J. Song (2016). How to Flip the Classroom? – A Pilot Study on a Novel Pedagogy to Improve Secondary School Students’ Problem Solving Skills in Mathematics. In Song, Y., Wu, Y.-T., Chan, T.-W., Kong, S. C., Ma, H. H., Lai, A.F., Chai, C. S., Wang, L., & Yu, H. (Eds.). (2016). Teacher Forum Proceedings of the 20th Global Chinese Conference on Computers in Education 2016. Hong Kong: The Hong Kong Institute of Education.
Johnson, G. B. (2013). Student perceptions of the flipped classroom. Retrieved June 1, 2016 from https://open.library.ubc.ca/cIRcle/collections/ubctheses/24/items/1.0073641.
638638638
Chen, W. et al. (Eds.) (2016). Proceedings of the 24th
International Conference on Computers in Education.
India: Asia-Pacific Society for Computers in Education
Synthesis of Theoretical Framework for
Augmented Reality Learning Environment to
Promote Creative Thinking on Topic
Implementation of Graphic Design for Grade
9 Students
Sathaporn WONGCHIRANUWAT a, Charuni SAMAT
b*
aMaster degree student of Educational Technology, Faculty of Education, Khon Kaen University, Thailand
bAssistant Professor of Computer Education, Faculty of Education, Khon Kaen University, Thailand
Abstract: This study aimed to synthesis of theoretical framework for designing of learning
environment to promote Creative Thinking. The document analysis method research design was
employed in this study. The procedures were as follows: analyzing of theories, principle and
literature review. The result revealed that: theoretical framework for designing of learning
environment comprised of 5 theoretical bases as following: (1) Context of school base; policies, targets, present situation, processes, and performances, (2) Psychology base; constructivist
theory, cognitive theory, (3) Pedagogical base; OLEs model, SOI model, situated learning,
cognitive apprenticeship, 4) Creative thinking base; 4 ability of creative thinking: fluency,
flexibility, originality, elaboration, (5) Technology and Media base; Technology: web-based
learning, augmented Reality (AR), The system of media: media symbol system, media attribute,
Keywords: Creative Thinking, Augmented Reality, Web-based Learning Environment
1. Introduction
The change in the age of globalization and the advancement of technology has made information distributed evenly everywhere. Arising from the use of information and communications technology (ICT) to link data from different sources. The course correlates to the principle of creative thinking
which is the major basis in the design of the instruction or the creation of education software learning innovations that responds to the course content and the needs of learners. Such instructional design corresponds to the major learning and innovation skills of the 21st Century, creativity and innovation.
Enhancement of creative thinking in learners based on the web-based learning environment was achieved using the principles and theories for synthesizing the theoretical framework and the environmental design framework which promote creative thinking (Samat, C. and Chaijaroen, S. ,2009) The theories and web-based characteristics were brought into the design of instruction that utilized the learning environment media and methods with important components of the Constructivist theory. The Augmented Reality is a technology that can create virtual images that appear in a 3D
animation, sound, and hypertext features hyperlinks. In this paper, we are presenting the principles related to the basis of creative thinking and innovation skills for producing student in the 21st Century and the basic context of student training in Thailand that would lead to development
Thus, this research was aimed at designing and developing the Augmented Reality Learning Environment to Promote Creative Thinking on Topic Implementation of Graphic Design for Grade 9 Students of the 21st Century in order to obtain the basis for constructing the appropriate and efficient learning environment models for the learners.
639639639
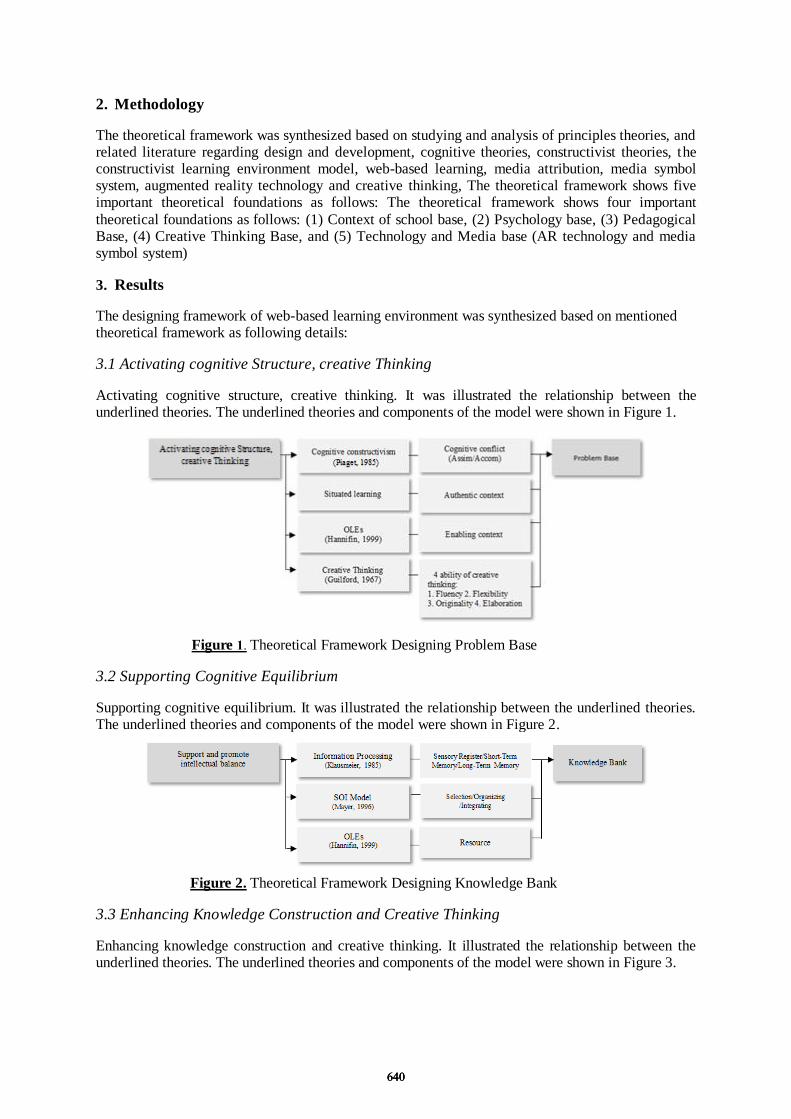
2. Methodology
The theoretical framework was synthesized based on studying and analysis of principles theories, and related literature regarding design and development, cognitive theories, constructivist theories, the constructivist learning environment model, web-based learning, media attribution, media symbol system, augmented reality technology and creative thinking, The theoretical framework shows five important theoretical foundations as follows: The theoretical framework shows four important
theoretical foundations as follows: (1) Context of school base, (2) Psychology base, (3) Pedagogical Base, (4) Creative Thinking Base, and (5) Technology and Media base (AR technology and media symbol system)
3. Results
The designing framework of web-based learning environment was synthesized based on mentioned theoretical framework as following details:
3.1 Activating cognitive Structure, creative Thinking
Activating cognitive structure, creative thinking. It was illustrated the relationship between the underlined theories. The underlined theories and components of the model were shown in Figure 1.
Figure 1. Theoretical Framework Designing Problem Base
3.2 Supporting Cognitive Equilibrium
Supporting cognitive equilibrium. It was illustrated the relationship between the underlined theories. The underlined theories and components of the model were shown in Figure 2.
Figure 2. Theoretical Framework Designing Knowledge Bank
3.3 Enhancing Knowledge Construction and Creative Thinking
Enhancing knowledge construction and creative thinking. It illustrated the relationship between the underlined theories. The underlined theories and components of the model were shown in Figure 3.
640640640
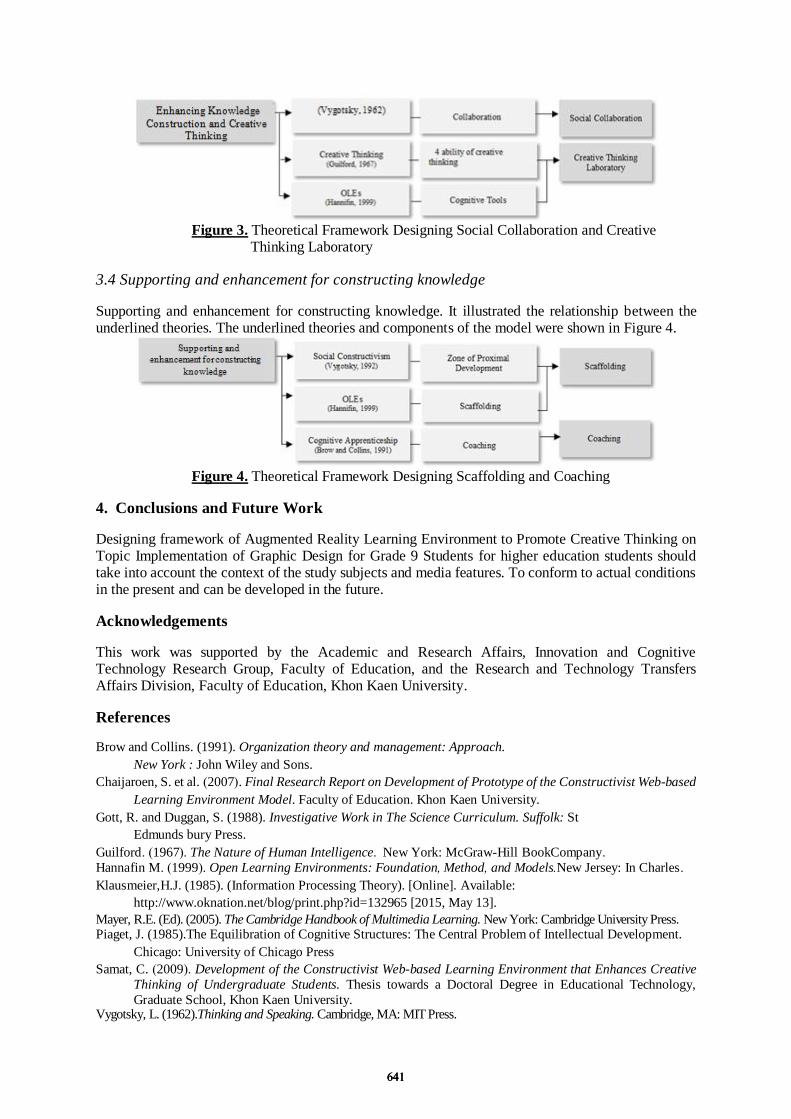
Figure 3. Theoretical Framework Designing Social Collaboration and Creative Thinking Laboratory
3.4 Supporting and enhancement for constructing knowledge
Supporting and enhancement for constructing knowledge. It illustrated the relationship between the underlined theories. The underlined theories and components of the model were shown in Figure 4.
Figure 4. Theoretical Framework Designing Scaffolding and Coaching
4. Conclusions and Future Work
Designing framework of Augmented Reality Learning Environment to Promote Creative Thinking on Topic Implementation of Graphic Design for Grade 9 Students for higher education students should take into account the context of the study subjects and media features. To conform to actual conditions in the present and can be developed in the future.
Acknowledgements
This work was supported by the Academic and Research Affairs, Innovation and Cognitive Technology Research Group, Faculty of Education, and the Research and Technology Transfers Affairs Division, Faculty of Education, Khon Kaen University.
References
Brow and Collins. (1991). Organization theory and management: Approach.
New York : John Wiley and Sons.
Chaijaroen, S. et al. (2007). Final Research Report on Development of Prototype of the Constructivist Web-based
Learning Environment Model. Faculty of Education. Khon Kaen University.
Gott, R. and Duggan, S. (1988). Investigative Work in The Science Curriculum. Suffolk: St
Edmunds bury Press.
Guilford. (1967). The Nature of Human Intelligence. New York: McGraw-Hill BookCompany.
Hannafin M. (1999). Open Learning Environments: Foundation, Method, and Models.New Jersey: In Charles.
Klausmeier,H.J. (1985). (Information Processing Theory). [Online]. Available:
http://www.oknation.net/blog/print.php?id=132965 [2015, May 13].
Mayer, R.E. (Ed). (2005). The Cambridge Handbook of Multimedia Learning. New York: Cambridge University Press. Piaget, J. (1985).The Equilibration of Cognitive Structures: The Central Problem of Intellectual Development.
Chicago: University of Chicago Press
Samat, C. (2009). Development of the Constructivist Web-based Learning Environment that Enhances Creative
Thinking of Undergraduate Students. Thesis towards a Doctoral Degree in Educational Technology,
Graduate School, Khon Kaen University. Vygotsky, L. (1962).Thinking and Speaking. Cambridge, MA: MIT Press.
641641641

Chen, W. et al. (Eds.) (2016). Proceedings of the 24th International Conference on Computers in Education.
India: Asia-Pacific Society for Computers in Education
A Pilot Study on the Effects of a Tangible
Learning System for Pre-Service Teacher
Training
Yusuke MORITAa*, Toru NAGAHAMA, Norio SETOZAKIb,
Keisuke TAJIRIc & Takeshi KITAZAWAd aFaculty of Human Sciences, Waseda University, Japan
bFaculty of Education, Nagasaki University, Japan cGraduate School of Human Sciences, Waseda University, Japan
dDepartment of Technology and Information Science, Tokyo Gakugei University, Japan
Abstract: The purpose of this pilot study was to discuss a possibility of a tangible learning
system for pre-service teacher training. For the purpose of this pilot study, the tangible learning
system was implemented and demonstrated in a science teacher training class. Then,
comprehension test scores before and after the class and a mental rotation test (MRT) score
were compared. 23 college students were divided into three groups based on the pre- and
post-comprehension test scores; HH (12 High-High students), LH (7 Low-High students), and
LL (4 Low-Low students). According to the ANOVA on the MRT, the LH students received an
average score on the post comprehension test, however the LL students scored lower due to
their lack of spatial thinking ability. The results of our study imply that the tangible learning
system is effective for college students to understand the phases of the Moon. Meanwhile, the
results also imply that there are some students who do not have enough spatial thinking ability.
These findings stress the importance of taking students' spatial ability into account especially in
science teacher training.
Keywords: Tangible Learning System, Spatial Thinking Ability, Teacher Training, STEM
education
1. IntroductionIn recent years, Science, Technology, Engineering, and Mathematics (STEM) education has become a
government policy in the United States and other countries (Baran et al. 2016). Spatial thinking is one
of the key abilities to understanding STEM's contents. Astronomy has some of the most difficult
content because it requires spatial thinking ability to comprehend the phenomena (Nasboum et al. 1983,
Vosniadou 1991). The positional relationships among celestial bodies that exhibit relative rotational
movement are difficult to understand not only for students but also teachers. Spatial thinking ability will
allow teachers to understand and as a result more effectively teach the phenomena. Therefore, it is
important to implement spatial thinking training in STEM teacher education.
Tangible User Interface (TUI: Ishii et al. 1997) is one solution to cultivate students' and
teachers' spatial thinking ability (Hawes et al.
2015). Schneider et al. (2013) developed and
implemented a tabletop TUI to study content
regarding neuroscience and reported the
usefulness of the learning environment because
it could be fundamental for improving student
performance. Morita et al. (2010) also
developed a tabletop tangible learning system
that facilitates viewpoint changing applying
TUI. The user can manipulate models of the
Sun, Earth, and Moon as visible tangible bodies
and the real objects are on the tabletop to
operate CG models. Figure 1. Tangible Learning System
642642642

The tangible learning system was also tested in a
science classroom (Morita et al. 2012). The previous
research reported the usefulness of the tangible learning
system through its implementation in an elementary
science class. The results clearly show that active
exploratory learning using the tangible learning system
supports the understanding of students with
comparatively high spatial ability. Although, the results
suggest that teachers need to consider how to facilitate
the understanding of students with comparatively low
spatial thinking ability.
The purpose of this pilot study was to discuss the
possibility of the tangible learning system for learning
the phases of the Moon in science teacher training. In this
research, the tangible learning system was implemented
in a teacher training class for future elementary school
teachers.
2. Method
2.1 Participants and ProcedureTwenty three college students in the Tokyo area participated in this practical study. The practical study
was conducted in a 90 minute period. The class was taught by a guest professor from another university.
Figure 1 shows the tangible learning system illustrating the phases of the Moon. In the
beginning of the class, the students were divided into two groups at random. First, one group used the
tangible learning system set in another classroom, and the other group worked with application software
in their lecture room. Once the first group completed their activity using the tangible learning system,
they then went back to their lecture room. Similarly, once the other group completed an exploratory
activity using tablet application software, they then went to the tangible learning system classroom.
2.2 Measurement and Analysis Measurement was performed using a pre- and a post-comprehension test, a questionnaire, and a mental
rotation test (MRT). The comprehension tests comprised 8 questions in the following four categories:
the shadow on the ball (Earth's viewpoint), the shadow on the Earth (overhead viewpoint), the shadows
on the models (Earth's viewpoint and spaceship's viewpoint), and the shadow on the Moon (the phases
of the Moon). The questionnaire comprised 6 items related to interest, understanding, and teaching
capability. The Mental Rotation Test (MRT) had twenty sets of quizzes.
In this study, the participating college students were divided into three groups based on their
comprehension test scores. Students who scored high (5-8 points) on both pre- and post-test were in
HH, students who scored low (0-4 points) on pre-test and scored high on post-test were LH, students
who scored high on pre-test and scored low on post-test were HL, and the others who scored low on
both the pre- and post-tests were LL. Then, the differences among MRT scores and questionnaire scores
were examined using one-way analysis of variance (ANOVA).
3. Results and DiscussionFigure 2 shows the average scores of the MRT. The results indicate that the 23 college students were
divided into three groups using the pre- and post-comprehension test scores; HH (12 High-High
students), LH (7 Low-High students), and LL (4 Low-Low students). It deserves special mention that no
students fell within the HL category. According to the result of ANOVA, the main effect indicates a
significant difference (F[2,20]=3.96, p<.05). Multiple comparisons using the Bonferroni method show
a significant difference between HH and LL students' scores. This indicates that the LL students could
not receive a high score on the comprehension tests because of their lack of spatial thinking ability.
Figure 2 shows average scores of the questionnaire items and the results of ANOVA at the 5%
level. On the item Q1, interest in astronomy, there is no significant difference (F[2,20]=0.74, n.s.). On
the item Q2, understanding in astronomy, the main effect indicates a significant difference
(F[2,20]=10.36, p<.01) and multiple comparisons using the Bonferroni method shows a significant
difference between HH and LL students' scores, also between LH and LL students' score. On the item
Figure 2. Comparison of MRT Score
643643643
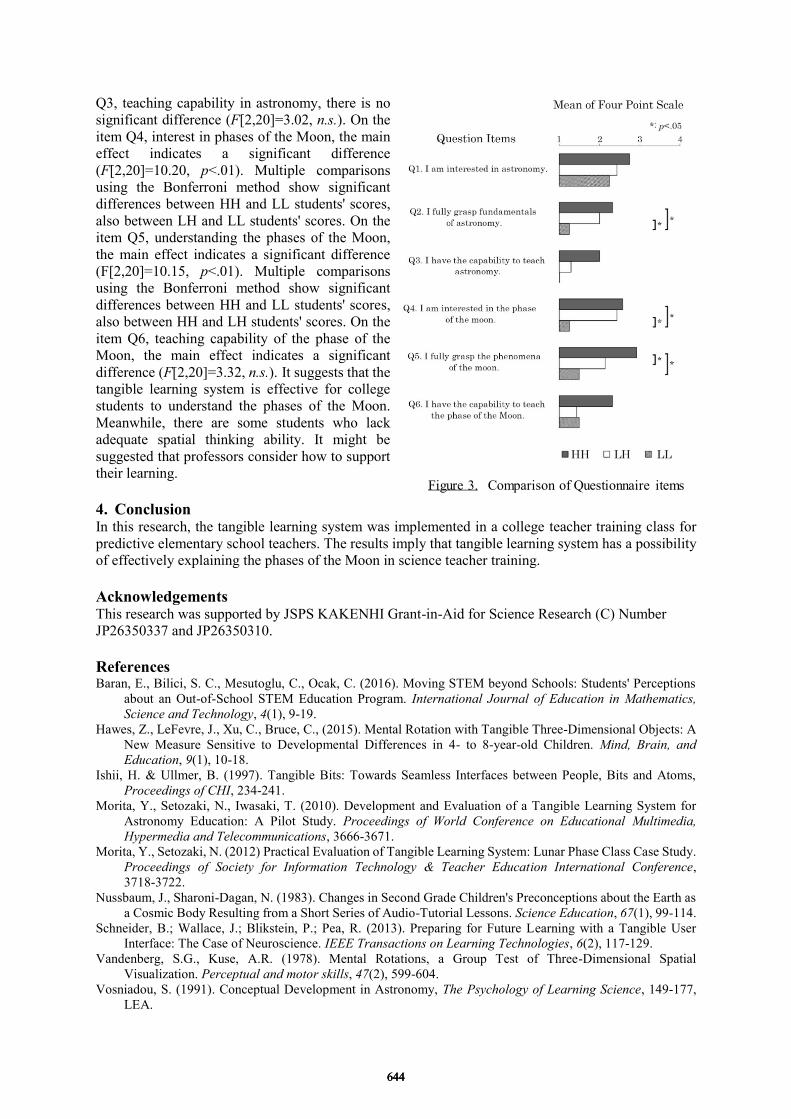
Q3, teaching capability in astronomy, there is no
significant difference (F[2,20]=3.02, n.s.). On the
item Q4, interest in phases of the Moon, the main
effect indicates a significant difference
(F[2,20]=10.20, p<.01). Multiple comparisons
using the Bonferroni method show significant
differences between HH and LL students' scores,
also between LH and LL students' scores. On the
item Q5, understanding the phases of the Moon,
the main effect indicates a significant difference
(F[2,20]=10.15, p<.01). Multiple comparisons
using the Bonferroni method show significant
differences between HH and LL students' scores,
also between HH and LH students' scores. On the
item Q6, teaching capability of the phase of the
Moon, the main effect indicates a significant
difference (F[2,20]=3.32, n.s.). It suggests that the
tangible learning system is effective for college
students to understand the phases of the Moon.
Meanwhile, there are some students who lack
adequate spatial thinking ability. It might be
suggested that professors consider how to support
their learning.
4. ConclusionIn this research, the tangible learning system was implemented in a college teacher training class for
predictive elementary school teachers. The results imply that tangible learning system has a possibility
of effectively explaining the phases of the Moon in science teacher training.
Acknowledgements This research was supported by JSPS KAKENHI Grant-in-Aid for Science Research (C) Number
JP26350337 and JP26350310.
References Baran, E., Bilici, S. C., Mesutoglu, C., Ocak, C. (2016). Moving STEM beyond Schools: Students' Perceptions
about an Out-of-School STEM Education Program. International Journal of Education in Mathematics,
Science and Technology, 4(1), 9-19.
Hawes, Z., LeFevre, J., Xu, C., Bruce, C., (2015). Mental Rotation with Tangible Three-Dimensional Objects: A
New Measure Sensitive to Developmental Differences in 4- to 8-year-old Children. Mind, Brain, and
Education, 9(1), 10-18.
Ishii, H. & Ullmer, B. (1997). Tangible Bits: Towards Seamless Interfaces between People, Bits and Atoms,
Proceedings of CHI, 234-241.
Morita, Y., Setozaki, N., Iwasaki, T. (2010). Development and Evaluation of a Tangible Learning System for
Astronomy Education: A Pilot Study. Proceedings of World Conference on Educational Multimedia,
Hypermedia and Telecommunications, 3666-3671.
Morita, Y., Setozaki, N. (2012) Practical Evaluation of Tangible Learning System: Lunar Phase Class Case Study.
Proceedings of Society for Information Technology & Teacher Education International Conference,
3718-3722.
Nussbaum, J., Sharoni-Dagan, N. (1983). Changes in Second Grade Children's Preconceptions about the Earth as
a Cosmic Body Resulting from a Short Series of Audio-Tutorial Lessons. Science Education, 67(1), 99-114.
Schneider, B.; Wallace, J.; Blikstein, P.; Pea, R. (2013). Preparing for Future Learning with a Tangible User
Interface: The Case of Neuroscience. IEEE Transactions on Learning Technologies, 6(2), 117-129.
Vandenberg, S.G., Kuse, A.R. (1978). Mental Rotations, a Group Test of Three-Dimensional Spatial
Visualization. Perceptual and motor skills, 47(2), 599-604.
Vosniadou, S. (1991). Conceptual Development in Astronomy, The Psychology of Learning Science, 149-177,
LEA.
Figure 3. Comparison of Questionnaire items
644644644
Chen, W. et al. (Eds.) (2016). Proceedings of the 24th International Conference on Computers in Education . India: Asia-Pacific Society for Computers in Education
Design of Cognitive Tools to Enhance Problem-
Solving in Computer Language Programming
for High School Students
Priew PHOLASAa & Charuni SAMATb* a Department of Computer Education, Faculty of Education, Khon Kaen University, Thailand b Department of Computer Education, Faculty of Education, Khon Kaen University, Thailand
Abstract: Programming is a complicated science and includes many skills, and it is also a key part in promoting problem-solving and higher-order thinking skills of students in the 21st century. The purposes of this research are to design and to develop the cognitive tools to enhance the problem-solving skill in computer language programming for high school
students. The research study is a developmental research, and the statistic method includes document analyses, surveys and case studies. The participants are experts in content validity, instructional design, media learning design, learning environment, and evaluation. In terms of the research procedure, this study was carried out through 5 steps: a study of the theories and research; a study of the context; a synthesis of theoretical framework of cognitive tools; a synthesis of designing framework of cognitive tools; and an evolution of the efficiency of the
cognitive tools designing framework. The data analysis employed an interpretation and conclusion by the researcher. The result revealed that the designing framework consisted of 7 essential elements which were: Problem-Based Tools, Information Seeking Tools, Information Presentation Tools, Knowledge Organization Tools, Knowledge Integration Tools, Knowledge Generation Tools, and Communication Tools . According to the expert review, the designing framework was of efficiency.
Keywords: Cognitive Tools, Problem-Solving, Programming
1. Introduction
Programming is an important skill to which everyone pays attention in 21st century and significantly
related to the problem solving process of students (VanLengen & Maddux, 1990). Programming is a
complicated science and difficult to understand because it involves many aspects of problem solving
(Jonassen & Reeves, 1996). Truly, most of students in the class are unable to analyze and design
solutions as well as they should. This is something that all students have to face inevitably.
To write a program successfully and effectively, programming should be separated into three
phases: problem solving and implementation. In addition, when a program has been written, it
involves the third phase: maintenance (Dale et al., 2007). All of these are integrated to a continuous
cycle of programming.
Computers and the Internet technology is state of the art which support and expand the
thinking processes of students as cognitive tools for creative communication and knowledge exchange
(Chaijaroen, 2008). The tool is an intellectual partner of students, which supports problem solving and
facilitates a meaningful learning (Jonassen & Reeves, 1996). Using the computer as a cognitive tool to
support learning is different from traditional instruction because the students will analyze problems,
design and manage their own learning process (Samat, 2008).
In light of this, the principles of using cognitive tools to support programming and to enhance
problem solving in essential way for learners in the 21st century have been presented. To enhance
problem solving in computer language programming, the cognitive tools have been designed based on
the web-based learning environment which applies and modifies the information-processing model
(Iiyoshi & Hannafin, 1998) and students will learn through mission scenarios and be supported by the
tools.
645645645
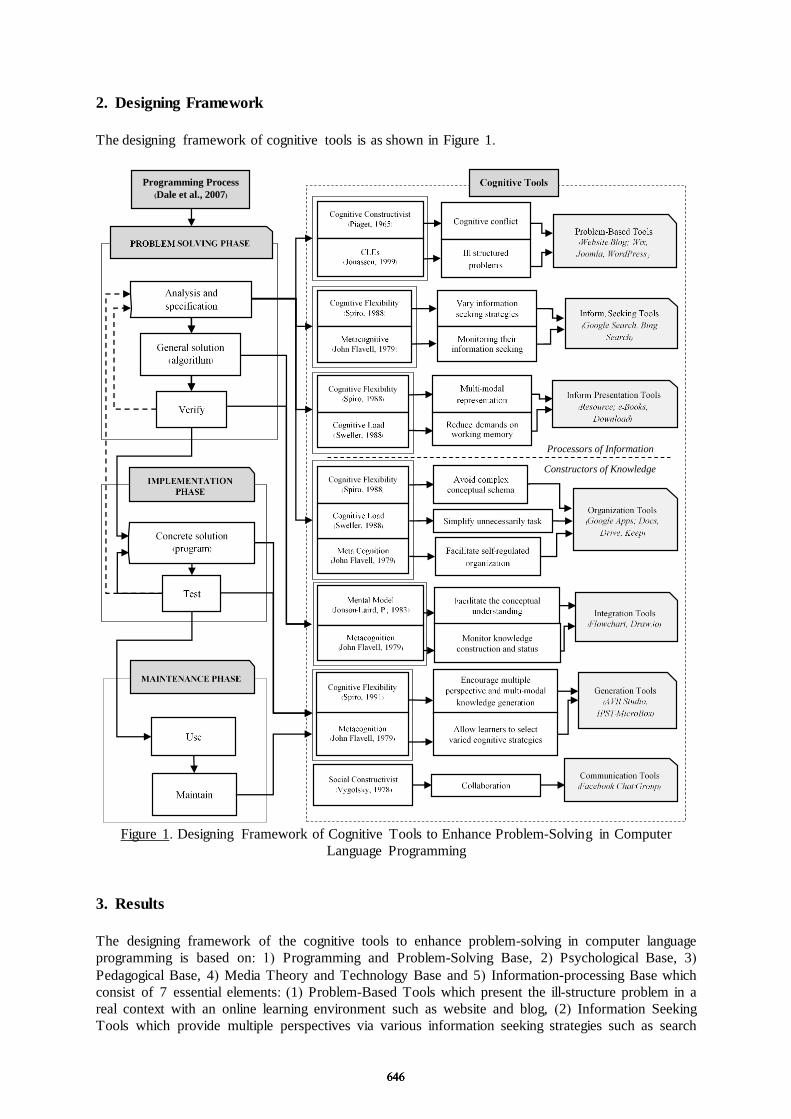
2. Designing Framework
The designing framework of cognitive tools is as shown in Figure 1.
Constructors of Knowledge
Processors of Information
Programming Process
(Dale et al., 2007)
Figure 1. Designing Framework of Cognitive Tools to Enhance Problem-Solving in Computer
Language Programming
3. Results
The designing framework of the cognitive tools to enhance problem-solving in computer language
programming is based on: 1) Programming and Problem-Solving Base, 2) Psychological Base, 3)
Pedagogical Base, 4) Media Theory and Technology Base and 5) Information-processing Base which
consist of 7 essential elements: (1) Problem-Based Tools which present the ill-structure problem in a
real context with an online learning environment such as website and blog, (2) Information Seeking
Tools which provide multiple perspectives via various information seeking strategies such as search
646646646
engine, (3) Information Presentation Tools which provide multi-modal representations and reduce
demands on working memory while processing information such as e-books, knowledge bank, (4)
Knowledge Organization Tools which help students to simplify a complex cognitive task and
facilitate self-regulated organization while constructing knowledge such as Google application, (5)
Knowledge Integration Tools which facilitate the conceptual understanding such as flow chart, (6)
Knowledge Generation Tools which encourage multiple perspectives and multi-modal knowledge
generation of students such as compiler and microcontroller, and (7) Communication Tools which
help student to communicate and share their problem solving via multiple perspectives such as social
network.
4. Conclusion and Future Work
The design of cognitive tools to enhance problem-solving in computer language programming
indicated 7 essential elements which are: Problem-Based Tools, Information Seeking Tools,
Information Presentation Tools, Knowledge Organization Tools, Knowledge Integration Tools,
Knowledge Generation Tools, and Communication Tools. In terms of deployment, the elements
should be adapted into the learning style of students, course context and appropriate learning
materials. To put it more explicitly, they require contribution of other high-order thinking skills and
should be integrated to learning taxonomy of students.
Acknowledgements
This research work was supported by the Academic and Research Affairs, Innovation and Cognitive
Technology Research Center, Faculty of Education, Research and Technology Transfers Affairs
Division, Graduate School, Khon Kaen University, and the institute for the Promotion of Teaching
Science and Technology, Thailand.
References
Chaijaroen, S. (2008). Cognitive Tools. Journal of Cognitive Technology, 3(1), 3–11. Dale, N. B., Weems, C., & Headington, M. (2007). Programming and Problem Solving with Java . Sudbury,
MA: Jones & Bartlett. Iiyoshi, T., & Hannafin, M. J. (1998). Cognitive Tools for Open-Ended Learning Environments: Theoretical and
Implementation Perspectives. Paper presented at the Annual Meeting of the American Educational
Research Association, San Diego, CA. Jonassen, D. H., & Reeves, T. C. (1996). Learning with technology: Using computer as cognitive tools. In
D. H. Jonassen (Eds.). Handbook of research on educational communication and technology .(pp. 693-719). NY: Scholastic Press.
Samat, C. (2008). Computer as Cognitive Tools. Journal of Cognitive Technology, 3(1), 19–26. VanLengen, C. A., & Maddux, C. D. (1990). Does Instruction in Computer Programming Improve Problem
Solving Ability?. CIS Educator Forum, 2(2), 11-16.
647647647

Chen, W. et al. (Eds.) (2016). Proceedings of the 24th
International Conference on Computers in Education.
India: Asia-Pacific Society for Computers in Education
Influence of Learning On Mathematics Realistic
ICT-Assisted Critical Thinking Skills Students
Desah AROFAHa, Sigid Edy PURWANTO
b* & Ayu TSURAYYA
c
aMathematics Education,University of Muhammadiyah Prof. DR. HAMKA, Indonesia
bMathematics Education,University of Muhammadiyah Prof. DR. HAMKA, Indonesia
cMathematics Education,University of Muhammadiyah Prof. DR. HAMKA, Indonesia
Abstract: The aim of the study is to know the effect of Realistic Mathematics Education (RME)
ICT Assisted on the Junior High School Students’ Critical Thinking Skill. The statistical
hypothesis of the study is there’s an effect of Critical Thinking of Students with Realistic
Mathematics Education (RME) ICT Assisted Approach. A quasi experimental method that
employed the nonequivalent control group design. This study was held in SMP N 3 Cibitung.
The sample consisted both of 41 students from the experimental class and 42 from control class
which were all randomly selected with purposive sampling technique. The instruments
consisted of critical thinking test. The result shows that there is a difference between students
who are taught by a Realistic Mathematics Education (RME) ICT assisted approach with
students taught by a non Realistic Mathematics Education (RME) ICT assisted approach
towards the students' critical thinking skills.
Keywords: Critical Thinking Skills, Realistic Mathematics Education, ICT
1. Introduction
The report of Trends in International Mathematics Science Study (TIMSS) shows that Indonesian
student mathematics achievement is low. At 2011 the average value of mathematics student of
Indonesia ranks 38th out of 42 countries.
2. Theory
2.1 Critical Thinking
According to Fisher (Susanto, A., 2013), the process of critical thinking is to explain how something is
thought out. The mind must be open, clear and based on facts (Harsanto, R., 2005). Not all the students
can think critically for critical higher-level thinking, but critical thinking can be trained and developed
by someone.
As said by Robert Stemberg that critical thinking consists of processes, strategies and mental
representations that people used to solve the problems, decision making, and learning new concepts
(Khodijah, N., 2014). Students who think critically not only believe what is described by the teachers,
students attempted to consider his reasoning and other information to obtain the truth.
2.2 Critical Thinking Skills
The optimally development of critical thinking skills requires interactive classroom (Susanto, A.,
2013). Critical thinking is characterized by the ability to: (1) identify the facts that are given clearly and
logically; (2) formulate the problem issues carefully and thoroughly; (3) apply the method that had been
studied in detail, systematic, and accurate; (4) reveal the data or definitions or theorems in solving the
problem in detail, systematic, and precise; (5) conclude and execute correctly; (6) evaluate the relevant
648648648

arguments in the resolution of a problem with meticulous; (7) distinguish between logical conclusions
based on valid and invalid (Rasiman, 2015).
2.3 Realistic Mathematics Education
According to Hans Freudenthal student can not be regarded as passive recipients of mathematics, but
mathematics learning should provide opportunities for students to rediscover the mathematical
knowledge to take advantage of opportunities and real situations experienced by students (Shadiq, F.
and Mustajab, N. A., 2010). Using the context of the "real world" is not just a mathematical source but
also as a place to re-apply mathematics. As said by the National Council of Teachers of Mathematics
(NTCM) that students should learn mathematics with understanding, actively building new knowledge
from experience and prior knowledge (Walle, J.A.V.D., 2006).
According Gravemeijer mathematics learning process based on RME needs to consider five
characteristics: (a) using the contextual problems; (b) using the model; (c) using the student
contributions and production; (d) interactive; (e) the relationship (intertwinment) (Lexbin, M., 2014).
Learning begins with contextual issues (real world), thus allowing students to use prior experience
directly. In the context of real-world use of this developed mathematical concepts such as numerical
ability, geometric, algebra, and statistics as part of the process priorities within the framework of math
critical thinking. Then the students create their own models to solve problems and construct
mathematical knowledge. Students courageous to refute and commented his opinion if it does not
correspond to their own opinion, then the students confidently deliver answers to his questions were
obtained and dare come forward in the form of representation in their own right. Then the teacher with
the students conclude the subject matter and to associate with other materials.
2.4 Information and Communication Technology
In this study, ICT is used to support a learning process that uses a mathematical approach to realistic,
while ICT is used in the form of computers and multimedia projectors. The use of this computer include
a powerpoint and GeoGebra software. The media as a tool in the learning process is a reality that can not
be denied. However, the use of media as tools can not arbitrarily according to the teacher, but must pay
attention to and consider the goals. GeoGebra Software is one example of the dynamic geometry
software or interactive geometry software, algebra, statistics and calculus applications that can be used.
GeoGebra derived from combining the word geometry and algebra, this software was first developed by
Hohenwarter (Siswanto, R., 2014).
3. Research Methodology
This is Quasi Experimental Design study. The sources of the data in this study were students of
experimental class taught by Realistic Mathematics Education (RME) ICT assisted approach, and
control class taught by a non RME ICT approach in SMP N 3 Cibitung, Indonesia. Experimental class
numbered 41 students when control class 42. The collecting data used written tests with instrument test
item description, which is to measure the critical thinking skills of students.
4. Result
Data were obtained from the test results of students' critical thinking skills in experimental class shows
the range of scores between 10 and 31 with the average score of 18.780, median 18; mode 12, 13 and 19,
and a standard deviation of 10.575. Data in the control class shows the range of scores between 4 to 19
with the average score of 11.667; median 10.5; mode 7; and a standard deviation of 6.133.
Hypothesis testing results stated that there is a difference between students who are taught by a
Realistic Mathematics Education (RME) ICT assisted approach with students taught by a non Realistic
649649649
Mathematics Education (RME) ICT assisted approach towards the students' critical thinking skills. The
proposed hypothesis is tested by using t-test.
Testing the effect size was conducted to test the effect of learning approaches Realistic
Mathematics Education (RME) ICT assisted to the students' critical thinking skills. The result of the
calculation is ES = 1.160 with the criteria of influence is high.
5. Conclusions
This study shows that the critical thinking skills of students who are taught by a Realistic Mathematics
Education (RME) ICT assisted approach obtain higher results than students who are taught by a non
Realistic Mathematics Education (RME) ICT assisted approach. Learning by a Realistic Mathematics
Education (RME) ICT assisted approach make students become more active and able to develop critical
thinking skills, teachers were able to form students the ability to think critically while finding issues in
mathematics. Teachers need to provide Realistic Mathematics Education (RME) ICT assisted approach
in order to create a fun learning environment for the students. The students will experience the process
of the invention. Students are not directly given the formula but students are required to be able to work
on the problems with their own thoughts. Realistic Mathematics Education (RME) ICT assisted could
apply the lessons learned from the school in daily life.
Acknowledgements
We would like to thank University of Muhammadiyah Prof. Dr. HAMKA of Jakarta for supporting this
study.
References
Harsanto, R. (2005). Melatih Anak Berpikir Analisis, Kritis, dan Kreatif. Jakarta: PT Gramedia
Khodijah, N. (2014). Psikologi Pendidikan. Jakarta: Rajawali Pers
Lexbin, M. (2014). Pendekatan Matematika Realistik Berbantuan Geometer’s Skethpad Merupakan Salah Satu
Pembelajaran Yang Relevan Dengan Tuntutan Kurikulum Tahun 2013. Prosiding Seminar Nasional
Pendidikan Matematika Program Pasca Sarjana STKIP Siliwangi Bandung. http://
publikasi.stkipsiliwangi.ac.id/files/2014/01/Prosiding-15-Januari-2014.pdf
Rasiman (2015). Penelusuran Proses Berpikir Kritis dalam Menyelesaikan Masalah Matematika Bagi Siswa
dengan Kemampuan Matematika Tinggi. IKIP PGRI Semarang. IAIN_T.A_Faridhotus_8.daftar pustaks.pdf
Siswanto, R. (2014). Peningkatan Kemampuan Penalaran dan Koneksi Matematis Melalui Penerapan Model
Pembelajaran Kooperatif Tipe STAD Berbantuan Software Geogebra. Studi Eksperimen Di SMAN 1
Cikulur Kabupaten Lebak Propinsi Banten.
http:www//pasca.ut.ac.idjournalindex.phpJPKarticledownload1111
Susanto, A. (2013). Teori Belajar dan Pembelajaran. Jakarta: Kencana Prenadamedia Group
Walle, J. A. V. D. 2006. Matematika Sekolah Dasar dan Menengah Pengembangan Pengajaran. Jakarta: Erlangga
650650650
Chen, W. et al. (Eds.) (2016). Proceedings of the 24th International Conference on Computers in Education. India: Asia-Pacific Society for Computers in Education
Characterizing Students’ Behavioral Patterns in an Online Reading Test
Hercy N. H. CHENG*, Jian-Wen SUN, Zhi LIU, San-Ya LIU National Engineering Research Center for E-Learning, Central China Normal University, China
Abstract: Understanding students’ testing behaviors may help researchers design better computer-based assessment. For this reason, this study aims at characterizing students’ behavioral patterns in online reading test by k-means clustering. The clustering algorithm adopts eight indicators: reading time, answering time, the number of choosing articles, the number of choosing questions, the number of selecting options, the number of marking questions, the number of revisiting a test and the final testing scores. The result identifies five clusters of student testers: slow readers, fast readers, question markers, fast responders, and re-readers.
Keywords: Testing behavioral patterns, k-mean clustering, online Chinese reading assessment
1. Introduction
Computer-based assessment not only helps teachers instantly evaluate students’ abilities, but also allows students to reflect themselves because of immediate feedback. Besides the efficiency of evaluation, computer-based assessment has better objectivity and lower cost, compared with paper-based tests (Wirth, 2008). Given the new form of assessment, computers may be able to evaluate more competence that traditional tests cannot easily capture. For example, since last year, PISA started to adopt computers to evaluate students’ ability to solve problems collaboratively. This is because computers are able to record and analyze students’ behaviors of reading and answering questions. Previous research evaluated students’ reading literacy skills by analyzing the number of their actions and reading time (Gil, Martinez, & Vidal-Abarca, 2015).
However, because of the complexity, students might not find an optimal solution easily in a computer-based testing environment (Sager et al. 2011). In a sense, students’ behaviors are likely influenced. Fortunately, computers’ ability to record students’ actions allows us to analyze their testing behaviors, so that we may understand how computers influence students. For this reason, this study attempts to characterize students’ behaviors in an online reading test. There are several methods for behavior analysis, such as clustering, frequent sequence mining, lag sequential analysis, and so forth. This study adopts clustering because clustering is an unsupervised method, which can classify data according to their natural properties. In this case, the study aims to classify student testers according to their online behaviors. If we can identify different clusters of online student testers, we may design more helpful online learning assessment in the future.
2. Method
2.1 Participants and setting
The participants were 120 fourth graders (73 male and 47 female students) and 120 fifth graders (64 male and 56 female students) from a primary school in Hubei province, China. The study was carried out in a computer lab in the primary school. Because of its capacity, there were 60 students each time. One researcher managed a test with four experts for solving possible technical problems. The participants were required to take at least one test. However, they were allowed to take several times, because the questions were randomly selected. Even so, this study only analyzed their first time of valid tests.
651651651

2.2 Online Chinese Reading Test System
An online Chinese reading test system was adopted in this study. The system was designed to evaluate students’ Chinese reading abilities. In each test, there are three Chinese articles with 18 items in total. After starting a test, students have to choose one of the three articles. Figure 1 illustrates the interface of one test. Students are allowed to read the article and choose an item for answering. The items are multiple-choose questions with four options. They were also allowed to mark any items that they want to come back later. When they submit their answers, they are prompted to make sure they want to submit. If they want to revisit the articles and their answers again, they are allowed to go back to the test. Students’ actions are automatically recorded in the database.
Figure 1. The online Chinese reading test system.
2.3 Data Analysis
This study adopted k-means clustering to characterize students’ online testing behaviors. More specifically, the clustering algorithm used the following eight indicators: reading time, answering time, the number of choosing articles, the number of choosing questions, the number of selecting options, the number of marking questions, the number of revisiting a test and the final testing scores. The definitions of the eight indicators are described in Table 1. The value of k was determined by the formula of q value in the study of Frias-Martinez, Chen, Macredie, and Liu (2007). In this case, five clusters were an optimal result.
Table 1: The indicators of the clustering algorithm.
Indicators Descriptions Reading time The time period between the first time that students choosing an article
and choosing the first question. Answering time The time period between students choosing a question and choosing an
option. The number of choosing articles The total times of students choosing articles in a test. The number of choosing questions The total times of students choosing questions in a test. The number of selecting options The total times of students selecting options in a test. The number of marking questions The total times of students marking questions in a test. The number of revisiting a test The total times of students deciding to revisit the test after submitting it. Scores The final testing scores that indicate students’ reading abilities.
3. Results
As shown in Table 1, there were five clusters of behavioral patterns in online Chinese reading tests. ANOVAs show that the eight indicators can all significantly differentiate the clusters. Post hoc analysis further indicates the significant differences among clusters. Among the five clusters, the students in the first cluster spent the longest time on reading articles and questions. Therefore, the cluster was labeled as slow readers. The reason perhaps was that they frequently checked the articles and questions. They also tended to change the options of their answers.
652652652
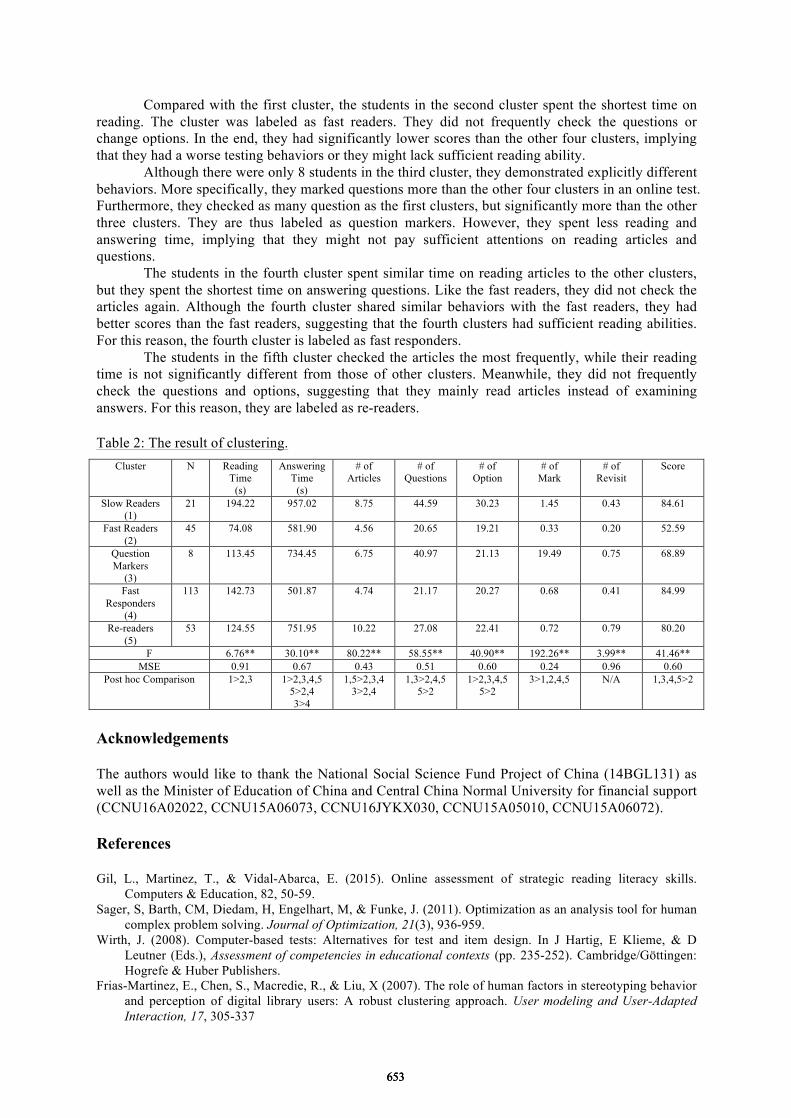
Compared with the first cluster, the students in the second cluster spent the shortest time on reading. The cluster was labeled as fast readers. They did not frequently check the questions or change options. In the end, they had significantly lower scores than the other four clusters, implying that they had a worse testing behaviors or they might lack sufficient reading ability.
Although there were only 8 students in the third cluster, they demonstrated explicitly different behaviors. More specifically, they marked questions more than the other four clusters in an online test. Furthermore, they checked as many question as the first clusters, but significantly more than the other three clusters. They are thus labeled as question markers. However, they spent less reading and answering time, implying that they might not pay sufficient attentions on reading articles and questions.
The students in the fourth cluster spent similar time on reading articles to the other clusters, but they spent the shortest time on answering questions. Like the fast readers, they did not check the articles again. Although the fourth cluster shared similar behaviors with the fast readers, they had better scores than the fast readers, suggesting that the fourth clusters had sufficient reading abilities. For this reason, the fourth cluster is labeled as fast responders.
The students in the fifth cluster checked the articles the most frequently, while their reading time is not significantly different from those of other clusters. Meanwhile, they did not frequently check the questions and options, suggesting that they mainly read articles instead of examining answers. For this reason, they are labeled as re-readers.
Table 2: The result of clustering. Cluster N Reading
Time (s)
Answering Time
(s)
# of Articles
# of Questions
# of Option
# of Mark
# of Revisit
Score
Slow Readers (1)
21 194.22 957.02 8.75 44.59 30.23 1.45 0.43 84.61
Fast Readers (2)
45 74.08 581.90 4.56 20.65 19.21 0.33 0.20 52.59
Question Markers
(3)
8 113.45 734.45 6.75 40.97 21.13 19.49 0.75 68.89
Fast Responders
(4)
113 142.73 501.87 4.74 21.17 20.27 0.68 0.41 84.99
Re-readers (5)
53 124.55 751.95 10.22 27.08 22.41 0.72 0.79 80.20
F 6.76** 30.10** 80.22** 58.55** 40.90** 192.26** 3.99** 41.46** MSE 0.91 0.67 0.43 0.51 0.60 0.24 0.96 0.60
Post hoc Comparison 1>2,3 1>2,3,4,55>2,43>4
1,5>2,3,4 3>2,4
1,3>2,4,5 5>2
1>2,3,4,55>2
3>1,2,4,5 N/A 1,3,4,5>2
Acknowledgements
The authors would like to thank the National Social Science Fund Project of China (14BGL131) as well as the Minister of Education of China and Central China Normal University for financial support (CCNU16A02022, CCNU15A06073, CCNU16JYKX030, CCNU15A05010, CCNU15A06072).
References
Gil, L., Martinez, T., & Vidal-Abarca, E. (2015). Online assessment of strategic reading literacy skills. Computers & Education, 82, 50-59.
Sager, S, Barth, CM, Diedam, H, Engelhart, M, & Funke, J. (2011). Optimization as an analysis tool for human complex problem solving. Journal of Optimization, 21(3), 936-959.
Wirth, J. (2008). Computer-based tests: Alternatives for test and item design. In J Hartig, E Klieme, & D Leutner (Eds.), Assessment of competencies in educational contexts (pp. 235-252). Cambridge/Göttingen: Hogrefe & Huber Publishers.
Frias-Martinez, E., Chen, S., Macredie, R., & Liu, X (2007). The role of human factors in stereotyping behavior and perception of digital library users: A robust clustering approach. User modeling and User-Adapted Interaction, 17, 305-337
653653653
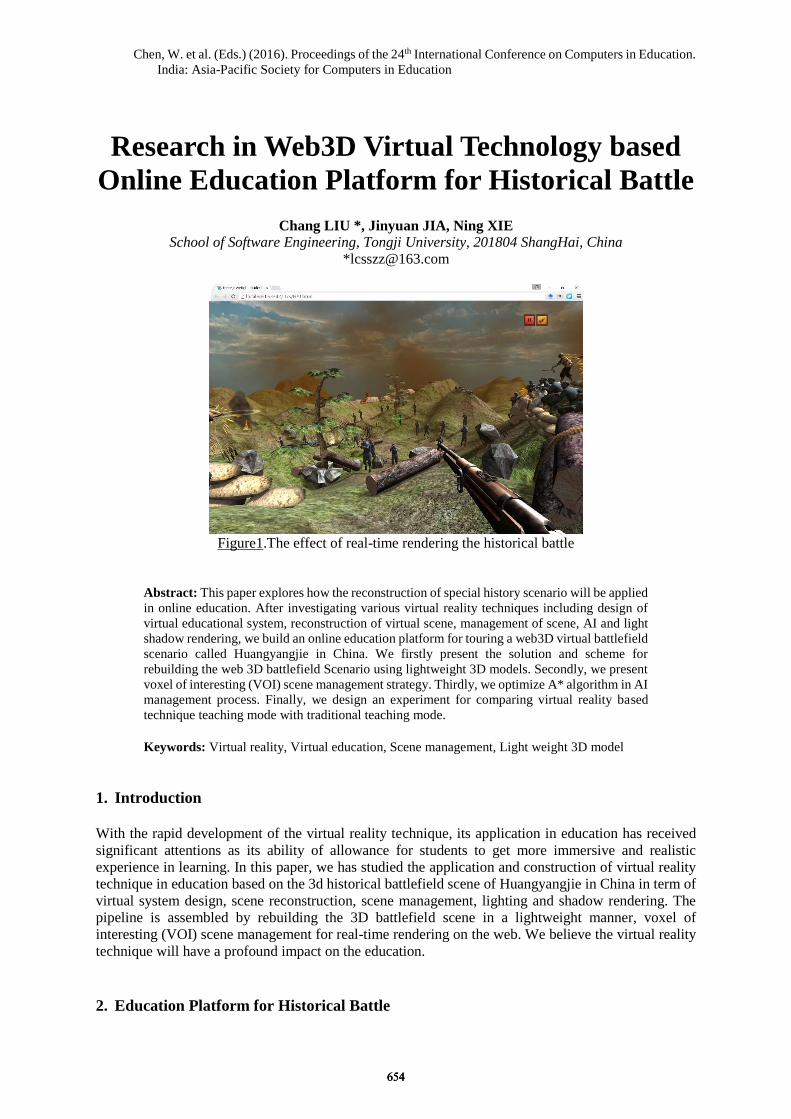
Chen, W. et al. (Eds.) (2016). Proceedings of the 24th International Conference on Computers in Education.
India: Asia-Pacific Society for Computers in Education
Research in Web3D Virtual Technology based
Online Education Platform for Historical Battle
Chang LIU *, Jinyuan JIA, Ning XIE
School of Software Engineering, Tongji University, 201804 ShangHai, China
Figure1.The effect of real-time rendering the historical battle
Abstract: This paper explores how the reconstruction of special history scenario will be applied
in online education. After investigating various virtual reality techniques including design of
virtual educational system, reconstruction of virtual scene, management of scene, AI and light
shadow rendering, we build an online education platform for touring a web3D virtual battlefield
scenario called Huangyangjie in China. We firstly present the solution and scheme for
rebuilding the web 3D battlefield Scenario using lightweight 3D models. Secondly, we present
voxel of interesting (VOI) scene management strategy. Thirdly, we optimize A* algorithm in AI
management process. Finally, we design an experiment for comparing virtual reality based
technique teaching mode with traditional teaching mode.
Keywords: Virtual reality, Virtual education, Scene management, Light weight 3D model
1. Introduction
With the rapid development of the virtual reality technique, its application in education has received
significant attentions as its ability of allowance for students to get more immersive and realistic
experience in learning. In this paper, we has studied the application and construction of virtual reality
technique in education based on the 3d historical battlefield scene of Huangyangjie in China in term of
virtual system design, scene reconstruction, scene management, lighting and shadow rendering. The
pipeline is assembled by rebuilding the 3D battlefield scene in a lightweight manner, voxel of
interesting (VOI) scene management for real-time rendering on the web. We believe the virtual reality
technique will have a profound impact on the education.
2. Education Platform for Historical Battle
654654654
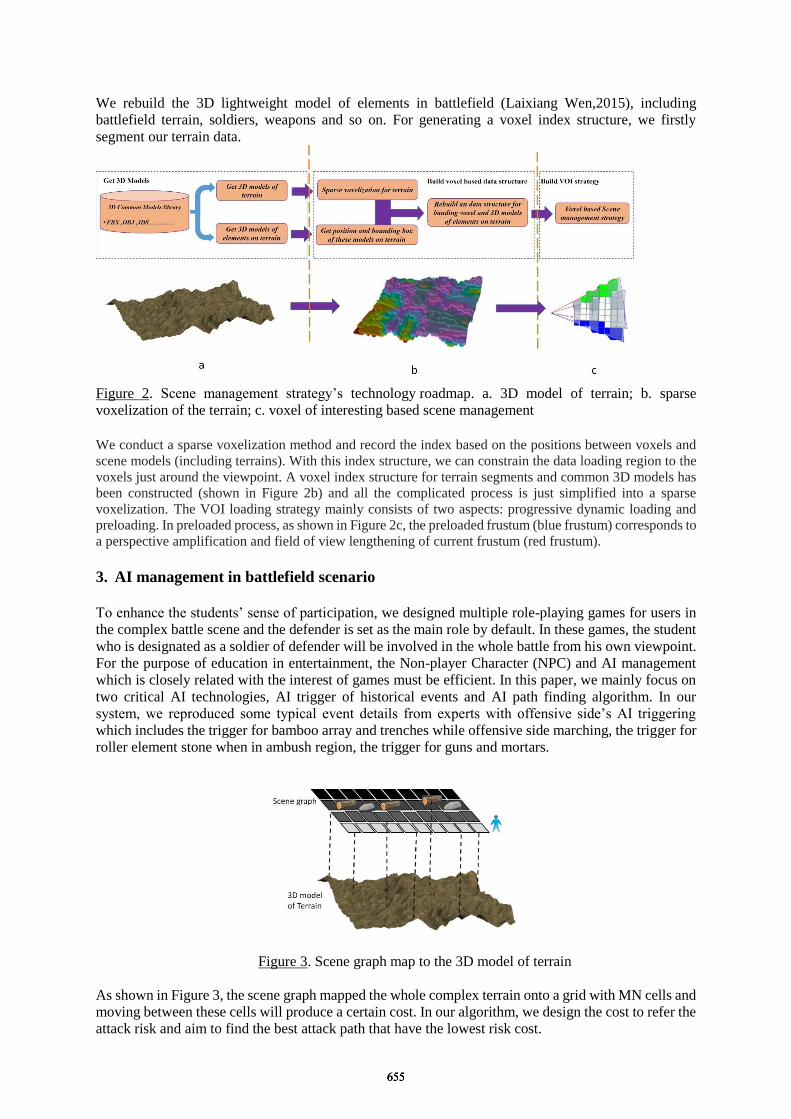
We rebuild the 3D lightweight model of elements in battlefield (Laixiang Wen,2015), including
battlefield terrain, soldiers, weapons and so on. For generating a voxel index structure, we firstly
segment our terrain data.
Figure 2. Scene management strategy’s technology roadmap. a. 3D model of terrain; b. sparse
voxelization of the terrain; c. voxel of interesting based scene management
We conduct a sparse voxelization method and record the index based on the positions between voxels and
scene models (including terrains). With this index structure, we can constrain the data loading region to the
voxels just around the viewpoint. A voxel index structure for terrain segments and common 3D models has
been constructed (shown in Figure 2b) and all the complicated process is just simplified into a sparse
voxelization. The VOI loading strategy mainly consists of two aspects: progressive dynamic loading and
preloading. In preloaded process, as shown in Figure 2c, the preloaded frustum (blue frustum) corresponds to
a perspective amplification and field of view lengthening of current frustum (red frustum).
3. AI management in battlefield scenario
To enhance the students’ sense of participation, we designed multiple role-playing games for users in
the complex battle scene and the defender is set as the main role by default. In these games, the student
who is designated as a soldier of defender will be involved in the whole battle from his own viewpoint.
For the purpose of education in entertainment, the Non-player Character (NPC) and AI management
which is closely related with the interest of games must be efficient. In this paper, we mainly focus on
two critical AI technologies, AI trigger of historical events and AI path finding algorithm. In our
system, we reproduced some typical event details from experts with offensive side’s AI triggering
which includes the trigger for bamboo array and trenches while offensive side marching, the trigger for
roller element stone when in ambush region, the trigger for guns and mortars.
Figure 3. Scene graph map to the 3D model of terrain
As shown in Figure 3, the scene graph mapped the whole complex terrain onto a grid with MN cells and
moving between these cells will produce a certain cost. In our algorithm, we design the cost to refer the
attack risk and aim to find the best attack path that have the lowest risk cost.
655655655

4. VR based teaching mode’s experiment and result
For comparing virtual reality based technique teaching mode with traditional teaching mode, our
experiment is designed to test 20 undergrad students.
Figurue4. a Result of questionnaire for historical battle b Result of questionnaire for students’
attitude toward VR based teaching mode
From figure 4a above, we find that the effect of historical battle study using VR based teaching mode is
better than using traditional teaching mode in the same time. And from figure4b above, 84% students
without using VR based teaching mode want to try it. 80% students who have used VR based teaching
mode have a positive attitude toward this teaching mode.
5. Conclusion
We implement an online 3D virtual education platform in order to help students to engage the courses.
Our contributions include virtual scene reconstruction, scene management, AI algorithm, and
educational analysis. In the whole process, we present the solution and scheme for rebuilding the web
3D battlefield scenario, create voxel of interest (VOI) scene management strategy based
terrain-voxel-model uniform structure, and optimize A* algorithm in AI management process. The
effect of historical battle study using VR based teaching mode is good, and most of students
have a positive attitude toward this teaching mode.
References
Deli, P., et al. 3D modeling of architectural objects from video data obtained with the fixed focal length lens
geometry[C]. Geodesy and Cartography.2013, 62: 123.
Haneta T, et al.: Construction of 3-Dimensional Virtual Environment Based on Photographed Image [C]. HCI
International 2015, Springer International Publishing. 2015: 683-689.
Kang, H. W., et al. : Tour Into the Picture using a Vanishing Line and its Extension to Panoramic Images
[J].Computer Graphics Forum, 2001, 20(3): 132-141.
Laixiang Wen, Ning Xie, Jinyuan Jia. LPM: Fast Accessing Web3D Contents Using Lightweight Progressive
Meshes[C]. Computer Animation and Virtual Worlds, 2015:124-129
Snavely, N., et al.: Photo tourism: exploring photo collections in 3D [J]. ACM Transactions on Graphics.
2006:25(3): 835-846.
656656656

Chen, W. et al. (Eds.) (2016). Proceedings of the 24th International Conference on Computers in Education.
India: Asia-Pacific Society for Computers in Education
ICT Based School Mapping Application for
Elementary Education in India
Nidhi Rawat
Research Scholar, NUEPA, New Delhi
Abstract: Policy implementation through proper planning, devised by sound methodological
practices in India have always been challenging due to demographic and socio-economic
diversities. In this context, any investigation into the use of ICT in education would generate
additional knowledge on educational impact of investments in ICT applications in education.
School mapping serves as an appropriate decision-support tool for planning for universalizing
access in the school education sector. The current study, however, looks into aspects of ICT
applications in educational planning techniques and methods, with focus on planning for
universal access and participation in school education.
.
Keywords: ICT based school mapping, Right to Education, distance matrix, National
University of Educational Planning
1. Introduction
School Mapping is a well accepted and longstanding approach to the planning of school locations, and
is also used to investigate and ensure the efficient and equitable distribution of resources within and
between school systems when large-scale reform or significant expansion of an education system takes
place (Hite, 2008). For a long time policy implementation was not given an appropriate interest
theoretically and practically. It was taken for granted that any policy or plan would be successfully
implemented once the decision or plan is made, even though sometimes it is difficult to make rational
decisions in the absence of alternative choices. Primary education in India is predominantly funded and
managed by the government. Therefore, investment decisions by the Government determine the pattern
of expansion of educational facilities. Over a period of time it is noticed that certain areas are more
endowed with school facilities than other areas. School mapping is an essential planning tool to
overcome possibilities of regional inequities arising from the investment policies of the public
authorities. ICT have a significant impact in education transformation, efficient ICT based applications
for policy planning and implementation can save huge time and resources. The current study looks into
the general trends in policy planning and ICT applications in education used in India; and the
application of ICT in planning techniques and methods, with focus on planning for universal access and
participation in school education.
2. Research Objectives and Methodology
2.1 Research Objectives
Keeping the scope of the study in view, the specific objectives of the study are as follows:
To look into the level of ICT applications in education, particularly for improving access,
classroom practices, school effectiveness and planning and management practices in the school
education sector on the basis of review of available literature at the global and national levels;
To assess the current level of ICT applications in planning for ensuring equitable access to school
education in general and elementary education in particular in India; and
657657657
To develop an ICT application to improve the school mapping technique that uses distance matrix
and validate the same at the elementary level of education in one of the sub-district level units (viz.
community development block) in Uttarakhand.
2.2 Research Methodology
ICT Application for school mapping that uses distance matrix is developed in Active Server Pages
(ASP.NET) of Visual Studio 2008 and SQL Server 2008 platforms. The development of the ICT
application has closely followed the steps involved in operationalzing a school mapping exercise. The
application then has used relevant primary and secondary data collected from the field for its empirical
testing and validation in the selected block. The school mapping steps along with distance matrices have
been coded in application. The application is made on client/server model. The major steps involved in
methodology are:
On site observation, interviews of stakeholders and survey methods are adopted in collecting
qualitative data i.e overall status of school mapping in India and quantitative data i.e literacy rate/
enrolment rate /retention rate/ dropout rate, number of teachers, teacher pupil ratio, building and
infrastructure facilities, assessment the number of children to be enrolled, distance data between
habitations, listing of habitation(s)/village(s) to identify school served areas, habitation wise
population data and identification of available schools of all management types.
Processing the data using the ICT application developed by the investigator, mainly for identifying
the catchment area of the existing primary and upper primary schools/sections;
Creation of a distance matrix of un-served habitations in the identified villages within the block
based on state RTE norms and upload distances between all habitations in the matrix but diagonal
of matrix remained 0.
The above original matrix was then translated into a norm-based zero-one matrix n* n i.e., for
primary school distance < =1.0 km = 0 and distance > 1.0 km=1; for upper primary distance < =3.0
km = 0 and distance > 3.0 km=1.
Highlighted the availability schooling facilities in the Zero, one Matrix.
Generation of Catchment Area of schools i.e 0/1 matrix showing habitations covered by schools.
Generation of reduced matrix is done by eliminating the habitations located in the catchment area
of existing schools. In the reduced matrix, filter for identifying the column with maximum number
of zeros (i.e. cluster of largest number of habitations) applied to generate the first option for
locating new school. Then all those habitations that fall in the catchment area of this proposed
school are deleted (from both columns and rows) from the reduced matrix resulting in another
smaller reduced matrix of un-served habitations. The same process is again follows to identify the
second proposed location for establishing a school, which serves the second largest cluster of
habitations in the reduced matrix. Same process of elimination of habitation again follows. This
process continues till all un-served habitations eligible for establishing new schools were identified
from the reduced matrix. This process is called spiraling for generating options for locating
3. Literature Review
Literature on school mapping with respect to implementation of the technique in India is very limited.
Apart from the UNESCO/IIEP efforts to popularize school mapping in decentralized educational
planning since1970s, NUEPA, New Delhi has contributed to the literature in introducing the concept of
distance matrix in SM for optimization of investments in school education following the existing
development policies, norms and standards (Varghese, 1997). SM, therefore, has become an
institutional requirement for enforcing RTE Act, 2009 in India. Therefore, in recent years, with the
implementation of large scale education reform programme it has now become mandatory for states and
union territories to carry out SM. As such, several states in India are using SM for planning for school
education, particularly at the compulsory level of education. However, in the recent past many states in
India have implemented GIS based SM but have no clarity as to how GIS can help them carry out the
SM and would it be able to meet the requirements of SM. As a result, the outcomes of GIS based SM in
states, often, have become misleading. There is, therefore, a need to gain an in-depth knowledge of the
658658658
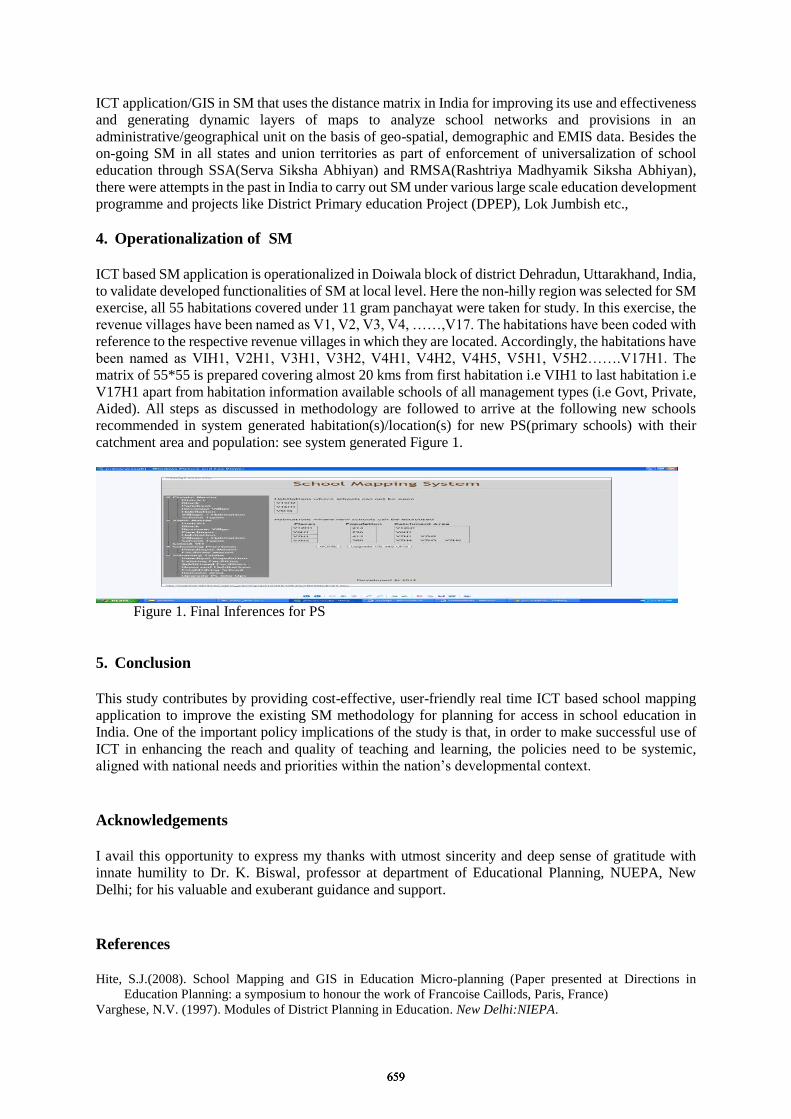
ICT application/GIS in SM that uses the distance matrix in India for improving its use and effectiveness
and generating dynamic layers of maps to analyze school networks and provisions in an
administrative/geographical unit on the basis of geo-spatial, demographic and EMIS data. Besides the
on-going SM in all states and union territories as part of enforcement of universalization of school
education through SSA(Serva Siksha Abhiyan) and RMSA(Rashtriya Madhyamik Siksha Abhiyan),
there were attempts in the past in India to carry out SM under various large scale education development
programme and projects like District Primary education Project (DPEP), Lok Jumbish etc.,
4. Operationalization of SM
ICT based SM application is operationalized in Doiwala block of district Dehradun, Uttarakhand, India,
to validate developed functionalities of SM at local level. Here the non-hilly region was selected for SM
exercise, all 55 habitations covered under 11 gram panchayat were taken for study. In this exercise, the
revenue villages have been named as V1, V2, V3, V4, ……,V17. The habitations have been coded with
reference to the respective revenue villages in which they are located. Accordingly, the habitations have
been named as VIH1, V2H1, V3H1, V3H2, V4H1, V4H2, V4H5, V5H1, V5H2…….V17H1. The
matrix of 55*55 is prepared covering almost 20 kms from first habitation i.e VIH1 to last habitation i.e
V17H1 apart from habitation information available schools of all management types (i.e Govt, Private,
Aided). All steps as discussed in methodology are followed to arrive at the following new schools
recommended in system generated habitation(s)/location(s) for new PS(primary schools) with their
catchment area and population: see system generated Figure 1.
Figure 1. Final Inferences for PS
5. Conclusion
This study contributes by providing cost-effective, user-friendly real time ICT based school mapping
application to improve the existing SM methodology for planning for access in school education in
India. One of the important policy implications of the study is that, in order to make successful use of
ICT in enhancing the reach and quality of teaching and learning, the policies need to be systemic,
aligned with national needs and priorities within the nation’s developmental context.
Acknowledgements
I avail this opportunity to express my thanks with utmost sincerity and deep sense of gratitude with
innate humility to Dr. K. Biswal, professor at department of Educational Planning, NUEPA, New
Delhi; for his valuable and exuberant guidance and support.
References
Hite, S.J.(2008). School Mapping and GIS in Education Micro-planning (Paper presented at Directions in
Education Planning: a symposium to honour the work of Francoise Caillods, Paris, France)
Varghese, N.V. (1997). Modules of District Planning in Education. New Delhi:NIEPA.
659659659
Chen, W. et al. (Eds.) (2016). Proceedings of the 24th
International Conference on Computers in Education.
India: Asia-Pacific Society for Computers in Education
Development of Constructivist Flipped
Classroom to Enhance Students’ Creative
Thinking for Designing Logo
Charuni SAMATa*
& Kridsana KAMPIRAb
aAssistant Professor of Computer Education, Faculty of Education, Khon Kaen University,
Thailand bBachelor’s Degree student in Computer Education, Faculty of Education, Khon Kaen
University, Thailand
Abstract: The purposes of this study were as follows: 1) To design and development of
constructivist flipped classroom to enhance student’s creative thinking for designing logo,
2) To examine students’ creative thinking, and 3) To examine study student’s opinions.
The target group of this research is grade 11 student of Pathumthep Witthayakarn School, high
school in Thailand. The pre-experimental design, particularly with one shot case study was
employed in this study. The research instruments were constructivist flipped classroom to
enhance creative thinking on logo design with Adobe Illustrator CS6, creative thinking test
form, and opinions survey form. The results revealed that: 1) The designing of constructivist
flipped classroom consisted of the following components; (1) Problem Base (2) Resources
(3) Creative Thinking Room (4) Collaboration (5) Scaffolding and (6) Coaching. 2) The
creative thinking was found from the creative thinking test form ( X = 31.59 and S.D. = 1.67) that every learner passes the 70% criterion of the specific scores. 3) The students’ opinion
towards the constructivist flipped classroom was divided into 3 aspects. They were 1) the
contents can be supported concept formation of the learners, 2) characteristic of constructivist
flipped classroom was designed for helping learners to easily for learning about in classroom and out of the classroom, 3) the constructivist flipped classroom supported and encouraging
learners to enhancing knowledge construction and creative thinking; fluency, flexibility,
originality and elaboration.
Keywords: Constructivist Learning, Flipped Classroom, Creative Thinking
1. Introduction
A flipped classroom is a classroom that swaps the arrangement of knowledge imparting and knowledge internalization comparing to traditional classroom. In the flipped classroom, the roles of teachers and students have been changed and the class time should have a new plan. Information technology and task of learning construct an individuation and cooperative learning environment for learners to create new learning culture (Zhang,Wang & Zhang, 2012). Based on the analysis of literature of flipped classroom
and some typical cases, we design and development of a flipped classroom based on constructivist learning theory. We also describe the challenges in the implementation of the flipped classroom teaching with learning environment. The paper provides an innovative way to reform teaching in Thailand high schools.
Flipped Learning is particularly well-suited into school settings for a variety of reasons. The in-class discussion and enrichment activities allowed by moving content delivery outside of class time provide opportunities for students to develop vital skills needed in the 21st century, focus on creative thinking (Guilford, 1967) consisted of 4 abilities of thinking as follows: Fluency, Flexibility, Originality and
Elaboration.
660660660
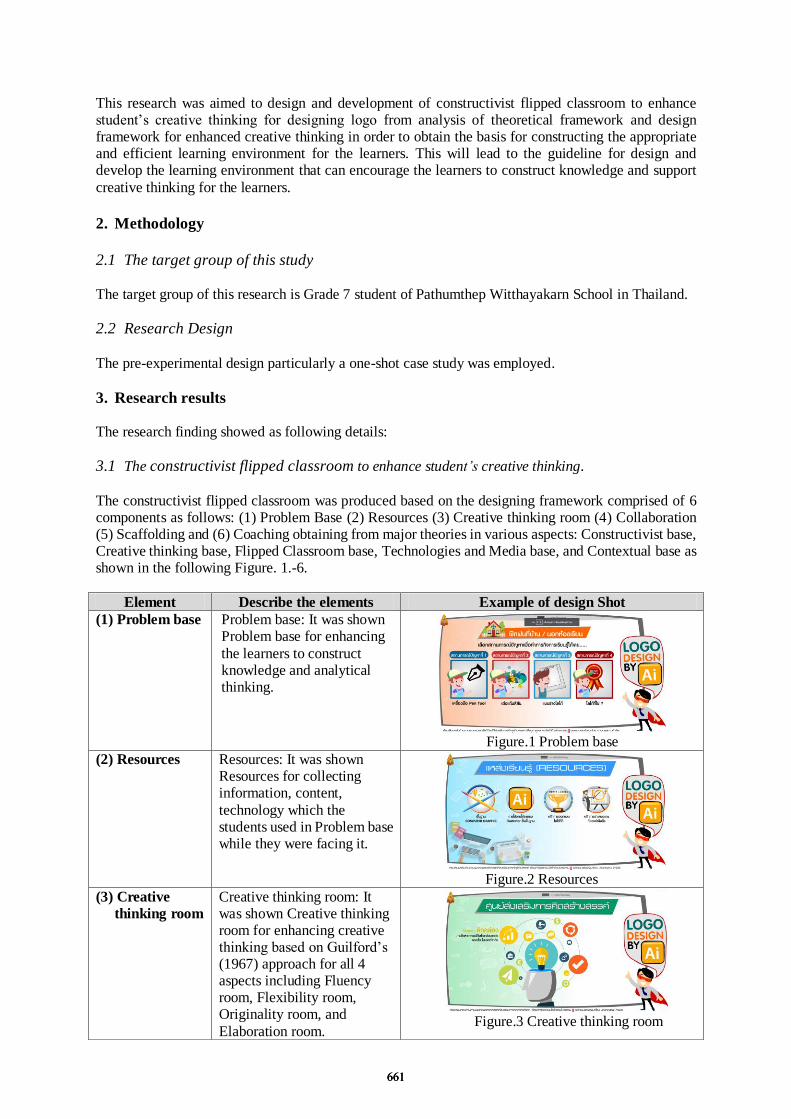
This research was aimed to design and development of constructivist flipped classroom to enhance student’s creative thinking for designing logo from analysis of theoretical framework and design framework for enhanced creative thinking in order to obtain the basis for constructing the appropriate and efficient learning environment for the learners. This will lead to the guideline for design and develop the learning environment that can encourage the learners to construct knowledge and support
creative thinking for the learners.
2. Methodology
2.1 The target group of this study
The target group of this research is Grade 7 student of Pathumthep Witthayakarn School in Thailand.
2.2 Research Design
The pre-experimental design particularly a one-shot case study was employed.
3. Research results
The research finding showed as following details:
3.1 The constructivist flipped classroom to enhance student’s creative thinking.
The constructivist flipped classroom was produced based on the designing framework comprised of 6 components as follows: (1) Problem Base (2) Resources (3) Creative thinking room (4) Collaboration (5) Scaffolding and (6) Coaching obtaining from major theories in various aspects: Constructivist base,Creative thinking base, Flipped Classroom base, Technologies and Media base, and Contextual base asshown in the following Figure. 1.-6.
Element Describe the elements Example of design Shot
(1) Problem base Problem base: It was shown Problem base for enhancing
the learners to construct knowledge and analytical thinking.
Figure.1 Problem base
(2) Resources Resources: It was shown Resources for collecting information, content,
technology which the students used in Problem base while they were facing it.
Figure.2 Resources
(3) Creative
thinking room
Creative thinking room: It was shown Creative thinking room for enhancing creative thinking based on Guilford’s (1967) approach for all 4 aspects including Fluency room, Flexibility room, Originality room, and
Elaboration room. Figure.3 Creative thinking room
661661661

Element Describe the elements Example of design Shot
(4) Collaboration Collaboration: It was shown Collaboration for supporting the students to share their experience with experts on logo design with Adobe Illustrator CS6 through
Facebook for expanding their multiple perspectives. Figure.4 Collaboration
(5) Scaffolding Scaffolding: It was shown Scaffolding for enhancing students to solve problems or learning in case that they couldn’t be able to do their own task by themselves.
Figure.5 Scaffolding
(6) Coaching Coaching: It was shown
Coaching by teachers and experts on logo design with Adobe Illustrator CS6 with best practice.
Figure.6 Coaching
3.2 The students’ creative thinking.
The results revealed that: The four kinds of abilities of the students’ creative thinking (Guilford, 1967) were found as follows: 1) Fluency that they can think of the answer quickly in limit time and variety of answers, 2) Flexibility that they can find various kinds of answers freely and they can apply and adapt them to be useful for problem solving and increasing fluency to be new and different invented things, 3) Originality that they can think with new and different from general thinking by applying priorknowledge and adapting it as new things, and 4) Elaboration that they can widely and farther expand
their thinking that they got used to practice such as their thinking in detail for decorating and expanding
their main idea to obtain a more complete. The creative thinking was found from the creative thinking
test form ( X = 31.59 and S.D. = 1.67) that every learner passes the 70% criterion of the specific scores.
3.3 The students’ opinion towards the constructivist flipped classroom.
The results revealed that: The students’ opinion towards the constructivist flipped classroom was divided into 3 aspects. They were 1) the contents can be supported concept formation of the learners,
2) characteristic of constructivist flipped classroom was designed for helping learners to easily forlearning about in classroom and out of the classroom, 3) the constructivist flipped classroom supportedand encouraging learners to enhancing knowledge construction and creative thinking.
Acknowledgements
This work was supported by the Academic and Research Affairs, Innovation and Cognitive Technology Research Group, Faculty of Education, and the Research and Technology Transfers Affairs Division, Faculty of Education, Khon Kaen University.
References
Guilford. (1967). The Nature of Human Intelligence. New York: McGraw-Hill BookCompany
Zhang Jinlei,Wang Ying & Zhang Baohui. (2012). Introducing a New Teaching Model:Flipped Classroom. Journal
of Distance Education. Tsinghua: Tongfang Knowledge Network Technology.
662662662
Author Index
AA, Parkavi 143A, Satheesh 143Agapito, Jenilyn 218, 259Akpan, Imaikop 13Albert, Dietrich 650Alissandrakis, Aris 206, 370Antin, Lakshmi 360Apte, Varsha 284Armstrong, Edward 647Arofah, Desah 125Arroyo, Ivon 218Awasekar, Dipali 119BBaloian, Nelson 344Beeck, Oliver 567Beh, Min Yan 386Bellamine, Narjes 555Biswas, Gautam 561Boonkerd, Jarukit 350Boticki, Ivica 177Buranarach, Marut 432CC.Senan, Divya 290Cai, Su 279Caluya, Nicko 259Casano, Jonathan 218Chaabouni, Mariem 488Chachoua, Soraya 451Chaikajornwat, Ratchapon 350Chan, Hwee Leng 504CHAN, Tak-Wai 198, 248Chang, Ben 469Chang, Chia-Jung 545Chang, Chih-Kai 174Chang, Chih-Kang 545Chang, Liu 131Chang, Ming-Hua 545Chang, Wan-Chen 198, 248Chang, Wei 190Chao, Po-Yao 545Chaurasia, Sushil 554
663663
Chen Hsieh, Jun Scott 203Chen, Nian-Shing 190Chen, Weiqin 392Chen, Xingliang 653Cheng, Hercy 128Cheng, Ya-Wen 190Cheok, Mei Lick 1Cheung, Kelvin 149Chiu, Bing-Cheng 545Chongphaisal, Pornpimol 137Choquet, Christophe 488Churcher, Neville 647DDalte, Olha 171Danahy, Ethan 570Dansarki, Dauda Isiyaku 7De Jong, Jill 611Derry, Sharon 510Dickes, Amanda 580Dimitrova, Vania 402Disney, Leigh 234Diy, Walfrido David 259Dol, Sunita 366Du, Jiazhi 608EEranki, Kiran L.N. 284Estraillier, Pascal 451FFan Chiang, Shih-Hsun 545Fang, Wei-Chieh 190Farris, Amy 580Fernando, Shantha 472Fujiki, Takashi 306Fujioka, Ryota 51Furukubo, Kazutoshi 637GGamage, Dilrukshi 472Ganguly, Sohinee 284Gao, Ming 435Geng, Gretchen 234Goh, Jesmine 19Goldberg, Benjamin S. 561Gong, Wei 369Gottipati, Swapna 386Gu, Xiaoqing 90, 171, 256, 369, 510
664664
Guan, Jueqi 309Guo, Wei 90Gupta, Diali 224, 526HH. G., Manasa 360Hajjami Ben Ghezala, Henda 488, 555Halkude, Shashikant 119Hannon, Daniel 570Hayashi, Yuki 667, 678Hayashi, Yusuke 494, 619, 637, 664He, Sujin 168Herault, Romain Christian 206Hew, Khe Foon 41Hirashima, Tsukasa 463, 494, 619, 637, 664Hirokawa, Sachio 326, 422Hoel, Tore 392Hong, Helen 504Hong, Hun-Gi 536Hoppe, Ulrich 370, 551Hori, Masahiro 77HSU, Chi-Yang 198Hsu, Ting-Chia 177Hu, Sichang 510Hussin, Munir 504Hwang, Fu-Kwun 545IIguchi, Keisuke 243Ikeda, Mitsuru 77, 667Itoh, Yukihiro 51, 380, 457, 485, 661Iyer, Sridhar 61JJansen, Marc 320, 344Jia, Jinyuan 131Jiang, Bo 435Jong, Morris 149Jouault, Corentin 678KK. M., Darshan 675Kaewyoun, Suchada 212Kampira, Kridsana 155Kasai, Toshinobu 628Kasi, Ganga 570Kawai, Junya 243Kawashima, Hiroyuki 187Kenkre, Anura 516
665665
Khan, Khalid 113Khrutthaka, Chonlada 350Kim, Beaumie 224, 526Kimura, Hiroaki 187Kitamura, Takuya 664Kitazawa, Takeshi 101Kiyota, Mahiro 296, 332Kogure, Satoru 51, 380, 457, 485, 661Koh, Elizabeth 504Kohda, Youji 137Kohen-Vacs, Dan 320Kojima, Kentaro 270Kondo, Makoto 661Kong, Siu Cheung 29, 35, 104, 265Konishi, Tatsuhiro 51, 380, 457, 485, 661Kothari, Pranav 542Kumamoto, Etsuko 326Kumar Bhowmick, Plaban 412, 441Kumar, Viraj 360, 675Kurata, Shin 306Kussmaul, Clifton 240LLai, Chia-Hsi 545Laroussi, Mona 488Lau, Lydia 402Le, Nguyen-Thinh 567Lee, Chang Youn 536Leng, Jing 171Li, Chunrong 608Li, Ping 29, 265Li, Shuhui 279Liao, Chang-Yen 198, 248Limsukhawat, Sirimon 212Lin, Li-Chun 190Lin, Yi-Hsuan 475Liu, Bowen 265Liu, Chen-Chung 545Liu, Enrui 279Liu, San-Ya 128Liu, Zhi 128Lo, David 386Lo, Sing Kai 265Looi, Chee-Kit 19Lu, Weigang 608Luk, Eric 149
666666
MMaeda, Kazushige 637Maeda, Keisuke 664Maeprasart, Vittunyuta 350Mahmud, Rosnaini 1Majumdar, Rwitajit 71Malki, Jamal 451Malzahn, Nils 370, 551Martinez, Joshua 590Mas Nida, Md. Khambari 7Mason, Jon 113, 234Mathews, Moffat 611, 647, 653Matsui, Tatsunori 673Maurer, Matthias 650Mavinkurve, Madhuri 95Miao, Yongwu 158Milrad, Marcelo 320, 344, 370Mistry, Roohshad 119Mitrovic, Antonija 402, 611, 653Mitsuhara, Hiroyuki 243Miyagishima, Kenta 661Mizoguchi, Riichiro 622, 628Mohd Ayub, Ahmad Fauzi 1, 7Morita, Yusuke 101Moudgalya, Kannan 284Mouri, Kousuke 296, 332Mukoyama, Shinji 422Murota, Masao 306Murthy, Sahana 61, 516Müller, Maximilian 370NNa Chai, Wasan 432Nadolski, Rob 650Nagahama, Toru 101Nagano, Kazuo 628Narayana, Soumya 95Nirgude, Manisha 119Noguchi, Yasuhiro 51, 380, 457, 485, 661Nussbaumer, Alexander 650OObispo, Jun Rangie 590Ogata, Hiroaki 270, 296, 332Ogata, Hiroyuki 422Oi, Misato 270Okubo, Fumiya 270
667667

Osawa, Ryota 380Ouamani, Fadoua 555PPailai, Jaruwat 619Pang, Alexis 338Panyajamorn, Titie 137Park, Chulkyu 536Park, Yuhyun 19Patil, Mahesh 95Peng, Zhongya 90Perera, Indika 472Pholasa, Priew 110Piau-Toffolon, Claudine 488Puranik, Kavitha 360Purwanto, Sigid Edy 125QQian, Dongming 309Qiu, Kai 158RRawat, Nidhi 134Rodrigo, Ma. Mercedes T. 218, 259, 590, 598Roy, Subhayan 412Ruangrajitpakorn, Taneth 432SS.Nair, Udaysankar 290Sahasrabudhe, Sameer 71Sahu, Archana 441Samat, Charuni 87, 110, 155Sato, Kazunori 315Savard, Isabelle 622Saxena, Anika 41Schneegaß, Christina 370, 551Sengupta, Pratim 580Seta, Kazuhisa 667, 678Setozaki, Norio 101, 315, 539Shankararaman, Venky 386Shen, Lingliang 309Shen, Yihua 279Shibani, Antonette 504Shih, Yen-An 469Shimada, Atsushi 270Shishibori, Masami 243Shukla, Nishchal 542Smith, Sue 113Sonoda, Miku 77
668668
Sottilare, Robert A. 561Steiner, Christina M. 650Sun, Jian-Wen 128Sun, Yanyan 309Supianto, Ahmad Afif 494Supnithi, Thepchai 137, 432Suzuki, Satoshi V. 422TTabanao, Emily 598Tajiri, Keisuke 101, 539Talandron, May Marie 590Tamani, Nouredine 451Tan, Jennifer Pei-Ling 504Tanaka, Koji 77Tawatsuji, Yoshimasa 673Tay, Kian Leng 504Tee, Yi-Huan 504Tezuka, Daiki 485Tscholl, Michael 561Tsurayya, Ayu 125UUanhoro, James O. 475Uehara, Ryo 422Uosaki, Noriko 296, 326, 332Uyouko, Arit 13VVeroy, Astrid 570Vidal, Eric Cesar E. Jr. 259WWang, Disi 158Wang, Peiwen 279Warriem, Jayakrishnan 61Weatherley, Anthony 338Weerasinghe, Amali 402Wen, Cai-Ting 545Wong, Lung-Hsiang 177Wong, Su 13Wong, Su Luan 1, 7Wongchiranuwat, Sathaporn 87Wongta, Jintana 212, 350Wongwatkit, Charoenchai 212, 350Wu, Lijie 256Wu, Longkai 19, 168Wu, Su-Wen 545Wu, Wen-Chi Vivian 203
669669
Wu, Ying-Tien 545Wunnasri, Warunya 619XXiang, Li 158Xie, Ning 131Xue, Yaofeng 90YYamada, Masanori 270Yamamoto, Raiya 457Yamamoto, Sho 463, 637Yamanaka, Akira 664Yamashita, Koichi 51, 380, 457, 485Yan, Jane Yin-Kim 326Yang, Jie Chi 203Yasuda, Keiji 187Yeh, Hsin-Yu 174Yin, Chengjiu 326Ying, Lisa 158Young, Shelley Shwu-Ching 475Yu, Fu-Yun 548Yu, Haibo 608ZZbick, Janosch 344Zheng, Yaqian 608Zurita, Gustavo 344
670670