IBM CICS Performance Analyzer for z/OS: Report Reference
394
IBM CICS Performance Analyzer for z/OS Report Reference Version 3 Release 2 SC34-7154-00
-
Upload
khangminh22 -
Category
Documents
-
view
0 -
download
0
Transcript of IBM CICS Performance Analyzer for z/OS: Report Reference

IBM CICS Performance Analyzer for z/OS
Report ReferenceVersion 3 Release 2
SC34-7154-00
���


IBM CICS Performance Analyzer for z/OS
Report ReferenceVersion 3 Release 2
SC34-7154-00
���

NoteBefore using this information and the product it supports, read the information in “Notices” on page 361.
This edition applies to Version 3 Release 2 of IBM CICS Performance Analyzer for z/OS (product number 5655-U87)and to all subsequent releases and modifications until otherwise indicated in new editions.
This edition replaces SC34-7047-04. The technical changes for this edition are summarized under “Summary ofchanges” on page xi and are indicated by a vertical bar in the left margin.
© Copyright IBM Corporation 2001, 2010.US Government Users Restricted Rights – Use, duplication or disclosure restricted by GSA ADP Schedule Contractwith IBM Corp.
© Fundi Software 2001, 2010

Contents
About this book . . . . . . . . . . . viiWho should read this book . . . . . . . . . viiConventions used in this book . . . . . . . . vii
Highlighting conventions. . . . . . . . . viiCommand syntax notational conventions . . . vii$ (the dollar symbol) . . . . . . . . . . viii
Terminology used in this book. . . . . . . . viiiService updates and support information . . . . ixWhere to find information . . . . . . . . . ixAccessibility . . . . . . . . . . . . . . ix
Summary of changes. . . . . . . . . xiDecember 2010: CICS PA V3.2 . . . . . . . . xiPrevious changes . . . . . . . . . . . . xii
April 2010: updates to V3.1 for PerformanceAlerts . . . . . . . . . . . . . . . xiiOctober 2009: updates to V3.1 . . . . . . . xiiiAugust 2009: updates to V3.1 . . . . . . . xiiiMay 2009: CICS PA V3.1 . . . . . . . . xiv
Part 1. Introduction to CICS PA . . . 1
Chapter 1. Introduction . . . . . . . . 3What is CICS PA? . . . . . . . . . . . . 3Data input . . . . . . . . . . . . . . . 4CICS PA reports and extracts . . . . . . . . . 5
Performance reports . . . . . . . . . . . 6Exception reports . . . . . . . . . . . . 7Transaction Resource Usage reports. . . . . . 7Statistics reports . . . . . . . . . . . . 8Subsystem reports . . . . . . . . . . . 8System reports. . . . . . . . . . . . . 9Performance Graph reports . . . . . . . . 9Extracts. . . . . . . . . . . . . . . 10
CICS PA concepts . . . . . . . . . . . . 11CICS PA Primary Option Menu . . . . . . 11CICS PA Profile . . . . . . . . . . . . 12System Definitions . . . . . . . . . . . 13Report Sets . . . . . . . . . . . . . 14Report Forms. . . . . . . . . . . . . 15Object Lists and Resource Lists . . . . . . . 15Historical Database . . . . . . . . . . . 15Statistics reporting . . . . . . . . . . . 16
Part 2. Report Set reports andextracts . . . . . . . . . . . . . . 17
Chapter 2. Performance reports . . . . 19Performance List report . . . . . . . . . . 19
Report command . . . . . . . . . . . 19Report content . . . . . . . . . . . . 20
Performance List Extended report . . . . . . . 28Report command . . . . . . . . . . . 28
Report content . . . . . . . . . . . . 29Performance Summary report . . . . . . . . 35
Report command . . . . . . . . . . . 35Report content . . . . . . . . . . . . 37
Performance Totals report . . . . . . . . . 47Report command . . . . . . . . . . . 48Report content . . . . . . . . . . . . 48
Wait Analysis report . . . . . . . . . . . 54Report command . . . . . . . . . . . 54Report content . . . . . . . . . . . . 55
Transaction Profiling report . . . . . . . . . 64Report command . . . . . . . . . . . 64Report content . . . . . . . . . . . . 66
Cross-System Work report . . . . . . . . . 66Report command . . . . . . . . . . . 67Report content . . . . . . . . . . . . 67Required CMF fields . . . . . . . . . . 72
Transaction Group report . . . . . . . . . . 73Report command . . . . . . . . . . . 73Report content . . . . . . . . . . . . 73Required CMF fields . . . . . . . . . . 79
BTS report . . . . . . . . . . . . . . . 80Report command . . . . . . . . . . . 80Report content . . . . . . . . . . . . 81Required CMF fields . . . . . . . . . . 84
Workload Activity report . . . . . . . . . . 84Report command . . . . . . . . . . . 85Report content . . . . . . . . . . . . 85Required CMF fields . . . . . . . . . . 91
Chapter 3. Exception reports . . . . . 93Exception List report . . . . . . . . . . . 93
Report command . . . . . . . . . . . 93Report content . . . . . . . . . . . . 93
Exception Summary report . . . . . . . . . 96Report command . . . . . . . . . . . 97Report content . . . . . . . . . . . . 97
Chapter 4. Transaction Resource Usagereports. . . . . . . . . . . . . . . 99File Usage Summary report . . . . . . . . . 99
Report command . . . . . . . . . . . 99Report content . . . . . . . . . . . . 100
Temporary Storage Usage Summary report . . . 102Report command . . . . . . . . . . . 103Report content . . . . . . . . . . . . 103
Distributed Program Link Usage Summary report 106Report command . . . . . . . . . . . 107Report content . . . . . . . . . . . . 107
Transaction Resource Usage List report . . . . . 109Report command . . . . . . . . . . . 110Report content . . . . . . . . . . . . 110
Chapter 5. Statistics reports . . . . . 119Statistics Alert reports . . . . . . . . . . 119
© Copyright IBM Corp. 2001, 2010 iii
||

Report command . . . . . . . . . . . 119Report content . . . . . . . . . . . . 120
Chapter 6. Subsystem reports . . . . 127DB2 report . . . . . . . . . . . . . . 127
Report command . . . . . . . . . . . 127Report content . . . . . . . . . . . . 128Required CMF fields . . . . . . . . . . 142How CICS PA builds the DB2 report . . . . 143
WebSphere MQ report . . . . . . . . . . 145WebSphere MQ accounting traces . . . . . 145Report command . . . . . . . . . . . 146Report content MQ Class 1 . . . . . . . . 147Report content MQ Class 3 . . . . . . . . 150
OMEGAMON reports . . . . . . . . . . 164Report command . . . . . . . . . . . 164Report content . . . . . . . . . . . . 165
Chapter 7. System reports . . . . . . 177System Logger report. . . . . . . . . . . 177
Report command . . . . . . . . . . . 177Report content . . . . . . . . . . . . 178
Chapter 8. Performance Graph reports 185Report command . . . . . . . . . . . . 185Report content . . . . . . . . . . . . . 186
Transaction Rate Graph report . . . . . . . 187Transaction Response Time Graph report . . . 187
Chapter 9. Extracts . . . . . . . . . 189Cross-System Work extract . . . . . . . . . 189
Extract command . . . . . . . . . . . 190Required CMF fields . . . . . . . . . . 190How CICS PA creates Cross-System records . . 191Cross-System Extract record format . . . . . 196
Performance Data extract . . . . . . . . . 197Extract command . . . . . . . . . . . 197Performance Data Extract record format . . . 198Importing into Lotus 1-2-3 . . . . . . . . 201Importing into Lotus Approach . . . . . . 201
Record Selection extract . . . . . . . . . . 201Extract command . . . . . . . . . . . 202Extract format . . . . . . . . . . . . 202Recap report. . . . . . . . . . . . . 203
HDB Load . . . . . . . . . . . . . . 205HDB Load command . . . . . . . . . . 205HDB format . . . . . . . . . . . . . 205Recap report. . . . . . . . . . . . . 205
System Logger extract . . . . . . . . . . 206Extract command . . . . . . . . . . . 206Extract content . . . . . . . . . . . . 206
Statistics extract . . . . . . . . . . . . 208Extract command . . . . . . . . . . . 208
Chapter 10. End of processing reports 211Dispatcher Tables Summary report . . . . . . 211
Report command . . . . . . . . . . . 211Report content . . . . . . . . . . . . 211
End of File Record Counts report. . . . . . . 212Report command . . . . . . . . . . . 212
Report content . . . . . . . . . . . . 212
Part 3. Historical Database reportsand extracts . . . . . . . . . . . 215
Chapter 11. Historical Database (HDB) 217HDB Load . . . . . . . . . . . . . . 218
HDB Load command . . . . . . . . . . 218HDB Load Recap report . . . . . . . . . 219
Performance HDB Reporting . . . . . . . . 219HDB Report command . . . . . . . . . 219HDB List report . . . . . . . . . . . 220HDB Summary report . . . . . . . . . 221
Statistics HDB Reporting . . . . . . . . . 222Statistics Alert HDB Reporting . . . . . . 222
HDB Export . . . . . . . . . . . . . . 223HDB Extract. . . . . . . . . . . . . . 223
HDB Extract command . . . . . . . . . 223HDB Extract record format . . . . . . . . 225HDB Extract Recap report . . . . . . . . 225
HDB Housekeeping . . . . . . . . . . . 226HDB Housekeeping command . . . . . . 226HDB Housekeeping report . . . . . . . . 226
Manifest Build . . . . . . . . . . . . . 227Manifest Build command . . . . . . . . 227Manifest Build Recap report . . . . . . . 227
Part 4. Statistics reporting usingthe dialog . . . . . . . . . . . . 229
Chapter 12. Statistics reporting usingthe dialog . . . . . . . . . . . . . 231Statistics intervals . . . . . . . . . . . . 232Statistics categories and reports . . . . . . . 232Label reports for global statistics . . . . . . . 236Tabular reports for resource statistics . . . . . 236Statistics Report Form . . . . . . . . . . 237
Statistics field help . . . . . . . . . . 238
Part 5. CICS-related SMF data . . . 239
Chapter 13. Shared SystemDefinitions . . . . . . . . . . . . 241Take-up from SMF Files . . . . . . . . . . 241
Chapter 14. Understanding CMF data 245CMF performance class data fields . . . . . . 245
DFHAPPL fields . . . . . . . . . . . 245DFHCBTS fields . . . . . . . . . . . 246DFHCHNL fields . . . . . . . . . . . 248DFHCICS fields . . . . . . . . . . . 249DFHDATA fields . . . . . . . . . . . 253DFHDEST fields . . . . . . . . . . . 255DFHDOCH fields . . . . . . . . . . . 255DFHEJBS fields. . . . . . . . . . . . 256DFHFEPI fields. . . . . . . . . . . . 256DFHFILE fields. . . . . . . . . . . . 257
iv IBM CICS Performance Analyzer for z/OS: Report Reference
||||||

DFHJOUR fields . . . . . . . . . . . 259DFHMAPP fields . . . . . . . . . . . 259DFHPROG fields . . . . . . . . . . . 259DFHRMI fields . . . . . . . . . . . . 262DFHSOCK fields . . . . . . . . . . . 263DFHSTOR user storage fields . . . . . . . 265DFHSTOR shared storage fields . . . . . . 266DFHSTOR program storage fields . . . . . 266DFHSYNC fields . . . . . . . . . . . 267DFHTASK fields . . . . . . . . . . . 268DFHTEMP fields . . . . . . . . . . . 286DFHTERM fields . . . . . . . . . . . 287DFHWEBB fields . . . . . . . . . . . 291Interpreting performance class data . . . . . 294Correlating performance class data . . . . . 307Correlating by network unit-of-work ID . . . 307Correlating by network unit-of-work ID andDB2 accounting token . . . . . . . . . 307Correlating by transaction group ID . . . . . 308Correlating by CICS BTS process ID (rootactivity ID) . . . . . . . . . . . . . 308CICS Web support. . . . . . . . . . . 309CICS TCP/IP support . . . . . . . . . 310
CMF exception class data fields . . . . . . . 310CMF transaction resource class data fields . . . . 316
Task identification fields. . . . . . . . . 317File entry fields. . . . . . . . . . . . 320Temporary storage queue entry fields . . . . 321DPL entry fields . . . . . . . . . . . 322
Part 6. Reference . . . . . . . . . 325
Chapter 15. CMF Field IDs by CICSversion . . . . . . . . . . . . . . 327
Chapter 16. CICS PA field names byCICS version . . . . . . . . . . . 337
Chapter 17. Fields by forms, HDBtemplates . . . . . . . . . . . . . 347
Chapter 18. CICS PA-specific fields 357
Part 7. Appendixes . . . . . . . . 359
Notices . . . . . . . . . . . . . . 361
Trademarks . . . . . . . . . . . . 363
Bibliography. . . . . . . . . . . . 365CICS Performance Analyzer books . . . . . . 365Books from related libraries . . . . . . . . 365
Index . . . . . . . . . . . . . . . 367
Contents v

vi IBM CICS Performance Analyzer for z/OS: Report Reference

About this book
This book contains information for IBM® CICS® Performance Analyzer for z/OS®
Version 3 Release 2.
CICS Performance Analyzer for z/OS is a reporting tool for analyzing and tuningthe performance of CICS systems. In this book, CICS Performance Analyzer forz/OS is referred to by its short name of CICS Performance Analyzer or CICS PA,and CICS Transaction Server is referred to as CICS.
This book describes the reports and extracts that can be requested, what theycontain and how to use them. It also describes the System Management Facility(SMF) data that provides the input.
The following releases of CICS are supported:640 CICS Transaction Server for z/OS Version 3 Release 1650 CICS Transaction Server for z/OS Version 3 Release 2660 CICS Transaction Server for z/OS Version 4 Release 1
Who should read this bookThis book is intended for managers, database administrators, system programmers,and application programmers responsible for monitoring and improving theperformance of CICS systems. It assumes that you understand basic CICS conceptsand your installation's CICS systems. If you are new to MVS™, OS/390®, z/OS,DFSORT, or CICS, you might want to review the information in Bibliographybefore using this book and the CICS Performance Analyzer for z/OS.
Before you read this book, you need to have a good understanding of how CICSworks. This assumes familiarity with many of the books in the CICS TransactionServer for z/OS library. You will also need to have a good understanding of theCICS Monitoring Facility (CMF), which is described in the CICS Performance Guide.
Conventions used in this bookThis book uses the following conventions.
Highlighting conventionsThis book uses the following highlighting conventions:v Boldface type indicates dialog commands or user interface controls such as
names of fields or menu choices.v Monospace type indicates examples of text and batch commands that you enter
exactly as shown.v Italic type indicates variables that you should replace with a value. It is also used
to indicate book titles and to emphasize significant words.
Command syntax notational conventionsThe notational conventions used in this book to describe the syntax of CICS PAbatch commands are as follows:
© Copyright IBM Corp. 2001, 2010 vii

Use of symbolsThe levels of nesting in the syntax are separated by parentheses. When you enterthe commands, enter the following symbols exactly as they appear in the list:, comma- hyphen= equals. period: colon( ) parentheses
The following symbols are used to distinguish operands and command syntax. Donot enter them when you enter commands:
brackets [ ]mean that you can select one of the operands, but they can be omitted. Ifthe brackets are nested, the outermost operand (enclosed by one pair ofbrackets) is the highest level of nesting. That operand must be selected toselect the next lower-level operand nested within it, and so forth.
underscore ______denotes a default option. If you don't specify an operand, this is theoperand the system selects.
vertical bar |separates operand alternatives within brackets.
Use of caseUppercase letters represent information that you must enter as shown. Someoperands can be abbreviated. The letters that must be used are in uppercase. Thesubsequent letters in lowercase can be omitted. For example, you can enter theoperand CROSSsystem either as a full word or abbreviated. The uppercase lettersCROSS are the shortest truncation that CICS PA accepts.
Lowercase letters represent variable information that you supply, such as starttime, owner, delimiter, DDname, and so on. For example, OUTPUT(ddname) showsthat the OUTPUT operand requires a DDname parameter.
$ (the dollar symbol)In the character sets given in this book, the dollar symbol ($) is used as a nationalcurrency symbol and is assumed to be assigned the EBCDIC code point X'5B'. Insome countries a different currency symbol, for example the pound symbol (£), orthe yen symbol (¥), is assigned the same EBCDIC code point. In these countries,the appropriate currency symbol should be used instead of the dollar symbol.
Terminology used in this bookIn this book, CICS Performance Analyzer for z/OS is referred to by its short nameof CICS Performance Analyzer or the abbreviation CICS PA, and CICS TransactionServer for z/OS is referred to as CICS TS.
CICS PA can produce various types of output, including reports (text or numericdata formatted for human readers), graphs (also for human readers), and extracts(data intended for use by other software applications). These outputs are oftenreferred to collectively as “reports”.
Much of the terminology in this book is based on CICS terminology. See CICSTransaction Server for OS/390: Glossary, GC33-1705.
viii IBM CICS Performance Analyzer for z/OS: Report Reference

The following Web site consolidates in one convenient location several of the mainglossaries created for IBM products, including the Glossary of Computing Terms:
http://www.ibm.com/ibm/terminology/
Service updates and support informationTo find service updates and support information, including software FixPaks, PTFs,Frequently Asked Question (FAQs), technical notes, troubleshooting information,and downloads, see the following Web page:
www.ibm.com/cics/support
Where to find informationThe CICS Library Web page provides current product documentation and IBMRedbooks® that you can view, print, and download. To locate publications with themost up-to-date information, see the following Web page:
www.ibm.com/cics/library
AccessibilityAccessibility features help a user who has a physical disability, such as restrictedmobility or limited vision, to use software products successfully.
You can perform most tasks required to set up, run, and maintain your CICSsystem in one of these ways:v using a 3270 emulator logged on to CICSv using a 3270 emulator logged on to TSOv using a 3270 emulator as an MVS system console
IBM Personal Communications provides 3270 emulation with accessibility featuresfor people with disabilities. You can use this product to provide the accessibilityfeatures you need in your CICS system.
About this book ix

x IBM CICS Performance Analyzer for z/OS: Report Reference

Summary of changes
Significant changes in this edition are summarized here, and marked by a verticalbar in the left margin.
December 2010: CICS PA V3.2CICS Performance Analyzer for z/OS, V3.2 includes the following features andchanges:
New CICS TS and CICS TG statistics data available through CICS Explorer™
In addition to the current Explorer Summary table, the CICS PA plug-in forCICS Explorer can now source CICS Statistics and Statistics Alerts data.The additional data is made available through the following facilities:v New fields in the HDB definition: Explorer, a flag to identify HDBs
intended for the CICS PA plug-in, and Qualifier, used to associaterelated HDBs/DB2 tables.
v Use of a report set or the HDB Load dialog to load the required datainto the associated HDBs and also to load the HDB updates into theirassociated DB2® tables.
v The manifest, which is a catalog of HDBs that are associated with aqualifier and for which the Explorer indicator is set.
Capture statistics alerts in HDBStatistics Alert reporting enables you to report on the statistics that matchspecified conditions. CICS PA now supports specifying an alert definitionin the statistics HDB definition. You select the required Statistics reports tobe collected in this HDB. When a CICS TS or CICS TG alert report isactivated to collect in this HDB, you can use a new line action called AO(Activate Alert-only collection) to collect only the reports that related tothis Alert. “Alert only” reports are only collected if Alert is triggered.
You can collect records that trigger alert conditions in the CICS TS andCICS TG Alert reports, or restrict existing reports to only those recordswhich triggered alert conditions, or you can do both. Where both the alertand the original report record are collected you can hyperlink betweenthem by use of a PF key.
Output batch reports as Portable Document Format (PDF) filesYou can use the new z/OS UNIX utility sysout2pdf that converts plain textbatch reports generated by CICS Performance Analyzer for z/OS intoAdobe Portable Document Format (PDF) files. You can write plug-in filtersfor sysout2pdf to manipulate the report contents, highlight text, or addPDF navigation features such as bookmarks. You can also use sysout2pdfto e-mail the PDF.
Documentation update: New CICS PA Getting Started GuideThe Getting Started Guide, SC34-7155-00, is a new publication intended tohelp new users to understand the main CICS PA concepts and to becomeproductive with the ISPF dialog interface and generating CICS PA reports.
Support for CICS Transaction Gateway V8.0CICS PA supports SMF 111 records generated by CICS TransactionGateway for z/OS V8.0, which is known by CICS PA as CICS TG VRM800.
© Copyright IBM Corp. 2001, 2010 xi
|
||
||||
|||
|||
||
||||||||
|||||
|||||||
||||
||||

Dropping support for CICS Transaction Server V2.2 and V2.3CICS PA has dropped support for SMF records created by CICS TS V2.2and V2.3. CICS PA V3.2 supports CICS TS V3.1 and later. Historical datafrom CICS TS V2.2 systems is still supported.
CICS PA V3.2 includes all new features that were introduced in CICS PA V3.1through service updates. For details, see “Previous changes.”
Previous changesThis section outlines what was new and changed in previous editions.
April 2010: updates to V3.1 for Performance AlertsAPAR PM04580 introduces Performance Alerts in CICS Performance Analyzer forz/OS V3.1, and includes the following new features and changes:
Performance AlertsAllow you to compare CICS transaction performance against user-definedlevels of acceptable performance. A Performance Alert Definition specifiesa list of CICS resources to be monitored or managed, together withthresholds that benchmark expected levels of performance. The reportsapply to CMF data only. You can report Performance Alerts in variousways:v By Transaction. The Performance List report has been enhanced to list all
transactions that have triggered one or more alerts. It can also be analert-specific report by reporting only those transactions that generate analert.
v By Transaction Summary. The Performance Summary report has beenenhanced to provide the total or percentage of transactions that havetriggered alerts.
Resource DefinitionsPrimary menu option 9 now invokes the Resource Definitions menu. Itincludes the two options previously available from the ApplicationGrouping menu which allowed you to define Resource Lists andApplication Groups. A third option has been added to allow you to definePerformance Alerts.
Copy alert definitionsYou can now copy definitions of Statistics Alerts and Performance Alerts tothe same or another repository.
Report FormsReport Forms have been enhanced to enable Performance Alert reportingwhile utilizing the flexibility of Forms. List and Summary Report Formsnow allow the SEV function for alert reporting fields. Existing List Formswill be automatically upgraded next time you edit them to include the newFn (Function) column required for the new alert SEV function. For SEVfields in the Summary Report Form, specify the alert severity level, INFO,WARNING or CRITICAL, and report type COUNT or PERCENT. Inaddition, the Summary Report Form supports the new ALERT field nameto provide total counts or percentages of transactions for each alert severityfor the summary key.
xii IBM CICS Performance Analyzer for z/OS: Report Reference
||||
||

Report SetsPerformance List and Summary report and extract specifications have beenenhanced to include predefined Performance Alerts to work together with,or instead of, Report Forms.
Also, you can request an interval-based Performance Summary report orextract to add or override the Form summary key fields without alteringthe underlying Report Form.
Sample JCLFour new JCL members are provided in the CICS PA sample library,SCPASAMP. The new sample jobs are CPAPALST, CPAPASUM,CPAPAXTL, and CPAPAXTS to request a List or Summary report or extractusing pre-defined Performance Alerts.
October 2009: updates to V3.1Contains updates for the following new feature introduced by APAR PK95922:
Extract CICS statistics to CSV files directly from SMF filesYou can now extract CICS statistics to delimited text files, such ascomma-separated value (CSV) files, directly from SMF files. You can thenuse these files with other applications, such as PC-based spreadsheets, forfurther processing. Previously, to extract statistics to delimited text files,you had to load the data from SMF files into a Statistics HDB, and thenextract the data from the HDB.
To extract CICS statistics from SMF files, select Report Sets from theCICS PA ISPF dialog primary option menu, and then select the newStatistics option from the Extracts category. The subsequent StatisticsExtract panels allow you to select the CICS statistics that you want toextract. These panels generate JCL containing the new CICSPA commandoperand EXTRACTSTATISTICS. For details, see “Statistics extract” on page208
The corresponding extract for performance data, previously known as theExport Extract, has been renamed to Performance Data Extract (or simplyPerformance Extract), to better distinguish it from the new StatisticsExtract. Similarly, Export in the Extracts category of a Report Set has beenrenamed to Performance. The CICSPA command operand EXPORT is stillsupported, but is now deprecated in favor of the new synonymEXTRACTPERFORMANCE.
August 2009: updates to V3.1Contains updates for fixes and new features introduced by APAR PK90007:
New Distributed Program Link (DPL) Usage Summary and List reportsCICS TS V4.1 introduces new transaction resource class data fields fordistributed program links (DPLs). CICS PA provides new DPL UsageSummary and List reports for these fields. For details, see Chapter 4,“Transaction Resource Usage reports,” on page 99.
Transaction Resource Usage List report: now includes originating transactionsIf the APPLID or the task number of a transaction, or both, do not matchits originating transaction, then the Task Identification section of theTransaction Resource Usage List report contains a second line thatdescribes the originating transaction. For details, see “Task identification”on page 112.
Summary of changes xiii

Record Selection extract: support for identity class dataCICS TS V4.1 introduces a new monitoring identity class data record (SMF110 subtype 1, class 6). You can now use CICS PA to extract these recordsfrom an SMF file, optionally compress them, and then save them toanother file for future processing.
Cross-System Work Extended report: support for unit-of-work post-processingPerformance Selection Criteria
The LISTX operand of the CICSPA batch command now supports theSELUOW suboperand. This means that you can now select the units ofwork that you want to include in a Cross-System Work Extended report.
Previously, if you used the CICS PA ISPF dialog to request a Cross-SystemWork Extended report (by specifying a Cross-System Work report with aReport Form), then CICS PA ignored any Performance Selection Criteriaunit-of-work post-processing that you might have specified. Similarly, ifyou wrote your own batch job to use the CICSPA LISTX operand toproduce a Cross-System Work Extended report, CICS PA ignored theSELUOW suboperand.
RECCOUNT field: now available in Performance Selection Criteria, and as a sortfield for LISTX
You can now use the field RECCOUNT (CICS field ID: PERRECNTDFHCICS A131) in Performance Selection Criteria. You can also now useRECCOUNT as a sort field in the List Extended report.
May 2009: CICS PA V3.1CICS Performance Analyzer for z/OS V3.1 includes the following features andchanges:
Statistics alert reportingStatistics alert reporting enables you to define conditions, in terms of CICSTransaction Server statistics or CICS Transaction Gateway statistics fieldvalues, that interest you. You can then use those conditions to report onstatistics stored in SMF files or historical databases. For details, see“Statistics Alert reports” on page 119.
Support for CICS Transaction Server V4.1All CICS PA reports, HDB, and the ISPF dialog support CICS TransactionServer for z/OS (CICS TS) V4.1, which is known by CICS PA as CICSVersion 660.
Support for CICS Transaction Gateway V7.2CICS PA support for CICS Transaction Gateway statistics (SMF type 111records) has been enhanced to support CICS Transaction Gateway V7.2.
Dropping support for CICS TS V1.3 and V2.1CICS PA has dropped support for SMF records created by CICS TS V1.3and V2.1. CICS PA V3.1 supports CICS TS V2.2 and later.
CICS PA plug-in sample report forms and DB2 view definitionTo create comma-separated value (CSV) files for use with the CICS PAplug-in for the CICS Explorer, use the sample summary report formEXPLORE3 (for CICS TS V3) or EXPLORE4 (for CICS TS V4). (EXPLORE3was already included in CICS PA V2.1 via the PTF for APAR PK71846.)
To create a DB2 view for use with the CICS PA plug-in, use memberCPAXPLRV of the CICS PA sample library (SCPASAMP).
xiv IBM CICS Performance Analyzer for z/OS: Report Reference

HDB Register data set name on Control Data Sets panelIn addition to the other panels where you can specify this data set name,you can now specify the HDB Register data set name on the CICS PAControl Data Sets panel (CICS PA dialog option 0.3).
z/OS V1.10 users: apply fix for DFSORT APAR PK80962Without this fix, DFSORT can produce system abend SA78-10 in CICS PA.
Terminology: “shared object lists” now “resource lists”Shared object lists, previously also known as “HDB object lists”, are nowknown as resource lists. Object lists, sometimes previously also known as“personal object lists”, remain as object lists.
Summary of changes xv

xvi IBM CICS Performance Analyzer for z/OS: Report Reference

Part 1. Introduction to CICS PA
The chapter in this part introduces you to CICS Performance Analyzer for z/OS(CICS PA) concepts and facilities. It describes the reports and extracts that can begenerated from Report Sets and the data that is used to produce them. It alsointroduces the Historical Database (HDB) facility which enables you to collect ahistory of CMF performance data, CICS and server statistics data, and CICSTransaction Gateway statistics data for reporting, DB2 export, and CSV extract. Thedialog facilities for reporting statistics are also introduced.
© Copyright IBM Corp. 2001, 2010 1

2 IBM CICS Performance Analyzer for z/OS: Report Reference

Chapter 1. Introduction
This chapter provides a brief introduction to CICS PA. It describes the reports andextracts that you can request and the types of data they process. It also describesthe fundamental concepts and facilities.
What is CICS PA?CICS Performance Analyzer for z/OS (CICS PA) is a reporting tool that providesinformation on the performance of your CICS systems and applications, and helpsyou tune, manage, and plan your CICS systems effectively. CICS PA also providesa historical database facility to help you manage CICS statistics and performancedata for your CICS transactions.
CICS PA is not an online monitoring tool. It produces reports and extracts usingdata normally collected by your system in MVS System Management Facility(SMF) data sets:v CICS Monitoring Facility (CMF) performance class, exception class, and
transaction resource class data in SMF 110 recordsv CICS statistics and server statistics data in SMF 110 recordsv CICS Transaction Gateway statistics data in SMF 111 recordsv DB2 accounting data in SMF 101 recordsv WebSphere® MQ accounting data in SMF 116 recordsv System Logger data in SMF 88 recordsv IBM Tivoli® OMEGAMON® XE for CICS on z/OS (OMEGAMON XE for CICS)
data in SMF 112 records, containing transaction data for Adabas, CA-Datacom,CA-IDMS, and Supra database management systems
It is designed to complement the CICS-supplied utilities and sample programssuch as DFH$MOLS, DFHSTUP, and DFH0STAT.
CICS PA can help:v System Programmers to track overall CICS system performance and evaluate the
results of their system tuning effortsv Application Programmers to analyze the performance of their applications and
the resources they usev Database Administrators to analyze the usage and performance of database
systems such as IMS™ and DB2v MQ Administrators to analyze the usage and performance of their WebSphere
MQ messaging systemsv Managers to ensure transactions are meeting their required Service Levels and
measure trends to help plan future requirements and strategies
CICS PA reports all aspects of CICS system activity and resource usage, including:v Transaction response timev CICS system resource usagev Cross-system performance, including multi-region operation (MRO) and
advanced program-to-program communication (APPC)v CICS Business Transaction Services (BTS)
© Copyright IBM Corp. 2001, 2010 3

v CICS Web supportv External subsystems, including DB2, IMS, and WebSphere MQv CICS transaction usage of database management systems that are monitored by
OMEGAMON XE for CICS: Adabas, CA-Datacom, CA-IDMS, and Suprav System Logger performancev Exception events that cause performance degradationv Transaction file and temporary storage usage
Data inputThe primary data source for CICS PA is the data collected by the CICS MonitoringFacility. CMF data is written to the MVS System Management Facility (SMF) dataset as SMF type 110 records, subtype 1.
There are three types, or “classes”, of CMF data analyzed by CICS PA:
CMF Performance class dataDetailed transaction-level information, such as the processor and elapsedtime for a transaction, or the time spent waiting for I/O.
CMF Exception class dataInformation about exceptional conditions suffered by a transaction, such asqueuing for file strings, or waiting for temporary storage. This datahighlights possible problems in system operation.
CMF Transaction resource class dataAdditional transaction-level information about individual resourcesaccessed by a transaction. Currently, the transaction resource class coversfile and temporary storage resources only.
Another major data source for CICS PA is:
CICS statistics and server statistics dataSMF type 110 records, subtypes 2, 3, 4, and 5.
CICS Transaction Gateway statisticsSMF type 111 records.
CICS PA also analyzes the following types of data:
DB2 accounting dataSMF type 101 records written by DB2 on behalf of CICS attached tasks.
WebSphere MQ accounting dataSMF type 116 records written by WebSphere MQ on behalf of CICSattached tasks.
System Logger dataSMF type 88 records written by the MVS System Logger on behalf of CICSTransaction Server journaling.
OMEGAMON XE for CICS dataSMF type 112 records written by OMEGAMON XE for CICS to log CICStransaction usage by the database management systems Adabas,CA-Datacom, CA-IDMS, and Supra.
The CICS PA Historical Database is a repository for CMF performance class data,CICS statistics and server statistics data, and CICS Transaction Gateway statisticsdata.
4 IBM CICS Performance Analyzer for z/OS: Report Reference

CICS PA reports and extractsCICS PA provides an ISPF menu-driven dialog to help you request and submityour reports and extracts. The available reports and extracts are grouped bycategory and briefly described below.v Performance Reports
ListList ExtendedSummaryTotalsWait AnalysisTransaction ProfilingCross-System WorkTransaction GroupBTSWorkload Activity
v Exception ReportsListSummary
v Transaction Resource Usage ReportsFile Usage SummaryTemporary Storage Usage SummaryDPL Usage SummaryTransaction Resource Usage List
v Statistics ReportsAlert
v Subsystem ReportsDB2WebSphere MQOMEGAMON
v System ReportsSystem Logger
v Performance GraphsTransaction RateTransaction Response Time
v ExtractsCross-System WorkPerformanceRecord SelectionHDB LoadSystem LoggerStatistics
The CICS PA dialog automatically generates the commands and JCL for batchreport processing.
The commands are under the //SYSIN DD statement of the JCL and have thegeneral format:CICSPA operand[(suboperand)][,operand[(suboperand)],]...
A brief description of the report categories and the reports and extracts follows.For a detailed discussion, see Part 2, “Report Set reports and extracts”.
Chapter 1. Introduction 5

Performance reportsThese reports are produced from CMF performance class data.
Performance ListLists in detail the CMF performance class data, and supports performancealert reporting. For more information, see “Performance List report” onpage 19.
Performance List ExtendedSorts and lists in detail the CMF performance class data. For moreinformation, see “Performance List Extended report” on page 28.
Performance SummarySummarizes the CMF performance class data, and supports performancealert reporting. For more information, see “Performance Summary report”on page 35.
Performance TotalsProvides totals and averages of the CMF performance class data. For moreinformation, see “Performance Totals report” on page 47.
Wait AnalysisSummarizes transaction activity by wait time. For each Transaction ID (orother ordering options), the resources that cause this transaction to besuspended are shown in the order of most to least expensive. This reporthighlights the system resource bottlenecks that might be causing badresponse time. More detailed analysis can then be performed, focusing onthe problem resources identified. For more information, see “Wait Analysisreport” on page 54.
Transaction ProfilingCompares two sets of CMF performance class data. For more information,see “Transaction Profiling report” on page 64.
Cross-System WorkA detailed listing of segments of work performed by the same or differentCICS systems via transaction routing, function shipping, or distributedtransaction processing on behalf of a single network unit-of-work ID. Formore information, see “Cross-System Work report” on page 66. The formatcan be tailored to produce the Cross-System Work Extended report (seeFigure 39 on page 72).
Transaction GroupA detailed listing of segments of work performed by the same or differentCICS systems on behalf of a single transaction group ID. For moreinformation, see “Transaction Group report” on page 73.
BTS (Business Transaction Services)A detailed listing of the segments of work performed by the same ordifferent CICS systems on behalf of a single CICS Business TransactionServices (BTS) process. For more information, see “BTS report” on page 80.
Workload ActivityProvides a transaction response time analysis by MVS Workload Manager(WLM) service and report class. This can be used in conjunction with thez/OS Resource Measurement Facility (RMF™) workload activity reports tounderstand from a CICS perspective how well your CICS transactions aremeeting their response time goals. The Workload Activity List report is across-system report that correlates CMF performance class data from singleor multiple CICS systems for each network unit-of-work. Importantly, this
6 IBM CICS Performance Analyzer for z/OS: Report Reference

report ties MRO and function shipping tasks to their originating task sothat their impact on response time can be assessed. The Workload ActivitySummary report summarizes response time by WLM service and reportclasses. For more information, see “Workload Activity report” on page 84.
Exception reportsThese reports are produced from CMF exception class data.
Exception ListLists in detail the CMF exception class data. For more information, see“Exception List report” on page 93.
Exception SummarySummarizes the CMF exception class data. For more information, see“Exception Summary report” on page 96.
Transaction Resource Usage reportsThese reports are produced from CMF performance class and transaction resourceclass data.
File Usage SummaryProvides two summaries of File usage:v The Transaction File Usage Summary Report summarizes Transactions
that use Files. The report consists of Transaction Identification and FileControl statistics from the CMF Performance records. In addition, thereis one sub-section for each File that this Transaction has used.
v The File Usage Summary Report summarizes File activity. For each File,it gives a breakdown of File usage by Transaction ID.
For more information, see “File Usage Summary report” on page 99.
Temporary Storage Usage SummaryProvides two summaries of Temporary Storage usage:v The Transaction Temporary Storage Usage Summary report summarizes
Temporary Storage usage by Transaction ID. For each Transaction ID, itgives Transaction and Temporary Storage statistics followed by abreakdown of Temporary Storage usage for each Temporary Storagequeue used.
v The Temporary Storage Usage Summary report summarizes TemporaryStorage activity. For each Temporary Storage queue, it gives abreakdown of Temporary Storage usage by Transaction ID.
For more information, see “Temporary Storage Usage Summary report” onpage 102.
DPL Usage SummaryProvides two summaries of distributed program link (DPL) usage:v The Transaction DPL Usage Summary report summarizes DPL usage by
Transaction ID. For each Transaction ID, it gives Transaction and DPLstatistics followed by a breakdown for each DPL used.
v The DPL Usage Summary report summarizes DPL activity. For eachDPL, it gives a breakdown of DPL usage by Transaction ID.
For more information, see “Distributed Program Link Usage Summaryreport” on page 106.
Transaction Resource Usage ListProvides a list of all Transaction resource class records in the sequence that
Chapter 1. Introduction 7

they appear in the SMF file. It gives Transaction information, detailingtheir individual Temporary Storage and File usage. This report processesonly transaction resource class data, not performance class data. For moreinformation, see “Transaction Resource Usage List report” on page 109.
Statistics reportsThese reports are produced from CICS statistics data. There is only one type ofreport in this category:
Statistics Alert reportsProcess CICS Transaction Server and CICS Transaction Gateway statisticsrecords. Before producing a Statistics Alert report, you must use theCICS PA dialog to create a Statistics Alert definition. A Statistics Alertdefinition specifies conditions, in terms of statistics field values, thatinterest you. When you request a Statistics Alert report, you specify theStatistics Alert definition that you want to use. The report identifies anystatistics in the input data that match the conditions in the definition. Formore information, see “Statistics Alert reports” on page 119.
In addition to producing these reports as part of a Report Set, from datastored in SMF files, you can also produce these reports outside of a ReportSet, from data stored in a Statistics HDB.
You can also view CICS statistics interactively, using the CICS PA dialog, andextract CICS statistics to delimited text files.
Subsystem reportsThe Subsystem reports are produced from database subsystem accounting datastored in SMF files. (Note that the DB2 report also processes CMF performanceclass data whereas the WebSphere MQ and OMEGAMON reports do not.) Thereports in this category are:
DB2 Correlates CICS CMF performance class (SMF 110) records and DB2accounting (SMF 101) records by network unit-of-work to produce aconsolidated and detailed view of DB2 usage by your CICS systems. TheDB2 report enables you to view CICS and DB2 resource usage statisticstogether in a single report. The DB2 List report shows detailed informationof DB2 activity for each transaction. The DB2 Summary reports summarizeDB2 activity by transaction. For more information, see “DB2 report” onpage 127.
WebSphere MQProcesses WebSphere MQ accounting (SMF 116) records to providecomprehensive performance analysis and resource usage for your CICStransactions that use MQ.
The WebSphere MQ List report provides a trace of MQ accounting records,reporting the comprehensive performance contained in subtype 0, 1 and 2records. The WebSphere MQ Summary report provides two summarizedviews of your MQ transactions:v Summary by CICS Transaction ID, showing the MQ system and queue
resources usev Summary by WebSphere MQ Queue name, showing the Transactions
they service and resources used
For more information, see “WebSphere MQ report” on page 145.
8 IBM CICS Performance Analyzer for z/OS: Report Reference

OMEGAMONProcesses OMEGAMON XE for CICS (SMF 112) records to produce adetailed view of how CICS transactions use the following types of databasemanagement system (DBMS):
AdabasCA-DatacomCA-IDMSSupra
For each type of DBMS, you can request up to three reports:v A List report, showing database usage for each transaction.v A Transaction Summary report, showing database usage summarized by
transaction ID.v A Database Summary report, showing database usage summarized by
database.
The information in each report varies depending on the type of DBMS, buttypically includes elapsed times and counts for each of the methods thattransactions use to access a database, such as read, write, add, update, anddelete.
For more information, see “OMEGAMON reports” on page 164.
System reportsThese reports are produced from system data stored in SMF files. Note that theSystem Logger report does not process CMF performance class data.
System LoggerProcesses System Logger (SMF 88) records to provide information on theSystem Logger logstreams and coupling facility structures that are used byCICS Transaction Server for logging, recovery and backout operations. Thereport can assist with measuring the effects of tuning changes andidentifying Logstream or Structure performance problems. The SystemLogger List report shows information on Logstream writes, deletes, andevents, as well as Structure Alter events for each SMF recording interval.The System Logger Summary report summarizes Logstream and Structurestatistics so you can measure Logger performance over a longer period oftime. These reports, when used in conjunction with the CICS Loggerreports produced from the standard CICS statistics reporting utilities,provide a comprehensive analysis of the logstream activity for all yourCICS systems. For more information, see “System Logger report” on page177.
Performance Graph reportsThese are graphical-style reports produced from CMF performance class data. Thegraph reports can be useful as daily indicators of system activity, as well as foranalyzing particular performance problem areas in your CICS system. The reportsin this category are:
Transaction RateA set of two graphs illustrating the average response time and the numberof transactions that completed in a specified time interval. For moreinformation, see “Transaction Rate Graph report” on page 187.
Transaction Response TimeA set of two graphs illustrating the average and maximum response time,
Chapter 1. Introduction 9

respectively, for all transactions that completed in a specified time interval.For more information, see “Transaction Response Time Graph report” onpage 187.
ExtractsWhile the other categories produce reports and graphs intended for humanreaders, the extracts produce data sets intended for use by software applications,including CICS PA itself.
Cross-System WorkThis data set is useful for cross-system analysis. CICS PA allows you tomerge CMF performance class data from segments of work performed bythe same or different CICS systems via transaction routing, functionshipping, or distributed transaction processing on behalf of a singlenetwork unit-of-work ID. This Cross-System Work data set can be used asinput to CICS PA Performance Reports such as the List, Summary, andTotals reports to monitor the total amount of resources used by atransaction within a single CICS system or across multiple CICS systems.For more information, see “Cross-System Work extract” on page 189.
Performance DataThis data set contains a selected subset of CMF performance class data,extracted and formatted as a delimited text file. This file can then beimported into DB2 databases or PC spreadsheet applications such asLotus® 1-2-3® for further reporting and analysis. The extract records have adefault format which includes all the clock fields, or the format can betailored like the Performance List or Performance Summary reports. Theextract supports performance alert reporting. For more information, see“Performance Data extract” on page 197.
Record SelectionThis data set contains only the SMF record types that are of interest to you.You can extract any combination of the SMF record types supported byCICS PA. The extract file can then be used as input to CICS PA, allowingfor more efficient reporting. For more information, see “Record Selectionextract” on page 201.
HDB LoadThe HDB Load is a facility that loads SMF data into a Historical Database(HDB). This same facility is available from Primary Menu option 5Historical Database, where the full set of HDB reporting facilities isavailable. However, from Report Sets you have the advantages of batchJCL generation and multiple load requests supported in the one job. ARecap report containing processing statistics is always printed at the end ofload processing. For more information, see “HDB Load” on page 205.
System LoggerThis data set contains a selected subset of System Logger data, extractedand formatted as a delimited text file. This file can then be imported intoDB2 databases or PC spreadsheet applications such as Lotus 1-2-3 forfurther reporting and analysis. For more information, see “System Loggerreport” on page 177.
StatisticsThis data set contains CICS statistics, extracted and formatted as adelimited text file. This file can then be imported into DB2 databases or PCspreadsheet applications such as Lotus 1-2-3 for further reporting andanalysis. The format of the extract records depends on the CICS statistics
10 IBM CICS Performance Analyzer for z/OS: Report Reference

ID of the extracted data: each statistics ID defines its own set of fields. Formore information, see “Statistics extract” on page 208.
CICS PA conceptsCICS PA is based on the following concepts which are reflected in the PrimaryOption Menu of the CICS PA dialog:1. Personal System Definitions2. Report Sets3. Report Forms4. Object Lists5. Historical Database6. Shared System Definitions7. Statistics reporting8. Transaction Profiling9. Resource Definitions: Resource Lists, Application Groups, Performance Alert
Definitions
The CICS PA dialog is an ISPF-based menu-driven dialog that helps you create,maintain and submit your report requests. It also helps you to specify your inputdata and tailor requests specific to your requirements without you having tounderstand the SMF data.
CICS PA Primary Option Menu
The following steps introduce the primary menu options and explain briefly howto use the dialog to start reporting:1. Define your CICS systems and their SMF files. When your CICS systems are
defined, you can start reporting against them. You can automate this process byusing the Take-Up facility. CICS PA extracts the relevant information aboutyour CICS systems from your SMF files. If you define your own CMF userfields, then specify your MCT definition. The user fields can then beincorporated into your CICS PA reports.Related CICS systems, such as those systems that connect via IRC/MRO,ISC/APPC, or IPIC can be grouped together for reporting purposes. Forexample, assigning the CICS MRO systems (CICSPTOR, CICSPAOR,CICSPFOR, CICSPDOR) and DB2 subsystem (DB2P) to a Group allows you toreport on these systems as a single entity. CICS PA reports can then show a
File Options Help-------------------------------------------------------------------------------V3R2M0 CICS Performance Analyzer – Primary Option MenuOption ===> ___________________________________________________________________
0 CICS PA Profile Customize your CICS PA dialog profile1 Personal Systems Specify personal CICS Systems, SMF Files and Groups2 Report Sets Request and submit reports and extracts3 Report Forms Define Report Forms4 Object Lists Define Object Lists5 Historical Database Collect and process historical data6 Shared Systems Specify shared CICS Systems, SMF Files and Groups7 Statistics Report CICS Statistics8 Profiling Request Transaction Profiling9 Resource Definitions Define Resource Lists, Application Groups and AlertsX Exit Terminate CICS PA
Figure 1. CICS PA Primary Option Menu
Chapter 1. Introduction 11

complete end-to-end picture of your MRO transaction activity, incorporatingdetailed DB2 statistics derived from the DB2 accounting data of subsystemDB2P.You can use Personal System Definitions (option 1) or Shared SystemDefinitions (option 6). Typically your personal definitions are maintained byyou and used by you for reporting. They are saved in your Personal ProfileLibrary (specified in option 0 CICS PA Profile). This contrasts with SharedSystem Definitions which are typically maintained by a central administratorand used by all users for reporting. They are saved in the HDB Register(specified in option 5 Historical Database).
2. Define Report Sets to build, submit, and save your report requests. A ReportSet contains the set of reports and extracts that you wish to run in a single job.Simply select the ones you require and submit.Specify Selection Criteria to filter the input records to report only theinformation that you are interested in. For example, you can specify SelectionCriteria to restrict reporting to:v A particular date/time rangev A group of related Transaction IDsv Transaction response times that exceed your thresholdsRun your Report Sets (or individual reports or extracts). The CICS PA dialogbuilds the JCL and commands to produce the reports and extracts. You can editthese jobs, or you can write your own jobs.
3. Define Report Forms to tailor the format and content of your reports andextracts. A simple to use editor allows you to design your own report byselecting the required CMF fields. Most CMF fields can be selected forreporting, and detailed explanations of each CMF field are available from thedialog. A comprehensive set of Sample Report Forms are provided to help youtailor your reports and extracts.
4. Define Object Lists to help you specify values for filtering and grouping objectssuch as transaction IDs and terminals. Object Lists are used when specifyingSelection Criteria for reports and extracts.
5. Define and maintain Historical Databases (HDBs) as repositories ofperformance data. Generate reports against your HDBs or export HDB data toDB2 for further manipulation and analysis.
6. See option 1.7. Report on statistics from eligible SMF files or HDBs, or create and maintain
Statistics Alert definitions (required for Statistics Alert reports).8. Request a Transaction Profiling report (you can also request this in a Report
Set, using option 2).9. Define Resource Definitions, including Resource Lists, Application Groups, and
Performance Alerts.
CICS PA ProfileThis facility allows you to customize your CICS PA user profile, which includes:v CICS PA dialog settings such as the name of your Personal Profile Library
(where personal system definitions are stored), your preferred date format, andthe job card CICS PA is to use when generating JCL.
v The allocation attributes of data sets that might need to be created during ReportSet processing. CICS PA uses these when generating JCL.
v Control data sets: the data sets to use for Report Sets, Report Forms, ObjectLists, and the HDB Register.
v DB2 settings, for exporting data to DB2 tables.
12 IBM CICS Performance Analyzer for z/OS: Report Reference

You can bypass this menu option because CICS PA uses defaults and prompts youif and when further information is required.
System DefinitionsUse System Definitions to define:v CICS systems (including CICS Transaction Gateway systems) and SMF files that
you want to report againstv DB2 subsystems and SMF files for the DB2 report and Record Selection extractv MQ subsystems and SMF files for the WebSphere MQ report and Record
Selection extractv System Loggers and SMF files for the System Logger report and Record
Selection extract
You can specify SMF data sets for each system (CICS, DB2, MQ, Logger) or foreach MVS system (image) where they run. In addition you can define groups ofsystems for reporting purposes, such as those systems that connect via IRC/MRO,ISC/APPC, or IPIC.
Your System Definitions are then used in the following ways:v By specifying the Systems (or Groups) in your Report Sets, CICS PA can
determine the related files to include in Report Set JCL generation.v By specifying a CICS APPLID when creating Report Forms and HDB Templates,
CICS PA can determine the user fields and CICS version. CICS PA can thenpopulate your Report Form or HDB Template with CMF fields appropriate tothe release of CICS and user fields for the particular CICS system.
v By specifying a CICS APPLID for the Cross-System Work extract, CICS PA candetermine the user fields for the particular CICS system for inclusion in theextract file.
v The SSID of specified DB2 Subsystems provides filtering on SSID for the DB2report and Record Selection extract.
v The SSID of specified MQ Subsystems provides filtering on SSID for theWebSphere MQ report and Record Selection extract.
For reporting, you can use either Personal System Definitions (Primary Menuoption 1) or Shared System Definitions (Primary Menu option 6), but not both atthe same time. Set Systems in the action bar to the definitions that you want to usefor report. Typically your personal definitions are maintained by you and used byyou for reporting.
Personal SystemsPersonal System Definitions are maintained using Primary Menu option 1. Theyare saved in your Personal Profile Library (specified in option 0 CICS PA ProfileSettings). Typically your personal definitions are maintained by you and used byyou for reporting.
The dialog provides a take-up facility to automatically define your personalsystems from an SMF file.
Shared SystemsShared System Definitions are maintained using Primary Menu option 6. They aresaved in the HDB Register. Typically the shared definitions are maintained by acentral administrator, but for reporting, they are used by all users of that register.
Chapter 1. Introduction 13

The dialog provides a take-up facility to automatically define your shared systemsfrom an SMF file. The dialog provides a second take-up facility to automaticallyload your personal definitions into the Shared System Definitions.
Report SetsA Report Set defines a selection of reports and extracts with their associatedoptions. The CICS PA reports and extracts are listed in “CICS PA reports andextracts” on page 5.
You can define any number of Report Sets and select any number of reports andextracts in a Report Set. The reports in a Report Set are produced as a group fromone pass of the input data sets.
A Report Set can be run on a one-off basis, or run repeatedly against differentinput each time. Changes are made to Report Sets using the CICS PA dialog, andimmediately affect the next run of the Report Set.
The data to be analyzed by a Report Set can optionally be restricted by aStart/Stop date and time specified at submit time. This reduces the volume of datato be analyzed as only a subset of the data in the input files is passed to the reportprocessors, thereby increasing the efficiency of the report processing.
Selection CriteriaSelection Criteria can be specified to provide filtering of the data to be reported orextracted. Selection Criteria are made up of a series of SELECT Statements whichspecify whether to include or exclude data based on:v date-time ranges or time slotsv started, stopped, or continuing (active) transactionsv particular field values
You can filter on many fields, and specify value lists, masks or ranges. Object Listsare a convenient way to specify the values and define groups of objects such astransaction IDs and terminals.
Running Report SetsThe CICS PA dialog generates the JCL for batch report processing. The Report Set(or individual report or extract), and any Report Forms and Object Lists it uses, areconverted to a stream of commands for batch execution. Eligible data sets specifiedin your System Selection are built into the JCL as input to the batch reportingprograms.
Enter the RUN command to run your Report Set. This prompts you to check orchange your run-time options before generating the JCL. Run-time options includeSystem Selection, Report Interval, and whether you want to edit the JCL beforesubmitting the job for batch execution.
Alternatives to the RUN command are JCL and SUB. These do the same as theRUN command except:v The JCL command selects the run-time option Edit JCL before Submit. This
allows you to review or modify the JCL before submit, or to save the JCL in anexternal library for later submission independent of the CICS PA dialog.
v The SUBMIT or SUB command does not select the run-time option Edit JCLbefore Submit. It requests that the job be submitted immediately.
14 IBM CICS Performance Analyzer for z/OS: Report Reference

Analyzing the outputView or print your reports using standard facilities such as SDSF or ISPF OutlistUtility.
Process your extract data sets according to their purpose:v Analyze the Cross-System Work extract data using CICS PA Performance
Reports such as the List, Summary, and Totals reports.v Analyze the Performance Data Extract or System Logger Extract using external
programs such as DB2, or PC tools such as Lotus 1-2-3.v Specify the Record Selection extract data sets as your SMF Files in System
Definitions to reduce the volume of data processed by CICS PA.
Report FormsReport Forms can be used to tailor the format and content of the following reportsand extracts:
Performance List reportPerformance List Extended reportPerformance Summary reportCross-System Work reportPerformance Data extract
One Report Form can be used by many reports of compatible type. The ReportForm defines the CMF fields to include in the report, the order of the columns, sortsequence (where applicable), and report title. Optionally, your List or SummaryReport Form can define which fields are for performance alert reporting.Alternatively, Performance Alert Definitions can be used for reporting togetherwith, or instead of, a Report Form. Note that alerts are not supported in ListXReport Forms.
List and Summary Report Forms can also be used to tailor HDB reports.
Object Lists and Resource ListsObject Lists provide a convenient way to specify field values for filtering the CMFdata and grouping objects for reporting purposes. For example, to analyze theresource usage of a particular group of transactions.
An Object List defines particular values, masks, or ranges of values which can beused in the Selection Criteria for as many reports and extracts as required. Longlists of field values need only be defined once and reused in Report Sets as oftenas desired.
Resource Lists offer similar benefits for specifying field values in HDB loadselection criteria, and Resource field values in Application Grouping and StatisticsAlerts.
Historical DatabaseHistorical Database (HDB) is a facility that allows you to manage performance andstatistics data for your CICS transactions. SMF data is saved in HDB container datasets that are managed from the CICS PA dialog.
There are three types of HDB:
Performance List HDBA List HDB is built from CMF performance class data. In a List HDB data
Chapter 1. Introduction 15

set, one record represents one transaction. Typically, List HDBs are used toanalyze recent transaction events. Data is usually only required for a shortperiod of time. The type of information and level of detail contained in aList HDB is determined by the List Template on which it is based.
Performance Summary HDBA Summary HDB is built from CMF performance class data. In a SummaryHDB data set, one record represents a summary of transaction activity overa user-specified time interval. Typically, Summary HDBs are used forlong-term trend analysis and capacity planning. Data is retained for alonger period of time, sometimes years. The type of information and levelof detail contained in a Summary HDB is determined by the SummaryTemplate on which it is based.
Statistics HDBA Statistics HDB contains collections of CICS statistics and server statisticsand CICS Transaction Gateway statistics over a specified time interval.
You can run reports against your HDB, export the HDB data to DB2 tables, orexport the HDB data to extract data sets in CSV format.
Statistics reportingCICS PA provides comprehensive reporting and analysis of CICS statistics andserver statistics data. It complements the CICS statistics reporting utilitiesDFHSTUP and DFH0STAT. CICS PA also provides comprehensive reporting andanalysis of statistics data from CICS Transaction Gateway. CICS PA caninteractively process, report, and extract statistics data directly from SMF files orfrom an HDB after collection. An advantage of collecting statistics data in an HDBis that you can then export the data to DB2 for further analysis.
Features of the interactive statistics reporting facility include:v Tabular reporting, sorting by field (column)v Forms to design personalized reportsv Hyperlinks to jump directly to related reportsv Print facility, either to a data set or to SYSOUT
In addition to interactively reporting statistics, you can also process statistics usingthe batch Statistics Alert reports, and extract statistics to delimited text files.
16 IBM CICS Performance Analyzer for z/OS: Report Reference

Part 2. Report Set reports and extracts
These topics provide a detailed description of each of the CICS PA Report Setreports and extracts, their content and sample output. The reports and extracts arediscussed in the order in which they are presented in the Report Set panel in theCICS PA dialog.
The batch commands and options to tailor the reports and extracts are also brieflydescribed. You can set up your own JCL or use the CICS PA dialog toautomatically generate your Report Set requests. For more information on usingthe CICS PA dialog, see the CICS PA User's Guide.
© Copyright IBM Corp. 2001, 2010 17

18 IBM CICS Performance Analyzer for z/OS: Report Reference

Chapter 2. Performance reports
The Performance reports are produced from CMF performance class data. Thereports in this category are:v “Performance List report”v “Performance List Extended report” on page 28v “Performance Summary report” on page 35v “Performance Totals report” on page 47v “Wait Analysis report” on page 54v “Cross-System Work report” on page 66 and “Tailored format: Cross-System
Work Extended” on page 71v “Transaction Group report” on page 73v “BTS report” on page 80v “Workload Activity report” on page 84
Performance List reportThe Performance List report provides a detailed list of the CMF performance classrecords.
You can request a list of all available records, or specify selection criteria to listonly the information that meets specific requirements.
Report commandThe Performance List report can be requested from a Report Set in the CICS PAdialog. Select the List report in the Performance Reports category.
In batch, the LIST command is used to request the Performance List report.
Performance List reportThe command to produce the default report is:CICSPA LIST
To tailor the report, you can specify report options as follows:CICSPA LIST(
[OUTPUT(ddname),][ALERTDEF(defname),][SEVERITY(CRITICAL|WARNING|INFO|ELIGIBILE|ALL),][FIELDS(field1[(options)],...),][LINECount(nnn),][TITLE1(’...sub-heading left...’),][TITLE2(’...sub-heading right...’),][SELECT(PERFORMANCE(INCLUDE|EXCLUDE(field1(values1),...),...)),][SELECT2(PERFORMANCE(INCLUDE|EXCLUDE(field1(values1),...),...))])
The CICS PA dialog generates the FIELDS operand when a Report Form isspecified. This controls the format of the report by specifying the desired fields,their format, and the order of the columns.
For Performance Alert reporting, ALERTDEF specifies the name of the PerformanceAlert Definition. SEVERITY specifies which of the following to report:v Critical alerts according to the CRITICAL threshold values in the Performance
Alert Definition
© Copyright IBM Corp. 2001, 2010 19

v Critical and Warning alerts according to the WARNING threshold values in thePerformance Alert Definition
v Critical, Warning, and Informational alerts according to the INFO thresholdvalues in the Performance Alert Definition
v Only those transactions that match the resource criteria in the Performance AlertDefinition
v All transactions
If the FIELDS operand is not specified, the default is:CICSPA LIST(FIELDS(TRAN, Transaction ID
STYPE, Start type of transactionTERM, Terminal IDUSERID, User IDRSYSID, Remote System IDPROGRAM, Initial program nameTASKNO, Transaction numberSTOP(TIMET), Stop time (hh:mm:ss.thm)RESPONSE, Response timeDISPATCH(TIME), Dispatch time (sss.thmi)CPU(TIME), CPU timeSUSPEND(TIME), Suspend timeDISPWAIT(TIME), Dispatch wait timeFCWAIT(TIME), File Control I/O wait timeFCAMCT, File Control access method callsIRWAIT(TIME))) Inter-Region (MRO) I/O wait time
Performance List ExtractThe LIST command can be used to tailor the format of the Performance DataExtract file.
The command format for the Performance List Extract is:CICSPA LIST(
[OUTPUT(ddname),][DDNAME(ddname),][DELIMIT(’field-delimiter’),][LABELS|NOLABELS,][FLOAT,][ALERTDEF(defname),][SEVERITY(CRITICAL|WARNING|INFO|ELIGIBILE|ALL),][FIELDS(field1[(options)],...),][TITLE1(’...1st 64 characters of title...’),][TITLE2(’...2nd 64 characters of title...’),][SELECT(PERFORMANCE(INCLUDE|EXCLUDE(field1(values1),...),...)),][SELECT2(PERFORMANCE(INCLUDE|EXCLUDE(field1(values1),...),...))])
See Figure 84 on page 200 for an example of the Performance List Extract file.
Report contentYou can specify a LIST Report Form (FIELDS operand) to tailor the format andcontent of the Performance List report. If a Report Form is not specified, thedefault format of the report is produced.
Default formatA report line is printed for each performance class record in the input file. Thedata is listed in the same order (time sequence) as it was written to SMF.
The following report is an example of the default Performance List report.
20 IBM CICS Performance Analyzer for z/OS: Report Reference

For the complete list of performance class data fields that can be selected for thePerformance List report, see the CICS Performance Analyzer for z/OS User's Guide.
A brief description of the fields in the default report follows. For more details, see“CMF performance class data fields” on page 245.
TranThe Transaction ID (field: TRAN, owner: DFHTASK, field ID: 001) identifiesthe name of the transaction that this performance class record represents.Applications that are using Distributed Program Link (DPL) requests shoulduse the TRANSID('xxxx') parameter on the EXEC CICS LINKPROGRAM('xxxxxxxx') command to enable better transaction/applicationanalysis from the monitoring performance class data. If the TRANSID('xxxx')parameter is not specified, all the performance class records on the targetsystem for a Distributed Program Link (DPL) mirror transaction will have thesame transaction ID. For example, 'CSMI' for a Distributed Program Link(DPL) request from another connected CICS system.
SCThe transaction start type (field: STYPE, owner: DFHTASK, field ID: 004). Thehigh-order bytes (0 and 1) are set to:TO Attached from terminal inputS Attached by automatic transaction initiation (ATI) without dataSD Attached by automatic transaction initiation (ATI) with dataQD Attached by transient data trigger levelU Attached by user requestTP Attached from terminal TCTTE transaction IDSZ Attached by Front End Programming Interface (FEPI).
TermThe Terminal ID (field: TERM, owner: DFHTERM, field ID: 002) is either theterminal ID or the session ID. This field is blank if the transaction was notassociated with a terminal or session facility.
V3R2M0 CICS Performance AnalyzerPerformance List
LIST0001 Printed at 12:03:45 7/15/2010 Data from 11:10:51 3/24/2010 APPLID CICSPA1 Page 1
Tran SC Term Userid RSID Program TaskNo Stop Response Dispatch User CPU Suspend DispWait FC Wait FCAMRq IR WaitTime Time Time Time Time Time Time Time
CSSY U CBAKER DFHAPATT 13 11:10:52.256 .6743 .0728 .0134 .6015 .4000 .0000 0 .0000CSSY U CBAKER DFHAPATT 10 11:10:52.289 .7498 .1910 .0228 .5588 .1997 .0000 0 .0000CSSY U CBAKER DFHAPATT 14 11:10:53.132 1.3344 .3202 .0378 1.0142 .2626 .0000 1 .0000CSSY U CBAKER DFHAPATT 11 11:10:53.341 1.4292 .1497 .0313 1.2794 .3461 .0000 0 .0000CPLT U CBAKER DFHSIPLT 7 11:11:07.123 15.9915 .3383 .0369 15.6532 .0155 .0000 0 .0000CSSY U CBAKER DFHAPATT III 11:11:07.345 16.0761 9.3488 2.3435 6.7273 1.1645 .9522 2059 .0000CWBG S CBAKER DFHWBGB 24 11:11:08.123 .0262 .0248 .0041 .0013 .0012 .0000 0 .0000CRSQ S CBAKER DFHCRQ 25 11:11:08.234 .0818 .0449 .0040 .0369 .0367 .0000 0 .0000CXRE S CBAKER DFHZXRE 27 11:11:09.345 .2255 .0243 .0049 .2011 .2009 .0000 0 .0000CLR2 TO R11 CBAKER DFHLUP 29 11:11:10.456 .0263 .0030 .0020 .0232 .0000 .0000 0 .0232CSFU S CBAKER DFHFCU 26 11:11:10.567 1.6968 1.5899 .1136 .1069 .0294 .0000 0 .0000CSAC TO SAMA CBAKER DFHACP 31 11:11:13.678 .5217 .0028 .0011 .5189 .0002 .0000 0 .0000CLQ2 U CBAKER DFHLUP 28 11:11:13.789 3.8259 .0818 .0068 3.7441 .0035 .0000 0 3.7344CEMT TO SAMA CBAKER DFHEMTP 32 11:11:13.890 .1877 .1842 .0264 .0035 .0030 .0000 0 .0000CEMT TO SAMA CBAKER DFHEMTP 33 11:11:14.801 .0091 .0068 .0026 .0023 .0001 .0000 0 .0000CEMT TO SAMA CBAKER DFHEMTP 34 11:11:15.912 .0092 .0068 .0025 .0024 .0000 .0000 0 .0000CSAC TO SAMA CBAKER DFHACP 35 11:11:16.023 .5109 .0042 .0012 .5067 .0001 .0000 0 .0000CSAC TO SAMA CBAKER DFHACP 36 11:11:17.120 .5150 .0011 .0011 .5139 .0001 .0000 0 .0000CSTE U CBAKER DFHTACP 37 11:11:17.231 .1420 .1381 .0126 .0039 .0037 .0000 0 .0000CATA U CBAKER DFHZATA 38 11:11:27.342 .0537 .0394 .0121 .0143 .0003 .0000 0 .0000CQRY S S208 CBAKER DFHQRY 39 11:11:28.453 .3476 .0451 .0048 .3025 .0038 .0000 0 .0000CQRY S S208 CBAKER DFHQRY 39 11:11:28.564 .4147 .0012 .0008 .4136 .0000 .0000 0 .0000CESN S S208 CBAKER DFHSNP 40 11:11:28.675 .0806 .0770 .0102 .0036 .0036 .0000 0 .0000CATA U CBAKER DFHZATA 41 11:11:28.786 .0309 .0048 .0045 .0261 .0003 .0000 0 .0000CQRY S S23D CBAKER DFHQRY 42 11:11:29.897 .2951 .0013 .0008 .2938 .0000 .0000 0 .0000CQRY S S23D CBAKER DFHQRY 42 11:11:29.908 .4037 .0012 .0008 .4024 .0000 .0000 0 .0000CESN S S23D CBAKER DFHSNP 43 11:11:29.099 .0030 .0029 .0020 .0001 .0000 .0000 0 .0000CESN TP S208 CBAKER DFHSNP 44 11:11:35.110 .0284 .0280 .0147 .0004 .0003 .0000 0 .0000CESN TP S23D CBAKER DFHSNP 45 11:11:41.221 .0203 .0197 .0114 .0006 .0006 .0000 0 .0000
Figure 2. Performance List report: default format
Chapter 2. Performance reports 21

UseridThe User identifier of the transaction (field: USERID, owner: DFHCICS, fieldID: 089).
RSIDThe Transaction Routing Sysid (field: RSYSID, owner: DFHCICS, field ID: 130)can be used to identify the connection name (sysid) of the remote system towhich the transaction was routed. If the transaction was not routed, this fieldis blank and the initial program name Program field will identify the initialapplication program name invoked for the transaction.
ProgramThe Program Name (field: PGMNAME, owner: DFHPROG, field ID: 071)identifies the initial application program invoked for the transaction.Depending on the type of transaction, this field contains either the applicationprogram name as defined in the transaction definition, the program namereturned by a user written dynamic routing program, the application programname passed on a function shipped Dynamic Program Link (DPL) request, theinitial application program name of an ONC RPC Alias Transaction, or theinitial application program name of a WEB Alias Transaction. A program nameof ######## indicates that the transaction was invoked using the definition ofthe transaction ID specified by the DTRTRAN system initialization parameter.
TaskNoThe transaction identification number (owner: DFHTASK, field ID: 031).Normally numeric, but some CICS system tasks are identified by specialcharacters in this field:III system initialization taskTCP terminal control task
Stop TimeThe transaction stop time (owner: DFHCICS, field ID: 005).
Response TimeThe transaction response time. This field is calculated by subtracting thetransaction start time (owner: DFHCICS, field ID: 005) from the transactionstop time (owner: DFHCICS, field ID: 006).
Dispatch TimeThe transaction dispatch time (owner: DFHTASK, field ID: 007).
User CPU TimeThe transaction CPU time (owner: DFHTASK, field ID: 008).
Suspend TimeThe transaction suspend time (owner: DFHTASK, field ID: 014).
DispWait TimeThe transaction dispatch wait time (owner: DFHTASK, field ID: 102).
FC WAIT TimeThe transaction file control I/O wait time (owner: DFHFILE, field ID: 063).
FCAMRqThe number of file control access method calls (field: FCAMCT, owner:DFHFILE, field ID: 070).
IR Wait TimeThe transaction inter-region (MRO) I/O wait time (field: IRIOWTT, owner:DFHTERM, field ID: 100).
22 IBM CICS Performance Analyzer for z/OS: Report Reference

Note: Some of the fields that contain large values might be represented inexponential format. For example, 2 834 000 might be shown as 2834E3.
Tailored formatYou can tailor the Performance List report to include any CMF performance classfield. From the CICS PA dialog, you can design a LIST Report Form to include therequired fields in your report. Sample Report Forms are available to help you tailoryour report for a specific purpose.
In batch the FIELDS operand of the LIST report command is used to specify therequired report fields.
Example: DBCTL: Sample Report Forms are provided to help you format a Listreport to show DBCTL transaction activity:
IMSDBLSTTransaction DBCTL Usage Analysis
IMSRQLSTTransaction DBCTL Req Analysis
You can edit the sample forms to tailor your reports. Alternatively, you can create anew Report Form, select to specify Field Categories, and select DBCTL to populatethe form with DBCTL fields.
Move the fields of interest above EOR to include them in the report.
Select Field CategoriesCommand ===> ____________________________________________________________
CMF Groups:/ DFHAPPL - Application naming / DFHJOUR - Journal/ DFHBTS - BTS / DFHMAPP - BMS Maps/ DFHCHNL - CHANNEL option / DFHPROG - Program Control/ DFHCICS - CICS task information / DFHRMI - Resource Manager (RMI)/ DFHDATA - Data processing / DFHSOCK - Secure Sockets/ DFHDEST - Transient Data / DFHSTOR - Storage Control/ DFHDOCH - Document Handler / DFHSYNC - Syncpoint processing/ DFHEJBS - EJB Server / DFHTASK - Task Control/ DFHFEPI - Front End (FEPI) / DFHTEMP - Temporary Storage/ DFHFILE - File Control / DFHTERM - Terminal Control
/ DFHWEBB - Web InterfaceRegion Types:_ AOR - Application-owning User Fields:_ FOR - File-owning / DBCTL - IMS DBCTL_ TOR - Terminal-owning _ CROSSYS - Cross-System_ DB2 - AOR with DB2 _ OMCICS - OMEGAMON
Figure 3. New Report Form - Select Field Categories: DBCTL
Chapter 2. Performance reports 23
||||||||||||||||||||||||
||
||
||
||||
|

This will produce a report with the following format.
Note: IMS Performance Analyzer (IMS PA) can provide a more comprehensiveanalysis of IMS DBCTL performance.
Example: Application naming: An example of a Performance List reportproduced from CMF performance class data with application naming enabled isshown in Figure 6 on page 25.
The commands to request this report are like the following:CICSPA IN(SMFIN002),
LIST(FIELDS(APPLTRAN, Application naming transaction ID
EDIT LIST Report Form - DBCTLIST
Field - User Field -Name Type Length Dictionary Definition Offset Length
__ TRAN____ _______ 4 TRAN DFHTASK C001 ___ _____ PSBNAME_ _______ 8 PSBNAME DBCTL C001 ___ _____ START___ TIMET__ 12 START DFHCICS T005 ___ _____ RESPONSE _______ 8 RESP CICSPA D901 ___ _____ CPU_____ TIME___ 8 USRCPUT DFHTASK S008 ___ _____ DISPATCH TIME___ 8 USRDISPT DFHTASK S007 ___ _____ SUSPEND_ TIME___ 8 SUSPTIME DFHTASK S014 ___ _____ POOLWAIT _______ 8 POOLWAIT DBCTL A002 ___ _____ INTCWAIT _______ 8 INTCWAIT DBCTL A003 ___ _____ SCHTELAP _______ 8 SCHTELAP DBCTL A004 ___ _____ DBIOELAP _______ 8 DBIOELAP DBCTL A005 ___ _____ PILOCKEL _______ 8 PILOCKEL DBCTL A006 ___ _____ DBIOCALL _______ 8 DBIOCALL DBCTL A007 ___ _____ DLICALLS _______ 8 DLICALLS DBCTL A017 ___ _____ EOR_____ _______ ___ _____ EOX_____ _______ ___ ___
Figure 4. LIST Report Form: DBCTL fields
V3R2M0 CICS Performance AnalyzerPerformance List
LIST0001 Printed at 12:03:45 7/15/2010 Data from 15:58:48 2/19/2010 APPLID CICPAOR1 Page 1DBCTL transactions
Tran PSB Start Response User CPU Dispatch Suspend PoolWait ICwait SchedElp DBIOElap PILockEl DBIOcall DLIcallsTime Time Time Time Time Time Time Time Time Time
DLI0 DDLPSB51 15:58:47.251 1.0479 .0483 .9427 .1052 .0000 .0000 .0079 .0000 .0000 0 0DLI0 DDLPSB51 15:58:49.634 .0615 .0118 .0168 .0447 .0000 .0000 .0034 .0000 .0000 0 0DLI0 DDLPSB51 16:51:16.979 1.4467 .0474 1.2820 .1648 .0000 .0000 .0080 .0000 .0000 0 0DLI0 DDLPSB51 16:58:03.662 .0934 .0114 .0176 .0758 .0000 .0000 .0034 .0000 .0000 0 0DLI0 DDLPSB51 16:58:04.244 .0933 .0114 .0161 .0772 .0000 .0000 .0035 .0000 .0000 0 0DLI2 DDLPSB51 17:00:16.874 3.0710 .0110 .1065 2.9644 .0000 .0000 .0034 .0000 .0000 0 0DLI7 DDLPSB51 17:00:17.180 3.0274 .0116 .1441 2.8833 .0000 .0000 .0245 .0000 .0000 0 0DLI3 DDLPSB51 17:00:17.212 3.2297 .0129 .0108 3.2189 .0000 .0000 .0056 .0000 .0000 0 0DLI4 DDLPSB51 17:00:17.213 3.7488 .0109 .0112 3.7375 .0000 .0000 .0036 .0000 .0000 0 0DLI9 DDLPSB51 17:00:17.217 18.7260 .0108 2.8553 15.8707 .0000 .0000 .0034 .0000 .0000 0 0DLI1 DDLPSB51 17:00:17.218 18.8168 .0131 .0227 18.7941 .0000 .0000 .0041 .0000 .0000 0 0DLI0 DDLPSB51 17:00:17.217 18.9042 .0130 2.7601 16.1441 .0000 .0000 .0034 .0000 .0000 0 0. . .DLI0 DDLPSB51 13:14:14.187 .5046 .0439 .1369 .3676 .0000 .0000 .0035 .0000 .0000 0 0DLI0 PSB99 13:01:22.918 5.9288 2.1340 3.8341 2.0947 .0000 .0000 1.0004 .0000 .0000 0 2DLI0 PSB99 13:17:35.232 3.5302 2.1659 2.7387 .7914 .0000 .0000 .0010 .0000 .0000 0 2DLI0 PSB99 13:45:38.833 3.4382 2.1744 2.4742 .9640 .0000 .0000 .0010 .0000 .0000 0 2DLI0 PSB99 13:48:16.354 1.0711 .0428 .2282 .8429 .0000 .0000 .0024 .0000 .0000 0 1DLI0 PSB99 13:48:24.131 .2516 .0118 .0184 .2332 .0000 .0000 .0010 .0000 .0000 0 1DLI0 PSB99 13:48:25.012 .3658 .0117 .0168 .3490 .0000 .0000 .0011 .0000 .0000 0 1DLI0 PSB99 13:48:25.963 .3745 .0118 .0174 .3571 .0000 .0000 .0010 .0000 .0000 0 1DLI0 PSB99 13:48:26.919 .2871 .0116 .0180 .2691 .0000 .0000 .0010 .0000 .0000 0 1DLI0 PSB99 13:48:27.907 .2511 .0117 .0170 .2341 .0000 .0000 .0010 .0000 .0000 0 1DLI0 PSB99 15:36:20.458 .7925 .0451 .2664 .5261 .0000 .0000 .0010 .0000 .0000 0 1DLI0 PSB99 15:38:29.047 .6985 .0466 .1953 .5032 .0000 .0000 .0011 .0000 .0000 0 2DLI0 PSB99 15:38:50.508 .5742 .0457 .1260 .4482 .0000 .0000 .0010 .0000 .0000 0 2DLI0 PSB99 15:49:07.072 .9596 .0486 .1879 .7717 .0000 .0000 .0010 .0000 .0000 0 2DLI2 PSB99 15:53:29.716 91.8213 1.8717 2.0128 89.8085 .0000 .0000 .0010 .0000 .0000 0 1DLI3 PSB99 15:53:30.402 156.501 1.9866 24.4980 132.003 .0000 .0000 .0055 .0000 .0000 0 1DLI5 PSB99 15:53:30.497 233.355 1.9771 18.1590 215.196 .0000 .0000 .0049 .0000 .0000 0 1DLI1 PSB99 15:56:53.478 95.2870 1.9511 16.4508 78.8363 .0000 .0000 .0050 .0000 .0000 0 1
Figure 5. Performance List report: DBCTL transactions
24 IBM CICS Performance Analyzer for z/OS: Report Reference

USERID, User identifierAPPLPROG, Application naming program nameTASKNO, Transaction identification numberSTOP(TIMET), Task stop time (hh:mm:ss.thm)DISPATCH(TIME), Dispatch timeCPU(TIME), CPU timeSUSPEND(TIME), Suspend timeDISPWAIT(TIME), Redispatch wait timeAPPLID, CICS Generic APPLIDJOBNAME, Job nameMVSID, MVS SMF IDRELEASE)) CICS release
Note: The APPLTRAN and APPLPROG fields are only available when applicationprograms invoke the application naming event monitoring points. For moreinformation, see the APPLNAME parameter on the DFHMCT TYPE=INITIALmacro in the CICS Customization Guide..
Example: Precision(4) and conversion of numeric fields: Figure 7 on page 26shows an example of a Performance List report with precision to 4 decimal placesfor clock fields and conversion of count and storage fields to K, M, KB, MB.
The commands to request this report are like the following:CICSPA IN(SMFIN001),
NOAPPLID,LINECNT(60),FORMAT(’:’,’/’),PRECISION(4),
LIST(OUTPUT(LIST0001),FIELDS(TRAN,
APPLID,TASKNO,PC31AHWM,PC31AHWM(K),PC31AHWM(KB),PC31AHWM(M),PC31AHWM(MB),RESPONSE))
V3R2M0 CICS Performance AnalyzerPerformance List
LIST0001 Printed at 12:03:45 7/15/2010 Data from 07:30:47 5/29/2010 Page 1
Tran Userid Program TaskNo Stop Dispatch User CPU Suspend DispWait APPLID Jobname MVS RlseTime Time Time Time Time
TOP1 CBAKER PROGOPT1 16 7:30:47.653 .0002 .0002 .0029 .0000 IYK2Z1V1 CI07CJB1 MV2C 0660TOP2 CBAKER PROGOPT2 17 7:30:47.660 .0019 .0007 .0067 .0000 IYK2Z1V1 CI07CJB1 MV2C 0660TOP3 CBAKER PROGOPT3 18 7:30:47.699 .0112 .0011 .0362 .0298 IYK2Z1V1 CI07CJB1 MV2C 0660TOP4 CBAKER PROGOPT4 13 7:30:47.785 .0189 .0031 .1189 .1157 IYK2Z1V1 CI07CJB1 MV2C 0660TOP5 CBAKER PROGOPT5 15 7:30:47.829 .0261 .0044 .1539 .1053 IYK2Z1V1 CI07CJB1 MV2C 0660TOP6 CBAKER PROGOPT6 12 7:30:47.842 .0363 .0034 .1587 .0012 IYK2Z1V1 CI07CJB1 MV2C 0660TOP7 CBAKER PROGOPT7 10 7:30:47.945 .1053 .0142 .1930 .1393 IYK2Z1V1 CI07CJB1 MV2C 0660
Figure 6. Performance List report: Application naming
Chapter 2. Performance reports 25

Example: Precision(6) and conversion of numeric fields: The following exampleis the same report as the previous example in Figure 7 but with microsecondprecision.
The commands to request this report are like the following:CICSPA IN(SMFIN001),
NOAPPLID,LINECNT(60),FORMAT(’:’,’/’),PRECISION(6),
LIST(OUTPUT(LIST0001),FIELDS(TRAN,
APPLID,TASKNO,PC31AHWM,PC31AHWM(K),PC31AHWM(KB),PC31AHWM(M),PC31AHWM(MB),RESPONSE))
V3R2M0 CICS Performance AnalyzerPerformance List
LIST0001 Printed at 12:03:45 7/15/2010 Data from 23:40:54 2/03/2010 Page 1
Tran APPLID TaskNo PC31aHWM PC31aHWM PC31aHWM PC31aHWM PC31aHWM ResponseK KB M MB Time
XCMT A02CICP1 3973 151184 151 148 0 0 6.0242NPXF A02CICP1 3993 21872 22 21 0 0 .0111HR00 A02CICP5 106 426832 427 417 0 0 .0650CWBG A02CICP5 107 768 1 1 0 0 .0018CRMF A02CICP5 108 1736 2 2 0 0 .0015CATD A02CICP5 109 258352 258 252 0 0 .0257CWBG A02CICP5 110 768 1 1 0 0 .0017CRMF A02CICP5 111 1736 2 2 0 0 .0015CWBG A02CICP5 112 768 1 1 0 0 .0014CWBG A02CICP5 114 768 1 1 0 0 .0014CRSQ A02CICP5 113 872 1 1 0 0 .0027CRMF A02CICP5 115 1736 2 2 0 0 .0014CWBG A02CICP5 116 768 1 1 0 0 .0015CRMF A02CICP5 117 1736 2 2 0 0 .0014CWBG A02CICP5 118 768 1 1 0 0 .0014CWBG A02CICP5 119 768 1 1 0 0 .0014CRMF A02CICP5 120 1736 2 2 0 0 .0014CWBG A02CICP5 121 768 1 1 0 0 .0014CRMF A02CICP5 122 1736 2 2 0 0 .0017SYSU A02CICP5 123 151104 151 148 0 0 .0324
Figure 7. Performance List report: Precision(4) and conversion of numeric fields
V3R2M0 CICS Performance AnalyzerPerformance List
LIST0001 Printed at 12:03:45 7/15/2010 Data from 23:40:54 2/03/2010 Page 1
Tran APPLID TaskNo PC31aHWM PC31aHWM PC31aHWM PC31aHWM PC31aHWM ResponseK KB M MB Time
XCMT A02CICP1 3973 151184 151 148 0 0 6.024186NPXF A02CICP1 3993 21872 22 21 0 0 .011066HR00 A02CICP5 106 426832 427 417 0 0 .065014CWBG A02CICP5 107 768 1 1 0 0 .001800CRMF A02CICP5 108 1736 2 2 0 0 .001499CATD A02CICP5 109 258352 258 252 0 0 .025707CWBG A02CICP5 110 768 1 1 0 0 .001672CRMF A02CICP5 111 1736 2 2 0 0 .001530CWBG A02CICP5 112 768 1 1 0 0 .001411CWBG A02CICP5 114 768 1 1 0 0 .001380CRSQ A02CICP5 113 872 1 1 0 0 .002673CRMF A02CICP5 115 1736 2 2 0 0 .001419CWBG A02CICP5 116 768 1 1 0 0 .001508CRMF A02CICP5 117 1736 2 2 0 0 .001436CWBG A02CICP5 118 768 1 1 0 0 .001418CWBG A02CICP5 119 768 1 1 0 0 .001378CRMF A02CICP5 120 1736 2 2 0 0 .001382CWBG A02CICP5 121 768 1 1 0 0 .001448CRMF A02CICP5 122 1736 2 2 0 0 .001702SYSU A02CICP5 123 151104 151 148 0 0 .032409
Figure 8. Performance List report: Precision(6) and conversion of numeric fields
26 IBM CICS Performance Analyzer for z/OS: Report Reference

Example: Performance Alerts List: This is an example of performance alertreporting, useful for monitoring compliance to Service Level Agreements and CICStransaction performance standards.
The commands to request this report are like the following:CICSPA IN(SMFIN001),
APPLID(*),PRECISION(4),
LIST(OUTPUT(LIST0001),ALERTDEF(ALERT99),FIELDS(TRAN,
PROGRAM,RESPONSE,RESPONSE(SEV),DISPATCH(TIME,SEV),CPU(TIME,SEV),SUSPEND(TIME,SEV),DISPWAIT(TIME),FCWAIT(TIME),FCAMCT,IRWAIT(TIME)))
To create an extract file, add the DD statement for the extract data set to the JCLand add the corresponding DDNAME operand to the LIST command.
V3R2M0 CICS Performance AnalyzerPerformance List
LIST0001 Printed at 17:19:36 4/21/2010 Data from 07:51:03 3/26/2009 APPLID XYZ299V2
Sev Sev Sev SevTran Program Response Response Dispatch Dispatch User CPU User CPU Suspend Suspend DispWait FC Wait FCAMRq IR Wait
Time Time Time Time Time Time Time Time Time Time TimeCESN DFHSNP .0456 Info .0453 Info .0043 Info .0003 .0003 .0000 0 .0000CSTE DFHTACP .0490 Info .0371 Info .0032 Info .0120 .0119 .0000 0 .0000CESN DFHSNP .0066 .0036 .0021 Info .0029 .0001 .0000 0 .0000CEJR DFHEJITL .0457 Info .0414 Info .0357 Warning .0043 .0000 .0000 0 .0000CEJR DFHEJITL .0006 .0003 .0002 .0004 .0000 .0000 0 .0000CEJR DFHEJITL .0006 .0001 .0001 .0005 .0000 .0000 0 .0000CEJR DFHEJITL .0275 Info .0233 Info .0017 Info .0043 .0003 .0007 10 .0000CRTP DFHZRTP .0080 .0056 .0016 .0024 .0004 .0000 0 .0000CEDA DFHEDAP 163.3748 Critical .5525 Warning .3450 Critical 162.8222 .0023 .3245 9589 .0000CSHQ DFHSHSY 192.6462 Critical .0922 Info .0091 Info 192.5540 .0057 .0000 0 .0000CESD DFHCESD .0037 .0008 .0007 .0028 .0001 .0000 0 .0000CISD DFHISCOP .0006 .0001 .0001 .0005 .0000 .0000 0 .0000CSKL EZACIC02 191.6213 Critical 190.8965 Critical .0134 Warning .7248 .0620 .0013 1 .0000CKAM DFHMQMON 197.1525 .0187 .0035 197.1338 .0945 .0000 0 .0000CSNC DFHCRNP 205.4532 Critical .0737 Info .0022 Info 205.3795 .0057 .0000 0 .0000CSNE DFHZNAC 199.6088 Critical .0366 Info .0035 Info 199.5722 .0001 .0000 0 .0000
Figure 9. Performance List report: Performance alerts
Tran;Program;Response Time;Response Time Sev;Dispatch Time Sev;User CPU Time Sev;Suspend Time Sev;DispWait Time;...CSSY;DFHAPATT; .0038; ; ; ; ; .0000; .0000; 0; .0000CSSY;DFHAPATT; .0060; ; ; ; ; .0000; .0000; 0; .0000CSSY;DFHAPATT; .0105;Info ; ; ; ; .0041; .0000; 0; .0000CSSY;DFHAPATT; .0364;Info ;Info ;Info ; ; .0053; .0000; 0; .0000CSSY;DFHAPATT; .0913;Info ;Info ;Info ; ; .0537; .0000; 0; .0000CGRP;DFHZCGRP; .1452;Warning ;Info ;Info ; ; .1134; .0000; 0; .0000CSSY;DFHAPATT; .1520;Warning ;Info ;Info ; ; .1096; .0000; 0; .0000CSSY;DFHAPATT; .1648;Warning ;Info ;Info ; ; .1353; .0000; 0; .0000CSSY;DFHAPATT; .2747;Warning ;Info ;Info ; ; .2072; .0000; 0; .0000CSSY;DFHAPATT; .3263;Warning ;Info ;Info ; ; .2422; .0000; 0; .0000CSSY;DFHAPATT; .3409;Warning ;Info ;Info ; ; .2649; .0000; 0; .0000CSSY;DFHAPATT; .4730;Warning ;Info ;Info ; ; .1103; .0000; 1; .0000CPLT;DFHSIPLT; 5.9899; ; ; ; ; .0031; .0210; 9; .0000CSSY;DFHAPATT; 5.9837;Critical;Critical;Critical; ; .3840; .5694; 3786; .0000CJSR;DFHSJITL; .0360;Info ;Info ;Info ; ; .0049; .0000; 0; .0000CRLR;DFHRLR ; .0485;Info ;Info ; ; ; .0198; .0000; 0; .0000CPIR;DFHPIITL; .0629; ; ; ; ; .0321; .0000; 0; .0000...
Figure 10. Performance List extract: Performance alerts
Chapter 2. Performance reports 27

Performance List Extended reportThe Performance List Extended report provides a detailed list of the CMFperformance class records. It differs from the Performance List report in that youcan specify the sorting criteria for the performance class records.
You can request a list of all available records, or specify selection criteria to listonly the information that meets specific requirements.
Report commandThe Performance List Extended report can be requested from a Report Set in theCICS PA dialog. Select the List Extended report in the Performance Reportscategory.
In batch, the LISTX command is used to request the Performance List Extendedreport.
Performance List ExtendedThe command to produce the default report is:CICSPA LISTX
To tailor the report, you can specify report options as follows:CICSPA LISTX(
[OUTPUT(ddname),][EXTERNAL(ddname),][BY(by1(ASCEND|DESCEND),
by2(ASCEND|DESCEND),by3(ASCEND|DESCEND)),]
[LIMIT(byfield(proclim)),][FIELDS(field1[(options)],...),][LINECOUNT(nnn),][TITLE1(’...sub-heading left ...’),][TITLE2(’...sub-heading right...’),][SELECT(PERFORMANCE(INCLUDE|EXCLUDE(field1(values1),...),...)),][SELECT2(PERFORMANCE(INCLUDE|EXCLUDE(field1(values1),...),...))])
The Performance List Extended report is produced using an external SORT facility.An External Work Data Set is required to store the records before they are sorted.This data set is either specified explicitly using EXTERNAL(ddname), or CICS PAassigns one from the External Work File pool.
The FIELDS operand controls the format of the report by specifying the desiredfields and the order of the columns.
The BY operand specifies up to 3 sort fields, ascending or descending. For one ofthe sort fields, LIMIT specifies the maximum number of records to process. Thedefault sort sequence is ascending BY(TRAN) with no LIMIT.
If BY and FIELDS are not specified, the default is:CICSPA LISTX(BY(TRAN),
FIELDS(TRAN, Transaction IDSTYPE, Start type of transactionUSERID, User IDRSYSID, Remote System IDPROGRAM, Initial program nameTASKNO, Transaction numberSTOP(TIMET), Stop time (hh:mm:ss.thm)RESPONSE, Response time
28 IBM CICS Performance Analyzer for z/OS: Report Reference

DISPATCH(TIME), Dispatch time (sss.thmi)CPU(TIME), CPU timeSUSPEND(TIME), Suspend timeDISPWAIT(TIME), Dispatch wait timeFCWAIT(TIME), File Control I/O wait timeFCAMCT(TIME), File Control access method callsIRWAIT(TIME))) Inter-Region (MRO) I/O wait time
The CICS PA dialog uses the LISTX Report Form to generate the FIELDS and BYoperands.
Cross-System Work ExtendedThe LISTX command can be used to produce the Cross-System Work Extendedreport as follows:CICSPA LISTX(
[OUTPUT(ddname),][EXTERNAL(ddname),][BY(UOWID),][PRINTMULTIPLE|NOPRINTMULTIPLE,][PRINTSINGLE|NOPRINTSINGLE,][FIELDS(field1[(options)],...),][LINECOUNT(nnn),][TITLE1(’...sub-heading left ...’),][TITLE2(’...sub-heading right...’),][SELECT(PERFORMANCE(INCLUDE|EXCLUDE(field1(values1),...),...)),][SELECT2(PERFORMANCE(INCLUDE|EXCLUDE(field1(values1),...),...))])
This produces a report similar to the Performance List Extended report, but notethe following differences:1. No other BY sort field can be specified.2. LIMIT is ignored.3. CMF records for the same Network UOWID are reported together. A blank line
separates each network unit-of-work, except when you specifyNOPRINTMULTIPLE,PRINTSINGLE. In this case, no blank lines are necessaryas each record is a distinct unit-of-work.
4. The report heading shows “Cross-System Work Extended”.5. The sorting sequence is the same as the default Cross-System Work report (see
“Cross-System Work report” on page 66):NETUOWPX
NETNAME (ascending)NETUOWSX
Network unit-of-work ID (ascending)NETUOWSX
Period or syncpoint count (descending)STOP Task Stop time (descending)APPLID
CICS generic APPLID (ascending)
For an example of the report, see Figure 39 on page 72.
Report contentYou can specify a LISTX Report Form (FIELDS operand) to tailor the format andcontent of the Performance List Extended report. If a Report Form is not specified,the default format of the report is produced.
Chapter 2. Performance reports 29

Default formatA report line is printed for each BY sort field combination, up to the specifiedLIMIT.
The following report is an example of the default Performance List Extendedreport.
For the complete list of performance class data fields that can be selected for thePerformance List report, see the CICS Performance Analyzer for z/OS User's Guide.
A brief description of the fields in the default report follows. For more details, see“CMF performance class data fields” on page 245.
TranThe Transaction ID (field: TRAN, owner: DFHTASK, field ID: 001) identifiesthe name of the transaction that this performance class record represents.Applications that are using Distributed Program Link (DPL) requests shoulduse the TRANSID('xxxx') parameter on the EXEC CICS LINKPROGRAM('xxxxxxxx') command to enable better transaction/applicationanalysis from the monitoring performance class data. If the TRANSID('xxxx')parameter is not specified all the performance class records on the targetsystem for a Distributed Program Link (DPL) mirror transaction will have thesame transaction ID. For example, 'CSMI' for a Distributed Program Link(DPL) request from another connected CICS system.
SCThe transaction start type (field: STYPE, owner: DFHTASK, field ID: 004).
UseridThe User identifier of the transaction (owner: DFHCICS, field ID: 089).
RSIDThe Transaction Routing Sysid (field: RSYSID, owner: DFHCICS, field ID: 130)can be used to identify the connection name (sysid) of the remote system to
V3R2M0 CICS Performance AnalyzerPerformance List Extended
LSTX0001 Printed at 12:03:45 7/15/2010 Data from 11:10:51 3/24/2010 TO 11:34:13 3/24/2010 Page 1
Tran SC Userid RSID Program TaskNo Stop Response Dispatch User CPU Suspend DispWait FC Wait FCAMRq IR WaitTime Time Time Time Time Time Time Time
AADD TO BRENNER DFHSAALL 52 11:12:54.123 .0945 .0831 .0084 .0114 .0113 .0000 0 .0000AADD TO BRENNER DFHSAALL 54 11:13:06.217 .0636 .0619 .0047 .0017 .0016 .0000 0 .0000AADD TP BRENNER DFHSAALL 65 11:14:27.328 .0029 .0026 .0017 .0003 .0002 .0000 3 .0000AADD TO BRENNER DFHSAALL 551 11:26:41.439 .0016 .0016 .0013 .0001 .0000 .0000 0 .0000AADD TP BRENNER DFHSAALL 561 11:27:02.540 .0026 .0022 .0017 .0003 .0002 .0000 3 .0000AADD TO GBURGES DFHSAALL 136 11:20:04.651 .0011 .0010 .0010 .0001 .0000 .0000 0 .0000AADD TO GBURGES DFHSAALL 137 11:20:08.762 .0022 .0021 .0012 .0001 .0000 .0000 0 .0000AADD TP GBURGES DFHSAALL 138 11:20:15.123 .0023 .0022 .0013 .0001 .0000 .0000 0 .0000AADD TO GBURGES DFHSAALL 183 11:21:51.234 .0022 .0022 .0012 .0001 .0000 .0000 0 .0000AADD TP GBURGES DFHSAALL 184 11:21:58.310 .0023 .0022 .0013 .0001 .0000 .0000 0 .0000ABRW TO CBAKER DFHSABRW 139 11:16:51.429 .6982 .6717 .0385 .0264 .0111 .0051 6 .0000ABRW TP CBAKER DFHSABRW 140 11:16:52.538 .0018 .0018 .0015 .0001 .0000 .0000 7 .0000ABRW TP CBAKER DFHSABRW 141 11:16:52.647 .0021 .0020 .0015 .0001 .0000 .0000 7 .0000ABRW TP CBAKER DFHSABRW 142 11:16:52.756 .0018 .0017 .0014 .0001 .0000 .0000 7 .0000ABRW TP CBAKER DFHSABRW 143 11:16:53.865 .0020 .0019 .0015 .0001 .0000 .0000 7 .0000ABRW TP CBAKER DFHSABRW 144 11:16:53.974 .0038 .0037 .0013 .0001 .0000 .0000 0 .0000ABRW TO CBAKER DFHSABRW 365 11:22:38.083 .0020 .0019 .0015 .0001 .0000 .0000 6 .0000ABRW TP CBAKER DFHSABRW 366 11:22:40.192 .0019 .0016 .0013 .0002 .0000 .0000 7 .0000ABRW TP CBAKER DFHSABRW 367 11:22:41.200 .0018 .0018 .0015 .0001 .0000 .0000 7 .0000ABRW TP CBAKER DFHSABRW 368 11:22:41.319 .0018 .0017 .0012 .0001 .0000 .0000 0 .0000ABRW TO CBAKER DFHSABRW 206 11:24:34.129 .0052 .0021 .0021 .0031 .0000 .0000 0 .0030ABRW TO BRENNER DFHSABRW 53 11:12:19.238 .5819 .0783 .0121 .5037 .0127 .0000 0 .4908ABRW TP BRENNER DFHSABRW 59 11:13:17.320 .0070 .0034 .0029 .0036 .0000 .0000 0 .0036ABRW TP BRENNER DFHSABRW 61 11:13:20.431 .0080 .0028 .0024 .0052 .0000 .0000 0 .0051ABRW TP BRENNER DFHSABRW 62 11:13:21.542 .0064 .0027 .0023 .0036 .0000 .0000 0 .0036ABRW TP BRENNER DFHSABRW 63 11:13:24.653 .0018 .0017 .0014 .0001 .0000 .0000 0 .0000ABRW TO GBURGES DFHSABRW 109 11:19:44.764 .0071 .0040 .0027 .0030 .0000 .0000 0 .0030ABRW TP GBURGES DFHSABRW 110 11:19:49.875 .0064 .0031 .0021 .0033 .0000 .0000 0 .0032ABRW TP GBURGES DFHSABRW 111 11:19:50.986 .0065 .0032 .0022 .0033 .0000 .0000 0 .0033
Figure 11. Performance List Extended report : default format
30 IBM CICS Performance Analyzer for z/OS: Report Reference

which the transaction was routed. If the transaction was not routed this field isblank and the initial program name Program field will identify the initialapplication program name invoked for the transaction.
ProgramThe Program Name (field: PGMNAME, owner: DFHPROG, field ID: 071)identifies the initial application program invoked for the transaction.Depending on the type of transaction, this field contains either the applicationprogram name as defined in the transaction definition, the program namereturned by a user written dynamic routing program, the application programname passed on a function shipped Dynamic Program Link (DPL) request, theinitial application program name of an ONC RPC Alias Transaction, or theinitial application program name of a WEB Alias Transaction. A program nameof ######## indicates that the transaction was invoked using the definition ofthe transaction id specified by the DTRTRAN system initialization parameter.
TaskNoThe transaction identification number (owner: DFHTASK, field ID: 031).
Stop TimeThe transaction stop time (owner: DFHCICS, field ID: 005).
Response TimeThe transaction response time. This field is calculated by subtracting thetransaction start time (owner: DFHCICS, field ID: 005) from the transactionstop time (owner: DFHCICS, field ID: 006).
Dispatch TimeThe transaction dispatch time (owner: DFHTASK, field ID: 007).
User CPU TimeThe transaction CPU time (owner: DFHTASK, field ID: 008).
Suspend TimeThe transaction suspend time (owner: DFHTASK, field ID: 014).
DispWait TimeThe transaction dispatch wait time (owner: DFHTASK, field ID: 102).
FC Wait TimeThe transaction file control I/O wait time (owner: DFHFILE, field ID: 063).
FCAMRqThe number of file control access method calls (field: FCAMCT, owner:DFHFILE, field ID: 070).
IR Wait TimeThe transaction inter-region (MRO) I/O wait time (field: IRIOWTT, owner:DFHTERM, field ID: 100).
Note: Some of the fields might contain large values and be represented inexponential format. For example, 2 834 000 might be shown as 2834E3.
Tailored formatYou can tailor the Performance List Extended report to include any CMFperformance class field. From the CICS PA dialog, you can design a LISTX ReportForm to include the required fields in your report. Sample Report Forms areavailable to help you tailor your report for a specific purpose.
In batch the FIELDS operand of the LISTX report command is used to specify therequired report fields, their format, and the order of the columns.
Chapter 2. Performance reports 31

Example: Top 20 worst transactions by various criteria: Sample Report Forms areprovided to help you format the report for different purposes:
BADCHMDSTop 20 worst change-TCB mode requests
BADCPUTop 20 worst CPU times
BADDB2RQTop 20 worst DB2 requests
BADFCRQTop 20 worst file requests
BADRESPTop 20 worst response times
BADRMITop 20 worst CICS RMI times
BADRMIRQTop 20 worst CICS RMI requests
BADSUSPTop 20 worst suspend times
BADTDRQTop 20 worst transient data queue requests
BADTSRQTop 20 worst temporary storage queue requests
BADWBRQTop 20 worst CICS Web requests
BADWMQRQTop 20 worst WebSphere MQ requests
You can edit and change a form to reformat the report. The example in Figure 13on page 33 was based on the sample form BADRESP, then modified and saved asBADTRANS.
32 IBM CICS Performance Analyzer for z/OS: Report Reference
||
||
||
||
||
||
||
||
||
||
||
||
||
|||

To format this report, specify that the records are sorted by descending responsetime within ascending transaction ID. Limit the performance class recordsprocessed to the first 10 records (the longest 10 response times) for each transactionID.
Example: Precision(4) and conversion of numeric fields: Figure 14 on page 34shows an example of a Performance List Extended report with precision to 4decimal places for clock fields and conversion of count and storage fields to K, M,KB, MB.
EDIT LISTX Report Form - BADTRANS
FieldName S Type Limit Description
__ TRAN____ A _______ ________ Transaction identifier__ RESPONSE D _______ 10______ Transaction response time__ TERM____ * _______ ________ Terminal ID__ STYPE___ _ _______ ________ Transaction start type__ USERID__ * _______ ________ User ID__ RSYSID__ _ _______ ________ Remote System ID__ PROGRAM_ _ _______ ________ Program name__ TASKNO__ _ _______ ________ Transaction identification number__ STOP____ * TIMES__ ________ Task stop time__ RESPONSE * _______ ________ Transaction response time__ DISPATCH * TIME___ ________ Dispatch time__ CPU_____ * TIME___ ________ CPU time__ SUSPEND_ * TIME___ ________ Suspend time__ DISPWAIT * TIME___ ________ Redispatch wait time__ FCWAIT__ _ TIME___ ________ File I/O wait time__ IRWAIT__ _ TIME___ ________ MRO link wait time__ EOR_____ _ _______ ---------------- End of Report --------------__ EOX_____ _ _______ ---------------- End of Extract -------------__ FCAMCT__ * _______ ________ File access-method requests
Figure 12. LISTX Report Form: using Sort Sequence and Limit
V3R2M0 CICS Performance AnalyzerPerformance List Extended
LSTX0001 Printed at 12:03:45 7/15/2010 Data from 11:10:51 2/14/2010 to 11:34:13 2/14/2010 Page 1Response Times by Transaction ID *** 10 worst times ***
Tran Response Term SC Userid RSID Program TaskNo Stop Dispatch User CPU Suspend DispWait FC Wait IR WaitTime Time Time Time Time Time Time Time
AADD .0945 S23C TO BRENNER DFHSAALL 52 11:12:54 .0831 .0084 .0114 .0113 .0000 .0000AADD .0636 S23C TO BRENNER DFHSAALL 54 11:13:06 .0619 .0047 .0017 .0016 .0000 .0000AADD .0029 S23C TP BRENNER DFHSAALL 65 11:14:27 .0026 .0017 .0003 .0002 .0000 .0000AADD .0026 S23C TP BRENNER DFHSAALL 561 11:27:02 .0022 .0017 .0003 .0002 .0000 .0000AADD .0023 TC26 TP GBURGES DFHSAALL 138 11:20:15 .0022 .0013 .0001 .0000 .0000 .0000AADD .0023 TC26 TP GBURGES DFHSAALL 184 11:21:58 .0022 .0013 .0001 .0000 .0000 .0000AADD .0022 TC26 TO GBURGES DFHSAALL 183 11:21:51 .0022 .0012 .0001 .0000 .0000 .0000AADD .0022 TC26 TO GBURGES DFHSAALL 137 11:20:08 .0021 .0012 .0001 .0000 .0000 .0000AADD .0016 S23C TO BRENNER DFHSAALL 551 11:26:41 .0016 .0013 .0001 .0000 .0000 .0000AADD .0011 TC26 TO GBURGES DFHSAALL 136 11:20:04 .0010 .0010 .0001 .0000 .0000 .0000ABRW .6982 P015 TO CBAKER DFHSABRW 139 11:16:51 .6717 .0385 .0264 .0111 .0051 .0000ABRW .5819 S23D TO BRENNER DFHSABRW 53 11:12:19 .0783 .0121 .5037 .0127 .0000 .4908ABRW .0156 TC26 TP GBURGES DFHSABRW 128 11:19:57 .0028 .0024 .0128 .0000 .0000 .0127ABRW .0146 TC26 TO GBURGES DFHSABRW 164 11:21:05 .0030 .0023 .0115 .0000 .0000 .0114ABRW .0124 TC26 TP GBURGES DFHSABRW 169 11:21:17 .0043 .0028 .0080 .0000 .0000 .0080ABRW .0120 TC32 TP GBURGES DFHSABRW 391 11:24:38 .0120 .0017 .0001 .0000 .0000 .0000ABRW .0097 TC26 TP GBURGES DFHSABRW 175 11:21:27 .0059 .0025 .0038 .0000 .0000 .0037ABRW .0094 TC26 TP GBURGES DFHSABRW 117 11:19:52 .0036 .0024 .0058 .0000 .0000 .0057ABRW .0085 TC26 TP GBURGES DFHSABRW 170 11:21:19 .0037 .0024 .0048 .0000 .0000 .0048ABRW .0085 TC26 TP GBURGES DFHSABRW 176 11:21:29 .0043 .0024 .0042 .0001 .0000 .0042AINQ .0040 TC26 TO GBURGES DFHSAALL 187 11:22:14 .0027 .0017 .0013 .0000 .0000 .0013AINQ .0024 S23C TO BRENNER DFHSAALL 574 11:27:26 .0016 .0015 .0008 .0000 .0000 .0000AINQ .0023 S23C TO BRENNER DFHSAALL 564 11:27:11 .0022 .0015 .0001 .0000 .0000 .0000AINQ .0020 S23C TO BRENNER DFHSAALL 341 11:21:19 .0019 .0014 .0001 .0000 .0000 .0000AINQ .0020 S23C TO BRENNER DFHSAALL 328 11:21:09 .0019 .0012 .0001 .0000 .0000 .0000AINQ .0018 S23C TO BRENNER DFHSAALL 580 11:27:34 .0017 .0014 .0001 .0000 .0000 .0000AINQ .0018 S23C TO BRENNER DFHSAALL 112 11:14:46 .0017 .0016 .0001 .0000 .0000 .0000AINQ .0014 R11 TO CBAKER DFHSAALL 232 11:26:30 .0013 .0012 .0000 .0000 .0000 .0000AINQ .0013 S23C TO BRENNER DFHSAALL 569 11:27:19 .0013 .0013 .0001 .0000 .0000 .0000AINQ .0012 TC26 TO GBURGES DFHSAALL 186 11:22:08 .0011 .0010 .0001 .0000 .0000 .0000AMNU .1724 S23D TO BRENNER DFHSAMNU 50 11:11:53 .1720 .0091 .0004 .0004 .0000 .0000AMNU .0713 CAAD TO CBAKER DFHSAMNU 249 11:19:41 .0519 .0085 .0194 .0042 .0000 .0000
Figure 13. Performance List Extended report: top 10 response times by transaction
Chapter 2. Performance reports 33
||||

The commands to request this report are like the following:CICSPA IN(SMFIN001),
NOAPPLID,LINECNT(60),FORMAT(’:’,’/’),PRECISION(4),
LISTX(OUTPUT(LSTX0001),EXTERNAL(CPAXW001),BY(TRAN,
CPU(DESCEND)),LIMIT(CPU(20)),FIELDS(TRAN,
CPU(TIME),PC31AHWM,PC31AHWM(K),PC31AHWM(KB)PC31AHWM(M),PC31AHWM(MB)RESPONSE))
Example: Precision(6) and conversion of numeric fields: The following exampleis the same report as the previous example in Figure 14 but with microsecondprecision.
The commands to request this report are like the following:CICSPA IN(SMFIN001),
NOAPPLID,LINECNT(60),FORMAT(’:’,’/’),PRECISION(6),
LISTX(OUTPUT(LSTX0001),EXTERNAL(CPAXW001),BY(TRAN,
CPU(DESCEND)),LIMIT(CPU(20)),FIELDS(TRAN,
CPU(TIME),PC31AHWM,
V3R2M0 CICS Performance AnalyzerPerformance List Extended
LSTX0001 Printed at 12:03:45 7/15/2010 Data from 19:06:30 2/01/2003 to 23:50:44 2/03/2010 Page 1
Tran User CPU PC31aHWM PC31aHWM PC31aHWM PC31aHWM PC31aHWM ResponseTime K KB M MB Time
CWBA .0283 92208 92 90 0 0 .2609CWBA .0251 1938E3 1938 1892 2 2 .1436CWBA .0212 92208 92 90 0 0 1.0060CWBA .0183 1938E3 1938 1892 2 2 .0673CWBA .0128 92208 92 90 0 0 .0287CWBA .0086 1975E3 1975 1928 2 2 .1011CWBA .0069 1975E3 1975 1928 2 2 .1101CWBA .0044 1959E3 1959 1913 2 2 .0171CWBA .0036 1973E3 1973 1926 2 2 .0620CWBA .0034 1972E3 1972 1926 2 2 .0043CWBA .0034 1972E3 1972 1926 2 2 .0046CWBA .0033 1972E3 1972 1926 2 2 .0040CWBA .0032 1972E3 1972 1926 2 2 .0039CWBA .0031 47632 48 47 0 0 .0203CWBA .0030 1959E3 1959 1913 2 2 .0042CWBA .0029 1959E3 1959 1913 2 2 .0048CWBA .0027 1975E3 1975 1928 2 2 .0436CWBA .0026 1959E3 1959 1913 2 2 .0037CWBA .0026 1959E3 1959 1913 2 2 .0039CWBA .0026 1959E3 1959 1913 2 2 .0038CWBG .0030 1056 1 1 0 0 .0171CWBG .0028 784 1 1 0 0 .0597CWBG .0028 1056 1 1 0 0 .0146CWBG .0027 1056 1 1 0 0 .0297CWBG .0026 784 1 1 0 0 .3154CWBG .0026 1056 1 1 0 0 .1528
Figure 14. Performance List Extended report: Precision(4) and conversion of numeric fields
34 IBM CICS Performance Analyzer for z/OS: Report Reference

PC31AHWM(K),PC31AHWM(KB)PC31AHWM(M),PC31AHWM(MB)RESPONSE))
Performance Summary reportThe Performance Summary report is a summary of the CMF performance classrecords.
You can request a report that summarizes all available records, or you can specifyselection criteria to summarize only the information that meets specificrequirements.
Report commandThe Performance Summary report can be requested from a Report Set in thedialog. Select the Summary report in the Performance Reports category.
In batch, the SUMMARY command is used to request the Performance Summaryreport.
Performance Summary reportThe command to produce the default report is:CICSPA SUMMARY
To tailor the report, you can specify report options as follows:CICSPA SUMMARY(
[OUTPUT(ddname),][EXTERNAL(ddname),][NOTOTALS|TOTALS(n),][INTERVAL(hh:mm:ss),][ALERTDEF(defname),][SEVERITY(ELIGIBLE|ALL),]
V3R2M0 CICS Performance AnalyzerPerformance List Extended
LSTX0001 Printed at 12:03:45 7/15/2010 Data from 19:06:30 2/01/2010 to 23:50:44 2/03/2010 Page 1
Tran User CPU PC31aHWM PC31aHWM PC31aHWM PC31aHWM PC31aHWM ResponseTime K KB M MB Time
CWBA .028304 92208 92 90 0 0 .260863CWBA .025072 1938E3 1938 1892 2 2 .143602CWBA .021184 92208 92 90 0 0 1.006030CWBA .018288 1938E3 1938 1892 2 2 .067328CWBA .012848 92208 92 90 0 0 .028668CWBA .008624 1975E3 1975 1928 2 2 .101078CWBA .006944 1975E3 1975 1928 2 2 .110104CWBA .004448 1959E3 1959 1913 2 2 .017112CWBA .003648 1973E3 1973 1926 2 2 .062020CWBA .003376 1972E3 1972 1926 2 2 .004337CWBA .003360 1972E3 1972 1926 2 2 .004596CWBA .003264 1972E3 1972 1926 2 2 .003970CWBA .003168 1972E3 1972 1926 2 2 .003947CWBA .003104 47632 48 47 0 0 .020255CWBA .002992 1959E3 1959 1913 2 2 .004209CWBA .002880 1959E3 1959 1913 2 2 .004786CWBA .002736 1975E3 1975 1928 2 2 .043593CWBA .002608 1959E3 1959 1913 2 2 .003677CWBA .002576 1959E3 1959 1913 2 2 .003896CWBA .002560 1959E3 1959 1913 2 2 .003811CWBG .002960 1056 1 1 0 0 .017110CWBG .002784 784 1 1 0 0 .059680CWBG .002768 1056 1 1 0 0 .014561CWBG .002656 1056 1 1 0 0 .029693CWBG .002624 784 1 1 0 0 .315409CWBG .002576 1056 1 1 0 0 .152797
Figure 15. Performance List Extended report: Precision(6) and conversion of numeric fields
Chapter 2. Performance reports 35

[FIELDS(fld1[(options[,SEV(CRITICAL|WARNING|INFO,COUNT|PERCENT)])],...),][LINECount(nnn),][TITLE1(’...sub-heading left...’),][TITLE2(’...sub-heading right...’),][SELECT(PERFORMANCE(INCLUDE|EXCLUDE(field1(values1),...),...)),][SELECT2(PERFORMANCE(INCLUDE|EXCLUDE(field1(values1),...),...))])
The FIELDS operand controls the format of the report by specifying the desiredfields, their format, the order of the columns, and for numeric fields, the statisticalfunctions (AVE|DEV|MIN|MAX|TOT|nn|RNGCOUNT(range)|RNGPERCENT(range)) used tosummarize the data. nn% represents a peak percentile, such as 95%. A range can bespecified as a lower limit and an upper limit separated by a hyphen (for example,0.1-0.2), or as a comparison operator (one of: = > >= < <=) followed by a value (forexample, >0). If the function is omitted, AVE is the default.
For Performance Alert reporting, SEV indicates a performance alert field.ALERTDEF specifies the Performance Alert Definition. SEVERITY specifies whetherto report all transactions or only those that match the resource criteria in thePerformance Alert Definition. ALERT is the field name used to provide count orpercentage totals of transactions for an alert severity level (CRITICAL, WARNING,or INFO) for the summary key.
You can specify up to 8 Sort Key fields to order in ascending or descendingsequence. The default is TRAN(ASCEND). The BY operand is optional. If the FIELDSoperand is specified with key fields, the BY operand is ignored.
Sort fields identify the grouping required for summarization, and can be STARTand STOP time, or any character field, including character user fields.
Key fields must be the first fields specified in the Form and must be contiguous.However, TASKCNT and TASKTCNT can be specified anywhere in the list offields, including amongst the key fields.
In addition to the Sort Key fields, one numeric field can be selected as Ascendingor Descending to activate Alternate Sequencing. This will change the order ofreport lines from Sort Key to numeric field sequence. For example, specifyAlternate Sequencing of D for RESPONSE time to see the transactions with thehighest response time at the top of the report. Note that grouping by Sort Keyremains unaffected.
If BY and FIELDS are omitted, the default is:CICSPA SUMMARY(
FIELDS(TRAN, Transaction IDTASKCNT, Number of CMF RecordsRESPONSE(AVE,MAX), Avg/Max Response TimeDISPATCH, Avg Dispatch TimeCPU, Avg CPU TimeSUSPEND(AVE,MAX), Avg/Max Suspend TimeDISPWAIT, Avg Dispatch Wait TimeFCWAIT, Avg File Control I/O Wait TimeFCAMCT, Avg FC Access Method CallsIRWAIT, Avg Inter-Region I/O Wait TimeSC24UHWM, Avg User Storage HWM below 16MBSC31UHWM)) Avg User Storage HWM above 16MB
If you specify a FIELDS operand that contains only sort key fields with or withoutthe special TASKCNT or TASKTCNT fields, then the report contains thoseexplicitly specified fields instead of the default sort key field TRAN, followed bythe remaining default fields. This enables you to customize the sort order of the
36 IBM CICS Performance Analyzer for z/OS: Report Reference

default report without explicitly specifying all of the fields in the report. Tosuppress the default fields, so that the report contains only the fields explicitlyspecified by the FIELDS operand, you must specify at least one field that is not asort key, and that is not TASKCNT or TASKTCNT: for example, the numeric fieldRESPONSE.
The CICS PA dialog uses the SUMMARY Report Form to generate the FIELDSoperand.
If the report becomes too large . . .The Performance Summary report sorts the input records before reporting.When the EXTERNAL operand is not specified, CICS PA performs aninternal sort using virtual storage. The amount of virtual storage requireddepends on the number of key fields and the resulting combinations. If thereport becomes too large for virtual storage, you can use an External WorkData Set to store the records before they are sorted. UseEXTERNAL(ddname) to specify the External Work Data Set and invokethe external SORT facility.
Performance Summary ExtractThe SUMMARY command can be used to tailor the format of the PerformanceData Extract file.
The command format for the Performance Summary Extract is:CICSPA SUMMARY(
[OUTPUT(ddname),]DDNAME(ddname),[DELIMIT(’field-delimiter’),][LABELS|NOLABELS,][FLOAT,][EXTERNAL(ddname),][INTERVAL(hh:mm:ss),][ALERTDEF(alertname),][SEVERITY(ELIGIBLE|ALL),][FIELDS(fld1[(options[,SEV(CRITICAL|WARNING|INFO,COUNT|PERCENT)])],...),][TITLE1(’...1st 64 characters of title.of Recap...’),][TITLE2(’...2nd 64 characters of title of Recap...’),][SELECT(PERFORMANCE(INCLUDE|EXCLUDE(field1(values1),...),...)),][SELECT2(PERFORMANCE(INCLUDE|EXCLUDE(field1(values1),...),...))])
See Figure 86 on page 200 for an example of the Performance Summary Extract file.
Totals are not written to the file. That is reserved for later processing of the extractdata.
Report contentYou can specify a SUMMARY Report Form (FIELDS operand) to tailor the formatand content of the Performance Summary report.
The first 1 to 8 character or time stamp (START, STOP) fields are used tosummarize and subtotal the Summary report entries. The combination of key fieldvalues determines the group of data for summarization. A summary line is printedfor each Key field combination. Depending on the value specified in the TOTALSoperand, the Summary report prints a subtotal line whenever a key field valuechanges.
If a Report Form is not specified, the default format of the report is produced.
Chapter 2. Performance reports 37

Default formatThe following report is an example of the default Performance Summary report.
For the complete list of performance class data fields that can be selected for thePerformance Summary report, see the CICS Performance Analyzer for z/OS User'sGuide.
The default report is summarized by transaction ID and contains the followinginformation. For more details on the fields in this report, see “CMF performanceclass data fields” on page 245.
TranThe Transaction ID.
#TasksThe number of tasks (performance records) summarized.
Avg Response TimeThe average response time.
Max Response TimeThe maximum response time.
Avg Dispatch TimeThe average dispatch time.
Avg User CPU TimeThe average CPU time.
Avg Suspend TimeThe average suspend time.
Max Suspend TimeThe maximum suspend time.
Avg DispWait TimeThe average dispatch wait time.
Avg FC Wait TimeThe average file control I/O wait time.
Avg FCAMRq CountThe average number of access method calls.
Avg IR Wait TimeThe average inter-region (MRO) I/O wait time.
Avg SC24UHWMThe average storage high-water mark below 16MB.
Avg SC31UHWMThe average storage high-water mark above 16MB.
V3R2M0 CICS Performance AnalyzerPerformance Summary
SUMM0001 Printed at 12:03:45 7/15/2010 Data from 11:10:51 3/24/2010 to 11:34:13 3/24/2010 Page 1
Avg Max Avg Avg Avg Max Avg Avg Avg Avg Avg AvgTran #Tasks Response Response Dispatch User CPU Suspend Suspend DispWait FC Wait FCAMRq IR Wait SC24UHWM SC31UHWM
Time Time Time Time Time Time Time Time TimeAADD 10 .0175 .0945 .0161 .0024 .0014 .0013 .0000 .0000 1 .0000 960 0ABRW 134 .0142 .6982 .0085 .0022 .0057 .0002 .0000 .0053 3 .0053 1007 0AINQ 10 .0020 .0040 .0017 .0014 .0003 .0000 .0000 .0001 1 .0001 928 0AMNU 12 .0270 .1724 .0246 .0028 .0023 .0008 .0000 .0000 0 .0000 424 221AUPD 12 .0144 .0665 .0083 .0030 .0061 .0014 .0000 .0010 0 .0010 960 0B 2 .0028 .0031 .0027 .0015 .0001 .0000 .0000 .0000 0 .0000 0 0BING 1 .0024 .0024 .0023 .0016 .0001 .0000 .0000 .0000 0 .0000 0 0
Figure 16. Performance Summary report: default format
38 IBM CICS Performance Analyzer for z/OS: Report Reference

Note: Some of the fields might contain very large values and be represented inexponential format. For example, 2 834 000 might be shown as 2834E3.
Tailored formatYou can tailor the Performance Summary report to include any CMF performanceclass field. From the CICS PA dialog, you can design a SUMMARY Report Form toinclude the required fields in your report. Sample Report Forms are available tohelp you tailor your report for a specific purpose.
In batch the FIELDS operand of the SUMMARY report command is used to specify therequired report fields.
Example: Summary by start time: The Performance Summary report in Figure 18on page 40 shows transaction activity broken down into 30 second time intervals.This allows you to measure transaction performance variations over time.
The commands to request this report are shown in the following example:CICSPA SUMMARY(
INTERVAL(00:00:30), Time Interval is 30 secondsFIELDS(TRAN, Transaction ID
START, Transaction Start TimeTASKCNT, Total Task countRESPONSE(AVE,MAX), Transaction response timeDISPATCH(TIME(AVE)), Dispatch timeCPU(TIME(AVE)), CPU timeSUSPEND(TIME(AVE)), Suspend timeDISPWAIT(TIME(AVE)), Redispatch wait timeFCWAIT(TIME(AVE)), File I/O wait timeFCAMCT(AVE), File access-method requestsIRWAIT(TIME(AVE)), MRO link wait timeSC24UHWM(AVE), UDSA HWM below 16MBSC31UHWM(AVE)), EUDSA HWM above 16MB
TITLE1(’Summary by Start Interval within Transaction ID’))
To use the CICS PA dialog to request this report, specify a Report Form like thefollowing:
EDIT SUMMARY Report Form - STARTIME
Field SortName + K O Type Fn Description
__ TRAN____ K A _______ ___ Transaction identifier__ START___ K A TIMES__ ___ Task start time__ TASKCNT_ _______ ___ Total Task count__ RESPONSE _______ AVE Transaction response time__ RESPONSE _______ MAX Transaction response time__ DISPATCH TIME___ AVE Dispatch time__ CPU_____ TIME___ AVE CPU time__ SUSPEND_ TIME___ AVE Suspend time__ DISPWAIT TIME___ AVE Redispatch wait time__ FCWAIT__ TIME___ AVE File I/O wait time__ FCAMCT__ _______ AVE File access-method requests__ IRWAIT__ TIME___ AVE MRO link wait time__ SC24UHWM _______ AVE UDSA HWM below 16MB__ SC31UHWM _______ AVE EUDSA HWM above 16MB__ EOR_____ _______ ___ ---------------- End of Report ----------------__ EOX_____ _______ ___ ---------------- End of Extract ---------------
Figure 17. SUMMARY Report Form: by start time within transaction
Chapter 2. Performance reports 39

Example: Summary by stop time: The Performance Summary report in Figure 20on page 41 shows transaction activity broken down into 1 minute intervals. Everytransaction that completed processing during the interval is reported. This allowsyou to look at periods of time during which performance might be degraded andexamine each Transaction ID's usage.
To request this report, specify a Time Interval of 00:01:00 (the default) on thePerformance Summary report panel, and use the sample Report FormTRTODSUM shown in the following example, or specify a similar form.
V3R2M0 CICS Performance AnalyzerPerformance Summary
SUMM0001 Printed at 12:03:45 7/15/2010 Data from 15:04:02 2/27/2010 to 15:07:28 2/27/2010 Page 1Summary by Start Interval within Transaction ID
Avg Max Avg Avg Avg Avg Avg Avg Avg Avg AvgTran Start #Tasks Response Response Dispatch User CPU Suspend DispWait FC Wait FCAMRq IR Wait SC24UHWM SC31UHWM
Interval Time Time Time Time Time Time Time TimeTR01 15:04:00 89 .0584 .1233 .0012 .0011 .0572 .0015 .0025 3 .0000 0 88363TR01 15:04:30 109 .0562 .1220 .0011 .0011 .0550 .0016 .0026 3 .0000 0 88360TR01 15:05:00 104 .0551 .1328 .0013 .0012 .0538 .0017 .0027 3 .0000 0 88356TR01 15:05:30 106 .0550 .1041 .0011 .0011 .0539 .0018 .0028 3 .0000 0 88355TR01 15:06:00 86 .0588 .1354 .0012 .0011 .0576 .0016 .0026 3 .0000 0 88362TR01 15:06:30 99 .0557 .0823 .0012 .0011 .0545 .0018 .0029 3 .0000 0 88352TR01 15:07:00 117 .0549 .0912 .0012 .0011 .0537 .0016 .0024 3 .0000 0 88353TR01 710 .0562 .1354 .0012 .0011 .0550 .0016 .0026 3 .0000 0 88357
TR02 15:04:00 101 .1719 .3674 .0030 .0029 .1689 .0055 .0134 18 .0000 0 88358TR02 15:04:30 98 .1612 .3661 .0029 .0028 .1583 .0056 .0134 18 .0000 0 88353TR02 15:05:00 105 .1548 .3683 .0029 .0029 .1519 .0045 .0116 18 .0000 0 88356TR02 15:05:30 104 .1693 .4151 .0030 .0029 .1663 .0048 .0122 19 .0000 0 88363TR02 15:06:00 105 .1631 .4046 .0030 .0029 .1601 .0043 .0122 18 .0000 0 88359TR02 15:06:30 89 .1572 .3499 .0030 .0028 .1541 .0049 .0125 18 .0000 0 88357TR02 15:07:00 88 .1541 .3164 .0031 .0028 .1511 .0050 .0123 18 .0000 0 88354TR02 690 .1619 .4151 .0030 .0029 .1589 .0049 .0125 18 .0000 0 88357
Figure 18. Performance Summary report: by start time within transaction
EDIT SUMMARY Report Form - TRTODSUM
Field SortName + K O Type Fn Description
__ STOP____ K A TIMES__ ___ Task stop time__ TRAN____ K A _______ ___ Transaction identifier__ TASKCNT_ _______ ___ Total Task count__ RESPONSE _______ AVE Transaction response time__ RESPONSE _______ MAX Transaction response time__ DISPATCH TIME___ AVE Dispatch time__ CPU_____ TIME___ AVE CPU time__ SUSPEND_ TIME___ AVE Suspend time__ DISPWAIT TIME___ AVE Redispatch wait time__ FCWAIT__ TIME___ AVE File I/O wait time__ FCAMCT__ _______ AVE File access-method requests__ IRWAIT__ TIME___ AVE MRO link wait time__ SC24UHWM _______ AVE UDSA HWM below 16MB__ SC31UHWM _______ AVE EUDSA HWM above 16MB__ EOR_____ _______ ___ ---------------- End of Report ----------------__ EOX_____ _______ ___ ---------------- End of Extract ---------------
Figure 19. SUMMARY Report Form: Transactions by Time-of-Day
40 IBM CICS Performance Analyzer for z/OS: Report Reference
||||||||||||||||||||||||
|

Example: DBCTL: An example of a Performance Summary report showing asummary of DBCTL activity by transaction is shown in Figure 22 on page 42. Thereport is sorted by transaction ID and PSB name.
Sample Report Forms are provided to help you format Summary reports to showDBCTL transaction activity:
IMSDBSUMTransaction DBCTL Usage Analysis
IMSRQSUMTransaction DBCTL Req Analysis
IMSSUMIMS DBCTL PSB Usage Analysis
You can edit the sample forms to tailor your reports. Alternatively, you can create anew Report Form, select to specify Field Categories, and select DBCTL to populatethe form with DBCTL fields as shown in Figure 3 on page 23.
Move the fields of interest above EOR to include them in the report.
V3R2M0 CICS Performance AnalyzerPerformance Summary
SUMM0001 Printed at 12:03:45 7/15/2010 Data from 15:04:02 2/13/2010 to 15:07:28 2/13/2010 Page 1Transactions by Time-of-Day
Avg Max Avg Avg Avg Avg Avg Avg Avg Avg AvgStop Tran #Tasks Response Response Dispatch User CPU Suspend DispWait FC Wait FCAMRq IR Wait SC24UHWM SC31UHWMInterval Time Time Time Time Time Time Time Time15:04:00 TR01 198 .0572 .1233 .0012 .0011 .0560 .0016 .0026 3 .0000 0 8836115:04:00 TR02 199 .0569 .2220 .0012 .0011 .0557 .0016 .0024 3 .0000 0 8835915:04:00 TR03 201 .1743 .3789 .0030 .0029 .1713 .0053 .0125 18 .0000 0 8836015:04:00 TR04 199 .1666 .3674 .0029 .0028 .1637 .0056 .0134 18 .0000 0 88356
. . .15:04:00 TR12 216 .0901 .1345 .0014 .0013 .0887 .0021 .0049 5 .0000 0 8835915:04:00 TR13 225 .0888 .1234 .0014 .0013 .0874 .0024 .0050 5 .0000 0 8835715:04:00 8903 .0473 .6318 .0013 .0013 .0460 .0015 .0035 7 .0000 0 69261
15:05:00 TR01 210 .0551 .1328 .0012 .0011 .0538 .0017 .0027 3 .0000 0 8835515:05:00 TR02 207 .1609 .4151 .0030 .0029 .1579 .0046 .0119 18 .0000 0 8835915:05:00 TR03 211 .0062 .0125 .0026 .0025 .0036 .0005 .0031 18 .0000 0 8835215:05:00 TR04 246 .0069 .0148 .0038 .0037 .0031 .0003 .0026 34 .0000 0 88352
. . .15:05:00 TR12 244 .0874 .1227 .0014 .0013 .0860 .0026 .0052 5 .0000 0 8835415:05:00 TR13 283 .0887 .1924 .0014 .0013 .0873 .0024 .0051 5 .0000 0 8836015:05:00 9275 .0476 .7551 .0014 .0013 .0462 .0014 .0035 7 .0000 0 70591
Figure 20. Performance Summary report: by transaction within stop time
Chapter 2. Performance reports 41
||
||
||
||
|||
|

This produces a report with the following format:
Note: IMS Performance Analyzer (IMS PA) can provide a more comprehensiveanalysis of IMS DBCTL performance.
Example: Application naming: An example of a Performance Summary reportproduced from CMF performance class data with application naming enabled isshown in Figure 24 on page 43. The report is sorted by transaction ID, applicationnaming transaction ID, and application naming program name.
The following sample Report Forms are provided to help you format the report.
PGAPLSUMTransactions by application naming program
TRAPLSUMTransactions by application naming transaction ID
You can edit a sample form, change it and SAVEAS to create a new report form.For example, modify TRAPLSUM by moving unwanted fields below EOR, thenSAVEAS TRAPLMOD.
EDIT SUMMARY Report Form - DBCTLSUM
Field Sort - User Field -Name + K O Type Fn Length Dictionary Definition Offset Length
__ TRAN____ K A _______ ___ 8 TRAN DFHTASK C001 ___ _____ PSBNAME_ K A _______ ___ 8 PSBNAME DBCTL C001 ___ _____ TASKCNT_ _______ ___ 8 TASKCNT CICSPA X902 ___ _____ RESPONSE _______ AVE 8 RESP CICSPA D901 ___ _____ CPU_____ TIME___ AVE 8 USRCPUT DFHTASK S008 ___ _____ DISPATCH TIME___ AVE 8 USRDISPT DFHTASK S007 ___ _____ SUSPEND_ TIME___ AVE 8 SUSPTIME DFHTASK S014 ___ _____ POOLWAIT _______ AVE 8 POOLWAIT DBCTL A002 ___ _____ INTCWAIT _______ AVE 8 INTCWAIT DBCTL A003 ___ _____ SCHTELAP _______ AVE 8 SCHTELAP DBCTL A004 ___ _____ DBIOELAP _______ AVE 8 DBIOELAP DBCTL A005 ___ _____ PILOCKEL _______ AVE 8 PILOCKEL DBCTL A006 ___ _____ DBIOCALL _______ AVE 8 DBIOCALL DBCTL A007 ___ _____ DLICALLS _______ AVE 8 DLICALLS DBCTL A017 ___ _____ EOR_____ _______ ___ ___ _____ EOX_____ _______ ___ ___ _____ APPLID__ K * _______ ___ 8 APPLID CICSPA C903 ___ _____ START___ K * TIMES__ ___ 8 START DFHCICS T005 ___ ___
Figure 21. SUMMARY Report Form (DBCTL fields)
V3R2M0 CICS Performance AnalyzerPerformance Summary
SUMM0001 Printed at 12:03:45 7/15/2010 Data from 15:58:47 2/19/2010 to 15:58:28 2/21/2010 Page 1*** All DBCTL transactions ***
Avg Avg Avg Avg Avg Avg Avg Avg Avg Avg AvgTran PSB #Tasks Response User CPU Dispatch Suspend PoolWait ICwait SchedElp DBIOElap PILockEl DBIOcall DLIcalls
Time Time Time Time Time Time Time Time Time Count CountDLI0 DDLPSB51 16 9.3221 .0255 .5016 8.8205 .0000 .0000 .0104 .0000 .0000 0 0DLI0 PSB99 13 1.4249 .5201 .7799 .6450 .0000 .0000 .0780 .0000 .0000 0 1DLI0 29 5.7820 .2472 .6264 5.1556 .0000 .0000 .0407 .0000 .0000 0 1
DLI1 DDLPSB51 4 26.4267 .0125 .8290 25.5977 .0000 .0000 .0041 .0000 .0000 0 0DLI1 PSB99 1 95.2870 1.9511 16.4508 78.8363 .0000 .0000 .0050 .0000 .0000 0 1DLI1 5 40.1988 .4003 3.9534 36.2454 .0000 .0000 .0043 .0000 .0000 0 0
DLI2 DDLPSB51 4 19.3463 .0125 .2029 19.1433 .0000 .0000 .0040 .0000 .0000 0 0DLI2 PSB99 1 91.8213 1.8717 2.0128 89.8085 .0000 .0000 .0010 .0000 .0000 0 1DLI2 5 33.8413 .3843 .5649 33.2764 .0000 .0000 .0034 .0000 .0000 0 0
Figure 22. Performance Summary report: DBCTL activity
42 IBM CICS Performance Analyzer for z/OS: Report Reference
|
||
||
|||
|

This produces a report with the following format and provides a summary ofactivity from each of the main menu options.
Note: The APPLTRAN and APPLPROG fields are only available when applicationprograms invoke the application naming event monitoring points. For moreinformation, see the APPLNAME parameter on the DFHMCT TYPE=INITIALmacro in the CICS Customization Guide..
Example: Precision(4) and conversion of numeric fields: Figure 25 on page 44shows an example of a Performance Summary report with precision to 4 decimalplaces for clock fields and conversion of storage fields to KB and MB.
The commands to request this report are like the following:CICSPA IN(SMFIN001),
APPLID(*),LINECNT(60),FORMAT(’:’,’/’),PRECISION(4),
SUMMARY(OUTPUT(SUMM0001),TOTALS(8),INTERVAL(24:00:00),FIELDS(
TRAN,TASKCNT,SC24UHWM(TOT), * Total <16MB storageSC24UHWM(TOT,KB), * Total <16MB storage in KB’s
EDIT SUMMARY Report Form - TRAPLMOD
Title . . Transactions by Application Transaction ID and Program name (APPLNAME)___________________________________________________________
Field Sort - User Field -/ Name + K O Type Fn Length Dictionary Definition Offset Length__ TRAN____ K A _______ ___ 8 TRAN DFHTASK C001 ___ _____ APPLTRAN K A _______ ___ 4 APPLNAME DFHAPPL C001 ___ _____ APPLPROG K A _______ ___ 8 APPLNAME DFHAPPL C001 ___ _____ TASKCNT_ _______ ___ 8 TASKCNT CICSPA X902 ___ _____ RESPONSE _______ AVE 8 RESP CICSPA D901 ___ _____ DISPATCH TIME___ AVE 8 USRDISPT DFHTASK S007 ___ _____ CPU_____ TIME___ AVE 8 USRCPUT DFHTASK S008 ___ _____ SUSPEND_ TIME___ AVE 8 SUSPTIME DFHTASK S014 ___ _____ DISPWAIT TIME___ AVE 8 DISPWTT DFHTASK S102 ___ _____ EOR_____ _______ ___ ___ _____ EOX_____ _______ ___ ___ _____ RESPONSE _______ MAX 8 RESP CICSPA D901 ___ _____ DISPATCH TIME___ MAX 8 USRDISPT DFHTASK S007 ___ _____ DISPATCH COUNT__ AVE 8 USRDISPT DFHTASK S007 ___ _____ CPU_____ COUNT__ AVE 8 USRCPUT DFHTASK S008 ___ _____ SUSPEND_ TIME___ MAX 8 SUSPTIME DFHTASK S014 ___ _____ SUSPEND_ COUNT__ AVE 8 SUSPTIME DFHTASK S014 ___ ___
Figure 23. SUMMARY Report Form (Application naming)
V3R2M0 CICS Performance AnalyzerPerformance Summary
SUMM0001 Printed at 12:03:45 7/15/2010 Data from 07:30:47 5/29/2010 to 08:35:48 5/29/2010Transactions by Application Transaction ID and Program name (APPLNAME)
Avg Avg Avg Avg AvgTran Tran Program #Tasks Response Dispatch User CPU Suspend DispWait
Time Time Time Time TimeMENU TOP1 PROGOPT1 5 1.4249 .0934 .0196 684.379 .0064MENU TOP2 PROGOPT2 48 1.0589 .7688 .2039 1.1260 .1046MENU TOP3 PROGOPT3 1 2.8065 .0002 .0002 .0029 .0000MENU TOP4 PROGOPT4 49 5.7820 .7531 .1997 1.1030 .1025MENU TOP5 PROGOPT5 4 3.1749 .0695 .0088 .0191 .0191
Figure 24. Performance Summary report: Application naming
Chapter 2. Performance reports 43
||||||||||||||||||||||||||||

SC31UHWM(TOT), * Total >16MB storageSC31UHWM(TOT,MB), * Total >16MB storage in MB’sRESPONSE(AVE),DISPATCH(TIME(AVE)),CPU(TIME(AVE)),SUSPEND(TIME(AVE)),DISPWAIT(TIME(AVE)),FCWAIT(TIME(AVE))),
TITLE1(’This report illustrates precision and numeric conversion ’))
Example: Precision(6) and conversion of numeric fields: The following exampleis the same report as the previous example in Figure 25 but with microsecondprecision.
The commands to request this report are like the following:CICSPA IN(SMFIN001),
APPLID(*),PRECISION(6),
SUMMARY(OUTPUT(SUMM0001),TOTALS(8),INTERVAL(24:00:00),FIELDS(
TRAN,TASKCNT,SC24UHWM(TOT), * Total <16MB storageSC24UHWM(TOT,KB), * Total <16MB storage in KB’sSC31UHWM(TOT), * Total >16MB storageSC31UHWM(TOT,MB), * Total >16MB storage in MB’sRESPONSE(AVE),DISPATCH(TIME(AVE)),CPU(TIME(AVE)),SUSPEND(TIME(AVE)),DISPWAIT(TIME(AVE)),FCWAIT(TIME(AVE))),
TITLE1(’This report illustrates precision and numeric conversion’))
V3R2M0 CICS Performance AnalyzerPerformance Summary
SUMM0001 Printed at 12:03:45 7/15/2010 Data from 19:06:30 2/01/2010 to 23:50:44 2/03/2010 Page 1This report illustrates precision and numeric conversion
Total Total Total Total Avg Avg Avg Avg Avg AvgTran #Tasks SC24UHWM SC24UHWM SC31UHWM SC31UHWM Response Dispatch User CPU Suspend DispWait FC Wait
Count KB Count MB Time Time Time Time Time TimeDEMM 39 3304032 3226 3658720 3 .6154 .1015 .0733 .5140 .0134 .1831DEM1 938 38038240 37146 65290528 62 .4187 .0618 .0521 .3569 .0122 .1936EE00 8 168624 164 147728 0 .0143 .0112 .0012 .0031 .0001 .0029EE01 248 6119856 5976 12332032 11 .0697 .0159 .0106 .0538 .0071 .0534EE02 389 8152944 7961 14707472 14 .0157 .0091 .0050 .0065 .0011 .0063EE03 268 5694816 5561 8823376 8 .0245 .0130 .0055 .0115 .0017 .0100EE07 101 2126304 2076 3427664 3 .0098 .0063 .0024 .0034 .0007 .0032EE08 63 1332336 1301 1848384 1 .0105 .0069 .0019 .0036 .0003 .0033EE11 148 3115584 3042 5221440 4 .0052 .0045 .0012 .0007 .0001 .0006EE29 33 693792 677 1196480 1 .0360 .0111 .0070 .0249 .0043 .0245HR00 661 3659296 3573 27345312 26 .3390 .0356 .0286 .3034 .0052 .0752HY00 933 34252816 33450 13116320 12 .0771 .0122 .0070 .0649 .0025 .0000HY12 230 7473936 7298 3204848 3 .0396 .0083 .0054 .0313 .0021 .0000HY14 526 20859344 20370 7263008 6 .0481 .0083 .0059 .0398 .0020 .0000HY38 432 14556320 14215 5994064 5 3.3657 .0078 .0052 3.3578 .0022 .0000HY59 297 23323808 22777 4137456 3 .1203 .0116 .0084 .1087 .0036 .0000NPXF 51943 218217E4 2131030 682439E3 650 .0218 .0050 .0038 .0168 .0014 .0000NPXR 1108 83417392 81462 27302512 26 .1108 .0123 .0101 .0984 .0039 .0000VO00 2348 12995184 12690 100638E3 95 .9938 .0266 .0214 .9672 .0050 .0083
Total 60713 245145E4 2394003 988094E3 942 .0965 .0075 .0058 .0890 .0018 .0046
Figure 25. Performance Summary report: Precision(4) and conversion of numeric fields
44 IBM CICS Performance Analyzer for z/OS: Report Reference

Example: Peak percentile: A sample Report Form is provided to help you formata Performance Summary report with a distribution of response time using peakpercentiles. This can be useful for monitoring service level compliance.
RESPPEAKResponse Time Peak Percentiles
You can edit the sample form, change it and SAVEAS to create a new form to tailorthe report to the needs of your analysis.
For example, modify RESPPEAK by overtyping the first four RESPONSE fieldswith the field names CPU, SUSPEND, DISPATCH, and DISPWAIT, and change thefunction of the next RESPONSE field from 75 to MIN (minimum), then SAVEASPEAKPERC.
This produces a report of response time peak percentiles in the following format.
V3R2M0 CICS Performance AnalyzerPerformance Summary
SUMM0001 Printed at 12:03:45 7/15/2010 Data from 23:17:59 2/01/2010 to 23:41:30 2/03/2010 Page 1This report illustrates precision and numeric conversion
Total Total Total Total Avg Avg Avg Avg Avg AvgTran #Tasks SC24UHWM SC24UHWM SC31UHWM SC31UHWM Response Dispatch User CPU Suspend DispWait FC Wait
Count KB Count MB Time Time Time Time Time TimeDEMM 39 3304032 3226 3658720 3 .615435 .101474 .073271 .513955 .013413 .183122DEM1 938 38038240 37146 65290528 62 .418662 .061761 .052133 .356893 .012196 .193565EE00 8 168624 164 147728 0 .014270 .011170 .001214 .003094 .000124 .002936EE01 248 6119856 5976 12332032 11 .069702 .015891 .010623 .053803 .007066 .053391EE02 389 8152944 7961 14707472 14 .015651 .009121 .004988 .006521 .001134 .006305EE03 268 5694816 5561 8823376 8 .024497 .013031 .005464 .011457 .001666 .009987EE07 101 2126304 2076 3427664 3 .009782 .006338 .002380 .003436 .000726 .003163EE08 63 1332336 1301 1848384 1 .010454 .006872 .001903 .003574 .000323 .003284EE11 148 3115584 3042 5221440 4 .005169 .004463 .001165 .000698 .000150 .000576EE29 33 693792 677 1196480 1 .035991 .011057 .006972 .024928 .004307 .024538HR00 661 3659296 3573 27345312 26 .339045 .035614 .028619 .303422 .005247 .075227HY00 933 34252816 33450 13116320 12 .077108 .012230 .006985 .064871 .002507 .000000HY12 230 7473936 7298 3204848 3 .039579 .008305 .005423 .031267 .002084 .000000HY14 526 20859344 20370 7263008 6 .048087 .008316 .005873 .039763 .001967 .000000HY38 432 14556320 14215 5994064 5 3.365655 .007800 .005166 3.357846 .002219 .000000HY59 297 23323808 22777 4137456 3 .120345 .011609 .008405 .108727 .003608 .000000NPXF 51943 218217E4 2131030 682439E3 650 .021812 .004965 .003825 .016839 .001363 .000000NPXR 1108 83417392 81462 27302512 26 .110790 .012350 .010116 .098432 .003871 .000000VO00 2348 12995184 12690 100638E3 95 .993789 .026573 .021438 .967208 .005024 .008326
Total 60713 245145E4 2394003 988094E3 942 .096514 .007529 .005819 .088977 .001830 .004576
Figure 26. Performance Summary report: Precision(6) and conversion of numeric fields
EDIT SUMMARY Report Form - PEAKPERC
Field Sort/ Name + K O Type Fn Description__ TRAN____ K A _______ ___ Transaction identifier__ TASKCNT_ _______ ___ Total Task count__ CPU_____ TIME___ AVE CPU time__ SUSPEND_ TIME___ AVE Suspend time__ DISPATCH TIME___ AVE Dispatch time__ DISPWAIT TIME___ AVE Redispatch wait time__ RESPONSE _______ MIN Transaction response time__ RESPONSE _______ 80_ Transaction response time__ RESPONSE _______ 85_ Transaction response time__ RESPONSE _______ 90_ Transaction response time__ RESPONSE _______ 95_ Transaction response time__ RESPONSE _______ 98_ Transaction response time__ RESPONSE _______ 99_ Transaction response time__ RESPONSE _______ MAX Transaction response time__ EOR_____ _______ ___ ---------------- End of Report ----------------
Figure 27. SUMMARY Report Form (Peak percentiles)
Chapter 2. Performance reports 45
|||||||||||||||||||||||
|||
||
||
||||
|

In this example, the global report option PRECISION(6) was specified. To refineyour analysis further, you can use Performance Alerts.
Example: Performance Alerts Summary: This is an example of performance alertreporting, useful for monitoring compliance to Service Level Agreements and CICStransaction performance standards.
The commands to request this report are like the following:CICSPA IN(SMFIN001),
APPLID(*),PRECISION(4),
SUMMARY(OUTPUT(SUMM0002),TOTALS(8),INTERVAL(00:01:00),ALERTDEF(ALERT08),SEVERITY(ELIGIBLE),FIELDS(TRAN(ASCEND),
TASKCNT,ALERT(SEV(CRITICAL,PERCENT)),ALERT(SEV(WARNING,PERCENT)),ALERT(SEV(INFO,PERCENT)),RESPONSE(AVE),RESPONSE(SEV(CRITICAL,PERCENT)),RESPONSE(SEV(WARNING,PERCENT)),RESPONSE(SEV(INFO,PERCENT)),DISPATCH(TIME(AVE)),CPU(TIME(AVE)),CPU(TIME(SEV(CRITICAL,COUNT))),CPU(TIME(SEV(WARNING,COUNT))),CPU(TIME(SEV(INFO,COUNT))))
This example shows the use of the ALERT field. It shows the percentage oftransactions for each severity level for the summary key. It also shows ResponseTime alerts as percentages (with two decimal places), while User CPU Time alertsare shown as counts (whole numbers with no decimal places).
V3R2M0 CICS Performance AnalyzerPerformance Summary
SUMM0004 Printed at 12:03:45 7/15/2010 Data from 16:20:08 12/15/2010 to 11:28:14 12/16/2010
Avg Avg Avg Avg Min 80% 85% 90% 95% 98% 99% MaxTran #Tasks User CPU Suspend Dispatch DispWait Response Response Response Response Response Response Response Response
Time Time Time Time Time Time Time Time Time Time Time TimeCATA 28 .003666 .012189 .086434 .006367 .000273 .263817 .301876 .350137 .421351 .501590 .554952 .866135CATR 33 .002185 .000693 .014265 .000660 .002807 .024125 .026234 .028909 .032857 .037304 .040262 .047388CDTS 21 .001264 .003115 .001481 .000030 .003943 .005198 .005335 .005508 .005763 .006051 .006242 .006927CEDA 67 .055209 26.48349 1.547822 .004297 .451570 134.2897 158.7721 189.8167 235.6265 287.2413 321.5671 954.6099CEDF 68 .001127 3.187671 .014316 .000323 .000203 12.11531 14.16897 16.77309 20.61578 24.94540 27.82476 58.90035CEJR 186 .550488 4.315791 8.343663 .048935 .001269 57.86544 68.28108 81.48849 100.9776 122.9363 137.5396 479.1123CESD 32 .001816 .249016 .029644 .076466 .000749 .637936 .720713 .825678 .980566 1.155080 1.271139 1.375740CGRP 43 .002864 .846599 .049918 .818119 .047297 1.703957 1.889993 2.125893 2.473990 2.866198 3.127032 3.139892CITS 40 .001177 .004175 .001746 .000052 .002395 .008443 .009023 .009758 .010842 .012064 .012876 .016951CJTR 10 .000899 .022832 .011030 .021589 .005166 .071792 .080529 .091607 .107955 .126374 .138624 .154776
Figure 28. Performance Summary report: Peak percentiles
46 IBM CICS Performance Analyzer for z/OS: Report Reference
||

In this example, transaction code (Tran) is the summary key. For transaction codeCSSY, there are 13 transactions, and we observe:v 15.38% (2 transactions) had Critical alerts, 46.16% (6 transactions) had Warning
alerts, and 69.23% (9 transactions) had Informational alerts.v Of the Critical alerts, 15.38% (2 transactions) were for Response Time, while 1
transaction (7.69%) was for User CPU Time. Since the Critical ALERT total is15.38%, we therefore know that 1 CSSY transaction had Critical alerts for bothResponse Time and User CPU Time.
v Of the Informational alerts, 23.08% (3 transactions) were for Response Time,while 8 transactions (61.54%) were for User CPU Time. Since the Info ALERTtotal is 69.23% (9 transactions), we therefore know that 2 transactions hadInformational alerts for both Response Time and User CPU Time.
To create an extract file, add the DD statement for the extract data set to the JCLand add the corresponding DDNAME operand to the SUMMARY command.
Performance Totals reportThe Performance Totals report provides detailed statistics of all fields in the CMFperformance class records. The statistics are accumulated during input fileprocessing, and printed at the End of File.
V3R2M0 CICS Performance AnalyzerPerformance Summary
SUMM0002 Printed at 17:31:29 4/21/2010 Data from 07:50:50 3/26/2009 to 07:54:23 3/26/2009
Critical Warning Info Avg Critical Warning Info Avg Avg Critical Warning InfoTran #Tasks ALERT ALERT ALERT Response Response Response Response Dispatch User CPU User CPU User CPU User CPU
Time Time Time Time Time Time Time Time TimeCATA 1 .00 .00 100.00 .0097 .00 .00 .00 .0074 .0028 0 0 1CFQR 1 100.00 .00 .00 212.5694 100.00 .00 .00 .0001 .0001 0 0 0CFQS 1 100.00 .00 100.00 212.5693 100.00 .00 .00 .0149 .0011 0 0 1CFTL 1 .00 .00 100.00 .0810 .00 .00 100.00 .0170 .0041 0 0 1CGRP 1 .00 100.00 100.00 .1452 .00 100.00 .00 .0274 .0015 0 0 1CISC 2 .00 .00 100.00 .0699 .00 .00 100.00 .0096 .0008 0 0 1CISD 1 .00 .00 .00 .0006 .00 .00 .00 .0001 .0001 0 0 0CISE 1 100.00 .00 100.00 207.0152 100.00 .00 .00 .0102 .0011 0 0 1CISR 1 100.00 .00 100.00 207.0153 100.00 .00 .00 .0122 .0011 0 0 1CJSR 1 .00 .00 100.00 .0360 .00 .00 100.00 .0150 .0011 0 0 1CKAM 1 100.00 .00 100.00 197.1525 100.00 .00 .00 .0187 .0035 0 0 1CQRY 1 .00 .00 100.00 .0112 .00 .00 100.00 .0048 .0014 0 0 1CRLR 1 .00 .00 100.00 .0485 .00 .00 100.00 .0126 .0010 0 0 0CRSQ 1 .00 .00 100.00 .0351 .00 .00 100.00 .0155 .0010 0 0 1CRTP 1 .00 .00 100.00 .0080 .00 .00 .00 .0056 .0016 0 0 1CSAC 1 .00 100.00 .00 .5235 .00 100.00 .00 .0003 .0003 0 0 0CSFU 1 .00 100.00 .00 .8119 .00 100.00 .00 .7219 .0415 0 1 0CSHQ 1 100.00 .00 100.00 192.6462 100.00 .00 .00 .0922 .0091 0 0 1CSKL 1 100.00 100.00 .00 191.6213 100.00 .00 .00 190.8965 .0134 0 1 0CSNC 1 100.00 .00 100.00 205.4532 100.00 .00 .00 .0737 .0022 0 0 1CSNE 2 50.00 .00 50.00 99.8076 50.00 .00 .00 .0189 .0020 0 0 1CSSY 13 15.38 46.15 69.23 1.3247 15.38 46.15 23.08 .2042 .0457 1 0 8CSTE 1 .00 .00 100.00 .0490 .00 .00 100.00 .0371 .0032 0 0 1CSZI 1 100.00 .00 100.00 209.1438 100.00 .00 .00 .0682 .0077 0 0 1CWBG 1 .00 .00 100.00 .0086 .00 .00 .00 .0084 .0016 0 0 1CXRE 1 .00 .00 100.00 .0672 .00 .00 100.00 .0121 .0010 0 0 1Total 40 30.00 25.00 75.00 51.3500 30.00 22.50 30.00 4.8696 .0175 1 2 27
Figure 29. Performance Summary report: Performance alerts
Tran;#Tasks;ALERT Critical;ALERT Warning;ALERT Info;Response Time Avg;Response Time Critical;Response Time Warning;Response Time Info...CATA ; 1; .00; .00; 100.00; .0097; .00; .00; .00; .0074; .0028; 0; 0; 1;CFQR ; 1; 100.00; .00; .00;212.5694; 100.00; .00; .00; .0001; .0001; 0; 0; 0;CFQS ; 1; 100.00; .00; 100.00;212.5693; 100.00; .00; .00; .0149; .0011; 0; 0; 1;CFTL ; 1; .00; .00; 100.00; .0810; .00; .00; 100.00; .0170; .0041; 0; 0; 1;CGRP ; 1; .00; 100.00; 100.00; .1452; .00; 100.00; .00; .0274; .0015; 0; 0; 1;CISC ; 2; .00; .00; 100.00; .0699; .00; .00; 100.00; .0096; .0008; 0; 0; 1;CISD ; 1; .00; .00; .00; .0006; .00; .00; .00; .0001; .0001; 0; 0; 0;CISE ; 1; 100.00; .00; 100.00;207.0152; 100.00; .00; .00; .0102; .0011; 0; 0; 1;CISR ; 1; 100.00; .00; 100.00;207.0153; 100.00; .00; .00; .0122; .0011; 0; 0; 1;CJSR ; 1; .00; .00; 100.00; .0360; .00; .00; 100.00; .0150; .0011; 0; 0; 1;CKAM ; 1; 100.00; .00; 100.00;197.1525; 100.00; .00; .00; .0187; .0035; 0; 0; 1;CQRY ; 1; .00; .00; 100.00; .0112; .00; .00; 100.00; .0048; .0014; 0; 0; 1;...
Figure 30. Performance Summary extract: Performance alerts
Chapter 2. Performance reports 47

You can request statistics from all available records, or you can specify selectioncriteria to request statistics from only the records that meet specific requirements.
Report commandThe Performance Totals report can be requested from a Report Set in the CICS PAdialog. Select the Totals report in the Performance Reports category.
In batch, the TOTAL command is used to request the Performance Totals report.
The command to produce the default report is:CICSPA TOTAL
To tailor the report, you can specify report options as follows:CICSPA TOTAL(
[OUTPUT(ddname),][LINECOUNT(nnn),][TITLE1(’...sub-heading left ...’),][TITLE2(’...sub-heading right...’),][SELECT(PERFORMANCE(INCLUDE|EXCLUDE(field1(values1),...),...))])
Report contentThe Performance Totals report has four parts:1. CICS System Statistics. Statistics about the CICS system as a whole, including:
v CPU and Dispatch timesv Performance Record and Task counts
2. CPU and Dispatch Statistics. Breakdown of CPU, Dispatch, and Suspendcounts and elapsed time.
3. Resource Utilization Statistics. Each field in the performance record issummarized:v For Clock fields, the count and time components are broken down.v For Count fields, the count values are reported.
4. User Field Statistics. Statistics for the User Fields defined in the CMFperformance class records.
Part 1: CICS system statisticsThe first part of the Performance Totals report provides statistics about the CICSsystem as a whole.
48 IBM CICS Performance Analyzer for z/OS: Report Reference

The columns are:
Dispatched TimeThe total elapsed time presented in days, hours, minutes, seconds, and then astotal seconds.
CPU TimeThe total CPU time presented in days, hours, minutes, seconds, and then astotal seconds.
The rows are:
Total Elapsed Run TimePerformance Totals report interval or elapsed time (first performance recordstart time to last performance record stop time).
From Selected Performance RecordsThe CICS TCB mode data.
QR Dispatch/CPU TimeThe total CICS TCB mode QR dispatch and CPU time accumulated from theselected performance class records.
MS Dispatch/CPU TimeThe total CICS TCB mode RO, CO, FO, RP, SZ, SL, and SO dispatch and CPUtime from the selected performance class records.
Total (QR + MS)The total CICS TCB mode QR, RO, CO, FO, RP, SZ, SL, and SO dispatch andCPU time accumulated from the selected performance class records.
V3R2M0 CICS Performance AnalyzerPerformance Totals
TOTL0001 Printed at 12:03:45 7/15/2010 Data from 16:20:08 12/15/2009 to 11:28:14 12/16/2009 Page 1
Dispatched Time CPU TimeDD HH:MM:SS Secs DD HH:MM:SS Secs
Total Elapsed Run Time 19:08:07 68887
From Selected Performance Records
QR Dispatch/CPU Time 00:23:05 1385 00:01:10 70MS Dispatch/CPU Time 00:30:59 1859 00:00:19 19
-------- ----- -------- ------TOTAL (QR + MS) 00:54:05 3245 00:01:29 89
L8 CPU Time 00:00:01 1J8 CPU Time 00:02:22 142S8 CPU Time 00:00:00 0T8 CPU Time 00:00:00 0X8 CPU Time 00:00:00 0
-------- ----- -------- ------TOTAL (L8 + J8 + S8 + T8 + X8) 00:04:04 244 00:02:22 142
L9 CPU Time 00:00:00 0J9 CPU Time 00:00:09 9X9 CPU Time 00:00:00 0
-------- ----- -------- ------TOTAL (L9 + J9 + X9) 00:00:12 12 00:00:09 9
-------- ----- -------- ------Total CICS TCB Time 00:58:21 3501 00:04:01 241
Total Performance Records (Type C) 0Total Performance Records (Type D) 247Total Performance Records (Type F) 327Total Performance Records (Type S) 0Total Performance Records (Type T) 15566
-------- --------Total Performance Records (Selected) 16140 Total Performance Records 16140
Figure 31. Performance Totals report (part 1): CICS system statistics
Chapter 2. Performance reports 49

L8 CPU TimeThe total CICS TCB mode L8 CPU Time accumulated from the selectedperformance class records.
J8 CPU TimeThe total CICS TCB mode J8 CPU time accumulated from the selectedperformance class records.
S8 CPU TimeThe total CICS TCB mode S8 CPU time accumulated from the selectedperformance class records.
T8 CPU TimeThe total CICS TCB mode T8 CPU time accumulated from the selectedperformance class records.
X8 CPU TimeThe total CICS TCB mode X8 CPU time accumulated from the selectedperformance class records.
Total (L8 + J8 + S8 + T8 + X8)The total CICS TCB mode L8, J8, S8, T8, and X8 dispatch and CPU timeaccumulated from the selected performance class records.
L9 CPU TimeThe total CICS TCB mode L9 CPU time accumulated from the selectedperformance class records.
J9 CPU TimeThe total CICS TCB mode J9 CPU time accumulated from the selectedperformance class records.
X9 CPU TimeThe total CICS TCB mode X9 CPU time accumulated from the selectedperformance class records.
Total (L9 + J9 + X9)The total CICS TCB mode L9, J9, and X9 dispatch and CPU time accumulatedfrom the selected performance class records.
Total CICS TCB TimeThe total CICS TCB time, all TCB modes dispatch and CPU time accumulatedfrom the selected performance class records.
Total Performance Records (Type C)The total number of Converse performance class records selected.
Total Performance Records (Type D)The total number of Deliver performance class records selected.
Total Performance Records (Type F)The total number of Frequency performance class records selected.
Total Performance Records (Type S)The total number of Syncpoint performance class records selected.
Total Performance Records (Type T)The total number of Terminate performance class records selected.
Total Performance Records (Selected)The total number of performance class records selected.
Total Performance RecordsThe total number of performance class records.
50 IBM CICS Performance Analyzer for z/OS: Report Reference

For more detailed descriptions of the performance class data fields, see “CMFperformance class data fields” on page 245.
Part 2: CPU and dispatch statisticsThe second part of the Performance Totals report displays the total, average pertask, and maximum per task for the CPU, Dispatch, and Suspend counts andelapsed time. Time values are represented in seconds, with millisecond precision.
The individual count fields might not always add up to the total count field. Thereare two reasons for this:1. Some individual fields might not have been collected for the duration of the
report. The counts are, however, still reflected in the total count (FCTOTAL).2. There might be a differential due to another count, which is not collected in the
CMF performance class record and not printed on the report. This other countis, however, reflected in the total count.
The information in this part of the report includes:
TotalTotal count or time value (in seconds) for all the records selected, based on theselection criteria provided.
Avg/TaskAverage count or time per task computed by dividing the count or time by thetotal number of selected tasks.
Max/TaskThe largest count or time value that was recorded for any one task.
A value of +++.+++ is substituted when the calculated value exceeds themaximum permitted in this column.
Response (minus TC Wait for Type C)The internal response time for conversational tasks.
V3R2M0 CICS Performance AnalyzerPerformance Totals
TOTL0001 Printed at 12:03:45 7/15/2010 Data from 16:20:08 12/15/2009 to 11:28:14 12/16/2009 Page 2
...... C O U N T S ...... ........... T I M E ...........From Selected Performance Records Total Avg/Task Max/Task Total Avg/Task Max/Task
Dispatch Time 108129 6.7 1587 3456 .214 756.551CPU Time 223 .014 6.233RLS CPU (SRB) Time 0 .000 .000WebSphere MQ API (SRB) CPU Time 0 .000 .000Suspend Time 108249 6.7 1587 923449 57.215 +++.+++Dispatch Wait Time 92456 5.7 1586 334 .021 7.393Dispatch Wait Time (QR Mode) 69952 4.3 1065 36 .002 7.393Response (-TCWait for Type C) 0 .000 .000Response (All Selected Tasks) 1955791 121.177 +++.+++QR Dispatch Time 85418 5.3 1066 1370 .085 756.549MS Dispatch Time 17876 1.1 227 1855 .115 478.739RO Dispatch Time 4746 .3 40 304 .019 13.317QR CPU Time 69 .004 1.699MS CPU Time 19 .001 .185RO CPU TIME 12 .001 .159L8 CPU Time 1 .000 .470L9 CPU Time 0 .000 .000J8 CPU Time 124 .008 6.221J9 CPU Time 9 .001 5.174S8 CPU Time 0 .000 .000T8 CPU Time 0 .000 .000X8 CPU Time 0 .000 .000X9 CPU Time 0 .000 .000z/OS XML System Services CPU Time 0 .000 .000
Figure 32. Performance Totals report (part 2): CPU and dispatch statistics
Chapter 2. Performance reports 51
||

Response (All Selected Tasks)The total time. This is the accumulation of the response times (Stop Timeminus Start Time) for all selected conversational (Type C) minus the TerminalControl I/O Wait Time for those tasks.
Part 3: Resource utilization statisticsThe third part of the Performance Totals report displays the count and time values(total, average per task, and maximum per task) from the CMF performance classrecords for the resource utilization fields. Time values are represented in seconds,with millisecond precision.
Note: Some of the fields might contain large values and be represented inexponential format. For example, 2 834 000 might be shown as 2834E3.
Some fields might show +++.+++ in place of a value that is too large.
52 IBM CICS Performance Analyzer for z/OS: Report Reference
|

V3R2M0 CICS Performance AnalyzerPerformance Totals
TOTL0001 Printed at 12:03:45 7/15/2010 Data from 16:20:08 12/15/2009 to 11:28:14 12/16/2009 Page 3
...... C O U N T S ...... ........... T I M E ...........From Selected Performance Records Total Avg/Task Max/Task Total Avg/Task Max/Task
FCWAIT File I/O wait time 5378 .3 294 15 .001 2.086RLSWAIT RLS File I/O wait time 8 .0 1 0 .000 .022TSWAIT VSAM TS I/O wait time 31 .0 3 0 .000 .005TSSHWAIT Asynchronous Shared TS wait time 0 .0 0 0 .000 .000JCWAIT Journal I/O wait time 2108 .1 66 6 .000 .870TDWAIT VSAM transient data I/O wait time 0 .0 0 0 .000 .000IRWAIT MRO link wait time 1493 .1 70 76 .005 4.863CFDTWAIT CF Data Table access requests wait time 0 .0 0 0 .000 .000CFDTSYNC CF Data Table syncpoint wait time 0 .0 0 0 .000 .000RUNTRWAI BTS run Process/Activity wait time 0 .0 0 0 .000 .000SYNCDLY SYNCPOINT parent request wait time 0 .0 0 0 .000 .000RMITIME Resource Manager Interface (RMI) elapsed time 22391 1.4 112 5395 .334 4458.381RMISUSP Resource Manager Interface (RMI) suspend time 139 .0 42 5389 .334 4458.379JVMITIME JVM initialize elapsed time 543 .0 30 32 .002 5.159JVMTIME JVM elapsed time 1514 .1 90 227 .014 10.493JVMRTIME JVM reset elapsed time 661 .0 40 1 .000 .111JVMSUSP JVM suspend time 6574 .4 562 13 .001 2.873JVMTHDWT JVM server thread wait time 0 .0 0 0 .000 .000DB2CONWT DB2 Connection wait time 0 .0 0 0 .000 .000DB2RDYQW DB2 Thread wait time 0 .0 0 0 .000 .000DB2WAIT DB2 SQL/IFI wait time 0 .0 0 0 .000 .000IMSWAIT IMS (DBCTL) wait time 0 .0 0 0 .000 .000WMQGETWT WebSphere MQ GETWAIT wait time 0 .0 0 0 .000 .000TCWAIT Terminal wait for input time 2556 .2 194 75437 4.674 +++.+++LU61WAIT LU6.1 wait time 0 .0 0 0 .000 .000LU62WAIT LU6.2 wait time 750 .0 53 6 .000 1.471SZWAIT FEPI services wait time 0 .0 0 0 .000 .000SOWAIT Inbound Socket I/O wait time 2904 .2 47 1000 .062 186.623OSOWAIT Outbound Socket I/O Wait Time 0 .0 0 0 .000 .000ISWAIT IPCONN link wait time 0 .0 0 0 .000 .000RQRWAIT Request Receiver Wait Time 0 .0 0 0 .000 .000RQPWAIT Request Processor Wait Time 173 .0 23 12 .001 2.847DSPDELAY First dispatch wait time 15467 1.0 2 9 .001 .793TCLDELAY First dispatch TCLSNAME wait time 0 .0 0 0 .000 .000MXTDELAY First dispatch MXT wait time 0 .0 0 0 .000 .000ENQDELAY Local Enqueue wait time 8 .0 1 119 .007 119.230GNQDELAY Global Enqueue wait time 0 .0 0 0 .000 .000ICDELAY Interval Control (IC) wait time 49 .0 2 78 .005 5.212GIVEUPWT Give up control wait time 9053 .6 127 4 .000 1.330WAITCICS CICS ECB wait time 156 .0 88 3552 .220 3521.733WAITEXT External ECB wait time 2409 .1 64 34684 2.149 4458.482PTPWAIT 3270 Bridge Partner wait time 0 .0 0 0 .000 .000RRMSWAIT Resource Recovery Services indoubt wait time 0 .0 0 0 .000 .000LOCKDLAY Lock Manager (LM) wait time 665 .0 24 791 .049 29.926DSTCBMWT Dispatcher TCB Mismatch wait time 0 .0 0 0 .000 .000MAXOTDLY Maximum Open TCB delay time 0 .0 0 0 .000 .000MAXJTDLY Maximum JVM TCB delay time 0 .0 0 0 .000 .000MAXSTDLY Maximum SSL TCB delay time 0 .0 0 0 .000 .000MAXTTDLY Maximum JVM server thread TCB delay time 0 .0 0 0 .000 .000MAXXTDLY Maximum XPLink TCB delay time 0 .0 0 0 .000 .000DSMMSCWT DS storage constraint wait time 0 .0 0 0 .000 .000PCLOADTM Program Library wait time 3094 .2 31 63 .004 2.761SYNCTIME SYNCPOINT processing time 16354 1.0 33 383 .024 252.070OTSINDWT OTS Indoubt Wait time 0 .0 0 0 .000 .000EXWAIT Exception Conditions wait time 1 .0 1 0 .000 .000DSCHMDLY Redispatch wait time caused by change-TCB mode 28019 1.7 1314 177 .011 3.041EICTOTCT EXEC CICS requests 0 .0 0 0 .000 .000ECEFOPCT Event Filter operations 0 .0 0 0 .000 .000ECEVNTCT Events captured 0 .0 0 0 .000 .000ECSIGECT SIGNAL EVENT requests 0 .0 0 0 .000 .000TCMSGIN1 Messages received count 3307 .2 195TCCHRIN1 Terminal characters received count 139647 8.7 8053TCMSGOU1 Messages sent count 3612 .2 195TCCHROU1 Terminal characters sent count 1290689 80.0 76437TCMSGIN2 Messages received from LU6.1 0 .0 0TCCHRIN2 LU6.1 characters received count 0 .0 0TCMSGOU2 Messages sent to LU6.1 0 .0 0TCCHROU2 LU6.1 characters sent count 0 .0 0TCALLOC TCTTE ALLOCATE requests 230 .0 10TCM62IN2 LU6.2 messages received count 0 .0 0TCC62IN2 LU6.2 characters received count 0 .0 0TCM62OU2 LU6.2 messages sent count 227 .0 4TCC62OU2 LU6.2 characters sent count 3279 .2 53ISALLOC Allocate Session requests for sessions on IP 0 .0 0FCADD File ADD requests 803 .0 30FCBROWSE File Browse requests 166097 10.3 9425FCDELETE File DELETE requests 855 .1 30FCGET File GET requests 5439 .3 163FCPUT File PUT requests 90 .0 10FCTOTAL File Control requests 197898 12.3 9682FCAMCT File access-method requests 201247 12.5 9697TDGET Transient data GET requests 261 .0 18TDPUT Transient data PUT requests 128312 7.9 4449TDPURGE Transient data PURGE requests 33 .0 3TDTOTAL Transient data Total requests 128606 8.0 4449TSGET Temporary Storage GET requests 574 .0 27TSPUTAUX Auxiliary TS PUT requests 497 .0 20TSPUTMAI Main TS PUT requests 782 .0 20TSTOTAL TS Total requests 2509 .2 52BMSMAP BMS MAP requests 24 .0 1BMSIN BMS IN requests 170 .0 10BMSOUT BMS OUT requests 521 .0 10BMSTOTAL BMS Total requests 721 .0 20JNLWRITE Journal write requests 31 .0 3LOGWRITE Log Stream write requests 2088 .1 66ICSTART I l C l START INITIATE 700 0 6
Chapter 2. Performance reports 53

Part 4: User field statisticsThis final part of the Performance Totals report displays the count and time valuesdescribed above for the user fields contained in the CMF performance classrecords. The CICS 12-byte ID is printed to define each field.
Wait Analysis reportThe Wait Analysis report provides a breakdown of wait activity by Transaction ID(or other ordering fields). You can see at a glance which CICS resources arecausing your transactions to be suspended. This report can help you to quicklyidentify the possible source of a performance response time problem.
Report commandThe Wait Analysis report can be requested from a Report Set in the CICS PAdialog. Select the Wait Analysis report in the Performance Reports category.
In batch, the WAITANALysis command is used to request the Wait Analysis report.
The command to produce the default report is:CICSPA WAITANALYSIS
To tailor the report, you can specify report options as follows:CICSPA WAITANALYSIS(
[BY(by1[,by2][,by3]),][INTERVAL(hh:mm:ss),][OUTPUT(ddname),][LINECOUNT(nnn),][TITLE1(’...sub-heading left ...’),][TITLE2(’...sub-heading right...’),][SELECT(PERFORMANCE(INCLUDE|EXCLUDE(field1(values1),...),...))])
You can specify up to three BY operands to determine the sort order of the report.If omitted, the default is BY(TRAN). Only fields of type T (Time) and C(Character) might be specified. The following fields are eligible sort fields:
APPLIDAPPLPROGAPPLTRAN
V3R2M0 CICS Performance AnalyzerPerformance Totals
TOTL0001 Printed at 12:03:45 7/15/2010 Data from 11:10:52 3/24/2009 to 11:34:12 3/24/2009 Page 10
...... C O U N T S ...... ........... T I M E ...........From Selected User Records Total Avg/Task Max/Task Total Avg/Task Max/Task
TEST TEST S001 21 .0 1 8 .011 1.180TEST TEST S002 21 .0 1 0 .000 .001RMITOTAL CPARMI A001 0 .0 0RMIOTHER CPARMI A002 0 .0 0RMIDB2 CPARMI A003 0 .0 0RMIDBCTL CPARMI A004 0 .0 0RMIEXDLI CPARMI A005 0 .0 0RMIMQM CPARMI A006 0 .0 0RMITCPIP CPARMI A007 0 .0 0ICTOTAL IC A001 0 .0 0ASKTIME IC A002 0 .0 0CANCEL IC A003 0 .0 0DELAY IC A004 0 .0 0INTERVAL IC A005 0 .0 0POST IC A006 0 .0 0RETRIEVE IC A007 0 .0 0START IC A008 0 .0 0
Figure 34. Performance Totals report (part 4): User field statistics
54 IBM CICS Performance Analyzer for z/OS: Report Reference

FCTYISIPICNMLUNAMEPROGRAMRLUNAMERPTCLASSSRVCLASSSTARTSTOPTCLASSNMTCPSRVCETERMTERMCNNMTRANUSERIDWBATMSNMWBPIPLNMWBPROGNMWBSVCENMWBSVOPNMWBURIMNM
The time interval applies when you want to summarize wait activity over time,and is only applicable when one of the BY operands is a time stamp (START orSTOP). The default time interval is 00:01:00 (1 minute).
Report contentThe Wait Analysis report provides a detailed breakdown of Suspend Wait time.The BY operands control the sort order and enable the data to be aggregated. ARecap report, printed at the conclusion of the detail report, provides an overallbreakdown of Suspend Wait Time.
Note: Some suspend times or counts, particularly in the Recap report, might belarge. Very large numbers are displayed in exponential format nnnnnnnEsmmwhere:
nnnnnnn is the leftmost 7 digits of the original numbermm is the exponents is the sign (+ or -)
Detail reportThe Wait Analysis report prints details per control break. Each BY sort fieldcombination causes a control break in the report.
Figure 35 on page 56 shows part of the Wait Analysis report and Figure 36 on page64 shows the Wait Analysis Recap report produced by the command:CICSPA WAITANAL(OUTPUT(WAIT0001),
INTERVAL(00:01:00))
Chapter 2. Performance reports 55

The Wait Analysis report has two sections:1. The first section provides a summary of common performance metrics,
including:v Number of tasksv Response timev Dispatch timev CPU timev Suspend wait timev Dispatch wait timev QR TCB Redispatch Wait Timev RMI elapsed timev RMI suspend time
2. The second section provides a detailed breakdown of Suspend time bycomponent, such as Dispatch wait, File wait, and so on. Components arereported in descending wait time order, thereby ensuring that the primarycause of task wait is at the top of the list.Only wait clocks with non-zero elapsed time are reported.
BY sort fields:
You can select up to three BY sort fields. If one of the BY fields is a Start or a Stoptime, the Interval specification is also reported. If a field is not present in the SMFinput records, a value of <Missing> is reported. Missing values are always shownafter values that are present.
Summary Data:
The column headings in this part of the Wait Analysis report are:
Time
TotalTotal elapsed time.
AverageAverage elapsed time (Total divided by #Tasks).
Count
V3R2M0 CICS Performance AnalyzerWait Analysis Report
WAIT0001 Printed at 12:31:46 10/08/2010 Data from 15:30:33 9/29/2010 to 23:59:52 9/29/2010
------------------------------------------------------------------------------------------------------------------------------------Tran=CEMTSummary Data -------- Time --------- ------ Count ------ ------ Ratio ------
Total Average Total Average# Tasks 14Response Time 86.9096 6.2078Dispatch Time 2.2610 0.1615 641 45.8 2.6% of ResponseCPU Time 0.1420 0.0101 641 45.8 6.3% of DispatchSuspend Wait Time 84.6485 6.0463 638 45.6 97.4% of ResponseDispatch Wait Time 0.0407 0.0029 627 44.8 0.0% of SuspendQR TCB Redispatch Wait Time 0.0153 0.0011 592 42.3 37.5% of Dispwait
Resource Manager Interface (RMI) elapsed time 0.0000 0.0000 0 0.0 0.0% of ResponseResource Manager Interface (RMI) suspend time 0.0000 0.0000 0 0.0 0.0% of Suspend
Suspend Detail ------------------- Suspend Time ------------------- ----- Count -----Total Average %age Graph Total Average
TCIOWTT Terminal wait for input time 75.7524 5.4109 89.5% |***************** 17 1.2ICDELAY Interval Control (IC) wait time 5.0984 0.3642 6.0% |* 1 0.1N/A Other Wait Time 3.6753 0.2625 4.3% | 608 43.4SZWAIT FEPI services wait time 0.1222 0.0087 0.1% | 1 0.1DSPDELAY First dispatch wait time 0.0002 0.0000 0.0% | 11 0.8
------------------------------------------------------------------------------------------------------------------------------------
Figure 35. Wait Analysis report
56 IBM CICS Performance Analyzer for z/OS: Report Reference
|
|

TotalTotal number of events.
AverageAverage number of events (Total divided by #Tasks).
RatioPercentage of time this component contributed to overall Response, Dispatchor Suspend time. Ratios are calculated using the values in the Total Timecolumn.
The row information includes:
# TasksThe total number of tasks.
Response TimeTask Response time, calculated as Stop time (owner: DFHCICS, field ID: 006)minus Start time (owner: DFHCICS, field ID: 005).
Dispatch TimeThe total elapsed time during which the user task was dispatched by the CICSdispatcher domain on each CICS TCB under which the task ran (field:USRDISPT, owner: DFHTASK, field ID: 007).
CPU TimeThe total processor (CPU) time during which the user task was dispatched bythe CICS dispatcher domain on each CICS TCB under which the task ran(field: USRCPUT, owner: DFHTASK, field ID: 008).
Suspend Wait TimeThe total elapsed suspend (wait) time for which the user task was suspendedby the CICS dispatcher domain (field: SUSPTIME, owner: DFHTASK, field ID:014).
Dispatch Wait TimeThe elapsed time for which the user task waited for redispatch by the CICSdispatcher domain (field: DISPWTT, owner: DFHTASK, field ID: 102). This isthe aggregate of the wait times between each wait event completion and theuser task being redispatched by the CICS dispatcher domain.
QR TCB Redispatch Wait TimeThe elapsed time that the user task waited for redispatch on the CICS QRmode TCB. This is an aggregate of the wait times between each wait eventcompletion and the user task being redispatched by the CICS dispatcherdomain on the QR mode TCB (field: QRMODDLY, owner: DFHTASK, field ID249).
Resource Manager Interface (RMI) elapsed timeThe total elapsed time the user task spent in the CICS Resource ManagerInterface (RMI) for all the resource managers invoked by the user task,including DB2, IMS (DBCTL), WebSphere MQ, CICS Sockets, and so on (field:RMITIME, owner: DFHTASK, field ID: 170).
Resource Manager Interface (RMI) suspend timeThe elapsed time during which the user task was suspended by the CICSdispatcher domain whilst in the CICS Resource Manager Interface (RMI) (field:RMISUSP, owner: DFHTASK, field ID: 171).
Suspend Detail:
Chapter 2. Performance reports 57
||||||

This section details the components of the Suspend Wait Time reported in theSummary Data section.
The column headings in this part of the Wait Analysis report are:
Suspend Time
TotalTotal component Suspend Time.
AverageAverage component Suspend Wait Time, calculated as Total componentSuspend Time divided by #Tasks (from Summary Data).
%agePercentage of time this component contributed to the Suspend Time,calculated as Total component Suspend Time divided by Suspend WaitTime (from Summary Data) multiplied by 100.
GraphA histogram representation of the %age value with one asterisk per 5%.100% is 20 asterisks, 5% is one asterisk. Any value less than 5% does notappear in the graph.
Count
TotalTotal component suspend count.
AverageAverage component suspend count, calculated as Total Count divided by#Tasks (from Summary Data).
The Suspend Detail includes one report line for every Suspend component clockwith a non-zero value. The components are reported in descending wait timeorder, ensuring that the primary cause of task wait is at the top of the list.
Note that occasionally there are Suspend Events that are wholly contained withinanother Suspend Event. These events are shown with their Suspend Descriptionprefixed with >. For example, DSPDELAY contains TCLDELAY and MXTDELAY.Dependent Suspend event metrics are not included in Totals as their Parent eventis assumed to contain all of the dependent events' resource usage.
N/AOccasionally, the total task suspend time is greater than the sum of thecomponent suspend times. This unaccounted time is reported with a FieldName of N/A and a description of Other Wait Time. This unaccounted time iscalculated as the difference between Suspend Wait Time (from the SummaryData section) minus the sum of the component values (from the SuspendDetail section). The Other Wait Time count value is calculated similarly.
CFDTWAIT CF Data Table access requests wait timeThe elapsed time in which the user task waited for a data table access requestto the coupling facility data table server to complete (owner: DFHFILE, fieldID: 176).
DB2CONWT DB2 Connection wait timeThe value of this field depends on the version of DB2 to which CICS isconnected:
58 IBM CICS Performance Analyzer for z/OS: Report Reference

v When CICS is connected to DB2 Version 5 or earlier, and is therefore notexploiting the CICS open transaction environment, (OTE) this field is theelapsed time in which the user task waited for a CICS subtask (TCB) tobecome available.
v When CICS is connected to DB2 Version 6 or later, and so is using the CICSopen transaction environment (OTE), this field is the elapsed time in whichthe user task waited for a DB2 connection to become available for use withthe user tasks open TCB.
(owner: DFHDATA, field ID: 188)
DB2RDYQW DB2 Thread wait timeThe elapsed time in which the user task waited for a DB2 thread to becomeavailable (owner: DFHDATA, field ID: 187).
DB2WAIT DB2 SQL/IFI wait timeIn CICS Transaction Server for z/OS Version 2.1 or earlier, this field is theelapsed time in which the user task waited for DB2 to service the DB2 EXECSQL and Instrumentation Facility Interface (IFI) requests issued by the usertask.
In CICS Transaction Server for z/OS Version 2.2 or later:v When CICS is connected to DB2 Version 5 or earlier, and is therefore not
exploiting the CICS open transaction environment (OTE), this field is theelapsed time in which the user task waited for DB2 to service the DB2 EXECSQL and Instrumentation Facility Interface (IFI) requests issued by the usertask.
v When CICS is connected to DB2 Version 6 or later, and so is using the CICSopen transaction environment (OTE), this field does not apply and is zero.This is because the CICS-DB2 attachment facility uses open TCBs as thethread TCBs rather than using specially created subtask TCBs and as a resultany waits in DB2 that occur on a CICS L8 mode TCB will not be visible tothe CICS dispatcher domain.
(owner: DFHDATA, field ID: 189).
DSCHMDLY Redispatch wait time caused by change-TCB modeThe elapsed time in which the user task waited for redispatch after a CICSDispatcher change-TCB mode request was issued by or on behalf of the usertask. For example, a change-TCB mode request from a CICS L8 or S8 modeTCB back to the CICS QR mode TCB might have to wait for the QR TCBbecause another task is currently dispatched on the QR TCB (owner:DFHTASK, field ID: 247).
DSMMSCWT CICS Dispatcher MVS Storage Constraint wait timeThe elapsed time which the user task spent waiting because no TCB wasavailable, and none could be created because of MVS storage constraints(owner: DFHTASK, field ID: 279).
DSPDELAY First Dispatch wait timeThe elapsed time in which the user task waited for the first dispatch by theCICS dispatcher domain (owner: DFHTASK, field ID: 125).
DSTCBMWT CICS Dispatcher TCB Mismatch wait timeThe elapsed time which the user task spent in TCB Mismatch waits, that is,waiting because there was no TCB available matching the request, but therewas at least one non-matching free TCB (owner: DFHTASK, field ID: 279). Fortransactions that invoke a Java program to run in a JVM, this shows the timespent waiting for a TCB of the correct mode (J8 or J9) and JVM profile.
Chapter 2. Performance reports 59

ENQDELAY Local Enqueue wait timeThe elapsed time in which the user task waited for a CICS task control localenqueue (owner: DFHTASK, field ID: 129).
FCIOWTT File I/O wait timeThe elapsed time in which the user task waited for non-RLS file I/O (owner:DFHFILE, field ID: 063).
GNQDELAY Global Enqueue wait timeThe elapsed time in which the user task waited for a CICS task control globalenqueue (owner: DFHTASK, field ID: 123).
GVUPWAIT Give up control wait timeThe elapsed time in which the user task waited as a result of giving up controlto another task (owner: DFHTASK, field ID: 184).
ICDELAY Interval Control (IC) wait timeThe elapsed time that the user task waited as a result of issuing either:v An interval control EXEC CICS DELAY command for a specified time
interval, orv An interval control EXEC CICS DELAY command for a specified time of day
to expire, orv An interval control EXEC CICS RETRIEVE command with the WAIT option
specified.
(owner: DFHTASK, field ID: 183).
IMSWAIT IMS (DBCTL) wait timeThe total elapsed time in which the user task waited for IMS (DBCTL) toservice the IMS requests issued by the user task (owner: DFHDATA, field ID:186).
IRIOWTT MRO link wait timeThe elapsed time in which the user task waited for control to return at this endof an MRO (Inter-Region Communication) connection (owner: DFHTERM, fieldID: 100).
ISIOWTT IPCONN link wait timeThe elapsed time for which a user task waited for control at this end of anIPIC connection (owner: DFHSOCK, field ID: 300).
JCIOWTT Journal I/O wait timeThe elapsed time in which the user task waited for journal (logstream) I/O(owner: DFHJOUR, field ID: 010).
JVMTHDWT JVM server thread wait timeThe elapsed time that the user task waited to obtain a JVM server threadbecause the CICS system had reached the thread limit for a JVM server in theCICS region (owner: DFHTASK, field ID: 401).
LMDELAY Lock Manager (LM) wait timeThe elapsed time in which the user task waited to acquire a lock on a resource.A user task cannot explicitly acquire a lock on a resource, but many CICSmodules lock resources on behalf of user tasks using the CICS lock manager(LM) domain (owner: DFHTASK, field ID: 128).
LU61WTT LU6.1 wait timeThe elapsed time in which the user task waited for I/O on a LUTYPE6.1connection or session. This time includes the waits for conversations acrossLUTYPE6.1 connections, but not the waits incurred due to LUTYPE6.1syncpoint flows. (owner: DFHTERM, field ID: 133).
60 IBM CICS Performance Analyzer for z/OS: Report Reference

LU62WTT LU6.2 wait timeThe elapsed time in which the user task waited for I/O on a LUTYPE6.2connection or session. This time includes the waits for conversations acrossLUTYPE6.2 (APPC) connections, but not the waits incurred due to LUTYPE6.2(APPC) syncpoint flows (owner: DFHTERM, field ID: 134).
MAXHTDLY Max Hot-Pooling TCB Delay timeThe elapsed time in which the user task waited to obtain a CICS Hot-PoolingTCB (H8 mode), because the CICS system had reached the limit set by thesystem parameter, MAXHPTCBS (owner: DFHTASK, field ID: 278). The H8mode open TCBs are used exclusively by HPJ-compiled Java programs definedwith HOTPOOL(YES). This field is not available from CICS Transaction ServerV3.1.
MAXJTDLY Max JVM TCB Delay timeThe elapsed time during which the user task waited to obtain a CICS JVM TCB(J8 mode), because the CICS system had reached the limit set by the systemparameter, MAXJVMTCBS (owner: DFHTASK, field ID: 277). The J8 mode openTCBs are used exclusively by Java programs defined with JVM(YES).
MAXOTDLY MAXOPENTCBS wait timeThe elapsed time in which the user task waited to obtain a CICS open modeTCB because the CICS system had reached the limit set by the systemparameter, MAXOPENTCBS (owner: DFHTASK, field ID: 250).
MAXSTDLY Maximum SSL TCB delay timeThe elapsed time in which the user task waited to obtain a CICS SSL TCB (S8mode), because the CICS system had reached the limit set by the systeminitialization parameter MAXSSLTCBS. The S8 mode open TCBs are usedexclusively by secure sockets layer (SSL) pthread requests issued by or onbehalf of a user task (owner: DFHTASK, field ID: 281).
MAXTTDLY Maximum JVM server thread TCB delay timeThe elapsed time in which the user task waited to obtain a T8 TCB, becausethe CICS system reached the limit of available threads. The T8 mode openTCBs are used by a JVM server to perform multithreaded processing. Each T8TCB runs under one thread. The thread limit is 1024 for each CICS region andeach JVM server in a CICS region can have up to 256 threads.
MAXXTDLY Maximum XPLink TCB delay timeThe elapsed time in which the user task waited to obtain a CICS XP TCB (X8or X9 mode), because the CICS system had reached the limit set by the systemparameter, MAXXPTCBS. The X8 and X9 mode open TCBs are used exclusivelyby C and C++ programs that were compiled with the XPLINK option (owner:DFHTASK, field ID: 282).
MXTDELAY First Dispatch MXT wait timeThe elapsed time in which the user task waited for first dispatch which wasdelayed because of the limits set by the MXT system parameter being reached(owner: DFHTASK, field ID: 127).
PTPWAIT 3270 Bridge Partner wait timeThe elapsed time in which the user task waited for the 3270 bridge partnertransaction to complete (owner: DFHTASK, field ID: 285).
RLSWAIT RLS File I/O wait timeThe elapsed time in which the user task waited for RLS file I/O (owner:DFHFILE, field ID: 174).
Chapter 2. Performance reports 61

RQPWAIT Request Processor wait timeThe elapsed time during which the request processor user task CIRP waited forany outstanding replies to be satisfied (owner: DFHTASK, field ID: 193).
RQRWAIT Request Receiver wait timeThe elapsed time during which the request receiver user task CIRR (or userspecified transaction ID) waited for any outstanding replies to be satisfied(owner: DFHTASK, field ID: 192).
RRMSWAIT Resource Recovery Services Indoubt wait timeThe elapsed time in which the user task waited indoubt using the MVSresource recovery services (RRS) for transactional EXCI (owner: DFHTASK,field ID: 191).
RUNTRWTT BTS run Process/Activity wait timeThe elapsed time in which the user task waited for completion of a transactionthat ran as a result of the user task issuing a CICS BTS run ACQPROCESS orrun activity request to run a process or activity synchronously (owner:DFHTASK, field ID: 195).
SOIOWTT Inbound Socket I/O wait timeThe elapsed time in which the user task waited for inbound socket I/O(owner: DFHSOCK, field ID: 241).
SOOIOWTT Outbound Socket I/O wait timeThe elapsed time in which the user task waited for outbound socket I/O(owner: DFHSOCK, field ID: 299).
SRVSYWTT CF Data Table syncpoint wait timeThe elapsed time in which the user task waited for completion of syncpoint orresynchronization processing using the coupling facility data table server tocomplete (owner: DFHSYNC, field ID: 177).
SYNCDLY SYNCPOINT parent request wait timeThe elapsed time in which the user task waited for a syncpoint request to beissued by it's parent transaction (owner: DFHSYNC, field ID: 196). The usertask was executing as a result of the parent transaction issuing a CICS BusinessTransaction Services (BTS) Run ACQPROCESS or Run Activity requests to runa process or activity synchronously.
SZWAIT FEPI services wait timeThe elapsed time in which the user task waited for FEPI services (owner:DFHFEPI, field ID: 156).
TCIOWTT Terminal wait for input timeThe elapsed time in which the user task waited for input from the terminaluser, after issuing an EXEC CICS RECEIVE request (owner: DFHTERM, fieldID: 009).
TCLDELAY First Dispatch TCLSNAME wait timeThe elapsed time in which the user task waited for first dispatch which wasdelayed because of the limits set for this transaction's transaction class (owner:DFHTASK, field ID: 126).
TDIOWTT VSAM transient data I/O wait timeThe elapsed time in which the user task waited for VSAM I/O to theintrapartition transient data set, DFHINTRA (owner: DFHDEST, field ID: 101).
TSIOWTT VSAM TS I/O wait timeThe elapsed time in which the user task waited for VSAM I/O to the auxiliarytemporary storage data set, DFHTEMP (owner: DFHTEMP, field ID: 011).
62 IBM CICS Performance Analyzer for z/OS: Report Reference

TSSHWAIT Asynchronous Shared TS wait timeThe elapsed time in which the user task waited for an asynchronous sharedtemporary storage request to a temporary storage data server to complete(owner: DFHTEMP, field ID: 178).
WMQGETWT WebSphere MQ GETWAIT wait timeThe elapsed time the user task waited for WebSphere MQ to service the usertask's GETWAIT request (owner: DFHDATA, field ID: 396).
WTCEWAIT CICS ECB wait timeThe elapsed time the user task waited for:v One or more ECBs, passed to CICS by the user task using the EXEC CICS
WAITCICS ECBLIST command, to be MVS POSTed.v Completion of an event initiated by the same or by another task.
(owner: DFHTASK, field ID: 182).
WTEXWAIT External ECB wait timeThe elapsed time the user task waited for one or more ECBs, passed to CICSby the user task using the EXEC CICS WAIT EXTERNAL ECBLIST() command,to be MVS POSTed. (owner: DFHTASK, field ID: 181).
Recap reportThe Wait Analysis report is always followed by the Wait Analysis Recap report toprovide a breakdown of the CMF input data. The BY fields are ignored.
The Recap report performs two functions:1. It provides an overview of system-wide wait time. All CMF suspend
components are reported in descending wait time order ensuring that theprimary cause of system-wide task wait is at the top of the list.
2. It shows Field Availability information:
PresentThe number of times the field was present in the CMF performancerecords
MissingThe number of times the field was not present in the CMF performancerecords
The Recap report shows all wait clocks, even clocks that accumulated no wait time.This allows you to see at a glance:v All the individual Suspend component clocks.v Which clocks might be missing.
For a description of the fields in the Recap report, see “Detail report” on page 55.
In addition, the Recap report might display an Average value of N/C whichindicates that it is not calculable. This occurs if there was no wait activity for thiscomponent.
Figure 35 on page 56 shows part of the Wait Analysis report and Figure 36 on page64 shows the Wait Analysis Recap report produced by the command:CICSPA WAITANAL(OUTPUT(WAIT0001),
INTERVAL(03:00:00),BY(TRAN,APPLID))
Chapter 2. Performance reports 63

Transaction Profiling reportThe Transaction Profiling report is a comparison of two sets of CMF performanceclass data. For example, the performance data for a particular CICS application intwo different time periods, or the performance data for all CICS applications ontwo systems. The two sets of data to be compared are known as the report dataand the baseline data.
The source of the report data or the baseline data can be either SMF files orperformance historical databases (HDBs).
Report commandYou can request the Transaction Profiling report in the dialog either:v From a Report Set. Select the Transaction Profiling report in the Performance
Reports category.v Independently of Report Set. Select Profiling on the Primary Option Menu.
V3R2M0 CICS Performance AnalyzerWait Analysis Recap Report
WAIT0001 Printed at 12:31:46 10/08/2010 Data from 15:30:33 9/29/2010 to 23:59:52 9/29/2010
--------- Time -------- ------ Ratio ------Total Average
# Tasks 84Response Time 2497.8095 29.7358Dispatch Time 23.1929 0.2761 0.9% of ResponseCPU Time 3.5547 0.0423 15.3% of DispatchSuspend Wait Time 2474.6159 29.4597 99.1% of ResponseDispatch Wait Time 2.2872 0.0272 0.1% of SuspendQR TCB Redispatch Wait Time 1.0313 0.0123 45.1% of Dispwait
Resource Manager Interface (RMI) elapsed time 0.0000 0.0000 0.0% of ResponseResource Manager Interface (RMI) suspend time 0.0000 0.0000 0.0% of Suspend
------------------- Suspend Time ------------------- Field AvailabilityTotal Average %age Graph Present Missing
N/A Other Wait Time 2361.2136 28.1097 95.4% |*******************TCIOWTT Terminal wait for input time 104.5363 1.2445 4.2% | 84 0ICDELAY Interval Control (IC) wait time 5.0984 0.0607 0.2% | 84 0FCIOWTT File I/O wait time 2.3381 0.0278 0.1% | 84 0LMDELAY Lock Manager (LM) wait time 1.1213 0.0133 0.0% | 84 0SZWAIT FEPI services wait time 0.1375 0.0016 0.0% | 84 0DSPDELAY First dispatch wait time 0.1085 0.0013 0.0% | 84 0MXTDELAY > First dispatch MXT wait time 0.0000 N/C 0.0% | 84 0TCLDELAY > First dispatch TCLSNAME wait time 0.0000 N/C 0.0% | 84 0RLSWAIT RLS File I/O wait time 0.0591 0.0007 0.0% | 84 0JCIOWTT Journal I/O wait time 0.0019 0.0000 0.0% | 84 0SOIOWTT Inbound Socket I/O wait time 0.0011 0.0000 0.0% | 84 0GVUPWAIT Give up control wait time 0.0002 0.0000 0.0% | 84 0RQPWAIT Request Processor Wait Time 0.0000 N/C 0.0% | 84 0RQRWAIT Request Receiver Wait Time 0.0000 N/C 0.0% | 84 0SOOIOWTT Outbound Socket I/O Wait Time 0.0000 N/C 0.0% | 84 0LU62WTT LU6.2 wait time 0.0000 N/C 0.0% | 84 0LU61WTT LU6.1 wait time 0.0000 N/C 0.0% | 84 0IRIOWTT MRO link wait time 0.0000 N/C 0.0% | 84 0TSSHWAIT Asynchronous Shared TS wait time 0.0000 N/C 0.0% | 84 0TSIOWTT VSAM TS I/O wait time 0.0000 N/C 0.0% | 84 0MAXOTDLY Maximum Open TCB delay time 0.0000 N/C 0.0% | 84 0RUNTRWTT BTS run Process/Activity wait time 0.0000 N/C 0.0% | 84 0RRMSWAIT Resource Recovery Services indoubt wait time 0.0000 N/C 0.0% | 84 0WTCEWAIT CICS ECB wait time 0.0000 N/C 0.0% | 84 0WTEXWAIT External ECB wait time 0.0000 N/C 0.0% | 84 0ENQDELAY Local Enqueue wait time 0.0000 N/C 0.0% | 84 0GNQDELAY Global Enqueue wait time 0.0000 N/C 0.0% | 84 0SYNCDLY SYNCPOINT parent request wait time 0.0000 N/C 0.0% | 84 0SRVSYWTT CF Data Table syncpoint wait time 0.0000 N/C 0.0% | 84 0CFDTWAIT CF Data Table access requests wait time 0.0000 N/C 0.0% | 84 0TDIOWTT VSAM transient data I/O wait time 0.0000 N/C 0.0% | 84 0DB2WAIT DB2 SQL/IFI wait time 0.0000 N/C 0.0% | 84 0DB2CONWT DB2 Connection wait time 0.0000 N/C 0.0% | 84 0DB2RDYQW DB2 Thread wait time 0.0000 N/C 0.0% | 84 0IMSWAIT IMS (DBCTL) wait time 0.0000 N/C 0.0% | 84 0
*Total* (All Suspend Wait events) 2474.6159 29.4597 100.0% |********************
Figure 36. Wait Analysis Recap report
64 IBM CICS Performance Analyzer for z/OS: Report Reference
|

To request the Transaction Profiling report in batch, you use the PROFILINGoperand.
The command to produce the default report is:CICSPA PROFILING(REPORT(SMF|hdbname)),
PROFILING(BASELINE(SMF|hdbname))
You must specify two PROFILING operands for each Transaction Profiling report:v One with a REPORT suboperand that defines the source of the report datav One with a BASELINE suboperand that defines the source of the baseline data
For example, REPORT(SMF) defines the source of the report data as the SMF filesidentified by either the most recent INPUT operand, if specified, or the DDnameSMFIN, if no INPUT operand is specified. BASELINE(hdbname) defines the sourceof the baseline data as the List or Summary Performance historical database namedhdbname that is defined in the HDB Register identified by the DDnameCPAHDBRG.
To tailor the report, you can specify report options as follows:CICSPA PROFILING([ID(profile#)],REPORT(SMF|hdbname),
[SMFSTART(date,time),][SMFSTOP(date,time),][SELECT(PERFORMANCE(INCLUDE|EXCLUDE(field1(values1),...),...)),][SELECT2(PERFORMANCE(INCLUDE|EXCLUDE(field1(values1),...),...)),][FIELDS(field1[(options)],...),][INTERVAL(hh:mm:ss),][PRINT(REPORT,BASELINE,DELTA,CHANGE,
FULL|EXCEPTIONSONLY,NOBLANKLINES|BLANKLINES),][THRESHOLD(%abovebaseline,%belowbaseline),][OUTPUT(ddname),][EXTERNAL(ddname),][NOTOTALS|TOTALS(n),][LINECount(nnn),][TITLE1(’...1st 64 characters of title... ’),][TITLE2(’...2nd 64 characters of title... ’),])
PROFILING([ID(profile#)],BASELINE(SMF|hdbname),[SMFSTART(date,time),][SMFSTOP(date,time),][SELECT(PERFORMANCE(INCLUDE|EXCLUDE(field1(values1),...),...)),][SELECT2(PERFORMANCE(INCLUDE|EXCLUDE(field1(values1),...),...)),][FIELDS(field1[(options)],...),][INTERVAL(hh:mm:ss)])
To understand how the Transaction Profiling report compares two sets of data, it isuseful to think of the Transaction Profiling report as a comparison of twoPerformance Summary reports:v One for the report data, as specified by the PROFILING(REPORT(...)...) operandv One for the baseline data, as specified by the PROFILING(BASELINE(...)...)
operand
Each Performance Summary report uses a SUMMARY Report Form (FIELDSoperand) to:1. Group and sort input records by key field values2. Summarize the values of non-key fields in each group of records (for example,
as an average or a total)
Chapter 2. Performance reports 65

The Transaction Profiling report consolidates the two sets of summarized data byfinding a row of summarized baseline data whose key fields match a row ofsummarized report data. The Transaction Profiling report then compares the valuesof the non-key fields in the two matched rows. Rows of summarized baseline datawhose key field values do not match any rows of summarized report data arediscarded.
When designing a Transaction Profiling report, you might find it useful to first runthe two Performance Summary reports. This enables you to review the two sets ofsummarized data separately, before using the Transaction Profiling report toconsolidate and compare them. Note that the Report Form and the Baseline Formboth affect how the Transaction Profiling report summarizes baseline data. TheTransaction Profiling report summarizes baseline data according to the order of thefields in the Report Form, and using only those fields that occur in both theBaseline Form and the Report Form.
Report contentThe content of a Transaction Profiling report is similar to a Performance Summaryreport, with additional row headings specific to the Transaction Profiling report(Report, Baseline, Delta, and Change%) appearing between the column for the lastkey field and the first non-key field:
Cross-System Work reportThe Cross-System Work report accepts performance class data from a single ormultiple CICS systems and correlates the data by network unit-of-work.
The report default is to print only the CMF performance class records that arecontained in a unique network unit-of-work that includes multiple performancerecords.
Note: The Cross-System Work report will also include multiple performance classrecords from a single system.
You can request a report from all available records, or you can specify selectioncriteria to request a report from only the records that meet specific requirements.The SELECT and SELUOW commands provide selection at the UOW (multi-task)level as well as the Task level.
V3R2M0 CICS Performance AnalyzerTransaction Profiling
__________________________________________________PROF0001 Printed at 12:03:45 7/15/2010 Report Data from 17:24:50 5/02/2006 to 17:27:15 5/02/2006
Baseline Data from 16:21:47 5/02/2006 to 16:23:42 5/02/2006
Avg Avg Avg Avg Avg Avg Avg Avg Avg AvgTran #Tasks Response Dispatch User CPU Suspend DispWait FC Wait FCAMRq IR Wait SC24UHWM SC31UHWM
Time Time Time Time Time Time Count Time Count CountDB2D Report 560 .0504 .0057 .0017 .0446 .0028 .0000 0 .0000 1040 1296DB2D Baseline 448 .0369 .0047 .0018 .0322 .0015 .0000 0 .0000 1040 1296
Delta +112 +.0134 +.0010 -.0000 +.0125 +.0012 +.0000 +0 +.0000 +0 +0Change% +25.00 +36.43 +20.59 -2.41 +38.77 +79.51 +.00 +.00 +.00 +.00 +.00
DCO1 Report 560 .0598 .0011 .0005 .0587 .0059 .0000 0 .0000 976 1296
GLCT Report 560 .0543 .0005 .0004 .0538 .0023 .0000 0 .0000 0 0GLCT Baseline 448 .0432 .0005 .0003 .0427 .0012 .0000 0 .0000 0 0
Delta +112 +.0111 +.0000 +.0000 +.0111 +.0011 +.0000 +0 +.0000 +0 +0Change% +25.00 +25.82 +7.37 +10.61 +26.03 +92.24 +.00 +.00 +.00 +.00 +.00
Figure 37. Transaction Profiling report (comparing data using the default form)
66 IBM CICS Performance Analyzer for z/OS: Report Reference

Report commandThe Cross-System Work report can be requested from a Report Set in the CICS PAdialog. Select the Cross-System Work report in the Performance Reports category.
In batch, the CROSSsystem command is used to request the Cross-System Workreport. To tailor the report, the LISTX command is used and produces theCross-System Work Extended report.
Cross-System WorkThe command to produce the default report is:CICSPA CROSSSYSTEM
To tailor the report, you can specify report options as follows:CICSPA CROSSSYSTEM(
[OUTPUT(ddname),][EXTERNAL(ddname),][PRINTMULTIPLE,][NOPRINTMULTIPLE,][PRINTSINGLE,][NOWRITE,][LINECOUNT(nnn),][TITLE1(’...sub-heading left ...’),][TITLE2(’...sub-heading right...’),]TASKORDER(START|STOP)[SELECT(PERFORMANCE(INCLUDE|EXCLUDE(field1(values1),...),...)),][SELUOW(PERFORMANCE(INCLUDE|EXCLUDE(field1(values1),...),...))])
Cross-System Work ExtendedTo tailor the format of the report, see “Cross-System Work Extended” on page 29.
Report contentYou can specify a LIST or LISTX Report Form to tailor the format and content ofthe Cross-System Work report. Specifying a Report Form produces theCross-System Work Extended report. Otherwise, the default format of theCross-System Work report is produced.
Default format: Cross-System WorkOn the Cross-System Work report, each line is printed from a single CMFperformance class record. Records that are part of the same network unit-of-workare printed sequentially in groups separated by lines containing four dashes (----).The printed information allows you to find the corresponding records in thePerformance List report.
The Cross-System Work report is produced using an external SORT facility. AnExternal Work Data Set is required to store the records before they are sorted. Thisdata set is either specified explicitly using EXTERNAL(ddname), or CICS PAassigns one from the External Work File pool.
The records are sorted in the following order:1. Network Unit-of-Work NETNAME2. Network Unit-of-Work ID3. Syncpoint count concatenated with either:
v Task stop time in descending (reverse) orderor
v Task start time in ascending order4. APPLID
Chapter 2. Performance reports 67

In the third sort field, the syncpoint count is used to resolve unsynchronizedSTORE CLOCK (STCK) values between systems. The syncpoint count and stoptime (or start time) show the sequence of tasks within the network unit-of-work. Insome cases (for example, where user event monitor points (EMPs) are used), thesyncpoint count does not reflect the sequence of events within a networkunit-of-work. For these instances, all the task records are printed, but notnecessarily in the order they happened. You can tell that this situation exists if thestop times are not in descending order (or the start times are not in ascendingorder).
For more information on correlating the performance class data by networkunit-of-work ID, see “Correlating performance class data” on page 307.
The Cross-System Work report shown in Figure 38 was created using thecommand:CICSPA CROSS(PRINTS,PRINTM,NOWRITE,OUTPUT(CROS0001))
The following fields are shown on the Cross-System Work report. For moreinformation on these fields, see “CMF performance class data fields” on page 245.
TranThe Transaction ID (field: TRAN, owner: DFHTASK, field ID: 001) identifiesthe name of the transaction that this performance class record represents.Applications that are using Distributed Program Link (DPL) requests shoulduse the TRANSID('xxxx') parameter on the EXEC CICS LINKPROGRAM('xxxxxxxx') command to enable better transaction/applicationanalysis from the monitoring performance class data. If the TRANSID('xxxx')parameter is not specified all the performance class records on the targetsystem for a Distributed Program Link (DPL) mirror transaction will have thesame transaction ID. For example, 'CSMI' for a Distributed Program Link(DPL) request from another connected CICS system.
V3R2M0 CICS Performance AnalyzerCross-System Work
CROS0001 Printed at 12:03:45 7/15/2010 Data from 11:10:29 2/04/2010 to 11:33:51 2/04/2010 Page 8
Request Fcty Conn UOW R Response ATran Userid SC TranType Term LUName Type Program T/Name Name NETName Seq APPLID Task T Stop Time Time B
STOC BRENNER U U R AP: DFH0STOC GBIBMIYA.IGCS23C 1 IYK2Z1V3 242 T 11:19:41.001 .7984RED1 BRENNER U U R AP: DFH0RED1 GBIBMIYA.IGCS23C 1 IYK2Z1V3 241 T 11:19:40.337 .1479SAL1 BRENNER TP U S23C IGCS23C AP: DFH0SAL1 T/S23C GBIBMIYA.IGCS23C 1 IYK2Z1V3 239 T 11:19:40.334 .1835----SAL1 BRENNER TP U S23C IGCS23C AP: DFH0SAL1 T/S23C GBIBMIYA.IGCS23C 1 IYK2Z1V3 251 T 11:19:42.763 .0022----SAL1 BRENNER TP U S23C IGCS23C AP: DFH0SAL1 T/S23C GBIBMIYA.IGCS23C 1 IYK2Z1V3 255 T 11:19:45.463 .0018----CBAM BRENNER TO U S23C IGCS23C AP: DFHECBAM T/S23C GBIBMIYA.IGCS23C 1 IYK2Z1V3 259 T 11:19:55.368 7.0077----PAYM BRENNER TO U S23C IGCS23C AP: DFH0PAY0 T/S23C GBIBMIYA.IGCS23C 1 IYK2Z1V3 289 T 11:20:00.569 .0026----PAY1 BRENNER TP U S23C IGCS23C AP: DFH0PAY1 T/S23C GBIBMIYA.IGCS23C 1 IYK2Z1V3 294 T 11:20:04.202 .1390SALE BRENNER U U R AP: DFH0SAL2 GBIBMIYA.IGCS23C 1 IYK2Z1V3 295 T 11:20:04.200 .1353----3333 BRENNER TO U S23C IGCS23C AP: ######## T/S23C GBIBMIYA.IGCS23C 1 IYK2Z1V3 300 T 11:20:08.003 .0028----PAYM BRENNER TO U S23C IGCS23C AP: DFH0PAY0 T/S23C GBIBMIYA.IGCS23C 1 IYK2Z1V3 303 T 11:20:15.964 .0022----PAY1 BRENNER TP U S23C IGCS23C AP: DFH0PAY1 T/S23C GBIBMIYA.IGCS23C 1 IYK2Z1V3 305 T 11:20:19.635 .0747SALE BRENNER U U R AP: DFH0SAL2 GBIBMIYA.IGCS23C 1 IYK2Z1V3 306 T 11:20:19.634 .0715----CSAC BRENNER TO U S23C IGCS23C AP: DFHACP T/S23C GBIBMIYA.IGCS23C 1 IYK2Z1V3 313 T 11:20:44.089 .0017----CBAM BRENNER TO U S23C IGCS23C AP: DFHECBAM T/S23C GBIBMIYA.IGCS23C 1 IYK2Z1V3 315 T 11:20:50.772 3.7993----RMNU BRENNER TO U S23C IGCS23C TR:CJB1 T/S23C GBIBMIYA.IGCS23C 1 IYK2Z1V3 323 T 11:20:54.392 .0317AMNU CBAKER TO U R11 IYK2Z1V3 AP: DFHSAMNU S/S23C CJB3 GBIBMIYA.IGCS23C 1 IYK2Z1V1 158 T 11:20:54.390 .0228
Figure 38. Cross-System Work report
68 IBM CICS Performance Analyzer for z/OS: Report Reference

UseridThe User identifier of the transaction (owner: DFHCICS, field ID: 089).
SCType of transaction start or start code (owner: DFHTASK, field ID: 004).
TranTypeThis column describes the transaction type:S System transactionU User transactionM Mirror transactionD DPL Mirror transactionO ONC RPC Alias transactionW WEB Alias transactionB Bridge transaction- ReservedR CICS BTS Run (ACQPROCESS or activity) transaction synchronous
The transaction type is represented as an byte 1 of the transaction flags field(owner: DFHTASK, field ID: 164).
TermThe Terminal ID (field: TERM, owner: DFHTERM, field ID: 002) is either theterminal ID or the session ID. This field is blank if the transaction was notassociated with a terminal or session facility.
LUNameThe LUname (field: LUNAME, owner: DFHTERM, field ID: 111) is either theVTAM® netname of the terminal ID (if the Access Method for the terminal isVTAM) or the VTAM APPLID of the connection for the session ID. For anEXCI connection, this field is blank. The transaction's terminal or session typecan be identified from the NATURE field (byte 0) within the terminalinformation field (field: TERMINFO, owner: DFHTERM, field ID: 165). Thisfield is blank if the transaction was not associated with a terminal or sessionfacility.
Request TypeThis field describes the type of request that the performance record represents:
Description
AP: An application program request. The Program field will identify theinitial application program name invoked for the transaction.
Note: Function shipped Distributed Program Link (DPL) requests areinterpreted as application requests. In this case the AP: is followed bythe '----' (as for other function shipping requests) to indicate the typesof requests issued by the application program.
FS:---- A function shipping request. The '----' indicate the types of functionshipping request:F File Control
I Interval ControlD Transient DataS Temporary Storage
TR:xxxxA transaction routing request from a terminal-owning region. The'xxxx' is the transaction routing sysid from the RSYSID field (owner:DFHCICS, field ID: 130) and identifies the connection name (sysid) ofthe remote system to which the transaction was routed.
Chapter 2. Performance reports 69

ProgramThe Initial Program Name (field: PGMNAME, owner: DFHPROG, field ID:071) identifies the initial application program invoked for the transaction.Depending on the type of transaction, this field contains either the applicationprogram name as defined in the transaction definition, the program namereturned by a user written dynamic routing program, the application programname passed on a function shipped Dynamic Program Link (DPL) request, theinitial application program name of an ONC RPC Alias Transaction, or theinitial application program name of a WEB Alias Transaction. A program nameof ######## indicates that the transaction was invoked using the definition ofthe transaction ID specified by the DTRTRAN system initialization parameter.
FCTY TThis field is an interpretation of byte 0 of the transaction flags field (owner:DFHTASK, field ID: 164) and describes the transaction's facility type:
Type Descriptionblank NoneT Terminal or SessionS SurrogateD Transient Data queueB Bridge Terminal
FCTY NameThe transaction's facility name (owner: DFHTASK, field ID: 163).
Conn NameThe terminal session connection name (owner: DFHTERM, field ID: 169). If theterminal facility associated with this transaction is a session, then this field isthe name of the owning connection (sysid).
NETNameThis column is the network unit-of-work ID (field: NETUOWPX, owner:DFHTASK, field ID: 097) from the system where the network unit-of-work IDoriginated. This name is constant within each network unit-of-work ID.
For more information on the NETUOWPX field, “DFHTASK fields” on page268.
UOW SeqThe syncpoint sequence number from the network unit-of-work ID (field:NETUOWSX, owner: DFHTASK, field ID: 098) that was assigned at transactionattach time.
For more information on the NETUOWSX field, see “DFHTASK fields” onpage 268.
APPLIDThe APPLID of the CICS system upon which the CMF performance record wascreated. This field indicates the CICS system that performed the work recordedin the record.
TaskThe transaction identification number (owner: DFHTASK, field ID: 031). This isprinted for all records to help identify the corresponding records on aPerformance List report.
R TThe performance class record type (field: RTYPE, owner: DFHCICS, field ID:112):
C Record output for a terminal converse.
70 IBM CICS Performance Analyzer for z/OS: Report Reference

D Record output by a user event monitoring point (EMP) DELIVERrequest.
F Record output for a long running transaction.
S Record output for a syncpoint request.
T Record was output for a transaction termination (detach).
Stop Time or Start TimeStop or start time (hh:mm:ss.thm) of the transaction (owner: DFHCICS, fieldID: 005 for start, 006 for stop). The transactions within the same networkunit-of-work are generally displayed in either descending stop time orascending start time sequence. This might not always be true, however, due tosyncpointing within the transaction, and to the difficulties involved insynchronizing the STORE CLOCK (STCK) values between different CPUs.
Response TimeThe transaction response time. This field is calculated by subtracting thetransaction Start Time (owner: DFHCICS, field ID: 005) from the transactionStop Time (owner: DFHCICS, field ID: 006).
A BY in this column indicates that the transaction abended.
Tailored format: Cross-System Work ExtendedYou can tailor the format of the Cross-System Work report. To use the CICS PAdialog to do this, simply specify a LIST or LISTX Report Form for theCross-System Work report. This produces the Cross-System Work Extended reportlike the example shown in Figure 39 on page 72. The commands to request thisreport are:CICSPA IN(SMFIN001),
LISTX(OUTPUT(CROS0001),EXTERNAL(CPAXW001),NOPRINTMULTIPLE,PRINTSINGLE,BY(UOWID),FIELDS(TRAN,
RESPONSE,USERID,TASKNO,STOP(TIMET),RESPONSE,DISPATCH(TIME),DISPATCH(COUNT),CPU(TIME),SUSPEND(TIME),SUSPEND(COUNT),DISPWAIT(TIME),DISPWAIT(COUNT),IRWAIT(TIME)))
Chapter 2. Performance reports 71

Required CMF fields
If you are using the CICS Monitoring Control Table (MCT) Exclude/Includeparameters to reduce the size of the performance class record, you must ensurethat the data fields required for the Cross-System Work report and extract are notexcluded.
The following table lists the fields that must be collected in the performance classrecords to ensure correct correlation of the data records for the Cross-System Workreport and extract.
Table 1. Cross-System Work report and extract: Required CMF fields
Owner Field ID CICS Informal Name
DFHCICS 112 RTYPE
DFHCICS 130 RSYSID
DFHDEST 091 TDTOTCT
DFHFILE 093 FCTOTCT
DFHPROG 071 PGMNAME
DFHPROG 113 ABCODEO
DFHTASK 031 TRANNUM
DFHTASK 066 ICTOTCT
DFHTASK 097 NETUOWPX
DFHTASK 098 NETUOWSX
DFHTASK 163 FCTYNAME
DFHTASK 164 TRANFLAG
DFHTEMP 092 TSTOTCT
DFHTERM 111 LUNAME
DFHTERM 169 TERMCNNM
V3R2M0 CICS Performance AnalyzerCross-System Work Extended
CROS0001 Printed at 12:03:45 7/15/2010 Data from 15:41:19 7/12/2010 to 16:19:15 7/12/2010 Page 1
Tran Response Userid TaskNo Stop Response Dispatch Dispatch User CPU Suspend Suspend DispWait DispWait IR WaitTime Time Time Time Count Time Time Count Time Count Time
CPLT .3939 CICSUSER 6 15:41:19.419 .3939 .0782 3 .0325 .3158 3 .3149 2 .0000CSSY 71.4053 CICSUSER III 15:42:30.828 71.4053 46.9670 401 17.6543 24.4382 401 9.9254 400 .0000CSSY 4.9137 CICSUSER 12 15:41:24.346 4.9137 .4928 66 .0476 4.4209 66 2.5618 65 .0000CSSY 5.3932 CICSUSER 10 15:41:24.822 5.3932 .8932 59 .2172 4.4999 59 2.7531 58 .0000CSSY 5.6419 CICSUSER 9 15:41:25.069 5.6419 1.6045 75 .1472 4.0374 75 2.9273 74 .0000CSSY 5.9801 CICSUSER 13 15:41:25.434 5.9801 .7826 87 .1627 5.1975 87 3.3042 86 .0000CSSY 2.9653 CICSUSER 14 15:41:22.420 2.9653 1.2597 14 .0555 1.7056 14 .0393 13 .0000CSSY .4372 CICSUSER 15 15:41:19.898 .4372 .0037 1 .0034 .4335 1 .0000 0 .0000CSSY .5093 CICSUSER 16 15:41:19.977 .5093 .0065 3 .0084 .5028 3 .0103 2 .0000CGRP 5.4980 CICSUSER 11 15:41:24.928 5.4980 .7931 69 .0613 4.7049 69 3.7141 68 .0000CSSY 3.3315 CICSUSER 17 15:41:22.805 3.3315 .0995 37 .0269 3.2321 37 1.3057 36 .0000CPLT .5196 CICSUSER 6 15:41:29.169 .5196 .1771 3 .0316 .3425 3 .3422 2 .0000
Figure 39. Cross-System Work Extended report
72 IBM CICS Performance Analyzer for z/OS: Report Reference

Transaction Group reportThe Transaction Group report accepts data from one or more CICS systems,correlating the data by transaction group ID. The default is to print only the CMFperformance class records that are contained in a transaction group that includesmultiple performance records.
The Transaction Group report can be used to understand the correlation of theperformance class records for the transactions that CICS runs as part of the sameincoming work request (for example, the CWXN and CWBA transactions for CICSWeb support requests).
You can request a report from all available records, or you can provide criteria toselect only the records that meet specific requirements.
Report commandThe Transaction Group report can be requested from a Report Set in the CICS PAdialog. Select the Transaction Group report in the Performance Reports category.
In batch, the TRANGROUP command is used to request the Transaction Group report.
The command to produce the default report is:CICSPA TRANGROUP
To tailor the report, you can specify report options as follows:CICSPA TRANGROUP(
[OUTPUT(ddname),][EXTERNAL(ddname),][PRINTMULTIPLE,][NOPRINTMULTIPLE,][PRINTSINGLE,][LINECOUNT(nnn),][TITLE1(’...sub-heading left ...’),][TITLE2(’...sub-heading right...’),][SELECT(PERFORMANCE(INCLUDE|EXCLUDE(field1(values1),...),
...))])
Report contentThe Transaction Group report consists of a detail report and a summary report. Forthe detail report, each line is printed from a single CMF performance class record.Records that are part of the same transaction group are printed sequentially ingroups, separated by blank lines. The reported information allows you to find thecorresponding records in the Performance List report. The summary reportsummarizes the information from the performance class records in the detailreport.
If you request this report and other reports in the same job, specify anOUTPUT(ddname) for each report. Output for the reports must be directed toseparate SYSOUT data sets to prevent interleaving of the report lines.
The Transaction Group report is produced using an external SORT facility. AnExternal Work Data Set is required to store the records before they are sorted. Thisdata set is either specified explicitly using EXTERNAL(ddname), or CICS PAassigns one from the External Work File pool.
The records are sorted in the following order:
Chapter 2. Performance reports 73

1. Transaction Group ID2. Task Stop Time in reverse (or descending) order.
Note: The Stop Time, sorted in reverse (descending) order, shows the sequence oftasks within the same Transaction Group ID.
For more information on correlating the performance class data by transactiongroup ID, see “Correlating performance class data” on page 307.
Detail reportThe Transaction Group report shown in Figure 40 was created using the command:CICSPA TRANGROUP(PRINTS,PRINTM,OUTPUT(TRGP0001))
This section gives a brief description of the performance class data fields shown inthe Transaction Group report. For more information, see “CMF performance classdata fields” on page 245.
TranThe Transaction ID (field: TRAN, owner: DFHTASK, field ID: 001) identifiesthe name of the transaction that this performance class record represents.Applications that are using Distributed Program Link (DPL) requests shoulduse the TRANSID('xxxx') parameter on the EXEC CICS LINKPROGRAM('xxxxxxxx') command to enable better transaction/applicationanalysis from the monitoring performance class data. If the TRANSID('xxxx')
V3R2M0 CICS Performance AnalyzerTransaction Group
TRGP0001 Printed at 12:03:45 7/15/2010 Data from 11:10:29 2/04/2010 to 11:33:51 2/04/2010 Page 41
Brdg Client Request Fcty Conn R ResponseTran Userid SC Origin Tran IP Address Type Program Term LUName T/Name Name APPLID Task T Stop Time Time
SALE BRENNER U SCHEDULE AP: DFH0SAL2 IYK2Z1V3 268 T 11:19:52.38 .0399
SALE BRENNER U SCHEDULE AP: DFH0SAL2 IYK2Z1V3 279 T 11:19:57.58 .0683
REM1 BRENNER U SCHEDULE AP: DFH0REM1 IYK2Z1V3 281 T 11:19:57.60 .0231
SALE BRENNER U SCHEDULE AP: DFH0SAL2 IYK2Z1V3 282 T 11:19:57.64 .0405
STAT CBAKER TO BRIDGE CWBA AP: DFH0STAT CAAE CAAE B/CAAE IYK2Z1V3 292 T 11:20:12.04 10.5089CWBA CBAKER U WEB 9.20.30.232 AP: DFHWBTTA IYK2Z1V3 291 T 11:20:01.65 .1188CWXN CBAKER U SOCKET 9.20.30.232 AP: DFHWBXN IYK2Z1V3 290 T 11:20:01.54 .0169
SALE BRENNER U SCHEDULE AP: DFH0SAL2 IYK2Z1V3 293 T 11:20:02.81 .0568
SALE BRENNER U SCHEDULE AP: DFH0SAL2 IYK2Z1V3 296 T 11:20:04.33 .1340
SALE BRENNER U SCHEDULE AP: DFH0SAL2 IYK2Z1V3 297 T 11:20:04.33 .1326
CWBA CBAKER U WEB 9.20.30.232 AP: DFHWBTTA IYK2Z1V3 299 T 11:20:07.37 1.0015CWXN CBAKER U SOCKET 9.20.30.232 AP: DFHWBXN IYK2Z1V3 298 T 11:20:06.38 .3103
CWBA CBAKER U WEB 9.20.30.232 AP: DFHWBTTA IYK2Z1V3 302 T 11:20:12.04 .0423CWXN CBAKER U SOCKET 9.20.30.232 AP: DFHWBXN IYK2Z1V3 301 T 11:20:12.01 .2331
CZUX CBAKER QD TDQUEUE AP: DFH0VZUX D/CSZX IYK2Z1V3 304 T 11:20:19.36 .0078
SALE BRENNER U SCHEDULE AP: DFH0SAL2 IYK2Z1V3 307 T 11:20:20.34 .7041
SALE BRENNER U SCHEDULE AP: DFH0SAL2 IYK2Z1V3 308 T 11:20:20.43 .7920
CWXN CBAKER U SOCKET 9.20.30.232 AP: DFHWBXN IYK2Z1V3 331 T 11:34:12.76 782.697CEMT CBAKER TO BRIDGE CWBA AP: DFHEMTP CAAG CAAG B/CAAG IYK2Z1V3 354 T 11:21:55.38 13.3797CWBA CBAKER U WEB 9.20.30.232 AP: DFHWBTTA IYK2Z1V3 353 T 11:21:42.10 .0986CWBA CBAKER U WEB 9.20.30.232 AP: IYK2Z1V3 332 T 11:21:10.12 .0529
CWXN CBAKER U SOCKET 9.20.30.232 AP: DFHWBXN IYK2Z1V3 333 T 11:25:52.65 282.577CWBA CBAKER U WEB 9.20.30.232 AP: DFHWBTTA IYK2Z1V3 351 T 11:21:32.85 .0378CWBA CBAKER U WEB 9.20.30.232 AP: IYK2Z1V3 334 T 11:21:10.12 .0485
CZUX CBAKER QD TDQUEUE AP: DFH0VZUX D/CSZX IYK2Z1V3 340 T 11:21:19.48 .0240
Figure 40. Transaction Group report (detail)
74 IBM CICS Performance Analyzer for z/OS: Report Reference

parameter is not specified, all the performance class records on the targetsystem for a Distributed Program Link (DPL) mirror transaction will have thesame transaction ID. For example, 'CSMI' for a Distributed Program Link(DPL) request from another connected CICS system.
UseridThe User identifier of the transaction (owner: DFHCICS, field ID: 089).
SCType of transaction start or start code (field: TTYPE, owner: DFHTASK, fieldID: 004).
OriginThis field is an interpretation of the transaction origin type from byte 4 of thetransaction flags field (field: TRANFLAG, owner: DFHTASK, field ID: 164) andcan be used as an indicator of the source of the transaction. This field can haveone of the following: values:
Origin Type Description
NONE None
TERMINAL Terminal
TDQUEUE Terminal data queue
START Start
TERM START Terminal start
SCHEDULE CICS BTS scheduler (CSHQ)
XM RUN XM run transaction
BRIDGE Bridge
SOCKET Socket
WEB Web
IIOP IIOP
RRS RRS
LU6.1 SESS LU 6.1 session
LU6.2 SESS LU 6.2 session
MRO SESS MRO session
ECI SESS ECI session
IIRQ RECVR II Request Receiver
RZ ST TRPT Request stream in-storage transport
IPIC SESS IP interconnectivity session
EVENT Event
The Origin Type is an interpretation of the primary transaction client type withwhich the transaction was attached using the CICS Transaction Manager.
Brdg TranThis field contains the name of the bridge listener transaction for thosetransactions that are attached by the CICS 3270 Bridge interface.
Client IP AddressThe client IP address (owner: DFHSOCK, field ID: 244, in CICS TS V3.2 andearlier; or 318, truncated to size, from CICS TS V4.1).
Chapter 2. Performance reports 75

Request TypeThis field describes the type of request that the performance record represents:
Description
AP: An application program request. The Program field will identify theinitial application program name invoked for the transaction.
Note: Function shipped Distributed Program Link (DPL) requests areinterpreted as application requests. In this case the AP: is followed bythe ---- (as for other function shipping requests) to indicate the types ofrequests issued by the application program.
FS:---- A function shipping request. The ---- indicate the types of functionshipping request:F File ControlI Interval ControlD Transient DataS Temporary Storage
TR:xxxxA transaction routing request from a terminal-owning region. The'xxxx' is the transaction routing sysid (field: RSYSID, owner: DFHCICS,field ID: 130) and identifies the connection name (sysid) of the remotesystem to which the transaction was routed.
ProgramThe Initial Program Name (field: PGMNAME, owner: DFHPROG, field ID:071) identifies the initial application program invoked for the transaction.Depending on the type of transaction, this field contains either the applicationprogram name as defined in the transaction definition, the program namereturned by a user written dynamic routing program, the application programname passed on a function shipped Dynamic Program Link (DPL) request, theinitial application program name of an ONC RPC Alias Transaction, or theinitial application program name of a WEB Alias Transaction. A program nameof ######## indicates that the transaction was invoked using the definition ofthe transaction ID specified by the DTRTRAN system initialization parameter.
TermThe Terminal ID (field: TERM, owner: DFHTERM, field ID: 002) is either theterminal ID or the session ID. This field is blank if the transaction was notassociated with a terminal or session facility.
LUNameThis field (field: LUNAME, owner: DFHTERM, field ID: 111) is either theVTAM netname of the terminal ID (if the Access Method for the terminal isVTAM) or the VTAM APPLID of the connection for the session ID. For anEXCI connection, this field is blank. The transaction's terminal or session typecan be identified from the NATURE field (byte 0) within the terminalinformation field (field: TERMINFO, owner: DFHTERM, field ID: 165). Thisfield is blank if the transaction was not associated with a terminal or sessionfacility.
Fcty TThis field is an interpretation of byte 0 of the transaction flags field (owner:DFHTASK, field ID: 164) and describes the transaction's facility type:
Type Descriptionblank NoneT Terminal or Session
76 IBM CICS Performance Analyzer for z/OS: Report Reference

S SurrogateD Transient Data queueB Bridge Terminal
Fcty NameThe transaction's facility name (owner: DFHTASK, field ID: 163).
Conn NameThe terminal session connection name (owner: DFHTERM, field ID: 169). If theterminal facility associated with this transaction is a session, then this field isthe name of the owning connection (sysid).
APPLIDThe APPLID of the CICS system upon which the CMF performance record wascreated. This field indicates the CICS system that performed the work recordedin the record.
TaskThe transaction identification number (owner: DFHTASK, field ID: 031). This isprinted for all records to help identify the corresponding record on aPerformance List report.
R TThe performance class record type (field: RTYPE, owner: DFHCICS, field ID:112):
C Record output for a terminal converse.
D Record output by a user event monitoring point (EMP) DELIVERrequest.
F Record output for a long running transaction.
S Record output for a syncpoint request.
T Record was output for a transaction termination (detach).
Stop TimeStop time of the transaction (owner: DFHCICS, field ID: 006). The transactionswithin the same network unit-of-work are generally displayed in ascendingstop time sequence. This might not always be true, however, due tosyncpointing within the transaction, and to the difficulties involved insynchronizing the STORE CLOCK (STCK) values between different CPUs.
Response TimeThe transaction response time. This field is calculated by subtracting thetransaction start time (owner: DFHCICS, field ID: 005) from the transactionstop time (owner: DFHCICS, field ID: 006).
Note: If the transaction response time is followed by an asterisk (*) then thetransaction has allocated a session to another CICS system for eithertransaction routing, function shipping, or distributed transaction processing.This information is determined from the terminal session allocation requestcount field (owner: DFHTERM, field ID: 069). See the Transaction Group reportin Figure 41 on page 78 for examples of transactions that illustrate this sessionallocation indicator.
Example: The following figure shows the Transaction Group report usingPRINTS, NOPRINTM.
Chapter 2. Performance reports 77

Summary reportThe Transaction Group Summary report summarizes the information from theperformance class records in the detail report.
The Transaction Group Summary report contains the following information:
V3R2M0 CICS Performance AnalyzerTransaction Group
TRGP0001 Printed at 12:03:45 7/15/2010 Data from 11:10:51 2/14/2010 to 11:34:13 2/14/2010 Page 5
Brdg Client Request Fcty Conn R ResponseTran Userid SC Origin Tran IP Address Type Program Term LUName T/Name Name APPLID Task T Stop Time Time
3333 BRENNER TO TERMINAL AP: ######## S23C IGCS23C T/S23C IYK2Z1V3 300 T 11:20:08.00 .0028
0AYM BRENNER TO TERMINAL AP: DFH0PAY0 S23C IGCS23C T/S23C IYK2Z1V3 303 T 11:20:15.96 .0022
PAY1 BRENNER TP TERMINAL AP: DFH0PAY1 S23C IGCS23C T/S23C IYK2Z1V3 305 T 11:20:19.64 .0747
SALE BRENNER U XM RUN AP: DFH0SAL2 IYK2Z1V3 306 T 11:20:19.63 .0715
CSAC BRENNER TO TERMINAL AP: DFHACP S23C IGCS23C T/S23C IYK2Z1V3 313 T 11:20:44.09 .0017
CBAM BRENNER TO TERMINAL AP: DFHECBAM S23C IGCS23C T/S23C IYK2Z1V3 315 T 11:20:50.77 3.7993
RMNU BRENNER TO TERMINAL AP: S23C IGCS23C T/S23C IYK2Z1V3 323 T 11:20:54.39 .0317*
AMNU BRENNER TO MRO SESS AP: DFHSAMNU R11 IYK2Z1V3 S/S23C CJB3 IYK2Z1V1 158 T 11:20:54.39 .0228
AINQ BRENNER TO TERMINAL AP: DFHSAALL S23C IGCS23C T/S23C IYK2Z1V3 328 T 11:21:09.56 .0020
AINQ BRENNER TO TERMINAL AP: DFHSAALL S23C IGCS23C T/S23C IYK2Z1V3 341 T 11:21:19.47 .0020
AMNU BRENNER TP TERMINAL AP: DFHSAMNU S23C IGCS23C T/S23C IYK2Z1V3 356 T 11:21:54.06 .0026
AUPD BRENNER TO TERMINAL AP: DFHSAALL S23C IGCS23C T/S23C IYK2Z1V3 358 T 11:22:10.66 .0020
1111 BRENNER TO TERMINAL AP: ######## S23C IGCS23C T/S23C IYK2Z1V3 360 T 11:22:15.07 .0021
AUPD BRENNER TO TERMINAL AP: DFHSAALL S23C IGCS23C T/S23C IYK2Z1V3 362 T 11:22:19.77 .0046
RUPD BRENNER TO TERMINAL AP: S23C IGCS23C T/S23C IYK2Z1V3 364 T 11:22:36.07 .0029*
AUPD CBAKER TO MRO SESS AP: DFHSAALL R11 IYK2Z1V3 S/S23C CJB3 IYK2Z1V1 192 T 11:22:36.07 .0013
CSAC BRENNER TO TERMINAL AP: DFHACP S23C IGCS23C T/S23C IYK2Z1V3 379 T 11:24:25.57 .0023
RING BRENNER TO TERMINAL AP: ######## S23C IGCS23C T/S23C IYK2Z1V3 547 T 11:26:23.88 .0020
RINQ BRENNER TO TERMINAL AP: S23C IGCS23C T/S23C IYK2Z1V3 548 T 11:26:30.17 .0036*
AINQ CBAKER TO MRO SESS AP: DFHSAALL R11 IYK2Z1V3 S/S23C CJB3 IYK2Z1V1 232 T 11:26:30.17 .0014
AADD BRENNER TO TERMINAL AP: DFHSAALL S23C IGCS23C T/S23C IYK2Z1V3 551 T 11:26:41.64 .0016
AADD BRENNER TP TERMINAL AP: DFHSAALL S23C IGCS23C T/S23C IYK2Z1V3 561 T 11:27:02.87 .0026
AINQ BRENNER TO TERMINAL AP: DFHSAALL S23C IGCS23C T/S23C IYK2Z1V3 564 T 11:27:11.57 .0023
Figure 41. Transaction Group report (detail): using PRINTS,NOPRINTM
V3R2M0 CICS Performance AnalyzerTransaction Group – Summary
TRGP0001 Printed at 12:03:45 7/15/2010 Data from 11:10:51 3/24/2010 to 11:34:13 3/24/2010 Page 45
Origin Average Average Average Average Average Average Average Average AverageType Transactions Response Dispatch CPU Time Suspend DispWait IR Wait RMI Susp FC Wait SO Wait
BRIDGE 17 10.140 .000 .000 .010 .000 .000 .000 .000 .000MRO SESS 163 .634 .000 .000 .001 .000 .001 .000 .000 .000NONE 51 82.697 .001 .000 .082 .000 .000 .000 .000 .000SCHEDULE 62 .280 .000 .000 .000 .000 .000 .000 .000 .000SOCKET 50 44.630 .000 .000 .045 .000 .000 .000 .000 .045START 22 .332 .000 .000 .000 .000 .000 .000 .000 .000TDQUEUE 23 .012 .000 .000 .000 .000 .000 .000 .000 .000TERM START 10 .018 .000 .000 .000 .000 .000 .000 .000 .000TERMINAL 860 4.150 .000 .000 .004 .000 .000 .000 .000 .000WEB 60 .154 .000 .000 .000 .000 .000 .000 .000 .000XM RUN 16 .424 .000 .000 .000 .000 .000 .000 .000 .000
------------ -------- -------- -------- -------- -------- -------- -------- -------- --------TOTAL 1334 7.747 .000 .000 .008 .000 .000 .000 .000 .002
Figure 42. Transaction Group Summary report
78 IBM CICS Performance Analyzer for z/OS: Report Reference

Origin TypeThe transaction origin type; see “Detail report” on page 74 for details.
TransactionsThe total number of transactions completed.
Average ResponseThe average response time. This field is calculated by subtracting thetransaction start time (owner: DFHCICS, field ID: 005) from the transactionstop time (owner: DFHCICS, field ID: 006).
Average DispatchThe average dispatch time (owner: DFHTASK, field ID: 007).
Average CPU TimeThe average CPU time (owner: DFHTASK, field ID: 008).
Average SuspendThe average suspend time (owner: DFHTASK, field ID: 014).
Average DispWaitThe average dispatch wait time (owner: DFHTASK, field ID: 102).
Average IR Wait TimeThe average inter-region (MRO) I/O wait time (owner: DFHTERM, field ID:100).
Average RMI SuspThe average RMI suspend time (owner: DFHTASK, field ID: 171).
Average FC WaitThe average file I/O wait time (owner: DFHFILE, field ID: 063).
Average SO WaitThe average inbound socket I/O wait time (owner: DFHSOCK, field ID: 241).
Required CMF fields
If you are using the CICS Monitoring Control Table (MCT) Exclude/Includeparameters to reduce the size of the performance class record, you must ensurethat the data fields required for the Transaction Group report are not excluded.
The following table lists the fields that must be collected in the performance classrecords to ensure correct correlation of the data records for the Transaction Groupreport.
Table 2. Transaction Group report: Required CMF fields
Owner Field ID CICS Informal Name
DFHCICS 112 RTYPE
DFHCICS 130 RSYSID
DFHDEST 091 TDTOTCT
DFHFILE 063 FCIOWTT
DFHFILE 093 FCTOTCT
DFHPROG 071 PGMNAME
DFHSOCK 241 SOIOWTT
DFHSOCK 244 (CICS TS V3.2 andearlier) or 318 (fromCICS TS V4.1)
CLIPADDR
Chapter 2. Performance reports 79

Table 2. Transaction Group report: Required CMF fields (continued)
Owner Field ID CICS Informal Name
DFHSOCK 245 TCPSRVCE
DFHSOCK 246 PORTNUM
DFHSOCK 299 SOOIOWTT
DFHTASK 007 USRDISPT
DFHTASK 008 USRCPUT
DFHTASK 014 SUSPTIME
DFHTASK 031 TRANNUM
DFHTASK 066 ICTOTCT
DFHTASK 082 TRNGRPID
DFHTASK 097 NETUOWPX
DFHTASK 098 NETUOWSX
DFHTASK 102 DISPWTT
DFHTASK 124 BRDGTRAN
DFHTASK 163 FCTYNAME
DFHTASK 164 TRANFLAG
DFHTASK 171 RMISUSP
DFHTEMP 092 TSTOTCT
DFHTERM 069 TCALLOCT
DFHTERM 100 IRIOWTT
DFHTERM 111 LUNAME
DFHTERM 169 TERMCNNM
BTS reportThe BTS report accepts data from one or more CICS systems, correlating the databy CICS BTS process ID (root activity ID).
You can request a report from all available records, or you can provide criteria toselect only the records that meet specific requirements.
Report commandThe BTS report can be requested from a Report Set in the CICS PA dialog. Selectthe BTS report in the Performance Reports category.
In batch, the BTS command is used to request the BTS report.
The command to produce the default report is:CICSPA BTS
To tailor the report, you can specify report options as follows:CICSPA BTS(
[OUTPUT(ddname),][EXTERNAL(ddname),][LINECOUNT(nnn),]
80 IBM CICS Performance Analyzer for z/OS: Report Reference

[TITLE1(’...sub-heading left ...’),][TITLE2(’...sub-heading right...’),][SELECT(PERFORMANCE(INCLUDE|EXCLUDE(field1(values1),...),...))])
Report contentOn the BTS report, each line is printed from a single CMF performance classrecord. Records that are part of the same CICS BTS Process ID (Root Activity ID)are printed sequentially in groups, separated by blank lines. The printedinformation allows you to find the corresponding records in the Performance Listreport.
The BTS report is produced using an external SORT facility. An External WorkData Set is required to store the records before they are sorted. This data set iseither specified explicitly using EXTERNAL(ddname), or CICS PA assigns onefrom the External Work File pool.
The records are sorted in the following order:1. CICS BTS Process ID (Root Activity ID)2. Transaction Identification Number3. Task Stop Time in ascending order
Note: The Transaction Identification Number is only used for those transactionsthat have had some CICS BTS request activity, as determined from the TotalRequest count fields, but which do not have a CICS BTS Process ID (Root ActivityID).
For more information on correlating the performance class data by CICS BTSProcess ID, see “Correlating performance class data” on page 307.
Figure 43 on page 82 shows an example of the BTS report.
Chapter 2. Performance reports 81

The following fields are shown on the CICS Business Transaction Services Report.For more information on the fields, see “CMF performance class data fields” onpage 245.
TranThe Transaction ID (field: TRAN, owner: DFHTASK, field ID: 001) identifiesthe name of the transaction that this performance class record represents.Applications that are using Distributed Program Link (DPL) requests shoulduse the TRANSID('xxxx') parameter on the EXEC CICS LINKPROGRAM('xxxxxxxx') command to enable better transaction/applicationanalysis from the monitoring performance class data. If the TRANSID('xxxx')parameter is not specified, all the performance class records on the targetsystem for a Distributed Program Link (DPL) mirror transaction will have thesame Transaction ID. For example, 'CSMI' for a Distributed Program Link(DPL) request from another connected CICS system.
SCThe Transaction Start Type (field: STYPE, owner: DFHTASK, field ID: 004).
TranTypeThis column describes the transaction type:
V3R2M0 CICS Performance AnalyzerBusiness Transaction Services (BTS)
CBTS0001 Printed at 12:03:45 7/15/2010 Data from 11:10:51 3/24/2010 to 11:34:13 3/24/2010 Page 1
Process Pro/Act Cont’er Event R ResponseTran SC TranType Process Name Type Activity Name Reqs Reqs Reqs Task T Stop Time Time
SAL1 TP U 2 2 0 146 T 11:17:04.85 .6881
PAY1 TP U 2 0 0 160 T 11:17:12.21 .2010
SAL1 TP U 2 2 0 174 T 11:17:53.63 .1657
PAY1 TP U 2 0 0 197 T 11:18:14.42 .0861
SAL1 TP U 2 2 0 211 T 11:18:47.27 .1222
SAL1 TP U 2 2 0 239 T 11:19:40.33 .1835
PAY1 TP U 2 0 0 294 T 11:20:04.20 .1390
PAY1 TP U 2 0 0 305 T 11:20:19.64 .0747
RED1 U U R SALES111111 ORDER CREDIT-CHECK 0 2 1 176 T 11:17:54.05 .5333STOC U U R SALES111111 ORDER STOCK-CHECK 0 2 1 177 T 11:17:54.05 .5145SALE U U R SALES111111 ORDER DFHROOT 10 5 4 175 T 11:17:54.05 .5675INV1 U U SALES111111 ORDER INVOICE-BUILD 0 1 1 178 T 11:17:54.09 .0359DEL1 U U SALES111111 ORDER DELIV-NOTE 0 1 1 179 T 11:17:55.29 1.2323SALE U U SALES111111 ORDER DFHROOT 0 0 0 180 T 11:17:55.31 1.2198SALE U U SALES111111 ORDER DFHROOT 1 3 2 183 T 11:17:55.37 .0800SALE U U SALES111111 ORDER DFHROOT 1 3 5 184 T 11:17:55.42 .0519SALE U U SALES111111 ORDER DFHROOT 2 2 1 186 T 11:18:00.65 .0566REM1 U U SALES111111 ORDER SEND-REMINDER 0 1 1 187 T 11:18:00.68 .0243SALE U U SALES111111 ORDER DFHROOT 1 0 3 188 T 11:18:00.72 .0389SALE U U SALES111111 ORDER DFHROOT 2 2 1 191 T 11:18:05.92 .0826REM1 U U SALES111111 ORDER SEND-REMINDER 0 1 1 192 T 11:18:05.96 .0367SALE U U SALES111111 ORDER DFHROOT 1 0 3 193 T 11:18:06.04 .0824SALE U U SALES111111 ORDER DFHROOT 2 2 1 194 T 11:18:11.13 .0463REM1 U U SALES111111 ORDER SEND-REMINDER 0 1 1 195 T 11:18:11.16 .0282SALE U U SALES111111 ORDER DFHROOT 1 0 3 196 T 11:18:11.20 .0437SALE U U R SALES111111 ORDER DFHROOT 0 1 3 198 T 11:18:14.42 .0821SALE U U SALES111111 ORDER DFHROOT 0 0 0 199 T 11:18:15.03 .6101
RED1 U U R SALES222222 ORDER CREDIT-CHECK 0 2 1 213 T 11:18:47.79 .6162STOC U U R SALES222222 ORDER STOCK-CHECK 0 2 1 214 T 11:18:47.79 .6072SALE U U R SALES222222 ORDER DFHROOT 10 5 4 212 T 11:18:47.79 .6282INV1 U U SALES222222 ORDER INVOICE-BUILD 0 1 1 215 T 11:18:47.82 .0312DEL1 U U SALES222222 ORDER DELIV-NOTE 0 1 1 216 T 11:18:49.58 1.7859SALE U U SALES222222 ORDER DFHROOT 0 0 0 217 T 11:18:49.59 1.7700SALE U U SALES222222 ORDER DFHROOT 1 3 2 219 T 11:18:49.63 .0488SALE U U SALES222222 ORDER DFHROOT 1 3 5 220 T 11:18:49.67 .0399SALE U U SALES222222 ORDER DFHROOT 2 2 1 222 T 11:18:54.91 .0479REM1 U U SALES222222 ORDER SEND-REMINDER 0 1 1 223 T 11:18:54.93 .0244SALE U U SALES222222 ORDER DFHROOT 1 0 3 224 T 11:18:54.97 .0400SALE U U SALES222222 ORDER DFHROOT 2 2 1 225 T 11:19:00.14 .0408REM1 U U SALES222222 ORDER SEND-REMINDER 0 1 1 226 T 11:19:00.17 .0248SALE U U SALES222222 ORDER DFHROOT 1 0 3 227 T 11:19:00.21 .0386SALE U U SALES222222 ORDER DFHROOT 2 2 1 228 T 11:19:05.39 .0419
Figure 43. BTS report
82 IBM CICS Performance Analyzer for z/OS: Report Reference

S System transactionU User transactionM Mirror transactionD DPL Mirror transactionO ONC RPC Alias transactionW WEB Alias transactionB Bridge transaction- ReservedR CICS BTS Run (ACQPROCESS or activity) transaction synchronous
The transaction type is represented as an interpretation of byte 1 of thetransaction flags field (owner: DFHTASK, field ID: 164).
Process NameThe name of the CICS Business Transaction Service (BTS) process (owner:DFHCBTS, field ID: 200) of which the user task formed part.
Process TypeThe process-type of the CICS BTS process (owner: DFHCBTS, field ID: 201) ofwhich the user task formed part.
Activity NameThe name of the CICS BTS activity (owner: DFHCBTS, field ID: 204) that theuser task implemented.
Pro/Act ReqsThe total number of CICS BTS process and activity requests (owner: DFHCBTS,field ID: 215) issued by the user task.
Cont'er ReqsThe total number of CICS BTS process container and activity container requests(owner: DFHCBTS, field ID: 218) issued by the user task.
Event ReqsThe total number of CICS BTS event-related requests (owner: DFHCBTS, fieldID: 222) issued by the user task.
TaskThe transaction identification number (owner: DFHTASK, field ID: 031). This isprinted for all records to help identify the corresponding records on aPerformance List report.
R TThe performance class record type (field: RTYPE, owner: DFHCICS, field ID:112):
C Record output for a terminal converse.
D Record output by a user event monitoring point (EMP) DELIVERrequest.
F Record output for a long running transaction.
S Record output for a syncpoint request.
T Record output for a transaction termination (detach).
Stop TimeStop time of the transaction (owner: DFHCICS, field ID: 006). The transactionswithin the same network unit-of-work are generally displayed in ascendingstop time sequence. This might not always be true, however, due tosyncpointing within the transaction, and to the difficulties involved insynchronizing the STORE CLOCK (STCK) values between different CPUs.
Chapter 2. Performance reports 83

Response TimeThe transaction response time. This field is calculated by subtracting thetransaction start time (owner: DFHCICS, field ID: 005) from the transactionstop time (owner: DFHCICS, field ID: 006).
For more information on CICS Business Transaction Services (BTS), see the CICSBusiness Transaction Services.
Required CMF fieldsIf you are using the CICS Monitoring Control Table (MCT) Exclude/Includeparameters to reduce the size of the performance class record, you must ensurethat the data fields required for the BTS report are not excluded.
The following table lists the fields that must be collected in the performance classrecords to ensure correct correlation of the data records.
Table 3. BTS report: Required CMF fields
Owner Field ID CICS Informal Name
DFHCBTS 200 PRCSNAME
DFHCBTS 201 PRCSTYPE
DFHCBTS 202 PRCSID
DFHCBTS 204 ACTVTYNM
DFHCBTS 215 BATOTPCT
DFHCBTS 218 BATOTCCT
DFHCBTS 222 BATOTECT
DFHCICS 112 RTYPE
DFHTASK 031 TRANNUM
DFHTASK 164 TRANFLAG
Workload Activity reportThe Workload Activity report provides a transaction response time analysis byMVS Workload Manager (WLM) service and report class. This can be used inconjunction with the z/OS Resource Measurement Facility (RMF) workload activityreports to understand from a CICS perspective how well your CICS transactionsare meeting their response time goals.
The Workload Activity List report is a cross-system report that correlates CMFperformance class data from single or multiple CICS systems for each networkunit-of-work. Importantly, this report ties MRO and function shipping tasks totheir originating task so that their impact on response time can be assessed.
The Workload Activity Summary report summarizes response time by WLMservice and report classes.
The report processes all CMF transaction performance class records for networkunits-of-work containing multiple performance records as well as those with only asingle performance record.
You can request a report from all available records, or you can specify selectioncriteria to request a report from only the records that meet specific requirements.
84 IBM CICS Performance Analyzer for z/OS: Report Reference

Report commandThe Workload Activity report can be requested from a Report Set in the CICS PAdialog. Select the Workload Activity report in the Performance Reports category.
In batch, the WORKLOAD or WLM command is used to request the Workload Activityreport.
You can request a detailed list of transaction activity, a summary report, or both.
The command to produce the default report, a summary of BTE transactions, is:CICSPA WORKLOAD
orCICSPA WORKLOAD(SUMMARY)
To produce a summary report of BTE and EXE Y transactions:CICSPA WORKLOAD(SUMMARY(EXE))
To produce a list report detailing BTE, EXE Y, and EXE N transactions:CICSPA WORKLOAD(LIST)
To tailor the report, you can specify report options as follows:CICSPA WORKLOAD(
[OUTPUT(ddname),][EXTERNAL(ddname),][SUMMARY[(EXE)],][LIST,][PEAK(percentile),]TASKORDER(START|STOP)[LINECount(nnn),][TITLE1(’...up to 64 characters...’),][TITLE2(’...up to 64 characters...’),][SELECT(PERFORMANCE(INCLUDE|EXCLUDE(field1(values1),...),
...))])
Report contentThe Workload Activity report consists of a List report and a Summary report. Forthe List report, each line is printed from a single CMF performance class record.Records that are part of the same network unit-of-work are printed sequentially ingroups, each group separated by a blank line. The printed information allows youto find the corresponding records in the Performance List report. The Summaryreport summarizes the information by Service Class and by Report Class.
The Workload Activity report is produced using an external SORT facility. AnExternal Work Data Set is required to store the records before they are sorted. Thisdata set is either specified explicitly using EXTERNAL(ddname), or CICS PAassigns one from the External Work File pool.
Note: If only the Summary report is requested, without EXE and without the Listreport, no external SORT is required.
The records are sorted in the following order:1. Network unit-of-work NETNAME2. Network unit-of-work ID3. Syncpoint count concatenated with either:
Chapter 2. Performance reports 85

v Task stop time in descending (reverse) orderor
v Task start time in ascending order
In the third sort field, the syncpoint count is used to resolve unsynchronizedSTORE CLOCK (STCK) values between systems. The syncpoint count and stoptime (or start time) show the sequence of tasks within the network unit-of-work. Insome cases (for example, where user event monitor points (EMPs) are used), thesyncpoint count does not reflect the sequence of events within a networkunit-of-work. For these instances, all the task records are printed, but notnecessarily in the order they happened. You can tell that this situation exists if thestop times are not in descending order (or the start times are not in ascendingorder).
For more information on correlating the performance class data by networkunit-of-work ID, see “Correlating performance class data” on page 307.
List reportThe Workload Activity report shown in Figure 44 was created using the command:CICSPA WORKLOAD(LIST,OUTPUT(ddname))
The following fields are shown on the Workload Activity List report. For moreinformation on these fields, see “CMF performance class data fields” on page 245.
TranThe Transaction ID (field: TRAN, owner: DFHTASK, field ID: 001) identifiesthe name of the transaction that this performance class record represents.Applications that are using Distributed Program Link (DPL) requests shoulduse the TRANSID('xxxx') parameter on the EXEC CICS LINKPROGRAM('xxxxxxxx') command to enable better transaction/applicationanalysis from the monitoring performance class data. If the TRANSID('xxxx')parameter is not specified, all the performance class records on the targetsystem for a Distributed Program Link (DPL) mirror transaction will have thesame transaction ID. For example, 'CSMI' for a Distributed Program Link(DPL) request from another connected CICS system.
UseridThe User identifier of the transaction (owner: DFHCICS, field ID: 089).
V3R2M0 CICS Performance AnalyzerWorkload Manager Activity List
WKLD0001 Printed at 12:03:45 7/15/2010 Data from 15:47:53 2/01/2010 to 15:58:53 2/01/2010 Page 1
Request Fcty Conn Service Report R Response ATran Userid SC TranType Term LUName Type Program T/Name Name Class Class APPLID Task T P C Stop Time Time B
FINA STEVEP TP <AAK CICPTOR1 AP: FINANCE S/0005 53T1 FINSCLAS FINRCLAS CICPAOR1 44 T EXE Y 15:57:53.92 .5239FINS STEVEP TP 0005 TCP00005 TR:AOR1 T/0005 FINSCLAS FINRCLAS CICPTOR1 73 T BTE 15:57:53.93 .5612
STOA SHIRLEY TP <AAK CICPTOR1 AP: STOCK S/0006 53T1 STOSCLAS STORCLAS CICPAOR1 46 T EXE Y 15:57:54.01 .8574STOS SHIRLEY TP 0006 TCP00006 TR:AOR1 T/0006 STOSCLAS STORCLAS CICPTOR1 78 T BTE 15:57:54.02 .9123
ORDQ SYLVIA TO 0011 TCP00011 AP: ORDRINQ T/0011 QUIKSERV QUIKSERV CICPAOR1 79 T BTE 15:57:55.12 .3762
ORDQ JOHNX TO 0012 TCP00012 AP: ORDRINQ T/0012 QUIKSERV QUIKSERV CICPAOR1 82 T BTE 15:50:55.23 .4321
ORDU SYLVIA TO 0011 TCP00011 AP: ORDRUPD T/0011 LONGSERV LONGSERV CICPAOR1 98 T BTE 15:54:56.13 1.4581
ORDU JOHNX TO 0012 TCP00012 AP: ORDRUPD T/0012 LONGSERV LONGSERV CICPAOR1 109 T BTE 15:58:56.17 1.2394
Figure 44. Workload Activity List report
86 IBM CICS Performance Analyzer for z/OS: Report Reference

SCType of transaction start or start code (owner: DFHTASK, field ID: 004).
TranTypeThis column describes the transaction type:S System transactionU User transactionM Mirror transactionD DPL Mirror transactionO ONC RPC Alias transactionW WEB Alias transactionB Bridge transaction- ReservedR CICS BTS Run (ACQPROCESS or activity) transaction synchronous
The transaction type is represented as an interpretation of byte 1 of thetransaction flags field (owner: DFHTASK, field ID: 164).
TermThe Terminal ID (field: TERM, owner: DFHTERM, field ID: 002) is either theterminal ID or the session ID. This field is blank if the transaction was notassociated with a terminal or session facility.
LUNameThe LUname (field: LUNAME, owner: DFHTERM, field ID: 111) is either theVTAM netname of the terminal ID (if the Access Method for the terminal isVTAM) or the VTAM APPLID of the connection for the session ID. For anEXCI connection, this field is blank. The transaction's terminal or session typecan be identified from the NATURE field (byte 0) within the terminalinformation field (field: TERMINFO, owner: DFHTERM, field ID: 165). Thisfield is blank if the transaction was not associated with a terminal or sessionfacility.
Request TypeThis field describes the type of request that the performance record represents:
Description
AP: An application program request. The Program field will identify theinitial application program name invoked for the transaction.
Note: Function shipped Distributed Program Link (DPL) requests areinterpreted as application requests. In this case the AP: is followed bythe '----' (as for other function shipping requests) to indicate the typesof requests issued by the application program.
FS:---- A function shipping request. The '----' indicate the types of functionshipping request:F File Control
I Interval ControlD Transient DataS Temporary Storage
TR:xxxxA transaction routing request from a terminal-owning region. The xxxxis the transaction routing sysid from the RSYSID field (owner:DFHCICS, field ID: 130) and identifies the connection name (sysid) ofthe remote system to which the transaction was routed.
ProgramThe Initial Program Name (field: PGMNAME, owner: DFHPROG, field ID:071) identifies the initial application program invoked for the transaction.
Chapter 2. Performance reports 87

Depending on the type of transaction, this field contains either the applicationprogram name as defined in the transaction definition, the program namereturned by a user written dynamic routing program, the application programname passed on a function shipped Dynamic Program Link (DPL) request, theinitial application program name of an ONC RPC Alias Transaction, or theinitial application program name of a WEB Alias Transaction. A program nameof ######## indicates that the transaction was invoked using the definition ofthe transaction ID specified by the DTRTRAN system initialization parameter.
Fcty TThis field is an interpretation of byte 0 of the transaction flags field (owner:DFHTASK, field ID: 164) and describes the transaction's facility type:
Type Descriptionblank NoneT Terminal or SessionS SurrogateD Transient Data queueB Bridge Terminal
Fcty NameThe transaction's facility name (owner: DFHTASK, field ID: 163).
Conn NameThe terminal session connection name (owner: DFHTERM, field ID: 169). If theterminal facility associated with this transaction is a session, then this field isthe name of the owning connection (sysid).
Service ClassThe MVS Workload Manager (WLM) service class for this transaction. Thisfield is blank if there are no transaction classification rules defined for CICSsubsystems in the active MVS Workload Manager (WLM) service policy or thetransaction was WLM-classified in another CICS region.
For an EXE Y transaction, the Service Class is derived from the related BTEtransaction. For an EXE N transaction, the Service Class is blank since it cannotbe determined as the transaction was not complete.
Report ClassThe MVS Workload Manager (WLM) report class for this transaction. This fieldis blank if there are no transaction classification rules defined for CICSsubsystems in the active MVS Workload Manager (WLM) service policy or thetransaction was WLM-classified in another CICS region.
For an EXE Y transaction, the Report Class is derived from the related BTEtransaction. For an EXE N transaction, the Report Class is blank since it cannotbe determined as the transaction was not complete.
APPLIDThe APPLID of the CICS system upon which the CMF performance record wascreated. This field indicates the CICS system that performed the work recordedin the record.
TaskThe transaction identification number (owner: DFHTASK, field ID: 031). This isprinted for all records to help identify the corresponding records on aPerformance List report.
R TThe performance class record type (field: RTYPE, owner: DFHCICS, field ID:112):
88 IBM CICS Performance Analyzer for z/OS: Report Reference

C Record output for a terminal converse.
D Record output by a user event monitoring point (EMP) DELIVERrequest.
F Record output for a long running transaction.
S Record output for a syncpoint request.
T Record output for a transaction termination (detach).
P This field describes the MVS Workload Manager phase as reported by CICS. Itcan be either:
BTE The begin-to-end phase takes place in the first region to begin processinga transaction.
EXE The execution phase takes place in an application owning region (AOR)and a file owning region (FOR). However, only the execution phase thattakes place in an application owning region (AOR) is reported to theMVS Workload Manager.
For a detailed explanation about Workload Manager state information, seeOS/390 MVS Workload Management Services.
C This field indicates the completion status of an execution phase of the workrequest as reported by CICS to the MVS Workload Manager. It can be either:
blank This performance class record is part of the begin-to-end phase of atransaction.
Y The entire execution phase of the work request, a transaction, has nowcompleted.
N Only a portion of the execution phase of the work request, a transaction,has completed.
Stop Time or Start TimeStop or start time (hh:mm:ss.thm) of the transaction (owner: DFHCICS, fieldID: 005 for start, 006 for stop). The transactions within the same networkunit-of-work are generally displayed in either descending stop time orascending start time sequence. This might not always be true, however, due tosyncpointing within the transaction, and to the difficulties involved insynchronizing the STORE CLOCK (STCK) values between different CPUs.
Response TimeThe transaction response time. This field is calculated by subtracting thetransaction start time (owner: DFHCICS, field ID: 005) from the transactionstop time (owner: DFHCICS, field ID: 006).
A BY in this column indicates that the transaction abended.
Summary reportThe Workload Activity Summary report provides summaries by Service Class andby Report Class of the transaction data detailed in the Workload Activity Listreport.
Chapter 2. Performance reports 89

The following columns appear on the report:
Service ClassThe MVS Workload Manager (WLM) service class. *Other* indicates theservice class is not available.
Report ClassThe MVS Workload Manager (WLM) report class. *Other* indicates the reportclass is not available.
APPLIDThe APPLID of the CICS system upon which the CMF performance recordswere created. This field indicates the CICS system that performed the workrecorded in the records.
PhaseThis field describes the MVS Workload Manager phase as reported by CICS. Itcan be either:
BTE For those transactions that completed a begin-to-end phase.
EXE For those transactions that completed an entire execution phase wherework runs in a non-originating region.
#TasksThe total number of transactions completed.
Average Response TimeThe average response time.
Std Dev Response TimeThe standard deviation of the response times. If this value is greater than or
V3R2M0 CICS Performance AnalyzerWorkload Manager Activity Summary by Service Class
WKLD0001 Printed at 12:03:45 7/15/2010 Data from 15:47:53 2/01/2010 to 15:58:53 2/01/2010
Service -------------- Response Time --------------Class APPLID Phase #Tasks Average Std Dev 90% Peak Maximum
FINSCLAS CICPTOR1 BTE 176 .5665 .4369 .8753 1.3745CICPAOR1 EXE 169 .5239 .4564 .8280 1.1684
STOSCLAS CICPTOR1 BTE 2123 .9265 .3981 1.2675 2.0246CICPAOR1 EXE 2078 .8639 .3627 1.1927 1.8327CICPTOR2 BTE 2 .9265 .3981 1.2675 1.0040
STOSCLAS *Total* BTE 2125 .9265 .3981 1.2675 2.0246*Total* EXE 2078 .8639 .3627 1.1927 1.8327
QUIKSERV CICPAOR1 BTE 5476 .3846 .1976 .4673 .6571LONGSERV CICPAOR1 BTE 1958 1.5861 .8392 2.2179 5.5094* Grand Total * BTE 9735 .9488 .4012 1.0079 5.5094* Grand Total * EXE 2247 .7689 .6211 1.0040 1.8327
V3R2M0 CICS Performance AnalyzerWorkload Manager Activity Summary by Report Class
WKLD0001 Printed at 12:03:45 7/15/2010 Data from 09:32:04 6/21/2010 to 10:43:39 6/21/2010
Report -------------- Response Time --------------Class APPLID Phase #Tasks Average Std Dev 90% Peak Maximum
FINSCLAS CICPTOR1 BTE 176 .5665 .4369 .8753 1.3745CICPAOR1 EXE 169 .5239 .4564 .8280 1.1684
STOSCLAS CICPTOR1 BTE 2123 .9265 .3981 1.2675 2.0246CICPAOR1 EXE 2078 .8639 .3627 1.1927 1.8327CICPTOR2 BTE 2 .9265 .3981 1.2675 1.0040
STOSCLAS *Total* BTE 2125 .9265 .3981 1.2675 2.0246*Total* EXE 2078 .8639 .3627 1.1927 1.8327
QUIKSERV CICPAOR1 BTE 5476 .3846 .1976 .4673 .6571LONGSERV CICPAOR1 BTE 1958 1.5861 .8392 2.2179 5.5094* Grand Total * BTE 9735 .9488 .4012 1.0079 5.5094* Grand Total * EXE 2247 .7689 .6211 1.0040 1.8327
Figure 45. Workload Activity Summary report
90 IBM CICS Performance Analyzer for z/OS: Report Reference

nearing the average response time, the distribution of response times willprobably not be a normal distribution; for example, possibly skewed or withmultiple peaks.
nnn% Peak Response Timennn% of transactions have a response time less than or equal to this responsetime. This is a statistical estimate assuming a normal distribution.
Maximum Response TimeThe maximum response time for any transaction within this Service Class orReport Class.
Required CMF fieldsIf you are using the CICS Monitoring Control Table (MCT) Exclude/Includeparameters to reduce the size of the performance class record, you must ensurethat the data fields required for the Workload Activity report are not excluded.
The following table lists the fields that must be collected in the performance classrecords to ensure correct correlation of the data records for the Workload Activityreport.
Table 4. Workload Activity report: Required CMF fields
Owner Field ID CICS Informal Name
DFHCICS 112 RTYPE
DFHCICS 130 RSYSID
DFHCICS 167 SRVCLASS
DFHCICS 168 RPTCLASS
DFHDEST 091 TDTOTCT
DFHFILE 093 FCTOTCT
DFHPROG 071 PGMNAME
DFHTASK 031 TRANNUM
DFHTASK 066 ICTOTCT
DFHTASK 097 NETUOWPX
DFHTASK 098 NETUOWSX
DFHTASK 163 FCTYNAME
DFHTASK 164 TRANFLAG
DFHTEMP 092 TSTOTCT
DFHTERM 111 LUNAME
DFHTERM 169 TERMCNNM
Chapter 2. Performance reports 91

92 IBM CICS Performance Analyzer for z/OS: Report Reference

Chapter 3. Exception reports
The Exception reports are produced from CMF exception class data.
Exception class monitoring data is information on CICS resource shortages that aresuffered by a transaction. This data highlights possible problems in CICS systemoperation and is intended to help you identify system constraints that affect theperformance of your transactions. There is one exception record for each type ofexception condition. The exception records are produced and written to SMF assoon as the resource constraint encountered by the transaction has been resolved.
The reports in this category are:v “Exception List report”v “Exception Summary report” on page 96
Exception List reportThe Exception List report provides two types of information:v The cause of the exception conditionv The information necessary to relate this record to the performance class record
on the Performance List report.
You can request a report that uses all the exception records, or you can providecriteria to select only the records that meet specific requirements.
Report commandThe Exception List report can be requested from a Report Set in the CICS PAdialog. Select the List report in the Exception Reports category.
In batch, the LISTEXCeption command is used to request the Exception List report.
The command to produce the default report is:CICSPA LISTEXCEPTION
To tailor the report, you can specify report options as follows:CICSPA LISTEXC(
[OUTPUT(ddname),][LINECOUNT(nnn),][TITLE1(’...sub-heading left ...’),][TITLE2(’...sub-heading right...’),][SELECT(EXCEPTION(INCLUDE|EXCLUDE(field1(values1),...),
...))])
Report contentIn this report, one line is printed for every exception record written by the CICSMonitoring Facility (CMF). Selected data within the exception record is displayedon this line. The reported information allows you to find the corresponding recordsin the Performance List report.
© Copyright IBM Corp. 2001, 2010 93

The leftmost columns in this report contain similar information as reported in thePerformance List report to identify the exception transaction. The rightmostcolumns provide additional information about the actual exception.
For detailed information on the exception class data fields shown in the ExceptionList report, see “CMF exception class data fields” on page 310.
The following columns are the same as the Performance List report:
TranThe Transaction ID (field: TRAN, owner: DFHTASK, field ID: 001) identifiesthe name of the transaction that this performance class record represents.Applications that are using Distributed Program Link (DPL) requests shoulduse the TRANSID('xxxx') parameter on the EXEC CICS LINKPROGRAM('xxxxxxxx') command to enable better transaction/applicationanalysis from the monitoring performance class data. If the TRANSID('xxxx')parameter is not specified all the performance class records on the targetsystem for a Distributed Program Link (DPL) mirror transaction will have thesame transaction ID. For example, 'CSMI' for a Distributed Program Link(DPL) request from another connected CICS system.
V3R2M0 CICS Performance AnalyzerException List
XLST0001 Printed at 12:03:45 7/15/2010 Data from 08:08:37 2/16/2010 APPLID
Tran Service Report Exp ..... Time ..... Current Resource ExceptionTran Term LUName Userid SC Class Class Class Taskno Seq Start Elapsed Program Type Resource ID Type
ABRW P045 IG2ZP045 CBAKER TP 834 1 08:08:37 10.189 DFHSABRW FILE FILEA STRINGABRW S205 IGCS205 BRENNER TP 835 1 08:08:47 7.245 DFHSABRW FILE FILEA STRINGABRW S220 IGCS220 BRENNER TP 837 1 08:08:52 2.996 DFHSABRW FILE FILEA STRINGCECI S220 IGCS220 BRENNER TO 1151 1 08:12:10 .005 DFHECID TEMPSTOR CACA BUFFERCECI S220 IGCS220 BRENNER TO 1151 2 08:12:10 .002 DFHECID TEMPSTOR CACA BUFFERCECI S220 IGCS220 BRENNER TO 1151 3 08:12:10 .002 DFHECID TEMPSTOR CACA BUFFERCECI P045 IG2ZP045 CBAKER TO 1149 1 08:12:10 .004 DFHECID TEMPSTOR LONGTSNAME BUFFERCECI P045 IG2ZP045 CBAKER TO 1149 2 08:12:10 .004 DFHECID TEMPSTOR LONGTSNAME BUFFERCECI P045 IG2ZP045 CBAKER TO 1149 3 08:12:10 .002 DFHECID TEMPSTOR LONGTSNAME BUFFERCECI P045 IG2ZP045 CBAKER TO 1149 4 08:12:10 .004 DFHECID TEMPSTOR LONGTSNAME BUFFERCECI P045 IG2ZP045 CBAKER TO 1149 5 08:12:10 .004 DFHECID TEMPSTOR LONGTSNAME BUFFERCECI P045 IG2ZP045 CBAKER TO 1149 6 08:12:10 .004 DFHECID TEMPSTOR LONGTSNAME BUFFERCECI P045 IG2ZP045 CBAKER TO 1149 7 08:12:10 .002 DFHECID TEMPSTOR LONGTSNAME BUFFERCECI P045 IG2ZP045 CBAKER TO 1149 8 08:12:10 .003 DFHECID TEMPSTOR LONGTSNAME BUFFERCECI P045 IG2ZP045 CBAKER TO 1149 9 08:12:10 .003 DFHECID TEMPSTOR LONGTSNAME BUFFERCECI P045 IG2ZP045 CBAKER TO 1149 10 08:12:11 .002 DFHECID TEMPSTOR LONGTSNAME BUFFERCECI P045 IG2ZP045 CBAKER TO 1149 11 08:12:11 .002 DFHECID TEMPSTOR LONGTSNAME BUFFERCECI P045 IG2ZP045 CBAKER TO 1149 12 08:12:11 .004 DFHECID TEMPSTOR LONGTSNAME BUFFERCECI P045 IG2ZP045 CBAKER TO 1149 13 08:12:11 .002 DFHECID TEMPSTOR LONGTSNAME BUFFERCECI P045 IG2ZP045 CBAKER TO 1149 14 08:12:11 .002 DFHECID TEMPSTOR LONGTSNAME BUFFERCECI P045 IG2ZP045 CBAKER TO 1149 15 08:12:11 .002 DFHECID TEMPSTOR LONGTSNAME BUFFERCECI P045 IG2ZP045 CBAKER TO 1149 16 08:12:11 .002 DFHECID TEMPSTOR LONGTSNAME BUFFERCECI P045 IG2ZP045 CBAKER TO 1149 17 08:12:11 .002 DFHECID TEMPSTOR LONGTSNAME BUFFERCECI P045 IG2ZP045 CBAKER TO 1149 18 08:12:11 .004 DFHECID TEMPSTOR LONGTSNAME BUFFERCECI S220 IGCS220 BRENNER TO 1151 4 08:12:11 .002 DFHECID TEMPSTOR CACA BUFFERCECI S220 IGCS220 BRENNER TO 1151 5 08:12:11 .002 DFHECID TEMPSTOR CACA BUFFERCECI S220 IGCS220 BRENNER TO 1151 6 08:12:11 .003 DFHECID TEMPSTOR CACA BUFFERCECI S220 IGCS220 BRENNER TO 1151 7 08:12:11 .003 DFHECID TEMPSTOR CACA BUFFERCECI S220 IGCS220 BRENNER TO 1151 8 08:12:11 .002 DFHECID TEMPSTOR CACA BUFFERCECI S220 IGCS220 BRENNER TO 1151 9 08:12:11 .003 DFHECID TEMPSTOR CACA BUFFERCECI S220 IGCS220 BRENNER TO 1151 10 08:12:11 .003 DFHECID TEMPSTOR CACA BUFFERCECI S220 IGCS220 BRENNER TO 1151 11 08:12:11 .003 DFHECID TEMPSTOR CACA BUFFERCECI S220 IGCS220 BRENNER TO 1151 12 08:12:12 .004 DFHECID TEMPSTOR CACA BUFFERCECI S220 IGCS220 BRENNER TO 1151 13 08:12:12 .003 DFHECID TEMPSTOR CACA BUFFERCECI S220 IGCS220 BRENNER TO 1151 14 08:12:12 .004 DFHECID TEMPSTOR CACA BUFFERCECI S205 IGCS205 BRENNER TO 1150 1 08:12:12 .002 DFHECID TEMPSTOR FRED BUFFERCECI S220 IGCS220 BRENNER TO 1151 15 08:12:12 .004 DFHECID TEMPSTOR CACA BUFFERCECI S205 IGCS205 BRENNER TO 1150 2 08:12:12 .004 DFHECID TEMPSTOR FRED BUFFERCECI S220 IGCS220 BRENNER TO 1151 16 08:12:12 .004 DFHECID TEMPSTOR CACA BUFFERCECI S205 IGCS205 BRENNER TO 1150 3 08:12:12 .004 DFHECID TEMPSTOR FRED BUFFERCECI S220 IGCS220 BRENNER TO 1151 17 08:12:12 .004 DFHECID TEMPSTOR CACA BUFFERCECI S205 IGCS205 BRENNER TO 1150 4 08:12:12 .004 DFHECID TEMPSTOR FRED BUFFERCECI S220 IGCS220 BRENNER TO 1151 18 08:12:12 .005 DFHECID TEMPSTOR CACA BUFFERCECI S205 IGCS205 BRENNER TO 1150 5 08:12:12 .006 DFHECID TEMPSTOR FRED BUFFERCECI S205 IGCS205 BRENNER TO 1150 6 08:12:12 .002 DFHECID TEMPSTOR FRED BUFFERCECI S205 IGCS205 BRENNER TO 1150 7 08:12:12 .002 DFHECID TEMPSTOR FRED BUFFERCECI S205 IGCS205 BRENNER TO 1150 8 08:12:12 .002 DFHECID TEMPSTOR FRED BUFFERCECI S205 IGCS205 BRENNER TO 1150 9 08:12:12 .002 DFHECID TEMPSTOR FRED BUFFERCECI S205 IGCS205 BRENNER TO 1150 10 08:12:12 .002 DFHECID TEMPSTOR FRED BUFFERCECI S205 IGCS205 BRENNER TO 1150 11 08:12:12 .002 DFHECID TEMPSTOR FRED BUFFER
Figure 46. Exception List report
94 IBM CICS Performance Analyzer for z/OS: Report Reference

TermThe Terminal ID (field: TERM, owner: DFHTERM, field ID: 002) is either theterminal ID or the session ID. This field is blank if the transaction was notassociated with a terminal or session facility.
LUNameThe LUname (field: LUNAME, owner: DFHTERM, field ID: 111) is either theVTAM netname of the terminal ID (if the Access Method for the terminal isVTAM) or the VTAM APPLID of the connection for the session ID. For anEXCI connection, this field is blank. The transaction's terminal or session typecan be identified from the NATURE field (byte 0) within the terminalinformation field (field: TERMINFO, owner: DFHTERM, field ID: 165). Thisfield is blank if the transaction was not associated with a terminal or sessionfacility.
UseridThe User identifier of the transaction (owner: DFHCICS, field ID: 089).
SCThe transaction start type (field: STYPE, owner: DFHTASK, field ID: 004).
Tran ClassThe transaction class for this transaction (owner: DFHTASK, field ID: 166). Ifthe transaction is not in a transaction class then this field is blank.
Service ClassThe MVS Workload Manager (WLM) service class (owner: DFHCICS, field ID:167) for the transaction (CICS Transaction Server Version 1.1 or later only).
Report ClassThe MVS Workload Manager (WLM) report class (owner: DFHCICS, field ID:168) for the transaction (CICS Transaction Server Version 1.1 or later only).
TasknoThe transaction identification number (owner: DFHTASK, field ID: 031).
Exp SeqThe sequence number of this exception within the transaction.
StartThe Start time of the exception condition.
ElapsedThe Elapsed time of the exception condition.
The following columns provide additional information about the exception:
Resource TypeThe exception resource type:
CFDTLRSWThe exception resource ID is a CFDTPOOL name.
CFDTPOOLThe exception resource ID is a CFDTPOOL name.
FILE The exception resource ID is a file name.
LSRPOOLThe exception resource ID is an LSRPOOL ID.
STORAGEThe exception resource ID is CICS storage.
Chapter 3. Exception reports 95

TEMPSTORThe exception resource ID is temporary storage queue name.
Resource IDThe exception resource ID.
Exception TypeThe exception type:
WAIT Exception is due to a wait.
BUFFERException is due to a buffer wait.
STRINGException is due to a string wait.
Table 5 shows the exception types and the corresponding resource type andresource ID values along with a brief description of the exception condition.
Table 5. Exception types
Exception Type Resource Type Resource ID Meaning
WAIT CFDTLRSW CFDTPOOL name Wait for CF (coupling facility) data table locking requestslot
WAIT CFDTPOOL CFDTPOOL name Wait for CF (coupling facility) data table non-lockingrequest slot
WAIT STORAGE CDSA Wait for CDSA storage
WAIT STORAGE ECDSA Wait for ECDSA storage
WAIT STORAGE GCDSA Wait for GCDSA storage
WAIT STORAGE UDSA Wait for UDSA storage
WAIT STORAGE EUDSA Wait for EUDSA storage
WAIT STORAGE SDSA Wait for SDSA storage
WAIT STORAGE ESDSA Wait for ESDSA storage
WAIT TEMPSTOR TS Qname Wait for temporary storage
STRING FILE filename Wait for VSAM string associated with a file
STRING LSRPOOL filename Wait for VSAM string associated with an LSRPOOL
STRING TEMPSTOR TS Qname Wait for VSAM string associated with DFHTEMP
BUFFER LSRPOOL LSRPOOL Wait for VSAM buffer associated with an LSRPOOL
BUFFER TEMPSTOR TS Qname Wait for VSAM buffer associated with DFHTEMP
To obtain the number of exception records written for each transaction, look at theCount component of the exception wait time (field: EXWTTIME, owner: DFHCICS,field ID: 103) on the Performance List report or Performance List Extended report.Note that this field is not in the default reports. You'll need to request the EXWAITfield in a Report Form or FIELDS operand.
Exception Summary reportThe Exception Summary report summarizes the exception records collected by theCICS Monitoring Facility (CMF). Records are summarized by transaction identifiercode. The report provides the total number of exceptions for each transaction,according to the following:v For auxiliary temporary storage VSAM buffer and string wait conditions
96 IBM CICS Performance Analyzer for z/OS: Report Reference

v For coupling facility data table pool wait conditionsv For VSAM LSRPOOL buffer and string wait conditionsv For VSAM file string wait conditionsv For temporary storage wait conditionsv For main storage wait conditions
You can request a report that summarizes all available records, or you can provideselection criteria to summarize only the data that meets specific requirements.
Report commandThe Exception Summary report can be requested from a Report Set in the CICS PAdialog. Select the Summary report in the Exception Reports category.
In batch, the SUMEXCeption command is used to request the Exception List report.
The command to produce the default report is:CICSPA SUMEXCEPTION
To tailor the report, you can specify report options as follows:CICSPA SUMEXC(
[OUTPUT(ddname),][LINECOUNT(nnn),][TITLE1(’...sub-heading left ...’),][TITLE2(’...sub-heading right...’),][SELECT(EXCEPTION(INCLUDE|EXCLUDE(field1(values1),...),
...))])
Report contentEach line on the report represents the summarized information for a singleTransaction ID, and is printed in alphanumeric order by Transaction ID.
For detailed information on the exception class data fields shown in the ExceptionSummary report, see “CMF exception class data fields” on page 310.
The Exception Summary report contains the following information:
TranThe Transaction ID.
Total ExceptsThe total number of exceptions for the transaction.
The average elapsed time (Average) and number of exceptions (Count) for thefollowing exception resource types:
TS-Buffer-WaitWaits for an auxiliary temporary storage VSAM buffer.
V3R2M0 CICS Performance AnalyzerException Summary
XSUM0001 Printed at 12:03:45 7/15/2010 Data from 08:08:37 2/16/2010 to 08:12:36 2/16/2010
Tran Total TS-Buffer-Wait TS-String-Wait Pool-Buffr-Wait Pool-Strng-Wait File-Strng-Wait ..Temp Storage. ..Main Storage.ID Excepts Average Count Average Count Average Count Average Count Average Count Average Count Average Count
ABRW 3 6.810 3CEBR 16 .003 16CECI 257 .006 256 .003 1
------- ------- ------- ------- ------- ------- ------- ------- ------- ------- ------- ------- ------- ------- -------TOTAL 276 .006 256 .003 17 6.810 3
Figure 47. Exception Summary report
Chapter 3. Exception reports 97

TS-String-WaitWaits for an auxiliary temporary storage VSAM string.
Pool-Buffr-WaitWaits for a VSAM LSRPOOL buffer.
Pool-Strng-WaitWaits for a VSAM LSRPOOL string.
File Strng-WaitsWaits for a VSAM file string.
Temp StorageWaits for auxiliary temporary storage (NOSPACE).
Main StorageWaits for storage from a CICS dynamic storage area (DSA).
98 IBM CICS Performance Analyzer for z/OS: Report Reference

Chapter 4. Transaction Resource Usage reports
The Transaction Resource Usage reports are produced from CMF performance classand transaction resource class data. The reports in this category are:v “File Usage Summary report”v “Temporary Storage Usage Summary report” on page 102v “Distributed Program Link Usage Summary report” on page 106v “Transaction Resource Usage List report” on page 109
File Usage Summary reportThe File Usage Summary report provides a detailed analysis of CMF transactionresource class data for Files.
Two reports can be requested:1. Transaction File Usage Summary. This report summarizes File usage by
Transaction ID. For each Transaction ID, it gives Transaction Identification andFile Control statistics followed by a breakdown of File usage for each File usedby the Transaction.
2. File Usage Summary. This report summarizes File activity. For each File, itgives a breakdown of File usage by Transaction ID.
You can request a report that summarizes all available records, or you can provideselection criteria to summarize only the data that meets specific requirements. Theselection criteria filters both performance class data and transaction resource classdata. However, only some selection criteria fields apply to transaction resourceclass records. For the selection criteria fields applicable to File Usage processing,see the File Usage Summary report in the CICS Performance Analyzer for z/OS User'sGuide.
Report commandThe File Usage Summary report can be requested from a Report Set in theCICS PA dialog. Select the File Usage Summary report in the TransactionResource Usage Reports category.
In batch, the RESUSAGE command is used to request the File Usage Summary report.
The command to produce the default report is:CICSPA RESUsage
This produces the two File Usage summary reports, the two Temporary StorageUsage summary reports, and the two DPL Usage summary reports. For the FileUsage summary reports, this is the same as specifying:CICSPA RESUSAGE(TRANSUMM(FILE), Transaction File Usage Summary
FILESUMM( File Usage SummaryBYTRAN, - break down by Transaction IDTOTAL)) - include transaction totals
To tailor the report, you can specify report options as follows:CICSPA RESUSAGE(
[OUTPUT(ddname),][TRANSUMMARY(FILE),]
© Copyright IBM Corp. 2001, 2010 99

[FILESUMMARY(BYTRAN,TOTAL),][LINECOUNT(nnn),][TITLE1(’...sub-heading left ...’),][TITLE2(’...sub-heading right...’),][SELECT(PERFORMANCE(INCLUDE|EXCLUDE(field1(value1),...),...))])
Report contentThe File Usage Summary report provides a detailed analysis of CMF transactionresource class data for Files. Reports break down individual File usage byTransaction. You can request one or both of the following:v “Transaction File Usage Summary report”v “File Usage Summary report” on page 102
Transaction File Usage Summary reportThe Transaction File Usage Summary report provides a summary of File usage byTransaction ID. For each Transaction ID, it gives Transaction Identification and FileControl statistics followed by a breakdown of File usage for each File used by theTransaction. See the sample report in Figure 48 created with the command:CICSPA RESUSAGE(TRANSUMM(FILE),OUTPUT(ddname))
The report consists of two sections:1. The Identification section that identifies the CICS Transaction ID. This section
consists of a summary of performance group DFHFILE fields. Note that data inthis section is obtained from CMF performance class records, not transactionresource class records.
TranThe Transaction ID identifies the name of the transaction that thistransaction resource class record represents. See the performance class datafield TRAN (owner: DFHTASK, field ID: 001).
#TasksTask count (CMF performance class).
2. The Files section associated with the Transaction ID immediately above it.
FileThe name of the File used by the Transaction.
V3R2M0 CICS Performance AnalyzerTransaction File Usage Summary
FILE0001 Printed at 12:03:45 7/15/2010 Data from 07:30:47 5/29/2010 to 08:35:48 5/29/2010 APPLID CICSPA1 Page 1
********************** FC Calls ********************* ******** I/O Waits ******* AccMethTran #Tasks Get Put Browse Add Delete Total File RLS CFDT Requests---- ------- -------- -------- -------- -------- -------- -------- -------- -------- -------- --------STOK 9 Elapse Avg .2452 .0000 .0000
Max 1.5718 .0000 .0000Count Avg 48 0 506 2 1 568 65 0 0 595
Max 369 7 4354 9 4 4739 426 0 0 4925
********************** FC Calls ********************* ******** I/O Waits ******* AccMethFile #Tasks Get Put Browse Add Delete Total File RLS CFDT Requests---------------- ------- -------- -------- -------- -------- -------- -------- -------- -------- -------- --------STOCKF1 9 Elapse Avg .1907 .0045 .0170 .0154 .0094 .2544 .2452 .0000 .0000
Max 1.4601 .0110 .1195 .0458 .0358 1.6370 1.5718 .0000 .0000Count Avg 48 0 506 2 1 568 65 0 0 595
Max 369 2 4354 8 4 4739 426 0 0 4925
STOCKF2 9 Elapse Avg .0261 .0054 .0036 .0113 .0068 .0712 .0690 .0000 .0000Max .0352 .0065 .0042 .0176 .0098 .1029 .0837 .0000 .0000
Count Avg 0 0 12 0 0 13 1 0 0 34Max 0 0 15 0 0 17 2 0 0 765
Figure 48. Transaction File Usage Summary report
100 IBM CICS Performance Analyzer for z/OS: Report Reference

#TasksTask count (CMF transaction resource class).
The Files section provides average and maximum values for each of the followingfields. For more information on these fields, see “File entry fields” on page 320.
FC CallsFile Control statistics.
Get ElapseThe elapsed time that the user task waited for completion of GET requestsissued by the user task for this file.
Get CountThe number of GET requests issued against the file by the user task.
Put ElapseThe elapsed time that the user task waited for completion of PUT requestsissued by the user task for this file.
Put CountThe number of PUT requests issued against the file by the user task.
Browse ElapseThe elapsed time that the user task waited for completion of BRO requestsissued by the user task for this file.
Browse CountThe number of BRO requests issued against the file by the user task.
Add ElapseThe elapsed time that the user task waited for completion of ADD requestsissued by the user task for this file.
Add CountThe number of ADD requests issued against the file by the user task.
Delete ElapseThe elapsed time that the user task waited for completion of DEL requestsissued by the user task for this file.
Delete CountThe number of DEL requests issued against the file by the user task.
Total ElapseThe total elapsed time that the user task waited for completion of allrequests issued by the user task for this file.
Total CountThe total number of all requests issued against the file by the user task.
I/O Waits
File ElapseThe total I/O wait time on this file by the user task.
File CountThe number of I/O waits on this file by the user task.
RLS ElapseThe elapsed time that the user task waited for RLS file I/O on this file.
RLS CountThe number of times that the user task waited for RLS file I/O on this file.
Chapter 4. Transaction Resource Usage reports 101

CFDT ElapseThe elapsed time that the user task waited for a data table access requestto the coupling facility data table server to complete for this file.
CFDT CountThe number of times that the user task waited for a data table accessrequest to the coupling facility data table server to complete for this file.
AccMeth Requests CountThe number of times the user task invoked file access-method interfaces.
File Usage Summary reportThe File Usage Summary report summarizes File activity. For each File, it gives abreakdown of File usage by Transaction ID. Optionally, the report can includeindividual transaction statistics or total transaction statistics or both. See thesample report in Figure 49 created with the command:CICSPA RESUSAGE(FILESUMM(BYTRAN,TOTAL),OUTPUT(ddname))
The report consists of one section:1. The File/Transaction ID section which shows for each File, a File usage
summary per Transaction.
The File Usage Summary report provides average and maximum values for eachfield in the report. For an explanation of these fields, see “Transaction File UsageSummary report” on page 100.
Temporary Storage Usage Summary reportThe Temporary Storage Usage Summary report provides a detailed analysis ofCMF transaction resource class data for temporary storage queues.
Two reports can be requested:1. Transaction Temporary Storage Usage Summary. This report summarizes
Temporary Storage usage by Transaction ID. For each Transaction ID, it givesTransaction Identification and Temporary Storage Control statistics followed bya breakdown of Temporary Storage usage for each Temporary Storage Queueused by the Transaction.
2. Temporary Storage Usage Summary. This report summarizes TemporaryStorage activity. For each Temporary Storage Queue, it gives a breakdown ofTemporary Storage usage by Transaction ID.
V3R2M0 CICS Performance AnalyzerFile Usage Summary
FILE0001 Printed at 12:03:45 7/15/2010 Data from 07:30:47 5/29/2010 to 08:35:48 5/29/2010 APPLID CICSPA1 Page 2
********************** FC Calls ********************* ******** I/O Waits ******* AccMethFile Tran #Tasks Get Put Browse Add Delete Total File RLS CFDT Requests-------- ---- ------- -------- -------- -------- -------- -------- -------- -------- -------- -------- --------STOCK1 STOK 9 Elapse Avg .1907 .0045 .0170 .0154 .0094 .2544 .2452 .0000 .0000
Max 1.4601 .0110 .1195 .0458 .0358 1.6370 1.5718 .0000 .0000Count Avg 48 0 506 2 1 568 65 0 0 595
Max 369 7 4354 9 4 4739 426 0 0 4925
ORDR 4 Elapse Avg .6174 .0000 10139.51 .0000 .0000 10140.44 1.2854 .0000 .0000Max .8421 .0000 40557.78 .0000 .0000 40557.78 1.3365 .0000 .0000
Count Avg 162 0 3273 0 0 3600 356 0 0 3754Max 217 0 3273 0 0 3710 356 0 0 3754
Totl 13 Elapse Avg .3220 .0031 3119.862 .0107 .0065 3120.313 .5653 .0000 .0000Max 2.4697 .0401 40558.06 .1390 .0842 40561.78 5.1415 .0000 .0000
Count Avg 83 0 1357 1 0 1501 154 0 0 1567Max 651 7 13092 23 12 14403 1424 0 0 15016
Figure 49. File Usage Summary report
102 IBM CICS Performance Analyzer for z/OS: Report Reference

You can request a report that summarizes all available records, or you can provideselection criteria to summarize only the data that meets specific requirements. Theselection criteria filters both performance class data and transaction resource classdata. However, only some selection criteria fields apply to transaction resourceclass records. For the selection criteria fields applicable to Temporary StorageUsage processing, see the Temporary Storage Usage Summary report in the CICSPerformance Analyzer for z/OS User's Guide.
Report commandThe Temporary Storage Usage Summary report can be requested from a Report Setin the CICS PA dialog. Select the Temporary Storage Usage Summary report inthe Transaction Resource Usage Reports category.
In batch, the RESUsage command is used to request the Temporary Storage UsageSummary report.
The command to produce the default report is:CICSPA RESUSAGE
This produces the two File Usage summary reports, the two Temporary StorageUsage summary reports, and the two DPL Usage summary reports. For theTemporary Storage Usage summary reports, this is the same as specifying:CICSPA RESUSAGE(TRANSUMM(TEMPSTOR), Transaction Temporary Storage Usage Summary
TEMPSTORSUMM( Temporary Storage Usage SummaryBYTRAN, - break down by Transaction IDTOTAL)) - include transaction totals
To tailor the report, you can specify report options as follows:CICSPA RESUSAGE(
[OUTPUT(ddname),][TRANSUMMARY(TEMPSTOR),][TEMPSTORSUMMARY(BYTRAN,TOTAL),][LINECOUNT(nnn),][TITLE1(’...sub-heading left ...’),][TITLE2(’...sub-heading right...’),][SELECT(PERFORMANCE(INCLUDE|EXCLUDE(field1(value1),...),...))])
Report contentThe Temporary Storage Usage Summary report provides a detailed analysis ofCMF transaction resource class data for Temporary Storage Queues. Reports breakdown individual Temporary Storage Queue usage by Transaction. You can requestone or both of the following:v “Transaction Temporary Storage Usage Summary report”v “Temporary Storage Usage Summary report” on page 106
Transaction Temporary Storage Usage Summary reportThe Transaction Temporary Storage Usage Summary report summarizesTransactions that use Temporary Storage queues. The report consists of TransactionIdentification and Temporary Storage statistics from the CMF Performance classrecords. In addition, there is one sub-section for each TSQueue that thisTransaction has used from the CMF transaction resource class records.
See the sample report in Figure 50 on page 104 created with the command:CICSPA RESUSAGE(TRANSUMM(TEMPSTOR),OUTPUT(ddname))
Chapter 4. Transaction Resource Usage reports 103

The report consists of two sections:1. The Identification section that identifies the CICS Transaction ID. This section
consists of a summary of performance group DFHTEMP fields. Note that datain this section is obtained from CMF performance class records, not transactionresource class records.
TranThe Transaction ID identifies the name of the transaction that thistransaction resource class record represents. See the performance class datafield TRAN (owner: DFHTASK, field ID: 001).
#TasksTask count (CMF performance class).
2. The Temporary Storage section associated with the Transaction ID immediatelyabove it.
TSQueueThe name of the Temporary Storage Queue used by the Transaction. If theTSQueue name contains unprintable characters, the hexadecimalrepresentation is reported immediately below the character name.
#TasksTask count (CMF transaction resource class).
The Temporary Storage section provides average and maximum values for each ofthe following fields. For more information on these fields, see “Temporary storagequeue entry fields” on page 321.
V3R2M0 CICS Performance AnalyzerTransaction Temporary Storage Usage Summary
TEMP0001 Printed at 12:03:45 7/15/2010 Data from 07:30:47 5/29/2010 to 08:35:48 5/29/2010 APPLID CICSPA1 Page 1
************* TS Calls ************* *** I/O Waits ***Tran #Tasks Get Put_Aux Put_Main Total TS Shr_TS---- ------- --------- -------- -------- -------- -------- --------CECI 3 Elapse Avg .0000 .0139
Max .0000 .0139Count Avg 2 0 6 8 0 10
Max 3 0 12 12 0 17
************** TS Calls *********** *** I/O Waits *** ******** TS Item *********TSQueue #Tasks Get Put_Aux Put_Main Total TS Shr_TS Get Put_Aux Put_Main---------------- ------- -------- -------- -------- -------- -------- -------- -------- -------- --------TS_Queue1 2 Elapse Avg .0104 .0000 .0002 .0106 .0000 .0139
Max .0104 .0000 .0002 .0104 .0000 .0139Count Avg 2 0 6 8 0 10 56 44 378
Max 3 0 12 12 0 17 Length 112 88 756
TS_Queue2 1 Elapse Avg .0104 .0000 .0002 .0000 .0000 .0139Max .0104 .0000 .0002 .0000 .0000 .0139
Count Avg 2 0 6 8 0 104 56 44 378Max 2 0 6 8 0 104 Length 112 88 756
Total 2 Elapse Avg .0104 .0000 .0002 .0000 .0000 .0139Max .0104 .0000 .0002 .0104 .0000 .0139
Count Avg 2 0 6 8 0 10 56 44 378Max 3 0 12 12 0 17 Length 112 88 756
************* TS Calls ************* *** I/O Waits ***Tran #Tasks Get Put_Aux Put_Main Total TS Shr_TS---- ------- --------- -------- -------- -------- -------- --------CEDA 9 Elapse Avg .0000 .0139
Max .0000 .0139Count Avg 48 0 506 2 1 568
Max 369 2 4354 8 4 4739
************** TS Calls *********** *** I/O Waits *** ******** TS Item *********TSQueue #Tasks Get Put_Aux Put_Main Total TS Shr_TS Get Put_Aux Put_Main---------------- ------- -------- -------- -------- -------- -------- -------- -------- -------- --------TS_Queue3 9 Elapse Avg .0104 .0000 .0002 .0106 .0000 .0139
Max .0104 .0000 .0002 .0104 .0000 .0139Count Avg 2 0 6 8 0 10 56 44 378
Max 3 0 12 12 0 17 Length 112 88 756
Figure 50. Transaction Temporary Storage Usage Summary report
104 IBM CICS Performance Analyzer for z/OS: Report Reference

TS CallsTemporary Storage Control statistics.
Get ElapseThe elapsed time that the user task waited for completion of temporarystorage GET requests issued by the user task against this temporarystorage queue.
Get CountThe number of temporary storage GET requests issued by the user taskagainst this temporary storage queue.
Put_Aux ElapseThe elapsed time that the user task waited for completion of PUT requeststo auxiliary temporary storage.
Put_Aux CountThe number of PUT requests to auxiliary temporary storage issued by theuser task.
Put_Main ElapseThe elapsed time that the user task waited for completion of PUT requeststo main temporary storage.
Put_Main CountThe number of PUT requests to main temporary storage issued by the usertask.
Total ElapseThe total elapsed time that the user task waited for completion of allrequests issued by the user task against this temporary storage queue.
Total CountThe total number of all requests issued by the user task against thistemporary storage queue.
I/O Waits
TS ElapseThe total elapsed time that the user task waited for temporary storage I/O.
TS CountThe number of I/O waits on this temporary storage queue by the usertask.
Shr_TS ElapseThe elapsed time that the user task waited for an asynchronous requestagainst this shared temporary storage queue to complete.
Shr_TS CountThe number of times that the user task waited for I/O on this sharedtemporary storage queue.
TS Item
Get LengthThe total length of all items obtained from this temporary storage queueby the user task.
Put_Aux LengthThe total length of all items written to the auxiliary temporary storagequeue by the user task.
Chapter 4. Transaction Resource Usage reports 105

Put_Main LengthThe total length of all items written to the main temporary storage queueby the user task.
Temporary Storage Usage Summary reportThe Temporary Storage Usage Summary report summarizes Temporary Storageactivity, breaking down individual TSQueue usage by Transaction ID. Optionally,you can request to include one or both of the following:v Break down by Transaction ID to include individual Transaction statistics.v Transaction Totals to include total Transaction statistics.
See the sample report in Figure 51 created with the command:CICSPA RESUSAGE(TEMPSTORSUMM(BYTRAN,TOTAL),OUTPUT(ddname))
The report consists of one section:1. The TSQueue/Transaction ID section which shows for each temporary storage
queue, a temporary storage usage summary per transaction.
The Temporary Storage Usage Summary report provides average and maximumvalues for each field in the report. For an explanation of these fields, see“Transaction Temporary Storage Usage Summary report” on page 103.
Distributed Program Link Usage Summary reportThe Distributed Program Link (DPL) Usage Summary report provides a detailedanalysis of CMF transaction resource class data for DPLs.
Two reports can be requested:1. Transaction DPL Usage Summary. This report summarizes DPL usage by
Transaction ID. For each Transaction ID, it gives Transaction Identification andDPL statistics followed by a breakdown of each DPL used by the Transaction.
2. DPL Usage Summary. This report summarizes DPL activity. For each DPL, itgives a breakdown of DPL usage by Transaction ID.
You can request a report that summarizes all available records, or you can provideselection criteria to summarize only the data that meets specific requirements. Theselection criteria filters both performance class data and transaction resource classdata. However, only some selection criteria fields apply to transaction resource
V3R2M0 CICS Performance AnalyzerTemporary Storage Usage Summary
TEMP0001 Printed at 12:03:45 7/15/2010 Data from 07:30:47 5/29/2010 to 08:35:48 5/29/2010 APPLID CICSPA1 Page 1
************* TS Calls ************ *** I/O Waits *** ******** TS Item *********TSQueue Tran #Tasks Get Put_Aux Put_Main Total TS Shr_TS Get Put_Aux Put_Main---------------- ---- ------- -------- -------- -------- -------- -------- -------- -------- -------- --------TS_QUEUE1 CEDA 9 Elapse Avg .0104 .0000 .0002 .0106 .0000 .0139
Max .0104 .0000 .0002 .0104 .0000 .0139Count Avg 2 0 6 8 0 10 56 44 378
Max 3 0 12 12 0 17 Length 112 88 756
CSSY 4 Elapse Avg .0104 .0000 .0002 .0000 .0000 .0139Max .0104 .0000 .0002 .0000 .0000 .0139
Count Avg 2 0 6 8 0 10 56 44 378Max 3 0 12 12 0 17 Length 112 88 756
Totl 13 Elapse Avg .0104 .0000 .0002 .0000 .0000 .0139Max .0104 .0000 .0002 .0000 .0000 .0139
Count Avg 2 0 6 8 0 10 56 44 378Max 3 0 12 12 0 17 Length 112 88 756
Figure 51. Temporary Storage Usage Summary report
106 IBM CICS Performance Analyzer for z/OS: Report Reference

class records. For the selection criteria fields applicable to DPL Usage processing,see the DPL Usage Summary report in the CICS Performance Analyzer for z/OSUser's Guide.
Report commandThe Distributed Program Link (DPL) Usage Summary report can be requested froma Report Set in the CICS PA dialog. Select the DPL Usage Summary report in theTransaction Resource Usage Reports category.
In batch, the RESUsage command is used to request the DPL Usage Summaryreport.
The command to produce the default report is:CICSPA RESUSAGE
This produces the two File Usage summary reports, the two Temporary StorageUsage summary reports, and the two DPL Usage summary reports. For the DPLUsage summary reports, this is the same as specifying:CICSPA RESUSAGE(TRANSUMM(DPL), Transaction DPL Usage Summary
DPLSUMM( DPL Usage SummaryBYTRAN, - break down by Transaction IDTOTAL)) - include transaction totals
To tailor the report, you can specify report options as follows:CICSPA RESUSAGE(
[OUTPUT(ddname),][TRANSUMMARY(DPL),][DPLSUMMARY(BYTRAN,TOTAL),][LINECOUNT(nnn),][TITLE1(’...sub-heading left ...’),][TITLE2(’...sub-heading right...’),][SELECT(PERFORMANCE(INCLUDE|EXCLUDE(field1(value1),...),...))])
Report contentThe DPL Usage Summary report provides a detailed analysis of CMF transactionresource class data for DPLs. Reports break down individual DPL usage byTransaction. You can request one or both of the following:v “Transaction Distributed Program Link Usage Summary report”v “Distributed Program Link Usage Summary report” on page 109
Transaction Distributed Program Link Usage Summary reportThe Transaction Distributed Program Link (DPL) Usage Summary reportsummarizes Transactions that use DPLs. The report consists of TransactionIdentification and DPL statistics from the CMF Performance class records. Inaddition, from the CMF transaction resource class records, there is one sub-sectionfor each program used by this Transaction ID that has requested a DPL.
See the sample report in Figure 52 on page 108 created with the command:CICSPA RESUSAGE(TRANSUMM(DPL),OUTPUT(ddname))
Chapter 4. Transaction Resource Usage reports 107

The report consists of two sections:1. The Identification section that identifies the CICS Transaction ID. This section
consists of a summary of performance group DFHTEMP fields. Note that datain this section is obtained from CMF performance class records, not transactionresource class records.
TranThe Transaction ID identifies the name of the transaction that thistransaction resource class record represents. See the performance class datafield TRAN (owner: DFHTASK, field ID: 001).
ProgramThe program associated with this Transaction ID.
#TasksTask count (CMF performance class).
DPL LINK RequestsThe average and maximum number of DPL requests for this TransactionID.
2. The DPL section associated with the Transaction ID immediately above it.
ProgramThe name of the specific program that issued the DPL request.
SYSIDThe ID of the MVS system on which this program ran.
#TasksTask count (CMF transaction resource class).
DPL LINK RequestsThe average and maximum number of DPL requests for this program.
V3R2M0 CICS Performance AnalyzerTransaction DPL Usage Summary
DPLS0001 Printed at 12:03:45 7/15/2010 Data from 07:12:47 7/15/2010 to 07:56:49 7/15/2010 APPLID CCVT41M Page 1
DPL LINKTran Program #Tasks Requests---- -------- ------- --------DIAD DIADPL 29 Count Avg 8
Max 13
DPL LINKProgram SYSID #Tasks Requests-------- ----- ------- --------DIADLET T41T 12 Count Avg 1
Max 1
DIADLET T41X 17 Count Avg 1Max 1
DIAREAD T41T 7 Count Avg 2Max 4
DIAREAD T41X 17 Count Avg 7Max 9
DIATDQ T41T 29 Count Avg 1Max 1
DIATDQ T41X 29 Count Avg 1Max 1
DIAWRITE T41T 12 Count Avg 1Max 1
DIAWRITE T41X 17 Count Avg 1Max 1
Total 140 Count Avg 1Max 9
Figure 52. Transaction DPL Usage Summary report
108 IBM CICS Performance Analyzer for z/OS: Report Reference

Distributed Program Link Usage Summary reportThe Distributed Program Link (DPL) Usage Summary report summarizes DPLactivity, breaking down individual DPL usage by Transaction ID. Optionally, youcan request to include one or both of the following:v Break down by Transaction ID to include individual Transaction statistics.v Transaction Totals to include total Transaction statistics.
See the sample report in Figure 53 created with the command:CICSPA RESUSAGE(DPLSUMM(BYTRAN,TOTAL),OUTPUT(ddname))
The report consists of one section:1. The Program/Transaction ID section which shows for each program, a DPL
usage summary per transaction.
Transaction Resource Usage List reportThe Transaction Resource Usage List report provides a detailed list of CMFtransaction resource class data. The records are reported in the sequence that theyappear in the SMF file. The report only processes transaction resource classrecords, it does not process performance class records. The report can list anycombination of File Usage records, Temporary Storage Usage records, andDistributed Program Link (DPL) Usage records.
The report gives Transaction information together with statistics by Transaction ofFile usage, Temporary Storage usage, or DPL usage.
V3R2M0 CICS Performance AnalyzerDPL Usage Summary
DPLS0001 Printed at 12:03:45 7/15/2010 Data from 07:12:47 7/15/2010 to 07:56:49 7/15/2010 APPLID CCVT41M Page 1
DPL LINKProgram SYSID Tran #Tasks Requests-------- ----- ---- ------- --------DIADLET T41T DIAD 12 Count Avg 1
Max 1
T41X DIAD 17 Count Avg 1Max 1
Totl 29 Count Avg 1Max 1
-------- ----- ---- ------- --------DIAREAD T41T DIAD 7 Count Avg 2
Max 4
T41X DIAD 17 Count Avg 7Max 9
Totl 24 Count Avg 5Max 9
-------- ----- ---- ------- --------DIATDQ T41T DIAD 29 Count Avg 1
Max 1
T41X DIAD 29 Count Avg 1Max 1
Totl 58 Count Avg 1Max 1
-------- ----- ---- ------- --------DIAWRITE T41T DIAD 12 Count Avg 1
Max 1
T41X DIAD 17 Count Avg 1Max 1
Totl 29 Count Avg 1Max 1
Figure 53. DPL Usage Summary report
Chapter 4. Transaction Resource Usage reports 109

You can request a report that lists all available records, or you can provideselection criteria to list only the data that meets specific requirements. Only someselection criteria fields apply to transaction resource class records:v For the selection criteria fields applicable to File Usage processing, see the File
Usage Summary report in the CICS Performance Analyzer for z/OS User's Guide.
v For the selection criteria fields applicable to Temporary Storage Usageprocessing, see the Temporary Storage Usage Summary report in the CICSPerformance Analyzer for z/OS User's Guide.
v For the selection criteria fields applicable to DPL Usage processing, see the DPLUsage Summary report in the CICS Performance Analyzer for z/OS User's Guide.
Report commandThe Transaction Resource Usage List report can be requested from a Report Set inthe CICS PA dialog. Select the Transaction Resource Usage List report in theTransaction Resource Usage Reports category.
In batch, the RESUsage(TRANLIST) command is used to request the TransactionResource Usage List report.
The command to produce the default report is:CICSPA RESUSAGE(TRANLIST)
This produces the Transaction Resource Usage List report for File, TemporaryStorage, and Distributed Program Link (DPL) usage, and is the same as specifying:CICSPA RESUSAGE(TRANLIST( Transaction Resource Usage List
FILE, - include File usage statisticsTEMPSTOR,) - include Temporary Storage usage statisticsDPL)) - include DPL usage statistics
To tailor the report, you can specify report options as follows:CICSPA RESUSAGE(
[OUTPUT(ddname),][TRANLIST(FILE,TEMPSTOR,DPL),][LINECOUNT(nnn),][TITLE1(’...sub-heading left ...’),][TITLE2(’...sub-heading right...’),][SELECT(PERFORMANCE(INCLUDE|EXCLUDE(field1(value1),...),...))])
Report contentThe Transaction Resource Usage List report provides a detailed list of transactionresource class records showing individual transaction File usage or TemporaryStorage usage or both. See the sample report in Figure 54 on page 111 created withthe command:CICSPA RESUSAGE(TRANLIST,OUTPUT(ddname))
110 IBM CICS Performance Analyzer for z/OS: Report Reference

The report consists of two sections:1. The Task Identification section that identifies the CICS task. The column
headings match the Cross-System Work report (see Figure 38 on page 68) toenable easy cross reference between the reports.
2. The Resource sections associated with the CICS task immediately above:depending on the specified report options, these sections can contain File,Temporary Storage, and Distributed Program Link (DPL) entries.
If applicable, the following message appears after the File statistics:CPA0375W Transaction xxxx has used additional Files and exceeded the File Resource Limit of nn
If applicable, the following message appears after the Temporary Storage statistics:CPA0375W Transaction xxxx has used additional TSQueues and exceeded the TSQueue Resource Limit of nn
If applicable, the following message appears after the DPL statistics:CPA0375W Transaction xxxx has used additional DPLs and exceeded the DPL Resource Limit of nn
The maximum number of files, temporary storage queues, and DPLs monitored foreach transaction is limited by the FILE, TSQUEUE, and DPL parameters on the
V3R2M0 CICS Performance AnalyzerTransaction Resource Usage List
RESU0001 Printed at 12:03:45 7/15/2010 Data from 15:05:47 5/15/2010 Page 1
Request Fcty Conn UOW R Stop / ResponseTran Userid SC TranType Term LUName Type Program T/Name Name NETName APPLID Task Seq T OStart Time Time---- -------- -- -------- ---- -------- ------- -------- ------ ---- ----------------- -------- ---- --- - ------------ --------CW2A CBAKER U U AP: DFHW2FI GBIBMIYA.IYK2Z1V2 IYK2Z1V2 44 1 T 15:06:26.734 .1473CWXN CBAKER - U - - - - B/ - - IYK2Z1V2 43 - - 15:06:26.580 .1541
********************** FC Calls ********************* ******* I/O Waits ******** AccMethFile Get Put Browse Add Delete Total File RLS CFDT Requests-------- -------- -------- -------- -------- -------- -------- -------- -------- -------- --------FILEA Elapse .0000 .0000 .0001 .0000 .0000 .0153 .0147 .0000 .0000
Count 11 0 66 0 0 143 2 0 0 143
Request Fcty Conn UOW R Stop / ResponseTran Userid SC TranType Term LUName Type Program T/Name Name NETName APPLID Task Seq T OStart Time Time---- -------- -- -------- ---- -------- ------- -------- ------ ---- ----------------- -------- ---- --- - ------------ --------CEJR CBAKER U S AP: DFHEJITL GBIBMIYA.IYK2Z1V2 IYK2Z1V2 58 1 T 15:11:26.947 .3140
********************** FC Calls ********************* ******* I/O Waits ******** AccMethFile Get Put Browse Add Delete Total File RLS CFDT Requests-------- -------- -------- -------- -------- -------- -------- -------- -------- -------- --------DFHEJDIR Elapse .0841 .0000 .0000 .0000 .0000 .0841 .0009 .0000 .0000
Count 1 0 0 0 0 1 2 0 0 1
DFHEJOS Elapse .0834 .0000 .0000 .0000 .0000 .0834 .0011 .0000 .0000Count 1 0 0 0 0 1 2 0 0 1
Total Elapse .1675 .0000 .0000 .0000 .0000 .1675 .0020 .0000 .0000Count 2 0 0 0 0 2 4 0 0 2
Request Fcty Conn UOW R Stop / ResponseTran Userid SC TranType Term LUName Type Program T/Name Name NETName APPLID Task Seq T OStart Time Time---- -------- -- -------- ---- -------- ------- -------- ------ ---- ----------------- -------- ---- --- - ------------ --------CECI CBAKER TO U T164 IYCWT164 AP: DFHECIP T/T164 GBIBMIYA.IYCWT164 IYK2Z1V2 75 1 T 15:13:16.521 10.0157
DPL DPL LINKProgram SYSID Requests-------- ----- --------DFH0STAT CJB1 Count 2
DFH0STAT CJB3 Count 4
Total Count 6
Request Fcty Conn UOW R Stop / ResponseTran Userid SC TranType Term LUName Type Program T/Name Name NETName APPLID Task Seq T OStart Time Time---- -------- -- -------- ---- -------- ------- -------- ------ ---- ----------------- -------- ---- --- - ------------ --------CEMT CBAKER TO U T164 IYCWT164 AP: DFHEMTP T/T164 GBIBMIYA.IYCWT164 IYK2Z1V2 89 6 T 15:17:57.532 14.5784
************* TS Calls ************ *** I/O Waits *** ********* TS Item ********TSQueue Get Put_Aux Put_Main Total TS Shr_TS Get Put_Aux Put_Main---------------- -------- -------- -------- -------- -------- -------- -------- -------- --------T164EZAI Elapse .0000 .0000 .0000 .0004 .0000 .0000
Count 0 1 0 2 0 0 Length 0 89 0
Figure 54. Transaction Resource Usage List report
Chapter 4. Transaction Resource Usage reports 111

DFHMCT TYPE=INITIAL macro. The default is FILE=8 for files, TSQUEUE=4 fortemporary storage queues, and DPL=0 for DPLs. Therefore, you might need toassemble an MCT that specifies FILE, TSQUEUE, and DPL options if the defaultvalues are insufficient.
Task identificationThe Task identification section provides the following fields. For more informationon these fields, see “Task identification fields” on page 317.
If the task number and the APPLID of a task match its originating transaction, thenthis section contains only a single line. However, if the APPLID or the tasknumber, or both, do not match the originating transaction, then this sectioncontains a second line describing the originating transaction. If a field is notavailable for the originating transaction, then the second line contains a dash (-) forthat field.
TranThe Transaction ID identifies the name of the transaction that this transactionresource class record represents. See the performance class data field TRAN(owner: DFHTASK, field ID: 001).
UseridThe User identifier of the transaction. See the performance class data fieldUSERID (owner: DFHCICS, field ID: 089).
SCType of transaction start or start code. See the performance class data field SC(owner: DFHTASK, field ID: 004).
TranTypeThis column describes the transaction type:S System transactionU User transactionM Mirror transactionD DPL Mirror transactionO ONC RPC Alias transactionW WEB Alias transactionB Bridge transaction- ReservedR CICS BTS Run (ACQPROCESS or activity) transaction synchronous
The transaction type is represented as an interpretation of byte 1 of thetransaction flags field. See the performance class data field TRANFLAG(owner: DFHTASK, field ID: 164).
TermThe Terminal ID is either the terminal ID or the session ID. This field is blankif the transaction was not associated with a terminal or session facility. See theperformance class data field TERM (owner: DFHTERM, field ID: 002).
LUNameThe LUname is either the VTAM netname of the terminal ID (if the AccessMethod for the terminal is VTAM) or the VTAM APPLID of the connection forthe session ID. This field is blank if the transaction was not associated with aterminal or session facility. See the performance class data field LUNAME(owner: DFHTERM, field ID: 111).
Request TypeThis field describes the type of request that the transaction resource recordrepresents:
112 IBM CICS Performance Analyzer for z/OS: Report Reference

Description
AP: An application program request. The Program field will identify theinitial application program name invoked for the transaction.
Note: Function shipped Distributed Program Link (DPL) requests areinterpreted as application requests. In this case the AP: is followed bythe ---- (as for other function shipping requests) to indicate the types ofrequests issued by the application program.
FS:---- A function shipping request. The ---- indicate the types of functionshipping request:F File ControlI Interval ControlD Transient DataS Temporary Storage
TR:xxxxA transaction routing request from a terminal-owning region. The xxxxis the transaction routing SYSID and identifies the connection name(SYSID) of the remote system to which the transaction was routed. Seethe performance class data field RSYSID (owner: DFHCICS, field ID:130).
ProgramThe initial program name (field: PGMNAME, owner: DFHPROG, field ID: 071).This identifies the initial application program invoked for the transaction.Depending on the type of transaction, this field contains either the applicationprogram name as defined in the transaction definition, the program namereturned by a user written dynamic routing program, the application programname passed on a function shipped Dynamic Program Link (DPL) request, theinitial application program name of an ONC RPC Alias Transaction, or theinitial application program name of a WEB Alias Transaction. A program nameof ######## indicates that the transaction was invoked using the definition ofthe transaction ID specified by the DTRTRAN system initialization parameter.
FCTY TThis field is an interpretation of byte 0 of the transaction flags field (field:TRANFLAG, owner: DFHTASK, field ID: 164). It describes the transaction'sfacility type:
Type Descriptionblank NoneT Terminal or SessionS SurrogateD Transient Data queueB Bridge Terminal
FCTY NameThe transaction's facility name (owner: DFHTASK, field ID: 163).
Conn NameThe terminal session connection name (field: TERMCNNM, owner: DFHTERM,field ID: 169). If the terminal facility associated with this transaction is asession, then this field is the name of the owning connection (SYSID).
NETNameThis column is the network unit-of-work ID from the system where thenetwork unit-of-work ID originated. This name is constant within each
Chapter 4. Transaction Resource Usage reports 113

network unit-of-work ID. See the performance class data field NETUOWPX(owner: DFHTASK, field ID: 097), “DFHTASK fields” on page 268.
APPLIDThe APPLID of the CICS system upon which the CMF transaction resourcerecord was created. This field indicates the CICS system that performed thework recorded in the record.
TaskThe transaction identification number (field: TRANNUM, owner: DFHTASK,field ID: 031). This is printed for all records to help identify the correspondingrecords on a Performance List report.
UOW SeqThis column is the syncpoint sequence number from the network unit-of-workID that was assigned at transaction attach time. See the performance class dataNETUOWSX (owner: DFHTASK, field ID: 098), “DFHTASK fields” on page268.
R TThe performance class record type (field: RTYPE, owner: DFHCICS, field ID:112):
C Record output for a terminal converse.
D Record output by a user event monitoring point (EMP) DELIVERrequest.
F Record output for a long running transaction.
S Record output for a syncpoint request.
T Record was output for a transaction termination (detach).
For transaction resource class data, this field is always T.
Stop / OStart TimeThe first line in this section contains the Stop time (hh:mm:ss.thm) of thetransaction (field: STOP, owner: DFHCICS, field ID: 006).
If the section contains two lines, then the second line contains the Start time ofthe originating transaction.
Response TimeThe first line in this section contains the transaction response time. This field iscalculated by subtracting the transaction Start Time (field: START, owner:DFHCICS, field ID: 005) from the transaction Stop Time (field: STOP, owner:DFHCICS, field ID: 006).
If the section contains two lines, then the second line shows the elapsed timebetween the Start time of the originating transaction and the Stop time of thetransaction shown on the first line. This is not the response time of theoriginating transaction: the Stop time of the originating transaction is notavailable in this report.
File entriesThe File entry provides the following fields. For more information on these fields,see “File entry fields” on page 320.
FileThe file name of the file used by the transaction.
FC CallsFile Control statistics.
114 IBM CICS Performance Analyzer for z/OS: Report Reference

Get ElapseThe elapsed time that the user task waited for completion of GET requestsissued for this file.
Get CountThe number of GET requests issued against the file.
Put ElapseThe elapsed time that the user task waited for completion of PUT requestsissued for this file.
Put CountThe number of PUT requests issued against the file.
Browse ElapseThe elapsed time that the user task waited for completion of BRO requestsissued for this file.
Browse CountThe number of BRO requests issued against the file.
Add ElapseThe elapsed time that the user task waited for completion of ADD requestsissued for this file.
Add CountThe number of ADD requests issued against the file.
Delete ElapseThe elapsed time that the user task waited for completion of DEL requestsissued for this file.
Delete CountThe number of DEL requests issued against the file.
Total ElapseThe total elapsed time that the user task waited for completion of allrequests issued for this file.
Total CountThe total number of all requests issued against the file.
I/O Waits
File ElapseThe total I/O wait time on this file.
File CountThe number of I/O waits on this file.
RLS ElapseThe elapsed time that the user task waited for RLS file I/O on this file.
RLS CountThe number of times that the user task waited for RLS file I/O on this file.
CFDT ElapseThe elapsed time that the user task waited for a data table access requestto the coupling facility data table server to complete for this file.
CFDT CountThe number of times that the user task waited for a data table accessrequest to the coupling facility data table server to complete for this file.
Chapter 4. Transaction Resource Usage reports 115

AccMeth Requests CountThe number of times the user task invoked file access-method interfaces.
Temporary Storage entriesThe Temporary Storage section provides the following fields. For more informationon these fields, see “Temporary storage queue entry fields” on page 321.
TSQueueThe name of the temporary storage queue used by the transaction.
TS CallsTemporary Storage Control statistics.
Get ElapseThe elapsed time that the user task waited for completion of temporarystorage GET requests issued against this temporary storage queue.
Get CountThe number of temporary storage GET requests issued against thistemporary storage queue.
Put_Aux ElapseThe elapsed time that the user task waited for completion of PUT requeststo auxiliary temporary storage.
Put_Aux CountThe number of PUT requests to auxiliary temporary storage issued.
Put_Main ElapseThe elapsed time that the user task waited for completion of PUT requeststo main temporary storage.
Put_Main CountThe number of PUT requests to main temporary storage issued.
Total ElapseThe total elapsed time that the user task waited for completion of allrequests issued against this temporary storage queue.
Total CountThe total number of all requests issued against this temporary storagequeue.
I/O Waits
TS ElapseThe total elapsed time that the user task waited for temporary storage I/O.
TS CountThe number of I/O waits on this temporary storage queue.
Shr_TS ElapseThe elapsed time that the user task waited for an asynchronous requestagainst this shared temporary storage queue to complete.
Shr_TS CountThe number of times that the user task waited for I/O on this sharedtemporary storage queue.
TS Item
Get LengthThe total length of all items obtained from this temporary storage queue.
116 IBM CICS Performance Analyzer for z/OS: Report Reference

Put_Aux LengthThe total length of all items written to the auxiliary temporary storagequeue.
Put_Main LengthThe total length of all items written to the main temporary storage queue.
Distributed Program Link entriesThe Distributed Program Link (DPL) section provides the following fields. Formore information on these fields, see “DPL entry fields” on page 322.
DPL ProgramThe name of the specific program that issued the DPL request.
SYSIDThe ID of the MVS system on which this program ran.
DPL LINK RequestsThe number of DPL requests by this program.
Chapter 4. Transaction Resource Usage reports 117

118 IBM CICS Performance Analyzer for z/OS: Report Reference

Chapter 5. Statistics reports
The Statistics reports are produced from CICS statistics data stored in SMF files.Only the Statistics Alert reports are in this category.
To extract CICS statistics to delimited text files for further processing by otherapplications, see “Statistics extract” on page 208.
You can also produce Statistics Alert reports outside of a Report Set, from statisticsstored in HDBs. For details, see “Statistics Alert HDB Reporting” on page 222.
Statistics Alert reportsThe Statistics Alert reports process CICS Transaction Server and CICS TransactionGateway statistics records.
Before requesting a Statistics Alert report, you need to use the CICS PA dialog tocreate a Statistics Alert definition (for details on how to do this, see the CICS PAUser's Guide.). A Statistics Alert definition specifies conditions, in terms of statisticsfield values, that interest you. When you request a Statistics Alert report, youspecify the Statistics Alert definition that you want to use to generate the report.The report identifies any statistics in the input data that match the conditions inthe definition.
Report commandYou can request Statistics Alert reports from a Report Set in the CICS PA dialog:select the Alert report in the Statistics Reports category.
In batch, you use the STATSALERT command to request a Statistics Alert report.
The command to request the default report is:CICSPA STATSALERT(STALTDEF(statistics-alert-definition))
where statistics-alert-definition is the name of a Statistics Alert definition that isstored in the current HDB Register, identified in the JCL by the ddnameCPAHDBRG. This produces a report sorted by interval.
To tailor the report, you can specify report options as follows:CICSPA STATSALERT([OUTPUT(ddname),]
[EXTERNAL(ddname),]STALTDEF(statistics-alert-definition),[BY(APPLID[(LIST,SUMMARY)]|
ALERT[(LIST,SUMMARY)]|COLLECT|INTERVAL|RESOURCE),]
[TYPE(EOD,INT,USS,REQ,RRT),][LINECount(nnn),][TITLE1(’...up to 64 characters...’),][TITLE2(’...up to 64 characters...’)])
© Copyright IBM Corp. 2001, 2010 119

Report contentThe content of a Statistics Alert report identifies statistics in the input data thatmatch Conditions in the specified Statistics Alert definition. If the statistics do notmatch any Conditions, CICS PA issues a message rather than creating an emptyreport.
All Statistics Alert reports have the same general structure. Each report consists ofone or more sections. Each section consists of a section heading followed bytabular data under column headings.
The content of the section heading and tabular data depend on the sorting optionyou request and, for reports sorted by APPLID or Alert, the report type: List (thedefault) or Summary. Other sorting options are available only as List reports. Listreports show details of each instance of an Alert. Summary reports show thenumber of Alerts, rather than the details of each instance.
If an Alert refers to tabular (multi-record) statistics, the report line following theAlert identifies the resource name of the statistics record that triggered the alert.For example, for an Alert that refers to Dispatcher TCB Modes statistics (thatcontains one record per TCB mode), the second line identifies the TCB mode, suchas TCB Mode Name = QR.
List by APPLIDThe Statistics Alerts - List by APPLID report contains a section for each APPLID(CICS system) whose statistics records have triggered an Alert.
The sections are sorted by the following information in the section headings:
System, Image, VRM, Type
Within each section, the tabular data is sorted by the following column headings:
Severity, Collection Time
Here is an example section:
For a longer example of this report, see “Example: List and Summary by APPLID”on page 124.
Summary by APPLIDSimilar to the List by APPLID report, the Statistics Alerts - Summary by APPLIDreport contains a section for each APPLID (CICS system) whose statistics recordshave triggered an Alert.
The sections are sorted by the following information in the section headings:
System: CCVQ32C Image: FTS1 VRM: 650 Type: TS
Sev Alert Threshold Actual Collection Time TypeW Program load requests that waited >0 2 2008-10-24 00.00.01 EODI DSA limit >=0K 5120K 2008-10-24 00.00.01 EODI DSA allocated >=0K 2304K 2008-10-24 00.00.01 EODI DSA peak >=0K 2304K 2008-10-24 00.00.01 EOD...
Figure 55. Statistics Alerts - List by APPLID report: example section
120 IBM CICS Performance Analyzer for z/OS: Report Reference

System, Image, Type
Within each section, the tabular data is sorted by the following column headings:
Severity, Alert, Resource Name
Here is an example section:
For a longer example of this report, see “Example: List and Summary by APPLID”on page 124.
List by AlertThe Statistics Alerts - List by Alert report contains a section for each Condition (inthe specified Statistics Alert definition) that matches the input statistics data.
The section headings are the Alert text of the Conditions. The sections are sorted inthe order in which the Conditions appear in the Statistics Alert definition.
Within each section, the tabular data is sorted by the following column headings:
Severity, System, Image, Collection Time, Type
Here is an example section:
Summary by AlertSimilar to the List by Alert report, the Statistics Alerts - Summary by Alert reportcontains a section for each Condition (in the specified Statistics Alert definition)that matches the input statistics data.
As per the List by Alert report, the section headings are the Alert text of theConditions. The sections are sorted in the order in which the Conditions appear inthe Statistics Alert definition.
Within each section, the tabular data is sorted by the following column headings:
System: CCVQ32C Image: FTS1 Type: TS
Sev Alert Intervals AlertsW Program load requests that waited 1 1I Tasks: limit 1 1I Tasks: current 1 1...
Figure 56. Statistics Alerts - Summary by APPLID report: example section
Alert: Transaction dumpcode taken
Sev System Image Collection Time Type Threshold ActualW CCVQ32D2 FTS1 2008-10-24 00.00.00 TS EOD >0 9
Dump Code = ASP9W CCVT41CX FTS1 2008-11-19 11.53.21 TS EOD >0 104
Dump Code = AWBMW CCVT41CX FTS1 2008-11-20 00.00.00 TS EOD >0 75
Dump Code = AWBMW CCVT41CX FTS1 2008-12-05 12.00.00 TS INT >0 8...
Figure 57. Statistics Alerts - List by Alert report: example section
Chapter 5. Statistics reports 121

Severity, Type, APPLID, Image, Resource
Here is an example section:
List by Collection TimeThe Statistics Alerts - List by Collection Time report contains a section for eachstatistics collection time.
The section headings are the collection time. The sections are sorted inchronological order.
Within each section, the tabular data is sorted by the following column headings:
Severity, System, Image, VRM, Type
Here is an example section:
List by IntervalThe Statistics Alerts - List by Interval report contains a section for each statisticsinterval. A statistics interval consists of the statistics for a particular combination ofCICS system, collection type (such as EOD), and collection time.
The section headings identify the statistics interval. The sections are sorted by thefollowing information in the section headings:
System, Image, VRM, Type, Collection Time
Within each section, the tabular data is sorted by severity.
Here is an example section:
Alert: Transaction dumpcode taken
Sev System Image Type Intervals AlertsW CCVQ32D2 FTS1 TS 1 1
Dump Code = ASP9 1W CCVT41CX FTS1 TS 4 4
Dump Code = AWBM 4W CCVT41M FTS1 TS 1 1
Dump Code = ATNI 1...
Figure 58. Statistics Alerts - Summary by Alert report: example section
Collection Time: 2010-03-02 02.33.10
Sev Alert Threshold Actual System Image VRM TypeI DSA limit >=0K 5120K IYK3Z7FA MV2C 660 TS EODI DSA allocated >=0K 1280K IYK3Z7FA MV2C 660 TS EODI DSA peak >=0K 1280K IYK3Z7FA MV2C 660 TS EOD...
Figure 59. Statistics Alerts - List by Collection Time report: example section
122 IBM CICS Performance Analyzer for z/OS: Report Reference

List by ResourceThe Statistics Alerts - List by Resource report processes tabular (multi-record)statistics only. This report does not process label-based (single-record) statistics.
This report contains a section for each resource name in the input statistics datathat triggers an Alert. For example, for Alerts triggered by Programs statistics, theresource name is the value of the Program Name field.
The section headings have the following format:
description = value
where description is the resource field description (such as “Program Name”) andvalue is the field value.
The sections are sorted in alphabetical order of resource field description, thenresource field value.
Within each section, the tabular data is sorted by the following column headings:
Severity, System, Image, VRM, Type, Collection Time
Here is an example section:
If a Condition in the Statistics Alert definition specifies a Resource value, it doesnot necessarily match the Resource value in the report section heading. This isbecause some multi-record statistics have resource identification fields in additionto the field shown in the section heading, and the Resource value in the StatisticsAlert definition might match one of those other fields. The Resource value in thedefinition selects records for testing against the Condition, whereas the Resourcevalue in the report identifies the record that matched the Condition. For example,for Programs statistics, the Resource field value in the Statistics Alert definitionmight match the program name shown in the section heading, or it might matchthe program library name.
System: CCVQ32C Image: FTS1 VRM: 650 Type: TS EOD Collection Time: 2008-10-24 00.00.01
Sev Alert Threshold ActualI Program load-to-use ratio (%) >=25 50
Program Name = DFHEIQCFI Program load-to-use ratio (%) >=25 50
Program Name = DFHEIQDHI Program load-to-use ratio (%) >=25 50
Program Name = DFHEIQDI...
Figure 60. Statistics Alerts - List by Interval report: example section
Resource: Dump Code = AEXZ
Sev Alert Threshold Actual System Image VRM Type Collection TimeW Transaction dumpcode taken >0 3 IYK3ZHD1 MV2C 650 TS EOD 2010-02-14 15.34.20W Transaction dumpcode taken >0 1 IYK3ZOF9 MV2C 640 TS INT 2009-12-16 09.15.00...
Figure 61. Statistics Alerts - List by Resource report: example section
Chapter 5. Statistics reports 123

Column and section heading descriptionsStatistics Alert reports can contain the following column headings and sectionheading labels, depending on the sorting option and report type:
AlertsSummary reports only: the number of instances of this Alert. (Statisticsrecords for a single interval can trigger multiple instances of an Alert.)
Actual The value of the formula (as specified in the Statistics Alert definition),calculated using the statistics in the input data, that triggered this Alert.
Alert The Alert text, as specified in the Statistics Alert definition.
Collection TimeThe collection time of the statistics that triggered this Alert.
Image The MVS image on which the CICS system ran.
IntervalsSummary reports only: the number of statistics collection intervals inwhich this Alert was triggered.
Sev The severity of the threshold for this alert, as specified in the StatisticsAlert definition:C CriticalW WarningI Information
Report sorted by severity show the most severe alerts first: C, then W, thenI.
SystemThe APPLID of the CICS system.
ThresholdThe threshold for this alert corresponding to the severity (shown in theSev column), as specified in the Statistics Alert definition.
Type The type of CICS system, the type of statistics collection interval, or both.
The type of CICS system can be either:TS CICS Transaction ServerTG CICS Transaction Gateway
The type of statistics collection interval can be one of the following:EOD End-of-dayREQ RequestedUSS UnsolicitedINT IntervalRRT Requested reset
For example, TS EOD refers to an end-of-day statistics collection intervalfor a CICS Transaction Server system.
VRM The release of CICS Transaction Gateway or CICS Transaction Server thatproduced the statistics.
Example: List and Summary by APPLIDThe following command produces a Statistics Alerts - List by APPLID reportfollowed by a Summary by APPLID report in the same output data set, STAL0001:
124 IBM CICS Performance Analyzer for z/OS: Report Reference

CICSPA STATSALERT(OUTPUT(STAL0001),EXTERNAL(CPAXW001),STALTDEF(SAMPLE2),BY(APPLID(LIST,SUMMARY)),TYPE(EOD,REQ,RRT,INT,USS))
V3R2M0 CICS Performance AnalyzerStatistics Alerts - List by APPLID
_____________________________________________STAL0001 Printed at 12:03:45 7/15/2010 Data from 02:33:10 1/12/2009 to 09:24:07 1/14/2009 Page 1
System: CCVQ32C Image: FTS1 VRM: 650 Type: TS
Sev Alert Threshold Actual Collection Time TypeW Program load requests that waited >0 2 2009-01-13 00.00.01 EODI DSA limit >=0K 5120K 2009-01-13 00.00.01 EODI DSA allocated >=0K 2304K 2009-01-13 00.00.01 EODI DSA peak >=0K 2304K 2009-01-13 00.00.01 EODI EDSA limit >=0K 614400K 2009-01-13 00.00.01 EODI EDSA allocated >=0K 49152K 2009-01-13 00.00.01 EODI EDSA peak >0K 49152K 2009-01-13 00.00.01 EODI MEMLIMIT size >=0M 0M 2009-01-13 00.00.01 EODI Active address space: current >=0M 0M 2009-01-13 00.00.01 EODI Active address space: peak >=0M 0M 2009-01-13 00.00.01 EODI Active GDSA: current >=0M 0M 2009-01-13 00.00.01 EODI Active GDSA: peak >=0M 0M 2009-01-13 00.00.01 EODI Dispatcher settings: ICV (ms) * 5.000 2009-01-13 00.00.01 EODI Dispatcher settings: ICVR (ms) * 5.000 2009-01-13 00.00.01 EODI Dispatcher settings: ICVTSD (ms) * 5.000 2009-01-13 00.00.01 EODI Dispatcher settings: PRTYAGE (ms) * 32.768 2009-01-13 00.00.01 EODI Dispatcher settings: SUBTSKS * 1 2009-01-13 00.00.01 EODI Dispatcher settings: MROBTCH * 1 2009-01-13 00.00.01 EODI Open TCBs limit * 12 2009-01-13 00.00.01 EOD
TCB Pool = OPENI Open TCBs current * 0 2009-01-13 00.00.01 EOD
TCB Pool = OPEN...I Program load-to-use ratio (%) >=25 100 2009-01-13 00.00.01 EOD
Program Name = CEEEV003...
System: CCVQ32D1 Image: FTS1 VRM: 650 Type: TS
Sev Alert Threshold Actual Collection Time TypeW Program load requests that waited >0 8 2009-01-13 00.00.00 EODW Maximum active transactions in class reached >0 329 2009-01-13 00.00.00 EOD
Tclass Name = DFHTCL02...
Figure 62. Statistics Alerts - List by APPLID report
Chapter 5. Statistics reports 125

V3R2M0 CICS Performance AnalyzerStatistics Alerts - Summary by APPLID
_____________________________________________STAL0001 Printed at 12:03:45 7/15/2010 Data from 02:33:10 1/12/2009 to 09:24:07 1/14/2009 Page 1
System: CCVQ32C Image: FTS1 Type: TS
Sev Alert Intervals AlertsW Program load requests that waited 1 1I Tasks: limit 1 1I Tasks: current 1 1I Tasks: peak 1 1I Tasks: total 1 1I Transaction class: task limit 6 14
Tclass Name = DFHCOMCL 1Tclass Name = DFHEDFTC 1Tclass Name = DFHTCIND 1...
System: CCVQ32D1 Image: FTS1 Type: TS
Sev Alert Intervals AlertsW Maximum active transactions in class reached 1 1
Tclass Name = DFHTCL02 1W Temporary storage: buffer waits on DFHTEMP 1 1W Program load requests that waited 1 1I Tasks: limit 1 1I Tasks: current 1 1I Tasks: peak 1 1I Tasks: total 1 1I Transaction class: task limit 6 14
Tclass Name = DFHCOMCL 1Tclass Name = DFHEDFTC 1Tclass Name = DFHTCIND 1...
Figure 63. Statistics Alerts - Summary by APPLID report
126 IBM CICS Performance Analyzer for z/OS: Report Reference

Chapter 6. Subsystem reports
The Subsystem reports are produced from database subsystem accounting datastored in SMF files. The reports in this category are:v “DB2 report”v “WebSphere MQ report” on page 145v “OMEGAMON reports” on page 164
DB2 reportThe DB2 report processes CICS CMF performance class (SMF 110) records and DB2accounting (SMF 101) records to produce a consolidated and detailed view of DB2usage by your CICS systems. The DB2 report enables you to view CICS and DB2resource usage statistics together in a single report.
The DB2 List report shows detailed information of DB2 activity for eachtransaction. The DB2 Summary reports summarize DB2 activity by transaction:v For CMF records: by APPLID/transaction/programv For DB2 records: by APPLID/transaction/program/SSID/plan
The reports include the following DB2 information:v DB2 Thread Identification, for easy cross-reference to DB2 PMv Class 1 Thread elapsed and CPU timesv Class 2 In-DB2 elapsed and CPU timesv Class 3 Suspend timesv Buffer Manager statisticsv Locking statisticsv SQL DML statistics
A Recap report showing processing statistics is always printed at the end.
Report commandThe DB2 report can be requested from a Report Set in the CICS PA dialog. Selectthe DB2 report in the Subsystem Reports category.
In batch, the DB2 command is used to request the DB2 report.
The command to produce the default report, a short summary showing averagevalues, is:CICSPA DB2
orCICSPA DB2(SHORTSUM)
To produce a long summary giving average and maximum values:CICSPA DB2(LONGSUM)
To produce a detailed listing of all network units-of-work with DB2 activity:CICSPA DB2(LIST)
To tailor the report, you can specify report options as follows:
© Copyright IBM Corp. 2001, 2010 127

CICSPA DB2([OUTPUT(ddname),][EXTERNAL(ddname),][LIST(
CLASS1,CLASS2,CLASS3,BUFFER,LOCKING,DML1,DML2|ALL),][LONGSUMMARY(
CLASS1,CLASS2,CLASS3,BUFFER,LOCKING,DML1,DML2|ALL),][SHORTSUMMARY,][SSID(id1,id2,...),][CMFONLY,][LISTZERO,][MAXLONGSUM|NOMAXLONGSUM,][LINECOUNT(nnn),][TITLE1(’...sub-heading left ...’),][TITLE2(’...sub-heading right...’),][SELECT(PERFORMANCE(INCLUDE|EXCLUDE(field1(values1),...),
...))])
The report processes all CMF transaction performance class records for networkunits-of-work containing multiple performance records as well as those with only asingle performance record.
You can request a report from all available records, or you can specify selectioncriteria to request a report from only the records that meet specific requirements.
Report contentYou can request up to three reports:1. DB2(LIST) requests the DB2 List report (see “List report”).2. DB2(LONG) requests the DB2 Long Summary report (see “Long Summary report”
on page 133).3. DB2(SHORTSUM) requests the DB2 Short Summary report (see “Short Summary
report” on page 137). This is the default.
The Recap report is always produced at the end of DB2 report processing (see“Recap report” on page 139).
In the DB2 report, all numeric fields are formatted to 8 bytes.
The following abbreviations can appear in numeric fields:
N/A Occurs when the field is not applicable. For example, DB2 Connection WaitTime is not applicable when DB2REQCT=0. Also, in the Recap report,various DB2 record and matching statistics are not applicable when no DB2records are selected, hence no record matching takes place.
N/C Occurs when a value cannot be calculated. For example, in the Recapreport, when the ‘% of Total' field cannot be calculated because the total iszero.
N/P Occurs when the data is not present. For example, in the DB2 List or LongSummary reports, when DB2 details are requested that are not present inthe DB2 Accounting records. For example, you requested Class 3 detailswhen only DB2 Accounting Classes 1 and 2 were traced.
List reportThe DB2 List report provides a detailed list of all network units-of-work with DB2activity. This report consolidates CICS CMF performance class records and DB2accounting statistics from a single or multiple CICS systems.
The following command produces a List report like that in Figure 64 on page 129.
128 IBM CICS Performance Analyzer for z/OS: Report Reference

CICSPA DB2(LIST(ALL),LISTZERO)
In the DB2 List report, two types of data are presented:1. The first is a single data line (in column format) for each CMF performance
class record2. The second is a block of data lines (in row format) for each associated DB2
accounting record
Records that are part of the same network unit-of-work are printed sequentially ingroups separated by blank lines. A network unit-of-work will only be presented ifit involved some DB2 activity.
The DB2 List report contains the following information:
CMF performance class based fields: Each CMF-based line of the reportrepresents a CMF data record, not necessarily a task. It is possible for CMF data tobe written at Syncpoint, on a Frequency basis (long running applications), at eachterminal Converse (conversational), or at user-specified Event Monitoring Points(EMPs) using a Deliver request. The Task Number, UOW Sequence, and RecordType fields are provided to clarify what the line of data represents.
By default, only CMF performance class records with DB2 Request Count greaterthan zero (DB2REQCT>0) are included in the report. You can specify LISTZERO toalso include those with DB2REQCT=0.
TranTransaction ID (field: TRAN, owner: DFHTASK, field ID: 001).
UseridUser Identifier of the transaction (owner: DFHCICS, field ID: 089).
ProgramInitial Program Name (field: PGMNAME, owner: DFHPROG, field ID: 071).
V3R2M0 CICS Performance AnalyzerDB2 - List
__________________________________________________DB2R0001 Printed at 12:03:45 7/15/2010 Data from 20:14:56 6/22/2007 to 21:14:31 6/22/2007 Page 1
Tran/ Userid/ Program/ UOW R ..DB2 Wait Time.. DB2 User CPU Response ASSID Authid Planname APPLID Task Seq T Term LUName Connect Thread ReqCnt Time Start Time Stop Time Time B
ILGN 5000853 NWTPXHPS ATPHP20 87302 4 T <B7N ATPWTC1 .000000 .000000 506 .121424 20:14:58.028 20:14:58.731 .703717
IBOA 5000853 NWTPXHPS ATPHP20 87311 3 T <B7N ATPWTC1 .000000 .000000 223 .211792 20:15:00.049 20:15:00.437 .387405
DBCR DB2OPER AGTPPLAN ATPHP20 87311 Thread Identification ID=POOLIBOA0019 NETName=DFHEXCIU.3MSE002A UOWID=C8DE57436768Begin Time: 20:15:00.051632 6/22/07 End Time: 20:15:00.434859 6/22/07Class1: Thread Time Elapsed= .383227 CPU= .188482Class2: In-DB2 Time Elapsed= .337977 CPU= .185725Class3: Suspend Time Total = .109145 I/O= .075235 Lock/Latch= .002409 Other= .031501Buffer Manager Summary GtPgRq= 3506 SyPgUp= 66Locking Summary Suspnd= 0 DeadLk= 0 TmeOut= 0 MxPgLk= 21SQL DML Query/Update Sel= 54 Ins= 7 Upd= 5 Del= 0SQL DML ’Other’ Des= 0 Pre= 0 Ope= 18 Fet= 31 Clo= 18
CSMI 5000853 NWTPPOLL ATPHP20 87312 2 T <B7O ATPWTC1 .000000 .000000 10 .003120 20:15:00.053 20:15:00.078 .025131
DBCR DB2OPER AGTPPLAN ATPHP20 87312 Thread Identification ID=POOLPOLL0020 NETName=DFHEXCIU.3MSE002A UOWID=C8DE57447A46Begin Time: 20:15:00.054013 6/22/07 End Time: 20:15:00.077526 6/22/07Class1: Thread Time Elapsed= .023513 CPU= .001434Class2: In-DB2 Time Elapsed= .021482 CPU= .001291Class3: Suspend Time Total = .019722 I/O= .019630 Lock/Latch= .000092 Other= .000000Buffer Manager Summary GtPgRq= 28 SyPgUp= 0Locking Summary Suspnd= 0 DeadLk= 0 TmeOut= 0 MxPgLk= 0SQL DML Query/Update Sel= 5 Ins= 0 Upd= 0 Del= 0SQL DML ’Other’ Des= 0 Pre= 0 Ope= 1 Fet= 3 Clo= 1
Figure 64. DB2 List report
Chapter 6. Subsystem reports 129

APPLIDAPPLID of the CICS system where the CMF record was created.
TaskTransaction identification number (owner: DFHTASK, field ID: 031).
UOW SeqSyncpoint sequence number from the Network UOWID (field: NETUOWSX,owner: DFHTASK, field ID: 098).
RTPerformance class record type (owner: DFHCICS, field ID: 112). The recordtypes are:C Converse record; Conversational transaction terminal converseD Deliver record; Deliver request at a user EMPF Frequency record; Long running transactionS Syncpoint recordT Termination (detach) record
TermTerminal ID (field: TERM, owner: DFHTERM, field ID: 002).
LUNameLU name (field: LUNAME, owner: DFHTERM, field ID: 111).
DB2 Wait Time: ConnectDB2 Connection Wait time; wait for DB2 subtask to become available (owner:DFHDATA, field ID: 188).
DB2 Wait Time: ThreadDB2 Ready Queue Wait time; wait for DB2 thread to become available (owner:DFHDATA, field ID: 187).
DB2 ReqCntDB2 Request Count (EXEC SQL and IFI) (field: DB2REQCT, owner: DFHDATA,field ID: 180).
User CPU TimeTransaction CPU time (owner: DFHTASK, field ID: 008).
Start TimeStart Time (hh:mm:ss.thm) of the transaction (owner: DFHCICS, field ID: 005).
Stop TimeStop Time (hh:mm:ss.thm) of the transaction (owner: DFHCICS, field ID: 006).
Response TimeTransaction response time, derived from Stop-Start time (owner: DFHCICS,field IDs: 006-005).
A BY in this column indicates that the transaction abended.
DB2 accounting based fields: A block of data lines is presented for each DB2Accounting record associated with the CMF performance record. This data is notpresent if CMFONLY is specified.
SSIDDB2 Subsystem ID (field: QWHSSSID). The values are filtered by the SSIDoperand.
AuthidAuthorization ID (field: QWHCAID).
130 IBM CICS Performance Analyzer for z/OS: Report Reference

PlannamePlan name (field: QWHCPLAN).
APPLIDConnection name (field: QWHCCN, when connecting system typeQWHCATYP is CICS attach QWHCCICS).
TaskTransaction identification number which, when combined with the APPLIDfield, identifies the CICS task to which the DB2 Accounting data relates.
This number is derived by CICS PA:v If CICS PA matches the DB2 Accounting record to a single CICS task, the
CMF task number is printed against the DB2 Accounting record details,otherwise the task number is N/C (cannot be calculated).
v If this field is N/C, then either the DB2 Accounting data could not becorrelated to a task, or it was found to relate to more than one task in theNetwork UOW. This can occur, for example, if thread reuse occurs within aNetwork UOW and ACCOUNTREC(TASK) is being used. CICS PA will notapportion statistics. If this field is N/C, then the DB2 data will not beincluded in the Summary reports.
Thread Identification:This is always present.
Thread IDCorrelation ID value (field: QWHCCV).
CICS NETNameTo correlate to DB2 PM reports.
CICS UOWIDTo correlate to DB2 PM reports.
Begin TimeBegin time (hh:mm:ss.thm mm/dd/yy) of the DB2 accounting period(STCK field: QWACBSC).
End TimeEnd time (hh:mm:ss.thm mm/dd/yy) of the DB2 accounting period(STCK field: QWACESC).
Note: When you run the DB2 report on a system with a different time zonesetting to that of the SMF data, the DB2 time stamps can be out of sync withthe CMF time stamps. Every CMF record includes a time zone conversionfactor. CICS PA uses this to convert the time stamps to reflect the local time ofthe SMF data. DB2 records, however, do not have a time zone conversionfactor. CICS PA uses the reporting system's time zone. To synchronize the CMFand DB2 time stamps, specify the ZONE operand to match the time zone ofthe SMF data. The ZONE specification is used to convert both CMF and DB2time stamps to local time, keeping them in sync.
Any combination of the following DB2 data lines can be requested, or you canspecify ALL to request all of them. If none are specified, the default is CLASS1,CLASS2, BUFFER, LOCKING.
Class1: Thread TimeThis line is present only if CLASS1 is specified.
ElapsedElapsed time covered by the DB2 Accounting record; derived from End
Chapter 6. Subsystem reports 131

Time minus Begin Time. It gives the time from when the DB2 thread isobtained (at the first SQL call) to the time it is terminated or reused byanother sign-on (which might be well after the task completes if it is aprotected thread).
CPU TCB CPU time used by the thread; derived from QWACEJST minusQWACBJST.
Class2: In-DB2 TimeThis is only available when DB2 Class 2 Accounting Trace data is present. Thisline is present only if CLASS2 is specified.
ElapsedAccumulated elapsed time used in DB2 (field: QWACASC).
CPU Accumulated TCB CPU time used in DB2 (field: QWACAJST).
Class3: Suspend TimeThis is only available when DB2 Class 3 Accounting Trace data is present. Thisline is present only if CLASS3 is specified.
Total Total Class 3 suspend time.
I/O Accumulated elapsed I/O wait time (field: QWACAWTI).
Lock/LatchAccumulated lock and latch time (field: QWACAWTL).
Other Total of the other nine Class 3 suspend clocks:1. Log Write I/O (field: QWACAWLG)2. Page Latch contention (field: QWACAWTP)3. Send Message to other DB2 members in the data sharing group
(field: QWACAWTG)4. Global contention for parent L-Locks (field: QWACAWTJ)5. Stored Procedure waiting for available TCB (field: QWACCAST)6. User-defined function waiting for available TCB (field:
QWACUDST)7. Read I/O done under another Thread (field: QWACAWTR)8. Write I/O done under another Thread (field: QWACAWTW)9. Synchronous Execution Unit Switch for DB2 Commit, Abort, or
Deallocation processing (field: QWACAWTE)
Buffer Manager SummaryThese fields will give the total for all buffer pools. This line is present only ifBUFFER is specified.
GtPgRqNumber of Get Page requests issued (field: QBACGET).
SyPgUpNumber of system page (buffer) updates (field: QBACSWS).
Locking SummaryThis line is present only if LOCKING is specified.
SuspndNumber of suspends due to lock conflict (field: QTASLOC).
DeadLkNumber of deadlocks (field: QTXADEA).
TmeOutNumber of timeouts (field: QTXATIM).
132 IBM CICS Performance Analyzer for z/OS: Report Reference

MxPgLkMaximum number of page locks held (field: QTXANPL).
SQL DML Query/UpdateThis line is present only if DML1 is specified.
Sel Number of SELECT statements processed (field: QXSELECT).
Ins Number of INSERT statements processed (field: QXINSRT).
Upd Number of UPDATE statements processed (field: QXUPDTE).
Del Number of DELETE statements processed (field: QXDELET).
SQL DML 'Other'This line is present only if DML2 is specified.
Des Number of DESCRIBE, DESCRIBE CURSOR, DESCRIBE INPUT, andDESCRIBE PROCEDURE statements processed (field: QXDESC).
Pre Number of SQL PREPARE statements processed (field: QXPREP).
Ope Number of OPEN statements processed (field: QXOPEN).
Fet Number of FETCH statements processed (field: QXFETCH).
Clo Number of CLOSE statements processed (field: QXCLOSE).
Long Summary reportThe DB2 Long Summary report provides a summary of DB2 activity by transactionand program within APPLID, giving average and maximum values for each.
The Summary report represents a subset of the total data presented in the DB2 Listreport. It includes DB2 data that can be matched within a network unit-of-work toa single task, or multiple tasks that all used the same transaction and program.There is no data apportioning by CICS PA.
The DB2 report shown in Figure 65 on page 134 was created using the command:CICSPA DB2(LONG(ALL))
Chapter 6. Subsystem reports 133

In the DB2 Long Summary report, two types of data are presented for eachAPPLID:1. The first is a single data line (in column format) for the CMF performance class
data summarized by transaction and program2. The second is a block of data lines (in row format) for the associated DB2
accounting data summarized by SSID and planname
The DB2 Long Summary report provides the following information:
CMF Performance based fields: A data line is presented for the CMFperformance class data summarized by transaction and program.
APPLID(In the report heading.) The APPLID of the CICS system where the CMFrecords were created.
V3R2M0 CICS Performance AnalyzerDB2 - Long Summary
DB2R0001 Printed at 12:03:45 7/15/2010 Data from 15:41:19 7/12/2010 to 16:19:15 7/12/2010 APPLID CICPAOR1 Page 1
Avg Max Avg Max Avg Max Avg Max Avg MaxTran/ Program/ #Tasks/ DB2ConWt DB2ConWt DB2ThdWt DB2ThdWt DB2Rqst DB2Rqst UserCPU UserCPU Response Response #AbendsSSID Planname #Threads Time Time Time Time Count Count Time Time Time Time
CRDE CORD14P 2 .0000 .0000 .0000 .0000 24.0 24 .036896 .052480 .3141 .5208 0
DB2P CPAPLAN 4 Thread Utilization Entry= 0 Pool= 4 Command= 0Class1: Thread Time Avg: Elapsed= .0369 CPU= .020809
Max: Elapsed= .0395 CPU= .024879Class2: In-DB2 Time Avg: Elapsed= .0166 CPU= .015381
Max: Elapsed= .0201 CPU= .019369Class3: Suspend Time Avg: Total = N/P I/O= N/P Lock/Latch= N/P Other= N/P
Max: Total = N/P I/O= N/P Lock/Latch= N/P Other= N/PBuffer Manager Summary Avg: GtPgRq= 3.3 SyPgUp= .0
Max: GtPgRq= 7 SyPgUp= 0Locking Summary Avg: Suspnd= .0 DeadLk= .0 TmeOut= .0 MxPgLk= 1.0
Max: Suspnd= 0 DeadLk= 0 TmeOut= 0 MxPgLk= 1SQL DML Query/Update Avg: Sel= .0 Ins= .0 Upd= .0 Del= .0
Max: Sel= 0 Ins= 0 Upd= 0 Del= 0SQL DML ’Other’ Avg: Des= .0 Pre= .0 Ope= 1.0 Fet= 10.0 Clo= 1.0
Max: Des= 0 Pre= 0 Ope= 1 Fet= 10 Clo= 1
CRD4 CORD04P 3 .0000 .0000 .0000 .0000 3075.3 9178 1.593973 4.693520 8.5758 24.9328 0
DB2P CPAPLAN 4 Thread Utilization Entry= 0 Pool= 4 Command= 0Class1: Thread Time Avg: Elapsed= .0569 CPU= .025045
Max: Elapsed= .0850 CPU= .029168Class2: In-DB2 Time Avg: Elapsed= .0205 CPU= .018777
Max: Elapsed= .0241 CPU= .022986Class3: Suspend Time Avg: Total = N/P I/O= N/P Lock/Latch= N/P Other= N/P
Max: Total = N/P I/O= N/P Lock/Latch= N/P Other= N/PBuffer Manager Summary Avg: GtPgRq= 3.3 SyPgUp= .0
Max: GtPgRq= 7 SyPgUp= 0Locking Summary Avg: Suspnd= .0 DeadLk= .0 TmeOut= .0 MxPgLk= 1.0
Max: Suspnd= 0 DeadLk= 0 TmeOut= 0 MxPgLk= 1SQL DML Query/Update Avg: Sel= .0 Ins= .0 Upd= .0 Del= .0
Max: Sel= 0 Ins= 0 Upd= 0 Del= 0SQL DML ’Other’ Avg: Des= .0 Pre= .0 Ope= 1.0 Fet= 10.0 Clo= 1.0
Max: Des= 0 Pre= 0 Ope= 1 Fet= 10 Clo= 1. . .
*** Total *** 23 .0000 .0000 .0000 .0000 417.3 9178 .227745 4.693520 1.2403 24.9328 0
DB2P 26 Thread Utilization Entry= 0 Pool= 26 Command= 0Class1: Thread Time Avg: Elapsed= .0702 CPU= .025824
Max: Elapsed= .5211 CPU= .055524Class2: In-DB2 Time Avg: Elapsed= .0204 CPU= .018508
Max: Elapsed= .0471 CPU= .040673Class3: Suspend Time Avg: Total = N/P I/O= N/P Lock/Latch= N/P Other= N/P
Max: Total = N/P I/O= N/P Lock/Latch= N/P Other= N/PBuffer Manager Summary Avg: GtPgRq= 2.8 SyPgUp= .0
Max: GtPgRq= 11 SyPgUp= 0Locking Summary Avg: Suspnd= .0 DeadLk= .0 TmeOut= .0 MxPgLk= 1.0
Max: Suspnd= 0 DeadLk= 0 TmeOut= 0 MxPgLk= 1SQL DML Query/Update Avg: Sel= .0 Ins= .0 Upd= .0 Del= .0
Max: Sel= 0 Ins= 0 Upd= 0 Del= 0SQL DML ’Other’ Avg: Des= .0 Pre= .0 Ope= 1.2 Fet= 13.8 Clo= 1.2
Max: Des= 0 Pre= 0 Ope= 2 Fet= 30 Clo= 2
Figure 65. DB2 Long Summary report
134 IBM CICS Performance Analyzer for z/OS: Report Reference

TranTransaction ID (field: TRAN, owner: DFHTASK, field ID: 001).
ProgramInitial Program Name (field: PGMNAME, owner: DFHPROG, field ID: 071).
#TasksThe number of tasks summarized.
Each CMF-based line of the List report represents a CMF data record. For thepurpose of accumulating for the Summary report, a record is considered torepresent a task, that is, for each CMF performance record included in theSummary report, #Tasks increments by 1. Only records with DB2REQCT>0 areincluded.
For each of the following fields (except #Abends), two values are presented:Average
The task average for the field.Maximum
The maximum value of the field over the reporting period.
DB2ConWt TimeDB2 Connection Wait time; wait for DB2 subtask to become available.
DB2ThdWt TimeDB2 Ready Queue Wait time; wait for DB2 thread to become available.
DB2Rqst CountDB2 Request Count (EXEC SQL and IFI).
UserCPU TimeCICS task CPU time (does not include DB2 CPU). This can be added to theClass1: Thread CPU Time to get a reasonable picture of the overall CPUutilization.
Response TimeTask response time.
#AbendsTotal number of abends for the transaction in the reporting period.
DB2 accounting based fields: For each APPLID, a block of data lines is presentedfor the DB2 accounting records associated with the CMF performance records. Thisdata is not present if CMFONLY is specified.
SSIDDB2 Subsystem ID (field: QWHSSSID). The values are filtered by the SSIDoperand.
PlannamePlan name (field: QWHCPLAN). Note that there might be multiple plansassociated with a Tran/Program if Dynamic Plan Selection or Dynamic PlanSwitching is used, or if an application is modified within the reporting period.
#ThreadsThe number of threads summarized where DB2 data has been included for thegiven plan.
This gives the total number of matched DB2 threads used (for thisAPPLID/transaction/program and SSID/plan) in the reporting period. Forsimple transactions with default performance monitoring andACCOUNTREC(TASK), this total would be expected to be equal to the #Tasks.
Chapter 6. Subsystem reports 135

Where a transaction has multiple UOWs however, the total number of threadsused can be greater than the #Tasks, depending on thread reuse.
Thread UtilizationThis data line is always present.
Entry The number of DB2Entry threads used in the reporting period.
Note: Transactions associated with a DB2Entry will generally runagainst a DB2Entry thread. However, it is possible for a transaction tooverflow to a pool thread should the number of active DB2Entrythreads reach the THREADLimit number defined for the DB2Entry.
Pool The number of Pool threads used in the reporting period.
CommandThe number of Command threads used in the reporting period.
Note: Command threads are reserved by the CICS DB2 attachmentfacility for issuing commands to DB2 using the DSNC transaction.When the demand is great, commands overflow to the pool, and use apool thread.
Any combination of the following DB2 data lines can be requested, or you canspecify ALL to request all of them. If none are specified, the default is CLASS1,CLASS2, BUFFER, LOCKING. See the DB2 List report's “DB2 accounting basedfields” on page 130 for an explanation of these DB2 data lines:
Class1: Thread TimeSpecify CLASS1 to request this line.
Class2: In-DB2 TimeSpecify CLASS2 to request this line.
Class3: Suspend TimeSpecify CLASS3 to request this line.
Buffer Manager SummarySpecify BUFFER to request this line.
Locking SummarySpecify LOCKING to request this line.
SQL DML Query/UpdateSpecify DML1 to request this line.
SQL DML 'Other'Specify DML2 to request this line.
For each of the DB2 data lines, two values are presented:
AverageThe thread average for the field.
MaximumThe maximum value of the field encountered for all threads within thereporting period. If NOMAXLONGSUM is specified, the maximum valuesare omitted from the report.
Total statistics are reported for each DB2 SSID and CICS APPLID.
136 IBM CICS Performance Analyzer for z/OS: Report Reference

Example: The following DB2 Long Summary report provides an example of Class3 Suspend time.
Short Summary reportThe DB2 Short Summary report is an abridged version of the Long SummaryReport. It provides a summary of DB2 activity by transaction and program withinAPPLID giving averages for each (no maximums).
The following command produces the default report like that shown in Figure 67.The default report is a Short Summary with both CMF performance records andDB2 Accounting records included. CMF performance records with DB2REQCT=0are not included.CICSPA DB2
orCICSPA DB2(SHORTSUM)
In the DB2 Short Summary report, two lines of data are presented for eachAPPLID:1. The first line is for the CMF performance class data summarized by transaction
and program2. The second line is for the associated DB2 accounting data summarized by SSID
and planname
V3R2M0 CICS Performance AnalyzerDB2 - Long Summary
DB2R0001 Printed at 12:03:45 7/15/2010 Data from 22:27:36 3/10/2010 to 22:27:36 3/10/2010 APPLID HMASW1A1 Page 1
Avg Max Avg Max Avg Max Avg Max Avg MaxTran/ Program/ #Tasks/ DB2ConWt DB2ConWt DB2ThdWt DB2ThdWt DB2Rqst DB2Rqst UserCPU UserCPU Response Response #AbendsSSID Planname #Threads Time Time Time Time Count Count Time Time Time Time
W001 MSHC301 1 .0000 .0000 .0000 .0000 4.0 4 .018432 .018432 .6679 .6679 0
DBH1 PWH0001 1 Thread Utilization Entry= 1 Pool= 0 Command= 0Class1: Thread Time Avg: Elapsed= .5509 CPU= .002450
Max: Elapsed= .5509 CPU= .002450Class2: In-DB2 Time Avg: Elapsed= .0145 CPU= .001930
Max: Elapsed= .0145 CPU= .001930Class3: Suspend Time Avg: Total = .003368 I/O= .003368 Lock/Latch= .000000 Other= .000000
Max: Total = .003368 I/O= .003368 Lock/Latch= .000000 Other= .000000Buffer Manager Summary Avg: GtPgRq= 10.0 SyPgUp= 3.0
Max: GtPgRq= 10 SyPgUp= 3
Figure 66. DB2 Long Summary report showing Class 3 Suspend time
V3R2M0 CICS Performance AnalyzerDB2 - Short Summary
DB2R0001 Printed at 12:03:45 7/15/2010 Data from 15:41:19 7/12/2010 to 16:19:15 7/12/2010 APPLID CICPAOR1 Page 1
Tran/ Program/ #Tasks/ ............Average Elapsed Time............ .....Average CPU Time..... .....Average Count....... #AbendsSSID Planname #Threads Response Thread In-DB2 DB2ConWt DB2ThdWt User Thread In-DB2 DB2Reqs GetPage SysPgUpd
CRD7 CORD07P 2 .4043 .0000 .0000 .031008 3.0 0DB2P CPAPLAN 2 .0631 .0106 .011408 .009811 4.0 .0
CRD9 CORD09P 2 .4091 .0000 .0000 .030680 3.0 0DB2P CPAPLAN 2 .0776 .0104 .011478 .009870 4.0 .0
SALE DFH0SAL2 10 .2271 .0000 .0000 .038147 1.0 0DB2P CPAPLAN 10 .1394 .0033 .003865 .003136 N/P N/P
SAL1 DFH0SAL1 2 1.0268 .0000 .0000 .038656 1.0 0DB2P CPAPLAN 2 .7898 .0033 .003843 .003114 N/P N/P
*** Total *** 16 .3720 .0000 .0000 .036385 1.5 0DB2P 16 .2034 .0051 .005757 .004809 4.0 .0
Figure 67. DB2 Short Summary report
Chapter 6. Subsystem reports 137

The DB2 Short Summary report contains the following information:
CMF Performance based fields:
APPLID(In the report heading.) The APPLID of the CICS system where the CMFrecords were created.
TranTransaction ID (field: TRAN, owner: DFHTASK, field ID: 001).
ProgramInitial Program Name (field: PGMNAME, owner: DFHPROG, field ID: 071).
#TasksThe number of tasks summarized.
Average Elapsed Response TimeAverage task response time.
Average Elapsed DB2ConWt TimeAverage task DB2 Connection Wait time; wait for DB2 subtask to becomeavailable.
Average Elapsed DB2ThdWt TimeAverage task DB2 Ready Queue Wait time; wait for DB2 thread to becomeavailable.
Average CPU Time: UserAverage CICS task CPU time (does not include DB2 CPU).
Average Count: DB2ReqsAverage task DB2 Request Count (EXEC SQL and IFI).
#AbendsTotal number of abends for the transaction in the reporting period.
DB2 accounting based fields:
SSIDDB2 Subsystem ID (field: QWHSSSID).
PlannamePlan name (field: QWHCPLAN). Note that there might be multiple plansassociated with a Tran/Program if Dynamic Plan Selection or Dynamic PlanSwitching is used, or if an application is modified within the reporting period.
#ThreadsThe number of threads summarized where DB2 data has been included for thegiven plan.
This gives the total number of matched DB2 threads used (for thisAPPLID/transaction/program and SSID/plan) in the reporting period. Forsimple transactions with default performance monitoring andACCOUNTREC(TASK), this total would be expected to be equal to the #Tasks.Where a transaction has multiple UOWs however, the total number of threadsused can be greater than the #Tasks, depending on thread reuse.
Average Elapsed Thread TimeAverage elapsed time covered by the DB2 accounting period. included for thegiven plan.
138 IBM CICS Performance Analyzer for z/OS: Report Reference

Average Elapsed In-DB2 TimeAverage In-DB2 elapsed time. This field is only available when Class 2 data ispresent.
Average CPU Time: ThreadAverage CPU time accumulated for the CICS-DB2 thread.
Average CPU Time: In-DB2Average In-DB2 CPU time used, derived from the accumulated TCB time. Thisfield is only available when Class 2 data is present.
Average Count: GetPageAverage task Get Page request count.
Average Count: SysPgUpdAverage task system page (buffer) update count.
Total statistics are reported for each DB2 SSID and CICS APPLID.
Recap reportAn example of the Recap report which is always printed at the end of processingis shown in Figure 68. This report provides statistics on the record processing andmatching.
The statistics reported are:
V3R2M0 CICS Performance AnalyzerDB2 - Recap
DB2R0001 Printed at 12:03:45 7/15/2010 Data from 15:41:19 7/12/2010 to 16:19:15 7/12/2010 Page 1
Records processed by the DB2 report processor:Count % of Total
CMF performance class records: --------- ----------Included . . . . . . . . . . . . . . . . . . . . 120 .6%Excluded:CICS PA record selection . . . . . . . . . . . 20,670 99.4%No DB2 activity . . . . . . . . . . . . . . . . 0 .0%Other . . . . . . . . . . . . . . . . . . . . . 0 .0%
Total . . . . . . . . . . . . . . . . . . . . . . 20,790
DB2 accounting records:Included . . . . . . . . . . . . . . . . . . . . 30 .5%Excluded:CICS PA record selection . . . . . . . . . . . 0 .0%Not CICS Attach . . . . . . . . . . . . . . . . 368 6.6%Accounting Token not set . . . . . . . . . . . 5,196 92.9%Other . . . . . . . . . . . . . . . . . . . . . 0 .0%
Total . . . . . . . . . . . . . . . . . . . . . . 5,594
Network units-of-work with DB2 activity:Count % of Total
Network units-of-work where: --------- ----------DB2 accounting records were resolved . . . . . . 30 100.0%DB2 accounting records were not resolved . . . . 0 .0%DB2 accounting records were not present . . . . . 0 .0%Total . . . . . . . . . . . . . . . . . . . . . . 30
CMF performance class records with DB2 activity:Matched to a DB2 accounting record . . . . . . . 30 100.0%Not matched to any DB2 accounting records . . . . 0 .0%Total . . . . . . . . . . . . . . . . . . . . . . 30
CMF performance class records with no DB2 activity:Total . . . . . . . . . . . . . . . . . . . . . . 0
DB2 accounting records:Eligible for summary reporting . . . . . . . . . 30 100.0%Matched to a single CICS task . . . . . . . . . 30 100.0%Matched to two or more CICS tasks . . . . . . . . 0 .0%Not matched to any CICS tasks . . . . . . . . . . 0 .0%Total . . . . . . . . . . . . . . . . . . . . . . 30
Figure 68. DB2 Recap report
Chapter 6. Subsystem reports 139

Records processed by the DB2 report processor: This section of the reportindicates the effect of basic record selection, and the effect of the LISTZERO andCMFONLY report options in terms of the volume of sort data.
Also, if DB2 connection options ACCOUNTREC(TASK) or ACCOUNTREC(UOW)were not set, this is clearly evident by the number of DB2 accounting records thatare excluded.
If no CMF performance data is selected for the report, only this section of theRecap report is produced.
CMF performance class records:The results of CMF performance class record selection.
IncludedThe number of CMF performance class records from the input file selectedfor report processing, and subsequently passed to Sort.
ExcludedThe number of CMF performance class records from the input fileexcluded from report processing for any of the following reasons:1. They do not satisfy the Record Selection Criteria.2. There was no DB2 activity. Using the report default, not-LISTZERO,
CMF performance class records with DB2REQCT=0 are excluded. Ifonly the Summary reports are requested, not-LISTZERO is assumedsince the Summary reports only report on CMF performance classrecords with DB2REQCT>0.
3. Other reasons, such as missing required fields. See “Required CMFfields” on page 142 for a list of the fields that must be present in theCMF performance record.
TotalThe total number of CMF performance class records passed to the DB2record processor from the input file.
DB2 accounting records:The results of DB2 accounting record selection.
IncludedThe number of DB2 accounting records from the input file selected forreport processing, and subsequently passed to Sort (provided at least oneCMF record was included).
ExcludedThe number of DB2 accounting records from the input file excluded fromreport processing for any of the following reasons:1. They do not satisfy the Record Selection Criteria.2. They are not generated by ‘CICS Attach'.3. The accounting token in the Correlation Header is not set. The
accounting token is only set if ACCOUNTREC(TASK) orACCOUNTREC(UOW) is specified.
4. Other reasons, such as records from unsupported DB2 releases.
TotalThe total number of DB2 accounting records passed to the DB2 recordprocessor from the input file.
140 IBM CICS Performance Analyzer for z/OS: Report Reference

Network units-of-work with DB2 activity: This section of the report providesdetails on the results of CMF-DB2 record matching and therefore indicates thevalue of the Summary reports. This is performed for each network unit-of-workthat has at least one CMF performance class record indicating DB2 activity(DB2REQCT>0).
The various CMF-DB2 matching statistics are marked N/A (not applicable) whenno DB2 records are selected, so no record matching takes place (for example, whenCMFONLY).
Network units-of-work where:The results of CMF-DB2 record matching for network units-of-work with DB2activity.
DB2 accounting records were resolvedThe number of network units-of-work where CMF-DB2 record matchingwas able to fully resolve the relationship between the data records, and atleast one DB2 accounting record was present.
DB2 accounting records were not resolvedThe number of network units-of-work where CMF-DB2 record matchingwas not able to fully resolve the relationship between the data records, andat least one DB2 accounting record was present.
DB2 accounting records were not presentThe number of network units-of-work where no DB2 accounting recordswere present.
TotalThe total number of network units-of-work.
CMF performance class records with DB2 activity:The results of CMF-DB2 record matching for the CMF performance classrecords with DB2 activity that are within network units-of-work with DB2activity.
Matched to a DB2 accounting recordThe number of CMF performance class records with DB2REQCT>0 thatwere able to be matched to a DB2 accounting record.
Not matched to any DB2 accounting recordsThe number of CMF performance class records with DB2REQCT>0 thatwere not able to be matched to any DB2 accounting records, that is, there is‘missing' DB2 accounting data.
TotalThe total number of CMF performance class records with DB2REQCT>0.
Total CMF performance class records with no DB2 activity:The total number of CMF performance class records with DB2REQCT=0.
When LISTZERO is specified (explicitly or implicitly because only Summaryreports are requested), this count is marked N/A (not applicable) because allCMF performance class records with DB2REQCT=0 are excluded.
DB2 accounting records:The results of CMF-DB2 record matching for the DB2 accounting records.
Eligible for summary reportingThe number of DB2 accounting records eligible for summary reporting. To
Chapter 6. Subsystem reports 141

be eligible, a DB2 accounting record must have been matched to either asingle CICS task, or multiple tasks which were all related to the sameAPPLID, transaction, and program.
Matched to a single CICS taskThe number of DB2 accounting records matched to a single CICS task.
Matched to two or more CICS taskThe number of DB2 accounting records matched to more than one CICStask. This can occur in a network unit-of-work that utilizes the DPLfunction.
Not matched to any CICS tasksThe number of DB2 accounting records that were not able to be matched toany CMF performance class records within the network unit-of-work, thatis, there is ‘missing' CMF data.
TotalThe total number of DB2 accounting records.
Required CMF fieldsIf you are using the CICS Monitoring Control Table (MCT) Exclude/Includeparameters to reduce the size of the performance class record, you must ensurethat the data fields required for the DB2 report are not excluded.
The following table lists the fields that must be collected in the performance classrecords so they are eligible for the DB2 report.
Table 6. DB2 report: Required CMF fields
Owner Field ID CICS Informal Name Description
DFHCICS 005 START Store clock start time
DFHCICS 006 STOP Store clock stop time
DFHCICS 089 USERID User ID
DFHCICS 112 RTYPE Record type
DFHDATA 180 DB2REQCT DB2 request count
DFHDATA 187 DB2RDYQW DB2 ready queue waittime
DFHDATA 188 DB2CONWT DB2 connection waittime
DFHPROG 071 PGMNAME Program name
DFHPROG 113 ABCODEO Original abend code
DFHPROG 114 ABCODEC Current abend code
DFHSYNC 060 SPSYNCCT Syncpoint count fortask
DFHTASK 001 TRAN Transaction name
DFHTASK 008 USRCPUT User CPU time
DFHTASK 031 TRANNUM Transaction sequencenumber
DFHTASK 097 NETUOWPX Network UOW - PX
DFHTASK 098 NETUOWSX Network UOWID - SX
DFHTASK 164 TRANFLAG Transaction flags
142 IBM CICS Performance Analyzer for z/OS: Report Reference

Table 6. DB2 report: Required CMF fields (continued)
Owner Field ID CICS Informal Name Description
DFHTERM 002 TERM Terminal ID
DFHTERM 111 LUNAME LU name
How CICS PA builds the DB2 reportCICS PA processes CMF performance data from multiple CICS systems along withassociated DB2 Accounting data, correlating the data by network unit-of-work. Foreach network unit-of-work with DB2 activity, CICS PA attempts to match each DB2Accounting record to a CMF task.
In the DB2 List report, a data line is presented for each CMF performance classrecord (column format), and a block of data lines is presented for each associatedDB2 Accounting record (row format). Records that are part of the same networkunit-of-work are printed sequentially in groups separated by blank lines. Anetwork unit-of-work will only be presented if it involved some DB2 activity, thatis, at least one CMF record is present with DB2 Request Count greater than zero(DB2REQCT>0).
The DB2 List report is presented in the same sequence as the Cross-System Workreport so you can correlate the two reports. Also, the printed information allowsyou to find the corresponding records in the CICS PA Performance List report andthe DB2 PM reports.
Two summary reports (Long Summary and Short Summary) offer a summary ofthe CMF performance and DB2 Accounting data presented in the DB2 List report.The data is collated by APPLID, transaction and program for CMF data, andadditionally by SSID and plan for DB2 data. Generally there is only one DB2 planper APPLID/transaction/program combination, but it is possible for there to bemore than one (via Dynamic Plan Switching), or for multiple plans to be used overtime (via Dynamic Plan Selection, or system modification). Only DB2 Accountingdata that matches a single CMF task is accumulated for the summary reports.There is no attempt to statistically apportion DB2 Accounting data that representsmore than one CMF task.
The DB2 report is produced from the following process:1. Record Selection. CMF performance records that are part of a network
unit-of-work that involves DB2 activity are selected. Associated DB2Accounting records are selected. See “CMF-DB2 record selection” on page 144.
2. Sort. The selected records are sorted using an EXTERNAL sort process. See“Sorting the CMF-DB2 records” on page 144.
3. Group by Network UOW. Records are grouped by network unit-of-workNETNAME and network unit-of-work ID.
4. Match CMF-DB2 Records within Network UOW. For each networkunit-of-work, DB2 Accounting records are matched (where possible) to CMFtasks. See “Matching CMF-DB2 records for a Network UOW” on page 145.
5. Report/Summarize.v If requested, the DB2 List report is produced. For each network unit-of-work,
one line is presented per CMF performance class record followed by the DB2Accounting data for that network unit-of-work.
v If requested, the DB2 Summary reports accumulate statistics for eachAPPLID, transaction, and program combination. Then the DB2 statistics are
Chapter 6. Subsystem reports 143

accumulated for each SSID and plan used by the APPLID/transaction/program. The Summary reports are produced after the List report (ifrequested) is complete.
CMF-DB2 record selectionFor the DB2 report, CMF record selection is the same as for all CMF Performancereports, with an additional criterion:v LISTZERO. List CMF performance class records that do not involve DB2 activity
(DB2REQCT=0) when they are part of a network unit-of-work that involvessome DB2 activity.
DB2 accounting record selection is based on:1. CMFONLY. Suppress DB2 record processing.2. SMFSTART, SMFSTOP. Like the CMF performance records, filter the DB2
Accounting records based on the SMF time stamp.3. SELECT(PERFORMANCE. INCLUDE or EXCLUDE DB2 Accounting records
based on whether the DB2 thread Begin-End times are within the specifiedFROM-TO report intervals. Also you can filter the DB2 Accounting recordsbased on UOWID field values.
4. APPLID. Select by CICS generic APPLID.5. SSID. Select by DB2 Subsystem ID.
Note: DB2 end time can be after CMF stop time if thread protection is in place.Consequently, if you specify SMFSTOP when protected threads are in use, it ispossible that DB2 Accounting records are excluded that relate to CMF records thatare included. In normal circumstances, 5 minutes (the initial DB2 threadPURGECYCLE delay after CICS startup) is expected to be the longest period aninactive DB2 thread is present before it is terminated by a PURGECYCLE. To allowfor this, you should specify the SMFSTOP time at least 5 minutes after the‘required stop time' specified in the FROM/TO report interval in the SELECTstatement.
Sorting the CMF-DB2 recordsThe DB2 report is produced using an external SORT facility. An External Work dataset is required to store the records before they are sorted. This data set is eitherspecified explicitly using EXTERNAL(ddname), or CICS PA assigns one from theExternal Work File pool.
The records are sorted in the following order (the same as that used in theCross-System Work report):1. Network unit-of-work NETNAME2. Network unit-of-work ID3. Syncpoint count concatenated with the task stop time in reverse (descending)
order4. APPLID
Note: The syncpoint count is used to resolve unsynchronized STORE CLOCK(STCK) values between systems. The syncpoint count and stop time, sorted inreverse (descending) order, shows the sequence of tasks within the networkunit-of-work. In some cases (for example, where user event monitor points (EMPs)are used), the syncpoint count does not reflect the sequence of events within anetwork unit-of-work. For these instances, all the task records are printed, but notnecessarily in the order they happened. You can tell that this situation exists if thestop times are not in descending order.
144 IBM CICS Performance Analyzer for z/OS: Report Reference

For more information on correlating the performance class data by networkunit-of-work ID, see “Correlating performance class data” on page 307.
For DB2 records:v Network unit-of-work NETNAME and ID are derived from the Accounting
Token (field: QWHCTOKN).v Syncpoint count and task stop time are not applicable. Thread ID and DB2 Begin
time (in ascending order) are used.v APPLID is the CICS generic APPLID taken from the Connection Name (field:
QWHCACCN).
Considerations for processing efficiency:
1. If LISTZERO is specified, CMF records without DB2 activity are passed to thesort as they might be part of a network unit-of-work that involved DB2 activity.Use of this option can dramatically increase the volume of sort data. This optionis only applicable to the DB2 List report.
2. If CMFONLY is specified, only CMF performance records are processed. Use ofthis option can dramatically reduce the volume of sort data as all DB2Accounting records are excluded.
Matching CMF-DB2 records for a Network UOWFor each network unit-of-work with DB2 activity, CICS PA attempts to match eachDB2 Accounting record to a CMF task.
The CICS-DB2 record relationship is usually one-to-one. However, it is possiblethat one DB2 thread serviced more than one CICS task. Conversely, it is possiblethat a single CICS task was associated with multiple DB2 threads (since threads arereleased at syncpoint). Also, with ACCOUNTREC(TASK), it is possible to get anetwork unit-of-work where the CMF-DB2 records cannot be correlated becausethe information available in the data records is insufficient.
DB2 Accounting data is accumulated for the Summary reports only if:v It matches a single CMF task, orv It matches multiple CMF tasks with the same APPLID/transaction/program, as
the thread statistics are not apportioned in this case.
WebSphere MQ reportThe WebSphere MQ report processes WebSphere MQ SMF accounting (SMF 116)records to produce a detailed view of WebSphere MQ usage by your CICS systems.
The WebSphere MQ List reports display, depending on the WebSphere MQaccounting traces that are active, details about Transactions, WebSphere MQQueues that were referenced, WebSphere MQ global (not Transaction-specific orQueue-specific) statistics and WebSphere Queue-specific commands issued byTransactions. These can be sorted and aggregated by any one of the following:v Transaction IDv Queue namev Transaction ID, then Queue namev Queue name, then Transaction ID
WebSphere MQ accounting tracesWebSphere MQ accounting records are produced when the Accounting Tracecomponent of WebSphere MQ is activated. If the MQ accounting trace is active,
Chapter 6. Subsystem reports 145

CLASS(1) subtype 0 records are always produced, but subtypes 1 and 2 are onlyproduced if CLASS(3) is specified when the trace is activated.
Report commandThe WebSphere MQ report can be requested from a Report Set in the CICS PAdialog. Select the WebSphere MQ report in the Subsystem Reports category.
In batch, the MQ command is used to request the WebSphere MQ report.
The command to produce the default report, a Class 1 Summary report, is:CICSPA MQ
orCICSPA MQ(SUMMARY,CLASS1)
To produce a Class 3 Summary report:CICSPA MQ(SUMMARY,CLASS3)
To produce a Class 1 List report:CICSPA MQ(LIST,CLASS1)
To produce a Class 3 List report:CICSPA MQ(LIST,CLASS3)
To tailor the report, you can specify report options as follows:CICSPA MQ(
[OUTPUT(ddname),][LIST,][SUMMARY,][CLASS1,][CLASS3,][SORT([TRAN,][QUEUE]),][QNAME(name),][SSID(id1,id2,...),][LINECount(nnn),][TITLE1(’...sub-heading left ...’),][TITLE2(’...sub-heading right...’),][SELECT(PERFORMANCE(INCLUDE|EXCLUDE(field1(values1),...),
...))])
Note: MQ accounting records do not have a time zone conversion factor. CICS PAuses the reporting system's time zone to convert the MQ time stamps to local time.However, when you run the WebSphere MQ report on a system with a differenttime zone setting to that of the SMF data, you will need to specify the ZONEoperand to match the time zone of the SMF data.
MQ record selectionThe report processes MQ accounting (SMF 116) records. You can request a reportfrom all available records, or you can specify one or more of the following filteringcommands to select only the records of interest:v Specify QNAME to select records for a particular WebSphere MQ queue name.
You can specify a pattern such as CICSMQ* to include more than one queuename. The queue name is case-sensitive.
v Specify SSID to identify the WebSphere MQ subsystems that you want to reportagainst. A Subsystem ID is up to 4 characters. Masking characters are allowed.
146 IBM CICS Performance Analyzer for z/OS: Report Reference

v Specify SELECT statements to include or exclude records based on time andfield values. The fields that can be specified in Selection Criteria are:
STARTSTOPACTIVETRAN (owner: DFHTASK, field ID: 001)TASKNO (owner: DFHTASK, field ID: 031)
You can also specify the global APPLID operand to filter on CICS APPLID:CICSPA APPLID(applid1,applid2,...)
Report content MQ Class 1You can request one or both of the following reports for WebSphere MQ Class 1data:1. “WebSphere MQ Class 1 List report”2. “WebSphere MQ Class 1 Summary report” on page 148
The Class 1 reports extract information from Subtype 0 MQ accounting records(SMF 116).
The reports consist of 2 sections:1. Task identification.
v SSID – extracted from the Instrumentation Standard Header Data (macroCSQDQWHS)
v APPLID, Tran, Task – extracted from the Instrumentation Correlation Data(macro CSQDQWHC)
2. Summary statistics.v CPU and Call count statistics – extracted from the Message Manager
Accounting Data (macro CSQDQMAC)
WebSphere MQ Class 1 List reportThe WebSphere MQ Class 1 List report provides a detailed list of MQ accountingclass 1 records.
The following command produces a Class 1 List report like that in Figure 69CICSPA MQ(LIST,CLASS1)
The WebSphere MQ Class 1 List report contains information in two sections:1. Task identification2. Summary statistics
Section 1 Task identification:
SSIDSubsystem name (field: QWHSSSID).
V3R2M0 CICS Performance AnalyzerWebsphere MQ Class 1 List
MQ000001 Printed at 12:03:45 7/15/2010 Data from 14:50:34 07/13/2010
SSID APPLID Tran Time Task CPU -------------- GET Counts ------------- ------------- PUTx Counts -------------<=99 <=999 <=9999 >=10000 <=99 <=999 <=9999 >=10000
MQMD CICS53A1 CKCN 14:50:34.88 35 0.000747 0 0 0 0 0 0 0 0MQMD CICS53A1 MQA1 14:51:13.27 41 0.064342 0 0 0 0 60 0 0 0MQMD CICS53A1 CKTI 14:51:24.52 37 0.001541 0 0 0 0 0 0 0 0
Figure 69. WebSphere MQ Class 1 List report
Chapter 6. Subsystem reports 147

APPLIDNetwork identifier (field: QWHCNID).
TranCICS Transaction ID, extracted from the MQ Correlation ID (field: QWHCCV).
TimeSMF record time stamp.
TaskCICS Task number, extracted from the MQ Correlation ID (field: QWHCCV).
Section 2 Summary statistics:
CPUCPU Time used (field: QMACCPUT).
GET Counts
<=99 Number of GET calls for length 0-99 bytes (field: QMACGETA).
<=999 Number of GET calls for length 100-999 bytes (field: QMACGETB).
<=9999Number of GET calls for length 1000-9999 bytes (field: QMACGETC).
>=10000Number of GET calls for length 10000 bytes or more (field:QMACGETD).
PUTx Counts
<=99 Number of PUT and PUT1 calls for length 0-99 bytes (field:QMACPUTA).
<=999 Number of PUT and PUT1 calls for length 100-999 bytes (field:QMACPUTB).
<=9999Number of PUT and PUT1 calls for length 1000-9999 bytes (field:QMACPUTC).
>=10000Number of PUT and PUT1 calls for length 10000 bytes or more (field:QMACPUTD).
WebSphere MQ Class 1 Summary reportThe WebSphere MQ Class 1 Summary report provides a summary of MQaccounting class 1 records.
The following command produces a Class 1 Summary report like that in Figure 70on page 149CICSPA MQ(SUMMARY,CLASS1)
148 IBM CICS Performance Analyzer for z/OS: Report Reference

The WebSphere MQ Class 1 Summary report contains information in two sections:1. Task identification2. Summary statistics
Section 1 Task identification:
SSIDSubsystem Name (field: QWHSSSID).
APPLIDNetwork identifier (field: QWHCNID).
TranCICS Transaction ID, extracted from the MQ Correlation ID (field: QWHCCV).
Section 2 Summary statistics:
CountTotal number of transactions.
Average CPUAverage CPU time per thread (field: QMACCPT/Number of threads).
Average CallsAverage GET/PUT calls (field: QMACGET(A,B,C,D)+QMACPUT(A,B,C,D)/Number of threads).
Average GET Counts
<=99 Average number of GET calls for length 0-99 bytes per thread(QMACGETA/Number of threads).
<=999 Average number of GET calls for length 100-999 bytes per thread(QMACGETB/Number of threads).
<=9999Average number of GET calls for length 1000-9999 bytes per thread(QMACGETC/Number of threads).
>=10000Average number of GET calls for length 10000 or more bytes perthread (QMACGETD/Number of threads).
Average PUTx Counts
<=99 Average number of PUT and PUT1 calls for length 0-99 bytes perthread (QMACPUTA/Number of threads).
<=999 Average number of PUT and PUT1 calls for length 100-999 bytes perthread (QMACPUTB/Number of threads).
<=9999Average number of PUT and PUT1 calls for length 1000-9999 bytes perthread (QMACPUTC/Number of threads).
V3R2M0 CICS Performance AnalyzerWebsphere MQ Class 1 Summary
MQ000003 Printed at 12:03:45 7/15/2010 Data from 14:50:34 07/13/2010 to 14:51:24 07/13/2010 Page 1
----- Average ----- --------- Average GET Counts --------- -------- Average PUTx Counts ---------SSID APPLID TRAN Count CPU Calls <=99 <=999 <=9999 >=10000 <=99 <=999 <=9999 >=10000
MQMD CICS53A1 CKCN 1 0.000747 0.0 0.0 0.0 0.0 0.0 0.0 0.0 0.0 0.0MQMD CICS53A1 CKTI 1 0.001541 0.0 0.0 0.0 0.0 0.0 0.0 0.0 0.0 0.0MQMD CICS53A1 MQA1 1 0.064342 60.0 0.0 0.0 0.0 0.0 60.0 0.0 0.0 0.0
Figure 70. WebSphere MQ Class 1 Summary report
Chapter 6. Subsystem reports 149

>=10000Average number of PUT and PUT1 calls for length 10000 or more bytesper thread (QMACPUTD/Number of threads).
Report content MQ Class 3You can request one or both of the following reports for WebSphere MQ Class 3data:1. “WebSphere MQ Class 3 List report”2. “WebSphere MQ Class 3 Summary report” on page 156
The Class 3 reports extract information from Subtypes 1 and 2 MQ accountingrecords (SMF 116).
The reports consist of 5 sections:1. Task Identification.
v SSID – extracted from the Instrumentation Standard Header Data (macroCSQDQWHS)
v APPLID, Tran, Task – extracted from the Instrumentation Correlation Data(macro CSQDQWHC)
v Userid, Netname, NETUOW, Channel, Channel Connection – extracted fromthe Task Identification Block (macro CSQDWTID)
2. Task related statistics.v Commit, Backout, Journal and Logging, Page Set 00 logging, DB2 Manager,
CF Manager and 'Other' statistics – extracted from the Task related statistics(macro CSQDWTAS)
3. Queue identification.v Queue name, type and other identifiers – extracted from the Identification
section at the start of the Queue Statistics (macro CSQDWQ)4. Queue call statistics.
v OPEN, CLOSE, GET, PUT, PUT1, INQ, SET and OTHER statistics – extractedfrom the Queue Statistics (macro CSQDWQ)
5. Queue Get/Put summary.v Additional summary information about GET and PUT calls – extracted from
the end of the Queue Statistics (macro CSQDWQ)
WebSphere MQ Class 3 List reportThe WebSphere MQ Class 3 List report provides a detailed list of MQ accountingclass 3 records.
The following command produces a Class 3 List report like that in Figure 71 onpage 151CICSPA MQ(LIST,CLASS3)
150 IBM CICS Performance Analyzer for z/OS: Report Reference

The WebSphere MQ Class 3 List report contains information in five sections:1. Task identification2. Task related statistics3. Queue identification4. Queue call statistics5. Queue Get/Put summary
Section 1 Task identification:
SSIDSubsystem Name (field: QWHSSSID).
APPLIDNetwork Identifier for RRS connections (field: WTIDNID).
TranCICS Transaction ID, extracted from the MQ Correlation ID (field: QWHCCV).
TaskCICS Task number, extracted from the MQ Correlation ID (field: QWHCCV).
UserIDUser (or Operator) ID (field: WTIDOPID).
NetNameNetwork name, extracted from the MQ Accounting Token (field: WTIDACCT).
UOWIDNetwork Unit of Work ID, extracted from the MQ Accounting Token (field:WTIDACCT).
ChannelChannel name for MVS mover (field: WTIDCHL).
V3R2M0 CICS Performance AnalyzerWebSphere MQ Class 3 List
MQ000002 Printed at 12:03:45 7/15/2010 Data from 09:54:55 2/20/2010
SSID: MQMD APPLID: CICS53A1 Tran: MQAK Task: 38 UserID: CICSUSER NetName: N/A UOWID: N/AChannel: Channel Connection: Start: 2/20/2010 09:54:51.76
Other Total Calls 1 Avg Elapsed 0.000470 Avg CPU 0.000170#Old Pages 127 #New Pages 2
Queue: CPPX.MQS520.TEST.TEMPQUEUE.070QType: LOCAL IType: NONE GDisp: Q_MGR Date: 2/20/2010 Time: 09:54:51 P/Set No: 0 BufferPool No: 0First Opened: 2/20/2010 09:49:51.09 Last Closed: 2/20/2010 09:54:55.35 CF Structure Name:
Count Elapsed CPU Susp Elp JnlWrt Elp PS Req’s PS Rd Elp Expired Page Skip Msgs Skip_________ _________ _________ _________ __________ _________ _________ _________ _________ _________
CLOSE 1 0.000132 0.000131GET 1 0.000241 0.000236 0.000000 0.000000 0.0 0.000000 0.0 0.0 0.0DES ANY 1
GET Total Bytes 0 #GET w/Data 0 Min Msg Size 10 Max Msg Siz 20
SSID: MQMD APPLID: CICS53A1 Tran: CKTI Task: 34 UserID: CICSUSER NetName: N/A UOWID: N/AChannel: Channel Connection: Start: 2/20/2010 09:52:51.17
Other Total Calls 1 Avg Elapsed 0.000716 Avg CPU 0.000396
Queue: CICSA1.INITQQType: LOCAL IType: NONE GDisp: Q_MGR Date: 2/20/2010 Time: 09:52:51 P/Set No: 0 BufferPool No: 0First Opened: 2/20/2010 09:49:42.03 Last Closed: 2/20/2010 09:59:20.63 CF Structure Name:
Figure 71. WebSphere MQ Class 3 List report
SSID: MQMD APPLID: CICS53A1 Tran: MQAK Task: 38 UserID: CICSUSER NetName: N/A UOWID: N/AChannel: Channel Connection: Start: 2/20/2010 09:54:51.76
Chapter 6. Subsystem reports 151

Channel ConnectionLong connection name for MVS mover (field: WTIDCHLC).
StartMQ thread start time stamp.
Section 2 Task related statistics:
Commit
Count Number of Commit requests (field: WTASCMN).
Avg ElapsedAverage Commit elapsed time (field: WTASCMET/WTASCMN).
Avg CPUAverage Commit CPU time (field: WTASCMCT/WTASCMN).
Backout
Count Number of Backout calls (field: WTASBAN).
Avg ElapsedAverage Backout elapsed time (field: WTASBAET/WTASBAN).
Avg CPUAverage Backout CPU time (field: WTASBACT/WTASBAN).
P/S 0Page Set 00 logging activity
Count Number of logging requests (field: WTASPSN0).
Avg ElapsedAverage logging request elapsed time (WTASPSE0/WTASPSN0).
Latch
Count MaxMaximum number of times a latch wait occurred (field: WTASLWN).
Elapsed MaxAverage maximum latch wait time (field: WTASMLW/WTASLWN).
OtherNon-queue other statistics.
Total CallsTotal number of 'Other' calls (field: WTASOTN).
Av ElapsedAverage elapsed time per 'Other' call (field: WTASOTET/WTASOTN).
Av CPUAverage CPU time per 'Other' call (field: WTASOTCT/WTASOTN).
#Old PagesNumber of old pages retrieved (field: WTASGPO).
#New PagesNumber of new pages retrieved (field: WTASGPN).
Other Total Calls 1 Avg Elapsed 0.000470 Avg CPU 0.000170#Old Pages 127 #New Pages 2
152 IBM CICS Performance Analyzer for z/OS: Report Reference

Jnl/Log
Bytes Total number of bytes written to the Journal (field: WTASJWB).
FORCEsTotal number of times the log was forced (field: WTASJCN).
Avg WAIT ElpAverage elapsed time waiting for the log to be forced (field:WTASJCET/WTASJCN).
Avg SUSPEND ElpAverage suspend time (field: WTASSUSE/WTASJCN).
DB2 Mgr
RequestsTotal number of DB2 calls (field: WTASDBCT).
Avg Jnl/Log Thread ElapsedAverage elapsed time per DB2 call (field: WTASDBET/WTASDBCT).
Avg Jnl/Log Server ElapsedAverage server elapsed time per DB2 call (field: WTASDBES/WTASDBCT).
Jnl/Log Thd Elp (Max)Maximum DB2 thread elapsed time (field: WTASDBMT).
Jnl/Log Svr Elp (Max)Maximum DB2 server elapsed time (field: WTASDBMS).
Section 3 Queue identification:
QueueQueue name as specified in OD of MQOPEN request (field: OBJNAME).
QTypeType of queue (field: QTYPE).
IType Index type of queue (field: INDXTYPE).
GDispQueue-sharing-Group disposition (field: QSGDISP).
Date Date from the SMF record time stamp.
Time Time from the SMF record time stamp.
P/Set NoPage Set number (field: NPS).
Bufferpool NoBuffer pool number (field: NBUFFPOOL).
First OpenedTime queue was first opened (field: OPENTIME).
Last ClosedTime queue was last closed (field: CLOSTIME).
Queue: CPPX.MQS520.TEST.TEMPQUEUE.070QType: LOCAL IType: NONE GDisp: Q_MGR Date: 2/20/2010 Time: 09:54:51 P/Set No: 0 BufferPool No: 0First Opened: 2/20/2010 09:49:51.09 Last Closed: 2/20/2010 09:54:55.35 CF Structure Name:
Chapter 6. Subsystem reports 153

CF Structure NameCoupling Facility structure name (field: CFSTRUCNAME).
Section 4 Queue call statistics:
OPEN
Count Total number of OPEN calls (field: OPENN).
ElapsedAverage elapsed time per OPEN call (field: OPENET/OPENN).
CPU Average CPU time per OPEN call (field: OPENCT/OPENN).
CLOSE
Count Total number of CLOSE calls (field: CLOSEN).
ElapsedAverage elapsed time per CLOSE call (field: CLOSECT/CLOSEN).
CPU Average CPU time per CLOSE call (field: CLOSEET/CLOSEN).
GET
Count Total number of GET calls (field: GETN). This is broken down bythe type of GET call:DES ANY
Destructive GET ANYDES SPE
Destructive GET SPECIFICBRW ANY
BROWSE ANYBRW SPE
BROWSE SPECIFIC
ElapsedAverage elapsed time per GET call (field: GETET/GETN).
CPU Average CPU time per GET call (field: GETCT/GETN).
Susp ElapAverage suspend time per GET call (field: GETSUSET/GETN).
JnlWrt ElpAverage elapsed time waiting for a journal write per GET call(field: GETJWET/GETN).
PS Req'sAverage number of reads from a Page Set per GET call (field:GETPSN/GETN).
PS RD ElpAverage elapsed time waiting for a read from a Page Set per GETcall (field: GETPSET/GETN).
ExpiredAverage number of expired messages (field: GETEXMSG/GETN).
Count Elapsed CPU Susp Elp JnlWrt Elp PS Req’s PS Rd Elp Expired Page Skip Msgs Skip_________ _________ _________ _________ __________ _________ _________ _________ _________ _________
CLOSE 1 0.000132 0.000131GET 1 0.000241 0.000236 0.000000 0.000000 0.0 0.000000 0.0 0.0 0.0DES ANY 1
154 IBM CICS Performance Analyzer for z/OS: Report Reference

Page SkipAverage number of pages skipped processing a GET (field:GETEPAGE/GETN).
Msgs SkipAverage number of messages skipped processing a GET (field:GETSMSG/GETN).
PUT
Count Total number of PUT calls (field: PUTN)
ElapsedAverage elapsed time per PUT call (field: PUTET/PUTN).
CPU Average CPU time per PUT call (field: PUTCT/PUTN).
Susp ElapAverage suspend time per PUT call (field: PUTSUSET/PUTN).
JnlWrt ElpAverage elapsed time waiting for a journal write per PUT call(field: PUTJWET/PUTN).
PS Req'sAverage number of PUT calls from a Page Set per PUT call (field:PUTPSN/PUTN)
PS RD ElpAverage elapsed time waiting for a read from a Page Set per PUTcall (field: PUTPSET/PUTN).
PUT1
Count Total number of PUT1 calls (field: PUT1N).
ElapsedAverage elapsed time per PUT1 call (field: PUT1ET/PUT1N).
CPU Average CPU time per PUT1 call (field: PUT1CT/PUT1N).
Susp ElapAverage suspend time per PUT1 call (field: PUT1SUSET/PUT1N).
JnlWrt ElpAverage elapsed time waiting for a Journal write per PUT1 call(field: PUT1JWET/PUT1N).
PS Req'sAverage number of PUT1 calls from a Page Set per PUT1 call(field: PUT1PSN/PUT1N).
PS RD ElpAverage elapsed time waiting for a read from a Page Set per PUT1call (field: PUT1PSET/PUT1N).
INQ
Count Total number of INQ calls (field: INQN).
ElapsedAverage elapsed time per INQ call (field: INQET/INQN).
CPU Average CPU time per INQ call (field: INQCT/INQN).
SET
Chapter 6. Subsystem reports 155

Count Total number of SET calls (field: SETN).
ElapsedAverage elapsed time per SET call (field: SETET/SETN).
CPU Average CPU time per SET call (field: SETCT/SETN).
Section 5 Queue Get/Put summary:
GET
Total BytesTotal number of data bytes read during MQGET (field:GETBYTES).
#GET w/DataTotal number of successful GET calls (field: VALIDGET).
Min Msg SizeMinimum message size retrieved by GET calls (field: GETMINMS).
Max Msg SizeMaximum message size retrieved by GET calls (field:GETMAXMS).
PUT
Total BytesTotal number of data bytes written during PUT1 (field:PUTBYTES).
#GET w/DataTotal number of successful PUT calls (field: VALIDPUT).
Min Msg SizeMinimum message size retrieved by PUT calls (field: PUTMINMS).
Max Msg SizeMaximum message size retrieved by PUT calls (field:PUTMAXMS).
WebSphere MQ Class 3 Summary reportThe WebSphere MQ Class 3 Summary report provides a summary of MQaccounting class 3 records.
You can request 4 sort options to summarize data in the required sequence: TRAN,QUEUE, TRAN/QUEUE (Queues referenced by a Transaction) and QUEUE/TRAN(Transactions that reference a Queue).
In all cases, the report is divided into two sections:1. A static header section.2. A variable length information section. In the variable section, data lines are
omitted if they have no activity against them (typically, the count value is zero).
The following command produces a Class 3 Summary report (sorted byTransaction ID) like that in Figure 72 on page 157CICSPA MQ(SUMMARY,CLASS3,SORT(TRAN))
GET Total Bytes 0 #GET w/Data 0 Min Msg Size 10 Max Msg Siz 20
156 IBM CICS Performance Analyzer for z/OS: Report Reference

The following command produces a Class 3 Summary report (sorted by Queuename) like that in Figure 73CICSPA MQ(SUMMARY,CLASS3,SORT(QUEUE))
The following command produces a Class 3 Summary report (sorted byTransaction ID, then Queue name) like that in Figure 74CICSPA MQ(SUMMARY,CLASS3,SORT(TRAN,QUEUE))
The following command produces a Class 3 Summary report (sorted by Queuename, then Transaction ID) like that in Figure 75 on page 158
V3R2M0 CICS Performance AnalyzerWebSphere MQ Class 3 Summary (By TRAN)
MQ000004 Printed at 12:03:45 7/15/2010 Data from 14:50:34 07/13/2010 to 14:51:24 07/13/2010
SSID: MQMD APPLID: CICS53A1 Tran: CKTI Threads: 1Other Avg Count 1.0 Avg Elapsed 0.000895 Avg CPU 0.000370
SSID: MQMD APPLID: CICS53A1 Tran: MQA1 Threads: 1Other Avg Count 1.0 Avg Elapsed 0.018721 Avg CPU 0.000258
Avg #Old Pages 120.0 Avg #New Pages 0.0
Figure 72. WebSphere MQ Class 3 Summary report (by TRAN)
V3R2M0 CICS Performance AnalyzerWebSphere MQ Class 3 Summary (By QUEUE)
MQ000005 Printed at 12:03:45 7/15/2010 Data from 14:50:34 07/13/2010 to 14:51:24 07/13/2010
Queue: CPPX.MQS520.TEST.TEMPQUEUE.001QType: LOCAL IType: NONE GDisp: Q_MGR QCount: 1
Count Elapsed CPU Susp Elp JnlWrt Elp PS Req’s PS Rd Elp Expired Page Skip Msgs Skip_________ _________ _________ _________ __________ _________ _________ _________ _________ _________
OPEN 1.0 0.000480 0.000472CLOSE 1.0 0.000122 0.000121PUT 1.0 0.000657 0.000562 0.000000 0.000000 0.0 0.000000 0.0 0.0 0.0
PUT Avg Bytes 10.0 Avg #PUT w/Data 1.0 Min Msg Size 10 Max Msg Size 10
Queue: CPPX.MQS520.TEST.TEMPQUEUE.002QType: LOCAL IType: NONE GDisp: Q_MGR QCount: 1
Count Elapsed CPU Susp Elp JnlWrt Elp PS Req’s PS Rd Elp Expired Page Skip Msgs Skip_________ _________ _________ _________ __________ _________ _________ _________ _________ _________
OPEN 1.0 0.000274 0.000270CLOSE 1.0 0.000053 0.000052PUT 1.0 0.000489 0.000484 0.000000 0.000000 0.0 0.000000 0.0 0.0 0.0
PUT Avg Bytes 10.0 Avg #PUT w/Data 1.0 Min Msg Size 10 Max Msg Size 10
Figure 73. WebSphere MQ Class 3 Summary report (by QUEUE)
V3R2M0 CICS Performance AnalyzerWebSphere MQ Class 3 Summary (By TRAN,QUEUE)
MQ000006 Printed at 12:03:45 7/15/2010 Data from 14:50:34 07/13/2010 to 14:51:24 07/13/2010
SSID: MQMD APPLID: CICS53A1 Tran: CKTI Threads: 1Other Avg Count 1.0 Avg Elapsed 0.000895 Avg CPU 0.000370
SSID: MQMD APPLID: CICS53A1 Tran: MQA1 Threads: 1Other Avg Count 1.0 Avg Elapsed 0.018721 Avg CPU 0.000258
Avg #Old Pages 120.0 Avg #New Pages 0.0
Queue: CPPX.MQS520.TEST.TEMPQUEUE.001QType: LOCAL IType: NONE GDisp: Q_MGR QCount: 1
Count Elapsed CPU Susp Elp JnlWrt Elp PS Req’s PS Rd Elp Expired Page Skip Msgs Skip_________ _________ _________ _________ __________ _________ _________ _________ _________ _________
OPEN 1.0 0.000480 0.000472CLOSE 1.0 0.000122 0.000121PUT 1.0 0.000657 0.000562 0.000000 0.000000 0.0 0.000000 0.0 0.0 0.0
PUT Avg Bytes 10.0 Avg #PUT w/Data 1.0 Min Msg Size 10 Max Msg Size 10
Figure 74. WebSphere MQ Class 3 Summary report (by TRAN,QUEUE)
Chapter 6. Subsystem reports 157

CICSPA MQ(SUMMARY,CLASS3,SORT(QUEUE,TRAN))
The WebSphere MQ Class 3 Summary report contains information in five sections:1. Task identification2. Task related statistics3. Queue identification4. Queue call statistics5. Queue Get/Put summary
Section 1 Task identification:
SSIDSubsystem name (field: QWHSSSID).
APPLIDNetwork identifier (field: QWHCNID).
TranCICS Transaction ID, extracted from the MQ Correlation ID (field: QWHCCV).
ThreadsThread count (field: QWHCCV). The number of MQ accounting records forthis SSID/APPLID/TRAN key.
Section 2 Task related statistics:
Commit
Count Average Commit requests per thread (field: WTASCMN/Number ofthreads).
Avg ElapsedAverage Commit elapsed time per thread (field: WTASCMET/Numberof threads).
V3R2M0 CICS Performance AnalyzerWebSphere MQ Class 3 Summary (By QUEUE,TRAN)
MQ000007 Printed at 12:03:45 7/15/2010 Data from 14:50:34 07/13/2010 to 14:51:24 07/13/2010
Queue: CPPX.MQS520.TEST.TEMPQUEUE.023QType: LOCAL IType: NONE GDisp: Q_MGR QCount: 1
Count Elapsed CPU Susp Elp JnlWrt Elp PS Req’s PS Rd Elp Expired Page Skip Msgs Skip_________ _________ _________ _________ __________ _________ _________ _________ _________ _________
OPEN 1.0 0.000272 0.000267CLOSE 1.0 0.000114 0.000113PUT 1.0 0.000502 0.000495 0.000000 0.000000 0.0 0.000000 0.0 0.0 0.0
PUT Avg Bytes 10.0 Avg #PUT w/Data 1.0 Min Msg Size 10 Max Msg Size 10
SSID: MQMD APPLID: CICS53A1 Tran: MQA1 Threads: 1Other Avg Count 1.0 Avg Elapsed 0.018721 Avg CPU 0.000258
Avg #Old Pages 120.0 Avg #New Pages 0.0
Figure 75. WebSphere MQ Class 3 Summary report (by QUEUE,TRAN)
SSID: MQMD APPLID: CICS53A1 Tran: MQA1 Threads: 1
Other Avg Count 1.0 Avg Elapsed 0.018721 Avg CPU 0.000258Avg #Old Pages 120.0 Avg #New Pages 0.0
158 IBM CICS Performance Analyzer for z/OS: Report Reference

Avg CPUAverage Commit CPU time per thread (field: WTASCMCT/Number ofthreads).
Backout
Count Average Backout calls per thread (field: WTASBAN/Number ofthreads).
Avg ElapsedAverage Backout elapsed time per thread (field: WTASCBAET/Numberof threads).
Avg CPUAverage Backout CPU time per thread (field: WTASCBACT/Numberof threads).
P/S 0Page Set 00 logging activity.
Count Average number of P/S 0 logging requests per thread (field:WTASPSN0/Number of threads).
Avg ElapsedAverage P/S 0 logging elapsed time per thread (field:WTASPSE0/Number of threads).
Latch
Count MaxThe highest latch class for which the longest waiting elapsed timeoccurred.
Elapsed MaxAverage elapsed time processing commit requests per thread (field:WTASCMET/Number of threads).
OtherNon-queue other statistics.
Total CallsAverage number of 'Other' calls per thread (field: WTASOTN/Numberof threads).
Av ElapsedAverage 'Other' calls elapsed time per thread (field:WTASOTET/Number of threads).
Av CPUAverage 'Other' calls CPU time per thread (field: WTASOTCT/Numberof threads).
#Old PagesAverage number of old pages retrieved per thread (field:WTASGPO/Number of threads).
#New PagesAverage number of new pages retrieved per thread (field:WTASGPN/Number of threads).
Jnl/Log
Bytes Average number of bytes written to the Journal per thread (field:WTASJWB/Number of threads).
Chapter 6. Subsystem reports 159

FORCEsAverage number of times the log was forced per thread (field:WTASJCN/Number of threads).
Avg WAIT ElpAverage elapsed time waiting for the log to be forced per thread (field:WTASJWET/Number of threads)
Avg SUSPEND ElpAverage suspend time per thread (field: WTASSUSE/Number ofthreads).
DB2 Mgr
RequestsAverage number of DB2 calls per thread (field: WTASDBCT/Numberof threads).
Avg Jnl/Log Thread ElapsedAverage DB2 calls elapsed time per thread (field: WTASCDBET/Number of threads).
Avg Jnl/Log Server ElapsedAverage DB2 calls server elapsed time per thread (field:WTASCDBES/Number of threads).
Jnl/Log Thd Elp (Max)Maximum DB2 thread elapsed time.
Jnl/Log Svr Elp (Max)Maximum DB2 server elapsed time.
CF Mgr
Avg Count (IXLLSTE)Average number of IXLLSTE calls per thread (field:WTASCSEC/Number of threads).
Avg Redrives (IXLLSTE)Average number of IXLLSTE redrives per thread (field:WTASRSEC/Number of threads).
Avg Count (IXLLSTM)Average number of IXLLSTM calls per thread (field:WTASCMEC/Number of threads).
Avg Redrives (IXLLSTM)Average number of IXLLSTM redrives per thread (field:WTASRMEC/Number of threads).
Section 3 Queue identification:
QueueQueue name as specified in OD of MQOPEN request (field: OBJNAME).
QTypeType of queue (field: QTYPE).
IType Index type of queue (field: INDXTYPE).
Queue: CPPX.MQS520.TEST.TEMPQUEUE.023QType: LOCAL IType: NONE GDisp: Q_MGR QCount: 1
160 IBM CICS Performance Analyzer for z/OS: Report Reference

GDispQueue-sharing-Group disposition (field: QSGDISP).
QCountNumber of MQ accounting records in which a transaction referenced theKey for this Queue.
Section 4 Queue call statistics:
OPEN
Count Average number of OPEN calls per Queue count (field:OPENN/QCount).
ElapsedAverage elapsed time per OPEN call (field: OPENET/OPENN).
CPU Average CPU time per OPEN call (field: OPENCT/OPENN).
CLOSE
Count Average number of CLOSE calls per Queue count (field:CLOSEN/QCount).
ElapsedAverage elapsed time per CLOSE call (field: CLOSEET/CLOSEN).
CPU Average CPU time per CLOSE call (field: CLOSECT/CLOSEN).
GET
Count Average number of GET calls per Queue Count (field:GETN/QCount). This is broken down by the type of GET call:DES ANY
Destructive GET ANYDES SPE
Destructive GET SPECIFICBRW ANY
BROWSE ANYBRW SPE
BROWSE SPECIFIC
ElapsedAverage elapsed time per GET call (field: GETET/GETN).
CPU Average CPU time per GET call (field: GETCT/GETN).
Susp ElapAverage suspend time per GET call (field: GETSUSET/GETN).
JnlWrt ElpAverage elapsed time waiting for a journal write per GET call(field: GETJWET/GETN).
PS Req'sAverage number of reads from a Page Set per GET call (field:GETPSN/GETN).
Count Elapsed CPU Susp Elp JnlWrt Elp PS Req’s PS Rd Elp Expired Page Skip Msgs Skip_________ _________ _________ _________ __________ _________ _________ _________ _________ _________
OPEN 1.0 0.000272 0.000267CLOSE 1.0 0.000114 0.000113PUT 1.0 0.000502 0.000495 0.000000 0.000000 0.0 0.000000 0.0 0.0 0.0
Chapter 6. Subsystem reports 161

PS RD ElpAverage elapsed time waiting for a read from a Page Set per GETcall (field: GETPSET/GETN).
ExpiredAverage number of expired messages (field: GETEXMSG/GETN).
Page SkipAverage number of pages skipped processing a GET (field:GETEPAGE/GETN).
Msgs SkipAverage number of messages skipped processing a GET (field:GETSMSG/GETN).
PUT
Count Average number of PUT calls per Queue count (field:PUTN/QCount).
ElapsedAverage elapsed time per PUT call (field: PUTET/PUTN).
CPU Average CPU time per PUT call (field: PUTCT/PUTN).
Susp ElapAverage suspend time per PUT call (field: PUTSUSET/PUTN).
JnlWrt ElpAverage elapsed time waiting for a journal write per PUT call(field: PUTJWET/PUTN).
PS Req'sAverage number of PUT calls from a Page Set per PUT call (field:PUTPSN/PUTN)
PS RD ElpAverage elapsed time waiting for a read from a Page Set per PUTcall (field: PUTPSET/PUTN).
PUT1
Count Average number of PUT1 calls per Queue count (field:PUT1N/QCount).
ElapsedAverage elapsed time per PUT1 call (field: PUT1ET/PUT1N).
CPU Average CPU time per PUT1 call (field: PUT1CT/PUT1N).
Susp ElapAverage suspend time per PUT1 call (field: PUT1SUSET/PUT1N).
JnlWrt ElpAverage elapsed time waiting for a Journal write per PUT1 call(field: PUT1JWET/PUT1N).
PS Req'sAverage number of PUT1 calls from a Page Set per PUT1 call(field: PUT1PSN/PUT1N).
PS RD ElpAverage elapsed time waiting for a read from a Page Set per PUT1call (field: PUT1PSET/PUT1N).
INQ
162 IBM CICS Performance Analyzer for z/OS: Report Reference

Count Average number of INQ calls per Queue count (field:INQN/QCount).
ElapsedAverage elapsed time per INQ call (field: INQET/INQN).
CPU Average CPU time per INQ call (field: INQCT/INQN).
SET
Count Average number of SET calls per Queue count (field:SETN/QCount).
ElapsedAverage elapsed time per SET call (field: SETET/SETN).
CPU Average CPU time per SET call (field: SETCT/SETN).
Section 5 Queue Get/Put summary:
GET
Total BytesAverage number of data bytes read during MQGET per Queuecount (field: GETBYTES/QCount).
#GET w/DataAverage number of successful GET calls per Queue count (field:VALIDGET/QCount).
Min Msg SizeMinimum message size retrieved by GET calls (field: GETMINMS).
Max Msg SizeMaximum message size retrieved by GET calls (field:GETMAXMS).
PUT
Total BytesAverage number of data bytes written during PUT1 per Queuecount (field: PUTBYTES/QCount).
#GET w/DataAverage number of successful PUT calls per Queue count (field:VALIDPUT/QCount).
Min Msg SizeMinimum message size retrieved by PUT calls (field: PUTMINMS).
Max Msg SizeMaximum message size retrieved by PUT calls (field:PUTMAXMS).
PUT Avg Bytes 10.0 Avg #PUT w/Data 1.0 Min Msg Size 10 Max Msg Size 10
Chapter 6. Subsystem reports 163

OMEGAMON reports
The OMEGAMON reports process OMEGAMON XE for CICS (SMF 112) records toproduce a detailed view of how CICS transactions use the following types ofdatabase management system (DBMS):
AdabasCA-DatacomCA-IDMSSupra
For each type of DBMS, you can request up to three reports:v A List report, showing database usage for each transaction.v A Transaction Summary report, showing database usage summarized by
transaction ID.v A Database Summary report, showing database usage summarized by database.
The information in each report varies depending on the type of DBMS, buttypically includes elapsed times and counts for each of the methods thattransactions use to access a database, such as read, write, add, update, and delete.
Report commandThe OMEGAMON reports can be requested from a Report Set in the CICS PAdialog. Select the OMEGAMON report in the Subsystem Reports category.
In batch, the OMEGAMON command is used to request the OMEGAMON reports.
The command to produce the default reports is:CICSPA OMEGAMON
or, equivalently:CICSPA OMEGAMON(OUTPUT(OMEG0001),DBMS(ADABAS,DATACOM,IDMS,SUPRA),
SUMMARY(TRAN,DATABASE,AVG,MAX),PRINT(TOTALS,DB))
The default reports consist of a Transaction Summary report and a DatabaseSummary report for each of the four types of DBMS.
If there are no input records for a type of DBMS, then no reports are produced forit (not even report headings), even when that type of DBMS is specified by thecommand.
To tailor the report, you can specify report options as follows:CICSPA OMEGAMON[(
[OUTPUT(ddname|OMEG0001),][LINECNT(nnn),][DBMS(ADABAS,DATACOM,IDMS,SUPRA),][LIST,][SUMMARY(TRAN,DATABASE,AVG,MAX,MIN,TOT,DEV,PEAK(percentile)),][PRINT(TOTALS,DB),][TITLE1(’...sub-heading left ...’),][TITLE2(’...sub-heading right...’)][SELECT(PERFORMANCE(INCLUDE|EXCLUDE(field1(values1),...),
...))])]
You can request a report from all available records, or you can specify selectioncriteria to request a report from only the records that meet specific requirements.
164 IBM CICS Performance Analyzer for z/OS: Report Reference

Report contentYou can request up to twelve reports with a single command. For example:v OMEGAMON(DBMS(dbms),LIST) requests up to four List reports, where dbms is any
combination of: ADABAS, DATACOM, IDMS, or SUPRA).v OMEGAMON(DBMS(dbms),SUMMARY(TRAN)) requests up to four Transaction Summary
reports.v OMEGAMON(DBMS(dbms),SUMMARY(DATABASE)) requests up to four Database
Summary reports.v OMEGAMON (with no operands) requests up to eight Summary reports.
List reports appear in the output first, followed by Transaction Summary reports,and then Database Summary reports. The List reports for each type of DBMS donot appear in a fixed order: if the first input record is for Adabas, then the AdabasList report will appear in the output first. The Summary reports appear in theorder: Adabas, CA-Datacom, CA-IDMS, Supra.
The List, Transaction Summary, and Database Summary reports for a particulartype of DBMS all contain the same information, with the same column headings.The difference between the List report and the Summary reports is that the Listreport contains information for each individual transaction, whereas the Summaryreports summarize all transactions that started in the specified reporting period.The difference between the Transaction Summary and Database Summary reportsis the grouping of information: the Transaction Summary report groupsinformation by transaction ID, whereas the Database Summary report groupsinformation by database. Also, the Transaction Summary report might includetotals sections (containing information from totals segments of the input records);these sections do not appear in the Database Summary report.
If you request multiple reports with a single command, then CICS PA writes allthe reports to the same DDname. To separate the reports into different output files(for example, List reports in one file, Summary reports in another), specify separatecommands.
List reportsA List report has the following structure, repeated for each input record:v A header section, containing: transaction start time, transaction code, task
number, CICS APPLID, unit of work (OUW) sequence, OUW ID, and originatingsystem VTAM network name (netname).
v If the PRINT(TOTALS) operand is specified: a totals section, containing fields fromthe input record's totals segment for the selected type of DBMS.
v If the PRINT(DB) operand is specified: one database section per database(belonging to the selected type of DBMS) accessed by the transaction. Thissection contains fields from the detail segments of the input record.
CA-IDMS only: For consistency with CA-IDMS terminology, the databasesections in the CA-IDMS reports are labelled under the column heading “FileName” rather than “Database”.
The content of the totals and database sections depends on the type of DBMS. Fordetails, see “Report content for each type of DBMS” on page 167.
Chapter 6. Subsystem reports 165

Summary reportsA Transaction Summary report has the following structure, repeated for eachtransaction ID:v If the PRINT(TOTALS) operand is specified: a totals section, containing
summarized information from the totals segments of the input records for thattransaction ID, for the selected type of DBMS.
v If the PRINT(DB) operand is specified: one database section per database (for theselected type of DBMS) accessed by the transaction. This section containssummarized information from the detail segments of the input records.
v If the PRINT(DB) operand is specified: a subtotal section (identified by the marker“*Total*” under the Database column), summarizing the information for thattransaction ID across all databases (for the selected type of DBMS).
A Database Summary report has the following structure, repeated for eachdatabase (for the selected type of DBMS):v One transaction section for each transaction ID that has accessed that database.
This section contains summarized information from the detail segments of theinput records.
v A subtotal section (identified by the marker “*Tot” under the Tran column),summarizing the information for that database across all transaction IDs.
The content of the totals, database, and subtotal sections depends on the type ofDBMS. For details, see “Report content for each type of DBMS” on page 167.
V3R2M0 CICS Performance AnalyzerOMEGAMON - Adabas List
__________________________________________________OMEG0001 Printed at 15:11:10 12/04/2006 Page 1
Start Time Tran Task No APPLID UOW Seq UOWID Netname------------ ---- -------- -------- ------- ------------ --------------------20.41.14.963 ADA5 54 CICSXX64 1 6D0ADE5C4E91 USCACO01.CICSXX64
Totals Opn User Proc ISN Search File Opr CHKPT/RS Misc Req End Tran Cls User------ -------- -------- -------- -------- -------- -------- -------- --------
Elapse 4271.571 4277.600 4855.497 4295.033 4295.295 4294.443 4295.950 4106.945Count 1 1 1 1 1 1 1 1
Database Proc ISN Search Read Rec Read Fld Read Des Hold Add Update Delete Release----------- -------- -------- -------- -------- -------- -------- -------- -------- -------- --------00054-00084 Elapse 4277.600 4855.497 .0000 .0000 .0000 .0000 .0000 4295.033 .0000 .0000
Count 1 1 0 0 0 0 0 1 0 0
Figure 76. OMEGAMON Adabas List report
166 IBM CICS Performance Analyzer for z/OS: Report Reference

Report content for each type of DBMSThe structure of the OMEGAMON reports are similar regardless of which DBMSthe report is for; however, the detailed contents depend on the DBMS. Thefollowing topics describe the report content for each type of DBMS. Each of thesetopics contains two tables:v The first table describes the contents of the totals sections in a report, based on
information from the totals segments in the input records.v The second table describes the contents of the database sections in a report,
based on information from the detail segments in the input records.
Adabas report content: The following tables describe the content ofOMEGAMON reports for Adabas.
Table 7. OMEGAMON report contents for Adabas: totals section
Column heading Row heading OMEGAMON field Description
Opn User Elapse ADABAS_T_CLOCK1 Elapsed time of the Open User (Adabas OP)requests run by this task.
Count ADABAS_T_COUNT1 Total Open User requests run by this task.
Proc ISN Elapse ADABAS_T_CLOCK2 Elapsed time of the Process ISN requests(Adabas S8 and S9) run by this task.
Count ADABAS_T_COUNT2 Total Process ISN requests run by this task.
Search Elapse ADABAS_T_CLOCK3 Elapsed time of the Search (Adabas S1, S2, S3,S4, and S5) requests run by this task.
Count ADABAS_T_COUNT3 Total Search requests run by this task.
V3R2M0 CICS Performance AnalyzerOMEGAMON - CA-DATACOM Transaction Summary
__________________________________________________OMEG0001 Printed at 12:03:45 7/15/2010 Data from 20:41:14 18/09/2006 to 23:01:08 18/09/2006 Page 1
Tran #Tasks Totals Add Backout Count Delete Get Next Get Set Loc Gen Loc Spec---- -------- ------ -------- -------- -------- -------- -------- -------- -------- --------DCO1 1022 Elapse Avg 8.0748 .3218 .2696 .2683 .2879 1.3106 .1756 .1304
Max 219.9388 31.9160 15.7942 10.2236 6.1604 64.1597 27.1319 56.1644Count Avg 1 1 1 1 1 1 1 1
Max 1 1 1 1 1 1 1 1
Log Oper Read Release Select Sel Set Sys/Othr Update-------- -------- -------- -------- -------- -------- --------
Elapse Avg .1059 .0851 .1009 .2673 .1338 .0733 .0934Max 18.5467 19.4642 7.1434 70.1891 34.6685 2.9491 3.8011
Count Avg 1 1 1 1 1 1 1Max 1 1 1 1 1 1 1
#Tasks Database Add Count Delete Get Next Get Set Loc Spec Read Release Select Sel Set Update-------- -------- -------- -------- -------- -------- -------- -------- -------- -------- -------- -------- --------
1 TBL998 Elapse Avg .0655 .0000 .0000 .0000 .0000 .0000 .0000 .0000 .3277 .0000 .0000Max .0655 .0000 .0000 .0000 .0000 .0000 .0000 .0000 .3277 .0000 .0000
Count Avg 1 1 1 1 1 1 1 1 1 1 1Max 1 1 1 1 1 1 1 1 1 1 1
...(other databases for this transaction)...
#Tasks Database Add Count Delete Get Next Get Set Loc Spec Read Release Select Sel Set Update-------- -------- -------- -------- -------- -------- -------- -------- -------- -------- -------- -------- --------
1022 *Total* Elapse Avg 8.0748 .2696 .2683 .2879 1.3106 .1304 .0851 .1009 .2673 .1338 .0934Max 219.9388 15.7942 10.2236 6.1604 64.1597 56.1644 19.4642 7.1434 70.1891 34.6685 3.8011
Count Avg 1 1 1 1 1 1 1 1 1 1 1Max 1 1 1 1 1 1 1 1 1 1 1...
(other transactions for this DBMS)
Figure 77. OMEGAMON CA-Datacom Transaction Summary report
Chapter 6. Subsystem reports 167

Table 7. OMEGAMON report contents for Adabas: totals section (continued)
Column heading Row heading OMEGAMON field Description
File Opr Elapse ADABAS_T_CLOCK4 Elapsed time of the File Operation requests runby this task. Individual File Operation requestsare recorded in the detail portion of the SMFtype 112 record.
Count ADABAS_T_COUNT4 Total File Operation requests run by this task.
CHKPT/RS Elapse ADABAS_T_CLOCK5 Elapsed time of the Checkpoint/Restart(Adabas C1, C2, and C3) requests run by thistask.
Count ADABAS_T_COUNT5 Total Checkpoint/Restart requests run by thistask.
Misc Req Elapse ADABAS_T_CLOCK6 Elapsed time of Miscellaneous (Adabas BT, C5,RC, and RE) requests run by this task.
Count ADABAS_T_COUNT6 Total Miscellaneous requests run by this task.
End Tran Elapse ADABAS_T_CLOCK7 Elapsed time of the End Transaction (AdabasET) requests run by this task.
Count ADABAS_T_COUNT7 Total End Transaction requests run by this task.
Cls User Elapse ADABAS_T_CLOCK8 Elapsed time of the Close User (Adabas CL)requests run by this task.
Count ADABAS_T_COUNT8 Total Close User requests run by this task.
Table 8. OMEGAMON report contents for Adabas: database section
Column heading Row heading OMEGAMON field Description
Proc ISN Elapse ADABAS_F_CLOCK1 Elapsed time of the Process ISN (Adabas S8)requests run by this task.
Count ADABAS_F_COUNT1 Total Process ISN requests run by this task.
Search Elapse ADABAS_F_CLOCK2 Elapsed time of the Search (Adabas S1, S2, S3,S4, and S5) requests run by this task.
Count ADABAS_F_COUNT2 Total Search requests run by this task.
Read Rec Elapse ADABAS_F_CLOCK3 Elapsed time of the Read Record (Adabas L1,L2, L3, L4, L5, and L6) requests run by thistask.
Count ADABAS_F_COUNT3 Total Read Record requests run by this task.
Read Fld Elapse ADABAS_F_CLOCK4 Elapsed time of the Read Field (Adabas LF)requests run by this task.
Count ADABAS_F_COUNT4 Total Read Field requests run by this task.
Read Des Elapse ADABAS_F_CLOCK5 Elapsed time of the Read Descriptor (AdabasL9) requests run by this task.
Count ADABAS_F_COUNT5 Total Read Descriptor requests run by this task.
Hold Elapse ADABAS_F_CLOCK6 Elapsed time of Hold (Adabas HI) requests runby this task.
Count ADABAS_F_COUNT6 Total Hold requests run by this task.
Add Elapse ADABAS_F_CLOCK7 Elapsed time of the Add (Adabas N1 and N2)requests run by this task.
Count ADABAS_F_COUNT7 Total Add requests run by this task.
168 IBM CICS Performance Analyzer for z/OS: Report Reference

Table 8. OMEGAMON report contents for Adabas: database section (continued)
Column heading Row heading OMEGAMON field Description
Update Elapse ADABAS_F_CLOCK8 Elapsed time of the Update (Adabas A1 andA4) requests run by this task.
Count ADABAS_F_COUNT8 Total Update requests run by this task.
Delete Elapse ADABAS_F_CLOCK9 Elapsed time of the Delete (Adabas E1 and E4)requests run by this task.
Count ADABAS_F_COUNT9 Total Delete requests run by this task.
Release Elapse ADABAS_F_CLOCK10 Elapsed time of the Release (Adabas RI)requests run by this task.
Count ADABAS_F_COUNT10 Total Release requests run by this task.
The following table summarizes how CICS PA maps the data for each Adabascommand to the column headings in the report.
Table 9. Mapping of Adabas commands to OMEGAMON report column headings
Adabas commands Database section Totals section
A1, A4 Update File Opr
BT Misc Req Misc Req
CL Cls User Cls User
C1 - C3 CHKPT/RS CHKPT/RS
C5 Misc Req Misc Req
ET Misc Req Misc Req
E1, E4 Delete File Opr
HI Hold File Opr
LF Read Fld File Opr
L1 - L6 Read Rec File Opr
L9 Read Des File Opr
N1, N2 Add File Opr
OP Opn User Opn User
RC Misc Req Misc Req
RE Misc Req Misc Req
RI Release File Opr
S1 - S5 Search Search
S8, S9 Proc ISN Proc ISN
CA-Datacom report content: The following tables describe the content ofOMEGAMON reports for CA-Datacom.
Table 10. OMEGAMON report contents for CA-Datacom: totals section
Columnheading
Rowheading
OMEGAMON field Description
Add Elapse DATACOM_T_CLOCK1 Elapsed time of the Add (CA-Datacom ADDIT) requestsrun by this task.
Count DATACOM_T_COUNT1 Total Add requests run by this task.
Chapter 6. Subsystem reports 169

Table 10. OMEGAMON report contents for CA-Datacom: totals section (continued)
Columnheading
Rowheading
OMEGAMON field Description
Backout Elapse DATACOM_T_CLOCK2 Elapsed time of the Backout requests run by this task.
Count DATACOM_T_COUNT2 Total Backout requests run by this task.
Count Elapse DATACOM_T_CLOCK3 Elapsed time of the Count requests run by this task.
Count DATACOM_T_COUNT3 Total Count requests run by this task.
Delete Elapse DATACOM_T_CLOCK4 Elapsed time of the Delete (CA-Datacom DELET) requestsrun by this task.
Count DATACOM_T_COUNT4 Total Delete requests run by this task.
Get Next Elapse DATACOM_T_CLOCK5 Elapsed time of the Get Next (CA-Datacom GETIT andGETPS) requests run by this task.
Count DATACOM_T_COUNT5 Total Get Next requests run by this task.
Get Set Elapse DATACOM_T_CLOCK6 Elapsed time of Get Set (CA-Datacom GSETL and GSETP)requests run by this task.
Count DATACOM_T_COUNT6 Total Get Set requests run by this task.
Loc Gen Elapse DATACOM_T_CLOCK7 Elapsed time of the Locate Generic requests run by thistask. Locate Generic and Locate Specific requests consist ofCA-Datacom requests LOCBR, LOCKG, LOCKI, LOCKL,LOCKR, LOCKX, LOCKY, LOCNE, LOCNK, LOCNR, andLOCNX.
Count DATACOM_T_COUNT7 Total Locate Generic requests run by this task.
Loc Spec Elapse DATACOM_T_CLOCK8 Elapsed time of the Locate Specific requests run by thistask.
Count DATACOM_T_COUNT8 Total Locate Specific requests run by this task.
Log Oper Elapse DATACOM_T_CLOCK9 Elapsed time of the Log Operation requests run by thistask.
Count DATACOM_T_COUNT9 Total Log Operation requests run by this task.
Read Elapse DATACOM_T_CLOCK10 Elapsed time of the Read requests run by this task. Readrequests consist of CA-Datacom requests REDBR, RDUBR,REDID, RDUID, REDKG, RDUKG, REDKL, RDUKL,REDKR, RDUKR, REDKX, RDUKX, REDKY, RDUKY,REDLE, RDULE, REDNE, RDUNE, REDNK, RDUNK,REDNR, RDUN, REDNX, and RDUNX.
Count DATACOM_T_COUNT10 Total Read requests run by this task.
Release Elapse DATACOM_T_CLOCK11 Elapsed time of the Release requests run by this task.
Count DATACOM_T_COUNT11 Total Release requests run by this task.
Select Elapse DATACOM_T_CLOCK12 Elapsed time of the Select requests run by this task. Selectrequests consist of CA-Datacom requests SELNR, SELSM,SELCN, SELFR, and SELST.
Count DATACOM_T_COUNT12 Total Select requests run by this task.
Sel Set Elapse DATACOM_T_CLOCK13 Elapsed time of the Select Set requests run by this task.
Count DATACOM_T_COUNT13 Total Select Set requests run by this task.
170 IBM CICS Performance Analyzer for z/OS: Report Reference

Table 10. OMEGAMON report contents for CA-Datacom: totals section (continued)
Columnheading
Rowheading
OMEGAMON field Description
Sys/Other Elapse DATACOM_T_CLOCK14 Elapsed time of the System/Other requests run by thistask. System/Other requests consist of CA-Datacomrequests LOGTB, CNTKR, CNTKY, CNTTB, LOGCP,LOGCR, LOGDR, LOGDW, LOGIT, LOGLB, RELES,RELFL, SELPR, ABEND, CLOSE, INQIN, NOOPS, OPEN,and TEST.
Count DATACOM_T_COUNT14 Total System/Other requests run by this task.
Update Elapse DATACOM_T_CLOCK15 Elapsed time of the Update (CA-Datacom UPDAT) requestsrun by this task.
Count DATACOM_T_COUNT15 Total Update requests run by this task.
Table 11. OMEGAMON report contents for CA-Datacom: database section
Columnheading
Rowheading
OMEGAMON field Description
Add Elapse DATACOM_F_CLOCK1 Elapsed time of the Add (CA-Datacom ADDIT) requestsrun by this task.
Count DATACOM_F_COUNT1 Total Add requests run by this task.
Count Elapse DATACOM_F_CLOCK3 Elapsed time of the Count (CA-Datacom CNTKR, CNTKY,and CNTTB) requests run by this task.
Count DATACOM_F_COUNT3 Total Count requests run by this task.
Delete Elapse DATACOM_F_CLOCK4 Elapsed time of the Delete (CA-Datacom DELET) requestsrun by this task.
Count DATACOM_F_COUNT4 Total Delete requests run by this task.
Get Next Elapse DATACOM_F_CLOCK5 Elapsed time of the Get Next (CA-Datacom GETIT andGETPS) requests run by this task.
Count DATACOM_F_COUNT5 Total Get Next requests run by this task.
Get Set Elapse DATACOM_F_CLOCK6 Elapsed time of Get Set (CA-Datacom GSETL and GSETP)requests run by this task.
Count DATACOM_F_COUNT6 Total Get Set requests run by this task.
Loc Spec Elapse DATACOM_F_CLOCK8 Elapsed time of the Locate Specific requests run by thistask. Locate Specific requests consist of CA-Datacomrequests LOCBR, LOCKG, LOCKI, LOCKL, LOCKR,LOCKX, LOCKY, LOCNE, LOCNK, LOCNR, and LOCNX.
Count DATACOM_F_COUNT8 Total Locate Specific requests run by this task.
Read Elapse DATACOM_F_CLOCK10 Elapsed time of the Read requests run by this task. Readrequests consist of CA-Datacom FREEX, CNTRL, COMIT,ENDLG, ENDTO, MARKL, QMARK, QUIET, RESET, andRSTAT requests.
Count DATACOM_F_COUNT10 Total Read requests run by this task.
Release Elapse DATACOM_F_CLOCK11 Elapsed time of the Release requests run by this task.Release requests consist of CA-Datacom requests GETIT,GETPS, GSETL, GSETP, REDBR, RDUBR, REDID, RDUID,REDKG, RDUKG, REDKL, RDUKL, REDKR, RDUKR,REDKX, RDUKX, REDKY, RDUKY, REDLE, RDULE,REDNE, RDUNE, REDNK, RDUNK, REDNR, RDUN,REDNX, and RDUNX.
Count DATACOM_F_COUNT11 Total Release requests run by this task.
Chapter 6. Subsystem reports 171

Table 11. OMEGAMON report contents for CA-Datacom: database section (continued)
Columnheading
Rowheading
OMEGAMON field Description
Select Elapse DATACOM_F_CLOCK12 Elapsed time of the Select (CA-Datacom SELNR andSELSM) requests run by this task.
Count DATACOM_F_COUNT12 Total Select requests run by this task.
Sel Set Elapse DATACOM_F_CLOCK13 Elapsed time of the Select Set (CA-Datacom SELCN, SELFR,and SELST) requests run by this task.
Count DATACOM_F_COUNT13 Total Select Set requests run by this task.
Update Elapse DATACOM_F_CLOCK15 Elapsed time of the Update (CA-Datacom UPDAT) requestsrun by this task.
Count DATACOM_F_COUNT15 Total Update requests run by this task.
CA-IDMS report content: The following tables describe the content ofOMEGAMON reports for CA-IDMS.
Table 12. OMEGAMON report contents for CA-IDMS: totals section
Columnheading
Row heading OMEGAMONfield
Description
Bind RU Elapse IDMS_T_CLOCK1 Elapsed time of the Bind RU (request unit) requests run bythis task. Bind RU requests consist of CA-IDMS 2, 48, and 59requests.
Count IDMS_T_COUNT1 Total Bind RU requests run by this task.
Rec Opr Elapse IDMS_T_CLOCK2 Elapsed time of the Record Operation requests run by thistask. Record Operation requests consist of CA-IDMS requests3, 4, 6, 7, 10-13, 18, 19, 22, 23, 32-35, 42-46, 50-53, 75-77, 89,and 90.
Count IDMS_T_COUNT2 Total Record Operation requests run by this task.
Area Opr Elapse IDMS_T_CLOCK3 Elapsed time of the Area Operation requests run by this task.Area Operation requests consist of CA-IDMS requests 9, 15,17, 21, 25, 36-41, 79, 93, and 94.
Count IDMS_T_COUNT3 Total Area Operation requests run by this task.
Set Opr Elapse IDMS_T_CLOCK4 Elapsed time of the Set Operation requests run by this task.Set Operation requests consist of CA-IDMS requests 8, 14, 16,20, 24, 31, 60, 62, 64, 65, 78, 80-86, 91 and 92.
Count IDMS_T_COUNT4 Total Set Operation requests run by this task.
Com/Rlbk Elapse IDMS_T_CLOCK5 Elapsed time of the Commit/Rollback requests run by thistask. Commit/Rollback requests consist of CA-IDMS requests66, 67, 95, and 96.
Count IDMS_T_COUNT5 Total Commit/Rollback requests run by this task.
Acc Stat Elapse IDMS_T_CLOCK6 Elapsed time of Accept Statistics requests run by this task.
Count IDMS_T_COUNT6 Total Accept Statistics requests run by this task.
AcCurKey Elapse IDMS_T_CLOCK7 Elapsed time of the Accept Key / Current Key (CA-IDMS54-57, 76-72, 87, and 88) requests run by this task.
Count IDMS_T_COUNT7 Total Accept Key / Current Key requests run by this task.
LRF Elapse IDMS_T_CLOCK8 Elapsed time of the Logical Record Facility) LRF requests runby this task.
Count IDMS_T_COUNT8 Total LRF requests run by this task.
172 IBM CICS Performance Analyzer for z/OS: Report Reference

Table 12. OMEGAMON report contents for CA-IDMS: totals section (continued)
Columnheading
Row heading OMEGAMONfield
Description
ProcLogic Elapse IDMS_T_CLOCK9 Elapsed time of the Proc / Logic requests run by this task.
Count IDMS_T_COUNT9 Total Proc / Logic requests run by this task.
FinishRU Elapse IDMS_T_CLOCK10 Elapsed time of the Finish RU (CA-IDMS 2, 48, and 59)requests run by this task.
Count IDMS_T_COUNT10 Total Finish RU requests run by this task.
Table 13. OMEGAMON report contents for CA-IDMS: database section (Record operations)
Columnheading
Row heading OMEGAMONfield
Description
Bind Rec Elapse IDMS_F_CLOCK1 Elapsed time of the Bind Record (CA-IDMS 48,6-25, 30-34, 43,50, 51, and 75-79) requests run by this task.
Count IDMS_F_COUNT1 Total Bind Record requests run by this task.
Gt/Fn/Ob Elapse IDMS_F_CLOCK2 Elapsed time of the Get/Find/Obtain requests run by thistask. Get/Find/Obtain requests consist of CA-IDMS requests6-25, 30-34, 43, 50, 51, 75-79, 54-57, 68-70, 72, and 80-86.
Count IDMS_F_COUNT2 Total Get/Find/Obtain requests run by this task.
Acc/Retn Elapse IDMS_F_CLOCK3 Elapsed time of the Accept/Return requests run by this task.Accept/Return requests consist of CA-IDMS requests 54-57,68-70, 72, 80-86, and 87-94.
Count IDMS_F_COUNT3 Total Accept/Return requests run by this task.
Keep Elapse IDMS_F_CLOCK4 Elapsed time of the Keep requests run by this task. Keepconsist of CA-IDMS requests 36-41, 60-65, and 87-94.
Count IDMS_F_COUNT4 Total Keep requests run by this task.
Stor Rec Elapse IDMS_F_CLOCK5 Elapsed time of the Store Records (CA-IDMS 42) requests runby this task.
Count IDMS_F_COUNT5 Total Store Records requests run by this task.
Modify Elapse IDMS_F_CLOCK6 Elapsed time of Modify (CA-IDMS 35) requests run by thistask.
Count IDMS_F_COUNT6 Total Modify requests run by this task.
Erase Perm Elapse IDMS_F_CLOCK7 Elapsed time of the Erase Perm (CA-IDMS 3) requests run bythis task.
Count IDMS_F_COUNT7 Total Erase Perm requests run by this task.
Eras Sel Elapse IDMS_F_CLOCK8 Elapsed time of the Erase Select (CA-IDMS 53) requests runby this task.
Count IDMS_F_COUNT8 Total Erase Select requests run by this task.
Eras All Elapse IDMS_F_CLOCK9 Elapsed time of the Erase All (CA-IDMS 4) requests run bythis task.
Count IDMS_F_COUNT9 Total Erase All requests run by this task.
Eras Unq Elapse IDMS_F_CLOCK10 Elapsed time of the Erase Unqualified (CA-IDMS 52) requestsrun by this task.
Count IDMS_F_COUNT10 Total Erase Unqualified requests run by this task.
Con/Disc Elapse IDMS_F_CLOCK11 Elapsed time of the Connect/Disconnect (CA-IDMS 44 and46) requests run by this task.
Count IDMS_F_COUNT11 Total Connect/Disconnect requests run by this task.
Chapter 6. Subsystem reports 173

Table 14. OMEGAMON report contents for CA-IDMS: database section (Area, Noname, or Set operations)
Columnheading
Row heading OMEGAMONfield
Description
Gt/Fn/Ob Elapse IDMS_F_CLOCK1 Elapsed time of the Get/Find/Obtain requests run by thistask. Get/Find/Obtain requests consist of CA-IDMS requests48, 6-25, 30-34, 43, 50, 51 and 75-79.
Count IDMS_F_COUNT1 Total Get/Find/Obtain requests run by this task.
Acc/Retn Elapse IDMS_F_CLOCK2 Elapsed time of the Accept/Return requests run by this task.Accept/Return requests consist of CA-IDMS requests 6-25,30-34, 43, 50, 51, 75-79, 54-57, 68-70, 72, and 80-86.
Count IDMS_F_COUNT2 Total Accept/Return requests run by this task.
Keep Elapse IDMS_F_CLOCK3 Elapsed time of the Keep requests run by this task. Keeprequests consist of CA-IDMS requests 54-57, 68-70, 72, 80-86,and 87-94.
Count IDMS_F_COUNT3 Total Keep requests run by this task.
Rdy Area Elapse IDMS_F_CLOCK4 Elapsed time of the Ready Area (Type A) or If Sets (Type S)requests run by this task. Ready Area or If Sets requestsconsist of CA-IDMS requests 36-41, 60-65, and 87-94. Notapplicable to Type N.
Count IDMS_F_COUNT4 Total Ready Area (Type A) or If Sets (Type S) requests run bythis task. Not applicable to Type N.
Supra report content: The following tables describe the content of OMEGAMONreports for Supra.
Table 15. OMEGAMON report contents for Supra: totals section
Columnheading
Rowheading
OMEGAMON field Description
Add Elapse SUPRA_T_CLOCK1 Elapsed time of the Add requests run by this task. Add requestsconsist of Supra requests ADD-M, ADDVA, ADDVB, ADDVC andADDVR.
Count SUPRA_T_COUNT1 Total Add requests run by this task.
Close Elapse SUPRA_T_CLOCK2 Elapsed time of the Close (Supra CLOSX) requests run by thistask.
Count SUPRA_T_COUNT2 Total Close requests run by this task.
Delete Elapse SUPRA_T_CLOCK3 Elapsed time of the Delete (Supra DEL-M and DELVD) requestsrun by this task.
Count SUPRA_T_COUNT3 Total Delete requests run by this task.
Find Elapse SUPRA_T_CLOCK4 Elapsed time of the Find (Supra FINDX) requests run by thistask.
Count SUPRA_T_COUNT4 Total Find requests run by this task.
Open Elapse SUPRA_T_CLOCK5 Elapsed time of the Open (Supra OPENX) requests run by thistask.
Count SUPRA_T_COUNT5 Total Open requests run by this task.
Read Elapse SUPRA_T_CLOCK6 Elapsed time of Read requests run by this task. The Read count iscomprised of Supra requests RDNXT, READD, READM, READR,READV, and READX.
Count SUPRA_T_COUNT6 Total Read requests run by this task.
174 IBM CICS Performance Analyzer for z/OS: Report Reference

Table 15. OMEGAMON report contents for Supra: totals section (continued)
Columnheading
Rowheading
OMEGAMON field Description
Release Elapse SUPRA_T_CLOCK7 Elapsed time of the Release requests run by this task.
Count SUPRA_T_COUNT7 Total Release requests run by this task.
Signoff Elapse SUPRA_T_CLOCK8 Elapsed time of the Signoff (Supra SINOF) requests run by thistask.
Count SUPRA_T_COUNT8 Total Signoff requests run by this task.
Signon Elapse SUPRA_T_CLOCK9 Elapsed time of the Signon (Supra SIGNON) requests run by thistask.
Count SUPRA_T_COUNT9 Total Signon requests run by this task.
Sys/Other Elapse SUPRA_T_CLOCK10 Elapsed time of the System/Other requests run by this task.System/Other requests consists of Supra requests FREEX,CNTRL, COMIT, ENDLG, ENDTO, MARKL, QMARK, QUIET,RESET, and RSTAT.
Count SUPRA_T_COUNT10 Total System/Other requests run by this task.
Write Elapse SUPRA_T_CLOCK11 Elapsed time of the Write (Supra WRITD, WRITM, and WRITV)requests run by this task.
Count SUPRA_T_COUNT11 Total Write requests run by this task.
Table 16. OMEGAMON report contents for Supra: database section
Columnheading
Rowheading
OMEGAMON field Description
Add Elapse SUPRA_F_CLOCK1 Elapsed time of the Add requests run by this task. Add requestsconsist of Supra requests ADD-M, ADDVA, ADDVB, ADDVC,and ADDVR.
Count SUPRA_F_COUNT1 Total Add requests run by this task.
Delete Elapse SUPRA_F_CLOCK2 Elapsed time of the Delete (Supra DEL-M and DELVD) requestsrun by this task.
Count SUPRA_F_COUNT2 Total Delete requests run by this task.
Find Elapse SUPRA_F_CLOCK3 Elapsed time of the Find (Supra FINDX) requests run by this task.
Count SUPRA_F_COUNT3 Total Find requests run by this task.
Read Elapse SUPRA_F_CLOCK4 Elapsed time of the Read requests run by this task. Read requestsconsist of Supra requests RDNXT, READD, READM, READR,READV, and READX.
Count SUPRA_F_COUNT4 Total Read requests run by this task.
Write Elapse SUPRA_F_CLOCK5 Elapsed time of the Write requests run by this task. Write requestsconsist of Supra requests WRITD, WRITM, and WRITV.
Count SUPRA_F_COUNT5 Total Write requests run by this task.
Chapter 6. Subsystem reports 175

176 IBM CICS Performance Analyzer for z/OS: Report Reference

Chapter 7. System reports
The System reports are produced from system data stored in SMF files. The reportin this category is:v “System Logger report”
System Logger reportThe System Logger report processes System Logger (SMF 88) records to provideinformation on the System Logger logstreams and coupling facility structures thatare used by CICS Transaction Server for logging, recovery, and backout operations.The report can assist with measuring the effects of tuning changes and identifyingLogstream or Structure performance problems.
The System Logger List report shows information on Logstream writes, deletes,and events, as well as Structure Alter events for each SMF recording interval.
The System Logger Summary report summarizes Logstream and Structure statisticsso you can measure Logger performance over a longer period of time.
These reports, when used in conjunction with the CICS Logger reports producedfrom the standard CICS statistics reporting utilities, provide a comprehensiveanalysis of the logstream activity for all your CICS systems.
Report commandThe System Logger report can be requested from a Report Set in the CICS PAdialog. Select the System Logger report in the System Reports category.
In batch, the LOGGER command is used to request the System Logger report.
You can request a detailed list of transaction activity, a summary report, or both.
The command to produce the default report, a summary report of System Loggeractivity by Logstream name, is:CICSPA LOGGER
orCICSPA LOGGER(SUMMARY)
To produce a detailed list of System Logger activity:CICSPA LOGGER(LIST)
To produce a detailed list of System Logger activity with Alter records:CICSPA LOGGER(LIST(ALTER))
To tailor the report, you can specify report options as follows:CICSPA LOGGER(
[OUTPUT(ddname),][EXTERNAL(ddname),][SUMMARY[(SUMMARYINTERVAL(hh:mm))],][LIST[(ALTER,TIMESEQ)],][INTERVAL(minutes),]
© Copyright IBM Corp. 2001, 2010 177

[SORT(LOGSTREAM|STRUCTURE),][TITLE1(’...up to 64 characters...’),][TITLE2(’...up to 64 characters...’),][SELECT(LOGGER(INCLUDE|EXCLUDE(field1(values1),...), ...))][LOGSTREAM(’name.or.pattern’),][STRUCTURE(’name.or.pattern’),])
Report contentThe System Logger report examines SMF 88 records.
The report is produced using an external SORT facility. An External Work data setis required to store the records before they are sorted. This data set is eitherspecified explicitly using the EXTERNAL(ddname) operand or CICS PA assignsone from the External Work File pool.
The records are sorted in the following order:v If SORT(LOGSTREAMNAME) is specified, the data is sorted by Logstream
name, MVS ID, Structure name, then time stamp. This is the default.v If SORT(STRUCTURENAME) is specified, the data is sorted by Structure name,
Logstream name, MVS ID, then time stamp.
If TIMESEQ is specified for the List report, the data is sorted by Logstream orStructure name within Interval expiry period.
You can filter on Logstream name or Structure name or both by specifying a nameor pattern in the LOGSTREAMNAME or STRUCTURENAME operands.
List reportThe following command produces a System Logger List report like that shown inFigure 78 on page 179.CICSPA NOAPPLID,
LOGGER(OUTPUT(LOGR0001),EXTERNAL(CPAXW001),LIST,SORT(LOGSTREAM))
178 IBM CICS Performance Analyzer for z/OS: Report Reference

The following fields are shown on the System Logger List report:
Logstream NameThe name of the logstream.
Structure NameThe name of the structure.
MVSIDMVS System ID.
GroupGROUP value for this logstream. Either PROD (production) or TEST.
FlagStaging. If the SMF88LFT flag is set, this logstream used the staging data setduring this interval.
Disconnect. If SMF88LDS is on, this SMF record was generated as a result of alogstream disconnect.
Interval expired atThe time of day when the current SMF interval expired.
Note: When you run the Logger report on a system with a different time zonesetting to that of the SMF data, you must specify the ZONE operand toconvert the System Logger time stamps from GMT to local time. By default,CICS PA will use the reporting system's time zone settings and the Loggerreport time stamps will not reflect the local time of the data. Specify ZONE tomatch the time zone of the SMF data and the Logger report time stamps willreflect the local time of the data.
CICS Performance AnalyzerSystem Logger report - List
LOGR0001 Printed at 12:03:45 7/15/2010 Data from 14:00:00:01 5/27/2010 to 14:30:00:12 5/27/2010 Page 1
Logstream name Structure name MVSID Group Flag Interval expired at LevelIYOT1.DFHLOG LOG_JG MV55 PROD Staging 09:00:00.00 6/20/2004 SP7.0.4
----------- IXGWRITES ---------- ---------------- DELETIONS -----------------Bytes Count Count Bytes Bytes
Writn to With Without After Int StorTotal Average Interim DASD DASD Offload w/o DASD
Count Bytes Bytes Storage Write Write w. DASD Write-------- -------- -------- -------- -------- -------- -------- --------
11248 4348827 386 6768128 0 9327 0 3348643
---------------------------------------------------- EVENTS --------------------------------------------------------Demand Demand Minimum Maximum Staging
Staging DASD Staging Entry Struct Init’d Block Block DS AsyncOffloads Threshld Shifts Full Full Full Offloads Length Length Buf Full-------- -------- -------- -------- -------- -------- -------- -------- -------- --------
3 0 0 0 0 0 0 116 1422 0
----------------------- EVENTS ------------------------- --------------- DASD Writes ----------------Struct Struct
Rebuilds Rebuilds TotalType1 Type2 Type3 Init’d Complt’d Count Bytes Average Waits
-------- -------- -------- -------- -------- -------- -------- -------- --------11216 32 0 0 0 0 0 0 0
____________________________________________________________________________________________________________________________________
Logstream name Structure name Flag MVSID Level*ALTER RECORD* LOG_JG Staging MV55 SP7.0.2
------------ STRUCTURE ALTER -----------------SMF record time stamp 19:15:00:23 10/07/2009
Current Current Targeted Struct Log LogBytes Average Average Size Data Streams
Written Offloads Bufsz Bufsz (Blocks) Writes Connectd-------- -------- -------- -------- -------- -------- --------
0 2 768 768 5056 0 0
Figure 78. System Logger List report
Chapter 7. System reports 179

LevelMVS Release level.
Information on IXGWRITES:
CountThe number of IXGWRITE requests.
Total BytesBytes written by IXGWRITE requests.
Average BytesThe average number of bytes written by IXGWRITE requests.
Bytes Writn to Interim StorageThe number of bytes written to interim storage.
Information on DELETIONS:
Count With DASD WriteThe number of deletes from interim storage written to DASD.
Count Without DASD WriteNumber of deletes from interim storage without having been written to the logdata set.
Bytes After Offload w. DASDBytes deleted after data was offloaded to DASD log data sets. If SMF88SIB ishigh and the SMF88SAB is low, CICS is successfully using interim storage toavoid the I/O incurred by offloading to DASD log data sets.
Bytes Int Stor w/o DASD WriteCount of bytes deleted instead of being written to DASD. Due to CICS tailtrimming, that is, deletion of records which are no longer required for recovery.It shows how successfully CICS avoids offloads for data that it intends todelete from interim storage.
Information on EVENTS:
OffloadsNumber of times the log stream was offloaded.
Staging ThreshldNumber of times system logger detected a Staging Data Set Threshold Hitcondition (HIGHOFFLOAD reached) for the staging data set.
Demand DASD ShiftsNumber of log stream DASD shifts (additional log data set allocates) initiatedby this system. For DFHLOG and DFHSHUNT this value should be small,otherwise too much data is being offloaded. (the LS_SIZE parameter for theIXCMIAPU logstream definition utility should be checked).
Staging FullNumber of times staging data set was full. The cause of any non-zerocondition should be investigated.
Entry FullNumber of times all log streams connected to the structure are offloaded byIXLOGR due to 90% of the structure's list entries being full.
Struct FullNumber of times a structure full condition was reached. The cause of anynon-zero condition should be investigated.
180 IBM CICS Performance Analyzer for z/OS: Report Reference

Demand Init'd OffloadsNumber of demand initiated offloads.
Staging DS Async Buf FullNumber of times the system logger detected a Staging Data Set Async BufferFull condition for this log stream on this system for this SMF interval.
Minimum Block LengthMinimum block length. If set to 7FFFFFFF then there was no activity for thisinterval.
Maximum Block LengthMaximum block length.
Type1Type 1 CF event. Normal write. Indicates that, after the write completed, thepercentage of resource in use by the structure was less than the high offloadthreshold, meaning that system logger is using the coupling facilitysuccessfully. This number should be high.
Type2Type 2 CF event. Indicates that, after the write completed, the percentage ofthe logstream in use was greater than or equal to the high off load threshold.This can happen at the point where the offload value is reached or the offloadis already in progress.
Type3Type 3 CF event. Indicates that a given log stream is close to consuming 90%of the coupling facility resource allocated to it. A type-3 completion can occurif there is a failure which prevents system logger from promptly moving datafrom the coupling facility structure to DASD log data sets or if the systemlogger configuration is tuned incorrectly. For example, system logger's access toits DASD log data sets would be slowed if those data sets reside on the samedevice as some other heavily-used data sets. A type-3 can also occur if manylog streams are defined to share the same structure, because each newlydefined log stream causes system logger to dynamically repartition storageamong the existing logstreams. If a log stream has a large proportion of type-3completions, system logger is getting dangerously close to the STRUCTUREFULL condition.
Struct Rebuilds Init'dNumber of structure rebuild events initiated for this log stream, as seen by thissystem. Excessive structure rebuilds should be investigated. Structures arerebuilt in the event of logstream connectivity failure in accordance with theREBUILDPERCENT parameter of the IXCMIAPU utility.
Struct Rebuilds Compl'dNumber of structure rebuild events completed for this log stream, as seen bythis system. Excessive structure rebuilds should be investigated. Structures arerebuilt in the event of logstream connectivity failure in accordance with theREBUILDPERCENT parameter of the IXCMIAPU utility.
Information on DASD Writes:
CountNo. of DASD write requests.
Total BytesTotal bytes written to DASD (offload data sets).
Chapter 7. System reports 181

AverageAverage number of bytes written to DASD (offload data sets).
WaitsNo. of times System Logger had to suspend processing before writing toDASD because a previous DASD write request had not completed.
Information on STRUCTURE ALTER:
SMF record time stampThe time of day when this SMF record was written.
Current Bytes WrittenCurrent WRITTEN-Bytes-Structure. Count of bytes written to the structure onthis system.
OffloadsThe number of offloads that occurred for this structure.
Current Average BufszCurrent allocated average buffer size for the structure.
Targeted Average BufszTargeted average buffer size. Average buffer size System Logger attempted toachieve, by altering the element to entry ratio.
Struct Size (Blocks)Structure Size. Represented in the number of 4K blocks.
Log Data WritesTotal number of log data writes at the time of the recording interval.
Log Streams ConnectdTotal number of log streams connected to the structure on this system at thetime of the recording interval.
Summary reportThe following command produces the Logstream and Structure Summary reportslike that shown in Figure 79 on page 183. The report is sorted by Logstream name,without Alter events, and uses the system default interval.CICSPA LOGGER
orCICSPA LOGGER(SUMMARY,SORT(LOGSTREAMNAME))
182 IBM CICS Performance Analyzer for z/OS: Report Reference

These reports summarize SMF 88 Subtype 1 and Subtype 11 record data. There aretwo types of summary report:1. Summary by Logstream. Data is sorted by Logstream, MVS ID, Structure, then
time stamp. The second row of result data represents the rate per second (forexample, IXGWRITEs per second) calculated from the estimated beginning timeof the lowest expiry interval to the end of the highest expiry interval. Thebeginning time of the lowest expiry interval is calculated by subtracting thefirst expired TOD from the second expired TOD and subtracting the result from
CICS Performance AnalyzerSystem Logger - Logstream Summary
LOGR0001 Printed at 12:03:45 7/15/2010 Data from 06:45:00.00 6/20/2010 to 09:30:00.00 6/20/2010 Page 20
Logstream name MVSID Structure name First interval start Last interval stop Total IntervalIYOT1.IYO1.DFHJ03 MV55 *DASDONLY* 06:45:00.00 6/20/2010 09:00:00.00 6/20/2010 0002:15:00
----------- IXGWRITES ---------- ---------------- DELETIONS -----------------Bytes Count Count Bytes Bytes
Writn to With Without After Int StorTotal Average Interim DASD DASD Offload w/o DASD
Count Bytes Bytes Storage Write Write w. DASD Write-------- -------- -------- -------- -------- -------- -------- --------
Total 45 2506582 55702 2543616 20 0 1130496 0Rate(/Sec) 0 309 314 0 0 140 0Minimum 45 2506582 2543616 20 0 1130496 0Maximum 45 2506582 2543616 20 0 1130496 0
------------------------------------------------ EVENTS ------------------------------------------------Demand Demand Staging
Staging DASD Block Staging Entry Struct Init’d DS AsyncOffloads Threshld Shifts Length Full Full Full Offloads Buf Full-------- -------- -------- -------- -------- -------- -------- -------- --------
Total 2 6 6 0 0 0 0 0Rate(/Sec) 0 0 0 0 0 0 0 0Minimum 2 0 6 16998 0 0 0 0 0Maximum 2 0 6 65372 0 0 0 0 0
----------------------- EVENTS ------------------------- --------------- DASD Writes ----------------Struct Struct
Rebuilds Rebuilds TotalType1 Type2 Type3 Init’d Complt’d Count Bytes Average Waits
-------- -------- -------- -------- -------- -------- -------- -------- --------Total 12 0 0 0 0 8 1114992 0 0Rate(/Sec) 0 0 0 0 0 0 138 0Minimum 0 0 0 0 0 8 1114992 0Maximum 12 0 0 0 0 8 1114992 0
CICS Performance AnalyzerSystem Logger - Structure Summary
LOGR0001 Printed at 12:03:45 7/15/2010 Data from 07:00:00.00 6/20/2010 to 09:30:00.00 6/20/2010 Page 39
Structure name MVSID First interval start Last interval stop Total IntervalLOG_JG MVS55 07:00:00.00 6/20/2010 09:00:00.00 6/20/2010 0002:15:00
----------- IXGWRITES ---------- ---------------- DELETIONS -----------------Bytes Count Count Bytes Bytes
Writn to With Without After Int StorTotal Average Interim DASD DASD Offload w/o DASD
Count Bytes Bytes Storage Write Write w. DASD Write-------- -------- -------- -------- -------- -------- -------- --------
Total 9025 2549654 283 4622848 4892 3484 1379383 984662Rate(/Sec) 1 315 571 0 0 170 122Minimum 0 0 0 0 0 0 0Maximum 9025 2549654 4622848 4891 3484 1379383 984662
------------------------------------------------ EVENTS ------------------------------------------------Demand Demand Staging
Staging DASD Block Staging Entry Struct Init’d DS AsyncOffloads Threshld Shifts Length Full Full Full Offloads Buf Full-------- -------- -------- -------- -------- -------- -------- -------- --------
Total 3 257 1 0 0 0 0 0Rate(/Sec) 0 0 0 0 0 0 0 0Minimum 0 0 0 116 0 0 0 0 0Maximum 2 257 1 63930 0 0 0 0 0
----------------------- EVENTS ------------------------- --------------- DASD Writes ----------------Struct Struct
Rebuilds Rebuilds TotalType1 Type2 Type3 Init’d Complt’d Count Bytes Average Waits
-------- -------- -------- -------- -------- -------- -------- -------- --------Total 9028 0 0 0 0 9 1575063 0 5Rate(/Sec) 1 0 0 0 0 0 194 0Minimum 0 0 0 0 0 0 0 0Maximum 9022 0 0 0 0 8 15749.7 5
Figure 79. System Logger Summary report
Chapter 7. System reports 183

the first expired TOD. If the report data contains only one expiry interval, ratesper second are omitted, since the length of the expired interval cannot beestimated.
2. Summary by Structure. Data is sorted by Structure, Logstream, MVS ID, thentime stamp.
These reports have the same fields as the System Logger List report. For moreinformation, see “List report” on page 178.
The summary statistics reported are:
Total Total for this field across all intervals
Rate(/Sec)Activity Rate per second for this field.
MinimumMinimum value seen for this field in any interval
MaximumMaximum value seen for this field in any interval
184 IBM CICS Performance Analyzer for z/OS: Report Reference

Chapter 8. Performance Graph reports
There are two Transaction Measurement graph reports available from CMFperformance class data:v “Transaction Rate Graph report” on page 187. This report shows the number of
transactions completed in the time period and the rate at which the CICS systemis running or is able to run.
v “Transaction Response Time Graph report” on page 187. This report shows theservice level (response time) for completed transactions.
These graphs are useful as daily indicators of system activity.
You can request a graph using all available records, or you can provide selectioncriteria to report only the data that meets specific requirements.
The following conditions might prevent the production of complete graph reports:v If all of the CMF performance class record fields providing data for the graph
program are excluded during installation, the graph does not print. A message isissued indicating that the data could not be found.
v If only part of the data for the graph can be located, the graph report prints withan error message indicating that the graph is incomplete.
Report commandThe Performance Graph reports can be requested from a Report Set in theCICS PA dialog. Select the Transaction Rate report or the Transaction ResponseTime report in the Performance Graphs category.
In batch, the GRAPH command is used to request the Performance Graph reports.
To create a graph report, use the command:CICSPA GRAPH(graphname)
where graphname is one of the following operands to designate the type of graphdesired:
TRANRATEfor the Transaction Rate graph
RESPONSEfor the Transaction Response Time graph
To tailor the report, you can specify report options as follows:CICSPA GRAPH(RESPONSE|TRANRATE,
[OUTPUT(ddname),][RANGE1(nnnnn),][RANGE2(nnnnn),][INTERVAL(hh:mm:ss),][LINECount(nnn),][TITLE1(’...up to 64 characters...’),][TITLE2(’...up to 64 characters...’),][SELECT(PERFORMANCE(INCLUDE|EXCLUDE(field1(values1),...),
...))])
© Copyright IBM Corp. 2001, 2010 185

Report contentAll the graphs produced by CICS PA have a similar structure. Data from the CMFperformance class records is collected and time-stamped based on the Stop Timefrom the CICS CMF performance class records. When the entire input data isprocessed, the graphing facility of CICS PA is used to print the data. Each line ona graph represents activity for transactions that stopped between the time markedon the current line and the time marked on the previous line.
The default is to print one line for each 5-minute period. The INTERVAL operandcan be used to accumulate data spanning from 1 second to 24 hours. The data ispresented as a single line on a graph. For example:CICSPA GRAPH(RESPONSE,INTERVAL(00:00:03))
This example generates the Transaction Response Time graph with each linecontaining data for each 3-second interval.
To limit the range of the y-axis, use SELECT(PERFORMANCE statements. Forexample, if the input file contains a week's worth of data, the command:CICSPA SELECT(PERFORMANCE(INCLUDE(
START(FROM(2010/02/13,08:00),STOP(TO(2010/02/13,18:00))))),
GRAPH(RESPONSE)
generates the Response Time graph, with the y-axis of the graph beginning at 8:00in the morning and ending at 6:00 in the evening on February 13, 2010.
The default range for the x-axis of the graph is from zero to the highest valuereported. Operands RANGE1 and RANGE2 can be used to set the high-valuerange of the x-axis of the left and right graphs, respectively. For example, if theservice level for response time is defined as a maximum of four seconds, thecommand:CICSPA GRAPH(RESPONSE,RANGE1(4),RANGE2(4))
generates the Transaction Response Time graph using the entire acceptable servicelevel as the range of the x-axis. If a line's data exceeds the x-axis range for a graph,the line is printed with an arrow (->) at the right.
The CMF performance class records might be reported in intervals which differfrom the intervals in which the data was written. The data is written either:v in the case of conversational transactions, when CMF can write a performance
record at the end of a conversation (specified by MNCONV=YES in the SIT), orv when a transaction issues a syncpoint and the monitoring syncpoint option has
been requested (specified by MNSYNC=YES in the SIT), orv when a transaction has resided in the system longer than the monitoring
frequency interval (specified by MNFREQ=hhmmss in the SIT), orv when a user event monitoring point (EMP) with the DELIVER option specified
is invoked by an application program, orv when the transaction finishes (is detached).
For example, if there are long-running transactions such as transactions which spanentire monitor intervals, the data from these records for these transactions isreflected in the graph of the interval in which the transaction finishes. This datamight be different from the intervals in which the data is collected.
186 IBM CICS Performance Analyzer for z/OS: Report Reference

For more information, see “Interpreting performance class data” on page 294.
Transaction Rate Graph reportThe Transaction Rate Graph helps you understand other graphs and reports byshowing the number of transactions on which the reported data is based. It is alsouseful in understanding the rate at which the CICS system is running or is able torun.
The command to produce the default graph report is:CICSPA GRAPH(TRANRATE)
Average Response Time (left graph)The average response time in each time interval is plotted against the y-axisusing asterisks (***).
This value is computed by subtracting the Start Time (DFHCICS T005) fromthe Stop Time (DFHCICS T006) for all transactions completed in this timeinterval. These times are summed and then divided by the Task Count at theend of the interval. The result is the average response time of thosetransactions that completed within the time interval.
For detailed information on these performance class data fields, see “CMFperformance class data fields” on page 245.
Number of Transactions Completed (right graph)The number of transactions completed in each time interval is plotted againstthe y-axis using asterisks (***).
This value is a count of all the CMF performance class records written duringthe interval.
Transaction Response Time Graph reportThe Transaction Response Time Graph can be requested daily to determine, over aperiod of time, the level of service (response time).
The command to produce the default graph report is:CICSPA GRAPH(RESPONSE)
V3R2M0 CICS Performance AnalyzerTransaction Rate
GRTE0002 Printed at 12:03:45 7/15/2010 Data from 11:10:51 3/14/2010 to 11:35:00 3/14/2010 Page 13/14/2010
Time Value | Average Response Time in Secs | Value | Number of Transactions Completed |HH.MM.SS | 1.10 2.19 3.29 4.39 5.48 6.58 7.67 8.77 9.87 10.9 | 80 160 240 320 400 480 560 640 720 80011:10:52 |----|----|----|----|----|----|----|----|----|----| |----|----|----|----|----|----|----|----|----|----|11:15:00 3.9 |****************** 51 |***11:20:00 3.0 |************** 67 |****11:25:00 4.0 |****************** 78 |*****11:30:00 3.6 |**************** 37 |**11:35:00 10.9 |************************************************** 713 |*********************************************
Figure 80. Transaction Rate Graph report
Chapter 8. Performance Graph reports 187

Average Response Time (left graph)The average response time in each time interval is plotted against the y-axisusing asterisks (***).
This value is computed by subtracting the start time (DFHCICS T005) from thestop time (DFHCICS T006) for all transactions completed in this time interval.These times are summed and then divided by the task count at the end of theinterval. The result is the average response time of those transactions thatcompleted within the time interval.
For detailed information on these performance class data fields, see “CMFperformance class data fields” on page 245.
Maximum Response Time (right graph)The maximum response time in each time interval is plotted against the y-axisusing asterisks (***).
This value is the same as the value in the left graph, except that the maximumresponse time is used instead of an average value. This value represents thetransaction with the longest response time among those completed during theinterval.
V3R2M0 CICS Performance AnalyzerResponse Time
GRSP0001 Printed at 12:03:45 7/15/2010 Data from 11:10:51 3/14/2010 to 11:35:00 3/14/2010 Page 13/14/2010
Time Value | Average Response Time in Secs | Value | Maximum Response Time in Secs |HH.MM.SS | 1.10 2.19 3.29 4.39 5.48 6.58 7.67 8.77 9.87 10.9 | 140 280 420 560 700 840 980 1120 1260 140011:10:52 |----|----|----|----|----|----|----|----|----|----| |----|----|----|----|----|----|----|----|----|----|11:15:00 3.9 |****************** 81.3 |***11:20:00 3.0 |************** 95.1 |***11:25:00 4.0 |****************** 308.9 |***********11:30:00 3.6 |**************** 61.0 |**11:35:00 10.9 |************************************************** 1,386.7 |**************************************************
Figure 81. Transaction Response Time Graph report
188 IBM CICS Performance Analyzer for z/OS: Report Reference

Chapter 9. Extracts
The Extract data sets are produced from CMF performance class records. TheRecord Selection extract also processes other supported record types if requested.The extracts in this category are:v “Cross-System Work extract”v “Performance Data extract” on page 197v “Record Selection extract” on page 201v “System Logger extract” on page 206v “Statistics extract” on page 208
Historical Database facilities are also available in this category:v “HDB Load” on page 205
Cross-System Work extractThe Cross-System Work Extract accepts performance class data from a single ormultiple CICS systems and correlates the data by network unit-of-work. A singleperformance class record is then written to the Extract data set. That one recordrepresents all the work done on behalf of the network unit-of-work.
The default is to extract only the CMF performance class records that are containedin a unique network unit-of-work that includes multiple performance records.
Note: The Cross-System Work Extract will also include multiple performance classrecords from a single system.
You can request an extract that processes all available input records, or you canspecify criteria for record selection to extract only the data that meets specificrequirements.
The extract records have the same format as CMF performance class recordswritten by the latest CICS release supported by CICS PA (VRM 660), regardless ofthe CICS releases of the input records.
After a Cross-System Work Extract data set has been created, it can be used asinput to CICS PA for further processing. For example, the Performance List,Performance List Extended, Performance Summary, and Performance TotalsReports can be run against this data set.
Note: If you are using conversational transactions, and you have specifiedMNCONV=YES in your system initialization parameters to get separate CMFrecords for each pair of terminal I/O requests, or you have specifiedMNSYNC=YES in your system initialization parameters to get separate CMFrecords for each unit-of-work, or you have applications that are using user eventmonitoring points (EMPs) with the DELIVER option, all records will still be part ofthe same network unit-of-work. Since they are part of the same networkunit-of-work, they will all be merged into one record in the Cross-System WorkExtract Data Set. If you, for example, run the Performance Summary Reportagainst this data set, the response time does not represent the response time of anindividual screen display, but the complete lifetime of this conversationaltransaction. The AVE, DEV, MAX, MIN, and TOT statistics might also be skewed inthe same way.
© Copyright IBM Corp. 2001, 2010 189

Extract commandThe Cross–System Work extract can be requested from a Report Set in the CICS PAdialog. Select the Cross-System Work extract in the Extracts category.
In batch, the CROSSsystem command is used to request the Cross-System Workextract:CICSPA CROSSSYSTEM
This is the basic command which produces the default Cross-System Work extractdata set. When the extract data set is created, the default is to create a newperformance record for a network unit-of-work only when there were multiplerecords within the same network unit-of-work. A network unit-of-work containinga single performance record is not written to the extract data set unless it isrequested. It is possible to request that all tasks, single and multiple, or any othervariation, be used to create the extract. For more information on how to do this,see the CICS Performance Analyzer for z/OS User's Guide, which also discusses howuser fields can be included when creating the data set.
To tailor the extract data set, specify extract options as follows:CICSPA CROSSSYSTEM(
[DDNAME(ddname),][EXTERNAL(ddname),][SYSID(applid,mvsid),][WRITEMULTIPLE,][NOWRITEMULTIPLE,][WRITESINGLE,][NOPRINT,][CHARACTER(OWNER(owner),LENGTH(nnn),HEADER(header)),][CLOCK(OWNER(owner),NUMBER(nnn),HEADER(header)),][COUNT(OWNER(owner),NUMBER(nnn),HEADER(header)),][COMPRESS|NOCOMPRESS,][SELECT(PERFORMANCE(INCLUDE|EXCLUDE(field1(values1),...),
...))])
Note:
1. The DDname used for the cross-system work data set defaults to CPAOCROS.The CICS PA dialog generates DDnames in the format CPAOXSnn where nn isa sequence number 01-99. The DDname can be overridden by specifying theDDNAME operand.
2. When extract records are written, CICS PA sets the APPLID and MVS SMF IDin the new record to your specification in the SYSID operand. The defaults areMULTIPLE and CICS respectively. The APPLID and MVS ID you specify canthen be defined in SMF Input in the CICS PA dialog, along with the Extractdata set name. This enables you to use the Extract data set for reporting fromthe CICS PA dialog.
Required CMF fields
If you are using the CICS Monitoring Control Table (MCT) Exclude/Includeparameters to reduce the size of the performance class record, you must ensurethat the data fields required for the Cross-System Work report and extract are notexcluded.
The following table lists the fields that must be collected in the performance classrecords to ensure correct correlation of the data records for the Cross-System Workreport and extract.
190 IBM CICS Performance Analyzer for z/OS: Report Reference

Table 17. Cross-System Work report and extract: Required CMF fields
Owner Field ID CICS Informal Name
DFHCICS 112 RTYPE
DFHCICS 130 RSYSID
DFHDEST 091 TDTOTCT
DFHFILE 093 FCTOTCT
DFHPROG 071 PGMNAME
DFHPROG 113 ABCODEO
DFHTASK 031 TRANNUM
DFHTASK 066 ICTOTCT
DFHTASK 097 NETUOWPX
DFHTASK 098 NETUOWSX
DFHTASK 163 FCTYNAME
DFHTASK 164 TRANFLAG
DFHTEMP 092 TSTOTCT
DFHTERM 111 LUNAME
DFHTERM 169 TERMCNNM
How CICS PA creates Cross-System recordsThe records that make up the Cross-System Work extract are created by combiningrecords, that is, by combining corresponding fields in the records, of the input datasets. How the fields are combined depends on both the type of record and the typeof field.
The types of records that can be combined are:v Normal Application recordsv Terminal Owning Region (TOR) recordsv Function Shipping request records.
Note: Function Shipped Distributed Program Link (DPL) records are interpretedas normal Application records.
The types of fields that can be combined are:v Character fieldsv Packed decimal fields (transaction sequence number)v Time of day fields (start and stop times)v Stopwatch (elapsed time) fieldsv Accumulators (counters)
– Normal– High-Water Marks (program storage and user storage)– Error flags– Terminal information flags– Transaction definition and status flags.
The following paragraphs describe how the different field types are combined tocreate the fields for the Cross-System extract records:
Character FieldsCharacter fields are normally taken from the application records, except for thefollowing special fields:
Chapter 9. Extracts 191

DFHCBTS C202 PRCSIDThe CICS-assigned identifier of the CICS BTS root activity (process ID).
DFHCBTS C203 ACTVTYIDThe CICS-assigned identifier of the CICS BTS activity.
DFHTASK C082 TRNGRPIDThe transaction group ID.
DFHTASK C190 RRMSURIDThe RRMS/MVS Unit-of-Recovery ID (URID).
DFHTASK C194 OTSTIDThe Object Transaction Service (OTS) Transaction ID (Tid).
The CICS BTS process ID and activity ID are taken from application recordsonly. If no application record is found, the process ID and activity ID fieldsappear as hexadecimal zeros.
The transaction group ID is taken from application records only. If noapplication record is found, the transaction group ID field appears ashexadecimal zeros.
The RRMS/MVS unit-of-recovery ID (URID) is taken from application recordsonly. If no application record is found, the unit-of-recovery ID (URID) fieldappears as hexadecimal zeros.
The OTS Tid is taken from application records only. If no application record isfound or the record is not part of an OTS transaction, the OTS transaction ID(OTSTID) field appears as hexadecimal zeros.
All other character fields are processed as follows:1. If no application record is found, the character fields appear as hexadecimal
zeros.2. If multiple application records are found, the character fields are taken
from the first one in the sort order. Because the sort order within thenetwork unit-of-work is in reverse stop time, the first one in the sort orderis usually the one with the latest stop time.
If the field is shorter in the output data than in the input data, only theleft-hand bytes that fit are saved. Also, if the field is shorter in the input datathan in the output data, it is padded on the right in the output record withhexadecimal zeros.
Packed FieldsThe only packed decimal field is the transaction sequence number. It is treatedin the same way as a character field and is usually taken from the applicationrecords. However:1. If no application record is found, the packed decimal field appears as
packed decimal zeros.2. If multiple application records are found, the packed decimal field is taken
from the first one in the sort order. Because the sort order within thenetwork unit-of-work is in reverse stop time, the first one in the sort orderis usually the one with the latest stop time.
Time of Day FieldsTime of day fields include the task start time and the task stop time. Theearliest start time of any record and the latest stop time of any record are used.(Exception: if a time is incorrectly set to hexadecimal zero, it is not used).Normally, the difference between the start and stop time is the length of time it
192 IBM CICS Performance Analyzer for z/OS: Report Reference

took to complete the entire unit-of-work (response time). This might not beaccurate due to unsynchronized STCK values across multiple systems.
The only other time of day field is processed as a special field:
DFHTASK T132 RMUOWIDThe identifier of the local unit of work (unit of recovery) for this task.
The local unit of work (unit of recovery) is taken from application records only.If no application record is found, the local unit of work field appears ashexadecimal zeros.
Stopwatch FieldsStopwatch fields are the fields that CICS uses to measure elapsed time such asdispatch time, CPU time, or terminal control wait time. These fields are addedtogether. However, each stopwatch is actually a combination of the threedifferent components of the stopwatch field described below:v The first component is the elapsed time measured, and is calculated by
adding all of the field time values in the input records.v The second field is one byte of flags CICS uses to indicate errors. The field is
OR'd together so that the result contains any flags that were turned on inany of the input records.
v The third field is a three-byte counter that counts the number of intervalsthat were timed, and is calculated by adding all of the field count values inthe input records.
Note: Whenever fields are added together, it is possible to get an overflow.If an overflow condition occurs, CICS PA catches the error and forces theresult to remain as the highest value that will fit within the field.
Accumulator FieldsThe accumulator fields are calculated by adding all of the field values in theinput records, except eighteen special fields, which are:
DFHSOCK A292 SONPSHWMThe non-persistent socket high-water mark.
DFHSOCK A293 SOPSHWMThe persistent socket high-water mark.
DFHSTOR A033 SCUSRHWMThe high-water mark of USER storage below 16MB.
DFHSTOR A106 SCUSRHWMThe high-water mark of USER storage above 16MB.
DFHSTOR A116 SCUSRHWMThe high-water mark of CICS storage below 16MB.
DFHSTOR A119 SCUSRHWMThe high-water mark of CICS storage above 16MB.
DFHSTOR A087 PCSTGHWMThe program storage high-water mark.
DFHSTOR A108 PC24BHWMThe program storage high-water mark below 16MB.
DFHSTOR A139 PC31AHWMThe program storage high-water mark above 16MB.
DFHSTOR A143 PC24CHWMThe CDSA program storage high-water mark below 16MB.
Chapter 9. Extracts 193

DFHSTOR A142 PC31CHWMThe ECDSA program storage high-water mark above 16MB.
DFHSTOR A160 PC24SHWMThe SDSA program storage high-water mark below 16MB.
DFHSTOR A161 PC31SHWMThe ESDSA program storage high-water mark above 16MB.
DFHSTOR A162 PC24RHWMThe RDSA program storage high-water mark below 16MB.
DFHSTOR A122 PC31RHWMThe ERDSA program storage high-water mark above 16MB.
DFHTASK A064 TASKFLAGThe transaction error flags for this transaction.
DFHTASK A164 TRANFLAGThe CICS transaction definition and status information flags for thetransaction.
DFHTERM A165 TERMINFOThe CICS terminal information for the transaction.
For the high-water mark fields, the highest value from any record within thenetwork unit-of-work is used.
Note: This provides a true high-water mark except for one condition: if twotasks within the same network unit-of-work run concurrently, it is not possibleto determine the total high-water mark. The tasks peak at different times.
The transaction error flags special accumulator field is a fullword field used asan indicator of error conditions. Instead of being added together, this field isOR'd together. The result has a flag turned on if it was turned on in any recordwithin that network unit-of-work.
The transaction definition and status information flags field is taken fromapplication records only. If no application record is found, the transaction flagsfield appears as hexadecimal zeros.
The terminal information is a four byte field containing terminal or sessioninformation for the task's principal facility. This information is taken fromterminal owning records (TOR) only; if no terminal owning record is found,the terminal information field appears as hexadecimal zeros.
User FieldsThe five user fields added by CICS PA are:
CICSPA A001 TOTRECSThe total number of input records that were added to produce thisrecord
CICSPA A002 APPLRECSThe total number of application program records that were added toproduce this record
CICSPA A003 TRANROUTThe total number of terminal-owning region records that were addedto produce this record
CICSPA A004 FUNCSHIPThe total number of function shipping request records that were addedto produce this record
194 IBM CICS Performance Analyzer for z/OS: Report Reference

CICSPA A005 DPLRECSThe total number of function shipping distributed program link (DPL)request records that were added into this record. This field is a subsetof the total number of function shipping requests field.
These CICS PA user fields are always present.
User-SpecifiedUser fields can also be specified on the CROSSsystem command. When specified,these user fields are added to the dictionary and the cross-system outputrecord.
Note: It is possible that the input data might not include the standard CICSfields or the user fields that you requested. If this occurs, the cross-systemperformance records created by CICS PA will still contain these fields.However, the values within the fields are null (hexadecimal zeros).
APPLID LimitationsBecause the input data sets typically contain CMF records from many CICSsystems, the APPLID of the output data set cannot be made to match the inputdata. Instead, it is set to MULTIPLE to indicate that this data containsinformation from multiple CICS systems with different APPLIDs. You canoverride this by specifying the SYSID operand.
Note: Do not use the APPLID of MULTIPLE for any of your online systems.This allows you to determine if the data you are processing is from CMF orfrom CICS PA simply by checking the APPLID.
CMF RequirementsBecause only CMF performance class records contain the token field thatassociates the record with a network unit-of-work, only CMF performancerecords are processed by the cross-system function of CICS PA.
Within a single logical record, CMF can block several types of data. Withineach type of data, CMF can block many data rows. CICS PA does not blockthe data within the logical record. This means that for every record there is asingle unit of data.
Note: A user typically concatenates, as input for the Cross-System WorkExtract, two or more unloaded SMF data sets containing CMF performanceclass records. An example of this would be data sets from a terminal owningregion, an application owning region, and a data base owning region.
You should not merge a Cross-System Work Extract data set with another CMFdata set, as the resulting records would not contain useful data. However, ifyou do, be aware of the following:v The five user fields added to the Cross-System record will no longer
accurately reflect the overall total for that network unit-of-work. The totalsin the Cross-System record are lost and will only reflect the totals from theadditional CMF data set.
v Any user fields included in the original Cross-System extract are notincluded in the final Cross-System data set unless they are specified on thecommand input.
v Due to the manner in which the different field types are combined, some ofthe final Cross-System records might not be correct. See “How CICS PAcreates Cross-System records” on page 191 to understand the possible resultswhen combining CMF records with cross-system records.
Chapter 9. Extracts 195

Recommendation
It is recommended that the Cross-System Work Extract created from the CMFperformance class records from two or more systems should not be concatenatedwith other CMF files. The results of such a concatenation are questionable as totheir use. The Cross-System Extract data set can be used by itself as input to theCICS PA Performance Reports (especially the List, List Extended, Summary, andTotals reports) to monitor the total amount of resources used by a transactionwithin a single or across multiple CICS systems.
Cross-System Extract record formatThe record format of the Cross-System Work Extract Data Set is variable blockedand the block size has to be large enough to contain a performance class recordplus the fields CICS PA adds and any other user fields specified. CICS PA willassign default DCB attributes of RECFM=VB,LRECL=8188,BLKSIZE=8192 if they are notspecified.
The Cross-System Work Extract that is created is fully compatible with the CICSMonitoring Facility (CMF) performance data format. However, there are someimportant differences between the data created by CICS PA and the data collectedby CMF. Still, any program that fully exploits the self-defining data format of CMFshould have no problem in processing the data created. The importantconsiderations are:v Fields
– Five user fields are in the extract, see “How CICS PA creates Cross-Systemrecords” on page 191.
– Additional user fields are in the extract if requested.– All standard CICS CMF fields are in the extract. If a field was missing in the
input data, it is set to hexadecimal zeros.v Records
– The records from each network unit-of-work ID are combined into one record.– Only performance class records are created.– Each SMF (CMF) record created contains only one performance class record.– The records are not written in time sequence.
v IDs and TIME STAMPs– The APPLID of the new data is set to MULTIPLE unless overridden by the
SYSID operand.– The SMF time stamp is set to the latest Stop Time of records in the UOW.– The Dictionary START and STOP time stamps are set to the earliest start and
latest stop time of records in the UOW.
Two factors make it difficult to create a DSECT for the Cross-System record:1. User fields can be added to the record. This adds additional information to the
middle of the record, and also adds to data for these fields at the end of therecord.
2. With a maintenance change to CICS PA, the record format can change as longas it remains compatible with the CICS CMF format using the dictionary recordsupplied at the front of the data set.
The format of the Cross-System Work Extract record is the same as that of astandard CMF performance class record. It corresponds to the default dictionaryrecord for the latest release of CICS. The default is 660. For a complete descriptionof each field and to understand how the fields are collected, see the CICSPerformance Guide.
196 IBM CICS Performance Analyzer for z/OS: Report Reference
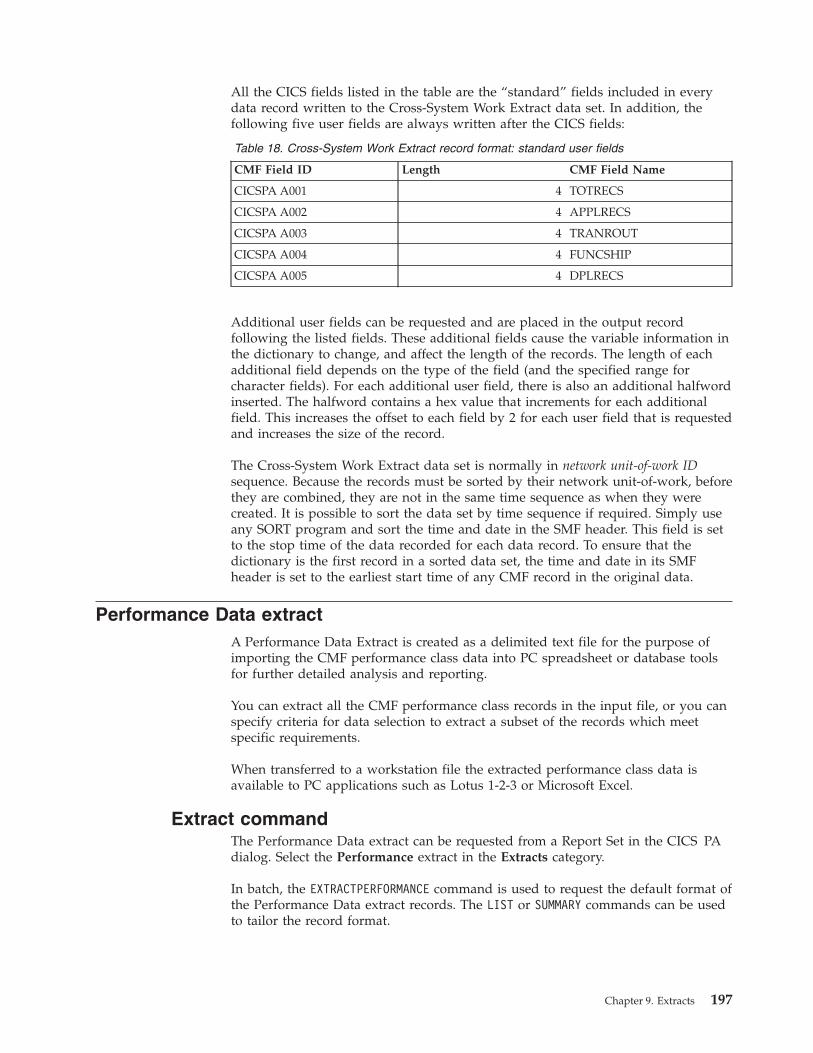
All the CICS fields listed in the table are the “standard” fields included in everydata record written to the Cross-System Work Extract data set. In addition, thefollowing five user fields are always written after the CICS fields:
Table 18. Cross-System Work Extract record format: standard user fields
CMF Field ID Length CMF Field Name
CICSPA A001 4 TOTRECS
CICSPA A002 4 APPLRECS
CICSPA A003 4 TRANROUT
CICSPA A004 4 FUNCSHIP
CICSPA A005 4 DPLRECS
Additional user fields can be requested and are placed in the output recordfollowing the listed fields. These additional fields cause the variable information inthe dictionary to change, and affect the length of the records. The length of eachadditional field depends on the type of the field (and the specified range forcharacter fields). For each additional user field, there is also an additional halfwordinserted. The halfword contains a hex value that increments for each additionalfield. This increases the offset to each field by 2 for each user field that is requestedand increases the size of the record.
The Cross-System Work Extract data set is normally in network unit-of-work IDsequence. Because the records must be sorted by their network unit-of-work, beforethey are combined, they are not in the same time sequence as when they werecreated. It is possible to sort the data set by time sequence if required. Simply useany SORT program and sort the time and date in the SMF header. This field is setto the stop time of the data recorded for each data record. To ensure that thedictionary is the first record in a sorted data set, the time and date in its SMFheader is set to the earliest start time of any CMF record in the original data.
Performance Data extractA Performance Data Extract is created as a delimited text file for the purpose ofimporting the CMF performance class data into PC spreadsheet or database toolsfor further detailed analysis and reporting.
You can extract all the CMF performance class records in the input file, or you canspecify criteria for data selection to extract a subset of the records which meetspecific requirements.
When transferred to a workstation file the extracted performance class data isavailable to PC applications such as Lotus 1-2-3 or Microsoft Excel.
Extract commandThe Performance Data extract can be requested from a Report Set in the CICS PAdialog. Select the Performance extract in the Extracts category.
In batch, the EXTRACTPERFORMANCE command is used to request the default format ofthe Performance Data extract records. The LIST or SUMMARY commands can be usedto tailor the record format.
Chapter 9. Extracts 197

Default Performance Data ExtractThe command to create the default Performance Data Extract file is:CICSPA EXTRACTPERFORMANCE
To tailor the extract file, specify extract options as follows:CICSPA EXTRACTPERFORMANCE(
[OUTPUT(ddname),][DDNAME(ddname),][DELIMIT(’field-delimiter’),][LABELS|NOLABELS,][SELECT(PERFORMANCE(INCLUDE|EXCLUDE(field1(values1),...),
...))])
The performance data extract is created using a subset of the CMF performanceclass data. The CMF exception class data is not used.
CICS PA extracts the data values from the CMF performance class records, formatsthem, and then adds a field delimiter after each field. The default field delimiter isa semicolon (;) but can be changed by specifying the DELIMIT operand.
If any of the required data fields were not collected by the CICS MonitoringFacility, a message is issued and the field in the extract record contains zeros orMissing.
The DDname for the Extract data set defaults to CPAOEXPT. The CICS PA dialoggenerates DDnames in the format CPAOEXnn where nn is a sequence number01-99. The DDname can be overridden by using the DDNAME operand.
Performance List ExtractTo tailor the format of the extract file like the Performance List report, see“Performance List Extract” on page 20. The List extract supports performancealerts as in the report.
Performance Summary ExtractTo tailor the format of the extract file like the Performance Summary report, see“Performance Summary Extract” on page 37. The Summary extract supportsperformance alerts as in the report.
Performance Data Extract record formatThree record formats are available:1. The EXTRACTPERFORMANCE command is used to request the default format of the
Performance Data extract records (see “Default Performance Data Extract”).2. The LIST command is used to request the Performance List Extract (see
“Performance List Extract” on page 199).3. The SUMMARY command is used to request the Performance Summary Extract
(see “Performance Summary Extract” on page 200).
Default Performance Data ExtractThe following table shows the fields in the extract file.
Table 19. Extract record format (default)
Data Field Length Description
APPLID 8 Generic APPLID
TRAN 4 Transaction ID
198 IBM CICS Performance Analyzer for z/OS: Report Reference

Table 19. Extract record format (default) (continued)
Data Field Length Description
TERM 4 Terminal ID
USERID 8 User ID
TASKNO 8 Transaction sequence number
STOP DATE 10 Transaction stop date (yyyy-mm-dd)
STOP TIME 12 Transaction stop time (hh:mm:ss.thm)
RESPONSE 8 Transaction response time
Clocks 8 All clock fields, elapsed time in seconds with a precisionof 0.0001 second
Note that the clock field MAXHTDLY (owner: DFHTASK, field ID: 278) is notavailable from CICS Transaction Server V3.1 and is omitted from the Extractrecord.
The format of the Performance Data Extract record is static and containsfixed-length blocked records with a record size of 700 bytes. Each field in therecord is followed by a text file field delimiter. The default field delimiter is asemicolon (;).
Performance List ExtractThe following command produces a Performance List Extract file like that inFigure 84 on page 200.CICSPA LIST(OUTPUT(EXPT0001),
DDNAME(CPAOEX01),DELIMIT(’;’),LABELS,FIELDS(TRAN,STYPE,TERM,USERID,RSYSID,
PROGRAM,TASKNO,STOP(TIMET),RESPONSE,DISPATCH(TIME),CPU(TIME),SUSPEND(TIME),DISPWAIT(TIME),FCWAIT(TIME),FCAMCT,IRWAIT(TIME)))
APPLID ;TRAN;TERM;USERID ; TASKNO; STOP DATE; STOP TIME ;RESPONSE;DISPATCH;CPU ;SUSPEND ;DISPWAIT;QRDISPT ;QRCPU ; . . .IYK2Z1V1;CSSY; ;CBAKER ; 14;2010-05-23; 9:00:11.306; .4796; .0837; .0145; .3958; .2169; .0763; .0136;IYK2Z1V1;CSSY; ;CBAKER ; 11;2010-05-23; 9:00:11.596; .7716; .1924; .0164; .5791; .3425; .0212; .0093;IYK2Z1V1;CSSY; ;CBAKER ; 10;2010-05-23; 9:00:11.600; .7756; .1598; .0169; .6158; .5744; .0087; .0041;IYK2Z1V1;CPLT; ;CBAKER ; 7;2010-05-23; 9:00:27.503; 16.8286; .8059; .0279; 16.0227; .0082; .0095; .0039;IYK2Z1V1;CSSY; ;CBAKER ; III;2010-05-23; 9:00:28.310; 17.4857; 10.3468; 1.9987; 7.1389; .7171; 2.8730; 1.6315;
. . .IYK2Z1V1;CMAC;0031;CBAKER ; 72;2010-05-23; 9:03:04.207; .0007; .0007; .0006; .0000; .0000; .0007; .0006;IYK2Z1V1;CMAC;0031;CBAKER ; 73;2010-05-23; 9:03:05.908; .0008; .0007; .0006; .0000; .0000; .0007; .0006;IYK2Z1V1;CMAC;0031;CBAKER ; 74;2010-05-23; 9:03:06.410; .0007; .0007; .0006; .0000; .0000; .0007; .0006;IYK2Z1V1;CSHQ; ;CBAKER ; 23;2010-05-23; 9:03:15.659; 167.394; .2466; .0246; 167.147; .0012; .0573; .0046;IYK2Z1V1;CESD; ;CBAKER ; 76;2010-05-23; 9:03:15.699; .0387; .0307; .0042; .0080; .0026; .0016; .0015;IYK2Z1V1;CSNC; ;CBAKER ; 21;2010-05-23; 9:03:17.527; 175.828; 1.0305; .0056; 174.797; .0071; 1.0053; .0020;
Figure 82. Performance Data Extract file (default format)
V3R2M0 CICS Performance AnalyzerPerformance Extract
EXPT0001 Printed at 12:03:45 7/15/2010 Data from 09:00:09 5/23/2010 to 09:03:22 5/23/2010 Page 1
CPAOEX01 Extract has completed successfullyData Set Name . . . . . CICSPA.DEFAULT.EXTRACTRecord count . . . . . . 74
Figure 83. Performance Data Extract Recap report (default extract)
Chapter 9. Extracts 199

To use the CICS PA dialog to request this extract, simply specify a LIST or LISTXReport Form for the Performance Data extract.
Performance Summary ExtractThe following command produces a Performance Summary Extract file like that inFigure 86.CICSPA SUMMARY(OUTPUT(EXPT0001),
DDNAME(CPAOEX01),DELIMIT(’;’),LABELS,EXTERNAL(CPAXW001),INTERVAL(00:01:00),FIELDS(TRAN,TASKCNT,
RESPONSE(AVE,MAX),DISPATCH(TIME(AVE)),CPU(TIME(AVE)),SUSPEND(TIME(AVE)),QRCPU(TIME(AVE)),MSCPU(TIME(AVE)),ROCPU(TIME(AVE)),KY8CPU(TIME(AVE)),J8CPU(TIME(AVE)),L8CPU(TIME(AVE)),S8CPU(TIME(AVE))),
TITLE1(’Transaction CICS TCB CPU Analysis - Summary’))
To use the CICS PA dialog to request this extract, simply specify a SUMMARYReport Form for the Performance Extract. You could use the sample Report Forms.This example is the same as using the sample Report Form CPUSUM.
Tran;SC;Term;Userid;RSID;Program;TaskNo;Stop Time;Response;Dispatch Time;User CPU Time;Suspend Time;DispWait Time;;FC Wait Ti . . .CPLT;U ; ;CICSUSER; ;DFHSIPLT; 6;15:41:29.169; .5196; .1771; .0316; .3425; .3422; .0000; 0; .0000CSSY;U ; ;CICSUSER; ;DFHAPATT; 15;15:41:30.057; .4595; .0036; .0033; .4558; .0000; .0000; 0; .0000CSSY;U ; ;CICSUSER; ;DFHAPATT; 16;15:41:30.570; .9663; .0069; .0088; .9594; .0795; .0000; 0; .0000CSSY;U ; ;CICSUSER; ;DFHAPATT; 17;15:41:33.624; 4.0131; .1379; .0311; 3.8752; 1.7449; .0000; 0; .0000CSSY;U ; ;CICSUSER; ;DFHAPATT; 12;15:41:33.783; 4.2133; .1621; .0494; 4.0511; 2.5906; .0000; 0; .0000CGRP;U ; ;CICSUSER; ;DFHZCGRP; 11;15:41:34.307; 5.1156; .1956; .0603; 4.9199; 1.9401; .0000; 0; .0000CSSY;U ; ;CICSUSER; ;DFHAPATT; 14;15:41:34.388; 4.7978; .1880; .0652; 4.6098; 2.3487; .0000; 0; .0000CSSY;U ; ;CICSUSER; ;DFHAPATT; 10;15:41:34.452; 5.2738; 1.4746; .2259; 3.7992; .6720; .0000; 0; .0000CSSY;U ; ;CICSUSER; ;DFHAPATT; 9;15:41:34.513; 5.3366; .7647; .1494; 4.5719; 1.6657; .0000; 0; .0000CSSY;U ; ;CICSUSER; ;DFHAPATT; 13;15:41:34.868; 5.2787; .7009; .1740; 4.5778; 2.0694; .0000; 0; .0000CLQ2;U ; ;CICSUSER; ;DFHLUP ; 19;15:42:31.258; 7.2473; .2907; .0416; 6.9566; 1.9555; .0000; 0; 3.7840CSSY;U ; ;CICSUSER; ;DFHAPATT; III;15:42:43.811; 74.6388; 48.6230; 18.0249; 26.0158; 7.7521; .6756; 1506; .0000CLR2;TO;<AAK;CICSUSER; ;DFHLUP ; 20;15:42:43.847; .4513; .0130; .0128; .4383; .0215; .0000; 0; .4363CSFU;S ; ;CICSUSER; ;DFHFCU ; 25;15:42:45.071; .3998; .3770; .0234; .0228; .0184; .0000; 0; .0000CRSQ;S ; ;CICSUSER; ;DFHCRQ ; 24;15:42:45.437; .7659; .0740; .0247; .6919; .6893; .0000; 0; .0000CXRE;S ; ;CICSUSER; ;DFHZXRE ; 26;15:42:45.919; .8530; .4739; .0316; .3791; .3788; .0000; 0; .0000CWBG;S ; ;CICSUSER; ;DFHWBGB ; 23;15:42:46.342; 1.6720; .4074; .0248; 1.2645; 1.2634; .0000; 0; .0000
Figure 84. Performance List Extract file
V3R2M0 CICS Performance AnalyzerPerformance List
EXPT0001 Printed at 12:03:45 7/15/2010 Data from 15:41:29 7/12/2010 APPLID CICPAOR1 Page 1
CPAOEX01 Extract has completed successfullyData Set Name . . . . CICSPA.LIST.EXTRACTRecord count . . . . 119
Figure 85. Performance List Extract Recap report
Tran;#Tasks;Response Avg;Response Max;Dispatch Time Avg;User CPU Time Avg;Suspend Time Avg;QR CPU Time Avg;MS CPU Time Avg; . . .CATA ; 2; .5038; .5107; .4635; .1050; .0403; .0339; .0711;Missing ;Missing ; .0000; .0000; .0000CATR ; 2; .3946; .4069; .2240; .0281; .1706; .0058; .0223;Missing ;Missing ; .0000; .0000; .0000CEMT ; 2; 6.2161; 7.2793; 2.8673; .7499; 3.3488; .2549; .4950;Missing ;Missing ; .0000; .0000; .0000CESD ; 2; .9081; .9702; .1021; .0411; .8061; .0163; .0249;Missing ;Missing ; .0000; .0000; .0000CEX2 ; 2; 1937.94; 1957.76; .3062; .0843; 1937.64; .0582; .0262;Missing ;Missing ; .0000; .0000; .0000CGRP ; 2; 5.3068; 5.4980; .4944; .0608; 4.8124; .0372; .0236;Missing ;Missing ; .0000; .0000; .0000CLQ2 ; 2; 12.7568; 18.2664; .6439; .0430; 12.1129; .0152; .0278;Missing ;Missing ; .0000; .0000; .0000CLR2 ; 2; .4497; .4513; .0131; .0124; .4366; .0124; .0000;Missing ;Missing ; .0000; .0000; .0000CPLT ; 2; .4568; .5196; .1276; .0321; .3291; .0030; .0290;Missing ;Missing ; .0000; .0000; .0000CQRY ; 2; .4066; .4157; .0955; .0321; .3110; .0075; .0246;Missing ;Missing ; .0000; .0000; .0000CRDB ; 2; 2.8808; 3.5474; .0676; .0256; 2.8132; .0108; .0148;Missing ;Missing ; .0000; .0000; .0000CRDC ; 2; .3234; .5345; .2274; .0243; .0960; .0096; .0148;Missing ;Missing ; .0000; .0000; .0000CRDD ; 2; .3828; .6006; .0551; .0241; .3277; .0098; .0144;Missing ;Missing ; .0000; .0000; .0000CRDE ; 2; .3141; .5208; .0670; .0369; .2470; .0227; .0142;Missing ;Missing ; .0000; .0000; .0000CRD3 ; 2; .5020; .8081; .0604; .0229; .4416; .0078; .0150;Missing ;Missing ; .0000; .0000; .0000
Figure 86. Performance Summary Extract file
200 IBM CICS Performance Analyzer for z/OS: Report Reference

Importing into Lotus 1-2-3To import the extracted performance data into Lotus 1-2-3, follow these steps:1. In 1-2-3, click the Import SmartIcon or choose File - New. 1-2-3 opens the File
dialog box.2. Select a text type of Text - Delimited (*.TXT).
3. Select the file to be opened. You might have to go to another folder or drive tofind it.
4. Click Open. 1-2-3 displays the Text File Options dialog box.5. Either click the option button start a new column at each Semicolon to
indicate the character that separates the data fields, or type the separatorcharacter in the Other characters text box.
6. Click OK. After a few seconds of processing, 1-2-3 imports the data intorecords in the worksheet.
Importing into Lotus ApproachTo import the extracted text file performance data set into Lotus Approach®, switchto the Approach Browse environment, and follow these steps:1. In Approach, click the Import SmartIcon or choose File - Import Data.
Approach opens the Import Data dialog box.2. Select a text type of Text - Delimited (*.TXT).
3. Select the file to be imported. You might have to go to another folder or driveto find it.
4. Click Import. Approach displays the Text File Options dialog box.5. Either click the option button to indicate the character that separates the data
fields or type the separator character in the Other text box.6. Place a checkmark in the First Row Contains Field Names checkbox. A
checked checkbox is the default.7. Click OK. Approach opens the Import Setup dialog box.8. Drag the fields on the right side of the dialog box to match the related fields
on the left side.9. Click OK. After a few seconds of processing, Approach imports the data into
records at the end of the file.10. Edit the new records as needed.
Record Selection extractThe Record Selection Extract is a facility that allows you to create a small extractfile containing only the records of interest to you. The extract file can then be usedas input to CICS PA, allowing more efficient reporting.
V3R2M0 CICS Performance AnalyzerPerformance Summary
EXPT0001 Printed at 2.43.23 7-24-2010 Data from 15.41.19 7-12-2010 to 16.19.15 7-12-2010 Page 1Transaction CICS TCB CPU Analysis - Summary
CPAOEX01 Extract has completed successfullyData Set Name . . . . CICSPA.SUMMARY.EXTRACTRecord count . . . . 41
Figure 87. Performance Summary Extract Recap report
Chapter 9. Extracts 201

The Record Selection Extract filters large SMF Files, writing only SMF records thatmatch the following criteria:v CICS, DB2, MQ, and Logger System Selectionv Selected record types, being any of:
– Performance– Exception– Resource– Statistics– OMEGAMON– DB2– WebSphere MQ– System Logger– Identity
v Performance Selection Criteriav Exception Selection Criteriav Logger Selection Criteriav Run-time SMF reporting interval
A Recap report containing processing statistics is always printed at the end ofextract processing.
Extract commandThe Record Selection extract can be requested from a Report Set in the CICS PAdialog. Select the Record Selection extract in the Extracts category.
In batch, the RECORDSELECTION or RECSEL command is used to request the RecordSelection extract.
The command to create the default extract file is:CICSPA RECSEL
orCICSPA RECORDSELECTION
To tailor the extract file, specify extract options as follows:[CICSPA APPLID(applid1,applid2,...)]CICSPA RECSEL(
[OUTPUT(ddname),][DDNAME(ddname),][PERFORMANCE,][EXCEPTION,][RESOURCE,][IDENTITY,][STATISTICS,][LOGGER,][OMEGAMON,][DB2,][MQ,][SSID(id1,id2,...),][COMPRESS|NOCOMPRESS,][SELECT(PERFORMANCE(INCLUDE|EXCLUDE(field1(value1),...),...),][SELECT(EXCEPTION(INCLUDE|EXCLUDE(field1(value1),...),...))][SELECT(LOGGER(INCLUDE|EXCLUDE(field1(values1),...), ...))][LOGSTREAM(’name.or.pattern’),][STRUCTURE(’name.or.pattern’),])
Extract formatThe extract file contains any of the following requested records:
202 IBM CICS Performance Analyzer for z/OS: Report Reference

v CMF performance, exception, resource, or identity class records (SMF 110,subtype 1)
v DB2 accounting records (SMF 101)v MQ accounting records (SMF 116)v Logger records (SMF 88)v CICS statistics (SMF 110, subtype 2) and server statistics records (SMF 110,
subtypes, 3, 4, and 5)v CICS Transaction Gateway statistics records (SMF 111)v OMEGAMON XE for CICS records (SMF 112)
Recap reportA Recap report is always produced at the end of extract processing.
The report contains the following information:
RSEL0001This is the DDname for the Recap output specified in the OUTPUT(ddname)operand. If not specified, the default is RECSnnnn where nnnn is0001-9999 to uniquely identify it.
CPAORS01This is the DDname of the extract data set specified in the DDNAME(ddname)operand. If not specified, the default is CPA0RSEL. The CICS PA dialoggenerates the DDnames CPARSnn where nn is the extract sequencenumber 01-99.
Data Set NameThe is the name of the extract data set. Your usual CICS PA reporting cannow occur using this data set as input.
Record CountsThe number of records written to the extract data set.
Performance DictionaryThe number of Dictionary records written.
Performance ClassThe number of CMF performance class data records written. TheAPPLID operand provides a filter on CICS generic APPLID. TheSELECT(PERFORMANCE statement selects only those records with datafields that match the selection criteria. If these operands are notspecified, then all CMF performance records are written.
Exception ClassThe number of CMF exception class data records written. The
V3R2M0 CICS Performance AnalyzerRecord Selection Extract
RSEL0001 Printed at 12:03:45 7/15/2010 Data from 15:41:28 7/12/2010 to 14:43:47 7/21/2010 Page 1
CPAORS01 Extract has completed successfullyData Set Name . . . . . CICSPA.RECSEL.EXTRACTRecord Counts:Performance Dictionary . 8Performance Class . . 573Exception Class . . . . . 0Resource Class . . . . . 0Identity Class . . . . . 0Statistics . . . . . . . 0DB2 Accounting . . . . . 172MQ Accounting . . . . . 0Logger . . . . . . . . . 0OMEGAMON . . . . . . . . 0CICS TG Statistics . . . 0SMF Records . . . . . . . 20
Figure 88. Record Selection extract (Recap report)
Chapter 9. Extracts 203

APPLID operand provides a filter on CICS generic APPLID. TheSELECT(EXCEPTION statement selects only those records with datafields that match the selection criteria. If these operands are notspecified, then all CMF exception records are written.
Resource ClassThe number of CMF performance class data records written. TheAPPLID operand provides a filter on CICS generic APPLID. TheSELECT(PERFORMANCE statement selects only those records with datafields that match the selection criteria. If these operands are notspecified, then all CMF resource class records are written.
Identity ClassThe number of CMF identity class data records written. The APPLIDoperand provides a filter on CICS generic APPLID. TheSELECT(PERFORMANCE statement selects only those records with datafields that match the selection criteria. If these operands are notspecified, then all CMF identity class records are written.
StatisticsThe number of CICS Transaction Server statistics records written.The APPLID operand provides a filter on CICS generic APPLID.
DB2 AccountingThe number of DB2 accounting records written. The SSID operandindicates that DB2 accounting data is required. Only records forDB2 Subsystems that match the ID or pattern are written. If theSSID operand is not specified, no DB2 accounting records arewritten.
MQ AccountingThe number of MQ accounting records written. The SSID operandindicates that MQ accounting data is required. Only records forWebSphere MQ Subsystems that match the ID or pattern arewritten. If the SSID operand is not specified, no MQ accountingrecords are written.
LoggerThe number of MVS Logger records written. The LOGGER operandindicates that Logger records are required.
OMEGAMONThe number of OMEGAMON XE for CICS records written. TheOMEGAMON operand indicates that OMEGAMON records arerequired.
CICS TG StatisticsThe number of CICS Transaction Gateway statistics records written.The APPLID operand provides a filter on CICS Transaction GatewayAPPLID.
SMF RecordsThe total number of SMF records written to the extract data set.There is only one Dictionary record per SMF record. There is onlyone DB2 Accounting record per SMF record. However there can bemany performance class records contained in one SMF record.
By comparing the numbers in the End of File Record Counts (see Figure 91 onpage 212) and the Record Selection Extract report you can see the effect of filteringon the extract process.
204 IBM CICS Performance Analyzer for z/OS: Report Reference

HDB LoadThe HDB Load is a facility that loads SMF data into a Historical Database (HDB).This same facility is available from Primary Menu option 5 Historical Database.However, from Report Sets you have the advantages of:v Reports and HDB Load in the one jobv Multiple load requests supported in the one jobv One pass of the data
A Recap report containing processing statistics is always printed at the end of loadprocessing.
HDB Load commandThe HDB Load can be requested from a Report Set in the CICS PA dialog. SelectHDB Load in the Extracts category.
In batch, the HDB(LOAD(hdbname)) operand requests CICS PA to load CMFPerformance or CICS Statistics data from SMF data sets into the specified HDB.
The command format is:CICSPA HDB(LOAD(hdbname),
[OUTPUT(ddname))]
where hdbname is the name of the HDB in the HDB Register identified in the JCLby DDname CPAHDBRG and ddname (default HDBL0001) identifies the Recapreport output.
HDB formatThe format of the HDB is as defined using Primary Menu option 5 HistoricalDatabase.
Recap reportSuccessful completion of the Load request generates a Recap report that providesinformation about the HDB Load, including a list of Container data sets created bythe Load process.
In this example, CICS PA created Container data setJOHN.CICSP1H.D10219.T092846.HDB for HDB CICSP1H. It contains 54,567 recordsfor the period 9:00am to 4:00pm on August 7, 2010.
V3R2M0 CICS Performance AnalyzerHDB Load Recap Report
HDBL0001 Printed at 9:28:48 9/07/2010 Data from 09:02:00 8/07/2010 to 16:29:00 8/07/2010 Page 1
LOAD requested for HDB: CICSP1H Register DSN: USER.CICSPA.HDB.REGISTER
The following Containers were created and loaded:Container DSN: JOHN.CICSP1H.D10219.T092846.HDB No of Records: 54,567Start Time Stamp: 2010-08-07-09.00.00 End Time Stamp: 2010-08-07-16.00.00
LOAD process complete.
Figure 89. HDB Load Recap report
Chapter 9. Extracts 205

System Logger extractA System Logger extract is created as a delimited text file for the purpose ofimporting System Logger (SMF 88) data into PC spreadsheet tools or databasetools (such as DB2) for further detailed analysis and reporting. When transferred toa workstation file the extracted System Logger data is available to PC applicationssuch as Lotus 1-2-3.
Extract commandThe command format for the System Logger extract is:CICSPA LOGGER(
[OUTPUT(ddname),][DDNAME(ddname),][DELIMIT(’field-delimiter’),][LABELS|NOLABELS,][FLOAT,][SELECT(LOGGER(INCLUDE|EXCLUDE(field1(values1),...), ...))][LOGSTREAM(’name.or.pattern’),][STRUCTURE(’name.or.pattern’),])
Extract contentThe following table describes the format of each line in the System Logger extract,including the extract labels (which occupy the first line of the extract, if you choseto include labels), the name of the original SMF 88 field, and the length of the datain the extract.
Table 20. System Logger extract content
Extract label Field Length Description
RecType SMF88PNM,SMF88STP
8 Concatenated value of field SMF88PNM (product name,SCLOG) and field SMF88STP (record subtype). For example,SCLOG01.
Interval Date
SMF88LTD
10 TOD-time when SMF global interval expired (from parameterlist of ENF event 37, which requested this SMF record fromlogger). Time is reported in GMT.
Appears in the extract as two separate fields: date (yyyy-mm-dd)and time (hh.mm.ss).
Interval Time 8
Logstream name SMF88LSN 26 Logstream name.
Structure name SMF88STN 16 Name of structure used for this logstream.
MVSID SMF88SID 4 MVS system ID.
MVS Level SMF88OSL 8 MVS product level.
Group SMF88GRP 8 GROUP value for this logstream. Either PROD (production) orTEST.
Flag SMF88LFT,SMF88LDS
10 Values in the extract can be:Staging
This log stream used staging data sets during theexpiring SMF interval.
DisconnectThe SMF record has been generated when thelogstream disconnected from the system.
Stag/DiscBoth of the above.
IXGWRIT Count SMF88LWI 8 IXGWRITE invocations for this logstream issued during theexpiring SMF interval.
206 IBM CICS Performance Analyzer for z/OS: Report Reference

Table 20. System Logger extract content (continued)
Extract label Field Length Description
IXGWRITBLOCKLEN Min
SMF88LIB 8 Minimum BLOCKLEN value of IXGWRITE seen during theexpiring SMF interval. Initialized to X'7FFFFFFF' if no SMFactivity occurs within the SMF interval.
IXGWRITBLOCKLEN Max
SMF88LAB 8 Maximum BLOCKLEN value of IXGWRITE seen by this logstream during the expiring SMF interval Initialized to zero if noSMF activity occurs within the SMF interval.
IXGWRIT BytesRequested
SMF88LWB 8 Bytes REQUESTED by user application(s) on IXGWRITEinvocations for this log stream during the expiring SMF interval(format: long floating point).
IXGWRIT BytesWritten
SMF88LDB 8 Count of bytes written to DASD during the expiring SMFinterval (format: long floating point). SMF88LDB = SMF88SAB +storage-for-LOGGR-internal-requirements (ex, rounding,internally-required control information.)
DASD Writes SMF88LIO 8 Number of times a request was made by System Logger towrite logstream data to DASD during the expiring SMF interval.
DASD WriteWaits
SMF88LIS 8 Number of times System Logger had to suspend before writinglogstream data to DASD because a previously initiated write toDASD had not yet completed during the expiring SMF interval.
DASD Shifts SMF88EDS 8 Number of logstream DASD-shifts initiated by this systemduring the expiring SMF interval.
Struct RebuildsInitiated
SMF88ERI 8 Number of Structure Rebuild events initiated for this logstreamduring the expiring SMF interval.
Struct RebuildsCompleted
SMF88ERC 8 Number of Structure Rebuild events completed for thislogstream during the expiring SMF interval.
Struct Full SMF88ESF 8 Number of times Logger detected “Structure full” condition forthis logstream on this system during the expiring SMF interval.
StagingThreshold
SMF88ETT 8 Number of times IXGLOGR detected “Staging-Dataset-Threshold-Hit” condition for this logstream on this systemduring the expiring SMF interval.
Staging Full SMF88ETF 8 Number of times IXGLOGR detected “Staging-Dataset-FULL”condition for this logstream on this system during the expiringSMF interval.
Offloads SMF88EO 8 Number of times IXGLOGR performed successful offload (>1byte of data) for this logstream on this system during theexpiring interval
Entry Full SMF88EFS 8 Number of times IXGLOGR performed an offload for all thelogstreams connected on this system to the structure due to thestructure's total in-use list entries reaching 90% of the totalavailable entries for the structure. This count is the number ofoccurances of this condition for the expiring interval.
Demand Offloads SMF88EDO 8 Number of times a demand initiated offload was requested (viaIXGOFFLD) for this logstream on this system during theexpiring interval.
Staging DSAsync Buf Full
SMF88EAF 8 Number of times IXGLOGR detected “Staging-Dataset-Async-Buffer_Full” condition for this logstream on this system duringthe expiring SMF interval.
Written Bytes SMF88SWB 8 Current WRITTEN-Bytes-Structure. Count of bytes written tointerim storage for this logstream for this interval (format: longfloating point).
Chapter 9. Extracts 207

Table 20. System Logger extract content (continued)
Extract label Field Length Description
Instead Bytes SMF88SIB 8 Current INSTEAD-Bytes count. Count of bytes deleted frominterim storage during this interval INSTEAD OF being movedto DASD (format: long floating point). This field is onlyincremented due to user ?IXGDELET invocations when the datahad not yet been migrated from interim storage to DASD.
After Bytes SMF88SAB 8 Current AFTER-Bytes count. Count of bytes deleted frominterim storage during this interval AFTER being moved toDASD (format: long floating point). This field is onlyincremented due to LOGGR internal management of interimstorage.
Instead Count SMF88SII 8 Current INSTEAD-Invoc count. Count of times a deletion frominterim storage was performed during this interval, where thedata was NOT first migrated to DASD.
After Count SMF88SAI 8 Current AFTER-Invoc count. Count of times a deletion frominterim storage was performed during this interval, AFTERbeing migrated to DASD (occurs due to LOGGR management ofinterim storage.)
Type-1Completions
SMF88SC1 8 Count of type-1 completions during the expired SMF interval.Logstream contents can remain in interim storage. No need tomove data from interim storage to DASD.
Type-2Completions
SMF88SC2 8 Count of type-2 completions during the expired SMF interval.Logstream is filling interim storage but space is not critical.Logger must move data from interim storage to DASD.
Type-3Completions
SMF88SC3 8 Count of type-3 completions during the expired SMF interval.Space used in interim storage (by this logstream) is critical butdoes not exceed 100 percent. Undefined for DASDONLYlogstreams.
The CICS PA Sample Library (SCPASAMP) contains sample JCL members forloading a System Logger extract into DB2:
CPALGDDLDDL to define a DB2 table for the System Logger extract data
CPALGLODDB2 Load Utility statements to load the System Logger extract data into apredefined DB2 table
Statistics extractA Statistics Extract is created as a delimited text file for the purpose of importingthe statistics into PC spreadsheet or database tools for further detailed analysis andreporting.
Extract commandThe Statistics extract can be requested from a Report Set in the CICS PA dialog.Select the Statistics extract in the Extracts category.
In batch, the EXTRACTSTATISTICS command is used to request the Statistics extract:CICSPA EXTRACTSTATISTICS(
[OUTPUT(ddname),][DELIMIT(’field-delimiter’),]
208 IBM CICS Performance Analyzer for z/OS: Report Reference

[LABELS|NOLABELS,][TYPE(EOD,INT,USS,REQ,RRT),]STTSxxxx(ddname)|STTGxxxx(ddname),...)
The STTSxxxx and STTGxxxx operands specify the CICS Transaction Server (TS) orCICS Transaction Gateway (TG) statistics that you want to extract, where xxxx isthe statistics ID. For example, specify STTS010A(TS010A01) to extract TransactionManager statistics (ID: 010A) to the data set specified in the DD statementTS010A01.
The format of the extract records depends on the statistics ID of the extracted data:each statistics ID defines its own set of fields.
Chapter 9. Extracts 209

210 IBM CICS Performance Analyzer for z/OS: Report Reference

Chapter 10. End of processing reports
Two reports are always produced at the end of CICS PA batch reporting to providesummary processing statistics:v “Dispatcher Tables Summary report”v “End of File Record Counts report” on page 212
Dispatcher Tables Summary reportThe Dispatcher Tables Summary Report provides a summary of the processingperformed by CICS PA. It can provide valuable information for problemdetermination. If no records are being processed for your requested reports andextracts, there is an excellent chance that the Dispatcher Tables Summary providesall the information needed to resolve the problem.
Report commandThe report is automatically produced before report and extract processing. Itcannot be explicitly requested.
Report content
The Dispatcher Tables Summary as shown in Figure 90 contains the followinginformation:
SMF FileThe DDname of the SMF input file, followed by a plus (+) sign if more thanone DDname was specified in the INPUT operand.
OffThis is the offset into the data record that the CICS PA scan program uses todetermine whether or not the record should be processed.
PreScanThe CICS PA module name that pre-processes each CMF record before theyare passed to the record processors.
RoutineThis is the name of the record processing module. Each specification of theprogram causes a separate use of the module. However, only one copy of themodule is loaded.
V3R2M0 07:49:07 3/12/2010 CICS Performance AnalyzerDispatcher Tables Summary
SMF File Off PreScan Routine Output EOF ParmName CodesSMFIN001+ 4 CPAPRSMF CPALSTMF LIST0001 Y LIST0001 31
CPALSXMF LSTX0001 Y LSTX0001 31CPASUMMF SUMM0001 Y SUMM0001 31CPAFNLMF TOTL0001 Y TOTL0001 31CPATRUMF RESU0001 Y RESU0001 31,35
SMFIN002 4 CPAPRSMF* CPALOGMF* LOGR0002 Y LOGR0002 58
SMFIN003 4 CPAPRSMF CPADB2MF DB2R0003 Y DB2R0001 31,65
SMFIN004+ 4 CPAPRSMF* CPAMROMF* CROS0001* Y CROS0003 31CPAMROMF* CROS000M* Y CROS0004 31CPAMROMF* CROS0001* Y CROS0005 31CPAMROMF* CROS000M* Y CROS0006 31CPAMROMF* CROS0001* Y CROS0007 31CPAMROMF* CROS000M* Y CROS0008 31
Figure 90. Dispatcher Tables Summary report
© Copyright IBM Corp. 2001, 2010 211

OutputThe output file DDname that was either specified in the OUTPUT operand orassigned by CICS PA. The name is followed by a (NO) if the file failed toopen. It can also be followed by a (DY) if the file is a DUMMY data set.
EOFA Y in this column indicates that the record processor is invoked at End of Fileof the input file.
ParmNameThis name is assigned by CICS PA to uniquely identify each invocation of arecord processing module.
CodesThis field represents the CMF record codes which are checked at the offsetlocation (Off) in the data record.
An asterisk (*) next to the PreScan routine, Record Processing routine or OutputDDname signifies that this entry has been used by a previous report. Try to avoidreusing Output DDnames, as the report output might be merged or difficult todistinguish.
End of File Record Counts reportThe End of File Record Counts report provides a summary of the input recordsprocessed. It can provide valuable information for problem determination.
Report commandThe report is automatically produced at the end of report and extract processing. Itcannot be explicitly requested.
Report content
The information shown in the End of File Record Counts report in Figure 91 is:
DDnameThis is the name associated with the SMF input file.
V3R2M0 16:26:54 7/23/2010 CICS Performance AnalyzerEnd of File Record Counts
DDname RecID Record Type Count Pct of TotalSMFIN001+ X’30’ Performance Dictionary 18 0.06%
X’31’ Performance Class 1,277 4.29%X’35’ Resource Usage 306 1.02%X’51’ CICS Statistics 26,829 90.13%X’58’ MVS System Logger 733 2.46%X’65’ DB2 Accounting 304 1.02%X’74’ MQ Accounting 305 1.02%
SMFIN001+ Total 29,772 100.00%Total SMF Records 2,092
SMFIN002 X’30’ Performance Dictionary 3 0.04%X’31’ Performance Class 250 3.18%X’51’ CICS Statistics 7,596 96.73%X’54’ CICS Server Statistics 4 0.05%
SMFIN002 Total 7,853 100.00%Total SMF Records 3,419
SMFIN003 X’30’ Performance Dictionary 3 0.01%X’31’ Performance Class 126 0.22%X’41’ Exception Class 8 0.01%X’51’ CICS Statistics 57,294 99.76%
SMFIN003 Total 57,431 100.00%Total SMF Records 2,462
Figure 91. End of File Record Counts report
212 IBM CICS Performance Analyzer for z/OS: Report Reference

RecIDThis is the hexadecimal ID of each SMF record in the input data set. This valuewas found at the offset (Off) shown in the Dispatcher Tables Summary. TheRecord ID values are:X'30' CMF performance class dictionaryX'31' CMF performance class dataX'35' CMF transaction resource class dataX'36' CMF identity class dataX'41' CMF exception class dataX'51' CICS statistics dataX'52' CICS temporary storage server statistics dataX'53' CICS coupling facility data table server statistics dataX'54' CICS named counter server statistics dataX'58' MVS System Logger dataX'65' DB2 Accounting dataX'6F' CICS Transaction Gateway statistics dataX'70' OMEGAMON XE for CICS dataX'74' MQ Accounting data
Record TypeThis is the name associated with the record type defined in the RecID field.
“Total SMF Records” is the total number of SMF records in the input file.
CountThis is a count of the number of records of the particular type in the input file.
The “Total SMF Records” is usually different from the “100% Total” becausethe one SMF record can contain many CMF performance class records.
Pct of TotalThis value represents the percentage of the records of the specified type againstthe total number of records in the file.
Chapter 10. End of processing reports 213
||

214 IBM CICS Performance Analyzer for z/OS: Report Reference

Part 3. Historical Database reports and extracts
These topics describe the reports that you can create from a Historical Database(HDB).
In addition, but not described here, CICS PA provides a Historical Database Exportfacility to export HDB data to DB2 tables. For more information on HistoricalDatabase facilities and creating HDB export data sets, see the CICS PA User'sGuide.
© Copyright IBM Corp. 2001, 2010 215

216 IBM CICS Performance Analyzer for z/OS: Report Reference

Chapter 11. Historical Database (HDB)
CICS PA Historical Database (HDB) is a repository of SMF data related to CICSsystem performance.
CICS PA Historical Database builds a history of transaction activity from yourCMF performance class data (“Performance HDB”), and a history of CICS statisticsand server statistics data and CICS Transaction Gateway statistics data (“StatisticsHDB”), that can be customized to meet your various reporting requirements. YourHistorical Database environment is controlled from the CICS PA ISPF dialog. Itprovides a fully managed environment from where you can control all aspects ofCICS performance data and CICS statistics data, including collection and reporting.
Initially, your HDB environment requires a minimal one-time setup. On theHistorical Database Menu, specify the name of the HDB Register. This is a VSAMKSDS where HDB definitions are saved.
The Historical Database Menu provides a pathway to the eight steps for definingand using HDBs:1. Template. (Performance HDB only, not applicable to Statistics HDB)
Defining a Performance HDB is a two step process: first define a Template andthen define an HDB based on that Template. The Template identifies whichCMF performance class fields to be kept in the HDB.
2. Definition.
After the Template is defined, then define the HDB and its options, such as thecharacteristics of the HDB data sets and the retention period of the data.
3. Load.
Loading data into the HDB is performed by the standard CICS PA batchreporting utility. The command that requests the utility to load an HDB is:HDB(LOAD(...
CICS PA reads the SMF data and builds the HDB data sets. Because the HDBLoad process is part of the normal batch reporting process, you can runCICS PA reports and load HDBs together with a single pass of the SMF data.
4. Report.
Performance HDB reporting is performed by the standard CICS PA batchreporting utility. The command that requests the utility to report against aPerformance HDB is:HDB(REPORT(...
You can tailor Performance HDB reporting by using a Report Form. This allowsyou to select which fields in the HDB are reported and how they are presented.Statistics HDB reporting is done interactively using the CICS PA dialog.Statistics HDB Alert reporting, which alerts you when statistics field valuesmeet specified conditions, is performed by the batch reporting utility. Thecommand that requests the utility to generate a Statistics Alert report against aStatistics HDB is:HDB(STATSALERT(...
Before requesting a Statistics Alert report, you must use the CICS PA dialog tocreate a Statistics Alert Definition.
© Copyright IBM Corp. 2001, 2010 217

5. Export.
Export allows you to load HDB data into a DB2 table. CICS PA automates thisprocess with two simple steps:a. First define the DB2 table to house the data. CICS PA generates JCL to do
this for you by creating the necessary DDL to define the table.b. Then load the data into the table. CICS PA generates JCL to do this for you
by creating the necessary DB2 Load Utility statements to load the data.6. Extract.
The HDB Extract facility allows you to export data from your HDB data sets toan extract data set in CSV format, suitable for import into PC-basedspreadsheet applications for further analysis.
7. Maintain.
HDB maintenance allows you to change your HDB definition and manage theHDB container data sets.
8. Housekeeping.
HDB housekeeping should be run periodically to clean-up your HDBenvironment. Housekeeping performs two tasks:a. Deletes HDB container data sets that have expired.b. Removes definitions from the HDB Register that are no longer required.
Batch processes are associated with four of these steps:Step 3 on page 217 Load HDBStep 4 on page 217 HDB reportingStep 6 HDB extract to CSVStep 8 HDB housekeeping
This chapter presents the commands and sample output for these batch processes.
HDB LoadOption 3 Load from the Historical Database Menu is where you request togenerate JCL to load historical performance data (List or Summary) or Statisticsdata into your HDB.
HDB Load commandThe HDB(LOAD) operand requests CICS PA to load CMF performance or CICSstatistics data from SMF data sets into an HDB.
The command format is:CICSPA HDB(LOAD(hdbname)
[,OUTPUT(ddname)])
The options are:
LOADSpecifies the name of the HDB to be loaded. The HDB must be defined inthe HDB Register (DDname CPAHDBRG).
OUTPUTDDname for the Recap report output. CICS PA records the results of theLoad operation in this File. If not specified, CICS PA assigns a DDname ofHDBLnnnn where nnnn is the numerical sequence number 0001-9999.
218 IBM CICS Performance Analyzer for z/OS: Report Reference

HDB Load Recap reportSuccessful completion of the Load request generates a Recap report that providesinformation about the HDB Load, including a list of Container data sets created bythe Load process.
In this example, CICS PA created Container data setJOHN.CICSP1H.D10219.T092846.HDB for HDB CICSP1H. It contains 54,567 recordsfor the period 9:00am to 4:00pm on August 7, 2010.
Performance HDB ReportingOption 4 Report from the Historical Database Menu is where you request to runreports against your Performance HDB.
There are two types of Performance HDB report:
List A LIST HDB contains data records for individual transactions. Typically,List HDB reports are used for the detailed analysis of recent transactionevents and the data typically has a short life span (retention).
SummaryA SUMMARY HDB contains data records that summarize transactionactivity over a specified time interval. Typically, Summary HDB reports areused for long-term trend analysis and capacity planning.
HDB Report commandThe HDB(REPORT) operand requests CICS PA to generate reports from HDBdata. The command applies to both List and Summary HDBs.
The command format is:CICSPA HDB(REPORT(hdbname),
[OUTPUT(ddname),][TOTALS(n)|NOTOTALS,][INTERVAL(hh:mm:ss),][FIELDS(field1[(options)],...),][LINECount(nnn),][SELECT(PERFORMANCE(INCLUDE|EXCLUDE(field1(values1),...),...)),][SELECT2(PERFORMANCE(INCLUDE|EXCLUDE(field1(values1),...),...))])
The options are:
REPORTSpecifies the name of the HDB to report against. The HDB must be definedin the HDB Register (DDname CPAHDBRG).
OUTPUTDDname for the report output. If not specified, CICS PA assigns a
V3R2M0 CICS Performance AnalyzerHDB Load Recap Report
HDBL0001 Printed at 9:28:48 9/07/2010 Data from 09:02:00 8/07/2010 to 16:29:00 8/07/2010 Page 1
LOAD requested for HDB: CICSP1H Register DSN: USER.CICSPA.HDB.REGISTER
The following Containers were created and loaded:Container DSN: JOHN.CICSP1H.D10219.T092846.HDB No of Records: 54,567Start Time Stamp: 2010-08-07-09.00.00 End Time Stamp: 2010-08-07-16.00.00
LOAD process complete.
Figure 92. HDB Load Recap report
Chapter 11. Historical Database (HDB) 219

DDname in the format HDBRnnnn where nnnn is the report sequencenumber 0001-9999 to uniquely identify the output.
TOTALS(n) | NOTOTALSThis option applies only to the Summary HDB report. Specify NOTOTALSif you do not want to include total lines in the report.
Specify TOTALS(n) to accumulate subtotals for up to 8 sort fields, print thesubtotals when the sort field changes, and print a grand total at the end ofthe report. If TOTALS(0) is specified, there are no subtotals, but the grandtotal will still be printed. TOTALS(8) is the default.
INTERVALSpecify an optional Time Interval when reporting Summary HDBs. Thedefault is the Time Interval used to create the data (as defined in theTemplate). In our example, Template PRODSUM used to create the HDBdata specified 15 minutes.
You can specify any interval greater than or equal to the Template Interval.For example, if you are reviewing many days worth of data then youmight specify 24:00:00 (24 hours) so that you can view the daily trend. Inthe example above, the Interval has been changed to 1 hour.
FIELDSSpecifies which fields are reported, the order in which they appear in thereport, and their summarization presentation. Only fields that are specifiedin the HDB Template can be specified. Fields not contained in the HDB arereported as Missing.
LINECountControls the number of lines per page in the HDB report.
SELECT, SELECT2Specifies what data to include or exclude from the report based on datafield values.
SELECT and SELECT2 can both be specified to perform record filtering.The CICS PA dialog generates SELECT2 statements in the command deckwhen you use a Report Form that has active Selection Criteria. If bothSELECT and SELECT2 are specified, then the record must pass selection byboth specifications for it to be included in the report.
HDB List reportThe HDB List report is produced from a List HDB.
The following report shows the HDB List report for a default List HDB (uses thedefault List Template). The report was generated by the command:CICSPA HDB(OUTPUT(HDBR0001),REPORT(HDBLIST1))
220 IBM CICS Performance Analyzer for z/OS: Report Reference

The fields in the default report are the fields defined in the default List Template(in order). Customized wider reports can generated by using a Report Form.
You can use a List Report Form to tailor the report or to report other fields in theHDB.
The HDB List report is very similar to the Performance List report (see Figure 2 onpage 21).
HDB Summary reportThe HDB Summary report is produced from a Summary HDB.
The following report shows the HDB Summary report for a default Summary HDB(uses the default Summary Template). The report was generated by the command:CICSPA HDB(OUTPUT(HDBR0001),REPORT(HDBSUMM1))
The fields in the default report are the fields defined in the default SummaryTemplate (in order). Fields that cause the report to exceed the maximum pagewidth are not reported. If no Report Form is specified, all fields in the HDB arereported to the maximum page width of 8000 characters. The report can becustomized by specifying a Report Form.
You can use a Summary Report Form to tailor the report or to report other fieldsin the HDB.
The HDB Summary report is very similar to the Performance Summary report (seeFigure 16 on page 38):
V3R2M0 CICS Performance AnalyzerHistorical Database List
HDBR0001 Printed at 12:03:45 8/15/2010 Data from 15:41:28 8/07/2010
Start MVS APPLID Tran Userid Program TaskNo Response Dispatch User CPU Suspend DispWait FC Wait FCAMRq IR WaitTime Time Time Time Time Time Time Time15:41:28.649 P390 CICS53A1 CPLT CICSUSER DFHSIPLT 6 .5196 .1771 .0316 .3425 .3422 .0000 0 .000015:41:29.598 P390 CICS53A1 CSSY CICSUSER DFHAPATT 15 .4595 .0036 .0033 .4558 .0000 .0000 0 .000015:41:29.604 P390 CICS53A1 CSSY CICSUSER DFHAPATT 16 .9663 .0069 .0088 .9594 .0795 .0000 0 .000015:41:29.610 P390 CICS53A1 CSSY CICSUSER DFHAPATT 17 4.0131 .1379 .0311 3.8752 1.7449 .0000 0 .000015:41:29.570 P390 CICS53A1 CSSY CICSUSER DFHAPATT 12 4.2133 .1621 .0494 4.0511 2.5906 .0000 0 .000015:41:29.191 P390 CICS53A1 CGRP CICSUSER DFHZCGRP 11 5.1156 .1956 .0603 4.9199 1.9401 .0000 0 .000015:41:29.591 P390 CICS53A1 CSSY CICSUSER DFHAPATT 14 4.7978 .1880 .0652 4.6098 2.3487 .0000 0 .000015:41:29.178 P390 CICS53A1 CSSY CICSUSER DFHAPATT 10 5.2738 1.4746 .2259 3.7992 .6720 .0000 0 .000015:41:29.177 P390 CICS53A1 CSSY CICSUSER DFHAPATT 9 5.3366 .7647 .1494 4.5719 1.6657 .0000 0 .000015:41:29.590 P390 CICS53A1 CSSY CICSUSER DFHAPATT 13 5.2787 .7009 .1740 4.5778 2.0694 .0000 0 .000015:42:24.011 P390 CICS53A1 CLQ2 CICSUSER DFHLUP 19 7.2473 .2907 .0416 6.9566 1.9555 .0000 0 3.784015:41:29.172 P390 CICS53A1 CSSY CICSUSER DFHAPATT III 74.6388 48.6230 18.0249 26.0158 7.7521 .6756 1506 .000015:42:43.395 P390 CICS53A1 CLR2 CICSUSER DFHLUP 20 .4513 .0130 .0128 .4383 .0215 .0000 0 .4363
Figure 93. HDB List report
V3R2M0 CICS Performance AnalyzerHistorical Database Summary
HDBR0001 Printed at 12:03:45 8/15/2010 Data from 15:41:00 8/07/2010 to 16:19:00 8/07/2010
Avg Avg Avg Avg Avg Avg Avg Avg AvgStart MVS APPLID Tran #Tasks Response Dispatch User CPU Suspend DispWait FC Wait FCAMRq IR Wait SC24UHWMInterval Time Time Time Time Time Time Time2010/08/07 15:41 P390 CICS53A1 CGRP 1 5.1156 .1956 .0603 4.9199 1.9401 .0000 0 .0000 02010/08/07 15:41 P390 CICS53A1 CPLT 1 .5196 .1771 .0316 .3425 .3422 .0000 0 .0000 02010/08/07 15:41 P390 CICS53A1 CSSY 9 11.6642 5.7846 2.0813 5.8796 2.1025 .0751 167 .0000 02010/08/07 15:41 P390 CICS53A1 11 10.0557 4.7668 1.7113 5.2890 1.9277 .0614 137 .0000 02010/08/07 15:41 P390 CICS53T1 CGRP 1 5.4980 .7931 .0613 4.7049 3.7141 .0000 0 .0000 02010/08/07 15:41 P390 CICS53T1 CPLT 1 .3939 .0782 .0325 .3158 .3149 .0000 0 .0000 02010/08/07 15:41 P390 CICS53T1 CSSY 9 11.1753 5.7900 2.0359 5.3853 2.5363 .2112 167 .0000 02010/08/07 15:41 P390 CICS53T1 11 9.6790 4.8164 1.6743 4.8626 2.4415 .1728 137 .0000 02010/08/07 15:41 P390 22 9.8674 4.7916 1.6928 5.0758 2.1846 .1171 137 .0000 02010/08/07 15:41 22 9.8674 4.7916 1.6928 5.0758 2.1846 .1171 137 .0000 0
Figure 94. HDB Summary report
Chapter 11. Historical Database (HDB) 221

v The key fields are reported in the left hand columns.v The Task count (#Tasks or #TTasks) is the number of CICS transactions (tasks)
that ran in the report interval. Specify one or both. The first one specified isused in the statistical calculations.
v The HDB statistics are reported to the right of the key fields.v Maximum and minimum values will not be reported because they cannot be
accurately determined from the summarized data.
Statistics HDB ReportingYou can request to run reports against your Statistics HDB from either: option 4Report from the Historical Database Menu; or option 7 Statistics from the PrimaryOption Menu, and then option 3 Historical Databases.... A Statistics HDB containsdata records from CICS Statistics class SMF records and CICS Transaction Gatewaystatistics SMF records.
There are two types of Statistics HDB report:
Online reportsRather than generating a batch report, you view Statistics HDB datainteractively using the CICS PA dialog. For details, see Chapter 12,“Statistics reporting using the dialog,” on page 231.
Statistics Alert HDB reportsThese batch reports alert you when data records in a Statistics HDB meetconditions that you have specified in a Statistics Alert definition. Fordetails, see “Statistics Alert HDB Reporting.”
Statistics Alert HDB ReportingStatistics Alert HDB reporting produces Statistics Alert reports from statistics HDBdata.
The HDB(STATSALERT) operand requests CICS PA to generate Statistics Alertreports from statistics HDB data.
The command format is:CICSPA HDB(STATSALERT(hdbname),
[OUTPUT(ddname),][EXTERNAL(ddname),]STALTDEF(statistics-alert-definition),[BY(APPLID[(LIST,SUMMARY)]|
ALERT[(LIST,SUMMARY)]|COLLECT|INTERVAL|RESOURCE),]
[TYPE(EOD,INT,USS,REQ,RRT)]
Except for the STATSALERT operand itself (which specifies the statistics HDB to beused), the options are the same as the options for the CICS PA STATSALERToperand to generate Statistics Alert reports from SMF data. For details, see “Reportcommand” on page 119.
222 IBM CICS Performance Analyzer for z/OS: Report Reference

HDB ExportOption 5 Export from the Historical Database Menu is where you request to exportdata from your HDB into DB2 tables.
CICS PA automates this process with two simple steps:1. First define the DB2 table to house the data. CICS PA generates JCL to do this
for you by creating the necessary DDL to define the table.2. Then load the data into the table. CICS PA generates JCL to do this for you by
creating the necessary DB2 Load Utility statements to load the data.
For more information on using the dialog, see the CICS Performance Analyzer forz/OS User's Guide.
For more information on working with DB2, see the DB2 UDB for z/OSAdministration Guide.
HDB ExtractThe HDB Extract facility allows you to export data from your HDB data sets to anextract data set in CSV (comma separated values) format, suitable as input intoPC-based spreadsheet applications.
Option 6 Extract from the Historical Database Menu is where you request to runextracts to CSV from your HDB.
There are three types of HDB extracts:1. List
A List HDB contains data records for individual transactions. Typically, ListHDB extracts are used for the detailed analysis of recent transaction events andthe data typically has a short life span (retention).
2. Summary
A Summary HDB contains data records that summarize transaction activityover a specified time interval. Typically, Summary HDB extracts are used forlong term trend analysis and capacity planning.
3. Statistics
A Statistics HDB contains collections of CICS statistics and server statistics dataand CICS Transaction Gateway statistics data over a specified time interval.
HDB Extract commandThe HDB(EXTRACT) operand requests CICS PA to generate extract data sets fromHDB data.
The command format is:CICSPA HDB(EXTRACT(hdbname),
[OUTPUT(ddname),][DDNAME(ddname),][INTERVAL(hh:mm:ss),][DELIMIT(’field-delimiter’),][LABELS|NOLABELS,][NOFLOAT|FLOAT,][FIELDS(field1[(options)],...),][SELECT(PERFORMANCE(INCLUDE|EXCLUDE(field1(values1),...),...)),][SELECT2(PERFORMANCE(INCLUDE|EXCLUDE(field1(values1),...),...))])
Chapter 11. Historical Database (HDB) 223

The options are:
EXTRACTThe name of the HDB. The HDB must be defined in the HDB Register(DDname CPAHDBRG).
OUTPUTDDname for the Recap report output. The CICS PA dialog assigns thedefault DDname HXTS0001.
DDNAMEDDname for the extract data set. The CICS PA dialog assigns the defaultDDname HDBX0001.
INTERVALApplicable to Summary HDBs. Optionally, specify the time interval forsummarizing transaction activity. The default is the Time Interval used tocreate the data (as defined in the Template).
You can specify any interval greater than or equal to the Template Intervalin the range 00:00:01 (1 second) to 24:00:00 (24 hours). For example, if youare reviewing many days worth of data then you might specify 24:00:00 sothat you can analyze the daily trend.
DELIMITThe field delimiter used to separate each data field in the extract records.Note that the specified delimiter is enclosed in quotes. The default fielddelimiter is a semicolon (;).
CICS PA extracts the data values from the HDB records, formats them, andthen adds a field delimiter after each field.
LABELS|NOLABELSLABELS indicates that the first record to be written to the extract data setis to be a field labels record. This is the default.
NOLABELS indicates that you do not want field labels written.
FLOAT|NOFLOATSpecify FLOAT format to write numeric fields to the extract data set inS390 FLOAT format. This is necessary if you plan to import the extract intoa DB2 table. When the DB2 Load Utility is used, it will interpret allnumerical fields reliably and consistently in FLOAT format.
If FLOAT is not specified, the numeric fields are written in a mixture ofinteger, real and exponential using character digits. This is the default andis suitable when importing the extract data into a PC spreadsheet tool.
FIELDSSpecifies which fields are exported to the extract data set, the order inwhich they appear in the extract record, and their summarizationpresentation. If any of the requested data fields were not collected in theHDB, a message is issued and the field in the extract record containsblanks (List HDB) or Missing (Summary HDB).
SELECT, SELECT2Specifies what data to include or exclude from the extract based on datafield values.
SELECT and SELECT2 can both be specified to perform record filtering.The CICS PA dialog generates SELECT2 statements in the command deckwhen you use a Report Form that has active Selection Criteria. If both
224 IBM CICS Performance Analyzer for z/OS: Report Reference

SELECT and SELECT2 are specified, then the record must pass selection byboth specifications for it to be included in the report.
HDB Extract record formatThe format of the HDB Extract record is determined by the particular HDB and therun time options. Here are some examples. Each field in the record is separated bya text file field delimiter, which by default is a semicolon (;). Optionally, the firstrecord contains the field labels.
HDB Extract Recap reportSuccessful completion of the HDB Extract generates a Recap report that providesinformation about the records processed and written to the extract data set.
Example 1:
In this example, 850 records were written in CSV format to data setCICSPA.SUMMARY.HDB.EXTRACT. The record count does not include the fieldlabels record.
Start Time;MVS;APPLID;Tran;Userid;Program;TaskNo;Response Time;Dispatch Time;User CPU Time;Suspend Time;DispWait Time; . . .07:41:29.998;MV2C;IYK3Z4 ;CSSY;CICSUSER;DFHAPATT; 17; .1413; .0708; .0082; .0705; .0680; .0000;07:41:29.995;MV2C;IYK3Z4 ;CSSY;CICSUSER;DFHAPATT; 14; .2025; .0195; .0022; .1830; .1808; .0000;07:41:29.995;MV2C;IYK3Z4 ;CSSY;CICSUSER;DFHAPATT; 11; .3219; .0658; .0096; .2562; .2487; .0000;07:41:29.995;MV2C;IYK3Z4 ;CSSY;CICSUSER;DFHAPATT; 12; .4355; .0976; .0116; .3379; .2886; .0000;07:41:29.999;MV2C;IYK3Z4 ;CSSY;CICSUSER;DFHAPATT; 19; .4625; .0669; .0056; .3956; .3856; .0000;07:41:29.999;MV2C;IYK3Z4 ;CSSY;CICSUSER;DFHAPATT; 18; .5860; .0998; .0071; .4862; .4820; .0000;07:41:29.997;MV2C;IYK3Z4 ;CSSY;CICSUSER;DFHAPATT; 16; .7682; .1838; .0131; .5844; .5694; .0000;07:41:29.995;MV2C;IYK3Z4 ;CGRP;CICSUSER;DFHZCGRP; 13; .8097; .0244; .0026; .7852; .7827; .0000;
Figure 95. List HDB Extract file
Start Date;Start Time;MVS;APPLID;Tran;#Tasks;Response Time Avg;Dispatch Time Avg;User CPU Time Avg;Suspend Time . . .2010/12/15 15:00:00;MV2C ;IYK3ZAC1;CSHQ ; 1;55155.62; .2103; .0212;55155.41; .0331; .0001;2010/12/15 15:00:00;MV2C ;IYK3ZAC1;CSNC ; 1;55159.06; .3379; .0041;55158.72; .0356; .0001;2010/12/15 15:00:00;MV2C ;IYK3ZAC1;CSNE ; 1;55153.97; .0881; .0060;55153.88; .0042; .0001;2010/12/15 18:00:00;MV2C ;IYK2ZFV1;CEX2 ; 1;50237.83; .5030; .2717;50237.33; .1800; .0001;2010/12/15 18:00:00;MV2C ;IYK2ZFV1;CSHQ ; 1;50234.95; .3105; .0190;50234.64; .5761; .0001;2010/12/15 18:00:00;MV2C ;IYK2ZFV1;CSNC ; 1;50393.54; .4259; .0058;50393.12; .0026; .0001;2010/12/15 18:00:00;MV2C ;IYK2ZFV1;CSNE ; 1;50389.87; .1321; .0177;50389.74; .0074; .0001;2010/12/15 18:00:00;MV2C ;IYK2ZFV2;CEX2 ; 1;50241.24; .2630; .1828;50240.98; .2255; .0001;2010/12/15 18:00:00;MV2C ;IYK2ZFV2;CKAM ; 1;50239.91; .0875; .0044;50239.82; .0522; .0001;2010/12/15 18:00:00;MV2C ;IYK2ZFV2;CSHQ ; 1;50238.49; .3122; .0197;50238.18; .8023; .0001;2010/12/15 18:00:00;MV2C ;IYK2ZFV2;CSNC ; 1;50248.39; .4899; .0051;50247.90; .0064; .0001;
Figure 96. Summary HDB Extract file
CPA.STAT01.STAT060A
Start Time;APPLID;MVSID;Global_Statistics_Length;CICS_TCB_MODEs;CICS_TCB_POOLs;Current_ICV_Time;C . . .2010-02-16-07.39.30;IYK3ZAC1;MV2C ;128;18;4;5000;5000;500;32768;0;1;34;54;2010-02-15-16.20.19;2010-02-16-07.42.00;IYK3Z4 ;MV2C ;128;18;4;5000;5000;500;32768;0;1;16;44;2010-02-16-07.41.38;2010-02-16-07.44.00;IYK3Z4 ;MV2C ;128;18;4;5000;5000;500;32768;0;1;16;17;2010-02-16-07.41.38;2010-02-16-07.44.24;IYK3Z4A1;MV2C ;128;18;4;5000;5000;500;32768;0;1;14;44;2010-02-16-07.41.33;
CPA.STAT01.STAT060B
Start Time;APPLID;MVSID;TCB_Mode_Name;TCB_Mode_Open;TCB_Pool;TCB_Attaches;TCB_Attach_Failu . . .2010-02-16-07.39.30;IYK3ZAC1;MV2C ;QR;NOTOPEN ;NA ;0;0;1;1;1;1;0;0;0;0;0;0;0;5787;2010-02-16-07.39.30;IYK3ZAC1;MV2C ;RO;NOTOPEN ;NA ;0;0;1;1;1;1;0;0;0;0;0;0;0;24;152010-02-16-07.39.30;IYK3ZAC1;MV2C ;CO;UNKNOWN ;NA ;0;0;0;0;0;0;0;0;0;0;0;0;0;0;00.2010-02-16-07.39.30;IYK3ZAC1;MV2C ;SZ;UNKNOWN ;NA ;0;0;0;0;0;0;0;0;0;0;0;0;0;0;00.2010-02-16-07.39.30;IYK3ZAC1;MV2C ;D2;UNKNOWN ;NA ;0;0;0;0;0;0;0;0;0;0;0;0;0;0;00.2010-02-16-07.39.30;IYK3ZAC1;MV2C ;JM;NOTOPEN ;NA ;0;0;0;0;0;0;0;0;0;0;0;0;0;0;00.
Figure 97. Statistics HDB Extract file
V3R2M0 CICS Performance AnalyzerHistorical Database Summary
HXTS0001 Printed at 12:03:45 7/15/2010 Data from 05:17:00 11/17/2009 to 21:31:00 01/17/2010 Page 1
HDBX0001 Extract has completed successfullyData Set Name . . . . CICSPA.SUMMARY.HDB.EXTRACTRecord count . . . . 850
Figure 98. Summary HDB Extract Recap report
Chapter 11. Historical Database (HDB) 225

Example 2:
In this example, 5,905 statistics records were written in CSV format to data setCICSPA.HDB.EXTRACT.STAT067A. The records are for Statistics ID 067 which isthe Files report in category Files and Databases.
CICS PA extracts CICS TG statistics to data set names with the low-level qualifier“HSTGnnnn”. This distinguishes them from CICS TS statistics, which CICS PAextracts to data set names with the low-level qualifier “STATnnnn”.
HDB HousekeepingOption 8 Housekeeping from the Historical Database Menu is where you requestto perform HDB housekeeping. HDB Housekeeping performs tasks to re-organizeand clean up your HDB environment:1. Submit HDB Housekeeping JCL.
Run HDB Housekeeping periodically to delete expired HDB data sets and tore-organize the HDB Register.
2. Repair HDB Register using VERIFY command.
The IDCAMS VERIFY command is used to repair the end-of-data-setinformation in the VSAM Catalog for the HDB Register. Use repair if messageIEC161I is being issued repeatedly. This condition is usually caused by anearlier HDB dialog or batch request that failed.This function is only available from the dialog.
HDB Housekeeping commandThe HDB(HKEEP) operand requests CICS PA to perform housekeeping on theHDB Register (DDname CPAHDBRG). Housekeeping deletes expired HDBcontainer data sets and removes definitions from the HDB Register that are nolonger required.
The command format is:CICSPA HDB(HKEEP)
HDB Housekeeping reportSuccessful completion of the Housekeeping request generates a report thatprovides information about the list of Container data sets that were deleted.
V3R2M0 CICS Performance AnalyzerHistorical Database Statistics
HXTS0002 Printed at 12:03:45 7/15/2010 Data from 07:39:23 12/16/2009 to 11:45:34 02/28/2010 Page 1
STAT067A Extract has completed successfullyData Set Name . . . . CICSPA.HDB.EXTRACT.STAT067AStatistics ID . . . . 067ARecord count . . . . 5,905
Figure 99. Statistics HDB Extract Recap report
226 IBM CICS Performance Analyzer for z/OS: Report Reference

In this example, CICS PA deleted two Container data sets for HDB CICSWEEK inRegister CICSPROD.CICSPA.HDB.REGISTER.
Manifest BuildA manifest is a proprietary DB2 table named qualifier.CPA_MANIFEST thatcontains all the information required by the CICS PA plug-in for CICS Explorer toaccess and use the historical data. A manifest is a catalog of HDBs that areassociated with the same qualifier and for which the Explorer indicator is set.
For more information about the IBM CICS Explorer, see the following Web page:
http://www.ibm.com/cics/explorer.
Manifest Build commandThe manifest qualifier and Explorer option for an HDB is specified using option 5.2Historical Database Define or 5.7 Historical Database Maintenance.
A manifest build is requested from option 5.5 Historical Database Export or option5.7 Historical Database Maintenance. From the list of HDBs, select Explorer ->Manifest Maintenance from the action bar. Specify the manifest qualifier and ifrequired, DB2 table details, then press Enter to generate the JCL.
The command format is:CICSPA MANIFEST(qualifier)
CICS PA assigns a DDname of MANB0001 for the Recap report output.
Manifest Build Recap reportSuccessful completion of the Manifest Build request produces a Recap report. Itcontains output from the job step that populates the manifest and lists the HDBsand their DB2 tables that were included for the specified qualifier.
V3R2M0 CICS Performance AnalyzerHDB Housekeeping Report
Housekeeping is being performed against HDB Register CICSPROD.CICSPA.HDB.REGISTER Page 1
The following Containers were deleted from the Register:Container DSN: CICSPA.HISTORY.CICSWEEK.D03208.T193605.HDB Reason: Expired No of Records: 1,323Created: 2010-09-27-19.36.07.575656 ; Record Range is from 2010-08-05-08.09.56.246647 to 2010-08-05-08.13.30.750026
Container DSN: CICSPA.HISTORY.CICSWEEK.D03208.T200611.HDB Reason: Expired No of Records: 1,323Created: 2010-09-27-20.06.13.182143 ; Record Range is from 2010-08-05-08.09.56.246647 to 2010-08-05-08.13.30.750026
Housekeeping process complete.
Figure 100. HDB Housekeeping report
Chapter 11. Historical Database (HDB) 227
|
||||
|
|
|
||
||||
|
|
|
|
||||

Confirm from the job output that the manifest DB2 table namedqualifier.CPA_MANIFEST was successfully defined or rebuilt. In this example,FINANCE.CPA_MANIFEST.
V3R2M0 CICS Performance AnalyzerManifest Build Recap Report
MANB0001 Printed at 9:28:48 9/07/2010
Manifest Build for Qualifier: FINANCE HDB Register DSN: CICSPROD.CICSPA.HDB.REGISTER
Number of Performance tables: 1Number of Statistics tables : 9
HDB Name Table Name Description Status-------- ------------ ------------------------------ ---------PERFP1 CPA_CMFPSUM Performance Summary Included
PERFP2 CPA_CMFPSUM Performance Summary Duplicate
STATS1 CPA_HST005A Domain Subpools IncludedCPA_HST006A Task Subpools IncludedCPA_HST014A Storage Overview IncludedCPA_HST014B DSAs IncludedCPA_HSTG000A Connection Manager IncludedCPA_HSTG001A CICS Server Statistics Included
STATS2 CPA_HST065A MVS TCBs IncludedCPA_HST014A Storage Overview Duplicate
STATS3 CPA_HSTG000A Connection Manager DuplicateCPA_HSTG001A CICS Server Statistics DuplicateCPA_HSTG002A CICS Server Instance for EXCI IncludedCPA_HSTG007A CICS Server Instance for IPIC Included
Figure 101. HDB Manifest Build Recap report
228 IBM CICS Performance Analyzer for z/OS: Report Reference
|||||||||||||||||||||||||||||||||||

Part 4. Statistics reporting using the dialog
This topic gives some examples of statistics reports that you can produce using theCICS PA dialog. For more information on how to use the dialog for statisticsreporting, see the CICS PA User's Guide.
For a brief description of each field in the reports, see the CICS PA online help.For more information on understanding and interpreting the CICS statistics data inthe reports, see “Using CICS statistics” in the CICS Transaction Server for z/OSPerformance Guide. For more information on understanding and interpreting theCICS Transaction Gateway statistics data in the reports, see “Monitoring andStatistics” in CICS Transaction Gateway: z/OS Administration.
For information on batch Statistics Alert reporting, see “Statistics Alert reports” onpage 119. For information on extracting statistics to delimited text files for furtherprocessing by other applications, see “Statistics extract” on page 208.
© Copyright IBM Corp. 2001, 2010 229

230 IBM CICS Performance Analyzer for z/OS: Report Reference

Chapter 12. Statistics reporting using the dialog
The CICS PA dialog provides comprehensive reporting for the following types ofstatistics:v CICS statistics and server statistics in SMF 110 records with the following
subtypes:2 CICS Statistics3 Shared Temporary Storage Server Statistics4 Coupling Facility Data Table Server Statistics5 Named Counter Sequence Number Server Statistics
v CICS Transaction Gateway statistics in SMF 111 records
Short-term in-depth analysis or long-term trend analysis for your CICS statistics isavailable via the CICS PA Historical Database (HDB) and Statistics Reportingfacilities.
CICS PA statistics reporting complements the CICS utilities DFH0STAT andDFHSTUP. CICS PA presents CICS statistics in a similar way to DFH0STAT, theCICS sample statistics program. It does not accumulate and report statisticsintervals like DFHSTUP.
Statistics reporting is available from the dialog. The procedure is:1. Specify an SMF File or HDB. A list of CICS statistics intervals for all systems is
displayed.2. Select the desired interval. A menu of statistics categories and reports is
displayed.3. Select the desired report. The statistics report is displayed. There are two types
of reports: label reports or tabular reports:v In label-based reports, fields are reported vertically. This is used when there
is only one record for the report, typically an overview report.v In tabular reports, fields are reported horizontally. This format is displayed
when there can be multiple records in the report, typically for CICSresources.
4. Sort on any column in the report, ascending or descending, usingpoint-and-shoot column heading underlines.
5. Hyperlink to related reports using point-and-shoot field values.6. Press Help (F1) to display descriptions of all fields in the report, together with
their CICS field name and DB2 column name.7. Press Form (F6) to edit the Report Form which controls the fields that are
displayed in the report.
For more information on using the dialog for HDB and statistics reporting, see theCICS Performance Analyzer for z/OS User's Guide.
For more information on understanding and interpreting the CICS statistics data inthe reports, see “Using CICS statistics” in the CICS Transaction Server for z/OSPerformance Guide. For more information on understanding and interpreting theCICS Transaction Gateway statistics data in the reports, see “Monitoring andStatistics” in CICS Transaction Gateway: z/OS Administration.
© Copyright IBM Corp. 2001, 2010 231

In addition to reporting statistics using the dialog, you can also process statistics inStatistics Alert batch reports, and extract statistics to delimited text files. Fordetails, see “Statistics Alert reports” on page 119 and “Statistics extract” on page208.
Statistics intervalsCICS PA scans specified SMF Files for statistics intervals and presents the list ofintervals for further analysis.
Select a collection interval for reporting.
Statistics categories and reportsFor a selected interval, CICS Statistics are displayed in a tree structure of categoriesand reports. The menu is release-specific. There are slight differences between thereports that are available in each CICS release.
CICS PA supports CICS Transaction Gateway statistics reporting for CICSTransaction Gateway VRM 710 and later (CICS Transaction Gateway Versions 7.1,7.2, and 8.0).
File Edit Filter Options Help------------------------------------------------------------------------------
Statistics Intervals Row 1 from 2028Command ===> Scroll ===> PAGE
Select the required CICS Statistics interval.
/ System Image VRM Type --- Collection Time --- Reset Duration_ IYK3ZAC1 MV2C 640 TS USS 2010/02/16 07:39:23 Thu 00:00:07_ IYK3ZAC1 MV2C 640 TS USS 2010/02/16 07:39:26 Thu 00:00:07_ IYK3ZAC1 MV2C 640 TS USS 2010/02/16 07:39:27 Thu 00:00:07_ IYK3ZAC1 MV2C 640 TS USS 2010/02/16 07:39:30 Thu 00:00:07_ IYK3ZAC1 MV2C 640 TS EOD 2010/02/16 07:39:30 Thu 00:00:07_ IYK3Z4A1 MV2C 640 TS USS 2010/02/16 07:41:25 Thu 07:41:14_ IYK3Z4A1 MV2C 640 TS USS 2010/02/16 07:41:27 Thu 07:41:14_ IYK3Z4A1 MV2C 640 TS USS 2010/02/16 07:41:30 Thu 07:41:14_ IYK3Z4 MV2C 640 TS USS 2010/02/16 07:41:31 Thu 07:41:20_ IYK3Z4 MV2C 640 TS USS 2010/02/16 07:41:32 Thu 07:41:20_ IYK3Z4 MV2C 640 TS USS 2010/02/16 07:41:33 Thu 07:41:20S IYK3Z4 MV2C 640 TS INT 2010/02/16 07:42:00 Thu 07:41:20 00:02:00_ IYK3Z4 MV2C 640 TS USS 2010/02/16 07:42:10 Thu 07:42:00_ IYK3Z4 MV2C 640 TS USS 2010/02/16 07:42:52 Thu 07:42:00_ IYK3Z4A1 MV2C 640 TS USS 2010/02/16 07:42:57 Thu 07:41:14_ IYK3Z4A1 MV2C 640 TS USS 2010/02/16 07:42:58 Thu 07:41:14_ IYK3Z7DA MV2C 640 TS USS 2010/02/16 07:43:01 Thu 07:42:53_ IYK3Z7DA MV2C 640 TS USS 2010/02/16 07:43:03 Thu 07:42:53_ IYK3Z7DA MV2C 640 TS USS 2010/02/16 07:43:08 Thu 07:42:53_ IYK3Z7DD MV2C 640 TS USS 2010/02/16 07:43:12 Thu 07:43:02_ IYK3Z7DD MV2C 640 TS USS 2010/02/16 07:43:13 Thu 07:43:02_ IYK3Z7DD MV2C 640 TS USS 2010/02/16 07:43:17 Thu 07:43:02_ IYK3Z4A1 MV2C 640 TS USS 2010/02/16 07:43:31 Thu 07:41:14_ IYK3Z4A1 MV2C 640 TS USS 2010/02/16 07:43:52 Thu 07:41:14_ IYK3Z4A1 MV2C 640 TS USS 2010/02/16 07:43:53 Thu 07:41:14_ IYK3Z4 MV2C 640 TS INT 2010/02/16 07:44:00 Thu 07:42:00 00:02:00_ IYK3Z4A1 MV2C 640 TS EOD 2010/02/16 07:44:24 Thu 07:41:14_ IYK3Z4A1 MV2C 640 TS USS 2010/02/16 07:44:24 Thu 07:44:24_ IYK3Z4A1 MV2C 640 TS USS 2010/02/16 07:44:31 Thu 07:44:31_ IYK3Z4A1 MV2C 640 TS USS 2010/02/16 07:45:07 Thu 07:44:31_ IYK3Z4A1 MV2C 640 TS USS 2010/02/16 07:45:08 Thu 07:44:31_ IYK3Z4A1 MV2C 640 TS USS 2010/02/16 07:45:50 Thu 07:44:31
Figure 102. CICS Statistics Intervals
232 IBM CICS Performance Analyzer for z/OS: Report Reference
|

Table 21. Statistics categories and reports
Category Subcategory or Report ID Minimum CICS TSVRM (640, unlessotherwise stated)
CICS Performance Analyzer - CICS TS Alert 0SA �1�
RegionsTransaction Manager 010
CICS DispatcherDispatcher Overview 060Dispatcher TCB Modes 060Dispatcher TCB Pools 060MVS TCB Overview 064MVS TCBs 065
CICS StorageStorage Overview 002/014 �2�DSAs 002/014 �2�Domain Subpools 005Task Subpools 006
CICS DumpsTransaction Dump Overview 087Transaction Dumps 085System Dump Overview 090System Dumps 088
Enqueue Pools 097
BUNDLE Resources 100 660
ConnectivityVTAM 021Terminal Autoinstall 024Terminals 034ISC/MRO Connections 052LU62 Mode Names 076ISC Security 054TCP/IP Overview 107TCPIPSERVICE Resources 108IPCONN Resources 109 650FEPI Connections 017FEPI Pools 016FEPI Targets 018
Files and DatabasesFiles 067VSAM LSR Pools 039VSAM LSR Pool Buffers 039VSAM LSR Pool Files 040DB2 Connections 102DB2 Entries 103IMS DBCTL Subsystems 028WebSphere MQ Connections 074 650
LoggingLogstream Overview 092MVS Logstreams 094
Chapter 12. Statistics reporting using the dialog 233
|
||||

Table 21. Statistics categories and reports (continued)
Category Subcategory or Report ID Minimum CICS TSVRM (640, unlessotherwise stated)
Journal Names 093Recovery Manager 099
QueuesTemporary Storage Overview 048Transient Data Overview 045Transient Data Queues 042
TransactionsTransactions 011Transaction Classes 012Request Models 111
ProgramsPrograms 025Program Autoinstall 023Loader Activity 030Loader DSAs 030LIBRARY Resources 031 650LIBRARY Data Set Names �3� 031 650PROGRAMDEF Resources 120 660
Event ProcessingEvent Capture 140 660EVENTBINDING Resources 141 660Event Processing 142 660CAPTURESPEC Resources 143 660
CICS Web SupportURIMAP Global 101URIMAP Resources 104PIPELINE Resources 105WEBSERVICE Resources 106DOCTEMPLATE Resources 112 650ATOMSERVICE Resources 110 660XMLTRANSFORM Resources 113 660
Java and Enterprise JavaJVM Pool and Class Cache 117JVM Profiles 118JVM Profile Modes 118JVM Programs 119JVMSERVER Resources 116CorbaServers 114Enterprise Java Beans 115
MiscellaneousMonitoring 081Statistics 066Table Manager 063User Domain 061
CICS ServerTemporary Storage
234 IBM CICS Performance Analyzer for z/OS: Report Reference
|

Table 21. Statistics categories and reports (continued)
Category Subcategory or Report ID Minimum CICS TSVRM (640, unlessotherwise stated)
List Structures 121Queue Buffer Pools 122Server Storage 123
Named CountersList Structures 124Server Storage 125
Coupling Facility Data TablesList Structures 126Table Access 127Requests 128Server Storage 129
CICS Performance Analyzer - CICS TG Alert 0SA �1�
CICS Transaction Gateway �4� Connection Manager 000 (Minimum CICS TGVRM 710)CICS Server Statistics 001
CICS Server Instance for EXCI 002CICS Server Instance for IPIC 007Gateway Daemon 003Protocol Handler 004Worker Thread 005System Environment 006
�1� The Alert report is only available for Statistics HDB reporting, not whenprocessing SMF files. It displays the statistics collected in the HDB thatcomplied with Alert conditions in the HDB definition. For similar batchreporting from the original SMF files, use the Statistics Alert reportavailable in the Report Sets facility.
�2� Statistics record ID 002 applies only to CICS version 640 and earlier.
�3� The Library Data Set Names statistics report appears in the tree structureonly when you are selecting the reports you want to collect in an HDB orexport to DB2. This report does not appear in the tree structure for viewingor printing reports. To view this report:1. View the LIBRARY Resources report.2. Move the cursor to a library name, and then press Enter (the library
name is a point-and-shoot field). The report displays the data set namesin the concatenation for that library.
�4� CICS Transaction Gateway statistics were introduced in CICS TransactionGateway V7.1. Selecting an interval from the Statistics Intervals list paneldisplays the Statistics Reports list panel, showing the appropriate reportsfor the system type, CICS Transaction Server (TS), or CICS TransactionGateway (TG).
When defining or maintaining a statistics HDB, the Statistics Reports listpanel shows both CICS TS and CICS TG reports, enabling you to specifywhether the HDB collects CICS TS statistics, CICS TG statistics, or both.Similarly, when exporting or extracting from a statistics HDB, this panelshows reports for both system types, so that you can export or extract datafor both system types in a single pass.
Chapter 12. Statistics reporting using the dialog 235
|
||||
||||||

Label reports for global statisticsIn label-based reports, fields are reported vertically. This is used when there is onlyone record for the report, typically an overview report.
Tabular reports for resource statisticsIn tabular reports, fields are reported horizontally. This format is displayed whenthere can be multiple records in the report, typically for CICS resources.
REPORT Storage Overview Line 00000001Command ===> Scroll ===> PAGE
System: IYK3Z4/MV2C Type: INT Interval: 2010/02/16 07:42:00 Thursday
Page Pools . . . . . . . . . . : 8Storage Protection . . . . . . : NOReentrant Programs Protected . : YESTransaction Isolation . . . . . : NOCurrent Unique Subspace Users . : 0Total Unique Subspace Users . . : 0Peak Unique Subspace Users . . : 0Current Common Subspace Users . : 0Total Common Subspace Users . . : 0Peak Common Subspace Users . . : 0Current DSA Limit . . . . . . . : 5120KCurrent EDSA Limit . . . . . . : 40960KCurrent DSA Total . . . . . . . : 1280KCurrent EDSA Total . . . . . . : 23552KPeak DSA Total . . . . . . . . : 1280KPeak EDSA Total . . . . . . . . : 23552KMVS Storage Wait Time . . . . . : 00.00.00.000000MVS Storage Request Waits . . . : 0
Figure 103. Statistics report (label format): Storage Overview
REPORT Domain Subpools Line 00000001 Col 002 008 >Command ===> Scroll ===> PAGE
System: IYK3Z4/MV2C Type: INT Interval: 2010/02/16 07:42:00 Thursday
Subpool DSA Element Fixed Element ElementName Name Type Length Chaining Boundary Location Acces
>LGJMC ECDSA FIXED 60 NO 4 ABOVE CICSAITM_TAB ECDSA FIXED 584 NO 8 ABOVE CICSAP_TCA24 CDSA FIXED 1536 NO 128 BELOW CICSAP_TCA31 ECDSA FIXED 1536 NO 128 ABOVE CICSAP_TXDEX ECDSA FIXED 72 NO 8 ABOVE CICSAPAID31 ECDSA FIXED 152 NO 8 ABOVE CICSAPBMS ECDSA VARIABLE 0 YES 16 ABOVE CICSAPCOMM31 ECDSA VARIABLE 0 NO 16 ABOVE CICSAPDWE ECDSA FIXED 32 NO 8 ABOVE CICSAPECA SDSA FIXED 8 NO 8 BELOW CICSAPICE31 ECDSA FIXED 208 NO 8 ABOVE CICSAPURD ECDSA VARIABLE 0 NO 16 ABOVE CICSASYNCBUF ECDSA FIXED 4096 NO 4 ABOVE CICSBAGENRAL ECDSA VARIABLE 0 NO 16 ABOVE CICSBAOFBUSG ECDSA FIXED 24 NO 8 ABOVE CICSBAOFT_ST ECDSA FIXED 136 NO 8 ABOVE CICSBR_BFBE ECDSA FIXED 80 NO 16 ABOVE CICSBR_BFNB ECDSA FIXED 96 NO 16 ABOVE CICS
Figure 104. Statistics report (tabular format): Domain Subpools
236 IBM CICS Performance Analyzer for z/OS: Report Reference

Statistics Report FormThe Statistics Report Form is used to tailor the Statistics report. Each line in theForm represents a row heading in the label report or a column heading in thetabular report.
The order of the fields in the Form dictates the order of the fields in the report.You can OMIT fields that you do not want reported. You can also FIX fields at thestart of the report so that they remain in view when horizontally scrolling thereport. For long character fields in tabular reports, you can truncate the field in thereport by specifying a column width.
FORM Transaction Manager Line 1 of 12Command ===> ________________________________________________ Scroll ===> PAGE
/ Heading Usage_ Transactions ______ Current MAXTASK ______ Current Active User Transactions ______ Current Queued User Transactions ______ Times at MAXTASK ______ Peak Active User Transactions ______ Peak Queued User Transactions ______ Total Active User Transactions ______ Total Delayed User Transactions ______ Total Queuing Time for MAXTASK OMIT__ Current Queuing Time for MAXTASK OMIT__ Total Transactions to Last Reset _____********************************* End of Form *********************************
Figure 105. Statistics Report Form (label format): Transaction Manager
FORM TCP/IP Services Line 1 of 23Command ===> ________________________________________________ Scroll ===> PAGE
------ Width ------/ Heading Usage Column Max Report_ TCP/IP Service FIX__ 8 8_ Transactions Attached _____ 12 22_ Current Connections _____ 11 35_ Peak Connections _____ 11 48_ Time Opened GMT _____ 19 69_ Time Opened Local _____ 19 90_ Time Closed GMT _____ 19 111_ Time Closed Local _____ 19 132_ Port Number _____ 10 144_ SSL Support Level _____ 8 154_ Port Backlog _____ 10 166_ Send Requests _____ 10 178_ Bytes Sent _____ 10 190_ Receive Requests _____ 10 202_ Bytes Received _____ 10 214_ IP Address _____ ___15 15 231_ WLM DNS Group _____ ___18 18 251_ Protocol _____ 8 261_ Authenticate _____ ___12 12 275_ Privacy _____ 8 285_ Attachsec _____ 9 296_ TSQ Prefix _____ 8 306_ MAXDATA Length _____ 10 318********************************* End of Form *********************************
Figure 106. Statistics Report Form (tabular format): TCP/IP Services
Chapter 12. Statistics reporting using the dialog 237

Statistics field helpField descriptions are available for all statistics reports.
The field help provides a description of each statistic, together with the CICS fieldname and the CICS PA DB2 column name.
Field Descriptions for Statistics Report
Category : Files and Databases Macro . . : DFHA17DSReport . : Files DSECT . . : DFHA17DS______________________________________________________________________________
More: +File Name
CICS field name: A17FNAM DB2 column name: FILE_NAME
The name you specified in the DEFINE FILE command of resource definitiononline.
Reset characteristic: Not reset______________________________________________________________________________
File Location
CICS field name: A17FLOC DB2 column name: FILE_LOCATION
The file is defined as being local to this CICS system, or resides on a remoteCICS system. The field is one byte long, and is set to "R" if remote.
Reset characteristic: Not reset______________________________________________________________________________
Data Table Fields
CICS field name: A17DT DB2 column name: DATA_TABLE_FIELDS
A one-byte field that contains the value R, S, T, L, K, or X, if data tablestatistics fields are present in the record. The values indicate:R This is a remote file for which table read and source read statistics are
present.S The resource was not opened as a table but was able to access data from a
table associated with the same data set.T The resource is a shared data table.L The resource is a coupling facility data table (locking model).K The resource is a coupling facility data table (contention model).X The resource has been opened with a source data set which has an
associated CICS maintained data table and the resource has been updatedwhich has caused the data table to also be updated.
Reset characteristic: Not reset
Figure 107. Statistics field help: Files (Statistics ID 067)
238 IBM CICS Performance Analyzer for z/OS: Report Reference

Part 5. CICS-related SMF data
These topics describe the Shared System Takeup Recap report and provide adetailed description of the CMF data to help you understand and interpretCICS PA reports and extracts.
© Copyright IBM Corp. 2001, 2010 239

240 IBM CICS Performance Analyzer for z/OS: Report Reference

Chapter 13. Shared System Definitions
The systems and data files that you want to report against must first be defined toCICS PA. The dialog provides two ways to do this:
Personal System DefinitionsSystem definitions that are typically maintained by you and used by youfor reporting. The definitions are saved in your Personal Profile Library inCICS PA Settings.
Shared System DefinitionsSystem definitions that are typically maintained by a central administratorand used by all permitted users for reporting. The definitions are saved inthe HDB Register.
Shared System Definitions can be maintained in a number of ways:1. Individually specify systems and their related files2. Individually specify groups and their related systems3. Take-up systems, files, and groups from personal System Definitions4. Take-up systems and files from SMF Files
Only the Take-up from SMF Files has a batch component described in this book.The other maintenance processes are dialog processes described in the CICSPerformance Analyzer for z/OS User's Guide.
Take-up from SMF FilesOption 4 Take-up from SMF File from the Shared System Definitions Menuprovides the facility to take-up system and file information from one SMF File.
Data Take-up from SMF File is a two-step process. First the system details areextracted from the file, then used to automatically update your Shared SystemDefinitions. Successful completion of the first step generates a Recap report thatprovides information about all the systems contained on the SMF Files.
File Options Help-------------------------------------------------------------------------------
Shared System Definitions MenuCommand ===> __________________________________________________________________
Select an option then press Enter
1 1. Define Systems and their SMF Files2. Maintain Group definitions3. Take-up from personal System Definitions4. Take-up from SMF File
Enter "/" to select option_ Always go directly to Systems View
HDB Register . . . ’CICSPA.HDB.REGISTER’_________________________ +
F1=Help F3=Exit F4=Prompt F6=Resize F10=Actions F12=Cancel
Figure 108. Shared System Definitions Menu
© Copyright IBM Corp. 2001, 2010 241

The batch command is:HDB(TAKEUP, analyze SMF file contents
[SYSTEMS,] load systems[FILEIMAGE|FILESYSTEM,] load files, connect to either image or system[OUTPUT(ddname)]) DDname for Recap report output
The following batch JCL illustrates how you can process multiple SMF Files. Itruns the first step only to analyze the contents of the SMF files.//CICSPA JOB ,CLASS=A,REGION=6M,MSGCLASS=T,MSGLEVEL=(1,1)//*//CICSPA EXEC PGM=CPAMAIN//STEPLIB DD DSN=CICSPA.V3R2M0.SCPALINK,DISP=SHR//CPAHDBRG DD DSN=CICSPA.HDB.REGISTER,DISP=SHR//SYSPRINT DD SYSOUT=*//* SMF FILES//SMFIN001 DD DISP=SHR,DSN=CICPRO.SMF(-2)// DD DISP=SHR,DSN=CICPRO.SMF(-1)// DD DISP=SHR,DSN=CICPRO.SMF(0)//SYSIN DD *
CICSPA IN(SMFIN001),HDB(TAKEUP)
/*
The following example shows part of the Recap report that is generated at the endof file processing. It shows the contents of the SMF files.
With this information you can elect to take-up Systems or Files or both, andspecify whether to connect the Files to the System or the Image.
Note that the Recap report is showing what is available for take-up from the SMFfiles, it is not showing the results of take-up. Review the Shared System Definitionsin the dialog to see the results of take-up.
If system definition take-up finds CICS TS and TG systems with the same APPLID,it creates a single CICS system definition. System definitions taken up from SMF111 records have a blank VRM field value (this field is for CICS TS versions, notCICS TG versions). To help distinguish CICS TS systems from CICS TG systems,definitions taken up from SMF 111 records have the description “CICS TG systemadded by Take-up”.
242 IBM CICS Performance Analyzer for z/OS: Report Reference

V3R2M0 CICS Performance AnalyzerShared System Take-up Recap Report By Data Set
HDB00001 Printed at 12:03:45 7/15/2010 Data from 16:30:00 03/13/2010 to 12:00:11 03/14/2010 Page 1-------Start------- --------Stop------- -------System------- Record
DDname Data Set Name Date Time Date Time Name Type Imag CountSMFIN001 CICPRO.SMF.G1443V00 2010-03-13 20.30.00 2010-03-14 12.00.00 SCLOG Logger FTS2 64
FTS2 Image 64CICPRO.SMF.G1442V00 2010-03-14 11.10.38 2010-03-14 12.00.11 CCVT22T CICS FTS1 3030
FTS1 Image 29390CCVT31M CICS FTS1 68CCVT22C CICS FTS1 12122CCVT31T CICS FTS1 122CCVT31C CICS FTS1 323CCVT23C CICS FTS1 6426CCVT41C CICS FTS1 432CCVT23T CICS FTS1 3747CCVT31CX CICS FTS1 51CCVT23CX CICS FTS1 72CCVT41CX CICS FTS1 72CCVT22CX CICS FTS1 228CCVT22M CICS FTS1 201CCVT41M CICS FTS1 72SCLOG Logger FTS1 102
CICPRO.SMF.G1441V00 2010-03-14 10.02.16 2010-03-14 11.10.13 CCVT22T CICS FTS1 8470FTS1 Image 34229CCVT31M CICS FTS1 272CCVT22C CICS FTS1 4655CCVT31T CICS FTS1 375CCVT31C CICS FTS1 374CCVT23C CICS FTS1 12852CCVT41C CICS FTS1 360CCVT23T CICS FTS1 3600
V3R2M0 CICS Performance AnalyzerShared System Take-up Recap Report By System
HDB00001 Printed at 12:03:45 7/15/2010 Data from 16:30:00 03/13/2010 to 12:00:11 03/14/2010 Page 3-------System------- -------Start------- --------Stop------- RecordName Type Imag DDname Data Set Name Date Time Date Time CountSCLOG Logger FTS2 SMFIN001 CICPRO.SMF.G1443V00 2010-03-13 20.30.00 2010-03-14 12.00.00 64
CICPRO.SMF.G1437V00 2010-03-13 16.30.00 2010-03-13 20.00.00 16FTS2 Image SMFIN001 CICPRO.SMF.G1443V00 2010-03-13 20.30.00 2010-03-14 12.00.00 64
CICPRO.SMF.G1437V00 2010-03-13 16.30.00 2010-03-13 20.00.00 16CCVT22T CICS FTS1 CICPRO.SMF.G1442V00 2010-03-14 11.10.38 2010-03-14 11.53.40 3030
CICPRO.SMF.G1441V00 2010-03-14 10.02.51 2010-03-14 11.09.00 8470CICPRO.SMF.G1440V00 2010-03-14 08.21.37 2010-03-14 09.57.37 12685CICPRO.SMF.G1439V00 2010-03-14 06.25.38 2010-03-14 08.16.59 8544CICPRO.SMF.G1438V00 2010-03-13 20.09.11 2010-03-14 00.00.00 266
FTS1 Image CICPRO.SMF.G1442V00 2010-03-14 11.10.38 2010-03-14 12.00.11 29390CICPRO.SMF.G1441V00 2010-03-14 10.02.16 2010-03-14 11.10.13 34229CICPRO.SMF.G1440V00 2010-03-14 08.19.31 2010-03-14 10.02.14 50835CICPRO.SMF.G1439V00 2010-03-14 06.25.38 2010-03-14 08.18.08 39768CICPRO.SMF.G1438V00 2010-03-13 20.00.51 2010-03-14 00.00.00 8720
Figure 109. Shared System Take-up Recap report
Chapter 13. Shared System Definitions 243

244 IBM CICS Performance Analyzer for z/OS: Report Reference

Chapter 14. Understanding CMF data
When the CICS Monitoring Facility (CMF) is running, it collects the followingtypes, or classes, of data:v Performance class datav Exception class datav Transaction resource class data
Subsequently the data can be made available offline for analysis by CICS PA.
To understand the function of CICS PA and to interpret the reports and extractsproperly, some knowledge of the CMF data records and their relationship to oneanother is necessary.
Special point
Care should be taken when using the information in this section to analyzemonitoring data that is appropriate to your release of CICS.
You can use Table 31 on page 327 to determine in which CICS release particularmonitoring fields are available.
CMF performance class data fieldsPerformance class data is detailed transaction-level information, such as theprocessor and elapsed time for a transaction, or the time spent waiting for I/O. Atleast one performance record is written for each transaction that is beingmonitored. Performance class data provides detailed, resource-level data that canbe used for accounting, performance analysis, and capacity planning. This datacontains information relating to individual task resource usage, and is completedfor each task when the task terminates.
The Monitoring Control Table (MCT) controls the CMF performance data that iscollected. The performance class data records are not fixed format, instead theformat is described in associated CMF dictionary records.
All the CMF performance class data fields are described in this section. Each datafield is listed by Field ID within Owner as defined in the monitoring dictionaryrecord.
For a complete description of the fields and to understand how the fields arecollected, see the CICS Performance Guide.
DFHAPPL fieldsDFHAPPL owns the following performance class data fields. They are onlyavailable when application programs invoke the application naming eventmonitoring points. For more information, see the APPLNAME parameter on theDFHMCT TYPE=INITIAL macro in the CICS Customization Guide..
001 (Type-C, APPLNAME, 12 bytes)The data written when the DFHAPPL.1 and DFHAPPL.2 application namingevent monitoring points are invoked. The 12 byte APPLNAME field comprises:
© Copyright IBM Corp. 2001, 2010 245

v DFHAPPL.1 in bytes 1 to 4. For example, a 4–byte transaction ID withCICS PA field name APPLTRAN.
v DFHAPPL.2 in bytes 5 to 12. For example, an 8–byte program name withCICS PA field name APPLPROG.
DFHCBTS fieldsDFHCBTS owns the following performance class data fields:
200 (Type-C, PRCSNAME, 36 bytes)The name of the CICS business transaction service (BTS) process of which theuser task formed part.
201 (Type-C, PRCSTYPE, 8 bytes)The process-type of the CICS BTS process of which the user task formed part.
202 (Type-C, PRCSID, 52 bytes)The CICS-assigned identifier of the CICS BTS root activity that the user taskimplemented.
203 (Type-C, ACTVTYID, 52 bytes)The CICS-assigned identifier of the CICS BTS activity that the user taskimplemented.
204 (Type-C, ACTVTYNM, 16 bytes)The name of the CICS BTS activity that the user task implemented.
205 (Type-A, BARSYNCT, 4 bytes)The number of CICS BTS run process or run activity requests issued by theuser task to run a child process or activity synchronously.
206 (Type-A, BARASYCT, 4 bytes)The number of CICS BTS run process and run activity requests issued by theuser task to run a child process or activity asynchronously.
207 (Type-A, BALKPACT, 4 bytes)The number of CICS BTS link process or link activity requests issued by theuser task.
208 (Type-A, BADPROCT, 4 bytes)The number of CICS BTS define process requests issued by the user task.
209 (Type-A, BADACTCT, 4 bytes)The number of CICS BTS define activity requests issued by the user task.
210 (Type-A, BARSPACT, 4 bytes)The number of CICS BTS reset process and reset activity requests issued by theuser task.
211 (Type-A, BASUPACT, 4 bytes)The number of CICS BTS suspend process and suspend activity requests issuedby the user task.
212 (Type-A, BARMPACT, 4 bytes)The number of CICS BTS resume process and resume activity requests issuedby the user task.
213 (Type-A, BADCPACT, 4 bytes)The number of CICS BTS delete activity, cancel process and cancel activityrequests issued by the user task.
214 (Type-A, BAACQPCT, 4 bytes)The number of CICS BTS acquire process and acquire activity requests issuedby the user task.
246 IBM CICS Performance Analyzer for z/OS: Report Reference
||
||

215 (Type-A, BATOTPCT, 4 bytes)The total number of CICS BTS process and activity requests issued by the usertask.
216 (Type-A, BAPRDCCT, 4 bytes)The number of CICS BTS delete, get, or put container requests for process datacontainers issued by the user task.
217 (Type-A, BAACDCCT, 4 bytes)The number of CICS BTS delete, get, or put container requests for activity datacontainers issued by the user task.
218 (Type-A, BATOTCCT, 4 bytes)The total number of CICS BTS process container and activity container requestsissued by the user task.
219 (Type-A, BARATECT, 4 bytes)The number of CICS BTS retrieve-reattach requests issued by the user task.
220 (Type-A, BADFIECT, 4 bytes)The number of CICS BTS define-input event requests issued by the user task.
221 (Type-A, BATIAECT, 4 bytes)The number of CICS BTS timer associated requests issued by the user task.
222 (Type-A, BATOTECT, 4 bytes)The total number of CICS BTS event-related requests issued by the user task.
Table 22. EXEC CICS business transaction services (BTS) commands related to the BTSmonitoring fields
EXEC CICS BTS command Monitoring fields
ACQUIRE ACTIVITYID BAACQPCT and BATOTPCT
ACQUIRE PROCESS BAACQPCT and BATOTPCT
ADD SUBEVENT BATOTECT
CANCEL ACTIVITY BADCPACT and BATOTPCT
CANCEL ACQPROCESS BADCPACT and BATOTPCT
CANCEL ACQPROCESS BADCPACT and BATOTPCT
CHECK ACQPROCESS BATOTPCT
CHECK ACTIVITY BATOTPCT
CHECK TIMER BATIAECT and BATOTECT
DEFINE ACTIVITY BADACTCT and BATOTPCT
DEFINE COMPOSITE EVENT BATOTECT
DEFINE INPUT EVENT BADFIECT and BATOTECT
DEFINE PROCESS BADPROCT and BATOTPCT
DEFINE TIMER BATIAECT and BATOTECT
DELETE ACTIVITY BADCPACT and BATOTPCT
DELETE CONTAINER ACTIVITY BAACDCCT and BATOTCCT
DELETE CONTAINER ACQACTIVITY BAACDCCT and BATOTCCT
DELETE CONTAINER PROCESS BAPRDCCT and BATOTCCT
DELETE CONTAINER ACQPROCESS BAPRDCCT and BATOTCCT
DELETE EVENT BATOTECT
DELETE TIMER BATIAECT and BATOTECT
Chapter 14. Understanding CMF data 247

Table 22. EXEC CICS business transaction services (BTS) commands related to the BTSmonitoring fields (continued)
EXEC CICS BTS command Monitoring fields
FORCE TIMER BATIAECT and BATOTECT
GET CONTAINER ACTIVITY BAACDCCT and BATOTCCT
GET CONTAINER ACQACTIVITY BAACDCCT and BATOTCCT
GET CONTAINER PROCESS BAPRDCCT and BATOTCCT
GET CONTAINER ACQPROCESS BAPRDCCT and BATOTCCT
LINK ACQPROCESS BALKPACT and BATOTPCT
LINK ACTIVITY BALKPACT and BATOTPCT
LINK ACQACTIVITY BALKPACT and BATOTPCT
PUT CONTAINER ACTIVITY BAACDCCT and BATOTCCT
PUT CONTAINER ACQACTIVITY BAACDCCT and BATOTCCT
PUT CONTAINER PROCESS BAPRDCCT and BATOTCCT
PUT CONTAINER ACQPROCESS BAPRDCCT and BATOTCCT
REMOVE SUBEVENT BATOTECT
RESET ACQPROCESS BARSPACT and BATOTPCT
RESET ACTIVITY BARSPACT and BATOTPCT
RESUME ACQACTIVITY BARMPACT and BATOTPCT
RESUME ACQPROCESS BARMPACT and BATOTPCT
RESUME ACTIVITY BARMPACT and BATOTPCT
RETRIEVE REATTACH EVENT BARATECT and BATOTECT
RETRIEVE SUBEVENT BATOTECT
RUN ACTIVITY SYNCHRONOUS BARSYNCT and BATOTPCT
RUN ACQACTIVITY SYNCHRONOUS BARSYNCT and BATOTPCT
RUN ACQPROCESS SYNCHRONOUS BARSYNCT and BATOTPCT
RUN ACTIVITY ASYNCHRONOUS BARASYCT and BATOTPCT
RUN ACQACTIVITY ASYNCHRONOUS BARASYCT and BATOTPCT
RUN ACQPROCESS ASYNCHRONOUS BARASYCT and BATOTPCT
SUSPEND ACQACTIVITY BASUPACT and BATOTPCT
SUSPEND ACQPROCESS BASUPACT and BATOTPCT
SUSPEND ACTIVITY BASUPACT and BATOTPCT
TEST EVENT BATOTECT
For more information on CICS BTS, see CICS Business Transaction Services.
DFHCHNL fieldsDFHCHNL owns the following performance class data fields:
321 (Type-A, PGTOTCCT, 4 bytes)The total number of requests for channel containers issued by the user task.
322 (Type-A, PGBRWCCT, 4 bytes)The number of browse requests for channel containers issued by the user task.
248 IBM CICS Performance Analyzer for z/OS: Report Reference

323 (Type-A, PGGETCCT, 4 bytes)The number of GET CONTAINER requests for channel containers issued bythe user task.
324 (Type-A, PGPUTCCT, 4 bytes)The number of PUT CONTAINER requests for channel containers issued bythe user task.
325 (Type-A, PGMOVCCT, 4 bytes)The number of MOVE CONTAINER requests for channel containers issued bythe user task.
326 (Type-A, PGGETCDL, 4 bytes)The total length, in bytes, of the data in the containers of all the GETCONTAINER CHANNEL commands issued by the user task.
327 (Type-A, PGPUTCDL, 4 bytes)The total length, in bytes, of the data in the containers of all the PUTCONTAINER CHANNEL commands issued by the user task.
328 (Type-A, PGCRECCT, 4 bytes)The number of containers created by MOVE and PUT CONTAINER requestsfor channel containers issued by the user task.
329 (Type-A, PGCSTHWM, 4 bytes)Maximum amount (high-water mark), in bytes, of container storage allocatedto the user task.
DFHCICS fieldsDFHCICS owns the following performance class data fields:
005 (Type-T, START, 8 bytes)The start time (in GMT) of the measurement period. This is either:v The time at which the task was attached, orv The time at which data recording was most recently restarted in support of a
user event monitoring point (EMP) DELIVER option or the monitoringoptions MNCONVerse, MNSYNCpoint, or MNFREQuency.
Note:
1. CICS PA will always convert the start time into local time beforeformatting and printing.
2. The transaction response time (or measurement period) can be calculatedby subtracting the START time from the STOP time.
006 (Type-T, STOP, 8 bytes)The finish time (in GMT) of the measurement period. This is either:v the time at which the task was detached, orv the time at which data recording was most recently completed for the
transaction in support of a user event monitoring point (EMP) DELIVERoption or the monitoring options MNCONVerse, MNSYNCpoint, orMNFREQuency.
Note:
1. CICS PA will always convert the stop time into local time before formattingand printing.
2. The transaction response time (or measurement period) can be calculatedby subtracting the START time from the STOP time.
Chapter 14. Understanding CMF data 249

025 (Type-A, CFCAPICT, 4 bytes)The total number of CICS OO foundation class requests and Java API for CICS(JCICS) class requests issued by the user task. CICS does not distinguishbetween the OO foundation class and JCICS class requests.
089 (Type-C, USERID, 8 bytes)User identification at task attach. This can also be a remote user identifier for atask created as the result of receiving an ATTACH request across an MRO orAPPC link with attach-time security enabled.
103 (Type-S, EXWTTIME, 8 bytes)Accumulated data for exception conditions. The timer component of the clockcontains the total elapsed time for which the user waited on exceptionconditions. The period count equals the number of exception conditions thathave occurred for this task.. For more information, see “CMF exception classdata fields” on page 310.
Note: This field is updated when any of the exception conditions areencountered by the user task even when the exception class is inactive.
112 (Type-C, RTYPE, 4 bytes)The performance record type (low-order byte-3). This field indicates the reasonwhy a performance record has been output for the user task. It can be one ofthe following values:C Record output for a terminal converseD Record output for a user EMP DELIVER requestF Record output for a long-running transactionS Record output for a syncpointT Record output for a task termination.
130 (Type-C, RSYSID, 4 bytes)The Transaction Routing Sysid RSYSID field IDentifies the connection name(sysid) of the remote system to which the transaction was routed. If thetransaction was not routed this field is null and the initial program name(field: PGMNAME, owner: DFHPROG, field ID: 071) will identify the initialapplication program name invoked for the transaction. See Table 25 on page260 for more details.
This field also identifies the connection name (sysid) of the remote system towhich the transaction was routed when using the CRTE routing transaction.However, this field is null for those CRTE transactions which establish orcancel the transaction routing session.
131 (Type-C, PERRECNT, 4 bytes)The total number of performance class records written by the CICS MonitoringFacility (CMF) for this user task.
167 (Type-C, SRVCLASS, 8 bytes)The MVS Workload Manager (WLM) service class for this transaction. Thisfield is null if there are no transaction classification rules defined for CICSsubsystems in the active MVS Workload Manager (WLM) service policy or thetransaction was WLM-classified in another CICS region.
The transaction flags field, TRANFLAG (owner: DFHTASK, field ID: 164) canbe used to determine if this transaction was WLM-classified in another region.
See “Workload Activity report” on page 84.
168 (Type-C, RPTCLASS, 8 bytes)The MVS Workload Manager (WLM) report class for this transaction. This fieldis null if there are no transaction classification rules defined for CICS
250 IBM CICS Performance Analyzer for z/OS: Report Reference

subsystems in the active MVS Workload Manager (WLM) service policy or thetransaction was WLM-classified in another CICS region.
The transaction flags field, TRANFLAG (owner: DFHTASK, field ID: 164) canbe used to determine if this transaction was WLM-classified in another region.
See “Workload Activity report” on page 84.
359 (Type-C, ONETWKID, 8 bytesThe network identifier from which this work request (transaction) originated.
360 (Type-C, OAPPLID, 8 bytes)The applid of the CICS region in which this work request (transaction)originated; (for example, the region in which the CWXN task ran).
361 (Type-T, OSTART, 8 bytes)The time at which the originating task (for example, the CWXN task) wasstarted.
362 (Type-P, OTRANNUM, 4 bytes)The number of the originating task (for example, the CWXN task).
363 (Type-C, OTRAN, 4 bytes)The transaction ID (TRANSID) of the originating task (for example, the CWXNtask).
364 (Type-C, OUSERID, 8 bytes)The originating Userid-2 or Userid-1 (for example, from CWBA), depending onthe originating task.
365 (Type-C, OUSERCOR, 64 bytes)The originating user correlator.
366 (Type-C, OTCPSVCE, 8 bytes)The name of the originating TCPIPSERVICE.
367 (Type-A, OPORTNUM, 4 bytes)The port number used by the originating TCPIPSERVICE.
368 (Type-C, OCLIPADR, 16 bytes)The IP address of the originating client (or Telnet client).
369 (Type-A, OCLIPORT, 4 bytes)The TCP/IP port number of the originating client (or Telnet client).
370 (Type-A, OTRANFLG, 8 bytes)Originating transaction flags, a string of 64 bits used for signaling transactiondefinition and status information:
Byte 0 The facility-type of the originating transaction:Bit 0 None (X'80')Bit 1 Terminal (X'40')Bit 2 Surrogate (X'20')Bit 3 Destination (X'10')Bit 4 3270 bridge (X'08')Bit 5 ReservedBit 6 ReservedBit 7 Reserved
Byte 1 Transaction identification information:Bit 0 System transaction (X'80')Bit 1 Mirror transaction (X'40')Bit 2 DPL mirror transaction (X'20')Bit 3 ONC/RPC Alias transaction (X'10')
Chapter 14. Understanding CMF data 251

Bit 4 WEB Alias transaction (X'08')Bit 5 3270 Bridge transaction (X'04')Bit 6 Reserved (X'02')Bit 7 CICS BTS Run transaction (X'01')
Byte 2 Reserved.
Byte 3 Transaction definition information:Bit 0 Taskdataloc = below (x'80')Bit 1 Taskdatakey = cics (x'40')Bit 2 Isolate = no (x'20')Bit 3 Dynamic = yes (x'10')Bit 4-7 Reserved
Byte 4 The type of the originating transaction:X'01' NoneX'02' TerminalX'03' Transient dataX'04' STARTX'05' Terminal-related STARTX'06' CICS business transaction services (BTS) schedulerX'07' Transaction manager domain (XM)-run transactionX'08' 3270 bridgeX'09' Socket domainX'0A' CICS Web support (CWS)X'0B' Internet Inter-ORB Protocol (IIOP)X'0C' Resource Recovery Services (RRS)X'0D' LU 6.1 sessionX'0E' LU 6.2 (APPC) sessionX'0F' MRO sessionX'10' External Call Interface (ECI) sessionX'11' IIOP domain request receiverX'12' Request stream (RZ) instore transportX'13' IP interconnectivity sessionX'14' Event
Byte 5 Reserved.
Byte 6 Reserved.
Byte 7 Recovery manager information:Bit 0 Indoubt wait = noBit 1 Indoubt action = commitBit 2 Recovery manager - UOW resolved with indoubt actionBit 3 Recovery manager - ShuntBit 4 Recovery manager - UnshuntBit 5 Recovery manager - Indoubt failureBit 6 Recovery manager - Resource owner failureBit 7 Reserved
371 (Type-C, OFCTYNME, 4 bytes)The facility name of the originating transaction. If the originating transaction isnot associated with a facility, this field is null. The transaction facility type, ifany, can be identified using byte 0 of the transaction flags, OTRANFLG (370),field.
372 (Type-C, OCLIPADR, 40 bytes)The IP address of the originating client or Telnet client.
252 IBM CICS Performance Analyzer for z/OS: Report Reference

402 (Type-A, EICTOTCT, 4 bytes)The total number of EXEC CICS commands issued by the user task.
405 (Type-A, TIASKTCT, 4 bytes)The number of EXEC CICS ASKTIME commands issued by the user task.
406 (Type-A, TITOTCT, 4 bytes)The total number of EXEC CICS ASKTIME, CONVERTTIME, andFORMATTIME commands issued by the user task.
408 (Type-A, BFDGSTCT, 4 bytes)The total number of EXEC CICS BIF DIGEST commands issued by the usertask.
409 (Type-A, BFTOTCT, 4 bytes)The total number of EXEC CICS BIF DEEDIT and BIF DIGEST commandsissued by the user task.
415 (Type-A, ECSIGECT, 4 bytes)The number of EXEC CICS SIGNAL EVENT commands issued by the usertask.
416 (Type-A, ECEFOPCT, 4 bytes)The number of event filter operations performed by the user task.
417 (Type-A, ECEVNTCT, 4 bytes)The number of events captured by the user task.
DFHDATA fieldsDFHDATA owns the following performance class data fields:
179 (Type-A, IMSREQCT, 4 bytes)The total number of IMS (DBCTL) requests issued by the user task.
180 (Type-A, DB2REQCT, 8 bytes)The total number of DB2 EXEC SQL and Instrumentation Facility Interface (IFI)requests issued by the user task.
For more information on DB2 accounting and monitoring, see the CICS DB2Guide.
186 (Type-S, IMSWAIT, 8 bytes)The total elapsed time in which the user task waited for IMS (DBCTL) toservice the IMS requests issued by the user task.
For more information, see “RMI elapsed and suspend time” on page 301 and“Transaction timing fields” on page 295.
Note: This field is a component of the task suspend time field, SUSPTIME(owner: DFHTASK, field ID: 014 and is also a component of the RMI suspendtime field, RMISUSP (owner: DFHTASK, field ID: 171).
187 (Type-S, DB2RDYQW, 8 bytes)The elapsed time in which the user task waited for a DB2 thread to becomeavailable.
For more general information on DB2 accounting and monitoring, see the CICSDB2 Guide.
For more information, see “RMI elapsed and suspend time” on page 301 and“Transaction timing fields” on page 295.
Chapter 14. Understanding CMF data 253

Note: This field is a component of the task suspend time field, SUSPTIME(group name: DFHTASK, field ID: 014 and is also a component of the RMIsuspend time field, RMISUSP (owner: DFHTASK, field ID: 171).
188 (Type-S, DB2CONWT, 8 bytes)The value of this field depends on the version of DB2 to which CICS isconnected:v When CICS is connected to DB2 Version 5 or earlier, and is therefore not
exploiting the CICS open transaction environment (OTE), this field is theelapsed time in which the user task waited for a CICS subtask (TCB) tobecome available.
v When CICS is connected to DB2 Version 6 or later, and so is using the CICSopen transaction environment (OTE), this field is the elapsed time in whichthe user task waited for a DB2 connection to become available for use withthe user tasks open TCB.
For more general information on DB2 accounting and monitoring, see the CICSDB2 Guide.
For more information, see “RMI elapsed and suspend time” on page 301 and“Transaction timing fields” on page 295.
Note: This field is a component of the task suspend time field, SUSPTIME(group name: DFHTASK, field ID: 014 and is also a component of the RMIsuspend time field, RMISUSP (owner: DFHTASK, field ID: 171).
For more general information on the open transaction environment (OTE), seethe CICS Application Programming Guide.
189 (Type-S, DB2WAIT, 8 bytes)The value of this field depends on the version of DB2 to which CICS isconnected:v When CICS is connected to DB2 Version 5 or earlier, and is therefore not
exploiting the CICS open transaction environment (OTE), this field is theelapsed time in which the user task waited for DB2 to service the DB2 EXECSQL and Instrumentation Facility Interface (IFI) requests issued by the usertask.
v When CICS is connected to DB2 Version 6 or later, and so is using the CICSopen transaction environment (OTE), this field does not apply and is zero.This is because the CICS-DB2 attachment facility uses open TCBs as thethread TCBs rather than using specially created subtask TCBs and as a resultany waits in DB2 that occur on a CICS L8 mode TCB will not be visible tothe CICS dispatcher domain.
For more general information on DB2 accounting and monitoring, see the CICSDB2 Guide.
For more information, see “RMI elapsed and suspend time” on page 301 and“Transaction timing fields” on page 295.
Note: This field is a component of the task suspend time field, SUSPTIME(group name: DFHTASK, field ID: 014 and is also a component of the RMIsuspend time field, RMISUSP (owner: DFHTASK, field ID: 171).
395 (Type-A, WMQREQCT, 4 bytes)The total number of MQ requests issued by the user task.
254 IBM CICS Performance Analyzer for z/OS: Report Reference

396 (Type-S, WMQGETWT, 12 bytes)The elapsed time the user task waited for WebSphere MQ to service the usertask's GETWAIT request.
397 (Type-S, WMQASRBT, 12 bytes)The WebSphere MQ SRB time this transaction spent processing MQ APIrequests. This field should be added to the transaction CPU time field(USRCPUT) when considering the measurement of the total CPU timeconsumed by a transaction. This field will be zero for point-to-point messagingactivity, it will be non-zero where MQ API requests have resulted in pub/sub(publish and subscribe) type messaging.
DFHDEST fieldsDFHDEST owns the following performance class data fields:
041 (Type-A, TDGETCT, 4 bytes)The number of transient data GET requests issued by the user task.
042 (Type-A, TDPUTCT, 4 bytes)The number of transient data PUT requests issued by the user task.
043 (Type-A, TDPURCT, 4 bytes)The number of transient data PURGE requests issued by the user task.
091 (Type-A, TDTOTCT, 4 bytes)The total number of transient data requests issued by the user task.
101 (Type-S, TDIOWTT, 4 bytes)The elapsed time in which the user task waited for VSAM I/O to theintrapartition transient data set, DFHINTRA. For more information, see“Transaction timing fields” on page 295.
Note: This field is a component of the task suspend time field, SUSPTIME(owner: DFHTASK, field ID: 014).
DFHDOCH fieldsDFHDOCH owns the following performance class data fields:
223 (Type-A, DHDELCT, 4 bytes)The number of document handler DELETE requests issued by the user task.
226 (Type-C, DHCRECT, 4 bytes)The number of document handler Create document requests issued by the usertask.
227 (Type-C, DHINSCT, 4 bytes)The number of document handler Insert data or Insert bookmark documentrequests issued by the user task.
228 (Type-C, DHSETCT, 4 bytes)The number of document handler Set requests issued by the user task.
229 (Type-C, DHRETCT, 4 bytes)The number of document handler Retrieve requests issued by the user task.
230 (Type-C, DHTOTCT, 4 bytes)The total number of document handler requests issued by the user task.
How the EXEC CICS document API commands correspond to the documenthandler domain monitoring fields is shown in Table 23 on page 256.
Chapter 14. Understanding CMF data 255

Table 23. EXEC CICS document commands related to the document handler controlmonitoring fields
EXEC CICS DOCUMENT command Monitoring fields
CREATE DHCRECT and DHTOTCT
INSERT DHINSCT and DHTOTCT
RETRIEVE DHRETCT and DHTOTCT
SET DHSETCT and DHTOTCT
Note: The number of “other” document handler requests can be calculated bysubtracting the document handler requests DHCRECT, DHINSCT, DHSETCT,and DHRETCT from the total document handler request count, DHTOTCT.The “other” CICS internal document handler requests include Inquiredocument, Delete bookmark, Delete document, and Delete Data requests.
240 (Type-C, DHTOTDCL, 4 bytes)The total length of all the documents created by the user task using thedocument handler EXEC CICS API requests.
Note: See the related performance data for DFHSOCK on page “DFHSOCK fields”on page 263 and DFHWEBB on page “DFHWEBB fields” on page 291.
For more information, see “CICS Web support” on page 309 and the CICS InternetGuide.
DFHEJBS fieldsDFHEJBS owns the following performance class data fields:
311 (Type-C, CBSRVRNM, 4 bytes)The CorbaServer for which this request processor instance is handling requests.Request processor transactions can be identified using byte 4 of the transactionflags field, TRANFLAG (owner: DFHTASK, field ID: 164).
312 (Type-A, EJBSACCT, 4 bytes)The number of bean activations that have occurred in this request processor.
313 (Type-A, EJBSPACT, 4 bytes)The number of bean passivations that have occurred in this request processor.
314 (Type-A, EJBCRECT, 4 bytes)The number of bean creation calls that have occurred in this request processor.
315 (Type-A, EJBREMCT, 4 bytes)The number of bean removal calls that have occurred in this request processor.
316 (Type-A, EJBTOTCT, 4 bytes)The total for this request processor of activation, passivation, creation, removaland method calls (fields 312–316).
317 (Type-A, EJBMTHCT, 4 bytes)The number of bean method calls run in this request processor.
DFHFEPI fieldsDFHFEPI owns the following performance class data fields:
150 (Type-A, SZALLOCT, 4 bytes)The number of FEPI conversations allocated by the user task. This number isincremented for each FEPI ALLOCATE POOL or FEPI CONVERSE POOL.
256 IBM CICS Performance Analyzer for z/OS: Report Reference

151 (Type-A, SZRCVCT, 4 bytes)The number of FEPI RECEIVE requests issued by the user task. This number isalso incremented for each FEPI CONVERSE request.
152 (Type-A, SZSENDCT, 4 bytes)The number of FEPI SEND requests issued by the user task. This number isalso incremented for each FEPI CONVERSE request.
153 (Type-A, SZSTRTCT, 4 bytes)The number of FEPI START requests issued by the user task.
154 (Type-A, SZCHROUT, 4 bytes)The number of characters sent through FEPI by the user task.
155 (Type-A, SZCHRIN, 4 bytes)The number of characters received through FEPI by the user task.
156 (Type-S, SZWAIT, 8 bytes)The elapsed time in which the user task waited for FEPI services. For moreinformation, see “Transaction timing fields” on page 295.
Note: This field is a component of the task suspend time field, SUSPTIME(owner: DFHTASK, field ID: 014).
157 (Type-A, SZALLCTO, 4 bytes)The number of times the user task timed out while waiting to allocate aconversation.
158 (Type-A, SZRCVTO, 4 bytes)The number of times the user task timed out while waiting to receive data.
159 (Type-A, SZTOTCT, 4 bytes)The total number of FEPI API and SPI requests issued by the user task.
For more information on FEPI, see the CICS Front End Programming Interface User'sGuide.
DFHFILE fieldsFor a break down by individual file of some of the DFHFILE information, you canrequest transaction resource monitoring. See “CMF transaction resource class datafields” on page 316 for details.
DFHFILE owns the following performance class data fields:
036 (Type-A, FCGETCT, 4 bytes)The number of file control GET requests issued by the user task.
037 (Type-A, FCPUTCT, 4 bytes)The number of file control PUT requests issued by the user task.
038 (Type-A, FCBRWCT, 4 bytes)The number of file control BROWSE requests issued by the user task.
039 (Type-A, FCADDCT, 4 bytes)The number of file control ADD requests issued by the user task.
040 (Type-A, FCDELCT, 4 bytes)The number of file control DELETE requests issued by the user task.
063 (Type-S, FCIOWTT, 8 bytes)The elapsed time in which the user task waited for non-RLS file I/O.
For more information, see “Transaction timing fields” on page 295.
Chapter 14. Understanding CMF data 257

Note: This field is a component of the task suspend time field, SUSPTIME(owner: DFHTASK, field ID: 014).
070 (Type-A, FCAMCT, 4 bytes)The number of times the user task invoked file access-method interfaces. Thisnumber excludes requests for file OPEN and CLOSE.
093 (Type-A, FCTOTCT, 4 bytes)The total number of file control requests issued by the user task. This numberexcludes any request for OPEN, CLOSE, ENABLE or DISABLE of a file.
How the EXEC CICS file API commands correspond to the file controlmonitoring fields is shown in Table 24.
Table 24. EXEC CICS file commands related to the file control monitoring fields
EXEC CICS file command Monitoring fields
READ FCGETCT and FCTOTCT
READ UPDATE FCGETCT and FCTOTCT
DELETE (after READ UPDATE) FCDELCT and FCTOTCT
DELETE (with RIDFLD) FCDELCT and FCTOTCT
REWRITE FCPUTCT and FCTOTCT
WRITE FCADDCT and FCTOTCT
STARTBR FCTOTCT
READNEXT FCBRWCT and FCTOTCT
READNEXT UPDATE FCBRWCT and FCTOTCT
READPREV FCBRWCT and FCTOTCT
READPREV UPDATE FCBRWCT and FCTOTCT
ENDBR FCTOTCT
RESETBR FCTOTCT
UNLOCK FCTOTCT
Note: The number of STARTBR, ENDBR, RESETBR and UNLOCK file controlrequests can be calculated by subtracting the file request counts FCGETCT,FCPUTCT, FCBRWCT, FCADDCT and FCDELCT from the total file controlrequest count, FCTOTCT.
174 (Type-S, RLSWAIT, 8 bytes)The elapsed time in which the user task waited for RLS file I/O.
For more information, see “Transaction timing fields” on page 295.
Note: This field is a component of the task suspend time field, SUSPTIME(owner: DFHTASK, field ID: 014).
175 (Type-S, RLSCPUT, 8 bytes)The RLS File Request CPU (SRB) time field (RLSCPUT) is the SRB CPU timethis transaction spent processing RLS file requests. This field should be addedto the transaction CPU time field (USRCPUT) when considering themeasurement of the total CPU time consumed by a transaction.
However, this field cannot be considered a subset of any other single CMFfield (including RLSWAIT). This is because the RLS file requests runasynchronously under an MVS SRB which can be running in parallel with the
258 IBM CICS Performance Analyzer for z/OS: Report Reference

requesting transaction. It is also possible for the SRB to complete its processingbefore the requesting transaction waits for the RLS file request to complete.
Note: This clock field could contain a CPU time of zero with a count of greaterthan zero. This is because the CMF timing granularity is measured in 16microsecond units and the RLS file requests might complete in less than thattime unit.
176 (Type-S, CFDTWAIT, 8 bytes)The elapsed time in which the user task waited for a data table access requestto the coupling facility data table server to complete.
For more information, see “Transaction timing fields” on page 295.
See the CICS System Definition Guide for more information on the CICS dataservers.
Note: This field is a component of the task suspend time field, SUSPTIME(owner: DFHTASK, field ID: 014).
DFHJOUR fieldsDFHJOUR owns the following performance class data fields:
010 (Type-S, JCIOWTT, 8 bytes)The elapsed time in which the user task waited for journal (logstream) I/O.
For more information, see “Transaction timing fields” on page 295.
Note: This field is a component of the task suspend time field, SUSPTIME(owner: DFHTASK, field ID: 014).
058 (Type-A, JNLWRTCT, 4 bytes)The number of journal write requests issued by the user task.
172 (Type-A, LOGWRTCT, 4 bytes)The number of CICS logstream write requests issued by the user task.
DFHMAPP fieldsDFHMAPP owns the following performance class data fields:
050 (Type-A, BMSMAPCT, 4 bytes)The number of BMS RECEIVE MAP requests issued by the user task. This fieldcorresponds to the number of RECEIVE MAP requests that did not incur aterminal I/O and the number of RECEIVE MAP FROM requests.
051 (Type-A, BMSINCT, 4 bytes)The number of BMS RECEIVE MAP requests issued by the user task that didincur a terminal I/O.
052 (Type-A, BMSOUTCT, 4 bytes)The number of BMS SEND MAP requests issued by the user task.
090 (Type-A, BMSTOTCT, 4 bytes)The total number of BMS requests issued by the user task. This field is the sumof the BMS RECEIVE MAP, RECEIVE MAP FROM and SEND MAP requests aswell as the number of BMS SEND TEXT and SEND CONTROL requests issuedby the user task.
DFHPROG fieldsDFHPROG owns the following performance class data fields:
Chapter 14. Understanding CMF data 259

055 (Type-A, PCLINKCT, 4 bytes)The number of program LINK requests issued by the user task.
056 (Type-A, PCXCTLCT, 4 bytes)The number of program XCTL requests issued by the user task.
057 (Type-A, PCLOADCT, 4 bytes)The number of program LOAD requests issued by the user task.
071 (Type-C, PGMNAME, 8 bytes)The name of the initial application program invoked at transaction attach.
Note these points about remote transactions:v If the CICS definition of the remote transaction does not specify a program
name, this field contains blanks.v If the CICS definition of the remote transaction specifies a program name,
this field contains the name of the specified program. (This program is notnecessarily the program that is run on the remote system.)
For a dynamically routed transaction, if the dynamic transaction routingprogram routes the transaction locally and specifies an alternative programname, this field contains the name of the alternative program.
For a dynamic program link (DPL) mirror transaction, this field contains theinitial program name specified in the dynamic program LINK request. DPLmirror transactions can be identified using byte 1 of the transaction flags,TRANFLAG (164), field.
For Web service applications, this field contains the target application programname.
For a Web alias transaction, this field contains the initial application programname called by the alias transaction. Web alias transactions can be identifiedusing byte 1 of the transaction flags, TRANFLAG (164), field.
For an ONC RPC transaction, this field contains the initial application programname called by the alias transaction. ONC RPC transactions can be identifiedusing byte 1 of the transaction flags, TRANFLAG (164), field.
For an ECI over TCP/IP transaction, this field contains the name of theapplication program specified in the External Call Interface (ECI) request fromthe client application.
Byte 4 of the transaction flags field, TRANFLAG (owner: DFHTASK, field ID:164) can also be used to provide additional detail on the transaction's origin.See “DFHTASK fields” on page 268 for more details on the transaction origintype.
Table 25 shows the transaction type values from byte 1 of the transaction flagsfield, TRANFLAG (owner: DFHTASK, field ID: 164) and its relationship withthe transaction routing sysid field, RSYSID (owner: DFHCICS, field ID: 130)and the initial program name field, PGMNAME (owner: DFHPROG, field ID:071).
Table 25. Transaction routing sysid and initial program name relationships
TRANFLAG (Byte 1) RSYSID Program Name
X'00' - User transaction 'xxxx' N/A
X'00' - User transaction null Initial application program
X'80' - System transaction N/A Initial application program
X'40' - Mirror transaction N/A Mirror program
260 IBM CICS Performance Analyzer for z/OS: Report Reference

Table 25. Transaction routing sysid and initial program name relationships (continued)
TRANFLAG (Byte 1) RSYSID Program Name
X'20' - DPL mirror transaction N/A Initial application program
X'10' - ONC RPC alias transaction N/A Initial application program
X'08' - WEB alias transaction N/A Initial application program
X'04' - 3270 bridge transaction N/A Initial application program
X'01' - CICS BTS run transaction N/A Initial application program
072 (Type-A, PCLURMCT, 4 bytes)The number of program LINK URM (user-replaceable module) requests issuedby the user task.
A user-replaceable module is a CICS-supplied program that is always invokedat a particular point in CICS processing as if it were part of the CICS code. Youcan modify the supplied program by including your own logic, or you canreplace it with a version that you write yourself.
The CICS-supplied user-replaceable modules are:v bridge exit program - DFH0CBRE, DFH0CBAE, DFHWBLT, or user specifiedv CICS JVM interface program - DFHJVMATv distributed dynamic routing program - DFHDSRP (or user specified)v document template exit program - user specified on the DOCTEMPLATE
resource definitionv dynamic routing program - DFHDYP (or user specified)v Internet Inter-ORB Protocol (IIOP) inbound request security exit program -
DFHXOPUSv Java hot-pooling pre-call program - DFHJHPATv node error program - DFHNEPv program autoinstall program - DFHPGAxX (or user specified)v program error program - DFHPEPv terminal autoinstall programs - DFHZATDX/DFHZATDYv terminal error program - DFHTEPv transaction restart program - DFHRTYv CICS-DBCTL interface status program - DFHDBUEXv CICS-DB2 dynamic plan exit program - DSNCUEXTv Enterprise JavaBeans (EJB) Distinguished Name program - DFHEJDNxv Enterprise JavaBeans (EJB) event program - DFHEJEP
For detailed information on the CICS user-replaceable modules, see the CICSCustomization Guide.
073 (Type-A, PCDPLCT, 4 bytes)The number of distributed program link (DPL) requests issued by the usertask.
113 (Type-C, ABCODEO, 4 bytes)If the transaction abends, this field contains the 4 character abend code of theoriginal abend.
114 (Type-C, ABCODEC, 4 bytes)If the transaction abends, this field contains the 4 character abend code of thecurrent abend.
Chapter 14. Understanding CMF data 261

115 (Type-S, PCLOADTM, 8 bytes)The total elapsed time in which the user task waited for program fetches fromthe DFHRPL program library. Only fetches for programs with installedprogram definitions or autoinstalled as a result of application program requestsare included in this figure. Installed programs residing in the LPA are notincluded because they do not incur a physical fetch from a program library.
For more information, see “Program load time” on page 301.
286 (Type-A, PCDLCSDL, 4 bytes)The total length, in bytes, of the data in the containers of all the distributedprogram link (DPL) requests, with the CHANNEL option, issued by the usertask. This total includes the length of any headers to the data.
287 (Type-A, PCDLCRDL, 4 bytes)The total length, in bytes, of the data in the containers of all the distributedprogram link (DPL) RETURN requests, with the CHANNEL option, issued bythe user task. This total includes the length of any headers to the data.
306 (Type-A, PCLNKCCT, 4 bytes)Number of local program LINK requests, with the CHANNEL option, issuedby the user task. Note: This field is a subset of the program LINK requestsfield, PCLINKCT (055).
307 (Type-A, PCXCLCCT, 4 bytes)Number of program XCTL requests, with the CHANNEL option, issued by theuser task. Note: This field is a subset of the program XCTL requests field,PCXCTLCT (056).
308 (Type-A, PCDPLCCT, 4 bytes)Number of program distributed program link (DPL) requests, with theCHANNEL option, issued by the user task. Note: This field is a subset of thedistributed program link requests field, PCDPLCT (073).
309 (Type-A, PCRTNCCT, 4 bytes)Number of remote pseudoconversational RETURN requests, with theCHANNEL option, issued by the user task.
310 (Type-A, PCRTNCDL, 4 bytes)The total length, in bytes, of the data in the containers of all the remotepseudoconversational RETURN CHANNEL commands issued by the user task.This total includes the length of any headers to the data.
DFHRMI fieldsDFHRMI fields are present in the performance class record only if RMI=YES isspecified on the DFHMCT TYPE=INITIAL macro. For more information, see theRMI parameter on the DFHMCT TYPE=INITIAL macro in the CICS CustomizationGuide.
DFHRMI owns the following performance class data fields. For more information,see “RMI elapsed and suspend time” on page 301.
001 (Type-S, RMITOTAL, 8 bytes)The total elapsed time spent in the CICS Resource Manager Interface (RMI).For more information, see “Transaction response time” on page 296 and“Clocks and time stamps” on page 294.
262 IBM CICS Performance Analyzer for z/OS: Report Reference

002 (Type-S, RMIOTHER, 8 bytes)The total elapsed time spent in the CICS RMI for resource manager requestsother than DB2, DBCTL, EXEC DLI, WebSphere MQ, CICSPlex® SM, and CICSTCP/IP socket requests.
003 (Type-S, RMIDB2, 8 bytes)The total elapsed time spent in the CICS RMI for DB2 requests.
004 (Type-S, RMIDBCTL, 8 bytes)The total elapsed time spent in the CICS RMI for DBCTL requests.
005 (Type-S, RMIEXDLI, 8 bytes)The total elapsed time spent in the CICS RMI for EXEC DLI requests.
006 (Type-S, RMIMQM, 8 bytes)The total elapsed time spent in the CICS RMI for WebSphere MQ requests.
007 (Type-S, RMICPSM, 8 bytes)The total elapsed time spent in the CICS RMI for CICSPlex SM requests.
008 (Type-S, RMITCPIP, 8 bytes)The total elapsed time spent in the CICS RMI for CICS TCP/IP socket requests.
DFHSOCK fieldsDFHSOCK owns the following performance class data fields relating to the CICS(Socket Domain) support for TCP/IP:
241 (Type-S, SOIOWTT, 8 bytes)The elapsed time in which the user task waited for inbound socket I/O. Theoutbound socket I/O wait time is measured in field ID: 299.
For more information, see “Transaction timing fields” on page 295.
Note: This field is a component of the task suspend time field, SUSPTIME(owner: DFHTASK, field ID: 014).
242 (Type-A, SOBYENCT, 4 bytes)The number of bytes encrypted by the secure sockets layer (SSL) for the usertask.
243 (Type-A, SOBYDECT, 4 bytes)The number of bytes decrypted by the secure sockets layer (SSL) for the usertask.
244 (Type-C, CLIPADDR, 16 bytes): IPIC onlyThe Client IP address in the form of nnn.nnn.nnn.nnn or Telnet client IPaddress.
245 (Type-C, TCPSRVCE, 8 bytes)The name of the installed TCP/IP service resource definition from which thetransaction was initiated.
246 (Type-A, PORTNUM, 4 bytes)The port number of the installed TCP/IP service resource definition fromwhich the transaction was initiated.
288 (Type-A, ISALLOCT, 4 bytes): IPIC onlyThe number of allocate session requests issued by the user task for sessionsusing IPIC.
289 (Type-A, SOEXTRCT, 4 bytes)The number of EXTRACT TCPIP and EXTRACT CERTIFICATE requests issuedby the user task.
Chapter 14. Understanding CMF data 263

290 (Type-A, SOCNPSCT, 4 bytes)The number of non-persistent outbound socket create requests issued by theuser task.
291 (Type-A, SOCPSCT, 4 bytes)The number of persistent outbound socket create requests issued by the usertask.
292 (Type-A, SONPSHWM, 4 bytes)The peak number (high-water mark) of non-persistent outbound socketsowned by the user task.
293 (Type-A, SOPSHWM, 4 bytes)The peak number (high-water mark) of persistent outbound sockets owned bythe user task.
294 (Type-A, SORCVCT, 4 bytes)The number of outbound socket RECEIVE requests issued by the user task.
295 (Type-A, SOCHRIN, 4 bytes)The number of characters received by outbound socket RECEIVE requestsissued by the user task.
296 (Type-A, SOSENDCT, 4 bytes)The number of outbound socket SEND requests issued by the user task.
297 (Type-A, SOCHROUT, 4 bytes)The number of characters sent by outbound socket SEND requests issued bythe user task.
298 (Type-A, SOTOTCT, 4 bytes)The total number of inbound and outbound socket requests issued by the usertask.
299 (Type-S, SOOIOWTT (OSOWAIT), 8 bytes)The elapsed time in which the user task waited for outbound socket I/O. Theinbound socket I/O wait time is measured in field ID: 241.
For more information, see “Transaction timing fields” on page 295.
Note: This field is a component of the task suspend time field, SUSPTIME(owner: DFHTASK, field ID: 014).
300 (Type-S, ISIOWTT, 8 bytes): IPIC onlyThe elapsed time for which a user task waited for control at this end of anIPIC connection.
301 (Type-A, SOMSGIN1, 4 bytes)The number of inbound socket RECEIVE requests issued by the user task.
302 (Type-A, SOCHRIN1, 4 bytes)The number of characters received by inbound socket RECEIVE requestsissued by the user task.
303 (Type-A, SOMSGOU1, 4 bytes)The number of inbound socket SEND requests issued by the user task.
304 (Type-A, SOCHROU1, 4 bytes)The number of characters sent by inbound socket SEND requests issued by theuser task.
305 (Type-C, ISIPCNNM, 8 bytes): IPIC onlyThe name of the IPIC connection whose TCP/IP service attached the user task.
264 IBM CICS Performance Analyzer for z/OS: Report Reference

318 (Type-C, CLIPADDR, 40 bytes): IPIC onlyThe IP address of the client or Telnet client.
330 (Type-A, CLIPPORT, 4 bytes): IPIC onlyThe port number of the client or Telnet client.
See “CICS TCP/IP support” on page 310 for additional information and relatedperformance data for DFHDOCH on page “DFHDOCH fields” on page 255 andDFHWEBB on page “DFHWEBB fields” on page 291.
For more information, see the CICS Internet Guide and the CICS External InterfacesGuide.
DFHSTOR user storage fieldsDFHSTOR owns the following performance class data fields relating to userstorage. For additional information on the user storage fields, see “User storage”on page 304.
033 (Type-A, SCUSRHWM, 4 bytes)Maximum amount (high-water mark) of user-storage allocated to the user taskbelow the 16MB line, in the user dynamic storage area (UDSA).
054 (Type-A, SCUGETCT, 4 bytes)The number of user-storage GETMAIN requests issued by the user task forstorage below the 16MB line, in the UDSA.
095 (Type-A, SCUSRSTG, 8 bytes)The storage occupancy of the user task below the 16MB line, in the UDSA.This is a measure of the area under the curve of the storage in use againstelapsed time. For more information, see “User storage occupancy” on page 304.
105 (Type-A, SCUGETCT, 4 bytes)The number of user-storage GETMAIN requests issued by the user task forstorage above the 16MB line, in the EUDSA.
106 (Type-A, SCUSRHWM, 4 bytes)Maximum amount (high-water mark) of user-storage allocated to the user taskabove the 16MB line, in the user dynamic storage area (EUDSA).
107 (Type-A, SCUSRSTG, 8 bytes)The storage occupancy of the user task above the 16MB line, in the EUDSA.This is a measure of the area under the curve of the storage in use againstelapsed time. For more information, see “User storage occupancy” on page 304.
116 (Type-A, SC24CHWM, 4 bytes)Maximum amount (high-water mark) of user-storage allocated to the user taskbelow the 16MB line, in the CICS dynamic storage area (CDSA).
117 (Type-A, SCCGETCT, 4 bytes)The number of user-storage GETMAIN requests issued by the user task forstorage below the 16MB line, in the CDSA.
118 (Type-A, SC24COCC, 8 bytes)The storage occupancy of the user task below the 16MB line, in the CDSA. Thisis a measure of the area under the curve of the storage in use against elapsedtime. For more information, see “User storage occupancy” on page 304.
119 (Type-A, SC31CHWM, 4 bytes)Maximum amount (high-water mark) of user-storage allocated to the user taskabove the 16MB line, in the CICS dynamic storage area (CDSA).
Chapter 14. Understanding CMF data 265

120 (Type-A, SCCGETCT, 4 bytes)The number of user-storage GETMAIN requests issued by the user task forstorage above the 16MB line, in the ECDSA.
121 (Type-A, SC31COCC, 8 bytes)The storage occupancy of the user task above the 16MB line, in the ECDSA.This is a measure of the area under the curve of the storage in use againstelapsed time. For more information, see “User storage occupancy” on page 304.
The following table shows the DFHSTOR user storage fields, what they measure,and in which storage area.
Table 26. User storage field ID cross-reference
CDSA UDSA ECDSA EUDSA
GETMAIN count 117 054 120 105
High-water mark 116 033 119 106
Occupancy 118 095 121 107
DFHSTOR shared storage fieldsDFHSTOR owns the following performance class data fields relating to sharedstorage. For additional information on the shared storage fields, see “Sharedstorage” on page 305.
144 (Type-A, SC24SGCT, 4 bytes)The number of storage GETMAIN requests issued by the user task for sharedstorage below the 16MB line, in the CDSA or SDSA.
145 (Type-A, SC24GSHR, 4 bytes)The number of bytes of shared storage GETMAINed by the user task belowthe 16MB line, in the CDSA or SDSA.
146 (Type-A, SC24FSHR, 4 bytes)The number of bytes of shared storage FREEMAINed by the user task belowthe 16MB line, in the CDSA or SDSA.
147 (Type-A, SC31SGCT, 4 bytes)The number of storage GETMAIN requests issued by the user task for sharedstorage above the 16MB line, in the ECDSA or ESDSA.
148 (Type-A, SC31GSHR, 4 bytes)The number of bytes of shared storage GETMAINed by the user task above the16MB line, in the ECDSA or ESDSA.
149 (Type-A, SC31FSHR, 4 bytes)The number of bytes of shared storage FREEMAINed by the user task abovethe 16MB line, in the CDSA or SDSA.
DFHSTOR program storage fieldsDFHSTOR owns the following performance class data fields relating to programstorage. For additional information on the program storage fields, see “Programstorage” on page 306.
087 (Type-A, PCSTGHWM, 4 bytes)The maximum amount (high-water mark) of program storage in use by theuser task both above and below the 16MB line.
266 IBM CICS Performance Analyzer for z/OS: Report Reference

108 (Type-A, PC24BHWM, 4 bytes)The maximum amount (high-water mark) of program storage in use by theuser task below the 16MB line. This field is a subset of PCSTGHWM (field ID:087) that resides below the 16MB line.
122 (Type-A, PC31RHWM, 4 bytes)The maximum amount (high-water mark) of program storage in use by theuser task above the 16MB line, in the extended read-only dynamic storage area(ERDSA). This field is a subset of PC31AHWM (field ID: 139) that residesabove the 16MB line.
139 (Type-A, PC31AHWM, 4 bytes)The maximum amount (high-water mark) of program storage in use by theuser task above the 16MB line. This field is a subset of PCSTGHWM (field ID:087) that resides above the 16MB line.
142 (Type-A, PC31CHWM, 4 bytes)The maximum amount (high-water mark) of program storage in use by theuser task above the 16MB line, in the extended CICS dynamic storage area(ECDSA). This field is a subset of PC31AHWM (field ID: 139) that resides inthe ECDSA.
143 (Type-A, PC24CHWM, 4 bytes)The maximum amount (high-water mark) of program storage in use by theuser task below the 16MB line, in the CICS dynamic storage area (CDSA). Thisfield is a subset of PC24BHWM (field ID: 108) that resides in the CDSA.
160 (Type-A, PC24SHWM, 4 bytes)The maximum amount (high-water mark) of program storage in use by theuser task below the 16MB line, in the shared dynamic storage area (SDSA).This field is a subset of PC24BHWM (field ID: 108) that resides in the SDSA.
161 (Type-A, PC31SHWM, 4 bytes)The maximum amount (high-water mark) of program storage in use by theuser task above the 16MB line, in the extended shared dynamic storage area(ESDSA). This field is a subset of PC31AHWM (field ID: 139) that resides inthe ESDSA.
162 (Type-A, PC24RHWM, 4 bytes)The maximum amount (high-water mark) of program storage in use by theuser task below the 16MB line, in the read-only dynamic storage area (RDSA).This field is a subset of PC24BHWM (field ID: 108) that resides in the RDSA.
DFHSYNC fieldsDFHSYNC owns the following performance class data fields relating to syncpointactivity:
060 (Type-A, SPSYNCCT, 4 bytes)The total number of syncpoint requests issued by the user task. This alsoincludes:v The SYNCPOINT implicitly issued as part of the task-detach processingv The SYNCPOINT issued at PSB termination for any DBCTL activity
173 (Type-S, SYNCTIME, 8 bytes)The elapsed time in which the user task was dispatched or suspendedprocessing syncpoint requests.
For more information, see “Syncpoint elapsed time” on page 301.
Chapter 14. Understanding CMF data 267

177 (Type-S, SRVSYWTT, 8 bytes)The elapsed time in which the user task waited for completion of syncpoint orresynchronization processing using the coupling facility data table server tocomplete.
Note: This field is a component of the task suspend time field, SUSPTIME(owner: DFHTASK, field ID: 014).
196 (Type-S, SYNCDLY, 8 bytes)The elapsed time in which the user task waited for a syncpoint request to beissued by it's parent transaction. The user task was executing as a result of theparent transaction issuing a CICS Business Transaction Services (BTS) RunACQPROCESS or Run Activity requests to run a process or activitysynchronously.
For more information on CICS BTS, see the CICS Business Transaction Services.
For more information, see “Syncpoint elapsed time” on page 301 and“Transaction timing fields” on page 295.
Note: This field is a component of the task suspend time field, SUSPTIME(owner: DFHTASK, field ID: 014).
199 (Type-S, OTSINDWT, 8 bytes)The elapsed time in which the user task was dispatched or suspended indoubtwhilst processing a syncpoint for an Object Transaction Service (OTS)Syncpoint request.
For more information, see “Syncpoint elapsed time” on page 301.
DFHTASK fieldsDFHTASK owns the following performance class data fields:
001 (Type-C, TRAN, 4 bytes)Transaction identification.
004 (Type-C, TTYPE, 4 bytes)Type of transaction start (Start Code or Start Type):
TOThe transaction was started (attached) by input of the transaction ID fromthe terminal user.
S Attached by automatic transaction initiation (ATI) without data. Thetransaction was started (attached) by an application program using theEXEC CICS START TRANSID('xxxx') ... API command. CICS internaltransactions such as CATR, CEJR, CESN, CQRY, CRPM, CRSQ, CSFU,CSGM, CXRE, and CWBG are just some examples of CICS transactionsthat use this start type.
SDAttached by automatic transaction initiation (ATI) with data. Thetransaction was started (attached) by an application program using theEXEC CICS START TRANSID('xxxx') FROM(xxxx) ... API command. CICSinternal transactions such as CLS1 is an example of a transaction that usesthis start type.
QDThe transaction was started (attached) because the trigger level of anintrapartition transient data queue was reached. If the transaction is not
268 IBM CICS Performance Analyzer for z/OS: Report Reference

associated with a terminal facility, the Transaction Facility Name (field:FCTYNAME, owner: DFHTASK, field ID: 163) provides the name of thetransient data queue ID.
U The transaction was started (attached) by a CICS internal functiongenerally as a result of some user request. CICS internal transactions suchas CATA, CATD, CEJR, CESC, CEX2, CFOR, CFQR, CFQS, CFTL, CGRP,CIEP, CIOF, CIOR, CIRP, CITS, CJTR, CLQ1, CLQ2, CLS2, COTR, COVR,CPLT, CPMI, CRSY, CSFR, CSHQ, CSNC, CSNE, CSOL, CSSY, CSTE, CSZI,CWBA, and CWXN are just some examples of the CICS transactions thatuse this start type. In addition to CICS internal functions, transaction's thatare being run under the control of the CICS Execution Diagnostic Facilitytransaction, CEDF, are also started (attached) with this start type.
TPAttached from terminal (TCTTE) transaction ID. The preset transaction wasstarted (attached) by input from the terminal user or by the previoustransaction using the EXEC CICS RETURN TRANSID('xxxx') IMMEDIATE... API command. The transaction ID can be preset either from the terminaldefinition, from using the CRTE routing transaction, or by the previoustransaction's application program using the EXEC CICS RETURNTRANSID('xxxx') ... API command with or without the IMMEDIATE optionspecified. Some examples of CICS transactions which use this start typeare: CESN (except when used as the initial good morning transaction),CRTE (when invoked on the routed system), and CSSF when invoked aspart of a 'CRTE CANCEL' (the initial CRTE transaction which establishesthe routing session uses the start type 'TO').
SZAttached by the Front End Programming Interface (FEPI). The transactionwas started (attached) as the receive program by the Front EndProgramming Interface as a result of inbound data. In addition to inbounddata arriving, the receive program is also started (attached) if the time limitset by a FEPI START command expires, the session is lost, or anything thatcauses a FEPI RECEIVE command to complete. See the CICS Front EndProgramming Interface User's Guide for more information on FEPI startedtasks.
007 (Type-S, USRDISPT, 12 bytes)Total elapsed time during which the user task was dispatched on each CICSTCB under which the task ran. The TCB modes managed by the CICSdispatcher are: QR, RO, CO, FO, SZ, RP, SL, SP, SO, EP, J8, J9, L8, L9, S8, TP,T8, X8, X9, JM, and D2. Be aware that, for each CICS release, new TCB modesmight be added to this list, or obsolete TCB modes might be removed.
008 (Type-S, USRCPUT, 12 bytes)Processor time for which the user task was dispatched on each CICS TCBunder which the task ran. The TCB modes managed by the CICS dispatcherare: QR, RO, CO, FO, SZ, RP, SL, SP, SO, EP, J8, J9, L8, L9, S8, TP, T8, X8, X9,JM, and D2. Be aware that, for each CICS release, new TCB modes might beadded to this list, or obsolete TCB modes might be removed.
014 (Type-S, SUSPTIME, 12 bytes)The total elapsed suspend (wait) time for which the user task was suspendedby the CICS dispatcher domain. This includes:v The task suspend (wait) time.
Chapter 14. Understanding CMF data 269

v The elapsed time that the transaction waited for its first dispatch. This alsoincludes any delay incurred because of the limits set for this transaction'stransaction class (if any) or by the system parameter MXT being reached bythis transaction.
v The elapsed time waiting for redispatch after a suspended task has beenresumed.
For more information, see “Transaction suspend (wait) time” on page 297.
031 (Type-P, TRANNUM, 4 bytes)The transaction identification number.
Note: The transaction number field is normally a 4-byte packed decimalnumber. However, some CICS system tasks are identified by special charactersin this field as follows:III for system initialization tasksTCP for the terminal control task
These special identifiers are placed in bytes 2 through 4. Byte 1 is blank (X'40')before the terminal control TCP identifier, and a null value (X'00') before theothers.
059 (Type-A, ICPUINCT, 4 bytes)The number of Interval Control START requests issued by the user task.
064 (Type-A, TASKFLAG, 4 bytes)Task error flags, a string of 32 bits used for signaling unusual conditionsoccurring during the user task:
Bit 0Reserved.
Bit 1The CICS Monitoring Facility (CMF) detected an attempt to start a userclock that was already running, or to stop one that was not running.
Bits 2-31Reserved.
065 (Type-A, ICSTACCT, 4 bytes)The total number of local interval control START requests, with the CHANNELoption, issued by the user task.
066 (Type-A, ICTOTCT, 4 bytes)The total number of Interval Control Start, Cancel, Delay, and Retrieve requestsissued by the user task.
Note: The number of interval control Cancel, Delay, and Retrieve requests canbe calculated by subtracting the interval control request count ICPUINCT fromthe total interval control request count, ICTOTCT.
082 (Type-C, TRNGRPID, 28 bytes)The transaction group ID is assigned at transaction attach time, and can beused to correlate the transactions that CICS runs for the same incoming workrequest (for example, the CWXN and CWBA transactions for Web requests).
This transaction group ID relationship is particularly useful when applied tothe requests that originate through the CICS Web support (CWS), IIOP, ECIover TCP/IP, or the 3270 bridge interface, as indicated by the transaction originin byte 4 of the transaction flags field (owner: DFHTASK, field ID: 164). Seebelow for more details on the transaction origin type.
270 IBM CICS Performance Analyzer for z/OS: Report Reference

For more information, see “Correlating performance class data” on page 307and the “Transaction Group report” on page 73.
097 (Type-C, NETUOWPX, 20 bytes)The fully qualified name by which the originating system is known to theVTAM network. This name is assigned at attach time using either the netnamederived from the terminal (when the task is attached to a local terminal), or thenetname passed as part of an IRC (MRO) or ISC (APPC) attach header. At leastthree padding bytes (X'00') are present at the right end of the name.
If the originating terminal is VTAM across an ISC APPC or IRC link, theNETNAME is the networkid.LUname. If the terminal is non-VTAM, theNETNAME is networkid.generic_APPLID.
All originating information is passed as part of an ISC LUTYPE6.1 attachheader has the same format as the non-VTAM terminal originators above.
When the originator is communicating over an external CICS interface (EXCI)session, the name is a concatenation of:
’DFHEXCIU | . | MVS ID | Address Space Id (ASID)’| | |
8 bytes | 1 byte | 4 bytes | 4 bytes
derived from the originating system. That is, the name is a 17-byte LU nameconsisting of:v An 8-byte eye-catcher set to 'DFHEXCIU'.v A 1-byte field containing a period '.'.v A 4-byte field containing the MVS ID, in characters, under which the client
program is running.v A 4-byte field containing the address space ID (AS ID) in which the client
program is running. This field contains the 4-character EBCDICrepresentation of the 2-byte hexadecimal address space ID.
For more information on the external CICS interface (EXCI), see the CICSExternal Interfaces Guide.
Note: That it is possible for transactions that are attached without a terminalor session facility to be given the same network unit-of-work netname in theformat of networkid.generic_APPLID.
For more information, see “Correlating performance class data” on page 307and the “Cross-System Work report” on page 66.
098 (Type-C, NETUOWSX, 8 bytes)The name by which the network unit-of-work ID is known within theoriginating system. This name is assigned at transaction attach time usingeither a STCK-derived token created by the originating system, or the networkunit-of-work ID passed as part of an IRC (MRO) or ISC (APPC) attach functionmanagement header (FMH).
The first six bytes of this field are a binary value derived from the systemclock of the originating system and which can wrap round at intervals ofseveral months.
The last two bytes of this field are a syncpoint sequence count. This countmight change during the life of the task as a result of syncpoint activity.
For CICS Business Transaction Services (BTS) transactions, the networkunit-of-work ID is also passed to a transaction that is invoked synchronouslyby an application program issuing either a CICS BTS run ACQPROCESSsynchronous or run activity synchronous command.
Chapter 14. Understanding CMF data 271

Note: When using MRO or ISC, the NETUOWSX field can be combined withthe NETUOWPX field (field ID: 097) to uniquely identify a task across eachCICS system. It must be combined with the NETUOWPX because theNETUOWSX field on its own is unique only to the originating CICS system.
For more information, see “Correlating performance class data” on page 307and “Cross-System Work report” on page 66.
102 (Type-S, DISPWTT, 12 bytes)The elapsed time for which the user task waited for redispatch by the CICSdispatcher domain. This is the aggregate of the wait times between each waitevent completion and the user task being redispatched by the CICS dispatcherdomain.
Note:
1. This field does not include the elapsed time spent waiting for the firstdispatch.
2. This field is a component of the task suspend time field, SUSPTIME(owner: DFHTASK, field ID: 014).
109 (Type-C, TRANPRI, 4 bytes)The transaction priority of the task when monitoring of the task was initializedat transaction attach.
123 (Type-S, GNQDELAY, 12 bytes)The elapsed time in which the user task waited for a CICS task control globalenqueue.
For more information, see “Transaction timing fields” on page 295.
Note: This field is a component of the task suspend time field, SUSPTIME(owner: DFHTASK, field ID: 014).
124 (Type-C, BRDGTRAN, 4 bytes)For those transactions that are attached by the CICS 3270 Bridge interface, thisfield contains the name of the bridge listener transaction that invoked thetransaction. A bridge transaction can be identified using byte 1 of thetransaction flags field, TRANFLAG (owner: DFHTASK, field ID: 164).
125 (Type-S, DSPDELAY, 12 bytes)The elapsed time in which the user task waited for the first dispatch by theCICS dispatcher domain.
Note: This field is a component of the task suspend time field, SUSPTIME(owner: DFHTASK, field ID: 014).
126 (Type-S, TCLDELAY, 12 bytes)The elapsed time in which the user task waited for first dispatch which wasdelayed because of the limits set for this transaction's transaction class. Thename of the transaction class for this transaction can be found in theTCLSNAME field, (owner: DFHTASK, field ID: 166).
For more information, see “Transaction timing fields” on page 295.
Note: This field is a component of the task suspend time field, SUSPTIME(owner: DFHTASK, field ID: 014) and the first dispatch delay time field,DSPDELAY (owner: DFHTASK, field ID: 125).
272 IBM CICS Performance Analyzer for z/OS: Report Reference

127 (Type-S, MXTDELAY, 12 bytes)The elapsed time in which the user task waited for first dispatch which wasdelayed because of the limits set by the MXT system parameter being reached.
For more information, see “Transaction timing fields” on page 295.
Note: This field is a component of the task suspend time field, SUSPTIME(owner: DFHTASK, field ID: 014) and the first dispatch delay time field,DSPDELAY (owner: DFHTASK, field ID: 125).
128 (Type-S, LMDELAY, 12 bytes)The elapsed time in which the user task waited to acquire a lock on a resource.A user task cannot explicitly acquire a lock on a resource, but many CICSmodules lock resources on behalf of user tasks using the CICS lock manager(LM) domain.
For more information, see “Transaction timing fields” on page 295.
For more information about the CICS lock manager, see the CICS ProblemDetermination Guide.
Note: This field is a component of the task suspend time field, SUSPTIME(owner: DFHTASK, field ID: 014).
129 (Type-S, ENQDELAY, 12 bytes)The elapsed time in which the user task waited for a CICS task control localenqueue. For more information, see “Transaction timing fields” on page 295
Note: This field is a component of the task suspend time field, SUSPTIME(owner: DFHTASK, field ID: 014).
132 (Type-T, RMUOWID, 8 bytes)The identifier of the local unit of work (unit of recovery) for this task. The localunit-of-recovery values are used to synchronize recovery operations amongstCICS systems and other resource managers, such as IMS (DBCTL) and DB2.
163 (Type-C, FCTYNAME, 4 bytes)Transaction facility name. This field is null if the transaction is not associatedwith a facility. The transaction facility type (if any) can be identified using byte0 of the transaction flags field, TRANFLAG (owner: DFHTASK, field ID: 164).
164 (Type-A, TRANFLAG, 8 bytes)Transaction flags, a string of 64 bits used for signaling transaction definitionand status information:
Byte 0 Transaction facility identification. The field identifies the type ofresource that is the transaction's principal facility and can have one ofthe following values:Bit 0 Transaction facility name = noneBit 1 Transaction facility name = terminalBit 2 Transaction facility name = surrogateBit 3 Transaction facility name = destinationBit 4 Transaction facility name = 3270 bridgeBit 5-7 Reserved
Byte 1 Transaction identification information:Bit 0 System transactionBit 1 Mirror transactionBit 2 Distributed Program Link (DPL) mirror transactionBit 3 ONC RPC alias transactionBit 4 WEB alias transaction
Chapter 14. Understanding CMF data 273

Bit 5 3270 bridge transactionBit 6 ReservedBit 7 CICS BTS run transaction (ACQPROCESS or activity)
synchronous
Byte 2 z/OS workload manager request (transaction) completion information:Bit 0 Report the total response time (begin-to-end phase) for the
completed work request (transaction)Bit 1 Notify that the entire execution phase of the work request
(transaction) is completeBit 2 Notify that a subset of the execution phase of the work request
(transaction) is completeBit 3 This transaction has been reported to the z/OS workload
manager as completing abnormally because it has tried toaccess DB2 and a “connection unavailable” response has beenreturned. This abnormal completion occurs when all thefollowing are true:1. Bit 0 is set.2. CICS is not connected to DB2.3. The CICS-DB2 adapter is in standby mode
(STANDBYMODE(RECONNECT) orSTANDBYMODE(CONNECT) ).
4. CONNECTERROR(SQLCODE) is specified, causing theapplication to receive a -923 SQL code.
Bits 4-7Reserved
Byte 3 Transaction definition information:Bit 0 Taskdataloc = BELOWBit 1 Taskdatakey = CICSBit 2 Isolate = NOBit 3 Dynamic = YESBit 4-7 Reserved
Byte 4 Transaction origin type:X'01' NoneX'02' TerminalX'03' Transient dataX'04' StartX'05' Terminal startX'06' CICS Business Transaction Services (BTS) schedulerX'07' Transaction Manager domain (XM) run transactionX'08' 3270 bridgeX'09' Socket domainX'0A' CICS Web support (CWS)X'0B' Internet Inter-ORB Protocol (IIOP)X'0C' Resource Recovery Services (RRS)X'0D' LU 6.1 sessionX'0E' LU 6.2 (APPC) sessionX'0F' MRO sessionX'10' External Call Interface (ECI) sessionX'11' II domain Request ReceiverX'12' Request stream (RZ) Instore TransportX'13' IPIC sessionX'14' Event
Byte 5Bit 0 The transaction origin
274 IBM CICS Performance Analyzer for z/OS: Report Reference

Bit 1 ReservedBit 2 Resource class record, or records, for this taskBit 3 Identity class record, or records, for this taskBit 4 ReservedBit 5 ReservedBit 6 Task purged on an open TCBBit 7 Task abnormally terminated
Note: If bit 6 is set, the task was purged while running on an openTCB, and its transaction timing clocks have been left in an unreliablestate. Because of this, the clocks will be set to zero when the record iswritten by the CICS Monitoring Facility (CMF).
Byte 6 CICS TS V3.2 and later: Reserved.
CICS TS V3.1 and earlier:
JVM status information:Bit 0 JVM marked unresettableBit 1-7 Reserved
Byte 7 Recovery manager status information:Bit 0 Indoubt wait = noBit 1 Indoubt action = commitBit 2 Recovery manager - UOW resolved with indoubt actionBit 3 Recovery manager - ShuntBit 4 Recovery manager - UnshuntBit 5 Recovery manager - Indoubt failureBit 6 Recovery manager - Resource owner failureBit 7 Reserved
Note: Bits 2 through 6 are reset on a SYNCPOINT request when theMNSYNC=YES option is specified.
166 (Type-C, TCLSNAME, 8 bytes)The transaction's transaction class name (TRANCLASS). If the transaction wasdelayed because of the limits set for the transaction class, the elapsed time thatthe transaction waited can be found in the TCLDELAY field, (owner:DFHTASK, field ID: 126).
The transaction class name field is null if the transaction is not defined in atransaction class.
170 (Type-S, RMITIME, 12 bytes)The total elapsed time the user task spent in the CICS Resource ManagerInterface (RMI) for all the resource managers invoked by the user task,including DB2, IMS (DBCTL), WebSphere MQ, CICS Sockets, and so on.
For information on the related fields for DB2 and IMS (DBCTL), see“DFHDATA fields” on page 253.
For more information, see “RMI elapsed and suspend time” on page 301.
Refer also to “DFHRMI fields” on page 262 for information that can provideadditional insight into understanding and interpreting CICS Resource ManagerInterface (RMI) performance problems.
171 (Type-S, RMISUSP, 12 bytes)The elapsed time during which the user task was suspended by the CICSdispatcher domain whilst in the CICS Resource Manager Interface (RMI).
Chapter 14. Understanding CMF data 275

For more information, see “RMI elapsed and suspend time” on page 301 and“Transaction timing fields” on page 295.
For information on the related fields for DB2 and IMS (DBCTL), see“DFHDATA fields” on page 253.
Note: This field is a component of the task suspend time field, SUSPTIME(owner: DFHTASK, field ID: 014).
181 (Type-S, WTEXWAIT, 12 bytes)The elapsed time the user task waited for one or more ECBs, passed to CICSby the user task using the EXEC CICS WAIT EXTERNAL ECBLIST() command,to be MVS POSTed. The user task can wait on one or more ECBs. If it waits onmore than one, the user task becomes dispatchable as soon as one of the ECBsis posted.
For more information, see “Transaction timing fields” on page 295.
Note: This field is a component of the task suspend time field, SUSPTIME(owner: DFHTASK, field ID: 014).
182 (Type-S, WTCEWAIT, 12 bytes)The elapsed time the user task waited for:v One or more ECBs, passed to CICS by the user task using the EXEC CICS
WAITCICS ECBLIST command, to be MVS POSTed. The user task can waiton one or more ECBs. If it waits on more than one, the user task becomesdispatchable as soon as one of the ECBs is posted.
v Completion of an event initiated by the same or by another task. The eventwould normally be the posting, at the expiration time, of a timer-eventcontrol area provided in response to an EXEC CICS POST command. TheEXEC CICS WAIT EVENT command provides a method of directly givingup control to some other task until the event being waited on is completed.
For more information, see “Transaction timing fields” on page 295.
Note: This field is a component of the task suspend time field, SUSPTIME(owner: DFHTASK, field ID: 014).
183 (Type-S, ICDELAY, 12 bytes)The elapsed time that the user task waited as a result of issuing either:v An interval control EXEC CICS DELAY command for a specified time
interval, orv An interval control EXEC CICS DELAY command for a specified time of day
to expire, orv An interval control EXEC CICS RETRIEVE command with the WAIT option
specified.
For more information, see “Transaction timing fields” on page 295.
Note: This field is a component of the task suspend time field, SUSPTIME(owner: DFHTASK, field ID: 014).
184 (Type-S, GVUPWAIT, 12 bytes)The elapsed time in which the user task waited as a result of giving up controlto another task. A user task can give up control in many ways. Some examplesare application programs that use one or more of the following EXEC CICSAPI or SPI commands:v Using the EXEC CICS SUSPEND command. This command causes the
issuing task to relinquish control to another task of higher or equal
276 IBM CICS Performance Analyzer for z/OS: Report Reference

dispatching priority. Control is returned to this task as soon as no other taskof a higher or equal priority is ready to be dispatched.
v Using the EXEC CICS CHANGE TASK PRIORITY command. This commandimmediately changes the priority of the issuing task and causes the task togive up control in order for it to be dispatched at its new priority. The taskis not redispatched until tasks of higher or equal priority, and that are alsodispatchable, have been dispatched.
v Using the EXEC CICS DELAY command with INTERVAL(0). This commandcauses the issuing task to relinquish control to another task of higher orequal dispatching priority. Control is returned to this task as soon as noother task of a higher or equal priority is ready to be dispatched.
v Using the EXEC CICS POST command requesting notification that aspecified time has expired. This command causes the issuing task torelinquish control to give CICS the opportunity to post the time-eventcontrol area.
v Using the CICS CICS PERFORM RESETTIME command to synchronize theCICS date and time with the MVS system date and time of day.
v Using the EXEC CICS START TRANSID command with the ATTACHoption.
For more information, see “Transaction timing fields” on page 295.
Note: This field is a component of the task suspend time field, SUSPTIME(owner: DFHTASK, field ID: 014).
190 (Type-C, RRMSURID, 16 bytes)The RRMS/MVS Unit-of-Recovery Id (URID).
For more general information on the Recoverable Resource ManagementServices (RRMS), see the CICS External Interfaces Guide.
191 (Type-S, RRMSWAIT, 12 bytes)The elapsed time in which the user task waited indoubt using the MVSresource recovery services (RRS) for transactional EXCI.
For more information, see “Transaction timing fields” on page 295.
Note: This field is a component of the task suspend time field, SUSPTIME(owner: DFHTASK, field ID: 014).
192 (Type-S, RQRWAIT, 12 bytes)The elapsed time during which the request receiver user task CIRR (or userspecified transaction ID) waited for any outstanding replies to be satisfied.
For more information, see “Transaction timing fields” on page 295.
Note: This field is a component of the task suspend time field, SUSPTIME(group name: DFHTASK, field ID: 014).
193 (Type-S, RQPWAIT, 12 bytes)The elapsed time during which the request processor user task CIRP waited forany outstanding replies to be satisfied.
For more information, see “Transaction timing fields” on page 295.
Note: This field is a component of the task suspend time field, SUSPTIME(group name: DFHTASK, field ID: 014).
Chapter 14. Understanding CMF data 277

194 (Type-C, OTSTID, 128 bytes)The OTS TID is the Object Transaction Service Transaction ID. It can be used tocorrelate all the transactions that are part of the same Object Transaction.
195 (Type-S, RUNTRWTT, 12 bytes)The elapsed time in which the user task waited for completion of a transactionthat run as a result of the user task issuing a CICS BTS run ACQPROCESS orrun activity request to run a process or activity synchronously.
For more information, see “Correlating performance class data” on page 307and “Transaction timing fields” on page 295.
Note: This field is a component of the task suspend time field, SUSPTIME(owner: DFHTASK, field ID: 014).
247 (Type-S, DSCHMDLY, 12 bytes)The elapsed time in which the user task waited for redispatch after a CICSDispatcher change-TCB mode request was issued by or on behalf of the usertask. For example, a change-TCB mode request from a CICS L8 or S8 modeTCB back to the CICS QR mode TCB might have to wait for the QR TCBbecause another task is currently dispatched on the QR TCB. Ideally thenumber of CICS dispatcher change-TCB modes should be kept to a minimum.See the section on the “Open transaction environment” on page 304 for moreadditional information.
For more information, see “Transaction timing fields” on page 295.
Note: This field is a component of the task suspend time field, SUSPTIME(owner: DFHTASK, field ID: 014).
248 (Type-A, CHMODECT, 4 bytes)The number of CICS dispatcher domain change-TCB modes issued by or onbehalf of the user task. Ideally the number of CICS dispatcher change-TCBmodes should be kept to a minimum. This field is not available in CICSTransaction Server for z/OS Version 3.1 or later. See the section on the “Opentransaction environment” on page 304 for additional information.
Before CICS Transaction Server Version 3, CHMODECT was the field in theCICS SMF 110 record that contained the count of TCB switches (changemodes). In CICS Transaction Server Version 3, the CHMODECT field has beenremoved and replaced by the composite field DSCHMDLY. This compositefield consists of a time and a count: The time portion represents the elapsedtime the user task waited for redispatch after change mode requests. Forexample, a change mode request from an L8 TCB back to the QR TCB mighthave to wait for the QR TCB because another task is currently dispatched onthe QR TCB. The count portion represents the number of change modes and isequivalent to CHMODECT in previous releases.
249 (Type-S, QRMODDLY, 12 bytes)The elapsed time in which the user task waited for redispatch on the CICS QRmode TCB. This is an aggregate of the wait times between each wait eventcompletion and the user task being redispatched by the CICS dispatcherdomain on the QR mode TCB. See the section on the “Open transactionenvironment” on page 304 for additional information.
This field is a subset of the wait for redispatch field, DISPWTT (owner:DFHTASK, field ID: 102).
For more information, see “Transaction timing fields” on page 295.
278 IBM CICS Performance Analyzer for z/OS: Report Reference

Note: This field is a component of the task suspend time field, SUSPTIME(owner: DFHTASK, field ID: 014).
250 (Type-S, MAXOTDLY, 12 bytes)The elapsed time in which the user task waited to obtain a CICS open modeTCB because the CICS system had reached the limit set by the systemparameter, MAXOPENTCBS.
This applies to L8 mode open TCBs only. L8 mode open TCBs are used bytask-related user exits that are enabled with the OPENAPI option. Thisincludes the CICS DB2 adaptor when CICS connects to DB2 Version 6 or later.See the section on the “Open transaction environment” on page 304 for moregeneral information.
For more information, see “Transaction timing fields” on page 295.
Note: This field is a component of the task suspend time field, SUSPTIME(owner: DFHTASK, field ID: 014).
251 (Type-A, TCBATTCT, 4 bytes)The number of CICS dispatcher domain TCB attaches issued by or on behalf ofthe user task. See the section on the “Open transaction environment” on page304 for additional information.
252 (Type-A, DSTCBHWM, 4 bytes)The peak number of CICS open TCBs (in TCB modes J8, J9, L8, L9, S8, T8, X8,and X9) that have been concurrently allocated to the user task.
253 (Type-S, JVMTIME, 12 bytes)The total elapsed time that the user task spent in the CICS Java VirtualMachine (JVM).
For more information, see “JVM elapsed and suspend time” on page 303.
254 (Type-S, JVMSUSP, 12 bytes)The elapsed time during which the user task was suspended by the CICSdispatcher domain while running in the CICS Java Virtual Machine (JVM).
For more information, see “JVM elapsed and suspend time” on page 303 and“Transaction timing fields” on page 295.
Note: This field is a component of the task suspend time field, SUSPTIME(owner: DFHTASK, field ID: 014).
255 (Type-S, QRDISPT, 12 bytes)The total elapsed time during which the user task was dispatched by the CICSdispatcher domain on the CICS QR mode TCB.
Note: This field is a component of the total task dispatch time field, USRDISPT(owner: DFHTASK, field ID: 007).
256 (Type-S, QRCPUT, 12 bytes)The total processor (CPU) time during which the user task was dispatched bythe CICS dispatcher domain on the CICS QR mode TCB.
Note: This field is a component of the total task CPU time field, USRCPUT(owner: DFHTASK, field ID: 008).
257 (Type-S, MSDISPT, 12 bytes)The total elapsed time during which the user task was dispatched by the CICSdispatcher domain on each CICS TCB, mode RO, CO, FO, SZ, RP, SL, SO, SP,D2 and JM. Note that:
Chapter 14. Understanding CMF data 279

v Mode RO is used for opening and closing CICS data sets, loading programs,issuing RACF® calls, and so on.
v Mode CO is used for processes which can safely run in parallel with otherCICS activity such as VSAM requests.
v Mode FO is used for opening and closing user data sets.v Mode SZ is used only if FEPI is active.v Mode RP is used only if ONC RPC support is active.v Modes SL, SO and SP are used only if TCPIP=YES is specified as a system
initialization parameter. Mode SL is used by the CICS support for TCP/IP(TCP/IP Service) Listener system transaction CSOL. Mode SO is used toprocess the CICS support for TCP/IP socket requests issued on by or onbehalf of the user task. Mode SP is the CICS support for TCP/IP sockets IPTtask (Initial Pthread TCB) and also owns all the SSL pthreads (S8 TCBs).
v Mode D2 is used to terminate DB2 protected threads. The CICS-DB2attachment facility long running system task, CEX2, associates eachprotected thread in turn to the CICS D2 mode TCB so that after twoprotected thread purge cycles it can call DB2 to terminate the thread. Theprotected thread purge cycle is defined in the PURGECYCLE parameter onthe DB2CONN resource definition. The CICS D2 mode TCB is also usedshould a user issue the DSNC DISCONNECT planname command topreempt the purge cycle and cause protected threads for a planname to beterminated immediately.
Note: Mode D2 is only used when CICS is connected to DB2 Version 6 orlater.
v Mode JM is used for shared class cache management purposes.v Mode EP is used for event processing.v CICS creates a TP mode TCB for every JVMSERVER resource definition that
is installed and enabled. The TP TCB owns the IPT task (Initial ProcessThread TCB), the Language Environment® enclave, the JVM, the THRD TCBpool, and the T8 TCBs for that JVM server.
Note: This field is a component of the total task dispatch time field, USRDISPT(owner: DFHTASK, field ID: 007).
258 (Type-S, MSCPUT, 12 bytes)The processor time for which the user task was dispatched on each CICS TCB.The usage of each CICS TCB is shown in the description for field MSDISPT(field ID: 257).
Note: This field is a component of the total task CPU time field, USRCPUT(owner: DFHTASK, field ID: 008).
259 (Type-S, L8CPUT, 12 bytes)The processor (CPU) time during which the user task was dispatched by theCICS dispatcher domain on a CICS L8 mode TCB.
A transaction is allocated and uses a CICS L8 mode TCB when it invokes atask-related user exit program that has been enabled with the OPENAPIoption. This includes the CICS DB2 adaptor when CICS connects to DB2Version 6 or later. However, when a task has been allocated an L8 mode TCB,that same TCB will remain associated with the task until the transaction isdetached.
For more information on the CICS open transaction environment (OTE), seethe CICS Application Programming Guide
280 IBM CICS Performance Analyzer for z/OS: Report Reference

For more information on the DB2 accounting and monitoring, see the CICSDB2 Guide.
Note: This field is a component of the total task CPU time field, USRCPUT(owner: DFHTASK, field ID: 008) and the task key 8 CPU time field, KY8CPUT(owner: DFHTASK, field ID: 263). See the section on the “Open transactionenvironment” on page 304 for more information.
260 (Type-S, J8CPUT, 12 bytes)The processor (CPU) time during which the user task was dispatched by theCICS dispatcher domain on a CICS J8 mode TCB. A transaction is allocatedand use a CICS J8 mode TCB each time the transaction invokes a CICS JavaVirtual Machine (JVM) application program. However, when a task has beenallocated a J8 mode TCB, that same TCB will remain associated with the taskuntil the transaction is detached.
Note: This field is a component of the total task CPU time field, USRCPUT(owner: DFHTASK, field ID: 008) and the task key 8 CPU time field, KY8CPUT(owner: DFHTASK, field ID: 263).
261 (Type-S, S8CPUT, 12 bytes)The processor (CPU) time during which the user task was dispatched by theCICS dispatcher domain on a CICS S8 mode TCB. A transaction is allocated aCICS S8 mode TCB when it is using the secure sockets layer (SSL) duringclient certification negotiation. The S8 mode TCB remains associated with thesame task for the life of the SSL request.
Note: This field is a component of the total task CPU time field, USRCPUT(owner: DFHTASK, field ID: 008) and the task key 8 CPU time field, KY8CPUT(owner: DFHTASK, field ID: 263).
262 (Type-S, KY8DISPT, 12 bytes)The total elapsed time during which the user task was dispatched by the CICSdispatcher domain on a CICS Key 8 mode TCB. A transaction is allocated anddispatched on a:v CICS H8 mode TCB when it invokes an HPJ-compiled Java application
program that has been defined to use Java hot-pooling.v CICS J8 mode TCB each time the transaction invokes a Java application
program that has been defined with JVM(YES). However, when a task hasbeen allocated a J8 mode TCB, that same TCB will remain associated withthe task until the transaction is detached. See the section on the “Opentransaction environment” on page 304 for more information.
v CICS L8 mode TCB when it invokes a task-related user exit program thathas with the OPENAPI option.This includes the CICS DB2 adaptor when CICS connects to DB2 Version 6or later. However, when a task has been allocated an L8 mode TCB, thatsame TCB will remain associated with the task until the transaction isdetached.For more general information on the CICS open transaction environment(OTE), see the CICS Application Programming Guide.
v CICS S8 mode TCB when it is using the secure sockets layer (SSL) duringclient certification negotiation. The S8 mode TCB will remain associated withthe same task until the secure socket close which normally occurs duringtask detach processing.
Chapter 14. Understanding CMF data 281

v CICS T8 mode when it is using a JVM server to perform multithreadedprocessing. When a thread is allocated a T8 mode TCB, that same TCBremains associated with the thread until the processing completes.
v CICS X8 mode TCB when a transaction invokes a C or C++ applicationprogram compiled with the XPLINK option on, and that is defined withEXECKEY=CICS. The TCB remains associated with the task until theprogram ends.
Note: This field is a component of the total task dispatch time field, USRDISPT(owner: DFHTASK, field ID: 007).
263 (Type-S, KY8CPUT, 12 bytes)The processor time during which the user task was dispatched by the CICSdispatcher on a CICS Key 8 mode TCB. The usage of the CICS Key 8 modeTCBs is shown in the description for field KY8DISPT (field ID: 262).
Note: This field is a component of the total task CPU time field, USRCPUT(owner: DFHTASK, field ID: 008).
264 (Type-S, KY9DISPT, 12 bytes)The total elapsed time during which the user task was dispatched by the CICSdispatcher on a CICS Key 9 mode TCB. A transaction is allocated anddispatched on a:v CICS J9 mode TCB when a transaction invokes a Java program defined with
EXECKEY=USER, that requires a JVM in user key. (If the storage protectionfacility is inactive, the transaction is allocated a J8 mode TCB instead of a J9mode TCB.) The TCB remains associated with the task until the Javaprogram completes.
v CICS L9 mode TCB when a transaction invokes an OPENAPI applicationprogram defined with EXECKEY=USER. The TCB remains associated withthe task until the transaction is detached.
v CICS X9 mode TCB when a transaction invokes a C or C++ program thatwas compiled with the XPLINK option, and that is defined withEXECKEY=USER. The TCB remains associated with the task until theprogram ends.
Note: This field is a component of the task dispatch time field, USRDISPT(owner: DFHTASK, field ID: 007).
265 (Type-S, KY9CPUT, 12 bytes)The total processor (CPU) time during which the user task was dispatched bythe CICS dispatcher on a CICS Key 9 mode TCB. A transaction is allocated anddispatched on a:v CICS J9 mode TCB when a transaction invokes a Java program defined with
EXECKEY=USER, that requires a JVM in user key. (If the storage protectionfacility is inactive, the transaction is allocated a J8 mode TCB instead of a J9mode TCB.) The TCB remains associated with the task until the Javaprogram completes.
v CICS L9 mode TCB when a transaction invokes an OPENAPI applicationprogram defined with EXECKEY=USER. The TCB remains associated withthe task until the transaction is detached.
v CICS X9 mode TCB when a transaction invokes a C or C++ program thatwas compiled with the XPLINK option, and that is defined withEXECKEY=USER. The TCB remains associated with the task until theprogram ends.
282 IBM CICS Performance Analyzer for z/OS: Report Reference

Note: This field is a component of the total task CPU time field, USRCPUT(owner: DFHTASK, field ID: 008).
266 (Type-S, L9CPUT, 12 bytes)The processor time during which the user task was dispatched by the CICSdispatcher domain on a CICS L9 mode TCB. When a transaction invokes anOPENAPI application program defined with EXECKEY=USER, it is allocatedand uses a CICS L9 mode TCB. (If the storage protection facility is inactive, anL8 mode TCB is used instead of an L9 mode TCB.) When a task has beenallocated an L9 mode TCB, that same TCB remains associated with the taskuntil the transaction is detached.
For more information on the CICS open transaction environment (OTE), seethe CICS Application Programming Guide.
Note: This field is a component of the total task CPU time field, USRCPUT(owner: DFHTASK, field ID: 008).
267 (Type-S, J9CPUT, 12 bytes)The processor time during which the user task was dispatched by the CICSdispatcher domain on a CICS J9 mode TCB. When a transaction invokes a Javaprogram defined with EXECKEY=USER, that requires a JVM in user key, it isallocated and uses a CICS J9 mode TCB. (If the storage protection facility isinactive, a J8 mode TCB is used instead of a J9 mode TCB.) When a task hasbeen allocated a J9 mode TCB, that same TCB remains associated with the taskuntil the Java program completes.
268 (Type-S, DSTCBMWT, 12 bytes)The elapsed time which the user task spent in TCB mismatch waits, that is,waiting because there was no TCB available matching the request, but therewas at least one non-matching free TCB. For transactions that invoke a Javaprogram to run in a JVM, this shows the time spent waiting for a TCB of thecorrect mode (J8 or J9) and JVM profile. See Java Application Development forCICS: Base Services and CORBA Client Support for more information about howCICS manages TCB mismatch waits for these transactions.
269 (Type-S, RODISPT, 12 bytes)The total elapsed time during which the user task was dispatched by the CICSdispatcher on the CICS RO mode TCB. The CICS RO mode TCB is used foropening and closing CICS data sets, loading programs, issuing RACF calls, andso on.
Note: This field is a component of the total task dispatch time field, USRDISPT(owner: DFHTASK, field ID: 007) and the task miscellaneous TCB dispatchtime field MSDISPT (owner: DFHTASK, field ID: 257).
270 (Type-S, ROCPUT, 12 bytes)The total processor (CPU) time during which the user task was dispatched bythe CICS dispatcher on the CICS RO mode TCB. The CICS RO mode TCB isused for opening and closing CICS data sets, loading programs, issuing RACFcalls, and so on.
Note: This field is a component of the total task CPU time field USRCPUT(owner: DFHTASK, field ID: 008) and the task miscellaneous TCB CPU timefield MSCPUT (owner: DFHTASK, field ID: 258).
271 (Type-S, X8CPUT, 12 bytes)The processor (CPU) time during which the user task was dispatched by theCICS dispatcher domain on a CICS X8 mode TCB. A transaction is allocated
Chapter 14. Understanding CMF data 283

and use a CICS X8 mode TCB each time the transaction invokes a C or C++application program that has been compiled with the XPLINK flag turned onand that is defined with EXECKEY=CICS. (An X8 mode TCB can also beallocated if the program is defined with EXECKEY=USER, but the storageprotection facility is inactive.) When a task has been allocated an X8 modeTCB, that same TCB remains associated with the task until the programcompletes.
Note: This field is a component of the total task CPU time field USRCPUT(owner: DFHTASK, field ID: 008) and the task key 8 CPU time field KY8CPUT(owner: DFHTASK, field ID: 263).
272 (Type-S, X9CPUT, 12 bytes)The processor (CPU) time during which the user task was dispatched by theCICS dispatcher domain on a CICS X9 mode TCB. A transaction is allocatedand use a CICS X9 mode TCB each time the transaction invokes a C or C++application program that has been compiled with the XPLINK flag turned on,and that is defined with EXECKEY=USER, it is allocated and uses a CICS X9mode TCB. (If the storage protection facility is inactive, an X8 mode TCB isused instead of an X9 mode TCB.) When a task has been allocated an X9 modeTCB, that same TCB remains associated with the task until the programcompletes.
Note: This field is a component of the total task CPU time field USRCPUT(owner: DFHTASK, field ID: 008) and the task key 9 CPU time field KY9CPUT(owner: DFHTASK, field ID: 265).
273 (Type-S, JVMITIME, 12 bytes)The elapsed time the user task spent initializing the CICS Java Virtual Machine(JVM) environment.
For more information, see “JVM elapsed and suspend time” on page 303.
Note: This field is a component of the task JVM elapsed time field JVMTIME(owner: DFHTASK, field ID: 253).
275 (Type-S, JVMRTIME, 12 bytes)The elapsed time the user task spent resetting or destroying the CICS JavaVirtual Machine (JVM) environment. If the reset fails, the JVM is markedun-resettable and the JVM is terminated.
For more information, see “JVM elapsed and suspend time” on page 303.
Note: This field is a component of the task JVM elapsed time field JVMTIME(owner: DFHTASK, field ID: 253).
277 (Type-S, MAXJTDLY, 12 bytes)The elapsed time in which the user task waited to obtain a CICS JVM TCB (J8or J9 mode), because the CICS system had reached the limit set by the systemparameter, MAXJVMTCBS. The J8 and J9 mode open TCBs are usedexclusively by Java programs defined with JVM(YES).
For more information, see “Transaction timing fields” on page 295.
Note: This field is a component of the task suspend time (field: SUSPTIME,owner: DFHTASK, field ID: 014).
278 (Type-S, MAXHTDLY, 12 bytes)The elapsed time in which the user task waited to obtain a CICS Hot-PoolingTCB (H8 mode), because the CICS system had reached the limit set by the
284 IBM CICS Performance Analyzer for z/OS: Report Reference

system parameter, MAXHPTCBS. The H8 mode open TCBs are usedexclusively by HPJ-compiled Java programs defined with HOTPOOL(YES).This field is not available in CICS Transaction Server for z/OS Version 3.1 orlater.
For more information, see “Transaction timing fields” on page 295.
Note: This field is a component of the task suspend time (field: SUSPTIME,owner: DFHTASK, field ID: 014).
279 (Type-S, DSMMSCWT, 12 bytes)The elapsed time which the user task spent waiting because no TCB wasavailable, and none could be created because of MVS storage constraints.
Note: This field is a component of the task suspend time (field: SUSPTIME,owner: DFHTASK, field ID: 014).
281 (Type-S, MAXSTDLY, 12 bytes)The elapsed time in which the user task waited to obtain a CICS SSL TCB (S8mode), because the CICS system had reached the limit set by the systemparameter, MAXSSLTCBS. The S8 mode open TCBs are used exclusively bysecure sockets layer (SSL) pthread requests issued by or on behalf of a usertask. For more information, see “Transaction timing fields” on page 295.
Note: This field is a component of the task suspend time (field: SUSPTIME,owner: DFHTASK, field ID: 014).
282 (Type-S, MAXXTDLY, 12 bytes)The elapsed time in which the user task waited to obtain a CICS XPLink TCB(X8 or X9 mode), because the CICS system had reached the limit set by thesystem parameter, MAXXPTCBS. The X8 and X9 mode open TCBs are usedexclusively by C or C++ programs compiled with the XPLINK flag turned on.For more information, see “Transaction timing fields” on page 295.
Note: This field is a component of the task suspend time (field: SUSPTIME,owner: DFHTASK, field ID: 014).
283 (Type-S, MAXTTDLY, 12 bytes)The elapsed time in which the user task waited to obtain a T8 TCB, becausethe CICS system reached the limit of available threads. The T8 mode openTCBs are used by a JVM server to perform multithreaded processing. Each T8TCB runs under one thread. The thread limit is 1024 for each CICS region andeach JVM server in a CICS region can have up to 256 threads.
285 (Type-S, PTPWAIT, 12 bytes)The elapsed time in which the user task waited for the 3270 bridge partnertransaction to complete. For more information on the CICS 3270 Bridge, see theCICS External Interfaces Guide.
For more information, see “Transaction timing fields” on page 295.
Note: This field is a component of the task suspend time (field: SUSPTIME,owner: DFHTASK, field ID: 014).
345 (Type-A, ICSTACDL, 4 bytes)The total length, in bytes, of the data in the containers of all the locally-runinterval control START requests, with the CHANNEL option, issued by theuser task. This total includes the length of any headers to the data.
Chapter 14. Understanding CMF data 285

346 (Type-A, ICSTRCCT, 4 bytes)The number of interval control START requests, with the CHANNEL option, tobe run on remote systems issued by the user task.
347 (Type-A, ICSTRCDL, 4 bytes)The total length, in bytes, of the data in the containers of all the remotely-runinterval control START requests, with the CHANNEL option, issued by theuser task. This total includes the length of any headers to the data.
400 (Type-S, T8CPUT, 12 bytes)The processor time during which the user task was dispatched by the CICSdispatcher domain on a CICS T8 mode TCB. T8 mode TCBs are used by a JVMserver to perform multithreaded processing. When a thread is allocated a T8mode TCB, that same TCB remains associated with the thread until theprocessing completes.
Note: This field is a component of the total task CPU time field, USRCPUT(field ID 008 in group DFHTASK), and the task key 8 CPU time field,KY8CPUT (field ID 263 in group DFHTASK).
401 (Type-S, JVMTHDWT, 12 bytes)The elapsed time that the user task waited to obtain a JVM server threadbecause the CICS system had reached the thread limit for a JVM server in theCICS region.
Note: This field is a component of the task suspend time field, SUSPTIME(group name: DFHTASK, field ID: 014).
DFHTEMP fieldsFor a breakdown by individual temporary storage queue of some of theDFHTEMP information, you can request transaction resource monitoring. See“Temporary storage queue entry fields” on page 321 for details.
DFHTEMP owns the following performance class data fields:
011 (Type-S, TSIOWTT, 8 bytes)The elapsed time in which the user task waited for VSAM I/O to the auxiliarytemporary storage data set, DFHTEMP.
For more information, see “Transaction timing fields” on page 295.
Note: This field is a component of the task suspend time (field: SUSPTIME,owner: DFHTASK, field ID: 014).
044 (Type-A, TSGETCT, 4 bytes)The number of temporary storage READQ requests issued by the user task.
046 (Type-A, TSPUTACT, 4 bytes)The number of temporary storage WRITEQ AUX requests issued by the usertask.
047 (Type-A, TSPUTMCT, 4 bytes)The number of temporary storage WRITEQ MAIN requests issued by the usertask.
092 (Type-A, TSTOTCT, 4 bytes)The total number of temporary storage DELETEQ, READQ, WRITEQ AUX andWRITEQ MAIN requests issued by the user task.
286 IBM CICS Performance Analyzer for z/OS: Report Reference

Note: The number of temporary storage DELETEQ requests can be calculatedby subtracting the temporary storage request counts TSGETCT, TSPUTACT,and TSPUTMCT from the total temporary storage request count, TSTOTCT.
178 (Type-S, TSSHWAIT, 8 bytes)The elapsed time in which the user task waited for an asynchronous sharedtemporary storage request to a temporary storage data server to complete.
For more information, see “Transaction timing fields” on page 295.
See the CICS System Definition Guide for more information on the CICS dataservers.
Note: This field is a component of the task suspend time (field: SUSPTIME,owner: DFHTASK, field ID: 014).
DFHTERM fieldsDFHTERM owns the following performance class data fields:
002 (Type-C, TERM, 4 bytes)Terminal or session identification. This field is null if the task is not associatedwith a terminal or session.
See the terminal information field, TERMINFO (owner: DFHTERM, field ID:165) for details on the type of terminal or session.
009 (Type-S, TCIOWTT, 8 bytes)The elapsed time in which the user task waited for input from the terminaluser, after issuing an EXEC CICS RECEIVE request.
For more information, see “Transaction timing fields” on page 295.
Note: This field is a component of the task suspend time field, SUSPTIME(owner: DFHTASK, field ID: 014).
034 (Type-A, TCMSGIN1, 4 bytes)The number of messages received from the task's principal terminal facility,including LUTYPE6.1 and LUTYPE6.2 (APPC) but not MRO (Inter-RegionCommunication).
035 (Type-A, TCMSGOU1, 4 bytes)The number of messages sent to the task's principal terminal facility, includingLUTYPE6.1 and LUTYPE6.2 (APPC) but not MRO (Inter-RegionCommunication).
067 (Type-A, TCMSGIN2, 4 bytes)The number of messages received from the LUTYPE6.1 alternate terminalfacilities allocated by the user task.
068 (Type-A, TCMSGOU2, 4 bytes)The number of messages sent to the LUTYPE6.1 alternate terminal facilitiesallocated by the user task.
069 (Type-A, TCALLOCT, 4 bytes)The number of session ALLOCATE requests issued by the user task for MRO(Inter-Region Communication), LUTYPE6.1, LUTYPE6.2 (APPC) sessions.
083 (Type-A, TCCHRIN1, 4 bytes)The number of characters received from the task's principal terminal facility,including LUTYPE6.1 and LUTYPE6.2 (APPC) but not MRO (Inter-RegionCommunication).
Chapter 14. Understanding CMF data 287
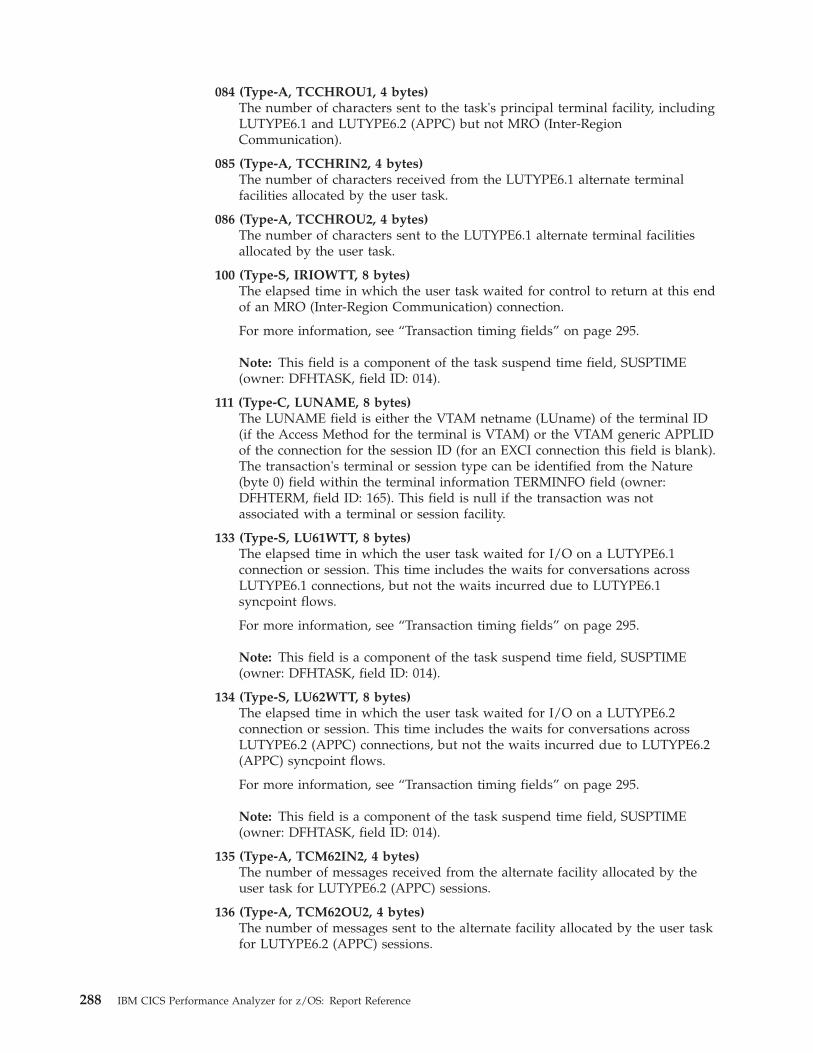
084 (Type-A, TCCHROU1, 4 bytes)The number of characters sent to the task's principal terminal facility, includingLUTYPE6.1 and LUTYPE6.2 (APPC) but not MRO (Inter-RegionCommunication).
085 (Type-A, TCCHRIN2, 4 bytes)The number of characters received from the LUTYPE6.1 alternate terminalfacilities allocated by the user task.
086 (Type-A, TCCHROU2, 4 bytes)The number of characters sent to the LUTYPE6.1 alternate terminal facilitiesallocated by the user task.
100 (Type-S, IRIOWTT, 8 bytes)The elapsed time in which the user task waited for control to return at this endof an MRO (Inter-Region Communication) connection.
For more information, see “Transaction timing fields” on page 295.
Note: This field is a component of the task suspend time field, SUSPTIME(owner: DFHTASK, field ID: 014).
111 (Type-C, LUNAME, 8 bytes)The LUNAME field is either the VTAM netname (LUname) of the terminal ID(if the Access Method for the terminal is VTAM) or the VTAM generic APPLIDof the connection for the session ID (for an EXCI connection this field is blank).The transaction's terminal or session type can be identified from the Nature(byte 0) field within the terminal information TERMINFO field (owner:DFHTERM, field ID: 165). This field is null if the transaction was notassociated with a terminal or session facility.
133 (Type-S, LU61WTT, 8 bytes)The elapsed time in which the user task waited for I/O on a LUTYPE6.1connection or session. This time includes the waits for conversations acrossLUTYPE6.1 connections, but not the waits incurred due to LUTYPE6.1syncpoint flows.
For more information, see “Transaction timing fields” on page 295.
Note: This field is a component of the task suspend time field, SUSPTIME(owner: DFHTASK, field ID: 014).
134 (Type-S, LU62WTT, 8 bytes)The elapsed time in which the user task waited for I/O on a LUTYPE6.2connection or session. This time includes the waits for conversations acrossLUTYPE6.2 (APPC) connections, but not the waits incurred due to LUTYPE6.2(APPC) syncpoint flows.
For more information, see “Transaction timing fields” on page 295.
Note: This field is a component of the task suspend time field, SUSPTIME(owner: DFHTASK, field ID: 014).
135 (Type-A, TCM62IN2, 4 bytes)The number of messages received from the alternate facility allocated by theuser task for LUTYPE6.2 (APPC) sessions.
136 (Type-A, TCM62OU2, 4 bytes)The number of messages sent to the alternate facility allocated by the user taskfor LUTYPE6.2 (APPC) sessions.
288 IBM CICS Performance Analyzer for z/OS: Report Reference

137 (Type-A, TCC62IN2, 4 bytes)The number of characters received from the alternate facility allocated by theuser task for LUTYPE6.2 (APPC) sessions.
138 (Type-A, TCC62OU2, 4 bytes)The number of characters sent to the alternate facility allocated by the usertask for LUTYPE6.2 (APPC) sessions.
165 (Type-A, TERMINFO, 4 bytes)Terminal or session information for this task's principal facility as identified inthe TERM field (owner: DFHTERM, field ID: 002). This field is null if the taskis not associated with a terminal or session facility.
Byte 0 Identifies whether this task is associated with a terminal or session.This field can be set to one of the following values:X'00' NoneX'01' TerminalX'02' Session
Byte 1 If the principal facility for this task is a session (Byte 0 = X'02'), thisfield IDentifies the session type. This field can be set to one of thefollowing values:X'00' NoneX'01' IRCX'02' IRC XMX'03' IRC XCFX'04' LU61X'05' LU62 SingleX'06' LU62 Parallel
Byte 2 Identifies the access method defined for the terminal ID or session IDin the TERM field. This field can be set to one of the following values:X'00' NoneX'01' VTAMX'02' BTAMX'03' BSAMX'04' TCAMX'05' TCAMSNAX'06' BGAMX'07' CONSOLE
Byte 3 Identifies the terminal or session type for the terminal ID or session IDin the TERM field. See the RDO Typeterm definition in the CICSResource Definition Guide for more information on the values in thisfield.
The following table shows the contents and relationships of the terminalinformation field, TERMINFO (owner: DFHTERM, field ID: 165) with thetransaction facility name field, FCTYNAME (owner: DFHTASK, field ID: 163),the terminal ID field, TERM (owner: DFHTERM, field ID: 002), the LUnamefield, LUNAME (owner: DFHTERM, field ID: 111), and the terminal sessionconnection name field, TERMCNNM (owner: DFHTERM, field ID: 169).
Table 27. Terminal information cross-reference
TRANFLAG(byte 0)
TERMINFO(byte 0)
TERMINFO(byte 1)
TERMINFO(byte 2)
FCTYNAME TERM LUNAME TERMCNNM
None X'80' N/A N/A N/A N/A N/A N/A N/A
Chapter 14. Understanding CMF data 289

Table 27. Terminal information cross-reference (continued)
TRANFLAG(byte 0)
TERMINFO(byte 0)
TERMINFO(byte 1)
TERMINFO(byte 2)
FCTYNAME TERM LUNAME TERMCNNM
TerminalX'40'
TerminalX'01'
N/A AccessMethod
Terminal ID Terminal ID LUname of theterminal if
VTAM
N/A
TerminalX'40'
Session X'02' Session type AccessMethod
Session ID Session ID MRO - APPLIDof the
connectionLU61 - APPLID
of theconnection
LU62 - APPLIDof the
connectionEXCI - Blank
IRC/ISC systementry name
SurrogateX'20'
Session X'02' Session type AccessMethod
Session ID Session ID MRO - APPLIDof the
connectionLU61 - APPLID
of theconnection
LU62 - APPLIDof the
connectionEXCI - Blank
IRC/ISC systementry name
DestinationX'10'
None X'00' N/A N/A DestinationID
N/A N/A N/A
Bridge X'48' TerminalX'01'
N/A AccessMethod(VTAM)
BridgeTerminal ID
BridgeTerminal ID
BridgeTerminal ID
N/A
Note: byte 0 of the transaction flags field, TRANFLAG (owner: DFHTASK,field ID: 164) can be used to initially identify whether the transaction has afacility and what type of facility it is (such as terminal or transient datadestination).
169 (Type-C, TERMCNNM, 4 bytes)Terminal session connection name. If the terminal facility associated with thistransaction is a session, this field is the name of the owning connection (sysid).
A terminal facility can be identified as a session using byte 0 of the terminalinformation field, (owner: DFHTERM, field ID: 165). If the value of theterminal information field is X'02' the terminal facility is a session.
197 (Type-C, NETID, 8 bytes)The network ID field, NETID, is the network ID portion of the NetworkQualified Name (NQNAME) received from VTAM during bind or logon forCICS terminal resources using any VTAM LUALIAS (defined or dynamic). Ifthe resource has not logged on or an NQNAME was not received then thisfield is set to null.
198 (Type-C, RLUNAME, 8 bytes)The Real LUname field, RLUNAME, is the VTAM netname (LUname) of theterminal ID for CICS terminal resources using any VTAM LUALIAS (definedor dynamic). If the resource has not logged on or an NQNAME was notreceived, then this field is set to null. Also, see the field, LUNAME (owner:DFHTERM, field ID: 111).
290 IBM CICS Performance Analyzer for z/OS: Report Reference

DFHWEBB fieldsDFHWEBB owns the following performance class data fields. See the relatedperformance data for “DFHDOCH fields” on page 255 and “DFHSOCK fields” onpage 263.
For more information, see “CICS Web support” on page 309 and the CICS InternetGuide.
224 (Type-A, WBREADCT, 4 bytes)The number of CICS Web support READ HTTPHEADER, READ FORMFIELD,and READ QUERYPARM requests issued by the user task when CICS is anHTTP server.
225 (Type-A, WBWRITCT, 4 bytes)The number of CICS (as an HTTP server) Web support WRITE HTTPHEADERand FORMFIELD requests issued by the user task when CICS is an HTTPserver.
231 (Type-A, WBRCVCT, 4 bytes)The number of CICS Web support RECEIVE requests issued by the user taskwhen CICS is an HTTP server.
232 (Type-A, WBCHRIN, 4 bytes)The number of characters received by the CICS Web support RECEIVErequests issued by the user task when CICS is an HTTP server.
233 (Type-A, WBSENDCT, 4 bytes)The number of CICS Web support SEND requests issued by the user taskwhen CICS is an HTTP server.
234 (Type-A, WBCHROUT, 4 bytes)The number of characters sent by the CICS Web support SEND requests issuedby the user task when CICS is an HTTP server.
235 (Type-A, WBTOTCT, 4 bytes)The total number of CICS Web support requests issued by the user task.
How the EXEC CICS WEB API commands correspond to the CICS Webmonitoring fields is shown in Table 28.
Table 28. EXEC CICS WEB commands related to the CWS monitoring fields
EXEC CICS WEB command Monitoring fields
CLOSE WBTOTCT
CONVERSE WBSNDOU1, WBRCVIN1, and WBTOTCT
ENDBROWSE WBBRWCT and WBTOTCT
EXTRACT WBEXTRCT and WBTOTCT
OPEN WBTOTCT
PARSE URL WBPARSCT and WBTOTCT
READ WBREADCT and WBTOTCT
READNEXT WBBRWCT and WBTOTCT
RECEIVE WBRCVCT and WBTOTCT
RETRIEVE WBTOTCT
SEND WBSENDCT and WBTOTCT
STARTBROWSE WBBRWCT and WBTOTCT
WRITE WBWRITCT and WBTOTCT
Chapter 14. Understanding CMF data 291

Note:
1. For CICS Transaction Server for OS/390, Version 1 Release 3, the number of“other” CICS Web support requests can be calculated by subtracting theCICS Web support requests WBBRWCT, WBEXTRCT, WBRCVCT andWBSENDCT from the total CICS Web support request count, WBTOTCT.This calculated “other” request count will include the CICS Web supportrequests such as START, BROWSE, READNEXT, HTTPHEADER/FORMFIELD, ENDBROWSE, EXTRACT, READ FORMFIELD, READHTTPHEADER, RETRIEVE, WRITE HTTPHEADER, and so on.
2. When requests are made using the CICS WEB CONVERSE command, thiswill increment both the CICS as an HTTP client send and receive requestcounts (WBSNDOU1 and WBRCVIN1) and the characters sent and received(WBCHRIN1 and WBCHROU1).
Note:
236 (Type-A, WBREPRCT, 4 bytes)The number of reads from the repository in temporary storage issued by theuser task.
Note: These repository requests will also be included in the temporary storagerequest counts as defined in “DFHTEMP fields” on page 286.
237 (Type-A, WBREPWCT, 4 bytes)The number of writes to the repository in temporary storage issued by the usertask.
Note: These repository requests will also be included in the temporary storagerequest counts as defined in “DFHTEMP fields” on page 286.
238 (Type-A, WBEXTRCT, 4 bytes)The number of CICS Web support EXTRACT requests issued by the user task.Also, see the field, SOEXTRCT (owner: DFHSOCK, field ID: 289).
239 (Type-A, WBBRWCT, 4 bytes)The number of CICS Web browsing requests for HTTPHEADER, FORMFIELD,and QUERYPARM (STARTBROWSE, READNEXT, and ENDBROWSE) issuedby the user task.
331 (Type-A, WBREDOCT, 4 bytes)The number of CICS Web support READ HTTPHEADER requests issued bythe user task when CICS is an HTTP client.
332 (Type-A, WBWRTOCT, 4 bytes)The number of CICS Web support WRITE HTTPHEADER requests issued bythe user task when CICS is an HTTP client.
333 (Type-A, WBRCVIN1, 4 bytes)The number of CICS Web support RECEIVE and CONVERSE requests issuedby the user task when CICS is an HTTP client.
334 (Type-A, WBCHRIN1, 4 bytes)The number of characters received by the CICS Web support RECEIVE andCONVERSE requests issued by the user task when CICS is an HTTP client.
335 (Type-A, WBSNDOU1, 4 bytes)The number of CICS Web support SEND and CONVERSE requests issued bythe user task when CICS is an HTTP client.
292 IBM CICS Performance Analyzer for z/OS: Report Reference

336 (Type-A, WBCHROU1, 4 bytes)The number of characters sent by the CICS Web support SEND andCONVERSE requests issued by the user task when CICS is an HTTP client.
337 (Type-A, WBPARSCT, 4 bytes)The number of CICS Web support PARSE URL requests issued by the user taskwhen CICS is an HTTP client.
338 (Type-A, WBBRWOCT, 4 bytes)The number of CICS Web support BROWSE HTTPHEADER requests(STARTBROWSE, READNEXT, and ENDBROWSE) issued by the user taskwhen CICS is an HTTP client.
340 (Type-A, WBIWBSCT, 4 bytes)The number of EXEC CICS INVOKE SERVICE and EXEC CICS INVOKEWEBSERVICE requests issued by the user task.
341 (Type-A, WBREPRDL, 4 bytes)The total length, in bytes, of the data read from the repository in temporarystorage by the user task.
342 (Type-A, WBREPWDL, 4 bytes)The total length, in bytes, of the data written to the repository in temporarystorage by the user task.
380 (Type-C, WBURIMNM, 8 bytes)For CICS Web support, Atom feeds, and Web service applications, the name ofthe URIMAP resource definition that was mapped to the URI of the inboundrequest that was processed by this task.
381 (Type-C, WBPIPLNM, 8 bytes)For Web service applications, the name of the PIPELINE resource definitionthat was used to provide information about the message handlers that act onthe service request processed by this task.
382 (Type-C, WBATMSNM, 8 bytes)For Atom feeds, the name of the ATOMSERVICE resource definition that wasused to process this task.
383 (Type-C, WBSVCENM, 32 bytes)For Web service applications, the name of the WEBSERVICE resource definitionthat was used to process this task.
384 (Type-C, WBSVOPNM, 64 bytes)For Web service applications, the first 64 bytes of the Web service operationname.
385 (Type-C, WBPROGNM, 8 bytes)For CICS Web support, the name of the program from the URIMAP resourcedefinition that was used to provide the application-generated response to theHTTP request processed by this task.
386 (Type-A, WBSFCRCT, 4 bytes)The number of EXEC CICS SOAPFAULT CREATE commands issued by theuser task.
387 (Type-A, WBSFTOCT, 4 bytes)The total number of EXEC CICS SOAPFAULT ADD, CREATE, and DELETEcommands issued by the user task.
Chapter 14. Understanding CMF data 293

388 (Type-A, WBISSFCT, 4 bytes)The total number of SOAP faults received in response to the EXEC CICSINVOKE SERVICE and EXEC CICS INVOKE WEBSERVICE commands issuedby the user task.
390 (Type-A, WBSREQBL, 4 bytes)For Web service applications, the SOAP request body length.
392 (Type-A, WBSRSPBL, 4 bytes)For Web service applications, the SOAP response body length.
411 (Type-S, MLXSSCTM, 12 bytes)The CPU time taken to convert a document using the z/OS XML SystemServices parser. This field is a subset of the total CPU time as measured in theUSRCPUT field (owner DFHTASK, field ID 008).
412 (Type-A, MLXSSTDL, 4 bytes)The total length of the documents that were parsed using the z/OS XMLSystem Services parser.
413 (Type-A, MLXMLTCT, 4 bytes)The number of EXEC CICS TRANSFORM commands issued by the user task.
420 (Type-A, WSACBLCT, 4 bytes)The number of EXEC CICS WSACONTEXT BUILD commands issued by theuser task.
421 (Type-A, WSACGTCT, 4 bytes)The number of EXEC CICS WSACONTEXT GET commands issued by the usertask.
422 (Type-A, WSAEPCCT, 4 bytes)The number of EXEC CICS WSAEPR CREATE commands issued by the usertask.
423 (Type-A, WSATOTCT, 4 bytes)The total number of EXEC CICS WS-Addressing commands issued by the usertask.
Interpreting performance class dataA user task can be represented by one or more performance class monitoringrecords depending on whether the monitoring system initialization parametersMNCONV, MNSYNC, or MNFREQ are selected and whether an applicationprogram invokes a user event monitoring point (EMP) with the DELIVER optionspecified. In the descriptions that follow, the term user task means that part or wholeof a transaction that is represented by a performance class record unless the descriptionstates otherwise.
Clocks and time stampsIn CICS PA, the term clock is distinguished from the term time stamp:
Clock A 32-bit value, expressed in units of 16 microseconds, accumulated duringone or more measurement periods. The 32-bit value is followed by 8reserved bits, which are in turn followed by a 24-bit value indicating thenumber of measurements periods.
Neither the 32-bit timer component of the clock nor its 24-bit period countare protected against wraparound. The timer capacity is about 18 hours,and the period count runs to modulo-16 777 216.
The eight reserved bits have the following significance:
294 IBM CICS Performance Analyzer for z/OS: Report Reference

Bits 0, 1, 2, and 3Used for online control of the clock when it is running, and shouldalways be zero on output.
Bits 4 and 7Not used.
Bits 5 and 6Used to indicate, when set to 1, that the clock has suffered at least oneout-of-phase start (bit 5) or stop (bit 6).
Time StampAn 8-byte copy of the output of a STCK instruction.
Transaction timing fieldsThe CMF performance class record provides detailed timing information for eachtransaction as it is processed by CICS. A transaction can be represented by one ormore performance class records depending on the monitoring options selected. Thekey transaction timing fields are:
Transaction response timeCalculated by subtracting the transaction Start time from the transaction Stoptime. The transaction Start time and Stop time represent the start and end of atransaction measurement interval. This is normally the period betweentransaction attach and transaction detach but the performance class recordcould represent a part of a transaction depending on the monitoring optionsselected. See “Transaction response time” on page 296 for more information.
Transaction dispatch timeThe elapsed time that the transaction was dispatched by the CICS dispatcherdomain. See “Transaction dispatch time” on page 297 for more information.
Transaction CPU timeThe amount of processor (CPU) time used during the execution of the taskwhile it is dispatched. See “Transaction CPU time” on page 297 for moreinformation.
Transaction suspend (wait) timeThe total elapsed time that the transaction was suspended by the CICSdispatcher domain. This includes all task suspend (wait) time including:v The wait time for first dispatch (First Dispatch Delay). This is then further
broken down into:– First Dispatch Delay due to TRANCLASS limits.– First Dispatch Delay due to MXT limits.
v The wait time for redispatch (Dispatch Wait). This is the time the transactionwas still suspended but awaiting dispatch (wait for redispatch) by the CICSdispatcher domain.
v The total I/O wait and other wait times.
See “Transaction suspend (wait) time” on page 297 for more information.
For detailed information on all the fields relating to the CICS dispatcher domainincluding the CICS open transaction environment (OTE), see “DFHTASK fields” onpage 268.
The CMF performance class data also provides several other important transactiontiming measurements. They include:
Exception wait timeThe accumulated time from all the exception conditions measured by the CMF
Chapter 14. Understanding CMF data 295

exception class records for the transaction. See “CMF exception class datafields” on page 310 for more information on the CMF exception class records.
Program load timeThe total program fetch time (dispatch time, CPU time and DFHRPL I/O waittime) for all programs invoked by the transaction that have to be loaded intoCICS program storage from the DFHRPL program library. See “Program loadtime” on page 301 for more information.
Syncpoint elapsed timeThe total elapsed time that the transaction spent processing a syncpoint. See“Syncpoint elapsed time” on page 301 for more information. The OTS indoubtwait time is the total elapsed time the transaction spent indoubt whilstprocessing an Object Transaction Service (OTS) syncpoint.
RMI elapsed timeThe total elapsed time the transaction spent in all Resource Managers (such asDB2, IMS DBCTL, WebSphere MQ) invoked by the transaction using the CICSResource Manager Interface (RMI). See “RMI elapsed and suspend time” onpage 301 for more information.
JVM elapsed timeThe total elapsed time the transaction spent in the Java Virtual Machine (JVM)for all the CICS Java application programs invoked by the transaction. See“JVM elapsed and suspend time” on page 303 for more information.
JVM initialization timeThe elapsed time the transaction spent initializing the Java Virtual Machine(JVM) for all the CICS Java application programs invoked by the transaction.See “JVM elapsed and suspend time” on page 303 for more information.
JVM reset timeThe elapsed time the transaction spent resetting the Java Virtual Machine(JVM) for all the CICS Java application programs invoked by the transaction.See “JVM elapsed and suspend time” on page 303 for more information.
Transaction response timeThe transaction response time can be calculated by subtracting the transaction starttime field (owner: DFHCICS, field ID: 005) from the transaction stop time field(owner: DFHCICS, field ID: 006).
Figure 110 on page 297 shows an overall view of the relationship of the transactionresponse time with the transaction's dispatch time, CPU time, and suspend (wait)time.
296 IBM CICS Performance Analyzer for z/OS: Report Reference

Transaction dispatch timeThe Transaction Total Dispatch time field (owner: DFHTASK, field ID: 007) is thetotal elapsed time during which the user task was dispatched by the CICSdispatcher domain on each CICS TCB under which the task run. This can includeany of the CICS dispatcher domain TCB modes QR, RO, CO, FO, SZ, RP, SL, SO,SP, EP, TP, D2, H8, J8, L8, L9, S8, X8, X9, and T8.
Transaction CPU timeThe transaction total CPU time field (owner: DFHTASK, field ID: 008) is the totalprocessor time during which the user task was dispatched by the CICS dispatcherdomain on each CICS TCB under which the task run. This can include any of theCICS dispatcher domain TCB modes QR, RO, CO, FO, SZ, RP, SL, SO, SP, EP, TP,D2, H8, J8, L8, L9, S8, X8, X9, and T8.
Transaction suspend (wait) timeThe transaction suspend (wait) time field (owner: DFHTASK, field ID: 014) is thetotal elapsed suspend (wait) time for which the user task was suspended by theCICS dispatcher domain. This includes:v The task suspend (wait) time.v The elapsed time the transaction waited for its first dispatch by the CICS
dispatcher domain. This also includes any delay incurred because of the limitsset for this transaction's transaction class (if any) or by the system parameterMXT being reached by this transaction.
v The elapsed time waiting for redispatch after a suspended task has beenresumed.
Table 29 identifies all the individual or specific suspend (wait) fields that arecollected in the performance class data. All the suspend (wait) time fields listed areincluded in the total transaction suspend time field (owner: DFHTASK, field ID:014). Each of the individual suspend (wait) time fields also contains a portion ofthe transaction's dispatch wait (wait for redispatch) time field (owner: DFHTASK,field ID: 102).
Table 29. Performance class suspend (wait) time fields
Field ID Owner Field description
009 DFHTERM Terminal Control I/O wait time
│ ││←────────────────────────────────Response Time────────────────────────────────→││ ↑ │S│ │ │ST│ │ │TA│←───────────Suspend Time───────────→│←─────────────Dispatch Time──────────────→│OR│ ↑ ↑ │ ↑ ↑ │PT│ │ │ │ │ │ ││ First │ │ │ │ │ │TT│←──Dispatch──→│ │←──Dispatch──→│ │←─────────CPU Time─────────→│ │II│ Delay │ │ Wait │ │ │ │MM│ │ │ │ │ │ │EE│ │ ││ │ ││ ││ │
Figure 110. Transaction response time relationships
Chapter 14. Understanding CMF data 297

Table 29. Performance class suspend (wait) time fields (continued)
Field ID Owner Field description
010 DFHJOUR Journal Control I/O wait time
011 DFHTEMP Temporary Storage I/O wait time
063 DFHFILE File Control I/O wait time
100 DFHTERM Inter-Region (MRO) I/O wait time
101 DFHDEST Transient Data I/O wait time
123 DFHTASK Global ENQ delay time
128 DFHTASK Lock Manager (LM) delay time
129 DFHTASK Local ENQ delay time
133 DFHTERM LU 6.1 I/O wait time
134 DFHTERM LU 6.2 I/O wait time
156 DFHFEPI FEPI I/O wait time
171 DFHTASK RMI suspend time
174 DFHFILE RLS File I/O wait time
176 DFHFILE Coupling facility data table server I/O wait time
177 DFHSYNC Coupling facility data table server syncpoint andresynchronization wait time
178 DFHTEMP Shared Temporary Storage I/O wait time
181 DFHTASK EXEC CICS WAIT EXTERNAL wait time
182 DFHTASK EXEC CICS WAITCICS and EXEC CICS WAITEVENT wait time
183 DFHTASK Interval Control delay time
184 DFHTASK Dispatchable Wait's wait time
186 DFHDATA IMS (DBCTL) wait time
187 DFHDATA DB2 ready queue wait time
188 DFHDATA DB2 connection wait time
189 DFHDATA DB2 wait time
191 DFHTASK RRMS/MVS Indoubt wait time
192 DFHTASK Request Receiver wait time
193 DFHTASK Request Processor wait time
195 DFHTASK CICS BTS Run transaction synchronous wait time
196 DFHSYNC CICS BTS Syncpoint delay time
241 DFHSOCK Inbound Socket I/O wait time
247 DFHTASK CICS change-TCB mode delay time
250 DFHTASK CICS MAXOPENTCBS delay time
254 DFHTASK Java Virtual Machine (JVM) suspend time
268 DFHTASK TCB mismatch wait time
277 DFHTASK CICS MAXJVMTCBS delay time
278 DFHTASK CICS MAXHPTCBS delay time
279 DFHTASK MVS storage constraint wait time
281 DFHTASK CICS MAXSSLTCBS delay time
298 IBM CICS Performance Analyzer for z/OS: Report Reference

Table 29. Performance class suspend (wait) time fields (continued)
Field ID Owner Field description
282 DFHTASK CICS MAXXPTCBS delay time
285 DFHTASK 3270 bridge partner wait time
299 DFHSOCK Outbound Socket I/O wait time
300 DFHSOCK IPCONN link wait time
396 DFHDATA WebSphere MQ GETWAIT wait time
The performance class data fields listed in Table 29 on page 297 all record theelapsed time waiting for a particular type of I/O operation or transaction suspend(wait). For example, DFHTERM field ID 009 records the elapsed time waiting forterminal I/O. The elapsed time includes not only the time during which the I/Ooperation is actually taking place, but also the time during which the accessmethod is completing the outstanding event control block, and the timesubsequent to that until the waiting transaction is redispatched by the CICSdispatcher domain.
Figure 111 shows a representation of the relationship of a typical transaction's waittime field with the suspend (wait) time, the dispatch time, CPU time and dispatchwait time (wait for redispatch) fields.
Calculated fields: In the examples that follow, a number of calculations areshown that can be performed using the transaction's total suspend (wait) time fieldand the individual suspend (wait) time fields.
Total I/O wait time
Total I/O wait time =(Terminal I/O wait time +Temporary Storage I/O wait time +Shared Temporary Storage I/O wait time +Transient Data I/O wait time +Journal (MVS Logger) I/O wait time +File I/O wait time +RLS File I/O wait time +Coupling Facility Data Table I/O wait time +Inbound Socket I/O wait time +Outbound Socket I/O wait time +Inter-Region (MRO) I/O wait time +LU 6.1 I/O wait time +LU 6.2 I/O wait time +
│ ││ ││←──────────── Wait Time ────────────→││ │
Dispatch │ │ Dispatchand │ │ and
─────────────────→│←───────────Suspend Time────────────→│←─────────────CPU Time │ ↑ │ CPU Time
│ │ Dispatch ││ │←──Wait───→││ │ │
Figure 111. Suspend (wait) time relationships
Chapter 14. Understanding CMF data 299

FEPI I/O wait time +IPCONN link wait time)
Total Other wait time
Total Other wait time =(First Dispatch delay time +CICS MAXHPTCBS delay time +CICS MAXJVMTCBS delay time +CICS MAXOPENTCBS delay time +Local ENQ delay time +Global ENQ delay time +Interval Control delay time +Lock Manager (LM) delay time +EXEC CICS WAIT EXTERNAL wait time +EXEC CICS WAITCICS wait time +Request Receiver wait time +Request Processor wait time +CICS MAXSSLTCBS delay time +CICS MAXXPTCBS delay time +CICS change-TCB mode delay time +RRMS/MVS indoubt wait time +3270 bridge partner wait time +Coupling Facility Data Table (CFDT) server syncpoint wait time +CICS BTS Run Transaction synchronous wait time +CICS BTS Syncpoint delay time +RMI suspend time +JVM suspend time +TCB mismatch wait time +MVS storage constraint wait time +Dispatchable Waits wait time)
Note:
1. The First Dispatch Delay field includes the MXT Delay and TRANCLASS delayfields.
2. The RMI Suspend Time field includes:v DB2 READYQ wait timev DB2 connection wait timev DB2 wait timev IMS wait timev WebSphere MQ GETWAIT wait timeSee “RMI elapsed and suspend time” on page 301 for further information.
Unaccounted (Uncaptured) wait time
The unaccounted wait time is the amount of transaction suspend (wait) time that isnot specifically measured in an individual wait time field.
Unaccounted wait time =(Suspend time - (Total I/O wait time + Total Other wait time))
Exception wait timeThe exception wait time field, EXWTTIME (owner: DFHCICS, field ID: 103) is theaccumulated time from all the exception conditions measured by the CMF
300 IBM CICS Performance Analyzer for z/OS: Report Reference

exception class records for the transaction. For more information on the exceptionclass records, see “CMF exception class data fields” on page 310.
Program load timeThe program load time is the total elapsed time during which the user task waitedfor program fetches from the DFHRPL program library. Only fetches for programswith installed program definitions or autoinstalled as a result of applicationprogram requests are included in this figure. Installed programs residing in theLPA are not included because they do not incur a physical fetch from a programlibrary.
Figure 112 shows an example of the relationship between the program load timefield (owner: DFHPROG, field ID: 115) and the transaction dispatch time (owner:DFHTASK, field ID: 007) and the transaction suspend time (owner: DFHTASK,field ID: 014).
Syncpoint elapsed timeThe performance class data includes a number of timing fields relating to thesyncpoint processing performed by a transaction. These data fields include thefollowing:v Syncpoint elapsed timev Coupling Facility Data Table (CFDT) server syncpoint timev CICS Business Transaction Services (BTS) syncpoint delay timev Object Transaction Services (OTS) indoubt wait time
These fields provide an in depth understanding of the amount of time atransaction spends processing syncpoints and the wait time for coupling facilitydata table server, CICS BTS syncpoint requests, and OTS indoubt time.
In particular, the CICS BTS syncpoint delay time field, SYNCDLY (owner:DFHSYNC, field ID: 196) can be used to determine the amount of time atransaction is suspended waiting for the syncpoint from the invoking (parent)transaction and should be analyzed in conjunction with the CICS BTS runtransaction (ACQPROCESS or activity) wait time field (owner: DFHTASK, field ID:195) from the invoking transaction to fully understand the syncpoint delay time inthe correct context.
RMI elapsed and suspend timeFigure 113 on page 302 shows an example of the relationship between the CICSResource Manager Interface (RMI) elapsed and suspend time fields (owner:
│ ││←────────────────────────────────Response Time────────────────────────────────→││ ↑ │S│ │ │ST│ │ │TA│←───────────Suspend Time───────────→│←─────────────Dispatch Time──────────────→│OR│ ↑ ↑ │ ↑ ↑ │PT│ │ │ │ │ │ ││ First │ │ │ │ │ │TT│←──Dispatch──→│ │←──Dispatch──→│ │←─────────CPU Time─────────→│ │II│ Wait │ │ Wait │ ↑ │ ↑ │ │MM│ │ │ │ │ │ │ │ │EE│ │ │ │ ││ │ │←─PCload─→│ ││ │ Time │ ││ │ │ │
Figure 112. Program load time
Chapter 14. Understanding CMF data 301

DFHTASK, field IDs: 170 and 171), the transaction dispatch time (owner:DFHTASK, field ID: 007) and the transaction suspend time (owner: DFHTASK,field ID: 014).
When investigating performance problems relating to the CICS Resource ManagerInterface (RMI) you will find it helpful in assisting your interpretation of the RMItiming fields if you have some knowledge of how CICS resource managers, such asDB2, IMS (DBCTL), WebSphere MQ, or user written, are being used by your CICSapplications.
If an application invokes a CICS resource manager that in turn invokes anotherCICS resource manager from within the task-related user exit program (sometimesknown as stacking RMIs) the CICS Resource Manager Interface (RMI) elapsed timefield (RMITIME) will contain the total elapsed time from entry to exit of the first,or highest, level CICS resource manager.
Note: In CICS Transaction Server Version 1.3 or later, the DB2 wait, DB2connection wait, and DB2 READYQ wait time fields as well as the IMS wait timefield are included in the RMI suspend time.
For more detailed information on the timing fields for DB2 and IMS, see“DFHDATA fields” on page 253.
When investigating performance problems relating to the CICS Resource ManagerInterface (RMI), you might also find it useful to read the following sections:v “Open transaction environment” on page 304v “DFHRMI fields” on page 262
RMI other wait time:
The RMI other wait time contains the suspend (wait) time in the CICS dispatcherdomain for other Resource Managers such CICS Sockets or user written.
RMI Other wait time =(RMI suspend -(IMS wait time +DB2 READYQ wait time +DB2 Connection wait time +DB2 wait time +
│ ││ ││←─────────────────RMI Elapsed Time──────────────────→││ ↑ ↑ ││ │ │ ││ │←─────────────Suspend Time─────────────→│ │
Dispatch │ │ │ │ Dispatchand CPU │ │ │ │ and CPU──────────┼────→│←───────────RMI Suspend Time───────────→│←─────┼──────────Time │ │ ↑ │ │ Time
│ │ │ │ ││ │ │←──Dispatch──→│ ││ │ │ Wait │ ││ │ │ │ ││ ││ │
Figure 113. CICS Resource Manager Interface (RMI) elapsed and suspend time
302 IBM CICS Performance Analyzer for z/OS: Report Reference

WebSphere MQ GETWAIT wait time))
JVM elapsed and suspend timeThe JVM elapsed and suspend time fields provide an insight into the amount oftime that a transaction spends in a Java Virtual Machine (JVM).
Care must be taken when using the JVM elapsed time (owner: DFHTASK, field ID:253) and JVM suspend time (owner: DFHTASK, field ID: 254) fields in anycalculation with other CMF timing fields. This is because of the likelihood ofdouble accounting other CMF timing fields in the performance class record withinthe JVM time fields. For example, if a Java application program invoked by atransaction issues a read file (non-RLS) request using the Java API for CICS (JCICS)classes, the file I/O wait time is included in both the file I/O wait time field(owner: DFHFILE, field ID: 063), the transaction suspend time field (owner:DFHTASK, field ID: 014) as well as the JVM suspend time field.
A JVM application will invoke the CICS JVM for a number of reasons not just toinvoke the main method of the application. These calls include:v Creating and destroying the JVMv Finding the wrapper class and the main method within the classv Building the arguments to pass to the main methodv Invoking the main method of the application
The JVM elapsed and suspend time fields are best evaluated from the overalltransaction performance view and their relationship with the transaction responsetime, transaction dispatch time, and transaction suspend time. The performanceclass data also includes the amount of processor (CPU) time that a transaction usedwhilst in a JVM on a CICS J8 mode TCB in the J8CPUT field (owner: DFHTASK,field ID: 260). When a transaction uses a JVM in user key, which runs on a CICS J9mode TCB, the processor time is recorded in the J9CPUT field (owner: DFHTASK,field ID: 267).
Note: The number of Java API for CICS (JCICS) requests issued by the user task isincluded in the CICS OO foundation class request count field (owner: DFHCICS,field ID: 025).
In CICS Transaction Server for z/OS Version 2 Release 1, new monitoring fieldswere introduced to provide additional insight into the processing of CICS Java(JVM) applications. These new fields are, the JVM init time (owner: DFHTASK,field ID: 273), the JVM reset time (owner: DFHTASK, field ID: 275), and the JVMstatus information in byte 6 of the TRANFLAG field (owner: DFHTASK, field ID:164).
Performance List and Summary reports: CICS PA provides Sample Report Formsthat show the fields related to a transaction's use of a Java Virtual Machine (JVM):
Sample FormReport
JVMLSTPerformance List report (see “Performance List report” on page 19)
JVMSUMPerformance Summary report (see “Performance Summary report” on page35)
Chapter 14. Understanding CMF data 303

Open transaction environmentThe performance class data includes a number of timing fields relating to theexploitation of the CICS open transaction environment (OTE) by a transaction.These data fields provide an in depth understanding into the CICS dispatcherdomain TCBs used by a transaction and include the following:v QR mode TCB Dispatch and CPU timev RO mode TCB Dispatch and CPU timev Key 8 mode TCB Dispatch and CPU timev Key 9 mode TCB Dispatch and CPU timev J8, L8, S8 and X8 mode TCB CPU timesv
v QR mode TCB dispatch delay timev CICS dispatcher TCB attach countv CICS dispatcher TCB high-water-markv CICS dispatcher TCB change mode countv CICS dispatcher change-TCB mode delay timev Max open TCB delay timev Max JVM TCB delay timev Max SSL TCB delay timev Max XPLink TCB delay time
For detailed information on all the fields relating to the CICS dispatcher domainincluding the CICS open transaction environment (OTE), see “DFHTASK fields” onpage 268.
For more general information on the CICS open transaction environment (OTE),see the CICS Application Programming Guide.
For more information on the CICS DB2 attachment facility and its use of the opentransaction environment (OTE), see the CICS DB2 Guide.
User storageThe performance class data provides a number of data fields relating to the CICSstorage used by a transaction. These fields are designed to provide detailedinformation on the amount and location of the CICS storage used by a transaction.For each CICS DSA (below or above the 16MB line) used by a transaction, the datafields provided include:v Storage GETMAIN request countv Storage high-water markv Storage occupancy measurement
The user storage fields are described in detail in “DFHSTOR user storage fields”on page 265.
User storage occupancy: A storage occupancy count measures the area under thecurve of user-task storage in use against elapsed time. The unit of measure is thebyte-unit, where the unit is equal to 1024 microseconds, or 1.024 milliseconds. Forexample, a user task occupying 256 bytes for 125 milliseconds is measured asfollows (where ms is milliseconds):125 / 1.024 ms = 122 units * 256
= 31232 byte-units
Note: All references to Start time and Stop time in the calculations below refer tothe middle 4 bytes of each 8 byte Start/Stop time field. The Start and Stop timefields are standard S/390® STCK time values where bit 51 of the Start time or Stoptime represents a unit of 16 microseconds.
304 IBM CICS Performance Analyzer for z/OS: Report Reference

1. To calculate the response time and convert into microsecond units:Response = ((Stop time - Start time) * 16)
2. To calculate the number of 1024 microsecond units:Units = (Response / 1024)orUnits = ((Stop time - Start time) / 64
3. To calculate the average user-task storage used from the storage occupancycount:Average user-task storage used = (Storage Occupancy / Units)
4. To calculate units per second:Units Per Second = (1000000 / 1024) = 976.5625
5. To calculate the response time in seconds:Response = (((Stop time - Start time) * 16) / 1000000)
During the life of a user task, CICS measures, calculates, and accumulates thestorage occupancy at the following points:v Before a storage GETMAIN request increases the current user-storage valuesv Before a storage FREEMAIN request decreases the current user-storage valuesv Just before a performance record is created for the user task.
Figure 114 shows a pictorial representation of how the user storage occupancymeasurement is calculated.
Shared storageThe performance class data also provides a number of fields relating to the CICSshared storage used by a transaction. These fields are designed to provide detailedinformation on the amount and location of the CICS shared storage used by atransaction. The data fields provided include:v Shared storage GETMAIN request countv Number of bytes of shared storage GETMAINedv Number of bytes of shared storage FREEMAINed.
The shared storage fields are described in detail in “DFHSTOR shared storagefields” on page 266.
│ ││←────────────────────────────────Response Time────────────────────────────────→││ │S│ │ST│ │TA│ ┌───────────────────┐ │OR│ │ │ ┌─────────┤PT│ ┌────┐ │ │ ┌─────────┐ │ ││....│....│....│...................│..............│.........│.........│.........│TT│ │ └────┘ └────┐ │ │ │ │II│ │ . . . │ │ │ │ │MM├────┘ . . . └─────────┘ └─────────┘ │EE│ . . . . . . . . ││ . . . . . . . . ││ . . . . . . . . │└───────────────────────────────────────────────────────────────────────────────┘
G F G F F G F G
G = GETMAINF = FREEMAINDotted line = Average storage occupancy
Figure 114. Transaction user storage occupancy
Chapter 14. Understanding CMF data 305

Program storageThe level of program storage in use is incremented at each program LOAD, LINK,and XCTL event by the size (in bytes) of the referenced program, and isdecremented at each program RELEASE or RETURN event.
Note: On a program XCTL event, the program storage currently in use is alsodecremented by the size of the program issuing the program XCTL because theprogram is no longer required by the task.
Figure 115 shows the relationships between the high-water mark data fields thatcontain the maximum amounts of program storage in use by the user task. FieldPCSTGHWM (owner: DFHSTOR, field ID: 087) contains the maximum amount ofprogram storage in use by the task both above and below the 16MB line. FieldsPC31AHWM (owner: DFHSTOR, field ID: 139) and PC24BHWM (owner:DFHSTOR, field ID: 108) are subsets of PCSTGHWM, containing the maximumamounts of program storage in use above and below the 16MB line, respectively.Other program storage fields, which are also a subset of PCSTGHWM, contain themaximum amounts of program storage in use by the task in each of the CICSdynamic storage areas (DSAs).
Note: The totaled values of all the subsets in a superset might not necessarilyequate to the value of the superset. For example, the value of PC31AHWM plusthe value of PC24BHWM might not equal the value of PCSTGHWM. This isbecause the peaks in the different types of program storage acquired by the usertask do not necessarily occur simultaneously.
The program storage high-water mark fields are described in detail in “DFHSTORprogram storage fields” on page 266.
PCSTGHWM - high-water mark of program storage in all CICS DSAs┌──────────────────────────────────────────────────────────┐│ ││ PC31AHWM - HWM of PC storage above 16MB ││ ││ ┌───────────────────────┐ ││ │ PC31CHWM - ECDSA HWM │ ││ ├───────────────────────┤ ││ │ PC31SHWM - ESDSA HWM │ ││ ├───────────────────────┤ ││ │ PC31RHWM - ERDSA HWM │ ││ └───────────────────────┘ ││16MB line │├──────────────────────────────────────────────────────────┤│ ││ PC24BHWM - HWM of PC storage below 16MB ││ ││ ┌───────────────────────┐ ││ │ PC24CHWM - CDSA HWM │ ││ ├───────────────────────┤ ││ │ PC24SHWM - SDSA HWM │ ││ ├───────────────────────┤ ││ │ PC24RHWM - RDSA HWM │ ││ └───────────────────────┘ ││ │└──────────────────────────────────────────────────────────┘
Figure 115. Relationships between the high-water mark program storage data fields
306 IBM CICS Performance Analyzer for z/OS: Report Reference

Correlating performance class dataThe performance class data provides several fields that can be used to correlate allthe related performance class data records from a single or multiple CICS systemsto monitor the total amount of resources used by a transaction. The performanceclass records can be correlated by any of the following:v Network unit-of-work IDv Network unit-of-work ID and DB2 accounting correlation tokenv Transaction group IDv CICS BTS process ID (root activity ID)
The following sections describe the various ways in which the performance classrecords can be correlated.
Correlating by network unit-of-work IDThe network unit-of-work ID (owner: DFHTASK, field IDs: 097 and 098) can beused to correlate the performance class data records from a single or multiple CICSsystems.
This name is assigned at transaction attach time using either a netname derivedfrom the terminal (when the task is attached to a local VTAM terminal), or thenetname passed as part of an IRC (MRO) or ISC (APPC) attach header combinedwith a STCK-derived token created by the originating system, or the networkunit-of-work ID passed as part of an IRC (MRO) or ISC (APPC) attach functionmanagement header (FMH).
Cross-System Work report and extractThe CICS PA Cross-System Work report correlates performance class data from asingle or multiple CICS systems, as long as the performance data is part of thesame network unit-of-work.
The Cross-System Work report is particularly useful in understanding the type andflow of a CICS transaction across CICS systems, including:v Transaction routingv Function shippingv Distributed Program Link (DPL)v External Call Interface (ECI) over TCP/IP
For more information, see “Cross-System Work report” on page 66 and“Cross-System Work extract” on page 189.
Workload Activity reportThe CICS PA Workload Activity report also correlates the performance records bynetwork unit-of-work ID and can be used to understand the type and flow of aCICS transaction across CICS systems and its relationship with the MVS WorkloadManager (WLM).
For more information on the Workload Activity report, see “Workload Activityreport” on page 84.
Correlating by network unit-of-work ID and DB2 accountingtoken
The CICS performance class data records can also be correlated with the DB2 SMF101 Class 2 accounting records. To provide the necessary accounting recordgranularity in the DB2 accounting records, you need to specify either
Chapter 14. Understanding CMF data 307

ACCOUNTREC(TASK) or ACCOUNTREC(UOW) in the DB2 connection and DB2entry resource definitions. Specifying ACCOUNTREC(TASK) ensures that there is aminimum of one DB2 accounting record for each task but there could be moredepending on thread reuse. ACCOUNTREC(TASK) is recommended rather thanACCOUNTREC(UOW) as this provides better matching between CMFperformance records and DB2 accounting records.
DB2 reportThe CICS PA DB2 report correlates the performance records by networkunit-of-work ID and for those with DB2 activity, matches the DB2 accounting (SMF101) records belonging to the same network unit-of-work. The DB2 report enablesyou to view CICS and DB2 resource usage statistics together in a single report.
For more information on the DB2 report, see “DB2 report” on page 127.
For more information on the CICS DB2 connection and DB2 entry definition, seethe CICS DB2 Guide and the CICS Resource Definition Guide.
For more information on DB2 accounting and monitoring, see the CICS DB2 Guide.
Correlating by transaction group IDThe transaction group ID (owner: DFHTASK, field ID: 082) is assigned attransaction attach time and can be used to correlate the performance class recordsfor the transactions that CICS runs for the same incoming work request (forexample, the CWXN and CWBA transactions for CICS Web support requests).
This transaction group ID relationship is particularly useful when applied to therequests that originate through the CICS Web support (CWS), CICS IIOP, ECI overTCP/IP, or the 3270 bridge interface. The transaction origin can be determinedfrom the transaction origin type in byte 4 of the transaction flags field (owner:DFHTASK, field ID: 164) as described in “DFHTASK fields” on page 268.
Transaction Group reportThe CICS PA Transaction Group report correlates the performance class datarecords from a single system, as long as the transactions are part of the sameincoming work request (they have the same transaction group ID).
The Transaction Group report is particularly useful in understanding therelationship and flow of transactions that originate through the CICS Web support(CWS), CICS Internet Inter-ORB protocol (IIOP), External Call Interface (ECI) overTCP/IP, or the 3270 bridge interface.
For more information on the Transaction Group report, see “Transaction Groupreport” on page 73.
Correlating by CICS BTS process ID (root activity ID)The CICS Business Transaction Services (BTS) process ID (owner: DFHCBTS, fieldID: 202), also known as the root activity ID, can be used to correlate theperformance class records for the transactions that CICS runs that form part of thesame process ID.
Note: Not all transactions that use CICS Business Transaction Services have aprocess ID assigned at transaction attach. However, the CICS PA BTS reportincludes all the performance class records for transactions that have used anyCICS BTS services regardless of whether they have been assigned a process ID at
308 IBM CICS Performance Analyzer for z/OS: Report Reference

transaction attach. In this case, whether or not the performance class records formpart of the same process ID is determined by comparing the transaction sequencenumber field (owner: DFHTASK, field ID: 031).
For detailed information on the monitoring data provided for the CICS BusinessTransaction Services (BTS) support, see “DFHCBTS fields” on page 246.
BTS reportThe CICS PA BTS report correlates the performance class records by CICS BTSprocess ID. See the “BTS report” on page 80 for information on the report providedby CICS PA to analyze the transactions using CICS Business Transaction Services.
For more information on CICS Business Transaction Services (BTS), see CICSBusiness Transaction Services.
CICS Web supportThe CICS Monitoring Facility provides extensive performance class monitoringdata for those applications using the CICS Web support (CWS). This data includes:v Client IP addressv EXEC CICS WEB API requestsv EXEC CICS DOCUMENT API requestsv CICS support for TCP/IP (socket domain) requests
In CICS Transaction Server for z/OS Version 2 Release 1, the performance classmonitoring data was significantly enhanced with the addition of a number of newdata fields which provided more detailed information for those applications usingthe CICS Web support. These fields included:v The TCP/IP service name and port number of the installed TCP/IP resource
definition from which the transaction was initiatedv EXEC CICS EXTRACT WEB API request countv EXEC CICS WEB Browse API requests countv EXEC CICS EXTRACT TCPIP and EXTRACT CERTIFICATE API requests count
In CICS Transaction Server for z/OS Version 3 Release 1, the performance classmonitoring data has been further enhanced with the addition of a number of newmonitoring data fields for the EXEC CICS WEB API requests used by applicationprograms that using the CICS Web support for CICS as an HTTP client.
For detailed information on the monitoring data provided for the CICS Websupport, see the DFHWEBB performance data on page “DFHWEBB fields” on page291, the DFHDOCH performance data on page “DFHDOCH fields” on page 255,and the DFHSOCK performance data on page “DFHSOCK fields” on page 263.
Transaction Group reportThe CICS PA Transaction Group report is particularly useful in understanding therelationship and flow of transactions that originate through the CICS Web support.For more information on this report, see “Transaction Group report” on page 73.
Performance List and Summary reportsCICS PA provides several Sample Report Forms that you can use for detailedanalysis of transactions that use CICS Web support:
Sample FormsReport
Chapter 14. Understanding CMF data 309

WBS3LST, WB3LSTPerformance List reports (see “Performance List report” on page 19)
WB3SUM, WBS3SUMPerformance Summary reports (see “Performance Summary report” onpage 35)
For more general information on the CICS Web support, see the CICS InternetGuide.
CICS TCP/IP supportIn CICS Transaction Server for z/OS Version 2, the performance class monitoringdata has been enhanced with the addition of a number of new data fields whichprovide additional detailed information for those applications using the CICS Websupport (CWS), CICS IIOP, and the CICS ECI over TCP/IP support.
The performance class monitoring data provided includes the following:v the TCP/IP service name and port number of the installed TCP/IP service
resource definition from which the transaction was initiatedv the Client IP address in the interpreted format of nnn.nnn.nnn.nnn.v Inbound and outbound socket I/O wait timesv Extract TCP/IP request countsv Inbound and Outbound Socket request and character counts, - send, receive, and
so on
For detailed information on the data provided for the CICS support for TCP/IP,see “DFHSOCK fields” on page 263.
For more information on the reports provided by CICS PA to analyze theperformance class data by transaction group ID, see “Transaction Group report” onpage 73.
CICS PA has provided two sample Report Forms that you can use to tailor thePerformance List Report (TCPLST Form) and Performance Summary Report(TCPSUM Form) for analyzing the performance class data for the CICS support forTCP/IP.
For more general information, see the CICS Internet Guide, the CICS ExternalInterfaces Guide, and CICS Family: Communicating from CICS on System/390®.
CMF exception class data fieldsAll of the exception class data fields that can be produced by the CICS MonitoringFacility (CMF) are described in this section.
In contrast to performance class data records whose format is described inassociated dictionary entries, exception class data records are not defined in thedictionary record. The exception class data records are fixed format.
The following field descriptions show the name of the exception class data field,the type, and the size. The data type can be one of the following:
A - a 32- or 64- bit countC - a character stringP - a packed decimalT - a time stamp
310 IBM CICS Performance Analyzer for z/OS: Report Reference

EXCMNTRN (Type-C, 4 bytes)Transaction identification.
EXCMNTER (Type-C, 4 bytes)Terminal or session identification. This field is null if the task is not associatedwith a terminal or session.
EXCMNUSR (Type-C, 8 bytes)User identification at task attach. This can also be a remote user identifier for atask created as the result of receiving an ATTACH request across an MRO orAPPC link with attach-time security enabled.
EXCMNTST (Type-C, 4 bytes)Type of transaction start (Start Code or Start Type):
TOThe transaction was started (attached) by input of the transaction ID fromthe terminal user.
S Attached by automatic transaction initiation (ATI) without data. Thetransaction was started (attached) by an application program using theEXEC CICS START TRANSID('xxxx') ... API command. CICS internaltransactions such as CATR, CEJR, CESN, CQRY, CRPM, CRSQ, CSFU,CSGM, CXRE, and CWBG are just some examples of CICS transactionsthat use this start type.
SDAttached by automatic transaction initiation (ATI) with data. Thetransaction was started (attached) by an application program using theEXEC CICS START TRANSID('xxxx') FROM(xxxx) ... API command. CICSinternal transactions such as CLS1 is an example of a transaction that usesthis start type.
QDThe transaction was started (attached) because the trigger level of anintrapartition transient data queue was reached. If the transaction is notassociated with a terminal facility, the Transaction Facility Name (field:FCTYNAME, owner: DFHTASK, field ID: 163) provides the name of thetransient data queue ID.
U The transaction was started (attached) by a CICS internal functiongenerally as a result of some user request. CICS internal transactions suchas CATA, CATD, CEJR, CESC, CEX2, CFOR, CFQR, CFQS, CFTL, CGRP,CIEP, CIOF, CIOR, CIRP, CITS, CJTR, CLQ1, CLQ2, CLS2, COTR, COVR,CPLT, CPMI, CRSY, CSFR, CSHQ, CSNC, CSNE, CSOL, CSSY, CSTE, CSZI,CWBA, and CWXN are just some examples of the CICS transactions thatuse this start type. In addition to CICS internal functions, transaction's thatare being run under the control of the CICS Execution Diagnostic Facilitytransaction, CEDF, are also started (attached) with this start type.
TPAttached from terminal (TCTTE) transaction ID. The preset transaction wasstarted (attached) by input from the terminal user or by the previoustransaction using the EXEC CICS RETURN TRANSID('xxxx') IMMEDIATE... API command. The transaction ID can be preset either from the terminaldefinition, from using the CRTE routing transaction, or by the previoustransaction's application program using the EXEC CICS RETURNTRANSID('xxxx') ... API command with or without the IMMEDIATE optionspecified. Some examples of CICS transactions which use this start typeare: CESN (except when used as the initial good morning transaction),
Chapter 14. Understanding CMF data 311

CRTE (when invoked on the routed system), and CSSF when invoked aspart of a CRTE CANCEL (the initial CRTE transaction which establishesthe routing session uses the start type 'TO').
SZAttached by the Front End Programming Interface (FEPI). The transactionwas started (attached) as the receive program by the Front EndProgramming Interface as a result of inbound data. In addition to inbounddata arriving, the receive program is also started (attached) if the time limitset by a FEPI START command expires, the session is lost, or anything thatcauses a FEPI RECEIVE command to complete. See the CICS Front EndProgramming Interface User's Guide for more information on FEPI startedtasks.
EXCMNSTA (Type-T, 8 bytes)Start time of the exception.
EXCMNSTO (Type-T, 8 bytes)Finish time of the exception.
Note: The performance class exception wait time field, EXWTTIME (owner:DFHCICS, field ID: 103), is a calculation based on subtracting the start time ofthe exception (EXCMNSTA) from the finish time of the exception(EXCNBSTO).
EXCMNTNO (Type-P, 4 bytes)The transaction identification number.
Note: The transaction number field is normally a 4-byte packed decimalnumber. However, some CICS system tasks are identified by special charactersin this field, as follows:III for system initialization tasksTCP for the terminal control task
These special identifiers are placed in bytes 2 through 4. Byte 1 is blank (X'40')before the terminal control TCP identifier, and a null value (X'00') before theothers.
EXCMNTPR (Type-A, 4 bytes)The transaction priority of the task when monitoring of the task was initializedat transaction attach.
EXCMNLUN (Type-C, 8 bytes)The LUNAME field is either the VTAM netname (LUname) of the terminal ID(if the Access Method for the terminal is VTAM) or the VTAM generic APPLIDof the connection for the session ID (for an EXCI connection this field is blank).The transaction's terminal or session type can be identified from the Nature(byte 0) field within the terminal information TERMINFO field (owner:DFHTERM, field ID: 165). This field is null if the transaction was notassociated with a terminal or session facility.
EXCMNEXN (Type-A, 4 bytes)The exception sequence number for this task.
EXCMNRTY (Type-C, 8 bytes)The exception resource type. For more information, see Table 30 on page 316.
EXCMNRID (Type-C, 8 bytes)The exception resource identification. For more information, see Table 30 onpage 316.
312 IBM CICS Performance Analyzer for z/OS: Report Reference

EXCMNTYP (Type-A, 2 bytes)The exception type. This field can be set to one of the following values:X'0001'
Exception due to a wait (EXCMNWT)X'0002'
Exception due to a buffer wait (EXCMNBWT)X'0003'
Exception due to a string wait (EXCMNSWT)
For more information on the exception types, see Table 30 on page 316.
EXCMNTCN (Type-C, 8 bytes)The transaction's transaction class name (TRANCLASS). This field is null if thetransaction is not defined in a transaction class.
EXCMNSRV (Type-C, 8 bytes)The MVS Workload Manager (WLM) service class for this transaction. Thisfield is null if there are no transaction classification rules defined for CICSsubsystems in the active MVS Workload Manager (WLM) service policy or thetransaction was WLM-classified in another CICS region.
EXCMNRPT (Type-C, 8 bytes)The MVS Workload Manager (WLM) report class for this transaction. This fieldis null if there are no transaction classification rules defined for CICSsubsystems in the active MVS Workload Manager (WLM) service policy or thetransaction was WLM-classified in another CICS region.
EXCMNNPX (Type-C, 20 bytes)The fully qualified name by which the originating system is known to theVTAM network. This name is assigned at attach time using either the netnamederived from the TCT (when the task is attached to a local terminal), or thenetname passed as part of an ISC APPC or IRC MRO attach header. At leastthree padding bytes (X'00') are present at the right end of the name.
If the originating terminal is VTAM across an ISC APPC or IRC MRO link, theNETNAME is the networkid.LUname. If the terminal is non-VTAM, theNETNAME is networkid.generic_APPLID.
All originating information is passed as part of an ISC LUTYPE6.1 attachheader has the same format as the non-VTAM terminal originators above.
When the originator is communicating over an external CICS interface (EXCI)session, the name is a concatenation of:
’DFHEXCIU | . | MVS Id | Address Space Id (ASID)’
8 bytes | 1 byte | 4 bytes | 4 bytes
derived from the originating system. That is, the name is a 17-byte LU nameconsisting of:v An 8-byte eye-catcher set to DFHEXCIU.v A 1-byte field containing a period.v A 4-byte field containing the MVSID, in characters, under which the client
program is running.v A 4-byte field containing the address space ID (ASID) in which the client
program is running. This field contains the 4-character EBCDICrepresentation of the 2-byte hexadecimal address space ID.
For more information on the external CICS interface (EXCI), see the CICSExternal Interfaces Guide.
Chapter 14. Understanding CMF data 313

EXCMNNSX (Type-C, 8 bytes)The name by which the network unit-of-work ID is known within theoriginating system. This name is assigned at transaction attach time usingeither a STCK-derived token created by the originating system, or the networkunit-of-work ID passed as part of an IRC (MRO) or ISC (APPC) attach functionmanagement header (FMH).
The first six bytes of this field are a binary value derived from the systemclock of the originating system and which can wrap round at intervals ofseveral months.
The last two bytes of this field are a syncpoint sequence count. This countmight change during the life of the task as a result of syncpoint activity.
For CICS BTS transactions, the network unit-of-work ID is also passed to atransaction that is invoked synchronously by an application program issuingeither a CICS BTS run ACQPROCESS synchronous or run activity synchronouscommand.
Note: When using MRO or ISC, the EXCMNNSX field can be combined withthe EXCMNNPX field to uniquely identify a task across each CICS system. Itmust be combined with the EXCMNNPX because the EXCMNNSX field on itsown is unique only to the originating CICS system.
EXCMNTRF (Type-A, 8 bytes)Transaction flags, a string of 64 bits used for signaling transaction definitionand status information:
Byte 0 Transaction facility identification:Bit 0 Transaction facility name = noneBit 1 Transaction facility name = terminalBit 2 Transaction facility name = surrogateBit 3 Transaction facility name = destinationBit 4 Transaction facility name = 3270 bridgeBit 5-7 Reserved
Byte 1 Transaction identification information:Bit 0 System transactionBit 1 Mirror transactionBit 2 DPL Mirror transactionBit 4 ONC RPC alias transactionBit 4 WEB alias transactionBit 5 3270 Bridge transactionBit 6 ReservedBit 7 CICS BTS run transaction (ACQPROCESS or activity)
synchronous
Byte 2 MVS workload manager request (transaction) completion information:Bit 0 Report the total response time (begin-to-end phase) for the
completed work request (transaction)Bit 1 Notify that the entire execution phase of the work request
(transaction) is completeBit 2 Notify that a subset of the execution phase of the work request
(transaction) is completeBit 3-7 Reserved
Byte 3 Transaction definition information:Bit 0 Taskdataloc = BELOWBit 1 Taskdatakey = CICSBit 2 Isolate = NO
314 IBM CICS Performance Analyzer for z/OS: Report Reference

Bit 3 Dynamic = YESBit 4-7 Reserved
Byte 4 Transaction origin type, “DFHTASK fields” on page 268 for details.
Byte 5 Reserved
Byte 6 JVM status information:Bit 0 JVM marked unresettableBit 1-7 Reserved
Byte 7 Recovery manager information:Bit 0 Indoubt wait = noBit 1 Indoubt action = commitBit 2 Recovery manager - UOW resolved with indoubt actionBit 3 Recovery manager - ShuntBit 4 Recovery manager - UnshuntBit 5 Recovery manager - Indoubt failureBit 6 Recovery manager - Resource owner failureBit 7 Reserved
EXCMNFCN (Type-C, 4 bytes)Transaction facility name. This field is null if the transaction is not associatedwith a facility. The transaction facility type (if any) can be identified using byte0 of the transaction flags field, TRANFLAG (owner: DFHTASK, field ID: 164).
EXCMNCPN (Type-C, 8 bytes)The name of the application program that was currently executing when theresource shortage condition occurred as identified by the exception record.
EXCMNBTR (Type-C, 4 bytes)3270 Bridge listener transaction identification.
EXCMNURI (Type-C, 16 bytes)RRMS/MVS unit-of-recovery ID (URID).
For more general information on the Recoverable Resource ManagementServices (RRMS), see the CICS External Interfaces Guide.
EXCMNRIL (Type-A, 4 bytes)The length of the resource name in the exception resource identification field,EXCMNRIX.
EXCMNRIX (Type-C, 256 bytes)The exception resource identification (extended).
EXCMNNID (Type-C, 8 bytes)The network ID field, NETID, is the network ID portion of the NetworkQualified Name (NQNAME) received from VTAM during bind or logon forCICS terminal resources using any VTAM LUALIAS (defined or dynamic). Ifthe resource has not logged on or an NQNAME was not received, then thisfield is set to null.
EXCMNRLU (Type-C, 8 bytes)The Real LUname (EXCMNRLU) field is the VTAM netname (LUname) of theterminal ID for CICS terminal resources using any VTAM LUALIAS (definedor dynamic). If the resource has not logged on or an NQNAME was notreceived, then this field is set to null. Also, see the field, EXCMNLUN.
Table 30 on page 316 shows the values and relationships of the exception type(EXCMNTYP), resource type (EXCMNRTY), and resource identification(EXCMNRID) fields.
Chapter 14. Understanding CMF data 315

Table 30. Relationships between the exception type, resource type, and resource identification
EXCMNTYP
Exception type
EXCMNRTY
Resource type
EXCMNRID
Resource ID
Exception description
EXCMNWT CFDTLRSW poolname Wait for a CF data table lockingrequest slot.
EXCMNWT CFDTPOOL poolname Wait for a CF data table non-lockingrequest slot.
EXCMNWT STORAGE CDSA Wait for CDSA storage
EXCMNWT STORAGE ECDSA Wait for ECDSA storage
EXCMNWT STORAGE UDSA Wait for UDSA storage
EXCMNWT STORAGE EUDSA Wait for EUDSA storage
EXCMNWT STORAGE SDSA Wait for SDSA storage
EXCMNWT STORAGE ESDSA Wait for ESDSA storage
EXCMNWT STORAGE RDSA Wait for RDSA storage
EXCMNWT STORAGE ERDSA Wait for ERDSA storage
EXCMNWT TEMPSTOR TS Qname Wait for temporary storage
EXCMNBWT LSRPOOL filename Wait for a buffer associated with anLSRPOOL
EXCMNBWT TEMPSTOR TS Qname Wait for a buffer associated withDFHTEMP
EXCMNSWT FILE filename Wait for a string associated with a file
EXCMNSWT LSRPOOL filename Wait for a string associated with anLSRPOOL
EXCMNSWT TEMPSTOR TS Qname Wait for a string associated withDFHTEMP
Note: The extended resource ID field, EXCMNRIX, should be used for analyzingthe exception records for the TEMPSTOR exception resource types because thetemporary storage queue names are now 16-bytes in length.
CMF transaction resource class data fieldsThe transaction resource class data fields produced by the CICS Monitoring Facility(CMF) are described in this section.
Transaction resource class data provides additional transaction-level informationabout individual resources accessed by a transaction. Currently, the transactionresource class covers file and temporary storage queue resources.
The maximum number of files and temporary storage queues monitored for eachtransaction is limited by the FILE and TSQUEUE parameters on the DFHMCTTYPE=INITIAL macro. The default is FILE=8 for files and TSQUEUE=4 fortemporary storage queues. Therefore, you might need to assemble an MCT thatspecifies either or both FILE and TSQUEUE options if the default values areinsufficient, or if you do not want to collect transaction resource data for eitherfiles or temporary storage queues. One transaction resource record is written foreach transaction that is being monitored, provided the transaction accesses at leastone of the resources for which monitoring data is requested, (for example, at least1 file if you specify FILE=number).
316 IBM CICS Performance Analyzer for z/OS: Report Reference

Transaction resource records are variable length, depending on the number ofresources for which data is being collected (for example, one transaction mightaccess only 1 file, another 5 files and 2 temporary storage queues, and so on).
For only one file, the record length is 188 bytes plus 96 bytes for the file data (284bytes). Each additional file adds another 96 bytes. The maximum number of filesfor which you can collect transaction resource data is 64.
For only one temporary storage queue, the record length is 188 bytes plus 96 bytesfor the temporary storage queue data (284 bytes). Each additional temporarystorage queue adds another 96 bytes. The maximum number of temporary storagequeues for which you can collect transaction resource data is 32.
Performance class data also provides information about file and temporary storagequeue resource accesses, but this information in the performance record is given intotal only for all files (see “DFHFILE fields” on page 257) and all temporarystorage queues (see “DFHTEMP fields” on page 286). Transaction resource databreaks this information down by individual file name and temporary storagequeue name, up to the maximum number specified in the MCT. Transactionresource information is completed for each task when the task terminates.
You enable transaction resource class monitoring at startup by coding MNRES=ON(together with MN=ON) as a system initialization parameter. Alternatively, you canuse one of the following commands to enable transaction resource class monitoringdynamically:v CEMT SET MONITOR ON RESRCEv EXEC CICS SET MONITOR STATUS(ON) RESRCECLASS(RESRCE)
In contrast to performance class data records whose format is described inassociated dictionary entries, transaction resource class data records are not definedin the dictionary record. The transaction resource class data records are fixedformat.
Task identification fieldsThis section describes the transaction header fields in a transaction monitoringresource record.
MNR_ID_TRANID (Type-C, 4 bytes)Transaction identifier.
MNR_ID_TERMID (Type-C, 4 bytes)Terminal identifier. This field is null if the task is not associated with aterminal or session.
MNR_ID_USERID (Type-C, 4 bytes)User identification at task creation. This can also be the remote user identifierfor a task created as the result of receiving an ATTACH request across an MROor APPC link with attach-time security enabled.
MNR_ID_SYTPE (Type-C, 4 bytes)Transaction start type. The high-order byte (0 and 1) can have one of thefollowing values:TO
Attached from terminal inputS Attached by automatic transaction initiation (ATI) without dataSD
Attached by automatic transaction initiation (ATI) with data
Chapter 14. Understanding CMF data 317

QDAttached by transient data trigger level
U Attached by user requestTP
Attached from terminal TCTTE transaction IDSZ
Attached by Front End Programming Interface (FEPI)
MNR_ID_START (Type-T, 8 bytes)Start time of the transaction.
MNR_ID_STOP (Type-T, 8 bytes)Stop time of the transaction.
MNR_ID_TASKNO (Type-A, 4 bytes)The transaction identification number (the task number allocated to thetransaction at task attach).
MNR_ID_LUNAME (Type-C, 8 bytes)VTAM logical unit name (if available) of the terminal associated with thistransaction. If the task is executing in an application-owning or file-owningregion, the LUNAME is the generic applid of the originating connection forMRO, LUTYPE6.1, and LUTYPE6.2 (APPC). The LUNAME is blank if theoriginating connection is an external CICS interface (EXCI).
MNR_ID_PGMNAME (Type-C, 8 bytes)The name of the first program invoked at attach-time. For more information,see the performance class data field PGMNAME (owner: DFHPROG, field ID:071).
MNR_ID_UOW_PX (Type-C, 20 bytes)This field contains the same information as the performance class data fieldNETUOWPX (owner: DFHTASK, field ID: 097).
MNR_ID_UOW_SX (Type-C, 8 bytes)This field contains the same information as the performance class data fieldNETUOWSX (owner: DFHTASK, field ID: 098).
MNR_ID_TRN_FLAGS (Type-A, 8 bytes)Transaction flags, a string of 64 bits used for signaling transaction definitionand status information. For details, see the performance class data fieldTRANFLAG (owner: DFHTASK, field ID: 164).
MNR_ID_RSYSID (Type-C, 4 bytes)The name (system ID) of the remote system to which this transaction wasrouted, either statically or dynamically. For more information, see theperformance class data field RSYSID (owner: DFHCICS, field ID: 130).
MNR_ID_FCTYNAME (Type-C, 4 bytes)Transaction facility name. This field is null if the transaction is not associatedwith a facility. You can identify the transaction facility type (if any) using byte0 of the transaction flags (MNR_ID_TRN_FLAGS) field. For details, see theperformance class data field FCTYNAME (owner: DFHTASK, field ID: 163).
MNR_ID_RTYPE (Type-C, 4 bytes)Transaction resource monitoring record type (low-order byte-3). Currently thiscan have only one value, T, indicating a record output for task termination. Formore information about record types, see the performance class data fieldRTYPE (owner: DFHCICS, field ID: 112).
TERMINFO (Type-A, 4 bytes)Terminal or session information for the task principal facility. For more
318 IBM CICS Performance Analyzer for z/OS: Report Reference

information about terminal information, see the performance class data fieldTERMINFO (owner: DFHTERM, field ID: 165).
MNR_ID_TERMCNNM (Type-C, 4 bytes)Terminal session connection name. If the terminal facility associated with thistransaction is a session, this field is the name of the owning connection (systemID). For more information, see the performance class data field TERMCNNM(owner: DFHTERM, field ID: 169).
MNR_ID_RES_FLAGS (Type-A, 4 bytes)Resource flags, a string of 32 bits used for signaling resource statusinformation.
Byte 0Resource status information:Bit 0
Maximum number of files to be monitored (defined in the MCT) hasbeen exceeded by the transaction (X'80')
Bit 1Maximum number of temporary storage queues to be monitored(defined in the MCT) has been exceeded by the transaction (X'40')
Bit 2The maximum number of distributed program link requests to bemonitored (defined in the MCT) has been exceeded by the transaction(X'20').
Bits 3-7Reserved.
Bytes 1-3Reserved.
MNR_ID_ISIPICNM (Type-C, 8 bytes)The name of the IPIC (IPCONN) entry of the TCP/IP service that attached theuser task. For more information, see field 305 (ISIPICNM) in the DFHSOCKperformance-class data group.
MNR_ID_CLIPADDR (Type-C, 40 bytes)The IP address of the originating client or Telnet client. For more information,see field 318 (CLIPADDR) in the DFHSOCK performance-class data group.
MNR_ID_ORIGIN_NETWKID (Type-C, 8 bytes)The network identifier from which this work request (transaction) originated.For more information, see field 359 (ONETWKID) in the DFHCICSperformance data group.
MNR_ID_ORIGIN_APPLID (Type-C, 8 bytes)The applid of the CICS region where this work request (transaction) originated;for example, the region in which the CWXN task ran. For more information,see field 360 (OAPPLID) in the DFHCICS performance data group.
MNR_ID_ORIGIN_ATT_TIME (Type-T, 8 bytes)The time when the originating task, for example, the CWXN task, was started.For more information, see field 361 (OSTART) in the DFHCICS performancedata group.
MNR_ID_ORIGIN_TRANNUM (Type-P, 4 bytes)The number of the originating task; for example, the CWXN task. For moreinformation, see field 362 (OTRANNUM) in the DFHCICS performance datagroup.
Chapter 14. Understanding CMF data 319

MNR_ID_ORIGIN_TRANID (Type-C, 4 bytes)The transaction ID (TRANSID) of the originating task; for example, the CWXNtask. For more information, see field 363 (OTRAN) in the DFHCICSperformance data group.
MNR_ID_ORIGIN_USERID (Type-C, 8 bytes)The originating Userid-2 or Userid-1, for example, from CWBA, depending onthe originating task. For more information, see field 364 (OUSERID) in theDFHCICS performance data group.
MNR_ID_ORIGIN_USER_CORR (Type-C, 64 bytes)The originating user correlator. For more information, see field 365(OUSERCOR) in the DFHCICS performance data group.
MNR_ID_ORIGIN_TCPIPSERV (Type-C, 8 bytes)The name of the originating TCPIPSERVICE. For more information, see field366 (OTCPSVCE) in the DFHCICS performance data group.
MNR_ID_ORIGIN_PORTNUM (Type-A, 4 bytes)The port number used by the originating TCPIPSERVICE. For moreinformation, see field 367 (OPORTNUM) in the DFHCICS performance datagroup.
MNR_ID_ORIGIN_CLIPADDR (Type-C, 40 bytes)The IP address of the originating client or Telnet client. For more information,see field 372 (OCLIPADR) in the DFHCICS performance data group.
MNR_ID_ORIGIN_CLIPPORT (Type-A, 4 bytes)The TCP/IP port number of the originating client or Telnet client. For moreinformation, see field 369 (OCLIPORT) in the DFHCICS performance datagroup.
MNR_ID_ORIGIN_TRANFLAG (Type-A, 8 bytes)The originating transaction flags. This 64-bit string is used for signalingtransaction definition and status information. For more information, see field370 (OTRANFLG) in the DFHCICS performance data group.
MNR_ID_ORIGIN_FCTYNAME (Type-C, 8 bytes)The facility name of the originating transaction. If the originating transaction isnot associated with a facility, this field is null. For more information, see field371 (OFCTYNME) in the DFHCICS performance data group.
File entry fieldsThis section describes the fields in each file entry in a transaction resourcemonitoring record.
For information about transaction file accesses in performance class monitoringdata, see “DFHFILE fields” on page 257.
MNR_FILE_NAME (Type-C, 8 bytes)The CICS 8-character name of the file to which the following data fields refer.
MNR_FILE_GET (Type-S, 8 bytes)The elapsed time that the user task waited for completion of GET requestsissued by the user task for this file. The count part of this field (the low order24 bits) contains the number of GET requests issued against the file. For moreinformation, see “Transaction response time” on page 296 and “Clocks andtime stamps” on page 294.
MNR_FILE_PUT (Type-S, 8 bytes)The elapsed time that the user task waited for completion of PUT requests
320 IBM CICS Performance Analyzer for z/OS: Report Reference

issued by the user task for this file. The count part of this field (the low order24 bits) contains the number of PUT requests issued against the file. For moreinformation, see “Transaction response time” on page 296 and “Clocks andtime stamps” on page 294.
MNR_FILE_BRWSE (Type-S, 8 bytes)The elapsed time that the user task waited for completion of BROWSE requestsissued by the user task for this file. The count part of this field (the low order24 bits) contains the number of BROWSE requests issued against the file. Formore information, see “Transaction response time” on page 296 and “Clocksand time stamps” on page 294.
MNR_FILE_ADD (Type-S, 8 bytes)The elapsed time that the user task waited for completion of ADD requestsissued by the user task for this file. The count part of this field (the low order24 bits) contains the number of ADD requests issued against the file. For moreinformation, see “Transaction response time” on page 296 and “Clocks andtime stamps” on page 294.
MNR_FILE_DEL (Type-S, 8 bytes)The elapsed time that the user task waited for completion of DELETE requestsissued by the user task for this file. The count part of this field (the low order24 bits) contains the number of DELETE requests issued against the file. Formore information, see “Transaction response time” on page 296 and “Clocksand time stamps” on page 294.
MNR_FILE_TOTAL (Type-S, 8 bytes)The total elapsed time that the user task waited for completion of all requestsissued by the user task for this file. The count part of this field (the low order24 bits) contains the number of all requests issued against the file. For moreinformation, see “Transaction response time” on page 296 and “Clocks andtime stamps” on page 294.
MNR_FILE_AM_RQ (Type-A, 4 bytes)Number of times the user task invoked file access-method interfaces. See alsothe performance class data field FCAMCT (owner: DFHFILE, field ID: 070).
MNR_FILE_IO_WT (Type-S, 8 bytes)The total I/O wait time on this file. For more information, see “Transactionresponse time” on page 296 and “Clocks and time stamps” on page 294.
MNR_RLS_FILE_IO_WT (Type-S, 8 bytes)Elapsed time in which the user task waited for RLS file I/O on this file. Formore information, see “Transaction response time” on page 296 and “Clocksand time stamps” on page 294.
MNR_CFDT_IO_WT (Type-S, 8 bytes)Elapsed time in which the user task waited for a data table access request tothe coupling facility data table server to complete for this file. For moreinformation, see “Transaction response time” on page 296 and “Clocks andtime stamps” on page 294.
Temporary storage queue entry fieldsThis section describes the fields in each temporary storage queue entry in atransaction resource monitoring record.
For information about transaction temporary storage queue accesses inperformance class monitoring data, see “DFHTEMP fields” on page 286.
Chapter 14. Understanding CMF data 321

MNR_TSQUEUE_NAME (Type-C, 16 bytes)The CICS 16-character name of the temporary storage queue to which thefollowing data fields refer.
MNR_TSQUEUE_GET (Type-S, 8 bytes)The elapsed time that the user task waited for completion of GET requestsissued by the user task for this temporary storage queue. The count part of thisfield (the low order 24 bits) contains the number of GET requests issuedagainst the temporary storage queue. For more information, see “Transactionresponse time” on page 296 and “Clocks and time stamps” on page 294.
MNR_TSQUEUE_PUT_AUX (Type-S, 8 bytes)The elapsed time that the user task waited for completion of PUT requests toauxiliary temporary storage, issued by the user task for this temporary storagequeue. The count part of this field (the low order 24 bits) contains the numberof PUT requests to auxiliary temporary storage issued against the temporarystorage queue. For more information, see “Transaction response time” on page296 and “Clocks and time stamps” on page 294.
MNR_TSQUEUE_PUT_MAIN (Type-S, 8 bytes)The elapsed time that the user task waited for completion of PUT requests tomain temporary storage, issued by the user task for this temporary storagequeue. The count part of this field (the low order 24 bits) contains the numberof PUT requests to main temporary storage issued against the temporarystorage queue. For more information, see “Transaction response time” on page296 and “Clocks and time stamps” on page 294.
MNR_TSQUEUE_TOTAL (Type-S, 8 bytes)The total elapsed time that the user task waited for completion of all requestsissued by the user task for this temporary storage queue. The count part of thisfield (the low order 24 bits) contains the number of all requests issued againstthe temporary storage queue. For more information, see “Transaction responsetime” on page 296 and “Clocks and time stamps” on page 294.
MNR_TSQUEUE_GET_ITEML (Type-S, 4 bytes)The total length of all items obtained from this temporary storage queue.
MNR_TSQUEUE_PUT_AUX_ITEML (Type-S, 4 bytes)The total length of all items written to the auxiliary temporary storage queue.
MNR_TSQUEUE_PUT_MAIN_ITEML (Type-S, 4 bytes)The total length of all items written to the main temporary storage queue.
MNR_TSQUEUE_IO_WT (Type-S, 8 bytes)The total I/O wait time on this temporary storage queue. For moreinformation, see “Transaction response time” on page 296 and “Clocks andtime stamps” on page 294.
MNR_SHR_TSQUEUE_IO_WT (Type-S, 8 bytes)The total I/O wait time on the shared temporary storage queue. For moreinformation, see “Transaction response time” on page 296 and “Clocks andtime stamps” on page 294.
DPL entry fieldsThis section describes the fields in each distributed program link entry in atransaction resource monitoring record.
For information about transaction program accesses in performance classmonitoring data, see “DFHPROG fields” on page 259.
322 IBM CICS Performance Analyzer for z/OS: Report Reference

MNR_DPL_PROGRAM_NAME (Type-C, 8 bytes)The name of the program to which the following data fields refer.
MNR_DPL_SYSID (Type-C, 4 bytes)The name of the remote system to which this program was routed for thedistributed program link.
MNR_DPL_LINK_REQS (Type-C, 4 bytes)The number of distributed program link requests issued by the user task forthis program and sysid combination.
Chapter 14. Understanding CMF data 323

324 IBM CICS Performance Analyzer for z/OS: Report Reference

Part 6. Reference
These topics contain cross-reference information designed to help you more easilyuse CICS PA and understand the data it is reporting. These topics contain threecross-reference tables that apply to CMF performance class and transactionresource class data:v “CMF Field IDs by CICS version” contains a cross-reference table relating the
CICS monitoring facility (CMF) fields with the corresponding CICS PA fieldnames and CICS version.
v “CICS PA field names by CICS version” contains a cross-reference table relatingthe CICS PA field names with the corresponding CICS CMF fields and CICSversion.
v “Fields by forms, HDB templates” contains a cross-reference table relating theCICS PA field names with the Report Forms and HDB Templates where theycan be specified.
© Copyright IBM Corp. 2001, 2010 325

326 IBM CICS Performance Analyzer for z/OS: Report Reference

Chapter 15. CMF Field IDs by CICS version
The following cross-reference table relates the CICS monitoring facility (CMF) fieldIDs for performance class and transaction resource class data with the CICSversions to which they apply.
Some columns in the table require explanation:
CICS PA field nameThe name used in report forms, HDB templates, and selection criteria (andthe corresponding batch command operands FIELDS and SELECT):v A blank value in this column indicates that the CICS PA field name is
the same as the CMF field name.v “N/A” indicates that the field is not available, typically because it is a
very long field, or it is an unprintable field such as a unit-of-work or aflag.
Column headingThe heading used to identify the field in CICS PA reports and extract datasets.
CICS versionThe CICS versions to which a field applies:v Yes, the field applies to this CICS version– No, the field does not apply to this CICS version
The table is sorted by CMF group and CMF field ID.
Note:
1. DBCTL fields can only be specified if the MCT contains the DBCTL EMPdefined in SDFHSAMP member DFH$MCTD.
2. Some special fields, such as APPLID and RESPONSE, are not defined in theCMF Dictionary and are given a group name of “CICSPA”. These fields areeither derived from the fixed section of the CMF record (for example, APPLID),or calculated from two or more other CMF fields (for example, RESPONSE).
3. The FILENAME, TSQNAME, and DPLNAME fields are only available whenCMF transaction resource class data is being collected.
4. The DFHAPPL fields are only available when application programs invoke theapplication naming event monitoring points.
Table 31. Cross-reference: CMF field ID × CICS version
CMF field
CICS PAfield name
Columnheading
CICSversion
DescriptionGroup Type ID Name
640
650
660
CICSPA A 001 TOTRECS TotlRecs v v v Cross-System Total record count
CICSPA A 002 APPLRECS APPLRecs v v v Cross-System Application records
CICSPA A 003 TRANROUT TranRout v v v Cross-System Transaction Routing records
CICSPA A 004 FUNCSHIP FuncShip v v v Cross-System Function Shipping records
CICSPA A 005 DPLRECS DPL Recs v v v Cross-System DPL records
CICSPA D 901 RESP RESPONSE Response v v v Transaction response time
CICSPA X 902 TASKCNT #Tasks v v v Total Task count
© Copyright IBM Corp. 2001, 2010 327

Table 31. Cross-reference: CMF field ID × CICS version (continued)
CMF field
CICS PAfield name
Columnheading
CICSversion
DescriptionGroup Type ID Name
640
650
660
CICSPA C 903 APPLID APPLID v v v CICS Generic APPLID
CICSPA C 904 MVSID MVS ID v v v MVS SMF ID
CICSPA C 905 JOBNAME Jobname v v v Job Name
CICSPA D 906 COMMWAIT CommWait v v v Communications wait time
CICSPA D 907 IOWAIT I/O Wait v v v Total IO wait time
CICSPA D 908 IRESP Int Resp v v v Transaction internal response time
CICSPA C 909 RELEASE Rlse v v v CICS release
CICSPA D 910 JVMMTIME JVM Meth v v v JVM Method time
CICSPA D 911 RMIOTIME RMIOTime v v v Resource Manager Interface (RMI) other time
CICSPA C 912 UOWID UOW ID v v v Network UOW ID
CICSPA C 913 UOWSEQ UOW Seq v v v Network UOW Sequence Number
CICSPA X 914 TASKTCNT #TTasks v v v Total Task Termination count
CICSPA A 915 ALERT ALERT v v v Total Alert count or percentage
CICSPA C 916 FILENAME FileName v v v File name
CICSPA C 917 TSQNAME TSQ Name v v v Temporary Storage Queue Name
CICSPA D 918 TOTCPU Tot CPU v v v Total Task CPU Time
CICSPA C 919 DPLNAME DPL Name v v v Distributed program link name
DBCTL C 001 PSBNAME PSB Name v v v PSB Name
DBCTL S 002 POOLWAIT PoolWait v v v Elapsed wait time for Pool Space
DBCTL S 003 INTCWAIT IntCWait v v v Elapsed wait time for Intent Conflict
DBCTL S 004 SCHTELAP SchTElap v v v Elapsed time for Schedule Process
DBCTL S 005 DBIOELAP DBIOElap v v v Elapsed time for Database I/O
DBCTL S 006 PILOCKEL PILockEl v v v Elapsed time for PI Locking
DBCTL A 007 DBIOCALL DBIOCall v v v Number of Database I/Os
DBCTL A 008 GUCALL GUcall v v v Number of Database GU calls issued
DBCTL A 009 GNCALL GNcall v v v Number of Database GN calls issued
DBCTL A 010 GNPCALL GNPcall v v v Number of Database GNP calls issued
DBCTL A 011 GHUCALL GHUcall v v v Number of Database GHU calls issued
DBCTL A 012 GHNCALL GHNcall v v v Number of Database GHN calls issued
DBCTL A 013 GHNPCALL GHNPcall v v v Number of Database GHNP calls issued
DBCTL A 014 ISRTCALL ISRTcall v v v Number of Database ISRT calls issued
DBCTL A 015 DLETCALL DLETcall v v v Number of Database DLET calls issued
DBCTL A 016 REPLCALL REPLcall v v v Number of Database REPL calls issued
DBCTL A 017 DLICALLS DLIcalls v v v Total DL/I Database calls
DBCTL A 018 TESTENQS TestENQs v v v Number of Test Enqueues
DBCTL A 019 TESTENQW TestENQW v v v Number of waits on Test Enqueues
DBCTL A 020 TESTDEQS TestDEQs v v v Number of Test Dequeues
DBCTL A 021 UPDTENQS UpdtENQs v v v Number of Update Enqueues
DBCTL A 022 UPDTENQW UpdtENQW v v v Number of waits on Update Enqueues
DBCTL A 023 UPDTDEQS UpdtDEQs v v v Number of Update Dequeues
DBCTL A 024 EXCLENQS ExclENQs v v v Number of Exclusive Enqueues
DBCTL A 025 EXCLENQW ExclENQW v v v Number of waits on Exclusive Enqueues
DBCTL A 026 EXCLDEQS ExclDEQs v v v Number of Exclusive Dequeues
DBCTL A 027 DEDBCALL DEDBcall v v v Number of DEDB calls
DBCTL A 028 DEDBRDOP DEDBRdOp v v v Number of DEDB read operations
DBCTL A 029 OVFLBFRU OvflBfrU v v v Number of Overflow Buffers used
DBCTL A 030 UOWCONTS UOWConts v v v Number of UOW Contentions
DBCTL A 031 DEDBBFRW DEDBBfrW v v v Number of waits for DEDB buffers
DBCTL S 032 THREDCPU ThredCPU v v v Thread TCB CPU time
DBCTL T 033 SCHEDSTA SchedSta v v v IMS Schedule start time
DBCTL T 034 SCHEDEND SchedEnd v v v IMS Schedule end time
DBCTL A 035 DBGETS DBget v v v Number of Database Get calls issued
DBCTL A 036 DBUPDATE DBupdate v v v Number of Database Update calls issued
DBCTL A 037 DBWAITS DBwait v v v Number of Database waits
DFHAPPL C 001 APPLNAME APPLPROG Program v v v Application naming Program
328 IBM CICS Performance Analyzer for z/OS: Report Reference

Table 31. Cross-reference: CMF field ID × CICS version (continued)
CMF field
CICS PAfield name
Columnheading
CICSversion
DescriptionGroup Type ID Name
640
650
660
DFHAPPL C 001 APPLNAME APPLTRAN Tran v v v Application naming Tran ID
DFHCBTS C 200 PRCSNAME BTS Proc v v v BTS Process name
DFHCBTS C 201 PRCSTYPE BTS PTyp v v v BTS Process type
DFHCBTS C 202 PRCSID N/A BTS Root v v v BTS Root Activity identifier
DFHCBTS C 203 ACTVTYID N/A BTSActID v v v BTS Activity identifier
DFHCBTS C 204 ACTVTYNM BTSActNm v v v BTS Activity name
DFHCBTS A 205 BARSYNCT BTS Sync v v v BTS synchronous Process/Activity count
DFHCBTS A 206 BARASYCT BTS Asyn v v v BTS asynchronous Process/Activity count
DFHCBTS A 207 BALKPACT BTS Link v v v BTS Link Process/Activity count
DFHCBTS A 208 BADPROCT BTS DefP v v v BTS Define Process requests
DFHCBTS A 209 BADACTCT BTS DefA v v v BTS Define Activity requests
DFHCBTS A 210 BARSPACT BTSReset v v v BTS Reset Process/Activity requests
DFHCBTS A 211 BASUPACT BTS Susp v v v BTS Suspend Process/Activity requests
DFHCBTS A 212 BARMPACT BTSResum v v v BTS Resume Process/Activity requests
DFHCBTS A 213 BADCPACT BTSCancl v v v BTS Cancel Process/Activity requests
DFHCBTS A 214 BAACQPCT BTSAcqui v v v BTS Acquire Process/Activity requests
DFHCBTS A 215 BATOTPCT BTSTotal v v v BTS Total Process/Activity requests
DFHCBTS A 216 BAPRDCCT BTSPDCRq v v v BTS Process Data Containers requests
DFHCBTS A 217 BAACDCCT BTSADCRq v v v BTS Activity Data Containers requests
DFHCBTS A 218 BATOTCCT BTSTDCRq v v v BTS Process/Activity Data Container requests
DFHCBTS A 219 BARATECT BTSRtvEv v v v BTS Retrieve-Reattach Event requests
DFHCBTS A 220 BADFIECT BTSDefEv v v v BTS Define-Input Event requests
DFHCBTS A 221 BATIAECT BTSTimEv v v v BTS TIMER Event requests
DFHCBTS A 222 BATOTECT BTSTotEv v v v BTS Event-related requests
DFHCHNL A 321 PGTOTCCT PGTOTCCT v v v Total number of CHANNEL CONTAINER requests
DFHCHNL A 322 PGBRWCCT PGBRWCCT v v v BROWSE CHANNEL CONTAINER requests
DFHCHNL A 323 PGGETCCT PGGETCCT v v v GET CHANNEL CONTAINER requests
DFHCHNL A 324 PGPUTCCT PGPUTCCT v v v PUT CHANNEL CONTAINER requests
DFHCHNL A 325 PGMOVCCT PGMOVCCT v v v MOVE CHANNEL CONTAINER requests
DFHCHNL A 326 PGGETCDL PGGETCDL v v v GET CHANNEL CONTAINER data length
DFHCHNL A 327 PGPUTCDL PGPUTCDL v v v PUT CHANNEL CONTAINER data length
DFHCHNL A 328 PGCRECCT PGCRECCT v v v Number of Containers created
DFHCHNL A 329 PGCSTHWM PGCSTHWM – v v Maximum Container Storage allocated to task
DFHCICS T 005 START Start v v v Task start time
DFHCICS T 006 STOP Stop v v v Task stop time
DFHCICS A 025 CFCAPICT CFClsAPI v v v OO Foundation Class requests
DFHCICS C 089 USERID Userid v v v User ID
DFHCICS S 103 EXWTTIME EXWAIT Exc Wait v v v Exception Conditions wait time
DFHCICS C 112 RTYPE RTyp v v v Performance record type
DFHCICS C 130 RSYSID RSID v v v Remote System ID
DFHCICS A 131 PERRECNT RECCOUNT RecCount v v v Task Performance record count
DFHCICS C 167 SRVCLASS SrvClass v v v WLM Service Class
DFHCICS C 168 RPTCLASS RptClass v v v WLM Report Class
DFHCICS C 359 ONETWKID ONETWKID – v v Originating Network ID
DFHCICS C 360 OAPPLID OAPPLID – v v Originating CICS APPLID
DFHCICS T 361 OSTART OStart – v v Originating Task start time
DFHCICS P 362 OTRANNUM OTASKNO OTaskNo – v v Originating Transaction number
DFHCICS C 363 OTRAN OTran – v v Originating Transaction identifier
DFHCICS C 364 OUSERID OUserid – v v Originating User ID
DFHCICS C 365 OUSERCOR OUserCor – v v Originating User Correlator
DFHCICS C 366 OTCPSVCE OTCPSRVC OTCPIPSr – v v Originating TCP/IP Service Name
DFHCICS A 367 OPORTNUM OPORT OPORT – v v Originating TCP/IP Port Number
DFHCICS C 368 OCLIPADR OCLINTIP OClintIP – v – Originating Client or Telnet IP address
DFHCICS A 369 OCLIPORT OCLIPORT – v v Originating Client IP Port Number
DFHCICS A 370 OTRANFLG OTranFlg – v v Originating Transaction flags
Chapter 15. CMF Field IDs by CICS version 329

Table 31. Cross-reference: CMF field ID × CICS version (continued)
CMF field
CICS PAfield name
Columnheading
CICSversion
DescriptionGroup Type ID Name
640
650
660
DFHCICS A 370 OTRANFLG OFCTYTYP OFctyTyp – v v Originating Transaction Facility Type
DFHCICS C 370 OTRANFLG OORIGIN OOrigin – v v Originating Transaction Origin type
DFHCICS C 370 OTRANFLG OTRANTYP OTranTyp – v v Originating Transaction type
DFHCICS C 371 OFCTYNME OFCTY OFcty – v v Originating Transaction Facility name
DFHCICS C 372 OCLIPADR OCLI6ADR OCli6Adr – – v Originating Client or Telnet IP address
DFHCICS A 402 EICTOTCT EICTotCt – – v EXEC CICS requests
DFHCICS A 405 TIASKTCT ASKTimCt – – v ASKTIME requests
DFHCICS A 406 TITOTCT TITOTcT – – v ASKTIME
DFHCICS A 408 BFDGSTCT BFDGSTcT – – v Built-in function BIF DIGEST requests
DFHCICS A 409 BFTOTCT BFTotCt – – v Total Built-in (BIF) function requests
DFHCICS A 415 ECSIGECT ECSIGECT – – v SIGNAL EVENT requests
DFHCICS A 416 ECEFOPCT ECEFOPCT – – v Event Filter operations
DFHCICS A 417 ECEVNTCT ECEVNTCT – – v Events captured
DFHDATA A 179 IMSREQCT IMS Reqs v v v IMS (DBCTL) requests
DFHDATA A 180 DB2REQCT DB2 Reqs v v v DB2 requests
DFHDATA S 186 IMSWAIT IMS Wait v v v IMS (DBCTL) wait time
DFHDATA S 187 DB2RDYQW DB2ThdWt v v v DB2 Thread wait time
DFHDATA S 188 DB2CONWT DB2ConWt v v v DB2 Connection wait time
DFHDATA S 189 DB2WAIT DB2SQLWt v v v DB2 SQL/IFI wait time
DFHDATA A 395 WMQREQCT WMQ Reqs – v v Number of WebSphere MQ requests
DFHDATA S 396 WMQGETWT WMQGetWt – v v WebSphere MQ GETWAIT wait time
DFHDATA S 397 WMQASRBT WMQSRBtm – – v WebSphere MQ API SRB CPU time
DFHDEST A 041 TDGETCT TDGET TDGET v v v Transient data GET requests
DFHDEST A 042 TDPUTCT TDPUT TDPUT v v v Transient data PUT requests
DFHDEST A 043 TDPURCT TDPURGE TDPURGE v v v Transient data PURGE requests
DFHDEST A 091 TDTOTCT TDTOTAL TD Total v v v Transient data Total requests
DFHDEST S 101 TDIOWTT TDWAIT TD Wait v v v VSAM transient data I/O wait time
DFHDOCH A 223 DHDELCT DHDELETE DHDELETE – v v Document Handler DELETE requests
DFHDOCH A 226 DHCRECT DHCREATE DHCREATE v v v Document Handler CREATE requests
DFHDOCH A 227 DHINSCT DHINSERT DHINSERT v v v Document Handler INSERT requests
DFHDOCH A 228 DHSETCT DHSET DHSET v v v Document Handler SET requests
DFHDOCH A 229 DHRETCT DHRETRVE DHRETRVE v v v Document Handler RETRIEVE requests
DFHDOCH A 230 DHTOTCT DHTOTAL DH Total v v v Document Handler Total requests
DFHDOCH A 240 DHTOTDCL DHDocLen v v v Total length of all documents created
DFHEJBS C 311 CBSRVRNM Corb v v v CorbaServer name
DFHEJBS A 312 EJBSACCT EJBACTIV EJBActiv v v v Number of Bean State Activation requests
DFHEJBS A 313 EJBSPACT EJBPASIV EJBPasiv v v v Number of Bean State Passivation requests
DFHEJBS A 314 EJBCRECT EJBCREAT EJBCreat v v v Number of Bean Creation requests
DFHEJBS A 315 EJBREMCT EJBREMOV EJBRemov v v v Number of Bean Removal requests
DFHEJBS A 316 EJBMTHCT EJBMETHD EJBMethd v v v Number of EJB Method Calls
DFHEJBS A 317 EJBTOTCT EJBTOTAL EJBTotal v v v Total Number of EJB requests
DFHFEPI A 150 SZALLOCT SZALLOC SZALLOC v v v Conversations allocated count
DFHFEPI A 151 SZRCVCT SZRCV SZRCV v v v FEPI RECEIVE requests
DFHFEPI A 152 SZSENDCT SZSEND SZSEND v v v FEPI SEND requests
DFHFEPI A 153 SZSTRTCT SZSTART SZSTART v v v FEPI START requests
DFHFEPI A 154 SZCHROUT SZChrOut v v v FEPI characters sent count
DFHFEPI A 155 SZCHRIN SZChrIn v v v FEPI characters received count
DFHFEPI S 156 SZWAIT SZ Wait v v v FEPI services wait time
DFHFEPI A 157 SZALLCTO SZAlocTO v v v Allocate conversation time-out count
DFHFEPI A 158 SZRCVTO SZRecvTO v v v Receive Data time-out count
DFHFEPI A 159 SZTOTCT SZTOTAL SZ Total v v v FEPI API and SPI requests
DFHFILE A 036 FCGETCT FCGET FCGET v v v File GET requests
DFHFILE A 037 FCPUTCT FCPUT FCPUT v v v File PUT requests
DFHFILE A 038 FCBRWCT FCBROWSE FCBROWSE v v v File Browse requests
DFHFILE A 039 FCADDCT FCADD FCADD v v v File ADD requests
330 IBM CICS Performance Analyzer for z/OS: Report Reference

Table 31. Cross-reference: CMF field ID × CICS version (continued)
CMF field
CICS PAfield name
Columnheading
CICSversion
DescriptionGroup Type ID Name
640
650
660
DFHFILE A 040 FCDELCT FCDELETE FCDELETE v v v File DELETE requests
DFHFILE S 063 FCIOWTT FCWAIT FC Wait v v v File I/O wait time
DFHFILE A 070 FCAMCT FCAMRq v v v File access-method requests
DFHFILE A 093 FCTOTCT FCTOTAL FC Total v v v File Control requests
DFHFILE S 174 RLSWAIT RLS Wait v v v RLS File I/O wait time
DFHFILE S 175 RLSCPUT RLSCPU RLS CPU v v v RLS File Request CPU (SRB) time
DFHFILE S 176 CFDTWAIT CFDTWait v v v CF Data Table access requests wait time
DFHJOUR S 010 JCIOWTT JCWAIT JC Wait v v v Journal I/O wait time
DFHJOUR A 058 JNLWRTCT JNLPUT JnlWrite v v v Journal write requests
DFHJOUR A 172 LOGWRTCT LOGWRITE LogWrite v v v Log Stream write requests
DFHMAPP A 050 BMSMAPCT BMSMAP BMSMAP v v v BMS MAP requests
DFHMAPP A 051 BMSINCT BMSIN BMSIN v v v BMS IN requests
DFHMAPP A 052 BMSOUTCT BMSOUT BMSOUT v v v BMS OUT requests
DFHMAPP A 090 BMSTOTCT BMSTOTAL BMSTotal v v v BMS Total requests
DFHPROG A 055 PCLINKCT PCLINK PCLINK v v v Program LINK requests
DFHPROG A 056 PCXCTLCT PCXCTL PCXCTL v v v Program XCTL requests
DFHPROG A 057 PCLOADCT PCLOAD PCLOAD v v v Program LOAD requests
DFHPROG C 071 PGMNAME PROGRAM Program v v v Program name
DFHPROG A 072 PCLURMCT PCLURM PCLNKURM v v v Program LINK URM requests
DFHPROG A 073 PCDPLCT PCDPL PCDPLINK v v v Distributed Program Link (DPL) requests
DFHPROG C 113 ABCODEO ABor v v v Original ABEND Code
DFHPROG C 114 ABCODEC ABcu v v v Current ABEND code
DFHPROG S 115 PCLOADTM PCLOADWt v v v Program Library wait time
DFHPROG A 286 PCDLCSDL PCDLCSDL v v v Container data length for DPL reqs withCHANNEL
DFHPROG A 287 PCDLCRDL PCDLCRDL v v v Container data length for DPL RETURN w/CHANNEL
DFHPROG A 306 PCLNKCCT PCLNKCCT v v v LINK requests with CHANNEL option
DFHPROG A 307 PCXCLCCT PCXCLCCT v v v XCTL requests with CHANNEL option
DFHPROG A 308 PCDPLCCT PCDPLCCT v v v DPL requests with CHANNEL option
DFHPROG A 309 PCRTNCCT PCRTNCCT v v v Program RETURN requests with CHANNELoption
DFHPROG A 310 PCRTNCDL PCRTNCDL v v v Container data length for RETURN withCHANNEL
DFHRMI S 001 RMITOTAL RMITotal v v v RMI total elapsed time
DFHRMI S 002 RMIOTHER RMI Othr v v v RMI other elapsed time
DFHRMI S 003 RMIDB2 RMI DB2 v v v RMI elapsed time for DB2 requests
DFHRMI S 004 RMIDBCTL RMIDBCTL v v v RMI elapsed time for DBCTL requests
DFHRMI S 005 RMIEXDLI RMIEXDLI v v v RMI elapsed time for EXEC DLI requests
DFHRMI S 006 RMIMQM RMI MQ v v v RMI elapsed time for WebSphere MQ requests
DFHRMI S 007 RMICPSM RMI CPSM v v v RMI elapsed time for CICSPlex SM requests
DFHRMI S 008 RMITCPIP RMITCPIP v v v RMI elapsed time for TCP/IP socket requests
DFHSOCK S 241 SOIOWTT SOWAIT SockWait v v v Inbound Socket I/O wait time
DFHSOCK A 242 SOBYENCT SockEcry v v v Secure Socket bytes encrypted count
DFHSOCK A 243 SOBYDECT SockDcry v v v Secure Socket bytes decrypted count
DFHSOCK C 244 CLIPADDR CLIENTIP ClientIP v v – Client or Telnet IP address
DFHSOCK C 245 TCPSRVCE TCPIPSrv v v v TCP/IP Service Name
DFHSOCK A 246 PORTNUM PORT PORT v v v TCP/IP Port Number
DFHSOCK A 288 ISALLOCT ISALLOC ISALLOC – v v Allocate Session requests for sessions on IP
DFHSOCK A 289 SOEXTRCT SOEXTRAC v v v EXTRACT TCP/IP and CERTIFICATE requests
DFHSOCK A 290 SOCNPSCT SOCNPSRq v v v Create Non-Persistent Outbound Socket reqs
DFHSOCK A 291 SOCPSCT SOCPSReq v v v Create Persistent Outbound Socket requests
DFHSOCK A 292 SONPSHWM SONPSHWM v v v Non-Persistent Outbound Socket HWM
DFHSOCK A 293 SOPSHWM SOPSHWM v v v Persistent Outbound Socket HWM
DFHSOCK A 294 SORCVCT SORCV SO Recv v v v Outbound Sockets RECEIVE requests
DFHSOCK A 295 SOCHRIN SOChrIn v v v Outbound Sockets characters received count
Chapter 15. CMF Field IDs by CICS version 331

Table 31. Cross-reference: CMF field ID × CICS version (continued)
CMF field
CICS PAfield name
Columnheading
CICSversion
DescriptionGroup Type ID Name
640
650
660
DFHSOCK A 296 SOSENDCT SOSEND SO SEND v v v Outbound Sockets SEND requests
DFHSOCK A 297 SOCHROUT SOChrOut v v v Outbound Sockets characters sent count
DFHSOCK A 298 SOTOTCT SOTOTAL SOTotal v v v Socket Total requests
DFHSOCK S 299 SOOIOWTT OSOWAIT OSO Wait v v v Outbound Socket I/O Wait Time
DFHSOCK S 300 ISIOWTT ISWAIT IS Wait – v v IPCONN link wait time
DFHSOCK A 301 SOMSGIN1 SOMsgIn1 v v v Inbound Sockets RECEIVE requests
DFHSOCK A 302 SOCHRIN1 SOChrIn1 v v v Inbound Sockets characters received count
DFHSOCK A 303 SOMSGOU1 SOMsgOu1 v v v Inbound Sockets SEND requests
DFHSOCK A 304 SOCHROU1 SOChrOu1 v v v Inbound Sockets characters sent count
DFHSOCK C 305 ISIPCNNM ISIPICNM ISIPICNM – v v Name of IPCONN definition that attached the task
DFHSOCK C 318 CLIPADDR CLIP6ADR Clip6Adr – – v Client or Telnet IP address
DFHSOCK A 330 CLIPPORT CLIPPORT – v v Client IP Port Number
DFHSTOR A 033 SCUSRHWM SC24UHWM SC24UHWM v v v UDSA HWM below 16MB
DFHSTOR A 054 SCUGETCT SC24UGET SC24UGet v v v UDSA GETMAINs below 16MB
DFHSTOR A 087 PCSTGHWM PCStgHWM v v v Program Storage HWM above and below 16MB
DFHSTOR A 095 SCUSRSTG SC24UOCC SC24UOcc v v v UDSA Storage Occupancy below 16MB
DFHSTOR A 105 SCUGETCT SC31UGET SC31UGet v v v EUDSA GETMAINs above 16MB
DFHSTOR A 106 SCUSRHWM SC31UHWM SC31UHWM v v v EUDSA HWM above 16MB
DFHSTOR A 107 SCUCRSTG SC31UOCC SC31UOcc v v v EUDSA Storage Occupancy above 16MB
DFHSTOR A 108 PC24BHWM PC24bHWM v v v Program Storage HWM below 16MB
DFHSTOR A 116 SC24CHWM SC24CHWM v v v CDSA HWM below 16MB
DFHSTOR A 117 SCCGETCT SC24CGET SC24CGet v v v CDSA GETMAINs below 16MB
DFHSTOR A 118 SC24COCC SC24COcc v v v CDSA Storage Occupancy below 16MB
DFHSTOR A 119 SC31CHWM SC31CHWM v v v ECDSA HWM above 16MB
DFHSTOR A 120 SCCGETCT SC31CGET SC31CGet v v v ECDSA GETMAINs above 16MB
DFHSTOR A 121 SC31COCC SC31COcc v v v ECDSA Storage Occupancy above 16MB
DFHSTOR A 122 PC31RHWM PC31RHWM v v v Program Storage (ERDSA) HWM above 16MB
DFHSTOR A 139 PC31AHWM PC31aHWM v v v Program Storage HWM above 16MB
DFHSTOR A 142 PC31CHWM PC31CHWM v v v Program Storage (ECDSA) HWM above 16MB
DFHSTOR A 143 PC24CHWM PC24CHWM v v v Program Storage (CDSA) HWM below 16MB
DFHSTOR A 144 SC24SGCT SC24SGET SC24SGet v v v CDSA/SDSA GETMAINs below 16MB
DFHSTOR A 145 SC24GSHR SC24GShr v v v CDSA/SDSA storage GETMAINed below 16MB
DFHSTOR A 146 SC24FSHR SC24FShr v v v CDSA/SDSA storage FREEMAINed below 16MB
DFHSTOR A 147 SC31SGCT SC31SGET SC31SGet v v v ECDSA/ESDSA GETMAINs above 16MB
DFHSTOR A 148 SC31GSHR SC31GShr v v v ECDSA/ESDSA storage GETMAINed above 16MB
DFHSTOR A 149 SC31FSHR SC31FShr v v v ECDSA/ESDSA storage FREEMAINed above 16MB
DFHSTOR A 160 PC24SHWM PC24SHWM v v v Program Storage (SDSA) HWM below 16MB
DFHSTOR A 161 PC31SHWM PC31SHWM v v v Program Storage (ESDSA) HWM above 16MB
DFHSTOR A 162 PC24RHWM PC24RHWM v v v Program Storage (RDSA) HWM below 16MB
DFHSYNC A 060 SPSYNCCT SYNCPT SYNCPT v v v SYNCPOINT requests
DFHSYNC S 173 SYNCTIME SYNCProc v v v SYNCPOINT processing time
DFHSYNC S 177 SRVSYWTT CFDTSYNC CFDTSync v v v CF Data Table syncpoint wait time
DFHSYNC S 196 SYNCDLY SYNC Dly v v v SYNCPOINT parent request wait time
DFHSYNC S 199 OTSINDWT OTSIndWt v v v OTS Indoubt Wait time
DFHTASK C 001 TRAN Tran v v v Transaction identifier
DFHTASK C 004 TTYPE STYPE SC v v v Transaction start type
DFHTASK S 007 USRDISPT DISPATCH Dispatch v v v Dispatch time
DFHTASK S 008 USRCPUT CPU User CPU v v v CPU time
DFHTASK S 014 SUSPTIME SUSPEND Suspend v v v Suspend time
DFHTASK P 031 TRANNUM TASKNO TaskNo v v v Transaction identification number
DFHTASK A 059 ICPUINCT ICPUT ICSTART v v v Interval Control START or INITIATE requests
DFHTASK A 064 TASKFLAG ERRFLAGS Err Flag v v v Task error flags
DFHTASK C 064 TASKFLAG N/A Err Flag v v v Task error flags
DFHTASK A 065 ICSTACCT ICSTACCT v v v Local IC START requests with CHANNEL option
DFHTASK A 066 ICTOTCT ICTOTAL IC Total v v v Interval Control requests
332 IBM CICS Performance Analyzer for z/OS: Report Reference

Table 31. Cross-reference: CMF field ID × CICS version (continued)
CMF field
CICS PAfield name
Columnheading
CICSversion
DescriptionGroup Type ID Name
640
650
660
DFHTASK C 082 TRNGRPID N/A Group ID v v v Transaction Group ID
DFHTASK C 097 NETUOWPX NETNAME NETName v v v Originating System VTAM network name
DFHTASK C 098 NETUOWSX NETUOWID v v v Network UOW ID
DFHTASK S 102 DISPWTT DISPWAIT DispWait v v v Redispatch wait time
DFHTASK A 109 TRANPRI TRANPRTY Prty v v v Transaction priority
DFHTASK S 123 GNQDELAY GNQDelay v v v Global Enqueue wait time
DFHTASK C 124 BRDGTRAN Brdg v v v Bridge Listener Transaction ID
DFHTASK S 125 DSPDELAY Disp1Dly v v v First dispatch wait time
DFHTASK S 126 TCLDELAY TCLDelay v v v First dispatch TCLSNAME wait time
DFHTASK S 127 MXTDELAY MXTDelay v v v First dispatch MXT wait time
DFHTASK S 128 LMDELAY LOCKDLAY LM Delay v v v Lock Manager (LM) wait time
DFHTASK S 129 ENQDELAY ENQDelay v v v Local Enqueue wait time
DFHTASK C 132 RMUOWID N/A RM UOWID v v v Recovery UOW ID
DFHTASK C 163 FCTYNAME FCTY Fcty v v v Transaction Facility name
DFHTASK A 164 TRANFLAG TranFlag v v v Transaction flags
DFHTASK A 164 TRANFLAG FCTYTYPE FctyType v v v Transaction facility type
DFHTASK C 164 TRANFLAG ORIGIN Origin v v v Transaction origin type
DFHTASK C 164 TRANFLAG TRANTYPE TranType v v v Transaction type
DFHTASK C 166 TCLSNAME TCLASSNM TCLSName v v v Transaction Class name
DFHTASK S 170 RMITIME RMI Elap v v v Resource Manager Interface (RMI) elapsed time
DFHTASK S 171 RMISUSP RMI Susp v v v Resource Manager Interface (RMI) suspend time
DFHTASK S 181 WTEXWAIT WAITEXT Ext Wait v v v External ECB wait time
DFHTASK S 182 WTCEWAIT WAITCICS CICSWait v v v CICS ECB wait time
DFHTASK S 183 ICDELAY IC Delay v v v Interval Control (IC) wait time
DFHTASK S 184 GVUPWAIT GIVEUPWT GiveUpWt v v v Give up control wait time
DFHTASK C 190 RRMSURID N/A RRMSURID v v v RRMS/MVS unit-of-recovery ID (URID)
DFHTASK S 191 RRMSWAIT RRMSWait v v v Resource Recovery Services indoubt wait time
DFHTASK S 192 RQRWAIT RQR Wait v v v Request Receiver Wait Time
DFHTASK S 193 RQPWAIT RQP Wait v v v Request Processor Wait Time
DFHTASK C 194 OTSTID OTSID OTS ID v v v OTS Transaction ID
DFHTASK S 195 RUNTRWTT BTSRunWt v v v BTS run Process/Activity wait time
DFHTASK S 247 DSCHMDLY DSCHMDLY v v v Redispatch wait time caused by change-TCB mode
DFHTASK A 248 CHMODECT ChngMode – – – Change-TCB modes requests
DFHTASK S 249 QRMODDLY QRModDly v v v CICS QR TCB redispatch wait time
DFHTASK S 250 MXTOTDLY MAXOTDLY MaxOTDly v v v Maximum Open TCB delay time
DFHTASK A 251 TCBATTCT TCBAtach v v v TCBs attached count
DFHTASK A 252 DSTCBHWM DSTCBHWM v v v CICS Dispatcher TCB HWM
DFHTASK S 253 JVMTIME JVM Elap v v v JVM elapsed time
DFHTASK S 254 JVMSUSP JVM Susp v v v JVM suspend time
DFHTASK S 255 QRDISPT QR Disp v v v CICS QR TCB dispatch time
DFHTASK S 256 QRCPUT QRCPU QR CPU v v v CICS QR TCB CPU time
DFHTASK S 257 MSDISPT MS Disp v v v CICS TCBs dispatch time
DFHTASK S 258 MSCPUT MSCPU MS CPU v v v CICS TCBs CPU time
DFHTASK S 259 L8CPUT L8CPU L8 CPU v v v CICS L8 TCB CPU time
DFHTASK S 260 J8CPUT J8CPU J8 CPU v v v CICS J8 TCB CPU time
DFHTASK S 261 S8CPUT S8CPU S8 CPU v v v CICS S8 TCB CPU time
DFHTASK S 262 KY8DISPT KY8 Disp v v v CICS Key 8 TCB dispatch time
DFHTASK S 263 KY8CPUT KY8CPU KY8 CPU v v v CICS Key 8 TCB CPU time
DFHTASK S 264 KY9DISPT KY9 Disp v v v User task Key 9 Mode Dispatch time
DFHTASK S 265 KY9CPUT KY9CPU KY9 CPU v v v User task Key 9 Mode CPU time
DFHTASK S 266 L9CPUT L9CPU L9 CPU v v v User task L9 CPU time
DFHTASK S 267 J9CPUT J9CPU J9 CPU v v v User task J9 Mode CPU time
DFHTASK S 268 DSTCBMWT DSTCBMWT v v v Dispatcher TCB Mismatch wait time
DFHTASK S 269 RODISPT RO Disp v v v CICS RO TCB dispatch time
DFHTASK S 270 ROCPUT ROCPU RO CPU v v v CICS RO TCB CPU time
Chapter 15. CMF Field IDs by CICS version 333

Table 31. Cross-reference: CMF field ID × CICS version (continued)
CMF field
CICS PAfield name
Columnheading
CICSversion
DescriptionGroup Type ID Name
640
650
660
DFHTASK S 271 X8CPUT X8CPU X8 CPU v v v CICS X8 TCB CPU time
DFHTASK S 272 X9CPUT X9CPU X9 CPU v v v User task X9 Mode CPU time
DFHTASK S 273 JVMITIME JVMITime v v v JVM initialize elapsed time
DFHTASK S 275 JVMRTIME JVMRTime v v v JVM reset elapsed time
DFHTASK S 277 MAXJTDLY MaxJTDly v v v Maximum JVM TCB delay time
DFHTASK S 278 MAXHTDLY MaxHTDly – – – Maximum Hot-Pooling TCB delay time
DFHTASK S 279 DSMMSCWT DS Wait v v v DS storage constraint wait time
DFHTASK S 281 MAXSTDLY MAXSTDLY v v v Maximum SSL TCB delay time
DFHTASK S 282 MAXXTDLY MAXXTDLY v v v Maximum XPLink TCB delay time
DFHTASK S 283 MAXTTDLY MAXTTDLY – – v Maximum JVM server thread TCB delay time
DFHTASK S 285 PTPWAIT PTP Wait v v v 3270 Bridge Partner wait time
DFHTASK A 345 ICSTACDL ICSTACDL v v v Container data len for Local IC START w/CHANNEL
DFHTASK A 346 ICSTRCCT ICSTRCCT v v v Remote IC START requests with CHANNEL option
DFHTASK A 347 ICSTRCDL ICSTRCDL v v v Container data len for Remot IC START w/CHANNEL
DFHTASK S 400 T8CPUT T8CPU T8 CPU – – v CICS T8 TCB CPU time
DFHTASK S 401 JVMTHDWT JVMThdWt – – v JVM server thread wait time
DFHTEMP S 011 TSIOWTT TSWAIT TS Wait v v v VSAM TS I/O wait time
DFHTEMP A 044 TSGETCT TSGET TSGET v v v Temporary Storage GET requests
DFHTEMP A 046 TSPUTACT TSPUTAUX TSPUTAux v v v Auxiliary TS PUT requests
DFHTEMP A 047 TSPUTMCT TSPUTMai v v v Main TS PUT requests
DFHTEMP A 092 TSTOTCT TSTOTAL TS Total v v v TS Total requests
DFHTEMP S 178 TSSHWAIT TSShWait v v v Asynchronous Shared TS wait time
DFHTERM C 002 TERM Term v v v Terminal ID
DFHTERM S 009 TCIOWTT TCWAIT TC Wait v v v Terminal wait for input time
DFHTERM A 034 TCMSGIN1 MSGIN1 MsgIn1 v v v Messages received count
DFHTERM A 035 TCMSGOU1 MSGOUT1 MsgOut1 v v v Messages sent count
DFHTERM A 067 TCMSGIN2 MSGIN2 MsgIn2 v v v Messages received from LU6.1
DFHTERM A 068 TCMSGOU2 MSGOUT2 MsgOut2 v v v Messages sent to LU6.1
DFHTERM A 069 TCALLOCT TCALLOC TCALLOC v v v TCTTE ALLOCATE requests
DFHTERM A 083 TCCHRIN1 CHARIN1 CharIn1 v v v Terminal characters received count
DFHTERM A 084 TCCHROU1 CHAROUT1 CharOut1 v v v Terminal characters sent count
DFHTERM A 085 TCCHRIN2 CHARIN2 CharIn2 v v v LU6.1 characters received count
DFHTERM A 086 TCCHROU2 CHAROUT2 CharOut2 v v v LU6.1 characters sent count
DFHTERM S 100 IRIOWTT IRWAIT IR Wait v v v MRO link wait time
DFHTERM C 111 LUNAME LUName v v v VTAM logical unit name
DFHTERM S 133 LU61WTT LU61WAIT LU61Wait v v v LU6.1 wait time
DFHTERM S 134 LU62WTT LU62WAIT LU62Wait v v v LU6.2 wait time
DFHTERM A 135 TCM62IN2 TCM62In2 v v v LU6.2 messages received count
DFHTERM A 136 TCM62OU2 TCM62Ou2 v v v LU6.2 messages sent count
DFHTERM A 137 TCC62IN2 TCC62In2 v v v LU6.2 characters received count
DFHTERM A 138 TCC62OU2 TCC62Ou2 v v v LU6.2 characters sent count
DFHTERM A 165 TERMINFO TermInfo v v v Terminal information
DFHTERM A 165 TERMINFO ACCMETH Acc Meth v v v Terminal Access Method
DFHTERM A 165 TERMINFO TERMCODE DevT v v v Terminal Device Type
DFHTERM A 165 TERMINFO NATURE Nature v v v Transaction
DFHTERM A 165 TERMINFO SESSTYPE SessType v v v Terminal session type
DFHTERM C 169 TERMCNNM ConnName v v v Terminal session Connection name
DFHTERM C 197 NETID NET ID v v v VTAM LUALIAS Network ID
DFHTERM C 198 RLUNAME RLUNAME v v v VTAM LUALIAS Logical Unit name
DFHWEBB A 224 WBREADCT WBREAD WB READ v v v Web READ requests
DFHWEBB A 225 WBWRITCT WBWRITE WB WRITE v v v Web WRITE requests
DFHWEBB A 231 WBRCVCT WBRCV WBRCV v v v Web RECEIVE requests
DFHWEBB A 232 WBCHRIN WBChrIn v v v Web characters received count
334 IBM CICS Performance Analyzer for z/OS: Report Reference

Table 31. Cross-reference: CMF field ID × CICS version (continued)
CMF field
CICS PAfield name
Columnheading
CICSversion
DescriptionGroup Type ID Name
640
650
660
DFHWEBB A 233 WBSENDCT WBSEND WBSEND v v v Web SEND requests
DFHWEBB A 234 WBCHROUT WBChrOut v v v Web characters sent count
DFHWEBB A 235 WBTOTWCT WBTOTAL WB Total v v v Web Total requests
DFHWEBB A 236 WBREPRCT WBRepoRd v v v Web Temporary Storage Repository read requests
DFHWEBB A 237 WBREPWCT WBRepoWr v v v Web Temporary Storage Repository write requests
DFHWEBB A 238 WBEXTRCT WBEXTRAC v v v Web EXTRACT requests
DFHWEBB A 239 WBBRWCT WBBROWSE WBBROWSE v v v Web Browse requests
DFHWEBB A 331 WBREDOCT WBREDOCT v v v CICS Web Support READ HTTPHEADER requests
DFHWEBB A 332 WBWRTOCT WBWRTOCT v v v CICS Web Support WRITE HTTPHEADER requests
DFHWEBB A 333 WBRCVIN1 WBRCVIN1 v v v CICS Web Support RECEIVE and CONVERSErequests
DFHWEBB A 334 WBCHRIN1 WBCHRIN1 v v v CICS Web Support RECEIVE and CONVERSEchars
DFHWEBB A 335 WBSNDOU1 WBSNDOU1 v v v CICS Web Support SEND and CONVERSE requests
DFHWEBB A 336 WBCHROU1 WBCHROU1 v v v CICS Web Support SEND and CONVERSE chars
DFHWEBB A 337 WBPARSCT WBPARSCT v v v CICS Web Support PARSE URL requests
DFHWEBB A 338 WBBRWOCT WBBRWOCT v v v CICS Web Support BROWSE HTTPHEADERrequests
DFHWEBB A 340 WBIWBSCT WBIWBSCT v v v INVOKE SERVICE and INVOKE WEBSERVICErequests
DFHWEBB A 341 WBREPRDL WBREPRDL v v v Repository Read data length
DFHWEBB A 342 WBREPWDL WBREPWDL v v v Repository Write data length
DFHWEBB C 380 WBURIMNM URI Map – – v Web URIMAP resource definition
DFHWEBB C 381 WBPIPLNM Pipeline – – v Web PIPELINE resource definition
DFHWEBB C 382 WBATMSNM ATOMSrvc – – v Web ATOMSERVICE resource definition
DFHWEBB C 383 WBSVCENM WebSrvc – – v Web WEBSERVICE resource definition
DFHWEBB C 384 WBSVOPNM WebSrvOp – – v Web WEBSERVICE operation name
DFHWEBB C 385 WBPROGNM Web Prog – – v Web program in URIMAP resource definition
DFHWEBB A 386 WBSFCRCT SOAPFtCr – – v SOAPFAULT CREATE requests
DFHWEBB A 387 WBSFTOCT SOAPFalt – – v SOAPFAULT ADD
DFHWEBB A 388 WBISSFCT ISSOAPFt – – v INVOKE SERVICE request SOAP faults received
DFHWEBB A 390 WBSREQBL SOAPRqBL – – v SOAP request SOAP body length
DFHWEBB A 392 WBSRSPBL SOAPRsBL – – v SOAP response SOAP body length
DFHWEBB S 411 MLXSSCTM XMLSSCPU – – v z/OS XML System Services CPU time
DFHWEBB A 412 MLXSSTDL XMLDocLn – – v Document length parsed - z/OS System Services
DFHWEBB A 413 MLXMLTCT XMLTrans – – v Application data TRANSFORM requests
DFHWEBB A 420 WSACBLCT WSACBld – – v WSACONTEXT BUILD requests
DFHWEBB A 421 WSACGTCT WSACGet – – v WSACONTEXT GET requests
DFHWEBB A 422 WSAEPCCT WSAEPCre – – v WSAEPR CREATE requests
DFHWEBB A 423 WSATOTCT WSAddr – – v Total Web Services Addressing requests
OMCICS C 001 DB2WARN DB2WARN v v v OMEGAMON DB2 Limit Warning
OMCICS C 002 DLIWARN DLIWARN v v v OMEGAMON DLI Limit Warning
OMCICS C 003 VSAMWARN VSAMWARN v v v OMEGAMON VSAM Limit warning
OMCICS C 004 MQWARN MQWARN v v v OMEGAMON MQ Limit Warning
OMCICS C 005 ADABWARN ADABWARN v v v OMEGAMON Adabas Limit Warning
OMCICS C 006 IDMSWARN IDMSWARN v v v OMEGAMON CA-IDMS Limit Warning
OMCICS C 007 SUPRWARN SUPRWARN v v v OMEGAMON Supra Limit Warning
OMCICS C 008 DCOMWARN DCOMWARN v v v OMEGAMON CA-Datacom Limit Warning
OMCICS C 009 CPUWARN CPUWARN v v v OMEGAMON CPU Limit Warning
OMCICS C 010 ELAPWARN ELAPWARN v v v OMEGAMON Elapsed Time Limit Warning
OMCICS C 011 DSAWARN DSAWARN v v v OMEGAMON DSA Limit Warning
OMCICS C 012 EDSAWARN EDSAWARN v v v OMEGAMON EDSA Limit Warning
OMCICS C 013 CALLWARN CALLWARN v v v OMEGAMON EXEC Calls Limit Warning
OMCICS C 014 UE1WARN UE1WARN v v v OMEGAMON User Event Limit Warning
OMCICS C 015 OMEGWORK OMEGWORK v v v OMEGAMON User work area
OMCICS S 016 IDMSREQ IDMSREQ v v v OMEGAMON monitored CA-IDMS requests
Chapter 15. CMF Field IDs by CICS version 335

Table 31. Cross-reference: CMF field ID × CICS version (continued)
CMF field
CICS PAfield name
Columnheading
CICSversion
DescriptionGroup Type ID Name
640
650
660
OMCICS S 017 ADABREQ ADABREQ v v v OMEGAMON monitored Adabas requests
OMCICS S 018 SUPRREQ SUPRREQ v v v OMEGAMON monitored Supra requests
OMCICS S 019 DCOMREQ DCOMREQ v v v OMEGAMON monitored CA-Datacom requests
OMCICS S 020 USREVNT USREVNT v v v OMEGAMON User defined events
336 IBM CICS Performance Analyzer for z/OS: Report Reference

Chapter 16. CICS PA field names by CICS version
The following cross-reference table relates the CICS PA names for CICS monitoringfacility (CMF) performance class and transaction resource class data fields to thecorresponding CMF field IDs and the CICS versions to which they apply.
Some columns in the table require explanation:
CICS PA field nameThe name used in report forms, HDB templates, and selection criteria (andtheir corresponding batch command operands FIELDS and SELECT).
A blank indicates that the field is not available, typically because it is avery long field, or it is an unprintable field such as a unit-of-work or aflag.
Column headingThe heading used to identify the field in CICS PA reports and extract datasets.
CICS versionThe CICS versions to which a field applies:v Yes, the field applies to this CICS version– No, the field does not apply to this CICS version
The table is sorted by CICS PA field name.
Note:
1. Some special fields, such as APPLID and RESPONSE, are not defined in theCMF Dictionary and are given a group name of “CICSPA”. These fields areeither derived from the fixed section of the CMF record (for example, APPLID),or calculated from two or more other CMF fields (for example, RESPONSE).
2. The FILENAME, TSQNAME, and DPLNAME fields are only available whenCMF transaction resource class data is being collected.
3. The APPLTRAN and APPLPROG fields are only available when applicationprograms invoke the application naming event monitoring points.
Table 32. Cross-reference: CICS PA field name × CICS version
CICS PAfield name
Columnheading
CMF fieldCICSversion
DescriptionGroup Type ID Name
640
650
660
BTS Root DFHCBTS C 202 PRCSID v v v BTS Root Activity identifier
BTSActID DFHCBTS C 203 ACTVTYID v v v BTS Activity identifier
Err Flag DFHTASK C 064 TASKFLAG v v v Task error flags
Group ID DFHTASK C 082 TRNGRPID v v v Transaction Group ID
RM UOWID DFHTASK C 132 RMUOWID v v v Recovery UOW ID
RRMSURID DFHTASK C 190 RRMSURID v v v RRMS/MVS unit-of-recovery ID (URID)
ABCODEC ABcu DFHPROG C 114 ABCODEC v v v Current ABEND code
ABCODEO ABor DFHPROG C 113 ABCODEO v v v Original ABEND Code
ACCMETH Acc Meth DFHTERM A 165 TERMINFO v v v Terminal Access Method
ACTVTYNM BTSActNm DFHCBTS C 204 ACTVTYNM v v v BTS Activity name
ADABREQ ADABREQ OMCICS S 017 ADABREQ v v v OMEGAMON monitored Adabas requests
ADABWARN ADABWARN OMCICS C 005 ADABWARN v v v OMEGAMON Adabas Limit Warning
© Copyright IBM Corp. 2001, 2010 337

Table 32. Cross-reference: CICS PA field name × CICS version (continued)
CICS PAfield name
Columnheading
CMF fieldCICSversion
DescriptionGroup Type ID Name
640
650
660
ALERT ALERT CICSPA A 915 ALERT v v v Total Alert count or percentage
APPLID APPLID CICSPA C 903 APPLID v v v CICS Generic APPLID
APPLPROG Program DFHAPPL C 001 APPLNAME v v v Application naming Program
APPLRECS APPLRecs CICSPA A 002 APPLRECS v v v Cross-System Application records
APPLTRAN Tran DFHAPPL C 001 APPLNAME v v v Application naming Tran ID
BAACDCCT BTSADCRq DFHCBTS A 217 BAACDCCT v v v BTS Activity Data Containers requests
BAACQPCT BTSAcqui DFHCBTS A 214 BAACQPCT v v v BTS Acquire Process/Activity requests
BADACTCT BTS DefA DFHCBTS A 209 BADACTCT v v v BTS Define Activity requests
BADCPACT BTSCancl DFHCBTS A 213 BADCPACT v v v BTS Cancel Process/Activity requests
BADFIECT BTSDefEv DFHCBTS A 220 BADFIECT v v v BTS Define-Input Event requests
BADPROCT BTS DefP DFHCBTS A 208 BADPROCT v v v BTS Define Process requests
BALKPACT BTS Link DFHCBTS A 207 BALKPACT v v v BTS Link Process/Activity count
BAPRDCCT BTSPDCRq DFHCBTS A 216 BAPRDCCT v v v BTS Process Data Containers requests
BARASYCT BTS Asyn DFHCBTS A 206 BARASYCT v v v BTS asynchronous Process/Activity count
BARATECT BTSRtvEv DFHCBTS A 219 BARATECT v v v BTS Retrieve-Reattach Event requests
BARMPACT BTSResum DFHCBTS A 212 BARMPACT v v v BTS Resume Process/Activity requests
BARSPACT BTSReset DFHCBTS A 210 BARSPACT v v v BTS Reset Process/Activity requests
BARSYNCT BTS Sync DFHCBTS A 205 BARSYNCT v v v BTS synchronous Process/Activity count
BASUPACT BTS Susp DFHCBTS A 211 BASUPACT v v v BTS Suspend Process/Activity requests
BATIAECT BTSTimEv DFHCBTS A 221 BATIAECT v v v BTS TIMER Event requests
BATOTCCT BTSTDCRq DFHCBTS A 218 BATOTCCT v v v BTS Process/Activity Data Container requests
BATOTECT BTSTotEv DFHCBTS A 222 BATOTECT v v v BTS Event-related requests
BATOTPCT BTSTotal DFHCBTS A 215 BATOTPCT v v v BTS Total Process/Activity requests
BFDGSTCT BFDGSTcT DFHCICS A 408 BFDGSTCT – – v Built-in function BIF DIGEST requests
BFTOTCT BFTotCt DFHCICS A 409 BFTOTCT – – v Total Built-in (BIF) function requests
BMSIN BMSIN DFHMAPP A 051 BMSINCT v v v BMS IN requests
BMSMAP BMSMAP DFHMAPP A 050 BMSMAPCT v v v BMS MAP requests
BMSOUT BMSOUT DFHMAPP A 052 BMSOUTCT v v v BMS OUT requests
BMSTOTAL BMSTotal DFHMAPP A 090 BMSTOTCT v v v BMS Total requests
BRDGTRAN Brdg DFHTASK C 124 BRDGTRAN v v v Bridge Listener Transaction ID
CALLWARN CALLWARN OMCICS C 013 CALLWARN v v v OMEGAMON EXEC Calls Limit Warning
CBSRVRNM Corb DFHEJBS C 311 CBSRVRNM v v v CorbaServer name
CFCAPICT CFClsAPI DFHCICS A 025 CFCAPICT v v v OO Foundation Class requests
CFDTSYNC CFDTSync DFHSYNC S 177 SRVSYWTT v v v CF Data Table syncpoint wait time
CFDTWAIT CFDTWait DFHFILE S 176 CFDTWAIT v v v CF Data Table access requests wait time
CHARIN1 CharIn1 DFHTERM A 083 TCCHRIN1 v v v Terminal characters received count
CHARIN2 CharIn2 DFHTERM A 085 TCCHRIN2 v v v LU6.1 characters received count
CHAROUT1 CharOut1 DFHTERM A 084 TCCHROU1 v v v Terminal characters sent count
CHAROUT2 CharOut2 DFHTERM A 086 TCCHROU2 v v v LU6.1 characters sent count
CHMODECT ChngMode DFHTASK A 248 CHMODECT – – – Change-TCB modes requests
CLIENTIP ClientIP DFHSOCK C 244 CLIPADDR v v – Client or Telnet IP address
CLIP6ADR Clip6Adr DFHSOCK C 318 CLIPADDR – – v Client or Telnet IP address
CLIPPORT CLIPPORT DFHSOCK A 330 CLIPPORT – v v Client IP Port Number
COMMWAIT CommWait CICSPA D 906 COMMWAIT v v v Communications wait time
CPU User CPU DFHTASK S 008 USRCPUT v v v CPU time
CPUWARN CPUWARN OMCICS C 009 CPUWARN v v v OMEGAMON CPU Limit Warning
DB2CONWT DB2ConWt DFHDATA S 188 DB2CONWT v v v DB2 Connection wait time
DB2RDYQW DB2ThdWt DFHDATA S 187 DB2RDYQW v v v DB2 Thread wait time
DB2REQCT DB2 Reqs DFHDATA A 180 DB2REQCT v v v DB2 requests
DB2WAIT DB2SQLWt DFHDATA S 189 DB2WAIT v v v DB2 SQL/IFI wait time
DB2WARN DB2WARN OMCICS C 001 DB2WARN v v v OMEGAMON DB2 Limit Warning
DBGETS DBget DBCTL A 035 DBGETS v v v Number of Database Get calls issued
DBIOCALL DBIOCall DBCTL A 007 DBIOCALL v v v Number of Database I/Os
DBIOELAP DBIOElap DBCTL S 005 DBIOELAP v v v Elapsed time for Database I/O
DBUPDATE DBupdate DBCTL A 036 DBUPDATE v v v Number of Database Update calls issued
338 IBM CICS Performance Analyzer for z/OS: Report Reference

Table 32. Cross-reference: CICS PA field name × CICS version (continued)
CICS PAfield name
Columnheading
CMF fieldCICSversion
DescriptionGroup Type ID Name
640
650
660
DBWAITS DBwait DBCTL A 037 DBWAITS v v v Number of Database waits
DCOMREQ DCOMREQ OMCICS S 019 DCOMREQ v v v OMEGAMON monitored CA-Datacom requests
DCOMWARN DCOMWARN OMCICS C 008 DCOMWARN v v v OMEGAMON CA-Datacom Limit Warning
DEDBBFRW DEDBBfrW DBCTL A 031 DEDBBFRW v v v Number of waits for DEDB buffers
DEDBCALL DEDBcall DBCTL A 027 DEDBCALL v v v Number of DEDB calls
DEDBRDOP DEDBRdOp DBCTL A 028 DEDBRDOP v v v Number of DEDB read operations
DHCREATE DHCREATE DFHDOCH A 226 DHCRECT v v v Document Handler CREATE requests
DHDELETE DHDELETE DFHDOCH A 223 DHDELCT – v v Document Handler DELETE requests
DHINSERT DHINSERT DFHDOCH A 227 DHINSCT v v v Document Handler INSERT requests
DHRETRVE DHRETRVE DFHDOCH A 229 DHRETCT v v v Document Handler RETRIEVE requests
DHSET DHSET DFHDOCH A 228 DHSETCT v v v Document Handler SET requests
DHTOTAL DH Total DFHDOCH A 230 DHTOTCT v v v Document Handler Total requests
DHTOTDCL DHDocLen DFHDOCH A 240 DHTOTDCL v v v Total length of all documents created
DISPATCH Dispatch DFHTASK S 007 USRDISPT v v v Dispatch time
DISPWAIT DispWait DFHTASK S 102 DISPWTT v v v Redispatch wait time
DLETCALL DLETcall DBCTL A 015 DLETCALL v v v Number of Database DLET calls issued
DLICALLS DLIcalls DBCTL A 017 DLICALLS v v v Total DL/I Database calls
DLIWARN DLIWARN OMCICS C 002 DLIWARN v v v OMEGAMON DLI Limit Warning
DPLNAME DPL Name CICSPA C 919 DPLNAME v v v Distributed program link name
DPLRECS DPL Recs CICSPA A 005 DPLRECS v v v Cross-System DPL records
DSAWARN DSAWARN OMCICS C 011 DSAWARN v v v OMEGAMON DSA Limit Warning
DSCHMDLY DSCHMDLY DFHTASK S 247 DSCHMDLY v v v Redispatch wait time caused by change-TCB mode
DSMMSCWT DS Wait DFHTASK S 279 DSMMSCWT v v v DS storage constraint wait time
DSPDELAY Disp1Dly DFHTASK S 125 DSPDELAY v v v First dispatch wait time
DSTCBHWM DSTCBHWM DFHTASK A 252 DSTCBHWM v v v CICS Dispatcher TCB HWM
DSTCBMWT DSTCBMWT DFHTASK S 268 DSTCBMWT v v v Dispatcher TCB Mismatch wait time
ECEFOPCT ECEFOPCT DFHCICS A 416 ECEFOPCT – – v Event Filter operations
ECEVNTCT ECEVNTCT DFHCICS A 417 ECEVNTCT – – v Events captured
ECSIGECT ECSIGECT DFHCICS A 415 ECSIGECT – – v SIGNAL EVENT requests
EDSAWARN EDSAWARN OMCICS C 012 EDSAWARN v v v OMEGAMON EDSA Limit Warning
EICTOTCT EICTotCt DFHCICS A 402 EICTOTCT – – v EXEC CICS requests
EJBACTIV EJBActiv DFHEJBS A 312 EJBSACCT v v v Number of Bean State Activation requests
EJBCREAT EJBCreat DFHEJBS A 314 EJBCRECT v v v Number of Bean Creation requests
EJBMETHD EJBMethd DFHEJBS A 316 EJBMTHCT v v v Number of EJB Method Calls
EJBPASIV EJBPasiv DFHEJBS A 313 EJBSPACT v v v Number of Bean State Passivation requests
EJBREMOV EJBRemov DFHEJBS A 315 EJBREMCT v v v Number of Bean Removal requests
EJBTOTAL EJBTotal DFHEJBS A 317 EJBTOTCT v v v Total Number of EJB requests
ELAPWARN ELAPWARN OMCICS C 010 ELAPWARN v v v OMEGAMON Elapsed Time Limit Warning
ENQDELAY ENQDelay DFHTASK S 129 ENQDELAY v v v Local Enqueue wait time
ERRFLAGS Err Flag DFHTASK A 064 TASKFLAG v v v Task error flags
EXCLDEQS ExclDEQs DBCTL A 026 EXCLDEQS v v v Number of Exclusive Dequeues
EXCLENQS ExclENQs DBCTL A 024 EXCLENQS v v v Number of Exclusive Enqueues
EXCLENQW ExclENQW DBCTL A 025 EXCLENQW v v v Number of waits on Exclusive Enqueues
EXWAIT Exc Wait DFHCICS S 103 EXWTTIME v v v Exception Conditions wait time
FCADD FCADD DFHFILE A 039 FCADDCT v v v File ADD requests
FCAMCT FCAMRq DFHFILE A 070 FCAMCT v v v File access-method requests
FCBROWSE FCBROWSE DFHFILE A 038 FCBRWCT v v v File Browse requests
FCDELETE FCDELETE DFHFILE A 040 FCDELCT v v v File DELETE requests
FCGET FCGET DFHFILE A 036 FCGETCT v v v File GET requests
FCPUT FCPUT DFHFILE A 037 FCPUTCT v v v File PUT requests
FCTOTAL FC Total DFHFILE A 093 FCTOTCT v v v File Control requests
FCTY Fcty DFHTASK C 163 FCTYNAME v v v Transaction Facility name
FCTYTYPE FctyType DFHTASK A 164 TRANFLAG v v v Transaction facility type
FCWAIT FC Wait DFHFILE S 063 FCIOWTT v v v File I/O wait time
FILENAME FileName CICSPA C 916 FILENAME v v v File name
Chapter 16. CICS PA field names by CICS version 339

Table 32. Cross-reference: CICS PA field name × CICS version (continued)
CICS PAfield name
Columnheading
CMF fieldCICSversion
DescriptionGroup Type ID Name
640
650
660
FUNCSHIP FuncShip CICSPA A 004 FUNCSHIP v v v Cross-System Function Shipping records
GHNCALL GHNcall DBCTL A 012 GHNCALL v v v Number of Database GHN calls issued
GHNPCALL GHNPcall DBCTL A 013 GHNPCALL v v v Number of Database GHNP calls issued
GHUCALL GHUcall DBCTL A 011 GHUCALL v v v Number of Database GHU calls issued
GIVEUPWT GiveUpWt DFHTASK S 184 GVUPWAIT v v v Give up control wait time
GNCALL GNcall DBCTL A 009 GNCALL v v v Number of Database GN calls issued
GNPCALL GNPcall DBCTL A 010 GNPCALL v v v Number of Database GNP calls issued
GNQDELAY GNQDelay DFHTASK S 123 GNQDELAY v v v Global Enqueue wait time
GUCALL GUcall DBCTL A 008 GUCALL v v v Number of Database GU calls issued
ICDELAY IC Delay DFHTASK S 183 ICDELAY v v v Interval Control (IC) wait time
ICPUT ICSTART DFHTASK A 059 ICPUINCT v v v Interval Control START or INITIATE requests
ICSTACCT ICSTACCT DFHTASK A 065 ICSTACCT v v v Local IC START requests with CHANNEL option
ICSTACDL ICSTACDL DFHTASK A 345 ICSTACDL v v v Container data len for Local IC START w/CHANNEL
ICSTRCCT ICSTRCCT DFHTASK A 346 ICSTRCCT v v v Remote IC START requests with CHANNEL option
ICSTRCDL ICSTRCDL DFHTASK A 347 ICSTRCDL v v v Container data len for Remot IC START w/CHANNEL
ICTOTAL IC Total DFHTASK A 066 ICTOTCT v v v Interval Control requests
IDMSREQ IDMSREQ OMCICS S 016 IDMSREQ v v v OMEGAMON monitored CA-IDMS requests
IDMSWARN IDMSWARN OMCICS C 006 IDMSWARN v v v OMEGAMON CA-IDMS Limit Warning
IMSREQCT IMS Reqs DFHDATA A 179 IMSREQCT v v v IMS (DBCTL) requests
IMSWAIT IMS Wait DFHDATA S 186 IMSWAIT v v v IMS (DBCTL) wait time
INTCWAIT IntCWait DBCTL S 003 INTCWAIT v v v Elapsed wait time for Intent Conflict
IOWAIT I/O Wait CICSPA D 907 IOWAIT v v v Total IO wait time
IRESP Int Resp CICSPA D 908 IRESP v v v Transaction internal response time
IRWAIT IR Wait DFHTERM S 100 IRIOWTT v v v MRO link wait time
ISALLOC ISALLOC DFHSOCK A 288 ISALLOCT – v v Allocate Session requests for sessions on IP
ISIPICNM ISIPICNM DFHSOCK C 305 ISIPCNNM – v v Name of IPCONN definition that attached the task
ISRTCALL ISRTcall DBCTL A 014 ISRTCALL v v v Number of Database ISRT calls issued
ISWAIT IS Wait DFHSOCK S 300 ISIOWTT – v v IPCONN link wait time
J8CPU J8 CPU DFHTASK S 260 J8CPUT v v v CICS J8 TCB CPU time
J9CPU J9 CPU DFHTASK S 267 J9CPUT v v v User task J9 Mode CPU time
JCWAIT JC Wait DFHJOUR S 010 JCIOWTT v v v Journal I/O wait time
JNLPUT JnlWrite DFHJOUR A 058 JNLWRTCT v v v Journal write requests
JOBNAME Jobname CICSPA C 905 JOBNAME v v v Job Name
JVMITIME JVMITime DFHTASK S 273 JVMITIME v v v JVM initialize elapsed time
JVMMTIME JVM Meth CICSPA D 910 JVMMTIME v v v JVM Method time
JVMRTIME JVMRTime DFHTASK S 275 JVMRTIME v v v JVM reset elapsed time
JVMSUSP JVM Susp DFHTASK S 254 JVMSUSP v v v JVM suspend time
JVMTHDWT JVMThdWt DFHTASK S 401 JVMTHDWT – – v JVM server thread wait time
JVMTIME JVM Elap DFHTASK S 253 JVMTIME v v v JVM elapsed time
KY8CPU KY8 CPU DFHTASK S 263 KY8CPUT v v v CICS Key 8 TCB CPU time
KY8DISPT KY8 Disp DFHTASK S 262 KY8DISPT v v v CICS Key 8 TCB dispatch time
KY9CPU KY9 CPU DFHTASK S 265 KY9CPUT v v v User task Key 9 Mode CPU time
KY9DISPT KY9 Disp DFHTASK S 264 KY9DISPT v v v User task Key 9 Mode Dispatch time
L8CPU L8 CPU DFHTASK S 259 L8CPUT v v v CICS L8 TCB CPU time
L9CPU L9 CPU DFHTASK S 266 L9CPUT v v v User task L9 CPU time
LOCKDLAY LM Delay DFHTASK S 128 LMDELAY v v v Lock Manager (LM) wait time
LOGWRITE LogWrite DFHJOUR A 172 LOGWRTCT v v v Log Stream write requests
LU61WAIT LU61Wait DFHTERM S 133 LU61WTT v v v LU6.1 wait time
LU62WAIT LU62Wait DFHTERM S 134 LU62WTT v v v LU6.2 wait time
LUNAME LUName DFHTERM C 111 LUNAME v v v VTAM logical unit name
MAXHTDLY MaxHTDly DFHTASK S 278 MAXHTDLY – – – Maximum Hot-Pooling TCB delay time
MAXJTDLY MaxJTDly DFHTASK S 277 MAXJTDLY v v v Maximum JVM TCB delay time
MAXOTDLY MaxOTDly DFHTASK S 250 MXTOTDLY v v v Maximum Open TCB delay time
340 IBM CICS Performance Analyzer for z/OS: Report Reference

Table 32. Cross-reference: CICS PA field name × CICS version (continued)
CICS PAfield name
Columnheading
CMF fieldCICSversion
DescriptionGroup Type ID Name
640
650
660
MAXSTDLY MAXSTDLY DFHTASK S 281 MAXSTDLY v v v Maximum SSL TCB delay time
MAXTTDLY MAXTTDLY DFHTASK S 283 MAXTTDLY – – v Maximum JVM server thread TCB delay time
MAXXTDLY MAXXTDLY DFHTASK S 282 MAXXTDLY v v v Maximum XPLink TCB delay time
MLXMLTCT XMLTrans DFHWEBB A 413 MLXMLTCT – – v Application data TRANSFORM requests
MLXSSCTM XMLSSCPU DFHWEBB S 411 MLXSSCTM – – v z/OS XML System Services CPU time
MLXSSTDL XMLDocLn DFHWEBB A 412 MLXSSTDL – – v Document length parsed - z/OS System Services
MQWARN MQWARN OMCICS C 004 MQWARN v v v OMEGAMON MQ Limit Warning
MSCPU MS CPU DFHTASK S 258 MSCPUT v v v CICS TCBs CPU time
MSDISPT MS Disp DFHTASK S 257 MSDISPT v v v CICS TCBs dispatch time
MSGIN1 MsgIn1 DFHTERM A 034 TCMSGIN1 v v v Messages received count
MSGIN2 MsgIn2 DFHTERM A 067 TCMSGIN2 v v v Messages received from LU6.1
MSGOUT1 MsgOut1 DFHTERM A 035 TCMSGOU1 v v v Messages sent count
MSGOUT2 MsgOut2 DFHTERM A 068 TCMSGOU2 v v v Messages sent to LU6.1
MVSID MVS ID CICSPA C 904 MVSID v v v MVS SMF ID
MXTDELAY MXTDelay DFHTASK S 127 MXTDELAY v v v First dispatch MXT wait time
NATURE Nature DFHTERM A 165 TERMINFO v v v Transaction
NETID NET ID DFHTERM C 197 NETID v v v VTAM LUALIAS Network ID
NETNAME NETName DFHTASK C 097 NETUOWPX v v v Originating System VTAM network name
NETUOWSX NETUOWID DFHTASK C 098 NETUOWSX v v v Network UOW ID
OAPPLID OAPPLID DFHCICS C 360 OAPPLID – v v Originating CICS APPLID
OCLI6ADR OCli6Adr DFHCICS C 372 OCLIPADR – – v Originating Client or Telnet IP address
OCLINTIP OClintIP DFHCICS C 368 OCLIPADR – v – Originating Client or Telnet IP address
OCLIPORT OCLIPORT DFHCICS A 369 OCLIPORT – v v Originating Client IP Port Number
OFCTY OFcty DFHCICS C 371 OFCTYNME – v v Originating Transaction Facility name
OFCTYTYP OFctyTyp DFHCICS A 370 OTRANFLG – v v Originating Transaction Facility Type
OMEGWORK OMEGWORK OMCICS C 015 OMEGWORK v v v OMEGAMON User work area
ONETWKID ONETWKID DFHCICS C 359 ONETWKID – v v Originating Network ID
OORIGIN OOrigin DFHCICS C 370 OTRANFLG – v v Originating Transaction Origin type
OPORT OPORT DFHCICS A 367 OPORTNUM – v v Originating TCP/IP Port Number
ORIGIN Origin DFHTASK C 164 TRANFLAG v v v Transaction origin type
OSOWAIT OSO Wait DFHSOCK S 299 SOOIOWTT v v v Outbound Socket I/O Wait Time
OSTART OStart DFHCICS T 361 OSTART – v v Originating Task start time
OTASKNO OTaskNo DFHCICS P 362 OTRANNUM – v v Originating Transaction number
OTCPSRVC OTCPIPSr DFHCICS C 366 OTCPSVCE – v v Originating TCP/IP Service Name
OTRAN OTran DFHCICS C 363 OTRAN – v v Originating Transaction identifier
OTRANFLG OTranFlg DFHCICS A 370 OTRANFLG – v v Originating Transaction flags
OTRANTYP OTranTyp DFHCICS C 370 OTRANFLG – v v Originating Transaction type
OTSID OTS ID DFHTASK C 194 OTSTID v v v OTS Transaction ID
OTSINDWT OTSIndWt DFHSYNC S 199 OTSINDWT v v v OTS Indoubt Wait time
OUSERCOR OUserCor DFHCICS C 365 OUSERCOR – v v Originating User Correlator
OUSERID OUserid DFHCICS C 364 OUSERID – v v Originating User ID
OVFLBFRU OvflBfrU DBCTL A 029 OVFLBFRU v v v Number of Overflow Buffers used
PC24BHWM PC24bHWM DFHSTOR A 108 PC24BHWM v v v Program Storage HWM below 16MB
PC24CHWM PC24CHWM DFHSTOR A 143 PC24CHWM v v v Program Storage (CDSA) HWM below 16MB
PC24RHWM PC24RHWM DFHSTOR A 162 PC24RHWM v v v Program Storage (RDSA) HWM below 16MB
PC24SHWM PC24SHWM DFHSTOR A 160 PC24SHWM v v v Program Storage (SDSA) HWM below 16MB
PC31AHWM PC31aHWM DFHSTOR A 139 PC31AHWM v v v Program Storage HWM above 16MB
PC31CHWM PC31CHWM DFHSTOR A 142 PC31CHWM v v v Program Storage (ECDSA) HWM above 16MB
PC31RHWM PC31RHWM DFHSTOR A 122 PC31RHWM v v v Program Storage (ERDSA) HWM above 16MB
PC31SHWM PC31SHWM DFHSTOR A 161 PC31SHWM v v v Program Storage (ESDSA) HWM above 16MB
PCDLCRDL PCDLCRDL DFHPROG A 287 PCDLCRDL v v v Container data length for DPL RETURN w/CHANNEL
PCDLCSDL PCDLCSDL DFHPROG A 286 PCDLCSDL v v v Container data length for DPL reqs withCHANNEL
PCDPL PCDPLINK DFHPROG A 073 PCDPLCT v v v Distributed Program Link (DPL) requests
Chapter 16. CICS PA field names by CICS version 341

Table 32. Cross-reference: CICS PA field name × CICS version (continued)
CICS PAfield name
Columnheading
CMF fieldCICSversion
DescriptionGroup Type ID Name
640
650
660
PCDPLCCT PCDPLCCT DFHPROG A 308 PCDPLCCT v v v DPL requests with CHANNEL option
PCLINK PCLINK DFHPROG A 055 PCLINKCT v v v Program LINK requests
PCLNKCCT PCLNKCCT DFHPROG A 306 PCLNKCCT v v v LINK requests with CHANNEL option
PCLOAD PCLOAD DFHPROG A 057 PCLOADCT v v v Program LOAD requests
PCLOADTM PCLOADWt DFHPROG S 115 PCLOADTM v v v Program Library wait time
PCLURM PCLNKURM DFHPROG A 072 PCLURMCT v v v Program LINK URM requests
PCRTNCCT PCRTNCCT DFHPROG A 309 PCRTNCCT v v v Program RETURN requests with CHANNELoption
PCRTNCDL PCRTNCDL DFHPROG A 310 PCRTNCDL v v v Container data length for RETURN withCHANNEL
PCSTGHWM PCStgHWM DFHSTOR A 087 PCSTGHWM v v v Program Storage HWM above and below 16MB
PCXCLCCT PCXCLCCT DFHPROG A 307 PCXCLCCT v v v XCTL requests with CHANNEL option
PCXCTL PCXCTL DFHPROG A 056 PCXCTLCT v v v Program XCTL requests
PGBRWCCT PGBRWCCT DFHCHNL A 322 PGBRWCCT v v v BROWSE CHANNEL CONTAINER requests
PGCRECCT PGCRECCT DFHCHNL A 328 PGCRECCT v v v Number of Containers created
PGCSTHWM PGCSTHWM DFHCHNL A 329 PGCSTHWM – v v Maximum Container Storage allocated to task
PGGETCCT PGGETCCT DFHCHNL A 323 PGGETCCT v v v GET CHANNEL CONTAINER requests
PGGETCDL PGGETCDL DFHCHNL A 326 PGGETCDL v v v GET CHANNEL CONTAINER data length
PGMOVCCT PGMOVCCT DFHCHNL A 325 PGMOVCCT v v v MOVE CHANNEL CONTAINER requests
PGPUTCCT PGPUTCCT DFHCHNL A 324 PGPUTCCT v v v PUT CHANNEL CONTAINER requests
PGPUTCDL PGPUTCDL DFHCHNL A 327 PGPUTCDL v v v PUT CHANNEL CONTAINER data length
PGTOTCCT PGTOTCCT DFHCHNL A 321 PGTOTCCT v v v Total number of CHANNEL CONTAINER requests
PILOCKEL PILockEl DBCTL S 006 PILOCKEL v v v Elapsed time for PI Locking
POOLWAIT PoolWait DBCTL S 002 POOLWAIT v v v Elapsed wait time for Pool Space
PORT PORT DFHSOCK A 246 PORTNUM v v v TCP/IP Port Number
PRCSNAME BTS Proc DFHCBTS C 200 PRCSNAME v v v BTS Process name
PRCSTYPE BTS PTyp DFHCBTS C 201 PRCSTYPE v v v BTS Process type
PROGRAM Program DFHPROG C 071 PGMNAME v v v Program name
PSBNAME PSB Name DBCTL C 001 PSBNAME v v v PSB Name
PTPWAIT PTP Wait DFHTASK S 285 PTPWAIT v v v 3270 Bridge Partner wait time
QRCPU QR CPU DFHTASK S 256 QRCPUT v v v CICS QR TCB CPU time
QRDISPT QR Disp DFHTASK S 255 QRDISPT v v v CICS QR TCB dispatch time
QRMODDLY QRModDly DFHTASK S 249 QRMODDLY v v v CICS QR TCB redispatch wait time
RECCOUNT RecCount DFHCICS A 131 PERRECNT v v v Task Performance record count
RELEASE Rlse CICSPA C 909 RELEASE v v v CICS release
REPLCALL REPLcall DBCTL A 016 REPLCALL v v v Number of Database REPL calls issued
RESPONSE Response CICSPA D 901 RESP v v v Transaction response time
RLSCPU RLS CPU DFHFILE S 175 RLSCPUT v v v RLS File Request CPU (SRB) time
RLSWAIT RLS Wait DFHFILE S 174 RLSWAIT v v v RLS File I/O wait time
RLUNAME RLUNAME DFHTERM C 198 RLUNAME v v v VTAM LUALIAS Logical Unit name
RMICPSM RMI CPSM DFHRMI S 007 RMICPSM v v v RMI elapsed time for CICSPlex SM requests
RMIDB2 RMI DB2 DFHRMI S 003 RMIDB2 v v v RMI elapsed time for DB2 requests
RMIDBCTL RMIDBCTL DFHRMI S 004 RMIDBCTL v v v RMI elapsed time for DBCTL requests
RMIEXDLI RMIEXDLI DFHRMI S 005 RMIEXDLI v v v RMI elapsed time for EXEC DLI requests
RMIMQM RMI MQ DFHRMI S 006 RMIMQM v v v RMI elapsed time for WebSphere MQ requests
RMIOTHER RMI Othr DFHRMI S 002 RMIOTHER v v v RMI other elapsed time
RMIOTIME RMIOTime CICSPA D 911 RMIOTIME v v v Resource Manager Interface (RMI) other time
RMISUSP RMI Susp DFHTASK S 171 RMISUSP v v v Resource Manager Interface (RMI) suspend time
RMITCPIP RMITCPIP DFHRMI S 008 RMITCPIP v v v RMI elapsed time for TCP/IP socket requests
RMITIME RMI Elap DFHTASK S 170 RMITIME v v v Resource Manager Interface (RMI) elapsed time
RMITOTAL RMITotal DFHRMI S 001 RMITOTAL v v v RMI total elapsed time
ROCPU RO CPU DFHTASK S 270 ROCPUT v v v CICS RO TCB CPU time
RODISPT RO Disp DFHTASK S 269 RODISPT v v v CICS RO TCB dispatch time
RPTCLASS RptClass DFHCICS C 168 RPTCLASS v v v WLM Report Class
RQPWAIT RQP Wait DFHTASK S 193 RQPWAIT v v v Request Processor Wait Time
342 IBM CICS Performance Analyzer for z/OS: Report Reference

Table 32. Cross-reference: CICS PA field name × CICS version (continued)
CICS PAfield name
Columnheading
CMF fieldCICSversion
DescriptionGroup Type ID Name
640
650
660
RQRWAIT RQR Wait DFHTASK S 192 RQRWAIT v v v Request Receiver Wait Time
RRMSWAIT RRMSWait DFHTASK S 191 RRMSWAIT v v v Resource Recovery Services indoubt wait time
RSYSID RSID DFHCICS C 130 RSYSID v v v Remote System ID
RTYPE RTyp DFHCICS C 112 RTYPE v v v Performance record type
RUNTRWTT BTSRunWt DFHTASK S 195 RUNTRWTT v v v BTS run Process/Activity wait time
S8CPU S8 CPU DFHTASK S 261 S8CPUT v v v CICS S8 TCB CPU time
SC24CGET SC24CGet DFHSTOR A 117 SCCGETCT v v v CDSA GETMAINs below 16MB
SC24CHWM SC24CHWM DFHSTOR A 116 SC24CHWM v v v CDSA HWM below 16MB
SC24COCC SC24COcc DFHSTOR A 118 SC24COCC v v v CDSA Storage Occupancy below 16MB
SC24FSHR SC24FShr DFHSTOR A 146 SC24FSHR v v v CDSA/SDSA storage FREEMAINed below 16MB
SC24GSHR SC24GShr DFHSTOR A 145 SC24GSHR v v v CDSA/SDSA storage GETMAINed below 16MB
SC24SGET SC24SGet DFHSTOR A 144 SC24SGCT v v v CDSA/SDSA GETMAINs below 16MB
SC24UGET SC24UGet DFHSTOR A 054 SCUGETCT v v v UDSA GETMAINs below 16MB
SC24UHWM SC24UHWM DFHSTOR A 033 SCUSRHWM v v v UDSA HWM below 16MB
SC24UOCC SC24UOcc DFHSTOR A 095 SCUSRSTG v v v UDSA Storage Occupancy below 16MB
SC31CGET SC31CGet DFHSTOR A 120 SCCGETCT v v v ECDSA GETMAINs above 16MB
SC31CHWM SC31CHWM DFHSTOR A 119 SC31CHWM v v v ECDSA HWM above 16MB
SC31COCC SC31COcc DFHSTOR A 121 SC31COCC v v v ECDSA Storage Occupancy above 16MB
SC31FSHR SC31FShr DFHSTOR A 149 SC31FSHR v v v ECDSA/ESDSA storage FREEMAINed above 16MB
SC31GSHR SC31GShr DFHSTOR A 148 SC31GSHR v v v ECDSA/ESDSA storage GETMAINed above 16MB
SC31SGET SC31SGet DFHSTOR A 147 SC31SGCT v v v ECDSA/ESDSA GETMAINs above 16MB
SC31UGET SC31UGet DFHSTOR A 105 SCUGETCT v v v EUDSA GETMAINs above 16MB
SC31UHWM SC31UHWM DFHSTOR A 106 SCUSRHWM v v v EUDSA HWM above 16MB
SC31UOCC SC31UOcc DFHSTOR A 107 SCUCRSTG v v v EUDSA Storage Occupancy above 16MB
SCHEDEND SchedEnd DBCTL T 034 SCHEDEND v v v IMS Schedule end time
SCHEDSTA SchedSta DBCTL T 033 SCHEDSTA v v v IMS Schedule start time
SCHTELAP SchTElap DBCTL S 004 SCHTELAP v v v Elapsed time for Schedule Process
SESSTYPE SessType DFHTERM A 165 TERMINFO v v v Terminal session type
SOBYDECT SockDcry DFHSOCK A 243 SOBYDECT v v v Secure Socket bytes decrypted count
SOBYENCT SockEcry DFHSOCK A 242 SOBYENCT v v v Secure Socket bytes encrypted count
SOCHRIN SOChrIn DFHSOCK A 295 SOCHRIN v v v Outbound Sockets characters received count
SOCHRIN1 SOChrIn1 DFHSOCK A 302 SOCHRIN1 v v v Inbound Sockets characters received count
SOCHROU1 SOChrOu1 DFHSOCK A 304 SOCHROU1 v v v Inbound Sockets characters sent count
SOCHROUT SOChrOut DFHSOCK A 297 SOCHROUT v v v Outbound Sockets characters sent count
SOCNPSCT SOCNPSRq DFHSOCK A 290 SOCNPSCT v v v Create Non-Persistent Outbound Socket reqs
SOCPSCT SOCPSReq DFHSOCK A 291 SOCPSCT v v v Create Persistent Outbound Socket requests
SOEXTRCT SOEXTRAC DFHSOCK A 289 SOEXTRCT v v v EXTRACT TCP/IP and CERTIFICATE requests
SOMSGIN1 SOMsgIn1 DFHSOCK A 301 SOMSGIN1 v v v Inbound Sockets RECEIVE requests
SOMSGOU1 SOMsgOu1 DFHSOCK A 303 SOMSGOU1 v v v Inbound Sockets SEND requests
SONPSHWM SONPSHWM DFHSOCK A 292 SONPSHWM v v v Non-Persistent Outbound Socket HWM
SOPSHWM SOPSHWM DFHSOCK A 293 SOPSHWM v v v Persistent Outbound Socket HWM
SORCV SO Recv DFHSOCK A 294 SORCVCT v v v Outbound Sockets RECEIVE requests
SOSEND SO SEND DFHSOCK A 296 SOSENDCT v v v Outbound Sockets SEND requests
SOTOTAL SOTotal DFHSOCK A 298 SOTOTCT v v v Socket Total requests
SOWAIT SockWait DFHSOCK S 241 SOIOWTT v v v Inbound Socket I/O wait time
SRVCLASS SrvClass DFHCICS C 167 SRVCLASS v v v WLM Service Class
START Start DFHCICS T 005 START v v v Task start time
STOP Stop DFHCICS T 006 STOP v v v Task stop time
STYPE SC DFHTASK C 004 TTYPE v v v Transaction start type
SUPRREQ SUPRREQ OMCICS S 018 SUPRREQ v v v OMEGAMON monitored Supra requests
SUPRWARN SUPRWARN OMCICS C 007 SUPRWARN v v v OMEGAMON Supra Limit Warning
SUSPEND Suspend DFHTASK S 014 SUSPTIME v v v Suspend time
SYNCDLY SYNC Dly DFHSYNC S 196 SYNCDLY v v v SYNCPOINT parent request wait time
SYNCPT SYNCPT DFHSYNC A 060 SPSYNCCT v v v SYNCPOINT requests
SYNCTIME SYNCProc DFHSYNC S 173 SYNCTIME v v v SYNCPOINT processing time
Chapter 16. CICS PA field names by CICS version 343

Table 32. Cross-reference: CICS PA field name × CICS version (continued)
CICS PAfield name
Columnheading
CMF fieldCICSversion
DescriptionGroup Type ID Name
640
650
660
SZALLCTO SZAlocTO DFHFEPI A 157 SZALLCTO v v v Allocate conversation time-out count
SZALLOC SZALLOC DFHFEPI A 150 SZALLOCT v v v Conversations allocated count
SZCHRIN SZChrIn DFHFEPI A 155 SZCHRIN v v v FEPI characters received count
SZCHROUT SZChrOut DFHFEPI A 154 SZCHROUT v v v FEPI characters sent count
SZRCV SZRCV DFHFEPI A 151 SZRCVCT v v v FEPI RECEIVE requests
SZRCVTO SZRecvTO DFHFEPI A 158 SZRCVTO v v v Receive Data time-out count
SZSEND SZSEND DFHFEPI A 152 SZSENDCT v v v FEPI SEND requests
SZSTART SZSTART DFHFEPI A 153 SZSTRTCT v v v FEPI START requests
SZTOTAL SZ Total DFHFEPI A 159 SZTOTCT v v v FEPI API and SPI requests
SZWAIT SZ Wait DFHFEPI S 156 SZWAIT v v v FEPI services wait time
T8CPU T8 CPU DFHTASK S 400 T8CPUT – – v CICS T8 TCB CPU time
TASKCNT #Tasks CICSPA X 902 TASKCNT v v v Total Task count
TASKNO TaskNo DFHTASK P 031 TRANNUM v v v Transaction identification number
TASKTCNT #TTasks CICSPA X 914 TASKTCNT v v v Total Task Termination count
TCALLOC TCALLOC DFHTERM A 069 TCALLOCT v v v TCTTE ALLOCATE requests
TCBATTCT TCBAtach DFHTASK A 251 TCBATTCT v v v TCBs attached count
TCC62IN2 TCC62In2 DFHTERM A 137 TCC62IN2 v v v LU6.2 characters received count
TCC62OU2 TCC62Ou2 DFHTERM A 138 TCC62OU2 v v v LU6.2 characters sent count
TCLASSNM TCLSName DFHTASK C 166 TCLSNAME v v v Transaction Class name
TCLDELAY TCLDelay DFHTASK S 126 TCLDELAY v v v First dispatch TCLSNAME wait time
TCM62IN2 TCM62In2 DFHTERM A 135 TCM62IN2 v v v LU6.2 messages received count
TCM62OU2 TCM62Ou2 DFHTERM A 136 TCM62OU2 v v v LU6.2 messages sent count
TCPSRVCE TCPIPSrv DFHSOCK C 245 TCPSRVCE v v v TCP/IP Service Name
TCWAIT TC Wait DFHTERM S 009 TCIOWTT v v v Terminal wait for input time
TDGET TDGET DFHDEST A 041 TDGETCT v v v Transient data GET requests
TDPURGE TDPURGE DFHDEST A 043 TDPURCT v v v Transient data PURGE requests
TDPUT TDPUT DFHDEST A 042 TDPUTCT v v v Transient data PUT requests
TDTOTAL TD Total DFHDEST A 091 TDTOTCT v v v Transient data Total requests
TDWAIT TD Wait DFHDEST S 101 TDIOWTT v v v VSAM transient data I/O wait time
TERM Term DFHTERM C 002 TERM v v v Terminal ID
TERMCNNM ConnName DFHTERM C 169 TERMCNNM v v v Terminal session Connection name
TERMCODE DevT DFHTERM A 165 TERMINFO v v v Terminal Device Type
TERMINFO TermInfo DFHTERM A 165 TERMINFO v v v Terminal information
TESTDEQS TestDEQs DBCTL A 020 TESTDEQS v v v Number of Test Dequeues
TESTENQS TestENQs DBCTL A 018 TESTENQS v v v Number of Test Enqueues
TESTENQW TestENQW DBCTL A 019 TESTENQW v v v Number of waits on Test Enqueues
THREDCPU ThredCPU DBCTL S 032 THREDCPU v v v Thread TCB CPU time
TIASKTCT ASKTimCt DFHCICS A 405 TIASKTCT – – v ASKTIME requests
TITOTCT TITOTcT DFHCICS A 406 TITOTCT – – v ASKTIME
TOTCPU Tot CPU CICSPA D 918 TOTCPU v v v Total Task CPU Time
TOTRECS TotlRecs CICSPA A 001 TOTRECS v v v Cross-System Total record count
TRAN Tran DFHTASK C 001 TRAN v v v Transaction identifier
TRANFLAG TranFlag DFHTASK A 164 TRANFLAG v v v Transaction flags
TRANPRTY Prty DFHTASK A 109 TRANPRI v v v Transaction priority
TRANROUT TranRout CICSPA A 003 TRANROUT v v v Cross-System Transaction Routing records
TRANTYPE TranType DFHTASK C 164 TRANFLAG v v v Transaction type
TSGET TSGET DFHTEMP A 044 TSGETCT v v v Temporary Storage GET requests
TSPUTAUX TSPUTAux DFHTEMP A 046 TSPUTACT v v v Auxiliary TS PUT requests
TSPUTMCT TSPUTMai DFHTEMP A 047 TSPUTMCT v v v Main TS PUT requests
TSQNAME TSQ Name CICSPA C 917 TSQNAME v v v Temporary Storage Queue Name
TSSHWAIT TSShWait DFHTEMP S 178 TSSHWAIT v v v Asynchronous Shared TS wait time
TSTOTAL TS Total DFHTEMP A 092 TSTOTCT v v v TS Total requests
TSWAIT TS Wait DFHTEMP S 011 TSIOWTT v v v VSAM TS I/O wait time
UE1WARN UE1WARN OMCICS C 014 UE1WARN v v v OMEGAMON User Event Limit Warning
UOWCONTS UOWConts DBCTL A 030 UOWCONTS v v v Number of UOW Contentions
344 IBM CICS Performance Analyzer for z/OS: Report Reference

Table 32. Cross-reference: CICS PA field name × CICS version (continued)
CICS PAfield name
Columnheading
CMF fieldCICSversion
DescriptionGroup Type ID Name
640
650
660
UOWID UOW ID CICSPA C 912 UOWID v v v Network UOW ID
UOWSEQ UOW Seq CICSPA C 913 UOWSEQ v v v Network UOW Sequence Number
UPDTDEQS UpdtDEQs DBCTL A 023 UPDTDEQS v v v Number of Update Dequeues
UPDTENQS UpdtENQs DBCTL A 021 UPDTENQS v v v Number of Update Enqueues
UPDTENQW UpdtENQW DBCTL A 022 UPDTENQW v v v Number of waits on Update Enqueues
USERID Userid DFHCICS C 089 USERID v v v User ID
USREVNT USREVNT OMCICS S 020 USREVNT v v v OMEGAMON User defined events
VSAMWARN VSAMWARN OMCICS C 003 VSAMWARN v v v OMEGAMON VSAM Limit warning
WAITCICS CICSWait DFHTASK S 182 WTCEWAIT v v v CICS ECB wait time
WAITEXT Ext Wait DFHTASK S 181 WTEXWAIT v v v External ECB wait time
WBATMSNM ATOMSrvc DFHWEBB C 382 WBATMSNM – – v Web ATOMSERVICE resource definition
WBBROWSE WBBROWSE DFHWEBB A 239 WBBRWCT v v v Web Browse requests
WBBRWOCT WBBRWOCT DFHWEBB A 338 WBBRWOCT v v v CICS Web Support BROWSE HTTPHEADERrequests
WBCHRIN WBChrIn DFHWEBB A 232 WBCHRIN v v v Web characters received count
WBCHRIN1 WBCHRIN1 DFHWEBB A 334 WBCHRIN1 v v v CICS Web Support RECEIVE and CONVERSEchars
WBCHROU1 WBCHROU1 DFHWEBB A 336 WBCHROU1 v v v CICS Web Support SEND and CONVERSE chars
WBCHROUT WBChrOut DFHWEBB A 234 WBCHROUT v v v Web characters sent count
WBEXTRCT WBEXTRAC DFHWEBB A 238 WBEXTRCT v v v Web EXTRACT requests
WBISSFCT ISSOAPFt DFHWEBB A 388 WBISSFCT – – v INVOKE SERVICE request SOAP faults received
WBIWBSCT WBIWBSCT DFHWEBB A 340 WBIWBSCT v v v INVOKE SERVICE and INVOKE WEBSERVICErequests
WBPARSCT WBPARSCT DFHWEBB A 337 WBPARSCT v v v CICS Web Support PARSE URL requests
WBPIPLNM Pipeline DFHWEBB C 381 WBPIPLNM – – v Web PIPELINE resource definition
WBPROGNM Web Prog DFHWEBB C 385 WBPROGNM – – v Web program in URIMAP resource definition
WBRCV WBRCV DFHWEBB A 231 WBRCVCT v v v Web RECEIVE requests
WBRCVIN1 WBRCVIN1 DFHWEBB A 333 WBRCVIN1 v v v CICS Web Support RECEIVE and CONVERSErequests
WBREAD WB READ DFHWEBB A 224 WBREADCT v v v Web READ requests
WBREDOCT WBREDOCT DFHWEBB A 331 WBREDOCT v v v CICS Web Support READ HTTPHEADER requests
WBREPRCT WBRepoRd DFHWEBB A 236 WBREPRCT v v v Web Temporary Storage Repository read requests
WBREPRDL WBREPRDL DFHWEBB A 341 WBREPRDL v v v Repository Read data length
WBREPWCT WBRepoWr DFHWEBB A 237 WBREPWCT v v v Web Temporary Storage Repository write requests
WBREPWDL WBREPWDL DFHWEBB A 342 WBREPWDL v v v Repository Write data length
WBSEND WBSEND DFHWEBB A 233 WBSENDCT v v v Web SEND requests
WBSFCRCT SOAPFtCr DFHWEBB A 386 WBSFCRCT – – v SOAPFAULT CREATE requests
WBSFTOCT SOAPFalt DFHWEBB A 387 WBSFTOCT – – v SOAPFAULT ADD
WBSNDOU1 WBSNDOU1 DFHWEBB A 335 WBSNDOU1 v v v CICS Web Support SEND and CONVERSE requests
WBSREQBL SOAPRqBL DFHWEBB A 390 WBSREQBL – – v SOAP request SOAP body length
WBSRSPBL SOAPRsBL DFHWEBB A 392 WBSRSPBL – – v SOAP response SOAP body length
WBSVCENM WebSrvc DFHWEBB C 383 WBSVCENM – – v Web WEBSERVICE resource definition
WBSVOPNM WebSrvOp DFHWEBB C 384 WBSVOPNM – – v Web WEBSERVICE operation name
WBTOTAL WB Total DFHWEBB A 235 WBTOTWCT v v v Web Total requests
WBURIMNM URI Map DFHWEBB C 380 WBURIMNM – – v Web URIMAP resource definition
WBWRITE WB WRITE DFHWEBB A 225 WBWRITCT v v v Web WRITE requests
WBWRTOCT WBWRTOCT DFHWEBB A 332 WBWRTOCT v v v CICS Web Support WRITE HTTPHEADER requests
WMQASRBT WMQSRBtm DFHDATA S 397 WMQASRBT – – v WebSphere MQ API SRB CPU time
WMQGETWT WMQGetWt DFHDATA S 396 WMQGETWT – v v WebSphere MQ GETWAIT wait time
WMQREQCT WMQ Reqs DFHDATA A 395 WMQREQCT – v v Number of WebSphere MQ requests
WSACBLCT WSACBld DFHWEBB A 420 WSACBLCT – – v WSACONTEXT BUILD requests
WSACGTCT WSACGet DFHWEBB A 421 WSACGTCT – – v WSACONTEXT GET requests
WSAEPCCT WSAEPCre DFHWEBB A 422 WSAEPCCT – – v WSAEPR CREATE requests
WSATOTCT WSAddr DFHWEBB A 423 WSATOTCT – – v Total Web Services Addressing requests
X8CPU X8 CPU DFHTASK S 271 X8CPUT v v v CICS X8 TCB CPU time
X9CPU X9 CPU DFHTASK S 272 X9CPUT v v v User task X9 Mode CPU time
Chapter 16. CICS PA field names by CICS version 345

346 IBM CICS Performance Analyzer for z/OS: Report Reference

Chapter 17. Fields by forms, HDB templates
The following cross-reference table lists the CICS PA field names for CICSmonitoring facility (CMF) performance class and transaction resource class dataand shows the report forms and HDB templates to which they apply.
Some columns in the table require explanation:
CICS PA field nameThe name used in report forms, HDB templates, and selection criteria (andtheir corresponding batch command operands FIELDS and SELECT).
A blank indicates that the field is not available, typically because it is avery long field, or it is an unprintable field such as a unit-of-work or aflag.
Report form and HDB templateThe report forms and HDB templates to which a field applies:v Yes, the field appliesS Yes, the field applies and is an eligible sort field (in a report form)
or key field (in an HDB template)– No, the field does not apply
Type Indicates the data type of the field:A 32-bit or 64-bit countC Character stringD Time derived by CICS PAP Packed decimal integerS ClockT STCK time stampX Count calculated by CICS PA
LengthThe default length in the output report or data set.
Clock (S) fields have two components, each of length 8:COUNT
Number of occurrencesTIME Elapsed time in seconds with specified precision 0.0001 - 0.000001,
default format sss.thmi
Time Stamp (T) fields vary in length (5 - 19) depending on the specifiedformat:TIMET
Time in the format hh:mm:ss.thmTIMEM
Time in the format hh:mmTIMES
Time in the format hh:mm:ssDATE Date in the format mm/dd/yyyyDATEISO
Date in the format yyyy-mm-ddDATEM
Date in the format mm/ddDATEYR
Date in the format mm/dd/yy
© Copyright IBM Corp. 2001, 2010 347

DATETIMDate and time in the format yyyy-mm-dd hh:mm:ss
Note:
1. Some special fields, such as APPLID and RESPONSE, are not defined in theCMF Dictionary and are given a group name of “CICSPA”. These fields areeither derived from the fixed section of the CMF record (for example, APPLID),or calculated from two or more other CMF fields (for example, RESPONSE).
2. The FILENAME, TSQNAME, and DPLNAME fields are only available whenCMF transaction resource class data is being collected.
3. The APPLTRAN and APPLPROG fields are only available when applicationprograms invoke the application naming event monitoring points.
Table 33. Cross-reference: fields × forms, HDB templates
CICS PAfield name
CMF field
Length
Report formHDBtemplate
DescriptionGroup Type ID
LIST
LISTX
SUMMARY
LIST
SUMMARY
DFHCBTS C 202 52 – – – – – BTS Root Activity identifier
DFHCBTS C 203 52 – – – – – BTS Activity identifier
DFHTASK C 064 4 – – – – – Task error flags
DFHTASK C 082 28 – – – – – Transaction Group ID
DFHTASK C 132 8 – – – – – Recovery UOW ID
DFHTASK C 190 16 – – – – – RRMS/MVS unit-of-recovery ID (URID)
ABCODEC DFHPROG C 114 4 v S S v S Current ABEND code
ABCODEO DFHPROG C 113 4 v S S v S Original ABEND Code
ACCMETH DFHTERM A 165 4 v S – v – Terminal Access Method
ACTVTYNM DFHCBTS C 204 16 v S – v – BTS Activity name
ADABREQ OMCICS S 017 8 v S v v v OMEGAMON monitored Adabas requests
ADABWARN OMCICS C 005 4 v S S v S OMEGAMON Adabas Limit Warning
ALERT CICSPA A 915 8 – – v – – Total Alert count or percentage
APPLID CICSPA C 903 8 v S S S S CICS Generic APPLID
APPLPROG DFHAPPL C 001 8 v S S v S Application naming Program
APPLRECS CICSPA A 002 8 v v v v v Cross-System Application records
APPLTRAN DFHAPPL C 001 4 v S S v S Application naming Tran ID
BAACDCCT DFHCBTS A 217 4 v S v v v BTS Activity Data Containers requests
BAACQPCT DFHCBTS A 214 4 v S v v v BTS Acquire Process/Activity requests
BADACTCT DFHCBTS A 209 4 v S v v v BTS Define Activity requests
BADCPACT DFHCBTS A 213 4 v S v v v BTS Cancel Process/Activity requests
BADFIECT DFHCBTS A 220 4 v S v v v BTS Define-Input Event requests
BADPROCT DFHCBTS A 208 4 v S v v v BTS Define Process requests
BALKPACT DFHCBTS A 207 4 v S v v v BTS Link Process/Activity count
BAPRDCCT DFHCBTS A 216 4 v S v v v BTS Process Data Containers requests
BARASYCT DFHCBTS A 206 4 v S v v v BTS asynchronous Process/Activity count
BARATECT DFHCBTS A 219 4 v S v v v BTS Retrieve-Reattach Event requests
BARMPACT DFHCBTS A 212 4 v S v v v BTS Resume Process/Activity requests
BARSPACT DFHCBTS A 210 4 v S v v v BTS Reset Process/Activity requests
BARSYNCT DFHCBTS A 205 4 v S v v v BTS synchronous Process/Activity count
BASUPACT DFHCBTS A 211 4 v S v v v BTS Suspend Process/Activity requests
BATIAECT DFHCBTS A 221 4 v S v v v BTS TIMER Event requests
BATOTCCT DFHCBTS A 218 4 v S v v v BTS Process/Activity Data Container requests
BATOTECT DFHCBTS A 222 4 v S v v v BTS Event-related requests
BATOTPCT DFHCBTS A 215 4 v S v v v BTS Total Process/Activity requests
BFDGSTCT DFHCICS A 408 4 v S v v v Built-in function BIF DIGEST requests
BFTOTCT DFHCICS A 409 4 v S v v v Total Built-in (BIF) function requests
348 IBM CICS Performance Analyzer for z/OS: Report Reference

Table 33. Cross-reference: fields × forms, HDB templates (continued)
CICS PAfield name
CMF field
Length
Report formHDBtemplate
DescriptionGroup Type ID
LIST
LISTX
SUMMARY
LIST
SUMMARY
BMSIN DFHMAPP A 051 4 v S v v v BMS IN requests
BMSMAP DFHMAPP A 050 4 v S v v v BMS MAP requests
BMSOUT DFHMAPP A 052 4 v S v v v BMS OUT requests
BMSTOTAL DFHMAPP A 090 4 v S v v v BMS Total requests
BRDGTRAN DFHTASK C 124 4 v S – v – Bridge Listener Transaction ID
CALLWARN OMCICS C 013 4 v S S v S OMEGAMON EXEC Calls Limit Warning
CBSRVRNM DFHEJBS C 311 4 v S S S S CorbaServer name
CFCAPICT DFHCICS A 025 4 v S v v v OO Foundation Class requests
CFDTSYNC DFHSYNC S 177 8 v S v v v CF Data Table syncpoint wait time
CFDTWAIT DFHFILE S 176 8 v S v v v CF Data Table access requests wait time
CHARIN1 DFHTERM A 083 4 v S v v v Terminal characters received count
CHARIN2 DFHTERM A 085 4 v S v v v LU6.1 characters received count
CHAROUT1 DFHTERM A 084 4 v S v v v Terminal characters sent count
CHAROUT2 DFHTERM A 086 4 v S v v v LU6.1 characters sent count
CHMODECT DFHTASK A 248 4 v S v v v Change-TCB modes requests
CLIENTIP DFHSOCK C 244 16 v S – v – Client or Telnet IP address
CLIP6ADR DFHSOCK C 318 40 v S – v – Client or Telnet IP address
CLIPPORT DFHSOCK A 330 4 v S – v – Client IP Port Number
COMMWAIT CICSPA D 906 8 v S – v – Communications wait time
CPU DFHTASK S 008 8 v S v v v CPU time
CPUWARN OMCICS C 009 4 v S S v S OMEGAMON CPU Limit Warning
DB2CONWT DFHDATA S 188 8 v S v v v DB2 Connection wait time
DB2RDYQW DFHDATA S 187 8 v S v v v DB2 Thread wait time
DB2REQCT DFHDATA A 180 8 v S v v v DB2 requests
DB2WAIT DFHDATA S 189 8 v S v v v DB2 SQL/IFI wait time
DB2WARN OMCICS C 001 4 v S S v S OMEGAMON DB2 Limit Warning
DBGETS DBCTL A 035 8 v S v v v Number of Database Get calls issued
DBIOCALL DBCTL A 007 8 v S v v v Number of Database I/Os
DBIOELAP DBCTL S 005 8 v S v v v Elapsed time for Database I/O
DBUPDATE DBCTL A 036 8 v S v v v Number of Database Update calls issued
DBWAITS DBCTL A 037 8 v S v v v Number of Database waits
DCOMREQ OMCICS S 019 8 v S v v v OMEGAMON monitored CA-Datacom requests
DCOMWARN OMCICS C 008 4 v S S v S OMEGAMON CA-Datacom Limit Warning
DEDBBFRW DBCTL A 031 8 v S v v v Number of waits for DEDB buffers
DEDBCALL DBCTL A 027 8 v S v v v Number of DEDB calls
DEDBRDOP DBCTL A 028 8 v S v v v Number of DEDB read operations
DHCREATE DFHDOCH A 226 4 v S v v v Document Handler CREATE requests
DHDELETE DFHDOCH A 223 4 v S v v v Document Handler DELETE requests
DHINSERT DFHDOCH A 227 4 v S v v v Document Handler INSERT requests
DHRETRVE DFHDOCH A 229 4 v S v v v Document Handler RETRIEVE requests
DHSET DFHDOCH A 228 4 v S v v v Document Handler SET requests
DHTOTAL DFHDOCH A 230 4 v S v v v Document Handler Total requests
DHTOTDCL DFHDOCH A 240 4 v S v v v Total length of all documents created
DISPATCH DFHTASK S 007 8 v S v v v Dispatch time
DISPWAIT DFHTASK S 102 8 v S v v v Redispatch wait time
DLETCALL DBCTL A 015 8 v S v v v Number of Database DLET calls issued
DLICALLS DBCTL A 017 8 v S v v v Total DL/I Database calls
DLIWARN OMCICS C 002 4 v S S v S OMEGAMON DLI Limit Warning
DPLNAME CICSPA C 919 8 – – – – – Distributed program link name
DPLRECS CICSPA A 005 8 v v v v v Cross-System DPL records
DSAWARN OMCICS C 011 4 v S S v S OMEGAMON DSA Limit Warning
DSCHMDLY DFHTASK S 247 8 v S v v v Redispatch wait time caused by change-TCB mode
Chapter 17. Fields by forms, HDB templates 349

Table 33. Cross-reference: fields × forms, HDB templates (continued)
CICS PAfield name
CMF field
Length
Report formHDBtemplate
DescriptionGroup Type ID
LIST
LISTX
SUMMARY
LIST
SUMMARY
DSMMSCWT DFHTASK S 279 8 v S v v v DS storage constraint wait time
DSPDELAY DFHTASK S 125 8 v S v v v First dispatch wait time
DSTCBHWM DFHTASK A 252 4 v S v v v CICS Dispatcher TCB HWM
DSTCBMWT DFHTASK S 268 8 v S v v v Dispatcher TCB Mismatch wait time
ECEFOPCT DFHCICS A 416 4 v S v v v Event Filter operations
ECEVNTCT DFHCICS A 417 4 v S v v v Events captured
ECSIGECT DFHCICS A 415 4 v S v v v SIGNAL EVENT requests
EDSAWARN OMCICS C 012 4 v S S v S OMEGAMON EDSA Limit Warning
EICTOTCT DFHCICS A 402 4 v S v v v EXEC CICS requests
EJBACTIV DFHEJBS A 312 4 v S v v v Number of Bean State Activation requests
EJBCREAT DFHEJBS A 314 4 v S v v v Number of Bean Creation requests
EJBMETHD DFHEJBS A 316 4 v S v v v Number of EJB Method Calls
EJBPASIV DFHEJBS A 313 4 v S v v v Number of Bean State Passivation requests
EJBREMOV DFHEJBS A 315 4 v S v v v Number of Bean Removal requests
EJBTOTAL DFHEJBS A 317 4 v S v v v Total Number of EJB requests
ELAPWARN OMCICS C 010 4 v S S v S OMEGAMON Elapsed Time Limit Warning
ENQDELAY DFHTASK S 129 8 v S v v v Local Enqueue wait time
ERRFLAGS DFHTASK A 064 4 v v – v – Task error flags
EXCLDEQS DBCTL A 026 8 v S v v v Number of Exclusive Dequeues
EXCLENQS DBCTL A 024 8 v S v v v Number of Exclusive Enqueues
EXCLENQW DBCTL A 025 8 v S v v v Number of waits on Exclusive Enqueues
EXWAIT DFHCICS S 103 8 v S v v v Exception Conditions wait time
FCADD DFHFILE A 039 4 v S v v v File ADD requests
FCAMCT DFHFILE A 070 4 v S v v v File access-method requests
FCBROWSE DFHFILE A 038 4 v S v v v File Browse requests
FCDELETE DFHFILE A 040 4 v S v v v File DELETE requests
FCGET DFHFILE A 036 4 v S v v v File GET requests
FCPUT DFHFILE A 037 4 v S v v v File PUT requests
FCTOTAL DFHFILE A 093 4 v S v v v File Control requests
FCTY DFHTASK C 163 4 v S S v S Transaction Facility name
FCTYTYPE DFHTASK A 164 4 v S – v – Transaction facility type
FCWAIT DFHFILE S 063 8 v S v v v File I/O wait time
FILENAME CICSPA C 916 8 – – – – – File name
FUNCSHIP CICSPA A 004 8 v v v v v Cross-System Function Shipping records
GHNCALL DBCTL A 012 8 v S v v v Number of Database GHN calls issued
GHNPCALL DBCTL A 013 8 v S v v v Number of Database GHNP calls issued
GHUCALL DBCTL A 011 8 v S v v v Number of Database GHU calls issued
GIVEUPWT DFHTASK S 184 8 v S v v v Give up control wait time
GNCALL DBCTL A 009 8 v S v v v Number of Database GN calls issued
GNPCALL DBCTL A 010 8 v S v v v Number of Database GNP calls issued
GNQDELAY DFHTASK S 123 8 v S v v v Global Enqueue wait time
GUCALL DBCTL A 008 8 v S v v v Number of Database GU calls issued
ICDELAY DFHTASK S 183 8 v S v v v Interval Control (IC) wait time
ICPUT DFHTASK A 059 4 v S v v v Interval Control START or INITIATE requests
ICSTACCT DFHTASK A 065 8 v S v v v Local IC START requests with CHANNEL option
ICSTACDL DFHTASK A 345 8 v S v v v Container data len for Local IC START w/ CHANNEL
ICSTRCCT DFHTASK A 346 8 v S v v v Remote IC START requests with CHANNEL option
ICSTRCDL DFHTASK A 347 8 v S v v v Container data len for Remot IC START w/ CHANNEL
ICTOTAL DFHTASK A 066 4 v S v v v Interval Control requests
IDMSREQ OMCICS S 016 8 v S v v v OMEGAMON monitored CA-IDMS requests
IDMSWARN OMCICS C 006 4 v S S v S OMEGAMON CA-IDMS Limit Warning
IMSREQCT DFHDATA A 179 4 v S v v v IMS (DBCTL) requests
350 IBM CICS Performance Analyzer for z/OS: Report Reference

Table 33. Cross-reference: fields × forms, HDB templates (continued)
CICS PAfield name
CMF field
Length
Report formHDBtemplate
DescriptionGroup Type ID
LIST
LISTX
SUMMARY
LIST
SUMMARY
IMSWAIT DFHDATA S 186 8 v S v v v IMS (DBCTL) wait time
INTCWAIT DBCTL S 003 8 v S v v v Elapsed wait time for Intent Conflict
IOWAIT CICSPA D 907 8 v S – v – Total IO wait time
IRESP CICSPA D 908 8 v S v – v Transaction internal response time
IRWAIT DFHTERM S 100 8 v S v v v MRO link wait time
ISALLOC DFHSOCK A 288 4 v S v v v Allocate Session requests for sessions on IP
ISIPICNM DFHSOCK C 305 8 v S S v S Name of IPCONN definition that attached the task
ISRTCALL DBCTL A 014 8 v S v v v Number of Database ISRT calls issued
ISWAIT DFHSOCK S 300 8 v S v v v IPCONN link wait time
J8CPU DFHTASK S 260 8 v S v v v CICS J8 TCB CPU time
J9CPU DFHTASK S 267 8 v S v v v User task J9 Mode CPU time
JCWAIT DFHJOUR S 010 8 v S v v v Journal I/O wait time
JNLPUT DFHJOUR A 058 4 v S v v v Journal write requests
JOBNAME CICSPA C 905 8 v S S v S Job Name
JVMITIME DFHTASK S 273 8 v S v v v JVM initialize elapsed time
JVMMTIME CICSPA D 910 8 v S v v v JVM Method time
JVMRTIME DFHTASK S 275 8 v S v v v JVM reset elapsed time
JVMSUSP DFHTASK S 254 8 v S v v v JVM suspend time
JVMTHDWT DFHTASK S 401 8 v S v v v JVM server thread wait time
JVMTIME DFHTASK S 253 8 v S v v v JVM elapsed time
KY8CPU DFHTASK S 263 8 v S v v v CICS Key 8 TCB CPU time
KY8DISPT DFHTASK S 262 8 v S v v v CICS Key 8 TCB dispatch time
KY9CPU DFHTASK S 265 8 v S v v v User task Key 9 Mode CPU time
KY9DISPT DFHTASK S 264 8 v S v v v User task Key 9 Mode Dispatch time
L8CPU DFHTASK S 259 8 v S v v v CICS L8 TCB CPU time
L9CPU DFHTASK S 266 8 v S v v v User task L9 CPU time
LOCKDLAY DFHTASK S 128 8 v S v v v Lock Manager (LM) wait time
LOGWRITE DFHJOUR A 172 4 v S v v v Log Stream write requests
LU61WAIT DFHTERM S 133 8 v S v v v LU6.1 wait time
LU62WAIT DFHTERM S 134 8 v S v v v LU6.2 wait time
LUNAME DFHTERM C 111 8 v S S v S VTAM logical unit name
MAXHTDLY DFHTASK S 278 8 v S v v v Maximum Hot-Pooling TCB delay time
MAXJTDLY DFHTASK S 277 8 v S v v v Maximum JVM TCB delay time
MAXOTDLY DFHTASK S 250 8 v S v v v Maximum Open TCB delay time
MAXSTDLY DFHTASK S 281 8 v S v v v Maximum SSL TCB delay time
MAXTTDLY DFHTASK S 283 8 v S v v v Maximum JVM server thread TCB delay time
MAXXTDLY DFHTASK S 282 8 v S v v v Maximum XPLink TCB delay time
MLXMLTCT DFHWEBB A 413 4 v S v v v Application data TRANSFORM requests
MLXSSCTM DFHWEBB S 411 8 v S v v v z/OS XML System Services CPU time
MLXSSTDL DFHWEBB A 412 4 v S v v v Document length parsed - z/OS System Services
MQWARN OMCICS C 004 4 v S S v S OMEGAMON MQ Limit Warning
MSCPU DFHTASK S 258 8 v S v v v CICS TCBs CPU time
MSDISPT DFHTASK S 257 8 v S v v v CICS TCBs dispatch time
MSGIN1 DFHTERM A 034 4 v S v v v Messages received count
MSGIN2 DFHTERM A 067 4 v S v v v Messages received from LU6.1
MSGOUT1 DFHTERM A 035 4 v S v v v Messages sent count
MSGOUT2 DFHTERM A 068 4 v S v v v Messages sent to LU6.1
MVSID CICSPA C 904 4 v S S S S MVS SMF ID
MXTDELAY DFHTASK S 127 8 v S v v v First dispatch MXT wait time
NATURE DFHTERM A 165 4 v S – v – Transaction
NETID DFHTERM C 197 8 v S – v – VTAM LUALIAS Network ID
NETNAME DFHTASK C 097 20 v S – v – Originating System VTAM network name
Chapter 17. Fields by forms, HDB templates 351

Table 33. Cross-reference: fields × forms, HDB templates (continued)
CICS PAfield name
CMF field
Length
Report formHDBtemplate
DescriptionGroup Type ID
LIST
LISTX
SUMMARY
LIST
SUMMARY
NETUOWSX DFHTASK C 098 8 – – – – – Network UOW ID
OAPPLID DFHCICS C 360 8 v S S v S Originating CICS APPLID
OCLI6ADR DFHCICS C 372 40 v S – v – Originating Client or Telnet IP address
OCLINTIP DFHCICS C 368 16 v S – v – Originating Client or Telnet IP address
OCLIPORT DFHCICS A 369 4 v S – v – Originating Client IP Port Number
OFCTY DFHCICS C 371 8 v S S v S Originating Transaction Facility name
OFCTYTYP DFHCICS A 370 4 v S – v – Originating Transaction Facility Type
OMEGWORK OMCICS C 015 32 v S S v S OMEGAMON User work area
ONETWKID DFHCICS C 359 8 v S S v S Originating Network ID
OORIGIN DFHCICS C 370 8 v S S v S Originating Transaction Origin type
OPORT DFHCICS A 367 4 v S – v – Originating TCP/IP Port Number
ORIGIN DFHTASK C 164 8 v S S v S Transaction origin type
OSOWAIT DFHSOCK S 299 8 v S v v v Outbound Socket I/O Wait Time
OSTART DFHCICS T 361 8 v S S v S Originating Task start time
OTASKNO DFHCICS P 362 4 v S – v – Originating Transaction number
OTCPSRVC DFHCICS C 366 8 v S S v S Originating TCP/IP Service Name
OTRAN DFHCICS C 363 4 v S S v S Originating Transaction identifier
OTRANFLG DFHCICS A 370 16 v S – v – Originating Transaction flags
OTRANTYP DFHCICS C 370 8 v v – v – Originating Transaction type
OTSID DFHTASK C 194 128 – – – – – OTS Transaction ID
OTSINDWT DFHSYNC S 199 8 v S v v v OTS Indoubt Wait time
OUSERCOR DFHCICS C 365 64 v S S v S Originating User Correlator
OUSERID DFHCICS C 364 8 v S S v S Originating User ID
OVFLBFRU DBCTL A 029 8 v S v v v Number of Overflow Buffers used
PC24BHWM DFHSTOR A 108 4 v S v v v Program Storage HWM below 16MB
PC24CHWM DFHSTOR A 143 4 v S v v v Program Storage (CDSA) HWM below 16MB
PC24RHWM DFHSTOR A 162 4 v S v v v Program Storage (RDSA) HWM below 16MB
PC24SHWM DFHSTOR A 160 4 v S v v v Program Storage (SDSA) HWM below 16MB
PC31AHWM DFHSTOR A 139 4 v S v v v Program Storage HWM above 16MB
PC31CHWM DFHSTOR A 142 4 v S v v v Program Storage (ECDSA) HWM above 16MB
PC31RHWM DFHSTOR A 122 4 v S v v v Program Storage (ERDSA) HWM above 16MB
PC31SHWM DFHSTOR A 161 4 v S v v v Program Storage (ESDSA) HWM above 16MB
PCDLCRDL DFHPROG A 287 8 v S v v v Container data length for DPL RETURN w/ CHANNEL
PCDLCSDL DFHPROG A 286 8 v S v v v Container data length for DPL reqs with CHANNEL
PCDPL DFHPROG A 073 4 v S v v v Distributed Program Link (DPL) requests
PCDPLCCT DFHPROG A 308 8 v S v v v DPL requests with CHANNEL option
PCLINK DFHPROG A 055 4 v S v v v Program LINK requests
PCLNKCCT DFHPROG A 306 8 v S v v v LINK requests with CHANNEL option
PCLOAD DFHPROG A 057 4 v S v v v Program LOAD requests
PCLOADTM DFHPROG S 115 8 v S v v v Program Library wait time
PCLURM DFHPROG A 072 4 v S v v v Program LINK URM requests
PCRTNCCT DFHPROG A 309 8 v S v v v Program RETURN requests with CHANNEL option
PCRTNCDL DFHPROG A 310 8 v S v v v Container data length for RETURN with CHANNEL
PCSTGHWM DFHSTOR A 087 4 v S v v v Program Storage HWM above and below 16MB
PCXCLCCT DFHPROG A 307 8 v S v v v XCTL requests with CHANNEL option
PCXCTL DFHPROG A 056 4 v S v v v Program XCTL requests
PGBRWCCT DFHCHNL A 322 8 v S v v v BROWSE CHANNEL CONTAINER requests
PGCRECCT DFHCHNL A 328 8 v S v v v Number of Containers created
PGCSTHWM DFHCHNL A 329 4 v S – v – Maximum Container Storage allocated to task
PGGETCCT DFHCHNL A 323 8 v S v v v GET CHANNEL CONTAINER requests
PGGETCDL DFHCHNL A 326 8 v S v v v GET CHANNEL CONTAINER data length
PGMOVCCT DFHCHNL A 325 8 v S v v v MOVE CHANNEL CONTAINER requests
352 IBM CICS Performance Analyzer for z/OS: Report Reference

Table 33. Cross-reference: fields × forms, HDB templates (continued)
CICS PAfield name
CMF field
Length
Report formHDBtemplate
DescriptionGroup Type ID
LIST
LISTX
SUMMARY
LIST
SUMMARY
PGPUTCCT DFHCHNL A 324 8 v S v v v PUT CHANNEL CONTAINER requests
PGPUTCDL DFHCHNL A 327 8 v S v v v PUT CHANNEL CONTAINER data length
PGTOTCCT DFHCHNL A 321 8 v S v v v Total number of CHANNEL CONTAINER requests
PILOCKEL DBCTL S 006 8 v S v v v Elapsed time for PI Locking
POOLWAIT DBCTL S 002 8 v S v v v Elapsed wait time for Pool Space
PORT DFHSOCK A 246 8 v S – v – TCP/IP Port Number
PRCSNAME DFHCBTS C 200 36 v v – v – BTS Process name
PRCSTYPE DFHCBTS C 201 8 v v S v S BTS Process type
PROGRAM DFHPROG C 071 8 v S S S S Program name
PSBNAME DBCTL C 001 8 v S S S S PSB Name
PTPWAIT DFHTASK S 285 8 v S v v v 3270 Bridge Partner wait time
QRCPU DFHTASK S 256 8 v S v v v CICS QR TCB CPU time
QRDISPT DFHTASK S 255 8 v S v v v CICS QR TCB dispatch time
QRMODDLY DFHTASK S 249 8 v S v v v CICS QR TCB redispatch wait time
RECCOUNT DFHCICS A 131 4 v S v v v Task Performance record count
RELEASE CICSPA C 909 4 v S S v S CICS release
REPLCALL DBCTL A 016 8 v S v v v Number of Database REPL calls issued
RESPONSE CICSPA D 901 8 v S v v v Transaction response time
RLSCPU DFHFILE S 175 8 v S v v v RLS File Request CPU (SRB) time
RLSWAIT DFHFILE S 174 8 v S v v v RLS File I/O wait time
RLUNAME DFHTERM C 198 8 v S S v S VTAM LUALIAS Logical Unit name
RMICPSM DFHRMI S 007 8 v S v v v RMI elapsed time for CICSPlex SM requests
RMIDB2 DFHRMI S 003 8 v S v v v RMI elapsed time for DB2 requests
RMIDBCTL DFHRMI S 004 8 v S v v v RMI elapsed time for DBCTL requests
RMIEXDLI DFHRMI S 005 8 v S v v v RMI elapsed time for EXEC DLI requests
RMIMQM DFHRMI S 006 8 v S v v v RMI elapsed time for WebSphere MQ requests
RMIOTHER DFHRMI S 002 8 v S v v v RMI other elapsed time
RMIOTIME CICSPA D 911 8 v S v v v Resource Manager Interface (RMI) other time
RMISUSP DFHTASK S 171 8 v S v v v Resource Manager Interface (RMI) suspend time
RMITCPIP DFHRMI S 008 8 v S v v v RMI elapsed time for TCP/IP socket requests
RMITIME DFHTASK S 170 8 v S v v v Resource Manager Interface (RMI) elapsed time
RMITOTAL DFHRMI S 001 8 v S v v v RMI total elapsed time
ROCPU DFHTASK S 270 8 v S v v v CICS RO TCB CPU time
RODISPT DFHTASK S 269 8 v S v v v CICS RO TCB dispatch time
RPTCLASS DFHCICS C 168 8 v S S v S WLM Report Class
RQPWAIT DFHTASK S 193 8 v S v v v Request Processor Wait Time
RQRWAIT DFHTASK S 192 8 v S v v v Request Receiver Wait Time
RRMSWAIT DFHTASK S 191 8 v S v v v Resource Recovery Services indoubt wait time
RSYSID DFHCICS C 130 4 v S S v S Remote System ID
RTYPE DFHCICS C 112 4 v v – v – Performance record type
RUNTRWTT DFHTASK S 195 8 v S v v v BTS run Process/Activity wait time
S8CPU DFHTASK S 261 8 v S v v v CICS S8 TCB CPU time
SC24CGET DFHSTOR A 117 4 v S v v v CDSA GETMAINs below 16MB
SC24CHWM DFHSTOR A 116 4 v S v v v CDSA HWM below 16MB
SC24COCC DFHSTOR A 118 8 v S v v v CDSA Storage Occupancy below 16MB
SC24FSHR DFHSTOR A 146 4 v S v v v CDSA/SDSA storage FREEMAINed below 16MB
SC24GSHR DFHSTOR A 145 4 v S v v v CDSA/SDSA storage GETMAINed below 16MB
SC24SGET DFHSTOR A 144 4 v S v v v CDSA/SDSA GETMAINs below 16MB
SC24UGET DFHSTOR A 054 4 v S v v v UDSA GETMAINs below 16MB
SC24UHWM DFHSTOR A 033 4 v S v v v UDSA HWM below 16MB
SC24UOCC DFHSTOR A 095 8 v S v v v UDSA Storage Occupancy below 16MB
SC31CGET DFHSTOR A 120 4 v S v v v ECDSA GETMAINs above 16MB
Chapter 17. Fields by forms, HDB templates 353

Table 33. Cross-reference: fields × forms, HDB templates (continued)
CICS PAfield name
CMF field
Length
Report formHDBtemplate
DescriptionGroup Type ID
LIST
LISTX
SUMMARY
LIST
SUMMARY
SC31CHWM DFHSTOR A 119 4 v S v v v ECDSA HWM above 16MB
SC31COCC DFHSTOR A 121 8 v S v v v ECDSA Storage Occupancy above 16MB
SC31FSHR DFHSTOR A 149 4 v S v v v ECDSA/ESDSA storage FREEMAINed above 16MB
SC31GSHR DFHSTOR A 148 4 v S v v v ECDSA/ESDSA storage GETMAINed above 16MB
SC31SGET DFHSTOR A 147 4 v S v v v ECDSA/ESDSA GETMAINs above 16MB
SC31UGET DFHSTOR A 105 4 v S v v v EUDSA GETMAINs above 16MB
SC31UHWM DFHSTOR A 106 4 v S v v v EUDSA HWM above 16MB
SC31UOCC DFHSTOR A 107 8 v S v v v EUDSA Storage Occupancy above 16MB
SCHEDEND DBCTL T 034 8 v – – v – IMS Schedule end time
SCHEDSTA DBCTL T 033 8 v – – v – IMS Schedule start time
SCHTELAP DBCTL S 004 8 v S v v v Elapsed time for Schedule Process
SESSTYPE DFHTERM A 165 4 v v – v – Terminal session type
SOBYDECT DFHSOCK A 243 4 v S v v v Secure Socket bytes decrypted count
SOBYENCT DFHSOCK A 242 4 v S v v v Secure Socket bytes encrypted count
SOCHRIN DFHSOCK A 295 8 v S v v v Outbound Sockets characters received count
SOCHRIN1 DFHSOCK A 302 8 v S v v v Inbound Sockets characters received count
SOCHROU1 DFHSOCK A 304 8 v S v v v Inbound Sockets characters sent count
SOCHROUT DFHSOCK A 297 8 v S v v v Outbound Sockets characters sent count
SOCNPSCT DFHSOCK A 290 8 v S v v v Create Non-Persistent Outbound Socket reqs
SOCPSCT DFHSOCK A 291 8 v S v v v Create Persistent Outbound Socket requests
SOEXTRCT DFHSOCK A 289 8 v S v v v EXTRACT TCP/IP and CERTIFICATE requests
SOMSGIN1 DFHSOCK A 301 8 v S v v v Inbound Sockets RECEIVE requests
SOMSGOU1 DFHSOCK A 303 8 v S v v v Inbound Sockets SEND requests
SONPSHWM DFHSOCK A 292 8 v S v v v Non-Persistent Outbound Socket HWM
SOPSHWM DFHSOCK A 293 8 v S v v v Persistent Outbound Socket HWM
SORCV DFHSOCK A 294 8 v S v v v Outbound Sockets RECEIVE requests
SOSEND DFHSOCK A 296 8 v S v v v Outbound Sockets SEND requests
SOTOTAL DFHSOCK A 298 8 v S v v v Socket Total requests
SOWAIT DFHSOCK S 241 8 v S v v v Inbound Socket I/O wait time
SRVCLASS DFHCICS C 167 8 v S S v S WLM Service Class
START DFHCICS T 005 8 v S S S S Task start time
STOP DFHCICS T 006 8 v S S S S Task stop time
STYPE DFHTASK C 004 2 v S – v – Transaction start type
SUPRREQ OMCICS S 018 8 v S v v v OMEGAMON monitored Supra requests
SUPRWARN OMCICS C 007 4 v S S v S OMEGAMON Supra Limit Warning
SUSPEND DFHTASK S 014 8 v S v v v Suspend time
SYNCDLY DFHSYNC S 196 8 v S v v v SYNCPOINT parent request wait time
SYNCPT DFHSYNC A 060 4 v S v v v SYNCPOINT requests
SYNCTIME DFHSYNC S 173 8 v S v v v SYNCPOINT processing time
SZALLCTO DFHFEPI A 157 4 v S v v v Allocate conversation time-out count
SZALLOC DFHFEPI A 150 4 v S v v v Conversations allocated count
SZCHRIN DFHFEPI A 155 4 v S v v v FEPI characters received count
SZCHROUT DFHFEPI A 154 4 v S v v v FEPI characters sent count
SZRCV DFHFEPI A 151 4 v S v v v FEPI RECEIVE requests
SZRCVTO DFHFEPI A 158 4 v S v v v Receive Data time-out count
SZSEND DFHFEPI A 152 4 v S v v v FEPI SEND requests
SZSTART DFHFEPI A 153 4 v S v v v FEPI START requests
SZTOTAL DFHFEPI A 159 4 v S v v v FEPI API and SPI requests
SZWAIT DFHFEPI S 156 8 v S v v v FEPI services wait time
T8CPU DFHTASK S 400 8 v S v v v CICS T8 TCB CPU time
TASKCNT CICSPA X 902 4 – – v – v Total Task count
TASKNO DFHTASK P 031 4 v S – v – Transaction identification number
354 IBM CICS Performance Analyzer for z/OS: Report Reference

Table 33. Cross-reference: fields × forms, HDB templates (continued)
CICS PAfield name
CMF field
Length
Report formHDBtemplate
DescriptionGroup Type ID
LIST
LISTX
SUMMARY
LIST
SUMMARY
TASKTCNT CICSPA X 914 4 – – v – v Total Task Termination count
TCALLOC DFHTERM A 069 4 v S v v v TCTTE ALLOCATE requests
TCBATTCT DFHTASK A 251 8 v S v v v TCBs attached count
TCC62IN2 DFHTERM A 137 4 v S v v v LU6.2 characters received count
TCC62OU2 DFHTERM A 138 4 v S v v v LU6.2 characters sent count
TCLASSNM DFHTASK C 166 8 v S S v S Transaction Class name
TCLDELAY DFHTASK S 126 8 v S v v v First dispatch TCLSNAME wait time
TCM62IN2 DFHTERM A 135 4 v S v v v LU6.2 messages received count
TCM62OU2 DFHTERM A 136 4 v S v v v LU6.2 messages sent count
TCPSRVCE DFHSOCK C 245 8 v S S v S TCP/IP Service Name
TCWAIT DFHTERM S 009 8 v S v v v Terminal wait for input time
TDGET DFHDEST A 041 4 v S v v v Transient data GET requests
TDPURGE DFHDEST A 043 4 v S v v v Transient data PURGE requests
TDPUT DFHDEST A 042 4 v S v v v Transient data PUT requests
TDTOTAL DFHDEST A 091 4 v S v v v Transient data Total requests
TDWAIT DFHDEST S 101 8 v S v v v VSAM transient data I/O wait time
TERM DFHTERM C 002 4 v S S v S Terminal ID
TERMCNNM DFHTERM C 169 4 v S S v S Terminal session Connection name
TERMCODE DFHTERM A 165 4 v v – v – Terminal Device Type
TERMINFO DFHTERM A 165 4 v v – v – Terminal information
TESTDEQS DBCTL A 020 8 v S v v v Number of Test Dequeues
TESTENQS DBCTL A 018 8 v S v v v Number of Test Enqueues
TESTENQW DBCTL A 019 8 v S v v v Number of waits on Test Enqueues
THREDCPU DBCTL S 032 8 v S v v v Thread TCB CPU time
TIASKTCT DFHCICS A 405 4 v S v v v ASKTIME requests
TITOTCT DFHCICS A 406 4 v S v v v ASKTIME
TOTCPU CICSPA D 918 8 v S v v v Total Task CPU Time
TOTRECS CICSPA A 001 8 v v v v v Cross-System Total record count
TRAN DFHTASK C 001 4 v S S S S Transaction identifier
TRANFLAG DFHTASK A 164 16 v v – v – Transaction flags
TRANPRTY DFHTASK A 109 4 v S – v – Transaction priority
TRANROUT CICSPA A 003 8 v v v v v Cross-System Transaction Routing records
TRANTYPE DFHTASK C 164 8 v v – v – Transaction type
TSGET DFHTEMP A 044 4 v S v v v Temporary Storage GET requests
TSPUTAUX DFHTEMP A 046 4 v S v v v Auxiliary TS PUT requests
TSPUTMCT DFHTEMP A 047 4 v S v v v Main TS PUT requests
TSQNAME CICSPA C 917 8 – – – – – Temporary Storage Queue Name
TSSHWAIT DFHTEMP S 178 8 v S v v v Asynchronous Shared TS wait time
TSTOTAL DFHTEMP A 092 4 v S v v v TS Total requests
TSWAIT DFHTEMP S 011 8 v S v v v VSAM TS I/O wait time
UE1WARN OMCICS C 014 4 v S S v S OMEGAMON User Event Limit Warning
UOWCONTS DBCTL A 030 8 v S v v v Number of UOW Contentions
UOWID CICSPA C 912 12 v v – v – Network UOW ID
UOWSEQ CICSPA C 913 5 v v – v – Network UOW Sequence Number
UPDTDEQS DBCTL A 023 8 v S v v v Number of Update Dequeues
UPDTENQS DBCTL A 021 8 v S v v v Number of Update Enqueues
UPDTENQW DBCTL A 022 8 v S v v v Number of waits on Update Enqueues
USERID DFHCICS C 089 8 v S S S S User ID
USREVNT OMCICS S 020 8 v S v v v OMEGAMON User defined events
VSAMWARN OMCICS C 003 4 v S S v S OMEGAMON VSAM Limit warning
WAITCICS DFHTASK S 182 8 v S v v v CICS ECB wait time
WAITEXT DFHTASK S 181 8 v S v v v External ECB wait time
Chapter 17. Fields by forms, HDB templates 355

Table 33. Cross-reference: fields × forms, HDB templates (continued)
CICS PAfield name
CMF field
Length
Report formHDBtemplate
DescriptionGroup Type ID
LIST
LISTX
SUMMARY
LIST
SUMMARY
WBATMSNM DFHWEBB C 382 8 v S S v S Web ATOMSERVICE resource definition
WBBROWSE DFHWEBB A 239 8 v S v v v Web Browse requests
WBBRWOCT DFHWEBB A 338 8 v S v v v CICS Web Support BROWSE HTTPHEADER requests
WBCHRIN DFHWEBB A 232 4 v S v v v Web characters received count
WBCHRIN1 DFHWEBB A 334 8 v S v v v CICS Web Support RECEIVE and CONVERSE chars
WBCHROU1 DFHWEBB A 336 8 v S v v v CICS Web Support SEND and CONVERSE chars
WBCHROUT DFHWEBB A 234 4 v S v v v Web characters sent count
WBEXTRCT DFHWEBB A 238 8 v S v v v Web EXTRACT requests
WBISSFCT DFHWEBB A 388 4 v S v v v INVOKE SERVICE request SOAP faults received
WBIWBSCT DFHWEBB A 340 8 v S v v v INVOKE SERVICE and INVOKE WEBSERVICE requests
WBPARSCT DFHWEBB A 337 8 v S v v v CICS Web Support PARSE URL requests
WBPIPLNM DFHWEBB C 381 8 v S S v S Web PIPELINE resource definition
WBPROGNM DFHWEBB C 385 8 v S S v S Web program in URIMAP resource definition
WBRCV DFHWEBB A 231 4 v S v v v Web RECEIVE requests
WBRCVIN1 DFHWEBB A 333 8 v S v v v CICS Web Support RECEIVE and CONVERSE requests
WBREAD DFHWEBB A 224 8 v S v v v Web READ requests
WBREDOCT DFHWEBB A 331 8 v S v v v CICS Web Support READ HTTPHEADER requests
WBREPRCT DFHWEBB A 236 4 v S v v v Web Temporary Storage Repository read requests
WBREPRDL DFHWEBB A 341 8 v S v v v Repository Read data length
WBREPWCT DFHWEBB A 237 4 v S v v v Web Temporary Storage Repository write requests
WBREPWDL DFHWEBB A 342 8 v S v v v Repository Write data length
WBSEND DFHWEBB A 233 4 v S v v v Web SEND requests
WBSFCRCT DFHWEBB A 386 4 v S v v v SOAPFAULT CREATE requests
WBSFTOCT DFHWEBB A 387 4 v S v v v SOAPFAULT ADD
WBSNDOU1 DFHWEBB A 335 8 v S v v v CICS Web Support SEND and CONVERSE requests
WBSREQBL DFHWEBB A 390 4 v S v v v SOAP request SOAP body length
WBSRSPBL DFHWEBB A 392 4 v S v v v SOAP response SOAP body length
WBSVCENM DFHWEBB C 383 32 v S S v S Web WEBSERVICE resource definition
WBSVOPNM DFHWEBB C 384 64 v S S v S Web WEBSERVICE operation name
WBTOTAL DFHWEBB A 235 4 v S v v v Web Total requests
WBURIMNM DFHWEBB C 380 8 v S S v S Web URIMAP resource definition
WBWRITE DFHWEBB A 225 8 v S v v v Web WRITE requests
WBWRTOCT DFHWEBB A 332 8 v S v v v CICS Web Support WRITE HTTPHEADER requests
WMQASRBT DFHDATA S 397 8 v S v v v WebSphere MQ API SRB CPU time
WMQGETWT DFHDATA S 396 8 v S v v v WebSphere MQ GETWAIT wait time
WMQREQCT DFHDATA A 395 4 v S v v v Number of WebSphere MQ requests
WSACBLCT DFHWEBB A 420 4 v S v v v WSACONTEXT BUILD requests
WSACGTCT DFHWEBB A 421 4 v S v v v WSACONTEXT GET requests
WSAEPCCT DFHWEBB A 422 4 v S v v v WSAEPR CREATE requests
WSATOTCT DFHWEBB A 423 4 v S v v v Total Web Services Addressing requests
X8CPU DFHTASK S 271 8 v S v v v CICS X8 TCB CPU time
X9CPU DFHTASK S 272 8 v S v v v User task X9 Mode CPU time
356 IBM CICS Performance Analyzer for z/OS: Report Reference

Chapter 18. CICS PA-specific fields
Here is a list of CICS PA-specific fields that you can use in report forms:
ALERTFor Performance Summary alert reporting, the count or percentage total oftransactions at the specified alert severity (Critical, Warning, or Info) forthe summary key.
APPLIDCICS generic APPLID.
APPLRECSNumber of Application records in this Network Unit-of-Work Extractrecord. All Cross-System Work Extract records include this field.
COMMWAITTotal time value of the communications related fields IRWAIT, ISWAIT,SZWAIT, TCWAIT, LU61WAIT, and LU62WAIT.
DPLRECSNumber of Distributed Program Link (DPL) records in this NetworkUnit-of-Work Extract record. This is a subset of FUNCSHIP, the FunctionShipping record count. All Cross-System Work Extract records include thisfield.
FILENAMETransaction resource class data only: VSAM file name.
FUNCSHIPNumber of Function Shipping records in this Network Unit-of-WorkExtract record. All Cross-System Work Extract records include this field.
IOWAITTotal time value of the I/O wait time fields FCWAIT, JCWAIT, TDWAIT,TSWAIT.
IRESP CICS internal response time for the transaction. It is calculated by thedifference in the Start and Stop times minus the time spent waiting on theterminal (operator think time).
JOBNAMEJobname of the CICS system.
JVMMTIMEJVM method time, the elapsed time spent in the CICS JVM by the usertask, excluding the JVM initialize and reset elapsed times. It is calculatedas:
JVM elapsed time (JVMTIME) - JVM init time (JVMITIME) - JVM resettime (JVMRTIME)
MVSIDSMF system ID.
RELEASECICS release. For example, CICS TS V4.1 is 660.
© Copyright IBM Corp. 2001, 2010 357

RESPONSECICS response time for the transaction. It is calculated as the differencebetween the Start and Stop times.
RMIOTIMEElapsed time the task was suspended by the dispatcher while in theResource Manager Interface (RMI), excluding time waiting for DB2 andIMS. It is calculated as:
RMI suspend time (RMISUSP) - IMS wait time (IMSWAIT) - DB2 readyqwait time (DB2RDYQW) - DB2 connection wait time (DB2CONWT) - DB2wait time (DB2WAIT)
TASKCNTFor Summary reporting only: the total number of tasks (CMF records).
TASKTCNTFor Summary reporting only: the total number of completed tasks (CMFtermination records).
TOTCPUThe total task CPU time. This field is calculated as:
User CPU Time (DFHTASK S008) + RLS File Request CPU Time (DFHFILES175)
TOTRECSTotal number of records in this Network Unit-of-Work Extract record. AllCross-System Work Extract records include this field. It is calculated as:
APPLRECS + TRANROUT + FUNCSHIP + DPLRECS
TRANROUTNumber of terminal-owning region records in this Network Unit-of-WorkExtract record. All Cross-System Work Extract records include this field.
UOWIDNetwork unit-of-work ID: the first 6 bytes of NETUOWSX DFHTASK C098that uniquely identifies this unit of work. This ID is assigned at attach timeusing either a STCK token (when the task is attached to a local terminal),or the network unit of work ID passed as part of an ISC APPC or IRCattach header. The system clock will wrap at intervals of several months.
UOWSEQNetwork unit-of-work ID sequence number: the last 2 bytes ofNETUOWSX DFHTASK C098. This field is the period count, typicallyincremented at each syncpoint.
358 IBM CICS Performance Analyzer for z/OS: Report Reference

Part 7. Appendixes
© Copyright IBM Corp. 2001, 2010 359

360 IBM CICS Performance Analyzer for z/OS: Report Reference

Notices
This information was developed for products and services offered in the U.S.A.IBM may not offer the products, services, or features discussed in this document inother countries. Consult your local IBM representative for information on theproducts and services currently available in your area. Any reference to an IBMproduct, program, or service is not intended to state or imply that only that IBMproduct, program, or service may be used. Any functionally equivalent product,program, or service that does not infringe any IBM intellectual property right maybe used instead. However, it is the user's responsibility to evaluate and verify theoperation of any non-IBM product, program, or service.
IBM may have patents or pending patent applications covering subject matterdescribed in this document. The furnishing of this document does not give youany license to these patents. You can send license inquiries, in writing, to:
IBM Director of LicensingIBM CorporationNorth Castle DriveArmonk, NY 10504-1785U.S.A.
For license inquiries regarding double-byte (DBCS) information, contact the IBMIntellectual Property Department in your country or send inquiries, in writing, to:
IBM World Trade Asia CorporationLicensing2-31 Roppongi 3-chome, Minato-kuTokyo 106, Japan
The following paragraph does not apply in the United Kingdom or any othercountry where such provisions are inconsistent with local law:
INTERNATIONAL BUSINESS MACHINES CORPORATION PROVIDES THISPUBLICATION "AS IS" WITHOUT WARRANTY OF ANY KIND, EITHEREXPRESS OR IMPLIED, INCLUDING, BUT NOT LIMITED TO, THE IMPLIEDWARRANTIES OF NON-INFRINGEMENT, MERCHANTABILITY, OR FITNESSFOR A PARTICULAR PURPOSE. Some states do not allow disclaimer of express orimplied warranties in certain transactions, therefore this statement may not applyto you.
This publication could include technical inaccuracies or typographical errors.Changes are periodically made to the information herein; these changes will beincorporated in new editions of the publication. IBM may make improvementsand/or changes in the product(s) and/or the program(s) described in thispublication at any time without notice.
Licensees of this program who want to have information about it for the purposeof enabling: (i) the exchange of information between independently createdprograms and other programs (including this one) and (ii) the mutual use of theinformation which has been exchanged, should contact IBM United KingdomLaboratories, MP151, Hursley Park, Winchester, Hampshire, England, SO21 2JN.
© Copyright IBM Corp. 2001, 2010 361

Such information may be available, subject to appropriate terms and conditions,including in some cases, payment of a fee.
The licensed program described in this information and all licensed materialavailable for it are provided by IBM under terms of the IBM Customer Agreement,IBM International Programming License Agreement, or any equivalent agreementbetween us.
362 IBM CICS Performance Analyzer for z/OS: Report Reference

Trademarks
IBM, the IBM logo, and ibm.com® are trademarks or registered trademarks ofInternational Business Machines Corp., registered in many jurisdictions worldwide.Other product and service names might be trademarks of IBM or other companies.A current list of IBM trademarks is available on the Web at Copyright andtrademark information at www.ibm.com/legal/copytrade.shtml.
Adobe and the Adobe logo are either registered trademarks or trademarks ofAdobe Systems Incorporated in the United States, and/or other countries.
Microsoft and Windows are trademarks of Microsoft Corporation in the UnitedStates, other countries, or both.
UNIX is a registered trademark of The Open Group in the United States and othercountries.
Java and all Java-based trademarks and logos are trademarks or registeredtrademarks of Oracle and/or its affiliates.
Other product and service names might be trademarks of IBM or other companies.
© Copyright IBM Corp. 2001, 2010 363

364 IBM CICS Performance Analyzer for z/OS: Report Reference

Bibliography
Additional information can be found in the following publications.
CICS Performance Analyzer booksUser's Guide, SC34-7153Report Reference, SC34-7154Getting Started Guide, SC34-7155Program Directory, GI13-0562
Books from related librariesYou might find the following publications useful when using CICS PerformanceAnalyzer to analyze and tune the performance of your CICS systems.
CICS Transaction Server for z/OS Version 4CICS System Definition Guide, SC34-6999CICS Customization Guide, SC34-7001CICS Resource Definition Guide, SC34-7000CICS Operations and Utilities Guide, SC34-7002CICS Supplied Transactions, SC34-7004CICS Application Programming Guide, SC34-7022CICS Application Programming Reference, SC34-7023CICS System Programming Reference, SC34-7024CICS Business Transaction Services, SC34-7029CICS External Interfaces Guide, SC34-7019CICS Internet Guide, SC34-7021CICS Performance Guide, SC34-7033CICS DB2 Guide, SC34-7011
CICS Transaction Server for z/OS Version 3CICS System Definition Guide, SC34-6813CICS Customization Guide, SC34-6814CICS Resource Definition Guide, SC34-6815CICS Operations and Utilities Guide, SC34-6816CICS Supplied Transactions, SC34-6817CICS Application Programming Guide, SC34-6818CICS Application Programming Reference, SC34-6819CICS System Programming Reference, SC34-6820CICS Business Transaction Services, SC34-6824CICS External Interfaces Guide, SC34-6830CICS Internet Guide, SC34-6831CICS Performance Guide, SC34-6833CICS DB2 Guide, SC34-6837
CICS Transaction Gatewayz/OS Administration, SC34-6961
IMS Performance Analyzer for z/OSIMS Performance Analyzer User's Guide, SC19-2732IMS Performance Analyzer Report Reference, SC19-2734
© Copyright IBM Corp. 2001, 2010 365
|

z/OSz/OS MVS System Management Facilities (SMF), SA22-7630z/OS DFSORT Application Programming Guide, SC26-7523
RMFz/OS RMF User's Guide, SC33-7990z/OS RMF Report Analysis, SC33-7991z/OS RMF Performance Management Guide, SC33-7992
WebSphere MQ for z/OSWebSphere MQ for z/OS System Setup Guide, SC34-6052
Tivoli Decision Support for z/OSAccounting Workstation for z/OS User Guide, SH19-4516Administration Guide, SH19-6816CICS Performance Feature Guide and Reference, SH19-6820
DB2DB2 UDB for z/OS Administration Guide, SC18-7413
DB2 PMDB2 Performance Monitor for z/OS Report Reference, SC18-7978DB2 Performance Monitor for z/OS Reporting User's Guide, SC18-7979
OthersThreadsafe Considerations for CICS, SG24-6351Systems Programmers Guide to: z/OS System Logger, SG24-6898Performance Considerations and Measurements for CICS and System Logger,REDP-3768
366 IBM CICS Performance Analyzer for z/OS: Report Reference

Index
Special characters+++ (overflow value) 51, 52
AAlert reports, Performance
List extract 27List report 27Summary extract 46Summary report 46
Alert reports, Statisticsdescribed 119report content 120
APPC 11application naming
APPLPROG field 24, 42, 245APPLTRAN field 24, 42, 245DFHAPPL performance class data
fields 245Performance List report example 24Performance Summary report
example 42PGAPLSUM sample form 42TRAPLSUM sample form 42
BBADRESP, sample form 32BTS
correlating performance classdata 308
performance class data fields 246BTS report
correlating by CICS BTS processID 309
corresponding Performance Listreport 81
described 80report content 81required CMF performance fields 84
Business Transaction Services report 80BY operand
Performance List Extended report 30Wait Analysis report 54
CCICS Explorer
manifest build 227CICS Monitoring Facility (CMF) 4CICS PA plug-in
See CICS ExplorerCICS Web support
DFHWEBB 291document handler 255performance class data fields 309Performance List report 309Performance Summary report 309TCP/IP 263, 310
CICS Web support (continued)Transaction Group report 73, 309
CICS PA-specific fields 357CICSPA command
general format 5syntax vii
CMFcross-reference - fields and CICS
version 337cross-reference - fields and CICS
versions 327data used by CICS PA 4exception class data fields 310fields, forms, HDB templates 347performance class data fields 245performance class data,
interpreting 294transaction resource class data
fields 316commands
syntax notational conventions viiconversion, numeric
Performance List Extended reportexample 33
Performance List report example 25Performance Summary report
example 43correlating performance class data
BTS report 81by CICS BTS process ID 308by network unit-of-work ID 307by network unit-of-work ID and DB2
accounting token 307by transaction group 308Cross-System Work report 66DB2 report 127described 307Transaction Group report 73
create Cross-System records 191cross-reference - fields and Forms, HDB
Templates 347cross-reference charts
CICS PA field names and CICSversions 337
CMF field ID and CICS versions 327fields, Forms, HDB Templates 347
Cross-System Work Extended reportLISTX report command 29report content 71
Cross-System Work extractAPPLID limitations 195CMF Requirements 191correlating by network unit-of-work
ID 307described 189dictionary record 196record format 196required CMF performance
fields 190user fields 191
Cross-System Work reportcorrelating by network unit-of-work
ID 307corresponding DB2 List report 143corresponding Performance List
report 67corresponding Transaction Resource
Usage List report 110Cross-System Work Extended
report 29described 66report content 67required CMF performance fields 72
CSVextract HDB to CSV 218, 223
Ddata sets
Cross-System Work extract 10Performance Data extract 10Record Selection extract 10Statistics extract 10System Logger extract 10
DB2DB2 accounting correlation
token 307export HDB to DB2 tables 218, 223performance class data fields 253
DB2 PM 143DB2 report
CMF-DB2 record selection 144CMF-DB2 record sort 144correlating by network unit-of-work
ID and DB2 accounting token 308corresponding Cross-System Work
report 143corresponding DB2 PM report 143corresponding Performance List
report 143described 127matching CMF-DB2 145numerics and mnemonics 128report content, List report 128report content, Long Summary 133report content, Recap 139report content, Short Summary 137required CMF performance
fields 142ZONE 131
DB2, to analyze extract data 15DBCTL 23, 41, 327DELIMIT operand
HDB extract 224Performance Data Extract 198
DFHAPPLapplication naming 245performance class data fields 245
dictionary recordCross-System Work extract 196End of File Record Counts 212
© Copyright IBM Corp. 2001, 2010 367

dictionary record (continued)Record Selection Extract Recap 203
dispatcherperformance class data fields 268
Dispatcher Tables Summary reportdescribed 211report content 211
Distributed Program Link (DPL) 74, 82,86, 94
Distributed Program Link UsageSummary report
described 106performance selection criteria 106report content 109
document handlerperformance class data fields 255
EEnd of File Record Counts report
described 212report content 212
exception class datafield descriptions 310
Exception List reportcorresponding Performance List
report 93described 93report content 93
Exception reportsdescribed 93introduced 7
Exception Summary reportdescribed 96report content 97
exception types 96Explorer
See CICS Explorerexponential format 23, 30, 38, 52, 55Export
List 20EXTERNAL operand
BTS report 80Cross-System Work Extended
report 29Cross-System Work extract 190Cross-System Work report 67DB2 report 144Performance Data Extract 197Performance List Extended report 28Performance Summary report 35System Logger report 178Transaction Group report 73Workload Activity report 85
external SORTPerformance Summary report 37
extract HDB to CSV 218EXTRACT operand, HDB 223extracts
analyzing the output 15Cross-System Work 189described 189HDB Load 205introduced 10Performance Data, default 197Performance List Extract 199Performance Summary 200
extracts (continued)Record Selection 201System Logger 206
FFEPI
performance class data fields 256File Usage Summary report
described 99performance selection criteria 99report content 102
Ggraph reports 185
HHDB
described 217Export 223EXTRACT 223Extract Recap report 225Extract record format 225HKEEP 226housekeeping 226List report 220LOAD 205, 218Load Recap report 205, 219REPORT 219reports 217SELECT, SELECT2 219, 224statistics reporting 222STATSALERT operand 222Summary report 221
HDB extract to CSV 218Historical Database 217housekeeping 226
Iimporting data
into Lotus 1-2-3 201into Lotus Approach 201
IMS PA 23, 42IMS Performance Analyzer
See IMS PAinternal SORT
Performance Summary report 35
JJava beans
performance class data fields 256JVM
performance class data fields 303
Kkey fields
Performance Summary report 38
Llarge report, external sort 37LIMIT operand
Performance List Extended report 30Load HDB 205, 218Lotus 1-2-3 15, 201Lotus Approach 201
Mmanifest
build command 227build for CICS PA plug-in for CICS
Explorer 227build recap report 227maintenance panel 227
MCT, required CMF fields 72microsecond precision 26, 34, 44Missing
Wait Analysis report 56mnemonics
DB2 report 128MQ report 145MRO 11multi-region operation 11MVS System Monitoring Facility
(SMF) 3
NN/A 58, 128N/C 63, 128, 131N/P 128network unit-of-work ID
correlating by 307Cross-System Work Extended
report 29Cross-System Work extract 196, 307Cross-System Work report 66, 307DB2 report 143, 308EXCMNNSX, EXCMNNPX 314NETUOWSX, NETUOWPX 271System Logger report 177Transaction Resource Usage List
report 113WebSphere MQ report 145Workload Activity report 84, 307
numeric conversionPerformance List Extended report
example 33Performance List report example 25Performance Summary report
example 43numerics
DB2 report 128exponential format 23, 30, 38, 52, 55Wait Analysis report 63
OObject Lists
introduced 15OMEGAMON reports
column heading descriptions 167described 164
368 IBM CICS Performance Analyzer for z/OS: Report Reference

open transaction environment (OTE) 304operands
command syntax notationalconventions vii
LABELS 224NOLABELS 224
Pparmname 212PC tools 15peak percentile
Performance Summary reportexample 45
RESPPEAK sample form 45performance alerts
List extract 27List report 27Summary extract 46Summary report 46
performance class datacorrelating
by CICS BTS process ID 308by network unit-of-work ID 307by network unit-of-work ID and
DB2 accounting token 307by transaction group 308
cross-reference - fields and CICSversions 327, 337
cross-reference - fields and Forms,HDB Templates 347
interpreting 294Performance Data Extract
default format 198described 197importing into Lotus 1-2-3 201importing into Lotus Approach 201Recap report, default 198Recap report, List Extract 200Recap report, Summary Extract 200Summary 37, 200
Performance ExtractList 199
Performance Graph reportsdescribed 185introduced 9Transaction Rate Graph report 187Transaction Response Time Graph
report 187Performance List Extended report
BY operand 30Cross-System Work Extended
report 29described 28numeric conversion example 33precision example 33report content 30
Performance List extractalert reporting example 27command 20
Performance List reportalert reporting example 27application naming example 24CICS Web support 309corresponding BTS report 81corresponding Cross-System Work
report 67
Performance List report (continued)corresponding DB2 List report 143corresponding Exception List
report 93corresponding Transaction Group
report 73corresponding Transaction Resource
Usage List report 112corresponding Workload Activity
report 85DBCTL example 23described 19Extract 20, 199numeric conversion example 25precision example 25report content, default 20report content, tailored 23SELECT2 19
Performance reportsdescribed 19introduced 6performance alerts 6
Performance Summary extractalert reporting example 46command 37
Performance Summary reportalert reporting example 46application naming example 42BY operand 37CICS Web support 309DBCTL example 41described 35Extract 37, 200if the report becomes too large 35numeric conversion example 43peak percentile example 45precision example 43report content 37RESPPEAK sample form 45
Performance Totals reportdescribed 47report content 48user fields 54
PGAPLSUM, sample form 42precision
microsecond 26, 34, 44Performance List Extended report
example 33Performance List report example 25Performance Summary report
example 43problem determination
Dispatcher Tables Summary 211End of File Record Counts 212
program storagedescribed 306performance class data fields 266
Rrecord format
Cross-System Work extract 196Performance Data Extract,
default 198Performance List Extract 199Performance Summary Extract 200
Record Selection extractdescribed 201report content, Recap 203
Report Formsapplicable CMF fields
cross-reference 347introduced 15
REPORT operand, HDB 219Report Sets
introduced 14reports
analyzing the output 15BTS 80Cross-System Work 66Cross-System Work Extended 29DB2 127Dispatcher Tables Summary 211Distributed Program Link Usage
Summary 106End of File Record Counts 212Exception List 93Exception Summary 96File Usage Summary 99graph reports 186HDB 217MQ 145OMEGAMON 164Performance List 19Performance List Extended 28Performance Summary 35Performance Totals 47run-time options 14Statistics Alert 119, 120Statistics, using the dialog 231System Logger 177Temporary Storage Usage
Summary 102Transaction Group 73Transaction Profiling 64Transaction Rate Graph 185Transaction Resource Usage List 109Transaction Response Time
Graph 185Wait Analysis 54WebSphere MQ 145Workload Activity 84
required CMF fieldsBTS report 84Cross-System Work extract 190Cross-System Work report 72DB2 report 142Transaction Group report 79Workload Activity report 91
Resource Listsintroduced 15
Resource Manager Interface 262RESPPEAK, sample form 45RMI
performance class data fields 262,301
RUN command 14run-time options 14
Ssample forms
BADRESP 32
Index 369

sample forms (continued)IMSDBLST (DBCTL) 23IMSDBSUM (DBCTL) 41IMSRQLST (DBCTL) 23IMSRQSUM (DBCTL) 41IMSSUM (DBCTL) 41PGAPLSUM (application naming) 42RESPPEAK (peak percentiles) 45TRAPLSUM (application naming) 42TRTODSUM 40worst transactions 32
SDSF 15SELECT
HDB extract 224HDB report 219introduced 14
SELECT2Cross-System Work Extended
report 29HDB extract 224HDB report 219Performance List Extended report 28Performance List extract 20Performance List report 19Performance Summary export 37Transaction Profiling report 64
selection criteria 14SELUOW 66shared storage
described 305performance class data fields 266
shared system definitionsintroduction 241Take-up Recap report 241
SMFdata used by CICS PA 3type 110 records, CMF 4type 110 records, statistics 231type 110 records, Statistics 4type 111 records, CICS Transaction
Gateway statistics 231type 88 records, System Logger 9
SMF filesdefining to CICS PA 13
SORT, externalBTS report 80Cross-System Work Extended
report 29Cross-System Work extract 190Cross-System Work report 67DB2 report 144Performance Data Extract 197Performance List Extended report 28Performance Summary report 35System Logger report 178Transaction Group report 73Workload Activity report 85
SORT, internalPerformance Summary report 35
Statisticsbatch reports, described 119reporting using the dialog 231
Statistics Alert HDB reports 222Statistics Alert reports
described 119report content 120
Statistics Extractdescribed 208
Statistics reportsdescribed 8
STATSALERT operand, HDB 222SUB command 14Subsystem reports
described 127introduced 8
syntaxcommands, notational
conventions viisystem definitions
introduction 241Shared System Take-up Recap
report 241System Logger extract
described 206System Logger report
described 177report content, List 178report content, Summary 182ZONE 178
System Monitoring Facility (SMF) 3System reports
described 177introduced 9
Ttake-up from SMF files 241TCP/IP
CICS Web support 310performance class data fields 263
Templates, HDBapplicable CMF fields
cross-reference 347temporary storage
performance class data fields 286Temporary Storage Usage Summary
reportdescribed 102performance selection criteria 103report content 106
terminal controlperformance class data fields 287TCP 22, 270, 312
time zone 131Totals report 47trademarks 363Transaction Distributed Program Link
Usage Summary reportreport content 107
Transaction File Usage Summary reportreport content 100
Transaction Group reportcorrelating by transaction group 308corresponding Performance List
report 73described 73report content, detail report 74report content, Summary report 78required CMF performance fields 79
transaction measurementCPU time 297dispatch time 297JVM 303
transaction measurement (continued)open transaction environment 304Resource Manager Interface 301response time 296suspend time 297timing fields 295wait time 297
Transaction Profiling reportdescribed 64report content 66
Transaction Rate Graph reportdescribed 185report content 186
transaction resource class datacross-reference - fields and CICS
versions 327, 337cross-reference - fields and
Forms 347field descriptions 316
Transaction Resource Usage List reportcorresponding Cross-System Work
report 110corresponding Performance List
report 112described 109performance selection criteria 110report content 110
Transaction Resource Usage reportsdescribed 99introduced 7
transaction response time 296Transaction Response Time Graph report
described 185report content 186
transaction storage usageperformance class data fields 265program storage 306shared storage 305user storage 304
Transaction Temporary Storage UsageSummary report
report content 103transient data
performance class data fields 255TRAPLSUM, sample form 42TRTODSUM, sample form 40
Uuser fields
Cross-System Work extract 190, 191Performance Totals report 54
user storagedescribed 304performance class data fields 265
WWait Analysis report
BY operand 54described 54report content, Detail 55report content, Recap 63
Web support 309WebSphere MQ report
described 145
370 IBM CICS Performance Analyzer for z/OS: Report Reference

WebSphere MQ report (continued)performance selection criteria 147record selection 146ZONE 146
WLM 85Workload Activity report
correlating by network unit-of-workID 307
corresponding Performance Listreport 85
described 84report content, List 86report content, Summary 89required CMF performance fields 91
ZZONE
DB2 report 131System Logger report 178WebSphere MQ report 146
Index 371

372 IBM CICS Performance Analyzer for z/OS: Report Reference

Readers’ Comments — We'd Like to Hear from You
IBM CICS Performance Analyzer for z/OSReport ReferenceVersion 3 Release 2
Publication No. SC34-7154-00
We appreciate your comments about this publication. Please comment on specific errors or omissions, accuracy,organization, subject matter, or completeness of this book. The comments you send should pertain to only theinformation in this manual or product and the way in which the information is presented.
For technical questions and information about products and prices, please contact your IBM branch office, yourIBM business partner, or your authorized remarketer.
When you send comments to IBM, you grant IBM a nonexclusive right to use or distribute your comments in anyway it believes appropriate without incurring any obligation to you. IBM or any other organizations will only usethe personal information that you supply to contact you about the issues that you state on this form.
Comments:
Thank you for your support.
Submit your comments using one of these channels:v Send your comments to the address on the reverse side of this form.v Send a fax to the following number: +44 (0) 1962 816151v Send your comments via email to: [email protected]
If you would like a response from IBM, please fill in the following information:
Name Address
Company or Organization
Phone No. Email address

Readers’ Comments — We'd Like to Hear from YouSC34-7154-00
SC34-7154-00
����Cut or FoldAlong Line
Cut or FoldAlong Line
Fold and Tape Please do not staple Fold and Tape
Fold and Tape Please do not staple Fold and Tape
PLACE
POSTAGE
STAMP
HERE
IBM United Kingdom LimitedUser Technologies Department (MP095)Hursley ParkWinchesterHampshireUnited KingdomSO21 2JN
_ _ _ _ _ _ _ _ _ _ _ _ _ _ _ _ _ _ _ _ _ _ _ _ _ _ _ _ _ _ _ _ _ _ _ _ _ _ _ _ _ _ _ _ _ _ _ _ _ _ _ _ _ _ _ _ _ _ _ _ _ _ _ _ _ _ _ _ _ _ _ _ _ _ _ _ _ _ _ _ _ _ _ _ _ _ _ _
_ _ _ _ _ _ _ _ _ _ _ _ _ _ _ _ _ _ _ _ _ _ _ _ _ _ _ _ _ _ _ _ _ _ _ _ _ _ _ _ _ _ _ _ _ _ _ _ _ _ _ _ _ _ _ _ _ _ _ _ _ _ _ _ _ _ _ _ _ _ _ _ _ _ _ _ _ _ _ _ _ _ _ _ _ _ _ _
__
__
__
__
__
__
__
__
__
__
__
__
__
__
__
__
__
__
__
__
__
__
__
__
__
__
__
__
__
__
__
__
__
__
__
__
__
__
__
__
__
__
__
__
__
__
__
__
__
_


����
SC34-7154-00