I The Cook Formation Reservoir Architecture, Stratigraphy and ...
125
I Open Silje Dahle Kvalvåg Petroleum Geosciences Engineering Rodmar Ravnås 2017 Cook Formation Facies Facies association Depositional elements Stratigraphy Paleography 30 117 19. december 2017 The Cook Formation Reservoir Architecture, Stratigraphy and Paleogeography in the Tampen Spur Area
-
Upload
khangminh22 -
Category
Documents
-
view
2 -
download
0
Transcript of I The Cook Formation Reservoir Architecture, Stratigraphy and ...

I
Open
Silje Dahle Kvalvåg
Petroleum Geosciences Engineering
Rodmar Ravnås
2017
Cook Formation
Facies
Facies association
Depositional elements
Stratigraphy
Paleography
30
117
19. december 2017
The Cook Formation Reservoir Architecture, Stratigraphy and Paleogeography in the Tampen Spur Area
II
The Cook Formation Reservoir Architecture, Stratigraphy
and Paleogeography in the Tampen Spur Area
By:
Silje Dahle Kvalvåg
Advisors:
Rodmar Ravnås
Master Thesis:
Presented to the Faculty of Science and Technology
The University of Stavanger
December 2017
III
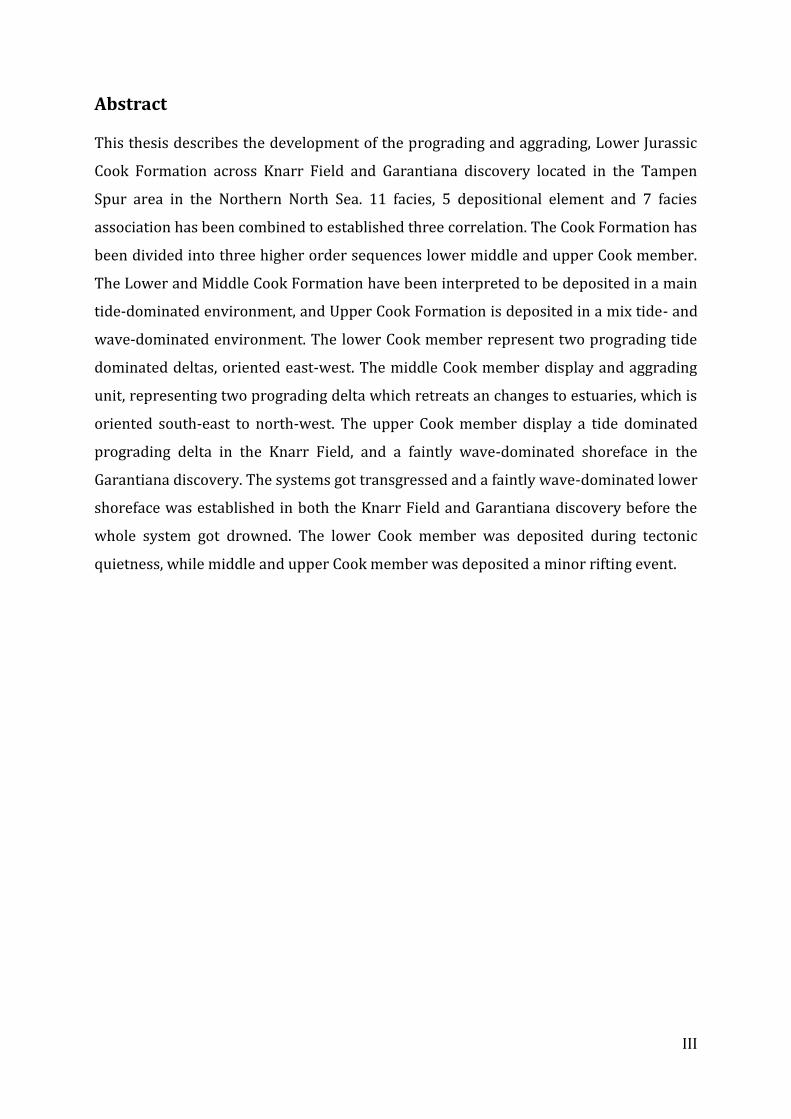
Abstract
This thesis describes the development of the prograding and aggrading, Lower Jurassic
Cook Formation across Knarr Field and Garantiana discovery located in the Tampen
Spur area in the Northern North Sea. 11 facies, 5 depositional element and 7 facies
association has been combined to established three correlation. The Cook Formation has
been divided into three higher order sequences lower middle and upper Cook member.
The Lower and Middle Cook Formation have been interpreted to be deposited in a main
tide-dominated environment, and Upper Cook Formation is deposited in a mix tide- and
wave-dominated environment. The lower Cook member represent two prograding tide
dominated deltas, oriented east-west. The middle Cook member display and aggrading
unit, representing two prograding delta which retreats an changes to estuaries, which is
oriented south-east to north-west. The upper Cook member display a tide dominated
prograding delta in the Knarr Field, and a faintly wave-dominated shoreface in the
Garantiana discovery. The systems got transgressed and a faintly wave-dominated lower
shoreface was established in both the Knarr Field and Garantiana discovery before the
whole system got drowned. The lower Cook member was deposited during tectonic
quietness, while middle and upper Cook member was deposited a minor rifting event.

IV
Acknowledgment
This master thesis is submitted in completion of the MSc in Petroleum Geosciences
Engineering at the University of Stavanger.
First of all I would like to thank my supervisor Rodmar Rvanås for his outstanding
guidance, help and encouragement during these last six months of hard work. I would
also thank Silje Skarpeid, and Sonja Eide who helped me at Shell. In addition, I would like
to thank Shell for providing the cores, dataset and workstation.
A special thanks to Hilde Camilla Mari Sæther, because without you I could not have
done this! Finally I would thank my mom, dad and boyfriend for their support and love.

V
Table of content
Abstract .............................................................................................................................................. III
Acknowledgment ............................................................................................................................ IV
List of Figures .................................................................................................................................. VII
List of Tables ................................................................................................................................. VIII
1.0 Introduction ................................................................................................................................ 1
1.1 Background and problem ................................................................................................................. 1
1.2 Aim of the study ................................................................................................................................... 2
1.3 Previous work ....................................................................................................................................... 3
1.4 Deliverables ........................................................................................................................................... 3
1.5 Study area ............................................................................................................................................... 4
2.0 Geological Framework and Evolution ................................................................................ 6
2.1 Structural setting of the northern North Sea ............................................................................ 6
2.2 Cook Formation .................................................................................................................................... 7
2.3 Mechanisms to explain Cook Formation advance ................................................................ 10
3.0 Dataset and Methodology .................................................................................................... 12
3.1 Dataset .................................................................................................................................................. 12
3.1.1 Core data ....................................................................................................................................... 12
3.1.2 Well logs ........................................................................................................................................ 12
3.2 Methodology ....................................................................................................................................... 13
4.0 Lithofacies, Depositional Elements and Facies Association .................................... 15
4.1 Facies ..................................................................................................................................................... 16
4.2 Depositional elements .................................................................................................................... 25
4.2.1 Mouth bar DE1 ............................................................................................................................ 31
4.2.2 Simple and Compound dunes DE2 ........................................................................................ 32
4.2.3 Collapsed (Breeched) dunes DE3 .......................................................................................... 35
4.2.4 Channel floor thalweg DE5 ..................................................................................................... 36
4.2.5 Abandoned channel DE6 .......................................................................................................... 38
4.3 Facies Association .............................................................................................................. 41
4.3.1 Shelfal FA1 .................................................................................................................................... 45
4.3.2 Prodelta FA2 ................................................................................................................................ 45
4.3.3 Delta Front to possible delta plain FA3A ........................................................................... 46

VI
4.3.4 Lower shoreface FA3B .............................................................................................................. 47
4.3.5 Upper shoreface/foreshore or intertidal to higher subtidal flats FA4 ..................... 48
4.3.6 Bay-fill FA5 ................................................................................................................................... 49
4.3.7 Tide dominated Estuary FA6 .................................................................................................. 50
4.4 Sedimentary logs/core descriptions ......................................................................................... 51
5.0 Cook Formation - Tampen Spur ........................................................................................ 69
5.1 Cook Stratigraphy ............................................................................................................................. 69
5.2 Lower Cook stratigraphic architecture and GDE distribution ........................................ 69
5.3 Middle Cook stratigraphic architecture and GDE distribution ....................................... 71
5.4 Upper Cook stratigraphic architecture and GDE distribution ......................................... 73
5.4 Cook Formation stratigraphic architecture and GDE distribution Garantiana
discovery to Knarr Field ........................................................................................................................ 74
6.0 Thickness trends .................................................................................................................... 76
6.1 Thickness variations - Knarr Field East-West ....................................................................... 76
6.2 Thickness variations Garantiana discovery East-West ...................................................... 78
6.3 Thickness variations - Knarr Field to Garantiana discovery South-North ................. 79
7.0 Sequence stratigraphy and reservoir architecture .................................................... 81
7.1. Sequence stratigraphy ................................................................................................................... 81
7.1.1 Lower Cook member- Sequence I .......................................................................................... 81
7.1.2 Middle Cook member- Sequence II ....................................................................................... 83
7.1.3 Upper Cook member- sequence III ........................................................................................ 85
7.2 Paleogeography .................................................................................................................. 89
7.2.1 Peak prograding of lower Cook member ........................................................................... 89
7.2.2 Peak aggradation of the middle Cook member................................................................ 91
7.2.3 Retrogradation of middle Cook Formation ....................................................................... 93
7.2.4 Peak progradation of Upper Cook Formation .................................................................. 95
7.2.5 Retrogradation of Upper Cook member ............................................................................. 96
7.3 New observations and interpretations .................................................................................... 97
8.0 Discussion ................................................................................................................................. 98
8.1 Cook Formation structure and sedimentary architecture ................................................ 98
8.2 Tide-dominance ..............................................................................................................................101
8.3 Sequence stratigraphic evolution .............................................................................................104
8.4 Remarks ..............................................................................................................................................105

VII
8.5 Analogues ............................................................................................................................ 106
8.5.1 Modern day analogue, Fly river delta ...............................................................................106
8.5.2 Ancient analogue, -Tilje Formation ...................................................................................107
9.0 Conclusion and Future Work............................................................................................ 108
9.1 Further Work ..................................................................................................................... 109
10. References............................................................................................................................... 110
List of Figures
Figure 1A) Location of the study area in the Northern North Sea, with the main
structural elements and the fields located in the study area B) Regional geosection
across the Northern north sea (source Millennium Atlas modified form NPD) ..................... 5
Figure 2 Lithostratigraphy and sequence stratigraphy of the Dunlin Group in the
northern North Sea, red square represent the Cook Formation (modified Charnock et al.,
2001). ................................................................................................................................................................... 9
Figure 3 Cross-section of the Cook Formation displaying the sequence stratigraphic
framework (Dreyer and Wiig, 1995 ...................................................................................................... 10
Figure 4 Eustatic sea-level curve of Lower Jurassic. (A) after Hallam (1988) and (B)
after Haq et al., (1987) (Hallam and Wingnall, 1999). ................................................................... 11
Figure 5 Example of the type of data used: well logs and core photo ..................................... 13
Figure 6 Simple and compound dunes by down-current bedform migration and
superposition (modified from bens et al., 2010) ............................................................................. 34
Figure 7 Schematization of breaching process (Weij et al., 2016) ........................................... 36
Figure 8 The location of the channel floor/Thalweg whitin a channel (Davis, 2008) ..... 38
Figure 9 Conceptual model of the interpreted depositional environment and
depositional elements and facies associations of the Cook Formation. .................................. 40
Figure 10 A) Shows the stacking patter of the Cook Formation B)shows the outbuilding
an retreat of the Cook Formation ........................................................................................................... 75
Figure 11......................................................................................................................................................... 84
Figure 12 West-East oriented well correlation of the Cook Formation in the Garantiana
Discovery. ........................................................................................................................................................ 86
Figure 13 West-East oriented well correlation of the Cook Formation in the Knarr Field.
............................................................................................................................................................................. 87
Figure 14 South-North oriented well correlation of the Cook Formation from the Knarr
Field to the Garantiana Discovery. ......................................................................................................... 88
Figure 16 Paleographic map of the lower Cook member peak progradaion, the red
squares marks the study area. ................................................................................................................. 90
Figure 17 Paleographic map of the middle Cook member peak aggradation, the red
squares marks the study area .................................................................................................................. 92

VIII
Figure 18 Paleographic map of the middle Cook member retrogradation, the red
squares marks the study area. ................................................................................................................. 94
Figure 19 Paleographic map of the lower Cook member peak progradaion, the red
squares marks the study area. ................................................................................................................. 95
Figure 20 Paleographic map of the lower Cook member peak retrograding, the red
squares marks the study area. ................................................................................................................. 96
Figure 21 Crossbedding reflcting neap-spring cycle. ..................................................................102
Figure 22 Tidal signatures in tide dominated facie. A. Mud drapes. B. Sigmoidal
signatures. C. Bidirectional. ....................................................................................................................103
List of Tables
Table 1 Observed facies from the 9 cores and core photos. ....................................................... 24
Table 2 Depositional elements based on the facies (table 4.1) ................................................. 30
Table 3 Facies associations based on facies (table 4.1) and depositional elements (table
4.2). .................................................................................................................................................................... 44
Table 4 Graphic Sedimentary log .......................................................................................................... 51
Table 5 Graphic Sedimentary log .......................................................................................................... 52
Table 6 Graphic Sedimentary log .......................................................................................................... 54
Table 7 Graphic Sedimentary log .......................................................................................................... 56
Table 8 Graphic Sedimentary log .......................................................................................................... 59
Table 9 Graphic Sedimentary log .......................................................................................................... 61
Table 10 Graphic Sedimentary log ....................................................................................................... 62
Table 11 Graphic Sedimentary log ....................................................................................................... 63
Table 12 Graphic Sedimentary log ....................................................................................................... 64
Table 13 Graphic Sedimentary log …………………………………………………………………………...66 Table 14 Graphic Sedimentary log……………………………………………………………………………67
CHAPTER 1: INTRODUCTION
1
1.0 Introduction
1.1 Background and problem
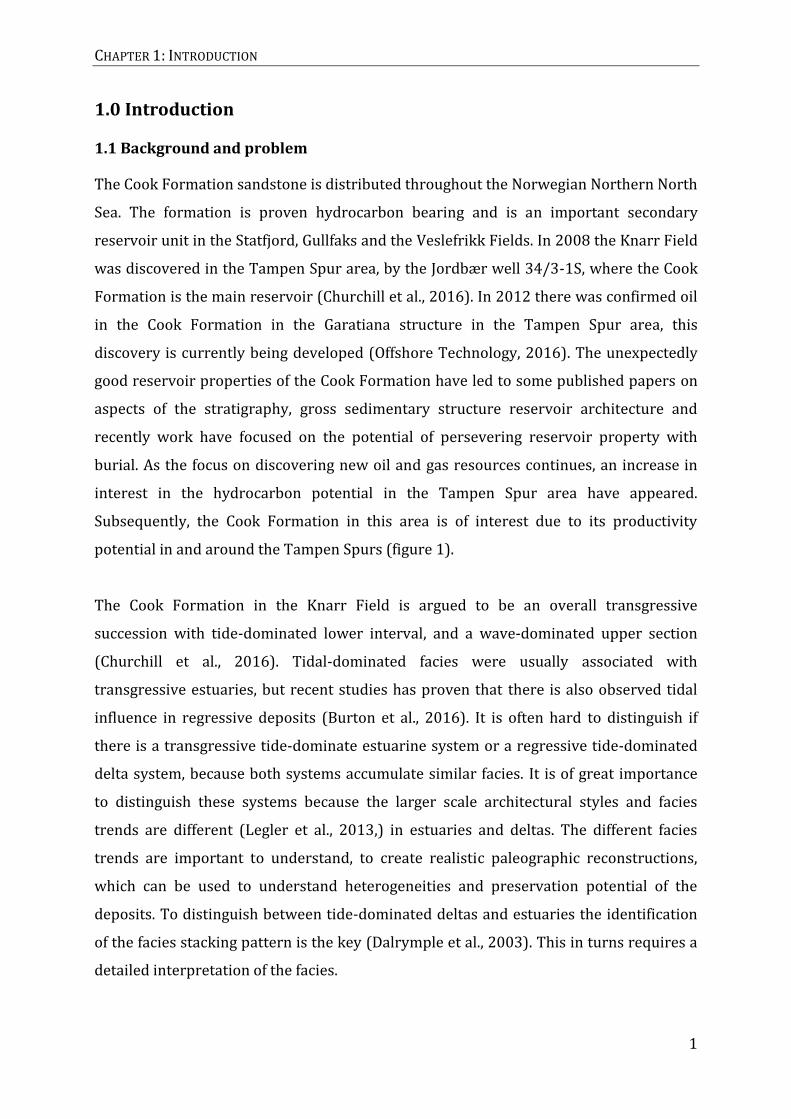
The Cook Formation sandstone is distributed throughout the Norwegian Northern North
Sea. The formation is proven hydrocarbon bearing and is an important secondary
reservoir unit in the Statfjord, Gullfaks and the Veslefrikk Fields. In 2008 the Knarr Field
was discovered in the Tampen Spur area, by the Jordbær well 34/3-1S, where the Cook
Formation is the main reservoir (Churchill et al., 2016). In 2012 there was confirmed oil
in the Cook Formation in the Garatiana structure in the Tampen Spur area, this
discovery is currently being developed (Offshore Technology, 2016). The unexpectedly
good reservoir properties of the Cook Formation have led to some published papers on
aspects of the stratigraphy, gross sedimentary structure reservoir architecture and
recently work have focused on the potential of persevering reservoir property with
burial. As the focus on discovering new oil and gas resources continues, an increase in
interest in the hydrocarbon potential in the Tampen Spur area have appeared.
Subsequently, the Cook Formation in this area is of interest due to its productivity
potential in and around the Tampen Spurs (figure 1).
The Cook Formation in the Knarr Field is argued to be an overall transgressive
succession with tide-dominated lower interval, and a wave-dominated upper section
(Churchill et al., 2016). Tidal-dominated facies were usually associated with
transgressive estuaries, but recent studies has proven that there is also observed tidal
influence in regressive deposits (Burton et al., 2016). It is often hard to distinguish if
there is a transgressive tide-dominate estuarine system or a regressive tide-dominated
delta system, because both systems accumulate similar facies. It is of great importance
to distinguish these systems because the larger scale architectural styles and facies
trends are different (Legler et al., 2013,) in estuaries and deltas. The different facies
trends are important to understand, to create realistic paleographic reconstructions,
which can be used to understand heterogeneities and preservation potential of the
deposits. To distinguish between tide-dominated deltas and estuaries the identification
of the facies stacking pattern is the key (Dalrymple et al., 2003). This in turns requires a
detailed interpretation of the facies.

CHAPTER 1: INTRODUCTION
2
There are also observed a high amount of double and single mud drapes in the upper
section of the Cook Formation indicating of more tidal dominance, than interpreted
earlier. In addition there have been recent developments in the understanding of tide-
dominated deltas and estuaries and several articles are published (e.g. Dalrymple et al.,
2003; Yoshida et al., 2003; Willis, 2005; Dalrymple & Choi, 2007; Legler et al., 2013;
Ravnås et al., 2014; Burton et al., 2016; Wei et al., 2016). This new knowledge of tide
dominated deltas makes it necessary with a new look at the Cook Formation.
1.2 Aim of the study
This thesis will focus on providing a detailed stratigraphic framework of the Cook
Formation, to evaluate a more semi-regional evaluation of the wells in the Knarr Field
and Garantiana discovery across the northern Tampen Spurs i.e. the area between the
Marflo Spur to the east (proximal part of the Cook system) and the Morl Horst to the
west (distal part of Cook system). The aim of the study is to get a better understanding
of the Cook Formation by interpreting and using different sets of data such as core and
well log data. The main object with this thesis was to:
To build a detailed facies, depositional element and facies association scheme for
the core section based on the sedimentological description of 10 cores, in order
to provide a better understanding of the stratigraphic and spatial
sedimentological variations.
Incorporate wireline logs (Gamma Ray, Neutron/Density, and Porosity) from the
studied wells and wells with no cores present, with the intention to investigate
the stratigraphic relationship within the formation. To identify if the tidal
reservoir in the Cook Formation in the Tampen Spur area is associated with
deltaic (regressive) or estuarine (transgressive) environment.
Use the observations to comment on sequence stratigraphy of the studied
interval and to create paleographic maps for the area at different stages through
the development of the Cook Formation.
Were changes in basin physiography a response to tectonic activity, or was there
a more complex control on the local shoreline bathymetry.
CHAPTER 1: INTRODUCTION
3
1.3 Previous work
There has not been written a lot of papers about the Cook Formation and most papers
are written before the discovery of the Knarr Field and Garantiana Discovery. Regional
evolution and sequence stratigraphy paper of the Cook Formation is written by
Partington et al., (1993), Steel, (1993), Marjanac and Steel, (1997), Husmo et al., (2003),
and Charnock et al., (2001). There is also written some semi-regional papers about local
fields. (Livbjerg and Mjøs, 1989) described the stratigraphy of the Cook Formation in the
Oseberg area located south of the Knarr Field. Dreyer and Wiig (1995) and Gupta and
Johnson (2001) gave a detailed description of the Cook Formation reservoir architecture
and sequence stratigraphy in the Gullfaks Field located south of the Knarr Field.
Marajanac (1995) described the architecture and sequence stratigraphy of the Dunlin
Group in the Veslefrikk Field located south of the Knarr Field. Folkestad et al., (2012)
gave a detailed sedimentological description of the Cook Formation in the Kvitebjørn
Field in the Valemon area. Churchill and Coworkers (2016) discussed the stratigraphic
architecture of the Cook Formation in the Knarr Field, which is part of the study area in
this thesis (figure 1).
1.4 Deliverables
A core description of the Cook Formation from 10 core samples in the Tampen
Spur area, interpreted in facies, depositional element and facies association.
Detailed well interpretation divided into sequences and correlated.
Paleographical maps that displays the evolution of the Cook Formation in the
Tampen Spur area.

CHAPTER 1: INTRODUCTION
4
1.5 Study area
The study area is located over the north-eastern part of the Tampen Supr, Marflo Spur
and Mort Horst area in the northern North Sea; more specific the Knarr Field and
Garantiana discovery (Figure 1). The Knarr Field was discovered in July 2008 and
production started in March 2015 (Churchill et al., 2016). Garantia was discovered in
2012, and is not yet producing (Offshore Technology, 2016).
The study area encompasses the Norwegian Blocks 34/2, 34/3, 34/4, 34/5, 34/6, 35/1
and 35/4 located about 120 km form the west coast of Norway. The water depth is
about 400 meters, and the Cook Formation burial depths are between 3500 to 4100
meters below sea level (NPD factpages).

CHAPTER 1: INTRODUCTION
5
Figure 1A) Location of the study area in the Northern North Sea, with the main structural elements and the fields located in the study area B) Regional geosection across the Northern north sea (source Millennium Atlas modified form NPD)
Knarr
Garantiana
Gullfaks Afrodite
Visund
Snorre
Statfjord
A)
B)

CHAPTER 2: GEOLOGICAL FRAMEWORK AND EVOLUTION
6
2.0 Geological Framework and Evolution
2.1 Structural setting of the northern North Sea
The basic structural framework of the northern North Sea is mainly a result of repeated
periods of crustal stretching and thinning and relative post-rift subsidence during
Permian-Early Triassic and Late Jurassic (Ziegler, 1990; Færseth 1996; Faleide et al.,
2010). As a consequence the area is characterized by large rotated fault blocks and
sedimentary basins in asymmetric half grabens, formed during the lithospheric episodes
of extension and crustal thinning (Badley et al., 1984; Færseth 1996; Faleide et al.,
2010).
The Paleozoic tectonic framework developed during two continental collisions to
terrane accretion events; the Caledonian and Variscan Mountain building events
(Coward et al., 2003). The basement of the Northern North Sea consists of an
extensionally thinned continental crust representing the eroded and stretched Pre-
Cambrian to Caledonide basement (Badley et al., 1998; Coward et al., 2003). The
Mesozoic basins floor was filled by eroded sediments from the mountains formed in the
Paleozoic as well as by cannibalization of older sediments from the basin margin (Badley
et al., 1984, Husmo et al., 2003).
The first major rifting event took place in the Late Permo to the Early Triassic,
generating series of half grabens within a broad depression bounded by N-S-trending
faults. The middle to late Triassic was a period dominated by post-rift subsidence
(Badley et al., 1988; Steel and Ryseth, 1990). During the Early and Middle Jurassic, the
Norwegian-Greenland Sea rift evolved, forming post-rift unit to the underlying Permo
Triassic and pre-rift strata to the overlying upper Jurassic syn-rift succession (Nøttvedt
et al., 2008; Færseth and Lien, 2002; Ravnås et al., 2014,). Varying subsidence and riffing
within the region generated variable structure influence on the infill patterns of the
Early to Middle Jurassic succession (e.g. Gjelberg et al.,1987; Corfield & Sharp, 2000;
Corfield et al., 2001; Martinius et al., 2001; Ravnås et al., 2014). In the Early Jurassic the
Northern North Sea was located in relatively warm and humid paleoclimate setting
(Hallman, 1994; Ravnås et al., 2014). There was a high rate of sedimentary supply
during the Early Jurassic which gradually wanted in the middle Jurassic (Ravnås et al.,

CHAPTER 2: GEOLOGICAL FRAMEWORK AND EVOLUTION
7
2014). As a consequence the Early to Middle Jurassic is marked by overall
retrogradational, layered package of alluvial, fluviodeltaic, shallow marine and shelfal
strata (Coward et al., 2003, Ravnås et al., 2014), in the Northern Province this is
represented by the outbuilding of the Cook Formation. In the Middle Jurassic volcanic
doming caused uplift and erosion over the Central North Sea, and the subsequently
deposition of the northward orientation Brent Delta (Underhill and Partington, 1993;
Husmo et al., 2003)
The second rifting episode lasted into the Early Cretaceous, forming structural
configuration (Færseth 1996; Badley et al. 1984). During this tectonic episode, major
block faulting caused uplift and tilting, creating considerable local topography with
erosion and sediment supply. Cretaceous post rift cooling, thermal subsidence and
sediment filling resulted in deep burial of the Jurassic succession (Badley et al., 1988,
Husmo et al., 2003).
2.2 Cook Formation
The Cook Formation was deposited during early Jurassic (Pliensbachian to Toracian)
across the north-eastern part of the Northern North Sea. The Cook Formation is
distributed throughout the eastern parts of the East Shetland Basin, the Tampen Spur,
the northern Viking Graben, the Sogn Graben and on the northern part of the Horda
Platform (Vollset and Doré, 1984).
The Cook Formation is included in the Dunlin Group, which is subdivided into five
lithostratigraphic units; the Amundsen, the Johansen, the Burton and the Drake
formations (Vollset and Doré, 1984) (figure 2). The Cook Formation sharply overly the
Burton and Amundsen formations, and is overlain and some places interbedded with the
Drake Formation (Marjanac and Steel, 1997).
The Cook Formation is mainly interpreted as marine sandstone formed in a variation of
marine settings. In The Statfjord area the Cook Formation is interpreted as marine
shoals by Dalrymple (2001). Dreyer and Wiig (1995) interpreted the Cook Formation in
the Gullfaks Field as shelf to shallow marginal marine deposits formed in a variety of
tide dominated settings, including tidal flats, bays, tidal channels and estuaries and
shallow marine deposits formed in an overall transgressive setting. Charnock and

CHAPTER 2: GEOLOGICAL FRAMEWORK AND EVOLUTION
8
coworkers (2001) interpreted the Cook Formation on the Horda platform to be offshore
and lower shoreface of wave dominated shoreline and estuaries. The Cook Formation in
the Kvitebjørn Field and the Valemon area is interpreted by Folkestad and co-workers
(2012) as a regressive mixed tidal-fluvial delta to transgressive wave-dominated
estuary. In the Oseberg Field the Cook Formation is interpreted as a tide dominated
subtidal marine sand body, representing mud banks and offshore sand ridges by
Livbjerg and Mjøs (1989). The Knarr Field and Garantiana discovery which is the focus
of this thesis is interpreted by Churchill and co-workers (2016) to form a bipartite unit:
the thicker Lower Cook respectively represent a tide-dominated system with tidal
channel, tidal bars and intertidal bar facies, and the thinner upper Cook Formation a
shoreface succession, consisting of shoreface facies to offshore transition zone.
There it is argued that the Cook Formation is prograding from east to west (Churchill et
al., 2016, Charnock et al., 2001) in the Knarr Field. But thickness trends and facies
distribution show indications that the system is changing orientation (see chapter 5, 6
and 7). By looking at the deposit form Garantiana discovery to Knarr filed there are
indication of a more south-east sedimentary supply in the middle and upper Cook
members. This indicates a much more complex Cook Formation basin-fill architecture
than recognized in previous studies.
The Cook Formation forms the core of the Cook megasequence (PR 5) (Steel, 1993,
Marjanac and Steel, 1997). The Cook Formation is interpreted to form parts of the
regressive segment of the megasequence composing the upper parts of stacked upward
coarsening units. Dreyer and Wiig (1995) established six main types of a higher order
sequence set for the units, with the higher order sequence bounded by surfaces; (1)
sequence bounding unconformity, (2) marine downshift surface, (3) transgressive
surface, (4) ravinement surface, (5) maximum flooding "surface", and (6) minor flooding
surfaces (figure 3). Dreyer and Wiig interpreted higher order sequences, which he
divided into Cook-1, Cook-2 (representing the first sequence) and Cook-3 (representing
the second sequence. Charnock and coworkers (2001) recognized 5 flooding surface in
the Cook Formation J14, J15, J16A, J16B and J18 (figure 2), which has been used as
guidelines in this study.

CHAPTER 2: GEOLOGICAL FRAMEWORK AND EVOLUTION
9
Figure 2 Lithostratigraphy and sequence stratigraphy of the Dunlin Group in the northern North Sea, red square represent the Cook Formation (modified Charnock et al., 2001).
(Charnock et al.,
2001)

CHAPTER 2: GEOLOGICAL FRAMEWORK AND EVOLUTION
10
Figure 3 Cross-section of the Cook Formation displaying the sequence stratigraphic framework (Dreyer and Wiig, 1995
2.3 Mechanisms to explain Cook Formation advance
The Cook Formation was deposited during the Pliensbachian to early Toarcian. This
indicates that the Cook Formation forms part of the post-rift unit to the underlying
Permo-Triassic and the pre-rift strata to the overlying Upper Jurassic syn-rift succession
(Færseth & Lien, 2002; Ravnås et al., 2014). This periods show less tectonic activity
compared to both the preceding Middle to Late Triassic and succeeding Late Jurassic rift
episodes, but some structuring is observed (Ravnås et al., 2014)
The Cook Formation was deposited during a post-rift phase, resulting in a thickness
distribution that is potentially controlled by an N-S trending fault pattern (Badley et al.,
1988; Charnock et al., 2001). During the latest Pliensbachian to early Toarcian there is
documented periods of minor footwall uplift in the Oseberg Fault (Livbjerg and Mjos
1989; Ravnås et al., 2000), the Alwyn-Ninian-Hutton alignment (Johnson and Essautier
1987; Sawyer and Keegan 1996, Ravnås et al., 2000), and in the Statfjord-Gullfaks area
along the western flank of the northern Viking Graben (Roberts et al, 1987; Ravnås et al.,
2000). The Footwall uplift and erosion led to the deposition of the Cook Formation in the
Oseberg area(Livbjerg & Mjos 1989, Ravnås 2000) and the retreat of the rift marginal
Cook Formation shoreline to the west (Steel 1993, Ravnås 2000). In the Gullfaks area the

CHAPTER 2: GEOLOGICAL FRAMEWORK AND EVOLUTION
11
Cook Formation may have similar origin but, is interpreted to represent tidally
influenced shorelines or tidal estuaries (Dreyer & Wiig 1995: Marjanac & Steel 1997,
Ravnås 2000).
Previous studies has documented varying rate of subsidence and sedimentary supply
across the northern north sea during the Triassic to middle Jurassic (e.g. Gabrielsen et
al., 1990; Steel and Ryseth 1990; Fæerseth and Ravnås 1998; Ravnås et al., 2000).
Ravnås and co-workers (2000) (2014) suggest that there was a slow stretching creating
minor extensional tectonics during the Early to Middle Jurassic, resulting in a repeated
structuring of the basin.
A relative sea-level rise took place in the end of the Early Toarcian during the deposition
of the Upper Cook Formation (Dreyer and Wiig, 1995; Parkinson and Hines, 1993).
These interpretations indicate that the Cook Formation deposition was controlled by
tectonic changes, as well as sea level changes (figure 3).
Figure 4 Eustatic sea-level curve of Lower Jurassic. (A) after Hallam (1988) and (B) after Haq et al., (1987) (Hallam and Wingnall, 1999).

CHAPTER 3: DATASET AND METHODOLOGY
12
3.0 Dataset and Methodology
3.1 Dataset
This thesis is based on core and well log data from wells containing the Cook Formation
in the Tampen Spur area. The dataset was provided by A/S Norske Shell and comprises
core data from 10 wells and additional well logs data from 15 wells from the Knarr Field
to Garantiana discovery, supplemented by data on the Marflo Spur to the east (proximal
part of the Cook system) and the Mort Horst to the west (distal part of Cook system).
3.1.1 Core data
The bulk of the core data are form the Knarr Field and adjacent structures (wells 34/2-2,
34/2-4, 34/3-1 ST2, 34/3-2S, 34/3-3S and 34/5-1S), the Garantiana discovery (34/6-2S,
34/6-3S), Marlof Spur (35/4-1) and Mort Horst (34/4-5). A total of 446 meters of cores
have been interpreted of the Cook Formation in the Tampen spure area, 217 meter in
the Knarr Field, 137 meter in the Garantiana area and additionally 92 meter in the
adjacent structures.
3.1.2 Well logs
The gamma ray, neutron and density and porosity well log data are from 15 wells
located in the Tampen Spur area (Knarr Field and Garantiana discovery). The well logs
data comprises the wells 34/2-2, 34/2-4, 34/3-1 ST2, 34/3-2S, 34/3-3S, 34/3-5, 34/4-5,
34/5-1A, 34/5-1S, 34/6-1, 34/6-2S, 34/6-3S, 34/6-4, 35/1-1 and 35/4-1. Jointly this
well data set provides a framework for prediction of the strata architecture of the Cook
Formation in the Tampen Spur area.

CHAPTER 3: DATASET AND METHODOLOGY
13
Figure 5 Example of the type of data used: well logs and core photo
3.2 Methodology
The first step of this thesis was to preform core interpretation. The 10 cores were
studied lateral, i.e. along depositional strike and proximal to distal i.e. depositional dip
profile over the study area. Cores were interpreted to identify facies,
depositional/architectural elements and facies associations in the Cook Formation. The
core interpretation was based on lithology, mineralogy, grain size, bed boundary, bed
thickness, texture, sedimentary structures, and degree of bioturbation. The software
sedlog 3.1 was used to create graphic sediment logs of the interpreted cores. The
interpretation of the cores were tied to gamma ray, neutron and density log and porosity
log signatures, which was used to identify similar facies, depositional elements and
facies associations in the uncored section of the wells. The graphic sedimentary logs and
the well logs were used to create three correlations across the study area. Then the wells

CHAPTER 3: DATASET AND METHODOLOGY
14
were interpreted into higher-order sequences to ensure a more solid and confident
correlation of depositional packages. This was semi-regional stratigraphic and more
detailed (field spathic) to develop a more detailed framework for the depositional
subenvironments, gross and reservoir architecture. As the Cook Formation in the study
area were comprised of series of flooding surface bounded, higher order stratigraphic
units, a genetic sequence stratigraphic approach was favored. Paleographic maps of the
study area were created after integrating the different facies and well correlations, to
investigate potential aspects of structuring, thickness trends and orientation of the Cook
Formation.
CHAPTER 4: LITHOFACIES, DEPOSITIONAL ELEMENTS AND FACIES ASSOCIATION
15
4.0 Lithofacies, Depositional Elements and Facies Association
Core data analysis was performed on 9 wells; 34/2-2, 34/2-4, 34/3-1 ST2, 34/3-2S,
34/3-3S, 34/4-1, 34/4-5, 34/5-1S, 34/6-2S, 34/6-3S and 35/4-1, to record the
occurrence of lithofacies, architectural elements and facies associations. The core
coverage in the different wells varies (34/2-2 and 34/2-4), but together they provide
fairly good core coverage of the Cook Formation in the Knarr Field to the Garantiana
discovery and wells in more distal (seaward, 34/2-2, 34/2-4, 34/4-5 and 34/5-1) and
proximal (landward, 35/4-1) positions. A total of 446 meters of cores have been
interpreted (thicknesses of the Cook Formation and core coverage in the interpreted
wells in table 4.6). Wire line log responses of uncored wells were correlated to the facies
analysis based on the core description. In order to do this a general classification of
identified associations based on well log response had to be established. The well log
response is based on the gamma ray log, porosity log, neutron and density log (only
gamma ray log is presented in the well correlations; figure 12, 13 and 14). Gamma ray
log response is extremely sensitive to grain size and clay content, which makes it very
useful in identifying lithology and subsequently interpreting depositional environment.
In the Cook Formation a total of 11 lithofacies were recognized (table 1). This can be
grouped into 5 depositional elements (table 2) and 6 facies associations (table 3).
Lithofacies identification and characterization was based on lithology, degree of
bioturbation, grain size, bed boundaries, bed thickness, texture, sedimentary structures
and log motif.

CHAPTER 4: LITHOFACIES, DEPOSITIONAL ELEMENTS AND FACIES ASSOCIATION
16
4.1 Facies
Facies Description Core Photo Bed thickness
Interpretation
1. Mudstone
A. Bioturbated mudstone
Dark grey to black mudstone. No internal structure to faintly planar laminated. Sharp to gradational contacts. The degree of bioturbation is high with high diversity, common traces are Diplocraterion, Teichicnus and some vertical burrows. The contact is sharp.
34/2-2 Depth 3674
Centimeter to decimeter thick intervals
The mud stone is interpreted to be deposited during low energy conditions in fully marine environment, as evidenced by the marine ichnofacies.
B. Massive mudstone
Massive dark grey to black organic rich mudstone. No internal structure. Degree of bioturbation is low to absent and represented by rare Planolites. Upper and lower sharp contact to unbedded facies (normally sharp)
34/3-3 Depth 3938
Millimeter to centimeter thick intervals
The dark color of the mudstone together with plant debris indicates that the sediments contain abundant organic materials (Arthur and Sageman, 1994) which suggest a terrestrial origin. The unbioturbated nature suggests deposition by rapid setting from high density suspension fluid muds.

CHAPTER 4: LITHOFACIES, DEPOSITIONAL ELEMENTS AND FACIES ASSOCIATION
17
2. Lenticular bedded heterolithics
Dark grey mudstone with brown very fine grained sandstone lenses. Some places there are asymmetrical ripples x-lamina, ripples with opposite direction or mud drapes present in the sandstone lenses. The degree of bioturbation is moderate to low, with low diversity. Bioturbation is represented by Arenicolites, Planolites and Teichicnus. Locally a higher diversity is observed with additional traces of Asterosoma, Diplocraterion, Roselia and vertical burrows. Gradational to sharp contact.
34/5-1 depth 3642
Decimeter to meter thick intervals
Lenticular bedding are produced in environment where deposition and preservation of mud is favorable (Reineck and Singh, 1980). Deposition of sand occurs from episodic low energy currents. The occurrence of mud drapes and opposite x-lamination in the sandstone lenses indicate tidal current reworking of the sediments (Visser, 1980; Dalrymple and Choi 2007; Wei et al., 2016). The low diversity marine ichnofauna suggest a stressed marine environment, the locally increased diversity of bioturbation suggest more open marine setting. Interpreted to be formed in shallow marine settings as distal part of tide dominated delta or more open bays.
3. Wavy bedded heterolithics
Grey to brown fine to very fine grained sandstone, and mudstone alternations, moderate to poorly sorted with subangular to subrounded grains. The internal structures consist of wavy bedded parallel laminated sandstone, opposite directed ripple x-lamination and occasionally cross bedding. The degree of bioturbation is moderate to high represented by Arenicolites, Planolites, Roselia and Teichicnus. Gradational contacts.
34/3-3 depth 3980
Decimeter to meter thick intervals
Produced in environment where deposition and preservation of both sand and mud are favorable (Reineck and Singh, 1980). Deposition in moderate to slow energy current. The occurrence of mud drapes and opposite directed asymmetrical ripples cross lamination indicate tidal current reworking of the sediments (Visser, 1980, Dalrymple and Choi 2007; Wei et al., 2016). Interpreted to be formed in a delta front, prodelta environment or higher energy setting of tide infill/drowned bays.

CHAPTER 4: LITHOFACIES, DEPOSITIONAL ELEMENTS AND FACIES ASSOCIATION
18
4. Flaser-bedded sandstone
Grey to brown, fine to medium-grained sandstone, variably sorted. Subangular to subrounded grains. The internal structure consists of organic rich millimeter thick mud drapes, opposite directed x-lamination mud drapes, mud clast and cross bedded to planar horizontal laminated sandstone. The degree of bioturbation is low to moderate with low diversity, mostly focused in the muddy layers, represented by Planolites. Gradational contacts.
34/3-3 depth 3990
Decimeter to meter thick intervals
This structure implies that both sand and mud are available in the system and deposited during periods of current activity alternating with calm periods. During periods of current activity the sand are transported and deposited as ripples, when the current decrease and increase mud is deposited. Produced during environment where conditions for deposition and preservation of sand is higher than for mud (Reineck and Singh, 1980). The occurrence of mud drapes and opposite directed asymmetrical ripples indicate tidal current reworking of the sediments (Visser, 1980; Dalrymple and Choi 2007, Wei et al., 2016). The thick organic rich mud drapes indicates terrestrial influx, probably from a fluvial channel. Interpreted to be formed in a relatively high energy upper delta front environment and interbedded tidal flats.
5. Hummocky cross stratified sandstone
Dark grey, fine to medium sandstone with subrouded grains. The internal structure consists of hummocky cross stratification, in some places single and double mud drapes occur in uppermost part of beds. Bioturbation varies from absent to a low degree of bioturbation normally of low diversity represented by Archichnius, Teichichnus and Planolites. Gradational contacts.
34/5-1depth 3650
Centimeter to decimeter thick intervals
This structure is interpreted to be deposited under high-energy combined flow processes associated with large storm waves (Hunter & Clifton, 1982; Klein & Marsaglia, 1987; Duke et al., 1985; Yang et al., 2006). The occurrence of single and double mud drapes suggest variating tide influences, varying storm conditions and transition into background conditions with slack water structures (Visser, 1980, Dalrymple and Choi 2007; Wei et al., 2016). The alternation of storm intervals and tide intervals suggests that storms were dominant regime while tidal signals were preserved in the inter-storm periods (Wei et al., 2016). Interpreted to be formed in a mixt wave tide energy lower delta front environment or shoreface.

CHAPTER 4: LITHOFACIES, DEPOSITIONAL ELEMENTS AND FACIES ASSOCIATION
19
6. Highly bioturbated fine grained sandy siltstone
Grey to brown very fine to fine muddy strongly bioturbated sandstone. Well sorted subrounded grains. Occasional layers with mud drapes and wave and current ripple x-lamination. The grade of bioturbation is high varying from high to low diversitry. The bioturbation is represented by Arenicolites, Planolites, Palaeophycus, Terebelina, Teichichnus and horizontal and vertical burrows. Gradational to sharp contact.
34/5-1 depth 3678
34/3-1 depth 3868
Decimeter to meter thick intervals
Deposited during intervals with slow sedimentation rate, allowing biogenic reworking processes. The sediments with higher diverse ichnofauna indicate open marine shelf, while the sediments with low diversity indicate more protected settings (Pemberton et al., 2001). Interpreted to be deposited in a restricted or stressed offshore setting such as outer parts of embayment lower delta front or shoreface enviornment.
CHAPTER 4: LITHOFACIES, DEPOSITIONAL ELEMENTS AND FACIES ASSOCIATION
20
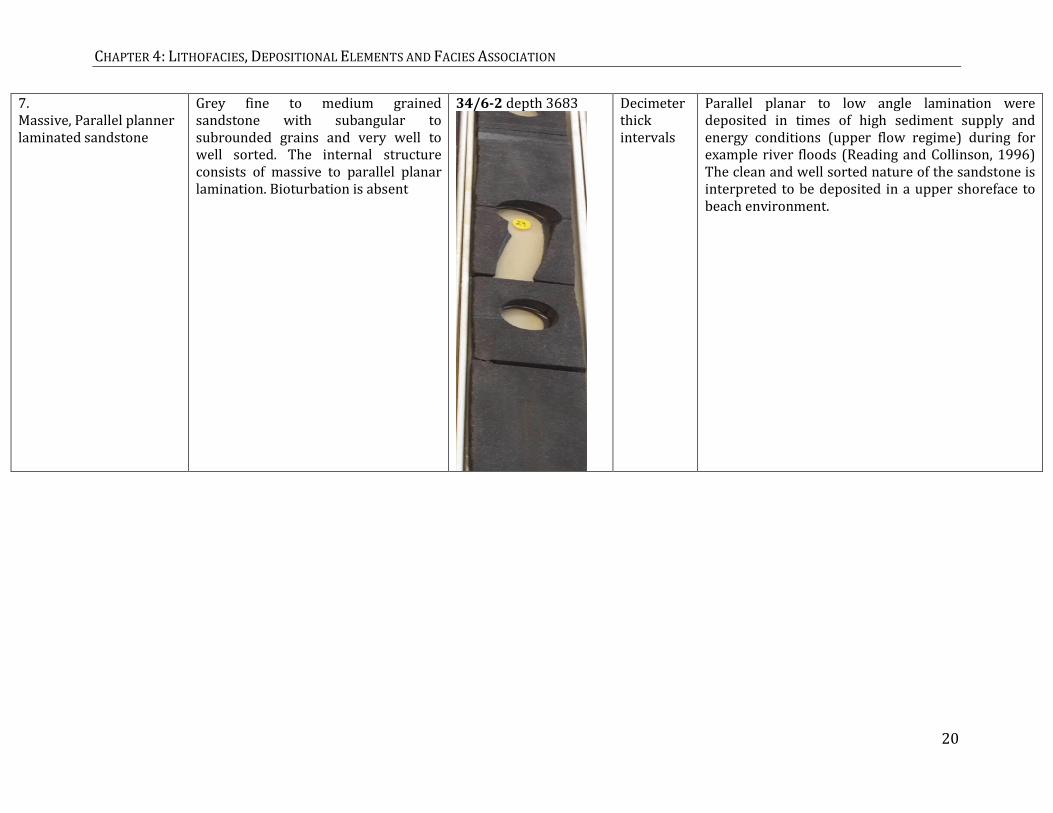
7. Massive, Parallel planner laminated sandstone
Grey fine to medium grained sandstone with subangular to subrounded grains and very well to well sorted. The internal structure consists of massive to parallel planar lamination. Bioturbation is absent
34/6-2 depth 3683
Decimeter thick intervals
Parallel planar to low angle lamination were deposited in times of high sediment supply and energy conditions (upper flow regime) during for example river floods (Reading and Collinson, 1996) The clean and well sorted nature of the sandstone is interpreted to be deposited in a upper shoreface to beach environment.
CHAPTER 4: LITHOFACIES, DEPOSITIONAL ELEMENTS AND FACIES ASSOCIATION
21
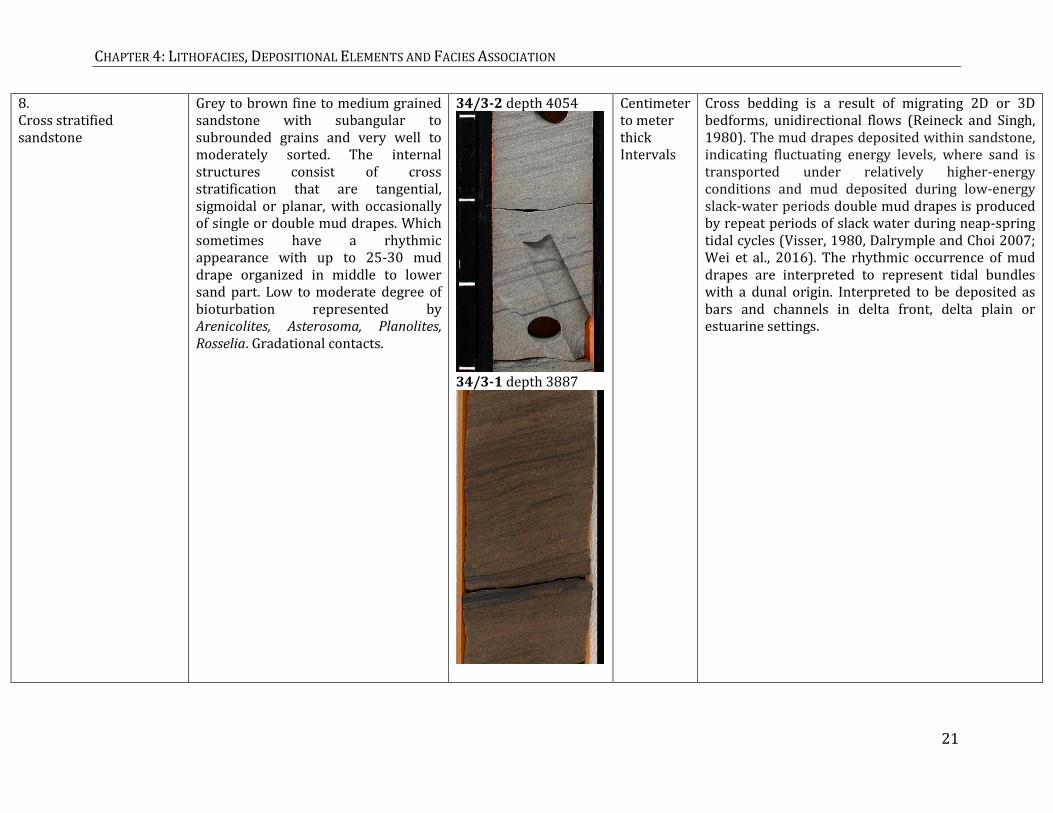
8. Cross stratified sandstone
Grey to brown fine to medium grained sandstone with subangular to subrounded grains and very well to moderately sorted. The internal structures consist of cross stratification that are tangential, sigmoidal or planar, with occasionally of single or double mud drapes. Which sometimes have a rhythmic appearance with up to 25-30 mud drape organized in middle to lower sand part. Low to moderate degree of bioturbation represented by Arenicolites, Asterosoma, Planolites, Rosselia. Gradational contacts.
34/3-2 depth 4054
34/3-1 depth 3887
Centimeter to meter thick Intervals
Cross bedding is a result of migrating 2D or 3D bedforms, unidirectional flows (Reineck and Singh, 1980). The mud drapes deposited within sandstone, indicating fluctuating energy levels, where sand is transported under relatively higher-energy conditions and mud deposited during low-energy slack-water periods double mud drapes is produced by repeat periods of slack water during neap-spring tidal cycles (Visser, 1980, Dalrymple and Choi 2007; Wei et al., 2016). The rhythmic occurrence of mud drapes are interpreted to represent tidal bundles with a dunal origin. Interpreted to be deposited as bars and channels in delta front, delta plain or estuarine settings.

CHAPTER 4: LITHOFACIES, DEPOSITIONAL ELEMENTS AND FACIES ASSOCIATION
22
9. Cross stratified sandstone with mud clasts/ Pebbly sediments
Grey to Brown fine to coarse grained sandstone with subangular to subrounded grains and very well to moderately sorted. The internal structure consist of cross stratification defined by alignment of mud clasts, the mudstone intraclasts are locally sideritized. Low to moderate bioturbation with low diversity, represented by Planolites. Gradational contacts to cross bedding.
34/3-3 depth 3978
Centimeter to decimeter thick intervals
Cross bedding is a result of migrating 2D or 3D bedforms, unidirectional flows (Reineck and Singh, 1980). Produced during high energy conditions. Mud pebbles are common in the channel bottom and in bars/dunes in tide-dominated environment. Thick mud drapes get deposited, and then currents are sufficiently strong to rework these drapes (Dalrymple and Choi, 2007). Interpreted to be deposited as bars/dunes and channels in delta front.
10. A. Massive sandstone
Grey medium grained structure less massive sandstone with subrounded to rounded grains and well to very well sorted. Structure less with occasionally scattered granules. Low degree of bioturbation, some shell fragments present. Gradational and occasional sharp contact.
34/3-2 depth 4059
Decimeter to meter thick intervals
Interpreted to be sandy bank transitioned intsandy debris. Sandbank failure are reported from large sandy bedforms. Grain flow failure represent deep fluvial channels, delta fronts or estuarine channels by breaching (van den Berg et al., 2017)

CHAPTER 4: LITHOFACIES, DEPOSITIONAL ELEMENTS AND FACIES ASSOCIATION
23
B. Channel-like massive-type sandbodies
Grey medium to coarse sandstone, with subrounded to rounded grains well sorted. Alternations between mud layers and massive and normally graded strata with occasionally mud clast. The internal structure consist of steeply overthrown to near vertical lamination. Bioturbation is absent. Sharp to gradational contacts, often occur with facies 9A and 9C
34/3-2 depth 4060
Decimeter to meter thick intervals
Interpreted to represent transitional sand banks filure i.e slumping transition into debris flows
C. Parrallel plannarr bedding
Grey medium grained sandstone with subrounded to rounded grains and well to very well sorted and some mud stone and mud draped horizontal laminationl. The internal structure consists of parallel plannar bedding and occasionally mud clast. Low to moderate degree of bioturbation. Gradational and occasional sharp contact, often occur with facies 9A and 9B.
34/3-2 depth 4057
Decimeter to meter thick intervals
Interpreted to be the more proximal part of compared to facies 9A and 9B in of sandbank failure.

CHAPTER 4: LITHOFACIES, DEPOSITIONAL ELEMENTS AND FACIES ASSOCIATION
24
11. Lags The lithology consist of dark gray to grey, poorly sorted, medium to coarse grained sandstone to poorly sorted matrix supported pebbly sandstone to mudstone. The boundaries are sharp. The composed are pebbles. Low degree of bioturbation. Sharp contact.
34/3-3 s depth 3981
Centimeter to decimeter thick intervals
Interpreted as a transgressive lag were sediments were reworked into transgressive sheets, wave winnowing of fine sediment transported alongshore by coastal currents (Harris et al., 1996). Interpreted to be deposited in a low delta front to prodelta or lower shoreface environment.
Table 1 Observed facies from the 9 cores and core photos.

CHAPTER 4: LITHOFACIES, DEPOSITIONAL ELEMENTS AND FACIES ASSOCIATION
25
4.2 Depositional elements
Depositional element
Description Core photos interpretation
1. Mouth bars The sandstone is moderate to well sorted and fine to medium grained. The base of the mouth bars consist of thin mud layers (facies 1B) wavy bedding (facies 3) going over to flaser bedding (facies 4) and overlain by low angle cross bedded layers with and without mud clasts (facies 8 and 9). Bars are stacked on top of each other in an upward coarsening and cleaning succession. Stacks bars form tens of centimeter up to tens of decimeter thick units. There is no bioturation to low degree; bioturbation is more common in fluid muds represented by Asterosoma and Planolites. The Gamma ray response shows a fairly low to moderate value, coarsening upward blocky signature.
34/3-3
The lack of wave or tide dominated structures and limited bioturbation indicate a distal deposition environment between prodelta to delta front.
CHAPTER 4: LITHOFACIES, DEPOSITIONAL ELEMENTS AND FACIES ASSOCIATION
26
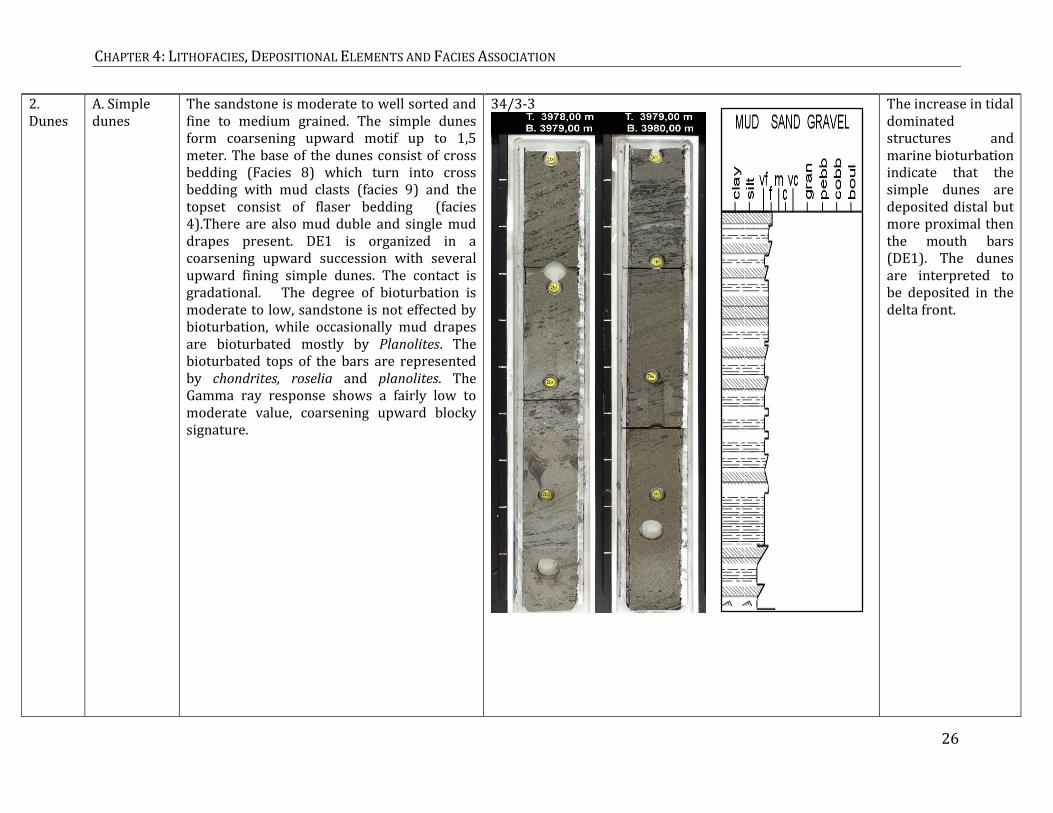
2. Dunes
A. Simple dunes
The sandstone is moderate to well sorted and fine to medium grained. The simple dunes form coarsening upward motif up to 1,5 meter. The base of the dunes consist of cross bedding (Facies 8) which turn into cross bedding with mud clasts (facies 9) and the topset consist of flaser bedding (facies 4).There are also mud duble and single mud drapes present. DE1 is organized in a coarsening upward succession with several upward fining simple dunes. The contact is gradational. The degree of bioturbation is moderate to low, sandstone is not effected by bioturbation, while occasionally mud drapes are bioturbated mostly by Planolites. The bioturbated tops of the bars are represented by chondrites, roselia and planolites. The Gamma ray response shows a fairly low to moderate value, coarsening upward blocky signature.
34/3-3
The increase in tidal dominated structures and marine bioturbation indicate that the simple dunes are deposited distal but more proximal then the mouth bars (DE1). The dunes are interpreted to be deposited in the delta front.

CHAPTER 4: LITHOFACIES, DEPOSITIONAL ELEMENTS AND FACIES ASSOCIATION
27
B. Compound dunes
The dunes consist of cosets of cross bedded sandstone, with a coarsening upward motif. Comprises thick layers of well to very well sorted fine to medium grained sandstone. Double and single mud drapes are present. The succession is upward cleaning, coarsening and thickening. Stacks of compound cross-beds form tens of decimeter up to one meter thick units. The contact is gradational to sharp. The degree of bioturbation is low to absent and represented by Planolites and Ophiomorpha. The Gamma ray response shows a fairly low to moderate value, coarsening upward blocky signature.
34/3-1
DE1B differs from DE1A by less mud, better sorted and less bioturbation which indicate either more proximal deposit in a delta front setting or more distal facies in a estuarine setting.

CHAPTER 4: LITHOFACIES, DEPOSITIONAL ELEMENTS AND FACIES ASSOCIATION
28
3. Collapsed (breaching) dunes
DE3 comprises thick layers of well to well sorted and fine to medium grained sandstone. The base consist of high angle cross stratification (facies 9B) intercalated with massive sandstone (facies 9A) and the top consist of parallel planar bedding (facies 8C). The succession is fining upward, with upward coarsening packages. The dunes form tens of decimeter up to two meter thick units. The contact is gradational. There are no bioturbation to low degree of bioturbation. The bioturbation is represented by escape structures and Planolites, and some shell fragments are present. The Gamma ray response shows a fairly low to moderate value, coarsening upward blocky signature.
34/3-2
Breach failure generates massive sands. The massive sands of collapsed dunes can be found in various ancient shallow water environments and possible deep marine settings. Interpreted to be found in estuary, fluid channel or delta front.

CHAPTER 4: LITHOFACIES, DEPOSITIONAL ELEMENTS AND FACIES ASSOCIATION
29
4. Channel floor/thalweg
DE5 comprises thick sandstone layers of poorly to moderate sorted and medium to coarse grained. The base of the channel fill consist of centimeter thick mud stone (facies 1B), interbedded cross bedded sets with mud clasts (facies 9) which is cleaning upward to cross bedding without mud clast (facies 8). The succession is fining upward and has a sharp base. The succession forms tens of decimeter up to one meter thick units. Bioturbation is absent to low degree bioturbation represented by Planolites. The Gamma ray response shows a fairly low to moderate value, fining upward signature.
34/3-2 34/3-3
Channel floors are formed in the deepest points and near the middle of the channel. thalweg shifting occurs within the active channel evidenced by overlaying compound dunes. Tide-segmented compound dunes restricted energy.

CHAPTER 4: LITHOFACIES, DEPOSITIONAL ELEMENTS AND FACIES ASSOCIATION
30
6. Abandoned channel /Bay-fill
DE6 consist of poorly to moderate sorted, very fine to fine medium grained sandstone, mudstone and silt. The base sometimes consist of lags (facies 11) overlain by lenticular bedding (facies 2), wavy-cross bedding (facies 3), flaser bedding (faices 4A), asymmetrical ripple x-lamination mud drapes (facies 7B) which are alternating with occasionally medium grained cross bedded sandstone with and without mud clasts (facies 8 and 9). The succession is coarsening upward. The contact is sharp. The succession forms meters thick units. The degree of bioturbation is moderately to high and represented by Arenicolites, Roselia, Planolites and Teichichnus. The Gamma ray response shows a variable low to high value, spiky signature.
34/3-3
Varying energy, with high energy sandstone units and low energy heterolitic units.
Table 2 Depositional elements based on the facies (table 4.1)

CHAPTER 4: LITHOFACIES, DEPOSITIONAL ELEMENTS AND FACIES ASSOCIATION
31
4.2.1 Mouth bar DE1
Description. DE2 is a heterolithic depositional element consisting of very fine to fine
grained sandstones interbedded with mudstone. The heterolitic basal part of the mouth
bars consist of mud stone (facies 1B, table 1) wavy bedded heteroliths (facies 3, table 1) and
flaser bedding (facies 4, table 1). Moving up-section the frequency and thickness of
mudstone interbreeds diminishes. The sandstone beds consist of ripple cross-lamination to
cross stratification (facies 8 and 9, table 1). The mouth bars define a coarsening upward
motif, and the thickness of the individual sand beds varies from centimeter to decimeter.
There are no bioturbation to low degree of bioturbation, sandstone is not affected by
bioturbation and mud drapes are occasionally bioturbated by Planolites and Asterosoma.
The Gamma ray response shows a fairly low to moderate value, coarsening upward blocky
signature.
Interpretation. Tidal signatures are represented by single and double mud drapes in the
cross bedded layers (facies 8, table 1) and hetreroliths with opposite directed ripple x-
lamination (facies 4, table 7)(Visser et al., 1980; Dalrymple and Choi et al., 2007; Wei et al.,
2016). There are occasionally centimeter thick structurless dark mudstone layers (facies
1B, table 1) at the base, the dark color of the mudstone and terrestrial debris indicates that
the sediments contain organic materials (Arthur & Sageman, 1994) which suggest that the
mud has terrestrial origin. These drapes are interpreted as fluid muds transported by a
fluvial channels. Dalrymple and Choi (2007) suggested that mouth bars lays a short
distance seaward form the turbidity maximum where fluid muds can be developed. The
exposed position of the mouth bare will experience strong frequency wave action,
consequently deposited mud that may be deposited has a high probability of being
resuspended except in locally sheltered sites (Dalrypmle and Choi 2007). Tidal current
action is stronger than river flow in the tidal mouth bars (Dalrymple and Choi 2007). The
mud clasts present in the cross bedding indicates current reworked clay laminae deposited
during slack water local erosion of fine sediments. The ripples cross lamination in the top of
the mouth bars indicate rapid deposition from waning in flow (Ashley et al., 1982). The
cleaning upward indicates shallowing toward a more proximal setting. The mouth bars are
the part of the delta that contains the finest sand in the system (Dalrymple and Choi 20007).

CHAPTER 4: LITHOFACIES, DEPOSITIONAL ELEMENTS AND FACIES ASSOCIATION
32
The absence of bioturbation indicates rapid bedform migration and high rate of
sedimentation which made it difficult for organisms to colonize the sandstone (Amos and
Long, 1980; Wei et al., 2016). The occasionally occurrence of bioturbated mud drapes could
indicate deposition during slack-water periods with slow sedimentation, indicating tidal
influence.
These observations indicate deposition during high energy conditions, with occasionally
low energy. The mouth bars are interpreted to be deposited in the upper dominated delta
front environment with alternating tidal and fluvial influence.
4.2.2 Simple and Compound dunes DE2
Description. These are defined by a single thick set or stacked cosets of sigmoidal cross-
stratified sandstones of (facies 8 and facies 9, table 1) bounded at their base and tops by
flaser-bedding (facies 4, table 1) and occasionally massive mudstone (facies 1B, table 1).
The sigmoidal cross-stratification is defined by mudstone lamina of varying thickness, often
with an apparent cyclic partitioning; thinner mudstone lamina commonly alternate with
thicker sandstones and thicker mudstone lamina co-occur with thinner sandstones. This is
interpreted to represent tidal bundle sequences. The single sets define a simple fining
occasionally coarsening-upward motif, whereas the cosets define more complex coarsening
and thickening upwards motifs. Individual motifs stack to form overall coarsening upwards
successions. Bioturbation is dominated by an impoverished Cruziana ichnofacies
(commonly by Asterosoma, Chondrites, Ophiomorpha, Planolites and Rosselia), which may be
present along topset, bottomsets and locally also along the sigmoidal foresets. Mud-drapes
are often more intensely bioturbated compared to the sandstones.
Interpretation. The dominance of tide generated facies (e.g., double and single mud
drapes, flaser bedding, current ripples with opposite direction and sigmoidal cross-
bedding), suggest deposition in a strongly tide-influenced or –dominated environment
(Visser et al., 1980; Dalrympole et al., 2007; Wei et al., 2016). The simple relatively thick
sigmoidal cross-stratified sandstone sets hence are interpreted to represent simple large
tide-generated dunes. The stacks of smaller scale dune bedforms or the coarsening upwards
and fining upward coset are accordingly interpreted to represent more complex bedforms,

CHAPTER 4: LITHOFACIES, DEPOSITIONAL ELEMENTS AND FACIES ASSOCIATION
33
formed by a series of smaller-scales dunes that amalgamate to form compound dunes.
Compound dunes are commonly associated with tidal dominated environments (Dalryple
and Choi, 2007). The increase in set thickness indicates energy levels increases (i.e., an
upward transition from ripples into planar–tabular crossbedding)(Dalrymple and Choi ,
2007). This occur because the current strength is less in the trough of the compound dune
than it is at the crest (Dalrymple and Choi , 2007). The partitioning of mudstone into bundle
sequences is related to tidal diurnal activity (Visser et al., 1980). ). There are occasionally
centimeter thick mudstone layers (facies 1B) sometimes bioturbated which suggest
possible reworking, interpreted as fluid mud layers (Dalrymple and Choi et al., 2007). These
observations indicate fluvial influence in a tide dominated setting. The thick fluid mud
deposited in channels between dunes are only present in the lower part of the stacked
dunes, indicating more tidal reworking of the dune succession. The common absence of
bioturbation within the parts dominated by thicker sigmoidal cross stratified sandstone
beds suggest that spring intervals were dominated by rapid bedform migration and high
rate of sedimentation (Amos and Long, 1980). Conversely, the intervals dominated by
thicker and relatively more intensely bioturbated mudstones suggest deposition during
neap intervals dominated by near inactivity or abandonment and slow sedimentation rate.
The presence of angular mudstone clasts within some intervals suggest rapid energy
fluctuations with alternating slack water mud deposition and higher energy flows that were
sufficiently strong to erode the muddy substrate and produce rip-up mud clasts. The
commonly bioturbated topsets of the motifs suggest temporal dune inactivity and cessation
of dune migration, perhaps as dune has aggraded to near sea-level heights.
The impoverished Cruziana ichnofacies hints to a stressed but fully marine environment. In
consort this is taken as support for the formation in a stressed, but fully marine tide-
dominated environment such as outer part of tidal deltas, i.e. the middle to lower delta-
front, or outer parts of tide-dominated estuaries or on ebb-tidal deltas on the seaward side
of wave-dominated estuaries.

CHAPTER 4: LITHOFACIES, DEPOSITIONAL ELEMENTS AND FACIES ASSOCIATION
34
The stacking of dunes to form thick successions suggests a gross near balance between
sediment supply and background subsidence/compaction, in term reflecting a near
stationary position of the shoreline-coastal delivery system (estuaries or deltas).
Compound dunes are differs from simple dunes by the less mud in the system, and better
sorted grains and less bioturbation (Figure5). Mud-drapes are often more intensely
bioturbated compared to the sandstones.
Figure 6 Simple and compound dunes by down-current bedform migration and superposition (modified from bens et al., 2010)
2.

CHAPTER 4: LITHOFACIES, DEPOSITIONAL ELEMENTS AND FACIES ASSOCIATION
35
4.2.3 Collapsed (Breeched) dunes DE3
Description. DE3 comprises thick beds of high angle Diffusive and distorted cross stratified
sandstone (facies 9B, table 1) intercalated with massive sandstones (facies 9A, table 1)
overlain by irregular to parallel planar bedded heteroliths (facies 8C, table 1). The
Collapsed dunes are coarsening upward. There are no bioturbation to low degree of
bioturbation. The bioturbation is represented in the top sets by escape structures and
Planolites, and some shell fragments are present. The Gamma ray response shows a fairly
low to moderate value, coarsening upward blocky signature.
Interpretation. The intercalation of high angle irregular cross bedded (facies 9B, table 1)
and massive sandstone (facies 9A, table 1) is interpreted to represent deposit cyclic release
of sediments between a breaching and a sliding mode (van den Berg et al., 2017). Fine to
medium grained Sandstone relatively tightly packed which gives a low void ratio. A slope
fails gradually because shear force is applied by the retrogradation and create negative
pore pressure, breaching sediments are released as massive sand gravity flows. During
breaching the negative excess pore pressure dissipates locally, and deposits become less
stable resulting in a phase of sliding. The sliding causes unloading and a drop in pore
pressure which strengthen the deposits and switches the slop failure process back to the
grain by grain mode (You et al.,2014Van den Berg et al., 2017). The cyclic release of
sediments between a breaching mode and a sliding mode is named “dual-mode dilative
failure” by You et al., 2014 (Van den Berg et al., 2017). The steep (up to vertical) cross
bedding is preserved do to shear deformation which cause volume to expand making a
negative pore pressure with respect to the hydrostatic and the underpressured pore water
“glues” the sand grains together(Van den Berg et al., 2017). Horizontal planar lamination
found together with massive sand bodies is interpreted as more proximal deposition (Van
den Berg et al., 2007).
In the planar laminated sandstone there are escape structure which indicate that the
deposition rate was very high. Shell fragments indicate shallow marine conditions.
Breaching process is a result of slow retrogressive failure mechanism of steep subaqueous

CHAPTER 4: LITHOFACIES, DEPOSITIONAL ELEMENTS AND FACIES ASSOCIATION
36
slope (Van den Berg et al., 2017). Breach failure is found in shallow water environments
within deep fluvial and estuarine channels (Van den Berg et al., 2017).
Figure 7 Schematization of breaching process (Weij et al., 2016)
4.2.4 Channel floor thalweg DE5
Description. DE5 comprises thick sandstone layers of poorly to moderate sorted and
medium to coarse grained. The base of the channel floor consist of occasionally centimeter
thick mud stone (facies 1B, table 1), overlain by cross bedding with mud clasts (facies 8,
table 1) which is cleaning upward into cross-bedded sandstone with mud drapes (facies 7,
table 1). The thick succession is built up of beds and bedsets that are either blocky or
slightly fining-up from sharply to erosive based surfaces, commonly associated with lags of
very coarse sand or granules. The fining upward successions initiate from a lower erosional
base with abundant mudstone clasts. Some places the fining upward successions are not so
clearly sharp based. A single set of cross-beds is typically a few tens of decimeters thick,
but thinner and thicker sets occur as there is a high degree of amalgamation of beds in this
facies. There is no visible bioturbation to low degree bioturbation represented by

CHAPTER 4: LITHOFACIES, DEPOSITIONAL ELEMENTS AND FACIES ASSOCIATION
37
planolites. The Gamma ray response shows a fairly low to moderate value, fining upward
signature.
Interpretation. The channel floor, or thalweg represent the deepest part of the channel and
is depositis the coarsest material transported by the river. This channel lag is occationally
represented by centimeter thick mudstone layers (facies 1B) interbedded with coarse
sandstone. The dark color of the mudstone and terrestrial debris indicates that the
sediments contain organic materials (Arthur & Sageman, 1994) which suggest that the mud
has been transported form land toward the basin. The mudstone layers are interpreted to
be fluid muds transported within a fluvial channel. Fluid muds are deposited in the
topographically low area such as channel bottoms, because fluid mud is a dense suspension
that hugs the bottom (Dalrymple and Choi 2007). The general medium to coarse grain size
of the deposits indicates high energy conditions of this depositional element. The poorly
sorted coarse grained cross strata represent migrating 2D and 3D dune bedforms that
covered the active channel floor. The overall fining and cleaning upward trend suggests a
reduction in flow strength upward onto channel bars (Dalrymple and Choi 2007) and an
upward decrease in the amount of the suspended-sediment concentration (Ichaso and
Darlymple, 2009).
The occurrence of double and single mud drapes (facies 7) suggest tidal current influence
(Visser et al., 1980; Dalrymple and Choi et al., 2007; Wei et al., 2016). The ripples cross
lamination in the top of the channel-fills indicate rapid deposition from waning in flow
(Ashley et al., 1982). The fluvial and tidal signatures indicate a fluvial dominated
environment with tidal influence. The low amount of bioturbation indicates stressed
environment could be a combined effect of fluvial freshwater influence and high
sedimentary rate.
The erosive sharp based fining upward sandstones unit are interpreted as fluvial channel
floor/thalweg with tidal influence.

CHAPTER 4: LITHOFACIES, DEPOSITIONAL ELEMENTS AND FACIES ASSOCIATION
38
Figure 8 The location of the channel floor/Thalweg whitin a channel (Davis, 2008)
4.2.5 Abandoned channel DE6
Description. DE6 is mainly heterotic and have a higher mud content and higher degree of
bioturbation then the surrounding depositional elements. The base consist of lags (facies
11, table 1) overlain by lenticular bedding (facies 2, Table 1), wavy-cross bedding (facies 3,
table 1), flaser bedding (faices, table 4A), asymmetrical ripple x-lamination mud drapes
(facies 7B, table 1) which are alternating with occasionally medium grained cross bedded
sandstone with and without mud clasts (facies 8 and 9, table 1). Fine to medium grained
sands are interbedded with more muddy deposits commonly organized in interbedds,
which displays a coarsening upward succession. The depositional element is characterized
by having a higher mud content and higher degree of bioturbation then the surrounding
depositional elements. The degree of bioturbation is moderately too high and represented
by the impoverished Cruziana ichnofaceis (common by Roselia and Teichichnus). The
Gamma ray response shows a low to high value, spiky signature.
Interpretation. The coarse grained interbedded pebbly lags at the base usually indicate a
transgression and flooding of the system. Coarse cross stratified sandstone is interpreted as
channel deposits indicating a proximity to the source possible reflecting crevassing from
adjacent channel in flood stage. The fine grained and heteroltic deposits indicate a more

CHAPTER 4: LITHOFACIES, DEPOSITIONAL ELEMENTS AND FACIES ASSOCIATION
39
distal deposition and a lower energy level. The alternation of proximal and distal deposits
and change in energy level could indicate a flooding or an switching and abandonment of
the channel. The low diversity of bioturbation could indicate brackish waters conditions.
Roselia generally associated with the Cruziana ichnofacies, representing a full marine
setting (Pemberton et al., 2004). The Theichicnus are often found in bays and characterize
brackish water. Arenicolites is usually associated with Skolithos ichnofacie which is
shallower marine then the Curziana ichnofacies (Pemberton et al., 2004), this could indicate
that there is not fully marine condition and a bay type of setting. Based on the local
occurrence of this association DE6 can alternatively be is interpreted as an abandoned
distributarychannel.
The higher content of finer grained sediments, and larger amount of bioturbation point
towards and abandonment of a tidal channel.

CHAPTER 4: LITHOFACIES, DEPOSITIONAL ELEMENTS AND FACIES ASSOCIATION
40
Distributary
channel
Abandoned
channel
simple and compund dunes
Channel
s
Compound
dunes
Pro Delta
Figure 9 Conceptual model of the interpreted depositional environment and depositional elements and facies associations of the Cook Formation.
Tidal Flats

CHAPTER 4: LITHOFACIES, DEPOSITIONAL ELEMENTS AND FACIES ASSOCIATION
41
4.3 Facies Association
Facies Associations
Description: Log motif Processes
FA1: Shelfal
Massive black to dark gray mudstone (facies 1A) with occasionally thin beds of very fine grained sandstone or siltstone ripple. The degree of bioturbation is intensely, and represented by Chondrites, Diplocraterion, Asterosoma, Arenicolites Terebelina and Teichichnus.
Deposited in calm water below the wave or current, in Marine water as identified by impoverished Cruziana ichnofacies The sand or silt ripples can indicate periods of higher energy.
FA1: Prodelta
Overall dominated by mudstone; massive black to dark grey mudstone (facies 1A), lenticular bedding (facies 2) and wavy bedding (facies 3), however occasionally layers of very fine grained sandstone to siltstone alternating with mudstones layers. The internal structure consists of structuresless bioturbated sandstone or siltstone (facies 8A) and wavy bedding (facies 3). The degree of bioturbation is low to intense, represented by Asterosoma, Arenicolites, Chondrites, Diplocraterion, Planolites and Teichichnus.
Deposited below fair-weather base, mainly tide influenced, in Marine water as identified by impoverished Cruziana ichnofacies

CHAPTER 4: LITHOFACIES, DEPOSITIONAL ELEMENTS AND FACIES ASSOCIATION
42
FA2: A Delta fron to possible delta plain
FA3 consists of fine to medium grained sandstone. Facies association 2 comprise mudstone (facies 1B) wavy bedding (facies 3), flaser bedding (facies 4A), asymmetrical ripple cross-lamination (facies 4B) low angle cross stratified layers (facies 7A and 8), sandstone with double and single mud drapes (facies 7B) and parallel planar to low angle lamination (facies 7C). This facies consists of distal tidal bars (DE 1), mouth bars (DE2) and channel fill (DE 4). The degree of bioturbation is low and represented by Arenicolites, Chondrites, Planolites, Roselia and some vertical burrows.
Deposited just above fair-weather wave base in marine waters. Tidal and fluvial dominated.

CHAPTER 4: LITHOFACIES, DEPOSITIONAL ELEMENTS AND FACIES ASSOCIATION
43
B Lower shore-face
Fine to very fine grained muddy sandstone and siltstone. Moderate to well sorted. Upward sanding and coarsening. The facies association consists of locally structure less sandstone with occasionally ripple cross-lamination (facies 4B) and some cemented intervals. Intense to high bioturbation represented by Asterosom, Rosselia, Planolites, Palaeophycus, Ophiomorpha, Terebellina and bivalve burrows.
Deposited just above fair-weather wave base. Interpreted as wave dominated. Due to the intense bioturbation structures are hard to observe.
FA3 Upper shoreface/ forshore
Coarsening upward very fine to medium grained well sorted sandstone. The facies association consist mainly of cross-stratification (facies 8A), and parallel planar lamination (facies 7C). No bioturbation present.
Deposited in the zone of breaking waves and swash zone. Wave and tide dominated.

CHAPTER 4: LITHOFACIES, DEPOSITIONAL ELEMENTS AND FACIES ASSOCIATION
44
FA5: Bay-fill
Very fine to fine grained sandstone, mudstone, silt and occasionally coarse sandstone packages. The bay-fill usually consists of lenticular bedding (facies 2), wavy bedding (facies 3) occasionally hummocky cross stratification (facies 5), double and single mud drapes (facies 7B), cross stratification with and without mud clasts (facies 7A and 8) and parallel planar to low angle lamination (facies 7C). The bioturbation is moderate to high and represented by Arenicolites, Asterosoma, Diplocraterion, Planolites and Theichicnus.
Tide and wave dominated
FA5: Tide dominated Estuary
Mainly fine to coarse well sorted sandstone. The Facies association consist of mud stone (facies 1B), low angle cross stratification (facies 7A), mud drapes (facies 7B), parallel planar to low angle lamination (facies 7C), massive sands (facies 9A), high angle cross stratification (facies 9B) and parallel planar lamination (9C). FA5 consists of dunes of breaching (DE3) and estuarine bars (DE4). Bioturbation is low to moderate with low diversity and represented by Ophiomorpha and Planolites.
Deposited just above fair-weather wave base. Tide dominated with fluvial influence.
Table 3 Facies associations based on facies (table 4.1) and depositional elements (table 4.2).
CHAPTER 4: LITHOFACIES, DEPOSITIONAL ELEMENTS AND FACIES ASSOCIATION
45
4.3.1 Shelfal FA1
Description. Facies association 1 consist of massive black to dark gray mudstone (facies
1A) with occasionally thin beds of very fine grained sandstone or siltstone with
occasionally ripple x-lamina (facies 4B). The completely bioturbated fine grained
sandstone to siltstone intervals has a diverse ichnofauna (commonly by Terebelina).
This succession is usually overlain by delta front (FA 3A, table 2), estuaries (FA 6, table
2) or upper to lower shoreface (FA 3B, table 2) deposits. The Gamma ray response
shows a high value, and has an erratic signature.
Interpretation. The massive mudstone deposits indicated deposited in calm water
below wave or current reach (Collinson, 1996). The bioturbation is of marine character
represented by Terebellina which is only one found near shore to outer shelf
(Chamberlain 1978). Because of the intense bioturbation there is hardly any
sedimentary structure visible in this section. These observations indicate deposition in
calm marine environment below storm wave base, which has led to the interpretation of
FA1 to be shelfal.
4.3.2 Prodelta FA2
Description. Facies association 2 is dominated by mudstone (facies 1A, facies 2 and
facies 3), however there are some sandstone layers alternating with the mud layers
(facies 7). The sandstone intervals are developed as continuous layers of up to tens of
centimeter thick upward thickening and coarsening succession. The mudstone intervals
consist of plane-parallel lamination and sandstone lenses. Silt and sand content
increases upward. The degree of bioturbation is low to intense, represented by
impoverished Cruziana ichnofaceis (commonly by Asterosoma, Arenicolites,
Diplocraterion and Teichichnus). The medium grained cross ripple cross-laminated
sandstone layers are unbioturbated. FA2 is usually overlain by delta front (FA3A)
deposits or lower shoreface deposits (FA3B). The Gamma ray response shows moderate
to a high value spiky signature.
Interpretation. The muddy thick layers with lenticular bedding indicate deposition in
calm water with low energy-deposition below fair-weather wave-base (Reading and
Collinson, 1996). The sandstone and siltstone intervals were brought by high-energy
event beds, suggested to be hyperphycnites/ density flows. The hyeperphycnites flows

CHAPTER 4: LITHOFACIES, DEPOSITIONAL ELEMENTS AND FACIES ASSOCIATION
46
are produced by high-density fluvial discharge events, like floods. This results in
turbulent sediment gravity flow along subaqueous slopes, which may extend to the
prodelta (Reading and Collinson, 1996). The completely bioturbated fine grained
sandstone to siltstone intervals have a diverse ichnofauna typical of marine fauna
represented by Terebelina. Because of the intense bioturbation there is hardly any
sedimentary structure visible in this section.
These observations with quiet water laminated, intensely bioturbated mudstone and
mass flow turbidities hyperphycnites flow suggest deposition took place between storm
and fair-weather wave base on the transition from inner shelf to prodelta and delta slope.
4.3.3 Delta Front to possible delta plain FA3A
Description. The regressive facies succession comprises laterally extensive coarsening
upward sequences characterized by tide dominated facies. The delta front comprises
(from distal to proximal); mouth bars (DE 1, table 2), simple and compound dunes (DE
2A and 2B, table 2), collapsed (breached) dunes (DE 3, table 2) and channel-
floor/thalweg (DE 4, table 2) (possible distributary channels). There is an upward
decrease in mud and increase in mean grain size and bed thickness. The succession is
usually overlaying sheflal (FA 1,table 3) or prodelta muds (FA 2, table 3), and coarse and
fine upward into estuarine deposits (FA 6, table 3) or shalfal (FA 1, table 3). The degree
of bioturbation is varying from absent to moderate, and represented by the Cruziana
ichnofacies and Skolithos ichnofacies. The Gamma ray response shows low to moderate
value, blocky coarsening upward for the bars GRLR1 and fining upward signature for the
channels.
Interpretation. The lower part of the succession shows basinet processes and
reworking of the deposits, represented by mouth bars (DE 1, table 2) with heterolitic
lamina (facies 2, facies 3 and facies 7) which is the most distal depositional element. The
mouth bars (DE 1, table 2) is overlying single (DE 1A, table 2) and compound dunes (DE
1B, table 2) with occasionally channel floor/thalweg (DE 4, table 2) at the base. Dunes
are very rare on bar flanks in deltas but common in channel bases, which is observed in
this study by the alternation of compound dunes (DE 1B, table 2) and channel
floor/thalweg (DE 4, table 2). There is also a possibility that some of the interpreted
channel floor/thalwege deposits are distributary channels.

CHAPTER 4: LITHOFACIES, DEPOSITIONAL ELEMENTS AND FACIES ASSOCIATION
47
The channels observed in well 35/4-1 show the clearest sharp base with very coarse
sandstone fining upward. In the other wells were channel-fills are observed the channels
display sharper erosive contact in the lower Cook member then in the middle and upper
Cook member. This indicates that well 35/4-1 and parts of the lower Cook member
could represent delta plain.
The change of facies show that the secession is changing from more distal deposits
toward more proximal deposits, indicate a regression. Corse sand that escapes form the
distributary mouths bars into the delta front will form dune cross bedding with bimodal
bedding (Dalrymple et al., 2003). There is a seaward increase in amount of mud which
generates an upward-coarsening succession.
The absence of storm-induced structures combined with intense tidal reworking
suggests a wave sheltered shallow marine environment, which in contrast with the
coarsening upward mouth bars (DE 1, table 2) suggest tide dominated delta front.
4.3.4 Lower shoreface FA3B
Description. The sandstone is muddy, moderate to well sort and fine to very fine
grained. The internal structure consists of structure less sandstone with occasionally
wave or current ripples (facies 6) with some cemented intervals. The succession is
cleaning and coarsening upwards with a sharp base. The degree of bioturbation is
intense to high with varying diversity, represented by Asterosom, Rosselia, Planolites,
Palaeophycus, Ophiomorpha, Terebellina and bivalve burrows. This facies association
usually overlay prodelta (FA 1) or upper shoreface deposits (FA 4). The Gamma ray
response shows a low to moderate value and a coarsening upward signature.
Introduction. This is an facies association with very intense bioturbation and with mud
content. The intense bioturation and mud content in the sandstone reflects slow
deposition and calm water conditions interpreted to be below fair-weather wave base
(Dalrymple and Choi 2007). The intense bioturbation makes it hard to notice any
sedimentary structure, but occasionally current and wave ripple cross lamination are
observed. These observations can indicate a facies association with a more wave
dominated environment than the other facies associations. The bioturbation is marine,
where Terebellina is the only one found near shore to outer shelf (Chamberlain 1978).
The deposits with higher diverse ichnofauna indicate an open marine shelf, while the
CHAPTER 4: LITHOFACIES, DEPOSITIONAL ELEMENTS AND FACIES ASSOCIATION
48
sediments with low diversity indicate more protected settings (Pemberton et al., 2001).
These observations suggest mainly basinal processes, which indicate deposition close to
the fair-weather wave base. This is interpreted as the protected lower shoreline to an
open lower shoreline.
4.3.5 Upper shoreface/foreshore or intertidal to higher subtidal flats FA4
Description. FA4 consists of thick well sorted, fine to medium grained, clean light grey
sandstone. The sedimentary structures are represented by massive to parallel planar
laminated (facies 7) and occasional local current ripples and cross stratification (facies
8). There is no bioturbation observed. FA6 is coarsening upward into. The shoreline is
overlain by a prodelta (FA 1). Bioturbation is absent. The Gamma ray response shows
low to moderate value and has a coarsening upward signature.
Interpretation. The massive to parallel planar laminae (facies 7) was probably
deposited in the foreshore since it is the zone of maximum sediment movement
(Reading and Collinson, 1996). This is consistent with swash zone deposition. The swash
is a turbulent layer of water that washes up on the beach after incoming waves break,
and moves materials up and down the beach. In the swash zone each wave produces a
shallow high velocity landward-directed swash flow followed by an even shallower
seaward-directed backwash, which may disappear by infiltration into the bed (Reading
and Collinson 2003). Cross stratification reflecting higher-energy wave conditions.
There is a coarsening upward grain size and upward increase in flow strength indicated
by the sedimentary structure. These structures and the absence of bioturbation
indicates deposition during moderate to high energy conditions. FA6 is interpreted as an
upper shoreline/beach.
The alternative interpretation could be that the facies association represent intertidal to
higher subtidal flats. Tidal flats and beach-shoreface often constitute the same end
members in a depositional environment (Dashtgard et al., 2009). Tidal flats are
dominated by tides during fairweater condition (Dalrymple 1992; Dashtgard et al.,
2009), whereas shorface is dominated by wave processes during fairweather
(Dahstgard et al., 2009). Hence the tidal flats will typically show a more complex facies
association, due to the greater importance of tidal influence (Dashtgard et al., 2009). The
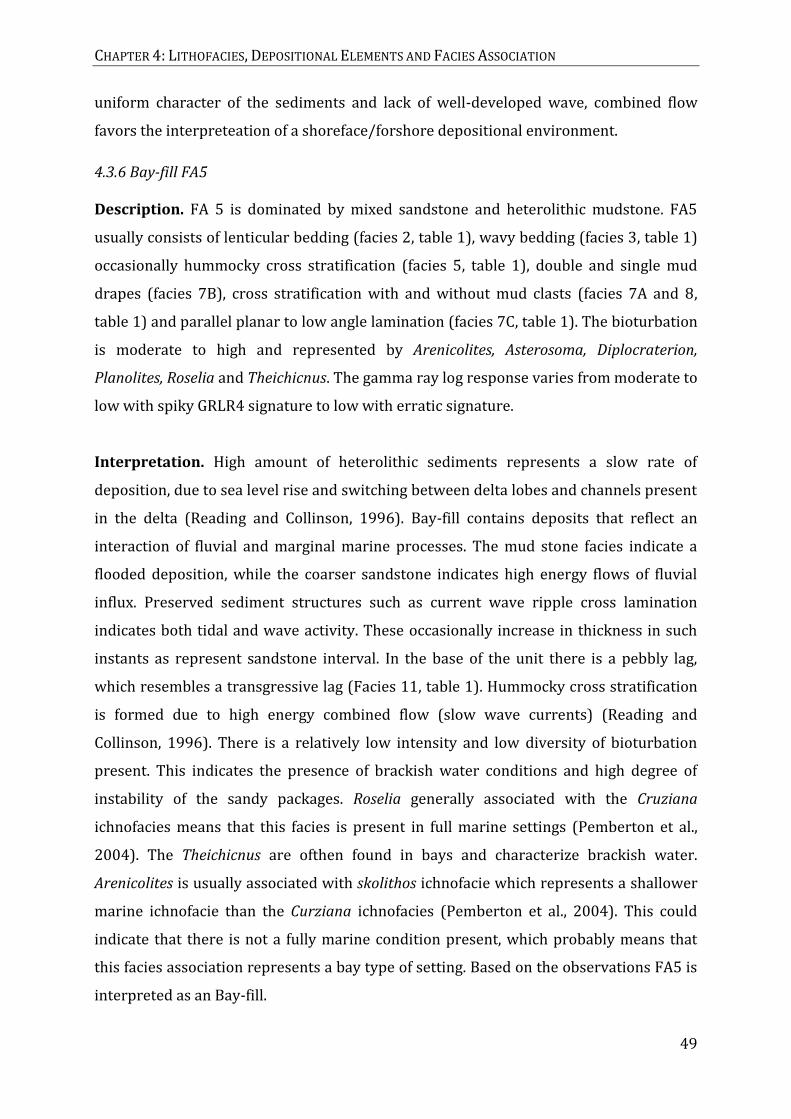
CHAPTER 4: LITHOFACIES, DEPOSITIONAL ELEMENTS AND FACIES ASSOCIATION
49
uniform character of the sediments and lack of well-developed wave, combined flow
favors the interpreteation of a shoreface/forshore depositional environment.
4.3.6 Bay-fill FA5
Description. FA 5 is dominated by mixed sandstone and heterolithic mudstone. FA5
usually consists of lenticular bedding (facies 2, table 1), wavy bedding (facies 3, table 1)
occasionally hummocky cross stratification (facies 5, table 1), double and single mud
drapes (facies 7B), cross stratification with and without mud clasts (facies 7A and 8,
table 1) and parallel planar to low angle lamination (facies 7C, table 1). The bioturbation
is moderate to high and represented by Arenicolites, Asterosoma, Diplocraterion,
Planolites, Roselia and Theichicnus. The gamma ray log response varies from moderate to
low with spiky GRLR4 signature to low with erratic signature.
Interpretation. High amount of heterolithic sediments represents a slow rate of
deposition, due to sea level rise and switching between delta lobes and channels present
in the delta (Reading and Collinson, 1996). Bay-fill contains deposits that reflect an
interaction of fluvial and marginal marine processes. The mud stone facies indicate a
flooded deposition, while the coarser sandstone indicates high energy flows of fluvial
influx. Preserved sediment structures such as current wave ripple cross lamination
indicates both tidal and wave activity. These occasionally increase in thickness in such
instants as represent sandstone interval. In the base of the unit there is a pebbly lag,
which resembles a transgressive lag (Facies 11, table 1). Hummocky cross stratification
is formed due to high energy combined flow (slow wave currents) (Reading and
Collinson, 1996). There is a relatively low intensity and low diversity of bioturbation
present. This indicates the presence of brackish water conditions and high degree of
instability of the sandy packages. Roselia generally associated with the Cruziana
ichnofacies means that this facies is present in full marine settings (Pemberton et al.,
2004). The Theichicnus are ofthen found in bays and characterize brackish water.
Arenicolites is usually associated with skolithos ichnofacie which represents a shallower
marine ichnofacie than the Curziana ichnofacies (Pemberton et al., 2004). This could
indicate that there is not a fully marine condition present, which probably means that
this facies association represents a bay type of setting. Based on the observations FA5 is
interpreted as an Bay-fill.

CHAPTER 4: LITHOFACIES, DEPOSITIONAL ELEMENTS AND FACIES ASSOCIATION
50
4.3.7 Tide dominated Estuary FA6
Description. FA7 mainly consists of medium to coarse well sorted sandstone. The tide
dominated estuaries is composed of compound dunes (DE 2B, table 2), collapsing
(breaching) dunes (DE 3, table 2) and channel floor thalweg (DE 4, table 2). The
estuarine deposits are usually overlain by a flooding surface prodelta (FA2, table 3), or
bay-fill (FA5, table 3). Bioturbation is low to moderate with low diversity, and
represented by Skolithos ichnofacies (commonly by Ophiomorpha and Planolites). The
Gamma ray response shows low to moderate values, and a coarsening upward signature.
Interpretation. Tide dominated estuaries are deposited as an embayment that has been
partially infilled by sediments derived from both fluvial and tidal processes. There is a
landward transportation movement of sediments (Harris et al., 1989; Dalrymple, 1992),
where the clean and well sorted deposits indicate high current energy levels with
frequent reworking of sediments. Because the estuary is close to a delta it will receive
suspended sediments from nearby distributary channels, which will cause abundance of
mud drapes. The compound dunes decrease in set thickness going upward, which
indicates that the energy levels decreases. This suggests that the dunes moves
downstream along the direction of sediment transport, meaning that they are moving
from being more proximal to becoming more distal (Allen, 1980; Ashley, 1990;
Dalrymple and Rhodes, 1995; Desjardins et al., 2012; Choi and Jo, 2015). Estuaries
contain brackish water conditions (Dalrymple, 1992; Boyd et al 2006), which can be
identified by the low rate and low diversity of bioturbation. The occurrence of mud
drapes and fine grained well sorted sandstone indicate tidal currents reworking the
sediments (Visser, 1980; Dalrymple and Choi 2007; Wei et al., 2016), while cross
stratification and thick mud drapes indicates a fluvial influence (Dalrymple and Choi,
2007). These observations are used to interpret FA7 to be a tide dominated estuary.
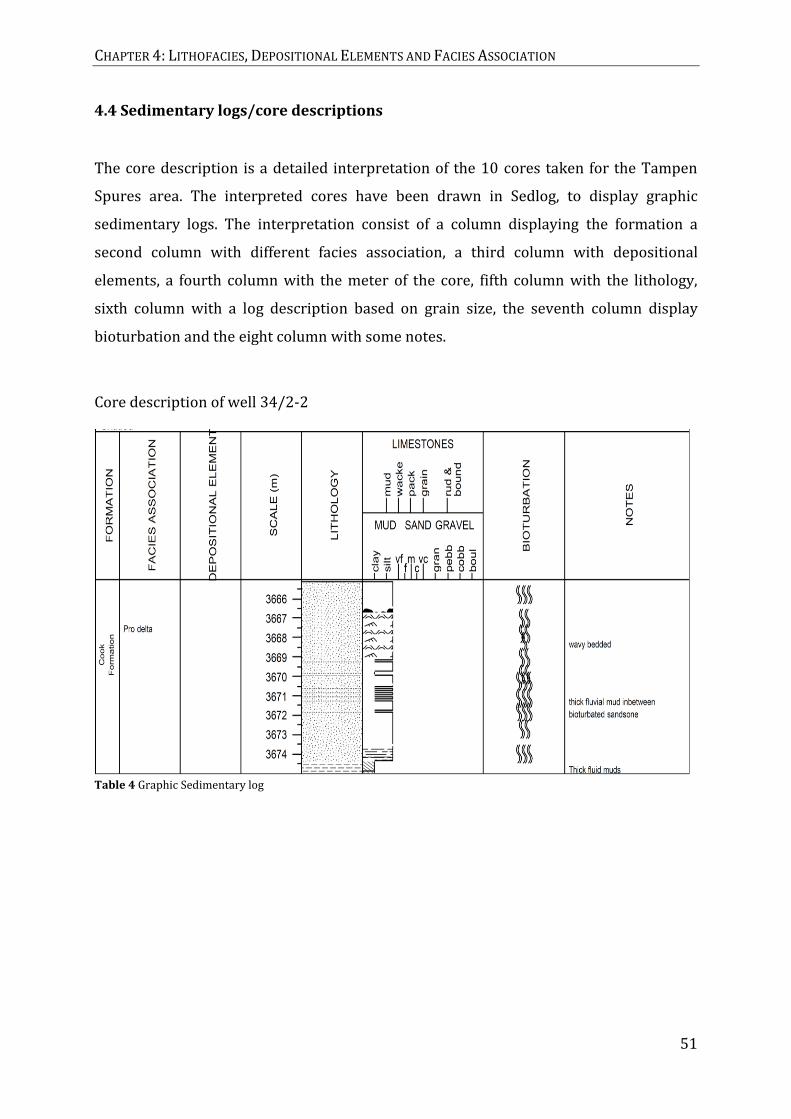
CHAPTER 4: LITHOFACIES, DEPOSITIONAL ELEMENTS AND FACIES ASSOCIATION
51
4.4 Sedimentary logs/core descriptions
The core description is a detailed interpretation of the 10 cores taken for the Tampen
Spures area. The interpreted cores have been drawn in Sedlog, to display graphic
sedimentary logs. The interpretation consist of a column displaying the formation a
second column with different facies association, a third column with depositional
elements, a fourth column with the meter of the core, fifth column with the lithology,
sixth column with a log description based on grain size, the seventh column display
bioturbation and the eight column with some notes.
Core description of well 34/2-2
Table 4 Graphic Sedimentary log

CHAPTER 4: LITHOFACIES, DEPOSITIONAL ELEMENTS AND FACIES ASSOCIATION
52
Core description of well 34/2-4
Table 5 Graphic Sedimentary log

CHAPTER 4: LITHOFACIES, DEPOSITIONAL ELEMENTS AND FACIES ASSOCIATION
53
Core description of well 34/3-1 ST2
Offshore
transition
zone
Offshore
transition
zone

CHAPTER 4: LITHOFACIES, DEPOSITIONAL ELEMENTS AND FACIES ASSOCIATION
54
Table 6 Graphic Sedimentary log
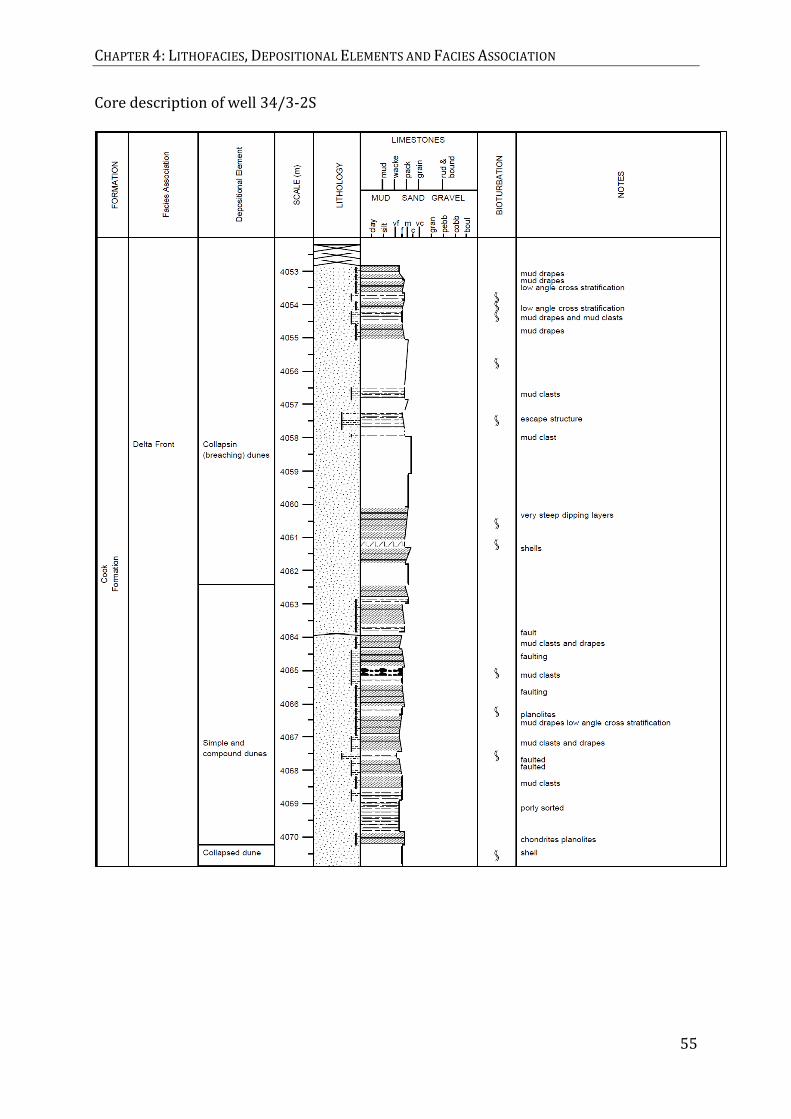
CHAPTER 4: LITHOFACIES, DEPOSITIONAL ELEMENTS AND FACIES ASSOCIATION
55
Core description of well 34/3-2S

CHAPTER 4: LITHOFACIES, DEPOSITIONAL ELEMENTS AND FACIES ASSOCIATION
56
Table 7 Graphic Sedimentary log
Offshore transition zone

CHAPTER 4: LITHOFACIES, DEPOSITIONAL ELEMENTS AND FACIES ASSOCIATION
57
Core description of well 34/3-3S

CHAPTER 4: LITHOFACIES, DEPOSITIONAL ELEMENTS AND FACIES ASSOCIATION
58
Offshore transition zone
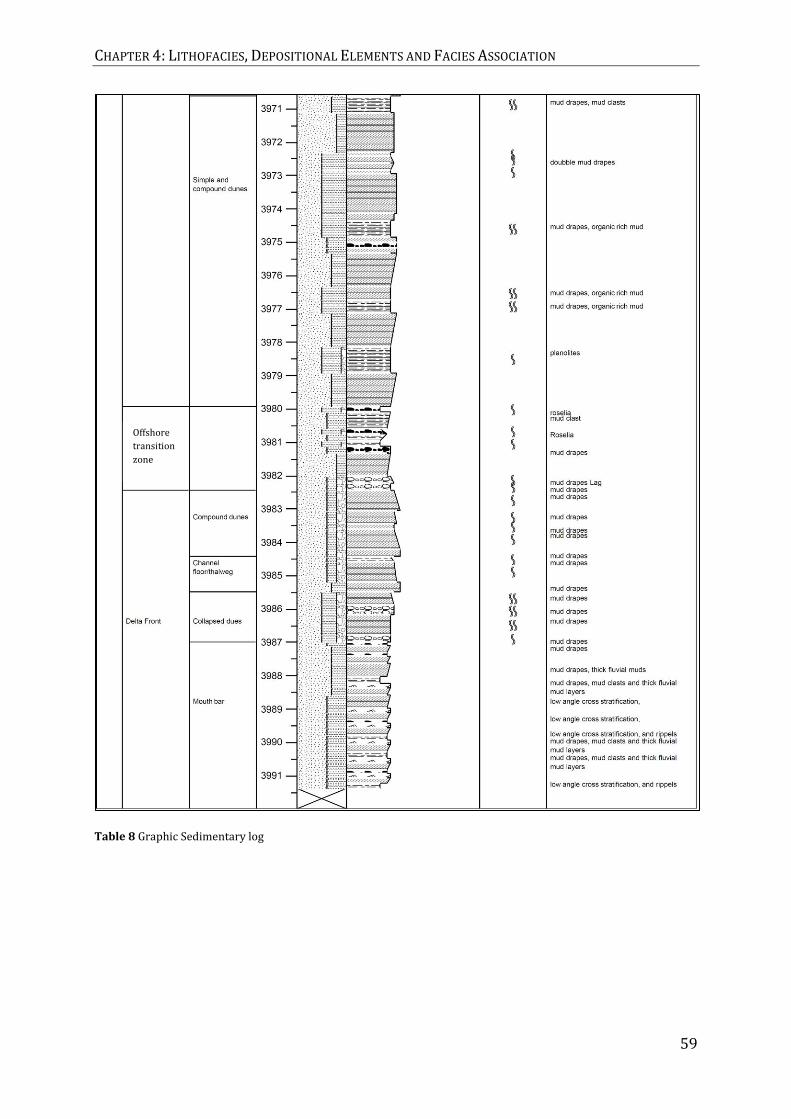
CHAPTER 4: LITHOFACIES, DEPOSITIONAL ELEMENTS AND FACIES ASSOCIATION
59
Table 8 Graphic Sedimentary log
Offshore
transition
zone

CHAPTER 4: LITHOFACIES, DEPOSITIONAL ELEMENTS AND FACIES ASSOCIATION
60
Core description of well 34/4-5

CHAPTER 4: LITHOFACIES, DEPOSITIONAL ELEMENTS AND FACIES ASSOCIATION
61
Table 9 Graphic Sedimentary log

CHAPTER 4: LITHOFACIES, DEPOSITIONAL ELEMENTS AND FACIES ASSOCIATION
62
Core description of well 34/5-1S
Table 10 Graphic Sedimentary log

CHAPTER 4: LITHOFACIES, DEPOSITIONAL ELEMENTS AND FACIES ASSOCIATION
63
Core description of well 34/6-2S
Table 11 Graphic Sedimentary log
Core description of well 34/6-3S
Offshore
transition
zone
Offshore
transition
zone

CHAPTER 4: LITHOFACIES, DEPOSITIONAL ELEMENTS AND FACIES ASSOCIATION
64
Table 12 Graphic Sedimentary log

CHAPTER 4: LITHOFACIES, DEPOSITIONAL ELEMENTS AND FACIES ASSOCIATION
65
Core description of well 34/6-3S

CHAPTER 4: LITHOFACIES, DEPOSITIONAL ELEMENTS AND FACIES ASSOCIATION
66
Offshore transition zone
Table 23 Graphic Sedimentary log

CHAPTER 4: LITHOFACIES, DEPOSITIONAL ELEMENTS AND FACIES ASSOCIATION
67
Core description of well 35/4-1
Table 14 Graphic Sedimentary log
Offshore
transition zone

CHAPTER 4: LITHOFACIES, DEPOSITIONAL ELEMENTS AND FACIES ASSOCIATION
68

CHAPTER 5: COOK FORMATION- TAMPEN SPUR
69
5.0 Cook Formation - Tampen Spur
5.1 Cook Stratigraphy
During the Pliensbachian to the Early Toarcian the Cook Formation in the Tampen Spurs
area formed an overall progradational to aggradational layered package of tidal-deltaic,
tidal estuarine, shoreface, and shallow marine to shelfal strata. The formation can be
organized into three upward coarsening units or higher order sequences; lower Cook
member, middle Cook member and upper Cook member, which are present across the
NE Tampen Spur (Figure 2). These three sandstone units are bounded by relatively thick
to thin shale and mudstones, which represent flooding across the paralic deltaic to
estuarine deposit.
5.2 Lower Cook stratigraphic architecture and GDE distribution
The lower Cook member forms up to 48 meter thick sandstone units. The units
represents a prograding tide-dominated delta front (DE3A, table 3) represented by
mouth bars (DE 1, table 2), simple dunes (DE 2A, table 2), compound dunes (DE 2B,
table 2) and Channel floor/thalweg deposits (DE 4, table 2) and capped by a
transgressive lag. The basal boundary is defined by a relatively thick marine claystone of
the Burtone Formation, which represent a major marine flooding and subsequently the
J13 flooding surface of Charnock et al., 2001.
Based on log signatures the lower Cook member is coarsening and thickening upward
from a sharp (possible erosive) base. The base of the lower Cook is not cored, but the
sharp transition from offshore mudstone to prodelta/delta front is interpreted to
represent a regression formed during relative sea level fall, hence it is interpreted as a
regressive surface of marine erosion (RSME) (e.g Marajanac, 1995).
Based on log signatures a fast prograding system is interpret below the Cook Formation.
This could indicate a highstand system tract underlying the Cook Formation, which
suggest that that the water was on its max point and started to fall during the deposition
of the lower Cook Formation which coinsides with the interpretation of a regressive
surface of marine erosion.

CHAPTER 5: COOK FORMATION- TAMPEN SPUR
70
The upward coarsening sandstone unit consists of mouth bars (DE 1, table 2) overlain
by simple dunes (DE 2A, table 2) and compound dunes (DE 2B, table 2) with occasional
intervening erosive channel floor/thalweg deposits (DE 4, table 2). This is the situation
in the Knarr Field (wells 34/3-2, 34/3-1 and 34/3-3), in the Garantiana discovery (wells
34/6-1S, 34/6-2S and 34/6-3S) and in the east of the Knarr Field and Garanatiana
discovery (well 35/4-1, 35/1-1).
Further west in the Knarr Field (well 35/5-1) mouth bar deposits (DE 1, table 2) are
overlain by erosive channel floor/thalweg deposits (DE 4, table 2) (possible distributary
channels). Further west from the Knarr Field and Garantiana discovery (wells 34/4-5
and 34/2-4) the Cook Formation consists of prodelta mouth bars deposits (DE 1, table
2). Mouth bars (DE1, table 2) are the most distal depositional element, which suggests
that the area has a more distal prodelta position. In well 34/2-2 the lower Cook member
is represented by prodelta deposits (FA2, table 3) with prodelta hyperphycnites/density
flow deposits, which indicate proximity to the delta front (DE3A, table 3).
There are observed single and double mud drapes, sigmoidal cross bedding and
heterolitic deposits that indicate tidal-influence in the deposits. The stacking pattern of
the depositional elements shows distal facies that are overlain by proximal facies. These
observations are interpreted to represent a shallowing upward motif from sharpe based
prodelta to lower/upper delta front to distributary channel-fills, which is interpreted to
represent a prograding tide-dominated delta.
These observations indicate that the proximal subenvironments are located to the east
and the distal depositional subenvironments are located toward west (figure 12 and
figure 13). This is a reflection of sediment input from the east. The Lower Cook member
is overlain by marine mudstone representing the J14 flooding surface of Charnock et al.,
2001, only separated by a ravinement surface and occasionally a thin transgressive lag.

CHAPTER 5: COOK FORMATION- TAMPEN SPUR
71
5.3 Middle Cook stratigraphic architecture and GDE distribution
The middle Cook member forms up to 60 meter thick sandstone units, conditionally
thicker than the lower Cook member. The sand consists of a tide-dominated delta front
(FA 3A, table 3) and a tide dominated estuary-fill (FA6, table 3) represented by mouth
bars (DE 1, table 2), simple dunes (DE 2A, table 2), compound dunes (DE 2B, table 2)
collapsed dunes (DE3) and Channel floor/thalweg deposits (DE 4, table 2). The basal
boundary is defined by the J14 flooding of Charnock et al., 2001. The upper boundary is
capped by a thick mudstone of the J15 flooding of Chanrock et al., 2001.
The lower part of the middle Cook member is coarsening upwards from marine
mudstone at the base. In the Knarr Field (wells 34/3-1, 34/3-2 and 34/3-3), the middle
Cook member consists of mouth bars (DE 1, table 2) overlain by a stacked simple dunes
(DE 2A, table 2) and compound dunes (DE 2B, table 2) with occasional interbedded
channel floor/thalweg deposits (DE 4, table 2). In the the Garantiana discovery (34/6-
1S, 34/6-2S and 34/6-3S) and in the eastern part of the study area (well 35/4-1, 35/1-1)
the middle Cook member consist of stacked simple dunes (DE 2A, table 2) and
compound dunes (DE 2B, table 2) with occasional interbedded channel floor/thalweg
deposits (DE 4, table 2). The Channel floor thalweg deposits do not show as distinct
sharp base as in the lower Cook member, which could indicate that the dunes are
deposited within a channel, where the main channel is only occasionally recognized by
coarser sands.
Further west of the Knarr Field and Garantiana discovery only prodelta (FA2, table 3) to
shelfal (FA1, table 3) deposits are observed (wells 34/2-2, 34/2-4 34/5-1 or 34/4-5).
These are distal facies associations, which suggest that the area represent a more distal
prodelta position (figure 12 and figure 13). The well 34/6-4 which is located between
the Knarr Field and Garantiana is not cored but based on well log signatures the well
displays worse reservoir quality then the other wells. In this study the well is
interpreted to represent a tidal flat deposit, which is also seen in well 34/4-1. This could
indicate that the two systems are more separated in the middle Cook member compared
to the lower Cook member.
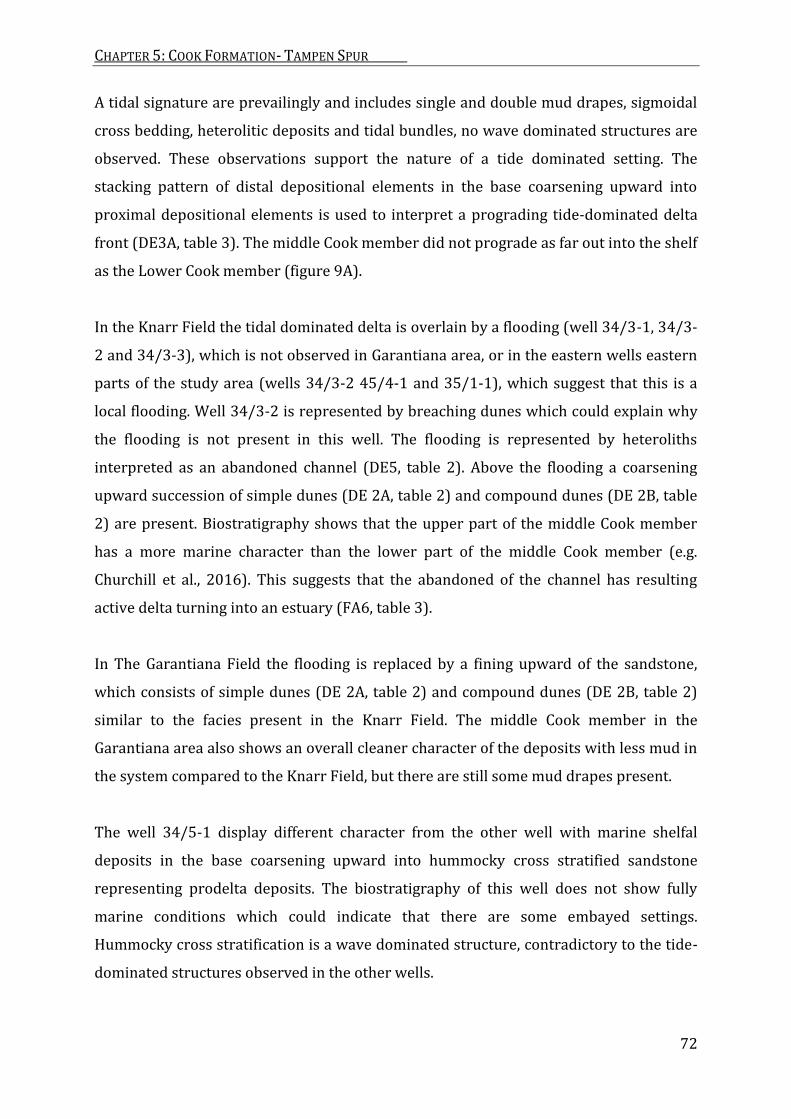
CHAPTER 5: COOK FORMATION- TAMPEN SPUR
72
A tidal signature are prevailingly and includes single and double mud drapes, sigmoidal
cross bedding, heterolitic deposits and tidal bundles, no wave dominated structures are
observed. These observations support the nature of a tide dominated setting. The
stacking pattern of distal depositional elements in the base coarsening upward into
proximal depositional elements is used to interpret a prograding tide-dominated delta
front (DE3A, table 3). The middle Cook member did not prograde as far out into the shelf
as the Lower Cook member (figure 9A).
In the Knarr Field the tidal dominated delta is overlain by a flooding (well 34/3-1, 34/3-
2 and 34/3-3), which is not observed in Garantiana area, or in the eastern wells eastern
parts of the study area (wells 34/3-2 45/4-1 and 35/1-1), which suggest that this is a
local flooding. Well 34/3-2 is represented by breaching dunes which could explain why
the flooding is not present in this well. The flooding is represented by heteroliths
interpreted as an abandoned channel (DE5, table 2). Above the flooding a coarsening
upward succession of simple dunes (DE 2A, table 2) and compound dunes (DE 2B, table
2) are present. Biostratigraphy shows that the upper part of the middle Cook member
has a more marine character than the lower part of the middle Cook member (e.g.
Churchill et al., 2016). This suggests that the abandoned of the channel has resulting
active delta turning into an estuary (FA6, table 3).
In The Garantiana Field the flooding is replaced by a fining upward of the sandstone,
which consists of simple dunes (DE 2A, table 2) and compound dunes (DE 2B, table 2)
similar to the facies present in the Knarr Field. The middle Cook member in the
Garantiana area also shows an overall cleaner character of the deposits with less mud in
the system compared to the Knarr Field, but there are still some mud drapes present.
The well 34/5-1 display different character from the other well with marine shelfal
deposits in the base coarsening upward into hummocky cross stratified sandstone
representing prodelta deposits. The biostratigraphy of this well does not show fully
marine conditions which could indicate that there are some embayed settings.
Hummocky cross stratification is a wave dominated structure, contradictory to the tide-
dominated structures observed in the other wells.
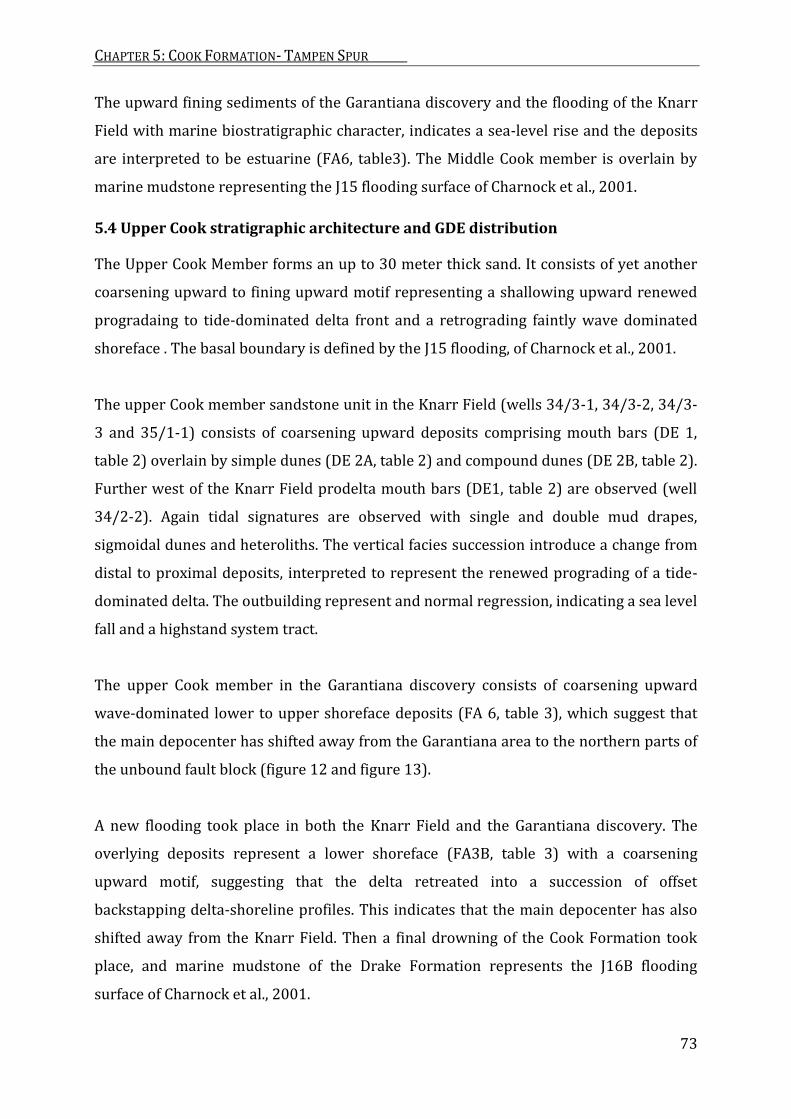
CHAPTER 5: COOK FORMATION- TAMPEN SPUR
73
The upward fining sediments of the Garantiana discovery and the flooding of the Knarr
Field with marine biostratigraphic character, indicates a sea-level rise and the deposits
are interpreted to be estuarine (FA6, table3). The Middle Cook member is overlain by
marine mudstone representing the J15 flooding surface of Charnock et al., 2001.
5.4 Upper Cook stratigraphic architecture and GDE distribution
The Upper Cook Member forms an up to 30 meter thick sand. It consists of yet another
coarsening upward to fining upward motif representing a shallowing upward renewed
progradaing to tide-dominated delta front and a retrograding faintly wave dominated
shoreface . The basal boundary is defined by the J15 flooding, of Charnock et al., 2001.
The upper Cook member sandstone unit in the Knarr Field (wells 34/3-1, 34/3-2, 34/3-
3 and 35/1-1) consists of coarsening upward deposits comprising mouth bars (DE 1,
table 2) overlain by simple dunes (DE 2A, table 2) and compound dunes (DE 2B, table 2).
Further west of the Knarr Field prodelta mouth bars (DE1, table 2) are observed (well
34/2-2). Again tidal signatures are observed with single and double mud drapes,
sigmoidal dunes and heteroliths. The vertical facies succession introduce a change from
distal to proximal deposits, interpreted to represent the renewed prograding of a tide-
dominated delta. The outbuilding represent and normal regression, indicating a sea level
fall and a highstand system tract.
The upper Cook member in the Garantiana discovery consists of coarsening upward
wave-dominated lower to upper shoreface deposits (FA 6, table 3), which suggest that
the main depocenter has shifted away from the Garantiana area to the northern parts of
the unbound fault block (figure 12 and figure 13).
A new flooding took place in both the Knarr Field and the Garantiana discovery. The
overlying deposits represent a lower shoreface (FA3B, table 3) with a coarsening
upward motif, suggesting that the delta retreated into a succession of offset
backstapping delta-shoreline profiles. This indicates that the main depocenter has also
shifted away from the Knarr Field. Then a final drowning of the Cook Formation took
place, and marine mudstone of the Drake Formation represents the J16B flooding
surface of Charnock et al., 2001.

CHAPTER 5: COOK FORMATION- TAMPEN SPUR
74
5.4 Cook Formation stratigraphic architecture and GDE distribution Garantiana
discovery to Knarr Field
The lower Cook member show similar outbuilding character across the Garantian
Discovery to the Knarr Field. But there is observed some variability in stratigraphic
structure, internal sedimentary architecture and energy regime (figure 12, 13 and 14).
The lower Cook member is the unit that displays the most similarity pattern across the
Garantian discovery to the Knarr Field (Figure 9A). In both the Garantiana discovery and
Knarr Field a prograding tide dominated delta is interpreted.
The middle Cook member shows similar facies but there is variability in the
stratigraphic structure (figure 9A). In both the Knarr Field and Garandtiana Discovery
the lower part is interpreted as delta front (DE3A, table 3) and the upper part as an
estuary(FA6, table 3). The Knarr Field consists of two coarsening upward backstepping
units, which are separated by a local flooding, while the Garantiana Discovery displays a
coarsening upward pattern in the base and a fining upward pattern toward the top. The
well 34/6-4 which is located between the Knarr Field and the Garantiana discovery is
not cored but the well log show different and worse reservoir quality in the middle Cook
member compared to the other wells. In this study the well is interpreted to represent
tidal flats. Tidal flat deposits are observed in well 35/4-1 which shows some similarities
with in log signatures of the well 34/6-4, which coincides with the interpretation of tidal
flats in well 34/6-4. These observations indicate that the systems are changing into
more distinct separate system and the orientations of the systems are slightly changing.
There is also observed wave dominated structures in well 34/5-1.
The upper Cook member is the unit that shows the strongest variability (figure 9A). The
Cook Formation in the Garantiana Discovery represent of a backstepping lower to upper
shoreface (DE4, table3), while the Knarr Field the formation represent of a prograding
delta and a backstepping shoreface. This indicates that there is more sediments supply
in the Knarr Field, while in the Garantiana discovery the deposcenter has shifted, which
could indicate tectonic activity.

CHAPTER 5: COOK FORMATION- TAMPEN SPUR
75
Figure 10 A) Shows the stacking patter of the Cook Formation B)shows the outbuilding an retreat of the Cook Formation
B)
Upper Cook member
Middle Cook member
Lower Cook member
Knarr Field
Garantiana discovery
Tidal delta
Estuary
Tidal delta
Shoreface Tidal delta
Tidal delta
Shoreface
RSME
FS
FS
FS
FS
A)
Local FS
Estuary
Tidal delta Tidal delta

CHAPTER 6: THICKNESS TRENDS
76
6.0 Thickness trends
The interpreted facies, depositional elements and facies associations of the Cook
Formation (chapter 4.0) shows lateral and proximal to distal changes between the
studied areas i.e. the 10 wells studied (figure 12, 13 and 14). The Cook Formation
sandstone has accumulated across the Tampen Spur area. For full regional
understanding of the outbuilding and retreat of the different Cook sandstone units and
the Cook system it is useful to investigate the thickness variations of the sandstone
bodies. The Cook Formation is divided into lower, middle and upper Cook member in
this study (chapter 5). The sandstone units are thickening landward and thinning
basinwards i.e. to the west, while the muddy heterolitic intervals that separate the sands
thicken basinward.
6.1 Thickness variations - Knarr Field East-West
The overall thickness of the Cook Formation in the Knarr Field displays a thinning
towards west (figure 13). In the lower and middle Cook member there is only small
variability in thicknesses, while the upper Cook member shows more pronounced
thickness variations.
The Lower Cook member is slightly thicker in the eastern end of the well correlation
profile (Figure 12, well 35/1-1), and there is a thinning towards west. This suggests that
there is more accommodation space available in the east, or that the western areas are
not filled to seal level. There is some minor variability in thickness over the Knarr Field,
but no large thickness variations are observed. Based on log signatures there is
interpreted a prograding system underlying the Knarr Field. This system is not present
in all wells in the Knarr Field, which could be one reason for the slight thickness
variability in the lower Cook member.
The Lower Cook member has relative uniform thickness that is slightly thinning towards
west. The thinning towards west combined with the distal facies located toward west
interpreted in chapter 5, could suggest that the eastern part is located proximal while
the western part is located more distal. The thickness variation of the Lower Cook
member shows overall uniform thicknesses, interpreted as a thinning towards the more
distal areas, which favors the explanation that the areas are not filled to seal level.

CHAPTER 6: THICKNESS TRENDS
77
The heterolitic unit overlying the lower Cook member shows variable thickness varying
from 2 meter (wells 34/3-3 S and 34/3-2S) up to 7 meter (34/3-1 ST2 well). This
thickness variation could be due to difference in accommodation.
The Middle Cook member has a similar thickness trend as the lower Cook member and
displays thinning toward west. This in paralleled with change of facies (distal
depositional element to the west and proximal depositional element to the east) could
indicate that the eastern part is located proximal and the western part is located distal.
The thickening trend is accordingly interpreted to represent degree of infilled
accommodation (not filled to sea level of the western end of profile). These thickness
variations within the Knarr Field i.e. the sandy deltaic deposits are attributed to
differential to combination with the amount of sediments removed locally during
transgressive reworks.
Overlying the middle Cook member a heteroliths unit is present, which is thickening
towards the northern part of the study area (well 34/2-4) and eastern part of the study
area (34/3-2S, 34/3-3S and 35/1-1). The thickness change could be due to differences in
accommodation space or some errors with the data/correlations.
The upper Cook member shows more variability in the thickness distribution. The
thickest part over the Knarr Field has a thickness up to 33 meter (well 34/3-3S), where
it is developed into sandier facies. There is a thinning present both lateral eastward
towards well 35/1-1 (25 meter), where it remains sandy, and westwards towards wells
34/2-2, 34/2-4, 34/5-1A, 34/5-1S and 34/4-5 where the deposits consists of muddy
deposits. The westward thinning is associated with a change of finer grained outer
shelfal mudstone facies (FA1, table 3). Hence similar controls as interpreted for the
middle Cook member are also predicted to the upper Cook member. In addition the
eastward thinning toward well 35/1-1 may reflect less transgressive rework of the
middle Cook member and the potential preservation of thinner eastern facies in the
uppermost part.

CHAPTER 6: THICKNESS TRENDS
78
of the Cook member in this well. Another possibility could be tectonic activity during the
deposition of the upper Cook member creating more accommodation space.
6.2 Thickness variations Garantiana discovery East-West
The Cook Formation in the Garantiana Discovery is generally thinning towards west. In
the lower and middle Cook member there is only a small variability in thicknesses, while
the upper Cook member shows more pronounced thickness variations (figure 12).
Lower Cook member is remarkably thicker in well on the (well 35/4-1) Marflo Spur
relative to wells located in the Garantiana area. From the Garantiana area to the Mort
ridge (34/4-5) the lower cook member displays a thinning, this could be due to
accommodation, sediments that are not filled to sea level or different compaction.
Separating the lower and middle Cook members there is a heterolitic unit present, that
shows relative uniform thickness, which could represent different accommodation
space.
Middle Cook member display relatively uniform thickness in all the wells expect for an
abrupt thinning within well 34/6-1S. The thinning could indicate that the well is located
at a distal position and that sediment is not filled to sea-level or different compaction.
The middle Cook member is deposited during rising sea-level, and sediments could be
locally removed during transgressive reworks.
Separating the upper and middle Cook Formation there is a heterolitic unit, which
increases in thickness towards the north (well 34/6-1) and east (well 34/6-3) which
could represent different accommodation space.
Upper Cook member maintains variable thickness distribution, with thicknesses up to
54 meter in well (34/6-1) thinning both lateral eastward (well 35/4-1) and westward
(34/4-5). The westward thinning is associated with a change of finer grained outer
shelfal mudstone facies (FA1, table 3), hence similar controls as interpreted earlier. In
addition the eastward thinning toward well 35/4-1 may reflect less transgressive
rework of the middle Cook member and the potential preservation of thinner eastern
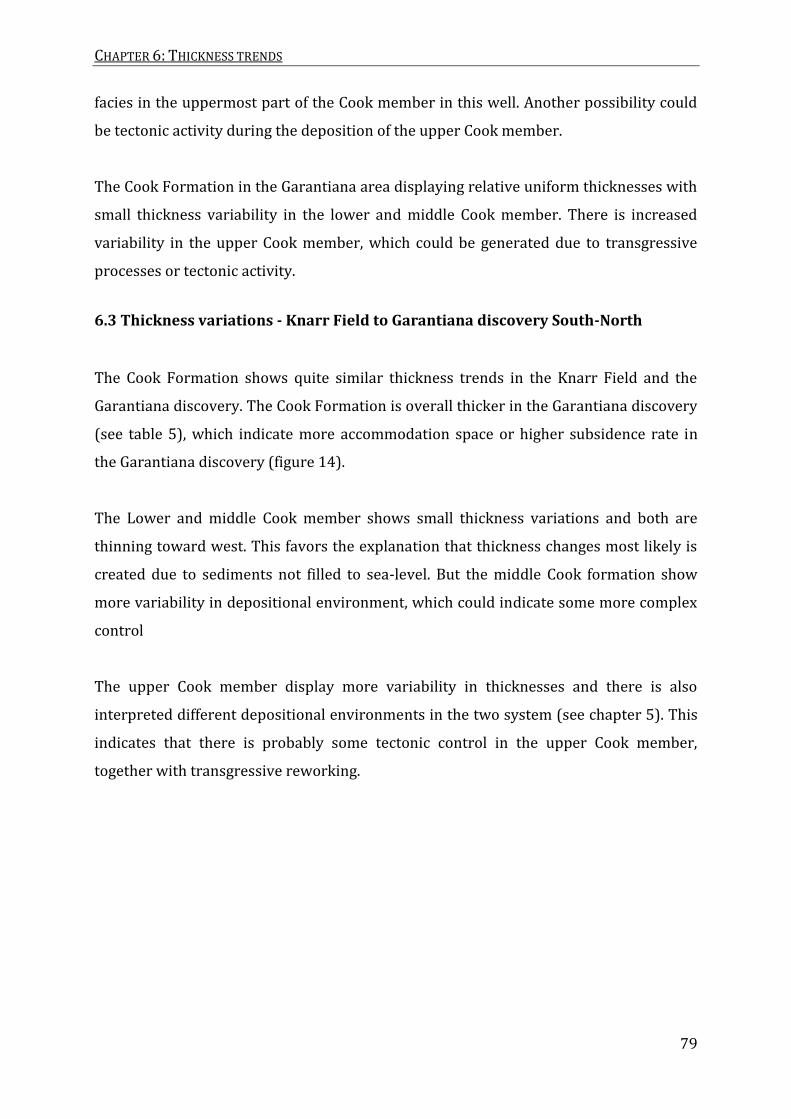
CHAPTER 6: THICKNESS TRENDS
79
facies in the uppermost part of the Cook member in this well. Another possibility could
be tectonic activity during the deposition of the upper Cook member.
The Cook Formation in the Garantiana area displaying relative uniform thicknesses with
small thickness variability in the lower and middle Cook member. There is increased
variability in the upper Cook member, which could be generated due to transgressive
processes or tectonic activity.
6.3 Thickness variations - Knarr Field to Garantiana discovery South-North
The Cook Formation shows quite similar thickness trends in the Knarr Field and the
Garantiana discovery. The Cook Formation is overall thicker in the Garantiana discovery
(see table 5), which indicate more accommodation space or higher subsidence rate in
the Garantiana discovery (figure 14).
The Lower and middle Cook member shows small thickness variations and both are
thinning toward west. This favors the explanation that thickness changes most likely is
created due to sediments not filled to sea-level. But the middle Cook formation show
more variability in depositional environment, which could indicate some more complex
control
The upper Cook member display more variability in thicknesses and there is also
interpreted different depositional environments in the two system (see chapter 5). This
indicates that there is probably some tectonic control in the upper Cook member,
together with transgressive reworking.

CHAPTER 6: THICKNESS TRENDS
80
Sandstone units
34/2-2 Depth (m)
34/2-4 depth (m)
34/3-1S Depth (m)
34/3-2S Depth (m)
34/3-3S Depth (m)
34/3-5 Depth (m)
34/4-5 depth (m)
34/5-1S depth (m)
34/5-1A Depth (m)
34/6-1S depth (m)
34/6-2S depth (m)
34/6-3S depth (m)
34/6-4 Depth (m)
35/1-1 Depth (m)
35/4-1 Depth (m)
Top Cook 3619 3821 3866 4012 3908 4140 3416 3629 4274 3807 3654 3851 3951 3970 4434
Base Cook 3683 3893 3958 4090 3996 4222 3480 3696 4345 3932 3777 4001 4066 4087 4556
Thickness of Upper Cook
- 10 29 23 32 28 - - - 54 31 51 17 24 26
Thickness of Middle Cook
- - 37 38 34 37 - - - 30 49 58 70 60 54
Thickness of Lower Cook
- - 17 12 15 10 11 18 12 21 22 27 26 20 37
Total Thickness
64 72 92 78 88 82 64 67 71 125 123 150 115 117 122
Table 5 Thicknesses of the Cook Formation in the Tampen Spur area.

CHAPTER 7: SEQUENCE STRATIGRAPHY AND RESERVOIR ARCHITECTURE
81
7.0 Sequence stratigraphy and reservoir architecture
Sequence stratigraphic analysis of the Cook Formation was preformed to ensure
realistic correlation of the facies associations defined in chapter 4.0 within a time
stratigraphic framework. The facies associations and their vertical stacking pattern in
wells have been used to define the genetic surfaces using Galloway (1989) method for
genetic stratigraphic sequence where maximum flooding surfaces are defined as
sequence boundaries. Parasequences stack into sets that display the longer-term
migration of the shoreline, controlled by the larger-scale balance between the rate of
sediment supply and accommodation space available (Howell and Flint, 2005).
Maximum flooding surfaces were picked and correlated between the wells. This has then
been used to identify the evolution trends for the Cook Formation depositional systems.
7.1. Sequence stratigraphy
The Cook Formation consists of a series of stacked deltaic units, ranging from shelfal
(deeper marine) to shallow marine tide-dominated delta front (DE3A, table 3), estuary
(FA6, table 3) and faintly wave-dominated shoreface. The Cook Formation in the
Tampen Spur is divided into three higher order sequences; each consisting of a
regressive segment and one transgressive segment. The sequences are bounded by
flooding surfaces at the base and top.
7.1.1 Lower Cook member- Sequence I
The first maximum flooding surface which signifies the base of sequence I is placed
below the Cook Formation and in a thick marine claystone unit of the Burton Formation,
corresponding to J13 flooding surface Charnock et al., 2001. The Lower Cook member is
interpreted in terms of delta front (DE3A, table 3) to prodelta deposits (FA2, table 3),.
The formation is strongly progradational and is the sequence that extend most distal.
Well log signatures of the underlying Burton Formation shows and fast prograding
character. This prograding signature of the underlying system could reflect a highstand
system tract that was completely drowned, and the flooding surface separating the two
systems represents a maximum flooding surface (J13 flooding surface Charnock et al.,
2001).
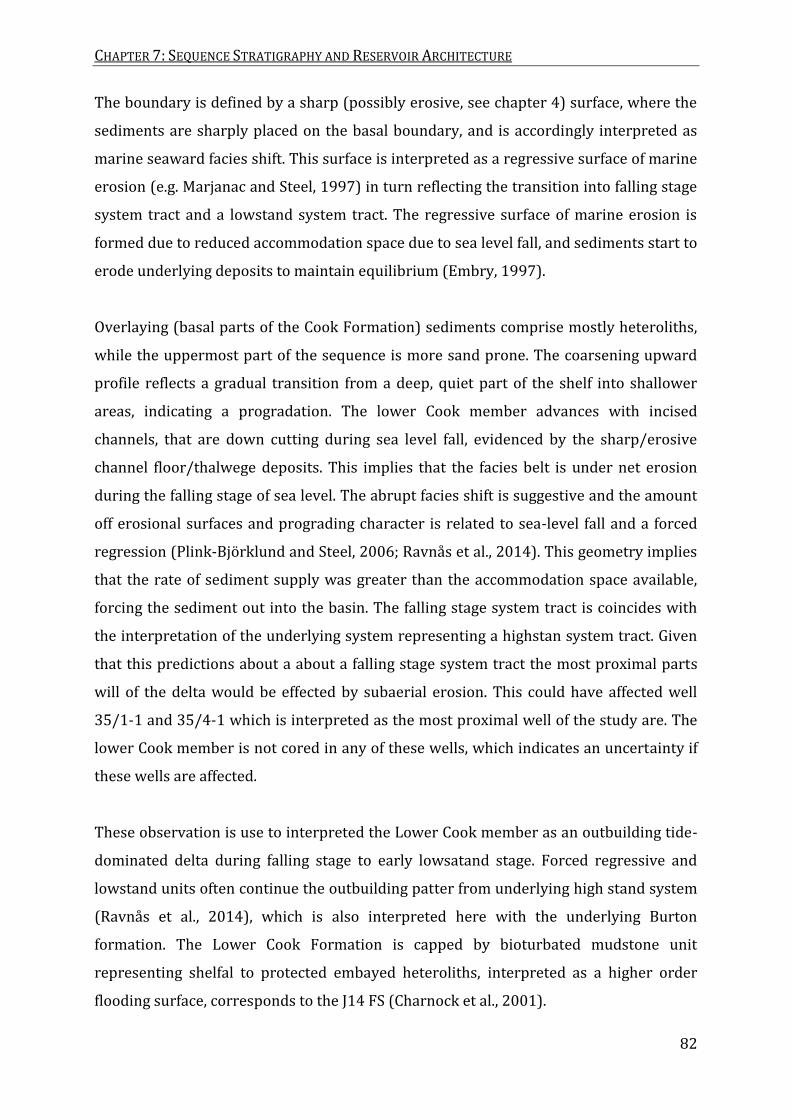
CHAPTER 7: SEQUENCE STRATIGRAPHY AND RESERVOIR ARCHITECTURE
82
The boundary is defined by a sharp (possibly erosive, see chapter 4) surface, where the
sediments are sharply placed on the basal boundary, and is accordingly interpreted as
marine seaward facies shift. This surface is interpreted as a regressive surface of marine
erosion (e.g. Marjanac and Steel, 1997) in turn reflecting the transition into falling stage
system tract and a lowstand system tract. The regressive surface of marine erosion is
formed due to reduced accommodation space due to sea level fall, and sediments start to
erode underlying deposits to maintain equilibrium (Embry, 1997).
Overlaying (basal parts of the Cook Formation) sediments comprise mostly heteroliths,
while the uppermost part of the sequence is more sand prone. The coarsening upward
profile reflects a gradual transition from a deep, quiet part of the shelf into shallower
areas, indicating a progradation. The lower Cook member advances with incised
channels, that are down cutting during sea level fall, evidenced by the sharp/erosive
channel floor/thalwege deposits. This implies that the facies belt is under net erosion
during the falling stage of sea level. The abrupt facies shift is suggestive and the amount
off erosional surfaces and prograding character is related to sea-level fall and a forced
regression (Plink-Björklund and Steel, 2006; Ravnås et al., 2014). This geometry implies
that the rate of sediment supply was greater than the accommodation space available,
forcing the sediment out into the basin. The falling stage system tract is coincides with
the interpretation of the underlying system representing a highstan system tract. Given
that this predictions about a about a falling stage system tract the most proximal parts
will of the delta would be effected by subaerial erosion. This could have affected well
35/1-1 and 35/4-1 which is interpreted as the most proximal well of the study are. The
lower Cook member is not cored in any of these wells, which indicates an uncertainty if
these wells are affected.
These observation is use to interpreted the Lower Cook member as an outbuilding tide-
dominated delta during falling stage to early lowsatand stage. Forced regressive and
lowstand units often continue the outbuilding patter from underlying high stand system
(Ravnås et al., 2014), which is also interpreted here with the underlying Burton
formation. The Lower Cook Formation is capped by bioturbated mudstone unit
representing shelfal to protected embayed heteroliths, interpreted as a higher order
flooding surface, corresponds to the J14 FS (Charnock et al., 2001).

CHAPTER 7: SEQUENCE STRATIGRAPHY AND RESERVOIR ARCHITECTURE
83
7.1.2 Middle Cook member- Sequence II
The middle Cook member show a varied architectural motif, including aggrading to
back-stepping of the delta, displaying a relatively thick transgressive succession. The
Middle Cook member does not extend as far as the Lower Cook member. The middle
Cook member is separated from the underlying progrational lower Cook member by the
mudstone unit J14 flooding of Charnock et al., 2001.
The Middle Cook member consists mainly of stacked simple (DE 2A, table 2) and
compound dunes (DE 2B, table 2). Other features present are channel floor surfaces but
they are not distinct erosive, which could indicate that the dunes have been deposited in
a fluvial channel. These observations indicate a repeated advance of the basin-marginal
delta, representing a normal regression. Normal regression form when sedimentary rate
outspace the sea-level rise, which represent highstand system tract.
In the Knarr Field local flooding surface is placed above the prograding delta (discussed
in chapter 4), interpreted as abandoned channel (FA 5 Table 2). The flooding is overlain
by simple dunes (DE 2A, table 2) and compound dunes (DE 2B, table 2) interpret as an
estuary (FA6, table 3). This implies that there is a retreated of the delta and the former
deltaic deposits changes into estuaries. In the Garantiana area the flooding surface is not
present, but the succession is fining and cleaning upward and also turning into an
estuary (figure11). The change into estuary (FA6, table 3) could be due to higher rate of
accommodation space created then sediment supply rate, or that the sea level rise is
faster than the sedimentary supply. This could either be due to abandonment of channel
creating an estuary (FA6, table 3) on a lager delta or there could be structuring creating
a tectonic estuary (e.g. Ravnås et al., 2014).
The Garantiana discovery and Knarr Field show similar facies architecture but there are
clear differences in in the aggrading unit. The Knarr Field is represented by a distinct
and layered aggradation succession of tide dominated delta and estuarine facies (figure
10). The Garantiana Discovery forms and cylinder shapes cleaner sand unit of
amalgamated sandy tide dominated deltaic and estuarine facies (Figure 10). The
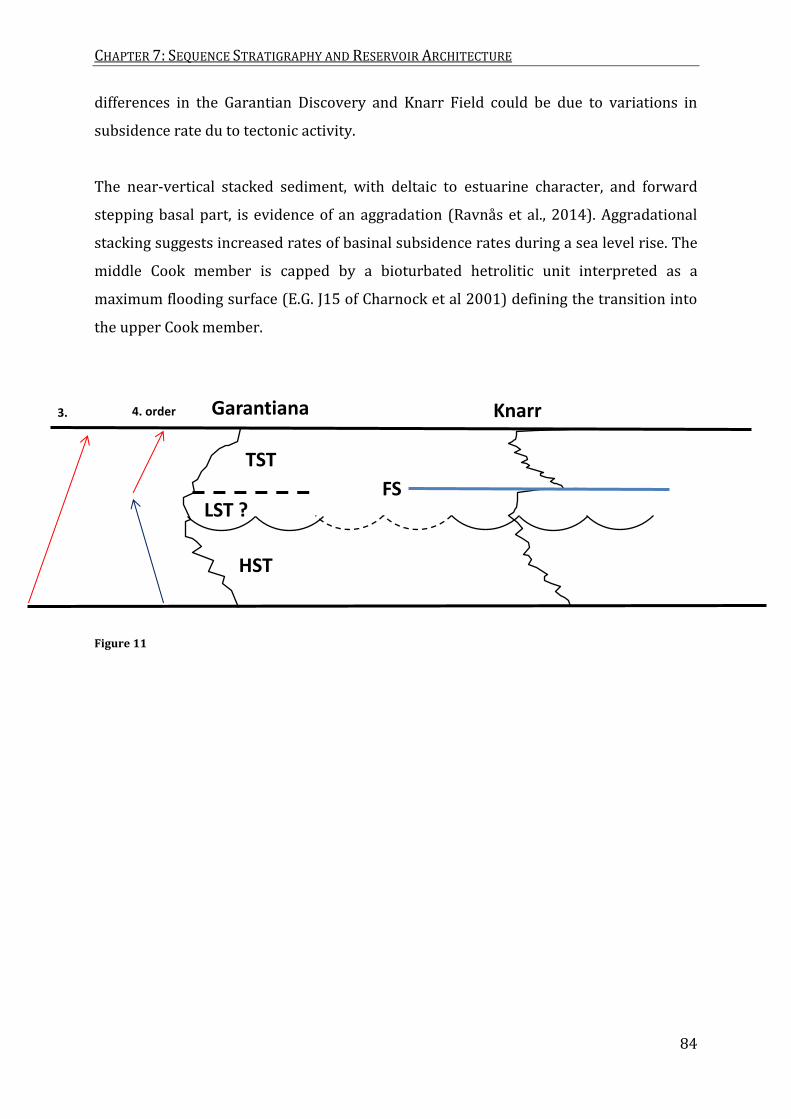
CHAPTER 7: SEQUENCE STRATIGRAPHY AND RESERVOIR ARCHITECTURE
84
differences in the Garantian Discovery and Knarr Field could be due to variations in
subsidence rate du to tectonic activity.
The near-vertical stacked sediment, with deltaic to estuarine character, and forward
stepping basal part, is evidence of an aggradation (Ravnås et al., 2014). Aggradational
stacking suggests increased rates of basinal subsidence rates during a sea level rise. The
middle Cook member is capped by a bioturbated hetrolitic unit interpreted as a
maximum flooding surface (E.G. J15 of Charnock et al 2001) defining the transition into
the upper Cook member.
Figure 11
Garantiana Knarr
HST
TST
FS
LST ?
3. order
4. order

CHAPTER 7: SEQUENCE STRATIGRAPHY AND RESERVOIR ARCHITECTURE
85
7.1.3 Upper Cook member- sequence III
The upper Cook member across the Garantiana discovery and Knarr Field shows
laterally and stratigraphically infill variability. The sequence represents and overall
back-stepping pattern of mixed tide- and wave-structured deltaic to shorface succession.
In the Knarr Field the upper Cook member consist of a relative thin renewed pulse of
tide-dominated delta-front progradation, which extend further then middle Cook
member but not as far as the Lower Cook member. While in the Garantiana disconvery
the upper Cook member consists of a prograding upper shoreface (DE4, table3). Both
systems show a coarsening upward motif, representing a normal regression, indicating a
highstand system tract. This observation implies that there is variability of sedimentary
supply in the two systems creating more local depositional system; there are also
interpreted thickness changes in the upper Cook member (chapter 6). The variating rate
of sedimentary supply implies that there is mild rifting.
There is a small flooding represented by marine strata and a final progradational event
with lower shoreface (FA3B, table 3) strata building out during the retreat phase in both
the Knarr Field and the Garantiana discovery representing the transgressive system
tract.
Then a final drowning of the system interpreted as the maximum flooding surface which
is placed on top of the Cook Formation, corresponding to J16B (E.G Churchill et al., 2016;
Marajanac and Steel 1997). At this point, accommodation is being created at its most
rapid rate, outpacing the rate of sediment supply and generating condensed marine
deposits.
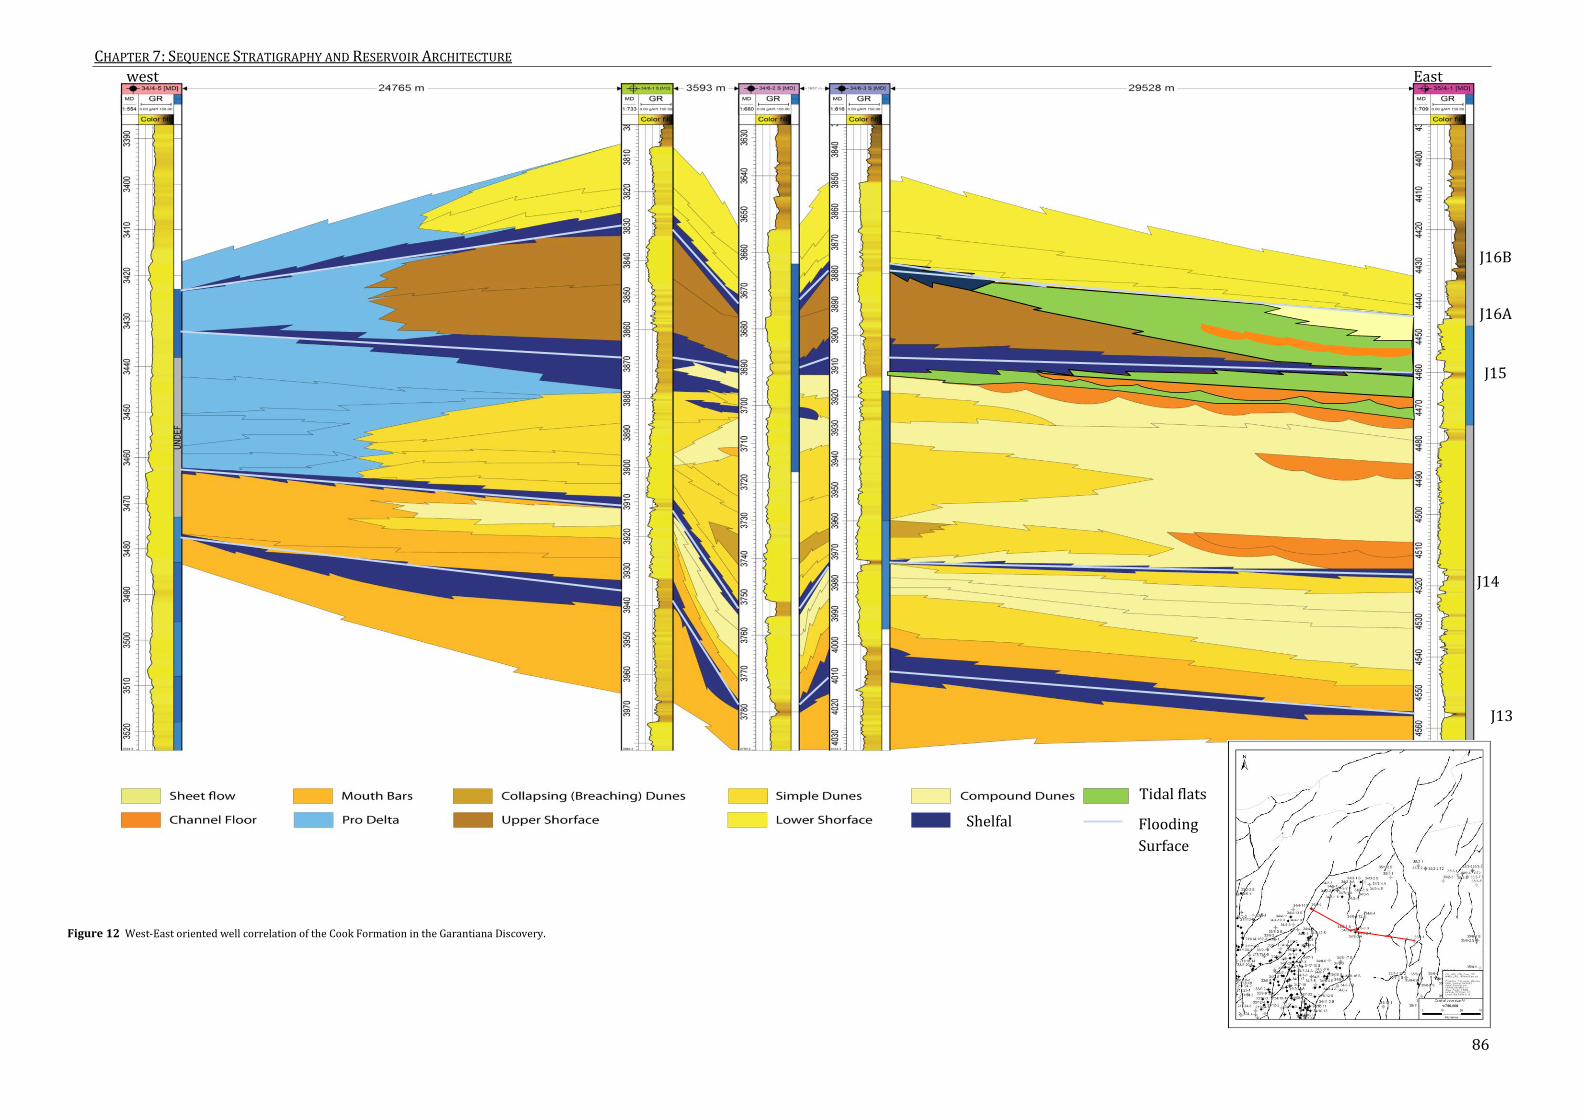
CHAPTER 7: SEQUENCE STRATIGRAPHY AND RESERVOIR ARCHITECTURE
86
Figure 12 West-East oriented well correlation of the Cook Formation in the Garantiana Discovery.
Shelfal
Tidal flats
west East
J16A
J16B
J15
J14
J13
Flooding
Surface

CHAPTER 7: SEQUENCE STRATIGRAPHY AND RESERVOIR ARCHITECTURE
87
Figure 13 West-East oriented well correlation of the Cook Formation in the Knarr Field.
Shelfal
Tidal flats
West East
J16A
J16B
J15
J14
J13
Flooding
Surface

CHAPTER 7: SEQUENCE STRATIGRAPHY AND RESERVOIR ARCHITECTURE
88
Figure 14 South-North oriented well correlation of the Cook Formation from the Knarr Field to the Garantiana Discovery.
Shelfal
Tidal flats
South North
J16A
J16B
J15
J14
J13
Flooding
Surface
CHAPTER 7: SEQUENCE STRATIGRAPHY AND RESERVOIR ARCHITECTURE
89
7.2 Paleogeography
The Lower Jurassic Cook Formation represents one megasequence with three higher
order sequences. The three higher order sequences represent the geological
development of the Cook deltaic system through the main phases of progradation,
aggradation, retrogradation and drowning (the lower part of the megasequence are
represented by the Amundsen-Burton and Johannesen shoreline shelf). These
observations are used to build a series of paleographic maps to illustrate the evolution
of the Cook Formation.
7.2.1 Peak prograding of lower Cook member
Progradation of the Cook Formation led to establishment of a tide-dominated delta-front
across and extending beyond the Knarr Field and Garantiana discovery. There are
interpreted two separate deltas lobes one extending across the Garantiana Discovery,
and one extending across the Knarr Field, but the facies are similar in both lobes. Based
on the observations done earlier (chapter 4 and chapter 5) a thinning toward west and
more distal facies observed in the west, is used to suggest a east-west orientation of the
two systems. The Lower Cook Formation is interpreted to represent a falling stage
system tract (see Chapter 6), and the falling-sea level forces the sediments far
basinward. The lower Cook member is capped by a flooding, representing the J14
Flooding of Charnock et al ., 2001.

CHAPTER 7: SEQUENCE STRATIGRAPHY AND RESERVOIR ARCHITECTURE
90
Figure 15 Paleographic map of the lower Cook member peak progradaion, the red squares marks the study area.

CHAPTER 7: SEQUENCE STRATIGRAPHY AND RESERVOIR ARCHITECTURE
91
7.2.2 Peak aggradation of the middle Cook member
Following the Pliensbachian J14 flooding, the Cook delta started to prograde again across
the Tampen Spur forming two delta lobes. The middle Cook member displays an
aggradational stacking patter. Tidal flats are interpreted between the two systems. Well
34/3-5 was also very thin in the lower Cook member and were interpreted to display distal
facies and in the middle Cook member the well has equal thickness and proximal facies
compared to the other wells which could indicate well 34/3-5 is more proximal to the
source in the upper Cook member. In the lower Cook wester well western 34/3-3 thicker
than the north eastern well 34/3-1 and 34/3-2, while in the middle cook the opposite is
observed. Well 34/6-4 which is located between the two systems also shows different
signatures then the other wells, the well has been interpreted as tidal flats. This indicates
that the systems are more separated in the middle Cook member then in the lower Cook
member. These changes in thickness and facies could indicate that the system located in the
Knarr Field has slightly shifted to a south-eastern source and is building out towards north-
west. In the Garantiana discovery middle Cook member thickness and facies show similar
trends as the in the Lower Cook member.

CHAPTER 7: SEQUENCE STRATIGRAPHY AND RESERVOIR ARCHITECTURE
92
Figure 16 Paleographic map of the middle Cook member peak aggradation, the red squares marks the study area

CHAPTER 7: SEQUENCE STRATIGRAPHY AND RESERVOIR ARCHITECTURE
93
7.2.3 Retrogradation of middle Cook Formation
The two deltas show different drowning stories: In the Garantiana discovery the retreat
of the middle Cook member is represented by a change to tide-dominated estuary (FA6,
table 3). In the Knarr Field the delta was flooded with the establishment of a short-lived
bay or “inactive distributaries” before the middle Cook delta prograded once more. The
final retreat off the system led to establishment of estuaries to Knarr-Garantiana (with
an evasion south to the west). The middle Cook member was bounded by a flooding
representing the J15 Flooding surface of Charnock et al., 2001. Well 34/5-1S displays
wave-dominated structures, which is contradictory to the tide-dominance in all the
other wells. The well is locates distal and to the north of the system. This can indicate
this well is located between the two systems in a more open setting which allow the
waves to rework deposits. This could also suggests that tides were weaker offshore and
increased landward.

CHAPTER 7: SEQUENCE STRATIGRAPHY AND RESERVOIR ARCHITECTURE
94
Figure 17 Paleographic map of the middle Cook member retrogradation, the red squares marks the study area.

CHAPTER 7: SEQUENCE STRATIGRAPHY AND RESERVOIR ARCHITECTURE
95
7.2.4 Peak progradation of Upper Cook Formation
Following the latest Pliensbachian J15 flooding the upper Cook member represents the
final progradation. In the Knarr Field the delta builds out again, while a shoreface
formed across the Garantiana discovery. This stage of Cook delta formation is correlated
with the preak progradation in the Kvitebjørn/Valemon and Gullfaks area (Dreyer and
Wiig 1995, Folkestad et al., 2012) based on the biostratigraphy provided by Charnock et
al., 2001.The marked deflection of the Cook delta with a northern and a southern branch
is attributed to increased subsidence along the embayed Viking Graben (see also Ravnås
et al., 2000).
Figure 18 Paleographic map of the lower Cook member peak progradaion, the red squares marks the study area.

CHAPTER 7: SEQUENCE STRATIGRAPHY AND RESERVOIR ARCHITECTURE
96
7.2.5 Retrogradation of Upper Cook member
The last stage of the retrogradation of the Cook Formation is represented by a
transgressive faintly wave-dominated shoreface, across the Knarr Filed and Garantiana.
This is the last stage before the whole system got drowned. The Cook Formation is
overlain by marine mudstone of the Drake Formation representing the J16B maximum
flooding surface of Charnock et al., 2001.
Figure 19 Paleographic map of the lower Cook member peak retrograding, the red squares marks the study area.

CHAPTER 7: SEQUENCE STRATIGRAPHY AND RESERVOIR ARCHITECTURE
97
7.3 New observations and interpretations
The new observations and interpretations in this study are related to the link between
the Cook Formation in the Knarr Field and the Garantiana discovery and the wells that
are located fare more distal (seaward) and proximal (landward) positions; 34/2-2,
34/2-4, 34/3-2S, 34/4-5, 34/5-1S, 35/1-1 and 35/4-1.
The distinction between deltas and estuaries lies in the identification of the facies
stacking pattern (Dalrymple et al., 2003). This in turns requires a detailed interpretation
of the facies. The Lower and Middle Cook Formation interpreted as mouth bars (DE 1,
table 2), Simple dunes (DE 2A, table 2), compound dunes (DE 2B, table 2), collapsing
(breaching) dunes (DE 3, table 2) and channel floor/thalweg (DE 4, table 2) deposits,
have previously been interpreted as tidal channel complex, tidal bar complex, intertidal
bar complex and proximal intertidal bar complex (Churchill et al., 2016). The lower and
middle part of the Cook Formation is interpreted by Churchill and coworkers (2016) as
only delta. The detailed interpretation of the bar architecture gives a more complex
interpretation of the delta advance then earlier interpreted. The change in bars from
proxiamel to distal or form distal toward proximal can help identifying estuarine
deposits. The upper Cook Formation interpreted as a prograding delta front (FA 2A,
table 3) with estuarine deposite (FA 6, table 2) switching to shoreface deposit (FA 2A
and FA3), which have previously been interpreted as only shoreface deposits (Churchill
et al., 2016).
Churchill and coworker interpreted the orientation of the delta to be supplied form east
and prograde toward west, which is similar to the interpretation of sequence I in this
study. Observation done in this thesis suggests a change in direction in sequence II and
III to sedimentary supply form south-east and prograding north-west.
The base of the Lower Cook Formation is interpreted to be influenced by tectonic
processes. The variation in thickness and fast chang in facies of the Upper Cook
Formation is possible due to tectonic activity fast transgression. Tectonic activity is the
preferred explanation, and as a result it has a highly variable thickens distribution.

CHAPTER 8: DISCUSSION
98
8.0 Discussion
8.1 Cook Formation structure and sedimentary architecture
Varying energy settings throughout a relative sea level cycle is a function of the coastal
bathymetry, shelf width, tidal resonance and sea level behavior, which can change at any
time during the relative sea-level cycle (Yoshida et al., 2007).
The lower Cook member developed during a relative sea-level fall (falling stage system
tract to early lowstand system tract). There are lateral facies changes simply because of
process variability laterally away from the river mouth. These are expressed as varying
degree of marine erosion related to wave- and-tide ravinement in front of the falling
stage shoreline, thickness and facies tracts within the falling stage shoreline-deltaic
system and amount of incision and thereby focusing of the late stage (lowtand) fluvial to
distributary channels. Distribution of facies tracts suggests an overall east to west
porgradation. The thickness is relative uniform with only immoral thickness variations.
The thinning toward the distal parts of the deltaic facies tracts is related to pinch-out
and ‘shale-out’ of the delta-fron to prodelta facies, suggesting that the most distal parts
of the delta was not filled to sea level. In consort observations imply that the
progradation was mainly driven by lack of accommodation forcing the sediment to build
out, with peak progradation and turn-around of the lower Cook lowstand deltas
controlled by sediment availability. The relative sea-level fall is attributed to upwaping
of the rift margin and its hinterland, which in turn forced the lower Cook delta
basinward (Steel, 1993; Ravnås et al., 2014). This suggests that the main control of the
lower Cook member hinterland structuring (in combination with any basinal
structuring) and related relative sea-level lowering or fall(e.g Steel, 1993, Ravnås et al.,
2014).
The middle Cook member was deposited during the subsequent sea-level rise, when
accommodation creation started to balance sediment supply. The middle Cook
Formation represents a relative thick aggrading sequence with relative uniform
thickness. This suggests that the middle Cook member reflect sea-level rise with high
sediment supply. Churchill et al.,2016 interpreted the Cook depositional system(s) in the
Knarr Field to always have their distributary channels oriented east to west. In this

CHAPTER 8: DISCUSSION
99
study the middle Cook member deltaic systems at the Knarr Field is interpreted to have
changed f to a more southeast to northwest orientation and progradation direction. This
may be attributed to an increased control of accommodation creation related to
reactivation of the inherited Permo-Triassic structural grain (e.g. see Gabrielsen et al.
1990; Steel & Ryseth 1990; Færseth & Ravnås 1998, Ravnås et al., 2000), with delta lobe
swithcing partly controlled by enhanced subsidence along north-south oriented faults
cross-cutting the NE Tampen Spur area (Norske Shell in-house Cook Formation isochore
maps) in response to mild late Pliensbachian-early Toarcian tectonic activity (e.g. see
Ravnås et al., 2000). The middle Cook member also show lateral variability in their
backstepping and downing stories, which would indicate differential subsidence, which
in turn is attributed to this renewed mild tectonic activity .
The upper Cook member shows increased variability in both thickness trends, facies
tracts partitioning and distribution of depositional environments. The upper Cook
member in the Knarr Field is represented by an outbuilding delta, while in the
Garantiana Discovery the Cook Formation is represented by an embayed shoreface
(DE4, table3). Also in the Gullfaks and Kvitebjørn-Valemon fields (Dreyer and Wiig,
1995; Folkestad et al., 2014) a progradational deltaic system developed, in the latter
(Kvitebjørn-Valemon) area this was succeeded by a barrier-lagoon system during the
delta drowning stage. The embayed upper shoreface (DE4, table3) on the Garantiana
(Visund north) area is accordingly located between the two delta lobes, i.e the one
across the northeasttern Tampen Spur (the ‘Knarr Field lobe) and the one across the
central parts of the Northern Viking Graben (the Kvitebjørn-Valemon-Gullfaks lobe),
potentially representing a protected, embayment setting between two delta lobes. The
marked deflection of the Cook delta with a northern and a southern branch is attributed
to increased subsidence along the embayed Viking Graben (see also Ravnås et al., 2000).
The variable sedimentary architecture of the transgressive segment or upper parts of
the Cook system with rapid flooding and sediment shut-off in the Garantian discovery
while on going subsidence and delta outbuilding in the Knarr and Kvitebjørn-Valemon-
Gullfaks fields favors a combination of possible eustatic sea-level rise and tectonic
activity leading to the final stage transgression of the Cook system.

CHAPTER 8: DISCUSSION
100
Steel (1993) interpreted the main controlling factor of the early to middle Jurassic
succession to be hinterland uplift, while Ravnås et al., (2000) argued for repeated
structuring of the basin areas. The lower Cook member favours hinterland structuring
while the middle and upper Cook members records gentle stretching and rifting within
the basin. The repeated Late Triassic to Middle Jurassic mild rifting generated
continuous background subsidence, which combined with sea level rise, resulted in
gradual drowning of the Northern North Sea (Ravnås et al., 2014). There is earlier
documented variable structural infill pattern the Lower to Middle Jurassic succession
with evidence for varying subsidence and rifting within this region and also elsewhere
on the Norwegian Continental Shelf (e.g. Gjelberg et al., 1987; Corfield & Sharp, 2000;
Corfield et al., 2001; Martinius et al., 2001, Ravnås et al., 2014).
CHAPTER 8: DISCUSSION
101
8.2 Tide-dominance
Tide-dominated deltas forms in areas with high tidal range and low wave-power (Willis,
2008). The Cook Formation is in this study interpreted as a tide-dominated delta, which is
shown by a predominance of tide-generated structures such as single and double mud drapes,
tidal bundles and sigmoidal dunes (figure 21 and 22). The abundance of mud in the system
and with reslutant heterolitic deposits are also common in tide-dominated deltas (Willis, 2008,
Goodbred and Satio, 2011). Abundance of tide-dominated facies is not enough to indicate a
tidal dominance of gross depositional environments (Dalrymple et al., 2003). In some of the
cores there is little direct evidence for the tidal nature of the deposits, however, as there is
limited or no wave-generated structuresa wave-dominated setting is not considered likely.,
The limited indications of wave-generated deposits are only encountered in the shoreface
deposits in the upper Cook member and in the middle Cook member bay to prodelta deposits
present in well 34/5-1A and 34/5-1S. Bidirectionalpaleo current indicators are not common
but current ripples with opposite facing directions can be seen in some of the heteroclite
facies. The repeated coarsening upward motifs with facies transits from shelf-prodelta to
delta-front deposits is taken as good indicator of facies successions related to the advance of
deltas Abrupt coarsening upward pattern from prodelta muds, as observed in the lower Cook
member, is a typical patter found in falling-stage to lowstand tide-influenced deltas (e.g Willis
et al 2005).
It is often difficult to distinguish between tide-dominated deltas, estuarine and other tide-
dominated or -influenced environments. However, based on the stacking patterns of the
identified depositional elements, deposition from tide-dominated deltas are the preferred
interpretation of the thicker and dominat parts of the lower, middle and upper and Cook
member successions, whereas estuarine succession is interpreted present only in the middle
Cook member. However, the thick units dominated by cross-stratified cosets representing
compound dunes, could also have formed in estuarine settings (e.g. see Dalrymple and Choi,
2007), thereby maikng it difficult to confidentially place these deposits within either a deltaic
or estuarine succession. Hence parts of the currently inferred deltaic succession may actually
be estuarine in oroigin, or there may be repeated changes back and forth between deltaic and
estuarine settings, represented by the succession dominated by compound dunes. Only
detailed interpretation of stacking patterns may resolve this issue, which the current available
dataset did not allow for.

CHAPTER 8: DISCUSSION
102
Figure 20 Crossbedding reflcting neap-spring cycle.
Spring
neap
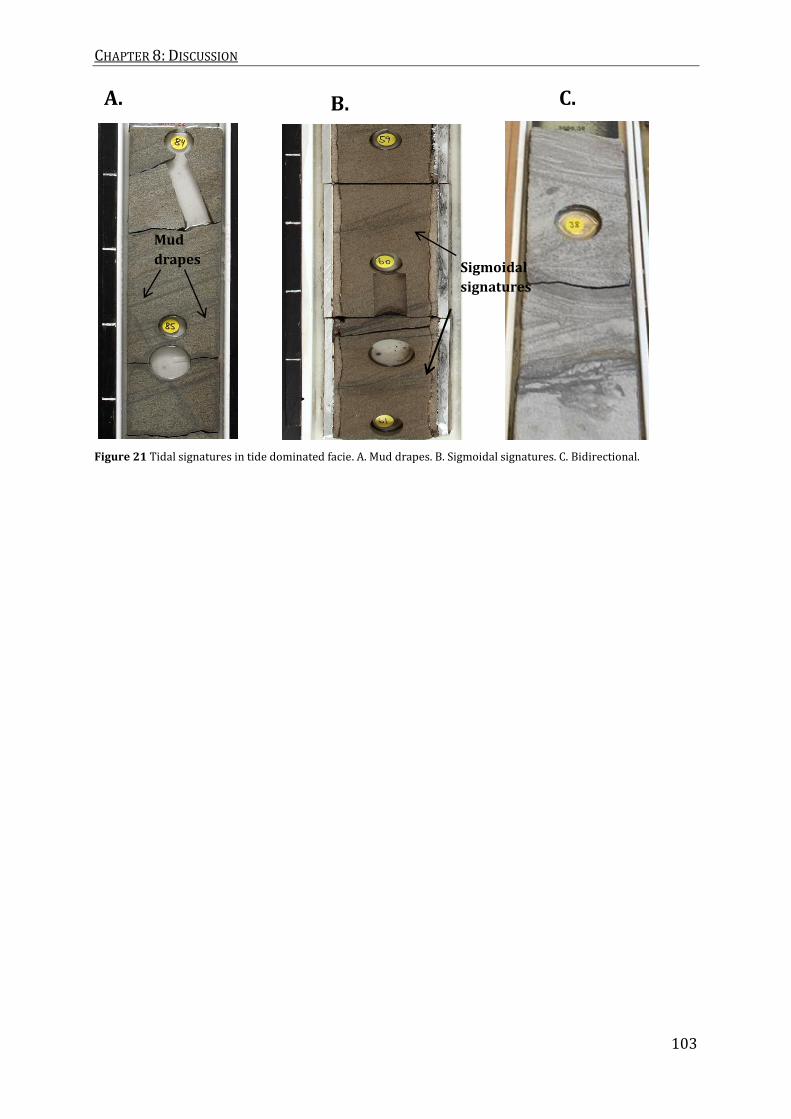
CHAPTER 8: DISCUSSION
103
Figure 21 Tidal signatures in tide dominated facie. A. Mud drapes. B. Sigmoidal signatures. C. Bidirectional.
Mud
drapes Sigmoidal
signatures
A. C. B.

CHAPTER 8: DISCUSSION
104
8.3 Sequence stratigraphic evolution
Yoshida and coworkers (2007) suggest that late stage transgressive system tract and
highstand system tract favors the preservation of wave-generated facies tracts (e.g.
hummocky and swaly cross stratified shoreface successions), whereas the falling stage
system tract (forced regression), lowstand system tract and early transgressive system
tract favor tide dominated facies tracts. This gross generalization does not fit with the
observed and interpreted development of the Cook Formation 4. order sequences in the
current study. The Cook Formation could possibly be divided into 3. rd order sequences,
where the transegressive surface of marine erosion is possibly coinciding with a 2nd-
order sequence boundary. In such a scenario the progradational or regressive lower
Cook member would represent the falling stage system tract to early lowstand system
tract, the aggrading middle Cook Formation represent the late lowstand to transgressive
and early highstand system tracts, while the Upper Cook member represent the late
highstand system tracts of a lower order or 2nd order sequence. This interpretation
corresponds better to Yoshida and coworkers (2007) model, but there is no wave-
influence interpreted in the Middle Cook formation transgressive system tract. An
alternative interpretation of the upper Cook member is that it form parts of the
transgressive systems tract, with the local progradation of the upper Cook deltas
representing local reggressive perturbations of an overall transgressive or backstepping
evolution. The time equivalent Tilje Formation in the Halten Terrace Show similar
characters (Ravnås et al., 2014), with a similar sequence stratigraphic evolution.

CHAPTER 8: DISCUSSION
105
8.4 Remarks
The Cook Formation is in general interpreted as marine sandstone formed in a variation
of marine settings. A common character of the Cook Formation in the different fields is
that the deposits are tide-influenced to tide-dominated.
Churchill and coworkers (2016) interpreted the lower part the upper Cook member in
the Knarr Field as a tide dominated shoreline-to-shelf depositional system, with local
evidence of wave- dominance. This stands in contrast to the tide-dominated deltaic
regressive unit interpreted in this study. The high amount of tide-generated facies
common also to this unit (Chapter 4) would favor a deltaic environment also for the
thicker part of also this member. In this study there is not recognized any wave
generated structures in the lower part of the Upper Cook Formation.
In the Oseberg Field the Cook Formation interpreted as a prograding tide-dominated
subtidal marine sand body representing mud banks and transgressive offshore sand
ridges by Livbjerg and Mjøs (1989). The lower prograding subtidal marine sand body
could form part of a tide dominated delta succession. Livbjerg and Mjøs (1989) argue
that tide-dominated sand ridges are interpreted as deposited during transgression due
to the amount of tide-generated structures.
The present interpretation of a larger portion of the Cook sandstones in the North East
Tampen Spur area actually representing deltaic deposits, may hence also applies to the
Cook Formation in other parts of the Northern North Sea. Recent advances in our
understanding of the tide-dominated to –influenced depositional systems warrants
caution in interpretation of related deposits, and should stimulate new look at the Cook
Formation in other parts of the basin where the unit forms a viable reservoir.

CHAPTER 8: DISCUSSION
106
8.5 Analogues
8.5.1 Modern day analogue, Fly river delta
A modern example of a tide-dominated delta with similar evolution is the Fly River delta
(figurer 12). Studies done shows that sedimentary supply is mainly restricted to the
southern channel, while the northern has little sedimentary supply while the far
northern channel are effectively abandoned inflow is stronger than outflow (Wolanski et
al., 1998, Dalrymple et al., 2003). The active channel in the southern part generated
deltaic deposits while abandonment channel in the far northern part generated
estuarine deposits. The abandoned channel in the far northern part formed coarse-
grained channel bottom facies alternating with dunes (Dalrymple et al., 2003)
Figure 6-11. The Fly river delta (Google maps)

CHAPTER 8: DISCUSSION
107
8.5.2 Ancient analogue, -Ile Formation
The Early Jurassic Ile Formation is time equivalent to the Cook Formation and has beed
interpreted as a sucession tide-dominated deltas and estuaries (Gjelberg et al., 1987;
Dalland et al., 1988; Harris, 1989; Pedersen et al., 1989; Ehrenberg et al., 1992; Saigal et
al., 1999; McIlroy, 2004; Martinius et al., 2005, Ravnås et al., 2014).
8.5.2 Ancient analogue, -Tilje Formation
The Early Jurassic Tilje Formation is time equivalent to the Cook Formation and more or
less facies equivalent. It is interpreted as a tide and fluvial dominated delta and tide
dominated estuarine and (Ravnås et al., 2014). The Tilje Formation also has a similar
sequence progradational-aggradation-retrogradational structure as the Cook Formation.

CHAPTER 9: CONCLUTION AND FUTURE WORK
108
9.0 Conclusion and Future Work
The Cook Formation has been studied in 9 cores and 16 wells logs from Knarr Field to
Garantiana discovery in the Tampen Spur area. A total of 446 meter of cores have been
interpreted which is the basis for this thesis.
In this study 11 facies were recognized in the Cook Formation, based on lithology, grain
size, sedimentary structure, bed boundaries, bed thickness, texture and degree of
bioturbation. The 11 facies was used to distinguish 5 depositional elements and 7 facies
associations, covering the progrdational deltaic and retrogradational estuarine and
shoreface part of the Cook Formation. The deltaic and estuarine deposits are mainly
influenced by fluvial input and tidal action, while the shorface deposits are mainly
influenced by wave activity.
Based on the interpreted core logs three correlation profiles have been produced. One
from west to east in the in the Garantiana discovery, another from west to east in Knarr
Field and the last south to north from Garantiana discovery to Knarr Field. The Cook
Formation is interpreted to represent one megasequence. Three higher order sequences
were recognized in the Garantiana discovery and the Knarr Field, each consisting of a
regressive and transgressive segment and bounded at their base and top by maximum
flooding surfaces. Lower Cook member is dominated by porgrading delta front deposits
(FA 3A table 3) in both the Knarr Field and Garantiana discovery which represents the
regressive segment with sedimentary supply form east and progradation toward west.
The middle Cook member comprises delta front deposits (FA3A, table 3) overlain by
estuarine deposits (FA6, table 3) in both the Knarr Field and Garantiana discovery,
which represent the aggrading segment with sedimentary supply form south-east and
prograding toward north-west. The upper Cook member comprises delta front deposits
(FA3A, table 3) and lower shoreface deposits (FA3B, table 3) in the Knarr Field, and in
the Garatiana discovery the sequence consist of lower and upper shoreface deposits
(DE4, table3).

CHAPTER 9: CONCLUTION AND FUTURE WORK
109
Due to relatively uniform thickness and faices in the lower Cook member is interpreted
to reflect eustatic control and hinterland structuring. In the middle and upper Cook
members there are more variability in facies, outbuilding and thickness which indicate
tectonic activity, with gentle rifting.
9.1 Further Work
Recommended future work would include interpreting seismic, to better tie the date
together and get a better understanding on the structural settings.

CHAPTER 10: REFERENCES
110
10. References
Allen, J.R.L., (1980): Sand waves: A model of origin and internal structure. Sediment. Geol. 26, 281–328. Amos, C.L. and Lang, B.F.N (1980): The sedimentary character of the Minas basin, bay of fundy, in: McCann, S.B, (ed) The Coastline of Canada: Geological Survey of Canada, paper 80-10, pp.123-152 Arthur, M.A. and B.B. Sageman (1994): Marine black shales: Depositional mechanisms and environments of ancient deposits. Annual Review of Earth and Planetary Sciences, v. 22, p. 499-551 Ashley, G.M., (1990): Classification of Large-Scale Subaqueous Bedforms: A New Look at an Old Problem-SEPM Bedforms and Bedding Structures. J. Sediment. Res. 60, 160–172. Ashley, G.M., Southard, J.B., Boothroyd, J.C., (1982): Deposition of climbing-ripple beds : a flume simulation.Sedimentology 29, 67–79. Badley, M.E., Price, J.D., Rambech-Dahl, C. and Agdestein, T. (1988): The structural evolution of the northern Viking Graben and its bearing upon extensional modes of basin formation J. Geol. Soc. London, vol. 145, pp 455–472. Bhattacharya, J.P., (2006): Deltas. In: Walker, R.G., and Posamentier, H., (Editors) Facies Models revisited, SEPM Special Publication, v. 84, p.237-292 Boyd, R., Dalrymple, R. W. and Zaitlin, B. A., (2006): Estuarine and incised-valley facies models. In: Posamentier, H.W and Walker, R.G (editors) facies model revised SEPM special publications, 84, pp171-235 Burton, D., Flaig, P. P. and Prather, .T. J. (2016): Regional controls on depositional trends in tidally modified deltas: insights from sequence stratigraphic correlation and mapping of the Loyd and Sego sandstone, Unita and Piceance basins of Utha and Colorado, U.S.A. In: Journal of Sedimentary Research, 2016, v. 86, 763–785 Chamberlain, C. K. (1978): Recognition of Trace Fossils in Cores in (Basan, P. B., ed.) Trace Fossil Concepts: Sosiety of Econmic Paleontologists and Mineralogists, short Course Notes 5, p. 133-183. Charnock, M.A, Kristiansen, I.L., Ryseth, A. and Fenton J.P.G (2001): Sequence stratigraphy of the Lower Jurassic Dunlin Group, Northern North Sea. In: Martinsen O. J. And Dreyer T. (Editors), Sedimentary Environments Offshore Norway - Paleozoic to Recent, Proceedings of the Norwegian Petroleum Society Conference Norwegian Petroleum Society, Special Publications 10, Bergen, Norway, pp. 145-174

CHAPTER 10: REFERENCES
111
Choi, K.S., and Jo, J. (2015): Morphodynamics and stratigraphic architecture of compound dunes on the open coast macrotidal flat in the northern Gyeonggi Bay, west coast of Korea. Mar. Geol. 366, pp 34-48 Corfield, S. and Sharp, I. (2000): Structural style and stratigraphic architecture of fault-propagation folding in extensional settings: a seismic example from the Smørbukk area, Halten terrace, Mid-Norway. Basin Res., 12, 329–341. Corfield, S., Sharp, I., Häger, K.-O., Dreyer, T. and Underhill, J. (2001): An integrated study of the Garn and Melke formations (Middle to Upper Jurassic) of the Smørbukk area, Halten terrace, mid-Norway. In: Sedimentary Environments Offshore Norway – Paleozoic to Recent (Eds O.J. Martinsen and T. Dreyer), NPF Spec. Publ., 10, 199–210. Coward, M. P., Dewey, J., Hempton, M. and Holroyd, D. (2003): Tectonic evolution in: Evans, D., Graham, C., Armour, A. and Brathurst, P. (Editors) The millennium Atlas: Petroleum Geology of the Central and Northern North Sea. Geol. Soc. London vol. 2, pp. 1-17. Churchill, J. M., Poole, M. T., Skarpeid, S. S. and Wakefield M. I. (2016): Stratigraphic architecture of the Knarr Field, Norwegian North Sea: sedimentology and biostratigraphy of an evolving tide- to wave-dominated shoreline system, Geological Society, London, Special Publications, vol. 444, pp. 35-58 Dalland, A., Worsley, D. and Ofstad, K. (1988). A lithostratigraphic scheme for the Mesozoic and Cenozoic succession offshore mid- and northern Norway. Norw. Petrol.Direct. Bull., 4, pp. 65. Dalrymple, R.W., Zaitlin, B.A. and Boyd, R. (1992): Estuarine facies models: Conceptual basis and stratigraphic implications: Journal of Sedimentary Petrology, v. 62, p. 1130–1146 Dalrymple, R.W., Rhodes, R.N., (1995): Estuarine dunes and bars, in: Perillo, G.M.E. (Ed.), Geomorphology and Sedimentology of Estuaries. Developments in Sedimentology 53. Elsevier Science, pp. 359–422. Dalrymple, M. (2001): Fluvial reservoir architecture in the Statfjord Formation (northern North Sea) augmented by outcrop analogue statistics. Petroleum Geoscience, 7, 115- 122. Dalrymple, R.W., Baker, E.K., Harris, P.T., Hughes, M.G., (2003): Sedimentology and Stratigraphy of a TideDominated, Foreland-Basin Delta (Fly River, Papua New Guinea). Trop. Deltas Southeast Asia -Sedimentol. Stratigr. Pet. Geol. SEPM Spec. Publ. 147–173. Dalrymple, R. W. and Choi, K., (2007): morphologic and facies trends through the fluvial marine transition in tide-dominated depositional systems: a schematic framework for environmental sequence-stratigraphic interpretation. In Earth-Science Rewiews 81 (3-4), pp 135-174

CHAPTER 10: REFERENCES
112
Dashtgard, S.E., Gingras, M.K., MacEachern, J. a., (2009): Tidally Modulated Shorefaces. J. Sediment. Res. 79, 793–807. Dashtgard, S.E., MacEachern, J. A., E. Frey, S. F. and Murray K. Gingras M. k. (2012): Tidal effects on the shoreface: Towards a conceptual framework Sedimentary Geology 279, pp. 42–61 Desjardins, P.R., Buatois, L.A., Pratt, B.R., Mangano, M.G., (2012). Forced regressive tidal flats: response to falling sea level in tide-dominated settings. J. Sediment. Res. 82, 149–162 Dore´, A.G., Hamar, G.P., Lilleng, T., Shaw, N.D., Skarpnes, O. and Vollset, J. (1984): Revised Jurassic lithostratigraphy of the Norwegian North Sea, northernarea. In: Vollset, J. and Dore, A.G. (Editors) A Revised Triassic and Jurassic Lithostratigraphic Nomenclature for the Norwegian North Sea. Norwegian Petroleum Society, Special Publications, v. 3, pp. 2–53 Dreyer, T. and Wiig, M., (1995): Reservoir architecture of the Cook Formation on the Gullfaks field based on sequence stratigraphic concepts. In: Steel R.J., Felt V., Johannessen E.E and Mathieu C. (Editors), Sequence Stratigraphy of the Northwest European Margin. Norwegian Petroleum Society (NPF), Special Publication 5. Elsevier, Amsterdam, pp. 109-142. Duke, W. L., (1985): Hummocky cross-stratification, tropical hurricanes and intense winter storms: Sedimentology, V32, pp. 167-194. Faleide, J.I., Bjørlykke, K., Gabrielsen, R.H. (2010): Geology of the Norwegian Continental Shelf. In: Knut Bjorlykke (editor) Petroleum Geoscience, From Sedimentary Environments to Rock Physics, Berlin, Heidelberg pp 467-499 Folkestad, A., Veseloysky, Z. and Roberts, P. (2012): Utilising borehole image logs to interpret delta to estuarine system: A case study of the subsurface Lower Jurassic Cook Formation in the Norwegian northern North Sea. In: Marine and Petroleum Geology, 29, 255-275. Færseth, R. (1996): Interaction of Permo-Triassic and Jurassic extensional fault-blocks during the development of the northern North Sea. Journal of the Geological Society 153, 931-944 Færseth, R. and Ravnås, R. 1998. Evolution of the Oseberg Fault Block in the context of the northern North Sea structural framework. Marine and Petroleum Geology. 15, 467-490. Færseth, R.B. and Lien, T. (2002). Cretaceous evolution in the Norwegian Sea – a period characterized by tectonic quiescence. Mar. Petrol. Geol., 19, 1005–1027. Embry, A.F., (1997): Global Sequence Boundaries of the Triassic and Their Identification in the Western Canada Sedimentary Basin. Bull. Can. Pet. Geol. 45, 415–433.

CHAPTER 10: REFERENCES
113
Ehrenberg, S.N., Gjerstad, H.M. and Hadler-Jacobsen, F. (1992): Smørbukk Field: A Gas Condensate Fault Trap in the Haltenbanken Province, Offshore Mid-Norway. In: Giant Oil and Gas Fields of the Decade 1978–1988 (Ed. M.T. Halbouty), AAPG Mem., 54, 323–348. Gabrielsen, R.H., R.B. Færseth, L.N. Jensen, J.E. Kalheim and F. Riis, (1990): Structural elements of the Norwegian continental shelf. Part 1: The Barents Sea region. Norwegian Petroleum Directorate Bulletin No. 6, pp: 1-33. Galloway, W.E. (1989) Genetic stratigraphic sequences in basin analysis, I. Architecture and genesis of flooding- surface bounded depositional units. American Association of Petroleum Geologists Bulletin 73, 125–142. Gjelberg, J., Dreyer, T., Høie, A., Tjelland, T. and Lilleng, T. (1987): Late Triassic to Mid-Jurassic development of the Barents and Mid-Norwegian Shelf. In: Petroleum Geology of Northwest Europe (Eds J. Brooks & K. Glennie). Graham & Trotman, London, 1105–1129. Gupta, R. Johnson H. D., (2002): High-resolution Facies Architecture of Heterolithic Tidal Deposits: An Integrated Outcrop and Electrofacies Analysis of a Complex Reservoir in M. Lovell and N. Parkinson, eds., Geological applications of well logs: AAPG Methods in Exploration No. 13, p. 161–184. Hallam A., Wignall P. B. (1999): Mass Extinctions and Sea-Level Changes: in Earth Science Reviews, V. 48, Issue 4, p. 217-250 Harris, N.B. (1989): Reservoir geology of Fangst Group (Middle Jurassic), Heidrun Field, offshore Mid-Norway. AAPG Bull., 73, 1415–1435. Haq, B.U., Hardenbol, J. and Vail P.R., (1987): Chronology of fluctuating sea levels since the Triassic, science 235, p1156-1166 Howell, J. A., and Flint, S.S. (2003): Sequence and system tracts in the Book Cliffs and sequence stratigraphy evolution of the Book Cliff Sucession in: Coe. A.L., (ed) The sedimentary Record of Sea-level change Cambridge, university press, pp. 179-208. Hunter, R. E. and Clifton, H. R. (1982): cyclic deposits and hummockey cross stratification of probable storm origin in Upper Cretaceous rocks of the Cape Sebasian area, southwestern Oregon: Journal of Sedimentary Petrology, V.52, PP.127-143 Husmo, T., Hamar, G. P., Høiland, O., Johannessen, E. P., Rømuld, A., Spencer, A. M., & Titterton, R. (2003). Lower and Middle Jurassic. In D. Evans, C. Graham, A. Armour & P. Bathurst (Eds.), The Millennium Atlas: Petroleum geology of thecentral and northern North Sea. (p. 129-155) London: The Geological Society of London Ichaso, A. A., Dalrymple, R. W., (2009): Tide-and wave generated fluid myd deposits in the Tilje Formation (Jurassic) offshore Norway. Geology 37, pp 539-542

CHAPTER 10: REFERENCES
114
Klein, G. de V. and Marsagelia, K. M. (1987): Discussion and reply Hummockey cross stratification, tropical hurricanes, and intense winter storms: in Sedimentology v. 34, pp.333-359 Legler, B., Johnson, H. D., Hampson, G. J., Massart, B. G., Jackson C. L, Jackson, M. D., El-Barkooky, A. and Ravnås R. (2013): Facies model of a fine-grained, tide-dominated delta: Lower Dir Abu Lifa Member (Eocene), Western Desert, Egypt. In: Sedimentology (2013) 60, 1313–1356 Livbjerg, F. and Mjøs, R., (1989): The Cook Formation, an offshore sand ridge in the Oseberg area, northern North Sea. In: J. D. Collinson (editor), Correlation in Hydrocarbon Exploration. Norwegian Petroleum Society. Graham and Trotman, London, pp. 299-312. Marjanac, T., (1995): Architecture and sequence stratigraphic perspectives of the Dunlin Group formations and proposal for new type and reference-wells. In: Steel R.J, Felt V.L., Johannessen E.E and Mathieu C. (Editors), Sequence Stratigraphy of the Northwest European Margin. Norwegian Petroleum Society (NPF), Special Publication 5. Elsevier, Amsterdam, pp. 143-165. Marjanac, T. and Steel, R.J. (1997): Dunlin Group sequence stratigraphy in the northern North Sea: a model for Cook sandstone deposition. American Association of Petroleum Geologists Bulletin, 81, 276–292. Martinius, A.W., Ringrose, P.S., Brostrøm, C., Elfenbein, C., Næss, A. and Ringås, J.E. (2005): Reservoir challenges of heterolithic tidal sandstone reservoirs in the Halten Terrace, mid-Norway. Petrol. Geosci., 11, 3–16. McIlroy, D. (2004): Ichnofabrics and sedimentary facies of a tide-dominated delta: Jurassic Ile Formation of Kristin Field, Haltenbanken Offshore Mid-Norway. In: The Application of Ichnology to Palaenvironmental and Stratigraphic Analysi Mulder, T., Syvitski, J., Migeon, S., Faugeres, J. and Savoye, B. (2003): Marine hyperpycnal flows; initiation, behavior and related deposits. A review. Marine and Petroleum Gology 20, p. 861-882. NPD Publications (2014): Geology of the North Sea. Url: http://www.npd.no/en/Publications/Reports/Compiled-CO2-atlas/4-The-Norwegian-NorthSea/41-Geology-of-the-North-Sea/ NPD Factpages: Url: http://factpages.npd.no/factpages/Default.aspx?culture=no Nøttvedt, A., Johannessen, E.P. and Surlyk, F. (2008): The Mesozoic of western Scandinavia and eastern Greenland. Episodes, 31, 59–65. OFFSHORE-TECHNOLOGY (2016): Knarr Field, North Sea, Norway [Online]. Available: http://www.offshore-technology.com/projects/knarr-field-north-sea/

CHAPTER 10: REFERENCES
115
Olsen, T.R. and Steel, R.J. (1995): Shoreface pinch-out style on the front of the ‘Brent delta’ in the easterly Tampen Spur. In: Sequence Stratigraphy on the Northwest European Margin. In: R.J. Steel, V.L. Felt, E.P. Johannessen and C. Mathieu (Editors), Norw. Petrol. Soc. Spec. Publ., vol. 5, pp 273–289. Olariu, C., Steel, R.J., Dalrymple, R.W., Gingras, M.K., 2012. Tidal dunes versus tidal bars: The sedimentological and architectural characteristics of compound dunes in a tidal seaway, the lower Baronia Sandstone (Lower Eocene), Ager Basin, Spain. Sediment. Geol. 279, 134–155 Parkinson, D.N. and Hines, EM., (1993): The lower Jurassic of the North Viking Graben in the context of Western European lower Jurassic stratigraphy. In (Editor) R. J. Steel, V. L. Felt, E. P. Johannessen, and C. Mathieu: Sequence stratigraphy on the northwest European margin: Norwegian Petroleum Society, Special publication 5, pp. 97-107 Partington, M.A., Copestake, P., Mitchener, B.C. and Underhill, J.R., (1993): Biostratigraphic calibration of genetic stratigraphic sequences in the Jurassic-lowermost Cretaceous (Hettangian to Ryazanian) of the North Sea and adjacent areas. In: Parker J.R., (Editor), Petroleum Geology of Northwest Europe. Proc. 4th Conf. London, Geol. Soc., London, pp. 371-386. Pedersen, T., Harms, J.C., Harris, N.B., Mitchell, R.W. and Tooby, K.M. (1989): The role of correlation in generating the Heidrun Field geological model. In: Correlation in Hydrocarbon Exploration (Ed. J.D. Collinson), Graham and Trotman, London, 113–130. Pemberton, S. G., MacEachern, J. A., and Saunders, T. (2004): Stratigraphic applications of substratespecific ichnofacies: delineating discontinuities in the rock record. Geological Society, London, Special Publications, 228(1), pp. 29-62. Plink-Björklund, P., and Steel, (2006): Incised Valleys on an Eocene Coastal Plain and Shelf, Spitsbergen – Part of a Linked Shelf-Slope System, in Dalrymple, R.W., Leckie, D.A., and Tillmann, R.W., eds., SEPM Special Publication 85, p. 281-308. Ravnås, R. and Steel, R.J. (1998): Architecture of marine rift basin succession. AAPG Bull., 82, 110–146. Ravnås, R., Nøttvedt, A., Steel, R.J. and Windelstad, J. (2000): Syn-rift sedimentary architectures in the Northern North Sea. In: Dynamics of the Norwegian margin (Eds A. Nøttvedt, B.T. Larsen, S. Olaussen., B. Tørudbakken, J. Skogseid, R.H. Garbrielsen., H. Brekke and Ø. Birkeland), Geol. Soc. Spec. Publ., 167, pp. 133–177. Ravnås, R., Berge, K., Campbell, H., Harvey, C. and Norton, M. J. (2014): Halten Terrace Lower and Middle Jurassic inter-rift megasequence analysis: megasequence structure, sedimentary architecture and controlling parameters Int. Assoc. Sedimentol. Spec. Publ. 46, pp .215–252

CHAPTER 10: REFERENCES
116
Reading, H. G., and Collinson, J. D. (1996): Clastic Coasts. In H. G. Reading (Editor), Sedimentary Environments: Processes, Facies and Stratigraphy third edition, pp. 154-231 Reading, H. G., and Levell, B. K. (1996): Controls on the sedimentary rock record. In H. G. Reading (Ed.), Sedimentary Environments: Processes, Facies and Stratigraphy (Third ed., pp. 5-36). Oxford: Blackwell Science. Reineck, H.E., Singh, I.B., (1980): Depositional Sedimentary Environments With Reference to Terrigenous Clastics. Springer-Verlag, Berlin-Heidelberg-New York, pp. 549 Roberts, D.G., Thompson, M., Mitchener, B., Hossack, J., Carmichael, S.M.M. and Bjørnseth, H.M. (1999) Palaeozoic to Tertiary rift and basin dynamics; mid-Norway to the Bay of Biscay; a new context for hydrocarbon prospectivity in the deep water frontier. In: Petroleum Geology of Northwest Europe: Proceedings of the 5th Conference (Eds A.J. Fleet and S.A.R. Boldy), Geol. Soc. London, 7–40. Rogers, K.G., Goodbred S.L. JR., (2014): The Sundarbans and Bengal Delta: The World’s Largest Tidal Mangrove and Delta System. In Kale V. S (Editor) Landscapes and landforms of India: World Geomorphological landscapes, New York, pp.181-187 Saigal, G.C., Amundsen, H.E.F., Bergan, M., Knarud, R., Olsen, J. and Sæther, T. (1999): Understanding the problems related to tidal depositional environments and their sequence stratigraphic interpretations – a few examples from the Jurassic Tilje and Ile Formations, offshore Norway and our approach. In: Sedimentary Environments Offshore Norway – Paleozoic to Recent – Extended Abstracts (Eds O.J. Martinsen and T. Dreyer), 121. SAWYER, M. & KEEGAN, J. (1996): Use of palynofacies characterization in sand-dominated sequences, Brent Group, Ninian Field, UK North Sea. Petroleum Geoscience, 2, 289-297. Steel, R. and Ryseth, A. (1990): The Triassic - Early Jurassic succession in the northern North Sea: megasequence stratigraphy and intra - Triassic tectonics. In: Hardman, R P. F. and Brooks, J (Editors), Tectonic events responsible for Britain’s Oil and Gas reserves. Geological Society Special Publication 55, 139-168 Steel, R.J., (1993): Triassic-Jurassic megasequence stratigraphy in the Northern North Sea: rift to post rift evolution. In: Parker J.R. (Editor), Petroleum Geology of North-West Europe: Proceedings of the 4th Conference. Geol.l Soc., London, pp. 299-315. Underhill, J.R. and M.A. Partington (1993): Jurassic thermal doming and deflation in the North Sea: Implications of the sequence stratigraphic evidence. In J.R. Parker (Ed.), Petroleum Geology of Northwest Europe. Proceedings Fourth Conference, p. 337-346 Van den Berg, J. H., Martinius, A.W and Houthuys, R. (2017): Breaching-related turbidites in fluvial and estuarine channels: Examples from outcrop and core and implications to reservoir models. In: (Editors) Zecchin M. and Hu M.Q Marine and Petroleum Geology, 82 pp 178-205
CHAPTER 10: REFERENCES
117
Visser, M. J. (1980): Neap-spring cycles reflected in Holocene subtidal large-scale bedform deposits: a preliminary note. Geology, 8(11), 543-546 Vollset, J. and Doré, A. G., (1984): A revised Triassic and Jurassic lithostratigraphic nomenclature for the Norwegian North Sea. Norway Pet. Direct. NPD-Bulletin No. 3, pp. 1-53 Willis, B.J., (2005): Tide-influenced river deltas, in Giosan, L., and Bhattacharya, J.P., eds., River Deltas—Concepts, Models, and Examples: SEPM, Special Publication 83, p. 87–129. Wei, X., Steel, R., Ravnås R., Jiang, Z., Olariu, C. and Folkestad, Atle(2016): Anatomy of anomalously thick sandstone units in the Brent Delta of the northern North Sea. A/S Norske Shell In-house. Wolanski, E., King, B., Galloway, D., (1995): Dynamics of the turbidity maximum in the Fly River estuary, Papua New Guinea. Estuarine, Coastal and Shelf Science 40, 321–337. Yang, B. C., Dalrymple, R. W. and Chun, S. S. (2006): The Significance of hummocky cross- stratification (HCS) wavelengths: evidence from an open-coast tidal flat south korea. J Sedimentologi v.76, pp. 2-8 Yoshida, S., Steel, R.J. and Dalrymple, R.W. (2007): Changes in depositional processes – an ingredient in the generation of new sequence-stratigraphic models. J. Sed. Res., 77, pp. 447–460. You, Y., Flemings, P., Mohrig, D., 2014. Mechanics of dual-mode dilative failure in subaqueous sediment deposits. In: Earth Planet. Sci. Lett. 397, 10-18. Ziegler, P.A. (1988): Evolution of the Arctic-North Atlantic and the Western Tethys. AAPG Mem., 43, pp. 198.