Cook et al
18
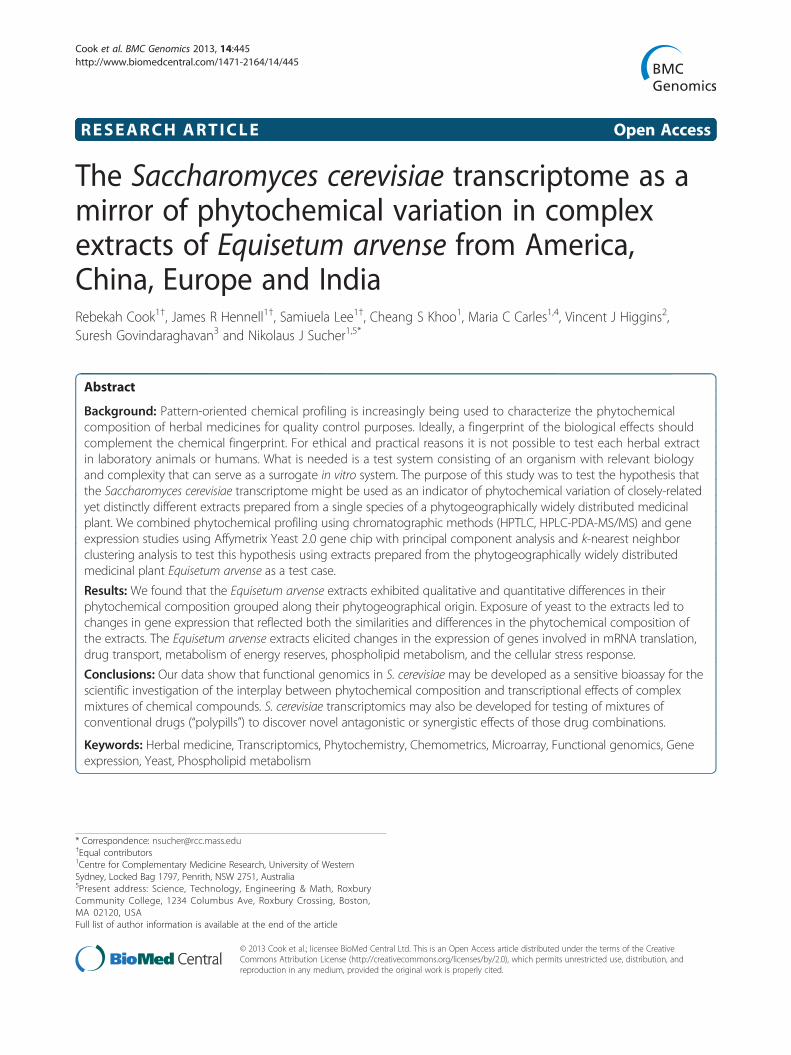
RESEARCH ARTICLE Open Access The Saccharomyces cerevisiae transcriptome as a mirror of phytochemical variation in complex extracts of Equisetum arvense from America, China, Europe and India Rebekah Cook 1† , James R Hennell 1† , Samiuela Lee 1† , Cheang S Khoo 1 , Maria C Carles 1,4 , Vincent J Higgins 2 , Suresh Govindaraghavan 3 and Nikolaus J Sucher 1,5* Abstract Background: Pattern-oriented chemical profiling is increasingly being used to characterize the phytochemical composition of herbal medicines for quality control purposes. Ideally, a fingerprint of the biological effects should complement the chemical fingerprint. For ethical and practical reasons it is not possible to test each herbal extract in laboratory animals or humans. What is needed is a test system consisting of an organism with relevant biology and complexity that can serve as a surrogate in vitro system. The purpose of this study was to test the hypothesis that the Saccharomyces cerevisiae transcriptome might be used as an indicator of phytochemical variation of closely-related yet distinctly different extracts prepared from a single species of a phytogeographically widely distributed medicinal plant. We combined phytochemical profiling using chromatographic methods (HPTLC, HPLC-PDA-MS/MS) and gene expression studies using Affymetrix Yeast 2.0 gene chip with principal component analysis and k-nearest neighbor clustering analysis to test this hypothesis using extracts prepared from the phytogeographically widely distributed medicinal plant Equisetum arvense as a test case. Results: We found that the Equisetum arvense extracts exhibited qualitative and quantitative differences in their phytochemical composition grouped along their phytogeographical origin. Exposure of yeast to the extracts led to changes in gene expression that reflected both the similarities and differences in the phytochemical composition of the extracts. The Equisetum arvense extracts elicited changes in the expression of genes involved in mRNA translation, drug transport, metabolism of energy reserves, phospholipid metabolism, and the cellular stress response. Conclusions: Our data show that functional genomics in S. cerevisiae may be developed as a sensitive bioassay for the scientific investigation of the interplay between phytochemical composition and transcriptional effects of complex mixtures of chemical compounds. S. cerevisiae transcriptomics may also be developed for testing of mixtures of conventional drugs (“polypills”) to discover novel antagonistic or synergistic effects of those drug combinations. Keywords: Herbal medicine, Transcriptomics, Phytochemistry, Chemometrics, Microarray, Functional genomics, Gene expression, Yeast, Phospholipid metabolism * Correspondence: [email protected] † Equal contributors 1 Centre for Complementary Medicine Research, University of Western Sydney, Locked Bag 1797, Penrith, NSW 2751, Australia 5 Present address: Science, Technology, Engineering & Math, Roxbury Community College, 1234 Columbus Ave, Roxbury Crossing, Boston, MA 02120, USA Full list of author information is available at the end of the article © 2013 Cook et al.; licensee BioMed Central Ltd. This is an Open Access article distributed under the terms of the Creative Commons Attribution License (http://creativecommons.org/licenses/by/2.0), which permits unrestricted use, distribution, and reproduction in any medium, provided the original work is properly cited. Cook et al. BMC Genomics 2013, 14:445 http://www.biomedcentral.com/1471-2164/14/445
Transcript of Cook et al
Cook et al. BMC Genomics 2013, 14:445http://www.biomedcentral.com/1471-2164/14/445
RESEARCH ARTICLE Open Access
The Saccharomyces cerevisiae transcriptome as amirror of phytochemical variation in complexextracts of Equisetum arvense from America,China, Europe and IndiaRebekah Cook1†, James R Hennell1†, Samiuela Lee1†, Cheang S Khoo1, Maria C Carles1,4, Vincent J Higgins2,Suresh Govindaraghavan3 and Nikolaus J Sucher1,5*
Abstract
Background: Pattern-oriented chemical profiling is increasingly being used to characterize the phytochemicalcomposition of herbal medicines for quality control purposes. Ideally, a fingerprint of the biological effects shouldcomplement the chemical fingerprint. For ethical and practical reasons it is not possible to test each herbal extractin laboratory animals or humans. What is needed is a test system consisting of an organism with relevant biologyand complexity that can serve as a surrogate in vitro system. The purpose of this study was to test the hypothesis thatthe Saccharomyces cerevisiae transcriptome might be used as an indicator of phytochemical variation of closely-relatedyet distinctly different extracts prepared from a single species of a phytogeographically widely distributed medicinalplant. We combined phytochemical profiling using chromatographic methods (HPTLC, HPLC-PDA-MS/MS) and geneexpression studies using Affymetrix Yeast 2.0 gene chip with principal component analysis and k-nearest neighborclustering analysis to test this hypothesis using extracts prepared from the phytogeographically widely distributedmedicinal plant Equisetum arvense as a test case.
Results: We found that the Equisetum arvense extracts exhibited qualitative and quantitative differences in theirphytochemical composition grouped along their phytogeographical origin. Exposure of yeast to the extracts led tochanges in gene expression that reflected both the similarities and differences in the phytochemical composition ofthe extracts. The Equisetum arvense extracts elicited changes in the expression of genes involved in mRNA translation,drug transport, metabolism of energy reserves, phospholipid metabolism, and the cellular stress response.
Conclusions: Our data show that functional genomics in S. cerevisiae may be developed as a sensitive bioassay for thescientific investigation of the interplay between phytochemical composition and transcriptional effects of complexmixtures of chemical compounds. S. cerevisiae transcriptomics may also be developed for testing of mixtures ofconventional drugs (“polypills”) to discover novel antagonistic or synergistic effects of those drug combinations.
Keywords: Herbal medicine, Transcriptomics, Phytochemistry, Chemometrics, Microarray, Functional genomics, Geneexpression, Yeast, Phospholipid metabolism
* Correspondence: [email protected]†Equal contributors1Centre for Complementary Medicine Research, University of WesternSydney, Locked Bag 1797, Penrith, NSW 2751, Australia5Present address: Science, Technology, Engineering & Math, RoxburyCommunity College, 1234 Columbus Ave, Roxbury Crossing, Boston,MA 02120, USAFull list of author information is available at the end of the article
© 2013 Cook et al.; licensee BioMed Central Ltd. This is an Open Access article distributed under the terms of the CreativeCommons Attribution License (http://creativecommons.org/licenses/by/2.0), which permits unrestricted use, distribution, andreproduction in any medium, provided the original work is properly cited.
Cook et al. BMC Genomics 2013, 14:445 Page 2 of 18http://www.biomedcentral.com/1471-2164/14/445
BackgroundThe notion that therapeutic effects of herbal medicineswere due to the presence of a distillable “quintessence” pop-ularized by Paracelsus and fellow alchemists some 450 yearsago [1], morphed over time into the scientific hypothesisthat pharmacological effects of herbal medicines are due totheir content of plant-derived chemical compounds (mainlyso called secondary metabolites) [2,3]. Research based onthis hypothesis conducted over the last two centuries hasled to the isolation and structural elucidation of some of thebest-known drugs and has led to the creation of modernpharmacology and pharmacological therapy [2,4-7]. Herbalmedicine, which can therefore rightfully be considered aprogenitor of modern pharmacotherapy, has along the waybeen relegated to the sidelines and its continued popularitywith the general public is viewed by many orthodox medicalprofessionals at best as a useless but harmless anachronismthat can be harnessed for its placebo effects or at worst as aharmful superstition with potentially lethal adverse effectsthat needs to be discouraged [8,9]. Herbal medicine willnot regain a foothold in modern science-based medicinewithout clear evidence of therapeutic efficacy [10]. Suchevidence has to come from testing in randomized, doubleblind clinical trials, which are considered as the “goldstandard” of clinical medicine. In addition, successfuldemonstration of clinical effectiveness has to becomplemented by an appropriate theoretical framework i.e.pre-clinical research providing a “mechanistic” basis for theobserved clinical effects. The biological “target” of the drugand its function in the pathophysiology of the diseaseshould be known [11-13]. A good drug is thought to actlike Paul Ehrlich’s “magical bullet” that finds its target andin the process “destroys” the disease process [14].While the immense success of modern pharmacotherapy
is patently obvious, the recent shift to a preponderance of“chronic” rather “acute” diseases and the threat of emptydrug “pipelines” has led to calls for a re-evaluation of thecurrent practice of drug treatment and development.Combination therapy and so-called network and systems-based approaches to drug discovery are being advocated[4,15-18]. Instead of magic bullets for single targets, thefuture is thought to lie in the use of both single drugs orcombinations of drugs with multi-target effects [19]. Thewheel appears to have turned full circle. What has beenregarded as its biggest problem, namely that herbalmedicines contain a myriad of chemical componentswith potentially synergistic effects is now hailed asthe basis of their purported therapeutic effectiveness inconditions, which have so far been refractory to singledrug therapy [20,21]. Elucidation of the molecular effectsand specificity of single ingredients in herbal extracts canbe difficult, but the determination of the action of everysingle chemical component in phytochemically complexextracts has been essentially elusive.
Pattern-oriented chemical profiling (“fingerprinting”)is being increasingly used to gain a more comprehen-sive summary of herbal medicine quality [22-25]. Incomparison, component-oriented single-marker basedapproaches (adapted from the mainstream pharmaceuticalindustry) do not account for the complex assortment ofmetabolites generally present in herbal medicine [22,23].The pattern-oriented approach considers all detectableconstituents of a given herbal material to establish acharacteristic chemical profile without necessarily charac-terizing all chemical constituents or their precise biologicaleffects. Ideally, a biological fingerprint should complementthe chemical fingerprint [26]. Preferably, fingerprints oftheir biological effects should be obtained in the veryorganism that will be treated with the herbal extracts. Forethical and practical reasons, however, it is not possible totest each herbal extract in laboratory animals or humans.What is needed then, is a test system consisting of anorganism with relevant biology but less complexity that canserve as a surrogate system.The species of yeast known as Saccharomyces cerevisiae
(S. cerevisiae) is arguably the best-understood eukaryoticorganism. It is inexpensive to maintain, easy to grow andit is classified as a “generally recognized as safe”microorganism (it is commonly referred to as baker’syeast). S. cerevisiae was at the very beginning of the“omics” revolution because it was both the first eukaryoticorganism for which the whole genome sequence was com-pleted [27] and the first organism that was studied at thewhole transcriptome level. The nature and time course ofthe transcriptional response of S. cerevisiae to a large num-ber of environmental changes have been characterizedboth qualitatively and quantitatively [28]. In addition,scientists have generated a collection of molecular-barcoded S. cerevisiae strains in which every singlegene has been selectively deleted [29,30]. Approxi-mately 45% of the S. cerevisiae genes are homologousto mammalian genes and hundreds of genes that havebeen linked to diseases in humans have orthologs inyeast [31].In this study, we wanted to test the hypothesis that the
S. cerevisiae transcriptome might be used as an indicatorof phytochemical variation of closely-related yet dis-tinctly different extracts prepared from a single speciesof a phytogeographically widely distributed medicinalplant. We chose the medicinal plant Equisetum arvensecommonly known as “horsetail” as model herb and thesingle celled fungus S. cerevisiae as model organism forour experiments. E. arvense is distributed worldwideover the northern hemisphere [32]. Equisetum speciesand hybrids are well understood to possess extensivemorphological, morphometric and chemotypical vari-ation [33,34]. E. arvense is used in traditional medicineas diuretic, anti-inflammatory, antioxidant, antidiabetic,
Cook et al. BMC Genomics 2013, 14:445 Page 3 of 18http://www.biomedcentral.com/1471-2164/14/445
vasorelaxant and hemostatic [35-41]. It is also used indozens of manufactured products claimed to promotegeneral wellbeing and improve the health of hair, nails,skin, and bone. The main constituents found within E.arvense include alkaloids, flavonoids, phenylcarboxylicacids, sterols, styrylpyrones, and silica [33,42-44], whichare thought to mediate the beneficial effects of thisherbal medicine. Veit and co-workers distinguished twodistinct chemotypes (chemodemes) of Equisetum based ontheir phenolic chemistry [33] but there is no informationon variation of the biological and clinical effects due tothese regional variants.Here we report that the gene expression in S. cerevisiae
exposed to globally sourced extracts of E. arvense reflectedvariation in their phytochemical composition. We havemade the microarray data obtained in this study publiclyavailable in the Gene Expression Omnibus (GEO) databaseof the National Center for Biotechnology Information ofthe USA (see Methods for details).
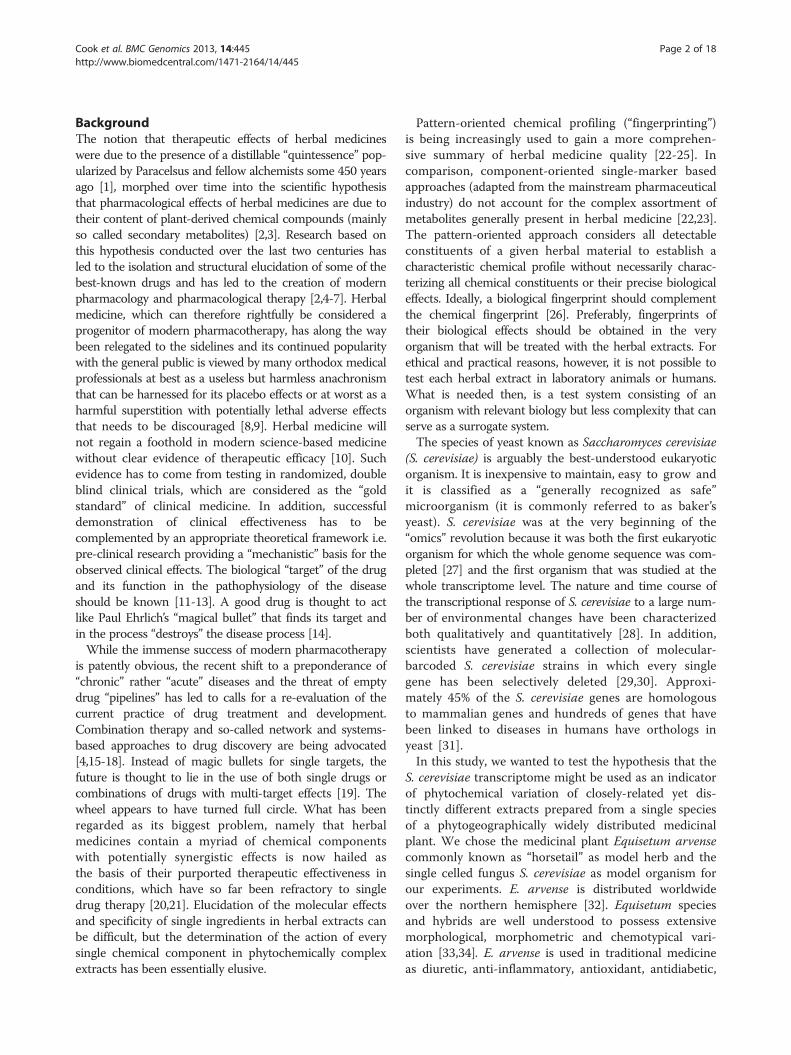
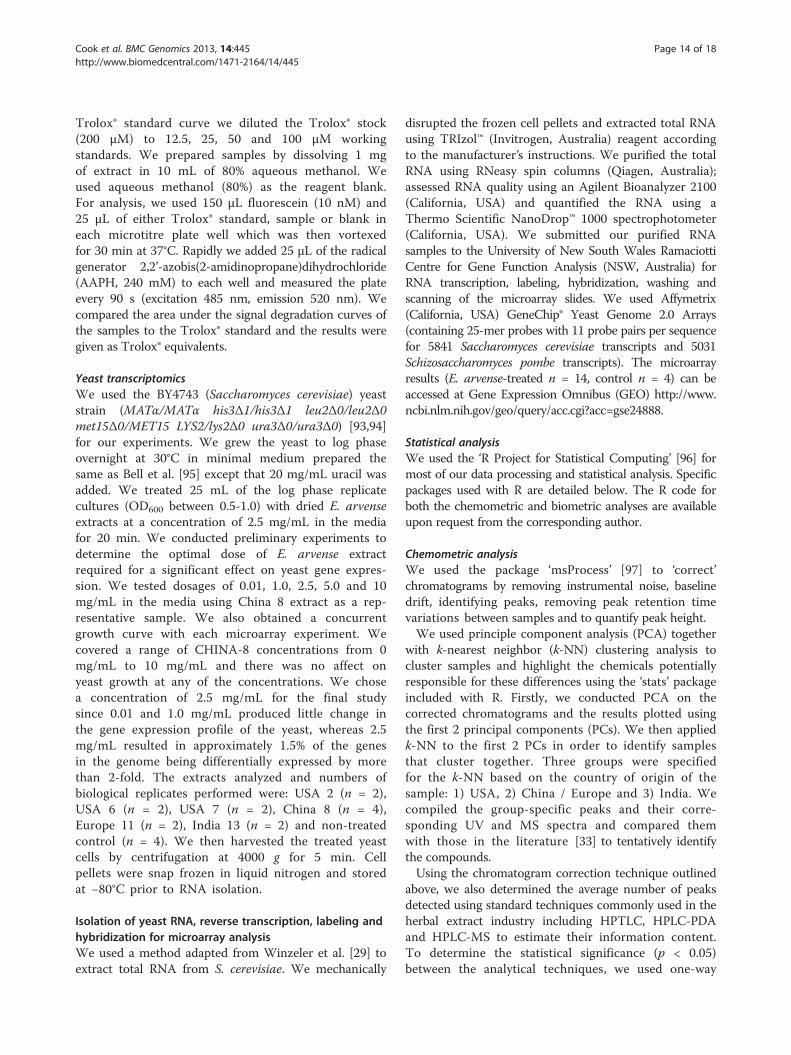
ResultsPhytochemical fingerprintingWe used 3 standard chromatography-based separationand detection techniques of increasing complexity tocharacterize the phytochemical composition of aqueousextracts of E. arvense that were obtained from sources inthe USA (n = 7; #1 - 7), China (n = 3; #8 - 10), Europe(n = 2; #11 - 12) and India (n = 1; # 13). The flavonoid andphenyl carboxylic acid high performance thin-layer chro-matography (HPTLC) profile resolved on average 9 ± 3peaks, but only a single peak was detected in the Indiasample (Figure 1A). The HPTLC profile clearly indicated ageneral quantitative difference in phenyl carboxylic acidand flavonoid concentration between the American and theEuropean and Chinese samples.Chromatograms generated using high performance
liquid chromatography (HPLC) and detection using aphotodiode array (PDA) set at 280 nm contained 35 ± 7peaks, triple the number of constituents contained inthe HPTLC profile (Figure 1B). The general trend in thevariation of in phenyl carboxylic acid and flavonoid con-centration along phytogeographical lines was similarto that obtained by HPTLC. The chromatograms fur-thermore exhibited clear qualitative differences between thesamples, especially in regards to the Indian sample, whichwere detectable due to the increased sensitivity of theHPLC-PDA technique over HPTLC.Next, we combined HPLC with mass spectrometry
(MS) to analyze the samples. HPLC-MS detected onaverage 43 ± 8 peaks and revealed both qualitativeand quantitative differences between the extracts aspresented (Figure 1C).Comparison of the different profiling techniques clearly
illustrates that the discoverable complexity of the
chemical composition of herbal extracts depends onthe analytical technique used (Figure 1D).The UV-Vis and mass spectra of peaks present in the
LC-PDA and LC-MS chromatograms respectively werecompared to the work by Veit et al [35] for tentativeidentification of some of the major chromatogram peaks(Table 1).A representative example of how we elucidated the
structure of dicaffeoyltartaric acid and a genkwaninacetylglucoside are presented in Additional file 1: Figure S1.Inspection of the HPTLC and HPLC chromatograms
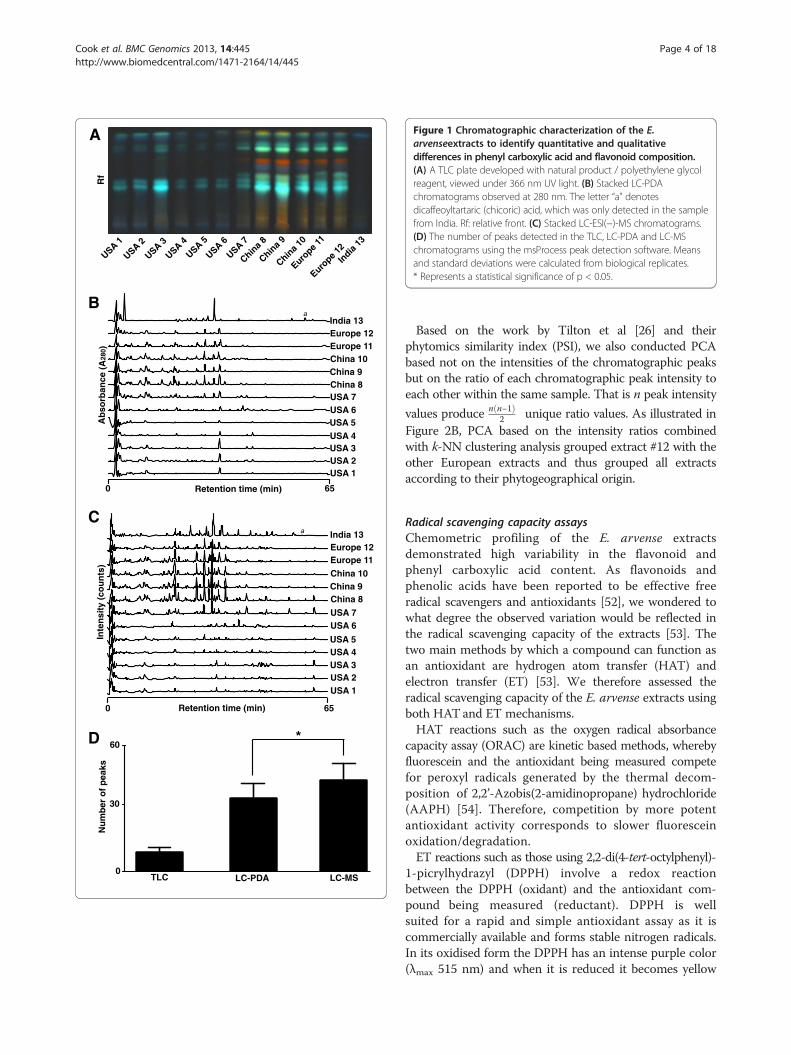
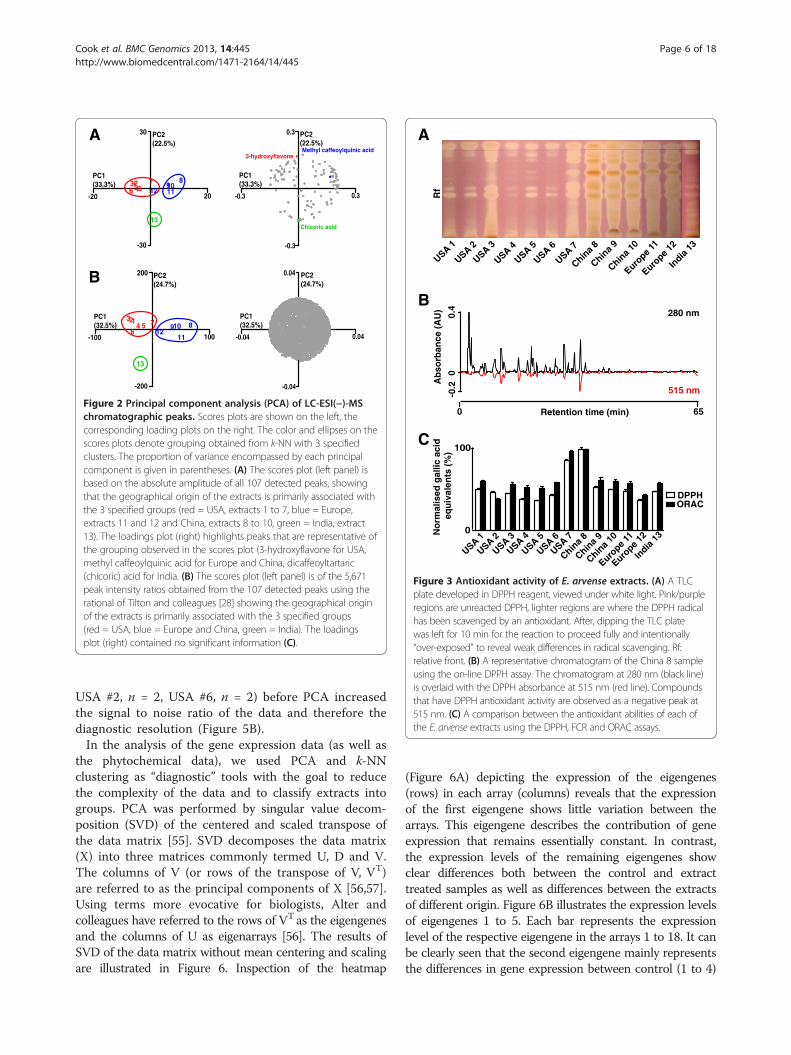
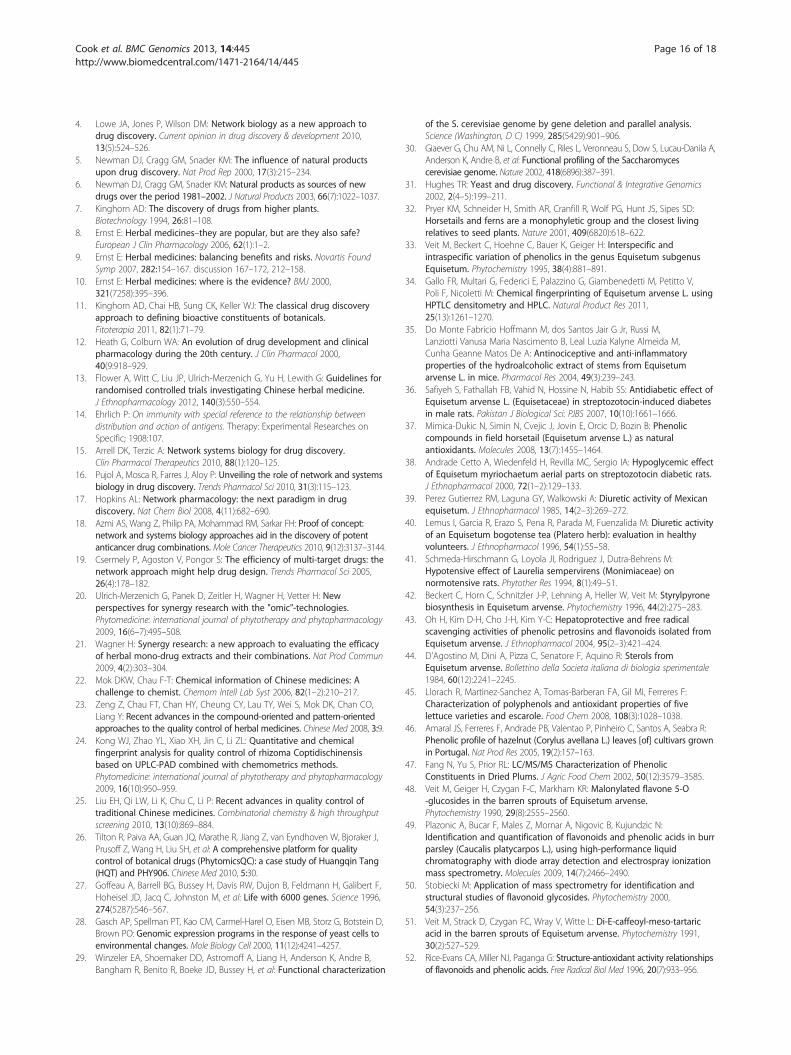
shown in Figure 1 appeared to suggest that the fingerprintsobtained from the Equisetum extracts grouped largelyaccording to their phytogeographical origin. The samplesfrom Europe and China were more closely similar to eachother then to the fingerprints of the Indian and Americansamples. American samples, in turn, appeared to be moreclosely related to each other then to the European andChinese samples. In order to see whether the existence ofsubgroups within the data could be verified statistically, weused the multivariate statistical techniques of principalcomponent analysis (PCA) and k-nearest neighbor (k-NN)clustering analysis to quantitatively characterize differencesand similarities between the HPLC-MS fingerprints of theE. arvense extracts (Figure 2).PCA essentially replaces the natural, albeit potentially
subjective pattern recognition ability of the human brain byreducing the highly complex chromatogram data into areduced data set, where each chromatogram is representedby a single point, which is then plotted in the so-calledscores plot in relation to the first 2 principal components ofthe entire data set. We used k-NN to colorize the PCA, byhighlighting samples that were classified into the 3 groups.PCA not only greatly reduces the complexity of the data itcan also be used to determine which peaks and thereforephytochemicals underlie the observed differentiationinto groups.Figure 2A illustrates how the PCA (left panel) combined
with k-NN clustering analysis (colored circles) groupedthe chromatograms of the extracts along the lines oftheir phytochemical origin (USA, red; China / Europe, blue;India, green) with the sole exception of the Europeanextract #12, which was grouped with the American extracts.Based on the similar proximity of chromatographic peaksin the loadings plot (right panel) to the sample groups inthe scores plot, we were able to determine the peaksgenerally responsible for group differentiation. Threerepresentative peaks have been highlighted in thesame colors as the sample groups. For example, PCAidentified dicaffeoyltartaric (chicoric) acid, which ishighlighted in Figure 2A (right panel), as a differenti-ating factor for the Indian sample. The correspondingpeak was indeed only detected in the Indian sample(Figure 1B and C, annotated by “a”).
0 65Retention time (min)
Ab
sorb
ance
(A
280)
0 65Retention time (min)
Inte
nsi
ty (
cou
nts
)
USA 1
A
B
C
0
60D
Nu
mb
er o
f p
eaks
TLC LC-PDA LC-MS
Rf
USA 2
USA 3
USA 4
USA 5
USA 6
USA 7
China 8
China 9
China 1
0
Europe 1
1
Europe 1
2In
dia 13
USA 1USA 2USA 3USA 4USA 5USA 6USA 7China 8China 9China 10Europe 11Europe 12India 13
USA 1USA 2USA 3USA 4USA 5
USA 6USA 7
China 8China 9China 10
Europe 11Europe 12India 13
30
*
a
a
Figure 1 Chromatographic characterization of the E.arvenseextracts to identify quantitative and qualitativedifferences in phenyl carboxylic acid and flavonoid composition.(A) A TLC plate developed with natural product / polyethylene glycolreagent, viewed under 366 nm UV light. (B) Stacked LC-PDAchromatograms observed at 280 nm. The letter “a” denotesdicaffeoyltartaric (chicoric) acid, which was only detected in the samplefrom India. Rf: relative front. (C) Stacked LC-ESI(−)-MS chromatograms.(D) The number of peaks detected in the TLC, LC-PDA and LC-MSchromatograms using the msProcess peak detection software. Meansand standard deviations were calculated from biological replicates.* Represents a statistical significance of p < 0.05.
Cook et al. BMC Genomics 2013, 14:445 Page 4 of 18http://www.biomedcentral.com/1471-2164/14/445
Based on the work by Tilton et al [26] and theirphytomics similarity index (PSI), we also conducted PCAbased not on the intensities of the chromatographic peaksbut on the ratio of each chromatographic peak intensity toeach other within the same sample. That is n peak intensity
values produce n n−1ð Þ2 unique ratio values. As illustrated in
Figure 2B, PCA based on the intensity ratios combinedwith k-NN clustering analysis grouped extract #12 with theother European extracts and thus grouped all extractsaccording to their phytogeographical origin.
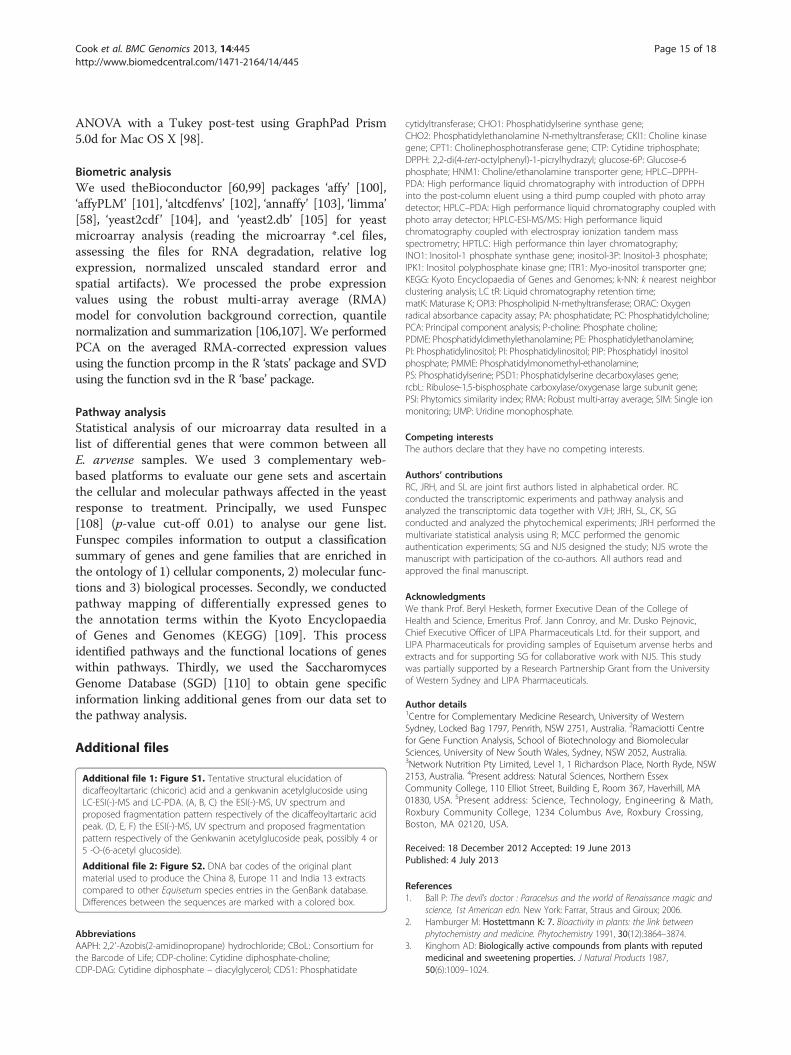
Radical scavenging capacity assaysChemometric profiling of the E. arvense extractsdemonstrated high variability in the flavonoid andphenyl carboxylic acid content. As flavonoids andphenolic acids have been reported to be effective freeradical scavengers and antioxidants [52], we wondered towhat degree the observed variation would be reflected inthe radical scavenging capacity of the extracts [53]. Thetwo main methods by which a compound can function asan antioxidant are hydrogen atom transfer (HAT) andelectron transfer (ET) [53]. We therefore assessed theradical scavenging capacity of the E. arvense extracts usingboth HAT and ET mechanisms.HAT reactions such as the oxygen radical absorbance
capacity assay (ORAC) are kinetic based methods, wherebyfluorescein and the antioxidant being measured competefor peroxyl radicals generated by the thermal decom-position of 2,2’-Azobis(2-amidinopropane) hydrochloride(AAPH) [54]. Therefore, competition by more potentantioxidant activity corresponds to slower fluoresceinoxidation/degradation.ET reactions such as those using 2,2-di(4-tert-octylphenyl)-
1-picrylhydrazyl (DPPH) involve a redox reactionbetween the DPPH (oxidant) and the antioxidant com-pound being measured (reductant). DPPH is wellsuited for a rapid and simple antioxidant assay as it iscommercially available and forms stable nitrogen radicals.In its oxidised form the DPPH has an intense purple color(λmax 515 nm) and when it is reduced it becomes yellow
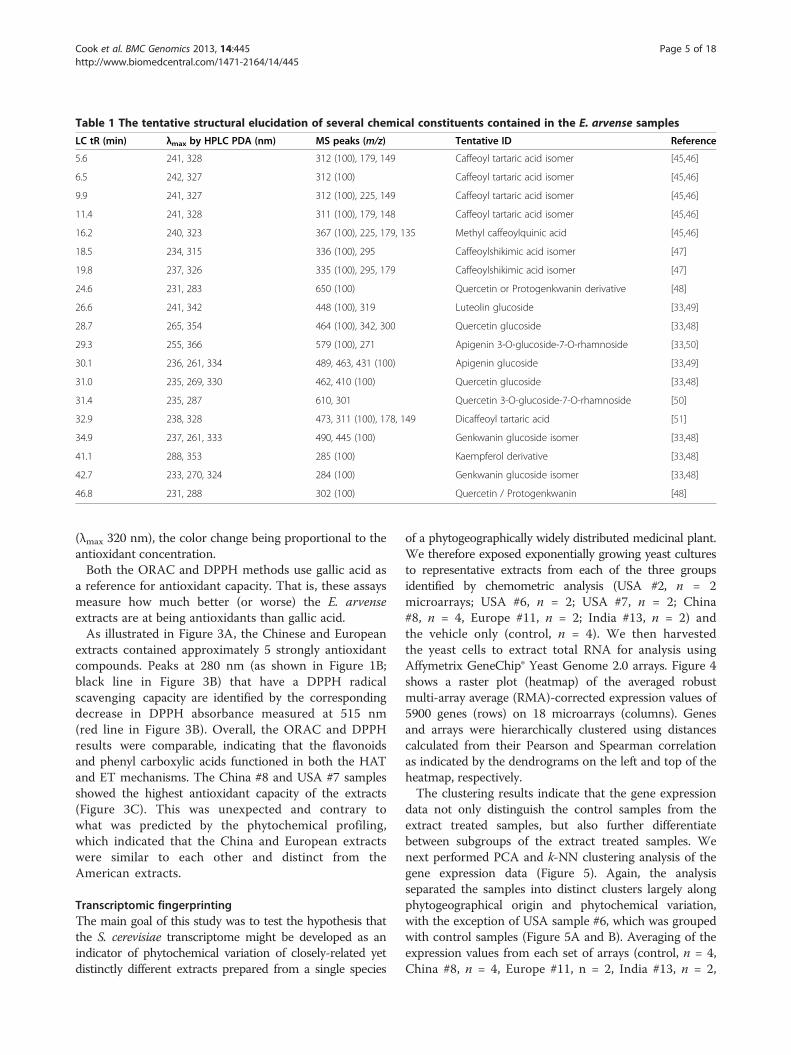
Table 1 The tentative structural elucidation of several chemical constituents contained in the E. arvense samples
LC tR (min) λmax by HPLC PDA (nm) MS peaks (m/z) Tentative ID Reference
5.6 241, 328 312 (100), 179, 149 Caffeoyl tartaric acid isomer [45,46]
6.5 242, 327 312 (100) Caffeoyl tartaric acid isomer [45,46]
9.9 241, 327 312 (100), 225, 149 Caffeoyl tartaric acid isomer [45,46]
11.4 241, 328 311 (100), 179, 148 Caffeoyl tartaric acid isomer [45,46]
16.2 240, 323 367 (100), 225, 179, 135 Methyl caffeoylquinic acid [45,46]
18.5 234, 315 336 (100), 295 Caffeoylshikimic acid isomer [47]
19.8 237, 326 335 (100), 295, 179 Caffeoylshikimic acid isomer [47]
24.6 231, 283 650 (100) Quercetin or Protogenkwanin derivative [48]
26.6 241, 342 448 (100), 319 Luteolin glucoside [33,49]
28.7 265, 354 464 (100), 342, 300 Quercetin glucoside [33,48]
29.3 255, 366 579 (100), 271 Apigenin 3-O-glucoside-7-O-rhamnoside [33,50]
30.1 236, 261, 334 489, 463, 431 (100) Apigenin glucoside [33,49]
31.0 235, 269, 330 462, 410 (100) Quercetin glucoside [33,48]
31.4 235, 287 610, 301 Quercetin 3-O-glucoside-7-O-rhamnoside [50]
32.9 238, 328 473, 311 (100), 178, 149 Dicaffeoyl tartaric acid [51]
34.9 237, 261, 333 490, 445 (100) Genkwanin glucoside isomer [33,48]
41.1 288, 353 285 (100) Kaempferol derivative [33,48]
42.7 233, 270, 324 284 (100) Genkwanin glucoside isomer [33,48]
46.8 231, 288 302 (100) Quercetin / Protogenkwanin [48]
Cook et al. BMC Genomics 2013, 14:445 Page 5 of 18http://www.biomedcentral.com/1471-2164/14/445
(λmax 320 nm), the color change being proportional to theantioxidant concentration.Both the ORAC and DPPH methods use gallic acid as
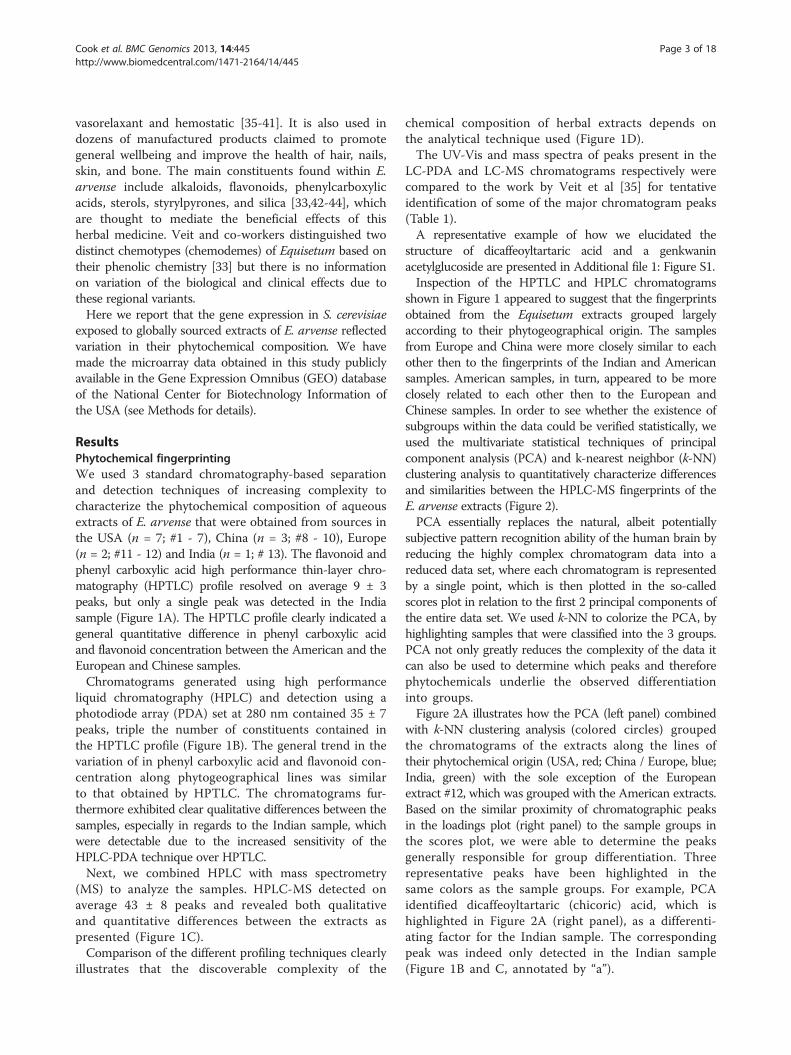
a reference for antioxidant capacity. That is, these assaysmeasure how much better (or worse) the E. arvenseextracts are at being antioxidants than gallic acid.As illustrated in Figure 3A, the Chinese and European
extracts contained approximately 5 strongly antioxidantcompounds. Peaks at 280 nm (as shown in Figure 1B;black line in Figure 3B) that have a DPPH radicalscavenging capacity are identified by the correspondingdecrease in DPPH absorbance measured at 515 nm(red line in Figure 3B). Overall, the ORAC and DPPHresults were comparable, indicating that the flavonoidsand phenyl carboxylic acids functioned in both the HATand ET mechanisms. The China #8 and USA #7 samplesshowed the highest antioxidant capacity of the extracts(Figure 3C). This was unexpected and contrary towhat was predicted by the phytochemical profiling,which indicated that the China and European extractswere similar to each other and distinct from theAmerican extracts.
Transcriptomic fingerprintingThe main goal of this study was to test the hypothesis thatthe S. cerevisiae transcriptome might be developed as anindicator of phytochemical variation of closely-related yetdistinctly different extracts prepared from a single species
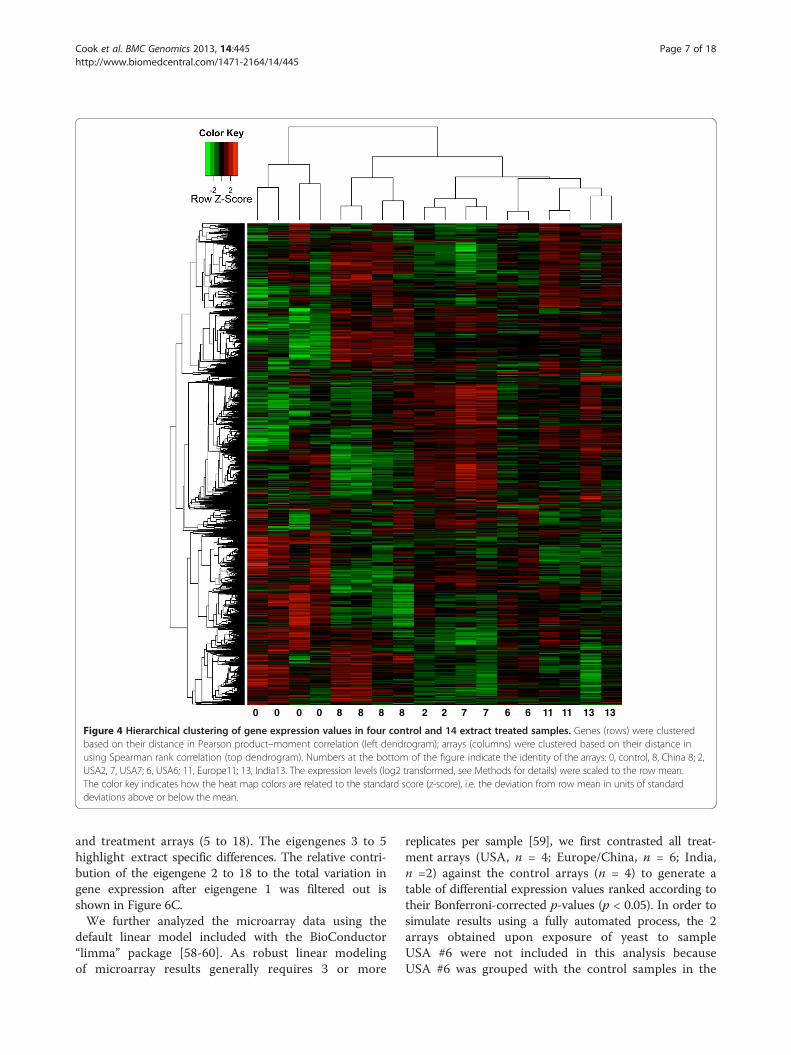
of a phytogeographically widely distributed medicinal plant.We therefore exposed exponentially growing yeast culturesto representative extracts from each of the three groupsidentified by chemometric analysis (USA #2, n = 2microarrays; USA #6, n = 2; USA #7, n = 2; China#8, n = 4, Europe #11, n = 2; India #13, n = 2) andthe vehicle only (control, n = 4). We then harvestedthe yeast cells to extract total RNA for analysis usingAffymetrix GeneChip® Yeast Genome 2.0 arrays. Figure 4shows a raster plot (heatmap) of the averaged robustmulti-array average (RMA)-corrected expression values of5900 genes (rows) on 18 microarrays (columns). Genesand arrays were hierarchically clustered using distancescalculated from their Pearson and Spearman correlationas indicated by the dendrograms on the left and top of theheatmap, respectively.The clustering results indicate that the gene expression
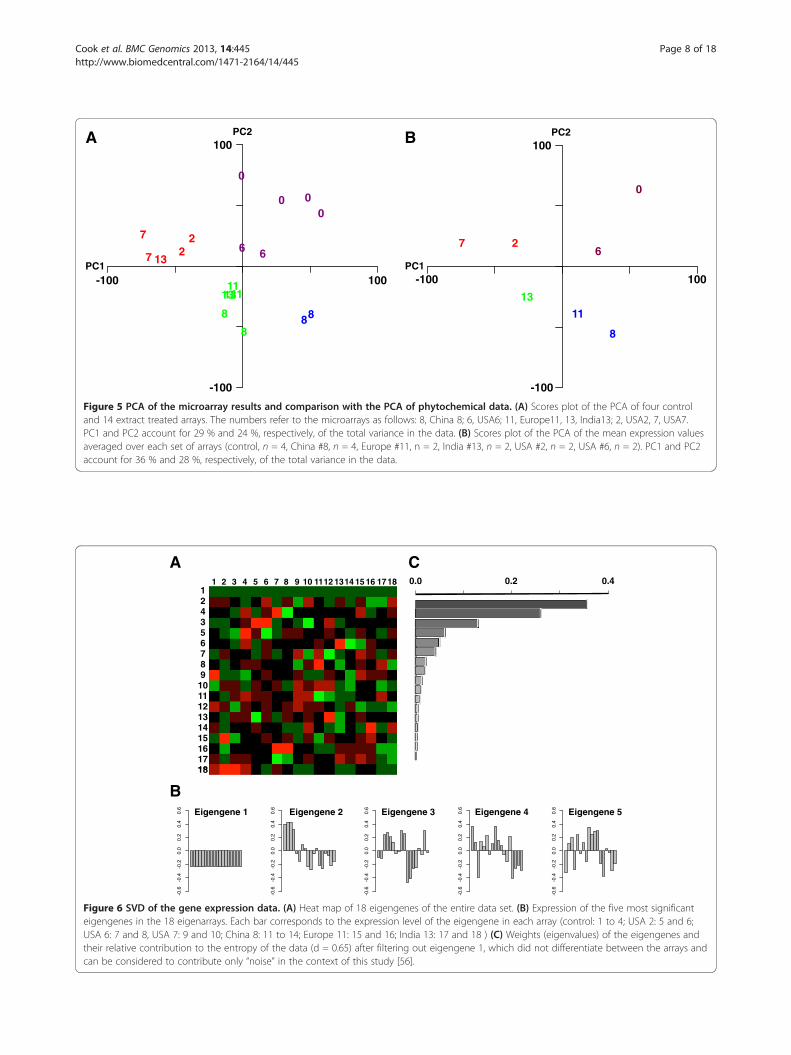
data not only distinguish the control samples from theextract treated samples, but also further differentiatebetween subgroups of the extract treated samples. Wenext performed PCA and k-NN clustering analysis of thegene expression data (Figure 5). Again, the analysisseparated the samples into distinct clusters largely alongphytogeographical origin and phytochemical variation,with the exception of USA sample #6, which was groupedwith control samples (Figure 5A and B). Averaging of theexpression values from each set of arrays (control, n = 4,China #8, n = 4, Europe #11, n = 2, India #13, n = 2,
00.
4B
Ab
sorb
ance
(A
U)
No
rmal
ised
gal
lic a
cid
eq
uiv
alen
ts (
%)
C
A
0
100R
f
USA 1
USA 2
USA 3
USA 4
USA 5
USA 6
USA 7
China 8
China 9
China 1
0
Europe 1
1
Europe 1
2
India
13
-0.2
0 65Retention time (min)
USA 1
USA 2
USA 3
USA 4
USA 5
USA 6
USA 7
China 8
China 9
China 1
0
Europe 1
1
Europe 1
2
India
13
DPPHORAC
280 nm
515 nm
Figure 3 Antioxidant activity of E. arvense extracts. (A) A TLCplate developed in DPPH reagent, viewed under white light. Pink/purpleregions are unreacted DPPH, lighter regions are where the DPPH radicalhas been scavenged by an antioxidant. After, dipping the TLC platewas left for 10 min for the reaction to proceed fully and intentionally“over-exposed” to reveal weak differences in radical scavenging. Rf:relative front. (B) A representative chromatogram of the China 8 sampleusing the on-line DPPH assay. The chromatogram at 280 nm (black line)is overlaid with the DPPH absorbance at 515 nm (red line). Compoundsthat have DPPH antioxidant activity are observed as a negative peak at515 nm. (C) A comparison between the antioxidant abilities of each ofthe E. arvense extracts using the DPPH, FCR and ORAC assays.
B
A
PC1 (33.3%)
PC2 (22.5%)
-20 20
30
-30
-0.3 0.3
0.3
-0.3
PC1 (33.3%)
PC2 (22.5%)
123456
7 89101112
13Chicoric acid
Methyl caffeoylquinic acid3-hydroxyflavone
PC1 (32.5%)
PC2 (24.7%)
-100 100
200
-200
1234 5
67 8910
11
13
12-0.04 0.04
0.04
-0.04
PC1 (32.5%)
PC2 (24.7%)
0.00
0.00
0.02
Figure 2 Principal component analysis (PCA) of LC-ESI(−)-MSchromatographic peaks. Scores plots are shown on the left, thecorresponding loading plots on the right. The color and ellipses on thescores plots denote grouping obtained from k-NN with 3 specifiedclusters. The proportion of variance encompassed by each principalcomponent is given in parentheses. (A) The scores plot (left panel) isbased on the absolute amplitude of all 107 detected peaks, showingthat the geographical origin of the extracts is primarily associated withthe 3 specified groups (red = USA, extracts 1 to 7, blue = Europe,extracts 11 and 12 and China, extracts 8 to 10, green = India, extract13). The loadings plot (right) highlights peaks that are representative ofthe grouping observed in the scores plot (3-hydroxyflavone for USA,methyl caffeoylquinic acid for Europe and China, dicaffeoyltartaric(chicoric) acid for India. (B) The scores plot (left panel) is of the 5,671peak intensity ratios obtained from the 107 detected peaks using therational of Tilton and colleagues [28] showing the geographical originof the extracts is primarily associated with the 3 specified groups(red = USA, blue = Europe and China, green = India). The loadingsplot (right) contained no significant information (C).
Cook et al. BMC Genomics 2013, 14:445 Page 6 of 18http://www.biomedcentral.com/1471-2164/14/445
USA #2, n = 2, USA #6, n = 2) before PCA increasedthe signal to noise ratio of the data and therefore thediagnostic resolution (Figure 5B).In the analysis of the gene expression data (as well as
the phytochemical data), we used PCA and k-NNclustering as “diagnostic” tools with the goal to reducethe complexity of the data and to classify extracts intogroups. PCA was performed by singular value decom-position (SVD) of the centered and scaled transpose ofthe data matrix [55]. SVD decomposes the data matrix(X) into three matrices commonly termed U, D and V.The columns of V (or rows of the transpose of V, VT)are referred to as the principal components of X [56,57].Using terms more evocative for biologists, Alter andcolleagues have referred to the rows of VT as the eigengenesand the columns of U as eigenarrays [56]. The results ofSVD of the data matrix without mean centering and scalingare illustrated in Figure 6. Inspection of the heatmap
(Figure 6A) depicting the expression of the eigengenes(rows) in each array (columns) reveals that the expressionof the first eigengene shows little variation between thearrays. This eigengene describes the contribution of geneexpression that remains essentially constant. In contrast,the expression levels of the remaining eigengenes showclear differences both between the control and extracttreated samples as well as differences between the extractsof different origin. Figure 6B illustrates the expression levelsof eigengenes 1 to 5. Each bar represents the expressionlevel of the respective eigengene in the arrays 1 to 18. It canbe clearly seen that the second eigengene mainly representsthe differences in gene expression between control (1 to 4)
0 0 00 8 8 8 8 2 2 7 7 66 11 13 1311
Figure 4 Hierarchical clustering of gene expression values in four control and 14 extract treated samples. Genes (rows) were clusteredbased on their distance in Pearson product–moment correlation (left dendrogram); arrays (columns) were clustered based on their distance inusing Spearman rank correlation (top dendrogram). Numbers at the bottom of the figure indicate the identity of the arrays: 0, control, 8, China 8; 2,USA2, 7, USA7; 6, USA6; 11, Europe11; 13, India13. The expression levels (log2 transformed, see Methods for details) were scaled to the row mean.The color key indicates how the heat map colors are related to the standard score (z-score), i.e. the deviation from row mean in units of standarddeviations above or below the mean.
Cook et al. BMC Genomics 2013, 14:445 Page 7 of 18http://www.biomedcentral.com/1471-2164/14/445
and treatment arrays (5 to 18). The eigengenes 3 to 5highlight extract specific differences. The relative contri-bution of the eigengene 2 to 18 to the total variation ingene expression after eigengene 1 was filtered out isshown in Figure 6C.We further analyzed the microarray data using the
default linear model included with the BioConductor“limma” package [58-60]. As robust linear modelingof microarray results generally requires 3 or more
replicates per sample [59], we first contrasted all treat-ment arrays (USA, n = 4; Europe/China, n = 6; India,n =2) against the control arrays (n = 4) to generate atable of differential expression values ranked according totheir Bonferroni-corrected p-values (p < 0.05). In order tosimulate results using a fully automated process, the 2arrays obtained upon exposure of yeast to sampleUSA #6 were not included in this analysis becauseUSA #6 was grouped with the control samples in the
-100
0
00
0
22
7
7
8
8
88
13
1113
6 6
1113-100 100
100
PC1
PC2
0
6
8
11
27
13
-100
-100 100
100
PC1
PC2A B
Figure 5 PCA of the microarray results and comparison with the PCA of phytochemical data. (A) Scores plot of the PCA of four controland 14 extract treated arrays. The numbers refer to the microarrays as follows: 8, China 8; 6, USA6; 11, Europe11, 13, India13; 2, USA2, 7, USA7.PC1 and PC2 account for 29 % and 24 %, respectively, of the total variance in the data. (B) Scores plot of the PCA of the mean expression valuesaveraged over each set of arrays (control, n = 4, China #8, n = 4, Europe #11, n = 2, India #13, n = 2, USA #2, n = 2, USA #6, n = 2). PC1 and PC2account for 36 % and 28 %, respectively, of the total variance in the data.
1 2 43 5 6 7 8 9 10 1112 13 1514 16 1718124356789
10111213
1514
161718
18 0.0 0.2 0.4
18
-0.6
-0.4
-0.2
0.0
0.2
0.4
0.6
-0.6
-0.4
-0.2
0.0
0.2
0.4
0.6
-0.6
-0.4
-0.2
0.0
0.2
0.4
0.6
-0.6
-0.4
-0.2
0.0
0.2
0.4
0.6
-0.6
-0.4
-0.2
0.0
0.2
0.4
0.6
A C
BEigengene 1 Eigengene 2 Eigengene 4Eigengene 3 Eigengene 5
Figure 6 SVD of the gene expression data. (A) Heat map of 18 eigengenes of the entire data set. (B) Expression of the five most significanteigengenes in the 18 eigenarrays. Each bar corresponds to the expression level of the eigengene in each array (control: 1 to 4; USA 2: 5 and 6;USA 6: 7 and 8, USA 7: 9 and 10; China 8: 11 to 14; Europe 11: 15 and 16; India 13: 17 and 18 ) (C) Weights (eigenvalues) of the eigengenes andtheir relative contribution to the entropy of the data (d = 0.65) after filtering out eigengene 1, which did not differentiate between the arrays andcan be considered to contribute only “noise” in the context of this study [56].
Cook et al. BMC Genomics 2013, 14:445 Page 8 of 18http://www.biomedcentral.com/1471-2164/14/445
Cook et al. BMC Genomics 2013, 14:445 Page 9 of 18http://www.biomedcentral.com/1471-2164/14/445
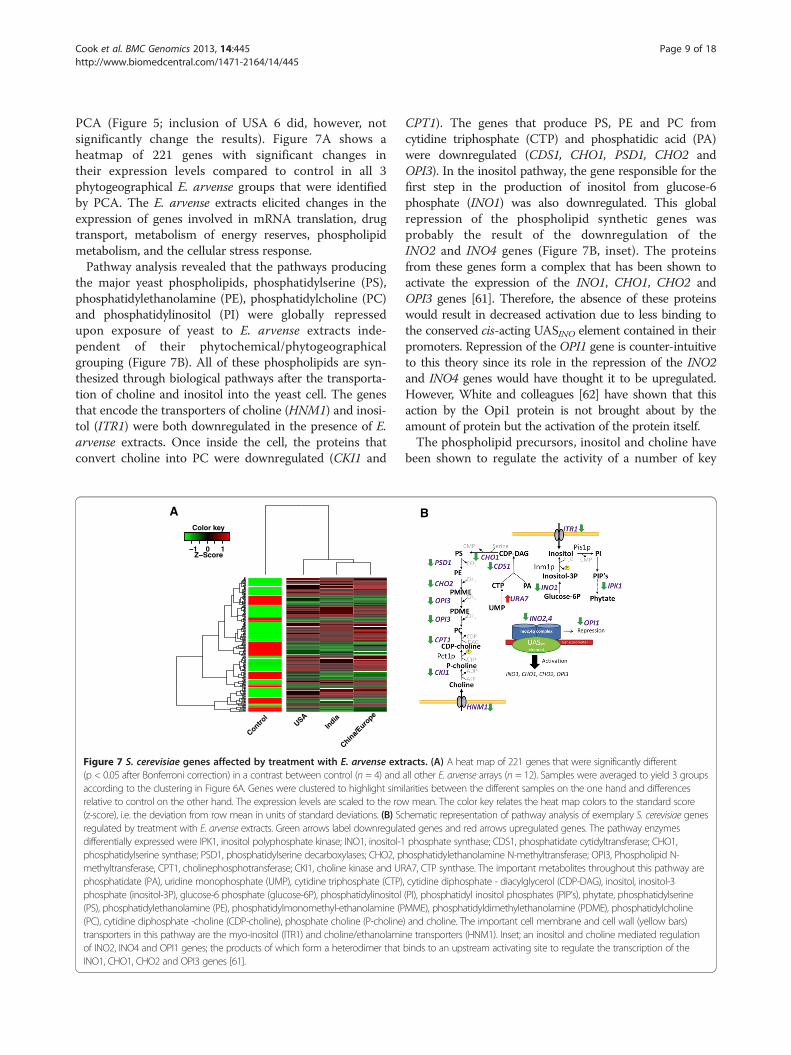
PCA (Figure 5; inclusion of USA 6 did, however, notsignificantly change the results). Figure 7A shows aheatmap of 221 genes with significant changes intheir expression levels compared to control in all 3phytogeographical E. arvense groups that were identifiedby PCA. The E. arvense extracts elicited changes in theexpression of genes involved in mRNA translation, drugtransport, metabolism of energy reserves, phospholipidmetabolism, and the cellular stress response.Pathway analysis revealed that the pathways producing
the major yeast phospholipids, phosphatidylserine (PS),phosphatidylethanolamine (PE), phosphatidylcholine (PC)and phosphatidylinositol (PI) were globally repressedupon exposure of yeast to E. arvense extracts inde-pendent of their phytochemical/phytogeographicalgrouping (Figure 7B). All of these phospholipids are syn-thesized through biological pathways after the transporta-tion of choline and inositol into the yeast cell. The genesthat encode the transporters of choline (HNM1) and inosi-tol (ITR1) were both downregulated in the presence of E.arvense extracts. Once inside the cell, the proteins thatconvert choline into PC were downregulated (CKI1 and
Control
USAIn
dia
China/E
urope
0
Color key
A
Figure 7 S. cerevisiae genes affected by treatment with E. arvense ext(p < 0.05 after Bonferroni correction) in a contrast between control (n = 4) andaccording to the clustering in Figure 6A. Genes were clustered to highlight simirelative to control on the other hand. The expression levels are scaled to the ro(z-score), i.e. the deviation from row mean in units of standard deviations. (B) Scregulated by treatment with E. arvense extracts. Green arrows label downreguladifferentially expressed were IPK1, inositol polyphosphate kinase; INO1, inositol-1phosphatidylserine synthase; PSD1, phosphatidylserine decarboxylases; CHO2, pmethyltransferase, CPT1, cholinephosphotransferase; CKI1, choline kinase and URphosphatidate (PA), uridine monophosphate (UMP), cytidine triphosphate (CTP)phosphate (inositol-3P), glucose-6 phosphate (glucose-6P), phosphatidylinositol(PS), phosphatidylethanolamine (PE), phosphatidylmonomethyl-ethanolamine (P(PC), cytidine diphosphate -choline (CDP-choline), phosphate choline (P-cholinetransporters in this pathway are the myo-inositol (ITR1) and choline/ethanolamiof INO2, INO4 and OPI1 genes; the products of which form a heterodimer thatINO1, CHO1, CHO2 and OPI3 genes [61].
CPT1). The genes that produce PS, PE and PC fromcytidine triphosphate (CTP) and phosphatidic acid (PA)were downregulated (CDS1, CHO1, PSD1, CHO2 andOPI3). In the inositol pathway, the gene responsible for thefirst step in the production of inositol from glucose-6phosphate (INO1) was also downregulated. This globalrepression of the phospholipid synthetic genes wasprobably the result of the downregulation of theINO2 and INO4 genes (Figure 7B, inset). The proteinsfrom these genes form a complex that has been shown toactivate the expression of the INO1, CHO1, CHO2 andOPI3 genes [61]. Therefore, the absence of these proteinswould result in decreased activation due to less binding tothe conserved cis-acting UASINO element contained in theirpromoters. Repression of the OPI1 gene is counter-intuitiveto this theory since its role in the repression of the INO2and INO4 genes would have thought it to be upregulated.However, White and colleagues [62] have shown that thisaction by the Opi1 protein is not brought about by theamount of protein but the activation of the protein itself.The phospholipid precursors, inositol and choline have
been shown to regulate the activity of a number of key
B
racts. (A) A heat map of 221 genes that were significantly differentall other E. arvense arrays (n = 12). Samples were averaged to yield 3 groupslarities between the different samples on the one hand and differencesw mean. The color key relates the heat map colors to the standard scorehematic representation of pathway analysis of exemplary S. cerevisiae genested genes and red arrows upregulated genes. The pathway enzymesphosphate synthase; CDS1, phosphatidate cytidyltransferase; CHO1,
hosphatidylethanolamine N-methyltransferase; OPI3, Phospholipid N-A7, CTP synthase. The important metabolites throughout this pathway are, cytidine diphosphate - diacylglycerol (CDP-DAG), inositol, inositol-3(PI), phosphatidyl inositol phosphates (PIP’s), phytate, phosphatidylserineMME), phosphatidyldimethylethanolamine (PDME), phosphatidylcholine) and choline. The important cell membrane and cell wall (yellow bars)ne transporters (HNM1). Inset; an inositol and choline mediated regulationbinds to an upstream activating site to regulate the transcription of the
0
y
YNR062CYOR378WCHA1BDS1OYE3RSB1PSD2VBA2YYRR1HPF1MET6HSP150SAM2DUT1SAM4RIB3SAM4APD1
MVP1SPO14YCK3MDS3ECM29DFR1IKI1CFD1DUS4RFC3ARG2LAA1VPS35ROT2CUE5IES6BRR6YBL095WMCH1POR2KTI11ORT1SNG1ISU2YHI9HUT1PYC1YCL002CGPX2RSP5CHC1OAC1ADE8ARG7
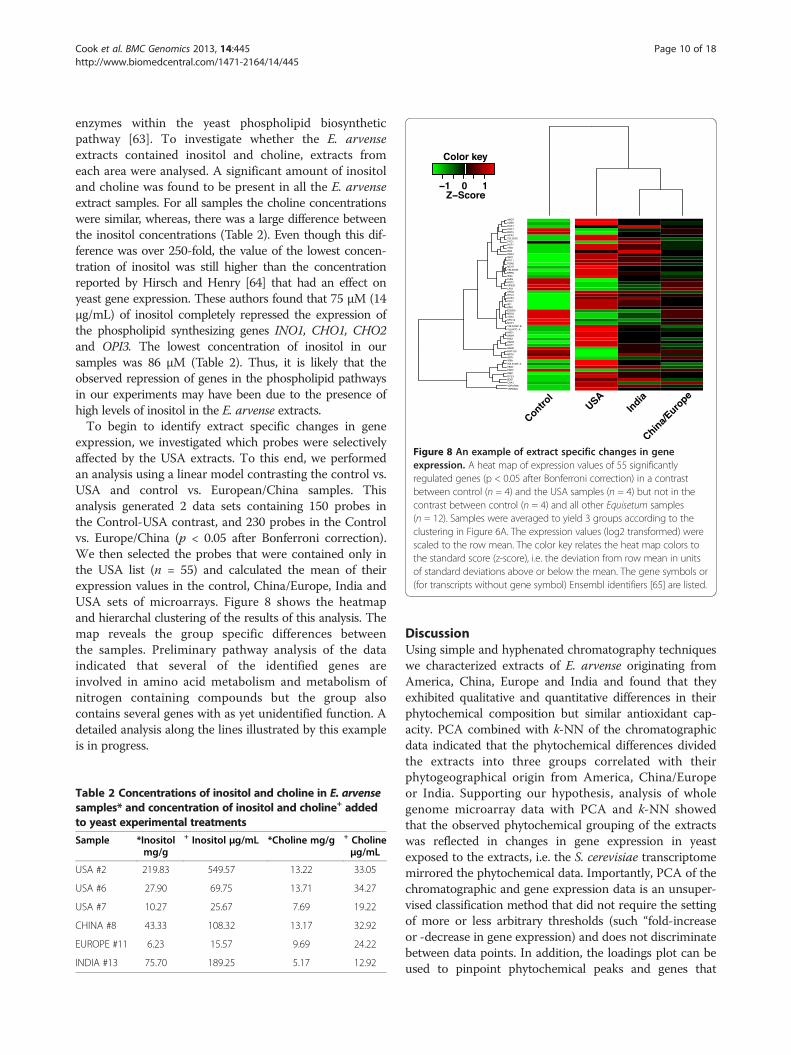
Figure 8 An example of extract specific changes in geneexpression. A heat map of expression values of 55 significantlyregulated genes (p < 0.05 after Bonferroni correction) in a contrastbetween control (n = 4) and the USA samples (n = 4) but not in thecontrast between control (n = 4) and all other Equisetum samples(n = 12). Samples were averaged to yield 3 groups according to theclustering in Figure 6A. The expression values (log2 transformed) werescaled to the row mean. The color key relates the heat map colors tothe standard score (z-score), i.e. the deviation from row mean in unitsof standard deviations above or below the mean. The gene symbols or(for transcripts without gene symbol) Ensembl identifiers [65] are listed.
Cook et al. BMC Genomics 2013, 14:445 Page 10 of 18http://www.biomedcentral.com/1471-2164/14/445
enzymes within the yeast phospholipid biosyntheticpathway [63]. To investigate whether the E. arvenseextracts contained inositol and choline, extracts fromeach area were analysed. A significant amount of inositoland choline was found to be present in all the E. arvenseextract samples. For all samples the choline concentrationswere similar, whereas, there was a large difference betweenthe inositol concentrations (Table 2). Even though this dif-ference was over 250-fold, the value of the lowest concen-tration of inositol was still higher than the concentrationreported by Hirsch and Henry [64] that had an effect onyeast gene expression. These authors found that 75 μM (14μg/mL) of inositol completely repressed the expression ofthe phospholipid synthesizing genes INO1, CHO1, CHO2and OPI3. The lowest concentration of inositol in oursamples was 86 μM (Table 2). Thus, it is likely that theobserved repression of genes in the phospholipid pathwaysin our experiments may have been due to the presence ofhigh levels of inositol in the E. arvense extracts.To begin to identify extract specific changes in gene
expression, we investigated which probes were selectivelyaffected by the USA extracts. To this end, we performedan analysis using a linear model contrasting the control vs.USA and control vs. European/China samples. Thisanalysis generated 2 data sets containing 150 probes inthe Control-USA contrast, and 230 probes in the Controlvs. Europe/China (p < 0.05 after Bonferroni correction).We then selected the probes that were contained only inthe USA list (n = 55) and calculated the mean of theirexpression values in the control, China/Europe, India andUSA sets of microarrays. Figure 8 shows the heatmapand hierarchal clustering of the results of this analysis. Themap reveals the group specific differences betweenthe samples. Preliminary pathway analysis of the dataindicated that several of the identified genes areinvolved in amino acid metabolism and metabolism ofnitrogen containing compounds but the group alsocontains several genes with as yet unidentified function. Adetailed analysis along the lines illustrated by this exampleis in progress.
Table 2 Concentrations of inositol and choline in E. arvensesamples* and concentration of inositol and choline+ addedto yeast experimental treatments
Sample *Inositolmg/g
+ Inositol μg/mL *Choline mg/g + Cholineμg/mL
USA #2 219.83 549.57 13.22 33.05
USA #6 27.90 69.75 13.71 34.27
USA #7 10.27 25.67 7.69 19.22
CHINA #8 43.33 108.32 13.17 32.92
EUROPE #11 6.23 15.57 9.69 24.22
INDIA #13 75.70 189.25 5.17 12.92
DiscussionUsing simple and hyphenated chromatography techniqueswe characterized extracts of E. arvense originating fromAmerica, China, Europe and India and found that theyexhibited qualitative and quantitative differences in theirphytochemical composition but similar antioxidant cap-acity. PCA combined with k-NN of the chromatographicdata indicated that the phytochemical differences dividedthe extracts into three groups correlated with theirphytogeographical origin from America, China/Europeor India. Supporting our hypothesis, analysis of wholegenome microarray data with PCA and k-NN showedthat the observed phytochemical grouping of the extractswas reflected in changes in gene expression in yeastexposed to the extracts, i.e. the S. cerevisiae transcriptomemirrored the phytochemical data. Importantly, PCA of thechromatographic and gene expression data is an unsuper-vised classification method that did not require the settingof more or less arbitrary thresholds (such “fold-increaseor -decrease in gene expression) and does not discriminatebetween data points. In addition, the loadings plot can beused to pinpoint phytochemical peaks and genes that
Cook et al. BMC Genomics 2013, 14:445 Page 11 of 18http://www.biomedcentral.com/1471-2164/14/445
contributed to the differences between the groups. k-NNclustering analysis can be used to confirm quantitativelygrouping of the extracts.Statistical analysis of the gene expression data
using a linear model revealed that the expression of221 genes changed significantly upon exposure of S.cerevisiae to E. arvense extracts. Performing pathwayanalysis with these genes showed that the pathwaysproducing the major S. cerevisiae phospholipids wereglobally repressed by all tested extracts independentof their phytochemical/phytogeographical grouping. Thisobservation prompted us to quantify the inositol andcholine content of the extracts, two essential componentsof the major yeast phospholipids. The data revealed thatall extracts contained saturating amounts of these twoessential nutrients.Inositol and choline containing phospholipids play an
important role in a large number of cellular processes inhealth and disease. Inositol is necessary for the synthesisof phosphoinositides, which function as lipid secondmessengers implicated in signal transduction and mem-brane trafficking [66]. Inositol has also been reported tobe critical for the growth of keratinocytes [67] consistentwith the use of E. arvense for the health of skin, hair andnails. Dietary administration of inositol has been claimedto have chemopreventive effects in rats [68]. Choline isnot only required for the synthesis of phosphatidylcho-line, lysophosphatidylcholine, choline plasmalogen, andsphingomyelin, which are essential components for allmembranes, it is also a major dietary source of methylgroups (via the synthesis of S-adenosylmethionine) formethylation reactions that play major roles in lipidbiosynthesis, the regulation of metabolic pathways, anddetoxification [69]. While humans can produce inositol,choline is an essential nutrient. Yet the mean intake ofcholine for most people is far below the adequate intake[69]. The high choline content of the E. arvense extracts(more then twice the content in egg yolks, the mostconcentrated source of choline in the American diet [69])is thus significant and supplementation of the diet with E.arvense might provide some general health benefits.It is interesting to note that previous phytochemical
studies of Equisetum mostly focused their general antioxi-dant properties and on phenolic compounds, sterols andthe silica content of the herb [33,34,37,43,44,70-76]. Tothe best of our knowledge, the role of inositol and cholinein relation to the beneficial effects of E. arvense has notbeen investigated previously. Our results immediately sug-gest further experiments. For example, it will beinteresting to investigate whether exposure of yeast tosaturating concentrations of choline and inositol alonewill elicit similar changes in the expression of genesin the phospholipid synthesis pathway as observed inthe present study. Exposure of yeast to the E. arvense
extract fraction without inositol and choline will bean interesting complementary experiment.Transcriptomic studies have previously been conducted
both for the discovery of molecular effects of herbal medi-cines as well as quality control purposes [26,77-80]. In twoprevious studies, investigators combined phytochemicalcharacterization of complex extracts from multiple herbsand microarray studies for what they called “bio-responsefingerprinting” [26,80]. The purpose of the present studywas diametrically opposite to that of the previous work.For example, Tilton and colleagues combined chemicalfingerprinting, differential cellular gene expression andanimal pharmacology studies followed by statistical pat-tern comparison to determine the similarity of thechemical and bio-response fingerprints among differentmanufactured batches of a multi herb preparation. Theseauthors used the cellular assay as a “biological detectorand the resulting genomic differential display profile afterexposure to the botanical extract … (as) a sensitive andglobal biological metric …(to) validate batch similarity …”[26] (emphasis in italics is ours). Our aim, in contrast, wasto test the hypothesis that the S. cerevisiae transcriptomemight be used as an indicator of phytochemical variationof herbal extracts. Our data demonstrate that changes inthe S. cerevisiae transcriptome reflected the phytochemicalvariation in complex extracts made from a single plantspecies. Thus, the yeast transcriptome can be used as adiagnostic tool for the classification of complex extractseven so the overwhelming majority of the genes did notshow significant changes. While the diagnostic signalswere relatively weak, they were picked out clearly by thePCA and cluster analyses. The functional significance ofthe observed changes for yeast remains to be establishedin future work.
ConclusionTogether, the results of our study serve as a proof (or betterdemonstration) of principle and encourage further develop-ment of transcriptomic assays for the characterization ofthe biological effects of phytochemical variation of complexherbal extracts. Yeast transcriptomics may also be usefulfor testing of mixtures of conventional drugs (“polypills”) todiscover novel antagonistic or synergistic effects of thosedrug combinations. Furthermore, it will be interestingwhether or not observed changes in the transcriptome willbe reflected at the proteome, interactome and metabolome[81-83]. Yeast is uniquely well positioned to serve as amodel system for all types of “omics” studies.We believe that the data presented here justify further
exploration of this and similar (e.g. mammalian cell–based)systems of increasing yet manageable complexity useful forthe development and testing of network and systems-basedpharmacological therapies. In particular, the availability ofyeast deletion and overexpression libraries offers the
Cook et al. BMC Genomics 2013, 14:445 Page 12 of 18http://www.biomedcentral.com/1471-2164/14/445
opportunity to study systematically the interaction betweencomplex mixtures of small molecules and differentgenomes. The unparalleled progress in our understandingof the molecular basis of life especially in the second halfof the 20th century was driven by reductionism. There is anincreasing number of scientists, however, who feel thatcomplex systems may never be completely understoodfrom the bottom up alone, especially in biological sys-tems, and therefore advocate holism [84,85]. Obvi-ously, single celled organisms such as S. cerevisiaecannot replace studies in multicellular organism butthey can be used to discover molecular markers formonitoring in animal and human studies and are thusa first (“reductionist”) step towards holism in pharma-cological studies of complex mixtures of chemicalcompounds.
MethodsSources of E. arvenseLIPA Pharmaceuticals Ltd (NSW, Australia) providedus with authenticated dried E. arvense herb and non-standardized water extracts (USA, n = 7, 4:1 extractratio, dicalcium phosphate excipient; China, n = 3,5:1 extract ratio, glucose excipient; Europe, n = 2,5:1 extract ratio, lactose monohydrate excipient; andIndia, n = 1, 4:1 extract ratio, dicalcium phosphateexcipient). The authenticity of the extracts was establishedby phytochemical comparison against reference extractsprepared from authenticated E. arvense herbs withthe traceability documents provided by each manufac-turer and if dried raw herbs were available by genomicauthentication.
Sample preparationWe removed the excipient from the commercial extracts inorder to minimize sample variability due to the type ofexcipient used and the extract-to-excipient ratio. Weweighed 4 g of each commercial extract into a 250 mLconical flask and added 250 mL of 80% aqueous methanol.We sonicated the solutions at 40 kHz for 1 h withoccasional stirring and centrifuged the mixture at4000 g for 5 min to pellet the insoluble excipient. Wefiltered the supernatant though a 0.45 μm PVDFsyringe filter to remove any remaining particulates.To reduce the solution to dryness we rotary evaporated at60°C to remove the methanol and then removed theremaining water by freeze drying for 12 h. We storedthe product at 4°C when not in use.
Genetic authentication of the E. arvense samplesWe extracted the genomic DNA from the dried aerialpart of the plant and purified it using a Qiagen DNeasymini plant mini kit (Victoria, Australia) according to themanufacturer’s instructions except we used water instead of
buffer AE. The loci we chose for genomic authenticationwere the chloroplast genes maturase K (matK) andribulose-1,5-bisphosphate carboxylase/oxygenase large sub-unit (rbcL) as specified by the Consortium for the Barcodeof Life (CBoL) [86]. For the PCR amplification of matK, weused the primers ATACCCCATTTTATTCATCC in theforward direction and TACTTTTATGTTTACGAGC inthe reverse direction as recommended by the RoyalBotanic Gardens, Kew [87]. For the PCR amplificationof rbcL we used the primers ATGTCACCACAAACAGAGACTAAAGC in the forward direction and GTAAAATCAAGTCCACCRCG in the reverse direction asrecommended by CBoL [86]. We used the iProofhigh-fidelity DNA polymerase PCR kit from Bio-RadLaboratories Inc. (NSW, Australia) for PCR amplificationas per the manufacturer’s instructions for a 50 μL reactionwith 35 cycles. The temperature program: initialdenaturation 98°C, 60 s; denaturation 98°C, 30 s;annealing 53°C, 40 s; extension 72°C, 40 s; finalextension 72°C, 5 min. PCR products we purifiedusing the Qiagen QIAquick PCR Purification Kitaccording to the manufacturer’s instructions exceptthat water is used instead of buffer AE. We sent ourPCR products to The Australian Genome ResearchFacility Ltd. (NSW, Australia) for sequencing. We pro-cessed our data using the online program Geneious™(Biomatters, Auckland, NZ).We were successful in using both the matK and rbcL
loci to authenticate the representative China, Europeand India E. arvense samples. We found the matK locuswas better at differentiating E. arvense from the otherEquisetum species than rbcL, with a BLAST search ofGenBank® yielding between 97.3 - 99.9% (India andEurope respectively) identical sites to the E. arvensedatabase entries using the matK products comparedto 98.9 - 100% (Europe and India respectively) forrbcL. Although the percentage match using rbcL ishigher, the percentages are equally shared with otherEquisetum species, for example India shared the 100%match with both E. fluviatile and E. diffusum. Numeroussingle nucleotide polymorphisms (SNPs) are present inthe matK sequence for the India sample, including aninsertion between 465–472 bp not present in any otherGenBank® entries. Nucleotide alignments of the China 8,Europe 11 and India 13 matK sequences against otherspecies in the GenBank® database we have presented inAdditional file 2: Figure S2. The sequences can be accessedthrough from GenBank® with the accession numbersJX392862-JX392864.
Phytochemical profilingHigh performance thin layer chromatography (HPTLC)We used a CAMAG (Muttenz, Switzerland) HPTLC sys-tem equipped with a sample applicator and visualization
Cook et al. BMC Genomics 2013, 14:445 Page 13 of 18http://www.biomedcentral.com/1471-2164/14/445
chamber with Merck (Darmstadt, Germany) silica gel60 F254 HPTLC plates (20 cm × 10 cm). Our HPTLCprofiling method was from Wagner et al. [88] using amobile phase of ethyl acetate : formic acid : glacialacetic acid : water (100:11:11:26 mL).We prepared working solutions of each extract bydissolving 50 mg of the purified sample in 1 mL 80%methanol. We then placed the solutions to sonicatebriefly to dissolve the extract and filtered them usinga 0.45 μm PVDF syringe filter. We applied 2 μl perlane to the plate.To visualize the flavonoid and phenyl carboxylic acid
profile, we developed the plate in natural products;diphenylboric acid 2-aminoethyl ester and polyethyleneglycol 4000 (PEG) reagent and viewed at 366 nm.To visualize the chemicals that scavenge the 2,2-
diphenyl-1-picryl hydrazyl (DPPH) free radical, we devel-oped the plate in DPPH reagent (200 μg/mL in ethanol)and visualized under white light. Chemicals that scavengethe DPPH radical appeared yellow.
HPLC–PDA and HPLC-ESI-MS/MSWe used a Varian (California, USA) LC system equippedwith a Prostar 430 autosampler, ProStar 335 photodiodearray detector (PDA) and 1200 L quadrupole MS/MSdetector. We used an Alltech (Queensland, Australia)Prevail C18 column (150 mm × 4.6 mm, 5 μm) witha Phenomenex (California, USA) Security C18 guardcolumn (2 mm × 4 mm, 5 μm).We prepared working solutions of each extract by
dissolving 50 mg of the purified sample in 1 mL 80%methanol. We sonicated the solution briefly to dissolvethe extract and then filtered using a 0.45 μm PVDFsyringe filter.We generated LC-PDA and LC-MS profiles using a
10 μL injection volume and a mobile phase flow rateof 1 mL/min and a mobile phase consisting of 0.1%aqueous formic acid (mobile phase A) and acetonitrile(mobile phase B). The mobile phase profile was 10%B for 10 min and a linear increase to 50% B between10–63 min. We washed with 100% B for 10 min andequilibrated with starting mobile phase for 10 minbetween each analysis.We split the post-column flow to send 80% to the PDA
and 20% to the mass spectrometer (MS) and acquiredPDA chromatograms at 280 nm. The MS was acquired innegative electrospray ionization ((−)ESI) mode, scanningbetween 70–700 m/z using a nebulization gas (nitrogen)temperature of 400°C at 19 psi, needle voltage −3900 V at15 μA, shield voltage −400 V, capillary voltage −100 V, andMS detector at −1700 V.We analyzed the inositol and choline contents of the
extracts using LC-MS in the (−)ESI mode with a selectiveion monitoring (SIM) mode at 179 m/z and 103 m/z for
inositol and choline, respectively. We set the nitrogenpressure to 20 psi at 250°C. The needle, capillary anddetector voltage were −4500 V, -45 V and −1700 Vrespectively. For quantification, we used commercialstandards. The limit of detection (LOD) being 3 μg/mLfor each compound (three times method standard devi-ation (SD) and the limit of quantification (LOQ) was 10μg/mL (ten times method SD).We determined the flavonoid content using LC-PDA
at 284 nm and used quercetin (3–300 μg/mL) as ourstandard to construct a calibration curve to quantify theflavonoid peaks. The total flavonoid content was 5 to10% (w/w).
HPLC–DPPH-PDAWe visualized the chromatographic peaks that scavengethe DPPH radial by introducing DPPH reagent (40 μg/mLin 60% A and 40% B) into the post-column eluent using athird pump (0.6 mL/min) and reacting the solution in acoil (5.0 m × 0.5 mm) based on the work by Bandonieneet al. [89]. The PDA detector acquired at both 280 nm tomonitor the chromatogram and 515 nm to monitor thedegradation of the DPPH radical.
Antioxidant assaysWe used a method adapted from Blois et al. andMolyneux et al. [90,91] to estimate the DPPH radicalscavenging capacity of the E. arvense extracts comparedto a gallic acid standard. We prepared all reagents in80% aqueous methanol and the gallic acid standardcurve by diluting a gallic acid stock (3 mM) to form 0.3,0.6, 0.9 and 1.5 mM working standards. Then weprepared the samples by dissolving 1 mg of the extractin 10 mL of 80% aqueous methanol. For the reagentblank we used 80% aqueous methanol. In triplicate, wepipetted 180 μL of the DPPH reagent (250 μM) into eachmicrotitre plate well and then 20 μL of either workingstandard, sample or blank to make a total volume of 200μL. To correct for sample absorbance (i.e. absorbance notdue to DPPH), we prepared sample blanks in triplicate byadding 180 μL of 80% aqueous methanol to the well and20 μL of sample. We vortexed the plate at 700 rpmfor 30 min in the dark prior to measuring absorbance at515 nm. The sample antioxidant scavenging capacity isreported as the gallic acid equivalent.
Oxygen radical absorbance capacity assayWe performed the oxygen radical absorbance capacity(ORAC) assay in order to measure the ability of theE. arvense extracts to protect fluorescein from degradationby peroxyl radicals using the method described in the BMGLABTECH application note 148 [92] using Trolox® asthe reference standard. We prepared all reagents inpH 7.4 phosphate buffer (10 mM). To construct the
Cook et al. BMC Genomics 2013, 14:445 Page 14 of 18http://www.biomedcentral.com/1471-2164/14/445
Trolox® standard curve we diluted the Trolox® stock(200 μM) to 12.5, 25, 50 and 100 μM workingstandards. We prepared samples by dissolving 1 mgof extract in 10 mL of 80% aqueous methanol. Weused aqueous methanol (80%) as the reagent blank.For analysis, we used 150 μL fluorescein (10 nM) and25 μL of either Trolox® standard, sample or blank ineach microtitre plate well which was then vortexedfor 30 min at 37°C. Rapidly we added 25 μL of the radicalgenerator 2,2’-azobis(2-amidinopropane)dihydrochloride(AAPH, 240 mM) to each well and measured the plateevery 90 s (excitation 485 nm, emission 520 nm). Wecompared the area under the signal degradation curves ofthe samples to the Trolox® standard and the results weregiven as Trolox® equivalents.
Yeast transcriptomicsWe used the BY4743 (Saccharomyces cerevisiae) yeaststrain (MATα/MATα his3Δ1/his3Δ1 leu2Δ0/leu2Δ0met15Δ0/MET15 LYS2/lys2Δ0 ura3Δ0/ura3Δ0) [93,94]for our experiments. We grew the yeast to log phaseovernight at 30°C in minimal medium prepared thesame as Bell et al. [95] except that 20 mg/mL uracil wasadded. We treated 25 mL of the log phase replicatecultures (OD600 between 0.5-1.0) with dried E. arvenseextracts at a concentration of 2.5 mg/mL in the mediafor 20 min. We conducted preliminary experiments todetermine the optimal dose of E. arvense extractrequired for a significant effect on yeast gene expres-sion. We tested dosages of 0.01, 1.0, 2.5, 5.0 and 10mg/mL in the media using China 8 extract as a rep-resentative sample. We also obtained a concurrentgrowth curve with each microarray experiment. Wecovered a range of CHINA-8 concentrations from 0mg/mL to 10 mg/mL and there was no affect onyeast growth at any of the concentrations. We chosea concentration of 2.5 mg/mL for the final studysince 0.01 and 1.0 mg/mL produced little change inthe gene expression profile of the yeast, whereas 2.5mg/mL resulted in approximately 1.5% of the genesin the genome being differentially expressed by morethan 2-fold. The extracts analyzed and numbers ofbiological replicates performed were: USA 2 (n = 2),USA 6 (n = 2), USA 7 (n = 2), China 8 (n = 4),Europe 11 (n = 2), India 13 (n = 2) and non-treatedcontrol (n = 4). We then harvested the treated yeastcells by centrifugation at 4000 g for 5 min. Cellpellets were snap frozen in liquid nitrogen and storedat −80°C prior to RNA isolation.
Isolation of yeast RNA, reverse transcription, labeling andhybridization for microarray analysisWe used a method adapted from Winzeler et al. [29] toextract total RNA from S. cerevisiae. We mechanically
disrupted the frozen cell pellets and extracted total RNAusing TRIzol™ (Invitrogen, Australia) reagent accordingto the manufacturer’s instructions. We purified the totalRNA using RNeasy spin columns (Qiagen, Australia);assessed RNA quality using an Agilent Bioanalyzer 2100(California, USA) and quantified the RNA using aThermo Scientific NanoDrop™ 1000 spectrophotometer(California, USA). We submitted our purified RNAsamples to the University of New South Wales RamaciottiCentre for Gene Function Analysis (NSW, Australia) forRNA transcription, labeling, hybridization, washing andscanning of the microarray slides. We used Affymetrix(California, USA) GeneChip® Yeast Genome 2.0 Arrays(containing 25-mer probes with 11 probe pairs per sequencefor 5841 Saccharomyces cerevisiae transcripts and 5031Schizosaccharomyces pombe transcripts). The microarrayresults (E. arvense-treated n = 14, control n = 4) can beaccessed at Gene Expression Omnibus (GEO) http://www.ncbi.nlm.nih.gov/geo/query/acc.cgi?acc=gse24888.
Statistical analysisWe used the ‘R Project for Statistical Computing’ [96] formost of our data processing and statistical analysis. Specificpackages used with R are detailed below. The R code forboth the chemometric and biometric analyses are availableupon request from the corresponding author.
Chemometric analysisWe used the package ‘msProcess’ [97] to ‘correct’chromatograms by removing instrumental noise, baselinedrift, identifying peaks, removing peak retention timevariations between samples and to quantify peak height.We used principle component analysis (PCA) together
with k-nearest neighbor (k-NN) clustering analysis tocluster samples and highlight the chemicals potentiallyresponsible for these differences using the ‘stats’ packageincluded with R. Firstly, we conducted PCA on thecorrected chromatograms and the results plotted usingthe first 2 principal components (PCs). We then appliedk-NN to the first 2 PCs in order to identify samplesthat cluster together. Three groups were specifiedfor the k-NN based on the country of origin of thesample: 1) USA, 2) China / Europe and 3) India. Wecompiled the group-specific peaks and their corre-sponding UV and MS spectra and compared themwith those in the literature [33] to tentatively identifythe compounds.Using the chromatogram correction technique outlined
above, we also determined the average number of peaksdetected using standard techniques commonly used in theherbal extract industry including HPTLC, HPLC-PDAand HPLC-MS to estimate their information content.To determine the statistical significance (p < 0.05)between the analytical techniques, we used one-way
Cook et al. BMC Genomics 2013, 14:445 Page 15 of 18http://www.biomedcentral.com/1471-2164/14/445
ANOVA with a Tukey post-test using GraphPad Prism5.0d for Mac OS X [98].
Biometric analysisWe used theBioconductor [60,99] packages ‘affy’ [100],‘affyPLM’ [101], ‘altcdfenvs’ [102], ‘annaffy’ [103], ‘limma’[58], ‘yeast2cdf ’ [104], and ‘yeast2.db’ [105] for yeastmicroarray analysis (reading the microarray *.cel files,assessing the files for RNA degradation, relative logexpression, normalized unscaled standard error andspatial artifacts). We processed the probe expressionvalues using the robust multi-array average (RMA)model for convolution background correction, quantilenormalization and summarization [106,107]. We performedPCA on the averaged RMA-corrected expression valuesusing the function prcomp in the R ‘stats’ package and SVDusing the function svd in the R ‘base’ package.
Pathway analysisStatistical analysis of our microarray data resulted in alist of differential genes that were common between allE. arvense samples. We used 3 complementary web-based platforms to evaluate our gene sets and ascertainthe cellular and molecular pathways affected in the yeastresponse to treatment. Principally, we used Funspec[108] (p-value cut-off 0.01) to analyse our gene list.Funspec compiles information to output a classificationsummary of genes and gene families that are enriched inthe ontology of 1) cellular components, 2) molecular func-tions and 3) biological processes. Secondly, we conductedpathway mapping of differentially expressed genes tothe annotation terms within the Kyoto Encyclopaediaof Genes and Genomes (KEGG) [109]. This processidentified pathways and the functional locations of geneswithin pathways. Thirdly, we used the SaccharomycesGenome Database (SGD) [110] to obtain gene specificinformation linking additional genes from our data set tothe pathway analysis.
Additional files
Additional file 1: Figure S1. Tentative structural elucidation ofdicaffeoyltartaric (chicoric) acid and a genkwanin acetylglucoside usingLC-ESI(-)-MS and LC-PDA. (A, B, C) the ESI(-)-MS, UV spectrum andproposed fragmentation pattern respectively of the dicaffeoyltartaric acidpeak. (D, E, F) the ESI(-)-MS, UV spectrum and proposed fragmentationpattern respectively of the Genkwanin acetylglucoside peak, possibly 4 or5 -O-(6-acetyl glucoside).
Additional file 2: Figure S2. DNA bar codes of the original plantmaterial used to produce the China 8, Europe 11 and India 13 extractscompared to other Equisetum species entries in the GenBank database.Differences between the sequences are marked with a colored box.
AbbreviationsAAPH: 2,2′-Azobis(2-amidinopropane) hydrochloride; CBoL: Consortium forthe Barcode of Life; CDP-choline: Cytidine diphosphate-choline;CDP-DAG: Cytidine diphosphate – diacylglycerol; CDS1: Phosphatidate
cytidyltransferase; CHO1: Phosphatidylserine synthase gene;CHO2: Phosphatidylethanolamine N-methyltransferase; CKI1: Choline kinasegene; CPT1: Cholinephosphotransferase gene; CTP: Cytidine triphosphate;DPPH: 2,2-di(4-tert-octylphenyl)-1-picrylhydrazyl; glucose-6P: Glucose-6phosphate; HNM1: Choline/ethanolamine transporter gene; HPLC–DPPH-PDA: High performance liquid chromatography with introduction of DPPHinto the post-column eluent using a third pump coupled with photo arraydetector; HPLC–PDA: High performance liquid chromatography coupled withphoto array detector; HPLC-ESI-MS/MS: High performance liquidchromatography coupled with electrospray ionization tandem massspectrometry; HPTLC: High performance thin layer chromatography;INO1: Inositol-1 phosphate synthase gene; inositol-3P: Inositol-3 phosphate;IPK1: Inositol polyphosphate kinase gne; ITR1: Myo-inositol transporter gne;KEGG: Kyoto Encyclopaedia of Genes and Genomes; k-NN: k nearest neighborclustering analysis; LC tR: Liquid chromatography retention time;matK: Maturase K; OPI3: Phospholipid N-methyltransferase; ORAC: Oxygenradical absorbance capacity assay; PA: phosphatidate; PC: Phosphatidylcholine;PCA: Principal component analysis; P-choline: Phosphate choline;PDME: Phosphatidyldimethylethanolamine; PE: Phosphatidylethanolamine;PI: Phosphatidylinositol; PI: Phosphatidylinositol; PIP: Phosphatidyl inositolphosphate; PMME: Phosphatidylmonomethyl-ethanolamine;PS: Phosphatidylserine; PSD1: Phosphatidylserine decarboxylases gene;rcbL: Ribulose-1,5-bisphosphate carboxylase/oxygenase large subunit gene;PSI: Phytomics similarity index; RMA: Robust multi-array average; SIM: Single ionmonitoring; UMP: Uridine monophosphate.
Competing interestsThe authors declare that they have no competing interests.
Authors’ contributionsRC, JRH, and SL are joint first authors listed in alphabetical order. RCconducted the transcriptomic experiments and pathway analysis andanalyzed the transcriptomic data together with VJH; JRH, SL, CK, SGconducted and analyzed the phytochemical experiments; JRH performed themultivariate statistical analysis using R; MCC performed the genomicauthentication experiments; SG and NJS designed the study; NJS wrote themanuscript with participation of the co-authors. All authors read andapproved the final manuscript.
AcknowledgmentsWe thank Prof. Beryl Hesketh, former Executive Dean of the College ofHealth and Science, Emeritus Prof. Jann Conroy, and Mr. Dusko Pejnovic,Chief Executive Officer of LIPA Pharmaceuticals Ltd. for their support, andLIPA Pharmaceuticals for providing samples of Equisetum arvense herbs andextracts and for supporting SG for collaborative work with NJS. This studywas partially supported by a Research Partnership Grant from the Universityof Western Sydney and LIPA Pharmaceuticals.
Author details1Centre for Complementary Medicine Research, University of WesternSydney, Locked Bag 1797, Penrith, NSW 2751, Australia. 2Ramaciotti Centrefor Gene Function Analysis, School of Biotechnology and BiomolecularSciences, University of New South Wales, Sydney, NSW 2052, Australia.3Network Nutrition Pty Limited, Level 1, 1 Richardson Place, North Ryde, NSW2153, Australia. 4Present address: Natural Sciences, Northern EssexCommunity College, 110 Elliot Street, Building E, Room 367, Haverhill, MA01830, USA. 5Present address: Science, Technology, Engineering & Math,Roxbury Community College, 1234 Columbus Ave, Roxbury Crossing,Boston, MA 02120, USA.
Received: 18 December 2012 Accepted: 19 June 2013Published: 4 July 2013
References1. Ball P: The devil's doctor : Paracelsus and the world of Renaissance magic and
science, 1st American edn. New York: Farrar, Straus and Giroux; 2006.2. Hamburger M: Hostettmann K: 7. Bioactivity in plants: the link between
phytochemistry and medicine. Phytochemistry 1991, 30(12):3864–3874.3. Kinghorn AD: Biologically active compounds from plants with reputed
medicinal and sweetening properties. J Natural Products 1987,50(6):1009–1024.
Cook et al. BMC Genomics 2013, 14:445 Page 16 of 18http://www.biomedcentral.com/1471-2164/14/445
4. Lowe JA, Jones P, Wilson DM: Network biology as a new approach todrug discovery. Current opinion in drug discovery & development 2010,13(5):524–526.
5. Newman DJ, Cragg GM, Snader KM: The influence of natural productsupon drug discovery. Nat Prod Rep 2000, 17(3):215–234.
6. Newman DJ, Cragg GM, Snader KM: Natural products as sources of newdrugs over the period 1981–2002. J Natural Products 2003, 66(7):1022–1037.
7. Kinghorn AD: The discovery of drugs from higher plants.Biotechnology 1994, 26:81–108.
8. Ernst E: Herbal medicines–they are popular, but are they also safe?European J Clin Pharmacology 2006, 62(1):1–2.
9. Ernst E: Herbal medicines: balancing benefits and risks. Novartis FoundSymp 2007, 282:154–167. discussion 167–172, 212–158.
10. Ernst E: Herbal medicines: where is the evidence? BMJ 2000,321(7258):395–396.
11. Kinghorn AD, Chai HB, Sung CK, Keller WJ: The classical drug discoveryapproach to defining bioactive constituents of botanicals.Fitoterapia 2011, 82(1):71–79.
12. Heath G, Colburn WA: An evolution of drug development and clinicalpharmacology during the 20th century. J Clin Pharmacol 2000,40(9:918–929.
13. Flower A, Witt C, Liu JP, Ulrich-Merzenich G, Yu H, Lewith G: Guidelines forrandomised controlled trials investigating Chinese herbal medicine.J Ethnopharmacology 2012, 140(3):550–554.
14. Ehrlich P: On immunity with special reference to the relationship betweendistribution and action of antigens. Therapy: Experimental Researches onSpecific; 1908:107.
15. Arrell DK, Terzic A: Network systems biology for drug discovery.Clin Pharmacol Therapeutics 2010, 88(1):120–125.
16. Pujol A, Mosca R, Farres J, Aloy P: Unveiling the role of network and systemsbiology in drug discovery. Trends Pharmacol Sci 2010, 31(3):115–123.
17. Hopkins AL: Network pharmacology: the next paradigm in drugdiscovery. Nat Chem Biol 2008, 4(11):682–690.
18. Azmi AS, Wang Z, Philip PA, Mohammad RM, Sarkar FH: Proof of concept:network and systems biology approaches aid in the discovery of potentanticancer drug combinations. Mole Cancer Therapeutics 2010, 9(12):3137–3144.
19. Csermely P, Agoston V, Pongor S: The efficiency of multi-target drugs: thenetwork approach might help drug design. Trends Pharmacol Sci 2005,26(4):178–182.
20. Ulrich-Merzenich G, Panek D, Zeitler H, Wagner H, Vetter H: Newperspectives for synergy research with the "omic"-technologies.Phytomedicine: international journal of phytotherapy and phytopharmacology2009, 16(6–7):495–508.
21. Wagner H: Synergy research: a new approach to evaluating the efficacyof herbal mono-drug extracts and their combinations. Nat Prod Commun2009, 4(2):303–304.
22. Mok DKW, Chau F-T: Chemical information of Chinese medicines: Achallenge to chemist. Chemom Intell Lab Syst 2006, 82(1–2):210–217.
23. Zeng Z, Chau FT, Chan HY, Cheung CY, Lau TY, Wei S, Mok DK, Chan CO,Liang Y: Recent advances in the compound-oriented and pattern-orientedapproaches to the quality control of herbal medicines. Chinese Med 2008, 3:9.
24. Kong WJ, Zhao YL, Xiao XH, Jin C, Li ZL: Quantitative and chemicalfingerprint analysis for quality control of rhizoma Coptidischinensisbased on UPLC-PAD combined with chemometrics methods.Phytomedicine: international journal of phytotherapy and phytopharmacology2009, 16(10):950–959.
25. Liu EH, Qi LW, Li K, Chu C, Li P: Recent advances in quality control oftraditional Chinese medicines. Combinatorial chemistry & high throughputscreening 2010, 13(10):869–884.
26. Tilton R, Paiva AA, Guan JQ, Marathe R, Jiang Z, van Eyndhoven W, Bjoraker J,Prusoff Z, Wang H, Liu SH, et al: A comprehensive platform for qualitycontrol of botanical drugs (PhytomicsQC): a case study of Huangqin Tang(HQT) and PHY906. Chinese Med 2010, 5:30.
27. Goffeau A, Barrell BG, Bussey H, Davis RW, Dujon B, Feldmann H, Galibert F,Hoheisel JD, Jacq C, Johnston M, et al: Life with 6000 genes. Science 1996,274(5287):546–567.
28. Gasch AP, Spellman PT, Kao CM, Carmel-Harel O, Eisen MB, Storz G, Botstein D,Brown PO: Genomic expression programs in the response of yeast cells toenvironmental changes. Mole Biology Cell 2000, 11(12):4241–4257.
29. Winzeler EA, Shoemaker DD, Astromoff A, Liang H, Anderson K, Andre B,Bangham R, Benito R, Boeke JD, Bussey H, et al: Functional characterization
of the S. cerevisiae genome by gene deletion and parallel analysis.Science (Washington, D C) 1999, 285(5429):901–906.
30. Giaever G, Chu AM, Ni L, Connelly C, Riles L, Veronneau S, Dow S, Lucau-Danila A,Anderson K, Andre B, et al: Functional profiling of the Saccharomycescerevisiae genome. Nature 2002, 418(6896):387–391.
31. Hughes TR: Yeast and drug discovery. Functional & Integrative Genomics2002, 2(4–5):199–211.
32. Pryer KM, Schneider H, Smith AR, Cranfill R, Wolf PG, Hunt JS, Sipes SD:Horsetails and ferns are a monophyletic group and the closest livingrelatives to seed plants. Nature 2001, 409(6820):618–622.
33. Veit M, Beckert C, Hoehne C, Bauer K, Geiger H: Interspecific andintraspecific variation of phenolics in the genus Equisetum subgenusEquisetum. Phytochemistry 1995, 38(4):881–891.
34. Gallo FR, Multari G, Federici E, Palazzino G, Giambenedetti M, Petitto V,Poli F, Nicoletti M: Chemical fingerprinting of Equisetum arvense L. usingHPTLC densitometry and HPLC. Natural Product Res 2011,25(13):1261–1270.
35. Do Monte Fabricio Hoffmann M, dos Santos Jair G Jr, Russi M,Lanziotti Vanusa Maria Nascimento B, Leal Luzia Kalyne Almeida M,Cunha Geanne Matos De A: Antinociceptive and anti-inflammatoryproperties of the hydroalcoholic extract of stems from Equisetumarvense L. in mice. Pharmacol Res 2004, 49(3):239–243.
36. Safiyeh S, Fathallah FB, Vahid N, Hossine N, Habib SS: Antidiabetic effect ofEquisetum arvense L. (Equisetaceae) in streptozotocin-induced diabetesin male rats. Pakistan J Biological Sci: PJBS 2007, 10(10):1661–1666.
37. Mimica-Dukic N, Simin N, Cvejic J, Jovin E, Orcic D, Bozin B: Phenoliccompounds in field horsetail (Equisetum arvense L.) as naturalantioxidants. Molecules 2008, 13(7):1455–1464.
38. Andrade Cetto A, Wiedenfeld H, Revilla MC, Sergio IA: Hypoglycemic effectof Equisetum myriochaetum aerial parts on streptozotocin diabetic rats.J Ethnopharmacol 2000, 72(1–2):129–133.
39. Perez Gutierrez RM, Laguna GY, Walkowski A: Diuretic activity of Mexicanequisetum. J Ethnopharmacol 1985, 14(2–3):269–272.
40. Lemus I, Garcia R, Erazo S, Pena R, Parada M, Fuenzalida M: Diuretic activityof an Equisetum bogotense tea (Platero herb): evaluation in healthyvolunteers. J Ethnopharmacol 1996, 54(1):55–58.
41. Schmeda-Hirschmann G, Loyola JI, Rodriguez J, Dutra-Behrens M:Hypotensive effect of Laurelia sempervirens (Monimiaceae) onnormotensive rats. Phytother Res 1994, 8(1):49–51.
42. Beckert C, Horn C, Schnitzler J-P, Lehning A, Heller W, Veit M: Styrylpyronebiosynthesis in Equisetum arvense. Phytochemistry 1996, 44(2):275–283.
43. Oh H, Kim D-H, Cho J-H, Kim Y-C: Hepatoprotective and free radicalscavenging activities of phenolic petrosins and flavonoids isolated fromEquisetum arvense. J Ethnopharmacol 2004, 95(2–3):421–424.
44. D'Agostino M, Dini A, Pizza C, Senatore F, Aquino R: Sterols fromEquisetum arvense. Bollettino della Societa italiana di biologia sperimentale1984, 60(12):2241–2245.
45. Llorach R, Martinez-Sanchez A, Tomas-Barberan FA, Gil MI, Ferreres F:Characterization of polyphenols and antioxidant properties of fivelettuce varieties and escarole. Food Chem 2008, 108(3):1028–1038.
46. Amaral JS, Ferreres F, Andrade PB, Valentao P, Pinheiro C, Santos A, Seabra R:Phenolic profile of hazelnut (Corylus avellana L.) leaves [of] cultivars grownin Portugal. Nat Prod Res 2005, 19(2):157–163.
47. Fang N, Yu S, Prior RL: LC/MS/MS Characterization of PhenolicConstituents in Dried Plums. J Agric Food Chem 2002, 50(12):3579–3585.
48. Veit M, Geiger H, Czygan F-C, Markham KR: Malonylated flavone 5-O-glucosides in the barren sprouts of Equisetum arvense.Phytochemistry 1990, 29(8):2555–2560.
49. Plazonic A, Bucar F, Males Z, Mornar A, Nigovic B, Kujundzic N:Identification and quantification of flavonoids and phenolic acids in burrparsley (Caucalis platycarpos L.), using high-performance liquidchromatography with diode array detection and electrospray ionizationmass spectrometry. Molecules 2009, 14(7):2466–2490.
50. Stobiecki M: Application of mass spectrometry for identification andstructural studies of flavonoid glycosides. Phytochemistry 2000,54(3):237–256.
51. Veit M, Strack D, Czygan FC, Wray V, Witte L: Di-E-caffeoyl-meso-tartaricacid in the barren sprouts of Equisetum arvense. Phytochemistry 1991,30(2):527–529.
52. Rice-Evans CA, Miller NJ, Paganga G: Structure-antioxidant activity relationshipsof flavonoids and phenolic acids. Free Radical Biol Med 1996, 20(7):933–956.
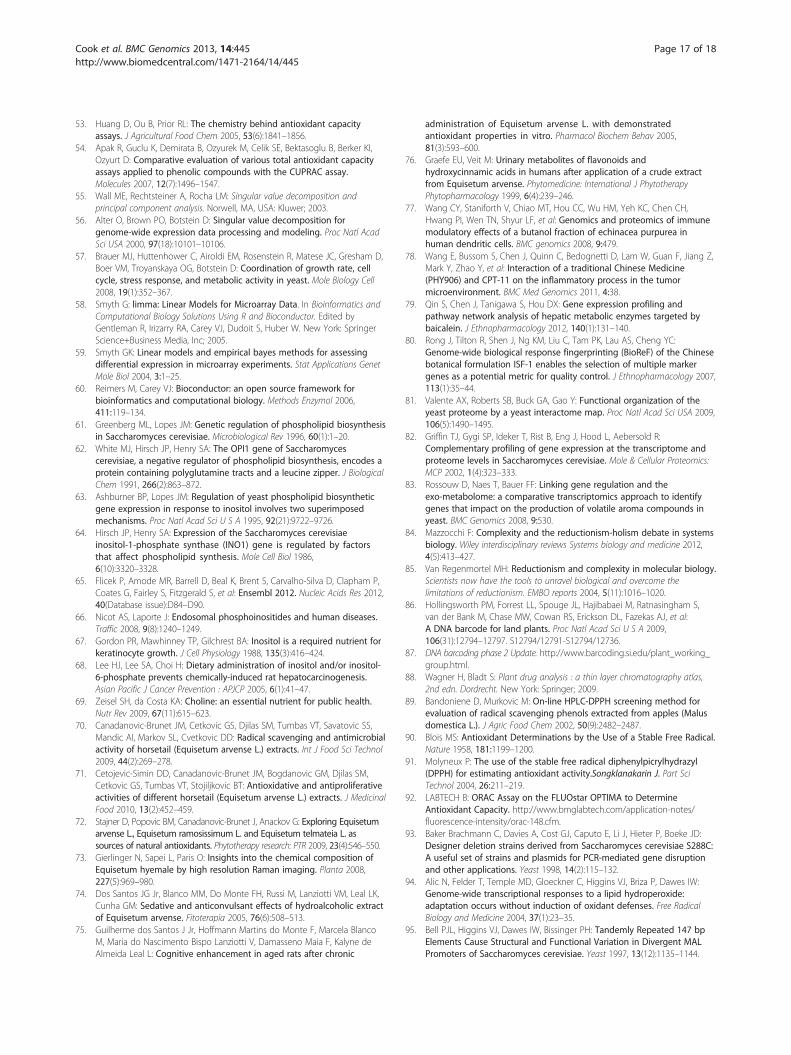
Cook et al. BMC Genomics 2013, 14:445 Page 17 of 18http://www.biomedcentral.com/1471-2164/14/445
53. Huang D, Ou B, Prior RL: The chemistry behind antioxidant capacityassays. J Agricultural Food Chem 2005, 53(6):1841–1856.
54. Apak R, Guclu K, Demirata B, Ozyurek M, Celik SE, Bektasoglu B, Berker KI,Ozyurt D: Comparative evaluation of various total antioxidant capacityassays applied to phenolic compounds with the CUPRAC assay.Molecules 2007, 12(7):1496–1547.
55. Wall ME, Rechtsteiner A, Rocha LM: Singular value decomposition andprincipal component analysis. Norwell, MA, USA: Kluwer; 2003.
56. Alter O, Brown PO, Botstein D: Singular value decomposition forgenome-wide expression data processing and modeling. Proc Natl AcadSci USA 2000, 97(18):10101–10106.
57. Brauer MJ, Huttenhower C, Airoldi EM, Rosenstein R, Matese JC, Gresham D,Boer VM, Troyanskaya OG, Botstein D: Coordination of growth rate, cellcycle, stress response, and metabolic activity in yeast. Mole Biology Cell2008, 19(1):352–367.
58. Smyth G: limma: Linear Models for Microarray Data. In Bioinformatics andComputational Biology Solutions Using R and Bioconductor. Edited byGentleman R, Irizarry RA, Carey VJ, Dudoit S, Huber W. New York: SpringerScience+Business Media, Inc; 2005.
59. Smyth GK: Linear models and empirical bayes methods for assessingdifferential expression in microarray experiments. Stat Applications GenetMole Biol 2004, 3:1–25.
60. Reimers M, Carey VJ: Bioconductor: an open source framework forbioinformatics and computational biology. Methods Enzymol 2006,411:119–134.
61. Greenberg ML, Lopes JM: Genetic regulation of phospholipid biosynthesisin Saccharomyces cerevisiae. Microbiological Rev 1996, 60(1):1–20.
62. White MJ, Hirsch JP, Henry SA: The OPI1 gene of Saccharomycescerevisiae, a negative regulator of phospholipid biosynthesis, encodes aprotein containing polyglutamine tracts and a leucine zipper. J BiologicalChem 1991, 266(2):863–872.
63. Ashburner BP, Lopes JM: Regulation of yeast phospholipid biosyntheticgene expression in response to inositol involves two superimposedmechanisms. Proc Natl Acad Sci U S A 1995, 92(21):9722–9726.
64. Hirsch JP, Henry SA: Expression of the Saccharomyces cerevisiaeinositol-1-phosphate synthase (INO1) gene is regulated by factorsthat affect phospholipid synthesis. Mole Cell Biol 1986,6(10):3320–3328.
65. Flicek P, Amode MR, Barrell D, Beal K, Brent S, Carvalho-Silva D, Clapham P,Coates G, Fairley S, Fitzgerald S, et al: Ensembl 2012. Nucleic Acids Res 2012,40(Database issue):D84–D90.
66. Nicot AS, Laporte J: Endosomal phosphoinositides and human diseases.Traffic 2008, 9(8):1240–1249.
67. Gordon PR, Mawhinney TP, Gilchrest BA: Inositol is a required nutrient forkeratinocyte growth. J Cell Physiology 1988, 135(3):416–424.
68. Lee HJ, Lee SA, Choi H: Dietary administration of inositol and/or inositol-6-phosphate prevents chemically-induced rat hepatocarcinogenesis.Asian Pacific J Cancer Prevention : APJCP 2005, 6(1):41–47.
69. Zeisel SH, da Costa KA: Choline: an essential nutrient for public health.Nutr Rev 2009, 67(11):615–623.
70. Canadanovic-Brunet JM, Cetkovic GS, Djilas SM, Tumbas VT, Savatovic SS,Mandic AI, Markov SL, Cvetkovic DD: Radical scavenging and antimicrobialactivity of horsetail (Equisetum arvense L.) extracts. Int J Food Sci Technol2009, 44(2):269–278.
71. Cetojevic-Simin DD, Canadanovic-Brunet JM, Bogdanovic GM, Djilas SM,Cetkovic GS, Tumbas VT, Stojiljkovic BT: Antioxidative and antiproliferativeactivities of different horsetail (Equisetum arvense L.) extracts. J MedicinalFood 2010, 13(2):452–459.
72. Stajner D, Popovic BM, Canadanovic-Brunet J, Anackov G: Exploring Equisetumarvense L., Equisetum ramosissimum L. and Equisetum telmateia L. assources of natural antioxidants. Phytotherapy research: PTR 2009, 23(4):546–550.
73. Gierlinger N, Sapei L, Paris O: Insights into the chemical composition ofEquisetum hyemale by high resolution Raman imaging. Planta 2008,227(5):969–980.
74. Dos Santos JG Jr, Blanco MM, Do Monte FH, Russi M, Lanziotti VM, Leal LK,Cunha GM: Sedative and anticonvulsant effects of hydroalcoholic extractof Equisetum arvense. Fitoterapia 2005, 76(6):508–513.
75. Guilherme dos Santos J Jr, Hoffmann Martins do Monte F, Marcela BlancoM, Maria do Nascimento Bispo Lanziotti V, Damasseno Maia F, Kalyne deAlmeida Leal L: Cognitive enhancement in aged rats after chronic
administration of Equisetum arvense L. with demonstratedantioxidant properties in vitro. Pharmacol Biochem Behav 2005,81(3):593–600.
76. Graefe EU, Veit M: Urinary metabolites of flavonoids andhydroxycinnamic acids in humans after application of a crude extractfrom Equisetum arvense. Phytomedicine: International J PhytotherapyPhytopharmacology 1999, 6(4):239–246.
77. Wang CY, Staniforth V, Chiao MT, Hou CC, Wu HM, Yeh KC, Chen CH,Hwang PI, Wen TN, Shyur LF, et al: Genomics and proteomics of immunemodulatory effects of a butanol fraction of echinacea purpurea inhuman dendritic cells. BMC genomics 2008, 9:479.
78. Wang E, Bussom S, Chen J, Quinn C, Bedognetti D, Lam W, Guan F, Jiang Z,Mark Y, Zhao Y, et al: Interaction of a traditional Chinese Medicine(PHY906) and CPT-11 on the inflammatory process in the tumormicroenvironment. BMC Med Genomics 2011, 4:38.
79. Qin S, Chen J, Tanigawa S, Hou DX: Gene expression profiling andpathway network analysis of hepatic metabolic enzymes targeted bybaicalein. J Ethnopharmacology 2012, 140(1):131–140.
80. Rong J, Tilton R, Shen J, Ng KM, Liu C, Tam PK, Lau AS, Cheng YC:Genome-wide biological response fingerprinting (BioReF) of the Chinesebotanical formulation ISF-1 enables the selection of multiple markergenes as a potential metric for quality control. J Ethnopharmacology 2007,113(1):35–44.
81. Valente AX, Roberts SB, Buck GA, Gao Y: Functional organization of theyeast proteome by a yeast interactome map. Proc Natl Acad Sci USA 2009,106(5):1490–1495.
82. Griffin TJ, Gygi SP, Ideker T, Rist B, Eng J, Hood L, Aebersold R:Complementary profiling of gene expression at the transcriptome andproteome levels in Saccharomyces cerevisiae. Mole & Cellular Proteomics:MCP 2002, 1(4):323–333.
83. Rossouw D, Naes T, Bauer FF: Linking gene regulation and theexo-metabolome: a comparative transcriptomics approach to identifygenes that impact on the production of volatile aroma compounds inyeast. BMC Genomics 2008, 9:530.
84. Mazzocchi F: Complexity and the reductionism-holism debate in systemsbiology. Wiley interdisciplinary reviews Systems biology and medicine 2012,4(5):413–427.
85. Van Regenmortel MH: Reductionism and complexity in molecular biology.Scientists now have the tools to unravel biological and overcome thelimitations of reductionism. EMBO reports 2004, 5(11):1016–1020.
86. Hollingsworth PM, Forrest LL, Spouge JL, Hajibabaei M, Ratnasingham S,van der Bank M, Chase MW, Cowan RS, Erickson DL, Fazekas AJ, et al:A DNA barcode for land plants. Proc Natl Acad Sci U S A 2009,106(31):12794–12797. S12794/12791-S12794/12736.
87. DNA barcoding phase 2 Update. http://www.barcoding.si.edu/plant_working_group.html.
88. Wagner H, Bladt S: Plant drug analysis : a thin layer chromatography atlas,2nd edn. Dordrecht. New York: Springer; 2009.
89. Bandoniene D, Murkovic M: On-line HPLC-DPPH screening method forevaluation of radical scavenging phenols extracted from apples (Malusdomestica L.). J Agric Food Chem 2002, 50(9):2482–2487.
90. Blois MS: Antioxidant Determinations by the Use of a Stable Free Radical.Nature 1958, 181:1199–1200.
91. Molyneux P: The use of the stable free radical diphenylpicrylhydrazyl(DPPH) for estimating antioxidant activity.Songklanakarin J. Part SciTechnol 2004, 26:211–219.
92. LABTECH B: ORAC Assay on the FLUOstar OPTIMA to DetermineAntioxidant Capacity. http://www.bmglabtech.com/application-notes/fluorescence-intensity/orac-148.cfm.
93. Baker Brachmann C, Davies A, Cost GJ, Caputo E, Li J, Hieter P, Boeke JD:Designer deletion strains derived from Saccharomyces cerevisiae S288C:A useful set of strains and plasmids for PCR-mediated gene disruptionand other applications. Yeast 1998, 14(2):115–132.
94. Alic N, Felder T, Temple MD, Gloeckner C, Higgins VJ, Briza P, Dawes IW:Genome-wide transcriptional responses to a lipid hydroperoxide:adaptation occurs without induction of oxidant defenses. Free RadicalBiology and Medicine 2004, 37(1):23–35.
95. Bell PJL, Higgins VJ, Dawes IW, Bissinger PH: Tandemly Repeated 147 bpElements Cause Structural and Functional Variation in Divergent MALPromoters of Saccharomyces cerevisiae. Yeast 1997, 13(12):1135–1144.
Cook et al. BMC Genomics 2013, 14:445 Page 18 of 18http://www.biomedcentral.com/1471-2164/14/445
96. R Core Development Team: A Language Environment for StatisticalComputing, A Language Environment for Statistical Computing. Vienna:Foundation for Statistical Computing; 2010.
97. Gong L, Constantine W, Chen YA: msProcess: Protein Mass SpectraProcessing. R Package, version 106 2011.
98. Software GP: Prism 5 for Mac OS X. In. GraphPad Software: San Diego; 2009.99. Gentleman RC, Carey VJ, Bates DM, Bolstad B, Dettling M, Dudoit S, Ellis B,
Gautier L, Ge Y, Gentry J, et al: Bioconductor: open software developmentfor computational biology and bioinformatics. Genome Biol 2004,5(10):R80.
100. Gautier L, Cope L, Bolstad BM, Irizarry RA: affy-analysis of AffymetrixGeneChip data at the probe level. Bioinformatics 2004, 20(3):307–315.
101. Bolstad BM, Collin F, Brettschneider J, Simpson K, Cope L, Irizarry RA, SpeedTP: Quality Assessment of Affymetrix GeneChip Data. In Bioinformaticsand Computational Biology Solutions Using R and Bioconductor. Edited byGentleman R, Irizarry RA, Carey VJ, Dudoit S, Huber W. New York: SpringerScience+Business Media, Inc; 2005.
102. Gautier L, Møller M, Friis-Hansen L, Knudsen S: Alternative mapping ofprobes to genes for Affymetrix chips. BMC Bioinformatics 2004, 5:111.
103. Smith C, Smith C, Smith CA: annaffy: Annotation tools for Affymetrixbiological metadata. R package version 1.32.0 2010.
104. The Bioconductor Project: yeast2cdf: yeast2cdf: yeast2cdf: yeast2cdf.R package version 2.12.0.
105. Carlson M, Falcon S, Pages H, Li N: yeast2.db: Affymetrix Yeast Genome2.0 Array annotation data (chip yeast2). R package version 2.9.0.
106. Irizarry R, Hobbs B, Collin F, Beazer-Barclay Y, Antonellis K, Scherf U, Speed T:Exploration, normalization, and summaries of high densityoligonucleotide array probe level data. Biostatistics 2003, 4(2):249–264.
107. Hennell JR: Quality control methods for herbal medicine: a multifacetedapproach. University of Western Sydney; 2012.
108. Robinson MD, Grigull J, Mohammad N, Hughes TR: FunSpec: a web-basedcluster interpreter for yeast. BMC bioinformatics 2002, 3:35.
109. Kanehisa M, Goto S, Sato Y, Furumichi M, Tanabe M: KEGG for integrationand interpretation of large-scale molecular data sets. Nucleic Acids Res2012, 40(Database issue):D109–114.
110. Cherry JM, Hong EL, Amundsen C, Balakrishnan R, Binkley G, Chan ET,Christie KR, Costanzo MC, Dwight SS, Engel SR, et al: SaccharomycesGenome Database: the genomics resource of budding yeast.Nucleic Acids Res 2012, 40(Database issue):D700–705.
doi:10.1186/1471-2164-14-445Cite this article as: Cook et al.: The Saccharomyces cerevisiaetranscriptome as a mirror of phytochemical variation in complexextracts of Equisetum arvense from America, China, Europe and India.BMC Genomics 2013 14:445.
Submit your next manuscript to BioMed Centraland take full advantage of:
• Convenient online submission
• Thorough peer review
• No space constraints or color figure charges
• Immediate publication on acceptance
• Inclusion in PubMed, CAS, Scopus and Google Scholar
• Research which is freely available for redistribution
Submit your manuscript at www.biomedcentral.com/submit