Hypoxia response and VEGF-A expression in human proximal tubular epithelial cells in stable and...
10
Hypoxia response and VEGF-A expression in human proximal tubular epithelial cells in stable and progressive renal disease Michael Rudnicki 1, * , Paul Perco 2,3, * , Julia Enrich 1 , Susanne Eder 1 , Dorothea Heininger 1 , Andreas Bernthaler 4 , Martin Wiesinger 4 , Rita Sarko ¨zi 1 , Susie-Jane Noppert 1 , Herbert Schramek 1 , Bernd Mayer 4 , Rainer Oberbauer 2,3 and Gert Mayer 1 Proteinuria, inflammation, chronic hypoxia, and rarefaction of peritubular capillaries contribute to the progression of renal disease by affecting proximal tubular epithelial cells (PTECs). To study the transcriptional response that separates patients with a stable course from those with a progressive course of disease, we isolated PTECs by laser capture microdissection from cryocut tissue sections of patients with proteinuric glomerulopathies (stable n ¼ 20, progressive n ¼ 11) with a median clinical follow-up of 26 months. Gene-expression profiling and a systems biology analysis identified activation of intracellular vascular endothelial growth factor (VEGF) signaling and hypoxia response pathways in progressive patients, which was associated with upregulation of hypoxia-inducible-factor (HIF)-1a and several HIF target genes, such as transferrin, transferrin-receptor, p21, and VEGF-receptor 1, but downregulation of VEGF-A. The inverse expression levels of HIF-1a and VEGF-A were significantly superior in predicting clinical outcome as compared with proteinuria, renal function, and degree of tubular atrophy and interstitial fibrosis at the time of biopsy. Interactome analysis showed the association of attenuated VEGF-A expression with the downregulation of genes that usually stimulate VEGF-A expression, such as epidermal growth factor (EGF), insulin-like growth factor-1 (IGF-1), and HIF-2a. In vitro experiments confirmed the positive regulatory effect of EGF and IGF-1 on VEGF-A transcription in human proximal tubular cells. Thus, in progressive but not in stable proteinuric kidney disease, human PTECs show an attenuated VEGF-A expression despite an activation of intracellular hypoxia response and VEGF signaling pathways, which might be due to a reduced expression of positive coregulators, such as EGF and IGF-1. Laboratory Investigation (2009) 89, 337–346; doi:10.1038/labinvest.2008.158; published online 12 January 2009 KEYWORDS: genomics; systems biology; microarray; proximal tubule cells; VEGF; hypoxia The increasing prevalence of patients on renal replacement therapy has become a major challenge for healthcare systems. 1 Frequently, end-stage renal disease (ESRD) is the terminal phase of a chronic process, and a better understanding of the pathophysiology could lead to the de- velopment of new treatment options for stabilizing renal function, thus reducing the incidence of ESRD. Furthermore, to use both new and already available drugs more efficiently, it is highly desirable to identify patients with an adverse prognosis in the early phases of the disease, as not all subjects show a relentlessly progressive decline in renal function. Histologically, the risk for ESRD and the rate of excretory function loss correlates substantially better with the degree of tubular atrophy and interstitial fibrosis (TAIF) than with the type and/or extent of glomerular pathology. 2 A variety of most likely interacting insults have been shown to trigger tubulointerstitial pathology, such as proteinuria, 3 leakage of glomerular filtrate into the periglomerular space, 4 or tubulointerstitial hypoxia and rarefaction of peritubular Received 01 August 2008; revised 4 November 2008; accepted 11 November 2008 1 Department of Internal Medicine IV, Nephrology and Hypertension, Medical University Innsbruck, Innsbruck, Austria; 2 Department of Internal Medicine III, KH Elisabethinen, Linz, Austria; 3 Division of Nephrology, Department of Internal Medicine III, Medical University of Vienna, Vienna, Austria and 4 Emergentec Biodeve- lopment GmbH, Vienna, Austria Correspondence: Dr M Rudnicki, MD, Department of Internal Medicine IV, Nephrology and Hypertension, Medical University Innsbruck, Anichstrasse 35, 6020 Innsbruck, Austria. E-mail: [email protected] *These authors contributed equally to this work. Laboratory Investigation (2009) 89, 337–346 & 2009 USCAP, Inc All rights reserved 0023-6837/09 $32.00 www.laboratoryinvestigation.org | Laboratory Investigation | Volume 89 March 2009 337
Transcript of Hypoxia response and VEGF-A expression in human proximal tubular epithelial cells in stable and...
Hypoxia response and VEGF-A expression in humanproximal tubular epithelial cells in stable andprogressive renal diseaseMichael Rudnicki1,*, Paul Perco2,3,*, Julia Enrich1, Susanne Eder1, Dorothea Heininger1, Andreas Bernthaler4,Martin Wiesinger4, Rita Sarkozi1, Susie-Jane Noppert1, Herbert Schramek1, Bernd Mayer4, Rainer Oberbauer2,3
and Gert Mayer1
Proteinuria, inflammation, chronic hypoxia, and rarefaction of peritubular capillaries contribute to the progression of renaldisease by affecting proximal tubular epithelial cells (PTECs). To study the transcriptional response that separates patientswith a stable course from those with a progressive course of disease, we isolated PTECs by laser capture microdissectionfrom cryocut tissue sections of patients with proteinuric glomerulopathies (stable n¼ 20, progressive n¼ 11) with amedian clinical follow-up of 26 months. Gene-expression profiling and a systems biology analysis identified activation ofintracellular vascular endothelial growth factor (VEGF) signaling and hypoxia response pathways in progressive patients,which was associated with upregulation of hypoxia-inducible-factor (HIF)-1a and several HIF target genes, such astransferrin, transferrin-receptor, p21, and VEGF-receptor 1, but downregulation of VEGF-A. The inverse expression levels ofHIF-1a and VEGF-A were significantly superior in predicting clinical outcome as compared with proteinuria, renal function,and degree of tubular atrophy and interstitial fibrosis at the time of biopsy. Interactome analysis showed the associationof attenuated VEGF-A expression with the downregulation of genes that usually stimulate VEGF-A expression, such asepidermal growth factor (EGF), insulin-like growth factor-1 (IGF-1), and HIF-2a. In vitro experiments confirmed the positiveregulatory effect of EGF and IGF-1 on VEGF-A transcription in human proximal tubular cells. Thus, in progressive but notin stable proteinuric kidney disease, human PTECs show an attenuated VEGF-A expression despite an activation ofintracellular hypoxia response and VEGF signaling pathways, which might be due to a reduced expression of positivecoregulators, such as EGF and IGF-1.Laboratory Investigation (2009) 89, 337–346; doi:10.1038/labinvest.2008.158; published online 12 January 2009
KEYWORDS: genomics; systems biology; microarray; proximal tubule cells; VEGF; hypoxia
The increasing prevalence of patients on renal replacementtherapy has become a major challenge for healthcaresystems.1 Frequently, end-stage renal disease (ESRD)is the terminal phase of a chronic process, and a betterunderstanding of the pathophysiology could lead to the de-velopment of new treatment options for stabilizingrenal function, thus reducing the incidence of ESRD.Furthermore, to use both new and already available drugsmore efficiently, it is highly desirable to identify patients withan adverse prognosis in the early phases of the disease, as not
all subjects show a relentlessly progressive decline in renalfunction.
Histologically, the risk for ESRD and the rate of excretoryfunction loss correlates substantially better with the degree oftubular atrophy and interstitial fibrosis (TAIF) thanwith the type and/or extent of glomerular pathology.2 Avariety of most likely interacting insults have been shown totrigger tubulointerstitial pathology, such as proteinuria,3
leakage of glomerular filtrate into the periglomerular space,4
or tubulointerstitial hypoxia and rarefaction of peritubular
Received 01 August 2008; revised 4 November 2008; accepted 11 November 2008
1Department of Internal Medicine IV, Nephrology and Hypertension, Medical University Innsbruck, Innsbruck, Austria; 2Department of Internal Medicine III, KHElisabethinen, Linz, Austria; 3Division of Nephrology, Department of Internal Medicine III, Medical University of Vienna, Vienna, Austria and 4Emergentec Biodeve-lopment GmbH, Vienna, AustriaCorrespondence: Dr M Rudnicki, MD, Department of Internal Medicine IV, Nephrology and Hypertension, Medical University Innsbruck, Anichstrasse 35, 6020 Innsbruck,Austria.E-mail: [email protected]
*These authors contributed equally to this work.
Laboratory Investigation (2009) 89, 337–346
& 2009 USCAP, Inc All rights reserved 0023-6837/09 $32.00
www.laboratoryinvestigation.org | Laboratory Investigation | Volume 89 March 2009 337
capillaries.5 In this context, proteinuria is especially inter-esting. Although the magnitude of proteinuria often shows apositive correlation with the loss of glomerular filtration rate(GFR), some nonproteinuric renal diseases also progress toESRD. In contrast, patients with minimal change diseaseoften develop a nephrotic syndrome even though their renalfunction remains well preserved.
Proximal tubular epithelial cells (PTECs) may mediate theeffects of proteinuria on tubulointerstitial damage by avariety of mechanisms, such as epithelial-to-mesenchymaltransition (EMT).6 Experimental evidence is also available,showing that proteinuria induces changes in gene expressionin PTEC, leading to alterations in the composition of pro-teins secreted mainly into the basolateral compartment, fa-voring the recruitment of inflammatory cells into the renalinterstitium and contributing to fibrogenic reactions andrenal scarring.7–9 On the other hand, it has also been sug-gested that under certain circumstances tubular expression ofantifibrotic cytokines, such as hepatocyte-growth factor andbone morphogenetic protein-7 (BMP-7), protects PTECfrom apoptosis10 and reduces interstitial collagen accumu-lation.11
It is, therefore, suggestive that the balance between pro-tective and deleterious networks is most likely to determinethe final outcome of renal diseases rather than alterations in asingle gene or a single pathway. Previous studies trying tounravel the molecular pathophysiology have been limited tousing a candidate gene approach.12–14 Recently, we havecombined a large-scale gene expression profiling with a sys-tems biology approach to study the transcriptional responseof isolated PTEC in proteinuric glomerulopathies.8 In a studyperformed by Schmid and coworkers,15 microarray technol-ogy and systems biology tools have also been successfullyapplied to differentiate the tubulointerstitial transcriptionalresponse in human diabetic nephropathy as compared withnondiabetic samples. However, in this study, no micro-dissection of specific cells was performed.
In this study, we identified gene expression profiles andregulatory pathways in PTEC obtained by laser capture mi-crodissection from biopsies of patients with proteinuric ne-phropathies that differentiate subjects with a stable andprogressive post-bioptical clinical course.
MATERIALS AND METHODSKidney BiopsiesWe used 31 kidney biopsies obtained from patients withproteinuric renal diseases during their routine diagnosticworkup for which we had sufficient clinical follow-up data(Supplementary Table 1). Microarray-based gene expressionprofiling was performed in 21 of these samples, real-timePCR experiments were performed in 15, and 5 samples wereanalyzed by both methods.
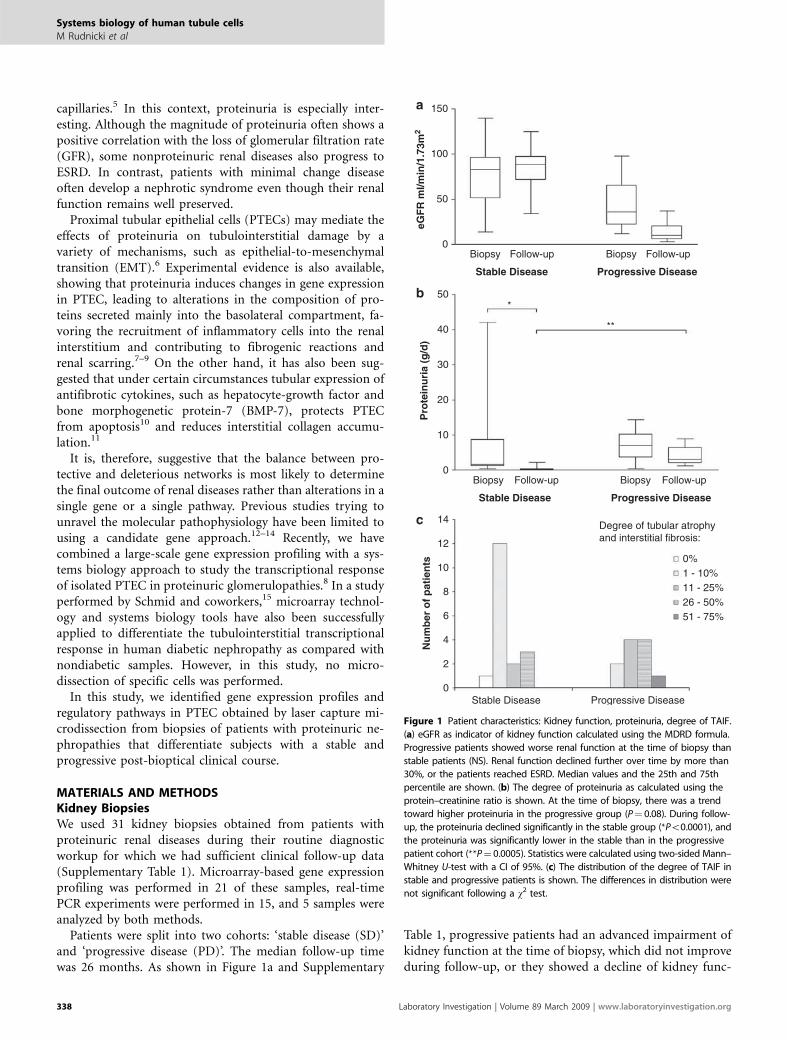
Patients were split into two cohorts: ‘stable disease (SD)’and ‘progressive disease (PD)’. The median follow-up timewas 26 months. As shown in Figure 1a and Supplementary
Table 1, progressive patients had an advanced impairment ofkidney function at the time of biopsy, which did not improveduring follow-up, or they showed a decline of kidney func-
150
100
50
0Biopsy Follow-up Biopsy Follow-up
Stable Disease Progressive Disease
Biopsy Follow-up Biopsy Follow-up
Stable Disease Progressive Disease
*
**
Pro
tein
uri
a (g
/d)
50
40
30
20
10
0
14
12
10
8
6
4
2
0Stable Disease Progressive Disease
Nu
mb
er o
f p
atie
nts
Degree of tubular atrophyand interstitial fibrosis:
0%1 - 10%11 - 25%26 - 50%51 - 75%
eGF
R m
l/min
/1.7
3m2
Figure 1 Patient characteristics: Kidney function, proteinuria, degree of TAIF.
(a) eGFR as indicator of kidney function calculated using the MDRD formula.
Progressive patients showed worse renal function at the time of biopsy than
stable patients (NS). Renal function declined further over time by more than
30%, or the patients reached ESRD. Median values and the 25th and 75th
percentile are shown. (b) The degree of proteinuria as calculated using the
protein–creatinine ratio is shown. At the time of biopsy, there was a trend
toward higher proteinuria in the progressive group (P¼ 0.08). During follow-
up, the proteinuria declined significantly in the stable group (*Po0.0001), and
the proteinuria was significantly lower in the stable than in the progressive
patient cohort (**P¼ 0.0005). Statistics were calculated using two-sided Mann–
Whitney U-test with a CI of 95%. (c) The distribution of the degree of TAIF in
stable and progressive patients is shown. The differences in distribution were
not significant following a w2 test.
Systems biology of human tubule cells
M Rudnicki et al
338 Laboratory Investigation | Volume 89 March 2009 | www.laboratoryinvestigation.org

tion of more than 30% (calculated as D of the estimated GFR(eGFR), or they reached ESRD. All other patients were de-fined as stable (n¼ 20). Proteinuria at the time of biopsy wasnot statistically different between stable and progressive pa-tients, although there was a trend toward higher proteinuriain the progressive group (stable 5.49±2.18 g/day; progressive7.09±1.28 g/day, P¼ 0.08 two-sided Mann–Whitney U-test).During the course of the disease, the reduction of proteinuriawas significantly higher in the stable group (Figure 1b). Thenumber of nephrotic and nephritic patients was not differentbetween the cohorts. TAIF was scored by an independentpathologist following a semiquantitative grading system onhaematoxylin and eosin and periodic acid–Schiff- or Pearse-stained sections: 0, no fibrosis; 1, 1–10%; 2, 11–25%; 3, 26–50%; 4, 51–75%; 5, 475%. Although the progressive cohortcontained more patients with higher degree of TAIF (Figure1c), the distribution of the respective grade of TAIF was notstatistically significant after a w2 test. Therapy with steroids orwith ACE-inhibitors or angiotensin receptor blockers did notdiffer significantly between the cohorts (w2 test): 5 of the 17stable patients (for which medication at the time of biopsyhas been documented) and 4 of the 11 progressive patientswere on steroid therapy (29 vs 36%, NS). Three of the 17stable patients and 1 of the 11 progressive patients weretreated with ACE-inhibitors (18 vs 9%, NS). This study wasapproved by the Institutional Review Board of the Universityof Innsbruck.
Laser Capture Microdissection, RNA Isolation, QualityControl, and RNA AmplificationProcessing of cryocut sections, isolation of proximal tubularcells, isolation of total RNA, quality control by RT-PCR, andT-7-based linear amplification of RNA were performed asdescribed on our previous articles.8,16 In brief, PTECs werestained for alkaline phosphatase using 4-nitro blue tetra-zolium chloride/5-bromo-4-chloro-3-indolyl phosphate un-der RNase-free conditions, and the cells were isolated usingthe PixCell IIs Laser Capture Microdissection System andCapSuret LCM Caps (Arcturus, Mountain View, CA, USA).Total RNA was isolated using the Pico Puret RNA IsolationKit (Arcturus, Mountain View, CA, USA). Owing to lowRNA amounts, we performed two rounds of linear RNAamplification using the RiboAmpt RNA Amplification Kit(Arcturus, Mountain View, CA, USA). Amplified UniversalHuman Reference RNA (Stratagene, La Jolla, CA, USA)served as reference material. The quality of the amplifiedRNA was assessed by spectrophotometry (A260/280) andwith the Agilent Bioanalyzer and RNA6000 LabChipt Kit(Agilent, Palo Alto, CA, USA). More detailed information onlaboratory procedures are freely accessible through ourwebsite www.microarray.at.
Microarray Hybridization, Analysis, and Data StorageRNA was labeled and cohybridized to cDNA microarrays asdescribed previously.16 cDNA microarrays were obtained
from the Stanford Functional Genomics Facility (http://www.microarray.org/sfgf/). The arrays contained 41 792spots, representing 30 325 genes assigned to a UniGenecluster and 11467 ESTs. Arrays were scanned using aGenePix 4000B microarray scanner, and the images wereanalyzed with the GenePix Pro 4.0 software (Axon Instru-ments, Union City, CA, USA). All samples were processed intechnical duplicates and gene expression values were aver-aged. Raw data as well as array images were uploaded to theStanford Microarray Database (SMD) http://genome-www5.stanford.edu/MicroArray/SMD and to the GeneExpression Omnibus (GEO) website http://www.ncbi.nlm.nih.gov/geo/ (GEO series accession number GSE11513). Allexperiments were performed according to the MIAME(Minimum Information About a Microarray Experiment)guidelines.17
Statistical and Pathway AnalysisWe excluded signals showing intensity values less than 2.5over background in either channel and focused our analyseson genes with valid data in at least 80% of processed samples,leaving 19 921 cDNA clones in the analysis data set. A two-sample t-test (Po0.05) and a twofold-change criterion wereused to identify differentially expressed genes (DEGs) whencomparing both patient cohorts. DEGs were functionallyannotated using gene ontology terms18 as provided by theSOURCE tool,19 the iHOP system (information HyperlinkedOver Proteins20), and PubMed. We furthermore searched forbiological pathways enriched/depleted in DEGs using thePANTHER (Protein Analysis Through Evolutionary Re-lationships) Classification System.21
Hypoxia Response and VEGF Signaling InteractomeAnalysisWe extracted all genes involved in these two pathways asprovided by the PANTHER Classification System and ex-tended this list by adding regulators and targets of hypoxia-inducible-factor (HIF) as well as regulatory proteins of vas-cular endothelial growth factor (VEGF), which were identi-fied in a comprehensive literature search. The complete list ofHIF- and VEGF-associated genes is shown in SupplementaryTable 1.
Correlation of Transcription Levels of VEGF-A and HIFswith Clinical Parameters and OutcomeThe correlations between VEGF-A, HIF-1a, and HIF-2a(EPAS1) to the level of proteinuria and the degree of TAIFwere calculated. In addition, linear regression models werebuilt with these genes as well as with proteinuria, eGFR, anddegree of TAIF as independent variables to predict outcomein the patient cohort at hand.
Real-Time PCRWe used the TaqMant PreAmp Master Mix (Ambion,Austin, TX, USA) together with the respective TaqMan
Systems biology of human tubule cells
M Rudnicki et al
www.laboratoryinvestigation.org | Laboratory Investigation | Volume 89 March 2009 339
probes (vide infra) for approximately 400-fold amplificationof the original RNA as the laser-capture microdissectionof proximal tubular cells from frozen sections yieldsabout 1 ng of total RNA per sample. The accuracy of thisamplification method was tested, and we did not find anyamplification bias (data not shown). In all real-time PCRexperiments, we used GAPDH (glyceraldehyde-3-phosphatedehydrogenase; Hs99999905_m1) and PPIA (cyclophilin A;Hs99999904_m1) as endogenous controls. We evaluated theRNA expression values of the following genes: HIF-1a(Hs00153153_m1), HIF-2a (EPAS1; Hs01026149_m1),cyclin-dependent kinase inhibitor 1 alpha (CDKN1a¼ p21;Hs00355782_m1), and VEGF-A (Hs00173626_m1).
ImmunohistochemistryFrozen tissue samples of four stable and four progressivepatients were fixed with cold acetone. For VEGF-Astaining, the sections were first incubated with a 1:100dilution of the affinity-purified rabbit polyclonal VEGF-Aantibody (sc-152, Santa Cruz Biotechnology Inc., Santa Cruz,CA, USA) for 1 h at room temperature. For visualization ofVEGF-A expression, a 1:400 dilution of a biotin-conjugatedgoat anti-rabbit secondary antibody (Jackson Immuno Re-search Laboratories, Newmarket, UK) and the VectastainElite ABC Kit (Vector Laboratories, Burlingame, CA, USA)were used. All sections were counterstained with Gill’shematoxylin.
Cell Culture ExperimentsCell culture reagents were obtained from GIBCO (LifeTechnologies, Lofer, Austria). Human kidney-2 (HK-2) cellswere cultured in keratinocyte-serum free medium containing10% fetal bovine serum, 5 ng/ml recombinant epidermalgrowth factor, 0.05 mg/ml bovine pituitary extract, 100 U/mlpenicillin, and 100 mg/ml streptomycin.22 The cells weregrown at 5% CO2 at 371C humidified atmosphere andsplit in a ratio 1:5 once a week. After growth to subconfluentstate, cells were washed once, made quiescent by incubationin serum- and supplement-free medium for 48 h, andthen used for the experiments. We performed stimulationswith TGF-b1, epidermal growth factor (EGF), and insulin-like growth factor-1 (IGF-1) at a concentration of 10 ng/ml inthe absence of serum and any other growth supplements.TGF-b1 was purchased from R&D Systems (Minneapolis,MN, USA), whereas EGF and IGF-1 were obtained fromSigma (St Louis, MO, USA). After 8 and 32 h total RNA wasextracted from cultured cells using TRI Reagent (MolecularResearch Center, Cincinnati, OH, USA) as recommended bythe manufacturer.
RESULTSPTECs in Stable and Progressive Nephropathies ShowDifferential Gene ExpressionOn the basis of the kidney function at the time of biopsy andD eGFR during a median follow-up of 26 months, patients
were defined as having SD or PD (Figure 1 and Supple-mentary Table 1). A total of 149 transcripts were differentiallyexpressed between both patient cohorts. A total of 122 ofthese clones, representing 113 unique genes based on Uni-Gene IDs were upregulated, and 27 cDNA clones weredownregulated in PD samples. Among the 113 genes upre-gulated in the PD cohort, 33 (29%) were involved in reg-ulatory processes, such as signal transduction or regulation oftranscription. Other prominent functional categories en-riched with DEGs were immune response with 18 (16%)upregulated genes, as well as metabolism (11; 10%) and cellcycle regulation or cell proliferation (5; 4%). Interestingly, inthe latter functional class, four of the five genes were asso-ciated with inhibition of cell proliferation or induction of cellcycle arrest in response to various stress stimuli (eg, p21). Inthe immune response group, we found a marked upregula-tion of interferon-induced transcripts, interferon-inducibleproteins, and interferon regulatory factors, as well as anupregulation of members of the complement cascade.Among the 27 genes downregulated in progressive disease, wefound decreased expression of BMP-7 and EGF. Microarray-derived gene-expression values of SD and PD samples wereconfirmed by real-time PCR for five genes, and we did notdetect any directional changes in transcription (data notshown).
Pathway AnalysisWe identified nine biological pathways that were significantlyenriched in DEGs upregulated in PD, whereas we did notfind any significantly enriched biological pathways in SD(Table 1). Among the top ranked pathways in PD samples, wefound hypoxia response through HIF activation (‘hypoxiaresponse’) and VEGF signaling. We focused on these twopathways, as hypoxia and VEGF expression have been de-scribed to play a role in human progressive tubulointerstitialfibrosis (reviewed by Schrijvers et al23). To confirm the ac-tivation of these pathways, we analyzed the expression of allpathway members with a differential expression between thecohorts of 41.7-fold, as, in our experience, a difference intranscription between two samples 41.7-fold represents areliable reproducibility. A total of 72 of these pathwaymembers were spotted on the arrays used, and 12 transcriptsshowed an induction in PD, whereas 4 genes were down-regulated (Table 2). Several key mediators of a hypoxia re-sponse-like HIF-1a and HIF-1b and CREB-binding protein(CREBBP)—a cofactor of the HIF complex—showed anupregulation, supporting the results from pathway analysis.Surprisingly, VEGF-A—a major target gene of HIF—wasdownregulated in PD samples. This contradiction of the ac-tivation of hypoxia response and VEGF signaling pathwayson the one hand and downregulation of VEGF-A RNA on theother hand prompted us to evaluate the expression of otherHIF targets as well as of HIF and VEGF regulators in oursamples.
Systems biology of human tubule cells
M Rudnicki et al
340 Laboratory Investigation | Volume 89 March 2009 | www.laboratoryinvestigation.org
Hypoxia Response and VEGF Signaling InteractomeAnalysisOn the basis of a scientific literature screening, we identified 39HIF-1a target genes, 18 positive and 7 negative HIF regulators,and 33 positive and 5 negative regulators of VEGF with
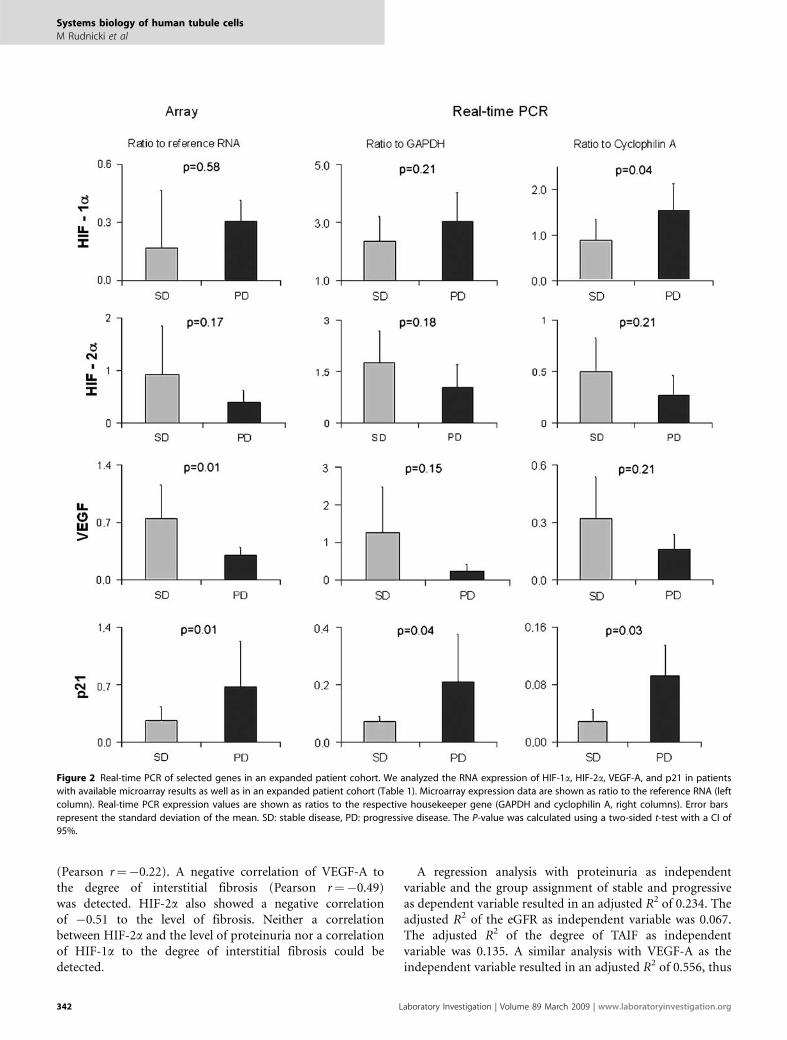
expression values in our data set (Supplementary Table 2).Of the HIF targets, cyclin-dependent kinase inhibitor 1A(CDKN-1A, p21), transferrin (TF), transferrin receptor (TFRC),and the VEGF receptor FLT-1 were upregulated, whereas aldolaseA (ALDO-A), carbonic anhydrase 12 (CA-12), and VEGF-Awere downregulated. Of the 18 positive regulators of HIF, theSRC oncogene, mitogen-activated protein kinase 1, and a sub-unit of the phosphoinositide-3-kinase (PIK-3CB) were upregu-lated, whereas we observed a downregulation of IGF-1 and EGF.There were no changes in expression of the seven negative reg-ulators of HIF. In the group of positive regulators of VEGF,NOS-1, SRC, prostaglandin E receptor 4 (PTGER-4), PDGF-D,HIF-1a and the transcription factor SP3 were induced in PDsamples. On the other hand, positive regulators of VEGF, whichshowed a downregulation in PD samples included EGF, IGF-1,HIF-2a (EPAS-1), and PTGER-3. There were no changes in theexpression of the five negative regulators of VEGF. We confirmedthe upregulation of HIF-1a and p21, and the downregulation ofHIF-2a and VEGF-A by real-time PCR in the array patientcohort as well as in independent patients (Figure 2).
VEGF-A and HIF-1a Gene Expression Predict OutcomeBetter than Degree of Proteinuria, eGFR, andTubulointerstitial Fibrosis AloneThe expression of HIF-1a correlated positively with the levelof proteinuria (Pearson r¼ 0.67), whereas the expression ofVEGF-A was marginally negatively correlated to proteinuria
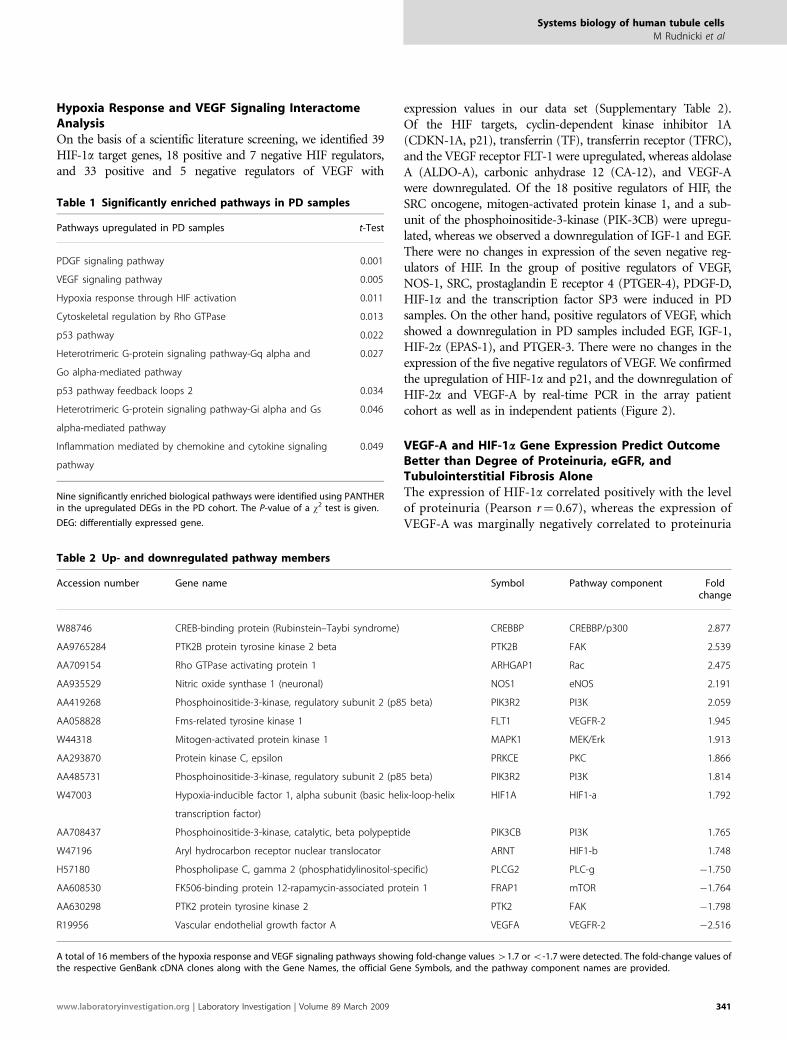
Table 1 Significantly enriched pathways in PD samples
Pathways upregulated in PD samples t-Test
PDGF signaling pathway 0.001
VEGF signaling pathway 0.005
Hypoxia response through HIF activation 0.011
Cytoskeletal regulation by Rho GTPase 0.013
p53 pathway 0.022
Heterotrimeric G-protein signaling pathway-Gq alpha and
Go alpha-mediated pathway
0.027
p53 pathway feedback loops 2 0.034
Heterotrimeric G-protein signaling pathway-Gi alpha and Gs
alpha-mediated pathway
0.046
Inflammation mediated by chemokine and cytokine signaling
pathway
0.049
Nine significantly enriched biological pathways were identified using PANTHERin the upregulated DEGs in the PD cohort. The P-value of a w2 test is given.
DEG: differentially expressed gene.
Table 2 Up- and downregulated pathway members
Accession number Gene name Symbol Pathway component Foldchange
W88746 CREB-binding protein (Rubinstein–Taybi syndrome) CREBBP CREBBP/p300 2.877
AA9765284 PTK2B protein tyrosine kinase 2 beta PTK2B FAK 2.539
AA709154 Rho GTPase activating protein 1 ARHGAP1 Rac 2.475
AA935529 Nitric oxide synthase 1 (neuronal) NOS1 eNOS 2.191
AA419268 Phosphoinositide-3-kinase, regulatory subunit 2 (p85 beta) PIK3R2 PI3K 2.059
AA058828 Fms-related tyrosine kinase 1 FLT1 VEGFR-2 1.945
W44318 Mitogen-activated protein kinase 1 MAPK1 MEK/Erk 1.913
AA293870 Protein kinase C, epsilon PRKCE PKC 1.866
AA485731 Phosphoinositide-3-kinase, regulatory subunit 2 (p85 beta) PIK3R2 PI3K 1.814
W47003 Hypoxia-inducible factor 1, alpha subunit (basic helix-loop-helix
transcription factor)
HIF1A HIF1-a 1.792
AA708437 Phosphoinositide-3-kinase, catalytic, beta polypeptide PIK3CB PI3K 1.765
W47196 Aryl hydrocarbon receptor nuclear translocator ARNT HIF1-b 1.748
H57180 Phospholipase C, gamma 2 (phosphatidylinositol-specific) PLCG2 PLC-g �1.750
AA608530 FK506-binding protein 12-rapamycin-associated protein 1 FRAP1 mTOR �1.764
AA630298 PTK2 protein tyrosine kinase 2 PTK2 FAK �1.798
R19956 Vascular endothelial growth factor A VEGFA VEGFR-2 �2.516
A total of 16 members of the hypoxia response and VEGF signaling pathways showing fold-change values 41.7 or o-1.7 were detected. The fold-change values ofthe respective GenBank cDNA clones along with the Gene Names, the official Gene Symbols, and the pathway component names are provided.
Systems biology of human tubule cells
M Rudnicki et al
www.laboratoryinvestigation.org | Laboratory Investigation | Volume 89 March 2009 341
(Pearson r¼�0.22). A negative correlation of VEGF-A tothe degree of interstitial fibrosis (Pearson r¼�0.49)was detected. HIF-2a also showed a negative correlationof �0.51 to the level of fibrosis. Neither a correlationbetween HIF-2a and the level of proteinuria nor a correlationof HIF-1a to the degree of interstitial fibrosis could bedetected.
A regression analysis with proteinuria as independentvariable and the group assignment of stable and progressiveas dependent variable resulted in an adjusted R2 of 0.234. Theadjusted R2 of the eGFR as independent variable was 0.067.The adjusted R2 of the degree of TAIF as independentvariable was 0.135. A similar analysis with VEGF-A as theindependent variable resulted in an adjusted R2 of 0.556, thus
Figure 2 Real-time PCR of selected genes in an expanded patient cohort. We analyzed the RNA expression of HIF-1a, HIF-2a, VEGF-A, and p21 in patients
with available microarray results as well as in an expanded patient cohort (Table 1). Microarray expression data are shown as ratio to the reference RNA (left
column). Real-time PCR expression values are shown as ratios to the respective housekeeper gene (GAPDH and cyclophilin A, right columns). Error bars
represent the standard deviation of the mean. SD: stable disease, PD: progressive disease. The P-value was calculated using a two-sided t-test with a CI of
95%.
Systems biology of human tubule cells
M Rudnicki et al
342 Laboratory Investigation | Volume 89 March 2009 | www.laboratoryinvestigation.org
being a superior predictor of outcome. VEGF-A and HIF-1aas independent variables together in the model resulted in aneven higher R2 value of 0.677, being significantly superior incomparison with proteinuria, eGFR, or the degree of TAIFalone (P-value: 0.001 following an ANOVA comparing themodel with VEGF-A and HIF-1a with the model with pro-teinuria).
EGF and IGF-1 Stimulate VEGF-A mRNA Expression inRenal Proximal Tubule Cells In VitroThe findings of the pathway-analysis showed a down-regulation of VEGF-A despite an activation of the hypoxiaresponse and VEGF signaling pathways in the progressivecohort. In the interactome analysis, we did not find anyoverexpressed negative regulators, but a downregulation ofseveral positive regulators of VEGF-A expression, such asEGF and IGF-1. EGF and IGF-1 have been shown to sti-mulate VEGF-A mRNA expression in various cell lines.24–27
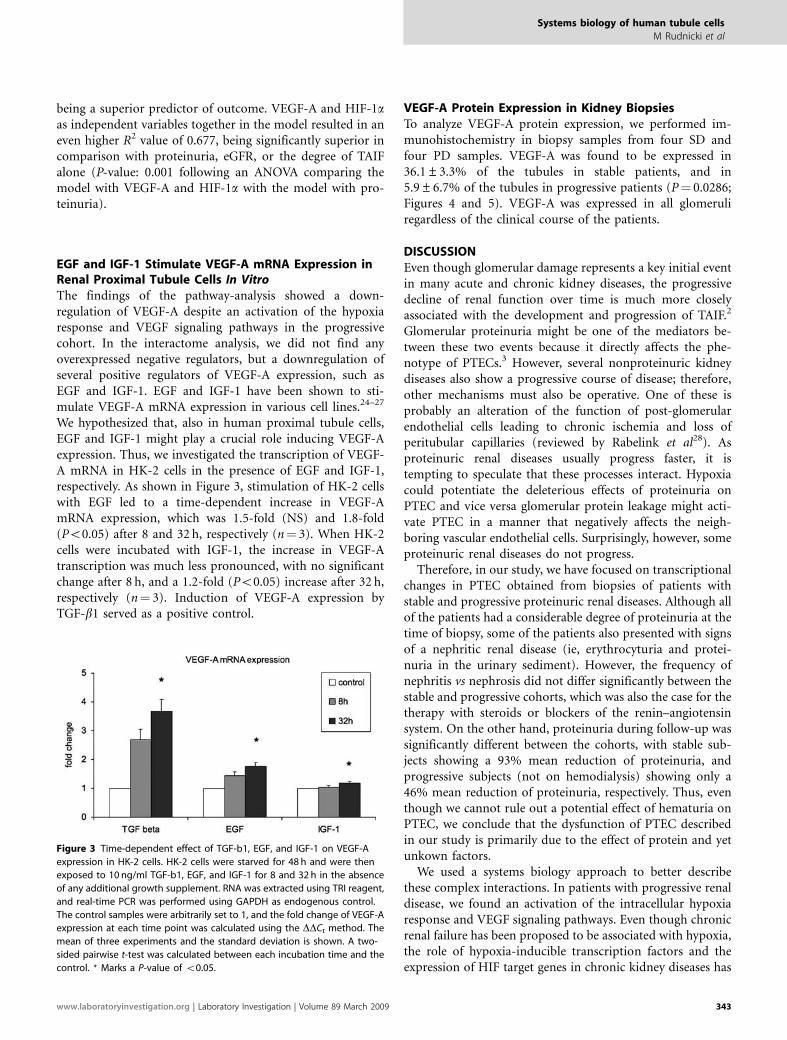
We hypothesized that, also in human proximal tubule cells,EGF and IGF-1 might play a crucial role inducing VEGF-Aexpression. Thus, we investigated the transcription of VEGF-A mRNA in HK-2 cells in the presence of EGF and IGF-1,respectively. As shown in Figure 3, stimulation of HK-2 cellswith EGF led to a time-dependent increase in VEGF-AmRNA expression, which was 1.5-fold (NS) and 1.8-fold(Po0.05) after 8 and 32 h, respectively (n¼ 3). When HK-2cells were incubated with IGF-1, the increase in VEGF-Atranscription was much less pronounced, with no significantchange after 8 h, and a 1.2-fold (Po0.05) increase after 32 h,respectively (n¼ 3). Induction of VEGF-A expression byTGF-b1 served as a positive control.
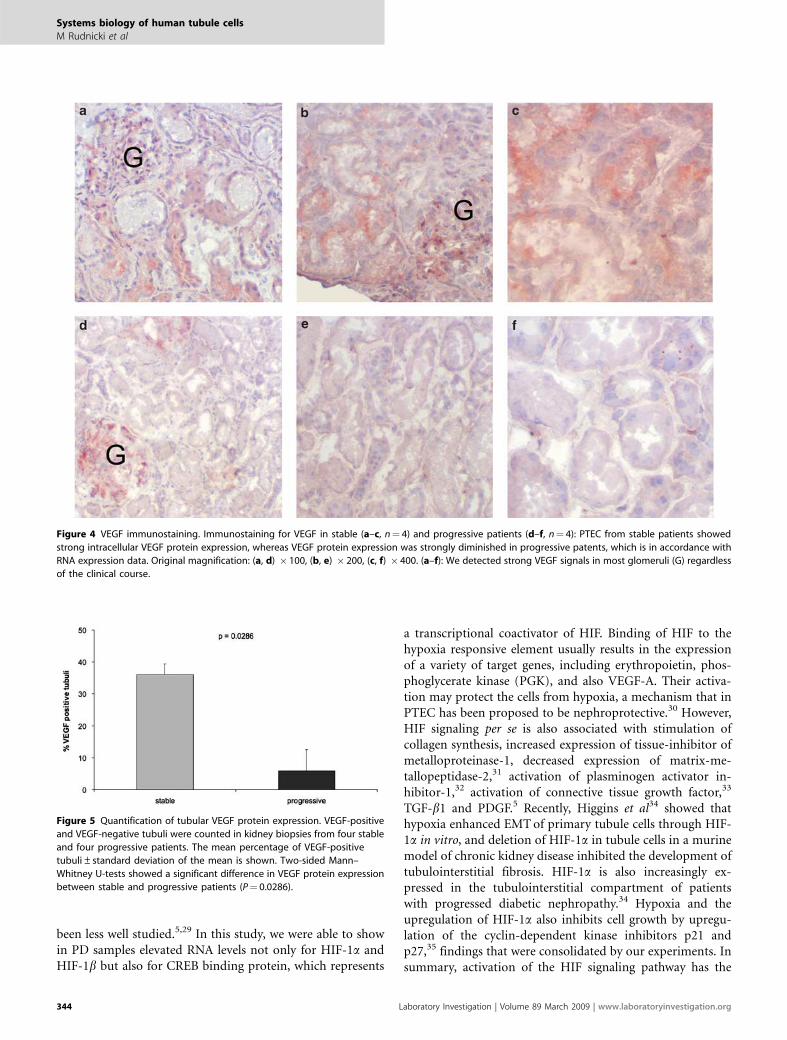
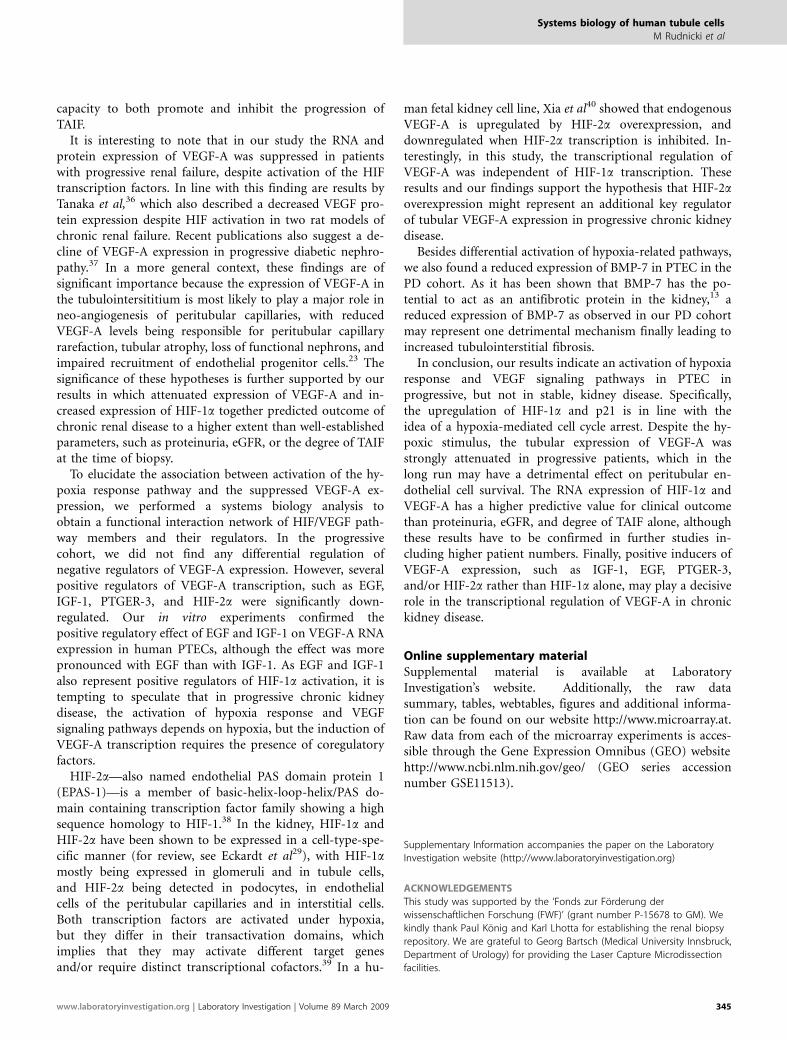
VEGF-A Protein Expression in Kidney BiopsiesTo analyze VEGF-A protein expression, we performed im-munohistochemistry in biopsy samples from four SD andfour PD samples. VEGF-A was found to be expressed in36.1±3.3% of the tubules in stable patients, and in5.9±6.7% of the tubules in progressive patients (P¼ 0.0286;Figures 4 and 5). VEGF-A was expressed in all glomeruliregardless of the clinical course of the patients.
DISCUSSIONEven though glomerular damage represents a key initial eventin many acute and chronic kidney diseases, the progressivedecline of renal function over time is much more closelyassociated with the development and progression of TAIF.2
Glomerular proteinuria might be one of the mediators be-tween these two events because it directly affects the phe-notype of PTECs.3 However, several nonproteinuric kidneydiseases also show a progressive course of disease; therefore,other mechanisms must also be operative. One of these isprobably an alteration of the function of post-glomerularendothelial cells leading to chronic ischemia and loss ofperitubular capillaries (reviewed by Rabelink et al28). Asproteinuric renal diseases usually progress faster, it istempting to speculate that these processes interact. Hypoxiacould potentiate the deleterious effects of proteinuria onPTEC and vice versa glomerular protein leakage might acti-vate PTEC in a manner that negatively affects the neigh-boring vascular endothelial cells. Surprisingly, however, someproteinuric renal diseases do not progress.
Therefore, in our study, we have focused on transcriptionalchanges in PTEC obtained from biopsies of patients withstable and progressive proteinuric renal diseases. Although allof the patients had a considerable degree of proteinuria at thetime of biopsy, some of the patients also presented with signsof a nephritic renal disease (ie, erythrocyturia and protei-nuria in the urinary sediment). However, the frequency ofnephritis vs nephrosis did not differ significantly between thestable and progressive cohorts, which was also the case for thetherapy with steroids or blockers of the renin–angiotensinsystem. On the other hand, proteinuria during follow-up wassignificantly different between the cohorts, with stable sub-jects showing a 93% mean reduction of proteinuria, andprogressive subjects (not on hemodialysis) showing only a46% mean reduction of proteinuria, respectively. Thus, eventhough we cannot rule out a potential effect of hematuria onPTEC, we conclude that the dysfunction of PTEC describedin our study is primarily due to the effect of protein and yetunkown factors.
We used a systems biology approach to better describethese complex interactions. In patients with progressive renaldisease, we found an activation of the intracellular hypoxiaresponse and VEGF signaling pathways. Even though chronicrenal failure has been proposed to be associated with hypoxia,the role of hypoxia-inducible transcription factors and theexpression of HIF target genes in chronic kidney diseases has
Figure 3 Time-dependent effect of TGF-b1, EGF, and IGF-1 on VEGF-A
expression in HK-2 cells. HK-2 cells were starved for 48 h and were then
exposed to 10 ng/ml TGF-b1, EGF, and IGF-1 for 8 and 32 h in the absence
of any additional growth supplement. RNA was extracted using TRI reagent,
and real-time PCR was performed using GAPDH as endogenous control.
The control samples were arbitrarily set to 1, and the fold change of VEGF-A
expression at each time point was calculated using the DDCt method. The
mean of three experiments and the standard deviation is shown. A two-
sided pairwise t-test was calculated between each incubation time and the
control. * Marks a P-value of o0.05.
Systems biology of human tubule cells
M Rudnicki et al
www.laboratoryinvestigation.org | Laboratory Investigation | Volume 89 March 2009 343
been less well studied.5,29 In this study, we were able to showin PD samples elevated RNA levels not only for HIF-1a andHIF-1b but also for CREB binding protein, which represents
a transcriptional coactivator of HIF. Binding of HIF to thehypoxia responsive element usually results in the expressionof a variety of target genes, including erythropoietin, phos-phoglycerate kinase (PGK), and also VEGF-A. Their activa-tion may protect the cells from hypoxia, a mechanism that inPTEC has been proposed to be nephroprotective.30 However,HIF signaling per se is also associated with stimulation ofcollagen synthesis, increased expression of tissue-inhibitor ofmetalloproteinase-1, decreased expression of matrix-me-tallopeptidase-2,31 activation of plasminogen activator in-hibitor-1,32 activation of connective tissue growth factor,33
TGF-b1 and PDGF.5 Recently, Higgins et al34 showed thathypoxia enhanced EMT of primary tubule cells through HIF-1a in vitro, and deletion of HIF-1a in tubule cells in a murinemodel of chronic kidney disease inhibited the development oftubulointerstitial fibrosis. HIF-1a is also increasingly ex-pressed in the tubulointerstitial compartment of patientswith progressed diabetic nephropathy.34 Hypoxia and theupregulation of HIF-1a also inhibits cell growth by upregu-lation of the cyclin-dependent kinase inhibitors p21 andp27,35 findings that were consolidated by our experiments. Insummary, activation of the HIF signaling pathway has the
Figure 4 VEGF immunostaining. Immunostaining for VEGF in stable (a–c, n¼ 4) and progressive patients (d–f, n¼ 4): PTEC from stable patients showed
strong intracellular VEGF protein expression, whereas VEGF protein expression was strongly diminished in progressive patents, which is in accordance with
RNA expression data. Original magnification: (a, d) � 100, (b, e) � 200, (c, f) � 400. (a–f): We detected strong VEGF signals in most glomeruli (G) regardless
of the clinical course.
Figure 5 Quantification of tubular VEGF protein expression. VEGF-positive
and VEGF-negative tubuli were counted in kidney biopsies from four stable
and four progressive patients. The mean percentage of VEGF-positive
tubuli±standard deviation of the mean is shown. Two-sided Mann–
Whitney U-tests showed a significant difference in VEGF protein expression
between stable and progressive patients (P¼ 0.0286).
Systems biology of human tubule cells
M Rudnicki et al
344 Laboratory Investigation | Volume 89 March 2009 | www.laboratoryinvestigation.org
capacity to both promote and inhibit the progression ofTAIF.
It is interesting to note that in our study the RNA andprotein expression of VEGF-A was suppressed in patientswith progressive renal failure, despite activation of the HIFtranscription factors. In line with this finding are results byTanaka et al,36 which also described a decreased VEGF pro-tein expression despite HIF activation in two rat models ofchronic renal failure. Recent publications also suggest a de-cline of VEGF-A expression in progressive diabetic nephro-pathy.37 In a more general context, these findings are ofsignificant importance because the expression of VEGF-A inthe tubulointersititium is most likely to play a major role inneo-angiogenesis of peritubular capillaries, with reducedVEGF-A levels being responsible for peritubular capillaryrarefaction, tubular atrophy, loss of functional nephrons, andimpaired recruitment of endothelial progenitor cells.23 Thesignificance of these hypotheses is further supported by ourresults in which attenuated expression of VEGF-A and in-creased expression of HIF-1a together predicted outcome ofchronic renal disease to a higher extent than well-establishedparameters, such as proteinuria, eGFR, or the degree of TAIFat the time of biopsy.
To elucidate the association between activation of the hy-poxia response pathway and the suppressed VEGF-A ex-pression, we performed a systems biology analysis toobtain a functional interaction network of HIF/VEGF path-way members and their regulators. In the progressivecohort, we did not find any differential regulation ofnegative regulators of VEGF-A expression. However, severalpositive regulators of VEGF-A transcription, such as EGF,IGF-1, PTGER-3, and HIF-2a were significantly down-regulated. Our in vitro experiments confirmed thepositive regulatory effect of EGF and IGF-1 on VEGF-A RNAexpression in human PTECs, although the effect was morepronounced with EGF than with IGF-1. As EGF and IGF-1also represent positive regulators of HIF-1a activation, it istempting to speculate that in progressive chronic kidneydisease, the activation of hypoxia response and VEGFsignaling pathways depends on hypoxia, but the induction ofVEGF-A transcription requires the presence of coregulatoryfactors.
HIF-2a—also named endothelial PAS domain protein 1(EPAS-1)—is a member of basic-helix-loop-helix/PAS do-main containing transcription factor family showing a highsequence homology to HIF-1.38 In the kidney, HIF-1a andHIF-2a have been shown to be expressed in a cell-type-spe-cific manner (for review, see Eckardt et al29), with HIF-1amostly being expressed in glomeruli and in tubule cells,and HIF-2a being detected in podocytes, in endothelialcells of the peritubular capillaries and in interstitial cells.Both transcription factors are activated under hypoxia,but they differ in their transactivation domains, whichimplies that they may activate different target genesand/or require distinct transcriptional cofactors.39 In a hu-
man fetal kidney cell line, Xia et al40 showed that endogenousVEGF-A is upregulated by HIF-2a overexpression, anddownregulated when HIF-2a transcription is inhibited. In-terestingly, in this study, the transcriptional regulation ofVEGF-A was independent of HIF-1a transcription. Theseresults and our findings support the hypothesis that HIF-2aoverexpression might represent an additional key regulatorof tubular VEGF-A expression in progressive chronic kidneydisease.
Besides differential activation of hypoxia-related pathways,we also found a reduced expression of BMP-7 in PTEC in thePD cohort. As it has been shown that BMP-7 has the po-tential to act as an antifibrotic protein in the kidney,13 areduced expression of BMP-7 as observed in our PD cohortmay represent one detrimental mechanism finally leading toincreased tubulointerstitial fibrosis.
In conclusion, our results indicate an activation of hypoxiaresponse and VEGF signaling pathways in PTEC inprogressive, but not in stable, kidney disease. Specifically,the upregulation of HIF-1a and p21 is in line with theidea of a hypoxia-mediated cell cycle arrest. Despite the hy-poxic stimulus, the tubular expression of VEGF-A wasstrongly attenuated in progressive patients, which in thelong run may have a detrimental effect on peritubular en-dothelial cell survival. The RNA expression of HIF-1a andVEGF-A has a higher predictive value for clinical outcomethan proteinuria, eGFR, and degree of TAIF alone, althoughthese results have to be confirmed in further studies in-cluding higher patient numbers. Finally, positive inducers ofVEGF-A expression, such as IGF-1, EGF, PTGER-3,and/or HIF-2a rather than HIF-1a alone, may play a decisiverole in the transcriptional regulation of VEGF-A in chronickidney disease.
Online supplementary materialSupplemental material is available at LaboratoryInvestigation’s website. Additionally, the raw datasummary, tables, webtables, figures and additional informa-tion can be found on our website http://www.microarray.at.Raw data from each of the microarray experiments is acces-sible through the Gene Expression Omnibus (GEO) websitehttp://www.ncbi.nlm.nih.gov/geo/ (GEO series accessionnumber GSE11513).
Supplementary Information accompanies the paper on the Laboratory
Investigation website (http://www.laboratoryinvestigation.org)
ACKNOWLEDGEMENTS
This study was supported by the ‘Fonds zur Forderung der
wissenschaftlichen Forschung (FWF)’ (grant number P-15678 to GM). We
kindly thank Paul Konig and Karl Lhotta for establishing the renal biopsy
repository. We are grateful to Georg Bartsch (Medical University Innsbruck,
Department of Urology) for providing the Laser Capture Microdissection
facilities.
Systems biology of human tubule cells
M Rudnicki et al
www.laboratoryinvestigation.org | Laboratory Investigation | Volume 89 March 2009 345

1. Coresh J, Selvin E, Stevens LA, et al. Prevalence of chronic kidneydisease in the United States. JAMA 2007;298:2038–2047.
2. Nath KA. Tubulointerstitial changes as a major determinant in theprogression of renal damage. Am J Kidney Dis 1992;20:1–17.
3. Zoja C, Benigni A, Remuzzi G. Cellular responses to protein overload:key event in renal disease progression. Curr Opin Nephrol Hypertens2004;13:31–37.
4. Kriz W, LeHir M. Pathways to nephron loss starting fromglomerular diseases-insights from animal models. Kidney Int2005;67:404–419.
5. Norman JT, Fine LG. Intrarenal oxygenation in chronic renal failure. ClinExp Pharmacol Physiol 2006;33:989–996.
6. Liu Y. Epithelial to mesenchymal transition in renal fibrogenesis:pathologic significance, molecular mechanism, and therapeuticintervention. J Am Soc Nephrol 2004;15:1–12.
7. Drumm K, Bauer B, Freudinger R, et al. Albumin induces NF-kappaBexpression in human proximal tubule-derived cells (IHKE-1). CellPhysiol Biochem 2002;12:187–196.
8. Rudnicki M, Eder S, Perco P, et al. Gene expression profiles of humanproximal tubular epithelial cells in proteinuric nephropathies. KidneyInt 2007;71:325–335.
9. Zoja C, Benigni A, Remuzzi G. Protein overload activates proximaltubular cells to release vasoactive and inflammatory mediators. ExpNephrol 1999;7:420–428.
10. Liu Y. Hepatocyte growth factor promotes renal epithelial cell survivalby dual mechanisms. Am J Physiol 1999;277:F624–F633.
11. Wang S, de Caestecker M, Kopp J, et al. Renal bone morphogeneticprotein-7 protects against diabetic nephropathy. J Am Soc Nephrol2006;17:2504–2512.
12. Ostendorf T, Rong S, Boor P, et al. Antagonism of PDGF-D by humanantibody CR002 prevents renal scarring in experimentalglomerulonephritis. J Am Soc Nephrol 2006;17:1054–1062.
13. Zeisberg M, Hanai J, Sugimoto H, et al. BMP-7 counteracts TGF-beta1-induced epithelial-to-mesenchymal transition and reverses chronicrenal injury. Nat Med 2003;9:964–968.
14. Ziyadeh FN, Hoffman BB, Han DC, et al. Long-term prevention of renalinsufficiency, excess matrix gene expression, and glomerularmesangial matrix expansion by treatment with monoclonalantitransforming growth factor-beta antibody in db/db diabetic mice.Proc Natl Acad Sci USA 2000;97:8015–8020.
15. Schmid H, Boucherot A, Yasuda Y, et al. Modular activation of nuclearfactor-kappaB transcriptional programs in human diabeticnephropathy. Diabetes 2006;55:2993–3003.
16. Rudnicki M, Eder S, Schratzberger G, et al. Reliability of t7-based mRNAlinear amplification validated by gene expression analysis of humankidney cells using cDNA microarrays. Nephron Exp Nephrol2004;97:e86–e95.
17. Brazma A, Hingamp P, Quackenbush J, et al. Minimum informationabout a microarray experiment (MIAME)-toward standards formicroarray data. Nat Genet 2001;29:365–371.
18. Ashburner M, Ball CA, Blake JA, et al. Gene ontology: tool for theunification of biology. The Gene Ontology Consortium. Nat Genet2000;25:25–29.
19. Diehn M, Sherlock G, Binkley G, et al. SOURCE: a unified genomicresource of functional annotations, ontologies, and gene expressiondata. Nucleic Acids Res 2003;31:219–223.
20. Hoffmann R, Valencia A. A gene network for navigating the literature.Nat Genet 2004;36:664.
21. Mi H, Guo N, Kejariwal A, et al. PANTHER version 6: protein sequenceand function evolution data with expanded representation ofbiological pathways. Nucleic Acids Res 2007;35:D247–D252.
22. Pollack V, Sarkozi R, Banki Z, et al. Oncostatin M-induced effects onEMT in human proximal tubular cells: differential role of ERK signaling.Am J Physiol Renal Physiol 2007;293:F1714–F1726.
23. Schrijvers BF, Flyvbjerg A, De Vriese AS. The role of vascular endothelialgrowth factor (VEGF) in renal pathophysiology. Kidney Int2004;65:2003–2017.
24. Goldman CK, Kim J, Wong WL, et al. Epidermal growth factorstimulates vascular endothelial growth factor production by humanmalignant glioma cells: a model of glioblastoma multiformepathophysiology. Mol Biol Cell 1993;4:121–133.
25. Gruden G, Araf S, Zonca S, et al. IGF-I induces vascular endothelialgrowth factor in human mesangial cells via a Src-dependentmechanism. Kidney Int 2003;63:1249–1255.
26. Kedar D, Baker CH, Killion JJ, et al. Blockade of the epidermal growthfactor receptor signaling inhibits angiogenesis leading to regression ofhuman renal cell carcinoma growing orthotopically in nude mice. ClinCancer Res 2002;8:3592–3600.
27. Menu E, Kooijman R, Van Valckenborgh E, et al. Specific roles for thePI3K and the MEK-ERK pathway in IGF-1-stimulated chemotaxis, VEGFsecretion and proliferation of multiple myeloma cells: study in the5T33MM model. Br J Cancer 2004;90:1076–1083.
28. Rabelink TJ, Wijewickrama DC, de Koning EJ. Peritubular endothelium:the Achilles heel of the kidney? Kidney Int 2007;72:926–930.
29. Eckardt KU, Bernhardt W, Willam C, et al. Hypoxia-inducibletranscription factors and their role in renal disease. Semin Nephrol2007;27:363–372.
30. Bernhardt WM, Warnecke C, Willam C, et al. Organ protection byhypoxia and hypoxia-inducible factors. Methods Enzymol2007;435:221–245.
31. Orphanides C, Fine LG, Norman JT. Hypoxia stimulates proximaltubular cell matrix production via a TGF-beta1-independentmechanism. Kidney Int 1997;52:637–647.
32. Kietzmann T, Samoylenko A, Roth U, et al. Hypoxia-inducible factor-1and hypoxia response elements mediate the induction of plasminogenactivator inhibitor-1 gene expression by insulin in primary rathepatocytes. Blood 2003;101:907–914.
33. Higgins DF, Biju MP, Akai Y, et al. Hypoxic induction of Ctgf is directlymediated by Hif-1. Am J Physiol Renal Physiol 2004;287:F1223–F1232.
34. Higgins DF, Kimura K, Bernhardt WM, et al. Hypoxia promotesfibrogenesis in vivo via HIF-1 stimulation of epithelial-to-mesenchymaltransition. J Clin Invest 2007;117:3810–3820.
35. Goda N, Ryan HE, Khadivi B, et al. Hypoxia-inducible factor 1alpha isessential for cell cycle arrest during hypoxia. Mol Cell Biol 2003;23:359–369.
36. Tanaka T, Miyata T, Inagi R, et al. Hypoxia in renal disease withproteinuria and/or glomerular hypertension. Am J Pathol2004;165:1979–1992.
37. Lindenmeyer MT, Kretzler M, Boucherot A, et al. Interstitial vascularrarefaction and reduced VEGF-A expression in human diabeticnephropathy. J Am Soc Nephrol 2007;18:1765–1776.
38. Ema M, Taya S, Yokotani N, et al. A novel bHLH-PAS factor with closesequence similarity to hypoxia-inducible factor 1alpha regulates theVEGF expression and is potentially involved in lung and vasculardevelopment. Proc Natl Acad Sci USA 1997;94:4273–4278.
39. Hu CJ, Iyer S, Sataur A, et al. Differential regulation of the transcriptionalactivities of hypoxia-inducible factor 1 alpha (HIF-1alpha) andHIF-2alpha in stem cells. Mol Cell Biol 2006;26:3514–3526.
40. Xia G, Kageyama Y, Hayashi T, et al. Regulation of vascular endothelialgrowth factor transcription by endothelial PAS domain protein 1(EPAS1) and possible involvement of EPAS1 in the angiogenesis ofrenal cell carcinoma. Cancer 2001;91:1429–1436.
Systems biology of human tubule cells
M Rudnicki et al
346 Laboratory Investigation | Volume 89 March 2009 | www.laboratoryinvestigation.org