Apiano: la colonización romana y los planes de Tiberio Graco
Upload
independentCategory
view
0download
0
Cent. Eur. J. Geosci. • 3(2) • 2011 • 155-168DOI: 10.2478/s13533-011-0012-8
Central European Journal of Geosciences
Hypogeal geological survey in the ”Grotta del ReTiberio” natural cave (Apennines, Italy): a valid tool forreconstructing the structural setting
Research Article
Alice Ghiselli1∗, Marzio Merazzi1, Andrea Strini1, Roberto Margutti2, Michele Mercuriali2
1 Studio Associato GSM, Geo and Speleo Matters cons.- Milano,20132, via Rizzoli, 49, Italy
2 Saint-Gobain PPC Italia S.p.A., Dip.t “Exploration, Mining & Recycling” - Milano,20145, via Ettore Romagnoli, 6, Italy
Received 23 November 2010; accepted 9 March 2011
Abstract: As karst systems are natural windows to the underground, speleology, combined with geological surveys, can beuseful tools for helping understand the geological evolution of karst areas.In order to enhance the reconstruction of the structural setting in a gypsum karst area (Vena del Gesso, RomagnaApennines), a detailed analysis has been carried out on hypogeal data. Structural features (faults, fractures, tec-tonic foliations, bedding) have been mapped in the ”Grotta del Re Tiberio” cave, in the nearby gypsum quarrytunnels and open pit benches. Five fracture systems and six fault systems have been identified. The fault sys-tems have been further analyzed through stereographic projections and geometric-kinematic evaluations in orderto reconstruct the relative chronology of these structures. This analysis led to the detection of two deformationphases.The results permitted linking of the hypogeal data with the surface data both at a local and regional scale. At thelocal scale, fracture data collected in the underground have been compared with previous authors’ surface datacoming from the quarry area. The two data sets show a very good correspondence, as every underground frac-ture system matches with one of the surface fracture system. Moreover, in the cave, a larger number of fracturesbelonging to each system could be mapped. At the regional scale, the two deformation phases detected canbe integrated in the structural setting of the study area, thereby enhancing the tectonic interpretation of the area(e.g., structures belonging to a new deformation phase, not reported before, have been identified underground).The structural detailed hypogeal survey has, thus, provided very useful data, both by integrating the existinginformation and revealing new data not detected at the surface. In particular, some small structures (e.g., dis-placement markers and short fractures) are better preserved in the hypogeal environment than on the surfacewhere the outcropping gypsum is more exposed to dissolution and recrystallization.The hypogeal geological survey, therefore, can be considered a powerful tool for integrating the surface and logdata in order to enhance the reconstruction of the deformational history and to get a three-dimensional model ofthe bedrock in karst areas.
Keywords: hypogeal geological survey • structural analysis • gypsum karst • Vena del Gesso • Grotta del Re Tiberio© Versita Sp. z o.o.
∗E-mail: [email protected]
155
Hypogeal geological survey in the ”Grotta del Re Tiberio” natural cave (Apennines, Italy): a valid tool for reconstructing the structural setting
1. IntroductionKarst systems are natural windows to the underground;therefore, speleology, combined with geological surveys,can be useful tools for helping understand the geologi-cal evolution of karst areas. In this paper, the results ofmesoscale structural analysis of hypogeal data are shown.The study area is the Re Tiberio karst system and the oldexploited tunnels of the nearby gypsum quarry, located inthe “Vena del Gesso” (Romagna Apennines, Italy). The“Vena del Gesso” is a spectacular gypsum ridge, up to30 km long, standing out on the smooth landscape of theWestern-Romagna foothills [1]. The wide gypsum outcropprovides a unique view to the primary evaporites relatedto the Messinian Salinity Crisis of the Mediterranean [2].The gypsum surface exposure to dissolution and recrys-tallization, though, sometimes prevents the detection ofmesoscale, both primary and secondary features. There-fore the presence of natural caves and quarry tunnels canprovide an important contribution to the interpretation ofthe geological evolution of the area.Moreover, the evaporitic rocks within sedimentary se-quences play an important role in localizing deformation,especially in thrust tectonics, implying that their strengthis generally lower than that of other rock [3]. Therefore,as gypsum can register deformation features that otherrocks do not show, its study can provide further informa-tion with respect to the contiguous rocks. Gypsum, in fact,accommodates strain by brittle and plastic deformationmechanisms, developing Riedel-like faults with plastic fo-liations and crystallographic preferred orientation as theother rocks [4], but at lower temperatures and strain rates.
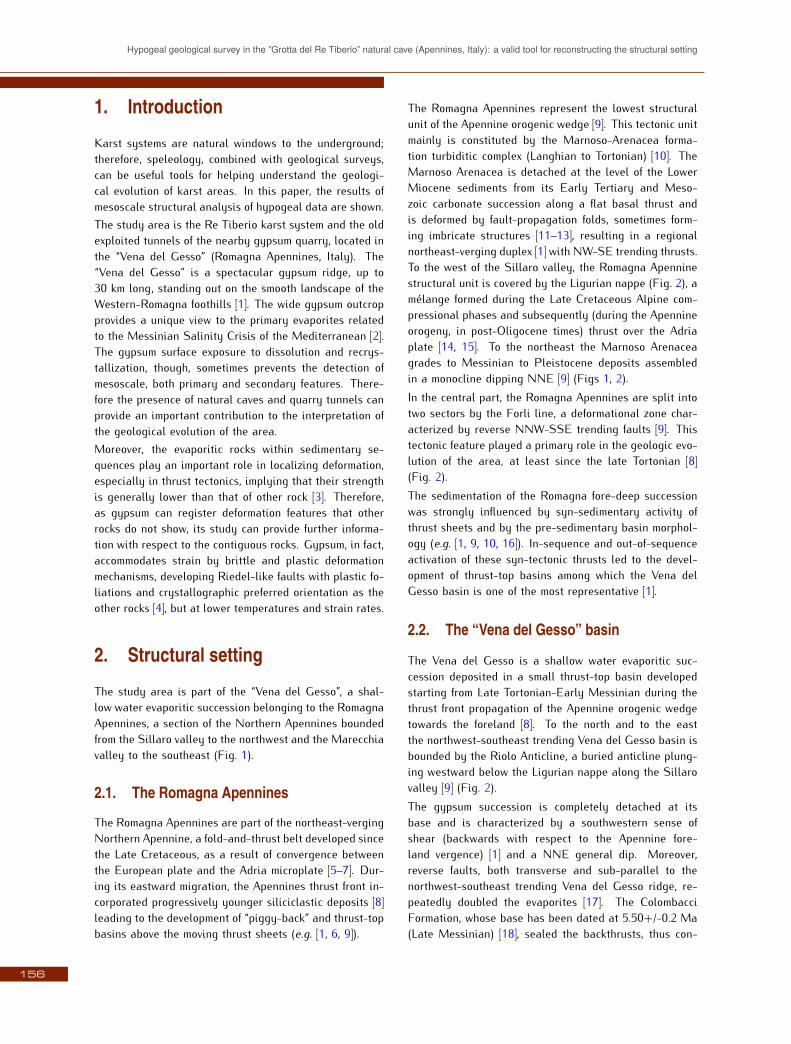
2. Structural settingThe study area is part of the “Vena del Gesso”, a shal-low water evaporitic succession belonging to the RomagnaApennines, a section of the Northern Apennines boundedfrom the Sillaro valley to the northwest and the Marecchiavalley to the southeast (Fig. 1).
2.1. The Romagna Apennines
The Romagna Apennines are part of the northeast-vergingNorthern Apennine, a fold-and-thrust belt developed sincethe Late Cretaceous, as a result of convergence betweenthe European plate and the Adria microplate [5–7]. Dur-ing its eastward migration, the Apennines thrust front in-corporated progressively younger siliciclastic deposits [8]leading to the development of “piggy-back” and thrust-topbasins above the moving thrust sheets (e.g. [1, 6, 9]).
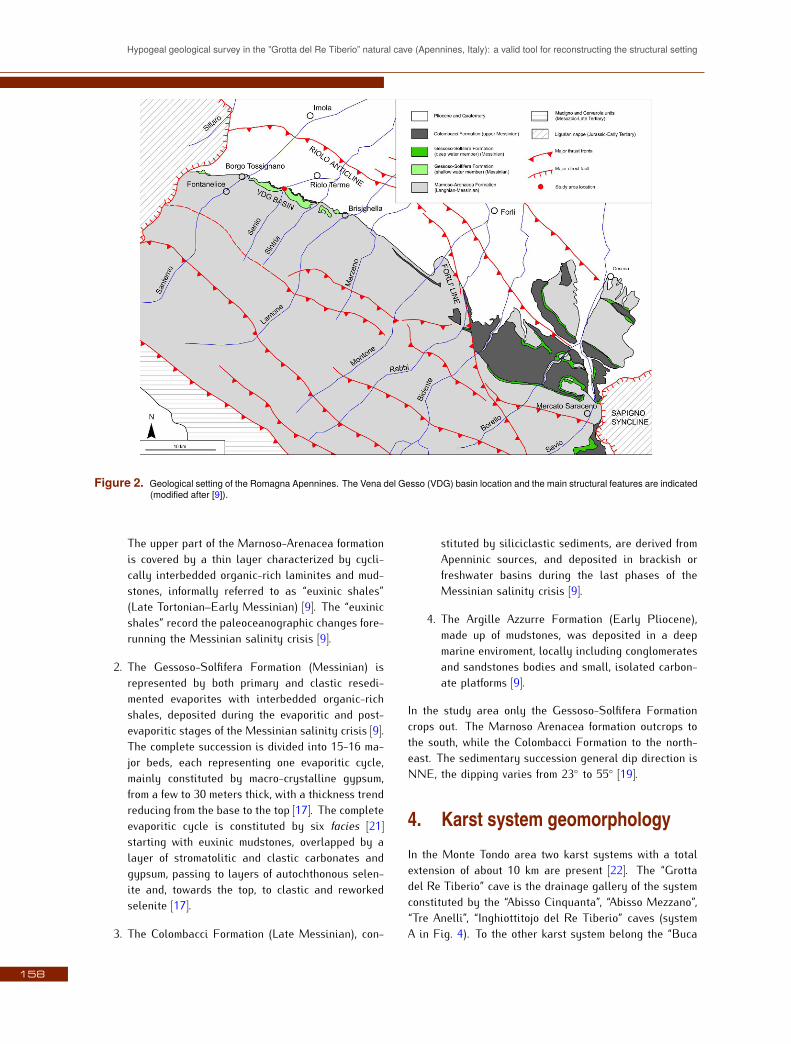
The Romagna Apennines represent the lowest structuralunit of the Apennine orogenic wedge [9]. This tectonic unitmainly is constituted by the Marnoso-Arenacea forma-tion turbiditic complex (Langhian to Tortonian) [10]. TheMarnoso Arenacea is detached at the level of the LowerMiocene sediments from its Early Tertiary and Meso-zoic carbonate succession along a flat basal thrust andis deformed by fault-propagation folds, sometimes form-ing imbricate structures [11–13], resulting in a regionalnortheast-verging duplex [1] with NW-SE trending thrusts.To the west of the Sillaro valley, the Romagna Apenninestructural unit is covered by the Ligurian nappe (Fig. 2), amélange formed during the Late Cretaceous Alpine com-pressional phases and subsequently (during the Apennineorogeny, in post-Oligocene times) thrust over the Adriaplate [14, 15]. To the northeast the Marnoso Arenaceagrades to Messinian to Pleistocene deposits assembledin a monocline dipping NNE [9] (Figs 1, 2).In the central part, the Romagna Apennines are split intotwo sectors by the Forli line, a deformational zone char-acterized by reverse NNW-SSE trending faults [9]. Thistectonic feature played a primary role in the geologic evo-lution of the area, at least since the late Tortonian [8](Fig. 2).The sedimentation of the Romagna fore-deep successionwas strongly influenced by syn-sedimentary activity ofthrust sheets and by the pre-sedimentary basin morphol-ogy (e.g. [1, 9, 10, 16]). In-sequence and out-of-sequenceactivation of these syn-tectonic thrusts led to the devel-opment of thrust-top basins among which the Vena delGesso basin is one of the most representative [1].
2.2. The “Vena del Gesso” basin
The Vena del Gesso is a shallow water evaporitic suc-cession deposited in a small thrust-top basin developedstarting from Late Tortonian-Early Messinian during thethrust front propagation of the Apennine orogenic wedgetowards the foreland [8]. To the north and to the eastthe northwest-southeast trending Vena del Gesso basin isbounded by the Riolo Anticline, a buried anticline plung-ing westward below the Ligurian nappe along the Sillarovalley [9] (Fig. 2).The gypsum succession is completely detached at itsbase and is characterized by a southwestern sense ofshear (backwards with respect to the Apennine fore-land vergence) [1] and a NNE general dip. Moreover,reverse faults, both transverse and sub-parallel to thenorthwest-southeast trending Vena del Gesso ridge, re-peatedly doubled the evaporites [17]. The ColombacciFormation, whose base has been dated at 5.50+/-0.2 Ma(Late Messinian) [18], sealed the backthrusts, thus con-
156
A. Ghiselli et al.
Figure 1. Geological setting of the Northern Apennines. The Romagna Apennines and the study area location are indicated (modified after [1]).
straining their timing of activity.Afterwards, the Vena del Gesso area was dissected bynear vertical, northeast-southwest trending faults, accom-modating the last stages of deformation [17].
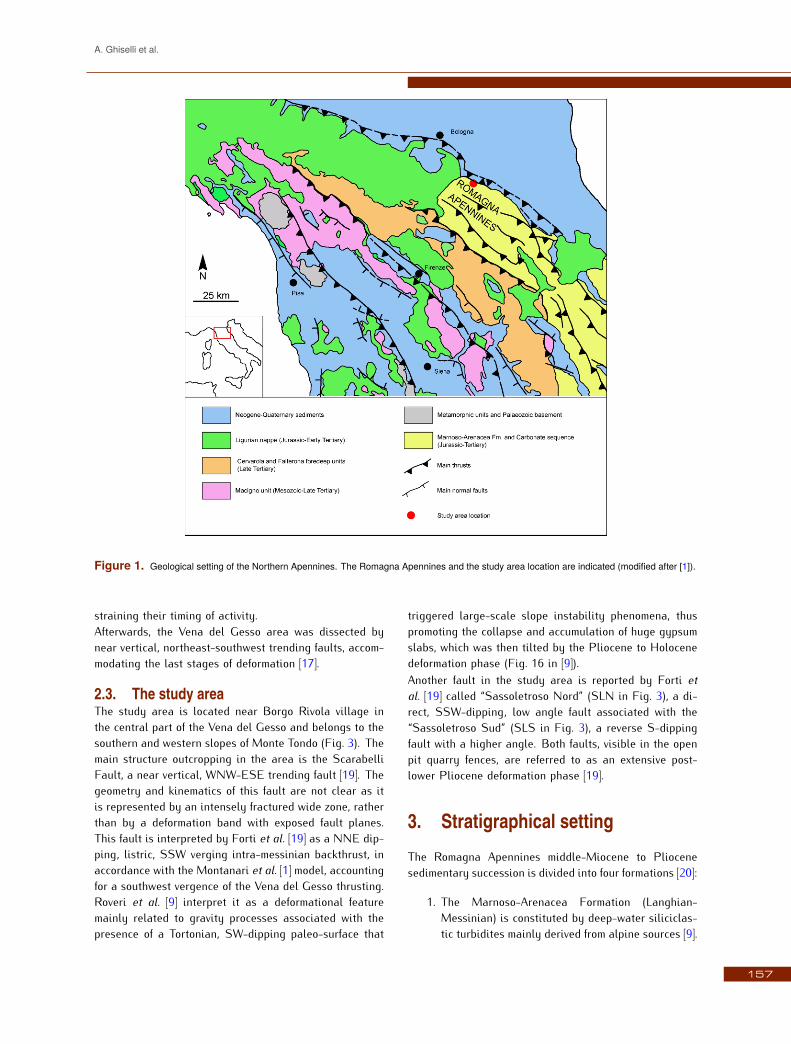
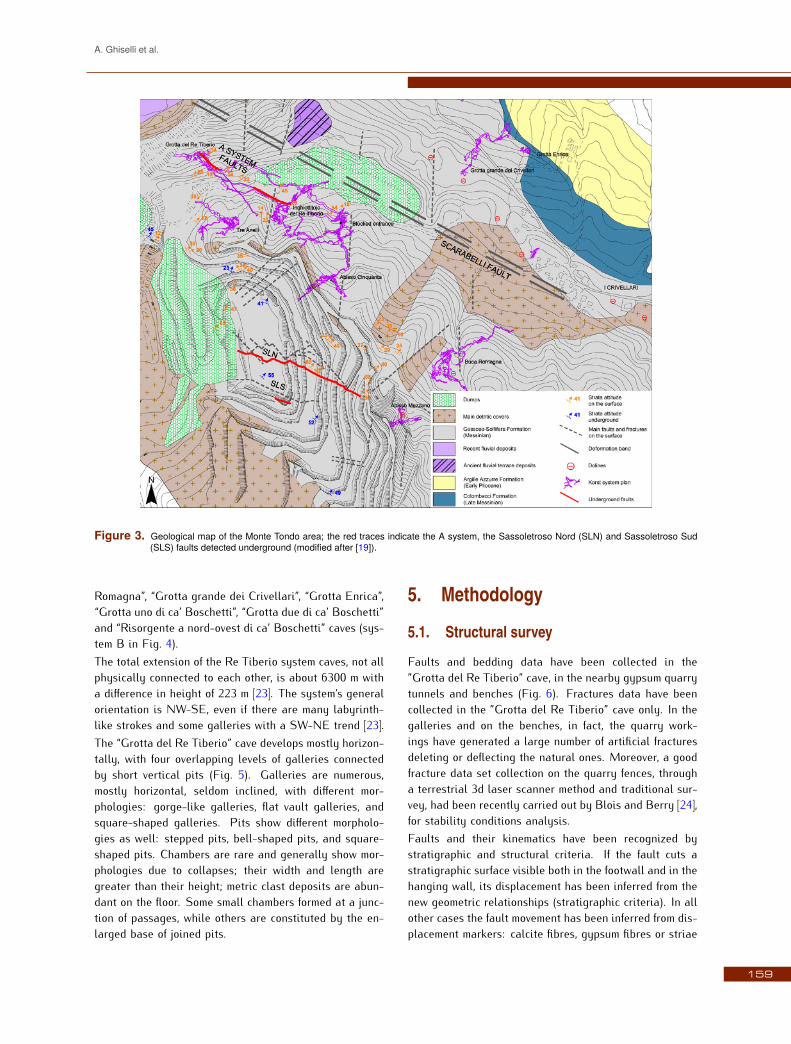
2.3. The study areaThe study area is located near Borgo Rivola village inthe central part of the Vena del Gesso and belongs to thesouthern and western slopes of Monte Tondo (Fig. 3). Themain structure outcropping in the area is the ScarabelliFault, a near vertical, WNW-ESE trending fault [19]. Thegeometry and kinematics of this fault are not clear as itis represented by an intensely fractured wide zone, ratherthan by a deformation band with exposed fault planes.This fault is interpreted by Forti et al. [19] as a NNE dip-ping, listric, SSW verging intra-messinian backthrust, inaccordance with the Montanari et al. [1] model, accountingfor a southwest vergence of the Vena del Gesso thrusting.Roveri et al. [9] interpret it as a deformational featuremainly related to gravity processes associated with thepresence of a Tortonian, SW-dipping paleo-surface that
triggered large-scale slope instability phenomena, thuspromoting the collapse and accumulation of huge gypsumslabs, which was then tilted by the Pliocene to Holocenedeformation phase (Fig. 16 in [9]).Another fault in the study area is reported by Forti etal. [19] called “Sassoletroso Nord” (SLN in Fig. 3), a di-rect, SSW-dipping, low angle fault associated with the“Sassoletroso Sud” (SLS in Fig. 3), a reverse S-dippingfault with a higher angle. Both faults, visible in the openpit quarry fences, are referred to as an extensive post-lower Pliocene deformation phase [19].
3. Stratigraphical settingThe Romagna Apennines middle-Miocene to Pliocenesedimentary succession is divided into four formations [20]:
1. The Marnoso-Arenacea Formation (Langhian-Messinian) is constituted by deep-water siliciclas-tic turbidites mainly derived from alpine sources [9].
157
Hypogeal geological survey in the ”Grotta del Re Tiberio” natural cave (Apennines, Italy): a valid tool for reconstructing the structural setting
Figure 2. Geological setting of the Romagna Apennines. The Vena del Gesso (VDG) basin location and the main structural features are indicated(modified after [9]).
The upper part of the Marnoso-Arenacea formationis covered by a thin layer characterized by cycli-cally interbedded organic-rich laminites and mud-stones, informally referred to as “euxinic shales”(Late Tortonian–Early Messinian) [9]. The “euxinicshales” record the paleoceanographic changes fore-running the Messinian salinity crisis [9].
2. The Gessoso-Solfifera Formation (Messinian) isrepresented by both primary and clastic resedi-mented evaporites with interbedded organic-richshales, deposited during the evaporitic and post-evaporitic stages of the Messinian salinity crisis [9].The complete succession is divided into 15-16 ma-jor beds, each representing one evaporitic cycle,mainly constituted by macro-crystalline gypsum,from a few to 30 meters thick, with a thickness trendreducing from the base to the top [17]. The completeevaporitic cycle is constituted by six facies [21]starting with euxinic mudstones, overlapped by alayer of stromatolitic and clastic carbonates andgypsum, passing to layers of autochthonous selen-ite and, towards the top, to clastic and reworkedselenite [17].
3. The Colombacci Formation (Late Messinian), con-
stituted by siliciclastic sediments, are derived fromApenninic sources, and deposited in brackish orfreshwater basins during the last phases of theMessinian salinity crisis [9].
4. The Argille Azzurre Formation (Early Pliocene),made up of mudstones, was deposited in a deepmarine enviroment, locally including conglomeratesand sandstones bodies and small, isolated carbon-ate platforms [9].
In the study area only the Gessoso-Solfifera Formationcrops out. The Marnoso Arenacea formation outcrops tothe south, while the Colombacci Formation to the north-east. The sedimentary succession general dip direction isNNE, the dipping varies from 23◦ to 55◦ [19].
4. Karst system geomorphologyIn the Monte Tondo area two karst systems with a totalextension of about 10 km are present [22]. The “Grottadel Re Tiberio” cave is the drainage gallery of the systemconstituted by the “Abisso Cinquanta”, “Abisso Mezzano”,“Tre Anelli”, “Inghiottitojo del Re Tiberio” caves (systemA in Fig. 4). To the other karst system belong the “Buca
158
A. Ghiselli et al.
Figure 3. Geological map of the Monte Tondo area; the red traces indicate the A system, the Sassoletroso Nord (SLN) and Sassoletroso Sud(SLS) faults detected underground (modified after [19]).
Romagna”, “Grotta grande dei Crivellari”, “Grotta Enrica”,“Grotta uno di ca’ Boschetti”, “Grotta due di ca’ Boschetti”and “Risorgente a nord-ovest di ca’ Boschetti” caves (sys-tem B in Fig. 4).The total extension of the Re Tiberio system caves, not allphysically connected to each other, is about 6300 m witha difference in height of 223 m [23]. The system’s generalorientation is NW-SE, even if there are many labyrinth-like strokes and some galleries with a SW-NE trend [23].The “Grotta del Re Tiberio” cave develops mostly horizon-tally, with four overlapping levels of galleries connectedby short vertical pits (Fig. 5). Galleries are numerous,mostly horizontal, seldom inclined, with different mor-phologies: gorge-like galleries, flat vault galleries, andsquare-shaped galleries. Pits show different morpholo-gies as well: stepped pits, bell-shaped pits, and square-shaped pits. Chambers are rare and generally show mor-phologies due to collapses; their width and length aregreater than their height; metric clast deposits are abun-dant on the floor. Some small chambers formed at a junc-tion of passages, while others are constituted by the en-larged base of joined pits.
5. Methodology
5.1. Structural survey
Faults and bedding data have been collected in the”Grotta del Re Tiberio” cave, in the nearby gypsum quarrytunnels and benches (Fig. 6). Fractures data have beencollected in the ”Grotta del Re Tiberio” cave only. In thegalleries and on the benches, in fact, the quarry work-ings have generated a large number of artificial fracturesdeleting or deflecting the natural ones. Moreover, a goodfracture data set collection on the quarry fences, througha terrestrial 3d laser scanner method and traditional sur-vey, had been recently carried out by Blois and Berry [24],for stability conditions analysis.Faults and their kinematics have been recognized bystratigraphic and structural criteria. If the fault cuts astratigraphic surface visible both in the footwall and in thehanging wall, its displacement has been inferred from thenew geometric relationships (stratigraphic criteria). In allother cases the fault movement has been inferred from dis-placement markers: calcite fibres, gypsum fibres or striae
159
Hypogeal geological survey in the ”Grotta del Re Tiberio” natural cave (Apennines, Italy): a valid tool for reconstructing the structural setting
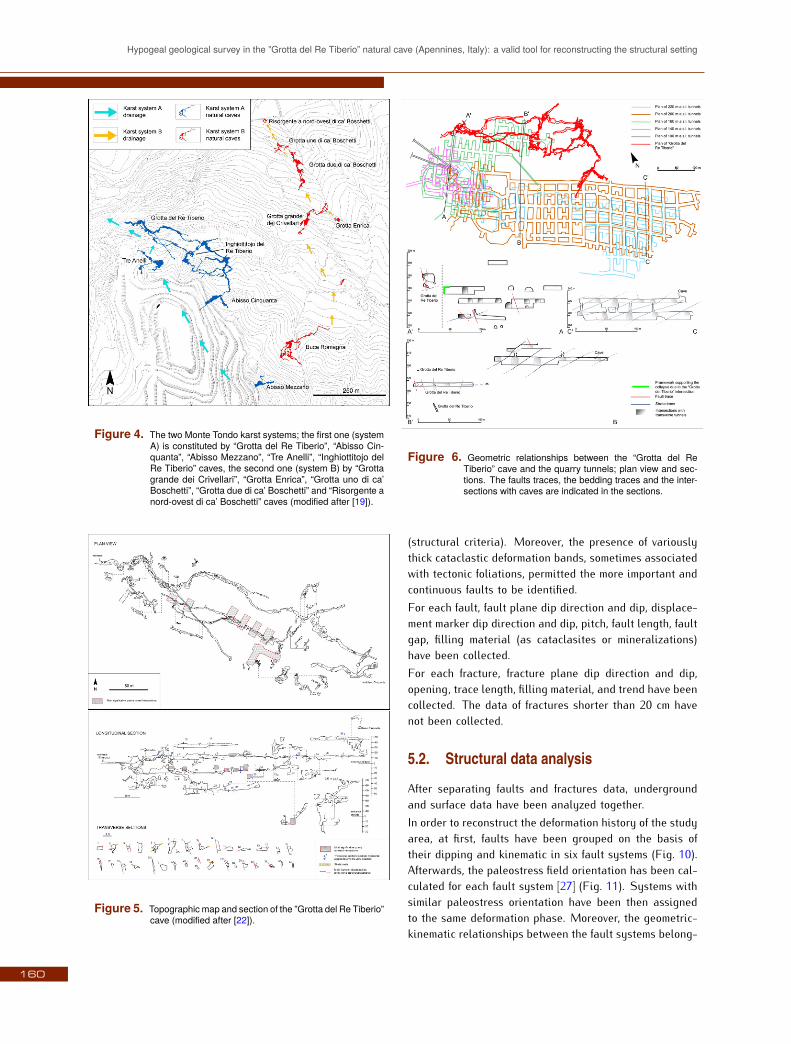
Figure 4. The two Monte Tondo karst systems; the first one (systemA) is constituted by “Grotta del Re Tiberio”, “Abisso Cin-quanta”, “Abisso Mezzano”, “Tre Anelli”, “Inghiottitojo delRe Tiberio” caves, the second one (system B) by “Grottagrande dei Crivellari”, “Grotta Enrica”, “Grotta uno di ca’Boschetti”, “Grotta due di ca’ Boschetti” and “Risorgente anord-ovest di ca’ Boschetti” caves (modified after [19]).
Figure 5. Topographic map and section of the ”Grotta del Re Tiberio”cave (modified after [22]).
Figure 6. Geometric relationships between the “Grotta del ReTiberio” cave and the quarry tunnels; plan view and sec-tions. The faults traces, the bedding traces and the inter-sections with caves are indicated in the sections.
(structural criteria). Moreover, the presence of variouslythick cataclastic deformation bands, sometimes associatedwith tectonic foliations, permitted the more important andcontinuous faults to be identified.For each fault, fault plane dip direction and dip, displace-ment marker dip direction and dip, pitch, fault length, faultgap, filling material (as cataclasites or mineralizations)have been collected.For each fracture, fracture plane dip direction and dip,opening, trace length, filling material, and trend have beencollected. The data of fractures shorter than 20 cm havenot been collected.
5.2. Structural data analysis
After separating faults and fractures data, undergroundand surface data have been analyzed together.In order to reconstruct the deformation history of the studyarea, at first, faults have been grouped on the basis oftheir dipping and kinematic in six fault systems (Fig. 10).Afterwards, the paleostress field orientation has been cal-culated for each fault system [27] (Fig. 11). Systems withsimilar paleostress orientation have been then assignedto the same deformation phase. Moreover, the geometric-kinematic relationships between the fault systems belong-
160
A. Ghiselli et al.
ing to the same deformation phase have been verifiedusing the Riedel model [25–28] (Fig. 7). Unfortunately,few intersection relationships between faults could be ob-served. Although the underground environment offers agreat 3d point of view, the narrow cavities do not permitfollowing of the outcropping structures for all their exten-sion. Therefore the intersection relationships could not beused for reconstructing the relative chronology of the ob-served structures. The relative chronology of the detecteddeformation phases could be inferred, though, thanks tothe presence of overlapping displacement markers on thesame fault planes.This chronological information has been integrated withthe existing structural data, permitting the insertion inthe regional tectonic setting.
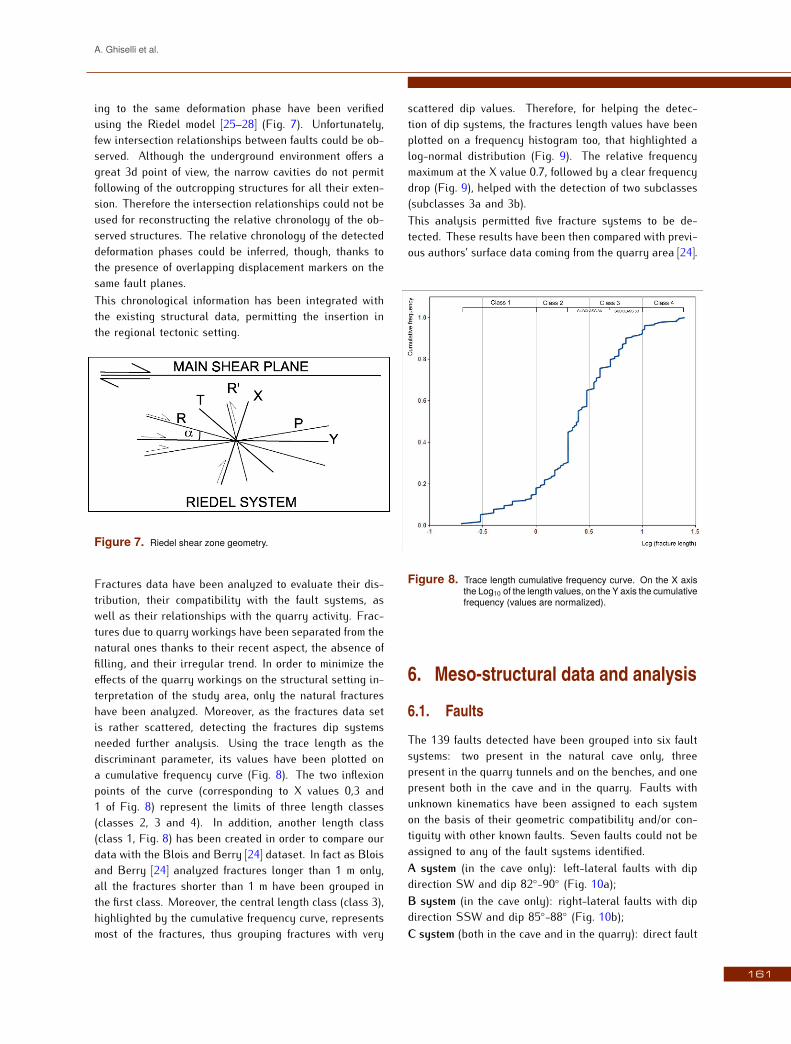
Figure 7. Riedel shear zone geometry.
Fractures data have been analyzed to evaluate their dis-tribution, their compatibility with the fault systems, aswell as their relationships with the quarry activity. Frac-tures due to quarry workings have been separated from thenatural ones thanks to their recent aspect, the absence offilling, and their irregular trend. In order to minimize theeffects of the quarry workings on the structural setting in-terpretation of the study area, only the natural fractureshave been analyzed. Moreover, as the fractures data setis rather scattered, detecting the fractures dip systemsneeded further analysis. Using the trace length as thediscriminant parameter, its values have been plotted ona cumulative frequency curve (Fig. 8). The two inflexionpoints of the curve (corresponding to X values 0,3 and1 of Fig. 8) represent the limits of three length classes(classes 2, 3 and 4). In addition, another length class(class 1, Fig. 8) has been created in order to compare ourdata with the Blois and Berry [24] dataset. In fact as Bloisand Berry [24] analyzed fractures longer than 1 m only,all the fractures shorter than 1 m have been grouped inthe first class. Moreover, the central length class (class 3),highlighted by the cumulative frequency curve, representsmost of the fractures, thus grouping fractures with very
scattered dip values. Therefore, for helping the detec-tion of dip systems, the fractures length values have beenplotted on a frequency histogram too, that highlighted alog-normal distribution (Fig. 9). The relative frequencymaximum at the X value 0.7, followed by a clear frequencydrop (Fig. 9), helped with the detection of two subclasses(subclasses 3a and 3b).This analysis permitted five fracture systems to be de-tected. These results have been then compared with previ-ous authors’ surface data coming from the quarry area [24].
Figure 8. Trace length cumulative frequency curve. On the X axisthe Log10 of the length values, on the Y axis the cumulativefrequency (values are normalized).
6. Meso-structural data and analysis
6.1. FaultsThe 139 faults detected have been grouped into six faultsystems: two present in the natural cave only, threepresent in the quarry tunnels and on the benches, and onepresent both in the cave and in the quarry. Faults withunknown kinematics have been assigned to each systemon the basis of their geometric compatibility and/or con-tiguity with other known faults. Seven faults could not beassigned to any of the fault systems identified.A system (in the cave only): left-lateral faults with dipdirection SW and dip 82◦-90◦ (Fig. 10a);B system (in the cave only): right-lateral faults with dipdirection SSW and dip 85◦-88◦ (Fig. 10b);C system (both in the cave and in the quarry): direct fault
161
Hypogeal geological survey in the ”Grotta del Re Tiberio” natural cave (Apennines, Italy): a valid tool for reconstructing the structural setting
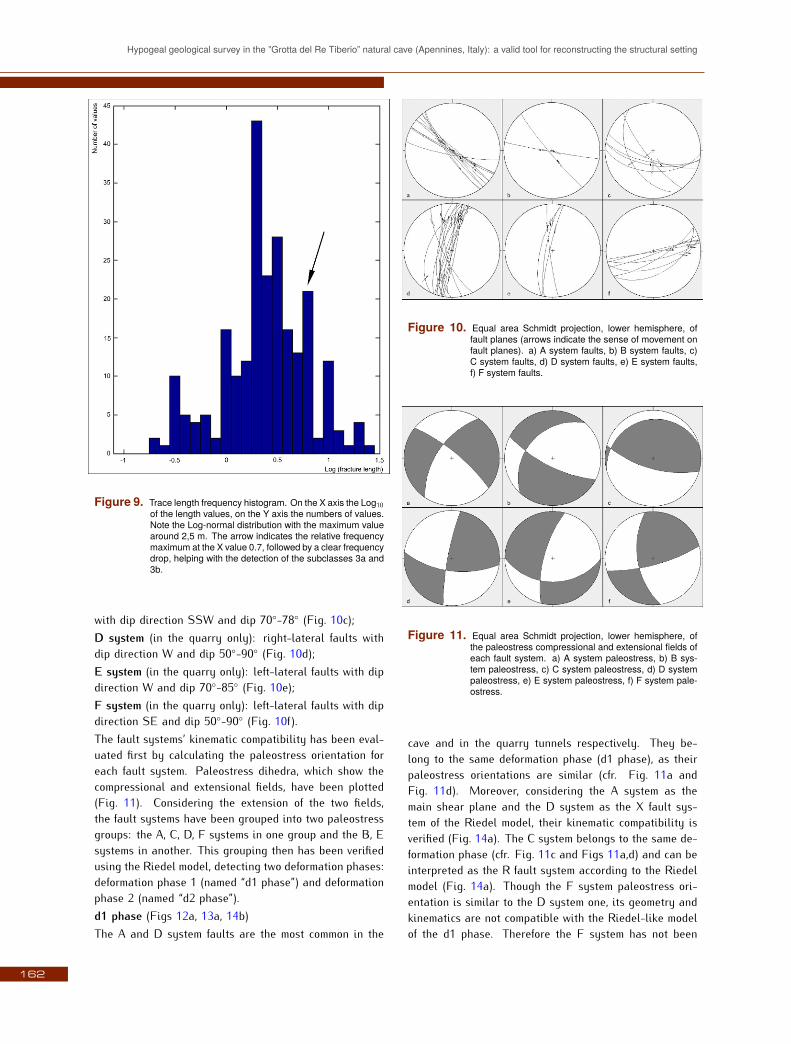
Figure 9. Trace length frequency histogram. On the X axis the Log10of the length values, on the Y axis the numbers of values.Note the Log-normal distribution with the maximum valuearound 2,5 m. The arrow indicates the relative frequencymaximum at the X value 0.7, followed by a clear frequencydrop, helping with the detection of the subclasses 3a and3b.
with dip direction SSW and dip 70◦-78◦ (Fig. 10c);D system (in the quarry only): right-lateral faults withdip direction W and dip 50◦-90◦ (Fig. 10d);E system (in the quarry only): left-lateral faults with dipdirection W and dip 70◦-85◦ (Fig. 10e);F system (in the quarry only): left-lateral faults with dipdirection SE and dip 50◦-90◦ (Fig. 10f).The fault systems’ kinematic compatibility has been eval-uated first by calculating the paleostress orientation foreach fault system. Paleostress dihedra, which show thecompressional and extensional fields, have been plotted(Fig. 11). Considering the extension of the two fields,the fault systems have been grouped into two paleostressgroups: the A, C, D, F systems in one group and the B, Esystems in another. This grouping then has been verifiedusing the Riedel model, detecting two deformation phases:deformation phase 1 (named “d1 phase”) and deformationphase 2 (named “d2 phase”).d1 phase (Figs 12a, 13a, 14b)The A and D system faults are the most common in the
Figure 10. Equal area Schmidt projection, lower hemisphere, offault planes (arrows indicate the sense of movement onfault planes). a) A system faults, b) B system faults, c)C system faults, d) D system faults, e) E system faults,f) F system faults.
Figure 11. Equal area Schmidt projection, lower hemisphere, ofthe paleostress compressional and extensional fields ofeach fault system. a) A system paleostress, b) B sys-tem paleostress, c) C system paleostress, d) D systempaleostress, e) E system paleostress, f) F system pale-ostress.
cave and in the quarry tunnels respectively. They be-long to the same deformation phase (d1 phase), as theirpaleostress orientations are similar (cfr. Fig. 11a andFig. 11d). Moreover, considering the A system as themain shear plane and the D system as the X fault sys-tem of the Riedel model, their kinematic compatibility isverified (Fig. 14a). The C system belongs to the same de-formation phase (cfr. Fig. 11c and Figs 11a,d) and can beinterpreted as the R fault system according to the Riedelmodel (Fig. 14a). Though the F system paleostress ori-entation is similar to the D system one, its geometry andkinematics are not compatible with the Riedel-like modelof the d1 phase. Therefore the F system has not been
162
A. Ghiselli et al.
assigned to the d1 phase.d2 phase (Figs. 12b, 13b, 14b)The B system paleostress orientation is not compatiblewith the d1 phase faults (cfr. Fig. 11b and Fig. 11a).Moreover, some B system structures are represented bythe same fault planes of the A system, with another seriesof displacement markers overlapped to the A system ones.Therefore the B system does not belong to the same de-formation phase of the A system and has been assignedto another deformation phase called the d2 phase.The E system paleostress orientation is similar to the Bsystem. According to the Riedel model, it represents theR’ fault system of the d2 phase, while the E system is themain shear plane (Fig. 14b).The F system is not compatible with any of the two phases;therefore, it belongs to another, not identified, deformationphase.
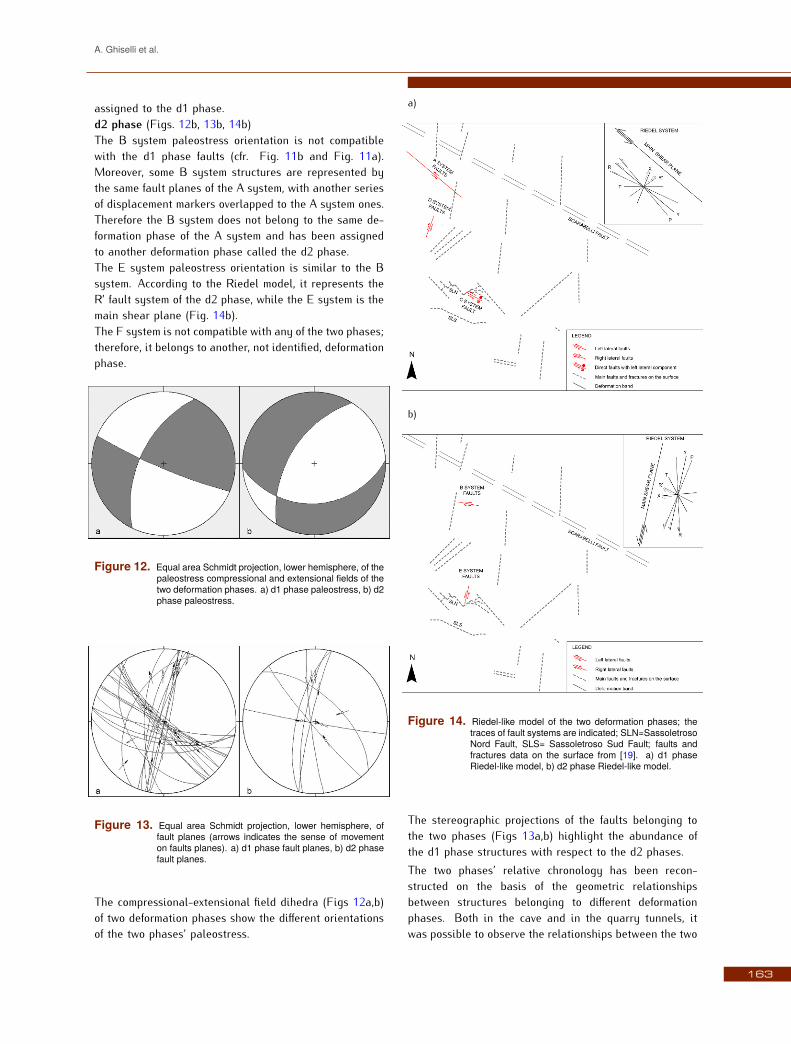
Figure 12. Equal area Schmidt projection, lower hemisphere, of thepaleostress compressional and extensional fields of thetwo deformation phases. a) d1 phase paleostress, b) d2phase paleostress.
Figure 13. Equal area Schmidt projection, lower hemisphere, offault planes (arrows indicates the sense of movementon faults planes). a) d1 phase fault planes, b) d2 phasefault planes.
The compressional-extensional field dihedra (Figs 12a,b)of two deformation phases show the different orientationsof the two phases’ paleostress.
a)
b)
Figure 14. Riedel-like model of the two deformation phases; thetraces of fault systems are indicated; SLN=SassoletrosoNord Fault, SLS= Sassoletroso Sud Fault; faults andfractures data on the surface from [19]. a) d1 phaseRiedel-like model, b) d2 phase Riedel-like model.
The stereographic projections of the faults belonging tothe two phases (Figs 13a,b) highlight the abundance ofthe d1 phase structures with respect to the d2 phases.The two phases’ relative chronology has been recon-structed on the basis of the geometric relationshipsbetween structures belonging to different deformationphases. Both in the cave and in the quarry tunnels, itwas possible to observe the relationships between the two
163
Hypogeal geological survey in the ”Grotta del Re Tiberio” natural cave (Apennines, Italy): a valid tool for reconstructing the structural setting
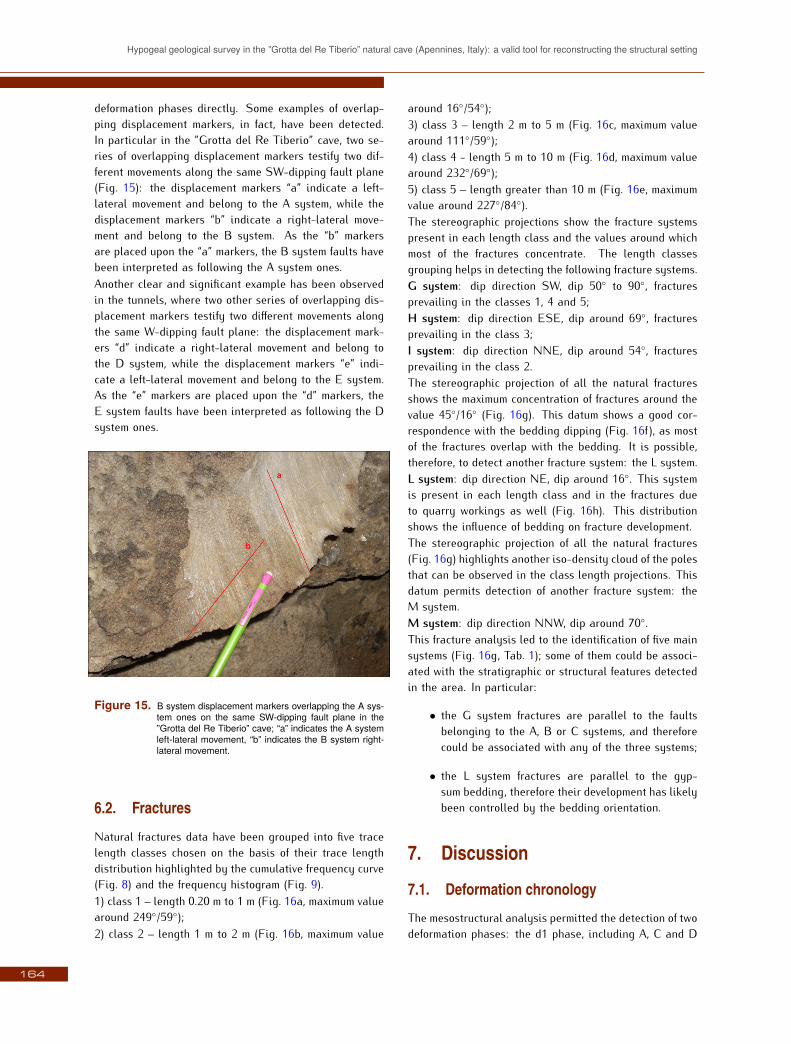
deformation phases directly. Some examples of overlap-ping displacement markers, in fact, have been detected.In particular in the ”Grotta del Re Tiberio” cave, two se-ries of overlapping displacement markers testify two dif-ferent movements along the same SW-dipping fault plane(Fig. 15): the displacement markers “a” indicate a left-lateral movement and belong to the A system, while thedisplacement markers “b” indicate a right-lateral move-ment and belong to the B system. As the “b” markersare placed upon the “a” markers, the B system faults havebeen interpreted as following the A system ones.Another clear and significant example has been observedin the tunnels, where two other series of overlapping dis-placement markers testify two different movements alongthe same W-dipping fault plane: the displacement mark-ers “d” indicate a right-lateral movement and belong tothe D system, while the displacement markers “e” indi-cate a left-lateral movement and belong to the E system.As the “e” markers are placed upon the “d” markers, theE system faults have been interpreted as following the Dsystem ones.
Figure 15. B system displacement markers overlapping the A sys-tem ones on the same SW-dipping fault plane in the”Grotta del Re Tiberio” cave; “a” indicates the A systemleft-lateral movement, “b” indicates the B system right-lateral movement.
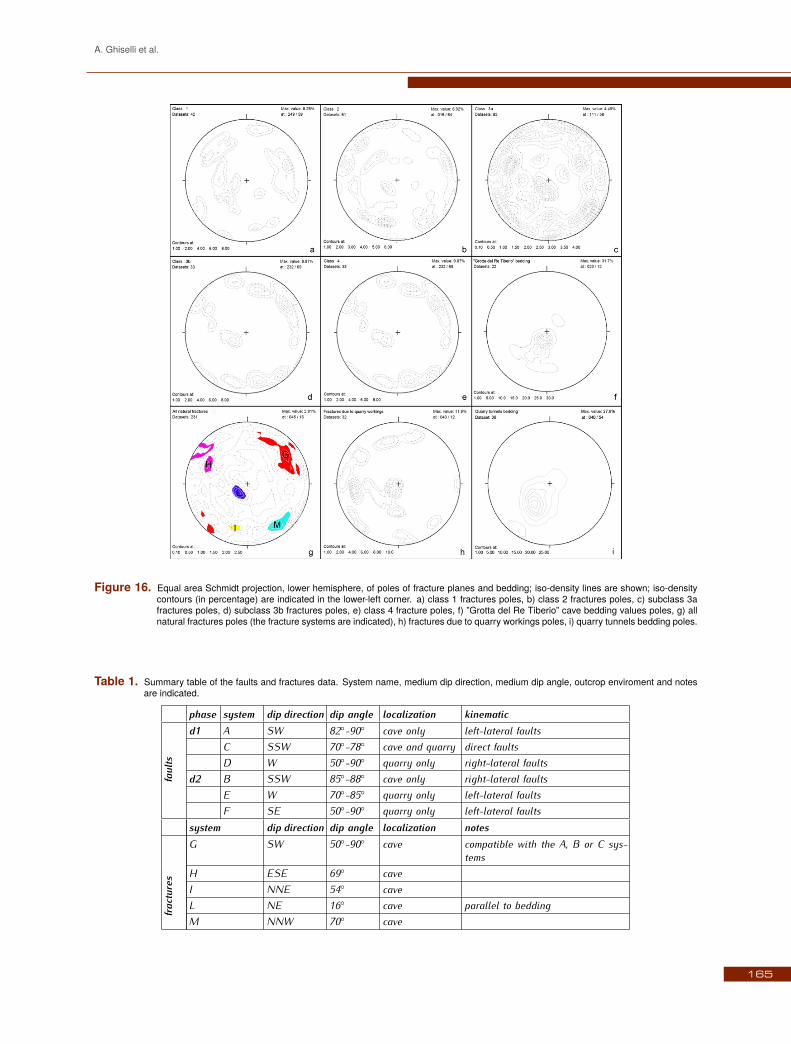
6.2. FracturesNatural fractures data have been grouped into five tracelength classes chosen on the basis of their trace lengthdistribution highlighted by the cumulative frequency curve(Fig. 8) and the frequency histogram (Fig. 9).1) class 1 – length 0.20 m to 1 m (Fig. 16a, maximum valuearound 249◦/59◦);2) class 2 – length 1 m to 2 m (Fig. 16b, maximum value
around 16◦/54◦);3) class 3 – length 2 m to 5 m (Fig. 16c, maximum valuearound 111◦/59◦);4) class 4 - length 5 m to 10 m (Fig. 16d, maximum valuearound 232◦/69◦);5) class 5 – length greater than 10 m (Fig. 16e, maximumvalue around 227◦/84◦).The stereographic projections show the fracture systemspresent in each length class and the values around whichmost of the fractures concentrate. The length classesgrouping helps in detecting the following fracture systems.G system: dip direction SW, dip 50◦ to 90◦, fracturesprevailing in the classes 1, 4 and 5;H system: dip direction ESE, dip around 69◦, fracturesprevailing in the class 3;I system: dip direction NNE, dip around 54◦, fracturesprevailing in the class 2.The stereographic projection of all the natural fracturesshows the maximum concentration of fractures around thevalue 45◦/16◦ (Fig. 16g). This datum shows a good cor-respondence with the bedding dipping (Fig. 16f), as mostof the fractures overlap with the bedding. It is possible,therefore, to detect another fracture system: the L system.L system: dip direction NE, dip around 16◦. This systemis present in each length class and in the fractures dueto quarry workings as well (Fig. 16h). This distributionshows the influence of bedding on fracture development.The stereographic projection of all the natural fractures(Fig. 16g) highlights another iso-density cloud of the polesthat can be observed in the class length projections. Thisdatum permits detection of another fracture system: theM system.M system: dip direction NNW, dip around 70◦.This fracture analysis led to the identification of five mainsystems (Fig. 16g, Tab. 1); some of them could be associ-ated with the stratigraphic or structural features detectedin the area. In particular:
• the G system fractures are parallel to the faultsbelonging to the A, B or C systems, and thereforecould be associated with any of the three systems;
• the L system fractures are parallel to the gyp-sum bedding, therefore their development has likelybeen controlled by the bedding orientation.
7. Discussion7.1. Deformation chronologyThe mesostructural analysis permitted the detection of twodeformation phases: the d1 phase, including A, C and D
164
A. Ghiselli et al.
Figure 16. Equal area Schmidt projection, lower hemisphere, of poles of fracture planes and bedding; iso-density lines are shown; iso-densitycontours (in percentage) are indicated in the lower-left corner. a) class 1 fractures poles, b) class 2 fractures poles, c) subclass 3afractures poles, d) subclass 3b fractures poles, e) class 4 fracture poles, f) ”Grotta del Re Tiberio” cave bedding values poles, g) allnatural fractures poles (the fracture systems are indicated), h) fractures due to quarry workings poles, i) quarry tunnels bedding poles.
Table 1. Summary table of the faults and fractures data. System name, medium dip direction, medium dip angle, outcrop enviroment and notesare indicated.
phase system dip direction dip angle localization kinematicd1 A SW 82◦-90◦ cave only left-lateral faults
faul
ts
C SSW 70◦-78◦ cave and quarry direct faultsD W 50◦-90◦ quarry only right-lateral faults
d2 B SSW 85◦-88◦ cave only right-lateral faultsE W 70◦-85◦ quarry only left-lateral faultsF SE 50◦-90◦ quarry only left-lateral faults
system dip direction dip angle localization notesG SW 50◦-90◦ cave compatible with the A, B or C sys-
tems
fract
ures
H ESE 69◦ caveI NNE 54◦ caveL NE 16◦ cave parallel to beddingM NNW 70◦ cave
165
Hypogeal geological survey in the ”Grotta del Re Tiberio” natural cave (Apennines, Italy): a valid tool for reconstructing the structural setting
systems, and the d2 phase, including B and E systems(Tab. 1).The Sassoletroso Nord fault reported by Forti et al. [19]belongs to the C system. In fact, it has been detectedboth in the quarry tunnels and on the benches (the Sas-soletroso faults traces are indicated in Fig. 3: the greylines represent the fault traces on the surface, from Fortiet al. [19], the red lines represent the fault traces, detectedin the quarry tunnels). The C system faults, therefore, canbe referred to as the same post-lower Pliocene deforma-tion phase of the Sassoletroso Nord and Sassoletroso Sudfaults (Fig. 3).The A system faults have the same trend of the Scara-belli fault (Fig. 3), even if their kinematic is different:though the Scarabelli Fault kinematic and orientation arenot clear (see the structural setting-study area paragraph)it can be interpreted as a reverse fault, while the A sys-tem faults are left-lateral faults. As no direct data onthe Scarabelli Fault kinematic exist, it is not possible tofind a clear relationship between the Scarabelli Fault andthe A system fault. However, a hypothesis can be for-mulated: the A system faults could have developed asreverse faults, together with the Scarabelli Fault, duringthe intra-messinian deformation phase [19] and then couldhave been later reactivated as left-lateral faults. Anyhow,as the A system faults belong to the same deformationphase of the C system faults they can be dated back to thepost-lower Pliocene deformation phase of Forti et al. [19].Therefore the d1 phase can be dated back to a periodpost-lower Pliocene.The structural analysis permitted reconstruction of the rel-ative chronology of the d1 and d2 phases through theoverlapping of displacement markers belonging to the twophases. As the E system faults have been interpreted asfollowing the D system ones, the d2 phase is more re-cent than the d1 phase. Therefore the d2 phase can bedated back to a period following the post-lower Pliocene.This phase can be related to the lower-middle Pliocene-Quaternary phase described by Marabini and Vai [17], asthe authors mention the development of lateral faults withgeometry similar to that of the E-system faults. They donot specify if these faults are left or right lateral, though,therefore it is not possible to certainly date back the d2phase to the lower-middle Pliocene-Quaternary. Furtherstudies would permit to clarification of the age of the d2phase.
7.2. Integration of existing surface data
Faults: As discussed in the previous paragraphs, thestructural data collection and the following analysis per-mitted six fault systems to be grouped into two defor-
mation phases to be identified. In the study area, allthe d2 phase, and some of the d1 phase, structures werenot reported by previous authors. In particular, the Aand B system faults have been interpreted as reacti-vated intra-messinian apenninic faults, with a strike-slipkinematic. Previous authors [17, 19] mentioned the reac-tivation during the post-lower Pliocene phase of intra-messinian structures, but only for anti-apenninic faults(i. e. faults that transverse to the apenninic thrusts’ maindirection). Moreover, in the whole area, a large number offaults were not reported before on the surface and couldbe mapped in the underground.Fractures: Fractures data of the ”Grotta del Re Tiberio”cave have been compared with surface data of Blois andBerry [24], coming from the quarry area. The two datasets show a very good correspondence: the G system cor-responds to the group 1 (average dip 225◦/78◦) of Bloisand Berry [24], the H system to the group 2 (averagedip 128◦/69◦), the I system to the group 5 (average dip38◦/62◦), the L system to the group 4 (average dip 35◦/36◦)even if the dip angle is lower in the cave than on thesurface, and the M system to the group 3 (average dip315◦/76◦). Therefore, all the fracture groups detected onthe surface in the quarry have been identified in the caveas well. Moreover, in the cave a larger number of fractureshave been mapped thanks to the better outcropping condi-tion. The hypogeal data set, though, shows a greater dis-persion with respect to the surface data set (cfr. Fig. 16gwith Fig. 8 in [24]).The differences between the two data sets can be inter-preted as follows. Regarding the greater data dispersionin the cave, the Blois and Berry [24] data set is less scat-tered both because of their choice of collecting data forfractures more than one meter long only, and because ofthe better outcropping condition in the cave which permit-ted us to identify a larger number of fractures. Even if theBlois and Berry [24] data set does not include fracturesshorter than one meter, the two data sets are still compa-rable. In fact, when removing the fractures belonging tothe class 1 (from 0.20 m to 1 m long), the analysis resultsdo not change as the shorter fractures do not highlighta particular fracture system not shown by other fractureclasses.Regarding the fracture dip variation between the L systemand the group 4 of Blois and Berry [24], the L system isdirectly controlled by rock bedding, which could be dueto a regional variation of the strata geometry. In fact, thedip of gypsum bedding in the tunnels is higher than in the”Grotta del Re Tiberio” cave (cfr. Fig. 16f and Fig. 16i) .The two data sets show an increase of the bedding mediumdip angle from 16◦ in the cave (to the NW) to 36◦ in thequarry tunnels (to the SE) (Fig. 3). As the tunnels are
166
A. Ghiselli et al.
closer to the quarry “amphitheatre”, sometimes even un-derneath, the steeper bedding could have controlled thedip of the group 4 fractures of Blois and Berry [24] on thebenches. This variation should explain the difference be-tween the medium dip angle of L system and the group 4.
8. ConclusionsThe structural data collection in the ”Grotta del ReTiberio” cave, in the tunnels and on the benches of thequarry nearby, together with the following analysis, per-mitted six fault systems, grouped into two deformationphases and five fracture systems to be identified (Tab. 1).The interpretation of the results permitted a link wth thehypogeal data, with the surface data both at a local anda regional scale.At the local scale, fractures data collected in the under-ground have been related to the surface data collected inthe quarry area by Blois and Berry [24]. The two datasets show a very good correspondence, as every under-ground fracture system matches with one of the surfacefracture system. Differences in the two data sets are dueto the variation of strata dip that controls the developmentof one of the fracture systems. The greater dispersion ofthe fracture data in the cave, with respect to the surface, isdue both to the underground collection of small fracturesand to the better outcropping condition in the cave, per-mitting identification of a larger number of fractures. Infact, small structures, as fractures, are better preserved inthe hypogeal environment than on the surface, where theoutcropping gypsum is more exposed to dissolution andrecrystallization that can delete some features.At the regional scale, the two deformation phases de-tected can be integrated in the structural setting of thestudy area. The d1 phase corresponds to the post-lowerPliocene phase of Forti et al. [19]. Besides the dip-slipfaulting pointed out by previous authors, the presence inthe study area of lateral faults, kinematically compatiblewith the dip-slip faults, permitted the detection of strike-slip faulting active during the post-lower Pliocene phase.The d2 phase, not reported by previous authors in thestudy area, could be related to the lower-middle Pliocene-Quaternary phase described by Marabini and Vai [17] inthe surrounding area.Therefore, the hypogeal geological survey in the studyarea permitted many new faults and one new deformationphase to be identified in the study area. In particular,strike-slip faulting, which probably reactivated some in-tramessinian faults, has been detected and related to thepost-lower Pliocene phase. Moreover, a new deforma-tion phase (the d2 phase) has been identified in the study
area and probably related to the lower-middle Pliocene-Quaternary phase of the regional setting.The hypogeal geological survey can be, therefore, con-sidered a powerful tool for integrating the surface andlog data. In fact, the underground data provide contin-uous information about the geometry of geological bod-ies under the topographic surface. Thus, the hypogealgeological survey can be used for enhancing the recon-struction of the deformational history and for getting ata three-dimensional model of the bedrock in karst areas.In addition, hypogeal survey can be considered as an al-ternative direct method of underground investigation formining engineering matters.
Acknowledgements
This study was financially supported by the Monte Tondoquarry property Saint-Gobain PPC Italia S.p.A., since sci-entific research is part of the company’s sustainable de-velopment program.Moreover, we would like to thank Dr. Fabrizio Felletti,Dr. Michele Zucali and an anonymous reviewer for theirprecious suggestions.
References
[1] Montanari D., del Ventisette C., Bonini M., SaniF., Passive-roof thrusting in the Messinian Vena delGesso basin (Northern Apennines, Italy): constraintsfrom field data and analogue models. Geol. J. , 2007,42, 455-476
[2] Selli R., Il Messiniano Mayer-Eymar 1867. Propostadi un Neostratotipo. Giornale di Geologia, 1960, 28,1-33
[3] Barberini V., Burlini L., Rutter E. H., Dapiaggi M.,High-strain deformation tests on natural gypsum ag-gregates in torsion. In: Bruhn D., Burlini L. (eds.),High-Strain Zones: Structure and Physical Proper-ties. Geological Society of London Special Publica-tions, London, 2005, 245, 277-290
[4] Zucali M., Barberini V., Chateigner D., Ouladdiaf B.,Lutterotti L., Brittle plus plastic deformation of gyp-sum aggregates experimentally deformed in torsion tohigh strains: quantitative microstructural and textureanalysis from optical and diffraction data. Geol. Soc.Spec. Publ., 2010, 332, 79-98
[5] Boccaletti M., Calamita F., Deiana G., Gelati R.,Massari F., Moratti G. et al., Migrating foredeep-thrust belt system in the Northern Apennines and
167
Hypogeal geological survey in the ”Grotta del Re Tiberio” natural cave (Apennines, Italy): a valid tool for reconstructing the structural setting
southern Alps. Palaeogeogr., Palaeoecol., 1990, 77,3-14
[6] Principi G., Treves B, Il Sistema Corso-Appenninocome prisma d’accrezione. Riflessi sul problemagenerale del limite Alpi-Appennini. Memorie dellaSocietá Geologica d’Italia, 1984, 28, 529-576
[7] Malinverno A., Ryan WBF, Extension in the Tyrrhe-nian Sea and shortening in the Apennines as a resultof arc migration driven by sinking of the lithosphere.Tectonics, 1986, 5, 227-246
[8] Ricci Lucchi F., The Oligocene to Holocene forelandbasins of the Northern Apennines. In: Allen P.A.,Homewood P. (eds.), Foreland basins. InternationalAssociation of Sedimentologists Special Publication,1986, 8, 105-139
[9] Roveri M., Manzi V., Ricci Lucchi F., Rogledi S., Sedi-mentary and tectonic evolution of the Vena del Gessobasin (Northern Apennines, Italy): implications forthe onset of the Messinian salinity crisis. Geol. Soc.Am. Bull., 2003, 115, 4, 387-405
[10] Ricci Lucchi F., Miocene paleogeography and basinanalysis in the Periadriatic Apennines. In: Squyres,C.H. (ed.), Geology of Italy. Petroleum ExplorationSociety of Lybia, Tripoli, 1975, 2, 129-236
[11] Capozzi R., Landuzzi A., Negri A., Vai G.B., Stili de-formativi ed evoluzione tettonica della successioneneogenica romagnola. Studi Geologici Camerti Spe-cial Volume, 1991, 1, 261-278
[12] Benini A., Farabegoli E., Martelli L., Stratigrafia epaleogeografia del Gruppo di S. Sofia (alto Appen-nino Forlivese). Memorie Descrittive della Carta Ge-ologica d’Italia,1991, 46, 231-243
[13] Farabegoli E., Benini A., Martelli L., Onorevoli G.,Severi P., Geologia dell’Appennino Romagnolo daCampigna a Cesenatico. Memorie Descrittive dellaCarta Geologica d’Italia, 1991, 46, 165-184
[14] Kligfield R.,The Northern Apennines as a collisionalorogen. Am. J. Sci., 1979, 279, 676-691
[15] Boccaletti M., Elter P., Guazzone G., Plate tecton-ics models for the development of Western Alps andNorthern Apennines. Nature, 1971, 234, 108-111
[16] Ricci Lucchi F., The Oligocene to Recent forelandbasins of the Northern Apennines. In: Allen P.A.,Homewood P. (eds.), Foreland Basins. InternationalAssociation of Sedimentologists Special Publications,1986, 8, 105-139
[17] Marabini S., Vai G.B., Analisi di facies e macrotetton-ica della Vena del Gesso in Romagna. B. Soc. Geol.Ital., 1985, 104, 21-42
[18] Krijgsman W, Hilgen FJ, Marabini S, Vai GB., New
paleomagnetic and cyclostratigraphic age constraintson the Messinian of the Northern Apennines (Venadel Gesso Basin, Italy). Memorie della Societá Geo-logica Italiana, 1999, 54, 25-33
[19] Forti P., Marabini S., Vai G.B., Convenzionecon il Comune di Riolo Terme sullo studio geo-logico, idrogeologico e carsico della porzione dellaVena del Gesso romagnola interessata dalla cavadi gesso di Borgo Rivola. Relazione Preliminare,Bologna, 1997 http://www.venadelgesso.org/testi/cave/fortimarabinivai/cava5.htm
[20] Vai G.B., A field trip guide to the Romagna Apen-nine geology, the Lamone valley. In: De Giuli C., VaiG.B. (eds.), Fossil vertebrates in the Lamone valley,Romagna Apennines, International Workshop: Conti-nental Faunas at the Mio-Pliocene Boundary, FieldTrip Guidebook, Litografica, Faenza, 1988, 7-37
[21] Vai G.B., Ricci Lucchi F., Algal crusts, autochtonousand clastic gypsum in a cannibalistic evaporite basin:a case history from the Messinian of Northern Apen-nines. Sedimentology, 1977, 24, 211-244
[22] Ercolani M., Lucci P., Sansavini B.,L’esplorazione deisistemi carsici del Re Tiberio e dei Crivellari (Venadel Gesso Romagnola) e la salvaguardia dell’area diMonte Tondo interessata dall’attivitá di cava. IstitutoItaliano di Speleologia – Memoria, 2003, 16, 2, 147-157
[23] Bentini L., I principali sistemi carsici della Vena delVesso romagnola e il loro condizionamento strut-turale. In: Gruppo speleologico bolognese (ed.), Pro-ceedings of the 19th National Congress of Speleol-ogy, Bologna, 2003, 27-31
[24] Blois L., Berry B., Measurements to characterize dis-continuities of quarry faces of chalk “Monte Tondo”in Riolo Terme (Italy) trough terrestrial 3d laserscanning method and to compare them at surveytechniques data traditional. Electronic Journal ofGeotechnical Engineering, 2008, 13, 1-29
[25] Riedel W., Zur mechanik geologischer Brucherschei-nungen. Zentralblatt fur Mineralogie, Geologie undPalaeontologie, 1929, B, 354-368
[26] Tchalenko J.S., Similarities between shear zones ofdifferent magnitudes. Geol. Soc. Am. Bull., 81, 1625-1639
[27] Nicolas A., Principles of rock deformation. ReidelPublishing Company, Dordrecht, 1987
[28] Gapais D., Cobbold P. R., Bourgeois O., Rouby D.,de Urreiztieta M., Tectonic significance of fault-slipdata. J. Struct. Geol., 2000, 22, 881-888
168
Copyright © 2022 FDOKUMEN