Amygdala kindling induces nestin expression in the leptomeninges of the neocortex
Upload
khangminh22Category
view
2download
0
164 Iran J Med Sci March 2018; Vol 43 No 2
IJMSVol 43, No 2, March 2018
Hyperuricemia Induces Wnt5a/Ror2 Gene Expression, Epithelial–Mesenchymal Transition, and Kidney Tubular Injury in Mice
Wiwit Ananda Wahyu Setyaningsih1, BS, MS; Nur Arfian1,MD, PhD; Efrayim Suryadi1, MD, MS, MHPE; Muhammad Mansyur Romi1, MD, MS; Untung Tranggono2, MD, MS, Surgeon, Urologist; Dwi Cahyani Ratna Sari1, MD, MS, PhD
1Department of Anatomy, Medical Faculty, Universitas Gadjah Mada, Yogyakarta, Indonesia; 2Department of Surgery, Medical Faculty, Universitas Gadjah Mada, Yogyakarta, Indonesia
Correspondence: Nur Arfian, MD, PhD; Department of Anatomy Faculty of Medicine, Universitas Gadjah Mada, Yogyakarta, Pharmaco Street, North Sekip, Yogyakarta 55281, Indonesia Tel: +62813 91244289 +62274 6492521 Email: [email protected]: 09 November 2016Revised: 01 January 2017Accepted: 29 January 2017
AbstractBackground: Hyperuricemia contributes to kidney injury, characterized by tubular injury with epithelial–mesenchymal transition (EMT). Wnt5a/Ror2 signaling drives EMT in many kidney pathologies. This study sought to evaluate the involvement of Wnt5a/Ror2 in hyperuricemia-induced EMT in kidney tubular injury.Methods: A hyperuricemia model was performed in male Swiss background mice (3 months old, 30–40 g) with daily intraperitoneal injections of 125 mg/kg body weight (BW) of uric acid. The mice were terminated on day 7 (UA7, n=5) and on day 14 (UA14, n=5). Allopurinol groups (UAl7 and UAl14, each n=5) were added with oral 50 mg/kg BW of allopurinol treatment. The serum uric acid level was quantified, and tubular injury was assessed based on PAS staining. Reverse transcriptase-PCR was done to quantify Wnt5a, Ror2, E-cadherin, and vimentin expressions. IHC staining was done for E-cadherin and collagen I. We used the Shapiro–Wilk for normality testing and one-way ANOVA for variance analysis with a P<0.05 as significance level using SPSS 22 software.Results: The hyperuricemia groups had a higher uric acid level, which was associated with a higher tubular injury score. Meanwhile, the allopurinol groups had a significantly lower uric acid level and tubular injury than the uric acid groups. Reverse transcriptase-PCR revealed downregulation of the E-cadherin expression. While vimentin and collagen I expression are upregulated, which was associated with a higher Wnt5a expression. However, the allopurinol groups had reverse results. Immunostaining revealed a reduction in E-cadherin staining in the epithelial cells and collagen I positive staining in the epithelial cells and the interstitial areas.Conclusion: Hyperuricemia induced tubular injury, which might have been mediated by EMT through the activation of Wnt5a.
Please cite this article as: Setyaningsih WAW, Arfian N,Suryadi E, Romi MM, Tranggono U, Sari DCR. Hyperuricemia Induces Wnt5a/Ror2 Gene Expression, Epithelial–Mesenchymal Transition, and Kidney Tubular Injury in Mice. Iran J Med Sci. 2018;43(2):164-173.
Keywords ● Hyperuricemia ● Tubular injury ● E-cadherin gene expression ● Vimentin, gene expression ● Wnt5a/Ror2
What’s Known
• Uric acid contributes to alterations in phenotype transition in kidney epithelial tubules.• Activation of Wnt5a/Ror2 signaling is associated with epithelial–mesenchymal transition (EMT) in tubular epithelial cells during renal fibrosis..
What’s New
• Wnt5a/Ror2 contributes to EMT induced by hyperuricemia in mice.
Introduction
Hyperuricemia is characterized by the excessive production of uric acid and is associated with metabolic syndrome, heart disease, endothelial dysfunction, and kidney injury.1,2 The
Original Article
Wnt5a/Ror2 in EMT induced by hyperuricemia
Iran J Med Sci March 2018; Vol 43 No 2 165
Indonesian Renal Registry (IRR) (2011) showed that one of the causes of chronic kidney disease is uric acid nephropathy (2%). It occurs because of uric acid hypersaturation or hyperuricemia. The prevalence of hyperuricemia ranges from 2.6% to 47.2%, which varies in each population and tends to increase. The hyperuricemia prevalence in Japan varied between 25% and 30% in the adult male population and increased until a few years ago. A meta-analysis study reported that the prevalence of hyperuricemia was mostly higher in men than in women.3,4 High levels of uric acid can induce inflammation, glomerular hypertension, and kidney diseases such as arteriosclerosis, glomerular injury, and tubulointerstitial fibrosis. The deposition of uric acid occurs in the tubules and interstitial area, especially on the outside of the renal medulla.5 Uric acid induces the de novo expression of fibronectin in renal tubular epithelial cells through URAT1 and increases the regulation of lysyl oxidase. The interaction between lysyl oxidase and Snail induces fibrosis.6 The activation of the transcription factor Snail suppresses the phenotype of epithelial cells and induces the transition of epithelial cells into mesenchymal cells.7
The epithelial cells lose their polarity, undergo biochemical changes, and become mesenchymal cells. The polarization of epithelial cells that undergo biochemical changes and transition phenotype become mesenchymal cells through a process called “epithelial–mesenchymal transition” (EMT).8,9 Epithelial to Mesenchymal Transition (EMT) is a transition process in which epithelial cells lost their polarity, undergo biochemical changes and become mesenchymal cells. EMT contributes to the pathogenesis of renal fibrosis and leads to an increase in myofibroblasts, thereby causing tubular atrophy. Recent evidence indicates that EMT is a process that is reversible so that the regulatory process EMT can be used as a potential target for preventing the progression of kidney tubulointerstitial fibrosis.10,11 According to this concept, tubular epithelial injury results in the progressive loss of E-cadherin, promotion of cytoskeletal reorganization, promotion of adhesion to mesenchymal cells, and alteration in the interaction between cell junction and extracellular matrix.12,13 Under the pathological condition, the expression of Wnt5a and Ror2 is increased.14,15 Wnt5a belongs to the Wnt-secreted glycoprotein family and acts as a ligand for receptor-mediated signaling pathways. Wnt5a signals primarily through the non-canonical pathway. It can bind to the different classes of frizzled receptors, receptor tyrosine
kinase-like orphan receptor 2, and co-receptors such as low-density lipoprotein receptor-related protein 5/6 (LRP 5/6).16 Ror2 is predominantly expressed by mesenchymal cells in tubules during fibrosis. This signaling undergoes activation through some stimuli from the environment including inflammation, cytokines, hypoxia, and extracellular matrix17 and then influences multiple responses. Wnt5a/Ror2 is known for its important role in inducing cell migration via independent pathways. In the unilateral ureteral obstruction mice model, it has been shown that Wnt5a/Ror2 regulates the transition of epithelial cells into mesenchymal cells by activating the PCP pathway via JNK/c-Jun (AP-1), thereby inducing cell polarity, migration, and invasion. Nevertheless, this pathway is not fully understood as regards the induction of EMT type II.
Allopurinol is a xanthine oxidase inhibitor and is used in the treatment of gout. It prevents the progression of chronic kidney disease in patients with hyperuricemia and prevents kidney fibrosis by inhibiting the synthesis of uric acid. Decreasing the levels of uric acid by using allopurinol can ameliorate kidney injury by inducing changes in E-cadherin and α-SMA.18 To understand the involvement of Wnt5a/Ror2 signaling pathways in the animal model of hyperuricemia, we examined the effects of hyperuricemia induction with and without allopurinol treatment on Wnt5a/Ror2 expression, kidney tubular injury, EMT, and collagen I expression in mice.
Materials and Methods
Hyperuricemia ModelTwenty-five adult male Swiss background
mice (3 months old, 30–40 g) were obtained from the Animal Model Care Unit, Universitas Gadjah Mada. The number of the animals was decided using the Federer formula, and they were divided into 5 groups randomly. The hyperuricemia model was performed by daily intraperitoneal injections of 125 mg/kg of body weight (BW) of uric acid (Sigma-Aldrich, U25-26 25G) for 7 days (UA7 group, n=5) and for 14 days (UA14 group, n=5). Hyperuricemia groups with allopurinol treatment were added by daily oral supplementations of allopurinol (50 mg/kg, Sigma-Aldrich, A8003-25G) for 7 days (UAl7 group, n=5) and 14 days (UAl14 group, n=5). A control group of hyperuricemia (n=5) was a group with NaCl 0.9% injection, and it was sacrificed 14 days following the injection. The mice were housed under 12 hours of the natural light-dark cycle and humidity of 50±5%. The animals were acclimatized for 1 week before treatment. The
Setyaningsih WAW, Arfian N, Suryadi E, Romi MM, Tranggono U, Sari DCR
166 Iran J Med Sci March 2018; Vol 43 No 2
mice were stable in a plastic cage, 50×30×15 cm in size, with each cage containing 2 mice. They were fed by using standard woof and water ad libitum. The animal experiment was conducted in accordance with the established guidelines for animal care of the Universitas Gadjah Mada. This research was granted a license from the Ethics Committee of the Medical Research and Health of Faculty of Medicine Universitas Gadjah Mada for research involving animals. This ethical clearance was recognized by the Forum for Ethical Review Committees in Asia and Western Pacific (FERCAP)19 based on a statement letter of ethical expediency (KE/FK/313/EC/2015, November 6, 2015).
Serum Uric Acid LevelBlood was collected from the retro-orbital vein
under anesthesia at the end of the study. Then, we performed centrifugation at 10,000 rpm for 10 minutes to make serum. The serum was analyzed for the uric acid level.
Histopathology ExaminationThe kidney paraffin blocks were cut in 4 μm of
thickness for periodic acid-Schiff (PAS) staining to determine the tubular injury score. Tubular injury was examined under a light microscope (Olympus CX22®), and the image was captured using the OptiLab software in 400× magnification of 15 random areas. Image capturing was conducted in the corticomedullary junction area. The tubular injury score was calculated using semiquantitative appraisal based on the kidney’s histopathology condition. The appraisals were given 4 scores, from 0 to 4 (0=normal, 1=tubular injury <25% of random areas, 2=tubular injury involving 25%–50% of random areas, 3=tubular injury involving >51%–75% of random areas, and 4=tubular injury involving >75% of random areas).20 The criteria used in the appraisal were the atrophy and dilatation of the kidney tubules, the loss of the brush border in the proximal tubules, the accumulation of inflammatory cells in the interstitial area, and the intraluminal cast.
RNA Extraction, cDNA Synthesis, and Reverse Transcriptase-Polymerase Chain Reaction
Kidney tissue was extracted using Genezol RNA solution (GENEzol™, Cat. No. GZR100) based on the protocol from the manufacturer. The RNA concentration was quantified using a spectrophotometer. The RNA was synthesized into cDNA using 5×RT-buffer (Toyobo, Cat. No. TRT-101), random primer (TAKARA, Cat. No. 3801), deoxyribonucleotide triphosphate (dNTP) (Takara, Cat. No. 4030), and ReverTra Ace® (Toyobo, Cat. No. TRT-101), with PCR
conditions of 30°C for 10 minutes (denaturation), 42°C for 60 minutes (annealing), and 99°C for 5 minutes (extension).
Reverse transcriptase-polymerase chain reaction (RT-PCR) was carried out to amplify the following specific cDNAs: Wnt5a (F: 5’-TTGGCCACGTTTTTCTCC-3’ and R: 5’-TGGCTGCAGAGAGGCTGT-3’3’)21 and Ror2 (F: 5’-CCACTGGGGTTCTATATGTGCG-3’ and R: 5’-AAATAGTCCGGTTCCCAATGAAG-3’),22 E-cadherin (F: 5’-CAGCCTTCTTTTCG GAAGACT-3’ and R: 5’-GGTAGACA GCTCCCTATGACTG-3’),23 vimentin (F: 5’-CGGAAAGTGGAATCCTTGCA-3’ and R: 5’ -CACATCGATCTGGACATGCTG-3’),24 collagen I (F: 5’-ATGCCGCGACCTCAAGATG-3’ and R: 5’-TGAGGCACAGACGGCTGAGTA-3’), and GAPDH (F: 5’-TGTGTCCGTCGTGGATCTGA-3’ and R: 5’-TTGCTGTTGAAGTCGCAGGAG-3’). PCR conditions were denaturation at 94 °C for 10 seconds, annealing at 60 °C for 30 seconds, and extension at 72 °C for 1 minute. The final extension phase was ended at 72 °C for 10 minutes.
RT-PCR was performed by mixing cDNA and Taq Master Mix (GoTaq®Green Master Mix, Cat. No. M7122). The PCR products were analyzed on 2% agarose gel along with a 100-bp DNA ladder (Bioron, Germany, Cat. No. 306009). The expression of the genes was quantified with a densitometry analysis using the ImageJ software. GAPDH expression was used to normalize the expression.
Immunohistochemical Staining of Collagen I and E-Cadherin
The paraffin slides were deparaffinized, heated in citrate buffer for 15 minutes, incubated in 3% H2O2 in PBS for endogenous peroxidase inhibition, and incubated in blocking solution (Biocare Medical, Cat No. STHRP700H). Thereafter, the slides were incubated with rabbit anti-E-cadherin antibody (Abcam, Cat. No. ab76319, 1:300 dilution) and Rabbit anti-collagen I (Abcam, Cat. No. ab34710, 1:300 dilution) overnight in a humidity chamber at 4°C. The sections were incubated with species-specific secondary antibodies for 1 hour at room temperature. The avidin-biotinylated complex–horseradish peroxidase technique (Biocare Medical, Cat No. STHRP700H) was employed to complete the detection of antigens.
Statistical AnalysisThe data were analyzed using SPSS 22
software for Windows. The data normality test was conducted using the Shapiro–Wilk and one-way ANOVA for normal data distribution
Wnt5a/Ror2 in EMT induced by hyperuricemia
Iran J Med Sci March 2018; Vol 43 No 2 167
and the Kruskal–Wallis test for abnormal data distribution. The significance level was set at a P<0.05.
Results
Serum Uric Acid LevelThere was a significant difference in the
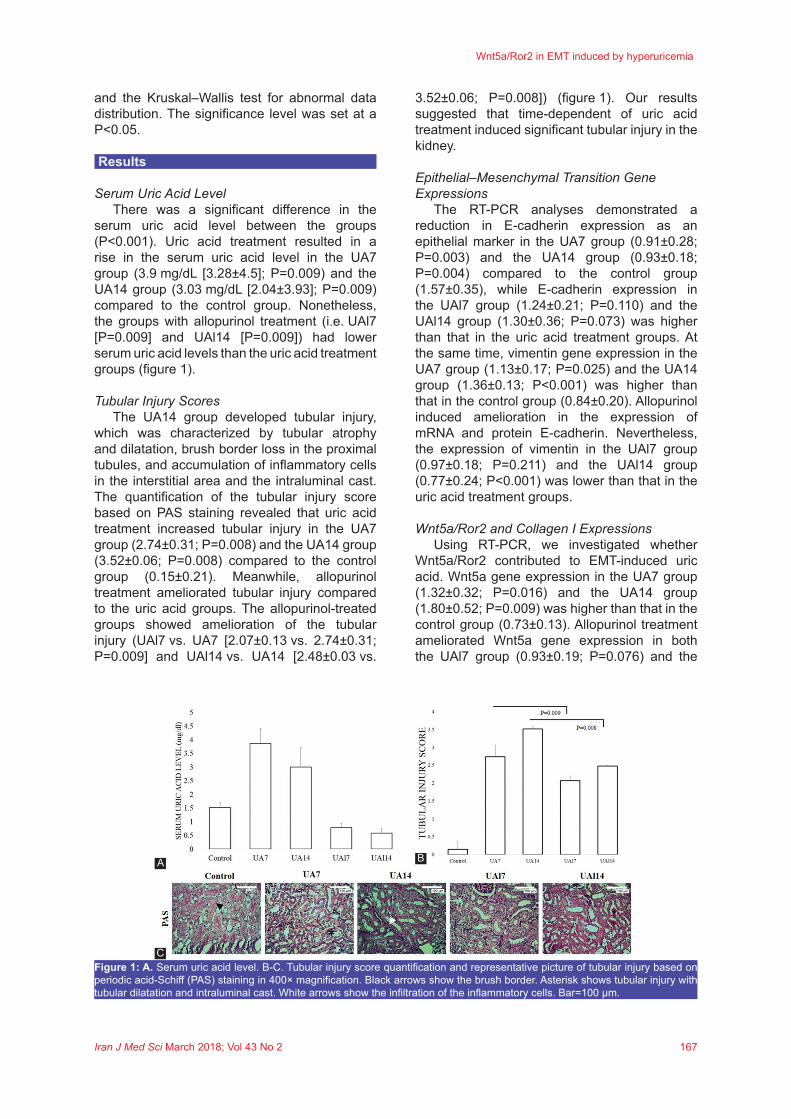
serum uric acid level between the groups (P<0.001). Uric acid treatment resulted in a rise in the serum uric acid level in the UA7 group (3.9 mg/dL [3.28±4.5]; P=0.009) and the UA14 group (3.03 mg/dL [2.04±3.93]; P=0.009) compared to the control group. Nonetheless, the groups with allopurinol treatment (i.e. UAl7 [P=0.009] and UAl14 [P=0.009]) had lower serum uric acid levels than the uric acid treatment groups (figure 1).
Tubular Injury ScoresThe UA14 group developed tubular injury,
which was characterized by tubular atrophy and dilatation, brush border loss in the proximal tubules, and accumulation of inflammatory cells in the interstitial area and the intraluminal cast. The quantification of the tubular injury score based on PAS staining revealed that uric acid treatment increased tubular injury in the UA7 group (2.74±0.31; P=0.008) and the UA14 group (3.52±0.06; P=0.008) compared to the control group (0.15±0.21). Meanwhile, allopurinol treatment ameliorated tubular injury compared to the uric acid groups. The allopurinol-treated groups showed amelioration of the tubular injury (UAl7 vs. UA7 [2.07±0.13 vs. 2.74±0.31; P=0.009] and UAl14 vs. UA14 [2.48±0.03 vs.
3.52±0.06; P=0.008]) (figure 1). Our results suggested that time-dependent of uric acid treatment induced significant tubular injury in the kidney.
Epithelial–Mesenchymal Transition Gene Expressions
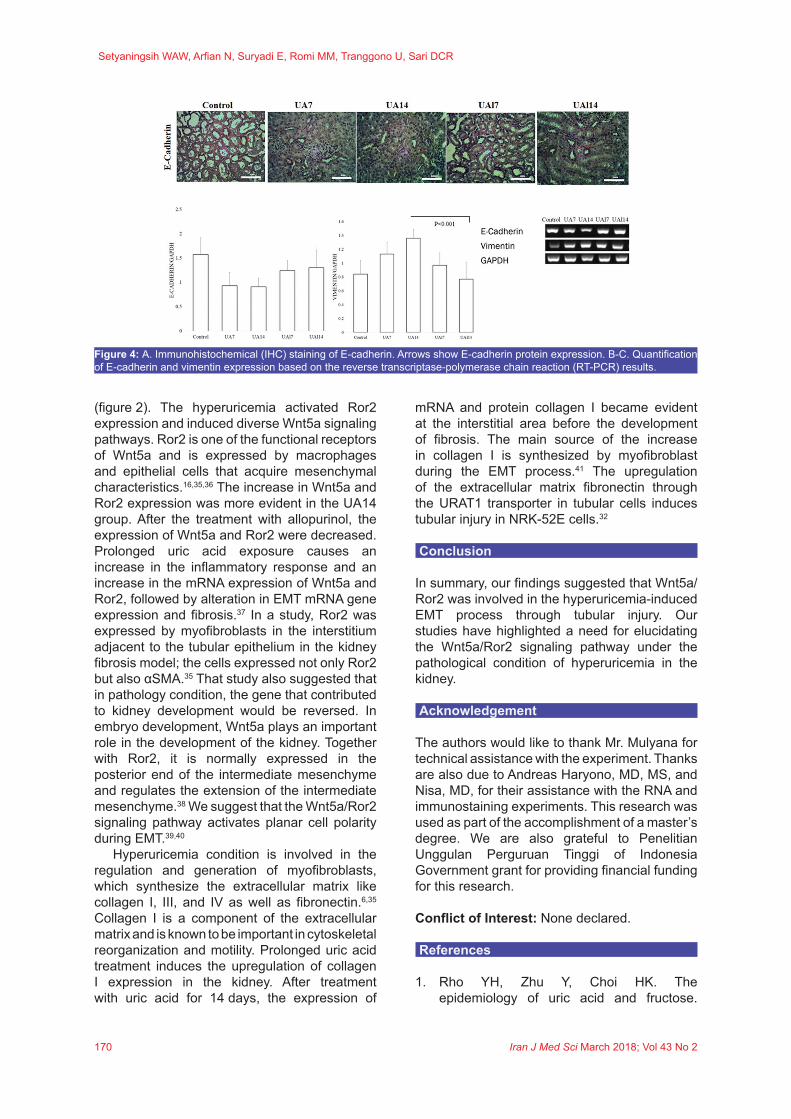
The RT-PCR analyses demonstrated a reduction in E-cadherin expression as an epithelial marker in the UA7 group (0.91±0.28; P=0.003) and the UA14 group (0.93±0.18; P=0.004) compared to the control group (1.57±0.35), while E-cadherin expression in the UAl7 group (1.24±0.21; P=0.110) and the UAl14 group (1.30±0.36; P=0.073) was higher than that in the uric acid treatment groups. At the same time, vimentin gene expression in the UA7 group (1.13±0.17; P=0.025) and the UA14 group (1.36±0.13; P<0.001) was higher than that in the control group (0.84±0.20). Allopurinol induced amelioration in the expression of mRNA and protein E-cadherin. Nevertheless, the expression of vimentin in the UAl7 group (0.97±0.18; P=0.211) and the UAl14 group (0.77±0.24; P<0.001) was lower than that in the uric acid treatment groups.
Wnt5a/Ror2 and Collagen I ExpressionsUsing RT-PCR, we investigated whether
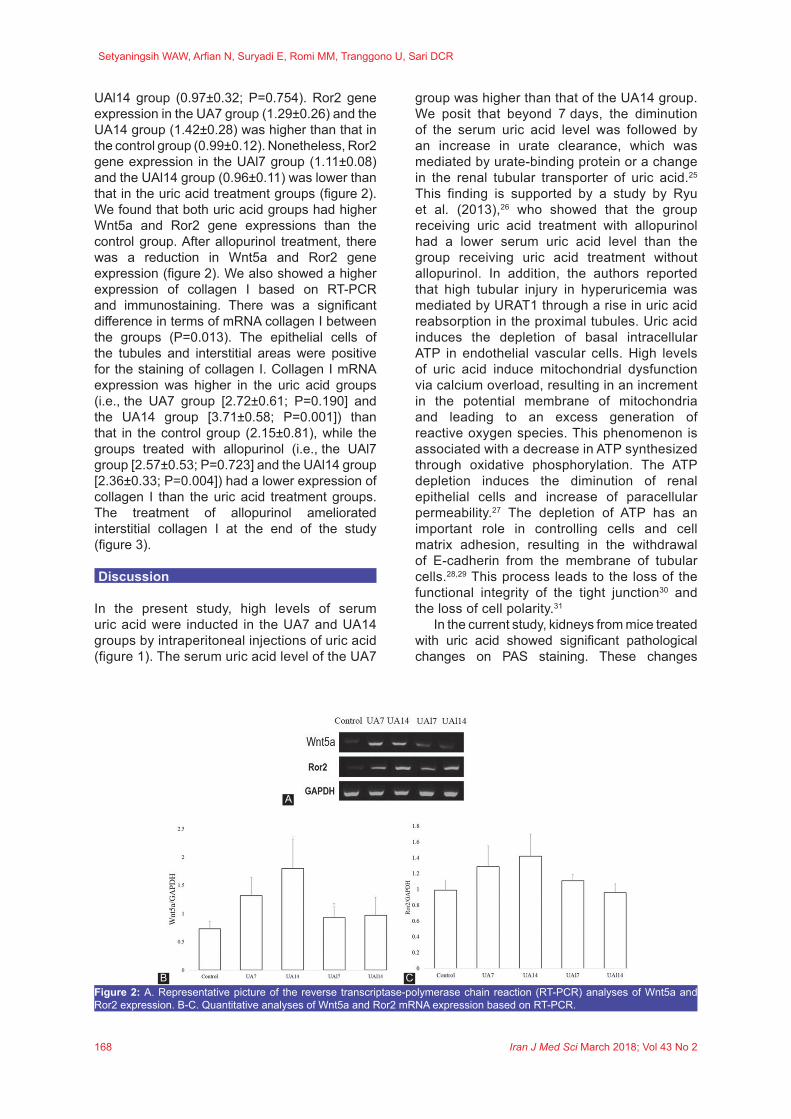
Wnt5a/Ror2 contributed to EMT-induced uric acid. Wnt5a gene expression in the UA7 group (1.32±0.32; P=0.016) and the UA14 group (1.80±0.52; P=0.009) was higher than that in the control group (0.73±0.13). Allopurinol treatment ameliorated Wnt5a gene expression in both the UAl7 group (0.93±0.19; P=0.076) and the
Figure 1: A. Serum uric acid level. B-C. Tubular injury score quantification and representative picture of tubular injury based on periodic acid-Schiff (PAS) staining in 400× magnification. Black arrows show the brush border. Asterisk shows tubular injury with tubular dilatation and intraluminal cast. White arrows show the infiltration of the inflammatory cells. Bar=100 µm.
A
C
B
Setyaningsih WAW, Arfian N, Suryadi E, Romi MM, Tranggono U, Sari DCR
168 Iran J Med Sci March 2018; Vol 43 No 2
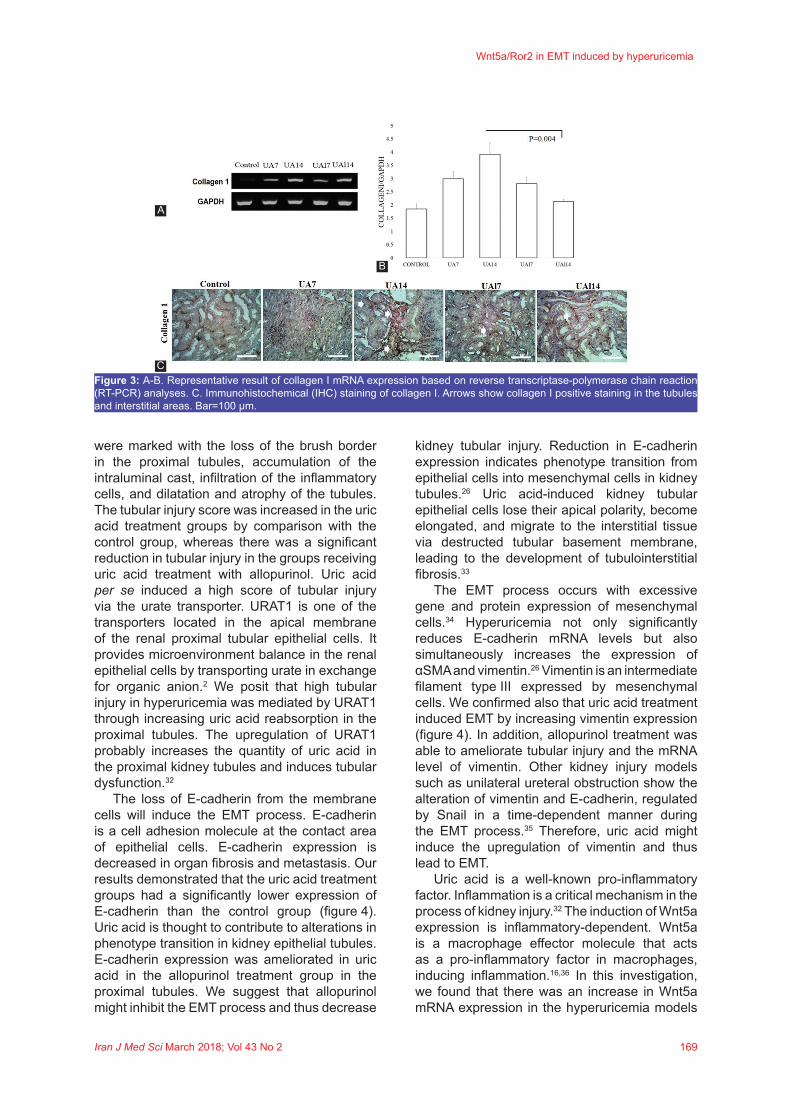
UAl14 group (0.97±0.32; P=0.754). Ror2 gene expression in the UA7 group (1.29±0.26) and the UA14 group (1.42±0.28) was higher than that in the control group (0.99±0.12). Nonetheless, Ror2 gene expression in the UAl7 group (1.11±0.08) and the UAl14 group (0.96±0.11) was lower than that in the uric acid treatment groups (figure 2). We found that both uric acid groups had higher Wnt5a and Ror2 gene expressions than the control group. After allopurinol treatment, there was a reduction in Wnt5a and Ror2 gene expression (figure 2). We also showed a higher expression of collagen I based on RT-PCR and immunostaining. There was a significant difference in terms of mRNA collagen I between the groups (P=0.013). The epithelial cells of the tubules and interstitial areas were positive for the staining of collagen I. Collagen I mRNA expression was higher in the uric acid groups (i.e., the UA7 group [2.72±0.61; P=0.190] and the UA14 group [3.71±0.58; P=0.001]) than that in the control group (2.15±0.81), while the groups treated with allopurinol (i.e., the UAl7 group [2.57±0.53; P=0.723] and the UAl14 group [2.36±0.33; P=0.004]) had a lower expression of collagen I than the uric acid treatment groups. The treatment of allopurinol ameliorated interstitial collagen I at the end of the study (figure 3).
Discussion
In the present study, high levels of serum uric acid were inducted in the UA7 and UA14 groups by intraperitoneal injections of uric acid (figure 1). The serum uric acid level of the UA7
group was higher than that of the UA14 group. We posit that beyond 7 days, the diminution of the serum uric acid level was followed by an increase in urate clearance, which was mediated by urate-binding protein or a change in the renal tubular transporter of uric acid.25 This finding is supported by a study by Ryu et al. (2013),26 who showed that the group receiving uric acid treatment with allopurinol had a lower serum uric acid level than the group receiving uric acid treatment without allopurinol. In addition, the authors reported that high tubular injury in hyperuricemia was mediated by URAT1 through a rise in uric acid reabsorption in the proximal tubules. Uric acid induces the depletion of basal intracellular ATP in endothelial vascular cells. High levels of uric acid induce mitochondrial dysfunction via calcium overload, resulting in an increment in the potential membrane of mitochondria and leading to an excess generation of reactive oxygen species. This phenomenon is associated with a decrease in ATP synthesized through oxidative phosphorylation. The ATP depletion induces the diminution of renal epithelial cells and increase of paracellular permeability.27 The depletion of ATP has an important role in controlling cells and cell matrix adhesion, resulting in the withdrawal of E-cadherin from the membrane of tubular cells.28,29 This process leads to the loss of the functional integrity of the tight junction30 and the loss of cell polarity.31
In the current study, kidneys from mice treated with uric acid showed significant pathological changes on PAS staining. These changes
Figure 2: A. Representative picture of the reverse transcriptase-polymerase chain reaction (RT-PCR) analyses of Wnt5a and Ror2 expression. B-C. Quantitative analyses of Wnt5a and Ror2 mRNA expression based on RT-PCR.
A
B C
Wnt5a/Ror2 in EMT induced by hyperuricemia
Iran J Med Sci March 2018; Vol 43 No 2 169
were marked with the loss of the brush border in the proximal tubules, accumulation of the intraluminal cast, infiltration of the inflammatory cells, and dilatation and atrophy of the tubules. The tubular injury score was increased in the uric acid treatment groups by comparison with the control group, whereas there was a significant reduction in tubular injury in the groups receiving uric acid treatment with allopurinol. Uric acid per se induced a high score of tubular injury via the urate transporter. URAT1 is one of the transporters located in the apical membrane of the renal proximal tubular epithelial cells. It provides microenvironment balance in the renal epithelial cells by transporting urate in exchange for organic anion.2 We posit that high tubular injury in hyperuricemia was mediated by URAT1 through increasing uric acid reabsorption in the proximal tubules. The upregulation of URAT1 probably increases the quantity of uric acid in the proximal kidney tubules and induces tubular dysfunction.32
The loss of E-cadherin from the membrane cells will induce the EMT process. E-cadherin is a cell adhesion molecule at the contact area of epithelial cells. E-cadherin expression is decreased in organ fibrosis and metastasis. Our results demonstrated that the uric acid treatment groups had a significantly lower expression of E-cadherin than the control group (figure 4). Uric acid is thought to contribute to alterations in phenotype transition in kidney epithelial tubules. E-cadherin expression was ameliorated in uric acid in the allopurinol treatment group in the proximal tubules. We suggest that allopurinol might inhibit the EMT process and thus decrease
kidney tubular injury. Reduction in E-cadherin expression indicates phenotype transition from epithelial cells into mesenchymal cells in kidney tubules.26 Uric acid-induced kidney tubular epithelial cells lose their apical polarity, become elongated, and migrate to the interstitial tissue via destructed tubular basement membrane, leading to the development of tubulointerstitial fibrosis.33
The EMT process occurs with excessive gene and protein expression of mesenchymal cells.34 Hyperuricemia not only signifi cantly reduces E-cadherin mRNA levels but also simultaneously increases the expression of αSMA and vimentin.26 Vimentin is an intermediate filament type III expressed by mesenchymal cells. We confirmed also that uric acid treatment induced EMT by increasing vimentin expression (figure 4). In addition, allopurinol treatment was able to ameliorate tubular injury and the mRNA level of vimentin. Other kidney injury models such as unilateral ureteral obstruction show the alteration of vimentin and E-cadherin, regulated by Snail in a time-dependent manner during the EMT process.35 Therefore, uric acid might induce the upregulation of vimentin and thus lead to EMT.
Uric acid is a well-known pro-inflammatory factor. Inflammation is a critical mechanism in the process of kidney injury.32 The induction of Wnt5a expression is inflammatory-dependent. Wnt5a is a macrophage effector molecule that acts as a pro-inflammatory factor in macrophages, inducing inflammation.16,36 In this investigation, we found that there was an increase in Wnt5a mRNA expression in the hyperuricemia models
Figure 3: A-B. Representative result of collagen I mRNA expression based on reverse transcriptase-polymerase chain reaction (RT-PCR) analyses. C. Immunohistochemical (IHC) staining of collagen I. Arrows show collagen I positive staining in the tubules and interstitial areas. Bar=100 µm.
C
A
B
Setyaningsih WAW, Arfian N, Suryadi E, Romi MM, Tranggono U, Sari DCR
170 Iran J Med Sci March 2018; Vol 43 No 2
(figure 2). The hyperuricemia activated Ror2 expression and induced diverse Wnt5a signaling pathways. Ror2 is one of the functional receptors of Wnt5a and is expressed by macrophages and epithelial cells that acquire mesenchymal characteristics.16,35,36 The increase in Wnt5a and Ror2 expression was more evident in the UA14 group. After the treatment with allopurinol, the expression of Wnt5a and Ror2 were decreased. Prolonged uric acid exposure causes an increase in the inflammatory response and an increase in the mRNA expression of Wnt5a and Ror2, followed by alteration in EMT mRNA gene expression and fibrosis.37 In a study, Ror2 was expressed by myofibroblasts in the interstitium adjacent to the tubular epithelium in the kidney fibrosis model; the cells expressed not only Ror2 but also αSMA.35 That study also suggested that in pathology condition, the gene that contributed to kidney development would be reversed. In embryo development, Wnt5a plays an important role in the development of the kidney. Together with Ror2, it is normally expressed in the posterior end of the intermediate mesenchyme and regulates the extension of the intermediate mesenchyme.38 We suggest that the Wnt5a/Ror2 signaling pathway activates planar cell polarity during EMT.39,40
Hyperuricemia condition is involved in the regulation and generation of myofibroblasts, which synthesize the extracellular matrix like collagen I, III, and IV as well as fibronectin.6,35 Collagen I is a component of the extracellular matrix and is known to be important in cytoskeletal reorganization and motility. Prolonged uric acid treatment induces the upregulation of collagen I expression in the kidney. After treatment with uric acid for 14 days, the expression of
mRNA and protein collagen I became evident at the interstitial area before the development of fibrosis. The main source of the increase in collagen I is synthesized by myofibroblast during the EMT process.41 The upregulation of the extracellular matrix fibronectin through the URAT1 transporter in tubular cells induces tubular injury in NRK-52E cells.32
Conclusion
In summary, our findings suggested that Wnt5a/Ror2 was involved in the hyperuricemia-induced EMT process through tubular injury. Our studies have highlighted a need for elucidating the Wnt5a/Ror2 signaling pathway under the pathological condition of hyperuricemia in the kidney.
Acknowledgement
The authors would like to thank Mr. Mulyana for technical assistance with the experiment. Thanks are also due to Andreas Haryono, MD, MS, and Nisa, MD, for their assistance with the RNA and immunostaining experiments. This research was used as part of the accomplishment of a master’s degree. We are also grateful to Penelitian Unggulan Perguruan Tinggi of Indonesia Government grant for providing financial funding for this research.
Conflict of Interest: None declared.
References
1. Rho YH, Zhu Y, Choi HK. The epidemiology of uric acid and fructose.
Figure 4: A. Immunohistochemical (IHC) staining of E-cadherin. Arrows show E-cadherin protein expression. B-C. Quantification of E-cadherin and vimentin expression based on the reverse transcriptase-polymerase chain reaction (RT-PCR) results.
Wnt5a/Ror2 in EMT induced by hyperuricemia
Iran J Med Sci March 2018; Vol 43 No 2 171
Semin Nephrol. 2011;31:410-9. doi: 10.1016/j.semnephrol.2011.08.004. PubMed PMID: 22000647; PubMed Central PMCID: PMCPMC3197219.
2. Ichida K. What lies behind serum urate concentration? Insights from genetic and genomic studies. Genome Med. 2009;1:118. doi: 10.1186/gm118. PubMed PMID: 20090896; PubMed Central PMCID: PMCPMC2808734.
3. Hakoda M. Recent trends in hyperuricemia and gout in Japan. Japan Med Assoc J. 2012;55:319-23. PubMed PMID: 25237240.
4. Liu B, Wang T, Zhao HN, Yue WW, Yu HP, Liu CX, et al. The prevalence of hyperuricemia in China: A meta-analysis. BMC Public Health. 2011;11:832. doi: 10.1186/1471-2458-11-832. PubMed PMID: 22032610; PubMed Central PMCID: PMCPMC3213156.
5. Johnson RJ, Nakagawa T, Jalal D, Sanchez-Lozada LG, Kang DH, Ritz E. Uric acid and chronic kidney disease: Which is chasing which? Nephrol Dial Transplant. 2013;28:2221-8. doi: 10.1093/ndt/gft029. PubMed PMID: 23543594; PubMed Central PMCID: PMCPMC4318947.
6. Yang Z, Xiaohua W, Lei J, Ruoyun T, Mingxia X, Weichun H, et al. Uric acid increases fibronectin synthesis through upregulation of lysyl oxidase expression in rat renal tubular epithelial cells. Am J Physiol Renal Physiol. 2010;299:F336-46. doi: 10.1152/ajprenal.00053.2010. PubMed PMID: 20484295.
7. Boutet A, De Frutos CA, Maxwell PH, Mayol MJ, Romero J, Nieto MA. Snail activation disrupts tissue homeostasis and induces fibrosis in the adult kidney. EMBO J. 2006;25:5603-13. doi: 10.1038/sj.emboj.7601421. PubMed PMID: 17093497; PubMed Central PMCID: PMCPMC1679761.
8. Guarino M, Tosoni A, Nebuloni M. Direct contribution of epithelium to organ fibrosis: Epithelial-mesenchymal transition. Hum Pathol. 2009;40:1365-76. doi: 10.1016/j.humpath.2009.02.020. PubMed PMID: 19695676.
9. Kang DH, Nakagawa T, Feng L, Watanabe S, Han L, Mazzali M, et al. A role for uric acid in the progression of renal disease. J Am Soc Nephrol. 2002;13:2888-97. PubMed PMID: 12444207.
10. Zeisberg M, Kalluri R. The role of epithelial-to-mesenchymal transition in renal fibrosis. J Mol Med (Berl). 2004;82:175-81. doi: 10.1007/s00109-003-0517-9. PubMed
PMID: 14752606.11. Bai Y, Lu H, Wu C, Liang Y, Wang S,
Lin C, et al. Resveratrol inhibits epithelial-mesenchymal transition and renal fibrosis by antagonizing the hedgehog signaling pathway. Biochem Pharmacol. 2014;92:484-93. doi: 10.1016/j.bcp.2014.09.002. PubMed PMID: 25219324.
12. Lamouille S, Xu J, Derynck R. Molecular mechanisms of epithelial-mesenchymal transition. Nat Rev Mol Cell Biol. 2014;15:178-96. doi: 10.1038/nrm3758. PubMed PMID: 24556840; PubMed Central PMCID: PMCPMC4240281.
13. Cheng TH, Lin JW, Chao HH, Chen YL, Chen CH, Chan P, et al. Uric acid activates extracellular signal-regulated kinases and thereafter endothelin-1 expression in rat cardiac fibroblasts. Int J Cardiol. 2010;139:42-9. doi: 10.1016/j.ijcard.2008.09.004. PubMed PMID: 18945502.
14. Edeling M, Ragi G, Huang S, Pavenstadt H, Susztak K. Developmental signalling pathways in renal fibrosis: The roles of Notch, Wnt and Hedgehog. Nat Rev Nephrol. 2016;12:426-39. doi: 10.1038/nrneph.2016.54. PubMed PMID: 27140856.
15. Liu M, Liu YZ, Feng Y, Xu YF, Che JP, Wang GC, et al. Novel evidence demonstrates that epithelial-mesenchymal transition contributes to nephrolithiasis-induced renal fibrosis. J Surg Res. 2013;182:146-52. doi: 10.1016/j.jss.2012.07.066. PubMed PMID: 22920554.
16. Bhatt PM, Malgor R. Wnt5a: A player in the pathogenesis of atherosclerosis and other inflammatory disorders. Atherosclerosis. 2014;237:155-62. doi: 10.1016/j.atherosclerosis.2014.08.027. PubMed PMID: 25240110; PubMed Central PMCID: PMCPMC4252768.
17. Gonzalez DM, Medici D. Signaling mechanisms of the epithelial-mesenchymal transition. Sci Signal. 2014;7:re8. doi: 10.1126/scisignal.2005189. PubMed PMID: 25249658; PubMed Central PMCID: PMCPMC4372086.
18. Kim IY, Lee DW, Lee SB, Kwak IS. The role of uric acid in kidney fibrosis: Experimental evidences for the causal relationship. Biomed Res Int. 2014;2014:638732. doi: 10.1155/2014/638732. PubMed PMID: 24877124; PubMed Central PMCID: PMCPMC4026934.
19. Kilkenny C, Browne WJ, Cuthill IC, Emerson M, Altman DG. Improving bioscience research reporting: The ARRIVE guidelines for reporting animal research.
Setyaningsih WAW, Arfian N, Suryadi E, Romi MM, Tranggono U, Sari DCR
172 Iran J Med Sci March 2018; Vol 43 No 2
PLoS Biol. 2010;8:e1000412. doi: 10.1371/journal.pbio.1000412. PubMed PMID: 20613859; PubMed Central PMCID: PMCPMC2893951.
20. Park JS, Jo CH, Kim S, Kim GH. Acute and chronic effects of dietary sodium restriction on renal tubulointerstitial fibrosis in cisplatin-treated rats. Nephrol Dial Transplant. 2013;28:592-602. doi: 10.1093/ndt/gfs496. PubMed PMID: 23129822.
21. Masckauchan TN, Agalliu D, Vorontchikhina M, Ahn A, Parmalee NL, Li CM, et al. Wnt5a signaling induces proliferation and survival of endothelial cells in vitro and expression of MMP-1 and Tie-2. Mol Biol Cell. 2006;17:5163-72. doi: 10.1091/mbc.E06-04-0320. PubMed PMID: 17035633; PubMed Central PMCID: PMCPMC1679681.
22. Zhang J, Li Y, Wu Y, Yang T, Yang K, Wang R, et al. Wnt5a inhibits the proliferation and melanogenesis of melanocytes. Int J Med Sci. 2013;10:699-706. doi: 10.7150/ijms.5664. PubMed PMID: 23569434; PubMed Central PMCID: PMCPMC3619119.
23. Kwon YJ, Petrie K, Leibovitch BA, Zeng L, Mezei M, Howell L, et al. Selective Inhibition of SIN3 Corepressor with Avermectins as a Novel Therapeutic Strategy in Triple-Negative Breast Cancer. Mol Cancer Ther. 2015;14:1824-36. doi: 10.1158/1535-7163.MCT-14-0980-T. PubMed PMID: 26078298; PubMed Central PMCID: PMCPMC4529816.
24. Bas A, Swamy M, Abeler-Dorner L, Williams G, Pang DJ, Barbee SD, et al. Butyrophilin-like 1 encodes an enterocyte protein that selectively regulates functional interactions with T lymphocytes. Proc Natl Acad Sci U S A. 2011;108:4376-81. doi: 10.1073/pnas.1010647108. PubMed PMID: 21368163; PubMed Central PMCID: PMCPMC3060244.
25. Fox IH, Halperin ML, Goldstein MB, Marliss ER. Renal excretion of uric acid during prolonged fasting. Metabolism. 1976;25:551-9. PubMed PMID: 1263845.
26. Ryu ES, Kim MJ, Shin HS, Jang YH, Choi HS, Jo I, et al. Uric acid-induced phenotypic transition of renal tubular cells as a novel mechanism of chronic kidney disease. Am J Physiol Renal Physiol. 2013;304:F471-80. doi: 10.1152/ajprenal.00560.2012. PubMed PMID: 23283992.
27. Sanchez-Lozada LG, Lanaspa MA, Cristobal-Garcia M, Garcia-Arroyo F, Soto V, Cruz-Robles D, et al. Uric acid-induced endothelial dysfunction is associated with mitochondrial alterations and decreased intracellular ATP
concentrations. Nephron Exp Nephrol. 2012;121:e71-8. doi: 10.1159/000345509. PubMed PMID: 23235493; PubMed Central PMCID: PMCPMC3656428.
28. Price VR, Reed CA, Lieberthal W, Schwartz JH. ATP depletion of tubular cells causes dissociation of the zonula adherens and nuclear translocation of beta-catenin and LEF-1. J Am Soc Nephrol. 2002;13:1152-61. PubMed PMID: 11961002.
29. Schwartz JH, Shih T, Menza SA, Lieberthal W. ATP depletion increases tyrosine phosphorylation of beta-catenin and plakoglobin in renal tubular cells. J Am Soc Nephrol. 1999;10:2297-305. PubMed PMID: 10541288.
30. Molitoris BA, Falk SA, Dahl RH. Ischemia-induced loss of epithelial polarity. Role of the tight junction. J Clin Invest. 1989;84:1334-9. doi: 10.1172/JCI114302. PubMed PMID: 2551926; PubMed Central PMCID: PMCPMC329795.
31. Molitoris BA, Geerdes A, McIntosh JR. Dissociation and redistribution of Na+,K(+)-ATPase from its surface membrane actin cytoskeletal complex during cellular ATP depletion. J Clin Invest. 1991;88:462-9. doi: 10.1172/JCI115326. PubMed PMID: 1650794; PubMed Central PMCID: PMCPMC295361.
32. Zhou Y, Fang L, Jiang L, Wen P, Cao H, He W, et al. Uric acid induces renal inflammation via activating tubular NF-kappaB signaling pathway. PLoS One. 2012;7:e39738. doi: 10.1371/journal.pone.0039738. PubMed PMID: 22761883; PubMed Central PMCID: PMCPMC3382585.
33. Liu Y. Epithelial to mesenchymal transition in renal fibrogenesis: Pathologic significance, molecular mechanism, and therapeutic intervention. J Am Soc Nephrol. 2004;15:1-12. PubMed PMID: 14694152.
34. Kim SM, Choi YW, Seok HY, Jeong KH, Lee SH, Lee TW, et al. Reducing serum uric acid attenuates TGF-beta1-induced profibrogenic progression in type 2 diabetic nephropathy. Nephron Exp Nephrol. 2012;121:e109-21. doi: 10.1159/000343567. PubMed PMID: 23307286.
35. Li X, Yamagata K, Nishita M, Endo M, Arfian N, Rikitake Y, et al. Activation of Wnt5a-Ror2 signaling associated with epithelial-to-mesenchymal transition of tubular epithelial cells during renal fibrosis. Genes Cells. 2013;18:608-19. doi: 10.1111/gtc.12064. PubMed PMID: 23755735.
36. Blumenthal A, Ehlers S, Lauber J, Buer J, Lange C, Goldmann T, et al. The Wingless
Wnt5a/Ror2 in EMT induced by hyperuricemia
Iran J Med Sci March 2018; Vol 43 No 2 173
homolog WNT5A and its receptor Frizzled-5 regulate inflammatory responses of human mononuclear cells induced by microbial stimulation. Blood. 2006;108:965-73. doi: 10.1182/blood-2005-12-5046. PubMed PMID: 16601243.
37. Weeraratna AT, Jiang Y, Hostetter G, Rosenblatt K, Duray P, Bittner M, et al. Wnt5a signaling directly affects cell motility and invasion of metastatic melanoma. Cancer Cell. 2002;1:279-88. PubMed PMID: 12086864.
38. Yun K, Ajima R, Sharma N, Costantini F, Mackem S, Lewandoski M, et al. Non-canonical Wnt5a/Ror2 signaling regulates kidney morphogenesis by controlling intermediate mesoderm extension. Hum Mol Genet. 2014;23:6807-14. doi: 10.1093/hmg/ddu397. PubMed PMID: 25082826; PubMed Central PMCID: PMCPMC4271060.
39. Ren D, Minami Y, Nishita M. Critical role
of Wnt5a-Ror2 signaling in motility and invasiveness of carcinoma cells following Snail-mediated epithelial-mesenchymal transition. Genes Cells. 2011;16:304-15. doi: 10.1111/j.1365-2443.2011.01487.x. PubMed PMID: 21342370.
40. Liu Q, Li J, Cheng R, Chen Y, Lee K, Hu Y, et al. Nitrosative stress plays an important role in Wnt pathway activation in diabetic retinopathy. Antioxid Redox Signal. 2013;18:1141-53. doi: 10.1089/ars.2012.4583. PubMed PMID: 23066786; PubMed Central PMCID: PMCPMC3579458.
41. Fan JM, Ng YY, Hill PA, Nikolic-Paterson DJ, Mu W, Atkins RC, et al. Transforming growth factor-beta regulates tubular epithelial-myofibroblast transdifferentiation in vitro. Kidney Int. 1999;56:1455-67. doi: 10.1046/j.1523-1755.1999.00656.x. PubMed PMID: 10504497.
Copyright © 2022 FDOKUMEN