Gene expression studies: From case-control to multiple ...
180
From the Institute of Human Genetics, Helmholtz Zentrum M ¨ unchen, Deutsches Forschungszentrum f ¨ ur Gesundheit und Umwelt (GmbH) Head: Prof. Dr. Thomas Meitinger Gene expression studies: From case-control to multiple-population-based studies Thesis Submitted for a Doctoral Degree in Natural Sciences at the Faculty of Medicine, Ludwig-Maximilians-Universit¨ at M ¨ unchen Katharina Schramm Dachau, Germany 2016
-
Upload
khangminh22 -
Category
Documents
-
view
0 -
download
0
Transcript of Gene expression studies: From case-control to multiple ...

From the Institute of Human Genetics,Helmholtz Zentrum Munchen,
Deutsches Forschungszentrum fur Gesundheit und Umwelt (GmbH)Head: Prof. Dr. Thomas Meitinger
Gene expression studies:
From case-control to
multiple-population-based studies
Thesis
Submitted for a Doctoral Degree in Natural Sciencesat the Faculty of Medicine,
Ludwig-Maximilians-Universitat Munchen
Katharina Schramm
Dachau, Germany
2016

With approval of the Faculty of MedicineLudwig-Maximilians-Universitat Munchen
Supervisor/Examiner: Prof. Dr. Thomas IlligCo-Examiners: Prof. Dr. Roland KapplerDean: Prof. Dr. med. dent. Reinhard HickelDate of oral examination: 22.12.2016
II

Dedicated to my family.
III


Abstract
Recent technological developments allow genome-wide scans of gene expression levels. Thereduction of costs and increasing parallelization of processing enable the quantification of47,000 transcripts in up to twelve samples on a single microarray. Thereby the data collec-tion of large population-based studies was improved.During my PhD, I first developed a workflow for the statistical analyses of case-control stu-dies of up to 50 samples. With large population-based data sets generated I established apipeline for quality control, data preprocessing and correction for confounders, which re-sulted in substantially improved data. In total, I processed more than 3,000 genome-wideexpression profiles using the generated pipeline. With 993 whole blood samples from thepopulation-based KORA (Cooperative Health Research in the Region of Augsburg) studywe established one of the largest population-based resource.Using this data set we contributed to a number of transcriptome-wide association studieswithin national (MetaXpress) and international (CHARGE) consortia. Here I will focus onthree studies with main contributions:I) Association study of gene expression levels with blood pressure related phenotypes.II) Association study investigating changes of gene expression levels associated with aging.III) Analysis of the impact of genetic variation on the gene expression levels.National and international collaborations substantially increased the power of the studiesand ensured independent replication. Within the German consortium we developed proto-cols for meta-analyses and optimized preprocessing of diverse data sets.Whole blood is particularly useful because of its easy sampling. Especially, we could showthat the impact of genetic variation is very robust and replicable within heterogeneous popu-lation-based studies.
V


Zusammenfassung
Moderne technologische Entwicklungen erlauben einen genomweiten Einblick in die Ex-pression der Gene. Die Kostenreduzierung und die Moglichkeit der Parallelisierung beider Probenvorbereitung erlaubt es 47.000 Transkripte in bis zu zwolf Proben mit einemMicroarray gleichzeitig zu quantifizieren. Dadurch wird die Datenerhebung von großerenpopulations-basierten Studien erleichtert.Wahrend meiner PhD Zeit entwickelte ich zunachst einen Arbeitsablauf fur die statistischeAnalyse von Fall-Kontroll-Studien mit weniger als 50 Proben. Mit der Generierung vonpopulations-basierten Datensatzen etablierte ich eine Pipeline fur die Qualitatskontrolle,die Vorbereitung der Daten und die Korrektur fur Storfaktoren, was zu einem deutlichverbesserten Datensatz fuhrte. Ingesamt habe ich mit dieser Pipeline mehr als 3.000 genom-weite Expressionsprofile fur die Auswertung vorbereitet. Mit 993 Proben aus Vollblut vonProbanden der populations-basierten KORA-Studie (Kooperative Gesundheitsforschung inder Region Augsburg) haben wir dabei eine der großten populations-basierten Ressourcengeschaffen.Mit diesem Datensatz haben wir zu zahlreichen transkriptom-weiten Assoziationsstudien innationalen (MetaXpress) und internationalen (CHARGE) Konsortien beigetragen. In dieserArbeit werde ich mich auf drei Studien, an denen wir maßgeblich beteiligt waren, fokusieren:I) Eine Assoziationsstudie der Genexpressionslevel mit Phanotypen, die im Zusammenhangmit Blutdruck stehen.II) Eine Assoziationsstudie, die die Veranderung der Genexpression im Alter untersuchte.III) Eine Studie uber den Einfluss der genetischen Variation auf die Genexpressionslevel.Nationale und internationale Kollaborationen haben die Aussagekraft dieser Studien we-sentlich erhoht und konnten unabhangige Replikationen sicher stellen. Im Rahmen desdeutschen Konsortiums entwickelten wir Protokolle fur Meta-Analysen und optimierten dieVorbereitung von verschiedenen Datensatzen.Dabei erwiesen sich Proben aus Vollblut wegen der einfachen Gewinnung als besonders hilf-reich. Außerdem konnten wir zeigen, dass vor allem der Einfluss der genetischen Variationsehr robust und replizierbar innerhalb heterogener populations-basierter Studien ist.
VII

Acknowledgements
Of course it is not possible to write a PhD thesis without any help. There are lots of peoplewho are involved in many steps of preparing this thesis and I owe them all a debt of grati-tude.
First of all I want to thank my doctoral thesis supervisor Prof. Dr. Thomas Illig for his sup-port and help during the last years. Especially for his straightforwardness and his patience.
I would also like to thank Prof. Dr. Thomas Meitinger and Dr. Holger Prokisch for allow-ing me to work in the Institute of Human Genetics and providing me all the data.
During the PhD project we had lots of collaborations and I would especially like to thankAlexander Teumer and Claudia Schurmann for lots of fruitful discussions per mail, on thephone, and in personal.I got help with the analysis of genotype data from Christian Gieger, Eva Albrecht and JaninaRied.For the analysis of the methylation data we had a very close and intensive collaboration withMelanie Waldenberger, Eva Reischl, Anja Kretschmer, Petra Wolf, Nazanin Karbalai, BrigitteKuhnel, and Carola Marzi. Without their help and support no results would have been pro-duced.Additionally I would like to thank all the members of the MetaXpress and CHARGE consor-tium for a great collaboration. And last, but not least I am indebted to all participants of theKORA study. Without them no data analysis would be possible.
A special thank goes to all the colleagues at the Institute of Human Genetics who alwayslistened to all the problems that appeared during my Phd student time. We had and stillhave a great time and they helped that the time flew. Especially I would like to thank Caro,Carola, Konzi, and Martina for spending a lot of time reading this thesis, Thomas S. for an-swering my Latex-questions, and Thomas W. for being my personal bioinformatician.
I gratefully dedicate this thesis to my parents, my sisters, my patient husband, and mylittle sunshines Annika and Adrian.
IX


Contents
Abstract V
Zusammenfassung VII
Acknowledgements IX
1. Introduction 11.1. Genetic background - From DNA to gene expression . . . . . . . . . . . . . . 21.2. Gene expression studies . . . . . . . . . . . . . . . . . . . . . . . . . . . . . . . 4
1.2.1. Case-control studies . . . . . . . . . . . . . . . . . . . . . . . . . . . . . 61.2.2. Population-based gene expression studies . . . . . . . . . . . . . . . . 71.2.3. Genome-wide association studies . . . . . . . . . . . . . . . . . . . . . 71.2.4. eQTL studies . . . . . . . . . . . . . . . . . . . . . . . . . . . . . . . . . 71.2.5. Statistical processing of gene expression data . . . . . . . . . . . . . . . 9
1.3. Outline of this thesis . . . . . . . . . . . . . . . . . . . . . . . . . . . . . . . . . 10
2. Material and methods 152.1. Study population and consortia . . . . . . . . . . . . . . . . . . . . . . . . . . . 15
2.1.1. KORA . . . . . . . . . . . . . . . . . . . . . . . . . . . . . . . . . . . . . 152.1.2. SHIP-TREND . . . . . . . . . . . . . . . . . . . . . . . . . . . . . . . . . 152.1.3. ECGUT . . . . . . . . . . . . . . . . . . . . . . . . . . . . . . . . . . . . . 162.1.4. GHS . . . . . . . . . . . . . . . . . . . . . . . . . . . . . . . . . . . . . . 162.1.5. MetaXpress . . . . . . . . . . . . . . . . . . . . . . . . . . . . . . . . . . 162.1.6. CHARGE . . . . . . . . . . . . . . . . . . . . . . . . . . . . . . . . . . . 17
2.2. Useful software for the analysis and visualization of gene expression data . . 172.2.1. GenomeStudio . . . . . . . . . . . . . . . . . . . . . . . . . . . . . . . . 172.2.2. R and Bioconductor . . . . . . . . . . . . . . . . . . . . . . . . . . . . . 182.2.3. PLINK . . . . . . . . . . . . . . . . . . . . . . . . . . . . . . . . . . . . . 182.2.4. SNAP . . . . . . . . . . . . . . . . . . . . . . . . . . . . . . . . . . . . . . 192.2.5. GWAS catalog . . . . . . . . . . . . . . . . . . . . . . . . . . . . . . . . . 192.2.6. Ingenuity Pathway Analysis Software . . . . . . . . . . . . . . . . . . . 212.2.7. Circos . . . . . . . . . . . . . . . . . . . . . . . . . . . . . . . . . . . . . 21
2.3. Statistical methods . . . . . . . . . . . . . . . . . . . . . . . . . . . . . . . . . . 242.3.1. Linear regression models . . . . . . . . . . . . . . . . . . . . . . . . . . 242.3.2. Sobel test . . . . . . . . . . . . . . . . . . . . . . . . . . . . . . . . . . . . 252.3.3. Analysis of variance (ANOVA) . . . . . . . . . . . . . . . . . . . . . . . 262.3.4. Fisher´s exact test . . . . . . . . . . . . . . . . . . . . . . . . . . . . . . . 272.3.5. Multiple testing problem . . . . . . . . . . . . . . . . . . . . . . . . . . 282.3.6. Pearson‘s and Spearman‘s correlation coefficient . . . . . . . . . . . . . 292.3.7. Agglomerative clustering . . . . . . . . . . . . . . . . . . . . . . . . . . 302.3.8. Principal component analysis . . . . . . . . . . . . . . . . . . . . . . . . 30
XI

Contents
2.4. Genotyping of KORA F3 and F4 samples . . . . . . . . . . . . . . . . . . . . . 322.4.1. Filtering of SNPs in KORA F3 . . . . . . . . . . . . . . . . . . . . . . . . 322.4.2. SNP selection in KORA F4 . . . . . . . . . . . . . . . . . . . . . . . . . . 33
2.5. Measuring of gene expression levels . . . . . . . . . . . . . . . . . . . . . . . . 332.5.1. Experimental protocol for measuring gene expression using Illumina
arrays . . . . . . . . . . . . . . . . . . . . . . . . . . . . . . . . . . . . . 332.5.2. Analyzing gene expression data using Affymetrix arrays . . . . . . . . 352.5.3. Normalization of microarry data . . . . . . . . . . . . . . . . . . . . . . 36
2.5.3.1. LOESS normalization . . . . . . . . . . . . . . . . . . . . . . . 362.5.3.2. Quantile normalization . . . . . . . . . . . . . . . . . . . . . . 38
2.5.4. Preparation of gene expression data for eQTL studies . . . . . . . . . . 392.5.4.1. KORA F3 . . . . . . . . . . . . . . . . . . . . . . . . . . . . . . 392.5.4.2. KORA F4 . . . . . . . . . . . . . . . . . . . . . . . . . . . . . . 39
2.6. Comparison of cis-eQTL results in KORA F4 with published cis-eQTLs . . . . 40
3. Analysis of gene expression data in case-control studies 453.1. Introduction to case-control studies . . . . . . . . . . . . . . . . . . . . . . . . . 453.2. Neurodegeneration and aging . . . . . . . . . . . . . . . . . . . . . . . . . . . . 46
3.2.1. Parkinson‘s disease and aging . . . . . . . . . . . . . . . . . . . . . . . 463.2.2. Data preparation and analysis . . . . . . . . . . . . . . . . . . . . . . . 473.2.3. Identification of a new risk gene for Parkinson‘s disease . . . . . . . . 493.2.4. Differences in expression patterns for Parkinson‘s disease and aging . 50
3.3. Gene expression in patients with mitochondrial disorders . . . . . . . . . . . . 513.4. Summary and discussion . . . . . . . . . . . . . . . . . . . . . . . . . . . . . . . 54
4. Improvement and development of quality control of gene expression data 574.1. Biological and technical replicates and manual quality control: KORA F3 . . . 57
4.1.1. Biological and technical replicates . . . . . . . . . . . . . . . . . . . . . 574.1.2. Quality control . . . . . . . . . . . . . . . . . . . . . . . . . . . . . . . . 594.1.3. Processing of the data . . . . . . . . . . . . . . . . . . . . . . . . . . . . 60
4.2. Validation of new technology: KORA F4 . . . . . . . . . . . . . . . . . . . . . . 604.2.1. One or two arrays per sample? . . . . . . . . . . . . . . . . . . . . . . . 604.2.2. Amount of cRNA, scanner regulation, and amount of RNA . . . . . . 614.2.3. Establishment of a comprehensive quality-controlled data set . . . . . 62
4.3. Common quality controlled preprocessing and analysis strategy: MetaXpress 634.3.1. Variance stabilization transformation versus log2 transformation . . . 644.3.2. Determination of factors influencing gene expression . . . . . . . . . . 654.3.3. Reduction of unexplained variance by adjustment for covariates . . . 684.3.4. SNPs in probes . . . . . . . . . . . . . . . . . . . . . . . . . . . . . . . . 774.3.5. Annotation . . . . . . . . . . . . . . . . . . . . . . . . . . . . . . . . . . 79
4.4. Summary and discussion . . . . . . . . . . . . . . . . . . . . . . . . . . . . . . . 80
5. Association studies 835.1. Gene expression and blood pressure related phenotypes . . . . . . . . . . . . 83
5.1.1. Results from KORA F3/F4 . . . . . . . . . . . . . . . . . . . . . . . . . 835.1.2. Results from MetaXpress . . . . . . . . . . . . . . . . . . . . . . . . . . 845.1.3. Results from CHARGE consortium . . . . . . . . . . . . . . . . . . . . 85
XII

Contents
5.2. Gene expression and aging . . . . . . . . . . . . . . . . . . . . . . . . . . . . . 885.2.1. Results from KORA F3 . . . . . . . . . . . . . . . . . . . . . . . . . . . . 885.2.2. Results from KORA F4 . . . . . . . . . . . . . . . . . . . . . . . . . . . . 895.2.3. Results from CHARGE consortium . . . . . . . . . . . . . . . . . . . . 90
5.2.3.1. Association between gene expression and age . . . . . . . . . 915.2.3.2. Age prediction . . . . . . . . . . . . . . . . . . . . . . . . . . . 915.2.3.3. Analysis of gene expression, methylation, and chronological
age . . . . . . . . . . . . . . . . . . . . . . . . . . . . . . . . . . 925.3. Summary and discussion . . . . . . . . . . . . . . . . . . . . . . . . . . . . . . . 94
6. Power issues in eQTL studies 996.1. Mapping of whole-blood cis- and trans-eQTLs in KORA F3 . . . . . . . . . . . 99
6.1.1. Identification of cis- and trans-eQTLs . . . . . . . . . . . . . . . . . . . 996.1.2. Adjusting for possible confounders in the KORA F3 discovery cohort 1026.1.3. Replication of whole-blood eQTLs in two independent cohorts . . . . 1026.1.4. Comparison of results with published peripheral blood eQTLs . . . . 1026.1.5. eQTL mapping of complex trait-associated variants . . . . . . . . . . . 1036.1.6. Summary of eQTLs in KORA F3 . . . . . . . . . . . . . . . . . . . . . . 104
6.2. eQTL study in KORA F4 . . . . . . . . . . . . . . . . . . . . . . . . . . . . . . . 1046.2.1. Discovery of cis- and trans-eQTLs for KORA F4 . . . . . . . . . . . . . 104
6.2.1.1. Detailed description of cis-results . . . . . . . . . . . . . . . . 1056.2.1.2. Detailed description of trans-results . . . . . . . . . . . . . . . 107
6.2.2. Replication of cis- and trans-eQTLs in two independent studies . . . . 1086.2.3. Correlation of mitochondrial SNPs with expression probes . . . . . . . 1106.2.4. Comparison of results with published cis-eQTLs from different tissues 1106.2.5. Functional properties of significant whole blood cis- and trans-eQTLs . 1116.2.6. Master regulatory loci . . . . . . . . . . . . . . . . . . . . . . . . . . . . 1116.2.7. Comparison of cis- and trans-results with the published GWAS catalog 1146.2.8. Comparison of cis-eQTLs with metQTLs . . . . . . . . . . . . . . . . . 1166.2.9. Summary of eQTLs in KORA F4 . . . . . . . . . . . . . . . . . . . . . . 118
6.3. Replication of eQTLs in CHARGE consortium . . . . . . . . . . . . . . . . . . 1206.4. Summary and discussion . . . . . . . . . . . . . . . . . . . . . . . . . . . . . . . 120
7. Summary and outlook 125
A. Appendix 129A.1. List of abbreviations . . . . . . . . . . . . . . . . . . . . . . . . . . . . . . . . . 129A.2. Statistics . . . . . . . . . . . . . . . . . . . . . . . . . . . . . . . . . . . . . . . . 130
A.2.1. Variance stabilization transformation . . . . . . . . . . . . . . . . . . . 130A.2.2. RNA Sequencing and FPKM . . . . . . . . . . . . . . . . . . . . . . . . 131
A.3. Tables and Figures . . . . . . . . . . . . . . . . . . . . . . . . . . . . . . . . . . 131
B. Declaration - Eidesstattliche Versicherung 137
Bibliography 139
XIII


List of Tables
1.1. Overview of conducted studies . . . . . . . . . . . . . . . . . . . . . . . . . . . 14
2.1. Example file for creating a circos plot: ”links.txt” . . . . . . . . . . . . . . . . . 232.2. Example file for creating a circos plot: ”gene.labels.txt” . . . . . . . . . . . . . 232.3. Number of errors committed when testing m null hypotheses . . . . . . . . . 28
3.1. Comparison of two case-control studies . . . . . . . . . . . . . . . . . . . . . . 453.2. Differentially expressed genes between Parkinson patients and old controls . 493.3. Canonical pathways specific for aging and for Parkinson‘s disease . . . . . . . 513.4. Results of pathway analysis for NBIA patients versus controls . . . . . . . . . 54
4.1. Gender classification in KORA S4, F4, and F4 OGTT . . . . . . . . . . . . . . . 624.2. Descriptive statistics of MetaXpress cohorts . . . . . . . . . . . . . . . . . . . . 644.3. Eigen-R2 values for technical and non-technical variables in KORA F4, SHIP-
TREND, and GHS . . . . . . . . . . . . . . . . . . . . . . . . . . . . . . . . . . . 704.4. Mean unexplained variance for BMI and the random phenotype in KORA F4 744.5. Mean standard errors after different covariate adjustments . . . . . . . . . . . 754.6. Distribution of KORA samples on amplication plates . . . . . . . . . . . . . . 78
5.1. Study description of KORA F3/F4 for blood pressure related phenotypes . . 845.2. Characteristics of the six study cohorts included in meta-analysis on blood
pressure related phenotypes . . . . . . . . . . . . . . . . . . . . . . . . . . . . . 855.4. Significantly associated genes for blood pressure related phenotypes . . . . . 865.3. Results from gene expression study on blood pressure related phenotypes . . 875.5. Significantly associated genes in KORA F3 with aging . . . . . . . . . . . . . . 885.6. Number of genes significantly associated with age in KORA F4 . . . . . . . . 895.7. Significantly associated genes with aging in different tissues . . . . . . . . . . 925.8. Association between transcriptomic age and age-related phenotypes . . . . . 93
6.1. List of eight novel GWAS catalog eSNPs significantly associated with expres-sion levels of the reported transcript in KORA F3 . . . . . . . . . . . . . . . . . 104
6.2. Study description of KORA F4, SHIP-TREND, and EGCUT . . . . . . . . . . . 1096.3. Comparison of cis-eQTLs to cis-eQTLs in different tissues . . . . . . . . . . . . 1116.4. Results of pathway analysis for cis- and trans-eQTLs in KORA F4 . . . . . . . 1126.5. Master regulatory loci . . . . . . . . . . . . . . . . . . . . . . . . . . . . . . . . 1146.6. Results of cross-associations for congruent metQTL- and eQTL-SNPs . . . . . 1196.7. Summary of eQTL results from KORA F3, KORA F4, and CHARGE . . . . . . 1216.8. Comparison of results obtained from linear regression and Spearman‘s rank
correlation test for cis-hits in KORA F4 . . . . . . . . . . . . . . . . . . . . . . . 123
A.1. Significant trans-eQTLs in KORA F4 . . . . . . . . . . . . . . . . . . . . . . . . 133
XV

List of Tables
A.2. Significantly associated expression probes with at least one mitochondrial SNP 133
XVI

List of Figures
1.1. Structural organization of DNA in the cell nucleus . . . . . . . . . . . . . . . . 21.2. Categories of CpG sites . . . . . . . . . . . . . . . . . . . . . . . . . . . . . . . . 31.3. Expected correlation of CpG sites and gene expression . . . . . . . . . . . . . 41.4. Shematic diagram of gene expression . . . . . . . . . . . . . . . . . . . . . . . 51.5. Definition of effects of SNPs on gene expression levels in cis and trans . . . . . 81.6. Overview of conducted studies . . . . . . . . . . . . . . . . . . . . . . . . . . . 101.7. Sample sizes in the gene expression studies described in this thesis . . . . . . 13
2.1. MetaXpress - Experimental procedure . . . . . . . . . . . . . . . . . . . . . . . 172.2. Published SNP-trait associations from the GWAS catalog from May 2014 . . . 202.3. Example circos plot . . . . . . . . . . . . . . . . . . . . . . . . . . . . . . . . . . 212.4. Additive effect of polymorphisms on gene expression levels . . . . . . . . . . 252.5. Mediation scheme . . . . . . . . . . . . . . . . . . . . . . . . . . . . . . . . . . . 262.6. Experimental workflow for measuring gene expression using an Illumina ex-
pression array in KORA F3 . . . . . . . . . . . . . . . . . . . . . . . . . . . . . 342.7. Boxplots of not normalized samples . . . . . . . . . . . . . . . . . . . . . . . . 362.8. Boxplots of normalized samples . . . . . . . . . . . . . . . . . . . . . . . . . . . 362.9. Quality plot to illustrate the necessity of normalization . . . . . . . . . . . . . 372.10. Number of unique significant cis-eQTL probes for different numbers of re-
moved Eigen-genes in KORA F4 . . . . . . . . . . . . . . . . . . . . . . . . . . 412.11. Number of unique significant trans-eQTL probes for different numbers of re-
moved Eigen-genes in KORA F4 . . . . . . . . . . . . . . . . . . . . . . . . . . 42
3.1. Experimental design of Parkinson study . . . . . . . . . . . . . . . . . . . . . . 463.2. Workflow for genome-wide expression profiles from single cells . . . . . . . . 473.3. Dendrogram of all samples from the Parkinson study . . . . . . . . . . . . . . 483.4. Differentially expressed genes between Parkinson patients and old controls . 493.5. Parkinson‘s disease as accelerated aging . . . . . . . . . . . . . . . . . . . . . . 503.6. Subgroups of NBIA . . . . . . . . . . . . . . . . . . . . . . . . . . . . . . . . . . 523.7. Dendrogram of NBIA samples . . . . . . . . . . . . . . . . . . . . . . . . . . . 53
4.1. Scatterplot matrix of three technical and biological replicates . . . . . . . . . . 584.2. RIN versus number of detected genes in KORA F3 . . . . . . . . . . . . . . . . 594.3. Histogram of deviations between expression values when using two different
arrays per sample . . . . . . . . . . . . . . . . . . . . . . . . . . . . . . . . . . . 614.4. Overlap of samples from KORA S4, F4, and F4 OGTT . . . . . . . . . . . . . . 634.5. Comparison of VST- and log2-transformed expression values in association
with BMI in KORA F4 . . . . . . . . . . . . . . . . . . . . . . . . . . . . . . . . 664.6. Explained variance by the Eigen-genes in KORA F4, GHS, and SHIP-TREND 674.7. Explained variance by the first 100 Eigen-genes for different filter methods in
SHIP-TREND . . . . . . . . . . . . . . . . . . . . . . . . . . . . . . . . . . . . . 69
XVII

List of Figures
4.8. Correlation of covariables with Eigen-genes in KORA F4 . . . . . . . . . . . . 714.9. Correlation of Eigen-genes with several factors in KORA F4, GHS, and SHIP-
TREND . . . . . . . . . . . . . . . . . . . . . . . . . . . . . . . . . . . . . . . . . 724.10. Mean unexplained variance in KORA F4, SHIP-TREND, and GHS for BMI
and the random phenotype . . . . . . . . . . . . . . . . . . . . . . . . . . . . . 734.11. Comparison of different adjustments in KORA F4 for BMI . . . . . . . . . . . 764.12. Effect of SNPs within a probe sequence on expression levels in KORA F4 . . . 794.13. RIN versus number of detected genes in KORA F3 and KORA F4 . . . . . . . 80
5.1. Analysis framework for gene expression study on blood pressure related phe-notypes . . . . . . . . . . . . . . . . . . . . . . . . . . . . . . . . . . . . . . . . . 87
5.2. Age-specific gene expression in KORA F3 . . . . . . . . . . . . . . . . . . . . . 895.3. Histogram of age distribution in KORA F3 and F4 . . . . . . . . . . . . . . . . 905.4. Boxplot of age in KORA F3 and F4 . . . . . . . . . . . . . . . . . . . . . . . . . 915.5. Chronological versus predicted age in KORA F4 . . . . . . . . . . . . . . . . . 935.6. Mediation of age-expression relationship by methylation . . . . . . . . . . . . 945.7. Manhattan plots of results from association study between gene expression
and aging in KORA F3, F4, and CHARGE . . . . . . . . . . . . . . . . . . . . . 965.8. Chronological age versus transcriptomic age in all participating cohorts of
gene expression working group in CHARGE . . . . . . . . . . . . . . . . . . . 97
6.1. Number of significant SNP-probe combinations for different window sizes inKORA F3 . . . . . . . . . . . . . . . . . . . . . . . . . . . . . . . . . . . . . . . . 100
6.2. Manhattan plot of significant cis-eQTLs in the KORA F3 discovery cohort . . 1016.3. Plot of distance between SNP and transcription start site in KORA F3 . . . . . 1016.4. Flowchart of the number of eQTLs from KORA F3 discovery cohort tested and
replicated in KORA F4 and SHIP-TREND . . . . . . . . . . . . . . . . . . . . . 1036.5. Manhattan plot of cis-results in KORA F4 . . . . . . . . . . . . . . . . . . . . . 1056.6. Distance of the SNP to transcription start site for significant cis-eQTLs in KORA
F4 . . . . . . . . . . . . . . . . . . . . . . . . . . . . . . . . . . . . . . . . . . . . 1066.7. Circos plot of trans-hits in KORA F4 . . . . . . . . . . . . . . . . . . . . . . . . 1076.8. Comparison of times of blood collection in KORA F4 and EGCUT . . . . . . . 1086.9. Comparison of p-values for eQTL replication between KORA F4, SHIP-TREND,
and EGCUT . . . . . . . . . . . . . . . . . . . . . . . . . . . . . . . . . . . . . . 1096.10. Trans hotspot 1 . . . . . . . . . . . . . . . . . . . . . . . . . . . . . . . . . . . . . 1136.11. Trans hotspot 2 . . . . . . . . . . . . . . . . . . . . . . . . . . . . . . . . . . . . . 1136.12. Trans hotspot 3 . . . . . . . . . . . . . . . . . . . . . . . . . . . . . . . . . . . . . 1136.13. Trans hotspot 4 . . . . . . . . . . . . . . . . . . . . . . . . . . . . . . . . . . . . . 1136.14. Triangular relationship between eQTL-SNP, gene expression level in trans,
and adiponectin . . . . . . . . . . . . . . . . . . . . . . . . . . . . . . . . . . . . 1156.15. Triangular relationship between eQTL-SNP, gene expression level in trans,
and mean platelet volume . . . . . . . . . . . . . . . . . . . . . . . . . . . . . . 1166.16. Triangular relationship between genomics, metabolomic, and transcriptomics
- PHGDH . . . . . . . . . . . . . . . . . . . . . . . . . . . . . . . . . . . . . . . . 1176.17. Triangular relationship between genomics, metabolomic, and transcriptomics
- FADS1 . . . . . . . . . . . . . . . . . . . . . . . . . . . . . . . . . . . . . . . . . 118
XVIII
List of Figures
6.18. Triangular relationship between genomics, metabolomic, and transcriptomics- ACADM . . . . . . . . . . . . . . . . . . . . . . . . . . . . . . . . . . . . . . . . 119
6.19. Manhattan plots of cis-eQTLs in KORA F3, F4, and in CHARGE . . . . . . . . 122
7.1. Dendrogram of RNASeq data of 42 controls and 41 NBIA patients . . . . . . . 1257.2. Experiment using RNASeq data: Differentially expressed gene between con-
trols and NBIA patients . . . . . . . . . . . . . . . . . . . . . . . . . . . . . . . 126
A.1. Cluster of all KORA S4, F4, and F4 OGTT samples having expression data . . 134A.2. Comparison of VST and log2 transformation for a random phenotype in KORA
F4 . . . . . . . . . . . . . . . . . . . . . . . . . . . . . . . . . . . . . . . . . . . . 135
XIX


1. Introduction
In the beginning of gene expression era statistical analyses were quite simple because geneexpression levels were determined only for a few candidate genes and could be comparedgraphically or by using simple statistical tests.The development of microarrays wherein thousands of measurements for one single sampleare conducted simultaneously led to the generation of large amounts of data making statisti-cal analyses more complex and time-consuming. These experiments started with very smallsample sizes and were mainly designed to compare cases with controls especially in humansand mice.The Institute of Human Genetics of the Helmholtz Center Munich was one of the first insti-tutions that established a larger genome-wide data set of more than 300 healthy individualsfrom a population-based study using whole blood. This data set provided us with an oppor-tunity to assess gene activity across the whole genome in a hypothesis-free approach.However soon it became clear that data analyses together with interpretation of multiplesignificant hits was no longer trivial, as sample sizes were continuously growing due to thepossibility to analyze the activity of the whole genome in a short time for less money (Ra-masamy et al., 2008).
Nowadays, the analysis of high-dimensional data is no longer an exception but rather nor-mal and all-round. There are lots of population-based studies with large sample sizes whichare analyzed together to identify even very small effects.This thesis reflects the development of gene expression studies from case-control studieswith small sample sizes (n<50) to studies with large sample sizes (n>7,000) using data fromdifferent populations.The challenges and improvements of quality control and analysis of data are shown overtime and for increasing sample sizes.This thesis can be regarded as a guideline to analyze gene expression data obtained mainlyfrom whole blood but also from other tissues. On the one hand it supports statisticianswho have not worked with genetic data so far and on the other hand biologists who are notfamiliar with statistical analyses of gene expression data. Therefore, both the genetic andstatistical background is given so that all analysis steps can be understood and reproduced.Especially for the reproducibility the required R codes are provided.The population-based phenotypes, gene expression and genetic data used in this thesiscan be obtained from KORA-PASST (project application self-service tool) on http://epi.helmholtz-muenchen.de/. The expression data can be downloaded (without any phe-notypes due to protection of data privacy) from ArrayExpress using the project numberE-MTAB-1708 (https://www.ebi.ac.uk/arrayexpress/).
1

1. Introduction
1.1. Genetic background - From DNA to gene expression
All genetic information of each human being (and of all other living organisms) is storedin the deoxyribonucleic acid (DNA) which is unique for each individual. The structure ofthe DNA was firstly described by James Watson and Francis Crick in 1953 in a Nature pub-lication: “Molecular structure of nucleic acids: A structure for deoxyribose nucleic acid”(WATSON and CRICK, 1953). They introduced the double-helix structure of two strands ofnucleotides (see Figure 1.1). Each nucleotide consists of three components:
1. One base: adenine (A), cytosine (C), guanine (G) or thymine (T)
2. One sugar (deoxyribose)
3. One phosphate
AA
AA
AA
CC
CC
CC
GG
GGGG
TT
TTTT
Chromosome
NucleusTelomere
ChromatidChromatid
Telomere
Centromere
Cell
Histones
DNA(double helix)
Base Pairs
Figure 1.1.: Structural organization of DNA in the cell nucleus:Base pairs build up the DNA in form of a double-helix. DNA is ordered andstructured by histones and form the chromosomes. Thereby each chromosomeconsists of two identical chromatids and its intersection called centromere. Thetelomeres at each end of the chromosome have a protective function (McClin-tock, 1941). Humans have 22 pairs of chromosomes and additionally two gender-specific chromosomes (females have two X-chromosomes, males have one X- andone Y-chromosome).
Thereby the sugar and the phosphate serve as the so-called backbone of the DNA and thebases are attached with hydrogen bonds. In this process an A can only bond to T and a Conly to G.The DNA can be found in the nucleus of each single cell. The different shapes and functionsof a cell are due to the different activity of genes. A gene is a defined part (ranging from a
2

1.1. Genetic background - From DNA to gene expression
few kilobases to several megabases) of the DNA and consists of a certain number of coding(exons) and non-coding (introns) regions.
The activity of the genes is called gene expression and this process consists of two steps:
1. Transcription: Generation of a copy of the gene, the so-called messenger RNA (mRNA).In contrast to the DNA, the Ribonucleic Acid (RNA) is single-stranded and contains ri-bose instead of deoxyribose. Additionally, the base thymine is replaced by uracil.
2. Translation: The information of the mRNA is translated to amino acids that form pro-teins.
If variation in the DNA sequence in comparison to the reference sequence is located in thecoding region of a gene, an exchange of an amino acid could be the consequence. If one ofthese changes with only one affected base pair occurs in more than 1% of the populationit is called a Single Nucleotide Polymorphism (SNP) (Wrba et al., 2007). In humans thesevariants can be found on average every 500 to 1,000 base pairs and normally they are notdisease-relevant. There are three different states (genotypes) possible for each SNP. Eitheran individual is homozygote for the major allele, meaning that both chromosomes carry thesame allele that is most frequent in the normal population at this locus, an individual ishomozygote for the minor allele or an individual is heterozygote, meaning that both chro-mosomes are carrying different alleles (Ziegler et al., 2010).
The tissue specific activation and inactivation of genes can be regulated by DNA methyla-tion which is one of the main epigenetic regulatory mechanisms (Portela and Esteller, 2010).Epigenetics is the study of heritable changes in gene function that occur without a changein the DNA sequence. Epigenetic mechanisms include histone modification, DNA methyla-tion, and RNA interference (Nikolova and Hariri, 2015).DNA methylation is the process in which a methyl group is added to the DNA, most com-monly to cytosine if it is directly followed by guanine (Tollefsbol, 2010). Thus cytosine canoccur “normally” or in a methylated version, i.e. with an attached methyl group. The re-gions in the DNA where the bases cytosine and guanine are only separated by a phosphateare called Cytosine-phosphate-guanine (CpG) sites (Miller et al., 1974). CpG islands are re-gions in the genome with a high frequency of CpG sites (Figure 1.2).
Figure 1.2.: Categories of CpG sites:Genomic regions with a high frequency of CpG sites are called CpG islands. Theregions 2 kb up- and downstream of CpG islands are called North and SouthShore, respectively and the flanking regions are called North and South Shelves,respectively (Bibikova et al., 2011).
3

1. Introduction
In humans it is assumed that methylation of CpG sites or CpG islands close to the tran-scription start site of a gene can repress gene expression (see Figure 1.3) but methylationwithin the gene body might not interfere with gene expression (Jones, 2012).
Figure 1.3.: Expected correlation of CpG sites and gene expression:A methylated CpG site or a CpG island (genomic regions enriched in CpG sites)might repress the expression of a neighboring gene (Nikolova and Hariri, 2015).
1.2. Gene expression studies
The principle of unidirectional information flow of genetic information was established inthe mid-1960s (Struhl, 1999) and thereby closed the gap between DNA in the nucleus andproteins in the cytoplasm (O’Connor and Adams, 2010). Volkin and Astrachan (1956) dis-covered that genetic information is transported from DNA and translated into proteins byRNA.
The DNA in the nucleus consists of exons and introns and is transcribed to RNA moleculesby enzymes called RNA polymerases (see Figure 1.4). The RNA is single-stranded and com-plementary to one strand of the DNA. The non-coding regions are removed and the re-maining exons are spliced together. Next, the messenger RNA is exported to the cytoplasmand the transcripts are translated to chains of amino acids which finally form the proteins(O’Connor and Adams, 2010).This highly complex process including transcription of gene and translation to protein iscalled gene expression. Gene regulation determines the amount and time point of specificgene products and can occur in each step (Maston et al., 2006). The mechanisms for re-gulation of gene expression levels occur mostly at the level of transcription (Holstege andYoung, 1999).A high proportion of gene regulation is a result of an interaction between DNA sites (bind-ing sites) and proteins that bind to these sites, so-called transcription factors. They can eitherbind to promoters (to initiate the transcription), enhancers (to enhance the transcription) orto silencers (to repress the transcription). Promoters, enhancers, and silencers are short parts
4

1.2. Gene expression studies
Figure 1.4.: Shematic diagram of gene expression:The DNA in the nucleus, divided in exons (blue) and introns (green), is tran-scribed to a pre-mRNA molecule (red regions align with blue exons and greenregions align with introns of DNA). Next, mRNA is build by removing intronsand splicing of exons. The newly formed mRNA is exported from the nucleusto the cytoplasm and translated to proteins which consists of different aminoacids (here illustrated by different colors) (O’Connor and Adams, 2010). Figureis taken from www.nature.com/scitable.
of DNA and are normally located close to the transcription start site of the regulated gene(Pennacchio et al., 2013; Blackwood and Kadonaga, 1998; Maston et al., 2006). Mostly, tran-scription factors interact with other proteins (coactivator and corepressor) to result in an up-or down-regulation of a gene, meaning the rate of transcription is increased or decreased,respectively.After transcription of DNA to mRNA there can be some post-transcriptional regulation todetermine the amount of mRNA that is translated to proteins. Post-transcriptional regula-tion also includes mechanisms to manipulate RNA transport or stability.Finally, genes can be regulated in translational and post-translational steps. This includes allstages of protein biosynthesis and chemical modifications of proteins (Mehta, 2009).
Microarrays measure the current level of a transcript and provide information about geneactivity.Variation in gene expression levels does not necessarily result in defined clinic symptoms butmay lead to complex diseases or influence quantitative traits like BMI or height. In contrast,diseases like Mendelian disorders represent an extreme consequence of genetic variation(Cheung et al., 2003).
Most gene expression studies were performed to investigate differences between specialconditions in gene expression levels. Although there are studies analyzing only a set ofgenes the focus of this thesis is the analysis of genome-wide microarray data, of up to 30,000transcripts.
5

1. Introduction
Generation and quantification of gene expression levels are not as robust as genome data. Invarious tissues (Petretto et al., 2006) and cellular states (Gerrits et al., 2009) different genes areexpressed and measurable. The RNA levels are more susceptible to experimental design ofthe study, to technical and biological variables, and to environmental factors. The variabilityof gene expression data can be used to identify differentially expressed genes that are alteredby traits or diseases.The analysis of the transcriptome aims to include the complete set of mRNA molecules ata given time point from a defined cell type or tissue (Cornelis and Hu, 2013). Mostly, thesetranscriptome-wide analyses are conducted in whole blood as it is easily available.
1.2.1. Case-control studies
Case-control studies are a type of observational studies in which samples from two differentgroups are compared for a better understanding of underlying biology and pathomecha-nism and to identify biomarkers. The “cases” are usually patients suffering from a diseaseor individuals with a particular condition (for example high BMI), whereas the “controls”are the individuals that are healthy (or are at least not affected by the disease of the cases) ordo not have the same conditions (for example low BMI). In comparison to population-basedstudies, in which the general population is investigated, in case-control studies the controlsare accurately chosen (for example they fit to the cases in age, gender and other sociodemo-graphic variables) to optimize the power for the identification of small differences betweenthe two groups. In this way it is possible to investigate even rare diseases with a small sam-ple size.In gene expression studies using whole blood usually the expected effects in gene expressionlevels between the groups are quite small as there is not always a direct connection betweenblood and the investigated disease and the genes of interest are not differentially expressedin blood. There are some possibilities to avoid this problem:
• Analysis of the affected tissue.Lots of genes are not expressed in every tissue and especially in whole blood. Whenanalyzing rare diseases sample sizes are usually small and therefore it is possible toinvestigate the affected tissue.
• High contrast between cases and controls.To increase the contrast between the groups it is necessary to have homogenous casesand controls. In the optimal situation each case gets one or more matched control basedon variables that are expected to be confounders (Rose and Laan, 2009).
• Analysis of selected genes.To reduce the number of tests it could be useful to restrict the analysis on a predefinedset of genes.
In practice it is not always possible to meet all these criteria. Mostly, the limitation is toinvestigate the affected tissue as there are high ethical standards that do not allow to conduct,for example, biopsies on healthy individuals. Therefore the selection of cases and controlsor the exclusion of samples with bad quality is even more important.
6

1.2. Gene expression studies
1.2.2. Population-based gene expression studies
Large cohort studies are usually based on individuals who represent the normal population.In these cohorts there are no specific tissues available and due to ethical reasons most of thetime only blood is taken -as easily available sample- from the voluntary study participants.However, it could be shown that up to 80% of all genes are expressed in whole blood (Liewet al., 2006). Therefore population-based transcriptome-wide association studies are mostlyconducted on whole blood samples using phenotypes that are accessible (e.g. BMI, height,age, blood pressure,...) or studying diseases that are quite common in the normal population(e.g. diabetes, hypertension,...). As usually large sample sizes and appropriate replicationcohorts are available there is high power to detect small effects even when not having theoptimal tissue.
1.2.3. Genome-wide association studies
Just like the measurement of gene expression levels, it is also possible to determine the geno-types of hundred of thousands SNPs on microarrays. The development of this techniquewas the beginning of genome-wide association studies (GWAS). In a GWAS genetic varia-tion is analyzed genome-wide to identify genetic loci that are associated with the trait ofinterest. The starting point of this era was the publication from Klein et al. (2005) who in-vestigated 103,611 SNPs from 96 AMD (age-related macular degeneration) patients and 50controls followed by the Wellcome Trust Case Control Consortium in 2007 which analyzedalmost 400,000 SNPs from 16,000 samples suffering from seven different diseases namelybipolar disorder, coronary artery disease, Crohn’s disease, hypertension, rheumatoid arthri-tis, type 1 diabetes, and type 2 diabetes (Consortium, 2007; Visscher et al., 2012). Since thenthousands of GWAS have been conducted and thousands of associations with diseases orphenotypes have been identified.GWAS are performed to determine a so-called quantitative trait locus (QTL), a genetic lo-cus that is associated with any quantitative phenotype or variable. Normally, the result of aGWAS is a list of SNPs which are associated with the disease (for example diabetes or car-diovascular diseases) or the trait (for example BMI or height) of interest. Most of the SNPsare located in intronic or even in intergenic regions and the function is not clear (Mehta et al.,2012).
1.2.4. eQTL studies
Jansen and Nap (2001) first introduced the concept of the genome-wide analysis of geneticand gene expression data (Li and Deng, 2010). As the molecular mechanism that is respon-sible for the association between the genetic locus and the phenotype is often not clear, geneexpression data can help to understand the functional consequences of SNPs. This becamemore important because of the constantly increasing number of GWAS identifying SNPs innon-coding regions. So far, more than three thousand loci have been identified to be associ-ated with a disease or a trait. These loci are all summarized in the GWAS catalog (Hindorffet al., 2009).With the development of expression-microarrays it is now possible to investigate the impact
7

1. Introduction
of genetic variation on gene expression levels systematically and independent from GWASresults. Gene expression levels are treated as quantitative phenotypes and analyzed genome-and transcriptome-wide to identify expression QTLs (eQTLs).An eQTL is a locus in the DNA that influences the expression level of one or more genes (Al-bert and Kruglyak, 2015) and is mainly identified in population-based studies. eQTL studiesprovide the opportunity to detect transcriptional regulatory relationships on a genome-widelevel (Fehrmann et al., 2011).There are two different kinds of associations between gene expression levels and geneticvariation that were described first by Haldane et al. (1941) and were mostly classified ac-cording to their physical distance (Gilad et al., 2008).
• cis-eQTLs:According to the original definition cis-acting elements have an influence on allele-specific gene expression. This includes for example promoter regions, silencer or en-hancers (Gilad et al., 2008). cis-eQTLs are often synonymous with local eQTLs (Albertand Kruglyak, 2015), meaning that the SNP is close to the regulated gene (Michaelsonet al., 2009).
• trans-eQTLs:trans-acting elements regulate the expression of both alleles (Gilad et al., 2008). Mostly,the locus is located far away from the regulated gene (distant eQTL), either on the sameor on a different chromosome.
When using microarrays it is not possible to measure allele-specific gene expression. There-fore it is not possible to definitely distinguish between mode of action of cis- and trans-eQTLs. Consequently, in eQTL studies it has been common to name all local eQTLs cis-eQTLs and all distant eQTLs trans-eQTLs (Albert and Kruglyak, 2015).So far, there is no common threshold to separate cis- and trans-eQTLs. It varies from 100 kb(Dixon et al., 2007) to 1 Mb (Hao et al., 2012). We defined “close” between SNP and regulatedgene as less than 500 kb upstream and downstream of the transcription start and end site,respectively (see Figure 1.5).
Figure 1.5.: Definition of effects of SNPs on gene expression levels in cis and trans:If the SNP is located less than 500 kb (or any other small predefined distance)from the expression probe on the same chromosome the eQTL is called cis-eQTL.If the SNP is located further away on the same chromosome or on an other chro-mosome than the expression probe, the eQTL is called trans-eQTL.
8

1.2. Gene expression studies
1.2.5. Statistical processing of gene expression data
Gene expression data are the result of several complex sample preparation and measure-ment steps followed by the computational translation of signals from microarrays into datapoints (Hartemink et al., 2001). Therefore there are lots of possibilities where variability ofdata could be caused by technical instead of biological factors of interest. As a consequence,experiments have to be prepared carefully to remove or at least reduce the technical vari-ability and increase the probability to detect real biological relevant signals. There are manychallenges in the analysis of gene expression data and the research on finding the optimalway for the preprocessing and analysis is still ongoing.
One characteristic of gene expression analysis is the p > n situation, meaning that thenumber of investigated features p is much larger than the sample size n. When using micro-arrays, up to 50,000 data points can be measured per sample. A study cohort only consistsof a few hundred to thousand individuals. Not all statistical methods can handle this prob-lem and multivariate models have to be applied carefully. Especially when analyzing geneexpression data from studies with a small sample size the study design has to be consideredwith caution to get a homogenous study population.
After choosing the optimal set of samples, problems can occur during the measurementsin the laboratory. As mentioned before, gene expression levels are influenced by severalenvironmental and technical factors especially batch effects. To make expression data com-parable across different studies, it is mandatory to standardize all experimental steps andthe following data preprocessing steps should include variance stabilization and normaliza-tion methods. Lastly, suitable statistical models are needed that are able to exclude variancedue to technical known and unknown factors.
Additional variance in the data set can be the result of outliers. A sample can be an out-lier due to several reasons. For example a bad quality of RNA can lead to overall lowerexpression levels and thereby decrease the number of detectable genes. Another possibilityis sample mixing in each step of the experiments. Especially when men and women samplesare mixed problems can occur in any gender-specific analysis because of highly different ex-pression patterns on sex-specific chromosomes. Therefore the data set can be improved byidentification and removal of outliers and potential mixed samples before analysis to har-monize the data set and reduce the variance.
Gene expression analyses are often performed to identify differentially expressed genesbetween two or more different groups of samples. These differentially expressed genes canbe used to obtain insights in diseases or serve as clinical biomarkers. In this approach allmeasured transcripts are investigated one by one and this results in are large number ofstatistical tests. To avoid false positive hits multiple testing correction methods have to beapplied.
Gene expression data are biological data that usually do not follow the assumptions of thedistributions of standard statistical models (Du et al., 2010). This has to be kept in mind whenapplying parametric approaches and could maybe be a reason for nonparametric models.
9

1. Introduction
In order to avoid type I error, results have to be confirmed in an independent data setof comparable population structure. Alternatively, data can be analyzed in a meta-analysiswith the additional advantage that this increases the sample size and thus the power todetect small differences or effects. Meta-analyses or analysis in large data sets can resultin large lists of potentially interesting genes. Statistical or bioinformatical tools are able toidentify relations between these results or identify enriched biological pathways (Krumsieket al., 2011).
1.3. Outline of this thesis
The main focus of this thesis is the analysis of whole genome expression data. An overviewof the outline of this thesis is given in Figure 1.6. Within the framework of this thesis sixstudies are described which display various different characteristics.
Figure 1.6.: Overview of conducted studies
1. They were conducted using different study designs: case-control studies (Chapter 3),quality control studies (Chapter 4), transcriptome-wide association studies (Chapter5), and eQTL studies (Chapter 6).
2. The expression of genes was measured in different samples/populations: a Parkinsoncase-sontrol sample (Section 3.2), a NBIA (Neurodegeneration with Brain Iron Accu-mulation) case-control sample (Section 3.3), and population-based studies (Chapter 4,5, and 6).
10

1.3. Outline of this thesis
3. They aimed to address different research questions such as: a) Identification of dif-ferentially expressed genes in case-control studies (Chapter 3), b) Optimization andstandardization of quality control and analysis (Chapter 4), and c) Identification of as-sociations using population-based data (Chapter 5 and 6).
The six studies conducted within the framework of this thesis are described in detail in thefollowing section. An overview of these studies is given in Table 1.3.
Case-control studies
In Chapter 3 two case-control studies with small sample sizes are introduced to show arisingproblems in analysis of gene expression data sets with small sample sizes. In the first case-control study (Section 3.2), we identified genes that were differentially expressed in singlecells from brain in Parkinson patients and age-matched controls. Results were followed upin young controls to describe Parkinson’s disease as accelerated aging. In the second case-control study (Section 3.3) we compared patients suffering from NBIA to controls using adifferent expression array system than in all other projects described in this thesis (i.e. arraysfrom Affymetrix instead of those from Illumina). The aims of both studies were:
• The development of an optimal preprocessing pipeline including the selection of thesamples to obtain a homogenous data set.For this purpose, expression data were normalized and clustered to identify and re-move outliers.
• The identification of differentially expressed genes between patients and controls.Expression levels of selected genes (Parkinson study) or transcriptome-wide expres-sion levels (NBIA study) were compared to identify differentially expressed genes.
• The identification of molecular mechanisms.Differentially expressed genes were used to identify pathways which explain relationsbetween the underlying genes and the disease phenotype.
Quality control studies
Chapter 4 can be seen as the basis for all further analyses in population-based data sets. Itdescribes the development of quality control steps from a manual quality control in a smallcohort (N=381) to a common data preparation and analysis strategy in a large consortiumconsisting of three population-based studies with altogether more than 3,000 individuals.The overall aims were:
• To explore robustness and variability of gene expression data by analyzing biologicaland technical replicates.Therefore, blood was taken from three voluntary individuals three times at three dif-ferent time points. Gene expression was measured to compare the inter- and intra-variability between all three samples.
• To optimize preparation of samples in the laboratory.Experimental processing for a larger data set of more than 3,000 samples was stan-dardized and different amounts of RNA were compared to obtain expression data withcomparable intensity levels.
11

1. Introduction
• To optimize preparation of data.With increasing sample size we were able to exclude sample outliers based on differentcriteria, like cluster outliers, mixed samples or samples with bad RNA quality.
• To identify technical and clinical variables that influence gene expression levels.In order to create three comparable data sets the most important pre-requisite for a jointconsortium analysis of population-based studies was the standardization of prepro-cessing steps. Two variance stabilization methods were compared (log2 versus vari-ance stabilization transformation). Using different approaches, we tried to uncovermain technical influences on variation of gene expression levels. We investigated theeffects of SNPs in probe sequences by calculating the association between gene expres-sion levels of transcripts having a SNP in the probe sequence and the correspondingSNP.
In summary, all steps were conducted with the objective to reduce disturbing variability inthe data in order to create comparable data sets. Combined analysis in consortia are noweasy to conduct due to the development of harmonized data sets.
Transcriptome-wide association studies
In Chapter 5 two different phenotypes (age and blood pressure related phenotypes) wereanalyzed on a transcriptome-wide scale. Each phenotype was analyzed in three differentpopulations.The first population-based association study (Section 5.1) was conducted to identify geneswhich are associated with phenotypes related to blood pressure such as systolic and dias-tolic blood pressure, pulse pressure, and hypertension.The second population-based study (Section 5.2) was focused on age-related gene expres-sion. The power to identify age-related expression patterns is limited in a population with1000 samples who are older than 60. However, we contributed with our data to a meta-analysis of more than 7,000 samples with a large range of age (20 years to 100 years).
eQTL studies
In Chapter 6, we investigated the impact of genetic variation on gene expression levels in aneQTL study in two different data sets of 322 and 890 samples. The aims of the studies were:
• To identify genetic determinants of gene-expression in cis and trans (i.e. cis- and trans-eQTLs).We identified cis- and trans-eQTLs on transcriptome- and genome-wide scales. Fortrans-eQTLs we also searched for what we called “master regulatory sites”. These locisimultaneously influence the activity of several genes.
• To analyze the robustness and reproducibility of eQTLs in whole blood across differentstudies.All eQTLs that have been identified in the eQTL studies described in this thesis weretested for replication in all together three different independent data sets. As one of
12

1.3. Outline of this thesis
these data sets showed differences in the preprocessing of gene expression samples itwas of particular interest to explore the robustness of eQTLs.
• To validate if whole blood can be used as a surrogate tissue.We compared the identified cis-eQTLs in whole blood to publicly available eQTL re-sults observed in other tissues (liver, lymphoblastoid cell lines, monocytes, b-cells, andlung tissue, respectively).
Taken together, this thesis shows the analysis of whole-transcriptome expression data in dif-ferent settings (different study design and various different study populations) with the aimto explore various important research questions.One major limitation in whole genome expression data are small effect sizes that requirelarge sample sizes in order to detect effects on a genome-wide scale.We started with about 20 samples in case-control studies and ended up with several thou-sand samples in transcriptome-wide association and eQTL studies, respectively (see Figure1.7).The development of increasing sample sizes required improved methods for data prepro-cessing and analysis which are summarized in this thesis.
● ● ●●
●
●
●
●
●
Study design
Sam
ple
size
010
0030
0050
0070
00
Case−control studies Quality studies Association studies eQTL studies
Figure 1.7.: Sample sizes in the gene expression studies described in this thesis:Each study was conducted in three different populations with increasing samplesizes. We performed two different association studies with two different phe-notypes: blood pressure related phenotypes (indicated with squares) and aging(indicated with triangles).
13

1. Introduction
NStudy
designTissue
Studypopulation
Aim
TraitC
hapterR
eference17
Case-control
Singlecells
Parkinsonpatients,
Disease-specific
3.2.3Elstner
etal.(2009)from
brainold
controlsidentification
24C
ase-controlSingle
cellsParkinson
patients,ofbiom
arkersdisease
3.2.4Elstner
etal.(2011)from
brainyoung/old
controlsand
20C
ase-controlw
holeblood
NBIA
patients,controlstargets
3.3H
artigetal.(2011)
381Q
ualitycontrol
whole
bloodK
OR
AF3
Developm
entof4.1
2,463Q
ualitycontrol
whole
bloodK
OR
AS4,F4,F4O
GTT
qualitycontrolled
quality4.2
3,358Q
ualitycontrol
whole
blood,M
etaXpress
preprocessingand
variables4.3
Schurmann
etal.(2012)m
onocytesanalysis
strategy377/989
Association
whole
bloodK
OR
AF3/F4
Identificationofgenes
5.1.15,907
Association
whole
blood,M
etaXpress,M
ESAassociated
with
blood5.1.2
Mueller
etal.(2014)m
onocytesblood
pressurepressure
7,017A
ssociationw
holeblood
CH
AR
GE
relatedphenotypes
5.1.3H
uanetal.(2015)
381A
ssociationK
OR
AF3
Identificationof
5.2.1M
ehta(2009)
993A
ssociationw
holeblood
KO
RA
F4age-related
age5.2.2
7,074A
ssociationC
HA
RG
Ephenotypes
5.2.3Peters
etal.(2015)322
Association
KO
RA
F3Identification
6.1M
ehtaetal.(2012)
890A
ssociationw
holeblood
KO
RA
F4ofcis-and
genetic6.2
Schramm
etal.(2014)6,913
Association
CH
AR
GE
trans-eQTLs
variation6.3
Westra
etal.(2013)
Table1.1.:O
verviewofconducted
studies:In
allstudiesgene
expressiondata
were
analyzedtranscriptom
e-wide
with
differenttraitsofinterest.
KO
RA
isthe
abbreviationforK
ooperativeG
esundheitsforschungin
derRegion
Augsburg
(Cooperative
Health
Research
inthe
Region
ofAugsburg).Itis
apopulation-based
studyconsisting
ofseveralsurveyssuch
asF3,S4
orF4.M
etaXpress
isa
consortiumconsisting
ofthreepopulation-based
studiesw
ithavailable
geneexpression
datam
easuredin
whole
bloodand
monocytes,respectively.M
ESAis
theabbreviation
forU
SM
ulti-EthnicStudy
ofA
therosclerosisand
isa
population-basedstudy.
CH
AR
GE
(TheC
ohortsfor
Heart
andA
gingR
esearchin
Genom
icEpidem
iology)isa
largeinternationalconsortium
andconsists
ofseveralEuropean,Am
erican,andA
ustralianpopulation-based
studies.
14

2. Material and methods
2.1. Study population and consortia
2.1.1. KORA
KORA (Kooperative Gesundheitsforschung in der Region Augsburg - Cooperative HealthResearch in the Region of Augsburg) exists since 1996 in the region of Augsburg in the southof Germany and builds on MONICA (Monitoring of trends and determinants in cardiovas-cular disease) (Holle et al., 2005). It is a regional research platform for population-basedsurveys and follow-up studies and a cohort of more than 18,000 subjects are actively fol-lowed up to date.Four cross-sectional healthy surveys S1 to S4 have been performed at five years intervalseach containing independent random samples with German nationality from Augsburg cityand sixteen communities from the adjacent counties. All study participants were asked forsociodemographic variables, risk factors (smoking, alcohol consumption, physical activity,etc.), medical history and family history of chronic diseases and some more clinical parame-ters.
The KORA F3 (follow-up study of KORA S3) samples were collected between 2003 and2004 and 2,974 individuals were included. Additionally the genotypes of 1,388 samples werecollected.
The measurement of gene expression levels in KORA S4 and F4 was a project in colla-boration with the DDZ (Deutsches Diabetes Zentrum - German Diabetes Center Dusseldorf)and therefore the aim of the study was the early diagnosis and the prediction of diabetes.Testing for pre-diabetes in a large population is only possible with a time-consuming oralglucose tolerance test (OGTT). Normal and easy fasting blood glucose monitoring methodsmiss about 40% of the undetected diabetics.Blood was taken from fasting subjects and the fasting blood glucose levels were determined.Then 75g of dextrose was drunk, two hours later blood was taken and the blood glucoselevel was determined again. So the reaction of the body to supply of glucose could be identi-fied. Altogether three blood probes of each sample were available: a baseline measurement(KORA S4), a follow-up measurement around eight years later (KORA F4) and the measure-ment after the oral glucose tolerance test (KORA F4 OGTT).Additionally there are several clinical and sociodemographic variables available and the ge-netic variation.
2.1.2. SHIP-TREND
SHIP is a population-based project in West Pomerania, a region in the northeast of Germany.For all projects in this thesis samples from the SHIP-TREND study were used. Baseline ex-aminations for this study started in 2008. From the total population of West Pomerania com-
15

2. Material and methods
prising approximately 210,000 inhabitants, a stratified random sample of 8,016 adults wasdrawn. Stratification variables were age, sex, and city/county of residence. By the end of2012, 4,420 samples have been examined. The detailed study design and sampling methodsare described by Volzke et al. (2010). All analyses in the SHIP-TREND study were conductedby Dr. Claudia Schurmann or Dr. Alexander Teumer.
2.1.3. ECGUT
The Biobank of the Estonian Genome Center of the University of Tartu (EGCUT) is basedon a population-based study which collected data of more than 50,000 individuals. In com-parison to the KORA F4 data the age distribution of EGCUT reflects the age distribution ofthe adult Estonian population. We worked together with Eva Reinmaa who conducted theanalysis in the EGCUT data set.
2.1.4. GHS
The Gutenberg Health Study (GHS) is designed as a community-based, prospective, obser-vational, single-center cohort study in the Rhine-Main area of Western Germany (Wild et al.,2010). All participants (50% males) live in Mainz and the district of Mainz-Bingen and arebetween 35 and 74 years of age. Baseline examinations of 15,000 study participants were per-formed between 2007 and 2012. All analyses were conducted by Arne Schillert and ChristianMuller.
2.1.5. MetaXpress
In 2011 the MetaXpress Consortium was founded within the DZHK - Deutsches Zentrumfur Herz-Kreislauf-Forschung (German Center for Cardiovascular Research). MetaXpressconsists of three large German study cohorts with available gene expression data:
• GHS (Mainz, Lubeck, Hamburg)Described in Section 2.1.4
• KORA F4 (Munich)Described in Section 2.1.1
• SHIP-TREND (Greifswald)Described in Section 2.1.2
Aim of the project is the common analysis of gene expression data associated with cardiovas-cular phenotypes, like obesity (BMI, Waist-to-hip ratio), hypertension (systolic and diastolicblood pressure, pulse pressure), and diabetes (fasting glucose, 2h-glucose).The experimental procedure was almost identical for KORA F4 and SHIP-TREND and slight-ly different for GHS (see Figure 2.1). One reason for this is that samples from KORA F4 andSHIP-TREND were both proceeded in Munich using the same protocol. Additionally forboth cohorts gene expression was measured in whole blood while GHS used monocytes.
16

2.2. Useful software for the analysis and visualization of gene expression data
Figure 2.1.: MetaXpress - Experimental procedure
2.1.6. CHARGE
CHARGE is the abbreviation for “The Cohorts for Heart and Aging Research in GenomicEpidemiology” Consortium. It consists of several European, American, and Australianpopulation-based studies. With the expression data of KORA F4 we contribute to the work-ing group “Gene Expression”.
2.2. Useful software for the analysis and visualization of geneexpression data
2.2.1. GenomeStudio
The GenomeStudio software from Illumina is useful to convert the scanned data to expres-sion values and to show first quality parameters. It can also be used to do some basic ana-lyses and graphics. But with an increasing number of samples a high amount of RAM isrequired to upload all samples in one project.One quality score is the detection p-value which indicates the probability that the observedexpression value of a transcript is significant higher than the background noise. All samples(if they are from the same tissue) should have an comparable number of detected transcripts.A low number could be an indication for a poorly processed sample and therefore the num-ber of detected transcripts is a good overall quality score (Illumina, 2007).
17

2. Material and methods
2.2.2. R and Bioconductor
R is a open source software environment for statistical computing and it is available fordownload at http://www.r-project.org/. It can be used on UNIX, Windows and Ma-cOS. It is especially helpful to handle large data sets but could also be used as a calculator.Problem specific code-packages are available on an internet platform (cran) which are madeavailable by other R users. Specifically the Bioconductor (www.bioconductor.org) is anextension of R and was developed to analyze biological data sets (Huber et al., 2015). Thefollowing two lines are necessary to install Bioconductor with the basic packages:
Listing 2.1: Installing Bioconductor with basic packages
source (” ht tp :// bioconductor . org/ b i o c L i t e . R”)b i o c L i t e ( )
The following R packages were used for the analysis in this thesis:
• lumiThis Bioconductor package was used for the normalization of the gene expression data.
• affyThis Bioconductor package was used for the preprocessing the data obtained from theexpression chip of Affymetrix.
• clusterThis package was used to cluster the gene expression data.
• qqman (Turner, 2014)A user-friendly function to create Manhattan plots.
• nlmeThis package was used to calculate linear mixed models.
2.2.3. PLINK
PLINK is a toolset for the analysis of genome-wide associations and the simple handlingof large genetic data. It can be downloaded for free from http://pngu.mgh.harvard.edu/˜purcell/plink/. A variety of questions could be addressed but in this thesis itwas mainly used to filter SNPs according to different criteria and to calculate associationsbetween SNPs and gene expression levels.PLINK is a command line program and needs the genotypes to be in two files.
• MAP-fileThis file contains the chromosome, the rs-number for the SNP, the genetic distance (thisis set to zero in the KORA data), and the position of the SNP (in bp units).
• PED-fileThis file is in the same order as the MAP file and contains the genotypes for each samp-le. The first and the second column contain the family and the sample ID (identical forKORA), the third and fourth column contain the paternal and maternal ID (set to zero
18

2.2. Useful software for the analysis and visualization of gene expression data
in KORA data), the fifth column contains the sex information (1=male, 2=female), andthe sixth column contains a phenotype if necessary (set to -9 in KORA data). Thefollowing columns contain the genotypes in two columns per sample indicating thetwo different alleles.
To calculate the association between any kind of phenotype and the genotypes the followingcode could be used:
Listing 2.2: Calculation of genome-wide association using PLINK
plink−− f i l e genotypes−−assoc−−pheno phenotype . t x t−−recode
2.2.4. SNAP
SNAP (SNP Annotation and Proxy Search) is a web-based tool to calculate the linkage dis-equilibrium (LD) between two SNPs or to search for proxy SNPs1 (Johnson et al., 2008). Thetool can be found on https://www.broadinstitute.org/mpg/snap/.The LD is calculated from real data obtained from the HapMap project.Proxy SNPs are indicated due to the LD structure, the localization on the genome and theavailability on commercial genotype platforms. This tool is very helpful if data from twodifferent genotype platforms should be compared because usually the genotyped SNPs arenot identical.
2.2.5. GWAS catalog
The NHGRI GWAS catalog on https://www.ebi.ac.uk/gwas/was initially founded bythe NHGRI (National Human Genome Research Institute) (Hindorff et al., 2009) and laterimproved by the European Bioinformatics Institute (EMBL-EBI) (Welter et al., 2014). Theaim was to collect the results from all published GWAS and make them available online. OnAugust, 25th 2015 the catalog contains
• 2,269 studies
• 15,020 SNPs
• 16,831 SNP-trait associations
All associations with p-value < 1.0 ∗ 10−5 published until May 2014 are shown in Figure2.2.
1A proxy SNP is a SNP that could replace another SNP and is highly correlated with this SNP (correlationcoefficient is greater than 0.8)
19

2. Material and methods
Figure 2.2.: Published SNP-trait association from the GWAS catalog from May 2014:The distribution of all associations from published GWAS with p-value < 1.0 ∗10−5 on the chromosomes is shown.
20

2.2. Useful software for the analysis and visualization of gene expression data
2.2.6. Ingenuity Pathway Analysis Software
Ingenuity pathway analysis software (IPA) is a commercial software and can be downloadedfrom http://www.ingenuity.com/. It is based on an internal library of pathways and iscalculating a p-value for each canonical pathway by using the probability that the pathwayoccurs by chance. Therefore the right-tailed Fisher´s exact test with an optional Benjamini-Hochberg correction is applied.Lists of genes can be uploaded to identify enriched pathways. The disadvantage of thissoftware is the cost intensiveness but it is justified by the fact that the data base is alwaysup-to-date.
2.2.7. Circos
Circos is a perl-based command line program to create plots that show connections be-tween data points. Because of its circular layout it is optimal to show connections acrossthe genome. The software can be downloaded free of charge from http://circos.ca/.
Figure 2.3.: Example circos plot
Figure 2.3 shows an example for a circos plot created with Circos. Here a SNP (rs12151621)is significantly associated with six different genes (PNKD, CALHM1, DYNLRB2, ZNF93,GHRHR, MLH3). The code for creating this figure is as follows:
21

2. Material and methods
Listing 2.3: Creating a circos plot
<co lors><<inc lude e t c / c o l o r s . conf>><<inc lude e t c /brewer . conf>></colors>
<fonts><<inc lude e t c / f o n t s . conf>></fonts>
<<inc lude ideogram . conf>><<inc lude t i c k s . conf>>
<image><<inc lude e t c /image . conf>></image>karyotype = data/karyotype/karyotype . human . hg19 . t x tchromosomes units = 1000000chromosomes display default = yes
# Links ( are defined in <l inks> blocks )<l inks>z = 0radius = 0 .975 rb e z i e r r a d i u s = 0 . 2 r
<l i n k segdup>show = yesc o l o r = black a5t h i c k n e s s = 5f i l e = l i n k s . t x tr e c o r d l i m i t = 5000</l ink></l inks>
##Adding Probe Gene Labels<plots><plot>type = t e x tc o l o r = blackf i l e = gene . l a b e l s . t x tr0 = 1 . 0 7 rr1 = 1 . 5 rshow links = yesl ink dims = 4p , 4 p , 8 p , 4 p , 4 p
22

2.2. Useful software for the analysis and visualization of gene expression data
l i n k t h i c k n e s s = 4pl i n k c o l o r = redl a b e l s i z e = 25pl a b e l f o n t = condensedpadding = 0prpadding = 0p</plot></rules><<inc lude e t c /housekeeping . conf>>r e s t r i c t p a r a m e t e r n a m e s ∗ = no
The files ”etc/colors.conf”, ”brewer.conf”, ”fonts.conf”, ”ideogram.conf”, ”ticks.conf”, ”im-age.conf”, ”housekeeping.conf” and ”data/karyotype/karyotype.human.hg19.txt” are in-cluded within the software. The files ”links.txt” and ”gene.labels.txt” have to be created.
The file ”links.txt” contains the information about the two data points that should be con-nected. The two data points need one common identifier (column 1 in Table 2.1). The secondcolumn shows the chromosome, then the start and the end position of the gene or the SNP,respectively (for SNPs the start and end position is identical).
eQTL1 hs2 85934498 85934498eQTL1 hs2 219187917 219211515eQTL2 hs2 85934498 85934498eQTL2 hs10 105213143 105218648eQTL3 hs2 85934498 85934498eQTL3 hs16 80574853 80584539eQTL4 hs2 85934498 85934498eQTL4 hs19 20011786 20045765eQTL5 hs2 85934498 85934498eQTL5 hs7 31003635 31019141eQTL6 hs2 85934498 85934498eQTL6 hs14 75480466 75518235
Table 2.1.: Example file for creating a circos plot: ”links.txt”
The file ”gene.labels.txt” (Table 2.2) contains information about every single data point:chromosome (column 1), start position (column 2), end position (column 3), and the label(column 4).
hs2 85934498 85934498 rs12151621hs2 219187917 219211515 PNKDhs10 105213143 105218648 CALHM1hs16 80574853 80584539 DYNLRB2hs19 20011786 20045765 ZNF93hs7 31003635 31019141 GHRHRhs14 75480466 75518235 MLH3
Table 2.2.: Example file for creating a circos plot: ”gene.labels.txt”
23

2. Material and methods
After preparing these two files the circos plot will be plotted by typing:perl bin/circos -conf circos_hotspot1.conf outputdir "/..."-outputfile plot.png
2.3. Statistical methods
2.3.1. Linear regression models
Linear models are usually applied to determine the influence of one or more covariables(x1, ..., xk) on a response variable (y). Normally the basic model looks like this:
yi = β0 + β1xi1 + ...+ βkxik + εi, i = 1, .., n
where ε1, ..εn are independent and identical distributed (i.i.d) unobservable errors with
E(εi) = 0, Var(εi) = σ2
The response variables y and the errors ε can be summarized in the vectors y and ε and allthe covariables in a matrix to get the matrix notation:
y = Xβ + ε
Now the βis (summarized in the vector β) can be estimated by the least-square method:
β = (XTX)−1XT y
This works only if the matrixXTX can be inverted, meaning that the inverseA−1 of a matrixA exists if and only if A is regular (|A| 6= 0) and has the property AA−1 = A−1A = I .The result is an unbiased (E(β) = β) estimator with minimal variance. But numerically thecalculation of the least-square estimator is inappropriate therefore the QR-decomposition isused. It is the decomposition of a matrix into an orthogonal2 and a right triangular matrix.
To test whether one of the covariables xj has an impact on the dependent variable y thefollowing hypotheses are used:
H0 : βj = 0, H1 : βj 6= 0
If H0 is true the covariable xj has no impact on the dependent variable. The test statistic forthis hypothesis is
Tj =βjσj
where σj is the estimated standard derivation of β. The null hypothesis is rejected if
|Tj | > t1−α/2(n− p− 1)
In R the command for the linear regression is
2A square matrix A is orthogonal if AAT = AT = I
24
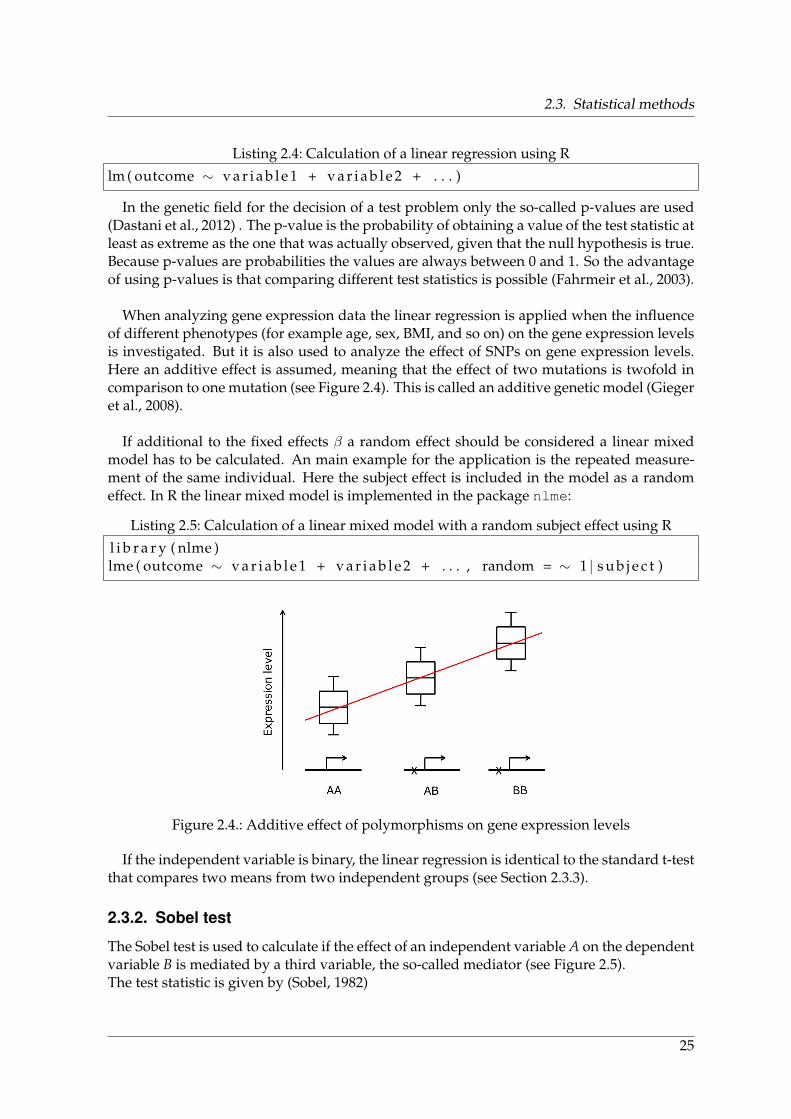
2.3. Statistical methods
Listing 2.4: Calculation of a linear regression using R
lm ( outcome ∼ v a r i a b l e 1 + v a r i a b l e 2 + . . . )
In the genetic field for the decision of a test problem only the so-called p-values are used(Dastani et al., 2012) . The p-value is the probability of obtaining a value of the test statistic atleast as extreme as the one that was actually observed, given that the null hypothesis is true.Because p-values are probabilities the values are always between 0 and 1. So the advantageof using p-values is that comparing different test statistics is possible (Fahrmeir et al., 2003).
When analyzing gene expression data the linear regression is applied when the influenceof different phenotypes (for example age, sex, BMI, and so on) on the gene expression levelsis investigated. But it is also used to analyze the effect of SNPs on gene expression levels.Here an additive effect is assumed, meaning that the effect of two mutations is twofold incomparison to one mutation (see Figure 2.4). This is called an additive genetic model (Giegeret al., 2008).
If additional to the fixed effects β a random effect should be considered a linear mixedmodel has to be calculated. An main example for the application is the repeated measure-ment of the same individual. Here the subject effect is included in the model as a randomeffect. In R the linear mixed model is implemented in the package nlme:
Listing 2.5: Calculation of a linear mixed model with a random subject effect using R
l i b r a r y ( nlme )lme ( outcome ∼ v a r i a b l e 1 + v a r i a b l e 2 + . . . , random = ∼ 1 | s u b j e c t )
Figure 2.4.: Additive effect of polymorphisms on gene expression levels
If the independent variable is binary, the linear regression is identical to the standard t-testthat compares two means from two independent groups (see Section 2.3.3).
2.3.2. Sobel test
The Sobel test is used to calculate if the effect of an independent variable A on the dependentvariable B is mediated by a third variable, the so-called mediator (see Figure 2.5).The test statistic is given by (Sobel, 1982)
25

2. Material and methods
Mediator
Independent variable Dependent variable-
�������3
QQQQQQQs
a (sa) b (sb)
Figure 2.5.: Mediation scheme:a is the regression coefficient for the association between the independent vari-able and the mediator and sa is the standard error of this association. b is thecoefficient for the association between the mediator and the dependent variable,adjusted for the independent variable and sb the corresponding standard error.
tSobel =a ∗ b√
b2 ∗ s2a + a2 ∗ s2
b
Thereby a is the regression coefficient for the association between the independent variableand the mediator and sa the corresponding standard error of the linear regression model. bis the coefficient for the association between the mediator and the dependent variable, ad-justed for the independent variable and sb the corresponding standard error.
When calculating the Sobel test with data from a meta-analysis and using the z-scores thetest statistic is
ZSobel =Z1Z2√Z2
1 + Z22
with Z1 is equal to a and Z2 is equal to b.
In R the Sobel test could be calculated using
Listing 2.6: Calculation of Sobel test using R
mediation . t e s t ( mediator . var , independent . var , dependent . var )
2.3.3. Analysis of variance (ANOVA)
The analysis of variance (ANOVA) is the generalization of the t-test and could be used tocompare more than two groups. The test statistic of a t-test is
T =X − Y√
S2(1/n+ 1/m)
where S2 = ((n − 1)S2X + (m − 1)S2
Y )/(n + m − 2) is the variance of the two independentgroups. The ANOVA takes also the variance between the groups into account which resultsin the following test statistic:
26

2.3. Statistical methods
F =variance between groups
variancewithin groups=
∑Ii=1 ni(Y i. − Y ..)
2/(I − 1)∑Ii=1
∑nij=1(Yij − Y i.)/(n− I)
where I is the number of groups and ni the number of samples in group i (Fahrmeir et al.,2003). The p-value of the ANOVA only indicates that there is an overall difference betweenthe groups but not between which groups. Therefore it is necessary to compare post-hoc allgroups pairwise.
In R the ANOVA could be calculated with the function
Listing 2.7: Calculation of an ANOVA using R
aov ( outcome ∼ group . v a r i a b l e )
2.3.4. Fisher´s exact test
The Fisher´s exact test is used to analyze the association between two groups and two dif-ferent characteristics which can be displayed in the following contingency table:
group 1 group 2 row sumtrait 1 a b a+btrait 2 c d c+dcolumn sum a+c b+d a+b+c+d=n
If there is no association between the groups the probability for any kind of values is deter-mined by the hypergeometric distribution:
p =(a+ba )(c+dc )
(na+c)=
(a+ b)!(c+ d)!(a+ c)!(b+ d)!
a!b!c!d!n!
In R the p-value could be determined using:
Listing 2.8: Calculation of Fisher´s exact test using R
f i s h e r . t e s t ( rbind ( c ( a , b ) , c ( c , d ) ) )
The Fisher´s exact test could be used for example to test if a population is in Hardy-Weinberg-Equilibrium (Wigginton et al., 2005).A population is in Hardy-Weinberg-Equilibrium if the distribution of the genotypes is thesame across several generations (without mutation, migration and with randomly pairing)(Victor, 2007). Assuming two alleles A and B the probability for genotype AA, genotype BBand genotype AB respectively is
P (AA) = P (A)2 P (BB) = P (B)2 P (AB) = 2P (A)P (B)
so that
P (AA) + P (AB) + P (BB) = P (A)2 + 2P (A)P (B) + P (B)2 = [P (A) + P (B)]2 = 1
27

2. Material and methods
2.3.5. Multiple testing problem
When analyzing gene expression data, often each gene is analyzed separately and thereforea high number of statistical tests is necessary and performed. Doing k independent tests theprobability α∗ for getting a false positive result is
α∗ = 1− (1− α)k
When choosing an α of 0.05 and doing 1000 tests the chance for a false positive result is
α∗ = 1− (1− 0.05)1000 = 1− 5.29 ∗ 10−23 ≈ 1
To handle the problem of an increasing false positive rate there are different commonly usedmethods:
• Controlling the family-wise error rate (FWER)In genetics mostly the Bonferroni correction is used because it is easy to apply. Eitherthe observed p-value is multiplied by the number of performed tests or the significancelevel is divided by the number of performed tests.
• Controlling the false discovery rate (FDR)This method is less conservative than controlling the FWER. Table 2.3 shows the sum-mary of a multiple testing situation.
# declared # declared∑
non-significant significant# true null hypotheses U V m0
# non-true null hypotheses T S m−m0∑m−R R m
Table 2.3.: Number of errors committed when testing m null hypotheses (from Benjaminiand Hochberg (1995)). Hereby only R is an observable variable, the others arerandom.
The false discovery rate Qe is the expectation of the random variable Q = V/(V + S)(proportion of rejected null hypotheses which are wrongly rejected)3:
Qe = E(Q) = E {V/(V + S)} = E(V/R)
In case all null hypotheses are true (s = 0 and v = r), the FDR equals to the FWER.Here Q = 0 if v = 0 and Q = 1 if v > 0. Then you get P (V ≥ 1) = E(Q) = Qe. Socontrolling the FDR means controlling the FWER in a weak sense.Benjamini and Hochberg (Benjamini and Hochberg, 1995) mentioned the procedure tocontrol the FDR in the following way (Dudoit et al., 2002):Assuming that it is planned to test m null hypotheses H1, H2, ...,Hm with p-values
3Definition: if V + S = 0, Q is defined to be 0
28

2.3. Statistical methods
p1, p2, ..., pm, where p(1) ≤ p(2)... ≤ p(m) are the ordered p-values and H(j) is the ac-cording hypothesis to p(j). To control the FDR (at significance level α) it has to bedefined that
j∗ = max{j : pj ≤
j
mα
}Then all hypotheses Hj for j = 1, ...j∗ will be rejected.Finally the adjusted equivalent p-values are
pj = mink=j,...,m
{min(
m
kpk, 1)
}• Permutation
Churchill and Doerge (1994) introduced the idea of permutations for microarray expe-riments. It can be used to estimate the significance level for each gene separately. Thedisadvantage is that it is very computer-intensive, especially for large sample sizeswhen the p-values have to be calculated for all possible permutations. The concept forthe permutation test is:
1. Choose any statistical test
2. Analyze the gene of interest and calculate the test statistic
3. Permute the samples and calculate the test statistics for each permutation (nor-mally about 1,000 permutations)
4. Compute the percentage of events where the permuted test statistic is higher thanthe “real” test statistic to obtain the p-value
2.3.6. Pearson‘s and Spearman‘s correlation coefficient
The correlation coefficient is a measurement for the relation between two traits. The Pear-son‘s correlation coefficient is defined by
r =
∑ni=1(xi − x)(yi − y)√∑n
i=1(xi − x)2∑n
i=1(yi − y)2
where −1 ≤ r ≤ 1.
This coefficient was used to determine the correlation between two SNPs which are codedby 0, 1, 2 or when using the imputed data4, the values range between 0 and 2.
The formula of the Spearman‘s correlation coefficient is identical to those of the Pearson‘scorrelation coefficient but applied on the ranks of the data:
r =
∑ni=1(rg(xi)− rgX)(rg(yi)− rgY )√∑n
i=1(rg(xi)− rgX)2∑n
i=1(rg(yi)− rgY )2
where
rgX =1
n
n∑i=1
rg(xi) =1
n
n∑i=1
i = (n+ 1)/2
4When genotype data are imputed the determined SNPs are used to impute the missing SNPs. So for eachimputed SNP the probability for each genotype is given.
29

2. Material and methods
rgY =1
n
n∑i=1
rg(yi) =1
n
n∑i=1
i = (n+ 1)/2
The Spearman‘s rank correlation test is based on the correlation coefficient and is a non-parametric alternative to the linear regression. In R it could be calculated by
Listing 2.9: Calculating Spearman‘s rank correlation test using R
cor . t e s t ( x , y , method = ‘ ‘ Spearman ’ ’ )
2.3.7. Agglomerative clustering
The aim of clustering gene expression data is to identify outliers that show a different ex-pression pattern than all other samples. Here the agglomerative clustering was used. Thismeans that the number of clusters is not predefined and in the beginning each sample be-longs to one small cluster. This small clusters were added together until no further similar-ities between two clusters could be identified. The distance between two samples could becalculated in different ways. The most commonly used distance is the Euclidean distance:
dist(x, y) =√
(x1 − y1)2 + ...+ (xn − yn)2
The result of the clustering is normally shown in a dendrogram (Rahnenfuhrer, 2004) tovisualize the following information:
• Associated clusters are next to each other and connected by a line.
• The length of the connecting line is the average distance between the observations inthe two clusters.
• The variation in the clusters on the left side is smaller than the variation in the clusterson the right side of the dendrogram.
The R package cluster and more precisely the function agnes() with default settingswas used to cluster all data.
2.3.8. Principal component analysis
The principal component analysis (PCA) is used to reduce the dimension of large data setswithout loosing information. Therefore a set of unrelated and orthogonal variables, the so-called principle components (PC), were determined. Principal components are linear com-binations of the original variables. The first PC is explaining most of the variance of theoriginal data. The remaining PCs are explaining less variance in a descending order. Forgenetic data the PCA (especially the first two PCSs) is sometimes used to identify outliers orclusters in the data.
If Yt = (Y1, ..., Ym) is a m-dimensional vector of random variables with expectation µ andcovariance matrix Σ (for expression data Y1 represents the expression values of probe i andso on) the aim is to identify new uncorrelated variables Z1, ..., Zm in which
Zj = a1jY1 + a2jY2 + ...+ amjYm = atjY,
30

2.3. Statistical methods
where atj = (a1j , a2j , ..., amj) is a vector of constant variables. To avoid arbitrary scales it isnormalized to atjaj =
∑mk=1 a
2kj = 1. The most important condition is the maximization of
V ar(Zj) = V ar(atjX).The so-called loadings aij are determined by applying a singular value decomposition whereX is decomposed to
Y = UDVT
where the matrices U and V are column orthogonal so that UTU = VTV = I and D is adiagonal matrix.
The PCA is implemented in the R function prcomp(). For all analyses in this thesis thefollowing setups which returns the Eigen-vectors (so-called Eigen-genes when working withgene expression data) were used :
Listing 2.10: Calculating a PCA using R
pc <− prcomp ( data , r e t x = TRUE, c e n t e r = TRUE, s c a l e . = TRUE)ev <− as . data . frame ( p c $ r o t a t i o n )
• retx = TRUEThe rotated variables are returned.
• center = TRUEThe variables are shifted to be zero centered.
• scale. = TRUEThe variables are scaled to have unit variance before the analysis.
The principal component analysis was used to determine the influence of technical vari-ables on the gene expression levels and to reduce the variance in the data by adjusting fora certain number of Eigen-genes. It is also the basic principle for the Eigen-R2 algorithm(Chen and Storey, 2008). The Eigen-R2 can be calculated for each kind of variable to deter-mine the proportion of variance that is explained by this variable. This algorithm consists offour steps:
1. Y is an m x n expression matrix with m probes and n samples. With the singular valuedecomposition this matrix is decomposed to Y = UDV T . U and V are column ortho-gonal and D is a diagonal matrix.
2. Each column of V is denoted by vi and the user can specify a model of vi on the in-dependent variable z for getting fitted values vi, where i = 1,2,...,n. Then the R2 iscalculated with the following formula:
R2vi
=σ2vi
σ2vi
=
∑nj=1(vij − vi)2∑nj=1(vij − vi)2
3. The proportion of variation that is explained by vi is calculated with the formula
πi =d2i∑L
l=1 d2l
Here di represent the Eigen-value of the i-th Eigen-vector.
31

2. Material and methods
4. At last the overall Eigen-R2 is calculated by:
Eigen−R2 =n∑i=1
πiR2vi
The algorithm is implemented in the R-package eigenR2 and was originally available onthe Biconductor homepage. Now it can only be downloaded from the author´s homepage:www.genomine.org/eigenr2/. The default settings were used which means that themodels were fitted by least squares.
2.4. Genotyping of KORA F3 and F4 samples
The genotypes of KORA F3 and F4 were determined using so called SNP chips, a microarray-based technology. The genotyping of KORA F3 was performed using the Affymetrix 500Karray set while KORA F4 was performed using the Affymetrix 6.0 chip.The genotype data were quality controlled and imputed using IMPUTE (Howie et al., 2009)in the Institute of Epidemiology at the Helmholtz Center Munich.
2.4.1. Filtering of SNPs in KORA F3
The SNPs were filtered using the same criteria as Doring et al. (2008). In total there were500,568 SNPs and PLINK was used to filter out all SNPs that pass the following criteria:
1. Not on X-chromosome: 490,032 autosomal SNPs are remaining.
2. Genotyping efficiency < 95%: 49,325 SNPs have more than 5% missing values.
3. Minor allele frequency < 5%: 10,1323 SNPs were excluded because the frequency ofthe less frequent allele is less than 5%.
4. Deviation from Hardy Weinberg equilibrium tested with Fisher´s exact test: 4,232 SNPswere excluded.
All together 335,152 SNPs were selected for the subsequent analysis.
The used PLINK code was:
Listing 2.11: Filtering of SNPs using PLINK
−− f i l e KORA Genotypes−−geno 0 . 0 5−−maf 0 . 0 5−−hwe 0.000001−−f i s h e r−−model−−recode−−out KORA Genotypes snps filtered
32

2.5. Measuring of gene expression levels
2.4.2. SNP selection in KORA F4
Genotype data of 993 samples from KORA S4 and F4 are available. PLINK was used to filterthe SNPs according to common filter criteria that were also used for the KORA F3 data:
• Starting with 692,637 SNPs
• 136 markers to be excluded based on HWE test ( p ≤ 1e−6 )
• 56 SNPs failed missingness test ( GENO > 0.05 )
• 75,555 SNPs failed frequency test ( MAF < 0.05 )
• Resulted in 616,941 SNPs
The positions of the SNPs were checked in a database and updated.The major and minor alleles and the minor allele frequency of each SNP were determinedwith the PLINK command --freq.SNPs with more than one hit in the database or with hits on the mitochondrial-chromosome(n = 26) were excluded from further analysis (all together n = 2,790 SNPs).
2.5. Measuring of gene expression levels
The development of microarrays allows to measure the expression levels of thousands genessimultaneously. The two largest providers of these arrays are Illumina and Affymetrix, twoAmerican companies that develop and sell products for the analysis of genetic information.With only one exception the expression arrays of Illumina are used and therefore the workflow for Illumina expression data is described here more in detail.
2.5.1. Experimental protocol for measuring gene expression using Illuminaarrays
The blood was collected in PAX tubes at the KORA study center in Augsburg and imme-diately transported to the Institute of Human Genetics of the Helmholtz Center in Munich.The PAX tubes were stored overnight at room temperature according to the manufacturersinstructions and then further stored at 4◦C until required.
The quality of the RNA was measured with the Agilent Bioanalyzer. The Bioanalyzer isan automated bio-analytical device to perform the quality control of DNA and RNA samp-les (Mueller et al., 2000). The most informative output is the RNA integrity number (RIN)(Schroeder et al., 2006) which ranges from 1-10. A RIN number of 1 indicates that the RNA isdestroyed by enzymes (degraded RNA) while a RIN number of 10 indicates an intact RNAsample.The amount of RNA was determined using the Invitrogen Ribogreen kit.
The RNA obtained from whole blood is usually not enough for a microarray experimentand furthermore it is not labeled. Therefore, a step of amplification combined with reversetranscription and labeling with Biotin is required before the sample can be processed on the
33

2. Material and methods
Collection of blood in PAX tubes in Augsburg
Transport to Munich
PAX tubes stored at room temperature overnight, then at 4◦C
RNA Isolation from whole blood
Quality check using Bioanalyzer Quantification using Ribogreen
RNA is amplified, reverse transcribed, and biotin-labeled into cRNA
cRNA hybridized on Illumina microarray
Washing, blocking, detection, and scanning of microarrays
Quality control of data using BeadStudio
Data analysis
?
?
?
?
?
?
?
Figure 2.6.: Experimental workflow for measuring gene expression using an Illumina expres-sion array in KORA F3
34

2.5. Measuring of gene expression levels
microarray. The Illumina Total Prep RNA amplification kit was used to generate biotiny-lated, amplified cRNA out of 500ng RNA for hybridization with Illumina arrays.
The Illumina system uses a direct hybridization assay, whereby gene-specific probes areused to detect labeled RNA. Each bead in the array contains a sequence-specific probe of50 nucleotides. Illumina offers three whole-genome formats: 6-sample (used for KORA F3),8-sample and 12-sample (used for KORA F4). Each array in the matrix consists of thousandsto tens of thousands of different oligonucleotide (short, single-stranded parts of RNA) probesequences. Multiple copies of each bead type are present in the array, on average≈ 30 copiesper probe.In KORA F3 1500ng and in KORA F4 3000ng of cRNA was used for the hybridization on theIllumina HumanWG-6 v2 (KORA F3) or the Illumina HumanHT-12 v3 (KORA S4 and F4)Expression BeadChip.
The Illumina Bead Array reader was used to image the Bead chips. After scanning, theraw data was imported from the Illumina BeadStudio (used for KORA F3 data) softwarewhich was replaced in 2009 by the GenomeStudio (used for KORA F4 data).
The main difference between KORA F3 and F4 was that the samples in KORA F3 wereused directly after the blood draw. The samples were transported immediately to the Helm-holtz Center and the RNA was isolated. For the S4 and F4 samples the blood was alsocollected in PAX tubes, but then they were frozen until the RNA isolation. The S4 sampleswere partly frozen up to ten years. Another difference is that the F3 samples were processedindividually however the F4 samples were processed in groups of 96.
2.5.2. Analyzing gene expression data using Affymetrix arrays
Blood samples (19ml of peripheral blood) were taken from patients and their healthy siblingsunder fasting conditions after informed consent. 2.5ml of the blood were collected directlyin PAXgene Blood RNA tubes (PreAnalytiX) and were stored for six months at −70◦C. TheRNA extraction was done using the PAXgene Blood RNA Kit (Qiagen).1µg of RNA of each sample was used to reduce the globin with the Ambion GLOBINclearTMKit. The following steps were done with both probes of each sample.RNA and cRNA quality control was carried out using the Bioanalyzer (Agilent) and quantifi-cation using Ribogreen (Invitrogen). The concentration was measured with the NanoDrop.200ng of RNA were reverse transcribed into cDNA and biotin-UTP-labeled the RNA usingthe GeneChip WT Terminal Labeling Kit from Ambion.
This was the only project where the cRNA was hybridized to the Affymetrix GeneChipHuman Gene 1.0 ST Array. Washing steps were carried out in accordance with the Affymetrixprotocol. The quality of the expression data was checked with the Affymetrix Software Ex-pression Console and due to bad quality of the RNA two samples were removed from furtheranalysis and 19 samples passed all quality criteria. The statistical analysis was done usingthe Bioconductor package affy. The expression values were calculated with the functionrma (Irizarry et al., 2003) and were by default logarithmized and normalized with the quan-tile normalization (see Figures 2.7 and 2.8). The R code for the transformation of the raw
35
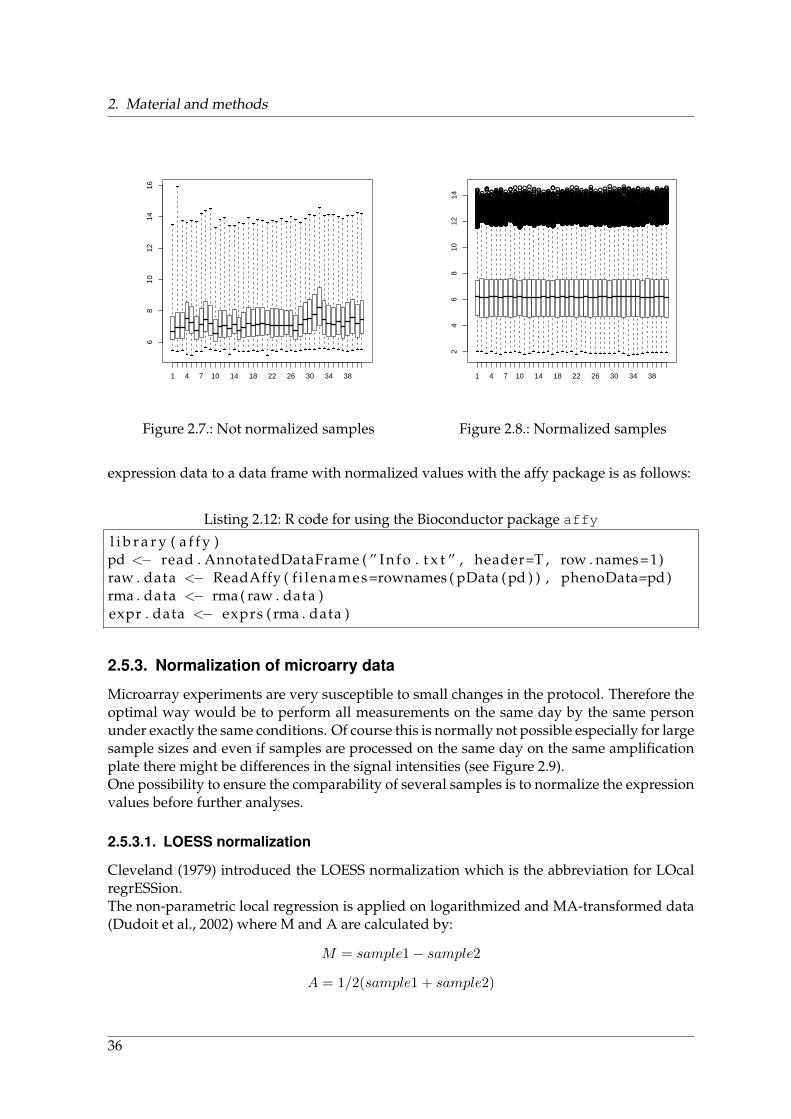
2. Material and methods
1 4 7 10 14 18 22 26 30 34 38
68
1012
1416
Figure 2.7.: Not normalized samples
●●●●
●
●
●
●
●●
●●●●
●●●
●
●
●
●●
●●
●
●
●
●
●●
●
●
●●●
●●
●
●
●●●●
●
●
●
●●●●●
●●●
●
●●
●
●●
●●●
●
●
●
●
●●●
●
●●
●
●●
●
●
●●
●
●
●●●
●●
●
●
●
●
●
●
●
●
●
●
●●
●
●●●●
●
●
●●
●
●
●
●
●
●
●
●
●●●
●●
●
●●●●●●●
●●
●●
●
●
●●●●●●
●
●●
●●
●
●
●
●
●
●
●
●
●
●●●
●
●
●●
●
●●●
●●
●
●●
●
●●●●
●
●
●
●●
●
●
●●
●
●
●
●
●
●
●
●
●
●
●
●
●
●
●
●
●
●●
●
●
●●
●
●
●
●●●
●
●●
●
●
●
●
●
●
●
●
●●●
●●●
●●
●
●●
●
●
●
●
●●●●●●●
●
●●
●●●
●
●●●
●
●●
●
●●●
●
●
●
●●
●
●●●●●●
●
●
●
●
●
●●
●
●●
●●●●
●
●●●●●
●●●
●
●
●
●
●●
●●●
●
●
●
●
●
●●
●
●
●●●
●
●●
●
●●
●
●●●●
●
●
●
●●
●●●●●
●
●●●
●
●
●
●●●
●●●●
●●●●●
●
●●●●●●●
●●
●●
●
●
●
●
●●
●●
●
●
●●
●
●
●
●
●
●
●
●●
●●
●
●
●
●
●
●●●●
●
●●●●●
●
●●●●●●
●●●
●●●●●
●
●●
●●
●
●●
●●●
●●●
●
●
●
●●
●
●●●
●
●
●
●●
●
●
●●
●
●
●
●
●
●
●
●
●
●
●
●
●●
●
●●●
●
●
●
●
●
●
●
●
●
●
●●
●●
●
●
●
●●
●
●●
●
●●
●
●
●
●
●
●
●
●●
●
●
●
●
●●
●●
●●
●
●
●
●●
●●
●
●
●
●●
●
●
●
●●
●
●●
●
●
●●●●
●
●
●
●●
●●
●●
●
●
●
●
●
●●
●
●
●
●
●●
●
●
●
●●●
●●●●●●
●
●
●●
●●●●●●
●●
●●
●
●●
●●
●
●
●●
●
●
●●
●
●
●
●●●
●
●
●
●
●
●
●
●
●
●●●
●●
●
●●●●
●
●
●●
●●
●●
●
●●
●
●
●●●
●●
●●
●●
●
●●
●●
●
●
●●
●●●●
●
●●
●●
●
●●
●
●
●●
●
●●●●
●
●●
●
●
●●●
●
●
●
●●●●●
●●
●
●●●●
●
●
●●
●
●
●
●
●
●
●
●
●
●
●●
●
●●●●●
●●
●
●
●
●
●
●●
●●
●
●●
●
●●
●
●
●
●
●●
●●●●●●
●
●●
●
●
●
●
●●
●●
●
●
●
●
●
●●
●●
●
●
●●●
●
●
●
●
●
●
●
●●
●●
●
●
●
●
●●
●
●
●
●●
●
●●
●
●
● ●●●●
●
●
●●●
●●●●●
●
●
●
●
●
●●●
●
●
●
●●
●
●
●●●●●
●●●
●
●
●●
●
●
●
●●●●●●●●●
●●
●
●●
●
●
●
●
●
●
●
●●
●●
●●●
●●
●●●●
●
●
●●
●●
●
●
●●●●
●●
●
●●●●
●
●
●●
●●
●●
●
●●●
●●●●●●●
●
●●●●
●●
●●●
●●●●●
●●●
●●
●
●
●
●
●
●
●
●
●●
●●●
●
●●
●
●
●●●●
●
●
●
●●●
●
●
●
●
●●
●●
●●
●
●
●
●
●
●
●
●
●
●
●
●
●
●●
●
●●●●●
●●
●
●
●
●
●
●●
●
●
●
●
●●
●●
●
●●
●
●
●
●
●
●●●
●●●●
●
●●●●●●
●
●●●
●●
●
●
●
●
●
●
●●
●
●
●
●
●
●
●●
●
●●●●
●
●
●
●
●
●
●
●●
●●●
●
●
●
●
●
●
●●
●
●
●
●
●
●●
●
●●
●
●
● ●●
●
●●
●
●●●
●●●●●
●
●●
●
●●
●●
●
●
●●
●●
●
●
●●●●
●
●
●●●●
●
●
●
●
●●●●
●●
●
●●
●●
●
●
●
●●●●
●
●●●
●
●
●
●●
●
●●●
●
●
●●●
●
●
●
●
●
●●●●
●●
●
●●●●●●
●
●
●●
●●
●
●
●
●
●
●
●●
●●
●●
●
●●
●●
●
●●
●●●
●●●●●
●
●
●●
●●
●●●
●
●
●
●
●
●●
●
●
●●
●
●
●
●
●●
●
●●●
●
●●●●
●
●
●●●
●
●●●●
●
●
●
●
●
●
●
●
●
●●
●
●
●
●
●●●●●●
●
●
●
●
●
●●
●
●
●
●●
●●
●
●
●
●
●
●●
●
●●
●●●●●
●
●●●
●
●●
●●●●
●
●
●●
●●
●●
●
●●
●
●●
●
●
●
●
●●
●
●
●●
●
●●●
●
●●
●
●
●
●●
●●
●●●
●
●
●
●
●●
●
●
●●●
●
●●
●
●●
●
●
● ●●
●●
●
●
●
●
●
●
●
●●●●
●
●●●
●●●●
●
●●●●
●
●
●●●●
●●●
●
●
●●
●
●
●●●●●●●●●●
●●
●●●
●
●
●
●
●
●
●
●
●
●●
●
●●
●
●●
●
●
●
●
●
●
●
●●
●●●
●
●
●●●
●
●
●●
●●
●
●●
●●●●●●
●●●●
●●
●●
●
●●
●●
●
●
●
●●
●●
●●
●
●
●
●
●
●
●●
●●
●
●
●
●
●
●●
●
●
●
●●●●
●●●
●
●
●●
●
●●
●
●
●
●
●
●
●
●●
●
●
●●
●
●
●
●●●●●●
●●
●
●
●
●
●
●
●
●
●
●
●●●
●●
●●●
●
●●
●●
●●
●
●
●●
●●●
●
●●●●
●
●
●●
●●
●
●●●●●●
●
●
●
●
●
●
●●
●●●
●●●●●●●●●
●●●
●
●●
●
●
●
●
●●
●
●
●
●
●
●●
●
●●
●
●
●
●
●
●●
●
●●●●
●
●
●
●●
●●●●●
●
●●
●●
●●
●
●●
●●●
●●●●
●
●
●●●●
●
●●●
●●●●●
●●
●
●●
●●
●
●
●
●
●
●●
●
●
●●
●●●
●
●
●
●
●
●
●
●●●●●
●
●●●
●
●
●●
●
●
●●
●
●●●
●●●●●●
●●●●●
●●●
●●●●●●
●
●●
●●
●
●●
●
●
●
●
●
●●
●●
●
●
●●
●
●
●●
●●
●
●
●●●●
●●
●
●
●
●
●●
●
●
●
●
●
●
●
●
●
●
●
●
●●
●
●●●●
●
●
●
●
●●
●
●●
●
●●●
●
●
●
●
●
●●
●●
●
●●
●●
●
●●●●
●
●●●●
●
●
●
●
●
●
●
●●●●
●
●●
●●●●
●
●
●
●
●
●
●
●●
●●●
●
●
●
●●
●
●
●●
●●
●
●●
●●●
●●●
●●
●
●
●●●
●●
●●●●
●●●●
●
●●●●
●●●●
●
●●●●
●
●●●
●●
●●
●●
●●●
●
●
●
●
●
●●
●●
●●
●●
●
●
●●●
●●
●●●●
●
●
●
●
●●
●
●●
●
●●●
●●●●●●●●●
●●●
●●
●
●●
●●
●
●
●●
●●●
●●●●
●
●
●●
●
●●
●●
●
●●●●
●
●●
●●●
●
●●
●
●
●
●
●
●
●
●
●
●
●●
●
●●●●●
●●
●
●
●
●
●
●●●
●●
●
●●●●
●
●
●●
●
●●●●
●
●
●●●
●
●●●
●●
●
●
●
●
●
●
●
●●●
●●
●
●
●
●
●
●●
●●
●
●
●
●●●
●●
●●
●
●●
●●● ●●
●
●
●
●
●
●●
●●
●●●
●
●
●●●
●●
●
●●●
●
●
●●●●●
●●●●●
●
●
●●●●●
●
●
●●
●
●
●
●
●
●●●
●
●●
●
●
●
●●●
●
●●●
●
●
●
●
●
●●●
●●
●
●●●●
●
●
●●
●●
●
●●●
●●●
●●●
●
●
●●
●
●●
●●
●
●
●●●●●
●●●
●●
●
●
●
●
●
●
●
●
●●●●
●
●●
●
●●●
●
●
●
●●●●●
●
●
●
●●●●
●
●
●
●
●●
●
●
●
●
●
●
●
●
●
●●
●
●
●
●
●●
●●●
●
●●
●
●
●
●●
●●
●●
●
●●
●
●●
●
●
●●
●
●
●●●
●
●●●●
●
●●●●●
●
●●●
●
●
●
●●
●
●●●●
●
●
●
●
●
●●
●
●
●●●●
●
●●●●
●
●
●
●
●
●
●
●●
●●●
●
●
●
●
●●
●
●
●
●●
●
●●
●
●●
●
● ●
●
●●
●●
●
●
●
●●
●●●
●●
●
●
●●●●
●●
●●●
●
●
●
●●
●
●
●
●●
●●
●
●●
●
●
●●
●
●
●
●●●●
●●●
●●
●
●●
●
●
●●
●
●
●
●
●●●
●
●
●●
●●
●
●
●
●
●●●
●
●●
●●
●
●
●
●
●
●
●●●●
●
●●
●
●●●
●
●
●●
●
●
●●
●
●●●
●●●●
●
●●●
●●●●
●
●●
●●●
●●●
●●●●
●
●●
●
●
●
●●
●
●
●●
●●●
●●
●
●
●
●
●
●
●
●●●●
●●
●
●
●
●●●●
●
●
●
●
●
●
●
●●
●
●●●
●
●●
●
●
●
●
●
●
●●
●
●
●
●●
●
●●●●●●
●
●
●
●
●
●
●
●●●
●
●
●
●
●
●
●
●
●
●
●
●
●
●
●●●
●
●
●●
●
●●●●●●●●●
●
●●●
●
●
●
●
●
●
●●●●●
●
●
●
●
●
●
●
●●
●
●●
●
●
●●●●
●
●
●
●
●
●
●
●●
●●●
●
●
●
●
●
●●●
●
●●●
●
●●
●
●●
●
●
●
●●●
●●
●
●
●
●
●
●●
●●●
●
●
●
●●
●●
●
●
●●●
●
●●●
●●●
●●●●●
●
●
●●●●●
●
●●
●●
●●
●
●●
●
●
●
●
●
●
●
●
●●
●
●●
●●
●
●
●
●
●
●
●
●
●●
●●●
●
●
●●●
●
●
●●
●
●●
●
●
●
●
●●●●
●●
●
●●●●
●●
●●
●
●
●●●●●
●●●
●
●
●
●●
●
●
●
●
●
●
●
●
●●
●
●
●●
●
●●●
●●
●
●●●●●●
●
●
●
●●●
●●
●
●
●●
●
●
●
●
●
●
●
●
●
●
●
●●
●
●●●●●●●
●
●
●
●
●
●
●●
●
●
●
●
●
●
●●
●
●●
●●
●●
●●
●●●
●
●●
●
●●
●●
●
●
●
●
●
●
●
●
●●
●
●●
●
●●●
●
●
●
●
●
●
●
●●
●●●
●
●
●
●
●●
●
●
●
●●
●
●●
●
●●
●
●●
●
●
●
●
●
●
●
●
●●●
●
●
●
●●●
●●
●●
●
●
●
●●
●
●
●
●●
●●●●
●
●
●●●
●
●
●●●●●●●
●
●●
●
●
●
●●
●
●
●
●
●●●
●
●●●
●●
●
●
●●●
●
●●●●
●
●
●
●
●
●●●
●●●
●
●●
●
●
●
●●
●
●●
●
●●
●●●
●●
●
●
●●●●●●
●●
●●
●
●
●●●
●●●●
●●●
●
●
●●
●
●●
●
●
●
●●●●
●●
●
●
●
●
●
●
●●
●●
●
●
●
●
●
●
●
●●
●
●
●
●●
●
●
●
●
●
●
●
●
●
●
●
●
●
●●
●
●
●●
●
●
●●●●●●●●
●
●
●
●
●
●
●●
●●
●
●
●
●
●●
●
●
●●
●●
●●●●●
●
●●●
●
●
●●●
●●
●
●
●
●●●
●
●●
●
●●●●
●
●●●●●
●
●
●
●
●
●
●
●
●●
●●
●
●
●●
●
●●
●
●
●
●
●●
●
●●
●
●
●
●●●
●●
●
●
●
●●
●●●
●●●
●
●
●
●●
●●
●
●
●
●
●●●
●●●
●●
●●●●●●
●
●●
●●●●●●●●
●
●●
●●
●
●●
●
●
●
●
●
●
●
●
●●
●
●
●●
●●
●●●●
●
●
●
●
●
●
●
●●
●●
●●
●●
●
●●●●
●
●
●●
●
●
●
●
●
●●●
●●●●
●
●
●
●
●●●●●
●●
●●●
●
●●
●●●●
●
●●
●●
●
●●
●
●
●
●
●
●
●
●
●
●
●
●
●
●
●●
●
●●●
●●
●
●
●
●●
●
●
●
●
●
●●
●
●
●
●●
●
●
●
●
●
●
●
●
●
●
●
●
●
●
●
●●
●
●
●●
●●●●●●
●
●
●
●
●
●
●
●●●
●
●
●●
●●
●
●●
●
●●●
●
●
●●●●
●
●●●
●
●●●
●●●
●
●●●●
●
●
●
●
●
●
●
●
●
●
●
●
●
●
●●
●
●●●
●
●
●
●
●
●
●
●●
●●●
●
●
●
●
●●●
●
●●
●
●●
●
●●
●
●
●●●●●
●
●
●
●
●●
●●●●●
●
●
●●●
●
●
●●●
●
●
●●●●●
●
●
●
●●●
●
●
●
●●●●●●
●
●
●●
●
●
●
●●
●
●
●●●
●
●●
●
●●
●●●
●
●
●●
●●
●●
●●
●
●
●
●●
●
●
●●
●
●●
●
●●●
●●●
●
●
●●●●●
●●
●●●
●●●
●●
●
●●
●●
●
●●
●
●
●
●
●
●
●●●●
●
●●
●
●
●●
●●
●
●●●●
●
●
●
●
●●●●
●
●
●
●
●●
●
●
●
●
●
●
●
●●
●
●●●●●●●
●
●
●
●
●
●
●
●
●
●●
●
●●
●
●●
●
●
●
●
●●●
●
●●●
●
●●●●
●
●●●
●
●
●
●
●
●
●
●
●
●
●
●
●
●
●
●●
●
●●●
●
●
●
●
●
●
●
●●
●●
●
●
●
●
●●
●
●
●
●
●●
●
●●
●
●●
●●●
●
●
●
●
●●
●●●
●●●
●
●●●●
●●
●●
●
●
●
●●●
●●●
●●
●●●●
●●
●
●●●
●●●
●●
●●
●●
●
●●
●
●
●
●
●●
●
●
●
●
●●
●●
●
●
●
●
●
●
●
●
●
●
●
●●●●●
●
●●●
●
●
●●
●
●
●●
●
●
●●
●●
●●
●●●●●●●
●●
●●●
●●●●
●●
●●●
●●
●
●●
●
●
●●
●●
●
●
●
●
●
●
●●
●
●●●
●●
●
●
●
●●●
●●
●
●
●●
●
●
●
●
●
●
●
●
●
●
●
●
●
●
●
●
●●●●●●
●
●
●
●
●
●
●●
●
●
●●
●
●
●●
●
●●●●
●
●●●●
●●●
●
●●●●
●
●
●
●
●
●●
●
●
●●●●●
●●●
●●
●
●
●
●●
●●
●
●
●
●●●
●
●
●
●
●
●
●●
●●
● ●●
●●
●
●
●
●
●
●●
●●●
●
●
●
●●
●●
●
●●●●
●●●
●●
●
●●●●●
●
●
●●●●●●●
●●
●●
●●
●
●
●
●●●
●
●
●●
●
●
●
●●●
●
●●●
●
●
●
●
●
●●●
●●
●
●●●●
●
●
●●●
●
●
●
●
●
●
●●●●
●●
●●●●
●
●●
●●
●
●●●●●●
●
●
●●
●●
●●
●
●
●
●
●
●●
●
●●●
●
●
●
●
●
●●
●●
●
●
●
●
●
●
●
●
●
●
●
●●●
●
●●
●
●
●
●
●
●
●
●
●
●
●
●●
●
●
●●●
●●●●●
●
●
●
●
●
●
●●●
●●
●
●●
●
●●
●
●●●
●
●
●●●●●
●
●●●●
●
●●●●●
●
●●●
●●
●●
●
●●●●●
●
●
●
●●
●
●●
●
●●●●●
●
●●●●●
●
●
●
●
●
●
●
●●
●●
●
●
●●
●
●●
●
●
●
●
●●
●
●●
●
●●
●
●●●●
●●
●
●
●●
●
●
●●
●
●
●●●●
●●●●
●
●
●
●●
●
●
●●●●
●
●
●
●
●●●
●
●
●●●
●●●●
●●
●
●●
●●●●
●
●
●
●
●●
●●●
●●
●●
●●
●
●
●
●●●
●
●
●●●
●
●
●
●
●
●●
●●
●●
●
●●●●●
●
●
●●
●
●
●
●
●
●
●
●
●●●
●
●●●
●
●●●
●●
●●●
●●●●
●
●
●
●●
●
●
●●
●
●
●
●●
●●
●●●
●
●
●
●●●
●
●
●
●
●●
●
●
●●●
●
●
●
●
●
●
●●●
●
●
●
●
●
●
●
●
●
●●
●
●
●
●
●
●
●
●●
●●●●●●
●
●
●
●
●
●
●
●
●●
●
●
●
●
●●
●
●
●
●
●
●
●
●
●●
●●●
●
●
●
●
●
●●●●●
●
●
●
●●●
●●
●●
●
●
●
●
●
●
●
●
●●●
●●●
●
●●●●●●
●
●
●
●
●
●
●
●●
●●●
●
●
●
●
●●
●
●
●●●●
●
●●
●
●●
●
●
●●●●
●
●
●
●
●●
●●●
●●
●
●
●●●●
●
●●●
●
●
●●●
●●●●
●●
●
●
●●●●●●●●●
●●
●●
●
●
●
●
●
●
●
●●
●
●
●
●
●
●
●
●
●●●●
●
●
●
●
●
●
●
●
●
●●
●
●
●
●
●●●
●●●●●
●
●●●●●●
●●
●
●●●●
●
●●●
●●
●●●
●
●
●
●
●
●●●
●
●●
●
●●
●
●●
●
●
●
●●
●
●●
●
●
●
●
●
●
●
●
●
●
●
●
●●
●
●●●●●●●●
●
●
●
●
●
●
●
●
●●
●
●●
●
●●
●
●●●●
●●
●
●●●
●
●●●
●
●●
●
●
●
●
●
●
●
●
●
●
●
●●●
●
●●
●
●
●
●
●
●
●
●●
●●
●
●
●
●
●●
●
●
●
●
●●
●
●●
●●
●●●
●
●
●
●●
●●●●●
●
●
●
●●
●●
●●
●
●●●
●
●
●●●●
●
●
●●●●
●
●
●
●
●●
●●
●
●●
●●
●●
●
●
●●
●●
●
●●●
●
●●
●●
●
●●
●●
●
●
●
●
●
●
●
●
●●●●●
●
●●
●
●
●●
●
●
●
●
●
●●●
●●●●
●
●
●●●
●
●●
●●
●
●●●●●●●
●
●●
●●
●
●●
●
●
●
●
●
●
●●●●
●
●●
●
●
●●●
●●
●
●
●
●●●
●●
●●
●
●●●
●
●
●
●●
●
●
●
●
●●
●
●●
●
●●●●
●
●
●
●
●
●
●●
●
●●
●●
●
●●
●
●
●
●●●●●●
●
●●
●
●●
●
●●
●●
●
●
●●
●
●
●
●
●
●
●●
●●●●
●
●
●
●
●
●
●
●●
●●
●
●
●
●
●●●
●
●●●
●
●●
●
●●
●
●
● ●●●●
●
●
●
●
●●
●
●
●
●●
●
●
●
●
●
●●
●
●
●●●
●
●
●●●●●
●●
●
●●●
●
●
●●●●●●
●
●
●
●●
●
●●
●
●
●
●
●
●●
●
●
●●
●
●
●
●●●
●
●●●●
●●
●
●
●
●●
●●
●
●●●●
●
●
●●●●●
●
●●●
●
●●●●●
●
●●●●●●
●●
●●●
●●●●●●
●
●●
●●
●●
●
●
●
●
●
●
●●●●
●
●●
●
●
●●
●
●
●
●●●●
●
●
●
●
●
●●
●
●
●
●
●
●●●
●
●
●
●
●
●
●
●●
●
●
●
●
●●
●●●
●
●
●●
●
●
●●
●●●
●
●
●●
●
●●
●
●
●●
●
●●
●●●●
●
●
●●
●
●●●●
●
●●
●
●●
●
●●
●
●●
●
●
●
●●
●
●●
●
●●
●●●
●
●●●●
●
●
●
●
●
●
●
●
●●
●●●
●
●
●
●
●
●
●
●
●
●●
●
●●
●
●●
●
●●
●
●
●
●●●
●●●
●●●
●●
●
●
●
●●
●●●
●
●
●●
●●
●
●●●●
●●●●
●●
●
●
●●●
●●
●●
●●
●●
●
●●
●
●
●
●
●
●
●
●●●
●
●
●●
●●
●●●
●
●●
●
●
●
●
●
●●●
●●●
●
●●
●
●
●
●
●●
●●
●●
●
●●●
●
●●●●●
●●●●
●●
●
●●●
●
●
●●●●●●
●●●
●●
●
●●●
●
●
●
●
●
●
●●●
●
●
●●
●
●
●●●●
●
●
●
●●●
●
●
●
●
●●
●●
●●
●
●
●
●
●
●
●
●
●
●
●
●
●
●
●
●
●●●●
●●
●
●
●
●
●
●
●●●
●
●●
●●●
●
●
●
●●
●
●●●●
●
●●
●
●●●
●●●●
●
●●●●
●
●
●
●
●
●●●
●
●●
●
●
●
●●●
●
●
●●●●
●
●
●
●
●
●
●
●●
●●
●
●
●
●
●
●
●
●
●
●
●●
●
●●
●
●●
●●●
●●●●
●
●
●
●●●
●●●●●
●
●
●●●
●
●
●
●
●●●
●●●
●
●●●●●
●
●●●●●●●
●
●
●●
●
●
●
●
●
●
●
●
●●●●
●
●●
●●
●
●
●●
●●
●
●
●●
●
●
●●
●
●
●●
●●
●●
●
●●●
●●●●●
●●●●
●●
●●
●
●●●
●●
●
●●
●●
●
●●
●
●
●
●
●●●●●
●
●●
●
●●
●●
●
●●●
●
●
●
●
●
●●
●●
●
●
●
●
●
●
●
●
●●
●
●●
●
●●●●●●
●●
●
●
●
●
●
●●
●●
●
●●●●
●
●
●
●
●●●●
●
●●
●
●●●●●
●●
●
●
●●
●
●
●
●
●
●●
●
●
●
●
●●●
●
●
●
●
●
●
●
●●
●●●
●
●
●
●
●
●
●
●●●
●
●●
●
●●
●
●
●
●●●
●
●
●
●
●●
●●●
●●●
●
●
●
●
●●
●
●
●
●●
●
●
●●●●
●●●●●●
●
●
●
●
●●●●●●
●●
●●
●
●●
●●
●
●
●●
●
●
●
●
●●
●●
●●
●
●
●
●
●●
●
●
●●
●●
●●
●
●●
●
●
●●
●●
●●
●
●●●
●●●●
●●●
●●●
●●
●●
●●●
●
●●●●●●
●
●●
●●
●
●●
●
●●
●
●●
●
●●
●●
●●
●
●●
●
●●●
●
●
●
●●●●●
●●
●●
●
●
●●
●
●
●
●
●
●
●
●
●
●
●
●
●
●
●●
●
●●●●●●●
●
●
●
●
●
●
●●●
●
●
●
●
●●
●
●●
●
●●●
●●
●●●
●●
●●●
●
●●●
●
●●
●
●●
●
●
●●
●
●
●
●
●
●
●
●
●●●●
●
●
●
●
●
●
●
●●
●●●
●
●
●
●
●
●
●
●
●●●
●
●●
●
●●
●
●
● ●
●
●●
●
●
●
●
●●
●●●
●●●
●
●
●
●●
●●
●
●
●
●
●●
●
●
●●●
●
●●●●●●
●
●●●●●●●●
●●
●●
●
●●
●
●
●
●
●
●
●
●●
●
●
●
●
●●
●
●
●
●
●
●
●
●●
●●●
●
●
●
●●
●
●●●●
●
●
●●
●
●
●●
●
●●●
●●●●
●●●●●●●
●●
●●●
●
●●●●●
●
●●
●●
●
●●
●
●
●
●
●
●●●●●
●
●
●
●
●●
●●
●
●
●●●●
●
●
●
●●
●
●
●●
●
●
●
●
●
●
●
●
●
●
●
●
●
●
●●
●
●●●●●●
●
●
●
●
●
●
●●
●
●
●
●●
●
●●
●
●●●
●●
●●
●
●
●
●●●●
●
●●●●●
●
●●●
●
●
●
●
●
●
●●
●
●
●●
●
●
●●
●●●●
●
●
●
●
●
●
●
●●
●●●
●
●
●
●
●
●
●
●
●
●
●●
●
●●
●
●●
●
●
●●●
●●
●
●
●
●
●●
●●
●●
●
●
●
●●●
●
●
●●●
●
●
●●●●●
●
●
●
●●●
●
●
●●
●
●●●●●
●
●
●●
●
●
●
●
●
●
●●
●●●
●
●
●
●●●
●
●●●
●●
●
●
●●●
●
●
●●●
●
●
●●●●
●
●●●
●
●●●
●●●
●
●●●
●
●●
●●●
●
●●●
●●
●
●●
●●
●
●●
●
●
●
●
●
●
●●●●
●
●●
●
●●
●
●
●
●●●●●
●
●●●●●
●
●
●
●
●●
●
●
●
●
●
●
●
●●
●
●●
●●
●●
●●●
●●
●
●
●
●●
●
●
●●
●●
●●
●
●●
●
●●●
●
●●●●
●
●
●●●
●
●●●
●
●
●
●
●
●●
●
●●
●
●
●
●
●
●●
●
●
●●
●
●
●●●
●
●
●
●
●
●
●
●●
●●
●
●
●
●
●●
●
●
●●●
●
●●
●
●●
●
●●●
●
●
●
●
●
●
●
●●●●
●
●
●
●
●●
●●●
●
●
●
●●
●●
●
●
●●
●●●
●●●●●
●
●
●●●●●●●
●
●
●●
●
●
●●
●
●
●
●
●●●
●
●●●●●
●
●●
●
●
●●
●
●
●
●●
●●●
●
●
●●●
●
●
●●
●
●
●
●
●●
●
●●
●●
●●
●
●
●●●
●
●●
●●●
●●
●●●
●
●
●●
●●
●●
●
●
●
●
●
●
●●
●
●
●
●
●●
●
●
●●
●●
●●
●●●
●●
●
●
●●●
●
●
●
●
●
●
●
●
●
●
●
●
●
●
●●
●
●
●●
●●
●●●
●
●
●
●
●
●
●●
●●
●●
●●
●●
●
●
●●●
●●●
●
●●●●
●
●●●
●●
●
●
●
●●
●
●●
●●
●
●
●●
●
●●
●●●
●●
●●●●●
●
●
●
●
●
●
●
●
●
●●
●
●
●
●
●
●
●
●
●
●●
●
●
●
●
●●
●
● ●●●
●
●
●
●
●●
●●●
●●●
●
●
●
●●
●●
●●
●
●
●
●●●
●
●●
●●
●
●●●●●
●
●
●●●●●
●●●
●●
●
●
●●
●●
●
●●●
●
●●●
●
●
●
●●
●
●
●
●
●
●
●
●
●●
●●●●
●
●●
●
●
●●
●
●
●
●
●
●●
●
●●●
●●
●●●●●●●
●
●
●
●●●
●●
●●●●
●
●●
●●
●
●●
●
●
●●
●●●
●
●
●
●
●
●
●
●●
●
●●
●●
●●
●
●●●
●●
●
●
●
●●●
●
●
●●●
●
●
●
●
●
●
●
●
●
●
●
●●
●
●●●●
●
●
●
●
●
●
●●●
●
●
●
●
●
●●
●
●
●
●●
●●
●
●
●●●
●
●●●●
●
●●
●
●
●
●●●●
●
●
●
●
●
●●
●
●
●●
●●●
●
●
●
●
●
●
●
●●
●●
●
●
●
●
●●●
●
●
●
●
●
●●
●
●●
●
●
●
●
●●●
●
●
●
●●●
●
●●●●
●
●
●
●●●
●●
●
●
●
●●
●
●
●●●●
●
●●●
●●
●
●
●●●
●●●●
●
●
●●
●
●
●
●
●
●
●
●
●
●●
●●
●●
●●
●●
●
●●
●●
●
●
●●
●
●
●
●●
●
●
●●
●●
●●
●
●●●
●
●●●
●●
●
●●●●
●●
●●●
●●●●●
●
●●
●●
●
●●
●
●
●
●
●
●
●●●
●
●
●●
●
●
●●●
●
●
●
●●●●
●
●
●
●●
●●
●●
●
●
●
●
●
●
●
●
●
●
●
●●
●
●●●●●●
●●
●
●
●
●●
●
●
●●
●●
●●●●
●
●
●
●
●●●
●
●●●
●
●●●●●
●
●●
●
●
●
●
●
●●
●
●●
●
●
●
●
●
●
●
●
●●●
●
●
●
●
●
●
●
●●
●●
●
●
●
●
●
●
●●
●
●
●
●●
●
●●
●
●
● ●●●
●
●
●
●
●
●●
●●●●●
●
●●
●●●
●
●
●
●●
●●
●
●
●●●●
●
●
●●
●
●
●
●
●
●●
●
●●●●●
●
●
●●●
●
●
●
●●
●
●●
●●
●
●
●●
●●
●
●
●
●●●
●
●
●
●●
●●●●
●
●
●●●●
●
●
●●
●●
●
●
●
●
●●
●●
●
●●
●
●●
●
●●●●
●
●
●●
●●●●
●
●
●
●●
●●
●
●
●
●
●
●
●
●
●●
●●●
●
●●
●
●
●●●●
●
●●
●
●
●
●
●
●
●
●
●●●
●
●
●
●
●
●
●
●
●
●
●
●
●
●●
●
●
●●●●●●●●●●
●
●
●
●
●
●
●
●
●●
●
●
●
●
●●
●
●
●
●
●●●
●
●●●●●●
●
●●●
●
●
●●●●●
●
●
●
●●●
●
●
●●
●
●●●●
●
●●
●
●
●
●●
●●
●●
●
●●●●●
●
●
●
●
●
●
●
●●
●●●
●
●
●
●
●●
●
●
●
●●●
●
●●
●
●●
●
●
● ●●●●
●
●
●
●
●
●●
●
●●●
●
●●
●●
●●
●
●
●●●
●●
●
●●
●
●●●●
●
●
●●●
●
●
●
●●●●●●●
●
●●
●
●
●
●●
●
●
●
●●
●●
●
●●
●
●
●
●
●●
●●●●●
●
●●●●
●●
●
●
●
●
●
●
●●
●
●●●
●
●
●
●●●●
●
●●●
●●
●●●●●●●●
●●●
●
●●
●●
●
●●●
●
●
●
●
●
●●
●●
●
●●
●
●
●
●
●
●●●●
●
●
●
●
●●●
●
●
●
●
●
●●
●
●●
●●
●●
●●
●
●
●
●
●●
●
●●
●
●
●
●
●
●●
●●●●●
●
●
●●
●
●
●
●
●●●●
●
●
●
●●
●
●
●
●
●
●
●
●●●●
●
●
●
●
●●
●
●●
●
●●●
●●
●●●●
●
●●●●●
●
●●●●●
●
●●
●●
●●●
●
●●●●
●
●
●
●
●
●
●●
●
●●
●
●
●●●●●
●
●●●
●
●●
●
●
●
●
●
●●
●●●
●
●
●
●
●
●
●
●
●
●
●●
●
●●
●
●
●●●●●
●
●
●
●
●●
●●
●
●●
●
●
●●
●●
●●
●
●
●
●●
●
●
●
●●●
●
●●●
●
●
●●●
●
●●
●
●●●●●●●
●
●
●
●
●●
●●●
●
●●
●
●
●
●
●
●
●
●
●●●
●
●
●●●●●
●
●●●●
●●
●
●
●●
●
●
●
●
●●●
●
●
●
●●●
●
●●
●
●●●●●
●●●●●●●●●●●●
●●
●●
●
●●●
●●●
●
●●
●
●
●
●●●
●
●
●
●
●
●
●●●●
●
●
●
●
●●●
●
●●
●
●
●
●●
●●●
●
●●
●●●●
●
●
●●
●
●
●●●
●
●
●
●
●●
●●
●
●
●
●
●
●●
●
●
●
●
●●
●●
●●
●
●●●
●●
●●
●●●
●●
●
●●
●
●●
●
●●●
●
●
●●●●
●
●●●
●
●
●●●●
●
●
●
●
●
●●●
●
●●●
●
●
●
●
●
●
●
●●
●●●
●
●
●●●●
●
●●●
●
●
●
●
●
●
●
●
●●
●●●
●
●
●
●
●
●
●
●
●
●
●
●●
●
●●
●
●
● ●●
●●
●
●
●
●●●
●●●●●
●
●●●●
●●●
●
●
●
●●●
●
●
●●●●
●●●●
●●
●
●
●●
●
●
●●●
●●
●
●
●
●
●
●●●
●
●●
●●●
●●●
●
●●
●●
●
●●●
●
●
●●
●
●
●●●●
●
●
●
●●
●
●
●
●●
●
●
●
●●●
●●
●●●●
●●●
●●●●●
●●
●●
●
●●●●●●
●
●●
●●
●●●
●
●●
●
●
●●
●
●●●
●
●
●
●
●
●
●
●●
●●
●
●●●●
●●
●
●
●
●
●
●
●
●
●
●
●
●●
●
●●●●●●
●
●
●
●
●
●
●
●
●
●●●
●●
●
●
●
●
●●
●
●
●
●●●●
●
●●
●●●●●●●
●
●
●●●●●
●
●
●
●●●
●
●
●
●
●
●
●
●
●●
●
●
●
●●
●
●●
●
●
●
●
●●●
●●●
●
●
●
●
●
●
●
●
●
●●
●
●
●●
●●●
●●●
●
●●
●
●
●
●●
●
●●●●
●●
●
●●●●●
●●
●
●●●
●
●
●●
●●●
●
●●
●●
●
●
●●●
●
●
●●●●●
●
●
●
●
●●
●
●
●
●●●●●●●●●
●●
●●
●
●●●●
●
●●
●
●
●
●
●
●
●●
●●
●
●●●
●
●
●
●
●
●
●●
●●●
●●
●●●●●●●●
●●●
●●●●
●
●
●●●
●
●
●
●
●●
●●
●
●
●●●
●
●
●
●●
●
●●
●
●●
●●
●
●●●
●●●
●●●●●●
●●
●●
●
●
●
●
●
●
●
●
●
●●
●
●●
●
●●
●●●●●●
●
●
●
●
●
●
●
●
●●●
●
●
●●
●●
●
●
●
●
●●
●
●
●●
●
●●●
●●●●●●
●
●
●
●●●
●
●
●
●
●
●●●
●
●
●
●
●
●
●●●
●
●
●
●
●●
●
●
●
●
●●
●●
●
●
●
●
●
●●
●
●●
●
●
●
●
●●
●●
●●●●●●
●
●
●
●●
●●●
●●●
●
●
●●
●●
●●
●
●
●●●
●
●
●
●●
●●
●
●●
●
●●●
●
●●●
●●●
●●
●●
●●●
●
●
●
●
●
●
●
●●
●
●
●
●●
●●
●
●
●
●
●●●
●
●
●●●
●●●
●
●
●
●●
●●●
●
●●●
●●
●
●
●
●
●●
●●●
●
●●●
●●●●
●●●
●●
●
●●●●
●
●
●
●●
●●
●
●
●●
●
●
●
●
●
●
●
●
●●
●
●
●
●●●●
●
●●
●●
●
●
●
●●
●
●
●
●●●●●
●●
●●
●●
●
●
●
●
●
●
●
●
●
●●
●
●●●●●●●●
●
●
●
●
●
●
●
●
●
●
●
●
●
●
●
●
●
●
●
●●
●
●
●
●●●
●
●
●●
●
●●●●●●
●
●●●●●
●
●●
●
●●
●
●●●●
●
●
●
●
●
●
●
●●●
●●
●
●
●
●
●●
●
●
●
●
●
●●
●●
●
●
●
●
●
●
●●●
●
●
●
●
●●
●
●●
●●● ●
●●●●
●
●
●
●●
●●●●
●●
●
●
●●
●●
●●
●
●
●
●●●●
●
●
●
●
●●
●
●
●
●
●●
●
●
●
●●●
●●●
●●
●●
●
●
●
●●
●●
●
●
●●
●
●
●●
●●
●●●●
●
●
●
●●●
●●
●
●
●●
●
●
●
●
●●●
●
●●●
●●
●●
●
●
●●
●●●●
●
●●
●●●●●●●●
●●●
●●●●
●
●
●●
●●
●
●●●
●
●●
●
●
●
●
●
●
●●
●
●
●
●
●●
●
●●
●●
●
●●
●
●●
●
●
●
●
●
●●●
●●●
●●
●
●
●
●
●
●
●
●
●
●
●
●
●
●●●●●●●●
●
●
●
●
●
●●
●
●
●
●
●●●
●
●
●
●
●
●
●
●
●
●
●●●
●
●
●●
●
●●●●●
●
●●●●●
●
●●
●
●
●
●●
●
●
●
●
●
●
●
●●●
●●●
●
●
●
●
●
●
●
●
●
●
●●
●●●
●
●
●
●
●
●●
●
●
●
●
●●
●
●●
●●
● ●●●●
●●
●
●
●
●●
●
●●
●●
●
●
●
●
●●
●●
●●
●
●●●
●●
●
●●
●
●●●
●●
●
●●●
●
●
●●●
●●●●
●
●●
●●
●
●
●
●
●
●
●
●
●
●
●●
●
●
●●
●●
●●
●
●●
●
●●
●
●
●
●
●●●
●●●
●
●
●●
●●
●
●●●
●●
●●
●
●●●
●●●●
●●
●
●●●●●
●●●
●●
●
●●●
●●●
●
●●
●●
●
●●
●
●
●
●●
●
●
●
●●
●●●
●
●
●●●
●
●●
●●
●
●
●
●
●●
●
●
●●●●
●
●
●
●
●
●
●
●
●
●
●
●
●
●
●
●
●
●
●●
●
●●
●
●●●●●
●
●●
●
●
●
●
●
●
●●●●
●●
●
●●
●
●●
●
●
●
●●
●●
●
●●
●
●
●●●●
●
●
●●
●●
●
●●
●
●●
●
●
●
●
●
●
●
●●●
●
●●
●
●●
●
●
●
●
●
●●
●
●●
●
●
●
●
●
●
●●
●
●
●
●
●
●
●●
●
●
● ●●●●
●
●
●
●●
●●●●●
●
●●●●●●●
●
●
●●●●●●●●●
●
●
●
●
●●●●●
●●
●●●●
●
●
●
●
●●●●
●●
●●
●
●
●●
●●
●
●
●●●
●
●●●
●
●●●●●
●
●●●●●●●●●●●●
●●
●●
●
●
●●●
●
●●
●●
●
●
●
●
●
●
●
●●
●
●●
●
●
●●
●
●
●
●
●●●●
●
●●●
●●●
●
●
●
●
●
●●
●
●●
●
●
●
●●●●
●
●●●
●
●
●
●
●●
●
●●
●
●●
●
●
●
●●
●
●●●
●
●●●
●
●
●
●●
●
●
●●
●
●
●
●●
●
●
●●
●
●●
●
●●●
●
●
●
●
●●
●●●
●
●
●
●
●
●
●
●●
●
●●
●
●●
●
● ●●
●●
●
●
●
●
●
●
●●●
●
●●
●
●
●
●
●●
●
●●●●
●
●
●
●
●●●
●●
●
●●●
●
●
●
●●●●●●●
●●
●
●
●●●
●
●●
●
●●
●
●
●
●
●
●●
●●●
●
●
●●
●
●
●●
●
●
●●
●
●
●●
●
●●●
●
●●
●
●
●●
●●●●●●●●
●●●
●●●
●●
●
●●●
●●●
●
●●
●●
●
●
●
●
●
●●
●
●●●●
●
●●
●
●
●●●
●
●
●●
●
●●●●
●
●●
●●●
●
●
●●
●
●
●
●
●
●
●●
●
●
●
●
●●
●
●
●●●●
●
●●
●
●
●
●
●
●
●●
●
●
●
●●
●
●●
●
●
●●
●
●●
●
●
●
●●●
●
●
●
●
●●
●●
●
●
●
●
●
●
●●
●
●●●
●●
●●●
●
●
●●
●●
●●
●
●
●
●
●●
●
●
●
●●
●
●●
●
● ●●
●●
●
●
●
●●
●●
●
●●
●
●
●●
●
●●
●●
●
●●
●
●●
●
●●
●
●●●
●
●●●●
●
●●●
●
●
●●●●●●
●
●●
●●
●
●
●
●●
●
●●
●
●
●
●
●
●●
●●●●●
●
●●
●
●
●●
●
●
●●●
●●
●
●
●
●●●
●
●●
●
●●●
●
●●●
●●●●●
●●
●●●
●●
●
●●●
●●●
●
●●
●
●
●
●
●
●
●
●
●
●●●●
●
●
●
●
●
●●●
●
●●
●
●
●
●●
●●
●
●
●●●●●
●
●
●●
●
●●
●
●
●
●
●
●●
●●
●
●
●
●
●
●●
●
●
●●
●●●
●
●●
●●
●
●
●
●●
●
●
●
●
●●
●
●●
●
●
●●
●
●●
●●●
●
●●
●●
●
●●●●●●
●
●
●
●
●
●●
●
●●
●
●
●
●
●
●●
●
●●●●
●
●●
●
●
●●
●
●
●
●
●●
●●
●
●
●
●
●●
●
●
●
●
●●
●
●●
●
●
● ●●●●●
●
●
●
●●
●●●●●
●
●●
●●
●
●
●
●
●●●
●
●
●●
●●●
●●
●
●●●
●
●●
●●●●●●
●●
●●
●
●
●●
●
●
●
●
●
●●
●●
●
●
●
●
●
●
●●●●
●●
●
●
●●
●
●●●●●
●
●
●●
●
●●●●
●●●●●●●●
●●
●
●●●●
●
●
●
●●
●
●●
●
●
●
●●
●
●
●
●
●●
●
●
●●
●
●●●
●
●
●
●●●
●
●
●●●●
●●
●
●
●
●
●
●
●
●
●
●●
●
●
●
●●
●
●●●●●
●
●
●
●
●
●
●
●
●
●
●●
●
●
●
●
●
●
●
●
●●
●●●
●
●
●●●●
●
●●
●●
●
●
●●●
●
●
●
●
●
●
●●
●●●
●
●●
●
●●
●
●
●
●
●
●●
●●●
●
●
●
●
●
●
●
●●
●
●●
●
●●
●
●
● ●●●●
●
●
●
●
●●
●●●
●●
●
●
●
●
●
●●
●
●
●●●
●
●
●●●●●●
●
●
●
●●
●
●●●●●●●●●
●●
●
●●
●
●
●
●●
●
●●●
●●
●●●●
●
●●
●●
●
●
●●
●
●
●●●
●
●●●●●
●
●●●
●●●●●●
●●
●●
●●
●
●●●●●●
●●
●●
●
●●
●
●
●
●
●
●
●●●
●
●●●
●
●●
●
●
●
●●●
●
●
●●●
●
●●
●
●
●
●
●
●
●
●●●●
●
●●
●
●●●●●
●●
●
●
●
●
●
●
●
●
●
●●●●
●
●
●
●
●
●
●
●
●●●
●
●●●●
●
●●
●
●
●
●
●●
●
●●
●
●
●
●
●
●
●●●
●
●
●●●
●
●●●
●
●
●
●
●●
●
●●
●
●
●
●
●
●
●
●
●
●
●
●●
●
●●
●
●
●
1 4 7 10 14 18 22 26 30 34 38
24
68
1012
14
Figure 2.8.: Normalized samples
expression data to a data frame with normalized values with the affy package is as follows:
Listing 2.12: R code for using the Bioconductor package affy
l i b r a r y ( a f f y )pd <− read . AnnotatedDataFrame ( ” Info . t x t ” , header=T , row . names=1)raw . data <− ReadAffy ( f i lenames=rownames ( pData ( pd ) ) , phenoData=pd )rma . data <− rma ( raw . data )expr . data <− exprs ( rma . data )
2.5.3. Normalization of microarry data
Microarray experiments are very susceptible to small changes in the protocol. Therefore theoptimal way would be to perform all measurements on the same day by the same personunder exactly the same conditions. Of course this is normally not possible especially for largesample sizes and even if samples are processed on the same day on the same amplificationplate there might be differences in the signal intensities (see Figure 2.9).One possibility to ensure the comparability of several samples is to normalize the expressionvalues before further analyses.
2.5.3.1. LOESS normalization
Cleveland (1979) introduced the LOESS normalization which is the abbreviation for LOcalregrESSion.The non-parametric local regression is applied on logarithmized and MA-transformed data(Dudoit et al., 2002) where M and A are calculated by:
M = sample1− sample2
A = 1/2(sample1 + sample2)
36

2.5. Measuring of gene expression levels
Figure 2.9.: Quality plot to illustrate the necessity of normalization:The quality plot from the GenomeStudio shows eight arrays that were processedat the same time on the same amplification plate. Nevertheless, the eight dif-ferent arrays differs substantially when comparing the average signal of the hy-bridization controls.
37

2. Material and methods
It is assumed that the response variable yi is explained by a smooth function f(zi)+εi (wherei = 1, ..., n). To identify the f(z) the following algorithm is used (Fahrmeir et al., 2007):
1. The k nearest neighbors of z are defined by N(z) where the neighborhood N(z) =i : di ∈ d(1), ..., d(k) and d(1), ...d(k) are the ordered distances di = |zi − z|
2. Define the largest distance of two data points by
∆(z) = maxi,j∈N(z)
|zi − zj |
3. Weights are defined by
w∆(z)(z, zi) = K(|z − zi|∆(z)
),
where K is a tricube core function
K(u) =
{(1− |u|3)3, if |x| < 10, otherwise
4. f(z) is calculated by (weighted) least squares based on the data points in the neighbor-hood N(z).
The normalization was performed using the R function loess() with default settings. Thesmoothing parameter which defines the size of the neighborhood was set to 0.1. The dis-advantage of this normalization is that one sample has to be chosen as reference sample.Depending which sample is chosen the results could differ appreciably.
2.5.3.2. Quantile normalization
The aim of the quantile normalization is to equalize the distribution of each sample (Bolstadet al., 2003).The concept of the normalization is shown here with random numbers:
1. Start with the raw data:
Sample1 Sample2 Sample3
Gene1 10 300 1100Gene2 100 200 15Gene3 1000 5 300
2. Order the data within each sample and calculate the mean for each row:
Sample1 Sample2 Sample3 Mean
Quantile1 10 5 15 10Quantile2 100 200 300 200Quantile3 1000 300 1100 800
38

2.5. Measuring of gene expression levels
3. Replace the raw data by the mean:
Sample1 Sample2 Sample3 Mean
Quantile1 10 10 10 10Quantile2 200 200 200 200Quantile3 800 800 800 800
4. Restore the order of the original data:
Sample1 Sample2 Sample3
Gene1 10 800 800Gene2 200 200 10Gene3 800 10 200
In R the quantile normalization is implemented in the package lumi which was developedfor the analysis of Illumina data but could also be used for any kind of expression data.The normalization function is called lumiN() where different normalization methods canbe applied. The quantile normalization is performed by using
Listing 2.13: Normalize expression data using R
lumiN ( data , method = ‘ ‘ q u a n t i l e ’ ’ )
2.5.4. Preparation of gene expression data for eQTL studies
2.5.4.1. KORA F3
Altogether there are 48,701 probes on the Illumina HumanWG-6 v2 expression array. Forthe first analyses the number of probes was reduced by using only these that are significantdetected in more than 5% of the samples. In KORA F3 this results in 13,767 probes.Later it was decided to keep also probes with low expression levels because replication co-horts were available to verify also effects in low-expressed probes. Therefore the 50bp se-quences of each probe were mapped to the human reference sequence hg18 and all probeswere kept that mapped uniquely or had only up to two mismatches per probe. 7,292 probesdid not map uniquely, so 41,409 probes remained and were used for analysis. Of theseprobes, 27,623 mapped to annotated transcripts and 13,786 mapped to intergenic regions.
2.5.4.2. KORA F4
On the Illumina HumanHT-12 v3 array are 48,803 expression probes. For the analyses theprobes were mapped by Alexander Teumer to the available mRNA sequences of the UCSCgenome annotation database (hg19). 28,691 probes could be perfectly mapped to an uniquemRNA or to known transcripts or annotated RefSeq genes. These probes map to 18,606 dif-ferent RefSeq genes.For further analyses probes that could not be mapped or mapped to intergenic regions wereremoved.
For the eQTL analysis it was decided to reduce the technical variance in the data by ad-justing for a determined number of Eigen-genes (this is described in detail in Section 4.3).
39

2. Material and methods
First, a principal component analysis was conducted and different numbers of Eigen-genes(five to 100 in steps of five) were removed from the data by keeping the residuals in a linearmodel with expression as dependent and Eigen-genes as independent variables5. Addition-ally the uncorrected and for age and gender corrected data were used.PLINK was used to test systematically the association of all SNP-probe combinations for alldifferent data sets. PLINK calculates linear regression models with additive effects of SNPswhere the direction of the regression coefficient represents the effect of each extra minor al-lele (i.e. a positive regression coefficient means that the minor allele increases the expressionlevels). Due to a limitation of memory capacity only combinations with a p-value below1 ∗ 10−7 were stored.
Listing 2.14: Calculation of association between gene expression levels and genotypes usingPLINK
−− f i l e KORA Genotypes snps f i l t e r e d−−assoc−−pheno express ion adjusted . t x t−−a l l−pheno−−p f i l t e r 1e−7
The number of significant probe-SNP-combinations and transcripts (p-value threshold =6.02 ∗ 10−9 and 2.81 ∗ 10−12 for cis- and trans-eQTL, respectively) were plotted (Figures 2.10and 2.11). Also mean standard error, beta, and explained variance R2. The optimal numberof Eigen-genes was graphically determined.
For the cis-analysis the highest number of significant eQTLs was observed when correctingfor 55 Eigen-genes. Correcting for more Eigen-genes led only to marginal more significanthits and the mean standard error did not get smaller any longer.For the trans-analysis the most hits were obtained when correcting for 25 Eigen-genes. Usingmore Eigen-genes even worsened the result. These results were similar to the results fromFehrmann et al. (2011). They removed 50 Eigen-genes for cis- and 25 Eigen-genes for trans-analysis, respectively.
2.6. Comparison of cis-eQTL results in KORA F4 with publishedcis-eQTLs
We compared the cis-eQTLs from whole blood with already published cis-eQTLs in differenttissues. The following publications were considered:
1. Fairfax et al. (2012) - eQTLs in monocytes and b-cellsTotal RNA from monocytes and b-cells from 283 healthy volunteer was quantified us-ing the Illumina HumanHT-12 v4 BeadChip. eQTLs were calculated for 29,022 expres-sion probes and 651,210 SNPs (from Illumina Human OmniExpress-12v1.0 BeadChips)using linear and Spearman´s rank models (because of little differences in both models
5In the original publication the Eigen-genes were misleadingly called principle components. That is the reasonfor slightly different figures in the original publication and this thesis.
40

2.6. Comparison of cis-eQTL results in KORA F4 with published cis-eQTLs
●
●
●
●
●
●
●
●
●
●●
●● ●
●● ● ●
0 20 40 60 80 100
2500
3000
3500
4000
Number of removed eigen−genes
Det
ecte
d un
ique
cis
−eQ
TL
prob
es
●●
●
●
●
●
●
●
●
●
●●
●●
●
●
●
●
0 20 40 60 80 100
0.01
20.
014
0.01
60.
018
0.02
0
Number of removed eigen−genes
mea
n S
E
Figure 2.10.: Number of unique significant cis-eQTL probes for different numbers of re-moved Eigen-genes in KORA F4:The expression levels were adjusted for different numbers of Eigen-genes andthe association between adjusted expression levels and genotypes were calcu-lated. The number of unique significant cis-eQTL with p-value < 6.02 ∗ 10−9 isplotted.
41

2. Material and methods
●
●
●
●
●
● ●
●●
●● ●
●●
●●
●
●
0 20 40 60 80 100
200
250
300
350
Number of removed eigen−genes
Det
ecte
d un
ique
tran
s−eQ
TL
prob
es
●●
●
●
●
●
●
●
●●
●
●
●●
●
●
●
●
0 20 40 60 80 100
0.01
50.
020
0.02
50.
030
0.03
50.
040
0.04
50.
050
Number of removed eigen−genes
mea
n S
E
Figure 2.11.: Number of unique significant trans-eQTL probes for different numbers of re-moved Eigen-genes in KORA F4:The expression levels were adjusted for different numbers of Eigen-genes andthe association between adjusted expression levels and genotypes were calcu-lated. The number of unique significant trans-eQTL with p-value < 2.81 ∗ 10−12
is plotted.
42

2.6. Comparison of cis-eQTL results in KORA F4 with published cis-eQTLs
only eQTLs that reached threshold in both analyses were carried forward). cis was de-fined as a 2.5 Mb-interval on either side of probe with a p-value threshold of 1 ∗ 10−3.To compare the results Table S1 from the original publication was downloaded whichconsists of 82,346 SNP-probe interactions.
2. Fehrmann et al. (2011) - eQTLs in whole bloodRNA from whole blood from 1,469 European samples was investigated. Illumina Hu-man HT-12 and H8v2 arrays were used which resulted in 52,061 unique probes wereanalyzed, representing 19,609 unique genes. Additionally 289,044 common SNPs (Il-lumina HumanHap300 platform) were analyzed. eQTLs were calculated using thenon-parametric Spearman´s rank correlation. The FDR was controlled at 0.05 by per-muting expression phenotypes 100 times. An eQTL was defined as cis-eQTL if thedistance from probe midpoint to the SNP was ≤ 250 kb. Supplement Table S1 with65,535 entries was downloaded to compare the results.
3. Zeller et al. (2010) - eQTLs in monocytesMonocyte cells from 1,490 European samples were analyzed using 675,350 SNPs fromthe Affymetrix Genome-Wide Human SNP Array 6.0 and 12,808 well characterizeddetected genes from the Illumina HT-12 v3 BeadChip. The associations were calculatedusing the ANOVA and were checked with the Kruskal-Wallis test6. For 2,477 genes acis-eQTL (distance between SNP and gene is less than 1 Mb) with a p-value less than5.78 ∗ 10−12 (Bonferroni threshold) could be observed and they are summarized inSupplement File S1.
4. Schadt et al. (2008) - eQTLs in liverLiver samples of 427 Caucasian samples were analyzed using an Agilent expressionarray which consists of 34,266 known and predicted genes of which 39,280 probes.The Kruskal-Wallis test was used for analyzing association between expression traitsand 782,476 SNPs (Affymetrix 500K genotyping array plus Illumina 650Y panel) andthe FDR (10%) was used for multiple testing correction. cis-eQTLs were defined asinteractions where the distance between probe and SNP is ≤ 1 Mb. As the comparisonof cis-eQTLs was already done by Zeller et al. (2010) the table was downloaded fromZeller et al. (2010) (Supplement File S4).
5. Stranger et al. (2007b) - eQTLs in LCLsThe Eppstein-Barr virus-transformed lymphoblastoid cell lines of 270 individuals fromHapMap consortium (30 Caucasian trios of northern and western European origin, 45unrelated Chinese individuals from Beijing, 45 unrelated Japanese individuals fromTokyo, 30 Yoruba trios from Ibadan, Nigeria) were anaylzed using 14,925 expressionprobes from the Illumina WG-6 v1 BeadChip and about 290,000 SNPs (HapMap). TheSpearman’s Rank Correlation test was performed. cis-eQTLs were defined as the dis-tance from probe genomic midpoint to SNP genomic location was ≤ 1Mb and thesignificance threshold was determined using 10,000 permutations of expression phe-notypes. As the comparison of cis-eQTLs was already done by Zeller et al. (2010) thetable was downloaded from Zeller et al. (2010) (Supplement File S2).
6. Innocenti et al. (2011) - eQTLs in liverThe study consists of three independent sample collections:
6The Kruskal-Wallis test is the non-parametric version of the ANOVA. It considers the ranks of the values.
43
2. Material and methods
• discovery set: primary liver tissues at University of Chicago (n=206)
• replication set: primary liver tissues at University of Washington (n=60)
• replication set: published set of liver eQTL data (Schadt; n= 266)
The genotyping was performed on Illumina SNP arrays (Illumina quad-610 and 55k,consisting of more than 500,000 SNPs) and gene expression was measured on Agilentand Illumina expression arrays (14,703 genes were surveyed in the reference study,11,245 RefSeq genes in all three studies). An eQTL was indicated as cis-eQTL whenthe distance between SNP and TSS was less than 250 kb and eQTL were calculatedusing a Bayesian regression. Supplement Table S1 was downloaded with eQTLs forall genes. According to the publication all genes with Bayes Factors > 5 (1,173 genes)were selected for comparison with KORA eQTLs.
7. Sasayama et al. (2013) - eQTLs in whole blood - Japanese samplesRNA from whole blood from 76 Japanese samples was analyzed using 534,404 auto-somal SNPs (Illumina HumanOmnil-Quad BeadChip) and 30,465 expression probes(Agilent Human Genome 4x44 K array). The Spearman´s rank correlation test wasused to calculate the association between gene expression and genotype and an eQTLwas indicated as cis-eQTL when the SNP was within 1 Mb upstream or downstreamof the gene. The significance threshold was 3.1∗10−12 (Bonferroni correction). Supple-ment Table S4 was downloaded which includes 3,883 SNP-probe pairs.
8. Hao et al. (2012) - eQTLs in lungLung samples from 1,111 individuals (409 samples from Laval, 363 samples from Gron-ingen, 339 samples from UBC) were analyzed using 51,627 expression probes (customAffymetrix array) and all SNPs from the Illumina Human1M-Duo BeadChip array. Acis-eQTL was defined as an association between an expression probe and the SNP inwhich the SNP is located within 1 Mb distance of the probe. eQTLs were calculatedusing the Kruskal-Wallis-Test with applying a FDR correction of 10%. Results weredownloaded from Supplement Table S2a which consists of 17,049 entries.
9. Dixon et al. (2007) - eQTLs in LCLsThe Eppstein-Barr virus-transformed lymphoblastoid cell lines from 400 children fromfamilies recruited through a proband with asthma were collected. 408,273 SNPs (Il-lumina Sentrix Human-1 Genotyping BeadChip and Illumina HumanHap300 Geno-typing BeadChip) and 54,675 transcripts (Affymetrix U144 Plus 2.0 GeneChip) wereanalyzed. Associations were calculated using a linear model with a Bonferroni correc-tion which leads to a significance threshold of 1.2 ∗ 10−7. The maximum distance forcis-eQTLs was 100 kb upstream or downstream of the gene. As the comparison of cis-eQTLs was already done by Zeller et al. (2010) the table was downloaded from Zelleret al. (2010) (Supplement File S3).
10. Goring et al. (2007) - eQTLs in lymphocytesLymphocytes of 1,240 samples from San Antonio Family Heart Study using 20,413 ex-pression probes (Illumina WG-6 v1 BeadChip) and 432 SNPs from the Human Map-Pairs Genome-Wide Screening Set Version 6 and 8 from Research Genetics were ana-lyzed. A linear model was used to test for association between expression levels andSNPs and an FDR of 5%. As the comparison of cis-eQTLs was already done by Zelleret al. (2010) the table was downloaded from Zeller et al. (2010) (Supplement File S5).
44

3. Analysis of gene expression data in case-controlstudies
3.1. Introduction to case-control studies
Case-control studies are a type of observational studies in which samples from two differentgroups are compared. The “cases” could be patients suffering from a disease or individualswith a particular condition (for example high BMI), whereas the “controls” are the individu-als that are healthy (or are at least not affected by the disease of the cases) or do not have thesame conditions. In comparison to population-based studies in which the general popula-tion is investigated the case-control studies have lower sample sizes and the controls shouldbe accurately chosen to ensure identification of even very small differences between the twogroups.The advantage of case-control studies is that it is possible to study rare diseases because thepatients are already affected by the disease when they are included in the study. The betterthe controls fit to the cases (for example in age, gender and other sociodemographic vari-ables) the higher the power to detect also small differences even when having small samplesizes.Case-control studies in which genome-wide gene expression levels should be compared be-tween two or more groups have to be designed carefully. As the expected effects betweenthe groups and the sample sizes are usually quite small the selection of cases and controlshave to be quite homogenous. Additionally it has to be considered that some samples haveto be excluded due to bad quality. But the advantage is that it is possible to measure thegene expression levels in the affected tissues, at least for the patients. If it is not possible toobtain the right tissue from the patients or due to ethical reasons it is not possible to get therelevant tissue of the controls the expression is measured in whole blood because it is easilyaccessible and cheap.In the following section two different case-control studies are presented (see Table 3.1). Inboth studies, patients with a neurodegenerative disorder are compared. In the first studypatients with Parkinson’s disease are compared to young and old controls and in the sec-ond study patients with two different subgroups of NBIA are compared to controls. In bothstudies gene expression was measured genome-wide using two different expression chipsfrom Illumina and Affymetrix respectively. For the Parkinson study it was possible to usethe affected tissue while for the NBIA project whole blood was used.
Parkinson study NBIA studyControls young and old controls one control groupPatients Parkinson patients two different subgroups of NBIAAnalyzed tissue single cells from brain whole bloodUsed expression platform Illumina Affymetrix
Table 3.1.: Comparison of two case-control studies
45

3. Analysis of gene expression data in case-control studies
Old controls76.8 ± 9.8 years
6 males/3 females
Patients78.6 ± 6.5 years
7 males/1 female
Young controls52.7 ± 2.4 years
7 males
-�Disease
Aging6
?
Figure 3.1.: Experimental design of Parkinson study.The age is depicted as mean ± standard deviation.
3.2. Neurodegeneration and aging
The aim of the study was the identification of differentially expressed genes between patientsand controls using genome-wide expression data obtained from single cells from brain thatwere isolated postmortem by Dr. Matthias Elstner in Newcastle, UK. Additionally the ef-fect of aging should be analyzed by also comparing the patients to a second control groupconsisting of younger controls, as well as both control groups, one against each other.
3.2.1. Parkinson‘s disease and aging
Parkinson‘s disease (PD) is a neurodegenerative disease and starts with problems of themovement: shaking, slowness of movement, rigidity and difficulty with walking. It is as-sumed that the reason for Parkinson‘s disease is an interaction of genetic and environmentalfactors (Sulzer, 2007). The trigger for the disease is the degeneration of dopaminergic neu-rons of the substantia nigra. This is a normal process of aging but in patients with Parkin-son’s disease this process is accelerated. The reason for the massive loss of the dopaminergicneurons is so far not clarified. A multi-causal development seems likely with genetic andenvironmental factors or severe medical conditions (like stroke or tumors).To identify differentially expressed genes altogether three groups were analyzed: Parkinsonpatients, age-matched controls and younger controls (see Figure 3.1). The young controlswere used to detect differences between normal aging processes and processes that could beexplained by the disease.
As most changes in gene expression levels should occur in the brain of the patients neu-rons were extracted from the substantia nigra and RNA was isolated from 100 neuronsper sample. The patients were clinically well-documented Parkinson patients and the age-
46

3.2. Neurodegeneration and aging
matched controls are without any neurological disease. In Figure 3.2 the experimental designfrom case selection over RNA isolation to the data analysis is shown.
Figure 3.2.: Workflow for genome-wide expression profiles from single cells:The frozen midbrains were sectioned at 20µm thickness, neurons were identifiedby toluidine stain and neuromelanin pigment, RNA was extracted from 100 neu-rons, two rounds of In vitro transcription yielded in > 3µg cRNA and was usedfor hybridization on Illumina WG-6 v1 expression chips.
3.2.2. Data preparation and analysis
The data set consisted of gene expression data from the Illumina WG-6 v1 BeadChip of 48probes from 28 different samples (eleven Parkinson patients, seven young controls and tenold controls). The raw expression values were extracted from the BeadStudio to R, logarith-mized and different normalization methods were applied. The LOESS normalization wasgraphically determined to be the optimal normalization method for these data (for detailssee (Heim, 2008)). Next, all probes were clustered using the R function agnes(). The den-drogram is shown in Figure 3.3. The twelve samples that clustered separately were excludedfrom further analyses due to possible quality problems. For all remaining samples that weremeasured twice the mean expression value was calculated and used for the analysis. Finallythe data set consisted of eight PD samples, seven young controls and nine old controls.
Due to the small sample size the power to detect any differentially expressed genes wasquite low. One possibility was to reduce the number of performed tests to increase the sig-nificance threshold and reduce the multiple testing problem. Therefore the number of ex-pression probes was reduced before the analysis by choosing only 8,491 out of 47,312 probesthat were significantly detected in all samples, meaning that the expression level of theseprobes is significantly higher than the background noise (detection p-value below 0.05).
47

3. Analysis of gene expression data in case-control studies
1401
7710
35 D
1401
7710
35 B
1401
7710
35 A
1401
7710
35 C
1401
7712
67 C
1401
7712
95 A
1401
7712
74 A
1401
7712
74 B
1401
7712
74 C
1401
7712
74 D
1401
7712
74 F
1401
7712
74 E
1401
7712
77 D
1401
7712
77 C
1401
7712
77 E 14
0177
1286
F
1401
7712
67 F
1401
7712
86 B
1401
7712
88 B
1401
7712
86 A
1401
7712
88 A
1401
7712
95 C
1401
7712
95 D
1401
7712
67 E
1401
7712
66 B
1401
7712
67 D
1401
7712
66 C
1401
7712
95 F
1401
7712
77 B
1401
7712
77 A
1401
7712
87 B
1401
7712
87 A
1401
7712
87 D 14
0177
1286
D
1401
7712
88 F
1401
7712
88 E
1401
7712
66 A
1401
7712
67 B
1401
7712
67 A
1401
7712
77 F
1401
7712
87 F
1401
7712
87 E
1401
7712
88 D
1401
7712
88 C
1401
7712
95 E
1401
7712
86 E
1401
7712
87 C
1401
7712
86 C
2040
6080
100
Dendrogramm of normalized data
Agglomerative Coefficient = 0.56
Hei
ght
Figure 3.3.: Dendrogram of all samples from the Parkinson study:All twelve samples that clustered in the right branch were excluded for furtheranalyses due to potential quality problems.
48

3.2. Neurodegeneration and aging
3.2.3. Identification of a new risk gene for Parkinson‘s disease
To identify differentially expressed genes between Parkinson patients and controls, all nineold control samples were compared to the eight patient samples using the t-test (Elstneret al., 2009). When applying a Bonferroni correction only four probes remained significant:MTND2, PDXK, SRGPA3 and TRAPPC4 (see Table 3.2 and Figure 3.4). The upregulation ofthe genes MTND2 and PDXK could be confirmed by real-time Polymerase Chain Reaction(PCR). This technology is usually used to amplify and quantify a DNA molecule. The resultsof the real-time PCR are shown in the upper two figures of Figure 3.4.
Gene Definition Fold Change p-value Biological processMTND2 Homo sapiens NADH1 up 1.70 1.14 ∗ 10−7 ATP2 synthesis coupled
dehydrogenase, electron transportsubunit 2 (complex I)
PDXK Homo sapiens pyridoxal up 1.32 3.27 ∗ 10−6 Pyridoxine biosynthetic(pyridoxine, vitamin B6) processkinase
SRGPA3 Homo sapiens SLIT- up 1.23 5.65 ∗ 10−6 Signal transductionROBO Rho GTPaseactivating protein 3
TRAPPC4 Homo sapiens trafficking down 1.69 5.8 ∗ 10−6 ER3 to Golgi vesicle-protein particle complex 4 mediated transport
Table 3.2.: Differentially expressed genes between patients and old controls:1Nicotinamide-Adenine-Dinucleotide-Hydrid, 2Adenosine triphosphate,3endoplasmic reticulum
Figure 3.4.: Differentially expressed genes between Parkinson patients and old controls:The light gray boxes represent the PD samples and the black boxes the controls.The small boxes in the upper two figures show the result of the gene expressionmeasurement by real-time PCR.
49

3. Analysis of gene expression data in case-control studies
3.2.4. Differences in expression patterns for Parkinson‘s disease and aging
To identify genes that are influenced not only by Parkinson‘s disease but also by normal ag-ing the seven young controls were taken into account (Elstner et al., 2011). The young con-trols were compared to the old controls and the Parkinson patients by applying an ANOVA.The Benjamini-Hochberg correction was used to control the false discovery rate. This re-sulted in 409 probes with p-value <0.01, 1,661 probes with p-value <0.05 and 2,953 probeswith p-value <0.1. The final threshold was set to 0.05. The significant probes could bemapped to 1,608 different genes using the Ingenuity Pathway Analysis Software (IPA).
Figure 3.5.: Parkinson‘s disease as accelerated aging:Following ANOVA analysis (FDR 5%), a total of 1,661 transcripts were signif-icantly altered between the three groups: young controls (YC), age-matched(old) controls (OC) and PD. We mainly found three patterns of alterations: i)PD-specific: 1,185 transcripts were differentially expressed in Parkinson patients(435 up-regulated in PD and 750 down-regulated in PD, respectively) ii) Age-specific: 256 transcripts were differentially expressed only in young controls (147up- and 109 down-regulated, respectively) iii) PD as accelerated aging: 78 tran-scripts were nominally significant (p < 0.05) differentially expressed betweenYC, OC and Parkinson patients, but the effects were going in the same direction.The numbers in brackets indicate the number of transcripts with p-value > 0.05.Only 54 transcripts were showing a different pattern.
To distinguish between expression patterns that are PD-specific or age-specific a t-testwas conducted between young and old controls, young controls and patients and old con-trols and patients with a nominal p-value threshold of 0.05. Remarkably, all hits were notdistributed equally across all possible patterns. The most common pattern was PD-specific,meaning that the expression level was almost identical in young and old controls and de-creased or rather increased in the patients. In the second common pattern the expressionlevels differed only in young controls (age-specific pattern). The third common pattern de-
50

3.3. Gene expression in patients with mitochondrial disorders
scribed Parkinson‘s disease as accelerated aging because the expression level increased/de-creased in the old controls and even more in the patients. All exact numbers and all otherpossible patterns can be seen in Figure 3.5.The age- (n=256) and PD-specific (n=1185) gene lists were used for a pathway analysis withIPA (Table 3.3).
Canonical pathway p-value ↑ / ↓ main directionSpecific for agingcAMP1-mediated signaling 2.95E-03 5/2 ↑GABA2 receptor signaling 3.16E-03 1/3 ↓Sphingolipid metabolism 9.33E-03 2/3 ↓Aminophosphonate metabolism 1.26E-02 0/3 ↓RAR3 activation 1.66E-02 5/1 ↑Cardiac-adrenergic signaling 1.86E-02 3/2 ↑Methionine metabolism 2.63E-02 0/3 ↓Selenoamino acid metabolism 2.88E-02 0/3 ↓Glucocorticoid receptor signaling 3.39E-02 6/1 ↑G-Protein coupled receptor signaling 4.07E-02 5/1 ↑IL4-22 signaling 4.07E-02 2/0 ↑Estrogen receptor signaling 4.07E-02 2/2 ↔TNFR25 signaling 4.37E-02 2/0 ↑Glycosaminoglycan degradation 4.68E-02 2/1 ↑
Aging and PDNicotinate and nicotinamide metabolism 1.62E-02 3/1 ↑Agrin interactions at neuromuscular junction 1.86E-02 2/1 ↑Regulation of actin-based motility by rho 3.39E-02 1/2 ↓PAK6 signaling 3.55E-02 1/2 ↓Purine metabolism 3.63E-02 2/5 ↓Huntington’s disease signaling 3.80E-02 2/3 ↓Pantothenate and CoA7 biosynthesis 4.37E-02 0/2 ↓
Table 3.3.: Canonical pathways specific for aging and for Parkinson‘s disease:For the pathway analysis 1,185 PD-specific transcripts and 256 age-specific tran-scripts were used as input for the Ingenuity Pathway Analysis Software.1Cyclic adenosine monophosphate, 2gamma-Aminobutyric acid, 3Retinoic acidreceptor, 4Interleukin 22, 5Tumor necrosis factor receptor 2, 6p21 activated kinase,7Coenzyme A
.
3.3. Gene expression in patients with mitochondrial disorders
As the main focus of my working group is the genetic of mitochondrial disorders, there wereperformed some gene expression measurements on patients with mitochondrial disorders.The mitochondria are the so-called power-plants of the cells. Defective mitochondria maycause failure of metabolism. The most common and best studied mitochondrial defects are
51

3. Analysis of gene expression data in case-control studies
defects of the respiratory chain. Defects of the respiratory chain cause a cellular energydeficiency and lead to neurodegenerative disorders. Most of the time the central nervoussystem, the skeletal muscle or the heart are affected because they have a high energy rate.Mitochondrial disorders are a very rare disease with a prevalence of 1:50,000.
This project was a collaboration with Dr. Monika Hartig and Dr. Arcangela Iuso from theInstitute of Human Genetics of the Technical University in Munich (Hartig et al., 2011) onNBIA.Neurodegeneration with Brain Iron Accumulation (NBIA) is a neurodegenerative disorder.It comprises a very homogeneous group of neurodegenerative disorders with various com-binations of symptoms. The only commonality are the abnormal high levels of brain ironwhich can be diagnosed with MRI (Magnetic Resonance Imaging)(TIRCON). There are tensubgroups of NBIA (see Figure 3.6) and the investigated patients are from the following twogroups:
Figure 3.6.: Subgroups of NBIA:In addition to the different subgroups of NBIA (displayed with the causal gene)also diseases like Parkinson‘s disease or Alzheimer or aging can cause iron accu-mulation in the brain.Adopted from http://Tircon.eu.
• The most common form is PKAN (pantothenate kinase associated neurodegeneration)which is caused by mutations in the PANK2 gene. An indication for PKAN is the so-called ”Eye of the tiger”-sign in the MRI.
• MPAN (mitochondrial membrane protein-associated neurodegeneration) is caused by
52
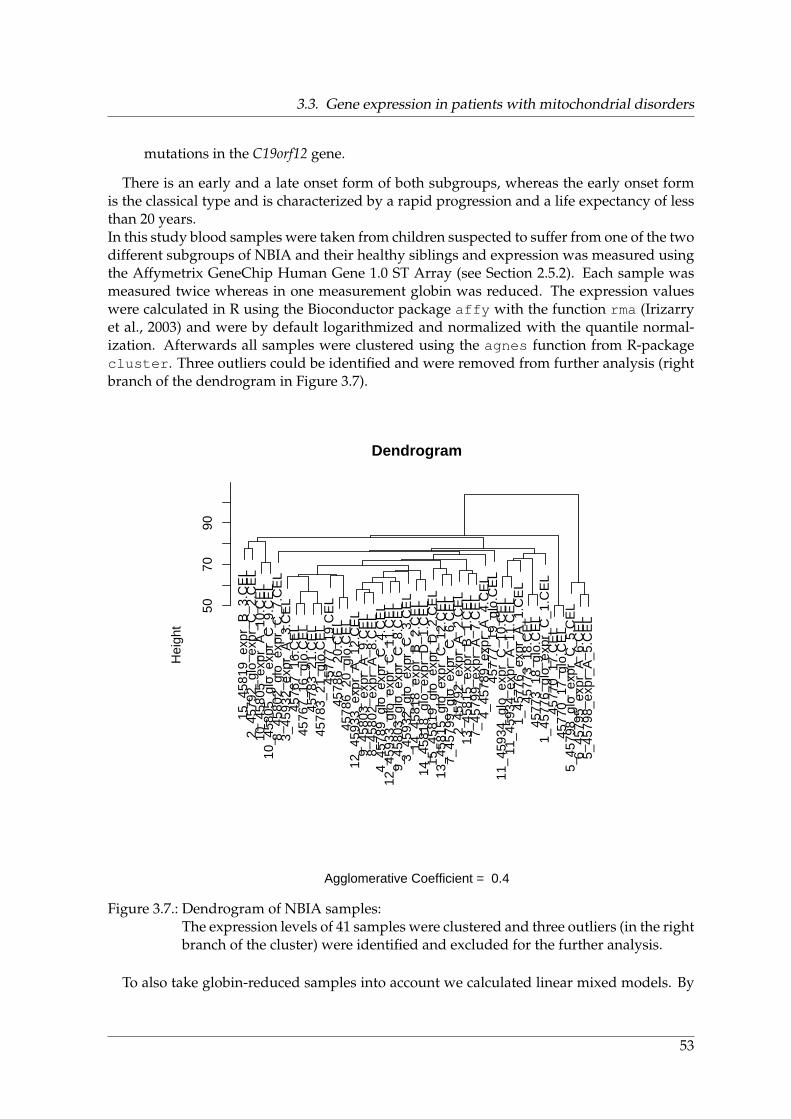
3.3. Gene expression in patients with mitochondrial disorders
mutations in the C19orf12 gene.
There is an early and a late onset form of both subgroups, whereas the early onset formis the classical type and is characterized by a rapid progression and a life expectancy of lessthan 20 years.In this study blood samples were taken from children suspected to suffer from one of the twodifferent subgroups of NBIA and their healthy siblings and expression was measured usingthe Affymetrix GeneChip Human Gene 1.0 ST Array (see Section 2.5.2). Each sample wasmeasured twice whereas in one measurement globin was reduced. The expression valueswere calculated in R using the Bioconductor package affy with the function rma (Irizarryet al., 2003) and were by default logarithmized and normalized with the quantile normal-ization. Afterwards all samples were clustered using the agnes function from R-packagecluster. Three outliers could be identified and were removed from further analysis (rightbranch of the dendrogram in Figure 3.7).
15_4
5819
_exp
r_B
_3.C
EL
2_45
792_
glo_
expr
_C_2
.CE
L10
_458
05_e
xpr_
A_1
0.C
EL
10_4
5805
_glo
_exp
r_C
_9.C
EL
8_45
802_
glo_
expr
_C_7
.CE
L3_
4593
2_ex
pr_A
_3.C
EL
4576
7_16
.CE
L45
767_
16_g
lo.C
EL
4578
3_21
.CE
L45
783_
21_g
lo.C
EL
4577
7_19
.CE
L45
786_
20.C
EL
4578
6_20
_glo
.CE
L12
_459
33_e
xpr_
A_1
2.C
EL
9_45
803_
expr
_A_9
.CE
L8_
4580
2_ex
pr_A
_8.C
EL
4_45
789_
glo_
expr
_C_4
.CE
L12
_459
33_g
lo_e
xpr_
C_1
1.C
EL
9_45
803_
glo_
expr
_C_8
.CE
L3_
4593
2_gl
o_ex
pr_C
_3.C
EL
14_4
5818
_exp
r_B
_2.C
EL
14_4
5818
_glo
_exp
r_D
_1.C
EL
15_4
5819
_glo
_exp
r_D
_2.C
EL
13_4
5815
_glo
_exp
r_C
_12.
CE
L7_
4579
9_gl
o_ex
pr_C
_6.C
EL
2_45
792_
expr
_A_2
.CE
L13
_458
15_e
xpr_
B_1
.CE
L7_
4579
9_ex
pr_A
_7.C
EL
4_45
789_
expr
_A_4
.CE
L45
777_
19_g
lo.C
EL
11_4
5934
_glo
_exp
r_C
_10.
CE
L11
_459
34_e
xpr_
A_1
1.C
EL
1_45
776_
expr
_A_1
.CE
L45
773_
18.C
EL
4577
3_18
_glo
.CE
L1_
4577
6_gl
o_ex
pr_C
_1.C
EL
4577
0_17
.CE
L45
770_
17_g
lo.C
EL
5_45
798_
glo_
expr
_C_5
.CE
L6_
4579
5_ex
pr_A
_6.C
EL
5_45
798_
expr
_A_5
.CE
L
5070
90
Dendrogram
Agglomerative Coefficient = 0.4
Hei
ght
Figure 3.7.: Dendrogram of NBIA samples:The expression levels of 41 samples were clustered and three outliers (in the rightbranch of the cluster) were identified and excluded for the further analysis.
To also take globin-reduced samples into account we calculated linear mixed models. By
53

3. Analysis of gene expression data in case-control studies
this we compared the expression levels of patients having a mutation in C19orf12 (N = 7)with the seven controls and patients having a mutation in PANK2 (N = 6) with the controls.The expression probes were sorted by p-value and the top 500 probes with lowest p-valueswere used for a pathway analysis with Ingenuity. Additionally we conducted a pathwayanalysis in C19orf12-coregulated genes identified in a healthy population (KORA; N=381).This population-based study is presented in detail in 2.1.1. In all three analyses pathwaysthat are related to mitochondrial functions are identified (see Table 3.4).
C19orf12 co-regulation Diff. expression in MPAN Diff. expression in PKANin controls (n=381) (n=6) versus controls (n=7) (n=7) versus controls (n=7)Fatty Acid Biosynthesis Natural Killer Cell Cholecystokinin/Gastrin-(4.64E-06) Signaling (2.49E-08) mediated Signaling (1.03E-03)
Valine, Leucine and Isoleucine Prolactin Signaling (1.36E-05) Mitochondrial DysfuntionDegradation (5.86E-04) (2.7E-03)
Protein Ubiquitination Fcg Receptor-mediated Oxidative PhosphorylationPathway (4.11E-03) Phagocytosis in Macrophages (3.72E-03)
and Monocytes (1.62E-05)
Propanoate Metabolism Growth Hormone Natural Killer Cell(5.33E-03) Signaling (6.25E-05) Signaling (4.92E-03)
Fatty Acid Elongation in Mitochondrial Dysfunction Folate BiosynthesisMitochondria (1.18E-02) (2.5E-03) (7.33E-03)
Table 3.4.: Results of pathway analysis for NBIA patients versus controls:Pathway analyses were conducted using Ingenuity Pathway Analysis Softwareusing three different gene lists. The first column shows the result from ahealthy population-based study (KORA) where genes that were co-regulated withC19orf12 were identified. For the second column six MPAN patients were com-pared to seven controls and for the third column seven PKAN patients were com-pared to the same controls.
3.4. Summary and discussion
The difficulty when analyzing gene expression data from case-control studies is the rela-tively small sample size in comparison to the large number of measured gene expressionprobes. To avoid this problem a few possibilities are available and were applied on the twodata sets.First of all a homogeneous data set is important because one extreme outlier could distortthe whole result and lead to wrong conclusions. For both data sets we used clustering toidentify samples with potentially bad quality and removed them from further analysis evenif this reduced the sample size rigorously (in the Illumina data twelve out of 48 samples wereremoved as they were cluster outliers).To decrease the multiple testing problem the expression probes in the Parkinson project werelimited by using only expression probes that are above the detection threshold. For the NBIAproject this was not possible because Affymetrix does not provide a score like the detection
54

3.4. Summary and discussion
p-value that indicates if the expression level is significant above the background. Thereforeall probes were used. Due to the fact that no gene was differentially expressed when cor-recting for multiple testing, the 500 top hits were selected for a pathway analysis and thisyielded in pathways that are related to mitochondrial functions.However the sample size was very small in both studies, the obtained results of both studieswere the beginning of future work.The biggest advantage of the Parkinson study is that the expression levels were measuredin the affected tissue and that there are two different kinds of control groups. We identifieda differential expressed gene between old controls and patients namely PDXK. This geneconverts vitamin b6 from the nutrition in its active form. Epidemiological studies showeda decreased risk for Parkinson’s disease in individuals with a high vitamin b6 level (de Lauet al., 2006). With our data we confirmed that the intake of vitamin b6 could decrease therisk for Parkinson’s disease .With the first results from the NBIA project it was possible to justify that a larger study is ne-cessary and helpful. It was the precursor experiment of a larger project with a larger samplesize, planned in the near future (see Chapter 7).
55

3. Analysis of gene expression data in case-control studies
56

4. Improvement and development of quality control ofgene expression data
The development of microarray technologies, the associated reduction of costs, the improve-ment of quality and reduced time requirement for experiments enables now the determina-tion of gene expression levels in population-based studies with larger sample sizes. Whenwe started to establish a genome-wide expression data set in a population-based study, forcomparison only data sets with few samples were available. Therefore the experimental set-tings have to be established first before measuring all samples. We started with KORA F3,improved the protocols in KORA F4 and finally standardized all procedures and protocolsin the German gene expression consortium MetaXpress.
4.1. Biological and technical replicates and manual qualitycontrol: KORA F3
Divya Mehta measured the gene expression of 381 samples of the KORA F3 cohort usingthe Illumina HumanWG-6 v2 BeadChip in the context of her dissertation (Mehta, 2009). TheKORA F3 cohort was among the first cohorts with genome-wide expression data. Therewere no comparable data sets available at this time so that a quality control protocol had tobe established and validated.
4.1.1. Biological and technical replicates
The first question to address was how robust and reproducible gene expression levels fromwhole blood samples are. In the beginning it was unknown to which extent the expres-sion levels differ from day to day and from individual to individual. Before the expressionlevels were measured in the KORA F3 samples the experimental protocol was validated bymeasuring three different samples (1-3) at three different time-points (a-c). Three healthyvoluntary males from the Institute of Human Genetics were recruited and blood was takenunder fasting conditions three times once a week. The expression values were normalized,Pearson‘s correlation coefficient was calculated and all samples were plotted pairwise (Fig-ure 4.1). All correlation coefficients were greater than 0.95 however not all nine samplescould be measured on the same array as one array can only be loaded with six samples inparallel.As differences between the three measurements of one individual are negligible the expres-sion levels seems to provide a good overview of the gene activity and it was started to mea-sure all samples with available PAX tubes from KORA F3.
57

4. Improvement and development of quality control of gene expression data
Figure 4.1.: Scatterplot matrix of three technical and biological replicates:The upper panels show the Pearson‘s correlation coefficient between technicaland biological replicates, which is always greater than 0.95, indicating a veryhigh correlation between all technical and biological replicates.
58

4.1. Biological and technical replicates and manual quality control: KORA F3
4.1.2. Quality control
The first quality score that can be obtained for each sample after RNA isolation is the RNAintegrity number (RIN). The RIN can reach values between 1 and 10 in which 1 means totallydegraded1 RNA and 10 nondegraded RNA (Schroeder et al., 2006). The RIN in the analyzedKORA F3 samples ranged from 2.3 to 8.4. One reason for this large range of the RIN mightbe the badly organized management of the PAX tubes. All PAX tubes from one day werecollected and transported via cab from the study center in Augsburg (where the blood wastaken) to the Institute of Human Genetics (where the RNA was isolated). The storage timeand temperature of the PAX tubes was not standardized and varied a lot.
It could be assumed that samples with high quality, indicated by a high RIN, have a highnumber of detected genes. The number of detected genes per sample could be obtained fromthe GenomeStudio (the software from Illumina that allows the quality control and some ba-sic analyses). It indicates the number of genes that are significantly higher expressed thanthe background noise. To verify the assumption that samples with a higher RIN also havemore detected genes, a linear regression model was calculated. Testing the effect of the RINon the number of detected genes a direct significant relationship could be observed with ap-value of 2.99∗10−18 (see Figure 4.2). Surprisingly, there are also samples with a very smallRIN (< 5) but more than 8,000 significant detected genes.However, it is difficult to make a statement on low expressed genes (gene level is less thanthe background noise). We kept also samples with lots of low expressed genes for the reasonthat power to detect significant changes in the expression levels increases with sample size.
● ●
●
●
●
●
●●●
●
●
●
●
● ●
●
●
●
●
●
●● ●
●
●●
●
●
●
●
●
●
●
●
●
●
●
●
●
●
●
●●
●
●
●
● ●
●
●
●
●●
●
●
●
●
●
●
●
●
●●
●
●●
●
●
●
●
●
●
●
●
●●
●
●
●
●●
●
●
●
●
●●
●
●
●
●●
●
●
●
●
●●
●● ●
●
●●
●
●
●
●●
●
●
●
●
●
●
●
●
●
●
●
●
●
●
●
●
●●
●
●
●
●
●●
●
●
●
●●
●● ●
●
●
●
●
●
●
●
●
●
●
●●
●
●●
●
●
●
●
●●
●
●
●
●●
●
●
●
●
●
●
●
●●●
●●●
●●
●
●
●
●
●
●
●●
●
●
●
●●●●
●
●
●
●
● ●
●●
●
●
●●
●
●
●
●
●
●
●
●● ●
●
●
●●
●●
●
●
●
● ●
●
●
●
●
●●
●
●
●
●
●
●
●
●
●
●●
●
●
●
●
●
●
●●
●
●●
●
●●
●
●
●
●●
●
●
●●
●
●
●
●
●
●
●
●
●
●
●
●●
●
●
●
●●
●
●
●
●
●
●
●●
●
●
●
●
●●
●
●
●
●●
●
●●
●
●
●
●
●●
●
●
●
●●
●
●●
●
●
●
●
●
●●
●●●
●
●●
●
●
●
●
●
●
●
●
●
●
●
●
●
●
●
●●
●
●
●●
●
●●
●
●
●
●
●
●
●
●
●●
●
●
●
●
●●
●
●
●
3 4 5 6 7 82000
6000
1000
014
000
RIN
Num
ber
of d
etec
ted
gene
s
Figure 4.2.: RIN versus number of detected genes in KORA F3:A higher RIN leads to significant more detected genes (p-value of linear regres-sion = 2.99 ∗ 10−18).
1RNA in cells is not very stable to allow a continuous degeneration. This process is done with enzymes(RNasen).
59

4. Improvement and development of quality control of gene expression data
When processing several hundred samples in parallel there is a risk for sample mixing.Since gender of the probands was given, one way to identify mixed samples is to take ad-vantage of the sex-specific expression pattern. Naturally women should have low expressionvalues for all Y-genes. Therefore the expression pattern of all genes on the Y-chromosomewas inspected graphically and three samples with high expression levels however they areindicated to be female or the other way round were excluded.
4.1.3. Processing of the data
To ensure the comparability of gene expression levels of samples that were measured on dif-ferent days and on different arrays, all 381 samples were normalized trying three differentnormalization methods (rank invariant, LOESS and VSN normalization). The samples werecompared graphically to determine the LOESS normalization as the optimal normalizationmethod (for more details see (Heim, 2008)).
The data set consisted now of 381 samples and the expression levels of 48,701 probes persample. When analyzing all probes separately the number of performed tests was obviouslyquite high and the number of false positive hits increased (multiple testing problem). Toface the multiple testing problem we reduced the number of probes. One way was to useonly probes that are significantly detected in more than 5% of all samples. “Significantlydetected” means in this case that the detection p-value was less than 0.01 in more than 19out of 381 samples. Using this threshold the number of probes was reduced from 48,701 to13,767. Applying a Bonferroni correction the threshold for significance changed just from0.05/48,701 = 1.03 ∗ 10−6 to 0.05/13,767 = 3.6 ∗ 10−6 but the number of performed tests isreduced by a third and speeded up the analysis, respectively.
4.2. Validation of new technology: KORA F4
The experiences gained from the first experiments with KORA F3 were used to establishan even larger whole-genome gene expression data set. PAX tubes were available for morethan 1,000 samples from KORA F4. Additionally there were samples from baseline survey S4which were frozen for several years. For most of participants who were non diabetics therewere blood samples collected after an oral glucose tolerance test (OGTT). Expected qualityfor the S4 samples was low after the long freezing time and therefore the focus was led onthe KORA F4 samples as better comparability to other expression data was expected.
4.2.1. One or two arrays per sample?
The KORA F3 samples were measured using the Illumina HumanWG-6 v2 Bead Chip whichcontains on average about 30 beads per probe. This array was no longer available whenstarting the measurement of the KORA F4 data. Another array was introduced by Illumina(Illumina HumanHT-12 v3) and due to the lower price and the advantage that 12 samplesinstead of 6 could be measured in parallel the HumanHT-12 v3 array was used for the fol-lowing experiments. The advantage was that two of this new arrays were cheaper than one
60

4.2. Validation of new technology: KORA F4
of HumanWG-6 v2 arrays. The disadvantage of the HT-12 v3 array was that it was not clearin the beginning if the quality of the data could be worse due to the fact that it contains onlyhalf amount of beads (n = 15) per probe compared to the HumanWG-6 v2 array.
Histogram of deviation
deviation chip1/chip2 in percent
Fre
quen
cy
−15 −10 −5 0 5 10 15
0e+
002e
+04
4e+
046e
+04
8e+
041e
+05
Figure 4.3.: Histogram of deviations between expression values when using two differentarrays per sample:Twelve samples were measured on two different arrays. Weighted means werecalculated for each probe of each sample using the number of beads as weights.One array has on average 15 beads per probe and two arrays ∼30 beads accord-ingly. The largest deviation from the weighted mean is 12% and 99.9% of thedeviations are less than 5%.
To figure out if two arrays are necessary to get the same result as with using only onearray the first twelve samples were measured on two different arrays. For each of the twelvesamples the deviation of expression values was calculated for every probe on the array. For97% of the probes the deviation was less than 5%. Further the probe specific weighted meanwas calculated by using the number of beads per probe as weight. The largest deviation fromthe weighted mean was 12% and 99.9% of the deviations are less than 5%. (see histogramin Figure 4.3). Double measurement did not improve the quality but would duplicate thework. Therefore we stayed with only one array per sample.
4.2.2. Amount of cRNA, scanner regulation, and amount of RNA
To establish and optimize the protocol for gene expression measurement four samples weremeasured three times and we used the “number of detected genes” as quality criterion.
• Different starting amounts of RNA were tested (100ng and 200ng RNA)⇒ 200ng RNA led to higher number of detected genes.
• Different amounts of cRNA for hybridization were tested (750ng cRNA, 1.5µg cRNA,
61

4. Improvement and development of quality control of gene expression data
and 3µg cRNA)⇒ 3µg cRNA showed the highest amount of detected genes.
• Different scanner settings were tested (default: gain1, gain2, and gain4)⇒No difference was observed between all settings and therefore the default regulationgain1 was chosen.
4.2.3. Establishment of a comprehensive quality-controlled data set
In total, RNA was isolated from 3,301 PAX tubes from KORA S4, F4 and F4 after the oralglucose tolerance test (F4 OGTT). For 391 PAX tubes the amount or quality of RNA did notmeet the quality criterion and was therefore excluded. Bad quality was defined by a RIN< 6(especially the samples from KORA S4 had low RINs (< 3)) to ensure a more homogenousdata set. In addition we defined a threshold for the number of detected genes > 6,000 whichfurther excluded 25 samples. Due to the limited number of detected genes (< 6,000) in thefirst run, we measured 327 probes two times. Ten probes were measured three times andfour probes four times. Sixteen probes (corresponding to nine different samples) were not inthe KORA data base and were not allowed to be used for further analysis.Altogether 341 probes were measured more than one time: 135 F4 samples, 126 F4 afterOGTT samples and 80 S4 samples. We could not observe that samples with an impairedglucose have to be measured more often than samples with a normal glucose.Finally we ended up with a data set consisting of expression levels of 2,509 samples withmore than 6,000 detected genes.For further processing all expression values were log2-transformed and normalized usingthe quantile normalization. To identify outliers all samples were clustered using the wholeexpression profile and thereby three outliers (three S4 samples) were identified and wereremoved from the data set (the dendrogram is shown in Appendix A.1).
In a second step we controlled for sample mixing by determine the gender of a sampleby clustering of samples due to the expression of probes that are located on the sex chromo-somes. Female samples should have very low expressed probes on the Y- and males shouldhave low expressed probes on the X-chromosome. To spot mixed samples, all three cohortswere clustered using only probes that were located on X- and Y-chromosome. 35 probes ofall three cohorts were deleted due to wrong classification (see Table 4.1). More than half ofthe wrongly classified samples were from the S4 cohort (57%). In KORA F4 only 5 out of 998samples (0.5%) have been mixed or contained unusual X-Y gene expression levels.
cohort males wrong females wrongmales females
S4 360 11 317 9F4 504 1 494 4F4 OGTT 403 6 420 4
Table 4.1.: Gender classification in KORA S4, F4, and F4 OGTT:The gender of each sample was determined by clustering all expression probesthat are located on X- and Y-chromosomes.
62

4.3. Common quality controlled preprocessing and analysis strategy: MetaXpress
After removing all outliers and mixed samples there were altogether 657 S4 samples, 993F4 samples and 813 F4 OGTT samples which were amplified on 32 different amplificationplates. For about half of the samples (N = 460) three measurements from the three differenttime points were available (see Figure 4.4).
Figure 4.4.: Overlap of samples from KORA S4, F4, and F4 OGTT
4.3. Common quality controlled preprocessing and analysisstrategy: MetaXpress
In 2011 the MetaXpress Consortium was founded within the DZHK - German Center forCardiovascular Research (Deutsches Zentrum fur Herz-Kreislauf-Forschung). MetaXpressconsists of three large German study cohorts with available gene expression data:
• KORA F4 (Munich)Described in Section 2.1.1.
• GHS (Mainz, Lubeck, Hamburg)Described in Section 2.1.4.
• SHIP-Trend (Greifswald)Described in Section 2.1.2.
Firstly the methodological aspects of the data preprocessing should be standardized in allthree participating cohorts to ensure the comparability. Since there was no gold standard forexpression data preprocessing, we compared available methods to stabilize the variation ofthe expression data and defined a set of confounders with impact on this variation.
In MetaXpress, we analyzed gene expression levels in terms of specific mRNA abundancesin whole blood (SHIP-TREND and KORA F4) or blood monocyte samples (GHS). The de-scriptive statistics of the participants and parameters analyzed in the studies are provided
63

4. Improvement and development of quality control of gene expression data
in Table 4.2. Despite higher age of the participants of KORA F4 (mean age = 70.4 years) thanin SHIP-TREND (mean age = 50.1 years) and GHS (mean age = 54.7 years) and the storagetime of the samples was longer in KORA F4 (855 days) than in SHIP-TREND (204 days) andGHS (314 days), there are no large differences between the three cohorts.
Variable (mean/SD) SHIP-TREND KORA F4 GHSSample size 991 993 1374Storage time∗ 204.0±153.8 855.5±179.4 314.4±91.6RNA integrity number (RIN) 8.56±0.50 8.68±0.61 9.36±0.43Females (%) 555 (56.0) 493 (49.6) 622 (48.4)Age [years] 50.1±13.7 70.4±5.4 54.7±11.0Body height [cm] 169.8±9.0 165.3±8.8 171.0±9.3Body weight [kg] 79.0±15.1 78.9±13.7 79.1±15.5Body mass index [kg/m2] 27.3±4.6 28.9±4.5 27.0±4.6Hip circumference [cm] 101.3±9.6 107.8±9.3 100.5±9.6Waist circumference [cm] 88.0±12.9 98.6±12.1 93.5±13.4Waist-to-hip ratio 0.87±0.09 0.91±0.08 0.93±0.09White blood cell count [Gpt/l] 5.72±1.48 6.00±1.80 7.04±3.81Red blood cell count [Tpt/l] 4.63±0.39 4.50±0.40 4.69±0.41Hematocrit 0.42±0.03 0.41±0.03 0.42±0.03Hemoglobin [mmol/l] 8.62±0.74 8.69±0.75 9.10±0.74Platelets [Gpt/l] 225.7±50.3 244.7±65.1 271.5±67.9Serum C-reactive protein [mg/l] NA 3.05±6.27 3.78±4.92High density lipoprotein [mmol/l] 1.48±0.37 1.43±0.36 1.47±0.40Serum triglycerides [mmol/l] 1.42±0.85 1.50±0.84 1.46±0.91Active smokers [%] 214 (22.0) 66 (6.7) 239 (18.6)Systolic blood pressure [mmHg] 124.4±16.9 128.7±20.0 132.2±17.8Diastolic blood pressure [mmHg] 76.6±9.8 74.0±10.1 83.5±9.68
Table 4.2.: Descriptive statistics of MetaXpress cohorts:∗Storage time: Time between blood sampling and RNA isolation (SHIP-TRENDand KORA F4) or time between RNA isolation and RNA amplification (GHS)[days].Serum C-reactive protein was not available in SHIP-TREND.
All statistical analyses were performed in each cohort separately. Dr. Claudia Schurmannand Dr. Alexander Teumer were responsible for the SHIP-TREND analysis, Arne Schillertand Christian Muller for the GHS analysis and I performed all analysis on the KORA F4 dataset.
4.3.1. Variance stabilization transformation versus log2 transformation
Gene expression levels can reach values between zero (not expressed) and infinite (very highexpressed). Thereby most of the expression levels are between zero and 100 which is iden-tical to or below the background level. For any kind of parametric statistic a symmetricaldistribution is assumed and therefore the values are usually logarithmized before the ana-
64

4.3. Common quality controlled preprocessing and analysis strategy: MetaXpress
lysis. It is irrelevant if the log10, loge or log2 is used. Biologists mostly prefer the log2 scalebecause these values are easier to understand. The whole blood data sets from KORA F4and SHIP-TREND were already on log2 scale whereas the monocyte data set from GHS wasprepared using the variance stabilization transformation (VST). For the log2 transformationthe average signal per probe (calculated from the about 15 beads per probe) is used. In com-parison to the log2 transformation the VST (for details see Appendix A.2.1) takes all singlemeasurements of each probe for each bead on the Illumina array into account.Comparing the log2 expression values to the VST expression values the average values perprobe are almost identical for large intensity values (> 29) in all three cohorts, but the log2values are recognizably smaller for low intensity values (see upper left part of Figure 4.5).This is consistent with already published results (Lin et al., 2008). To compare the effectsof the two different transformations we created a random normal distributed phenotype(N(0,1)) and calculated the associations for all expression probes with this uncorrelated phe-notype by using a linear regression model. Further we used the body mass index (BMI)which is known to be highly correlated with gene expression levels in monocytes (Zelleret al., 2010) and whole blood (Xu et al., 2011). For both phenotypes the absolute effect sizesand the standard errors (SE) from the linear model were smaller when applying the VST inlow intensity values (see Figure 4.5 for BMI and Figure A.2 for the random phenotype). Thisresulted in highly correlated association p-values (R2 = 0.9956 in KORA F4). Therefore weconcluded that there is no relevant difference between both transformation methods. As thelog2 transformation is most often used, easier to apply and to interpret all three data setswere log2-transformed.
4.3.2. Determination of factors influencing gene expression
To identify technical variables with influence on gene expression levels principal compo-nent analysis was conducted in all three data sets. More than 96% of the variance in theexpression data is explained by the first Eigen-vector (the so called Eigen-gene)2 in all threecohorts. This result was independent of the applied variance stabilization method and theused tissue (see Figure 4.6).
In the SHIP-TREND data set it was additionally tested if more or less variance is explainedby the first Eigen-vectors when excluding all probes with low intensity values (detection p-value less than 0.01 in at least 50% of the samples). No difference could be observed betweenthe log2 transformation and the VST even when excluding the probes with low intensity val-ues (see two upper figures of Figure 4.7). More than 95% of the variation in the expressionlevels is explained by the first Eigen-vectors.Xu et al. (2011) also analyzed the impact of the first principal components on the variationof the gene expression levels. He investigated 24 whole blood samples measured on theAffymetrix GeneChip. In comparison to our results in this data set only 28.2% of the varia-tion in the expression levels was explained by the first principal component. To test if thisdifference was due to the different sample sizes we selected a random sample of 24 individu-als and calculated how much of the variation is explained by the first Eigen-vectors. For our
2In the original publication the Eigen-vectors were misleadingly called principal components however theEigen-vectors were meant.
65

4. Improvement and development of quality control of gene expression data
Figure 4.5.: Comparison of VST- and log2-transformed expression values in association withBMI in KORA F4:The figures show the difference between the VST- and log2-transformed expres-sion values in association with BMI. Each dot represents one probe and the colorcode is given in the legend of the plots. Differences are observed for the mean in-tensity values for low intensity values, for betas, and for standard errors of betas.Despite those differences the p-values are highly correlated (r2=0.9956).
66

4.3. Common quality controlled preprocessing and analysis strategy: MetaXpress
PCs
Exp
lain
ed v
aria
nce
[%]
●
●
●
●
●
●
●
●
●
●●
●●
●●
●●
●● ● ● ● ● ● ● ● ● ● ● ● ● ● ● ● ● ● ● ● ● ● ● ● ● ● ● ● ● ● ● ● ● ● ● ● ● ● ● ● ● ● ● ● ● ● ● ● ● ● ● ● ● ● ● ● ● ● ● ● ● ● ● ● ● ● ● ● ● ● ● ● ● ● ● ● ● ● ● ● ● ●
0 20 40 60 80 100
9596
9798
9910
0
●
●
●
●
●
●
●
●
●
●
●●
●●
●●
●●
● ● ● ● ● ● ● ● ● ● ● ● ● ● ● ● ● ● ● ● ● ● ● ● ● ● ● ● ● ● ● ● ● ● ● ● ● ● ● ● ● ● ● ● ● ● ● ● ● ● ● ● ● ● ● ● ● ● ● ● ● ● ● ● ● ● ● ● ● ● ● ● ● ● ● ● ● ● ● ● ● ●
0 20 40 60 80 100
9596
9798
9910
0
●
●
●
●
●
●
●●
●●
●●
●● ● ● ● ● ● ● ● ● ● ● ● ● ● ● ● ● ● ● ● ● ● ● ● ● ● ● ● ● ● ● ● ● ● ● ● ● ● ● ● ● ● ● ● ● ● ● ● ● ● ● ● ● ● ● ● ● ● ● ● ● ● ● ● ● ● ● ● ● ● ● ● ● ● ● ● ● ● ● ● ● ● ● ● ● ● ●
0 20 40 60 80 100
9596
9798
9910
0
●
●
●
●
●
cohort
SHIP−TRENDKORA F4GHStransformationL2TVST
Figure 4.6.: Explained variance by the Eigen-genes in KORA F4, GHS, and SHIP-TREND:The explained variance is depicted for the first 100 Eigen-genes in all three co-horts for the two different transformations (log2 transformation and VST). Morethan 95% of the variance is explained by the first Eigen-gene in all three cohorts,independent from the transformation.
67

4. Improvement and development of quality control of gene expression data
data we could not see a difference between the original and the reduced sample size. In thereduced subset of 24 samples the first Eigen-vector explains 97.3% of the variation in the ex-pression data (see figure in the left lower corner of Figure 4.7). To investigate whether techni-cal issues due to the different expression platforms (Illumina versus Affymetrix) could causethis large differences the whole SHIP-TREND data set was adjusted for technical factors (Am-plification batch, sample storage time and RIN). Now the first Eigen-vector just explained 5.9%of the variation of gene expression (see figure in the right lower corner of Figure 4.7). Thisresult suggested that the Eigen-vectors are highly correlated with technical factors and thedifferences to the data set from Xu et al. (2011) might be explained by the sample preprocess-ing (96 samples in parallel on one amplification plate) or the Illumina array (twelve sampleson one array).
To identify the variables with the highest impact on the variation of expression levels theEigen-R2 was calculated for 25 technical, biological and clinical variables which were avail-able in all three cohorts (and the Serum C-reactive protein as it is known to be associatedwith expression levels of some genes in whole blood). The Eigen-R2 is a measurement forthe explained variance of predefined variables. The Eigen-R2 are shown in Table 4.3 for allthree cohorts separated in technical and non-technical factors.
Most of the variance of expression levels in all three cohorts can be explained by the Illu-mina chip design (twelve samples per array). The highest value of 48.18% in KORA F4 canbe explained by the higher number of samples that were processed. In KORA the expres-sion was measured in S4, F4 and F4 OGTT at once and therefore the factor representing theIllumina chip number has more levels. In GHS only 26.55% of the variation was explainedby the Illumina chip. One reason for this is the most optimal preprocessing of the samples.Since all samples were prepared on the same day the variation due to technical variableswas smaller than in SHIP-TREND and KORA.Beside those observations all Eigen-R2 values were similar in all three cohorts. Only forblood cell-related factors (white and red blood cell count, hematocrit, and hemoglobin) weobserved differences between the whole blood and the monocyte data.
Additionally to the calculation of the Eigen-R2 the Eigen-genes were correlated with thesame technical, biological, and clinical variables. Figure 4.8 shows the results for KORA F4and Figure 4.9 for all three cohorts, respectively. For most technical variables the highestcorrelation was observed with one of the first five Eigen-genes but they are correlated withalmost all Eigen-genes. The highest correlation was observed for the plate design which ishighly correlated with the Illumina chip due to the distribution of 96 samples from one plateon eight arrays (twelve samples per array).
4.3.3. Reduction of unexplained variance by adjustment for covariates
To reduce the unexplained variance in the linear regression models the same phenotypes asin Section 4.3.1 were used (BMI and the random phenotype). We first included systematicallyup to 100 Eigen-genes in steps of five to the linear model, saved the adjusted R2 values andcalculated the means for each cohort separately. We could reduce the unexplained varianceby about 30% when adding 50 Eigen-genes to the linear regression model (see Table 4.4 and
68

4.3. Common quality controlled preprocessing and analysis strategy: MetaXpress
PCs
Exp
lain
ed v
aria
nce
[%]
0 20 40 60 80 100
9596
9798
9910
0
●
●
●
●
●
●●●●●●●●●●●●●●●●●●●●●●●●●●●●●●●●●●●●●●●●●●●●●●●●●●●●●●●●●●●●●●●●●●●●●●●●●●●●●●●●●●●●●●●●●●●●●●●
●
●
●
●
●
●
●●●●●●●●●●●●●●●●●●●●●●●●●●●●●●●●●●●●●●●●●●●●●●●●●●●●●●●●●●●●●●●●●●●●●●●●●●●●●●●●●●●●●●●●●●●●●●
●
●
L2T
all probesfiltered
PCs
Exp
lain
ed v
aria
nce
[%]
0 20 40 60 80 10095
9697
9899
100
●
●
●
●
●
●●●●●●●●●●●●●●●●●●●●●●●●●●●●●●●●●●●●●●●●●●●●●●●●●●●●●●●●●●●●●●●●●●●●●●●●●●●●●●●●●●●●●●●●●●●●●●●
●
●
●
●
●
●
●●●●●●●●●●●●●●●●●●●●●●●●●●●●●●●●●●●●●●●●●●●●●●●●●●●●●●●●●●●●●●●●●●●●●●●●●●●●●●●●●●●●●●●●●●●●●●
●
●
VST
all probesfiltered
PCs
Exp
lain
ed v
aria
nce
[%]
5 10 15 20
9697
9899
100
●
●
●
●
●
●
●
●
●
●●
●●
●●
●●
●●
●●
●●
●
●
●
●
●
●
●
●
●
●
●
●●
●●
●●
●●
●●
●●
●●
●
●
L2T − 24 samples
all probesfiltered ●
PCs
Exp
lain
ed v
aria
nce
[%]
0 20 40 60 80 100
05
1020
3040
5060
●
●
●
●
●●●●●●●●●●●●●●●●●●●●●●●●●●●●●●●●●●●●●●●●●●●●●●●●●●●●●●●●●●●●●●●●●●●●●●●●●●●●●●●●●●●●●●●●●●●●●●●●
●
●
●
●
●
●
●●●●●●●●●●●●●●●●●●●●●●●●●●●●●●●●●●●●●●●●●●●●●●●●●●●●●●●●●●●●●●●●●●●●●●●●●●●●●●●●●●●●●●●●●●●●●●
●
●
Adj.Tech
all probesfiltered
Figure 4.7.: Explained variance by the first 100 Eigen-genes for different filter methods inSHIP-TREND:In SHIP-TREND it was tested if different filtering methods reduced the explainedvariance by the Eigen-genes. The upper two figures show the difference betweenusing all expression probes that are available on the array (all probes) and usingonly the significantly detected probes (filtered) for the log2 transformation andVST, respectively.The figure at the bottom left shows the difference between all and filtered probes,but using only 24 random samples. Only in the figure at the bottom right theexplained variance by the first Eigen-gene is reduced to less than 10%. These datawere adjusted for the technical variables (amplification plate, RIN, and samplestorage time). The filtering of probes shows the same result.
69

4. Improvement and development of quality control of gene expression data
Parameter SHIP-TREND KORA F4 GHSIllumina Chip (12 samples per array) 33.75% 48.18% 26.55%RNA amplification batch (96 well plate) 20.18% 24.30% 12.44%Storage time [days]∗ 2.86% 1.60% 1.70%Month of blood sampling 18.72% 3.31% 8.11%Time of blood sampling [h] 0.20% 0.41% 0.61%RNA integrity number 1.36% 0.77% 0.29%Sex 0.95% 0.87% 1.51%Age [years] 0.58% 0.45% 0.30%Body height [cm] 0.54% 0.48% 0.82%Body weight [kg] 0.59% 0.60% 0.51%Body mass index [kg/m2] 0.68% 0.54% 0.35%Hip circumference [cm] 0.60% 0.41% 0.27%Waist circumference [cm] 0.77% 0.67% 0.52%Waist to hip ratio 0.65% 0.70% 0.82%White blood cell count [Gpt/l] 0.89% 0.74% 0.23%Red blood cell count [Tpt/l] 0.38% 0.35% 0.65%Hematocrit 0.47% 0.46% 0.83%Hemoglobin [mmol/l] 0.50% 0.42% 1.03%Platelets [Gpt/l] 0.32% 0.27% 0.63%High density lipoprotein [mmol/l] 0.49% 0.48% 0.48%Serum triglycerides [mmol/l] 0.68% 0.87% 0.23%Active smokers [%] 0.36% 0.23% 0.26%Systolic blood pressure [mmHg] 0.41% 0.15% 0.26%Diastolic blood pressure [mmHg] 0.37% 0.14% 0.19%Serum C-reactive protein [mg/l] NA 0.30% 0.26%
Table 4.3.: Eigen-R2 values for technical and non-technical variables in KORA F4, SHIP-TREND, and GHS:∗Storage time means the time between blood sampling and RNA isolation inKORA F4 and SHIP-TREND and between RNA isolation and amplification inGHS. Serum C-reactive protein was not available in SHIP-TREND.
70

4.3. Common quality controlled preprocessing and analysis strategy: MetaXpress
Figure 4.8.: Correlation of covariables with the first 50 Eigen-genes in KORA F4:The smaller the p-value the larger the dots. The smallest p-value per covariable isindicated with a triangle. (CRP: Serum C-reactive protein, GLUK2a: 2h-glucoselevel (after glucose tolerance test), GLUK1a: fasting glucose level, HABA1C: gly-cated hemoglobin, DBP: diastolic blood pressure, SBP: systolic blood pressure,WHR: waist-hip-ratio, PLT: platelets, HCT: hematocrit, RBC: red blood cell count,WBC: white blood cell count)
71

4. Improvement and development of quality control of gene expression data
PCs
1 3 5 7 9 11 13 15 17 19 21 23 25 27 29 31 33 35 37 39 41 43 45 47 49
● ● ● ● ● ● ● ● ● ● ● ● ● ● ● ● ● ● ● ● ● ● ● ● ● ● ● ● ● ● ● ● ● ● ● ● ● ● ● ● ● ● ● ● ● ● ● ● ●
● ● ● ● ● ● ● ● ● ● ● ● ● ● ● ● ● ● ● ● ● ● ● ● ● ● ● ● ● ● ● ● ● ● ● ● ● ● ● ● ● ● ● ● ● ● ● ● ●
● ● ● ● ● ● ● ● ● ● ● ● ● ● ● ● ● ● ● ● ● ● ● ● ● ● ● ● ● ● ● ● ● ● ● ● ● ● ● ● ● ● ● ● ● ● ● ● ● ●
K
● ● ● ● ● ● ● ● ● ● ● ● ● ● ● ● ● ● ● ● ● ● ● ● ● ● ● ● ● ● ● ● ● ● ● ● ● ● ● ● ● ● ● ● ● ● ● ● ●
● ● ● ● ● ● ● ● ● ● ● ● ● ● ● ● ● ● ● ● ● ● ● ● ● ● ● ● ● ● ● ● ● ● ● ● ● ● ● ● ● ● ● ● ● ● ● ● ● ●
● ● ● ● ● ● ● ● ● ● ● ● ● ● ● ● ● ● ● ● ● ● ● ● ● ● ● ● ● ● ● ● ● ● ● ● ● ● ● ● ● ● ● ● ● ● ● ● ● ●
LIP
● ● ● ● ● ● ● ● ● ● ● ● ● ● ● ● ● ● ● ● ● ● ● ● ● ● ● ● ● ● ● ● ● ● ● ● ● ● ● ● ● ● ● ● ● ● ● ● ●
● ● ● ● ● ● ● ● ● ● ● ● ● ● ● ● ● ● ● ● ● ● ● ● ● ● ● ● ● ● ● ● ● ● ● ● ● ● ● ● ● ● ● ● ● ● ● ● ●
● ● ● ● ● ● ● ● ● ● ● ● ● ● ● ● ● ● ● ● ● ● ● ● ● ● ● ● ● ● ● ● ● ● ● ● ● ● ● ● ● ● ● ● ● ● ● ● ● ●
CA
● ● ● ● ● ● ● ● ● ● ● ● ● ● ● ● ● ● ● ● ● ● ● ● ● ● ● ● ● ● ● ● ● ● ● ● ● ● ● ● ● ● ● ● ● ● ● ● ●
● ● ● ● ● ● ● ● ● ● ● ● ● ● ● ● ● ● ● ● ● ● ● ● ● ● ● ● ● ● ● ● ● ● ● ● ● ● ● ● ● ● ● ● ● ● ● ● ●
● ● ● ● ● ● ● ● ● ● ● ● ● ● ● ● ● ● ● ● ● ● ● ● ● ● ● ● ● ● ● ● ● ● ● ● ● ● ● ● ● ● ● ● ● ● ● ● ● ●
PTT
● ● ● ● ● ● ● ● ● ● ● ● ● ● ● ● ● ● ● ● ● ● ● ● ● ● ● ● ● ● ● ● ● ● ● ● ● ● ● ● ● ● ● ● ● ● ● ● ●
● ● ● ● ● ● ● ● ● ● ● ● ● ● ● ● ● ● ● ● ● ● ● ● ● ● ● ● ● ● ● ● ● ● ● ● ● ● ● ● ● ● ● ● ● ● ● ● ● ●
● ● ● ● ● ● ● ● ● ● ● ● ● ● ● ● ● ● ● ● ● ● ● ● ● ● ● ● ● ● ● ● ● ● ● ● ● ● ● ● ● ● ● ● ● ● ● ● ● ●
B12
● ● ● ● ● ● ● ● ● ● ● ● ● ● ● ● ● ● ● ● ● ● ● ● ● ● ● ● ● ● ● ● ● ● ● ● ● ● ● ● ● ● ● ● ● ● ● ● ●
● ● ● ● ● ● ● ● ● ● ● ● ● ● ● ● ● ● ● ● ● ● ● ● ● ● ● ● ● ● ● ● ● ● ● ● ● ● ● ● ● ● ● ● ● ● ● ● ●
● ● ● ● ● ● ● ● ● ● ● ● ● ● ● ● ● ● ● ● ● ● ● ● ● ● ● ● ● ● ● ● ● ● ● ● ● ● ● ● ● ● ● ● ● ● ● ● ● ●
LDH
● ● ● ● ● ● ● ● ● ● ● ● ● ● ● ● ● ● ● ● ● ● ● ● ● ● ● ● ● ● ● ● ● ● ● ● ● ● ● ● ● ● ● ● ● ● ● ● ●
● ● ● ● ● ● ● ● ● ● ● ● ● ● ● ● ● ● ● ● ● ● ● ● ● ● ● ● ● ● ● ● ● ● ● ● ● ● ● ● ● ● ● ● ● ● ● ● ●
● ● ● ● ● ● ● ● ● ● ● ● ● ● ● ● ● ● ● ● ● ● ● ● ● ● ● ● ● ● ● ● ● ● ● ● ● ● ● ● ● ● ● ● ● ● ● ● ●
HIP
● ● ● ● ● ● ● ● ● ● ● ● ● ● ● ● ● ● ● ● ● ● ● ● ● ● ● ● ● ● ● ● ● ● ● ● ● ● ● ● ● ● ● ● ● ● ● ● ●
● ● ● ● ● ● ● ● ● ● ● ● ● ● ● ● ● ● ● ● ● ● ● ● ● ● ● ● ● ● ● ● ● ● ● ● ● ● ● ● ● ● ● ● ● ● ● ● ● ●
● ● ● ● ● ● ● ● ● ● ● ● ● ● ● ● ● ● ● ● ● ● ● ● ● ● ● ● ● ● ● ● ● ● ● ● ● ● ● ● ● ● ● ● ● ● ● ● ● ●
MG
● ● ● ● ● ● ● ● ● ● ● ● ● ● ● ● ● ● ● ● ● ● ● ● ● ● ● ● ● ● ● ● ● ● ● ● ● ● ● ● ● ● ● ● ● ● ● ● ●
● ● ● ● ● ● ● ● ● ● ● ● ● ● ● ● ● ● ● ● ● ● ● ● ● ● ● ● ● ● ● ● ● ● ● ● ● ● ● ● ● ● ● ● ● ● ● ● ●
● ● ● ● ● ● ● ● ● ● ● ● ● ● ● ● ● ● ● ● ● ● ● ● ● ● ● ● ● ● ● ● ● ● ● ● ● ● ● ● ● ● ● ● ● ● ● ● ●
HDL
● ● ● ● ● ● ● ● ● ● ● ● ● ● ● ● ● ● ● ● ● ● ● ● ● ● ● ● ● ● ● ● ● ● ● ● ● ● ● ● ● ● ● ● ● ● ● ● ●
● ● ● ● ● ● ● ● ● ● ● ● ● ● ● ● ● ● ● ● ● ● ● ● ● ● ● ● ● ● ● ● ● ● ● ● ● ● ● ● ● ● ● ● ● ● ● ● ●
● ● ● ● ● ● ● ● ● ● ● ● ● ● ● ● ● ● ● ● ● ● ● ● ● ● ● ● ● ● ● ● ● ● ● ● ● ● ● ● ● ● ● ● ● ● ● ● ● ●
ALAT
● ● ● ● ● ● ● ● ● ● ● ● ● ● ● ● ● ● ● ● ● ● ● ● ● ● ● ● ● ● ● ● ● ● ● ● ● ● ● ● ● ● ● ● ● ● ● ● ●
● ● ● ● ● ● ● ● ● ● ● ● ● ● ● ● ● ● ● ● ● ● ● ● ● ● ● ● ● ● ● ● ● ● ● ● ● ● ● ● ● ● ● ● ● ● ● ● ●
● ● ● ● ● ● ● ● ● ● ● ● ● ● ● ● ● ● ● ● ● ● ● ● ● ● ● ● ● ● ● ● ● ● ● ● ● ● ● ● ● ● ● ● ● ● ● ● ●
WEIGHT
● ● ● ● ● ● ● ● ● ● ● ● ● ● ● ● ● ● ● ● ● ● ● ● ● ● ● ● ● ● ● ● ● ● ● ● ● ● ● ● ● ● ● ● ● ● ● ● ●
● ● ● ● ● ● ● ● ● ● ● ● ● ● ● ● ● ● ● ● ● ● ● ● ● ● ● ● ● ● ● ● ● ● ● ● ● ● ● ● ● ● ● ● ● ● ● ● ●
● ● ● ● ● ● ● ● ● ● ● ● ● ● ● ● ● ● ● ● ● ● ● ● ● ● ● ● ● ● ● ● ● ● ● ● ● ● ● ● ● ● ● ● ● ● ● ● ●
BMI
● ● ● ● ● ● ● ● ● ● ● ● ● ● ● ● ● ● ● ● ● ● ● ● ● ● ● ● ● ● ● ● ● ● ● ● ● ● ● ● ● ● ● ● ● ● ● ● ●
● ● ● ● ● ● ● ● ● ● ● ● ● ● ● ● ● ● ● ● ● ● ● ● ● ● ● ● ● ● ● ● ● ● ● ● ● ● ● ● ● ● ● ● ● ● ● ● ●
● ● ● ● ● ● ● ● ● ● ● ● ● ● ● ● ● ● ● ● ● ● ● ● ● ● ● ● ● ● ● ● ● ● ● ● ● ● ● ● ● ● ● ● ● ● ● ● ●
WAIST
● ● ● ● ● ● ● ● ● ● ● ● ● ● ● ● ● ● ● ● ● ● ● ● ● ● ● ● ● ● ● ● ● ● ● ● ● ● ● ● ● ● ● ● ● ● ● ● ●
● ● ● ● ● ● ● ● ● ● ● ● ● ● ● ● ● ● ● ● ● ● ● ● ● ● ● ● ● ● ● ● ● ● ● ● ● ● ● ● ● ● ● ● ● ● ● ● ●
● ● ● ● ● ● ● ● ● ● ● ● ● ● ● ● ● ● ● ● ● ● ● ● ● ● ● ● ● ● ● ● ● ● ● ● ● ● ● ● ● ● ● ● ● ● ● ● ●
WBC
● ● ● ● ● ● ● ● ● ● ● ● ● ● ● ● ● ● ● ● ● ● ● ● ● ● ● ● ● ● ● ● ● ● ● ● ● ● ● ● ● ● ● ● ● ● ● ● ●
● ● ● ● ● ● ● ● ● ● ● ● ● ● ● ● ● ● ● ● ● ● ● ● ● ● ● ● ● ● ● ● ● ● ● ● ● ● ● ● ● ● ● ● ● ● ● ● ●
● ● ● ● ● ● ● ● ● ● ● ● ● ● ● ● ● ● ● ● ● ● ● ● ● ● ● ● ● ● ● ● ● ● ● ● ● ● ● ● ● ● ● ● ● ● ● ● ●
TG
● ● ● ● ● ● ● ● ● ● ● ● ● ● ● ● ● ● ● ● ● ● ● ● ● ● ● ● ● ● ● ● ● ● ● ● ● ● ● ● ● ● ● ● ● ● ● ● ●
● ● ● ● ● ● ● ● ● ● ● ● ● ● ● ● ● ● ● ● ● ● ● ● ● ● ● ● ● ● ● ● ● ● ● ● ● ● ● ● ● ● ● ● ● ● ● ● ●
● ● ● ● ● ● ● ● ● ● ● ● ● ● ● ● ● ● ● ● ● ● ● ● ● ● ● ● ● ● ● ● ● ● ● ● ● ● ● ● ● ● ● ● ● ● ● ● ●
RIN
● ● ● ● ● ● ● ● ● ● ● ● ● ● ● ● ● ● ● ● ● ● ● ● ● ● ● ● ● ● ● ● ● ● ● ● ● ● ● ● ● ● ● ● ● ● ● ● ●
● ● ● ● ● ● ● ● ● ● ● ● ● ● ● ● ● ● ● ● ● ● ● ● ● ● ● ● ● ● ● ● ● ● ● ● ● ● ● ● ● ● ● ● ● ● ● ● ●
● ● ● ● ● ● ● ● ● ● ● ● ● ● ● ● ● ● ● ● ● ● ● ● ● ● ● ● ● ● ● ● ● ● ● ● ● ● ● ● ● ● ● ● ● ● ● ● ●
Time
● ● ● ● ● ● ● ● ● ● ● ● ● ● ● ● ● ● ● ● ● ● ● ● ● ● ● ● ● ● ● ● ● ● ● ● ● ● ● ● ● ● ● ● ● ● ● ● ●
● ● ● ● ● ● ● ● ● ● ● ● ● ● ● ● ● ● ● ● ● ● ● ● ● ● ● ● ● ● ● ● ● ● ● ● ● ● ● ● ● ● ● ● ● ● ● ● ●
● ● ● ● ● ● ● ● ● ● ● ● ● ● ● ● ● ● ● ● ● ● ● ● ● ● ● ● ● ● ● ● ● ● ● ● ● ● ● ● ● ● ● ● ● ● ● ● ● ●
Lympho
● ● ● ● ● ● ● ● ● ● ● ● ● ● ● ● ● ● ● ● ● ● ● ● ● ● ● ● ● ● ● ● ● ● ● ● ● ● ● ● ● ● ● ● ● ● ● ● ●
● ● ● ● ● ● ● ● ● ● ● ● ● ● ● ● ● ● ● ● ● ● ● ● ● ● ● ● ● ● ● ● ● ● ● ● ● ● ● ● ● ● ● ● ● ● ● ● ●
● ● ● ● ● ● ● ● ● ● ● ● ● ● ● ● ● ● ● ● ● ● ● ● ● ● ● ● ● ● ● ● ● ● ● ● ● ● ● ● ● ● ● ● ● ● ● ● ● ●
Neutro
● ● ● ● ● ● ● ● ● ● ● ● ● ● ● ● ● ● ● ● ● ● ● ● ● ● ● ● ● ● ● ● ● ● ● ● ● ● ● ● ● ● ● ● ● ● ● ● ●
● ● ● ● ● ● ● ● ● ● ● ● ● ● ● ● ● ● ● ● ● ● ● ● ● ● ● ● ● ● ● ● ● ● ● ● ● ● ● ● ● ● ● ● ● ● ● ● ● ●
● ● ● ● ● ● ● ● ● ● ● ● ● ● ● ● ● ● ● ● ● ● ● ● ● ● ● ● ● ● ● ● ● ● ● ● ● ● ● ● ● ● ● ● ● ● ● ● ●
DetGene
● ● ● ● ● ● ● ● ● ● ● ● ● ● ● ● ● ● ● ● ● ● ● ● ● ● ● ● ● ● ● ● ● ● ● ● ● ● ● ● ● ● ● ● ● ● ● ● ●
● ● ● ● ● ● ● ● ● ● ● ● ● ● ● ● ● ● ● ● ● ● ● ● ● ● ● ● ● ● ● ● ● ● ● ● ● ● ● ● ● ● ● ● ● ● ● ● ● ●
● ● ● ● ● ● ● ● ● ● ● ● ● ● ● ● ● ● ● ● ● ● ● ● ● ● ● ● ● ● ● ● ● ● ● ● ● ● ● ● ● ● ● ● ● ● ● ● ●
mISO
● ● ● ● ● ● ● ● ● ● ● ● ● ● ● ● ● ● ● ● ● ● ● ● ● ● ● ● ● ● ● ● ● ● ● ● ● ● ● ● ● ● ● ● ● ● ● ● ●
● ● ● ● ● ● ● ● ● ● ● ● ● ● ● ● ● ● ● ● ● ● ● ● ● ● ● ● ● ● ● ● ● ● ● ● ● ● ● ● ● ● ● ● ● ● ● ● ● ●
● ● ● ● ● ● ● ● ● ● ● ● ● ● ● ● ● ● ● ● ● ● ● ● ● ● ● ● ● ● ● ● ● ● ● ● ● ● ● ● ● ● ● ● ● ● ● ● ●
StNR
● ● ● ● ● ● ● ● ● ● ● ● ● ● ● ● ● ● ● ● ● ● ● ● ● ● ● ● ● ● ● ● ● ● ● ● ● ● ● ● ● ● ● ● ● ● ● ● ●
● ● ● ● ● ● ● ● ● ● ● ● ● ● ● ● ● ● ● ● ● ● ● ● ● ● ● ● ● ● ● ● ● ● ● ● ● ● ● ● ● ● ● ● ● ● ● ● ● ●
● ● ● ● ● ● ● ● ● ● ● ● ● ● ● ● ● ● ● ● ● ● ● ● ● ● ● ● ● ● ● ● ● ● ● ● ● ● ● ● ● ● ● ● ● ● ● ● ● ●
pISO
● ● ● ● ● ● ● ● ● ● ● ● ● ● ● ● ● ● ● ● ● ● ● ● ● ● ● ● ● ● ● ● ● ● ● ● ● ● ● ● ● ● ● ● ● ● ● ● ●
● ● ● ● ● ● ● ● ● ● ● ● ● ● ● ● ● ● ● ● ● ● ● ● ● ● ● ● ● ● ● ● ● ● ● ● ● ● ● ● ● ● ● ● ● ● ● ● ● ●
● ● ● ● ● ● ● ● ● ● ● ● ● ● ● ● ● ● ● ● ● ● ● ● ● ● ● ● ● ● ● ● ● ● ● ● ● ● ● ● ● ● ● ● ● ● ● ● ●
mDON
● ● ● ● ● ● ● ● ● ● ● ● ● ● ● ● ● ● ● ● ● ● ● ● ● ● ● ● ● ● ● ● ● ● ● ● ● ● ● ● ● ● ● ● ● ● ● ● ●
● ● ● ● ● ● ● ● ● ● ● ● ● ● ● ● ● ● ● ● ● ● ● ● ● ● ● ● ● ● ● ● ● ● ● ● ● ● ● ● ● ● ● ● ● ● ● ● ●
● ● ● ● ● ● ● ● ● ● ● ● ● ● ● ● ● ● ● ● ● ● ● ● ● ● ● ● ● ● ● ● ● ● ● ● ● ● ● ● ● ● ● ● ● ● ● ● ●
pAMP
● ● ● ● ● ● ● ● ● ● ● ● ● ● ● ● ● ● ● ● ● ● ● ● ● ● ● ● ● ● ● ● ● ● ● ● ● ● ● ● ● ● ● ● ● ● ● ● ●
● ● ● ● ● ● ● ● ● ● ● ● ● ● ● ● ● ● ● ● ● ● ● ● ● ● ● ● ● ● ● ● ● ● ● ● ● ● ● ● ● ● ● ● ● ● ● ● ●
● ● ● ● ● ● ● ● ● ● ● ● ● ● ● ● ● ● ● ● ● ● ● ● ● ● ● ● ● ● ● ● ● ● ● ● ● ● ● ● ● ● ● ● ● ● ● ● ●
pCHIP
● ● ●GHS SHIP−TREND KORA F4
Figure 4.9.: Correlation of Eigen-genes with several factors in KORA F4, GHS, and SHIP-TREND:The smaller the p-value the larger the dots. The smallest p-value per variable isindicated with a triangle. Grey dots show a missing trait in the cohort.On the y-axis are depicted: Illumina chip (pCHIP), RNA amplification batch (pAMP),month of blood sampling (mDON), RNA isolation batch (96 well plate) (pISO), signal-to-noise ratio (StNR), month of RNA isolation (mISO), number of detected genes (Det-Gene), percentage of neutrophils (Neutro), percentage of lymphocytes (Lympho), stor-age time (Time), RNA integrity number (RIN), serum triglyceride concentrations (TG),white blood cell count (WBC), waist circumference (WAIST), body mass index (BMI),body weight (WEIGHT), alanine aminotransferase concentrations (ALAT), high densitylipoprotein concentrations (HDL), serum magnesium concentration (MG), hip circum-ference (HIP), lactate dehydrogenase concentrations (LDH), vitamin B12 concentrations(B12), partial thromboplastin time (PTT), serum calcium concentrations (CA), serum li-pase concentrations (LIP) and serum potassium concentrations (K).
72

4.3. Common quality controlled preprocessing and analysis strategy: MetaXpress
Figure 4.10). Adding more than 50 Eigen-genes to the model did not further decreased theunexplained variance.
0 20 40 60 80 100
5060
7080
9010
0
Number of principal components
Une
xpla
ined
var
ianc
e [%
]
●
●
●
●
●
●
●
●
●
●
●
●
●
●
●●
●●
●●
●●
● ● ● ● ● ●
●
●
●
●
●
●
●
●
●
●
●
●
●
●
●
●
●
●●
●●
●●
●●
●●
●●
●
●
●
●
●
●
●
●
●
●●
●
●
●●
●●
●●
●● ● ● ● ● ● ● ● ●
●
●
●
GHSKORA F4SHIP−TREND
A
0 20 40 60 80 100
5060
7080
9010
0
Number of principal components
Une
xpla
ined
var
ianc
e [%
]
●
●
●
●
●
●
●
●
●
●
●
●
●
●
●●
●●
●●
●●
● ● ● ● ● ●
●
●
●
●
●
●
●
●
●
●
●
●
●
●
●
●
●
●●
●●
●●
●●
●●
●●
●
●
●
●
●
●
●
●
●
●●
●
●
●●
●●
●●
●● ● ● ● ● ● ● ● ●
●
●
●
GHSKORA F4SHIP−TREND
B
Figure 4.10.: Mean unexplained variance in KORA F4, SHIP-TREND, and GHS for BMI (A)and the random phenotype (B):A linear regression was conducted in all three cohorts with expression levelsas dependent variable and BMI or the random phenotype as independent vari-able. Systematically more Eigen-genes were added to the model, the adjustedR2 values were saved and the mean was calculated for each number of Eigen-genes.
In addition we compared the effect sizes, standard errors, and p-values when adding dif-ferent covariates to the linear model. According to the results that we obtained from theEigen-R2 calculation we used mainly technical variables (because they explain most of thevariation in the expression data) to further reduce the residual variance. We therefore com-pared ten different models for BMI and the random phenotype:gene expression ∼ BMI/random phenotype +
• nothing
• age + sex
• age + sex + technical variables (amplification plate, RIN, sample storage time)
• technical variables (amplification plate, RIN, sample storage time)
• technical variables + first Eigen-gene
• technical variables + number of significant detected genes
• technical variables + Signal-to-noise-ratio (comparison of measured signal with back-ground level)
73

4. Improvement and development of quality control of gene expression data
removed Eigen-genes BMI Random Phenotype0 1.00 1.001 0.98 0.982 0.90 0.903 0.87 0.874 0.85 0.855 0.83 0.836 0.79 0.797 0.78 0.788 0.77 0.779 0.76 0.7610 0.75 0.7515 0.72 0.7220 0.71 0.7125 0.70 0.7030 0.69 0.6935 0.68 0.6840 0.67 0.6745 0.66 0.6650 0.66 0.6655 0.66 0.6660 0.65 0.6565 0.65 0.6570 0.64 0.6475 0.64 0.6480 0.64 0.6485 0.63 0.6390 0.63 0.6395 0.63 0.63100 0.62 0.62
Table 4.4.: Mean unexplained variance for BMI and the random phenotype in KORA F4:A linear regression with expression levels as dependent variable and BMI or therandom phenotype as independent variables was conducted. Systematically dif-ferent numbers of Eigen-genes were added to the model, the adjusted R2 valueswere saved, and the mean was calculated for each number of Eigen-genes.
74

4.3. Common quality controlled preprocessing and analysis strategy: MetaXpress
• 50 Eigen-genes
• age + sex + technical variables + cell types
• technical variables + all non technical variables (white blood cell count, red blood cellcount, hematocrit, and mean platelet in KORA F4)
The mean standard errors for all models were calculated for all three cohorts (Table 4.5). Thelowest mean standard error could be observed for the 50 Eigen-genes for the random pheno-type in all three cohorts. The standard errors were reduced by 21%, 27%, and 25% comparedto the unadjusted models in SHIP-TREND, KORA F4, and GHS, respectively.
Mean SEPhenotype additional covariates
(besides phenotype) SHIP-TREND KORA F4 GHSRandom none 0.0060256 0.007050737 0.005558932phenotype age+sex 0.0060040 0.006928487 0.005541641
age+sex+technical 0.0054934 0.006401871 0.005288458technical 0.0055128 0.006413871 0.005305218technical+Eigen-gene1 0.0054879 0.00637871 0.005004323technical+detected genes 0.0054451 0.006270553 -technical+signal-to-noise ratio 0.0054482 0.006290344 -50 Eigen-genes 0.0047421 0.005124327 0.004193441age+sex+technical+cell types 0.0054243 - -technical+all non technical 0.0055731 - -
BMI none 0.0013035 0.001547339 0.001149232age+sex 0.0013500 0.001547741 0.001172341age+sex+technical 0.0012342 0.001425894 0.001121818technical 0.0011932 0.001425156 0.001099153technical+Eigen-gene1 0.0011921 0.001416861 0.001094797technical+detected genes 0.0011854 0.001409976 -techCov+signal-to-noise ratio 0.0011949 0.001413946 -50 Eigen-genes 0.0012536 0.001264766 0.001055827age+sex+technical+cell types 0.00123254 - -technical+all non technical 0.01305295 - -
Table 4.5.: Mean standard errors after different covariate adjustments:The mean standard errors (for all probes) were calculated in each cohort for linearmodels with gene expression as dependent and BMI or the random phenotypeas independent variable. Different covariates were added to the model. Missingcovariates in cohorts are indicated with a dash.cell types: percentage of lymphocytes, neutrophils, monocytes, eosinophils andbasophils, detected genes: number of genes with detection p-value less than 0.01,technical: RNA amplification batch, RIN, and sample storage time, non-technical:parameters with an Eigen-R2 > 0.3% in SHIP-TREND, signal-to-noise ratio: Com-parison of measured signal to background level.
For BMI the mean standard error decreased with adjusting for 50 Eigen-genes. ThreeEigen-genes (5, 7 and 28) are correlated with BMI (see Figure 4.8) and further all significantassociations were lost if we adjusted for these three Eigen-genes. For almost all available
75

4. Improvement and development of quality control of gene expression data
Figure 4.11.: Comparison of different adjustments in KORA F4 for BMI:Linear models with gene expression as dependent and BMI as indepen-dent variable were calculated. The models were adjusted for age + gender(age.gender), amplification plate + RIN + sample storage time (tech), ampli-fication plate + RIN + sample storage time + white blood cell count + red bloodcell count + hematocrit + mean platelet (tech.clin) and, 50 Eigen-genes (50PCs),respectively. In the gray boxes the standard errors and in the white boxes theeffect sizes of these different models are shown.
76

4.3. Common quality controlled preprocessing and analysis strategy: MetaXpress
covariates significant associations with at least one Eigen-gene were observed and thereforewe do not recommend to include them in the linear model.Since adjustment for the technical variables RNA amplification batch, RIN, and the samplestorage time (time between blood sampling and RNA isolation in SHIP-TREND and KORAF4 and time between RNA isolation and amplification in GHS) decreased the standard er-rors for both phenotypes by about 8% we decided to use those three variables for all furtheranalyses.The mean standard error increased when we adjusted for sex and age in the BMI regressionmodel in comparison to the unadjusted model. This might be explained by the correlationbetween BMI and sex (p-value of t-test = 0.01699 in KORA F4).
For further analyses we wanted to establish a KORA F4 data set that was already adjustedfor the three relevant technical variables (RNA amplification batch, RIN, and the samplestorage time). Firstly, I adjusted the expression values for KORA S4, F4, and F4 OGTT datatogether for these variables by calculating a linear model with gene expression as depen-dent and the technical variables as independent variables and kept the residuals from thesemodels. To test whether the explained variance was reduced in the residuals I calculatedthe Eigen-R2 for the amplification plate as this was the variable with the highest explainedvariance in KORA F4 (Eigen-R2 = 24.30%). In the residuals the Eigen-R2 in KORA F4 for theamplification plate was still 3.83% and 11.61% in S4. This might be due to the unbalanceddistribution of the samples from the three studies on the amplification plates (see Table 4.6).Especially the S4 samples were distributed unequally.Therefore I secondly split the data set in the three studies (S4, F4, and F4 OGTT) and thenadjusted for the technical variables. This approach reduced the explained variance by theamplification plate to 2.06 ∗ 10−16% in S4 and 2.41 ∗ 10−16% in F4, respectively.Applying the above described method to the three cohorts separately reduced the explainedvariance of the amplification plate more efficiently. The residuals of this second approachwere regarded as the best optimized expression data set and was used for all followingprojects.
4.3.4. SNPs in probes
SNPs that are located within a probe sequence on the array could cause a decrease in thehybridization efficiency and reduce the signal intensities due to a lower binding efficiency.This could cause false positive results when analyzing these probes. Therefore 8,898 probesthat cover exactly one exon and could be mapped uniquely to an annotated UCSC transcript((Kent et al., 2002), (Dreszer et al., 2012)) were analyzed systematically to test whether theSNP influences the expression level. Of these transcripts 3,376 (38%) contain at least oneSNP according to the 1000 Genomes3 reference panel (Altshuler et al., 2010).In SHIP-TREND for 986 individuals the genotyping information was known. 24% of theprobes contained a polymorphic SNP with a minor allele frequency greater than 0.01 (7%)and 0.05 (4%) respectively. For 1,561 probes containing 2,128 SNPs the effect of the SNP onthe expression level was analyzed using linear regression adjusted for sex, age, and the first50 Eigen-genes. Out of these, 55% of the SNPs were associated with an decreased signal
3The 1000 Genomes Project was the first project with the aim to sequence a large number of individuals toprovide public available data to analyze the genomic variation in humans.
77

4. Improvement and development of quality control of gene expression data
Plate all probes used probes S4 F4 F4 OGTTPlate01 87 55 7 28 20Plate02 60 60 18 24 18Plate03 108 81 10 36 35Plate04 111 80 24 28 28Plate05 100 83 20 33 30Plate06 90 85 32 28 25Plate07 96 88 22 34 32Plate08 96 1 0 0 1Plate09 36 32 11 10 11Plate09a 51 46 15 18 13Plate10 79 72 10 27 35Plate11 100 94 38 35 21Plate12 98 84 22 33 29Plate13 97 92 52 20 20Plate14 96 92 0 53 39Plate15 99 96 0 56 40Plate16 97 79 2 44 33Plate17 70 55 2 36 17Plate18 96 94 0 51 43Plate19 98 86 2 45 39Plate20 121 78 11 40 27Plate21 92 91 0 52 39Plate22 100 96 0 56 40Plate23 86 64 2 38 24Plate24 96 94 9 48 37Plate25 67 48 11 20 17Plate26 97 70 8 29 33Plate27 91 76 27 26 23Plate28 96 81 66 9 6Plate29 96 88 88 0 0Plate30 76 66 0 29 37Plate31 96 79 79 0 0
Table 4.6.: Distribution of KORA samples on amplification plates:The distribution of all KORA samples having gene expression data available onthe amplification plates is shown. The numbers of “all probes” and “used probes”differ because of the excluding of some samples due to bad quality.
78

4.3. Common quality controlled preprocessing and analysis strategy: MetaXpress
intensity. Surprisingly, for 45% of the SNPs the effect was in the opposite direction than ex-pected.KORA F4 individuals were genotyped with different arrays. Only 70 of the 2,128 SNPs wereinvestigated. But it was seen that the effects are in both directions, negative (55%) and posi-tive (see Figure 4.12).In summary, the results look more randomly than systematically and we cannot exclude adecrease in the hybridization efficiency without seeing a systematic scheme. Conclusively,we recommend not to exclude probes including SNPs within their sequence but point to-wards an additional investigation when this probe shows significant further results.
Figure 4.12.: Effect of SNPs within a probe sequence on expression levels in KORA F4:The mean expression levels of all probes containing a SNP (66 probes) in theKORA F4 data set is plotted against the effect sizes of the linear model withexpression level as dependent variable and SNP as independent variable. Eachspot displays the effect of a SNP on a probe. Associations with significant p-values after Bonferroni correction (p< 2.3 ∗ 10−5) are colored in red and withp-values below 0.05 are colored in orange. For 55% the effect of the SNPs wasnegative, meaning that the SNP was associated with a decreased signal inten-sity.
4.3.5. Annotation
Illumina arrays contain both, probes that map to a well annotated transcript and probeswhich map to a potential transcript. The probe annotation from Illumina is only updatedwhen a new array is introduced and it is normally not up to date. Therefore Dr. AlexanderTeumer mapped all probe sequences to the available mRNA sequences of the UCSC genomeannotation database (version 12/06/2009, February 2009 assembly of the human genome,HG19). Out of all probes, 28,691 probes could be perfectly mapped to known transcripts orannotated RefSeq genes.
79

4. Improvement and development of quality control of gene expression data
The updated annotation file provides the date genome positions of all mappable probes andis now in use for all analyses.
4.4. Summary and discussion
In the beginning of my PhD there were no other large population-based studies with expres-sion data and no standards for the quality control. One aim of my thesis was to optimizeexpression data for analysis. Since our research is in a very active and new field some ofthe methods we tried in the beginning are no longer up to date, for example the exclusionof expression probes to reduce the number of tests. In KORA F3 probes that are not de-tected significantly in more than 5% of the samples were excluded from further analysis.This approach is nowadays no longer recommended because even low signals reflect lowexpression values and several studies have shown that results based on low signal probescontain valuable information and can be replicated.
The improvement in experimental processing steps from KORA F3 to KORA F4 are shownin Figure 4.13. The variation in the detected genes was smaller in KORA F4 although it con-sists of more samples (standard deviation in KORA F3 is 2,587 in KORA F4 922). In KORA F3each sample was transported separately to the Helmholtz Center and not all samples weretreated identically. The KORA F4 samples were all frozen in the study center in Augsburgand then transported together to the Helmholtz Center. This is reflected in the quality ofthe RNA. The KORA F4 data set is more homogenous than the F3 data set as the selectioncriteria for samples was more stringent (RIN > 6 and number of detected genes > 6,000).
● ●
●
●
●
●
●●●
●
●
●
●
● ●
●
●
●
●
●
●● ●
●
●●
●
●
●
●
●
●
●
●
●
●
●
●
●
●
●
●
●
●
●
●
● ●
●
●
●
●●
●
●
●
●
●
●
●
●
●●
●
●●
●
●
●
●
●
●
●
●
●●
●
●
●
●●
●
●
●
●
●●
●
●
●
●●
●
●
●
●
●●
●●
●
●
●●
●
●
●
●●
●
●
●
●
●
●
●
●
●
●
●
●
●
●
●
●
●●
●
●
●
●
●●
●
●
●
●●
●● ●
●
●
●
●
●
●
●
●
●
●
●●
●
●●
●
●
●
●
●●
●
●
●
●●
●
●
●
●
●
●
●
●●●
●●●
●●
●
●
●
●
●
●
●
●
●
●
●
●●●●
●
●
●
●
● ●
●●
●
●
●●
●
●
●
●
●
●
●
●● ●
●
●
●●
●●
●
●
●
● ●
●
●
●
●
●●
●
●
●
●
●
●
●
●
●
●●
●
●
●
●
●
●
●●
●
●●
●
●●
●
●
●
●●
●
●
●●
●
●
●
●
●
●
●
●
●
●
●
●●
●
●
●
●●
●
●
●
●
●
●
●●
●
●
●
●
●●
●
●
●
●●
●
●●
●
●
●
●
●●
●
●
●
●●
●
●●
●
●
●
●
●
●●
●●●
●
●●
●
●
●
●
●
●
●
●
●
●
●
●
●
●
●
●●
●
●
●●
●
●●
●
●
●
●
●
●
●
●
●●
●
●
●
●
●●
●
●
●
2 4 6 8 102000
6000
1000
014
000
KORA F3
RIN
Num
ber
of d
etec
ted
gene
s
●
●
●
●
●●
●
●
●
●● ●
●
●● ●
●
●●
●
●
●
●●
●●
●●
●●●● ● ●
●
● ●
●
●
●
●
●●●
●
●
●●
●●
●
●
●
●
●●
●●
●
●
●
●
●●
●
●
●
●●
●
●●
●
●●
●
●●
●
●
●
●
●●
●
●
●●
● ●
●
●
●●
●
●
●
●
●●●●
●●
●
●
●
●
●●
●●
●●
●
●
● ●
●●
●
●●●
●
●
●
●
●
●
●
●●
●
●●
●●
●
●
●
●
●
●●
●●
●
●
●
●
●
●●
●
●
●
●
●
●
●
●
●
●●●●
●
●
●
●●
●●
●
●●
●
●
●●●
●● ●
●
●
●
●
●
●●
●● ●
●
●
●
●●●
●
●
●
●
●
●
●
●
●
●
●
●
●
●● ●
●
●
●
●
●●
●
●
●
●
●
●
●●
●
●
●
●
●●
●
●
●
●
●
●
●
●
●
●
●
●
●
●
●●●
●●
●
●
●● ●●
●
●●
●
●
●
●
●
●
●
● ●
●
● ●
●
●
●●
●●
●
●●
●●
●
●●
●
●
●
●
● ●●
●● ●
●
●
●
●●
●
●●
● ●
●
●
●
●
●
●
●
●
●
●
● ●
●●
● ●
●
●
●
●●
●
●
● ●●
●
●
●
●
●
●●
●
●
●
●●
●
●
●
●●●
●
●
●●
●
●
●
●
●
●
●
●
●●
●●
●
●●
●● ●
●
●●
●
●
●●
●
●
●
●
●
●
●●●
●
●
●
●●
●
●
●
● ●● ●
●
●
●
●
●●
●
●●
●
● ●●
●
●
●
●
●
●
●
●
●
●
●
●
●
●
●
●●
●●
●●
●
●●●
●
●●
●
●
●●
●
●●
●
●●
●●
●
●
●
●
●● ●●
●
●
●●
●
●
●●
●
●
●
●
●●
●
●
●●
●●
●●
●
●
●
●
●
●
●
●
●●
●●
●
●●
●●
●
● ●
●
●
●●●
●
●
●● ●
●
●●
● ●
● ●
●
●
● ●
● ●●
●
●
●
●●
●
●
●●
●
●
●●
●
●
●●
●
●
●
●
●
●
●
● ●
●
●
●
●
●
●●●●
●
●
●
●●
●
●
●
●
●
●
●
●
●
●
●
●
●
●
●●●
●●
●●●
●
●●
●
●
●
●
●
●
●
●
●
●
●
●
●
●
●
●
●
●●
●
●
●
●
●●
●●
●●
●
●
●
●
●●
●●
●
●
●
●
●
●
●●
●
●
●
●
●
●
●
●
●
●
● ●●
●●
●
●
●
●●
●
●
●
●
●
●
●
●
●
●
●●
●
●
●
●
●
●
●
●
●
●
●●
●
● ●
●●
●
● ●
●●
●
●●
●
●
● ● ●●
●
●
●
● ●●
●
●
●●
●
●
●
●●
●
●
●
●
●
●
●
●
●
●
●●
●
●
●●●
●
●●
●
●
●
●
●●
●
●
●
●
●
●●
●●
●
●
●
●
●●
●
●
●
●●
●●
●
●
●
●
●
●
●
●
●
●●
●
●
●
●
●
●
●
●
●●
●
●●●
●●●
●
● ●●●
●●
●
●
●
●
●
●
●
●
●
●●
●
●
●
●
●
●
●
●
●
●
●
●
●
●
●
●●
●
●
●
●
● ●●
●
●●
●
●
●
●●
●
●●●
●
●
●
●
●●
●
●
●
●
●
●
●●
●●
●
●
●●
●●
●
●
●●●
●
●
●●
●
●●
●
●
● ●
●
●
●
●
●
●●●
●
●
●
●
●
●
●●
●
●
●● ●
●
●
●
●
●
●
●●
●●
●
●
●
●
●
●
●
●●
●●
●
●●
●
●
●
●
●
●●
●
● ●
●
●
●
●
●
●
●
●●●
●
●
● ●●
●
●●
●
●
●
●
●
●
●●
●
●
●●
● ●●
●
●
●
●
●
●
●
●
●
●
●
●
●
●
●
●●
2 4 6 8 102000
6000
1000
014
000
KORA F4
RIN
Num
ber
of d
etec
ted
gene
s
Figure 4.13.: RIN versus number of detected genes in KORA F3 and KORA F4:The correlation between RIN and detected genes is significant for both cohorts(p-value = 2.99 ∗ 10−18 for KORA F3 and p-value = 7.63 ∗ 10−5 for KORA F4),but if the RIN increases by one in KORA F3 the average number of detectedgenes increases by 731, in KORA F4 just by 190. The low RIN in KORA F4 wasa measurement error from the Bioanalyzer and therefore this sample was alsoused for further analysis.
Currently the most frequently used normalization method for large data sets is the quan-
80
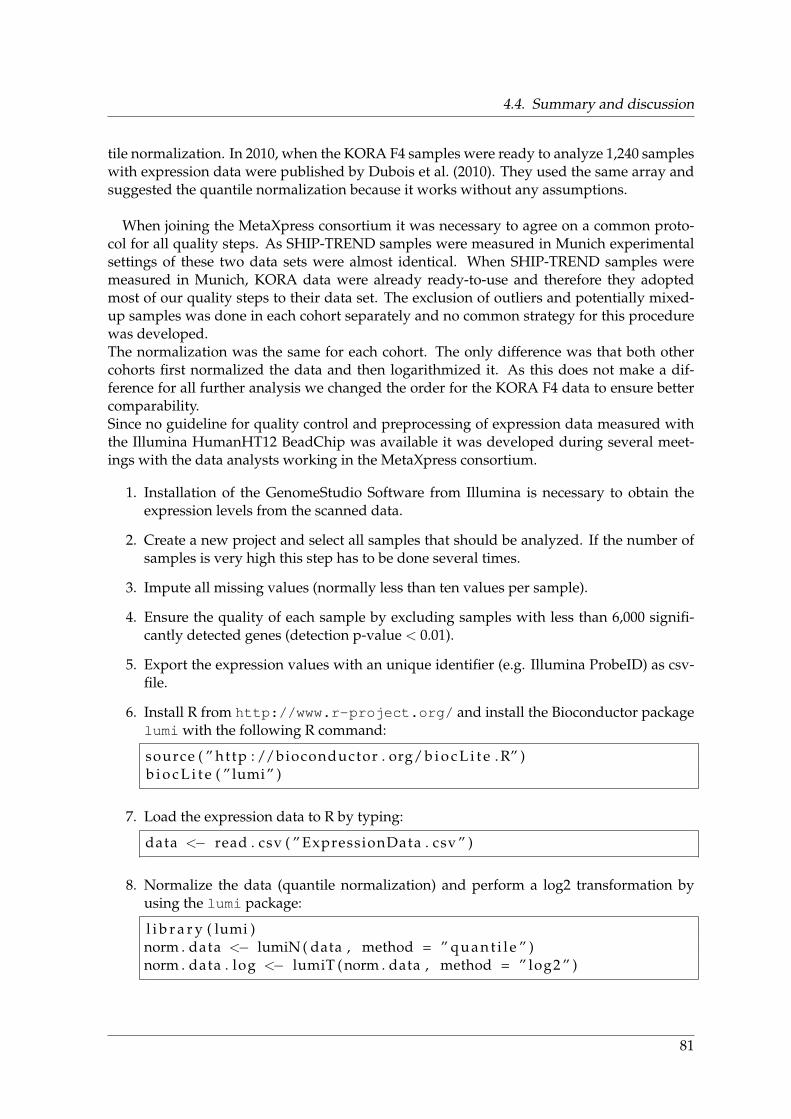
4.4. Summary and discussion
tile normalization. In 2010, when the KORA F4 samples were ready to analyze 1,240 sampleswith expression data were published by Dubois et al. (2010). They used the same array andsuggested the quantile normalization because it works without any assumptions.
When joining the MetaXpress consortium it was necessary to agree on a common proto-col for all quality steps. As SHIP-TREND samples were measured in Munich experimentalsettings of these two data sets were almost identical. When SHIP-TREND samples weremeasured in Munich, KORA data were already ready-to-use and therefore they adoptedmost of our quality steps to their data set. The exclusion of outliers and potentially mixed-up samples was done in each cohort separately and no common strategy for this procedurewas developed.The normalization was the same for each cohort. The only difference was that both othercohorts first normalized the data and then logarithmized it. As this does not make a dif-ference for all further analysis we changed the order for the KORA F4 data to ensure bettercomparability.Since no guideline for quality control and preprocessing of expression data measured withthe Illumina HumanHT12 BeadChip was available it was developed during several meet-ings with the data analysts working in the MetaXpress consortium.
1. Installation of the GenomeStudio Software from Illumina is necessary to obtain theexpression levels from the scanned data.
2. Create a new project and select all samples that should be analyzed. If the number ofsamples is very high this step has to be done several times.
3. Impute all missing values (normally less than ten values per sample).
4. Ensure the quality of each sample by excluding samples with less than 6,000 signifi-cantly detected genes (detection p-value < 0.01).
5. Export the expression values with an unique identifier (e.g. Illumina ProbeID) as csv-file.
6. Install R from http://www.r-project.org/ and install the Bioconductor packagelumi with the following R command:
source ( ” ht tp : //bioconductor . org/ b i o c L i t e . R” )b i o c L i t e ( ” lumi” )
7. Load the expression data to R by typing:
data <− read . csv ( ” ExpressionData . csv ” )
8. Normalize the data (quantile normalization) and perform a log2 transformation byusing the lumi package:
l i b r a r y ( lumi )norm . data <− lumiN ( data , method = ” q u a n t i l e ” )norm . data . log <− lumiT ( norm . data , method = ” log2 ” )
81

4. Improvement and development of quality control of gene expression data
9. Use the expression levels of genes on sex-specific chromosomes to identify mixedsamples.
10. When analyzing associations between expression levels and phenotypes always con-sider RNA amplification batch, RIN, and the sample storage time as covariables. ForeQTL studies use the Eigen-vectors, the so called Eigen-genes to remove most of thetechnical variation from the data and increase the number of significant eQTLs.
11. Use an updated annotation file.
12. As probes containing SNPs are not excluded, have a closer look at these probes afteranalysis of the data.
82

5. Association studies
5.1. Gene expression and blood pressure related phenotypes
High blood pressure is a major risk factor for several cardiovascular diseases. The phe-notypes “systolic” and “diastolic blood pressure”, as well as “pulse pressure” (differencebetween diastolic and systolic blood pressure) were chosen to be analyzed within the Meta-Xpress Consortium. On August, 19th 2015, 51 studies identifying 416 associations concern-ing several blood pressure traits were found in the GWAS catalog (for example (Newton-Cheh et al., 2009), (Levy et al., 2009), (Ehret et al., 2011)). In spite of a lot of known loci theproportion of explained variance is very small. The International Consortium of Blood Pres-sure (ICBP) calculated an explained variance for all 29 identified and reported loci of aboutone percent in the general population (Ehret et al., 2011).We hypothesized that an association study between gene expression and blood pressuremight help to close the gap between estimated and explained variance for blood pressure.All of the so far published studies analyzing gene expression and blood pressure did notreplicate their results or had small sample sizes:
• Leonardson et al. (2010) analyzed 40 Caucasian males from the greater Reykjavik areain Iceland and identified 896 significant associations with systolic and 3,329 with dias-tolic blood pressure using a p-value threshold of 0.0001. No replication of these hitswas performed.
• Zeller et al. (2010) analyzed 1,490 monocyte samples from Germany (GHS study, seeSection 2.1.4) and identified 48 expression traits that were associated with systolicblood pressure and 18 with diastolic blood pressure, respectively. These results werealso not replicated.
• Bull et al. (2004) compared gene expression levels between 15 patients suffering pul-monary arterial hypertension and 6 healthy controls. Of all analyzed genes, 28 had ap-value below 0.01. Two genes could be verified using qPCR.
• Korkor et al. (2011) compared three patients suffering hypertension to three healthycontrols. By this, 49 differentially expressed genes were identified. Ten of these genescould be verified using qPCR.
5.1.1. Results from KORA F3/F4
In KORA F3 and F4 the association between gene expression levels and systolic and diastolicblood pressure was analyzed. As individuals taking anti-hypertensive drugs could falsifythe results, the analyses were also repeated without these individuals (N=173 in KORA F3and N=571 in KORA F4). In KORA F3 377 samples and in KORA F4 989 samples wereanalyzed. The linear regression model for both cohorts was the following:
expression level ∼ phenotype+ age+ sex+BMI + technical variables
83

5. Association studies
with the technical variables being RIN, sample storage time, and amplification plate inKORA F4 and RIN in KORA F3.When analyzing all KORA F4 samples only one gene was significantly associated with sys-tolic (p-value = 2.84 ∗ 10−08) and diastolic (p-value = 4.22 ∗ 10−08) blood pressure. The geneis called FOSB and is located on chromosome 19. In 990 SHIP-TREND samples p-values forthis gene are 1.51 ∗ 10−05 (diastolic blood pressure) and 1.47 ∗ 10−05 (systolic blood pressure)respectively.When including only subjects that did not take anti-hypertensive drugs no gene was sig-nificantly associated with systolic or diastolic blood pressure. The p-values for FOSB were2.32∗10−04 (systolic blood pressure) and 2.95∗10−04 (diastolic blood pressure), respectively.
Cohort KORA F3 KORA F4Sample size 377 989diastolic BP (mm Hg) 83.2 74.0systolic BP (mm Hg) 136.7 128.7Samples taking drugs 173 571diastolic BP (mm Hg)(without drugs) 84.97 75.4systolic BP (mm Hg)(without drugs) 136.6 128.5
Table 5.1.: Study description of KORA F3/F4 for blood pressure related phenotypes
5.1.2. Results from MetaXpress
Altogether, results of the association studies on blood pressure phenotypes in whole bloodof KORA F4 participants were not promising. In contrast, several significant hits could beidentified in the monocyte sample of the GHS. Therefore, monocyte samples plus samplesfrom the US Multi-Ethnic Study of Atherosclerosis (MESA) cohort were used as discoverypanel (N= 2,549) and whole blood samples from KORA F4 and SHIP-TREND were usedas replication cohorts (Mueller et al., 2014). All four studies used the same linear regres-sion model for the three phenotypes diastolic and systolic blood pressure, as well as pulsepressure:
expression level ∼ phenotype+ age+ sex+BMI + technical variables
Results from GHS and MESA were meta-analyzed and an association was called significantif the Benjamini-Hochberg adjusted p-value was below 0.05. P-values of these associationswere assessed in KORA F4 and SHIP-TREND. If the p-values in both studies were below0.05 and the direction of the effect was consistent, the gene was chosen for validation in aclinical trial (TEAMSTA1). A qPCR was performed to measure the expression level of eachof the eight candidate genes in 613 hypertension patients before and after a six-month treat-ment with anti-hypertensive drugs. For the analysis the patients were divided in responders(systolic blood pressure decreased≥ 10mmHg) and non-responders (systolic blood pressuredecreased ≤ 2mmHg) and in both groups both time-points were compared separately.All eight genes showed significant differences between start and end point of the clinical trial
1“This was a multicenter, multinational, 8-week randomized, double-blind, parallel-group study that evaluatedthe efficacy and safety of two SPCs of telmisartan/amlodipine (T/A) compared with amlodipine monother-apy in patients with uncontrolled hypertension.” (Neldam et al., 2011)
84

5.1. Gene expression and blood pressure related phenotypes
(p-value < 0.05/8=0.00625) . These eight genes were CEBPA, CRIP1, F12, LMNA, MYADM,TIPARP, TPPP3, and TSC22D3.
5.1.3. Results from CHARGE consortium
The blood pressure project in CHARGE included 7,017 samples from six population-basedstudies, namely Framingham Heart Study (FHS), EGCUT, Rotterdam Study (RS), InCHI-ANTI, SHIP-TREND and KORA F4 (Table 5.2).Gene expression levels were associated with three phenotypes, namely systolic (SBP) and di-astolic (DBP) blood pressure, and hypertension (HTN) with hypertension being defined asSBP ≥ 140 mm Hg or DBP ≥ 90 mm Hg. For each expression probe a linear model adjustedfor age, sex, BMI, cell counts (if available) and technical covariates (RIN, sample storagetime, and amplification plate in KORA) was applied. FHS used a mixed model to adjust forfamily structure.
FHS EGCUT RS InCHIANTI KORA F4 SHIP-TRENDSample size 3,679 972 604 597 565 600Age 51±12 36±14 58±8 71±16 72±5 46±13SBP (mm Hg) 118±15 122±16 132±20 132±20 129±21 120±15DBP (mm Hg) 74±9 76±10 82±11 78±10 73±11 75±9Hypertension 11% 19% 35% 45% 26% 12%
Table 5.2.: Characteristics of the six study cohorts included in meta-analysis on blood pres-sure related phenotypes:Individuals receiving anti-hypertensive treatment were excluded from the analy-sis. Hypertension was defined as SBP ≥ 140 mm Hg or DBP ≥ 90 mm Hg.
As gene expression levels of all six cohorts were measured using two different platforms(FHS used Affymetrix, while all others used Illumina) the analysis was conducted in twosteps (Figure 5.1). At first, panels using different platforms were analyzed separately andthe significant hits were replicated in the panel using the other platform and secondly, bothpanels were meta-analyzed (This was possible for an intersecting set of 7,717 genes that weremeasured with both platforms). Results are summarized in Table 5.3.
The meta-analysis of all six cohorts resulted in 34 significant differentially expressed genes(Table 5.4) associated with either SBP (21), DBP (20), or HTN (5), whereat expression levelsof ten genes are associated with more than one phenotype. For 33 of these genes a cis- andfor 26 a trans-eQTL in whole blood was identified in an eQTL study (Westra et al., 2013).
Gene CHR FHS p-value Illumina p-value Meta p-valueSBP Signature genesSLC31A2 9 1.2E-13 9.9E-11 <1E-16MYADM 19 2.2E-14 2.2E-12 <1E-16DUSP1 5 1.1E-08 3.7E-07 2.0E-14TAGLN2 1 1.0E-06 1.3E-06 5.8E-12CD97 19 1.4E-07 1.6E-05 1.0E-11BHLHE40 3 4.3E-06 6.4E-07 1.2E-11
85

5. Association studies
MCL1 1 7.5E-07 1.5E-06 1.4E-11PRF1 10 2.5E-09 1.0E-03 1.6E-11GPR56 16 3.5E-09 3.0E-03 3.9E-11PPP1R15A 19 1.7E-09 2.8E-05 1.5E-08FGFBP2 4 5.8E-06 1.5E-03 3.3E-08GNLY 2 3.6E-05 3.0E-04 4.0E-08FOS 14 1.6E-11 3.6E-05 4.8E-08NKG7 19 1.9E-05 8.8E-03 9.4E-07GRAMD1A 19 2.1E-05 1.8E-02 1.1E-06GLRX5 14 1.3E-05 3.5E-02 1.5E-06TMEM43 3 3.0E-04 2.4E-03 2.3E-06TIPARP 3 1.3E-07 3.3E-04 2.6E-06AHNAK 11 4.1E-04 4.0E-03 5.2E-06PIGB 15 5.3E-04 1.9E-03 6.1E-06TAGAP 6 5.7E-12 7.1E-04 6.4E-06DBP Signature genesBHLHE40 3 2.3E-06 2.8E-06 2.7E-11ANXA1 9 1.2E-09 6.3E-03 6.5E-11PRF1 10 3.2E-07 5.7E-04 6.7E-10KCNJ2 17 3.9E-06 2.6E-04 4.9E-09CLC 19 2.6E-06 5.7E-04 5.8E-09CD97 19 1.6E-06 1.1E-03 7.4E-09IL2RB 22 3.0E-06 2.4E-03 2.5E-08S100A10 1 2.4E-07 9.9E-03 4.0E-08GPR56 16 1.1E-06 1.7E-02 5.5E-08TIPARP 3 1.3E-04 2.8E-04 1.4E-07HAVCR2 5 3.8E-04 1.8E-04 2.4E-07PTGS2 1 2.2E-05 9.0E-03 1.0E-06MYADM 19 1.7E-08 8.6E-05 1.1E-06ANTXR2 4 5.2E-06 5.5E-02 1.7E-06OBFC2A 2 7.2E-06 3.8E-02 1.8E-06GRAMD1A 19 1.4E-05 7.8E-02 2.8E-06ARHGAP15 2 1.1E-03 1.5E-03 5.2E-06FBXL5 4 2.1E-05 5.5E-02 5.3E-06SLC31A2 9 1.0E-08 2.6E-03 5.4E-06VIM 10 5.5E-06 2.0E-01 6.2E-06HTN Signature genesSLC31A2 9 1.9E-05 2.1E-06 1.8E-10MYADM 19 1.2E-08 6.2E-04 3.0E-07TAGAP 6 3.2E-05 5.3E-03 7.3E-07GZMB 14 1.1E-11 9.6E-04 1.4E-06KCNJ2 17 8.4E-04 5.5E-04 1.7E-06
Table 5.4.: Significantly associated genes for blood pressure related phenotypes:Linear models were calculated for three different phenotypes (SBP, DBP, and hy-pertension) in FHS, all cohorts that used Illumina arrays, and in meta-analysis ofall cohorts.
86

5.1. Gene expression and blood pressure related phenotypes
Figure 5.1.: Analysis framework for gene expression study on blood pressure related pheno-types
SBP DBP HTNIllumina cohorts 6 1 1replicated 6 1 1Affymetrix cohort 73 31 8replicated 10 (of 55) 5 (of 22) 2 (of 8)Meta-analysis 21 20 5
Table 5.3.: Results from gene expression study on blood pressure related phenotypes:Number of significant genes for all three phenotypes using two different expres-sion platforms. “Significant” was defined as Bonferroni corrected p-value below0.05. Not all significant genes from the Affymetrix panel were available on theIllumina array. The number of available genes is displayed in brackets.
87

5. Association studies
5.2. Gene expression and aging
As demonstrated in Section 3.2 aging is one of the main factors for age-related diseases likeParkinson’s disease, Alzheimer or cardiac infarction. Therefore, many of the studies listedin the GWAS catalog (n=98) are linked to aging (August, 10th 2015). In comparison, only 52,36, and 9 studies are listed for BMI, height, and hair color, respectively. But as genetic is justa static investigation, it is very interesting to analyze gene expression levels as an indicatorfor gene activity.
5.2.1. Results from KORA F3
In the beginning of the gene expression era assumptions were not very stringent. The firstpublished results from KORA F3 (Mehta, 2009) on the association between gene expressionand aging did not consider any confounders. The model was:
expression level ∼ age
This model was applied to the 13,767 probes that were significantly detected in more than5% of the samples. This resulted in eleven probes significantly associated with aging afterBonferroni correction (see Table 5.5).
Gene CHR ProbeId old gene name from Illumina p-valueLRRN3 CHR7 ILMN 1773650 LRRN3 1.33E-08
SGK223 CHR8 ILMN 1766236 DKFZP761P0423 2.92E-07GPR18 CHR13 ILMN 1780368 GPR18 4.07E-07CD248 CHR11 ILMN 1726589 CD248 4.16E-07
ANXA2R CHR5 ILMN 1675465 C5ORF39 9.14E-07CCR7 CHR17 ILMN 1715131 CCR7 1.53E-06
OCIAD2 CHR4 ILMN 1700306 OCIAD2 1.76E-06ILMN 1674983 LOC387841 2.79E-06
FBL CHR19 ILMN 1719205 FBL 3.36E-06PCED1B CHR12 ILMN 1712431 FAM113B 3.37E-06
CHR6 ILMN 1804935 VNN3 3.49E-06
Table 5.5.: Significantly associated genes in KORA F3 with aging
Expression levels of these eleven probes were used to create a prediction model for age.All significantly associated probes were simply included in one linear model:
age = β1 ∗ LRRN3 + β2 ∗DKFZP761P1 + β3 ∗ GPR18 + β4 ∗ CD248 + β5 ∗ LOC389289+β6 ∗ CCR7 + β7 ∗ LOC387841 + β8 ∗OCIAD2 + β9 ∗ VNN3 + β10 ∗ LY9
+β11 ∗ FAM113B + ε
For 25% of the samples the difference between chronological and predicted age was lessthan 2.5 years. For 50% the difference was between 2.5 and 8 years and for the remaining
88

5.2. Gene expression and aging
●
●●
●
●
●
●
●●
●
●
●
●
●
●
●
●
●
●
●●
●
● ●
●
● ●
●
●
●
●
●
●
●
●
●●
●
●
●
●●
●
● ●
●
●●
●
●
●
●●●
●
●
●
●●
●
●
●
●●
●
●
●
●
●
●
●
●
●●●
●
●
●●
● ●
●●
●●
●●
●
●
●
●
●●
●
●●
●●
●
●
●●
●
●●
●
●
●
●
●
●
●
●
●
●●
●●
●
●
●
●
●
●
●
●
●
●
●
●
●
●
●
●
●
●
●
●
●
●
●
●
●
●
●
●
●
●
●
●
●
●
●
●
●
●
●●●
●●
●
●
●
●
●
●
●
●
●
●
●
●
●
●
●
●
●
●
●●
●●
●
●
●
●
●
●
●
●
●
●
●
●●●
●●
●
●
●
●
●
●
●
●
●
●
●
●
●
●●
●
●
●
●
●
●
●
●
●
●
●●
●
●
●
●
●●
●
●
●
●
●
●
●
●
●
●
●
●
●
●
●
● ●
●
●
●
●
●
●
●
●
●
●
●
●●
●●
●
●
●
●
●
●
●
● ●
●
●
●
●
●
●
● ●
●
●
●
●
●
● ● ●
●●
●
●
●
●
● ●●
●
●●
●
●
●●
●●
●
●
●
●●
●
● ●
●
●
●
●
●
●
●●
●
●
●
●●
●
●
●
●
●
●
●
●●
●
●
●
●
●●
●
●
●
●●● ●
●
●
●
●
●
●
●
●
●●
●
●
●
●
●●
●
●
●
●
●
●
●
●
●
●
●
●●
●
●
50 55 60 65 70 75 80 85
7.0
7.5
8.0
8.5
9.0
9.5
Age
log2
exp
ress
ion
of L
RR
N3
Figure 5.2.: Age-specific gene expression in KORA F3:The age is plotted versus the expression level of the most significant gene:LRRN3
samples it was more than 8 years.
For a better comparison of these results the analysis was repeated using all availableprobes on the array and using sex and RIN (as technical variable for KORA F3) as covari-ables. This resulted in five significant associations between gene expression and age (CD248,SGK223, GPR18, LRRN3, and NELL2).
5.2.2. Results from KORA F4
KORA F4 expression data are highly affected by batch effects. Nevertheless, the associationsbetween gene expression and aging were calculated identically as in KORA F3, to show thatmissing covariates that influence gene expression levels could lead to false positive associa-tions. Therefore, the linear model was calculated once without any covariables and once ad-justed for sex and technical covariables (RIN, sample storage time, and amplification plate).To compare the results from F4 to F3 the models were also calculated in a random subsetof KORA F4 with the same sample size as in F3 (N=381). Results of these comparisons areshown in Table 5.6.
Unadjusted Adjusted OverlapN=993 370 194 83N=381 74 45 13Overlap 64 31
Table 5.6.: Number of genes significantly associated with age in KORA F4
Due to the known strong batch effects in KORA F4 results of the unadjusted model mightbe false-positive findings and not directly comparable to the results of KORA F3. Thisdemonstrated that the consideration of technical variables bisected the number of significanthits. It also shows that in the KORA F4 data more probes are associated with age, althoughthe age distribution in both data sets is similar. There is even a wider age range in KORA F3
89

5. Association studies
compared to KORA F4 (see Figures 5.3 and 5.4).
KORA F3
Age
Fre
quen
cy
50 60 70 80
020
4060
80
KORA F4
Age
Fre
quen
cy
50 60 70 80
050
100
150
200
250
Figure 5.3.: Histogram of age distribution in KORA F3 and F4
When using the model adjusted for sex and technical variables in KORA F4, 194 expres-sion probes were significantly associated with age. Four of these loci were also identified inKORA F3 (CD248, GPR18, LRRN3 and NELL2). For SGK223 the p-value was marginally notsignificant (p = 1.67 ∗ 10−6). A Bonferroni threshold of 1.02 ∗ 10−6 was applied.
5.2.3. Results from CHARGE consortium
The association between gene expression and aging was the first project of the gene expres-sion working group of the CHARGE consortium. Six independent cohorts with expressionlevels measured in whole blood were included in the analyses resulting in a total of 7,074samples:
• EGCUT: N=1,086 (described in 2.1.3)
• FHS-2nd generation: N=2,446 (Framingham Heart Study, consists of three generationsof participants, in the 2nd generation (1971) the offspring of the first generation from1948 were investigated)
• InCHIANTI: N=698 (Invecchiare in Chianti - aging in the Chianti area, population-based prospective study in Italy)
• KORA F4: N=993 (described in 2.1.1)
• RS III: N=881 (Rotterdam Study III, population-based prospective study, all samplesare older than 45)
• SHIP-TREND: N=970 (described in 2.1.2)
90

5.2. Gene expression and aging
KORA F3 KORA F4
5055
6065
7075
8085
Age
Figure 5.4.: Boxplot of age in KORA F3 and F4
5.2.3.1. Association between gene expression and age
Out of 11,908 genes with significant expression levels, 2,228 were significantly associatedwith age in the discovery stage with p-value < 4.2 ∗ 10−6. The association was tested us-ing linear models adjusted for technical variables, cell counts (not available in KORA F4),smoking, and fasting status (in KORA F4 there were eight non-fasting samples). For replica-tion, 7,909 whole-blood samples from seven different cohorts were available and 1,497 genescould be replicated with p-value < 2.2 ∗ 10−5.For the replicated genes it was tested whether they were also significantly associated withage in samples with different ancestry or in different tissues (Table 5.7). Due to the low num-ber of samples for African Americans (n=359) and two brain tissues (n=394) the numberof genes associated with age was quite low (27%, 19%, and 26%, respectively). But for thelarger samples of Native (n=1,457) and Hispanic (n=1,244) Americans the rates were quitehigh (71% and 74%, respectively). To investigate whether the effects of age on gene expres-sion levels are also existent in populations with different ancestry or in other tissues highersample sizes comparable to that of discovery cohorts will be required.
5.2.3.2. Age prediction
The prediction of age using expression levels results in the so-called “transcriptomic age”.The difference between the chronological and the transcriptomic age (here called ∆age)could be explained by the biological age.For the age prediction in all participating CHARGE cohorts a formula was applied for eachcohort separately by using all expressed genes and calculate the meta-analysis without therelevant cohort. That way, an own prediction formula was generated for each individual ofeach cohort:
Z =∑
xv(i)bR(i)
91

5. Association studies
Ancestry/tissue sample size expressed genes genes with p<0.05Native Americans 1,457 95% 1,005 (71%)Hispanic Americans 1,244 40% 440 (74%)African Americans 359 99% 392 (27%)Cerebellum brain tissue 394 58% 163 (19%)Frontal cortex brain tissue 394 58% 229 (26%)
Table 5.7.: Significantly associated genes with aging in different tissues:The expression levels of all genes that could be replicated in 7,909 samples weretested for association with age in different tissues and in samples with differentancestry. Due to low sample sizes in the samples from different tissues, the num-ber of replicated genes was quite low (<30%).
where xv(i) is the expression level of the i-th probe in the cohort and bR = (R + Iλ/n)−1b.Here, R is the correlation matrix between expression probes in a reference sample, I is theidentity matrix, λ is a parameter that was optimized in the BSGS cohort, n is the sample sizeand b is defined as
b =z√
n+ z2
with z being the test statistic from the meta-analysis. In a last step the predicted age wasscaled:
ZS = µage + (Z − µZ) ∗ σageσZ
with µage and σage being the mean and standard deviation of the chronological age and µZand σZ the mean and the standard deviation of the predicted age Z.
The correlation between the chronological and the transcriptomic age was significant inall cohorts with p-values < 2∗10−29 (in KORA the p-value was 1.71∗10−29) and the averagedifference was 7.8 years (in KORA 4.84 years). The small difference in KORA F4 shows noindication for a very remarkable prediction because the standard deviation of age is only 5.4.The results from KORA F4 are shown in Figure 5.5.
For all samples the difference between the chronological and the transcriptomic age wascalculated. Samples having a positive ∆age were predicted to be older than they are. Thiscould be a hint that they age faster than other individuals. Therefore, it was tested whetherthe ∆agewas associated with biological phenotypes known to be correlated with the chrono-logical age. The p-values for the correlation adjusted for chronological age of the meta-analysis and of KORA F4 are shown in Table 5.8. When assuming the Bonferroni thresholdof 0.05/12 = 4.17 ∗ 10−3 as significance threshold, only fasting glucose levels were positivelycorrelated with ∆age in KORA F4, meaning that individuals that have a higher ∆age alsohave higher fasting glucose levels which could be an indication for type 2 diabetes. In themeta-analysis also systolic and diastolic blood pressure, total and HDL cholesterol levels,BMI, and waist-hip-ratio were positively correlated with ∆age (see Table 5.8).
5.2.3.3. Analysis of gene expression, methylation, and chronological age
It is known that not only gene expression but also methylation changes along with higherage (Richardson, 2003). Therefore, methylation data were additionally analyzed. Methy-
92

5.2. Gene expression and aging
●
●
●
●
●
●
●
● ●
●
●
●
●
●
●●
●
●
●
●
●
●
●
●
●
●
●
●
●
● ●
●
●
●
●
● ●
●
●
●
●
●
●
●
●
●●
●
●
●
●
●
●●
●
●
●
●
●
●
●
●
●
●
●
●
●
●
●
●
●
●
●
●
●
●
●
●
●
●
●
●
●
●
●
●
●
●
●
●
●
●
●
●
●
●
●
●
●
●●
●
●
●
●
●
●
●
●
●
●
● ●
●
● ●
●
●
●
●
●
●
●
●
●
●
●
●
●
●
●
●●
●
●
●
●
●
● ●●
●
●
●
●
●
●●●
●
●
● ●
●
●
●●
●
●
●
●
●
●
●
●
●
●
●
●
●
●
●●
●
●
●
●
●
●
●
●
●
●●
●
●
●●
●
●●
●
●
●
●
●
●●
●●
●
●
●
●
●
●
●
●
●
●
●
●
●
●
●
●
●
●
●
●
●
●
●●
●
●
●
●
●
●
●
●
●
●
●
●
●●
●
●●
● ●
●
●
●
●
●●
●
●
●
●
●
●
●
●
●
●
●
●●
●
●
●
●
●
●●
●
●
●
●
●
●
●
●●
●
●
●
●
●
●
●
●
●
●
●
●
●
●
●
●
●
●
●
●
●
●
●
●
●
●
●
●
●
●
●
●
●
●
●
●
●●
●
●
●
●
●
●
●
●●
●
●
●
●
●
●
●
●
●
●
●
●
●
●●
●
●
●
●
●
●
●●
●
●
●
●
●
●
●
●
●
●
●
●
●
●
●
●
●
●
●
●
●
●
●
●
●
●●
●
●
●
●●
●
●
●
●●
●
●
●●
●
●
●
●
●
●
●
●
●
●
●
●
●
●
●
●
●
●
●
●
● ●
●
●
●
●
●
●
●
●
●
● ●
●
●
●
●
●
●
●
●●
●
●
●
●
●
●
●
●
●
●
●
●
●
●
●
●
●
●
●
●●
●
●
●
● ●●
●
●
●●
●
●
●
●
●●
●●
●
●
●
●
●
●
●
●
●
●
●
●
●
●
●
●
● ●
●
●
●
●
●
●
●
●
●
●
●
●
●
●
●
●
●
●
●
●
●
●
●
●
●
●
●
●
●
● ●
●
●
●
●
●
● ●
●
●
●
●
●
●
●
●
●
●
●
●●
●
●
●
●
●
●
●
●
●
●
●
●
●●
●
●
●
●
●
●
●
●
●
●
●
●
●
●
●
●
●
●
●
●
●
●
●
●
●
●
●
●
●
●
●
●
●● ●
●
●●
●
●
●
●
●
●●
●
●
●
●
●
●
●
●
●
●
●
●
●
●
●
●
●
●
●
●
●●
● ●
●
●
●
●
●
● ●
●
●
●
●
●
●
●
●
●
●
●
●
●
●
●
●
●
●
●
●
●
●
●
●
●
●
●
●
●
●
●
●●
●
●
●
●
●
●
●
●
●
●
●
●
●
●
●●
●
●
●
●
●
●
● ●
●
●
●
●
●●
●●
●
●
●
●
●●
●
●
●
●
● ●
●
●
●
●●
●
●
●
●●
●●
●
●
●
●
●
●●
●
● ●
●
●
●
●
●
●
●
●
●
●
●
●●
●
●
●
●
●
● ●
●●
●
●
●
●
●
●
●
●
●
●
●
●
●
●
●
●
●
●
●
●
●
●
●
●●
●
●
●
●
●
●
●
●
●
●
●
●●
●
●
●
●
●
●
●
●
●
●
●
●
●
●
●
●
●
●
●●
●
●
●
●
●●
●
●
●●
●
●
●
●
●
●
●
●
●
●
●●
●
●
●
●
●
●
●
●
●
●
●
●
●
●
●
●
● ●
●
●
●
●
●
●●
●
●●
●
●
●
●
●
●
●
●
●
●
●
●
●
●
●●
●
●
●
●
●
●
●
●
●
●
●
●
●
●
●
●
●
●
●
● ●
●
●
●
●●
●
●
●●
●
●
●●
●
●
●
●●
●
●
●
●●
●
●●
●
●
●
●
●
●
●
●●
●
● ●
●
●
●
●
●
●
●
●
●
●
●
●
●
●
●
●
●
●
●
●
●
●
●
●●
●
●
●
●
●
●
●
●
●
●
●
●
●
●
●
●
●
●
●
●
●
●
●
●
●
●
●
●
●
●
●
0 20 40 60 80 100
020
4060
8010
0
Transcriptomic age vs Chronological age
Chronological Age
Tran
scrip
tom
ic A
ge
Correlation r = 0.348 ; r2 = 0.121 pvalue = 1.71e−29
Figure 5.5.: Chronological versus predicted age in KORA F4
KORA F4 meta-analysisPhenotype of Interest Effect P n Zscore P Direction nSex (0=male, 1=female) 0.0007 8.33E-01 984 -27.610 5.76E-03 –+–+-+ 8,836Systolic BP (mmHg) 0.2752 3.03E-02 983 98.510 6.78E-23 ++++++++ 8,571Diastolic BP (mmHg) 0.0187 7.64E-01 983 77.200 1.16E-14 ++++++++ 8,568Total cholesterol (mmol/L) -0.0031 6.38E-01 984 54.190 5.99E-08 +++++-++ 8,688HDL cholesterol (mmol/L) -0.0018 4.28E-01 984 44.630 8.07E-06 +++++-+- 8,687Fasting glucose (mmol/L) 0.4725 1.56E-03 984 69.330 4.11E-12 ++++++?? 7,330Body Mass Index (kg/m2) 0.0804 5.18E-03 984 53.860 7.21E-08 ++++++++ 8,829Waist Hip Ratio 0.0011 2.52E-02 984 33.800 7.25E-04 ++??++++ 4,837Hand grip strength (kg) na na na -15.120 1.31E-01 ++?-???? 3,651Renal function na na na 0.8740 3.82E-01 +++-+?-? 7,317Mini Mental State Exam na na na -13.130 1.89E-01 –?????? 1,492Current smoking 0.0025 1.07E-01 984 55.100 3.59E-08 +-?+++– 7,379
Table 5.8.: Association between transcriptomic age and age-related phenotypes:The association between transcriptomic age and age-related phenotypes was cal-culated using different subgroups of the meta-analysis having the according phe-notype. The p-values are displayed for KORA F4 and the meta-analysis.
93

5. Association studies
Methylation
Chronological age Gene expression-
�������3
QQQQQQQs
Figure 5.6.: Mediation of age-expression relationship by methylation
lation data from the Illumina 450K array were available for seven cohorts including KORAF4. Altogether there were 3,073 samples with KORA F4 being the largest cohort with 735samples.Only 135,230 CpG sites located in a 250kb window around all 1,497 genes significantly as-sociated with the chronological age were analyzed. The window size was chosen based ona prior publication of Bonder et al. (2014) which showed that gene expression is most likelyinfluenced by methylation of a CpG site within this distance.
Three models were calculated in each cohort for all CpG sites:
Model 1 : methylation ∼ age+ covariates
Model 2 : expression ∼ methylation+ covariates
Model 3 : expression ∼ methylation+ age+ covariates
The covariates in all three models were sex, fasting and smoking status, cell counts (not avail-able in KORA F4) and technical variables. The results of all models were meta-analyzed andthe significance threshold was defined as 0.05/135,230 = 3.7 ∗ 10−7.For 31,331 CpG sites significant association between methylation and the chronological age(model 1) could be observed and 12,280 CpG sites were correlated with expression levels ofa nearby gene (model 2).
To test whether the association between gene expression and chronological age was medi-ated by methylation (see Figure 5.6) the Sobel test was applied (Sobel, 1982) where the Sobelz-score was calculated by
ZSobel =Z1Z2√Z2
1 + Z22
with Z1 being the Z-score from model 1 and Z2 being the Z-score from model 3.
83% of the age-associated genes (1,248 out of 1,497) had at least one mediating CpG sitewhereas each gene was mediated by one to 154 CpG sites.
5.3. Summary and discussion
In the last chapter I presented two different association studies with gene expression data inwhole blood. Initially, we investigated the impact of phenotypes related to blood pressure
94

5.3. Summary and discussion
on gene expression levels and afterward we analyzed the effect of aging on gene expressionlevels. For both association studies we started with the small KORA F3 data set, then an-alyzed the KORA F4 data set and finally contributed with the KORA F4 data set to a metaanalysis of the CHARGE consortium. The blood pressure phenotypes were additionally an-alyzed in the MetaXpress consortium.
The impact of blood pressure on gene expression levels (or vice versa) seems to be quitesmall, at least in whole blood. This could be a reason why no significant association wasfound in 377 KORA F3 samples and just one significant association was detected in 989KORA F4 samples. But due to the fact that the association between systolic/diastolic bloodpressure and the expression level of FOSB was not identified in the MetaXpress and theCHARGE consortium, the relevance of FOSB has yet to be validated.At least two of the eight genes that were identified in the MetaXpress study could be con-firmed in the CHARGE data: MYADM and TIPARP with TIPARP being linked to blood pres-sure at least partly via SNP rs3184504 (Levy et al., 2009). This SNP was identified in a GWASto be associated with blood pressure and was also a trans-eQTL for TIPARP and five othergenes that were associated with blood pressure (FOS, PP1R15A, TAGAP, S100A10, FGBP2).Functional characterization of the eight candidate genes that were identified in the mono-cyte samples, replicated in the whole blood samples, and validated in the clinical trial is stillongoing.
The association of gene expression and age was analyzed in three different studies. Firstly,in the smallest study KORA F3 with 381 samples, secondly in the larger KORA F4 study with993 samples, and lastly in a consortium of 7,074 samples. As can be seen in Figure 5.7 thenumber of significant hits increased with the sample size.When using the adjusted model (for sex and technical variables) in 993 KORA F4 samples194 expression probes were significantly associated with age. Four of these were also identi-fied in 381 KORA F3 samples (CD248, GPR18, LRRN3 and NELL2). For SGK223 the p-valuewas only marginally not significant (1.67 ∗ 10−6). The Bonferroni threshold was 1.02 ∗ 10−6.Out of 194 significant genes in KORA F4, 150 were analyzed in 7,074 samples of the CHARGEconsortium and 130 of them were also significant in the discovery cohort and 105 addition-ally in the replication cohort.
The age prediction in KORA was very difficult and biased because of the small age rangein the data set. In KORA F3, the age ranged from 51 to 84, in KORA F4 from 62 to 81. Ascan be seen in Figure 5.8 the age distribution in the other cohorts was wider and therefore,the results of the age prediction were more precise when using the correlation between pre-dicted age and chronological age as a marker for a “good” prediction.
To improve the age prediction the methylation data could be taken into account as it wasshown that 31,331 CpG sites were correlated with chronological age and 83% of the age-associated genes had at least one mediating CpG site. For KORA F4 and the RotterdamStudy two epigenetic age predictors ((Horvath, 2013) and (Hannum et al., 2013)) were avail-able and were compared to the transcriptomic predictor. Both prediction methods werepositively correlated with the transcriptomic predictor. But the epigenetic predictor wasassociated with different clinical phenotypes (transcriptomic predictor was associated withsystolic blood pressure, waist-hip-ratio, and smoking, Horvath predictor only with waist-
95

5. Association studies
Figure 5.7.: Manhattan plots of results from association study between gene expression andaging in KORA F3, F4, and CHARGE:The genomic location of each expression probe (meaning the TSS of the transcriptto which the probe was mapped) is plotted against the -log10(p-value) of theresult from the association between gene expression level and age. The red linesindicate the Bonferroni significance threshold.
96
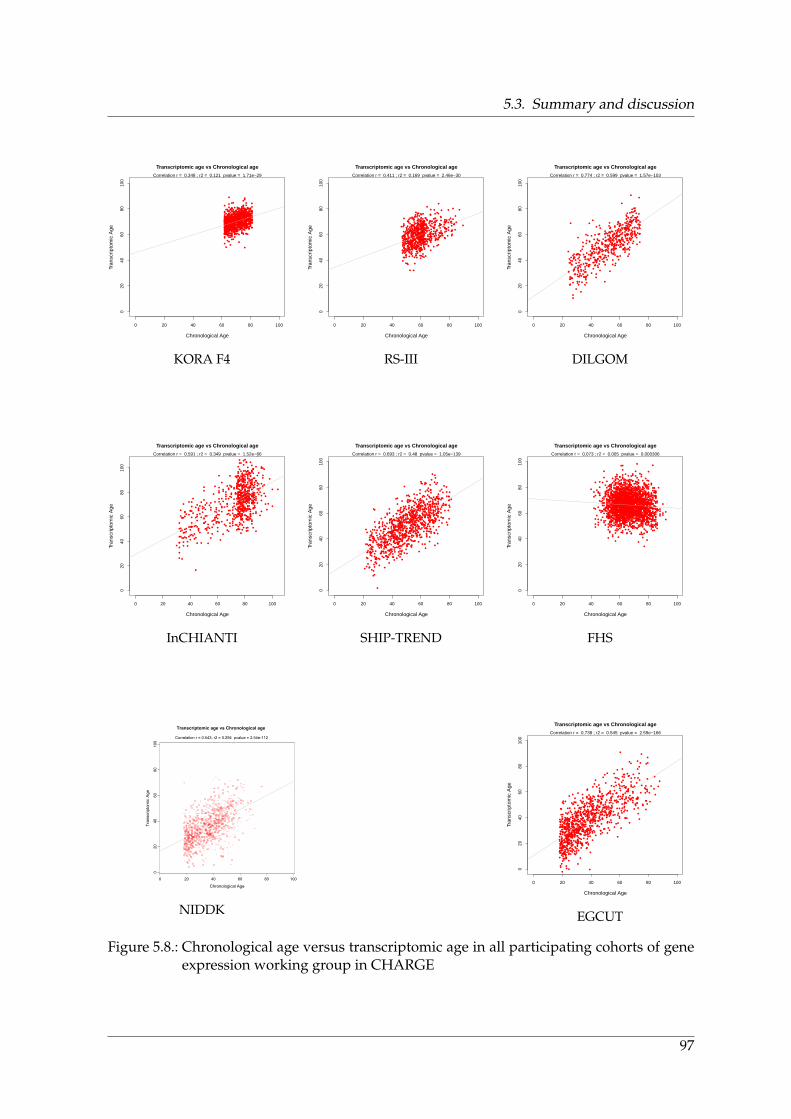
5.3. Summary and discussion
●
●
●
●
●
●
●
● ●
●
●
●
●
●
●●
●
●
●
●
●
●
●
●
●
●
●
●
●
● ●
●
●
●
●
● ●
●
●
●
●
●
●
●
●
●●
●
●
●
●
●
●●
●
●
●
●
●
●
●
●
●
●
●
●
●
●
●
●
●
●
●
●
●
●
●
●
●
●
●
●
●
●
●
●
●
●
●
●
●
●
●
●
●
●
●
●
●
●●
●
●
●
●
●
●
●
●
●
●
● ●
●
● ●
●
●
●
●
●
●
●
●
●
●
●
●
●
●
●
●●
●
●
●
●
●
● ●●
●
●
●
●
●
●●●
●
●
● ●
●
●
●●
●
●
●
●
●
●
●
●
●
●
●
●
●
●
●●
●
●
●
●
●
●
●
●
●
●●
●
●
●●
●
●●
●
●
●
●
●
●●
●●
●
●
●
●
●
●
●
●
●
●
●
●
●
●
●
●
●
●
●
●
●
●
●●
●
●
●
●
●
●
●
●
●
●
●
●
●●
●
●●
● ●
●
●
●
●
●●
●
●
●
●
●
●
●
●
●
●
●
●●
●
●
●
●
●
●●
●
●
●
●
●
●
●
●●
●
●
●
●
●
●
●
●
●
●
●
●
●
●
●
●
●
●
●
●
●
●
●
●
●
●
●
●
●
●
●
●
●
●
●
●
●●
●
●
●
●
●
●
●
●●
●
●
●
●
●
●
●
●
●
●
●
●
●
●●
●
●
●
●
●
●
●●
●
●
●
●
●
●
●
●
●
●
●
●
●
●
●
●
●
●
●
●
●
●
●
●
●
●●
●
●
●
●●
●
●
●
●●
●
●
●●
●
●
●
●
●
●
●
●
●
●
●
●
●
●
●
●
●
●
●
●
● ●
●
●
●
●
●
●
●
●
●
● ●
●
●
●
●
●
●
●
●●
●
●
●
●
●
●
●
●
●
●
●
●
●
●
●
●
●
●
●
●●
●
●
●
● ●●
●
●
●●
●
●
●
●
●●
●●
●
●
●
●
●
●
●
●
●
●
●
●
●
●
●
●
● ●
●
●
●
●
●
●
●
●
●
●
●
●
●
●
●
●
●
●
●
●
●
●
●
●
●
●
●
●
●
● ●
●
●
●
●
●
● ●
●
●
●
●
●
●
●
●
●
●
●
●●
●
●
●
●
●
●
●
●
●
●
●
●
●●
●
●
●
●
●
●
●
●
●
●
●
●
●
●
●
●
●
●
●
●
●
●
●
●
●
●
●
●
●
●
●
●
●● ●
●
●●
●
●
●
●
●
●●
●
●
●
●
●
●
●
●
●
●
●
●
●
●
●
●
●
●
●
●
●●
● ●
●
●
●
●
●
● ●
●
●
●
●
●
●
●
●
●
●
●
●
●
●
●
●
●
●
●
●
●
●
●
●
●
●
●
●
●
●
●
●●
●
●
●
●
●
●
●
●
●
●
●
●
●
●
●●
●
●
●
●
●
●
● ●
●
●
●
●
●●
●●
●
●
●
●
●●
●
●
●
●
● ●
●
●
●
●●
●
●
●
●●
●●
●
●
●
●
●
●●
●
● ●
●
●
●
●
●
●
●
●
●
●
●
●●
●
●
●
●
●
● ●
●●
●
●
●
●
●
●
●
●
●
●
●
●
●
●
●
●
●
●
●
●
●
●
●
●●
●
●
●
●
●
●
●
●
●
●
●
●●
●
●
●
●
●
●
●
●
●
●
●
●
●
●
●
●
●
●
●●
●
●
●
●
●●
●
●
●●
●
●
●
●
●
●
●
●
●
●
●●
●
●
●
●
●
●
●
●
●
●
●
●
●
●
●
●
● ●
●
●
●
●
●
●●
●
●●
●
●
●
●
●
●
●
●
●
●
●
●
●
●
●●
●
●
●
●
●
●
●
●
●
●
●
●
●
●
●
●
●
●
●
● ●
●
●
●
●●
●
●
●●
●
●
●●
●
●
●
●●
●
●
●
●●
●
●●
●
●
●
●
●
●
●
●●
●
● ●
●
●
●
●
●
●
●
●
●
●
●
●
●
●
●
●
●
●
●
●
●
●
●
●●
●
●
●
●
●
●
●
●
●
●
●
●
●
●
●
●
●
●
●
●
●
●
●
●
●
●
●
●
●
●
●
0 20 40 60 80 100
020
4060
8010
0
Transcriptomic age vs Chronological age
Chronological Age
Tran
scrip
tom
ic A
ge
Correlation r = 0.348 ; r2 = 0.121 pvalue = 1.71e−29
KORA F4
●
●
●
●
●
●
●
●
●
●
●
●
●
●
●
●●
●
●
●
●
●
●
●
●
● ●●
●
●
●
●
●
●
●●
●
●●
●
●
●
●
●
●
●
●●
●
●
●
●
●
●
●
●
●
●
●
●
●
●
●
●
●
● ●
●
● ●
●
●
●
●
●
●●
●
●
●
●
●
●
●
●
●
●
●
●
●
●
●
●
●
●
●
●
●
●
●
●
●
●●
●
●
●
●
●
●
●
●
●
●
●
●
●●
●
●
●
●
●●
●
●
●
●●
●
●
●
●
●
●
●
●
●
●
●
●
●
●
●
●
●
●
●
●
●
●
●
●
●
●●
● ●●
●
●
●
●
●
●
●
●●
●
●
●●
●
●
●
●
●
●
●
●
●
●
●
●
●
●
●
●
●
●
●
●
●
●
●
●
●
●
●
●
●
●
●
●
●
●
●
●
●
●
●
●
●
●● ●
●
●
●
●
●
●
●
●
●
●
●
●
●
●
●
●
●
●
●
●
●
●
●●
●
●
●
●●
●
●
●
●●
●
●
●
●
●
●
●
●●
●
●
●
●
●
●
●
●●
●
●
●
●
●
●
●
●
●
●
●
●
●
●
●
●
●
●
●
●
●
●
●
●
●
●
●
●
●
●
●
●
●
●
●
●
●
●
●
●
●
●
●
●
●
●
●
●
●
●
●
●
●
●
●
●
●
●
●
●●
●
●
●
●
●
●
●
●
●●
●
●
●
●
●
●
●
●
●
●
●
●
●
●
●
●
●
●
●
●
●
●
●
●
●
●
●
●
●
●
●
●
● ●
●
●
●
●
●
●
●
●
●
●
●
●
●
●
●
●
●
●
●
●
●
●
●
●
●
●
●
●
●
●
●
●
●
●
●
●
●
●
●
●
●
●
●
●
●
●
●
●
●
●
●
●
●●
●
●
●
●
●
●
● ●
● ●●
●
●
●
●
●●
●
●
●
●
●
●
●
●
●
●
●
●
●
●
●
●
●
●
●
●
●
●
●
●
●
●
●
●
●
●●
●
●
●
●
●
●
●
●
●
●
●
●
●
●
●
●
●
●
●
●
●
●
●
●
●
●
●
●
●
●
●
●
●
●
●
●
●
●
●
●
●
●
●
●
●
●
●
●
●
●
●●
●
●
●
●
●
●
●
●
●
●
●
● ●
●
●
●
●
●●
●
●
●
●
●
●
●
●
●
●
●
●
●
●
●
●
●
●
●
●
●
●
●
●
●
●
●
●
●
●
●
●
●
●
●
●
●
●
●
●
●
●
●
●
●
●
●
●
●
●
●
●
●
●
●
●
●
●
●
●
●
●
●
●
●
●
●
●
●
●
●
●
●
●
●
●
●●
●
●
●
●
●
●
●
●
●
●
●
●
●
●
●
●●
●
●●
●
●
●
●
●
●●
●
●
●
●
●
●
●
●
●
●
●● ●
●
●
●
●
●
●
●
●
●
●
●●
●
●
●
●
●
●
●
●
●
●
●
●
●●
●
●
●
●
●
●
●
●●
●
●
●
●
●
●
●
●
●
●
●
0 20 40 60 80 1000
2040
6080
100
Transcriptomic age vs Chronological age
Chronological Age
Tran
scrip
tom
ic A
ge
Correlation r = 0.411 ; r2 = 0.169 pvalue = 2.46e−30
RS-III
●
●
●
●
●
●
●
●
●
● ●
●
●
●
●
●
●
●
●
●
●
●
●
●
●
●
●
●
●
●
●
●●
●
●
●
●
●
●
●
●
●
●
●
●
●
●
●
●
●
●
●
●
●
●
●
●
●
●
●
●
●
●
●
●
●
● ●
●
●
●
●
●
●
●
●
●
●
●
●
●
●
●
●
●
●
●
●
●
●
●
●
●
●
●
●
● ●
●
●
●
●
●
●
●
●
●
●
●
●
●
●
●
●
●
●
●
●●
●
●
●
●
●
●
●
●
●
●
●
●
●
●
●
●
●
●
●
●
●
●
●
●
●
●
●
●
●
●
●
●
●
●
●
●
●
●
●
●
●
●
●
●
●
●
●
●
●
●
●
●
●
●
●
●
●
●
●
●
●
●
●
●
●
●
●
●●
●
●
●
●
●
●
●
●
●
●
●
●
●
●
●
●
●
●
●
●
●
●
●
●
●
●
●
●
●
●
●
●
●
●
●
●
●
●
●
●
●
●
●
●
●
●
●
●
●
●
●
●
●
●
●
●
●
●
●
●
●
●●
●
●
●
●
●
●
●
●
●
●
●
●
●
●
●
●
●
●
●
●
●
●
●
●
●
●
●
●
●●
●
●
●
●
●
●
●
●
●
●
●
●
●
●
●
●
●
●
●
●
●
●
●
●
●
●
●●
●
●
●
●
●
●
●●
●
●
●
●
●
●
●
●
●
●
●
●
●
●
●
●
●
●
●
●
●
●
●
●
●
●●
●
●
●
●
●
●
●
●
●
●
●
●
●
●
●
●
●
●
●
●
●
●
●
●
●
●
●
●
●
●
●
●
●
●
●
●
●
●
●
●
●
●
●
●
●
●
●
●
●
●
●
●
●
●
●
●
●
●
●
●
●
●●
● ●
●
●
●
●
●
●
●
●
●
●
●
●
●
●
●●
●
●
●
●
●
●
●
●
●
●
●
●
● ●
●
●
●
●
●
●
●
●
●
●
●
●
●
●
●
●
●
●
●
●
●
●
●
●
●●
●
●
●
●
●
●
●
●
●
●
●
●
●
●
●
●
●
●
●
●●
●
●
●
●
●
●
●
●
●
●
●
●
●●
●
●
●
●
●
●
●
●●
●
●
●
●
0 20 40 60 80 100
020
4060
8010
0
Transcriptomic age vs Chronological age
Chronological Age
Tran
scrip
tom
ic A
ge
Correlation r = 0.774 ; r2 = 0.599 pvalue = 1.57e−103
DILGOM
●
●
●
●
●
●
●
●
●
●
●
●
●
●
●
●
●
●
●
●
●
●
●
●
●
●
●
●
●
●
●
●
●
● ●
●
●
●
●
●
●
●
●
●
●
●
●
●
●
●
●
●
●
●
●
●
●
●
●
●
●
●●
●
●
●
●
●
●
●
●
●
●
●
●
●
●
●
●
●●
●
●
●
●
●
●
●
●
●
●
●
●
●
●
●
●
●
●
●
●
●
●
●
●
●
●
●
●
●
●
●
● ●
●
●
●
●
●
●
●
●
●
●●
●
●
●
●
●●
●
●
●●
●
●
●
●
●
●
●
●
●
●
●
●
●
●
●
●
●
●
●
●
●
●●
●
●
●
●
●
●
●
●
●
●
●
●
●
●
●
●
●
●
●
●
●
●
●
●
●
●
●
●
●
●
●
●
●
●
●
●
●
●●
●
●
●
●
●
●
●
●
●
●
●
●
●
●
●
●
●
●
●
●
●
●
●
●
●
●
●
●
●
●
●
●●
●
●
●
●
●
●
●
●
●
●
●
●
●
●
●●
●
●
●
●
●
●
●
●
●
●
●
●
●
●
●
●
●
●
●●
●
●
●
●
●
●
●●
●
●
●
●
●
●●
●
●
●
●
●
●
●
●
●
●
●
●
●
●
●
●
●
●
●
●
●
●
●
●
●
●
●
●
●
●
●
●
●
●
●
●
●
●
●
●
●
●
●
●
●
●
●
●
●
●
●
●
●
●
●
●
●
●
●
●
●
●
●
●
●
●
●
●
●
●
●
●
●
●
●
●
●
●
●
●
●
●
●
●
●
●
●●
●
●
●
●
●
●
●
●
●
●
●
●
●
●
●
●
●
●
●
●
●
●
●
●
●
●
●
●
●
●
●
●
●
●
●
●
●
●
●
●
●
●
●
●
●
●
●
●
●
●
●
●
●
●
●
●
●
●
●
●
●
●
●
●
●
●
●
●
●
●
●
●
●
●
●
●
●
●
●
●
●
●
●●
●
●
●
●
●
●
●
●
●
●
●
●
●
●
●
●
●
●
●
●
●
●
●
●
●
●
●
●
●
●
●
●
●
●
●
●
●
●
●
●
●
●
●
●
●
●
●
●
●
●
●
●
●
●
●
●
●
●
●
●
●
●●
●
●
●
●
●
●
●
●
●
●
●
●
●
●
●
●
●
●
●●
●
●
●
●●
●
●
●
●
●●
●
●
●
●
●
●
●
● ●
●
●
●
●
●
●
●
●
●
●
●
●
●
●
●
●
●
●
●
●
●
●
●
●
●
●
●
●
●
●
●
●●
●
●
●
●
●
●
●
●
●
●
●
●
●
●
●
●
●
●
●
●
●
● ●
●
●
●
●
●●
●
●
●
●
●
●
●
●
●
●
●
●
●
●
●
●
●
●
●
●
●
●
●
●
●
●
●
●
●
●
●
●
●
●
●
●
●
●
●
●
●
●
●
●
●
●
●
●
●
●
●
●
●
●
●
●
●●
●
●
●
●
●
●
●
●
●
●
●
●
●
●
●
●
●
●
●
0 20 40 60 80 100
020
4060
8010
0
Transcriptomic age vs Chronological age
Chronological Age
Tran
scrip
tom
ic A
ge
Correlation r = 0.591 ; r2 = 0.349 pvalue = 1.52e−66
InCHIANTI
●
●
●
●
●
●
●
●
●
●
●
●
●
●
●
●
●
●
●
●
●
●
●
●
●
●
●
●
●
●
●
●
●
●
●
●
●
●
●●
●
●
●
●
●
●
●
●
●
●
●
●
●
●
●
●
●
●
●
●
●
●
●
●
●
●
●
●
●
●
●
●
●
●
●
●
●
●
●
●
●
●
●
●
●
●
●
●
●
●
●
●
●
●
●
●
●
●
●
●
●
●
●
●
●
●
●
●
●
●
●
●
●
●
●
●
●
●
●
●
●
●
●
●
●
●
●●●
●●
●
●
●
●
●
●
●
●
●
●
●
●
●
●
●
●
●
●
●
●●
●
●
●
●
●
●
●
●
●
●
●
●
●
●
●
●
●
●
●
●
●
●
●
●
●
●
●
●
●
●
●
●
●
●
●
●
●
●
●
●
●
●
●
●
●
●
●
●
●
●
●
●
●
● ●
●
●
●
●
● ●
●
●
●
●
●
●
●
●
●
●●
●
●
●
●
●
●
●
●
●
●
●
●
●
●
●
●
●
●
●
●
●
●
●
●
●
●
●
●
●
●
●
●
●
●
●
●
●
●
●
●
●
●
●
●
●
●
●
●
●
●
●
●
●
●
●
●
●
●
●●
●
●
●
●
●
●
●
●
●●
●
●
●
●
●
●
●
●●
●
●
●
●
●
●
●
●
●
●
●
●
●
●
●
●
●
●
●
●●
●
●
●
●
●
●
●
●
●
●
●
●
●
●
●
●
●
●
●
●
●
●
●
●
●
●
●
●
●
●
●
●
●
●
●●
●
●
●
●
●
●
●
●
●
●
●
●
●
●
●
●
●
●
●
●
●●
●
●
●
●
●
●
●
●
●
●
●
●
●
●
●
●
●
●
●
●
●●
●
●
●
●
●
●
●
●
●
●
●
●
●
●
●
●
●
●
●
●
●
●
●
●
●
●
●
●
●
●
●●
●
●
●
●
●
●
●
●
●
●
●
●
●
●
●
●
●
●
●
●
●
●
●
●
●
●
●
●
●
●
●
●
●
●
●
●
●
●
●
●
●
●
●
●
●
●
●
●
●
●
●
●●
●
●
●
●
●
●
●
●
●
●
● ●
●
●
●
●
●
●
●
●
●
●
●
●
●
●
●
●
●
●
●
●
●
●
●
●
●●
●
●
●
●
●
●
●
●
●
●
●
●
●●
●
●
●
●
●
●
●
●●
●
●
●
●
●
●
●
●
●
●
●
●
●
●
●
●
●
●
●
●
●
●
●
●
●
●
●
●
●
●
●
●
●
●
●
●
●
●
●
●
●
●●
●
●
●
●
●
●
●
●
●
●
●
●●
●
●
●
●
●
●
●●
●
●
●
●
●
●
●
●
●
●
●
●
●
●
●
●
●
●
●
●
●
●
●
●
●
●
●
●
●
●
●
●
●
●
●
●
●
●
●
●
●
●
●
●
●
●
●
●
●
●
●
●
● ●
●
●
●
●
●●
●
●
●
●
●
●
●
●
●
●
●
●
●
●
●
●
●
●
●
●
●
●
●
●
●
●
●
●
●
●
●
●
●
●
●
●
●
●
●
●
●
●
●
●
●
●
●
●
●
●
●
●
●
●
●
●
●
●
●
●
●
●
●
●
●
●
●
●
●
●
●
●●
●
●
●
●
●
●
●
●
●
●
●
●
●
●
●
●
●
●
●
●
●
●
●●
●
●
●
●
●
●
●
●
●
●
●
●
●
●
●
●
●
●
●
●
●
●
●
●
●
●
●
●
●
●
●
●
●
●
●
●
●
●
●
●
●
●
●
●
●
●
●
●
●
●
●
●
●
●
●
●
●
●
●
●
●
●
●
●
●
●
●
●
●
●
●
●
●
● ●
●●
●
●
●
●
●
●
●●
●
●
●
●
●
●
●
●
●
●
●
●
●
●
●
●
●
●
●
●
●
●
●
●
●
●
●
●
●
●●
●
●
●
●
●
●
●●
●
●
●
●
●
●
●
●
●
●
●●
●●
●●
●
●
●
●
●
●●
●
●
●
●
●
●
●
●
●
●
●
●
●
●
●
●
●
●
●
●
●
●
●
●
●
●
●
●
●
●
●
●
●
●
●
●
●
●
●
●
●
●
●
●
● ●
●
●
●
●
●
●
0 20 40 60 80 100
020
4060
8010
0
Transcriptomic age vs Chronological age
Chronological Age
Tran
scrip
tom
ic A
ge
Correlation r = 0.693 ; r2 = 0.48 pvalue = 1.05e−139
SHIP-TREND
●
●
●
●
●
●
●
●
●
●
●
●
●
●
●
●
●
●
●●
●
● ●
●
●
●
●
●
●
●
●
●
●
●
●
●
●
●
●
●
●●
●
●
●
●
●
●●
●
●
●
●
●
●
●
●
●
●
●
●●
●
●
●
●
●
●
●
●
●●
●
●
●●
●
●
●
●
●
●
●
●
●
●
●
●
●
●
●
●
●
●
●
●
●
●
●
●
●
●
●
●
●
●
●
●
●
●
●
●
●
●
●
●
●
●
●
●
●
●
●
●
●
●
●
●
●
●
●●
●
●
●
●
●
●
●●
●
●
●
●
●
●
●
●
●
●
●
●
●
●
●
●
●
●
●
●
●
●
●
●●
●
●
●
●
●
●
●
● ●
●
●
●
●
●
●
●
● ●
●
●●
●
●
●
●
●
●
●
●
●
●
●
●
●
●
●
●
●
●
●
●
●
●
●
●
●
●●
●
●
●
●
●
●
●
●
●
●
●
●
●
●
●
●
●
●
●
●
●
●
●
●
●
● ●
●
●
●
●
●
● ●
●
●
●
●
●
●
●
●
●
●
●
●
●
●
●
●
●
●
●
●
●
●
●
●
●
●
●●
●
●
●
●
●
●●
●
●
●
●
●
●
●
●
●
●
●
●
●
●
●
●●
●●
●
●
●
●
●
●
●●
●
●
●
●●
●
●●
●
●
●
●
●
●
●
●
●
●
●
●
●
●
●
●
●
●
●
●
●
●
●
●
●
●
●
●
●
●
●
●
●●
●
●
●
●
●
●
●
●
●
●
●
●
●
●
●
●
●
●
●
●
●
●
●
●
●
●
●
●
●●
●
●
●
●
●
●
●
●
●
●
●
●
●
●
●
●
●
●
●
●
●
●●
●
●
●
●
●
●
●
●
● ●
●
●
●●
●
●
●
●
●
●
●
●
●●
●
●
●
●
●
●
●
●
●
●
●
●
●
●
●
●
●
●
●
●
●
●
●
●
●
●
●
● ●
●
●
●
●
●
●
●
●
●
●●
●
●
●
●
●
●
●
●
●
●●
●
●
●
●
●
●
●
●
●
●
●
●
●
●
●
●
●
●
●
●
●
●
●
●
●
●
●
●
●
●
●
●
●
●
●
●
●
●
●
●
●
●
●
●
●
●
●
●
●
●
●
●
●
●
●
●
●
●
●
●
●
●
●
●
●
●
●
●●
●
●
●
●
●
●
●
●
●
●
●
●
●
●
●
●
●
●
●
●
●
●
●
●
●●
●●
●
●
●●
●
●
●
●
●
●
●
●●
● ●
●
●
●
●
●
●
●
●
●
●
●
●
●
●
● ●●
●
●
●
●
●
●
●
●
●
●
●
●
●
●
●
●
● ●
●
●
●
●
●
●
●
●
●●
●
●●
●
●
●
●
●
●
●
●
●
●
●
●
●
●
●
●
●
●
●
●
●
●
●●
●
●
●
●
●
●
●
●
●
●
●
●
●
●
●
●
●
●
●
●
●
●
●
●
●●
●
●
● ●
●
●
●
●
●
●
●
●
●
●
● ●
●
●
●
●
●
●
●
●
●
●
●
●
●
●
●
●
●
●
●
●
●
●
●
●
●
●
● ●●
●
●
●
●
●
●
●
●
●
●
●
●●
●
●
●
●
●
●
●
●
●
●
●
●
●
● ●
●
●
●
●
●●
●
●
●
●
●
●
●
●
●
●
●
●
●
●
●
●
●
●
●
●
●
●
●
●
●
●
●
●
●
●
●
●●
●
●
●
●
●
●
●
●
●
●●
●
●
●
●
●
●
●●
●
●
●
●
●
●
●
●
●
●
●
●
●
●
●
●
●
●
●
●
●
●
●●
●
●
●
●
●
●
●●
●
●
●
●
●
●●
●
●●
●
●
●
●
●
●●●
●
●
●
●
●
●
●
●
●
●
●
●
●
●
●
●
●
●
●
●
●
●
●
●
●
●
●
●
●
●
●
●
●
●
●
●
●
●
●
●
●
●
●
●
●
●
●
●
●
●
●
●
●
●●
●
●
●
●
●
● ●
●
●
●
●
●
●
●
●
●
●
● ●
●
●
●
●
●
●
●
●
●
●
●
●
●
●
●
●
●
●
●
●
●
●
●
●
●●
●
●
●
●
●
●
●
●
●
●
●
●
●
●
●
●
●
●
●
●
●
●
●
●
●
●
●
●
●
●
●
●
●
●
●
●
●
●
●
●
●
●
●
●
●
●●
●
●
●
●
●
●●
●
●
●
●
●
●
●
●
●
●
●
●
●●
●
●
●
●
●
●
●
●
●
●
●
●
●
●
●
●
●
●
●
●
●
●
●
●
●
●
●
●
●
●
●
●
●●
●
●
●
●
●
●
●
●
●
●
●
●
●
●●
●
●●
●
●
●
●
●
●
●
●
●
●
●
●
●
●
●●●
●
●
●
●
●
●●
●
●
●
●
●
●
●
●
●
●
●
● ●
●●
●
●
●
●
●
●
●
● ●
●
●●
●
●
●
●●
●
●
●
●
●
●
●
●
●
●
●
●
●
●
●
●
●
●
●
●
●
●
●
●
●
●
●
●
●
●
●
●
●
●
●
●
●
●
●
●
●
●
●
●
●
●
●
●
●
● ●
●
●
●
●
●
●
●
●
●
●
●
●
●
●
●
●
●●
●
●
●
●
●
●
●
●
●
●
●
●
●
●
●
●
●
●
●
●
●
●
●
●
●
●
●
●
●●
●
●
●
●
●
●
●
●
●
●
●
●
●
●
●
●
●
●
●
●
●
●
●
●
●
●
●
●
●
●
●
●
●
●
●
●
●
●
●
●●
●
●
●
●
●
●
●●
●
●
●
●
●
●
●
●
●
●
●
●
●
● ●
●
●
●
●
●
●
●
●
●
●
●
●
●
●
●
●
●
●
●
●
●
●
●
●
●
●
●
●
●
●
●
●
●
●
●
●
●
●
●
●●
●
●●
●
●
●
●
●
●● ●
●
●
●
●
●
●
●●
●
●
●
●
●
●
●
●
●
●
●
●
●
●
●
●
●
●
●
●
●
●
●
●
●
●
●
●
●
●
●
●
●
●
●
●
●
●
●
●
●
●
●
●
●
●
●
●
●
●
●
●
●
●
●
●
●
●
●
●
●
●
●
●
●
●
●
●
●
●
●
●
●
●
●
●
●
●
●●
●
●
●
●
●
●
●
●
●
●
●
●
●
●
●
●●
●
●
●
●
●
●
●
●
●
●●●
●●
●
●
●
●
●●
●
●
●
●
●
●
●
●
●●
●
●
●
●
●
●
●
●
●
●
●
●
●
●
●
●
●
●
●
●
●
●
●
●●
●
●
●
●
●
●
●
●
●
●
●
●
●
●
●● ●
●
●
●
●
●
●
●
●
●
●
●
●
●
●
●
●
●
●
●
●
●
●
●
●
●
●
●
●
●
●
●
●
●
●
●
●
●
●
●
●
●
●●
●
●
●
●
●
●
●
●
●
●
●
●
●
●
●
●
●
●
●
●
●
●
●
●
●
●
●
●
●
●
●
●
●
●
●
●
●
●
●
●
●
●
●
●
●
●
●
●
●
●
●
●
●
●
●
●
●
●●
●
●
●
●
●
●
●
●
●
●
●
●
●
●
●
●
● ●
●
●
●
●
●
●
●
●
●
●
●●
●
●
●
●
●●
●
●
●
●
●●
●
●
●
●
●
●
●
●
●
●
●
●
●
●
●
●
●
●
●
●
●
●
●
●
●
●
●
●
●
●
●
●
●
●
●
●
●
●
●
●
●
●
●
●
●
●
●●
●
●
●
●
●●
●
●
●
●
●
●
●
●
●
●
●
●
●
●
●
●
●
●
●
●
●
●
●
●
●
●
●
●
●
●
●
●
●
●
●
●
●
●
●
●
●
●
●
●
●
●
●
●
●
●
●
●
●
●
●
●
●
●●
●
●
●
●
●
●
●
●
●
●
●
●
●
●●
●
●
●
●
●
●
●●
●
●
●
●
●
●
●
●
●
●
●
●
●
●
●
●
●
●
●
●
●
●
●
●
●
●
●
● ●
●
●
●
●
●
●
●
●
●
●
●
●
●
●
●
●
●
●
●
●
●
●
●
●
●
●
●
● ●
●
●
●
●
●
●
●
●
●
●
●
●
●
●
●
●
●
●
●
●●
●
●
●
●
●
●
●
●
●
●
●
●
●
●
●
●
●
●
●
●
●
●
●
●●
●
●
●
●
●
●
●
●
●
●
●
●●
●
●
●
●
●
●
●
●
●
●●
●
●
●
●
●
●
●
●
●
●
●
●
●
●
●
●
● ●
●
●
●
●
●
●
●
●
●
●
●
●
●
●
●
●
●
●
●
●
●
●
●
●
●
●
●
●
●
●
●
●●
●
●
●
●●
●
●
●
●
●
●
●
●
●
●
●
●
●●
●
●
●
●
●
●
●
●
●
●
●
●
●
●
●
●
●
●
●
●
●
●
●
●
●
●
●
●
●
●
●
●
●
●
●
●
●
●
●
●
●
●
●
●
●
●
●
●
●
●
●
●
●
●
●
●
●
●
●
●
●
●
●
●
●
●
●
●
●
●
●
●
●
●
●
●
●
●
●
●
●
●
●
●
●
●●
●
●
●
●
●
●
●
●
●
●
●
●
●
●
●
●
●
●
●
●
●
●
●
●
●
● ●
●
●
●
●
●●
●
●
●
●
●
●
●
●
●
●
●
●
●
●
●
●
●
●
●
●
●
●
●
●
●
●
●
●
●
●
●
●
●
●
●
●
●
●
●
●
●
●
●
●
●
●
●●
●
●
●
●
●●
●
●
●
●
●
●
●
●
●
●
●
●
●●
●
●
●
●
●
●
●
●
●
●
●
●
●
●
●
●
●
●
●
●
●
●
●
●
●
●
●
●
●
●
●
●
●
●
●
●
●
●
●
●
● ●
●
●
●
●
●
●
●
●
●
●
●
●
●
●
●
●
●
●
●
●
●
●
●
●
●
●
●
●
●
●
●
●
●
●
●
●
●
●
●
●
●
●
●
●
●
●
●
●
●
●
●
●
●
●
●
●
●
●
●
●
● ●
●●
●
●
●
●
●
●
●
●
●
●
●
●
●
●●
●
●
●
●
●●
●
●
●
●
●●
●
●
●
●
●
●
●
●
●
●
●
●
●
●
●
●
●
●
●
●
●
●
●
●
●
●
●
●
●●
●
●
●
● ●
●●
●
●
●
●
●
●
●
●
●
●
●
●
●
●
●
●
●
●●
●
●
●
●
●
●
●
●
●
● ●
●
●
●
●●
●
●
●
●
●
●
●
●
●
●
●
●
●
●
●
●
●
●
●
●
●
●
●
●
●
●
●
●
●
●
●
●
●
●
●
●
●
0 20 40 60 80 100
020
4060
8010
0
Transcriptomic age vs Chronological age
Chronological Age
Tran
scrip
tom
ic A
ge
Correlation r = 0.073 ; r2 = 0.005 pvalue = 0.000306
FHS
Tra
nscr
ipto
mic
Age
020
4060
8010
0
Chronological Age
0 20 40 60 80 100
Transcriptomic age vs Chronological age
Correlation r = 0.543; r2 = 0.294 pvalue = 2.54e-112
NIDDK
●
●
●
●
●
●
●
●
●
●
●
●
●
●
●
●
●
●
●
●
●
●
●
●
●
●
●
●
●
●
●
●
●●
●
●
●
●
●
●
●
●
●
●
●
●
●
●
●
●
●
●
●
●
●
●
●
●
●
●
●
●
●
●
●
●
●
●
●
●
●
●
●
●
●
●
●
●
●
●
●
●
●
●
●
●
●
●
●
●
●
●
●
●
●●
●
●
●
●
●
●
●
●
●
●
●
●
●
●
●
●
●
●
●
●
●
●
●
●
●
●
●
●
●
●
●
●
●
●
●
●
●
●
●
●
●
●
●
●
●
●
●
●
●●
●
●
●
●
●
●
●
●
●
●
●
●
●
●
●
●
●
●
●
●
●
●
●
●
●
●
●
●
●
●●
●
●
●
●
●
●
●
●
●
●
●
●
●
●
●
●
●
●
●
●
●
●
●
●
●
●
●
●
●
●
●
●
●
●
●
●
●
●
●
●
●
●
●
●●
●
●
●
●
●
●
●
●
●
●
●
●
●
●
●
●
●
●
●
●
●
●
●
●
●
●
●
●
●
●
●
●
●
●
●
●
●
●
●
●
●
●
●
●
●
●
●
●
●
●
●
●
●
●
●
●
●
●
●
●
●
●
●
●
●
●
●
●
●
●
●
●
●
●
●
●
●
●
●
●
●
●
●
●
●
●
●
●
●
●
●
●
●
●
●
●
●
●
●
●
●
●
●
●
●
●
●
●
●
●
●
●
●
●
●
●
●
●
●
●
●
●
●
●
●
●
●
●
●
●
●
●
●
●
●
●
●
●
●
●
●
●
●
●
●
●
●
● ●
●
●
●
●
●
●
●
●
●
●
●
●
●
●
●
●
●
●
●
●
●
●
●
●
●
●
●
●
●
●
●
●
●
●
●
●
●
●
●
●
●
●
●
●
●
●
●
●
●
●
●
●
●
●
●
●
●
●
●
●
●
●
●
●
●
●
●
●
●
●
●
●
●
●
●
●
●
●
●
●
●
●
●
●
●
●
●
●
●
●
●
●
●
●
●
●
●
●
●
●
●
●
●
●
●
●
●
●
●
●
●
●
●
●
●
●
●
●
●
●
●
●
●
●●
●
●
●
●
●
●
●
●
●
●
●
●
●
●
●
●
●
●
●
●
●
●
●
●
●
●
●
●
●
●
●
●
●
●
●
●
●
●
●
●
●
●
●
●
●
●
●
●
●
●
●
●
●
●
●
●
●
●
●
●●
●
●
●
●
●
●
●
●
●
●
●
●
●
●
●
●
●
●
●
●
●
●
●
●
●
●
●
●
●
●
●
●
●
●
●
●
●
●●
●
●
●
●
●
●
●
●
●
●
●
●
●
●
●
●
●
●
●
●
●
●
●
●
●
●
●
●
●
●
●
●●
●
●
●
●
●
●
●
●
●
●
●
●
●
●
●
●
●
●
●
●
●
●
●
●
●
●
●
●
●
●
●
●
●
●
●
●
●
●
●
●
●
●
●
●
●
●
●
●
●
●
●
●
●
●
●
●
●
●
●
●
●
●
●
●
●
●
●
●
●
●
●
●
●
●
●
●
●
●
●
●
●
●
●
●
●
●
●
●
●
●
●
●
●
●
●
●
●
●
●
●
●
●
●
●
●
●
●
●
●
●
●
●
●
●
●
●
●
●
●
●
●
●
●
●
●
●
● ●
●
●
●
●
●
●
●●
●
●
●
●
●
●
●
●
●
●
●
●
●
●
●
●●
●
●
●●
●
●
●
●
●
●
●
●
●
●
●
●
●
●
●
●
●
●
●
●
●
●
●
●
●
●
●
●
●
●
●
●
●
●
●
●
●
●
●
●
●
●
●
●
●
●
●
●
●
●
●
●
●
●
●
●
●
●
●
●
●
●
●
●
●
●
●
●
●
●
●
●
●
●●
●●
●
●
●
●
●
●
●●
●
●●
●
●
●
●
●
●
●
●
●
●
●
●
●
●
●
●
●
●
●
●
●
●
●
●
●
●
●
●
●
●
●
●
●
●
●
●
●
●●
●
●
●
●
●
●
●
●
●
●
●
●
●
●
●
●
●
●
●
●
●
●
●
●
●
●
●
●
●
●
●
●
●●
●
●
●
●
●
●
●
●
●
●
●
●
●
●
●
0 20 40 60 80 100
020
4060
8010
0
Transcriptomic age vs Chronological age
Chronological Age
Tran
scrip
tom
ic A
ge
Correlation r = 0.738 ; r2 = 0.545 pvalue = 2.59e−166
EGCUT
Figure 5.8.: Chronological age versus transcriptomic age in all participating cohorts of geneexpression working group in CHARGE
97

5. Association studies
hip-ratio, Hannun predictor with fasting glucose, waist-hip-ratio, and smoking)2. Therefore,a combination of both prediction methods (epigenetic and transcriptomic prediction) wouldmake sense and should be tested in a larger sample size.In conclusion, a large list of age-associated genes was identified in the meta-analysis with7,074 samples. The gene expression levels from whole blood could be used as biomarker topredict the biological age. The transcriptomic age prediction in combination with the epige-netic age prediction could be used to identify subjects that have a higher biological age andtherefore a higher risk to suffer any age-related disease.
2These models were adjusted for chronological age, sex, and BMI.
98

6. Power issues in eQTL studies
To identify the influence of genetic variation on gene expression levels eQTL studies are per-formed to identify SNPs which affect expression levels of nearby or distant genes. IdeallyeQTLs help to detect molecular mechanism underlying a SNP-phenotype association iden-tified in a GWAS (Gilad et al., 2008).The first eQTL studies were conducted in less than 100 samples ((Stranger et al., 2005), (Che-ung et al., 2005)). However, sample sizes increased fast to nowadays more than 5,000 samp-les (Westra et al., 2013) and will soon increase further to more than 20,000 samples (ongoingproject within the CHARGE consortium).We started the first eQTL study using 322 samples from the KORA F3 cohort (Mehta et al.,2012), continued with 890 samples from the KORA F4 cohort (Schramm et al., 2014) andparticipated as replication cohort with 740 KORA F4 samples in a large eQTL consortium(Westra et al., 2013). The following chapter describes the development and differences ineQTL studies with increased sample sizes.
6.1. Mapping of whole-blood cis- and trans-eQTLs in KORA F3
Aims of this first eQTL study were:
• The identification of eQTLs in whole blood of human samples.
• Analysis of the robustness and reproducibility across different studies.
• Exploration whether whole blood eQTLs allow the identification of functional variantsobserved in GWAS.
6.1.1. Identification of cis- and trans-eQTLs
The analysis of 41,409 expression probes and 335,152 SNPs yielded in 4,802,373 SNP-probecombinations with the SNP being located within +/−500kb from the transcription start andend site. The 500kb window was determined by comparing the number of significant asso-ciations between SNPs and expression probes for different window sizes (see Figure 6.1).Linear models using log-transformed and normalized expression levels as dependent and
SNP, age and gender as independent variables were calculated for each SNP-probe pair in322 KORA F3 samples with expression and genotype data. An additive model was assumedwhere the homozygous major allele is coded with 0 and the homozygous minor allele iscoded with 2 (see Figure 2.4).When using the stringent Bonferroni correction (threshold = 1.03 ∗ 10−8), 2,149 significantSNP-probe pairs corresponding to 363 different eQTLs were identified. These associationswere distributed equally across the genome (see Figure 6.2). The SNPs with the lowest p-values are located close to the transcription start site (Figure 6.3) which supports the thres-hold of 500kb for cis-eQTLs.
99

6. Power issues in eQTL studies
Figure 6.1.: Number of significant SNP-probe combinations for different window sizes inKORA F3:The distance between gene and SNP (in bp) is plotted against the number of sig-nificant cis-associations to determine the optimal window size. Using a windowsize of more than 500kb leads to less significant hits due to the higher number oftests and the lower Bonferroni threshold of significance.
100

6.1. Mapping of whole-blood cis- and trans-eQTLs in KORA F3
Figure 6.2.: Manhattan plot of significant cis-eQTLs in the KORA F3 discovery cohort:The genomic position of each SNP is plotted against the -log10(p-value). The redline indicates the Bonferroni threshold of significance.
Figure 6.3.: Plot of distance between SNP and transcription start site in KORA F3:The difference between the genomic position of the SNP and the TSS is plottedagainst the -log10(p-values). The red dots show the associations where the SNPis located within the transcripts. The histogram additionally shows the distribu-tion of the associations.
101

6. Power issues in eQTL studies
Furthermore, 50 of the 363 probes contained a SNP annotated within its probe sequence bythe Illumina chip using the re-annotation pipeline from Barbosa-Morais et al. (2010). UsingSNAP, we determined the correlation between the SNP within the probe and the identifiedeQTL SNP. For ten eQTLs R2 was higher than 0.7 and we could not exclude that the SNPwithin the probe is responsible for the changes of the expression level. For all other eQTLsR2 was either lower or could not be determined because of a low minor allele frequency(< 1% for 20 SNPs) of the SNP within the probe. We did not exclude probes with SNPs fromthe analysis which is consistent with other published studies (Murphy et al., 2010; Emilssonet al., 2008).
The trans-analysis was conducted using the software PLINK and like for the cis-analysisthe linear model was also adjusted for age and gender. Due to large linkage disequilibriumblocks trans-hits were limited to SNPs being on a different chromosome than the probe orthe distance between probe and SNP being greater than 4 Mb. The Bonferroni thresholdof significance was 3.6 ∗ 10−12. With these stringent criteria we identified 37 SNP-probepairs corresponding to 8 eQTLs. Because of this small number of trans-eQTLs we could notobserve any master regulators or eQTL hotspots.
6.1.2. Adjusting for possible confounders in the KORA F3 discovery cohort
Due to the fact that whole blood is used to measure gene expression levels it is sometimesrecommended to adjust for different cell types. Therefore we also included the number ofwhite and red blood cell counts to the linear model. 352 (97%) of the 363 eQTLs remainedsignificant.
6.1.3. Replication of whole-blood eQTLs in two independent cohorts
For replication we used the independent cohorts KORA F4 and SHIP-TREND.All significant associations were tested in 740 KORA F4 samples and 653 SHIP-TREND sam-ples. The summary of the replication is shown in Figure 6.4.
It was decided to use two different thresholds of significance: The most stringent variantby using the threshold from the discovery cohort and the less stringent threshold of p < 0.05.This way we were able to replicate 98.6% of cis- and 40% of trans-eQTLs using p < 0.05 and81.8% of cis- and 20% of trans-eQTLs when applying the discovery Bonferroni threshold ofsignificance.
6.1.4. Comparison of results with published peripheral blood eQTLs
In addition to replications in KORA F4 and SHIP-TREND the eQTLs were compared toeQTLs detected in whole blood in 1,469 individuals and available online (Fehrmann et al.,2011). They also used the Illumina HumanHT-12 chip but a different genotyping platform(Illumina HumanHap 300). We only compared identical SNP-probe pairs. Due to the differ-ent platforms, the overlap contained about 50,000 SNPs. In spite these technical limitations32% (117 out of 363) of the cis- and 14% (one out of seven) of the trans-eQTLs were identi-
102

6.1. Mapping of whole-blood cis- and trans-eQTLs in KORA F3
Figure 6.4.: Flowchart of the number of eQTLs from KORA F3 discovery cohort tested andreplicated in KORA F4 and SHIP-TREND
cal in both studies. This additional replication indicates a high reproducibility of eQTLs inwhole blood.
6.1.5. eQTL mapping of complex trait-associated variants
In a next step all GWAS hits published so far were downloaded from the GWAS catalog. InOctober 2011, 1,058 GWAS studies for 566 different traits were available and we could test7,995 unique SNP-probe pairs in KORA F3. For this analysis imputed genotypes were usedto maximize the number of SNPs.Of the 3,699 unique SNPs, 639 SNPs were nominally associated with the expression level ofthe reported transcript. After Bonferroni correction (threshold of significance = 6.25 ∗ 10−6)79 SNPs remained significant. 43 of these SNPs were already described to be associated withthe expression level of the relevant transcript. 28 SNPs are located on chromosome 6 in theHLA-region and because of the high LD structure of this region their biological significanceremains unclear.Eight of the SNPs were not reported to be an eQTL in any tissue previously. These eightnovel findings are summarized in Table 6.1.
Especially in cases where the SNP is reported to be correlated with several genes the ex-pression results could allow prioritization of this transcript compared to other candidatesthat are located close to the SNP. This is remarkable because blood is not related to all ofthese traits.
103

6. Power issues in eQTL studies
GWAS GWAS trait SNP Gene ProbeID p-value adjusted R2 beta First authorlocus
1 Beta thalassemia rs2071348 HBE1 6520176 0.283414 -0.00503376 -0.18484 Nuinoon M.hemoglobin E disease rs2071348 HBG2 6400079 5.38E-08 0.09514532 0.52015
rs2071348 HBG2 6620605 0.030536 0.00723574 -0.01432rs2071348 HBG2 940181 0.365623 -0.00315586 0.006403rs2071348 HBG1 4150187 1.94E-06 0.07676854 0.443254rs2071348 HBD 6250037 0.195357 -0.00360737 -0.11191rs2071348 HBBP1 7100747 0.881443 -0.00768138 -0.00186
2 Crohn’s disease rs2058660 IL18RAP 6770424 0.154442 -0.00297075 -0.01054 Franke A.rs2058660 IL18RAP 5130475 2.68E-15 0.18068679 -0.44984rs2058660 IL12RL2 NA NA NA NArs2058660 IL18R1 1500328 0.698045 -0.00654905 -0.01298rs2058660 IL1RL1 670411 0.909656 0.00344823 -0.00091rs2058660 IL1RL1 3870753 0.349253 -0.00614557 -0.00746
3 Graves’ disease rs9355610 RNASET2 5310131 7.05E-19 0.21555351 0.27063 Chu X.rs9355610 FGFR1OP 6580446 0.424956 -0.00652282 -0.00825
4 Body mass index rs7359397 SH2B1 6620092 0.133159 0.00166276 0.032315 Speliotes E.K.rs7359397 APOB48R 2070044 0.927515 0.0020211 0.002928rs7359397 SULT1A2 1740113 0.095138 0.01485394 -0.01268rs7359397 SULT1A2 1980554 0.316768 -0.00467373 0.010131rs7359397 AC138894.2 NA NA NA NArs7359397 ATXN2L 990524 0.21315 0.00104259 0.007658rs7359397 ATXN2L 1300541 0.227558 -0.001122 0.007915rs7359397 ATXN2L 5720435 0.668993 -0.00590007 0.005323rs7359397 TUFM 6270735 4.89E-10 0.10666734 0.139009
5 Systemic lupus rs131654 HIC2 7050673 0.210732 -0.00152262 -0.01773 Han J.W.erythematosus rs131654 UBE2L3 770523 0.179421 0.00400821 0.011055
rs131654 UBE2L3 1050360 1.24E-06 0.06346902 -0.151296 Asthma rs11078927 GSDMB 6620170 4.02E-18 0.20898095 -0.22407 Torgerson D.G.7 Alzheimer’s disease rs6859 PVRL2 2570544 7.03E-07 0.07723456 -0.18595 Abraham R.
Alzheimer’s disease rs6859 TOMM40 3400747 0.462314 0.00170593 0.013467 Naj A.C.(late onset) rs6859 APOE 4150338 0.686794 -0.00123172 0.002674
8 Alcohol dependence rs8062326 SYT17 730725 5.72E-07 0.0710058 0.798277 Lydall G.J.rs8062326 ITPRIPL2 2710551 0.998 0.003417 0.001
Table 6.1.: List of eight novel GWAS catalog eSNPs (SNP that is associated with gene expres-sion level) significantly associated with expression levels of the reported transcriptin KORA F3.
6.1.6. Summary of eQTLs in KORA F3
We performed a genome-wide eQTL mapping study in 322 KORA F3 samples and used 740KORA F4 and 653 SHIP-TREND samples as replication cohorts. Due to the small sample sizeof the discovery cohort the power to detect eQTLs was relatively small. Nevertheless, weidentified 363 cis- and 8 trans-associations. Using a p-value threshold of 0.05 we could repli-cate 98.6% of cis- and 40% of trans-eQTLs. Additionally we found eight novel GWAS catalogeSNPs that are significantly associated with expression levels of the reported transcript inthe KORA F3 data set.
6.2. eQTL study in KORA F4
In the last chapter the eQTL analysis that was conducted in 322 KORA F3 subjects was de-scribed. A high number of cis-eQTLs could be replicated, but an identification of trans-eQTLs was difficult due to the problem of multiple testing and the relatively small samplesize. Therefore, this analysis was repeated in 890 KORA F4 individuals with available geneexpression levels and genotypes. The expectation was to increase the number of significanteQTLs because of the higher sample size and an improved quality of expression data.
6.2.1. Discovery of cis- and trans-eQTLs for KORA F4
Altogether, 4,210 eQTLs reached genome-wide significance when applying the most conser-vative Bonferroni correction (p-value threshold = 6.02 ∗ 10−9 and 2.81 ∗ 10−12 for cis- and
104

6.2. eQTL study in KORA F4
trans-eQTLs, respectively). 4,116 of these eQTLs were defined as cis-eQTLs (p-value range= 6.1 ∗ 10−299 − 6.0 ∗ 10−9) when using the same window size as for the KORA F3 data(500kb). The 4,116 cis-eQTLs corresponded to 3,449 RefSeq genes (HG19). The remaining161 SNP-probe associations were defined as trans-eQTLs. After removing SNPs that are inhigh LD (R2 > 0.7) using SNAP, 94 genomic loci out of the 161 SNP-probe associations withan impact on several distant genes remained (p-value range = 2.8 ∗ 10−248 − 2.8 ∗ 10−12).
6.2.1.1. Detailed description of cis-results
The definition of a cis-eQTL as being in a 500kb window around the transcription unit re-sulted in 8,308,092 possible SNP-probe combinations in the data set, consisting of 616,941different SNPs and 28,691 expression probes. The linear model with expression probe (ad-justed for 55 Eigen-genes) as dependent and SNP as independent variable was calculatedfor each combination. After applying Bonferroni correction 55,593 SNP-probe combinationshad a p-value below 6.02 ∗ 10−9 and were identified to be significantly associated. The dis-tribution of p-values of all calculated SNP-probe combinations across the chromosomes isshown in Figure 6.5.Lots of probes are associated with SNPs that are located very closely (Figure 6.5). As many
Figure 6.5.: Manhattan plot of cis-results in KORA F4:The genomic position of the SNP is plotted against the -log10(p-value). The redline indicates the Bonferroni threshold of significance.
of these SNPs could be in high LD they might not describe different eQTLs. Hence, we re-stricted the results to the top-SNP per probe and kept only the SNPs with the lowest p-value.eQTLs with low p-values are located in close proximity to the transcription start site (see
Figure 6.6). This finding replicates the observation in KORA F3. Furthermore, it supportsthe restriction of cis-effects to a 500 kb window as a larger window size would not result inmore meaningful hits.
105

6. Power issues in eQTL studies
Figure 6.6.: Distance of the SNP to transcription start site for significant cis-eQTLs in KORAF4:The distance between the TSS and the SNP is plotted against the -log10(p-value).
106

6.2. eQTL study in KORA F4
6.2.1.2. Detailed description of trans-results
All expression probes that were associated with a SNP that is located in a distance of morethan 500 kb we tested whether the probe was also associated with a SNP in cis. Only if thesetwo SNPs were not in the same LD block the association was called a trans-hit. For 77 ex-pression probes the trans-SNP was highly correlated with the cis-SNP (R2 > 0.5, tested withSNAP). Additionally, the LD was assessed for all SNPs residing on the same chromosomethat were associated with the same transcription probe. This resulted in 94 remaining dif-ferent trans-eQTLs (see circos plot in Figure 6.7 and a list of all trans-eQTLs in Appendix A.1).
Figure 6.7.: Circos plot of trans-hits in KORA F4:All significant trans-associations on all chromosomes in KORA F4 are shown.The orange lines indicate hits where the SNP and the expression probe are ondifferent chromosomes while the black lines show associations on the same chro-mosome.
107

6. Power issues in eQTL studies
Altogether 74 loci are associated with just one probe, seven with two probes, seven withthree probes, two with four probes, one with five probes, one with six probes, one with sevenprobes, one with 13 probes and one with 14 probes.
6.2.2. Replication of cis- and trans-eQTLs in two independent studies
The SHIP-TREND study from Greifswald and the EGCUT study from Estonia were used asreplication cohorts using an R script prepared by Claudia Schurmann.The SHIP-TREND samples were prepared almost identical as the KORA samples. RNA wasisolated in Greifswald and then sent to the Helmholtz Center for the remaining steps. Incontrast, the EGCUT study is based on samples of non-fasting individuals and blood wastaken during the whole day (see Figure 6.8). Additionally, they used a different blood stor-age system (Tempus tubes instead of PAX tubes). It is already known that usage of PAXtubes and Tempus tubes results in heterogeneous measurements and it is recommended notto use data from these two systems in a joint analysis (Menke et al., 2012).
The preparation of the 890 KORA F4, 976 SHIP-TREND, and 842 EGCUT samples is de-
Figure 6.8.: Comparison of times of blood collection in KORA F4 and EGCUT:While the KORA F4 blood samples were all taken in the morning before eleveno´clock in EGCUT the blood was taken the whole day.
scribed in Table 6.2 to indicate differences and similarities between the three cohorts.All significant probe-SNP combinations were taken forward for replication in both replica-tion studies and for that purpose either the identical or a proxy SNP (if the identical SNPwas not available the proxy SNP was determined using SNAP) was used. Based on previ-ous data assessment studies the replication studies decided to adjust their linear models for50 (cis) and 25 (trans) Eigen-genes. We indicated an eQTL as significantly replicated if the
108

6.2. eQTL study in KORA F4
p-value was below 1.21 ∗ 10−5 for cis and 3.1 ∗ 10−4 for trans, respectively (0.05 divided bythe number of conducted tests).
Study N Age Gender Fasting RNA RNA isolation Expression Genotyping Imputationstatus collection Chip
KORA 890 70.57 448 males, fasting (8 PAX PAXgene Illumina Affymetrix 6.0F4 ±5.42 442 females non-fasting tubes Blood miRNA HumanHT-
samples) Kit 12 v3SHIP- 976 50.12 428 males, all fasting PAX PAXgene Illumina Illumina IMPUTETREND ±13.74 548 females tubes Blood miRNA HumanHT- HumanOmni2.5- v2.1.2.3
Kit 12 v3 QuadEGCUT 842 37.16 415 males, non-fasting Tempus Tempus Spin Illumina Illumina IMPUTE
±15.60 427 females tubes RNA Isolation HumanHT- Human370CNV v2.2.3Kit 12 v3
Table 6.2.: Study description of KORA F4, SHIP-TREND, and EGCUT
Of all 4,116 significant eQTLs we were able to replicate 3,847 (91%) in at least one of thestudies. As expected from the previous results the number of replicated cis-eQTLs washigher than the number of replicated trans-eQTLs (92% versus 84%). A comparison of p-values is shown in Figure 6.9.
Suppl. Figure 2. X-, Y, and Z-axis present p-values for KORA F4, SHIP-TREND, and EGCUT, respectively.
Figure 6.9.: Comparison of p-values for eQTL replication between KORA F4, SHIP-TREND,and EGCUT:The p-values of all significant associations in KORA F4 are plotted against thep-values from SHIP-TREND and EGCUT. Red dots represent all hits that arereplicated in both replication cohorts, blue dots are hits that are only replicatedin SHIP-TREND, and green dots only replicated in EGCUT, respectively. Thepink dots show all hits that could not be replicated.
When we compared the single replication rates separately in SHIP-TREND and EGCUTwe observed a slightly higher replication rate in EGCUT (82% - 85% cis- and 72% trans-eQTLs) than in SHIP-TREND (78% - 81% cis- and 75% trans-eQTLs). This was in contrastto the a priori hypothesis of a higher replication rate in SHIP-TREND due to more similarstudy characteristics and data handling. This indicates a high robustness of whole bloodeQTLs in contrast to whole blood gene expression profiles.
109

6. Power issues in eQTL studies
6.2.3. Correlation of mitochondrial SNPs with expression probes
Out of all identified SNPs, 26 SNPs were located within the mitochondrial DNA. The mito-chondrial DNA (mtDNA) is double-stranded, circular and located in the mitochondria. Itconsists of 16,569 basepairs (http://www.ncbi.nlm.nih.gov/nuccore/251831106)and 37 genes. For one of the SNPs all samples had the same genotype and therefore thisSNP was excluded from the analysis. Because it was not clear a priori if only cis-effectscould be observed, 25 Eigen-genes were used as covariates in the linear model.Thirteen SNPs were associated with at least one probe when applying a Bonferroni correc-tion (p-value < 3.94 ∗ 10−8). This corresponded to six different probes two of which didnot match to the genome and to two different chromosomes respectively. LOC653566 andRNF113A were associated with seven SNPs. The expression levels of these two genes werecorrelated (Pearson‘s correlation coefficient r2 = 0.37). Four SNPs (rs3915952, rs28359172,rs28359178 and rs3088309) were correlated with expression levels of a probe that could notbe matched to the mRNA. The results are shown in Table A.2.The expression levels of 834 probes were associated with at least one SNP with a p-valuebelow 1 ∗ 10−3. These probes were used for a pathway analysis. Only 538 of the 834 probeswere annotated in the Ingenuity database and were included in the pathway analysis. Whenapplying a Benjamini-Hochberg correction for the Fisher´s Exact p-value no pathway wassignificant. The top pathway “Role of NFAT (nuclear factor of activated T-cells) in CardiacHypertrophy” had a corrected p-value of 0.656. Our finding is in line with a few publicationsabout a relation between mitochondria and cardiac hypertrophy (Rosca et al., 2013).
6.2.4. Comparison of results with published cis-eQTLs from different tissues
It is known that gene expression levels vary across different cell types. However, as wholeblood cells are easily to obtain and analyze, it is interesting to investigate if it is a suitablesurrogate tissue and also reflect transcriptional relationships of other tissues. Therefore, wecompared our results to already published eQTLs in different cell lines and tissues. Unfortu-nately, databases provided by other studies and publicly available were mostly restricted tocis-eQTLs ((Fehrmann et al., 2011), (Sasayama et al., 2013), (Fairfax et al., 2012), (Zeller et al.,2010), (Schadt et al., 2008), (Stranger et al., 2007a), (Innocenti et al., 2011), (Dixon et al., 2007),(Hao et al., 2012)). We therefore limited our comparison to the cis-results.
Zeller et al. (2010) already did the comparison of their eQTLs in monocytes with publisheddata. They used datasets of eQTLs in liver (Schadt et al., 2008), lymphoblastoid cell lines((Dixon et al., 2007) and (Stranger et al., 2007b)), and lymphocytes (Goring et al., 2007). Weadditionally compared our eQTLs to eQTLs in whole blood ((Fehrmann et al., 2011) and(Sasayama et al., 2013)), in monocytes ((Zeller et al., 2010), (Fairfax et al., 2012)), in b-cells(Fairfax et al., 2012), in lung tissue (Hao et al., 2012) and in liver tissue (Innocenti et al.,2011).All studies are shortly presented in Section 2.6 and results of the cis-eQTL comparison aresummarized in Table 6.3.
The comparison of eQTLs across different tissues was not easily to address. Usage of dif-ferent expression platforms and different versions of expression arrays made comparisonchallenging. Therefore, only genes with identical names were included.We observed an overlap of 65%-68% with two more cis-eQTL studies conducted in whole
110

6.2. eQTL study in KORA F4
First author Tissue Year N cis eQTLs available identicalSchramm whole blood 2014 890 3,449
monocytes 7,468 5,694 1,764Fairfaxb-cells
2011 2836,831 5,073 1,354
Zeller monocytes 2011 1,490 2,477 2,323 1,620Schadt liver 2008 427 1,525 1,401 642Stranger lymphoblastoid cell lines 2007 90 412 378 229Fehrmann whole blood 2011 1,469 5,928 4,194 2,250Innocenti liver 2011 206 1,173 1,057 487Dixon lymphoblastoid cell lines 2007 400 727 659 373Goring lymphocytes 2007 1,240 6,684 6,163 1,768Sasayama whole blood 2013 76 308 252 171Hao lung 2012 1,111 9,138 7,556 2,252
Table 6.3.: Comparison of cis-eQTLs to cis-eQTLs in different tissues:We compared the replicated cis-hits to online availabe cis-eQTLs in different tis-sues. Available means here that we analyzed the same gene and identical meansit was significant in our data.
blood and 51%-70% with cis-eQTL studies conducted in primary monocytes and lympho-cytes from whole blood or blood-derived lymphoblastoid cell lines (LCLs) (see Table 6.3).Additionaly, we observed major cross-tissue similarity when comparing our results to thoseof eQTL studies conducted in b-cells, lung, and liver tissue (40-70%, Table 6.3).
6.2.5. Functional properties of significant whole blood cis- and trans-eQTLs
The Ingenuity Pathway Analysis (IPA) software was used to relate whole blood eQTLs incis and trans to known pathways. Only the replicated eQTLs were included and most ofthem were annotated in the Ingenuity data base (3,720 out of 3,768 cis-eQTLs and 139 outof 144 trans-eQTLs, respectively). When applying the Benjamini-Hochberg correction twosignificant canonical pathways with p-values below 2.28 ∗ 10−2 and ten with p-values below3.45 ∗ 10−2 could be identified for the cis- and trans-eQTLs, respectively (see Table 6.4).
6.2.6. Master regulatory loci
In the significant trans-list we identified 21 eQTL-SNPs that were significantly associatedwith expression levels of two or more genes. Four of these SNPs had an impact on theexpression level of five or more genes and were therefore called “master regulatory loci”(Table 6.5). These loci are:
• Hotspot 1 on chromosome 2: rs12151621 (2:85934499) upstream of ATOH8.Genes: PNKD, CALHM1, DYNLRB2, ZNF93, GHRHR, MLH3Displayed in Figure 6.10.
111

6. Power issues in eQTL studies
Transcripts associated with cis-eQTL
Significant Canonical Pathways -log(B-H p-value) MoleculesNAD Salvage Pathway II 1.89 NT5C3B,NT5C3A,ACP2,NMRK1,NT5E,NT5M,
ACP1,NT5C2,ACP5,NMNAT3,ACPL2,ACPPGlutathione Redox Reactions I 1.64 GSR,GSTT1,GPX3,MGST1,MGST2,
GPX4, GPX7,PRDX6,MGST3,GSTK1Transcripts associated with trans-eQTL
Significant Canonical Pathways -log(B-H p-value) MoleculesAllograft Rejection Signaling 4.38 HLA-DRB4,HLA-A,HLA-DRB3,HLA-DQA1,HLA-DQB1,
HLA-DPB1Cytotoxic T Lymphocyte-mediated 4.38 HLA-DRB4,HLA-A,HLA-DRB3,HLA-DQA1,HLA-DQB1,Apoptosis of Target Cells HLA-DPB1OX40 Signaling Pathway 4.30 HLA-DRB4,HLA-A,HLA-DRB3,HLA-DQA1,HLA-DQB1,
HLA-DPB1Antigen Presentation Pathway 3.93 HLA-DRB4,HLA-A,HLA-DRB3,HLA-DQA1,HLA-DPB1Cdc42 Signaling 3.33 HLA-DRB4,HLA-A,HLA-DRB3,HLA-DQA1,MYL4,
HLA-DQB1,HLA-DPB1Dendritic Cell Maturation 2.64 HLA-DRB4,HLA-A,HLA-DRB3,CREB1,HLA-DQA1,HLA-DQB1,IL37Graft-versus-Host Disease Signaling 2.46 HLA-A,HLA-DQA1,HLA-DQB1,IL37Crosstalk between Dendritic Cells and 2.36 KIR2DL5B,HLA-DRB4,KIR2DL5A,HLA-A,HLA-DRB3Natural Killer CellsCommunication between Innate and 1.54 HLA-DRB4,HLA-A,HLA-DRB3,IL37Adaptive Immune CellsAutoimmune Thyroid Disease Signaling 1.46 HLA-A,HLA-DQA1,HLA-DQB1
Table 6.4.: Results of pathway analysis for cis- and trans-eQTLs in KORA F4:3,720 cis-eQTL genes were annotated in IPA and two significant pathways withp-value < 2.28 ∗ 10−2 were identified. For trans-results, 139 genes were annotatedand ten significant pathways with p-value < 3.45 ∗ 10−2 were identified.
• Hotspot 2 on chromosome 3: rs1344142 (3:56857433) in ARHGEF3 involved in osteo-porosis and rs12485738 (3:56865776, p14.3) in ARHGEF3.Genes: MMRN1, ITGB5, PROS1, NAT8B, ALOX12, TSPAN9, CALD1, GP9, CLEC1B,PARVB, GUCY1A3, CTDSPL, ITGB3Displayed in Figure 6.11.This locus was already reported by Meisinger et al. (2009) and Fairfax et al. (2012).
• Hotspot 3 on chromosome 11: rs10742583 (11:5248641) and rs12786766 (11:5225505) inHBB.Genes: ADCK2, PTDSS1, ASAP1, RAD51C, DTYMK, HDAC1, PWP1, TRAPPC11, SYNE2,CNBP, WDR59, GPS1, WDR37Displayed in Figure 6.12.
• Hotspot 4 on chromosome 12: rs10784774, rs2231700, rs11177577, rs2603089, rs11177644upstream of LYZ.Genes: EID2B, AFMID, CDKN2AIPNL, ITPK1-AS1, SHCBP1, CREB1, KIAA0101Displayed in Figure 6.13.This locus was also already reported by Fairfax et al. (2012).
All master regulatory loci could be replicated in both replication studies. Surprisingly, allthese eQTLs were not found to be significant cis-eQTLs, although one of the loci (on chro-mosome 12) was already identified to be a cis- and trans-eQTL in monocytes (Fairfax et al.,2012). The cis-association was observed in a much smaller sample size of 283 individualsindicating a monocyte specific effect or at least a very small effect in whole blood.
112

6.2. eQTL study in KORA F4
Figure 6.10.: Trans hotspot 1 Figure 6.11.: Trans hotspot 2
Figure 6.12.: Trans hotspot 3 Figure 6.13.: Trans hotspot 4
113

6. Power issues in eQTL studies
SNP* Chr SNP Gene of SNP Probe Id Gene of probe Chr gene n BETA SE Pvaluers12151621 2 N/A ILMN 2282282 MLH3 14 888 0.1904 0.01396 1.312e-38
2 N/A ILMN 1679130 CALHM1 10 888 0.1424 0.01326 2.244e-252 N/A ILMN 1697317 DYNLRB2 16 888 0.1389 0.01285 1.124e-252 N/A ILMN 1652161 PNKD 2 888 0.1407 0.01227 1.892e-282 N/A ILMN 1724158 ZNF93 19 888 0.09093 0.0125 7.624e-132 N/A ILMN 1740186 GHRHR 7 888 0.07777 0.00913 6.929e-17
rs12485738 3 ARHGEF3 ILMN 1787919 PARVB 22 890 -0.1362 0.01922 2.769e-123 ARHGEF3 ILMN 1729453 TSPAN9 12 890 -0.1682 0.02039 5.695e-163 ARHGEF3 ILMN 1668374 ITGB5 3 890 -0.1388 0.01918 9.885e-133 ARHGEF3 ILMN 2392189 CTDSPL 3 890 -0.1302 0.0172 9.16e-143 ARHGEF3 ILMN 1743290 GP9 3 890 -0.1793 0.02214 1.823e-153 ARHGEF3 ILMN 1730487 CALD1 7 890 -0.08874 0.01179 1.263e-133 ARHGEF3 ILMN 1713731 ALOX12 17 890 -0.1091 0.01538 2.607e-123 ARHGEF3 ILMN 1691264 NAT8B 2 890 -0.1413 0.01871 1.055e-133 ARHGEF3 ILMN 1671928 PROS1 3 890 -0.1616 0.01783 7.819e-193 ARHGEF3 ILMN 1808590 GUCY1A3 4 890 -0.1073 0.01453 3.579e-133 ARHGEF3 ILMN 1660114 MMRN1 4 890 -0.08856 0.01129 1.231e-143 ARHGEF3 ILMN 1745103 CLEC1B 12 890 -0.1498 0.02055 6.809e-13
rs10784774 12 N/A ILMN 2334242 CREB1 2 889 0.1903 0.0123 5.329e-4812 N/A ILMN 2182482 SHCBP1 16 889 0.189 0.009911 3.288e-6812 N/A ILMN 2095653 AFMID 17 889 -0.1173 0.009898 3.367e-3012 N/A ILMN 2412521 KIAA0101 15 889 0.1283 0.009883 2.183e-3512 N/A ILMN 2134381 ITPK1-AS1 14 889 0.09329 0.01308 2.021e-1212 N/A ILMN 2051900 EID2B 19 889 0.1495 0.01267 5.998e-3012 N/A ILMN 2130078 CDKN2AIPNL 5 889 0.07231 0.009745 2.737e-13
rs10742583 11 N/A ILMN 1743049 PWP1 12 890 -0.1424 0.01076 1.198e-3611 N/A ILMN 1688753 PTDSS1 8 890 0.2389 0.01192 5.786e-7411 N/A ILMN 1769319 CNBP 3 890 0.1136 0.01028 1.015e-2611 N/A ILMN 1752086 TRAPPC11 4 890 -0.07452 0.009111 9.901e-1611 N/A ILMN 1727458 HDAC1 1 890 0.1139 0.01002 4.303e-2811 N/A ILMN 1795428 WDR59 16 890 -0.0939 0.009298 8.944e-2311 N/A ILMN 1795876 GPS1 17 890 0.06541 0.007896 4.36e-1611 N/A ILMN 1690963 ASAP1 8 890 0.1099 0.01438 5.594e-1411 N/A ILMN 1663132 ADCK2 7 890 0.0939 0.01212 2.552e-1411 N/A ILMN 1716445 DTYMK 2 890 0.09812 0.01061 1.688e-1911 N/A ILMN 1796464 WDR37 10 890 0.09877 0.009316 8.254e-2511 N/A ILMN 1754579 SYNE2 14 890 0.06739 0.008484 5.915e-1511 N/A ILMN 1695386 RAD51C 17 890 0.09094 0.01153 8.906e-15
Table 6.5.: Master regulatory loci:We defined master regulatory loci as eQTLs with simultaneous impact on the ex-pression of at least five genes. Only the SNP which displayed strongest associa-tions in the region is displayed.
6.2.7. Comparison of cis- and trans-results with the published GWAS catalog
On July, 18th 2012 the GWAS catalog consisted of 1,310 publications including 6,603 SNPs(according to the information on the homepage). The whole catalog was downloaded andconsisted of 10,421 SNP-gene combinations (10,099 unique). 214 were deleted because noSNP and no gene were reported (NR). The SNP-gene combinations that were reported bymore than one study were merged and altogether 8,566 unique combinations were system-atically compared to the cis- and trans-results. There were 4,471 unique genes of which 3,508could be found in our annotation file.In the first step the overlap between the reported genes and the eQTL genes was determinedand for the corresponding SNPs all proxy SNPs with R2 > 0.7 were selected using SNAP.181 gene-SNP combinations of the GWAS catalog could also be found in the list of signifi-cant cis-hits, either with the exactly same SNP as reported or with a SNP that was in highLD (R2 > 0.7) with the reported SNP. Two SNPs as well as four genes could additionally befound in the list of significant trans-hits.In addition, when we looked up GWAS hits in our hits we identified 565 reported genesin the cis-list, 16 of which were also in the trans-list. Three SNPs of this list are also in thetrans-list.Of the 6,966 gene-SNP combinations that were not in the cis-list, ten genes and 13 SNPs werein the trans-list.
114

6.2. eQTL study in KORA F4
We focused on the 746 genes that were both eQTL-genes and reported to be associated witha clinical or any other phenotype. These findings could be helpful to improve the knowledgeabout the reported associations and to identify mechanisms underlying the SNP-phenotypeassociation.
As this project was a collaboration with the Diabetes Center in Dusseldorf we were par-ticulary interested in genes that were reported to be associated with diabetes-relevant phe-notypes. One SNP (rs592423, located on chromosme 6) of our list was reported to be as-sociated with adiponectin (low levels of adiponectin could increase the risk for diabetes,while high levels lead to a protection against diabetes) (Dastani et al., 2012). We identified atrans-association with the expression level of a type 2 diabetes gene called IGF2BP2 (insulin-like growth factor 2 mRNA-binding protein 2) on chromosome 3 (p-value = 1.2 ∗ 10−13). As theadiponectin levels two hours after an oral glucose tolerance test were available for 738 KORAF4 samples, we tested if there was a correlation between this level and the gene expressionlevel. Because the p-value for this association was below 0.05 (p=0.025) we hypothesizedthat there might be a possible effect of rs592423 on adiponectin level via the expression ofIGF2BP2 (see Figure 6.14).
Chr 6 Chr. 3q27.2 IGF2BP2 - Insulin-Like Growth Factor 2 mRNA-Binding Protein 2 Associated with type 2 diabetes
X
Circulating adiponectin levels
P=1.2*10-13
Transcript level SNP
rs592423
Figure 6.14.: Triangular relationship between eQTL-SNP rs592423, gene expression level ofIGF2BP2 in trans, and adiponectin
In the GWAS catalog several SNPs are reported to be associated with different clinicalphenotypes (with so-called pleiotropic associations). In our data we identified two SNPsthat on the one hand had an impact on several gene expression levels and on the other handshowed such pleiotropic effects:
115

6. Power issues in eQTL studies
• SNP rs10784774, which was published to affect height (Gudbjartsson et al., 2008), pul-monary function decline (Imboden et al., 2012), and response to diuretic therapy (Turneret al., 2010) in GWAS.
• SNP rs12485738 with reported associations for creatinine levels (Chambers et al., 2010),blood pressure (Wain et al., 2011), chronic kidney disease (Kottgen et al., 2010), andmean platelet volume (Meisinger et al., 2009; Soranzo et al., 2009).
For the SNP rs12485738 we could provide evidence for a triangular relationship betweenthe SNP, mean platelet volume (measured in 889 KORA F4 samples) and gene expressionactivity of nine out of the twelve annotated genes.
Chr 3 Chr. 3 ITGB5 GP9 PROS1 CTDSPL Chr. 4 GUCY1A3 Chr. 7 CALD1 Chr. 12 TSPAN9 Chr. 17 ALOX12 Chr. 22 PARVB
X
rs12485738
Mean Platelet Volume
P<2.8*10-12
Transcript levels SNP
Figure 6.15.: Triangular relationship between eQTL-SNP rs12485738, gene expression levelsin trans and mean platelet volume:For nine out of twelve significant trans-eQTL genes for rs12485738 we couldidentify significant triangular relationships between SNP, mean platelet volumeand gene expression levels.
6.2.8. Comparison of cis-eQTLs with metQTLs
In the KORA F4 samples also metabolite concentrations are measured in whole blood. Anddue to the fact that it has already been observed that metabolic phenotypes could combinegenetic and environmental factors to explain complex disorders (Suhre and Gieger, 2012) thecis-eQTLs were compared to results obtained from a GWAS of metabolic traits. This GWASwas conducted in 1,809 samples from KORA F4 and the results were replicated in 422 samp-les of the TwinsUK study. Thereby, 163 metabolic traits that were measured in whole blood
116

6.2. eQTL study in KORA F4
were analyzed. Illig et al. (2010) identified 18 SNPs that were associated with several metabo-lites or the ratio of two metabolites, so-called metabolomic quantitative trait loci (metQTLs).These results are available in the Supplement Table 2 of the original publication.Of these 18 SNPs six SNPs (rs174547, rs211718, rs8396, rs541503, rs272889, and rs964184)were also cis-eQTLs in our data set (see Table 6.6). To identify triangular relationships bet-ween transcriptomics, genomics, and metabolomics the missing association between geneexpression and the metabolite concentration or the ratio of two metabolites was calculated.Additionally, p-values for the SNP-metabolite association and the p-values for the SNP- gene expression association were determined in the smaller subset. For these analysesmetabolomic and transcriptomic data of 717 KORA F4 samples were available.
In this effort we identified three significant triangular relationships:
1. SNP rs541503 which is located upstream of PHGDH (Phosphoglycerate Dehydrogenase)was associated with the expression level of PHGDH (p-value = 4.14 ∗ 10−11) and withthe metabolite Serine (Ser, p-value = 2.59 ∗ 10−3). The expression level of PHGDHwas also associated with the metabolite concentration (p-value = 9.38 ∗ 10−4). Thetriangular relationship is illustrated in Figure 6.16.
X Chr 1
Ser-PTC
P=4.14*10-11
rs541503
Breast Cancer Metabolite concentration
SNP
Phenotypes
Transcript level
PHGDH Phosphoglycerate dehydrogenase Energy metabolism
Figure 6.16.: Triangular relationship between genomics, metabolomic, and transcriptomics -PHGDH
2. SNP rs174547 is located intronic of FADS1 (Fatty Acid Desaturase 1) and was associatedwith the expression level of FADS1 (p-value = 2.055 ∗ 10−14) and additionally withthe neighboring gene TREM258 (Transmembrane Protein 258, p-value = 3.075 ∗ 10−14).The p-value for the association between SNP and the metabolite ratio PC aa C36:3 /PC aa C36:4 (Phosphatidylcholine diacyl C36:3 / Phosphatidylcholine diacyl C36:4)was 3.58∗10−69. The expression levels of both FADS1 and TREM258 were significantly
117

6. Power issues in eQTL studies
correlated with the metabolite ratio (p-value = 1.56∗10−2 and 1.68∗10−3, respectively).The triangular relationship is shown in Figure 6.17.
X Chr 11
PC aa C36:3 PC aa C36:4
P=3.08*10-14 and 2.06*10-14
rs174547
Lipid metabolism: LDL cholesterol, HDL cholesterol and triglycerides Glucose metabolism: fasting glucose and homeostatic model assessment B (HOMA-B) Other phenotypes: Crohn’s disease and resting heart rate
Metabolite ratio
SNP
Phenotypes
Transcript level
TMEM258 Transmembrane protein 258 FADS1 Fatty acid desaturase 1, Polyunsaturated fatty acid biosynthesis
Figure 6.17.: Triangular relationship between genomics, metabolomic, and transcriptomics -FADS1
3. SNP rs211718 is located upstream of ACADM (Acetylcoenzyme A Dehydrognase) andwas associated with the expression level of this gene (p-value = 1.778 ∗ 10−31) andwith two different metabolites: C6(C4:1-DC) (Hexanoylcarnitine (Fumarylcarnitine),p-value = 3.72∗10−15) and the ratio C12 / C10 (Dodecanoylcarnitine / Decanoylcarni-tine, p-value = 3.87∗10−24). The expression level of ACADM was correlated with bothmetabolite and the metabolite concentration (p-value = 1.28 ∗ 10−3 and 9.60 ∗ 10−3,respectively). Figure 6.18 displays this triangular relationship.
Illig et al. (2010) and Suhre et al. (2011) described that all these three SNPs were knownto be associated with clinical traits as cardiovascular disease, resting heart rate, Crohn‘s dis-ease, and glucose as well as lipid metabolism for rs174547, medium-chain acyl-coenzyme Adehydrogenase deficiency for rs211718, and breast cancer for rs541503. In addition, PHGDH,FADS1, and ACADM are all enzymes encoding genes with functions in human lipid meta-bolism.
6.2.9. Summary of eQTLs in KORA F4
The eQTL study using data from KORA F4 was at the time of publication one of the largeststudies analyzing both cis- and trans-eQTLs genome-wide in whole blood. 91% of the eQTLscould be replicated in at least one of the two replication cohorts although, there were somesystematic differences in the study design between the discovery and one replication cohort.
118

6.2. eQTL study in KORA F4
X Chr 1
C6(C4:1-DC)
P=1.78*10-31
rs211718
Medium-Chain Acyl-Coenzyme A Dehydrogenase Deficiency
Metabolite concentration
SNP
Phenotypes
Transcript level
ACADM Acyl-coenzyme A dehydrogenase, β-oxidation
Figure 6.18.: Triangular relationship between genomics, metabolomic, and transcriptomics -ACADM
Illig et al. Schramm et al.(N=1,809) (N=717)
SNP Chr Probe Id Gene Metabolic trait p-value1 p-value1 p-value2 p-value3
rs541503 1 1704537 PHGDH Ser-PTC 3.06−07 2.59−03 4.14−11 9.38−04
rs211718 1 1778104 ACADM C6(C4:1-DC) 1.74−12 3.72−15 1.78−31 1.28−03
rs174547 11 1786759 TMEM258 PCaaC36:3PCaaC36:4
3.88−102 3.58−69 3.08−14 1.68−03
rs211718 1 1778104 ACADM C12C10
5.14−34 3.87−24 1.78−31 9.60−03
rs174547 11 1670134 FADS1 PC aa C38:4 3.95−27 1.49−15 2.06−14 1.28−02
rs174547 11 1670134 FADS1 PCaaC36:3PCaaC36:4
3.88−102 3.58−69 2.06−14 1.56−02
rs541503 1 1704537 PHGDH Thr−PTCSer−PTC
5.62−11 1.49−05 4.14−11 4.71−02
rs272889 5 1685057 SLC22A4 C5 2.88−05 5.47−05 3.24−09 7.70−02
rs272889 5 1699357 SLC22A5 V al−PTCC5
7.69−10 4.77−09 4.50−28 1.15−01
rs272889 5 2050911 SLC22A4 V al−PTCC5
7.69−10 4.77−09 1.75−17 1.67−01
rs174547 11 1786759 TMEM258 PC aa C38:4 3.95−27 1.49−15 3.08−14 3.01−01
rs8396 4 1758034 ETFDH SM (OH) C24:1 1.60−05 2.49−01 9.27−19 3.30−01
rs272889 5 2050911 SLC22A4 C5 2.88−05 5.47−05 1.75−17 3.71−01
rs964184 11 1778668 TAGLN PC aa C34:2 1.30−05 1.19−02 1.14−10 4.20−01
rs272889 5 1699357 SLC22A5 C5 2.88−05 5.47−05 4.50−28 4.59−01
rs964184 11 1791912 SIDT2 PCaaC36:2SMC16:0
2.22−11 4.33−01 4.63−09 4.88−01
rs8396 4 1758034 ETFDH C14:1−OHC10
8.22−15 5.47−11 9.27−19 5.92−01
rs964184 11 1791912 SIDT2 PC aa C34:2 1.30−05 1.19−02 4.63−09 7.04−01
rs272889 5 1685057 SLC22A4 V al−PTCC5
7.69−10 4.77−09 3.24−09 7.14−01
rs964184 11 1778668 TAGLN PCaaC36:2SMC16:0
2.22−11 4.33−01 1.14−10 8.53−01
Table 6.6.: Results of cross-associations for congruent metQTL- and eQTL-SNPs:For six SNPs that were both, cis-eQTLs and metQTLs, we calculated the associa-tion between transcriptomics, genomics, and metabolomics.1indicates the p-value for the association between the SNP and the metabolic traitor the ratio of two metabolic traits2indicates the p-value for the association between the SNP and the transcript level3indicates the p-value for the association between the transcript level and themetabolic trait or the ratio of two metabolic traits
119

6. Power issues in eQTL studies
Together with the large overlap of eQTLs in other tissues there was evidence that wholeblood might be an informative and useful tissue for the determination of regulatory effectsand useful for biomarker studies.In this study we combined data derived from multiple omics-technologies (i.e. genotypes,metabolomics, and transcriptomics) and could show that such an approach is useful to iden-tify triangular relationships.
6.3. Replication of eQTLs in CHARGE consortium
With the KORA F4 gene expression and genotype data we also participated in a joint effortof the CHARGE consortium. In this project the KORA eQTL data were used to replicatefindings of the discovery cohorts.One CHARGE investigator Harm-Jan Westra, developed a java-based tool to calculate cis-eQTLs faster than using R or PLINK. The software can be downloaded at https://github.com/molgenis/systemsgenetics/tree/master/eqtl-mapping-pipeline. As in-put it requires raw expression data and imputed genotype data.
The discovery set consists of 5,311 samples from seven studies, namely
• EGCUT (n=891)
• InCHIANTI (n=611)
• Rotterdam Study (n=762)
• Fehrmann (n=1,469)
• HVH (n=106)
• SHIP-TREND (n=963)
• DILGOM (n=509)
Altogether, 1,513 trans-eQTLs including 346 unique SNPs having an effect on 430 differ-ent genes were detected using 4,542 SNPs from the GWAS Catalog that had already beenpublished with different traits or diseases. 52% of these significant associations could bereplicated in 740 samples of the KORA F4 study. The second replication cohort was theBrisbane Systems Genetics Study (BSGS) which also had expression data from whole blood.This study consists of 862 samples and due to the larger sample size 79% of all significanthits could be replicated. When using both studies for a meta-analysis 89% were significantlyreplicated and beside significance 97% showed consistent allelic direction. This rate was 91%in KORA F4 only.
6.4. Summary and discussion
In summary, three different eQTLs studies were conducted using different sample sizes. Theaim of all studies was mainly to show that whole blood is a useable tissue for eQTL studies.
120

6.4. Summary and discussion
Our two eQTL studies could demonstrate the high robustness and reproducibility of genet-ically determined regulatory effects in whole blood. In both studies high replication ratescould be observed and for the larger KORA F4 study there was also a high overlap witheQTLs in other tissues.When comparing the numbers of significant cis- and trans-eQTLs in Table 6.7 it is conspicu-ous that the difference of significant hits from 322 samples to 890 is relatively much higher(more than ten times more hits for cis- and trans-eQTLs) than from 890 to 5,311 samples(1.4 times more hits for cis- and 2.4 times more hits for trans-eQTLs, respectively) indicatingthat the number of detectable eQTLs in whole blood might not be infinitely. Nevertheless, alarger eQTL study is already in progress and eQTLs are calculated in the framework of theeQTLGen Consortium. It will finally consist of more than 20,000 samples and we will joinwith the KORA F4 data.
Cohort KORA F3 KORA F4 CHARGESamples 322 890 5,311Number of tested SNPs (cis) 335,152 616,941 1,962,237Number of tested SNP probe pairs (cis) 4,802,373 8,308,092 11,172,453Bonferroni threshold (cis) 1.03E-8 6.02E-9 4.5E-9Number of significant cis-eQTLs 363 3,449 4,690Number of tested SNP probe pairs (trans) 13,878,309,168 17,867,228,301 153,134,630Tested SNPs 335,152 616,941 4,542Tested expression probes 41,409 28,961 34,061Bonferroni threshold (trans) 3.6E-12 2.81E-12 3.3E-10Number of significant trans-eQTLs 8 94 223
Table 6.7.: Summary of eQTL results from KORA F3, KORA F4, and CHARGE
In all eQTL analyses decribed above linear regression models were used to assess the as-sociation between SNPs and gene expression levels. However, linear regression requiresnormal distribution and in spite of extensive efforts to normalize transcriptomics data thenormalization is an approximation. Beside the linear regression the Spearman‘s rank corre-lation test is often used to test the association between SNP and gene expression levels ineQTL studies (Sul et al., 2015). Its advantage is that this is a non-parametric test and it isquite robust to any deviations from the normal distribution. The software PLINK is not ableto calculate this test, therefore, the analysis was repeated only for all possible cis SNP-probecombinations in KORA F4.The results of the comparison between the linear model and the Spearman‘s rank correlationtest are summarized in Table 6.8. 96% of the expression probes that were significant whenanalyzing all SNP-probe combinations using a linear model were also significant when us-ing the Spearman‘s rank correlation test indicating comparability of both tests in our dataset. For future eQTL projects it could be debated if it makes sense to prefer Spearman‘s ranktest for a better comparability with results from other cohorts.
For the eQTL analyses in KORA F3 and F4 the multiple testing problem was solved byapplying a Bonferroni correction. Although this correction is very conservative and strin-gent the large sample sizes of the discovery cohort (KORA F4) and of the replication cohortsallow to identify and verify a still high number of true-positive cis-eQTLs. In the eQTL
121

6. Power issues in eQTL studies
Figure 6.19.: Manhattan plots of cis-eQTLs in KORA F3, F4, and in CHARGE:The genomic position of the SNPs is plotted against the -log10(p-value). Theread line depicts the Bonferroni threshold of significance.
122

6.4. Summary and discussion
Linear model Spearman‘s rank test Overlapsignificant SNP-probe combinations 55,592 55,051 52,503significant unique probes 4,116 4,106 3,958
Table 6.8.: Comparison of results obtained from linear regression and Spearman‘s rank cor-relation test for cis-hits in KORA F4:The calculations were conducted for 8,308,092 possible SNP-probe combinationsin 890 KORA F4 samples. The significance threshold was 6.02 ∗ 10−09 (Bonferronithreshold).
project of CHARGE standard procedure for calculating p-values in eQTL studies was used:the permutation (but they also indicated the number of significant hits for the Bonferronicorrection). The advantage is that it also takes into account the LD structure of the genomewhich is not considered when using Bonferroni correction (Sul et al., 2015). The disadvan-tage and the reason why it was not possible for us to use it for the trans-calculation is that itis very time- and computer-intensive. In the CHARGE consortium this problem was mini-mized by reducing the number of analyzed SNPs and by doing only ten permutations whichis quite below the standard of several thousand permutations (Sul et al., 2015).Wright et al. (2014) published the last eQTL study so far using more than 2,500 samples. Thisalmost reached dimensions of GWAS which normally also apply a multiple testing correc-tion that is based on Bonferroni. Normally here a significance threshold of 5 ∗ 10−8 is usedwhich takes the LD structure into account.
The advantage of the eQTL studies in KORA F3 and F4 was that we were able to calculatethe associations between all expression levels and all available SNPs and due to the lowernumber of significant hits we were able to perform some additional analyses like the com-parison of our two replication cohorts of KORA F4. In spite of various systematic differencesin the study design of the two replication samples (fasting versus non-fasting status of parti-cipants, time of blood collection, and different laboratory tools, namely, PAXgeneTM versusTempusTM tubes) replication overlaps of both replication samples were comparable (78%and 82%). Together with a total replication overlap of 91% in at least one of the samples thisdemonstrates a high robustness and reproducibility of genetically determined regulatory ef-fects in whole blood. Consequently, whole blood gene expression provides a means for thediscovery of biomarkers which are of clinical relevance for the perturbation of the system ina disease status.Finally, we could include metabolomics data to show that eQTL studies provide a hypothesis-free approach to link genetic variation with human metabolism.
123

6. Power issues in eQTL studies
124

7. Summary and outlook
The progress and rapid advances in the field of gene expression data during my PhD projectwas highly visible and is continuously ongoing.We started with two case-control studies with small sample sizes. In one study we comparedeight Parkinson patients with nine old controls. This resulted in the discovery of four differ-entially expressed genes (Elstner et al., 2009). The inclusion of seven young controls allowedus to describe Parkinson’s disease as accelerated aging (Elstner et al., 2011).In the second case-control study 13 NBIA patients were compared to six controls. Here, nosignificant differentially expressed gene could be identified, but the top 500 genes were usedfor a pathway analysis and showed pathways that are significantly related to mitochondrialfunctions (Hartig et al., 2011). Nevertheless the second project was the beginning of a largeNBIA study (TIRCON project). Within the framework of this study the gene expression lev-els of 41 patients and 42 controls were determined. In comparison to all data that were usedin this thesis no arrays were used but the RNA was sequenced. In comparison to array-based methods sequencing is less susceptible to technical artifacts, much more accurate andnot limited by background noise for low signals. Despite of all the advantages so far arrayswere much often used due to the lower costs. Now the RNA-sequencing is getting cheaperand therefore more lucrative also for larger sample sizes.Therefore we started to analyze the gene expression levels obtained from RNA-sequencingof 41 PKAN patients with 42 healthy age-matched controls. Similar to the preprocessing ofdata from arrays the raw values have to be normalized before the analysis. Here we usedthe FPKM values (for details see A.2.2) that consider the number of mapped reads and thelength of the genes.
MU
C16
78M
UC
1472
MU
C15
03M
UC
1530
MU
C17
07M
UC
1539
MU
C15
21M
UC
1544
MU
C14
91M
UC
1486
MU
C16
56M
UC
1665
MU
C14
54M
UC
1470
MU
C16
99M
UC
1735
MU
C16
76M
UC
1708
MU
C17
02M
UC
1670
MU
C15
27M
UC
1471
MU
C16
94M
UC
1460
MU
C14
65M
UC
1691
MU
C15
12M
UC
1495
MU
C14
69M
UC
1502
MU
C14
61M
UC
1720
MU
C14
53M
UC
1519
MU
C17
14M
UC
1457
MU
C17
40M
UC
1534
MU
C16
64M
UC
1724
MU
C14
56M
UC
1684
MU
C15
06M
UC
1466
MU
C17
29M
UC
1723
MU
C17
43M
UC
1452
MU
C14
49M
UC
1451
MU
C17
03M
UC
1478
MU
C16
71M
UC
1499
MU
C16
50M
UC
1738
MU
C15
26M
UC
1513
MU
C14
87M
UC
1719
MU
C17
34M
UC
1698
MU
C14
74M
UC
1712
MU
C15
20M
UC
1695
MU
C16
61M
UC
1741
MU
C17
37M
UC
1518
MU
C15
35M
UC
1660
MU
C14
77M
UC
1507
MU
C15
40M
UC
1482
MU
C14
96M
UC
1473
MU
C14
98M
UC
1481
MU
C14
92M
UC
1690
MU
C15
31
0e+
001e
+05
2e+
053e
+05
4e+
055e
+05
Dendrogram
Agglomerative Coefficient = 0.98
Hei
ght
Figure 7.1.: Dendrogram of RNASeq data of 42 controls and 41 NBIA patients
125

7. Summary and outlook
In a next step an outlier was detected by clustering all samples using all expression values(see Figure 7.1). For this sample a mistake in the laboratory was already reported and a repe-tition is in progress. The expression levels of the remaining 40 patients and 42 controls werecompared using a linear model adjusted for age and gender. Especially the age could be animportant confounder due to the fact that younger patients are more likely to be affected bya more severe form of the disease.
pvalue = 1.08322211437214e−06
CLD
N16
●
●●
●
●●●●0.
010.
020.
030.
040.
050.
06
Controls Baseline Patients
●
0.01
0.02
0.03
0.04
0.05
0.06
Figure 7.2.: Experiment using RNASeq data: Differentially expressed gene between controlsand NBIA patients:When comparing 40 NBIA patients and 42 controls using a linear model adjustedfor age and gender, one gene was differentially expressed when applying theBenjamini-Hochberg correction.
When applying the Bonferroni correction no gene was differentially expressed betweenthe controls and the patients. Using the Benjamini-Hochberg correction, we could identifyone gene called CLDN16 (see Figure 7.2), but the expression level of this gene was quite low
126

(< 1) and we cannot guarantee that the effect is not due to background noise. So far no otherdata set with the same patients is available and the result cannot be replicated. As the mea-surement of more samples is in progress, we hope that we can verify this result in a highersample size or identify some other interesting candidate genes.
The first eQTL study using RNA sequenced data of 156 individuals was published already(Sul et al., 2015) and it should be only a question of time that these data are available for theKORA samples. Then, all analyses conducted in this thesis can be repeated in a data set withhigher quality.
After the case-control studies we established one of the first larger gene expression dataset from a population-based study namely KORA F3 in Munich. This data set was used toestablish the first quality scores and optimize the experimental protocol. At this time-pointit was one of the largest studies with 381 individuals. We could improve the quality of thisdata set and establish an even more homogenous data set with the samples from the KORAF4 cohort. When this data was ready for analysis, the German consortium MetaXpress wasfounded to harmonize the analysis of genome-wide expression data. We herein establisheda well-structured analysis protocol.The KORA F3 and F4 data sets were used to analyze the effects of different phenotypes andvariables on the expression levels. We started with blood pressure related phenotypes whichseem to have a small impact on expression levels in whole blood. Even in the large CHARGEconsortium with more than 7,000 samples only 34 genes could be identified that are associ-ated with one of the phenotype (diastolic/systolic blood pressure or hypertension).The impact of age on the expression levels is much higher. Here the findings in KORA F3and F4 increased from five to 194 significantly associated genes. In the large CHARGE con-sortium with more than 7,000 samples we identified almost 1,500 significant genes that couldbe replicated in an independent cohort.Lastly, it was analyzed if the genetic variation changes the expression levels of genes in cis orin trans. With 322 KORA F3 samples we detected 363 cis- and eight trans-associations and in-creased this number with 890 KORA F4 samples to 3,449 cis- and 94 trans-associations. Withthis sample size the eQTL study was one of the largest whole genome eQTL analysis thatanalyzed effects in both cis and trans in whole blood samples in European populations sofar. Even in the much larger eQTL study of CHARGE with 5,311 samples not all trans-effectswere determined as they were using only SNPs that are reported in the GWAS catalog at thistime-point. The next study in CHARGE is already in progress and it is planned to includemore than 20,000 samples to analyze both cis- and trans-effects genome-wide.
The next project is the genome-wide analysis of gene expression levels with methylation,which already started. For the analysis of gene expression and age we analyzed for signif-icantly associated genes the impact of methylation on gene expression levels. Additionally,we tested if the effect of aging on the expression levels is mediated by methylation. Weidentified 1,248 age associated genes (83%) that had at least one mediating CpG site whereaseach gene had between one and 154 mediating CpG sites.To analyze these effects genome-wide we have to consider the high number of CpG sites(more than 450,000) and the fact that we do not know if these effects are only visible in cis(< 500 kb distance between gene and CpG site) or also in trans. To conduct these calculationsin an acceptable speed and time, our collaborators from the Framingham Heart Study (FHS)
127

7. Summary and outlook
developed a GPU-based code that reduced the calculation time from several weeks to just 20minutes. The disadvantages of this program are, that it is not very flexible and can calculatelinear models only without any further covariables. We avoided this problem by adjustingthe data for all relevant covariables before the calculation.Using the Bonferroni correction we could identify in this way 3,422 cis- and 39,859 trans-associations. The replication (especially of the high number of trans-associations) is still on-going. In a next step it is also possible to include genetic data to identify also SNPs that areresponsible for the variation in the methylation and expression levels and to see if expressionlevels are a consequence of methylation or the other way round.
128

A. Appendix
A.1. List of abbreviations
ANOVA Analysis of variance
BMI Body mass index
BP Blood pressure
CHARGE The Cohorts for heart and aging research in genomic epidemiology
cDNA Coding deoxyribonucleic acid
cRNA Coding ribonucleic acid
DBP Diastolic blood pressure
DNA Deoxyribonucleic acid
DZHK Deutsches Zentrum fur Herz-Kreislaufforschung - German Center forCardiovascular Research
ECGUT Biobank of Estonian Genome Center of the University of Tartu
eQTL Expression quantitative locus
FDR False discovery rate
FWER Family-wise error rate
GHS Gutenberg Health Study
GWAS Genome-wide association study
HTN Hypertension
IPA Ingenuity pathway analysis software
KORA Kooperative Gesundheitsforschung in der Region Augsburg - Cooperative HealthResearch in the Region of Augsburg
LD Linkage disequilibrium
MAF Minor allele frequency
mRNA Messenger ribonucleic acid
NBIA Neurodegeneration with brain iron accumulation
129

A. Appendix
OGTT Oral glucose tolerance test
PC Principal component
PCA Principal component analysis
PCR Polymerase chain reaction
PD Parkinson’s disease
QC Quality control
qPCR Quantitative real-time polymerase chain reaction
QTL Quantitative trait locus
RIN RNA integrity number
RNA Ribonucleic acid
SBP Systolic blood pressure
SE Standard error
SNP Single nucleotide polymorphism
TSS Transcription start site
VST Variance stabilization transformation
A.2. Statistics
A.2.1. Variance stabilization transformation
The variance stabilization transformation (VST) was developed to stabilize the variance ofgene expression data measured with Illumina arrays. In comparison to the log2 transfor-mation (which is based on the average expression level of each probe), it takes the severalmeasurements of one probe into account.The following steps have to be performed to find a function h for Y where the variance ofthe transformed Y is independent from the mean (Lin et al., 2008):
1. All background probes with detection p-values higher than a predefined threshold(normally 0.01) are selected as it is assumed that these probes measure the backgroundnoise.
2. The variance of the background noise is estimated (called c3).
130

A.3. Tables and Figures
3. The following formula is used to calculate c1 and c2:
√v(u)− c3 = c1u+ c2
where v(u) is the relationship between the mean u and the variance v of the measure-ment Y and can be displayed in a quadratic form
v(u) = (sη/mη)2(u− α)2 + σ2
ε = (c1u+ c2)2 + c3
where mη and sη are the mean and the standard deviation of eη (coming from thegeneral model Y = α + µeη + ε), α is the offset of the general model, and σε is thestandard deviation of ε.
4. The transformed values are calculated using:
h(y) =
{1/c1 arcsin(c2/
√c3 + c1y/
√c3),when c3 > 0
1/c1 ln(c2 + c1y), when c3 = 0
It can be shown that the VST-transformed values are close to the log2-transformed valuesfor high expression values.The VST is implemented in the Bioconductor package lumi (Du et al., 2008).
A.2.2. RNA Sequencing and FPKM
RNA sequencing is a next-generation sequencing based technology to measure the gene ex-pression levels. The RNA is converted to a library of cDNA fragments and each molecule issequenced from both ends (pair-end sequencing). In our lab the Illumina HiSeq2500 wasused which produces reads with a length of 100 base pairs. Afterward the reads weremapped to a reference genome (Wang et al., 2009).To take the number of mapped reads and the length of genes in account, the expression val-ues are indicated as FPKM values. FPKM is the abbreviation for Fragments Per Kilobase oftranscript per Million mapped reads.
A.3. Tables and Figures
genomic top CHR ProbeId Gene CHR P-value P-value P-valuelocus SNP SNP Gene KORA SHIP-TREND EGCUT
1 rs10736767 11 ILMN 2336609 SYTL2 11 1.60E-21 6.65E-15 5.29E-082 rs862242 5 ILMN 1653039 10 1.75E-153 7.71E-191 6.01E-2623 rs2141180 3 ILMN 1654946 ZSCAN18 19 2.76E-17 7.99E-19 2.34E-183 rs9859077 3 ILMN 1658173 ZNF418 19 2.67E-12 2.39E-03 2.77E-043 rs2141180 3 ILMN 1724052 ZNF814 19 1.98E-23 4.89E-06 1.84E-163 rs2141180 3 ILMN 1726368 ZNF135 19 5.49E-14 1.16E-03 8.74E-054 rs6600227 16 ILMN 1658957 1 4.93E-15 1.63E-13 5.30E-095 rs12485738 3 ILMN 1660114 MMRN1 4 1.23E-14 8.20E-09 2.62E-055 rs12485738 3 ILMN 1668374 ITGB5 3 9.89E-13 8.66E-19 5.63E-065 rs12485738 3 ILMN 1671928 PROS1 3 7.82E-19 6.38E-12 1.26E-095 rs12485738 3 ILMN 1691264 NAT8B 2 1.06E-13 5.56E-13 1.49E-015 rs12485738 3 ILMN 1713731 ALOX12 17 2.61E-12 1.84E-15 1.22E-035 rs12485738 3 ILMN 1729453 TSPAN9 12 5.69E-16 2.76E-21 2.76E-125 rs12485738 3 ILMN 1730487 CALD1 7 1.26E-13 1.43E-15 1.76E-035 rs1344142 3 ILMN 1733324 ITGB3 17 6.35E-13 8.77E-16 8.61E-085 rs12485738 3 ILMN 1743290 GP9 3 1.82E-15 7.40E-18 2.10E-055 rs12485738 3 ILMN 1745103 CLEC1B 12 6.81E-13 2.01E-07 1.28E-015 rs1359142 6 ILMN 1767766 PRDX2 19 5.38E-16 4.48E-16 3.84E-175 rs12485738 3 ILMN 1787919 PARVB 22 2.77E-12 9.84E-23 2.28E-105 rs12485738 3 ILMN 1808590 GUCY1A3 4 3.58E-13 6.38E-12 3.22E-10
131

A. Appendix
5 rs12485738 3 ILMN 2392189 CTDSPL 3 9.16E-14 1.76E-18 5.16E-105 rs10463053 5 ILMN 1798557 FAM153A 5 3.38E-21 5.34E-13 5.75E-066 rs10252204 7 ILMN 1660927 FAM185A 7 1.08E-18 1.12E-05 7.31E-027 rs9272346 6 ILMN 1661266 6 7.15E-116 7.00E-164 5.71E-1087 rs502771 6 ILMN 1752592 HLA-DRB4 6 5.90E-45 7.07E-607 rs9272346 6 ILMN 1791534 6 2.09E-17 4.99E-30 2.57E-127 rs9272346 6 ILMN 2159694 HLA-DRB4 6 4.43E-29 2.55E-32 1.74E-137 rs9272346 6 ILMN 2165753 HLA-A 6 9.51E-18 3.83E-37 2.40E-068 rs10742583 11 ILMN 1663132 ADCK2 7 2.55E-14 1.18E-15 4.30E-118 rs10742583 11 ILMN 1688753 PTDSS1 8 5.79E-74 6.46E-47 7.35E-648 rs10742583 11 ILMN 1690963 ASAP1 8 5.59E-14 5.75E-16 7.16E-068 rs10742583 11 ILMN 1695386 RAD51C 17 8.91E-15 2.20E-03 4.85E-218 rs10742583 11 ILMN 1716445 DTYMK 2 1.69E-19 5.17E-13 3.92E-098 rs10742583 11 ILMN 1727458 HDAC1 1 4.30E-28 3.82E-26 8.63E-348 rs10742583 11 ILMN 1743049 PWP1 12 1.20E-36 1.65E-79 6.68E-148 rs10742583 11 ILMN 1752086 TRAPPC11 4 9.90E-16 6.92E-32 5.60E-068 rs10742583 11 ILMN 1754579 SYNE2 14 5.92E-15 4.37E-04 3.73E-198 rs10742583 11 ILMN 1769319 CNBP 3 1.01E-26 2.18E-33 1.55E-118 rs10742583 11 ILMN 1795428 WDR59 16 8.94E-23 1.79E-24 2.43E-048 rs10742583 11 ILMN 1795876 GPS1 17 4.36E-16 3.88E-21 5.88E-068 rs10742583 11 ILMN 1796464 WDR37 10 8.25E-25 1.74E-09 3.00E-179 rs9939012 16 ILMN 1667034 PDPR 16 5.82E-15 5.21E-08 7.06E-179 rs9939012 16 ILMN 1778013 PDPR 16 6.95E-15 2.70E-05 2.87E-11
10 rs225245 17 ILMN 1671686 EPB49 8 1.22E-12 2.96E-16 7.43E-2110 rs225245 17 ILMN 1697529 RNF10 12 4.15E-16 1.87E-19 2.91E-1011 rs12933929 16 ILMN 1671809 DUSP22 6 2.37E-23 8.98E-24 1.21E-1711 rs12933929 16 ILMN 1813275 DUSP22 6 1.99E-25 2.70E-28 8.31E-2311 rs12933929 16 ILMN 2159152 TP53TG3B 16 2.45E-15 3.60E-07 3.32E-0612 rs3779106 7 ILMN 1673337 PMS2CL 7 1.50E-22 4.52E-06 3.84E-0413 rs10417909 19 ILMN 1673991 ATIC 2 4.29E-21 1.28E-31 4.45E-2714 rs6901565 6 ILMN 1676459 ZNF785 16 5.20E-14 1.25E-08 3.43E-0415 rs2856553 16 ILMN 1678730 NOMO1 16 3.36E-21 1.49E-09 8.08E-0315 rs2856553 16 ILMN 2126957 NOMO1 16 1.38E-13 6.82E-13 1.16E-0416 rs4130579 19 ILMN 1680388 1 4.74E-14 2.61E-06 1.94E-2217 rs12669559 7 ILMN 1684255 MYL4 17 2.32E-16 2.97E-13 2.51E-1417 rs12669559 7 ILMN 1695058 SLC38A5 X 1.10E-16 5.61E-14 1.72E-1517 rs12669559 7 ILMN 1787526 C2ORF88 2 4.72E-33 2.17E-41 2.67E-1618 rs3745902 19 ILMN 1685843 KIR2DL5B 19 6.25E-24 5.69E-06 3.32E-1518 rs3745902 19 ILMN 1793451 KIR2DL5B 19 3.12E-56 9.86E-30 2.45E-2618 rs3745902 19 ILMN 2415650 KIR2DL5B 19 5.33E-38 6.07E-12 2.56E-2019 rs845787 20 ILMN 1688318 FRG1B 20 4.56E-24 4.55E-33 5.24E-1220 rs10861779 12 ILMN 1692962 CTDSP2 12 1.65E-15 3.55E-19 1.41E-0621 rs13053817 22 ILMN 1697286 SF3A1 22 5.57E-13 1.89E-14 1.34E-0522 rs12151742 2 ILMN 1652161 PNKD 2 1.89E-28 9.91E-08 7.22E-3022 rs12151621 2 ILMN 1679130 CALHM1 10 2.24E-25 3.31E-12 4.24E-2622 rs12151621 2 ILMN 1697317 DYNLRB2 16 1.12E-25 1.14E-08 8.48E-3522 rs12151621 2 ILMN 1724158 ZNF93 19 7.62E-13 1.24E-04 2.30E-0922 rs12151621 2 ILMN 1740186 GHRHR 7 6.93E-17 9.43E-03 1.51E-1622 rs12151621 2 ILMN 2282282 MLH3 14 1.31E-38 1.50E-20 1.59E-4423 rs5750715 22 ILMN 1697710 IL37 2 5.30E-27 6.02E-18 9.25E-1124 rs592423 6 ILMN 1702447 IGF2BP2 3 1.20E-13 3.82E-15 4.04E-1625 rs12189695 6 ILMN 1702866 LINC00115 1 9.77E-37 4.50E-09 8.02E-1626 rs6854996 4 ILMN 1703246 SBF1 22 1.86E-13 7.79E-16 1.85E-0427 rs7165535 15 ILMN 1703538 AIF1 6 5.58E-38 1.18E-14 9.65E-3928 rs11247355 15 ILMN 1704376 GLDN 15 1.43E-19 3.61E-33 8.91E-1129 rs11642055 16 ILMN 1709747 EXOG 3 1.75E-16 4.37E-13 2.51E-0830 rs4792935 17 ILMN 1710207 FAM178A 10 8.44E-13 2.94E-30 4.69E-0231 rs199448 17 ILMN 1712657 BPTF 17 1.45E-94 3.07E-20 3.16E-1031 rs199448 17 ILMN 1743621 C17ORF69 17 1.45E-43 1.38E-16 7.21E-1831 rs199448 17 ILMN 1772603 LOC644172 17 2.69E-144 3.26E-54 4.27E-0731 rs199448 17 ILMN 1784428 MGC57346 17 1.32E-103 5.49E-72 1.29E-4632 rs700415 7 ILMN 1712721 GAST 17 1.69E-16 3.33E-10 5.30E-1733 rs4390943 3 ILMN 1712936 GCFC1 21 7.59E-36 5.29E-27 3.34E-1634 rs615672 6 ILMN 1717261 HLA-DRB1;HLA-DRB3 6 7.45E-21 7.30E-06 9.68E-2635 rs11130549 3 ILMN 1717793 C19ORF33 19 1.32E-12 1.74E-05 2.39E-0236 rs1476415 21 ILMN 1732467 OR2AG1 11 3.05E-27 1.36E-22 5.08E-2537 rs7005151 8 ILMN 1738793 ZNF71 19 2.14E-36 3.09E-2138 rs10814410 9 ILMN 1739199 WASH3P 15 5.85E-22 9.84E-0539 rs12612045 2 ILMN 1739942 FAM117B 2 9.94E-15 9.09E-18 7.19E-1640 rs11171739 12 ILMN 1740094 BEND4 4 1.62E-67 2.90E-54 1.05E-1340 rs11171739 12 ILMN 1753440 DCAF16 4 1.55E-17 2.77E-20 1.66E-0540 rs11171739 12 ILMN 2180866 RPS26P11 X 2.80E-248 3.53E-280 3.26E-1741 rs12744267 1 ILMN 1745885 POLR2F 22 3.74E-13 2.04E-25 2.26E-0242 rs791900 6 ILMN 1749070 HLA-DPB1 6 3.26E-21 2.89E-23 1.05E-2443 rs7708899 5 ILMN 1754156 FLJ45340 7 1.14E-32 1.65E-21 1.28E-0244 rs470119 22 ILMN 1761321 KREMEN2 16 1.13E-13 1.97E-05 2.33E-2245 rs4704164 5 ILMN 1770498 GUSBP1 5 3.01E-19 3.17E-08 9.37E-1345 rs4704164 5 ILMN 1780700 GUSBP2 6 7.79E-14 4.68E-06 1.62E-1245 rs4704164 5 ILMN 1813191 5 6.61E-38 3.40E-41 6.97E-3146 rs2244468 9 ILMN 1772888 17 1.23E-41 2.66E-38 9.55E-4547 rs2217065 15 ILMN 1775590 SCAND2 15 9.76E-16 1.54E-0548 rs2942219 8 ILMN 1778213 STK33 11 1.80E-19 2.57E-08 1.85E-0149 rs11871616 17 ILMN 1779572 PLEKHM1 17 2.61E-84 4.35E-80 8.26E-2150 rs7395116 11 ILMN 1783753 TXNDC12 1 2.20E-46 2.49E-1651 rs2353678 19 ILMN 1784352 CCM2 7 3.52E-18 3.37E-05 1.18E-1052 rs12936834 17 ILMN 1789407 FAM18B2 17 6.02E-32 3.34E-05 1.66E-1953 rs4447245 12 ILMN 1791297 8 2.60E-28 1.88E-1054 rs4895441 6 ILMN 1792455 TMEM158 3 6.10E-15 7.12E-23 1.67E-1254 rs4895441 6 ILMN 1796678 HBG2;HBG1 11 7.41E-18 1.88E-38 7.22E-3254 rs4895441 6 ILMN 2084825 HBG2 11 5.54E-16 6.61E-34 9.36E-28
132

A.3. Tables and Figures
55 rs10172646 2 ILMN 1796678 HBG2;HBG1 11 1.40E-19 5.28E-27 1.99E-1255 rs10172646 2 ILMN 1806710 ESPN 1 2.52E-23 7.43E-19 1.03E-1355 rs10172646 2 ILMN 2084825 HBG2 11 1.93E-17 1.91E-23 2.12E-1257 rs9534145 13 ILMN 1802023 OR7E156P 13 8.26E-13 1.20E-01 2.20E-0758 rs291040 16 ILMN 1803945 6 4.34E-15 2.60E-15 1.66E-1059 rs225245 17 ILMN 1806349 SLC6A8 X 2.83E-14 1.12E-21 6.33E-0660 rs6503934 17 ILMN 1810274 HOXB2 17 2.79E-20 1.14E-1061 rs10000012 4 ILMN 1811443 AVP 20 4.92E-32 1.11E-07 2.38E-3161 rs10000012 4 ILMN 2406439 SPTBN4 19 4.26E-18 9.52E-08 4.77E-2662 rs1317548 10 ILMN 1906187 LOC283070 10 3.26E-25 1.71E-30 1.33E-1863 rs642112 1 ILMN 2050023 CCDC23 1 8.58E-19 1.14E-2064 rs10784774 12 ILMN 2051900 EID2B 19 6.00E-30 3.30E-11 6.16E-6864 rs10784774 12 ILMN 2095653 AFMID 17 3.37E-30 8.42E-45 1.10E-11864 rs10784774 12 ILMN 2130078 CDKN2AIPNL 5 2.74E-13 6.28E-09 4.50E-3664 rs10784774 12 ILMN 2134381 ITPK1-AS1 14 2.02E-12 2.40E-15 3.93E-3464 rs10784774 12 ILMN 2182482 SHCBP1 16 3.29E-68 5.99E-54 3.59E-14564 rs10784774 12 ILMN 2334242 CREB1 2 5.33E-48 2.65E-59 1.61E-8664 rs10784774 12 ILMN 2412521 KIAA0101 15 2.18E-35 8.33E-21 1.89E-5165 rs4723226 7 ILMN 2089977 FKBP9L 7 6.28E-31 1.06E-28 4.99E-2866 rs10203656 2 ILMN 2094416 PLGLB2 2 1.11E-61 6.23E-173 1.77E-6367 rs10950029 7 ILMN 2118663 ZNF117 7 5.43E-24 6.49E-18 7.18E-2568 rs3810444 19 ILMN 2134224 ATP13A1 19 3.48E-28 7.74E-46 1.72E-1569 rs4665083 2 ILMN 2142752 MANSC1 12 2.68E-12 3.22E-06 2.53E-0770 rs3748144 8 ILMN 2144088 FDFT1 8 6.45E-14 5.26E-09 1.53E-0270 rs3763114 5 ILMN 2313926 CDC42SE2 5 1.73E-12 1.48E-11 6.30E-0171 rs8058597 16 ILMN 2147105 16 6.22E-173 2.11E-79 4.64E-3272 rs1555823 10 ILMN 2151056 C10ORF32 10 4.23E-21 6.28E-14 2.61E-1773 rs11673276 19 ILMN 2175715 KIR2DS5 19 1.52E-59 3.84E-3674 rs2912495 8 ILMN 2199439 CA2 8 1.37E-12 7.94E-16 3.03E-2475 rs7921218 10 ILMN 2209578 AGAP6 10 9.43E-16 1.72E-06 1.57E-0576 rs10116248 9 ILMN 2276758 POFUT1 20 1.45E-12 1.05E-22 7.64E-5877 rs13048152 21 ILMN 2291619 RAB3IP 12 3.03E-34 4.16E-26 4.82E-2178 rs11633427 15 ILMN 2320480 15 1.42E-18 3.72E-09 3.02E-0679 rs3917989 1 ILMN 2334242 CREB1 2 4.51E-18 1.61E-04 1.44E-03
Table A.1.: Significant trans-eQTLs in KORA F4
ILMN 1724609 ILMN 1743078 ILMN 1780382 ILMN 1786388 ILMN 1816342 ILMN 2408645Matched Genes SLC2A8 LOC653566 RNF113A SPCS2,LOC653566
Matched CHR 9 1 X 17QC comment good no matched mRNA good good good >1 matched chr
rs28358576 5.04E-02 6.35E-01 3.95E-51 1.26E-34 6.19E-01 3.33E-12rs3928306 6.50E-28 3.27E-05 1.98E-04 4.85E-02 1.20E-01 2.82E-01rs2854131 7.22E-02 4.12E-01 3.01E-01 9.89E-02 1.42E-11 9.38E-02
rs9743 7.11E-03 9.64E-02 1.84E-110 3.84E-59 8.31E-01 1.23E-22rs28358280 5.45E-03 9.80E-02 5.57E-116 1.07E-60 7.47E-01 4.65E-23rs3915952 6.25E-01 8.95E-11 2.53E-03 4.52E-03 6.09E-01 6.00E-01
rs28358285 4.47E-02 1.49E-01 5.66E-74 1.45E-37 9.25E-01 1.03E-13rs2853493 1.06E-02 8.06E-01 8.09E-26 8.82E-17 2.37E-04 1.40E-04rs2853498 5.28E-02 4.82E-01 3.64E-21 3.61E-14 1.82E-03 4.60E-04
rs28359172 2.40E-02 6.34E-14 3.85E-03 2.66E-02 6.89E-01 5.12E-01rs2853503 2.18E-01 4.71E-01 1.43E-01 1.17E-01 5.56E-10 1.75E-01
rs28359178 3.30E-02 2.44E-14 3.02E-03 1.70E-02 4.95E-01 7.45E-01rs3088309 4.84E-01 7.79E-11 1.68E-03 2.48E-03 5.99E-01 6.95E-01
Table A.2.: Significantly associated expression probes with at least one mitochondrial SNP:Associations were calculated between all expression levels and all mitochondrialSNPs using a linear regression model adjusted for 25 Eigen-genes. The displayedSNPs were significantly associated with at least one expression probes. Signifi-cant associations with p-value < 3.94 ∗ 10−8 are shown in bold.
133

A. Appendix
S4,1,plate28S4,0S4,0
S4,410,plate31S4,0
S4,0S4,1049,plate11
OGTT,424,plate07S4,0S4,0
S4,5,plate05S4,74,plate29
S4,290,plate22S4,47,plate19
S4,0S4,955,plate14
S4,0S4,11,plate23
S4,497,plate02S4,528,plate26
S4,0F4,762,plate28
S4,0S4,0
S4,0S4,0
S4,15,plate18S4,997,plate18
S4,0S4,112,plate05
S4,1043,plate03S4,0
S4,0S4,0
S4,0S4,0
S4,0S4,0
S4,709,plate03S4,0
S4,0S4,0S4,0S4,0
S4,0S4,448,plate19
S4,0S4,31,plate28
S4,0S4,390,plate14
S4,0S4,0S4,0
S4,0S4,0
S4,0S4,830,plate14
S4,0S4,0
S4,0S4,48,plate19
S4,0S4,0
S4,0S4,0S4,0
S4,0S4,0S4,0
S4,0S4,0S4,0
S4,0S4,0S4,845,plate19
S4,0S4,0
S4,0S4,0
S4,98,plate12S4,0
S4,0S4,0S4,0
S4,0S4,0
S4,0S4,0S4,0
S4,0S4,69,plate22S4,0
S4,0S4,0
S4,645,plate18S4,554,plate20
S4,0S4,0
S4,0S4,0
S4,0S4,0S4,0
S4,0S4,0S4,0
S4,0S4,0S4,0
S4,0S4,0
S4,0S4,0S4,0
S4,0S4,0
S4,651,plate32S4,0
S4,0S4,0
S4,0S4,0
S4,103,plate15S4,0S4,0
S4,0S4,0S4,0S4,141,plate22
S4,0S4,0
S4,0S4,0
S4,0S4,0S4,0
S4,0S4,0
S4,214,plate15S4,325,plate13
S4,0S4,95,plate03
S4,0S4,0
S4,1035,plate31S4,1087,plate14
S4,0S4,0
S4,0S4,285,plate22
S4,0S4,933,plate24
S4,0S4,0S4,0
S4,0S4,0
S4,0S4,0
S4,0S4,0
S4,0S4,250,plate02
S4,0S4,0
OGTT,651,plate32S4,0
S4,37,plate16S4,739,plate26
S4,0S4,0
S4,0S4,0S4,0
S4,0S4,0
S4,0S4,0
S4,97,plate27S4,0S4,0
S4,0S4,0
S4,0S4,0
S4,0S4,0
S4,0S4,0
S4,0S4,347,plate32
S4,804,plate13S4,0
S4,0S4,0
S4,0S4,381,plate32
S4,0S4,0
S4,0S4,474,plate13
S4,0S4,0S4,0S4,961,plate21
S4,722,plate06S4,0S4,0
S4,0S4,0
S4,982,plate30S4,0
S4,316,plate12S4,0S4,0
S4,0S4,0
S4,659,plate03S4,0S4,0
S4,0S4,0
S4,786,plate16S4,0S4,0
S4,329,plate06S4,0
S4,439,plate15S4,548,plate11
S4,0S4,0
S4,35,plate31S4,0
S4,0S4,0
S4,318,plate12S4,877,plate29S4,0S4,0
S4,0S4,0S4,0
S4,322,plate11S4,0
S4,791,plate21S4,0
S4,0S4,371,plate05
S4,0S4,81,plate21
S4,333,plate26S4,0
S4,0S4,0
S4,584,plate12S4,0S4,0
S4,0S4,0
S4,342,plate16S4,59,plate29
S4,0S4,0
S4,0S4,0
S4,0S4,612,plate15
S4,0S4,0
S4,0S4,0
S4,602,plate17S4,0
S4,0S4,0S4,0
S4,0S4,0S4,0
S4,0S4,0
S4,0S4,0
S4,0S4,366,plate27
S4,0S4,0S4,0
S4,0F4,873,plate29F4,972,plate03
S4,0S4,0
S4,0S4,0
S4,948,plate09aS4,0
S4,426,plate25S4,1001,plate01
S4,0S4,0
S4,666,plate05S4,0
S4,0OGTT,185,plate11
OGTT,555,plate18OGTT,595,plate01
OGTT,347,plate32F4,347,plate32
OGTT,755,plate07OGTT,836,plate21OGTT,950,plate23
OGTT,393,plate22S4,0
S4,455,plate13S4,640,plate19
S4,0S4,0S4,0
S4,549,plate12S4,0
S4,0S4,0
S4,0S4,190,plate17
S4,999,plate31S4,0S4,0
S4,0OGTT,668,plate09aOGTT,558,plate10
OGTT,613,plate13OGTT,917,plate26OGTT,790,plate18
S4,754,plate07F4,2,plate15
F4,632,plate13OGTT,632,plate13
F4,77,plate11F4,983,plate26
OGTT,986,plate24F4,691,plate13
OGTT,691,plate13OGTT,638,plate26
F4,638,plate26OGTT,801,plate20
F4,801,plate20F4,1025,plate01
F4,93,plate10OGTT,392,plate22
F4,393,plate22OGTT,320,plate25
F4,321,plate24F4,598,plate20
F4,987,plate24F4,461,plate16
OGTT,689,plate03F4,689,plate03
OGTT,870,plate28F4,484,plate22
OGTT,897,plate05F4,124,plate31
F4,426,plate25OGTT,426,plate25
F4,597,plate27OGTT,597,plate27
F4,624,plate31OGTT,624,plate31
F4,521,plate31F4,475,plate01
OGTT,478,plate22OGTT,711,plate27
F4,712,plate27OGTT,782,plate26
F4,783,plate04F4,592,plate16
OGTT,592,plate16F4,876,plate15
OGTT,856,plate32OGTT,421,plate18
F4,421,plate18F4,938,plate30
OGTT,938,plate30OGTT,287,plate17
F4,291,plate11F4,346,plate19
F4,631,plate13F4,812,plate15
F4,944,plate03OGTT,944,plate03
OGTT,33,plate14F4,36,plate13
F4,459,plate28F4,742,plate19
OGTT,742,plate19F4,1067,plate26
OGTT,1067,plate26F4,736,plate16
F4,817,plate16OGTT,817,plate16
OGTT,386,plate12F4,387,plate19
F4,810,plate31OGTT,334,plate24
F4,334,plate24F4,837,plate05
OGTT,837,plate05F4,162,plate02
F4,500,plate30F4,994,plate15
OGTT,507,plate09F4,629,plate27
OGTT,630,plate27F4,611,plate15
OGTT,1017,plate17F4,1017,plate17
F4,708,plate03OGTT,710,plate03
OGTT,400,plate23F4,400,plate23
F4,957,plate10F4,910,plate13
OGTT,910,plate13F4,20,plate28
F4,510,plate09aOGTT,514,plate02
F4,104,plate13F4,540,plate20
F4,955,plate14OGTT,992,plate12
F4,992,plate12F4,711,plate27
OGTT,959,plate15OGTT,443,plate24
OGTT,976,plate28OGTT,859,plate11
F4,859,plate11F4,719,plate03
OGTT,719,plate03OGTT,87,plate24F4,1011,plate11
F4,842,plate04OGTT,461,plate16
F4,367,plate27OGTT,369,plate13
F4,1051,plate23OGTT,1051,plate23
F4,219,plate21OGTT,1092,plate25
F4,474,plate13OGTT,474,plate13
F4,832,plate30OGTT,832,plate30
OGTT,440,plate28F4,578,plate01
OGTT,578,plate01OGTT,419,plate19
F4,423,plate07F4,150,plate04
F4,324,plate11OGTT,371,plate05
F4,371,plate05F4,939,plate16
OGTT,940,plate11F4,589,plate22
OGTT,589,plate22F4,564,plate03
OGTT,564,plate03F4,365,plate22
F4,449,plate19OGTT,452,plate15
OGTT,462,plate28F4,462,plate28
OGTT,456,plate03F4,456,plate03
F4,586,plate18OGTT,330,plate17
OGTT,335,plate26F4,335,plate26
OGTT,521,plate31F4,382,plate30
OGTT,312,plate11F4,330,plate17
F4,948,plate09aF4,386,plate12
OGTT,386,plate12F4,968,plate15
OGTT,968,plate15F4,844,plate04
F4,543,plate18OGTT,543,plate18F4,980,plate21
OGTT,981,plate31OGTT,619,plate10
OGTT,688,plate06F4,688,plate06OGTT,926,plate26
F4,926,plate26F4,740,plate26
F4,713,plate27OGTT,714,plate04
F4,1088,plate14F4,1075,plate01
OGTT,1075,plate01OGTT,560,plate16
F4,560,plate16F4,653,plate22
OGTT,653,plate22OGTT,805,plate13
F4,805,plate13F4,782,plate26
F4,528,plate26F4,718,plate28
OGTT,596,plate01OGTT,467,plate12
F4,381,plate32F4,667,plate01
OGTT,501,plate16F4,501,plate16
OGTT,525,plate28F4,676,plate22
F4,567,plate06OGTT,567,plate06
F4,840,plate27F4,327,plate06
F4,614,plate01F4,1076,plate14
OGTT,749,plate18F4,750,plate22
F4,901,plate03OGTT,901,plate03
F4,934,plate28F4,1048,plate11
F4,21,plate21OGTT,24,plate07
OGTT,657,plate17F4,657,plate17
F4,984,plate26OGTT,984,plate26
F4,1047,plate26F4,146,plate13
OGTT,147,plate18F4,820,plate20
F4,977,plate11OGTT,977,plate11
F4,616,plate03OGTT,616,plate03
OGTT,739,plate26OGTT,267,plate20
F4,271,plate12F4,600,plate31
OGTT,904,plate05OGTT,352,plate09a
F4,352,plate09aF4,808,plate28
OGTT,808,plate28F4,388,plate19
F4,472,plate24F4,534,plate15
F4,766,plate11OGTT,766,plate11
F4,530,plate07OGTT,530,plate07
OGTT,939,plate16F4,819,plate11
F4,1024,plate28F4,346,plate19
F4,1089,plate32F4,350,plate26
F4,971,plate24OGTT,451,plate15
F4,451,plate15F4,362,plate06
F4,1049,plate11F4,447,plate24
OGTT,692,plate12OGTT,716,plate05
F4,717,plate27F4,633,plate13
OGTT,634,plate14OGTT,724,plate06
F4,726,plate03F4,727,plate07
OGTT,728,plate07OGTT,945,plate24
F4,946,plate24F4,765,plate11
OGTT,765,plate11OGTT,655,plate11
F4,656,plate23S4,0
F4,763,plate17OGTT,432,plate07
F4,432,plate07OGTT,864,plate21
F4,864,plate21F4,922,plate24
F4,728,plate07OGTT,526,plate09
F4,710,plate03F4,860,plate06
OGTT,12,plate13F4,947,plate04
OGTT,950,plate23OGTT,623,plate28
F4,623,plate28F4,477,plate22
OGTT,477,plate22F4,886,plate19
OGTT,30,plate21F4,516,plate07
OGTT,518,plate07F4,843,plate32
OGTT,846,plate31F4,815,plate31
OGTT,493,plate07F4,494,plate29
OGTT,747,plate13OGTT,949,plate29
F4,949,plate29OGTT,440,plate28
OGTT,1021,plate09aOGTT,342,plate16
F4,383,plate30F4,1019,plate17
F4,642,plate15OGTT,642,plate15
F4,360,plate20OGTT,715,plate04
OGTT,570,plate10F4,570,plate10
OGTT,508,plate09OGTT,1065,plate20
F4,1065,plate20F4,594,plate09a
F4,646,plate23OGTT,646,plate23
F4,771,plate27OGTT,771,plate27
OGTT,397,plate21F4,397,plate21
F4,344,plate28F4,1069,plate26
F4,1090,plate25OGTT,1090,plate25
OGTT,705,plate11OGTT,875,plate21OGTT,435,plate13
OGTT,497,plate02OGTT,729,plate05
F4,729,plate05F4,989,plate25
OGTT,989,plate25F4,1064,plate13
F4,622,plate14F4,925,plate24
OGTT,925,plate24OGTT,512,plate05
F4,512,plate05F4,843,plate32
OGTT,843,plate32F4,934,plate28
F4,320,plate25F4,361,plate07
OGTT,822,plate13F4,1070,plate22
F4,423,plate07F4,877,plate29
F4,1027,plate01OGTT,1027,plate01
F4,359,plate20OGTT,359,plate20
F4,558,plate10OGTT,534,plate15OGTT,759,plate27
F4,584,plate12F4,1006,plate14
F4,428,plate19OGTT,428,plate19
OGTT,546,plate11F4,546,plate11
OGTT,602,plate17F4,602,plate17F4,1028,plate18
OGTT,1028,plate18OGTT,744,plate19
F4,744,plate19F4,50,plate22
F4,1000,plate01OGTT,546,plate11
F4,547,plate11OGTT,387,plate19
F4,387,plate19F4,370,plate06
F4,1015,plate06OGTT,814,plate15
F4,814,plate15OGTT,609,plate27
OGTT,321,plate24F4,321,plate24
F4,1008,plate29OGTT,538,plate20
F4,639,plate26OGTT,639,plate26
F4,703,plate07F4,1050,plate29
OGTT,1050,plate29OGTT,39,plate07
F4,44,plate29F4,985,plate32
OGTT,985,plate32OGTT,931,plate09a
F4,932,plate29OGTT,733,plate30
F4,670,plate16F4,309,plate21F4,429,plate19
F4,545,plate18F4,333,plate26
OGTT,333,plate26OGTT,630,plate27
F4,630,plate27F4,554,plate20
OGTT,554,plate20OGTT,740,plate26
F4,741,plate25OGTT,1010,plate19
OGTT,997,plate18F4,997,plate18
F4,629,plate27F4,558,plate10
OGTT,559,plate16OGTT,871,plate22
F4,871,plate22F4,404,plate30
OGTT,404,plate30F4,354,plate05
OGTT,457,plate13F4,504,plate13
OGTT,504,plate13F4,872,plate22
OGTT,669,plate16F4,671,plate23
OGTT,318,plate12F4,318,plate12
OGTT,878,plate25F4,878,plate25
OGTT,599,plate20OGTT,841,plate27
F4,841,plate27OGTT,748,plate13
F4,748,plate13OGTT,816,plate14
F4,816,plate14OGTT,1036,plate14
F4,1036,plate14OGTT,776,plate05
F4,776,plate05OGTT,380,plate07
F4,380,plate07F4,904,plate05
OGTT,175,plate31F4,751,plate22
OGTT,751,plate22F4,125,plate15F4,723,plate06
F4,703,plate07OGTT,463,plate14F4,1054,plate21
OGTT,1062,plate23OGTT,442,plate24
OGTT,1022,plate09aF4,1022,plate09a
F4,442,plate24F4,601,plate30
OGTT,1063,plate22F4,1063,plate22
F4,746,plate29F4,945,plate24
F4,959,plate15F4,976,plate28
OGTT,1031,plate12F4,1031,plate12
F4,480,plate27F4,389,plate14
F4,194,plate01OGTT,201,plate29
F4,671,plate23OGTT,671,plate23
OGTT,349,plate18F4,907,plate30
OGTT,907,plate30OGTT,238,plate09aOGTT,998,plate18
OGTT,666,plate05F4,666,plate05
F4,861,plate06OGTT,861,plate06
OGTT,906,plate05F4,906,plate05
OGTT,61,plate19OGTT,1049,plate11
OGTT,372,plate06F4,373,plate19
OGTT,875,plate21F4,875,plate21
OGTT,1071,plate22F4,1071,plate22
F4,1014,plate06OGTT,1014,plate06
F4,465,plate12OGTT,465,plate12
OGTT,1056,plate31OGTT,137,plate18OGTT,962,plate11
F4,302,plate13F4,933,plate24
OGTT,353,plate09aF4,353,plate09a
F4,548,plate11OGTT,803,plate20
F4,491,plate13OGTT,491,plate13
F4,836,plate21F4,520,plate15F4,325,plate13
OGTT,806,plate13F4,808,plate28
F4,1030,plate18F4,588,plate18
OGTT,614,plate01F4,615,plate03
OGTT,452,plate15F4,452,plate15
F4,963,plate11OGTT,1085,plate20
F4,1085,plate20F4,559,plate16
OGTT,559,plate16F4,476,plate01
OGTT,476,plate01F4,544,plate19
OGTT,544,plate19OGTT,694,plate12
F4,105,plate13OGTT,464,plate14
F4,468,plate21F4,538,plate20
F4,635,plate09aOGTT,535,plate32
F4,537,plate30F4,974,plate17
OGTT,670,plate16OGTT,331,plate32OGTT,340,plate11
OGTT,600,plate31F4,495,plate02
OGTT,687,plate06F4,727,plate07
OGTT,727,plate07F4,594,plate09a
OGTT,873,plate29OGTT,935,plate23
F4,936,plate30F4,770,plate27
OGTT,770,plate27OGTT,813,plate15
F4,900,plate19OGTT,894,plate04
F4,894,plate04OGTT,779,plate19
F4,779,plate19OGTT,967,plate15
F4,222,plate12S4,232,plate16F4,735,plate32
F4,581,plate05F4,752,plate29
OGTT,752,plate29F4,600,plate31F4,419,plate19
F4,1072,plate10OGTT,1072,plate10
OGTT,744,plate19F4,746,plate29
F4,306,plate10OGTT,1030,plate18
F4,1030,plate18F4,605,plate06
F4,487,plate19F4,553,plate26
OGTT,519,plate03F4,519,plate03
F4,408,plate21OGTT,712,plate27
F4,712,plate27F4,139,plate31
F4,848,plate09aOGTT,849,plate09a
OGTT,608,plate27F4,646,plate23
OGTT,650,plate23OGTT,140,plate22
OGTT,735,plate32F4,967,plate15
OGTT,479,plate27OGTT,542,plate10OGTT,429,plate19
OGTT,523,plate30F4,673,plate25
F4,529,plate26OGTT,529,plate26
OGTT,685,plate11S4,0S4,0
OGTT,822,plate13OGTT,999,plate31
F4,999,plate31OGTT,762,plate28OGTT,886,plate19
F4,1043,plate03OGTT,1043,plate03
OGTT,428,plate19F4,430,plate27
OGTT,620,plate17OGTT,1002,plate01
F4,1033,plate13OGTT,55,plate31
F4,56,plate24F4,327,plate06
OGTT,650,plate23F4,650,plate23
OGTT,662,plate03F4,662,plate03
OGTT,905,plate05F4,905,plate05
OGTT,918,plate13F4,918,plate13
F4,301,plate27F4,460,plate16
OGTT,460,plate16OGTT,142,plate14
OGTT,383,plate30OGTT,478,plate22
F4,435,plate13OGTT,910,plate13
F4,822,plate13OGTT,362,plate06
F4,774,plate17OGTT,774,plate17
F4,527,plate04F4,811,plate15
OGTT,909,plate31OGTT,1064,plate13
F4,1065,plate20F4,909,plate31
OGTT,1037,plate14F4,1037,plate14
F4,378,plate16F4,99,plate30
OGTT,100,plate30OGTT,407,plate24
F4,408,plate21OGTT,515,plate32
F4,515,plate32F4,880,plate14
OGTT,880,plate14OGTT,774,plate17
F4,778,plate19F4,427,plate29
F4,659,plate03OGTT,659,plate03
F4,4,plate27F4,893,plate27
OGTT,896,plate04OGTT,355,plate05
F4,355,plate05OGTT,499,plate22
F4,499,plate22OGTT,504,plate13
F4,505,plate13F4,846,plate31
OGTT,555,plate18F4,555,plate18
OGTT,737,plate28F4,737,plate28OGTT,647,plate23
F4,647,plate23F4,973,plate09
OGTT,973,plate09OGTT,887,plate16
F4,887,plate16F4,129,plate14F4,895,plate09
F4,694,plate12OGTT,1011,plate11
F4,1012,plate10OGTT,824,plate13
F4,824,plate13F4,1007,plate14
OGTT,1007,plate14F4,882,plate14
OGTT,882,plate14OGTT,1013,plate24
F4,1015,plate06OGTT,527,plate04
F4,527,plate04F4,863,plate21
OGTT,865,plate12OGTT,322,plate11
F4,322,plate11F4,587,plate32
OGTT,587,plate32OGTT,583,plate05
F4,764,plate29F4,1062,plate23
OGTT,901,plate03F4,902,plate04
F4,339,plate11OGTT,339,plate11
OGTT,345,plate19F4,345,plate19
F4,517,plate07F4,800,plate21
OGTT,800,plate21OGTT,314,plate10
OGTT,884,plate31F4,886,plate19
OGTT,797,plate07F4,797,plate07
OGTT,764,plate29F4,931,plate09a
OGTT,931,plate09aF4,956,plate10
OGTT,956,plate10F4,669,plate16
F4,283,plate19OGTT,286,plate29
OGTT,498,plate22F4,498,plate22
OGTT,1079,plate19F4,1081,plate06
OGTT,793,plate27F4,793,plate27
F4,492,plate07OGTT,492,plate07
F4,652,plate22OGTT,826,plate14
OGTT,493,plate07F4,576,plate07
OGTT,96,plate03OGTT,914,plate02
OGTT,1085,plate20OGTT,357,plate07
F4,357,plate07F4,475,plate01
S4,0OGTT,475,plate01
F4,127,plate01OGTT,128,plate09
OGTT,1025,plate01F4,675,plate29
OGTT,675,plate29OGTT,881,plate14
F4,883,plate13OGTT,1084,plate20
F4,1084,plate20OGTT,349,plate18
F4,349,plate18F4,674,plate18F4,760,plate27F4,753,plate07
OGTT,753,plate07OGTT,867,plate12
F4,1040,plate21F4,608,plate27
F4,131,plate13OGTT,132,plate13
OGTT,852,plate19OGTT,524,plate30
F4,524,plate30F4,468,plate21
OGTT,468,plate21OGTT,635,plate09a
F4,1010,plate19OGTT,741,plate25
F4,741,plate25F4,804,plate13
OGTT,804,plate13S4,23,plate07
F4,641,plate19F4,395,plate22F4,825,plate31
F4,939,plate16F4,1044,plate03F4,416,plate20
OGTT,827,plate13F4,827,plate13
OGTT,319,plate24F4,319,plate24
OGTT,348,plate18F4,854,plate02
OGTT,306,plate10F4,795,plate15
F4,724,plate06F4,1055,plate21
OGTT,1055,plate21F4,738,plate16
F4,921,plate31OGTT,921,plate31
F4,1074,plate10OGTT,1074,plate10
OGTT,332,plate17F4,335,plate26
F4,453,plate15F4,953,plate28
F4,794,plate31OGTT,794,plate31
OGTT,946,plate24F4,946,plate24
F4,803,plate20F4,726,plate03
F4,990,plate25OGTT,990,plate25
F4,975,plate17OGTT,170,plate04
F4,310,plate21F4,780,plate26
F4,656,plate23F4,821,plate31F4,885,plate19
F4,1050,plate29OGTT,1053,plate31
F4,364,plate29F4,730,plate23
F4,493,plate07F4,826,plate14
F4,916,plate26S4,1090,plate25
S4,0S4,0
F4,526,plate09OGTT,301,plate27
F4,764,plate29OGTT,770,plate27
OGTT,301,plate27OGTT,563,plate04
OGTT,350,plate26F4,533,plate15
OGTT,833,plate10F4,833,plate10
F4,497,plate02OGTT,821,plate31
OGTT,625,plate20F4,625,plate20
OGTT,351,plate26F4,352,plate09a
OGTT,810,plate31OGTT,1048,plate11
OGTT,388,plate19OGTT,495,plate02
S4,0F4,713,plate27
OGTT,713,plate27OGTT,1033,plate13
OGTT,934,plate28OGTT,819,plate11
OGTT,599,plate20F4,956,plate10
F4,549,plate12OGTT,549,plate12
F4,1044,plate03OGTT,64,plate20
F4,65,plate18F4,596,plate01
OGTT,761,plate18OGTT,652,plate22
F4,654,plate10OGTT,1003,plate10
F4,407,plate24OGTT,327,plate06
F4,367,plate27F4,563,plate04F4,577,plate07
F4,75,plate24OGTT,76,plate11
F4,753,plate07F4,914,plate02
F4,583,plate05F4,1091,plate25
OGTT,1091,plate25F4,698,plate09a
OGTT,698,plate09aF4,86,plate20
OGTT,119,plate09aF4,122,plate10
F4,677,plate11OGTT,677,plate11
OGTT,1011,plate11OGTT,963,plate11
F4,964,plate13OGTT,615,plate03
F4,937,plate26OGTT,801,plate20
F4,414,plate31OGTT,414,plate31
OGTT,490,plate16F4,490,plate16
F4,309,plate21OGTT,311,plate32
OGTT,390,plate14F4,251,plate01
OGTT,254,plate04OGTT,392,plate22OGTT,572,plate26
OGTT,66,plate18F4,67,plate22
F4,566,plate06OGTT,461,plate16
F4,462,plate28F4,379,plate06
OGTT,379,plate06F4,522,plate15
F4,778,plate19OGTT,215,plate29
F4,216,plate14OGTT,779,plate19
F4,463,plate14F4,725,plate02
F4,1066,plate20F4,585,plate12
OGTT,920,plate01OGTT,759,plate27
F4,761,plate18OGTT,785,plate13
F4,785,plate13OGTT,1052,plate21
F4,1052,plate21F4,642,plate15
F4,619,plate10OGTT,619,plate10
OGTT,930,plate09aOGTT,614,plate01F4,978,plate11
F4,754,plate07OGTT,754,plate07
F4,930,plate09aF4,235,plate25
OGTT,769,plate21OGTT,362,plate06
F4,637,plate09aOGTT,113,plate03
F4,115,plate03F4,422,plate07
F4,348,plate18F4,641,plate19
F4,1032,plate12F4,307,plate11
OGTT,308,plate32F4,1091,plate25
F4,693,plate12OGTT,693,plate12
OGTT,700,plate09aS4,458,plate28F4,460,plate16
F4,996,plate31OGTT,703,plate07
S4,0F4,700,plate09a
F4,539,plate20OGTT,539,plate20
F4,980,plate21F4,412,plate06
F4,585,plate12OGTT,1038,plate28
F4,1038,plate28F4,505,plate13
F4,392,plate22F4,572,plate26
F4,445,plate22F4,586,plate18
OGTT,586,plate18F4,1093,plate14
OGTT,838,plate04F4,838,plate04
F4,881,plate14F4,339,plate11
OGTT,341,plate16F4,620,plate17
OGTT,823,plate13F4,823,plate13
F4,1003,plate10OGTT,607,plate22
F4,607,plate22OGTT,678,plate19
F4,678,plate19F4,402,plate29
F4,143,plate14F4,970,plate25
OGTT,970,plate25F4,1083,plate09
OGTT,589,plate22OGTT,683,plate10
F4,683,plate10F4,834,plate27
OGTT,834,plate27OGTT,720,plate03
F4,720,plate03F4,785,plate13
OGTT,787,plate32F4,1060,plate19
OGTT,988,plate31F4,988,plate31
F4,377,plate30F4,516,plate07
OGTT,516,plate07OGTT,995,plate15
F4,995,plate15F4,415,plate20
F4,562,plate04F4,819,plate11
OGTT,502,plate32OGTT,406,plate24
F4,406,plate24F4,446,plate24
OGTT,446,plate24F4,923,plate24
OGTT,923,plate24OGTT,1021,plate09a
F4,1022,plate09aOGTT,368,plate27
F4,368,plate27F4,502,plate32
F4,307,plate11OGTT,307,plate11
F4,957,plate10OGTT,958,plate15
F4,687,plate06OGTT,328,plate06
OGTT,623,plate28F4,684,plate11
F4,1039,plate23F4,873,plate29
OGTT,365,plate22F4,924,plate01
OGTT,736,plate16F4,569,plate10
OGTT,879,plate14F4,772,plate27
F4,748,plate13F4,736,plate16
OGTT,737,plate28F4,332,plate17F4,919,plate13
F4,1034,plate13F4,685,plate11F4,991,plate12
OGTT,912,plate28OGTT,991,plate12
OGTT,612,plate15F4,520,plate15
F4,342,plate16F4,862,plate06
OGTT,354,plate05F4,483,plate21F4,828,plate13
F4,853,plate02F4,759,plate27
OGTT,361,plate07F4,6,plate05
F4,866,plate12OGTT,866,plate12
OGTT,892,plate28F4,892,plate28
F4,420,plate18OGTT,420,plate18
F4,1061,plate19OGTT,83,plate21
OGTT,1095,plate27F4,982,plate30
F4,1053,plate31F4,610,plate27
F4,878,plate25OGTT,879,plate14
OGTT,862,plate06OGTT,919,plate13
F4,874,plate21OGTT,389,plate14OGTT,974,plate17
F4,743,plate19F4,10,plate28
F4,831,plate31F4,1056,plate31
F4,187,plate11F4,457,plate13
F4,430,plate27OGTT,430,plate27
F4,470,plate15OGTT,470,plate15
OGTT,704,plate11F4,1021,plate09a
F4,704,plate11F4,715,plate04
F4,358,plate07OGTT,552,plate26
F4,552,plate26F4,384,plate12
OGTT,384,plate12OGTT,399,plate32
F4,399,plate32F4,561,plate04
F4,478,plate22F4,508,plate09
F4,350,plate26OGTT,436,plate23OGTT,655,plate11
F4,438,plate18F4,655,plate11
F4,1077,plate14F4,681,plate29
OGTT,681,plate29F4,879,plate14
F4,374,plate19F4,312,plate11F4,417,plate20
OGTT,895,plate09F4,897,plate05
OGTT,916,plate26OGTT,484,plate22
F4,173,plate02F4,667,plate01
F4,962,plate11F4,575,plate07
OGTT,576,plate07F4,856,plate32
OGTT,585,plate12F4,964,plate13
OGTT,964,plate13F4,798,plate07F4,839,plate15
OGTT,489,plate29OGTT,534,plate15F4,855,plate02
OGTT,643,plate18F4,643,plate18
F4,440,plate28F4,898,plate17
OGTT,900,plate19OGTT,1016,plate06
F4,1016,plate06OGTT,263,plate13
F4,264,plate13F4,612,plate15F4,761,plate18
F4,966,plate03OGTT,966,plate03
OGTT,633,plate13F4,633,plate13
OGTT,357,plate07F4,359,plate20
F4,1086,plate20OGTT,439,plate15
F4,439,plate15F4,351,plate26
OGTT,351,plate26OGTT,51,plate29
F4,757,plate27F4,52,plate05
F4,305,plate12OGTT,305,plate12
F4,694,plate12F4,450,plate27
F4,915,plate01F4,485,plate22
OGTT,487,plate19F4,375,plate29F4,747,plate13
OGTT,1026,plate01OGTT,209,plate22
F4,213,plate15F4,541,plate10
OGTT,562,plate04F4,562,plate04
F4,491,plate13F4,595,plate01
F4,225,plate07OGTT,227,plate30
F4,551,plate12F4,890,plate12
F4,855,plate02F4,865,plate12
OGTT,865,plate12F4,521,plate31
OGTT,526,plate09F4,343,plate28
F4,331,plate32F4,366,plate27F4,852,plate19
OGTT,706,plate11F4,1073,plate10
OGTT,898,plate17F4,898,plate17
OGTT,437,plate18F4,437,plate18
F4,626,plate09F4,734,plate20F4,664,plate05
OGTT,971,plate24F4,902,plate04
OGTT,1023,plate14F4,394,plate22
F4,707,plate09aF4,410,plate31
F4,858,plate19OGTT,858,plate19
F4,701,plate07F4,850,plate27
F4,14,plate28OGTT,16,plate25
F4,1038,plate28OGTT,1042,plate05
OGTT,532,plate07F4,532,plate07
F4,360,plate20F4,733,plate30
F4,1018,plate17OGTT,1018,plate17
OGTT,466,plate12OGTT,652,plate22
S4,0OGTT,912,plate28
F4,912,plate28F4,607,plate22F4,790,plate18
OGTT,993,plate28OGTT,1069,plate26
F4,995,plate15OGTT,967,plate15
F4,739,plate26F4,409,plate21
OGTT,1019,plate17F4,1019,plate17
OGTT,394,plate22OGTT,329,plate06
F4,621,plate28OGTT,621,plate28
F4,672,plate24OGTT,942,plate17
F4,942,plate17OGTT,718,plate28
F4,718,plate28OGTT,26,plate27
F4,28,plate21OGTT,617,plate10
F4,617,plate10F4,628,plate04
OGTT,593,plate09aOGTT,308,plate32
OGTT,695,plate32F4,644,plate31
OGTT,644,plate31F4,983,plate26
F4,328,plate06OGTT,328,plate06
F4,202,plate19OGTT,205,plate16
F4,1026,plate01F4,811,plate15
F4,1013,plate24OGTT,302,plate13
F4,302,plate13F4,444,plate22
OGTT,444,plate22F4,569,plate10
OGTT,570,plate10F4,660,plate03
OGTT,664,plate05OGTT,665,plate05
F4,665,plate05F4,755,plate07
OGTT,781,plate26F4,781,plate26
F4,950,plate23OGTT,986,plate24
F4,986,plate24OGTT,603,plate06
F4,603,plate06OGTT,690,plate03
F4,316,plate12OGTT,316,plate12
OGTT,373,plate19F4,373,plate19
OGTT,506,plate17F4,506,plate17
F4,921,plate31OGTT,503,plate13
F4,1042,plate05OGTT,900,plate19
F4,645,plate18F4,699,plate09a
OGTT,148,plate18OGTT,449,plate19
F4,449,plate19F4,535,plate32
OGTT,887,plate16F4,911,plate15
OGTT,911,plate15OGTT,668,plate09a
F4,668,plate09aOGTT,948,plate09a
OGTT,906,plate05OGTT,674,plate18
OGTT,850,plate27OGTT,860,plate06
OGTT,551,plate12F4,326,plate13F4,941,plate13
F4,660,plate03OGTT,660,plate03
OGTT,343,plate28OGTT,796,plate07
F4,796,plate07F4,675,plate29
F4,889,plate27OGTT,889,plate27
OGTT,750,plate22F4,750,plate22
OGTT,531,plate07F4,531,plate07
F4,978,plate11F4,716,plate05
OGTT,716,plate05F4,580,plate27
OGTT,580,plate27OGTT,855,plate02
F4,913,plate15F4,1058,plate14
OGTT,1040,plate21F4,884,plate31
OGTT,884,plate31F4,1078,plate31
F4,707,plate09aF4,680,plate30
F4,1086,plate20F4,556,plate03
OGTT,556,plate03OGTT,90,plate21
F4,92,plate10F4,1033,plate13
OGTT,1036,plate14OGTT,834,plate27
F4,1035,plate31F4,305,plate12
OGTT,306,plate10OGTT,577,plate07
OGTT,629,plate27OGTT,433,plate03
F4,434,plate03F4,434,plate03
OGTT,434,plate03OGTT,611,plate15
OGTT,446,plate24F4,447,plate24
F4,557,plate03OGTT,915,plate01
OGTT,799,plate23F4,799,plate23
OGTT,395,plate22OGTT,450,plate27
OGTT,375,plate29F4,813,plate15
OGTT,565,plate03F4,565,plate03
F4,947,plate04OGTT,947,plate04
OGTT,868,plate13F4,868,plate13
OGTT,674,plate18F4,1057,plate14
OGTT,1081,plate06F4,1081,plate06
F4,1088,plate14OGTT,1088,plate14
OGTT,70,plate31F4,71,plate29
F4,634,plate14OGTT,634,plate14
F4,809,plate30F4,503,plate13
F4,337,plate03OGTT,337,plate03
F4,783,plate04OGTT,664,plate05
OGTT,472,plate24F4,791,plate21
OGTT,509,plate09aF4,509,plate09a
OGTT,831,plate31OGTT,663,plate03
F4,706,plate11OGTT,706,plate11
OGTT,701,plate07OGTT,890,plate12
OGTT,680,plate30OGTT,920,plate01
OGTT,433,plate03F4,651,plate32
S4,154,plate03F4,156,plate03
OGTT,1075,plate01F4,940,plate11
OGTT,645,plate18F4,690,plate03
OGTT,996,plate31F4,941,plate13
OGTT,942,plate17OGTT,363,plate06
F4,573,plate31F4,32,plate14
OGTT,961,plate21F4,993,plate28
OGTT,993,plate28OGTT,376,plate31
F4,863,plate21F4,961,plate21
F4,393,plate22F4,709,plate03
OGTT,709,plate03OGTT,1079,plate19
F4,841,plate27F4,539,plate20
F4,1066,plate20F4,730,plate23
OGTT,413,plate06F4,135,plate06
OGTT,134,plate06OGTT,245,plate22
F4,918,plate13F4,696,plate23
OGTT,696,plate23F4,299,plate24
OGTT,317,plate12OGTT,538,plate20
OGTT,496,plate01F4,496,plate01
OGTT,513,plate02F4,513,plate02
F4,1094,plate14OGTT,1094,plate14
OGTT,300,plate28F4,511,plate09a
OGTT,303,plate12F4,315,plate10
OGTT,315,plate10OGTT,867,plate12
OGTT,767,plate11F4,1045,plate04
OGTT,488,plate16OGTT,658,plate17
F4,658,plate17OGTT,1045,plate04
OGTT,990,plate25F4,991,plate12
F4,424,plate07F4,812,plate15
OGTT,818,plate11OGTT,869,plate13
OGTT,857,plate19F4,1008,plate29
OGTT,957,plate10OGTT,594,plate09a
S4,0F4,840,plate27
OGTT,309,plate21OGTT,628,plate04
OGTT,734,plate20F4,734,plate20
OGTT,802,plate20F4,1054,plate21
OGTT,453,plate15OGTT,881,plate14
F4,777,plate05OGTT,777,plate05
F4,273,plate12OGTT,545,plate18
F4,545,plate18F4,636,plate09a
OGTT,636,plate09aF4,314,plate10
F4,684,plate11F4,580,plate27
F4,976,plate28OGTT,1013,plate24
F4,606,plate22F4,1023,plate14
F4,699,plate09aOGTT,700,plate09a
F4,1079,plate19F4,317,plate12
F4,928,plate13OGTT,928,plate13
OGTT,627,plate09F4,627,plate09
F4,488,plate16F4,891,plate12
F4,489,plate29F4,767,plate11
F4,731,plate31S4,0
F4,455,plate13OGTT,455,plate13
F4,789,plate18F4,308,plate32
F4,599,plate20OGTT,790,plate18
F4,697,plate23OGTT,697,plate23
F4,868,plate13F4,917,plate26
OGTT,917,plate26F4,903,plate09F4,431,plate07
F4,613,plate13OGTT,925,plate24
F4,803,plate20F4,502,plate32
OGTT,503,plate13F4,954,plate27
F4,160,plate02F4,1072,plate10
F4,413,plate06F4,869,plate13
OGTT,1070,plate22OGTT,972,plate03
F4,415,plate20OGTT,416,plate20
OGTT,604,plate05F4,604,plate05
OGTT,1068,plate30OGTT,851,plate19
OGTT,311,plate32F4,311,plate32OGTT,547,plate11
F4,547,plate11F4,860,plate06
OGTT,427,plate29F4,851,plate19
F4,239,plate21F4,1046,plate26
OGTT,1046,plate26S4,19,plate21
S4,107,plate32S4,0
S4,0OGTT,1073,plate10
S4,89,plate21S4,120,plate09a
S4,0S4,888,plate16
S4,0S4,0
S4,0S4,0
S4,0S4,197,plate29F4,857,plate19
S4,0S4,0
S4,536,plate30S4,0S4,0
S4,0S4,0
OGTT,445,plate22S4,0S4,0
S4,0S4,0
S4,0S4,0
S4,1078,plate31OGTT,218,plate21OGTT,374,plate19
F4,425,plate25OGTT,425,plate25
OGTT,789,plate18F4,789,plate18
S4,0OGTT,1064,plate13
S4,0S4,0S4,0
F4,943,plate03OGTT,731,plate31
OGTT,598,plate20OGTT,924,plate01
OGTT,505,plate13F4,466,plate12
OGTT,584,plate12OGTT,798,plate07OGTT,815,plate31
F4,1020,plate09aOGTT,402,plate29OGTT,581,plate05
S4,0S4,0
OGTT,422,plate07F4,453,plate15
S4,0S4,60,plate30
S4,0S4,0
F4,1082,plate05S4,0
OGTT,417,plate20OGTT,763,plate17
S4,0OGTT,853,plate02
S4,7,plate05S4,1005,plate10
S4,0S4,0
S4,13,plate18S4,0S4,0
S4,507,plate09S4,138,plate18
S4,0S4,937,plate26
S4,0S4,223,plate13S4,897,plate05S4,224,plate07
S4,0S4,304,plate12
S4,0S4,411,plate06
S4,466,plate12S4,0
S4,0S4,0
S4,0S4,0
S4,109,plate11S4,0
S4,987,plate24S4,0S4,0
S4,0S4,0
S4,788,plate14S4,356,plate05
S4,0S4,0S4,0
S4,0S4,0S4,0
S4,0S4,0S4,0
S4,755,plate07S4,0
S4,0S4,49,plate22
S4,591,plate32S4,0S4,0
S4,0S4,1017,plate17
S4,358,plate07S4,486,plate19
S4,0S4,0
F4,523,plate30S4,0
S4,0S4,0S4,0
S4,618,plate11S4,0
S4,0S4,58,plate15
S4,151,plate04S4,0
S4,0S4,0
S4,519,plate03S4,0
S4,0S4,0
S4,899,plate25S4,144,plate12
S4,0S4,424,plate07
S4,0S4,490,plate16
S4,0S4,588,plate18S4,0S4,0
S4,807,plate30S4,0
OGTT,857,plate19S4,994,plate15
S4,0S4,0S4,0
S4,336,plate03S4,0S4,0
S4,515,plate32S4,0
S4,437,plate18S4,1057,plate14
S4,0S4,773,plate17
S4,0S4,880,plate14
S4,268,plate01S4,0S4,0
S4,0S4,0
S4,0S4,0
S4,354,plate05S4,0
S4,0S4,0
S4,1023,plate14S4,0S4,0
S4,0S4,511,plate09a
S4,0S4,0
S4,701,plate07S4,0
S4,0S4,0
S4,0S4,0
S4,0S4,0
S4,0S4,0
S4,0S4,483,plate21
S4,729,plate05S4,0S4,0
S4,0S4,0S4,0
S4,0S4,0
S4,0S4,133,plate13S4,564,plate03
S4,0S4,54,plate05
S4,73,plate24S4,0
S4,0S4,0
S4,943,plate03S4,0
S4,0S4,0
S4,0OGTT,155,plate03OGTT,940,plate11
S4,1074,plate10S4,0S4,0
S4,0S4,0
S4,0S4,0
S4,0F4,111,plate05
S4,560,plate16S4,821,plate31
S4,0S4,0
OGTT,483,plate21S4,0S4,0
F4,336,plate03OGTT,336,plate03
S4,163,plate16S4,501,plate16
S4,0S4,0
S4,25,plate13S4,0
S4,0S4,872,plate22
S4,0S4,541,plate10
S4,0S4,831,plate31
S4,0S4,0S4,0
S4,0S4,0
S4,0S4,0
S4,0S4,0S4,0
S4,595,plate01S4,0
S4,0S4,0S4,0
S4,0S4,0
S4,578,plate01S4,661,plate04
S4,0S4,0S4,0
S4,923,plate24S4,0
S4,237,plate03S4,0
S4,0S4,0S4,0
S4,0S4,247,plate01
S4,0S4,610,plate27
S4,969,plate24S4,0
S4,798,plate07S4,0
S4,0S4,0
S4,523,plate30S4,0S4,0
S4,745,plate19S4,0
S4,0S4,0
S4,681,plate29S4,0S4,0
S4,0S4,159,plate24
S4,0S4,0
S4,0S4,0
S4,0S4,171,plate02
S4,965,plate08S4,471,plate15
S4,0S4,0
S4,0OGTT,1009,plate19
S4,0S4,274,plate12
S4,1069,plate26S4,0
S4,0S4,0
S4,312,plate11S4,406,plate24
S4,0S4,0
S4,375,plate29S4,0S4,0S4,0
S4,914,plate02S4,0
S4,0S4,0
OGTT,444,plate22F4,445,plate22
F4,482,plate21OGTT,707,plate09a
F4,848,plate09aF4,157,plate29
OGTT,158,plate24OGTT,565,plate03
F4,567,plate06F4,788,plate14
OGTT,8,plate05F4,9,plate23
F4,935,plate23F4,458,plate28
OGTT,18,plate25OGTT,708,plate03
OGTT,576,plate07OGTT,616,plate03
F4,617,plate10OGTT,1027,plate01
F4,1029,plate31OGTT,177,plate15
F4,181,plate03OGTT,1001,plate01
F4,1001,plate01OGTT,795,plate15
OGTT,625,plate20F4,626,plate09
F4,896,plate04F4,927,plate26
OGTT,775,plate17F4,775,plate17
S4,689,plate03S4,0
OGTT,1080,plate19F4,1080,plate19
F4,867,plate12OGTT,1062,plate23
OGTT,935,plate23S4,206,plate31
S4,0S4,0
S4,0F4,557,plate03
S4,696,plate23S4,0
OGTT,902,plate04OGTT,825,plate31
S4,0F4,1076,plate14
F4,391,plate19F4,454,plate15
OGTT,454,plate15F4,903,plate09
F4,1009,plate19F4,849,plate09aF4,996,plate31
OGTT,313,plate11F4,680,plate30
OGTT,682,plate19S4,0
OGTT,699,plate09aF4,883,plate13
OGTT,1086,plate20OGTT,883,plate13
OGTT,234,plate25F4,404,plate30
OGTT,405,plate31F4,590,plate22OGTT,391,plate19
OGTT,849,plate09aOGTT,472,plate24
F4,473,plate31OGTT,1057,plate14
OGTT,768,plate21F4,768,plate21
F4,780,plate26OGTT,780,plate26
F4,340,plate11F4,363,plate06
OGTT,1070,plate22OGTT,272,plate12
OGTT,1012,plate10F4,1012,plate10
OGTT,366,plate27F4,769,plate21
OGTT,937,plate26F4,745,plate19
OGTT,927,plate26OGTT,913,plate15
F4,916,plate26F4,732,plate23
OGTT,732,plate23F4,702,plate07
OGTT,702,plate07F4,845,plate19
F4,929,plate09aF4,615,plate03
S4,256,plate24S4,0
S4,828,plate13S4,275,plate28
S4,0S4,0S4,0
S4,0S4,0
S4,0S4,0
OGTT,370,plate06OGTT,746,plate29
F4,981,plate31OGTT,981,plate31
S4,0S4,0
OGTT,514,plate02F4,500,plate30F4,960,plate21
OGTT,257,plate24F4,261,plate04
F4,826,plate14F4,277,plate14
OGTT,279,plate18F4,542,plate10
OGTT,542,plate10OGTT,500,plate30OGTT,960,plate21
OGTT,908,plate23F4,908,plate23
F4,795,plate15F4,514,plate02
OGTT,661,plate04F4,661,plate04
F4,705,plate11F4,749,plate18
OGTT,749,plate18F4,370,plate06
OGTT,480,plate27F4,480,plate27
F4,571,plate26F4,395,plate22
OGTT,397,plate21S4,396,plate21
S4,0S4,0
S4,0S4,0
OGTT,313,plate11F4,315,plate10
F4,847,plate19OGTT,847,plate19
F4,398,plate23F4,431,plate07
OGTT,432,plate07F4,829,plate13
OGTT,830,plate14OGTT,835,plate21
F4,938,plate30F4,784,plate30F4,830,plate14
OGTT,721,plate03OGTT,959,plate15
F4,960,plate21F4,756,plate30
OGTT,757,plate27F4,989,plate25
F4,550,plate12F4,648,plate28
OGTT,438,plate18F4,438,plate18
OGTT,891,plate12OGTT,893,plate27
F4,893,plate27F4,679,plate17F4,758,plate27F4,792,plate27
F4,469,plate20F4,579,plate27F4,936,plate30
F4,951,plate26F4,403,plate30
OGTT,394,plate22OGTT,649,plate23
F4,649,plate23OGTT,448,plate19
S4,0F4,448,plate19
F4,908,plate23OGTT,909,plate31
F4,303,plate12F4,1059,plate28
OGTT,320,plate25F4,356,plate05
S4,603,plate06F4,911,plate15
F4,968,plate15OGTT,1048,plate11
F4,85,plate20F4,338,plate03
OGTT,338,plate03F4,624,plate31
F4,369,plate13OGTT,369,plate13
F4,486,plate19OGTT,486,plate19
OGTT,1053,plate31OGTT,441,plate15
F4,441,plate15F4,690,plate03
OGTT,691,plate13F4,300,plate28
OGTT,471,plate15F4,471,plate15
OGTT,323,plate11F4,323,plate11
F4,479,plate27F4,682,plate19
F4,952,plate26F4,568,plate06
OGTT,324,plate11F4,324,plate11
F4,965,plate08OGTT,965,plate08
OGTT,574,plate14F4,574,plate14
F4,582,plate05OGTT,582,plate05
OGTT,610,plate27OGTT,807,plate30
F4,807,plate30F4,672,plate24
OGTT,367,plate27F4,467,plate12
OGTT,593,plate09aF4,593,plate09a
F4,319,plate24F4,800,plate21
OGTT,979,plate21OGTT,720,plate03OGTT,728,plate07
F4,550,plate12OGTT,551,plate12
OGTT,116,plate03OGTT,1093,plate14
F4,380,plate07OGTT,385,plate12
F4,330,plate17F4,418,plate20
OGTT,1041,plate05OGTT,686,plate06
F4,433,plate03F4,1025,plate01
OGTT,1026,plate01S4,0S4,0
F4,473,plate31OGTT,473,plate31
OGTT,636,plate09aOGTT,408,plate21OGTT,553,plate26
F4,890,plate12S4,0
OGTT,747,plate13OGTT,161,plate02OGTT,724,plate06
F4,296,plate04OGTT,511,plate09a
S4,0OGTT,536,plate30
F4,1004,plate10OGTT,932,plate29
F4,932,plate29OGTT,609,plate27
F4,609,plate27F4,620,plate17
OGTT,409,plate21OGTT,431,plate07
S4,0S4,0
S4,0F4,313,plate11
OGTT,590,plate22F4,481,plate27
F4,927,plate26OGTT,577,plate07
OGTT,745,plate19OGTT,845,plate19
S4,176,plate16S4,0
S4,0S4,0
S4,0S4,0
OGTT,292,plate11F4,663,plate03
S4,0OGTT,402,plate29OGTT,784,plate30
OGTT,936,plate30F4,401,plate22
OGTT,799,plate23S4,0
S4,0OGTT,952,plate26
F4,953,plate28F4,773,plate17
F4,1041,plate05F4,183,plate03
OGTT,398,plate23OGTT,1077,plate14OGTT,485,plate22
S4,0S4,0
OGTT,829,plate13S4,0S4,0
S4,0
20406080100120140160
Den
drog
ram
of
agne
s(x
= t(
norm
.clu
ster
))
Agg
lom
erat
ive
Coe
ffici
ent =
0.6
6t(
norm
.clu
ster
)
Height
Figure A.1.: Cluster of all KORA S4, F4, and F4 OGTT samples having expression data:The expression levels of 2,509 samples were clustered using the agglomerativeclustering implemented in the R package cluster. Three S4 samples clusteredseparately (at the top of the cluster) and were therefore called outliers and wereremoved for further analyses.
134

A.3. Tables and Figures
Figure A.2.: Comparison of VST and log2 transformation for a random phenotype in KORAF4:The figures show the difference between the VST- and log2-transformed expres-sion values in association with a random normal distributed phenotype. Eachdot represents one probe and the color code is given in the legend of the plots.Differences are observed for the mean intensity values for low intensity values,for betas, and for standard errors of betas. Despite those differences the p-valuesare highly correlated (r2=0.9939).
135

A. Appendix
136

B. Declaration - Eidesstattliche Versicherung
Ich erklare hiermit an Eides statt,dass ich die vorliegende Dissertation mit dem Thema
Gene expression studies:From case-control to multiple-population-based studies
selbstandig verfasst, mich außer der angegebenen keiner weiteren Hilfsmittel bedient undalle Erkenntnisse, die aus dem Schrifttum ganz oder annahernd ubernommen sind, als solchekenntlich gemacht und nach ihrer Herkunft unter Bezeichnung der Fundstelle einzeln nach-gewiesen habe. Ich erklare des Weiteren, dass die hier vorgelegte Dissertation nicht in glei-cher oder in ahnlicher Form bei einer anderen Stelle zur Erlangung eines akademischenGrades eingereicht wurde.
Ort, Datum Katharina Schramm
137

B. Declaration - Eidesstattliche Versicherung
138

Bibliography
Frank W. Albert and Leonid Kruglyak. The role of regulatory variation in complex traitsand disease. Nat Rev Genet, 16(4):197–212, Apr 2015. doi: 10.1038/nrg3891. URL http://dx.doi.org/10.1038/nrg3891.
David Matthew Altshuler, Eric Steven Lander, Lauren Ambrogio, Toby Bloom, KristianCibulskis, Tim J Fennell, Stacey B Gabriel, David B Jaffe, Erica Shefler, Carrie L Sougnez,et al. A map of human genome variation from population scale sequencing. 2010. URLhttp://dash.harvard.edu/handle/1/5339502.
Nuno L Barbosa-Morais, Mark J Dunning, Shamith A Samarajiwa, Jeremy FJ Darot,Matthew E Ritchie, Andy G Lynch, and Simon Tavare. A re-annotation pipeline for il-lumina beadarrays: improving the interpretation of gene expression data. Nucleic acids re-search, 38(3):e17–e17, 2010. URL http://nar.oxfordjournals.org/content/38/3/e17.short.
Yoav Benjamini and Yosef Hochberg. Controlling the false discovery rate: A practical andpowerful approach to multiple testing. Journal of the Royal Statistical Society, 57:289–300,1995.
Marina Bibikova, Bret Barnes, Chan Tsan, Vincent Ho, Brandy Klotzle, Jennie M. Le, DavidDelano, Lu Zhang, Gary P. Schroth, Kevin L. Gunderson, Jian-Bing Fan, and Richard Shen.High density dna methylation array with single cpg site resolution. Genomics, 98:288–295,2011.
E. M. Blackwood and J. T. Kadonaga. Going the distance: a current view of enhancer action.Science, 281(5373):60–63, Jul 1998.
B. M. Bolstad, R. A. Irizarry, M. Astrand, and T. P. Speed. A comparison of normalizationmethods for high density oligonucleotide array data based on variance and bias. Bioinfor-matics, 19(2):185–193, Jan 2003.
Marc J Bonder, Silva Kasela, Mart Kals, Riin Tamm, Kaie Lokk, Isabel Barragan, Wim ABuurman, Patrick Deelen, Jan-Willem Greve, Maxim Ivanov, et al. Genetic and epigeneticregulation of gene expression in fetal and adult human livers. BMC genomics, 15(1):860,2014.
Todd M. Bull, Christopher D. Coldren, Mark Moore, Sylk M. Sotto-Santiago, David V. Pham,S Patrick Nana-Sinkam, Norbert F. Voelkel, and Mark W. Geraci. Gene microarray analysisof peripheral blood cells in pulmonary arterial hypertension. Am J Respir Crit Care Med, 170(8):911–919, Oct 2004. doi: 10.1164/rccm.200312-1686OC. URL http://dx.doi.org/10.1164/rccm.200312-1686OC.
John C. Chambers, Weihua Zhang, Graham M. Lord, Pim van der Harst, Debbie A. Lawlor,Joban S. Sehmi, Daniel P. Gale, Mark N. Wass, Kourosh R. Ahmadi, Stephan J L. Bakker,
139

Bibliography
Jacqui Beckmann, Henk J G. Bilo, Murielle Bochud, Morris J. Brown, Mark J. Caulfield,John M C. Connell, H Terence Cook, Ioana Cotlarciuc, George Davey Smith, Ranil deSilva, Guohong Deng, Olivier Devuyst, Lambert D. Dikkeschei, Nada Dimkovic, MarkDockrell, Anna Dominiczak, Shah Ebrahim, Thomas Eggermann, Martin Farrall, LuigiFerrucci, Jurgen Floege, Nita G. Forouhi, Ron T. Gansevoort, Xijin Han, Bo Hedblad, Jaap J.Homan van der Heide, Bouke G. Hepkema, Maria Hernandez-Fuentes, Elina Hypponen,Toby Johnson, Paul E. de Jong, Nanne Kleefstra, Vasiliki Lagou, Marta Lapsley, Yun Li,Ruth J F. Loos, Jian’an Luan, Karin Luttropp, Celine Marechal, Olle Melander, Patricia B.Munroe, Louise Nordfors, Afshin Parsa, Leena Peltonen, Brenda W. Penninx, EsperanzaPerucha, Anneli Pouta, Inga Prokopenko, Paul J. Roderick, Aimo Ruokonen, Nilesh J.Samani, Serena Sanna, Martin Schalling, David Schlessinger, Georg Schlieper, Marc A J.Seelen, Alan R. Shuldiner, Marketa Sjogren, Johannes H. Smit, Harold Snieder, NicoleSoranzo, Timothy D. Spector, Peter Stenvinkel, Michael J E. Sternberg, RamasamyiyerSwaminathan, Toshiko Tanaka, Lielith J. Ubink-Veltmaat, Manuela Uda, Peter Vollenwei-der, Chris Wallace, Dawn Waterworth, Klaus Zerres, Gerard Waeber, Nicholas J. Wareham,Patrick H. Maxwell, Mark I. McCarthy, Marjo-Riitta Jarvelin, Vincent Mooser, Goncalo R.Abecasis, Liz Lightstone, James Scott, Gerjan Navis, Paul Elliott, and Jaspal S. Kooner.Genetic loci influencing kidney function and chronic kidney disease. Nat Genet, 42(5):373–375, May 2010. doi: 10.1038/ng.566. URL http://dx.doi.org/10.1038/ng.566.
Lin S Chen and John D Storey. Eigen-r2 for dissecting variation in high-dimensionalstudies. Bioinformatics, 24(19):2260–2262, 2008. URL http://bioinformatics.oxfordjournals.org/content/24/19/2260.short.
Vivian G. Cheung, Laura K. Conlin, Teresa M. Weber, Melissa Arcaro, Kuang-Yu Jen, MichaelMorley, and Richard S. Spielman. Natural variation in human gene expression assessedin lymphoblastoid cells. Nat Genet, 33(3):422–425, Mar 2003. doi: 10.1038/ng1094. URLhttp://dx.doi.org/10.1038/ng1094.
Vivian G Cheung, Richard S Spielman, Kathryn G Ewens, Teresa M Weber, Michael Mor-ley, and Joshua T Burdick. Mapping determinants of human gene expression by regionaland genome-wide association. Nature, 437(7063):1365–1369, Oct 2005. doi: 10.1038/nature04244. URL http://dx.doi.org/10.1038/nature04244.
G. A. Churchill and R. W. Doerge. Empirical threshold values for quantitative trait mapping.Genetics, 138(3):963–971, Nov 1994.
William S. Cleveland. Robust locally weighted regression and smoothing scatterplots. Jour-nal of the American Statistical Association, 74:829–836, 1979.
Wellcome Trust Case Control Consortium. Genome-wide association study of 14,000 casesof seven common diseases and 3,000 shared controls. Nature, 447(7145):661–678, Jun 2007.doi: 10.1038/nature05911. URL http://dx.doi.org/10.1038/nature05911.
Marilyn C. Cornelis and Frank B. Hu. Systems epidemiology: A new direction in nu-trition and metabolic disease research. Curr Nutr Rep, 2(4), Dec 2013. doi: 10.1007/s13668-013-0052-4. URL http://dx.doi.org/10.1007/s13668-013-0052-4.
Zari Dastani, Marie-France Hivert, Nicholas Timpson, John R B. Perry, Xin Yuan, Robert A.Scott, Peter Henneman, Iris M. Heid, Jorge R. Kizer, Leo-Pekka Lyytikainen, Christian
140

Bibliography
Fuchsberger, Toshiko Tanaka, Andrew P. Morris, Kerrin Small, Aaron Isaacs, Marian Beek-man, Stefan Coassin, Kurt Lohman, Lu Qi, Stavroula Kanoni, James S. Pankow, Hae-WonUh, Ying Wu, Aurelian Bidulescu, Laura J. Rasmussen-Torvik, Celia M T. Greenwood,Martin Ladouceur, Jonna Grimsby, Alisa K. Manning, Ching-Ti Liu, Jaspal Kooner, Vin-cent E. Mooser, Peter Vollenweider, Karen A. Kapur, John Chambers, Nicholas J. Ware-ham, Claudia Langenberg, Rune Frants, Ko Willems-Vandijk, Ben A. Oostra, Sara M.Willems, Claudia Lamina, Thomas W. Winkler, Bruce M. Psaty, Russell P. Tracy, JenniferBrody, Ida Chen, Jorma Viikari, Mika Kahonen, Peter P. Pramstaller, David M. Evans,Beate St Pourcain, Naveed Sattar, Andrew R. Wood, Stefania Bandinelli, Olga D. Carl-son, Josephine M. Egan, Stefan Bohringer, Diana van Heemst, Lyudmyla Kedenko, KatiKristiansson, Marja-Liisa Nuotio, Britt-Marie Loo, Tamara Harris, Melissa Garcia, AlkaKanaya, Margot Haun, Norman Klopp, H-Erich Wichmann, Panos Deloukas, Efi Katsareli,David J. Couper, Bruce B. Duncan, Margreet Kloppenburg, Linda S. Adair, Judith B. Borja,D. I. A. G. R. A. M+ Consortium , M. A. G. I. C Consortium , G. L. G. C Investigators ,MuT. H. E. R Consortium , James G. Wilson, Solomon Musani, Xiuqing Guo, Toby John-son, Robert Semple, Tanya M. Teslovich, Matthew A. Allison, Susan Redline, Sarah G.Buxbaum, Karen L. Mohlke, Ingrid Meulenbelt, Christie M. Ballantyne, George V. De-doussis, Frank B. Hu, Yongmei Liu, Bernhard Paulweber, Timothy D. Spector, P ElineSlagboom, Luigi Ferrucci, Antti Jula, Markus Perola, Olli Raitakari, Jose C. Florez, VeikkoSalomaa, Johan G. Eriksson, Timothy M. Frayling, Andrew A. Hicks, Terho Lehtimaki,George Davey Smith, David S. Siscovick, Florian Kronenberg, Cornelia van Duijn, RuthJ F. Loos, Dawn M. Waterworth, James B. Meigs, Josee Dupuis, J Brent Richards, Ben-jamin F. Voight, Laura J. Scott, Valgerdur Steinthorsdottir, Christian Dina, Ryan P. Welch,Eleftheria Zeggini, Cornelia Huth, Yurii S. Aulchenko, Gudmar Thorleifsson, Laura J. Mc-Culloch, Teresa Ferreira, Harald Grallert, Najaf Amin, Guanming Wu, Cristen J. Willer,Soumya Raychaudhuri, Steve A. McCarroll, Oliver M. Hofmann, Ayellet V. Segre, Mandyvan Hoek, Pau Navarro, Kristin Ardlie, Beverley Balkau, Rafn Benediktsson, Amanda J.Bennett, Roza Blagieva, Eric Boerwinkle, Lori L. Bonnycastle, Kristina Bengtsson Bostrom,Bert Bravenboer, Suzannah Bumpstead, Noel P. Burtt, Guillaume Charpentier, Peter S.Chines, Marilyn Cornelis, Gabe Crawford, Alex S F. Doney, Katherine S. Elliott, Amanda L.Elliott, Michael R. Erdos, Caroline S. Fox, Christopher S. Franklin, Martha Ganser, Chris-tian Gieger, Niels Grarup, Todd Green, Simon Griffin, Christopher J. Groves, CandaceGuiducci, Samy Hadjadj, Neelam Hassanali, Christian Herder, Bo Isomaa, Anne U. Jack-son, Paul R V. Johnson, Torben Jørgensen, Wen H L. Kao, Augustine Kong, Peter Kraft,Johanna Kuusisto, Torsten Lauritzen, Man Li, Aloysius Lieverse, Cecilia M. Lindgren, Va-leriya Lyssenko, Michel Marre, Thomas Meitinger, Kristian Midthjell, Mario A. Morken,Narisu Narisu, Peter Nilsson, Katharine R. Owen, Felicity Payne, Ann-Kristin Petersen,Carl Platou, Christine Proenca, Inga Prokopenko, Wolfgang Rathmann, N William Rayner,Neil R. Robertson, Ghislain Rocheleau, Michael Roden, Michael J. Sampson, Richa Saxena,Beverley M. Shields, Peter Shrader, Gunnar Sigurdsson, Thomas Sparsø, Klaus Strass-burger, Heather M. Stringham, Qi Sun, Amy J. Swift, Barbara Thorand, Jean Tichet, Ti-inamaija Tuomi, Rob M. van Dam, Timon W. van Haeften, Thijs van Herpt, Jana V. vanVliet-Ostaptchouk, G Bragi Walters, Michael N. Weedon, Cisca Wijmenga, Jacqueline Wit-teman, Richard N. Bergman, Stephane Cauchi, Francis S. Collins, Anna L. Gloyn, Ulf Gyl-lensten, Torben Hansen, Winston A. Hide, Graham A. Hitman, Albert Hofman, David J.Hunter, Kristian Hveem, Markku Laakso, Andrew D. Morris, Colin N A. Palmer, IgorRudan, Eric Sijbrands, Lincoln D. Stein, Jaakko Tuomilehto, Andre Uitterlinden, Mark
141

Bibliography
Walker, Richard M. Watanabe, Goncalo R. Abecasis, Bernhard O. Boehm, Harry Camp-bell, Mark J. Daly, Andrew T. Hattersley, Oluf Pedersen, Ines Barroso, Leif Groop, RobSladek, Unnur Thorsteinsdottir, James F. Wilson, Thomas Illig, Philippe Froguel, Cor-nelia M. van Duijn, Kari Stefansson, David Altshuler, Michael Boehnke, Mark I. McCarthy,Nicole Soranzo, Eleanor Wheeler, Nicole L. Glazer, Nabila Bouatia-Naji, Reedik Magi,Joshua Randall, Paul Elliott, Denis Rybin, Abbas Dehghan, Jouke Jan Hottenga, KijoungSong, Anuj Goel, Taina Lajunen, Alex Doney, Christine Cavalcanti-Proenca, Meena Ku-mari, Nicholas J. Timpson, Carina Zabena, Erik Ingelsson, Ping An, Jeffrey O’Connell,Jian’an Luan, Amanda Elliott, Steven A. McCarroll, Rosa Maria Roccasecca, Francois Pat-tou, Praveen Sethupathy, Yavuz Ariyurek. Novel loci for adiponectin levels and theirinfluence on type 2 diabetes and metabolic traits: a multi-ethnic meta-analysis of 45,891individuals. PLoS Genet, 8(3):e1002607, 2012. doi: 10.1371/journal.pgen.1002607. URLhttp://dx.doi.org/10.1371/journal.pgen.1002607.
L M L. de Lau, P. J. Koudstaal, J C M. Witteman, A. Hofman, and M M B. Breteler. Dietaryfolate, vitamin b12, and vitamin b6 and the risk of parkinson disease. Neurology, 67(2):315–318, Jul 2006. doi: 10.1212/01.wnl.0000225050.57553.6d. URL http://dx.doi.org/10.1212/01.wnl.0000225050.57553.6d.
Anna L Dixon, Liming Liang, Miriam F Moffatt, Wei Chen, Simon Heath, Kenny C C Wong,Jenny Taylor, Edward Burnett, Ivo Gut, Martin Farrall, G. Mark Lathrop, Goncalo RAbecasis, and William O C Cookson. A genome-wide association study of global geneexpression. Nat Genet, 39(10):1202–1207, Oct 2007. doi: 10.1038/ng2109. URL http://dx.doi.org/10.1038/ng2109.
Timothy R Dreszer, Donna Karolchik, Ann S Zweig, Angie S Hinrichs, Brian J Raney,Robert M Kuhn, Laurence R Meyer, Mathew Wong, Cricket A Sloan, Kate R Rosenbloom,et al. The ucsc genome browser database: extensions and updates 2011. Nucleic acids re-search, 40(D1):D918–D923, 2012. URL http://nar.oxfordjournals.org/content/40/D1/D918.short.
Angela Doring, Christian Gieger, Divya Mehta, Henning Gohlke, Holger Prokisch, StefanCoassin, Guido Fischer, Kathleen Henke, Norman Klopp, Florian Kronenberg, BernhardPaulweber, Arne Pfeufer, Dieter Rosskopf, Henry Volzke, Thomas Illig, Thomas Meitinger,H-Erich Wichmann, and Christa Meisinger. SLC2A9 influences uric acid concentrationswith pronounced sex-specific effects. Nat Genet, 40(4):430–436, Apr 2008. doi: 10.1038/ng.107. URL http://dx.doi.org/10.1038/ng.107.
Pan Du, Warren A Kibbe, and Simon M Lin. lumi: a pipeline for processing illumina mi-croarray. Bioinformatics, 24(13):1547–1548, Jul 2008. doi: 10.1093/bioinformatics/btn224.URL http://dx.doi.org/10.1093/bioinformatics/btn224.
Pan Du, Xiao Zhang, Chiang-Ching Huang, Nadereh Jafari, Warren Kibbe, Lifang Hou, andSimon Lin. Comparison of beta-value and m-value methods for quantifying methylationlevels by microarray analysis. BMC bioinformatics, 11(1):587, 2010.
Patrick C A. Dubois, Gosia Trynka, Lude Franke, Karen A. Hunt, Jihane Romanos, Alessan-dra Curtotti, Alexandra Zhernakova, Graham A R. Heap, Roza Adany, Arpo Aromaa,Maria Teresa Bardella, Leonard H. van den Berg, Nicholas A. Bockett, Emilio G. de la
142

Bibliography
Concha, Barbara Dema, Rudolf S N. Fehrmann, Miguel Fernandez-Arquero, Szilvia Fi-atal, Elvira Grandone, Peter M. Green, Harry J M. Groen, Rhian Gwilliam, Roderick H J.Houwen, Sarah E. Hunt, Katri Kaukinen, Dermot Kelleher, Ilma Korponay-Szabo, KalleKurppa, Padraic MacMathuna, Markku Maki, Maria Cristina Mazzilli, Owen T. McCann,M Luisa Mearin, Charles A. Mein, Muddassar M. Mirza, Vanisha Mistry, Barbara Mora,Katherine I. Morley, Chris J. Mulder, Joseph A. Murray, Concepcion Nunez, Elvira Oos-terom, Roel A. Ophoff, Isabel Polanco, Leena Peltonen, Mathieu Platteel, Anna Rybak,Veikko Salomaa, Joachim J. Schweizer, Maria Pia Sperandeo, Greetje J. Tack, GrahamTurner, Jan H. Veldink, Wieke H M. Verbeek, Rinse K. Weersma, Victorien M. Wolters,Elena Urcelay, Bozena Cukrowska, Luigi Greco, Susan L. Neuhausen, Ross McManus, Do-natella Barisani, Panos Deloukas, Jeffrey C. Barrett, Paivi Saavalainen, Cisca Wijmenga,and David A. van Heel. Multiple common variants for celiac disease influencing im-mune gene expression. Nat Genet, 42(4):295–302, Apr 2010. doi: 10.1038/ng.543. URLhttp://dx.doi.org/10.1038/ng.543.
Sandrine Dudoit, Yee Hwa Yang, Matthew J. Callow, and Terence P. Speed. Statistical meth-ods for identifying differentially expressed genes in replicated cDNA microarray experi-ments. Statistica Sinica, 12:111–139, 2002.
Georg B. Ehret, Patricia B. Munroe, Kenneth M. Rice, Murielle Bochud, Andrew D. John-son, Daniel I. Chasman, Albert V. Smith, Martin D. Tobin, Germaine C. Verwoert, Shih-Jen Hwang, Vasyl Pihur, Peter Vollenweider, Paul F. O’Reilly, Najaf Amin, Jennifer L.Bragg-Gresham, Alexander Teumer, Nicole L. Glazer, Lenore Launer, Jing Hua Zhao, YuriiAulchenko, Simon Heath, Siim Sober, Afshin Parsa, Jian’an Luan, Pankaj Arora, AbbasDehghan, Feng Zhang, Gavin Lucas, Andrew A. Hicks, Anne U. Jackson, John F. Peden,Toshiko Tanaka, Sarah H. Wild, Igor Rudan, Wilmar Igl, Yuri Milaneschi, Alex N. Parker,Cristiano Fava, John C. Chambers, Ervin R. Fox, Meena Kumari, Min Jin Go, Pim vander Harst, Wen Hong Linda Kao, Marketa Sjogren, D. G. Vinay, Myriam Alexander, Ya-suharu Tabara, Sue Shaw-Hawkins, Peter H. Whincup, Yongmei Liu, Gang Shi, JohannaKuusisto, Bamidele Tayo, Mark Seielstad, Xueling Sim, Khanh-Dung Hoang Nguyen,Terho Lehtimaki, Giuseppe Matullo, Ying Wu, Tom R. Gaunt, N Charlotte Onland-Moret,Matthew N. Cooper, Carl G P. Platou, Elin Org, Rebecca Hardy, Santosh Dahgam, JuttaPalmen, Veronique Vitart, Peter S. Braund, Tatiana Kuznetsova, Cuno S P M. Uiter-waal, Adebowale Adeyemo, Walter Palmas, Harry Campbell, Barbara Ludwig, MaciejTomaszewski, Ioanna Tzoulaki, Nicholette D. Palmer, C. A. R. D. IoG. R. A. M consor-tium , C. K. D. Gen Consortium , KidneyGen Consortium , EchoGen consortium ,C. H. A. R. G. E-H. F consortium , Thor Aspelund, Melissa Garcia, Yen-Pei C. Chang,Jeffrey R. O’Connell, Nanette I. Steinle, Diederick E. Grobbee, Dan E. Arking, Sharon L.Kardia, Alanna C. Morrison, Dena Hernandez, Samer Najjar, Wendy L. McArdle, DavidHadley, Morris J. Brown, John M. Connell, Aroon D. Hingorani, Ian N M. Day, Debbie A.Lawlor, John P. Beilby, Robert W. Lawrence, Robert Clarke, Jemma C. Hopewell, Halit On-gen, Albert W. Dreisbach, Yali Li, J Hunter Young, Joshua C. Bis, Mika Kahonen, JormaViikari, Linda S. Adair, Nanette R. Lee, Ming-Huei Chen, Matthias Olden, Cristian Pat-taro, Judith A Hoffman Bolton, Anna Kottgen, Sven Bergmann, Vincent Mooser, NishChaturvedi, Timothy M. Frayling, Muhammad Islam, Tazeen H. Jafar, Jeanette Erdmann,Smita R. Kulkarni, Stefan R. Bornstein, Jurgen Grassler, Leif Groop, Benjamin F. Voight,Johannes Kettunen, Philip Howard, Andrew Taylor, Simonetta Guarrera, Fulvio Ricceri,
143

Bibliography
Valur Emilsson, Andrew Plump, Ines Barroso, Kay-Tee Khaw, Alan B. Weder, Steven C.Hunt, Yan V. Sun, Richard N. Bergman, Francis S. Collins, Lori L. Bonnycastle, Laura J.Scott, Heather M. Stringham, Leena Peltonen, Markus Perola, Erkki Vartiainen, Stefan-Martin Brand, Jan A. Staessen, Thomas J. Wang, Paul R. Burton, Maria Soler Artigas,Yanbin Dong, Harold Snieder, Xiaoling Wang, Haidong Zhu, Kurt K. Lohman, Megan E.Rudock, Susan R. Heckbert, Nicholas L. Smith, Kerri L. Wiggins, Ayo Doumatey, DanielShriner, Gudrun Veldre, Margus Viigimaa, Sanjay Kinra, Dorairaj Prabhakaran, Vikal Tri-pathy, Carl D. Langefeld, Annika Rosengren, Dag S. Thelle, Anna Maria Corsi, AndrewSingleton, Terrence Forrester, Gina Hilton, Colin A. McKenzie, Tunde Salako, NaoharuIwai, Yoshikuni Kita, Toshio Ogihara, Takayoshi Ohkubo, Tomonori Okamura, HirotsuguUeshima, Satoshi Umemura, Susana Eyheramendy, Thomas Meitinger, H-Erich Wich-mann, Yoon Shin Cho, Hyung-Lae Kim, Jong-Young Lee, James Scott, Joban S. Sehmi,Weihua Zhang, Bo Hedblad, Peter Nilsson, George Davey Smith, Andrew Wong, Nar-isu Narisu, Alena Stancakova, Leslie J. Raffel, Jie Yao, Sekar Kathiresan, Christopher J.O’Donnell, Stephen M. Schwartz, M Arfan Ikram, WT Longstreth, Jr, Thomas H. Mosley,Sudha Seshadri, Nick R G. Shrine, Louise V. Wain, Mario A. Morken, Amy J. Swift, JaanaLaitinen, Inga Prokopenko, Paavo Zitting, Jackie A. Cooper, Steve E. Humphries, JohnDanesh, Asif Rasheed, Anuj Goel, Anders Hamsten, Hugh Watkins, Stephan J L. Bakker,Wiek H. van Gilst, Charles S. Janipalli, K Radha Mani, Chittaranjan S. Yajnik, Albert Hof-man, Francesco U S. Mattace-Raso, Ben A. Oostra, Ayse Demirkan, Aaron Isaacs, Fer-nando Rivadeneira, Edward G. Lakatta, Marco Orru, Angelo Scuteri, Mika Ala-Korpela,Antti J. Kangas, Leo-Pekka Lyytikainen, Pasi Soininen, Taru Tukiainen, Peter Wurtz, RickTwee-Hee Ong, Marcus Dorr, Heyo K. Kroemer, Uwe Volker, Henry Volzke, Pilar Galan,Serge Hercberg, Mark Lathrop, Diana Zelenika, Panos Deloukas, Massimo Mangino,Tim D. Spector, Guangju Zhai, James F. Meschia, Michael A. Nalls, Pankaj Sharma, JanosTerzic, M V Kranthi Kumar, Matthew Denniff, Ewa Zukowska-Szczechowska, Lynne E.Wagenknecht, F Gerald R. Fowkes, Fadi J. Charchar, Peter E H. Schwarz, Caroline Hay-ward, Xiuqing Guo, Charles Rotimi, Michiel L. Bots, Eva Brand, Nilesh J. Samani, OzrenPolasek, Philippa J. Talmud, Fredrik Nyberg, Diana Kuh, Maris Laan, Kristian Hveem,Lyle J. Palmer, Yvonne T. van der Schouw, Juan P. Casas, Karen L. Mohlke, Paolo Vineis,Olli Raitakari, . Genetic variants in novel pathways influence blood pressure and cardio-vascular disease risk. Nature, 478(7367):103–109, Oct 2011. doi: 10.1038/nature10405. URLhttp://dx.doi.org/10.1038/nature10405.
Matthias Elstner, Christopher M Morris, Katharina Heim, Peter Lichtner, Andreas Ben-der, Divya Mehta, Claudia Schulte, Manu Sharma, Gavin Hudson, Stefano Goldwurm,Alessandro Giovanetti, Massimo Zeviani, David J Burn, Ian G McKeith, Robert H Perry,E. Jaros, Rejko Kruger, H-Erich Wichmann, Stefan Schreiber, Harry Campbell, James F Wil-son, Alan F Wright, Malcolm Dunlop, Giorgio Pistis, Daniela Toniolo, Patrick F Chinnery,Thomas Gasser, Thomas Klopstock, Thomas Meitinger, Holger Prokisch, and Douglass MTurnbull. Single-cell expression profiling of dopaminergic neurons combined with associ-ation analysis identifies pyridoxal kinase as parkinson’s disease gene. Ann Neurol, 66(6):792–798, Dec 2009. doi: 10.1002/ana.21780. URL http://dx.doi.org/10.1002/ana.21780.
Matthias Elstner, Christopher M Morris, Katharina Heim, Andreas Bender, Divya Mehta,Evelyn Jaros, Thomas Klopstock, Thomas Meitinger, Douglass M Turnbull, and Holger
144

Bibliography
Prokisch. Expression analysis of dopaminergic neurons in parkinson’s disease and aginglinks transcriptional dysregulation of energy metabolism to cell death. Acta Neuropathol,122(1):75–86, Jul 2011. doi: 10.1007/s00401-011-0828-9. URL http://dx.doi.org/10.1007/s00401-011-0828-9.
Valur Emilsson, Gudmar Thorleifsson, Bin Zhang, Amy S Leonardson, Florian Zink,Jun Zhu, Sonia Carlson, Agnar Helgason, G Bragi Walters, Steinunn Gunnarsdottir,et al. Genetics of gene expression and its effect on disease. Nature, 452(7186):423–428, 2008. URL http://www.nature.com/nature/journal/v452/n7186/abs/nature06758.html.
Ludwig Fahrmeir, Rita Kunstler, Iris Pigeot, and Gerhard Tutz. Statistik - Der Weg zur Daten-analyse. Springer-Verlag, 2003.
Ludwig Fahrmeir, Thomas Kneib, and Stefan Lang. Regression - Modelle and Methoden undAnwendungen. Springer-Verlag, 2007.
Benjamin P Fairfax, Seiko Makino, Jayachandran Radhakrishnan, Katharine Plant, StephenLeslie, Alexander Dilthey, Peter Ellis, Cordelia Langford, Fredrik O Vannberg, and Julian CKnight. Genetics of gene expression in primary immune cells identifies cell type-specificmaster regulators and roles of hla alleles. Nat Genet, 44(5):502–510, May 2012. doi: 10.1038/ng.2205. URL http://dx.doi.org/10.1038/ng.2205.
Rudolf S N Fehrmann, Ritsert C Jansen, Jan H Veldink, Harm-Jan Westra, Danny Arends,Marc Jan Bonder, Jingyuan Fu, Patrick Deelen, Harry J M Groen, Asia Smolonska, Rinse KWeersma, Robert M W Hofstra, Wim A Buurman, Sander Rensen, Marcel G M Wolfs,Mathieu Platteel, Alexandra Zhernakova, Clara C Elbers, Eleanora M Festen, GosiaTrynka, Marten H Hofker, Christiaan G J Saris, Roel A Ophoff, Leonard H van den Berg,David A van Heel, Cisca Wijmenga, Gerard J Te Meerman, and Lude Franke. Trans-eqtls reveal that independent genetic variants associated with a complex phenotype con-verge on intermediate genes and with a major role for the hla. PLoS Genet, 7(8):e1002197,Aug 2011. doi: 10.1371/journal.pgen.1002197. URL http://dx.doi.org/10.1371/journal.pgen.1002197.
Alice Gerrits, Yang Li, Bruno M. Tesson, Leonid V. Bystrykh, Ellen Weersing, AlbertinaAusema, Bert Dontje, Xusheng Wang, Rainer Breitling, Ritsert C. Jansen, and Gerald deHaan. Expression quantitative trait loci are highly sensitive to cellular differentiationstate. PLoS Genet, 5(10):e1000692, Oct 2009. doi: 10.1371/journal.pgen.1000692. URLhttp://dx.doi.org/10.1371/journal.pgen.1000692.
Christian Gieger, Ludwig Geistlinger, Elisabeth Altmaier, Martin Hrabe de Angelis,Florian Kronenberg, Thomas Meitinger, Hans-Werner Mewes, H-Erich Wichmann,Klaus M. Weinberger, Jerzy Adamski, Thomas Illig, and Karsten Suhre. Genetics meetsmetabolomics: a genome-wide association study of metabolite profiles in human serum.PLoS Genet, 4(11):e1000282, Nov 2008. doi: 10.1371/journal.pgen.1000282. URL http://dx.doi.org/10.1371/journal.pgen.1000282.
Yoav Gilad, Scott A. Rifkin, and Jonathan K. Pritchard. Revealing the architecture of generegulation: the promise of eqtl studies. Trends Genet, 24(8):408–415, Aug 2008. doi: 10.1016/j.tig.2008.06.001. URL http://dx.doi.org/10.1016/j.tig.2008.06.001.
145

Bibliography
Harald H H Goring, Joanne E Curran, Matthew P Johnson, Thomas D Dyer, JacCharlesworth, Shelley A Cole, Jeremy B M Jowett, Lawrence J Abraham, David L Rain-water, Anthony G Comuzzie, Michael C Mahaney, Laura Almasy, Jean W MacCluer,Ahmed H Kissebah, Gregory R Collier, Eric K Moses, and John Blangero. Discovery ofexpression QTLs using large-scale transcriptional profiling in human lymphocytes. NatGenet, 39(10):1208–1216, Oct 2007. doi: 10.1038/ng2119. URL http://dx.doi.org/10.1038/ng2119.
Daniel F. Gudbjartsson, G Bragi Walters, Gudmar Thorleifsson, Hreinn Stefansson, Bjarni V.Halldorsson, Pasha Zusmanovich, Patrick Sulem, Steinunn Thorlacius, Arnaldur Gylfa-son, Stacy Steinberg, Anna Helgadottir, Andres Ingason, Valgerdur Steinthorsdottir, Elin-borg J. Olafsdottir, Gudridur H. Olafsdottir, Thorvaldur Jonsson, Knut Borch-Johnsen,Torben Hansen, Gitte Andersen, Torben Jorgensen, Oluf Pedersen, Katja K. Aben, J Al-fred Witjes, Dorine W. Swinkels, Martin den Heijer, Barbara Franke, Andre L M. Ver-beek, Diane M. Becker, Lisa R. Yanek, Lewis C. Becker, Laufey Tryggvadottir, ThorunnRafnar, Jeffrey Gulcher, Lambertus A. Kiemeney, Augustine Kong, Unnur Thorsteins-dottir, and Kari Stefansson. Many sequence variants affecting diversity of adult hu-man height. Nat Genet, 40(5):609–615, May 2008. doi: 10.1038/ng.122. URL http://dx.doi.org/10.1038/ng.122.
John Burdon Sanderson Haldane et al. New paths in genetics. New Paths in Genetics., 1941.
Gregory Hannum, Justin Guinney, Ling Zhao, Li Zhang, Guy Hughes, SriniVas Sadda,Brandy Klotzle, Marina Bibikova, Jian-Bing Fan, Yuan Gao, Rob Deconde, Menzies Chen,Indika Rajapakse, Stephen Friend, Trey Ideker, and Kang Zhang. Genome-wide methy-lation profiles reveal quantitative views of human aging rates. Mol Cell, 49(2):359–367,Jan 2013. doi: 10.1016/j.molcel.2012.10.016. URL http://dx.doi.org/10.1016/j.molcel.2012.10.016.
Ke Hao, Yohan Bosse, David C Nickle, Peter D Pare, Dirkje S Postma, Michel Laviolette, An-drew Sandford, Tillie L Hackett, Denise Daley, James C Hogg, W. Mark Elliott, ChristianCouture, Maxime Lamontagne, Corry-Anke Brandsma, Maarten van den Berge, GerardKoppelman, Alise S Reicin, Donald W Nicholson, Vladislav Malkov, Jonathan M Derry,Christine Suver, Jeffrey A Tsou, Amit Kulkarni, Chunsheng Zhang, Rupert Vessey, Greg JOpiteck, Sean P Curtis, Wim Timens, and Don D Sin. Lung eqtls to help reveal the molecu-lar underpinnings of asthma. PLoS Genet, 8(11):e1003029, Nov 2012. doi: 10.1371/journal.pgen.1003029. URL http://dx.doi.org/10.1371/journal.pgen.1003029.
Alexander J. Hartemink, David K. Gifford, Tommi S. Jaakkola, and Richard A. Young. Max-imum likelihood estimation of optimal scaling factors for expression array normalization.SPIE BiOS, 2001.
Monika B Hartig, Arcangela Iuso, Tobias Haack, Tomasz Kmiec, Elzbieta Jurkiewicz, Katha-rina Heim, Sigrun Roeber, Victoria Tarabin, Sabrina Dusi, Malgorzata Krajewska-Walasek,Sergiusz Jozwiak, Maja Hempel, Juliane Winkelmann, Matthias Elstner, Konrad Oexle,Thomas Klopstock, Wolfgang Mueller-Felber, Thomas Gasser, Claudia Trenkwalder, Vale-ria Tiranti, Hans Kretzschmar, Gerd Schmitz, Tim M Strom, Thomas Meitinger, and HolgerProkisch. Absence of an orphan mitochondrial protein and c19orf12 and causes a distinctclinical subtype of neurodegeneration with brain iron accumulation. Am J Hum Genet, 89
146

Bibliography
(4):543–550, Oct 2011. doi: 10.1016/j.ajhg.2011.09.007. URL http://dx.doi.org/10.1016/j.ajhg.2011.09.007.
Katharina Heim. Association analysis of ggenotype and gene expression in the kora popu-lation. Master’s thesis, Ludwig-Maximilians-Universitat Munchen, 2008.
Lucia A Hindorff, Praveen Sethupathy, Heather A Junkins, Erin M Ramos, Jayashri P Mehta,Francis S Collins, and Teri A Manolio. Potential etiologic and functional implications ofgenome-wide association loci for human diseases and traits. Proceedings of the NationalAcademy of Sciences, 106(23):9362–9367, 2009. URL http://www.pnas.org/content/106/23/9362.short.
R. Holle, M.Happich, H.Lowel, and H.-E. Wichmann. KORA - a research platform for pop-ulation based health research. Gesundheitswesen, 67:19–25, 2005.
F. C. Holstege and R. A. Young. Transcriptional regulation: contending with complexity.Proc Natl Acad Sci U S A, 96(1):2–4, Jan 1999.
Steve Horvath. Dna methylation age of human tissues and cell types. Genome Biol, 14(10):R115, 2013. doi: 10.1186/gb-2013-14-10-r115. URL http://dx.doi.org/10.1186/gb-2013-14-10-r115.
Bryan N. Howie, Peter Donnelly, and Jonathan Marchini. A flexible and accurate genotypeimputation method for the next generation of genome-wide association studies. PLoSGenet, 5(6):e1000529, Jun 2009. doi: 10.1371/journal.pgen.1000529. URL http://dx.doi.org/10.1371/journal.pgen.1000529.
Tianxiao Huan, Tonu Esko, Marjolein J. Peters, Luke C. Pilling, Katharina Schramm, ClaudiaSchurmann, Brian H. Chen, Chunyu Liu, Roby Joehanes, Andrew D. Johnson, Chen Yao,Sai-Xia Ying, Paul Courchesne, Lili Milani, Nalini Raghavachari, Richard Wang, PochingLiu, Eva Reinmaa, Abbas Dehghan, Albert Hofman, Andre G. Uitterlinden, Dena G. Her-nandez, Stefania Bandinelli, Andrew Singleton, David Melzer, Andres Metspalu, MarenCarstensen, Harald Grallert, Christian Herder, Thomas Meitinger, Annette Peters, MichaelRoden, Melanie Waldenberger, Marcus Dorr, Stephan B. Felix, Tanja Zeller, InternationalConsortium for Blood Pressure G. W. A. S (I. C. B. P) , Ramachandran Vasan, Christopher J.O’Donnell, Peter J. Munson, Xia Yang, Holger Prokisch, Uwe Volker, Joyce B J. van Meurs,Luigi Ferrucci, and Daniel Levy. A meta-analysis of gene expression signatures of bloodpressure and hypertension. PLoS Genet, 11(3):e1005035, Mar 2015. doi: 10.1371/journal.pgen.1005035. URL http://dx.doi.org/10.1371/journal.pgen.1005035.
Wolfgang Huber, Vincent J. Carey, Robert Gentleman, Simon Anders, Marc Carlson, Be-nilton S. Carvalho, Hector Corrada Bravo, Sean Davis, Laurent Gatto, Thomas Girke,Raphael Gottardo, Florian Hahne, Kasper D. Hansen, Rafael A. Irizarry, MichaelLawrence, Michael I. Love, James MacDonald, Valerie Obenchain, Andrzej K. Ole?, HervePages, Alejandro Reyes, Paul Shannon, Gordon K. Smyth, Dan Tenenbaum, Levi Wal-dron, and Martin Morgan. Orchestrating high-throughput genomic analysis with bio-conductor. Nat Methods, 12(2):115–121, Feb 2015. doi: 10.1038/nmeth.3252. URL http://dx.doi.org/10.1038/nmeth.3252.
147

Bibliography
Thomas Illig, Christian Gieger, Guangju Zhai, Werner Romisch-Margl, Rui Wang-Sattler,Cornelia Prehn, Elisabeth Altmaier, Gabi Kastenmuller, Bernet S. Kato, Hans-WernerMewes, Thomas Meitinger, Martin Hrabe de Angelis, Florian Kronenberg, Nicole Soranzo,H-Erich Wichmann, Tim D. Spector, Jerzy Adamski, and Karsten Suhre. A genome-wideperspective of genetic variation in human metabolism. Nat Genet, 42(2):137–141, Feb 2010.doi: 10.1038/ng.507. URL http://dx.doi.org/10.1038/ng.507.
Illumina. Gene expression microarray data quality control. Technical report, Illumina andInc., 2007.
Medea Imboden, Emmanuelle Bouzigon, Ivan Curjuric, Adaikalavan Ramasamy, AshishKumar, Dana B. Hancock, Jemma B. Wilk, Judith M. Vonk, Gian A. Thun, Valerie Siroux,Rachel Nadif, Florent Monier, Juan R. Gonzalez, Matthias Wjst, Joachim Heinrich, Laura R.Loehr, Nora Franceschini, Kari E. North, Janine Altmuller, Gerard H. Koppelman, Ste-fano Guerra, Florian Kronenberg, Mark Lathrop, Miriam F. Moffatt, George T. O’Connor,David P. Strachan, Dirkje S. Postma, Stephanie J. London, Christian Schindler, Manolis Ko-gevinas, Francine Kauffmann, Debbie L. Jarvis, Florence Demenais, and Nicole M. Probst-Hensch. Genome-wide association study of lung function decline in adults with and with-out asthma. J Allergy Clin Immunol, 129(5):1218–1228, May 2012. doi: 10.1016/j.jaci.2012.01.074. URL http://dx.doi.org/10.1016/j.jaci.2012.01.074.
Federico Innocenti, Gregory M Cooper, Ian B Stanaway, Eric R Gamazon, Joshua D Smith,Snezana Mirkov, Jacqueline Ramirez, Wanqing Liu, Yvonne S Lin, Cliona Moloney,Shelly Force Aldred, Nathan D Trinklein, Erin Schuetz, Deborah A Nickerson, Ken EThummel, Mark J Rieder, Allan E Rettie, Mark J Ratain, Nancy J Cox, and Christopher DBrown. Identification and replication and and functional fine-mapping of expressionquantitative trait loci in primary human liver tissue. PLoS Genet, 7(5):e1002078, May 2011.doi: 10.1371/journal.pgen.1002078. URL http://dx.doi.org/10.1371/journal.pgen.1002078.
Rafael A Irizarry, Benjamin M Bolstad, Francois Collin, Leslie M Cope, Bridget Hobbs, andTerence P Speed. Summaries of affymetrix genechip probe level data. Nucleic Acids Res,31(4):e15, Feb 2003.
R. C. Jansen and J. P. Nap. Genetical genomics: the added value from segregation. TrendsGenet, 17(7):388–391, Jul 2001.
Andrew D Johnson, Robert E Handsaker, Sara L Pulit, Marcia M Nizzari, Christopher JO’Donnell, and Paul IW de Bakker. Snap: a web-based tool for identification and an-notation of proxy snps using hapmap. Bioinformatics, 24(24):2938–2939, 2008. URLhttp://bioinformatics.oxfordjournals.org/content/24/24/2938.short.
Peter A. Jones. Functions of dna methylation: islands, start sites, gene bodies and beyond.Nat Rev Genet, 13(7):484–492, Jul 2012. doi: 10.1038/nrg3230. URL http://dx.doi.org/10.1038/nrg3230.
W James Kent, Charles W Sugnet, Terrence S Furey, Krishna M Roskin, Tom H Pringle,Alan M Zahler, and David Haussler. The human genome browser at ucsc. Genome re-search, 12(6):996–1006, 2002. URL http://genome.cshlp.org/content/12/6/996.short.
148

Bibliography
Robert J. Klein, Caroline Zeiss, Emily Y. Chew, Jen-Yue Tsai, Richard S. Sackler, Chad Haynes,Alice K. Henning, John Paul SanGiovanni, Shrikant M. Mane, Susan T. Mayne, Michael B.Bracken, Frederick L. Ferris, Jurg Ott, Colin Barnstable, and Josephine Hoh. Comple-ment factor h polymorphism in age-related macular degeneration. Science, 308(5720):385–389, Apr 2005. doi: 10.1126/science.1109557. URL http://dx.doi.org/10.1126/science.1109557.
Melvin T. Korkor, Fan Bo Meng, Shen Yang Xing, Mu Chun Zhang, Jin Rui Guo, Xiao XueZhu, and Ping Yang. Microarray analysis of differential gene expression profile in periph-eral blood cells of patients with human essential hypertension. Int J Med Sci, 8(2):168–179,2011.
Jan Krumsiek, Karsten Suhre, Thomas Illig, Jerzy Adamski, and Fabian J. Theis. Gaussiangraphical modeling reconstructs pathway reactions from high-throughput metabolomicsdata. BMC Syst Biol, 5:21, 2011. doi: 10.1186/1752-0509-5-21. URL http://dx.doi.org/10.1186/1752-0509-5-21.
Anna Kottgen, Cristian Pattaro, Carsten A. Boger, Christian Fuchsberger, Matthias Olden,Nicole L. Glazer, Afshin Parsa, Xiaoyi Gao, Qiong Yang, Albert V. Smith, Jeffrey R.O’Connell, Man Li, Helena Schmidt, Toshiko Tanaka, Aaron Isaacs, Shamika Ketkar,Shih-Jen Hwang, Andrew D. Johnson, Abbas Dehghan, Alexander Teumer, GuillaumePare, Elizabeth J. Atkinson, Tanja Zeller, Kurt Lohman, Marilyn C. Cornelis, Nicole M.Probst-Hensch, Florian Kronenberg, Anke Tonjes, Caroline Hayward, Thor Aspelund,Gudny Eiriksdottir, Lenore J. Launer, Tamara B. Harris, Evadnie Rampersaud, Braxton D.Mitchell, Dan E. Arking, Eric Boerwinkle, Maksim Struchalin, Margherita Cavalieri, An-drew Singleton, Francesco Giallauria, Jeffrey Metter, Ian H. de Boer, Talin Haritunians,Thomas Lumley, David Siscovick, Bruce M. Psaty, M Carola Zillikens, Ben A. Oostra,Mary Feitosa, Michael Province, Mariza de Andrade, Stephen T. Turner, Arne Schillert,Andreas Ziegler, Philipp S. Wild, Renate B. Schnabel, Sandra Wilde, Thomas F. Mun-zel, Tennille S. Leak, Thomas Illig, Norman Klopp, Christa Meisinger, H-Erich Wich-mann, Wolfgang Koenig, Lina Zgaga, Tatijana Zemunik, Ivana Kolcic, Cosetta Minelli,Frank B. Hu, Asa Johansson, Wilmar Igl, Ghazal Zaboli, Sarah H. Wild, Alan F. Wright,Harry Campbell, David Ellinghaus, Stefan Schreiber, Yurii S. Aulchenko, Janine F. Fe-lix, Fernando Rivadeneira, Andre G. Uitterlinden, Albert Hofman, Medea Imboden,Dorothea Nitsch, Anita Brandstatter, Barbara Kollerits, Lyudmyla Kedenko, Reedik Magi,Michael Stumvoll, Peter Kovacs, Mladen Boban, Susan Campbell, Karlhans Endlich,Henry Volzke, Heyo K. Kroemer, Matthias Nauck, Uwe Volker, Ozren Polasek, VeroniqueVitart, Sunita Badola, Alexander N. Parker, Paul M. Ridker, Sharon L R. Kardia, StefanBlankenberg, Yongmei Liu, Gary C. Curhan, Andre Franke, Thierry Rochat, BernhardPaulweber, Inga Prokopenko, Wei Wang, Vilmundur Gudnason, Alan R. Shuldiner, JosefCoresh, Reinhold Schmidt, Luigi Ferrucci, Michael G. Shlipak, Cornelia M. van Duijn,Ingrid Borecki, Bernhard K. Kramer, Igor Rudan, Ulf Gyllensten, James F. Wilson, Jacque-line C. Witteman, Peter P. Pramstaller, Rainer Rettig, Nick Hastie, Daniel I. Chasman, W. H.Kao, Iris M. Heid, and Caroline S. Fox. New loci associated with kidney function andchronic kidney disease. Nat Genet, 42(5):376–384, May 2010. doi: 10.1038/ng.568. URLhttp://dx.doi.org/10.1038/ng.568.
Amy S. Leonardson, Jun Zhu, Yanqing Chen, Kai Wang, John R. Lamb, Marc Reitman, Valur
149

Bibliography
Emilsson, and Eric E. Schadt. The effect of food intake on gene expression in humanperipheral blood. Hum Mol Genet, 19(1):159–169, Jan 2010. doi: 10.1093/hmg/ddp476.URL http://dx.doi.org/10.1093/hmg/ddp476.
Daniel Levy, Georg B. Ehret, Kenneth Rice, Germaine C. Verwoert, Lenore J. Launer, Ab-bas Dehghan, Nicole L. Glazer, Alanna C. Morrison, Andrew D. Johnson, Thor As-pelund, Yurii Aulchenko, Thomas Lumley, Anna Kottgen, Ramachandran S. Vasan, Fer-nando Rivadeneira, Gudny Eiriksdottir, Xiuqing Guo, Dan E. Arking, Gary F. Mitchell,Francesco U S. Mattace-Raso, Albert V. Smith, Kent Taylor, Robert B. Scharpf, Shih-JenHwang, Eric J G. Sijbrands, Joshua Bis, Tamara B. Harris, Santhi K. Ganesh, Christopher J.O’Donnell, Albert Hofman, Jerome I. Rotter, Josef Coresh, Emelia J. Benjamin, Andre G.Uitterlinden, Gerardo Heiss, Caroline S. Fox, Jacqueline C M. Witteman, Eric Boerwin-kle, Thomas J. Wang, Vilmundur Gudnason, Martin G. Larson, Aravinda Chakravarti,Bruce M. Psaty, and Cornelia M. van Duijn. Genome-wide association study of bloodpressure and hypertension. Nat Genet, 41(6):677–687, Jun 2009. doi: 10.1038/ng.384. URLhttp://dx.doi.org/10.1038/ng.384.
Hong Li and Hongwen Deng. Systems genetics, bioinformatics and eqtl mapping. Genetica,138(9-10):915–924, Oct 2010. doi: 10.1007/s10709-010-9480-x. URL http://dx.doi.org/10.1007/s10709-010-9480-x.
Choong-Chin Liew, Jun Ma, Hong-Chang Tang, Run Zheng, and Adam A. Dempsey. Theperipheral blood transcriptome dynamically reflects system wide biology: a potential di-agnostic tool. J Lab Clin Med, 147(3):126–132, Mar 2006. doi: 10.1016/j.lab.2005.10.005.URL http://dx.doi.org/10.1016/j.lab.2005.10.005.
Simon M Lin, Pan Du, Wolfgang Huber, and Warren A Kibbe. Model-based variance-stabilizing transformation for illumina microarray data. Nucleic Acids Res, 36(2):e11,Feb 2008. doi: 10.1093/nar/gkm1075. URL http://dx.doi.org/10.1093/nar/gkm1075.
Glenn A. Maston, Sara K. Evans, and Michael R. Green. Transcriptional regulatoryelements in the human genome. Annu Rev Genomics Hum Genet, 7:29–59, 2006.doi: 10.1146/annurev.genom.7.080505.115623. URL http://dx.doi.org/10.1146/annurev.genom.7.080505.115623.
B. McClintock. The stability of broken ends of chromosomes in zea mays. Genetics, 26(2):234–282, Mar 1941.
Divya Mehta. Genome-wide association study to search for SNPs affecting gene expression in ageneral population. PhD thesis, Technische Universitat Munchen, 2009.
Divya Mehta, Katharina Heim, Christian Herder, Maren Carstensen, Gertrud Eckstein, Clau-dia Schurmann, Georg Homuth, Matthias Nauck, Uwe Volker, Michael Roden, ThomasIllig, Christian Gieger, Thomas Meitinger, and Holger Prokisch. Impact of common reg-ulatory single-nucleotide variants on gene expression profiles in whole blood. Eur J HumGenet, Jun 2012. doi: 10.1038/ejhg.2012.106. URL http://dx.doi.org/10.1038/ejhg.2012.106.
150

Bibliography
Christa Meisinger, Holger Prokisch, Christian Gieger, Nicole Soranzo, Divya Mehta, DieterRosskopf, Peter Lichtner, Norman Klopp, Jonathan Stephens, Nicholas A Watkins, PanosDeloukas, Andreas Greinacher, Wolfgang Koenig, Matthias Nauck, Christian Rimmbach,Henry Volzke, Annette Peters, Thomas Illig, Willem H Ouwehand, Thomas Meitinger, H-Erich Wichmann, and Angela Doring. A genome-wide association study identifies threeloci associated with mean platelet volume. Am J Hum Genet, 84(1):66–71, Jan 2009. doi:10.1016/j.ajhg.2008.11.015. URL http://dx.doi.org/10.1016/j.ajhg.2008.11.015.
Andreas Menke, Monika Rex-Haffner, Torsten Klengel, Elisabeth B. Binder, and DivyaMehta. Peripheral blood gene expression: it all boils down to the rna collection tubes.BMC Res Notes, 5:1, 2012. doi: 10.1186/1756-0500-5-1. URL http://dx.doi.org/10.1186/1756-0500-5-1.
Jacob J. Michaelson, Salvatore Loguercio, and Andreas Beyer. Detection and interpretationof expression quantitative trait loci (eqtl). Methods, 48(3):265–276, Jul 2009. doi: 10.1016/j.ymeth.2009.03.004. URL http://dx.doi.org/10.1016/j.ymeth.2009.03.004.
O. J. Miller, W. Schnedl, J. Allen, and B. F. Erlanger. 5-methylcytosine localised in mammalianconstitutive heterochromatin. Nature, 251(5476):636–637, Oct 1974.
C. Mueller, K. Schramm, C. Schurmann, S. Kwon, D. Lau A. Schillert and, A. Jagodzinski,C. Herder, G. Homuth, S. Wahl, H. Grallert, T. Illig, A. Peters, M. Dorr, X. Guo, W. Palmas,T. Meitinger, A. Teumer, M. Carstensen, P. S. Wild, H. Volzke, M. Roden, D. M. Herrington,U. Volker, A. Ziegler, Y. Liu, T. Zeller, S. Blankenberg, H. Prokisch, and S. B. Felix. Identi-fication of blood pressure (bp) related genes by population-based transcriptome analysesand validation in a bp lowering clinical trial. In Abstract for ASHG, 2014.
O. Mueller, K. Hahnenberger, M. Dittmann, H. Yee, R. Dubrow, R. Nagle, and D. Ilsley. A mi-crofluidic system for high-speed reproducible dna sizing and quantitation. Electrophoresis,21(1):128–134, Jan 2000. doi: 3.0.CO;2-M. URL http://dx.doi.org/3.0.CO;2-M.
Amy Murphy, Jen-Hwa Chu, Mousheng Xu, Vincent J Carey, Ross Lazarus, Andy Liu,Stanley J Szefler, Robert Strunk, Karen DeMuth, Mario Castro, et al. Mapping of nu-merous disease-associated expression polymorphisms in primary peripheral blood cd4+lymphocytes. Human molecular genetics, 19(23):4745–4757, 2010. URL http://hmg.oxfordjournals.org/content/19/23/4745.short.
Steen Neldam, Margreet Lang, Russell Jones, and T. E. A. M. S. T. A-5 Investigators . Telmis-artan and amlodipine single-pill combinations vs amlodipine monotherapy for superiorblood pressure lowering and improved tolerability in patients with uncontrolled hyper-tension: results of the teamsta-5 study. J Clin Hypertens (Greenwich), 13(7):459–466, Jul2011. doi: 10.1111/j.1751-7176.2011.00468.x. URL http://dx.doi.org/10.1111/j.1751-7176.2011.00468.x.
Christopher Newton-Cheh, Toby Johnson, Vesela Gateva, Martin D. Tobin, Murielle Bochud,Lachlan Coin, Samer S. Najjar, Jing Hua Zhao, Simon C. Heath, Susana Eyheramendy,Konstantinos Papadakis, Benjamin F. Voight, Laura J. Scott, Feng Zhang, Martin Farrall,Toshiko Tanaka, Chris Wallace, John C. Chambers, Kay-Tee Khaw, Peter Nilsson, Pim vander Harst, Silvia Polidoro, Diederick E. Grobbee, N Charlotte Onland-Moret, Michiel L.
151

Bibliography
Bots, Louise V. Wain, Katherine S. Elliott, Alexander Teumer, Jian’an Luan, Gavin Lucas,Johanna Kuusisto, Paul R. Burton, David Hadley, Wendy L. McArdle, Wellcome Trust CaseControl Consortium , Morris Brown, Anna Dominiczak, Stephen J. Newhouse, Nilesh J.Samani, John Webster, Eleftheria Zeggini, Jacques S. Beckmann, Sven Bergmann, NohaLim, Kijoung Song, Peter Vollenweider, Gerard Waeber, Dawn M. Waterworth, Xin Yuan,Leif Groop, Marju Orho-Melander, Alessandra Allione, Alessandra Di Gregorio, Simon-etta Guarrera, Salvatore Panico, Fulvio Ricceri, Valeria Romanazzi, Carlotta Sacerdote,Paolo Vineis, Ines Barroso, Manjinder S. Sandhu, Robert N. Luben, Gabriel J. Crawford,Pekka Jousilahti, Markus Perola, Michael Boehnke, Lori L. Bonnycastle, Francis S. Collins,Anne U. Jackson, Karen L. Mohlke, Heather M. Stringham, Timo T. Valle, Cristen J. Willer,Richard N. Bergman, Mario A. Morken, Angela Doring, Christian Gieger, Thomas Illig,Thomas Meitinger, Elin Org, Arne Pfeufer, H Erich Wichmann, Sekar Kathiresan, JaumeMarrugat, Christopher J. O’Donnell, Stephen M. Schwartz, David S. Siscovick, Isaac Subi-rana, Nelson B. Freimer, Anna-Liisa Hartikainen, Mark I. McCarthy, Paul F. O’Reilly, LeenaPeltonen, Anneli Pouta, Paul E. de Jong, Harold Snieder, Wiek H. van Gilst, Robert Clarke,Anuj Goel, Anders Hamsten, John F. Peden, Udo Seedorf, Ann-Christine Syvanen, Gio-vanni Tognoni, Edward G. Lakatta, Serena Sanna, Paul Scheet, David Schlessinger, AngeloScuteri, Marcus Dorr, Florian Ernst, Stephan B. Felix, Georg Homuth, Roberto Lorbeer,Thorsten Reffelmann, Rainer Rettig, Uwe Volker, Pilar Galan, Ivo G. Gut, Serge Hercberg,G Mark Lathrop, Diana Zelenika, Panos Deloukas, Nicole Soranzo, Frances M. Williams,Guangju Zhai, Veikko Salomaa, Markku Laakso, Roberto Elosua, Nita G. Forouhi, HenryVolzke, Cuno S. Uiterwaal, Yvonne T. van der Schouw, Mattijs E. Numans, Giuseppe Mat-ullo, Gerjan Navis, Goran Berglund, Sheila A. Bingham, Jaspal S. Kooner, John M. Connell,Stefania Bandinelli, Luigi Ferrucci, Hugh Watkins, Tim D. Spector, Jaakko Tuomilehto,David Altshuler, David P. Strachan, Maris Laan, Pierre Meneton, Nicholas J. Wareham,Manuela Uda, Marjo-Riitta Jarvelin, Vincent Mooser, Olle Melander, Ruth J F. Loos, PaulElliott, Goncalo R. Abecasis, Mark Caulfield, and Patricia B. Munroe. Genome-wide asso-ciation study identifies eight loci associated with blood pressure. Nat Genet, 41(6):666–676,Jun 2009. doi: 10.1038/ng.361. URL http://dx.doi.org/10.1038/ng.361.
Yuliya S. Nikolova and Ahmad R. Hariri. Can we observe epigenetic effects on human brainfunction? Trends Cogn Sci, 19(7):366–373, Jul 2015. doi: 10.1016/j.tics.2015.05.003. URLhttp://dx.doi.org/10.1016/j.tics.2015.05.003.
C. M. O’Connor and J. U. Adams. Essentials of Cell Biology. Cambridge, MA: NPG Education,2010.
Len A. Pennacchio, Wendy Bickmore, Ann Dean, Marcelo A. Nobrega, and Gill Bejerano.Enhancers: five essential questions. Nat Rev Genet, 14(4):288–295, Apr 2013. doi: 10.1038/nrg3458. URL http://dx.doi.org/10.1038/nrg3458.
Marjolein J. Peters, Roby Joehanes, Luke C. Pilling, Claudia Schurmann, Karen N. Con-neely, Joseph Powell, Eva Reinmaa, George L. Sutphin, Alexandra Zhernakova, KatharinaSchramm, Yana A. Wilson, Sayuko Kobes, Taru Tukiainen, N. A. B. E. C/U. K. B. E. C Con-sortium , Yolande F. Ramos, Harald H H. Goring, Myriam Fornage, Yongmei Liu, Sina A.Gharib, Barbara E. Stranger, Philip L. De Jager, Abraham Aviv, Daniel Levy, Joanne M.Murabito, Peter J. Munson, Tianxiao Huan, Albert Hofman, Andre G. Uitterlinden, Fer-nando Rivadeneira, Jeroen van Rooij, Lisette Stolk, Linda Broer, Michael M P J. Verbiest,
152

Bibliography
Mila Jhamai, Pascal Arp, Andres Metspalu, Liina Tserel, Lili Milani, Nilesh J. Samani, PartPeterson, Silva Kasela, Veryan Codd, Annette Peters, Cavin K. Ward-Caviness, ChristianHerder, Melanie Waldenberger, Michael Roden, Paula Singmann, Sonja Zeilinger, ThomasIllig, Georg Homuth, Hans-Jorgen Grabe, Henry Volzke, Leif Steil, Thomas Kocher, AnnaMurray, David Melzer, Hanieh Yaghootkar, Stefania Bandinelli, Eric K. Moses, Jack W.Kent, Joanne E. Curran, Matthew P. Johnson, Sarah Williams-Blangero, Harm-Jan Wes-tra, Allan F. McRae, Jennifer A. Smith, Sharon L R. Kardia, Iiris Hovatta, Markus Per-ola, Samuli Ripatti, Veikko Salomaa, Anjali K. Henders, Nicholas G. Martin, Alicia K.Smith, Divya Mehta, Elisabeth B. Binder, K Maria Nylocks, Elizabeth M. Kennedy, TorstenKlengel, Jingzhong Ding, Astrid M. Suchy-Dicey, Daniel A. Enquobahrie, Jennifer Brody,Jerome I. Rotter, Yii-Der I. Chen, Jeanine Houwing-Duistermaat, Margreet Kloppenburg,P Eline Slagboom, Quinta Helmer, Wouter den Hollander, Shannon Bean, Towfique Raj,Noman Bakhshi, Qiao Ping Wang, Lisa J. Oyston, Bruce M. Psaty, Russell P. Tracy, Grant W.Montgomery, Stephen T. Turner, John Blangero, Ingrid Meulenbelt, Kerry J. Ressler, JianYang, Lude Franke, Johannes Kettunen, Peter M. Visscher, G Gregory Neely, Ron Ko-rstanje, Robert L. Hanson, Holger Prokisch, Luigi Ferrucci, Tonu Esko, Alexander Teumer,Joyce B J. van Meurs, and Andrew D. Johnson. The transcriptional landscape of age inhuman peripheral blood. Nat Commun, 6:8570, 2015. doi: 10.1038/ncomms9570. URLhttp://dx.doi.org/10.1038/ncomms9570.
Enrico Petretto, Jonathan Mangion, Nicholas J. Dickens, Stuart A. Cook, Mande K. Kumaran,Han Lu, Judith Fischer, Henrike Maatz, Vladimir Kren, Michal Pravenec, Norbert Hubner,and Timothy J. Aitman. Heritability and tissue specificity of expression quantitative traitloci. PLoS Genet, 2(10):e172, Oct 2006. doi: 10.1371/journal.pgen.0020172. URL http://dx.doi.org/10.1371/journal.pgen.0020172.
Anna Portela and Manel Esteller. Epigenetic modifications and human disease. Nat Biotech-nol, 28(10):1057–1068, Oct 2010. doi: 10.1038/nbt.1685. URL http://dx.doi.org/10.1038/nbt.1685.
Jorg Rahnenfuhrer. Unsupervised learning methods for the analysis of microarray data. Com-putational Biology and Applied Algorithmics and Max Planck Institute for Informatics,Saarbrucken and Germany, March 2004.
Adaikalavan Ramasamy, Adrian Mondry, Chris C. Holmes, and Douglas G. Altman. Keyissues in conducting a meta-analysis of gene expression microarray datasets. PLoS Med, 5(9):e184, Sep 2008. doi: 10.1371/journal.pmed.0050184. URL http://dx.doi.org/10.1371/journal.pmed.0050184.
Bruce Richardson. Impact of aging on dna methylation. Ageing Res Rev, 2(3):245–261, Jul2003.
Mariana G. Rosca, Bernard Tandler, and Charles L. Hoppel. Mitochondria in cardiac hyper-trophy and heart failure. J Mol Cell Cardiol, 55:31–41, Feb 2013. doi: 10.1016/j.yjmcc.2012.09.002. URL http://dx.doi.org/10.1016/j.yjmcc.2012.09.002.
Sherri Rose and Mark J van der Laan. Why match? investigating matched case-controlstudy designs with causal effect estimation. Int J Biostat, 5(1):Article 1, 2009. doi: 10.2202/1557-4679.1127. URL http://dx.doi.org/10.2202/1557-4679.1127.
153

Bibliography
Daimei Sasayama, Hiroaki Hori, Seiji Nakamura, Ryo Miyata, Toshiya Teraishi, KotaroHattori, Miho Ota, Noriko Yamamoto, Teruhiko Higuchi, Naoji Amano, and HiroshiKunugi. Identification of single nucleotide polymorphisms regulating peripheral bloodmrna expression with genome-wide significance: An eqtl study in the japanese popu-lation. PLoS One, 8(1):e54967, 2013. doi: 10.1371/journal.pone.0054967. URL http://dx.doi.org/10.1371/journal.pone.0054967.
Eric E Schadt, Cliona Molony, Eugene Chudin, Ke Hao, Xia Yang, Pek Y Lum, An-drew Kasarskis, Bin Zhang, Susanna Wang, Christine Suver, Jun Zhu, Joshua Millstein,Solveig Sieberts, John Lamb, Debraj GuhaThakurta, Jonathan Derry, John D Storey, Il-iana Avila-Campillo, Mark J Kruger, Jason M Johnson, Carol A Rohl, Atila van Nas, Mar-garete Mehrabian, Thomas A Drake, Aldons J Lusis, Ryan C Smith, F. Peter Guengerich,Stephen C Strom, Erin Schuetz, Thomas H Rushmore, and Roger Ulrich. Mapping the ge-netic architecture of gene expression in human liver. PLoS Biol, 6(5):e107, May 2008. doi:10.1371/journal.pbio.0060107. URL http://dx.doi.org/10.1371/journal.pbio.0060107.
Katharina Schramm, Carola Marzi, Claudia Schurmann, Maren Carstensen, Eva Reinmaa,Reiner Biffar, Gertrud Eckstein, Christian Gieger, Hans-Jorgen Grabe, Georg Homuth,Gabriele Kastenmuller, Reedik Magi, Andres Metspalu, Evelin Mihailov, Annette Pe-ters, Astrid Petersmann, Michael Roden, Konstantin Strauch, Karsten Suhre, AlexanderTeumer, Uwe Volker, Henry Volzke, Rui Wang-Sattler, Melanie Waldenberger, ThomasMeitinger, Thomas Illig, Christian Herder, Harald Grallert, and Holger Prokisch. Mappingthe genetic architecture of gene regulation in whole blood. PLoS One, 9(4):e93844, 2014.doi: 10.1371/journal.pone.0093844. URL http://dx.doi.org/10.1371/journal.pone.0093844.
Andreas Schroeder, Odilo Mueller, Susanne Stocker, Ruediger Salowsky, Michael Leiber,Marcus Gassmann, Samar Lightfoot, Wolfram Menzel, Martin Granzow, and ThomasRagg. The rin: an rna integrity number for assigning integrity values to rna measure-ments. BMC Mol Biol, 7:3, 2006. doi: 10.1186/1471-2199-7-3. URL http://dx.doi.org/10.1186/1471-2199-7-3.
Claudia Schurmann, Katharina Heim, Arne Schillert, Stefan Blankenberg, MarenCarstensen, Marcus Dorr, Karlhans Endlich, Stephan B. Felix, Christian Gieger, HaraldGrallert, Christian Herder, Wolfgang Hoffmann, Georg Homuth, Thomas Illig, JochenKruppa, Thomas Meitinger, Christian Muller, Matthias Nauck, Annette Peters, RainerRettig, Michael Roden, Konstantin Strauch, Uwe Volker, Henry Volzke, Simone Wahl,Henri Wallaschofski, Philipp S. Wild, Tanja Zeller, Alexander Teumer, Holger Prokisch,and Andreas Ziegler. Analyzing illumina gene expression microarray data from differenttissues: methodological aspects of data analysis in the metaxpress consortium. PLoS One,7(12):e50938, 2012. doi: 10.1371/journal.pone.0050938. URL http://dx.doi.org/10.1371/journal.pone.0050938.
Michael E Sobel. Asymptotic confidence intervals for indirect effects in structural equationmodels. Sociological methodology, 13(1982):290–312, 1982.
Nicole Soranzo, Tim D. Spector, Massimo Mangino, Brigitte Kuhnel, Augusto Rendon,Alexander Teumer, Christina Willenborg, Benjamin Wright, Li Chen, Mingyao Li, Perttu
154

Bibliography
Salo, Benjamin F. Voight, Philippa Burns, Roman A. Laskowski, Yali Xue, Stephan Men-zel, David Altshuler, John R. Bradley, Suzannah Bumpstead, Mary-Susan Burnett, JosephDevaney, Angela Doring, Roberto Elosua, Stephen E. Epstein, Wendy Erber, Mario Falchi,Stephen F. Garner, Mohammed J R. Ghori, Alison H. Goodall, Rhian Gwilliam, Hakon H.Hakonarson, Alistair S. Hall, Naomi Hammond, Christian Hengstenberg, Thomas Il-lig, Inke R. Konig, Christopher W. Knouff, Ruth McPherson, Olle Melander, VincentMooser, Matthias Nauck, Markku S. Nieminen, Christopher J. O’Donnell, Leena Pelto-nen, Simon C. Potter, Holger Prokisch, Daniel J. Rader, Catherine M. Rice, Robert Roberts,Veikko Salomaa, Jennifer Sambrook, Stefan Schreiber, Heribert Schunkert, Stephen M.Schwartz, Jovana Serbanovic-Canic, Juha Sinisalo, David S. Siscovick, Klaus Stark, IdaSurakka, Jonathan Stephens, John R. Thompson, Uwe Volker, Henry Volzke, Nicholas A.Watkins, George A. Wells, H-Erich Wichmann, David A. Van Heel, Chris Tyler-Smith,Swee Lay Thein, Sekar Kathiresan, Markus Perola, Muredach P. Reilly, Alexandre F R.Stewart, Jeanette Erdmann, Nilesh J. Samani, Christa Meisinger, Andreas Greinacher,Panos Deloukas, Willem H. Ouwehand, and Christian Gieger. A genome-wide meta-analysis identifies 22 loci associated with eight hematological parameters in the haem-gen consortium. Nat Genet, 41(11):1182–1190, Nov 2009. doi: 10.1038/ng.467. URLhttp://dx.doi.org/10.1038/ng.467.
Stranger, Barbara E, Forrest, Matthew S, Clark, Andrew G, Minichiello, Mark J, Deutsch,Samuel, Lyle, Robert, Hunt, Sarah, Kahl, Brenda, Antonarakis, Stylianos E, Tavare, Simon,Deloukas, Panagiotis, Dermitzakis, and Emmanouil T. Genome-wide associations of geneexpression variation in humans. PLoS Genetics, 1:695–704, 2005.
Barbara E Stranger, Matthew S Forrest, Mark Dunning, Catherine E Ingle, Claude Beazley,Natalie Thorne, Richard Redon, Christine P Bird, Anna de Grassi, Charles Lee, Chris Tyler-Smith, Nigel Carter, Stephen W Scherer, Simon Tavare, Panagiotis Deloukas, Matthew EHurles, and Emmanouil T Dermitzakis. Relative impact of nucleotide and copy numbervariation on gene expression phenotypes. Science, 315(5813):848–853, Feb 2007a. doi: 10.1126/science.1136678. URL http://dx.doi.org/10.1126/science.1136678.
Barbara E Stranger, Alexandra C Nica, Matthew S Forrest, Antigone Dimas, Christine P Bird,Claude Beazley, Catherine E Ingle, Mark Dunning, Paul Flicek, Daphne Koller, StephenMontgomery, Simon Tavare, Panos Deloukas, and Emmanouil T Dermitzakis. Populationgenomics of human gene expression. Nat Genet, 39(10):1217–1224, Oct 2007b. doi: 10.1038/ng2142. URL http://dx.doi.org/10.1038/ng2142.
K. Struhl. Fundamentally different logic of gene regulation in eukaryotes and prokaryotes.Cell, 98(1):1–4, Jul 1999. doi: 10.1016/S0092-8674(00)80599-1. URL http://dx.doi.org/10.1016/S0092-8674(00)80599-1.
Karsten Suhre and Christian Gieger. Genetic variation in metabolic phenotypes: study de-signs and applications. Nat Rev Genet, 13(11):759–769, Nov 2012. doi: 10.1038/nrg3314.URL http://dx.doi.org/10.1038/nrg3314.
Karsten Suhre, So-Youn Shin, Ann-Kristin Petersen, Robert P. Mohney, David Meredith,Brigitte Wagele, Elisabeth Altmaier, C. A. R. D. IoG. R. A. M. , Panos Deloukas, JeanetteErdmann, Elin Grundberg, Christopher J. Hammond, Martin Hrabe de Angelis, GabiKastenmuller, Anna Kottgen, Florian Kronenberg, Massimo Mangino, Christa Meisinger,
155
Bibliography
Thomas Meitinger, Hans-Werner Mewes, Michael V. Milburn, Cornelia Prehn, JohannesRaffler, Janina S. Ried, Werner Romisch-Margl, Nilesh J. Samani, Kerrin S. Small, H-Erich Wichmann, Guangju Zhai, Thomas Illig, Tim D. Spector, Jerzy Adamski, NicoleSoranzo, and Christian Gieger. Human metabolic individuality in biomedical and phar-maceutical research. Nature, 477(7362):54–60, Sep 2011. doi: 10.1038/nature10354. URLhttp://dx.doi.org/10.1038/nature10354.
Jae Hoon Sul, Towfique Raj, Simone de Jong, Paul I W. de Bakker, Soumya Raychaudhuri,Roel A. Ophoff, Barbara E. Stranger, Eleazar Eskin, and Buhm Han. Accurate and fastmultiple-testing correction in eqtl studies. Am J Hum Genet, 96(6):857–868, Jun 2015. doi:10.1016/j.ajhg.2015.04.012. URL http://dx.doi.org/10.1016/j.ajhg.2015.04.012.
David Sulzer. Multiple hit hypotheses for dopamine neuron loss in parkinson’s disease.Trends Neurosci, 30(5):244–250, May 2007. doi: 10.1016/j.tins.2007.03.009. URL http://dx.doi.org/10.1016/j.tins.2007.03.009.
TIRCON. Website. URL http://tircon.eu/.
Trygve Tollefsbol. Handbook of epigenetics: the new molecular and medical genetics. AcademicPress, London, 2010.
Stephen T. Turner. qqman: an r package for visualizing gwas results using q-q and manhat-tan plots. biorXiv DOI: 10.1101/005165, 2014. URL biorXivDOI:10.1101/005165.
Stephen T. Turner, Gary L. Schwartz, Arlene B. Chapman, Amber L. Beitelshees, John G.Gums, Rhonda M. Cooper-DeHoff, Eric Boerwinkle, Julie A. Johnson, and Kent R. Bai-ley. Plasma renin activity predicts blood pressure responses to beta-blocker and thiazidediuretic as monotherapy and add-on therapy for hypertension. Am J Hypertens, 23(9):1014–1022, Sep 2010. doi: 10.1038/ajh.2010.98. URL http://dx.doi.org/10.1038/ajh.2010.98.
Anja Victor. Bewertung genetischer Forschungsergebnisse - Methoden und vermeidbareFehler. G+G Wissenschaft, 7:14–22, 2007.
Peter M. Visscher, Matthew A. Brown, Mark I. McCarthy, and Jian Yang. Five years of gwasdiscovery. Am J Hum Genet, 90(1):7–24, Jan 2012. doi: 10.1016/j.ajhg.2011.11.029. URLhttp://dx.doi.org/10.1016/j.ajhg.2011.11.029.
E. Volkin and L. Astrachan. Intracellular distribution of labeled ribonucleic acid after phageinfection of escherichia coli. Virology, 2(4):433–437, Aug 1956.
Henry Volzke, Dietrich Alte, Carsten Oliver Schmidt, Dorte Radke, Roberto Lorbeer, NeleFriedrich, Nicole Aumann, Katharina Lau, Michael Piontek, Gabriele Born, et al. Cohortprofile: the study of health in pomerania. International journal of epidemiology, page dyp394,2010.
Louise V. Wain, Germaine C. Verwoert, Paul F. O’Reilly, Gang Shi, Toby Johnson, An-drew D. Johnson, Murielle Bochud, Kenneth M. Rice, Peter Henneman, Albert V. Smith,Georg B. Ehret, Najaf Amin, Martin G. Larson, Vincent Mooser, David Hadley, MarcusDorr, Joshua C. Bis, Thor Aspelund, Tonu Esko, A Cecile J W. Janssens, Jing Hua Zhao,
156

Bibliography
Simon Heath, Maris Laan, Jingyuan Fu, Giorgio Pistis, Jian’an Luan, Pankaj Arora, GavinLucas, Nicola Pirastu, Irene Pichler, Anne U. Jackson, Rebecca J. Webster, Feng Zhang,John F. Peden, Helena Schmidt, Toshiko Tanaka, Harry Campbell, Wilmar Igl, Yuri Mi-laneschi, Jouke-Jan Hottenga, Veronique Vitart, Daniel I. Chasman, Stella Trompet, Jen-nifer L. Bragg-Gresham, Behrooz Z. Alizadeh, John C. Chambers, Xiuqing Guo, TerhoLehtimaki, Brigitte Kuhnel, Lorna M. Lopez, Ozren Polasek, Mladen Boban, Christo-pher P. Nelson, Alanna C. Morrison, Vasyl Pihur, Santhi K. Ganesh, Albert Hofman,Suman Kundu, Francesco U S. Mattace-Raso, Fernando Rivadeneira, Eric J G. Sijbrands,Andre G. Uitterlinden, Shih-Jen Hwang, Ramachandran S. Vasan, Thomas J. Wang, SvenBergmann, Peter Vollenweider, Gerard Waeber, Jaana Laitinen, Anneli Pouta, Paavo Zit-ting, Wendy L. McArdle, Heyo K. Kroemer, Uwe Volker, Henry Volzke, Nicole L. Glazer,Kent D. Taylor, Tamara B. Harris, Helene Alavere, Toomas Haller, Aime Keis, Mari-LiisTammesoo, Yurii Aulchenko, Ines Barroso, Kay-Tee Khaw, Pilar Galan, Serge Hercberg,Mark Lathrop, Susana Eyheramendy, Elin Org, Siim Sober, Xiaowen Lu, Ilja M. Nolte,Brenda W. Penninx, Tanguy Corre, Corrado Masciullo, Cinzia Sala, Leif Groop, Ben-jamin F. Voight, Olle Melander, Christopher J. O’Donnell, Veikko Salomaa, Adamo Piod’Adamo, Antonella Fabretto, Flavio Faletra, Sheila Ulivi, Fabiola M. Del Greco, Mau-rizio Facheris, Francis S. Collins, Richard N. Bergman, John P. Beilby, Joseph Hung,A William Musk, Massimo Mangino, So-Youn Shin, Nicole Soranzo, Hugh Watkins, AnujGoel, Anders Hamsten, Pierre Gider, Marisa Loitfelder, Marion Zeginigg, Dena Hernan-dez, Samer S. Najjar, Pau Navarro, Sarah H. Wild, Anna Maria Corsi, Andrew Single-ton, Eco J C. de Geus, Gonneke Willemsen, Alex N. Parker, Lynda M. Rose, BrendanBuckley, David Stott, Marco Orru, Manuela Uda, LifeLines Cohort Study , Melanie M.van der Klauw, Weihua Zhang, Xinzhong Li, James Scott, Yii-Der Ida Chen, Gregory L.Burke, Mika Kahonen, Jorma Viikari, Angela Doring, Thomas Meitinger, Gail Davies,John M. Starr, Valur Emilsson, Andrew Plump, Jan H. Lindeman, Peter A C ’t Hoen,Inke R. Konig, EchoGen consortium , Janine F. Felix, Robert Clarke, Jemma C. Hopewell,Halit Ongen, Monique Breteler, Stephanie Debette, Anita L. Destefano, Myriam Fornage,AortaGen Consortium , Gary F. Mitchell, C. H. A. R. G. E Consortium Heart FailureWorking Group , Nicholas L. Smith, KidneyGen consortium , Hilma Holm, Kari Ste-fansson, Gudmar Thorleifsson, Unnur Thorsteinsdottir, C. K. D. Gen consortium , Car-diogenics consortium , CardioGram , Nilesh J. Samani, Michael Preuss, Igor Rudan,Caroline Hayward, Ian J. Deary, H-Erich Wichmann, Olli T. Raitakari, Walter Palmas, Jas-pal S. Kooner, Ronald P. Stolk, J Wouter Jukema, Alan F. Wright, Dorret I. Boomsma, Ste-fania Bandinelli, Ulf B. Gyllensten, James F. Wilson, Luigi Ferrucci, Reinhold Schmidt,Martin Farrall, Tim D. Spector, Lyle J. Palmer, Jaakko Tuomilehto, Arne Pfeufer, PaoloGasparini, David Siscovick, David Altshuler, Ruth J F. Loos, Daniela Toniolo, HaroldSnieder, Christian Gieger, Pierre Meneton, Nicholas J. Wareham, Ben A. Oostra, AndresMetspalu, Lenore Launer, Rainer Rettig, David P. Strachan, Jacques S. Beckmann, Jacque-line C M. Witteman, Jeanette Erdmann, Ko Willems van Dijk, Eric Boerwinkle, MichaelBoehnke, Paul M. Ridker, Marjo-Riitta Jarvelin, Aravinda Chakravarti, Goncalo R. Abeca-sis, Vilmundur Gudnason, Christopher Newton-Cheh, Daniel Levy, Patricia B. Munroe,Bruce M. Psaty, Mark J. Caulfield, Dabeeru C. Rao, Martin D. Tobin, Paul Elliott, and Cor-nelia M. van Duijn. Genome-wide association study identifies six new loci influencingpulse pressure and mean arterial pressure. Nat Genet, 43(10):1005–1011, Oct 2011. doi:10.1038/ng.922. URL http://dx.doi.org/10.1038/ng.922.
157

Bibliography
Zhong Wang, Mark Gerstein, and Michael Snyder. Rna-seq: a revolutionary tool for tran-scriptomics. Nature Reviews Genetics, 10(1):57–63, 2009.
J. D. WATSON and F. H. CRICK. Molecular structure of nucleic acids; a structure for de-oxyribose nucleic acid. Nature, 171(4356):737–738, Apr 1953.
Danielle Welter, Jacqueline MacArthur, Joannella Morales, Tony Burdett, Peggy Hall,Heather Junkins, Alan Klemm, Paul Flicek, Teri Manolio, Lucia Hindorff, et al. The nhgrigwas catalog, a curated resource of snp-trait associations. Nucleic acids research, 42(D1):D1001–D1006, 2014.
Harm-Jan Westra, Marjolein J. Peters, Tonu Esko, Hanieh Yaghootkar, Claudia Schur-mann, Johannes Kettunen, Mark W. Christiansen, Benjamin P. Fairfax, KatharinaSchramm, Joseph E. Powell, Alexandra Zhernakova, Daria V. Zhernakova, Jan H. Veldink,Leonard H. Van den Berg, Juha Karjalainen, Sebo Withoff, Andre G. Uitterlinden, AlbertHofman, Fernando Rivadeneira, Peter A C. ’t Hoen, Eva Reinmaa, Krista Fischer, MariNelis, Lili Milani, David Melzer, Luigi Ferrucci, Andrew B. Singleton, Dena G. Hernandez,Michael A. Nalls, Georg Homuth, Matthias Nauck, Dorte Radke, Uwe Volker, MarkusPerola, Veikko Salomaa, Jennifer Brody, Astrid Suchy-Dicey, Sina A. Gharib, Daniel A.Enquobahrie, Thomas Lumley, Grant W. Montgomery, Seiko Makino, Holger Prokisch,Christian Herder, Michael Roden, Harald Grallert, Thomas Meitinger, Konstantin Strauch,Yang Li, Ritsert C. Jansen, Peter M. Visscher, Julian C. Knight, Bruce M. Psaty, Samuli Ri-patti, Alexander Teumer, Timothy M. Frayling, Andres Metspalu, Joyce B J. van Meurs,and Lude Franke. Systematic identification of trans eqtls as putative drivers of knowndisease associations. Nat Genet, 45(10):1238–1243, Oct 2013. doi: 10.1038/ng.2756. URLhttp://dx.doi.org/10.1038/ng.2756.
Janis E Wigginton, David J Cutler, and Goncalo R Abecasis. A note on exact tests of Hardy-Weinberg equilibrium. Am J Hum Genet, 76(5):887–893, May 2005. doi: 10.1086/429864.URL http://dx.doi.org/10.1086/429864.
Philipp S Wild, Christoph R Sinning, Alexander Roth, Sandra Wilde, Renate B Schn-abel, Edith Lubos, Tanja Zeller, Till Keller, Karl J Lackner, Maria Blettner, Ramachan-dran S Vasan, Thomas Munzel, and Stefan Blankenberg. Distribution and catego-rization of left ventricular measurements in the general population: results from thepopulation-based gutenberg heart study. Circ Cardiovasc Imaging, 3(5):604–613, Sep2010. doi: 10.1161/CIRCIMAGING.109.911933. URL http://dx.doi.org/10.1161/CIRCIMAGING.109.911933.
Wrba, Dolznig, and Mannhalter. Genetik verstehen. UTB, 2007.
Fred A. Wright, Patrick F. Sullivan, Andrew I. Brooks, Fei Zou, Wei Sun, Kai Xia, VeredMadar, Rick Jansen, Wonil Chung, Yi-Hui Zhou, Abdel Abdellaoui, Sandra Batista, CaseyButler, Guanhua Chen, Ting-Huei Chen, David D’Ambrosio, Paul Gallins, Min Jin Ha,Jouke Jan Hottenga, Shunping Huang, Mathijs Kattenberg, Jaspreet Kochar, Christel M.Middeldorp, Ani Qu, Andrey Shabalin, Jay Tischfield, Laura Todd, Jung-Ying Tzeng, Ger-ard van Grootheest, Jacqueline M. Vink, Qi Wang, Wei Wang, Weibo Wang, GonnekeWillemsen, Johannes H. Smit, Eco J. de Geus, Zhaoyu Yin, Brenda W J H. Penninx, andDorret I. Boomsma. Heritability and genomics of gene expression in peripheral blood.
158

Bibliography
Nat Genet, 46(5):430–437, May 2014. doi: 10.1038/ng.2951. URL http://dx.doi.org/10.1038/ng.2951.
Qinghua Xu, Shujuan Ni, Fei Wu, Fang Liu, Xun Ye, Bruno Mougin, Xia Meng, and XiangDu. Investigation of variation in gene expression profiling of human blood by extendedprinciple component analysis. PLoS One, 6(10):e26905, 2011. doi: 10.1371/journal.pone.0026905. URL http://dx.doi.org/10.1371/journal.pone.0026905.
Tanja Zeller, Philipp Wild, Silke Szymczak, Maxime Rotival, Arne Schillert, RaphaeleCastagne, Seraya Maouche, Marine Germain, Karl Lackner, Heidi Rossmann, Medea Eleft-heriadis, Christoph R Sinning, Renate B Schnabel, Edith Lubos, Detlev Mennerich, WernerRust, Claire Perret, Carole Proust, Viviane Nicaud, Joseph Loscalzo, Norbert Hubner,David Tregouet, Thomas Munzel, Andreas Ziegler, Laurence Tiret, Stefan Blankenberg,and Francois Cambien. Genetics and beyond–the transcriptome of human monocytes anddisease susceptibility. PLoS One, 5(5):e10693, 2010. doi: 10.1371/journal.pone.0010693.URL http://dx.doi.org/10.1371/journal.pone.0010693.
Andreas Ziegler, Inke R. Konig, and Friedrich Pahlke. A statistical approach to genetic epidemi-ology: concepts and applications. Wiley-Blackwell, 2010.
159