
Hydrologic processes on tree islands in the Everglades (Florida, USA): tracking the effects of tree...
12
Hydrologic processes on tree islands in the Everglades (Florida, USA): tracking the effects of tree establishment and growth Pamela L. Sullivan & René M. Price & Michael S. Ross & Leonard J. Scinto & Susana L. Stoffella & Eric Cline & Thomas W. Dreschel & Fred H. Sklar Abstract The hydrodynamics of tree islands during the growth of newly planted trees has been found to be influenced by both vegetation biomass and geologic conditions. From July 2007 through June 2009, ground- water and surface-water levels were monitored on eight recently planted tree islands at the Loxahatchee Impoundment Landscape Assessment (LILA) facility in Boynton Beach, Florida, USA. Over the 2-year study, stand development coincided with the development of a water-table depression in the center of each of the islands that was bounded by a hydraulic divide along the edges. The water-table depression was greater in islands composed of limestone as compared to those composed of peat. The findings of this study suggest that groundwater evapotranspiration by trees on tree islands creates complex hydrologic interactions between the shallow groundwater in tree islands and the surrounding surface water and groundwater bodies. Keywords Groundwater/surface-water relations . Groundwater evapotranspiration . Tree islands . USA . Everglades Introduction Variation in groundwater evapotranspiration (ET G ) rates may be one of the largest driving factors in groundwater/ surface-water interactions and, thus, the formation of landscape patterning across ecosystems of low topo- graphic relief (Eppinga et al. 2008; Wetzel et al. 2005; Rietkerk et al. 2004). Groundwater/surface-water interac- tions strongly influence the chemistry of shallow ground- water and the location and patterns of vegetation in wetlands (Ferone and Devito 2004; Glaser et al. 1981). The Great Vasyugan Bog, Siberia, and the Okavango Delta, Botswana, are examples of wetlands comprised of raised ridges or islands that coincide with the presence of elevated ion and nutrient concentrations in groundwater and higher-order vascular plants, compared to the surrounding hollows and sloughs (Eppinga et al. 2008; McCarthy et al. 1998). A combination of positive and negative feedback mechanisms has been proposed for the formation of self-organizing patterns found in many wetlands (Rietkerk et al. 2004; Rietkerk and van der Koppel 2008). The hypothesis behind these feedbacks is that areas with high ET G rates would lower the water table, creating an inward convective transport of nutrients and ions, which could increase the growth rate of biomass, and lead to an accelerated rate of soil accretion. The elevated ion and nutrient concentrations have a positive feedback on local biomass while negatively impacting vegetation at a greater distance by inhibiting their access to resources (Rietkerk and van der Koppel 2008). This hypothesis is supported by Engel et al.’ s(2005) findings in the Pampas of South America, where sap-flow measure- ments and diurnal water-table fluctuations suggested that the ratio of ET G to precipitation was greater in the tree plantation than in the surrounding grasslands. Further- more, the increased ET G coincided with a lowering of the water table and the development of elevated ion concen- trations under the plantation (Jobbágy and Jackson 2007). Received: 11 May 2010 /Accepted: 22 November 2010 * Springer-Verlag 2010 Electronic supplementary material The online version of this article (doi:10.1007/s10040-010-0691-0) contains supplementary material, which is available to authorized users. P. L. Sullivan ()) : R. M. Price : M. S. Ross : L. J. Scinto Department of Earth and the Environment, Florida International University, Miami, FL 33199, USA e-mail: sullivap@fiu.edu Tel.: +1-305-3480281 Fax: +1-305-3483877 R. M. Price : M. S. Ross : L. J. Scinto : S. L. Stoffella Southeastern Environmental Research Center, Florida International University, Miami, FL 33199, USA E. Cline : T. W. Dreschel : F. H. Sklar South Florida Water Management District, Everglades Division, West Palm Beach, FL 33406, USA Hydrogeology Journal DOI 10.1007/s10040-010-0691-0
Transcript of Hydrologic processes on tree islands in the Everglades (Florida, USA): tracking the effects of tree...
Hydrologic processes on tree islands in the Everglades (Florida, USA):tracking the effects of tree establishment and growth
Pamela L. Sullivan & René M. Price & Michael S. Ross &
Leonard J. Scinto & Susana L. Stoffella & Eric Cline &
Thomas W. Dreschel & Fred H. Sklar
Abstract The hydrodynamics of tree islands during thegrowth of newly planted trees has been found to beinfluenced by both vegetation biomass and geologicconditions. From July 2007 through June 2009, ground-water and surface-water levels were monitored on eightrecently planted tree islands at the LoxahatcheeImpoundment Landscape Assessment (LILA) facilityin Boynton Beach, Florida, USA. Over the 2-year study,stand development coincided with the development of awater-table depression in the center of each of theislands that was bounded by a hydraulic divide alongthe edges. The water-table depression was greater inislands composed of limestone as compared to thosecomposed of peat. The findings of this study suggestthat groundwater evapotranspiration by trees on treeislands creates complex hydrologic interactions betweenthe shallow groundwater in tree islands and thesurrounding surface water and groundwater bodies.
Keywords Groundwater/surface-water relations .Groundwater evapotranspiration . Tree islands . USA .Everglades
Introduction
Variation in groundwater evapotranspiration (ETG) ratesmay be one of the largest driving factors in groundwater/surface-water interactions and, thus, the formation oflandscape patterning across ecosystems of low topo-graphic relief (Eppinga et al. 2008; Wetzel et al. 2005;Rietkerk et al. 2004). Groundwater/surface-water interac-tions strongly influence the chemistry of shallow ground-water and the location and patterns of vegetation inwetlands (Ferone and Devito 2004; Glaser et al. 1981).The Great Vasyugan Bog, Siberia, and the OkavangoDelta, Botswana, are examples of wetlands comprised ofraised ridges or islands that coincide with the presence ofelevated ion and nutrient concentrations in groundwaterand higher-order vascular plants, compared to thesurrounding hollows and sloughs (Eppinga et al. 2008;McCarthy et al. 1998). A combination of positive andnegative feedback mechanisms has been proposed for theformation of self-organizing patterns found in manywetlands (Rietkerk et al. 2004; Rietkerk and van derKoppel 2008). The hypothesis behind these feedbacks isthat areas with high ETG rates would lower the watertable, creating an inward convective transport of nutrientsand ions, which could increase the growth rate of biomass,and lead to an accelerated rate of soil accretion. Theelevated ion and nutrient concentrations have a positivefeedback on local biomass while negatively impactingvegetation at a greater distance by inhibiting their accessto resources (Rietkerk and van der Koppel 2008). Thishypothesis is supported by Engel et al.’s (2005) findingsin the Pampas of South America, where sap-flow measure-ments and diurnal water-table fluctuations suggested thatthe ratio of ETG to precipitation was greater in the treeplantation than in the surrounding grasslands. Further-more, the increased ETG coincided with a lowering of thewater table and the development of elevated ion concen-trations under the plantation (Jobbágy and Jackson 2007).
Received: 11 May 2010 /Accepted: 22 November 2010
* Springer-Verlag 2010
Electronic supplementary material The online version of thisarticle (doi:10.1007/s10040-010-0691-0) contains supplementarymaterial, which is available to authorized users.
P. L. Sullivan ()) :R. M. Price :M. S. Ross : L. J. ScintoDepartment of Earth and the Environment,Florida International University,Miami, FL 33199, USAe-mail: [email protected].: +1-305-3480281Fax: +1-305-3483877
R. M. Price :M. S. Ross : L. J. Scinto : S. L. StoffellaSoutheastern Environmental Research Center,Florida International University,Miami, FL 33199, USA
E. Cline : T. W. Dreschel : F. H. SklarSouth Florida Water Management District,Everglades Division,West Palm Beach, FL 33406, USA
Hydrogeology Journal DOI 10.1007/s10040-010-0691-0
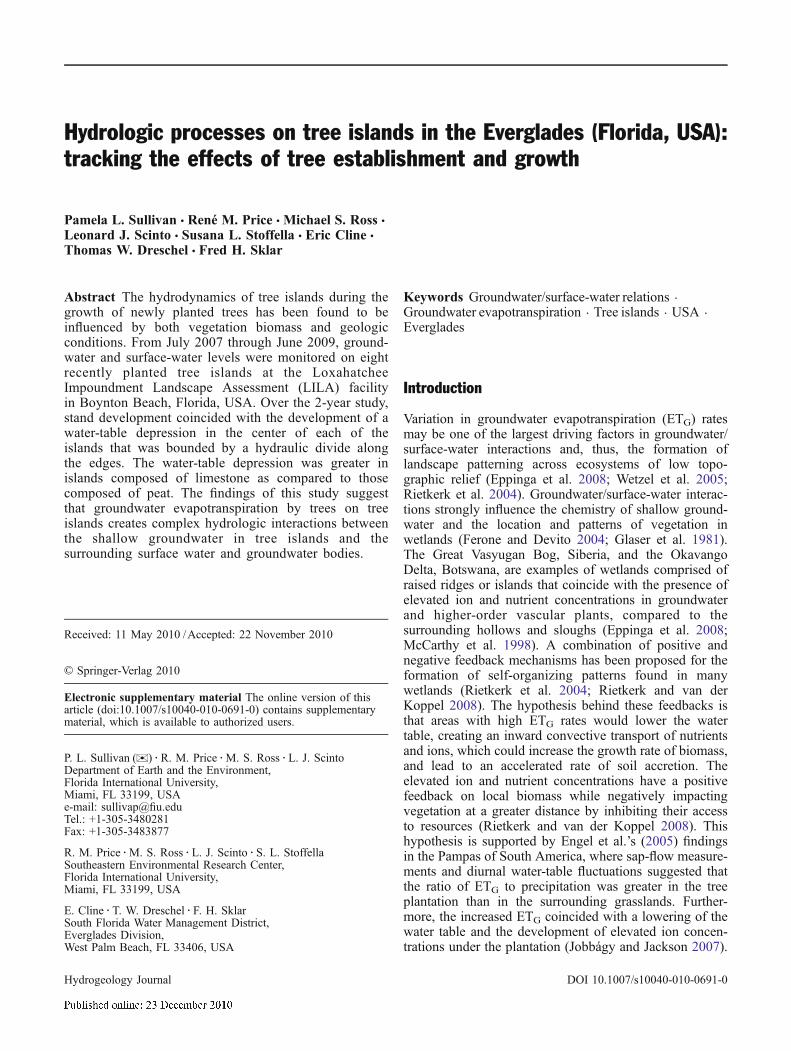
Similar feedback patterns may have led to the ridge-slough-tree-island topography of the Florida Everglades,USA (Fig. 1), where some of the highest soil andgroundwater nutrient concentrations have been detectedin tree islands. Gann et al. (2005) detected total soilphosphorus concentrations that were six-fold higher intree islands (446 g kg–1) compared to the adjacent marsh(78 g kg–1). In addition, Ross et al. (2006) detected pore-water concentrations of soluble reactive phosphorus (SRP)to be two to three orders of magnitude higher in the treeislands compared to the surrounding marsh. Potentialsources suggested for the high phosphorus concentrationsdetected in tree islands are the capture of dust from theatmosphere by the tree canopy, inputs of bird guano andbones (Coultas et al. 2008), and high ETG rates thatincreased inputs of high nutrient groundwater (Wetzel etal. 2005). High rates of ETG relative to recharge wereagain suggested as a driving factor when a diurnaldrawdown in the water table was observed betweensunrise and sunset on tree islands in the Everglades duringthe December–May dry season (Ross et al. 2006).Furthermore, the use of oxygen and hydrogen-stableisotopes of stem water, soil water and groundwater in ahardwood hammock tree island indicated that trees onsuch islands relied on groundwater during the dry season(Ewe et al. 1999). Less than 1% of the water utilized bytrees was groundwater during the wet season, but during
the dry season, groundwater constituted 86% of thewater utilized. While nutrient concentrations, dielgroundwater fluctuations, and groundwater isotopicvalues suggest a link between overlying vegetationand tree-island hydrodynamics, the impact of the ETG
on tree-island groundwater/surface-water interactionshas yet to be clarified.
Over the last century, the construction of canals, dikesand levees across the Everglades has led to drastichydrologic changes, which have been linked to a 60 and90% reduction in tree-island cover in Water ConservationAreas (WCA) 3 and 2, respectively (Sklar and van derValk 2002) (Fig. 1). While such losses are sometimesattributable to fire, in many cases they result fromextended periods of high surface-water levels, which havedrowned trees and caused the loss of peat from the islandsand ridges, and resulted in the accumulation of peat insloughs (Sklar and van der Valk 2002). The loss of treeislands is a major concern in efforts to restore theEverglades because they harbor the highest plant andanimal species diversity of the region (Gawlik et al. 2002).In addition, tree islands provide a topographic refuge forplant species that are non-flood tolerant and have highnutrient requirements (Davis and Ogden 1994).
The majority of the remaining tree islands in theEverglades are located in and around Shark Slough in thesouthern Everglades, the western edge of Water Con-servation Area 3, and in Loxahatchee National WildlifeRefuge (LNWR, WCA-1) in the northern Everglades(Wetzel et al. 2005; Brandt et al. 2002). Though treeislands located in the northern and southern portions of theEverglades contain many of the same tree species, theirunderlying geology differs. In the southern Everglades,the limestone bedrock is very close to the soil surface.Most of the tree islands are thought to originate fromlimestone outcrops or mineral sediment mounds (Ross andJones 2004). These tree islands are generally teardrop inshape and form a raised head and elongated tail orientedin the direction of surface-water flow. In LNWR, a thicklayer of peat, 1.5–3.5 m deep, overwhelms any sign of theminor topographic change in the limestone bedrock. Treeislands in LNWR are of two types; typically small andround, or large and elongated in the direction of flow butwithout distinct tails (Brandt et al. 2000). The formergroup is known as “battery” tree islands that developwhen a large piece of peat detaches from the bottom of aslough during high water levels (Stone et al. 2002).Although extensive studies have been conducted to definetree-island vegetation, shape, morphology, and surface-water dynamics, the relationship between tree-islandhydrodynamics and the underlying geologic compositionhas not been well established.
The main objective of this research was to investigatethe hydrodynamics of tree islands in their early stages ofdevelopment. The project was conducted on constructedtree islands that were planted with tree saplings. Ground-water and surface-water levels were monitored over 2years. Two types of tree islands were investigated: thosethat were constructed of peat, and others that were
Fig. 1 Loxahatchee Impoundment Landscape Assessment (LILA) islocated on the eastern edge of Water Conservation Area 1 (WCA 1), inBoynton Beach, Florida
Hydrogeology Journal DOI 10.1007/s10040-010-0691-0

constructed of limestone rubble with overlying peat. Theeffects of standing live biomass on ETG rates andgroundwater levels were also investigated.
Study siteConstructed in 2003, the Loxahatchee ImpoundmentLandscape Assessment (LILA) Facility represents a largephysical model of the Everglades. LILA is located at theArthur R. Marshall Loxahatchee National Wildlife Ref-uge, Boynton Beach, Florida (26º29.600′N, 80º13.000′W)and spans just over 34 ha (Fig. 1). LILA consists of four8-ha macrocosms (M1 through M4), which mimic theEverglades ridge-and-slough and tree-island landscapefeatures (Fig. 2). Each macrocosm contains two treeislands with different underlying geologic material, oneconsisting entirely of peat (peat islands) and one having alimestone rubble core overlaid by a thin layer of peat(limestone islands; van de Valk et al. 2008). The soilsurvey of the area classifies the peats in the LILA vicinityas 80% Okeelanta muck and 20% minor components(Natural Resources Conservation Service 2010). Each ofthe islands at LILA is approximately 43×71 m in size.The limestone tree islands were constructed of locallimestone rubble extending approximately 7 m to thenorth and south and 24 m to the east and west of thecenter of the islands. The limestone rubble was buriedabout 31 cm beneath the peat and extended to a depth
about 91 cm (van der Valk et al. 2008). Over 700 saplingswere planted on each tree island consisting of eightspecies common to the Everglades (Stoffella et al. 2010).Tree islands in M1 and M4 were planted in March 2006(Planting-1), while the tree islands in M2 and M3 wereplanted in March 2007 (Planting-2).
The climate of the region is characterized by distinctwet (mid-May through October) and dry (November tomid-May) seasons with a 30-year annual average of133 cm of precipitation (Ali et al. 2000). During thewet season, precipitation can be described as bimodal,with peaks in June and August. The surface-waterlevels in LILA are controlled to mimic those of theEverglades, with the highest surface-water levels occur-ring from September to January, flooding the treeislands, and the lowest surface-water levels occurringfrom April to June.
Materials and methods
Experimental design and water levelsNine wells were drilled or augered into each of the eight treeislands; six wells were located on the edge of the islandswhile three were located in the center. The lithology of thesediments encountered during drilling was characterized.The wells had an average depth of 1.34±0.15 m and anaverage bottom elevation of 3.49±0.08 m (relative to theNational Geodetic Vertical Datum of 1929, NGVD29). EachPVC-encased well had a diameter of 3.8 cm and a 0.6-mscreen interval at the bottom. The two edge wells and onecenter well were equipped with In-Situ Level Troll 500pressure transducers.Water levels in these wells were used todetermine the effects of the proximity to the island’s edgeand the aboveground biomass on the water table and on ETGrates.
A total of 28 wells were monitored from July 2007 toJuly 2009 (Fig. 2). Groundwater levels were recorded at15-min intervals with the pressure transducers having anaccuracy of 3.5 mm. Water pressure was corrected forwater-specific gravity (0.99 as determined by a hydro-meter) using the software provided by In-Situ. Theelevation of the top of the PVC pipe was determinedusing a Wild Nak-2 level and stadia rod, which provided a3-mm level of accuracy. The distance from the top of thePVC pipe to the bottom of the pressure transducer wasmeasured to within 2 mm.
Surface-water stage was monitored at the eastern andwestern ends of each of the four 8-ha macrocosms,comprising a total of eight stations (Fig. 2). Surface-waterstages were maintained according to an establishedhydrograph and surface-water levels were recorded every15 min. Daily average surface-water levels were computedfrom the 15-min values. Surface-water levels at the centerof the two tree island in each macrocosm were estimatedfrom a linear interpolation between the surface-waterstages on the eastern and western of the macrocosms.Hydraulic gradients were determined between the surface-water level and groundwater levels for the center of each
Fig. 2 LILA is comprised of four macrocosms that mimic theEverglades; each macrocosm has two tree islands with an under-lying geology of either peat or limestone. Of the 72 wells at LILA, atotal of 28 wells were monitored over the eight islands. GWgroundwater; SW surface water
Hydrogeology Journal DOI 10.1007/s10040-010-0691-0

of the tree islands. Positive hydraulic gradients indicatedgroundwater discharging to the surface water whilenegative values indicated surface water recharging to thegroundwater.
Daily rainfall values were collected from stationLXWS (26°29′56.257″, 80°13′20.159″), located about1 km from LILA, from July 2007 through June 2009.Daily values were summed to determine monthlytotals. The monthly totals were compared to 30-year-average values obtained from rain gauge LWD.L28(26°29′44.257″, 80°12′10.157″), located 1.8 km fromLILA.
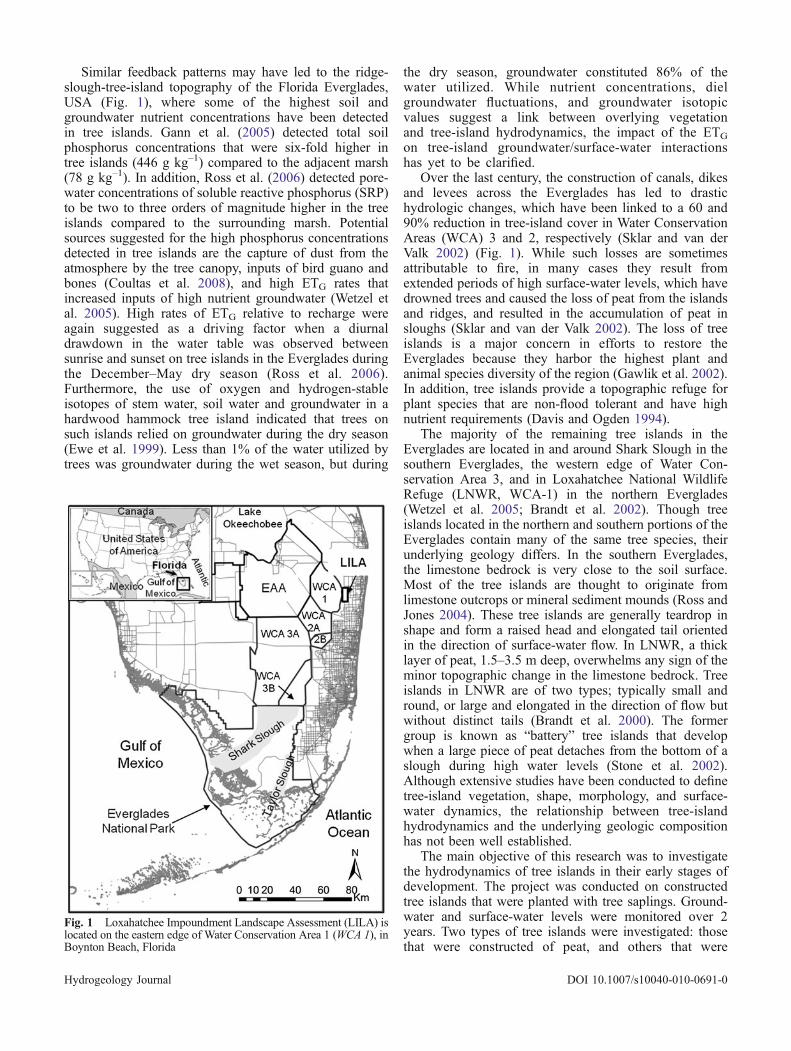
Groundwater evapotranspirationWhite (1932) determined that a diurnal drawdown of thewater table during daylight hours was a product ofphreatophytic plants taking up groundwater and could beused to determine the average daily ETG rate. The Whitemethod required that three assumptions be made: first,transpiration was negligible between midnight and4:00 am; second, the diurnal water-table fluctuations werea result of groundwater uptake by plants and not aphenomena of pumping or recharge of the aquifer; andthird, reasonable values of specific yield were obtained(Loheide et al. 2005; Healy and Cook 2002). The Whitemethod utilized the equation:
ETG ¼ S y Ds=t � rð Þ ð1Þwhere the average daily loss of groundwater throughevapotranspiration (ETG) was the product of the specificyield (Sy), and the sum of the change in storage (Δs) perunit time (t) and the net recovery rate of the water table(r). The change in storage term was calculated by takingthe difference between the water level at midnight on theday of interest and the water level at midnight 24 h later.Positive values indicated that there was a decline in theoverall trend in the water table, while negative valuesindicated a rise in the water table. The net recovery rate ofthe water table was determined as the slope of the linearregression of the groundwater levels between midnightand 4:00 am (Fig. 3).
Specific yieldLaboratory and field methods were used to determine thereadily available specific yield of the tree-island sedi-ments. Polycarbonate tubes with a diameter of 5.08 cmwere inserted in the center of the peat-based tree islands tocollect soil cores. Three cores were obtained from a depthof 5–25 cm and two obtained from a depth 25–45 cm for atotal five cores that had an average length of 15.06 cm. Inthe laboratory, each core was slowly submerged in waterfrom the bottom to the top of the soil profile. Care wastaken to ensure the entire column was saturated. Eachcore was oriented vertically and allowed to drain for12 h. This time duration was chosen to attain theamount of water released over the diurnal fluctuation
time period (Meyboom 1967). The Sy was calculatedbased on the following expression (Meinzer 1923):
S y ¼ V d=V t ð2Þwhere the readily available specific yield (Sy) was the ratioof the volume of water that drained by weight (Vd),compared to the total volume of each core (Vt). Each corewas tested twice (n=10) and the results were averaged todetermine a mean Sy, and standard error.
Specific yield has been shown to increase with thedepth of the water table in aquifers with a shallowwater table, only reaching a stable value when the depthof the water table was approximately 2–3 m deep(Nachabe 2002; Loheide et al. 2005). To take thisvariability into account, the effective specific yield wasalso calculated using a modified version of the watertable fluctuation method (Gerla 1992; Rosenberry andWinter 1997):
S ye ¼ P =Dh ð3Þwhere the effective specific yield (Sye) was equal to theratio of precipitation inputs (P) to the change in ground-water level (Δh). Precipitation data from rain gaugeLXWS were used to determine P, while groundwater-level data from each of the wells were used to determinethe Δh. Equation 3 required the assumptions thatevapotranspiration, runoff, and subsurface flow werenegligible over time and that the soil was above fieldcapacity (Healy and Cook 2002). The effective specificyield was determined per rain event and averaged toobtain a monthly Sye per well. The average monthly Syeper well was then used in the White equation to calculatethe average monthly ETG per well.
BiomassAllometric biomass equations were developed by collect-ing plant attributes (height, basal diameter and crowndimensions) and biomass data from individuals compris-ing the range of heights present in LILA tree islands (up to5 m). The complete procedure and data analysis used todevelop the equations is described in Stoffella et al.(2009). In the present work, a mixed-species regressionmodel based solely on total height (measured on allindividuals at 6-month intervals with a telescoping heightpole) was used for biomass estimation. To comparebiomass between the edges and centers of the islands,the biomass of each tree located within a 7-m radiusaround the monitoring wells was summed and divided bythe area of the circle thereby circumscribed. On eachisland, two monitoring wells located on the edges of theislands were averaged to determined edge biomass whilethe biomass around the center monitoring well was used torepresent the center biomass. The biomass at the centerand the edges of islands were then averaged across allislands of similar geology and year of planting.
Hydrogeology Journal DOI 10.1007/s10040-010-0691-0
Results
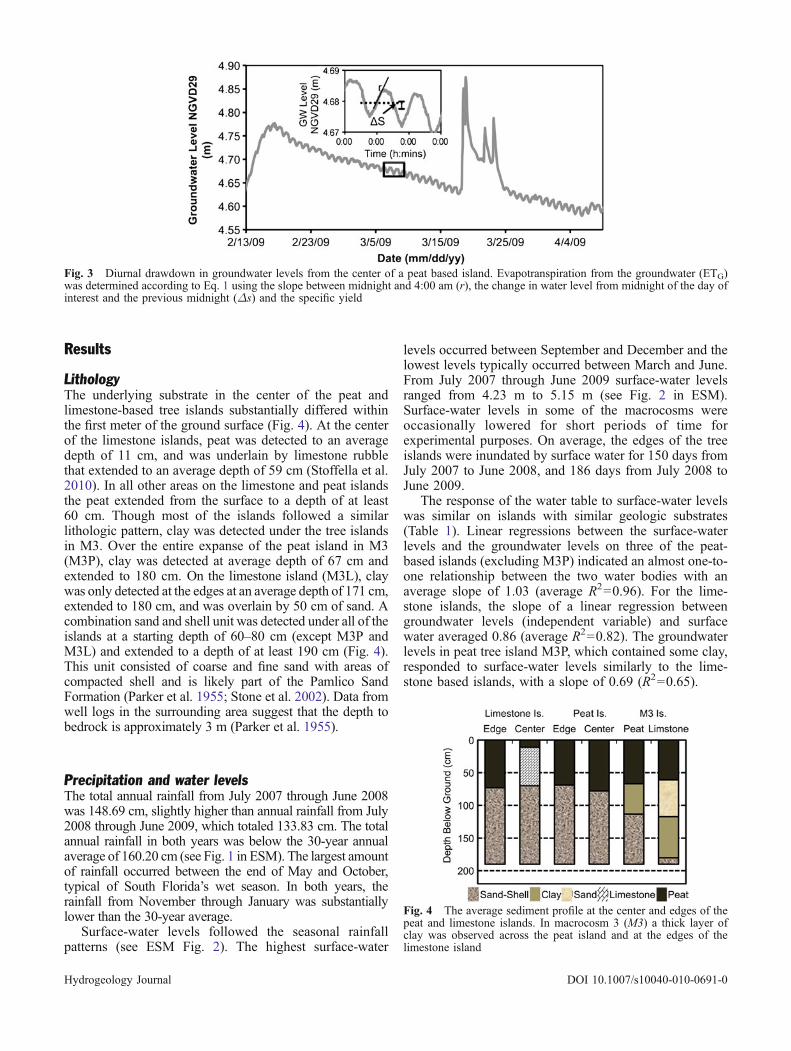
LithologyThe underlying substrate in the center of the peat andlimestone-based tree islands substantially differed withinthe first meter of the ground surface (Fig. 4). At the centerof the limestone islands, peat was detected to an averagedepth of 11 cm, and was underlain by limestone rubblethat extended to an average depth of 59 cm (Stoffella et al.2010). In all other areas on the limestone and peat islandsthe peat extended from the surface to a depth of at least60 cm. Though most of the islands followed a similarlithologic pattern, clay was detected under the tree islandsin M3. Over the entire expanse of the peat island in M3(M3P), clay was detected at average depth of 67 cm andextended to 180 cm. On the limestone island (M3L), claywas only detected at the edges at an average depth of 171 cm,extended to 180 cm, and was overlain by 50 cm of sand. Acombination sand and shell unit was detected under all of theislands at a starting depth of 60–80 cm (except M3P andM3L) and extended to a depth of at least 190 cm (Fig. 4).This unit consisted of coarse and fine sand with areas ofcompacted shell and is likely part of the Pamlico SandFormation (Parker et al. 1955; Stone et al. 2002). Data fromwell logs in the surrounding area suggest that the depth tobedrock is approximately 3 m (Parker et al. 1955).
Precipitation and water levelsThe total annual rainfall from July 2007 through June 2008was 148.69 cm, slightly higher than annual rainfall from July2008 through June 2009, which totaled 133.83 cm. The totalannual rainfall in both years was below the 30-year annualaverage of 160.20 cm (see Fig. 1 in ESM). The largest amountof rainfall occurred between the end of May and October,typical of South Florida’s wet season. In both years, therainfall from November through January was substantiallylower than the 30-year average.
Surface-water levels followed the seasonal rainfallpatterns (see ESM Fig. 2). The highest surface-water
levels occurred between September and December and thelowest levels typically occurred between March and June.From July 2007 through June 2009 surface-water levelsranged from 4.23 m to 5.15 m (see Fig. 2 in ESM).Surface-water levels in some of the macrocosms wereoccasionally lowered for short periods of time forexperimental purposes. On average, the edges of the treeislands were inundated by surface water for 150 days fromJuly 2007 to June 2008, and 186 days from July 2008 toJune 2009.
The response of the water table to surface-water levelswas similar on islands with similar geologic substrates(Table 1). Linear regressions between the surface-waterlevels and the groundwater levels on three of the peat-based islands (excluding M3P) indicated an almost one-to-one relationship between the two water bodies with anaverage slope of 1.03 (average R2=0.96). For the lime-stone islands, the slope of a linear regression betweengroundwater levels (independent variable) and surfacewater averaged 0.86 (average R2=0.82). The groundwaterlevels in peat tree island M3P, which contained some clay,responded to surface-water levels similarly to the lime-stone based islands, with a slope of 0.69 (R2=0.65).
Fig. 3 Diurnal drawdown in groundwater levels from the center of a peat based island. Evapotranspiration from the groundwater (ETG)was determined according to Eq. 1 using the slope between midnight and 4:00 am (r), the change in water level from midnight of the day ofinterest and the previous midnight (Δs) and the specific yield
Fig. 4 The average sediment profile at the center and edges of thepeat and limestone islands. In macrocosm 3 (M3) a thick layer ofclay was observed across the peat island and at the edges of thelimestone island
Hydrogeology Journal DOI 10.1007/s10040-010-0691-0
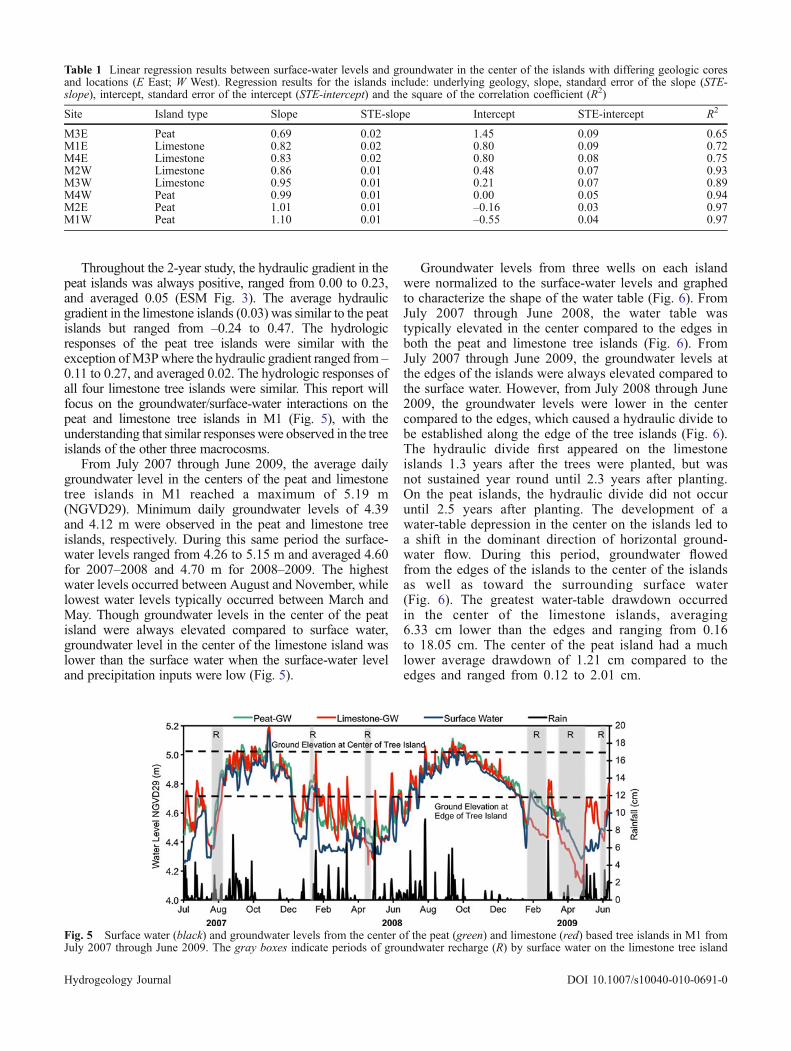
Throughout the 2-year study, the hydraulic gradient in thepeat islands was always positive, ranged from 0.00 to 0.23,and averaged 0.05 (ESM Fig. 3). The average hydraulicgradient in the limestone islands (0.03) was similar to the peatislands but ranged from –0.24 to 0.47. The hydrologicresponses of the peat tree islands were similar with theexception ofM3Pwhere the hydraulic gradient ranged from –0.11 to 0.27, and averaged 0.02. The hydrologic responses ofall four limestone tree islands were similar. This report willfocus on the groundwater/surface-water interactions on thepeat and limestone tree islands in M1 (Fig. 5), with theunderstanding that similar responses were observed in the treeislands of the other three macrocosms.
From July 2007 through June 2009, the average dailygroundwater level in the centers of the peat and limestonetree islands in M1 reached a maximum of 5.19 m(NGVD29). Minimum daily groundwater levels of 4.39and 4.12 m were observed in the peat and limestone treeislands, respectively. During this same period the surface-water levels ranged from 4.26 to 5.15 m and averaged 4.60for 2007–2008 and 4.70 m for 2008–2009. The highestwater levels occurred between August and November, whilelowest water levels typically occurred between March andMay. Though groundwater levels in the center of the peatisland were always elevated compared to surface water,groundwater level in the center of the limestone island waslower than the surface water when the surface-water leveland precipitation inputs were low (Fig. 5).
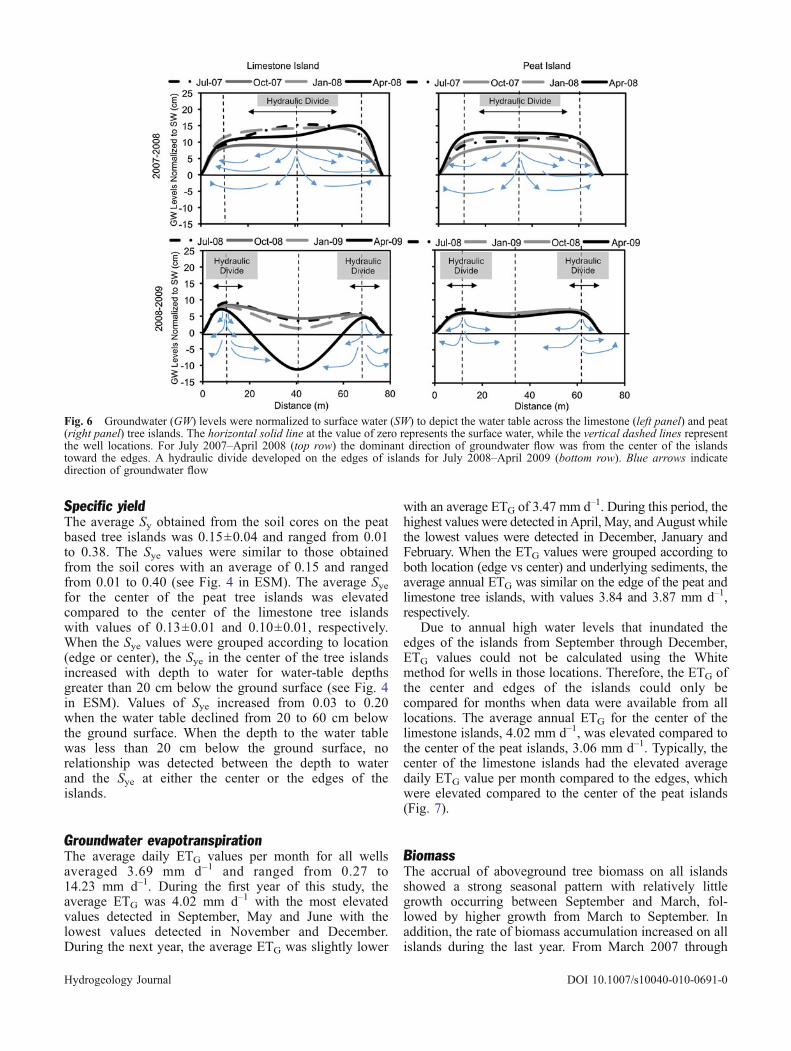
Groundwater levels from three wells on each islandwere normalized to the surface-water levels and graphedto characterize the shape of the water table (Fig. 6). FromJuly 2007 through June 2008, the water table wastypically elevated in the center compared to the edges inboth the peat and limestone tree islands (Fig. 6). FromJuly 2007 through June 2009, the groundwater levels atthe edges of the islands were always elevated compared tothe surface water. However, from July 2008 through June2009, the groundwater levels were lower in the centercompared to the edges, which caused a hydraulic divide tobe established along the edge of the tree islands (Fig. 6).The hydraulic divide first appeared on the limestoneislands 1.3 years after the trees were planted, but wasnot sustained year round until 2.3 years after planting.On the peat islands, the hydraulic divide did not occuruntil 2.5 years after planting. The development of awater-table depression in the center on the islands led toa shift in the dominant direction of horizontal ground-water flow. During this period, groundwater flowedfrom the edges of the islands to the center of the islandsas well as toward the surrounding surface water(Fig. 6). The greatest water-table drawdown occurredin the center of the limestone islands, averaging6.33 cm lower than the edges and ranging from 0.16to 18.05 cm. The center of the peat island had a muchlower average drawdown of 1.21 cm compared to theedges and ranged from 0.12 to 2.01 cm.
Table 1 Linear regression results between surface-water levels and groundwater in the center of the islands with differing geologic coresand locations (E East; W West). Regression results for the islands include: underlying geology, slope, standard error of the slope (STE-slope), intercept, standard error of the intercept (STE-intercept) and the square of the correlation coefficient (R2)
Site Island type Slope STE-slope Intercept STE-intercept R2
M3E Peat 0.69 0.02 1.45 0.09 0.65M1E Limestone 0.82 0.02 0.80 0.09 0.72M4E Limestone 0.83 0.02 0.80 0.08 0.75M2W Limestone 0.86 0.01 0.48 0.07 0.93M3W Limestone 0.95 0.01 0.21 0.07 0.89M4W Peat 0.99 0.01 0.00 0.05 0.94M2E Peat 1.01 0.01 –0.16 0.03 0.97M1W Peat 1.10 0.01 –0.55 0.04 0.97
Fig. 5 Surface water (black) and groundwater levels from the center of the peat (green) and limestone (red) based tree islands in M1 fromJuly 2007 through June 2009. The gray boxes indicate periods of groundwater recharge (R) by surface water on the limestone tree island
Hydrogeology Journal DOI 10.1007/s10040-010-0691-0
Specific yieldThe average Sy obtained from the soil cores on the peatbased tree islands was 0.15±0.04 and ranged from 0.01to 0.38. The Sye values were similar to those obtainedfrom the soil cores with an average of 0.15 and rangedfrom 0.01 to 0.40 (see Fig. 4 in ESM). The average Syefor the center of the peat tree islands was elevatedcompared to the center of the limestone tree islandswith values of 0.13±0.01 and 0.10±0.01, respectively.When the Sye values were grouped according to location(edge or center), the Sye in the center of the tree islandsincreased with depth to water for water-table depthsgreater than 20 cm below the ground surface (see Fig. 4in ESM). Values of Sye increased from 0.03 to 0.20when the water table declined from 20 to 60 cm belowthe ground surface. When the depth to the water tablewas less than 20 cm below the ground surface, norelationship was detected between the depth to waterand the Sye at either the center or the edges of theislands.
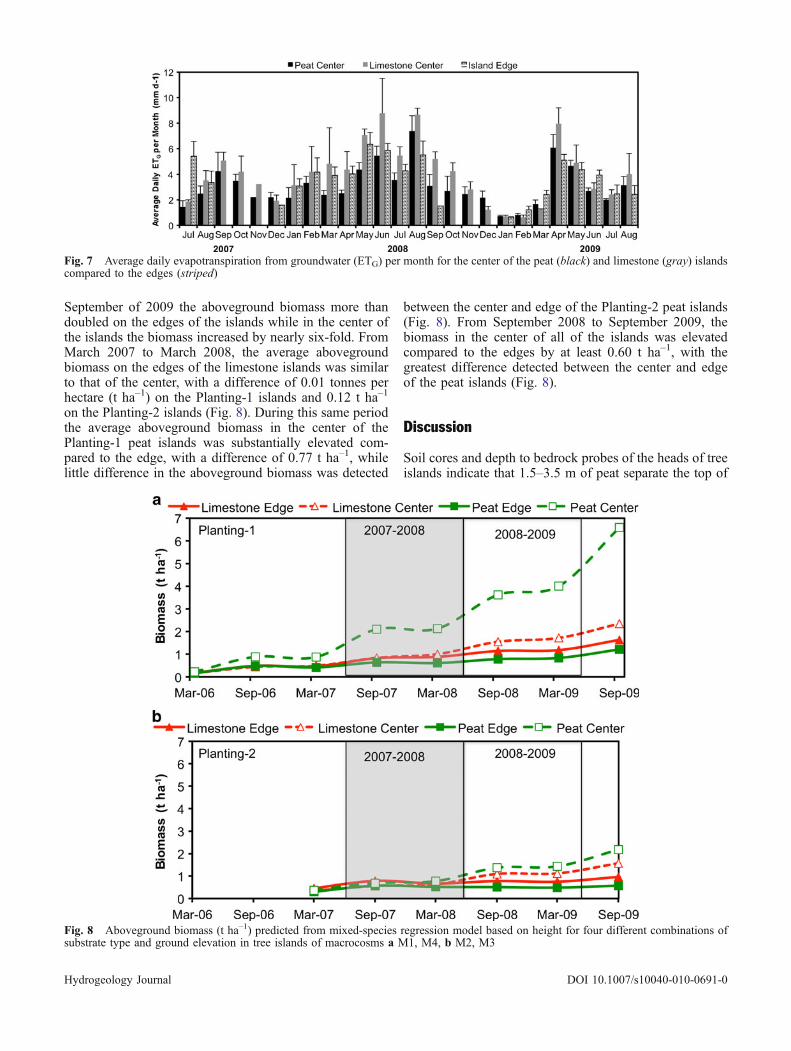
Groundwater evapotranspirationThe average daily ETG values per month for all wellsaveraged 3.69 mm d–1 and ranged from 0.27 to14.23 mm d–1. During the first year of this study, theaverage ETG was 4.02 mm d–1 with the most elevatedvalues detected in September, May and June with thelowest values detected in November and December.During the next year, the average ETG was slightly lower
with an average ETG of 3.47 mm d–1. During this period, thehighest values were detected in April, May, and August whilethe lowest values were detected in December, January andFebruary. When the ETG values were grouped according toboth location (edge vs center) and underlying sediments, theaverage annual ETG was similar on the edge of the peat andlimestone tree islands, with values 3.84 and 3.87 mm d–1,respectively.
Due to annual high water levels that inundated theedges of the islands from September through December,ETG values could not be calculated using the Whitemethod for wells in those locations. Therefore, the ETG ofthe center and edges of the islands could only becompared for months when data were available from alllocations. The average annual ETG for the center of thelimestone islands, 4.02 mm d–1, was elevated compared tothe center of the peat islands, 3.06 mm d–1. Typically, thecenter of the limestone islands had the elevated averagedaily ETG value per month compared to the edges, whichwere elevated compared to the center of the peat islands(Fig. 7).
BiomassThe accrual of aboveground tree biomass on all islandsshowed a strong seasonal pattern with relatively littlegrowth occurring between September and March, fol-lowed by higher growth from March to September. Inaddition, the rate of biomass accumulation increased on allislands during the last year. From March 2007 through
Fig. 6 Groundwater (GW) levels were normalized to surface water (SW) to depict the water table across the limestone (left panel) and peat(right panel) tree islands. The horizontal solid line at the value of zero represents the surface water, while the vertical dashed lines representthe well locations. For July 2007–April 2008 (top row) the dominant direction of groundwater flow was from the center of the islandstoward the edges. A hydraulic divide developed on the edges of islands for July 2008–April 2009 (bottom row). Blue arrows indicatedirection of groundwater flow
Hydrogeology Journal DOI 10.1007/s10040-010-0691-0
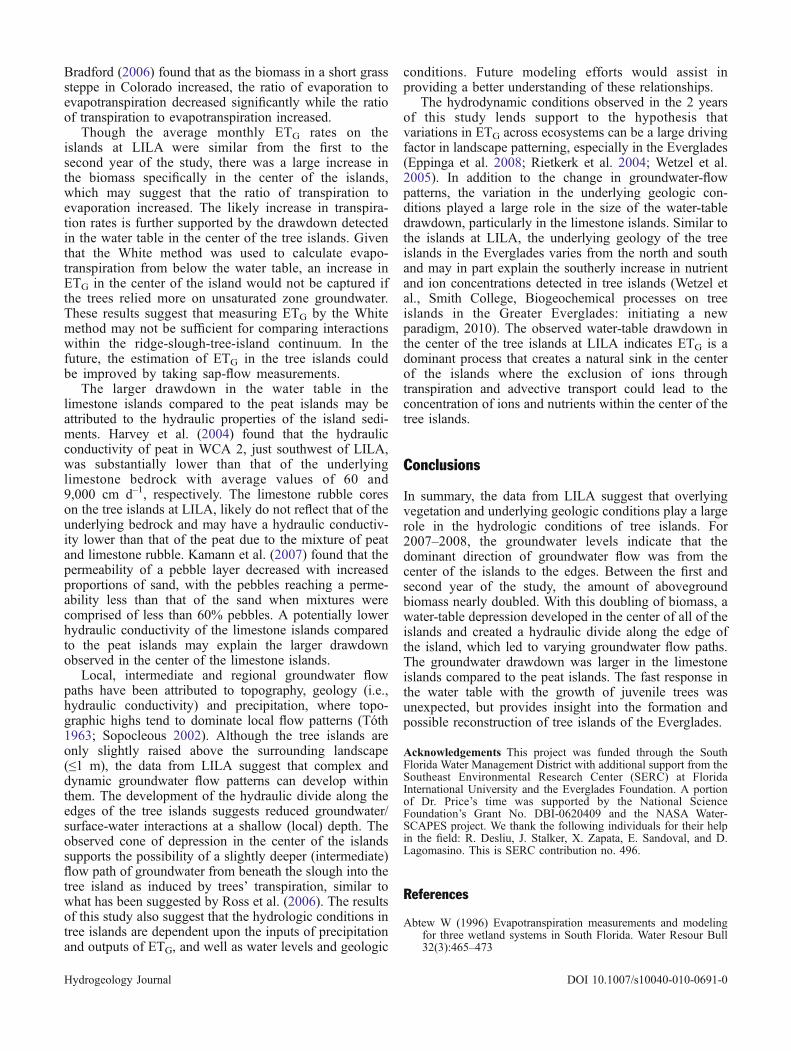
September of 2009 the aboveground biomass more thandoubled on the edges of the islands while in the center ofthe islands the biomass increased by nearly six-fold. FromMarch 2007 to March 2008, the average abovegroundbiomass on the edges of the limestone islands was similarto that of the center, with a difference of 0.01 tonnes perhectare (t ha–1) on the Planting-1 islands and 0.12 t ha–1
on the Planting-2 islands (Fig. 8). During this same periodthe average aboveground biomass in the center of thePlanting-1 peat islands was substantially elevated com-pared to the edge, with a difference of 0.77 t ha–1, whilelittle difference in the aboveground biomass was detected
between the center and edge of the Planting-2 peat islands(Fig. 8). From September 2008 to September 2009, thebiomass in the center of all of the islands was elevatedcompared to the edges by at least 0.60 t ha–1, with thegreatest difference detected between the center and edgeof the peat islands (Fig. 8).
Discussion
Soil cores and depth to bedrock probes of the heads of treeislands indicate that 1.5–3.5 m of peat separate the top of
Fig. 7 Average daily evapotranspiration from groundwater (ETG) per month for the center of the peat (black) and limestone (gray) islandscompared to the edges (striped)
Fig. 8 Aboveground biomass (t ha–1) predicted from mixed-species regression model based on height for four different combinations ofsubstrate type and ground elevation in tree islands of macrocosms a M1, M4, b M2, M3
Hydrogeology Journal DOI 10.1007/s10040-010-0691-0

the tree islands from the underlying bedrock in thenorthern Everglades, while only 25–90 cm peat overliesthe mineral substrate or bedrock in the central andsouthern Everglades (Brandt et al. 2002; Mason and vander Valk 2002; Stone et al. 2002; Schwadron 2006). Withsimilar thickness in the overlying peat, the peat treesislands at LILA seem to mimic those of the WaterConservation Area 3, located in the central portion ofthe Everglades (Mason and van der Valk 2002). Further-more, the limestone islands at LILA may be similar to anumber of fixed islands in Everglades National Park suchas Crandon and Sour Orange hammocks. On these islands,25–50 cm of organic coarse loamy soil separated the topof the islands from a 40–75 cm thick mineralized orcalcrete layer that was underlain by a 50-cm thick layer ofdense-black-earth midden before reaching bedrock (Grafet al. 2008; Coultas et al. 2008). Although the thickness ofoverlying peat, presence of a calcrete layer, and depth tobedrock vary widely between tree islands of the Ever-glades, the variability in tree-island stratigraphy iscaptured in the constructed islands at LILA.
The range in the hydraulic gradients from the limestonetree islands at LILA (–0.24 to 0.47) was greater thanvalues previously reported in the Everglades. The highestpublished hydraulic gradient was 0.10 measured adjacentto a levee road (Harvey et al. 2004). However, the averagehydraulic gradients measured on the peat (0.05) andlimestone (0.03) tree islands at LILA were similar to avalue of 0.02 reported in the interior of the WaterConservation Area 2 (Harvey et al. 2000), but signifi-cantly greater than a hydraulic gradient of 0.005 reportedfor Taylor Slough (Harvey et al. 2004). The largevariability in the hydraulic gradients observed in the treeislands at LILA were most likely due to the managedsurface-water level, which was sometimes raised orlowered quickly to accommodate other studies or to stayon the operational hydrograph.
The Sye values at LILA varied greatly (0.10–0.27)when the water table was within 20 cm of the groundsurface, while the Sye values increased from 0.03 to 0.20with water-table depth deeper than 20 cm. Though slightlyelevated, specific yield modeling results of Evergladespeat showed similar patterns to those at LILA. When thewater table was within 15–20 cm of the ground surface,the specific yield values were highly variable and rangedfrom 0.1–0.5, but when the depth of the water table wasgreater than 20–30 cm, the specific yield increased withdepth to 0.2 (Sumner, 2007). The readily available specificyields of mineral soils were also found to increase withwater-table depth when the water table was within 1 m ofthe ground surface (Loheide et al. 2005), though thereverse was observed in peat soils (Boelter 1965; Heloitis1989). The increase in Sye with water-table depth, atdepths greater than 20 cm, on the islands at LILA may beattributed to the sand-shell layer that underlies the peat onall of the islands.
The ETG rates at LILA followed a seasonal pattern andmonthly mean akin to those of a forested area with a shallowwater table examined in Hillsborough County, Florida
(Nachabe et al. 2005); using theWhite method, these authorsfound that the average daily ETG per month in the forestranged from 0.1 to 7.8 mm d–1, with the highest ratesdetected in May through July. Lysimeter data for theEverglades Nutrient Removal project, 25 km from LILA,showed seasonal evapotranspiration patterns analogous tothe ETG rates at LILA, with the highest rates detectedbetween May and July, but with a much smaller range,exhibiting values of 1.9 to 5.8 mm d–1 (Abtew 1996). Usingthe energy budget method, German and Sumner (2002)calculated rates of evapotranspiration that ranged from 1.69to 5.92 mm d–1 during a drought year in a sawgrass area ofBlue Cypress Marsh, located north of Loxahatchee. Theaverage daily ETG per month detected in the summer of2008 at LILA were elevated compared to data reported byAbtew (1996) and German and Sumner (2002). The largerange in specific yield values that occurred when the watertable was close to the ground surface may have led to an overestimation of ETG during the wet season.
The greater ETG rates in the center of the limestonetree islands compared to the peat islands may be attributedto variations in the overlying biomass. Stoffella et al.(2010) found that the height of the trees increased in thepeat tree islands with increasing elevation. Furthermore,they noted from aerial photos that fewer ruderal herbs andshrubs persisted in the center of the peat tree islandscompared to the limestone. The lower ETG rates in thecenter of the peat-based islands may be attributed toincreased shading, lower air and soil temperatures,development of a litter layer and the reduced air flowassociated with the greater aboveground tree biomass (LeMaitre et al. 1999; Holmgren et al. 1997).
In addition to the amount of aboveground biomassmore than doubling from 2007–2008 to 2008–2009, thedistribution of the aboveground biomass also changed. In2007–2008 the aboveground biomass was equally dis-tributed between the edge and center for most of theislands while for 2008–2009, the center of the islands hadat least 1.5 times more aboveground biomass compared tothe edges. Over the same time period, a shift occurred inthe groundwater flow direction in the islands. For 2007–2008 groundwater consistently flowed radially away fromthe center of the islands toward the edges where itdischarged to the surface water. In 2008–2009, the watertable in the center of the islands was depressed comparedto the edges, which created a hydraulic divide along theedge of the islands. From this divide, groundwater flowedin two directions; one from the edges of the island towardits center, and the other from the edges of the island to thesurface water (Fig. 6). Though the average monthly ETG
rates slightly decreased from 2007–2008 to 2008–2009 onboth island types, the aboveground biomass increased.This increment was particularly high in the center of thepeat tree islands where biomass increased 5.7 t ha–1 inPlanting-1 islands and 1.8 t ha–1 in Planting-2 (Fig. 8). Anincrease in aboveground biomass would be expected toincrease transpiration, but could have also increasedshading, reduced soil temperatures and increased humid-ity, all of which would reduce evaporation. Lauenroth and
Hydrogeology Journal DOI 10.1007/s10040-010-0691-0
Bradford (2006) found that as the biomass in a short grasssteppe in Colorado increased, the ratio of evaporation toevapotranspiration decreased significantly while the ratioof transpiration to evapotranspiration increased.
Though the average monthly ETG rates on theislands at LILA were similar from the first to thesecond year of the study, there was a large increase inthe biomass specifically in the center of the islands,which may suggest that the ratio of transpiration toevaporation increased. The likely increase in transpira-tion rates is further supported by the drawdown detectedin the water table in the center of the tree islands. Giventhat the White method was used to calculate evapo-transpiration from below the water table, an increase inETG in the center of the island would not be captured ifthe trees relied more on unsaturated zone groundwater.These results suggest that measuring ETG by the Whitemethod may not be sufficient for comparing interactionswithin the ridge-slough-tree-island continuum. In thefuture, the estimation of ETG in the tree islands couldbe improved by taking sap-flow measurements.
The larger drawdown in the water table in thelimestone islands compared to the peat islands may beattributed to the hydraulic properties of the island sedi-ments. Harvey et al. (2004) found that the hydraulicconductivity of peat in WCA 2, just southwest of LILA,was substantially lower than that of the underlyinglimestone bedrock with average values of 60 and9,000 cm d–1, respectively. The limestone rubble coreson the tree islands at LILA, likely do not reflect that of theunderlying bedrock and may have a hydraulic conductiv-ity lower than that of the peat due to the mixture of peatand limestone rubble. Kamann et al. (2007) found that thepermeability of a pebble layer decreased with increasedproportions of sand, with the pebbles reaching a perme-ability less than that of the sand when mixtures werecomprised of less than 60% pebbles. A potentially lowerhydraulic conductivity of the limestone islands comparedto the peat islands may explain the larger drawdownobserved in the center of the limestone islands.
Local, intermediate and regional groundwater flowpaths have been attributed to topography, geology (i.e.,hydraulic conductivity) and precipitation, where topo-graphic highs tend to dominate local flow patterns (Tóth1963; Sopocleous 2002). Although the tree islands areonly slightly raised above the surrounding landscape(≤1 m), the data from LILA suggest that complex anddynamic groundwater flow patterns can develop withinthem. The development of the hydraulic divide along theedges of the tree islands suggests reduced groundwater/surface-water interactions at a shallow (local) depth. Theobserved cone of depression in the center of the islandssupports the possibility of a slightly deeper (intermediate)flow path of groundwater from beneath the slough into thetree island as induced by trees’ transpiration, similar towhat has been suggested by Ross et al. (2006). The resultsof this study also suggest that the hydrologic conditions intree islands are dependent upon the inputs of precipitationand outputs of ETG, and well as water levels and geologic
conditions. Future modeling efforts would assist inproviding a better understanding of these relationships.
The hydrodynamic conditions observed in the 2 yearsof this study lends support to the hypothesis thatvariations in ETG across ecosystems can be a large drivingfactor in landscape patterning, especially in the Everglades(Eppinga et al. 2008; Rietkerk et al. 2004; Wetzel et al.2005). In addition to the change in groundwater-flowpatterns, the variation in the underlying geologic con-ditions played a large role in the size of the water-tabledrawdown, particularly in the limestone islands. Similar tothe islands at LILA, the underlying geology of the treeislands in the Everglades varies from the north and southand may in part explain the southerly increase in nutrientand ion concentrations detected in tree islands (Wetzel etal., Smith College, Biogeochemical processes on treeislands in the Greater Everglades: initiating a newparadigm, 2010). The observed water-table drawdown inthe center of the tree islands at LILA indicates ETG is adominant process that creates a natural sink in the centerof the islands where the exclusion of ions throughtranspiration and advective transport could lead to theconcentration of ions and nutrients within the center of thetree islands.
Conclusions
In summary, the data from LILA suggest that overlyingvegetation and underlying geologic conditions play a largerole in the hydrologic conditions of tree islands. For2007–2008, the groundwater levels indicate that thedominant direction of groundwater flow was from thecenter of the islands to the edges. Between the first andsecond year of the study, the amount of abovegroundbiomass nearly doubled. With this doubling of biomass, awater-table depression developed in the center of all of theislands and created a hydraulic divide along the edge ofthe island, which led to varying groundwater flow paths.The groundwater drawdown was larger in the limestoneislands compared to the peat islands. The fast response inthe water table with the growth of juvenile trees wasunexpected, but provides insight into the formation andpossible reconstruction of tree islands of the Everglades.
Acknowledgements This project was funded through the SouthFlorida Water Management District with additional support from theSoutheast Environmental Research Center (SERC) at FloridaInternational University and the Everglades Foundation. A portionof Dr. Price’s time was supported by the National ScienceFoundation’s Grant No. DBI-0620409 and the NASA Water-SCAPES project. We thank the following individuals for their helpin the field: R. Desliu, J. Stalker, X. Zapata, E. Sandoval, and D.Lagomasino. This is SERC contribution no. 496.
References
Abtew W (1996) Evapotranspiration measurements and modelingfor three wetland systems in South Florida. Water Resour Bull32(3):465–473
Hydrogeology Journal DOI 10.1007/s10040-010-0691-0

Ali A, Abtew W, Van Horn S, Khanal N (2000) Temporal andspatial characterization of rainfall over Central and SouthFlorida. J Am Water Resour Assoc 36(4):833–848
Boelter HD (1965) Hydraulic conductivity of peats. Soil Sci 100(4):227–231
Brandt LA, Portier KM, Kitchens WM (2000) Patterns of change intree islands in Arthur R. Marshall Loxahatchee national wildliferefuge from 1950–1991. Wetlands 20(1):1–14
Brandt LA, Siliveria JE, Kitchens WM (2002) Tree islands ofArthur R. Marshall Loxahatchee National Wildlife Refuge. In:Sklar FH, van der Valk AG (eds) Tree islands of the Everglades.Kluwers, Dordecht, The Netherlands
Coultas CL, Schawrdon M, Galbraith JM (2008) Petrocalcichorizon formation and prehistoric people’s effect on Evergladestree island soils, Florida. Soil Surv Horiz 49(1):16–21
Daivs SM, Ogden JC (1994) Everglades: the ecosystem and itrestoration. St. Lucie, Boca Raton, FL
Engel VC, Jobbágy EG, Stieglitz M, Williams M, Jackson RB(2005) Hydrological consequences of Eucalyptus afforesta-tion in the Argentine Pampas. Water Resour Res 41,W10409, 14 pp
Eppinga MB, Rietkerk M, Borren W, Lapshina ED, Bleuten W,Wassen MJ (2008) Regular surface patterning of peatlands:confronting theory with field data. Ecosystems 11:520–536
Ewe SML, da Silveira Lobo Sternberg L, Busch DE (1999)Water-use patterns of woody species in pineland andhammock communities of South Florida. For Ecol Manage118:139–148
Ferone JM, Devito KJ (2004) Shallow groundwater-surface waterinteractions in pond-peatland complexes along Boreal Plainstopographic gradient. J Hydrol 292:75–95
Gann TGT, Childers DL, Randeaau DN (2005) Ecosystem structure,nutrient dynamics, and hydrologic relationships in tree islands of thesouthern Everglades, Florida, USA. For Ecol Manage 214:11–27
Gawlik DE, Gronemyer P, Powell RA (2002) Habitat-use patternsof avian seed dispersers in the central Everglades. In: Sklar FH,van der Valk AG (eds) Tree islands of the Everglades. Kluwer,Dordecht, The Netherlands
Gerla PJ (1992) The relationship of water table changes to thecapillary fringe, evapotranspiration, and precipitation in inter-mittent wetlands. Wetlands 12(2):91–98
German ER, Sumner DM (2002) Evapotranspiration rates fromtwo different sawgrass communities in South Florida duringdrought conditions. Second Federal Interagency HydrologicModeling Conference, Las Vegas, NV, 28 July–1 August2002, 12 pp
Glaser PH, Wheeler GA, Gorham E, Wright HE Jr (1981) Thepatterned mires of the Red Lake peatland, northern Minnesota:vegetation, water chemistry, and landforms. J Ecol 69(2):575–599
Graf MT, Schwadron M, Stone PA, Ross M, Chmura GL (2008) Anenigmatic carbonate layer in Everglades tree island peats. EOSTrans AGU 89(12):117–124
Harvey WJ, Jackson JM, Mooney RH, Choi J (2000) Interactionbetween ground water and surface water in Taylor Slough andVicinity, Everglades National Park, South Florida. US GeolSurv Open-File Rep 00–483
Harvey WJ, Krupa SL, Krest JM (2004) Ground water recharge anddischarge in the central Everglades. Ground Water 47(7):1090–1102
Healy WR, Cook PG (2002) Using groundwater levels to estimaterecharge. Hydrogeol J 10:91–109
Heliotis FD (1989) Water storage capacity of wetland used forwastewater treatment. J Environ Eng 115(4):822–834
Holmgren M, Scheffer M, Huston AM (1997) The interplay offacilitation and competition of plant communities. Ecology 78(7):1966–1975
Jobbágy EG, Jackson RB (2007) Groundwater and soil chemicalchanges under phyreatophytic tree plantations. J Geophys Res112(G0213):1–15
Kamann PJ, Ritzi RW, Dominic DF, Conrad CM (2007) Porosityand permeability in sediment mixtures. Ground Water 45(4):429–438
Lauenroth WK, Bradford JB (2006) Ecohydrology and the partitionAET between transpiration and evaporation in semiarid steppe.Ecosystems 9:756–767
Le Maitre DC, Scott DF, Colvin C (1999) A review of informationon interactions between vegetation and groundwater. Water S A25(2):137–152
Loheide SP II, Butler JJ Jr, Gorelick SM (2005) Estimatinggroundwater consumption by phreatophytes using diurnal watertable fluctuations: a saturated-unsaturated flow assessment.Water Resour Res 40, W07030
Mason DH, van der Valk A (2002) Vegetation, peat elevation, andpeat depth on two tree islands in Water Conservation Area-3A.In: Sklar FH, van der Valk AG (eds) Tree islands of theEverglades. Kluwer, Dordecht, The Netherlands
McCarthy TS, Ellery WN, Danergfield JM (1998) The role of biotain the initiation and growth of islands on the floodplain of theOkavanga Alluvial Fan, Bostwana. Earth Surf Process Land23:281–316
Meinzer OE (1923) The occurrence of groundwater in the UnitedStates with a discussion of principles. US Geol Surv WaterSuppl Pap 489
Meyboom P (1967) Groundwater studies in the Assiniboine Riverdrainage basin: part II, hydrologic characteristics of phyreato-phytic vegetation in south-central Saskatchewan. Geol SurvCanada Bull 139
Nachabe MH (2002) Analytical expressions for transient specificyield and shallow water table drainage. Water Resour Res 38(10):1193–1204
Nachabe M, Shah N, Ross M, Vomacka J (2005) Evapotranspirationof two vegetation covers in shallow water table environment.Soil Sci Soc Am J 69:429–499
National Resources Conservation Survey (2010) Web soilsurvey, national cooperative soil survey. National ResourcesConservation Survey, Washington, DC. http://websoilsurvey.nrcs.usda.gov/app/WebSoilSurvey.aspx. Cited 21 March2010
Parker GG, Ferguson GE, Love SK et al (1955) Water resources ofsoutheastern Florida with special reference to the geology andground water of the Miami area. US Geol Surv Water Suppl Pap1255
Rietkerk M, van der Koppel J (2008) Regular pattern formation inreal ecosystems. Trends Ecol Evol 23(3):169–176
Rietkerk M, Dekker SC, Wassen MJ, Verkroost AWM, BierkensMFP (2004) A putative mechanism for bog patterning. AmNaturalist 163(5):699–708
Rosenberry DO, Winter TC (1997) Dynamics of water-tablefluctuations in an upland between two prairie-pothole wetlandsin North Dakota. J Hydrol 191:266–289
Ross MS, Jones DT (2004) Tree islands in the Shark Sloughlandscape: interactions of vegetation, hydrology and soils. Finalreport, Submitted to the Everglades National Park, Homestead,FL, 196 pp
Ross MS, Mitchell-Brucker S, Sah JP, Stothoff S, Ruiz PL, ReedDL, Jayachandran K, Coultas CL (2006) Interaction ofhydrology and nutrient limitation in ridge and slough landscapeof southern Florida. Hydrobiology 569:37–59
Schwadron M (2006) Everglades tree islands prehistory: archeo-logical evidence for regional Holocene variability and earlyhuman settlement. Antiquity 80(310)
Sklar FH, van der Valk A (2002) Tree islands of theEverglades: an overview. In: Sklar FH, van der Valk AG(eds) Tree islands of the Everglades. Kluwer, Dordecht, TheNetherlands
Sophocleous M (2002) Interactions between groundwater andsurface water: the state of science. Hydrogeol J 10:52–67
Stoffella SL, Ross MS, Sah J, Ruiz P, Lopez l, Colbert N,Dodge C, Heinrich J Trujillo D (2009) Estimating biomassproduction and nutrient concentrations of tree speciesgrowing along hydrologic gradient on LILA tree islandsBiomass Estimation. Report to the South Florida WaterManagement District. SFWMD, West Palm Beach, FL,12 pp
Hydrogeology Journal DOI 10.1007/s10040-010-0691-0

Stoffella SL, Ross MS, Sah JP, Price MP, Sullivan PL, Cline AE,Scinto LJ (2010) Survival and growth responses of eightEverglades tree species along an experimental hydrologicgradient on two tree island types. Appl Veg Sci. doi:10.1111/j.1654-109X.2010.01081.x
Stone PA, Gleason PJ, Chmura GL (2002) Bayhead Tree Islands ondeep peats of the northeastern Everglades, chapter 3. In: SklarFH, van der Valk AG (eds) Tree islands of the Everglades.Kluwer, Dordecht, The Netherlands
Sumner DM (2007) Effects of capillarity and microtopography onwetlands specific yield. Wetlands 27(3):693–701
Tóth J (1963) A theoretical analysis of groundwater flow in a smalldrainage basin. J Geophys Res 68(16):4795–4812
van der Valk AG, Wetzel P, Cline E, Sklar FH (2008)Restoring Tree Islands in the Everglades: experimentalstudies of tree seedling survival. Restor Ecol 16(2):281–289
Wetzel PR, van der Valk AG, Newman S, Gawlik DE, GannTT, Coronado-Moliana CA, Childers DL, Sklar FH (2005)Maintaining tree islands in the Florida Everglades:nutrient redistribution is the key. Front Ecol Environ 3(7):370–376
White WN (1932) A method of estimating ground-water suppliesbased on discharge by plants and evaporations from soils:results of investigations in Escalante Valley, Utah. US GeolSurv Water Suppl Pap 659-A
Hydrogeology Journal DOI 10.1007/s10040-010-0691-0