The effect of free lime on the hydration kinetics and rheology ...
Current Opinion in Colloid & Interface Science 16 (2011) 517–524
Contents lists available at ScienceDirect
Current Opinion in Colloid & Interface Science
j ourna l homepage: www.e lsev ie r.com/ locate /coc is
Hydration force due to the reduced screening of the electrostatic repulsion infew-nanometer-thick films
Peter A. Kralchevsky ⁎, Krassimir D. Danov, Elka S. BashevaDepartment of Chemical Engineering, Faculty of Chemistry, Sofia University, 1164 Sofia, Bulgaria
⁎ Corresponding author. Tel.: +359 2 8161262; fax:E-mail address: [email protected] (P.A. Kralchevs
1359-0294/$ – see front matter © 2011 Elsevier Ltd. Aldoi:10.1016/j.cocis.2011.04.005
a b s t r a c t
a r t i c l e i n f oArticle history:Received 24 March 2011Received in revised form 21 April 2011Accepted 22 April 2011Available online 4 May 2011
Keywords:Surface forcesHydration repulsionFoam filmsEffect of counterion size
Experiments with foam films from solutions of 1 mM SDS+100 mM electrolyte (LiCl, NaCl and CsCl) werecarried out by a thin-film-pressure balance. The measured dependences of disjoining pressure versus filmthickness exhibit a steep increase when the thickness of the film's water core becomes smaller than 3.7 nm.This behavior can be interpreted as amanifestation of the hydration force.We unsuccessfully tried to interpretthe data with different available theoretical models. Eventually, we found that a relatively simple model of“reduced screening” can fit the data. Such reduced screening of the electric field could exist only in a narrowrange of film thicknesses, which practically coincides with the region where the hydration repulsion is acting.This model and its experimental verification are described in the article.
+359 2 9625643.ky).
l rights reserved.
© 2011 Elsevier Ltd. All rights reserved.
1. Introduction
The existence of a “hydration” layer was proposed as a possibleexplanation for the stability of hydrophilic colloids, even when theparticles are uncharged [1]. The existence of a short range (≤4 nm)repulsive pressure was observed in experiments on the swelling ofclays [2,3] and on the stabilization of foam films [4]. This short-rangerepulsion has been called the “hydration force” [5]. The Derjaguin'sschool terms it “structural component of disjoining pressure” [6].Indications for its action were found in measurements of interactionsbetween phospholipid bilayers by Parsegian, Rand et al. [7,8].Israelachvili et al. [9–11] and Pashley [12–14] examined the validityof the Derjaguin–Landau–Verwey–Overbeek (DLVO) theory [15,16] atsmall film thickness by a surface-force apparatus in experiments withfilms from aqueous electrolyte solutions confined between twocurved mica surfaces, bare or covered by adsorbed layers. Atelectrolyte concentrations below 10−4 M, they observed the typicalDLVO maximum. However, at electrolyte concentrations higher than10−3 M they did not observe the expected DLVO maximum andprimary minimum [11]. Instead a strong short-range repulsion wasdetected, which can be empirically described by exponential law witha decay length 0.6–1.1 nm [17]. Similar repulsion was detectedbetween silica sheets [18,19] and dihexadecyl phosphate monolayersdeposited on a solid surface [20].
As known, the conventional electrostatic (double layer) repulsionis suppressed if the solution's ionic strength is increased [15,16]. In
contrast, the hydration repulsion is detected at higher ionic strengths[11], at which it is the main stabilizing factor in liquid films andcolloidal dispersions. Such strong repulsion at high salt concentrationswas observed between apoferritin molecules in solutions [21,22] andbetween the adsorption layers of this protein on silica surfaces [23]. Ingeneral, the hydration force plays an important role for the stability ofproteins in physiological media. Effects of monovalent anions of theHofmeister series on the hydration repulsion between lipid bilayershave been experimentally investigated [24,25]. The hydrationrepulsion affects the stability of emulsions [26]; the rheology ofconcentrated suspensions [27]; the interactions of biological cells[28], and the fusion rate of vesicles in the cellular inter-organelletraffic [29]. Additional information can be found in the review articles[30–34].
Different models have been proposed for theoretical explanationof the hydration repulsion. In thewater-structuringmodels, the short-range repulsive interaction is attributed to an alignment of waterdipoles in the vicinity of a hydrophilic surface, where the range of thesurface force is determined by the orientation-correlation length ofthe solvent molecules [35–37].
The image-charge models take into account the discreteness of thesurface charges, which induce orientation in the adjacent water di-poles [38–41]. Dipoles due to zwitterionic surface groups, e.g.phospholipid headgroups [42], have been also taken into consider-ation in models of the electrostatic interaction between planar latticesof dipoles [43–47].
The dielectric-saturationmodels attribute the hydration repulsion tothe presence of a layerwith lower dielectric constant, ε, in the vicinity ofthe interfaces. Models with a stepwise [48,49] and continuous [50]variation of ε have been proposed.
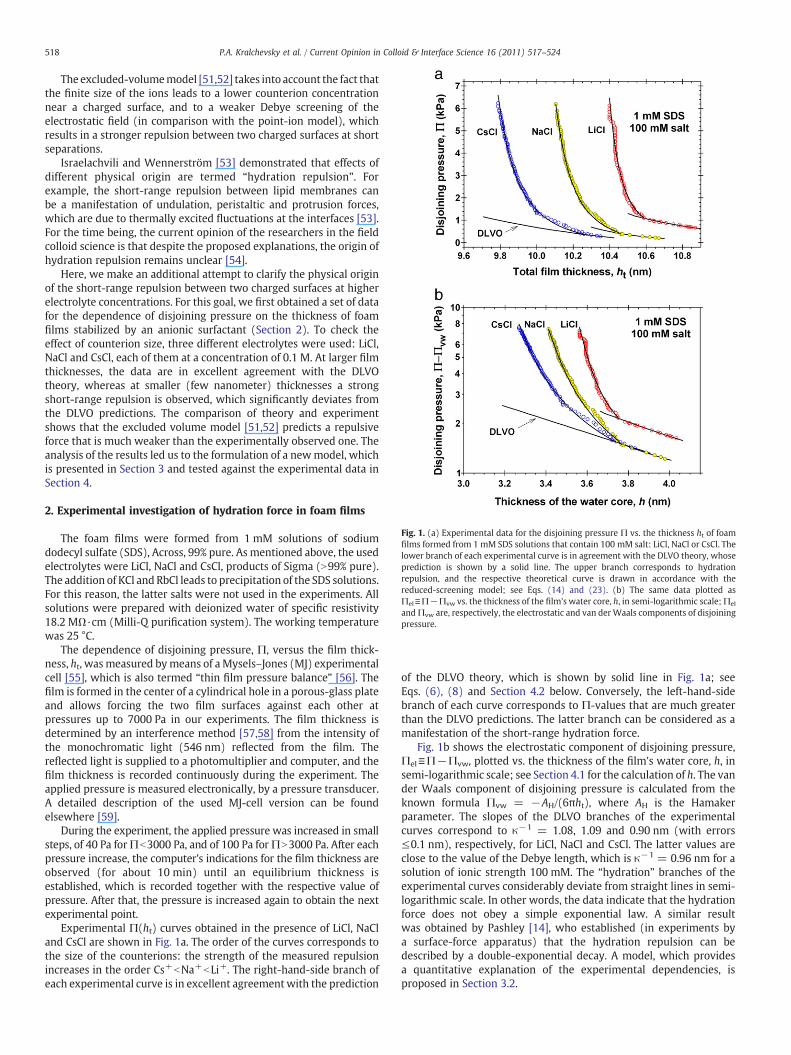
Fig. 1. (a) Experimental data for the disjoining pressure Π vs. the thickness ht of foamfilms formed from 1 mM SDS solutions that contain 100 mM salt: LiCl, NaCl or CsCl. Thelower branch of each experimental curve is in agreement with the DLVO theory, whoseprediction is shown by a solid line. The upper branch corresponds to hydrationrepulsion, and the respective theoretical curve is drawn in accordance with thereduced-screening model; see Eqs. (14) and (23). (b) The same data plotted asΠel≡Π−Πvw vs. the thickness of the film's water core, h, in semi-logarithmic scale;Πel
andΠvw are, respectively, the electrostatic and van derWaals components of disjoiningpressure.
518 P.A. Kralchevsky et al. / Current Opinion in Colloid & Interface Science 16 (2011) 517–524
The excluded-volumemodel [51,52] takes into account the fact thatthe finite size of the ions leads to a lower counterion concentrationnear a charged surface, and to a weaker Debye screening of theelectrostatic field (in comparison with the point-ion model), whichresults in a stronger repulsion between two charged surfaces at shortseparations.
Israelachvili and Wennerström [53] demonstrated that effects ofdifferent physical origin are termed “hydration repulsion”. Forexample, the short-range repulsion between lipid membranes canbe a manifestation of undulation, peristaltic and protrusion forces,which are due to thermally excited fluctuations at the interfaces [53].For the time being, the current opinion of the researchers in the fieldcolloid science is that despite the proposed explanations, the origin ofhydration repulsion remains unclear [54].
Here, we make an additional attempt to clarify the physical originof the short-range repulsion between two charged surfaces at higherelectrolyte concentrations. For this goal, we first obtained a set of datafor the dependence of disjoining pressure on the thickness of foamfilms stabilized by an anionic surfactant (Section 2). To check theeffect of counterion size, three different electrolytes were used: LiCl,NaCl and CsCl, each of them at a concentration of 0.1 M. At larger filmthicknesses, the data are in excellent agreement with the DLVOtheory, whereas at smaller (few nanometer) thicknesses a strongshort-range repulsion is observed, which significantly deviates fromthe DLVO predictions. The comparison of theory and experimentshows that the excluded volume model [51,52] predicts a repulsiveforce that is much weaker than the experimentally observed one. Theanalysis of the results led us to the formulation of a newmodel, whichis presented in Section 3 and tested against the experimental data inSection 4.
2. Experimental investigation of hydration force in foam films
The foam films were formed from 1 mM solutions of sodiumdodecyl sulfate (SDS), Across, 99% pure. As mentioned above, the usedelectrolytes were LiCl, NaCl and CsCl, products of Sigma (N99% pure).The addition of KCl and RbCl leads to precipitation of the SDS solutions.For this reason, the latter salts were not used in the experiments. Allsolutions were prepared with deionized water of specific resistivity18.2 MΩ·cm (Milli-Q purification system). The working temperaturewas 25 °C.
The dependence of disjoining pressure, Π, versus the film thick-ness, ht, was measured bymeans of aMysels–Jones (MJ) experimentalcell [55], which is also termed “thin film pressure balance” [56]. Thefilm is formed in the center of a cylindrical hole in a porous-glass plateand allows forcing the two film surfaces against each other atpressures up to 7000 Pa in our experiments. The film thickness isdetermined by an interference method [57,58] from the intensity ofthe monochromatic light (546 nm) reflected from the film. Thereflected light is supplied to a photomultiplier and computer, and thefilm thickness is recorded continuously during the experiment. Theapplied pressure is measured electronically, by a pressure transducer.A detailed description of the used MJ-cell version can be foundelsewhere [59].
During the experiment, the applied pressure was increased in smallsteps, of 40 Pa forΠb3000 Pa, and of 100 Pa forΠN3000 Pa. After eachpressure increase, the computer's indications for the film thickness areobserved (for about 10 min) until an equilibrium thickness isestablished, which is recorded together with the respective value ofpressure. After that, the pressure is increased again to obtain the nextexperimental point.
Experimental Π(ht) curves obtained in the presence of LiCl, NaCland CsCl are shown in Fig. 1a. The order of the curves corresponds tothe size of the counterions: the strength of the measured repulsionincreases in the order Cs+bNa+bLi+. The right-hand-side branch ofeach experimental curve is in excellent agreementwith the prediction
of the DLVO theory, which is shown by solid line in Fig. 1a; seeEqs. (6), (8) and Section 4.2 below. Conversely, the left-hand-sidebranch of each curve corresponds to Π-values that are much greaterthan the DLVO predictions. The latter branch can be considered as amanifestation of the short-range hydration force.
Fig. 1b shows the electrostatic component of disjoining pressure,Πel≡Π−Πvw, plotted vs. the thickness of the film's water core, h, insemi-logarithmic scale; see Section 4.1 for the calculation of h. The vander Waals component of disjoining pressure is calculated from theknown formula Πvw = −AH/(6πht), where AH is the Hamakerparameter. The slopes of the DLVO branches of the experimentalcurves correspond to κ−1 = 1.08, 1.09 and 0.90 nm (with errors≤0.1 nm), respectively, for LiCl, NaCl and CsCl. The latter values areclose to the value of the Debye length, which is κ−1 = 0.96 nm for asolution of ionic strength 100 mM. The “hydration” branches of theexperimental curves considerably deviate from straight lines in semi-logarithmic scale. In other words, the data indicate that the hydrationforce does not obey a simple exponential law. A similar resultwas obtained by Pashley [14], who established (in experiments bya surface-force apparatus) that the hydration repulsion can bedescribed by a double-exponential decay. A model, which providesa quantitative explanation of the experimental dependencies, isproposed in Section 3.2.

519P.A. Kralchevsky et al. / Current Opinion in Colloid & Interface Science 16 (2011) 517–524
3. Theoretical models
3.1. Comparison with the ionic-excluded-volume model
As already mentioned, we tried to fit the experimental Π(ht)curves in Fig. 1 by means of the excluded-volume model that takesinto account the finite size of the hydrated ions in the solution.Because the effect of dielectric saturation was found to be small [51],we used the “purely-excluded-volume” version of the model fromRef. [52]. First, this model was applied to fit the lower (right-hand-side) branch of each experimental curve, which turns out tocorrespond to a fixed potential. From the respective fit, the value ofthe surface electrostatic potential was determined, which was furtherapplied to compute the whole theoretical curve. To our surprise,under the conditions of our experiment, the theoretical curvescomputed by the excluded-volume model [52] practically coincidewith the predictions of the DLVO theory shown in Fig. 1, i.e. this modelcannot explain the “hydration” branches of the data. The curvespredicted by the two models (“excluded volume” and DLVO) are soclose that they cannot be distinguished in the scale of Fig. 1. Thedistinct difference between the twomodels presented in Fig. 4b of Ref.[52] corresponds to film thicknesses that are considerably smallerthan those of the water core in our experiments, and to pressurevalues that are by many orders of magnitude higher than thoseregistered in our experiments (Fig. 1). It is possible to fit the wholeexperimental curves (including the “hydration” branch) by the“excluded volume” model if we assume that the surface electricpotential strongly increases with the decrease of the film thickness,which is rather unlikely.
3.2. Reduced-screening (RS) model
To explain the powerful repulsion observed at small distances,here we propose a new model that takes into account the fact that innanometer-thick films the free ions are unable to screen the electricfield of the film surfaces as effectively as they are doing that at largerthicknesses. The idea is illustrated in Fig. 2.
Fig. 2. Sketch of a foam film stabilized by anionic surfactant. A part of the adsorbedsurfactant ions (shown in gray color) are neutralized by bound counterions. (a) Atlarger thicknesses, the electrostatic repulsion is screened by both counterionsdissociated from the film surfaces and ions from the dissolved electrolyte (Debyescreening). (b) At sufficiently small thicknesses (in few-nanometer-thick films), onlycounterions dissociated from the surfaces remain in the film which leads to a reducedscreening of the electrostatic field and to a stronger repulsion between the film surfaces.s is the thickness of the adsorption layer at the film surface; h is the thickness of thewater core, and ht=h+2s is the total film thickness.
Let us consider a part of the film (a cell) that contains one electriccharge on each of the two film surfaces. In Fig. 2, this cell is confinedbetween the two vertical dashed lines. In average, such a cell must beelectroneutral. Hence, it can contain the two counterions of the ionizedsurface groups, as well as an integer number of dissociated moleculesfrom the added electrolyte. (In Fig. 2a, one such dissociated moleculeis shown.) If the distance between the two film surfaces isdiminishing, the number of dissociated electrolyte molecules in thecell will diminish because of the restricted space, until eventually onlythe two counterions dissociated from the ionized surface groupsremain in the cell, as shown in Fig. 2b. The transition from thesituation in Fig. 2a to that in Fig. 2b is accompanied with a significantweakening in the screening of the electrostatic field, as demonstratedbelow on the basis of the Poisson–Boltzmann equation.
First, let us numerate the ionic components present in theconsidered system: 1 — surfactant ion (like the dodecyl-sulfateanion); 2— counterion (like Li+, Na+ or Cs+), and 3— co-ion from thesalt (like Cl−). At the higher electrolyte concentrations, at which thehydration repulsion is observed, the Boltzmann equation is accuratein terms of activities [60]:
a1 = a1∞e−Φ
; a2 = a2∞eΦ; a3 = a3∞e
−Φ ð1Þ
where ai is the local activities of the respective ion (i=1, 2, 3);ai∞=ci∞γ± , where ai∞ is the bulk activity; ci∞ is the bulk concentrationand γ± is the bulk activity coefficient; Φ is the dimensionlesselectrostatic potential:
Φ≡ e jψ jkT
ð2Þ
T is the temperature; k is the Boltzmann constant; e is the electroniccharge, andψ is the dimensional potential.Φ defined by Eq. (2) is non-negative; as usual Φ=0 in the bulk of solution. The Boltzmanndistributions in Eq. (1) are equivalent to the condition for uniformityof the electrochemical potential of the respective ions throughout theelectric double layer [60].
In view of Eqs. (1) and (2), for the film of greater thickness (Fig. 2a)the Poisson–Boltzmann equation can be presented in the form:
d2Φdx2
=12κ2 eΦ−e−Φ
� �ð3Þ
where we have used the relationship a1∞+a3∞=a2∞, which is acorollary from the bulk electroneutrality condition; x is the coordinatein direction normal to the film surfaces; κ is the Debye parameter interms of activities:
κ2≡2e2a2∞εε0kT
ð4Þ
ε0 is the dielectric permittivity of vacuumand ε is the dielectric constantofwater. The Poisson–Boltzmann equation in terms of activities, Eq. (3),has been successfully applied for numerical interpretation of thesurface-tension isotherms of numerous ionic surfactants at varioussalt concentrations [61–65]. Here, our goal is to compare the basicequations of the DLVO theory and of the RS model.
In the framework of the DLVO theory, the integration of Eq. (3)yields [15]:
dΦdx
=ffiffiffi2
pκ coshΦ− coshΦmð Þ1=2 ð5Þ
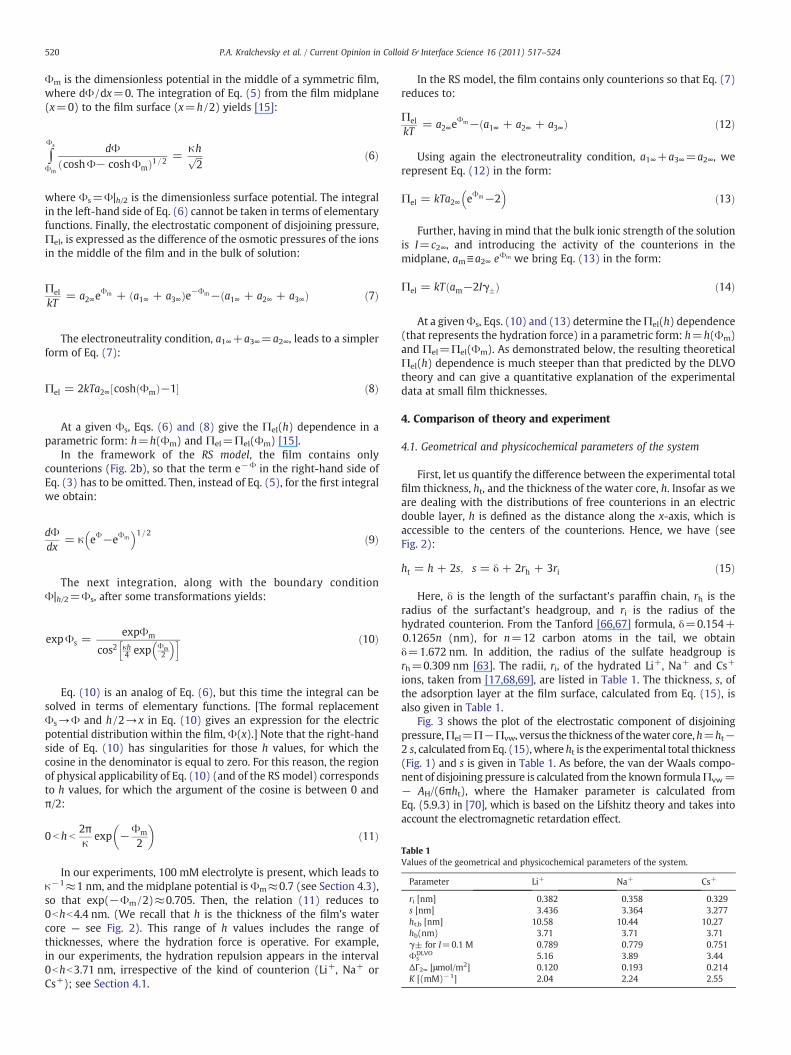
Table 1Values of the geometrical and physicochemical parameters of the system.
Parameter Li+ Na+ Cs+
ri [nm] 0.382 0.358 0.329s [nm] 3.436 3.364 3.277ht,b [nm] 10.58 10.44 10.27hb(nm) 3.71 3.71 3.71γ± for I=0.1 M 0.789 0.779 0.751Φs
DLVO 5.16 3.89 3.44ΔΓ2∞ [μmol/m2] 0.120 0.193 0.214K [(mM)−1] 2.04 2.24 2.55
520 P.A. Kralchevsky et al. / Current Opinion in Colloid & Interface Science 16 (2011) 517–524
Φm is the dimensionless potential in the middle of a symmetric film,where dΦ /dx=0. The integration of Eq. (5) from the film midplane(x=0) to the film surface (x=h /2) yields [15]:
∫Φs
Φm
dΦcoshΦ− coshΦmð Þ1=2 =
κhffiffiffi2
p ð6Þ
where Φs=Φ|h/2 is the dimensionless surface potential. The integralin the left-hand side of Eq. (6) cannot be taken in terms of elementaryfunctions. Finally, the electrostatic component of disjoining pressure,Πel, is expressed as the difference of the osmotic pressures of the ionsin the middle of the film and in the bulk of solution:
Πel
kT= a2∞e
Φm + a1∞ + a3∞ð Þe−Φm− a1∞ + a2∞ + a3∞ð Þ ð7Þ
The electroneutrality condition, a1∞+a3∞=a2∞, leads to a simplerform of Eq. (7):
Πel = 2kTa2∞ cosh Φmð Þ−1½ � ð8Þ
At a given Φs, Eqs. (6) and (8) give the Πel(h) dependence in aparametric form: h=h(Φm) and Πel=Πel(Φm) [15].
In the framework of the RS model, the film contains onlycounterions (Fig. 2b), so that the term e−Φ in the right-hand side ofEq. (3) has to be omitted. Then, instead of Eq. (5), for the first integralwe obtain:
dΦdx
= κ eΦ−eΦm� �1=2 ð9Þ
The next integration, along with the boundary conditionΦ|h/2=Φs, after some transformations yields:
expΦs =expΦm
cos2 κh4 exp Φm
2
� �h i ð10Þ
Eq. (10) is an analog of Eq. (6), but this time the integral can besolved in terms of elementary functions. [The formal replacementΦs→Φ and h /2→x in Eq. (10) gives an expression for the electricpotential distribution within the film, Φ(x).] Note that the right-handside of Eq. (10) has singularities for those h values, for which thecosine in the denominator is equal to zero. For this reason, the regionof physical applicability of Eq. (10) (and of the RS model) correspondsto h values, for which the argument of the cosine is between 0 andπ/2:
0 b h b2πκ
exp −Φm
2
� �ð11Þ
In our experiments, 100 mM electrolyte is present, which leads toκ−1≈1 nm, and the midplane potential is Φm≈0.7 (see Section 4.3),so that exp(−Φm/2)≈0.705. Then, the relation (11) reduces to0bhb4.4 nm. (We recall that h is the thickness of the film's watercore — see Fig. 2). This range of h values includes the range ofthicknesses, where the hydration force is operative. For example,in our experiments, the hydration repulsion appears in the interval0bhb3.71 nm, irrespective of the kind of counterion (Li+, Na+ orCs+); see Section 4.1.
In the RS model, the film contains only counterions so that Eq. (7)reduces to:
Πel
kT= a2∞e
Φm− a1∞ + a2∞ + a3∞ð Þ ð12Þ
Using again the electroneutrality condition, a1∞+a3∞=a2∞, werepresent Eq. (12) in the form:
Πel = kTa2∞ eΦm−2� �
ð13Þ
Further, having in mind that the bulk ionic strength of the solutionis I=c2∞, and introducing the activity of the counterions in themidplane, am≡a2∞ eΦm we bring Eq. (13) in the form:
Πel = kT am−2Iγ�ð Þ ð14Þ
At a givenΦs, Eqs. (10) and (13) determine theΠel(h) dependence(that represents the hydration force) in a parametric form: h=h(Φm)and Πel=Πel(Φm). As demonstrated below, the resulting theoreticalΠel(h) dependence is much steeper than that predicted by the DLVOtheory and can give a quantitative explanation of the experimentaldata at small film thicknesses.
4. Comparison of theory and experiment
4.1. Geometrical and physicochemical parameters of the system
First, let us quantify the difference between the experimental totalfilm thickness, ht, and the thickness of the water core, h. Insofar as weare dealing with the distributions of free counterions in an electricdouble layer, h is defined as the distance along the x-axis, which isaccessible to the centers of the counterions. Hence, we have (seeFig. 2):
ht = h + 2s; s = δ + 2rh + 3ri ð15Þ
Here, δ is the length of the surfactant's paraffin chain, rh is theradius of the surfactant's headgroup, and ri is the radius of thehydrated counterion. From the Tanford [66,67] formula, δ=0.154+0.1265n (nm), for n=12 carbon atoms in the tail, we obtainδ=1.672 nm. In addition, the radius of the sulfate headgroup isrh=0.309 nm [63]. The radii, ri, of the hydrated Li+, Na+ and Cs+
ions, taken from [17,68,69], are listed in Table 1. The thickness, s, ofthe adsorption layer at the film surface, calculated from Eq. (15), isalso given in Table 1.
Fig. 3 shows the plot of the electrostatic component of disjoiningpressure,Πel=Π−Πvw, versus the thickness of thewater core, h=ht−2 s, calculated fromEq. (15),where ht is the experimental total thickness(Fig. 1) and s is given in Table 1. As before, the van der Waals compo-nent of disjoining pressure is calculated from the known formulaΠvw=− AH/(6πht), where the Hamaker parameter is calculated fromEq. (5.9.3) in [70], which is based on the Lifshitz theory and takes intoaccount the electromagnetic retardation effect.
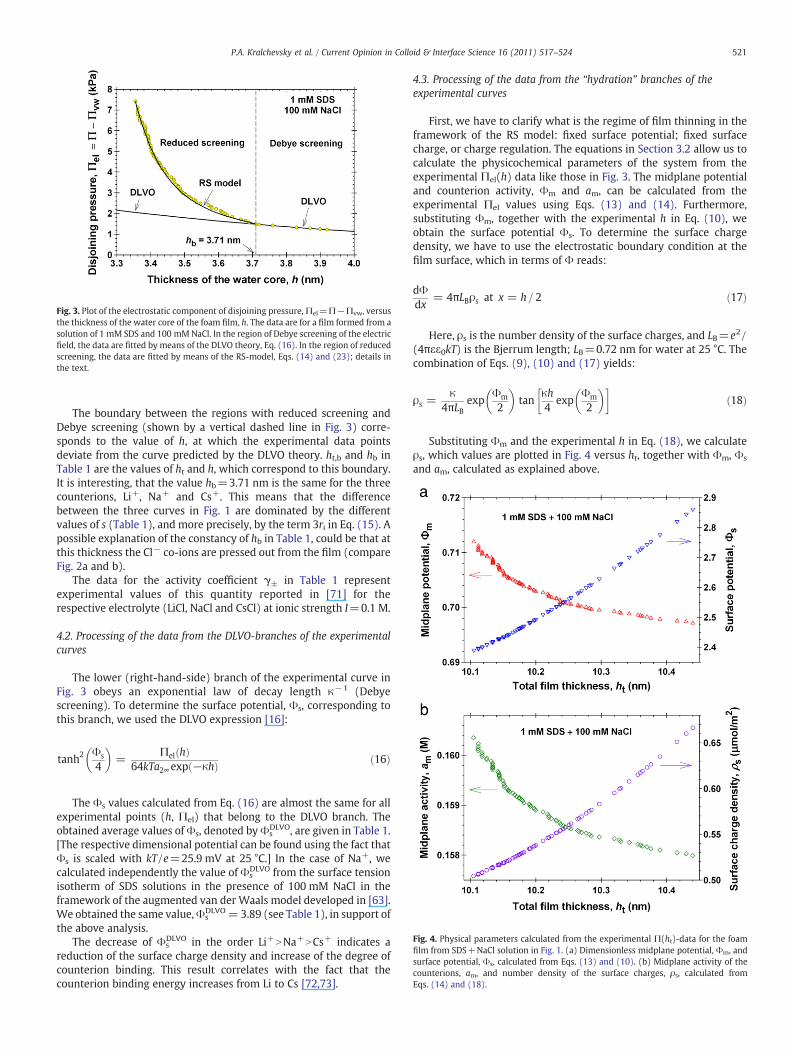
Fig. 3. Plot of the electrostatic component of disjoining pressure,Πel=Π−Πvw, versusthe thickness of the water core of the foam film, h. The data are for a film formed from asolution of 1 mM SDS and 100 mMNaCl. In the region of Debye screening of the electricfield, the data are fitted by means of the DLVO theory, Eq. (16). In the region of reducedscreening, the data are fitted by means of the RS-model, Eqs. (14) and (23); details inthe text.
Fig. 4. Physical parameters calculated from the experimental Π(ht)-data for the foamfilm from SDS+NaCl solution in Fig. 1. (a) Dimensionless midplane potential, Φm, andsurface potential, Φs, calculated from Eqs. (13) and (10). (b) Midplane activity of thecounterions, am, and number density of the surface charges, ρs, calculated fromEqs. (14) and (18).
521P.A. Kralchevsky et al. / Current Opinion in Colloid & Interface Science 16 (2011) 517–524
The boundary between the regions with reduced screening andDebye screening (shown by a vertical dashed line in Fig. 3) corre-sponds to the value of h, at which the experimental data pointsdeviate from the curve predicted by the DLVO theory. ht,b and hb inTable 1 are the values of ht and h, which correspond to this boundary.It is interesting, that the value hb=3.71 nm is the same for the threecounterions, Li+, Na+ and Cs+. This means that the differencebetween the three curves in Fig. 1 are dominated by the differentvalues of s (Table 1), and more precisely, by the term 3ri in Eq. (15). Apossible explanation of the constancy of hb in Table 1, could be that atthis thickness the Cl− co-ions are pressed out from the film (compareFig. 2a and b).
The data for the activity coefficient γ± in Table 1 representexperimental values of this quantity reported in [71] for therespective electrolyte (LiCl, NaCl and CsCl) at ionic strength I=0.1 M.
4.2. Processing of the data from the DLVO-branches of the experimentalcurves
The lower (right-hand-side) branch of the experimental curve inFig. 3 obeys an exponential law of decay length κ−1 (Debyescreening). To determine the surface potential, Φs, corresponding tothis branch, we used the DLVO expression [16]:
tanh2 Φs
4
� �=
Πel hð Þ64kTa2∞exp −κhð Þ ð16Þ
The Φs values calculated from Eq. (16) are almost the same for allexperimental points (h, Πel) that belong to the DLVO branch. Theobtained average values ofΦs, denoted byΦs
DLVO, are given in Table 1.[The respective dimensional potential can be found using the fact thatΦs is scaled with kT /e=25.9 mV at 25 °C.] In the case of Na+, wecalculated independently the value of Φs
DLVO from the surface tensionisotherm of SDS solutions in the presence of 100 mM NaCl in theframework of the augmented van der Waals model developed in [63].We obtained the same value,Φs
DLVO= 3.89 (see Table 1), in support ofthe above analysis.
The decrease of ΦsDLVO in the order Li+NNa+NCs+ indicates a
reduction of the surface charge density and increase of the degree ofcounterion binding. This result correlates with the fact that thecounterion binding energy increases from Li to Cs [72,73].
4.3. Processing of the data from the “hydration” branches of theexperimental curves
First, we have to clarify what is the regime of film thinning in theframework of the RS model: fixed surface potential; fixed surfacecharge, or charge regulation. The equations in Section 3.2 allow us tocalculate the physicochemical parameters of the system from theexperimental Πel(h) data like those in Fig. 3. The midplane potentialand counterion activity, Φm and am, can be calculated from theexperimental Πel values using Eqs. (13) and (14). Furthermore,substituting Φm, together with the experimental h in Eq. (10), weobtain the surface potential Φs. To determine the surface chargedensity, we have to use the electrostatic boundary condition at thefilm surface, which in terms of Φ reads:
dΦdx
= 4πLBρs at x = h= 2 ð17Þ
Here, ρs is the number density of the surface charges, and LB=e2/(4πεε0kT) is the Bjerrum length; LB=0.72 nm for water at 25 °C. Thecombination of Eqs. (9), (10) and (17) yields:
ρs =κ
4πLBexp
Φm
2
� �tan
κh4
expΦm
2
� �� �ð18Þ
Substituting Φm and the experimental h in Eq. (18), we calculateρs, which values are plotted in Fig. 4 versus ht, together with Φm, Φs
and am, calculated as explained above.
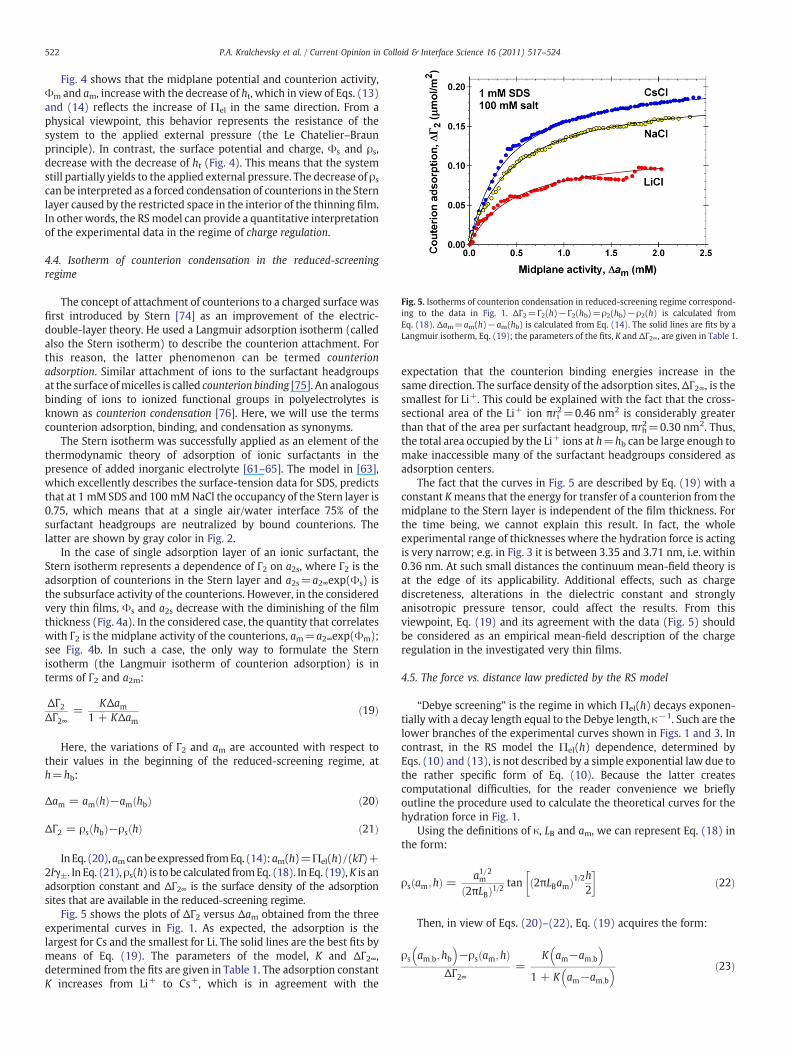
Fig. 5. Isotherms of counterion condensation in reduced-screening regime correspond-ing to the data in Fig. 1. ΔΓ2=Γ2(h)−Γ2(hb)=ρ2(hb)−ρ2(h) is calculated fromEq. (18). Δam=am(h)−am(hb) is calculated from Eq. (14). The solid lines are fits by aLangmuir isotherm, Eq. (19); the parameters of the fits, K and ΔΓ2∞, are given in Table 1.
522 P.A. Kralchevsky et al. / Current Opinion in Colloid & Interface Science 16 (2011) 517–524
Fig. 4 shows that the midplane potential and counterion activity,Φm and am, increasewith the decrease of ht, which in view of Eqs. (13)and (14) reflects the increase of Πel in the same direction. From aphysical viewpoint, this behavior represents the resistance of thesystem to the applied external pressure (the Le Chatelier–Braunprinciple). In contrast, the surface potential and charge, Φs and ρs,decrease with the decrease of ht (Fig. 4). This means that the systemstill partially yields to the applied external pressure. The decrease of ρscan be interpreted as a forced condensation of counterions in the Sternlayer caused by the restricted space in the interior of the thinning film.In other words, the RSmodel can provide a quantitative interpretationof the experimental data in the regime of charge regulation.
4.4. Isotherm of counterion condensation in the reduced-screeningregime
The concept of attachment of counterions to a charged surface wasfirst introduced by Stern [74] as an improvement of the electric-double-layer theory. He used a Langmuir adsorption isotherm (calledalso the Stern isotherm) to describe the counterion attachment. Forthis reason, the latter phenomenon can be termed counterionadsorption. Similar attachment of ions to the surfactant headgroupsat the surface ofmicelles is called counterion binding [75]. An analogousbinding of ions to ionized functional groups in polyelectrolytes isknown as counterion condensation [76]. Here, we will use the termscounterion adsorption, binding, and condensation as synonyms.
The Stern isotherm was successfully applied as an element of thethermodynamic theory of adsorption of ionic surfactants in thepresence of added inorganic electrolyte [61–65]. The model in [63],which excellently describes the surface-tension data for SDS, predictsthat at 1 mM SDS and 100 mMNaCl the occupancy of the Stern layer is0.75, which means that at a single air/water interface 75% of thesurfactant headgroups are neutralized by bound counterions. Thelatter are shown by gray color in Fig. 2.
In the case of single adsorption layer of an ionic surfactant, theStern isotherm represents a dependence of Γ2 on a2s, where Γ2 is theadsorption of counterions in the Stern layer and a2s=a2∞exp(Φs) isthe subsurface activity of the counterions. However, in the consideredvery thin films, Φs and a2s decrease with the diminishing of the filmthickness (Fig. 4a). In the considered case, the quantity that correlateswith Γ2 is the midplane activity of the counterions, am=a2∞exp(Φm);see Fig. 4b. In such a case, the only way to formulate the Sternisotherm (the Langmuir isotherm of counterion adsorption) is interms of Γ2 and a2m:
ΔΓ2ΔΓ2∞
=KΔam
1 + KΔamð19Þ
Here, the variations of Γ2 and am are accounted with respect totheir values in the beginning of the reduced-screening regime, ath=hb:
Δam = am hð Þ−am hbð Þ ð20Þ
ΔΓ2 = ρs hbð Þ−ρs hð Þ ð21Þ
InEq. (20),amcanbeexpressed fromEq. (14):am(h)=Πel(h)/(kT)+2Iγ±. In Eq. (21), ρs(h) is to be calculated fromEq. (18). In Eq. (19),K is anadsorption constant and ΔΓ2∞ is the surface density of the adsorptionsites that are available in the reduced-screening regime.
Fig. 5 shows the plots of ΔΓ2 versus Δam obtained from the threeexperimental curves in Fig. 1. As expected, the adsorption is thelargest for Cs and the smallest for Li. The solid lines are the best fits bymeans of Eq. (19). The parameters of the model, K and ΔΓ2∞,determined from the fits are given in Table 1. The adsorption constantK increases from Li+ to Cs+, which is in agreement with the
expectation that the counterion binding energies increase in thesame direction. The surface density of the adsorption sites, ΔΓ2∞, is thesmallest for Li+. This could be explained with the fact that the cross-sectional area of the Li+ ion πri2=0.46 nm2 is considerably greaterthan that of the area per surfactant headgroup, πrh2=0.30 nm2. Thus,the total area occupied by the Li+ ions at h=hb can be large enough tomake inaccessible many of the surfactant headgroups considered asadsorption centers.
The fact that the curves in Fig. 5 are described by Eq. (19) with aconstant Kmeans that the energy for transfer of a counterion from themidplane to the Stern layer is independent of the film thickness. Forthe time being, we cannot explain this result. In fact, the wholeexperimental range of thicknesses where the hydration force is actingis very narrow; e.g. in Fig. 3 it is between 3.35 and 3.71 nm, i.e. within0.36 nm. At such small distances the continuum mean-field theory isat the edge of its applicability. Additional effects, such as chargediscreteness, alterations in the dielectric constant and stronglyanisotropic pressure tensor, could affect the results. From thisviewpoint, Eq. (19) and its agreement with the data (Fig. 5) shouldbe considered as an empirical mean-field description of the chargeregulation in the investigated very thin films.
4.5. The force vs. distance law predicted by the RS model
“Debye screening” is the regime in which Πel(h) decays exponen-tially with a decay length equal to the Debye length, κ−1. Such are thelower branches of the experimental curves shown in Figs. 1 and 3. Incontrast, in the RS model the Πel(h) dependence, determined byEqs. (10) and (13), is not described by a simple exponential law due tothe rather specific form of Eq. (10). Because the latter createscomputational difficulties, for the reader convenience we brieflyoutline the procedure used to calculate the theoretical curves for thehydration force in Fig. 1.
Using the definitions of κ, LB and am, we can represent Eq. (18) inthe form:
ρs am;hð Þ = a1=2m
2πLBð Þ1=2 tan 2πLBamð Þ1=2h2
� �ð22Þ
Then, in view of Eqs. (20)–(22), Eq. (19) acquires the form:
ρs am;b;hb� �
−ρs am; hð ÞΔΓ2∞
=K am−am;b
� �
1 + K am−am;b
� � ð23Þ
523P.A. Kralchevsky et al. / Current Opinion in Colloid & Interface Science 16 (2011) 517–524
am is determined by solving Eq. (23) numerically for a given value of h.Finally, the obtained value of am is substituted in Eq. (14) to calculateΠel. The input parameters are LB;ΔΓ2∞; K; hb, and am,b=Πel(hb)/(kT)+2Iγ±; see Eq. (14) and Table 1. In our calculations, Πel(hb) was takenfrom the experiment, at the border between the regimes of reduced andDebye screening; see Fig. 3. In the case of theoretical modeling, one canuse the Πel(hb) value predicted by the DLVO theory. The model isapplicable not only to foam films, but also to any films from aqueouselectrolyte solutions that are formed between two charged surfaces,including solid ones. Additional work is necessary to verify theapplicability of the RS model to different systems at various electrolyteconcentrations.
With the surface-force apparatus [17] and with the CP-AFMtechnique [34], it is possible to measure greater surface forcesbetween solid surfaces in comparison with the MJ method [55],which is applicable to free foam films. Therefore, it is interesting toinvestigate the predictions of the RS model at smaller thicknesses andhigher pressures. From a physical viewpoint, the decrease of h leads totwo competitive effects: (i) increase of the osmotic-overlap repulsiondue to the counterions confined between the two film surfaces and(ii) enhancement of the counterion condensation (Fig. 5). As shownbelow, each of these two tendencies may prevail depending on theparameter values.
First, let us consider the case of ρs(hb)NΔΓ2∞. For h→0, Eq. (22)yields ρs=amh /2. Hence, at a finite ρs we have am→∞ for h→0. Then,Eq. (23) reduces to [ρs(hb)−amh /2] /ΔΓ2∞=1. Expressing am fromthe latter equation and substituting it in Eq. (14), we obtain theasymptotics of Πel:
Πel = kT2h
ρs hbð Þ−ΔΓ2∞½ � for h→0 ð24Þ
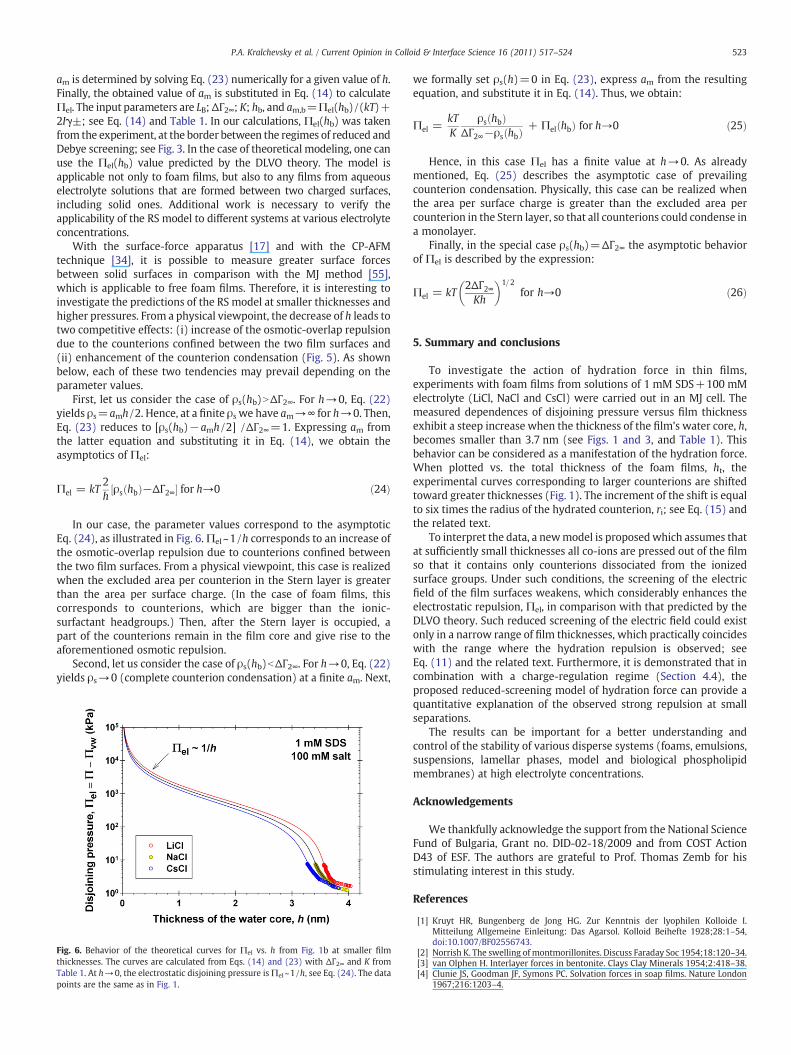
In our case, the parameter values correspond to the asymptoticEq. (24), as illustrated in Fig. 6.Πel~1/h corresponds to an increase ofthe osmotic-overlap repulsion due to counterions confined betweenthe two film surfaces. From a physical viewpoint, this case is realizedwhen the excluded area per counterion in the Stern layer is greaterthan the area per surface charge. (In the case of foam films, thiscorresponds to counterions, which are bigger than the ionic-surfactant headgroups.) Then, after the Stern layer is occupied, apart of the counterions remain in the film core and give rise to theaforementioned osmotic repulsion.
Second, let us consider the case of ρs(hb)bΔΓ2∞. For h→0, Eq. (22)yields ρs→0 (complete counterion condensation) at a finite am. Next,
Fig. 6. Behavior of the theoretical curves for Πel vs. h from Fig. 1b at smaller filmthicknesses. The curves are calculated from Eqs. (14) and (23) with ΔΓ2∞ and K fromTable 1. At h→0, the electrostatic disjoining pressure isΠel~1/h, see Eq. (24). The datapoints are the same as in Fig. 1.
we formally set ρs(h)=0 in Eq. (23), express am from the resultingequation, and substitute it in Eq. (14). Thus, we obtain:
Πel =kTK
ρs hbð ÞΔΓ2∞−ρs hbð Þ + Πel hbð Þ for h→0 ð25Þ
Hence, in this case Πel has a finite value at h→0. As alreadymentioned, Eq. (25) describes the asymptotic case of prevailingcounterion condensation. Physically, this case can be realized whenthe area per surface charge is greater than the excluded area percounterion in the Stern layer, so that all counterions could condense ina monolayer.
Finally, in the special case ρs(hb)=ΔΓ2∞ the asymptotic behaviorof Πel is described by the expression:
Πel = kT2ΔΓ2∞Kh
� �1=2for h→0 ð26Þ
5. Summary and conclusions
To investigate the action of hydration force in thin films,experiments with foam films from solutions of 1 mM SDS+100 mMelectrolyte (LiCl, NaCl and CsCl) were carried out in an MJ cell. Themeasured dependences of disjoining pressure versus film thicknessexhibit a steep increase when the thickness of the film's water core, h,becomes smaller than 3.7 nm (see Figs. 1 and 3, and Table 1). Thisbehavior can be considered as a manifestation of the hydration force.When plotted vs. the total thickness of the foam films, ht, theexperimental curves corresponding to larger counterions are shiftedtoward greater thicknesses (Fig. 1). The increment of the shift is equalto six times the radius of the hydrated counterion, ri; see Eq. (15) andthe related text.
To interpret the data, a newmodel is proposedwhich assumes thatat sufficiently small thicknesses all co-ions are pressed out of the filmso that it contains only counterions dissociated from the ionizedsurface groups. Under such conditions, the screening of the electricfield of the film surfaces weakens, which considerably enhances theelectrostatic repulsion, Πel, in comparison with that predicted by theDLVO theory. Such reduced screening of the electric field could existonly in a narrow range of film thicknesses, which practically coincideswith the range where the hydration repulsion is observed; seeEq. (11) and the related text. Furthermore, it is demonstrated that incombination with a charge-regulation regime (Section 4.4), theproposed reduced-screening model of hydration force can provide aquantitative explanation of the observed strong repulsion at smallseparations.
The results can be important for a better understanding andcontrol of the stability of various disperse systems (foams, emulsions,suspensions, lamellar phases, model and biological phospholipidmembranes) at high electrolyte concentrations.
Acknowledgements
We thankfully acknowledge the support from the National ScienceFund of Bulgaria, Grant no. DID-02-18/2009 and from COST ActionD43 of ESF. The authors are grateful to Prof. Thomas Zemb for hisstimulating interest in this study.
References
[1] Kruyt HR, Bungenberg de Jong HG. Zur Kenntnis der lyophilen Kolloide I.Mitteilung Allgemeine Einleitung: Das Agarsol. Kolloid Beihefte 1928;28:1–54,doi:10.1007/BF02556743.
[2] Norrish K. The swelling ofmontmorillonites. Discuss Faraday Soc 1954;18:120–34.[3] van Olphen H. Interlayer forces in bentonite. Clays Clay Minerals 1954;2:418–38.[4] Clunie JS, Goodman JF, Symons PC. Solvation forces in soap films. Nature London
1967;216:1203–4.
524 P.A. Kralchevsky et al. / Current Opinion in Colloid & Interface Science 16 (2011) 517–524
[5] Jordine EStA. Specific interactions which need nonequilibrium particle/particlemodels. J Colloid Interface Sci 1973;45:435–9.
[6] Derjaguin BV, Churaev NV. Structural component of disjoining pressure of thinlayers of liquids. Croatica Chem Acta 1977;50:187–95.
[7] LeNeveu DM, Rand RP, Parsegian VA, Gingell D. Measurement and modification offorces between lecithin bilayers. Biophys J 1977;18:209–30.
[8] Lis LJ, McAlister M, Fuller N, Rand RP, Parsegian VA. Interactions between neutralphospholipid bilayer membranes. Biophys J 1982;37:657–65.
[9] Israelachvili JN, Adams GE. Measurements of forces between two mica surfaces inaqueous electrolyte solutions in the range 0–100 nm. J Chem Soc Faraday Trans 11978;74:975–1001.
[10] Pashley RM, Israelachvili JN. A comparison of surface forces and interfacialproperties of mica in purified surfactant solutions. Colloids Surfaces 1981;2:169–87.
[11] Pashley RM, Israelachvili J. Molecular layering of water in thin films between micasurfaces and its relation to hydration forces. J Colloid Interface Sci 1984;101:511–22.
[12] Pashley RM. Hydration forces between mica surfaces in aqueous electrolytesolutions. J Colloid Interface Sci 1981;80:153–62.
[13] Pashley RM. DLVO and hydration forces between mica surfaces in Li+, Na+, K+,and Cs+ electrolyte solutions: a correlation of double-layer and hydration forceswith surface cation exchange properties. J Colloid Interface Sci 1981;83:531–46.
[14] Pashley RM. Hydration forces between mica surfaces in electrolyte solutions. AdvColloid Interface Sci 1982;16:57–62.
[15] Derjaguin BV, Landau LD. Theory of the stability of strongly charged lyophobic solsand of the adhesion of strongly charged particles in solutions of electrolytes. ActaPhysicochim URS 1941;14:633–62.
[16] Verwey EJW, Overbeek JThG. Theory of the stability of lyophobic colloids.Amsterdam: Elsevier; 1948.
[17] Israelachvili JN. Intermolecular and surface forces. London: Academic Press; 1992.[18] Peschel G, Belouschek P, Müller MM, Müller MR, König R. The interaction of solid
surfaces in aqueous systems. Colloid Polym Sci 1982;260:444–51.[19] Horn RG, Smith DT, Haller W. Surface forces and viscosity of water measured
between silica sheets. Chem Phys Lett 1989;162:404–8.[20] Claesson P, Carmona-Ribeiro AM, Kurihara K. Dihexadecyl phosphate monolayers:
intralayer and interlayer interactions. J Phys Chem 1989;93:917–22.[21] Petsev DN, Vekilov PG. Evidence for non-DLVO hydration interactions in solutions
of the protein apoferritin. Phys Rev Lett 2000;84:1339–42.[22] Petsev DN, Thomas BR, Yau S-T, Vekilov PG. Interactions and aggregation of
apoferritin molecules in solution: effects of added electrolytes. Biophys J 2000;78:2060–9.
[23] Valle-Delgado JJ, Molina-Bolívar JA, Galisteo-González F, Gálvez-Ruiz MJ, Feiler A,Rutland MW. Existence of hydration forces in the interaction between apoferritinmolecules adsorbed on silica surfaces. Langmuir 2005;21:9544–54.
[24] Aroti A, Leontidis E, Dubios M, Zemb T. Effects of monovalent anions of thehofmeister series on DPPC lipid bilayers Part I: swelling and in-plane equations ofstate. Biophys J 2007;93:1580–90.
[25] Leontidis E, Aroti A, Belloni L, Dubios M, Zemb T. Effects of monovalent anions ofthe hofmeister series on DPPC lipid bilayers Part II: modeling the perpendicularand lateral equation-of-state. Biophys J 2007;93:1591–607.
[26] Sanfeld A, Steinchen A. Emulsions stability, from dilute to dense emulsions — roleof drops deformation. Adv Colloid Interface Sci 2008;140:1–65.
[27] Kaldasch J, Senge B, Laven J. The impact of non-DLVO forces on the onset of shearthickening of concentrated electrically stabilized suspensions. Rheol Acta2009;48:665–72.
[28] Bongrand P. Intermolecular forces. In: Bongrand P, editor. Physical basis of cell–cell adhesion. Boca Raton, FL: CRC Press; 1987. p. 1–37.
[29] Binder B, Goede A, Berndt N, Holzhütter H-G. A conceptual mathematical model ofthe dynamic self-organisation of distinct cellular organelles. PLoS One 2009;4:1–12, doi:10.1371/journal.pone.0008295.
[30] Rand R, Parsegian V. Hydration forces between phospholipid bilayers. BiochimBiophys Acta 1989;988:351–76.
[31] Cevc G. Hydration force and the interfacial structure of the polar surface. J ChemSoc Faraday Trans 1991;87:2733–9.
[32] Leikin S, Parsegian VA, Rau DC, Rand RP. Hydration forces. Annu Rev Phys Chem1993;44:369–95.
[33] Israelachvili J, Wennerström H. Role of hydration and water structure in biologicaland colloidal interactions. Nature 1996;379:219–25.
[34] Butt H-J, Capella B, Kappl M. Force measurements with the atomic forcemicroscope: technique, interpretation and applications. Surface Sci Reports2005;59:1–152.
[35] Marčelja S, RadićN. Repulsion of interfaces due to boundary water. Chem Phys Lett1976;42:129–30.
[36] Besseling NAM. Theory of hydration forces between surfaces. Langmuir 1997;13:2113–22.
[37] Forsman J, Woodward CE, Jönsson B. The origins of hydration forces: Monte Carlosimulations and density functional theory. Langmuir 1997;13:5459–64.
[38] Jönsson B, Wennerström H. Image-charge forces in phospholipid bilayer systems.J Chem Soc Faraday Trans 2 1983;79:19–35.
[39] Kjellander R. On the image-charge model for the hydration force. J Chem SocFaraday Trans 2 1984;80:1323–48.
[40] Bratko D, Jönsson B. Electrical double layer interactions with image charges. ChemPhys Lett 1986;128:449–54.
[41] Trokhymchuk A, Henderson D, Wasan DT. A molecular theory of the hydrationforce in an electrolyte solution. J Colloid Interface Sci 1999;210:320–31.
[42] Simon SA, McIntosh TJ. Magnitude of the solvation pressure depends on dipolepotential. Proc Natl Acad Sci USA 1989;86:9263–7.
[43] Richmond P. Electrical forces between particles with arbitrary fixed surface chargedistributions in ionic solution. J Chem Soc Faraday Trans 2 1974;70:1066–73.
[44] Dzhavakhidze PG, Kornyshev AA, Levadny VG. The structure of the interface in thesolvent-mediated interaction of dipolar surfaces. Nuovo Cimento 1988;10D:627–53.
[45] Kornyshev AA, Leikin S. Fluctuation theory of hydration forces: the dramaticeffects of inhomogeneous boundary conditions. Phys Rev A 1989;40:6431–7.
[46] Leikin S, Kornyshev AA. Theory of hydration forces. Nonlocal electrostaticinteraction of neutral surfaces. J Chem Phys 1990;92:6890–8.
[47] Attard P, Patey GN. Continuum electrostatic interactions between planar lattices ofdipoles and thepossible relevance to thehydration force. PhysRevA1991;43:2953–62.
[48] Henderson D, Lozada-Cassou M. A simple theory for the force between spheresimmersed in a fluid. J Colloid Interface Sci 1986;114:180–3.
[49] Henderson D, Lozada-Cassou M. Note: does dielectric saturation provide aplausible explanation of the hydration solvation force? J Colloid Interface Sci1994;162:508–9.
[50] Basu S, Sharma MM. Effect of dielectric saturation on disjoining pressure in thinfilms of aqueous electrolytes. J Colloid Interface Sci 1994;165:355–66.
[51] Paunov VN, Dimova RI, Kralchevsky PA, Broze G, Mehreteab A. The hydrationrepulsion between charged surfaces as an interplay of volume exclusion anddielectric saturation effects. J Colloid Interface Sci 1996;182:239–48.
[52] Paunov VN, Binks BP. Analytical expression for the electrostatic disjoiningpressure taking into account the excluded volume of the hydrated ions betweencharged interfaces in electrolyte. Langmuir 1999;15:2015–21.
[53] Israelachvili JN, Wennerström H. Entropic forces between amphiphilic surfaces inliquids. J Phys Chem 1992;96:520–31.
[54] Brzozowska AM, Spruijt E, de Keizer A, Cohen Stuart MA, NordeW. On the stabilityof the polymer brushes formed by adsorption of ionomer complexes onhydrophilic and hydrophobic surfaces. J Colloid Interface Sci 2011;353:380–91.
[55] Mysels KJ, Jones MN. Direct measurement of the variation of double-layerrepulsion with distance. Discuss Faraday Soc 1966;42:42–50.
[56] Schelero N, Hedicke G, Linse P, von Klitzing R. Effects of counterions and co-ions onfoam films stabilized by anionic dodecyl sulfate. J Phys Chem B 2010;114:15523–9.
[57] Sheludko A. Thin liquid films. Adv Colloid Interface Sci 1967;1:391–464.[58] Bergeron V, Radke CJ. Equilibrium measurements of oscillatory disjoining
pressures in aqueous foam films. Langmuir 1992;8:3020–6.[59] Dimitrova TD, Leal-Calderon F, Gurkov TD, Campbell B. Disjoining pressure vs
thickness isotherms of thin emulsion films stabilized by proteins. Langmuir 2001;17:8069–77.
[60] Kirkwood JG, Oppenheim I. Chemical thermodynamics. New York: McGraw-Hill;1961.
[61] Kralchevsky PA, Danov KD, Broze G, Mehreteab A. Thermodynamics of ionicsurfactant adsorption with account for the counterion binding: effect of salts ofvarious valency. Langmuir 1999;15:2351–65.
[62] Kolev VL, Danov KD, Kralchevsky PA, Broze G, Mehreteab A. Comparison of the vander Waals and Frumkin adsorption isotherms for sodium dodecyl sulfate atvarious salt concentrations. Langmuir 2002;18:9106–9.
[63] Kralchevsky PA, Danov KD, Kolev VL, Broze G, Mehreteab A. Effect of nonionicadmixtures on the adsorption of ionic surfactants at fluid interfaces. 1. Sodiumdodecyl sulfate and dodecanol. Langmuir 2003;19:5004–18.
[64] Valkovska DS, Shearman GC, Bain CD, Darton RC, Eastoe J. Adsorption of ionicsurfactants at an expanding air–water interface. Langmuir 2004;20:4436–45.
[65] Kralchevsky PA, Danov KD, Denkov ND. Chemical physics of colloid systems andinterfaces. In: Birdi KS, editor. Handbook of surface and colloid chemistry. BocaRaton, FL: CRC Press; 2008. p. 197–377.
[66] Tanford C. The hydrophobic effect. The formation of micelles and biologicalmembranes. New York: Wiley; 1980.
[67] Hiemenz PC, Rajagopalan R. Principles of colloid and surface chemistry. New York:Marcel Dekker; 1997.
[68] Cotton FA, Wilkinson G. Advanced inorganic chemistry. New York: Wiley; 1983.[69] Pandey S, Bagwe RP, Shah DO. Effect of counterions on surface and foaming
properties of dodecyl sulfate. J Colloid Interface Sci 2003;267:160–6.[70] Russel WB, Saville DA, Schowalter WR. Colloidal dispersions. Cambridge:
Cambridge University Press; 1989.[71] Hamer WJ, Wu Y-C. Osmotic coefficients and mean activity coefficients of
univalent electrolytes in water at 25 °C. J Phys Chem Ref Data 1972;1:1047–99.[72] Lu JR, Marrocco A, Su TJ, Thomas RK, Penfold J. Adsorption of dodecyl sulfate
surfactants with monovalent metal counterions at the air–water interface studiedby neutron reflection and surface tension. J Colloid Interface Sci 1993;158:303–16.
[73] Karakashev S, Tsekov R, Manev E. Adsorption of alkali dodecyl sulfates onair/water surface. Langmuir 2001;17:5403–5.
[74] Stern O. Zur Theorie der Elektrolytischen Doppelschicht. Z Elektrochem 1924;30:508–16.
[75] Rathman JF, Scamehorn JF. Counterion binding on mixed micelles. J Phys Chem1984;88:5807–16.
[76] Oosawa F. Polyelectrolytes. New York: M. Dekker; 1971.
Copyright © 2022 FDOKUMEN